Embed Size (px)
Citation preview
1
Supporting Information for
Interdependence of Pyrene Interactions and Tetramolecular G4-DNA Assembly
by Osman Doluca,a,c Jamie M. Withers,a Trevor S. Loo,a Patrick J. B. Edwards,a Carlos
Gonzalez,b Vyacheslav V. Filichev*a
OligonucleotideSynthesis
Oligonucleotides (ONs) were synthesised with an Mer-Maid 4 automated DNA synthesiser from
BioAutomation Corporation using 4,5-dicyanoimidazole (DCI) as an activator. Oxidation and
deprotection times were set to 40 s and the activation time at 60 s for 1.0 μmol synthesis scale. For
coupling of modified nucleotides, automated DNA synthesis was paused after the deblocking step.
TINA phosphoramidite (10 mg per coupling) was added into each 1 µmol column and 750 µL of an
activator (0.25 M DCI in dry acetonitrile) was directly injected onto the column under argon by the
automated DNA synthesiser. Coupling time was extended for hand coupling (up to 5 min). All
oligonucleotides were synthesised in DMT-on mode. TINA-conjugated ONs were purified using
reverse-phase HPLC instrument (Waters™ 600) using a C-18 column from Alltech with 250 mm
length and 10 mm internal diameter. The residue was dissolved in H2O (1 mL). Buffer A [0.05 M
TEAA in H2O (pH = 7.0)] and buffer B (75 % acetonitrile, 25 % H2O). Flow 2.5 mL min-1.
Gradients: 2 min 100 % buffer A, linear gradient to 100 % buffer B in 48 min, linear gradient to 100
% buffer A in 2 min, 100 % buffer A for 10 min. The corresponding UV-active fractions were
freeze-dried. After purification, DMT-on-ONs were treated with 80 % aqueous AcOH (100 µL) for
20 min at +4 °C to remove 5′-O-DMT group. NaOAc (3 M, 50 µL) followed by EtOH (1 mL) were
added and vortexed. Solutions were cooled to -18 °C for two hours in order to precipitate the ONs.
Samples were centrifuged for 20 min at 13000 rpm and supernatant was removed. Pellets were
washed with EtOH (2 × 500 µL), centrifuged and the supernatant was removed. Then, the rest of
the solvent was evaporated at 50 °C for 15 min. 100 µL H2O was added to dissolve the ONs.
Purities of ONs were confirmed by denaturing gel electrophoresis using 20 % polyacrylamide gel
(0.75 mm thickness, 19:1 acrylamide/bisacrylamide ratio) and found to be more than 95 % pure.
Gels were prepared in 1× TBE buffer (100 mM Tris, 90 mM boric acid, and 10 mM EDTA) under
denaturing conditions (7 M urea). ONs were loaded onto gels after preincubation at 90 °C for 10
min. Molecular weight of ONs was confirmed by mass-spectroscopy analysis (Table S1).
PolyacrylamideGelElectrophoresis
For non-denaturing 20 % PAGE, gels were prepared in HEPES buffer (50 mM) in corresponding
salt concentrations (110 mM NaCl or KCl, the same buffer was used as a running buffer) with 0.75
Electronic Supplementary Material (ESI) for Organic & Biomolecular Chemistry.This journal is © The Royal Society of Chemistry 2015
2
mm thickness, 19:1 acrylamide/bisacrylamide ratio. ONs were prepared at 100 µM strand
concentration, incubated in 50 mM HEPES using the same salt concentrations and heated up to 90
°C for between 10 and 30 min before cooling down and incubating at 4 °C overnight. All gel
electrophoresis were performed at room temperature. After the electrophoresis, gels were stained
with 5 % Stains-All® in 50 % water/formamide for 5–10 min and then destained in H2O until
complete washing of the dye from the gel background occurred.
UV‐VisSpectroscopy
UV-Vis spectroscopy was performed using Cary 100Bio UV-Vis spectrometer using quartz
cuvettes with 1 cm pathlength and a 2 × 6 multicell block with a Peltier temperature controller.
Extinction coefficient (ε) of TINA is 22000 [L/(mol×cm)].
1.1.1 UV‐VisThermalDifferenceSpectra(UV‐VisTDS)
Thermal difference spectra were determined for the DNA complexes (with 10 µM strand
concentration) by subtraction of UV-Vis spectra obtained in Li cacodylate buffer (10 mM) and
NaCl or KCl (110 mM) at 20 °C after 2-7 days on incubation of samples at 4°C from UV-Vis
spectra obtained after 30 min incubation at 90 °C.
1.1.2 DeterminationofMeltingandAnnealingTemperatures
The melting temperatures (Tm [°C]) were determined for G-quadruplexes [prepared at 10 µM strand
concentration in Li cacodylate buffer (10 mM) and NaCl or KCl (110 mM)] as the maxima of the
first derivative plots of the melting curves obtained by measuring absorbance at 373 nm against
increasing temperatures (0.18, 0.5 or 1 °C/min). The change in absorbance was also recorded at 295
nm (see Figure S3).
AssociationRateConstant(kon)Measurements
Association rate constants (kon) for G-quadruplex formations were measured using CD and UV-Vis
spectroscopy as previously described (Mergny, De Cian et al. 2005). Stock solution of ONs was
preincubated at 90 °C for 30 min and then transferred into Li cacodylate buffer (10 mM) and NaCl
(110 mM) solution at 20 °C. Stock solution of dTG6T was treated with LiOH at 90 °C for 15 min to
ensure full denaturation of the complex followed by HCl neutralisation. As soon as the ONs were
diluted in a buffer, changes in absorbance at 275, 280, 295 and 373 nm or changes in CD signal at
3
265 (G3X, TG6T) or 295 nm (GXG) were then recorded every 5 min for 12.5 h. The data were used
to plot the change in absorbance versus time (s) in Kleida Graph software. A curve was fit to the
data using the following equation (Mergny, De Cian et al. 2005):
1 1 C
Absi refers to absorbance of the sample when all strands exist in unfolded, single-stranded form.
Absf represent the absorbance of the sample when equilibrium is reached between folded and
unfolded forms of the ONs. C represents the strand concentration, n represents the order of the
reaction, which is 4 for tetramolecular G-quadruplexes, and t represents the time elapsed in seconds.
Experimental data and kon values are presented in Figure S5 and Tables 1 and S4.
CircularDichroism(CD)Spectroscopy
CD spectra were recorded using a Chirascan CD spectrophotometer (150 W Xe arc) from Applied
Photophysics with a Quantum Northwest TC125 temperature controller. CD spectra (average of at
least 3 scans) were recorded between 200 and 500 nm with 1 nm intervals, 120 nm/min scan rate
and 1 cm pathlength followed by substraction of a background spectrum (buffer only). CD spectra
of G-quadruplexes were recorded at 10 µM strand concentration in Li cacodylate (10 mM)
supplemented with NaCl or KCl (110 mM) at pH 7.2 or in 150 mM ammonium acetate buffer, pH
7.0 at 20 °C.
FluorescenceSpectroscopy
Fluorescence spectroscopy studies were performed using a FluoroMax-4 Spectrofluorometer from
HORIBA Scientific. Fluorescence emission spectra were recorded for all TINA-containing ONs
between 380 and 600 nm when excited at 373 nm (excitation and emission slits were 2 nm).
Fluorescence excitation spectra were recorded between 250 and 450 nm while monitoring emission
at 480 nm (excitation and emission slits were 2 nm). Samples were prepared as described for UV-
Vis spectroscopy and adjusted to an identical optical density at an excitation wavelength of 373 nm.
For convenience the values in the y-axis (fluorescence intensity) were divided by 104.
ESI‐massSpectrometry
TINA G4-DNA samples were annealed at 400-500 µM concentration in a Na-containing buffer (75-
100 µL), 10 M aq. ammonium acetate (35 µL) was added and DNA were precipitated upon addition
of ethanol (1 mL) followed by incubation for 2 hr at -20 °C. Samples were centrifuged, solvent was
decanted and pillets after washing with ethanol (2 × 500 µL) were dried in vacuo. Pillets were
dissolved in 150 mM ammonium acetate buffer (250 µL, pH 7.0). Samples were left at +4 °C for 5
days. Each sample was diluted to 10 µM concentration in 150 mM ammonium acetate buffer and

4
just before an injection samples was further diluted with 15% MeCN. Samples were also analysed
using 15 % MeOH as a co-solvent but it did not result in an improved electrospray signal. Each
diluted sample (3 µL) was injected into an Agilent 1200 analytical liquid chromatography system
(Agilent Technologies, Hanover, Germany) delivering an isocratic gradient containing 50% (v/v)
acetonitrile and 50% (v/v) water at a flow rate of 200 µL min-1 in bypass mode. The LC eluent was
directly infused into a duel electrospray ionization (ESI) source coupled to an Agilent 6520
quadrupole time of flight (Q-TOF) mass spectrometer (Agilent Technologies, Hanover, Germany).
Mass drifts were constantly corrected with reference standards in real time. Ions generated by ESI
operated at a nitrogen flow of 5.0 L min-1, gas temperature of 290 °C and a neubiliser spray
pressure at 30 psi were analysed in negative ion mode with a capillary voltage of 3,500 V, a
fragmentator voltage of 175 V and a skimmer voltage of 65 V.
Total ion count (TIC) was recorded in profile mode over the m/z range of 100-3,000 and analysed
using Agilent MassHunter Workstation Qualitative Analysis software version B.6.0633.10 (Agilent
Technologies, Hanover, Germany).
NMRSpectroscopyofOligonucleotides
NMR spectroscopy of G-quadruplexes formed by GXG and TXG were performed on 700 MHz
Brüker instrument and processed with Topspin software. ONs (100, 500 or 1000 µM) were
incubated overnight in 10 % D2O, 10 mM Na+ phosphate buffer supplemented with or without NaCl
(100 mM) or KCl (10 mM), pH 7.0 at 20 °C prior to NMR spectroscopy. Trimethylsilyl propionate
(TSP, 25 µM) was used as internal standard in 1H NMR (δ = 0.003 ppm).
IP-COSY (1), TOCSY and NOESY experiments were recorded in H2O/D2O. The NOESY spectra
were acquired with mixing times of 100 and 250 ms, and the TOCSY spectra were recorded with
standard MLEV-17 spin-lock sequence, and 60-ms mixing time. Water suppression was achieved
by including either a WATERGATE (2) or excitation-sculpting (3) module in the pulse sequence
prior to acquisition. NOESY spectra in D2O were acquired with 150 ms and 250 ms mixing times.
Two-dimensional experiments in D2O were carried out at temperatures ranging from 5 ºC to 25 ºC,
whereas spectra in H2O were recorded at 5 ºC to reduce the exchange with water. The spectral
analysis program Sparky (4) was used for semiautomatic assignment of the NOESY cross-peaks
and quantitative evaluation of the NOE intensities.
NMR‐basedmolecularmodeling. The computer package Sybyl was used to build TINA
structure and to perform the adequate insertion in the DNA sequence. Structural model were
calculated with the SANDER module of the molecular dynamics package AMBER (5).
Parametrization of the AMBER force field for TINA was carried out following standard methods in
ANTECHAMBER program. Charges were calculated using RESP/6-31G(d). In a first step, a model
5
of a dimeric quadruplex formed by the association of two hairpins was built. Atomic coordinates for
initial modeling were taken from of the solution structure of the Bombyx Mori telomeric G-
quadruplex (1AFF) determined by Kettani, et al (6). This structure was chosen because it is
stabilized by two G-tetrads and its content of syn and anti guanines is consistent with the
experimental information obtained for our TINA conjugates. Only the guanine residues were
considered. Two TINA blocks were used to connect contiguous antiparallel G-tracts, giving rise to
two hairpins oriented in a head-to-head way. Thymine residues were added at the 5’- and 3’-ends of
each of the resulting hairpins. This model was energy minimized and submitted to a short molecular
dynamics run in vacuo to eliminate bas steric contacts. The relative orientation of the two TINA
moieties was constrained during these calculations. As a second step, the resulting dimeric
structures were used to build a tetramer consisting of two dimeric quadruplexes with the program
Sybyl. The relative orientation of the two quadruplexes was selected manually trying to maximize
TINA-TINA contacts. The resulting structures were submitted to a molecular dynamics run
including explicit solvent, periodic boundary conditions and the Particle-Mesh-Ewald method to
evaluate long-range electrostatic interactions (7). Thus, the structures obtained in the previous step
were placed in the center of a water-box with around 4000 water molecules and 24 sodium
counterions to obtain electroneutral systems. We used the parmbsc0 revision of the parm99 force
field (8) including suitable parameters for the TINA nucleotide calculated for this work. The TIP3P
model was used to describe water molecules (9). The protocol for the constrained molecular
dynamics refinement in solution consisted of an equilibration period of 160 ps using a standard
equilibration process (10), followed by 10 independent 500 ps runs. Averaged structures were
obtained by averaging the last 250 ps of individual trajectories and further relaxation of the
structure.
Analysis of the representative structures as well as the MD trajectories was carried out with the
programs MOLMOL (11), the analysis tools of AMBER, and other “in house” programs.
6
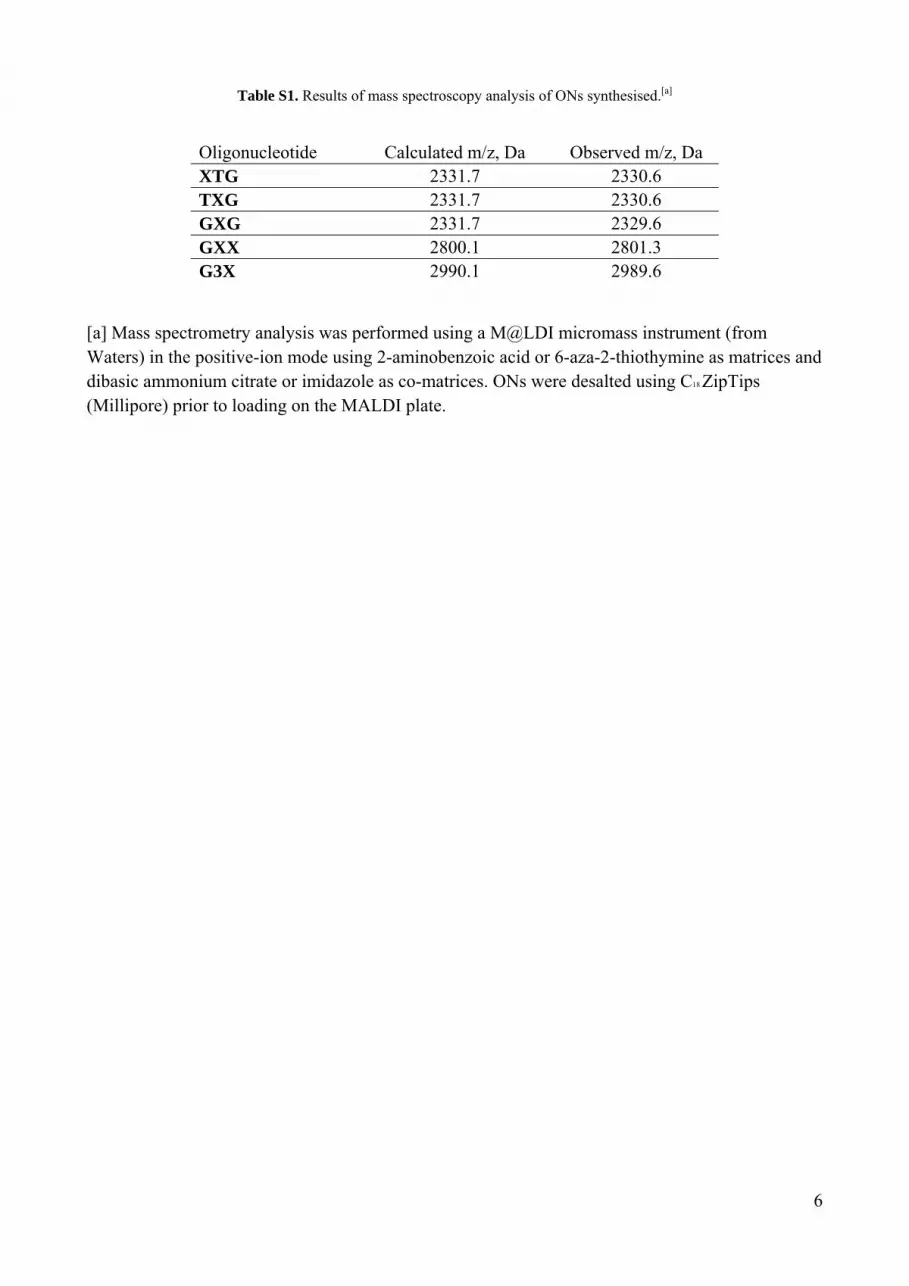
Table S1. Results of mass spectroscopy analysis of ONs synthesised.[a]
Oligonucleotide Calculated m/z, Da Observed m/z, Da XTG 2331.7 2330.6 TXG 2331.7 2330.6 GXG 2331.7 2329.6 GXX 2800.1 2801.3 G3X 2990.1 2989.6
[a] Mass spectrometry analysis was performed using a M@LDI micromass instrument (from Waters) in the positive-ion mode using 2-aminobenzoic acid or 6-aza-2-thiothymine as matrices and dibasic ammonium citrate or imidazole as co-matrices. ONs were desalted using C18 ZipTips (Millipore) prior to loading on the MALDI plate.

7
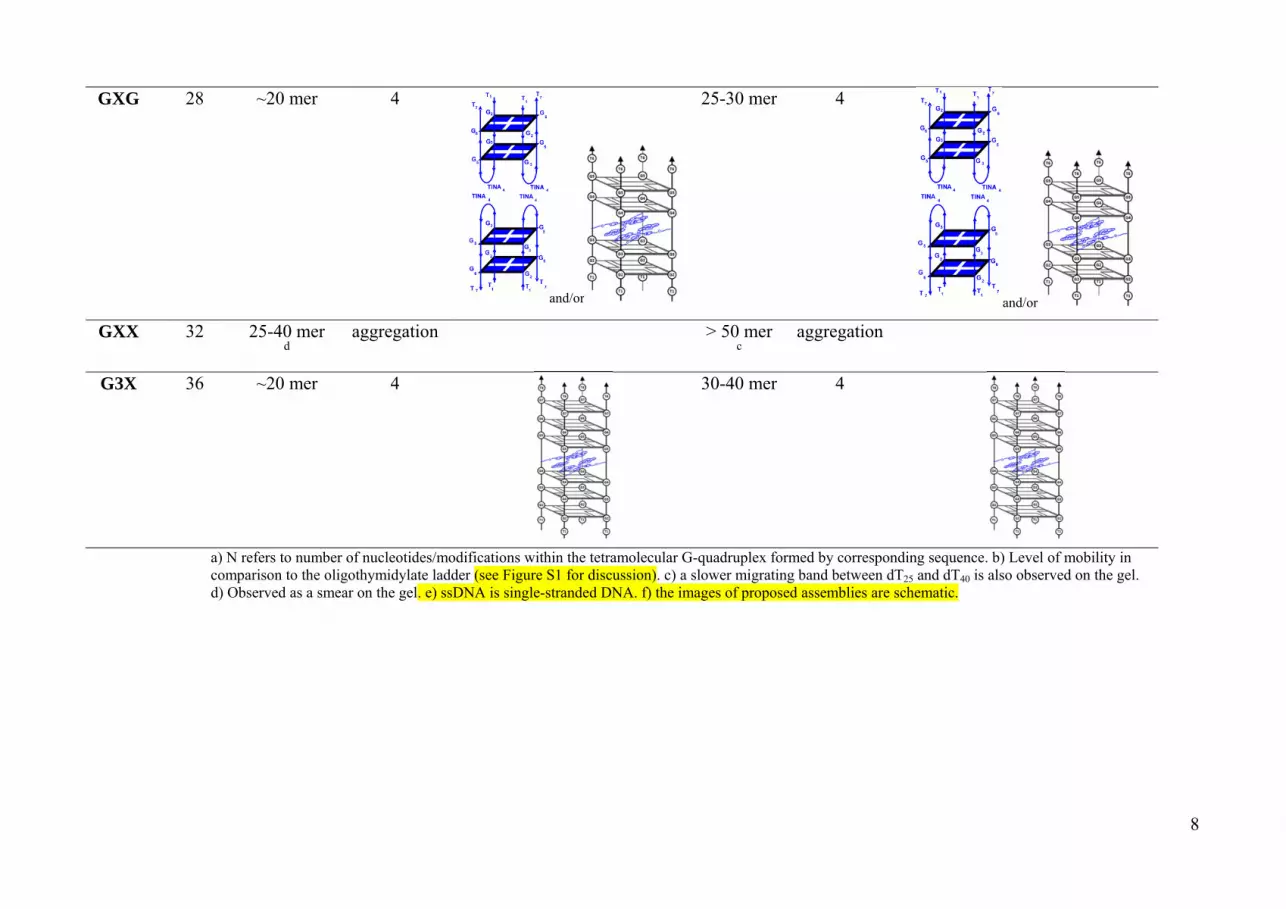
Table S2. Retardation of the G-quadruplexes formed by TINA-TG4T sequences in native PAGE (20 %) and molecularity in the presence of 110 mM NaCl or KCl in 50 mM HEPES
buffer at pH 7.2, room temperature.
N a NaCl KCl (N=n×4) mobility b molecularity Proposed assemblyf mobility b molecularity Proposed assembly
TG4T 24 10-15 mer 4 15-20 mer 4
XTG 28 25-30 mer 4
> 50 mer aggregation
and at high DNA concentrations
TXG 28 25-30 mer 4
25 mer c 4
GTG 28 10-15 mer ssDNAe ~10 mer ssDNA
20-25 mer 4
8
GXG 28 ~20 mer 4
and/or
25-30 mer 4
and/or
GXX 32 25-40 mer d
aggregation > 50 mer c
aggregation
G3X 36 ~20 mer 4
30-40 mer 4
a) N refers to number of nucleotides/modifications within the tetramolecular G-quadruplex formed by corresponding sequence. b) Level of mobility in
comparison to the oligothymidylate ladder (see Figure S1 for discussion). c) a slower migrating band between dT25 and dT40 is also observed on the gel. d) Observed as a smear on the gel. e) ssDNA is single-stranded DNA. f) the images of proposed assemblies are schematic.

9
Figure S1. A) Denaturing PAGE (20 %, 7M urea) analysis of oligonucleotides (100 µM, samples were heated at 95 °C
for 30 min in 7M urea prior loading); B-D) Representative images of native PAGE (20 %) of oligonucleotides (100
µM) in the presence of 110 mM NaCl (B) and 110 mM KCl (C, D) in 50 mM HEPES buffer at pH 7.2, room
temperature. Ladder (L) contains 10-, 15-, 20-, 25-, 40- or 50-mer oligothymidylates as indicated.
TINA-modified TG4(6)T sequence have similar mobility in the denaturing PAGE (Fig. S1A), just
above dT10 component of the ladder and are slightly retarded in comparison with controls dTG4T
and GTG. In native PAGE, all complexes migrate slower in K+ than in Na+ relative to the ladder
components. G3X and GXG sequences form complexes with similar mobility in Na+ and K+. The
presence of TINA and an additional phosphate results in slower mobility of G3X and GXG in
comparison with (TG4T)4 and (GTG)4 in K+ (Figure S1D). Of note, GTG only partially forms G4-
DNA at 100 µM oligonucleotide concentration in K+ (two bands are observed). TXG and XTG
sequences form a hydrophobic pocket at the 5’-end of corresponding G4-DNAs which lead to
slower mobility in the native gel (Na+) in comparison to GXG and G3X assemblies (Fig. S1B). In
K+, TXG complex migrates similar to G3X (25-30 mer, Fig. S1C), whereas XTG has significantly
slower mobility (>50 mer, Fig. S1D) indicating that XTG forms a dimeric G4-DNA (8-strands)
assisted by TINA-TINA aggregation (Table S2). Two transitions detected in melting profile (Figure
S4) suggest that dimeric aggregate of (XTG)4 dissociates at 25-30 °C followed by dissociation of
10
G4-DNA (> 90 °C). It also means that 5’-dT prevents formation of aggregates in TXG both Na+
and K+. GXX sequence form a slow migrating smear in both Na+ and K+ which suggest
aggregation.

11
Figure S2. Normalised UV-vis spectra of TINA-TG4T constructs in the TINA absorbance region at 10 µM strand concentration before (90 °C) and after annealing (20 °C) in the presence of NaCl in
10 mM Li cacodylate buffer at pH 7.2.
0
0.2
0.4
0.6
0.8
1
320 370 420
Abs, norm
Wavelength, nm
XTG Na 20°C
XTG Na 90°C
0
0.2
0.4
0.6
0.8
1
320 370 420
Abs, norm
Wavelength, nm
TXG Na 20°C
TXG Na 90°C
0
0.2
0.4
0.6
0.8
1
320 370 420
Abs, norm
Wavelength, nm
GXG Na 20°C
GXG Na 90°C
0
0.2
0.4
0.6
0.8
1
320 370 420Abs, norm
Wavelength, nm
G3X Na 20°C
G3X Na 90°C
0
0.2
0.4
0.6
0.8
1
320 370 420
Abs, norm
Wavelength, nm
GXX Na 20°C
GXX Na 90°C

12
Figure S3. UV-Vis Thermal difference spectra of G-quadruplex samples at 10 µM strand concentration after annealing
in the presence of 110 mM KCl (dashed line) or NaCl (grey line) in 10 mM Li cacodylate buffer at pH 7.2.
‐0.05
0
0.05
0.1
0.15
220 270 320 370 420
ΔAbs (a.u.)
Wavelength (nm)
TG4T in KCl
‐0.05
0
0.05
0.1
220 270 320 370 420
ΔAbs (a.u.)
Wavelength (nm)
XTG in NaCl
XTG in KCl
‐0.05
0
0.05
0.1
220 270 320 370 420
ΔAbs (a.u.)
Wavelength (nm)
TXG in NaCl
TXG in KCl
‐0.2
‐0.1
0
0.1
0.2
0.3
220 270 320 370 420ΔAbs (a.u.)
Wavelength (nm)
GXG in NaCl
GXG in KCl
‐0.05
0.05
0.15
0.25
220 270 320 370 420
ΔAbs (a.u.)
Wavelength (nm)
GXX in NaClGXX in KCl
‐0.2
‐0.1
0
0.1
0.2
0.3
220 270 320 370 420ΔAbs (a.u.)
Wavelength (nm)
G3X in NaClG3X in KCl
13
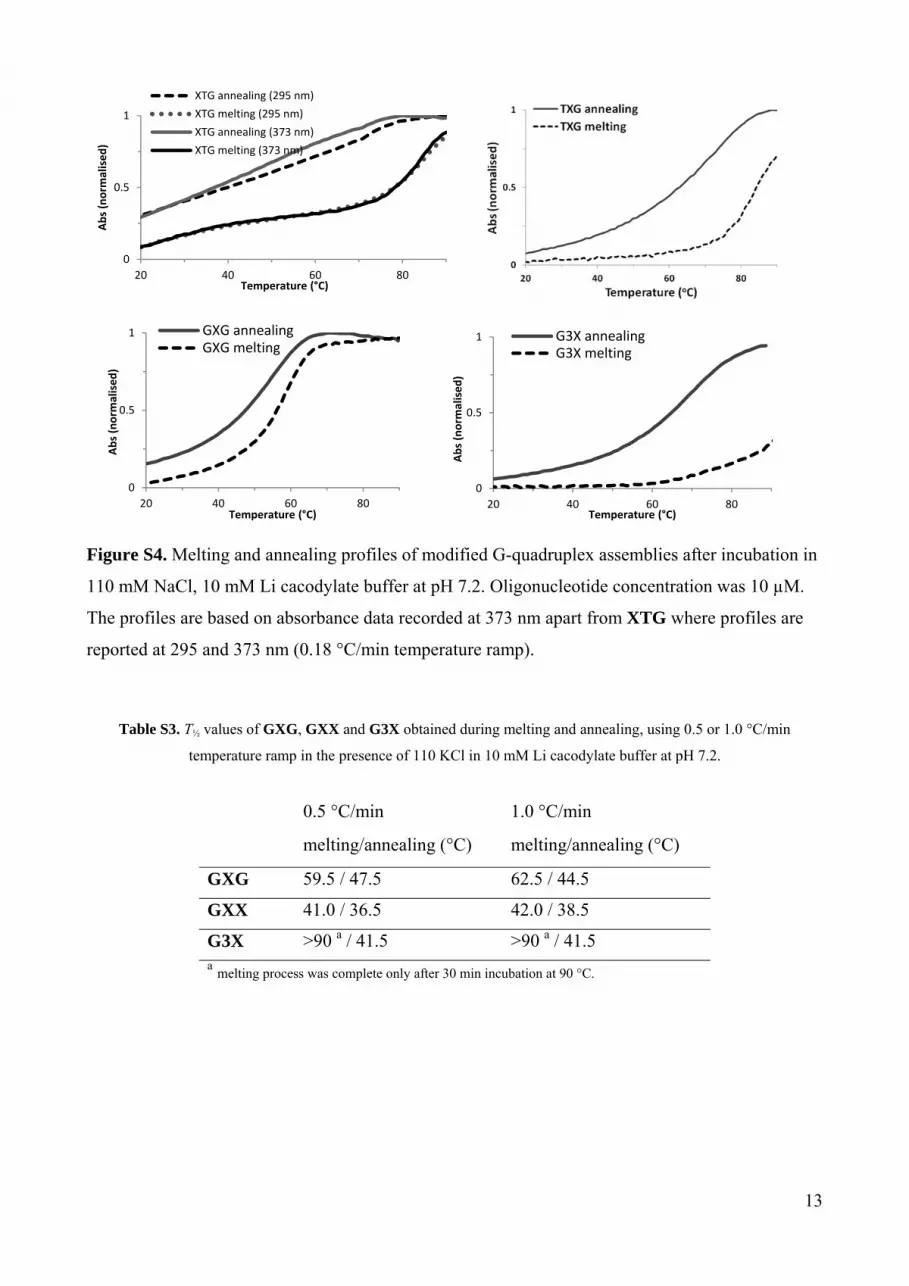
Figure S4. Melting and annealing profiles of modified G-quadruplex assemblies after incubation in
110 mM NaCl, 10 mM Li cacodylate buffer at pH 7.2. Oligonucleotide concentration was 10 µM.
The profiles are based on absorbance data recorded at 373 nm apart from XTG where profiles are
reported at 295 and 373 nm (0.18 °C/min temperature ramp).
Table S3. T½ values of GXG, GXX and G3X obtained during melting and annealing, using 0.5 or 1.0 °C/min
temperature ramp in the presence of 110 KCl in 10 mM Li cacodylate buffer at pH 7.2.
0.5 °C/min 1.0 °C/min
melting/annealing (°C) melting/annealing (°C)
GXG 59.5 / 47.5 62.5 / 44.5
GXX 41.0 / 36.5 42.0 / 38.5
G3X >90 a / 41.5 >90 a / 41.5 a melting process was complete only after 30 min incubation at 90 °C.
0
0.5
1
20 40 60 80
Abs (norm
alised)
Temperature (°C)
XTG annealing (295 nm)
XTG melting (295 nm)
XTG annealing (373 nm)
XTG melting (373 nm)
0
0.5
1
20 40 60 80
Abs (norm
alised)
Temperature (°C)
GXG annealingGXG melting
0
0.5
1
20 40 60 80
Abs (norm
alised)
Temperature (°C)
G3X annealingG3X melting
14
A) B)
C) D)
E)
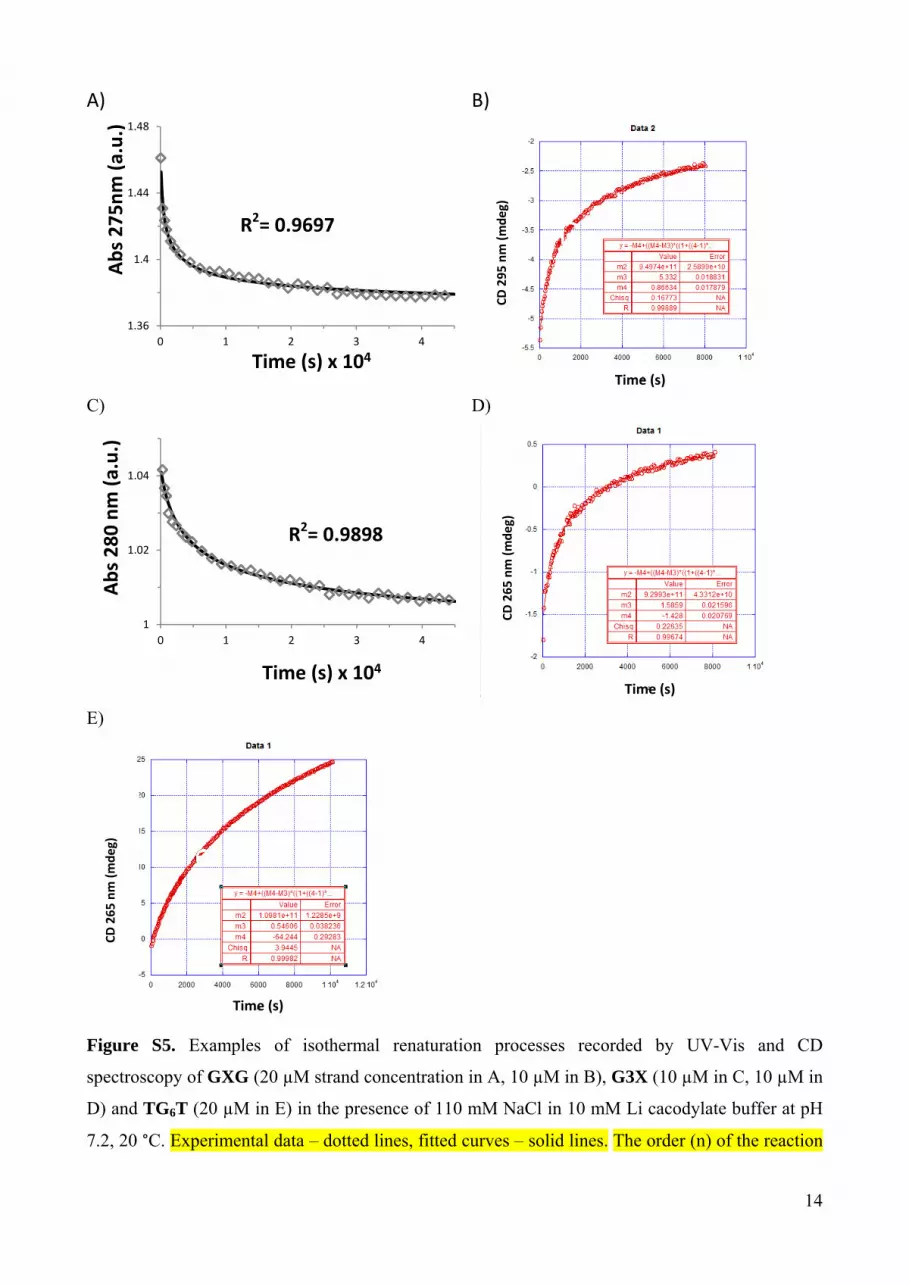
Figure S5. Examples of isothermal renaturation processes recorded by UV-Vis and CD
spectroscopy of GXG (20 µM strand concentration in A, 10 µM in B), G3X (10 µM in C, 10 µM in
D) and TG6T (20 µM in E) in the presence of 110 mM NaCl in 10 mM Li cacodylate buffer at pH
7.2, 20 °C. Experimental data – dotted lines, fitted curves – solid lines. The order (n) of the reaction
1.36
1.4
1.44
1.48
0 1 2 3 4
Time (s) x 104
Abs 275nm (a.u.)
1
1.02
1.04
0 1 2 3 4
Time (s) x 104
Abs 280 nm (a.u.)
R2= 0.9697
R2= 0.9898
CD 295 nm (mdeg)
CD 265 nm (mdeg)
CD 265 nm (mdeg)
Time (s)
Time (s)
Time (s)

15
in separate strands was initially floating and the data could be fitted with n = 3.97, we defined n = 4
for determination of kon Table 1.
Table S4. kon values determined using UV-Vis and CD.a
Abbreviation Sequence kon / UV-Vis kon / CD
GXG dTGGXGGT 2.73 × 10¹¹ 7.30 × 10¹¹
G3X dTGGGXGGGT 2.28 × 10¹¹ 9.38 × 10¹¹
TG6T dTGGGGGGT ~1.0 × 10¹⁰ 8.90 × 10¹⁰ a kon values (± 30%) of selected assemblies were experimentally obtained by monitoring ellipticities
at 265 (G3X, TG6T) and 295 nm (GXG) using CD spectrometer or by monitoring absorbance at
275 (GXG) and 280 nm (G3X) using UV-Vis spectrometer in 10 mM Li cacodylate buffer and 110
mM NaCl at 20 °C, pH 7.2. kon value for TG6T (UV-Vis) at 20 °C was estimated from the literature.

16
Figure S6. A) Fluorescence emission spectra of TINA-TG4(6)T assemblies and TINA duplex (5’-
dAGCTTGXCTTGAG/5’-dCTCAAGXCAAGCT) at 10 µM strand concentration in the presence
of 110 mM KCl in 10 mM Li cacodylate buffer at pH 7.2, 20 °C. λex = 373 nm. Poor overlap of
TINA moieties in the middle of the duplex does not result in excimer formation and only
monomeric fluorescence is observed (12). B) Fluorescence excitation spectra at 10 µM strand
concentration in the presence of 110 mM NaCl or 110 mM KCl in 10 mM Li cacodylate buffer at
pH 7.2, 20 °C. λem = 495 nm.
0
20
40
60
80
100
120
380 430 480 530 580 630
I Fl(a.u.)
Wavelength (nm)
GXG K
G3X K
GXX K
XTG K
TXG K
TINA duplex
0
200000
400000
600000
800000
1000000
1200000
1400000
1600000
1800000
2000000
250 300 350 400 450
GXG KGXG NaTXG KTXG NaG3X KG3X NaGXX KGXX NaXTG KXTG Na
Wavelength, nm
IFl, a.u.
A)
B)
17
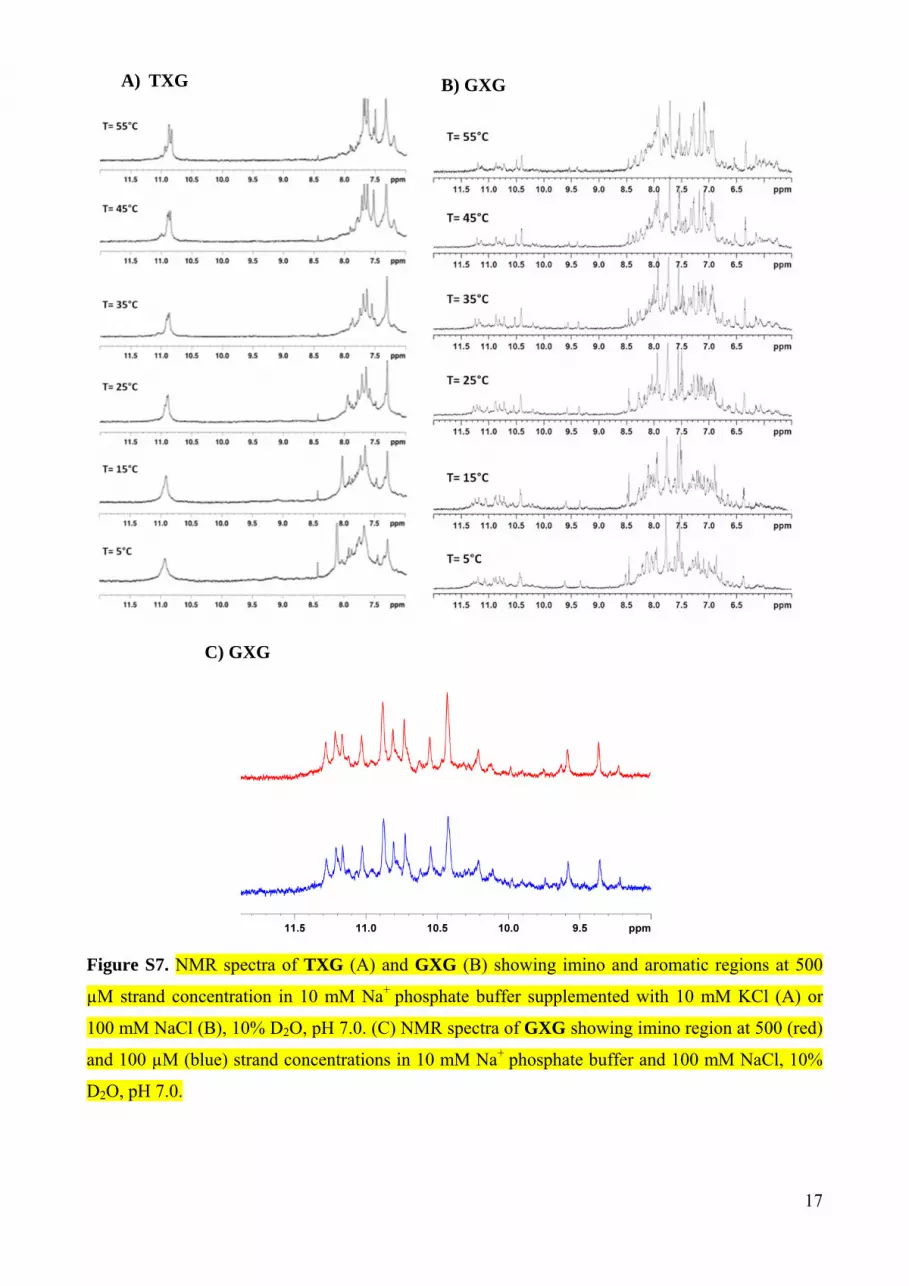
C) GXG
Figure S7. NMR spectra of TXG (A) and GXG (B) showing imino and aromatic regions at 500
µM strand concentration in 10 mM Na+ phosphate buffer supplemented with 10 mM KCl (A) or
100 mM NaCl (B), 10% D2O, pH 7.0. (C) NMR spectra of GXG showing imino region at 500 (red)
and 100 µM (blue) strand concentrations in 10 mM Na+ phosphate buffer and 100 mM NaCl, 10%
D2O, pH 7.0.
A) TXG B) GXG

18
Figure S8. Two regions of the NOESY spectra of GXG in 10 mM Na+ phosphate buffer, 10% D2O,
pH 7.0. NOE cross-peaks are labelled according to partial assignments. Ga and Gs stand for anti-
and syn-guanines, respectively. Strong intra-residual H8-H1’ cross-peaks, characteristic of syn-Gs,
are labelled in green (bottom panel). Three tracts of GsGa T were found and are labelled as m,
n, and o. Three GsGaTINA protons are labelled as p, q, and r. The three remaining Gs, not
showing sequential cross-peaks, are labelled as s, t, and u. DNA-TINA cross-peaks are shown in
magenta, and TINA-TINA cross-peaks in cyan. TINA protons could be identified in the TOCSY
spectra (see Fig S9), but unambiguous assignment of specific protons was not possible.

19
Figure S9. Two regions of the IP-COSY spectrum of GXG in Na+ phosphate buffer in 90%
H2O/D2O. Top: Methyl-H6 regions, showing at least six thymines. Bottom: Multiple cross-peaks
between TINA protons. The number of signals indicates the presence of several TINA species.

20
Figure S10. Possible configurations of dimers formed by TINA mediated interaction of two
antiparallel quadruplex subunits. Species A and B have both a C2 symmetry axis and a centre of
inversion. The four hairpins of each structure are magnetically equivalent, but those of A are not
equivalent to those in B. In structure C the hairpins are no longer all equivalent. Each subunit is
formed from a pair of magnetically non-equivalent hairpins which are related between the subunits
by a C2 axis. Excluding coincidental overlap, these structures could account for six of the thymine
Methyl-H6 correlations in Figure S9. A further species with no symmetry and generating additional
NMR signals could be formed by the dimerization of subunits from species A and B/C.
21
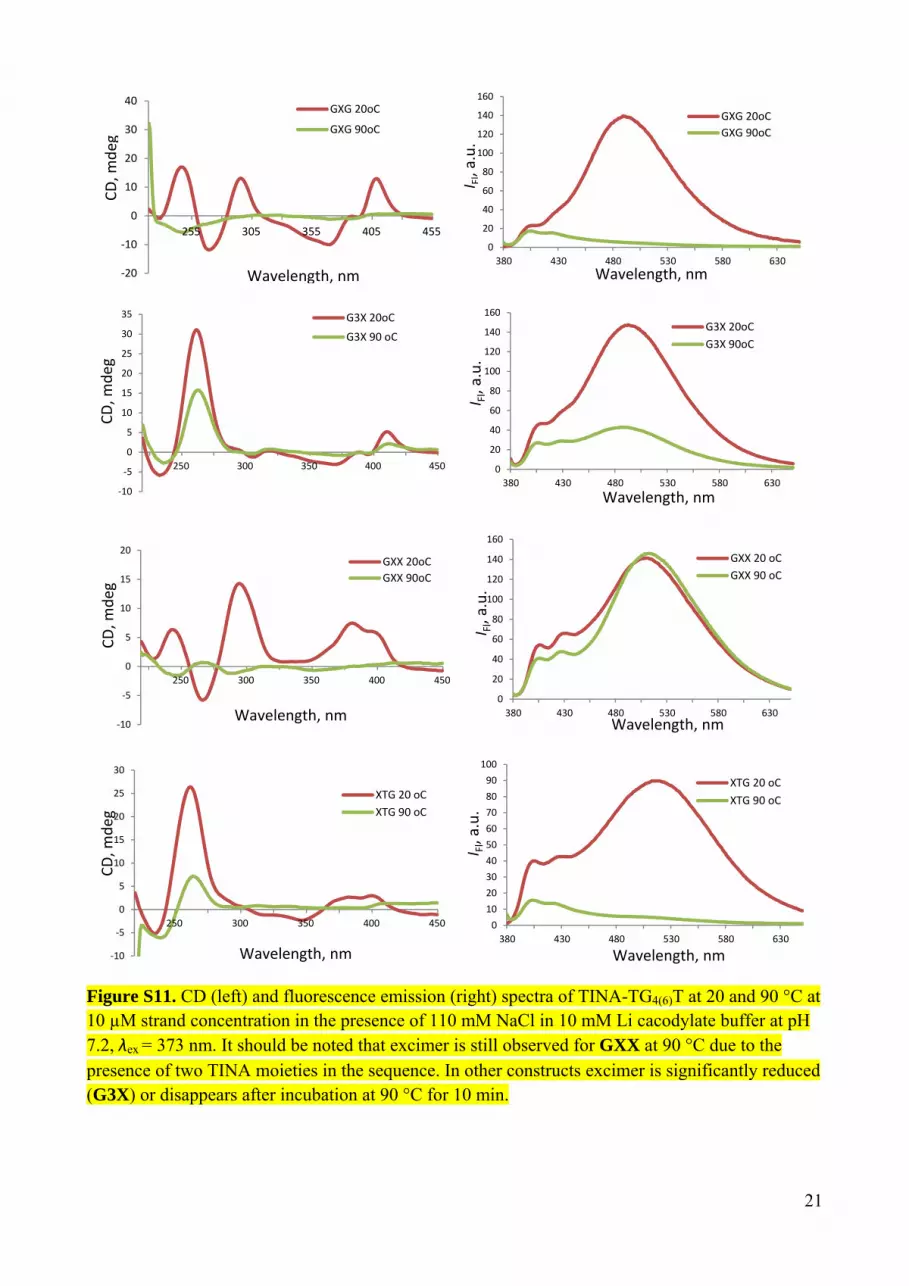
Figure S11. CD (left) and fluorescence emission (right) spectra of TINA-TG4(6)T at 20 and 90 °C at 10 µM strand concentration in the presence of 110 mM NaCl in 10 mM Li cacodylate buffer at pH 7.2, λex = 373 nm. It should be noted that excimer is still observed for GXX at 90 °C due to the presence of two TINA moieties in the sequence. In other constructs excimer is significantly reduced (G3X) or disappears after incubation at 90 °C for 10 min.
‐20
‐10
0
10
20
30
40
455405355305255
GXG 20oC
GXG 90oC
Wavelength, nm
CD, m
deg
0
20
40
60
80
100
120
140
160
380 430 480 530 580 630
GXG 20oC
GXG 90oC
Wavelength, nm
I Fl, a.u.
‐10
‐5
0
5
10
15
20
25
30
35
450400350300250
G3X 20oC
G3X 90 oC
CD, m
deg
0
20
40
60
80
100
120
140
160
380 430 480 530 580 630
G3X 20oC
G3X 90oC
Wavelength, nm
I Fl, a.u.
‐10
‐5
0
5
10
15
20
450400350300250
GXX 20oC
GXX 90oC
Wavelength, nm
CD, m
deg
0
20
40
60
80
100
120
140
160
380 430 480 530 580 630
GXX 20 oC
GXX 90 oC
Wavelength, nm
I Fl, a.u.
‐10
‐5
0
5
10
15
20
25
30
450400350300250
XTG 20 oC
XTG 90 oC
Wavelength, nm
CD, m
deg
0
10
20
30
40
50
60
70
80
90
100
380 430 480 530 580 630
XTG 20 oC
XTG 90 oC
Wavelength, nm
I Fl, a.u.
22
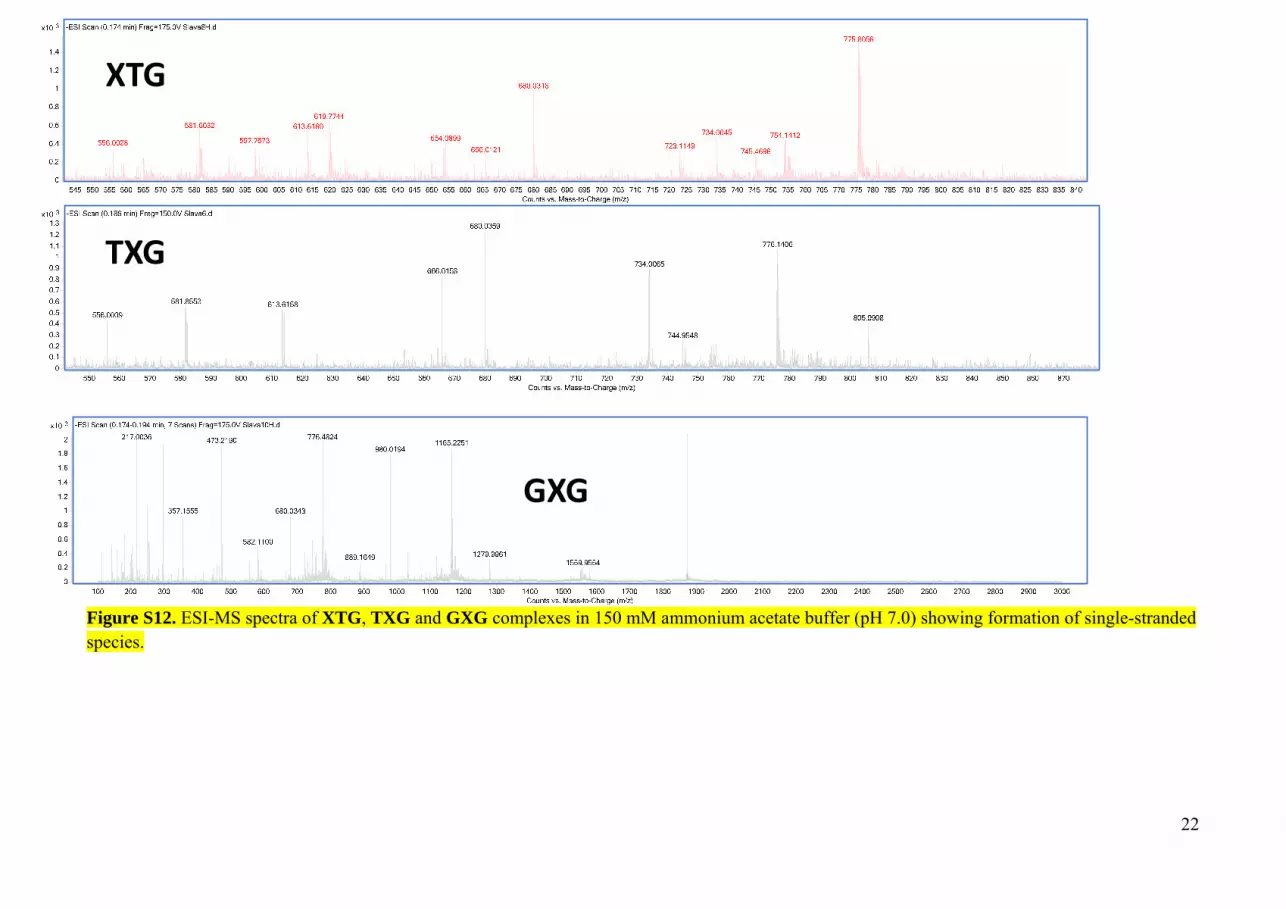
Figure S12. ESI-MS spectra of XTG, TXG and GXG complexes in 150 mM ammonium acetate buffer (pH 7.0) showing formation of single-stranded species.
XTG
TXG
GXG

23
References
. [1] Xia, Y., Legge, G., Jun, K. Y., Qi, Y., Lee, H., & Gao, X. Magn Reson Chem 2005, 43(5), 372-379.
. [2] Piotto, M.; Saudek, V.; Sklenar, V. J. Biomol. NMR 1992, 2, 661
[3] Hwang, T. L., & Shaka, A. J. 1995, Journal of Magnetic Resonance, Series A, 112, 275-
279
. [4] Goddard, D. T.; Kneller, G.; Program Sparky 3. ed.; University of California: San
Francisco
. [5] D. A. P. David A Case, James W Caldwell, Thomas E Cheatham III, Junmei Wang,
Wilson S Ross, CL Simmerling, TA Darden, Kenneth M Merz, Robert V Stanton, AL
Cheng, James J Vincent, Mike Crowley, Vickie Tsui, Holger Gohlke, RJ Radmer, Yong
Duan, Jed Pitera, Irina Massova, George L Seibel, U Chandra Singh, PK Weiner, Peter A
Kollman, University of California, San Francisco, 2007.
. [6] Kettani, et al. Nat Struct Biol. 1997, 4, 382-389
. [7] T. Darden, D. York, L. Pedersen, J. Chem. Phys. 1993, 98, 10089-10092.
. [8] a) T. E. Cheatham, P. Cieplak, P. A. Kollman, J. Biomol. Struct. Dyn. 1999, 16, 845-
862; b) W. D. Cornell, P. Cieplak, C. I. Bayly, I. R. Gould, K. M. Merz, D. M. Ferguson, D.
C. Spellmeyer, T. Fox, J. W. Caldwell, P. A. Kollman, J. Am. Chem. Soc. 1996, 118, 2309-
2309.
. [9] W. L. Jorgensen, J. Chandrasekhar, J. D. Madura, R. W. Impey, M. L. Klein, J. Chem.
Phys. 1983, 79, 926-935.
. [10] G. C. Shields, C. A. Laughton, M. Orozco, J. Am. Chem. Soc. 1997, 119, 7463-7469.
. [11] Koradi, R.; Billeter, M.; Wüthrich, K. J. Mol. Graphics 1996, 14, 29
. [12] V. V. Filichev, I. V. Astakhova, A. D. Malakhov, V. A. Korshun, E. B. Pedersen,
Chem.—Eur. J. 2008, 14, 9968-9980.


