Embed Size (px)
Citation preview
2013Annual Report
Innovative solutions that help solve healthcare challenges
2 GE TINGE ANNUAL REPORT 2013
2013 in brief
2
2013 2012Order intake, SEK M 25,395 24,416
Order intake, adjusted for exchange-rate effects and acquisitions, % 4.0 2.7
Net sales, SEK M 25,287 24,248
Net sales, adjusted for exchange-rate effects and acquisitions, % 4.2 2.8
Restructuring and integration costs, SEK M 401 184
Acquisition expenses, SEK M 13 44
EBITA before restructuring, SEK M 4,766 4,849
EBITA margin before restructuring, % 18.8 20.0
Earnings per share after comprehensive tax, SEK 9.59 10.58
No. of shares, thousand 238,323 238,323
Interest-coverage ratio, multiple 6.90 7.30
Working capital, SEK M 32,526 31,920
Return on working capital, % 12.8 13.1
Return on shareholders’ equity, % 14.4 17.0
Net debt/equity ratio, multiple 1.10 1.21
Cash conversion, % 63.1 64.0
Equity/assets ratio, % 37.4 35.4
Equity per share, SEK 69.60 63.66
Order intake rose 4.0%. SEK 25,395 M (24,416). Organic growth up 4.0%.
Net sales increased 4.3%. SEK 25,287 M (24,248). Organic growth up 4.2%.
Profit before tax declined 8.2%. SEK 3,153 M (3,436).
Net profit decreased 9.3%. SEK 2,295 M (2,531).
Earnings per share declined 9.4%. SEK 9.59 (10.58).
EBITA before restructuring decreased 1.7%. SEK 4,766 M (4,849). Adjusted for exchange-rate effects and the US Medical Device Tax, EBITA rose 8.3%.
Dividend per share proposed at SEK 4.15 (4.15). Corresponding to SEK 989 M (989).
2013 in brief
Group, key figures
3GE TINGE ANNUAL REPORT 2013
2013 in brief
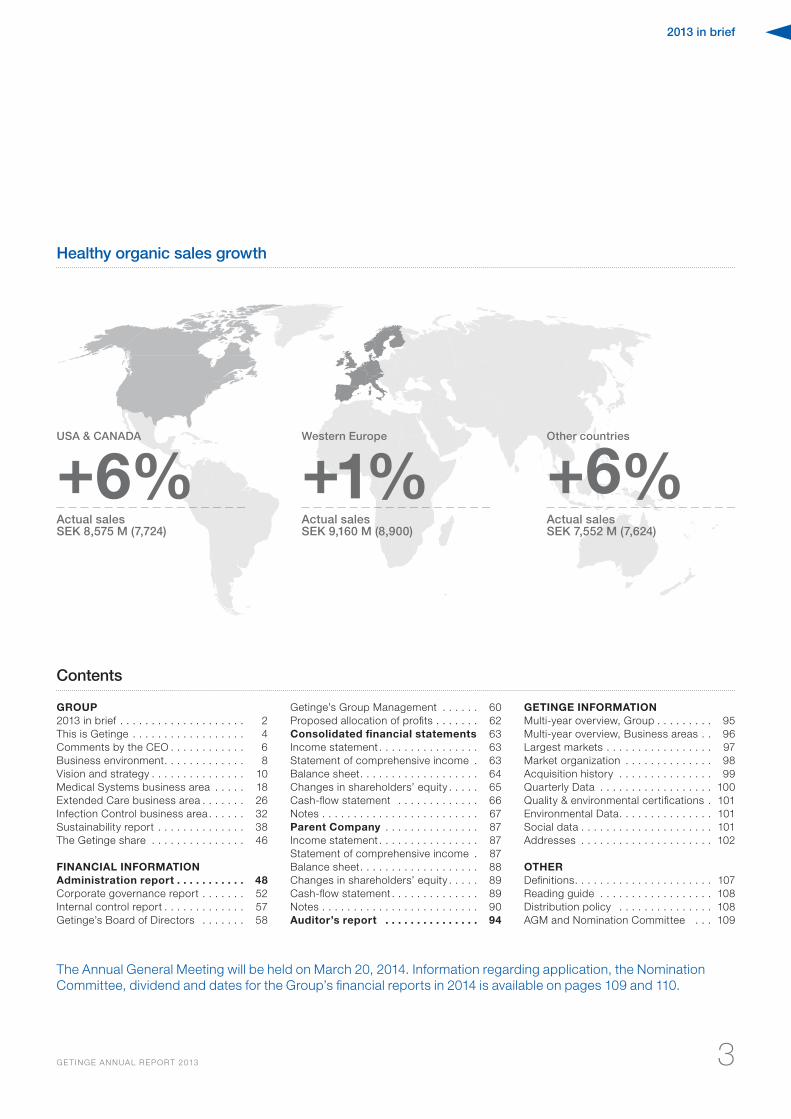
Healthy organic sales growth
USA & CANADA
+6%Actual salesSEK 8,575 M (7,724)
Western Europe
+1%Actual salesSEK 9,160 M (8,900)
Other countries
+6%Actual salesSEK 7,552 M (7,624)
GROUP2013 in brief . . . . . . . . . . . . . . . . . . . . 2This is Getinge . . . . . . . . . . . . . . . . . . 4Comments by the CEO . . . . . . . . . . . . 6 Business environment . . . . . . . . . . . . . 8Vision and strategy . . . . . . . . . . . . . . . 10Medical Systems business area . . . . . 18Extended Care business area . . . . . . . 26Infection Control business area . . . . . . 32Sustainability report . . . . . . . . . . . . . . 38The Getinge share . . . . . . . . . . . . . . . 46
FINANCIAL INFORMATIONAdministration report . . . . . . . . . . . 48Corporate governance report . . . . . . . 52Internal control report . . . . . . . . . . . . . 57Getinge’s Board of Directors . . . . . . . 58
Getinge’s Group Management . . . . . . 60Proposed allocation of profits . . . . . . . 62Consolidated financial statements 63Income statement . . . . . . . . . . . . . . . . 63Statement of comprehensive income . 63Balance sheet . . . . . . . . . . . . . . . . . . . 64Changes in shareholders’ equity . . . . . 65Cash-flow statement . . . . . . . . . . . . . 66Notes . . . . . . . . . . . . . . . . . . . . . . . . . 67Parent Company . . . . . . . . . . . . . . . 87Income statement . . . . . . . . . . . . . . . . 87Statement of comprehensive income . 87Balance sheet . . . . . . . . . . . . . . . . . . . 88Changes in shareholders’ equity . . . . . 89Cash-flow statement . . . . . . . . . . . . . . 89Notes . . . . . . . . . . . . . . . . . . . . . . . . . 90Auditor’s report . . . . . . . . . . . . . . . 94
GETINGE INFORMATIONMulti-year overview, Group . . . . . . . . . 95Multi-year overview, Business areas . . 96Largest markets . . . . . . . . . . . . . . . . . 97Market organization . . . . . . . . . . . . . . 98Acquisition history . . . . . . . . . . . . . . . 99Quarterly Data . . . . . . . . . . . . . . . . . . 100Quality & environmental certifications . 101Environmental Data . . . . . . . . . . . . . . . 101Social data . . . . . . . . . . . . . . . . . . . . . 101Addresses . . . . . . . . . . . . . . . . . . . . . 102
OTHERDefinitions . . . . . . . . . . . . . . . . . . . . . . 107Reading guide . . . . . . . . . . . . . . . . . . 108Distribution policy . . . . . . . . . . . . . . . 108AGM and Nomination Committee . . . 109
Contents
The Annual General Meeting will be held on March 20, 2014. Information regarding application, the Nomination Committee, dividend and dates for the Group’s financial reports in 2014 is available on pages 109 and 110.
4 GE TINGE ANNUAL REPORT 2013
This is Getinge
4
This is Getinge
Every day, Getinge’s products contribute to saving lives, ensuring excellent care and preventing the spread of infection. This is something that Getinge is extremely proud of and which drives the Group to continuously improve in all parts of operations. The Group operates in the areas of surgery, intensive care, infection control, care ergonomics and wound care.
Currently, the Group generates sales of SEK 25 billion and conducts sales through proprietary companies throughout the world. Production is conducted at facilities in France, Canada, China, Poland, the UK, Sweden, Turkey, Germany and the US. The Group has a total of slightly more than 15,000 employees in 40 countries.
Western Europe is the largest region with 36% of sales, closely followed by the US and Canada with 34% and the Other countries market area with 30%. 84% of sales are to the healthcare industry, while the elderly care sector accounts for 9% and the life science industry for 7%.
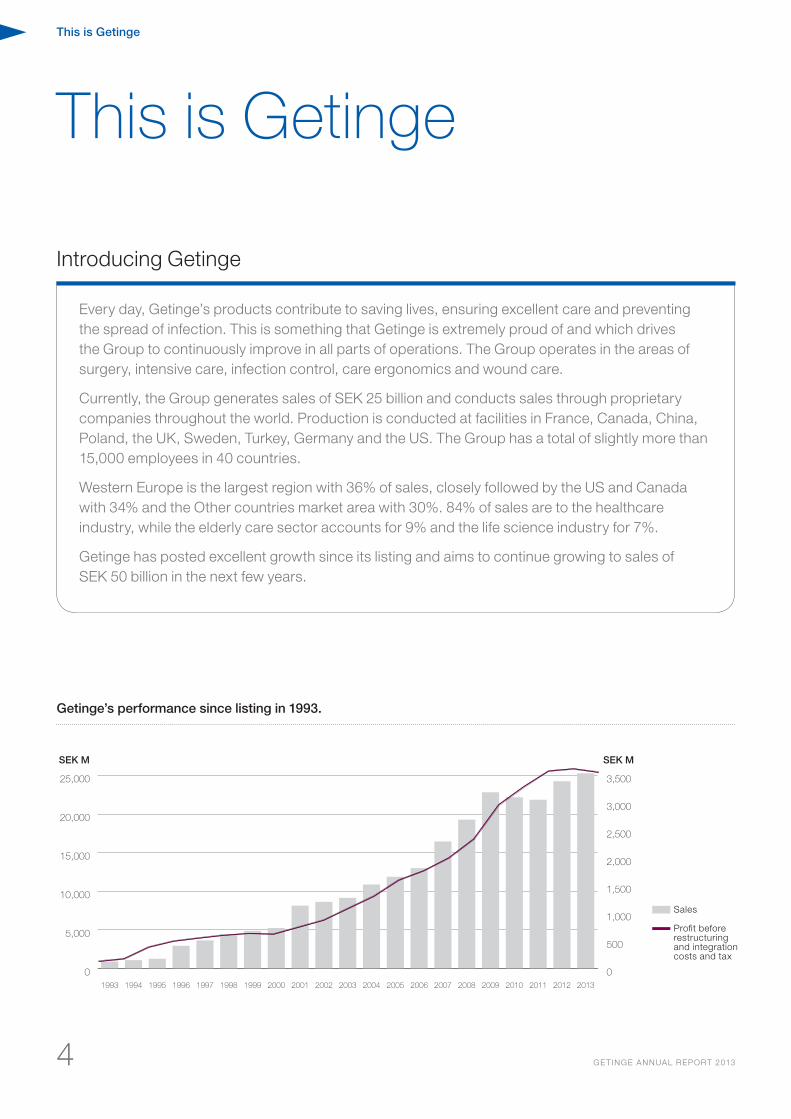
Getinge has posted excellent growth since its listing and aims to continue growing to sales of SEK 50 billion in the next few years.
Getinge’s performance since listing in 1993.
0
5,000
10,000
15,000
20,000
25,000
201320122011201020092008200720062005200420032002200120001999199819971996199519941993
0
500
1,000
1,500
2,000
2,500
3,000
3,500
SEK M SEK M
Sales
Profit beforerestructuring and integration costs and tax
Introducing Getinge
5GE TINGE ANNUAL REPORT 2013
This is Getinge
5
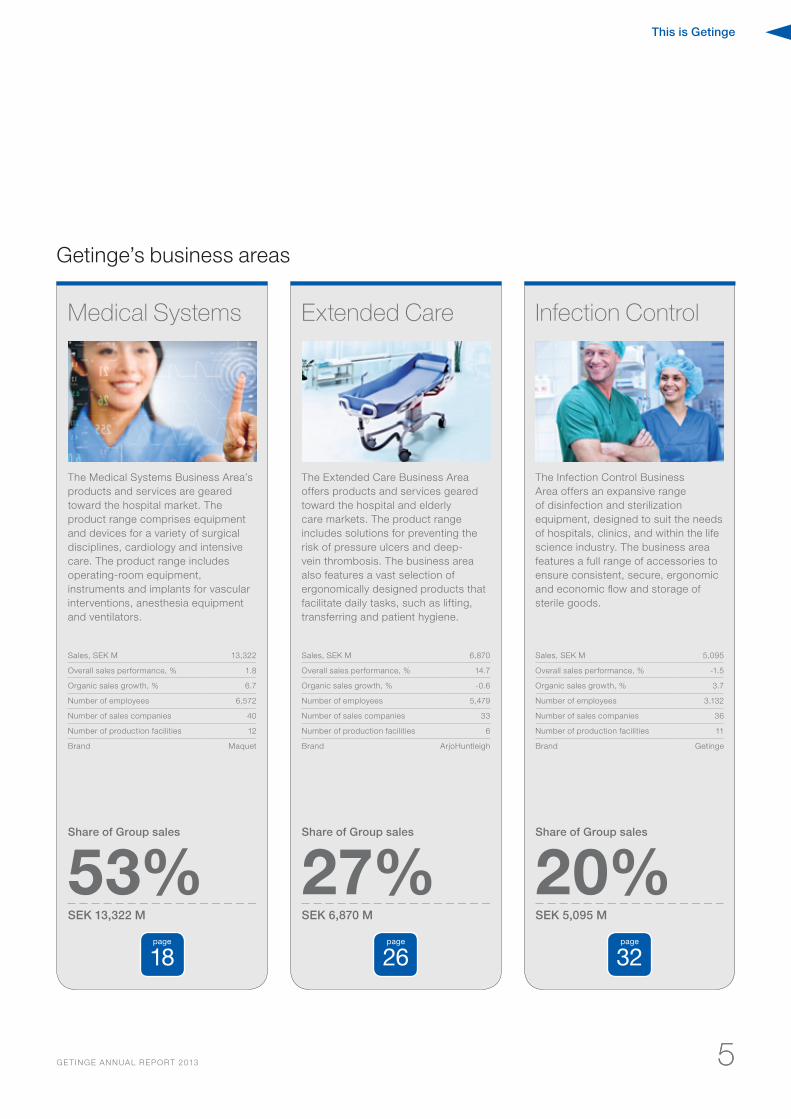
Medical Systems Extended Care Infection Control
The Medical Systems Business Area’s products and services are geared toward the hospital market. The product range comprises equipment and devices for a variety of surgical disciplines, cardiology and intensive care. The product range includes operating-room equipment, instruments and implants for vascular interventions, anesthesia equipment and ventilators.
Sales, SEK M 13,322
Overall sales performance, % 1.8
Organic sales growth, % 6.7
Number of employees 6,572
Number of sales companies 40
Number of production facilities 12
Brand Maquet
The Extended Care Business Area offers products and services geared toward the hospital and elderly care markets. The product range includes solutions for preventing the risk of pressure ulcers and deep-vein thrombosis. The business area also features a vast selection of ergonomically designed products that facilitate daily tasks, such as lifting, transferring and patient hygiene.
Sales, SEK M 6,870
Overall sales performance, % 14.7
Organic sales growth, % -0.6
Number of employees 5,479
Number of sales companies 33
Number of production facilities 6
Brand ArjoHuntleigh
The Infection Control Business Area offers an expansive range of disinfection and sterilization equipment, designed to suit the needs of hospitals, clinics, and within the life science industry. The business area features a full range of accessories to ensure consistent, secure, ergonomic and economic flow and storage of sterile goods.
Sales, SEK M 5,095
Overall sales performance, % -1.5
Organic sales growth, % 3.7
Number of employees 3,132
Number of sales companies 36
Number of production facilities 11
Brand Getinge
Share of Group sales
53%Share of Group sales
27%Share of Group sales
20%SEK 13,322 M SEK 6,870 M SEK 5,095 M
page
18page
26page
32
Getinge’s business areas
Comments by the CEO
6 GE TINGE ANNUAL REPORT 2013
2013 was a challenging year for the Getinge Group. The improvements in demand and volume growth noted during the year were not reflected in earnings to the extent we expected at the start of the year. Despite an earnings trend below expectations, we have continued to invest in our future at an undiminished rate in terms of new products, markets and operations in the knowledge that demand for efficient medical devices will remain highly substantial.
THE YEAR IN FIGURESDemand for the Group’s products im-proved over the year and the organic or-der intake increased 4%, a figure that out-performed our forecast at the start of the year and a figure that compares well with other global medical technology compa-nies. Growth in the North American mar-ket maintained a consistent healthy level in 2013. In the Western European market, which shrank over the past few years, a turn came in the latter part of 2013 and there is good reason to believe that the market has bottomed out. In the emerging markets, the trend is mixed and, taken to-gether, growth was slightly under expec-tations. The earnings trend did not quite meet the expectations we set ahead of the year. The weaker earnings trend was part-ly attributable to challenging exchange-rate conditions, which remain and, to a lesser extent, on the US Medical Device Tax introduced in the US at the start of the year. After adjustment of operating profit to reflect these factors, profit grew slightly more than 8% for the full year. The last year was also charged with nonrecurring expenses of about SEK 400 M related to streamlining measures at Infection Control and the integration of TSS, which was ac-quired in the fourth quarter of 2012.
NUMEROUS KEY PRODUCT LAUNCHESFor a number of years now, Getinge has consistently increased its investment in the production of new and innovative products aimed at increasing growth and profitability. Getinge’s most important as-signment is to contribute to the best pos-sible treatment results and patient safety in parallel with our products leading to im-
proved healthcare economics. These aims are clearly reflected in our product devel-opment. In 2013, numerous key products were launched including: SERVO-U – a new interactive ventilator platform, EIRUS – an intensive-care product for continuous monitoring of glucose and lactate levels in critically ill patients, TigerPaw – a new technology to prevent strokes, OTESUS – a new and multi-faceted surgical table and VOLISTA – a revolutionary new surgi-cal light. A total of 20 new products were presented over the past year and will all contribute the Group’s continued growth.
NEW MARKET CONDITIONS – NEW STRATEGYThe past five years, in the aftermath of the financial crisis, have been character-ized by low global growth in the medi-cal technology industry when measured in historic terms. Growth will gradually improve over the coming years, but it is unlikely that growth will return to the lev-els prevalent before 2009, particularly in the developed markets. The healthcare systems in the more mature markets are under stringent financial pressure with low GDP growth and increasingly ageing and care-intensive populations. Companies in the medical technology industry that can participate and contribute to a sustainable and financially justifiable healthcare sys-tem continue to have major possibilities for development in the mature markets. The challenges appear somewhat different in the emerging markets where growth is ex-pected to remain high moving forward. In these more rapidly growing markets, ma-jor opportunities exist for companies that can provide simpler products suited to the lower purchasing power.
To meet these, to some extent new chal-lenges, the Group has developed a new strategy during the past year that will ensure continued profitable growth. For the developed markets, the new strategy means an increased focus on the customer offering, with its documented evidence of leading to clinical and economic improve-ments for our customers. Strengthening of the sales model and sales capabilities with increased focus on, to some extent, new and more financially oriented decision makers in the healthcare sector is another key ingredient in our strategy for the devel-oped markets. To continue our growth in the emerging markets, we are working on widening our product offering to include simpler funtionality and cost-efficient pro-ducts. These simpler products are being produced at our existing development centers in countries including China and Turkey, but we also visualize acquisitions as a route to complementing our own product development efforts. The acqui-sition of Trans Medikal in Turkey and of Acare in China were both completed with this aim.
In parallel with more aggressive initiatives to strengthen the customer offering and the sales model, the work required to in-crease the Group’s cost efficiency is also ongoing. Production will be concentrated to fewer plants with greater resources and a larger proportion of our sourcing and production will be located in coun-tries with lower cost levels. A key ingredi-ent of the new strategy will be enhanced utilization, compared with efforts to date, of economies of scale in sourcing and ad-ministration through cooperation between business areas. Annual costs for admin-
Comments by the CEO
High activity and new strategy
Comments by the CEO
7GE TINGE ANNUAL REPORT 2013
istrative services and sourcing amount to close to SEK 11 billion at the Group. In-creased coordination of these functions will generate major savings and efficiency enhancements over the next two to five years.
CRITICAL MASS A KEY SUCCESS FACTORAcquisitions have been a key element in building the Getinge Group. In total, Get-inge has completed some 60 acquisitions since its listing in 1993 and last year made three acquisitions. In the wake of the con-solidation that is ongoing among health-care providers and the increased focus on creating a financially sustainable health-care sector, it is increasingly important for suppliers to be large to achieve long-term success. Getinge’s many acquisi-tions should be viewed against this back-ground. Our assessment is that a doubling of Getinge’s size in the mid-long term
would be both desirable and possible. In other words, acquisitions will remain a key element of our operations moving forward.
OUTLOOKDemand in the developed markets has gradually strengthened over the past year and, in parallel, we have noted weaker and more uncertain demand from the growth economies. Our assessment for the 2014 fiscal year is that organic volume growth will amount to about 4%, which is in line with the year earlier. Efforts to increase cost-efficiency in the Group will remain in focus in 2014, while the effects of the measures implemented in 2012 and 2013 will contribute to increased profitability. The continuous strengthening of the SEK means continued negative exchange-rate effects and these are expected to total about SEK 250 M in 2014 based on the existing exchange-rate scenario. Restruc-turing costs are expected to decline by
about SEK 250 M compared with 2013.
Finally, I would like to send a warm thank you to all employees who contribute on a daily basis to making Getinge the fantastic company that it is.
Johan MalmquistPresident and CEO
8 GE TINGE ANNUAL REPORT 2013
Business environment
A new landscape is emerging
New challenges create new opportunities
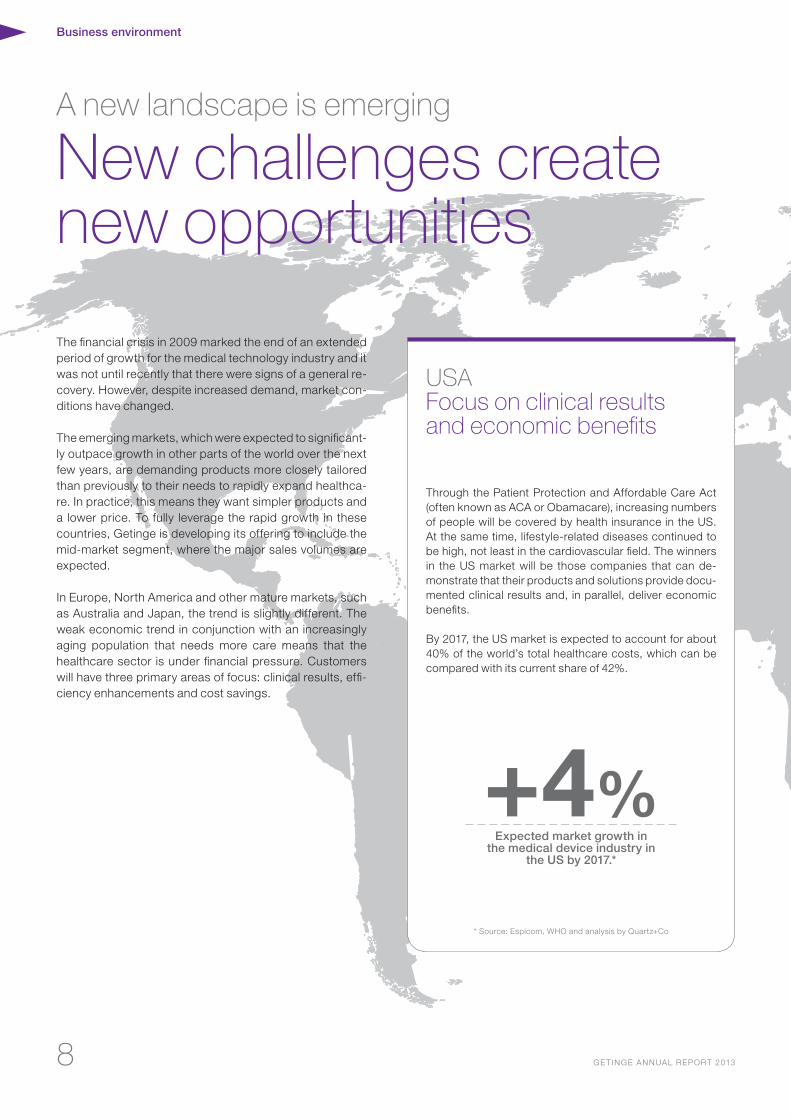
USA Focus on clinical results and economic benefits
Through the Patient Protection and Affordable Care Act (often known as ACA or Obamacare), increasing numbers of people will be covered by health insurance in the US. At the same time, lifestyle-related diseases continued to be high, not least in the cardiovascular field. The winners in the US market will be those companies that can de-monstrate that their products and solutions provide docu-mented clinical results and, in parallel, deliver economic benefits.
By 2017, the US market is expected to account for about 40% of the world’s total healthcare costs, which can be compared with its current share of 42%.
The financial crisis in 2009 marked the end of an extended period of growth for the medical technology industry and it was not until recently that there were signs of a general re-covery. However, despite increased demand, market con-ditions have changed.
The emerging markets, which were expected to significant-ly outpace growth in other parts of the world over the next few years, are demanding products more closely tailored than previously to their needs to rapidly expand healthca-re. In practice, this means they want simpler products and a lower price. To fully leverage the rapid growth in these countries, Getinge is developing its offering to include the mid-market segment, where the major sales volumes are expected.
In Europe, North America and other mature markets, such as Australia and Japan, the trend is slightly different. The weak economic trend in conjunction with an increasingly aging population that needs more care means that the healthcare sector is under financial pressure. Customers will have three primary areas of focus: clinical results, effi-ciency enhancements and cost savings.
+4%Expected market growth in
the medical device industry in the US by 2017.*
* Source: Espicom, WHO and analysis by Quartz+Co
9GE TINGE ANNUAL REPORT 2013
Business environment
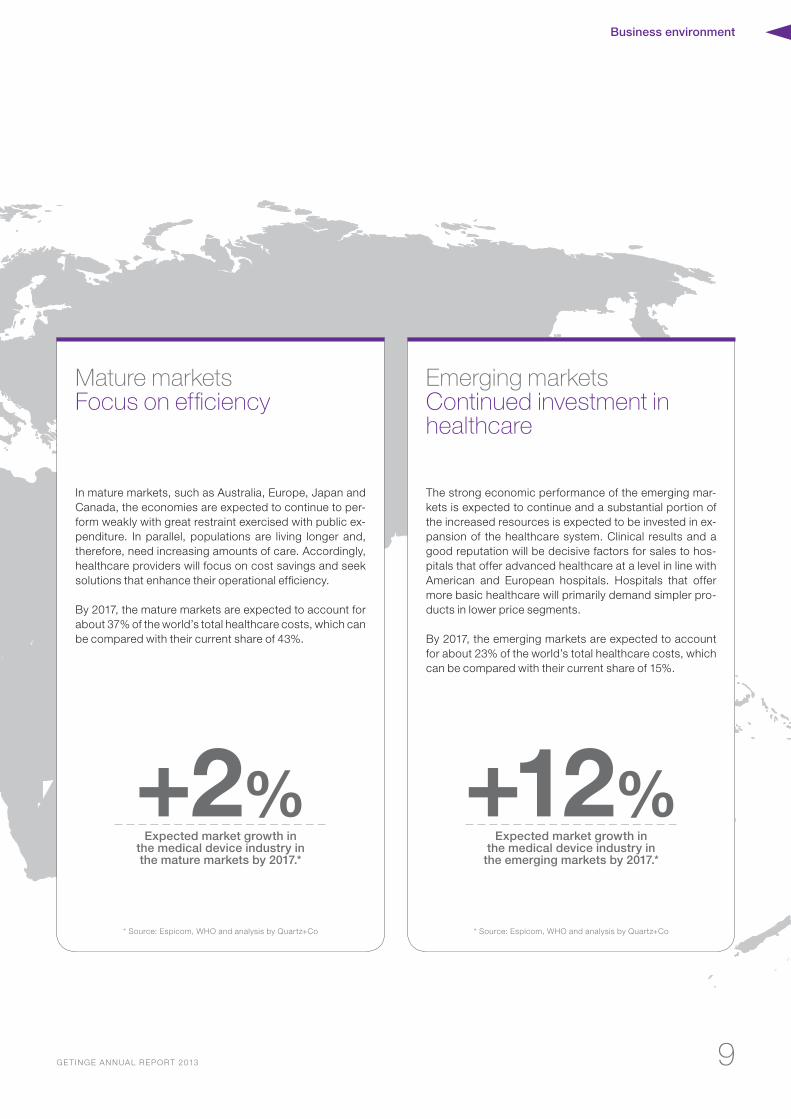
Mature marketsFocus on efficiency
In mature markets, such as Australia, Europe, Japan and Canada, the economies are expected to continue to per-form weakly with great restraint exercised with public ex-penditure. In parallel, populations are living longer and, therefore, need increasing amounts of care. Accordingly, healthcare providers will focus on cost savings and seek solutions that enhance their operational efficiency.
By 2017, the mature markets are expected to account for about 37% of the world’s total healthcare costs, which can be compared with their current share of 43%.
Emerging markets Continued investment in healthcare
The strong economic performance of the emerging mar-kets is expected to continue and a substantial portion of the increased resources is expected to be invested in ex-pansion of the healthcare system. Clinical results and a good reputation will be decisive factors for sales to hos-pitals that offer advanced healthcare at a level in line with American and European hospitals. Hospitals that offer more basic healthcare will primarily demand simpler pro-ducts in lower price segments.
By 2017, the emerging markets are expected to account for about 23% of the world’s total healthcare costs, which can be compared with their current share of 15%.
+2%Expected market growth in
the medical device industry in the mature markets by 2017.*
+12%Expected market growth in
the medical device industry in the emerging markets by 2017.*
* Source: Espicom, WHO and analysis by Quartz+Co * Source: Espicom, WHO and analysis by Quartz+Co
Vision and strategy
1010
Vision and strategy
To capture these new opportunities and meet the new challenges, Getinge adopted its strategy to the new reality in 2013. The strategy is still based on the three cornerstones that have long contributed to the Group’s strong performance, that is:
• Global market leadership• Integrated solutions• Excellent customer relations
In 2013, five well-defined focus areas were added to this strategy to bolster organic growth. The aim is to continue to develop operations and offer solutions to the major challenges facing healthcare and also, moving forward, to comprise a preferred partner to hospitals around the world.
Size and critical mass will be crucial to success. Over the next few years, Getinge needs to grow into a corporation with sales of around SEK 50 billion, which is twice current sales. At this size, Getinge will be one of the world’s leading medical technology companies and an attractive partner for its customers.
Acquisitions will continue to play a key role in achieving sales of SEK 50 billion. When the Group has reached this size, acquisitions will become a complement, while continued growth will come mainly from the company’s organic growth.
Read more about Getinge’s new strategy on the following pages.
GE TINGE ANNUAL REPORT 2013
1111
Vision and strategy
GE TINGE ANNUAL REPORT 2013
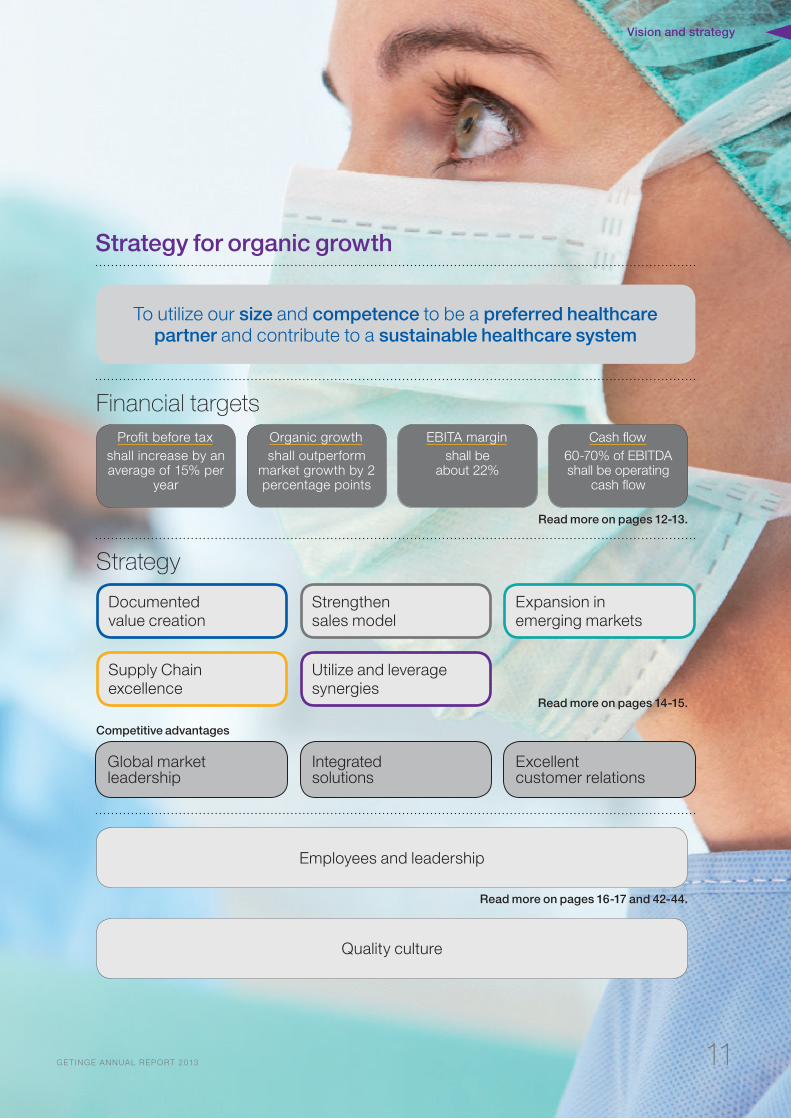
Financial targets
To utilize our size and competence to be a preferred healthcare partner and contribute to a sustainable healthcare system
Profit before tax shall increase by an average of 15% per
year
Organic growth shall outperform
market growth by 2 percentage points
EBITA margin shall be
about 22%
Cash flow 60-70% of EBITDA shall be operating
cash flow
Strategy
Employees and leadership
Global market leadership
Integrated solutions
Excellent customer relations
Competitive advantages
Documented value creation
Supply Chain excellence
Strengthen sales model
Utilize and leverage synergies
Expansion in emerging markets
Read more on pages 12-13.
Read more on pages 14-15.
Strategy for organic growth
Quality culture
Read more on pages 16-17 and 42-44.
Vision and strategy
12 GE TINGE ANNUAL REPORT 2013
Financial targets
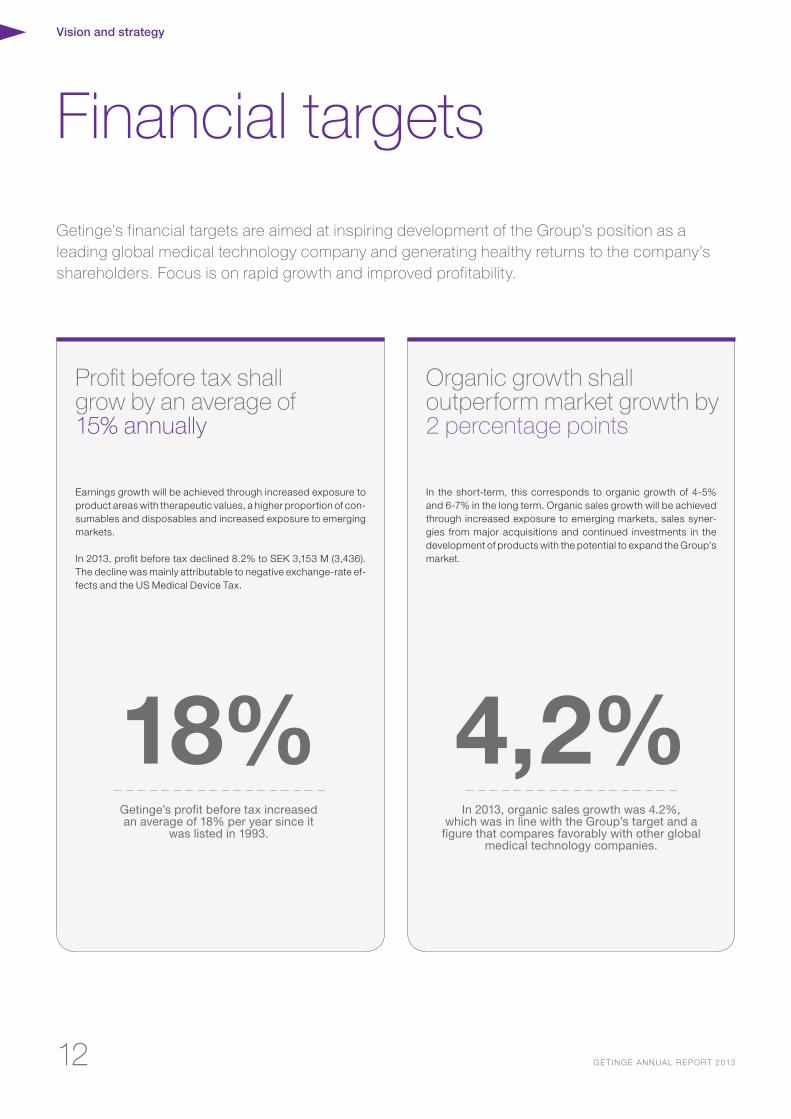
Profit before tax shall grow by an average of 15% annually
Earnings growth will be achieved through increased exposure to product areas with therapeutic values, a higher proportion of con-sumables and disposables and increased exposure to emerging markets.
In 2013, profit before tax declined 8.2% to SEK 3,153 M (3,436). The decline was mainly attributable to negative exchange-rate ef-fects and the US Medical Device Tax.
Organic growth shall outperform market growth by 2 percentage points
In the short-term, this corresponds to organic growth of 4-5% and 6-7% in the long term. Organic sales growth will be achieved through increased exposure to emerging markets, sales syner-gies from major acquisitions and continued investments in the development of products with the potential to expand the Group’s market.
Getinge’s financial targets are aimed at inspiring development of the Group’s position as a leading global medical technology company and generating healthy returns to the company’s shareholders. Focus is on rapid growth and improved profitability.
18%Getinge’s profit before tax increased an average of 18% per year since it
was listed in 1993.
4,2%In 2013, organic sales growth was 4.2%,
which was in line with the Group’s target and a figure that compares favorably with other global
medical technology companies.
Vision and strategy
13GE TINGE ANNUAL REPORT 2013
The EBITA margin shall be about 22%
The EBITA margin will be reached primarily through lowering costs by streamlining the Group’s supply chain including the con-solidation of manufacturing units. Secondly, the operating margin will be boosted through increased exposure to product segments with higher profitability and increased collaboration between bu-siness areas to optimize sourcing and administrative processes.
Cash conversion. 60 to 70% of EBITDA shall be converted to operating cash flow
Getinge works in a structured manner to ensure effective capi-tal management. Among other items, the initiative includes ac-tive work with accounts receivable, business inventories and ac-counts payable. The lower financing cost that these efforts create is used to invest in the Group’s future in the form of product deve-lopment, innovation and acquisitions.
18%In 2013, the EBITA margin was 18.0%. Adjusted for exchange-rate effects and the US Medical
Device Tax, the EBITA margin was 20.8%.
63%In 2013, cash conversion was 63.1%,
which is in line with the Group’s target.
Vision and strategy
14 GE TINGE ANNUAL REPORT 2013
Reaching the targets
Strenghten the sales model through dialog with senior executives
Documented value creation through strengthened innovativeness
Getinge will develop the sales process to include hospital management and central procurement functions, while strengthening the organization’s ability to convey advanced arguments based on a hospital’s financial and economic situation.
Work with innovation and product rene-wal at Getinge will result in products, sys-tems and solutions with a documented ability to deliver excellent clinical results and economic benefits. Put simply, it will pay to invest in Getinge’s products.
In 2013, Getinge completed a comprehensive strategic review to further strengthen its position as a preferred supplier to the healthcare industry and to reach the Group’s financial targets. The efforts are aimed at strengthening the Group’s competitiveness in key areas, such as the customer offering, sales, geographic expansion and a streamlined supply chain.
The global healthcare industry has un-dergone major changes since 2009 and market conditions have changed. The healthcare systems in the mature mar-kets are currently under stringent finan-cial pressure with low GDP growth and ageing populations. Companies in the medical technology industry that can contribute to a sustainable healthcare system continue to have major possibili-ties for development in the mature mar-kets. In the emerging markets, substan-tial opportunities exist for companies that can provide products suited to the lower purchasing power.
To meet these, to some extent new chal-lenges, in the optimal manner and to en-sure continued profitable growth, Ge-tinge has developed a new strategy over the past year. Implications of the strate-gy include increased focus on new deci-sion makers in the healthcare sector and the establishment of a product offering that is tailored to the mid-segment of the emerging markets where the most rapid developments are expected.
In parallel with the more aggressive ini-tiatives, work is ongoing with the initi-atives required to increase the Group’s cost efficiency. Production will be con-centrated to fewer plants with greater resources and a larger proportion of sourcing and production will be located in countries with lower cost levels. An-other key element of the new strategy is leveraging economies of scale through increased collaboration between the Group’s business areas.
Vision and strategy
15GE TINGE ANNUAL REPORT 2013
Utilize and leverage synergies through increased collaboration between business areas
Supply Chain Excellence through reduced complexity and geographic optimization
Expansion in emerging markets through a market-adapted product offering
The coordination of the Group’s sourcing and centralization of certain administra-tive services and functions will allow Ge-tinge to better utilize its size and substan-tial purchasing power to lower costs and increase competitiveness.
Getinge’s supply chain will be streamlined through concentrating of production to fewer plants with greater resources, redu-cing manufacturing complexity, transfer-ring sourcing to competitive suppliers and optimizing the Group’s logistics solutions.
Emerging markets are expected to con-tinue to post a positive trend and, ac-cordingly, Getinge will strengthen its pre-sence in these countries. The Group will continue to support its leading position among the more demanding hospitals and strengthen its existing position, while also developing a product range tailored to the market’s mid-segment. The Group will, thereby, be well positioned to take advantage of the next growth wave.
Vision and strategy
16 GE TINGE ANNUAL REPORT 2013
Employees and leadershipStrong leaders and committed employees are a prerequisite for Getinge to deliver on its targets. In 2013, an extensive training program started for the Group’s leaders with the aim of driving and supporting the implementation of the Group’s new strategy. In the autumn, a new survey was conducted to map employee engagement and listen to their perception of working conditions at Getinge.
Business focused leaders are a prerequisite for continued success
As part of ensuring that the new strategy is im-plemented and has full impact in the organiza-tion, Getinge has started an extensive training program for the Group’s leaders. The program, in collaboration with a number of the world’s leading academic institutions, extends over 14 months and combines theoretical training with operational work.
Linking the Group’s overall strategy to individual and organizational development is a key issue. This training program allows Getinge to ensure that leaders have a solid understanding of the strategy and can convert the overall plan into ac-tivities that drive the Group toward the strategic goals.
In addition to the training program for today’s leaders, Getinge has initiated a training program for the Group’s next generation of leaders. The course aims to secure tomorrow’s leadership talents who can contribute to retaining the cur-rent leading positions and continue to develop the Getinge Group in line with the strategic goals.
Proud, motivated employees drive operations forward
Committed and engaged employees are an im-portant cornerstone of successful enterprises. In autumn 2013, Getinge implemented a Group-wide employee survey. The aim of the survey was to lis-ten to the employees and identify the Group’s strengths and areas for improvement. The respon-se rate was an impressive 90%, in itself a sign of high commitment.
The results show that Getinge’s employees are dedicated to their work and proud of what they do. They perceive their work as meaningful and feel that excellent opportunities exist to develop their professional skills. The areas for improvement in-dicated by the survey are primarily related to a de-sire to better understand the Group’s overriding goals and strategies as well as what these mean for the employees’ own work.
Vision and strategy
17GE TINGE ANNUAL REPORT 2013 17
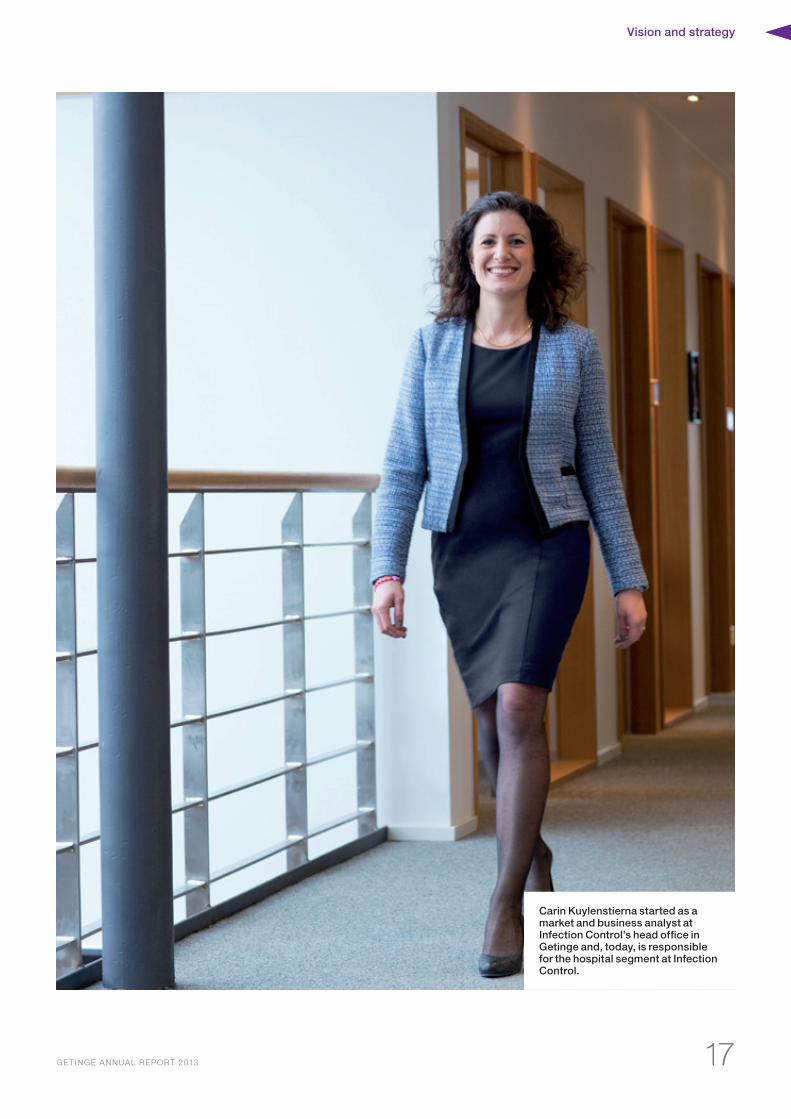
Carin Kuylenstierna started as a market and business analyst at Infection Control’s head office in Getinge and, today, is responsible for the hospital segment at Infection Control.
Medical Systems
18 GE TINGE ANNUAL REPORT 2013
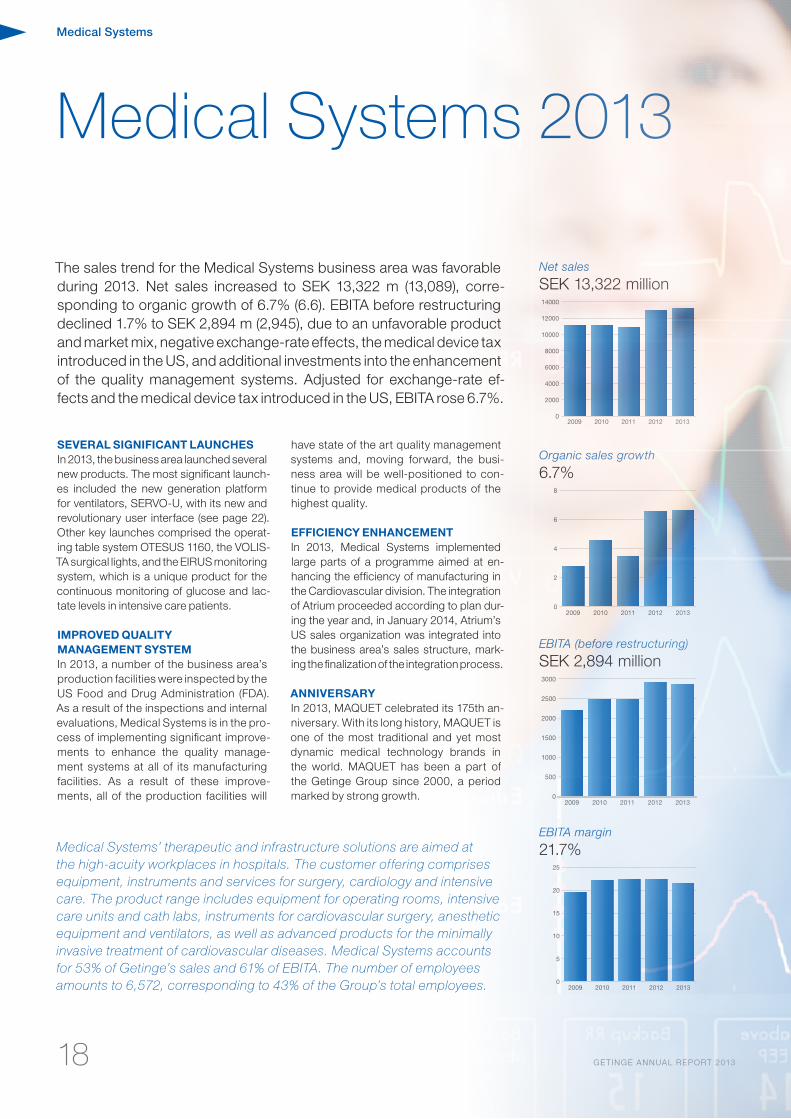
The sales trend for the Medical Systems business area was favorable during 2013. Net sales increased to SEK 13,322 m (13,089), corre-sponding to organic growth of 6.7% (6.6). EBITA before restructuring declined 1.7% to SEK 2,894 m (2,945), due to an unfavorable product and market mix, negative exchange-rate effects, the medical device tax introduced in the US, and additional investments into the enhancement of the quality management systems. Adjusted for exchange-rate ef-fects and the medical device tax introduced in the US, EBITA rose 6.7%.
SEvERAL SIGNIFICANT LAUNCHESIn 2013, the business area launched several new products. The most significant launch-es included the new generation platform for ventilators, SERVO-U, with its new and revolutionary user interface (see page 22). Other key launches comprised the operat-ing table system OTESUS 1160, the VOLIS-TA surgical lights, and the EIRUS monitoring system, which is a unique product for the continuous monitoring of glucose and lac-tate levels in intensive care patients.
IMPROvED qUALITY MANAGEMENT SYSTEM In 2013, a number of the business area’s production facilities were inspected by the US Food and Drug Administration (FDA). As a result of the inspections and internal evaluations, Medical Systems is in the pro-cess of implementing significant improve-ments to enhance the quality manage-ment systems at all of its manufacturing facilities. As a result of these improve-ments, all of the production facilities will
have state of the art quality management systems and, moving forward, the busi-ness area will be well-positioned to con-tinue to provide medical products of the highest quality.
EFFICIENCY ENHANCEMENTIn 2013, Medical Systems implemented large parts of a programme aimed at en-hancing the efficiency of manufacturing in the Cardiovascular division. The integration of Atrium proceeded according to plan dur-ing the year and, in January 2014, Atrium’s US sales organization was integrated into the business area’s sales structure, mark-ing the finalization of the integration process.
ANNIvERSARYIn 2013, MAQUET celebrated its 175th an-niversary. With its long history, MAQUET is one of the most traditional and yet most dynamic medical technology brands in the world. MAQUET has been a part of the Getinge Group since 2000, a period marked by strong growth.
Medical Systems 2013
0
2000
4000
6000
8000
10000
12000
14000
20132012201120102009
0
2
4
6
8
20132012201120102009
0
500
1000
1500
2000
2500
3000
20132012201120102009
0
5
10
15
20
25
20132012201120102009
Net sales
SEK 13,322 million
Organic sales growth
6.7%
EBITA (before restructuring)
SEK 2,894 million
EBITA margin
21.7%Medical Systems’ therapeutic and infrastructure solutions are aimed at the high-acuity workplaces in hospitals. The customer offering comprises equipment, instruments and services for surgery, cardiology and intensive care. The product range includes equipment for operating rooms, intensive care units and cath labs, instruments for cardiovascular surgery, anesthetic equipment and ventilators, as well as advanced products for the minimally invasive treatment of cardiovascular diseases. Medical Systems accounts for 53% of Getinge’s sales and 61% of EBITA. The number of employees amounts to 6,572, corresponding to 43% of the Group’s total employees.

19
Medical Systems
19
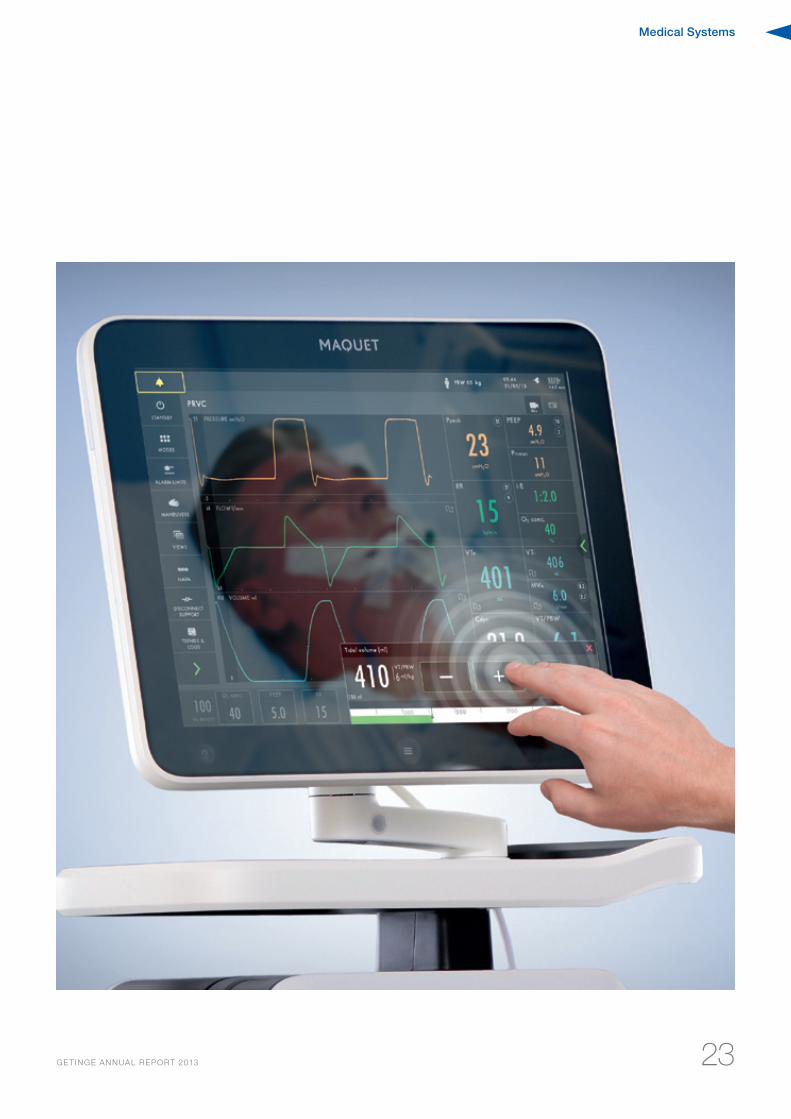
The third quarter saw the start of the launch of SERVO-U – the next-generation ventilator plat-form. With its intuitive user interface, SERVO-U takes a revolutionary leap in the area of ventilator technology and ensures effective treatment of intensive care patients. SERVO-U has been very positively received by the customers who have used it.
Medical Systems
20 GE TINGE ANNUAL REPORT 2013
Market trend 2013Good organic growth in USA/Canada and in many emerging markets
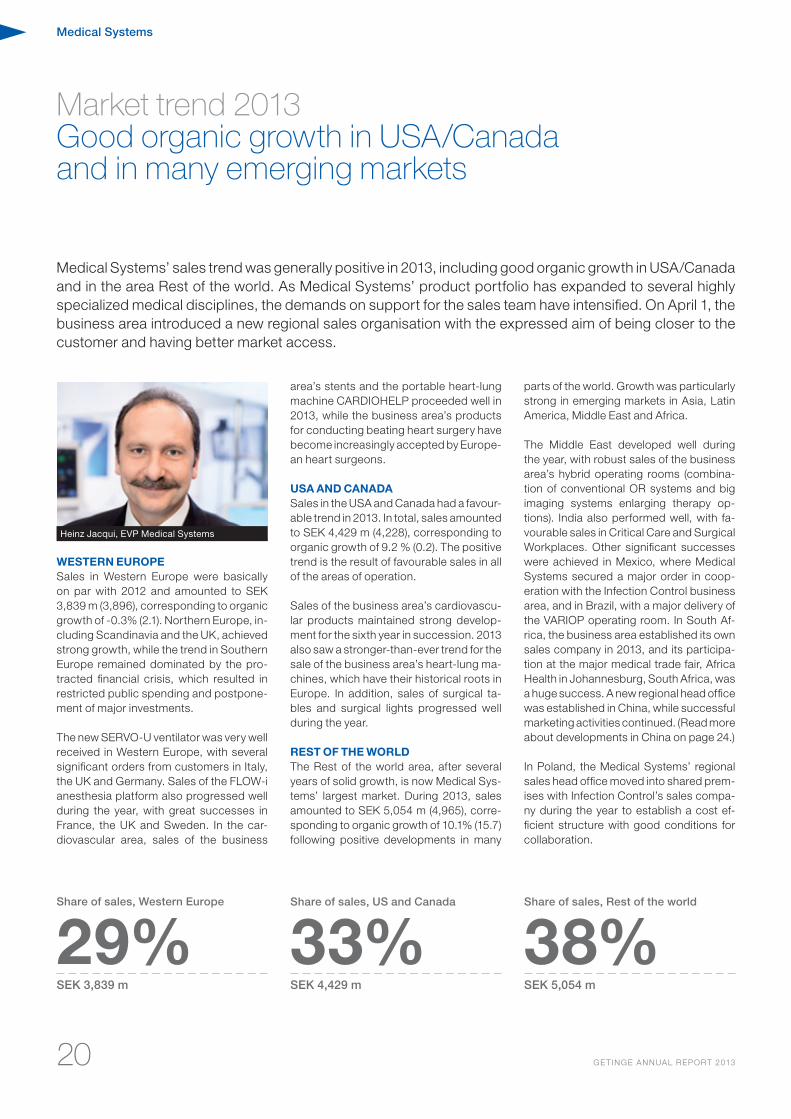
Medical Systems’ sales trend was generally positive in 2013, including good organic growth in USA/Canada and in the area Rest of the world. As Medical Systems’ product portfolio has expanded to several highly specialized medical disciplines, the demands on support for the sales team have intensified. On April 1, the business area introduced a new regional sales organisation with the expressed aim of being closer to the customer and having better market access.
WESTERN EUROPESales in Western Europe were basically on par with 2012 and amounted to SEK 3,839 m (3,896), corresponding to organic growth of -0.3% (2.1). Northern Europe, in-cluding Scandinavia and the UK, achieved strong growth, while the trend in Southern Europe remained dominated by the pro-tracted financial crisis, which resulted in restricted public spending and postpone-ment of major investments.
The new SERVO-U ventilator was very well received in Western Europe, with several significant orders from customers in Italy, the UK and Germany. Sales of the FLOW-i anesthesia platform also progressed well during the year, with great successes in France, the UK and Sweden. In the car-diovascular area, sales of the business
area’s stents and the portable heart-lung machine CARDIOHELP proceeded well in 2013, while the business area’s products for conducting beating heart surgery have become increasingly accepted by Europe-an heart surgeons.
USA AND CANADASales in the USA and Canada had a favour-able trend in 2013. In total, sales amounted to SEK 4,429 m (4,228), corresponding to organic growth of 9.2 % (0.2). The positive trend is the result of favourable sales in all of the areas of operation.
Sales of the business area’s cardiovascu-lar products maintained strong develop-ment for the sixth year in succession. 2013 also saw a stronger-than-ever trend for the sale of the business area’s heart-lung ma-chines, which have their historical roots in Europe. In addition, sales of surgical ta-bles and surgical lights progressed well during the year.
REST OF THE WORLDThe Rest of the world area, after several years of solid growth, is now Medical Sys-tems’ largest market. During 2013, sales amounted to SEK 5,054 m (4,965), corre-sponding to organic growth of 10.1% (15.7) following positive developments in many
parts of the world. Growth was particularly strong in emerging markets in Asia, Latin America, Middle East and Africa.
The Middle East developed well during the year, with robust sales of the business area’s hybrid operating rooms (combina-tion of conventional OR systems and big imaging systems enlarging therapy op-tions). India also performed well, with fa-vourable sales in Critical Care and Surgical Workplaces. Other significant successes were achieved in Mexico, where Medical Systems secured a major order in coop-eration with the Infection Control business area, and in Brazil, with a major delivery of the VARIOP operating room. In South Af-rica, the business area established its own sales company in 2013, and its participa-tion at the major medical trade fair, Africa Health in Johannesburg, South Africa, was a huge success. A new regional head office was established in China, while successful marketing activities continued. (Read more about developments in China on page 24.)
In Poland, the Medical Systems’ regional sales head office moved into shared prem-ises with Infection Control’s sales compa-ny during the year to establish a cost ef-ficient structure with good conditions for collaboration.
Share of sales, Western Europe
29%Share of sales, US and Canada
33%Share of sales, Rest of the world
38%SEK 3,839 m SEK 4,429 m SEK 5,054 m
Heinz Jacqui, EVP Medical Systems
Medical Systems
21GE TINGE ANNUAL REPORT 2013
2000
3000
4000
5000
6000
20132012201120102009
SEK m
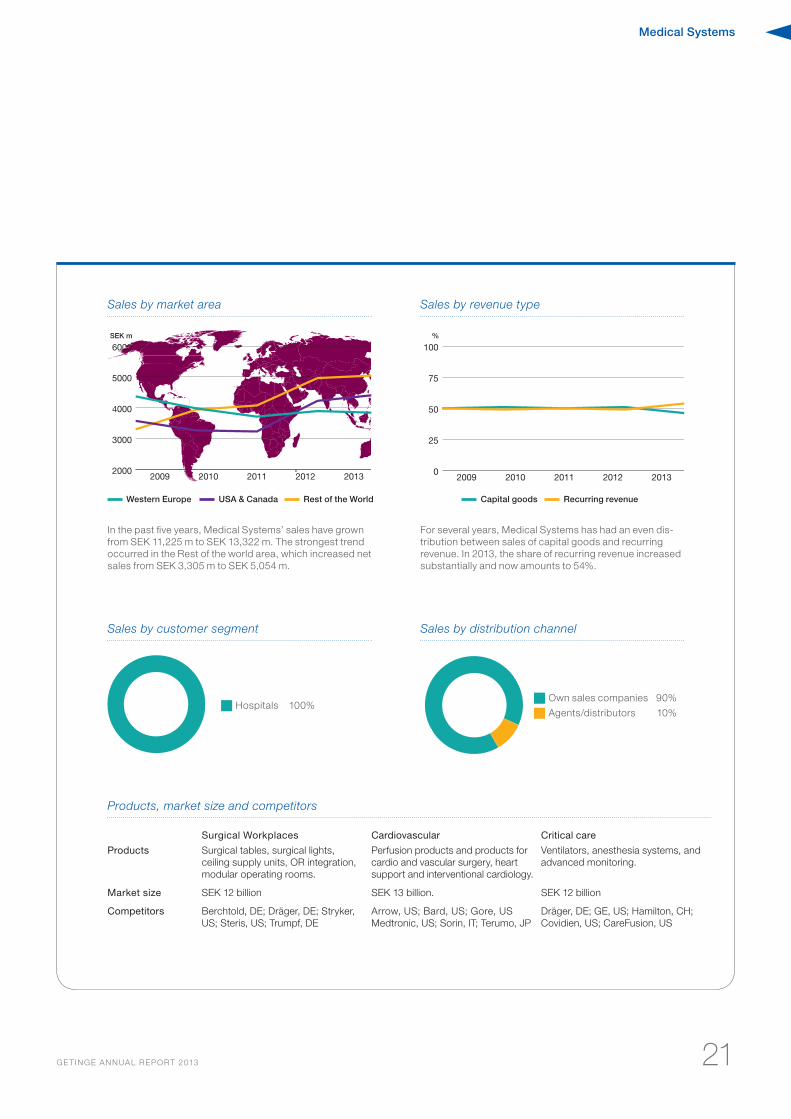
Sales by market area
Western Europe USA & Canada Rest of the World
In the past five years, Medical Systems’ sales have grown from SEK 11,225 m to SEK 13,322 m. The strongest trend occurred in the Rest of the world area, which increased net sales from SEK 3,305 m to SEK 5,054 m.
0
25
50
75
100
20132012201120102009
%
Sales by revenue type
For several years, Medical Systems has had an even dis-tribution between sales of capital goods and recurring revenue. In 2013, the share of recurring revenue increased substantially and now amounts to 54%.
Capital goods Recurring revenue
Sales by customer segment Sales by distribution channel
Products, market size and competitors
Surgical Workplaces Cardiovascular Critical care
Products Surgical tables, surgical lights, ceiling supply units, OR integration, modular operating rooms.
Perfusion products and products for cardio and vascular surgery, heart support and interventional cardiology.
Ventilators, anesthesia systems, and advanced monitoring.
Market size SEK 12 billion SEK 13 billion. SEK 12 billion
Competitors Berchtold, DE; Dräger, DE; Stryker, US; Steris, US; Trumpf, DE
Arrow, US; Bard, US; Gore, US Medtronic, US; Sorin, IT; Terumo, JP
Dräger, DE; GE, US; Hamilton, CH; Covidien, US; CareFusion, US
49%
49%
■ Own sales companies 90%
■ Agents/distributors 10%■ Hospitals 100%
Medical Systems
GE TINGE ANNUAL REPORT 201322
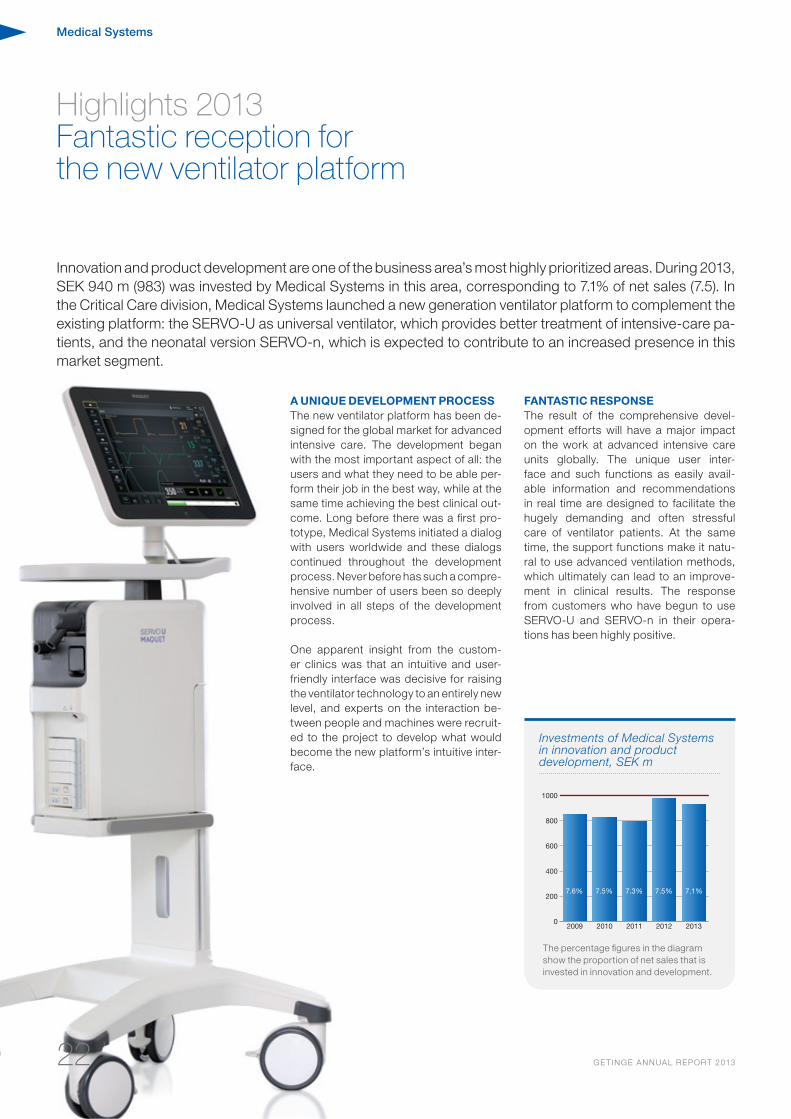
Innovation and product development are one of the business area’s most highly prioritized areas. During 2013, SEK 940 m (983) was invested by Medical Systems in this area, corresponding to 7.1% of net sales (7.5). In the Critical Care division, Medical Systems launched a new generation ventilator platform to complement the existing platform: the SERVO-U as universal ventilator, which provides better treatment of intensive-care pa-tients, and the neonatal version SERVO-n, which is expected to contribute to an increased presence in this market segment.
A UNIqUE DEvELOPMENT PROCESSThe new ventilator platform has been de-signed for the global market for advanced intensive care. The development began with the most important aspect of all: the users and what they need to be able per-form their job in the best way, while at the same time achieving the best clinical out-come. Long before there was a first pro-totype, Medical Systems initiated a dialog with users worldwide and these dialogs continued throughout the development process. Never before has such a compre-hensive number of users been so deeply involved in all steps of the development process.
One apparent insight from the custom-er clinics was that an intuitive and user-friendly interface was decisive for raising the ventilator technology to an entirely new level, and experts on the interaction be-tween people and machines were recruit-ed to the project to develop what would become the new platform’s intuitive inter-face.
FANTASTIC RESPONSEThe result of the comprehensive devel-opment efforts will have a major impact on the work at advanced intensive care units globally. The unique user inter-face and such functions as easily avail-able information and recommendations in real time are designed to facilitate the hugely demanding and often stressful care of ventilator patients. At the same time, the support functions make it natu-ral to use advanced ventilation methods, which ultimately can lead to an improve-ment in clinical results. The response from customers who have begun to use SERVO-U and SERVO-n in their opera-tions has been highly positive.
Highlights 2013 Fantastic reception for the new ventilator platform
Investments of Medical Systems in innovation and product development, SEK m
0
200
400
600
800
1000
20132012201120102009
7.6% 7.5% 7.3% 7.5% 7.1%
The percentage figures in the diagram show the proportion of net sales that is invested in innovation and development.
Medical Systems
23GE TINGE ANNUAL REPORT 2013
Medical Systems
24 GE TINGE ANNUAL REPORT 2013
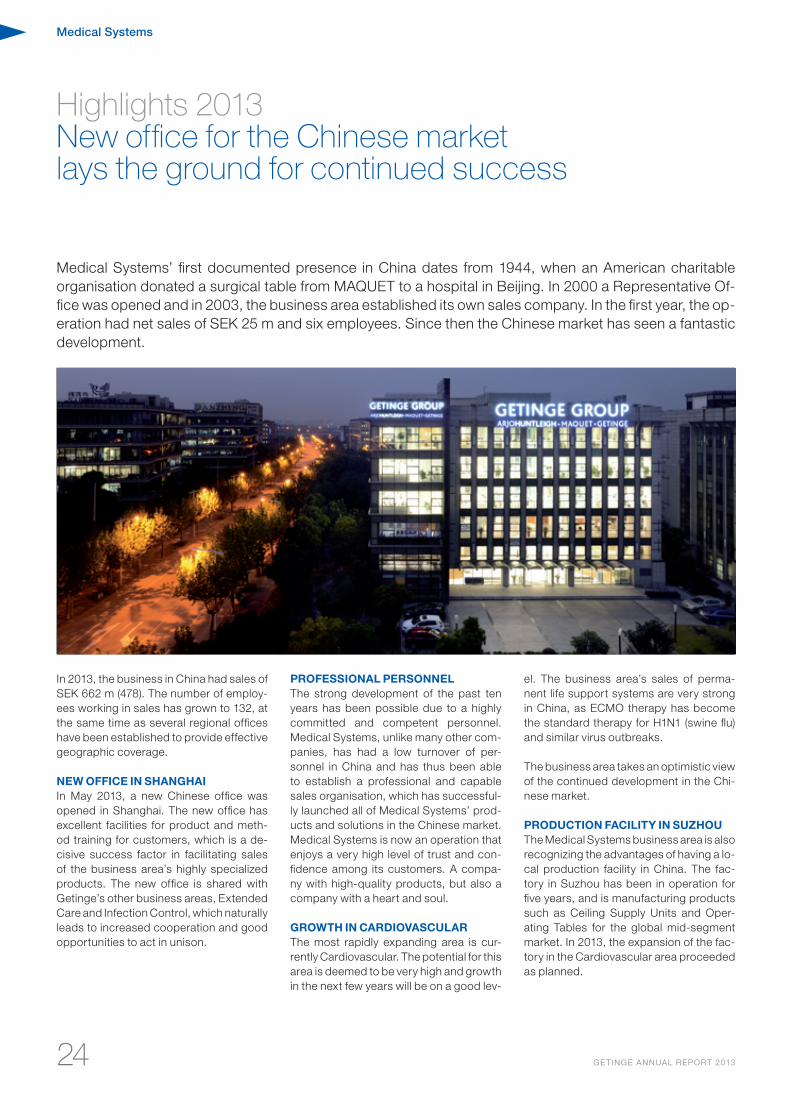
Medical Systems’ first documented presence in China dates from 1944, when an American charitable organisation donated a surgical table from MAQUET to a hospital in Beijing. In 2000 a Representative Of-fice was opened and in 2003, the business area established its own sales company. In the first year, the op-eration had net sales of SEK 25 m and six employees. Since then the Chinese market has seen a fantastic development.
In 2013, the business in China had sales of SEK 662 m (478). The number of employ-ees working in sales has grown to 132, at the same time as several regional offices have been established to provide effective geographic coverage.
NEW OFFICE IN SHANGHAIIn May 2013, a new Chinese office was opened in Shanghai. The new office has excellent facilities for product and meth-od training for customers, which is a de-cisive success factor in facilitating sales of the business area’s highly specialized products. The new office is shared with Getinge’s other business areas, Extended Care and Infection Control, which naturally leads to increased cooperation and good opportunities to act in unison.
PROFESSIONAL PERSONNELThe strong development of the past ten years has been possible due to a highly committed and competent personnel. Medical Systems, unlike many other com-panies, has had a low turnover of per-sonnel in China and has thus been able to establish a professional and capable sales organisation, which has successful-ly launched all of Medical Systems’ prod-ucts and solutions in the Chinese market. Medical Systems is now an operation that enjoys a very high level of trust and con-fidence among its customers. A compa-ny with high-quality products, but also a company with a heart and soul.
GROWTH IN CARDIOvASCULARThe most rapidly expanding area is cur-rently Cardiovascular. The potential for this area is deemed to be very high and growth in the next few years will be on a good lev-
el. The business area’s sales of perma-nent life support systems are very strong in China, as ECMO therapy has become the standard therapy for H1N1 (swine flu) and similar virus outbreaks.
The business area takes an optimistic view of the continued development in the Chi-nese market.
PRODUCTION FACILITY IN SUzHOUThe Medical Systems business area is also recognizing the advantages of having a lo-cal production facility in China. The fac-tory in Suzhou has been in operation for five years, and is manufacturing products such as Ceiling Supply Units and Oper-ating Tables for the global mid-segment market. In 2013, the expansion of the fac-tory in the Cardiovascular area proceeded as planned.
Highlights 2013New office for the Chinese market lays the ground for continued success
Medical Systems
25GE TINGE ANNUAL REPORT 2013
Brazil is a large and important market for Medical Systems. Growth has been favorable for the past ten years and in 2013, net sales amounted to SEK 554 m (474), which makes Brazil the business area’s seventh larg-est market. During the year, a new facility for the production of consumables for the heart-lung area was established to considerably strengthen local competitiveness.
The new facility for the manufacture of con-sumables in the heart-lung area is located close to Sao Paulo. The foremost reasons for establishing production in Brazil is to get closer to customers, increase flexibili-ty and thereby strengthening competitive-ness considerably. In addition to this, the regulatory processes become substan-tially smoother compared with the situa-tion for imported products.
By having production operations in the country, the business area can also meet customers’ demands for rapid and flexi-ble deliveries in an efficient manner, which contributes to further strengthening com-petitiveness. With 50,000 open heart sur-
geries, Brazil accounts for about 50% of this type of procedure in the region. Ac-cordingly, Brazil is now the primary market for the production in Sao Paulo, but in the long term it may be of interest to supply products to other countries in the region. During 2014, manufacturing will expand to include more products in the heart-lung area to capitalize on the benefits provided by local production.
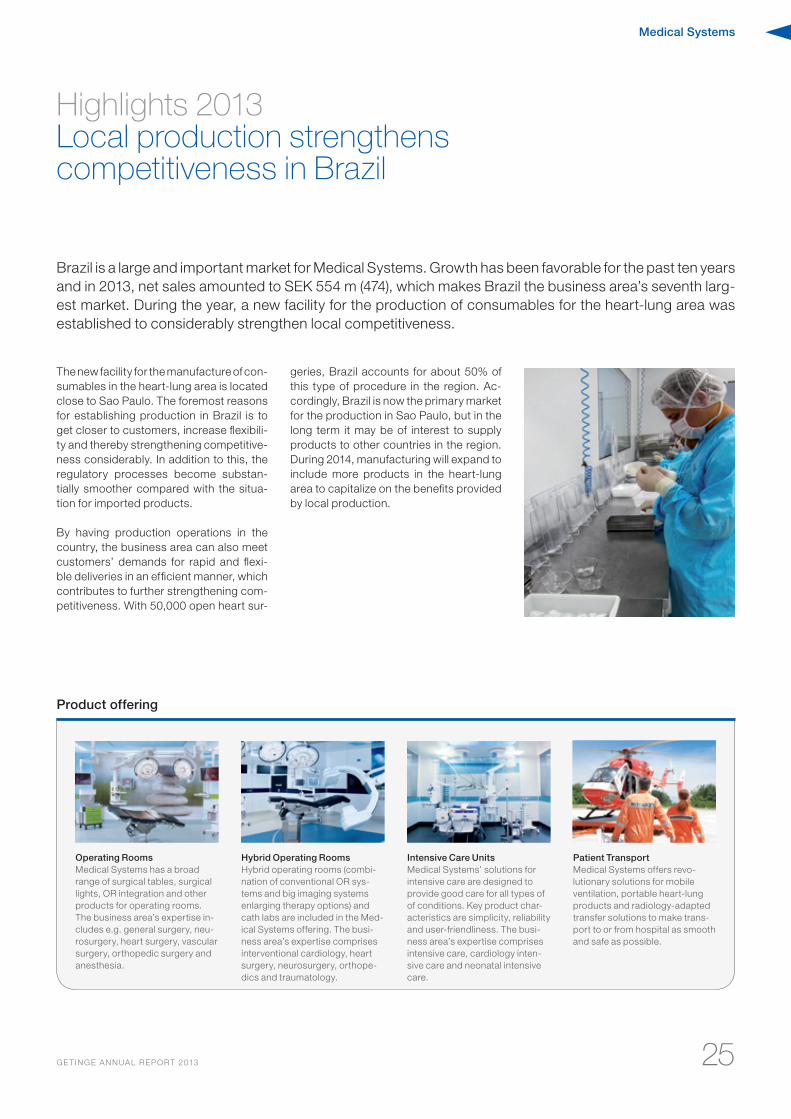
Product offering
Operating RoomsMedical Systems has a broad range of surgical tables, surgical lights, OR integration and other products for operating rooms. The business area’s expertise in-cludes e.g. general surgery, neu-rosurgery, heart surgery, vascular surgery, orthopedic surgery and anesthesia.
Hybrid Operating RoomsHybrid operating rooms (combi-nation of conventional OR sys-tems and big imaging systems enlarging therapy options) and cath labs are included in the Med-ical Systems offering. The busi-ness area’s expertise comprises interventional cardiology, heart surgery, neurosurgery, orthope-dics and traumatology.
Intensive Care UnitsMedical Systems’ solutions for intensive care are designed to provide good care for all types of of conditions. Key product char-acteristics are simplicity, reliability and user-friendliness. The busi-ness area’s expertise comprises intensive care, cardiology inten-sive care and neonatal intensive care.
Patient TransportMedical Systems offers revo-lutionary solutions for mobile ventilation, portable heart-lung products and radiology-adapted transfer solutions to make trans-port to or from hospital as smooth and safe as possible.
Highlights 2013Local production strengthens competitiveness in Brazil
Extended Care
26
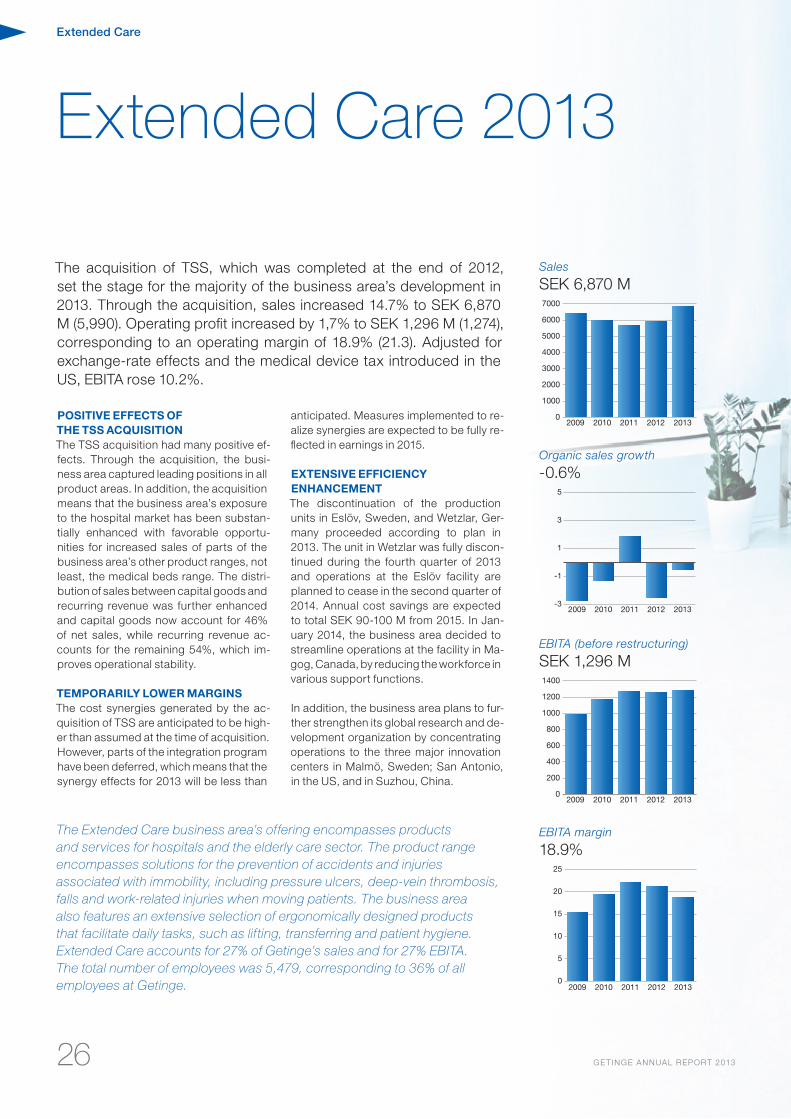
The acquisition of TSS, which was completed at the end of 2012, set the stage for the majority of the business area’s development in 2013. Through the acquisition, sales increased 14.7% to SEK 6,870 M (5,990). Operating profit increased by 1,7% to SEK 1,296 M (1,274), corresponding to an operating margin of 18.9% (21.3). Adjusted for exchange-rate effects and the medical device tax introduced in the US, EBITA rose 10.2%.
POSITIvE EFFECTS OF THE TSS ACqUISITION The TSS acquisition had many positive ef-fects. Through the acquisition, the busi-ness area captured leading positions in all product areas. In addition, the acquisition means that the business area’s exposure to the hospital market has been substan-tially enhanced with favorable opportu-nities for increased sales of parts of the business area’s other product ranges, not least, the medical beds range. The distri-bution of sales between capital goods and recurring revenue was further enhanced and capital goods now account for 46% of net sales, while recurring revenue ac-counts for the remaining 54%, which im-proves operational stability.
TEMPORARILY LOWER MARGINSThe cost synergies generated by the ac-quisition of TSS are anticipated to be high-er than assumed at the time of acquisition. However, parts of the integration program have been deferred, which means that the synergy effects for 2013 will be less than
anticipated. Measures implemented to re-alize synergies are expected to be fully re-flected in earnings in 2015. EXTENSIvE EFFICIENCY ENHANCEMENT The discontinuation of the production units in Eslöv, Sweden, and Wetzlar, Ger-many proceeded according to plan in 2013. The unit in Wetzlar was fully discon-tinued during the fourth quarter of 2013 and operations at the Eslöv facility are planned to cease in the second quarter of 2014. Annual cost savings are expected to total SEK 90-100 M from 2015. In Jan-uary 2014, the business area decided to streamline operations at the facility in Ma-gog, Canada, by reducing the workforce in various support functions.
In addition, the business area plans to fur-ther strengthen its global research and de-velopment organization by concentrating operations to the three major innovation centers in Malmö, Sweden; San Antonio, in the US, and in Suzhou, China.
Extended Care 2013
0
1000
2000
3000
4000
5000
6000
7000
20132012201120102009
-3
-1
1
3
5
20132012201120102009
0
200
400
600
800
1000
1200
1400
20132012201120102009
0
5
10
15
20
25
20132012201120102009
Sales
SEK 6,870 M
Organic sales growth
-0.6%
EBITA (before restructuring)
SEK 1,296 M
EBITA margin
18.9%The Extended Care business area’s offering encompasses products and services for hospitals and the elderly care sector. The product range encompasses solutions for the prevention of accidents and injuries associated with immobility, including pressure ulcers, deep-vein thrombosis, falls and work-related injuries when moving patients. The business area also features an extensive selection of ergonomically designed products that facilitate daily tasks, such as lifting, transferring and patient hygiene. Extended Care accounts for 27% of Getinge’s sales and for 27% EBITA. The total number of employees was 5,479, corresponding to 36% of all employees at Getinge.
GE TINGE ANNUAL REPORT 2013
27
Extended Care
27
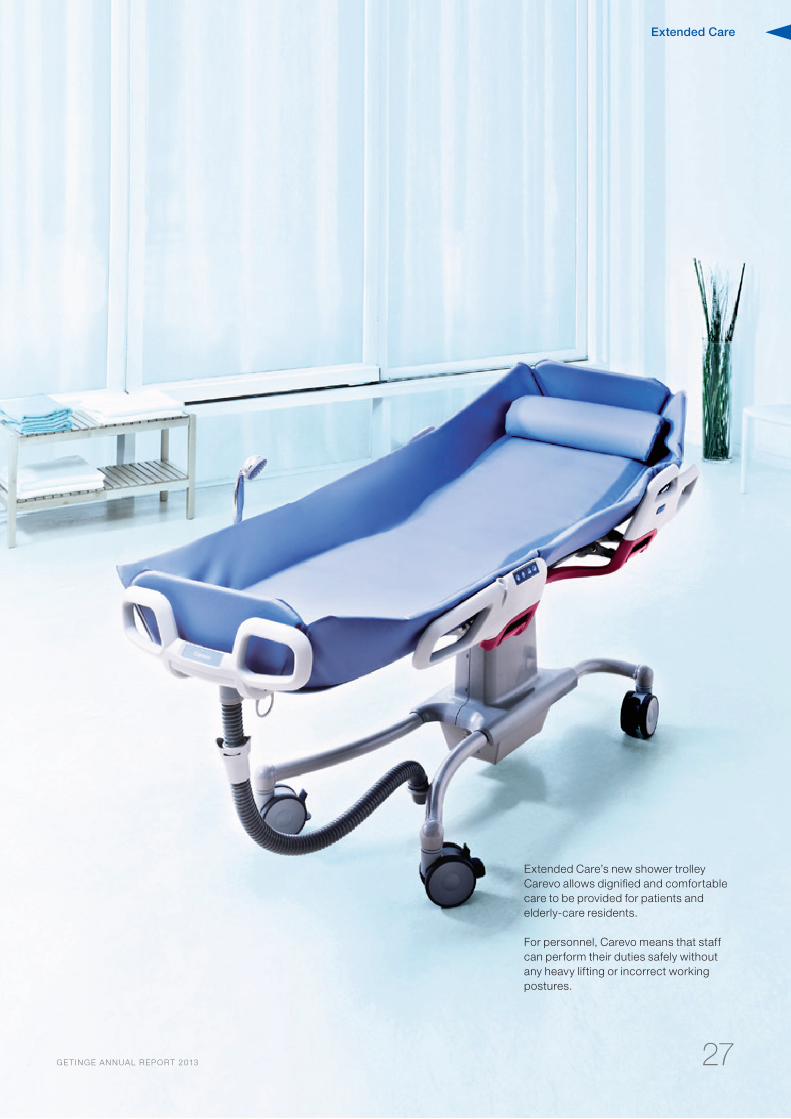
Extended Care’s new shower trolley Carevo allows dignified and comfortable care to be provided for patients and elderly-care residents.
For personnel, Carevo means that staff can perform their duties safely without any heavy lifting or incorrect working postures.
GE T INGE ANNUAL REPORT 2013
Extended Care
28 GE TINGE ANNUAL REPORT 2013
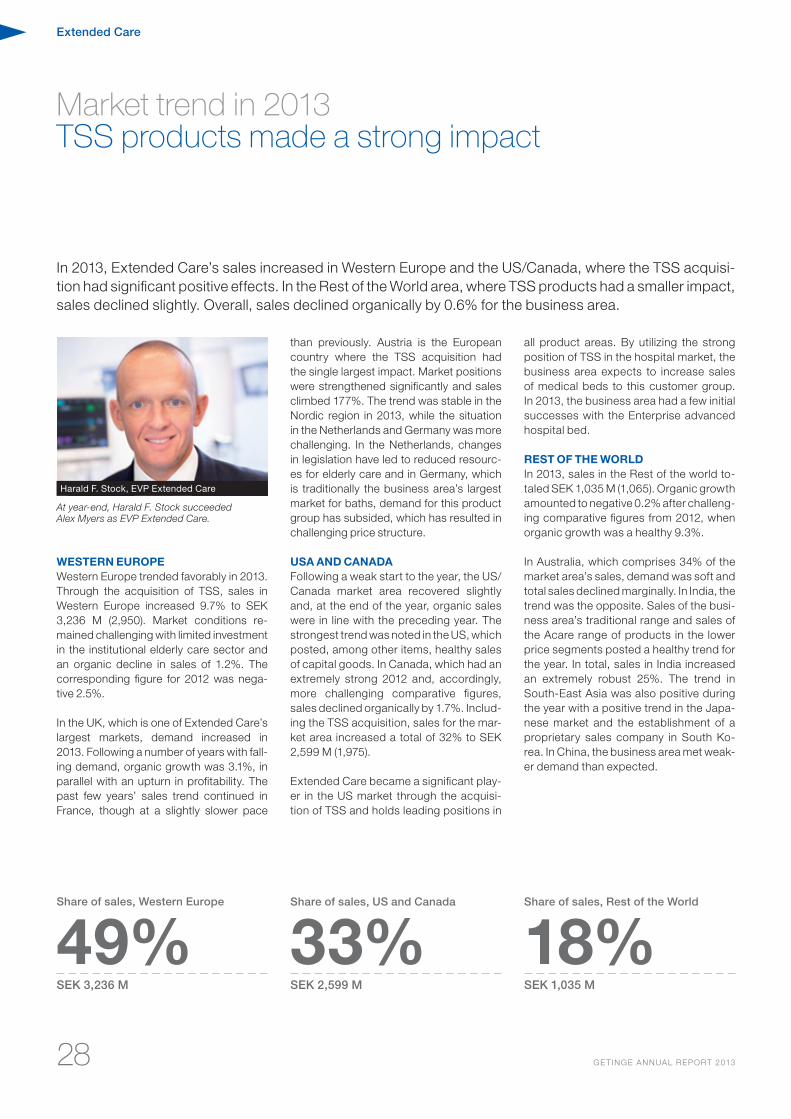
Market trend in 2013TSS products made a strong impact
In 2013, Extended Care’s sales increased in Western Europe and the US/Canada, where the TSS acquisi-tion had significant positive effects. In the Rest of the World area, where TSS products had a smaller impact, sales declined slightly. Overall, sales declined organically by 0.6% for the business area.
WESTERN EUROPEWestern Europe trended favorably in 2013. Through the acquisition of TSS, sales in Western Europe increased 9.7% to SEK 3,236 M (2,950). Market conditions re-mained challenging with limited investment in the institutional elderly care sector and an organic decline in sales of 1.2%. The corresponding figure for 2012 was nega-tive 2.5%.
In the UK, which is one of Extended Care’s largest markets, demand increased in 2013. Following a number of years with fall-ing demand, organic growth was 3.1%, in parallel with an upturn in profitability. The past few years’ sales trend continued in France, though at a slightly slower pace
than previously. Austria is the European country where the TSS acquisition had the single largest impact. Market positions were strengthened significantly and sales climbed 177%. The trend was stable in the Nordic region in 2013, while the situation in the Netherlands and Germany was more challenging. In the Netherlands, changes in legislation have led to reduced resourc-es for elderly care and in Germany, which is traditionally the business area’s largest market for baths, demand for this product group has subsided, which has resulted in challenging price structure.
USA AND CANADAFollowing a weak start to the year, the US/Canada market area recovered slightly and, at the end of the year, organic sales were in line with the preceding year. The strongest trend was noted in the US, which posted, among other items, healthy sales of capital goods. In Canada, which had an extremely strong 2012 and, accordingly, more challenging comparative figures, sales declined organically by 1.7%. Includ-ing the TSS acquisition, sales for the mar-ket area increased a total of 32% to SEK 2,599 M (1,975).
Extended Care became a significant play-er in the US market through the acquisi-tion of TSS and holds leading positions in
all product areas. By utilizing the strong position of TSS in the hospital market, the business area expects to increase sales of medical beds to this customer group. In 2013, the business area had a few initial successes with the Enterprise advanced hospital bed. REST OF THE WORLDIn 2013, sales in the Rest of the world to-taled SEK 1,035 M (1,065). Organic growth amounted to negative 0.2% after challeng-ing comparative figures from 2012, when organic growth was a healthy 9.3%.
In Australia, which comprises 34% of the market area’s sales, demand was soft and total sales declined marginally. In India, the trend was the opposite. Sales of the busi-ness area’s traditional range and sales of the Acare range of products in the lower price segments posted a healthy trend for the year. In total, sales in India increased an extremely robust 25%. The trend in South-East Asia was also positive during the year with a positive trend in the Japa-nese market and the establishment of a proprietary sales company in South Ko-rea. In China, the business area met weak-er demand than expected.
Share of sales, Western Europe
49%Share of sales, US and Canada
33%Share of sales, Rest of the World
18%SEK 3,236 M SEK 2,599 M SEK 1,035 M
Harald F. Stock, EVP Extended Care
At year-end, Harald F. Stock succeeded Alex Myers as EVP Extended Care.
Extended Care
29GE TINGE ANNUAL REPORT 2013
0
1 000
2 000
3 000
4 000
20132012201120102009
Mkr
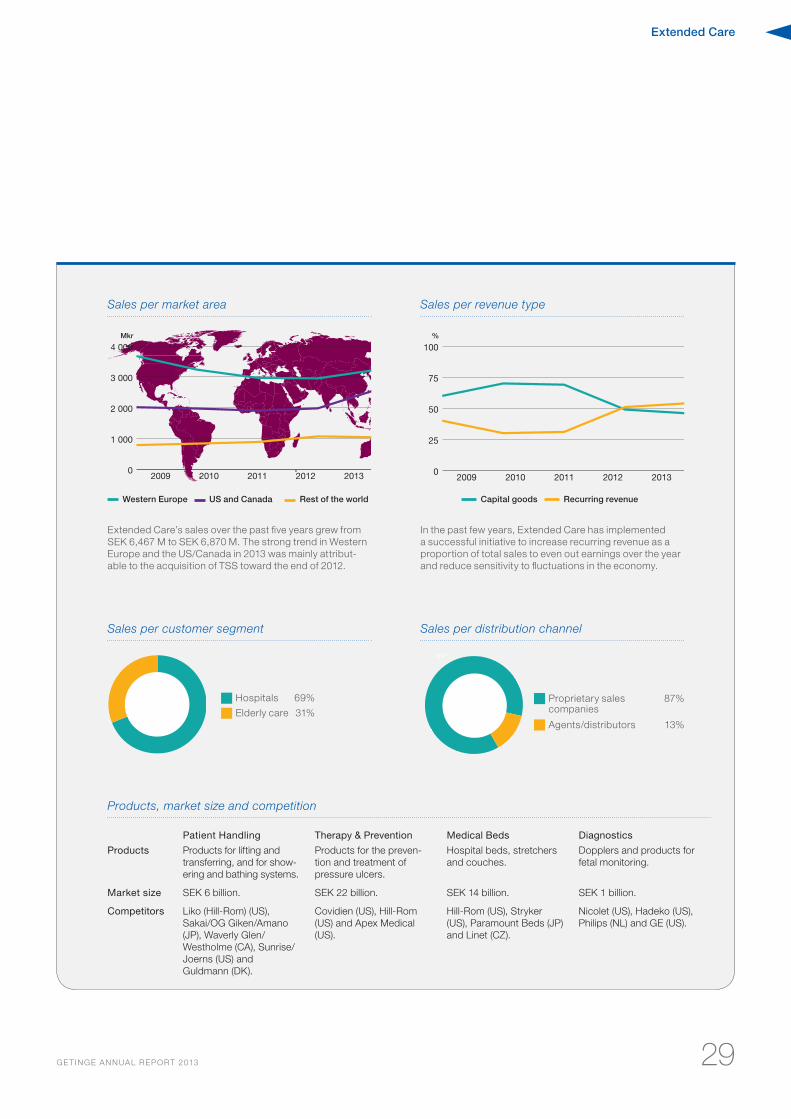
Sales per market area
Western Europe US and Canada Rest of the world
Extended Care’s sales over the past five years grew from SEK 6,467 M to SEK 6,870 M. The strong trend in Western Europe and the US/Canada in 2013 was mainly attribut-able to the acquisition of TSS toward the end of 2012.
0
25
50
75
100
20132012201120102009
%
Sales per revenue type
In the past few years, Extended Care has implemented a successful initiative to increase recurring revenue as a proportion of total sales to even out earnings over the year and reduce sensitivity to fluctuations in the economy.
Capital goods Recurring revenue
Sales per customer segment Sales per distribution channel
Products, market size and competition
Patient Handling Therapy & Prevention Medical Beds Diagnostics
Products Products for lifting and transferring, and for show-ering and bathing systems.
Products for the preven-tion and treatment of pressure ulcers.
Hospital beds, stretchers and couches.
Dopplers and products for fetal monitoring.
Market size SEK 6 billion. SEK 22 billion. SEK 14 billion. SEK 1 billion.
Competitors Liko (Hill-Rom) (US), Sakai/OG Giken/Amano (JP), Waverly Glen/ Westholme (CA), Sunrise/Joerns (US) and Guldmann (DK).
Covidien (US), Hill-Rom (US) and Apex Medical (US).
Hill-Rom (US), Stryker (US), Paramount Beds (JP) and Linet (CZ).
Nicolet (US), Hadeko (US), Philips (NL) and GE (US).
49%
49%
■ Proprietary sales companies
87%
■ Agents/distributors 13%
■ Hospitals 69%
■ Elderly care 31%
Extended Care
30 GE TINGE ANNUAL REPORT 2013
Three dedicated innovation centers
In 2014, the business area’s organization for innovation and product development will be restructured – from 11 local devel-opment departments each linked to one of the business area’s plants – to three inde-pendent global innovation centers. Each innovation center is responsible for a well-defined part of Extended Care’s develop-ment operations.
In Malmö, focus is on future solutions for patient handling and hygiene systems. In Suzhou, China, the business area’s prod-ucts for emerging markets are being de-veloped with a focus on medical beds and therapeutic surfaces; and in San Antonio in the US, innovation efforts are directed at solving the complications that can afflict patients with long-term reduced mobility, for example, pressure ulcers and blood clots.
The transition from a development organi-zation with 11 local development depart-ments to three global innovation centers creates an organization with increased competence, clearer focus and substan-tial capacity to deliver new products and solutions.
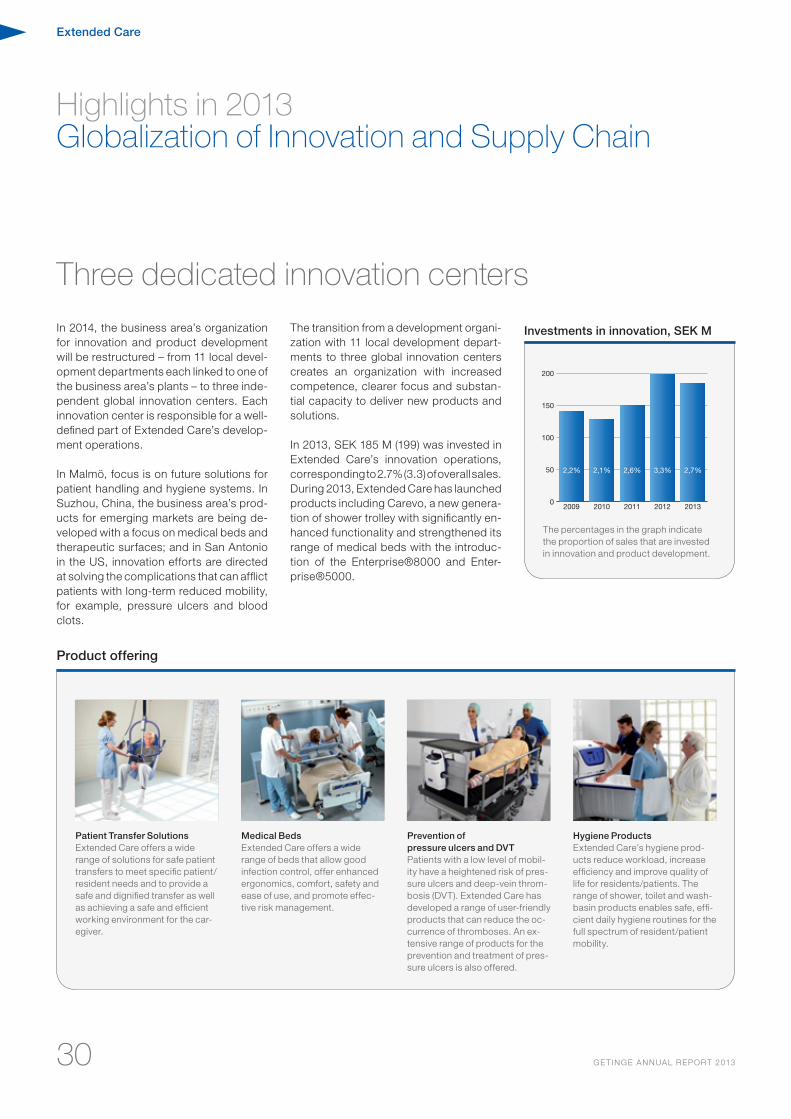
In 2013, SEK 185 M (199) was invested in Extended Care’s innovation operations, corresponding to 2.7% (3.3) of overall sales. During 2013, Extended Care has launched products including Carevo, a new genera-tion of shower trolley with significantly en-hanced functionality and strengthened its range of medical beds with the introduc-tion of the Enterprise®8000 and Enter-prise®5000.
Highlights in 2013Globalization of Innovation and Supply Chain
Product offering
Patient Transfer SolutionsExtended Care offers a wide range of solutions for safe patient transfers to meet specific patient/resident needs and to provide a safe and dignified transfer as well as achieving a safe and efficient working environment for the car-egiver.
Medical Beds Extended Care offers a wide range of beds that allow good infection control, offer enhanced ergonomics, comfort, safety and ease of use, and promote effec-tive risk management.
Prevention of pressure ulcers and DVTPatients with a low level of mobil-ity have a heightened risk of pres-sure ulcers and deep-vein throm-bosis (DVT). Extended Care has developed a range of user-friendly products that can reduce the oc-currence of thromboses. An ex-tensive range of products for the prevention and treatment of pres-sure ulcers is also offered.
Hygiene ProductsExtended Care’s hygiene prod-ucts reduce workload, increase efficiency and improve quality of life for residents/patients. The range of shower, toilet and wash-basin products enables safe, effi-cient daily hygiene routines for the full spectrum of resident/patient mobility.
Investments in innovation, SEK M
The percentages in the graph indicate the proportion of sales that are invested in innovation and product development.
0
50
100
150
200
20132012201120102009
2,2% 2,1% 2,6% 3,3% 2,7%
Extended Care
31GE TINGE ANNUAL REPORT 2013
Global Supply Chain sharpens competitiveness
Over the past few years, Extended Care’s supply chain has become significant-ly more efficient. Operations in 15 small-er plants have been concentrated to five substantial production facilities, in parallel with a strengthened presence in Eastern Europe and Asia.
In 2013, focus has been on the integration of TSS operations and on bolstering the competitiveness of the business area’s hy-giene products. As part of the integration of TSS, the plant in San Antonio in the US was closed and production moved to the business area’s facility in Poznan, Poland.
Several measures are being implement-ed to strengthen the competitiveness of hygiene products. The plants in Eslöv, Sweden and Wetzlar, Germany are being discontinued and production transferred to the business area’s facility in Poznan, Poland and, for baths, to an external sup-plier in Eastern Europe. A decline in sales of baths means that a cost-effective and flexible solution is needed to remain com-petitive in this market segment. This is the first time that the business area has out-sourced production of an entire product to an external supplier.
The restructuring costs for transferring operations from Eslöv and Wetzlar are es-timated at SEK 96 M and are expected to lead to annual savings of SEK 90-100 M from 2015.
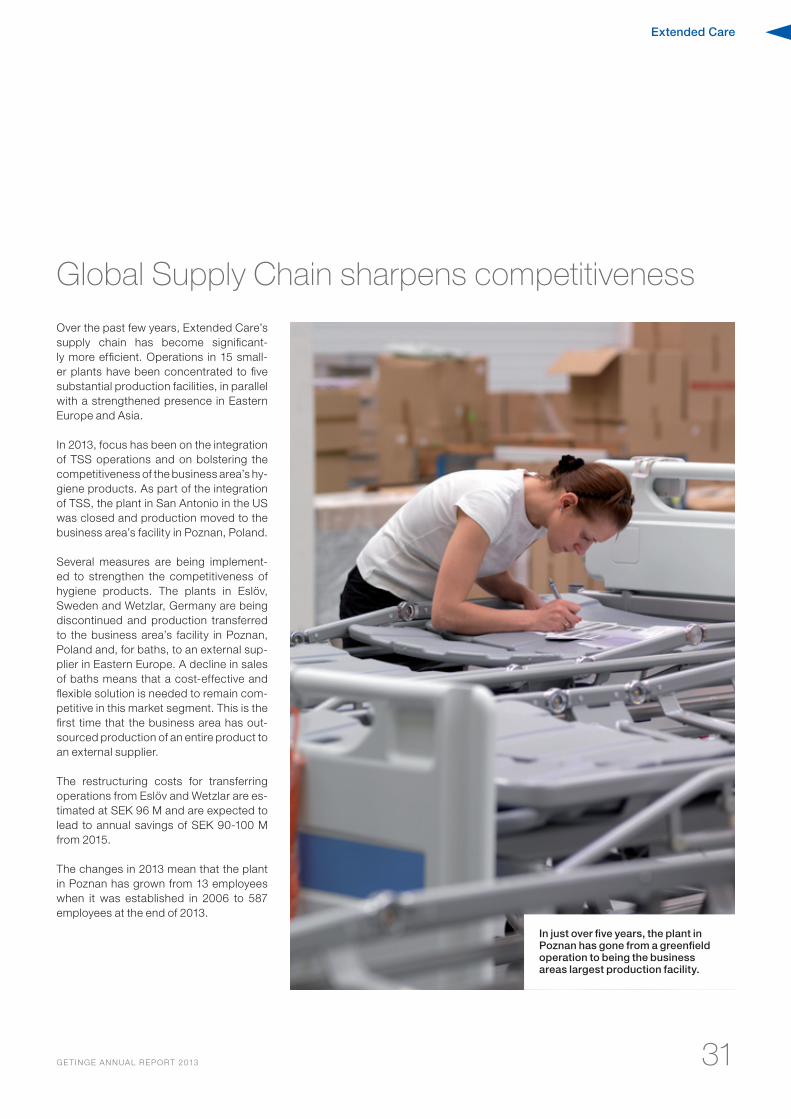
The changes in 2013 mean that the plant in Poznan has grown from 13 employees when it was established in 2006 to 587 employees at the end of 2013.
In just over five years, the plant in Poznan has gone from a greenfield operation to being the business areas largest production facility.
Infection Control
32 GE TINGE ANNUAL REPORT 2013
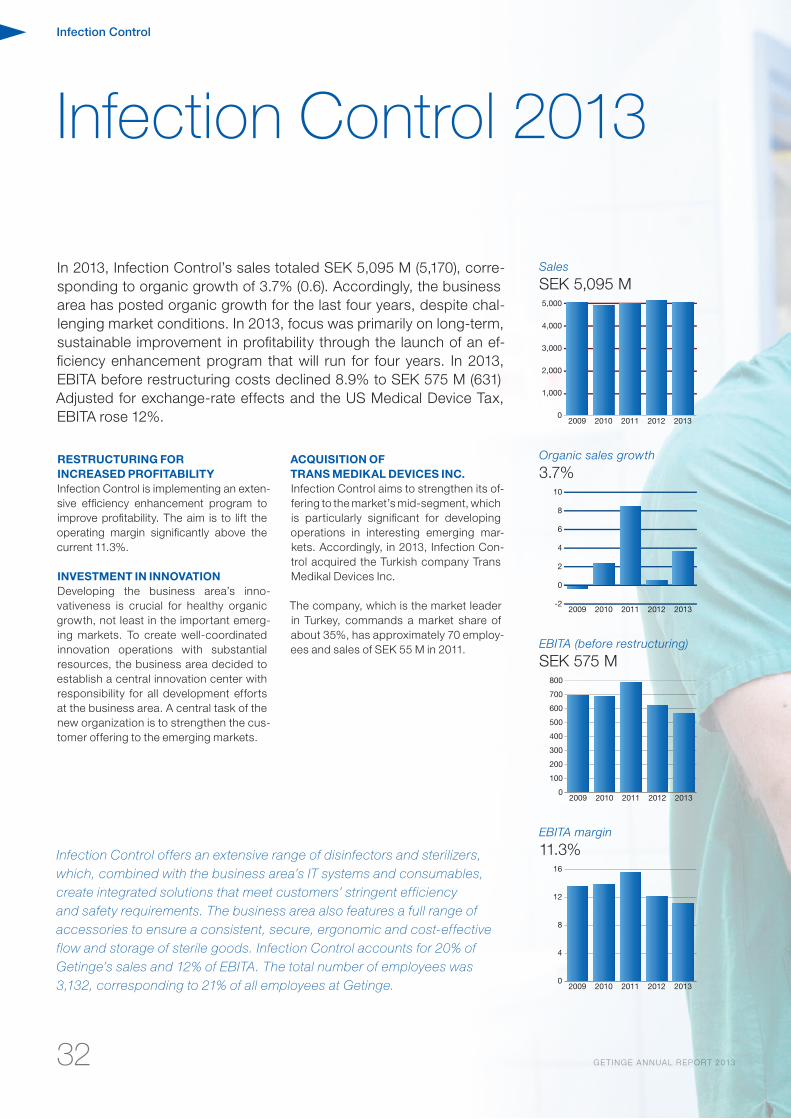
In 2013, Infection Control’s sales totaled SEK 5,095 M (5,170), corre-sponding to organic growth of 3.7% (0.6). Accordingly, the business area has posted organic growth for the last four years, despite chal-lenging market conditions. In 2013, focus was primarily on long-term, sustainable improvement in profitability through the launch of an ef-ficiency enhancement program that will run for four years. In 2013, EBITA before restructuring costs declined 8.9% to SEK 575 M (631) Adjusted for exchange-rate effects and the US Medical Device Tax, EBITA rose 12%.
RESTRUCTURING FOR INCREASED PROFITABILITYInfection Control is implementing an exten-sive efficiency enhancement program to improve profitability. The aim is to lift the operating margin significantly above the current 11.3%.
INvESTMENT IN INNOvATIONDeveloping the business area’s inno-vativeness is crucial for healthy organic growth, not least in the important emerg-ing markets. To create well-coordinated innovation operations with substantial resources, the business area decided to establish a central innovation center with responsibility for all development efforts at the business area. A central task of the new organization is to strengthen the cus-tomer offering to the emerging markets.
ACqUISITION OF TRANS MEDIKAL DEvICES INC .Infection Control aims to strengthen its of-fering to the market’s mid-segment, which is particularly significant for developing operations in interesting emerging mar-kets. Accordingly, in 2013, Infection Con-trol acquired the Turkish company Trans Medikal Devices Inc.
The company, which is the market leader in Turkey, commands a market share of about 35%, has approximately 70 employ-ees and sales of SEK 55 M in 2011.
Infection Control 2013
0
1,000
2,000
3,000
4,000
5,000
20132012201120102009
-2
0
2
4
6
8
10
20132012201120102009
0
100
200
300
400
500
600
700
800
20132012201120102009
0
4
8
12
16
20132012201120102009
Sales
SEK 5,095 M
Organic sales growth
3.7%
EBITA (before restructuring)
SEK 575 M
EBITA margin
11.3%Infection Control offers an extensive range of disinfectors and sterilizers, which, combined with the business area’s IT systems and consumables, create integrated solutions that meet customers’ stringent efficiency and safety requirements. The business area also features a full range of accessories to ensure a consistent, secure, ergonomic and cost-effective flow and storage of sterile goods. Infection Control accounts for 20% of Getinge’s sales and 12% of EBITA. The total number of employees was 3,132, corresponding to 21% of all employees at Getinge.

33
Infection Control
33
Infection Control
34 GE TINGE ANNUAL REPORT 2013
Market trend in 2013Positive trend during the year
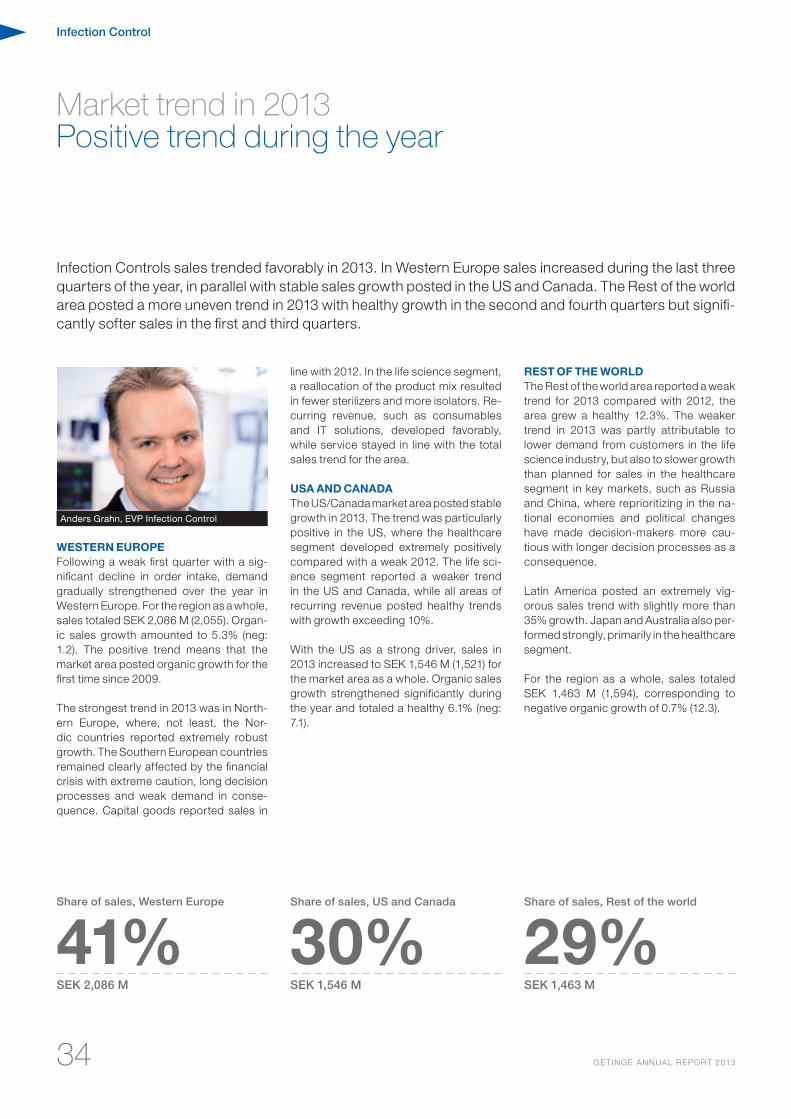
Infection Controls sales trended favorably in 2013. In Western Europe sales increased during the last three quarters of the year, in parallel with stable sales growth posted in the US and Canada. The Rest of the world area posted a more uneven trend in 2013 with healthy growth in the second and fourth quarters but signifi-cantly softer sales in the first and third quarters.
WESTERN EUROPEFollowing a weak first quarter with a sig-nificant decline in order intake, demand gradually strengthened over the year in Western Europe. For the region as a whole, sales totaled SEK 2,086 M (2,055). Organ-ic sales growth amounted to 5.3% (neg: 1.2). The positive trend means that the market area posted organic growth for the first time since 2009.
The strongest trend in 2013 was in North-ern Europe, where, not least, the Nor-dic countries reported extremely robust growth. The Southern European countries remained clearly affected by the financial crisis with extreme caution, long decision processes and weak demand in conse-quence. Capital goods reported sales in
line with 2012. In the life science segment, a reallocation of the product mix resulted in fewer sterilizers and more isolators. Re-curring revenue, such as consumables and IT solutions, developed favorably, while service stayed in line with the total sales trend for the area.
USA AND CANADAThe US/Canada market area posted stable growth in 2013. The trend was particularly positive in the US, where the healthcare segment developed extremely positively compared with a weak 2012. The life sci-ence segment reported a weaker trend in the US and Canada, while all areas of recurring revenue posted healthy trends with growth exceeding 10%.
With the US as a strong driver, sales in 2013 increased to SEK 1,546 M (1,521) for the market area as a whole. Organic sales growth strengthened significantly during the year and totaled a healthy 6.1% (neg: 7.1).
REST OF THE WORLDThe Rest of the world area reported a weak trend for 2013 compared with 2012, the area grew a healthy 12.3%. The weaker trend in 2013 was partly attributable to lower demand from customers in the life science industry, but also to slower growth than planned for sales in the healthcare segment in key markets, such as Russia and China, where reprioritizing in the na-tional economies and political changes have made decision-makers more cau-tious with longer decision processes as a consequence.
Latin America posted an extremely vig-orous sales trend with slightly more than 35% growth. Japan and Australia also per-formed strongly, primarily in the healthcare segment.
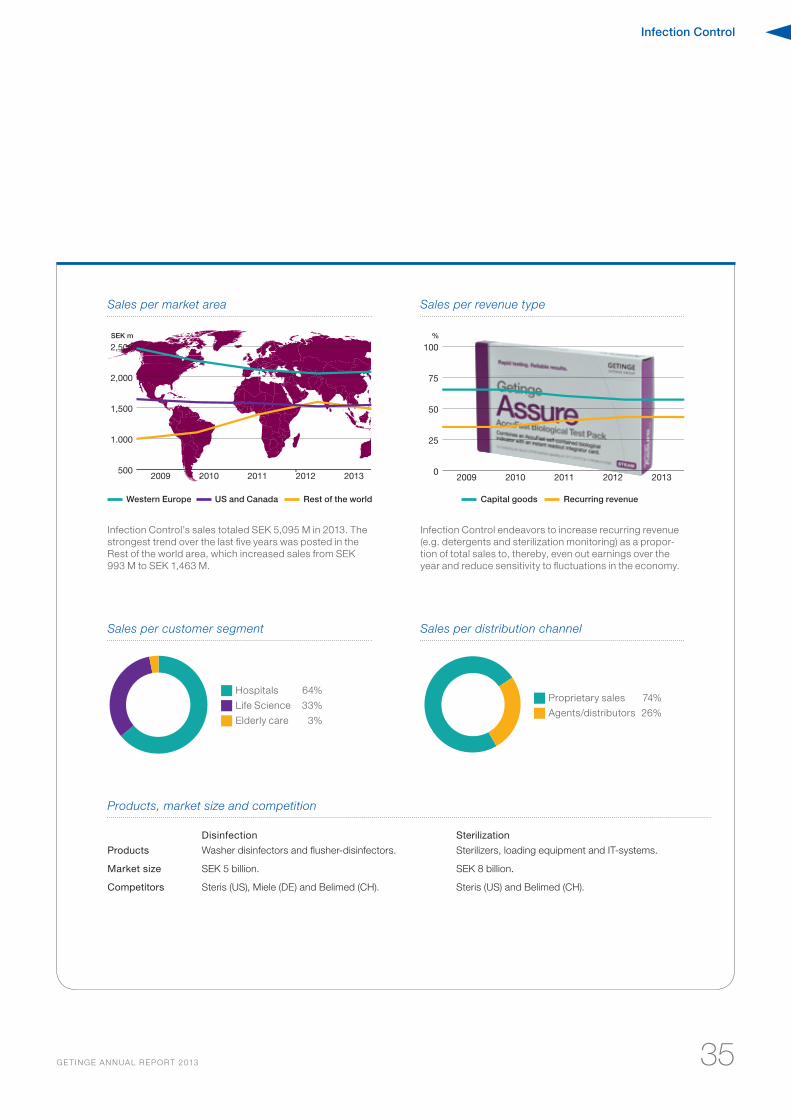
For the region as a whole, sales totaled SEK 1,463 M (1,594), corresponding to negative organic growth of 0.7% (12.3).
Share of sales, Western Europe
41%Share of sales, US and Canada
30%Share of sales, Rest of the world
29%SEK 2,086 M SEK 1,546 M SEK 1,463 M
Anders Grahn, EVP Infection Control
Infection Control
35GE TINGE ANNUAL REPORT 2013
500
1.000
1,500
2,000
2,500
20132012201120102009
SEK m
Sales per market area
Western Europe US and Canada Rest of the world
Infection Control’s sales totaled SEK 5,095 M in 2013. The strongest trend over the last five years was posted in the Rest of the world area, which increased sales from SEK 993 M to SEK 1,463 M.
0
25
50
75
100
20132012201120102009
%
Sales per revenue type
Infection Control endeavors to increase recurring revenue (e.g. detergents and sterilization monitoring) as a propor-tion of total sales to, thereby, even out earnings over the year and reduce sensitivity to fluctuations in the economy.
Capital goods Recurring revenue
Sales per customer segment Sales per distribution channel
Products, market size and competition
Disinfection Sterilization
Products Washer disinfectors and flusher-disinfectors. Sterilizers, loading equipment and IT-systems.
Market size SEK 5 billion. SEK 8 billion.
Competitors Steris (US), Miele (DE) and Belimed (CH). Steris (US) and Belimed (CH).
Äldrevård
Life Science
Sjukus
49%
49%
■ Proprietary sales 74%
■ Agents/distributors 26%
■ Hospitals 64%
■ Life Science 33%
■ Elderly care 3%
Infection Control
36 GE TINGE ANNUAL REPORT 2013
Highlights in 2013The efficiency enhancement program lays the foundation for a significant improvement in profitability
Product offering
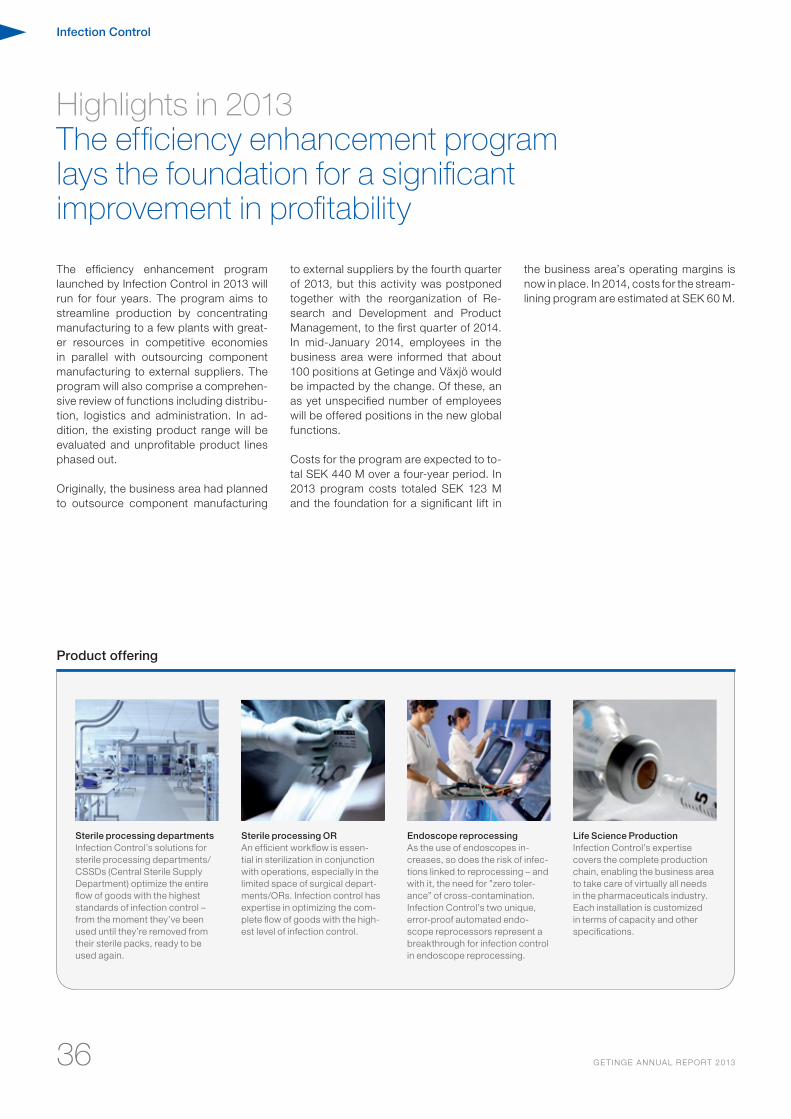
Sterile processing departmentsInfection Control’s solutions for sterile processing departments/CSSDs (Central Sterile Supply Department) optimize the entire flow of goods with the highest standards of infection control – from the moment they’ve been used until they’re removed from their sterile packs, ready to be used again.
Sterile processing ORAn efficient workflow is essen-tial in sterilization in conjunction with operations, especially in the limited space of surgical depart-ments/ORs. Infection control has expertise in optimizing the com-plete flow of goods with the high-est level of infection control.
Endoscope reprocessingAs the use of endoscopes in-creases, so does the risk of infec-tions linked to reprocessing – and with it, the need for ”zero toler-ance” of cross-contamination. Infection Control’s two unique, error-proof automated endo-scope reprocessors represent a breakthrough for infection control in endoscope reprocessing.
Life Science ProductionInfection Control’s expertise covers the complete production chain, enabling the business area to take care of virtually all needs in the pharmaceuticals industry. Each installation is customized in terms of capacity and other specifications.
The efficiency enhancement program launched by Infection Control in 2013 will run for four years. The program aims to streamline production by concentrating manufacturing to a few plants with great-er resources in competitive economies in parallel with outsourcing component manufacturing to external suppliers. The program will also comprise a comprehen-sive review of functions including distribu-tion, logistics and administration. In ad-dition, the existing product range will be evaluated and unprofitable product lines phased out.
Originally, the business area had planned to outsource component manufacturing
to external suppliers by the fourth quarter of 2013, but this activity was postponed together with the reorganization of Re-search and Development and Product Management, to the first quarter of 2014. In mid-January 2014, employees in the business area were informed that about 100 positions at Getinge and Växjö would be impacted by the change. Of these, an as yet unspecified number of employees will be offered positions in the new global functions.
Costs for the program are expected to to-tal SEK 440 M over a four-year period. In 2013 program costs totaled SEK 123 M and the foundation for a significant lift in
the business area’s operating margins is now in place. In 2014, costs for the stream-lining program are estimated at SEK 60 M.
Infection Control
37GE TINGE ANNUAL REPORT 2013
Strengthening the business area’s innovativeness is crucial for continued healthy organic growth, not least in the important emerging markets. To create well-coordinated innovation operations with substantial re-sources, the business area decided to establish a central innovation center.
The new center, which will control all de-velopment efforts at the business area, will be located in Gothenburg, Sweden, with excellent access to competence and close to a renowned university hospital and first-class academic institutions. The operation was established in the first quarter of 2014 and initially encompasses about 20 em-ployees. A central task of the new orga-nization is to continue efforts to strength-en the customer offering to the emerging markets.
NEW WASHER DISINFECTOR FOR THE EMERGING MARKETSAt the start of 2014, a new washer disin-fector was launched on the Chinese mar-ket. The product, which is specifically de-veloped for the growth economies, will be launched in a number of other interesting markets in 2014.
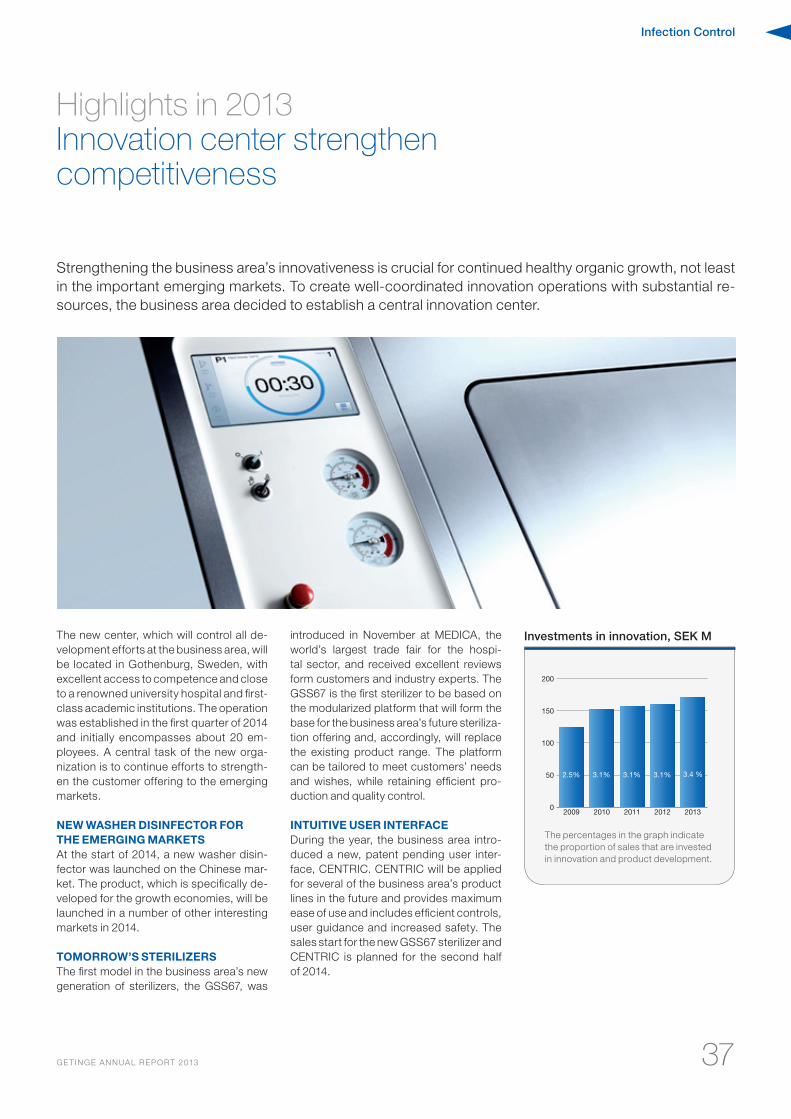
TOMORROW’S STERILIzERSThe first model in the business area’s new generation of sterilizers, the GSS67, was
introduced in November at MEDICA, the world’s largest trade fair for the hospi-tal sector, and received excellent reviews form customers and industry experts. The GSS67 is the first sterilizer to be based on the modularized platform that will form the base for the business area’s future steriliza-tion offering and, accordingly, will replace the existing product range. The platform can be tailored to meet customers’ needs and wishes, while retaining efficient pro-duction and quality control.
INTUITIvE USER INTERFACEDuring the year, the business area intro-duced a new, patent pending user inter-face, CENTRIC. CENTRIC will be applied for several of the business area’s product lines in the future and provides maximum ease of use and includes efficient controls, user guidance and increased safety. The sales start for the new GSS67 sterilizer and CENTRIC is planned for the second half of 2014.
Investments in innovation, SEK M
The percentages in the graph indicate the proportion of sales that are invested in innovation and product development.
0
50
100
150
200
20132012201120102009
2.5% 3.1% 3.1% 3.1% 3.4 %
Highlights in 2013Innovation center strengthen competitiveness
38 GE TINGE ANNUAL REPORT 2013
Sustainability Report
Sustainability Report
Sustainability efforts are assigned high priority on Getinge’s agenda. In 2013, the Group continued its long-term climate and environmental efforts. In the area of social responsibility, the Group has continued to strengthen Getinge’s corporate culture by sharpening its focus on the Group’s employees and their commitment to the company.
Getinge feels a considerable sense of re-sponsibility in terms of contributing to long-term sustainable development. This applies to both the environmental im-pact in manufacturing operations and to the development of new products. Envi-ronmentally compatible product develop-ment, EcoDesign, has already been es-tablished at the Group, and development work is now conducted within the frame-work of the established procedures and guidelines. Regular environmental report-ing from all of the Group’s production units provides excellent opportunities for fol-low-ups and comprises the basis for de-cisions concerning environmental goals and activities in the environmental area.
The Getinge Group’s work in the area of social responsibility is based on the Group’s Code of Conduct, which is based on such international principles as the UN Universal Declaration of Human Rights, ILO’s Declaration on Fundamental Princi-
ples and Rights at Work and the OECD’s guidelines for multinational companies. The Code of Conduct stipulates how the company and its employees must con-duct operations pursuant to ethical prin-ciples and in accordance with the appli-cable laws and regulations.
The Getinge Group’s sustainability efforts also aim to ensure the Group’s long-term earnings capacity and strengthen the com-pany’s competitiveness. The sustainabil-ity efforts have a favorable impact on the Group’s ability to attract and retain custom-ers and employees; which is crucial for the continued development of Getinge.
The Getinge Group endeavors to make positive contributions to the countries in which the company is active. While em-ployees are encouraged to actively partic-ipate in social issues, the company does not make any contributions to political parties and makes no political donations.
GETINGE’S GROUP-WIDE ENVIRONMENTAL GOALS
Energy and climateOptimize energy use and minimize the climate impact of our production and transportation.
Waste Minimize the environmental impact of our waste management.
Emissions to airMinimize the environmental impact of our emissions to air.
EcoDesign Optimize the use of natural resourc-es and minimize our environmental impact through the application of EcoDesign principles throughout our product and process develop-ment.
Getinge’s environmental policyThe Getinge Group’s overall goal is to contribute to a sustainable society. We have taken it upon ourselves to optimize our use of energy and natural resources, minimize our emissions to air and reduce the environmental impact of our waste management.
Accordingly, we will integrate environmental consideration in all of our activities; consider environmental legislation and regulations as minimum requirements; encourage employees to take personal responsibility and thus contribute to sustainable social development as well as continuously improve our environmental effor t and regularly report our performance to our stakeholders.
Environment | Sustainability Report
3939
Sustainability Report
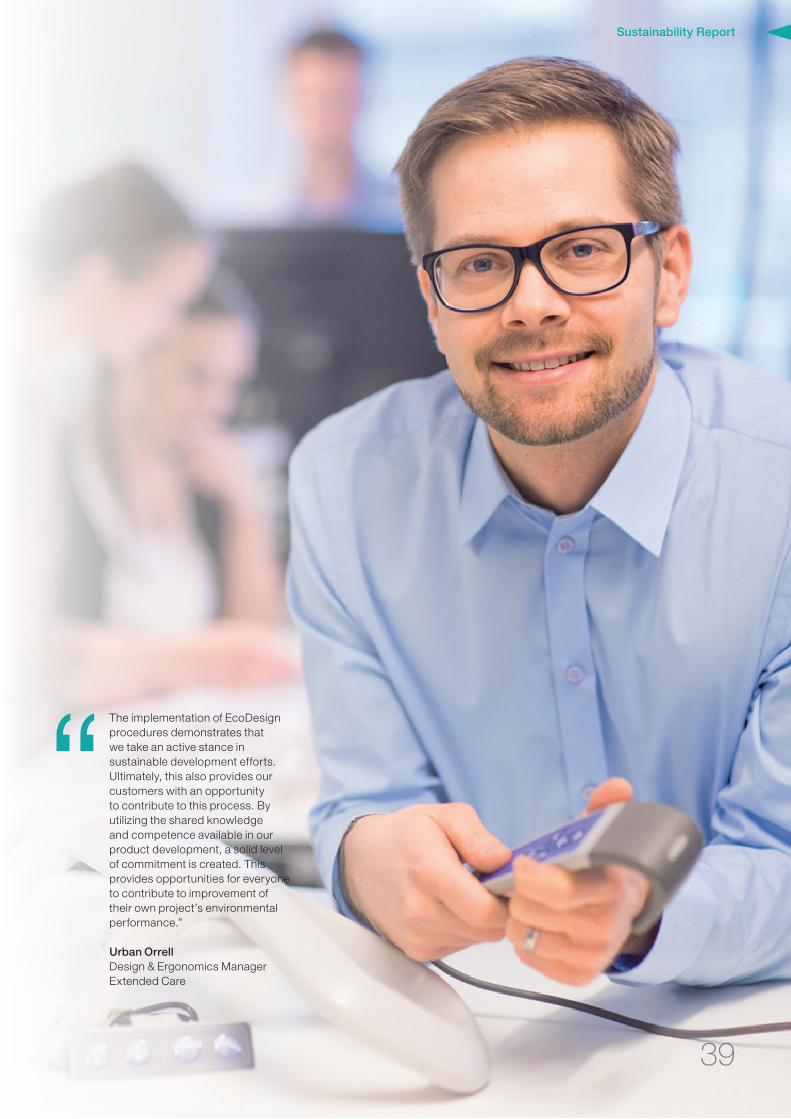
“ The implementation of EcoDesign procedures demonstrates that we take an active stance in sustainable development efforts. Ultimately, this also provides our customers with an opportunity to contribute to this process. By utilizing the shared knowledge and competence available in our product development, a solid level of commitment is created. This provides opportunities for everyone to contribute to improvement of their own project’s environmental performance.” Urban Orrell Design & Ergonomics Manager Extended Care
Sustainability Report | Environment
40 GE TINGE ANNUAL REPORT 2013
Environmental responsibilityContinued focus on the Group’s environmental goals
In 2013, efforts with environmentally compatible product development intensified and all development work is now performed in line with the previously introduced EcoDesign principles. EcoDesign is a core compo-nent of Getinge’s contribution to long-term sustainable development. For production facilities, focus dur-ing the year continued to be on energy-efficiency enhancements and on measures to reduce total waste volumes and increase the proportion of waste sent for material or energy recycling. All production facilities submit quarterly reports on their environmental performance, which provides excellent opportunities for following up the Group’s environmental goals.
Environmental-management system. Internally, Getinge requires all manufac-turing units to implement and certify man-agement systems that meet the ISO 14001 standard. New operations must have certi-fied management systems in place within two years of being acquired or established.
The implemented environmental-man-agement systems ensure structured en-vironmental efforts through requirements for follow-up of the environmental impact of own operations and the preparation of goals, actions and procedures for signifi-cant areas. Goals and actions are focused on the elements that comprise the most significant environmental impact for each facility. Regular external and internal au-dits ensure that the management system develops continuously and contributes to an effective environmental effort. Except for recently acquired units, all production facilities in the Group now have certified environmental-management systems. For more information, please refer to the sum-mary of certifications on page 101.
Environmental reporting. All production facilities prepare quarterly reports on their environmental performance vis-à-vis con-sumption of fuel and electricity, quantities of waste and recycling as well as emis-sions of solvents. The reporting is, since earlier, fully integrated with the Group’s financial reporting and enables excellent opportunities to follow up the progress of the work with the Group’s environmental goals. The information is regularly updat-ed on the Group’s Intranet.
Waste and recycling. One of the Group’s environmental goals applies to increased recycling of waste from the production fa-cilities. Reaching the vision of recycling all production waste requires investments in efficient waste handling equipment, changed attitudes and behavior as well as environmentally compatible product de-velopment. Methodical work has resulted in the proportion of waste being sent to re-cycling gradually increasing year-by-year.
ENERGY AND CLIMATEReducing the environmental impact from operations constitutes a key element of environmental efforts. The Group’s envi-ronmental goals include a 10% reduction of CO2 emissions from production be-tween 2010 and 2015 and a 22% reduc-tion in emissions from the Group’s vehicle fleet by 2015.
Energy-efficiency enhancements. Ener-gy-efficiency enhancements were imple-mented at the majority of facilities during the year. This included the replacement of lighting with LED lighting or energy-ef-ficient fluorescent lighting in production and warehouse premises, which resulted in a considerable reduction in electricity consumption. Even small measures im-plemented methodically have a significant effect in the long-term. Examples of these include, changed procedures as well as the installation of items, such as move-ment detectors for warehouse lighting and office premises.
At a few facilities, more efficient heating
equipment has been installed including, bland heat recovery equipment and heat pumps, which have reduced energy con-sumption at these units. The direct emis-sions from burning fuel have also been gradually reduced.
Indirect emissions from electricity use. As part of further reducing the Group’s cli-mate impact, more of the production facili-ties, including the units in Växjö and Get-inge, have conducted a procurement of green electricity. Other facilities have ac-tively chosen suppliers with a favorable electricity production mix. Accordingly, it was possible to decrease indirect emis-sions in a number of countries. In certain parts of the world, it is more difficult to locate suitable electricity suppliers. Traditionally, emerging markets have higher emissions from electricity generation, which means that emissions in these markets increase with increased production. This was the primary reason why the Group’s total CO2 emissions have not declined more signifi-cantly. An ongoing inventory is being per-formed covering the possibility of locating electricity suppliers with low emissions from their electricity generation.
Freight transportation. A key compo-nent of Getinge’s climate endeavors re-lates to emissions from freight transpor-tation. This applies to transportation with the Group’s own vehicles, such as service visits, and to freight transportation.
The previously introduced car policy, which imposes stringent requirements on
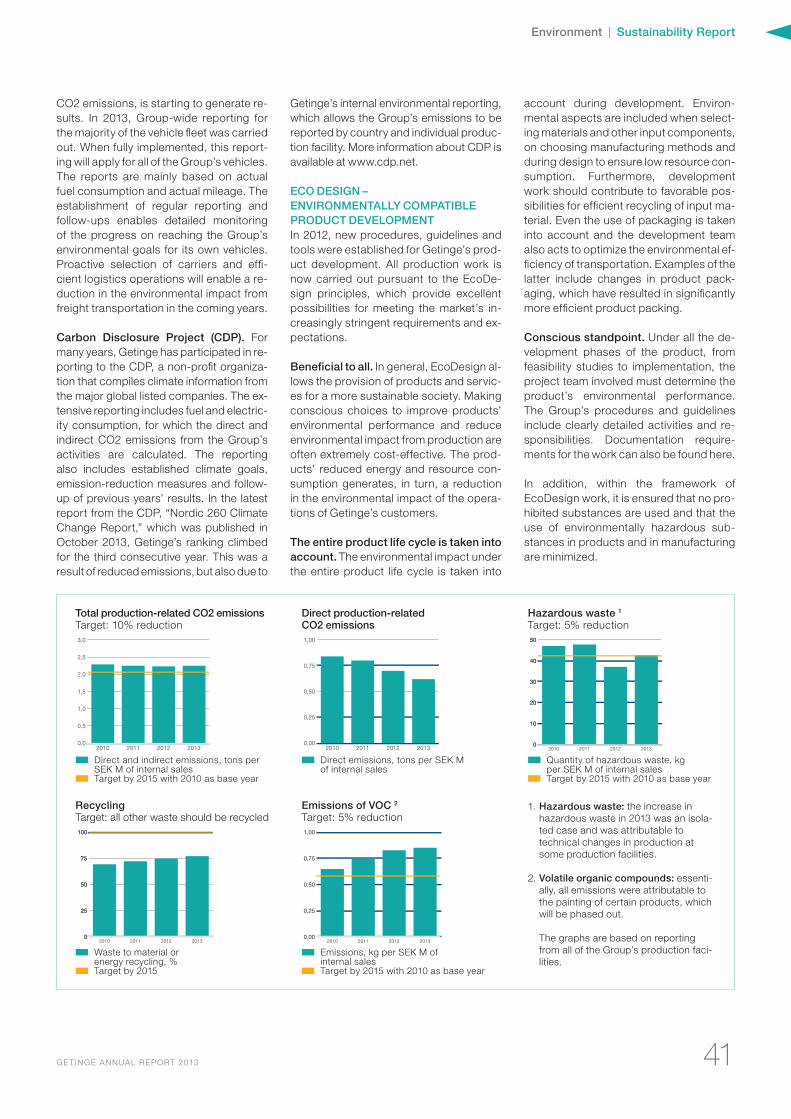
Environment | Sustainability Report
41GE TINGE ANNUAL REPORT 2013
CO2 emissions, is starting to generate re-sults. In 2013, Group-wide reporting for the majority of the vehicle fleet was carried out. When fully implemented, this report-ing will apply for all of the Group’s vehicles. The reports are mainly based on actual fuel consumption and actual mileage. The establishment of regular reporting and follow-ups enables detailed monitoring of the progress on reaching the Group’s environmental goals for its own vehicles. Proactive selection of carriers and effi-cient logistics operations will enable a re-duction in the environmental impact from freight transportation in the coming years.
Carbon Disclosure Project (CDP). For many years, Getinge has participated in re-porting to the CDP, a non-profit organiza-tion that compiles climate information from the major global listed companies. The ex-tensive reporting includes fuel and electric-ity consumption, for which the direct and indirect CO2 emissions from the Group’s activities are calculated. The reporting also includes established climate goals, emission-reduction measures and follow-up of previous years’ results. In the latest report from the CDP, “Nordic 260 Climate Change Report,” which was published in October 2013, Getinge’s ranking climbed for the third consecutive year. This was a result of reduced emissions, but also due to
Getinge’s internal environmental reporting, which allows the Group’s emissions to be reported by country and individual produc-tion facility. More information about CDP is available at www.cdp.net.
ECO DESIGN – ENVIRONMENTALLY COMPATIBLE PRODUCT DEVELOPMENTIn 2012, new procedures, guidelines and tools were established for Getinge’s prod-uct development. All production work is now carried out pursuant to the EcoDe-sign principles, which provide excellent possibilities for meeting the market’s in-creasingly stringent requirements and ex-pectations.
Beneficial to all. In general, EcoDesign al-lows the provision of products and servic-es for a more sustainable society. Making conscious choices to improve products’ environmental performance and reduce environmental impact from production are often extremely cost-effective. The prod-ucts’ reduced energy and resource con-sumption generates, in turn, a reduction in the environmental impact of the opera-tions of Getinge’s customers.
The entire product life cycle is taken into account. The environmental impact under the entire product life cycle is taken into
account during development. Environ-mental aspects are included when select-ing materials and other input components, on choosing manufacturing methods and during design to ensure low resource con-sumption. Furthermore, development work should contribute to favorable pos-sibilities for efficient recycling of input ma-terial. Even the use of packaging is taken into account and the development team also acts to optimize the environmental ef-ficiency of transportation. Examples of the latter include changes in product pack-aging, which have resulted in significantly more efficient product packing.
Conscious standpoint. Under all the de-velopment phases of the product, from feasibility studies to implementation, the project team involved must determine the product’s environmental performance. The Group’s procedures and guidelines include clearly detailed activities and re-sponsibilities. Documentation require-ments for the work can also be found here.
In addition, within the framework of EcoDesign work, it is ensured that no pro-hibited substances are used and that the use of environmentally hazardous sub-stances in products and in manufacturing are minimized.
■ ■ Direct and indirect emissions, tons per SEK M of internal sales■ ■ Target by 2015 with 2010 as base year
■ ■ Waste to material or energy recycling, %■ ■ Target by 2015
■ ■ Direct emissions, tons per SEK M of internal sales
■ ■ Emissions, kg per SEK M of internal sales ■ ■ Target by 2015 with 2010 as base year
■ ■ Quantity of hazardous waste, kg per SEK M of internal sales ■ ■ Target by 2015 with 2010 as base year
0,0
0,5
1,0
1,5
2,0
2,5
3,0
2013201220112010
0
25
50
75
100
20132012201120100
25
50
75
100
0,00
0,25
0,50
0,75
1,00
2013201220112010
0,00
0,25
0,50
0,75
1,00
2013201220112010
0
10
20
30
40
50
20132012201120100
10
20
30
40
50
Total production-related CO2 emissions Target: 10% reduction
RecyclingTarget: all other waste should be recycled
Direct production-related CO2 emissions
Emissions of VOC 2
Target: 5% reduction
Hazardous waste 1
Target: 5% reduction
1. Hazardous waste: the increase in hazardous waste in 2013 was an isola-ted case and was attributable to technical changes in production at some production facilities.
2. Volatile organic compounds: essenti-ally, all emissions were attributable to the painting of certain products, which will be phased out.
The graphs are based on reporting from all of the Group’s production faci-lities.
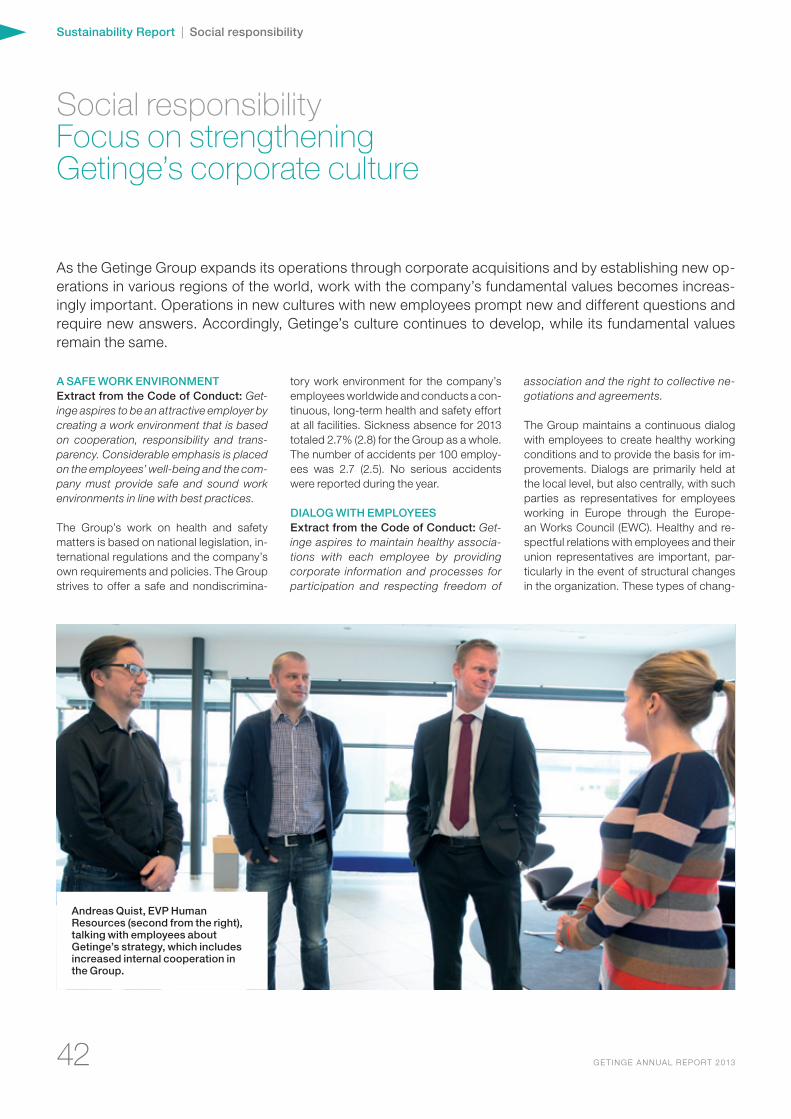
42 GE TINGE ANNUAL REPORT 2013
Sustainability Report | Social responsibility
Social responsibilityFocus on strengthening Getinge’s corporate culture
As the Getinge Group expands its operations through corporate acquisitions and by establishing new op-erations in various regions of the world, work with the company’s fundamental values becomes increas-ingly important. Operations in new cultures with new employees prompt new and different questions and require new answers. Accordingly, Getinge’s culture continues to develop, while its fundamental values remain the same.
A SAFE WORK ENVIRONMENTExtract from the Code of Conduct: Get-inge aspires to be an attractive employer by creating a work environment that is based on cooperation, responsibility and trans-parency. Considerable emphasis is placed on the employees’ well-being and the com-pany must provide safe and sound work environments in line with best practices.
The Group’s work on health and safety matters is based on national legislation, in-ternational regulations and the company’s own requirements and policies. The Group strives to offer a safe and nondiscrimina-
tory work environment for the company’s employees worldwide and conducts a con-tinuous, long-term health and safety effort at all facilities. Sickness absence for 2013 totaled 2.7% (2.8) for the Group as a whole. The number of accidents per 100 employ-ees was 2.7 (2.5). No serious accidents were reported during the year.
DIALOG WITH EMPLOYEESExtract from the Code of Conduct: Get-inge aspires to maintain healthy associa-tions with each employee by providing corporate information and processes for participation and respecting freedom of
association and the right to collective ne-gotiations and agreements.
The Group maintains a continuous dialog with employees to create healthy working conditions and to provide the basis for im-provements. Dialogs are primarily held at the local level, but also centrally, with such parties as representatives for employees working in Europe through the Europe-an Works Council (EWC). Healthy and re-spectful relations with employees and their union representatives are important, par-ticularly in the event of structural changes in the organization. These types of chang-
Andreas Quist, EVP Human Resources (second from the right), talking with employees about Getinge’s strategy, which includes increased internal cooperation in the Group.
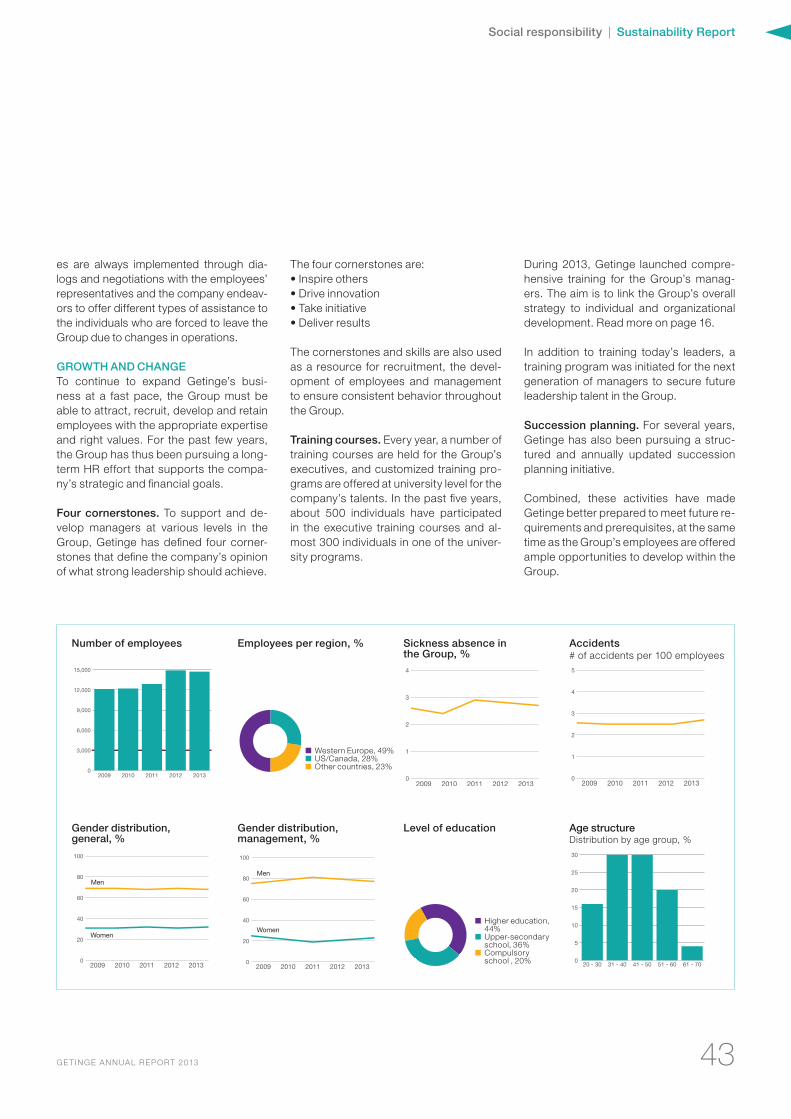
43GE TINGE ANNUAL REPORT 2013
Social responsibility | Sustainability Report
es are always implemented through dia-logs and negotiations with the employees’ representatives and the company endeav-ors to offer different types of assistance to the individuals who are forced to leave the Group due to changes in operations.
GROWTH AND CHANGETo continue to expand Getinge’s busi-ness at a fast pace, the Group must be able to attract, recruit, develop and retain employees with the appropriate expertise and right values. For the past few years, the Group has thus been pursuing a long-term HR effort that supports the compa-ny’s strategic and financial goals.
Four cornerstones. To support and de-velop managers at various levels in the Group, Getinge has defined four corner-stones that define the company’s opinion of what strong leadership should achieve.
The four cornerstones are:• Inspire others• Drive innovation• Take initiative• Deliver results
The cornerstones and skills are also used as a resource for recruitment, the devel-opment of employees and management to ensure consistent behavior throughout the Group.
Training courses. Every year, a number of training courses are held for the Group’s executives, and customized training pro-grams are offered at university level for the company’s talents. In the past five years, about 500 individuals have participated in the executive training courses and al-most 300 individuals in one of the univer-sity programs.
During 2013, Getinge launched compre-hensive training for the Group’s manag-ers. The aim is to link the Group’s overall strategy to individual and organizational development. Read more on page 16. In addition to training today’s leaders, a training program was initiated for the next generation of managers to secure future leadership talent in the Group.
Succession planning. For several years, Getinge has also been pursuing a struc-tured and annually updated succession planning initiative.
Combined, these activities have made Getinge better prepared to meet future re-quirements and prerequisites, at the same time as the Group’s employees are offered ample opportunities to develop within the Group.
0
3,000
6,000
9,000
12,000
15,000
20132012201120102009
0
20
40
60
80
100
Women
Men
20132012201120102009 0
20
40
60
80
100
Women
Men
20132012201120102009
0
1
2
3
4
201320122011201020090
1
2
3
4
5
20132012201120102009
0
5
10
15
20
25
30
61 - 7051 - 6041 - 5031 - 4020 - 30
Number of employees
Gender distribution, general, %
Gender distribution, management, %
Level of education Age structure Distribution by age group, %
Employees per region, % Sickness absence in the Group, %
Accidents# of accidents per 100 employees
VästeuropaTillväxtUSA
■ Western Europe, 49%■ US/Canada, 28%■ Other countries, 23%
Högskola
Grundskola
Gymnasium
■ Higher education, 44%■ Upper-secondary school, 36%■ Compulsory school , 20%
44 GE TINGE ANNUAL REPORT 2013
Sustainability Report | Social responsibility
EMPLOYEE SURVEYIn autumn 2013, Getinge implemented a Group-wide employee survey. Participa-tion in the survey was a healthy 90%, which is a clear signal that the Group’s employees want to participate and exert influence. The survey showed that Getinge has many committed and motivated employees, who are proud of the work they perform and who believe they have excellent opportunities to use the skills they possess. In addition, the work itself is perceived as meaningful and immediate managers as respectful.
The survey also indicated areas that could be improved, for example, the communi-cation of goals and strategies in terms of employees’ daily life and not just from a fi-nancial perspective. Based on the results of the survey, Getinge has prepared a plan that aims to further strengthen commit-ment to the company by developing the weaker areas in the survey results.
DIVERSITY AND EQUAL OPPORTUNITIESThe Getinge Group endeavors to create a business with extensive overall expertise and a wide range of experience to create a dynamic organization that can continue to advance the company in line with its stra-tegic objectives. Accordingly, Getinge ac-tively works on diversity issues, which are a key element of the company’s Code of Conduct.
By creating an organization that attracts the best and most innovative men and women from the entire world, Getinge fur-ther reinforces its already highly result-ori-ented culture.
EQUAL OPPORTUNITIESAll employees must be given a proper and fair salary based on their individual per-formance and their contribution to the company’s success. All employees must be offered the opportunity for appropriate continued training to help them assimilate the relevant skills, grow within the compa-ny and advance their careers. Alongside diversity initiatives, Getinge also prepared a policy in 2011 to ensure that all employ-ees – regardless of gender, race, religion and other irrelevant contextual factors – are given equal opportunity to develop and receive equal wages for equal work in due consideration of local conditions.
SUPPLY CHAIN RESPONSIBILITYTo strengthen its competitiveness, Getinge has relocated parts of its supplier base in recent years from Western Europe and the US, to more competitive countries in East-ern Europe and Asia. To ensure that the Group’s Code of Conduct is also upheld even in the supply chain, in 2012, the Group decided that all supplier agreements must be supplemented with an agreement un-der which the supplier pledges to comply with the requirements in Getinge’s Code of Conduct. This supplemental agreement was completed in autumn 2012 and its im-plementation is ongoing.
HIGH-RISK COUNTRIESIn many of the countries where Getinge is active, health and safety in the workplace is regulated by stringent national legisla-tion. However, the Getinge Group is also active in countries where this legislation is significantly weaker. Nonetheless, the Group places the same demands on all of its operations in terms of health and safety, discrimination and ethics regard-less of where in the world operations are conducted.
For operations in countries with weaker legislation, the company’s Code of Con-duct and policies are of the utmost impor-tance and govern activities in the absence of legislation.
CORRUPTIONGifts, corporate representation, compen-sation and personal benefits may only be offered to outside parties if they are of mi-nor value and associated with the prevail-ing norms. No gifts, corporate represen-tation or personal benefits may be given if they contravene the applicable legislation or prevailing norms. Gifts that do not meet these requirements must be reported to management, which will determine what action is to be taken.
None of Getinge’s employees are permit-ted to strive for or accept gifts or bene-fits that can be presumed to impact their business decisions. Gifts that can be pre-sumed to impact business decisions must be reported to the company’s manage-ment, which will determine what action is to be taken.
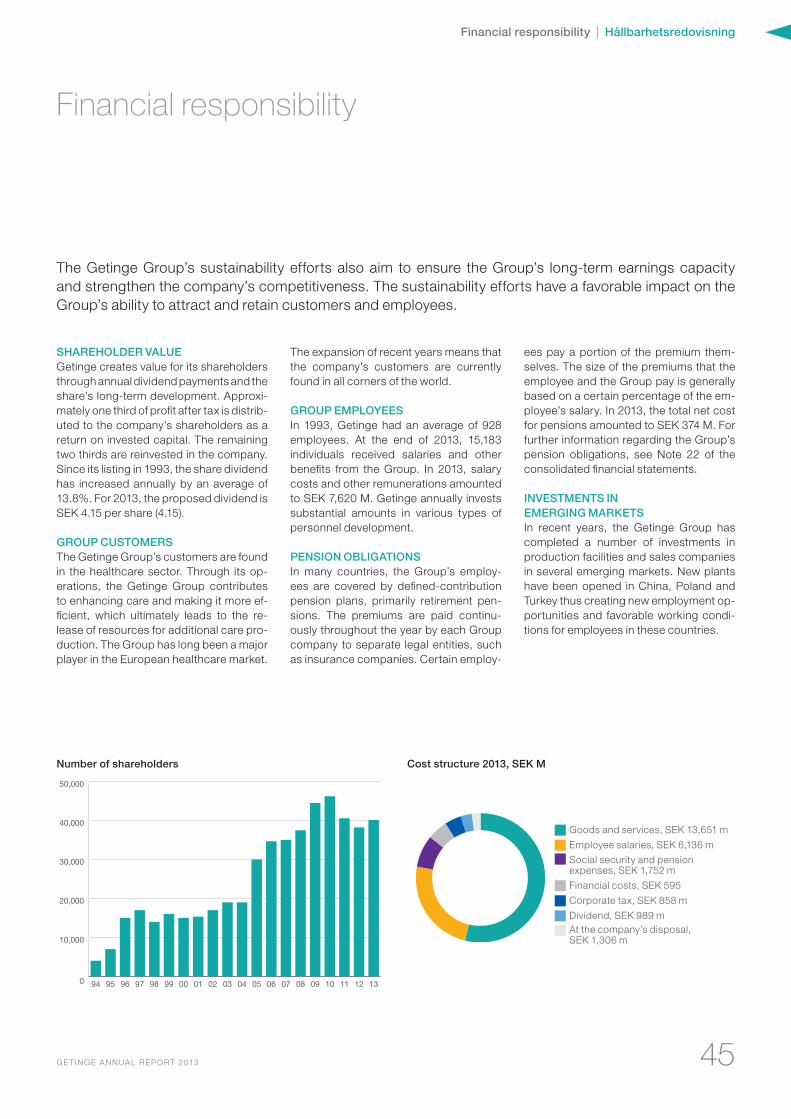
45GE TINGE ANNUAL REPORT 2013
Financial responsibility | Hållbarhetsredovisning
The Getinge Group’s sustainability efforts also aim to ensure the Group’s long-term earnings capacity and strengthen the company’s competitiveness. The sustainability efforts have a favorable impact on the Group’s ability to attract and retain customers and employees.
SHAREHOLDER VALUEGetinge creates value for its shareholders through annual dividend payments and the share’s long-term development. Approxi-mately one third of profit after tax is distrib-uted to the company’s shareholders as a return on invested capital. The remaining two thirds are reinvested in the company. Since its listing in 1993, the share dividend has increased annually by an average of 13.8%. For 2013, the proposed dividend is SEK 4.15 per share (4.15).
GROUP CUSTOMERSThe Getinge Group’s customers are found in the healthcare sector. Through its op-erations, the Getinge Group contributes to enhancing care and making it more ef-ficient, which ultimately leads to the re-lease of resources for additional care pro-duction. The Group has long been a major player in the European healthcare market.
The expansion of recent years means that the company’s customers are currently found in all corners of the world.
GROUP EMPLOYEESIn 1993, Getinge had an average of 928 employees. At the end of 2013, 15,183 individuals received salaries and other benefits from the Group. In 2013, salary costs and other remunerations amounted to SEK 7,620 M. Getinge annually invests substantial amounts in various types of personnel development.
PENSION OBLIGATIONSIn many countries, the Group’s employ-ees are covered by defined-contribution pension plans, primarily retirement pen-sions. The premiums are paid continu-ously throughout the year by each Group company to separate legal entities, such as insurance companies. Certain employ-
ees pay a portion of the premium them-selves. The size of the premiums that the employee and the Group pay is generally based on a certain percentage of the em-ployee’s salary. In 2013, the total net cost for pensions amounted to SEK 374 M. For further information regarding the Group’s pension obligations, see Note 22 of the consolidated financial statements.
INVESTMENTS IN EMERGING MARKETSIn recent years, the Getinge Group has completed a number of investments in production facilities and sales companies in several emerging markets. New plants have been opened in China, Poland and Turkey thus creating new employment op-portunities and favorable working condi-tions for employees in these countries.
Financial responsibility
0
10,000
20,000
30,000
40,000
50,000
1312111009080706050403020100999897969594
Number of shareholders Cost structure 2013, SEK M
■ Goods and services, SEK 13,651 m
■ Employee salaries, SEK 6,136 m
■ Social security and pension expenses, SEK 1,752 m
■ Financial costs, SEK 595
■ Corporate tax, SEK 858 m
■ Dividend, SEK 989 m
■ At the company’s disposal, SEK 1,306 m
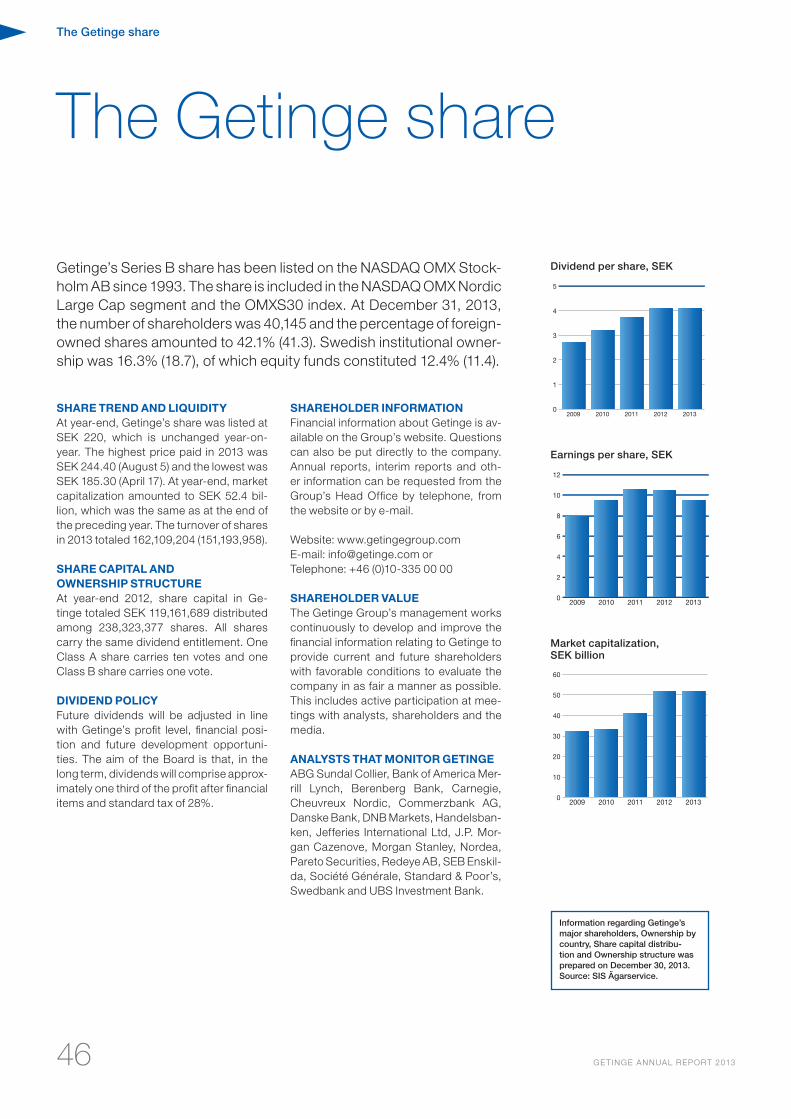
The Getinge share
46 GE TINGE ANNUAL REPORT 2013
The Getinge share
Getinge’s Series B share has been listed on the NASDAQ OMX Stock-holm AB since 1993. The share is included in the NASDAQ OMX Nordic Large Cap segment and the OMXS30 index. At December 31, 2013, the number of shareholders was 40,145 and the percentage of foreign-owned shares amounted to 42.1% (41.3). Swedish institutional owner-ship was 16.3% (18.7), of which equity funds constituted 12.4% (11.4).
SHARE TREND AND LIqUIDITYAt year-end, Getinge’s share was listed at SEK 220, which is unchanged year-on-year. The highest price paid in 2013 was SEK 244.40 (August 5) and the lowest was SEK 185.30 (April 17). At year-end, market capitalization amounted to SEK 52.4 bil-lion, which was the same as at the end of the preceding year. The turnover of shares in 2013 totaled 162,109,204 (151,193,958).
SHARE CAPITAL AND OWNERSHIP STRUCTUREAt year-end 2012, share capital in Ge-tinge totaled SEK 119,161,689 distributed among 238,323,377 shares. All shares carry the same dividend entitlement. One Class A share carries ten votes and one Class B share carries one vote.
DIvIDEND POLICYFuture dividends will be adjusted in line with Getinge’s profit level, financial posi-tion and future development opportuni-ties. The aim of the Board is that, in the long term, dividends will comprise approx-imately one third of the profit after financial items and standard tax of 28%.
SHAREHOLDER INFORMATIONFinancial information about Getinge is av-ailable on the Group’s website. Questions can also be put directly to the company. Annual reports, interim reports and oth-er information can be requested from the Group’s Head Office by telephone, from the website or by e-mail.
Website: www.getingegroup.comE-mail: [email protected] orTelephone: +46 (0)10-335 00 00
SHAREHOLDER vALUEThe Getinge Group’s management works continuously to develop and improve the financial information relating to Getinge to provide current and future shareholders with favorable conditions to evaluate the company in as fair a manner as possible. This includes active participation at mee-tings with analysts, shareholders and the media.
ANALYSTS THAT MONITOR GETINGEABG Sundal Collier, Bank of America Mer-rill Lynch, Berenberg Bank, Carnegie, Cheuvreux Nordic, Commerzbank AG, Danske Bank, DNB Markets, Handelsban-ken, Jefferies International Ltd, J.P. Mor-gan Cazenove, Morgan Stanley, Nordea, Pareto Securities, Redeye AB, SEB Enskil-da, Société Générale, Standard & Poor’s, Swedbank and UBS Investment Bank.
Information regarding Getinge’s major shareholders, Ownership by country, Share capital distribu-tion and Ownership structure was prepared on December 30, 2013. Source: SIS Ägarservice.
0
2
4
6
8
10
12
20132012201120102009
0
1
2
3
4
5
20132012201120102009
0
10
20
30
40
50
60
20132012201120102009
Dividend per share, SEK
Earnings per share, SEK
Market capitalization, SEK billion
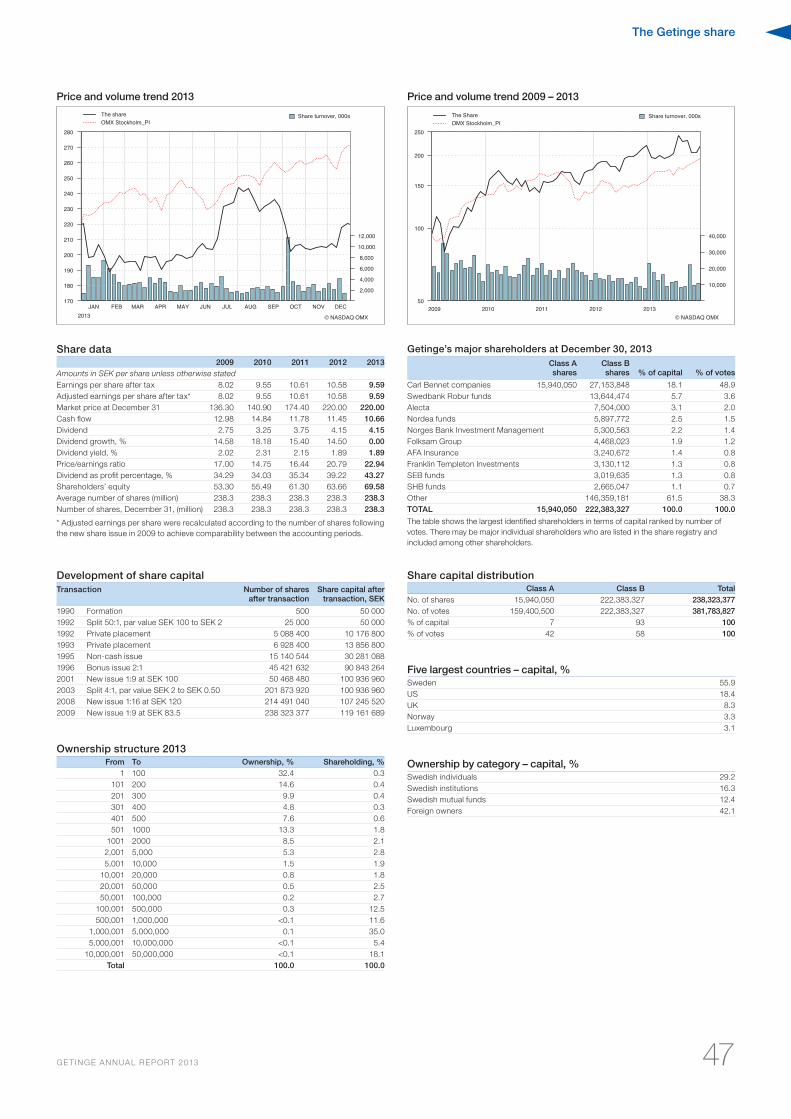
The Getinge share
47GE TINGE ANNUAL REPORT 2013
Share data2009 2010 2011 2012 2013
Amounts in SEK per share unless otherwise statedEarnings per share after tax 8.02 9.55 10.61 10.58 9.59Adjusted earnings per share after tax* 8.02 9.55 10.61 10.58 9.59Market price at December 31 136.30 140.90 174.40 220.00 220.00Cash flow 12.98 14.84 11.78 11.45 10.66Dividend 2.75 3.25 3.75 4.15 4.15Dividend growth, % 14.58 18.18 15.40 14.50 0.00Dividend yield, % 2.02 2.31 2.15 1.89 1.89Price/earnings ratio 17.00 14.75 16.44 20.79 22.94Dividend as profit percentage, % 34.29 34.03 35.34 39.22 43.27Shareholders’ equity 53.30 55.49 61.30 63.66 69.58Average number of shares (million) 238.3 238.3 238.3 238.3 238.3Number of shares, December 31, (million) 238.3 238.3 238.3 238.3 238.3
* Adjusted earnings per share were recalculated according to the number of shares following the new share issue in 2009 to achieve comparability between the accounting periods.
Ownership structure 2013From To Ownership, % Shareholding, %
1 100 32.4 0.3101 200 14.6 0.4201 300 9.9 0.4301 400 4.8 0.3401 500 7.6 0.6501 1000 13.3 1.8
1001 2000 8.5 2.12,001 5,000 5.3 2.85,001 10,000 1.5 1.9
10,001 20,000 0.8 1.820,001 50,000 0.5 2.550,001 100,000 0.2 2.7
100,001 500,000 0.3 12.5500,001 1,000,000 <0.1 11.6
1,000,001 5,000,000 0.1 35.05,000,001 10,000,000 <0.1 5.4
10,000,001 50,000,000 <0.1 18.1Total 100.0 100.0
Development of share capitalTransaction Number of shares
after transactionShare capital after
transaction, SEK
1990 Formation 500 50 0001992 Split 50:1, par value SEK 100 to SEK 2 25 000 50 0001992 Private placement 5 088 400 10 176 8001993 Private placement 6 928 400 13 856 8001995 Non-cash issue 15 140 544 30 281 0881996 Bonus issue 2:1 45 421 632 90 843 2642001 New issue 1:9 at SEK 100 50 468 480 100 936 9602003 Split 4:1, par value SEK 2 to SEK 0.50 201 873 920 100 936 9602008 New issue 1:16 at SEK 120 214 491 040 107 245 5202009 New issue 1:9 at SEK 83.5 238 323 377 119 161 689
Five largest countries – capital, % Sweden 55.9US 18.4UK 8.3Norway 3.3Luxembourg 3.1
Ownership by category – capital, %Swedish individuals 29.2Swedish institutions 16.3Swedish mutual funds 12.4Foreign owners 42.1
Getinge’s major shareholders at December 30, 2013Class A shares
Class B shares % of capital % of votes
Carl Bennet companies 15,940,050 27,153,848 18.1 48.9Swedbank Robur funds 13,644,474 5.7 3.6Alecta 7,504,000 3.1 2.0Nordea funds 5,897,772 2.5 1.5Norges Bank Investment Management 5,300,563 2.2 1.4Folksam Group 4,468,023 1.9 1.2AFA Insurance 3,240,672 1.4 0.8Franklin Templeton Investments 3,130,112 1.3 0.8SEB funds 3,019,635 1.3 0.8SHB funds 2,665,047 1.1 0.7Other 146,359,181 61.5 38.3TOTAL 15,940,050 222,383,327 100.0 100.0
The table shows the largest identified shareholders in terms of capital ranked by number of votes. There may be major individual shareholders who are listed in the share registry and included among other shareholders.
Share capital distributionClass A Class B Total
No. of shares 15,940,050 222,383,327 238,323,377No. of votes 159,400,500 222,383,327 381,783,827% of capital 7 93 100% of votes 42 58 100
2,000
4,000
6,000
8,000
10,000
12,000
2013JAN FEB MAR APR MAY JUN JUL AUG SEP OCT NOV DEC
170
180
190
200
210
220
230
240
250
260
270
280
Share turnover, 000sThe shareOMX Stockholm_PI
Getinge 2013
© NASDAQ OMX
Price and volume trend 2013
10,000
20,000
30,000
40,000
2009 2010 2011 2012 201350
100
150
200
250
Share turnover, 000sThe ShareOMX Stockholm_PI
Getinge 2009−2013
© NASDAQ OMX
Price and volume trend 2009 – 2013
Administration Report
48 GE TINGE ANNUAL REPORT 2013
Operation and structure
Getinge is a global company with operations in 40 countries and proprietary production in nine countries. The pace of change and growth since the stock-market listing has been high, with an average growth of about 18%. Every day, Getinge’s products contrib-ute to saving lives, ensuring excellent care and preventing the spread of infection. The Group operates in the areas of surgery, inten-sive care, infection control, care ergonomics and wound care.
Organization. Getinge comprises three business areas: Medical Systems, Extend-ed Care and Infection Control. Approximate-
ly 86% of sales are conducted through the Group’s proprietary sales companies and the remaining 14% are sold by agents and distributors in markets for which the Getinge Group lacks proprietary representation. Pro-duction is conducted at a total of 29 facilities in Canada, China, France, Poland, the UK, Sweden, Turkey, Germany and the US.
Product range. Medical Systems specializ-es in solutions and products for surgery and intensive care. The product range includes surgical tables, surgical lamps, telemedicine, perfusion products, instruments for bypass operations, ventilators, anesthesia systems,
synthetic vascular implants and stents. Ex-tended Care focuses on ergonomic solutions for patient mobility and on wound care. The product range encompasses bathing and shower solutions, lifting equipment and mat-tresses for the treatment and prevention of pressure ulcers, as well as service and con-sulting. Infection Control provides solutions for infection control in preventive healthcare and healthcare, and contamination preven-tion operations in the life sciences. The prod-uct range comprises disinfectors, sterilizers, IT systems and related equipment, as well as service and consulting.
Financial overview
Revenues. Consolidated net sales increased 4.3% to SEK 25,287 M (24,248). Adjusted for corporate acquisitions and exchange-rate fluctuations, net sales rose 4.2%.
Operating profit. The Group’s operating profit declined 6.4% to SEK 3,748 M (4,006), which corresponds to 14.8% (16.5) of net sales.
Net financial items. Net financial items amounted to an expense of SEK 505 M (ex-pense: 570), of which net interest items com-prised an expense of SEK 561 M (expense: 525).
Profit before tax. The Group’s profit before tax declined 8.2% to SEK 3,153 M (3,436), which corresponds to 12.5% (14.2) of net sales.
Taxes. The Group’s total taxes amounted to SEK 858 M (905), corresponding to 27.2% (26.3) of profit before tax (see Note 9). Paid tax amounted to SEK 859 M (966), corre-sponding to 27.2% (28.1) of profit before tax.
Tied-up capital. Stock-in-trade was SEK 4,254 M (4,060) and accounts receivable to-taled SEK 6,630 M (6,150). The average con-solidated working capital was SEK 32,526 M (31,920). Return on working capital was 12.8% (13.1). Goodwill totaled SEK 17,391 M (17,044) at the end of the fiscal year.
Investments. Net investments in non-cur-rent assets amounted to SEK 1,004 M (959). Investments primarily pertained to produc-tion facilities, production tools and IT proj-ects.
Financial position and equity/assets ratio. The Group’s net debt totaled SEK 18,319 M (18,382), corresponding to a net debt/eq-uity ratio of 1.10 (1.21). Shareholders’ equi-ty at year-end amounted to SEK 16,610 M (15,200), corresponding to an equity/assets ratio of 37.4% (35.4).
Cash flow. Operating cash flow amounted to SEK 3,544 M (3,687). The cash conversion was 63.1% (64.1).
Shareholders’ equity. For information re-garding trading of shares in the company, the number of shares, the classes of shares and the rights associated with these in the com-pany, see the Getinge Share section on pag-es 46-47.
Product development
Innovation and product development are a cornerstone of the Group’s strategy to strengthen the customer offering and thereby establish sustainable organic growth. Trends in the business environment are continuous-ly monitored and a large number of potential projects are evaluated each year. The acqui-
sition of suitable companies is also a com-plement to internal product development. In 2013, research and development costs amounted to SEK 1,298 M (1,343). Of this amount, SEK 679 M (745) was capitalized as intangible assets, as it was deemed that these will generate future financial gains. In 2013,
the Getinge Group introduced a number of new and updated products. More detailed information is available under each business area section.
Personnel
At December 31, 2013, there were 15,183 (14,919) employees, of whom 1,440 (1,523) were employed in Sweden. In 2013, the Get-inge Group continued its extensive efforts to strengthen the Group’s personnel and man-agement development. The work is based on an analysis of the company’s needs for spe-cialist and management competence and
the company’s demographic structure. In 2013, Getinge has also continued long-term efforts to increase diversity. Getinge has a previously implemented policy to ensure that all employees – regardless of gender, race, creed and other irrelevant factors – are giv-en equal opportunity to develop and receive equal pay for equal work. For information
about the guidelines for remuneration to se-nior executives adopted by the 2013 Annual General Meeting, refer to the Corporate Gov-ernance Report on page 56. In regard to re-muneration to senior executives in 2013, re-fer to Note 27.
Administration Report
Administration Report
49GE TINGE ANNUAL REPORT 2013
Environmental impact
The company’s environmental policy and the international environmental standard ISO 14001 form the basis of Getinge’s environ-mental work. Through the implementation of an environmental-management system that fulfills the requirements of this international standard, a structured and active environ-mental program is ensured at the Group’s manufacturing units. Accordingly, Getinge’s manufacturing is exclusively conducted at certified plants with the exception of one re-cently acquired unit where certification ef-
forts are under way with the goal of becoming certified within two years of being acquired. There are two Swedish companies in the Getinge Group that conduct operations re-quiring permits under the Swedish Environ-mental Code and two companies that con-duct operations requiring declaration. The permits pertain to products for which each company bears responsibility. Apart from a general permit for the engineering industry, there are also permits for paint plants, the transport of waste, and for liquid petroleum
gas storage. The external environmental im-pact consists of air and water emissions and noise pollution from plants. The external en-vironmental impact of all Swedish produc-tion facilities is subject to regulatory and per-mit requirements. The environmental impact of the companies is reported in annual re-ports, which are submitted to the regulatory authorities. Further information concerning Getinge’s environmental work is presented in the Sustainability Report on pages 38-41.
Risk management
Compensation system. Political decisions represent the single greatest market risk to the Getinge Group. Changes to the health-care compensation system can have a major impact on individual markets by reducing or deferring grants. Since Getinge is active in a large number of geographical markets, the risk for the Group as a whole is limited.
Customers. Activities conducted by Get-inge’s customers are generally financed di-rectly or indirectly by public funds and ability to pay is usually very solid, although payment behavior can vary between different coun-tries. All transactions outside the OECD area are covered by payment guarantees, unless the customer’s ability to pay is well docu-mented.
Authorities and control bodies. Parts of Getinge’s product range are covered by leg-islation stipulating rigorous assessments, quality control and documentation. It can-not be ruled out that Getinge’s operations, financial position and earnings may be neg-atively impacted in the future by difficulties in complying with current regulations and re-quirements of authorities and control bod-
ies or changes to such regulations and re-quirements. To limit these risks to the great-est possible extent, Getinge conducts exten-sive work focused on quality and regulatory issues. Each business area has an appointed person with overall responsibility for quality and regulatory matters (QRM). The majority of the Group’s production facilities are certi-fied according to the medical device quality standard ISO 13485 and/or the general qual-ity standard ISO 9001.
Research and development. To a certain ex-tent, Getinge’s future growth depends on the company’s ability to develop new and suc-cessful products. Research and develop-ment efforts are costly and it is impossible to guarantee that developed products will be commercially successful. As a means of maximizing the return on research and devel-opment efforts, the Group has a very struc-tured selection and planning process to en-sure that the company prioritizes correctly when choosing which potential projects to pursue. This process comprises thorough analysis of the market, technical develop-ment and choice of production method and subcontractors. The actual development
work is also conducted in a structured man-ner and each project undergoes a number of fixed control points.
Product liability and damage claims. Health-care suppliers run a risk, like other players in the healthcare industry, of being subject to claims relating to product liability and other legal claims. Such claims can involve large amounts and significant legal expenses. Getinge cannot provide any guarantees that its operations will not be subject to compen-sation claims. A comprehensive insurance program is in place to cover any property or liability risks (e.g. product liability) to which the Group is exposed.
Protection of intellectual property. The Get-inge Group is a market leader in the areas in which it operates and invests significant amounts in product development. To secure returns on these investments, the Group ac-tively upholds its rights and monitors com-petitors’ activities closely. If required, the company will protect its intellectual property rights through legal processes.
Financial risk management
In its business, Getinge is exposed to a range of financial risks. Financial risks principally pertain to risks related to currency and inter-est risks, as well as credit risks. Risk man-agement is regulated by the finance policy adopted by the Board. The overriding re-sponsibility to manage the Group’s finan-cial risks and develop methods and poli-cies to manage financial risks lies with Group management and the finance function. The most significant financial risks the Group is exposed to are currency risks, interest risks, credit risks and counterparty risks. For fur-ther information concerning these risks, see Note 26 Financial risk management and fi-nancial derivative instruments. The Group has a number of participations in foreign op-erations whose net assets are exposed to currency risks. Currency exposure that aris-es from net assets in the Group’s foreign op-erations is primarily managed by borrowing in said foreign currency.
Currency. The effect of exchange-rate movements on earnings and shareholders’ equity is calculated using forecast volumes and earnings in foreign currency, taking into consideration currency hedging that has been conducted. In addition, there is the ex-change-rate impact on net financial items re-lated to interest expenses in foreign curren-cies. Based on the estimated rates for 2014, presented in the table below, the Group as-sesses the net exchange-rate impact on prof-it or loss for 2014 to amount to about negative SEK 275 M compared with the actual rates for 2013. For a rate movement of 5%, the im-pact on shareholders’ equity of a remeasure-ment of the Group’s portfolio of currency de-rivatives held for hedging purposes is about SEK 125 M. At a 5% rate movement, the im-pact of other translation effects on share-holders’ equity is approximately SEK 450 M. Sensitivity to exchange-rate fluctuations on earnings is detailed in the table below, based on the exchange rates specified in the table.
Currency: Estimated rate in 2014
Budgeted net volume in 2014,
millions
Impact in SEK M of 5%
rate movement
JPY: 6.55 1,265 +/- 5
EUR: 8.79 100 +/- 40
GBP: 10.31 75 +/- 40
USD: 6.38 190 +/- 60
Sensitivity analysis. Getinge’s earnings are affected by a series of external factors. The table below shows how changes to some of the key factors that are important to Getinge could have affected the Group’s profit before tax in 2013.
Change in profit before tax SEK M
Price change +/- 1 % +/- 242
Cost of goods sold +/- 1 % +/- 115
Salary costs +/- 1 % +/- 48
Interest rates +/- 1 percentage point
+/- 44
Administration Report
50 GE TINGE ANNUAL REPORT 2013
The effect of a +/- 1 percentage point change in interest rates on the Group’s profit before tax was calculated based on the Group’s in-terest-bearing liabilities, excluding pension
liabilities, at year-end 2013. The impact of a +/- 1 percentage point change in interest rates on shareholders’ equity is about SEK 330 M. Consideration was given to the effect
of the various risk-management measures that Getinge applies in accordance with its approved policy.
Sales trend
During the year, net sales increased 4.3% to SEK 25,287 M (24,248). Net sales rose or-ganically by 4.2%. In 2013, Medical Systems’ sales amounted to SEK 13,322 M (13,089). Sales grew organically by 6.7% (6.6). In Ex-tended Care, sales totaled SEK 6,870 M
(5,990), corresponding to negative organic growth of 0.6% (neg: 2.6). In Infection Con-trol, sales amounted to SEK 5,095 M (5,170), corresponding to organic growth of 3.7% (0.6). Western Europe remains the Group’s largest market, accounting for 36% (37) of
sales, followed by the US and Canada at 34% (32). Other countries account for 30% (31) of sales. The hospital segment accounts for 84% (82) of sales, elderly care for 9% (11) and the life science industry for 7% (7).
Acquired companies and operations
STS East LLC. During the first quarter of 2013, Infection Control acquired the US ser-vice company STS East LCC, which gener-ates sales of SEK 25 M and has 17 employ-ees. The total purchase consideration was about SEK 29 M. The operation will be in-cluded in Getinge’s sales and operating profit from January 1, 2013.
Trans Medikal Devices Inc. During the first quarter of 2013, Infection Control acquired
the Turkish company Trans Medikal Devic-es Inc. The Company, engaged in the manu-facture of autoclaves and distribution of dis-infectors, generates sales of SEK 55 M and has about 70 employees. The total purchase consideration was about SEK 93 M, of which SEK 63 M was paid upon acquisition. The op-eration will be included in Getinge’s sales and operating profit from April 1, 2013.
LAAx Inc. During the first quarter of 2013, Medical Systems acquired the US compa-ny LAAx Inc. The company, which is active in cardiac and vascular surgery, generates sales of about SEK 8 M and has about 5 em-ployees. The total purchase consideration was about SEK 182 M, of which SEK 156 M was paid upon acquisition. The operation will be included in Getinge’s sales and operating profit from April 1, 2013.
Key events and activities
MEDICAL SYSTEMS BUSINESS AREA Public offer for Pulsion. In December 2013, Getinge announced its intention to make a public offer to acquire all of the shares out-standing in the German company Pulsion Medical Systems SE (“Pulsion”) listed on the German Stock Exchange (Deutsche Börse) for an offer price of EUR 16.90 per share in cash. Pulsion is a leading supplier of specialized so-lutions for hemodynamic monitoring of critical-ly ill patients. In January, Getinge secured over 75% of the shares in Pulsion and the transac-tion won approval from the German Federal Cartel Office. The transaction is expected to be completed in the first quarter of 2014.
Divestment of product lines. During the year, Medical Systems divested two prod-uct lines: SAFEGUARD ® and AIR-BANDTM. These products are used for medically caus-ing hemostasis (causing bleeding to stop by coagulation) following catheter-based pro-cedures. The purchaser of both products is Merit Medical Systems, Inc, based in Utah in the US, which is considered to have great-er potential to develop the products and in-crease sales. The products generate annual sales volumes of approximately SEK 46 M. The purchase consideration amounted to about SEK 180 M and is expected to gener-ate a capital gain of SEK 92 M.
Product launches. Medical Systems launched several new products during the year. Dur-ing the period, MIRA-i was launched, which is an instrument for less invasive cardiac sur-gery. The product is a key supplement to the business area’s existing customer of-fering for cardiac surgery and will contrib-ute to a quicker recovery for patients while
also offering physicians another alternative for performing high-quality, minimally inva-sive treatments. The launch of SERVO-U, the next generation ventilator platform, be-gan in the third quarter. The reception from customers who have used the product has been highly positive. Product approval from the FDA for VOLISTA was received during the same quarter. VOLISTA is a new generation of surgical lamps that utilizes LED technol-ogy that enables individual regulation of each specific light diode so that at any given time during a procedure the area of operations on a patient is optimally lit, color corrected and free from shadows. EIRUS also received CE marking in Europe during the quarter. EIRUS is a unique product for continuous monitor-ing of glucose and lactate levels in intensive-care patients. EIRUS is deemed to have the potential to become a significant product in the global intensive-care market.
Enhanced manufacturing quality systems. The Medical Systems Business Area of Get-inge Group announced today that, over the past year, a number of its manufacturing fa-cilities have been inspected by the U.S. Food and Drug Administration (FDA). As a result of the inspections, as well as its own internal quality evaluations, Medical Systems is in the process of making significant improvements to enhance the quality management sys-tems at its manufacturing facilities around the world.
The FDA inspections generated observa-tions related to the Business Area’s qual-ity management systems and these obser-vations are being used to help guide the im-provements now underway. Medical Sys-
tems is in discussions with the FDA about these inspectional observations and is com-mitted to promptly addressing them.
With these improvements, all Medical Sys-tems facilities will have in place state of the art manufacturing quality systems, and the Business Area will be well positioned in the future to continue to provide medical prod-ucts of the highest quality.
Integration of Atrium Medical. The integra-tion of Atrium, which was acquired in the au-tumn of 2011, is proceeding as planned. The costs for the integration of Atrium are expect-ed to total about SEK 45 M, of which SEK 15 M was expensed in 2013. Integration was completed at the start of 2014.
Restructuring project in the Cardiovascu-lar division. In 2013, Medical Systems im-plemented parts of a restructuring program aimed at enhancing the efficiency of vascular implant manufacturing. Costs related to the restructuring program were expensed as ear-ly as year-end 2011. The program is expected to be completed in the first quarter of 2015.
Acquisitions. In 2013, Medical Systems ac-quired the US company LAAx Inc., which has developed a unique implant that minimizes the risk for strokes in patients suffering from atrial fibrillation. The product has been ap-proved by the FDA, secured CE labelling and was available for global sale as of April 2013. The purchase consideration for LAAx Inc., including all product rights, totaled SEK 182 M. Sales of the product are ultimately ex-
Administration Report
51GE TINGE ANNUAL REPORT 2013
pected to total between SEK 300-500 M with strong profitability.
EXTENDED CARE BUSINESS AREAIntegration of Therapeutic Support Sys-tems (TSS). The integration of TSS continued in 2013. The cost synergies generated by the acquisition are anticipated to be more than assumed at the time of acquisition. However, parts of the integration program have been deferred, which means that the synergy ef-fects for 2013 will be less than anticipated. The restructuring and integration program is anticipated to be fully completed in 2014. Transaction and restructuring costs related to the TSS acquisition are expected to to-tal SEK 240 M, of which SEK 170 M was ex-pensed in the 2012 financial statements. A further SEK 70 M was expensed in 2013.
Continued streamlining of production structure. The discontinuation of the pro-duction units in Eslöv, Sweden, and Wetz-lar, Germany proceeded according to plan in 2013 and the transfer of manufacturing to the business area’s production unit in Poland and to an external supplier in Eastern Europe was started during the year. The discontinu-ation of the German production facility was completed by the fourth quarter of the year and the relocation of the Swedish operation is expected to be completed in the second quarter of 2014. Restructuring costs are ex-pected to amount to SEK 96 M and were ex-pensed in the first quarter of the year. The changes to the business area’s production structure are expected to lead to annual sav-ings of SEK 90-100 M from 2015.
Product launches. Extended Care released a number of new products in 2013. Carevo and Evolve were launched in the first quarter. Carevo is a new generation of shower trolley with significantly enhanced functionality and profitability, which will further strengthen the business area’s leading position in the show-er segment, which is the fastest growing seg-
ment in the hygiene market. Evolve is a pres-sure-reducing mattress for the prevention and treatment of pressure ulcers in emergen-cy care and elderly care. During the second quarter, the business area boosted its range of medical beds through the launch of the En-terprise® 8000 and Enterprise® 5000. The Enterprise range was developed with focus on risk management, ease of use and servic-ing. The Enterprise® 8000 is a premium prod-uct for the most demanding customers in the intensive-care sector and has been approved in accordance with the latest International Electrotechnical Commission (IEC) standard. Enterprise® 8000 and Enterprise® 5000 are both equipped with a large number of func-tions to improve patient safety. (The IEC is a commission tasked primarily with preparing and establishing international standards in electrical engineering and electronics.)
New Executive Vice President. On January 1, 2014, Harald F. Stock took up his position as President of ArjoHuntleigh, and Executive Vice President of the Extended Care business area. Harald F. Stock joins Getinge’s Group management and succeeds Alex Myers, who has moved on to a position outside the Group. Harald Stock has almost 20 years’ experience of the healthcare industry and a PhD. in chem-istry from Heidelberg University, in Germany.
INFECTION CONTROL BUSINESS AREA Enhanced profitability. In 2013, Infection Control initiated an extensive streamlining program aimed at improving the business ar-ea’s EBITA margin from about 12% to 15-16% by 2014/2015 and, in time, to levels in excess of 17%. A key phase of the streamlining pro-gram is to concentrate the business area’s production to fewer plants with greater re-sources and to gear manufacturing toward assembly, thus resulting in the outsourcing of component manufacturing to external sup-pliers in low-cost countries. The streamlining program also encompasses the monitoring of distribution, logistics and administrative
processes, and the discontinuation of un-profitable product lines. Restructuring costs for completing the program are expected to amount to about SEK 440 M over a four-year period. Restructuring costs of SEK 123 M were expensed in 2013.
Global innovation center in Gothenburg. In the past year, Infection Control’s operations have quickly evolved into a more function-based and global organization. A global Re-search and Development center will be es-tablished to control all product development activities conducted in the business area, including those currently being conducted in the vicinity of the existing business units. The new innovation center will be located in Gothenburg, Sweden, close to a skilled uni-versity hospital and first-class academic in-stitutions, while also offering better access to production-development expertise nec-essary for the future. The operation will ini-tially encompass about 20 employees and is expected to be established during the first quarter of 2014.
Acquisitions. During the first quarter of 2013, Infection Control acquired the US company STS East LCC which generates sales of SEK 25 M and has 17 employees. The total pur-chase consideration was about SEK 29 M. The operation is included in Getinge’s sales and income statement as of 1 January 2013. The acquisition of the Turkish company Trans Medikal Devices Inc. was completed in the same quarter. The company’s range of auto-claves will represent Getinge’s product offer-ing in the growing mid-segment and contrib-ute to increased exposure to the emerging markets. The company is the market leader in Turkey and commands a market share of about 35%. Trans has about 70 employees and generated sales of SEK 55 M in 2011. Trans has been included in the consolidated financial statements from April 1, 2013.
Outlook
Moving forward, the Group expects demand in the market in Western Europe to make a slow recovery in volumes. In the North Ameri-can market, demand is expected to remain at current levels. Long-term growth pros-pects in markets outside of Western Europe and North America are positive even though short-term challenges exist that can nega-tively impact volumes. The Group expects that the majority of product launches and product acquisitions completed recently will continue to contribute to growth. Overall, or-ganic volume growth for 2014 is expected to remain in line with that of 2013. Restruc-
turing costs, which were significant in 2013, will decrease and are expected to amount to about SEK 145 M (401) in 2014. The gradu-al strengthening of the SEK will continue to have a negative impact on the Group’s earn-ings in 2014 and currency-transaction effects of SEK 250 M are expected to be charged to the year’s earnings.
In 2013, the Getinge Group Getinge com-pleted an extensive strategy update. The de-cision to coordinate certain processes and functions between the Group’s three busi-ness areas was a key outcome of the new di-
rection. The areas primarily affected by the above comprise financial and administra-tive services as well as sourcing. Getinge’s annual costs in the above areas amount to between SEK 10 and 11 billion and poten-tial savings are estimated as substantial. The Group is currently working on preparing a plan that details the financial consequences of the new initiative for the 2014-2017 peri-od. Getinge’s aim is to present the results of this initiative in conjunction with the capital market day to be held in the second quar-ter of 2014.
52 GE TINGE ANNUAL REPORT 2013
Administration Report | Corporate governance
Corporate governance report
Introduction
Getinge is a global company with operations in 40 countries and proprietary production in nine countries. The pace of change and growth since the stock-market listing has been high, with an average growth of about 18%.
The Group’s customer offering has been continuously expanded with new products and operational areas. The Group’s custom-ers are found in the healthcare, elderly care and life science area, and the Group’s prod-ucts are often pivotal to the quality and ef-ficiency of customers’ businesses. Accord-ingly, confidence in Getinge and its products
is entirely decisive for continued sales suc-cesses.
Corporate governance at Getinge is aimed at ensuring the continued strong development of the company and, consequently, that the Group fulfills its obligations to shareholders, customers, employees, suppliers, creditors and society.
Getinge’s corporate governance and inter-nal regulations are consistently geared to-ward business objectives and strategies. The Group’s risks are well-analyzed and risk management is integrated in the work of the
Board and in operational activities. Gear-ing corporate governance so clearly toward the Group’s business objectives creates the speed and flexibility in the decision-making process that can so often be decisive to suc-cess.
Getinge’s organization is designed to be able to react promptly to market changes. Ac-cordingly, operational decisions are taken at the company or business area level, while overriding decisions concerning strategy and direction are made by Getinge’s Board and Group management.
External and internal regulations
Getinge’s corporate governance is based on Swedish legislation, primarily the Swed-ish Companies Act, the company’s Articles of Association, NASDAQ OMX Stockholm’s Rulebook for Issuers and the rules and rec-ommendations issued by the relevant orga-nizations. Getinge applies the Swedish Cor-porate governance Code (“the Code”). The Code is based on the “comply or explain”
principle, meaning that a company that ap-plies the Code may deviate from regulations under the Code, but must provide explana-tions for each deviation. Getinge complies with the Code’s regulations and presents an explanation below for any deviation from the Code’s regulations in 2013. The Code is available at: www.bolagsstyrning.se. Inter-nal regulations that affect Getinge’s corpo-
rate governance include the company’s Ar-ticles of Association, the Board’s formal work plan, the CEO’s instructions, policy docu-ments and the Group’s Code of Conduct. The company’s Articles of Association are available on the Group’s website: www.get-ingegroup.com.
Shareholders
At year-end 2013, Getinge had nearly 40,145 shareholders according to the share register maintained by SIS Ägarservice AB. The share capital of Getinge at year-end comprised 238,323,377 shares, of which 15,940,050 shares were Class A and 222,383,327
shares were Class B. One Class A share car-ries ten votes and one Class B share carries one vote. Getinge’s shares are traded on NASDAQ OMX Stockholm. Getinge’s market capitalization amounted to SEK 52.4 billion at December 31, 2013. The company’s largest
shareholder is Carl Bennet AB, which repre-sents 48.9% of the total number of votes in the company. Further information concern-ing such factors as Getinge’s ownership structure and share performance is present-ed on pages 46-47.
2013 Annual General Meeting (AGM)
A total of 562 shareholders, representing 58.1% of the number of shares and 73.8% of the total number of votes in the company, at-tended Getinge’s AGM on March 21, 2013, in Halmstad, Sweden. The entire Board of Di-rectors, CEO, CFO and the company’s au-ditor were present at the Meeting. The AGM re-elected Board members Carl Bennet, Jo-han Bygge, Cecilia Daun Wennborg, Carola Lemne, Johan Malmquist, Johan Stern and Maths Wahlström. Carl Bennet was elected Chairman of the Board. It was noted that the employee-representative organizations ap-pointed Henrik Blomdahl and Thomas Funk
as Board members, and Peter Jörmalm and Rickard Karlsson as deputy members. The minutes from the AGM are available at: www.getingegroup.com
The Meeting’s resolutions:• Adoption of the income statements and
balance sheets presented for the Parent Company and the Group.
• Dividend. The AGM approved the Board’s proposal of a dividend of SEK 4.15 per share.
• Discharge from liability. The Meeting resolved to discharge the members of the
Board and the CEO from liability for the 2012 fiscal year.
• Board fees. It was resolved that the Board be paid fees totaling SEK 3,675,000 excluding committee fees. More detailed information is available on page 56.
• Guidelines for the remuneration to senior executives. The AGM approved the Board’s proposal for guidelines for the remuneration to senior executives. More detailed information is available on page 56.
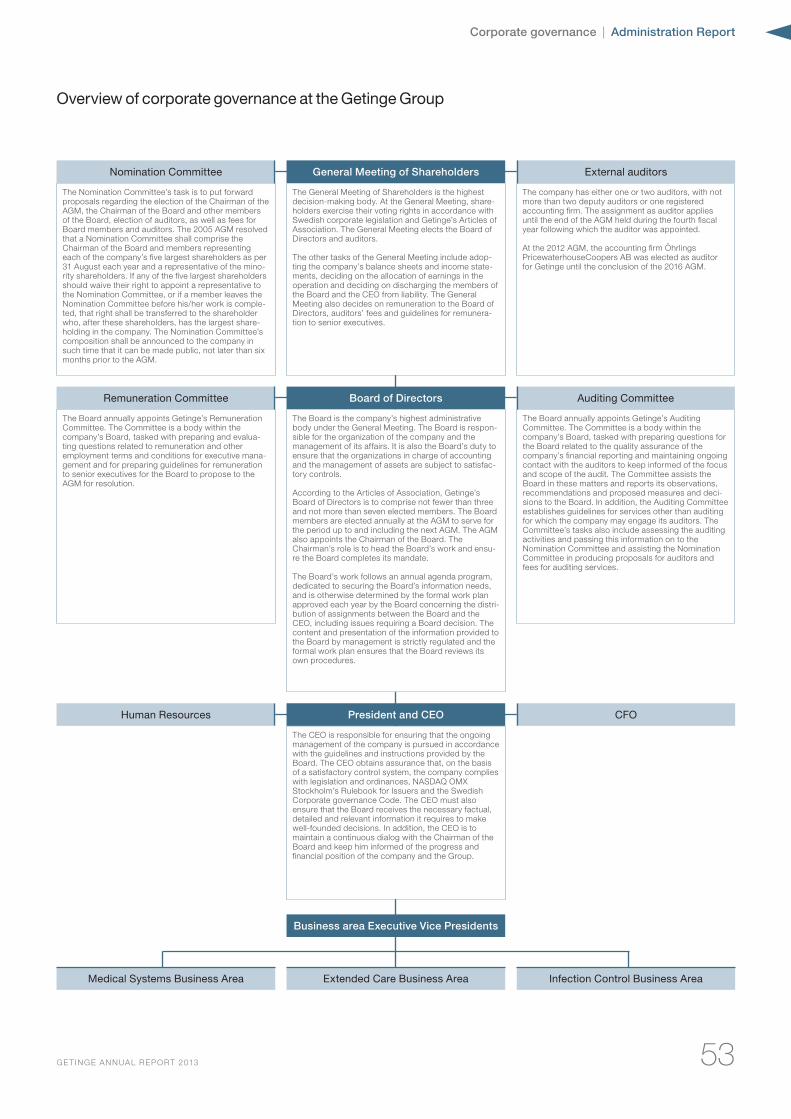
53GE TINGE ANNUAL REPORT 2013
Corporate governance | Administration Report
Nomination Committee
Remuneration Committee
Human Resources
Medical Systems Business Area Extended Care Business Area Infection Control Business Area
The Nomination Committee’s task is to put forward proposals regarding the election of the Chairman of the AGM, the Chairman of the Board and other members of the Board, election of auditors, as well as fees for Board members and auditors. The 2005 AGM resolved that a Nomination Committee shall comprise the Chairman of the Board and members representing each of the company’s five largest shareholders as per 31 August each year and a representative of the mino-rity shareholders. If any of the five largest shareholders should waive their right to appoint a representative to the Nomination Committee, or if a member leaves the Nomination Committee before his/her work is comple-ted, that right shall be transferred to the shareholder who, after these shareholders, has the largest share-holding in the company. The Nomination Committee’s composition shall be announced to the company in such time that it can be made public, not later than six months prior to the AGM.
The Board annually appoints Getinge’s Remuneration Committee. The Committee is a body within the company’s Board, tasked with preparing and evalua-ting questions related to remuneration and other employment terms and conditions for executive mana-gement and for preparing guidelines for remuneration to senior executives for the Board to propose to the AGM for resolution.
General Meeting of Shareholders
Board of Directors
President and CEO
Business area Executive Vice Presidents
The General Meeting of Shareholders is the highest decision-making body. At the General Meeting, share-holders exercise their voting rights in accordance with Swedish corporate legislation and Getinge’s Articles of Association. The General Meeting elects the Board of Directors and auditors.
The other tasks of the General Meeting include adop-ting the company’s balance sheets and income state-ments, deciding on the allocation of earnings in the operation and deciding on discharging the members of the Board and the CEO from liability. The General Meeting also decides on remuneration to the Board of Directors, auditors’ fees and guidelines for remunera-tion to senior executives.
The Board is the company’s highest administrative body under the General Meeting. The Board is respon-sible for the organization of the company and the management of its affairs. It is also the Board’s duty to ensure that the organizations in charge of accounting and the management of assets are subject to satisfac-tory controls.
According to the Articles of Association, Getinge’s Board of Directors is to comprise not fewer than three and not more than seven elected members. The Board members are elected annually at the AGM to serve for the period up to and including the next AGM. The AGM also appoints the Chairman of the Board. The Chairman’s role is to head the Board’s work and ensu-re the Board completes its mandate.
The Board’s work follows an annual agenda program, dedicated to securing the Board’s information needs, and is otherwise determined by the formal work plan approved each year by the Board concerning the distri-bution of assignments between the Board and the CEO, including issues requiring a Board decision. The content and presentation of the information provided to the Board by management is strictly regulated and the formal work plan ensures that the Board reviews its own procedures.
The CEO is responsible for ensuring that the ongoing management of the company is pursued in accordance with the guidelines and instructions provided by the Board. The CEO obtains assurance that, on the basis of a satisfactory control system, the company complies with legislation and ordinances, NASDAQ OMX Stockholm’s Rulebook for Issuers and the Swedish Corporate governance Code. The CEO must also ensure that the Board receives the necessary factual, detailed and relevant information it requires to make well-founded decisions. In addition, the CEO is to maintain a continuous dialog with the Chairman of the Board and keep him informed of the progress and financial position of the company and the Group.
External auditors
Auditing Committee
CFO
The company has either one or two auditors, with not more than two deputy auditors or one registered accounting firm. The assignment as auditor applies until the end of the AGM held during the fourth fiscal year following which the auditor was appointed.
At the 2012 AGM, the accounting firm Öhrlings PricewaterhouseCoopers AB was elected as auditor for Getinge until the conclusion of the 2016 AGM.
The Board annually appoints Getinge’s Auditing Committee. The Committee is a body within the company’s Board, tasked with preparing questions for the Board related to the quality assurance of the company’s financial reporting and maintaining ongoing contact with the auditors to keep informed of the focus and scope of the audit. The Committee assists the Board in these matters and reports its observations, recommendations and proposed measures and deci-sions to the Board. In addition, the Auditing Committee establishes guidelines for services other than auditing for which the company may engage its auditors. The Committee’s tasks also include assessing the auditing activities and passing this information on to the Nomination Committee and assisting the Nomination Committee in producing proposals for auditors and fees for auditing services.
Overview of corporate governance at the Getinge Group
54 GE TINGE ANNUAL REPORT 2013
Administration Report | Corporate governance
Nomination Committee
The composition of the Nomination Commit-tee ahead of the 2014 AGM was published on October 15, 2013 and all shareholders have had the opportunity to submit nomina-tion proposals to the Committee. The Nomi-nation Committee conducts an evaluation of the Board and its work. A proposal for the new Board is subsequently drawn up and submitted with the notice of the forthcom-ing AGM. Ahead of the 2014 AGM, the Nom-ination Committee convened on three oc-casions. For the 2014 AGM, the Nomination Committee comprises the following repre-sentatives of the largest shareholders:
• Carl Bennet, Carl Bennet AB• Bo Selling, Alecta• Marianne Nilsson, Swedbank Robur AB• Carina Lundberg Markow, Folksam
Gruppen• Hans Ek, SEB Fonder• Anders Olsson, representing minority
shareholders
Chairman of the Board Carl Bennet was ap-pointed Chairman of the Nomination Com-mittee ahead of the 2014 AGM, which devi-ates from the rules of the Code. The compa-ny’s largest shareholders have explained that
this is because the Chairman of the Board is very well suited to lead the Nomination Com-mittee in an effective manner to achieve the best results for the company’s shareholders.
Evaluation. As a basis for its proposal to the 2014 AGM, the Nomination Committee has made an assessment as to whether the cur-rent Board of Directors is suitably composed and meets the demands that are placed on the Board in view of the company’s position and future focus. The Nomination Commit-tee’s proposal will be published not later than in conjunction with the notice of the AGM.
Board of Directors
The Board held its statutory meeting on March 21, 2013 and convened 16 times dur-ing the year, with an average attendance rate of 97%. The Board also convened a meet-ing in January 2014, at which the results for 2013 were addressed and subsequent-ly published. With the exception of the CEO, no member of the Getinge Group’s Board holds an operational position in the compa-ny. A more detailed description of the Board of Directors and CEO is presented on pages 58-59.
Independence. Getinge fulfils the require-ments for independent Board members as stipulated in the Code. It is the opinion of the Nomination Committee that Johan Malmquist, in his capacity as CEO, is not to be regarded as independent in relation to the
company and executive management, and that Carl Bennet and Johan Stern, as repre-sentatives and Board members of Getinge’s principal owner Carl Bennet AB, are not to be regarded as independent in relation to the largest shareholders. The Nomination Committee deems the other Board members elected by the General Meeting – Johan Byg-ge, Cecilia Daun Wennborg, Carola Lemne and Maths Wahlström – to be independent in relation to the company, executive manage-ment and the largest shareholders.
The Secretary of the Board meetings is Ulf Grunander, Chief Financial Officer. At its scheduled meetings, the Board addresses fixed items in compliance with the Board’s formal work plan, including the business situ-ation, budget, year-end financial statements
and interim reports, as well as comprehen-sive issues related to the economy and re-lated cost issues, corporate acquisitions and other investments, long-term strategies, fi-nancial matters, and structural and organi-zational changes. To increase efficiency and broaden the Board’s work on certain issues, two committees have been established: the Auditing Committee and the Remunera-tion Committee. The delegation of respon-sibilities and rights of decision held by these committees are stipulated in the Board’s for-mal work plan. Minutes are prepared to re-cord the issues addressed and the deci-sions made at these committee meetings and these are presented at the subsequent Board meeting.
BOARD OF DIRECTORS AND COMMITTEES IN 2013
Committees Attendance
Board members elected by the AGM Year elected Dependent1Auditing
CommitteeRemuneration
CommitteeBoard
meetingsAuditing
CommitteeRemuneration
Committee
Carl Bennet, ordförande 1989 ■ Chairman 16/16 3/3Johan Bygge 2007 Chairman 16/16 6/6Cecilia Daun Wennborg 2010 Member 16/16 6/6Carola Lemne 2003 Member 14/16 6/6Johan Malmquist 1997 ▲ 16/16Johan Stern 2004 ● Member Member 16/16 6/6 3/3Maths Wahlström 2012 Member 15/16 3/3Board members appointed by employeesHenrik Blomdahl 2009 14/16Thomas Funk 2012 15/16Peter Jörmalm (suppleant) 2012 16/16Rickard Karlsson (suppleant) 2013 16/16
1. As defined by the Swedish Corporate governance Code■ = Representing Getinge’s principal owner Carl Bennet AB▲ = President and CEO● = Board member of Getinge’s principal owner Carl Bennet AB
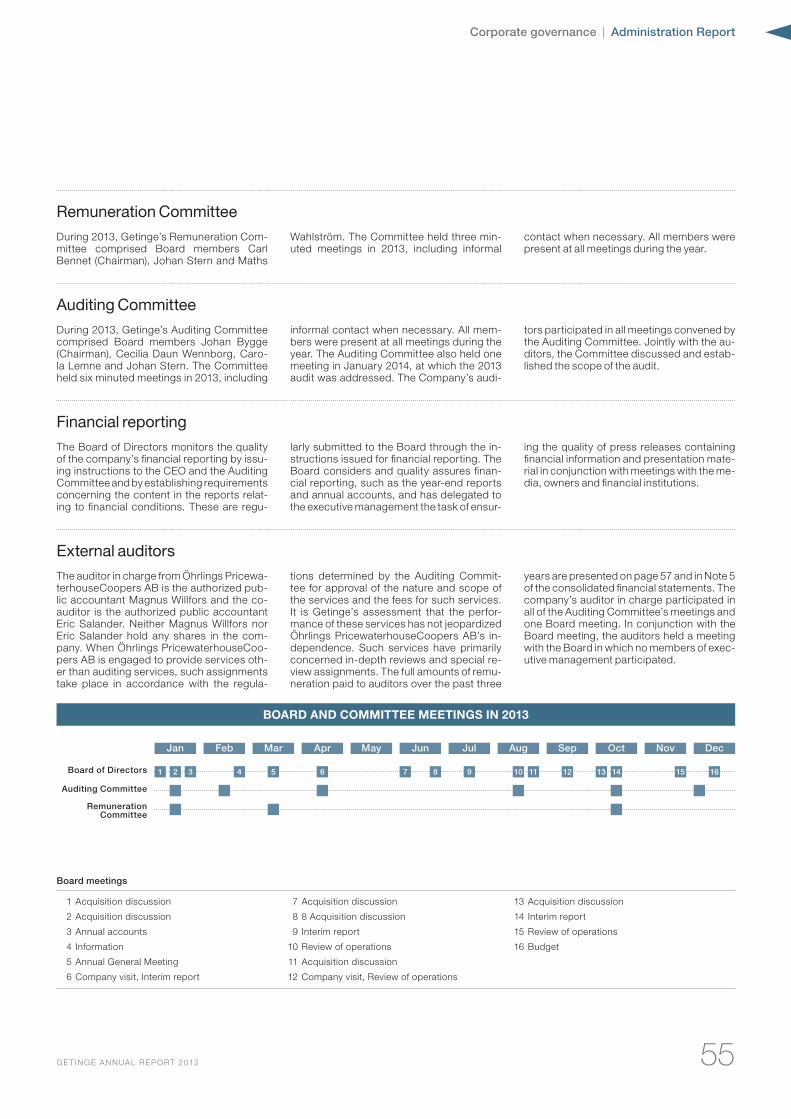
55GE TINGE ANNUAL REPORT 2013
Corporate governance | Administration Report
Remuneration Committee
During 2013, Getinge’s Remuneration Com-mittee comprised Board members Carl Bennet (Chairman), Johan Stern and Maths
Wahlström. The Committee held three min-uted meetings in 2013, including informal
contact when necessary. All members were present at all meetings during the year.
Auditing Committee
During 2013, Getinge’s Auditing Committee comprised Board members Johan Bygge (Chairman), Cecilia Daun Wennborg, Caro-la Lemne and Johan Stern. The Committee held six minuted meetings in 2013, including
informal contact when necessary. All mem-bers were present at all meetings during the year. The Auditing Committee also held one meeting in January 2014, at which the 2013 audit was addressed. The Company’s audi-
tors participated in all meetings convened by the Auditing Committee. Jointly with the au-ditors, the Committee discussed and estab-lished the scope of the audit.
Financial reporting
The Board of Directors monitors the quality of the company’s financial reporting by issu-ing instructions to the CEO and the Auditing Committee and by establishing requirements concerning the content in the reports relat-ing to financial conditions. These are regu-
larly submitted to the Board through the in-structions issued for financial reporting. The Board considers and quality assures finan-cial reporting, such as the year-end reports and annual accounts, and has delegated to the executive management the task of ensur-
ing the quality of press releases containing financial information and presentation mate-rial in conjunction with meetings with the me-dia, owners and financial institutions.
External auditors
The auditor in charge from Öhrlings Pricewa-terhouseCoopers AB is the authorized pub-lic accountant Magnus Willfors and the co-auditor is the authorized public accountant Eric Salander. Neither Magnus Willfors nor Eric Salander hold any shares in the com-pany. When Öhrlings PricewaterhouseCoo-pers AB is engaged to provide services oth-er than auditing services, such assignments take place in accordance with the regula-
tions determined by the Auditing Commit-tee for approval of the nature and scope of the services and the fees for such services. It is Getinge’s assessment that the perfor-mance of these services has not jeopardized Öhrlings PricewaterhouseCoopers AB’s in-dependence. Such services have primarily concerned in-depth reviews and special re-view assignments. The full amounts of remu-neration paid to auditors over the past three
years are presented on page 57 and in Note 5 of the consolidated financial statements. The company’s auditor in charge participated in all of the Auditing Committee’s meetings and one Board meeting. In conjunction with the Board meeting, the auditors held a meeting with the Board in which no members of exec-utive management participated.
Board meetings
1 Acquisition discussion 7 Acquisition discussion 13 Acquisition discussion
2 Acquisition discussion 8 8 Acquisition discussion 14 Interim report
3 Annual accounts 9 Interim report 15 Review of operations
4 Information 10 Review of operations 16 Budget
5 Annual General Meeting 11 Acquisition discussion
6 Company visit, Interim report 12 Company visit, Review of operations
Board of Directors
Auditing Committee
Remuneration Committee
Jan Feb Mar Apr May Jun Jul Aug Sep Oct Nov Dec
1 2 3 4 5 6 7 8 9 10 11 12 13 14 15 16
BOARD AND COMMITTEE MEETINGS IN 2013
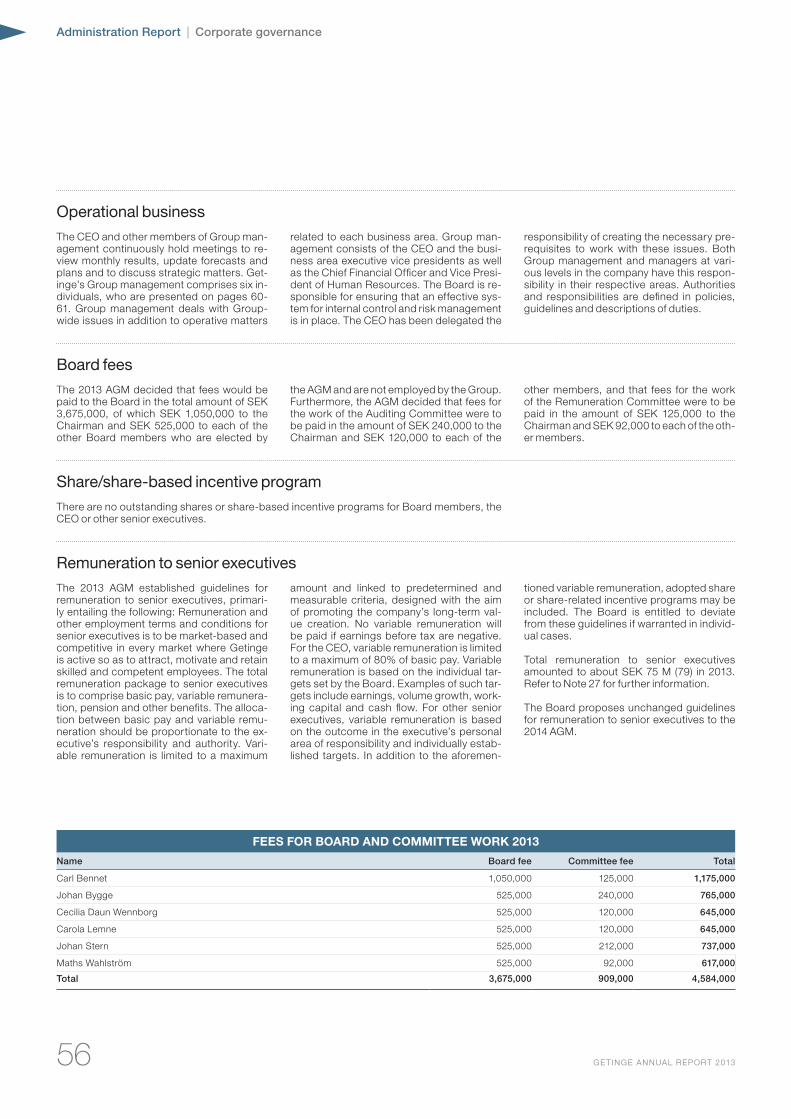
56 GE TINGE ANNUAL REPORT 2013
Administration Report | Corporate governance
Operational business
The CEO and other members of Group man-agement continuously hold meetings to re-view monthly results, update forecasts and plans and to discuss strategic matters. Get-inge’s Group management comprises six in-dividuals, who are presented on pages 60-61. Group management deals with Group-wide issues in addition to operative matters
related to each business area. Group man-agement consists of the CEO and the busi-ness area executive vice presidents as well as the Chief Financial Officer and Vice Presi-dent of Human Resources. The Board is re-sponsible for ensuring that an effective sys-tem for internal control and risk management is in place. The CEO has been delegated the
responsibility of creating the necessary pre-requisites to work with these issues. Both Group management and managers at vari-ous levels in the company have this respon-sibility in their respective areas. Authorities and responsibilities are defined in policies, guidelines and descriptions of duties.
Board fees
The 2013 AGM decided that fees would be paid to the Board in the total amount of SEK 3,675,000, of which SEK 1,050,000 to the Chairman and SEK 525,000 to each of the other Board members who are elected by
the AGM and are not employed by the Group. Furthermore, the AGM decided that fees for the work of the Auditing Committee were to be paid in the amount of SEK 240,000 to the Chairman and SEK 120,000 to each of the
other members, and that fees for the work of the Remuneration Committee were to be paid in the amount of SEK 125,000 to the Chairman and SEK 92,000 to each of the oth-er members.
Share/share-based incentive program
There are no outstanding shares or share-based incentive programs for Board members, the CEO or other senior executives.
Remuneration to senior executives
The 2013 AGM established guidelines for remuneration to senior executives, primari-ly entailing the following: Remuneration and other employment terms and conditions for senior executives is to be market-based and competitive in every market where Getinge is active so as to attract, motivate and retain skilled and competent employees. The total remuneration package to senior executives is to comprise basic pay, variable remunera-tion, pension and other benefits. The alloca-tion between basic pay and variable remu-neration should be proportionate to the ex-ecutive’s responsibility and authority. Vari-able remuneration is limited to a maximum
amount and linked to predetermined and measurable criteria, designed with the aim of promoting the company’s long-term val-ue creation. No variable remuneration will be paid if earnings before tax are negative. For the CEO, variable remuneration is limited to a maximum of 80% of basic pay. Variable remuneration is based on the individual tar-gets set by the Board. Examples of such tar-gets include earnings, volume growth, work-ing capital and cash flow. For other senior executives, variable remuneration is based on the outcome in the executive’s personal area of responsibility and individually estab-lished targets. In addition to the aforemen-
tioned variable remuneration, adopted share or share-related incentive programs may be included. The Board is entitled to deviate from these guidelines if warranted in individ-ual cases.
Total remuneration to senior executives amounted to about SEK 75 M (79) in 2013. Refer to Note 27 for further information.
The Board proposes unchanged guidelines for remuneration to senior executives to the 2014 AGM.
FEES FOR BOARD AND COMMITTEE WORK 2013
Name Board fee Committee fee Total
Carl Bennet 1,050,000 125,000 1,175,000
Johan Bygge 525,000 240,000 765,000
Cecilia Daun Wennborg 525,000 120,000 645,000
Carola Lemne 525,000 120,000 645,000
Johan Stern 525,000 212,000 737,000
Maths Wahlström 525,000 92,000 617,000
Total 3,675,000 909,000 4,584,000
57GE TINGE ANNUAL REPORT 2013
Corporate governance | Administration Report
Fees to auditors
Öhrlings PricewaterhouseCoopers is the company’s auditor. Auditing assignments re-fer to the auditing of the annual accounts and financial statements, including the Board’s and the President’s administration, other as-signments that the company’s auditors are
required to perform and advice or other sup-port brought about by observations from auditing or conducting similar tasks. Oth-er assignments refer mainly to consultancy services related to auditing and taxation is-sues as well as assistance in connection with
company acquisitions. Fees for auditing as-signments in 2013 amounted to SEK 21 M (19) and fees for other assignments totaled SEK 8 M (12).
Internal Control and risk management in the financial reporting
Description At the Getinge Group, internal control of financial reporting is an integral part of corporate governance. It comprises processes and methods to safeguard the Group’s assets and accuracy in the financial reporting, and in this manner, protects the shareholders’ investment in the company.
Control environment. The Getinge Group’s organization is designed to quickly respond to changes in the market. Operational deci-sions are thus made at the company or busi-ness-area level, while decisions on strategy, focus, acquisitions and overall financial is-sues are made by the Getinge Group’s Board and Group management. The internal con-trol of financial reporting within Getinge is de-signed to manage these conditions. The ba-sis of the internal control of the financial re-porting comprises the control environment, including the organization, decision-making channels, authorities and the responsibilities that are documented and communicated in steering documents.
Each year, the Board adopts a formal work plan that regulates the duties of the Chairman and the CEO. The Board has established an Auditing Committee to increase knowledge of the level of transparency and control of the company’s accounts, financial reporting and risk management, and a Remuneration Com-mittee to manage remuneration to company management. Each business area has one or more administrative centers that are respon-sible for the day-to-day handling of transac-tions and accounting. Each business area has a financial manager, who is responsible for the financial control of the business unit and for ensuring that the financial statements are ac-curate, complete and submitted in good time prior to consolidated reporting.
Risk assessment. Risk assessment is based on the Group’s financial targets. The over-all financial risks have been defined and are mostly industry specific. By conduct-ing quantitative and qualitative risk analyses based on the consolidated balance sheet and income statement, Getinge can identify the key risks that could threaten the achieve-ment of business and financial targets. In ad-
dition, several units in each business area are analyzed to gain a more detailed under-standing of the actual application of the exist-ing rules and regulations. Accordingly, mea-sures to minimize identified risks are formu-lated centrally within the Group.
Control activities. The identified risks relat-ed to financial reporting are handled by the company’s control activities. For example, there are automated controls in IT-based systems that manage authority levels and rights to authorization, as well as manual controls, such as duality in the day-to-day re-cording of transactions and closing entries. Detailed financial analyses of results and fol-low-ups against budgets and forecasts sup-plement the operation-specific controls and provide overall confirmation of the quality of the reporting. The Group follows standard-ized templates and models to identify and document processes and controls.
Information and communication. The Group has information and communication proce-dures to promote completeness and accu-racy in the financial reporting. Policies, man-uals and work descriptions are available on the company’s intranet and/or in printed form. Information channels were established to monitor how efficiently the internal con-trols in the Group function and data is regu-larly presented through the relevant parties within the organization via implemented re-porting tools.
Follow-up and monitoring. The finance de-partment and management perform month-ly analyses of the financial reporting at a de-tailed level. The Auditing Committee follows up the financial reporting at its meetings and the company’s auditors report on their ob-servations and provide recommendations. The Board receives financial reports on a monthly basis and the company’s financial position is discussed at every Board meet-ing. The efficiency of the internal control ac-tivities is regularly followed up at different lev-els in the Group and comprises an assess-ment of the formulation and operative func-tion of key control elements that have been identified and documented.
Self-assessment and validation. Since 2006, the Getinge Group has worked with a formalized process for the follow-up and evaluation of the effectiveness of documen-tation and control activities. The control con-sists of both a Group-wide IT-based tool for self-assessment and validation of the self-assessments. The validations are carried out by controllers from another business unit.
During 2013, self-assessments were con-ducted at all of the most important operating units within the Group. In conjunction with the standard audits, the auditors conducted a validation of the internal control. The self-assessment and validation function encom-pass the processes relating to financial re-porting, production, inventories, sourcing and revenues from products and services.
The system of self-assessment and valida-tion provides the Board with a proper over-view of how the Group manages different flows of information, how the Group reacts to new information and how the various control systems function.
Outcome 2013. The follow-up of the internal control in 2013 indicated that documentation and control activities were, in all material re-spects, established at the validated compa-nies. Based on the internal control that was conducted, the Board has decided that there is no need to introduce a separate audit func-tion (internal audit function).
Follow-on work. Over the next year, the con-tinuing work related to internal control in the Getinge Group will principally focus on risk assessment, control activities and follow-up/monitoring. An update of the risk analysis as regards relevant control processes and risk areas is conducted as a recurring annual ac-tivity. In the Control activities area, resources will be used to document additional process-es resulting from the annual risk analysis. De-pending on the outcome of the implemented self-assessment, it may be necessary to ad-dress reported shortcomings.
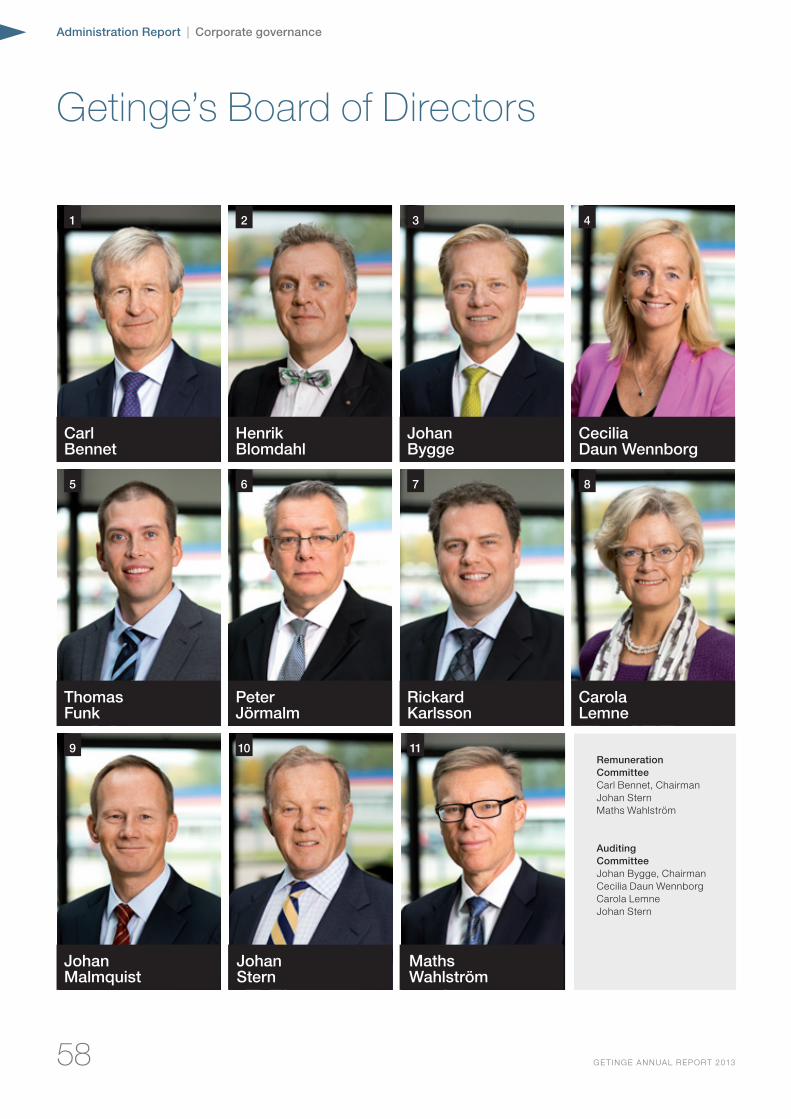
58 GE TINGE ANNUAL REPORT 2013
Administration Report | Corporate governance
Getinge’s Board of Directors
Remuneration CommitteeCarl Bennet, ChairmanJohan SternMaths Wahlström
Auditing CommitteeJohan Bygge, ChairmanCecilia Daun WennborgCarola LemneJohan Stern
1
5
9
2
6
10
3
7
11
4
8
Carl Bennet
Henrik Blomdahl
Johan Bygge
Cecilia Daun Wennborg
JohanMalmquist
Thomas Funk
JohanStern
PeterJörmalm
MathsWahlström
RickardKarlsson
CarolaLemne
59GE TINGE ANNUAL REPORT 2013
Corporate governance | Administration Report
1. Carl Bennet (1951) Chairman of the Board M.Sc. (Economics), Dr. Tech. h.c• Assignments on Getinge’s Board:
Chairman of the Board since 1997. Chairman of the Nomination Committee. Chairman of the Remuneration Committee. Board member since 1989.
• Current assignments: Managing Director of Carl Bennet AB, Chairman of Elanders and Lifco. Board member of Holmen and L E Lundbergsföretagen.
• Previous assignments: President and CEO of Getinge
• Holds 15,940,050 Class A shares and 27,153,848 Class B shares through companies.
2. Henrik Blomdahl (1963) Board member, representative for the
Swedish white-collar trade union, Unionen
Head of Environmental Effort• Assignments on Getinge’s Board:
Representative since 2012. Deputy from 2009 to 2011.
• Shareholding: Holds no shares.
3. Johan Bygge (1956) Board member elected by AGM M.Sc. (Economics)• Assignments on Getinge’s Board:
Chairman of the Auditing Committee. Board member since 2007.
• Current assignments: Chief Operating Officer EQT Partners AB, Chairman of Novare Human Capital AB and Samsari AB. Board member of Anticimex International AB and Sanitec Oyj.
• Previous assignments: CFO of Investor AB, Executive Vice President of Electrolux and CFO of Electrolux.
• Shareholding: Holds 5,000 Class B shares.
4. Cecilia Daun Wennborg (1963) Board member elected by AGM M.Sc. (Economics)• Assignments on Getinge’s Board: Member
of the Auditing Committee. Board member since 2010.
• Current assignments: Board member of companies including ICA Gruppen AB, Loomis AB, Proffice AB, Ikano Bank AB, Carnegie Fonder AB, Eniro AB, AB Svensk Bilprovning and Sophiahemmet.
• Previous assignments: Executive Vice President for Ambea AB. President of Carema Vård och Omsorg AB, CFO of Ambea AB and Carema Vård och Omsorg AB, acting President of Skandiabanken, Head of Swedish Operations at Skandia and President of Skandia Link.
• Shareholding: Holds 750 Class B shares.
5. Thomas Funk (1971) Board member since 2013, representative
of the Swedish Metalworkers’ Union Quality department• Assignments on Getinge’s Board: Board
member since 2013. Deputy representative from 2012 to 2013. Employed by Getinge Disinfection AB.
• Shareholding: Holds no shares.
6. Peter Jörmalm (1959) Deputy representative of the Swedish
white-collar trade union, Unionen After Sales/Parts Management• Assignments on Getinge’s Board: Deputy
representative since 2012. Employed by Getinge Infection Control AB.
• Shareholding: Holds no shares.
7. Rickard Karlsson (1970) Deputy representative of the Swedish
Metalworkers’ Union• Assignments on Getinge’s Board: Deputy
representative since 2013. Employed by Getinge Sterilization AB.
• Shareholding: Holds no shares.
8. Carola Lemne (1958) Board member elected by AGM M.D, Ph.D., senior lecturer• Assignments on Getinge’s Board: Member
of the Auditing Committee. Board member since 2003.
• Current assignments: President and CEO of Praktikertjänst AB. Senior lecturer at Karolinska Institutet. Board member of Investor AB and the Confederation of Swedish Enterprises. Chairman of Uppsala University. Member of the Advisory Council of the Swedish Dental and Pharmaceutical Benefits Agency and the Swedish Corporate Governance Board. Co-owner of CALGO holding company.
• Previous assignments: CEO of Danderyds Sjukhus AB. Clinical Research Manager at Pharmacia & Upjohn AB.
• Shareholding: Holds 2,300 Class B shares.
9. Johan Malmquist (1961) President and CEO M.Sc. (Economics)• Assignments on Getinge’s Board: Board
member elected by AGM since 1997. Employed by Getinge since 1990.
• Shareholding: Holds 55,555 Class B shares
10. Johan Stern (1951) Board member elected by AGM M.Sc. (Economics)• Assignments on Getinge’s Board: Member
of the Auditing Committee. Member of the Remuneration Committee. Board member since 2004.
• Current assignments: Chairman of Healthinvest Partners AB, Fädriften Invest AB, Skanör Falsterbo Kallbadhus AB and Harry Cullberg’s Fund Foundation. Board member of Carl Bennet AB, Elanders AB, Lifco AB, Rolling Optics AB, RP Ventures AB, Swedish-American Chamber of Commerce, Inc and Estea AB.
• Previous assignments: Active within SEB’s operations in Sweden and the US.
• Shareholding: Holds 30,104 Class B shares.
11. Maths Wahlström (1954) Board member elected by AGM M.Sc. (ECONOMICS)• Assignments on Getinge’s Board: Member
of the Remuneration Committee. Board member since 2012.
• Current assignments: CEO and Chairman of KMG Capital Partners, LLC, Chairman of PCI | HealthDev, LLC, and Board member of Coherus Biosciences INC, Zynex INC and Alteco Medical AB.
• Previous assignments: Has more than 27 years’ international experience in preventive care and healthcare from such positions as CFO of the Gambro Group and as CEO of Gambro Healthcare AB. He has also served as CEO of Fresenius Medical Services and was a member of the Group management for Fresenius Medical Care AG & Co KGaA.
• Shareholding: Holds 9,000 Class B shares.
AUDITORSÖhrlings PricewaterhouseCoopers AB• Magnus Willfors, Chief Auditor Authorized Public Accountant• Eric Salander, Co-auditor Authorized Public Accountant
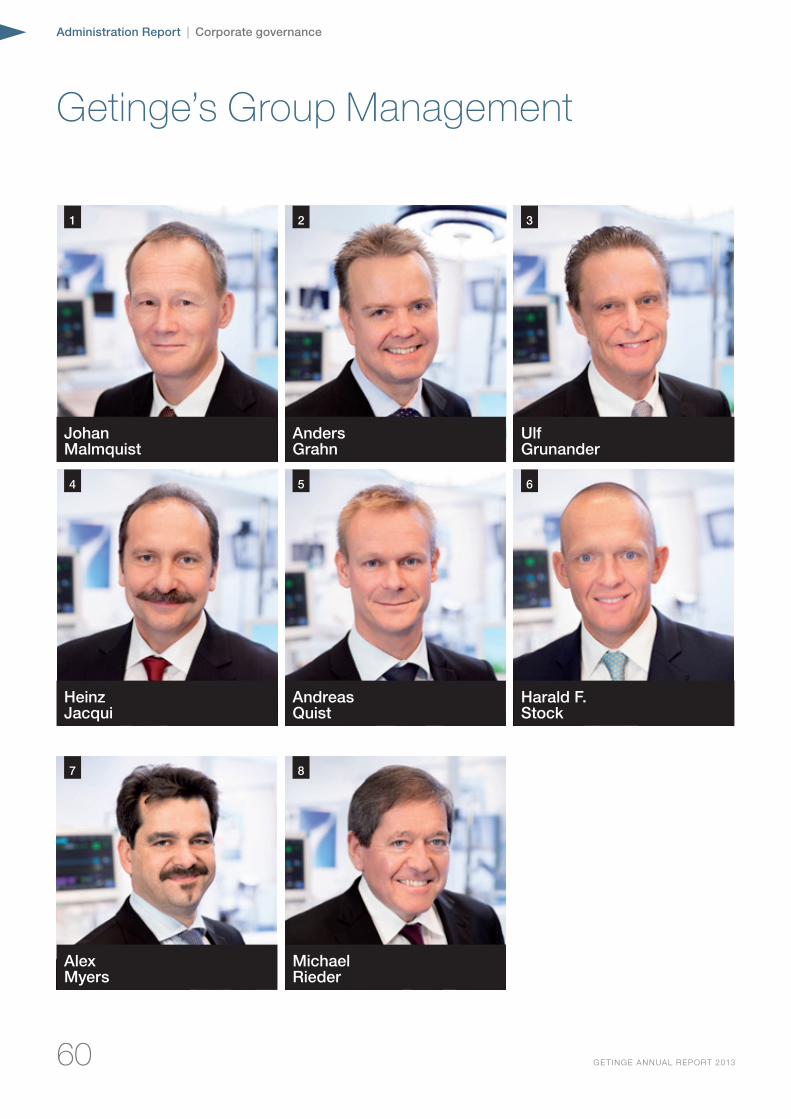
60 GE TINGE ANNUAL REPORT 2013
Administration Report | Corporate governance
Getinge’s Group Management
1 2 3
4 5
JohanMalmquist
AndersGrahn
UlfGrunander
8
MichaelRieder
6
Harald F.Stock
HeinzJacqui
AndreasQuist
7
Alex Myers
61GE TINGE ANNUAL REPORT 2013
Corporate governance | Administration Report
1. Johan Malmquist (1961) CEO, Getinge Group• M.Sc. (Economics)• Swedish citizen.• Employed since 1990.• CEO since 1997.• Shareholding: 55,555 Class B shares.
Previous experiencePrior to becoming CEO of the Getinge Group, Johan Malmquist was Executive Vice President (1992-1997) and President of one of the Group’s French subsidiaries (1990-1992). Before joining Getinge, Johan Malmquist worked at Electrolux Storkök.
2. Anders Grahn (1969) Executive Vice President, Infection Control Business Area• M.Sc. (Economics)• Swedish citizen.• Employed since 2012.• Shareholding: Holds no shares.
Previous experienceAnders Grahn previously worked among suppliers to the automotive industry for many years and possesses extensive experience of advancing operational efficiency and profitability.
3. Ulf Grunander (1954) CFO M.Sc. (Economics)• Swedish citizen.• Employed since 1993.• Shareholding: 38,170 Class B shares.
Previous experienceUlf Grunander has been Getinge’s CFO since the company was listed in 1993. In this role, Ulf Grunander’s achievements include 45 corporate acquisitions. Between 1979 and 1993, Ulf Grunander worked as an Authorized Public Accountant.
4. Heinz Jacqui (1961) Executive Vice President, Medical Systems Business Area• Diploma in mechanical and process
engineering• German citizen.• Employed since 2012.• Shareholding: Holds no shares.
Previous experienceHeinz Jacqui has had an extensive international career in the medical-technical sector and has held executive positions at such companies as Olympus Medical and Draeger Medical.
5. Andreas Quist (1974) Executive Vice President, Human Resources & Sustainability• M.P.S. in business administration• Swedish citizen.• Employed since 2010.• Shareholding: Holds no shares.
Previous experienceAndreas Quist started his career at the Getinge Group in 2010 as Vice President Human Resources for the Extended Care Business Area. He has previously held a number of senior international HR positions at major international corporations including Nokia.
6. Harald F. Stock (1968) Executive Vice President Extended Care Business Area• PhD. in inorganic chemistry• German citizen.• Employed since 2014.• Shareholding: Holds no shares.
On January 1, 2014, Harald F. Stock succeeded Alex Myers as Executive Vice President of the Extended Care Business Area.
Previous experienceHarald Stock has almost 20 years’ experience of and a successful track record from the healthcare industry. He most recently served as the chief executive officer of the Grünenthal Group and, previously, held executive positions with companies including the Roche Group and at DePuy, the Orthopedics Division of Johnson & Johnson.
7. Alex Myers (1963) Executive Vice President, Extended Care Business Area• B.A. Organizational Behavior & Economics.• Swedish citizen.• Employed as Executive Vice President
since 2009.• Shareholding: Holds 1,000 Class B shares
through pension fund.
At year-end, Alex Myers stepped down from his position as Executive Vice President of Extended Care to continue his career outside of the Getinge Group. He was succeeded by Harald F. Stock.
8. Michael Rieder (1952) Executive Vice President, Sales & Marketing, Medical Systems• Economist• German citizen.• Employed since 2001.• Shareholding: Holds no shares.
Following a long and successful career at Medical Systems, Michael Rieder retired at the end of the year.
62 GE TINGE ANNUAL REPORT 2013
Administration Report | Proposed allocation of profits
The following profits in the Parent Company are at the disposal of the Annual General Meeting:
Share premium reserve 3,435Retained earnings 2,467Net profit for the year 522
Total 6,424
The Board and Chief Executive Officer propose that a dividend of SEK 4.15 per share shall be distributed to shareholders 989
To be carried forward 5,435
Total 6,424
The members of the Board are of the opinion that the proposed dividend is justifiable considering the demands on the Group’s equity imposed by the type, scope and risks of the business and with regard to the Group’s consolidation requirements, liquidity and overall position.
For information regarding the results and financial position of the Group and the Parent Company, refer to the following financial statements. The income statements and balance sheets will be presented for approval to the Annual General Meeting on 20 March 2014.
The Board of Directors and CEO affirm that the consolidated financial statements have been prepared in accordance with international financial reporting standards IFRS, which have been adopted by the EU, and provide a fair and accurate account of the Group’s financial position and profit. This Annual Report was prepared in accordance with generally accepted accounting policies and provides a fair and accurate account of the Parent Company’s financial position and profit.
The Administration Report for the Group and Parent Company provides a fair and accurate overview of the performance of the Parent Company and the Group’s operations, financial position and earnings and describes the material risks and uncertainties faced by the Parent Company and companies belonging to the Group.
Getinge, February 18, 2014
Carl Bennet Johan Bygge Henrik Blomdahl
Chairman AGM-elected Board member Board member
Representative of the Swedish
white-collar trade union, Unionen
Maths Wahlström Carola Lemne Tomas Funk
AGM-elected Board member AGM-elected Board member Board member
Representative of the Swedish Metalworkers’
Union
Cecilia Daun Wennborg Johan Stern Johan Malmquist
AGM-elected Board member AGM-elected Board member AGM-elected Board member
CEO
Proposed allocation of profits Getinge AB (publ), Corp. Reg. No. 556408-5032
Our auditor’s report was submitted on February18, 2014
Öhrlings PricewaterhouseCoopers AB
Magnus Willfors Eric Salander
Authorized Public Accountant Authorized Public Accountant
Chief Auditor
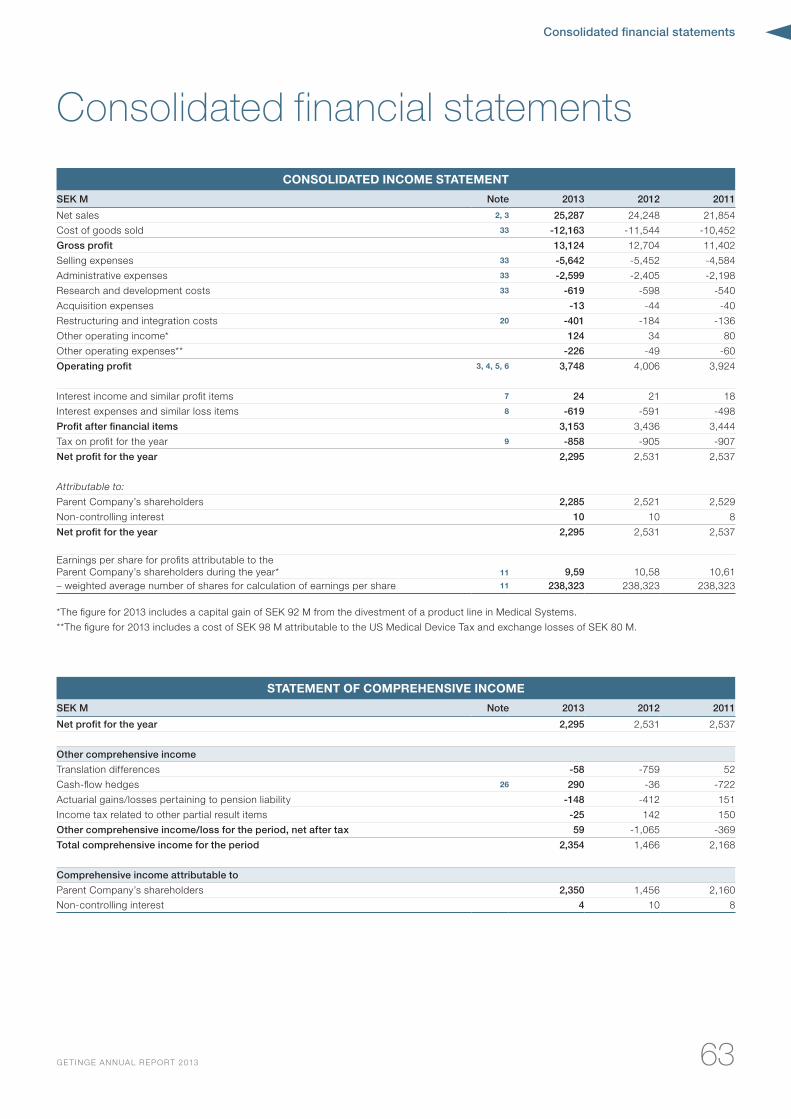
Consolidated financial statements
63GE TINGE ANNUAL REPORT 2013
CONSOLIDATED INCOME STATEMENT
SEK M Note 2013 2012 2011
Net sales 2, 3 25,287 24,248 21,854
Cost of goods sold 33 -12,163 -11,544 -10,452
Gross profit 13,124 12,704 11,402
Selling expenses 33 -5,642 -5,452 -4,584
Administrative expenses 33 -2,599 -2,405 -2,198
Research and development costs 33 -619 -598 -540
Acquisition expenses -13 -44 -40
Restructuring and integration costs 20 -401 -184 -136
Other operating income* 124 34 80
Other operating expenses** -226 -49 -60
Operating profit 3, 4, 5, 6 3,748 4,006 3,924
Interest income and similar profit items 7 24 21 18
Interest expenses and similar loss items 8 -619 -591 -498
Profit after financial items 3,153 3,436 3,444
Tax on profit for the year 9 -858 -905 -907
Net profit for the year 2,295 2,531 2,537
Attributable to:
Parent Company’s shareholders 2,285 2,521 2,529
Non-controlling interest 10 10 8
Net profit for the year 2,295 2,531 2,537
Earnings per share for profits attributable to the Parent Company’s shareholders during the year* 11 9,59 10,58 10,61– weighted average number of shares for calculation of earnings per share 11 238,323 238,323 238,323
*The figure for 2013 includes a capital gain of SEK 92 M from the divestment of a product line in Medical Systems.
**The figure for 2013 includes a cost of SEK 98 M attributable to the US Medical Device Tax and exchange losses of SEK 80 M.
STATEMENT OF COMPREHENSIVE INCOME
SEK M Note 2013 2012 2011
Net profit for the year 2,295 2,531 2,537
Other comprehensive income
Translation differences -58 -759 52
Cash-flow hedges 26 290 -36 -722
Actuarial gains/losses pertaining to pension liability -148 -412 151
Income tax related to other partial result items -25 142 150
Other comprehensive income/loss for the period, net after tax 59 -1,065 -369
Total comprehensive income for the period 2,354 1,466 2,168
Comprehensive income attributable to
Parent Company’s shareholders 2,350 1,456 2,160
Non-controlling interest 4 10 8
Consolidated financial statements
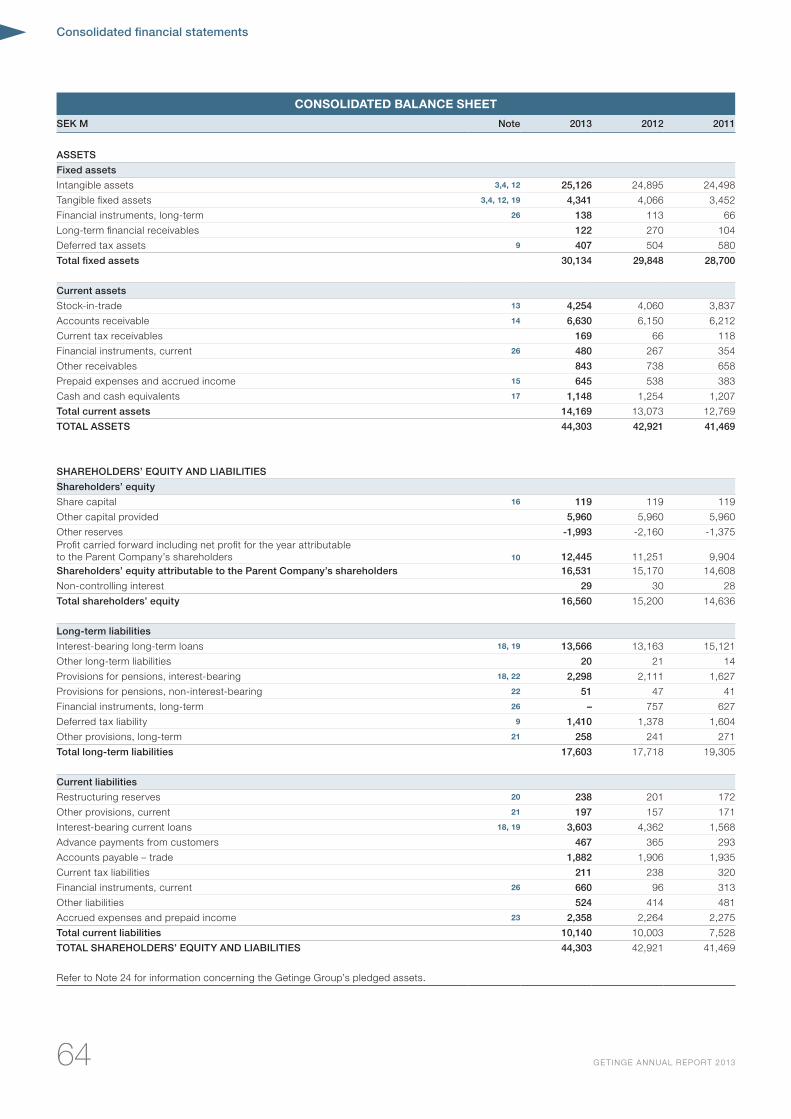
Consolidated financial statements
64 GE TINGE ANNUAL REPORT 2013
CONSOLIDATED BALANCE SHEET
SEK M Note 2013 2012 2011
ASSETS
Fixed assets
Intangible assets 3,4, 12 25,126 24,895 24,498
Tangible fixed assets 3,4, 12, 19 4,341 4,066 3,452
Financial instruments, long-term 26 138 113 66
Long-term financial receivables 122 270 104
Deferred tax assets 9 407 504 580
Total fixed assets 30,134 29,848 28,700
Current assets
Stock-in-trade 13 4,254 4,060 3,837
Accounts receivable 14 6,630 6,150 6,212
Current tax receivables 169 66 118
Financial instruments, current 26 480 267 354
Other receivables 843 738 658
Prepaid expenses and accrued income 15 645 538 383
Cash and cash equivalents 17 1,148 1,254 1,207
Total current assets 14,169 13,073 12,769
TOTAL ASSETS 44,303 42,921 41,469
SHAREHOLDERS’ EQUITY AND LIABILITIES
Shareholders’ equity
Share capital 16 119 119 119
Other capital provided 5,960 5,960 5,960
Other reserves -1,993 -2,160 -1,375Profit carried forward including net profit for the year attributable to the Parent Company’s shareholders 10 12,445 11,251 9,904Shareholders’ equity attributable to the Parent Company’s shareholders 16,531 15,170 14,608
Non-controlling interest 29 30 28
Total shareholders’ equity 16,560 15,200 14,636
Long-term liabilities
Interest-bearing long-term loans 18, 19 13,566 13,163 15,121
Other long-term liabilities 20 21 14
Provisions for pensions, interest-bearing 18, 22 2,298 2,111 1,627
Provisions for pensions, non-interest-bearing 22 51 47 41
Financial instruments, long-term 26 – 757 627
Deferred tax liability 9 1,410 1,378 1,604
Other provisions, long-term 21 258 241 271
Total long-term liabilities 17,603 17,718 19,305
Current liabilities
Restructuring reserves 20 238 201 172
Other provisions, current 21 197 157 171
Interest-bearing current loans 18, 19 3,603 4,362 1,568
Advance payments from customers 467 365 293
Accounts payable – trade 1,882 1,906 1,935
Current tax liabilities 211 238 320
Financial instruments, current 26 660 96 313
Other liabilities 524 414 481
Accrued expenses and prepaid income 23 2,358 2,264 2,275
Total current liabilities 10,140 10,003 7,528
TOTAL SHAREHOLDERS’ EQUITY AND LIABILITIES 44,303 42,921 41,469
Refer to Note 24 for information concerning the Getinge Group’s pledged assets.
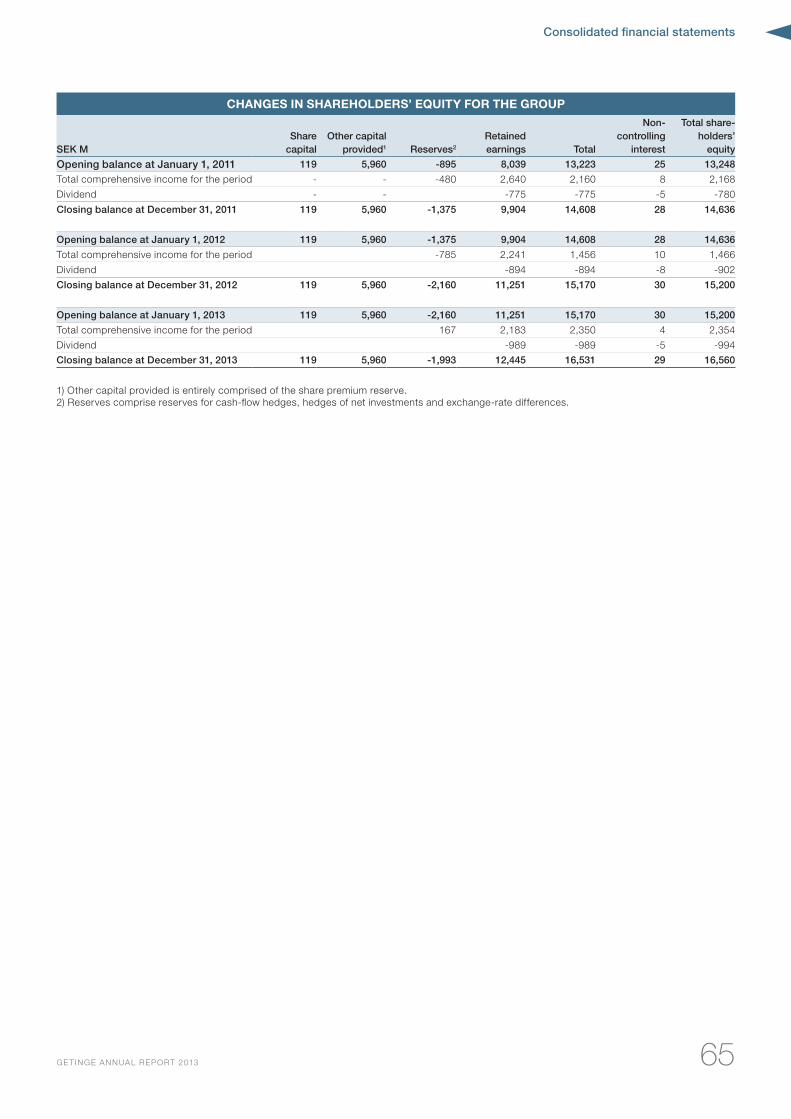
Consolidated financial statements
65GE TINGE ANNUAL REPORT 2013
CHANGES IN SHAREHOLDERS’ EQUITY FOR THE GROUP
SEK MShare
capitalOther capital
provided1 Reserves2
Retained earnings Total
Non-controlling
interest
Total share-holders’
equity
Opening balance at January 1, 2011 119 5,960 -895 8,039 13,223 25 13,248
Total comprehensive income for the period - - -480 2,640 2,160 8 2,168
Dividend - - -775 -775 -5 -780
Closing balance at December 31, 2011 119 5,960 -1,375 9,904 14,608 28 14,636
Opening balance at January 1, 2012 119 5,960 -1,375 9,904 14,608 28 14,636
Total comprehensive income for the period -785 2,241 1,456 10 1,466
Dividend -894 -894 -8 -902
Closing balance at December 31, 2012 119 5,960 -2,160 11,251 15,170 30 15,200
Opening balance at January 1, 2013 119 5,960 -2,160 11,251 15,170 30 15,200
Total comprehensive income for the period 167 2,183 2,350 4 2,354
Dividend -989 -989 -5 -994
Closing balance at December 31, 2013 119 5,960 -1,993 12,445 16,531 29 16,560
1) Other capital provided is entirely comprised of the share premium reserve.2) Reserves comprise reserves for cash-flow hedges, hedges of net investments and exchange-rate differences.
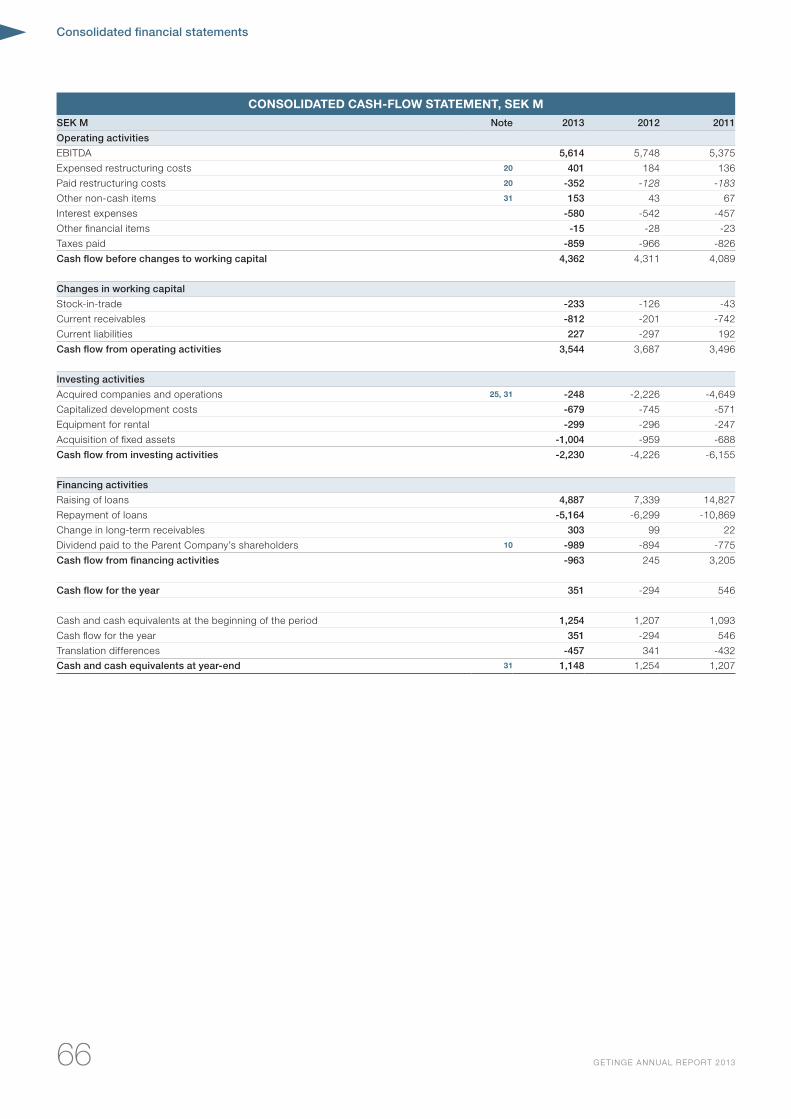
Consolidated financial statements
66 GE TINGE ANNUAL REPORT 2013
CONSOLIDATED CASH-FLOW STATEMENT, SEK M
SEK M Note 2013 2012 2011
Operating activities
EBITDA 5,614 5,748 5,375
Expensed restructuring costs 20 401 184 136
Paid restructuring costs 20 -352 -128 -183
Other non-cash items 31 153 43 67
Interest expenses -580 -542 -457
Other financial items -15 -28 -23
Taxes paid -859 -966 -826
Cash flow before changes to working capital 4,362 4,311 4,089
Changes in working capital
Stock-in-trade -233 -126 -43
Current receivables -812 -201 -742
Current liabilities 227 -297 192
Cash flow from operating activities 3,544 3,687 3,496
Investing activities
Acquired companies and operations 25, 31 -248 -2,226 -4,649
Capitalized development costs -679 -745 -571
Equipment for rental -299 -296 -247
Acquisition of fixed assets -1,004 -959 -688
Cash flow from investing activities -2,230 -4,226 -6,155
Financing activities
Raising of loans 4,887 7,339 14,827
Repayment of loans -5,164 -6,299 -10,869
Change in long-term receivables 303 99 22
Dividend paid to the Parent Company’s shareholders 10 -989 -894 -775
Cash flow from financing activities -963 245 3,205
Cash flow for the year 351 -294 546
Cash and cash equivalents at the beginning of the period 1,254 1,207 1,093
Cash flow for the year 351 -294 546
Translation differences -457 341 -432
Cash and cash equivalents at year-end 31 1,148 1,254 1,207
Consolidated financial statements
67GE TINGE ANNUAL REPORT 2013
GENERAL INFORMATIONGetinge AB, which is the Parent Company of the Get-inge Group, is a limited liability company with its regis-tered offices in Getinge, Sweden. The company’s ad-dress can be found on page 102. A description of the company’s operations is included in the Administra-tion Report on page 48.
ACCOUNTING AND MEASUREMENT POLICIESGetinge’s consolidated financial statements have been prepared in accordance with International Fi-nancial Reporting Standards (IFRS), issued by the International Accounting Standards Board (IASB), including interpretations issued by the International Financial Reporting Interpretations Committee (IF-RIC) as adopted by the EU. In addition, the Swedish Financial Reporting Board’s recommendation RFR 1 has been applied. The consolidated financial state-ments include the financial statements for Getinge AB and its subsidiaries and were prepared in accordance with the cost method. The Parent Company applies the same accounting policies as the Group, except in the instances stated below in the section “Parent Company’s accounting policies.” The differences that arise between the Parent Company and the Group’s accounting policies are attributable to the limited op-portunities for the application of IFRS in the Parent Company, as a result of the Swedish Annual Accounts Act and the Swedish Pension Obligations Vesting Act. The Parent Company’s functional currency is Swed-ish kronor (SEK), which is also the Parent Company’s and Group’s reporting currency. This means that the financial statements are presented in Swedish kronor (SEK). Unless otherwise stated, all amounts are given in millions of Swedish kronor (SEK M).
NEW GROUP ACCOUNTING POLICIES IN 2013A list of the standards being applied by the Group for the first time for the fiscal year starting January 1, 2013 and, which materially impact the consolidated finan-cial statements follow:
• An amendment was made to IAS 1 “Presentation of financial statements,” concerning other com-prehensive income. The most significant change in the amended IAS 1 is the requirement that the items that are recognized in “other comprehensive income” must be divided into two different catego-ries. The division is based on whether the items can be reclassified to profit or loss (reclassification ad-justments) or not.
• IAS 19 “Employee benefits” was amended in June 2011. Costs for performing services in previous years will be recognized immediately. Interest ex-penses and expected returns on plan assets will be replaced by a net interest rate that is calculated using the discount rate, based on the net surplus or net deficit in the defined-benefit plan. The effect on the financial statements is presented in Note 22.
• IFRS 13 “Fair value measurement” aims to make measurements at fair value more consistent and less complex by providing a precise definition and a joint source in IFRS for fair-value measurements and the associated disclosures. The standard pro-vides guidance on fair-value measurements for all types of assets and liabilities, financial and non-fi-nancial. While the requirements do not expand the application area for when fair value is to be applied, it provides guidance on how to apply it for cases in which other IFRS standards already require or al-low measurements at fair value.
SIGNIFICANT ESTIMATES AND ASSESSMENTSTo prepare the financial statements in accordance with IFRS, the company management is required to make assessments and assumptions that affect the recognized amounts of assets and liabilities and other information, such as contingent liabilities and so forth, in the financial statements and for revenues and ex-penses recognized during the period. Assumptions, assessments and estimates are reviewed on a regular
basis. The actual outcome may diverge from these as-sessments, estimates and assumptions. The Board of Directors and Group management have deemed that the following areas may have a significant impact on Getinge’s earnings and financial position:
Measurement of identifiable assets and liabilities in connection with acquisitions. In conjunction with ac-quisitions, all identifiable assets and liabilities in the acquired company are identified and measured at fair value, including the value of assets and liabilities in the previously owned share as well as the share attribut-able to non-controlling interests.
Goodwill and other intangible assets with an inde-terminable useful life. The impairment requirement for goodwill and other intangible assets with an in-determinable useful life is tested annually by Getinge in accordance with the accounting policy described here in Note 1. The recoverable value for cash gener-ating units (CGUs) has been established through the measurement of value in use. For these calculations, certain estimations must be made (see Note 12).
Pension commitments. Recognition of the costs of defined-benefit pensions and other applicable retire-ment benefits is based on actuarial valuations, relying on key assumptions for discount rates, future salary increases, personnel-turnover rates and mortality ta-bles. In turn, the discount rate assumptions are based on rates for high-quality fixed-interest investments with durations similar to the pension schemes (see Note 22).
Obsolescence reserve. Stock-in-trade is recognized at the lower of cost according to the first in/first out principle, and net realizable value. The value of stock-in-trade is adjusted for the estimated decrease in val-ue attributable to products no longer sold, surplus stock-in-trade, physical damage, lead times for stock-in-trade, and handling and sales overheads. If the net realizable value is lower than the cost, a valuation re-serve is established for stock-in-trade obsolescence (see Note 13).
Deferred tax. The measurement of loss carryforwards and the company’s ability to utilize unutilized loss car-ryforwards is based on the company’s assessments of future taxable income in various tax jurisdictions and includes assumptions regarding whether expens-es that have not yet been subject to taxation are tax deductible. Deferred tax is recognized in profit and loss unless the deferred tax is attributable to items recognized in other comprehensive income, in which case the deferred tax is recognized together with the underlying transaction in other comprehensive in-come (refer to Note 9).
CONSOLIDATED FINANCIAL STATEMENTSGetinge’s consolidated financial statements comprise the Parent Company, Getinge AB, and all companies in which Getinge AB owns, either directly or indirectly, more than half of the shares’ voting rights or where Getinge exercises a controlling influence on the basis of agreements. Subsidiaries are included in the con-solidated financial statements from the point in time at which the controlling influence is transferred to the Group and are no longer included in the consolidated financial statements from the point in time at which the controlling influence ceases. The controlling in-fluence is usually transferred at the date of acquisi-tion. Acquired companies are consolidated into the consolidated financial statements in accordance with the purchase method, which means that the cost of the shares in subsidiaries is eliminated against their shareholders’ equity at the date of acquisition. Ac-cordingly, only the portion of the subsidiary’s share-holders’ equity that has arisen after the acquisition is included in consolidated shareholders’ equity. Get-inge applies IFRS 3, Business Combinations, for ac-quisitions after January 1, 2004, in accordance with the interim regulations in IFRS 1. Getinge has chosen
not to restate earlier acquisitions. Shareholders’ eq-uity in the subsidiaries is thus determined on a mar-ket-based valuation of identifiable assets, liabilities, provisions and contingent liabilities at the date of the acquisition. If the cost of the shares in the subsidiar-ies exceeds the value of the acquired net assets, cal-culated as described above, the difference is recog-nized as goodwill. If the acquisition cost falls below the fair value of the acquired subsidiary’s net assets, the negative goodwill is recognized directly in profit and loss as other operating income. If assets are in-cluded in the subsidiary at the time of acquisition – for example, property, participations or other opera-tions – that will not be retained but sold in the near future, these assets are recognized in the acquisition analysis at the amount expected to be received. De-ferred tax is calculated on the difference between the calculated market values of assets and liabilities and the fiscal residual values. Intra-Group transactions and unrealized inter-company profits are eliminated in the consolidated financial statements, except with respect of shares in non-controlling interests. The fis-cal effect is also calculated when eliminating internal transactions, based on the nominal tax rate. In profit and loss, net profit/loss is recognized without deduc-tions for non-controlling interests in profit/loss for the year. Non-controlling interests are recognized as a separate item in consolidated shareholders’ equity in the balance sheet. The Group applies IFRS 3 Business Combinations to all acquisitions made after January 1, 2010, whereby the most significant change entails expensing transaction costs in conjunction with an acquisition.
FOREIGN CURRENCIESFunctional currency. Transactions in foreign curren-cies are translated to the functional currency of the fi-nancial statements according to the exchange rate on the date of the transaction. Receivables and liabilities in foreign currencies are measured at closing rates, and unrealized exchange-rate gains and losses are in-cluded in profit and loss. Exchange-rate differences attributable to operating receivables and liabilities are recognized as other operating income (operating ex-penses). Exchange-rate differences regarding finan-cial assets and liabilities are recognized under “Other financial items.” When preparing the consolidated fi-nancial statements, the balance sheets of the Group’s foreign operations are translated from their functional currency to SEK, based on the exchange rate prevail-ing on the balance-sheet date.
Translation of foreign operations. Getinge applies the current method for translation of foreign subsid-iaries’ balance sheets and income statements. This means that all assets and liabilities in subsidiaries are translated at balance-sheet date rates, and all income statement items are translated at average annual ex-change rates. Translation differences arising in this context are due to the difference between the income statement’s average exchange rates and closing-date rates, and to the net assets being translated at a differ-ent exchange rate at year-end than at the beginning of the year. Translation differences are recognized under other comprehensive income. The total translation dif-ferences in conjunction with divestments are recog-nized together with the gains/losses arising from the transaction. Hedge accounting is applied to external loans raised in order to reduce translation effects in exposed currencies to match the net assets in for-eign subsidiaries. Exchange-rate differences for these loans are recognized directly in other comprehensive income for the Group.
REvENUE RECOGNITIONSales include products, services and rents, excluding indirect sales tax and discounts provided. Income is recognized when, essentially, all risks and rights con-nected with ownership have been transferred to the buyer. This usually occurs in connection with delivery, after the price has been determined and collection of
1 Accounting policies
Consolidated financial statements
68 GE TINGE ANNUAL REPORT 2013
the receivable is appropriately secured. If delivery of fin-ished goods is postponed at the buyer’s request, but the buyer assumes the proprietary rights and accepts the invoice (a “bill and hold” sale), income is recognized when the proprietary rights are transferred. Income is normally recognized once the buyer has accepted de-livery and after installation and final inspection. How-ever, income is recognized immediately after delivery if the installation and final inspection are of a simple na-ture, and after establishing provisions for estimated re-sidual expenses. Income recognition for services takes place as and when the services are performed. Income from rental is allocated to a particular period over the term of the rental agreement. Interest income is recog-nized continuously and dividends received are recog-nized after the right to the dividend is deemed secure. In the consolidated financial statements, intra-Group sales are eliminated. For larger assignments extending over more than one accounting period, where outcome can be measured in a reliable manner, income and ex-penses are recognized in relation to the degree of com-pletion of the assignment on the closing date. The de-gree of completion of an assignment is established in a ratio between accrued assignment costs for work completed on the balance-sheet date and the calcu-lated total assignment costs, except in those instances this does not correspond to the degree of completion. Changes in the scope and claims of the assignment are included only if there is an agreement with the cus-tomer. When the outcome of an assignment cannot be calculated in a reliable manner, only the amount cor-responding to the accrued assignment costs that will probably be paid by the client is recognized as revenue. Other accrued assignment costs are recognized as costs in the period in which they occur. If it is probable that the total amount of accrued assignment costs will exceed total revenue from the assignment, the expect-ed loss is promptly recognized as a cost in its entirety.
GOvERNMENT GRANTSGovernment grants are recognized at fair value when it is probable that the terms associated with the grants will be met and that the grants will be received. Gov-ernment grants relating to costs are recognized in profit and loss. The income is recognized in the same period as the cost that grants are intended to com-pensate. Government grants relating to the acquisi-tion of assets reduce the assets’ carrying amounts. Grants affect recognized earnings over the assets’ useful life by reducing depreciation.
FINANCIAL INCOME AND EXPENSESFinancial income and expenses include interest income on bank deposits and receivables, interest expenses on loans, income from dividends, unrealized and re-alized profits and losses on financial investments, ex-change-rate differences, and the change in value of derivative instruments used in financial activities. Bor-rowing costs in conjunction with the raising of loans are recognized as part of the loan to which they pertain and are charged to profit during the term of the loan.
INTANGIBLE ASSETSGoodwill. Goodwill comprises the portion of a pur-chase price for an acquisition that exceeds the mar-ket value of the identifiable assets, with deductions for liabilities and contingent liabilities, calculated on the date of acquisition, on the share of the acquired company’s assets acquired by the Group. In a busi-ness acquisition whereby the acquisition costs are less than the net value of acquired assets, assumed li-abilities and contingent liabilities, the difference is rec-ognized directly in profit and loss. Goodwill arising in conjunction with the acquisition of a foreign entity is treated as an asset in the foreign entity and translat-ed at the exchange rate on the closing date. Goodwill arising from the acquisition of associated companies is included in the value of the holdings in the associ-ated company. An impairment test of goodwill is con-ducted once per year or more often if there is an indi-cation that there could have been a decrease in value. Impairment of goodwill is recognized in profit and loss. The gain or loss in connection with the divestment of an entity includes the residual carrying amount of goodwill that pertains to the divested unit.
Other intangible assets. Other intangible assets com-prise capitalized development costs, customer rela-tions, technical knowhow, trademarks, agreements and other assets. Intangible assets are recognized at cost with deductions for accumulated amortiza-tion and any impairment losses. Amortization is ap-plied proportionally over the asset’s anticipated useful life, which usually varies between three and 15 years. Acquired intangible assets are recognized separate-ly from goodwill if they fulfill the criteria for qualifying as an asset, implying they can be separated or they are based on contractual or other legal rights and that their market value can be established in a reliable man-ner. Intangible assets that are recognized separately from goodwill in the context of acquisitions of opera-tions include customer relations, technical knowhow, trademarks, agreements, etc. Acquired intangible as-sets are measured at market value and amortized on a straight-line basis over their expected useful life. The useful life can, in certain cases, be indefinite. These intangible assets are not amortized, instead they are subject to an impairment test every year or more of-ten if there is an indication that there could have been a decrease in value. Costs for development, whereby research results or other knowledge is applied to pro-duce new products, are recognized as an asset in the balance sheet to the extent that these products are expected to generate future financial benefits. These costs are capitalized when management deems that the product is technically and financially viable, which is usually when a product-development project has reached a defined milestone in accordance with an established project model. The capitalized value in-cludes expenses for material, direct expenses for salaries and indirect expenses that can be assigned to the asset in a reasonable and consistent manner. In other cases, development costs are expensed as they arise. Research costs are charged to earnings as they arise. Capitalized expenses are amortized on a straight-line basis from the point in time at which the asset is put into commercial operation and during the asset’s estimated useful life. The amortization period is between three and 15 years.
TANGIBLE FIXED ASSETSProperties, machinery, equipment and other tangible fixed assets are recognized at cost, with deductions for accumulated depreciation and any impairment losses. The cost includes the purchase price and ex-penses directly attributable to the asset to bring the asset to the site and in the working condition for its intended use. Examples of expenses included in the cost are expenses for delivery and handling, installa-tion, legal services and consultancy services. Assets provided to the company in conjunction with the ac-quisition of new subsidiaries are recognized at mar-ket value on the acquisition date. Depreciation is con-ducted over a straight line. The value in the balance sheet represents acquisition costs with deduction for accumulated depreciation and any impairment loss-es. Land is not depreciated since it is deemed to have an infinite economic life, however, the depreciation of other assets is based on the following anticipated use-ful lives:
Class of assets Depreciation, number of years Land 40 – 50 Buildings 10 – 50 Machinery 5 – 25 Equipment 10 Production tools 5 Equipment for rental 5 Cars 4 Computer equipment 3
Tangible fixed assets comprising parts with different useful lives are treated as separate components of tan-gible fixed assets. Standard maintenance and repair costs are expensed during the periods in which they arise. More extensive repair and upgrading costs are capitalized and depreciated over the item’s remaining expected useful life. Capital gains/losses are recog-nized under “Other operating income/ expenses.”
LEASING . GETINGE AS A LESSEEFinancial leasing. Leasing of properties, machines and equipment, whereby the Group essentially as-sumes the same rights as for direct ownership of the asset, is classified as financial leasing. Financial leas-ing is capitalized from the date on which the lease agreement is entered into, at the lower amount of the assets’ market value or the calculated present val-ue of the underlying leasing payments. Each leasing payment is divided between liabilities and financial expenses so that interest payments on outstanding liabilities are proportional. The corresponding rental li-ability, after deduction for financing costs, is attributed to interest-bearing liabilities, while the interest portion of leasing costs is recognized in revenue during the lease period. Properties, machines and equipment acquired by leasing are depreciated over their antici-pated useful lives.
Operational leasing. Leasing of assets whereby the lessor essentially remains the owner of the asset is classified as operational leasing, and payments made according to operational leasing contracts or rental agreements are expensed proportionally dur-ing the lease or rental period, respectively. Any com-pensation, according to agreement, that the lessee is obliged to pay to the lessor if the leasing contract is terminated prematurely is expensed during the period in which the contract is terminated.
GETINGE AS A LESSORLeasing agreements are defined in two categories, operational and financial, depending on the financial significance of the agreement. Operational leasing agreements are recognized as fixed assets. Revenues from operational leasing are recognized evenly over the lease period. Straight-line depreciation is applied to these assets in accordance with the undertakings and the depreciation amount is adjusted to correspond with the estimated realizable value when the undertak-ing expires. The estimated impairment requirement is immediately charged to profit and loss. The products’ estimated realizable value at the expiration of the un-dertaking is continuously followed up on an individual basis. Financial leasing agreements are recognized as long-term and current receivables. Payments received from financial leasing agreements are divided between interest income and depreciation of receivables.
IMPAIRMENTAt the end of each accounting period, the carrying amount of the assets is assessed to determine wheth-er there is any indication that impairment is required. If there is such an indication, the asset’s recoverable value is established. The recoverable value is deemed to be the higher of the asset’s net realizable value and its value in use, for which the impairment loss is recog-nized as soon as the carrying amount exceeds the re-coverable value. Earlier recognized impairment losses on machines and equipment are reversed if the recov-erable value is deemed to have increased, although the impairment losses are not reversed to an amount greater than what the carrying amount would have been if no impairment losses had been recognized in earlier years. Recognized impairments of goodwill are not reversed.
STOCK-IN-TRADEStock-in-trade is measured at the lower of cost and production value, according to the first in/first out (FIFO) principle, and net realizable value. Stock-in-trade in-cludes a share of indirect costs related to this. The val-ue of finished products includes raw materials, direct work, other direct costs and production-related ex-penses including depreciation. The net realizable value is calculated as the estimated sales price less estimat-ed completion and selling expenses. An assessment of obsolescence in stock-in-trade is conducted on an ongoing basis during the year. The value of stock-in-trade is adjusted for the estimated decrease in value at-tributable to products no longer sold, surplus stock-in-trade, physical damage, lead times for stock-in-trade, and handling and sales overheads. If the net realizable value is lower than the cost, a valuation reserve is es-tablished for stock-in-trade obsolescence.
Consolidated financial statements
69GE TINGE ANNUAL REPORT 2013
FINANCIAL INSTRUMENTSA financial asset or financial liability is recognized in the balance sheet when the company is party to the con-tractual conditions of the instrument. A financial asset is derecognized from the balance sheet when the con-tractual rights to the asset are realized, extinguished or the company loses control over them. A financial li-ability is derecognized from the balance sheet when the contractual obligation has been fulfilled or in some other manner extinguished. Acquisitions and sales of financial assets are recognized on the transaction date, which is the date on which the company commits to acquire or sell the assets, apart from cases in which the company acquires or sells listed securities, when liquidity-date reporting is applied. Financial instru-ments are recognized at amortized cost or fair value, depending on the initial classification according to IAS 39 (see below). At the end of each accounting period, the company assesses whether there are objective in-dications that a financial asset or group of financial as-sets requires impairment.
Further information about financial instruments can be found in Note 14 Accounts receivable, Note 18 The Group’s interest-bearing net debt and Note 26 Finan-cial risk management and financial derivative instru-ments.
Financial assets recognized at fair value in profit and loss. Financial assets in this category comprise de-rivatives. They are included in current assets if they are expected to be settled within 12 months of the end of the reporting period, otherwise, they are classified as fixed assets. All derivatives are recognized at fair value in the balance sheet. Changes in fair value are recog-nized as a component of other comprehensive income insofar as they are part of a hedging relationship that qualifies as hedge accounting. They are reversed to profit and loss when the hedged transaction occurs at which point they are recognized as part of gross profit.
Loan receivables and accounts receivable. Assets in this category comprise long-term financial receiv-ables, accounts receivable and other current receiv-ables. They are included in current assets with the ex-ception of items that fall due more than 12 months after the close of the reporting period, which are classified as fixed assets. Assets in this category are initially recog-nized at fair value including transaction costs. After the date of acquisition, they are recognized at amortized cost using the effective interest method. Accounts re-ceivable are recognized in the amounts that are expect-ed to be received after deductions for doubtful receiv-ables, which are assessed on a case-by-case basis. The expected term of accounts receivable is short, which is why amounts are reported at nominal values without discounting. Any impairment of accounts re-ceivable is recognized in operating expenses.
Cash and cash equivalents. The major portion of cash and cash equivalents comprises cash funds held at financial institutions, and only a minor portion com-prises current liquid investments with a term from the date of acquisition of less than three months, which are exposed to only an insignificant risk of value fluc-tuations. Cash and cash equivalents are recognized at nominal amounts, which are equivalent to fair value.
Other financial liabilities. This category includes lia-bilities to credit institutions, issued bonds, accounts payable and other current liabilities. Long-term liabili-ties have an expected term longer than one year while current liabilities have a term of less than one year. Items in this category are initially measured at fair val-ue and in the subsequent periods at amortized cost using the effective interest method.
Hedge accounting. For derivative instruments or oth-er financial instruments that meet hedge-accounting requirements under the cash-flow hedging method or hedging of net investments in foreign operations method, the effective component of the value change is recognized in other comprehensive income. Accu-mulated value changes from cash-flow hedges are re-versed from shareholders’ equity to profit and loss at
the same time as the hedged item impacts profit and loss. Accumulated value changes from the hedging of net investments in foreign operations are reversed from shareholders’ equity to profit and loss when the foreign operation is divested in full or in part. Interest-bearing liabilities to which hedge accounting has been applied in accordance with the method for fair-val-ue hedging are measured at fair value regarding the hedged risk. The effect of the hedge is recognized on the same line as the hedged item.
Fair value. The fair value of derivative instruments was calculated using the most reliable market prices avail-able. This requires all instruments that are traded in an effective market, such as currency forward contracts, to be measured at marked-to-market. In terms of in-struments for which no reliable prices were available, such as interest-rate swaps, cash flows were dis-counted using deposit and interest-rate swaps for the currency in question. Translation to SEK is conducted at the exchange rate prevailing on the closing date.
REMUNERATION OF EMPLOYEES Recognition of pensions. Getinge has both defined-contribution and defined-benefit pension plans, of which some have assets in special funds or similar se-curities. The plans are usually financed by payments from the respective Group companies and the em-ployees. The Group’s Swedish companies are gener-ally covered by the ITP plan, which does not require any payments from employees.
Defined-benefit plans. Pension costs for defined-ben-efit plans are calculated using the Projected Unit Credit Method in a manner that distributes expenses over the employee’s working life. The calculation is performed annually by independent actuaries. These commit-ments are measured at the present value of expected future payments, with consideration for calculated fu-ture salary increases, utilizing a discount rate corre-sponding to the interest rate of first-class company or government bonds with a remaining term that is almost equivalent to the actual commitments. The Group net liability for each defined-benefit plan (which is also rec-ognized in the balance sheet), comprises the present value of the obligation less the fair value of the plan as-sets. If the value of the plan assets exceeds the value of the obligation, a surplus arises, which is recognized as an asset in other long-term receivables. The recog-nized asset value is limited to the total of costs related to services rendered during previous periods and the present value of future repayments from the plan, or re-ductions in future contributions to the plan. The actuar-ial assumptions constitute the company’s best assess-ment of the different variables that determine the costs of providing the benefits. When actuarial assumptions are used, the actual results could differ from the esti-mated results, and actuarial assumptions change from one period to another. These differences are recog-nized as actuarial gains and losses. Actuarial gains and losses are recognized in other comprehensive income for the period in which they are incurred.
Costs for defined-benefit pension plans in profit and loss comprise the total costs for service during the current and earlier years, interest on commitments and the expected return on plan assets. Costs for ser-vice during the current period and previous periods are recognized as employee costs. The interest com-ponent of pension expenses is recognized under fi-nancial expenses.
Defined-contribution plans. These are plans in which the company pays fixed fees to a separate legal entity and does not have any legal or informal obligation to pay additional fees. The Group’s payments for defined-contribution plans are recognized as expenses during the period in which the employees perform the services that the fee covers. The part of the Swedish ITP plan concerning family pension, disability pension, and em-ployment group life insurance financed by insurance with Alecta is a defined-benefit pension multi-employer plan. For this pension scheme, according to IAS 19, a company is primarily to recognize its proportional share of the defined-benefit pension commitment and the
plan assets and expenses associated with the pension plan. The financial statements also include disclosures required for defined-benefit pension plans. Alecta is currently unable to provide the necessary information and therefore the above pension plans are recognized as defined-contribution plans in accordance with item 30 of IAS 19. This means that premiums paid to Alecta will also be recognized on an ongoing basis as expens-es in the period to which they pertain.
PROvISIONS Provisions are recognized when the Group has a legal or informal obligation as a result of past events and it is probable that payment will be required to fulfill the commitment and if a reliable estimation can be made of the amount to be paid. Pensions, deferred tax li-abilities, restructuring measures, guarantee commit-ments and similar items are recognized as provisions in the balance sheet. Provisions are reviewed at the end of each accounting period.
CONTINGENT LIABILITIES Contingent liabilities are commitments not recognized as liabilities/provisions either because it is not certain that an outflow of resources will be required to regu-late the commitment or because it is not possible to make a reliable estimate of the amount.
INCOME TAXES Getinge’s income taxes include taxes on Group com-panies’ profits recognized during the accounting pe-riod and tax adjustments attributable to earlier peri-ods and changes in deferred taxes. Measurement of all tax liabilities/receivables is conducted at nominal amounts and in accordance with enacted tax regula-tions and tax rates or those that have been announced and will almost certainly be enacted. Tax is recognized directly in shareholders’ equity if the tax is attribut-able to items that are recognized directly in sharehold-ers’ equity. Deferred tax is calculated to correspond to the tax effect arising when final tax is determined. Deferred tax corresponds to the net effect of tax on all existing differences between fiscal and book values of assets and liabilities by applying applicable tax rates. Temporary differences primarily arise from the depre-ciation of properties, machines and equipment, the market valuations of identifiable assets, liabilities and contingent liabilities in acquired companies, the mar-ket valuation of investments classified as available-for-sale and financial derivatives, gains from intra-Group inventory transactions, untaxed reserves and tax loss carryforwards, of which the latter is recognized as an asset only to the extent that it is probable that these loss carryforwards will be matched by future taxable profits. The deferred tax liability pertaining to tempo-rary differences that are attributable to investments in subsidiaries and affiliates is not recognized, since the Parent Company, in each instance, can control the point in time of reversal of the temporary differenc-es and a reversal in the foreseeable future has been deemed improbable.
SEGMENT REPORTING Getinge’s operations are controlled and reported pri-marily by business area. Each segment is consolidat-ed according to the same policies as for the Group in its entirety. The earnings of the segments represent their contribution to the Group’s earnings and include distributed central head office expenses. Assets in a segment include all operating assets used by the seg-ment and primarily comprise intangible assets, tan-gible fixed assets, stock-in-trade, external accounts receivable, other receivables and prepaid expenses and accrued income. Liabilities in a segment include all operating liabilities utilized by the segment and pri-marily comprise provisions excluding interest-bearing pension provisions and deferred tax liabilities, exter-nal accounts payable, other current liabilities, accrued expenses and prepaid income. Non-distributed as-sets and liabilities include all tax items and all items of a financial, interest-bearing nature.
CASH-FLOW STATEMENTSCash-flow statements are prepared in accordance with IAS 7 Cash-flow statements, indirect method.
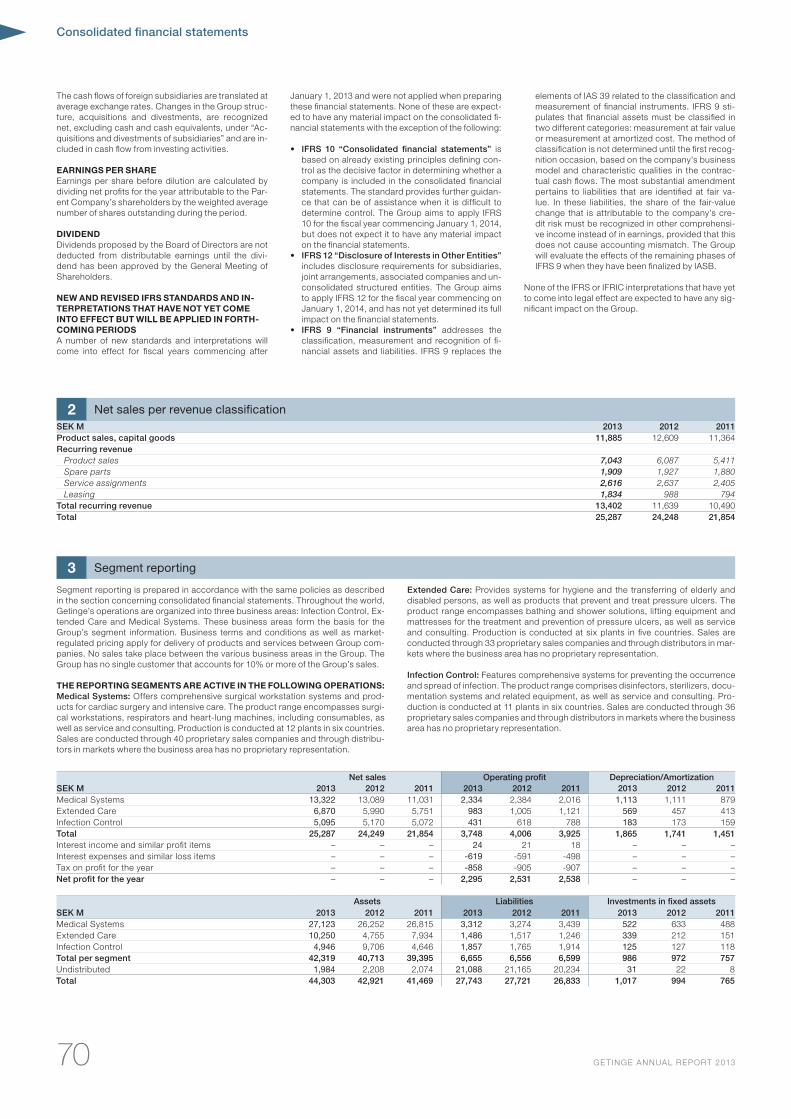
Consolidated financial statements
70 GE TINGE ANNUAL REPORT 2013
The cash flows of foreign subsidiaries are translated at average exchange rates. Changes in the Group struc-ture, acquisitions and divestments, are recognized net, excluding cash and cash equivalents, under “Ac-quisitions and divestments of subsidiaries” and are in-cluded in cash flow from investing activities.
EARNINGS PER SHARE Earnings per share before dilution are calculated by dividing net profits for the year attributable to the Par-ent Company’s shareholders by the weighted average number of shares outstanding during the period.
DIvIDENDDividends proposed by the Board of Directors are not deducted from distributable earnings until the divi-dend has been approved by the General Meeting of Shareholders.
NEW AND REvISED IFRS STANDARDS AND IN-TERPRETATIONS THAT HAvE NOT YET COME INTO EFFECT BUT WILL BE APPLIED IN FORTH-COMING PERIODSA number of new standards and interpretations will come into effect for fiscal years commencing after
January 1, 2013 and were not applied when preparing these financial statements. None of these are expect-ed to have any material impact on the consolidated fi-nancial statements with the exception of the following:
• IFRS 10 “Consolidated financial statements” is based on already existing principles defining con-trol as the decisive factor in determining whether a company is included in the consolidated financial statements. The standard provides further guidan-ce that can be of assistance when it is difficult to determine control. The Group aims to apply IFRS 10 for the fiscal year commencing January 1, 2014, but does not expect it to have any material impact on the financial statements.
• IFRS 12 “Disclosure of Interests in Other Entities” includes disclosure requirements for subsidiaries, joint arrangements, associated companies and un-consolidated structured entities. The Group aims to apply IFRS 12 for the fiscal year commencing on January 1, 2014, and has not yet determined its full impact on the financial statements.
• IFRS 9 “Financial instruments” addresses the classification, measurement and recognition of fi-nancial assets and liabilities. IFRS 9 replaces the
elements of IAS 39 related to the classification and measurement of financial instruments. IFRS 9 sti-pulates that financial assets must be classified in two different categories: measurement at fair value or measurement at amortized cost. The method of classification is not determined until the first recog-nition occasion, based on the company’s business model and characteristic qualities in the contrac-tual cash flows. The most substantial amendment pertains to liabilities that are identified at fair va-lue. In these liabilities, the share of the fair-value change that is attributable to the company’s cre-dit risk must be recognized in other comprehensi-ve income instead of in earnings, provided that this does not cause accounting mismatch. The Group will evaluate the effects of the remaining phases of IFRS 9 when they have been finalized by IASB.
None of the IFRS or IFRIC interpretations that have yet to come into legal effect are expected to have any sig-nificant impact on the Group.
Segment reporting is prepared in accordance with the same policies as described in the section concerning consolidated financial statements. Throughout the world, Getinge’s operations are organized into three business areas: Infection Control, Ex-tended Care and Medical Systems. These business areas form the basis for the Group’s segment information. Business terms and conditions as well as market-regulated pricing apply for delivery of products and services between Group com-panies. No sales take place between the various business areas in the Group. The Group has no single customer that accounts for 10% or more of the Group’s sales.
THE REPORTING SEGMENTS ARE ACTIvE IN THE FOLLOWING OPERATIONS:Medical Systems: Offers comprehensive surgical workstation systems and prod-ucts for cardiac surgery and intensive care. The product range encompasses surgi-cal workstations, respirators and heart-lung machines, including consumables, as well as service and consulting. Production is conducted at 12 plants in six countries. Sales are conducted through 40 proprietary sales companies and through distribu-tors in markets where the business area has no proprietary representation.
Extended Care: Provides systems for hygiene and the transferring of elderly and disabled persons, as well as products that prevent and treat pressure ulcers. The product range encompasses bathing and shower solutions, lifting equipment and mattresses for the treatment and prevention of pressure ulcers, as well as service and consulting. Production is conducted at six plants in five countries. Sales are conducted through 33 proprietary sales companies and through distributors in mar-kets where the business area has no proprietary representation.
Infection Control: Features comprehensive systems for preventing the occurrence and spread of infection. The product range comprises disinfectors, sterilizers, docu-mentation systems and related equipment, as well as service and consulting. Pro-duction is conducted at 11 plants in six countries. Sales are conducted through 36 proprietary sales companies and through distributors in markets where the business area has no proprietary representation.
3 Segment reporting
Net sales Operating profit Depreciation/AmortizationSEK M 2013 2012 2011 2013 2012 2011 2013 2012 2011Medical Systems 13,322 13,089 11,031 2,334 2,384 2,016 1,113 1,111 879Extended Care 6,870 5,990 5,751 983 1,005 1,121 569 457 413Infection Control 5,095 5,170 5,072 431 618 788 183 173 159Total 25,287 24,249 21,854 3,748 4,006 3,925 1,865 1,741 1,451Interest income and similar profit items – – – 24 21 18 – – –Interest expenses and similar loss items – – – -619 -591 -498 – – –Tax on profit for the year – – – -858 -905 -907 – – –Net profit for the year – – – 2,295 2,531 2,538 – – –
Assets Liabilities Investments in fixed assets SEK M 2013 2012 2011 2013 2012 2011 2013 2012 2011Medical Systems 27,123 26,252 26,815 3,312 3,274 3,439 522 633 488Extended Care 10,250 4,755 7,934 1,486 1,517 1,246 339 212 151Infection Control 4,946 9,706 4,646 1,857 1,765 1,914 125 127 118Total per segment 42,319 40,713 39,395 6,655 6,556 6,599 986 972 757Undistributed 1,984 2,208 2,074 21,088 21,165 20,234 31 22 8Total 44,303 42,921 41,469 27,743 27,721 26,833 1,017 994 765
2 Net sales per revenue classificationSEK M 2013 2012 2011Product sales, capital goods 11,885 12,609 11,364Recurring revenue
Product sales 7,043 6,087 5,411Spare parts 1,909 1,927 1,880Service assignments 2,616 2,637 2,405Leasing 1,834 988 794
Total recurring revenue 13,402 11,639 10,490Total 25,287 24,248 21,854
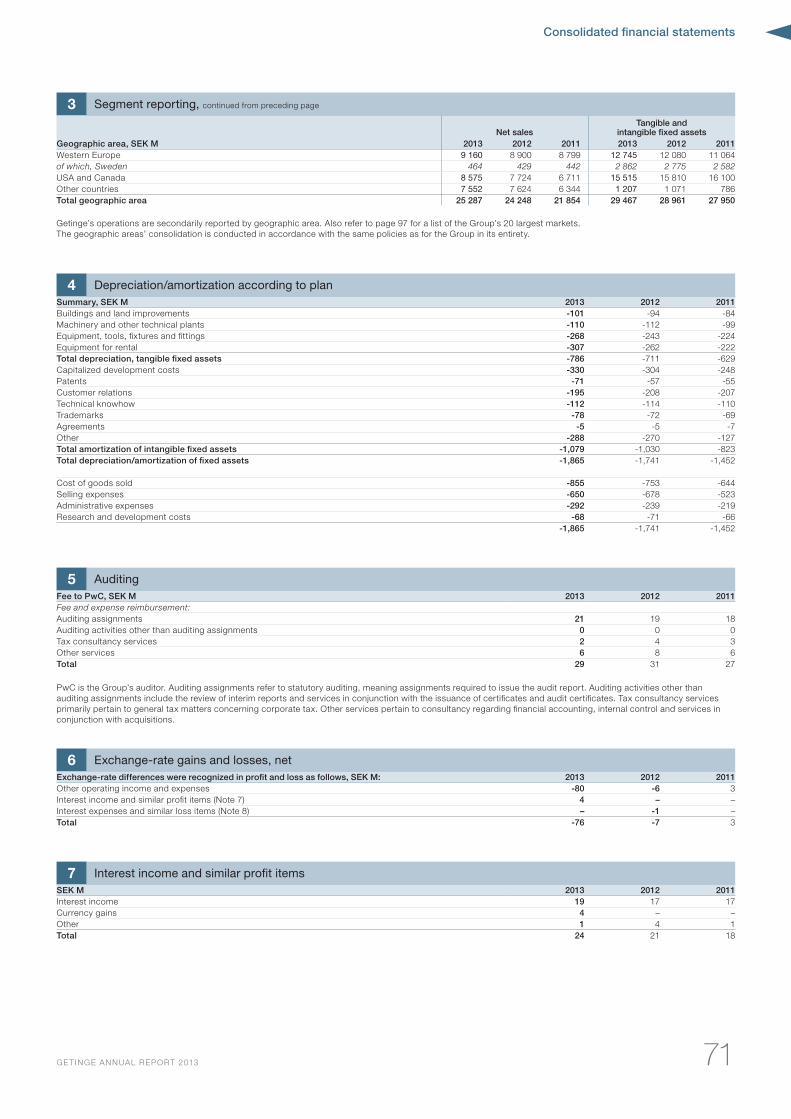
Consolidated financial statements
71GE TINGE ANNUAL REPORT 2013
3 Segment reporting, continued from preceding page
Net salesTangible and
intangible fixed assetsGeographic area, SEK M 2013 2012 2011 2013 2012 2011Western Europe 9 160 8 900 8 799 12 745 12 080 11 064of which, Sweden 464 429 442 2 862 2 775 2 582USA and Canada 8 575 7 724 6 711 15 515 15 810 16 100Other countries 7 552 7 624 6 344 1 207 1 071 786Total geographic area 25 287 24 248 21 854 29 467 28 961 27 950
Getinge’s operations are secondarily reported by geographic area. Also refer to page 97 for a list of the Group’s 20 largest markets. The geographic areas’ consolidation is conducted in accordance with the same policies as for the Group in its entirety.
5 AuditingFee to PwC, SEK M 2013 2012 2011Fee and expense reimbursement:Auditing assignments 21 19 18Auditing activities other than auditing assignments 0 0 0Tax consultancy services 2 4 3Other services 6 8 6Total 29 31 27
PwC is the Group’s auditor. Auditing assignments refer to statutory auditing, meaning assignments required to issue the audit report. Auditing activities other than auditing assignments include the review of interim reports and services in conjunction with the issuance of certificates and audit certificates. Tax consultancy services primarily pertain to general tax matters concerning corporate tax. Other services pertain to consultancy regarding financial accounting, internal control and services in conjunction with acquisitions.
7 Interest income and similar profit itemsSEK M 2013 2012 2011Interest income 19 17 17Currency gains 4 – –Other 1 4 1Total 24 21 18
6 Exchange-rate gains and losses, netExchange-rate differences were recognized in profit and loss as follows, SEK M: 2013 2012 2011Other operating income and expenses -80 -6 3Interest income and similar profit items (Note 7) 4 – –Interest expenses and similar loss items (Note 8) – -1 –Total -76 -7 3
4 Depreciation/amortization according to planSummary, SEK M 2013 2012 2011Buildings and land improvements -101 -94 -84Machinery and other technical plants -110 -112 -99Equipment, tools, fixtures and fittings -268 -243 -224Equipment for rental -307 -262 -222Total depreciation, tangible fixed assets -786 -711 -629Capitalized development costs -330 -304 -248Patents -71 -57 -55Customer relations -195 -208 -207Technical knowhow -112 -114 -110Trademarks -78 -72 -69Agreements -5 -5 -7Other -288 -270 -127Total amortization of intangible fixed assets -1,079 -1,030 -823Total depreciation/amortization of fixed assets -1,865 -1,741 -1,452
Cost of goods sold -855 -753 -644Selling expenses -650 -678 -523Administrative expenses -292 -239 -219Research and development costs -68 -71 -66
-1,865 -1,741 -1,452
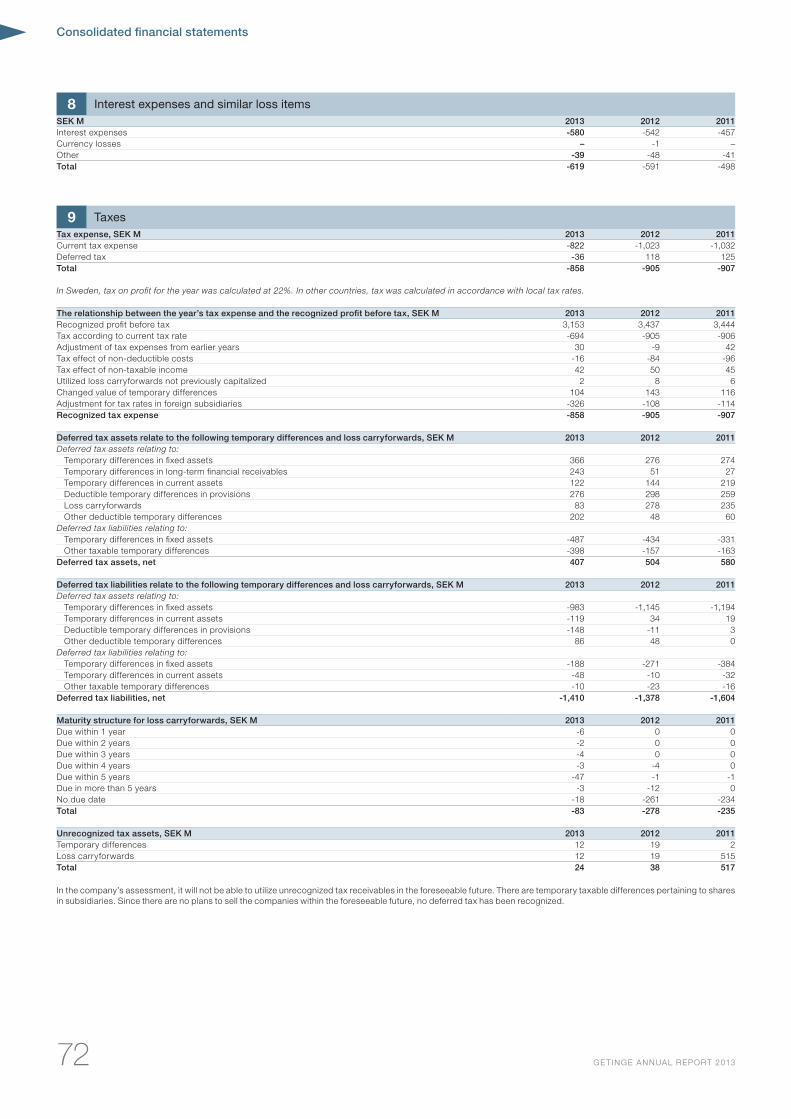
Consolidated financial statements
72 GE TINGE ANNUAL REPORT 2013
8 Interest expenses and similar loss itemsSEK M 2013 2012 2011Interest expenses -580 -542 -457Currency losses – -1 –Other -39 -48 -41Total -619 -591 -498
9 TaxesTax expense, SEK M 2013 2012 2011Current tax expense -822 -1,023 -1,032Deferred tax -36 118 125Total -858 -905 -907
In Sweden, tax on profit for the year was calculated at 22%. In other countries, tax was calculated in accordance with local tax rates.
The relationship between the year’s tax expense and the recognized profit before tax, SEK M 2013 2012 2011Recognized profit before tax 3,153 3,437 3,444Tax according to current tax rate -694 -905 -906Adjustment of tax expenses from earlier years 30 -9 42Tax effect of non-deductible costs -16 -84 -96Tax effect of non-taxable income 42 50 45Utilized loss carryforwards not previously capitalized 2 8 6Changed value of temporary differences 104 143 116Adjustment for tax rates in foreign subsidiaries -326 -108 -114Recognized tax expense -858 -905 -907
Deferred tax assets relate to the following temporary differences and loss carryforwards, SEK M 2013 2012 2011Deferred tax assets relating to:
Temporary differences in fixed assets 366 276 274Temporary differences in long-term financial receivables 243 51 27Temporary differences in current assets 122 144 219Deductible temporary differences in provisions 276 298 259Loss carryforwards 83 278 235Other deductible temporary differences 202 48 60
Deferred tax liabilities relating to:Temporary differences in fixed assets -487 -434 -331Other taxable temporary differences -398 -157 -163
Deferred tax assets, net 407 504 580
Deferred tax liabilities relate to the following temporary differences and loss carryforwards, SEK M 2013 2012 2011Deferred tax assets relating to:
Temporary differences in fixed assets -983 -1,145 -1,194Temporary differences in current assets -119 34 19Deductible temporary differences in provisions -148 -11 3Other deductible temporary differences 86 48 0
Deferred tax liabilities relating to:Temporary differences in fixed assets -188 -271 -384Temporary differences in current assets -48 -10 -32Other taxable temporary differences -10 -23 -16
Deferred tax liabilities, net -1,410 -1,378 -1,604
Maturity structure for loss carryforwards, SEK M 2013 2012 2011Due within 1 year -6 0 0Due within 2 years -2 0 0Due within 3 years -4 0 0Due within 4 years -3 -4 0Due within 5 years -47 -1 -1Due in more than 5 years -3 -12 0No due date -18 -261 -234Total -83 -278 -235
Unrecognized tax assets, SEK M 2013 2012 2011Temporary differences 12 19 2Loss carryforwards 12 19 515Total 24 38 517
In the company’s assessment, it will not be able to utilize unrecognized tax receivables in the foreseeable future. There are temporary taxable differences pertaining to shares in subsidiaries. Since there are no plans to sell the companies within the foreseeable future, no deferred tax has been recognized.
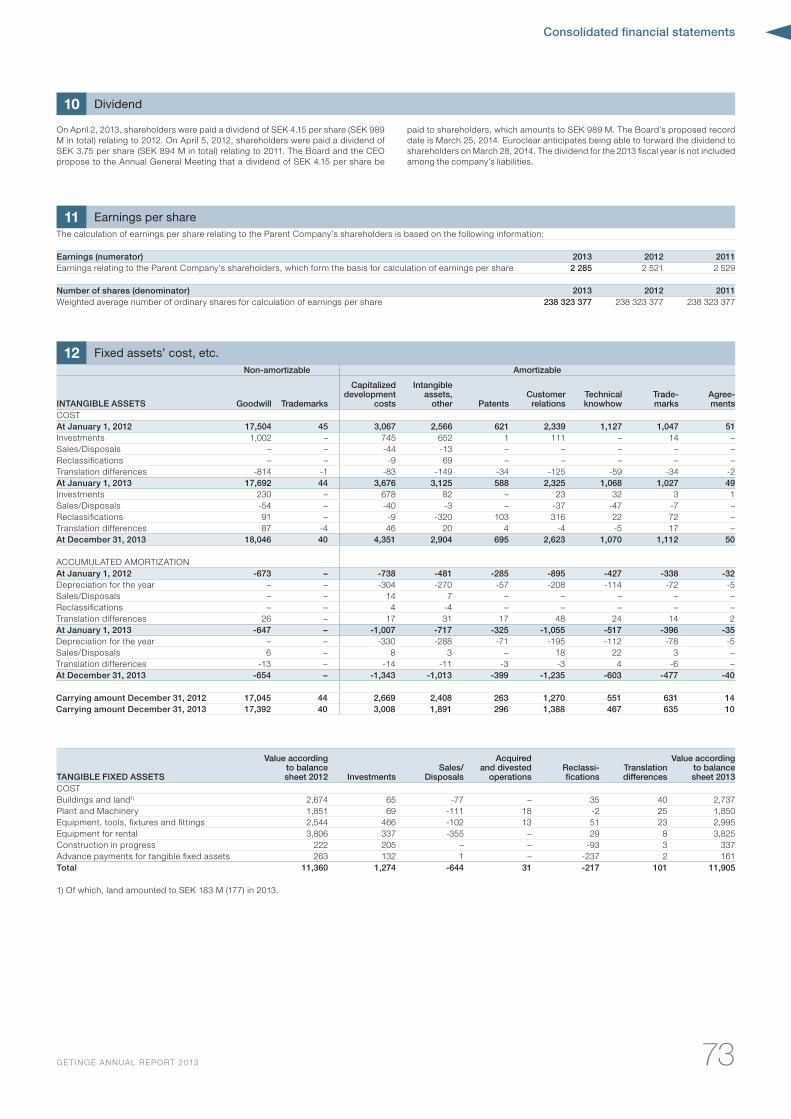
Consolidated financial statements
73GE TINGE ANNUAL REPORT 2013
TANGIBLE FIXED ASSETS
Value according to balance sheet 2012 Investments
Sales/Disposals
Acquired and divested
operations Reclassi-fications
Translation differences
Value according to balance sheet 2013
COSTBuildings and land1) 2,674 65 -77 – 35 40 2,737Plant and Machinery 1,851 69 -111 18 -2 25 1,850Equipment, tools, fixtures and fittings 2,544 466 -102 13 51 23 2,995Equipment for rental 3,806 337 -355 – 29 8 3,825Construction in progress 222 205 – – -93 3 337Advance payments for tangible fixed assets 263 132 1 – -237 2 161Total 11,360 1,274 -644 31 -217 101 11,905
1) Of which, land amounted to SEK 183 M (177) in 2013.
12 Fixed assets’ cost, etc.Non-amortizable Amortizable
INTANGIBLE ASSETS Goodwill Trademarks
Capitalized development
costs
Intangible assets,
other PatentsCustomer
relationsTechnical knowhow
Trade-marks
Agree-ments
COSTAt January 1, 2012 17,504 45 3,067 2,566 621 2,339 1,127 1,047 51Investments 1,002 – 745 652 1 111 – 14 –Sales/Disposals – – -44 -13 – – – – –Reclassifications – – -9 69 – – – – –Translation differences -814 -1 -83 -149 -34 -125 -59 -34 -2At January 1, 2013 17,692 44 3,676 3,125 588 2,325 1,068 1,027 49Investments 230 – 678 82 – 23 32 3 1Sales/Disposals -54 – -40 -3 – -37 -47 -7 –Reclassifications 91 – -9 -320 103 316 22 72 –Translation differences 87 -4 46 20 4 -4 -5 17 –At December 31, 2013 18,046 40 4,351 2,904 695 2,623 1,070 1,112 50
ACCUMULATED AMORTIZATIONAt January 1, 2012 -673 – -738 -481 -285 -895 -427 -338 -32Depreciation for the year – – -304 -270 -57 -208 -114 -72 -5Sales/Disposals – – 14 7 – – – – –Reclassifications – – 4 -4 – – – – –Translation differences 26 – 17 31 17 48 24 14 2At January 1, 2013 -647 – -1,007 -717 -325 -1,055 -517 -396 -35Depreciation for the year – – -330 -288 -71 -195 -112 -78 -5Sales/Disposals 6 – 8 3 – 18 22 3 –Translation differences -13 – -14 -11 -3 -3 4 -6 –At December 31, 2013 -654 – -1,343 -1,013 -399 -1,235 -603 -477 -40
Carrying amount December 31, 2012 17,045 44 2,669 2,408 263 1,270 551 631 14Carrying amount December 31, 2013 17,392 40 3,008 1,891 296 1,388 467 635 10
11 Earnings per shareThe calculation of earnings per share relating to the Parent Company’s shareholders is based on the following information:
Earnings (numerator) 2013 2012 2011Earnings relating to the Parent Company’s shareholders, which form the basis for calculation of earnings per share 2 285 2 521 2 529
Number of shares (denominator) 2013 2012 2011Weighted average number of ordinary shares for calculation of earnings per share 238 323 377 238 323 377 238 323 377
10 Dividend
On April 2, 2013, shareholders were paid a dividend of SEK 4.15 per share (SEK 989 M in total) relating to 2012. On April 5, 2012, shareholders were paid a dividend of SEK 3.75 per share (SEK 894 M in total) relating to 2011. The Board and the CEO propose to the Annual General Meeting that a dividend of SEK 4.15 per share be
paid to shareholders, which amounts to SEK 989 M. The Board’s proposed record date is March 25, 2014. Euroclear anticipates being able to forward the dividend to shareholders on March 28, 2014. The dividend for the 2013 fiscal year is not included among the company’s liabilities.
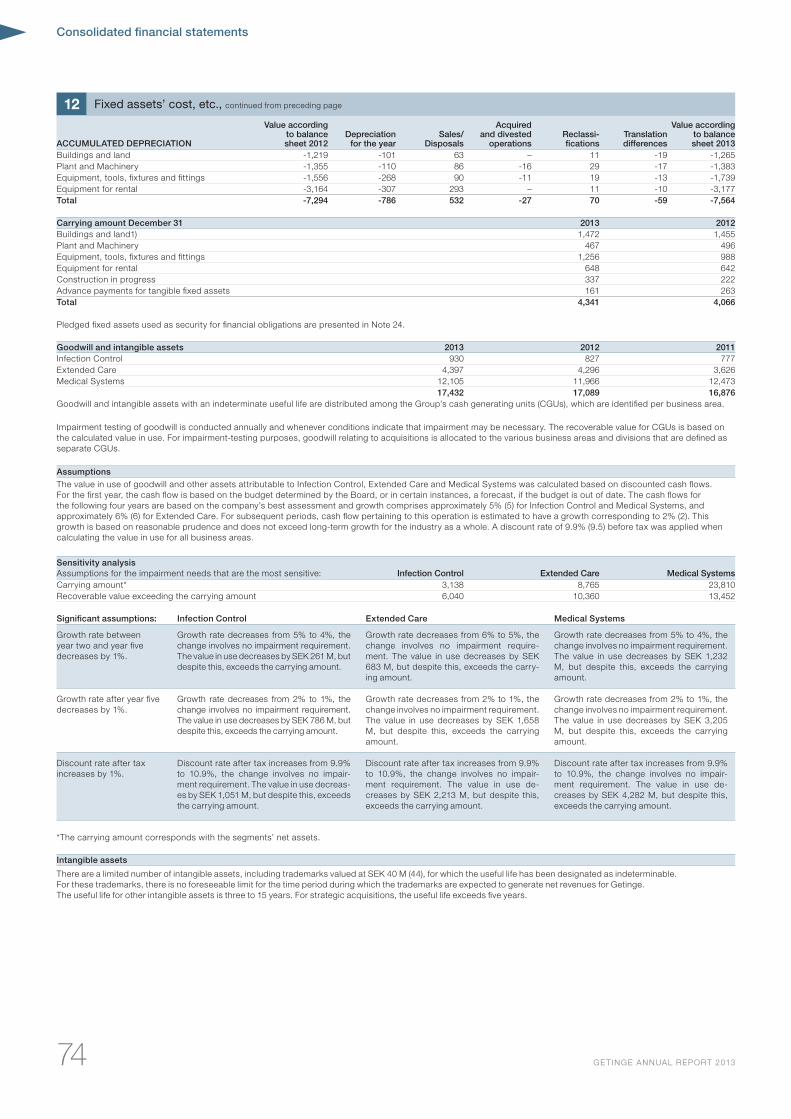
Consolidated financial statements
74 GE TINGE ANNUAL REPORT 2013
12 Fixed assets’ cost, etc., continued from preceding page
ACCUMULATED DEPRECIATION
Value according to balance sheet 2012
Depreciation for the year
Sales/Disposals
Acquired and divested
operationsReclassi-fications
Translation differences
Value according to balance sheet 2013
Buildings and land -1,219 -101 63 – 11 -19 -1,265Plant and Machinery -1,355 -110 86 -16 29 -17 -1,383Equipment, tools, fixtures and fittings -1,556 -268 90 -11 19 -13 -1,739Equipment for rental -3,164 -307 293 – 11 -10 -3,177Total -7,294 -786 532 -27 70 -59 -7,564
Carrying amount December 31 2013 2012Buildings and land1) 1,472 1,455Plant and Machinery 467 496Equipment, tools, fixtures and fittings 1,256 988Equipment for rental 648 642Construction in progress 337 222Advance payments for tangible fixed assets 161 263Total 4,341 4,066
Pledged fixed assets used as security for financial obligations are presented in Note 24.
Goodwill and intangible assets 2013 2012 2011Infection Control 930 827 777Extended Care 4,397 4,296 3,626Medical Systems 12,105 11,966 12,473
17,432 17,089 16,876Goodwill and intangible assets with an indeterminate useful life are distributed among the Group’s cash generating units (CGUs), which are identified per business area.
Impairment testing of goodwill is conducted annually and whenever conditions indicate that impairment may be necessary. The recoverable value for CGUs is based on the calculated value in use. For impairment-testing purposes, goodwill relating to acquisitions is allocated to the various business areas and divisions that are defined as separate CGUs.
AssumptionsThe value in use of goodwill and other assets attributable to Infection Control, Extended Care and Medical Systems was calculated based on discounted cash flows. For the first year, the cash flow is based on the budget determined by the Board, or in certain instances, a forecast, if the budget is out of date. The cash flows for the following four years are based on the company’s best assessment and growth comprises approximately 5% (5) for Infection Control and Medical Systems, and approximately 6% (6) for Extended Care. For subsequent periods, cash flow pertaining to this operation is estimated to have a growth corresponding to 2% (2). This growth is based on reasonable prudence and does not exceed long-term growth for the industry as a whole. A discount rate of 9.9% (9.5) before tax was applied when calculating the value in use for all business areas.
Sensitivity analysisAssumptions for the impairment needs that are the most sensitive: Infection Control Extended Care Medical SystemsCarrying amount* 3,138 8,765 23,810Recoverable value exceeding the carrying amount 6,040 10,360 13,452
Significant assumptions: Infection Control Extended Care Medical Systems
Growth rate between year two and year five decreases by 1%.
Growth rate decreases from 5% to 4%, the change involves no impairment requirement. The value in use decreases by SEK 261 M, but despite this, exceeds the carrying amount.
Growth rate decreases from 6% to 5%, the change involves no impairment require-ment. The value in use decreases by SEK 683 M, but despite this, exceeds the carry-ing amount.
Growth rate decreases from 5% to 4%, the change involves no impairment requirement. The value in use decreases by SEK 1,232 M, but despite this, exceeds the carrying amount.
Growth rate after year five decreases by 1%.
Growth rate decreases from 2% to 1%, the change involves no impairment requirement. The value in use decreases by SEK 786 M, but despite this, exceeds the carrying amount.
Growth rate decreases from 2% to 1%, the change involves no impairment requirement. The value in use decreases by SEK 1,658 M, but despite this, exceeds the carrying amount.
Growth rate decreases from 2% to 1%, the change involves no impairment requirement. The value in use decreases by SEK 3,205 M, but despite this, exceeds the carrying amount.
Discount rate after tax increases by 1%.
Discount rate after tax increases from 9.9% to 10.9%, the change involves no impair-ment requirement. The value in use decreas-es by SEK 1,051 M, but despite this, exceeds the carrying amount.
Discount rate after tax increases from 9.9% to 10.9%, the change involves no impair-ment requirement. The value in use de-creases by SEK 2,213 M, but despite this, exceeds the carrying amount.
Discount rate after tax increases from 9.9% to 10.9%, the change involves no impair-ment requirement. The value in use de-creases by SEK 4,282 M, but despite this, exceeds the carrying amount.
*The carrying amount corresponds with the segments’ net assets.
Intangible assets
There are a limited number of intangible assets, including trademarks valued at SEK 40 M (44), for which the useful life has been designated as indeterminable. For these trademarks, there is no foreseeable limit for the time period during which the trademarks are expected to generate net revenues for Getinge. The useful life for other intangible assets is three to 15 years. For strategic acquisitions, the useful life exceeds five years.
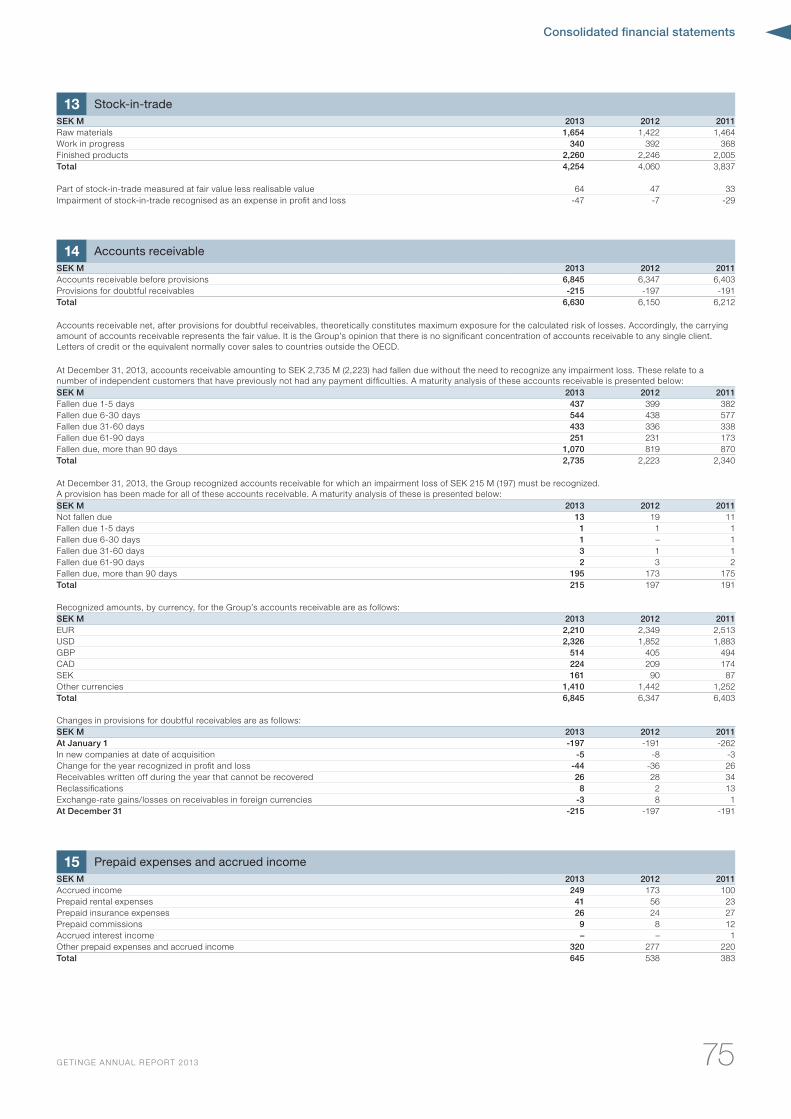
Consolidated financial statements
75GE TINGE ANNUAL REPORT 2013
14 Accounts receivableSEK M 2013 2012 2011Accounts receivable before provisions 6,845 6,347 6,403Provisions for doubtful receivables -215 -197 -191Total 6,630 6,150 6,212
Accounts receivable net, after provisions for doubtful receivables, theoretically constitutes maximum exposure for the calculated risk of losses. Accordingly, the carrying amount of accounts receivable represents the fair value. It is the Group’s opinion that there is no significant concentration of accounts receivable to any single client. Letters of credit or the equivalent normally cover sales to countries outside the OECD.
At December 31, 2013, accounts receivable amounting to SEK 2,735 M (2,223) had fallen due without the need to recognize any impairment loss. These relate to a number of independent customers that have previously not had any payment difficulties. A maturity analysis of these accounts receivable is presented below: SEK M 2013 2012 2011Fallen due 1-5 days 437 399 382Fallen due 6-30 days 544 438 577Fallen due 31-60 days 433 336 338Fallen due 61-90 days 251 231 173Fallen due, more than 90 days 1,070 819 870Total 2,735 2,223 2,340
At December 31, 2013, the Group recognized accounts receivable for which an impairment loss of SEK 215 M (197) must be recognized. A provision has been made for all of these accounts receivable. A maturity analysis of these is presented below: SEK M 2013 2012 2011Not fallen due 13 19 11Fallen due 1-5 days 1 1 1Fallen due 6-30 days 1 – 1Fallen due 31-60 days 3 1 1Fallen due 61-90 days 2 3 2Fallen due, more than 90 days 195 173 175Total 215 197 191
Recognized amounts, by currency, for the Group’s accounts receivable are as follows:SEK M 2013 2012 2011EUR 2,210 2,349 2,513USD 2,326 1,852 1,883GBP 514 405 494CAD 224 209 174SEK 161 90 87Other currencies 1,410 1,442 1,252Total 6,845 6,347 6,403
Changes in provisions for doubtful receivables are as follows:SEK M 2013 2012 2011At January 1 -197 -191 -262In new companies at date of acquisition -5 -8 -3Change for the year recognized in profit and loss -44 -36 26Receivables written off during the year that cannot be recovered 26 28 34Reclassifications 8 2 13Exchange-rate gains/losses on receivables in foreign currencies -3 8 1At December 31 -215 -197 -191
15 Prepaid expenses and accrued incomeSEK M 2013 2012 2011Accrued income 249 173 100Prepaid rental expenses 41 56 23Prepaid insurance expenses 26 24 27Prepaid commissions 9 8 12Accrued interest income – – 1Other prepaid expenses and accrued income 320 277 220Total 645 538 383
13 Stock-in-tradeSEK M 2013 2012 2011Raw materials 1,654 1,422 1,464Work in progress 340 392 368Finished products 2,260 2,246 2,005Total 4,254 4,060 3,837
Part of stock-in-trade measured at fair value less realisable value 64 47 33Impairment of stock-in-trade recognised as an expense in profit and loss -47 -7 -29
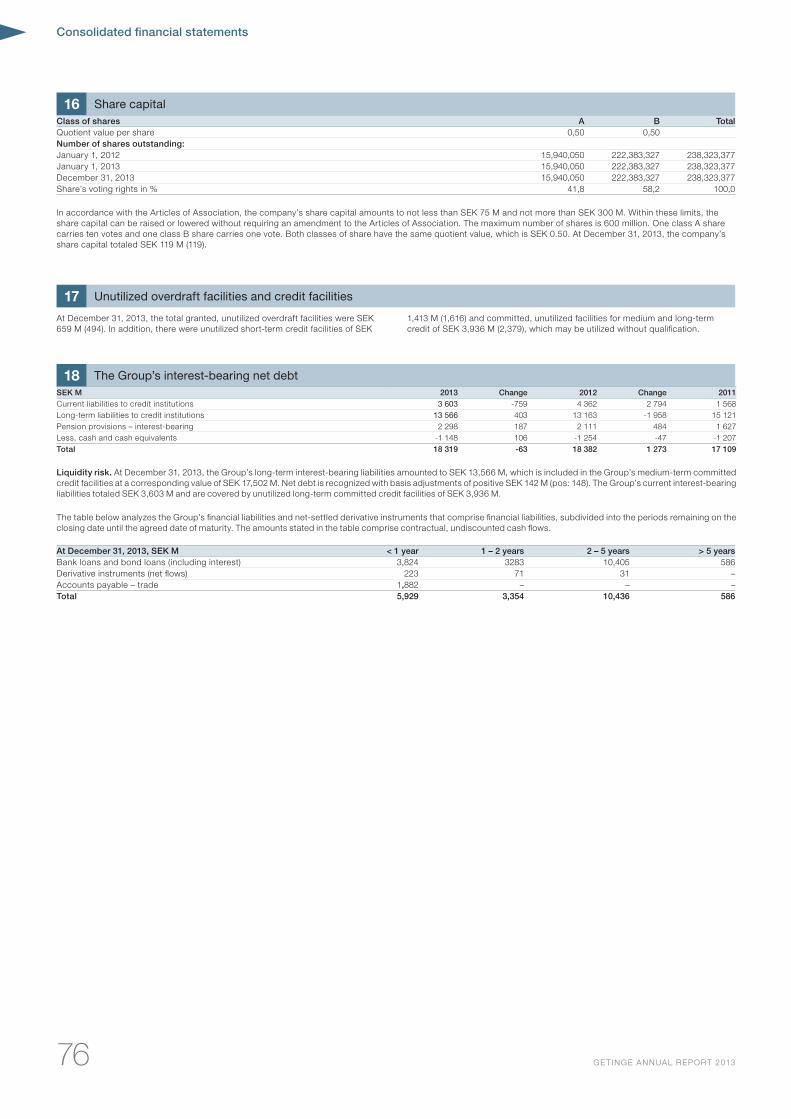
Consolidated financial statements
76 GE TINGE ANNUAL REPORT 2013
At December 31, 2013, SEK M < 1 year 1 – 2 years 2 – 5 years > 5 yearsBank loans and bond loans (including interest) 3,824 3283 10,405 586Derivative instruments (net flows) 223 71 31 –Accounts payable – trade 1,882 – – –Total 5,929 3,354 10,436 586
16 Share capitalClass of shares A B TotalQuotient value per share 0,50 0,50Number of shares outstanding:January 1, 2012 15,940,050 222,383,327 238,323,377January 1, 2013 15,940,050 222,383,327 238,323,377December 31, 2013 15,940,050 222,383,327 238,323,377Share’s voting rights in % 41,8 58,2 100,0
In accordance with the Articles of Association, the company’s share capital amounts to not less than SEK 75 M and not more than SEK 300 M. Within these limits, the share capital can be raised or lowered without requiring an amendment to the Articles of Association. The maximum number of shares is 600 million. One class A share carries ten votes and one class B share carries one vote. Both classes of share have the same quotient value, which is SEK 0.50. At December 31, 2013, the company’s share capital totaled SEK 119 M (119).
17 Unutilized overdraft facilities and credit facilities
At December 31, 2013, the total granted, unutilized overdraft facilities were SEK 659 M (494). In addition, there were unutilized short-term credit facilities of SEK
1,413 M (1,616) and committed, unutilized facilities for medium and long-term credit of SEK 3,936 M (2,379), which may be utilized without qualification.
18 The Group’s interest-bearing net debtSEK M 2013 Change 2012 Change 2011Current liabilities to credit institutions 3 603 -759 4 362 2 794 1 568Long-term liabilities to credit institutions 13 566 403 13 163 -1 958 15 121Pension provisions – interest-bearing 2 298 187 2 111 484 1 627Less, cash and cash equivalents -1 148 106 -1 254 -47 -1 207Total 18 319 -63 18 382 1 273 17 109
Liquidity risk. At December 31, 2013, the Group’s long-term interest-bearing liabilities amounted to SEK 13,566 M, which is included in the Group’s medium-term committed credit facilities at a corresponding value of SEK 17,502 M. Net debt is recognized with basis adjustments of positive SEK 142 M (pos: 148). The Group’s current interest-bearing liabilities totaled SEK 3,603 M and are covered by unutilized long-term committed credit facilities of SEK 3,936 M.
The table below analyzes the Group’s financial liabilities and net-settled derivative instruments that comprise financial liabilities, subdivided into the periods remaining on the closing date until the agreed date of maturity. The amounts stated in the table comprise contractual, undiscounted cash flows.
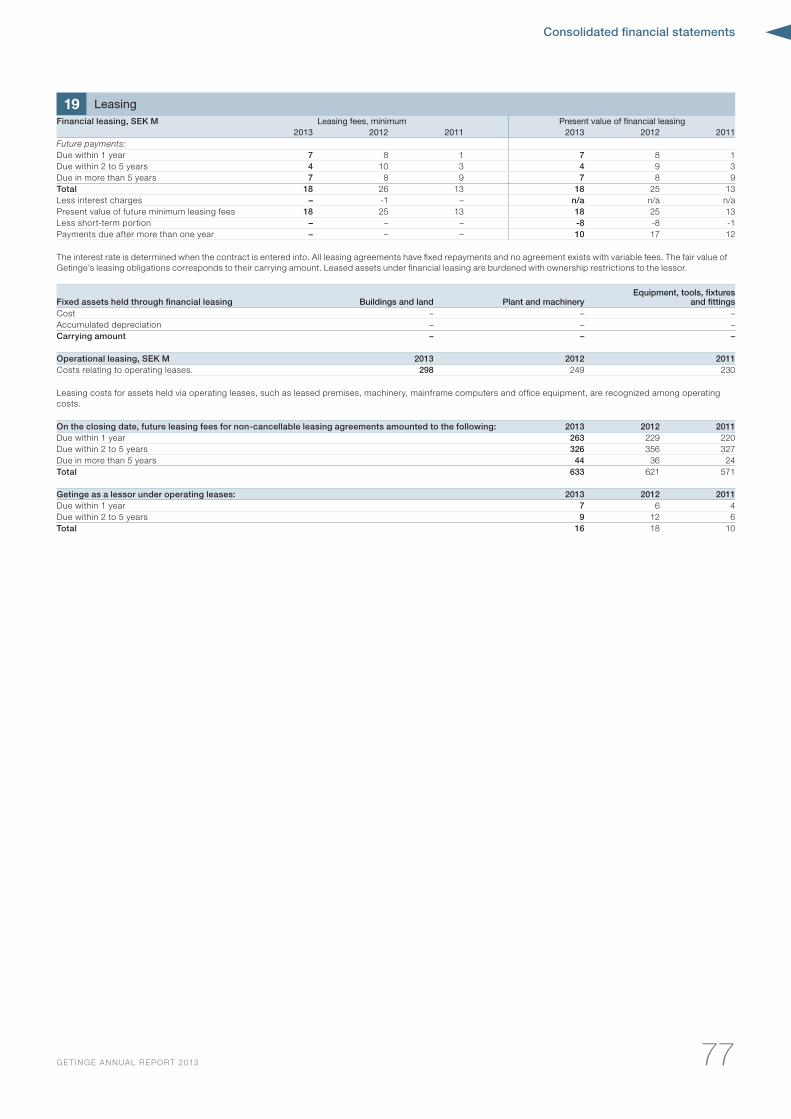
Consolidated financial statements
77GE TINGE ANNUAL REPORT 2013
19 LeasingFinancial leasing, SEK M Leasing fees, minimum Present value of financial leasing
2013 2012 2011 2013 2012 2011Future payments:Due within 1 year 7 8 1 7 8 1Due within 2 to 5 years 4 10 3 4 9 3Due in more than 5 years 7 8 9 7 8 9Total 18 26 13 18 25 13Less interest charges – -1 – n/a n/a n/aPresent value of future minimum leasing fees 18 25 13 18 25 13Less short-term portion – – – -8 -8 -1Payments due after more than one year – – – 10 17 12
The interest rate is determined when the contract is entered into. All leasing agreements have fixed repayments and no agreement exists with variable fees. The fair value of Getinge’s leasing obligations corresponds to their carrying amount. Leased assets under financial leasing are burdened with ownership restrictions to the lessor.
Fixed assets held through financial leasing Buildings and land Plant and machineryEquipment, tools, fixtures
and fittingsCost – – –Accumulated depreciation – – –Carrying amount – – –
Operational leasing, SEK M 2013 2012 2011Costs relating to operating leases. 298 249 230
Leasing costs for assets held via operating leases, such as leased premises, machinery, mainframe computers and office equipment, are recognized among operating costs.
On the closing date, future leasing fees for non-cancellable leasing agreements amounted to the following: 2013 2012 2011Due within 1 year 263 229 220Due within 2 to 5 years 326 356 327Due in more than 5 years 44 36 24Total 633 621 571
Getinge as a lessor under operating leases: 2013 2012 2011Due within 1 year 7 6 4Due within 2 to 5 years 9 12 6Total 16 18 10
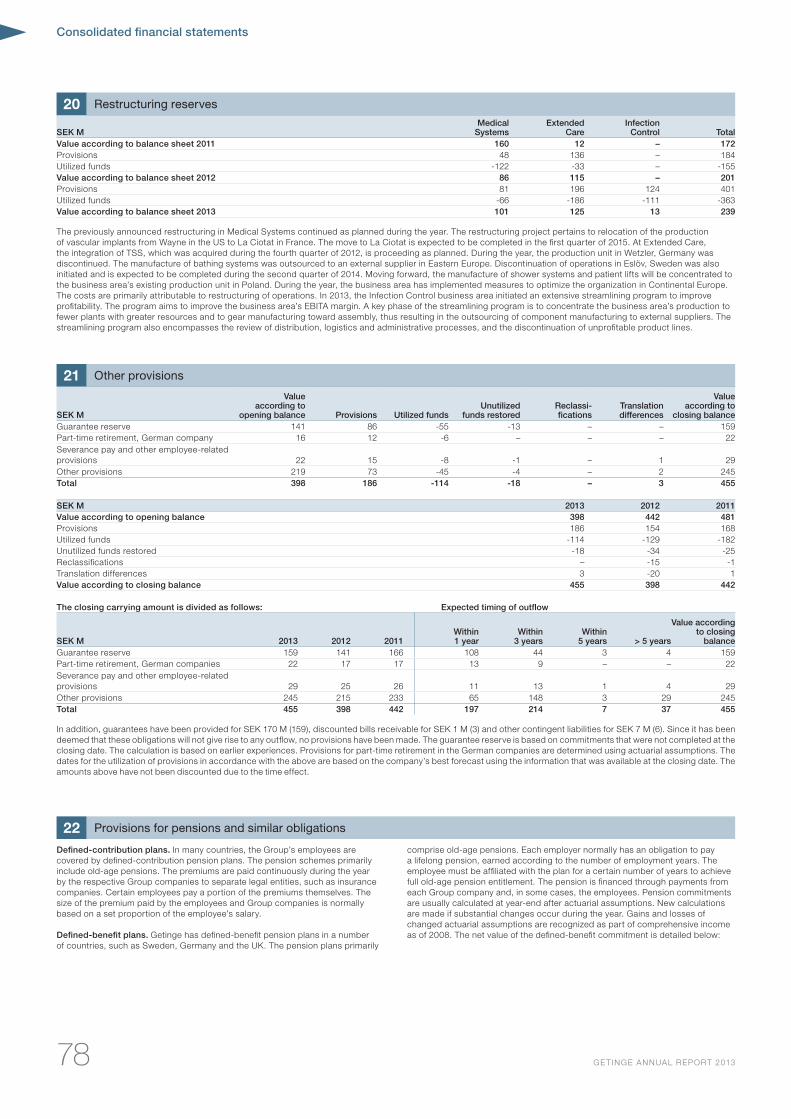
Consolidated financial statements
78 GE TINGE ANNUAL REPORT 2013
20 Restructuring reserves
21 Other provisions
SEK MMedical
SystemsExtended
CareInfection
Control TotalValue according to balance sheet 2011 160 12 – 172Provisions 48 136 – 184Utilized funds -122 -33 – -155Value according to balance sheet 2012 86 115 – 201Provisions 81 196 124 401Utilized funds -66 -186 -111 -363Value according to balance sheet 2013 101 125 13 239
The previously announced restructuring in Medical Systems continued as planned during the year. The restructuring project pertains to relocation of the production of vascular implants from Wayne in the US to La Ciotat in France. The move to La Ciotat is expected to be completed in the first quarter of 2015. At Extended Care, the integration of TSS, which was acquired during the fourth quarter of 2012, is proceeding as planned. During the year, the production unit in Wetzler, Germany was discontinued. The manufacture of bathing systems was outsourced to an external supplier in Eastern Europe. Discontinuation of operations in Eslöv, Sweden was also initiated and is expected to be completed during the second quarter of 2014. Moving forward, the manufacture of shower systems and patient lifts will be concentrated to the business area’s existing production unit in Poland. During the year, the business area has implemented measures to optimize the organization in Continental Europe. The costs are primarily attributable to restructuring of operations. In 2013, the Infection Control business area initiated an extensive streamlining program to improve profitability. The program aims to improve the business area’s EBITA margin. A key phase of the streamlining program is to concentrate the business area’s production to fewer plants with greater resources and to gear manufacturing toward assembly, thus resulting in the outsourcing of component manufacturing to external suppliers. The streamlining program also encompasses the review of distribution, logistics and administrative processes, and the discontinuation of unprofitable product lines.
SEK M
Value according to
opening balance Provisions Utilized funds Unutilized
funds restored Reclassi-fications
Translation differences
Value according to
closing balance Guarantee reserve 141 86 -55 -13 – – 159Part-time retirement, German company 16 12 -6 – – – 22Severance pay and other employee-related provisions 22 15 -8 -1 – 1 29Other provisions 219 73 -45 -4 – 2 245Total 398 186 -114 -18 – 3 455
SEK M 2013 2012 2011Value according to opening balance 398 442 481Provisions 186 154 168Utilized funds -114 -129 -182Unutilized funds restored -18 -34 -25Reclassifications – -15 -1Translation differences 3 -20 1Value according to closing balance 455 398 442
The closing carrying amount is divided as follows: Expected timing of outflow
SEK M 2013 2012 2011Within 1 year
Within 3 years
Within 5 years > 5 years
Value according to closing
balanceGuarantee reserve 159 141 166 108 44 3 4 159Part-time retirement, German companies 22 17 17 13 9 – – 22Severance pay and other employee-related provisions 29 25 26 11 13 1 4 29Other provisions 245 215 233 65 148 3 29 245Total 455 398 442 197 214 7 37 455
In addition, guarantees have been provided for SEK 170 M (159), discounted bills receivable for SEK 1 M (3) and other contingent liabilities for SEK 7 M (6). Since it has been deemed that these obligations will not give rise to any outflow, no provisions have been made. The guarantee reserve is based on commitments that were not completed at the closing date. The calculation is based on earlier experiences. Provisions for part-time retirement in the German companies are determined using actuarial assumptions. The dates for the utilization of provisions in accordance with the above are based on the company’s best forecast using the information that was available at the closing date. The amounts above have not been discounted due to the time effect.
22 Provisions for pensions and similar obligations
Defined-contribution plans. In many countries, the Group’s employees are covered by defined-contribution pension plans. The pension schemes primarily include old-age pensions. The premiums are paid continuously during the year by the respective Group companies to separate legal entities, such as insurance companies. Certain employees pay a portion of the premiums themselves. The size of the premium paid by the employees and Group companies is normally based on a set proportion of the employee’s salary.
Defined-benefit plans. Getinge has defined-benefit pension plans in a number of countries, such as Sweden, Germany and the UK. The pension plans primarily
comprise old-age pensions. Each employer normally has an obligation to pay a lifelong pension, earned according to the number of employment years. The employee must be affiliated with the plan for a certain number of years to achieve full old-age pension entitlement. The pension is financed through payments from each Group company and, in some cases, the employees. Pension commitments are usually calculated at year-end after actuarial assumptions. New calculations are made if substantial changes occur during the year. Gains and losses of changed actuarial assumptions are recognized as part of comprehensive income as of 2008. The net value of the defined-benefit commitment is detailed below:
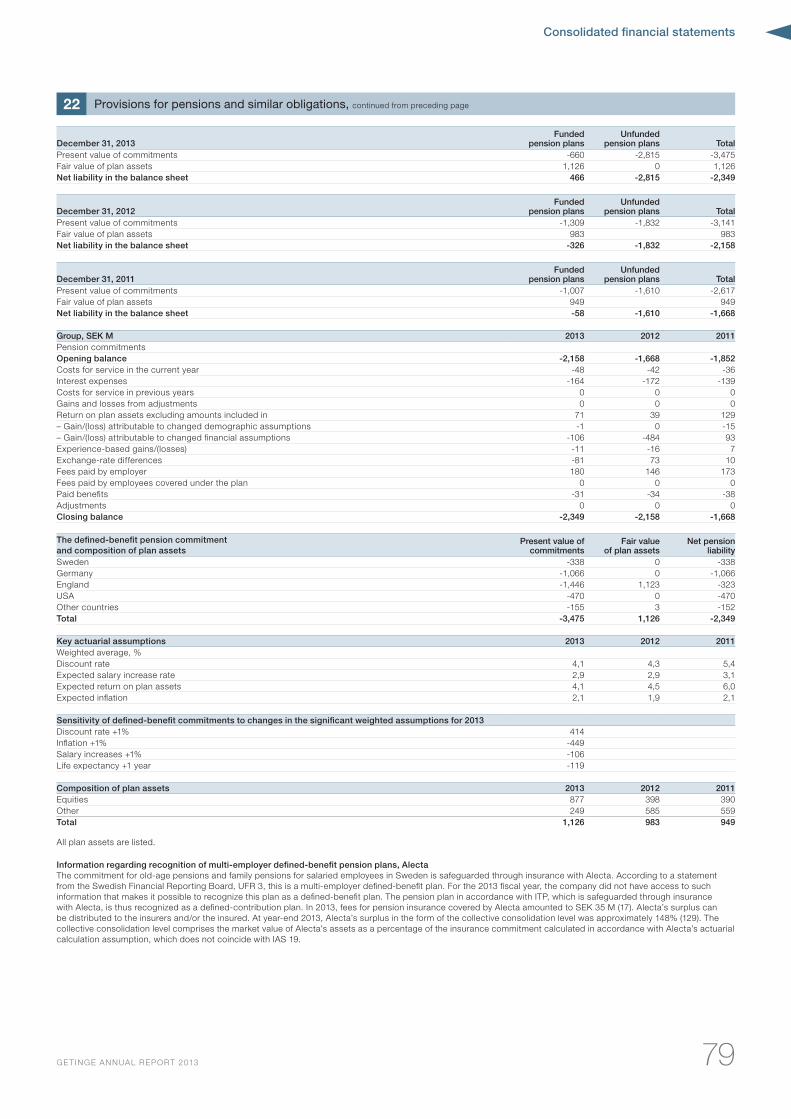
Consolidated financial statements
79GE TINGE ANNUAL REPORT 2013
December 31, 2013Funded
pension plans Unfunded
pension plans TotalPresent value of commitments -660 -2,815 -3,475Fair value of plan assets 1,126 0 1,126Net liability in the balance sheet 466 -2,815 -2,349
December 31, 2012 Funded
pension plans Unfunded
pension plans TotalPresent value of commitments -1,309 -1,832 -3,141Fair value of plan assets 983 983Net liability in the balance sheet -326 -1,832 -2,158
December 31, 2011Funded
pension plans Unfunded
pension plans TotalPresent value of commitments -1,007 -1,610 -2,617Fair value of plan assets 949 949Net liability in the balance sheet -58 -1,610 -1,668
Group, SEK M 2013 2012 2011Pension commitmentsOpening balance -2,158 -1,668 -1,852Costs for service in the current year -48 -42 -36Interest expenses -164 -172 -139Costs for service in previous years 0 0 0Gains and losses from adjustments 0 0 0Return on plan assets excluding amounts included in 71 39 129– Gain/(loss) attributable to changed demographic assumptions -1 0 -15– Gain/(loss) attributable to changed financial assumptions -106 -484 93Experience-based gains/(losses) -11 -16 7Exchange-rate differences -81 73 10Fees paid by employer 180 146 173Fees paid by employees covered under the plan 0 0 0Paid benefits -31 -34 -38Adjustments 0 0 0Closing balance -2,349 -2,158 -1,668
The defined-benefit pension commitment and composition of plan assets
Present value of commitments
Fair value of plan assets
Net pension liability
Sweden -338 0 -338Germany -1,066 0 -1,066England -1,446 1,123 -323USA -470 0 -470Other countries -155 3 -152Total -3,475 1,126 -2,349
Key actuarial assumptions 2013 2012 2011Weighted average, %Discount rate 4,1 4,3 5,4Expected salary increase rate 2,9 2,9 3,1Expected return on plan assets 4,1 4,5 6,0Expected inflation 2,1 1,9 2,1
Sensitivity of defined-benefit commitments to changes in the significant weighted assumptions for 2013Discount rate +1% 414Inflation +1% -449Salary increases +1% -106Life expectancy +1 year -119
Composition of plan assets 2013 2012 2011Equities 877 398 390Other 249 585 559Total 1,126 983 949
All plan assets are listed.
Information regarding recognition of multi-employer defined-benefit pension plans, AlectaThe commitment for old-age pensions and family pensions for salaried employees in Sweden is safeguarded through insurance with Alecta. According to a statement from the Swedish Financial Reporting Board, UFR 3, this is a multi-employer defined-benefit plan. For the 2013 fiscal year, the company did not have access to such information that makes it possible to recognize this plan as a defined-benefit plan. The pension plan in accordance with ITP, which is safeguarded through insurance with Alecta, is thus recognized as a defined-contribution plan. In 2013, fees for pension insurance covered by Alecta amounted to SEK 35 M (17). Alecta’s surplus can be distributed to the insurers and/or the insured. At year-end 2013, Alecta’s surplus in the form of the collective consolidation level was approximately 148% (129). The collective consolidation level comprises the market value of Alecta’s assets as a percentage of the insurance commitment calculated in accordance with Alecta’s actuarial calculation assumption, which does not coincide with IAS 19.
22 Provisions for pensions and similar obligations, continued from preceding page
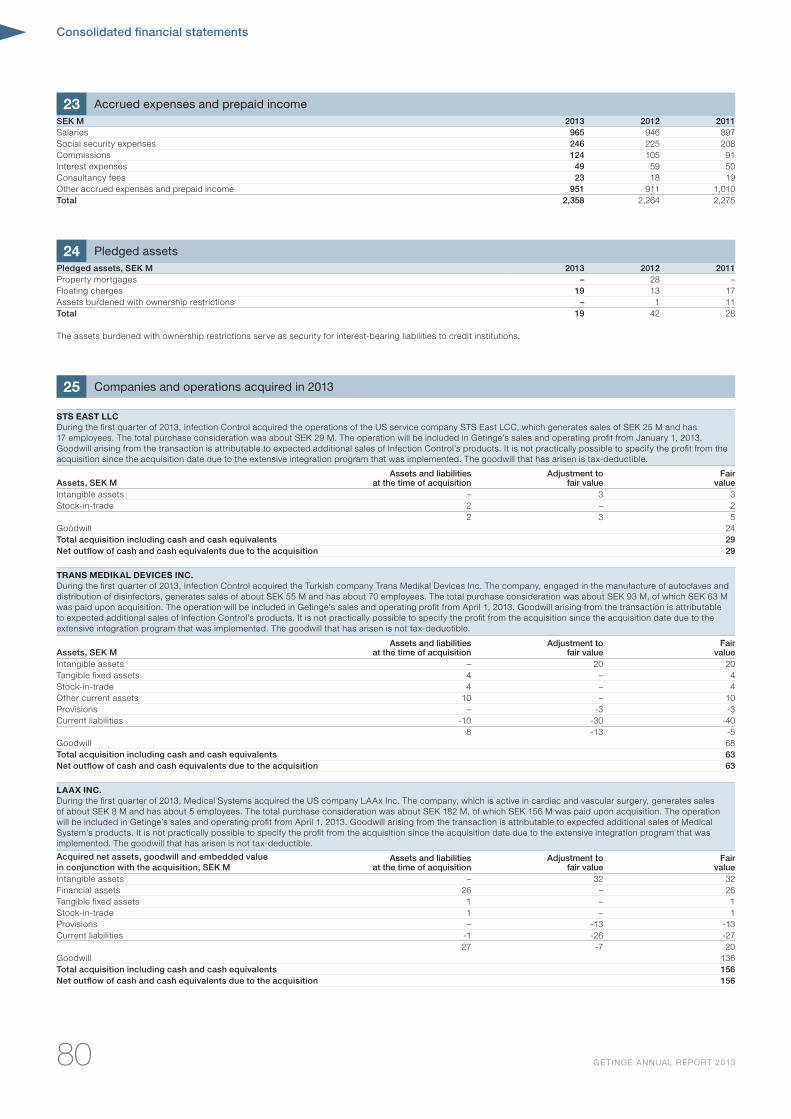
Consolidated financial statements
80 GE TINGE ANNUAL REPORT 2013
23 Accrued expenses and prepaid incomeSEK M 2013 2012 2011Salaries 965 946 897Social security expenses 246 225 208Commissions 124 105 91Interest expenses 49 59 50Consultancy fees 23 18 19Other accrued expenses and prepaid income 951 911 1,010Total 2,358 2,264 2,275
24 Pledged assetsPledged assets, SEK M 2013 2012 2011Property mortgages – 28 –Floating charges 19 13 17Assets burdened with ownership restrictions – 1 11Total 19 42 28
The assets burdened with ownership restrictions serve as security for interest-bearing liabilities to credit institutions.
25 Companies and operations acquired in 2013
STS EAST LLCDuring the first quarter of 2013, Infection Control acquired the operations of the US service company STS East LCC, which generates sales of SEK 25 M and has 17 employees. The total purchase consideration was about SEK 29 M. The operation will be included in Getinge’s sales and operating profit from January 1, 2013. Goodwill arising from the transaction is attributable to expected additional sales of Infection Control’s products. It is not practically possible to specify the profit from the acquisition since the acquisition date due to the extensive integration program that was implemented. The goodwill that has arisen is tax-deductible.
Assets, SEK MAssets and liabilities
at the time of acquisition Adjustment to
fair value Fair
value Intangible assets – 3 3Stock-in-trade 2 – 2
2 3 5Goodwill 24Total acquisition including cash and cash equivalents 29Net outflow of cash and cash equivalents due to the acquisition 29
TRANS MEDIKAL DEvICES INC .During the first quarter of 2013, Infection Control acquired the Turkish company Trans Medikal Devices Inc. The company, engaged in the manufacture of autoclaves and distribution of disinfectors, generates sales of about SEK 55 M and has about 70 employees. The total purchase consideration was about SEK 93 M, of which SEK 63 M was paid upon acquisition. The operation will be included in Getinge’s sales and operating profit from April 1, 2013. Goodwill arising from the transaction is attributable to expected additional sales of Infection Control’s products. It is not practically possible to specify the profit from the acquisition since the acquisition date due to the extensive integration program that was implemented. The goodwill that has arisen is not tax-deductible.
Assets, SEK MAssets and liabilities
at the time of acquisitionAdjustment to
fair valueFair
value Intangible assets – 20 20Tangible fixed assets 4 – 4Stock-in-trade 4 – 4Other current assets 10 – 10Provisions – -3 -3Current liabilities -10 -30 -40
8 -13 -5Goodwill 68Total acquisition including cash and cash equivalents 63Net outflow of cash and cash equivalents due to the acquisition 63
LAAX INC .During the first quarter of 2013, Medical Systems acquired the US company LAAx Inc. The company, which is active in cardiac and vascular surgery, generates sales of about SEK 8 M and has about 5 employees. The total purchase consideration was about SEK 182 M, of which SEK 156 M was paid upon acquisition. The operation will be included in Getinge’s sales and operating profit from April 1, 2013. Goodwill arising from the transaction is attributable to expected additional sales of Medical System’s products. It is not practically possible to specify the profit from the acquisition since the acquisition date due to the extensive integration program that was implemented. The goodwill that has arisen is not tax-deductible.
Acquired net assets, goodwill and embedded value in conjunction with the acquisition, SEK M
Assets and liabilities at the time of acquisition
Adjustment to fair value
Fair value
Intangible assets – 32 32Financial assets 26 – 26Tangible fixed assets 1 – 1Stock-in-trade 1 – 1Provisions – -13 -13Current liabilities -1 -26 -27
27 -7 20Goodwill 136Total acquisition including cash and cash equivalents 156Net outflow of cash and cash equivalents due to the acquisition 156
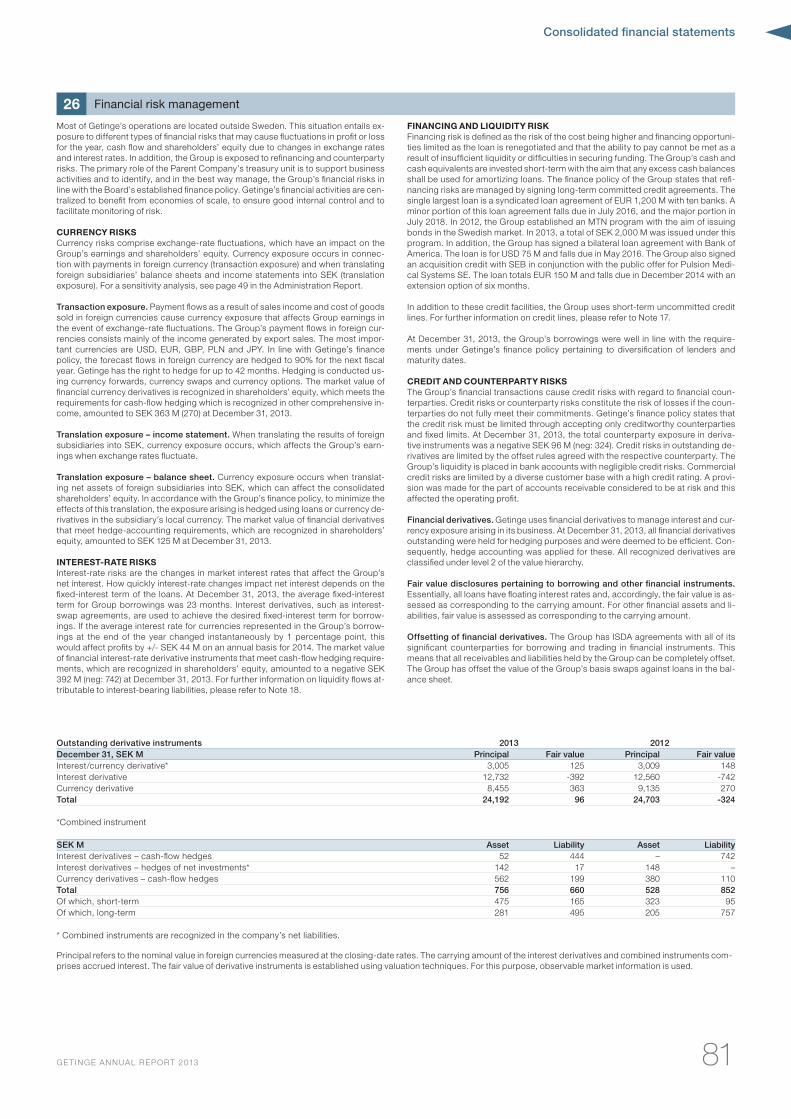
Consolidated financial statements
81GE TINGE ANNUAL REPORT 2013
Most of Getinge’s operations are located outside Sweden. This situation entails ex-posure to different types of financial risks that may cause fluctuations in profit or loss for the year, cash flow and shareholders’ equity due to changes in exchange rates and interest rates. In addition, the Group is exposed to refinancing and counterparty risks. The primary role of the Parent Company’s treasury unit is to support business activities and to identify, and in the best way manage, the Group’s financial risks in line with the Board’s established finance policy. Getinge’s financial activities are cen-tralized to benefit from economies of scale, to ensure good internal control and to facilitate monitoring of risk.
CURRENCY RISKSCurrency risks comprise exchange-rate fluctuations, which have an impact on the Group’s earnings and shareholders’ equity. Currency exposure occurs in connec-tion with payments in foreign currency (transaction exposure) and when translating foreign subsidiaries’ balance sheets and income statements into SEK (translation exposure). For a sensitivity analysis, see page 49 in the Administration Report.
Transaction exposure. Payment flows as a result of sales income and cost of goods sold in foreign currencies cause currency exposure that affects Group earnings in the event of exchange-rate fluctuations. The Group’s payment flows in foreign cur-rencies consists mainly of the income generated by export sales. The most impor-tant currencies are USD, EUR, GBP, PLN and JPY. In line with Getinge’s finance policy, the forecast flows in foreign currency are hedged to 90% for the next fiscal year. Getinge has the right to hedge for up to 42 months. Hedging is conducted us-ing currency forwards, currency swaps and currency options. The market value of financial currency derivatives is recognized in shareholders’ equity, which meets the requirements for cash-flow hedging which is recognized in other comprehensive in-come, amounted to SEK 363 M (270) at December 31, 2013.
Translation exposure – income statement. When translating the results of foreign subsidiaries into SEK, currency exposure occurs, which affects the Group’s earn-ings when exchange rates fluctuate.
Translation exposure – balance sheet. Currency exposure occurs when translat-ing net assets of foreign subsidiaries into SEK, which can affect the consolidated shareholders’ equity. In accordance with the Group’s finance policy, to minimize the effects of this translation, the exposure arising is hedged using loans or currency de-rivatives in the subsidiary’s local currency. The market value of financial derivatives that meet hedge-accounting requirements, which are recognized in shareholders’ equity, amounted to SEK 125 M at December 31, 2013.
INTEREST-RATE RISKSInterest-rate risks are the changes in market interest rates that affect the Group’s net interest. How quickly interest-rate changes impact net interest depends on the fixed-interest term of the loans. At December 31, 2013, the average fixed-interest term for Group borrowings was 23 months. Interest derivatives, such as interest-swap agreements, are used to achieve the desired fixed-interest term for borrow-ings. If the average interest rate for currencies represented in the Group’s borrow-ings at the end of the year changed instantaneously by 1 percentage point, this would affect profits by +/- SEK 44 M on an annual basis for 2014. The market value of financial interest-rate derivative instruments that meet cash-flow hedging require-ments, which are recognized in shareholders’ equity, amounted to a negative SEK 392 M (neg: 742) at December 31, 2013. For further information on liquidity flows at-tributable to interest-bearing liabilities, please refer to Note 18.
FINANCING AND LIqUIDITY RISK Financing risk is defined as the risk of the cost being higher and financing opportuni-ties limited as the loan is renegotiated and that the ability to pay cannot be met as a result of insufficient liquidity or difficulties in securing funding. The Group’s cash and cash equivalents are invested short-term with the aim that any excess cash balances shall be used for amortizing loans. The finance policy of the Group states that refi-nancing risks are managed by signing long-term committed credit agreements. The single largest loan is a syndicated loan agreement of EUR 1,200 M with ten banks. A minor portion of this loan agreement falls due in July 2016, and the major portion in July 2018. In 2012, the Group established an MTN program with the aim of issuing bonds in the Swedish market. In 2013, a total of SEK 2,000 M was issued under this program. In addition, the Group has signed a bilateral loan agreement with Bank of America. The loan is for USD 75 M and falls due in May 2016. The Group also signed an acquisition credit with SEB in conjunction with the public offer for Pulsion Medi-cal Systems SE. The loan totals EUR 150 M and falls due in December 2014 with an extension option of six months.
In addition to these credit facilities, the Group uses short-term uncommitted credit lines. For further information on credit lines, please refer to Note 17.
At December 31, 2013, the Group’s borrowings were well in line with the require-ments under Getinge’s finance policy pertaining to diversification of lenders and maturity dates.
CREDIT AND COUNTERPARTY RISKSThe Group’s financial transactions cause credit risks with regard to financial coun-terparties. Credit risks or counterparty risks constitute the risk of losses if the coun-terparties do not fully meet their commitments. Getinge’s finance policy states that the credit risk must be limited through accepting only creditworthy counterparties and fixed limits. At December 31, 2013, the total counterparty exposure in deriva-tive instruments was a negative SEK 96 M (neg: 324). Credit risks in outstanding de-rivatives are limited by the offset rules agreed with the respective counterparty. The Group’s liquidity is placed in bank accounts with negligible credit risks. Commercial credit risks are limited by a diverse customer base with a high credit rating. A provi-sion was made for the part of accounts receivable considered to be at risk and this affected the operating profit.
Financial derivatives. Getinge uses financial derivatives to manage interest and cur-rency exposure arising in its business. At December 31, 2013, all financial derivatives outstanding were held for hedging purposes and were deemed to be efficient. Con-sequently, hedge accounting was applied for these. All recognized derivatives are classified under level 2 of the value hierarchy.
Fair value disclosures pertaining to borrowing and other financial instruments. Essentially, all loans have floating interest rates and, accordingly, the fair value is as-sessed as corresponding to the carrying amount. For other financial assets and li-abilities, fair value is assessed as corresponding to the carrying amount.
Offsetting of financial derivatives. The Group has ISDA agreements with all of its significant counterparties for borrowing and trading in financial instruments. This means that all receivables and liabilities held by the Group can be completely offset. The Group has offset the value of the Group’s basis swaps against loans in the bal-ance sheet.
Outstanding derivative instruments 2013 2012December 31, SEK M Principal Fair value Principal Fair valueInterest/currency derivative* 3,005 125 3,009 148Interest derivative 12,732 -392 12,560 -742Currency derivative 8,455 363 9,135 270Total 24,192 96 24,703 -324
*Combined instrument
SEK M Asset Liability Asset LiabilityInterest derivatives – cash-flow hedges 52 444 – 742Interest derivatives – hedges of net investments* 142 17 148 –Currency derivatives – cash-flow hedges 562 199 380 110Total 756 660 528 852Of which, short-term 475 165 323 95Of which, long-term 281 495 205 757
* Combined instruments are recognized in the company’s net liabilities.
Principal refers to the nominal value in foreign currencies measured at the closing-date rates. The carrying amount of the interest derivatives and combined instruments com-prises accrued interest. The fair value of derivative instruments is established using valuation techniques. For this purpose, observable market information is used.
26 Financial risk management
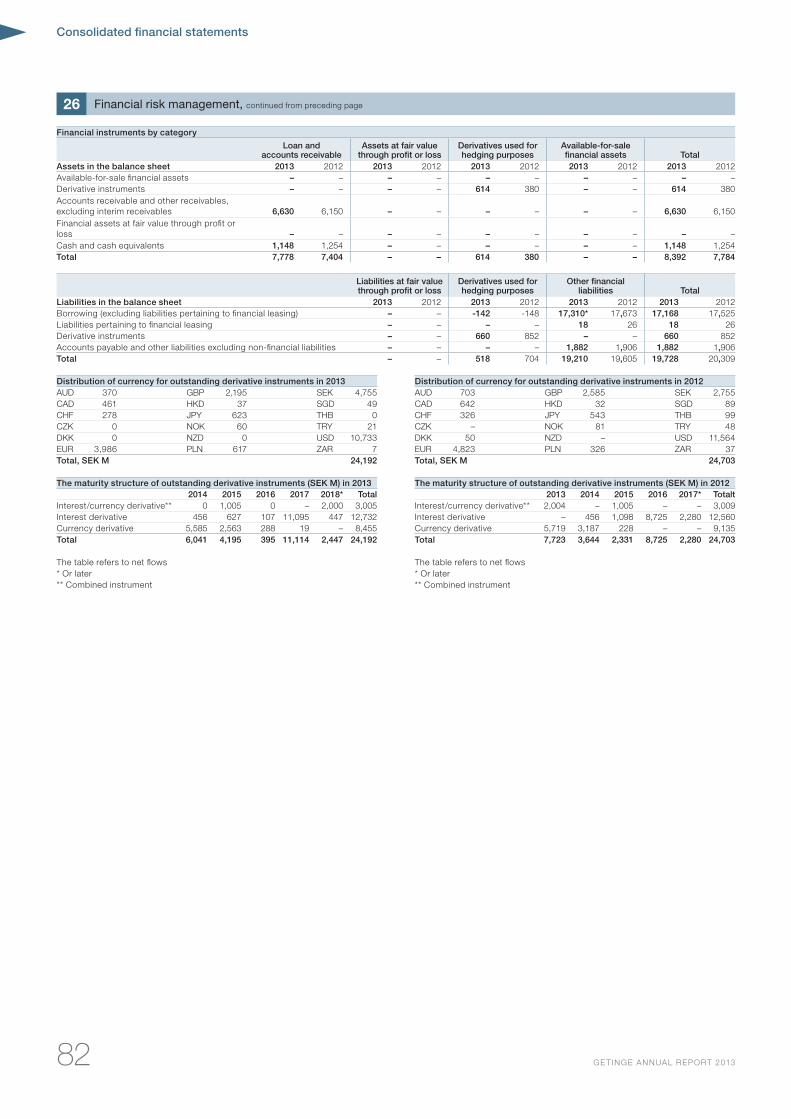
Consolidated financial statements
82 GE TINGE ANNUAL REPORT 2013
26 Financial risk management, continued from preceding page
Financial instruments by category
Loan and accounts receivable
Assets at fair value through profit or loss
Derivatives used for hedging purposes
Available-for-sale financial assets Total
Assets in the balance sheet 2013 2012 2013 2012 2013 2012 2013 2012 2013 2012Available-for-sale financial assets – – – – – – – – – –Derivative instruments – – – – 614 380 – – 614 380Accounts receivable and other receivables, excluding interim receivables 6,630 6,150 – – – – – – 6,630 6,150Financial assets at fair value through profit or loss – – – – – – – – – –Cash and cash equivalents 1,148 1,254 – – – – – – 1,148 1,254Total 7,778 7,404 – – 614 380 – – 8,392 7,784
Liabilities at fair value through profit or loss
Derivatives used for hedging purposes
Other financial liabilities Total
Liabilities in the balance sheet 2013 2012 2013 2012 2013 2012 2013 2012Borrowing (excluding liabilities pertaining to financial leasing) – – -142 -148 17,310* 17,673 17,168 17,525Liabilities pertaining to financial leasing – – – – 18 26 18 26Derivative instruments – – 660 852 – – 660 852Accounts payable and other liabilities excluding non-financial liabilities – – – – 1,882 1,906 1,882 1,906Total – – 518 704 19,210 19,605 19,728 20,309
Distribution of currency for outstanding derivative instruments in 2013AUD 370 GBP 2,195 SEK 4,755CAD 461 HKD 37 SGD 49CHF 278 JPY 623 THB 0CZK 0 NOK 60 TRY 21DKK 0 NZD 0 USD 10,733EUR 3,986 PLN 617 ZAR 7Total, SEK M 24,192
Distribution of currency for outstanding derivative instruments in 2012AUD 703 GBP 2,585 SEK 2,755CAD 642 HKD 32 SGD 89CHF 326 JPY 543 THB 99CZK – NOK 81 TRY 48DKK 50 NZD – USD 11,564EUR 4,823 PLN 326 ZAR 37Total, SEK M 24,703
The maturity structure of outstanding derivative instruments (SEK M) in 20132014 2015 2016 2017 2018* Total
Interest/currency derivative** 0 1,005 0 – 2,000 3,005Interest derivative 456 627 107 11,095 447 12,732Currency derivative 5,585 2,563 288 19 – 8,455Total 6,041 4,195 395 11,114 2,447 24,192
The table refers to net flows* Or later** Combined instrument
The maturity structure of outstanding derivative instruments (SEK M) in 20122013 2014 2015 2016 2017* Totalt
Interest/currency derivative** 2,004 – 1,005 – – 3,009Interest derivative – 456 1,098 8,725 2,280 12,560Currency derivative 5,719 3,187 228 – – 9,135Total 7,723 3,644 2,331 8,725 2,280 24,703
The table refers to net flows* Or later** Combined instrument
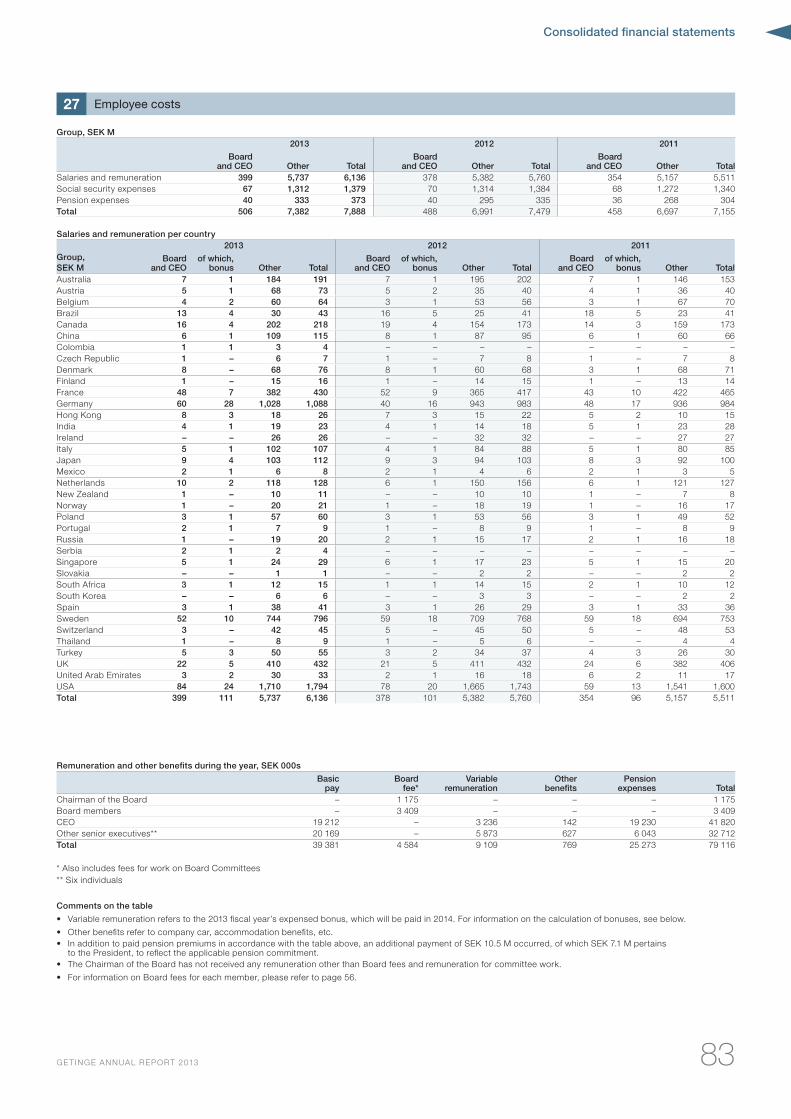
Consolidated financial statements
83GE TINGE ANNUAL REPORT 2013
Group, SEK M2013 2012 2011
Board and CEO Other Total
Board and CEO Other Total
Board and CEO Other Total
Salaries and remuneration 399 5,737 6,136 378 5,382 5,760 354 5,157 5,511Social security expenses 67 1,312 1,379 70 1,314 1,384 68 1,272 1,340Pension expenses 40 333 373 40 295 335 36 268 304Total 506 7,382 7,888 488 6,991 7,479 458 6,697 7,155
Salaries and remuneration per country2013 2012 2011
Group, SEK M
Board and CEO
of which, bonus Other Total
Board and CEO
of which, bonus Other Total
Board and CEO
of which, bonus Other Total
Australia 7 1 184 191 7 1 195 202 7 1 146 153Austria 5 1 68 73 5 2 35 40 4 1 36 40Belgium 4 2 60 64 3 1 53 56 3 1 67 70Brazil 13 4 30 43 16 5 25 41 18 5 23 41Canada 16 4 202 218 19 4 154 173 14 3 159 173China 6 1 109 115 8 1 87 95 6 1 60 66Colombia 1 1 3 4 – – – – – – – –Czech Republic 1 – 6 7 1 – 7 8 1 – 7 8Denmark 8 – 68 76 8 1 60 68 3 1 68 71Finland 1 – 15 16 1 – 14 15 1 – 13 14France 48 7 382 430 52 9 365 417 43 10 422 465Germany 60 28 1,028 1,088 40 16 943 983 48 17 936 984Hong Kong 8 3 18 26 7 3 15 22 5 2 10 15India 4 1 19 23 4 1 14 18 5 1 23 28Ireland – – 26 26 – – 32 32 – – 27 27Italy 5 1 102 107 4 1 84 88 5 1 80 85Japan 9 4 103 112 9 3 94 103 8 3 92 100Mexico 2 1 6 8 2 1 4 6 2 1 3 5Netherlands 10 2 118 128 6 1 150 156 6 1 121 127New Zealand 1 – 10 11 – – 10 10 1 – 7 8Norway 1 – 20 21 1 – 18 19 1 – 16 17Poland 3 1 57 60 3 1 53 56 3 1 49 52Portugal 2 1 7 9 1 – 8 9 1 – 8 9Russia 1 – 19 20 2 1 15 17 2 1 16 18Serbia 2 1 2 4 – – – – – – – –Singapore 5 1 24 29 6 1 17 23 5 1 15 20Slovakia – – 1 1 – – 2 2 – – 2 2South Africa 3 1 12 15 1 1 14 15 2 1 10 12South Korea – – 6 6 – – 3 3 – – 2 2Spain 3 1 38 41 3 1 26 29 3 1 33 36Sweden 52 10 744 796 59 18 709 768 59 18 694 753Switzerland 3 – 42 45 5 – 45 50 5 – 48 53Thailand 1 – 8 9 1 – 5 6 – – 4 4Turkey 5 3 50 55 3 2 34 37 4 3 26 30UK 22 5 410 432 21 5 411 432 24 6 382 406United Arab Emirates 3 2 30 33 2 1 16 18 6 2 11 17USA 84 24 1,710 1,794 78 20 1,665 1,743 59 13 1,541 1,600Total 399 111 5,737 6,136 378 101 5,382 5,760 354 96 5,157 5,511
Remuneration and other benefits during the year, SEK 000s
Basic pay
Board fee*
Variable remuneration
Other benefits
Pension expenses Total
Chairman of the Board – 1 175 – – – 1 175Board members – 3 409 – – – 3 409CEO 19 212 – 3 236 142 19 230 41 820Other senior executives** 20 169 – 5 873 627 6 043 32 712Total 39 381 4 584 9 109 769 25 273 79 116
* Also includes fees for work on Board Committees** Six individuals
Comments on the table
• Variable remuneration refers to the 2013 fiscal year’s expensed bonus, which will be paid in 2014. For information on the calculation of bonuses, see below.
• Other benefits refer to company car, accommodation benefits, etc.• In addition to paid pension premiums in accordance with the table above, an additional payment of SEK 10.5 M occurred, of which SEK 7.1 M pertains to the President, to reflect the applicable pension commitment.• The Chairman of the Board has not received any remuneration other than Board fees and remuneration for committee work.
• For information on Board fees for each member, please refer to page 56.
27 Employee costs
Consolidated financial statements
84 GE TINGE ANNUAL REPORT 2013
REMUNERATION TO SENIOR EXECUTIVES
Principles: The Annual General Meeting decides on remuneration to the Chairman of the Board and Board members. Employee representatives do not receive Board remuneration. Remuneration to the CEO and other senior executives comprises ba-sic pay, variable remuneration, other benefits as well as pensions. Other senior ex-ecutives comprise the six individuals, who together with the CEO, comprise Group management. For the Group management structure, see page 60. The division be-tween basic pay and variable remuneration should be in proportion to the manager’s level of responsibility and authority. The CEO’s variable remuneration is a maximum of 80% of the basic pay. Other senior executives’ variable remuneration is based on results in relation to individually set goals.
The CEO has health insurance totaling 24.5% of the pensionable pay between 20 and 30 price base amounts and 32.5% of the pensionable pay that exceeds 30 price base amounts. The agreement is independent in relation to other pension benefits.
Bonus: The CEO’s bonus for 2013 was based on the individual goals set by the Board. The bonus amount for 2013 corresponded to 17% of basic pay. For other senior executives, bonuses for 2013 were based on a combination of results for the individual’s area of responsibility and individual goals.
Pensions: Pension benefits for the CEO, not including the applicable ITP pension, are as follows: The CEO is entitled to a pension from the age of 60. The pension will be 70% of the pensionable pay between 60 and 65. At 65 and thereafter, the pension will be 50% of the pensionable pay in excess of 20 base amounts that the CEO re-ceived from the company at age 60. Pensionable pay refers to basic salary. Survivor annuity is 16.25% of the pensionable pay in excess of 20 price base amounts. For other senior executives, pension ages vary between 60 and 65. Pension agreements
have been signed in accordance with local legislation in the country where the ex-ecutive resides. Subsequently, pension levels vary from 3 to 62% of the pensionable pay. All pension benefits are transferable, i.e. not conditional on future employment.
Severance pay: If the CEO gives notice, the period of notice i six months. If notice is served by the company, the CEO is entitled to salary for a period of notice corre-sponding to one year. Severance pay is not offset against any other income. Upon termination of employment of any other senior executives, they have the right to sev-erance pay of a minimum of six months and a maximum of one year.
Drafting and decision-making process: During the year, the Remuneration Com-mittee gave the Board its recommendations concerning policies for the remunera-tion to senior executives. The recommendations included the proportion between fixed and variable remuneration and the size of possible pay increases. The Remu-neration Committee also proposed criteria for determining bonuses, allotment and the size of the pension conditions and redundancy payment. The Board discussed the Remuneration Committee’s proposals and decided in line with the Remunera-tion Committee’s recommendations.
Remuneration to the CEO for the 2013 fiscal year was decided by the Board taking into account the Remuneration Committee’s recommendations.
Remuneration to other senior executives was decided by the CEO in consultation with the Chairman of the Board. During 2013, the Remuneration Committee was convened on three occasions. The committee’s work was conducted with the sup-port of external experts in issues concerning remuneration levels and structures.
27 Employee costs, continued from preceding page
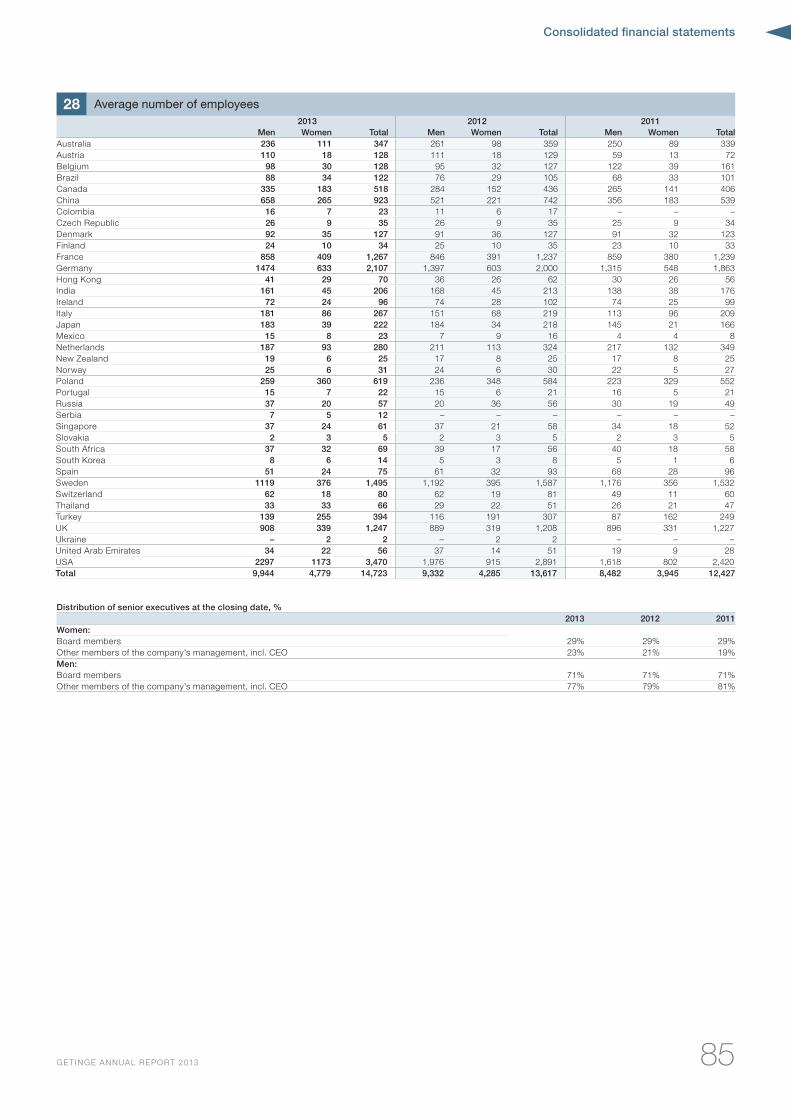
Consolidated financial statements
85GE TINGE ANNUAL REPORT 2013
2013 2012 2011Men Women Total Men Women Total Men Women Total
Australia 236 111 347 261 98 359 250 89 339Austria 110 18 128 111 18 129 59 13 72Belgium 98 30 128 95 32 127 122 39 161Brazil 88 34 122 76 29 105 68 33 101Canada 335 183 518 284 152 436 265 141 406China 658 265 923 521 221 742 356 183 539Colombia 16 7 23 11 6 17 – – –Czech Republic 26 9 35 26 9 35 25 9 34Denmark 92 35 127 91 36 127 91 32 123Finland 24 10 34 25 10 35 23 10 33France 858 409 1,267 846 391 1,237 859 380 1,239Germany 1474 633 2,107 1,397 603 2,000 1,315 548 1,863Hong Kong 41 29 70 36 26 62 30 26 56India 161 45 206 168 45 213 138 38 176Ireland 72 24 96 74 28 102 74 25 99Italy 181 86 267 151 68 219 113 96 209Japan 183 39 222 184 34 218 145 21 166Mexico 15 8 23 7 9 16 4 4 8Netherlands 187 93 280 211 113 324 217 132 349New Zealand 19 6 25 17 8 25 17 8 25Norway 25 6 31 24 6 30 22 5 27Poland 259 360 619 236 348 584 223 329 552Portugal 15 7 22 15 6 21 16 5 21Russia 37 20 57 20 36 56 30 19 49Serbia 7 5 12 – – – – – –Singapore 37 24 61 37 21 58 34 18 52Slovakia 2 3 5 2 3 5 2 3 5South Africa 37 32 69 39 17 56 40 18 58South Korea 8 6 14 5 3 8 5 1 6Spain 51 24 75 61 32 93 68 28 96Sweden 1119 376 1,495 1,192 395 1,587 1,176 356 1,532Switzerland 62 18 80 62 19 81 49 11 60Thailand 33 33 66 29 22 51 26 21 47Turkey 139 255 394 116 191 307 87 162 249UK 908 339 1,247 889 319 1,208 896 331 1,227Ukraine – 2 2 – 2 2 – – –United Arab Emirates 34 22 56 37 14 51 19 9 28USA 2297 1173 3,470 1,976 915 2,891 1,618 802 2,420Total 9,944 4,779 14,723 9,332 4,285 13,617 8,482 3,945 12,427
Distribution of senior executives at the closing date, %2013 2012 2011
Women:Board members 29% 29% 29%Other members of the company’s management, incl. CEO 23% 21% 19%Men:Board members 71% 71% 71%Other members of the company’s management, incl. CEO 77% 79% 81%
28 Average number of employees
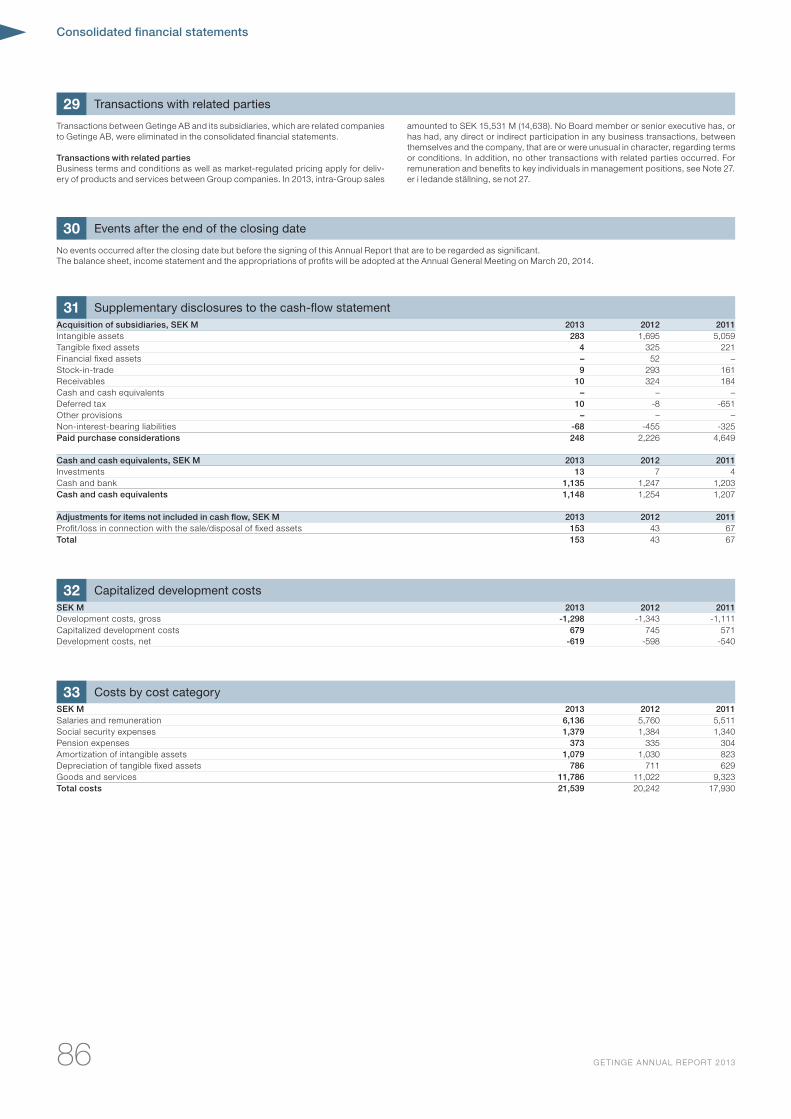
Consolidated financial statements
86 GE TINGE ANNUAL REPORT 2013
Transactions between Getinge AB and its subsidiaries, which are related companies to Getinge AB, were eliminated in the consolidated financial statements.
Transactions with related partiesBusiness terms and conditions as well as market-regulated pricing apply for deliv-ery of products and services between Group companies. In 2013, intra-Group sales
amounted to SEK 15,531 M (14,638). No Board member or senior executive has, or has had, any direct or indirect participation in any business transactions, between themselves and the company, that are or were unusual in character, regarding terms or conditions. In addition, no other transactions with related parties occurred. For remuneration and benefits to key individuals in management positions, see Note 27.er i ledande ställning, se not 27.
No events occurred after the closing date but before the signing of this Annual Report that are to be regarded as significant. The balance sheet, income statement and the appropriations of profits will be adopted at the Annual General Meeting on March 20, 2014.
Acquisition of subsidiaries, SEK M 2013 2012 2011Intangible assets 283 1,695 5,059Tangible fixed assets 4 325 221Financial fixed assets – 52 –Stock-in-trade 9 293 161Receivables 10 324 184Cash and cash equivalents – – –Deferred tax 10 -8 -651Other provisions – – –Non-interest-bearing liabilities -68 -455 -325Paid purchase considerations 248 2,226 4,649
Cash and cash equivalents, SEK M 2013 2012 2011Investments 13 7 4Cash and bank 1,135 1,247 1,203Cash and cash equivalents 1,148 1,254 1,207
Adjustments for items not included in cash flow, SEK M 2013 2012 2011Profit/loss in connection with the sale/disposal of fixed assets 153 43 67Total 153 43 67
SEK M 2013 2012 2011Development costs, gross -1,298 -1,343 -1,111Capitalized development costs 679 745 571Development costs, net -619 -598 -540
29 Transactions with related parties
30 Events after the end of the closing date
31 Supplementary disclosures to the cash-flow statement
32 Capitalized development costs
SEK M 2013 2012 2011Salaries and remuneration 6,136 5,760 5,511 Social security expenses 1,379 1,384 1,340 Pension expenses 373 335 304 Amortization of intangible assets 1,079 1,030 823 Depreciation of tangible fixed assets 786 711 629 Goods and services 11,786 11,022 9,323 Total costs 21,539 20,242 17,930
33 Costs by cost category
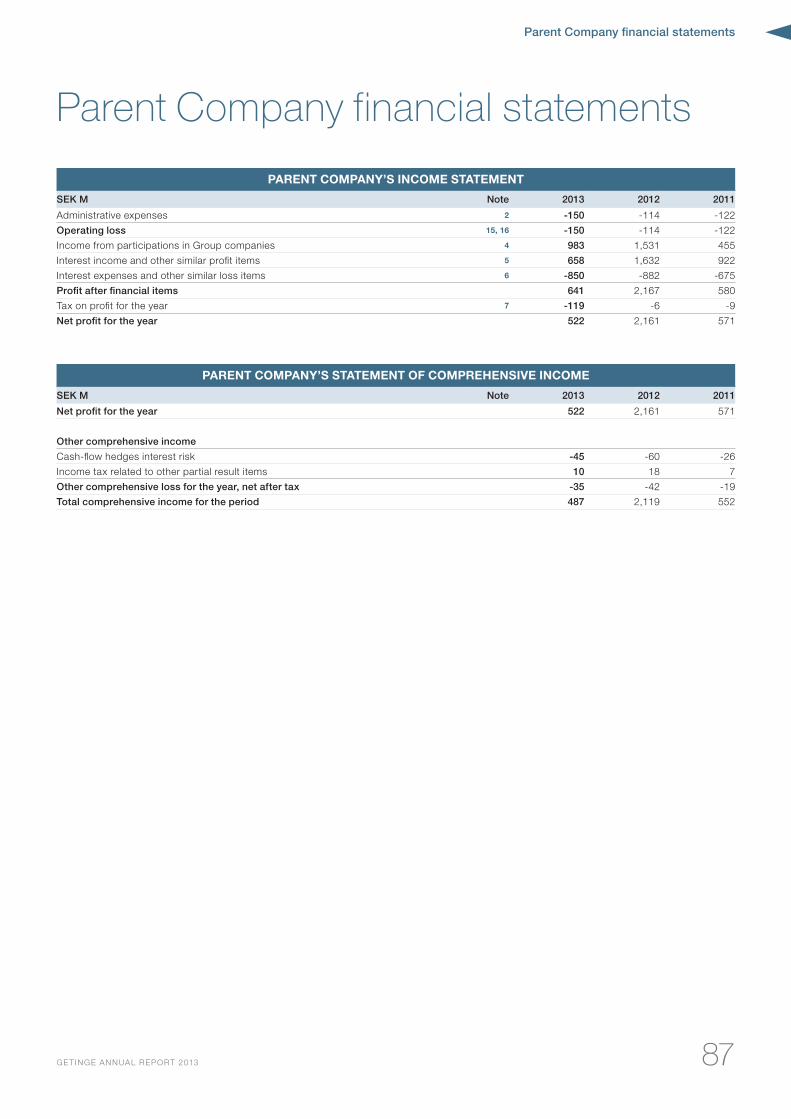
Parent Company financial statements
87GE TINGE ANNUAL REPORT 2013
PARENT COMPANY’S INCOME STATEMENT
SEK M Note 2013 2012 2011
Administrative expenses 2 -150 -114 -122
Operating loss 15, 16 -150 -114 -122
Income from participations in Group companies 4 983 1,531 455
Interest income and other similar profit items 5 658 1,632 922
Interest expenses and other similar loss items 6 -850 -882 -675
Profit after financial items 641 2,167 580
Tax on profit for the year 7 -119 -6 -9
Net profit for the year 522 2,161 571
PARENT COMPANY’S STATEMENT OF COMPREHENSIVE INCOME
SEK M Note 2013 2012 2011
Net profit for the year 522 2,161 571
Other comprehensive income
Cash-flow hedges interest risk -45 -60 -26
Income tax related to other partial result items 10 18 7
Other comprehensive loss for the year, net after tax -35 -42 -19
Total comprehensive income for the period 487 2,119 552
Parent Company financial statements
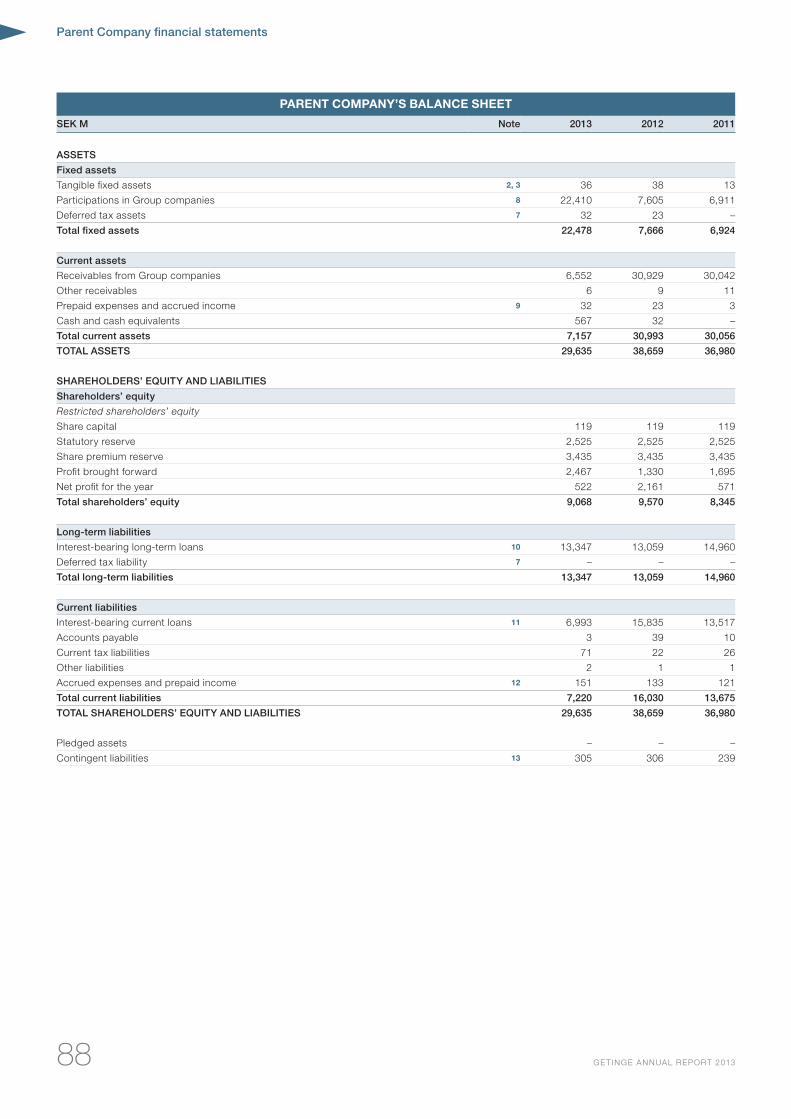
Parent Company financial statements
88 GE TINGE ANNUAL REPORT 2013
PARENT COMPANY’S BALANCE SHEET
SEK M Note 2013 2012 2011
ASSETS
Fixed assets
Tangible fixed assets 2, 3 36 38 13
Participations in Group companies 8 22,410 7,605 6,911
Deferred tax assets 7 32 23 –
Total fixed assets 22,478 7,666 6,924
Current assets
Receivables from Group companies 6,552 30,929 30,042
Other receivables 6 9 11
Prepaid expenses and accrued income 9 32 23 3
Cash and cash equivalents 567 32 –
Total current assets 7,157 30,993 30,056
TOTAL ASSETS 29,635 38,659 36,980
SHAREHOLDERS’ EQUITY AND LIABILITIES
Shareholders’ equity
Restricted shareholders’ equity
Share capital 119 119 119
Statutory reserve 2,525 2,525 2,525
Share premium reserve 3,435 3,435 3,435
Profit brought forward 2,467 1,330 1,695
Net profit for the year 522 2,161 571
Total shareholders’ equity 9,068 9,570 8,345
Long-term liabilities
Interest-bearing long-term loans 10 13,347 13,059 14,960
Deferred tax liability 7 – – –
Total long-term liabilities 13,347 13,059 14,960
Current liabilities
Interest-bearing current loans 11 6,993 15,835 13,517
Accounts payable 3 39 10
Current tax liabilities 71 22 26
Other liabilities 2 1 1
Accrued expenses and prepaid income 12 151 133 121
Total current liabilities 7,220 16,030 13,675
TOTAL SHAREHOLDERS’ EQUITY AND LIABILITIES 29,635 38,659 36,980
Pledged assets – – –
Contingent liabilities 13 305 306 239
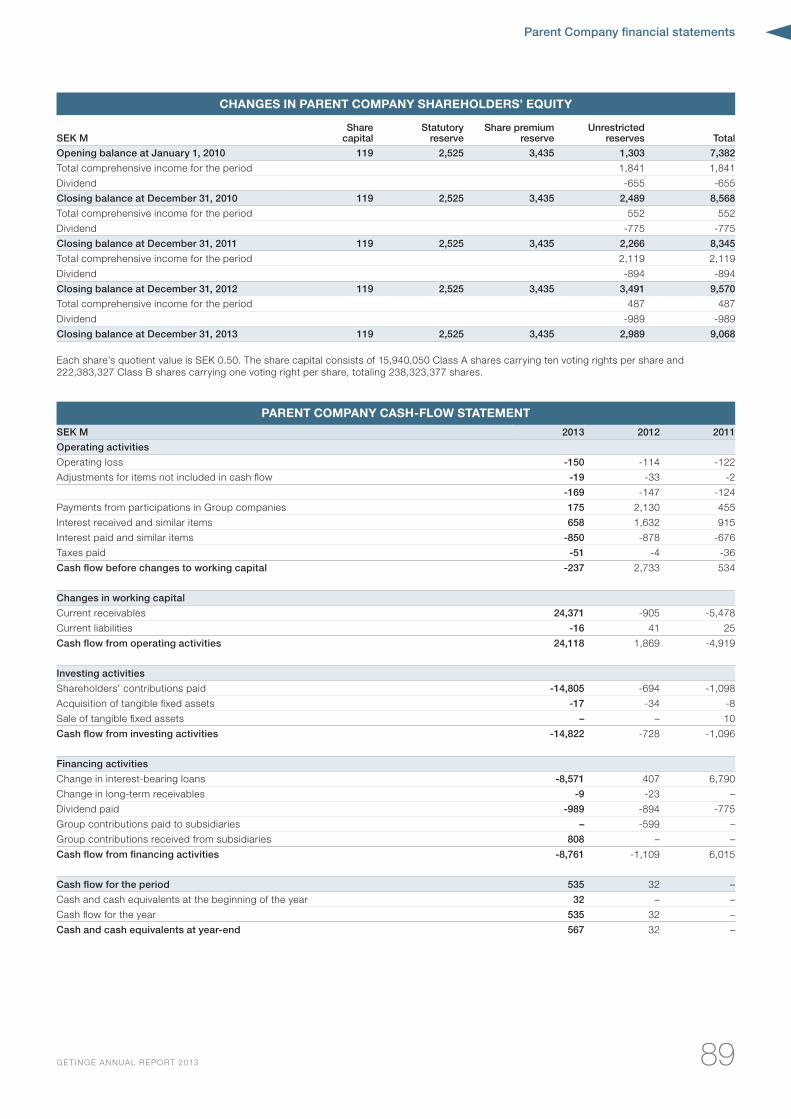
Parent Company financial statements
89GE TINGE ANNUAL REPORT 2013
CHANGES IN PARENT COMPANY SHAREHOLDERS’ EQUITY
SEK MShare
capitalStatutory
reserveShare premium
reserveUnrestricted
reserves Total
Opening balance at January 1, 2010 119 2,525 3,435 1,303 7,382
Total comprehensive income for the period 1,841 1,841
Dividend -655 -655
Closing balance at December 31, 2010 119 2,525 3,435 2,489 8,568
Total comprehensive income for the period 552 552
Dividend -775 -775
Closing balance at December 31, 2011 119 2,525 3,435 2,266 8,345
Total comprehensive income for the period 2,119 2,119
Dividend -894 -894
Closing balance at December 31, 2012 119 2,525 3,435 3,491 9,570
Total comprehensive income for the period 487 487
Dividend -989 -989
Closing balance at December 31, 2013 119 2,525 3,435 2,989 9,068
Each share’s quotient value is SEK 0.50. The share capital consists of 15,940,050 Class A shares carrying ten voting rights per share and 222,383,327 Class B shares carrying one voting right per share, totaling 238,323,377 shares.
PARENT COMPANY CASH-FLOW STATEMENT
SEK M 2013 2012 2011
Operating activities
Operating loss -150 -114 -122
Adjustments for items not included in cash flow -19 -33 -2
-169 -147 -124
Payments from participations in Group companies 175 2,130 455
Interest received and similar items 658 1,632 915
Interest paid and similar items -850 -878 -676
Taxes paid -51 -4 -36
Cash flow before changes to working capital -237 2,733 534
Changes in working capital
Current receivables 24,371 -905 -5,478
Current liabilities -16 41 25
Cash flow from operating activities 24,118 1,869 -4,919
Investing activities
Shareholders’ contributions paid -14,805 -694 -1,098
Acquisition of tangible fixed assets -17 -34 -8
Sale of tangible fixed assets – – 10
Cash flow from investing activities -14,822 -728 -1,096
Financing activities
Change in interest-bearing loans -8,571 407 6,790
Change in long-term receivables -9 -23 –
Dividend paid -989 -894 -775
Group contributions paid to subsidiaries – -599 –
Group contributions received from subsidiaries 808 – –
Cash flow from financing activities -8,761 -1,109 6,015
Cash flow for the period 535 32 –
Cash and cash equivalents at the beginning of the year 32 – –
Cash flow for the year 535 32 –
Cash and cash equivalents at year-end 567 32 –
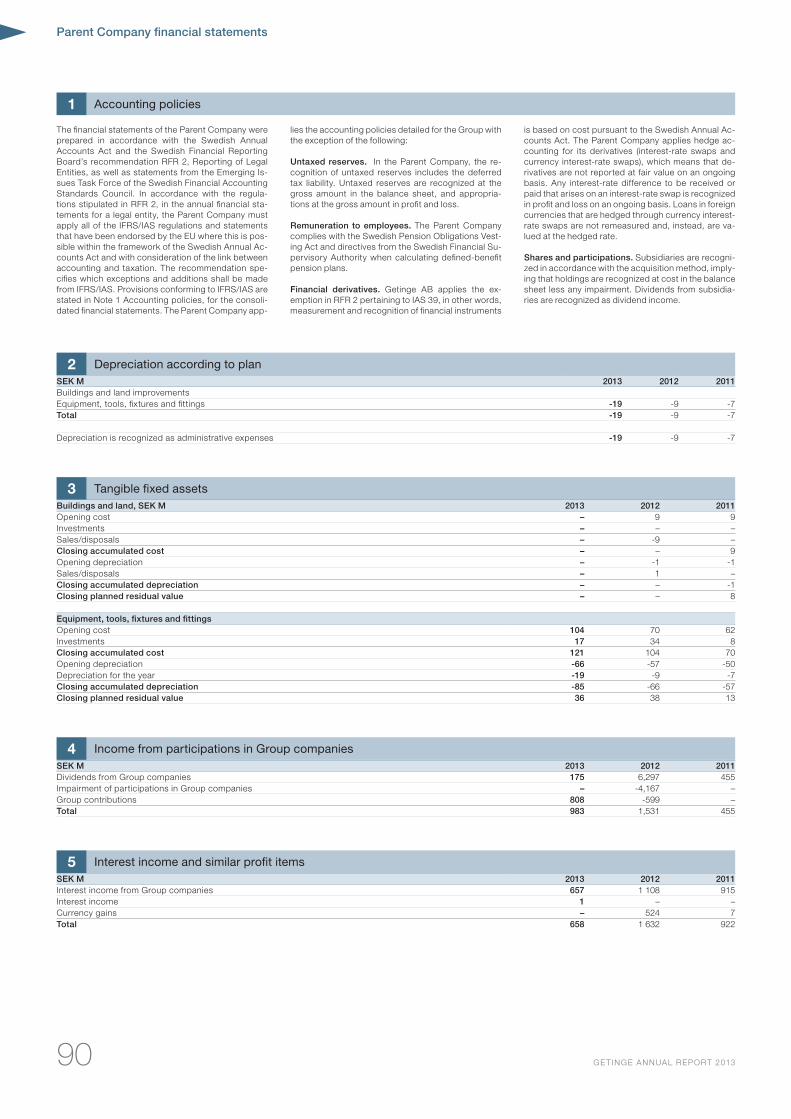
Parent Company financial statements
90 GE TINGE ANNUAL REPORT 2013
The financial statements of the Parent Company were prepared in accordance with the Swedish Annual Accounts Act and the Swedish Financial Reporting Board’s recommendation RFR 2, Reporting of Legal Entities, as well as statements from the Emerging Is-sues Task Force of the Swedish Financial Accounting Standards Council. In accordance with the regula-tions stipulated in RFR 2, in the annual financial sta-tements for a legal entity, the Parent Company must apply all of the IFRS/IAS regulations and statements that have been endorsed by the EU where this is pos-sible within the framework of the Swedish Annual Ac-counts Act and with consideration of the link between accounting and taxation. The recommendation spe-cifies which exceptions and additions shall be made from IFRS/IAS. Provisions conforming to IFRS/IAS are stated in Note 1 Accounting policies, for the consoli-dated financial statements. The Parent Company app-
lies the accounting policies detailed for the Group with the exception of the following:
Untaxed reserves. In the Parent Company, the re-cognition of untaxed reserves includes the deferred tax liability. Untaxed reserves are recognized at the gross amount in the balance sheet, and appropria-tions at the gross amount in profit and loss.
Remuneration to employees. The Parent Company complies with the Swedish Pension Obligations Vest-ing Act and directives from the Swedish Financial Su-pervisory Authority when calculating defined-benefit pension plans.
Financial derivatives. Getinge AB applies the ex-emption in RFR 2 pertaining to IAS 39, in other words, measurement and recognition of financial instruments
is based on cost pursuant to the Swedish Annual Ac-counts Act. The Parent Company applies hedge ac-counting for its derivatives (interest-rate swaps and currency interest-rate swaps), which means that de-rivatives are not reported at fair value on an ongoing basis. Any interest-rate difference to be received or paid that arises on an interest-rate swap is recognized in profit and loss on an ongoing basis. Loans in foreign currencies that are hedged through currency interest-rate swaps are not remeasured and, instead, are va-lued at the hedged rate.
Shares and participations. Subsidiaries are recogni-zed in accordance with the acquisition method, imply-ing that holdings are recognized at cost in the balance sheet less any impairment. Dividends from subsidia-ries are recognized as dividend income.
1 Accounting policies
4 Income from participations in Group companiesSEK M 2013 2012 2011Dividends from Group companies 175 6,297 455Impairment of participations in Group companies – -4,167 –Group contributions 808 -599 –Total 983 1,531 455
5 Interest income and similar profit itemsSEK M 2013 2012 2011Interest income from Group companies 657 1 108 915Interest income 1 – –Currency gains – 524 7Total 658 1 632 922
3 Tangible fixed assetsBuildings and land, SEK M 2013 2012 2011Opening cost – 9 9Investments – – –Sales/disposals – -9 –Closing accumulated cost – – 9Opening depreciation – -1 -1Sales/disposals – 1 –Closing accumulated depreciation – – -1Closing planned residual value – – 8
Equipment, tools, fixtures and fittingsOpening cost 104 70 62Investments 17 34 8Closing accumulated cost 121 104 70Opening depreciation -66 -57 -50Depreciation for the year -19 -9 -7Closing accumulated depreciation -85 -66 -57Closing planned residual value 36 38 13
2 Depreciation according to planSEK M 2013 2012 2011Buildings and land improvementsEquipment, tools, fixtures and fittings -19 -9 -7Total -19 -9 -7
Depreciation is recognized as administrative expenses -19 -9 -7
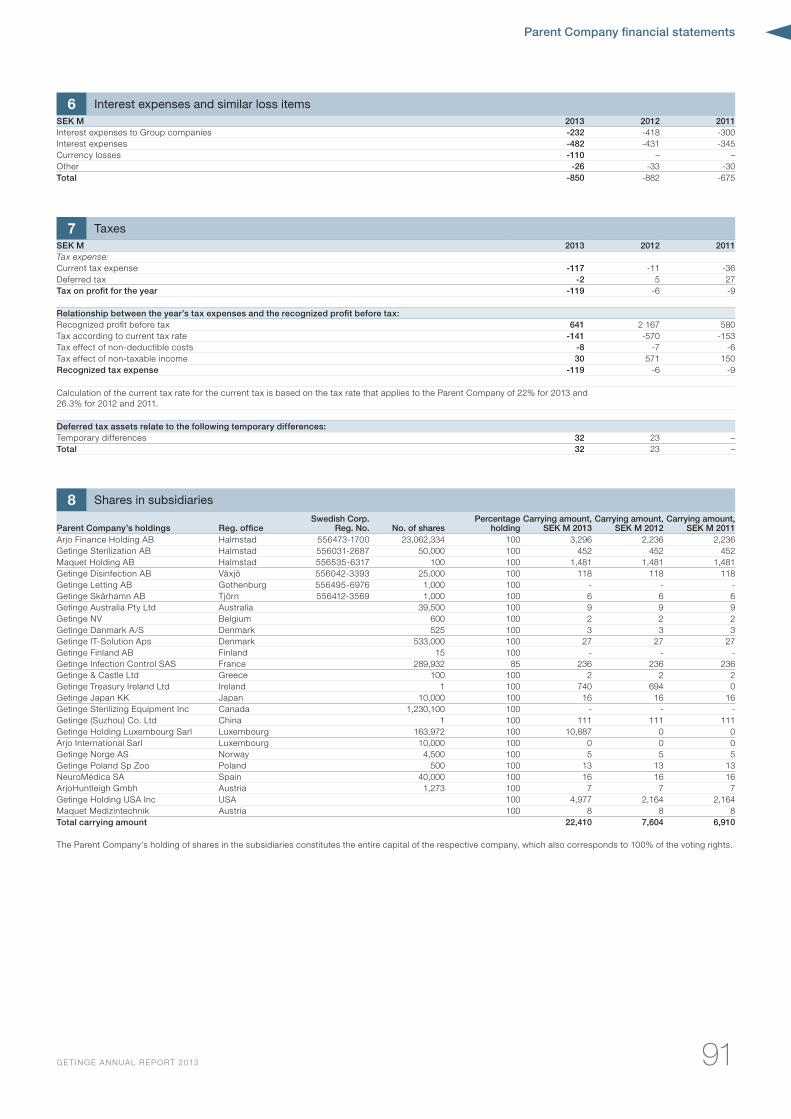
Parent Company financial statements
91GE TINGE ANNUAL REPORT 2013
6 Interest expenses and similar loss itemsSEK M 2013 2012 2011Interest expenses to Group companies -232 -418 -300Interest expenses -482 -431 -345Currency losses -110 – –Other -26 -33 -30Total -850 -882 -675
7 TaxesSEK M 2013 2012 2011Tax expense:Current tax expense -117 -11 -36Deferred tax -2 5 27Tax on profit for the year -119 -6 -9
Relationship between the year’s tax expenses and the recognized profit before tax:Recognized profit before tax 641 2 167 580Tax according to current tax rate -141 -570 -153Tax effect of non-deductible costs -8 -7 -6Tax effect of non-taxable income 30 571 150Recognized tax expense -119 -6 -9
Calculation of the current tax rate for the current tax is based on the tax rate that applies to the Parent Company of 22% for 2013 and 26.3% for 2012 and 2011.
Deferred tax assets relate to the following temporary differences:Temporary differences 32 23 –Total 32 23 –
8 Shares in subsidiaries
Parent Company’s holdings Reg. officeSwedish Corp.
Reg. No. No. of sharesPercentage
holdingCarrying amount,
SEK M 2013 Carrying amount,
SEK M 2012 Carrying amount,
SEK M 2011 Arjo Finance Holding AB Halmstad 556473-1700 23,062,334 100 3,296 2,236 2,236Getinge Sterilization AB Halmstad 556031-2687 50,000 100 452 452 452Maquet Holding AB Halmstad 556535-6317 100 100 1,481 1,481 1,481Getinge Disinfection AB Växjö 556042-3393 25,000 100 118 118 118Getinge Letting AB Gothenburg 556495-6976 1,000 100 - - -Getinge Skärhamn AB Tjörn 556412-3569 1,000 100 6 6 6Getinge Australia Pty Ltd Australia 39,500 100 9 9 9Getinge NV Belgium 600 100 2 2 2Getinge Danmark A/S Denmark 525 100 3 3 3Getinge IT-Solution Aps Denmark 533,000 100 27 27 27Getinge Finland AB Finland 15 100 - - -Getinge Infection Control SAS France 289,932 85 236 236 236Getinge & Castle Ltd Greece 100 100 2 2 2Getinge Treasury Ireland Ltd Ireland 1 100 740 694 0Getinge Japan KK Japan 10,000 100 16 16 16Getinge Sterilizing Equipment Inc Canada 1,230,100 100 - - -Getinge (Suzhou) Co. Ltd China 1 100 111 111 111Getinge Holding Luxembourg Sarl Luxembourg 163,972 100 10,887 0 0Arjo International Sarl Luxembourg 10,000 100 0 0 0Getinge Norge AS Norway 4,500 100 5 5 5Getinge Poland Sp Zoo Poland 500 100 13 13 13NeuroMédica SA Spain 40,000 100 16 16 16ArjoHuntleigh Gmbh Austria 1,273 100 7 7 7Getinge Holding USA Inc USA 100 4,977 2,164 2,164Maquet Medizintechnik Austria 100 8 8 8Total carrying amount 22,410 7,604 6,910
The Parent Company’s holding of shares in the subsidiaries constitutes the entire capital of the respective company, which also corresponds to 100% of the voting rights.
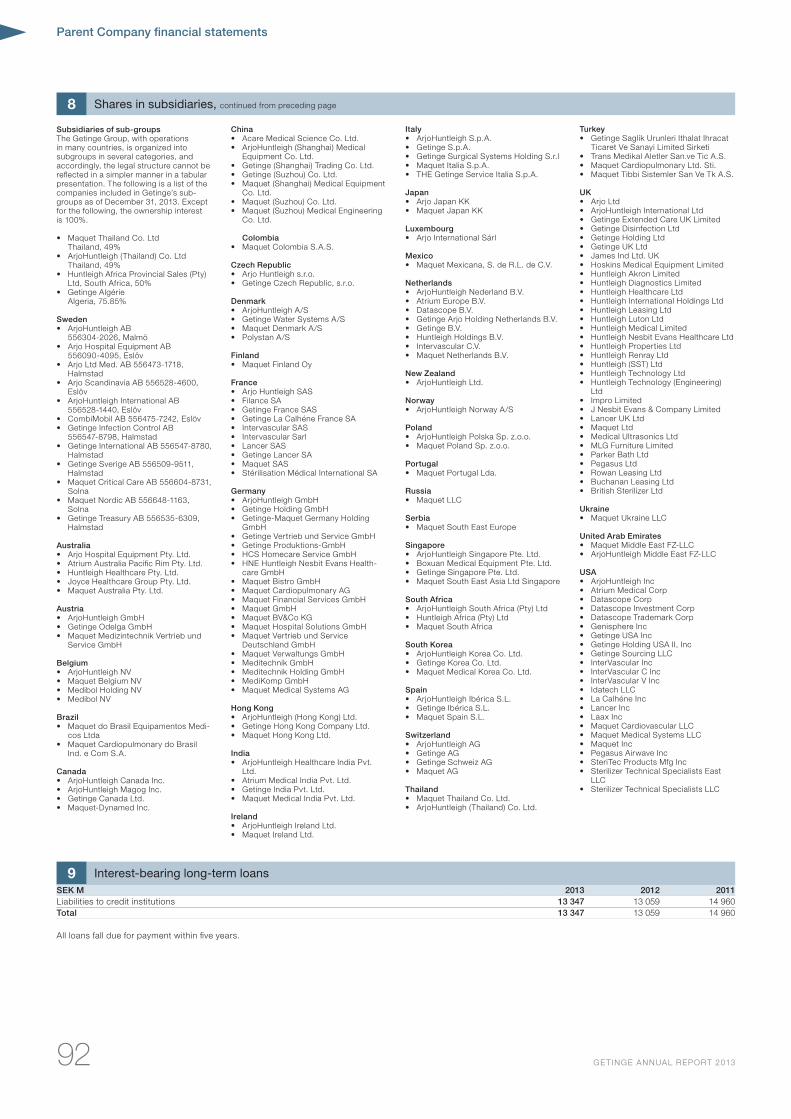
Parent Company financial statements
92 GE TINGE ANNUAL REPORT 2013
8 Shares in subsidiaries, continued from preceding page
Subsidiaries of sub-groupsThe Getinge Group, with operations in many countries, is organized into subgroups in several categories, and accordingly, the legal structure cannot be reflected in a simpler manner in a tabular presentation. The following is a list of the companies included in Getinge’s sub-groups as of December 31, 2013. Except for the following, the ownership interest is 100%.
• Maquet Thailand Co. Ltd Thailand, 49%• ArjoHuntleigh (Thailand) Co. Ltd Thailand, 49%• Huntleigh Africa Provincial Sales (Pty) Ltd, South Africa, 50%• Getinge Algérie Algeria, 75.85%
Sweden• ArjoHuntleigh AB 556304-2026, Malmö• Arjo Hospital Equipment AB 556090-4095, Eslöv• Arjo Ltd Med. AB 556473-1718, Halmstad• Arjo Scandinavia AB 556528-4600,
Eslöv• ArjoHuntleigh International AB
556528-1440, Eslöv• CombiMobil AB 556475-7242, Eslöv• Getinge Infection Control AB 556547-8798, Halmstad• Getinge International AB 556547-8780,
Halmstad• Getinge Sverige AB 556509-9511,
Halmstad• Maquet Critical Care AB 556604-8731,
Solna• Maquet Nordic AB 556648-1163,
Solna• Getinge Treasury AB 556535-6309,
Halmstad
Australia• Arjo Hospital Equipment Pty. Ltd.• Atrium Australia Pacific Rim Pty. Ltd.• Huntleigh Healthcare Pty. Ltd.• Joyce Healthcare Group Pty. Ltd.• Maquet Australia Pty. Ltd.
Austria• ArjoHuntleigh GmbH• Getinge Odelga GmbH• Maquet Medizintechnik Vertrieb und
Service GmbH
Belgium• ArjoHuntleigh NV• Maquet Belgium NV• Medibol Holding NV• Medibol NV
Brazil• Maquet do Brasil Equipamentos Medi-
cos Ltda• Maquet Cardiopulmonary do Brasil
Ind. e Com S.A.
Canada• ArjoHuntleigh Canada Inc.• ArjoHuntleigh Magog Inc.• Getinge Canada Ltd.• Maquet-Dynamed Inc.
China• Acare Medical Science Co. Ltd.• ArjoHuntleigh (Shanghai) Medical
Equipment Co. Ltd.• Getinge (Shanghai) Trading Co. Ltd.• Getinge (Suzhou) Co. Ltd.• Maquet (Shanghai) Medical Equipment
Co. Ltd.• Maquet (Suzhou) Co. Ltd.• Maquet (Suzhou) Medical Engineering
Co. Ltd.
Colombia• Maquet Colombia S.A.S.
Czech Republic• Arjo Huntleigh s.r.o.• Getinge Czech Republic, s.r.o.
Denmark• ArjoHuntleigh A/S• Getinge Water Systems A/S• Maquet Denmark A/S• Polystan A/S
Finland• Maquet Finland Oy
France• Arjo Huntleigh SAS• Filance SA• Getinge France SAS• Getinge La Calhéne France SA• Intervascular SAS• Intervascular Sarl• Lancer SAS• Getinge Lancer SA• Maquet SAS• Stérilisation Médical International SA
Germany• ArjoHuntleigh GmbH• Getinge Holding GmbH• Getinge-Maquet Germany Holding
GmbH• Getinge Vertrieb und Service GmbH• Getinge Produktions-GmbH• HCS Homecare Service GmbH• HNE Huntleigh Nesbit Evans Health-
care GmbH• Maquet Bistro GmbH• Maquet Cardiopulmonary AG• Maquet Financial Services GmbH• Maquet GmbH• Maquet BV&Co KG• Maquet Hospital Solutions GmbH• Maquet Vertrieb und Service
Deutschland GmbH• Maquet Verwaltungs GmbH• Meditechnik GmbH• Meditechnik Holding GmbH• MediKomp GmbH• Maquet Medical Systems AG
Hong Kong• ArjoHuntleigh (Hong Kong) Ltd.• Getinge Hong Kong Company Ltd.• Maquet Hong Kong Ltd.
India• ArjoHuntleigh Healthcare India Pvt.
Ltd.• Atrium Medical India Pvt. Ltd.• Getinge India Pvt. Ltd.• Maquet Medical India Pvt. Ltd.
Ireland• ArjoHuntleigh Ireland Ltd.• Maquet Ireland Ltd.
Italy• ArjoHuntleigh S.p.A.• Getinge S.p.A.• Getinge Surgical Systems Holding S.r.l• Maquet Italia S.p.A.• THE Getinge Service Italia S.p.A.
Japan• Arjo Japan KK• Maquet Japan KK
Luxembourg• Arjo International Sárl
Mexico• Maquet Mexicana, S. de R.L. de C.V.
Netherlands• ArjoHuntleigh Nederland B.V.• Atrium Europe B.V.• Datascope B.V.• Getinge Arjo Holding Netherlands B.V.• Getinge B.V.• Huntleigh Holdings B.V.• Intervascular C.V.• Maquet Netherlands B.V.
New Zealand• ArjoHuntleigh Ltd.
Norway• ArjoHuntleigh Norway A/S
Poland• ArjoHuntleigh Polska Sp. z.o.o.• Maquet Poland Sp. z.o.o.
Portugal• Maquet Portugal Lda.
Russia• Maquet LLC
Serbia• Maquet South East Europe
Singapore• ArjoHuntleigh Singapore Pte. Ltd.• Boxuan Medical Equipment Pte. Ltd.• Getinge Singapore Pte. Ltd.• Maquet South East Asia Ltd Singapore
South Africa• ArjoHuntleigh South Africa (Pty) Ltd• Huntleigh Africa (Pty) Ltd• Maquet South Africa
South Korea• ArjoHuntleigh Korea Co. Ltd.• Getinge Korea Co. Ltd.• Maquet Medical Korea Co. Ltd.
Spain• ArjoHuntleigh Ibérica S.L.• Getinge Ibérica S.L.• Maquet Spain S.L.
Switzerland• ArjoHuntleigh AG• Getinge AG• Getinge Schweiz AG• Maquet AG
Thailand• Maquet Thailand Co. Ltd.• ArjoHuntleigh (Thailand) Co. Ltd.
Turkey• Getinge Saglik Urunleri Ithalat Ihracat
Ticaret Ve Sanayi Limited Sirketi• Trans Medikal Aletler San.ve Tic A.S.• Maquet Cardiopulmonary Ltd. Sti.• Maquet Tibbi Sistemler San Ve Tk A.S.
UK• Arjo Ltd• ArjoHuntleigh International Ltd• Getinge Extended Care UK Limited• Getinge Disinfection Ltd• Getinge Holding Ltd• Getinge UK Ltd• James Ind Ltd. UK• Hoskins Medical Equipment Limited• Huntleigh Akron Limited• Huntleigh Diagnostics Limited• Huntleigh Healthcare Ltd• Huntleigh International Holdings Ltd• Huntleigh Leasing Ltd• Huntleigh Luton Ltd• Huntleigh Medical Limited• Huntleigh Nesbit Evans Healthcare Ltd• Huntleigh Properties Ltd• Huntleigh Renray Ltd• Huntleigh (SST) Ltd• Huntleigh Technology Ltd• Huntleigh Technology (Engineering)
Ltd• Impro Limited• J Nesbit Evans & Company Limited• Lancer UK Ltd• Maquet Ltd• Medical Ultrasonics Ltd• MLG Furniture Limited• Parker Bath Ltd• Pegasus Ltd• Rowan Leasing Ltd• Buchanan Leasing Ltd• British Sterilizer Ltd
Ukraine• Maquet Ukraine LLC
United Arab Emirates• Maquet Middle East FZ-LLC• ArjoHuntleigh Middle East FZ-LLC
USA• ArjoHuntleigh Inc• Atrium Medical Corp• Datascope Corp• Datascope Investment Corp• Datascope Trademark Corp• Genisphere Inc• Getinge USA Inc• Getinge Holding USA II, Inc• Getinge Sourcing LLC• InterVascular Inc• InterVascular C Inc• InterVascular V Inc• Idatech LLC• La Calhéne Inc• Lancer Inc• Laax Inc• Maquet Cardiovascular LLC• Maquet Medical Systems LLC• Maquet Inc• Pegasus Airwave Inc• SteriTec Products Mfg Inc• Sterilizer Technical Specialists East
LLC• Sterilizer Technical Specialists LLC
9 Interest-bearing long-term loansSEK M 2013 2012 2011Liabilities to credit institutions 13 347 13 059 14 960Total 13 347 13 059 14 960
All loans fall due for payment within five years.
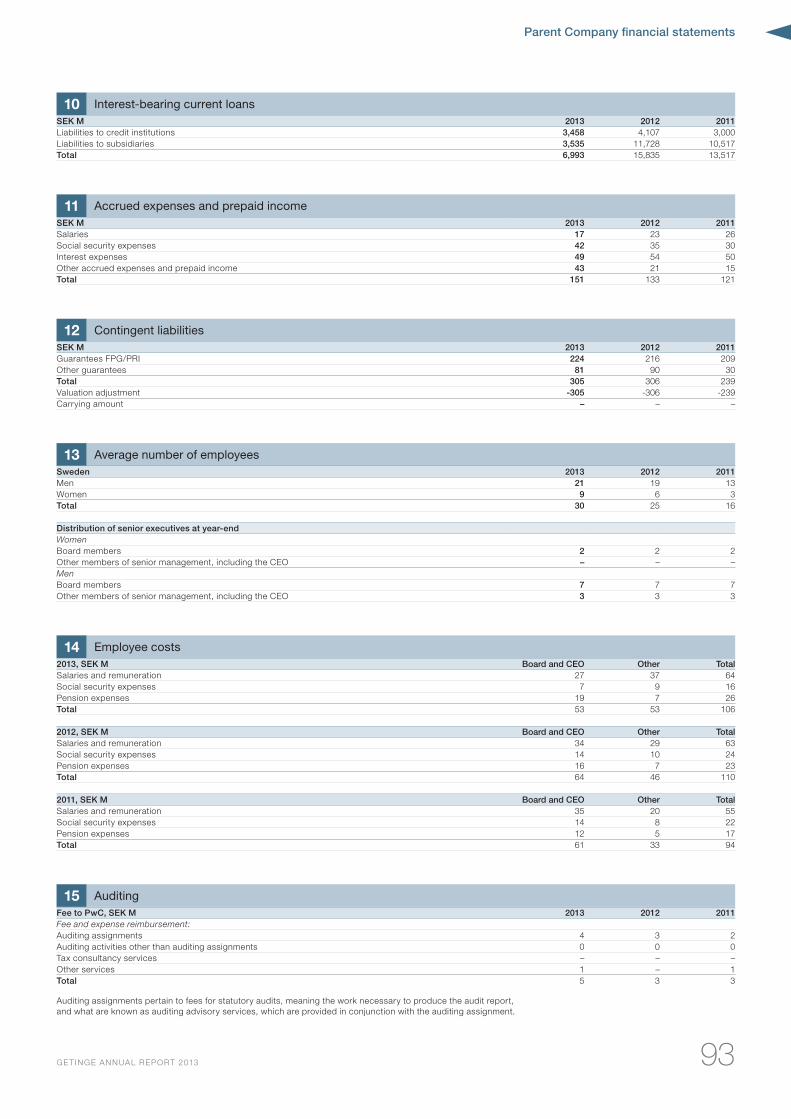
Parent Company financial statements
93GE TINGE ANNUAL REPORT 2013
10 Interest-bearing current loansSEK M 2013 2012 2011Liabilities to credit institutions 3,458 4,107 3,000Liabilities to subsidiaries 3,535 11,728 10,517Total 6,993 15,835 13,517
11 Accrued expenses and prepaid incomeSEK M 2013 2012 2011Salaries 17 23 26Social security expenses 42 35 30Interest expenses 49 54 50Other accrued expenses and prepaid income 43 21 15Total 151 133 121
12 Contingent liabilitiesSEK M 2013 2012 2011Guarantees FPG/PRI 224 216 209Other guarantees 81 90 30Total 305 306 239Valuation adjustment -305 -306 -239Carrying amount – – –
13 Average number of employeesSweden 2013 2012 2011Men 21 19 13Women 9 6 3Total 30 25 16
Distribution of senior executives at year-endWomenBoard members 2 2 2Other members of senior management, including the CEO – – –MenBoard members 7 7 7Other members of senior management, including the CEO 3 3 3
14 Employee costs2013, SEK M Board and CEO Other TotalSalaries and remuneration 27 37 64Social security expenses 7 9 16Pension expenses 19 7 26Total 53 53 106
2012, SEK M Board and CEO Other TotalSalaries and remuneration 34 29 63Social security expenses 14 10 24Pension expenses 16 7 23Total 64 46 110
2011, SEK M Board and CEO Other TotalSalaries and remuneration 35 20 55Social security expenses 14 8 22Pension expenses 12 5 17Total 61 33 94
15 AuditingFee to PwC, SEK M 2013 2012 2011Fee and expense reimbursement:Auditing assignments 4 3 2Auditing activities other than auditing assignments 0 0 0Tax consultancy services – – –Other services 1 – 1Total 5 3 3
Auditing assignments pertain to fees for statutory audits, meaning the work necessary to produce the audit report, and what are known as auditing advisory services, which are provided in conjunction with the auditing assignment.
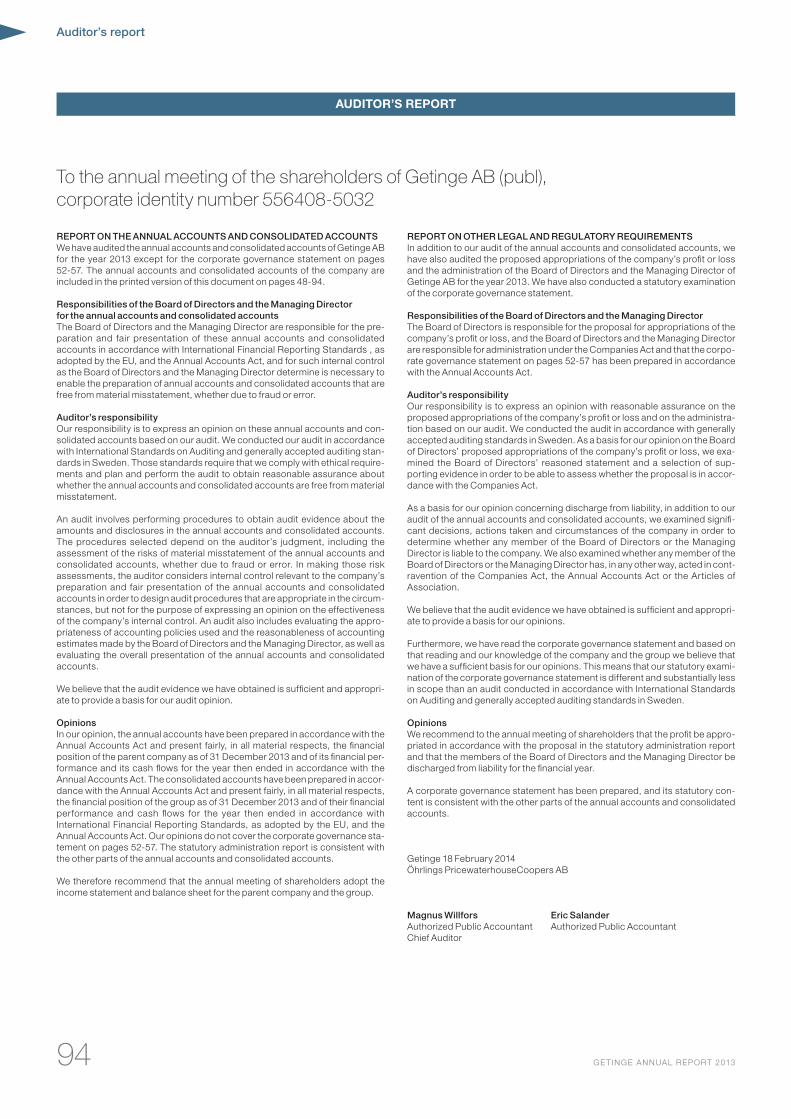
94 GE TINGE ANNUAL REPORT 2013
Auditor’s report
AUDITOR’S REPORT
To the annual meeting of the shareholders of Getinge AB (publ), corporate identity number 556408-5032
REPORT ON THE ANNUAL ACCOUNTS AND CONSOLIDATED ACCOUNTSWe have audited the annual accounts and consolidated accounts of Getinge AB for the year 2013 except for the corporate governance statement on pages 52-57. The annual accounts and consolidated accounts of the company are included in the printed version of this document on pages 48-94.
Responsibilities of the Board of Directors and the Managing Director for the annual accounts and consolidated accounts The Board of Directors and the Managing Director are responsible for the pre-paration and fair presentation of these annual accounts and consolidated accounts in accordance with International Financial Reporting Standards , as adopted by the EU, and the Annual Accounts Act, and for such internal control as the Board of Directors and the Managing Director determine is necessary to enable the preparation of annual accounts and consolidated accounts that are free from material misstatement, whether due to fraud or error.
Auditor’s responsibility Our responsibility is to express an opinion on these annual accounts and con-solidated accounts based on our audit. We conducted our audit in accordance with International Standards on Auditing and generally accepted auditing stan-dards in Sweden. Those standards require that we comply with ethical require-ments and plan and perform the audit to obtain reasonable assurance about whether the annual accounts and consolidated accounts are free from material misstatement.
An audit involves performing procedures to obtain audit evidence about the amounts and disclosures in the annual accounts and consolidated accounts. The procedures selected depend on the auditor’s judgment, including the assessment of the risks of material misstatement of the annual accounts and consolidated accounts, whether due to fraud or error. In making those risk assessments, the auditor considers internal control relevant to the company’s preparation and fair presentation of the annual accounts and consolidated accounts in order to design audit procedures that are appropriate in the circum-stances, but not for the purpose of expressing an opinion on the effectiveness of the company’s internal control. An audit also includes evaluating the appro-priateness of accounting policies used and the reasonableness of accounting estimates made by the Board of Directors and the Managing Director, as well as evaluating the overall presentation of the annual accounts and consolidated accounts.
We believe that the audit evidence we have obtained is sufficient and appropri-ate to provide a basis for our audit opinion.
OpinionsIn our opinion, the annual accounts have been prepared in accordance with the Annual Accounts Act and present fairly, in all material respects, the financial position of the parent company as of 31 December 2013 and of its financial per-formance and its cash flows for the year then ended in accordance with the Annual Accounts Act. The consolidated accounts have been prepared in accor-dance with the Annual Accounts Act and present fairly, in all material respects, the financial position of the group as of 31 December 2013 and of their financial performance and cash flows for the year then ended in accordance with International Financial Reporting Standards, as adopted by the EU, and the Annual Accounts Act. Our opinions do not cover the corporate governance sta-tement on pages 52-57. The statutory administration report is consistent with the other parts of the annual accounts and consolidated accounts.
We therefore recommend that the annual meeting of shareholders adopt the income statement and balance sheet for the parent company and the group.
REPORT ON OTHER LEGAL AND REGULATORY REQUIREMENTS In addition to our audit of the annual accounts and consolidated accounts, we have also audited the proposed appropriations of the company’s profit or loss and the administration of the Board of Directors and the Managing Director of Getinge AB for the year 2013. We have also conducted a statutory examination of the corporate governance statement.
Responsibilities of the Board of Directors and the Managing DirectorThe Board of Directors is responsible for the proposal for appropriations of the company’s profit or loss, and the Board of Directors and the Managing Director are responsible for administration under the Companies Act and that the corpo-rate governance statement on pages 52-57 has been prepared in accordance with the Annual Accounts Act.
Auditor’s responsibility Our responsibility is to express an opinion with reasonable assurance on the proposed appropriations of the company’s profit or loss and on the administra-tion based on our audit. We conducted the audit in accordance with generally accepted auditing standards in Sweden. As a basis for our opinion on the Board of Directors’ proposed appropriations of the company’s profit or loss, we exa-mined the Board of Directors’ reasoned statement and a selection of sup-porting evidence in order to be able to assess whether the proposal is in accor-dance with the Companies Act.
As a basis for our opinion concerning discharge from liability, in addition to our audit of the annual accounts and consolidated accounts, we examined signifi-cant decisions, actions taken and circumstances of the company in order to determine whether any member of the Board of Directors or the Managing Director is liable to the company. We also examined whether any member of the Board of Directors or the Managing Director has, in any other way, acted in cont-ravention of the Companies Act, the Annual Accounts Act or the Articles of Association.
We believe that the audit evidence we have obtained is sufficient and appropri-ate to provide a basis for our opinions.
Furthermore, we have read the corporate governance statement and based on that reading and our knowledge of the company and the group we believe that we have a sufficient basis for our opinions. This means that our statutory exami-nation of the corporate governance statement is different and substantially less in scope than an audit conducted in accordance with International Standards on Auditing and generally accepted auditing standards in Sweden.
OpinionsWe recommend to the annual meeting of shareholders that the profit be appro-priated in accordance with the proposal in the statutory administration report and that the members of the Board of Directors and the Managing Director be discharged from liability for the financial year.
A corporate governance statement has been prepared, and its statutory con-tent is consistent with the other parts of the annual accounts and consolidated accounts.
Getinge 18 February 2014 Öhrlings PricewaterhouseCoopers AB
Magnus Willfors Eric Salander Authorized Public Accountant Authorized Public Accountant Chief Auditor
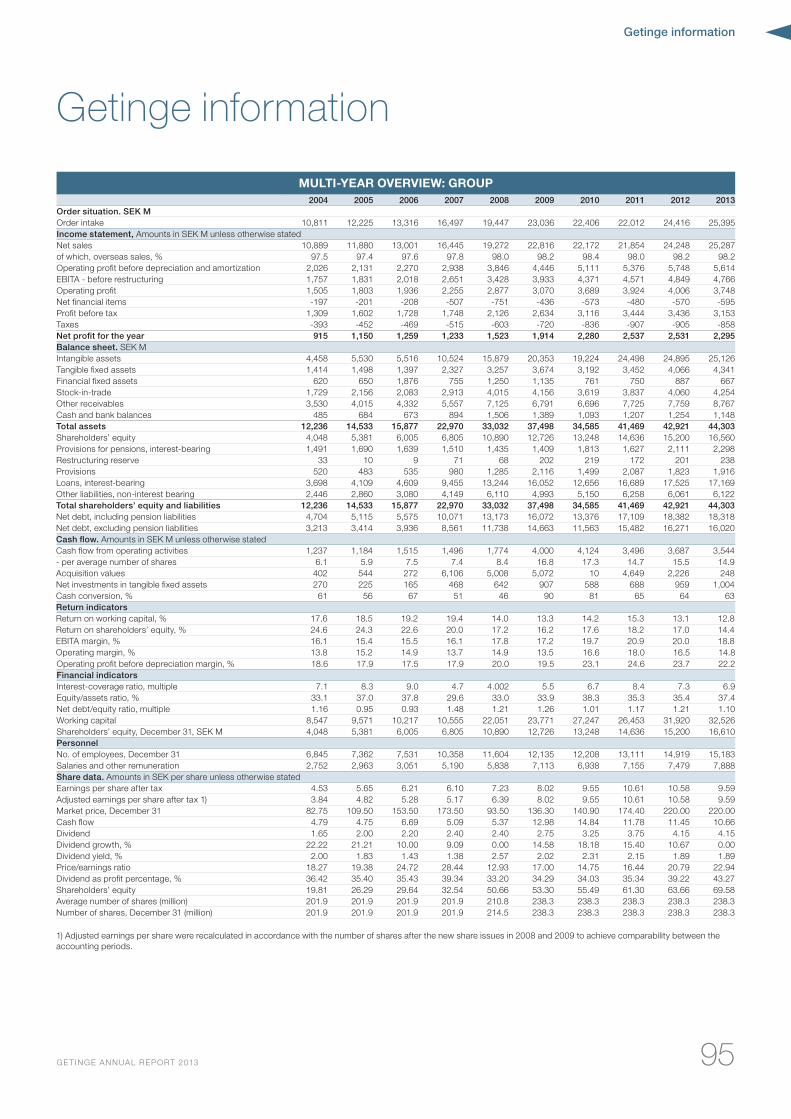
Getinge information
95GE TINGE ANNUAL REPORT 2013
MULTI-YEAR OVERVIEW: GROUP 2004 2005 2006 2007 2008 2009 2010 2011 2012 2013
Order situation. SEK MOrder intake 10,811 12,225 13,316 16,497 19,447 23,036 22,406 22,012 24,416 25,395Income statement, Amounts in SEK M unless otherwise statedNet sales 10,889 11,880 13,001 16,445 19,272 22,816 22,172 21,854 24,248 25,287of which, overseas sales, % 97.5 97.4 97.6 97.8 98.0 98.2 98.4 98.0 98.2 98.2Operating profit before depreciation and amortization 2,026 2,131 2,270 2,938 3,846 4,446 5,111 5,376 5,748 5,614EBITA - before restructuring 1,757 1,831 2,018 2,651 3,428 3,933 4,371 4,571 4,849 4,766Operating profit 1,505 1,803 1,936 2,255 2,877 3,070 3,689 3,924 4,006 3,748Net financial items -197 -201 -208 -507 -751 -436 -573 -480 -570 -595Profit before tax 1,309 1,602 1,728 1,748 2,126 2,634 3,116 3,444 3,436 3,153Taxes -393 -452 -469 -515 -603 -720 -836 -907 -905 -858Net profit for the year 915 1,150 1,259 1,233 1,523 1,914 2,280 2,537 2,531 2,295Balance sheet. SEK MIntangible assets 4,458 5,530 5,516 10,524 15,879 20,353 19,224 24,498 24,895 25,126Tangible fixed assets 1,414 1,498 1,397 2,327 3,257 3,674 3,192 3,452 4,066 4,341Financial fixed assets 620 650 1,876 755 1,250 1,135 761 750 887 667Stock-in-trade 1,729 2,156 2,083 2,913 4,015 4,156 3,619 3,837 4,060 4,254Other receivables 3,530 4,015 4,332 5,557 7,125 6,791 6,696 7,725 7,759 8,767Cash and bank balances 485 684 673 894 1,506 1,389 1,093 1,207 1,254 1,148Total assets 12,236 14,533 15,877 22,970 33,032 37,498 34,585 41,469 42,921 44,303Shareholders’ equity 4,048 5,381 6,005 6,805 10,890 12,726 13,248 14,636 15,200 16,560Provisions for pensions, interest-bearing 1,491 1,690 1,639 1,510 1,435 1,409 1,813 1,627 2,111 2,298Restructuring reserve 33 10 9 71 68 202 219 172 201 238Provisions 520 483 535 980 1,285 2,116 1,499 2,087 1,823 1,916Loans, interest-bearing 3,698 4,109 4,609 9,455 13,244 16,052 12,656 16,689 17,525 17,169Other liabilities, non-interest bearing 2,446 2,860 3,080 4,149 6,110 4,993 5,150 6,258 6,061 6,122Total shareholders’ equity and liabilities 12,236 14,533 15,877 22,970 33,032 37,498 34,585 41,469 42,921 44,303Net debt, including pension liabilities 4,704 5,115 5,575 10,071 13,173 16,072 13,376 17,109 18,382 18,318Net debt, excluding pension liabilities 3,213 3,414 3,936 8,561 11,738 14,663 11,563 15,482 16,271 16,020Cash flow. Amounts in SEK M unless otherwise statedCash flow from operating activities 1,237 1,184 1,515 1,496 1,774 4,000 4,124 3,496 3,687 3,544- per average number of shares 6.1 5.9 7.5 7.4 8.4 16.8 17.3 14.7 15.5 14.9Acquisition values 402 544 272 6,106 5,008 5,072 10 4,649 2,226 248Net investments in tangible fixed assets 270 225 165 468 642 907 588 688 959 1,004Cash conversion, % 61 56 67 51 46 90 81 65 64 63Return indicatorsReturn on working capital, % 17.6 18.5 19.2 19.4 14.0 13.3 14.2 15.3 13.1 12.8Return on shareholders’ equity, % 24.6 24.3 22.6 20.0 17.2 16.2 17.6 18.2 17.0 14.4EBITA margin, % 16.1 15.4 15.5 16.1 17.8 17.2 19.7 20.9 20.0 18.8Operating margin, % 13.8 15.2 14.9 13.7 14.9 13.5 16.6 18.0 16.5 14.8Operating profit before depreciation margin, % 18.6 17.9 17.5 17.9 20.0 19.5 23.1 24.6 23.7 22.2Financial indicatorsInterest-coverage ratio, multiple 7.1 8.3 9.0 4.7 4.002 5.5 6.7 8.4 7.3 6.9Equity/assets ratio, % 33.1 37.0 37.8 29.6 33.0 33.9 38.3 35.3 35.4 37.4Net debt/equity ratio, multiple 1.16 0.95 0.93 1.48 1.21 1.26 1.01 1.17 1.21 1.10Working capital 8,547 9,571 10,217 10,555 22,051 23,771 27,247 26,453 31,920 32,526Shareholders’ equity, December 31, SEK M 4,048 5,381 6,005 6,805 10,890 12,726 13,248 14,636 15,200 16,610PersonnelNo. of employees, December 31 6,845 7,362 7,531 10,358 11,604 12,135 12,208 13,111 14,919 15,183Salaries and other remuneration 2,752 2,963 3,051 5,190 5,838 7,113 6,938 7,155 7,479 7,888Share data. Amounts in SEK per share unless otherwise statedEarnings per share after tax 4.53 5.65 6.21 6.10 7.23 8.02 9.55 10.61 10.58 9.59Adjusted earnings per share after tax 1) 3.84 4.82 5.28 5.17 6.39 8.02 9.55 10.61 10.58 9.59Market price, December 31 82.75 109.50 153.50 173.50 93.50 136.30 140.90 174.40 220.00 220.00Cash flow 4.79 4.75 6.69 5.09 5.37 12.98 14.84 11.78 11.45 10.66Dividend 1.65 2.00 2.20 2.40 2.40 2.75 3.25 3.75 4.15 4.15Dividend growth, % 22.22 21.21 10.00 9.09 0.00 14.58 18.18 15.40 10.67 0.00Dividend yield, % 2.00 1.83 1.43 1.38 2.57 2.02 2.31 2.15 1.89 1.89Price/earnings ratio 18.27 19.38 24.72 28.44 12.93 17.00 14.75 16.44 20.79 22.94Dividend as profit percentage, % 36.42 35.40 35.43 39.34 33.20 34.29 34.03 35.34 39.22 43.27Shareholders’ equity 19.81 26.29 29.64 32.54 50.66 53.30 55.49 61.30 63.66 69.58Average number of shares (million) 201.9 201.9 201.9 201.9 210.8 238.3 238.3 238.3 238.3 238.3Number of shares, December 31 (million) 201.9 201.9 201.9 201.9 214.5 238.3 238.3 238.3 238.3 238.3
1) Adjusted earnings per share were recalculated in accordance with the number of shares after the new share issues in 2008 and 2009 to achieve comparability between the accounting periods.
Getinge information
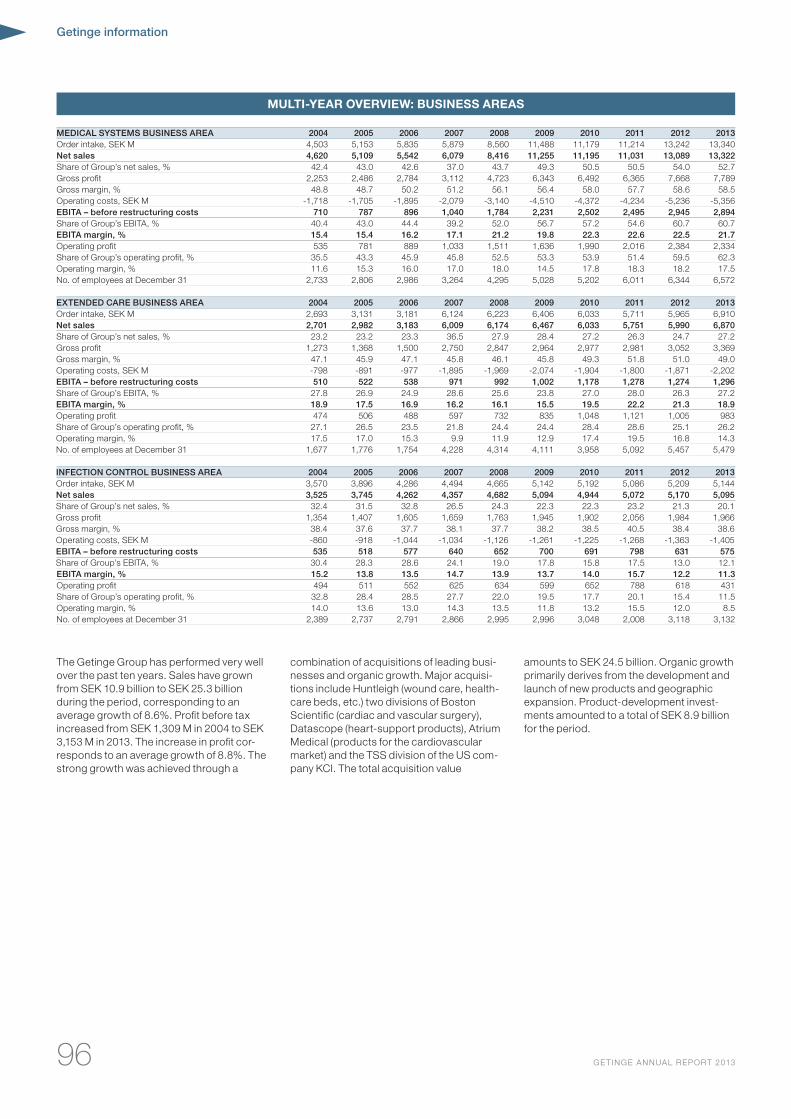
Getinge information
96 GE TINGE ANNUAL REPORT 2013
The Getinge Group has performed very well over the past ten years. Sales have grown from SEK 10.9 billion to SEK 25.3 billion during the period, corresponding to an average growth of 8.6%. Profit before tax increased from SEK 1,309 M in 2004 to SEK 3,153 M in 2013. The increase in profit cor-responds to an average growth of 8.8%. The strong growth was achieved through a
combination of acquisitions of leading busi-nesses and organic growth. Major acquisi-tions include Huntleigh (wound care, health-care beds, etc.) two divisions of Boston Scientific (cardiac and vascular surgery), Datascope (heart-support products), Atrium Medical (products for the cardiovascular market) and the TSS division of the US com-pany KCI. The total acquisition value
amounts to SEK 24.5 billion. Organic growth primarily derives from the development and launch of new products and geographic expansion. Product-development invest-ments amounted to a total of SEK 8.9 billion for the period.
MULTI-YEAR OVERVIEW: BUSINESS AREAS
MEDICAL SYSTEMS BUSINESS AREA 2004 2005 2006 2007 2008 2009 2010 2011 2012 2013Order intake, SEK M 4,503 5,153 5,835 5,879 8,560 11,488 11,179 11,214 13,242 13,340Net sales 4,620 5,109 5,542 6,079 8,416 11,255 11,195 11,031 13,089 13,322Share of Group’s net sales, % 42.4 43.0 42.6 37.0 43.7 49.3 50.5 50.5 54.0 52.7Gross profit 2,253 2,486 2,784 3,112 4,723 6,343 6,492 6,365 7,668 7,789Gross margin, % 48.8 48.7 50.2 51.2 56.1 56.4 58.0 57.7 58.6 58.5Operating costs, SEK M -1,718 -1,705 -1,895 -2,079 -3,140 -4,510 -4,372 -4,234 -5,236 -5,356EBITA – before restructuring costs 710 787 896 1,040 1,784 2,231 2,502 2,495 2,945 2,894Share of Group’s EBITA, % 40.4 43.0 44.4 39.2 52.0 56.7 57.2 54.6 60.7 60.7EBITA margin, % 15.4 15.4 16.2 17.1 21.2 19.8 22.3 22.6 22.5 21.7Operating profit 535 781 889 1,033 1,511 1,636 1,990 2,016 2,384 2,334Share of Group’s operating profit, % 35.5 43.3 45.9 45.8 52.5 53.3 53.9 51.4 59.5 62.3Operating margin, % 11.6 15.3 16.0 17.0 18.0 14.5 17.8 18.3 18.2 17.5No. of employees at December 31 2,733 2,806 2,986 3,264 4,295 5,028 5,202 6,011 6,344 6,572
EXTENDED CARE BUSINESS AREA 2004 2005 2006 2007 2008 2009 2010 2011 2012 2013Order intake, SEK M 2,693 3,131 3,181 6,124 6,223 6,406 6,033 5,711 5,965 6,910Net sales 2,701 2,982 3,183 6,009 6,174 6,467 6,033 5,751 5,990 6,870Share of Group’s net sales, % 23.2 23.2 23.3 36.5 27.9 28.4 27.2 26.3 24.7 27.2Gross profit 1,273 1,368 1,500 2,750 2,847 2,964 2,977 2,981 3,052 3,369Gross margin, % 47.1 45.9 47.1 45.8 46.1 45.8 49.3 51.8 51.0 49.0Operating costs, SEK M -798 -891 -977 -1,895 -1,969 -2,074 -1,904 -1,800 -1,871 -2,202EBITA – before restructuring costs 510 522 538 971 992 1,002 1,178 1,278 1,274 1,296Share of Group’s EBITA, % 27.8 26.9 24.9 28.6 25.6 23.8 27.0 28.0 26.3 27.2EBITA margin, % 18.9 17.5 16.9 16.2 16.1 15.5 19.5 22.2 21.3 18.9Operating profit 474 506 488 597 732 835 1,048 1,121 1,005 983Share of Group’s operating profit, % 27.1 26.5 23.5 21.8 24.4 24.4 28.4 28.6 25.1 26.2Operating margin, % 17.5 17.0 15.3 9.9 11.9 12.9 17.4 19.5 16.8 14.3No. of employees at December 31 1,677 1,776 1,754 4,228 4,314 4,111 3,958 5,092 5,457 5,479
INFECTION CONTROL BUSINESS AREA 2004 2005 2006 2007 2008 2009 2010 2011 2012 2013Order intake, SEK M 3,570 3,896 4,286 4,494 4,665 5,142 5,192 5,086 5,209 5,144Net sales 3,525 3,745 4,262 4,357 4,682 5,094 4,944 5,072 5,170 5,095Share of Group’s net sales, % 32.4 31.5 32.8 26.5 24.3 22.3 22.3 23.2 21.3 20.1Gross profit 1,354 1,407 1,605 1,659 1,763 1,945 1,902 2,056 1,984 1,966Gross margin, % 38.4 37.6 37.7 38.1 37.7 38.2 38.5 40.5 38.4 38.6Operating costs, SEK M -860 -918 -1,044 -1,034 -1,126 -1,261 -1,225 -1,268 -1,363 -1,405EBITA – before restructuring costs 535 518 577 640 652 700 691 798 631 575Share of Group’s EBITA, % 30.4 28.3 28.6 24.1 19.0 17.8 15.8 17.5 13.0 12.1EBITA margin, % 15.2 13.8 13.5 14.7 13.9 13.7 14.0 15.7 12.2 11.3Operating profit 494 511 552 625 634 599 652 788 618 431Share of Group’s operating profit, % 32.8 28.4 28.5 27.7 22.0 19.5 17.7 20.1 15.4 11.5Operating margin, % 14.0 13.6 13.0 14.3 13.5 11.8 13.2 15.5 12.0 8.5No. of employees at December 31 2,389 2,737 2,791 2,866 2,995 2,996 3,048 2,008 3,118 3,132
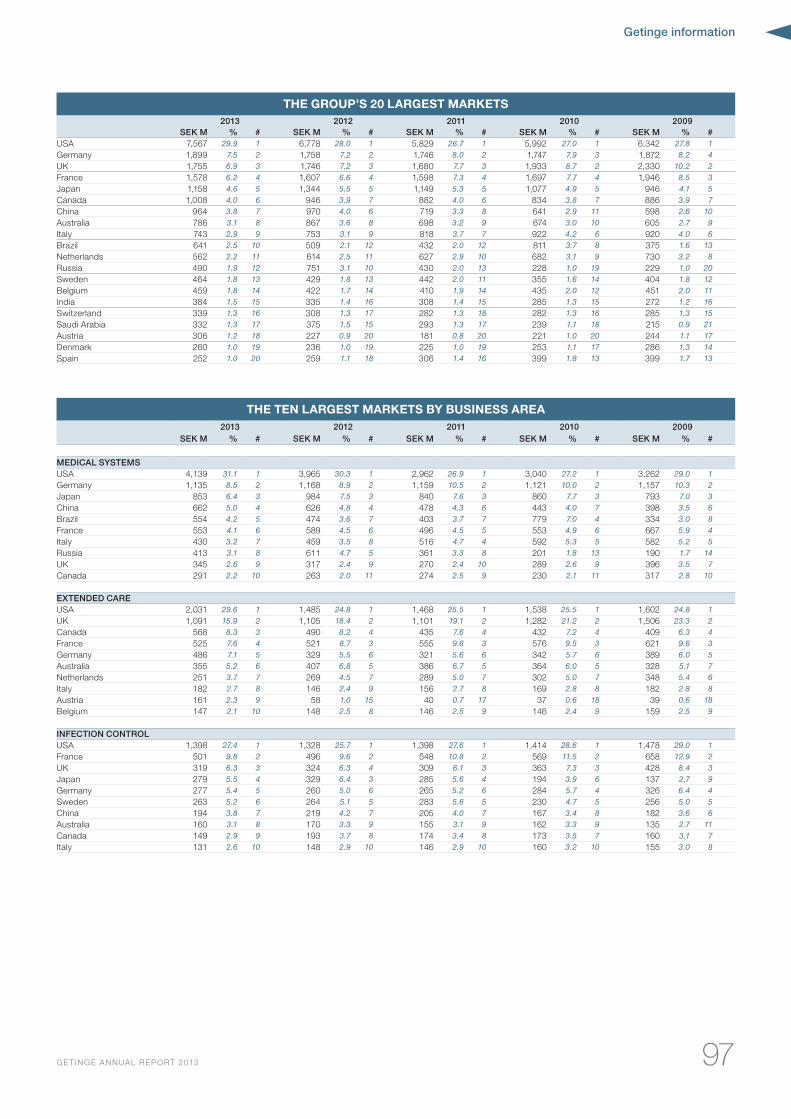
Getinge information
97GE TINGE ANNUAL REPORT 2013
THE GROUP’S 20 LARGEST MARKETS 2013 2012 2011 2010 2009
SEK M % # SEK M % # SEK M % # SEK M % # SEK M % #USA 7,567 29.9 1 6,778 28.0 1 5,829 26.7 1 5,992 27.0 1 6,342 27.8 1Germany 1,899 7.5 2 1,758 7.2 2 1,746 8.0 2 1,747 7.9 3 1,872 8.2 4UK 1,755 6.9 3 1,746 7.2 3 1,680 7.7 3 1,933 8.7 2 2,330 10.2 2France 1,578 6.2 4 1,607 6.6 4 1,598 7.3 4 1,697 7.7 4 1,946 8.5 3Japan 1,158 4.6 5 1,344 5.5 5 1,149 5.3 5 1,077 4.9 5 946 4.1 5Canada 1,008 4.0 6 946 3.9 7 882 4.0 6 834 3.8 7 886 3.9 7China 964 3.8 7 970 4.0 6 719 3.3 8 641 2.9 11 598 2.6 10Australia 786 3.1 8 867 3.6 8 698 3.2 9 674 3.0 10 605 2.7 9Italy 743 2.9 9 753 3.1 9 818 3.7 7 922 4.2 6 920 4.0 6Brazil 641 2.5 10 509 2.1 12 432 2.0 12 811 3.7 8 375 1.6 13Netherlands 562 2.2 11 614 2.5 11 627 2.9 10 682 3.1 9 730 3.2 8Russia 490 1.9 12 751 3.1 10 430 2.0 13 228 1.0 19 229 1.0 20Sweden 464 1.8 13 429 1.8 13 442 2.0 11 355 1.6 14 404 1.8 12Belgium 459 1.8 14 422 1.7 14 410 1.9 14 435 2.0 12 451 2.0 11India 384 1.5 15 335 1.4 16 308 1.4 15 285 1.3 15 272 1.2 16Switzerland 339 1.3 16 308 1.3 17 282 1.3 18 282 1.3 16 285 1.3 15Saudi Arabia 332 1.3 17 375 1.5 15 293 1.3 17 239 1.1 18 215 0.9 21Austria 306 1.2 18 227 0.9 20 181 0.8 20 221 1.0 20 244 1.1 17Denmark 260 1.0 19 236 1.0 19 225 1.0 19 253 1.1 17 286 1.3 14Spain 252 1.0 20 259 1.1 18 306 1.4 16 399 1.8 13 399 1.7 13
THE TEN LARGEST MARKETS BY BUSINESS AREA 2013 2012 2011 2010 2009
SEK M % # SEK M % # SEK M % # SEK M % # SEK M % #
MEDICAL SYSTEMSUSA 4,139 31.1 1 3,965 30.3 1 2,962 26.9 1 3,040 27.2 1 3,262 29.0 1Germany 1,135 8.5 2 1,168 8.9 2 1,159 10.5 2 1,121 10.0 2 1,157 10.3 2Japan 853 6.4 3 984 7.5 3 840 7.6 3 860 7.7 3 793 7.0 3China 662 5.0 4 626 4.8 4 478 4.3 6 443 4.0 7 398 3.5 6Brazil 554 4.2 5 474 3.6 7 403 3.7 7 779 7.0 4 334 3.0 8France 553 4.1 6 589 4.5 6 496 4.5 5 553 4.9 6 667 5.9 4Italy 430 3.2 7 459 3.5 8 516 4.7 4 592 5.3 5 582 5.2 5Russia 413 3.1 8 611 4.7 5 361 3.3 8 201 1.8 13 190 1.7 14UK 345 2.6 9 317 2.4 9 270 2.4 10 289 2.6 9 396 3.5 7Canada 291 2.2 10 263 2.0 11 274 2.5 9 230 2.1 11 317 2.8 10
EXTENDED CAREUSA 2,031 29.6 1 1,485 24.8 1 1,468 25.5 1 1,538 25.5 1 1,602 24.8 1UK 1,091 15.9 2 1,105 18.4 2 1,101 19.1 2 1,282 21.2 2 1,506 23.3 2Canada 568 8.3 3 490 8.2 4 435 7.6 4 432 7.2 4 409 6.3 4France 525 7.6 4 521 8.7 3 555 9.6 3 576 9.5 3 621 9.6 3Germany 486 7.1 5 329 5.5 6 321 5.6 6 342 5.7 6 389 6.0 5Australia 355 5.2 6 407 6.8 5 386 6.7 5 364 6.0 5 328 5.1 7Netherlands 251 3.7 7 269 4.5 7 289 5.0 7 302 5.0 7 348 5.4 6Italy 182 2.7 8 146 2.4 9 156 2.7 8 169 2.8 8 182 2.8 8Austria 161 2.3 9 58 1.0 15 40 0.7 17 37 0.6 18 39 0.6 18Belgium 147 2.1 10 148 2.5 8 146 2.5 9 146 2.4 9 159 2.5 9
INFECTION CONTROLUSA 1,398 27.4 1 1,328 25.7 1 1,398 27.6 1 1,414 28.6 1 1,478 29.0 1France 501 9.8 2 496 9.6 2 548 10.8 2 569 11.5 2 658 12.9 2UK 319 6.3 3 324 6.3 4 309 6.1 3 363 7.3 3 428 8.4 3Japan 279 5.5 4 329 6.4 3 285 5.6 4 194 3.9 6 137 2.7 9Germany 277 5.4 5 260 5.0 6 265 5.2 6 284 5.7 4 326 6.4 4Sweden 263 5.2 6 264 5.1 5 283 5.6 5 230 4.7 5 256 5.0 5China 194 3.8 7 219 4.2 7 205 4.0 7 167 3.4 8 182 3.6 6Australia 160 3.1 8 170 3.3 9 155 3.1 9 162 3.3 9 135 2.7 11Canada 149 2.9 9 193 3.7 8 174 3.4 8 173 3.5 7 160 3.1 7Italy 131 2.6 10 148 2.9 10 146 2.9 10 160 3.2 10 155 3.0 8
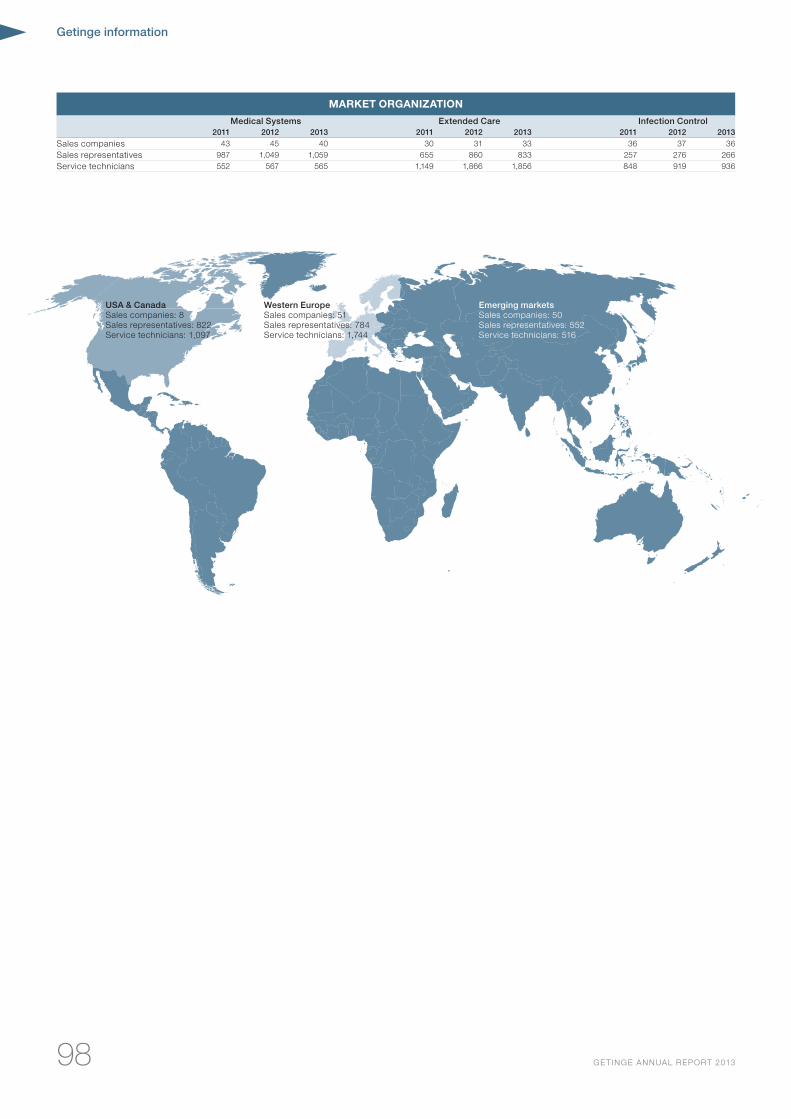
Getinge information
98 GE TINGE ANNUAL REPORT 2013
MARKET ORGANIZATION
Medical Systems Extended Care Infection Control2011 2012 2013 2011 2012 2013 2011 2012 2013
Sales companies 43 45 40 30 31 33 36 37 36Sales representatives 987 1,049 1,059 655 860 833 257 276 266Service technicians 552 567 565 1,149 1,866 1,856 848 919 936
USA & CanadaSales companies: 8Sales representatives: 822Service technicians: 1,097
Western EuropeSales companies: 51Sales representatives: 784Service technicians: 1,744
Emerging marketsSales companies: 50Sales representatives: 552Service technicians: 516
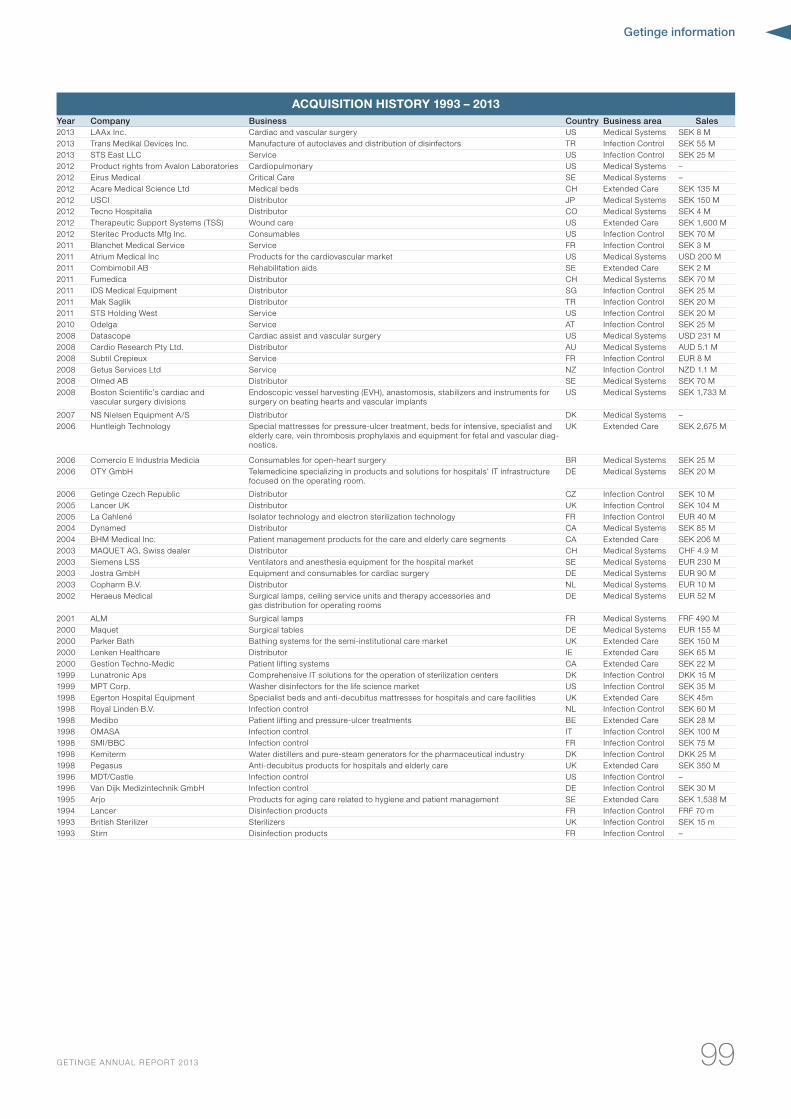
Getinge information
99GE TINGE ANNUAL REPORT 2013
ACQUISITION HISTORY 1993 – 2013Year Company Business Country Business area Sales2013 LAAx Inc. Cardiac and vascular surgery US Medical Systems SEK 8 M2013 Trans Medikal Devices Inc. Manufacture of autoclaves and distribution of disinfectors TR Infection Control SEK 55 M2013 STS East LLC Service US Infection Control SEK 25 M2012 Product rights from Avalon Laboratories Cardiopulmonary US Medical Systems –2012 Eirus Medical Critical Care SE Medical Systems –2012 Acare Medical Science Ltd Medical beds CH Extended Care SEK 135 M2012 USCI Distributor JP Medical Systems SEK 150 M2012 Tecno Hospitalia Distributor CO Medical Systems SEK 4 M2012 Therapeutic Support Systems (TSS) Wound care US Extended Care SEK 1,600 M2012 Steritec Products Mfg Inc. Consumables US Infection Control SEK 70 M2011 Blanchet Medical Service Service FR Infection Control SEK 3 M2011 Atrium Medical Inc Products for the cardiovascular market US Medical Systems USD 200 M2011 Combimobil AB Rehabilitation aids SE Extended Care SEK 2 M2011 Fumedica Distributor CH Medical Systems SEK 70 M2011 IDS Medical Equipment Distributor SG Infection Control SEK 25 M2011 Mak Saglik Distributor TR Infection Control SEK 20 M2011 STS Holding West Service US Infection Control SEK 20 M2010 Odelga Service AT Infection Control SEK 25 M2008 Datascope Cardiac assist and vascular surgery US Medical Systems USD 231 M2008 Cardio Research Pty Ltd. Distributor AU Medical Systems AUD 5.1 M2008 Subtil Crepieux Service FR Infection Control EUR 8 M2008 Getus Services Ltd Service NZ Infection Control NZD 1.1 M2008 Olmed AB Distributor SE Medical Systems SEK 70 M2008 Boston Scientific’s cardiac and
vascular surgery divisionsEndoscopic vessel harvesting (EVH), anastomosis, stabilizers and instruments for surgery on beating hearts and vascular implants
US Medical Systems SEK 1,733 M
2007 NS Nielsen Equipment A/S Distributor DK Medical Systems –2006 Huntleigh Technology Special mattresses for pressure-ulcer treatment, beds for intensive, specialist and
elderly care, vein thrombosis prophylaxis and equipment for fetal and vascular diag-nostics.
UK Extended Care SEK 2,675 M
2006 Comercio E Industria Medicia Consumables for open-heart surgery BR Medical Systems SEK 25 M2006 OTY GmbH Telemedicine specializing in products and solutions for hospitals’ IT infrastructure
focused on the operating room.DE Medical Systems SEK 20 M
2006 Getinge Czech Republic Distributor CZ Infection Control SEK 10 M2005 Lancer UK Distributor UK Infection Control SEK 104 M2005 La Cahlené Isolator technology and electron sterilization technology FR Infection Control EUR 40 M2004 Dynamed Distributor CA Medical Systems SEK 85 M2004 BHM Medical Inc. Patient management products for the care and elderly care segments CA Extended Care SEK 206 M2003 MAQUET AG, Swiss dealer Distributor CH Medical Systems CHF 4.9 M2003 Siemens LSS Ventilators and anesthesia equipment for the hospital market SE Medical Systems EUR 230 M2003 Jostra GmbH Equipment and consumables for cardiac surgery DE Medical Systems EUR 90 M2003 Copharm B.V. Distributor NL Medical Systems EUR 10 M2002 Heraeus Medical Surgical lamps, ceiling service units and therapy accessories and
gas distribution for operating roomsDE Medical Systems EUR 52 M
2001 ALM Surgical lamps FR Medical Systems FRF 490 M2000 Maquet Surgical tables DE Medical Systems EUR 155 M2000 Parker Bath Bathing systems for the semi-institutional care market UK Extended Care SEK 150 M2000 Lenken Healthcare Distributor IE Extended Care SEK 65 M2000 Gestion Techno-Medic Patient lifting systems CA Extended Care SEK 22 M1999 Lunatronic Aps Comprehensive IT solutions for the operation of sterilization centers DK Infection Control DKK 15 M1999 MPT Corp. Washer disinfectors for the life science market US Infection Control SEK 35 M1998 Egerton Hospital Equipment Specialist beds and anti-decubitus mattresses for hospitals and care facilities UK Extended Care SEK 45m1998 Royal Linden B.V. Infection control NL Infection Control SEK 60 M1998 Medibo Patient lifting and pressure-ulcer treatments BE Extended Care SEK 28 M1998 OMASA Infection control IT Infection Control SEK 100 M1998 SMI/BBC Infection control FR Infection Control SEK 75 M1998 Kemiterm Water distillers and pure-steam generators for the pharmaceutical industry DK Infection Control DKK 25 M1998 Pegasus Anti-decubitus products for hospitals and elderly care UK Extended Care SEK 350 M1996 MDT/Castle Infection control US Infection Control –1996 Van Dijk Medizintechnik GmbH Infection control DE Infection Control SEK 30 M1995 Arjo Products for aging care related to hygiene and patient management SE Extended Care SEK 1,538 M1994 Lancer Disinfection products FR Infection Control FRF 70 m1993 British Sterilizer Sterilizers UK Infection Control SEK 15 m1993 Stirn Disinfection products FR Infection Control –
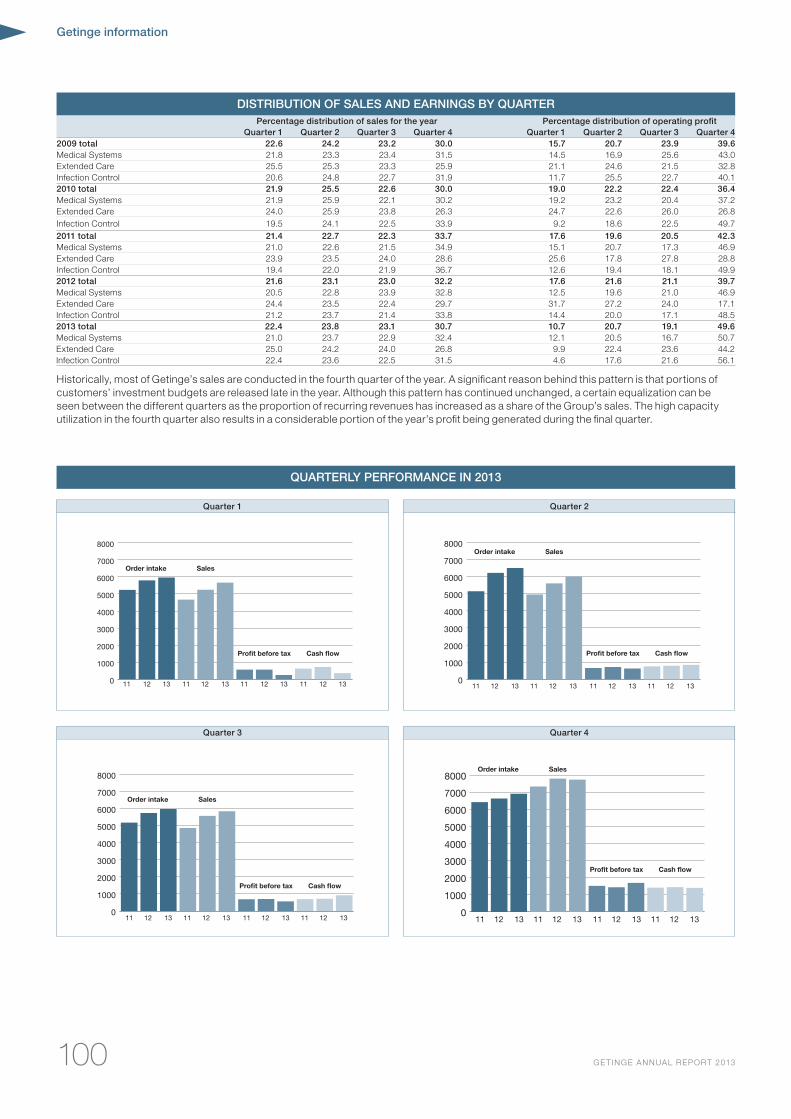
Getinge information
100 GE TINGE ANNUAL REPORT 2013
Quarter 1 Quarter 2
Quarter 3 Quarter 4
DISTRIBUTION OF SALES AND EARNINGS BY QUARTERPercentage distribution of sales for the year Percentage distribution of operating profit
Quarter 1 Quarter 2 Quarter 3 Quarter 4 Quarter 1 Quarter 2 Quarter 3 Quarter 42009 total 22.6 24.2 23.2 30.0 15.7 20.7 23.9 39.6Medical Systems 21.8 23.3 23.4 31.5 14.5 16.9 25.6 43.0Extended Care 25.5 25.3 23.3 25.9 21.1 24.6 21.5 32.8Infection Control 20.6 24.8 22.7 31.9 11.7 25.5 22.7 40.12010 total 21.9 25.5 22.6 30.0 19.0 22.2 22.4 36.4Medical Systems 21.9 25.9 22.1 30.2 19.2 23.2 20.4 37.2Extended Care 24.0 25.9 23.8 26.3 24.7 22.6 26.0 26.8Infection Control 19.5 24.1 22.5 33.9 9.2 18.6 22.5 49.72011 total 21.4 22.7 22.3 33.7 17.6 19.6 20.5 42.3Medical Systems 21.0 22.6 21.5 34.9 15.1 20.7 17.3 46.9Extended Care 23.9 23.5 24.0 28.6 25.6 17.8 27.8 28.8Infection Control 19.4 22.0 21.9 36.7 12.6 19.4 18.1 49.92012 total 21.6 23.1 23.0 32.2 17.6 21.6 21.1 39.7Medical Systems 20.5 22.8 23.9 32.8 12.5 19.6 21.0 46.9Extended Care 24.4 23.5 22.4 29.7 31.7 27.2 24.0 17.1Infection Control 21.2 23.7 21.4 33.8 14.4 20.0 17.1 48.52013 total 22.4 23.8 23.1 30.7 10.7 20.7 19.1 49.6Medical Systems 21.0 23.7 22.9 32.4 12.1 20.5 16.7 50.7Extended Care 25.0 24.2 24.0 26.8 9.9 22.4 23.6 44.2Infection Control 22.4 23.6 22.5 31.5 4.6 17.6 21.6 56.1
Historically, most of Getinge’s sales are conducted in the fourth quarter of the year. A significant reason behind this pattern is that portions of customers’ investment budgets are released late in the year. Although this pattern has continued unchanged, a certain equalization can be seen between the different quarters as the proportion of recurring revenues has increased as a share of the Group’s sales. The high capacity utilization in the fourth quarter also results in a considerable portion of the year’s profit being generated during the final quarter.
QUARTERLY PERFORMANCE IN 2013
0
1000
2000
3000
4000
5000
6000
7000
80002013
2012
2011
Cash flowProfit before tax
SalesOrder intake
1311 12 1311 12 1311 12 1311 12
130
1000
2000
3000
4000
5000
6000
7000
80002013
2012
2011
Cash flowProfit before tax
SalesOrder intake
11 12 1311 12 1311 12 1311 12
0
1000
2000
3000
4000
5000
6000
7000
80002013
2012
2011
Cash flowProfit before tax
SalesOrder intake
1311 12 1311 12 1311 12 1311 12
0
1000
2000
3000
4000
5000
6000
7000
80002013
2012
2011
Cash flowProfit before tax
SalesOrder intake
1311 12 1311 12 1311 12 1311 12
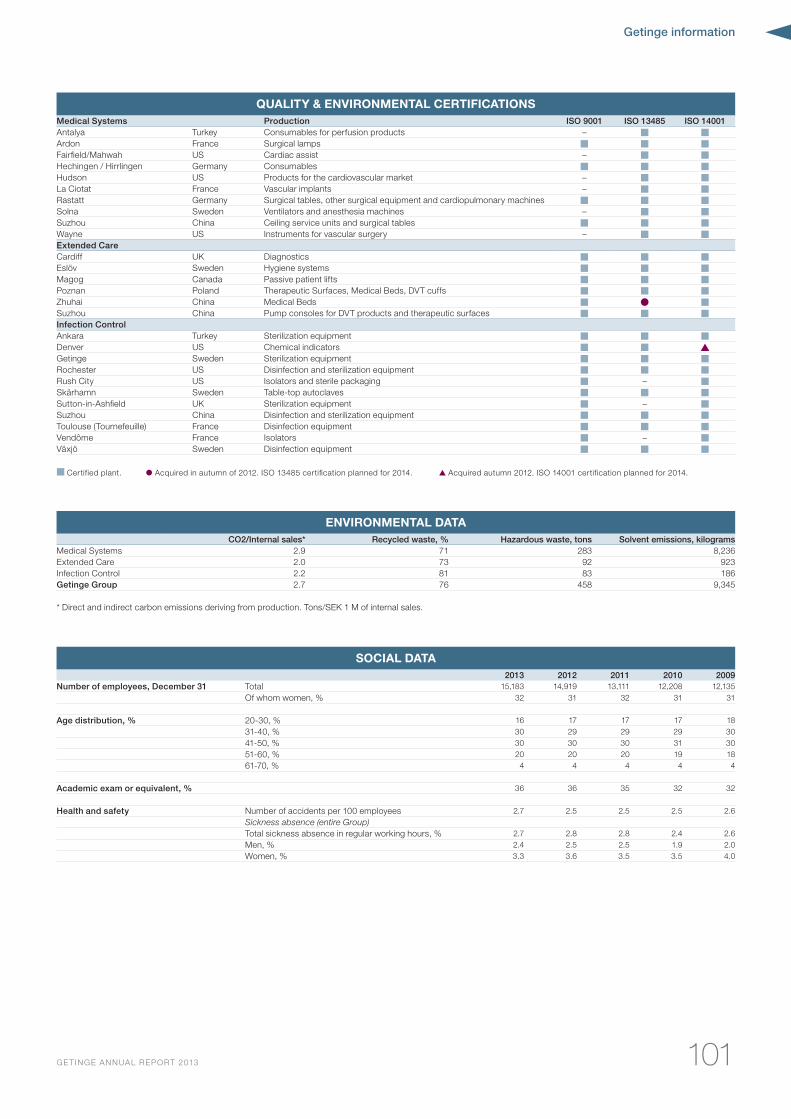
Getinge information
101GE TINGE ANNUAL REPORT 2013
QUALITY & ENVIRONMENTAL CERTIFICATIONSMedical Systems Production ISO 9001 ISO 13485 ISO 14001Antalya Turkey Consumables for perfusion products – ■ ■Ardon France Surgical lamps ■ ■ ■Fairfield/Mahwah US Cardiac assist – ■ ■Hechingen / Hirrlingen Germany Consumables ■ ■ ■Hudson US Products for the cardiovascular market – ■ ■La Ciotat France Vascular implants – ■ ■Rastatt Germany Surgical tables, other surgical equipment and cardiopulmonary machines ■ ■ ■Solna Sweden Ventilators and anesthesia machines – ■ ■Suzhou China Ceiling service units and surgical tables ■ ■ ■Wayne US Instruments for vascular surgery – ■ ■Extended CareCardiff UK Diagnostics ■ ■ ■Eslöv Sweden Hygiene systems ■ ■ ■Magog Canada Passive patient lifts ■ ■ ■Poznan Poland Therapeutic Surfaces, Medical Beds, DVT cuffs ■ ■ ■Zhuhai China Medical Beds ■ ■Suzhou China Pump consoles for DVT products and therapeutic surfaces ■ ■ ■Infection ControlAnkara Turkey Sterilization equipment ■ ■ ■Denver US Chemical indicators ■ ■ ▲Getinge Sweden Sterilization equipment ■ ■ ■Rochester US Disinfection and sterilization equipment ■ ■ ■Rush City US Isolators and sterile packaging ■ – ■Skärhamn Sweden Table-top autoclaves ■ ■ ■Sutton-in-Ashfield UK Sterilization equipment ■ – ■Suzhou China Disinfection and sterilization equipment ■ ■ ■Toulouse (Tournefeuille) France Disinfection equipment ■ ■ ■Vendôme France Isolators ■ – ■Växjö Sweden Disinfection equipment ■ ■ ■
■ Certified plant. Acquired in autumn of 2012. ISO 13485 certification planned for 2014. ▲ Acquired autumn 2012. ISO 14001 certification planned for 2014.
ENVIRONMENTAL DATACO2/Internal sales* Recycled waste, % Hazardous waste, tons Solvent emissions, kilograms
Medical Systems 2.9 71 283 8,236Extended Care 2.0 73 92 923Infection Control 2.2 81 83 186Getinge Group 2.7 76 458 9,345
* Direct and indirect carbon emissions deriving from production. Tons/SEK 1 M of internal sales.
SOCIAL DATA2013 2012 2011 2010 2009
Number of employees, December 31 Total 15,183 14,919 13,111 12,208 12,135Of whom women, % 32 31 32 31 31
Age distribution, % 20-30, % 16 17 17 17 1831-40, % 30 29 29 29 3041-50, % 30 30 30 31 3051-60, % 20 20 20 19 1861-70, % 4 4 4 4 4
Academic exam or equivalent, % 36 36 35 32 32
Health and safety Number of accidents per 100 employees 2.7 2.5 2.5 2.5 2.6Sickness absence (entire Group)Total sickness absence in regular working hours, % 2.7 2.8 2.8 2.4 2.6Men, % 2.4 2.5 2.5 1.9 2.0Women, % 3.3 3.6 3.5 3.5 4.0
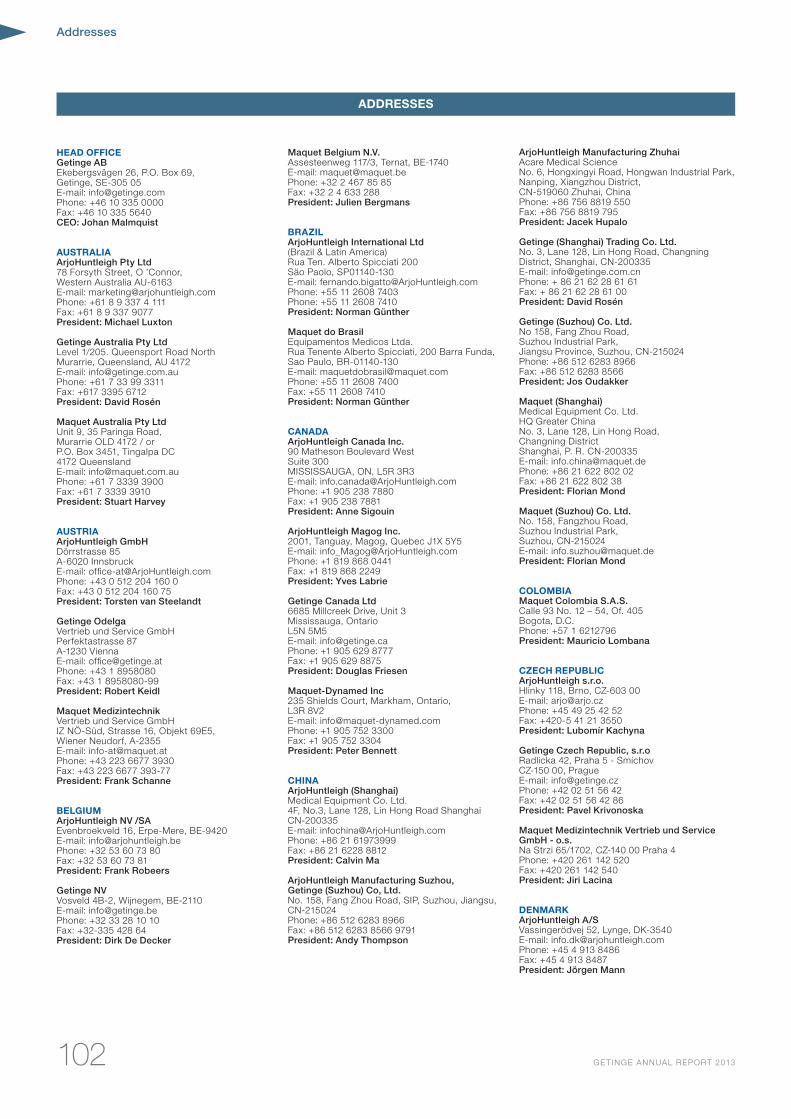
102 GE TINGE ANNUAL REPORT 2013
Addresses
HEAD OFFICEGetinge ABEkebergsvägen 26, P.O. Box 69,Getinge, SE-305 05E-mail: [email protected]: +46 10 335 0000Fax: +46 10 335 5640CEO: Johan Malmquist
AUSTRALIAArjoHuntleigh Pty Ltd78 Forsyth Street, O ’Connor,Western Australia AU-6163E-mail: [email protected]: +61 8 9 337 4 111Fax: +61 8 9 337 9077President: Michael Luxton
Getinge Australia Pty LtdLevel 1/205. Queensport Road NorthMurarrie, Queensland, AU 4172E-mail: [email protected]: +61 7 33 99 3311Fax: +617 3395 6712President: David Rosén
Maquet Australia Pty LtdUnit 9, 35 Paringa Road,Murarrie OLD 4172 / orP.O. Box 3451, Tingalpa DC4172 QueenslandE-mail: [email protected]: +61 7 3339 3900Fax: +61 7 3339 3910President: Stuart Harvey
AUSTRIAArjoHuntleigh GmbHDörrstrasse 85A-6020 InnsbruckE-mail: [email protected]: +43 0 512 204 160 0Fax: +43 0 512 204 160 75President: Torsten van Steelandt
Getinge OdelgaVertrieb und Service GmbHPerfektastrasse 87A-1230 ViennaE-mail: [email protected]: +43 1 8958080Fax: +43 1 8958080-99President: Robert Keidl
Maquet MedizintechnikVertrieb und Service GmbHIZ NÖ-Süd, Strasse 16, Objekt 69E5,Wiener Neudorf, A-2355E-mail: [email protected]: +43 223 6677 3930Fax: +43 223 6677 393-77President: Frank Schanne
BELGIUMArjoHuntleigh NV /SAEvenbroekveld 16, Erpe-Mere, BE-9420E-mail: [email protected]: +32 53 60 73 80Fax: +32 53 60 73 81President: Frank Robeers
Getinge NVVosveld 4B-2, Wijnegem, BE-2110E-mail: [email protected]: +32 33 28 10 10Fax: +32-335 428 64President: Dirk De Decker
Maquet Belgium N.V.Assesteenweg 117/3, Ternat, BE-1740E-mail: [email protected]: +32 2 467 85 85Fax: +32 2 4 633 288President: Julien Bergmans
BRAzILArjoHuntleigh International Ltd(Brazil & Latin America)Rua Ten. Alberto Spicciati 200Säo Paolo, SP01140-130E-mail: [email protected]: +55 11 2608 7403Phone: +55 11 2608 7410President: Norman Günther
Maquet do BrasilEquipamentos Medicos Ltda.Rua Tenente Alberto Spicciati, 200 Barra Funda,Sao Paulo, BR-01140-130E-mail: [email protected]: +55 11 2608 7400Fax: +55 11 2608 7410President: Norman Günther
CANADAArjoHuntleigh Canada Inc.90 Matheson Boulevard WestSuite 300MISSISSAUGA, ON, L5R 3R3E-mail: [email protected]: +1 905 238 7880Fax: +1 905 238 7881President: Anne Sigouin
ArjoHuntleigh Magog Inc.2001, Tanguay, Magog, Quebec J1X 5Y5E-mail: [email protected]: +1 819 868 0441Fax: +1 819 868 2249President: Yves Labrie
Getinge Canada Ltd6685 Millcreek Drive, Unit 3Mississauga, OntarioL5N 5M5E-mail: [email protected]: +1 905 629 8777Fax: +1 905 629 8875President: Douglas Friesen
Maquet-Dynamed Inc235 Shields Court, Markham, Ontario,L3R 8V2E-mail: [email protected]: +1 905 752 3300Fax: +1 905 752 3304President: Peter Bennett
CHINAArjoHuntleigh (Shanghai)Medical Equipment Co. Ltd.4F, No.3, Lane 128, Lin Hong Road ShanghaiCN-200335E-mail: [email protected]: +86 21 61973999Fax: +86 21 6228 8812President: Calvin Ma
ArjoHuntleigh Manufacturing Suzhou, Getinge (Suzhou) Co, Ltd. No. 158, Fang Zhou Road, SIP, Suzhou, Jiangsu, CN-215024 Phone: +86 512 6283 8966 Fax: +86 512 6283 8566 9791 President: Andy Thompson
ArjoHuntleigh Manufacturing ZhuhaiAcare Medical ScienceNo. 6, Hongxingyi Road, Hongwan Industrial Park,Nanping, Xiangzhou District,CN-519060 Zhuhai, ChinaPhone: +86 756 8819 550Fax: +86 756 8819 795President: Jacek Hupalo
Getinge (Shanghai) Trading Co. Ltd.No. 3, Lane 128, Lin Hong Road, ChangningDistrict, Shanghai, CN-200335E-mail: [email protected]: + 86 21 62 28 61 61Fax: + 86 21 62 28 61 00President: David Rosén
Getinge (Suzhou) Co. Ltd.No 158, Fang Zhou Road,Suzhou Industrial Park,Jiangsu Province, Suzhou, CN-215024Phone: +86 512 6283 8966Fax: +86 512 6283 8566President: Jos Oudakker
Maquet (Shanghai)Medical Equipment Co. Ltd.HQ Greater ChinaNo. 3, Lane 128, Lin Hong Road,Changning DistrictShanghai, P. R. CN-200335E-mail: [email protected]: +86 21 622 802 02Fax: +86 21 622 802 38President: Florian Mond
Maquet (Suzhou) Co. Ltd.No. 158, Fangzhou Road,Suzhou Industrial Park,Suzhou, CN-215024E-mail: [email protected]: Florian Mond
COLOMBIAMaquet Colombia S.A.S.Calle 93 No. 12 – 54, Of. 405Bogota, D.C.Phone: +57 1 6212796President: Mauricio Lombana
CzECH REPUBLICArjoHuntleigh s.r.o.Hlinky 118, Brno, CZ-603 00E-mail: [email protected]: +45 49 25 42 52Fax: +420-5 41 21 3550President: Lubomír Kachyna
Getinge Czech Republic, s.r.oRadlicka 42, Praha 5 - SmíchovCZ-150 00, PragueE-mail: [email protected]: +42 02 51 56 42Fax: +42 02 51 56 42 86President: Pavel Krivonoska
Maquet Medizintechnik Vertrieb und ServiceGmbH - o.s.Na Strzi 65/1702, CZ-140 00 Praha 4Phone: +420 261 142 520Fax: +420 261 142 540President: Jiri Lacina
DENMARKArjoHuntleigh A/SVassingerödvej 52, Lynge, DK-3540E-mail: [email protected]: +45 4 913 8486Fax: +45 4 913 8487President: Jörgen Mann
ADDRESSES
103GE TINGE ANNUAL REPORT 2013
Addresses
Getinge Danmark A/SIndustriparken 44B, Ballerup, DK-2750E-mail: [email protected]: +45 459 32 727Fax: +45 459 34 120President: Ole Mortensen
Getinge IT Solutions ApSAmaliegade 4DK-1256 Copenhagen KE-mail: [email protected]: +45 33 33 88 55Fax: +45 33 33 88 70President: Michael Lunau
Maquet Danmark A/SIndustriparken 44 B, 1 sal.DK-2750 BallerupE-mail: [email protected]: +45 4694 4216Fax: +45 4468 1566President: Magnus Back
FINLANDArjoHuntleigh OYVanha Porvoontie 229FI-01380 VantaaPhone: +358 9 4730 4320Fax: +358 9 4730 4999
Getinge Finland OyNiittykatu 8, Espoo, FI-02200E-mail: [email protected]: +358 96 82 41 20Fax: +358-96 82 41 22President: Peter Holmberg
Maquet Finland OYNiittykatu 8, Espoo, FI-02200President: Magnus Back
FRANCEArjoHuntleigh SAS2 Avenue Alcide de GasperiCS 7013359436 RONCQ CEDEXFranceE-mail: [email protected]: +33 320 281 313Fax: +33-320 281 314President: Edouard Wang
Getinge France SAS7 avenue du CanadaCS2004991978 Courtaboeuf les Ulis CedexE-mail: [email protected]: +33 164 868 900Fax: +33 164 868 989President: Stephane Le Roy
Getinge Infection Control SAS30, Bld de l’Industrie, ZI Pahin, Tournefeuille,FR-31170Phone: +33 56 11 55 764Fax: +33 56 11 51 616President: Alain Sayag
Getinge-La Calhène France1, Rue du Comté de Donegal, Vendome Cedex,FR-41102Phone: +33 2 54 734 747Fax: +33 2 54 734 748President: Thierry Girard
Getinge Lancer SAS30 Boulevard de l’Industrie, ZI PahinFR-31170 TournefeuilleE-mail: [email protected]: +33 5 61 15 11 11Fax: +33 5 61 15 16 16President: Alain Sayag
Maquet SASParc de Limère, Avenue de la Pomme de Pin,Ardon,FR-45074 Orleans, Cedex 2Phone: +33 2 38 25 88 88Fax: +33 2 38 25 88 00President: Frédéric Pette
GERMANYArjoHuntleigh GmbHPeter-Sander-Strasse 10, Mainz-Kastel,DE-55252E-mail: [email protected]: +49 6134 1860Fax: +49 6134 18 6160President: Matthias Brumm
Getinge Vertrieb und Service GmbHKehler Strasse 31, Rastatt, DE-76437Phone: + 49 7222 932 645Fax: + 49 7222 932 19645President: Martin Ballauf
Maquet Holding B.V & Co. KGKehler Strasse 31, DE 76437 RastattE-mail: [email protected]: +49 7222 932 0Fax: +49 7222 932 571CEO: Heinz JacquiMD: Michael Rieder/Reinhard Mayer
Maquet Cardiopulmonary AGKehler Strasse 31,DE 76437 RastattE-mail: [email protected]: +49 7222 932 0Fax: +49 7222 932 100President: Hartmut Schmid
Maquet GmbHKehler Strasse 31,DE-76437 RastattE-mail: [email protected]: +49 7222 932 0Fax: +49 7222 932 571VD Surgical Workplaces: Markus Medart
Maquet Vertrieb und ServiceDeutschland GmbHKehler Strasse 31, DE-76437 RastattE-mail: [email protected]: +49 1803 2121 33Fax: +49 1803 2121 77President: Frank Schanne
MAQUET Hospital Solutions GmbHKehler Strasse 31, DE-76437 RastattPhone: +49 7222 932 0Fax: +49 7222 932 828President: Björn Werner
HONG KONGArjoHuntleigh (Hong Kong) Limited1510-17, 15/F, Tower 2, Kowloon CommerceCentre,51 Kwai Cheong Road, Kwai Chung, NTE-mail: [email protected]: +852 2207 6363Fax: +852 2207 6368President: Robert de Deugd
Getinge Hong Kong Co., Ltd.1510-17, 15/F, Tower 2, Kowloon CommerceCentre,51 Kwai Cheong Road, Kwai Chung, NTE-mail: [email protected]: +852 2207 6328Fax: +852 2207 6338President: David Rosén
Maquet Hong Kong Ltd1510-17, 15/F, Tower 2, Kowloon CommerceCentre,51 Kwai Cheong Road, Kwai Chung, NTE-mail: [email protected]: +852 2207 6111Fax: +852-2207 6112President: Florian Mond
INDIAArjoHuntleigh Healthcare India Pve Ltd.Plot No. 8, Shah Industrial Estate,Off Veera Desai Road, Andheri (West)Mumbai, IN-400053E-mail: [email protected]: + 91 22 6694 6697Fax: + 91 22 2673 4244President: Chander Tahiliani
Getinge India Pvt. Limited8, Shah Industrial Estate,Off Veera Desai Road, Andheri (West)Mumbai, IN-400053E-mail: [email protected]: + 91 22 4260 8000Fax: + 91 22 4260 8010President: Anant Agarwal
Maquet Medical India Pvt. Ltd2nd & 3rd Floor, “Mehta Trade Centre”, No.1,Shivaji Colony, Plot No.94, CTS No. 306,Sir Mathuradass Vissanji Road,(Andheri Kurla Rd.)Andheri (East) Mumbai, IN – 400 099Phone: +91 22 406 921 00Fax: +91 22 406 92 150President: Ashim Purohit
IRELANDArjoHuntleigh Ireland Ltd19 Heron Road, Sydenham Business Park, Unit16-18,Belfast BT3 9LEE-mail: [email protected]: +44 28 9050 2000Fax: +44 28 9050 2001President: William Dorrian
ArjoHuntleigh Ireland LtdEA HouseDamastown Industrial AreaDublin 15E-mail: [email protected]: +353 01 809 8960Fax: +353 01 8098971President: William Dorrian
Maquet IrelandB6 Calmount Park, Ballymount, Dublin 12E-mail: [email protected]: +353 1 426 0032Fax: +353 1 426 0033President: Avril Forde
ITALYArjoHuntleigh S.p.A.Via di Tor Vergata 432, Rome, IT-00133E-mail: [email protected]: +39 06 87426211Fax: + 39 06 874 262 22President: Emanuele Gribaudo
Getinge S.p.A.Via dei Buonvisi 61/D, Rome, IT-00148E-mail: [email protected]: +39 066 56 631Fax: +39 066 56 63203President: Michele Neirotti
104 GE TINGE ANNUAL REPORT 2013
Maquet Italia S.p.A.Via Gozzano 14, Cinisello Balsamo,Milan, IT-20092E-mail: [email protected]: +39 026 111 351Fax: +39 026 111 35 260President: Sandro Lombardi
JAPANGetinge Japan K.K.3-9-2 Tatsumi, Koto-kuTokyo, JP-135-0053E-mail: [email protected]: +81 3 6758 2280Fax: +81 3 6758 2289President: Masaru Kaneko
ArjoHuntleigh Japan OfficeShibuya 3-5-16, 3chome-Square Building 2F,Shibuya, Tokyo 150-0002Phone: +81 3 6868 7397Mobile: 81 80 6591 4771Email: [email protected]
Maquet Japan K.K.Sphere Tower Tennoz 23F2-2-8 Higashi-shinagawa, Shinagawa-kuTokyo 140-0002E-mail: [email protected]: +81 3 5463 8310Fax: +81 3 5463 6856President: Hideaki Yamashita
KOREAArjoHuntleigh Korea Co. Ltd.13F GeumKang Bldg,681 Yeoksam-dong,Gangnam-gu, Seoul 135-916Phone: +82 2567 6501Fax: +82 2576 1770E-mail: [email protected]: Jae In Park
Getinge Korea Co. Ltd.11F Shinil Bldg., 64-5Chungmu-ro 2-ga, Jung-gu100-861, SeoulPhone: +82 273 914 60Fax: +82 273 914 63President: David Rosén
Maquet Medical Korea Co., Ltd.13F, KeumKang Building, 304, Bongeunsa-roGangnam-gu, Seoul 135-916Phone: +82 255 822 71Fax: +82 255 822 84President: Philippe Rocher
MEXICOMaquet Mexicana, S. de R.L. de C.V.World Trade CenterCalle de Montecito no 38, piso 10,oficina 17, Colonia Nápoles,03810, México, D.F.E-mail: [email protected]: +52 55 9000 8970Fax: +52 55 9000 8970President: Daniel Merlo
NETHERLANDSArjoHuntleigh Netherlands BVBiezenwei 21, MB Tiel, NL-3334KAE-mail: [email protected]: +31 344 640 800Fax: +31 344 640 885President: Mattias Lundin
Getinge B.V.Fruiteniersstraat 27, Zwijndrecht, NL-3334E-mail: [email protected]: +31-786 102 433Fax: +31-786 101 582President: Bettina Quaedvlieg
Maquet Netherlands B.V.Oscar Romerolaan 3, TJ Hilversum, NL-1216E-mail: [email protected]: +31 35 62 55 320Fax: +31 35 62 55 321President: Rob Stoopman
NEW zEALANDArjoHuntleigh Limited41, Vestey Drive Mt. Wellington, Auckland 1060Phone: +64 9 573 5344Fax: +64 9 573 5384E-mail: [email protected]: Anthony Blyth
Getinge Australia Pty LtdUnit 4, 10 Cryers Road East TamakiAuckland 2013E-mail: [email protected]: +64 09 272 9039Fax: +64 09 272 9079N.Z. Service Manager: Steven Gorrie
MAQUET Australia Pty. Ltd.Dominion Road, Auckland 1446E-mail: [email protected]: +61 7 3339 3900Fax: +61 7 3339 3910President: Stuart Harvey
NORWAYArjoHuntleigh Norway ASOlaf Helsets vei 5, Oslo, N-0694E-mail: [email protected]: +47 2208 0050Fax: +47 2208 0051President: Morten Braastad
Getinge Norge A/SRyenstubben 2, Oslo, NO-0679E-mail: [email protected]: +47 2303 5200Fax: +47 2303 5202President: Vegard Oulie
POLANDArjoHuntleigh Polska Sp. z.o.o.ul. Ks. Wawrzyniaka 2, Komorniki, PL-62-052Phone: +48 61 662 1550Fax: +48 61 662 15 90E-mail: [email protected]: Pawel Cisowski
Getinge Poland Sp. z.o.o.ul. Osmańska 14, 02-823 WarsawE-mail: [email protected]: +48 22 882 06 26Fax: +48 22 882 24 52President: Jerzy Bartos
Maquet Polska Sp. z.o.o.ul. Osmańska 14, 02-823 WarsawPhone: +48 22 882 06 44Fax: +48 22 823 80 83President: Witold Rychwalski
PORTUGALArjoHuntleigh em Portugal:MAQUET Portugal, Lda. (Distribudor Exclusivo)Rua Poeta Bocage n.º 2 - 2G1600-233 LisbonPhone: +351 214 189 815Fax: +351 214 177 413E-mail: [email protected]
Maquet Portugal LdaRua Poeta Bocage, 2 -2G, Telheiras, Lisbon,PT-1600-233Phone: +351 214 189 815Fax: +351 214 177 413President: Rui Viegas
RUSSIAMaquet LLCStanislavskogo 21, Bld.3 Moscow, RU-109004E-mail: [email protected]: +7 495 514 0055Fax: +7 495 514 0056President: Kseniya Uljanova
SERBIAMaquet South East Europe Ltd.Spaniskih Boraca 3, 11070 BelgradePhone: +381 11 7856377President: Saza Pozder
SINGAPOREArjoHuntleigh Singapore Pte Ltd20, Bendemeer Road, # 06-03,Cyberhub Building,Singapore, SG-339914Phone: +65 6293 3387Fax: +65 6293 3389E-mail: [email protected]: Steve Blyth
Getinge Singapore Pte. Ltd20, Bendemeer Road#06-02 Cyberhub BuildingSingapore 339914Phone: +65 6 396 7298Fax: +65 6 396 7978President: David Rosén
Maquet South East Asia Pte. Ltd20, Bendemeer Road, #06-01/02,Cyberhub Building,Singapore, SG-339914E-mail: [email protected]: +65 6 296 1992Fax: +65 6 296 1937President: Philippe Rocher
SLOvAKIAMaquet Medizintechnik Vertrieb undService GmbH – o.z.Pribinova 25, Bratislava, SK-81109Phone: +42 1 2335 54149Fax: +42 1 2335 54140President: Jiri Lacina
SOUTH AFRICAArjoHuntleigh Africa (Pty) Ltd2, Willem Cruywagen Avenue, Klerksoord, PretoriaP.O. Box 16216, Pretoria North, 0116Phone: +27 12 527 2000Fax: +27 12 527 2016E-mail: [email protected]: Vassie Ponsamy
Maquet Southern Africa (PTY) Ltd.Harrowdene Office Park Building 7Western Services RoadWoodmead, Sandton 2148Phone: +27 11 656 3306Fax: +27 11 656 3307President: Simon Meredith
Addresses
105GE TINGE ANNUAL REPORT 2013
Addresses
SPAINArjoHuntleigh Ibérica S.L.U.Ctra. De Rubí, 88, 1a Planta – A1,08173 Santa Cugat del Vallés, Barcelona,ES-08130E-mail: [email protected]: +34 93 583 1120Fax: +34 93 583 1122President: Stéphane Lutran
Getinge Ibérica S.LAvenida Castilla, 2P.E. San Fernando, Edif. Francia 1a PlantaMadrid, ES-28830E-mail: [email protected]: +34 916 782 626Fax: +34 916 784 051President: Olivier Bertolini
Maquet Spain S.L.U.Parque Empresarial Rivas FuturaC/Marie Curie 5Edificio Alfa Planta 6 oficina 6.1-6.2ES-28521 Rivas VaciamadridPhone: +34 91 678 1652Fax: +34 91 678 1653President: Manuel Moreno
SWEDENArjoHuntleigh ABNeptunigatan 1Malmö, SE-211 20Phone: +46 413 645 00Fax: +46 413 138 76President: Harald Stock
Arjo Hospital Equipment ABVerkstadsvägen 5, Eslöv, SE-241 38Phone: +46 413 645 00Fax: +46 413 138 76President: Anna Eklöf-Persson
ArjoHuntleigh, Innovation CenterHans Michelsens gata 10Malmö, SE-21120Phone: +46 413 645 00Fax: +46 413 138 76
Arjo Scandinavia ABVerkstadsvägen 5, Eslöv, SE-241 38E-mail: [email protected]: +46 413 645 00Fax: +46 413 645 83President: Jörgen Mann
Getinge ABEkebergsvägen 26, P.O. Box 69,Getinge, SE-305 05E-mail: [email protected]: +46 10 335 0000Fax: +46 10 335 5640President: Johan Malmquist
Getinge Disinfection ABLjungadalsgatan 11, P.O. Box 1505,SE-35115 VäxjöE-mail: [email protected]: +46 10 335 9800Fax: +46 470 20 832President: Marcus Johansson
Getinge Infection Control ABEkebergsvägen 26, P.O. Box 69,SE-305 05 GetingeE-mail: [email protected]: +46 10 335 0000Fax: +46 10 335 1450President: Anders Grahn
Getinge International ABEkebergsvägen 26, P.O. Box 69,Getinge, SE-305 05E-mail: [email protected]: +46 10 335 0000Fax: +46 10 335 6392President: John Hansson
Getinge Sterilization ABEkebergsvägen 26, P.O. Box 69,SE-305 05 GetingeE-mail: [email protected]: +46 10 335 0000Fax: +46 35 549 52President: Stefan Nybonn
Getinge Skärhamn ABIndustrivägen 5, Skärhamn, SE-471 31E-mail: [email protected]: +46 10 335 0200Fax: +46 10 335 0229President: Gert Linder
Getinge Sverige ABEkebergsvägen 26, P.O. Box 69,Getinge, SE-305 05E-mail: [email protected]: +46 10 335 0000Fax: +46 10 335 6388President: Axel Sjöblad
Maquet Critical Care ABRöntgenvägen 2, Solna, SE-171 54Phone: +46 8 730 7300Fax: +46 8 985 775President Critical Care: Jens Viebke
Maquet Nordic ABRöntgenvägen 2, Solna, SE-171 54E-mail: [email protected]: +46 8 730 7300Fax: +46 8 295 532President: Magnus Back
SWITzERLANDArjoHuntleigh AGFabriksstrasse 8, Hägendorf, CH-4164E-mail: [email protected]: +41 61 3379 777Fax: +41 61 3119 742President: Torsten van Steelandt
Getinge Schweiz AG Quellenstrasse 41bCH-4310 RheinfeldenE-mail: [email protected]: +41 61 836 47 70Fax +41 61 836 47 71President: André Wyrsch
Maquet AGWilerstrasse 75, Gossau, CH-9201E-mail: [email protected]: +41 71 3350 303Fax: +41 71 3350 313President: Frank Schanne
TAIWANArjoHuntleigh TaiwanRepresentative OfficeSuite 1003, 10/F,333 Keelung Road Section 1,110 TaipeiPhone: +886 2 2757 7286 ext.113Fax: +886 2 2729 6515E-mail: [email protected]: Steven Lee
Maquet Hong Kong Ltd Taiwan BranchSuite 1511, 15F, 333 Keelung Road,Section 1,110 TaipeiPhone: +886 287 582 738Fax: +886 287 582 999President: Florian Mond
THAILANDMaquet Thailand6th. Dr. Gerhard Link Building33 Soi Lertnava, 88, Krungthepkreetha RoadHua Mark, BangkapiBangkok 10240E-mail: [email protected]: 66 2 704 4388 ext. 109President: Philippe Rocher
TURKEYGetinge Saglik Urunleri Ith. Ihr. Tic. San. Ve Ltd. Sti.Sahrayı Cedid Mahallesi Halk Sokak No:27Golden Plaza A Blok Kat:7 D:14-1534734 Kozyatağı/ İstanbulPhone: +90 216 360 62 74Fax: +90 216 360 62 75President: Vecihe Özek
Maquet Cardiopulmonary MedikalTeknik San. Tic. Ltd. StiSerbest Bölge, R Ada Yeni Liman, TR- 07070AntalyaE-mail: [email protected]: Murat Calik
Maquet Tibbi Sistemler San. Ve Tic. Ltd.A.S.Kozyatağı Mah. Sarı Kanarya Sok. No: 14Kat: 4,Kadıköy TR-34742 IstanbulPhone: +90 216 410 28 56Fax: +90 216 410 28 15President: Ahmet Eke
Trans Medikal Aletler Sanayi ve Tic A.ŞCevat Dündar Cad. 65. SokNo 1Ostim 06370 Ankara - TPhone: +90 312 385 77 20Fax: +90 312 385 71 00President: Mehmet Ak
UKArjoHuntleigh International LtdArjoHuntleigh HouseHoughton Hall Business ParkHoughton RegisBedfordshire LU5 5XFE-mail: [email protected]: +44 1582 745800Fax: +44 1582 745866President: Stéphane Lutran
ArjoHuntleigh UK and ServiceSt Catherine Street, Gloucester, GL1 2SLE-mail: [email protected]: +44 8456 114 114Fax: +44 1452 555 207President: Paul Lyon
Getinge UK LtdOrchard Way, Calladine Park,Sutton-in-Ashfield, Nottinghamshire NG17 1JUE-mail: [email protected]: +44 16 23 51 00 33Fax : +44 16 23 44 04 56President: Nick Satchell
Huntleigh Healthcare Ltd.Diagnostics Product Division35 Portmanmoor Road, Cardiff, CF24 5HNE-mail: [email protected]: +44 29 2048 5885Fax: +44 29 2049 2520President: Peter Cashin
106 GE TINGE ANNUAL REPORT 2013
Addresses
ArjoHuntleigh – UKArjoHuntleigh HouseHoughton Hall Business ParkHoughton RegisBedfordshire, LU5 5XFE-mail: [email protected]: +44 1582 745 700Fax: +44 1582 745745President: Paul Lyon
Getinge Production UK Ltd1 Pembroke Avenue, Waterbeach,Cambridge, CB5 9QRPhone: +44 122 386 1665Fax: +44 122 386 1990President: Nick Satchell
Maquet Ltd14-15 Burford Way, Boldon Business Park,Sunderland, Tyne & Wear, NE35 9PZE-mail: [email protected]: +44 191 519 6200Fax: +44 191 519 6201President: Avril Forde
UKRAINEMaquet LLCBogdana Khmelnitskogo street, 17/52 A, 01030Kiev/UkraineE-mail: [email protected]: +7 495 514 0055Fax: +7 495 514 0056President: Kseniya Uljanova
UNITED ARAB EMIRATESArjoHuntleigh Middle East FZ LLCG005 Nucleotide ComplexDubai Biotechnology & Research ParkP.O. Box 214742DUBAIPhone: +971 4 447 0942Fax: +971 4 447 2814E-mail: [email protected]: Ahmed Qawasmeh
Getinge International AB – Middle East andAfricaG005 Nucleotide Complex DubiotechDubai UAEPhone: +97144470941Fax +97144472813President: Wilhelm Tham
MAQUET Middle East FZ-LLCG005 Nucleotide ComplexDubai Biotechnology & Research ParkP.O. Box 214742E-mail: [email protected], [email protected]: +971 4 447 0963Fax: +971 4 447 0962President: Salah Malek
USAArjoHuntleigh Inc.2349 W Lake Street, Suite 250,Addison, IL 60101E-mail: [email protected]: +1 630 307 2756Fax: +1 630 307 6195President: Rick Lytle
Atrium Medical Corporation5 Wentworth DriveHudson, New Hampshire 03051-4929, USAPhone: +1 603 880 1433Fax: +1 603 880 4545President: Trevor Carlton
ArjoHuntleigh Inc. Distribution Center50, North Gary Avenue, Suite ARoselle, Illinois, 60172 USE-mail: [email protected]: +1 630 785 4490Fax: +1 630 576 5020President: Rick Lytle
ArjoHuntleigh Inc.12625 Wetmore Rd., Ste 308San Antonio, TX 78247Email: [email protected]: Rick Lytle
Getinge Sourcing LLC1777 East Henrietta Road, RochesterNY 14623-3133E-mail: [email protected]: +1 585 475 1400Fax: +1 585 272 5299President: David Pritchard
Datascope Corp.Cardiac Assist15 Law DriveCN 40011Fairfield, New Jersey 07004Phone : +1 973 244 6100President: Peter W. J. Hinchliffe
Getinge USA Inc.1777 East Henrietta Road, Rochester,NY 14623-3133Phone : +1 585 475 1400Fax: +1 585 272 5033President: Andrew G. Ray
Getinge-La Calhene USA1325 Field Avenue South,Rush City, MN55069Phone: +1 320 358 4713Fax: +1 320 358 3549President: Thierry Girard
Lancer Sales USA Inc & Getinge Life Sciences1150 Emma Oaks TRL STE 140FL-32746E-mail: [email protected]: +1 407 327 8488Fax: +1 407 327 1229President: Andrew G Ray, Director Lancer Michael Henley
MAQUET Medical Systems USA LLC45 Barbour Pond DriveWayne, New Jersey 07470Phone: +1 908 947 2300Fax: +1 908 947 2301President: Raoul Quintero
MAQUET Cardiovascular LLCCardiac Surgery170 Baytech Drive-San Jose, CA 9513445 Barbour Pond DriveWayne, New Jersey 07470President: Peter Hinchliffe
MAQUET CardiovascularVascular Interventions45 Barbour Pond DriveWayne, New Jersey 07470
MAQUET Cardiovascular LLCBusiness Unit Cardiovascular45 Barbour Pond DriveWayne, New Jersey 07470President: Peter W. J. Hinchliffe
SteriTec Products MFG Inc74 Inverness Dr. EEnglewood, CO 80112Phone: +1 303 660 4201Fax: +1 303 660 4213President: Dale Schuster
vIETNAMMaquet South East Asia Pte. Ltd.41 Nguyen Thi Minh Khai, 6th Floor, Yoco BuildingDistrict 1, Ho Chi Minh CityPhone: +65 6 2961992Fax: +65 6 2961937President: Philippe Rocher
107GE TINGE ANNUAL REPORT 2013
Definitions
FINANCIAL TERMS
Cash flow per share. Cash flow after investments in tangible fixed assets divided by the number of shares.
Cash conversion. Cash flow from operating activities in relation to EBITDA.
Dividend yield. Dividend in relation to the market share price on December 31.
EBIT. Operating profit before interest and taxes.
EBITA. Earnings before interest, taxes and the amortisation of acquisition-related intangible assets.
EBITA margin. EBITA in relation to net sales.
EBITDA. Earnings before interest, taxes and the amortisation and depreciation of tangible and intangible assets.
EBITDA margin. EBITDA in relation to net sales.
Equity/assets ratio. Shareholders’ equity plus non-controlling interests in relation to total assets.
Earnings per share. Net profit for the year divided by number of shares (the average number).
Interest-coverage ratio. Profit after net financial items plus interest expenses, as a percentage of interest expenses.
Net debt/equity ratio. Interest-bearing liabilities, including pension liabilities, less cash and cash equivalents in relation to shareholders’ equity.
Operating margin. Operating profit in relation to net sales.
P/E ratio. Share price (final price) divided by earnings per share.
Recurring revenue. Revenues from consumables, service, spare parts and similar items.
Return on shareholders’ equity. Net profit for the year in relation to average shareholders’ equity.
Return on working capital. Operating profit in relation to working capital.
Working capital. Total assets, less cash and cash equivalents and non-interest-bearing liabilities. Based on the average and calculated over the year.
MEDICAL TERMS
Ablation. Removal (to remove something).
Anastomosis. Open connection, for example, between blood vessels (may be natural or created surgically).
Anaesthesia. Narcosis.
Angiography. X-ray image of blood vessel.
Artificial grafts. Artificial blood vessel implants.
Autoclave. A type of pressure-cooker for sterilization.
Bariatric care. Care of morbidly obese patients.
Cardiac Assist. Technology that improves blood circulation in a patients’ coronary artery in the heart by forcing blood into the coronary artery with the help of a balloon pump placed in the aorta. The pump works in synchronisation with the heart rhythm and increased blood circulation in the coronary artery supplies more oxygen to the heart muscle, which thus improves its ability to pump.
Cardiopulmonary. Pertaining or belonging to both heart and lung.
Cardiovascular. Pertaining or belonging to both heart and blood vessels.
Cath lab. Short for “catheterization laboratory” – a laboratory or smaller operating room that is equipped for interventional cardiology/minimally invasive cardiovascular procedures.
Cystostatic. Pharmaceutical treatment for various types of cancer. Also known as cytotoxin.
Deep-vein thrombosis (DVT). Formation of a blood clot in a deep leg vein.
Doppler. Ultrasound method commonly used to assess flows, such as in a blood vessel or the heart.
ECMO (Extracorporeal Membrane Oxygenation). Oxygenation outside the body using a membrane. Often referred to as an artificial lung.
Endoscope. Equipment for visual examination of the body’s cavities, such as the stomach.
Endoscopic vessel harvesting (EVH). Minimally invasive (see below) technique that removes part of a blood vessel (often from the leg) and uses this blood vessel to replace the diseased coronary artery.
Endovascular intervention. Operation on the cardiac and vascular system conducted without invasive surgery. Through small holes in the skin and selected blood vessels, instruments are inserted into the vessel where the surgery takes place.
Reimbursement system. The system that defines how the healthcare sector receives reimbursement for various services.
Interventional cardiology. A subcategory of the medical speciality cardiology (cardio and vascular diseases), which involves active operations in addition to medication. May include cardiac assist (see above), for example.
Surgical ablation. To remove something surgically.
Cardiovascular surgery. Surgical treatment of cardiovascular diseases.
Cardiovascular diseases. Heart and blood vessel diseases.
Mechanical ventilation. Maintaining a patient’s ability to breathe through a ventilator (respirator).
Microorganisms. Bacteria, viruses, fungus and similar organisms that can only be observed through a microscope.
Minimally invasive instruments. Various types of instruments that make it possible to conduct treatment and other measures through very small operations without the need for major surgery. The benefits of minimally invasive operations include less pain for the patient, shorter rehabilitation periods and lower costs.
Obese. Morbidly overweight.
Oxygenator. The component in perfusion products (see below) that oxygenates the blood during cardio surgery.
Perfusion. Artificial circulation of body fluids, such as blood.
Perfusion products. Products that handle blood circulation and oxygenation during cardio surgery, often referred to as heart-lung machines.
Resistance problems. Problems with bacteria that have become resistant to penicillin or other antibiotics.
Telemedicine. Providing remote medical care by real time video conference within a hospital or using external specialists.
Terminal sterilization. Sterilization at the end of the production process in the pharmaceuticals industry.
Thrombosis. Blood clot.
Pressure ulcers. Ulcers that arise as a result of blood flow to the skin being limited by external pressure. Most often affects patients with limited mobility.
Prevention/profylaxis. Preventive activity/treatment
Vein. Blood vessel that carries blood to the heart.
DEFINITIONS
108 GE TINGE ANNUAL REPORT 2013
Reading guide and distribution policy
Reading guide • The Getinge Group is referred to as Getinge in the Annual Report.• Figures in parentheses pertain to operations in 2012, unless otherwise
specified.• Swedish kronor (SEK) are used throughout.• Millions of kronor are abbreviated SEK M.• All figures pertain to SEK M, unless otherwise specified.• The term EBITA is defined as “Earnings before interest, taxes and amorti-
zation of acquisition-related intangible assets.”• The term EBITDA is defined as “Earnings before interest, taxes and the
amortization and depreciation of tangible and intangible assets.”
Information provided in the Annual Report concerning markets, competition and future growth constitutes the Getinge Group’s assessment based mainly on material compiled within the Group.
This document is essentially a translation of the Swedish language version. In the event of any discrepancies between this translation and the original Swedish document, the latter shall be deemed correct.
Distribution policyThe printed version of Getinge AB’s Annual Report is only distributed to sha-reholders who expressly request a copy. The Annual Report is also available in its entirety at the Group’s website: www.getingegroup.com
READING GUIDE AND DISTRIBUTION POLICY
109GE TINGE ANNUAL REPORT 2013
Annual General Meeting and Nomination Committee
Annual General MeetingThe Annual General Meeting will be held on March 20, 2014, at 2:00 p.m. in Kongresshallen at Hotel Tylösand, Halmstad, Sweden.
ApplicationShareholders wishing to participate at the Annual General Meeting should:
• Be registered in the shareholders’ register kept by Euroclear, (the Swedish Central Securities Depository), not later than March 14, 2014
• Inform the company of their intention to participate not later than March 14, 2014
Applications can be submitted in the following ways:• Getinge’s website: www.getinge.com• By conventional mail to: Getinge AB, Att: Annual General Meeting,
Box 69, SE-305 05 Getinge, Sweden• By fax: +46 35 549 52• By phone: +46 10 355 0818
Nominee-registered sharesShareholders whose shares are registered in the name of a nominee must have temporarily registered their shares in their own name, well in advance of March 14, 2014, to be able to participate at the Annual General Meeting. Shareholders represented by proxy must submit a power of attorney to the company prior to the meeting. Anyone representing a legal entity must have a copy of the registration certificate or a corresponding authorization docu-ment that indicates the proper authorized signatory.
Nomination Committee Getinge AB’s interim report for the third quarter of 2013 contained instruc-tions for shareholders on how to proceed to submit proposals to Getinge’s Nomination Committee and how to propose motions to be addressed at the Annual General Meeting.
Dividend The Board of Directors and President propose that a dividend for 2013 of SEK 4.15 (4.15) per share be paid, totaling SEK 989 M (989). The Board’s proposed record date is March 25, 2014. Euroclear anticipates being able to forward the dividend to shareholders on March 28, 2014.
ANNUAL GENERAL MEETING AND NOMINATION COMMITTEE
110 GE TINGE ANNUAL REPORT 2013
Financial information
On Getinge’s website, www.getingegroup.com, there is up-to-date informa-tion on, for example, the Getinge share and corporate governance.
The annual report, year-end and interim reports are published in Swedish and English and can be downloaded from www.getingegroup.com.
The annual report can also be ordered from: Getinge ABAtt: Informationsavdelningen Box 69SE-305 05 Getinge Telephone: +46 10 335 00 00
Financial information For fiscal year 2014, the following information will be published:
• April 16, 2014: Interim report January-March• July 15, 2014: Interim report January-June• October 16, 2014: Interim report January-September • January 2015: Year-end Report 2014 • March 2015: Annual Report for 2014
FINANCIAL INFORMATION

GETINGE ABP.O. Box 69SE-305 05 Getinge
Telephone: +46 10-335 00 00E-mail: [email protected]
Getinge Group is a leading global provider of equipment and systems that contribute
to quality enhancement and cost efficiency within healthcare and life sciences.


