Embed Size (px)
Citation preview
INJURY CRITERIA FOR SIDE IMPACT DUMMIES
May, 2004
By Shashi Kuppa
National Transportation Biomechanics Research Center National Highway Traffic Safety Administration
1
TABLE OF CONTENTS
EXECUTIVE SUMMARY........................................................................................................... 2 INJURY CRITERIA AND RISK CURVES FOR THE ES-2re DUMMY................................ 2 INJURY CRITERIA AND RISK CURVES FOR THE SID-IIsFRG DUMMY ....................... 5
COMPARISON OF INJURY CRITERIA AND ASSOCIATED IARVS……...……………...8 INJURY CRITERIA DEVELOPMENT FOR THE ES-2re DUMMY ................................... 9
HEAD INJURY CRITERIA FOR THE ES-2re DUMMY ...................................................... 10 THORACIC INJURY CRITERIA ...………………………………………....………………12 THORACIC INJURY CRITERIA DEVELOPMENT USING ES-2RE MEASUREMENTS 26
ABDOMINAL INJURY CRITERIA FOR THE ES-2re DUMMY......................................... 33 PELVIC INJURY CRITERIA FOR THE ES-2re DUMMY ................................................... 37
INJURY CRITERIA DEVELOPMENT FOR THE SID-IIsFRG DUMMY........................ 42
THORACIC INJURY CRITERIA FOR THE SID-IIsFRG ..................................................... 43 ANALYSIS USING CADAVER INJURY RESPONSES AND SID IIsFRG MEASUREMENT ................................................................................................................ 48
PRELIMINARY ABDOMINAL INJURY CRITERIA FOR THE SID-IIsFRG..................... 53 PELVIC INJURY CRITERIA FOR THE SID-IIsFRG ........................................................... 55
REFERENCES............................................................................................................................ 56 APPENDIX A. Side Impact Cadaveric Sled Test Data Conducted at the Medical College of Wisconsin..................................................................................................................................... 59 APPENDIX B. ES-2re SLED TEST data conducted at Medical College of Wisconsin..... 60 APPENDIX C. Side impact cadaver sled test data published by Cavanaugh et al., (1993)61 APPENDIX D. Cadaver Drop Tests, Walfisch et al (1980).................................................... 62 APPENDIX E. Cadaver Pendulum Impact Tests, Viano (1989) ........................................... 63 APPENDIX F. Pelvic impact test data with cadaveric subjects and the EuroSID-1 dummy, Bouquet et al. (1998). .................................................................................................................. 64 APPENDIX G. Lateral impact sled test data from Zhu et al. (1993).................................... 65 APPENDIX H: SID-IIsFRG Sled Test Data Conducted at Medical College Of Wisconsin 66 APPENDIX I: Combined Side Impact Test Data from Eppinger et al. (1984) and Cavanaugh et al. (1993). ............................................................................................................. 67
INJURY CRITERIA FOR SIDE IMPACT DUMMIES
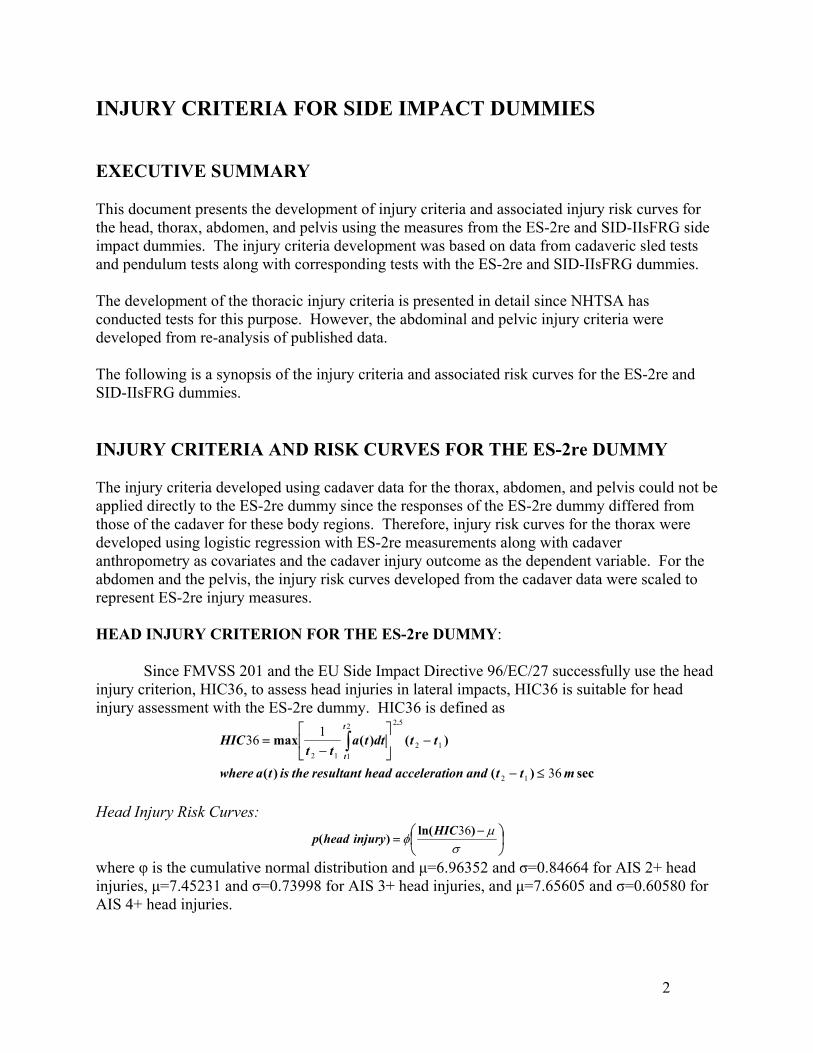
EXECUTIVE SUMMARY This document presents the development of injury criteria and associated injury risk curves for the head, thorax, abdomen, and pelvis using the measures from the ES-2re and SID-IIsFRG side impact dummies. The injury criteria development was based on data from cadaveric sled tests and pendulum tests along with corresponding tests with the ES-2re and SID-IIsFRG dummies. The development of the thoracic injury criteria is presented in detail since NHTSA has conducted tests for this purpose. However, the abdominal and pelvic injury criteria were developed from re-analysis of published data. The following is a synopsis of the injury criteria and associated risk curves for the ES-2re and SID-IIsFRG dummies. INJURY CRITERIA AND RISK CURVES FOR THE ES-2re DUMMY The injury criteria developed using cadaver data for the thorax, abdomen, and pelvis could not be applied directly to the ES-2re dummy since the responses of the ES-2re dummy differed from those of the cadaver for these body regions. Therefore, injury risk curves for the thorax were developed using logistic regression with ES-2re measurements along with cadaver anthropometry as covariates and the cadaver injury outcome as the dependent variable. For the abdomen and the pelvis, the injury risk curves developed from the cadaver data were scaled to represent ES-2re injury measures. HEAD INJURY CRITERION FOR THE ES-2re DUMMY:
Since FMVSS 201 and the EU Side Impact Directive 96/EC/27 successfully use the head injury criterion, HIC36, to assess head injuries in lateral impacts, HIC36 is suitable for head injury assessment with the ES-2re dummy. HIC36 is defined as
sec)()(
)()(max.
mttandonacceleratiheadresultanttheistawhere
ttdttatt
HICt
t
36
136
12
12
522
112
≤−
−
−= ∫
Head Injury Risk Curves:
−
=σ
µφ
)ln()( 36HICinjuryheadp
where φ is the cumulative normal distribution and µ=6.96352 and σ=0.84664 for AIS 2+ head injuries, µ=7.45231 and σ=0.73998 for AIS 3+ head injuries, and µ=7.65605 and σ=0.60580 for AIS 4+ head injuries.
2
Values of HIC36 at 25% and 50% risk of head injury for 50th percentile adult male. 25% prob. of injury 50% prob. of injury Injury
Predictor AIS 2+ AIS 3+ AIS 4+ AIS 2+ AIS 3+ AIS 4+ HIC36 Std. Error
600 482 - 745
950 744 - 1212
1400 1122 -1747
1050 896 - 1231
1680 1410 - 1930
2113 1796 - 2465
THORACIC INJURY CRITERIA FOR THE ES-2re DUMMY:
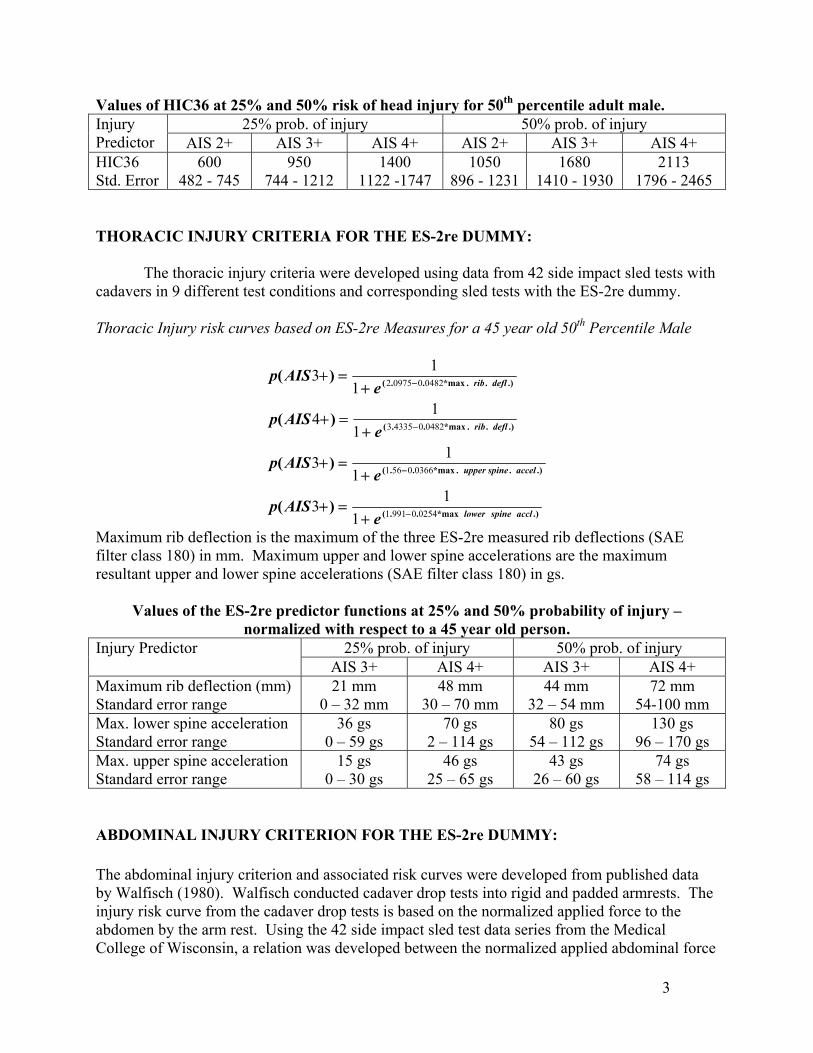
The thoracic injury criteria were developed using data from 42 side impact sled tests with cadavers in 9 different test conditions and corresponding sled tests with the ES-2re dummy. Thoracic Injury risk curves based on ES-2re Measures for a 45 year old 50th Percentile Male
.)*max..(
.)..*max..(
.)..*max..(
.)..*max..(
)(
)(
)(
)(
acclspinelower
accelspineupper
deflrib
deflrib
eAISp
eAISp
eAISp
eAISp
025409911
03660561
0482043353
0482009752
113
113
114
113
−
−
−
−
+=+
+=+
+=+
+=+
Maximum rib deflection is the maximum of the three ES-2re measured rib deflections (SAE filter class 180) in mm. Maximum upper and lower spine accelerations are the maximum resultant upper and lower spine accelerations (SAE filter class 180) in gs.
Values of the ES-2re predictor functions at 25% and 50% probability of injury – normalized with respect to a 45 year old person.
25% prob. of injury 50% prob. of injury Injury Predictor AIS 3+ AIS 4+ AIS 3+ AIS 4+
Maximum rib deflection (mm) Standard error range
21 mm 0 – 32 mm
48 mm 30 – 70 mm
44 mm 32 – 54 mm
72 mm 54-100 mm
Max. lower spine acceleration Standard error range
36 gs 0 – 59 gs
70 gs 2 – 114 gs
80 gs 54 – 112 gs
130 gs 96 – 170 gs
Max. upper spine acceleration Standard error range
15 gs 0 – 30 gs
46 gs 25 – 65 gs
43 gs 26 – 60 gs
74 gs 58 – 114 gs
ABDOMINAL INJURY CRITERION FOR THE ES-2re DUMMY: The abdominal injury criterion and associated risk curves were developed from published data by Walfisch (1980). Walfisch conducted cadaver drop tests into rigid and padded armrests. The injury risk curve from the cadaver drop tests is based on the normalized applied force to the abdomen by the arm rest. Using the 42 side impact sled test data series from the Medical College of Wisconsin, a relation was developed between the normalized applied abdominal force
3
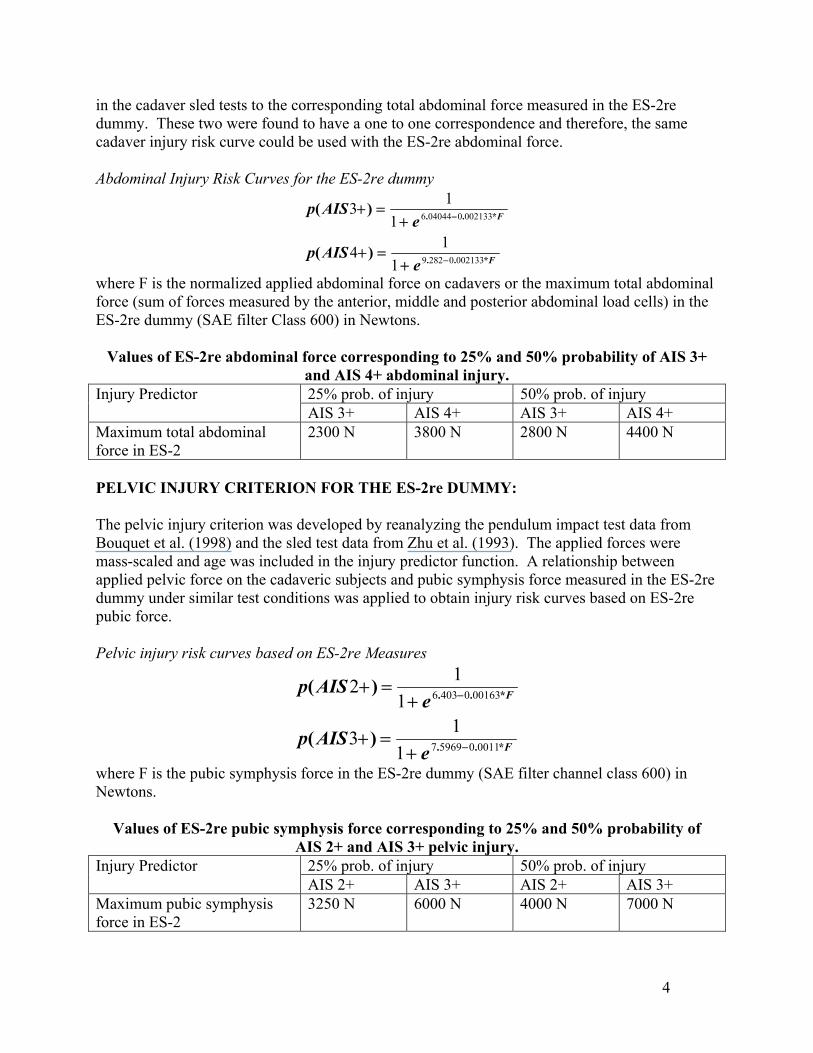
in the cadaver sled tests to the corresponding total abdominal force measured in the ES-2re dummy. These two were found to have a one to one correspondence and therefore, the same cadaver injury risk curve could be used with the ES-2re abdominal force. Abdominal Injury Risk Curves for the ES-2re dummy
F
F
eAISp
eAISp
*..
*..
)(
)(
00213302829
0021330040446
114
113
−
−
+=+
+=+
where F is the normalized applied abdominal force on cadavers or the maximum total abdominal force (sum of forces measured by the anterior, middle and posterior abdominal load cells) in the ES-2re dummy (SAE filter Class 600) in Newtons.
Values of ES-2re abdominal force corresponding to 25% and 50% probability of AIS 3+ and AIS 4+ abdominal injury. 25% prob. of injury 50% prob. of injury Injury Predictor AIS 3+ AIS 4+ AIS 3+ AIS 4+
Maximum total abdominal force in ES-2
2300 N 3800 N 2800 N 4400 N
PELVIC INJURY CRITERION FOR THE ES-2re DUMMY: The pelvic injury criterion was developed by reanalyzing the pendulum impact test data from Bouquet et al. (1998) and the sled test data from Zhu et al. (1993). The applied forces were mass-scaled and age was included in the injury predictor function. A relationship between applied pelvic force on the cadaveric subjects and pubic symphysis force measured in the ES-2re dummy under similar test conditions was applied to obtain injury risk curves based on ES-2re pubic force. Pelvic injury risk curves based on ES-2re Measures
F
F
eAISp
eAISp
*..
*..
)(
)(
0011059697
0016304036
113
112
−
−
+=+
+=+
where F is the pubic symphysis force in the ES-2re dummy (SAE filter channel class 600) in Newtons.
Values of ES-2re pubic symphysis force corresponding to 25% and 50% probability of AIS 2+ and AIS 3+ pelvic injury.
25% prob. of injury 50% prob. of injury Injury Predictor AIS 2+ AIS 3+ AIS 2+ AIS 3+
Maximum pubic symphysis force in ES-2
3250 N 6000 N 4000 N 7000 N
4
5
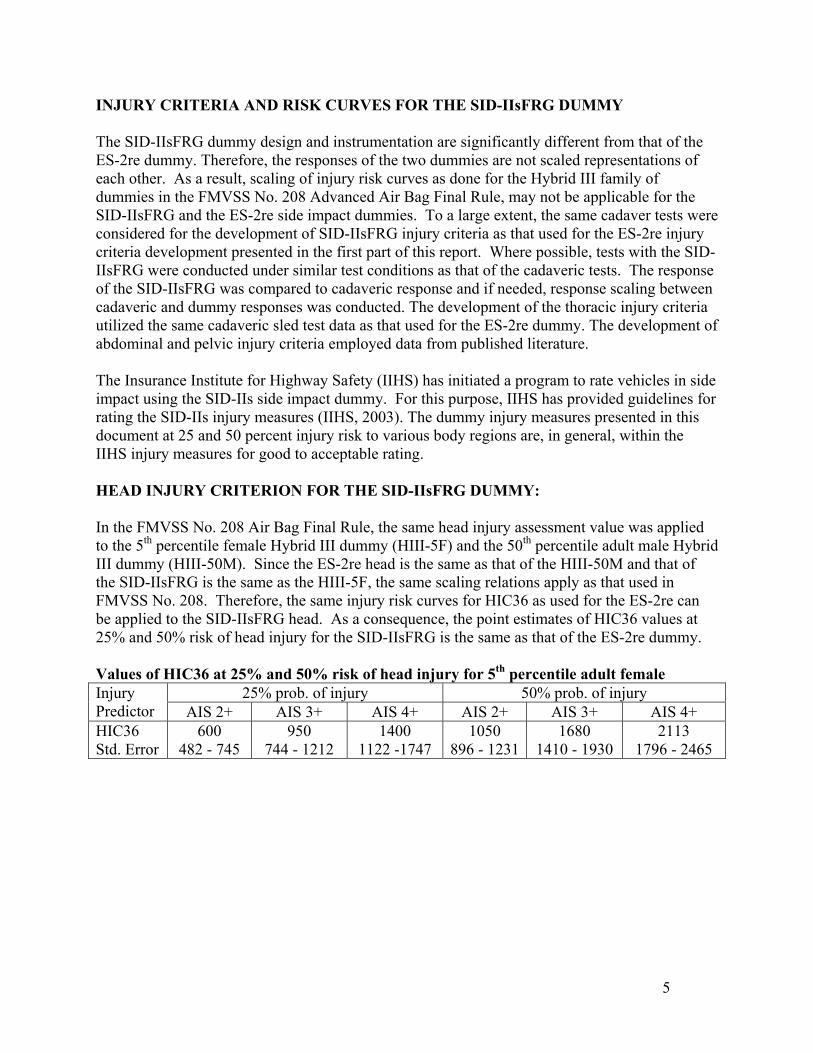
INJURY CRITERIA AND RISK CURVES FOR THE SID-IIsFRG DUMMY The SID-IIsFRG dummy design and instrumentation are significantly different from that of the ES-2re dummy. Therefore, the responses of the two dummies are not scaled representations of each other. As a result, scaling of injury risk curves as done for the Hybrid III family of dummies in the FMVSS No. 208 Advanced Air Bag Final Rule, may not be applicable for the SID-IIsFRG and the ES-2re side impact dummies. To a large extent, the same cadaver tests were considered for the development of SID-IIsFRG injury criteria as that used for the ES-2re injury criteria development presented in the first part of this report. Where possible, tests with the SID-IIsFRG were conducted under similar test conditions as that of the cadaveric tests. The response of the SID-IIsFRG was compared to cadaveric response and if needed, response scaling between cadaveric and dummy responses was conducted. The development of the thoracic injury criteria utilized the same cadaveric sled test data as that used for the ES-2re dummy. The development of abdominal and pelvic injury criteria employed data from published literature. The Insurance Institute for Highway Safety (IIHS) has initiated a program to rate vehicles in side impact using the SID-IIs side impact dummy. For this purpose, IIHS has provided guidelines for rating the SID-IIs injury measures (IIHS, 2003). The dummy injury measures presented in this document at 25 and 50 percent injury risk to various body regions are, in general, within the IIHS injury measures for good to acceptable rating. HEAD INJURY CRITERION FOR THE SID-IIsFRG DUMMY: In the FMVSS No. 208 Air Bag Final Rule, the same head injury assessment value was applied to the 5th percentile female Hybrid III dummy (HIII-5F) and the 50th percentile adult male Hybrid III dummy (HIII-50M). Since the ES-2re head is the same as that of the HIII-50M and that of the SID-IIsFRG is the same as the HIII-5F, the same scaling relations apply as that used in FMVSS No. 208. Therefore, the same injury risk curves for HIC36 as used for the ES-2re can be applied to the SID-IIsFRG head. As a consequence, the point estimates of HIC36 values at 25% and 50% risk of head injury for the SID-IIsFRG is the same as that of the ES-2re dummy. Values of HIC36 at 25% and 50% risk of head injury for 5th percentile adult female
25% prob. of injury 50% prob. of injury Injury Predictor AIS 2+ AIS 3+ AIS 4+ AIS 2+ AIS 3+ AIS 4+ HIC36 Std. Error
600 482 - 745
950 744 - 1212
1400 1122 -1747
1050 896 - 1231
1680 1410 - 1930
2113 1796 - 2465
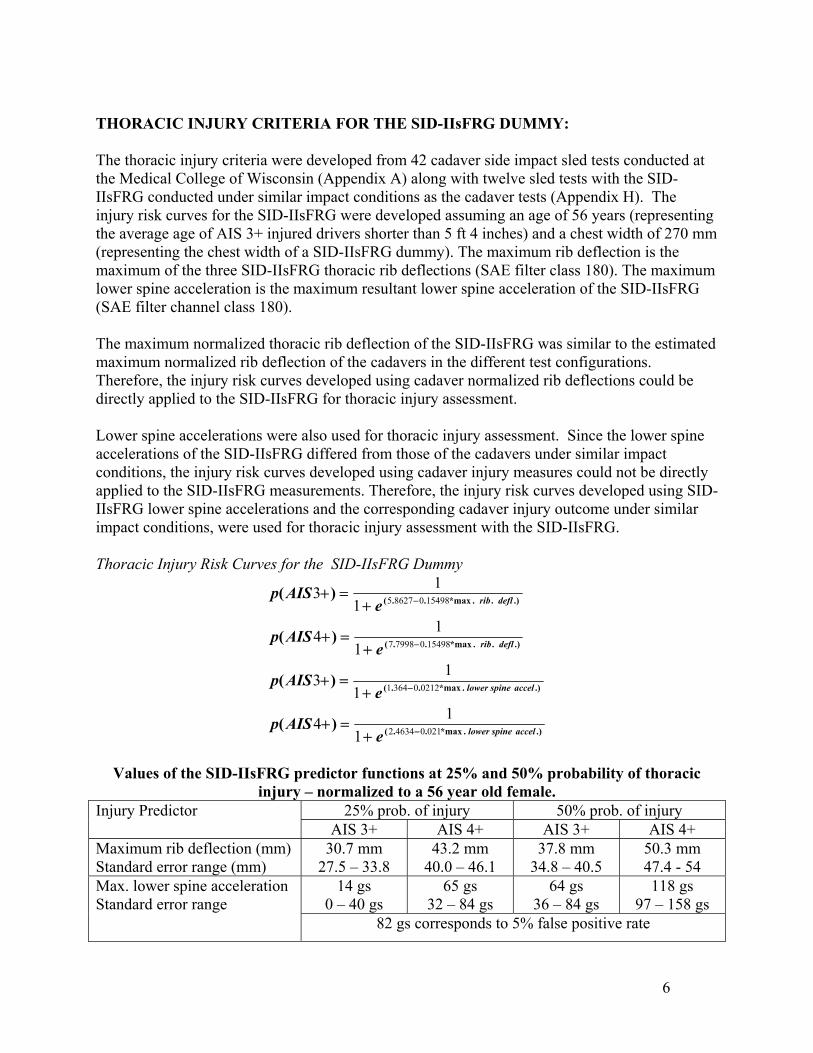
THORACIC INJURY CRITERIA FOR THE SID-IIsFRG DUMMY: The thoracic injury criteria were developed from 42 cadaver side impact sled tests conducted at the Medical College of Wisconsin (Appendix A) along with twelve sled tests with the SID-IIsFRG conducted under similar impact conditions as the cadaver tests (Appendix H). The injury risk curves for the SID-IIsFRG were developed assuming an age of 56 years (representing the average age of AIS 3+ injured drivers shorter than 5 ft 4 inches) and a chest width of 270 mm (representing the chest width of a SID-IIsFRG dummy). The maximum rib deflection is the maximum of the three SID-IIsFRG thoracic rib deflections (SAE filter class 180). The maximum lower spine acceleration is the maximum resultant lower spine acceleration of the SID-IIsFRG (SAE filter channel class 180). The maximum normalized thoracic rib deflection of the SID-IIsFRG was similar to the estimated maximum normalized rib deflection of the cadavers in the different test configurations. Therefore, the injury risk curves developed using cadaver normalized rib deflections could be directly applied to the SID-IIsFRG for thoracic injury assessment. Lower spine accelerations were also used for thoracic injury assessment. Since the lower spine accelerations of the SID-IIsFRG differed from those of the cadavers under similar impact conditions, the injury risk curves developed using cadaver injury measures could not be directly applied to the SID-IIsFRG measurements. Therefore, the injury risk curves developed using SID-IIsFRG lower spine accelerations and the corresponding cadaver injury outcome under similar impact conditions, were used for thoracic injury assessment with the SID-IIsFRG. Thoracic Injury Risk Curves for the SID-IIsFRG Dummy
.).*max..(
.).*max..(
.)..*max..(
.)..*max..(
)(
)(
)(
)(
accelspinelower
accelspinelower
deflrib
deflrib
eAISp
eAISp
eAISp
eAISp
021046342
021203641
15498079987
15498086275
114
113
114
113
−
−
−
−
+=+
+=+
+=+
+=+
Values of the SID-IIsFRG predictor functions at 25% and 50% probability of thoracic
injury – normalized to a 56 year old female. 25% prob. of injury 50% prob. of injury Injury Predictor
AIS 3+ AIS 4+ AIS 3+ AIS 4+ Maximum rib deflection (mm) Standard error range (mm)
30.7 mm 27.5 – 33.8
43.2 mm 40.0 – 46.1
37.8 mm 34.8 – 40.5
50.3 mm 47.4 - 54
14 gs 0 – 40 gs
65 gs 32 – 84 gs
64 gs 36 – 84 gs
118 gs 97 – 158 gs
Max. lower spine acceleration Standard error range 82 gs corresponds to 5% false positive rate
6
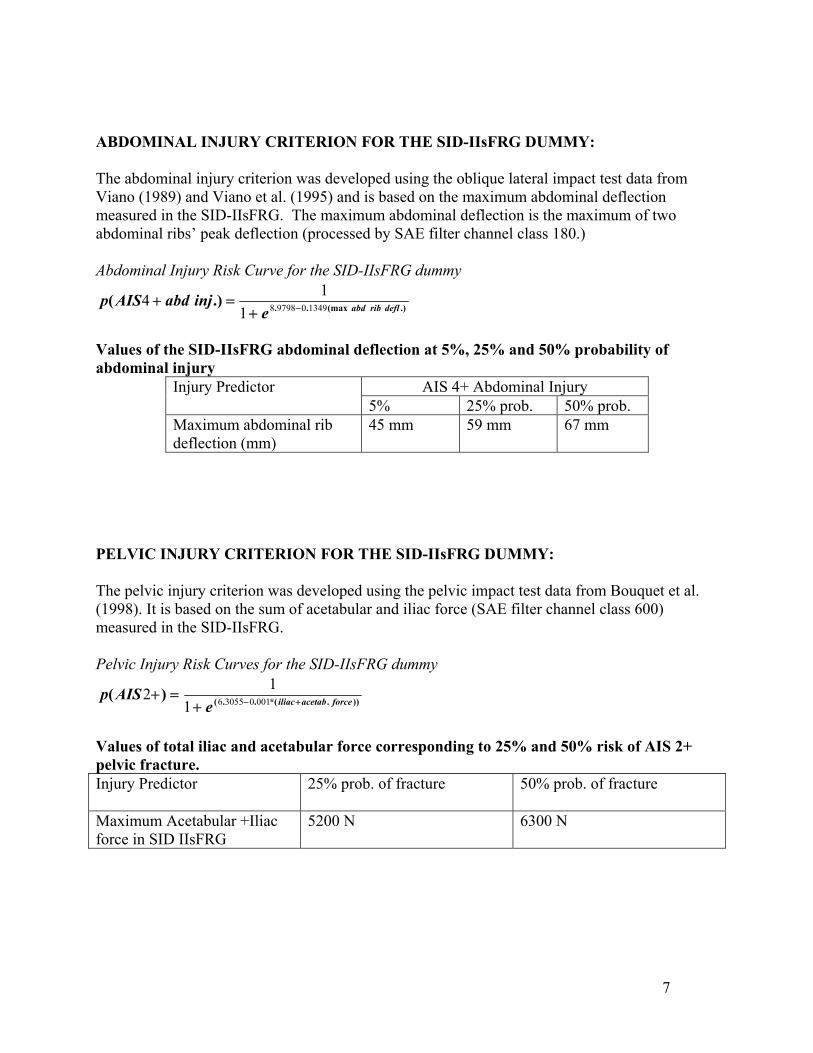
ABDOMINAL INJURY CRITERION FOR THE SID-IIsFRG DUMMY: The abdominal injury criterion was developed using the oblique lateral impact test data from Viano (1989) and Viano et al. (1995) and is based on the maximum abdominal deflection measured in the SID-IIsFRG. The maximum abdominal deflection is the maximum of two abdominal ribs’ peak deflection (processed by SAE filter channel class 180.) Abdominal Injury Risk Curve for the SID-IIsFRG dummy
.)(max...)( deflribabdeinjabdAISp 13490979881
14 −+=+
Values of the SID-IIsFRG abdominal deflection at 5%, 25% and 50% probability of abdominal injury
AIS 4+ Abdominal Injury Injury Predictor 5% 25% prob. 50% prob.
Maximum abdominal rib deflection (mm)
45 mm 59 mm 67 mm
PELVIC INJURY CRITERION FOR THE SID-IIsFRG DUMMY: The pelvic injury criterion was developed using the pelvic impact test data from Bouquet et al. (1998). It is based on the sum of acetabular and iliac force (SAE filter channel class 600) measured in the SID-IIsFRG. Pelvic Injury Risk Curves for the SID-IIsFRG dummy
)).*(..()( forceacetabiliaceAISp +−+
=+ 001030556112
Values of total iliac and acetabular force corresponding to 25% and 50% risk of AIS 2+ pelvic fracture. Injury Predictor 25% prob. of fracture 50% prob. of fracture
Maximum Acetabular +Iliac force in SID IIsFRG
5200 N 6300 N
7
8
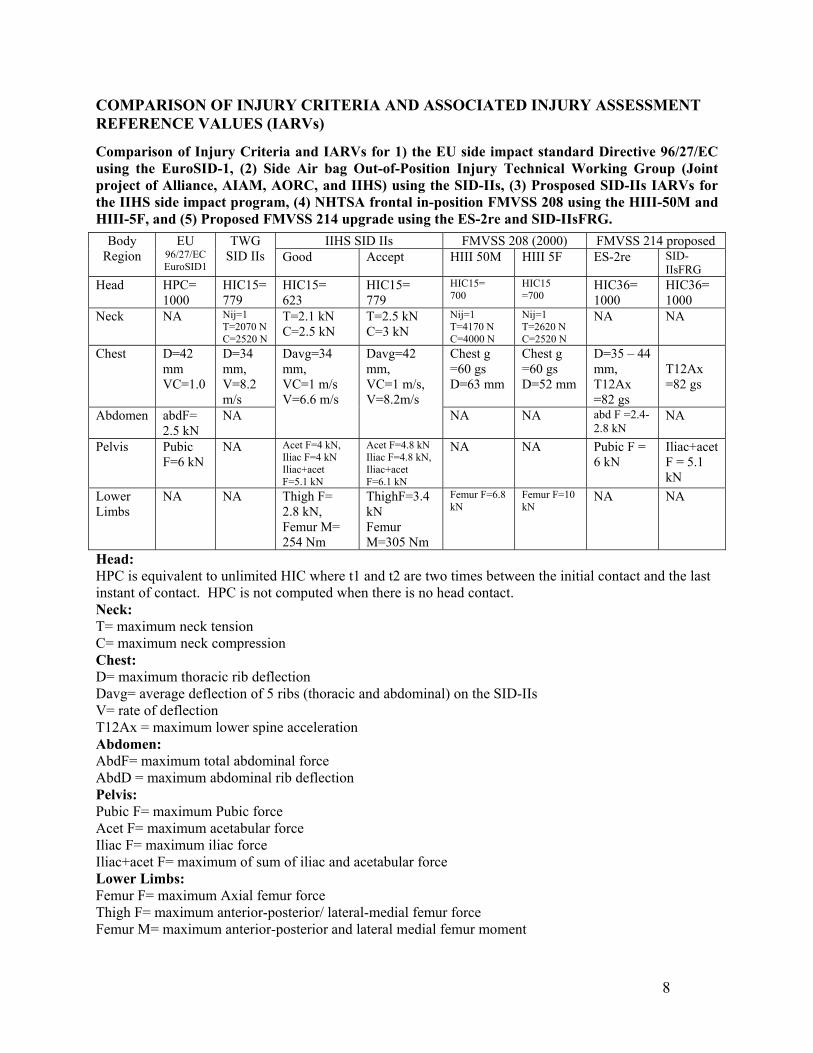
COMPARISON OF INJURY CRITERIA AND ASSOCIATED INJURY ASSESSMENT REFERENCE VALUES (IARVs)
Comparison of Injury Criteria and IARVs for 1) the EU side impact standard Directive 96/27/EC using the EuroSID-1, (2) Side Air bag Out-of-Position Injury Technical Working Group (Joint project of Alliance, AIAM, AORC, and IIHS) using the SID-IIs, (3) Prosposed SID-IIs IARVs for the IIHS side impact program, (4) NHTSA frontal in-position FMVSS 208 using the HIII-50M and HIII-5F, and (5) Proposed FMVSS 214 upgrade using the ES-2re and SID-IIsFRG.
IIHS SID IIs FMVSS 208 (2000) FMVSS 214 proposed Body Region
EU 96/27/EC EuroSID1
TWG SID IIs Good Accept HIII 50M HIII 5F ES-2re SID-
IIsFRG Head HPC=
1000 HIC15= 779
HIC15= 623
HIC15= 779
HIC15= 700
HIC15 =700
HIC36= 1000
HIC36= 1000
Neck NA Nij=1 T=2070 N C=2520 N
T=2.1 kN C=2.5 kN
T=2.5 kN C=3 kN
Nij=1 T=4170 N C=4000 N
Nij=1 T=2620 N C=2520 N
NA NA
Chest D=42 mm VC=1.0
D=34 mm, V=8.2 m/s
Chest g =60 gs D=63 mm
Chest g =60 gs D=52 mm
D=35 – 44 mm, T12Ax =82 gs
T12Ax =82 gs
Abdomen abdF= 2.5 kN
NA
Davg=34 mm, VC=1 m/s V=6.6 m/s
Davg=42 mm, VC=1 m/s, V=8.2m/s
NA NA abd F =2.4-2.8 kN
NA
Pelvis Pubic F=6 kN
NA Acet F=4 kN, Iliac F=4 kN Iliac+acet F=5.1 kN
Acet F=4.8 kN Iliac F=4.8 kN, Iliac+acet F=6.1 kN
NA NA Pubic F = 6 kN
Iliac+acet F = 5.1 kN
Lower Limbs
NA NA Thigh F= 2.8 kN, Femur M= 254 Nm
ThighF=3.4 kN Femur M=305 Nm
Femur F=6.8 kN
Femur F=10 kN
NA NA
Head: HPC is equivalent to unlimited HIC where t1 and t2 are two times between the initial contact and the last instant of contact. HPC is not computed when there is no head contact. Neck: T= maximum neck tension C= maximum neck compression Chest: D= maximum thoracic rib deflection Davg= average deflection of 5 ribs (thoracic and abdominal) on the SID-IIs V= rate of deflection T12Ax = maximum lower spine acceleration Abdomen: AbdF= maximum total abdominal force AbdD = maximum abdominal rib deflection Pelvis: Pubic F= maximum Pubic force Acet F= maximum acetabular force Iliac F= maximum iliac force Iliac+acet F= maximum of sum of iliac and acetabular force Lower Limbs: Femur F= maximum Axial femur force Thigh F= maximum anterior-posterior/ lateral-medial femur force Femur M= maximum anterior-posterior and lateral medial femur moment
9
INJURY CRITERIA DEVELOPMENT FOR THE ES-2re DUMMY
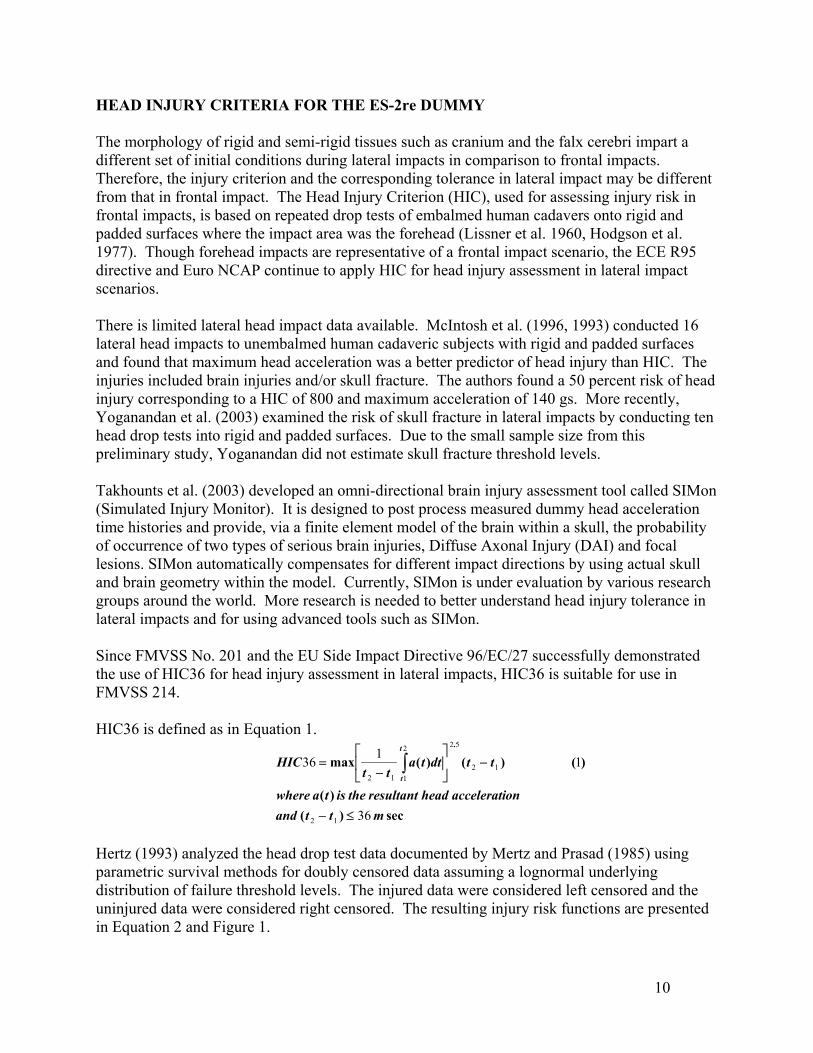
HEAD INJURY CRITERIA FOR THE ES-2re DUMMY The morphology of rigid and semi-rigid tissues such as cranium and the falx cerebri impart a different set of initial conditions during lateral impacts in comparison to frontal impacts. Therefore, the injury criterion and the corresponding tolerance in lateral impact may be different from that in frontal impact. The Head Injury Criterion (HIC), used for assessing injury risk in frontal impacts, is based on repeated drop tests of embalmed human cadavers onto rigid and padded surfaces where the impact area was the forehead (Lissner et al. 1960, Hodgson et al. 1977). Though forehead impacts are representative of a frontal impact scenario, the ECE R95 directive and Euro NCAP continue to apply HIC for head injury assessment in lateral impact scenarios. There is limited lateral head impact data available. McIntosh et al. (1996, 1993) conducted 16 lateral head impacts to unembalmed human cadaveric subjects with rigid and padded surfaces and found that maximum head acceleration was a better predictor of head injury than HIC. The injuries included brain injuries and/or skull fracture. The authors found a 50 percent risk of head injury corresponding to a HIC of 800 and maximum acceleration of 140 gs. More recently, Yoganandan et al. (2003) examined the risk of skull fracture in lateral impacts by conducting ten head drop tests into rigid and padded surfaces. Due to the small sample size from this preliminary study, Yoganandan did not estimate skull fracture threshold levels. Takhounts et al. (2003) developed an omni-directional brain injury assessment tool called SIMon (Simulated Injury Monitor). It is designed to post process measured dummy head acceleration time histories and provide, via a finite element model of the brain within a skull, the probability of occurrence of two types of serious brain injuries, Diffuse Axonal Injury (DAI) and focal lesions. SIMon automatically compensates for different impact directions by using actual skull and brain geometry within the model. Currently, SIMon is under evaluation by various research groups around the world. More research is needed to better understand head injury tolerance in lateral impacts and for using advanced tools such as SIMon. Since FMVSS No. 201 and the EU Side Impact Directive 96/EC/27 successfully demonstrated the use of HIC36 for head injury assessment in lateral impacts, HIC36 is suitable for use in FMVSS 214.
HIC36 is defined as in Equation 1.
sec)()(
)()()(max.
mttandonacceleratiheadresultanttheistawhere
ttdttatt
HICt
t
36
1136
12
12
522
112
≤−
−
−= ∫
Hertz (1993) analyzed the head drop test data documented by Mertz and Prasad (1985) using parametric survival methods for doubly censored data assuming a lognormal underlying distribution of failure threshold levels. The injured data were considered left censored and the uninjured data were considered right censored. The resulting injury risk functions are presented in Equation 2 and Figure 1.
10
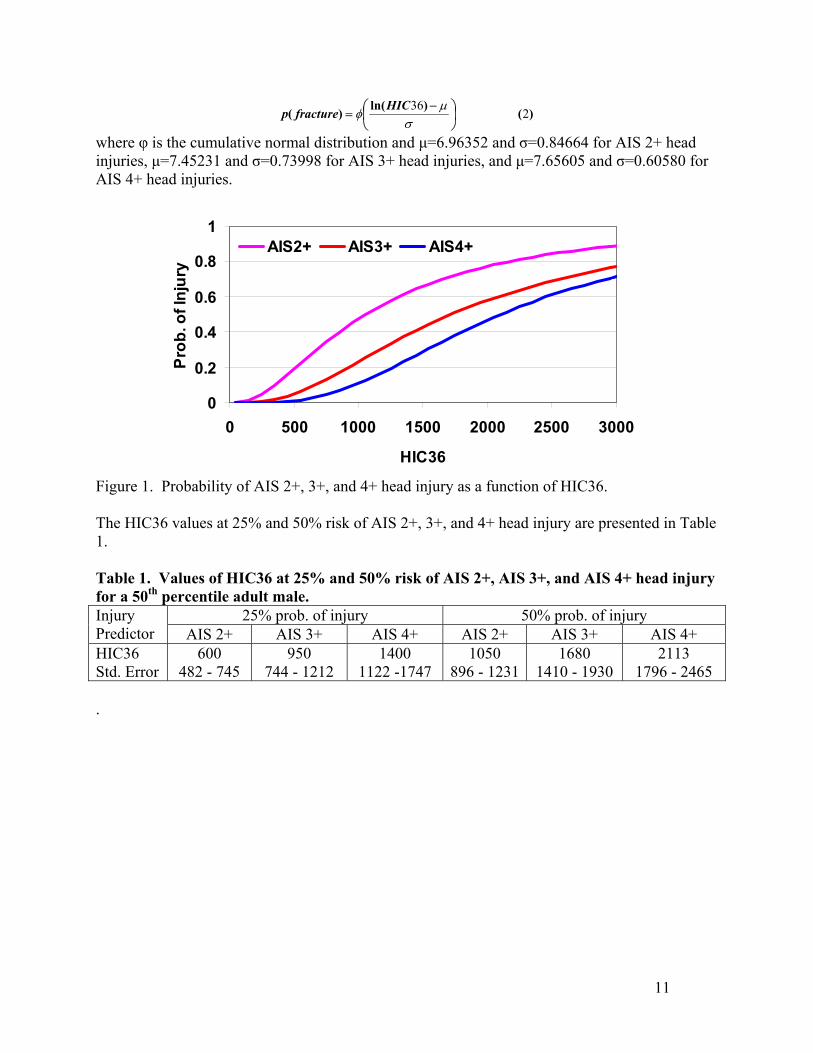
)()ln()( 236
−
=σ
µφ
HICfracturep
where φ is the cumulative normal distribution and µ=6.96352 and σ=0.84664 for AIS 2+ head injuries, µ=7.45231 and σ=0.73998 for AIS 3+ head injuries, and µ=7.65605 and σ=0.60580 for AIS 4+ head injuries.
0
0.2
0.4
0.6
0.8
1
0 500 1000 1500 2000 2500 3000
HIC36
Prob
. of I
njur
y
AIS2+ AIS3+ AIS4+
Figure 1. Probability of AIS 2+, 3+, and 4+ head injury as a function of HIC36. The HIC36 values at 25% and 50% risk of AIS 2+, 3+, and 4+ head injury are presented in Table 1. Table 1. Values of HIC36 at 25% and 50% risk of AIS 2+, AIS 3+, and AIS 4+ head injury for a 50th percentile adult male.
25% prob. of injury 50% prob. of injury Injury Predictor AIS 2+ AIS 3+ AIS 4+ AIS 2+ AIS 3+ AIS 4+ HIC36 Std. Error
600 482 - 745
950 744 - 1212
1400 1122 -1747
1050 896 - 1231
1680 1410 - 1930
2113 1796 - 2465
.
11
12
THORACIC INJURY CRITERIA INTRODUCTION Thoracic injury criteria in side impact has been developed and evaluated by various researchers. The Thoracic Trauma Index, TTI, a chest acceleration-based criteria, combined with anthropometric data was developed by the National Highway Traffic Safety Administration (Eppinger, et al., 1984, Morgan et al., 1986) and was included in the FMVSS 214 side impact protection standard in 1990. Tarriere et al. (1979) analyzed force deflection data of the struck side of the thorax in a series of cadaver lateral drop tests onto an unpadded and padded force plate. They found chest compression to correlate better with thoracic injury than thoracic accelerations. Based on the results from these studies, the EU side impact standard employs a rib deflection injury threshold of 42 mm and a VC threshold of 1.0 m/s. Lau and Viano (1986) proposed the viscous criteria (VC), a function in time formed by the product of the velocity of chest deformation, V(t), and the instantaneous compression, C(t). Viano et al. (1989) also conducted sixteen lateral impacts to the thorax of whole body cadavers and found that the maximum viscous response, VCmax, and maximum chest compression were significantly better predictors of thoracic injury than spinal accelerations. Logistic regression of this data indicated a 50 percent risk of AIS 3+ thoracic injury with 33 percent of chest deflection with respect to total width and a VC of 1 m/sec. Cavanaugh (1992) proposed ASA (average spine acceleration) as a predictor of thoracic injury in side impact. ASA is computed as the slope of a line joining 15% and 85% of maximum velocity points on the lower spine velocity curve obtained by integration of the corresponding measured acceleration time history. Kallieris (1994) conducted forty-two side impact tests with human cadavers in the age range 18 to 65 years located at the near side passenger seat in 90 degree car to car lateral collisions. Analysis of the data indicated age of the subject at the time of death was the best predictor of thoracic injury followed by TTI. Rib deflections, which were computed from rib accelerometer data, were not as good predictors of injury as TTI. Pintar, et al. (1997) analyzed the data from a series of twenty-six human cadaver sled tests using the Heidelberg type sled system. Pintar proposed the use of TTI*C formed by the product of TTI and normalized chest deflection as a predictor of thoracic injury in side impacts. Kuppa, et al. (2000) analyzed 34 cadaveric side impact sled tests using various statistical techniques such as ANOVA, linear regression, logistic regression, and categorical analysis. The age of the subject was found to influence injury severity significantly (p<0.05) while gender and mass had little influence on injury outcome. This analysis indicated that maximum normalized resultant upper spine acceleration was the best individual predictor of injury severity followed by maximum normalized chest deflection and TTI. A model using a linear combination of age, maximum
13
normalized chest deflection, and maximum normalized resultant upper spine acceleration was the best predictor of thoracic injury. Wang (1989) in an analytical study and Chung (1999) based on lateral pendulum impacts to cadaveric subjects concluded that injury criteria based on stored energy is a better predictor of thoracic injury than is TTI, chest deflection, or VC. Viano et al. (1995) evaluated the biofidelity of the side impact dummies - EuroSID-1 and the BioSID. Viano et al. correlated the responses of the EuroSID-1 dummy to cadaver responses in similar cadaveric pendulum impact tests published in 1989 and developed thoracic injury criteria that can be directly applied to the EuroSID-1 dummy. According to this injury criterion, a 50% risk of AIS 3+ thoracic injury corresponds to maximum ES-1 measured rib deflection of 57 mm and a VC of 1 m/s. The current study is an extension of the Pintar (1997) and the Kuppa (2000) studies. The previous two analyses developed injury criteria based on measurements on the cadaveric subject. In order to develop injury criteria for use with the ES-2re, analysis was also conducted using the injury response from the cadaveric sled test data and the physical measurements made on the ES-2re in similar paired sled tests. The resulting injury criteria can be directly applied to the ES-2re without any need for adjustment to account for the differences in measured responses between cadaveric subjects and the ES-2 dummy under similar impact conditions. Such an approach was utilized by ISO, Working Group 6, (ISO, 2003) for developing injury criteria and risk curves for the EuroSID-1. The current study has an expanded data set of sled tests using cadavers and the ES-2re dummy compared to the Kuppa, et al. (2000) study. This work has already been published at the 2003, Forty-Seventh Stapp Car Crash Conference (Kuppa et al., 2003). TEST METHODOLOGY A series of 42 side impact sled tests using fully instrumented human cadaveric subjects and 16 sled tests using the ES-2re were conducted at the Medical College of Wisconsin (MCW). MCW utilized a deceleration sled with a Heidelberg type side impact sled apparatus (Pintar et al., 1997) configured for left side impacts (Figure 2). The test surrogate was seated on a bench at a specific distance away from the impact wall. Due to sled deceleration, the surrogate slides down the bench and strikes the wall surface. Unlike previous Heidelberg side impact sled setups (Cavanaugh et al., 1993, Kallieris et al., 1981), the height of the wall was adjusted such that the shoulder did not contact the wall. This configuration was selected to represent door contact in side impact crashes where the shoulder is above the level of the windowsill for a mid-size male. The impact surface consisted of four plates configured such that the upper plate impacted the thorax, the middle plate impacted the abdomen, the lower plate impacted the pelvis, and the lowest plate served as a contacting surface for the lower limbs. The four plates were instrumented with load cells to measure the impact force. The impact surface was either a flat wall or offset by 12 cm at the level of the pelvis, the abdomen, or the thorax. The impact surface was either rigid (with no padding) or padded with 10 cm of Ethafoam, LC 200 padding. Four
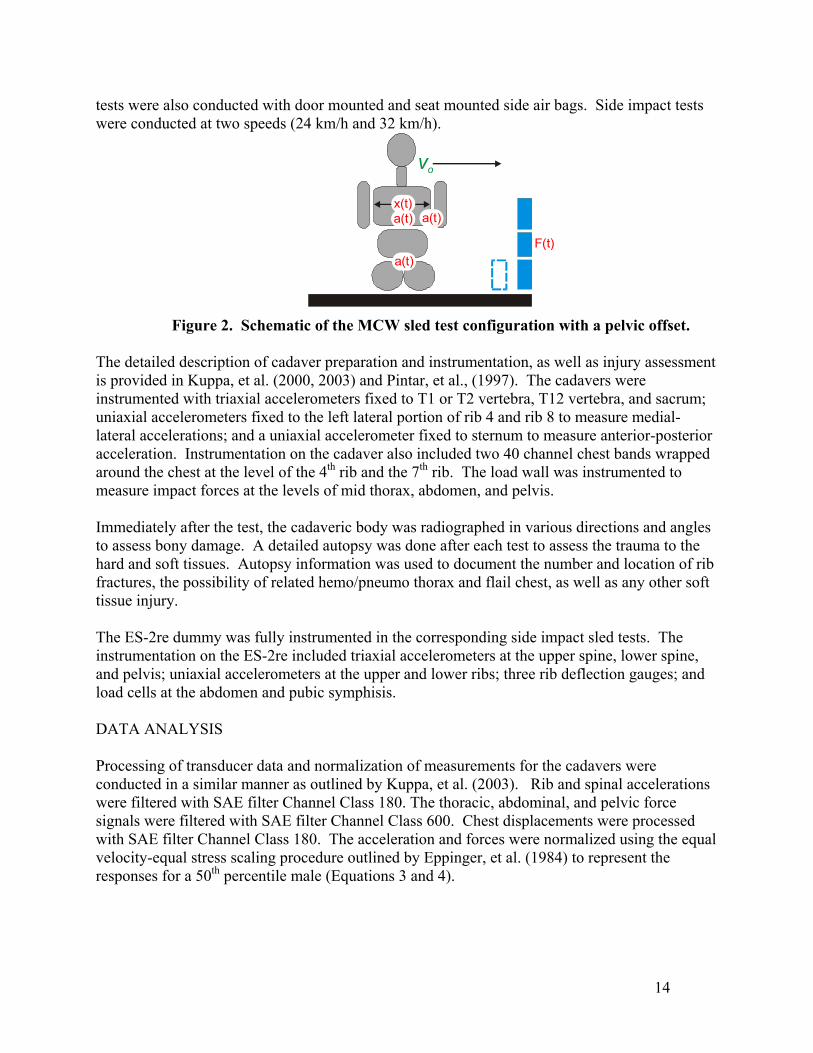
tests were also conducted with door mounted and seat mounted side air bags. Side impact tests were conducted at two speeds (24 km/h and 32 km/h).
F(t)
x(t)a(t)a(t)
a(t)
Figure 2. Schematic of the MCW sled test configuration with a pelvic offset. The detailed description of cadaver preparation and instrumentation, as well as injury assessment is provided in Kuppa, et al. (2000, 2003) and Pintar, et al., (1997). The cadavers were instrumented with triaxial accelerometers fixed to T1 or T2 vertebra, T12 vertebra, and sacrum; uniaxial accelerometers fixed to the left lateral portion of rib 4 and rib 8 to measure medial-lateral accelerations; and a uniaxial accelerometer fixed to sternum to measure anterior-posterior acceleration. Instrumentation on the cadaver also included two 40 channel chest bands wrapped around the chest at the level of the 4th rib and the 7th rib. The load wall was instrumented to measure impact forces at the levels of mid thorax, abdomen, and pelvis. Immediately after the test, the cadaveric body was radiographed in various directions and angles to assess bony damage. A detailed autopsy was done after each test to assess the trauma to the hard and soft tissues. Autopsy information was used to document the number and location of rib fractures, the possibility of related hemo/pneumo thorax and flail chest, as well as any other soft tissue injury. The ES-2re dummy was fully instrumented in the corresponding side impact sled tests. The instrumentation on the ES-2re included triaxial accelerometers at the upper spine, lower spine, and pelvis; uniaxial accelerometers at the upper and lower ribs; three rib deflection gauges; and load cells at the abdomen and pubic symphisis. DATA ANALYSIS Processing of transducer data and normalization of measurements for the cadavers were conducted in a similar manner as outlined by Kuppa, et al. (2003). Rib and spinal accelerations were filtered with SAE filter Channel Class 180. The thoracic, abdominal, and pelvic force signals were filtered with SAE filter Channel Class 600. Chest displacements were processed with SAE filter Channel Class 180. The acceleration and forces were normalized using the equal velocity-equal stress scaling procedure outlined by Eppinger, et al. (1984) to represent the responses for a 50th percentile male (Equations 3 and 4).
14
subjectofmasstotaltheiskgmasswherekgmass
forceforce
kgmassonaccelerationaccelerati
norm
norm
)(
)()(
)()(
/
/
475
375
32
31
×=
×=
TTI for cadavers was computed according to Eppinger et al. (1985) that include the effect of age and mass of the subject. For the computation of TTI, the accelerations at the 4th rib (rlu), the 8th rib (rll), and the lower spine acceleration (spl) were processed using FIR100 filter (Equation 5). The average spine acceleration (ASA) was computed and normalized according to ASA20, defined by Cavanaugh (1993) (Equation 6). ASA20 was computed as the slope of the line joining the points 20% and 80% of maximum velocity on the lower spine velocity curve. ASA20 was used since preliminary data analysis suggested that ASA20 was better correlated to injury than ASA10 or ASA15 as defined by Cavanaugh (1993).
( )
)()(
)()(
.
)..(.maxmax
max
67545
20
5752
141
02231
kgmassageASAASA
kgmasssplribageTTI
rllandrluoftheisribwhere
××=
×++×=
−×
TTIkernel was computed as in Equation 5 without the age term (1.4xage). ASAkernel was computed according to Equation 6 with age/45 term set to 1.0.
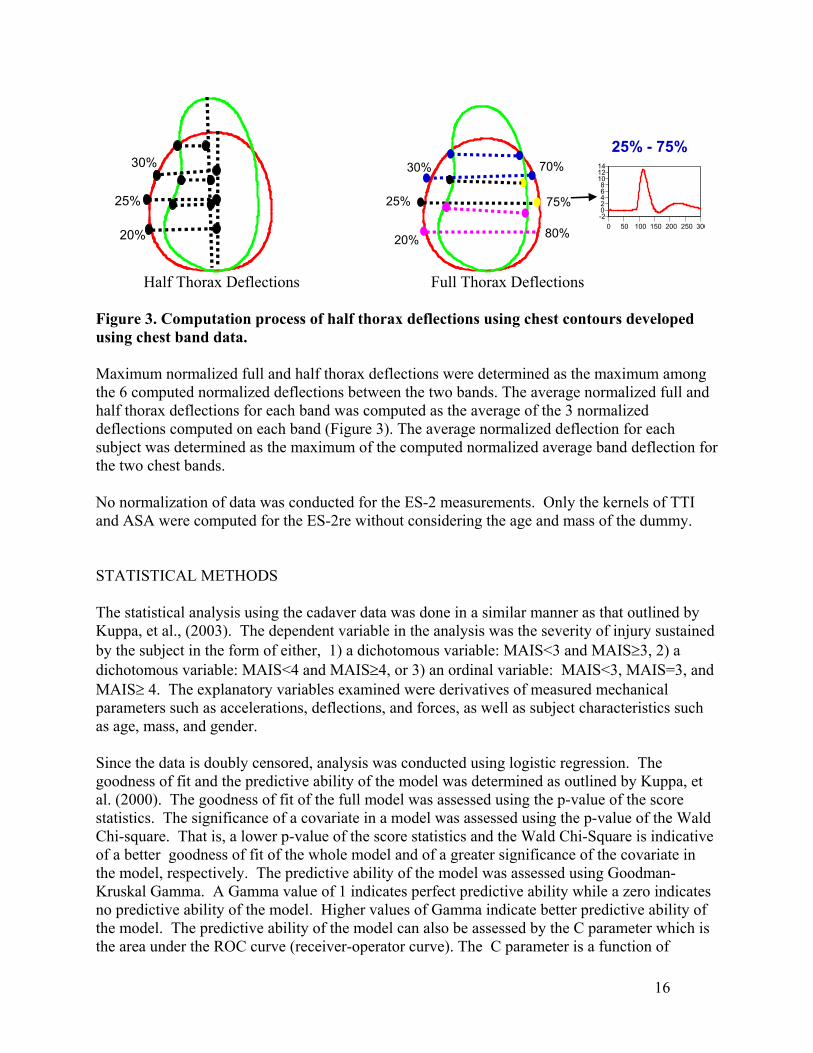
Full and half thorax deflections were computed using upper and lower chest band data at every millisecond during the impact event as outlined by Kuppa, et al. (2003). The centerline of the spine was considered as the origin of the contour and the sternum was considered to be the point along the band circumference at a distance of 50% of the circumference. Starting at the spine and following the contour in a clockwise direction, and considering the entire circumferential distance as 100%, three locations were marked at 20%, 25%, 30%, 70%, 75%, and 80% of the contour’s circumference for each deformation contour. Full thorax deflections were obtained from the distance between 20% and 80% points on the circumference and similarly between 25% and 75% points and 30% and 70% points on the circumference. Half thorax deflections were obtained from the perpendicular distance between the 20%, 25%, and 30% points and the mid-sagittal line joining the spine to the sternum. While computing half thorax deflections, the sternum and spine locations were assumed to remain at 50% and 0% along the contour circumference through out the event. Full and half thorax chest deflections were normalized with respect to initial full thorax width before the impact event at the location of deflection computation.
The full and half thorax rate of deflection (V) was obtained by differentiating the deflections processed by SAE filter Channel Class 180. The Viscous Criterion (VC) was obtained as the product of the rate of deflection (V) and the normalized thoracic deflection. Full and half thorax average normalized deflections, V, and VC were computed for each band as the average of the three normalized deflections, V, and VC, respectively, of each band.
15
25%
30%
20%
-202468
101214
0 50 100 150 200 250 300
25% - 75%
25%
30% 70%
75%
20% 80%
Half Thorax Deflections Full Thorax Deflections
Figure 3. Computation process of half thorax deflections using chest contours developed using chest band data.
Maximum normalized full and half thorax deflections were determined as the maximum among the 6 computed normalized deflections between the two bands. The average normalized full and half thorax deflections for each band was computed as the average of the 3 normalized deflections computed on each band (Figure 3). The average normalized deflection for each subject was determined as the maximum of the computed normalized average band deflection for the two chest bands. No normalization of data was conducted for the ES-2 measurements. Only the kernels of TTI and ASA were computed for the ES-2re without considering the age and mass of the dummy. STATISTICAL METHODS The statistical analysis using the cadaver data was done in a similar manner as that outlined by Kuppa, et al., (2003). The dependent variable in the analysis was the severity of injury sustained by the subject in the form of either, 1) a dichotomous variable: MAIS<3 and MAIS≥3, 2) a dichotomous variable: MAIS<4 and MAIS≥4, or 3) an ordinal variable: MAIS<3, MAIS=3, and MAIS≥ 4. The explanatory variables examined were derivatives of measured mechanical parameters such as accelerations, deflections, and forces, as well as subject characteristics such as age, mass, and gender. Since the data is doubly censored, analysis was conducted using logistic regression. The goodness of fit and the predictive ability of the model was determined as outlined by Kuppa, et al. (2000). The goodness of fit of the full model was assessed using the p-value of the score statistics. The significance of a covariate in a model was assessed using the p-value of the Wald Chi-square. That is, a lower p-value of the score statistics and the Wald Chi-Square is indicative of a better goodness of fit of the whole model and of a greater significance of the covariate in the model, respectively. The predictive ability of the model was assessed using Goodman-Kruskal Gamma. A Gamma value of 1 indicates perfect predictive ability while a zero indicates no predictive ability of the model. Higher values of Gamma indicate better predictive ability of the model. The predictive ability of the model can also be assessed by the C parameter which is the area under the ROC curve (receiver-operator curve). The C parameter is a function of
16
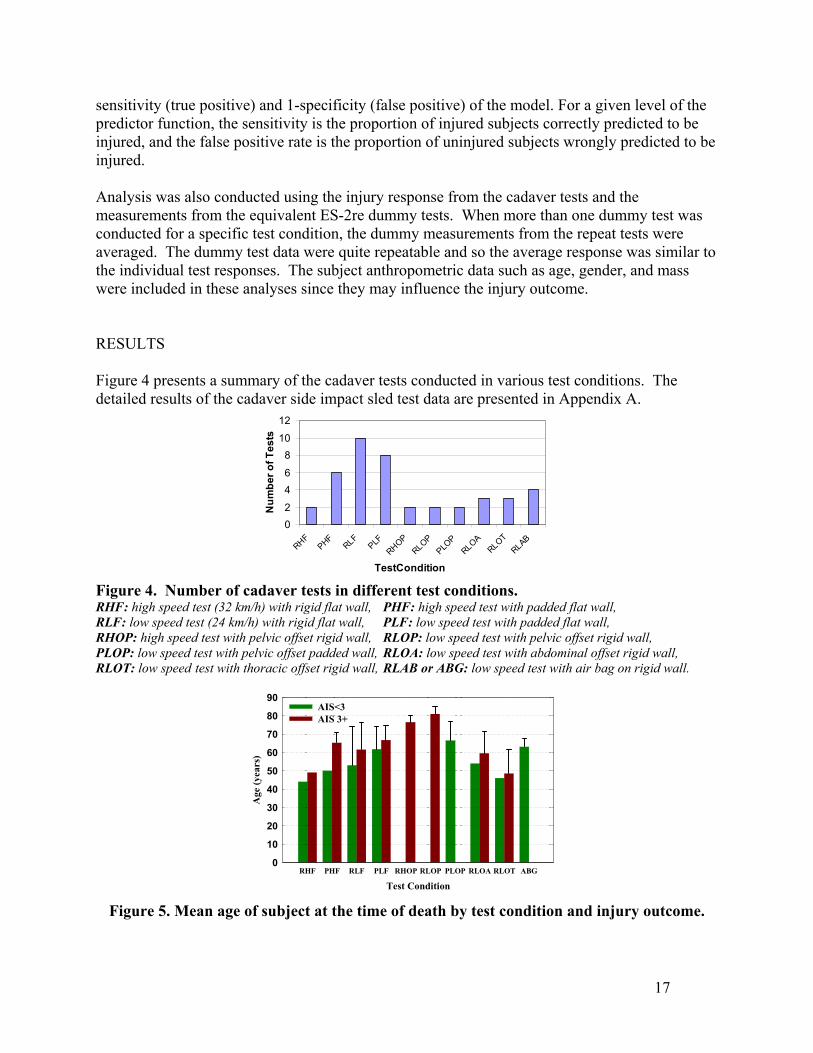
sensitivity (true positive) and 1-specificity (false positive) of the model. For a given level of the predictor function, the sensitivity is the proportion of injured subjects correctly predicted to be injured, and the false positive rate is the proportion of uninjured subjects wrongly predicted to be injured. Analysis was also conducted using the injury response from the cadaver tests and the measurements from the equivalent ES-2re dummy tests. When more than one dummy test was conducted for a specific test condition, the dummy measurements from the repeat tests were averaged. The dummy test data were quite repeatable and so the average response was similar to the individual test responses. The subject anthropometric data such as age, gender, and mass were included in these analyses since they may influence the injury outcome. RESULTS Figure 4 presents a summary of the cadaver tests conducted in various test conditions. The detailed results of the cadaver side impact sled test data are presented in Appendix A.
02
46
810
12
RHFPHF
RLFPLF
RHOPRLOP
PLOP
RLOARLOT
RLAB
TestCondition
Num
ber o
f Tes
ts
Figure 4. Number of cadaver tests in different test conditions. RHF: high speed test (32 km/h) with rigid flat wall, PHF: high speed test with padded flat wall, RLF: low speed test (24 km/h) with rigid flat wall, PLF: low speed test with padded flat wall, RHOP: high speed test with pelvic offset rigid wall, RLOP: low speed test with pelvic offset rigid wall, PLOP: low speed test with pelvic offset padded wall, RLOA: low speed test with abdominal offset rigid wall, RLOT: low speed test with thoracic offset rigid wall, RLAB or ABG: low speed test with air bag on rigid wall.
Test ConditionRHF PHF RLF PLF RHOP RLOP PLOP RLOA RLOT ABG
Age
(yea
rs)
0
10
20
30
40
50
60
70
80
90AIS<3AIS 3+
Figure 5. Mean age of subject at the time of death by test condition and injury outcome.
17
Mean age of subjects in the MCW tests was 61.7±12.8 years. Among the 42 subjects in this test series, 13 were female. Figure 5 presents the mean age of subjects in different test conditions and for different injury outcomes. The mean age of AIS 3+ injured subjects (64.2±12.3 years) is higher than those with no injury or AIS<3 injuries (58.3±13 years). This difference in age was however non-significant due to the small sample size in each test condition.
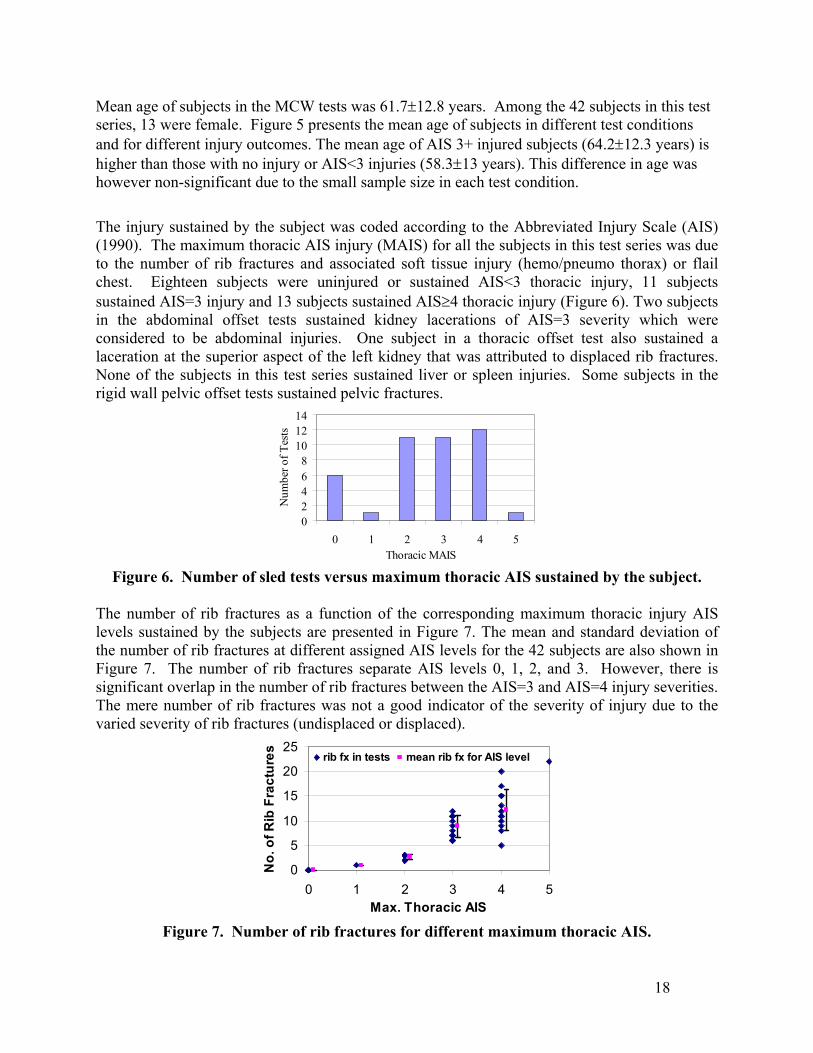
The injury sustained by the subject was coded according to the Abbreviated Injury Scale (AIS) (1990). The maximum thoracic AIS injury (MAIS) for all the subjects in this test series was due to the number of rib fractures and associated soft tissue injury (hemo/pneumo thorax) or flail chest. Eighteen subjects were uninjured or sustained AIS<3 thoracic injury, 11 subjects sustained AIS=3 injury and 13 subjects sustained AIS≥4 thoracic injury (Figure 6). Two subjects in the abdominal offset tests sustained kidney lacerations of AIS=3 severity which were considered to be abdominal injuries. One subject in a thoracic offset test also sustained a laceration at the superior aspect of the left kidney that was attributed to displaced rib fractures. None of the subjects in this test series sustained liver or spleen injuries. Some subjects in the rigid wall pelvic offset tests sustained pelvic fractures.
02468
101214
0 1 2 3 4 5Thoracic MAIS
Num
ber o
f Tes
ts
Figure 6. Number of sled tests versus maximum thoracic AIS sustained by the subject.
The number of rib fractures as a function of the corresponding maximum thoracic injury AIS levels sustained by the subjects are presented in Figure 7. The mean and standard deviation of the number of rib fractures at different assigned AIS levels for the 42 subjects are also shown in Figure 7. The number of rib fractures separate AIS levels 0, 1, 2, and 3. However, there is significant overlap in the number of rib fractures between the AIS=3 and AIS=4 injury severities. The mere number of rib fractures was not a good indicator of the severity of injury due to the varied severity of rib fractures (undisplaced or displaced).
0
5
10
15
20
25
0 1 2 3 4 5Max. Thoracic AIS
No.
of R
ib F
ract
ures rib fx in tests mean rib fx for AIS level
Figure 7. Number of rib fractures for different maximum thoracic AIS.
18
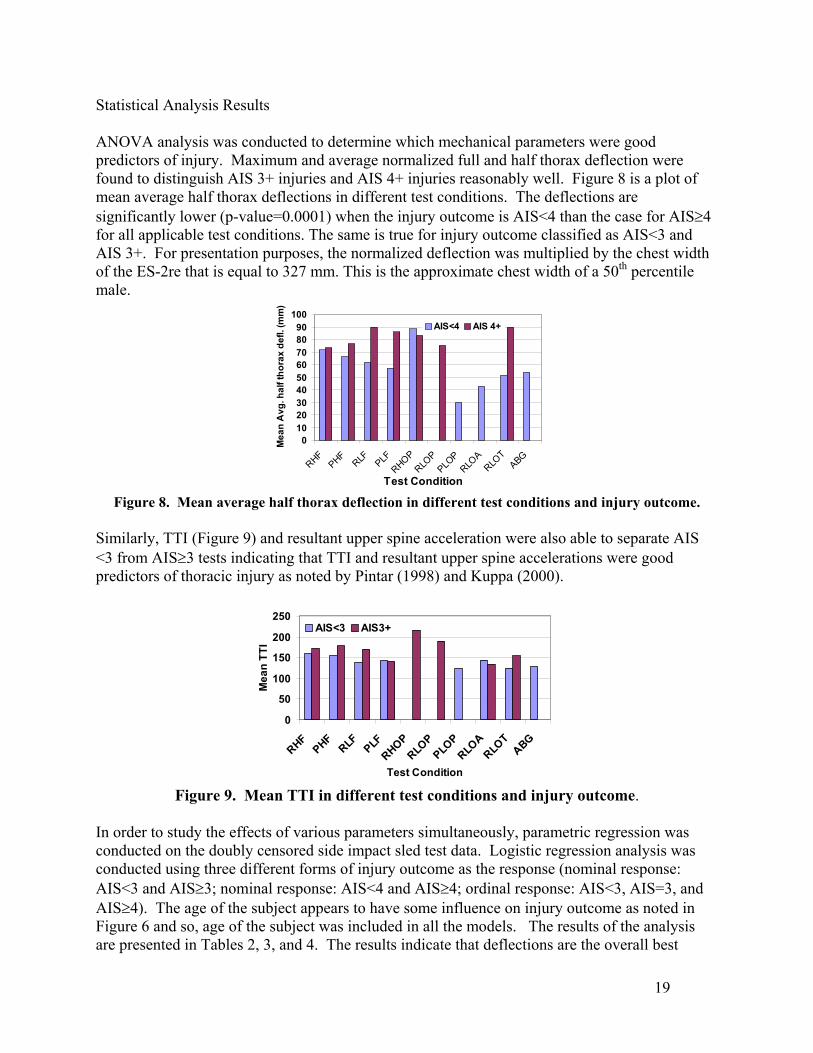
Statistical Analysis Results ANOVA analysis was conducted to determine which mechanical parameters were good predictors of injury. Maximum and average normalized full and half thorax deflection were found to distinguish AIS 3+ injuries and AIS 4+ injuries reasonably well. Figure 8 is a plot of mean average half thorax deflections in different test conditions. The deflections are significantly lower (p-value=0.0001) when the injury outcome is AIS<4 than the case for AIS≥4 for all applicable test conditions. The same is true for injury outcome classified as AIS<3 and AIS 3+. For presentation purposes, the normalized deflection was multiplied by the chest width of the ES-2re that is equal to 327 mm. This is the approximate chest width of a 50th percentile male.
0102030405060708090
100
RHFPHF
RLF PLFRHOP
RLOP
PLOP
RLOA
RLOT
ABG
Test Condition
Mea
n A
vg. h
alf t
hora
x de
fl. (m
m)
AIS<4 AIS 4+
Figure 8. Mean average half thorax deflection in different test conditions and injury outcome.
Similarly, TTI (Figure 9) and resultant upper spine acceleration were also able to separate AIS <3 from AIS≥3 tests indicating that TTI and resultant upper spine accelerations were good predictors of thoracic injury as noted by Pintar (1998) and Kuppa (2000).
0
50
100
150
200
250
RHFPHF
RLF PLFRHOP
RLOP
PLOP
RLOA
RLOT
ABG
Test Condition
Mea
n TT
I
AIS<3 AIS3+
Figure 9. Mean TTI in different test conditions and injury outcome.
In order to study the effects of various parameters simultaneously, parametric regression was conducted on the doubly censored side impact sled test data. Logistic regression analysis was conducted using three different forms of injury outcome as the response (nominal response: AIS<3 and AIS≥3; nominal response: AIS<4 and AIS≥4; ordinal response: AIS<3, AIS=3, and AIS≥4). The age of the subject appears to have some influence on injury outcome as noted in Figure 6 and so, age of the subject was included in all the models. The results of the analysis are presented in Tables 2, 3, and 4. The results indicate that deflections are the overall best
19
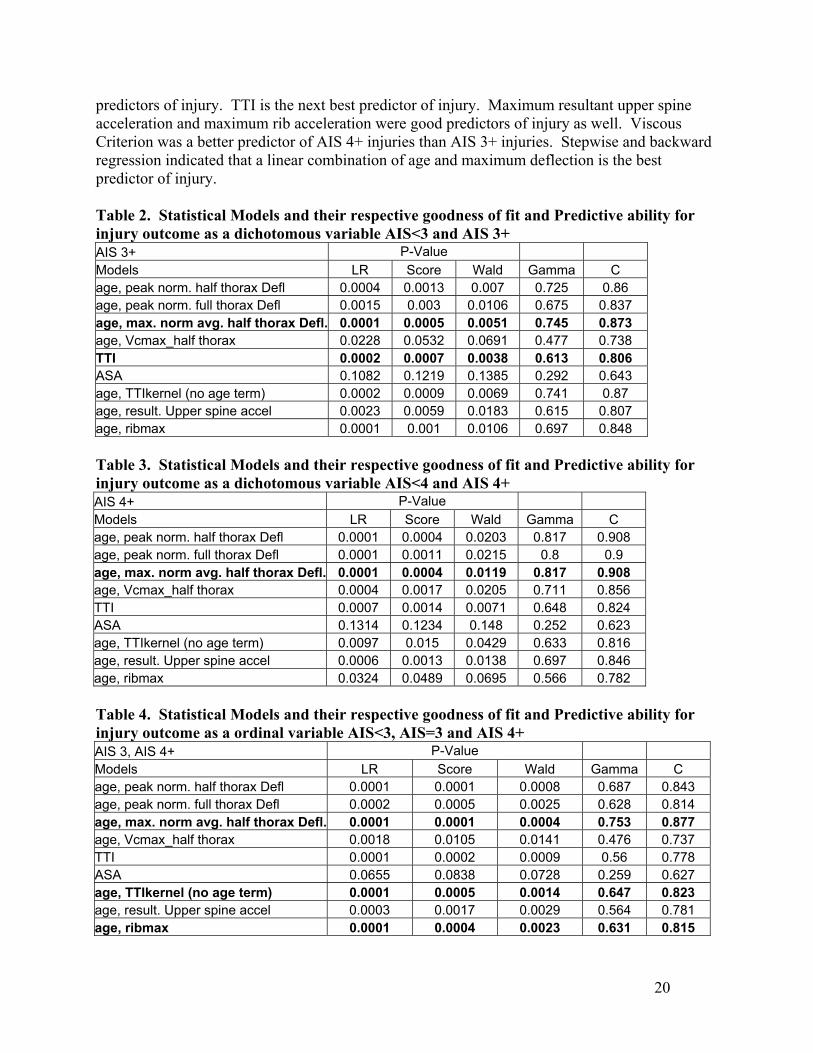
20
predictors of injury. TTI is the next best predictor of injury. Maximum resultant upper spine acceleration and maximum rib acceleration were good predictors of injury as well. Viscous Criterion was a better predictor of AIS 4+ injuries than AIS 3+ injuries. Stepwise and backward regression indicated that a linear combination of age and maximum deflection is the best predictor of injury. Table 2. Statistical Models and their respective goodness of fit and Predictive ability for injury outcome as a dichotomous variable AIS<3 and AIS 3+ AIS 3+ P-Value Models LR Score Wald Gamma C age, peak norm. half thorax Defl 0.0004 0.0013 0.007 0.725 0.86 age, peak norm. full thorax Defl 0.0015 0.003 0.0106 0.675 0.837 age, max. norm avg. half thorax Defl. 0.0001 0.0005 0.0051 0.745 0.873 age, Vcmax_half thorax 0.0228 0.0532 0.0691 0.477 0.738 TTI 0.0002 0.0007 0.0038 0.613 0.806 ASA 0.1082 0.1219 0.1385 0.292 0.643 age, TTIkernel (no age term) 0.0002 0.0009 0.0069 0.741 0.87 age, result. Upper spine accel 0.0023 0.0059 0.0183 0.615 0.807 age, ribmax 0.0001 0.001 0.0106 0.697 0.848 Table 3. Statistical Models and their respective goodness of fit and Predictive ability for injury outcome as a dichotomous variable AIS<4 and AIS 4+ AIS 4+ P-Value Models LR Score Wald Gamma C age, peak norm. half thorax Defl 0.0001 0.0004 0.0203 0.817 0.908 age, peak norm. full thorax Defl 0.0001 0.0011 0.0215 0.8 0.9 age, max. norm avg. half thorax Defl. 0.0001 0.0004 0.0119 0.817 0.908 age, Vcmax_half thorax 0.0004 0.0017 0.0205 0.711 0.856 TTI 0.0007 0.0014 0.0071 0.648 0.824 ASA 0.1314 0.1234 0.148 0.252 0.623 age, TTIkernel (no age term) 0.0097 0.015 0.0429 0.633 0.816 age, result. Upper spine accel 0.0006 0.0013 0.0138 0.697 0.846 age, ribmax 0.0324 0.0489 0.0695 0.566 0.782 Table 4. Statistical Models and their respective goodness of fit and Predictive ability for injury outcome as a ordinal variable AIS<3, AIS=3 and AIS 4+ AIS 3, AIS 4+ P-Value Models LR Score Wald Gamma C age, peak norm. half thorax Defl 0.0001 0.0001 0.0008 0.687 0.843 age, peak norm. full thorax Defl 0.0002 0.0005 0.0025 0.628 0.814 age, max. norm avg. half thorax Defl. 0.0001 0.0001 0.0004 0.753 0.877 age, Vcmax_half thorax 0.0018 0.0105 0.0141 0.476 0.737 TTI 0.0001 0.0002 0.0009 0.56 0.778 ASA 0.0655 0.0838 0.0728 0.259 0.627 age, TTIkernel (no age term) 0.0001 0.0005 0.0014 0.647 0.823 age, result. Upper spine accel 0.0003 0.0017 0.0029 0.564 0.781 age, ribmax 0.0001 0.0004 0.0023 0.631 0.815
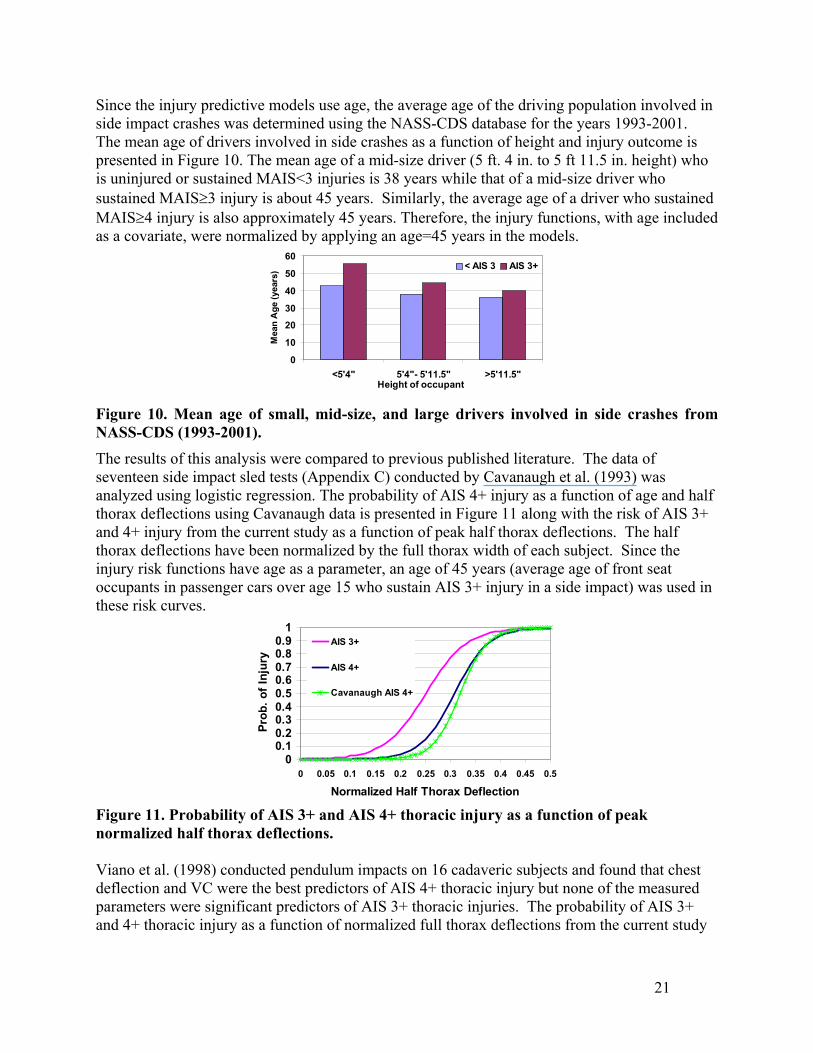
Since the injury predictive models use age, the average age of the driving population involved in side impact crashes was determined using the NASS-CDS database for the years 1993-2001. The mean age of drivers involved in side crashes as a function of height and injury outcome is presented in Figure 10. The mean age of a mid-size driver (5 ft. 4 in. to 5 ft 11.5 in. height) who is uninjured or sustained MAIS<3 injuries is 38 years while that of a mid-size driver who sustained MAIS≥3 injury is about 45 years. Similarly, the average age of a driver who sustained MAIS≥4 injury is also approximately 45 years. Therefore, the injury functions, with age included as a covariate, were normalized by applying an age=45 years in the models.
0
10
20
30
40
50
60
<5'4" 5'4"- 5'11.5" >5'11.5"Height of occupant
Mea
n A
ge (y
ears
) < AIS 3 AIS 3+
Figure 10. Mean age of small, mid-size, and large drivers involved in side crashes from NASS-CDS (1993-2001). The results of this analysis were compared to previous published literature. The data of seventeen side impact sled tests (Appendix C) conducted by Cavanaugh et al. (1993) was analyzed using logistic regression. The probability of AIS 4+ injury as a function of age and half thorax deflections using Cavanaugh data is presented in Figure 11 along with the risk of AIS 3+ and 4+ injury from the current study as a function of peak half thorax deflections. The half thorax deflections have been normalized by the full thorax width of each subject. Since the injury risk functions have age as a parameter, an age of 45 years (average age of front seat occupants in passenger cars over age 15 who sustain AIS 3+ injury in a side impact) was used in these risk curves.
00.10.20.30.40.50.60.70.80.9
1
0 0.05 0.1 0.15 0.2 0.25 0.3 0.35 0.4 0.45 0.5
Normalized Half Thorax Deflection
Prob
. of I
njur
y
AIS 3+
AIS 4+
Cavanaugh AIS 4+
Figure 11. Probability of AIS 3+ and AIS 4+ thoracic injury as a function of peak normalized half thorax deflections. Viano et al. (1998) conducted pendulum impacts on 16 cadaveric subjects and found that chest deflection and VC were the best predictors of AIS 4+ thoracic injury but none of the measured parameters were significant predictors of AIS 3+ thoracic injuries. The probability of AIS 3+ and 4+ thoracic injury as a function of normalized full thorax deflections from the current study
21
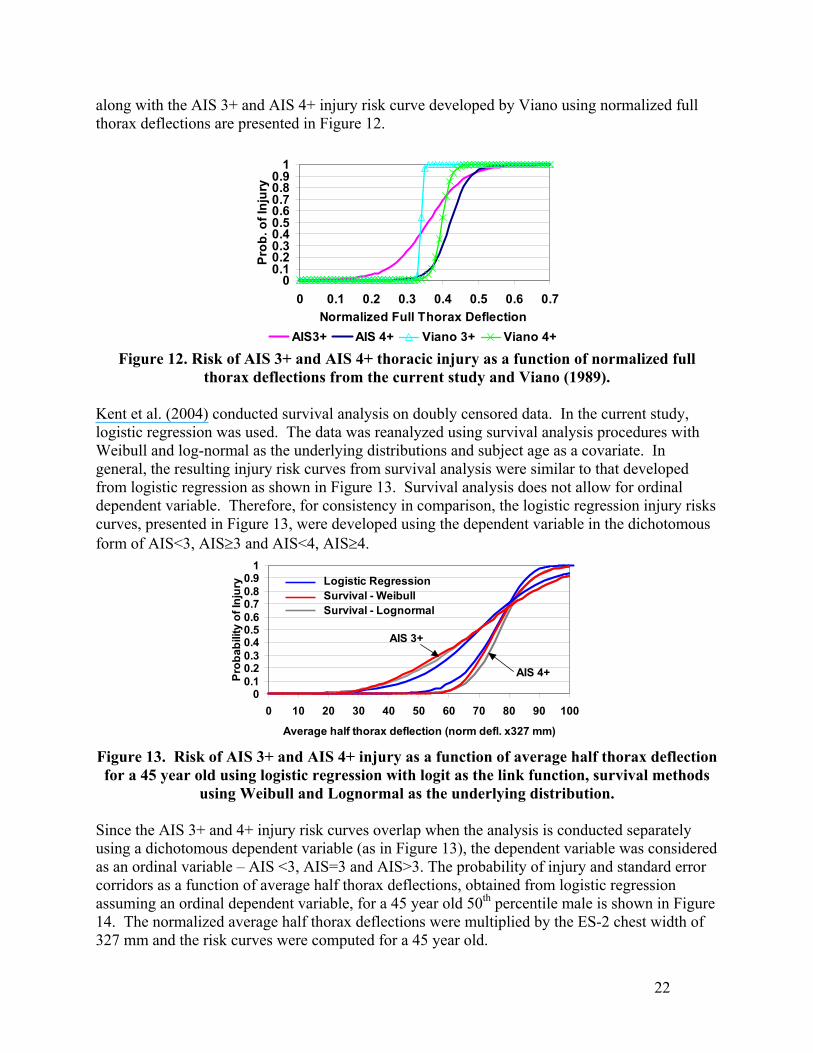
along with the AIS 3+ and AIS 4+ injury risk curve developed by Viano using normalized full thorax deflections are presented in Figure 12.
00.10.20.30.40.50.60.70.80.9
1
0 0.1 0.2 0.3 0.4 0.5 0.6 0.7Normalized Full Thorax Deflection
Prob
. of I
njur
y
AIS3+ AIS 4+ Viano 3+ Viano 4+ Figure 12. Risk of AIS 3+ and AIS 4+ thoracic injury as a function of normalized full
thorax deflections from the current study and Viano (1989).
Kent et al. (2004) conducted survival analysis on doubly censored data. In the current study, logistic regression was used. The data was reanalyzed using survival analysis procedures with Weibull and log-normal as the underlying distributions and subject age as a covariate. In general, the resulting injury risk curves from survival analysis were similar to that developed from logistic regression as shown in Figure 13. Survival analysis does not allow for ordinal dependent variable. Therefore, for consistency in comparison, the logistic regression injury risks curves, presented in Figure 13, were developed using the dependent variable in the dichotomous form of AIS<3, AIS≥3 and AIS<4, AIS≥4.
00.10.20.30.40.50.60.70.80.9
1
0 10 20 30 40 50 60 70 80 90 100
Average half thorax deflection (norm defl. x327 mm)
Prob
abili
ty o
f Inj
ury
AIS 3+
AIS 4+
Logistic RegressionSurvival - WeibullSurvival - Lognormal
Figure 13. Risk of AIS 3+ and AIS 4+ injury as a function of average half thorax deflection for a 45 year old using logistic regression with logit as the link function, survival methods
using Weibull and Lognormal as the underlying distribution.
Since the AIS 3+ and 4+ injury risk curves overlap when the analysis is conducted separately using a dichotomous dependent variable (as in Figure 13), the dependent variable was considered as an ordinal variable – AIS <3, AIS=3 and AIS>3. The probability of injury and standard error corridors as a function of average half thorax deflections, obtained from logistic regression assuming an ordinal dependent variable, for a 45 year old 50th percentile male is shown in Figure 14. The normalized average half thorax deflections were multiplied by the ES-2 chest width of 327 mm and the risk curves were computed for a 45 year old.
22
00.10.20.30.40.50.60.70.80.9
1
0 10 20 30 40 50 60 70 80 90 100 110 120
Average half thorax deflection (norm defl. x327 mm)Pr
obab
ility
of I
njur
y AIS 3+ risk and standard error
AIS 4+ risk and standard error
Figure 14. Risk of AIS 3+ and AIS 4+ thoracic injury as a function of average half thorax deflections for a 45 year old 50th percentile male.
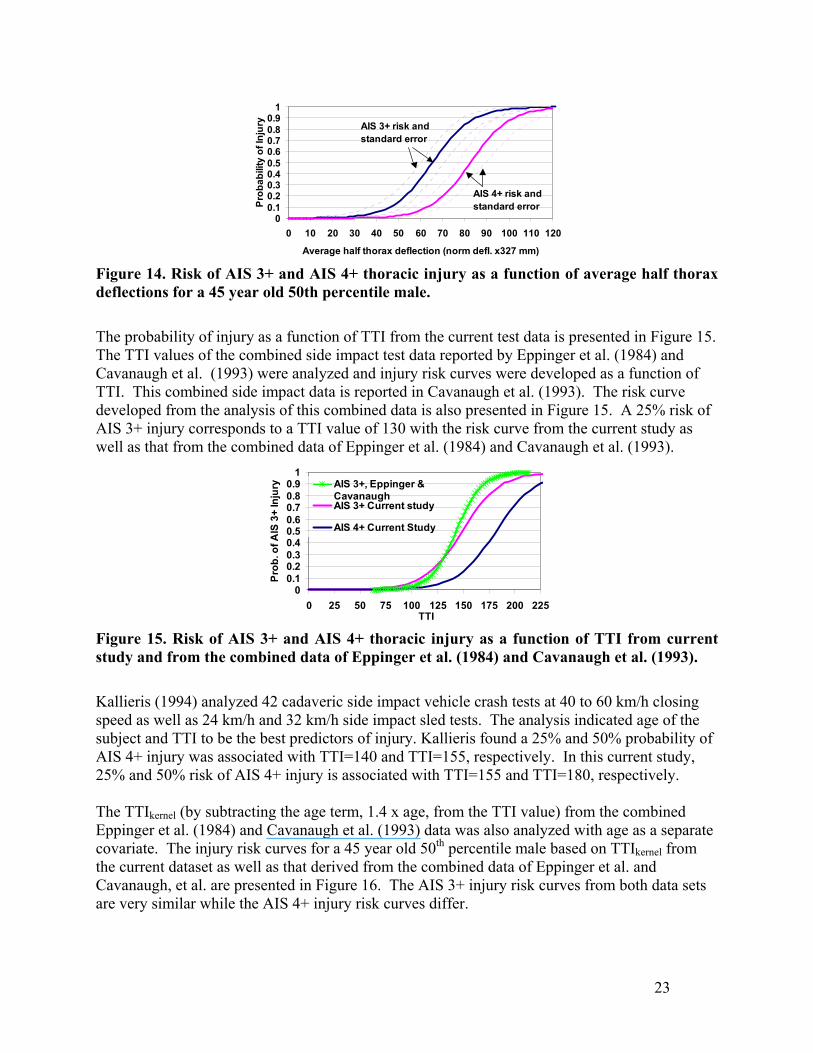
The probability of injury as a function of TTI from the current test data is presented in Figure 15. The TTI values of the combined side impact test data reported by Eppinger et al. (1984) and Cavanaugh et al. (1993) were analyzed and injury risk curves were developed as a function of TTI. This combined side impact data is reported in Cavanaugh et al. (1993). The risk curve developed from the analysis of this combined data is also presented in Figure 15. A 25% risk of AIS 3+ injury corresponds to a TTI value of 130 with the risk curve from the current study as well as that from the combined data of Eppinger et al. (1984) and Cavanaugh et al. (1993).
00.10.20.30.40.50.60.70.80.9
1
0 25 50 75 100 125 150 175 200 225TTI
Pro
b. o
f AIS
3+
Inju
ry AIS 3+, Eppinger &CavanaughAIS 3+ Current study
AIS 4+ Current Study
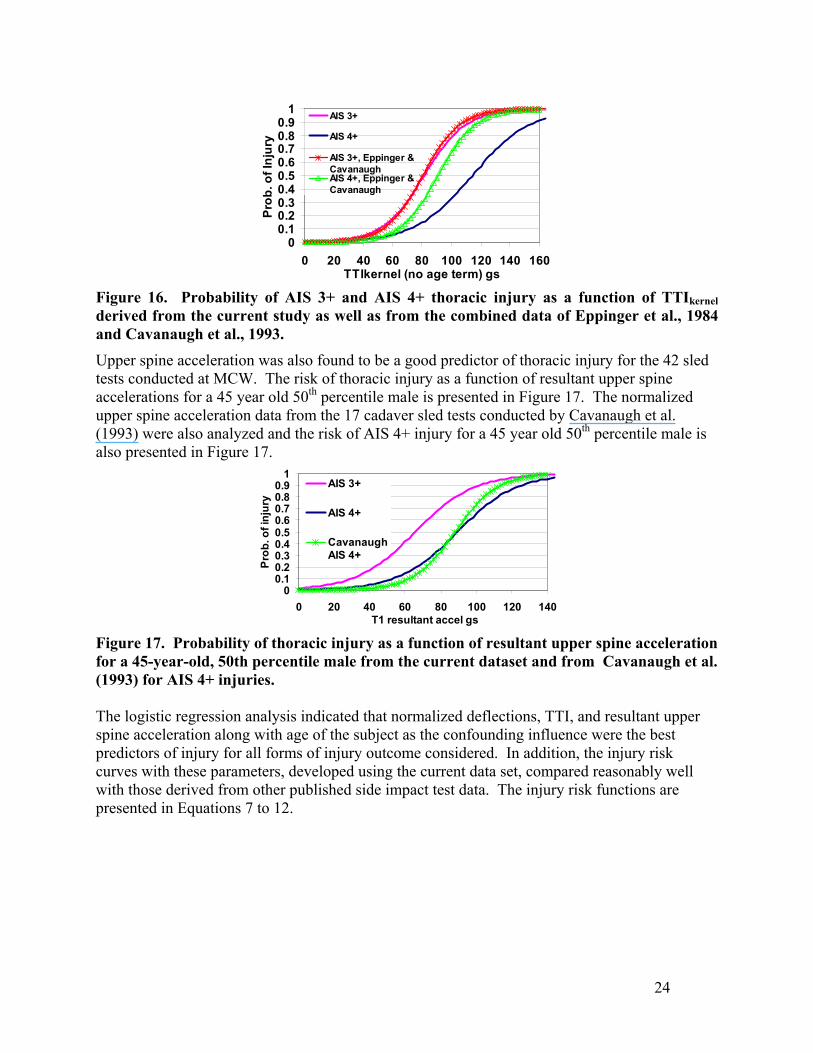
Figure 15. Risk of AIS 3+ and AIS 4+ thoracic injury as a function of TTI from current study and from the combined data of Eppinger et al. (1984) and Cavanaugh et al. (1993). Kallieris (1994) analyzed 42 cadaveric side impact vehicle crash tests at 40 to 60 km/h closing speed as well as 24 km/h and 32 km/h side impact sled tests. The analysis indicated age of the subject and TTI to be the best predictors of injury. Kallieris found a 25% and 50% probability of AIS 4+ injury was associated with TTI=140 and TTI=155, respectively. In this current study, 25% and 50% risk of AIS 4+ injury is associated with TTI=155 and TTI=180, respectively. The TTIkernel (by subtracting the age term, 1.4 x age, from the TTI value) from the combined Eppinger et al. (1984) and Cavanaugh et al. (1993) data was also analyzed with age as a separate covariate. The injury risk curves for a 45 year old 50th percentile male based on TTIkernel from the current dataset as well as that derived from the combined data of Eppinger et al. and Cavanaugh, et al. are presented in Figure 16. The AIS 3+ injury risk curves from both data sets are very similar while the AIS 4+ injury risk curves differ.
23
00.10.20.30.40.50.60.70.80.9
1
0 20 40 60 80 100 120 140 160TTIkernel (no age term) gs
Prob
. of I
njur
y
AIS 3+
AIS 4+
AIS 3+, Eppinger &CavanaughAIS 4+, Eppinger &Cavanaugh
Figure 16. Probability of AIS 3+ and AIS 4+ thoracic injury as a function of TTIkernel derived from the current study as well as from the combined data of Eppinger et al., 1984 and Cavanaugh et al., 1993.
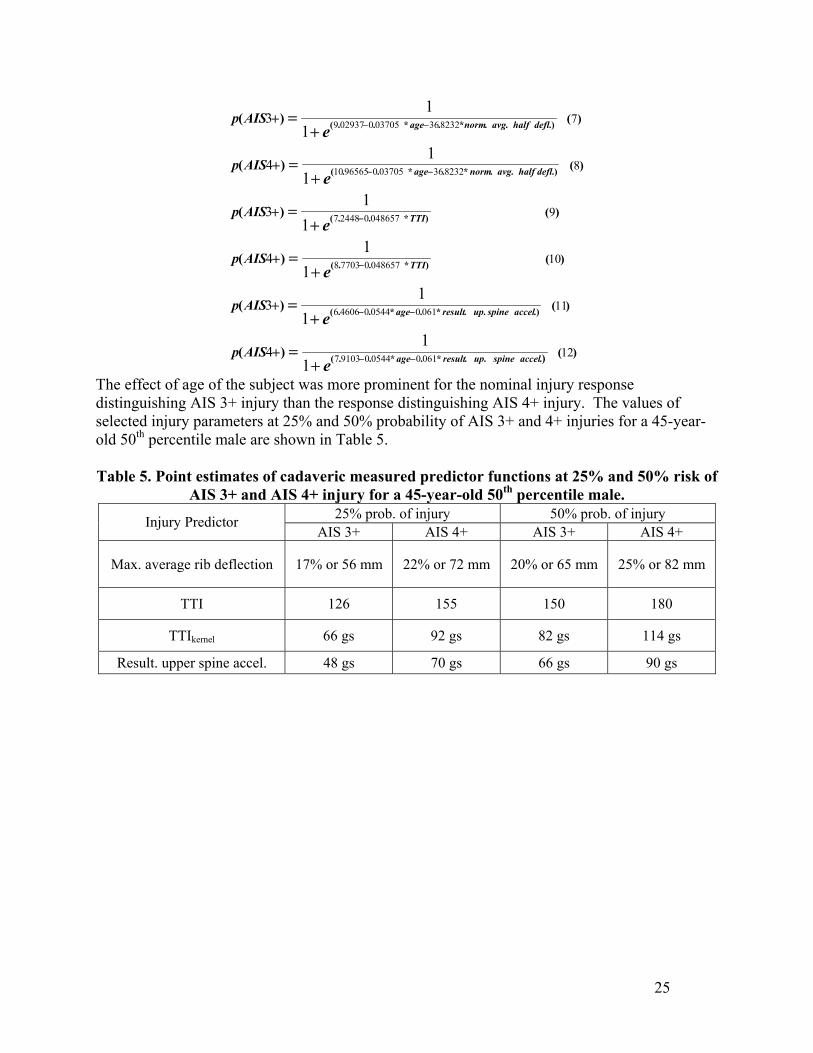
Upper spine acceleration was also found to be a good predictor of thoracic injury for the 42 sled tests conducted at MCW. The risk of thoracic injury as a function of resultant upper spine accelerations for a 45 year old 50th percentile male is presented in Figure 17. The normalized upper spine acceleration data from the 17 cadaver sled tests conducted by Cavanaugh et al. (1993) were also analyzed and the risk of AIS 4+ injury for a 45 year old 50th percentile male is also presented in Figure 17.
00.10.20.30.40.50.60.70.80.9
1
0 20 40 60 80 100 120 140T1 resultant accel gs
Prob
. of i
njur
y
AIS 3+
AIS 4+
CavanaughAIS 4+
Figure 17. Probability of thoracic injury as a function of resultant upper spine acceleration for a 45-year-old, 50th percentile male from the current dataset and from Cavanaugh et al. (1993) for AIS 4+ injuries. The logistic regression analysis indicated that normalized deflections, TTI, and resultant upper spine acceleration along with age of the subject as the confounding influence were the best predictors of injury for all forms of injury outcome considered. In addition, the injury risk curves with these parameters, developed using the current data set, compared reasonably well with those derived from other published side impact test data. The injury risk functions are presented in Equations 7 to 12.
24
)(
)(
)(
)(
)(
)(
)...*.*..(
.)..*.*..(
)*..(
)*..(
.)..*.*..(
.)..*.*..(
)(
)(
)(
)(
)(
)(
12
11
10
9
8
7
06100544091037
06100544046066
048657077038
048657024487
8232360370509656510
823236037050029379
11
11
11
11
11
11
4
3
4
3
4
3
accelspineupresultage
accelspineupresultage
TTI
TTI
deflhalfavgnormage
deflhalfavgnormage
e
e
e
e
e
e
AISp
AISp
AISp
AISp
AISp
AISp
−−
−−
−
−
−−
−−
+=
+=
+=
+=
+=
+=
+
+
+
+
+
+
The effect of age of the subject was more prominent for the nominal injury response distinguishing AIS 3+ injury than the response distinguishing AIS 4+ injury. The values of selected injury parameters at 25% and 50% probability of AIS 3+ and 4+ injuries for a 45-year-old 50th percentile male are shown in Table 5. Table 5. Point estimates of cadaveric measured predictor functions at 25% and 50% risk of
AIS 3+ and AIS 4+ injury for a 45-year-old 50th percentile male. 25% prob. of injury 50% prob. of injury Injury Predictor
AIS 3+ AIS 4+ AIS 3+ AIS 4+
Max. average rib deflection 17% or 56 mm 22% or 72 mm 20% or 65 mm 25% or 82 mm
TTI 126 155 150 180
TTIkernel 66 gs 92 gs 82 gs 114 gs
Result. upper spine accel. 48 gs 70 gs 66 gs 90 gs
25
THORACIC INJURY CRITERIA DEVELOPMENT USING ES-2RE MEASUREMENTS Sixteen sled tests were conducted in similar test configurations as those of the cadaver tests (Appendix B). For test conditions where more than one ES-2re dummy tests were available, the responses from the tests were averaged. In general, the responses of the ES-2re dummy in repeat tests were quite similar. The injury responses and the anthropometric data (age, gender, mass, and height) of the subjects were taken from the cadaver data and combined with the physical parameters (TTI, ASA, maximum half thorax deflection, spine accelerations, etc.) that are derived from ES-2re measurements in similar condition sled tests. The tests with airbags that were conducted with the cadavers were not repeated with the ES-2re dummy. Consequently, there are only 38 paired cadaver and ES-2re dummy tests conducted in similar test conditions.
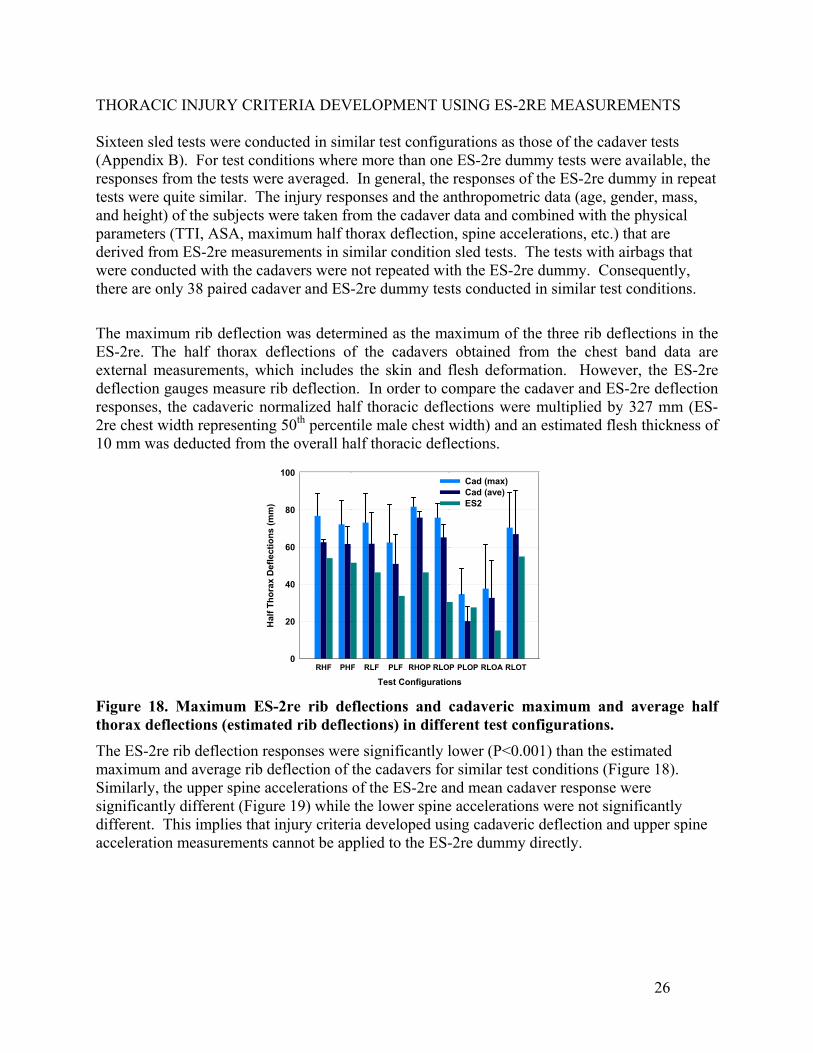
The maximum rib deflection was determined as the maximum of the three rib deflections in the ES-2re. The half thorax deflections of the cadavers obtained from the chest band data are external measurements, which includes the skin and flesh deformation. However, the ES-2re deflection gauges measure rib deflection. In order to compare the cadaver and ES-2re deflection responses, the cadaveric normalized half thoracic deflections were multiplied by 327 mm (ES-2re chest width representing 50th percentile male chest width) and an estimated flesh thickness of 10 mm was deducted from the overall half thoracic deflections.
Test ConfigurationsRHF PHF RLF PLF RHOP RLOP PLOP RLOA RLOT
Hal
f Tho
rax
Def
lect
ions
(mm
)
0
20
40
60
80
100Cad (max)Cad (ave)ES2
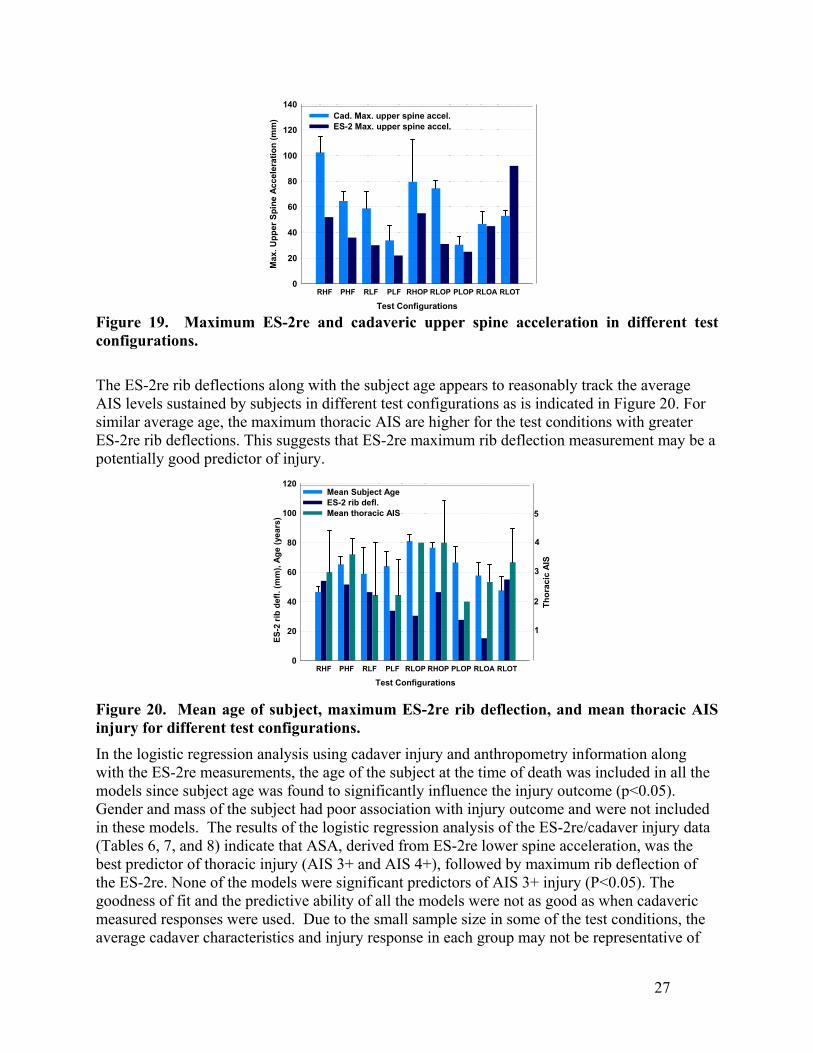
Figure 18. Maximum ES-2re rib deflections and cadaveric maximum and average half thorax deflections (estimated rib deflections) in different test configurations. The ES-2re rib deflection responses were significantly lower (P<0.001) than the estimated maximum and average rib deflection of the cadavers for similar test conditions (Figure 18). Similarly, the upper spine accelerations of the ES-2re and mean cadaver response were significantly different (Figure 19) while the lower spine accelerations were not significantly different. This implies that injury criteria developed using cadaveric deflection and upper spine acceleration measurements cannot be applied to the ES-2re dummy directly.
26
Test ConfigurationsRHF PHF RLF PLF RHOP RLOP PLOP RLOA RLOT
Max
. Upp
er S
pine
Acc
eler
atio
n (m
m)
0
20
40
60
80
100
120
140Cad. Max. upper spine accel.ES-2 Max. upper spine accel.
Figure 19. Maximum ES-2re and cadaveric upper spine acceleration in different test configurations.
The ES-2re rib deflections along with the subject age appears to reasonably track the average AIS levels sustained by subjects in different test configurations as is indicated in Figure 20. For similar average age, the maximum thoracic AIS are higher for the test conditions with greater ES-2re rib deflections. This suggests that ES-2re maximum rib deflection measurement may be a potentially good predictor of injury.
Test ConfigurationsRHF PHF RLF PLF RLOP RHOP PLOP RLOA RLOT
ES-2
rib
defl.
(mm
), Ag
e (y
ears
)
0
20
40
60
80
100
120Mean Subject AgeES-2 rib defl.Mean thoracic AIS
1
2
3
4
5
Thor
acic
AIS
Figure 20. Mean age of subject, maximum ES-2re rib deflection, and mean thoracic AIS injury for different test configurations.
In the logistic regression analysis using cadaver injury and anthropometry information along with the ES-2re measurements, the age of the subject at the time of death was included in all the models since subject age was found to significantly influence the injury outcome (p<0.05). Gender and mass of the subject had poor association with injury outcome and were not included in these models. The results of the logistic regression analysis of the ES-2re/cadaver injury data (Tables 6, 7, and 8) indicate that ASA, derived from ES-2re lower spine acceleration, was the best predictor of thoracic injury (AIS 3+ and AIS 4+), followed by maximum rib deflection of the ES-2re. None of the models were significant predictors of AIS 3+ injury (P<0.05). The goodness of fit and the predictive ability of all the models were not as good as when cadaveric measured responses were used. Due to the small sample size in some of the test conditions, the average cadaver characteristics and injury response in each group may not be representative of
27
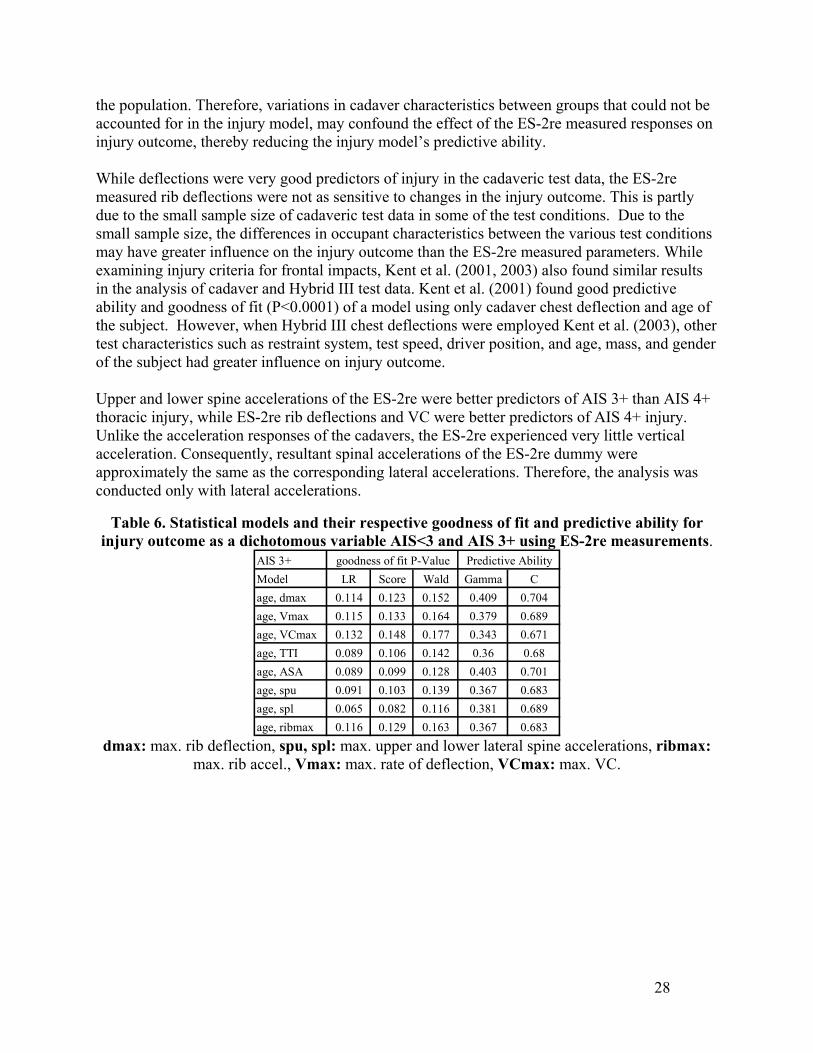
the population. Therefore, variations in cadaver characteristics between groups that could not be accounted for in the injury model, may confound the effect of the ES-2re measured responses on injury outcome, thereby reducing the injury model’s predictive ability. While deflections were very good predictors of injury in the cadaveric test data, the ES-2re measured rib deflections were not as sensitive to changes in the injury outcome. This is partly due to the small sample size of cadaveric test data in some of the test conditions. Due to the small sample size, the differences in occupant characteristics between the various test conditions may have greater influence on the injury outcome than the ES-2re measured parameters. While examining injury criteria for frontal impacts, Kent et al. (2001, 2003) also found similar results in the analysis of cadaver and Hybrid III test data. Kent et al. (2001) found good predictive ability and goodness of fit (P<0.0001) of a model using only cadaver chest deflection and age of the subject. However, when Hybrid III chest deflections were employed Kent et al. (2003), other test characteristics such as restraint system, test speed, driver position, and age, mass, and gender of the subject had greater influence on injury outcome. Upper and lower spine accelerations of the ES-2re were better predictors of AIS 3+ than AIS 4+ thoracic injury, while ES-2re rib deflections and VC were better predictors of AIS 4+ injury. Unlike the acceleration responses of the cadavers, the ES-2re experienced very little vertical acceleration. Consequently, resultant spinal accelerations of the ES-2re dummy were approximately the same as the corresponding lateral accelerations. Therefore, the analysis was conducted only with lateral accelerations.
Table 6. Statistical models and their respective goodness of fit and predictive ability for injury outcome as a dichotomous variable AIS<3 and AIS 3+ using ES-2re measurements.
AIS 3+Model LR Score Wald Gamma Cage, dmax 0.114 0.123 0.152 0.409 0.704age, Vmax 0.115 0.133 0.164 0.379 0.689age, VCmax 0.132 0.148 0.177 0.343 0.671age, TTI 0.089 0.106 0.142 0.36 0.68age, ASA 0.089 0.099 0.128 0.403 0.701age, spu 0.091 0.103 0.139 0.367 0.683age, spl 0.065 0.082 0.116 0.381 0.689age, ribmax 0.116 0.129 0.163 0.367 0.683
goodness of fit P-Value Predictive Ability
dmax: max. rib deflection, spu, spl: max. upper and lower lateral spine accelerations, ribmax:
max. rib accel., Vmax: max. rate of deflection, VCmax: max. VC.
28
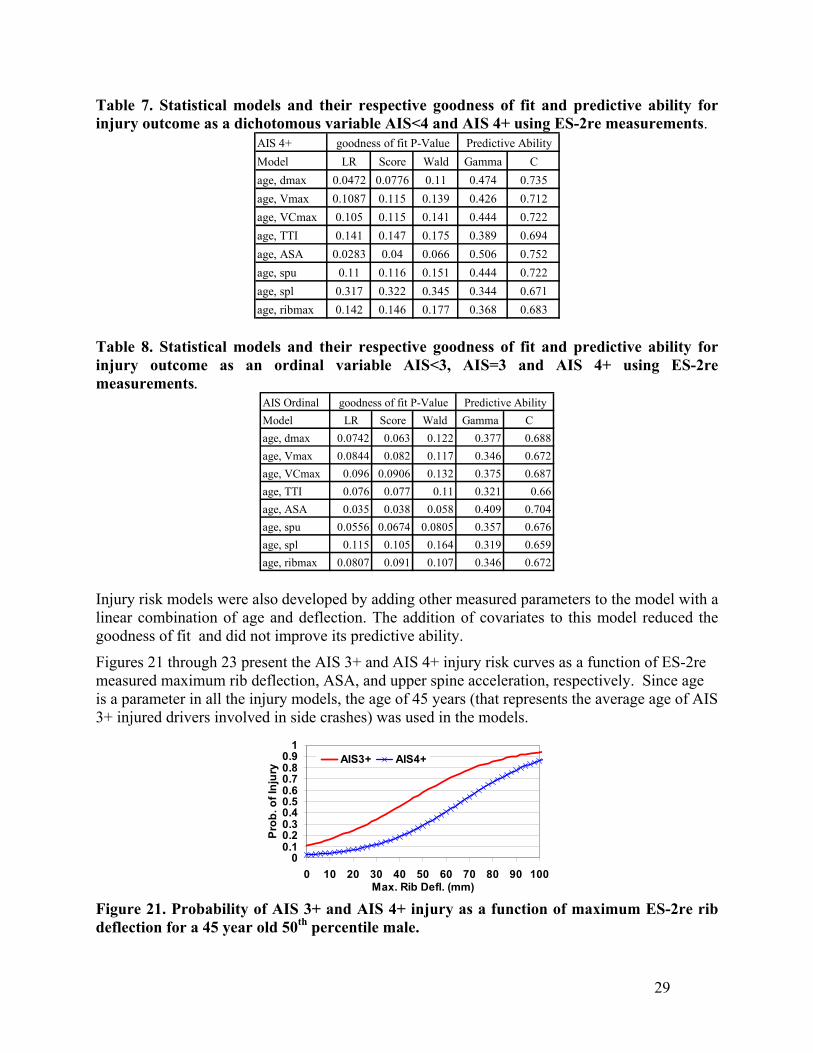
Table 7. Statistical models and their respective goodness of fit and predictive ability for injury outcome as a dichotomous variable AIS<4 and AIS 4+ using ES-2re measurements.
AIS 4+Model LR Score Wald Gamma Cage, dmax 0.0472 0.0776 0.11 0.474 0.735age, Vmax 0.1087 0.115 0.139 0.426 0.712age, VCmax 0.105 0.115 0.141 0.444 0.722age, TTI 0.141 0.147 0.175 0.389 0.694age, ASA 0.0283 0.04 0.066 0.506 0.752age, spu 0.11 0.116 0.151 0.444 0.722age, spl 0.317 0.322 0.345 0.344 0.671age, ribmax 0.142 0.146 0.177 0.368 0.683
goodness of fit P-Value Predictive Ability
Table 8. Statistical models and their respective goodness of fit and predictive ability for injury outcome as an ordinal variable AIS<3, AIS=3 and AIS 4+ using ES-2re measurements.
AIS OrdinalModel LR Score Wald Gamma Cage, dmax 0.0742 0.063 0.122 0.377 0.688age, Vmax 0.0844 0.082 0.117 0.346 0.672age, VCmax 0.096 0.0906 0.132 0.375 0.687age, TTI 0.076 0.077 0.11 0.321 0.66age, ASA 0.035 0.038 0.058 0.409 0.704age, spu 0.0556 0.0674 0.0805 0.357 0.676age, spl 0.115 0.105 0.164 0.319 0.659age, ribmax 0.0807 0.091 0.107 0.346 0.672
goodness of fit P-Value Predictive Ability
Injury risk models were also developed by adding other measured parameters to the model with a linear combination of age and deflection. The addition of covariates to this model reduced the goodness of fit and did not improve its predictive ability.
Figures 21 through 23 present the AIS 3+ and AIS 4+ injury risk curves as a function of ES-2re measured maximum rib deflection, ASA, and upper spine acceleration, respectively. Since age is a parameter in all the injury models, the age of 45 years (that represents the average age of AIS 3+ injured drivers involved in side crashes) was used in the models.
00.10.20.30.40.50.60.70.80.9
1
0 10 20 30 40 50 60 70 80 90 100Max. Rib Defl. (mm)
Prob
. of I
njur
y AIS3+ AIS4+
Figure 21. Probability of AIS 3+ and AIS 4+ injury as a function of maximum ES-2re rib deflection for a 45 year old 50th percentile male.
29
00.10.20.30.40.50.60.70.80.9
1
0 10 20 30 40 50 60 70 80 90 100ASA
Prob
. of I
njur
y AIS3+ AIS4+
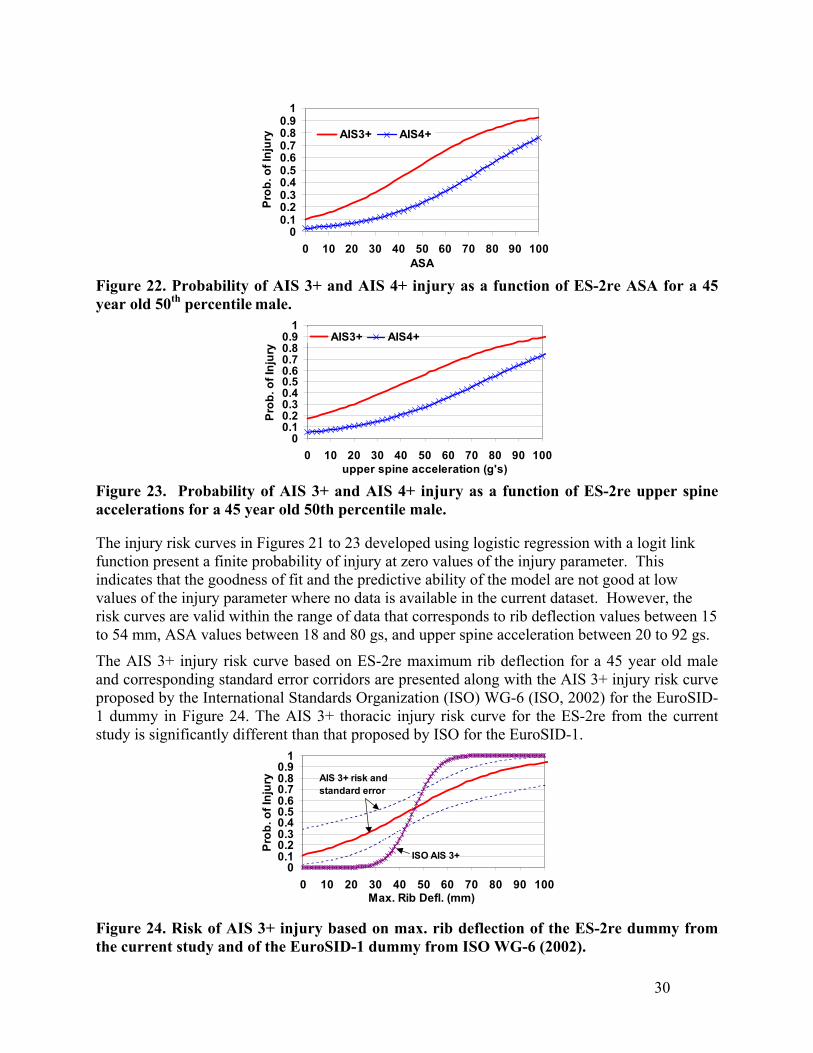
Figure 22. Probability of AIS 3+ and AIS 4+ injury as a function of ES-2re ASA for a 45 year old 50th percentile male.
00.10.20.30.40.50.60.70.80.9
1
0 10 20 30 40 50 60 70 80 90 100upper spine acceleration (g's)
Prob
. of I
njur
y
AIS3+ AIS4+
Figure 23. Probability of AIS 3+ and AIS 4+ injury as a function of ES-2re upper spine accelerations for a 45 year old 50th percentile male. The injury risk curves in Figures 21 to 23 developed using logistic regression with a logit link function present a finite probability of injury at zero values of the injury parameter. This indicates that the goodness of fit and the predictive ability of the model are not good at low values of the injury parameter where no data is available in the current dataset. However, the risk curves are valid within the range of data that corresponds to rib deflection values between 15 to 54 mm, ASA values between 18 and 80 gs, and upper spine acceleration between 20 to 92 gs.
The AIS 3+ injury risk curve based on ES-2re maximum rib deflection for a 45 year old male and corresponding standard error corridors are presented along with the AIS 3+ injury risk curve proposed by the International Standards Organization (ISO) WG-6 (ISO, 2002) for the EuroSID-1 dummy in Figure 24. The AIS 3+ thoracic injury risk curve for the ES-2re from the current study is significantly different than that proposed by ISO for the EuroSID-1.
00.10.20.30.40.50.60.70.80.9
1
0 10 20 30 40 50 60 70 80 90 100Max. Rib Defl. (mm)
Prob
. of I
njur
y AIS 3+ risk and standard error
ISO AIS 3+
Figure 24. Risk of AIS 3+ injury based on max. rib deflection of the ES-2re dummy from the current study and of the EuroSID-1 dummy from ISO WG-6 (2002).
30
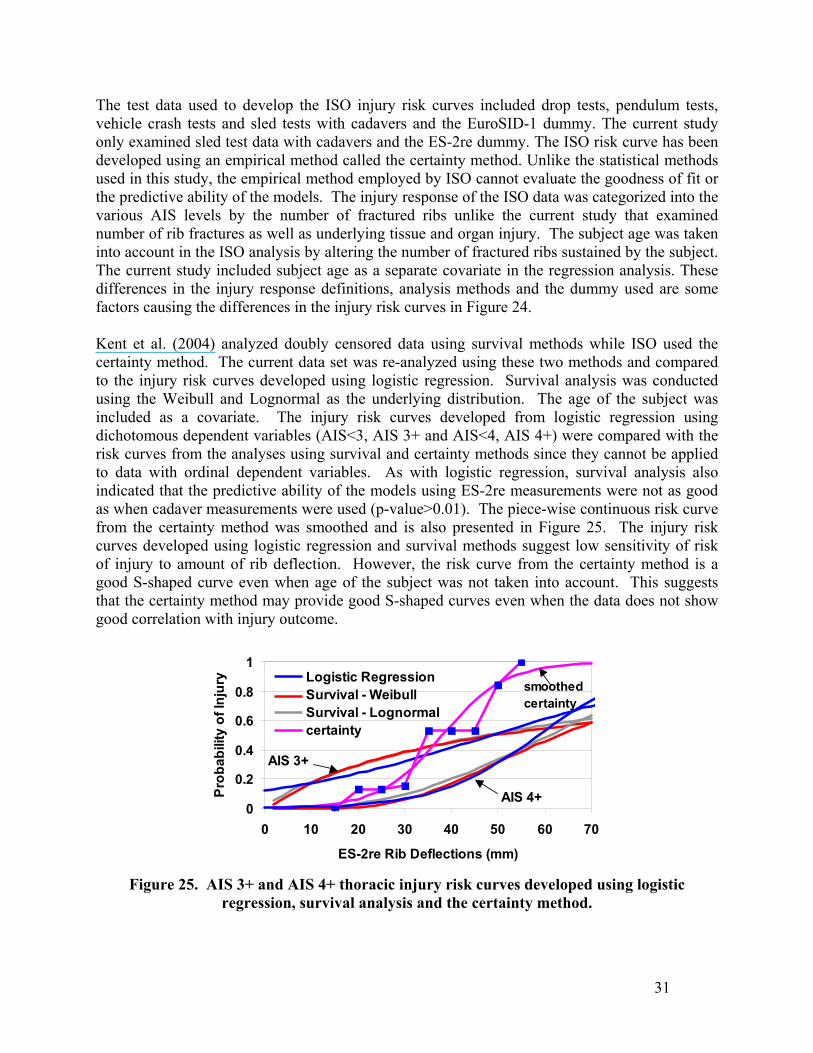
The test data used to develop the ISO injury risk curves included drop tests, pendulum tests, vehicle crash tests and sled tests with cadavers and the EuroSID-1 dummy. The current study only examined sled test data with cadavers and the ES-2re dummy. The ISO risk curve has been developed using an empirical method called the certainty method. Unlike the statistical methods used in this study, the empirical method employed by ISO cannot evaluate the goodness of fit or the predictive ability of the models. The injury response of the ISO data was categorized into the various AIS levels by the number of fractured ribs unlike the current study that examined number of rib fractures as well as underlying tissue and organ injury. The subject age was taken into account in the ISO analysis by altering the number of fractured ribs sustained by the subject. The current study included subject age as a separate covariate in the regression analysis. These differences in the injury response definitions, analysis methods and the dummy used are some factors causing the differences in the injury risk curves in Figure 24. Kent et al. (2004) analyzed doubly censored data using survival methods while ISO used the certainty method. The current data set was re-analyzed using these two methods and compared to the injury risk curves developed using logistic regression. Survival analysis was conducted using the Weibull and Lognormal as the underlying distribution. The age of the subject was included as a covariate. The injury risk curves developed from logistic regression using dichotomous dependent variables (AIS<3, AIS 3+ and AIS<4, AIS 4+) were compared with the risk curves from the analyses using survival and certainty methods since they cannot be applied to data with ordinal dependent variables. As with logistic regression, survival analysis also indicated that the predictive ability of the models using ES-2re measurements were not as good as when cadaver measurements were used (p-value>0.01). The piece-wise continuous risk curve from the certainty method was smoothed and is also presented in Figure 25. The injury risk curves developed using logistic regression and survival methods suggest low sensitivity of risk of injury to amount of rib deflection. However, the risk curve from the certainty method is a good S-shaped curve even when age of the subject was not taken into account. This suggests that the certainty method may provide good S-shaped curves even when the data does not show good correlation with injury outcome.
0
0.2
0.4
0.6
0.8
1
0 10 20 30 40 50 60 70
ES-2re Rib Deflections (mm)
Prob
abili
ty o
f Inj
ury Logistic Regression
Survival - WeibullSurvival - Lognormalcertainty
AIS 3+
AIS 4+
smoothed certainty
Figure 25. AIS 3+ and AIS 4+ thoracic injury risk curves developed using logistic
regression, survival analysis and the certainty method.
31
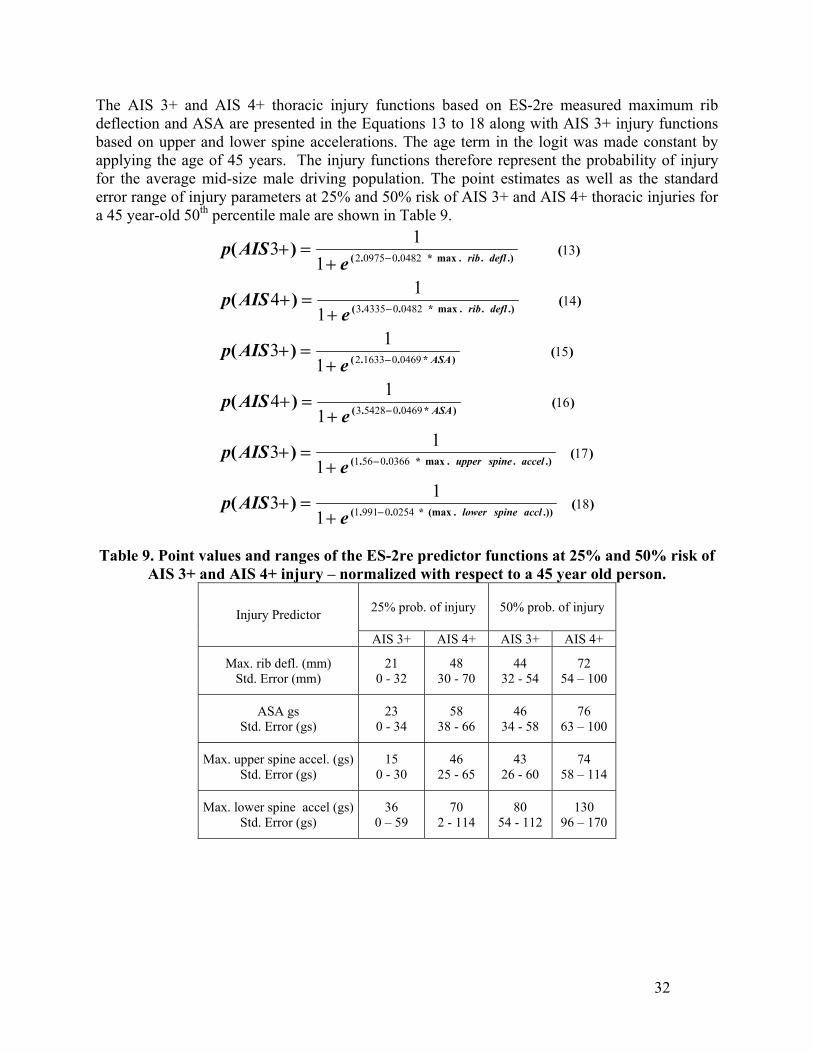
The AIS 3+ and AIS 4+ thoracic injury functions based on ES-2re measured maximum rib deflection and ASA are presented in the Equations 13 to 18 along with AIS 3+ injury functions based on upper and lower spine accelerations. The age term in the logit was made constant by applying the age of 45 years. The injury functions therefore represent the probability of injury for the average mid-size male driving population. The point estimates as well as the standard error range of injury parameters at 25% and 50% risk of AIS 3+ and AIS 4+ thoracic injuries for a 45 year-old 50th percentile male are shown in Table 9.
)(
)(
)(
)(
)(
)(
.)).(max*..(
.)..max*..(
)*..(
)*..(
.)..max*..(
.)..max*..(
)(
)(
)(
)(
)(
)(
18
17
16
15
14
13
025409911
03660561
0469054283
0469016332
0482043353
0482009752
113
113
114
113
114
113
acclspinelower
accelspineupper
ASA
ASA
deflrib
deflrib
eAISp
eAISp
eAISp
eAISp
eAISp
eAISp
−
−
−
−
−
−
+=+
+=+
+=+
+=+
+=+
+=+
Table 9. Point values and ranges of the ES-2re predictor functions at 25% and 50% risk of
AIS 3+ and AIS 4+ injury – normalized with respect to a 45 year old person.
25% prob. of injury 50% prob. of injury Injury Predictor
AIS 3+ AIS 4+ AIS 3+ AIS 4+
Max. rib defl. (mm) Std. Error (mm)
21 0 - 32
48 30 - 70
44 32 - 54
72 54 – 100
ASA gs Std. Error (gs)
23 0 - 34
58 38 - 66
46 34 - 58
76 63 – 100
Max. upper spine accel. (gs) Std. Error (gs)
15 0 - 30
46 25 - 65
43 26 - 60
74 58 – 114
Max. lower spine accel (gs)Std. Error (gs)
36 0 – 59
70 2 - 114
80 54 - 112
130 96 – 170
32
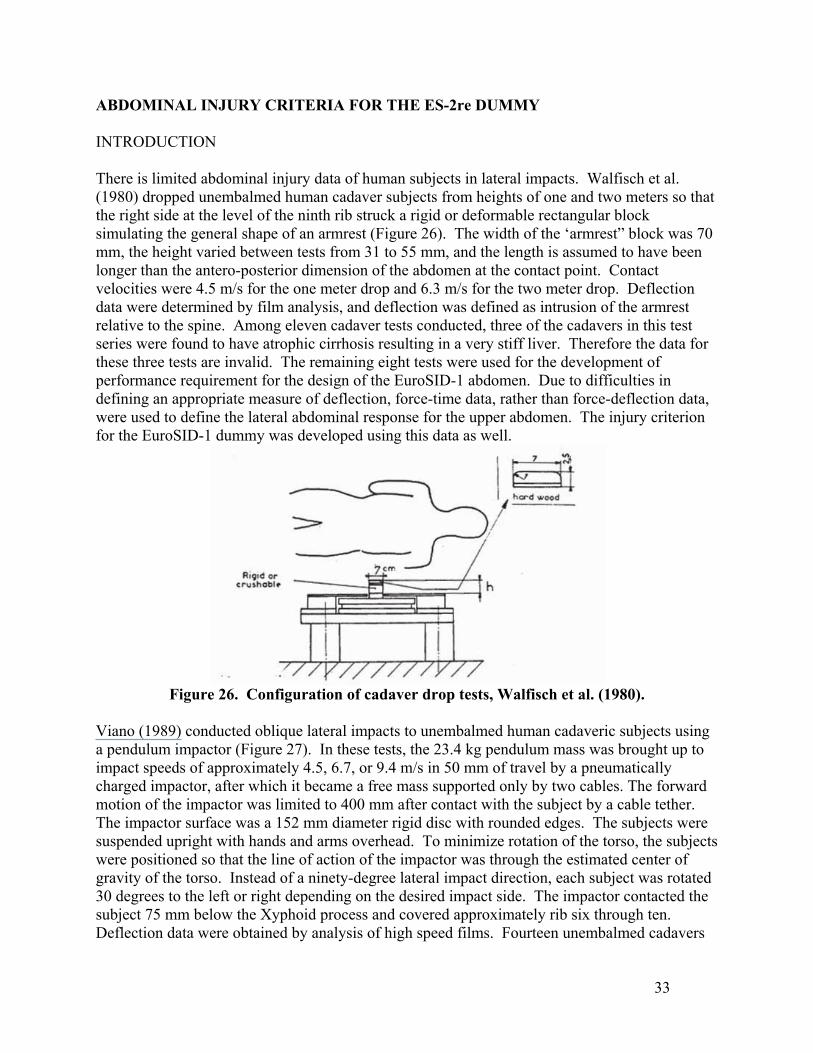
ABDOMINAL INJURY CRITERIA FOR THE ES-2re DUMMY INTRODUCTION There is limited abdominal injury data of human subjects in lateral impacts. Walfisch et al. (1980) dropped unembalmed human cadaver subjects from heights of one and two meters so that the right side at the level of the ninth rib struck a rigid or deformable rectangular block simulating the general shape of an armrest (Figure 26). The width of the ‘armrest” block was 70 mm, the height varied between tests from 31 to 55 mm, and the length is assumed to have been longer than the antero-posterior dimension of the abdomen at the contact point. Contact velocities were 4.5 m/s for the one meter drop and 6.3 m/s for the two meter drop. Deflection data were determined by film analysis, and deflection was defined as intrusion of the armrest relative to the spine. Among eleven cadaver tests conducted, three of the cadavers in this test series were found to have atrophic cirrhosis resulting in a very stiff liver. Therefore the data for these three tests are invalid. The remaining eight tests were used for the development of performance requirement for the design of the EuroSID-1 abdomen. Due to difficulties in defining an appropriate measure of deflection, force-time data, rather than force-deflection data, were used to define the lateral abdominal response for the upper abdomen. The injury criterion for the EuroSID-1 dummy was developed using this data as well.
Figure 26. Configuration of cadaver drop tests, Walfisch et al. (1980).
Viano (1989) conducted oblique lateral impacts to unembalmed human cadaveric subjects using a pendulum impactor (Figure 27). In these tests, the 23.4 kg pendulum mass was brought up to impact speeds of approximately 4.5, 6.7, or 9.4 m/s in 50 mm of travel by a pneumatically charged impactor, after which it became a free mass supported only by two cables. The forward motion of the impactor was limited to 400 mm after contact with the subject by a cable tether. The impactor surface was a 152 mm diameter rigid disc with rounded edges. The subjects were suspended upright with hands and arms overhead. To minimize rotation of the torso, the subjects were positioned so that the line of action of the impactor was through the estimated center of gravity of the torso. Instead of a ninety-degree lateral impact direction, each subject was rotated 30 degrees to the left or right depending on the desired impact side. The impactor contacted the subject 75 mm below the Xyphoid process and covered approximately rib six through ten. Deflection data were obtained by analysis of high speed films. Fourteen unembalmed cadavers
33
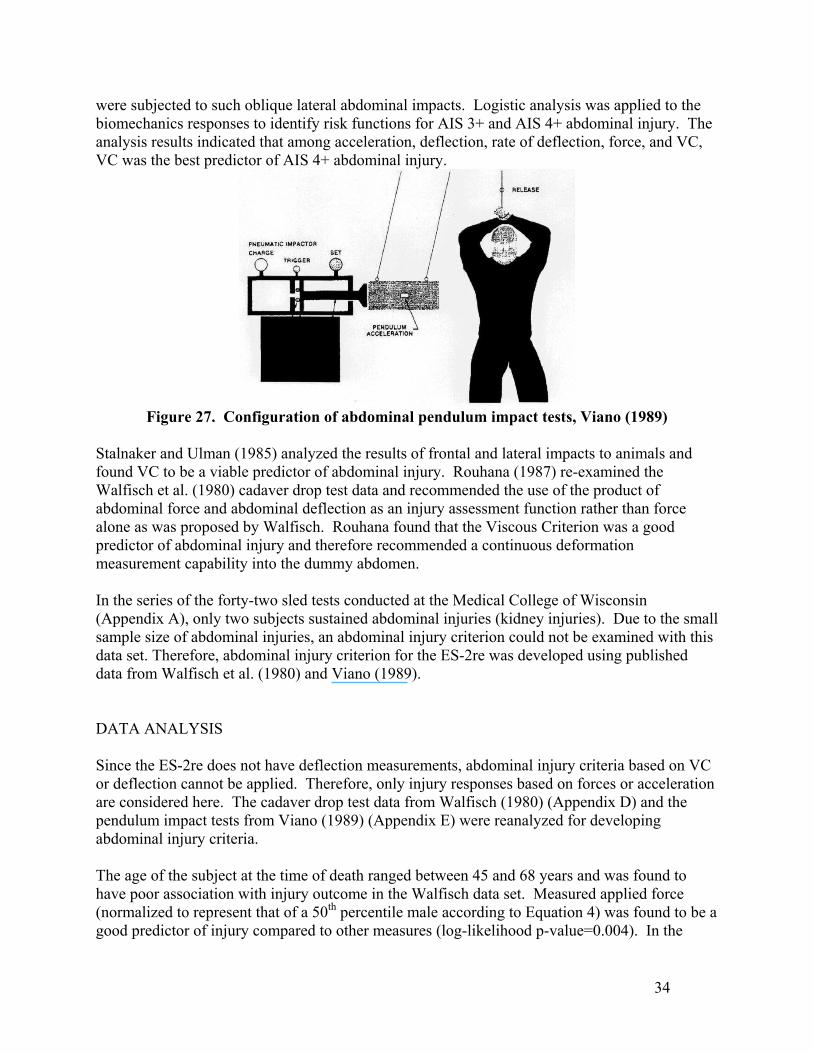
were subjected to such oblique lateral abdominal impacts. Logistic analysis was applied to the biomechanics responses to identify risk functions for AIS 3+ and AIS 4+ abdominal injury. The analysis results indicated that among acceleration, deflection, rate of deflection, force, and VC, VC was the best predictor of AIS 4+ abdominal injury.
Figure 27. Configuration of abdominal pendulum impact tests, Viano (1989)
Stalnaker and Ulman (1985) analyzed the results of frontal and lateral impacts to animals and found VC to be a viable predictor of abdominal injury. Rouhana (1987) re-examined the Walfisch et al. (1980) cadaver drop test data and recommended the use of the product of abdominal force and abdominal deflection as an injury assessment function rather than force alone as was proposed by Walfisch. Rouhana found that the Viscous Criterion was a good predictor of abdominal injury and therefore recommended a continuous deformation measurement capability into the dummy abdomen. In the series of the forty-two sled tests conducted at the Medical College of Wisconsin (Appendix A), only two subjects sustained abdominal injuries (kidney injuries). Due to the small sample size of abdominal injuries, an abdominal injury criterion could not be examined with this data set. Therefore, abdominal injury criterion for the ES-2re was developed using published data from Walfisch et al. (1980) and Viano (1989).
DATA ANALYSIS Since the ES-2re does not have deflection measurements, abdominal injury criteria based on VC or deflection cannot be applied. Therefore, only injury responses based on forces or acceleration are considered here. The cadaver drop test data from Walfisch (1980) (Appendix D) and the pendulum impact tests from Viano (1989) (Appendix E) were reanalyzed for developing abdominal injury criteria. The age of the subject at the time of death ranged between 45 and 68 years and was found to have poor association with injury outcome in the Walfisch data set. Measured applied force (normalized to represent that of a 50th percentile male according to Equation 4) was found to be a good predictor of injury compared to other measures (log-likelihood p-value=0.004). In the
34
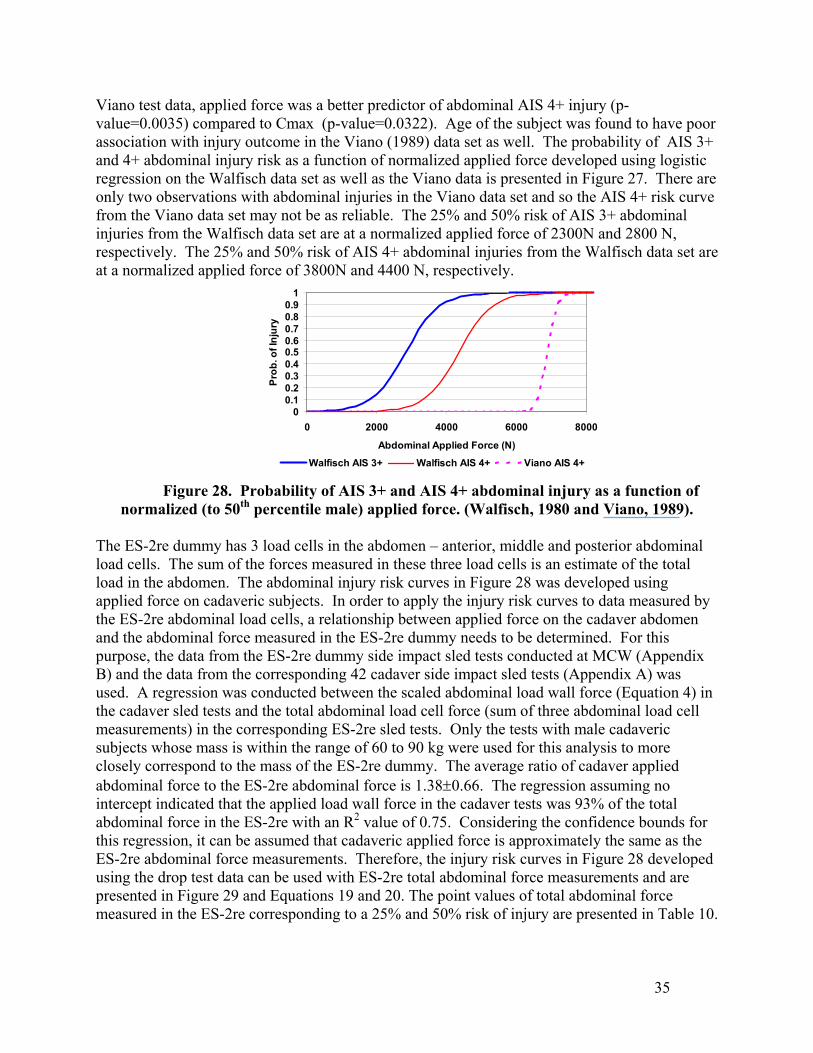
Viano test data, applied force was a better predictor of abdominal AIS 4+ injury (p-value=0.0035) compared to Cmax (p-value=0.0322). Age of the subject was found to have poor association with injury outcome in the Viano (1989) data set as well. The probability of AIS 3+ and 4+ abdominal injury risk as a function of normalized applied force developed using logistic regression on the Walfisch data set as well as the Viano data is presented in Figure 27. There are only two observations with abdominal injuries in the Viano data set and so the AIS 4+ risk curve from the Viano data set may not be as reliable. The 25% and 50% risk of AIS 3+ abdominal injuries from the Walfisch data set are at a normalized applied force of 2300N and 2800 N, respectively. The 25% and 50% risk of AIS 4+ abdominal injuries from the Walfisch data set are at a normalized applied force of 3800N and 4400 N, respectively.
00.10.20.30.40.50.60.70.80.9
1
0 2000 4000 6000 8000
Abdominal Applied Force (N)
Prob
. of I
njur
y
Walfisch AIS 3+ Walfisch AIS 4+ Viano AIS 4+
Figure 28. Probability of AIS 3+ and AIS 4+ abdominal injury as a function of normalized (to 50th percentile male) applied force. (Walfisch, 1980 and Viano, 1989).
The ES-2re dummy has 3 load cells in the abdomen – anterior, middle and posterior abdominal load cells. The sum of the forces measured in these three load cells is an estimate of the total load in the abdomen. The abdominal injury risk curves in Figure 28 was developed using applied force on cadaveric subjects. In order to apply the injury risk curves to data measured by the ES-2re abdominal load cells, a relationship between applied force on the cadaver abdomen and the abdominal force measured in the ES-2re dummy needs to be determined. For this purpose, the data from the ES-2re dummy side impact sled tests conducted at MCW (Appendix B) and the data from the corresponding 42 cadaver side impact sled tests (Appendix A) was used. A regression was conducted between the scaled abdominal load wall force (Equation 4) in the cadaver sled tests and the total abdominal load cell force (sum of three abdominal load cell measurements) in the corresponding ES-2re sled tests. Only the tests with male cadaveric subjects whose mass is within the range of 60 to 90 kg were used for this analysis to more closely correspond to the mass of the ES-2re dummy. The average ratio of cadaver applied abdominal force to the ES-2re abdominal force is 1.38±0.66. The regression assuming no intercept indicated that the applied load wall force in the cadaver tests was 93% of the total abdominal force in the ES-2re with an R2 value of 0.75. Considering the confidence bounds for this regression, it can be assumed that cadaveric applied force is approximately the same as the ES-2re abdominal force measurements. Therefore, the injury risk curves in Figure 28 developed using the drop test data can be used with ES-2re total abdominal force measurements and are presented in Figure 29 and Equations 19 and 20. The point values of total abdominal force measured in the ES-2re corresponding to a 25% and 50% risk of injury are presented in Table 10.
35
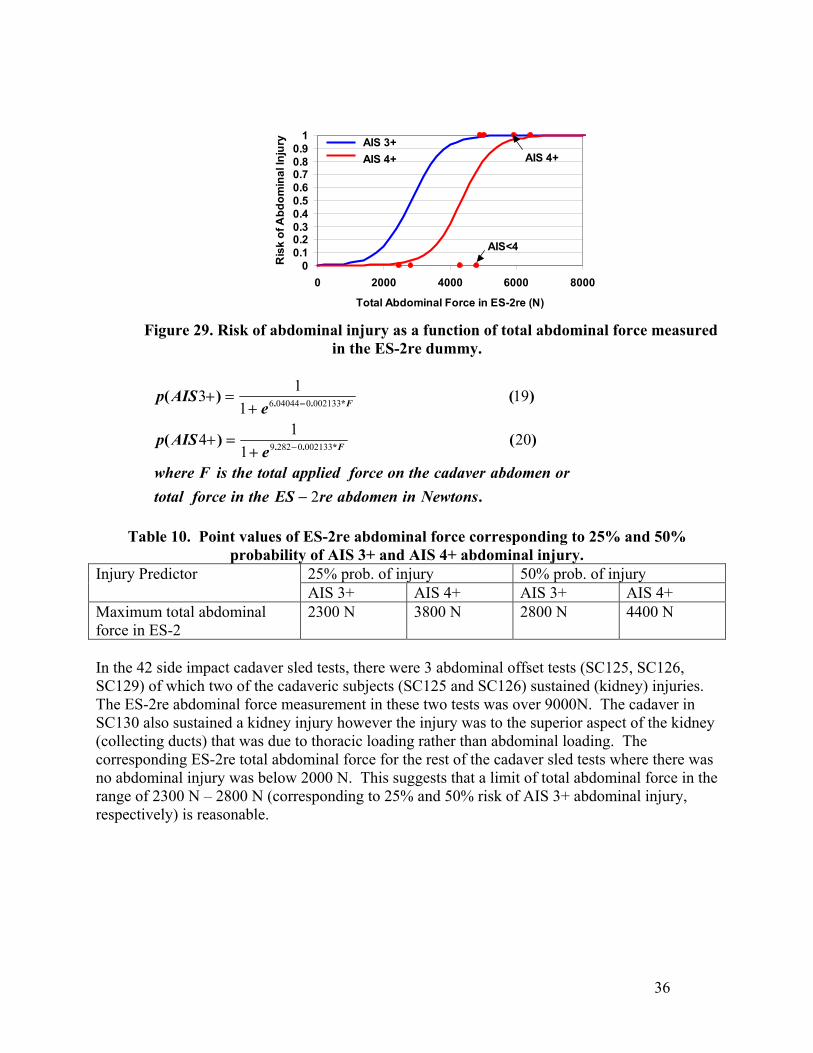
00.10.20.30.40.50.60.70.80.9
1
0 2000 4000 6000 8000
Total Abdominal Force in ES-2re (N)
Ris
k of
Abd
omin
al In
jury
AIS<4
AIS 4+AIS 3+AIS 4+
Figure 29. Risk of abdominal injury as a function of total abdominal force measured
in the ES-2re dummy.
.
)()(
)()(
*..
*..
NewtonsinabdomenreEStheinforcetotalorabdomencadavertheonforceappliedtotaltheisFwhere
eAISp
eAISp
F
F
2
201
14
191
13
00213302829
0021330040446
−
+=+
+=+
−
−
Table 10. Point values of ES-2re abdominal force corresponding to 25% and 50%
probability of AIS 3+ and AIS 4+ abdominal injury. 25% prob. of injury 50% prob. of injury Injury Predictor AIS 3+ AIS 4+ AIS 3+ AIS 4+
Maximum total abdominal force in ES-2
2300 N 3800 N 2800 N 4400 N
In the 42 side impact cadaver sled tests, there were 3 abdominal offset tests (SC125, SC126, SC129) of which two of the cadaveric subjects (SC125 and SC126) sustained (kidney) injuries. The ES-2re abdominal force measurement in these two tests was over 9000N. The cadaver in SC130 also sustained a kidney injury however the injury was to the superior aspect of the kidney (collecting ducts) that was due to thoracic loading rather than abdominal loading. The corresponding ES-2re total abdominal force for the rest of the cadaver sled tests where there was no abdominal injury was below 2000 N. This suggests that a limit of total abdominal force in the range of 2300 N – 2800 N (corresponding to 25% and 50% risk of AIS 3+ abdominal injury, respectively) is reasonable.
36
37
PELVIC INJURY CRITERIA FOR THE ES-2re DUMMY INTRODUCTION Pelvic injuries in side impacts include hip joint injuries, injuries to the soft tissues within the pelvic cavity, and to the pelvic bone. Pelvic injuries consist mainly of fractures resulting from intrusion. Bone fractures may occur at various sites about the pelvic ring, including the acetabulum, the sacro-iliac junction, the pubic symphysis, the pubic rami, and the iliac wing. The pubic rami (the boney area between the symphysis and the acetabulum) is considered to be the weakest part of the pelvic ring, which is where fractures typically occur first. In the series of 42 side impact tests conducted at the Medical College of Wisconsin (MCW), only three subjects sustained pelvic fractures that were in the rigid wall pelvic offset crash tests. Due to the sparseness of pelvic injuries in this data set, it was not possible to develop a robust pelvic injury criterion with this data set. Therefore, the pelvic injury criteria was developed using published research. PREVIOUS RESEARCH Several researchers have carried out cadaver tests to better understand the relationship between pelvic injury tolerance and dummy measurements. Cesari (1980) carried out a series of pelvic impact tests on cadavers using a 17 kg guided hemisphere directed to the greater trochanter (the part of the femur that protrudes from the acetabulum). Based on this data, Cesari (1982) offered a pelvis applied force-based criteria with a 10 kN limit on 50th percentile males. An acceleration-based criterion was proposed by Haffner (1985). An analysis of several cadaver experiments resulted in two probability of fracture functions that are based on pelvic acceleration measurements. The first was proposed under a stress-based analogy and uses acceleration directly. The second used a strain-based analogy in which pelvic deflections were computed from accelerometer data. For a 50th percentile male of age 40, a Weibull distribution was used to model the probability of pelvic fracture: Stress-based: P(Fx) = F(Acc + 40/2) 143 g gives P(Fx)=20%. Strain-based: P(Fx) = F( Defl/22.5 cm + (0.025)*40) 13.7 mm gives P(Fx)=20%. Haffner (1985) observed a load path dependency on the measured pelvic accelerations and forces. When lateral loads thru the pelvis were distributed along two paths (such as the iliac wing and the greater trochanter), a much higher acceleration was needed to produce a fracture than if only a single load path was taken. Concentrated pelvic loading can result in fractures occurring at accelerations less than 100 g’s. For example, if only the greater trochanter was loaded, pelvic fracture can occur at less than 100 g’s. Since NHTSA’s tests that were used to formulate the FMVSS 214 requirement of 130 g were based on both load paths, pelvic accelerations at fracture were greater than 100 g.
38
Cadaver pelvic impact tests using a 23-kg pendulum impactor were reported by Viano (1989). Viano found that lateral pubic ramus fracture correlated with compression of the pelvis, and not with pelvic impact force or pelvic acceleration. Pelvic compression was obtained from high speed film analysis. Viano (1987) recommended a pelvic tolerance limit of 27% pelvic compression.
Cavanaugh (1990) conducted a series of twelve load wall sled tests on cadavers using a set-up very similar to the MCW setup described in the Thoracic Injury Criteria section. The load wall was either a flat rigid or padded wall or with a six inch pelvic offset. Several observations emerged from these tests: 1) Pelvic fractures occur mainly within the pubic rami, which is the most-stressed part of the pelvis, 2) Impactor force correlated well with fracture while pelvic acceleration did not correlate well, and 3) Load tolerance to fracture was found to be mass dependent.
Cavanaugh proposed an applied pelvic force limit of 8 kN (corresponding to 25% probability of fracture) for a load path primarily through the greater trochanter of the femur. On the other hand, Cavanaugh also measured hip deflection via film analysis and found that lateral half-width Vmax*Cmax and compression (or deflection) were better correlates with fracture. Limits of Vmax*Cmax = 2.7 m/s and normalized compression = 36% were offered for a 25 percent risk of fracture.
In a continuation of Cavanaugh’s load-wall tests (1990), Zhu (1993) developed an “average force” criteria that was based on the slope of the pelvic momentum trace, in which the force-time history is integrated to yield a nearly linear momentum curve. The slope of the momentum curve is defined as Favg (Average Pelvic Force). Zhu (1993) reported that an average pelvic force of 5 kN and a peak pelvis force of 7.3 kN corresponded to a 25% probability of pelvic fracture. The ES-2re only has a pubic symphysis force and pelvic acceleration measurement capability and so injury criteria for the ES-2re dummy cannot be based on deflection or rate of deflection measures. Viano (1995) developed pelvic injury criteria for the EuroSID-1 dummy using 14 pendulum impact tests with cadaveric subjects conducted at Wayne State University. Viano developed pelvic injury risk curves based on pubic force in the EuroSID-1 and pelvic acceleration. Based on these risk curves, a 25% probability of injury was associated with 7100 N of EuroSID-1 pubic symphysis force and 100 gs of pelvic acceleration. Bouquet (1998) conducted pendulum impact tests to the pelvis at varying energy inputs on eleven unembalmed cadaveric subjects and conducted corresponding impact tests with the EuroSID-1 dummy. The impacting device was a guided linear impactor with a mass of 12 or 16 kg and an impact surface which was a 200X200 mm square. This surface was comprised of two trapezoidal areas in such a way as to be able to disassociate the bearing on the iliac crest from that on the trochanter. Bouquet (1998) combined this data with similar pendulum pelvic impacts at low and high energy levels on 10 cadaveric subjects (Bouquet, 1994). Analysis of this data indicated a 50% risk of AIS 2+ pelvic injury at 7.6 kN applied force and that for AIS 3+ pelvic injury at 11.4 kN. In order to develop a pelvic injury risk criteria based on EuroSID-1 pelvic
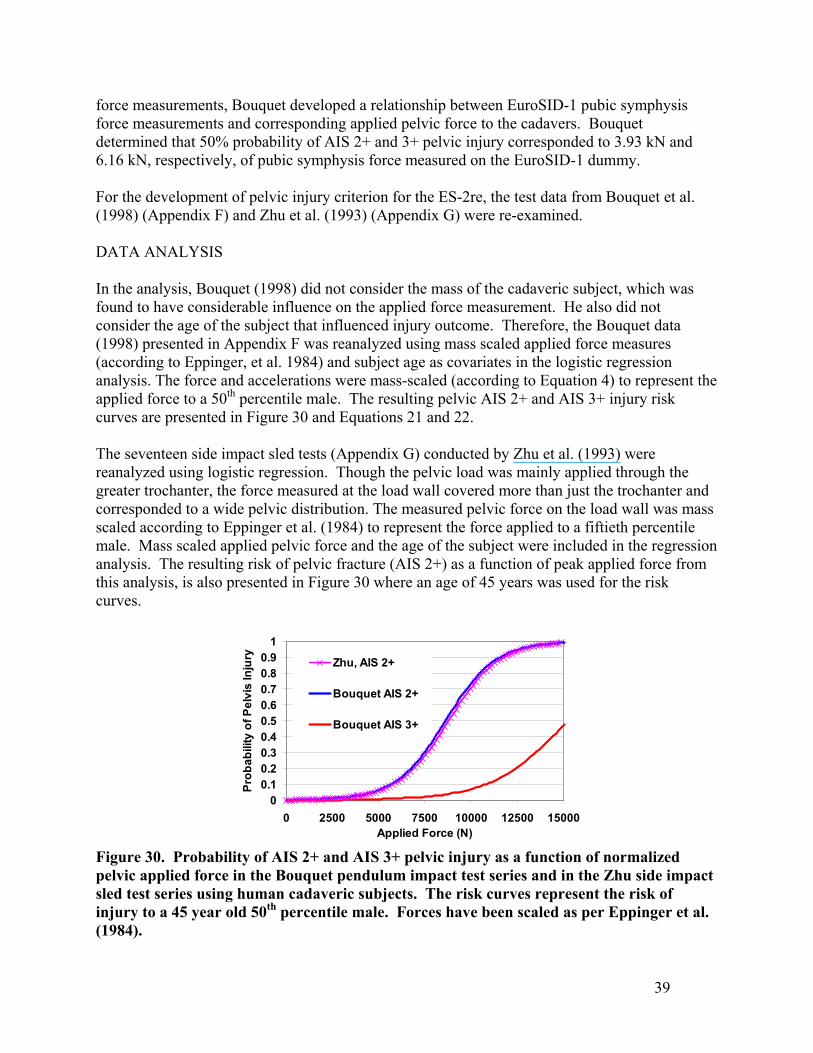
force measurements, Bouquet developed a relationship between EuroSID-1 pubic symphysis force measurements and corresponding applied pelvic force to the cadavers. Bouquet determined that 50% probability of AIS 2+ and 3+ pelvic injury corresponded to 3.93 kN and 6.16 kN, respectively, of pubic symphysis force measured on the EuroSID-1 dummy. For the development of pelvic injury criterion for the ES-2re, the test data from Bouquet et al. (1998) (Appendix F) and Zhu et al. (1993) (Appendix G) were re-examined.
DATA ANALYSIS In the analysis, Bouquet (1998) did not consider the mass of the cadaveric subject, which was found to have considerable influence on the applied force measurement. He also did not consider the age of the subject that influenced injury outcome. Therefore, the Bouquet data (1998) presented in Appendix F was reanalyzed using mass scaled applied force measures (according to Eppinger, et al. 1984) and subject age as covariates in the logistic regression analysis. The force and accelerations were mass-scaled (according to Equation 4) to represent the applied force to a 50th percentile male. The resulting pelvic AIS 2+ and AIS 3+ injury risk curves are presented in Figure 30 and Equations 21 and 22. The seventeen side impact sled tests (Appendix G) conducted by Zhu et al. (1993) were reanalyzed using logistic regression. Though the pelvic load was mainly applied through the greater trochanter, the force measured at the load wall covered more than just the trochanter and corresponded to a wide pelvic distribution. The measured pelvic force on the load wall was mass scaled according to Eppinger et al. (1984) to represent the force applied to a fiftieth percentile male. Mass scaled applied pelvic force and the age of the subject were included in the regression analysis. The resulting risk of pelvic fracture (AIS 2+) as a function of peak applied force from this analysis, is also presented in Figure 30 where an age of 45 years was used for the risk curves.
00.10.20.30.40.50.60.70.80.9
1
0 2500 5000 7500 10000 12500 15000Applied Force (N)
Prob
abili
ty o
f Pel
vis
Inju
ry Zhu, AIS 2+
Bouquet AIS 2+
Bouquet AIS 3+
Figure 30. Probability of AIS 2+ and AIS 3+ pelvic injury as a function of normalized pelvic applied force in the Bouquet pendulum impact test series and in the Zhu side impact sled test series using human cadaveric subjects. The risk curves represent the risk of injury to a 45 year old 50th percentile male. Forces have been scaled as per Eppinger et al. (1984).
39
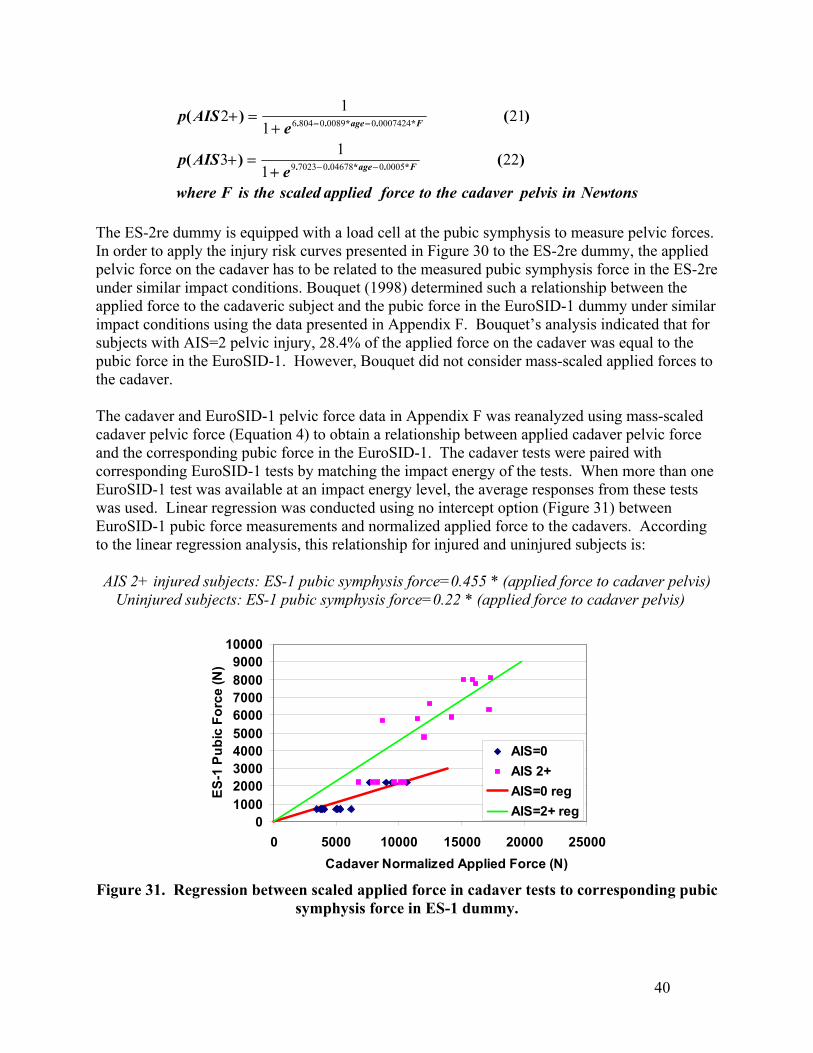
NewtonsinpelviscadaverthetoforceappliedscaledtheisFwheree
AISp
eAISp
Fage
Fage
)()(
)()(
*.*..
*.*..
221
13
211
12
0005004678070239
00074240008908046
−−
−−
+=+
+=+
The ES-2re dummy is equipped with a load cell at the pubic symphysis to measure pelvic forces. In order to apply the injury risk curves presented in Figure 30 to the ES-2re dummy, the applied pelvic force on the cadaver has to be related to the measured pubic symphysis force in the ES-2re under similar impact conditions. Bouquet (1998) determined such a relationship between the applied force to the cadaveric subject and the pubic force in the EuroSID-1 dummy under similar impact conditions using the data presented in Appendix F. Bouquet’s analysis indicated that for subjects with AIS=2 pelvic injury, 28.4% of the applied force on the cadaver was equal to the pubic force in the EuroSID-1. However, Bouquet did not consider mass-scaled applied forces to the cadaver. The cadaver and EuroSID-1 pelvic force data in Appendix F was reanalyzed using mass-scaled cadaver pelvic force (Equation 4) to obtain a relationship between applied cadaver pelvic force and the corresponding pubic force in the EuroSID-1. The cadaver tests were paired with corresponding EuroSID-1 tests by matching the impact energy of the tests. When more than one EuroSID-1 test was available at an impact energy level, the average responses from these tests was used. Linear regression was conducted using no intercept option (Figure 31) between EuroSID-1 pubic force measurements and normalized applied force to the cadavers. According to the linear regression analysis, this relationship for injured and uninjured subjects is:
AIS 2+ injured subjects: ES-1 pubic symphysis force=0.455 * (applied force to cadaver pelvis)
Uninjured subjects: ES-1 pubic symphysis force=0.22 * (applied force to cadaver pelvis)
0100020003000400050006000700080009000
10000
0 5000 10000 15000 20000 25000Cadaver Normalized Applied Force (N)
ES-1
Pub
ic F
orce
(N)
AIS=0AIS 2+AIS=0 regAIS=2+ reg
Figure 31. Regression between scaled applied force in cadaver tests to corresponding pubic
symphysis force in ES-1 dummy.
40
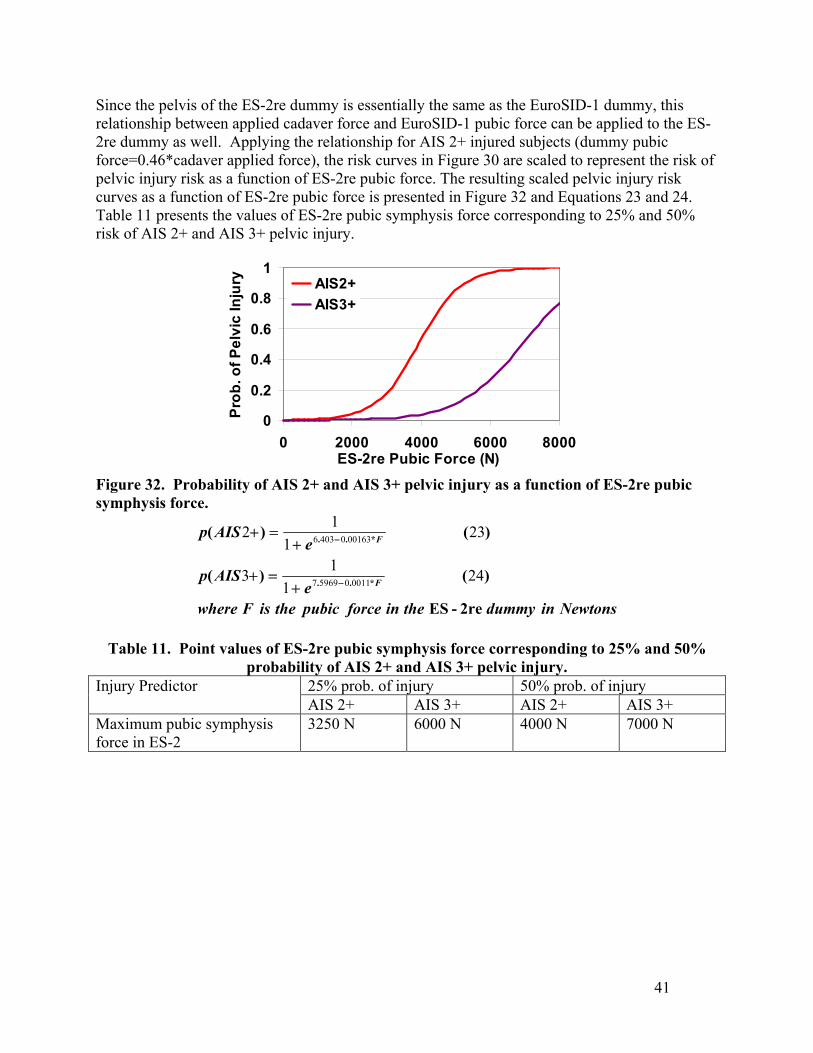
Since the pelvis of the ES-2re dummy is essentially the same as the EuroSID-1 dummy, this relationship between applied cadaver force and EuroSID-1 pubic force can be applied to the ES-2re dummy as well. Applying the relationship for AIS 2+ injured subjects (dummy pubic force=0.46*cadaver applied force), the risk curves in Figure 30 are scaled to represent the risk of pelvic injury risk as a function of ES-2re pubic force. The resulting scaled pelvic injury risk curves as a function of ES-2re pubic force is presented in Figure 32 and Equations 23 and 24. Table 11 presents the values of ES-2re pubic symphysis force corresponding to 25% and 50% risk of AIS 2+ and AIS 3+ pelvic injury.
0
0.2
0.4
0.6
0.8
1
0 2000 4000 6000 8000ES-2re Pubic Force (N)
Prob
. of P
elvi
c In
jury AIS2+
AIS3+
Figure 32. Probability of AIS 2+ and AIS 3+ pelvic injury as a function of ES-2re pubic symphysis force.
NewtonsindummytheinforcepubictheisFwheree
AISp
eAISp
F
F
2re-ES
)()(
)()(
*..
*..
241
13
231
12
0011059697
0016304036
−
−
+=+
+=+
Table 11. Point values of ES-2re pubic symphysis force corresponding to 25% and 50%
probability of AIS 2+ and AIS 3+ pelvic injury. 25% prob. of injury 50% prob. of injury Injury Predictor AIS 2+ AIS 3+ AIS 2+ AIS 3+
Maximum pubic symphysis force in ES-2
3250 N 6000 N 4000 N 7000 N
41
42
INJURY CRITERIA DEVELOPMENT FOR THE SID-IIsFRG DUMMY
THORACIC INJURY CRITERIA FOR THE SID-IIsFRG Twelve side impact sled tests using the SID-IIsFRG were conducted at the Medical College of Wisconsin (MCW) (Appendix H) under similar impact conditions as those of cadaver tests presented in Appendix A. All test conditions presented in Appendix A were also conducted with the SID-IIsFRG except for the side air bag tests. The responses of the SID-IIsFRG in the nine test conditions were compared to the average scaled cadaver responses under similar impact conditions. For this comparison, the cadaver accelerations and forces were scaled to represent those of a 5th percentile female with total mass of 48 kg according to the equal stress-equal velocity method outlined by Eppinger et al. (1984) and presented in Equations 25 and 26.
subjectofmasstotaltheiskgmasswherekgmass
forceforce
kgmassonaccelerationaccelerati
norm
norm
)(
)()(
)()(
/
/
2648
2548
32
31
×=
×=
The cadaver half thorax chest deflections were normalized with respect to the initial chest width at the point of measurement. The maximum deflection of the SID-IIsFRG is the maximum rib deflection of the three thoracic ribs. The cadaveric thoracic deflection measurement is external which includes the skin and flesh while the SID-IIsFRG deflection measurements are rib deflections. For comparison purposes, 8 mm was added to the SID-IIsFRG rib deflections to represent the external half thoracic deflection of a 5th percentile female. The SID-IIsFRG estimated external chest deflections were normalized with respect to a chest width of 270 mm. Figure 33 presents the estimated maximum normalized half thorax external deflections of the SID-IIsFRG and the maximum average normalized half thorax deflection of cadavers for similar impact test conditions. ANOVA analysis suggested that the maximum average normalized half thorax cadaver deflections were not different from that of the SID-IIsFRG under similar impact conditions. While the normalized cadaver deflections were quite similar to the SID-IIsFRG deflections in the flat wall tests, differences in normalized deflections of the SID-IIsFRG and the cadavers in the offset tests were observed. These differences in deflection in the pelvic and abdominal offset tests could be due to geometric positioning of the offset resulting in different loading patterns on the SID-IIsFRG compared to the cadavers.
43
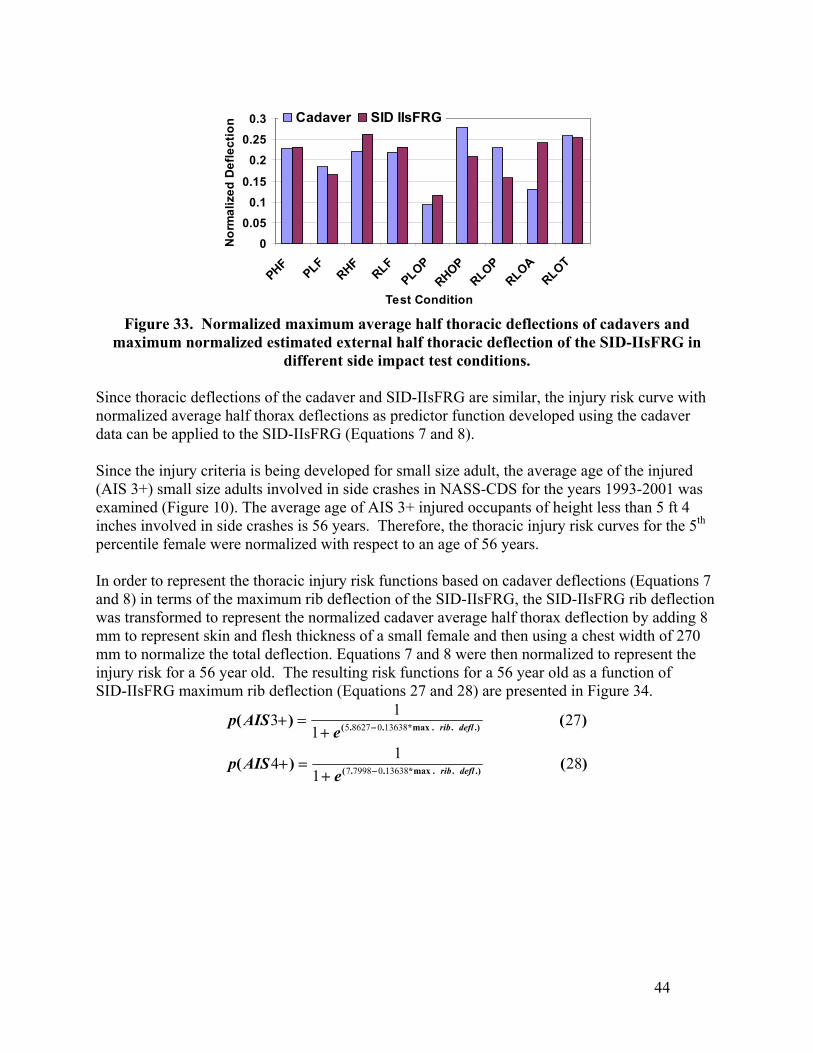
00.05
0.10.15
0.20.25
0.3
PHFPLF
RHFRLF
PLOPRHOP
RLOPRLOA
RLOT
Test Condition
Nor
mal
ized
Def
lect
ion Cadaver SID IIsFRG
Figure 33. Normalized maximum average half thoracic deflections of cadavers and
maximum normalized estimated external half thoracic deflection of the SID-IIsFRG in different side impact test conditions.
Since thoracic deflections of the cadaver and SID-IIsFRG are similar, the injury risk curve with normalized average half thorax deflections as predictor function developed using the cadaver data can be applied to the SID-IIsFRG (Equations 7 and 8). Since the injury criteria is being developed for small size adult, the average age of the injured (AIS 3+) small size adults involved in side crashes in NASS-CDS for the years 1993-2001 was examined (Figure 10). The average age of AIS 3+ injured occupants of height less than 5 ft 4 inches involved in side crashes is 56 years. Therefore, the thoracic injury risk curves for the 5th percentile female were normalized with respect to an age of 56 years. In order to represent the thoracic injury risk functions based on cadaver deflections (Equations 7 and 8) in terms of the maximum rib deflection of the SID-IIsFRG, the SID-IIsFRG rib deflection was transformed to represent the normalized cadaver average half thorax deflection by adding 8 mm to represent skin and flesh thickness of a small female and then using a chest width of 270 mm to normalize the total deflection. Equations 7 and 8 were then normalized to represent the injury risk for a 56 year old. The resulting risk functions for a 56 year old as a function of SID-IIsFRG maximum rib deflection (Equations 27 and 28) are presented in Figure 34.
)()(
)()(
.)..max*..(
.)..max*..(
281
14
271
13
13638079987
13638086275
deflrib
deflrib
eAISp
eAISp
−
−
+=+
+=+
44
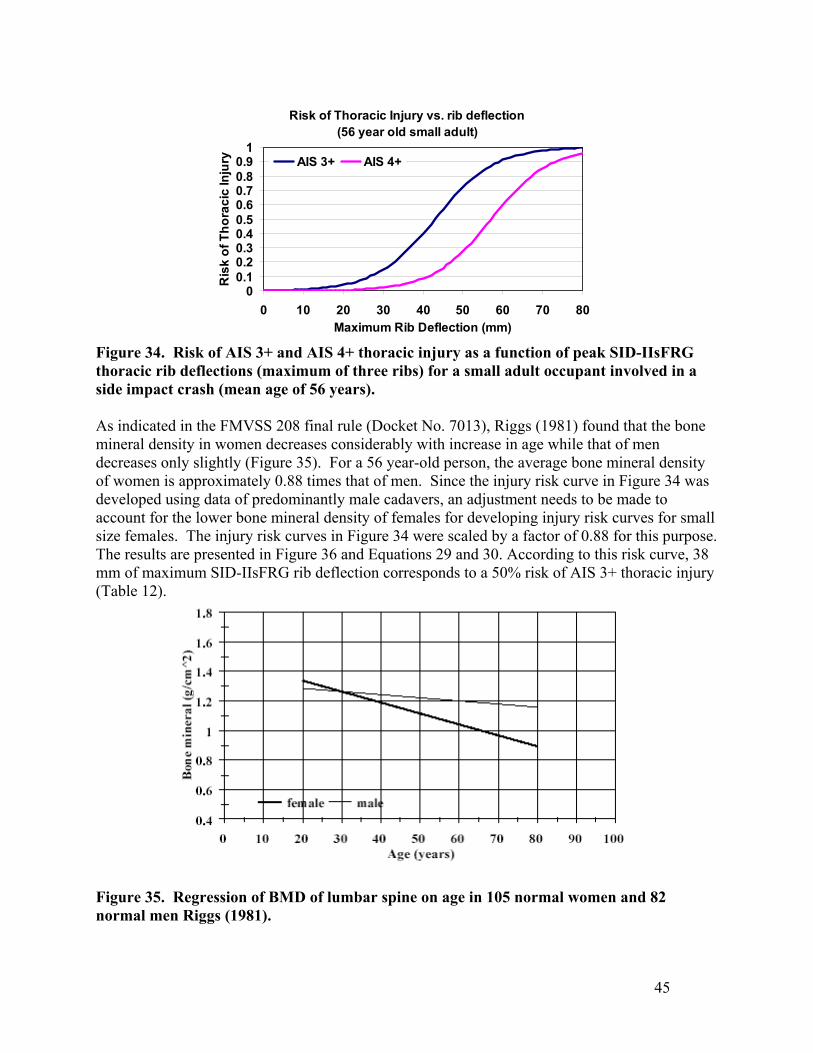
Risk of Thoracic Injury vs. rib deflection (56 year old small adult)
00.10.20.30.40.50.60.70.80.9
1
0 10 20 30 40 50 60 70 80Maximum Rib Deflection (mm)
Ris
k of
Tho
raci
c In
jury AIS 3+ AIS 4+
Figure 34. Risk of AIS 3+ and AIS 4+ thoracic injury as a function of peak SID-IIsFRG thoracic rib deflections (maximum of three ribs) for a small adult occupant involved in a side impact crash (mean age of 56 years). As indicated in the FMVSS 208 final rule (Docket No. 7013), Riggs (1981) found that the bone mineral density in women decreases considerably with increase in age while that of men decreases only slightly (Figure 35). For a 56 year-old person, the average bone mineral density of women is approximately 0.88 times that of men. Since the injury risk curve in Figure 34 was developed using data of predominantly male cadavers, an adjustment needs to be made to account for the lower bone mineral density of females for developing injury risk curves for small size females. The injury risk curves in Figure 34 were scaled by a factor of 0.88 for this purpose. The results are presented in Figure 36 and Equations 29 and 30. According to this risk curve, 38 mm of maximum SID-IIsFRG rib deflection corresponds to a 50% risk of AIS 3+ thoracic injury (Table 12).
Figure 35. Regression of BMD of lumbar spine on age in 105 normal women and 82 normal men Riggs (1981).
45
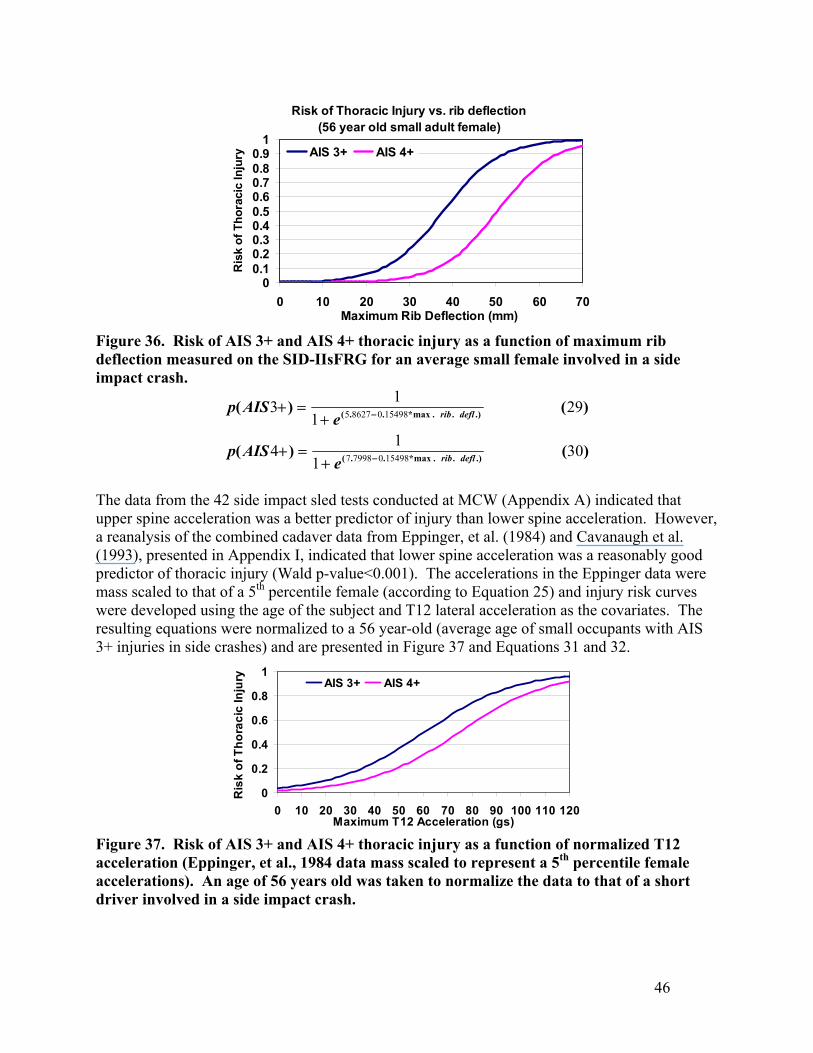
Risk of Thoracic Injury vs. rib deflection (56 year old small adult female)
00.10.20.30.40.50.60.70.80.9
1
0 10 20 30 40 50 60 70Maximum Rib Deflection (mm)
Ris
k of
Tho
raci
c In
jury AIS 3+ AIS 4+
Figure 36. Risk of AIS 3+ and AIS 4+ thoracic injury as a function of maximum rib deflection measured on the SID-IIsFRG for an average small female involved in a side impact crash.
)()(
)()(
.)..max*..(
.)..max*..(
301
14
291
13
15498079987
15498086275
deflrib
deflrib
eAISp
eAISp
−
−
+=+
+=+
The data from the 42 side impact sled tests conducted at MCW (Appendix A) indicated that upper spine acceleration was a better predictor of injury than lower spine acceleration. However, a reanalysis of the combined cadaver data from Eppinger, et al. (1984) and Cavanaugh et al. (1993), presented in Appendix I, indicated that lower spine acceleration was a reasonably good predictor of thoracic injury (Wald p-value<0.001). The accelerations in the Eppinger data were mass scaled to that of a 5th percentile female (according to Equation 25) and injury risk curves were developed using the age of the subject and T12 lateral acceleration as the covariates. The resulting equations were normalized to a 56 year-old (average age of small occupants with AIS 3+ injuries in side crashes) and are presented in Figure 37 and Equations 31 and 32.
0
0.2
0.4
0.6
0.8
1
0 10 20 30 40 50 60 70 80 90 100 110 120Maximum T12 Acceleration (gs)
Ris
k of
Tho
raci
c In
jury AIS 3+ AIS 4+
Figure 37. Risk of AIS 3+ and AIS 4+ thoracic injury as a function of normalized T12 acceleration (Eppinger, et al., 1984 data mass scaled to represent a 5th percentile female accelerations). An age of 56 years old was taken to normalize the data to that of a short driver involved in a side impact crash.
46
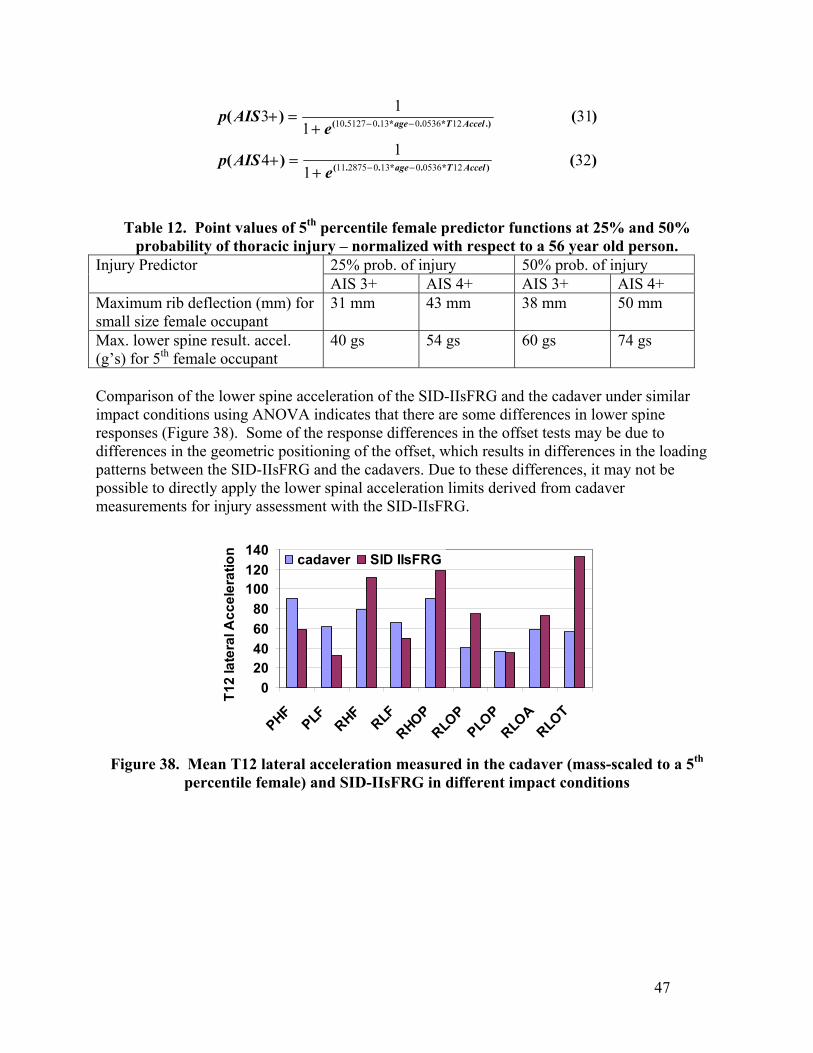
)()(
)()(
)*.*..(
.)*.*..(
321
14
311
13
1205360130287511
1205360130512710
AccelTage
AccelTage
eAISp
eAISp
−−
−−
+=+
+=+
Table 12. Point values of 5th percentile female predictor functions at 25% and 50% probability of thoracic injury – normalized with respect to a 56 year old person.
25% prob. of injury 50% prob. of injury Injury Predictor AIS 3+ AIS 4+ AIS 3+ AIS 4+
Maximum rib deflection (mm) for small size female occupant
31 mm 43 mm 38 mm 50 mm
Max. lower spine result. accel. (g’s) for 5th female occupant
40 gs 54 gs 60 gs 74 gs
Comparison of the lower spine acceleration of the SID-IIsFRG and the cadaver under similar impact conditions using ANOVA indicates that there are some differences in lower spine responses (Figure 38). Some of the response differences in the offset tests may be due to differences in the geometric positioning of the offset, which results in differences in the loading patterns between the SID-IIsFRG and the cadavers. Due to these differences, it may not be possible to directly apply the lower spinal acceleration limits derived from cadaver measurements for injury assessment with the SID-IIsFRG.
020406080
100120140
PHFPLF RHF
RLFRHOP
RLOP
PLOP
RLOA
RLOT
T12
late
ral A
ccel
erat
ion cadaver SID IIsFRG
Figure 38. Mean T12 lateral acceleration measured in the cadaver (mass-scaled to a 5th
percentile female) and SID-IIsFRG in different impact conditions
47
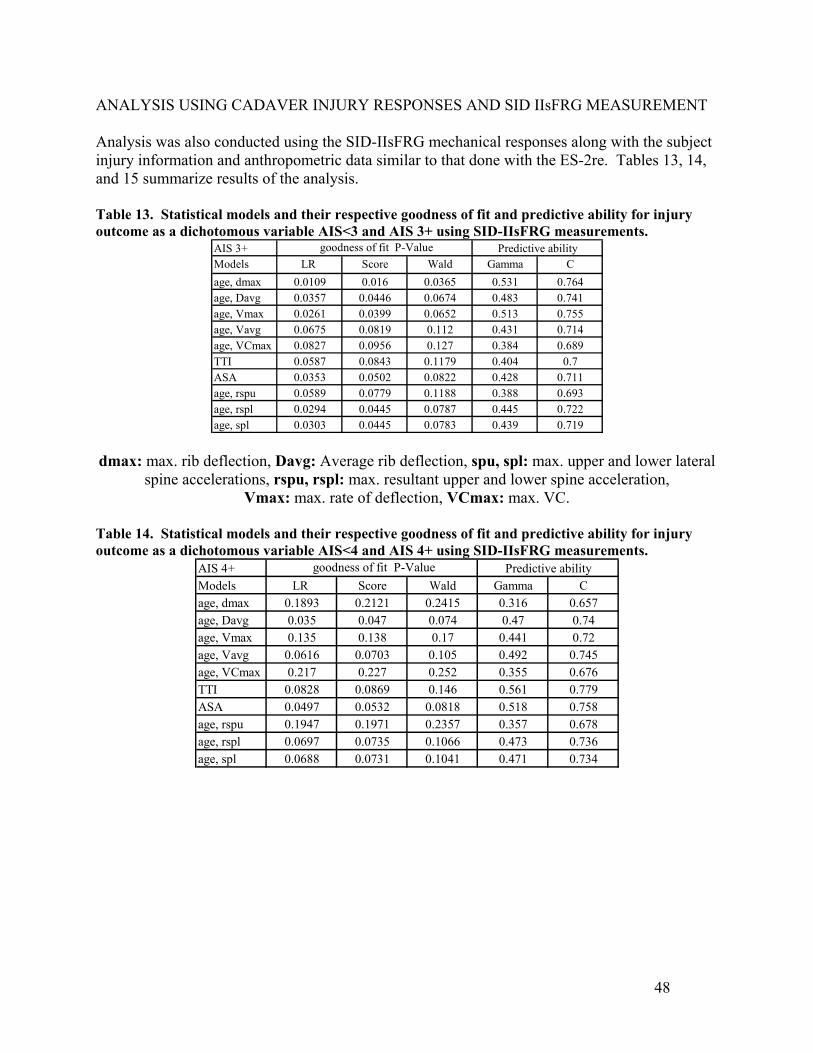
ANALYSIS USING CADAVER INJURY RESPONSES AND SID IIsFRG MEASUREMENT Analysis was also conducted using the SID-IIsFRG mechanical responses along with the subject injury information and anthropometric data similar to that done with the ES-2re. Tables 13, 14, and 15 summarize results of the analysis. Table 13. Statistical models and their respective goodness of fit and predictive ability for injury outcome as a dichotomous variable AIS<3 and AIS 3+ using SID-IIsFRG measurements.
AIS 3+Models LR Score Wald Gamma Cage, dmax 0.0109 0.016 0.0365 0.531 0.764age, Davg 0.0357 0.0446 0.0674 0.483 0.741age, Vmax 0.0261 0.0399 0.0652 0.513 0.755age, Vavg 0.0675 0.0819 0.112 0.431 0.714age, VCmax 0.0827 0.0956 0.127 0.384 0.689TTI 0.0587 0.0843 0.1179 0.404 0.7ASA 0.0353 0.0502 0.0822 0.428 0.711age, rspu 0.0589 0.0779 0.1188 0.388 0.693age, rspl 0.0294 0.0445 0.0787 0.445 0.722age, spl 0.0303 0.0445 0.0783 0.439 0.719
goodness of fit P-Value Predictive ability
dmax: max. rib deflection, Davg: Average rib deflection, spu, spl: max. upper and lower lateral
spine accelerations, rspu, rspl: max. resultant upper and lower spine acceleration, Vmax: max. rate of deflection, VCmax: max. VC.
Table 14. Statistical models and their respective goodness of fit and predictive ability for injury outcome as a dichotomous variable AIS<4 and AIS 4+ using SID-IIsFRG measurements.
AIS 4+Models LR Score Wald Gamma Cage, dmax 0.1893 0.2121 0.2415 0.316 0.657age, Davg 0.035 0.047 0.074 0.47 0.74age, Vmax 0.135 0.138 0.17 0.441 0.72age, Vavg 0.0616 0.0703 0.105 0.492 0.745age, VCmax 0.217 0.227 0.252 0.355 0.676TTI 0.0828 0.0869 0.146 0.561 0.779ASA 0.0497 0.0532 0.0818 0.518 0.758age, rspu 0.1947 0.1971 0.2357 0.357 0.678age, rspl 0.0697 0.0735 0.1066 0.473 0.736age, spl 0.0688 0.0731 0.1041 0.471 0.734
goodness of fit P-Value Predictive ability
48
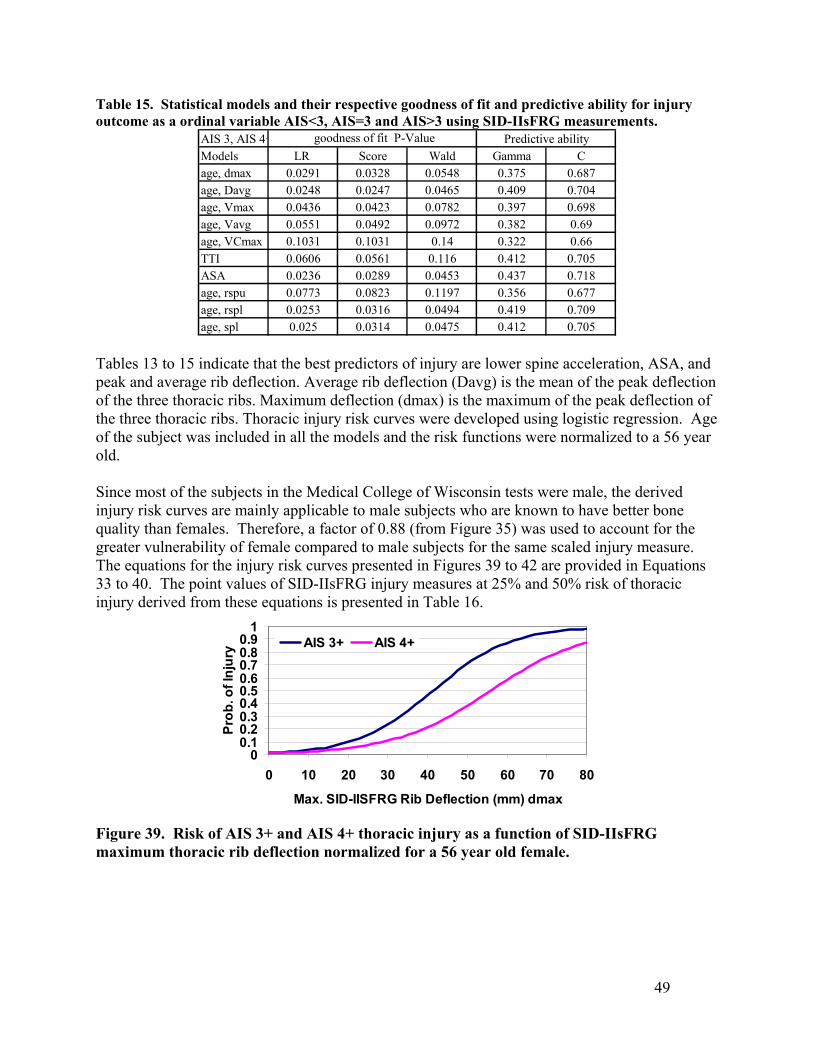
Table 15. Statistical models and their respective goodness of fit and predictive ability for injury outcome as a ordinal variable AIS<3, AIS=3 and AIS>3 using SID-IIsFRG measurements.
AIS 3, AIS 4+Models LR Score Wald Gamma Cage, dmax 0.0291 0.0328 0.0548 0.375 0.687age, Davg 0.0248 0.0247 0.0465 0.409 0.704age, Vmax 0.0436 0.0423 0.0782 0.397 0.698age, Vavg 0.0551 0.0492 0.0972 0.382 0.69age, VCmax 0.1031 0.1031 0.14 0.322 0.66TTI 0.0606 0.0561 0.116 0.412 0.705ASA 0.0236 0.0289 0.0453 0.437 0.718age, rspu 0.0773 0.0823 0.1197 0.356 0.677age, rspl 0.0253 0.0316 0.0494 0.419 0.709age, spl 0.025 0.0314 0.0475 0.412 0.705
goodness of fit P-Value Predictive ability
Tables 13 to 15 indicate that the best predictors of injury are lower spine acceleration, ASA, and peak and average rib deflection. Average rib deflection (Davg) is the mean of the peak deflection of the three thoracic ribs. Maximum deflection (dmax) is the maximum of the peak deflection of the three thoracic ribs. Thoracic injury risk curves were developed using logistic regression. Age of the subject was included in all the models and the risk functions were normalized to a 56 year old. Since most of the subjects in the Medical College of Wisconsin tests were male, the derived injury risk curves are mainly applicable to male subjects who are known to have better bone quality than females. Therefore, a factor of 0.88 (from Figure 35) was used to account for the greater vulnerability of female compared to male subjects for the same scaled injury measure. The equations for the injury risk curves presented in Figures 39 to 42 are provided in Equations 33 to 40. The point values of SID-IIsFRG injury measures at 25% and 50% risk of thoracic injury derived from these equations is presented in Table 16.
00.10.20.30.40.50.60.70.80.9
1
0 10 20 30 40 50 60 70 80
Max. SID-IISFRG Rib Deflection (mm) dmax
Prob
. of I
njur
y AIS 3+ AIS 4+
Figure 39. Risk of AIS 3+ and AIS 4+ thoracic injury as a function of SID-IIsFRG maximum thoracic rib deflection normalized for a 56 year old female.
49
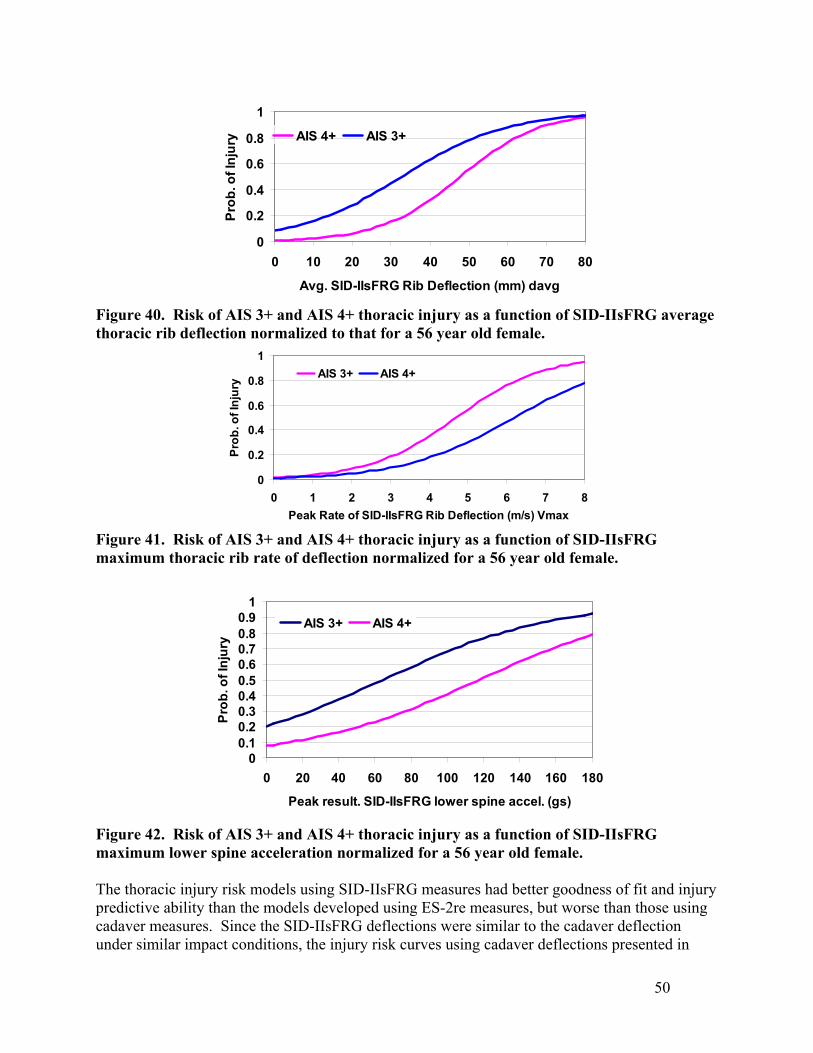
0
0.2
0.4
0.6
0.8
1
0 10 20 30 40 50 60 70 80
Avg. SID-IIsFRG Rib Deflection (mm) davg
Prob
. of I
njur
y AIS 4+ AIS 3+
Figure 40. Risk of AIS 3+ and AIS 4+ thoracic injury as a function of SID-IIsFRG average thoracic rib deflection normalized to that for a 56 year old female.
0
0.2
0.4
0.6
0.8
1
0 1 2 3 4 5 6 7 8Peak Rate of SID-IIsFRG Rib Deflection (m/s) Vmax
Prob
. of I
njur
y AIS 3+ AIS 4+
Figure 41. Risk of AIS 3+ and AIS 4+ thoracic injury as a function of SID-IIsFRG maximum thoracic rib rate of deflection normalized for a 56 year old female.
00.10.20.30.40.50.60.70.80.9
1
0 20 40 60 80 100 120 140 160 180
Peak result. SID-IIsFRG lower spine accel. (gs)
Prob
. of I
njur
y
AIS 3+ AIS 4+
Figure 42. Risk of AIS 3+ and AIS 4+ thoracic injury as a function of SID-IIsFRG maximum lower spine acceleration normalized for a 56 year old female. The thoracic injury risk models using SID-IIsFRG measures had better goodness of fit and injury predictive ability than the models developed using ES-2re measures, but worse than those using cadaver measures. Since the SID-IIsFRG deflections were similar to the cadaver deflection under similar impact conditions, the injury risk curves using cadaver deflections presented in
50
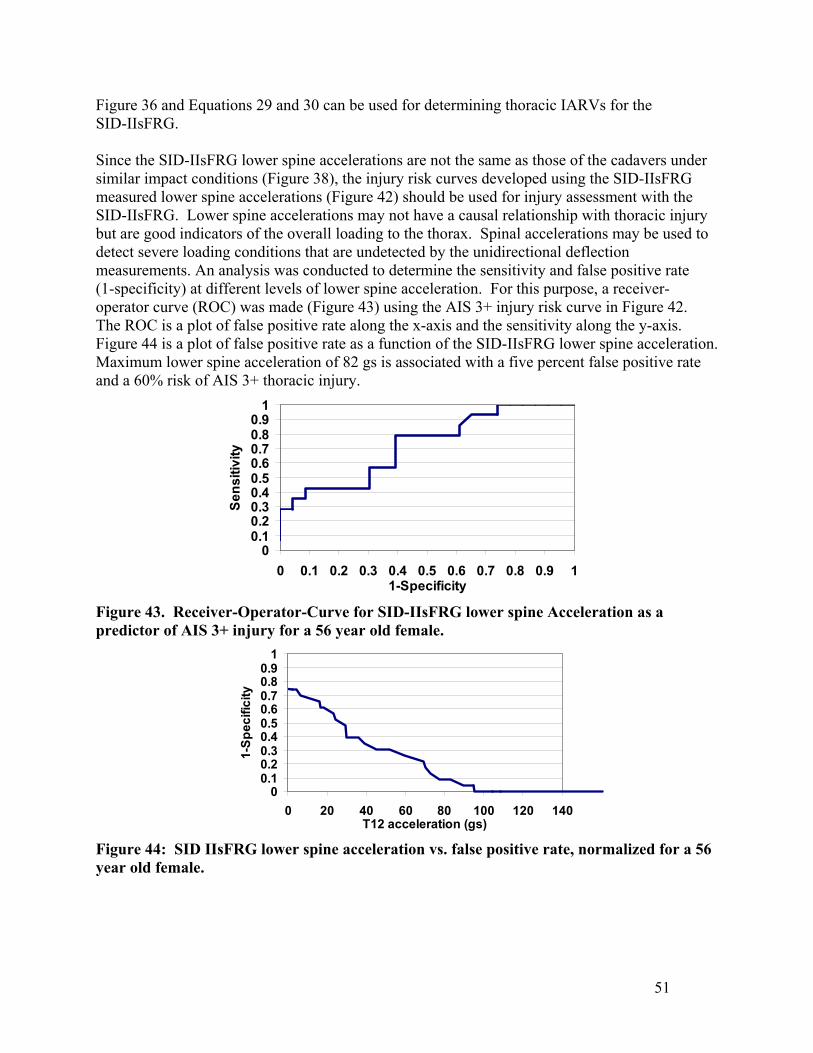
Figure 36 and Equations 29 and 30 can be used for determining thoracic IARVs for the SID-IIsFRG. Since the SID-IIsFRG lower spine accelerations are not the same as those of the cadavers under similar impact conditions (Figure 38), the injury risk curves developed using the SID-IIsFRG measured lower spine accelerations (Figure 42) should be used for injury assessment with the SID-IIsFRG. Lower spine accelerations may not have a causal relationship with thoracic injury but are good indicators of the overall loading to the thorax. Spinal accelerations may be used to detect severe loading conditions that are undetected by the unidirectional deflection measurements. An analysis was conducted to determine the sensitivity and false positive rate (1-specificity) at different levels of lower spine acceleration. For this purpose, a receiver-operator curve (ROC) was made (Figure 43) using the AIS 3+ injury risk curve in Figure 42. The ROC is a plot of false positive rate along the x-axis and the sensitivity along the y-axis. Figure 44 is a plot of false positive rate as a function of the SID-IIsFRG lower spine acceleration. Maximum lower spine acceleration of 82 gs is associated with a five percent false positive rate and a 60% risk of AIS 3+ thoracic injury.
00.10.20.30.40.50.60.70.80.9
1
0 0.1 0.2 0.3 0.4 0.5 0.6 0.7 0.8 0.9 11-Specificity
Sens
itivi
ty
Figure 43. Receiver-Operator-Curve for SID-IIsFRG lower spine Acceleration as a predictor of AIS 3+ injury for a 56 year old female.
00.10.20.30.40.50.60.70.80.9
1
0 20 40 60 80 100 120 140T12 acceleration (gs)
1-Sp
ecifi
city
Figure 44: SID IIsFRG lower spine acceleration vs. false positive rate, normalized for a 56 year old female.
51
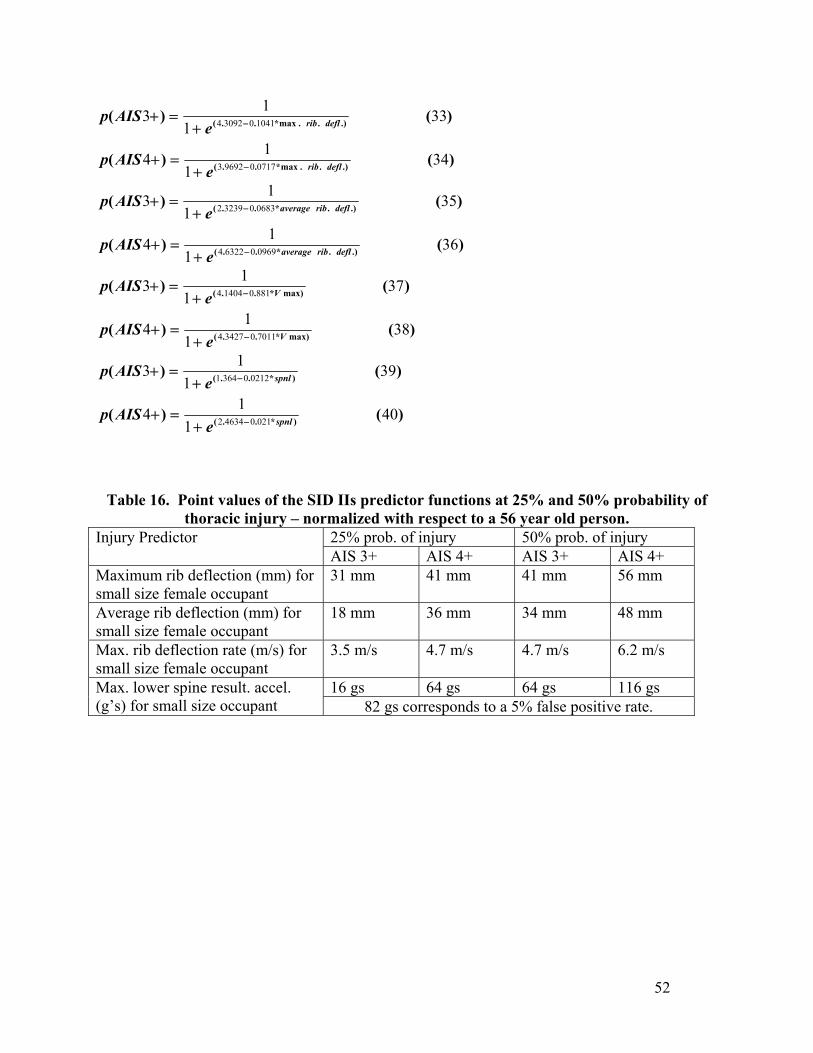
)()(
)()(
.)..max*..(
.)..max*..(
341
14
331
13
0717096923
1041030924
deflrib
deflrib
eAISp
eAISp
−
−
+=+
+=+
)()(
)()(
.).*..(
.).*..(
361
14
351
13
0969063224
0683032392
deflribaverage
deflribaverage
eAISp
eAISp
−
−
+=+
+=+
)()(
)()(
max)*..(
max)*..(
381
14
371
13
7011034274
881014044
V
V
eAISp
eAISp
−
−
+=+
+=+
)()(
)()(
)*..(
)*..(
401
14
391
13
021046342
021203641
spnl
spnl
eAISp
eAISp
−
−
+=+
+=+
Table 16. Point values of the SID IIs predictor functions at 25% and 50% probability of thoracic injury – normalized with respect to a 56 year old person.
25% prob. of injury 50% prob. of injury Injury Predictor AIS 3+ AIS 4+ AIS 3+ AIS 4+
Maximum rib deflection (mm) for small size female occupant
31 mm 41 mm 41 mm 56 mm
Average rib deflection (mm) for small size female occupant
18 mm 36 mm 34 mm 48 mm
Max. rib deflection rate (m/s) for small size female occupant
3.5 m/s 4.7 m/s 4.7 m/s 6.2 m/s
16 gs 64 gs 64 gs 116 gs Max. lower spine result. accel. (g’s) for small size occupant 82 gs corresponds to a 5% false positive rate.
52
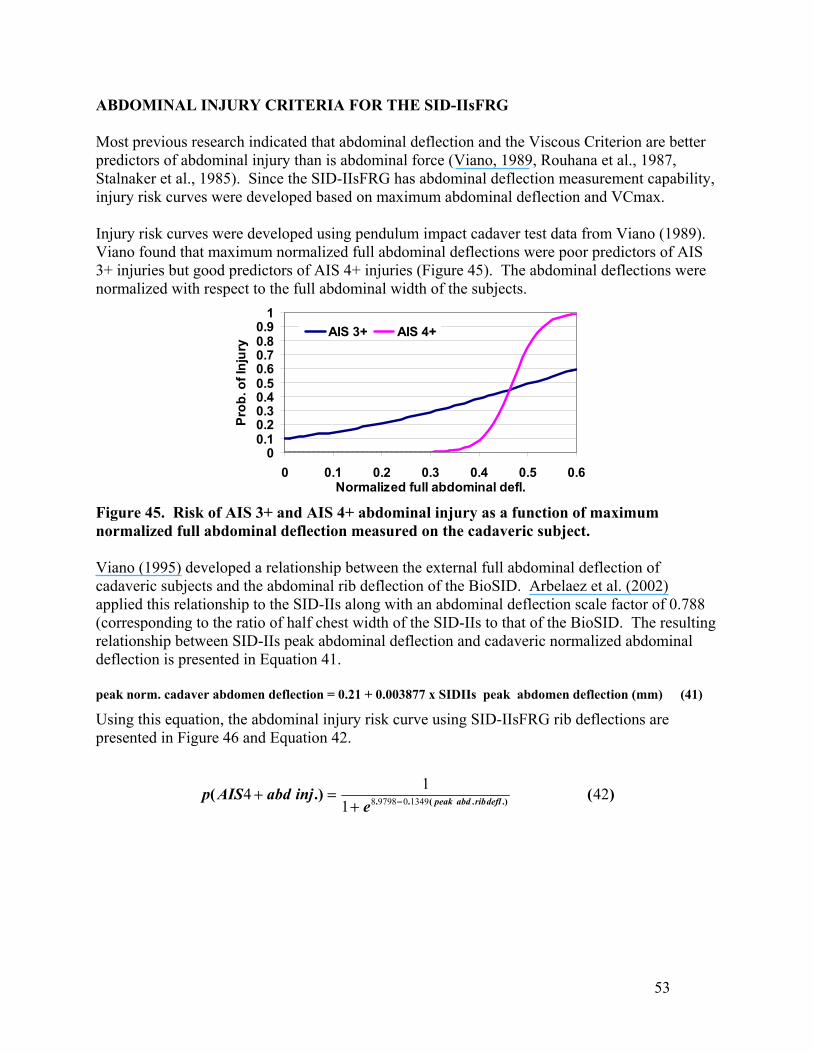
ABDOMINAL INJURY CRITERIA FOR THE SID-IIsFRG Most previous research indicated that abdominal deflection and the Viscous Criterion are better predictors of abdominal injury than is abdominal force (Viano, 1989, Rouhana et al., 1987, Stalnaker et al., 1985). Since the SID-IIsFRG has abdominal deflection measurement capability, injury risk curves were developed based on maximum abdominal deflection and VCmax. Injury risk curves were developed using pendulum impact cadaver test data from Viano (1989). Viano found that maximum normalized full abdominal deflections were poor predictors of AIS 3+ injuries but good predictors of AIS 4+ injuries (Figure 45). The abdominal deflections were normalized with respect to the full abdominal width of the subjects.
00.10.20.30.40.50.60.70.80.9
1
0 0.1 0.2 0.3 0.4 0.5 0.6Normalized full abdominal defl.
Prob
. of I
njur
y
AIS 3+ AIS 4+
Figure 45. Risk of AIS 3+ and AIS 4+ abdominal injury as a function of maximum normalized full abdominal deflection measured on the cadaveric subject. Viano (1995) developed a relationship between the external full abdominal deflection of cadaveric subjects and the abdominal rib deflection of the BioSID. Arbelaez et al. (2002) applied this relationship to the SID-IIs along with an abdominal deflection scale factor of 0.788 (corresponding to the ratio of half chest width of the SID-IIs to that of the BioSID. The resulting relationship between SID-IIs peak abdominal deflection and cadaveric normalized abdominal deflection is presented in Equation 41. peak norm. cadaver abdomen deflection = 0.21 + 0.003877 x SIDIIs peak abdomen deflection (mm) (41)
Using this equation, the abdominal injury risk curve using SID-IIsFRG rib deflections are presented in Figure 46 and Equation 42.
)(.)( .).(.. 421
14 1349097988 deflribabdpeake
injabdAISp −+=+
53
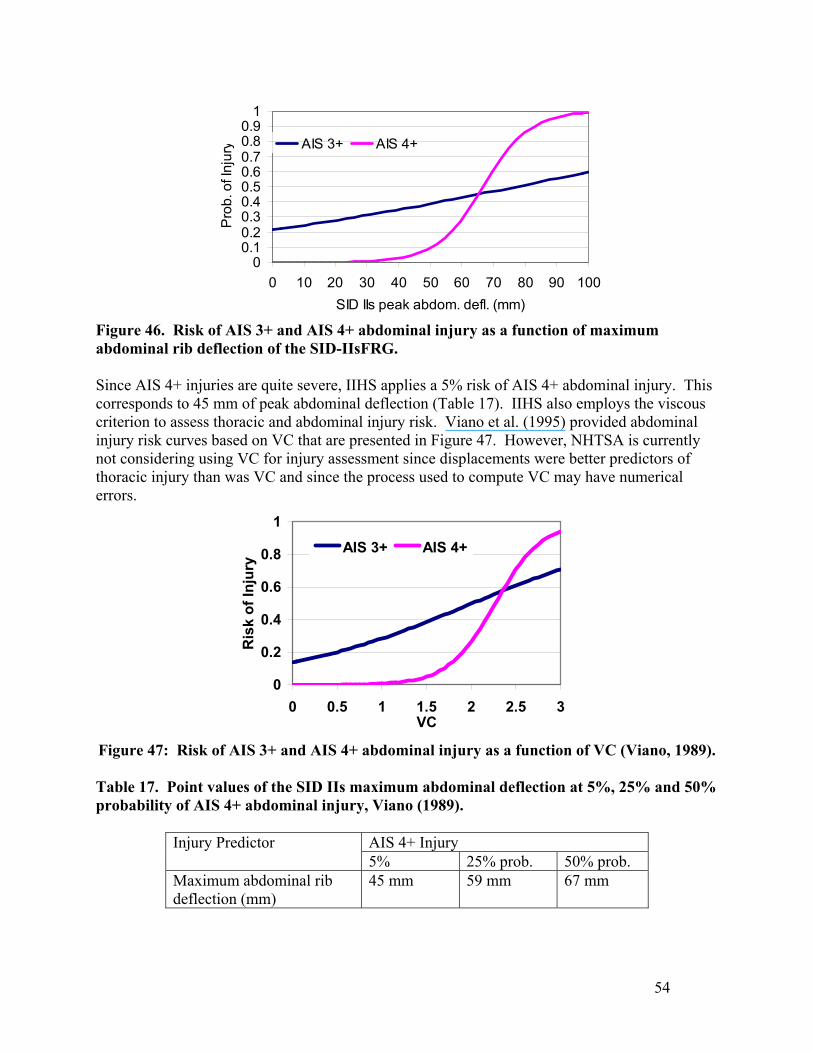
00.10.20.30.40.50.60.70.80.9
1
0 10 20 30 40 50 60 70 80 90 100SID IIs peak abdom. defl. (mm)
Pro
b. o
f Inj
ury AIS 3+ AIS 4+
Figure 46. Risk of AIS 3+ and AIS 4+ abdominal injury as a function of maximum abdominal rib deflection of the SID-IIsFRG.
Since AIS 4+ injuries are quite severe, IIHS applies a 5% risk of AIS 4+ abdominal injury. This corresponds to 45 mm of peak abdominal deflection (Table 17). IIHS also employs the viscous criterion to assess thoracic and abdominal injury risk. Viano et al. (1995) provided abdominal injury risk curves based on VC that are presented in Figure 47. However, NHTSA is currently not considering using VC for injury assessment since displacements were better predictors of thoracic injury than was VC and since the process used to compute VC may have numerical errors.
0
0.2
0.4
0.6
0.8
1
0 0.5 1 1.5 2 2.5 3VC
Ris
k of
Inju
ry
AIS 3+ AIS 4+
Figure 47: Risk of AIS 3+ and AIS 4+ abdominal injury as a function of VC (Viano, 1989). Table 17. Point values of the SID IIs maximum abdominal deflection at 5%, 25% and 50% probability of AIS 4+ abdominal injury, Viano (1989).
AIS 4+ Injury Injury Predictor 5% 25% prob. 50% prob.
Maximum abdominal rib deflection (mm)
45 mm 59 mm 67 mm
54
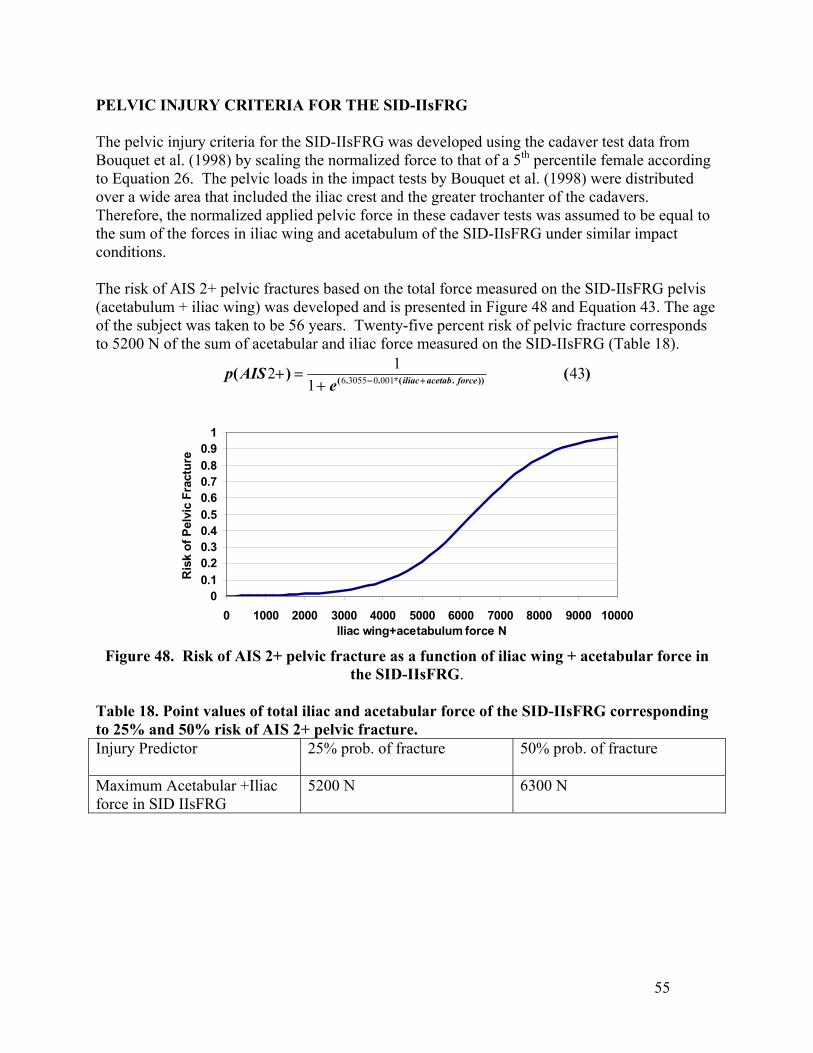
PELVIC INJURY CRITERIA FOR THE SID-IIsFRG The pelvic injury criteria for the SID-IIsFRG was developed using the cadaver test data from Bouquet et al. (1998) by scaling the normalized force to that of a 5th percentile female according to Equation 26. The pelvic loads in the impact tests by Bouquet et al. (1998) were distributed over a wide area that included the iliac crest and the greater trochanter of the cadavers. Therefore, the normalized applied pelvic force in these cadaver tests was assumed to be equal to the sum of the forces in iliac wing and acetabulum of the SID-IIsFRG under similar impact conditions. The risk of AIS 2+ pelvic fractures based on the total force measured on the SID-IIsFRG pelvis (acetabulum + iliac wing) was developed and is presented in Figure 48 and Equation 43. The age of the subject was taken to be 56 years. Twenty-five percent risk of pelvic fracture corresponds to 5200 N of the sum of acetabular and iliac force measured on the SID-IIsFRG (Table 18).
)()( )).(*..( 431
12 001030556 forceacetabiliaceAISp +−+
=+
00.10.20.30.40.50.60.70.80.9
1
0 1000 2000 3000 4000 5000 6000 7000 8000 9000 10000Iliac wing+acetabulum force N
Ris
k of
Pel
vic
Frac
ture
Figure 48. Risk of AIS 2+ pelvic fracture as a function of iliac wing + acetabular force in
the SID-IIsFRG. Table 18. Point values of total iliac and acetabular force of the SID-IIsFRG corresponding to 25% and 50% risk of AIS 2+ pelvic fracture. Injury Predictor 25% prob. of fracture 50% prob. of fracture
Maximum Acetabular +Iliac force in SID IIsFRG
5200 N 6300 N
55
56
REFERENCES
Arbelaez, R., Nolan, J., Dakin, G., Lund, A. (2002) Comparison of EuroSID-2 and SID-IIs in Vehicle Side Impact Tests with the IIHS Barrier, Stapp Car Crash Journal, Vol. 46, pp. 397-415.
Bouquet, R., Ramet, M., Bermond, F., Vyes, C. (1998) Pelvic Human Response to Lateral Impact, 16th International Technical Conference on the Enhanced Safety of Vehicles, Paper No. 98-S7-W-16, National Highway Traffic Administration, Windsor, 1998.
Cavanaugh, J. M., Zhu, Y., Huang, Y., King, A. (1993) Injury and Response of the Thorax in Side Impact Cadaveric Tests. Proc. Thirty-Seventh Stapp Car Crash Conference, pp. 199-222, Society of Automotive Engineers, Warrendale, PA.
Cavanaugh, J., Walilko, T., Malhotra, A., Zhu, Y, King, A. (1990) Biomechanical Response and Injury Tolerance of the Pelvis in Twelve Sled Side Impacts, Proc. of the Thirty-Fourth Stapp Car Crash Conference, SAE Paper No. 902305, Society of Automotive Engineers, Warrendale, PA.
Cesari, D., Ramet, M. (1982) Pelvic Tolerance and Protection Criteria in Side Impact, SAE Paper No. 821159, Society of Automotive Engineers, Warrendale, PA.
Chung, J., Cavanaugh, J., King, A., Koh, S., Deng, Y. (1999) Thoracic Injury Mechanisms and Biomechanical Responses in Lateral Velocity Pulse Impact. Proc. Forty-Third Stapp Car Crash Conference, pp. 39-54, Society of Automotive Engineers, Warrendale, PA.
Eppinger, R. H., Marcus, J., Morgan, R. (1984) Development of Dummy and Injury Index for NHTSA’s Thoracic Side Impact Protection Research Program. SAE Paper No. 840885. Government/Industry Meeting and Exposition, Washington, D.C, Society of Automotive Engineers, Warrendale, PA.
Haffner, M., (1985) Synthesis of Pelvic Fracture Criteria for Lateral Impact Loading, Eleventh ESV Conference, Paper No. 856022, National Highway Traffic Safety Administration.
Hertz, E. (1993) A Note on the Head Injury Criteria (HIC) as a predictor of the Risk of Skull Fracture, Proceedings of the Association for the Advancement of Automotive Medicine.
Insurance Institute for Highway Safety (2003) Side Impact Crashworthiness Evaluation – Guidelines for Rating Injury Measures, Report, October 2003.
International Standards Organization (ISO) Working Group 6, ISO TC 22/SC 12/ WG 6, Road Vehicles – Injury Risk Curves to Evaluate Occupant Protection in Side Impact, ISO/TR 12350:2002(E), Draft Copy, to be published.
Kallieris, D., Mattern, R., Schmidt, G., Eppinger, R. (1981) Quantification of Side Impact Responses and Injuries. Proceedings of the Twenty-Fifth Stapp Car Crash Conference, pp. 329-368, Society of Automotive Engineers, Warrendale, PA.
Kallieris, D., Boggasch, F., Mattern, R., (1994) Protection for the Thorax Injury Severity in the 90-Degree Lateral Collision. Paper No. 94-S1-O-02, Proc. Fourteenth ESV Conference. Germany, National Highway Traffic Safety Administration, Washington, D.C.
Kent, R., Bolton, J., Crandall, J., Prasad, P., Nusholtz, G., Mertz, H., Kallieris, D. (2001) Restrained Hybrid III dummy-based criteria for thoracic hard tissue injury prediction.
57
International IRCOBI Conference on the Biomechanics of Impact, pp. 215-232, IRCOBI, Bron, France.
Kent, R., Funk J. (2004) Data Censoring and Parametric Distribution Assignment in the Development of Injury Risk Functions from Biomechanical Data, SAE Paper No. 2004-01-0317,2004 SAE World Congress.
Kuppa, S., Eppinger, R., Maltese, M., Naik, R., Pintar, F., Yoganandan, N., Saul, R., McFadden, J. (2000) Assessment of Thoracic Injury Criteria for Side Impact. International IRCOBI Conference on the Biomechanics of Impact, pp. 131-146, IRCOBI, Bron, France.
Kuppa, S., Eppinger, R., McKoy, F., Nguyen, T., Pintar, F., Yoganandan, N. (2003) Development of Side Impact Thoracic Injury Criteria and their Application to the Modified ES-2 Dummy with Rib Extensions (ES-2re), Stapp Car Crash Journal, Stapp Association, pp. 189-210, Vol. 47.
Lau, I., Viano, D. (1986) The Viscous Criterion –Bases and Applications of an Injury Severity Index for Soft Tissues. Proceedings of the Thirtieth Stapp Car Crash Conference. pp. 123-142, Society of Automotive Engineers, Warrendale, PA.
Prasad, P. and Martz, H. (1985) The Position of the United States Delegation to the ISO Working Group 6 on the Use of HIC in the Automotive Environment, SAE Paper No. 851246, Society of Automotive Engineers, Warrendale, PA.
Morgan, R. M., Marcus, J. H., and Eppinger, R. H. (1986) Side Impact – the Biofidelity of NHTSA’s Proposed ATD and Efficacy of TTI. Proc. Thirtieth Stapp Car Crash Conference, pp. 27-40, Society of Automotive Engineers, Warrendale, PA.
Pintar, F., Yoganandan, N., Sances, A., Eppinger, R. (1996) Instrumentation of Human Surrogates for Side Impact. Proc. Fortieth Stapp Car Crash Conference, pp. 29-42, Society of Automotive Engineers, Warrendale, PA.
Pintar, F., Yoganandan, N., Hines, M., Maltese, M., McFadden, J., Saul, R., Eppinger, R., Khaewpong, N., Kleinberger, M. (1997) Chestband Analysis of Human Tolerance to Side Impact. Proc. Forty-First Stapp Car Crash Conference, pp. 63-74, Society of Automotive Engineers, Warrendale, PA.
Riggs, B. L., Warner, H. W., Dunn, W. L., Mazess, R. B., Offord, K. P., Melton, L. J. (1981) Differential Changes in Bone Mineral Density of the Appendicular and Axial Skeleton with Aging. J. Clin. Invest. Vol. 67. February, 1981. pp. 328-335.
Rouhana, S. (1987) Abdominal Injury Prediction Lateral Impact – An Analysis of the Biofidelity of the Euro-SID Abdomen, Proc. of the Thirty-First Stapp Car Crash Conference, SAE Paper No. 872203, Society of Automotive Engineers, Warrendale, PA.
SAS Version 8 Users’ Guide, Version 8, The SAS Institute Inc., Cary, NC, 1998.
Stalnaker, R., Ulman, M. (1985) Abdominal Trauma – Review, Response, and Criteria. Proc. of the Twenty-Ninth Stapp Car Crash Conference, SAE Paper No. 851720, Society of Automotive Engineers, Warrendale, PA.
Tarriere, C., Walfisch, G., Fayon, A., Rosey, J., Got, C., Patel, A., Delmas, A. (1979) Synthesis of Human Tolerances Obtained from Lateral Impact Simulations. Seventh International Conference on Experimental Safety Vehicles, pp. 359-373, NHTSA.
58
Viano, D. (1989) Biomechanical Responses and Injuries in Blunt Lateral Impact. Proc. Thirty-third Stapp Car Crash Conference, pp. 113-142, Society of Automotive Engineers, Warrendale, PA.
Viano, D., Lau, I., Asbury, C., King, A., Begeman, P. (1989) Biomechanics of the Human Chest, Abdomen, and Pelvis in Lateral Impact, Accident Analysis and Prevention, Vol. 21, No. 6, pp. 553-574.
Viano, D., Fan, A., Ueno, K., Walilko, T., Cavanaugh, J., King, A. (1995) Biofidelity and Injury Assessment in EuroSID I and Biosid. Proc. Thirty-Ninth Stapp Car Crash Conference, pp. 307-326, Society of Automotive Engineers, Warrendale, PA.
Wang, J. T. (1989) Analytical Studies of Injury Criteria for the Thorax. Journal of Biomechanical Engineering, Vol. 111.
Walfisch, G., Fayon, C., Terriere, J., et al., “Designing of a Dummy’s Abdomen for Detecting Injuries in Side Impact Collisions,” 5th International IRCOBI Conference, 1980.
Zhu, J., Cavanaugh, J., King, A., “Pelvic Biomechanical Response and Padding Benefits in Side Impact Based on a Cadaveric Test Series,” SAE Paper No. 933128, 37th Stapp Car Crash Conference, 1993.
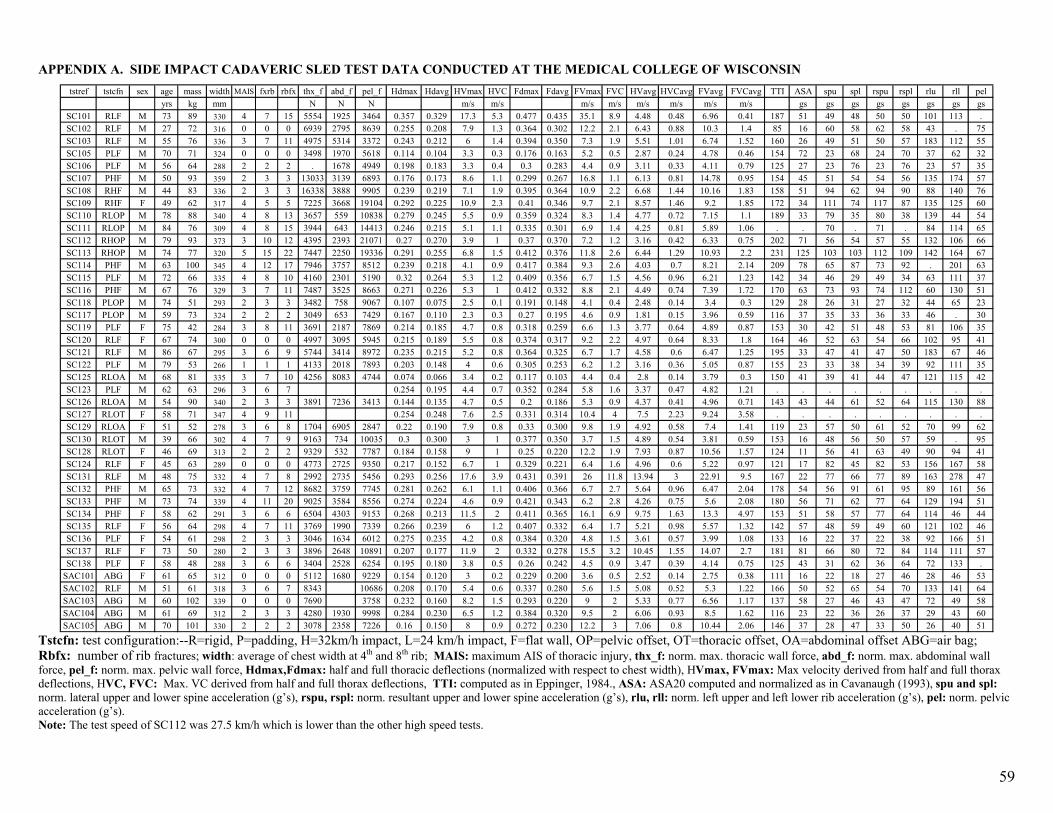
59
tstref tstcfn sex age mass width MAIS fxrb rbfx thx_f abd_f pel_f Hdmax Hdavg HVmax HVC Fdmax Fdavg FVmax FVC HVavg HVCavg FVavg FVCavg TTI ASA spu spl rspu rspl rlu rll pelyrs kg mm N N N m/s m/s m/s m/s m/s m/s m/s m/s gs gs gs gs gs gs gs gs
SC101 RLF M 73 89 330 4 7 15 5554 1925 3464 0.357 0.329 17.3 5.3 0.477 0.435 35.1 8.9 4.48 0.48 6.96 0.41 187 51 49 48 50 50 101 113 .SC102 RLF M 27 72 316 0 0 0 6939 2795 8639 0.255 0.208 7.9 1.3 0.364 0.302 12.2 2.1 6.43 0.88 10.3 1.4 85 16 60 58 62 58 43 . 75SC103 RLF M 55 76 336 3 7 11 4975 5314 3372 0.243 0.212 6 1.4 0.394 0.350 7.3 1.9 5.51 1.01 6.74 1.52 160 26 49 51 50 57 183 112 55SC105 PLF M 70 71 324 0 0 0 3498 1970 5618 0.114 0.104 3.3 0.3 0.176 0.163 5.2 0.5 2.87 0.24 4.78 0.46 154 72 23 68 24 70 37 62 32SC106 PLF M 56 64 288 2 2 2 . 1678 4949 0.198 0.183 3.3 0.4 0.3 0.283 4.4 0.9 3.11 0.33 4.11 0.79 125 27 23 76 23 76 23 57 35SC107 PHF M 50 93 359 2 3 3 13033 3139 6893 0.176 0.173 8.6 1.1 0.299 0.267 16.8 1.1 6.13 0.81 14.78 0.95 154 45 51 54 54 56 135 174 57SC108 RHF M 44 83 336 2 3 3 16338 3888 9905 0.239 0.219 7.1 1.9 0.395 0.364 10.9 2.2 6.68 1.44 10.16 1.83 158 51 94 62 94 90 88 140 76SC109 RHF F 49 62 317 4 5 5 7225 3668 19104 0.292 0.225 10.9 2.3 0.41 0.346 9.7 2.1 8.57 1.46 9.2 1.85 172 34 111 74 117 87 135 125 60SC110 RLOP M 78 88 340 4 8 13 3657 559 10838 0.279 0.245 5.5 0.9 0.359 0.324 8.3 1.4 4.77 0.72 7.15 1.1 189 33 79 35 80 38 139 44 54SC111 RLOP M 84 76 309 4 8 15 3944 643 14413 0.246 0.215 5.1 1.1 0.335 0.301 6.9 1.4 4.25 0.81 5.89 1.06 . . 70 . 71 . 84 114 65SC112 RHOP M 79 93 373 3 10 12 4395 2393 21071 0.27 0.270 3.9 1 0.37 0.370 7.2 1.2 3.16 0.42 6.33 0.75 202 71 56 54 57 55 132 106 66SC113 RHOP M 74 77 320 5 15 22 7447 2250 19336 0.291 0.255 6.8 1.5 0.412 0.376 11.8 2.6 6.44 1.29 10.93 2.2 231 125 103 103 112 109 142 164 67SC114 PHF M 63 100 345 4 12 17 7946 3757 8512 0.239 0.218 4.1 0.9 0.417 0.384 9.3 2.6 4.03 0.7 8.21 2.14 209 78 65 87 73 92 . 201 63SC115 PLF M 72 66 335 4 8 10 4160 2301 5190 0.32 0.264 5.3 1.2 0.409 0.356 6.7 1.5 4.56 0.96 6.21 1.23 142 34 46 29 49 34 63 111 37SC116 PHF M 67 76 329 3 7 11 7487 3525 8663 0.271 0.226 5.3 1 0.412 0.332 8.8 2.1 4.49 0.74 7.39 1.72 170 63 73 93 74 112 60 130 51SC118 PLOP M 74 51 293 2 3 3 3482 758 9067 0.107 0.075 2.5 0.1 0.191 0.148 4.1 0.4 2.48 0.14 3.4 0.3 129 28 26 31 27 32 44 65 23SC117 PLOP M 59 73 324 2 2 2 3049 653 7429 0.167 0.110 2.3 0.3 0.27 0.195 4.6 0.9 1.81 0.15 3.96 0.59 116 37 35 33 36 33 46 . 30SC119 PLF F 75 42 284 3 8 11 3691 2187 7869 0.214 0.185 4.7 0.8 0.318 0.259 6.6 1.3 3.77 0.64 4.89 0.87 153 30 42 51 48 53 81 106 35SC120 RLF F 67 74 300 0 0 0 4997 3095 5945 0.215 0.189 5.5 0.8 0.374 0.317 9.2 2.2 4.97 0.64 8.33 1.8 164 46 52 63 54 66 102 95 41SC121 RLF M 86 67 295 3 6 9 5744 3414 8972 0.235 0.215 5.2 0.8 0.364 0.325 6.7 1.7 4.58 0.6 6.47 1.25 195 33 47 41 47 50 183 67 46SC122 PLF M 79 53 266 1 1 1 4133 2018 7893 0.203 0.148 4 0.6 0.305 0.253 6.2 1.2 3.16 0.36 5.05 0.87 155 23 33 38 34 39 92 111 35SC125 RLOA M 68 81 335 3 7 10 4256 8083 4744 0.074 0.066 3.4 0.2 0.117 0.103 4.4 0.4 2.8 0.14 3.79 0.3 150 41 39 41 44 47 121 115 42SC123 PLF M 62 63 296 3 6 7 0.254 0.195 4.4 0.7 0.352 0.284 5.8 1.6 3.37 0.47 4.82 1.21 . . . . . . . . .SC126 RLOA M 54 90 340 2 3 3 3891 7236 3413 0.144 0.135 4.7 0.5 0.2 0.186 5.3 0.9 4.37 0.41 4.96 0.71 143 43 44 61 52 64 115 130 88SC127 RLOT F 58 71 347 4 9 11 0.254 0.248 7.6 2.5 0.331 0.314 10.4 4 7.5 2.23 9.24 3.58 . . . . . . . . .SC129 RLOA F 51 52 278 3 6 8 1704 6905 2847 0.22 0.190 7.9 0.8 0.33 0.300 9.8 1.9 4.92 0.58 7.4 1.41 119 23 57 50 61 52 70 99 62SC130 RLOT M 39 66 302 4 7 9 9163 734 10035 0.3 0.300 3 1 0.377 0.350 3.7 1.5 4.89 0.54 3.81 0.59 153 16 48 56 50 57 59 . 95SC128 RLOT F 46 69 313 2 2 2 9329 532 7787 0.184 0.158 9 1 0.25 0.220 12.2 1.9 7.93 0.87 10.56 1.57 124 11 56 41 63 49 90 94 41SC124 RLF F 45 63 289 0 0 0 4773 2725 9350 0.217 0.152 6.7 1 0.329 0.221 6.4 1.6 4.96 0.6 5.22 0.97 121 17 82 45 82 53 156 167 58SC131 RLF M 48 75 332 4 7 8 2992 2735 5456 0.293 0.256 17.6 3.9 0.431 0.391 26 11.8 13.94 3 22.91 9.5 167 22 77 66 77 89 163 278 47SC132 PHF M 65 73 332 4 7 12 8682 3759 7745 0.281 0.262 6.1 1.1 0.406 0.366 6.7 2.7 5.64 0.96 6.47 2.04 178 54 56 91 61 95 89 161 56SC133 PHF M 73 74 339 4 11 20 9025 3584 8556 0.274 0.224 4.6 0.9 0.421 0.343 6.2 2.8 4.26 0.75 5.6 2.08 180 56 71 62 77 64 129 194 51SC134 PHF F 58 62 291 3 6 6 6504 4303 9153 0.268 0.213 11.5 2 0.411 0.365 16.1 6.9 9.75 1.63 13.3 4.97 153 51 58 57 77 64 114 46 44SC135 RLF F 56 64 298 4 7 11 3769 1990 7339 0.266 0.239 6 1.2 0.407 0.332 6.4 1.7 5.21 0.98 5.57 1.32 142 57 48 59 49 60 121 102 46SC136 PLF F 54 61 298 2 3 3 3046 1634 6012 0.275 0.235 4.2 0.8 0.384 0.320 4.8 1.5 3.61 0.57 3.99 1.08 133 16 22 37 22 38 92 166 51SC137 RLF F 73 50 280 2 3 3 3896 2648 10891 0.207 0.177 11.9 2 0.332 0.278 15.5 3.2 10.45 1.55 14.07 2.7 181 81 66 80 72 84 114 111 57SC138 PLF F 58 48 288 3 6 6 3404 2528 6254 0.195 0.180 3.8 0.5 0.26 0.242 4.5 0.9 3.47 0.39 4.14 0.75 125 43 31 62 36 64 72 133 .
SAC101 ABG F 61 65 312 0 0 0 5112 1680 9229 0.154 0.120 3 0.2 0.229 0.200 3.6 0.5 2.52 0.14 2.75 0.38 111 16 22 18 27 46 28 46 53SAC102 RLF M 51 61 318 3 6 7 8343 10686 0.208 0.170 5.4 0.6 0.337 0.280 5.6 1.5 5.08 0.52 5.3 1.22 166 50 52 65 54 70 133 141 64SAC103 ABG M 60 102 339 0 0 0 7690 3758 0.232 0.160 8.2 1.5 0.293 0.220 9 2 5.33 0.77 6.56 1.17 137 58 27 46 43 47 72 49 58SAC104 ABG M 61 69 312 2 3 3 4280 1930 9998 0.284 0.230 6.5 1.2 0.384 0.320 9.5 2 6.06 0.93 8.5 1.62 116 23 22 36 26 37 29 43 60SAC105 ABG M 70 101 330 2 2 2 3078 2358 7226 0.16 0.150 8 0.9 0.272 0.230 12.2 3 7.06 0.8 10.44 2.06 146 37 28 47 33 50 26 40 51
Tstcfn: test configuration:--R=rigid, P=padding, H=32km/h impact, L=24 km/h impact, F=flat wall, OP=pelvic offset, OT=thoracic offset, OA=abdominal offset ABG=air bag; Rbfx: number of rib fractures; width: average of chest width at 4th and 8th rib; MAIS: maximum AIS of thoracic injury, thx_f: norm. max. thoracic wall force, abd_f: norm. max. abdominal wall force, pel_f: norm. max. pelvic wall force, Hdmax,Fdmax: half and full thoracic deflections (normalized with respect to chest width), HVmax, FVmax: Max velocity derived from half and full thorax deflections, HVC, FVC: Max. VC derived from half and full thorax deflections, TTI: computed as in Eppinger, 1984., ASA: ASA20 computed and normalized as in Cavanaugh (1993), spu and spl: norm. lateral upper and lower spine acceleration (g’s), rspu, rspl: norm. resultant upper and lower spine acceleration (g’s), rlu, rll: norm. left upper and left lower rib acceleration (g’s), pel: norm. pelvic acceleration (g’s).
APPENDIX A. SIDE IMPACT CADAVERIC SLED TEST DATA CONDUCTED AT THE MEDICAL COLLEGE OF WISCONSIN
Note: The test speed of SC112 was 27.5 km/h which is lower than the other high speed tests.
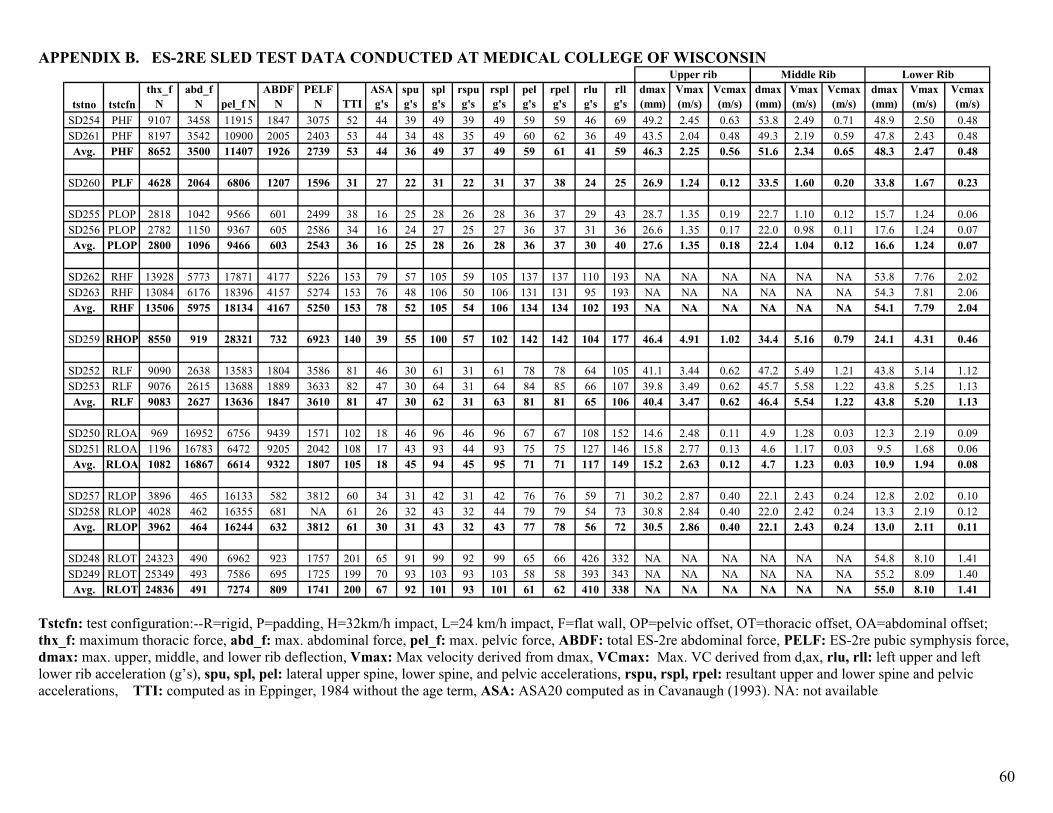
60
APPENDIX B. ES-2RE SLED TEST DATA CONDUCTED AT MEDICAL COLLEGE OF WISCONSIN Upper rib
tstno tstcfnthx_f
Nabd_f
N pel_f NABDF
NPELF
N TTIASA g's
spu g's
spl g's
rspu g's
rspl g's
pel g's
rpel g's
rlu g's
rll g's
dmax (mm)
Vmax (m/s)
Vcmax (m/s)
dmax (mm)
Vmax (m/s)
Vcmax (m/s)
dmax (mm)
Vmax (m/s)
Vcmax (m/s)
SD254 PHF 9107 3458 11915 1847 3075 52 44 39 49 39 49 59 59 46 69 49.2 2.45 0.63 53.8 2.49 0.71 48.9 2.50 0.48SD261 PHF 8197 3542 10900 2005 2403 53 44 34 48 35 49 60 62 36 49 43.5 2.04 0.48 49.3 2.19 0.59 47.8 2.43 0.48Avg. PHF 8652 3500 11407 1926 2739 53 44 36 49 37 49 59 61 41 59 46.3 2.25 0.56 51.6 2.34 0.65 48.3 2.47 0.48
SD260 PLF 4628 2064 6806 1207 1596 31 27 22 31 22 31 37 38 24 25 26.9 1.24 0.12 33.5 1.60 0.20 33.8 1.67 0.23
SD255 PLOP 2818 1042 9566 601 2499 38 16 25 28 26 28 36 37 29 43 28.7 1.35 0.19 22.7 1.10 0.12 15.7 1.24 0.06SD256 PLOP 2782 1150 9367 605 2586 34 16 24 27 25 27 36 37 31 36 26.6 1.35 0.17 22.0 0.98 0.11 17.6 1.24 0.07Avg. PLOP 2800 1096 9466 603 2543 36 16 25 28 26 28 36 37 30 40 27.6 1.35 0.18 22.4 1.04 0.12 16.6 1.24 0.07
SD262 RHF 13928 5773 17871 4177 5226 153 79 57 105 59 105 137 137 110 193 NA NA NA NA NA NA 53.8 7.76 2.02SD263 RHF 13084 6176 18396 4157 5274 153 76 48 106 50 106 131 131 95 193 NA NA NA NA NA NA 54.3 7.81 2.06Avg. RHF 13506 5975 18134 4167 5250 153 78 52 105 54 106 134 134 102 193 NA NA NA NA NA NA 54.1 7.79 2.04
SD259 RHOP 8550 919 28321 732 6923 140 39 55 100 57 102 142 142 104 177 46.4 4.91 1.02 34.4 5.16 0.79 24.1 4.31 0.46
SD252 RLF 9090 2638 13583 1804 3586 81 46 30 61 31 61 78 78 64 105 41.1 3.44 0.62 47.2 5.49 1.21 43.8 5.14 1.12SD253 RLF 9076 2615 13688 1889 3633 82 47 30 64 31 64 84 85 66 107 39.8 3.49 0.62 45.7 5.58 1.22 43.8 5.25 1.13Avg. RLF 9083 2627 13636 1847 3610 81 47 30 62 31 63 81 81 65 106 40.4 3.47 0.62 46.4 5.54 1.22 43.8 5.20 1.13
SD250 RLOA 969 16952 6756 9439 1571 102 18 46 96 46 96 67 67 108 152 14.6 2.48 0.11 4.9 1.28 0.03 12.3 2.19 0.09SD251 RLOA 1196 16783 6472 9205 2042 108 17 43 93 44 93 75 75 127 146 15.8 2.77 0.13 4.6 1.17 0.03 9.5 1.68 0.06Avg. RLOA 1082 16867 6614 9322 1807 105 18 45 94 45 95 71 71 117 149 15.2 2.63 0.12 4.7 1.23 0.03 10.9 1.94 0.08
SD257 RLOP 3896 465 16133 582 3812 60 34 31 42 31 42 76 76 59 71 30.2 2.87 0.40 22.1 2.43 0.24 12.8 2.02 0.10SD258 RLOP 4028 462 16355 681 NA 61 26 32 43 32 44 79 79 54 73 30.8 2.84 0.40 22.0 2.42 0.24 13.3 2.19 0.12Avg. RLOP 3962 464 16244 632 3812 61 30 31 43 32 43 77 78 56 72 30.5 2.86 0.40 22.1 2.43 0.24 13.0 2.11 0.11
SD248 RLOT 24323 490 6962 923 1757 201 65 91 99 92 99 65 66 426 332 NA NA NA NA NA NA 54.8 8.10 1.41SD249 RLOT 25349 493 7586 695 1725 199 70 93 103 93 103 58 58 393 343 NA NA NA NA NA NA 55.2 8.09 1.40Avg. RLOT 24836 491 7274 809 1741 200 67 92 101 93 101 61 62 410 338 NA NA NA NA NA NA 55.0 8.10 1.41
Middle Rib Lower Rib
Tstcfn: test configuration:--R=rigid, P=padding, H=32km/h impact, L=24 km/h impact, F=flat wall, OP=pelvic offset, OT=thoracic offset, OA=abdominal offset; thx_f: maximum thoracic force, abd_f: max. abdominal force, pel_f: max. pelvic force, ABDF: total ES-2re abdominal force, PELF: ES-2re pubic symphysis force, dmax: max. upper, middle, and lower rib deflection, Vmax: Max velocity derived from dmax, VCmax: Max. VC derived from d,ax, rlu, rll: left upper and left lower rib acceleration (g’s), spu, spl, pel: lateral upper spine, lower spine, and pelvic accelerations, rspu, rspl, rpel: resultant upper and lower spine and pelvic accelerations, TTI: computed as in Eppinger, 1984 without the age term, ASA: ASA20 computed as in Cavanaugh (1993). NA: not available
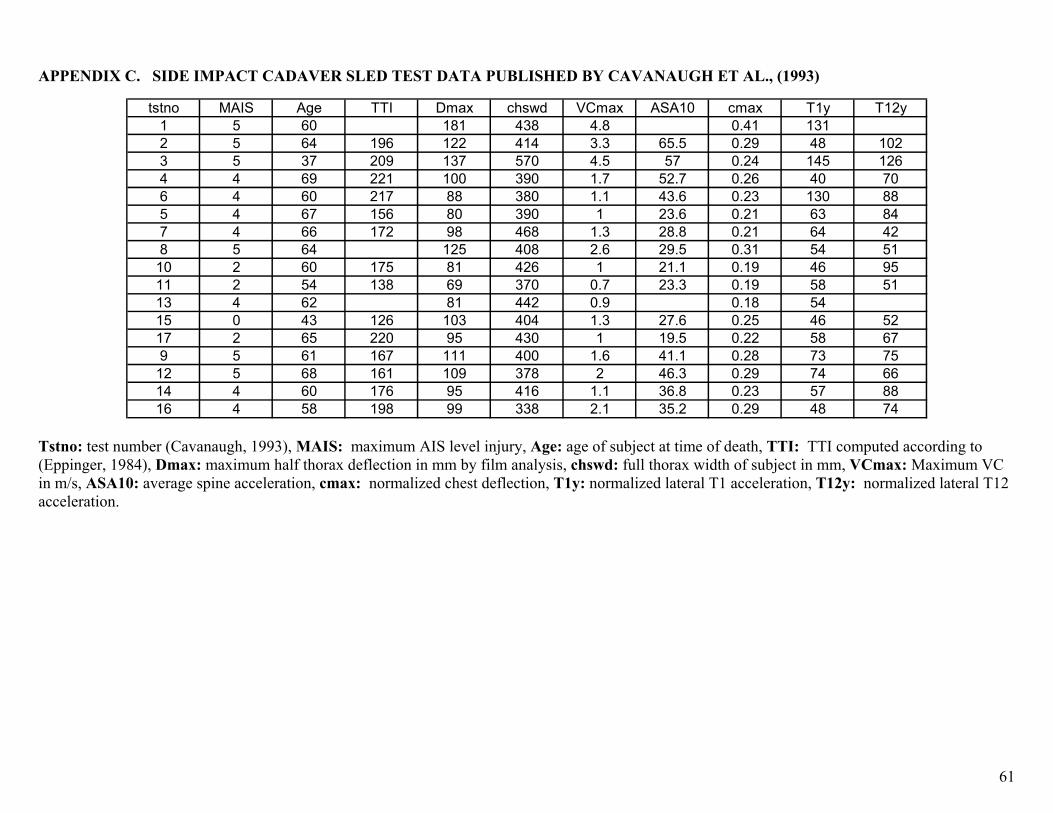
61
APPENDIX C. SIDE IMPACT CADAVER SLED TEST DATA PUBLISHED BY CAVANAUGH ET AL., (1993)
tstno MAIS Age TTI Dmax chswd VCmax ASA10 cmax T1y T12y1 5 60 181 438 4.8 0.41 1312 5 64 196 122 414 3.3 65.5 0.29 48 1023 5 37 209 137 570 4.5 57 0.24 145 1264 4 69 221 100 390 1.7 52.7 0.26 40 706 4 60 217 88 380 1.1 43.6 0.23 130 885 4 67 156 80 390 1 23.6 0.21 63 847 4 66 172 98 468 1.3 28.8 0.21 64 428 5 64 125 408 2.6 29.5 0.31 54 51
10 2 60 175 81 426 1 21.1 0.19 46 9511 2 54 138 69 370 0.7 23.3 0.19 58 5113 4 62 81 442 0.9 0.18 5415 0 43 126 103 404 1.3 27.6 0.25 46 5217 2 65 220 95 430 1 19.5 0.22 58 679 5 61 167 111 400 1.6 41.1 0.28 73 75
12 5 68 161 109 378 2 46.3 0.29 74 6614 4 60 176 95 416 1.1 36.8 0.23 57 8816 4 58 198 99 338 2.1 35.2 0.29 48 74
Tstno: test number (Cavanaugh, 1993), MAIS: maximum AIS level injury, Age: age of subject at time of death, TTI: TTI computed according to (Eppinger, 1984), Dmax: maximum half thorax deflection in mm by film analysis, chswd: full thorax width of subject in mm, VCmax: Maximum VC in m/s, ASA10: average spine acceleration, cmax: normalized chest deflection, T1y: normalized lateral T1 acceleration, T12y: normalized lateral T12 acceleration.
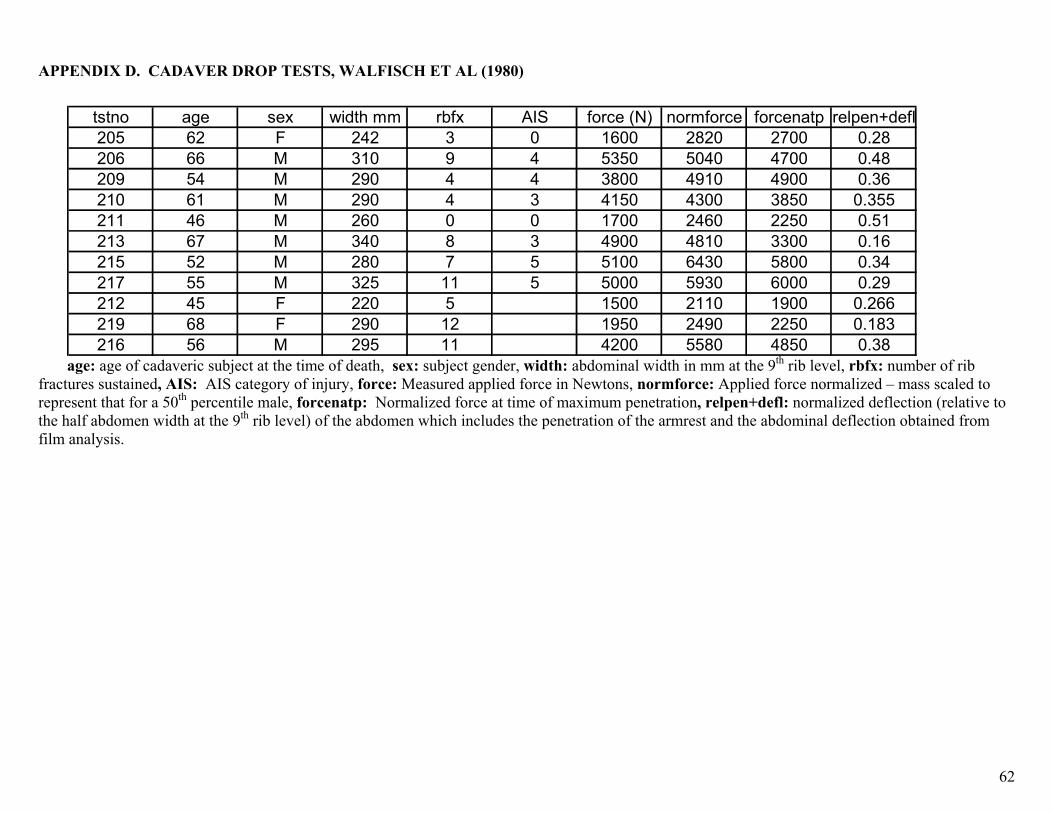
62
APPENDIX D. CADAVER DROP TESTS, WALFISCH ET AL (1980)
Ststno age sex width mm rbfx AI force (N) normforce forcenatp relpen+defl
205 62 F 242 3 0 1600 2820 2700 0.28206 66 M 310 9 4 5350 5040 4700 0.48209 54 M 290 4 4 3800 4910 4900 0.36210 61 M 290 4 3 4150 4300 3850 0.355211 46 M 260 0 0 1700 2460 2250 0.51213 67 M 340 8 3 4900 4810 3300 0.16215 52 M 280 7 5 5100 6430 5800 0.34217 55 M 325 11 5 5000 5930 6000 0.29212 45 F 220 5 1500 2110 1900 0.266219 68 F 290 12 1950 2490 2250 0.183216 56 M 295 11 4200 5580 4850 0.38
age: age of cadaveric subject at the time of death, sex: subject gender, width: abdominal width in mm at the 9th rib level, rbfx: number of rib fractures sustained, AIS: AIS category of injury, force: Measured applied force in Newtons, normforce: Applied force normalized – mass scaled to represent that for a 50th percentile male, forcenatp: Normalized force at time of maximum penetration, relpen+defl: normalized deflection (relative to the half abdomen width at the 9th rib level) of the abdomen which includes the penetration of the armrest and the abdominal deflection obtained from film analysis.
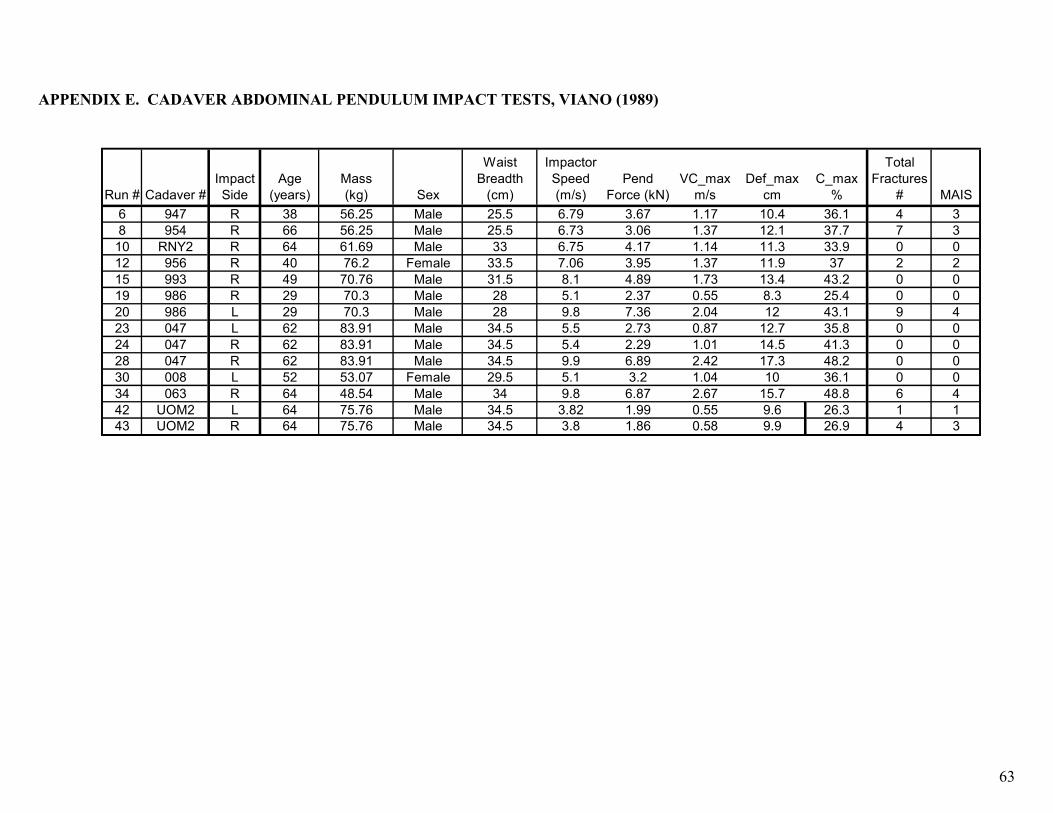
63
Run # Cadaver #Impact Side
Age (years)
Mass (kg) Sex
Waist Breadth
(cm)
Impactor Speed (m/s)
Pend Force (kN)
VC_max m/s
Def_max cm
C_max %
Total Fractures
# MAIS6 947 R 38 56.25 Male 25.5 6.79 3.67 1.17 10.4 36.1 4 38 954 R 66 56.25 Male 25.5 6.73 3.06 1.37 12.1 37.7 7 3
10 RNY2 R 64 61.69 Male 33 6.75 4.17 1.14 11.3 33.9 0 012 956 R 40 76.2 Female 33.5 7.06 3.95 1.37 11.9 37 2 215 993 R 49 70.76 Male 31.5 8.1 4.89 1.73 13.4 43.2 0 019 986 R 29 70.3 Male 28 5.1 2.37 0.55 8.3 25.4 0 020 986 L 29 70.3 Male 28 9.8 7.36 2.04 12 43.1 9 423 047 L 62 83.91 Male 34.5 5.5 2.73 0.87 12.7 35.8 0 024 047 R 62 83.91 Male 34.5 5.4 2.29 1.01 14.5 41.3 0 028 047 R 62 83.91 Male 34.5 9.9 6.89 2.42 17.3 48.2 0 030 008 L 52 53.07 Female 29.5 5.1 3.2 1.04 10 36.1 0 034 063 R 64 48.54 Male 34 9.8 6.87 2.67 15.7 48.8 6 442 UOM2 L 64 75.76 Male 34.5 3.82 1.99 0.55 9.6 26.3 1 143 UOM2 R 64 75.76 Male 34.5 3.8 1.86 0.58 9.9 26.9 4 3
APPENDIX E. CADAVER ABDOMINAL PENDULUM IMPACT TESTS, VIANO (1989)
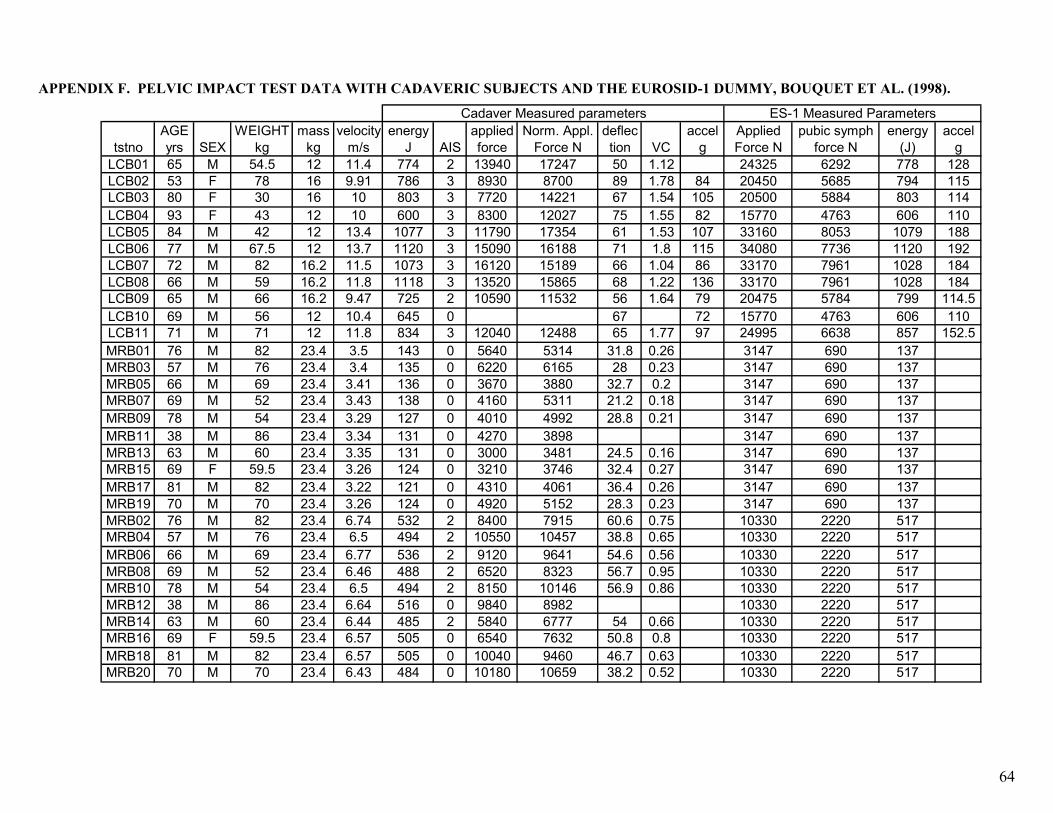
64
tstnoAGE yrs SEX
WEIGHT kg
mass kg
velocity m/s
energy J AIS
applied force
Norm. Appl. Force N
deflection VC
accel g
Applied Force N
pubic symph force N
energy (J)
accel g
LCB01 65 M 54.5 12 11.4 774 2 13940 17247 50 1.12 24325 6292 778 128LCB02 53 F 78 16 9.91 786 3 8930 8700 89 1.78 84 20450 5685 794 115LCB03 80 F 30 16 10 803 3 7720 14221 67 1.54 105 20500 5884 803 114LCB04 93 F 43 12 10 600 3 8300 12027 75 1.55 82 15770 4763 606 110LCB05 84 M 42 12 13.4 1077 3 11790 17354 61 1.53 107 33160 8053 1079 188LCB06 77 M 67.5 12 13.7 1120 3 15090 16188 71 1.8 115 34080 7736 1120 192LCB07 72 M 82 16.2 11.5 1073 3 16120 15189 66 1.04 86 33170 7961 1028 184LCB08 66 M 59 16.2 11.8 1118 3 13520 15865 68 1.22 136 33170 7961 1028 184LCB09 65 M 66 16.2 9.47 725 2 10590 11532 56 1.64 79 20475 5784 799 114.5LCB10 69 M 56 12 10.4 645 0 67 72 15770 4763 606 110LCB11 71 M 71 12 11.8 834 3 12040 12488 65 1.77 97 24995 6638 857 152.5MRB01 76 M 82 23.4 3.5 143 0 5640 5314 31.8 0.26 3147 690 137MRB03 57 M 76 23.4 3.4 135 0 6220 6165 28 0.23 3147 690 137MRB05 66 M 69 23.4 3.41 136 0 3670 3880 32.7 0.2 3147 690 137MRB07 69 M 52 23.4 3.43 138 0 4160 5311 21.2 0.18 3147 690 137MRB09 78 M 54 23.4 3.29 127 0 4010 4992 28.8 0.21 3147 690 137MRB11 38 M 86 23.4 3.34 131 0 4270 3898 3147 690 137MRB13 63 M 60 23.4 3.35 131 0 3000 3481 24.5 0.16 3147 690 137MRB15 69 F 59.5 23.4 3.26 124 0 3210 3746 32.4 0.27 3147 690 137MRB17 81 M 82 23.4 3.22 121 0 4310 4061 36.4 0.26 3147 690 137MRB19 70 M 70 23.4 3.26 124 0 4920 5152 28.3 0.23 3147 690 137MRB02 76 M 82 23.4 6.74 532 2 8400 7915 60.6 0.75 10330 2220 517MRB04 57 M 76 23.4 6.5 494 2 10550 10457 38.8 0.65 10330 2220 517MRB06 66 M 69 23.4 6.77 536 2 9120 9641 54.6 0.56 10330 2220 517MRB08 69 M 52 23.4 6.46 488 2 6520 8323 56.7 0.95 10330 2220 517MRB10 78 M 54 23.4 6.5 494 2 8150 10146 56.9 0.86 10330 2220 517MRB12 38 M 86 23.4 6.64 516 0 9840 8982 10330 2220 517MRB14 63 M 60 23.4 6.44 485 2 5840 6777 54 0.66 10330 2220 517MRB16 69 F 59.5 23.4 6.57 505 0 6540 7632 50.8 0.8 10330 2220 517MRB18 81 M 82 23.4 6.57 505 0 10040 9460 46.7 0.63 10330 2220 517MRB20 70 M 70 23.4 6.43 484 0 10180 10659 38.2 0.52 10330 2220 517
Cadaver Measured parameters ES-1 Measured Parameters
APPENDIX F. PELVIC IMPACT TEST DATA WITH CADAVERIC SUBJECTS AND THE EUROSID-1 DUMMY, BOUQUET ET AL. (1998).
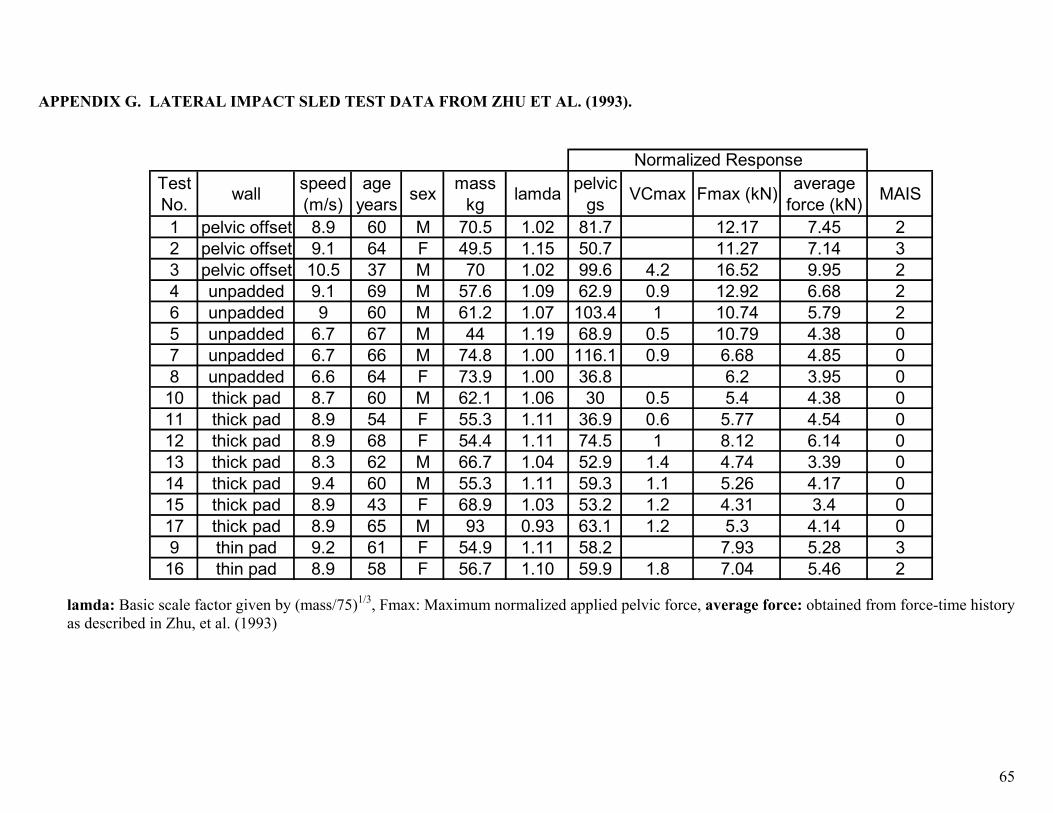
65
APPENDIX G. LATERAL IMPACT SLED TEST DATA FROM ZHU ET AL. (1993).
Test No. wall speed
(m/s)age
years sex mass kg lamda pelvic
gs VCmax Fmax (kN) average force (kN) MAIS
1 pelvic offset 8.9 60 M 70.5 1.02 81.7 12.17 7.45 22 pelvic offset 9.1 64 F 49.5 1.15 50.7 11.27 7.14 33 pelvic offset 10.5 37 M 70 1.02 99.6 4.2 16.52 9.95 24 unpadded 9.1 69 M 57.6 1.09 62.9 0.9 12.92 6.68 26 unpadded 9 60 M 61.2 1.07 103.4 1 10.74 5.79 25 unpadded 6.7 67 M 44 1.19 68.9 0.5 10.79 4.38 07 unpadded 6.7 66 M 74.8 1.00 116.1 0.9 6.68 4.85 08 unpadded 6.6 64 F 73.9 1.00 36.8 6.2 3.95 0
10 thick pad 8.7 60 M 62.1 1.06 30 0.5 5.4 4.38 011 thick pad 8.9 54 F 55.3 1.11 36.9 0.6 5.77 4.54 012 thick pad 8.9 68 F 54.4 1.11 74.5 1 8.12 6.14 013 thick pad 8.3 62 M 66.7 1.04 52.9 1.4 4.74 3.39 014 thick pad 9.4 60 M 55.3 1.11 59.3 1.1 5.26 4.17 015 thick pad 8.9 43 F 68.9 1.03 53.2 1.2 4.31 3.4 017 thick pad 8.9 65 M 93 0.93 63.1 1.2 5.3 4.14 09 thin pad 9.2 61 F 54.9 1.11 58.2 7.93 5.28 3
16 thin pad 8.9 58 F 56.7 1.10 59.9 1.8 7.04 5.46 2
Normalized Response
lamda: Basic scale factor given by (mass/75)1/3, Fmax: Maximum normalized applied pelvic force, average force: obtained from force-time history as described in Zhu, et al. (1993)
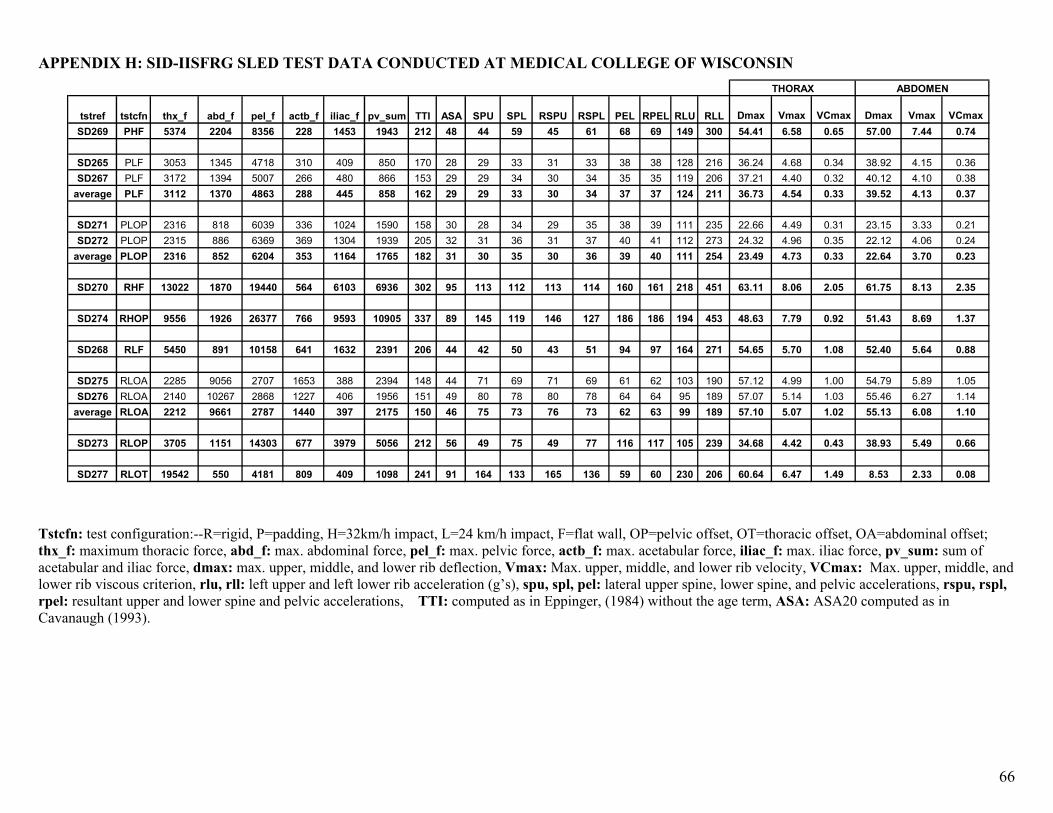
66
APPENDIX H: SID-IISFRG SLED TEST DATA CONDUCTED AT MEDICAL COLLEGE OF WISCONSIN
tstref tstcfn thx_f abd_f pel_f actb_f iliac_f pv_sum TTI ASA SPU SPL RSPU RSPL PEL RPEL RLU RLL Dmax Vmax VCmax Dmax Vmax VCmaxSD269 PHF 5374 2204 8356 228 1453 1943 212 48 44 59 45 61 68 69 149 300 54.41 6.58 0.65 57.00 7.44 0.74
SD265 PLF 3053 1345 4718 310 409 850 170 28 29 33 31 33 38 38 128 216 36.24 4.68 0.34 38.92 4.15 0.36SD267 PLF 3172 1394 5007 266 480 866 153 29 29 34 30 34 35 35 119 206 37.21 4.40 0.32 40.12 4.10 0.38
average PLF 3112 1370 4863 288 445 858 162 29 29 33 30 34 37 37 124 211 36.73 4.54 0.33 39.52 4.13 0.37
SD271 PLOP 2316 818 6039 336 1024 1590 158 30 28 34 29 35 38 39 111 235 22.66 4.49 0.31 23.15 3.33 0.21SD272 PLOP 2315 886 6369 369 1304 1939 205 32 31 36 31 37 40 41 112 273 24.32 4.96 0.35 22.12 4.06 0.24
average PLOP 2316 852 6204 353 1164 1765 182 31 30 35 30 36 39 40 111 254 23.49 4.73 0.33 22.64 3.70 0.23
SD270 RHF 13022 1870 19440 564 6103 6936 302 95 113 112 113 114 160 161 218 451 63.11 8.06 2.05 61.75 8.13 2.35
SD274 RHOP 9556 1926 26377 766 9593 10905 337 89 145 119 146 127 186 186 194 453 48.63 7.79 0.92 51.43 8.69 1.37
SD268 RLF 5450 891 10158 641 1632 2391 206 44 42 50 43 51 94 97 164 271 54.65 5.70 1.08 52.40 5.64 0.88
SD275 RLOA 2285 9056 2707 1653 388 2394 148 44 71 69 71 69 61 62 103 190 57.12 4.99 1.00 54.79 5.89 1.05SD276 RLOA 2140 10267 2868 1227 406 1956 151 49 80 78 80 78 64 64 95 189 57.07 5.14 1.03 55.46 6.27 1.14
average RLOA 2212 9661 2787 1440 397 2175 150 46 75 73 76 73 62 63 99 189 57.10 5.07 1.02 55.13 6.08 1.10
SD273 RLOP 3705 1151 14303 677 3979 5056 212 56 49 75 49 77 116 117 105 239 34.68 4.42 0.43 38.93 5.49 0.66
SD277 RLOT 19542 550 4181 809 409 1098 241 91 164 133 165 136 59 60 230 206 60.64 6.47 1.49 8.53 2.33 0.08
THORAX ABDOMEN
Tstcfn: test configuration:--R=rigid, P=padding, H=32km/h impact, L=24 km/h impact, F=flat wall, OP=pelvic offset, OT=thoracic offset, OA=abdominal offset; thx_f: maximum thoracic force, abd_f: max. abdominal force, pel_f: max. pelvic force, actb_f: max. acetabular force, iliac_f: max. iliac force, pv_sum: sum of acetabular and iliac force, dmax: max. upper, middle, and lower rib deflection, Vmax: Max. upper, middle, and lower rib velocity, VCmax: Max. upper, middle, and lower rib viscous criterion, rlu, rll: left upper and left lower rib acceleration (g’s), spu, spl, pel: lateral upper spine, lower spine, and pelvic accelerations, rspu, rspl, rpel: resultant upper and lower spine and pelvic accelerations, TTI: computed as in Eppinger, (1984) without the age term, ASA: ASA20 computed as in Cavanaugh (1993).
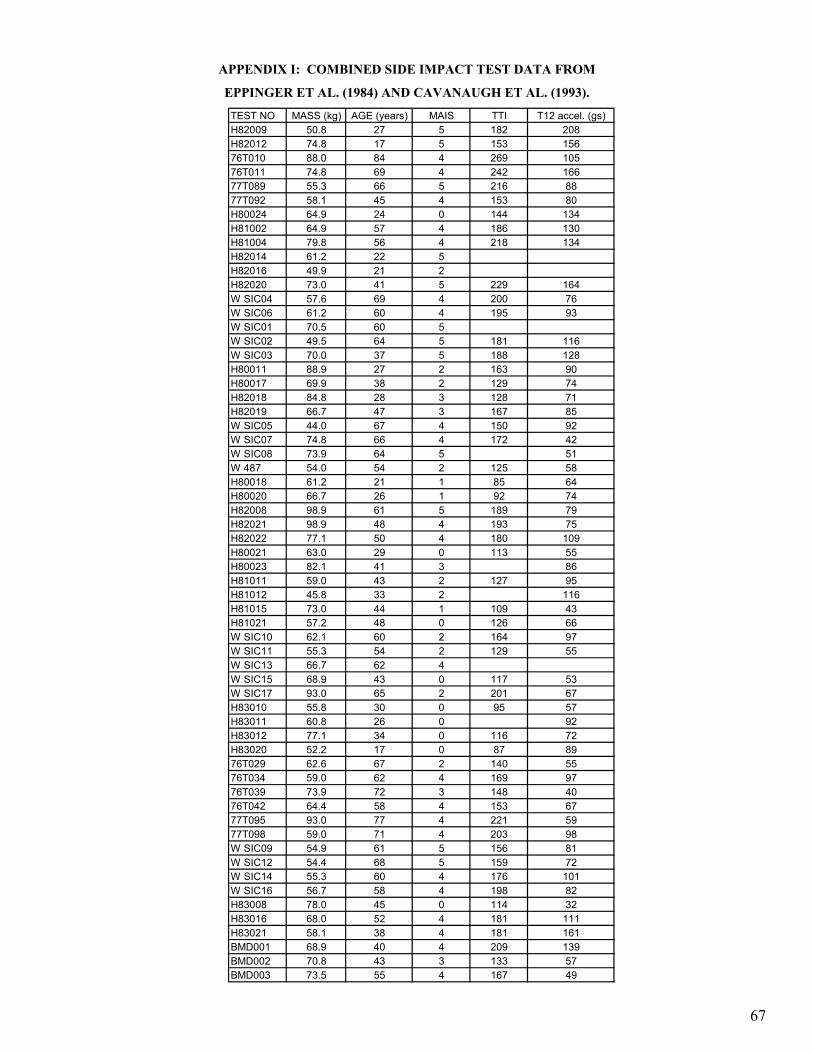
APPENDIX I: COMBINED SIDE IMPACT TEST DATA FROM
EPPINGER ET AL. (1984) AND CAVANAUGH ET AL. (1993).
TEST NO MASS (kg) AGE (years) MAIS TTI T12 accel. (gs)H82009 50.8 27 5 182 208H82012 74.8 17 5 153 15676T010 88.0 84 4 269 10576T011 74.8 69 4 242 16677T089 55.3 66 5 216 8877T092 58.1 45 4 153 80H80024 64.9 24 0 144 134H81002 64.9 57 4 186 130H81004 79.8 56 4 218 134H82014 61.2 22 5H82016 49.9 21 2H82020 73.0 41 5 229 164W SIC04 57.6 69 4 200 76W SIC06 61.2 60 4 195 93W SIC01 70.5 60 5W SIC02 49.5 64 5 181 116W SIC03 70.0 37 5 188 128H80011 88.9 27 2 163 90H80017 69.9 38 2 129 74H82018 84.8 28 3 128 71H82019 66.7 47 3 167 85W SIC05 44.0 67 4 150 92W SIC07 74.8 66 4 172 42W SIC08 73.9 64 5 51W 487 54.0 54 2 125 58H80018 61.2 21 1 85 64H80020 66.7 26 1 92 74H82008 98.9 61 5 189 79H82021 98.9 48 4 193 75H82022 77.1 50 4 180 109H80021 63.0 29 0 113 55H80023 82.1 41 3 86H81011 59.0 43 2 127 95H81012 45.8 33 2 116H81015 73.0 44 1 109 43H81021 57.2 48 0 126 66W SIC10 62.1 60 2 164 97W SIC11 55.3 54 2 129 55W SIC13 66.7 62 4W SIC15 68.9 43 0 117 53W SIC17 93.0 65 2 201 67H83010 55.8 30 0 95 57H83011 60.8 26 0 92H83012 77.1 34 0 116 72H83020 52.2 17 0 87 8976T029 62.6 67 2 140 5576T034 59.0 62 4 169 9776T039 73.9 72 3 148 4076T042 64.4 58 4 153 6777T095 93.0 77 4 221 5977T098 59.0 71 4 203 98W SIC09 54.9 61 5 156 81W SIC12 54.4 68 5 159 72W SIC14 55.3 60 4 176 101W SIC16 56.7 58 4 198 82H83008 78.0 45 0 114 32H83016 68.0 52 4 181 111H83021 58.1 38 4 181 161BMD001 68.9 40 4 209 139BMD002 70.8 43 3 133 57BMD003 73.5 55 4 167 49
67


