Embed Size (px)
Citation preview

doi:10.1182/blood-2008-05-157842Prepublished online October 31, 2008;
J. C. Broekhuis, William E. Evans, Rob Pieters and Monique L. Den BoerEsther Hulleman, Karin M. Kazemier, Amy Holleman, David J. VanderWeele, Charles M. Rudin, Mathilde lymphoblastic leukemia cellsInhibition of glycolysis modulates prednisolone resistance in acute
(1414 articles)Lymphoid Neoplasia �Articles on similar topics can be found in the following Blood collections
http://bloodjournal.hematologylibrary.org/site/misc/rights.xhtml#repub_requestsInformation about reproducing this article in parts or in its entirety may be found online at:
http://bloodjournal.hematologylibrary.org/site/misc/rights.xhtml#reprintsInformation about ordering reprints may be found online at:
http://bloodjournal.hematologylibrary.org/site/subscriptions/index.xhtmlInformation about subscriptions and ASH membership may be found online at:
digital object identifier (DOIs) and date of initial publication. theindexed by PubMed from initial publication. Citations to Advance online articles must include
final publication). Advance online articles are citable and establish publication priority; they areappeared in the paper journal (edited, typeset versions may be posted when available prior to Advance online articles have been peer reviewed and accepted for publication but have not yet
Copyright 2011 by The American Society of Hematology; all rights reserved.20036.the American Society of Hematology, 2021 L St, NW, Suite 900, Washington DC Blood (print ISSN 0006-4971, online ISSN 1528-0020), is published weekly by
For personal use only. by guest on June 6, 2013. bloodjournal.hematologylibrary.orgFrom
1
Inhibition of glycolysis modulates prednisolone
resistance in acute lymphoblastic leukemia cells
Short title: Reversal of prednisolone resistance in ALL
Esther Hulleman1, Karin M. Kazemier1, Amy Holleman1, David J.
VanderWeele2, Charles M. Rudin2, Mathilde J. C. Broekhuis1, William E. Evans3,
Rob Pieters1 and Monique L. Den Boer1, #
1 Erasmus MC - Sophia Children’s Hospital, University Medical Center, Dept. of Pediatric Oncology
and Hematology, Rotterdam, The Netherlands.
2 Sidney Kimmel Comprehensive Cancer Center, Johns Hopkins University, Dept. of Oncology,
Baltimore, USA.
3 St. Jude Children’s Research Hospital, Dept. of Pharmaceutical Sciences, Memphis, USA.
# Correspondence: M. L. den Boer ErasmusMC, Sophia Children’s Hospital Dept. of Pediatric Oncology and Hematology Dr Molewaterplein 60 3015 GJ Rotterdam The Netherlands Ph: +31 10 7036691; F: +31 10 7044761 [email protected]
Blood First Edition Paper, prepublished online October 31, 2008; DOI 10.1182/blood-2008-05-157842
Copyright © 2008 American Society of Hematology
For personal use only. by guest on June 6, 2013. bloodjournal.hematologylibrary.orgFrom

2
ABSTRACT
Treatment failure in pediatric acute lymphoblastic leukemia (ALL) is
related to cellular resistance to glucocorticoids (e.g. prednisolone). Recently, we
demonstrated that genes associated with glucose metabolism are differentially
expressed between prednisolone-sensitive and –resistant precursor B-lineage
leukemic patients. Here, we show that prednisolone resistance is associated with
an increased glucose consumption and that inhibition of glycolysis sensitizes
prednisolone-resistant ALL cell lines to glucocorticoids. Treatment of
prednisolone-resistant Jurkat and Molt4 cells with 2-deoxy-D-glucose (2-DG),
lonidamine (LND) or 3-bromopyruvate (3-BrPA) increased the in vitro sensitivity
to glucocorticoids, while treatment of the prednisolone-sensitive cell lines Tom-1
and RS4;11 did not influence drug cytotoxicity. This sensitizing effect of the
glycolysis inhibitors in glucocorticoid resistant ALL cells was not found for other
classes of antileukemic drugs (i.e., vincristine and daunorubicin). Moreover,
downregulation of the expression of GAPDH by RNA interference also sensitized
to prednisolone, comparable to treatment with glycolytic inhibitors. Importantly,
the ability of 2-DG to reverse glucocorticoid resistance was not limited to cell
lines, but was also observed in isolated primary ALL cells from patients.
Together, these findings indicate the importance of the glycolytic pathway in
glucocorticoid resistance in ALL, and suggest that targeting glycolysis is a viable
strategy for modulating prednisolone resistance in ALL.
For personal use only. by guest on June 6, 2013. bloodjournal.hematologylibrary.orgFrom
3
INTRODUCTION
Treatment of childhood acute lymphoblastic leukemia (ALL) includes the use of
several classes of chemotherapeutic agents, including glucocorticoids (GCs), Vinca
alkaloids and anthracyclines. The glucocorticoids prednisolone and dexamethasone
play an essential role in essentially all therapy protocols, due to their ability to block
cell cycle progression and induce apoptosis in ALL cells1-3. Although treatment of
childhood ALL has greatly improved over the past decades, conventional combination
chemotherapy still fails in approximately 20% of the patients4. Most therapeutic
failures can be explained by cellular resistance to antileukemic drugs5. Resistance to
prednisolone at initial diagnosis in particular is related to an unfavourable event free
survival. In addition, in vitro prednisolone resistance is recognized as an important
negative parameter for long-term clinical outcome, even in patients who initially have
a good in vivo response to glucocorticoids6-8. Therefore, it is important to find
alternative therapies that can reverse resistance towards prednisolone and
dexamethasone.
Previous experiments performed in our laboratories showed that prednisolone
resistance in precursor B-ALL patients is associated with an increased expression of
genes involved in glucose metabolism, suggesting that glucocorticoid resistance may
be linked with an increased rate of glycolysis9. Glycolysis is a series of metabolic
reactions by which one molecule of glucose is converted to two molecules of pyruvate
with a net gain of energy in the form of two molecules of ATP10. Each reaction in the
glycolytic pathway is catalyzed by a specific enzyme, such as hexokinase (HK),
phosphofructokinase (PFK), glyceraldehyde-3-phosphate dehydrogenase (GAPDH)
and enolase. Under aerobic conditions, pyruvate can be further oxidized in the
mitochondria to CO2 and H2O through oxidative phosphorylation, yielding 36 ATP
For personal use only. by guest on June 6, 2013. bloodjournal.hematologylibrary.orgFrom
4
molecules per molecule glucose; in the absence of oxygen, glycolysis prevails. Cancer
cells also shift their metabolism from oxidative phosphorylation towards the less
efficient glycolysis, independent of the presence of oxygen11. Here we show that an
increased glycolytic rate in ALL cells is directly related to glucocorticoid resistance
and that inhibition of glycolysis, either by the use of synthetic compounds or by use of
RNA interference, renders otherwise resistant leukemic cells susceptible to
prednisolone. Importantly, reversal of prednisolone resistance was not limited to
established cell lines, but was also observed in primary leukemic cells of pediatric
ALL patients. These data suggest that targeting the glycolytic pathway may be a
valuable strategy to modulate glucocorticoid resistance in the treatment of pediatric
ALL.
For personal use only. by guest on June 6, 2013. bloodjournal.hematologylibrary.orgFrom

5
MATERIALS AND METHODS
Cell culture and lentiviral infections
Human 293T cells and Jurkat, Molt4, Tom-1, RS4;11 leukemia cell lines were
cultured at 37°C in a 5% humidified atmosphere in DMEM (293T) or RPMI 1640
plus 10% fetal calf serum, 100IU/ml penicillin, 100μg/ml streptomycin and
0.125μg/ml fungizone (PSF; Gibco BRL). Pools of early passage Jurkat shGAPDH
cells were generated by infection with lentiviral pLKO.1 Mission™ shRNA vectors
(Sigma-Aldrich) using Retronectin® (Takara Bio Inc.), according to the
manufacturer’s instructions, and selected in 1μg/ml puromycin.
Patient samples
Within 24 hours after sampling, mononuclear cells from bone marrow- or peripheral-
blood samples from untreated children at initial diagnosis of ALL were isolated by
density gradient centrifugation using Lymphoprep (density 1.077g/ml; Nycomed
Pharma, Oslo, Norway), centrifuged at 480g for 15 minutes at room temperature.
Isolated mononuclear cells were washed twice and resuspended in RPMI 1640
medium (Dutch modification without L-glutamine; Invitrogen Life Technologies),
5μg/ml insulin, 5μg/ml transferrin, 5ng/ml sodium selenite (ITS media supplement;
Sigma, St Louis, MO), 100IU/ml penicillin, 100μg/ml streptomycin, 0.125μg/ml
amphotericin B, 0.2mg/ml gentamicin and 20% fetal calf serum (Invitrogen Life
Technologies). Contaminating nonleukemic cells were removed using
immunomagnetic beads as described earlier12. Bone marrow and peripheral blood
samples were collected from children with newly diagnosed ALL as approved by the
institutional review board of Erasmus MC and after written informed consent was
obtained in accordance with the declaration of Helsinki.
For personal use only. by guest on June 6, 2013. bloodjournal.hematologylibrary.orgFrom
6
In vitro MTT drug resistance assay
Responsiveness of leukemia cells to prednisolone (PRED; Bufa Pharmaceutical
Products, The Netherlands), vincristine (VCR; TEVA Pharma, The Netherlands),
dexamethasone sodium phosphate (DEX; Brocacef, The Netherlands), L-asparaginase
(ASP; Paronal, Christiaens, The Netherlands), and daunorubicin (DNR; Cerubidine,
Rhône-Poulenc Rorer, The Netherlands) was determined by the 4-day in vitro MTT
drug resistance assay13. The drug concentration lethal to 50% of the ALL cells (LC50)
was used as a measure of cellular drug resistance. The final drug concentrations
ranged from 24–15000μg/ml prednisolone and 1.5-800μg/ml dexamethasone for the
prednisolone-resistant cell lines (Jurkat and Molt4) and from 0.008-250μg/ml
prednisolone and 10-5-10–2μg/ml dexamethasone for the prednisolone-sensitive cell
lines (Tom-1 and RS4;11) and patient cells. Different concentrations were used due to
differences in glucocorticoid resistance, but correspond with the induction of similar
amounts of cell death. For RS4;11 and Tom-1 cell lines the amount of prednisolone
used corresponds with the LC50 of in vitro good responding patients, while the
amount used for Jurkat and Molt4 corresponds with poor responders8. The
concentrations L-asparaginase, vincristine and daunorubicin were the same for all cell
lines (0.003-10IU/ml ASP, 0.0005-50μg/ml VCR and 0.002-2μg/ml DNR
respectively). Inhibition of glycolysis was established by addition of 0.25-2mM 2-
deoxy-D-glucose (2-DG), 62.5μM lonidamine (LND) or 30μM 3-bromopyruvate (3-
BrPA, Sigma-Aldrich). The metabolic MTT assay revealed similar results as a trypan
blue exclusion assay, which is based on cell counting (supplementary figure 1).
For personal use only. by guest on June 6, 2013. bloodjournal.hematologylibrary.orgFrom

7
Calculation of synergy
A possible synergistic effect was tested according to the criteria described by
Berenbaum14 [1977]. Briefly, a dose-response curve was constructed for each single
drug and for combinations of two drugs together. Equipotent drug concentrations
were then applied to the equation used by Berenbaum as follows: [Drug Ain combination
with B] / [Drug Aalone] + [Drug Bin combination with A] / [Drug Balone]. The value calculated
from this formula is referred to as the synergy factor (Fsyn) and a value less than 1
indicates synergy, Fsyn=1 indicates an additive effect, and Fsyn>1 an antagonistic effect
(negative synergy).
Glucose consumption assay
Glucose consumption was measured as the conversion of glucose to 6-
phosphogluconate and NADH with the Glucose (HK) Assay Kit, as described by the
manufacturer (Sigma-Aldrich). Briefly, 106 leukemic cells were grown in RPMI
containing 2g/l glucose. After 4 days, the medium was collected by centrifugation to
remove the cells, and incubated for 2 hours with glucose assay buffer, containing
1.5mM NAD, 1mM ATP, 1U/ml hexokinase and 1U/ml glucose-6-phosphate
dehydrogenase. During this time, glucose is phosphorylated to glucose-6-phosphate.
Glucose-6-phosphate is then oxidized to 6-phospho-gluconate in the presence of
oxidized nicotinamide adenine dinucleotide (NAD), reducing NAD to an equimolar
amount of NADH. The conversion of NAD to NADH can be measured by the
increase in absorbance at 340nm, directly proportional to the glucose concentration.
For personal use only. by guest on June 6, 2013. bloodjournal.hematologylibrary.orgFrom
8
RNA extraction and quantitative Real-Time PCR
Total RNA was extracted from a minimum of 5x10⁶ leukemic cells using TRIzol
reagent (Invitrogen Life Technologies) or the Qiagen RNeasy kit (Qiagen) according
to the manufacturer’s instructions with minor modifications. Quantification of RNA
was performed using a spectrophotometer and cDNA was synthesized using
Superscript II, 1µg of total mRNA template and random hexamers as primers (Gibco
BRL/Life Technologies). Quantitative RT-PCR analysis was performed on the
Perkin-Elmer/Applied Biosystems Prism 7700 Sequence Detection System (Foster
City, CA, USA) by monitoring the increase of fluorescence by degradation of a
Taqman® probe from double-stranded DNA. PCR primers were designed with Oligo
6.22 software (Molecular Biology Insights) and spanned exon junctions to prevent the
amplification of any possible contaminating genomic DNA. Ribosomal protein S20
(RPS20) was used as a control gene for normalization. Primer sequences are available
upon request.
For personal use only. by guest on June 6, 2013. bloodjournal.hematologylibrary.orgFrom
9
RESULTS
Several genes involved in glucose metabolism were previously identified in our lab as
being differentially expressed in pediatric precursor B-ALL in relation to
glucocorticoid resistance9. Microarray gene expression profiling experiments showed
that expression levels of hypoxia-inducible factor-1 alpha (HIF-1α), glucose
transporter 3 (GLUT3/SLC2A3), carbonic anhydrase 4 (CA4) and glyceraldehyde-3-
phosphate dehydrogenase (GAPDH) were significantly higher (p≤0.00075) in
prednisolone-resistant precursor B-ALL cells compared to prednisolone-sensitive
ALL cells. To further investigate whether the glycolysis pathway is associated with
glucocorticoid resistance in ALL, several experiments were carried out.
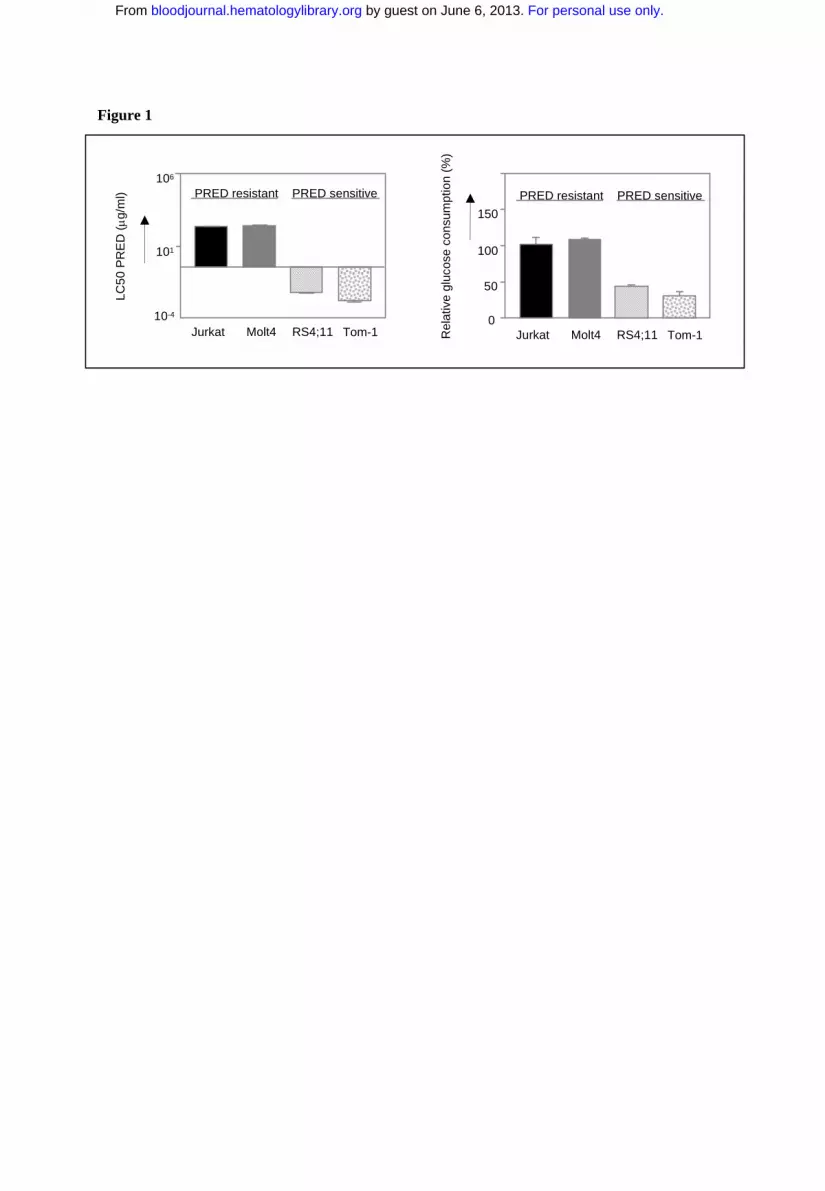
First, the glucose uptake of various prednisolone-resistant and -sensitive
leukemic cell lines was determined. As shown in Figure 1, the prednisolone-resistant
cell lines Jurkat and Molt4 (LC50 ≥ 250 µg/ml) show high glucose consumption
compared to the prednisolone-sensitive cell lines Tom-1 and RS4;11, concordant with
the microarray data.
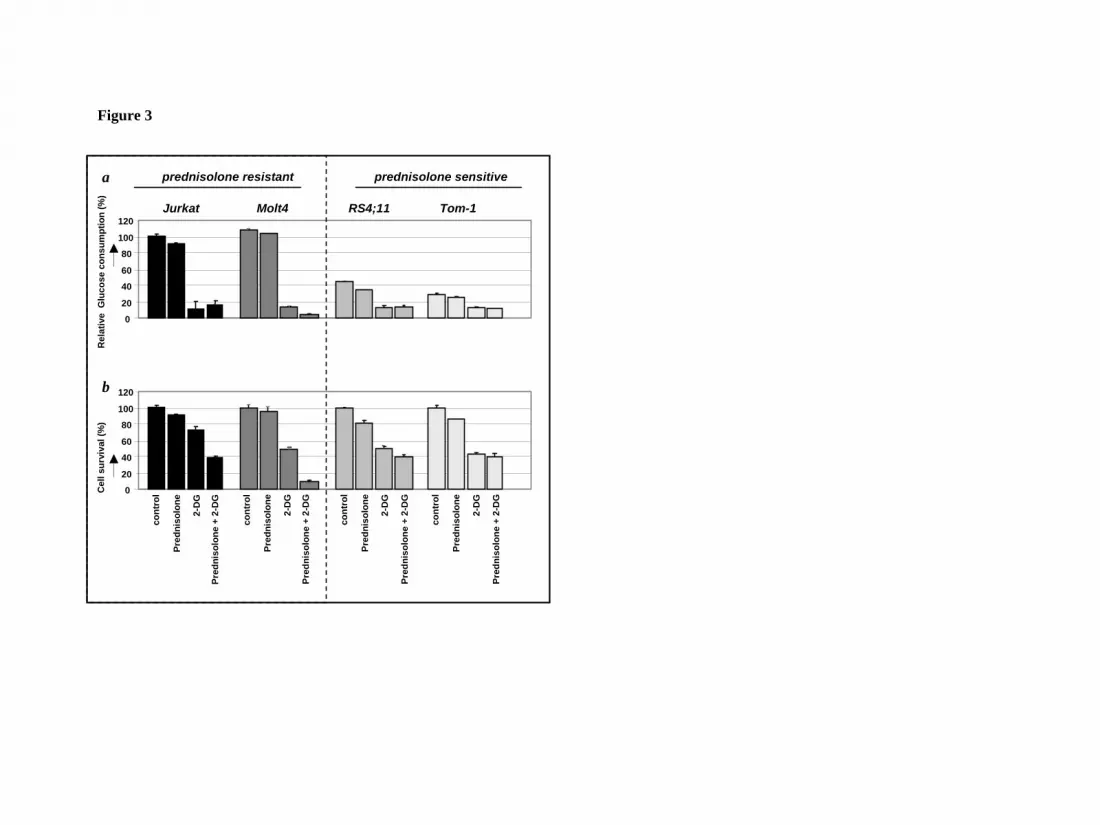
Next, we investigated the response of these leukemic cell lines to prednisolone
while inhibiting the glycolysis pathway. Cells were incubated with the glucose analog
2-deoxy-D-glucose (2-DG), which competes with glucose for transmembrane
transport and is phosphorylated by hexokinase to 2-deoxyglucose-6-phosphate. After
phosphorylation, 2-DG cannot be metabolized further, leading to a proximal blockade
of glycolysis15 (Fig. 2). Treatment of the cell lines Jurkat, Molt4, RS4;11 and Tom-1
with sublethal concentrations of 2-DG, either alone or in combination with
prednisolone, resulted in a considerable reduction of glucose uptake compared to non-
treated cells (Fig. 3a). This decrease in glucose consumption was not seen when cells
were incubated with prednisolone alone. Interestingly, the combination of 2-DG and
For personal use only. by guest on June 6, 2013. bloodjournal.hematologylibrary.orgFrom
10
prednisolone resulted in markedly increased cell death in the prednisolone-resistant
cell lines Jurkat and Molt4, compared to treatment with 2-DG or prednisolone as
single drugs (Fig. 3b). This synergistic effect (Fsyn = 0.61 ± 0.05 and 0.39 ± 0.25 for
Jurkat and Molt4 respectively) on cell death was not observed in the prednisolone-
sensitive cell lines RS4;11 and Tom-1 (Fsyn = 0.98 ± 0.03 and 1.05 ± 0.04).
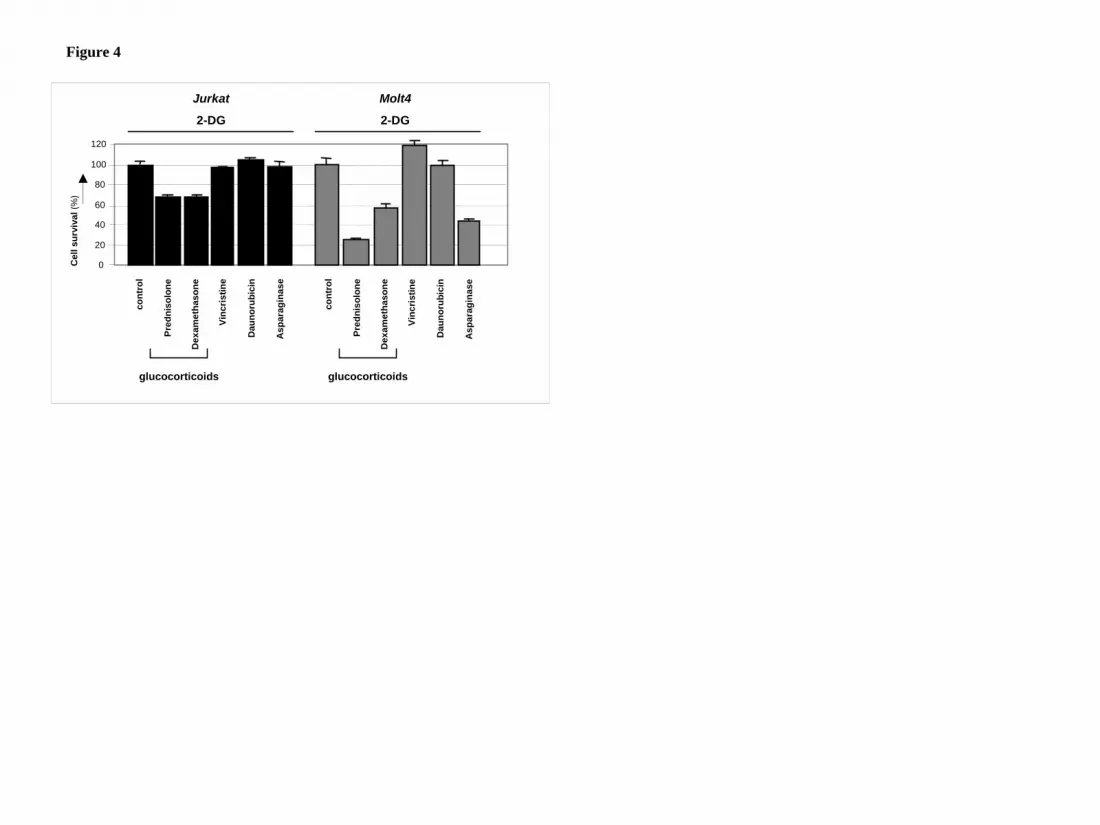
2-DG acts in synergy with glucocorticoids but not with vincristine or daunorubicin
2-DG has recently been reported to cooperate with non-glucocorticoid drugs in
inducing cell death of several types of carcinoma cells16-18. To test if the observed
synergism of 2-DG with prednisolone in leukemic cells was specific for
glucocorticoids, 2-DG was co-incubated with sublethal concentrations of the
prednisolone-analogue dexamethasone or with other cytostatics that are frequently
used in the treatment of leukemia, i.e. vincristine, daunorubicin and asparaginase. As
shown in figure 4, the antimitotic agent vincristine or the topoisomerase II inhibitor
daunorubicin did not synergize with 2-DG in the leukemic cell lines Jurkat and Molt4;
no difference was observed in the amount of cell death between a combination of 2-
DG and these agents or treatment with 2-DG alone. Addition of L-asparaginase in
combination with 2-DG on the other hand, increased cytotoxicity in Molt4 cells (Fsyn
= 0.67 ± 0.07), but this synergism was not observed in Jurkat cells. Incubation of 2-
DG in combination with the glucocorticoids prednisolone or dexamethasone,
however, markedly affected cell survival in both cell lines tested, indicating that 2-DG
consistently alters glucocorticoid resistance in these cell lines.
For personal use only. by guest on June 6, 2013. bloodjournal.hematologylibrary.orgFrom
11
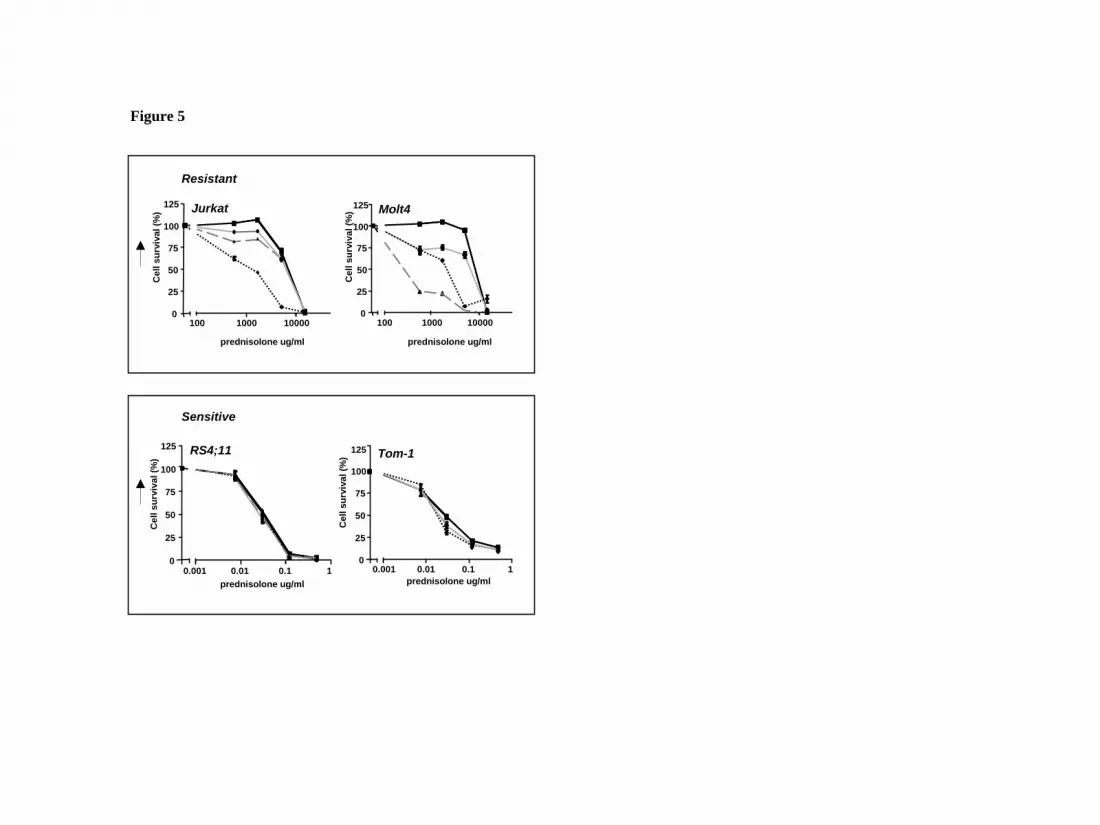
Inhibition of the glycolytic pathway increases prednisolone-induced toxicity
Although the use of 2-DG as an inhibitor of glycolysis is widely recognized, 2-DG
can modulate other cellular processes as well, such as protein glycosylation or the so-
called unfolded protein response (UPR) in the endoplasmic reticulum19. Therefore,
two other compounds that inhibit glucose metabolism were tested for their effect on
prednisolone sensitivity in leukemic cell lines. Addition of 30µM 3-bromopyruvate
(3-BrPA)20 or 62.5µM lonidamine (LND)21, that affect both glycolysis and oxidative
phosphorylation (Fig. 2) also modulated prednisolone resistance in Jurkat and Molt4
cells, but did not affect prednisolone sensitivity in RS4;11 and Tom-1, analogous to
the results of 2-DG treatment (Fig. 5).
To further demonstrate that the glycolytic pathway is associated with
prednisolone resistance in ALL cells, Jurkat cells were infected with lentiviral short
hairpin RNA (shRNA) plasmids to stably silence GAPDH gene expression22. The
efficiency of RNA interference was monitored at the RNA level by real time Q-PCR,
because GAPDH is a very abundant protein and differences in expression are difficult
to detect on Western blot. As shown in Figure 6a, RNA interference with two
different shRNA sequences targeting GAPDH resulted in a reduction in gene
expression of ~60%, and increased prednisolone-sensitivity, confirming the link
between glycolysis and glucocorticoid-resistance (Fig.6b). RNA interference for
another gene that was differentially regulated in the microarray experiments, HIF-1α,
did not affect prednisolone sensitivity in Jurkat cells (Fig.6c/d), suggesting that the
upregulation of HIF-1α is not causally related to glucocorticoid resistance in ALL.
For personal use only. by guest on June 6, 2013. bloodjournal.hematologylibrary.orgFrom

12
2-DG increases prednisolone-induced toxicity in ALL patient cells
The results described above clearly show that inhibition of glycolytic metabolism
increases prednisolone sensitivity in ALL cell lines. To further evaluate the
importance of this finding for treatment of ALL patients, in vitro studies were
performed on primary leukemia cells isolated from bone marrow of patients with
newly diagnosed ALL, utilizing the MTT assay. The effect of 2-DG on prednisolone-
induced toxicity was tested on leukemic cells of ALL patient samples that were
identified as prednisolone-resistant (LC50≥150, n=4), as intermediately resistant (LC50
= 0.1-150, n=4) or sensitive to prednisolone (LC50≤0.1, n=4). In concordance with the
cell line results, a synergistic effect was observed between 2-DG and prednisolone in
ALL cells from resistant patients (Fsyn<0.5) and in some of the intermediately resistant
cells, but not in patients whose ALL cells were sensitive to prednisolone (Fig. 7).
For personal use only. by guest on June 6, 2013. bloodjournal.hematologylibrary.orgFrom
13
DISCUSSION
Resistance to glucocorticoids is a well-recognized poor prognostic feature in the
treatment of childhood ALL. Considering the poor prognosis of glucocorticoid
resistance and the importance of prednisolone and dexamethasone in contemporary
ALL treatment protocols, the development of strategies to reverse resistance to these
agents could have a profound impact on ALL treatment efficacy. Several potential
mechanisms for prednisolone resistance have been studied in leukemic cell lines and
ALL patients, but most of them did not reveal clues for causes of resistance. Although
the P-glycolprotein pump (P-gp) plays a role in glucocorticoid transport, we have
shown previously that the efflux of glucocorticoids by P-gp is not a significant
contributor to glucocorticoid resistance in leukemic blasts23. Also, the expression of
the glucocorticoid receptor (GR) is not related to glucocorticoid resistance in
childhood ALL and mutations in the GR are rare24, 25. Furthermore, reduced affinity of
GR for its ligand, defective translocation of GR across the nuclear membrane and
binding of the GR to the glucocorticoid responsive element are also not thought to be
of major importance in glucocorticoid resiststance in leukemia [reviewed by 1, 26].
Here we show that leukemic cells that are in vitro resistant to glucocorticoid treatment
have increased glucose consumption compared to sensitive cells, and that
downregulation of glycolysis can attenuate glucocorticoid resistance in pediatric ALL.
It has been shown before that cancer cells, including leukemic cells, shift their
energy production from oxidative phosphorylation towards the less efficient
glycolysis pathway and catabolize glucose at a higher rate than their non-transformed
counterparts – the so-called Warburg effect27, 28. This increased glycolysis rate is due
to an upregulation of several genes involved in glycolysis or glucose uptake28, 29. We
observed a similarly higher expression of glycolysis-related genes in glucocorticoid-
For personal use only. by guest on June 6, 2013. bloodjournal.hematologylibrary.orgFrom
14
resistant ALL cells in our previous analysis of gene expression in primary ALL cells9.
This upregulation in gene expression is generally believed to be due to activation of
the transcription factors c-MYC30 or hypoxia-inducible factor (HIF-1α)31-32. HIF-1α
has been shown to stimulate glucose consumption when cells are deprived of oxygen
(hypoxia) and to directly regulate the expression of genes involved in glycolysis,
including glycolytic enzymes33-35 and membrane glucose transporters36. However,
HIF activity can also be stabilized in the presence of oxygen, by growth factors and
signal transduction routes that also participate in carcinogenesis, including the Ras
pathway37. Interestingly, HIF-1 dependent transactivation can be stimulated by
glucocorticoids via the glucocorticoid receptor38, providing a direct link between
glycolysis and glucocorticoids. Since HIF-1α was one of the genes with an increased
expression in prednisolone-resistant ALL cells in our microarray data, it was tempting
to suggest a role for HIF-1α in the upregulation of glycolysis genes observed in our
experiments. However, inhibition of HIF-1α by RNA interference showed no
alteration in the sensitivity for prednisolone in Jurkat or Molt4 cell lines in vitro. This
indicates that prednisolone resistance in pediatric precursor B-ALL patients is not due
to upregulation of HIF-1α at the transcriptional level.
Another key factor that is thought to be involved in the regulation of
glycolysis is the serine/threonine kinase PKB/Akt39. Akt has been implicated in the
regulation of glucose uptake40 and has been shown to induce the expression of the
glucose transporters GLUT-1 and GLUT-3 41-43. Moreover, activation of Akt has been
shown to specifically activate glycolysis without affecting mitochondrial oxidative
phosphorylation44. Akt functions through the mammalian target of rapamycin
(mTOR) pathway and the phosphorylation of Akt and mTOR are thought to be rate-
limiting steps in glycolysis45-47. Interestingly, inhibition of mTOR by rapamycin
For personal use only. by guest on June 6, 2013. bloodjournal.hematologylibrary.orgFrom

15
decreased prednisolone resistance in ALL cell lines48, suggesting the involvement of
the Akt/mTOR pathway in glucocorticoid resistance in pediatric ALL. A role for Akt
in glucocorticoid resistance is even more plausible if one thinks about its function in
cell survival. Akt has been shown to promote mitochondrial integrity and inhibit
cytochrome c release, thereby preventing apoptosis49. Importantly, Akt requires the
presence of glucose to exert its anti-apoptotic function50, stressing once more the
importance of the glycolysis pathway as a target for cancer treatment.
Given that cancer cells have higher glycolytic rates than their non-transformed
counterparts, inhibition of glycolysis more specifically affects tumor cells and has
little or no effect on normal cells51. Inhibition of glycolysis by 2-DG but not inhibition
of the oxidative phosphorylation process was shown to reduce the viability of the
PER-427 T-ALL cell line pointing to glycolysis as potential therapeutic target.28 Here,
we show here that disruption of the glycolytic pathway specifically affects
prednisolone-resistant leukemia cells with high metabolic activity, while no
sensitizing effect is observed in cells already sensitive to prednisolone. This
synergistic effect is independent of the glycolytic-inhibitor used: addition of 2-DG, 3-
BrPA or LND all rendered otherwise resistant leukemia cells more susceptible to
prednisolone. Moreover, downregulation of GAPDH by use of RNA interference also
modulated prednisolone sensitivity, confirming a direct link between glucocorticoid
resistance and glucose metabolism. Because the sensitizing effect of glycolytic
inhibitors on prednisolone resistance was not only observed in ALL cell lines but also
in primary cells of pediatric ALL patients, interference with the glycolysis pathway
seems a promising way to reverse glucocorticoid resistance in childhood leukemia.
In the past years, targeting glycolysis has become increasingly more attractive
as a therapeutic approach for several kinds of tumors52-53. However, short-term
For personal use only. by guest on June 6, 2013. bloodjournal.hematologylibrary.orgFrom

16
inhibition of glycolysis alone appears not to be sufficient to produce significant anti-
tumor effects in vivo. Some of the compounds that are used to block glucose
metabolism, such as 3-BrPA, are relatively unstable and show significant inhibition of
glycolysis only at relatively high concentrations54. Similarly, the dose of LND
necessary to achieve clinical efficacy is associated with toxicity, limiting the use of
these compounds as primary therapy51. Instead, the use of glycolysis inhibitors in
combination with other agents appears to be a more promising approach. Glycolytic
inhibitors have been reported to increase the cytotoxicity of other agents, possibly by
reducing the cell’s ability to repair damage caused by those agents or by increasing
the permeability of tumor cells. Addition of LND, for example, has been shown to
result in a significant increase in the intracellular concentrations of doxorubicin55.
Moreover, LND has been shown to increase the efficacy of cisplatin, doxorubicin and
melphalan both in vitro and in vivo56-57. Similarly, the addition of 3-BrPA was found
to increase the cytotoxic effect of doxorubicin, vincristine and Ara-C in HL-60/AR
cells54 and the concurrent administration of 2-DG increased the in vivo efficacy of
both doxorubicin and paclitaxel in osteosarcoma and non-small cell lung cancer
xenografts51. In our experiments the co-incubation of 2-DG did not increase the
cytotoxicity of vincristine or daunorubicin in leukemia cells, while it sensitized
towards both prednisolone and dexamethasone, suggesting that 2-DG particularly
interferes with glucocorticoid action in ALL. Recently, clinical trials have been
performed using glycolytic inhibitors in breast cancer, ovarian cancer, lung cancer
and malignant glioma52, 58-59 and a phase I/II trial is currently ongoing for prostate
cancer, administering 30mg/kg (~ 0.2mM) 2-DG on a daily schedule for 2 weeks60
[www.clinicaltrials.gov, trial NCT00633087]. Moreover, clinical evaluation in brain
tumor patients showed that 2-DG is safe to use at doses up to 250mg/kg body weight
For personal use only. by guest on June 6, 2013. bloodjournal.hematologylibrary.orgFrom

17
(~1.5mM) given weekly for 7 weeks61. This implies that the concentrations of 2-DG
used in our in vitro experiments are also applicable in clinical practice. Together, the
results presented here point to the importance of the glycolytic pathway in
glucocorticoid resistance and suggest that targeting this pathway may be a particularly
promising approach to reverse prednisolone resistance in pediatric ALL in patients for
whom currently alternative treatment protocols are less successful, e.g. patients
suffering from a second or later relapse.
ACKNOWLEDGEMENTS
This work was supported by the Pediatric Oncology Foundation Rotterdam
and the Dutch Cancer Society (EMCR 2005-3662 and EMCR 2005-3313 grants).
AUTHOR CONTRIBUTION
Esther Hulleman designed and performed research, analyzed data and wrote
the paper. Karin M. Kazemier, Amy Holleman and Mathilde J.C. Broekhuis
performed research, David J. VanderWeele, Charles M. Rudin, William E. Evans and
Rob Pieters discussed data and revised the manuscript, Monique Den Boer designed
research, analyzed and interpreted data and revised the paper.
The authors declare no competing financial interests.
For personal use only. by guest on June 6, 2013. bloodjournal.hematologylibrary.orgFrom

18
REFERENCES
1. Tissing WJ, Meijerink JP, den Boer ML, Pieters R. Molecular determinants of
glucocorticoid sensitivity and resistance in acute lymphoblastic leukemia.
Leukemia. 2003; 17:17-25.
2. Ausserlechner MJ, Obexer P, Böck G, Geley S, Kofler R. Cyclin D3 and c-MYC
control glucocorticoid-induced cell cycle arrest but not apoptosis in lymphoblastic
leukemia cells. Cell Death Differ. 2004; 11:165-174.
3. Ploner C, Schmidt A, Presul E, et al. Glucocorticoid-induced apoptosis and
glucocorticoid resistance in acute lymphoblastic leukemia. J Steroid Biochem Mol
Biol. 2005; 93:153-160.
4. Pui CH, Evans WE. Treatment of acute lymphoblastic leukemia. N Engl J Med.
2006; 354:166-178.
5. Pieters R, Klumper E, Kaspers GJ, Veerman AJ. Everything you always wanted to
know about cellular drug resistance in childhood acute lymphoblastic leukemia.
Crit Rev Oncol Hematol. 1997; 25:11-26.
6. Hongo T, Yajima S, Sakurai M, Hoikoshi Y, Hanada R. In vitro drug sensitivity
testing can predict induction failure and early relapse of childhood acute
lymphoblastic leukemia. Blood. 1997; 89:2959-2965.
7. Kaspers GJ, Pieters R, Van Zantwijk CH, Van Wering ER, Van Der Does-Van
den Berg A, Veerman AJ. Prednisolone resistance in childhood acute
lymphoblastic leukemia: vitro-vivo correlations and cross-resistance to other
drugs. Blood. 1998; 92:259-266.
8. Den Boer ML, Harms DO, Pieters R. et al. Patient stratification based on
prednisolone-vincristine-asparaginase resistance profiles in children with acute
lymphoblastic leukemia. J Clin Oncol. 2003; 21:3262-3268.
For personal use only. by guest on June 6, 2013. bloodjournal.hematologylibrary.orgFrom
19
9. Holleman A, Cheok MH, den Boer ML, et al. Gene-expression patterns in drug-
resistant acute lymphoblastic leukemia cells and response to treatment. N Engl J
Med. 2004; 351:533-542.
10. Berg JM, Tymoczko JL, Stryer L. Glycolysis and Gluconeogenesis. In:
Biochemistry 6th ed. New York, NY: WH Freeman & Co; 2007: 483-508.
11. Gatenby RA, Gillies RJ. Why do cancers have high aerobic glycolysis? Nat Rev
Cancer. 2004; 4:891-899.
12. Kaspers GJ, Veerman AJ, Pieters R, et al. Mononuclear cells contaminating acute
lymphoblastic leukaemic samples tested for cellular drug resistance using the
methyl-thiazol-tetrazolium assay. Br J Cancer. 1994; 70:1047-1052.
13. Pieters R, Loonen AH, Huismans DR, et al. In vitro drug sensitivity of cells from
children with leukemia using the MTT assay with improved culture conditions.
Blood. 1990; 76:2327-2336.
14. Berenbaum MC. Synergy, additivism and antagonism in immunosuppression. Clin
exp immunol. 1977; 28:1-18.
15. Chi MM, Pusateri ME, Carter JG, Norris BJ, McDougal DB Jr, Lowry OH.
Enzymatic assays for 2-deoxyglucose and 2-deoxyglucose 6-phosphate. Anal
Biochem. 1987; 161:508-513.
16. Maschek G, Savaraj N, Priebe W, et al. 2-deoxy-D-glucose increases the efficacy
of adriamycin and paclitaxel in human osteosarcoma and non-small cell lung
cancers in vivo. Cancer Res. 2004; 64:31-34.
17. Simons AL, Ahmad IM, Mattson DM, Dornfeld KJ, Spitz DR. 2-Deoxy-D-
glucose combined with cisplatin enhances cytotoxicity via metabolic oxidative
stress in human head and neck cancer cells. Cancer Res. 2007; 67:3364-3370.
For personal use only. by guest on June 6, 2013. bloodjournal.hematologylibrary.orgFrom

20
18. Heyfets A, Flescher E. Cooperative cytotoxicity of methyl jasmonate with anti-
cancer drugs and 2-deoxy-D-glucose. Cancer Lett. 2007; 250:300-310.
19. Kang HT, Hwang ES. 2-Deoxyglucose: an anticancer and antiviral therapeutic,
but not any more a low glucose mimetic. Life Sci. 2006; 78:1392-1399.
20. Ko YH, Smith BL, Wang Y, et al. Advanced cancers: eradication in all cases
using 3-bromopyruvate therapy to delete ATP. Biochem Biophys Res Commun.
2004; 324:269-275.
21. Floridi A, Paggi MG, Marcante ML, Silvestrini B, Caputo A, De Martino C.
Lonidamine, a selective inhibitor of aerobic glycolysis of murine tumor cells. J
Natl Cancer Inst. 1981; 66:497-499.
22. Sumimoto H, Kawakami Y. Lentiviral vector-mediated RNAi and its use for
cancer research. Future Oncol. 2007; 3:655-664.
23. Den Boer ML, Pieters R, Kazemier KM, et al. Relationship between major vault
protein/lung resistance protein, multidrug resistance-associated protein, P-
glycoprotein expression and drug resistance in childhood leukaemia. Blood. 1998;
91:2092-2098.
24. Tissing W, Lauten M, Meijerink JPP, et al. Expression of the glucocorticoid
receptor and its isoforms in relation to glucocorticoid resistance in childhood
acute lymphocytic leukemia. Haematologica 2005; 90:1279-1281.
25. Tissing W, Meijerink JPP, Brinkhof B, et al. Glucocorticoid-induced
glucocorticoid-receptor expression and promoter usage is not linked to
glucocorticoid resistance in childhood ALL. Blood 2006; 108:1045-1049.
26. Haarman, EG, Kaspers GJ, Veerman AJ. Glucocorticoid resistance in childhood
leukaemia: mechanisms and modulation. Br J Haematol. 2003; 120:919-929.
For personal use only. by guest on June 6, 2013. bloodjournal.hematologylibrary.orgFrom
21
27. Kim JW, Dang CV. Cancer's molecular sweet tooth and the Warburg effect.
Cancer Res. 2006; 66:8927-8930.
28. Boag JM, Beesley AH, Firth MJ et al. Altered glucose metabolism in childhood
pre-B acute lymphoblastic leukaemia. Leukemia. 2006; 20:1731-1737.
29. Moreno-Sánchez R, Rodríguez-Enríquez S, Maríin-Hernández A, Saavedra E.
Energy metabolism in tumor cells. FEBS J. 2007; 274:1393-1418.
30. Osthus RC, Shim H, Kim S, et al. Deregulation of glucose transporter 1 and
glycolytic gene expression by c-Myc. J Biol Chem. 2000; 275:21797-21800.
31. Gordan JD, Thompson CB, Simon MC. HIF and c-Myc: sibling rivals for control
of cancer cell metabolism and proliferation. Cancer Cell. 2007; 12:108-113.
32. DeBerardinis RJ, Lum JJ, Hatzivassiliou G, Thompson CB. The biology of
cancer: metabolic reprogramming fuels cell growth and proliferation. Cell Metab.
2008; 7:11-20.
33. Semenza GL, Roth PH, Fang HM, Wang GL. Transcriptional regulation of genes
encoding glycolytic enzymes by hypoxia-inducible factor 1. J Biol Chem. 1994;
269:23757-23763.
34. O’Rourke JF, Pugh CW, Bartlett SM, Ratcliffe PJ. Identification of hypoxically
inducible mRNAs in HeLa cells using differential-display PCR. Role of hypoxia-
inducible factor-1. Eur J Biochem. 1996; 241:403-410.
35. Airley RE, Mobasheri A. Hypoxic regulation of glucose transport, anaerobic
metabolism and angiogenesis in cancer: novel pathways and targets for anticancer
therapeutics. Chemotherapy. 2007; 53:233-256.
36. Greijer AE, van der Groep P, Kemming D, et al. Up-regulation of gene expression
by hypoxia is mediated predominantly by hypoxia-inducible factor 1 (HIF-1). J
Pathol. 2005; 206:291-304.
For personal use only. by guest on June 6, 2013. bloodjournal.hematologylibrary.orgFrom
22
37. Chen C, Pore N, Behrooz A, Ismail-Beigi F, Maity A. Regulation of glut1 mRNA
by hypoxia-inducible factor-1. Interaction between H-ras and hypoxia. J Biol
Chem. 2001; 276:9519-9525.
38. Kodama T, Shimizu N, Yoshikawa N, et al. Role of the glucocorticoid receptor
for regulation of hypoxia-dependent gene expression. J Biol Chem. 2003;
278:33384-33391.
39. Manning BD, Cantley LC. AKT/PKB signaling: navigating downstream. Cell.
2007; 129:1261-1274.
40. Plas DR, Thompson CB. Akt-dependent transformation: there is more to growth
than just surviving. Oncogene. 2005; 24:7435-7442.
41. Hajduch E, Alessi DR, Hemmings BA, Hundal HS. Constitutive activation of
protein kinase B alpha by membrane targeting promotes glucose and system A
amino acid transport, protein synthesis, and inactivation of glycogen synthase
kinase 3 in L6 muscle cells. Diabetes. 1998; 47:1006-1013.
42. Barthel A, Okino ST, Liao J, et al. Regulation of GLUT1 gene transcription by the
serine/threonine kinase Akt1. J Biol Chem. 1999; 274:20281-20286.
43. Wofford JA, Wieman HL, Jacobs SR, Zhao Y and Rathmell JC. IL-7 promotes
Glut1 trafficking and glucose uptake via STAT5-mediated activation of Akt to
support T-cell survival. Blood. 2008; 111:2101-2111.
44. Elstrom RL, Bauer DE, Buzzai M, et al. Akt stimulates aerobic glycolysis in
cancer cells. Cancer Res. 2004; 64:3892-3899.
45. Edinger AL, Thompson CB. Akt maintains cell size and survival by increasing
mTOR-dependent nutrient uptake. Mol Biol Cell. 2002; 13:2276-2288.
For personal use only. by guest on June 6, 2013. bloodjournal.hematologylibrary.orgFrom
23
46. Peng T, Golub TR, Sabatini DM. The immunosuppressant rapamycin mimics a
starvation-like signal distinct from amino acid and glucose deprivation. Mol Cell
Biol. 2002; 22:5575-5584.
47. Wieman HL, Wofford JA, Rathmell JC. Cytokine stimulation promotes glucose
uptake via phosphatidylinositol-3 kinase/Akt regulation of Glut1 activity and
trafficking. Mol Biol Cell. 2007; 18:1437-1446.
48. Wei G, Twomey D, Lamb J et al. Gene expression-based chemical genomics
identifies rapamycin as a modulator of MCL1 and glucocorticoid resistance.
Cancer Cell. 2006; 10:331-342.
49. Parcellier A, Tintignac AL, Zhuravleva E, Hemmings BA. PKB and the
mitochondria: AKTing on apoptosis. Cell Signal. 2008; 20:21-30.
50. Robey RB, Hay N. Mitochondrial hexokinases, novel mediators of the
antiapoptotic effects of growth factors and Akt. Oncogene. 2006; 25:4683-4696.
51. Gatenby RA, Gillies RJ. Glycolysis in cancer: a potential target for therapy. Int J
Biochem Cell Biol. 2007; 39:1358-1366.
52. Pelicano H, Martin S, Xu R-H, Huang P. Glycolysis inhibition for anticancer
treatment. Oncogene. 2006; 25:4633-4646.
53. Chen Z, Lu W, Garcia-Prieto, Huang P. The Warburg effect and its cancer
therapeutic implications. J Bioenerg Biomembr. 2007; 39:267-274.
54. Xu R-H, Pelicano H, Zhou Y, et al. Inhibition of glycolysis in cancer cells: a
novel strategy to overcome drug resistance associated with mitochondrial
respiratory defect and hypoxia. Cancer Res. 2005; 65:613-621.
55. Floridi A, Bruno T, Miccadei S, Fanciulli M, Federico A, Paggi MG.
Enhancement of doxorubicin content by the antitumor drug lonidamine in resistant
For personal use only. by guest on June 6, 2013. bloodjournal.hematologylibrary.orgFrom

24
Ehrlich ascites tumor cells through modulation of energy metabolism. Biocehm
Pharmacol. 1998; 56:841-849.
56. Gornati D, Zaffaroni N, Villa R, De Marco C, Silvestrini R. Modulation of
melphalan and cisplatin cytotoxicity in human ovarian cancer cells resistant to
alkylating drugs. Anticancer Drugs. 1997; 8:509-516.
57. Amadori D, Frassinetti GL, De Matteis A, et al. Modulating effect of lonidamine
on response to doxorubicin in metastatic breast cancer patients: results from a
multicenter prospective randomized trial. Breast Cancer Res Treat. 1998; 49:209-
217.
58. Oudard S, Carpentier A, Banu E, et al. Phase II study of lonidamine and diazepam
in the treatment of recurrent glioblastoma multiforme. J Neurooncol. 2003; 63:81-
86.
59. Raez LE, Rosenblatt J, Schlesselman J, et al. Combining glycolytic inhibitors with
chemotherapy: Phase I trial of 2-deoxyglucose and docetaxel in patients with solid
tumors [abstract]. J Clin Oncol. 2005; 23:16S. Abstract 3190.
60. DiPaola RS, Dvorzhiniski D, May M et al. Therapeutic starvation and autophagy
in prostate cancer: a new paradigm. J Clin Oncol. 2007:25:18S. Abstract 10530.
61. Singh D, Banerji AK, Dwarakanath BS, et al. Optimizing cancer radiotherapy
with 2-deoxy-d-glucose dose escalation studies in patients with glioblastoma
multiforme. Strahlenther Onkol. 2005; 181:507-514.
For personal use only. by guest on June 6, 2013. bloodjournal.hematologylibrary.orgFrom

25
FIGURE LEGENDS
Fig. 1: Glycolysis is upregulated in prednisolone-resistant human leukaemia
cells.
Graphic representation of in vitro prednisolone responsiveness (left panel) and
glucose consumption (right panel) of two prednisolone-resistant and two –sensitive
human ALL cell lines. Response to prednisolone was measured by the MTT assay;
glucose consumption was calculated per cell by measuring the conversion of glucose
to 6-phosphogluconate. The glucose consumption in Jurkat cells after 4 days of
incubation was set to be 100%, corresponding to about 75% of the total glucose
present in the medium (1.5 g/l). A representative experiment is shown; data are
presented as means ± SD (n=3).
Figure 2: Schematic representation of glucose metabolism in mammalian cells.
Glycolytic inhibitors used in this study are indicated as 2-DG (2-deoxy-D-glucose), 3-
BrPA (3-bromopyruvate) and LND (lonidamine).
Figure 3: Effect of 2-DG treatment on glucose consumption and prednisolone
induced cytotoxicity in human ALL cell lines.
Graphic representation of relative glucose consumption (upper panel) or in vitro
prednisolone responsiveness (lower panel) in two prednisolone–resistant and two –
sensitive ALL cell lines after 2-DG treatment. Glucose consumption was calculated
by measuring the conversion of glucose to 6-phosphogluconate and glucose
consumption in Jurkat cells was set to be 100%. Response to prednisolone was
measured by the MTT assay; cell survival in non-treated cells was set to be 100%.
For personal use only. by guest on June 6, 2013. bloodjournal.hematologylibrary.orgFrom

26
Used concentrations of prednisolone and 2-DG varied depending on cellular toxicity
(550µg/ml and 0.078µg/ml prednisolone and 2mM and 0.5mM for –resistant and –
sensitive cell lines respectively). Representative experiments are shown; data are
presented as means ± SD (n=3).
Figure 4: Modulation of drug-resistance by 2-DG.
Graphic representation of in vitro responsiveness to cytotoxic drugs in two
prednisolone–resistant ALL cell lines after 2-DG treatment, as assessed by the MTT
assay. Concentrations used were 1mM (Molt4) or 2mM 2-DG (Jurkat), 550µg/ml
prednisolone, 100µg/ml dexamethasone, 0.5ng/ml vincristine and 0.0098U/ml L-
asparaginase. Cell survival in cells treated only with 2-DG was set to be 100% in
order to visualize the effect of synergy. Representative experiments are shown; data
are presented as means ± SD (n=3).
Figure 5: Effect of glycolytic inhibitors on prednisolone induced cytotoxicity in
prednisolone–resistant and –sensitive cell lines.
Cell survival curves representing in vitro prednisolone responsiveness, as assessed by
the MTT assay in two prednisolone–resistant (upper panel) and two –sensitive ALL
cell lines (lower panel) after treatment with glycolytic inhibitors. Cells were treated
with 1mM (Jurkat, Molt4) or 0.5mM 2-DG (-▲-), 62.5μM LND (--�--), 30μM 3-
BrPA (-●-) in combination with prednisolone as indicated in the figure. Cells treated
only with prednisolone served as controls (-■-). In order to visualize synergy, the
survival rate of prednisolone in combination with an inhibitor was corrected for the
toxicitiy caused by the inhibitor itself (set to 100%). A representative experiment is
shown; data are presented as means ± SD (n=3).
For personal use only. by guest on June 6, 2013. bloodjournal.hematologylibrary.orgFrom
27
Figure 6: Inhibition of GAPDH expression by RNA interference increases
prednisolone-induced cytotoxicity.
a) mRNA levels of GAPDH in Jurkat cells as measured by Q-PCR. Two different
shRNA sequences targeting GAPDH were used (shGAPDH-1 and –2). Expression of
cells infected with non-silencing shRNA sequences was set to be 100% and relative
expression levels were calculated.
b) Cell survival curves representing in vitro prednisolone responsiveness after RNA
interference in cells interfered for GAPDH (-�- / -▲- ) or in cells infected with a non-
silencing shRNA sequence (-■-).
c) mRNA levels of HIF-1α in Jurkat cells as measured by Q-PCR. Two different
shRNA sequences targeting HIF-1α were used (sh HIF-1α-1 and –2). Expression of
cells infected with non-silencing shRNA sequences was set to be 100% and relative
expression levels were calculated.
d) Cell survival curves representing in vitro prednisolone responsiveness after RNA
interference in cells interfered for HIF-1α (-�- / -▲- ) or in cells infected with a non-
silencing shRNA sequence (-■-). A representative experiment is shown; data are
presented as means ± SD (n=3).
Figure 7: Effect of 2-DG treatment on prednisolone induced cytotoxicity in
primary ALL cells.
Cell survival curves representing in vitro prednisolone responsiveness, in
prednisolone–resistant ALL patients (upper panel), -intermediate patients (middle
panel) and –sensitive patients (lower panel) as assessed by the MTT assay.
Concentrations 2-DG varied from 0.2mM-2mM (-▼-), depending on the patient
sample sensitivity. In order to visualize the synergy, the survival of cells treated with
For personal use only. by guest on June 6, 2013. bloodjournal.hematologylibrary.orgFrom
28
prednisolone and 2-DG was corrected for the toxic effect of 2-DG given as single
drug (set at 100%). Cells treated only with prednisolone served as controls (-■-). A
representative experiment is shown; data are presented as means ± SD (n=3).
For personal use only. by guest on June 6, 2013. bloodjournal.hematologylibrary.orgFrom
Rel
ativ
e gl
ucos
e co
nsum
ptio
n (%
)
0
50
100
150
Jurkat Molt4 RS4;11 Tom-1
PRED resistant PRED sensitive
LC50
PR
ED
(μg/
ml) PRED resistant PRED sensitive
10-4
101
106
Jurkat Molt4 RS4;11 Tom-1
Figure 1
For personal use only. by guest on June 6, 2013. bloodjournal.hematologylibrary.orgFrom

Fructose-6-Phosphate
Glyceraldehyde 3-Phosphate
Glucose GlucoseGlucose-6-phosphate
ADP ATP2
36 ATPHCO3-
33--BrPABrPA
22--DGDG
Pyruvate
Lactate
ADPATP2
Mitochondrion
ADP + PATP
LNDLND
ATPADP
ATPADP
LNDLND
Figure 2
F
or personal use only. by guest on June 6, 2013.
bloodjournal.hematologylibrary.org
From
Rel
ativ
e G
luco
se c
onsu
mpt
ion
(%)
0
20
40
60
80
100
120Jurkat
prednisolone resistant
Molt4 RS4;11 Tom-1
prednisolone sensitive
0
20
40
60
80
100
120
cont
rol
Pred
niso
lone
2-D
G
Pred
niso
lone
+ 2-
DG
Cel
l sur
viva
l (%
)
cont
rol
Pred
niso
lone
2-D
G
Pred
niso
lone
+ 2-
DG
cont
rol
Pred
niso
lone
2-D
G
Pred
niso
lone
+ 2-
DG
cont
rol
Pred
niso
lone
2-D
G
Pred
niso
lone
+ 2-
DG
Figure 3
a
b
F
or personal use only. by guest on June 6, 2013.
bloodjournal.hematologylibrary.org
From
Jurkat
0
20
40
60
80
100
120
Molt4
Cel
lsur
viva
l(%
)
cont
rol
Pred
niso
lone
Dex
amet
haso
ne
Vinc
ristin
e
Dau
noru
bici
n
Asp
arag
inas
e
glucocorticoids
cont
rol
Pred
niso
lone
Dex
amet
haso
ne
Vinc
ristin
e
Dau
noru
bici
n
Asp
arag
inas
e
glucocorticoids
Figure 4
2-DG 2-DG
F
or personal use only. by guest on June 6, 2013.
bloodjournal.hematologylibrary.org
From
Molt4
0
25
50
75
100
125
100 1000 10000
Cel
l sur
viva
l (%
)prednisolone ug/mlprednisolone ug/ml
Jurkat
0
25
50
75
100
125
100 1000 10000
Cel
l sur
viva
l (%
)
Resistant
Tom-1
0
25
50
75
100
125
0.001 0.01 0.1 1
Cel
l sur
viva
l (%
)
prednisolone ug/ml
Sensitive
RS4;11
0
25
50
75
100
125
0.001 0.01 0.1 1
Cel
l sur
viva
l (%
)
prednisolone ug/ml
Figure 5
F
or personal use only. by guest on June 6, 2013.
bloodjournal.hematologylibrary.org
From
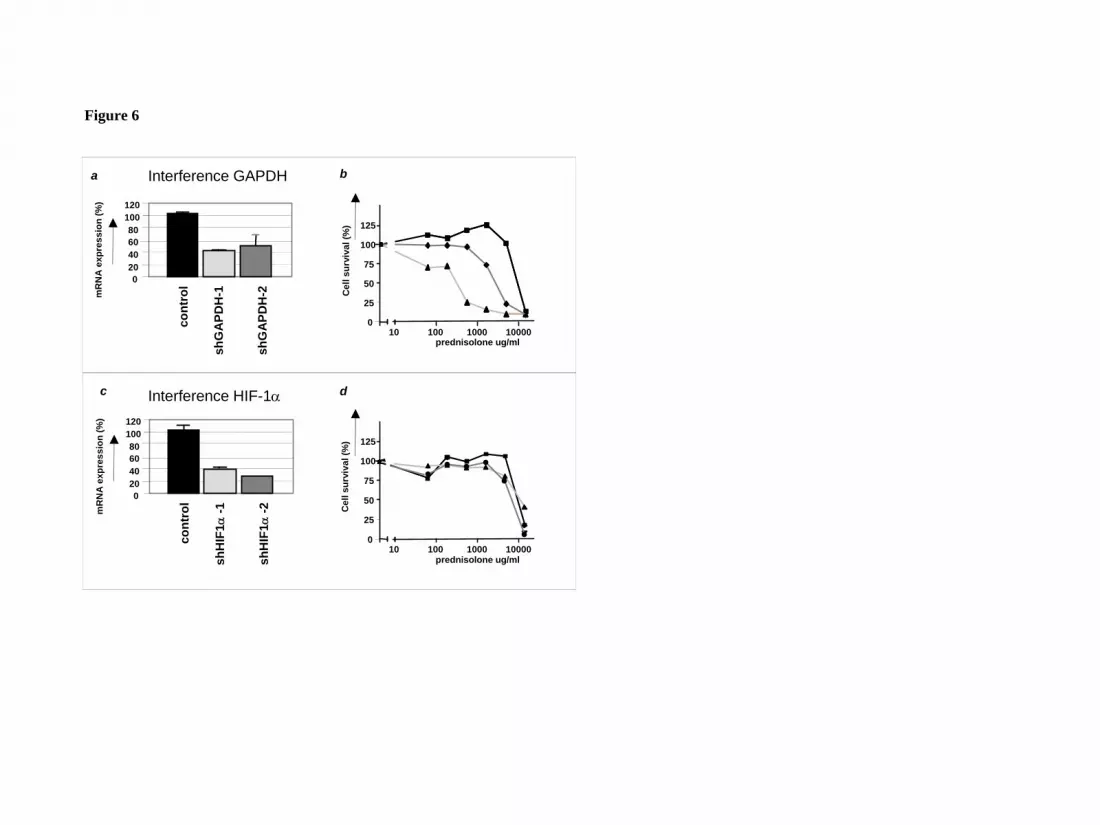
Figure 6
Cel
l sur
viva
l (%
)
0
25
50
75
100
125
10 100 1000 10000prednisolone ug/ml
dc
020406080
100120
cont
rol
shH
IF1α
-1
shH
IF1α
-2mR
NA
exp
ress
ion
(%)
Cel
l sur
viva
l (%
)
0
25
50
75
100
125
10 100 1000 10000prednisolone ug/ml
ba
020406080
100120
cont
rol
shG
APD
H-1
shG
APD
H-2m
RN
A e
xpre
ssio
n (%
)
Interference GAPDH
Interference HIF-1α
F
or personal use only. by guest on June 6, 2013.
bloodjournal.hematologylibrary.org
From

Intermediate
0
25
50
75
100
125
0.01 0.1 1 10 100 1000prednisolone ug/ml
Cel
l sur
viva
l (%
)
control2DG 0.2mM
control2DG 0.67mM
0
25
50
75
100
125
prednisolone ug/ml0.01 0.1 1 10 100 1000
0
25
50
75
100
125
prednisolone ug/ml0.01 0.1 1 10 100
control2DG 0.67mM
0
25
50
75
100
125
prednisolone ug/ml0.01 0.1 1 10 100
control2DG 0.67mM
Resistant
Cel
l sur
viva
l (%
)
control2DG 2mM
10000
25
50
75
100
125
0.01 0.1 1 10 100prednisolone ug/ml
0
25
50
75
100
125
0.01 0.1 1 10 100prednisolone ug/ml
1000
control2DG 0.2mM
0
25
50
75
100
125
0.01 0.1 1 10 100 1000prednisolone ug/ml
control2DG 0.67mM
0
25
50
75
100
125
0.01 0.1 1 10 100 1000prednisolone ug/ml
control2DG 0.2mM
Sensitive
125
0
25
50
75
100
0.01 0.1 1 10 100prednisolone ug/ml
1000
control2DG 0.67mM
Cel
l sur
viva
l (%
)
0
25
50
75
100
125
0.01 0.1 1 10 100 1000prednisolone ug/ml
control2DG 0.67mM
0
25
50
75
100
125
0.01 0.1 1 10 100 1000prednisolone ug/ml
control2DG 0.2mM
0
25
50
75
100
125
0.01 0.1 1 10 100 1000prednisolone ug/ml
control2DG 0.2mM
Figure 7
F
or personal use only. by guest on June 6, 2013.
bloodjournal.hematologylibrary.org
From


