Embed Size (px)
Citation preview

INTELLIGENCE 8, 23%258 (1984)
Information Processing Abilities in Twins Reared Apart*
M A T T M C G U E
Washington University School of Medicine St. Louis, MO.
T H O M A S J . B O U C H A R D , JR.
D A V I D T . L Y K K E N
University of Minnesota, Minneapolis, MN
D A L E F E U E R
Minneapolis, MN
A battery of information processing measures and psychometric tests of specific and general cognitive abilities was administered to a sample of 105 individuals which included 34 monozygotic and 13 dizygotic reared apart twin pairs or triplets. Correla- tions between information processing parameters and psychometric abilities as well as twin resemblances for the information processing parameters were examined. In a principal components analysis of the information processing parameters, three compo- nents were identified which accounted for 67% of the total variation; Overall Speed of Response (OSR), Speed of Information Processing (SIP), and Speed of Spatial Pro- cessing (SSP). OSR was significantly correlated with WAIS IQ, and psychometric measures of verbal reasoning, spatial ability, and perceptual speed and accuracy. SIP was significantly correlated with WA1S IQ, measures of verbal reasoning, and one of the perceptual speed and accuracy measures. SSP was significantly correlated with measures of both spatial ability and perceptual speed and accuracy. Due to the small size of the dizygotic twin sample, no strong conclusions could be drawn regarding the magnitude of their resemblance. The correlation between component scores of reared apart monozygotic twins was significant for OSR, but not for SIP or SSP.
I N T R O D U C T I O N
In r e c e n t r e s e a r c h in c o g n i t i v e p s y c h o l o g y m o d e r a t e , bu t c o n s i s t e n t , re la-
t i o n s h i p s b e t w e e n m e a s u r e s o f t he ra te w i th w h i c h an i nd iv idua l p e r f o r m s s i m p l e
*This research was partially supported by grants to the Minnesota Study of Twins Reared Apart from The Pioneer Fund, The Spencer Foundation, Harcourt, Brace & Jovanavich Inc., The National Science Foundation (BNS-7926654), and The Graduate School of the University of Minnesota and by NIH grant GM 28719. We would like to thank Alan Kuse for kindly making the results of the Hawaii normative regressions available to us, Daniel Keating for advice and assistance in construct- ing the information processing battery, and Robert Plomin for critically reviewing an earlier draft of this paper.
Correspondence and request for reprints should be sent to Thomas J. Bouchard, Jr., Department of Psychology, Elliott Hall, 75 East River Rd., University of Minnesota, Minneapolis, MN. 55455.
239

240 MCGUE, BOUCHARD, LYKKEN, AND FEUER
mechanistic thought processes, such as scanning memory, and psychometric measures of cognitive ability have been reported (Jenkinson, 1983; Lansman, Donaldson, Hunt, & Yantis, 1982; Vernon, 1983). Jensen (1982) and Vernon (1983) have suggested that the basis for these relationships is a general speed of mental processing factor which is related to, and forms an important component of, general intelligence (i.e., 'g'). Conversely, Hunt (1983) and Carroll (1976) have suggested that the mechanisms of information processing are specific, and, consequently, should correlate differentially with psychometrically defined spe- cial mental abilities. Furthermore, Hunt (1983) rejects the construct of intel- ligence as an abstraction which has no cause, suggesting that biological factors have their primary effects upon the mechanisms rather than the content of thought. He claims that,
There are individual differences in specific cognitive behaviors, these dif- ferences have causes, and the causes merit investigation. Physical influ- ences, such as heredity, nutrition, and brain damage, must exert their influ- ence through alteration of mechanistic processes. Educational and cultural influences must exert their influence through changes in representations and strategies (Hunt, 1983, p. 146).
One implication of this position is that genetic effects, should they exist for cognitive abilities, would be greater for measures of information processing (i.e.. referents of the mechanisms of thought) than for psychometric tests (i.e., referents of the content of thought).
The study reported here is made up of two parts. Part one examines, using a large heterogeneous sample, the pattern of relationships between information processing parameters and psychometric measures of special mental ability and general intelligence. Part two examines the relative role of heredity and environ- ment in the determination of individual difference variance on mechanistic thought processes.
METHOD
Sample
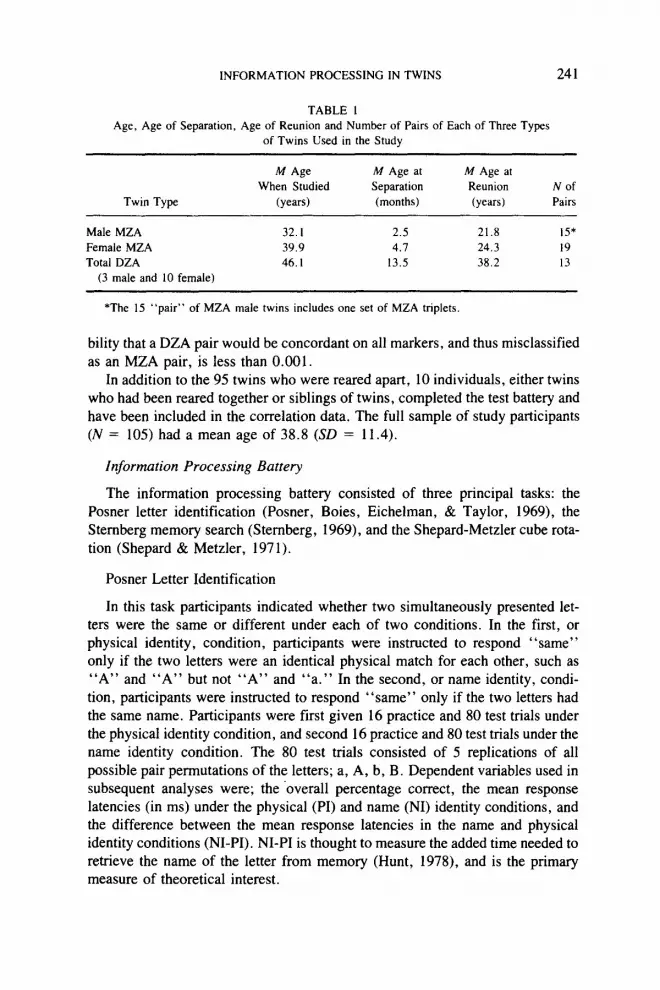
The sample is made up, in part, of participants in the Minnesota Study of Twins Reared Apart, a psychological and medical investigation of monozygotic (MZA) and dizygotic (DZA) twins who had been separated early in life. The study has been described in detail elsewhere (Bouchard, Heston, Eckert, Keyes, & Resnick, 1981). The characteristics of the twin sample studied are given in Table 1.
Zygosity determination was based on the analysis of eight blood group sys- tems, four serum proteins, six red blood cell enzymes, fingerprint ridge count, ponderal index, and cephalic index as explained by Lykken (1978). The'proba-
INFORMATION PROCESSING IN TWINS
TABLE 1 Age, Age of Separation, Age of Reunion and Number of Pairs of Each of Three Types
of Twins Used in the Study
241
M Age M Age at M Age at When Studied Separation Reunion N of
Twin Type (years) (months) (years) Pairs
Male MZA 32. I 2.5 21.8 15" Female MZA 39.9 4.7 24.3 19 Total DZA 46. I 13.5 38.2 13
(3 male and 10 female)
*The 15 "pair" of MZA male twins includes one set of MZA triplets.
bility that a DZA pair would be concordant on all markers, and thus misclassified as an MZA pair, is less than 0.001.
In addition to the 95 twins who were reared apart, 10 individuals, either twins who had been reared together or siblings of twins, completed the test battery and have been included in the correlation data. The full sample of study participants (N = 105) had a mean age of 38.8 (SD = 11.4).
Information Processing Battery
The information processing battery consisted of three principal tasks: the Posner letter identification (Posner, Boies, Eichelman, & Taylor, 1969), the Sternberg memory search (Sternberg, 1969), and the Shepard-Metzler cube rota- tion (Shepard & Metzler, 1971).
Posner Letter Identification
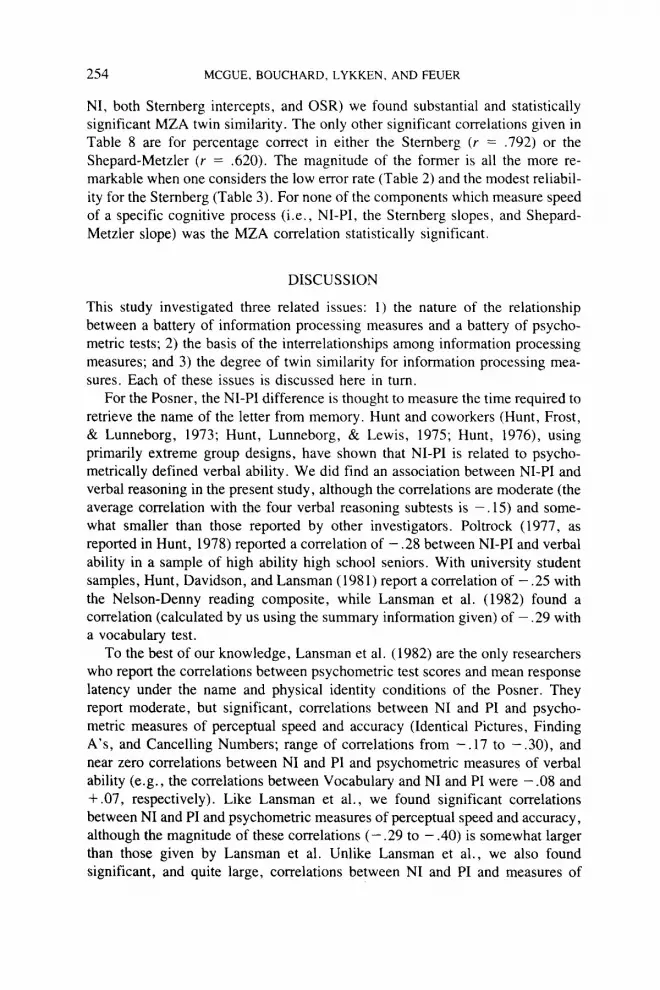
In this task participants indicated whether two simultaneously presented let- ters were the same or different under each of two conditions. In the first, or physical identity, condition, participants were instructed to respond " same" only if the two letters were an identical physical match for each other, such as " A " and " A " but not " A " and " a . " In the second, or name identity, condi- tion, participants were instructed to respond " s a m e " only if the two letters had the same name. Participants were first given 16 practice and 80 test trials under the physical identity condition, and second 16 practice and 80 test trials under the name identity condition. The 80 test trials consisted of 5 replications of all possible pair permutations of the letters; a, A, b, B. Dependent variables used in subsequent analyses were; the overall percentage correct, the mean response latencies (in ms) under the physical (PI) and name (NI) identity conditions, and the difference between the mean response latencies in the name and physical identity conditions (NI-PI). NI-PI is thought to measure the added time needed to retrieve the name of the letter from memory (Hunt, 1978), and is the primary measure of theoretical interest.

242 MCGUE, BOUCHARD, LYKKEN, AND FEUER
Sternberg Memory Search
The second experimental task was designed to assess the speed with which active memory is scanned. The procedure requires that the participant first mem- orize a set of either one, three, or five digits (selected from among 0 to 9). After a brief pause, a single probe digit is presented and the subject is instructed to respond "yes " if the probe was a member of the memory set, and " n o " if not. The task consisted of 15 practice and 90 test trials. The test trials were composed of 45 keyed " y e s " and 45 keyed " n o " items, with 30 presentations at each set size, and each serial position in the memory set being probed equally often. Subjects were given 4s to memorize the memory set digits. For each memory set size, the mean response time for the correct responses was calculated and re- gressed against the size of the memory set. An excellent fit of the linear model to data of this type has been reported in earlier research (e.g., Keating & Bobbitt, 1978). The slope of the regression line measures the amount of time needed to scan an additional item in active memory and is the primary measure of the- oretical interest. The intercept measures the speed of all additional processing (e.g., encoding, deciding, responding, etc.).
Shepard-Metzler Cube Rotation
In the final information processing task, adapted from Shepard and Metzler's research on mental rotation, a pair of three dimensional figures projected onto a two dimensional plane were presented to participants who were instructed to respond " s a m e " if the two figures were the same object shown from different angles, or "different" if the two figures were two entirely different objects. The basic set of items consisted of 100 stimulus pairs, 50 keyed " s ame" and 50 keyed "different." The " s a m e " responses were composed of 5 presentations at each of 10 angular displacements which ranged from 0 to 180 deg. in 20 deg. increments. Sample figures are given by Lansman et al. (1982).
Ten practice trials followed by 100 test trials were administered to participants on each of two consecutive days. For the " s ame" responses, the median re- sponse time for the correct responses was determined and regressed against angular displacement. The dependent variables used in subsequent analyses were the slope of the regression of median reaction time on angular displacement, a measure of rate of mental rotation; the intercept, a measure of speed of all remaining processing; and the percentage correct over the 200 trials.
Psychometric Battery
The psychometric battery consisted of specific and general measures of cog- nitive ability. The tests of specific cognitive ability included selected subtests from the battery used in the Hawaii study of cognition (DeFries, Johnson, Kuse, McClearn, Polovina, Vandenberg, & Wilson, 1979), and three subtests selected

INFORMATION PROCESSING IN TWINS 243
from the Kit of Factor-Referenced Cognitive Tests (the Identical Pictures, Cubes and Paper Folding subtests; Ekstrom, French, & Harman, 1976). The fifteen cognitive subtests were selected to represent four broad areas or clusters of cognitive performance; verbal reasoning (4 tests), spatial ability (7), perceptual speed and accuracy (2), and visual memory (2). The subtests along with their cluster identifications are listed in Table 4. The measure of general cognitive ability used was the Weschler Adult Intelligence Scale (WAIS) (Matarazzo, 1972). The extensive cognitive assessment of the participants in the Minnesota Study of Twins Reared Apart included additional measures of specific cognitive ability (subtests of the Comprehensive Ability Battery; Hakstian, & Cattell, 1978), and general cognitive ability (the Raven Progressive Matrices and a modification of the Mill-Hill Vocabulary test; Lykken, 1982) which are not reported on here.
Apparatus
The apparatus for administering the information processing measures in- cluded a subject console, an electromechanical programming device, a Beckman Universal Timer (model 5320), an amplifier, and a Kodak 750 carousel slide projector. The subject console contained a rear projection screen, 45.5 cm wide and 39 cm high, positioned at eye level 50 cm from the subject. Slides were presented by a slide projector placed behind the screen. Directly in front of the screen lay a response panel consisting of two buttons 14 cm apart labeled same/yes and different/no as appropriate to that task.
Procedure
The psychometric battery was, in large part, administered prior to administra- tion of the information processing battery. The latter was administered on two consecutive days. See Bouchard et al. (1981) for a typical assessment schedule for a pair of twins. The order for administering the information processing battery was the same for all study participants. The Posner physical identity condition was administered first followed by the Posner name identity condition, the Sternberg memory search, and, finally, the Shepard-Metzler cube rotation. All information processing tasks except the second administration of the cube rotation were administered on the first day (approximate testing time of 90 rain). The second 100 trials of the cube rotation were administered on the second day (approximate testing time of 30 min). Participants were given brief rest periods between experimental tasks. Each trial began with a blank screen. Approximately one half second before slide presentation a tone would sound to signal the subject. The interval between response and onset of the next trial was 3 s. Participants were instructed to keep their hands resting on the response buttons, and to respond as quickly as possible without sacrificing the

244 MCGUE, BOUCHARD, LYKKEN, AND FEUER
aceuracy of their responses. The response buttons were labeled to insure that the positive response was keyed to the subject's preferred hand. All responses were recorded in ms. Due to scheduling conflicts that sometimes arose during the week long assessment, every participant did not complete all psychometric and information processing tasks. Analyses and summary statistics were based on all available information for that variable.
Scoring
In calculating summary measures for the information processing tasks, only latencies for the correct responses were used. Both the Sternberg and Shepard- Metzler required the fitting of a regression equation individually for each subject. The equation fit was:
y = a + b x
Where y was the mean response time for the Sternberg and median response time for the Shepard-Metzler, and x was the memory set size for the Sternberg and angular displacement for the Shepard-Metzler. The slope, b, and the intercept, a, were estimated by minimizing a weighted least squares criterion, the weights being equal to the number of correct responses upon which either the mean or median was calculated.
As the existence of substantial age and sex effects for many of the variables could lead to overestimation of both the degree of twin similarity and the magni- tude of the correlation between test scores (McGue & Bouchard, in press), all variables were adjusted for the effects of age and sex prior to estimation of correlations. For the subtests from the Hawaii battery, scores were age-sex adjusted using results from the regression of age and age 2 on test score fit separately for the two sexes in a large normative sample (Kuse, 1977). For the remaining variables, all available data was used to estimate the coefficients in the regression of test score on age and age 2 fit separately for the two sexes. These coefficients were then used to define the age-sex adjusted scores.
RESULTS
Descriptive Characteristics of Responses to Information Processing Tasks
Descriptive statistics for the responses to the information processing tasks, uncorrected for the effects of age and sex, are given in Table 2. For the Posner letter identification, there is a high percentage of correct responses. The mean response latencies under both the name and physical identity conditions are comparable to those reported elsewhere (Hunt, Lunneborg, & Lewis, 1975;

INFORMATION PROCESSING IN TWINS
TABLE 2 Means and Standard Deviations for Information Processing Measures Derived
from the Posner, Sternberg, and Shepard-Metzler Tasks
245
Variable N M SD
Posner Letter Identification % Correct 96 96.4 3.4 Physical Identity (ms) (PI) 96 605.8 162.8 Name Identity (ms) (NI) 96 688.4 135.3 NI-PI (ms) 96 82.6 123.3
Sternberg Memory Search % Correct 95 97.0 4.1 Intercept Positive (ms) 95 471.0 162.1 Slope Positive (ms) 95 88.5 57.0 Correlation Positive 95 .948 .057 Intercept Negative (ms) 95 537.9 166.7 Slope Negative (ms) 95 77.6 39.5 Correlation Negative 95 .940 .165
Shepard-Metzler Cube Rotation % Correct 97 79.5 13.9 Intercept (ms) 90 2773.0 1494.8 Slope (ms) 90 22.8 17.1 Correlation 90 .767 .169
Lansman et al., 1982), while the mean NI-PI difference is within the range typically reported for college students and young adults (Hunt, 1978; Lansman et al., 1982).
As with the Posner, there is a high percentage of correct responses on the Sternberg memory search task. As there existed a significant differenee in the average response latency between the positive and negative items, slopes and intercepts were estimated separately for the two types of items. The average intercept values are comparable to those reported by Chiang and Atkinson (1976), although the average slopes here are much greater than the average slope of 43.0 --- 3.65 reported by these researchers for a sample of 30 Stanford undergraduates. This discrepancy could be due, in part, to age differences be- tween the two groups (the correlations between age and slope based upon positive or negative items were . 139 and. 136, respectively), and/or the fact that we were working with a predominantly nonstudent sample. The average correla- tions for the fit of the linear model were high for both types of items, supporting the adequacy of the linear model.
Consistent with its greater difficulty, the average level of accuracy is much less for the Shepard-Metzler cube rotation than for either the Posner or Stem- berg. Individual slopes and intercepts were estimated only for those participants

246 MCGUE, BOUCHARD, LYKKEN, AND FEUER
TABLE 3 Intercorrelations Among the Age-Sex Adjusted Information Processing Measures and Estimates
of Internal Consistency Reliability
Variable I 2 3 4 5 6 7 8 9 10 11 12
Posner Letter ldentil~ication 1. % Correct 2. PI .26 3. NI .25 .66 4. NI - PI - .05 - .54 .27
Sternberg Memory Search 5. % Correct .28 .07 .17 .08 6. Intercept Positive .23 .47 .56 .01 .16 7. Slope Positive .06 .03 .19 .17 .35 .05 8. Intercept Negative .28 .51 .54 - . 06 - . 04 .81 .18 9. Slope Negative .02 .07 .28 .23 - .03 .18 .51 .00
Shepard-Metzler Cube Rotation 10. %Correct .02 .05 - . 06 .00 .13 - .05 - . 09 .03 - .07 I1. Intercept .04 .15 .21 .05 .04 .13 .08 .10 .10 .22 12. Slope .04 .01 - . 08 .10 .04 - .03 .01 .02 - .07 .09 .26
Internal Consistency Reliability .81 .97 .98 .88 .42 .93 .88 .95 .9l .66 .90 .94
Italicized correlations, absolute value greater than or equal to .17, are significantly different from zero atp < .05. Sample sizes for intercorrelations range from 90 to 97, and equalled 55 for the measurement of internal consistency reliability.
who performed significantly better than chance (3 male and 4 female protocols were deleted). The average slopes for males, 17.0 -+ 2.43, and females, 26.7 -+ 2.41, are comparable to those reported by Tapley and Bryden (1977) for a college sample; male mean of 15.7 and female mean of 21.0.
Reliability
Split-half reliabilities were calculated on a subsample of 55 individuals. An odd-even split of item responses was made, relevant indices computed on the two halves, the two measures correlated, and reliability estimated using the Spearman-Brown prophecy formula (Nunnally, 1967). The estimated reli- abilities are given in the last row of Table 3. The internal consistency reliabilities are quite high, consistent with those reported by Lansman et al. (1982), and comparable to those typically reported for psychometric tests. For the psycho- metric tests used in this study, the average coefficient alpha, a measure of internal consistency reliability, estimated in a large normative sample was, ap- proximately, .86 (Kuse, 1977; Wilson, DeFries, McClearn, Vandenberg, John- son, Mi, & Rashad, 1975).

INFORMATION PROCESSING IN TWINS 247
Correlations Among Information Processing Measures
T h e i n t e r c o r r e l a t i o n s a m o n g t h e a g e - s e x a d j u s t e d i n f o r m a t i o n p r o c e s s i n g
v a r i a b l e s a re g i v e n in T a b l e 3, T h e l a r g e s t c o r r e l a t i o n s a re b e t w e e n v a r i a b l e s
w h i c h p r i m a r i l y m e a s u r e s p e e d o f r e s p o n s e r e g a r d l e s s o f c o n t e n t ( i . e . , b e t w e e n
PI , N I , a n d b o t h S t e r n b e r g i n t e r c e p t s , a l t h o u g h no t t he S h e p a r d - M e t z l e r in ter -
cep t ) . T h e i n t e r c o r r e l a t i o n s a m o n g t h o s e c o m p o n e n t s w h i c h p r i m a r i l y m e a s u r e a
TABLE 4 Correlations Between Psychometric Test Scores and Posner Paradigm Reaction Time Measures
Reaction Time Measures
Physical Name Identity Identity
Ability % Correct (PI) (NI) NI-PI
VERBAL REASONING Vocabulary - . 0 5 - . 15 - . 3 5 " * - . 18" Pedigrees - . 0 2 - . 2 5 " * - . 4 6 " * - . 19" Word Beg. & End. - . 1 0 - . 2 1 " - . 4 1 " * - . 1 8 ' Things - . 1 7 - . 2 4 * * - . 3 1 " * - . 0 4
M - . 0 9 - . 2 1 " - . 3 8 * * - . 1 5
SPATIAL ABILITY Mental Rotations .11 - . 0 2 .09 .13 Lines and Dots .07 - . 16 - . 0 6 .14 Card Rotations .01 - . 12 - . 0 2 .13 Hidden Paterns - .02 - . 17 - .21 * - .00 Paper Form Board .01 - . 19" - . 17 .06 Cubes .10 - . 2 2 " - . 2 4 ' * .03 Paper Folding .02 - . 15 - .21 * - . 0 6
M .04 - . 15 - . 12 .06
PERCEPTUAL SPEED AND ACCURACY Subtraction and
Multiplication .01 - . 3 7 " * - . 4 0 " * ,04 Identical Pictures .02 - . 2 9 * * - . 3 4 * * .00
M .02 - , 3 3 " * - . 3 7 * * .02
VISUAL MEMORY Immediate .02 - . 10 - . 0 8 .05 Delayed .01 - . 0 7 - . 10 - . 0 2
M .02 - . 0 9 - . 0 9 .02
WAIS IQ - . 0 4 - . 2 7 " * - . 44** - . 12
Note: N = 96, All variables are age-sex adjusted. *p < .05
**p < .01

248 MCGUE, BOUCHARD, LYKKEN, AND FEUER
specific component of information processing (i.e., NI-PI and the three slope measures) are low, although in some cases significantly greater than zero. A principal components analysis of the intercorrelations among the information processing measures is discussed next.
Correlations Between Psychometric Tests and Information Processing Measures
Posner Letter Identification
The correlations between the psychometric tests and the Posner measures are given in Table 4. As expected, the NI-PI difference correlates negatively with psychometric measures of verbal ability. The average correlation between NI-PI and the verbal ability subtests if - . 15 . Although this was highest of the four cluster averages, it is lower than the correaltions of - . 2 5 to - . 3 5 which have been reported elsewhere (Hunt, 1978; Hunt, Davidson, & Lansman, 1981).
Surprisingly, the individual NI and PI reaction times correlate more highly with verbal ability scores and WAIS IQ than does the NI-PI difference. On the average, NI and PI correlate as highly with psychometric measures of perceptual speed and accuracy as with measures of verbal ability; their correlations with measures of either spatial ability or visual memory were usually small, although in the former case sometimes significantly greater than zero. For verbal ability measures, the correlations with NI are consistently higher than the correlations for PI, while for all other ability clusters the correlations with the two compo- nents are comparable.
Sternberg Memory Search
The correlations between the Sternberg individual difference parameters and psychometric test performance are given in Table 5. The largest correlations are found between the information processing parameters and subtests in the verbal reasoning cluster, especially Pedigrees, and WAIS IQ. The correlations with WAIS IQ are homogeneous across the two slopes and two intercepts, and al- though the slope parameters tend to be more highly correlated than the intercept parameters with measures of verbal reasoning, this difference is slight and not statistically significant. The only remaining significant correlations are with the Subtraction and Multiplication, but not the Identical Pictures, subtest of the perceptual speed and accuracy cluster, and with two subtests in the spatial ability cluster.
Shepard-Metzler Cube Rotation
The correlations between the Shepard-Metzler parameters and the psycho- metric tests are given in Table 6. As expected the highest correlations are within

INFORMATION PROCESSING IN TWINS 249
TABLE 5 Correlations Between Psychometric Test Scores and Steinberg Paradigm Reaction Time Measures
Reaction Time Measures
% Intercept Slope Intercept Slope ABILITY Correct Positive Positive Negative Negative
VERBAL REASONING Vocabulary - . 19" - . 09 - . 16 - . 0 0 - . 16 Pedigrees - .03 - .20* - .31"* - .22* - .27** Word Beg. & End. - .20* - . 1 6 - .26** - . 19" - .18" Things - . 17 - .15 - .11 - .13 - . 16
M - .15 - .15 - . 21" - .14 - .19"
SPATIAL ABILITY Mental Rotations .00 .11 .11 .12 .14 Lines and Dots .09 - . 17 .06 - .20* - . 10 Card Rotations .01 - .01 - . 08 .01 - . 06 Hidden Patems .00 - .05 - . 03 - . 06 - . 04 Paper Form Board .00 - . 09 .03 - .08 .02 Cubes - .03 - . 19" - . 10 - . 14 - . 11 Paper Folding .03 - . 16 - .04 - . 09 - .07
M .01 - .07 - .01 - . 06 - .01
PERCEPTUAL SPEED AND ACCURACY
Subtraction and Multiplication .04 - . 12 - . ! 9" - . 18 * - . 14
Identical Pictures - . 0 9 - . 09 - . 0 4 - . 06 - . 15 M - .03 - .11 - . 12 - .12 - .15
VISUAL MEMORY Immedia~ - . 02 .03 - . 04 - . 04 .07 Delayed .05 .03 - .11 - . 02 - . 07
M .02 .03 - .08 - .03 .00
WAIS IQ - .01 - .29** - .27** - .24** - .25**
Note: N = 95. All variables are adjusted for the effects of age and sex. *p < .05
**p < .01
the spatial ability cluster; the percentage correct was significantly correlated with six of the seven subtests, the intercept with all seven, and the slope with three. Mental Rotations, which is composed of items equivalent in their stimulus mate° rial to those used in the experimental cube rotation task, is significantly corre- lated with percentage correct (r = .47), intercept (r = - . 40 ) , and slope (r = - . 26 ) . This is consistent with the results of other investigators who report significant and substantial correlations between reaction time measures and psy-

2 5 0 MCGUE, BOUCHARD, LYKKEN, AND FEUER
TABLE 6 Correlations Between Psychometric Test Scores and Shepard-Metzler
Paradigm Reaction Time Measures
Reaction Time Measures
%
ABILITY Correct Intercept Slope
VERBAL REASONING Vocabulary .23* - .27** - .02 Pedigrees .30"* - . 3 5 " * - .03 Word Beg. & End. .15 - . 0 9 .06 Things .11 - . 13 .04
M .20* - . 2 1 " .01
SPATIAL ABILITY Mental Rotations .47* * - .40* * - . 2 6 " * Lines and Dots .15 - . 2 6 * * - . 19"* Card Rotations .45** - . 3 2 * * - . 0 9 Hidden Paterns .42** - . 3 8 * * .04 Paper Form Board .24* - . 3 8 * * - . 14 Cubes .40"* - .45"* - . 2 2 " Paper Folding .50** - . 3 7 * * - . 0 7
M .38** - . 3 7 * * - . 1 3
PERCEPTUAL SPEED AND ACCURACY
Subtraction and Multiplication - . 0 4 - . 01 .13
Identical Pictures .11 - . 4 6 * * - . 3 2 * * M .04 - .23* - . 10
VISUAL MEMORY Immediate .16 - . 19" .04 Delayed .12 - . 13 .14
M .14 - , 1 6 .09
WAIS IQ .38** - . 3 1 " * .10
Note: N = 90. All variables are adjusted for the effects of age and sex. *p < .05
**p < .01
c h o m e t r i c t e s t s c o r e s w h i c h s h a r e c o m m o n s t i m u l u s m a t e r i a l ( B e r g , H e r t z o g , &
H u n t , 1982; L a n s m a n e t a l . , 1982) .
T h e i n t e r c e p t , b u t n o t t h e s l o p e , p a r a m e t e r c o r r e l a t e s q u i t e h i g h l y w i t h W A I S
IQ (r = - . 3 1 ) , a n d t w o o f t h e f o u r s u b t e s t s in t h e v e r b a l ab i l i t y c l u s t e r ( V o c a b u -
lary a n d P e d i g r e e s , r = - . 2 7 a n d - . 3 5 , r e s p e c t i v e l y ) . A s w i t h t h e S t e r n b e r g ,

INFORMATION PROCESSING IN TWINS 251
we find significant correlations between reaction time measures and one of the two perceptual speed and accuracy subtests, although in this case it is the Identi- cal Pictures subtest which demonstrated significant correlations with both the intercept (r = - . 46 ) and the slope (r = - .32) .
Principal Components Analysis of the Information Processing Parameters
To investigate the basis of the covariation among the information processing measures, a principal components analysis was performed in a subsample of 84 individuals who had completed the entire information processing battery. Eight age-sex adjusted variables were analyzed; both slopes and intercepts from the Sternberg, the slope and intercept from the Shepard-Metzler, the NI-PI dif- ference, and, because including NI and PI along with their difference would lead to a singularity, the sum of N1 and PI (here designated NI+PI). A principal components analysis with varimax rotation identified three components with eigen values greater than one which accounted for 67.4% of the total variation. The first component, accounting for 29.8% of the total variance (eigen value equal to 2.39), loaded highest on the two Steinberg intercepts (loadings of 0.911 and 0.904 for positive and negative, respectively), and NI+PI (loading of 0.476); no other loading exceeded 0.20 in absolute value. The first component appears to reflect overall speed of response when using overlearned stimuli (i.e., letters and numbers). This overall speed of response includes components due to speed of motor response as well as the speed of various cognitive processes. The second rotated component, which accounted for 20.8% of the total variance (eigen value of 1.67), loaded highest on the two Sternberg slopes (loadings of 0.796 for the slope positive and 0.831 for the slope negative) and NI-PI (loading of 0.545); no other loading exceeded 0.15 in absolute value. These three param- eters are measures of the amount of time needed to perform simple, and specific, cognitive processes in the Sternberg (scan one additional item of memory) and Posner (amount of time needed to recall name of a letter from memory). Conse- quently, the second component is interpreted as speed of information processing. The third component, which accounted for 16.7% of the total variance (eigen value of 1.34), loaded highest on 'the Shepard-Metzler intercept (loading of 0.767) and Shepard-Metzler slope (loading of 0.833); no other loading exceeded 0.20 in absolute value. The third component may reflect speed of spatial process- ing and/or method variance specific to the administration of the cube rotation task. Correlations with psychometric test performance, presented below, indicate that the former, rather than the latter, is the appropriate interpretation for this component. For brevity, the three components will be denoted overall speed of response (OSR), speed of information processing (SIP), and speed of spatial processing (SSP).
Component scores were generated for all participants who had completed the entire information processing battery (N = 84). The correlations between the

252 MCGUE, BOUCHARD, LYKKEN, AND FEUER
TABLE 7 Correlations Between Psychometric Test Scores and Information Processing Component Scores
Component
Overall Speed of Speed of Speed of Information Spatial
ABILITY Response Processing Processing
VERBAL REASONING Vocabulary - . 10 - . 2 4 " - . 16 Pedigrees - . 2 5 " * - .38** - .23* Word Beg. & End. - . 2 0 * - . 3 1 " * - . 0 2 Things - . 17" - . 14 .06
M - . 18" - .27** - . 12
SPATIAL ABILITY Mental Rotations .10 ~ 14 - . 41 * * Lines and Dots - . 19" .02 - .27"* Card Rotations - . 0 3 - . 0 3 - . 3 0 * * Hidden Paterns - . 0 7 - . 0 7 - . 2 2 * Paper Form Board - . 12 .04 - .34** Cubes - . 24* - . 11 - . 4 7 " * Paper Folding - . 15 - . 0 9 - . 2 2 *
M - . 1 0 - . 01 - . 3 2 * *
PERCEPTUAL SPEED AND ACCURACY
Subtraction and Multiplication - . 2 6 " * - , 2 0 " .05
Identical Pictures - . 14 - . 11 - .47* * M - .20* - . 16 - .23*
VISUAL MEMORY Immediate - .06 - .05 - .05 Delayed - . 0 2 - . 14 .14
M - . 0 4 - . 10 .05
WAIS IQ - . 3 1 ' * - . 3 2 * * - . 1 4
Note: N = 84. All variables are adjusted for the effects of age and sex. *p < .05
**p < .01
t h r e e c o m p o n e n t s c o r e s a n d s c o r e s o n t h e p s y c h o m e t r i c b a t t e r y a re g i v e n in
T a b l e 7. O S R is s i g n i f i c a n t l y c o r r e l a t e d w i t h t h r e e o f t h e f o u r v e r b a l r e a s o n i n g
s u b t e s t s , t w o o f t h e s e v e n s p a t i a l s u b t e s t s , o n e o f t h e t w o p e r c e p t u a l s p e e d a n d
a c c u r a c y s u b t e s t s , a n d W A I S IQ . I n c o n t r a s t to t he g e n e r a l p a t t e r n o f c o r r e l a t i o n
f o u n d w i t h O S R , S I P w a s s i g n i f i c a n t l y c o r r e l a t e d w i t h W A I S IQ a n d t h r e e o f t h e
f o u r v e r b a l a b i l i t y s u b t e s t s . T h e o n l y r e m a i n i n g s i g n i f i c a n t c o r r e l a t i o n is w i t h t h e

INFORMATION PROCESSING IN TWINS 253
TABLE 8 MZA and DZA Twin lntraclass Correlations for Individual
and Component Information Processing Scores
VARIABLE
DZA MZA Twin Pairs Twin Pairs
(N = 11-13) (N = 28-31)
PosnerLetter Identification % Correct .139 .135 PI .011 .571" NI -.340 .604* NI-PI .478 .116
Sternberg Memory Search % Correct -.044 .792* Intercept Positive - . 500 .316 Slope Positive .126 .163 Intercept Negative -.275 .371 * Slope Negative - . 173 .199
Shepard-Metzler Cube Rotations % Correct - . 186 .620* Intercept - . 122 .244 Slope .500 .256
Component Scores Overall Speed of Response Speed of Information Processing Speed of Spatial Processing
-.144 .456* .298 .125 .513" .196
Note. All variables are adjusted for the effects of age and sex *p < .05
Subtraction and Multiplication subtest from the perceptual speed and accuracy cluster. SSP also demonstrates a specific pattern of correlation with the psycho- metric measures. SSP is significantly correlated with all seven of the spatial ability subtests, and only two other subtests (Pedigrees and Identical Pictures).
Twin Similarity for the Information Processing Measures
The twin intraclass correlations for all information processing measures are given in Table 8. As the DZA sample is small, the DZA correlations, which are reported for completeness, are not discussed in any detail here. In only one case out of 15 was the DZA correlation significantly different from zero in either a positive or negative direction. The MZA sample, which is larger, does provide sufficient stability of results to allow reliable interpretation.
For those measures which primarily measure overall speed of response (PI,
254 MCGUE, BOUCHARD, LYKKEN, AND FEUER
NI, both Sternberg intercepts, and OSR) we found substantial and statistically significant MZA twin similarity. The only other significant correlations given in Table 8 are for percentage correct in either the Sternberg (r = .792) or the Shepard-Metzler (r = .620). The magnitude of the former is all the more re- markable when one considers the low error rate (Table 2) and the modest reliabil- ity for the Sternberg (Table 3). For none of the components which measure speed of a specific cognitive process (i.e., NI-PI, the Sternberg slopes, and Shepard- Metzler slope) was the MZA correlation statistically significant.
DISCUSSION
This study investigated three related issues: 1) the nature of the relationship between a battery of information processing measures and a battery of psycho- metric tests; 2) the basis of the interrelationships among information processing measures; and 3) the degree of twin similarity for information processing mea- sures. Each of these issues is discussed here in turn.
For the Posner, the NI-PI difference is thought to measure the time required to retrieve the name of the letter from memory. Hunt and coworkers (Hunt, Frost, & Lunneborg, 1973; Hunt, Lunneborg, & Lewis, 1975; Hunt, 1976), using primarily extreme group designs, have shown that NI-PI is related to psycho- metrically defined verbal ability. We did find an association between NI-PI and verbal reasoning in the present study, although the correlations are moderate (the average correlation with the four verbal reasoning subtests is - . 15) and some- what smaller than those reported by other investigators. Poltrock (1977, as reported in Hunt, 1978) reported a correlation of - . 2 8 between NI-PI and verbal ability in a sample of high ability high school seniors. With university student samples, Hunt, Davidson, and Lansman ( 1981) report a correlation of - . 25 with the Nelson-Denny reading composite, while Lansman et al. (1982) found a correlation (calculated by us using the summary information given) of - . 29 with a vocabulary test.
To the best of our knowledge, Lansman et al. (1982) are the only researchers who report the correlations between psychometric test scores and mean response latency under the name and physical identity conditions of the Posner. They report moderate, but significant, correlations between NI and PI and psycho- metric measures of perceptual speed and accuracy (Identical Pictures, Finding A's, and Cancelling Numbers; range of correlations from - . 17 to - . 30 ) , and near zero correlations between NI and PI and psychometric measures of verbal ability (e.g., the correlations between Vocabulary and NI and PI were - . 0 8 and +.07, respectively). Like Lansman et al., we found significant correlations between NI and PI and psychometric measures of perceptual speed and accuracy, although the magnitude of these correlations ( - . 2 9 to - . 40 ) is somewhat larger than those given by Lansman et al. Unlike Lansman et al., we also found significant, and quite large, correlations between NI and PI and measures of
INFORMATION PROCESSING IN TWINS 255
verbal reasoning. Furthermore, NI is more negatively correlated than is NI-PI with WAIS IQ and all four verbal reasoning tests. A similar result is also evident for PI, which presumably contains no verbal processing component. General speed appears to be more related to verbal ability than speed of the specific verbal process measured by N1-PI.
Those psychometric tests most highly correlated with the Sternberg slope and intercept parameters are also those considered to be referents of general cognitive ability or " g " (i.e., WAIS IQ and Pedigrees, that subtest from the Hawaii battery on which the first principal component had its highest loading; Kuse, 1977). The slopes and intercepts are also moderately correlated with Subtraction and Multiplication; a psychometric measure of perceptual speed and accuracy which, unlike Identical Pictures which is primarily perceptual, lequires simple mental processing. The correlations between the Sternberg parameters and the psychometric measures of memory and spatial ability were near zero. This is contrary to Carroll's (1976) preliminary cross classification of psychometric factors and cognitive processes which explicitly associates short-term memory processes, such as those measured by the Sternberg, with spatial and memory- span factors, but not with verbal ability factors or 'g. '
With the Shepard-Metzler, we found that the slope measure correlated signifi- cantly with measures of spatial ability, and, except for Identical Pictures, no other ability test. Nonetheless, the magnitude of these correlations was moderate and significant for only three of the seven spatial ability subtests. Furthermore, the intercept parameter was more strongly related to spatial ability than was the slope parameter, and was correlated nearly as much with WAIS IQ and selected measures of verbal reasoning as with measures of spatial ability.
The nature of the relationship between the information processing measures and psychometric test performance becomes more coherent when considering the results of the principal components analysis. The first identified component was a general speed factor not unlike the general cognitive ability factor usually found when factoring psychometric tests. This general speed component ac- counted for a large proportion of the variance in the information processing measures, and showed a consistent pattern of significant correlations with psy- chometric measures of general cognitive ability, verbal reasoning, and percep- tual speed and accuracy. The second identified component appeared to be specif- ically involved with the theoretically derived measures of cognitive processing in the Posner and Sternberg tasks. This component, which we denoted speed of information processing reflects, perhaps, speed of memory processing, and shows a differential pattern of correlation with the psychometric tests. It is significantly correlated with measures of general cognitive ability and verbal reasoning. The final component was specifically involved with the spatial pro- cessing measures and correlated significantly with measures of spatial ability and the Identical Pictures and Pedigrees subtests. Note that Identical Pictures, al- though a measure of speed, is composed of figural or spatial items.

256 MCGUE, BOUCHARD, LYKKEN, AND FEUER
There is much evidence for substantial twin resemblance on psychometric measures of cognitive ability such as those used here (Nichols, 1983), and, in part, the basis of this similarity appears to be due to the genetic or biological similarity of the twins (DeFries, Vandenberg, & McClearn, 1976). Here we have reported results for twins who were separated early in life. As these twins have had little exposure to each other and the magnitude of selective placement ap- pears to be minimal (Bouchard, Lykken, Heston, Eckert, Tellegen, & Got- tesman, 1984), whatever resemblance that we observe could be attributed, in large part, to genetic effects. There was significant twin similarity only for those information processing measures which reflect general speed of response. For those measures which assess rate of specific cognitive processes, the measures of primary theoretical concern in the paradigms used, there was essentially no twin resemblance. These results are not consistent with Hunt's (1983) notion that biological differences will have their greatest influence upon measures of the rate of cognitive processing.
The results reported here support the existence of a general speed component underlying performance on most experimental cognitive tasks which is strongly related to psychometric measures of 'g, ' and for which there are substantial genetic effects. Although much of the relationship between psychometric test perormance and processing speed may be attributed to the relationship between this general speed factor and 'g, ' we did find evidence for a second component which loads on measures of the rate of specific cognitive processes, which was specifically associated with psychometric measures of verbal ability, and which appeared to have little or no genetic basis.
Our results support Sternberg and Gardner's (1982) recent interpretation of the IQ and information processing literature. We quote them at length; "A result that at first glance appears most peculiar has emerged from many of these task analyses . . . The regression intercept, or global 'constant,' often turns out to be as highly correlated or more highly correlated with scores from IQ tests than are the analyzed parameters representing separated sources of variance. Since the constant includes speed of response, e.g., button pressing, one could interpret such results trivially as indicating that motor speed is an essential ingredient of intelligence. A more plausible interpretation, and, as it will turn out, one more consistent with the bulk of the data, is that there are certain constancies in information-processing tasks that tend to be shared across wide variations in item types. We suggest that the search for the general component(s) and the search for the general factor are one and the same search--that whatever it is that leads to a unitary source of individual differences across subjects also leads to a unitary source of differences across stimulus types." (Sternberg & Gardner, 1982; pp. 232-233).
There is remarkable convergence of results from the analysis of information processing parameters and the analysis of psychometric test performance. This is explicit in Sternberg and Gardner's discussion of the general factor cited above.

INFORMATION PROCESSING IN TWINS 257
W e , as we l l as L a n s m a n et al. ( i 982) , p r e s e n t r e su l t s w h i c h s u p p o r t the e x i s t e n c e
o f a v e r b a l - s p a t i a l d i s t i n c t i o n fo r i n f o r m a t i o n p r o c e s s i n g m e a s u r e s m u c h l ike the
d i s t i nc t i on f o u n d wi th p s y c h o m e t r i c t e s t s ( c . f . V e r n o n , 1961). It is l ike ly tha t , as
add i t i ona l re l iab l~ and va l id i n f o r m a t i o n p r o c e s s i n g t a sks are d e v e l o p e d , a s t r ong
i s o m o r p h i s m b e t w e e n the t w o d o m a i n s wil l be f o u n d .
R E F E R E N C E S
Berg. C.. Henzog, C., & Hunt, E. (1982). Age differences in the speed of mental rotation. Develop- mental Po'chology. 18. 95-107.
Bouchard. Y. J., Jr., Heston. L. L., Eci(ert, E., Keyes. M., & Resnick, S. (1981). The Minnesota study of twins reared apart: Project description and sample results in the developmental domain. In L. Gedda, P. Parisi. & W. E. Nance (Eds.), Twin research. Part B. intelligence, personali~.'. and development. New York: Allan R. Liss.
Bouchard. T. J., Jr., Lykken. D. T.. Heston, L. L., Eckert, E.. Tellegen. A., & Gottesman. I. I. (inpreparation. 1984). Similarities in intelligence between twins reared apart.
Carroll. J. B. (1976). Psychometric tests as cognitive tasks: A new "'structure of intellect." In L. B. Resnick fed.), The nature of intelligence. Hillsdale. N J: Erlbaum.
Chiang. A.. & Atkinson. R, C. (1976). Individual differences and interrelationships among a select set of cognitive skills. Memo o" and Cognition. 4. 661-672.
DeFiles, J, C.. Johnson. R C.. Kuse. A. R., McClearu. G. E., Polovina. J., Vandenberg. S. G.. & Wilson, J. R. (1979). Familial resemblance for specific cognitive abilities, Behavior Genetics. 9. 23-43.
DeFries. J. C.. Vandenberg. S. G,. & McClearn, G. E. (1976). Genetics of specific cognitive abilities. Annual Review of Genetics. 10. 179-207.
Ekstrom. R. B., French, J. W,. & Harman. H. H. (1976). Manual for kit of factor-referenced cognitive tests. Princeton, NJ: Educational Testing Service.
Hakstian. A. R., & Cattell. R. B. (1978). Higher-stratum ability structures on the basis of twenty primary, abilities. Journal of Educational Psy'chology. 70. 657-669.
Hunt. E. B. (1976). Varieties of cognitive power, in L. B. Resnick (Ed.), The nature of intelligence. Hillsdale, NJ: Erlbaum.
Hunt, E. B. (1978). Mechanics of verbal ability. Po'chological Review. 85. 109-130. Hunt. E. B. (1983). On the nature of intelligence. Science, 219. 141-146. Hunt, E. B., Davidson, J., & Lansman, M. (1981). Individual differences in longterm memory
acess. Memory and Cognition. 9. 599-608. Hunt. E. B., Frost, N., & Lunneborg, C. E. (1973). Individual differences in cognition. In G. Bower
fed.). Advances in learning and memory (Vol. 7). New York: Academic Press. Hunt. E B.. Lunneborg, C., & Lewis, J. (1975). What does it mean to be high verbal? Cognitive
Po'chology, 7, 194-227. Jenkinson, J. C. (1983), Is speed of information processing related to fluid or crystallized intel-
ligence. 7. 91-106. Jensen. A. R. (1982). Reaction and inspection time measures of intelligence. In H. J. Eysenck (Ed.),
A model for intelligence. Berlin: Springer-Verlag. Keating, D. P., & Bobbitt, B. L. (1978). Individual and developmental differences in cognitive-
processing components of mental ability. ChiM Development, 49, 155-167. Kuse, A. R. (1977). Familial resemblance for cognitive abilities estimated from two test batteries in
Hawaii. Unpublished doctoral dissertation, University of Colorado at Boulder. Lansman, M., Donaldson, G., Hunt, E. B., & Yantis. S. (1982). Ability factors and cognitive
processes. Intelligence, 6, 347-386.

258 MCGUE, BOUCHARD, LYKKEN, AND FEUER
Lykken, D. T. (1982). Research with twins: The concept of emergenesis. Psychophysiology, 19, 361-373.
Lykken, D. T. (1978). The diagnosis of zygosity in twins. Behavior Genetics, 8, 437-473. Matarazzo, J. D. (1972). Weschler' s measurement and appraisal of adult intelligence (5th & en-
larged ed.). Baltimore: Williams & Wilkins. McGue, M., & Bouchard, T. J., Jr. (in press). Adjustment of twin data for the effects of age and sex.
Behavior Genetics. Nichols, P. L. (1983). Familial resemblance in cognitive performance. Paper presented at Behavior
Genetics Association meetings; London, England. Nunnally, J. C. (1967). Psychometric theory. New York: McGraw Hill. Posner, M., Boies, S., Eichelman, W., & Taylor, R. (1969). Retention of visual and name codes of
single letters. Journal of Experimental Psychology, 79, 1-16. Shepard, R., & Metzler, J. (1971). Mental rotation of three dimensional objects. Science, 171,701-
703. Sternberg, S. (1969). The discovery of processing stages: Extension of Donders' method. Acta
Psychologica, 30, 276-315. Sternberg, R. J., & Gardner, M. K. (1982). A componential interpretation of the general factor in
human intelligence. In H. J. Eysenck (Ed.), A model for intelligence. Berlin: Springer-Verlag. Tapley, S. M., & Bryden, M. P. (1977). An investigation of sex differences in spatial ability: Mental
rotation of three-dimensional objects. Canadian Journal of Psychology, 31, 122-130. Vernon, P. A. (1983). Speed of information processing and general intelligence. Intelligence, 7, 53-
70. Vernon, P. E. (1961). The structure of human abilities (2nd ed.) London: Methuen. Wilson, J. R., DeFries, J. C., McClearn, G. E., Vandenberg, S. G., Johnson, R. C., Mi, M. P., &
Rashad, M. N. (1975). Cognitive abilities: Use of family data as a control to assess sex and age differences in two ethnic groups. International Journal of Aging and Human Development, 6, 261-276.


![[Chinua Achebe] Things Fall Apart (Everyman's Libr(BookZa.org)](https://img.dokumen.tips/doc/110x75/635d44081b1c1ace2608f32a/chinua-achebe-things-fall-apart-everymans-librbookzaorg.jpg)


