Embed Size (px)
Citation preview

CONTENTS
Brief History
Railway Recovery and Reform Programme
Schematic Organogram
Private Sector Association
Development Plan Outlays
Track, Bridges, Stations & Signalling
Tele communication
Rolling Stock, Railway Ferry Services and Electrical
Stores, Passenger and Freight Traffic
Operational Problems
Officers and Staff Welfare
Social Cost
Security
Financial Summary
Statistical Highlights
Statistical Tables
Railway Stations
Block & Non-block Stations
Route Kilometers
District-wise Route Kilometers
Track Kilometers Operated
Locomotives
Coaching Vehicles
Type- wise Passenger Coaching Vehicles
Type-wise Other Coaching Vehicles
Abandonment of Coaching Vehicles
Addition of Coaching Vehicles
Freight Wagons
Type-wise Freight Wagons
Abandonment of Freight Wagons
Addition of Freight Wagons
Summary of Rolling Stock

Availability of Rolling Stock
Passenger Traffic
Gauge-wise Passenger Traffic
Passenger Traffic Air-conditioned and First Class Passenger Traffic Second Class Class-wise Percentage of Passenger Traffic Class-wise Percentage of Passenger-kilometers Intercity Passenger Traffic Service-wise Passenger Traffic Occupancy of Intercity Trains Freight Wagons Loaded Freight Tonnes Carried Gauge-wise Freight Tonnes Carried Principal Commodities Carried Earnings from Principal Commodities Freight Traffic in Descending Order of Tonnes Carried Passenger Trains and Train-kilometers (BG) Passenger Trains and Train-kilometers (MG- East & West Zone Combined) Passenger Trains and Train-kilometers (MG-Zone-wise) Running of Passenger Trains (MG-Zone-wise) Passenger Train-kilometers (MG-Zone-wise) Punctuality of Passenger Trains (BG & MG) Punctuality of Passenger Trains (MG-Zone-wise) Coaching Vehicles per Train and Coaching Vehicle-kilometers (BG) Coaching Vehicles per Train and Coaching Vehicle-kilometers (MG)
Coaching Vehicles per Train and Coaching Vehicle-kilometers (MG-Zone wise) Freight Trains (BG) Freight Trains (MG) Freight Trains (MG-Zone-wise) Freight Trains Gross Tonne-kilometers Container Services Speed and Net Load of Freight Trains (BG) Speed and Net Load of Freight Trains (MG) Speed and Net Load of Freight Trains (MG-Zone-wise) Coaching Vehicle Performance (BG)
Coaching Vehicle Performance (MG-East & West Zone Combined) Freight Wagon Performance (BG) Freight Wagon Performance (MG-East & West Zone Combined) Locomotive Performance (BG) Locomotive Performance (MG-East & West Zone Combined) Engine Kilometers-Passenger, Goods and others (BG) Engine Kilometers-Passenger, Goods and Others (MG-East & West Zone Combined) Fuel Consumption Fuel Consumption (Zone-wise) Traffic Density (West Zone) Traffic Density (East Zone) Train Accidents Analysis of Train Accidents Casualties Passenger and Freight Revenue Class-wise Passenger Earnings and Passenger-kilometers. Class-wise Revenue per Passenger-kilometer Operating Revenue and Their Percentage Operating Expenses and Their Percentage Net Operating Income (Without Considering PSO & Welfare Grant) Net Operating Income and Operating Ratio (Considering PSO Compensation & Welfare Grant) Zone-wise Operating Revenue Zone-wise Operating Expenses Operating Ratio (Without Considering PSO & Welfare Grant) Number and Cost of Employees Department-wise Number of Employees Zone-wise Number of Employees Department-wise Percentage of Employees Department-wise Employees of Project Management Organization List of Closed Branch Line LIST OF PRINCIPAL OFFICERS Director General`s Office East Zone West Zone

Project Management Organization Other Principal Officers LIST OF PRINCIPAL OFFICERS
Director General`s Office
East Zone
West Zone
Project Management Organization
Other Principal Officers
EXPLANATORY REMARKS
1. The Financial year is the period from 1st July of the previous year
to 30th June of the current year.
2. Tonnage figures are all in Metric tons.
I Metric ton = 2204. 62 lbs.
3. Exchange rates:
1 Bangladesh Taka = 100 paisha
1 US$ = Tk. 78.950
Pound Sterling = 106.1050
1 Taka = 0.01266 U.S. Dollar
1 Taka = 0.009424 Pound Sterling
4. Lakh. = 100,000
5. The abbreviations `BG' and `MG’ indicate Broad Gauge (5'-6'' or 1676
mm) and Metre Gauge (3'-3-3/8'' or 1000 mm) respectively.
6. The abbreviation `DG' indicates Dual Gauge (Broad Gauge and Metre
Gauge combined)
7. No Broad Gauge System exists in the East Zone.
8. The Zone-wise Statistics have been introduced from the financial year
1982-83.
9. All Statistics have been expressed in Metric Units.
CONVERSION COEFFICIENTS
LENGTH One mile = 1.609344 kilometers
One kilometer = 0.621371 mile
One meter = 39.369996 inches
= 3.280833 feet
= 1.093611 yards
One inch = 0.0254 metre
One feet = 0.3048 metre
One yard = 0.9144 metre
One long ton-mile = 1.635169 tonne- kilometres.
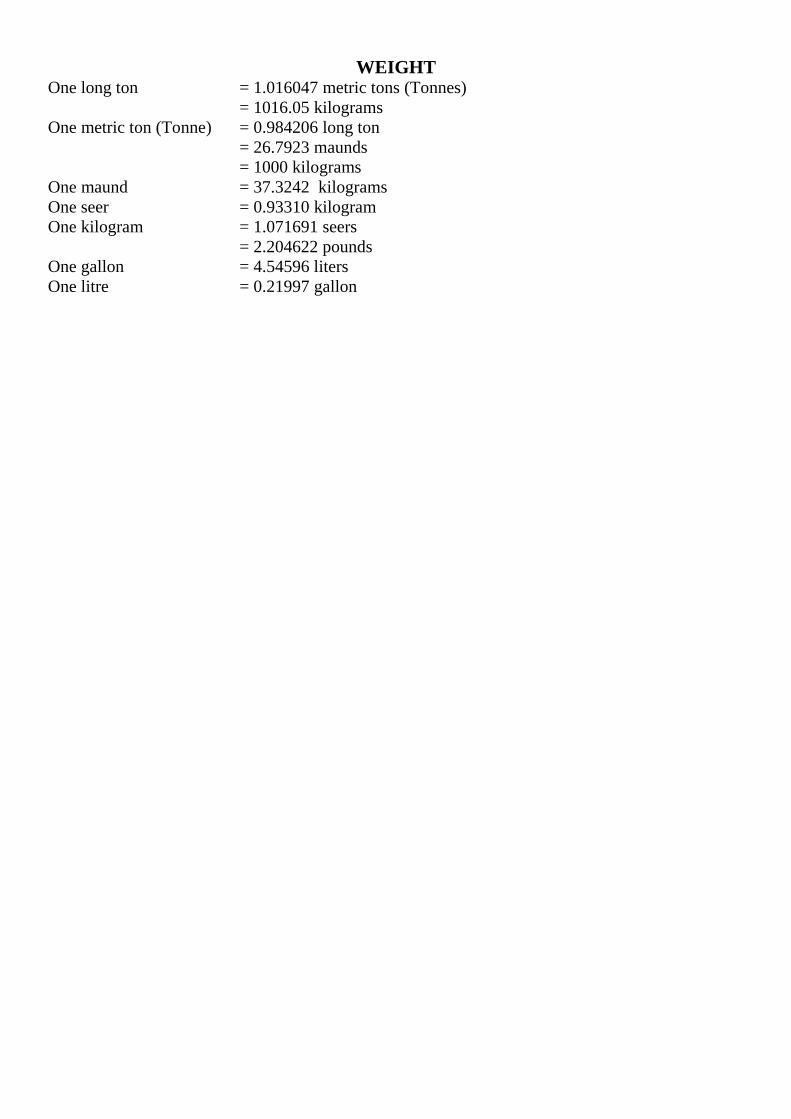
WEIGHT One long ton = 1.016047 metric tons (Tonnes)
= 1016.05 kilograms
One metric ton (Tonne) = 0.984206 long ton
= 26.7923 maunds
= 1000 kilograms
One maund = 37.3242 kilograms
One seer = 0.93310 kilogram
One kilogram = 1.071691 seers
= 2.204622 pounds
One gallon = 4.54596 liters
One litre = 0.21997 gallon
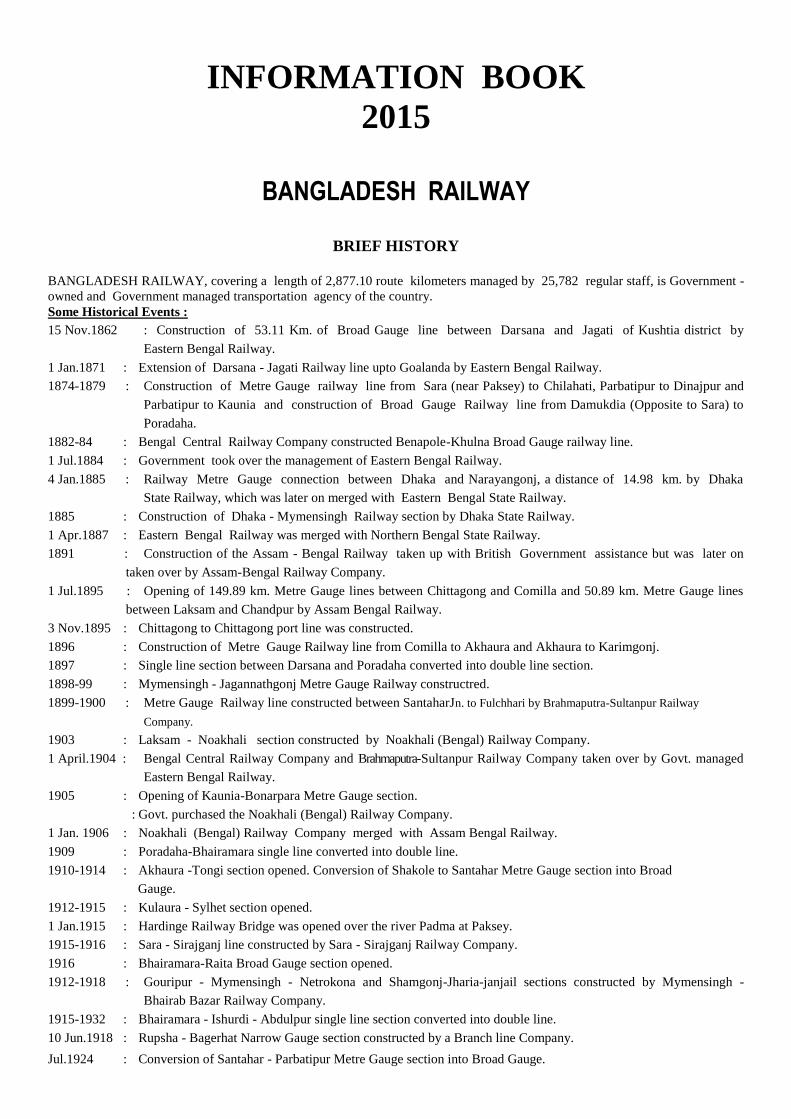
INFORMATION BOOK
2015
BANGLADESH RAILWAY
BRIEF HISTORY
BANGLADESH RAILWAY, covering a length of 2,877.10 route kilometers managed by 25,782 regular staff, is Government -
owned and Government managed transportation agency of the country.
Some Historical Events :
15 Nov.1862 : Construction of 53.11 Km. of Broad Gauge line between Darsana and Jagati of Kushtia district by
Eastern Bengal Railway.
1 Jan.1871 : Extension of Darsana - Jagati Railway line upto Goalanda by Eastern Bengal Railway.
1874-1879 : Construction of Metre Gauge railway line from Sara (near Paksey) to Chilahati, Parbatipur to Dinajpur and
Parbatipur to Kaunia and construction of Broad Gauge Railway line from Damukdia (Opposite to Sara) to
Poradaha.
1882-84 : Bengal Central Railway Company constructed Benapole-Khulna Broad Gauge railway line.
1 Jul.1884 : Government took over the management of Eastern Bengal Railway.
4 Jan.1885 : Railway Metre Gauge connection between Dhaka and Narayangonj, a distance of 14.98 km. by Dhaka
State Railway, which was later on merged with Eastern Bengal State Railway.
1885 : Construction of Dhaka - Mymensingh Railway section by Dhaka State Railway.
1 Apr.1887 : Eastern Bengal Railway was merged with Northern Bengal State Railway.
1891 : Construction of the Assam - Bengal Railway taken up with British Government assistance but was later on
taken over by Assam-Bengal Railway Company.
1 Jul.1895 : Opening of 149.89 km. Metre Gauge lines between Chittagong and Comilla and 50.89 km. Metre Gauge lines
between Laksam and Chandpur by Assam Bengal Railway.
3 Nov.1895 : Chittagong to Chittagong port line was constructed.
1896 : Construction of Metre Gauge Railway line from Comilla to Akhaura and Akhaura to Karimgonj.
1897 : Single line section between Darsana and Poradaha converted into double line section.
1898-99 : Mymensingh - Jagannathgonj Metre Gauge Railway constructred.
1899-1900 : Metre Gauge Railway line constructed between SantaharJn. to Fulchhari by Brahmaputra-Sultanpur Railway
Company.
1903 : Laksam - Noakhali section constructed by Noakhali (Bengal) Railway Company.
1 April.1904 : Bengal Central Railway Company and Brahmaputra-Sultanpur Railway Company taken over by Govt. managed
Eastern Bengal Railway.
1905 : Opening of Kaunia-Bonarpara Metre Gauge section.
: Govt. purchased the Noakhali (Bengal) Railway Company.
1 Jan. 1906 : Noakhali (Bengal) Railway Company merged with Assam Bengal Railway.
1909 : Poradaha-Bhairamara single line converted into double line.
1910-1914 : Akhaura -Tongi section opened. Conversion of Shakole to Santahar Metre Gauge section into Broad
Gauge.
1912-1915 : Kulaura - Sylhet section opened.
1 Jan.1915 : Hardinge Railway Bridge was opened over the river Padma at Paksey.
1915-1916 : Sara - Sirajganj line constructed by Sara - Sirajganj Railway Company.
1916 : Bhairamara-Raita Broad Gauge section opened.
1912-1918 : Gouripur - Mymensingh - Netrokona and Shamgonj-Jharia-janjail sections constructed by Mymensingh -
Bhairab Bazar Railway Company.
1915-1932 : Bhairamara - Ishurdi - Abdulpur single line section converted into double line.
10 Jun.1918 : Rupsha - Bagerhat Narrow Gauge section constructed by a Branch line Company.
Jul.1924 : Conversion of Santahar - Parbatipur Metre Gauge section into Broad Gauge.
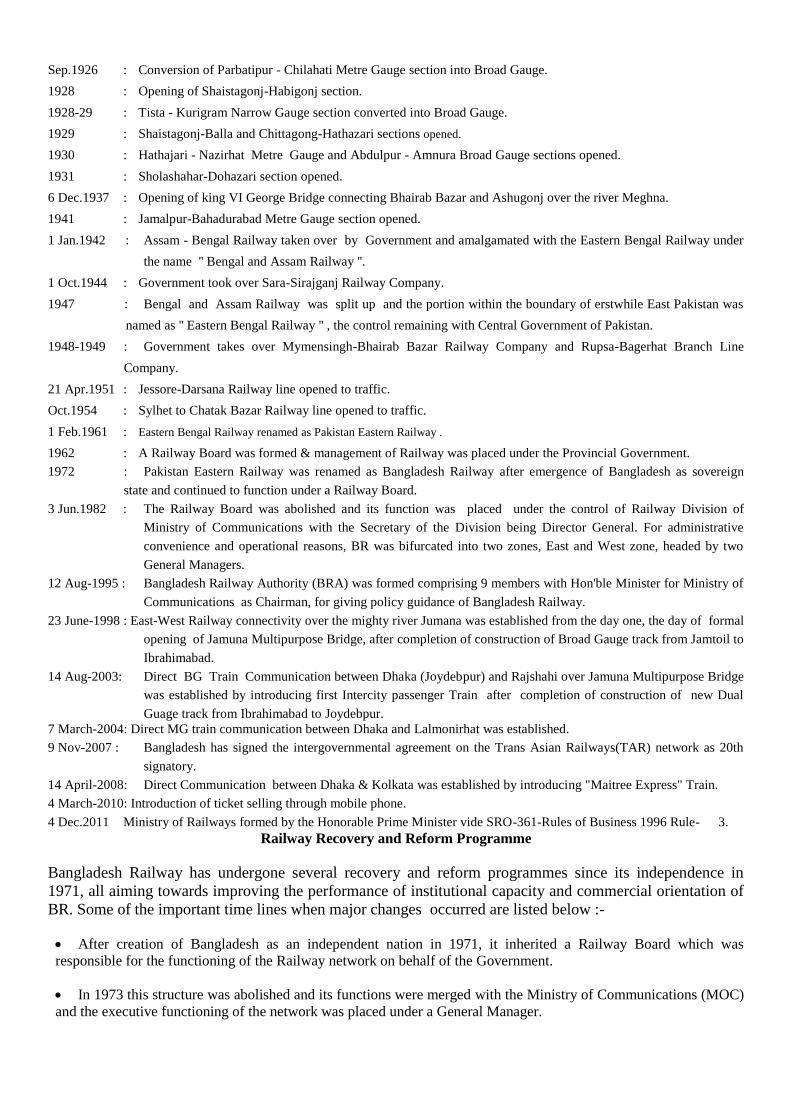
Sep.1926 : Conversion of Parbatipur - Chilahati Metre Gauge section into Broad Gauge.
1928 : Opening of Shaistagonj-Habigonj section.
1928-29 : Tista - Kurigram Narrow Gauge section converted into Broad Gauge.
1929 : Shaistagonj-Balla and Chittagong-Hathazari sections opened.
1930 : Hathajari - Nazirhat Metre Gauge and Abdulpur - Amnura Broad Gauge sections opened.
1931 : Sholashahar-Dohazari section opened.
6 Dec.1937 : Opening of king VI George Bridge connecting Bhairab Bazar and Ashugonj over the river Meghna.
1941 : Jamalpur-Bahadurabad Metre Gauge section opened.
1 Jan.1942 : Assam - Bengal Railway taken over by Government and amalgamated with the Eastern Bengal Railway under
the name '' Bengal and Assam Railway ''.
1 Oct.1944 : Government took over Sara-Sirajganj Railway Company.
1947 : Bengal and Assam Railway was split up and the portion within the boundary of erstwhile East Pakistan was
named as '' Eastern Bengal Railway '' , the control remaining with Central Government of Pakistan.
1948-1949 : Government takes over Mymensingh-Bhairab Bazar Railway Company and Rupsa-Bagerhat Branch Line
Company.
21 Apr.1951 : Jessore-Darsana Railway line opened to traffic.
Oct.1954 : Sylhet to Chatak Bazar Railway line opened to traffic.
1 Feb.1961 : Eastern Bengal Railway renamed as Pakistan Eastern Railway .
1962 : A Railway Board was formed & management of Railway was placed under the Provincial Government.
1972 : Pakistan Eastern Railway was renamed as Bangladesh Railway after emergence of Bangladesh as sovereign
state and continued to function under a Railway Board.
3 Jun.1982 : The Railway Board was abolished and its function was placed under the control of Railway Division of
Ministry of Communications with the Secretary of the Division being Director General. For administrative
convenience and operational reasons, BR was bifurcated into two zones, East and West zone, headed by two
General Managers.
12 Aug-1995 : Bangladesh Railway Authority (BRA) was formed comprising 9 members with Hon'ble Minister for Ministry of
Communications as Chairman, for giving policy guidance of Bangladesh Railway.
23 June-1998 : East-West Railway connectivity over the mighty river Jumana was established from the day one, the day of formal
opening of Jamuna Multipurpose Bridge, after completion of construction of Broad Gauge track from Jamtoil to
Ibrahimabad.
14 Aug-2003: Direct BG Train Communication between Dhaka (Joydebpur) and Rajshahi over Jamuna Multipurpose Bridge
was established by introducing first Intercity passenger Train after completion of construction of new Dual
Guage track from Ibrahimabad to Joydebpur.
7 March-2004: Direct MG train communication between Dhaka and Lalmonirhat was established.
9 Nov-2007 : Bangladesh has signed the intergovernmental agreement on the Trans Asian Railways(TAR) network as 20th
signatory.
14 April-2008: Direct Communication between Dhaka & Kolkata was established by introducing "Maitree Express" Train.
4 March-2010: Introduction of ticket selling through mobile phone.
4 Dec.2011 Ministry of Railways formed by the Honorable Prime Minister vide SRO-361-Rules of Business 1996 Rule- 3.
Railway Recovery and Reform Programme
Bangladesh Railway has undergone several recovery and reform programmes since its independence in
1971, all aiming towards improving the performance of institutional capacity and commercial orientation of
BR. Some of the important time lines when major changes occurred are listed below :-
After creation of Bangladesh as an independent nation in 1971, it inherited a Railway Board which was
responsible for the functioning of the Railway network on behalf of the Government.
In 1973 this structure was abolished and its functions were merged with the Ministry of Communications (MOC)
and the executive functioning of the network was placed under a General Manager.
In 1976, on the advice of the Asian Development Bank, the Government (GOB) agreed to re-establish the
Railway Board to conduct the management functions with MOC exercising policy control.
The Railway Board was again abolished with effect from June 2, 1982 and a Railway Division was created under
the MOC with the Railway Division being vested with the functions being discharged bythe erstwhile
Railway Board. Secretary, Railway Division under the MOC was made to head BR and to discharge the
functions of DG/BR. The Railway was bifurcated into East and West Zones, each placed under a General
Manager with supporting administrative structure.
The Railway Recovery Programme(RRP)launched in 1991: The RRP was launched to
improve the performance of Bangladesh Railway through (i) Reduction in manpower, (ii) Introduction of Public
Service Obligation (PSO) concept. (iii)Withdrawal of concessions in tariff, (iv) Introduction of Welfare Grant
and,
(v)Closure of unnecessary functions. As a result, the work force was reduced from 58,000 to 35,000 through
voluntary separation and natural attrition. Apart from this, a number of revenue losing branch lines, sheds,
depots etc, were closed and some of the non- profitable passenger train services were withdrawn.
The Organization Reform Programme (phase-I) launched in 1994 had the key recommendations: (i) To separate
Railway Organization from Ministry of Communication, (ii) Formation of Bangladesh Railway Authority
(BRA), (iii) Allocation of Authority and Power among Bangladesh Government, BRA and BR Management and
(iv) Restructuring of BR. The Phase-II & Phase-III of Organizational Reform with the same objective followed
subsequently.
* With a view to transform BR into a more market oriented, commercialized and autonomous entity with full
public accountability and to improve the operational and financial performance of the network on a sustainable
basis, ADB under its Railway Recovery Programme, recommended creation of a Bangladesh Railway Authority
(BRA) through a legislative process. However, on grounds of expediting implementation, the GOB created this
new structure through a Cabinet Resolution dated August 12,1995 and delineated the authority matrix between
GOB, BRA and BR through another Govt.Resolution dated March -9 1996. BRA was constituted for providing policy
guidance to BR in railway matters with the Minister of Communications chairing this multi disciplinary body
consisting of 8 members drawn from Govt.(MOC, Ministry of Finance and Planning Commission). BR (DG/BR
and two functional ADGs) and the private sector (Two number). BRA and BR were placed under the administrative
control of the Roads and Railway Division of MOC with the instruction of not exercising the role of a
director/controller over the railway management. At the same time, DG/BR was appointed from the organized
Railway cadre without ex-officio status as Secretary to GOB. The ex-officio status of the other railway
functionaries under DG/BR was also withdrawn. GOB was assigned the role of formulating national transport
policy, set safety standards for BR operations, approving and arranging funding of BR’s long –term investments
and determining the financial implications of public service obligation (PSO) services. BRA was charged with the
responsibility to determine policies relating to railway operation in the context of National Transport Policy, ensure
accountability of BR management and determine long term investment plan and strategy of BR. BR, headed by a
DG, was assigned responsibility for the day-to-day operations of the Railway. A new Marketing and Corporate
Planning Department and a full fledged Personnel Department were also created in the DG’s office to focus on the
marketing and Human Resource Development (HRD) functions. DG/BR was made an ex-officio member of BRA
along with two ADGs of BR as non-voting members.
Bangladesh Railway Reform programme launched in 2006:Bangladesh Railway has embarked upon a comprehensive
reform programme to achieve the guidelines of the National Land Transport Policy designed to integrate all aspects
covered under earlier programme with more focus on Restructuring BR into Lines of Business(LOB)structure,
improvement of financial management & accounting system, preparation of asset registry for all LOBs, improvement
of HR management structures etc. The programme, like the earlier ones, is funded by Asian Development Bank
(ADB). An International Consulting firm has been engaged for achieving the above tasks.
Under this reform programme, it is proposed that BR will be restructured in 8 (eight) Lines of Business (LOB) i.e.
Passenger, Freight, Infrastructure, Rolling Stock, Finance, Corporate Services, Project and Estate LOBs. There will be
a Railway Advisory Board vested with the policy making authority on behalf of the Government. A separate Railway
Executive Board under the Chairmanship of Director General, Bangladesh Railway will be formed. Passenger,
Freight, Infrastructure, Rolling Stock, Finance & Corporate Services LOB heads will be the member of the Railway
Executive Board. The proposed Railway Advisory Board and Railway Executive Board are under process of approval
by GOB.
An independent Ministry named ``Ministry of Railway'' established for Bangladesh Railway on 4 December, 2011 for
rapid development and service improvement of Railway in a dynamic operational environment.
PRIVATE SECTOR ASSOCIATION
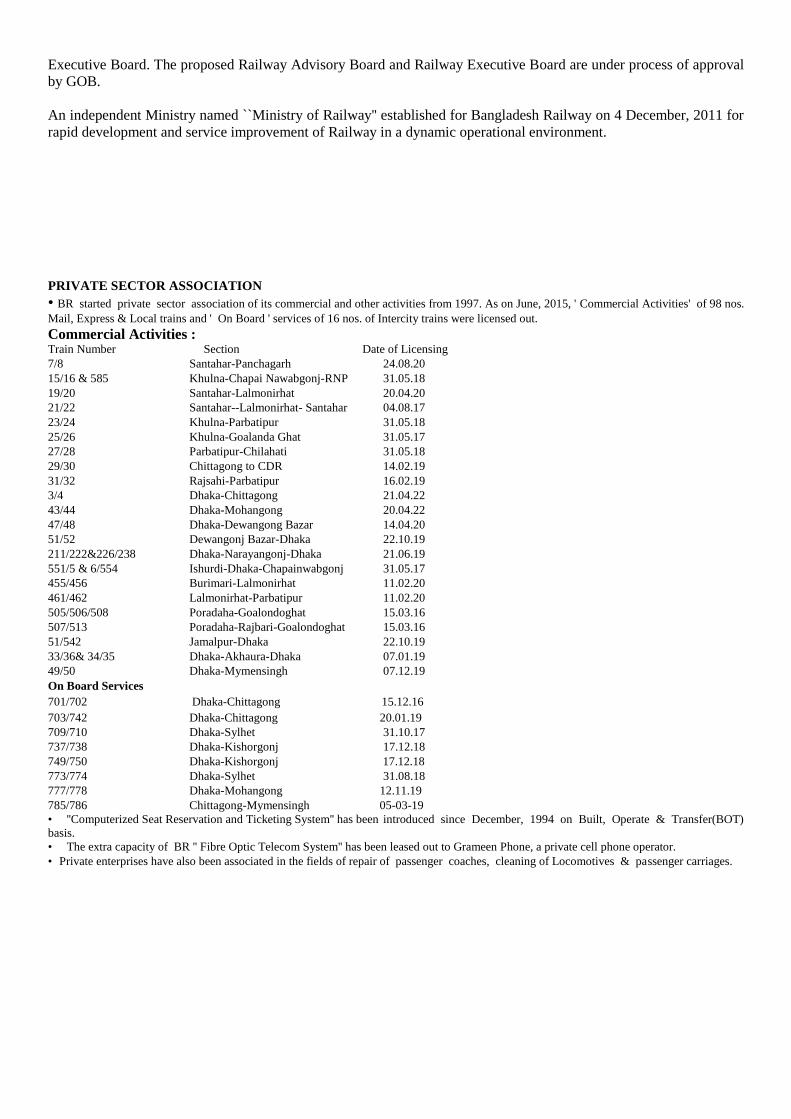
• BR started private sector association of its commercial and other activities from 1997. As on June, 2015, ' Commercial Activities' of 98 nos.
Mail, Express & Local trains and ' On Board ' services of 16 nos. of Intercity trains were licensed out.
Commercial Activities : Train Number Section Date of Licensing
7/8 Santahar-Panchagarh 24.08.20
15/16 & 585 Khulna-Chapai Nawabgonj-RNP 31.05.18
19/20 Santahar-Lalmonirhat 20.04.20
21/22 Santahar--Lalmonirhat- Santahar 04.08.17
23/24 Khulna-Parbatipur 31.05.18
25/26 Khulna-Goalanda Ghat 31.05.17
27/28 Parbatipur-Chilahati 31.05.18
29/30 Chittagong to CDR 14.02.19
31/32 Rajsahi-Parbatipur 16.02.19
3/4 Dhaka-Chittagong 21.04.22
43/44 Dhaka-Mohangong 20.04.22
47/48 Dhaka-Dewangong Bazar 14.04.20
51/52 Dewangonj Bazar-Dhaka 22.10.19
211/222&226/238 Dhaka-Narayangonj-Dhaka 21.06.19
551/5 & 6/554 Ishurdi-Dhaka-Chapainwabgonj 31.05.17
455/456 Burimari-Lalmonirhat 11.02.20
461/462 Lalmonirhat-Parbatipur 11.02.20
505/506/508 Poradaha-Goalondoghat 15.03.16
507/513 Poradaha-Rajbari-Goalondoghat 15.03.16
51/542 Jamalpur-Dhaka 22.10.19
33/36& 34/35 Dhaka-Akhaura-Dhaka 07.01.19
49/50 Dhaka-Mymensingh 07.12.19
On Board Services
701/702 Dhaka-Chittagong 15.12.16
703/742 Dhaka-Chittagong 20.01.19
709/710 Dhaka-Sylhet 31.10.17
737/738 Dhaka-Kishorgonj 17.12.18
749/750 Dhaka-Kishorgonj 17.12.18
773/774 Dhaka-Sylhet 31.08.18
777/778 Dhaka-Mohangong 12.11.19
785/786 Chittagong-Mymensingh 05-03-19
• ''Computerized Seat Reservation and Ticketing System'' has been introduced since December, 1994 on Built, Operate & Transfer(BOT)
basis.
• The extra capacity of BR '' Fibre Optic Telecom System'' has been leased out to Grameen Phone, a private cell phone operator.
• Private enterprises have also been associated in the fields of repair of passenger coaches, cleaning of Locomotives & passenger carriages.
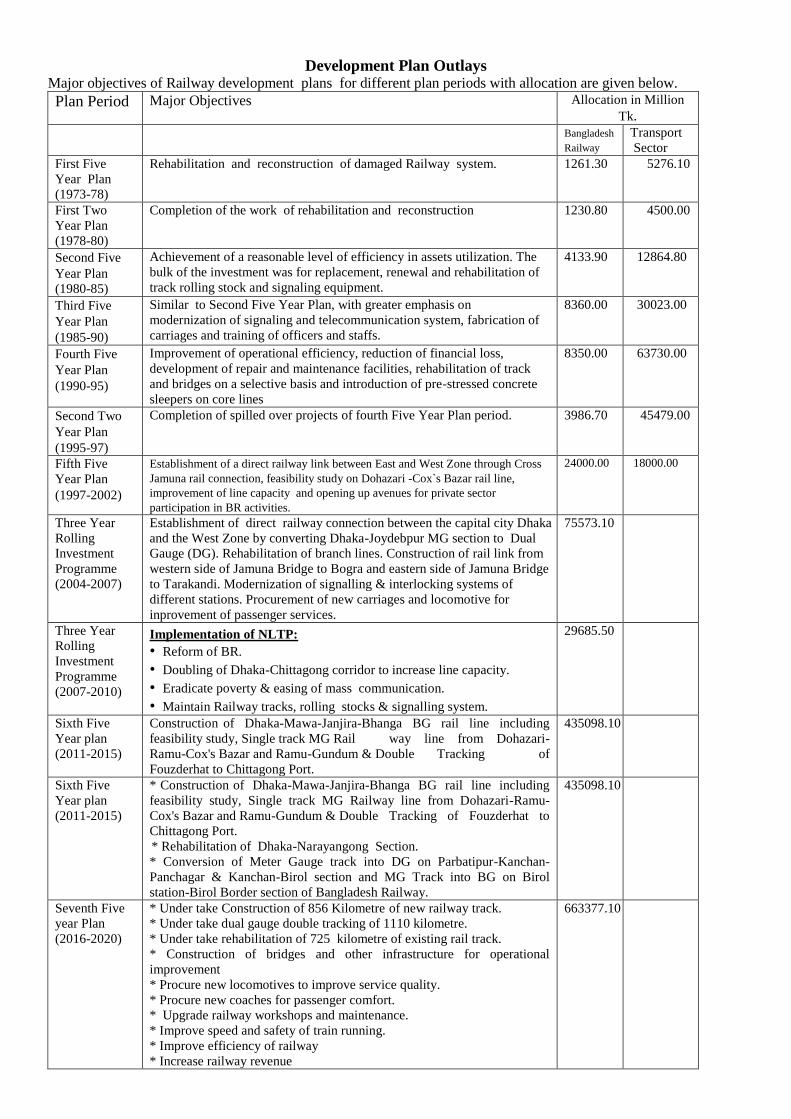
Development Plan Outlays Major objectives of Railway development plans for different plan periods with allocation are given below.
Plan Period Major Objectives Allocation in Million
Tk. Bangladesh
Railway
Transport
Sector
First Five
Year Plan
(1973-78)
Rehabilitation and reconstruction of damaged Railway system. 1261.30 5276.10
First Two
Year Plan
(1978-80)
Completion of the work of rehabilitation and reconstruction 1230.80 4500.00
Second Five
Year Plan
(1980-85)
Achievement of a reasonable level of efficiency in assets utilization. The
bulk of the investment was for replacement, renewal and rehabilitation of
track rolling stock and signaling equipment.
4133.90 12864.80
Third Five
Year Plan
(1985-90)
Similar to Second Five Year Plan, with greater emphasis on
modernization of signaling and telecommunication system, fabrication of
carriages and training of officers and staffs.
8360.00 30023.00
Fourth Five
Year Plan
(1990-95)
Improvement of operational efficiency, reduction of financial loss,
development of repair and maintenance facilities, rehabilitation of track
and bridges on a selective basis and introduction of pre-stressed concrete
sleepers on core lines
8350.00 63730.00
Second Two
Year Plan
(1995-97)
Completion of spilled over projects of fourth Five Year Plan period. 3986.70 45479.00
Fifth Five
Year Plan
(1997-2002)
Establishment of a direct railway link between East and West Zone through Cross
Jamuna rail connection, feasibility study on Dohazari -Cox`s Bazar rail line,
improvement of line capacity and opening up avenues for private sector
participation in BR activities.
24000.00 18000.00
Three Year
Rolling
Investment
Programme
(2004-2007)
Establishment of direct railway connection between the capital city Dhaka
and the West Zone by converting Dhaka-Joydebpur MG section to Dual
Gauge (DG). Rehabilitation of branch lines. Construction of rail link from
western side of Jamuna Bridge to Bogra and eastern side of Jamuna Bridge
to Tarakandi. Modernization of signalling & interlocking systems of
different stations. Procurement of new carriages and locomotive for
inprovement of passenger services.
75573.10
Three Year
Rolling
Investment
Programme
(2007-2010)
Implementation of NLTP:
• Reform of BR.
• Doubling of Dhaka-Chittagong corridor to increase line capacity.
• Eradicate poverty & easing of mass communication.
• Maintain Railway tracks, rolling stocks & signalling system.
29685.50
Sixth Five
Year plan
(2011-2015)
Construction of Dhaka-Mawa-Janjira-Bhanga BG rail line including
feasibility study, Single track MG Rail way line from Dohazari-
Ramu-Cox's Bazar and Ramu-Gundum & Double Tracking of
Fouzderhat to Chittagong Port.
435098.10
Sixth Five
Year plan
(2011-2015)
* Construction of Dhaka-Mawa-Janjira-Bhanga BG rail line including
feasibility study, Single track MG Railway line from Dohazari-Ramu-
Cox's Bazar and Ramu-Gundum & Double Tracking of Fouzderhat to
Chittagong Port.
* Rehabilitation of Dhaka-Narayangong Section.
* Conversion of Meter Gauge track into DG on Parbatipur-Kanchan-
Panchagar & Kanchan-Birol section and MG Track into BG on Birol
station-Birol Border section of Bangladesh Railway.
435098.10
Seventh Five
year Plan
(2016-2020)
* Under take Construction of 856 Kilometre of new railway track.
* Under take dual gauge double tracking of 1110 kilometre.
* Under take rehabilitation of 725 kilometre of existing rail track.
* Construction of bridges and other infrastructure for operational
improvement
* Procure new locomotives to improve service quality.
* Procure new coaches for passenger comfort.
* Upgrade railway workshops and maintenance.
* Improve speed and safety of train running.
* Improve efficiency of railway
* Increase railway revenue
663377.10
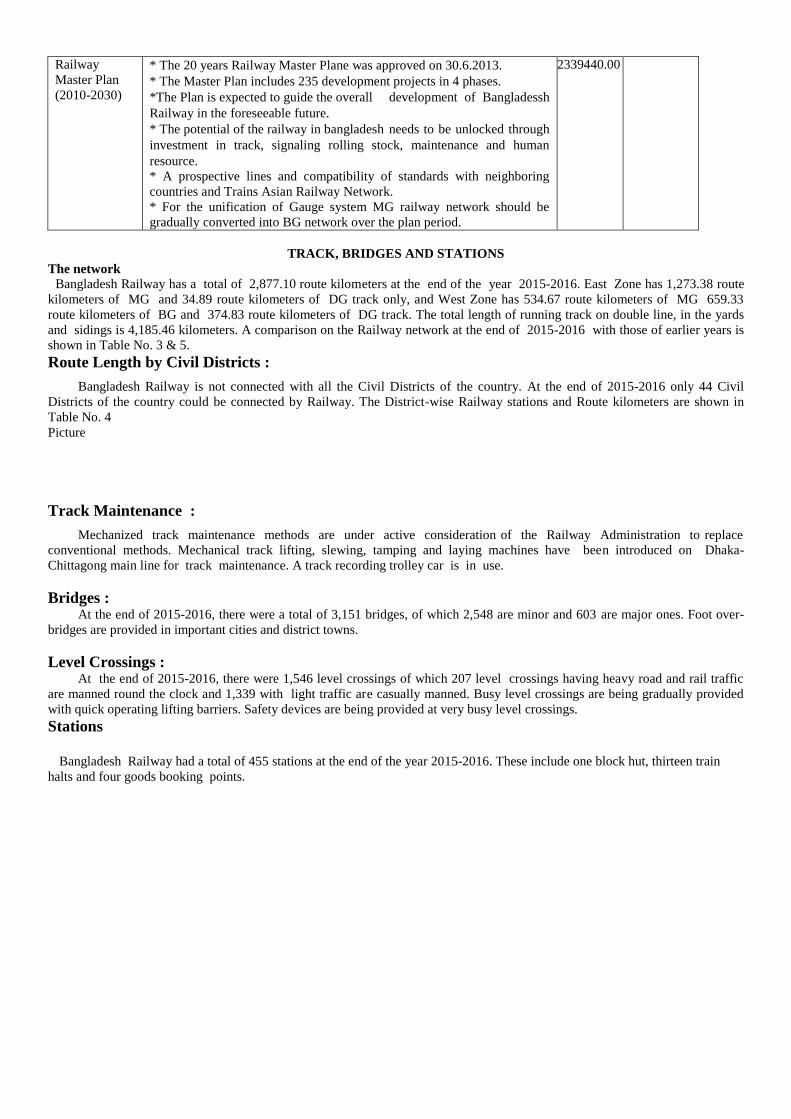
Railway
Master Plan
(2010-2030)
* The 20 years Railway Master Plane was approved on 30.6.2013.
* The Master Plan includes 235 development projects in 4 phases.
*The Plan is expected to guide the overall development of Bangladessh
Railway in the foreseeable future.
* The potential of the railway in bangladesh needs to be unlocked through
investment in track, signaling rolling stock, maintenance and human
resource.
* A prospective lines and compatibility of standards with neighboring
countries and Trains Asian Railway Network.
* For the unification of Gauge system MG railway network should be
gradually converted into BG network over the plan period.
2339440.00
TRACK, BRIDGES AND STATIONS
The network
Bangladesh Railway has a total of 2,877.10 route kilometers at the end of the year 2015-2016. East Zone has 1,273.38 route
kilometers of MG and 34.89 route kilometers of DG track only, and West Zone has 534.67 route kilometers of MG 659.33
route kilometers of BG and 374.83 route kilometers of DG track. The total length of running track on double line, in the yards
and sidings is 4,185.46 kilometers. A comparison on the Railway network at the end of 2015-2016 with those of earlier years is
shown in Table No. 3 & 5.
Route Length by Civil Districts :
Bangladesh Railway is not connected with all the Civil Districts of the country. At the end of 2015-2016 only 44 Civil
Districts of the country could be connected by Railway. The District-wise Railway stations and Route kilometers are shown in
Table No. 4
Picture
Track Maintenance :
Mechanized track maintenance methods are under active consideration of the Railway Administration to replace
conventional methods. Mechanical track lifting, slewing, tamping and laying machines have been introduced on Dhaka-
Chittagong main line for track maintenance. A track recording trolley car is in use.
Bridges : At the end of 2015-2016, there were a total of 3,151 bridges, of which 2,548 are minor and 603 are major ones. Foot over-
bridges are provided in important cities and district towns.
Level Crossings :
At the end of 2015-2016, there were 1,546 level crossings of which 207 level crossings having heavy road and rail traffic
are manned round the clock and 1,339 with light traffic are casually manned. Busy level crossings are being gradually provided
with quick operating lifting barriers. Safety devices are being provided at very busy level crossings.
Stations
Bangladesh Railway had a total of 455 stations at the end of the year 2015-2016. These include one block hut, thirteen train
halts and four goods booking points.
SIGNALLING & TELECOMMUNICATION
Signalling :
The importance of rail line between Dhaka and Chittagong increased immediately after the partition of India in 1947 as
this connects the capital city of Dhaka and the principal port city of Chittagong. To meet the needs for the speed and density of the
traffic, signaling on the section were modernized in phases starting from the early sixties. The entire section between Tongi -
Chittagong is existing with colour light signalling & relay interlocking with tokenless block working except
Akhaura.Double wire upper quadrant mechanical signalling is provided in sections Joydebpur- Mymensingh, Bhairab Bazar-
Gouripur Mymensingh, Santahar-Bonarpara & Khulna-Darsana, Relay interlocking system also exists at 10(ten) stations in
Mymensingh-Jamalpur and Mymensingh-Gouripur Mymensingh section inEast Zone and at 2( two) junction stations in West
Zone. viz.Parbatipur & Ishurdi. Computer based signalling and interlocking system was intruduced at 7 (seven ) stations from
Joydebpur to Bongabandhu Bridge west and at another 7(seven) stations from Jamtail to Muladuli Computer based signalling and
Interlocking system has also been introduced at 23 stations in Akhauara - Sylhat section and at 6 (six) stations in Dhaka-joydebpur
section and 4 stations in West Zone such as Santahar, Abdulpur, Azimnagar & Ishardi by pass. Moreover modernization of
signaling and interlock system of 13(thirteen) stations from Bhawl Gagipur to Mymensingh is under construction and that of 11
stations from Paksey to Darsana Junctions and another 11 stations from Chittagong Junction cabin to Chinky Astana is under pipe
line. Most important and busy level crossing gates are also provided with interlocking system including approach warning and
road signal.
Non intelocked colour light signal has been introduced in Dhaka - Narayangonj, Jamalpur-Tarakandi,Laksam-Noakhali,
Sholashar-Fatehabad, Abdulpur-Chapainababgonj-Rohanpur and Lalmonirhat-Burimari branch line sections instead of
Mechanical Semaphore arm signal.
TELECOMMUNICATION Till late eighties Bangladesh Railway's most of the Telecommunication facilities used to be taken on lease from Bangladesh
Telegraph and Telephone Board (BTTB). These facilities were land line based, prone to interference and unreliable. In 1984, BR
went for the modernization of its Telecommunication Facilities. BR has an optical fibre based digital tele-communication
network. The tele-communication network spans approximately over 2009 kms. and connects about 300 Railway stations. The
system also serves about 1300 users through ten telephone exchanges. In addition to 1300 dial up type digital telephones, BR`s
Telecommunication system provides about 260 Train Control Telephones and 503 number of station to station telephone
connection. Copper conductors are used for Block Instruments and the Block telephones . Computerized Seat Reservation and
Ticketing System (CSRTS) and Computerized Wagon Control System (CWCS) have been installed using this network.
ROLLING STOCK
Locomotives : Bangladesh Railway now owns basically two types of locomotives viz Diesel Electric (DE) & Diesel Hydraulic (DH). The
total fleet as on 30th June 2016 is 278 out of which 278 Diesel Electric (94 BG & 184 MG) and 8 Diesel Hydraulic( 3 BG & 6
M.G.) locomotives. The active holding is 282 out of which to 274 Diesel Electric(94 BG & 180 MG) and 8 Diesel Hydrolic(2 BG
& 6 MG) Locomotives (Excluding offf schedule). The type-wise breakdown of the locomotives during the past years is shown in
table No.6.
Pahartali and Dhaka Diesel Workshops undertake repairs of MG Diesel Locomotives while Parbatipur Diesel Workshop
undertakes repairs of both BG & MG Diesel Locomotives. Heavy repairs and overhauls of diesel locomotives are done at Central
Locomotive Workshop, Parbatipur. The existing main line locos are all DE type manufactured by ALCO (USA) , MLW/
Bombardier Inc. (Canada) & Hitachi (Japan) for BG and General Motors (USA/Canada), MLW (Canada), Hitachi (Japan), ABB
Henschel (Germany), DLW (India) and Hyundai(S. Korea) for MG.
ELECTRICAL
To ensure easy and comfortable traveling of passengers, Electrical department is to provide light, fan and air conditioning
facilities in the running trains. In the past power supply for the operation of light, fan and air conditioning system of trains were
activated by Axle driven Alter motor Dynamo only. To improve the service with adequate reliability and cheeper cost,the
Conventional System is being replaced by Mid on Generation (MOG)/End on Generation(EOG) system gradually. Out of 135
numbers Passenger Trains, 76 Nos. run as MOG & 59 Nos. runs as conventional in West Zone and out of 199 Nos. Passenger
trains, 68 Nos runs as MOG/EOG & 131 Nos. runs as Conventional in East Zone. There are, 49 Nos Power Car & 24 Nos air
condition coaches in West Zone and 53 Nos. Power Car & 69Nos. air condition coaches in East Zone .
Bangladesh Railway has two major General Electric Repair ( GER) Shop at Pahartali and Saidpur. Besides this, Electrical
Department is to maintain
Electric supply with self owned 51 numbers electric sub-station in East zone and 39 numbers in West Zone to provide electricity
at Railway Stations, Workshop, Sheds, Hospital, Deep well Terbine and submersible water pumps, Service and residential
building through overhead and underground cable network system. Moreover, there are two 33/11KV substation to feed SDP
Workshop & CLW/PBT which is maintained by electrical department.
Coaching Vehicles :
At the end of the year 2015-2016, BR had a total of 1,249 coaching vehicles out of which 1,226 are for conveyance of
passengers and 23 are for conveyance of Tourist, motor vans etc. as well as for departmental use. The gauge-wise breakdown of
passenger carriages and other coaching vehicles owned by BR over the past years is furnished in Table No. 7.
Freight Wagons :
At the end of the year 2015-2016, BR had a total of 8,677 wagons comprising 5,576 covered, 769 open and 2,332 special
type wagons. The gauge-wise breakdown of the wagons owned by BR over the past years is given in Table No.12.
Containers : Bangladesh Railway has entered into a new era in transportation of freight traffic in containers from Chittagong to
Dhaka. Special type Flat Wagons required for container movement were initially arranged by converting some existing
wagons. Subsequently 130 bogie container flats were procured from China and another 100 bogie container flats were procured
from India. An Inland Container Depot has been opened at Dhaka with custom and port facilities for clearance of container traffic.
Exclusive container train was introduced on 5th August,1991. Since then, volume of container traffic gained momentum.
Mechanical Workshops : Bangladesh Railway has sheds, depots and workshops for maintenance of Rolling Stock. Locomotives are maintained in
3(Three) places viz shed shop & CLW, Carriage & Wagons are maintained in two places i.e. in C&W Depot & workshop.
A. LOCOMOTIVES ARE MAINTAINED IN FOLLOWING WORKSHOPS :
1. Central Locomotive Workshop at Parbatipur, Dinajpur(CLW)
2. Diesel Workshop at Pahartali, Chittagong.
3. Diesel Workshop in Dhaka.
4. Diesel Workshop at Parbatipur,Dinajpur.
B. CARRIAGE & WAGONS ARE MAINTAINED IN FOLLOWING WORKSHOPS.
1. C & W Shop at Saidpur, Nilphamari.
2. C&W shop at Pahartali, Chittagong.
Railway Ferry Services : There were 19 marine vessels under Mechanical Department at the end of 2015-2016. The fleet of the marine vessels
consists of no Passenger vessels, 3 Tugs, 2 Wagon Ferry Barges, 2 Pontoon ramps, 3 Flats and 2 Berthing Pontoon and 7other
Crafts.
STORES Railway Material Management Department, known as the Stores Department of Bangladesh Railway carries out the
responsibilities of assessing, purchasing, inspecting, stocking, preservation and supplying of the materials as required and
demanded by different using departments. Apart from the non-recurring items, about 35,000 items are stocked in the main depots
at Pahartali and Saidpur and also at Diesel Sub Depots at Parbatipur, Dhaka and Pahartali for diesel spares.
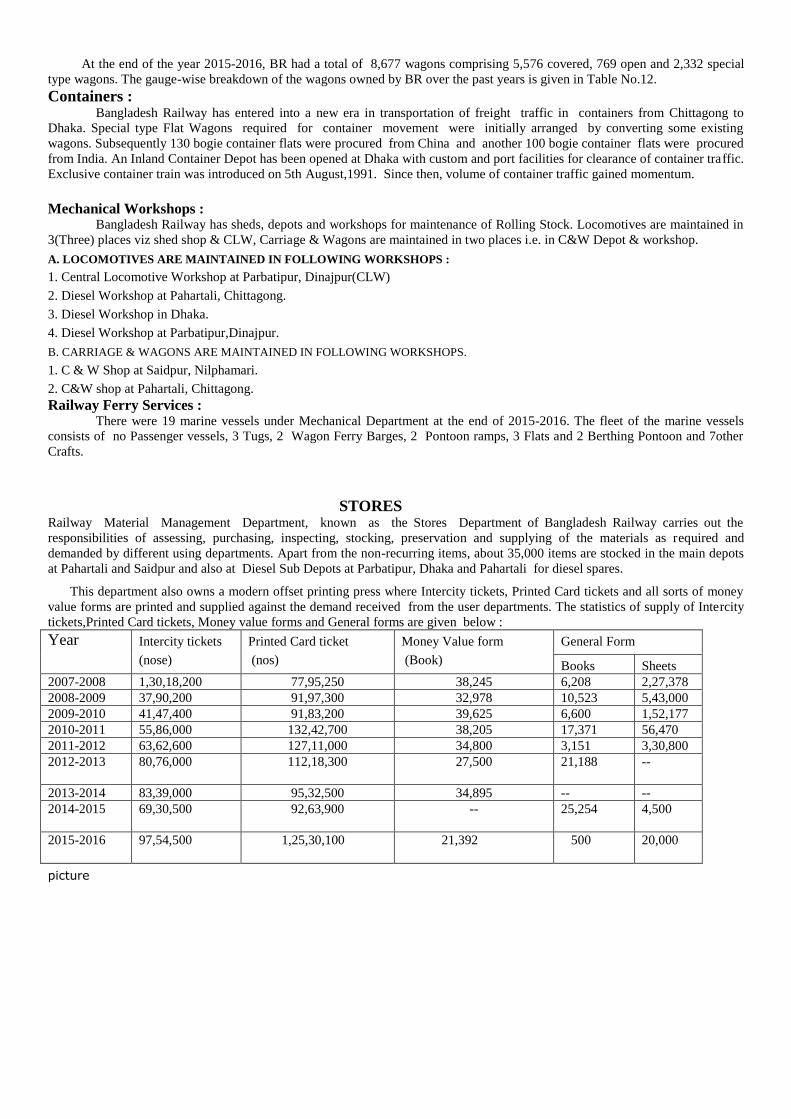
This department also owns a modern offset printing press where Intercity tickets, Printed Card tickets and all sorts of money
value forms are printed and supplied against the demand received from the user departments. The statistics of supply of Intercity
tickets,Printed Card tickets, Money value forms and General forms are given below :
Year Intercity tickets
(nose)
Printed Card ticket
(nos)
Money Value form
(Book)
General Form
Books Sheets
2007-2008 1,30,18,200 77,95,250 38,245 6,208 2,27,378
2008-2009 37,90,200 91,97,300 32,978 10,523 5,43,000
2009-2010 41,47,400 91,83,200 39,625 6,600 1,52,177
2010-2011 55,86,000 132,42,700 38,205 17,371 56,470
2011-2012 63,62,600 127,11,000 34,800 3,151 3,30,800
2012-2013 80,76,000
112,18,300 27,500 21,188 --
2013-2014 83,39,000 95,32,500 34,895 -- --
2014-2015 69,30,500
92,63,900 -- 25,254 4,500
2015-2016 97,54,500
1,25,30,100 21,392 500 20,000
picture
PASSENGER AND FREIGHT TRAFFIC
Passenger Traffic : Bangladesh Railway is the principal mode of transportation in the country. With the development of road transport
facilities there has been a shift in the trend of passenger traffic with short distance passengers preferring road transport, because of
their frequent and point to point services. During 2015-2016, about 70.83 million passengers were transported by Bangladesh
Railway against about 67.34 million during 2014-2015. In order to render better services to the passengers, Bangladesh Railway
introduced Intercity Train services in 1985. At present there are 88 nos of Intercity Trains running. Around 40.9% of the total
passengers of Bangladesh Railway are being carried by the Intercity trains which contribute approximately 83.6 % of the total
earning of passenger traffic. Details are shown in Table No.24 & 25.
Freight Traffic : The railway has been facing tough competition with other modes of transport for the high rated traffic, which pay more
revenue. On the other hand, the railway is called upon to carry traditional low rated essentials. As a national carrier, BR has
obligation to carry essential commodities like food grains, fertilizer, jute, cement, coal, iron and steel, stone & boulders, petroleum
products, salt, sugar etc. to the remote corners of the country at a cheaper rate. The freight traffic during 2015-2016 was 2,486
thousand Metric Tons against 2,555 Thousand Metric Tons during 2014-2015.
OPERATIONAL PROBLEMS The Railway system comprises three gauges, Broad , Meter and Dual which involves transshipments of traffic at the break of
gauge points. Bangladesh Railway is bisected by the river Jamuna which resulted in much setback in efficient operation of train
services which may be enumerated as under :-
(1). Break of gauge. (2). Riverine points ( 3) Transhipment problem (4) Directional flow of traffic (5) Frequent change of ghat
due to soil erosion. (6) Old tottering rail line (7) Shortage of Rolling stock i.e Locomotives, Coaches and wagons (8) Frequent
suspension of ferry crossing during both dry and rainy seasons. (9) Shortage of essential staff i.e Station master, Guard,
Locomotive Master) (10) Longer block section and absence of third line in Ishwardi- Joydebpur Section and (11) Speed
restriction on Banga bandhu Bridge.
picture
The railway link over the Bangabandhu Bridge connecting the East and West zones through the construction of 99 km new dual
gauge line and rehabilitation and conversion of 245 km Broad Gauge line from Jamtoil to Parbatipur to Dual Gauge has eased out
these operational problems considerably. Improvement will be achieved after completion of the following on going/ proposed
work, viz.(a) railway link between western side of Jamuna Bridge to Bogra.(b) Track doubling between Tongi-Bhairab Bazar and
Laksham-Akhaura of Dhaka-Chittagong corridor. Further improvement will be achieved after implementation of 6th five year
plan which commenced from 2011.
picture
OFFICERS & STAFF WELFARE Numbers :
As on date 30th June, 2016, there are 428 officers & 25,354 staff of different categories. The staff are graded/classified
as Class-III and Class-IV staff. The ratio of officers and staff is about 1.60.
Training :
Bangladesh Railway has got a built- in system of imparting training to Railway Officials including BCS cadre officers
and all categories of non-gazette staff to enable them to improve their skills & ability. For safe and efficient operation of the
railway a well equipped & modern Railway Training Academy has been established in 1984 which is now located at
Halishahar, Chittagong. Four workshop Training units at Pahartali, Dhaka, Parbatipur and Ishurdi have been transferred under the
control of Rector/Railway Training Academy, Halishahar, Chittagong w.e.f. 03-01-04 for imparting Training in Locomotive
maintenance and operation staff of Mechanical department. In the year 2015-2016 total 913 persons of different categories were
trained including 9 nos BCS Cadre Officers.
Festival &Bengali New Year Allowance :
The system of giving festival allowance to the employees was introduced in the year 1984. This is not linked with
productivity/profit. The festival allowance is given twice in a year. Each allowance is equal to the one month`s basic salary of the
employee concerned.Bengali New Year allowance 20%of basic pay once in a year introduce from 2015-2016.
Medicare & family welfare :
Well equipped network of hospital and dispensaries have been working in the system to provide proper medical care to
the employees & their dependents. There are around 10 well equipped hospitals with a total of 440 beds, one Modern Chest
Disease Hospital at Chittagong with 50 beds, and 30 dispensaries with qualified doctors. BR has also family welfare programme.
At present there are 12 maternity & child welfare centers in the system to look after the health of the expectant mothers, postnatal
cases, toddlers and infants.
Housing Facilities : Nearly 70% of the staff are provided with residential accommodation. The government has been pleased to approve a
housing scheme under the caption '' Bangladesh Railway Employees Co-operative Housing Society Limited'' at Chittagong for
the employees for enabling them to become owners of houses.
Kallyan Trust : The Trust is doing various welfare activities for railway employees. An amount of Tk. 17.42 million from the Railway
revenue was contributed to the Trust during the year under review. The main activities of the Trust are to provide grant to
employees undergoing medical treatment, donation to the staff on distress and monthly educational allowance & monetary
assistance to the children of low paid employees for education.
Benevolent Fund : This fund is providing financial assistance to the families of deceased employees. About 5,272 such families were given
grant to the extent of Tk. 35.98 million out of this fund during the year.
Group Insurance : Group Insurance Scheme was introduced on 1st October,1970 in order to ensure the lives of the Railway employees.
Premium for non-gazette staff are borne by the Railway. 289nos. of claim for death amounting to Tk.22.10 million has been
finalized during the year.
Sports & Recreation : 42 Institutes & Recreation Clubs provided with requisite facilities for outdoor & indoor games exist at different centers of
BR. Under the supervision of Bangladesh Railway Sports Control Board, there are eight zonal sports club at different centers.
Railway is also playing an important role in the National Scouting.
Education : Adequate facilities are provided by the Railway Administration for education of the children of Railway employees. Ten High
Schools are run by Railway at important centers and a sum of Tk.63.10 million was spent on management of these Schools
during the year 2015-2016. Besides, 138 privately managed Schools, Colleges & Madrashas are functioning in Railway
premises.
Trade Union : There are eight registered trade unions in BR to maintain a healthy relation between the employees and administration to pave
the way for congenial working atmosphere on the system.

SOCIAL COST
BR is one of the largest Govt. enterprises in the country, playing a vital role in the socio-economic development &
industrialization of the country. BR is expected to serve both as a commercial enterprise and as a public utility service. As a
commercial enterprise, BR has an obligation to generate sufficient revenue to meet its cost and as a public utility service it has a
special responsibility to provide transport facilities to large number of passengers and movement of essential commodities for
mass consumption. BR is also required to provide transport facilities in emergent situations like flood, cyclone, draught etc. In
addition, the Railway has to bear some costs in the matter of education and medical care of railway employees and their wards,
deployment of police forces in railway premises, etc.
In discharging all these social obligations, BR has to bear certain cost burdens namely ' Social Cost'. Some important items
of social cost are noted below. * Carrying essential commodities and rendering transport facilities to
passengers at lower prices than cost of services.
*Operation of un-economic branch lines ;
*Carrying Relief Materials at concessional rates ;
* Carrying military traffic at less than normal tariff.
Compensation for Social Cost : BR is compensated under ''Public Service Obligation (PSO)'' system for operating specific services which are not
commercially viable but socially necessary. This concept has been accepted by the Govt. which are being reflected in the
Revenue Budget since 1993-94. This replaced the open-ended subsidy and BR has been able to cover its operating expenses.
SECURITY
The Government Railway Police:- Prevention and detection of crime committed against passengers traveling by train and their properties and also
maintenance of law and order in the Railway premises are the direct responsibilities of the Railway Police working
under the control of National police Head quarters as well as Ministry of Home Affairs.
The general duties of the staff and jurisdiction of Railway Police have been enumerated in the Police Regulation of
Bengal 1943. The duties are as under :-
1. Control of passenger traffic inside the station premises more particularly on the platforms, in the booking
office, waiting halls at the entrance and exit gates and wherever specially required on emergency by the
station officials.
2. The control of vehicular and other traffic in the station compound.
3. The maintenance of law and order at stations and in standing passengers trains, prevention of over crowding.
4. Watching loaded passenger trains when standing in the station.
5. The arrest of those found committing nuisances or suffering from infectious disease and keeping the station
premises clear of idlers and beggars.
6. The examination of all empty carriages on arrival at terminal station for property left behind by passengers
and to see that carriage fittings have not been tampered with:
7. The removal of bodies and persons dying in the train and on station premises and the conveyance to hospital
of the sick people.
8. Investigation into cognizable offences committed with railway limits and prevention of the same.
9. The arrest offenders in cognizable cases and detention of them in custody as well as persons arrested by
Railway Officers and made over to the police, and their production before the Magistrate.
10. The reporting of non-cognizable case or infringement of bye-laws of the line to proper authorities as also all
instances of oppression or fraud on the part of Railway sub-ordinates or others.
11. The prosecution of cognizable case as well as non-cognizable cases under Railway act, 1890 on behalf of the
management.
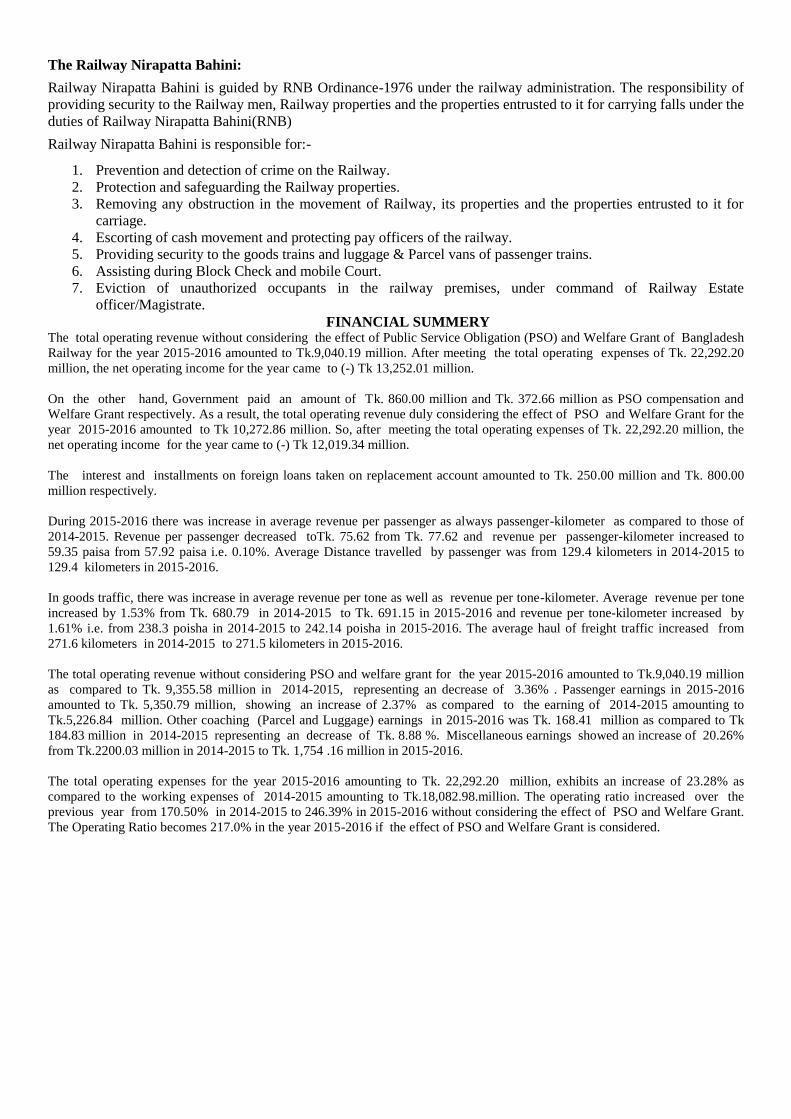
The Railway Nirapatta Bahini:
Railway Nirapatta Bahini is guided by RNB Ordinance-1976 under the railway administration. The responsibility of
providing security to the Railway men, Railway properties and the properties entrusted to it for carrying falls under the
duties of Railway Nirapatta Bahini(RNB)
Railway Nirapatta Bahini is responsible for:-
1. Prevention and detection of crime on the Railway.
2. Protection and safeguarding the Railway properties.
3. Removing any obstruction in the movement of Railway, its properties and the properties entrusted to it for
carriage.
4. Escorting of cash movement and protecting pay officers of the railway.
5. Providing security to the goods trains and luggage & Parcel vans of passenger trains.
6. Assisting during Block Check and mobile Court.
7. Eviction of unauthorized occupants in the railway premises, under command of Railway Estate
officer/Magistrate.
FINANCIAL SUMMERY The total operating revenue without considering the effect of Public Service Obligation (PSO) and Welfare Grant of Bangladesh
Railway for the year 2015-2016 amounted to Tk.9,040.19 million. After meeting the total operating expenses of Tk. 22,292.20
million, the net operating income for the year came to (-) Tk 13,252.01 million.
On the other hand, Government paid an amount of Tk. 860.00 million and Tk. 372.66 million as PSO compensation and
Welfare Grant respectively. As a result, the total operating revenue duly considering the effect of PSO and Welfare Grant for the
year 2015-2016 amounted to Tk 10,272.86 million. So, after meeting the total operating expenses of Tk. 22,292.20 million, the
net operating income for the year came to (-) Tk 12,019.34 million.
The interest and installments on foreign loans taken on replacement account amounted to Tk. 250.00 million and Tk. 800.00
million respectively.
During 2015-2016 there was increase in average revenue per passenger as always passenger-kilometer as compared to those of
2014-2015. Revenue per passenger decreased toTk. 75.62 from Tk. 77.62 and revenue per passenger-kilometer increased to
59.35 paisa from 57.92 paisa i.e. 0.10%. Average Distance travelled by passenger was from 129.4 kilometers in 2014-2015 to
129.4 kilometers in 2015-2016.
In goods traffic, there was increase in average revenue per tone as well as revenue per tone-kilometer. Average revenue per tone
increased by 1.53% from Tk. 680.79 in 2014-2015 to Tk. 691.15 in 2015-2016 and revenue per tone-kilometer increased by
1.61% i.e. from 238.3 poisha in 2014-2015 to 242.14 poisha in 2015-2016. The average haul of freight traffic increased from
271.6 kilometers in 2014-2015 to 271.5 kilometers in 2015-2016.
The total operating revenue without considering PSO and welfare grant for the year 2015-2016 amounted to Tk.9,040.19 million
as compared to Tk. 9,355.58 million in 2014-2015, representing an decrease of 3.36% . Passenger earnings in 2015-2016
amounted to Tk. 5,350.79 million, showing an increase of 2.37% as compared to the earning of 2014-2015 amounting to
Tk.5,226.84 million. Other coaching (Parcel and Luggage) earnings in 2015-2016 was Tk. 168.41 million as compared to Tk
184.83 million in 2014-2015 representing an decrease of Tk. 8.88 %. Miscellaneous earnings showed an increase of 20.26%
from Tk.2200.03 million in 2014-2015 to Tk. 1,754 .16 million in 2015-2016.
The total operating expenses for the year 2015-2016 amounting to Tk. 22,292.20 million, exhibits an increase of 23.28% as
compared to the working expenses of 2014-2015 amounting to Tk.18,082.98.million. The operating ratio increased over the
previous year from 170.50% in 2014-2015 to 246.39% in 2015-2016 without considering the effect of PSO and Welfare Grant.
The Operating Ratio becomes 217.0% in the year 2015-2016 if the effect of PSO and Welfare Grant is considered.

Information Mirror 2016
Route Kilometres 2,877.10
Track Kilometres 4,185.06
Number of Stations 455
Passengers carried (million) 70.83
Passenger-Kilometres(million) 9,167.18
Average lead of a passenger (Kilometres) 129.4
Tonnes Carried (million) 2.48
Tonne-Kilometres (million) 675.09
Average lead of a tonne of freight (kilometres) 271.6
Number of passenger trains daily 340
Number of freight trains daily 36
Total operating revenue (million Tk.) 9,040.19
(Without considering PSO & Welfare grant)
Total operating revenue (million Tk.) 10,272.86
(Considering PSO & welfare grant)
Total operating expenses (million Tk.) 22,292.20
Net operating income (million Tk.) (-) 13,252.00
(Without considering PSO & Welfare grant)
Net operating income (million Tk.) (-) 12,019.34
(Considering PSO & Welfare grant)
Operating Ratio (%) 246.59
(Without considering PSO & Welfare grant)
Operating Ratio (%) 217.0
(Considering PSO & Welfare grant)
Revenue per passenger (Tk.) 75.62
Revenue per passenger-kilometer (Paisa) 59.35
Revenue per tone (Tk.) 691.15
Revenue per tone-kilometer (Paisa) 242.14
Number of employees(June 2014) 25,782
Cost of employees (million Tk.) 6,119.00
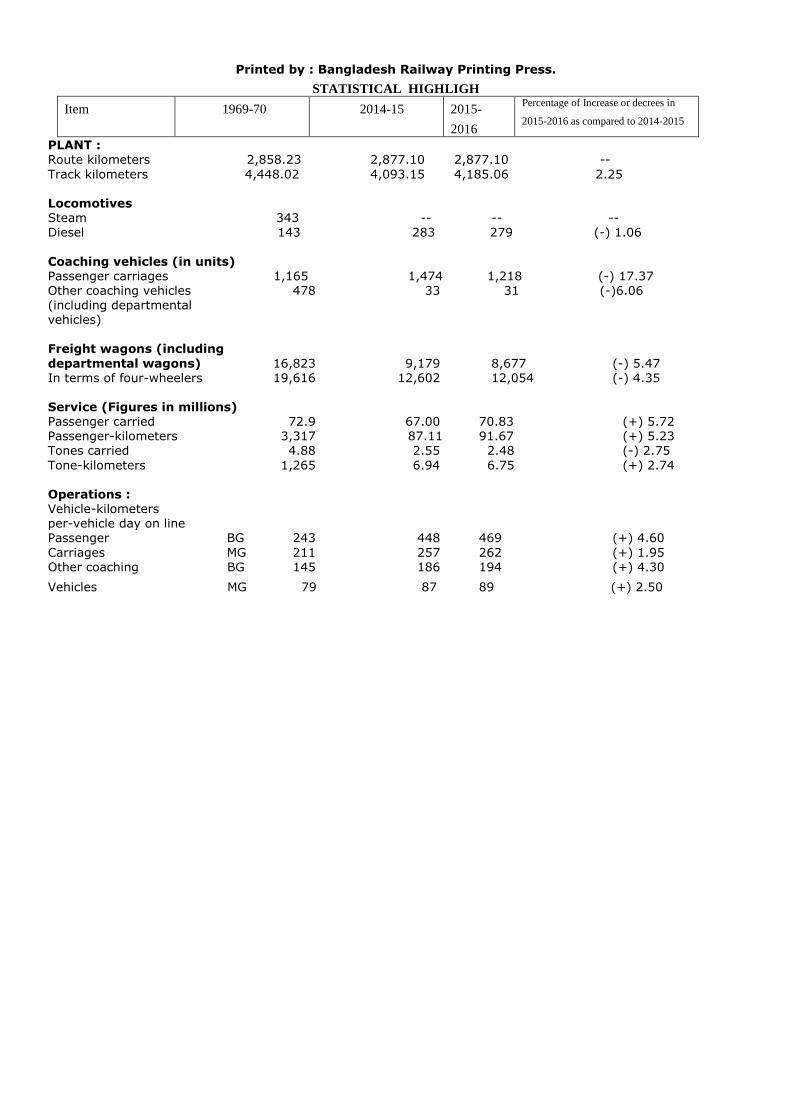
Printed by : Bangladesh Railway Printing Press.
STATISTICAL HIGHLIGH
Item 1969-70 2014-15 2015-
2016
Percentage of Increase or decrees in
2015-2016 as compared to 2014-2015
PLANT : Route kilometers 2,858.23 2,877.10 2,877.10 --
Track kilometers 4,448.02 4,093.15 4,185.06 2.25 Locomotives Steam 343 -- -- -- Diesel 143 283 279 (-) 1.06
Coaching vehicles (in units) Passenger carriages 1,165 1,474 1,218 (-) 17.37 Other coaching vehicles 478 33 31 (-)6.06 (including departmental vehicles) Freight wagons (including
departmental wagons) 16,823 9,179 8,677 (-) 5.47 In terms of four-wheelers 19,616 12,602 12,054 (-) 4.35 Service (Figures in millions) Passenger carried 72.9 67.00 70.83 (+) 5.72 Passenger-kilometers 3,317 87.11 91.67 (+) 5.23 Tones carried 4.88 2.55 2.48 (-) 2.75
Tone-kilometers 1,265 6.94 6.75 (+) 2.74 Operations : Vehicle-kilometers per-vehicle day on line Passenger BG 243 448 469 (+) 4.60
Carriages MG 211 257 262 (+) 1.95 Other coaching BG 145 186 194 (+) 4.30
Vehicles MG 79 87 89 (+) 2.50
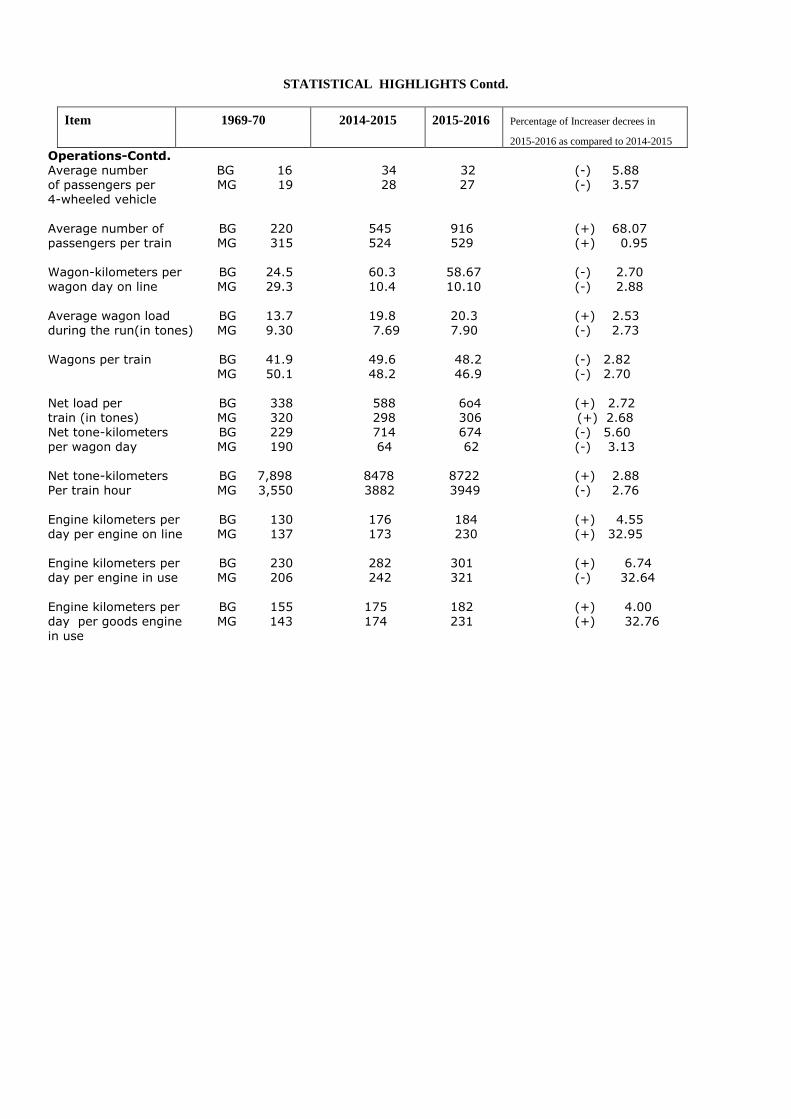
STATISTICAL HIGHLIGHTS Contd.
Item 1969-70 2014-2015 2015-2016 Percentage of Increaser decrees in
2015-2016 as compared to 2014-2015
Operations-Contd. Average number BG 16 34 32 (-) 5.88 of passengers per MG 19 28 27 (-) 3.57 4-wheeled vehicle
Average number of BG 220 545 916 (+) 68.07 passengers per train MG 315 524 529 (+) 0.95 Wagon-kilometers per BG 24.5 60.3 58.67 (-) 2.70 wagon day on line MG 29.3 10.4 10.10 (-) 2.88
Average wagon load BG 13.7 19.8 20.3 (+) 2.53 during the run(in tones) MG 9.30 7.69 7.90 (-) 2.73
Wagons per train BG 41.9 49.6 48.2 (-) 2.82 MG 50.1 48.2 46.9 (-) 2.70
Net load per BG 338 588 6o4 (+) 2.72 train (in tones) MG 320 298 306 (+) 2.68 Net tone-kilometers BG 229 714 674 (-) 5.60 per wagon day MG 190 64 62 (-) 3.13 Net tone-kilometers BG 7,898 8478 8722 (+) 2.88 Per train hour MG 3,550 3882 3949 (-) 2.76
Engine kilometers per BG 130 176 184 (+) 4.55 day per engine on line MG 137 173 230 (+) 32.95 Engine kilometers per BG 230 282 301 (+) 6.74 day per engine in use MG 206 242 321 (-) 32.64
Engine kilometers per BG 155 175 182 (+) 4.00 day per goods engine MG 143 174 231 (+) 32.76 in use
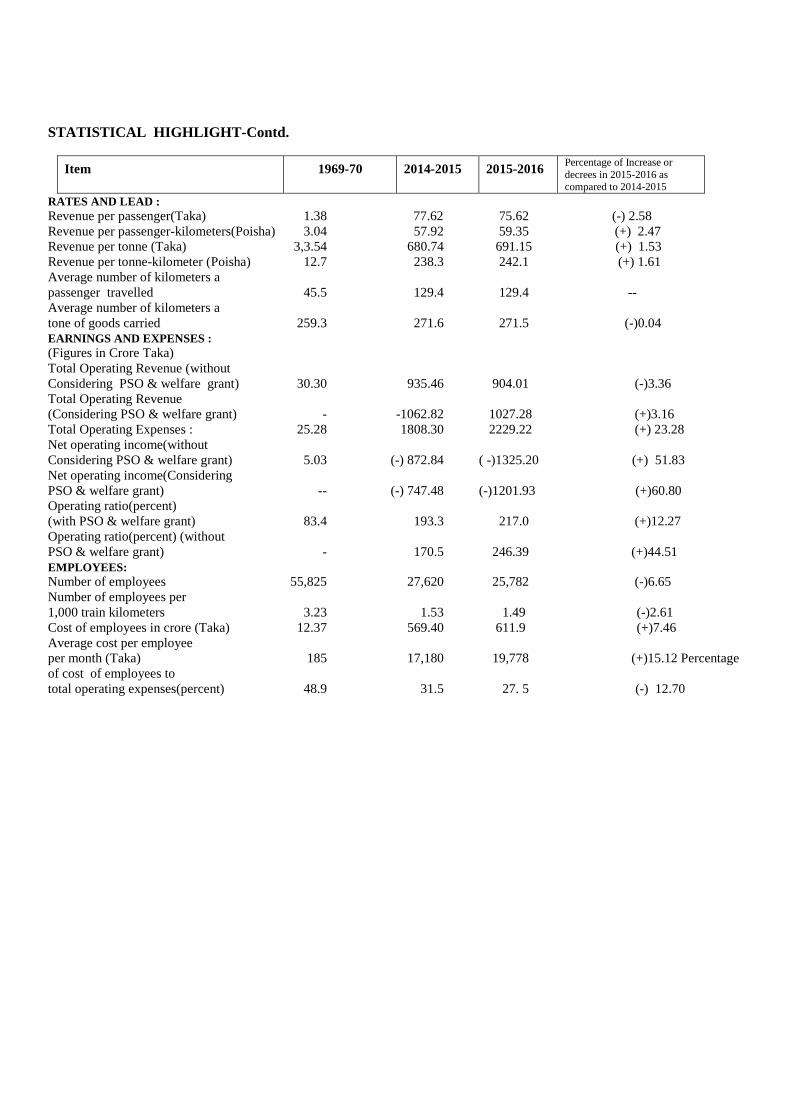
STATISTICAL HIGHLIGHT-Contd.
Item 1969-70 2014-2015 2015-2016 Percentage of Increase or
decrees in 2015-2016 as compared to 2014-2015
RATES AND LEAD : Revenue per passenger(Taka) 1.38 77.62 75.62 (-) 2.58
Revenue per passenger-kilometers(Poisha) 3.04 57.92 59.35 (+) 2.47
Revenue per tonne (Taka) 3,3.54 680.74 691.15 (+) 1.53
Revenue per tonne-kilometer (Poisha) 12.7 238.3 242.1 (+) 1.61
Average number of kilometers a
passenger travelled 45.5 129.4 129.4 --
Average number of kilometers a
tone of goods carried 259.3 271.6 271.5 (-)0.04
EARNINGS AND EXPENSES : (Figures in Crore Taka)
Total Operating Revenue (without
Considering PSO & welfare grant) 30.30 935.46 904.01 (-)3.36
Total Operating Revenue
(Considering PSO & welfare grant) - -1062.82 1027.28 (+)3.16
Total Operating Expenses : 25.28 1808.30 2229.22 (+) 23.28
Net operating income(without
Considering PSO & welfare grant) 5.03 (-) 872.84 ( -)1325.20 (+) 51.83
Net operating income(Considering
PSO & welfare grant) -- (-) 747.48 (-)1201.93 (+)60.80
Operating ratio(percent)
(with PSO & welfare grant) 83.4 193.3 217.0 (+)12.27
Operating ratio(percent) (without
PSO & welfare grant) - 170.5 246.39 (+)44.51
EMPLOYEES: Number of employees 55,825 27,620 25,782 (-)6.65
Number of employees per
1,000 train kilometers 3.23 1.53 1.49 (-)2.61
Cost of employees in crore (Taka) 12.37 569.40 611.9 (+)7.46
Average cost per employee
per month (Taka) 185 17,180 19,778 (+)15.12 Percentage
of cost of employees to
total operating expenses(percent) 48.9 31.5 27. 5 (-) 12.70
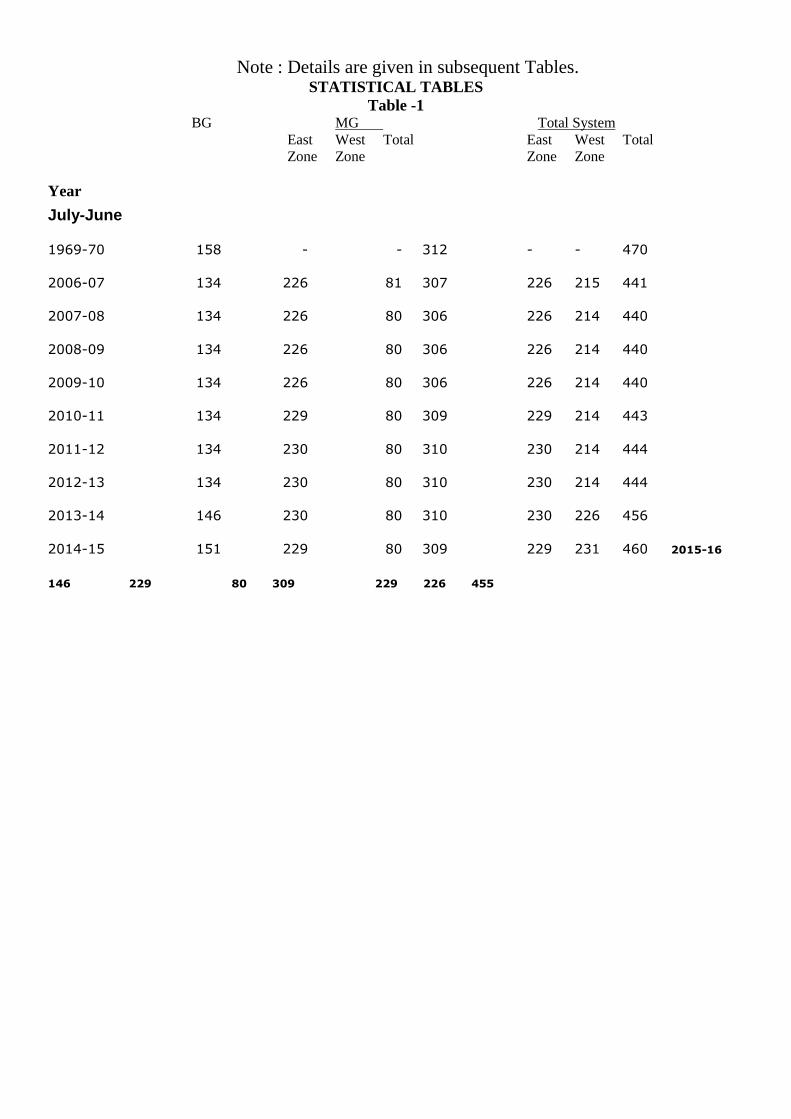
Note : Details are given in subsequent Tables. STATISTICAL TABLES
Table -1 BG MG Total System
East West Total East West Total
Zone Zone Zone Zone
Year
July-June
1969-70 158 - - 312 - - 470
2006-07 134 226 81 307 226 215 441
2007-08 134 226 80 306 226 214 440
2008-09 134 226 80 306 226 214 440
2009-10 134 226 80 306 226 214 440
2010-11 134 229 80 309 229 214 443
2011-12 134 230 80 310 230 214 444
2012-13 134 230 80 310 230 214 444
2013-14 146 230 80 310 230 226 456
2014-15 151 229 80 309 229 231 460 2015-16
146 229 80 309 229 226 455

Table-2
BLOCK AND NON-BLOCK STATIONS Zone Block Non-Block Total
Gauge Station Station
East Zone
M.G. 169 60 229
West Zone
BG 110 36 146
MG 59 21 80
Total 169 57 226
Grand Total 338* 107 455
Note : * Out of 455 block stations, 338stations are provided with different types of Interlocking System as given
below :
Type of Block Equipment Number
Computer based Interlocking(CBI) 37
Relay-Interlocked 71
Double-Wire Mechanical 47
Single wire Mechanical Interlocked(SWMI) 47
Non-Interlocked Color Light(NICL) 88
Non-Interlocked Mechanical(NIM) 48
Table-3
ROUTE KILOMETRES Figures are in Kilometers
Year MG BG DG Total System
July-
June
East
Zone
West
Zone
Total
East
Zone
West
Zone
Total East
Zone
West
Zone
Total East
Zone
West
Zone
Total
2001-02 1,276.71 553.03 1,829.74 -- 936.25 936.25 -- -- -- 1,276.71 1,489.28 2,765.99
2006-07 1,266.21 534.67 1,800.88 -- 659.33 659.33 -- 374.83 374.83 1,266.21 1,568.83 2,835.04
2007-08 1,266.21 534.67 1,800.88 -- 659.33 659.33 -- 374.83 374.83 1,266.21 1,568.83 2,835.04
2008-09 1,266.21 534.67 1,800.88 -- 659.33 659.33 -- 374.83 374.83 1,266.21 1,568.83 2835.04
2009-10 1,266.21 534.67 1,800.88 -- 659.33 659.33 -- 374.83 374.83 1,266.21 1,568.83 2,835.04
2010-11 1,222.21 534.67 1,756.88 -- 659.33 659.33 -- 374.83 374.83 1,222.21 1,568.83 2,791.04
2011-12 1,273.38 534.67 1,808.05 -- 659.33 659.33 34.89 374.83 409.72 1,308.27 1,568.83 2,877.10
2012-13 1,273.38 534.67 1,808.05 -- 659.33 659.33 34.89 374.83 409.72 1,308.27 1,568.83 2,877.10
2013-14 1,273.38 534.67 1,808.05 -- 659.33 659.33 34.89 374.83 409.72 1,308.27 1,564.83 2,877.10
2014-15 1,273.38 534.67 1,808.05 -- 659.33 659.33 34.89 374.83 409.72 1,308.27 1,568.83 2,877.10
2015-16 1,273.38 534.67 1.808.05 -- 659.33 659.33 34.89 374.83 409.72 1308.27 1,568.83 2,877.10
(MG= Meter Gauge, BG= Broad Gauge, DG= Dual Gauge(both broad and meter gauge mixed)
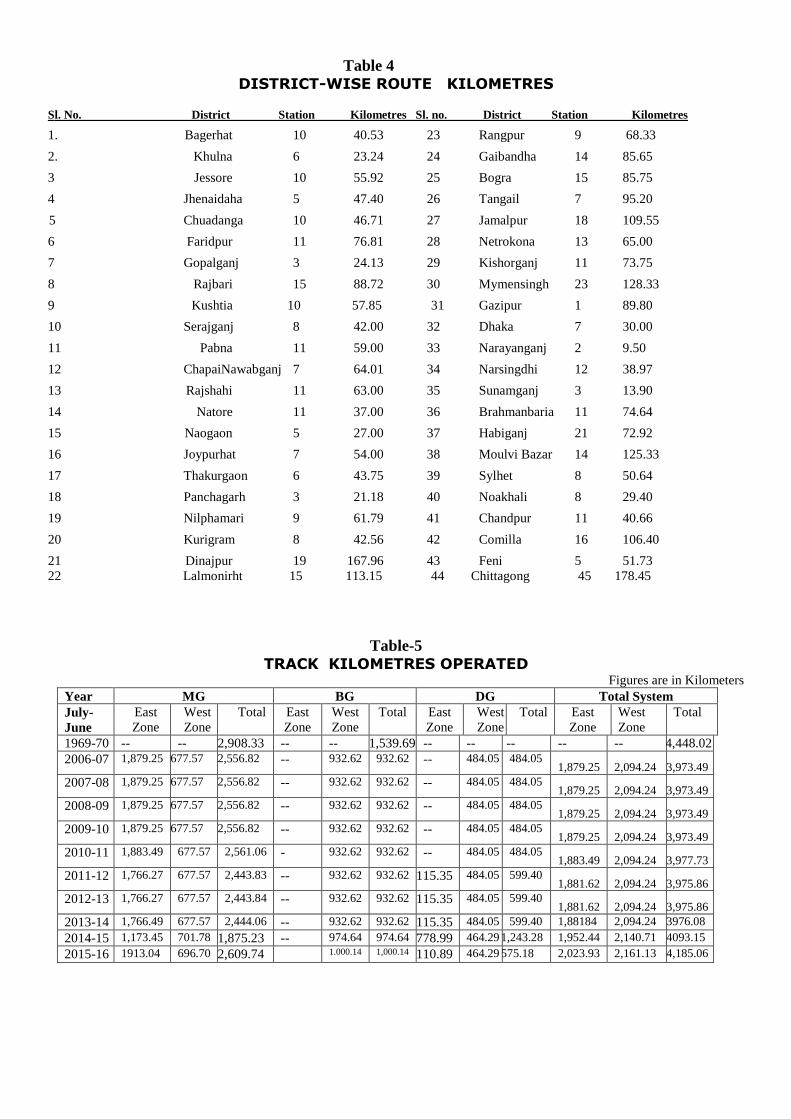
Table 4
DISTRICT-WISE ROUTE KILOMETRES
Sl. No. District Station Kilometres Sl. no. District Station Kilometres
1. Bagerhat 10 40.53 23 Rangpur 9 68.33
2. Khulna 6 23.24 24 Gaibandha 14 85.65
3 Jessore 10 55.92 25 Bogra 15 85.75
4 Jhenaidaha 5 47.40 26 Tangail 7 95.20
5 Chuadanga 10 46.71 27 Jamalpur 18 109.55
6 Faridpur 11 76.81 28 Netrokona 13 65.00
7 Gopalganj 3 24.13 29 Kishorganj 11 73.75
8 Rajbari 15 88.72 30 Mymensingh 23 128.33
9 Kushtia 10 57.85 31 Gazipur 1 89.80
10 Serajganj 8 42.00 32 Dhaka 7 30.00
11 Pabna 11 59.00 33 Narayanganj 2 9.50
12 ChapaiNawabganj 7 64.01 34 Narsingdhi 12 38.97
13 Rajshahi 11 63.00 35 Sunamganj 3 13.90
14 Natore 11 37.00 36 Brahmanbaria 11 74.64
15 Naogaon 5 27.00 37 Habiganj 21 72.92
16 Joypurhat 7 54.00 38 Moulvi Bazar 14 125.33
17 Thakurgaon 6 43.75 39 Sylhet 8 50.64
18 Panchagarh 3 21.18 40 Noakhali 8 29.40
19 Nilphamari 9 61.79 41 Chandpur 11 40.66
20 Kurigram 8 42.56 42 Comilla 16 106.40
21 Dinajpur 19 167.96 43 Feni 5 51.73
22 Lalmonirht 15 113.15 44 Chittagong 45 178.45
Table-5
TRACK KILOMETRES OPERATED Figures are in Kilometers
Year MG BG DG Total System
July-
June
East
Zone
West
Zone
Total
East
Zone
West
Zone
Total East
Zone
West
Zone
Total East
Zone
West
Zone
Total
1969-70 -- -- 2,908.33 -- -- 1,539.69 -- -- -- -- -- 4,448.02
2006-07 1,879.25 677.57 2,556.82 -- 932.62 932.62 -- 484.05 484.05 1,879.25 2,094.24 3,973.49
2007-08 1,879.25 677.57 2,556.82 -- 932.62 932.62 -- 484.05 484.05 1,879.25 2,094.24 3,973.49
2008-09 1,879.25 677.57 2,556.82 -- 932.62 932.62 -- 484.05 484.05 1,879.25 2,094.24 3,973.49
2009-10 1,879.25 677.57 2,556.82 -- 932.62 932.62 -- 484.05 484.05 1,879.25 2,094.24 3,973.49
2010-11 1,883.49 677.57 2,561.06 - 932.62 932.62 -- 484.05 484.05 1,883.49 2,094.24 3,977.73
2011-12 1,766.27 677.57 2,443.83 -- 932.62 932.62 115.35 484.05 599.40 1,881.62 2,094.24 3,975.86
2012-13 1,766.27 677.57 2,443.84 -- 932.62 932.62 115.35 484.05 599.40 1,881.62 2,094.24 3,975.86
2013-14 1,766.49 677.57 2,444.06 -- 932.62 932.62 115.35 484.05 599.40 1,88184 2,094.24 3976.08
2014-15 1,173.45 701.78 1,875.23 -- 974.64 974.64 778.99 464.29 1,243.28 1,952.44 2,140.71 4093.15
2015-16 1913.04 696.70 2,609.74 1.000.14 1,000.14 110.89 464.29 575.18 2,023.93 2,161.13 4,185.06

Table-6
LOCOMOTIVES
BG MG Total System
Steam Diesel Steam Diesel Steam Diesel Total
Year
July-June 1969-70 121 18 222 125 343 143 486
2006-07 -- 78 -- 208 -- 286 286
2007-08 -- 78 -- 208 -- 286 286
2008-09 -- 78 -- 208 -- 286 286
2009-10 -- 78 -- 208 -- 286 286
2010-11 -- 71 -- 188 -- 259 259
2011-12 -- 78 -- 217 -- 295 295
2012-13 -- 73 -- 185 -- 258 258
2013-14 -- 97 -- 196 -- 293 293
2014-15 -- 96 -- 186 -- 282 282
2015-16 -- 94 -- 184 -- 278 278
Table 7
COACHING VEHICLES
BG MG Total System Passenger
Carriages
Other Coaching
vehicles
Passenger
Carriages
Other Coaching
vehicles
Passenger
Carriages
Other Coaching
vehicles
Total Coaching
vehicles
Year July-June
1969-70 275 143 890 335 1,165 478 1,643
2006-07 310 14 1,075 17 1,385 31 1,416
2007-08 312 14 1,123 21 1,435 35 1,470
2008-09 312 14 1,139 21 1,451 35 1,486
2009-10 322 04 1150 33 1,472 37 1,509
2010-11 312 12 930 17 1,242 29 1,271
2011-12 312 12 1144 21 1,456 33 1,489
2012-13 312 12 1,160 21 1,472 33 1,505
2013-14 312 12 1164 21 1476 33 1,509
2014-15 312 12 1162 21 1474 33 1,507
2015-16 335 12 883 19 1218 31 1,249

Table-8 TYPE-WISE PASSENGER COACHING VEHICLES
Type BG MG
Bogie Carriages- 01. Fully Air-Conditioned Chair Coach (WJC, WJCC) 24 37
02. Partial Air-Conditioned (WJFC, JFC) 6 06
03. Shovan Air conditioned (WJEC,WJCCDR) -- 12
04. Chair Car (WCC) -- 18
05. First Class Shovan Coupe(WFC,WFE, FC) 14 47
06. First Class Compartment (F) -- --
07. Shovan Class (WE) 57 90
08. Shovan Guard Coach (WES,WER, WECR) 07 29
09. Shovan Chair Coach (WEC) 43 112
10. Shulov Class (WY) 4 --
11. Second Class (S) 68 276
12. Composite First & Shulov Class(WFY,WFC,) -- -
13. Composite First & Second Class (FS) 11 01
14. Composite Dining Car with Shovan Class(WECD, WECDR, WECCD)WCDE 09 24
15. Composite Dining Car with Shulov Class (WCDY,CDY,WCD) 05 04
16. Composite Dining Car with Guard Room (WCDR) -- 01
17. Composite Dining Car with Second Class(CDS) -- 03
18. Composite Shovan chair, with
Luggage & Guard Room(WELR,WECLR) 27 18
19. Composite Shulov Class with Luggage & Guard Room (WYLR) 9 --
20. Composite Second Class with Luggage & Guard Room (SLR) 05 67
21. Composite Second Class with Postal Van (SPP) -- 08
22. Composite Second Class with Guard Room (SR) 7 05
23. Composite Power Car with Shovan Class (WEPC, 26 46
WECPCR)
24 Luggege Van (L)(VK) 10 43
25. Composite Power Car with Shulov Class (WPC) -- 10
26. Motor Van (V.K) -- 10
27. Composite Power Car and Guard Room with Second Class (SPC,SPR)WSPC 13 --
28. Rail Cars (ZSZ) -- 16
Total Passenger Carriages 345 883 29.
DEMU -- 18

Table 9
TYPE-WISE OTHER COACHING VEHICLES
Type BG MG
Bogie Carriages-
Dining Cars (CD,WCD) -- --
Tourist Cars (CT) -- 3
Luggage Vans (L,VE) -- --
Motor Vans(VK) -- --
Miscellaneous including brake-vans(CR, MV,CRCD,PV etc.) -- 5
Railway Service vehicles (FCH, CE, RA etc.) -- 7
Store Vans (RS) 2 6
Miscellaneous including brake-vans(EVG,EVKP,EVE,ELRO,ERH,etc.) -- --
Railway service vehicles (ERB,ERD,DRS,DRH,ERT,CE,etc.) -- --
Total 2 21
Table 10
ABANDONMENT OF COACHING VEHICLES
BG MG Total System Passenger
Carriages
Other Coaching
vehicles
Passenger
Carriages
Other Coaching
vehicles
Passenger
Carriages
Other Coaching
vehicles
Total Coaching
vehicles
Year
July-June
1969-70 18 7 24 13 42 20 62
2006-07 -- -- 4 -- 4 -- 4
2007-08 -- -- -- -- -- -- --
2008-09 -- -- -- -- -- -- --
2009-10 -- -- -- -- -- -- --
2010-11 -- -- -- -- -- -- --
2011-12 -- -- --- -- -- -- --
2012-13 -- -- -- -- -- -- --
2013-14 -- -- 2 -- 2 -- 2
2014-15 -- -- -- - -- -- --
2015-16 -- -- -- 29 -- -- --

Table 11
ADDITION OF COACHING VEHICLES
BG MG Total System Passenger
Carriages
Other Coaching
vehicles
Passenger
Carriages
Other Coaching
vehicles
Passenger
Carriages
Other Coaching
vehicles
Total Coaching
vehicles
Year
July-June
1969-70 6 -- 20 16 26 16 42
2006-07 50 -- -- -- 50 -- 50
2007-08 -- -- 50 2 50 2 52
2008-09 -- -- -- -- -- -- --
2009-10 -- -- -- -- -- -- --
2010-11 -- -- -- -- -- -- --
2011-12 -- --- -- -- -- -- --
2012-13 -- -- -- -- -- -- --
2013-14 -- -- 15 -- 15 -- 15
2014-15 -- -- -- -- -- -- --
2015-16 -- -- -- -- -- -- --
Table 12
FREIGHT WAGON
BG MG Total System Unit Four- Unit Four- Unit Four
Wheelers Wheelers Wheelers
Year
July-June
1969-70 4,464 4,632 12,359 14,984 16,823 19,616
2006-07 1,935 2,686 7,538 9,757 9,473 12,443
2007-08 1,932 2,683 7,477 9,643 9,409 12,326
2008-09 1,929 2,680 7,069 9,229 8,998 11,909
2009-10 1,916 2,667 8,054 10,441 9,970 13,108
2010-11 1,916 2,667 6,944 9,168 8,860 11,835
2011-12 1,916 2,667 8,058 10,383 9,974 13,050
2012-13 2,087 3,009 7,792 10,100 9,879 13,109
2013-14 2,087 3,009 7,614 9,915 9,701 12,924
2014-15 2,079 3,001 7,100 9,601 9,179 12,602
2015-16 1,830 2,751 6,847 9,303 8,677 12,054
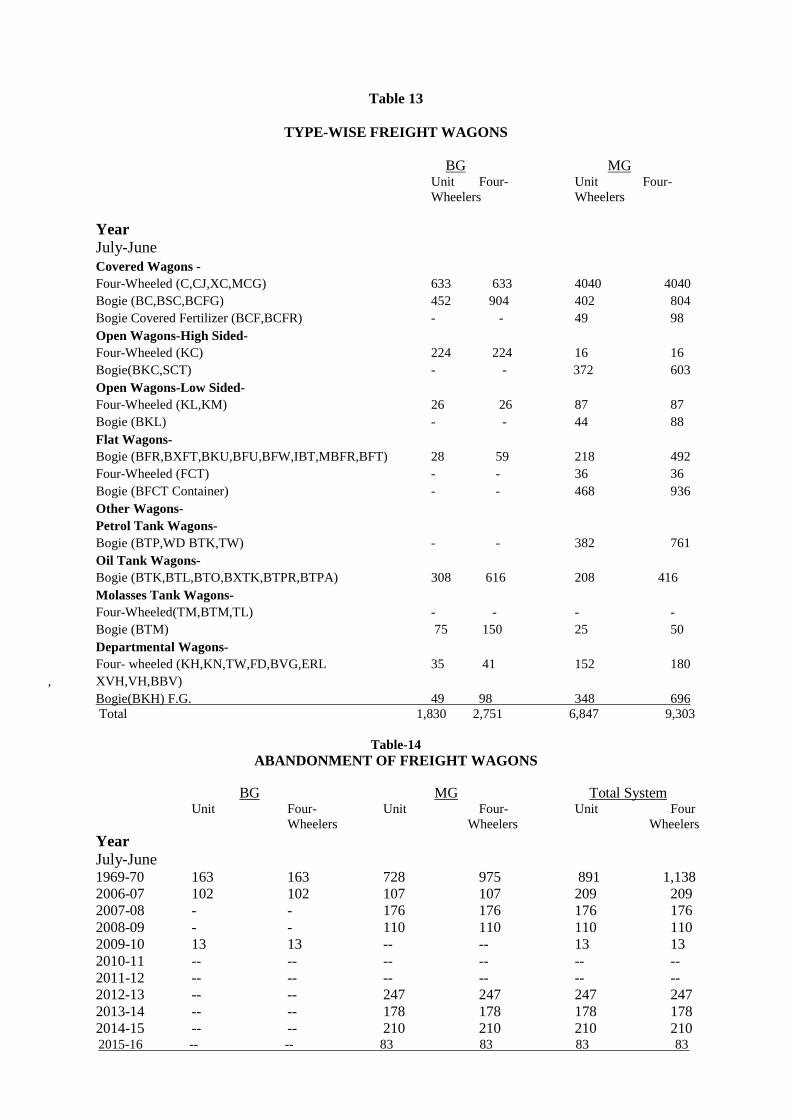
Table 13
TYPE-WISE FREIGHT WAGONS
BG MG Unit Four- Unit Four-
Wheelers Wheelers
Year
July-June
Covered Wagons -
Four-Wheeled (C,CJ,XC,MCG) 633 633 4040 4040
Bogie (BC,BSC,BCFG) 452 904 402 804
Bogie Covered Fertilizer (BCF,BCFR) - - 49 98
Open Wagons-High Sided-
Four-Wheeled (KC) 224 224 16 16
Bogie(BKC,SCT) - - 372 603
Open Wagons-Low Sided-
Four-Wheeled (KL,KM) 26 26 87 87
Bogie (BKL) - - 44 88
Flat Wagons-
Bogie (BFR,BXFT,BKU,BFU,BFW,IBT,MBFR,BFT) 28 59 218 492
Four-Wheeled (FCT) - - 36 36
Bogie (BFCT Container) - - 468 936
Other Wagons-
Petrol Tank Wagons-
Bogie (BTP,WD BTK,TW) - - 382 761
Oil Tank Wagons-
Bogie (BTK,BTL,BTO,BXTK,BTPR,BTPA) 308 616 208 416
Molasses Tank Wagons-
Four-Wheeled(TM,BTM,TL) - - - -
Bogie (BTM) 75 150 25 50
Departmental Wagons-
Four- wheeled (KH,KN,TW,FD,BVG,ERL 35 41 152 180
, XVH,VH,BBV)
Bogie(BKH) F.G. 49 98 348 696
Total 1,830 2,751 6,847 9,303
Table-14
ABANDONMENT OF FREIGHT WAGONS
BG MG Total System Unit Four- Unit Four- Unit Four
Wheelers Wheelers Wheelers
Year
July-June 1969-70 163 163 728 975 891 1,138
2006-07 102 102 107 107 209 209
2007-08 - - 176 176 176 176
2008-09 - - 110 110 110 110
2009-10 13 13 -- -- 13 13
2010-11 -- -- -- -- -- --
2011-12 -- -- -- -- -- --
2012-13 -- -- 247 247 247 247
2013-14 -- -- 178 178 178 178
2014-15 -- -- 210 210 210 210 2015-16 -- -- 83 83 83 83

Table-15
ADDITION OF FREIGHT WAGONS
BG MG Total System Unit Four- Unit Four- Unit Four
Wheelers Wheelers Wheelers
Year
July-June
1969-70 10 20 84 164 94 184
2006-07 -- -- -- -- -- --
2007-08 -- -- 100 100 100 100
2008-09 -- -- -- -- -- --
2009-10 -- -- -- -- -- --
2010-11 -- -- -- -- -- --
2011-12 -- -- -- -- -- --
2012-13 -- -- -- -- -- --
2013-14 -- -- -- -- -- --
2014-15 -- -- 99 99 99 99 2015-16 -- -- -- -- -- --
Table-16
SUMMARY OF ROLLING STOCK
Stock BG MG Total
Locomotives Steam -- -- --
Diesel 94 184 278
Total 94 184 278
Carriages Passenger Carriages 335 883 1,218
Other Coaching Vehicles 12 19 31
Total 347 902 1,249
Unit 4-W Unit 4-W Unit 4-W
Freights Covered Wagons 1,085 1,537 4,491 4,942 5,576 6,479
Special Type Wagons 754 1,214 2,356 4,361 3,101 5,575
Total 1,830 2,751 6,847 9,303 8,677 12,054
Note : 4-W = 4- Wheelers
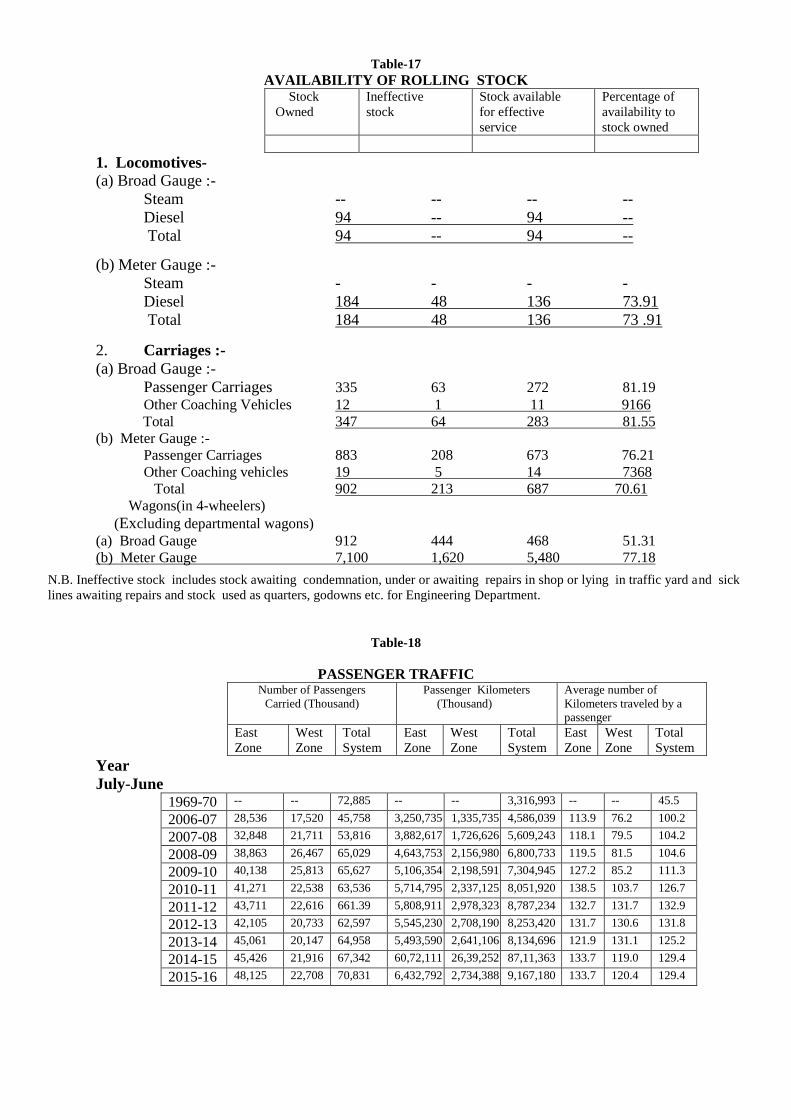
Table-17
AVAILABILITY OF ROLLING STOCK
Stock
Owned Ineffective
stock Stock available
for effective
service
Percentage of
availability to
stock owned
1. Locomotives- (a) Broad Gauge :-
Steam -- -- -- --
Diesel 94 -- 94 --
Total 94 -- 94 --
(b) Meter Gauge :-
Steam - - - -
Diesel 184 48 136 73.91
Total 184 48 136 73 .91
2. Carriages :-
(a) Broad Gauge :-
Passenger Carriages 335 63 272 81.19 Other Coaching Vehicles 12 1 11 9166
Total 347 64 283 81.55
(b) Meter Gauge :-
Passenger Carriages 883 208 673 76.21
Other Coaching vehicles 19 5 14 7368
Total 902 213 687 70.61
Wagons(in 4-wheelers)
(Excluding departmental wagons)
(a) Broad Gauge 912 444 468 51.31
(b) Meter Gauge 7,100 1,620 5,480 77.18
N.B. Ineffective stock includes stock awaiting condemnation, under or awaiting repairs in shop or lying in traffic yard and sick
lines awaiting repairs and stock used as quarters, godowns etc. for Engineering Department.
Table-18
PASSENGER TRAFFIC Number of Passengers
Carried (Thousand) Passenger Kilometers
(Thousand) Average number of
Kilometers traveled by a
passenger East
Zone
West
Zone
Total
System
East
Zone
West
Zone
Total
System
East
Zone
West
Zone
Total
System
Year
July-June 1969-70 -- -- 72,885 -- -- 3,316,993 -- -- 45.5
2006-07 28,536 17,520 45,758 3,250,735 1,335,735 4,586,039 113.9 76.2 100.2
2007-08 32,848 21,711 53,816 3,882,617 1,726,626 5,609,243 118.1 79.5 104.2
2008-09 38,863 26,467 65,029 4,643,753 2,156,980 6,800,733 119.5 81.5 104.6
2009-10 40,138 25,813 65,627 5,106,354 2,198,591 7,304,945 127.2 85.2 111.3
2010-11 41,271 22,538 63,536 5,714,795 2,337,125 8,051,920 138.5 103.7 126.7
2011-12 43,711 22,616 661.39 5,808,911 2,978,323 8,787,234 132.7 131.7 132.9
2012-13 42,105 20,733 62,597 5,545,230 2,708,190 8,253,420 131.7 130.6 131.8
2013-14 45,061 20,147 64,958 5,493,590 2,641,106 8,134,696 121.9 131.1 125.2
2014-15 45,426 21,916 67,342 60,72,111 26,39,252 87,11,363 133.7 119.0 129.4
2015-16 48,125 22,708 70,831 6,432,792 2,734,388 9,167,180 133.7 120.4 129.4
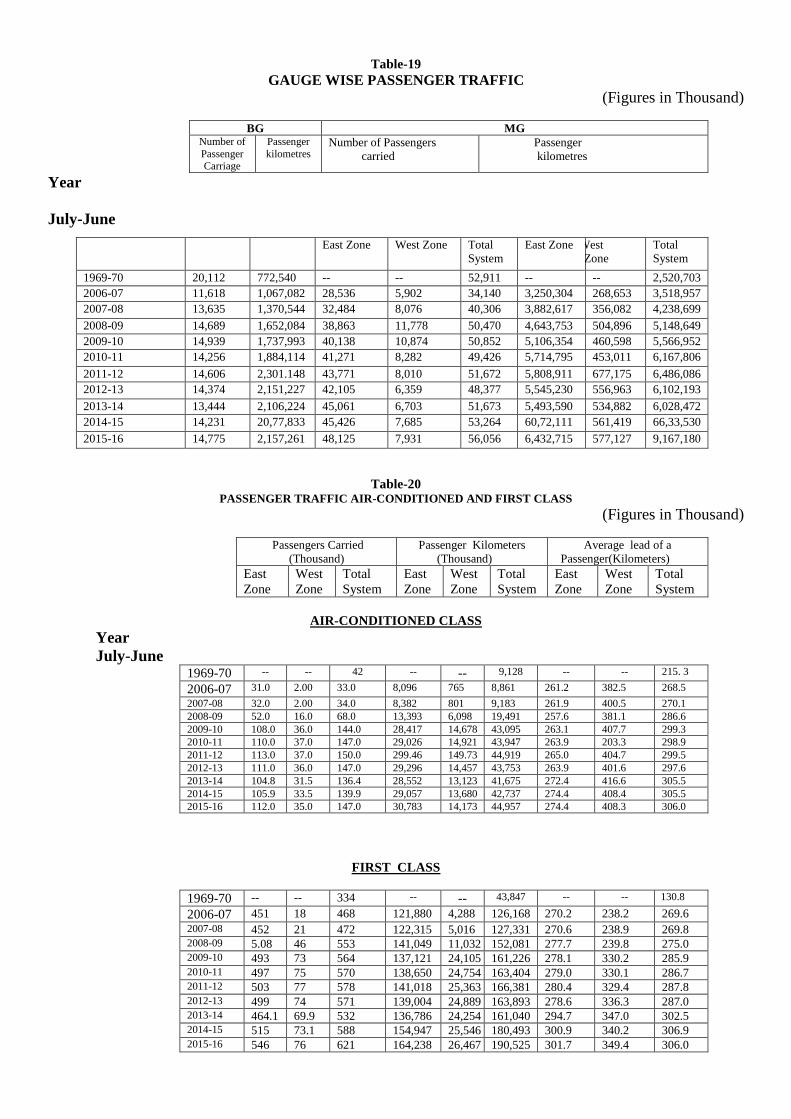
Table-19
GAUGE WISE PASSENGER TRAFFIC
(Figures in Thousand)
BG MG Number of
Passenger Carriage
Passenger
kilometres Number of Passengers
carried
Passenger
kilometres
Year
July-June
East Zone West Zone Total
System
East Zone West
Zone
Total
System
1969-70 20,112 772,540 -- -- 52,911 -- -- 2,520,703
2006-07 11,618 1,067,082 28,536 5,902 34,140 3,250,304 268,653 3,518,957
2007-08 13,635 1,370,544 32,484 8,076 40,306 3,882,617 356,082 4,238,699
2008-09 14,689 1,652,084 38,863 11,778 50,470 4,643,753 504,896 5,148,649
2009-10 14,939 1,737,993 40,138 10,874 50,852 5,106,354 460,598 5,566,952
2010-11 14,256 1,884,114 41,271 8,282 49,426 5,714,795 453,011 6,167,806
2011-12 14,606 2,301.148 43,771 8,010 51,672 5,808,911 677,175 6,486,086
2012-13 14,374 2,151,227 42,105 6,359 48,377 5,545,230 556,963 6,102,193
2013-14 13,444 2,106,224 45,061 6,703 51,673 5,493,590 534,882 6,028,472
2014-15 14,231 20,77,833 45,426 7,685 53,264 60,72,111 561,419 66,33,530
2015-16 14,775 2,157,261 48,125 7,931 56,056 6,432,715 577,127 9,167,180
Table-20 PASSENGER TRAFFIC AIR-CONDITIONED AND FIRST CLASS
(Figures in Thousand)
Passengers Carried
(Thousand)
Passenger Kilometers
(Thousand) Average lead of a
Passenger(Kilometers)
East
Zone
West
Zone
Total
System
East
Zone
West
Zone
Total
System
East
Zone
West
Zone
Total
System
AIR-CONDITIONED CLASS
Year
July-June 1969-70 -- -- 42 -- -- 9,128 -- -- 215. 3
2006-07 31.0 2.00 33.0 8,096 765 8,861 261.2 382.5 268.5
2007-08 32.0 2.00 34.0 8,382 801 9,183 261.9 400.5 270.1
2008-09 52.0 16.0 68.0 13,393 6,098 19,491 257.6 381.1 286.6
2009-10 108.0 36.0 144.0 28,417 14,678 43,095 263.1 407.7 299.3
2010-11 110.0 37.0 147.0 29,026 14,921 43,947 263.9 203.3 298.9
2011-12 113.0 37.0 150.0 299.46 149.73 44,919 265.0 404.7 299.5
2012-13 111.0 36.0 147.0 29,296 14,457 43,753 263.9 401.6 297.6
2013-14 104.8 31.5 136.4 28,552 13,123 41,675 272.4 416.6 305.5 2014-15 105.9 33.5 139.9 29,057 13,680 42,737 274.4 408.4 305.5 2015-16 112.0 35.0 147.0 30,783 14,173 44,957 274.4 408.3 306.0
FIRST CLASS
1969-70 -- -- 334 -- -- 43,847 -- -- 130.8
2006-07 451 18 468 121,880 4,288 126,168 270.2 238.2 269.6
2007-08 452 21 472 122,315 5,016 127,331 270.6 238.9 269.8 2008-09 5.08 46 553 141,049 11,032 152,081 277.7 239.8 275.0 2009-10 493 73 564 137,121 24,105 161,226 278.1 330.2 285.9 2010-11 497 75 570 138,650 24,754 163,404 279.0 330.1 286.7 2011-12 503 77 578 141,018 25,363 166,381 280.4 329.4 287.8 2012-13 499 74 571 139,004 24,889 163,893 278.6 336.3 287.0 2013-14 464.1 69.9 532 136,786 24,254 161,040 294.7 347.0 302.5 2014-15 515 73.1 588 154,947 25,546 180,493 300.9 340.2 306.9 2015-16 546 76 621 164,238 26,467 190,525 301.7 349.4 306.0
Table-21
PASSENGER TRAFFIC SECOND CLASS (Figures in Thousand)
Passengers
Carried (Thousand) Passenger Kilometres
(Thousand) Average lead of a
passenger(Kilometers) East
Zone
West
Zone
Total
System
East
Zone
West
Zone
Total
System
East
Zone
West
Zone
Total
System
Year
July-June 1969-70 -- -- 72,509 -- -- 3,264,018 -- -- 45.0
2006-07 28,054 17,500 45,257 3,120,328 1,330,682 4,451,010 111.2 76.0 98.3
2007-08 32,000 21,688 53,310 3,751,920 1,720,809 5,472,729 117.2 79.3 102.7 2008-09 38,303 26,406 64,408 4,489,311 2,139,850 6,629,161 117.2 81.0 102.9
2009-10 39,537 25,704 64,918 4,940,816 2,159,808 7,100,624 125.0 84.0 109.4 2010-11 40,664 22,426 62,819 5,547,119 2,297,450 7,844,569 136.4 102.4 124.9 2011-12 43,155 22,502 65,411 5,637,947 2,937,987 8,575,934 130.6 130.6 131.1
2012-13 41,495 20,623 61,879 5,376,930 2,668,844 8,045,774 129.6 129.4 130.0 2013-14 44,492.1 20,045.6 64,289.3 5,328,252 2,603,729 7,931,981 119.8 129.9 123.4 2014-15 45,426 21,916 67,342 58,88,107 2,600,026 8,488,133 131.4 117.8 127.4 2015-16 47,467 22,596 70,063 6,237,951 2,693,748 8,931,699 131.4 119.2 127.4
Table-22
CLASS-WISE PERCENTAGE OF PASSENGER TRAFFIC ( Percentage to total)
Air condition Class First Class Second Class East
Zone
West
Zone
Total
System
East
Zone
West
Zone
Total
System
East
Zone
West
Zone
Total
System
Year
July-June 1969-70 -- -- 0.06 -- -- 0.46 -- -- 99.5
2006-07 0.07 0.004 0.07 0.99 0.04 1.02 61.3 38.2 98.9 2007-08 0.06 0.004 0.06 0.84 0.04 0.88 59.5 40.3 99.1 2008-09 0.08 0.002 0.10 0.78 0.07 0.85 59.8 40.1 99.0 2009-10 0.16 0.054 0.22 0.75 0.11 0.86 60.2 39.2 98.9 2010-11 0.17 0.058 0.23 0.78 0.12 0.90 64.0 35.3 98.9 2011-12 0.17 0.056 0.23 0.76 0.12 0.87 65.3 34.0 98.9 2012-13 0.18 0.058 0.23 0.80 0.12 0.91 66.3 32.9 98.8 2013-14 0.16 0.048 0.21 0.71 0.11 0.82 68.5 30.9 99.0 2014-15 0.16 0.050 0.21 0.76 0.11 0.87 66.1 32.8 98.9 2015-16 0.16 0.050 0.21 0.77 0.11 0.88 67.1 31.9 99.0
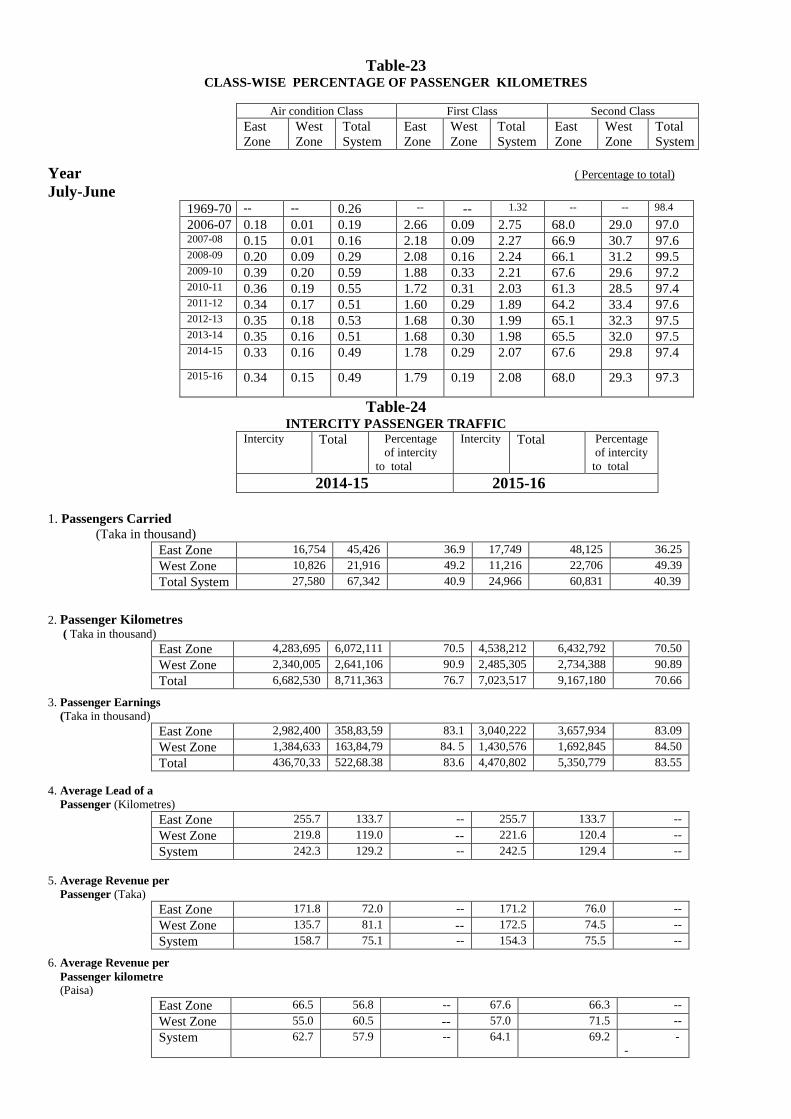
Table-23 CLASS-WISE PERCENTAGE OF PASSENGER KILOMETRES
Air condition Class First Class Second Class East
Zone
West
Zone
Total
System
East
Zone
West
Zone
Total
System
East
Zone
West
Zone
Total
System
Year ( Percentage to total)
July-June 1969-70 -- -- 0.26 -- -- 1.32 -- -- 98.4
2006-07 0.18 0.01 0.19 2.66 0.09 2.75 68.0 29.0 97.0 2007-08 0.15 0.01 0.16 2.18 0.09 2.27 66.9 30.7 97.6 2008-09 0.20 0.09 0.29 2.08 0.16 2.24 66.1 31.2 99.5 2009-10 0.39 0.20 0.59 1.88 0.33 2.21 67.6 29.6 97.2 2010-11 0.36 0.19 0.55 1.72 0.31 2.03 61.3 28.5 97.4 2011-12 0.34 0.17 0.51 1.60 0.29 1.89 64.2 33.4 97.6 2012-13 0.35 0.18 0.53 1.68 0.30 1.99 65.1 32.3 97.5 2013-14 0.35 0.16 0.51 1.68 0.30 1.98 65.5 32.0 97.5 2014-15
0.33 0.16 0.49 1.78 0.29 2.07 67.6 29.8 97.4
2015-16 0.34 0.15 0.49 1.79 0.19 2.08 68.0 29.3 97.3
Table-24 INTERCITY PASSENGER TRAFFIC
Intercity Total Percentage
of intercity
to total
Intercity Total Percentage
of intercity
to total
2014-15 2015-16
1. Passengers Carried
(Taka in thousand)
East Zone 16,754 45,426 36.9 17,749 48,125 36.25
West Zone 10,826 21,916 49.2 11,216 22,706 49.39
Total System 27,580 67,342 40.9 24,966 60,831 40.39
2. Passenger Kilometres
( Taka in thousand)
East Zone 4,283,695 6,072,111 70.5 4,538,212 6,432,792 70.50
West Zone 2,340,005 2,641,106 90.9 2,485,305 2,734,388 90.89
Total 6,682,530 8,711,363 76.7 7,023,517 9,167,180 70.66
3. Passenger Earnings
(Taka in thousand)
East Zone 2,982,400 358,83,59 83.1 3,040,222 3,657,934 83.09
West Zone 1,384,633 163,84,79 84. 5 1,430,576 1,692,845 84.50
Total 436,70,33 522,68.38 83.6 4,470,802 5,350,779 83.55
4. Average Lead of a
Passenger (Kilometres)
East Zone 255.7 133.7 -- 255.7 133.7 --
West Zone 219.8 119.0 -- 221.6 120.4 --
System 242.3 129.2 -- 242.5 129.4 --
5. Average Revenue per
Passenger (Taka)
East Zone 171.8 72.0 -- 171.2 76.0 --
West Zone 135.7 81.1 -- 172.5 74.5 --
System 158.7 75.1 -- 154.3 75.5 --
6. Average Revenue per
Passenger kilometre (Paisa)
East Zone 66.5 56.8 -- 67.6 66.3 --
West Zone 55.0 60.5 -- 57.0 71.5 --
System 62.7 57.9 -- 64.1 69.2 -
-
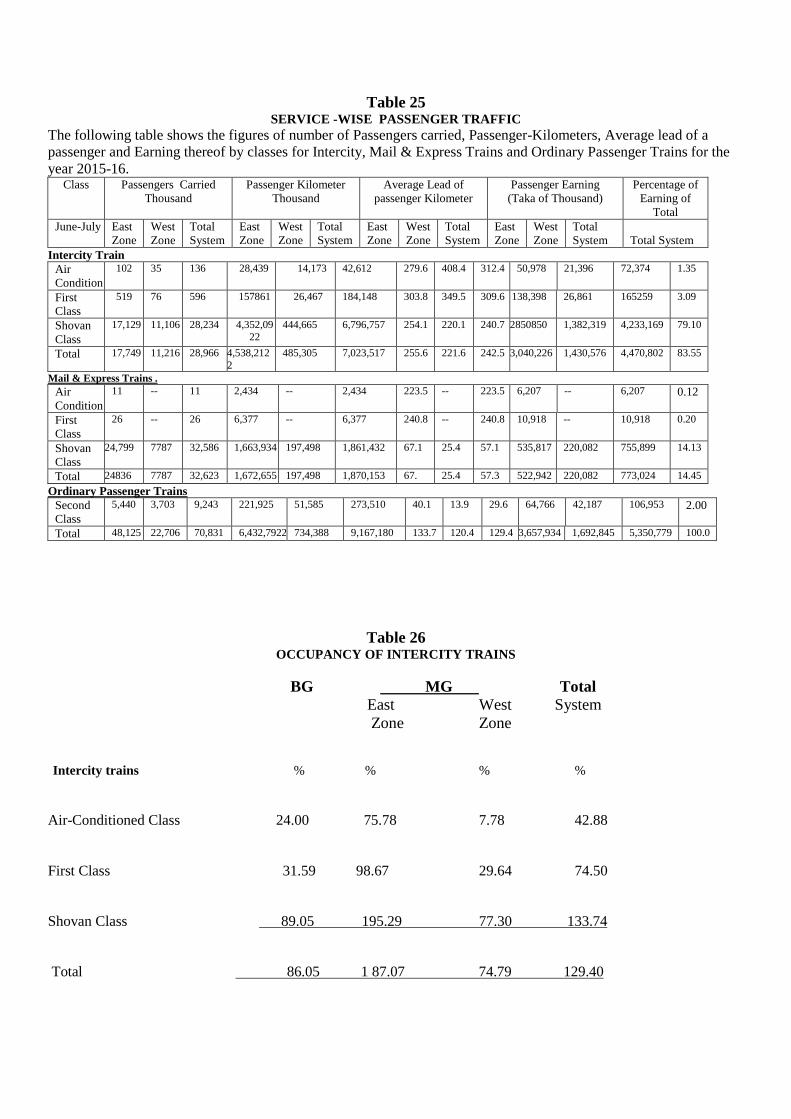
Table 25 SERVICE -WISE PASSENGER TRAFFIC
The following table shows the figures of number of Passengers carried, Passenger-Kilometers, Average lead of a
passenger and Earning thereof by classes for Intercity, Mail & Express Trains and Ordinary Passenger Trains for the
year 2015-16. Class Passengers Carried
Thousand
Passenger Kilometer
Thousand
Average Lead of
passenger Kilometer
Passenger Earning
(Taka of Thousand)
Percentage of
Earning of
Total
June-July East
Zone
West
Zone
Total
System
East
Zone
West
Zone
Total
System
East
Zone
West
Zone
Total
System
East
Zone
West
Zone
Total
System
Total System
Intercity Train
Air
Condition
102 35 136 28,439 14,173 42,612 279.6 408.4 312.4 50,978 21,396 72,374 1.35
First
Class
519 76 596 157861 26,467 184,148 303.8 349.5 309.6 138,398 26,861 165259 3.09
Shovan
Class
17,129 11,106 28,234 4,352,09
22
444,665 6,796,757 254.1 220.1 240.7 2850850 1,382,319 4,233,169 79.10
Total 17,749 11,216 28,966 4,538,212
2
485,305 7,023,517 255.6 221.6 242.5 3,040,226 1,430,576 4,470,802 83.55
Mail & Express Trains .
Air
Condition
11
-- 11 2,434
-- 2,434 223.5
-- 223.5 6,207
-- 6,207 0.12
First
Class
26
-- 26 6,377
-- 6,377 240.8
-- 240.8 10,918
-- 10,918 0.20
Shovan
Class
24,799 7787 32,586 1,663,934 197,498 1,861,432 67.1 25.4 57.1 535,817 220,082 755,899 14.13
Total 24836 7787 32,623 1,672,655 197,498 1,870,153 67. 25.4 57.3 522,942 220,082 773,024 14.45
Ordinary Passenger Trains
Second
Class
5,440 3,703 9,243 221,925 51,585 273,510 40.1 13.9 29.6 64,766 42,187 106,953 2.00
Total 48,125 22,706 70,831 6,432,7922 734,388 9,167,180 133.7 120.4 129.4 3,657,934 1,692,845 5,350,779 100.0
Table 26 OCCUPANCY OF INTERCITY TRAINS
BG MG Total
East West System
Zone Zone
Intercity trains % % % %
Air-Conditioned Class 24.00 75.78 7.78 42.88
First Class 31.59 98.67 29.64 74.50
Shovan Class 89.05 195.29 77.30 133.74
Total 86.05 1 87.07 74.79 129.40
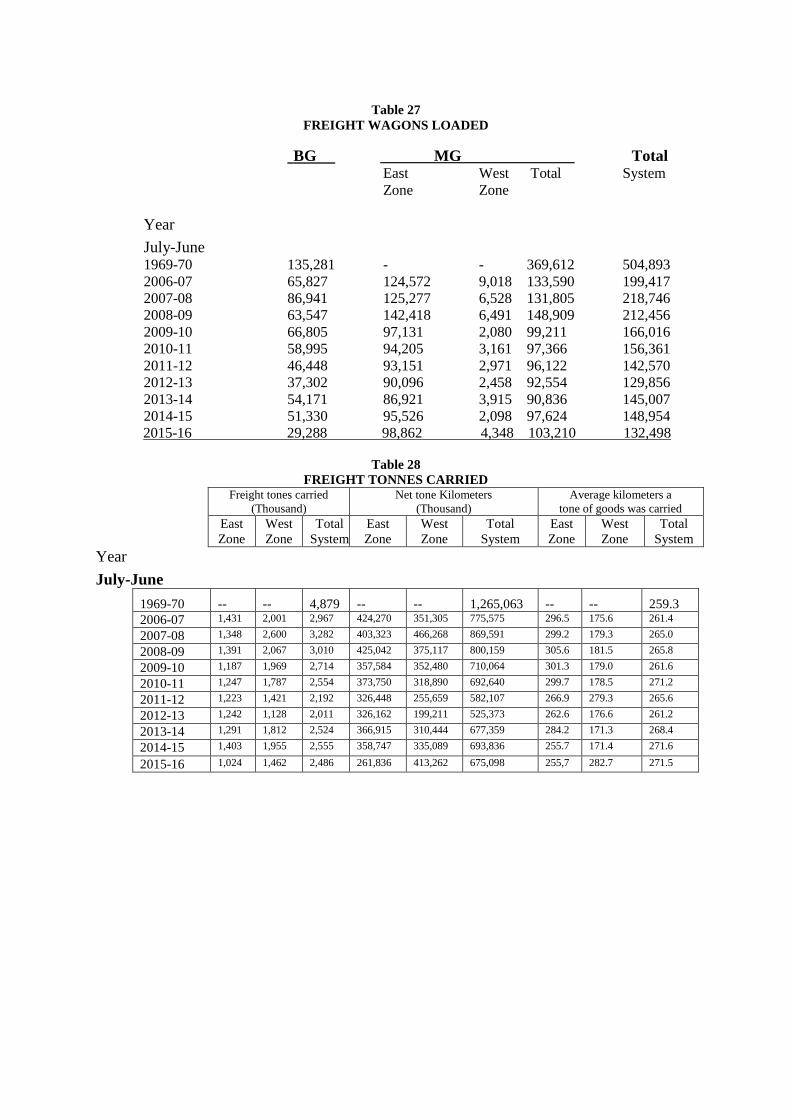
Table 27
FREIGHT WAGONS LOADED
BG MG Total East West Total System
Zone Zone
Year
July-June 1969-70 135,281 - - 369,612 504,893
2006-07 65,827 124,572 9,018 133,590 199,417
2007-08 86,941 125,277 6,528 131,805 218,746
2008-09 63,547 142,418 6,491 148,909 212,456
2009-10 66,805 97,131 2,080 99,211 166,016
2010-11 58,995 94,205 3,161 97,366 156,361
2011-12 46,448 93,151 2,971 96,122 142,570
2012-13 37,302 90,096 2,458 92,554 129,856
2013-14 54,171 86,921 3,915 90,836 145,007
2014-15 51,330 95,526 2,098 97,624 148,954
2015-16 29,288 98,862 4,348 103,210 132,498
Table 28
FREIGHT TONNES CARRIED Freight tones carried
(Thousand) Net tone Kilometers
(Thousand) Average kilometers a
tone of goods was carried
East
Zone
West
Zone
Total
System
East
Zone
West
Zone
Total
System
East
Zone
West
Zone
Total
System
Year
July-June
1969-70 -- -- 4,879 -- -- 1,265,063 -- -- 259.3
2006-07 1,431 2,001 2,967 424,270 351,305 775,575 296.5 175.6 261.4
2007-08 1,348 2,600 3,282 403,323 466,268 869,591 299.2 179.3 265.0
2008-09 1,391 2,067 3,010 425,042 375,117 800,159 305.6 181.5 265.8
2009-10 1,187 1,969 2,714 357,584 352,480 710,064 301.3 179.0 261.6
2010-11 1,247 1,787 2,554 373,750 318,890 692,640 299.7 178.5 271.2
2011-12 1,223 1,421 2,192 326,448 255,659 582,107 266.9 279.3 265.6
2012-13 1,242 1,128 2,011 326,162 199,211 525,373 262.6 176.6 261.2
2013-14 1,291 1,812 2,524 366,915 310,444 677,359 284.2 171.3 268.4
2014-15 1,403 1,955 2,555 358,747 335,089 693,836 255.7 171.4 271.6
2015-16 1,024 1,462 2,486 261,836 413,262 675,098 255,7 282.7 271.5
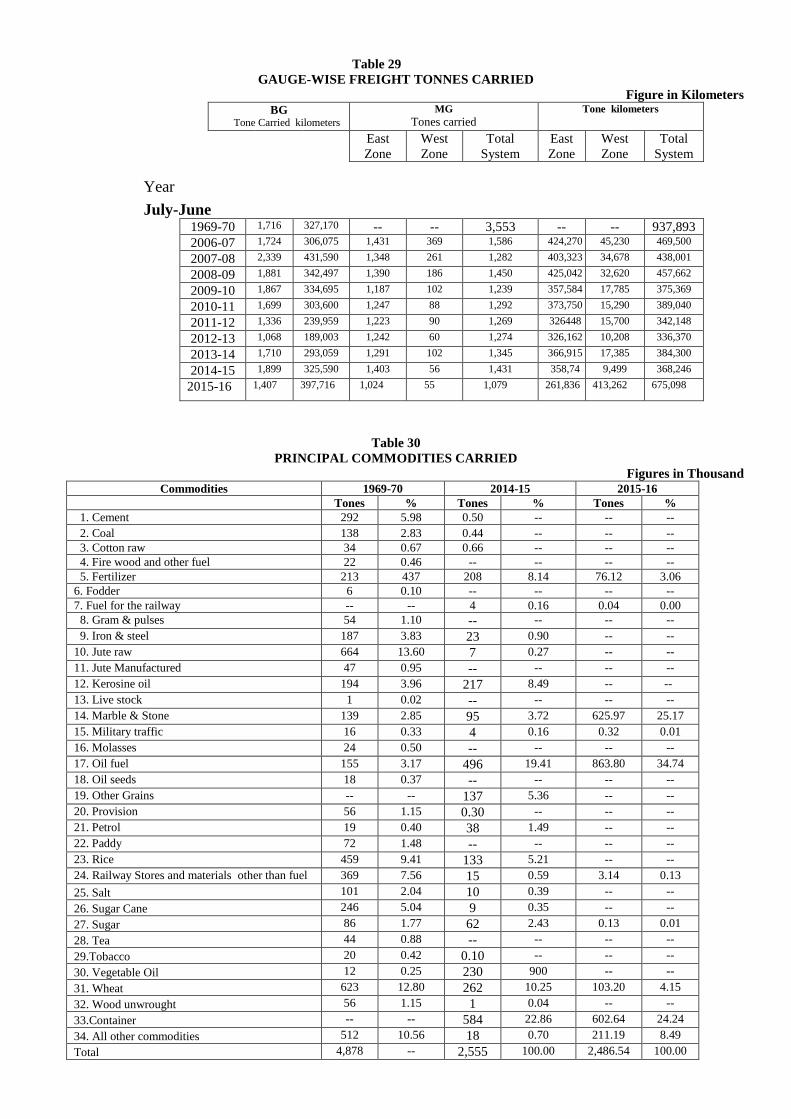
Table 29
GAUGE-WISE FREIGHT TONNES CARRIED
Figure in Kilometers
BG Tone Carried kilometers
MG
Tones carried Tone kilometers
East
Zone
West
Zone
Total
System
East
Zone
West
Zone
Total
System
Year
July-June 1969-70 1,716 327,170 -- -- 3,553 -- -- 937,893
2006-07 1,724 306,075 1,431 369 1,586 424,270 45,230 469,500
2007-08 2,339 431,590 1,348 261 1,282 403,323 34,678 438,001
2008-09 1,881 342,497 1,390 186 1,450 425,042 32,620 457,662
2009-10 1,867 334,695 1,187 102 1,239 357,584 17,785 375,369
2010-11 1,699 303,600 1,247 88 1,292 373,750 15,290 389,040
2011-12 1,336 239,959 1,223 90 1,269 326448 15,700 342,148
2012-13 1,068 189,003 1,242 60 1,274 326,162 10,208 336,370
2013-14 1,710 293,059 1,291 102 1,345 366,915 17,385 384,300
2014-15 1,899 325,590 1,403 56 1,431 358,74 9,499 368,246
2015-16 1,407 397,716 1,024 55 1,079 261,836 413,262 675,098
Table 30
PRINCIPAL COMMODITIES CARRIED
Figures in Thousand
Commodities 1969-70 2014-15 2015-16
Tones % Tones % Tones %
1. Cement 292 5.98 0.50 -- -- --
2. Coal 138 2.83 0.44 -- -- --
3. Cotton raw 34 0.67 0.66 -- -- --
4. Fire wood and other fuel 22 0.46 -- -- -- --
5. Fertilizer 213 437 208 8.14 76.12 3.06
6. Fodder 6 0.10 -- -- -- --
7. Fuel for the railway -- -- 4 0.16 0.04 0.00
8. Gram & pulses 54 1.10 -- -- -- --
9. Iron & steel 187 3.83 23 0.90 -- --
10. Jute raw 664 13.60 7 0.27 -- --
11. Jute Manufactured 47 0.95 -- -- -- --
12. Kerosine oil 194 3.96 217 8.49 -- --
13. Live stock 1 0.02 -- -- -- --
14. Marble & Stone 139 2.85 95 3.72 625.97 25.17
15. Military traffic 16 0.33 4 0.16 0.32 0.01
16. Molasses 24 0.50 -- -- -- --
17. Oil fuel 155 3.17 496 19.41 863.80 34.74
18. Oil seeds 18 0.37 -- -- -- --
19. Other Grains -- -- 137 5.36 -- --
20. Provision 56 1.15 0.30 -- -- --
21. Petrol 19 0.40 38 1.49 -- --
22. Paddy 72 1.48 -- -- -- --
23. Rice 459 9.41 133 5.21 -- --
24. Railway Stores and materials other than fuel 369 7.56 15 0.59 3.14 0.13
25. Salt 101 2.04 10 0.39 -- --
26. Sugar Cane 246 5.04 9 0.35 -- --
27. Sugar 86 1.77 62 2.43 0.13 0.01
28. Tea 44 0.88 -- -- -- --
29.Tobacco 20 0.42 0.10 -- -- --
30. Vegetable Oil 12 0.25 230 900 -- --
31. Wheat 623 12.80 262 10.25 103.20 4.15
32. Wood unwrought 56 1.15 1 0.04 -- --
33.Container -- -- 584 22.86 602.64 24.24
34. All other commodities 512 10.56 18 0.70 211.19 8.49
Total 4,878 -- 2,555 100.00 2,486.54 100.00
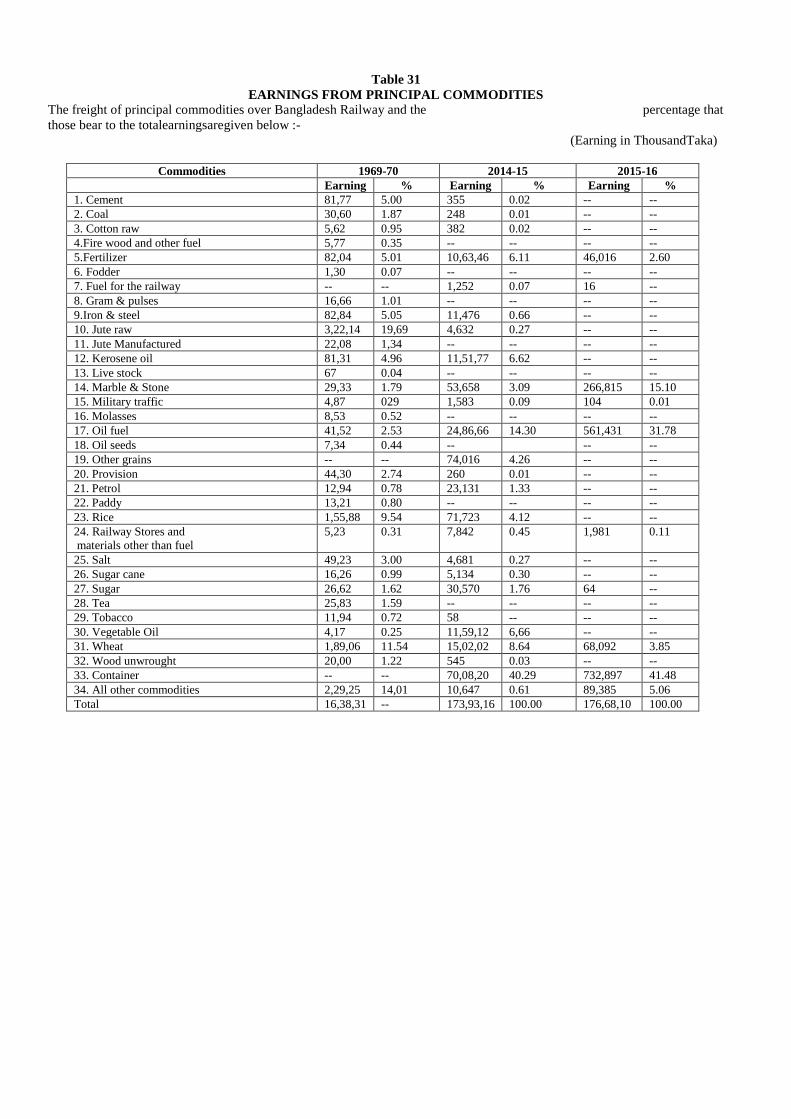
Table 31
EARNINGS FROM PRINCIPAL COMMODITIES
The freight of principal commodities over Bangladesh Railway and the percentage that
those bear to the totalearningsaregiven below :-
(Earning in ThousandTaka)
Commodities 1969-70 2014-15 2015-16
Earning % Earning % Earning %
1. Cement 81,77 5.00 355 0.02 -- --
2. Coal 30,60 1.87 248 0.01 -- -- 3. Cotton raw 5,62 0.95 382 0.02 -- --
4.Fire wood and other fuel 5,77 0.35 -- -- -- --
5.Fertilizer 82,04 5.01 10,63,46 6.11 46,016 2.60
6. Fodder 1,30 0.07 -- -- -- --
7. Fuel for the railway -- -- 1,252 0.07 16 --
8. Gram & pulses 16,66 1.01 -- -- -- --
9.Iron & steel 82,84 5.05 11,476 0.66 -- --
10. Jute raw 3,22,14 19,69 4,632 0.27 -- --
11. Jute Manufactured 22,08 1,34 -- -- -- --
12. Kerosene oil 81,31 4.96 11,51,77 6.62 -- --
13. Live stock 67 0.04 -- -- -- --
14. Marble & Stone 29,33 1.79 53,658 3.09 266,815 15.10
15. Military traffic 4,87 029 1,583 0.09 104 0.01
16. Molasses 8,53 0.52 -- -- -- --
17. Oil fuel 41,52 2.53 24,86,66 14.30 561,431 31.78
18. Oil seeds 7,34 0.44 -- -- --
19. Other grains -- -- 74,016 4.26 -- --
20. Provision 44,30 2.74 260 0.01 -- --
21. Petrol 12,94 0.78 23,131 1.33 -- --
22. Paddy 13,21 0.80 -- -- -- --
23. Rice 1,55,88 9.54 71,723 4.12 -- --
24. Railway Stores and
materials other than fuel
5,23 0.31 7,842 0.45 1,981 0.11
25. Salt 49,23 3.00 4,681 0.27 -- --
26. Sugar cane 16,26 0.99 5,134 0.30 -- --
27. Sugar 26,62 1.62 30,570 1.76 64 -- 28. Tea 25,83 1.59 -- -- -- --
29. Tobacco 11,94 0.72 58 -- -- --
30. Vegetable Oil 4,17 0.25 11,59,12 6,66 -- --
31. Wheat 1,89,06 11.54 15,02,02 8.64 68,092 3.85
32. Wood unwrought 20,00 1.22 545 0.03 -- --
33. Container -- -- 70,08,20 40.29 732,897 41.48
34. All other commodities 2,29,25 14,01 10,647 0.61 89,385 5.06
Total 16,38,31 -- 173,93,16 100.00 176,68,10 100.00
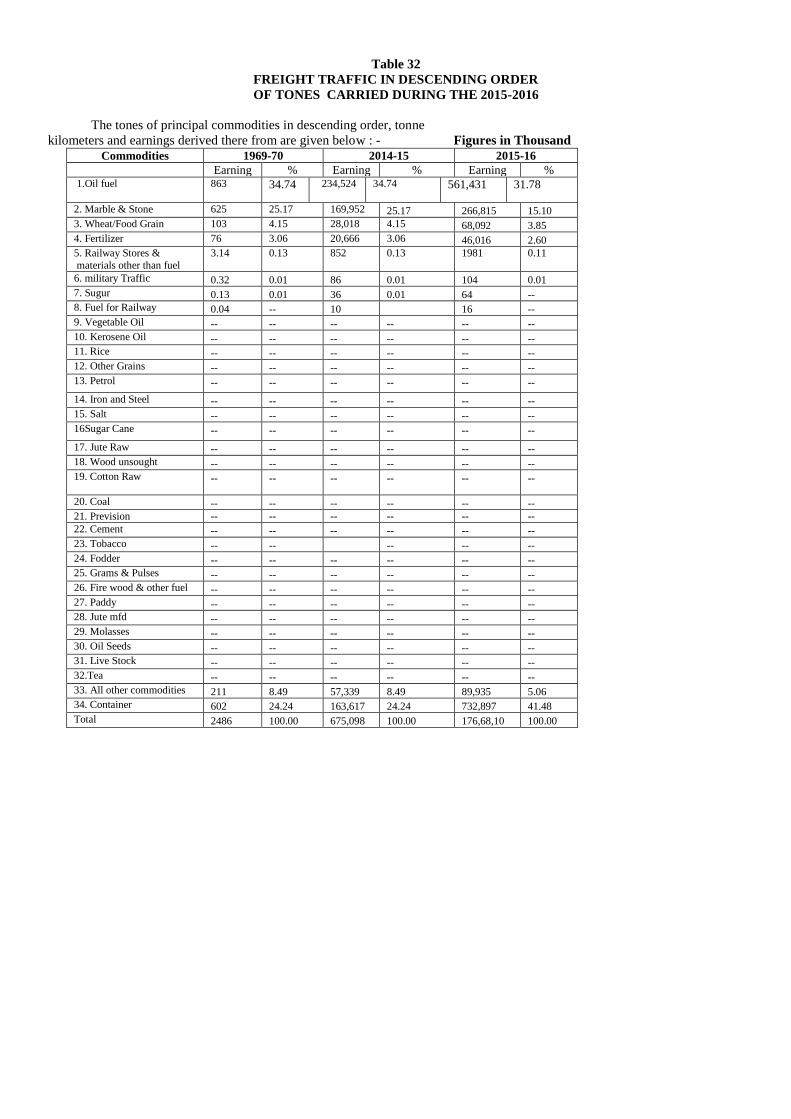
Table 32
FREIGHT TRAFFIC IN DESCENDING ORDER
OF TONES CARRIED DURING THE 2015-2016
The tones of principal commodities in descending order, tonne
kilometers and earnings derived there from are given below : - Figures in Thousand
Commodities 1969-70 2014-15 2015-16
Earning % Earning % Earning % 1.Oil fuel
863 34.74 234,524 34.74 561,431 31.78
2. Marble & Stone 625 25.17 169,952 25.17 266,815 15.10
3. Wheat/Food Grain 103 4.15 28,018 4.15 68,092 3.85
4. Fertilizer 76 3.06 20,666 3.06 46,016 2.60
5. Railway Stores &
materials other than fuel
3.14 0.13 852 0.13 1981 0.11
6. military Traffic 0.32 0.01 86 0.01 104 0.01
7. Sugur 0.13 0.01 36 0.01 64 --
8. Fuel for Railway 0.04 -- 10 16 --
9. Vegetable Oil -- -- -- -- -- --
10. Kerosene Oil -- -- -- -- -- --
11. Rice -- -- -- -- -- --
12. Other Grains -- -- -- -- -- --
13. Petrol -- -- -- -- -- --
14. Iron and Steel -- -- -- -- -- --
15. Salt -- -- -- -- -- --
16Sugar Cane -- -- -- -- -- --
17. Jute Raw -- -- -- -- -- --
18. Wood unsought -- -- -- -- -- --
19. Cotton Raw
-- -- -- -- -- --
20. Coal -- -- -- -- -- --
21. Prevision -- -- -- -- -- --
22. Cement -- -- -- -- -- --
23. Tobacco -- -- -- -- --
24. Fodder -- -- -- -- -- --
25. Grams & Pulses -- -- -- -- -- --
26. Fire wood & other fuel -- -- -- -- -- --
27. Paddy -- -- -- -- -- --
28. Jute mfd -- -- -- -- -- --
29. Molasses -- -- -- -- -- --
30. Oil Seeds -- -- -- -- -- --
31. Live Stock -- -- -- -- -- --
32.Tea -- -- -- -- -- --
33. All other commodities 211 8.49 57,339 8.49 89,935 5.06
34. Container 602 24.24 163,617 24.24 732,897 41.48
Total 2486 100.00 675,098 100.00 176,68,10 100.00
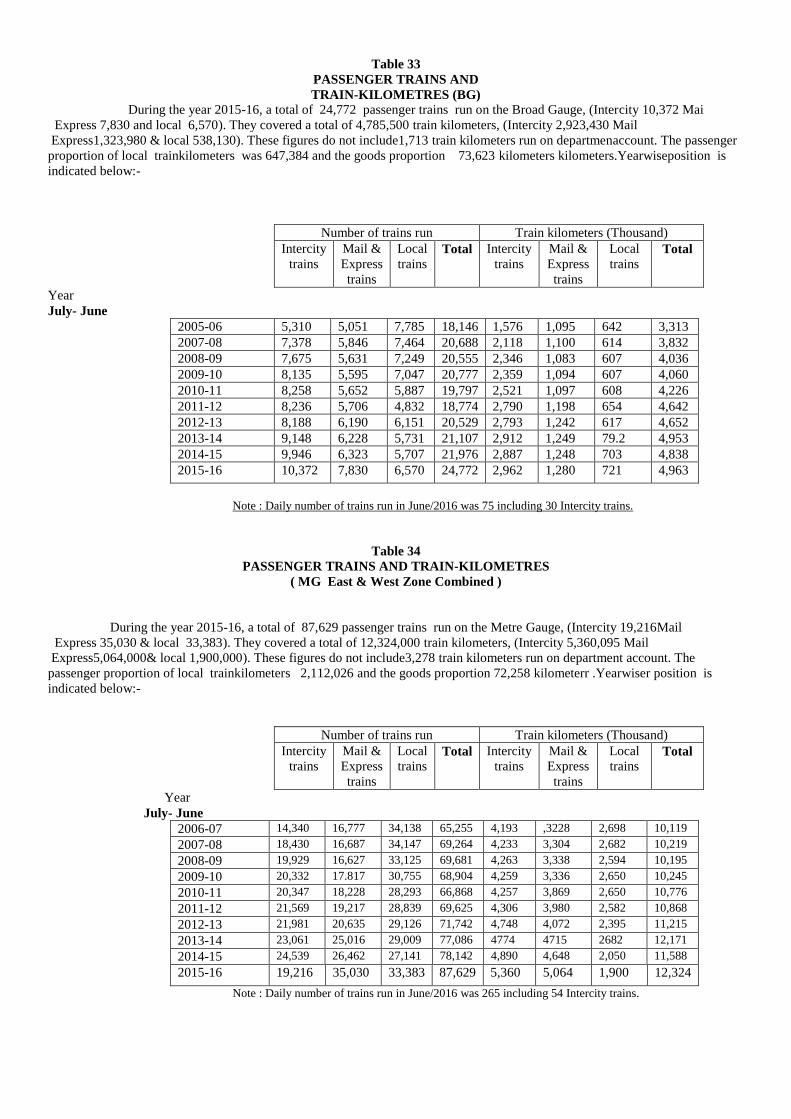
Table 33
PASSENGER TRAINS AND
TRAIN-KILOMETRES (BG)
During the year 2015-16, a total of 24,772 passenger trains run on the Broad Gauge, (Intercity 10,372 Mai
Express 7,830 and local 6,570). They covered a total of 4,785,500 train kilometers, (Intercity 2,923,430 Mail
Express1,323,980 & local 538,130). These figures do not include1,713 train kilometers run on departmenaccount. The passenger
proportion of local trainkilometers was 647,384 and the goods proportion 73,623 kilometers kilometers.Yearwiseposition is
indicated below:-
Number of trains run Train kilometers (Thousand)
Intercity
trains
Mail &
Express
trains
Local
trains
Total Intercity
trains
Mail &
Express
trains
Local
trains
Total
Year
July- June
2005-06 5,310 5,051 7,785 18,146 1,576 1,095 642 3,313
2007-08 7,378 5,846 7,464 20,688 2,118 1,100 614 3,832
2008-09 7,675 5,631 7,249 20,555 2,346 1,083 607 4,036
2009-10 8,135 5,595 7,047 20,777 2,359 1,094 607 4,060
2010-11 8,258 5,652 5,887 19,797 2,521 1,097 608 4,226
2011-12 8,236 5,706 4,832 18,774 2,790 1,198 654 4,642
2012-13 8,188 6,190 6,151 20,529 2,793 1,242 617 4,652
2013-14 9,148 6,228 5,731 21,107 2,912 1,249 79.2 4,953
2014-15 9,946 6,323 5,707 21,976 2,887 1,248 703 4,838
2015-16 10,372 7,830 6,570 24,772 2,962 1,280 721 4,963
Note : Daily number of trains run in June/2016 was 75 including 30 Intercity trains.
Table 34
PASSENGER TRAINS AND TRAIN-KILOMETRES
( MG East & West Zone Combined )
During the year 2015-16, a total of 87,629 passenger trains run on the Metre Gauge, (Intercity 19,216Mail
Express 35,030 & local 33,383). They covered a total of 12,324,000 train kilometers, (Intercity 5,360,095 Mail
Express5,064,000& local 1,900,000). These figures do not include3,278 train kilometers run on department account. The
passenger proportion of local trainkilometers 2,112,026 and the goods proportion 72,258 kilometerr .Yearwiser position is
indicated below:-
Number of trains run Train kilometers (Thousand)
Intercity
trains
Mail &
Express
trains
Local
trains
Total Intercity
trains
Mail &
Express
trains
Local
trains
Total
Year
July- June
2006-07 14,340 16,777 34,138 65,255 4,193 ,3228 2,698 10,119
2007-08 18,430 16,687 34,147 69,264 4,233 3,304 2,682 10,219
2008-09 19,929 16,627 33,125 69,681 4,263 3,338 2,594 10,195
2009-10 20,332 17.817 30,755 68,904 4,259 3,336 2,650 10,245
2010-11 20,347 18,228 28,293 66,868 4,257 3,869 2,650 10,776
2011-12 21,569 19,217 28,839 69,625 4,306 3,980 2,582 10,868
2012-13 21,981 20,635 29,126 71,742 4,748 4,072 2,395 11,215
2013-14 23,061 25,016 29,009 77,086 4774 4715 2682 12,171
2014-15 24,539 26,462 27,141 78,142 4,890 4,648 2,050 11,588
2015-16 19,216 35,030 33,383 87,629 5,360 5,064 1,900 12,324
Note : Daily number of trains run in June/2016 was 265 including 54 Intercity trains.
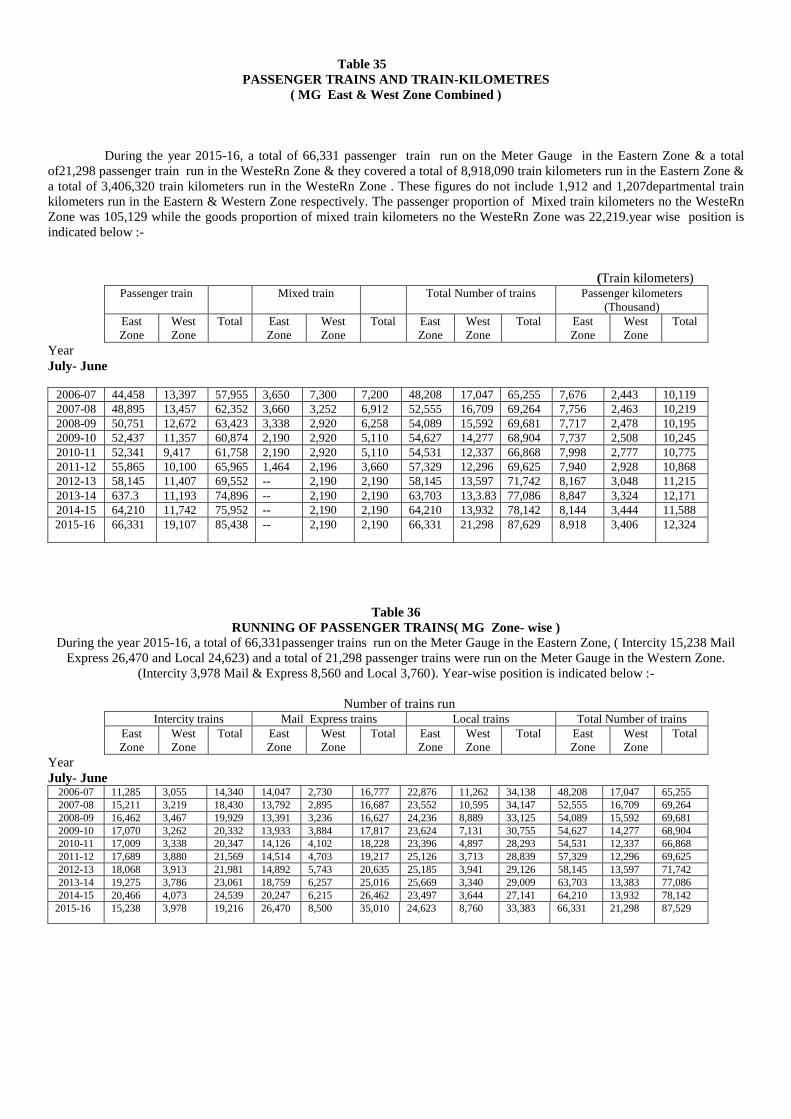
Table 35
PASSENGER TRAINS AND TRAIN-KILOMETRES
( MG East & West Zone Combined )
During the year 2015-16, a total of 66,331 passenger train run on the Meter Gauge in the Eastern Zone & a total
of21,298 passenger train run in the WesteRn Zone & they covered a total of 8,918,090 train kilometers run in the Eastern Zone &
a total of 3,406,320 train kilometers run in the WesteRn Zone . These figures do not include 1,912 and 1,207departmental train
kilometers run in the Eastern & Western Zone respectively. The passenger proportion of Mixed train kilometers no the WesteRn
Zone was 105,129 while the goods proportion of mixed train kilometers no the WesteRn Zone was 22,219.year wise position is
indicated below :-
(Train kilometers) Passenger train Mixed train Total Number of trains Passenger kilometers
(Thousand)
East
Zone
West
Zone
Total East
Zone
West
Zone
Total East
Zone
West
Zone
Total East
Zone
West
Zone
Total
Year
July- June
2006-07 44,458 13,397 57,955 3,650 7,300 7,200 48,208 17,047 65,255 7,676 2,443 10,119
2007-08 48,895 13,457 62,352 3,660 3,252 6,912 52,555 16,709 69,264 7,756 2,463 10,219 2008-09 50,751 12,672 63,423 3,338 2,920 6,258 54,089 15,592 69,681 7,717 2,478 10,195
2009-10 52,437 11,357 60,874 2,190 2,920 5,110 54,627 14,277 68,904 7,737 2,508 10,245 2010-11 52,341 9,417 61,758 2,190 2,920 5,110 54,531 12,337 66,868 7,998 2,777 10,775 2011-12 55,865 10,100 65,965 1,464 2,196 3,660 57,329 12,296 69,625 7,940 2,928 10,868 2012-13 58,145 11,407 69,552 -- 2,190 2,190 58,145 13,597 71,742 8,167 3,048 11,215 2013-14 637.3 11,193 74,896 -- 2,190 2,190 63,703 13,3.83 77,086 8,847 3,324 12,171
2014-15 64,210 11,742 75,952 -- 2,190 2,190 64,210 13,932 78,142 8,144 3,444 11,588 2015-16 66,331 19,107 85,438 -- 2,190 2,190 66,331 21,298 87,629 8,918 3,406 12,324
Table 36
RUNNING OF PASSENGER TRAINS( MG Zone- wise ) During the year 2015-16, a total of 66,331passenger trains run on the Meter Gauge in the Eastern Zone, ( Intercity 15,238 Mail
Express 26,470 and Local 24,623) and a total of 21,298 passenger trains were run on the Meter Gauge in the Western Zone.
(Intercity 3,978 Mail & Express 8,560 and Local 3,760). Year-wise position is indicated below :-
Number of trains run Intercity trains Mail Express trains Local trains Total Number of trains
East
Zone
West
Zone
Total East
Zone
West
Zone
Total East
Zone
West
Zone
Total East
Zone
West
Zone
Total
Year
July- June 2006-07 11,285 3,055 14,340 14,047 2,730 16,777 22,876 11,262 34,138 48,208 17,047 65,255
2007-08 15,211 3,219 18,430 13,792 2,895 16,687 23,552 10,595 34,147 52,555 16,709 69,264
2008-09 16,462 3,467 19,929 13,391 3,236 16,627 24,236 8,889 33,125 54,089 15,592 69,681
2009-10 17,070 3,262 20,332 13,933 3,884 17,817 23,624 7,131 30,755 54,627 14,277 68,904
2010-11 17,009 3,338 20,347 14,126 4,102 18,228 23,396 4,897 28,293 54,531 12,337 66,868
2011-12 17,689 3,880 21,569 14,514 4,703 19,217 25,126 3,713 28,839 57,329 12,296 69,625
2012-13 18,068 3,913 21,981 14,892 5,743 20,635 25,185 3,941 29,126 58,145 13,597 71,742
2013-14 19,275 3,786 23,061 18,759 6,257 25,016 25,669 3,340 29,009 63,703 13,383 77,086
2014-15 20,466 4,073 24,539 20,247 6,215 26,462 23,497 3,644 27,141 64,210 13,932 78,142
2015-16 15,238 3,978 19,216 26,470 8,500 35,010 24,623 8,760 33,383 66,331 21,298 87,529

Table-37 PASSENGER TRAIN-KILOMETRES ( MG Zone- wise )
During the year 2015-16, a total of 8,834,980 train kilometers run on the Meter Gauge in the Eastern Zone, (Intercity 3,967,880
Mail Express 3,877,870and Local 989,230 and a total of 3,504,890 train kilometers were run on the Meter Gauge in the Western
Zone), (Intercity 1,471,700 Mail Express 1,135,290,and Local 897,900). This figures do not include 2,912 & departmental train
1,207 kilometers run in the Eastern & Western Zone respectively. The passenger proportion of Local train kilometers in the
Eastern Zone was nil and that on the Western Zone was 105,129. Year-wise position is indicated below :-
Train kilometers (Thousand) Intercity trains Mail Express trains Local trains Total Train kilometers
East
Zone
West
Zone
Total East
Zone
West
Zone
Total East
Zone
West
Zone
Total East
Zone
West
Zone
Total
Year June-July
2006-07 3,108 1,085 4,193 2,847 381 3,228 1,721 977 2,698 7,676 2,443 10,119 2007-08 3,111 1,122 4,233 2,920 384 3,304 1,725 957 2,682 7,756 2,463 10,219 2008-09 3,102 1,161 4,263 2,949 389 3,338 1,666 928 2,5,94 7,717 2,478 10,195 2009-10 3,103 1,156 4,259 2,915 421 3,336 1,719 931 2,650 7,737 2,508 10,245 2010-11 3,102 1,154 4,256 3,177 692 3,869 1,719 931 2,650 7,998 2,777 10,775 2011-12 3,187 1,199 4,306 3,059 921 3,980 1,774 808 2,582 7,940 2,928 10,868 2012-13 3,261 1,486 4,647 3,126 946 4,072 1,780 615 2,395 8,167 3,048 11,215 2013-14 3,327 1,447 4,774 3,724 991 4,715 1,796 886 2,682 8,847 3,324 12,171
2014-15 3,443 1,447 4,890 3,537 1,111 4,648 1,164 886 2,050 8,144 3,444 11,588 2015-16 3,924 1,430 5,354 3,916 1,148 5,064 1,072 828 1900 8,917 3,407 12,324
Table-38 PUNCTUALITY OF PASSENGER TRAINS (BG & MG)
During the year 2015-16, The punctuality i.e. the percentage of trains not losing time to total no. of Trains run was 89.8 (BG) and
62.3(MG) percent in Intercity trains, 78.8(BG) and 66.5 ( MG ) percent in Mail Express trains and 79.8 (BG) and 75.6 (MG)
percent in Local trains. Year-wise position is indicated below :-
Percentage of trains not losing time to
total number of trains run
BG MG Intercity Mail Express Local Intercity Mail Express Local trains
trains Trains Train Trains Trains
Year
June-July
1969-70 -- 90.5 90.1 -- 72.4 79.0
2007-08 90.7 89.4 68.8 63.2 63.7 79.0
2008-09 88.3 83.6 62.3 61.0 65.5 83.1
2009-10 67.3 71.4 58.5 69.3 57.5 72.0
2010-11 69.6 68.4 59.0 41.9 42.5 77.6
2011-12 75.2 71.9 69.4 46.0 50.8 81.2
2012-13 82.2 77.8 76.1 51.1 49.7 82.0
2013-14 77.2 72.3 71.2 42.2 43.7 80.2
2014-15 83.7 73.2 73.1 42.3 49.4 84.3 2015-16 89.8 78.8 79.8 62.0 66.5 75.6
Note : The figures of other passenger and Mixed trains for the year 1969-70 have been included in local trains
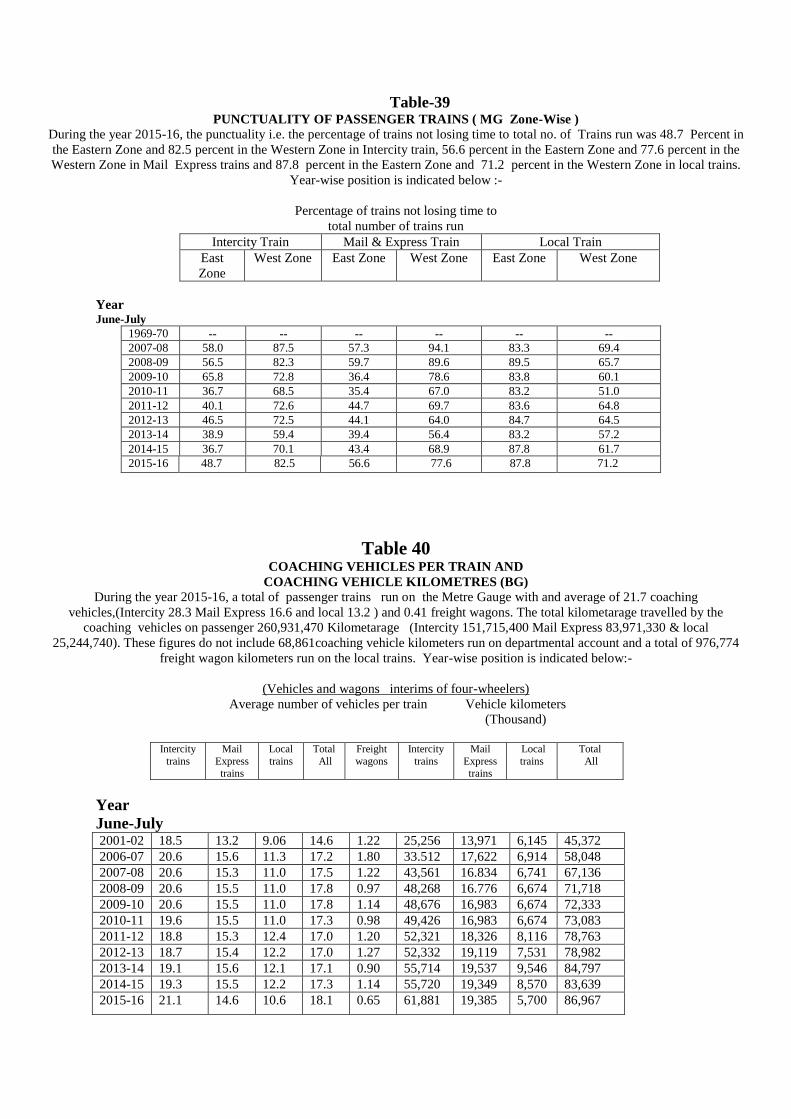
Table-39 PUNCTUALITY OF PASSENGER TRAINS ( MG Zone-Wise )
During the year 2015-16, the punctuality i.e. the percentage of trains not losing time to total no. of Trains run was 48.7 Percent in
the Eastern Zone and 82.5 percent in the Western Zone in Intercity train, 56.6 percent in the Eastern Zone and 77.6 percent in the
Western Zone in Mail Express trains and 87.8 percent in the Eastern Zone and 71.2 percent in the Western Zone in local trains.
Year-wise position is indicated below :-
Percentage of trains not losing time to
total number of trains run
Intercity Train Mail & Express Train Local Train
East
Zone
West Zone East Zone West Zone East Zone West Zone
Year June-July
1969-70 -- -- -- -- -- --
2007-08 58.0 87.5 57.3 94.1 83.3 69.4
2008-09 56.5 82.3 59.7 89.6 89.5 65.7
2009-10 65.8 72.8 36.4 78.6 83.8 60.1
2010-11 36.7 68.5 35.4 67.0 83.2 51.0
2011-12 40.1 72.6 44.7 69.7 83.6 64.8
2012-13 46.5 72.5 44.1 64.0 84.7 64.5
2013-14 38.9 59.4 39.4 56.4 83.2 57.2
2014-15 36.7 70.1 43.4 68.9 87.8 61.7
2015-16 48.7 82.5 56.6 77.6 87.8 71.2
Table 40 COACHING VEHICLES PER TRAIN AND
COACHING VEHICLE KILOMETRES (BG)
During the year 2015-16, a total of passenger trains run on the Metre Gauge with and average of 21.7 coaching
vehicles,(Intercity 28.3 Mail Express 16.6 and local 13.2 ) and 0.41 freight wagons. The total kilometarage travelled by the
coaching vehicles on passenger 260,931,470 Kilometarage (Intercity 151,715,400 Mail Express 83,971,330 & local
25,244,740). These figures do not include 68,861coaching vehicle kilometers run on departmental account and a total of 976,774
freight wagon kilometers run on the local trains. Year-wise position is indicated below:-
(Vehicles and wagons interims of four-wheelers)
Average number of vehicles per train Vehicle kilometers
(Thousand)
Intercity
trains Mail
Express trains
Local
trains Total
All Freight
wagons Intercity
trains Mail
Express trains
Local
trains Total
All
Year
June-July 2001-02 18.5 13.2 9.06 14.6 1.22 25,256 13,971 6,145 45,372
2006-07 20.6 15.6 11.3 17.2 1.80 33.512 17,622 6,914 58,048
2007-08 20.6 15.3 11.0 17.5 1.22 43,561 16.834 6,741 67,136
2008-09 20.6 15.5 11.0 17.8 0.97 48,268 16.776 6,674 71,718
2009-10 20.6 15.5 11.0 17.8 1.14 48,676 16,983 6,674 72,333
2010-11 19.6 15.5 11.0 17.3 0.98 49,426 16,983 6,674 73,083
2011-12 18.8 15.3 12.4 17.0 1.20 52,321 18,326 8,116 78,763
2012-13 18.7 15.4 12.2 17.0 1.27 52,332 19,119 7,531 78,982
2013-14 19.1 15.6 12.1 17.1 0.90 55,714 19,537 9,546 84,797
2014-15 19.3 15.5 12.2 17.3 1.14 55,720 19,349 8,570 83,639
2015-16 21.1 14.6 10.6 18.1 0.65 61,881 19,385 5,700 86,967
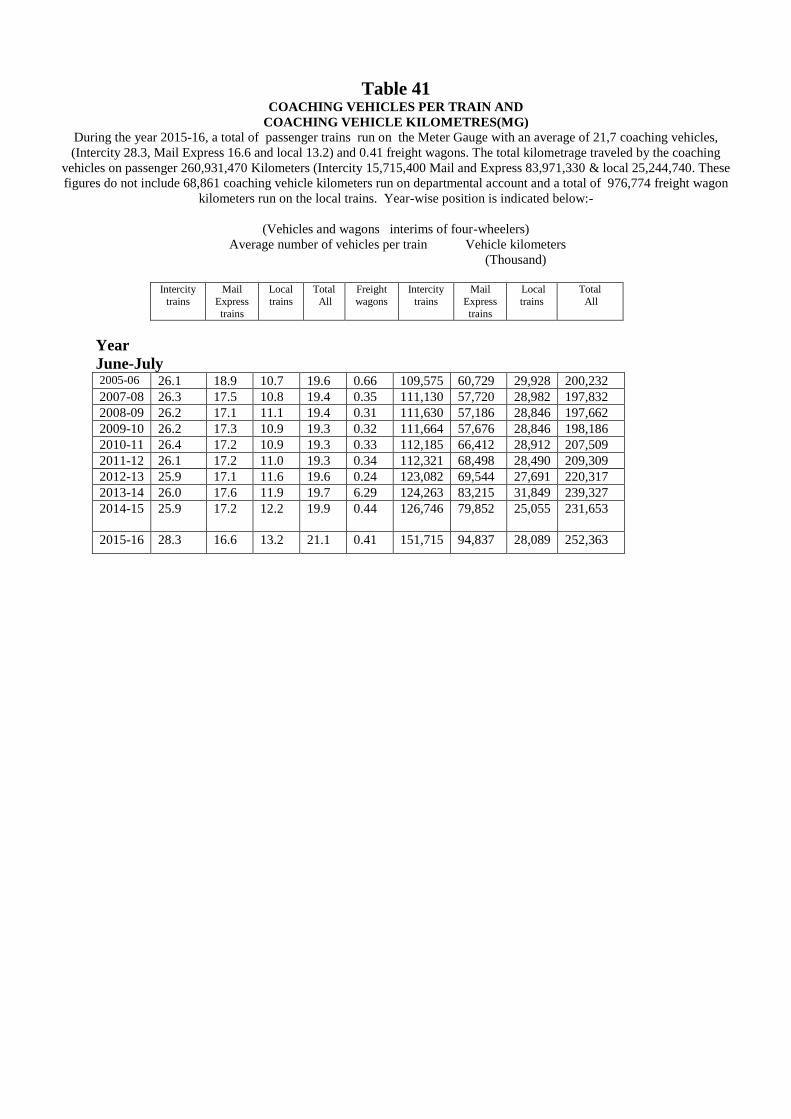
Table 41 COACHING VEHICLES PER TRAIN AND
COACHING VEHICLE KILOMETRES(MG)
During the year 2015-16, a total of passenger trains run on the Meter Gauge with an average of 21,7 coaching vehicles,
(Intercity 28.3, Mail Express 16.6 and local 13.2) and 0.41 freight wagons. The total kilometrage traveled by the coaching
vehicles on passenger 260,931,470 Kilometers (Intercity 15,715,400 Mail and Express 83,971,330 & local 25,244,740. These
figures do not include 68,861 coaching vehicle kilometers run on departmental account and a total of 976,774 freight wagon
kilometers run on the local trains. Year-wise position is indicated below:-
(Vehicles and wagons interims of four-wheelers)
Average number of vehicles per train Vehicle kilometers
(Thousand)
Intercity
trains Mail
Express
trains
Local
trains Total
All Freight
wagons Intercity
trains Mail
Express
trains
Local
trains Total
All
Year
June-July 2005-06 26.1 18.9 10.7 19.6 0.66 109,575 60,729 29,928 200,232
2007-08 26.3 17.5 10.8 19.4 0.35 111,130 57,720 28,982 197,832
2008-09 26.2 17.1 11.1 19.4 0.31 111,630 57,186 28,846 197,662
2009-10 26.2 17.3 10.9 19.3 0.32 111,664 57,676 28,846 198,186
2010-11 26.4 17.2 10.9 19.3 0.33 112,185 66,412 28,912 207,509
2011-12 26.1 17.2 11.0 19.3 0.34 112,321 68,498 28,490 209,309
2012-13 25.9 17.1 11.6 19.6 0.24 123,082 69,544 27,691 220,317
2013-14 26.0 17.6 11.9 19.7 6.29 124,263 83,215 31,849 239,327
2014-15
25.9 17.2 12.2 19.9 0.44 126,746 79,852 25,055 231,653
2015-16 28.3 16.6 13.2 21.1 0.41 151,715 94,837 28,089 252,363
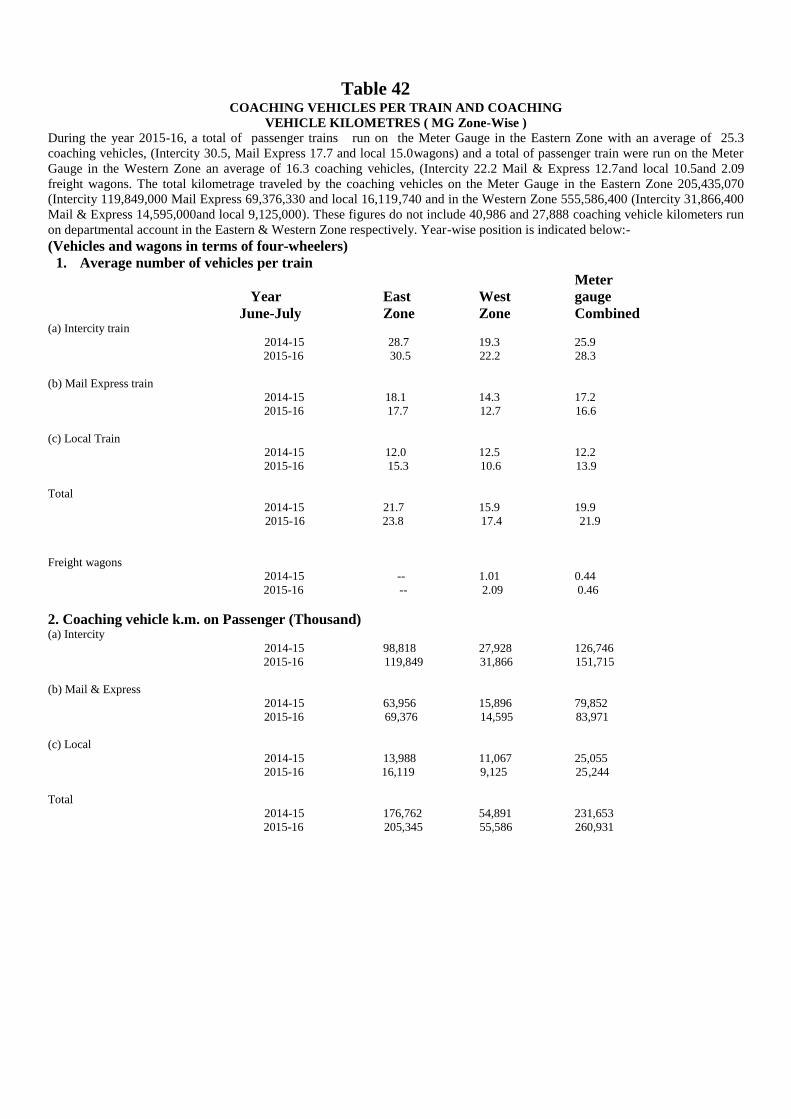
Table 42 COACHING VEHICLES PER TRAIN AND COACHING
VEHICLE KILOMETRES ( MG Zone-Wise )
During the year 2015-16, a total of passenger trains run on the Meter Gauge in the Eastern Zone with an average of 25.3
coaching vehicles, (Intercity 30.5, Mail Express 17.7 and local 15.0wagons) and a total of passenger train were run on the Meter
Gauge in the Western Zone an average of 16.3 coaching vehicles, (Intercity 22.2 Mail & Express 12.7and local 10.5and 2.09
freight wagons. The total kilometrage traveled by the coaching vehicles on the Meter Gauge in the Eastern Zone 205,435,070
(Intercity 119,849,000 Mail Express 69,376,330 and local 16,119,740 and in the Western Zone 555,586,400 (Intercity 31,866,400
Mail & Express 14,595,000and local 9,125,000). These figures do not include 40,986 and 27,888 coaching vehicle kilometers run
on departmental account in the Eastern & Western Zone respectively. Year-wise position is indicated below:-
(Vehicles and wagons in terms of four-wheelers)
1. Average number of vehicles per train
Meter
Year East West gauge
June-July Zone Zone Combined (a) Intercity train
2014-15 28.7 19.3 25.9
2015-16 30.5 22.2 28.3
(b) Mail Express train
2014-15 18.1 14.3 17.2
2015-16 17.7 12.7 16.6
(c) Local Train
2014-15 12.0 12.5 12.2
2015-16 15.3 10.6 13.9
Total
2014-15 21.7 15.9 19.9
2015-16 23.8 17.4 21.9
Freight wagons
2014-15 -- 1.01 0.44
2015-16 -- 2.09 0.46
2. Coaching vehicle k.m. on Passenger (Thousand)
(a) Intercity
2014-15 98,818 27,928 126,746
2015-16 119,849 31,866 151,715
(b) Mail & Express
2014-15 63,956 15,896 79,852
2015-16 69,376 14,595 83,971
(c) Local
2014-15 13,988 11,067 25,055
2015-16 16,119 9,125 25,244
Total
2014-15 176,762 54,891 231,653
2015-16 205,345 55,586 260,931

Table-43 FREIGHT TRAINS (BG)
During the year 2015-16, the number of freight trains run on the broad Gauge totaled 4,909 and they covered 459,153 kilometers.
These figures exclude 245,823 train- kilometers run on departmental account. The goods proportion of the mixed train-
kilometrage was 21,184 during the year under review. Freight wagon kilometers on goods as well as mixed trains were
26,769,987 and these do not include 6,133,714 wagon-kilometers on departmental account. Year-wise position is indicated
below:-
Number of
freight
trains run
Freight
Train
kilometers
(Thousand)
Number of
loaded Wagons
per train
Total Number
of wagons per
train
Wagon
kilometers
(Thousand)
Year
June-July 1969-70 6,440 732 29.1 41.9 35,082
2006-07 4,786 447 26.6 46.6 23,917
2007-08 4,712 434 27.0 48.1 23,299 2008-09 4,517 413 29.2 50.4 22,948
2009-10 4,566 414 29.2 50.5 23,046
2010-11 4,656 440 29.5 50.9 24,580
2011-12 4,652 427 28.2 48.9 23,295
2012-13 4,654 434 29.2 50.5 24,232
2013-14 4800 445 28.8 47.7 24,656
2014-15 5046 472 29.7 49.6 27,513
2015-16 4,909 459 28.9 48.2 26,769
Table-44 FREIGHT TRAINS (MG)
During the year 2015-16, the number of freight trains run on the Meter Gauge totaled 13,432 and they covered a total 1,133,530
train kilometers. These figures do not include 539.381train-kilometers run on departmental account. The goods proportion of the
mixed train-kilometres was 67,707 during the year under review. Freight wagon kilometers on goods as well as mixed trains were
58,470,130 and these do not include 13,490,921 wagon-kilometers on departmental account. Year-wise position is indicated
below:-
Number of
freight
trains run
Freight
Train
kilometers
(Thousand)
Number of
loaded Wagons
per train
Total Number
of wagons per
train
Wagon
kilometers
(Thousand)
Year
June-July 1969-70 30,517 2,858 35.1 50.1 144,028 2007-08 13,085 1,073 37.7 46.8 54,789
2008-09 13,450 1,059 38.0 46.9 54,149 2009-10 13,063 1,086 37.0 46.9 55,485
2010-11 13,122 1,123 36.0 45.8 56,088
2011-12 13,051 1,089 38.6 47.9 54,609
2012-13 13,088 1,096 37.9 47.7 55,348
2013-14 13,536 1,085 38.7 48.6 56,155
2014-15 13,805 1,165 36.4 48.2 60,093 2015-16 13,432 1,133 35.4 46.9 58,470
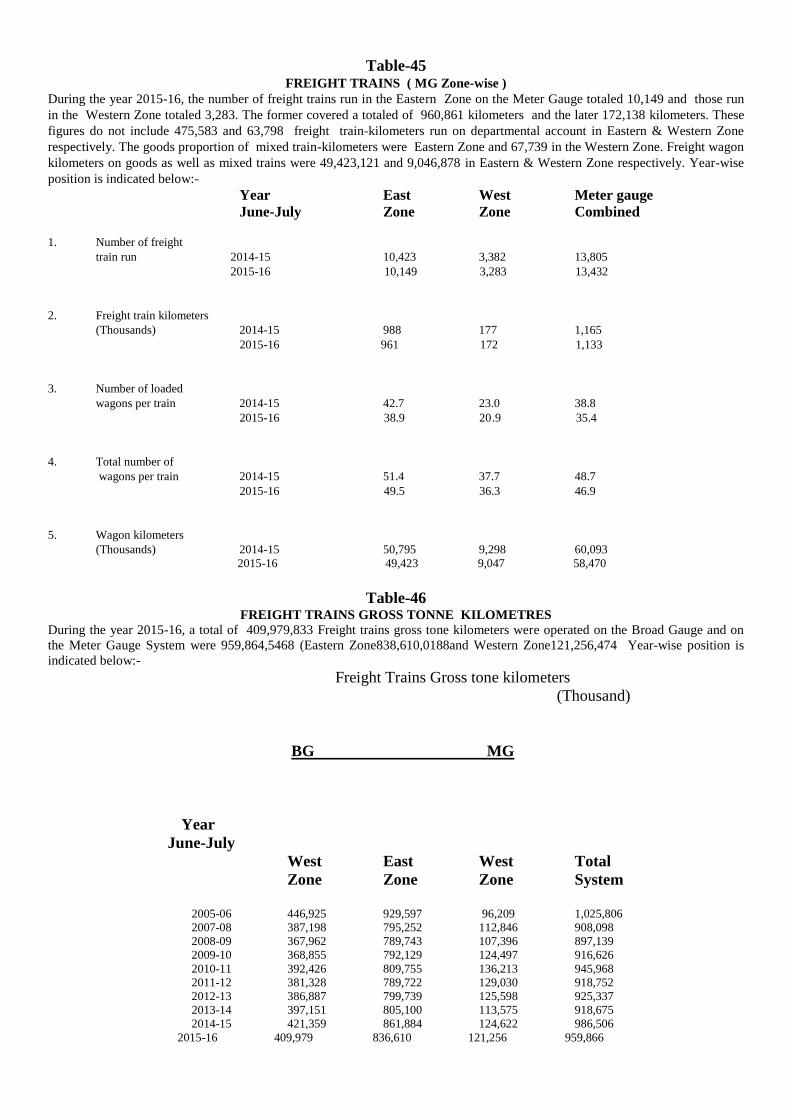
Table-45 FREIGHT TRAINS ( MG Zone-wise )
During the year 2015-16, the number of freight trains run in the Eastern Zone on the Meter Gauge totaled 10,149 and those run
in the Western Zone totaled 3,283. The former covered a totaled of 960,861 kilometers and the later 172,138 kilometers. These
figures do not include 475,583 and 63,798 freight train-kilometers run on departmental account in Eastern & Western Zone
respectively. The goods proportion of mixed train-kilometers were Eastern Zone and 67,739 in the Western Zone. Freight wagon
kilometers on goods as well as mixed trains were 49,423,121 and 9,046,878 in Eastern & Western Zone respectively. Year-wise
position is indicated below:-
Year East West Meter gauge
June-July Zone Zone Combined
1. Number of freight
train run 2014-15 10,423 3,382 13,805
2015-16 10,149 3,283 13,432
2. Freight train kilometers
(Thousands) 2014-15 988 177 1,165
2015-16 961 172 1,133
3. Number of loaded
wagons per train 2014-15 42.7 23.0 38.8
2015-16 38.9 20.9 35.4
4. Total number of
wagons per train 2014-15 51.4 37.7 48.7
2015-16 49.5 36.3 46.9
5. Wagon kilometers
(Thousands) 2014-15 50,795 9,298 60,093
2015-16 49,423 9,047 58,470
Table-46 FREIGHT TRAINS GROSS TONNE KILOMETRES
During the year 2015-16, a total of 409,979,833 Freight trains gross tone kilometers were operated on the Broad Gauge and on
the Meter Gauge System were 959,864,5468 (Eastern Zone838,610,0188and Western Zone121,256,474 Year-wise position is
indicated below:-
Freight Trains Gross tone kilometers
(Thousand)
BG MG
Year
June-July
West East West Total
Zone Zone Zone System
2005-06 446,925 929,597 96,209 1,025,806
2007-08 387,198 795,252 112,846 908,098
2008-09 367,962 789,743 107,396 897,139
2009-10 368,855 792,129 124,497 916,626
2010-11 392,426 809,755 136,213 945,968
2011-12 381,328 789,722 129,030 918,752
2012-13 386,887 799,739 125,598 925,337
2013-14 397,151 805,100 113,575 918,675
2014-15 421,359 861,884 124,622 986,506
2015-16 409,979 836,610 121,256 959,866
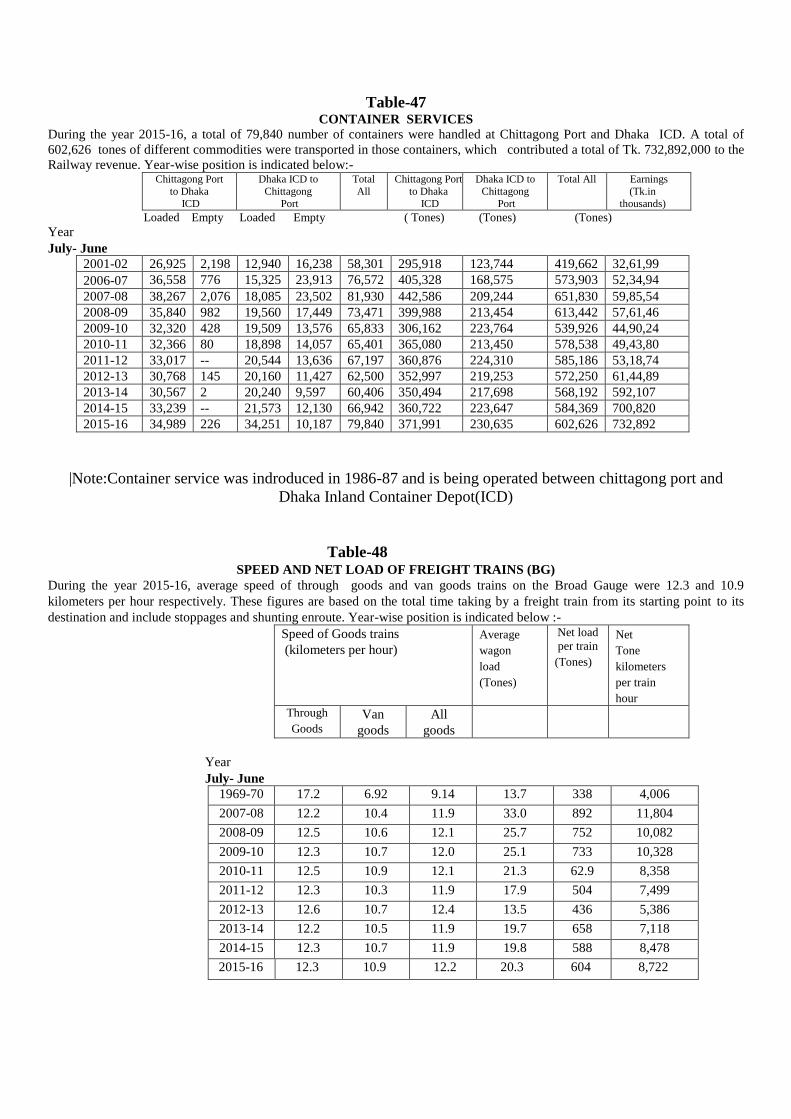
Table-47 CONTAINER SERVICES
During the year 2015-16, a total of 79,840 number of containers were handled at Chittagong Port and Dhaka ICD. A total of
602,626 tones of different commodities were transported in those containers, which contributed a total of Tk. 732,892,000 to the
Railway revenue. Year-wise position is indicated below:- Chittagong Port
to Dhaka
ICD
Dhaka ICD to
Chittagong
Port
Total
All Chittagong Port
to Dhaka
ICD
Dhaka ICD to
Chittagong
Port
Total All Earnings
(Tk.in
thousands)
Loaded Empty Loaded Empty ( Tones) (Tones) (Tones)
Year
July- June
2001-02 26,925 2,198 12,940 16,238 58,301 295,918 123,744 419,662 32,61,99
2006-07 36,558 776 15,325 23,913 76,572 405,328 168,575 573,903 52,34,94
2007-08 38,267 2,076 18,085 23,502 81,930 442,586 209,244 651,830 59,85,54
2008-09 35,840 982 19,560 17,449 73,471 399,988 213,454 613,442 57,61,46
2009-10 32,320 428 19,509 13,576 65,833 306,162 223,764 539,926 44,90,24
2010-11 32,366 80 18,898 14,057 65,401 365,080 213,450 578,538 49,43,80
2011-12 33,017 -- 20,544 13,636 67,197 360,876 224,310 585,186 53,18,74
2012-13 30,768 145 20,160 11,427 62,500 352,997 219,253 572,250 61,44,89
2013-14 30,567 2 20,240 9,597 60,406 350,494 217,698 568,192 592,107
2014-15 33,239 -- 21,573 12,130 66,942 360,722 223,647 584,369 700,820
2015-16 34,989 226 34,251 10,187 79,840 371,991 230,635 602,626 732,892
|Note:Container service was indroduced in 1986-87 and is being operated between chittagong port and
Dhaka Inland Container Depot(ICD)
Table-48 SPEED AND NET LOAD OF FREIGHT TRAINS (BG)
During the year 2015-16, average speed of through goods and van goods trains on the Broad Gauge were 12.3 and 10.9
kilometers per hour respectively. These figures are based on the total time taking by a freight train from its starting point to its
destination and include stoppages and shunting enroute. Year-wise position is indicated below :-
Speed of Goods trains
(kilometers per hour)
Average
wagon
load
(Tones)
Net load
per train
(Tones)
Net
Tone
kilometers
per train
hour Through
Goods Van
goods
All
goods
Year
July- June
1969-70 17.2 6.92 9.14 13.7 338 4,006
2007-08 12.2 10.4 11.9 33.0 892 11,804
2008-09 12.5 10.6 12.1 25.7 752 10,082
2009-10 12.3 10.7 12.0 25.1 733 10,328
2010-11 12.5 10.9 12.1 21.3 62.9 8,358
2011-12 12.3 10.3 11.9 17.9 504 7,499
2012-13 12.6 10.7 12.4 13.5 436 5,386
2013-14 12.2 10.5 11.9 19.7 658 7,118
2014-15 12.3 10.7 11.9 19.8 588 8,478
2015-16 12.3 10.9 12.2 20.3 604 8,722
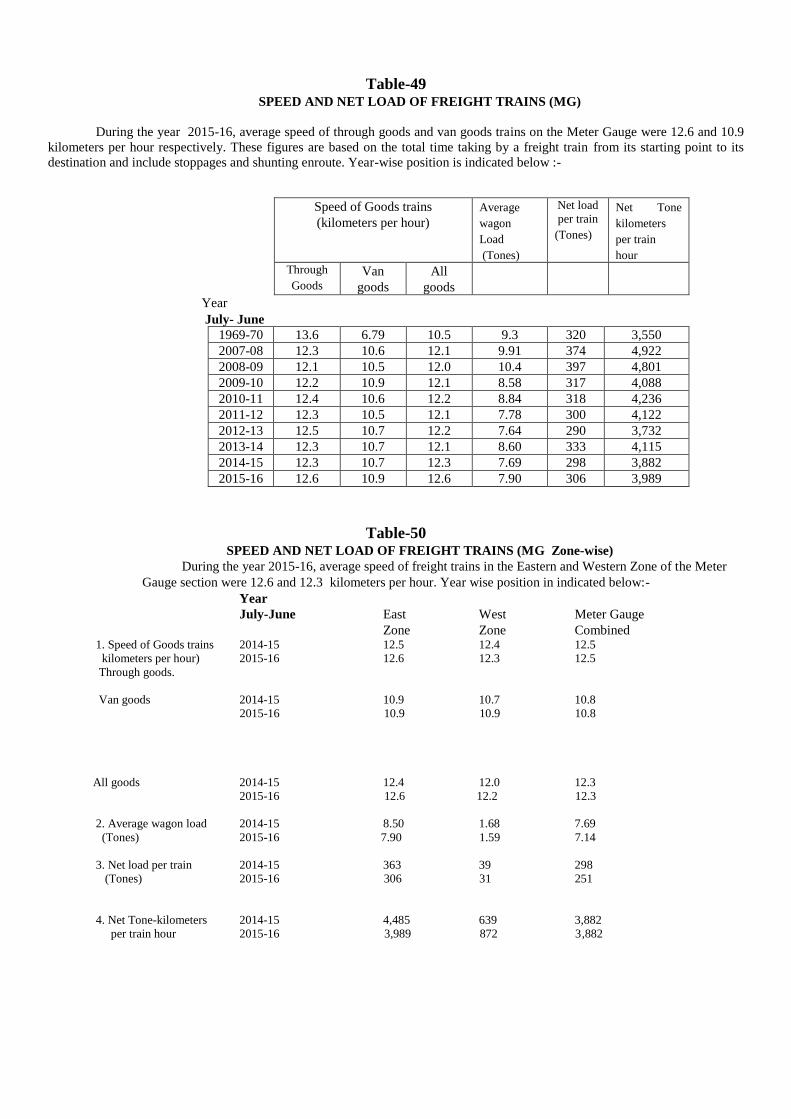
Table-49 SPEED AND NET LOAD OF FREIGHT TRAINS (MG)
During the year 2015-16, average speed of through goods and van goods trains on the Meter Gauge were 12.6 and 10.9
kilometers per hour respectively. These figures are based on the total time taking by a freight train from its starting point to its
destination and include stoppages and shunting enroute. Year-wise position is indicated below :-
Speed of Goods trains
(kilometers per hour)
Average
wagon
Load
(Tones)
Net load
per train
(Tones)
Net Tone
kilometers
per train
hour Through
Goods Van
goods
All
goods
Year
July- June
1969-70 13.6 6.79 10.5 9.3 320 3,550
2007-08 12.3 10.6 12.1 9.91 374 4,922
2008-09 12.1 10.5 12.0 10.4 397 4,801
2009-10 12.2 10.9 12.1 8.58 317 4,088
2010-11 12.4 10.6 12.2 8.84 318 4,236
2011-12 12.3 10.5 12.1 7.78 300 4,122
2012-13 12.5 10.7 12.2 7.64 290 3,732
2013-14 12.3 10.7 12.1 8.60 333 4,115
2014-15 12.3 10.7 12.3 7.69 298 3,882
2015-16 12.6 10.9 12.6 7.90 306 3,989
Table-50 SPEED AND NET LOAD OF FREIGHT TRAINS (MG Zone-wise)
During the year 2015-16, average speed of freight trains in the Eastern and Western Zone of the Meter
Gauge section were 12.6 and 12.3 kilometers per hour. Year wise position in indicated below:-
Year
July-June East West Meter Gauge
Zone Zone Combined 1. Speed of Goods trains 2014-15 12.5 12.4 12.5
kilometers per hour) 2015-16 12.6 12.3 12.5
Through goods.
Van goods 2014-15 10.9 10.7 10.8
2015-16 10.9 10.9 10.8
All goods 2014-15 12.4 12.0 12.3
2015-16 12.6 12.2 12.3
2. Average wagon load 2014-15 8.50 1.68 7.69
(Tones) 2015-16 7.90 1.59 7.14
3. Net load per train 2014-15 363 39 298
(Tones) 2015-16 306 31 251
4. Net Tone-kilometers 2014-15 4,485 639 3,882
per train hour 2015-16 3,989 872 3,882
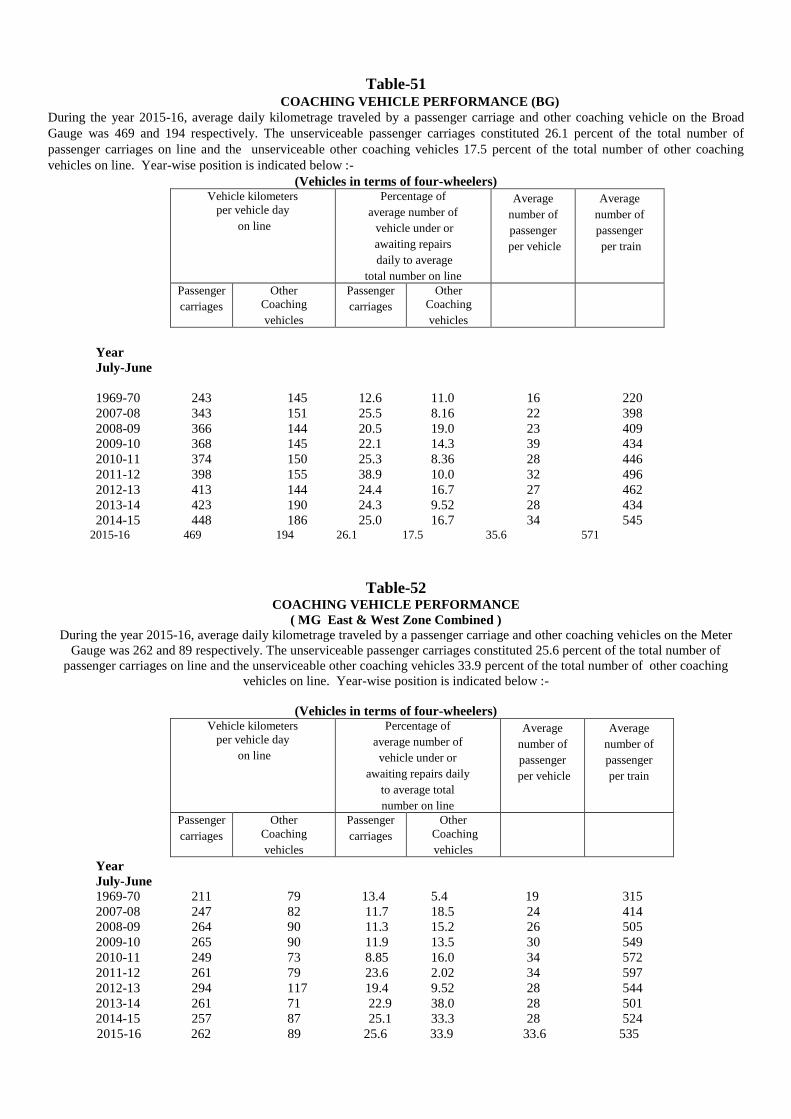
Table-51 COACHING VEHICLE PERFORMANCE (BG)
During the year 2015-16, average daily kilometrage traveled by a passenger carriage and other coaching vehicle on the Broad
Gauge was 469 and 194 respectively. The unserviceable passenger carriages constituted 26.1 percent of the total number of
passenger carriages on line and the unserviceable other coaching vehicles 17.5 percent of the total number of other coaching
vehicles on line. Year-wise position is indicated below :-
(Vehicles in terms of four-wheelers) Vehicle kilometers
per vehicle day
on line
Percentage of
average number of
vehicle under or
awaiting repairs
daily to average
total number on line
Average
number of
passenger
per vehicle
Average
number of
passenger
per train
Passenger
carriages
Other
Coaching
vehicles
Passenger
carriages
Other
Coaching
vehicles
Year
July-June
1969-70 243 145 12.6 11.0 16 220
2007-08 343 151 25.5 8.16 22 398
2008-09 366 144 20.5 19.0 23 409
2009-10 368 145 22.1 14.3 39 434
2010-11 374 150 25.3 8.36 28 446
2011-12 398 155 38.9 10.0 32 496
2012-13 413 144 24.4 16.7 27 462
2013-14 423 190 24.3 9.52 28 434
2014-15 448 186 25.0 16.7 34 545
2015-16 469 194 26.1 17.5 35.6 571
Table-52 COACHING VEHICLE PERFORMANCE
( MG East & West Zone Combined )
During the year 2015-16, average daily kilometrage traveled by a passenger carriage and other coaching vehicles on the Meter
Gauge was 262 and 89 respectively. The unserviceable passenger carriages constituted 25.6 percent of the total number of
passenger carriages on line and the unserviceable other coaching vehicles 33.9 percent of the total number of other coaching
vehicles on line. Year-wise position is indicated below :-
(Vehicles in terms of four-wheelers) Vehicle kilometers
per vehicle day
on line
Percentage of
average number of
vehicle under or
awaiting repairs daily
to average total
number on line
Average
number of
passenger
per vehicle
Average
number of
passenger
per train
Passenger
carriages
Other
Coaching
vehicles
Passenger
carriages
Other
Coaching
vehicles
Year
July-June
1969-70 211 79 13.4 5.4 19 315
2007-08 247 82 11.7 18.5 24 414
2008-09 264 90 11.3 15.2 26 505
2009-10 265 90 11.9 13.5 30 549
2010-11 249 73 8.85 16.0 34 572
2011-12 261 79 23.6 2.02 34 597
2012-13 294 117 19.4 9.52 28 544
2013-14 261 71 22.9 38.0 28 501
2014-15 257 87 25.1 33.3 28 524
2015-16 262 89 25.6 33.9 33.6 535

Table-53 FREIGHT WAGON PERFORMANCE (BG)
During the year 2015-16 average daily kilometrage traveled by a freight wagon was 58.67. Unserviceable wagons constituted
10.81 percent of the total number of wagons on line. Year-wise position is indicated below :-
(Wagons in terms of four-wheelers) Wagon
kilometers
per wagon day
on line
Percentage of
average number of
wagons under or
awaiting repairs
daily to average
total number on line
Wagon Kilo-
meter per
engine
hour
Net tone
Kilometers
per wagon
day
Average Turn
Round of a
wagon
Covered Open
Year
July-June
1969-70 24.5 6.1 154 229 8.5 45.4
2007-08 85.8 85.4 211 1,596 10.1 3.77
2008-09 136.0 128.5 220 2,043 10.5 5.78
2009-10 29.2 31.1 220 424 9.75 --
2010-11 31.8 27.0 235 393 8.99 10.0
2011-12 153.3 76.3 214 1,580 9.00 10.6
2012-13 172.4 18.7 228 1,345 9.58 10.9
2013-14 54.0 31.3 217 642 9.60 10.7
2014-15 60.3 23.0 244 714 10.4 10.3
2015-16 58.6 10.8 237 674 9.62 0.45

Table-54 FREIGHT WAGON PERFORMANCE
( MG East & West Zone Combined )
During the year 2015-16, average daily kilometrage travelled by a freight wagon was 10.1. Unserviceable wagons constituted
18.6 percent of the total number of wagons on line. Year-wise position is indicated below :-
(Wagons in terms of four-wheelers) Wagon
kilometers
per wagon
day
on line
Percentage of
average number
of wagons under
or awaiting
repairs
daily to average
total number
on line
Wagon
Kilometer
per
engine
hour
Net tone
Kilometers
per wagon
day
Average Turn
Round of a
wagon
Covered Open
Year
July-June
1969-70 29.3 8.1 134 190 10.2 24.20
2007-08 10.8 9.97 225 87 14.0 5.22
2008-09 10.7 5.56 222 91 15.7 5.89
2009-10 17.3 21.5 231 117 11.8 9.32
2010-11 11.2 23.7 235 79 12.5 5.98
2011-12 13.7 7.17 226 86 11.9 9.32
2012-13 14.0 15.0 228 85 9.78 11.00
2013-14 9.8 18.4 229 68 11.3 6.60
2014-15 10.4 18.6 236 64 12.1 11.70
2015-16 10.1 18.6 229 62 30.4 30.40
It was calculated on stock available for loading divided by loading on the division as well as loads received from contiguous
divisions and foreign railways.
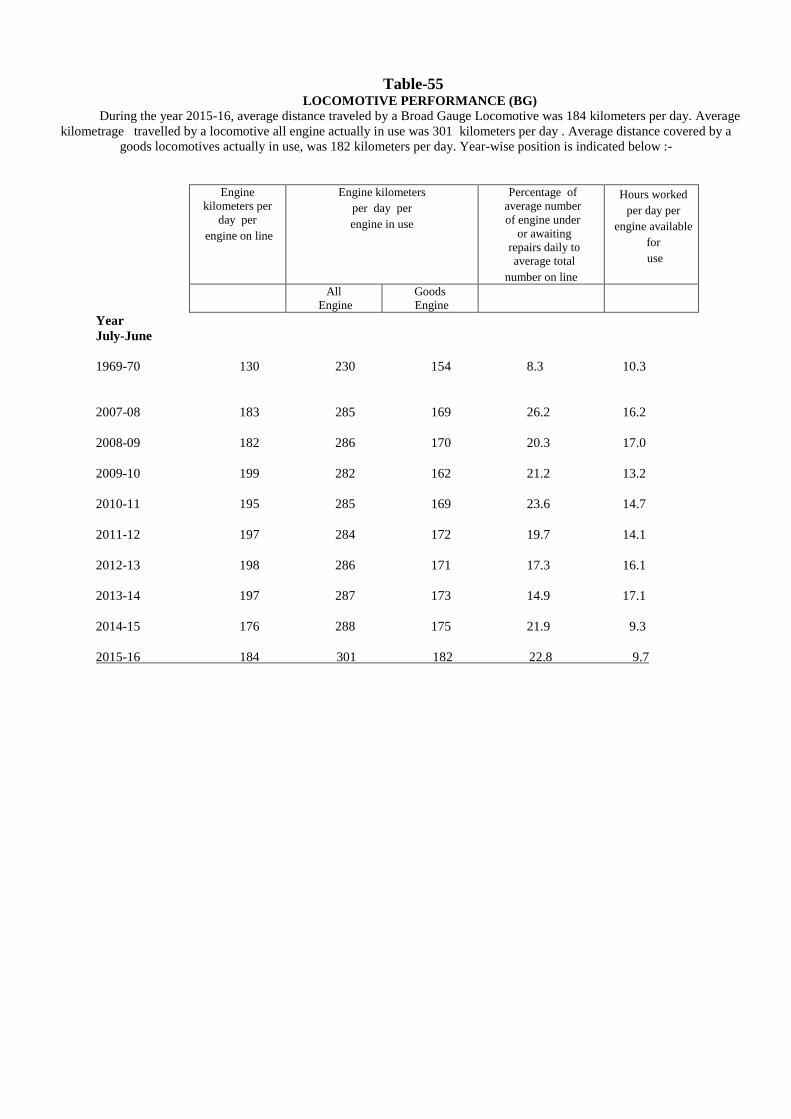
Table-55 LOCOMOTIVE PERFORMANCE (BG)
During the year 2015-16, average distance traveled by a Broad Gauge Locomotive was 184 kilometers per day. Average
kilometrage travelled by a locomotive all engine actually in use was 301 kilometers per day . Average distance covered by a
goods locomotives actually in use, was 182 kilometers per day. Year-wise position is indicated below :-
Engine
kilometers per
day per
engine on line
Engine kilometers
per day per
engine in use
Percentage of
average number
of engine under
or awaiting
repairs daily to
average total
number on line
Hours worked
per day per
engine available
for
use
All
Engine
Goods
Engine
Year
July-June
1969-70 130 230 154 8.3 10.3
2007-08 183 285 169 26.2 16.2
2008-09 182 286 170 20.3 17.0
2009-10 199 282 162 21.2 13.2
2010-11 195 285 169 23.6 14.7
2011-12 197 284 172 19.7 14.1
2012-13 198 286 171 17.3 16.1
2013-14 197 287 173 14.9 17.1
2014-15 176 288 175 21.9 9.3
2015-16 184 301 182 22.8 9.7
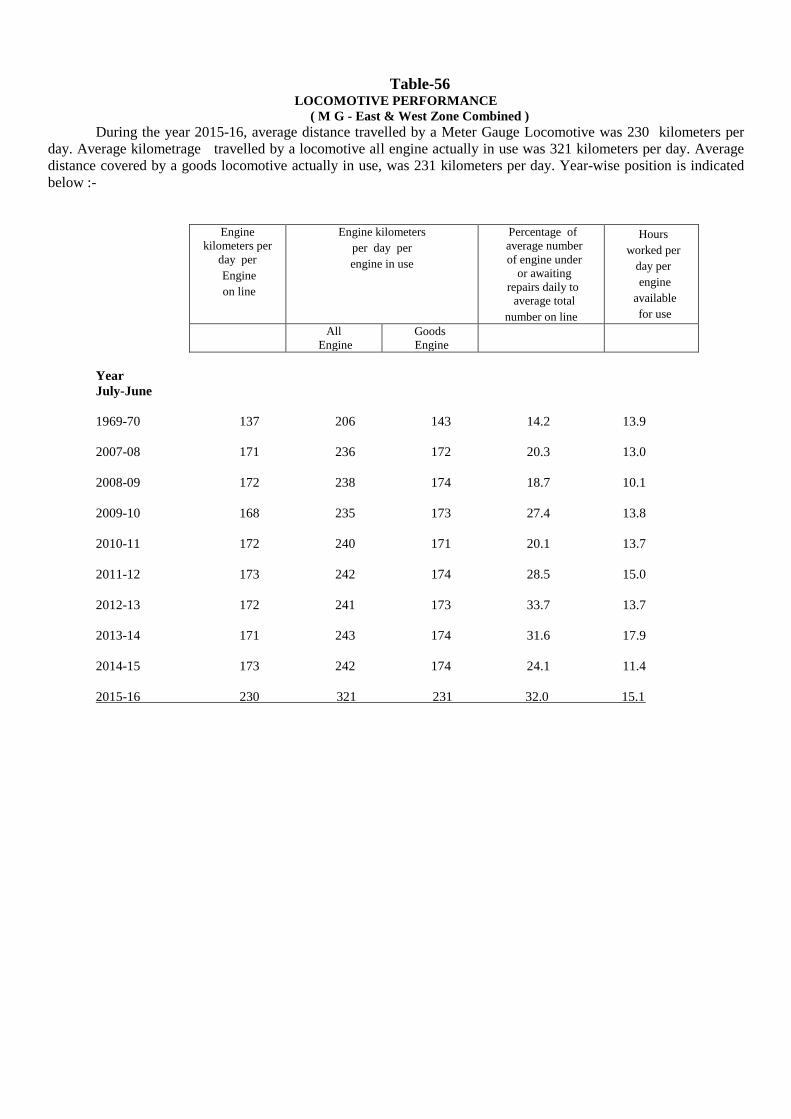
Table-56 LOCOMOTIVE PERFORMANCE
( M G - East & West Zone Combined )
During the year 2015-16, average distance travelled by a Meter Gauge Locomotive was 230 kilometers per
day. Average kilometrage travelled by a locomotive all engine actually in use was 321 kilometers per day. Average
distance covered by a goods locomotive actually in use, was 231 kilometers per day. Year-wise position is indicated
below :-
Engine
kilometers per
day per
Engine
on line
Engine kilometers
per day per
engine in use
Percentage of
average number
of engine under
or awaiting
repairs daily to
average total
number on line
Hours
worked per
day per
engine
available
for use
All
Engine
Goods
Engine
Year
July-June
1969-70 137 206 143 14.2 13.9
2007-08 171 236 172 20.3 13.0
2008-09 172 238 174 18.7 10.1
2009-10 168 235 173 27.4 13.8
2010-11 172 240 171 20.1 13.7
2011-12 173 242 174 28.5 15.0
2012-13 172 241 173 33.7 13.7
2013-14 171 243 174 31.6 17.9
2014-15 173 242 174 24.1 11.4
2015-16 230 321 231 32.0 15.1

Table-57
ENGINE KILOMETRES- PASSENGER,
GOODS & OTHERS (BG)
During the year 2015-16 a total of 6,332,862 Engine kilometers run on the Broad Gauge in the Western Zone,
(Passenger 4,993,628 Goods 522,252 and others 786,982. Year wise position in indicated below:-
Engine Kilometers
Passenger Goods Others Total Year
July-June 2000-01 3,265,848 522,648 397,008 4,185,504
2007-08 3,859,929 488,475 684,891 5,033,295
2008-09 4,074,045 467,505 645,000 5,186,550
2009-10 4,074,040 467,517 618,528 5,160,085
2010-11 4,256,197 498,655 594,371 5,349,223
2011-12 4,665,383 487,186 666,922 5,819,491
2012-13 4,676,030 493,368 688,823 5,858,221
2013-14 4,981,758 504,396 749,693 6,235,847
2014-15 4,866,876 537,044 767,220 6,171,140
2015-16 4,993,628 525,252 786,952 6,332,862
Note : The Figures in column others include Departmental & Regular shunting Engine kilometers.
Table-58
ENGINE KILOMETRES- PASSENGER,GOODS
& OTHERS (MG -East & West Zone Combined)
During the year 2015-116 a total of 15,537,433 Engine kilometers run on the Meter Gauge in the Eastern and Western Zone,
Combined (Passenger 11,747,332 Goods 1,249,952 and others 1,757,533 Year wise position in indicated below:
Engine Kilometers
Passenger Goods Others Total
Year
July-June .
1998-99 9,586,993 1,189,701 1,661,005 12,437,699
2007-08 10,362,270 1,152,593 1,351,094 12,865,957
2008-09 10,344,672 1,130,146 1,281,653 12,756,471
2009-10 10,344,653 1,158,140 1,288,936 12,791,729
2010-11 10,967,143 1,200,687 1,073,124 13,241,538
2011-12 11,061,023 1,171,384 1,346,457 13,578,864
2012-13 11,407,555 1,174,404 1,325,846 13,907,805
2013-14 12,333,510 1,177,176 1,489,280 14,999,966
2014-15 11,747,332 1,285,256 1,600,360 14,632,948 2015-16 12,529,948 1,249,952 1,757,533 15,537,433
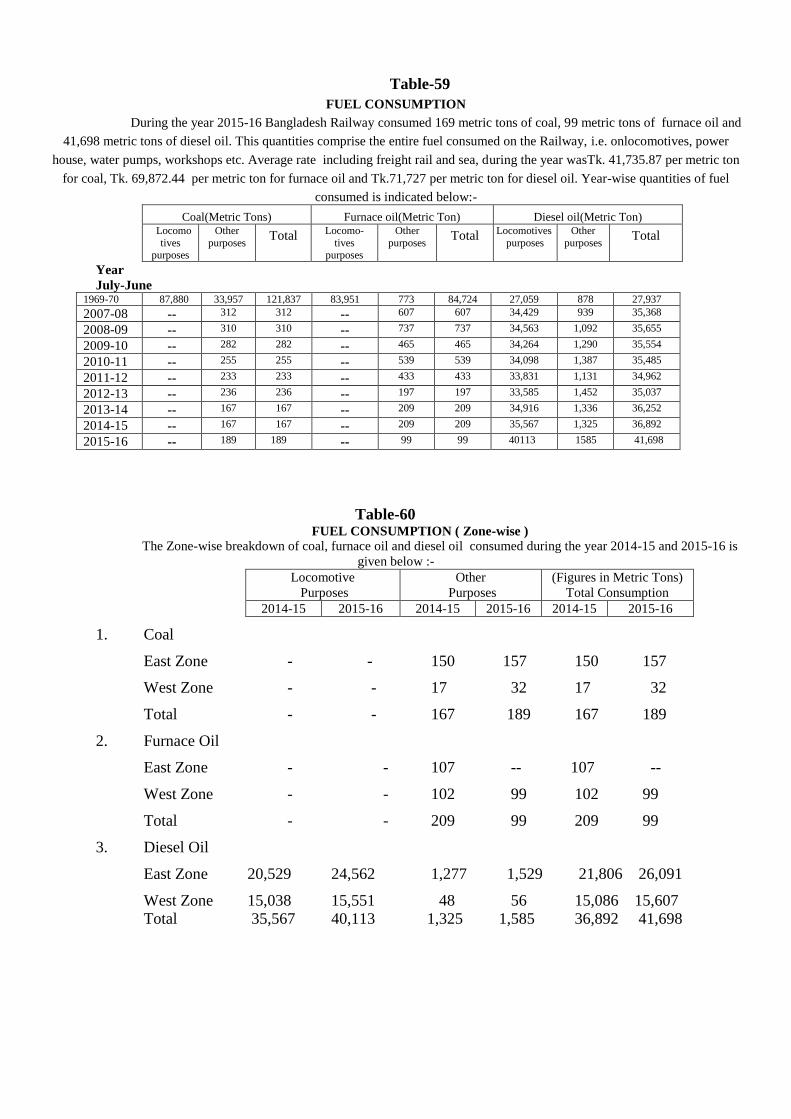
Table-59
FUEL CONSUMPTION
During the year 2015-16 Bangladesh Railway consumed 169 metric tons of coal, 99 metric tons of furnace oil and
41,698 metric tons of diesel oil. This quantities comprise the entire fuel consumed on the Railway, i.e. onlocomotives, power
house, water pumps, workshops etc. Average rate including freight rail and sea, during the year wasTk. 41,735.87 per metric ton
for coal, Tk. 69,872.44 per metric ton for furnace oil and Tk.71,727 per metric ton for diesel oil. Year-wise quantities of fuel
consumed is indicated below:-
Coal(Metric Tons) Furnace oil(Metric Ton) Diesel oil(Metric Ton) Locomo
tives purposes
Other
purposes Total Locomo-
tives purposes
Other
purposes Total Locomotives
purposes Other
purposes Total
Year
July-June 1969-70 87,880 33,957 121,837 83,951 773 84,724 27,059 878 27,937
2007-08 -- 312 312 -- 607 607 34,429 939 35,368
2008-09 -- 310 310 -- 737 737 34,563 1,092 35,655
2009-10 -- 282 282 -- 465 465 34,264 1,290 35,554
2010-11 -- 255 255 -- 539 539 34,098 1,387 35,485
2011-12 -- 233 233 -- 433 433 33,831 1,131 34,962
2012-13 -- 236 236 -- 197 197 33,585 1,452 35,037
2013-14 -- 167 167 -- 209 209 34,916 1,336 36,252
2014-15 -- 167 167 -- 209 209 35,567 1,325 36,892
2015-16 -- 189 189 -- 99 99 40113 1585 41,698
Table-60 FUEL CONSUMPTION ( Zone-wise )
The Zone-wise breakdown of coal, furnace oil and diesel oil consumed during the year 2014-15 and 2015-16 is
given below :-
Locomotive
Purposes
Other
Purposes
(Figures in Metric Tons)
Total Consumption
2014-15 2015-16 2014-15 2015-16 2014-15 2015-16
1. Coal
East Zone - - 150 157 150 157
West Zone - - 17 32 17 32
Total - - 167 189 167 189
2. Furnace Oil
East Zone - - 107 -- 107 --
West Zone - - 102 99 102 99
Total - - 209 99 209 99
3. Diesel Oil
East Zone 20,529 24,562 1,277 1,529 21,806 26,091
West Zone 15,038 15,551 48 56 15,086 15,607
Total 35,567 40,113 1,325 1,585 36,892 41,698
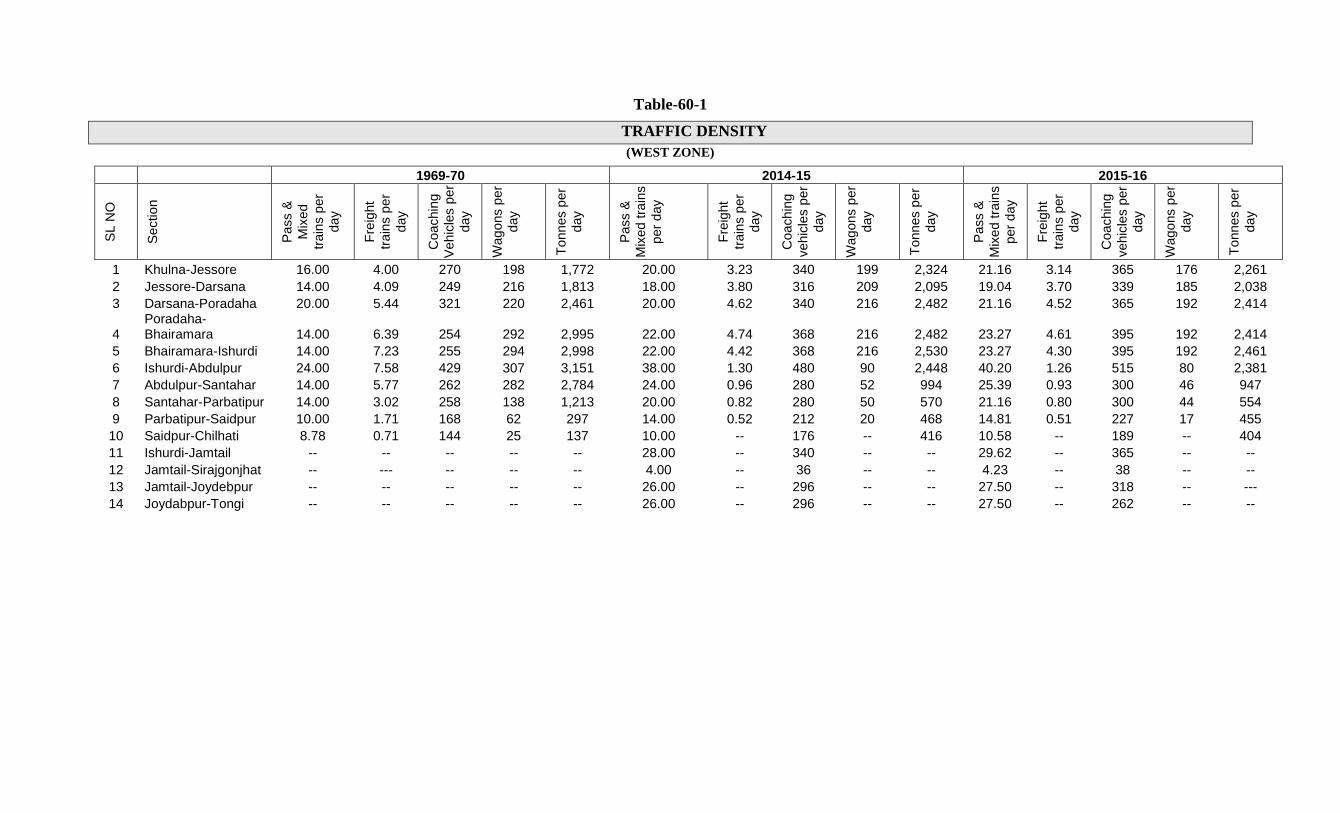
Table-60-1
TRAFFIC DENSITY
(WEST ZONE)
1969-70 2014-15 2015-16
SL N
O
Section
Pass &
Mix
ed
train
s p
er
day
Fre
ight
train
s p
er
day
Coachin
g
Veh
icle
s p
er
day
Wag
ons p
er
day
Tonnes p
er
day
Pass &
Mix
ed t
rain
s
per
day
Fre
ight
train
s p
er
day
Coachin
g
vehic
les p
er
day
Wag
ons p
er
day
Tonnes p
er
day
Pass &
Mix
ed t
rain
s
per
day
Fre
ight
train
s p
er
day
Coachin
g
vehic
les p
er
day
Wag
ons p
er
day
Tonnes p
er
day
1 Khulna-Jessore 16.00 4.00 270 198 1,772 20.00 3.23 340 199 2,324 21.16 3.14 365 176 2,261
2 Jessore-Darsana 14.00 4.09 249 216 1,813 18.00 3.80 316 209 2,095 19.04 3.70 339 185 2,038
3 Darsana-Poradaha 20.00 5.44 321 220 2,461 20.00 4.62 340 216 2,482 21.16 4.52 365 192 2,414
4 Poradaha-Bhairamara 14.00 6.39 254 292 2,995 22.00 4.74 368 216 2,482 23.27 4.61 395 192 2,414
5 Bhairamara-Ishurdi 14.00 7.23 255 294 2,998 22.00 4.42 368 216 2,530 23.27 4.30 395 192 2,461
6 Ishurdi-Abdulpur 24.00 7.58 429 307 3,151 38.00 1.30 480 90 2,448 40.20 1.26 515 80 2,381
7 Abdulpur-Santahar 14.00 5.77 262 282 2,784 24.00 0.96 280 52 994 25.39 0.93 300 46 947
8 Santahar-Parbatipur 14.00 3.02 258 138 1,213 20.00 0.82 280 50 570 21.16 0.80 300 44 554
9 Parbatipur-Saidpur 10.00 1.71 168 62 297 14.00 0.52 212 20 468 14.81 0.51 227 17 455
10 Saidpur-Chilhati 8.78 0.71 144 25 137 10.00 -- 176 -- 416 10.58 -- 189 -- 404
11 Ishurdi-Jamtail -- -- -- -- -- 28.00 -- 340 -- -- 29.62 -- 365 -- --
12 Jamtail-Sirajgonjhat -- --- -- -- -- 4.00 -- 36 -- -- 4.23 -- 38 -- --
13 Jamtail-Joydebpur -- -- -- -- -- 26.00 -- 296 -- -- 27.50 -- 318 -- ---
14 Joydabpur-Tongi -- -- -- -- -- 26.00 -- 296 -- -- 27.50 -- 262 -- --
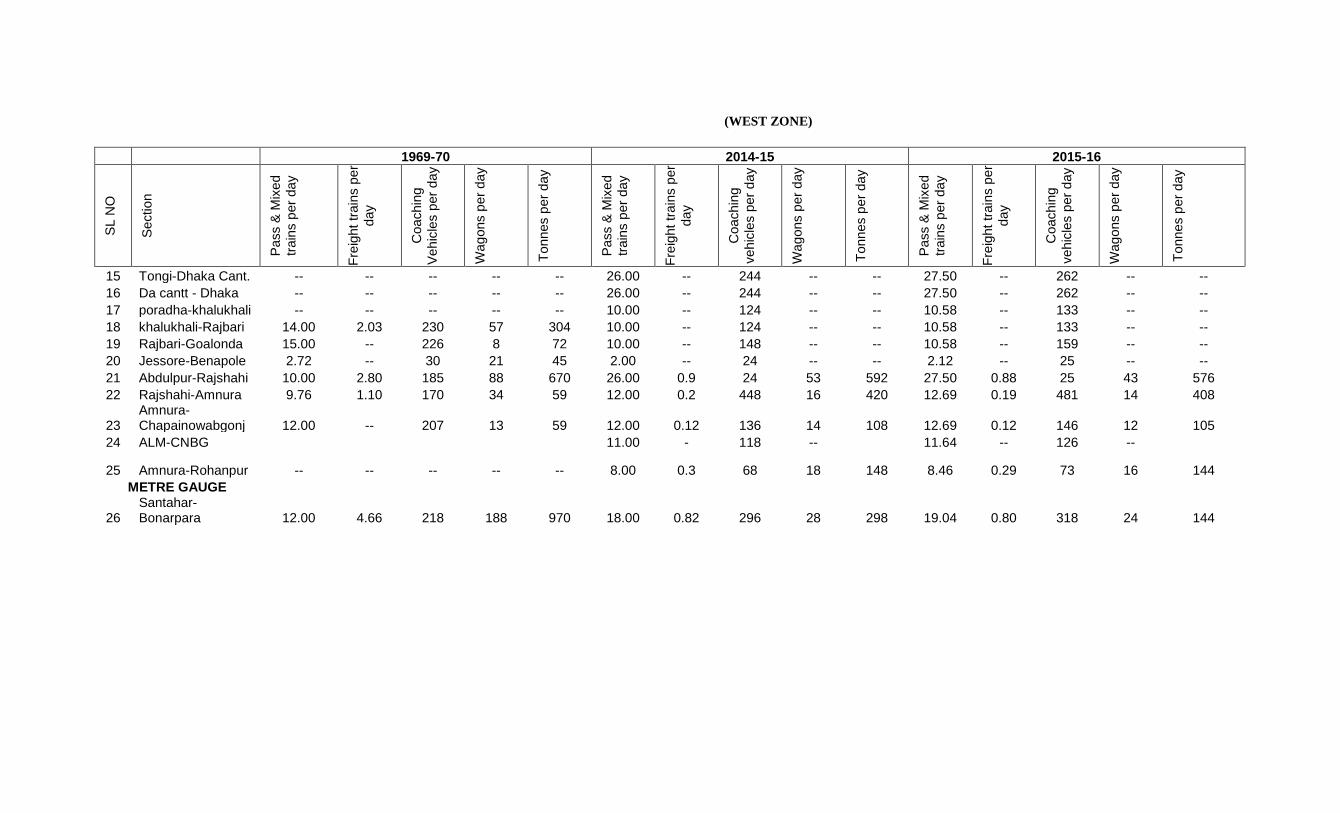
(WEST ZONE)
1969-70 2014-15 2015-16
SL N
O
Section
Pass &
Mix
ed
train
s p
er
day
Fre
ight
train
s p
er
day
Coachin
g
Veh
icle
s p
er
day
Wag
ons p
er
day
Tonnes p
er
day
Pass &
Mix
ed
train
s p
er
day
Fre
ight
train
s p
er
day
Coachin
g
vehic
les p
er
day
Wag
ons p
er
day
Tonnes p
er
day
Pass &
Mix
ed
train
s p
er
day
Fre
ight
train
s p
er
day
Coachin
g
vehic
les p
er
day
Wag
ons p
er
day
Tonnes p
er
day
15 Tongi-Dhaka Cant. -- -- -- -- -- 26.00 -- 244 -- -- 27.50 -- 262 -- --
16 Da cantt - Dhaka -- -- -- -- -- 26.00 -- 244 -- -- 27.50 -- 262 -- --
17 poradha-khalukhali -- -- -- -- -- 10.00 -- 124 -- -- 10.58 -- 133 -- --
18 khalukhali-Rajbari 14.00 2.03 230 57 304 10.00 -- 124 -- -- 10.58 -- 133 -- --
19 Rajbari-Goalonda 15.00 -- 226 8 72 10.00 -- 148 -- -- 10.58 -- 159 -- --
20 Jessore-Benapole 2.72 -- 30 21 45 2.00 -- 24 -- -- 2.12 -- 25 -- --
21 Abdulpur-Rajshahi 10.00 2.80 185 88 670 26.00 0.9 24 53 592 27.50 0.88 25 43 576
22 Rajshahi-Amnura 9.76 1.10 170 34 59 12.00 0.2 448 16 420 12.69 0.19 481 14 408
23 Amnura-Chapainowabgonj 12.00 -- 207 13 59 12.00 0.12 136 14 108 12.69 0.12 146 12 105
24 ALM-CNBG 11.00 - 118 -- 11.64 -- 126 --
25 Amnura-Rohanpur -- -- -- -- -- 8.00 0.3 68 18 148 8.46 0.29 73 16 144
METRE GAUGE
26 Santahar-Bonarpara 12.00 4.66 218 188 970 18.00 0.82 296 28 298 19.04 0.80 318 24 144

(WEST ZONE-Contd.)
1969-70 2014-15 2015-16
SL N
O
Section
Pass &
Mix
ed
train
s p
er
day
Fre
ight
train
s p
er
day
Coachin
g
Veh
icle
s p
er
day
Wag
ons p
er
day
Tonnes p
er
day
Pass &
Mix
ed
train
s p
er
day
Fre
ight
train
s p
er
day
Coachin
g
vehic
les p
er
day
Wag
ons p
er
day
Tonnes p
er
day
Pass &
Mix
ed
train
s p
er
day
Fre
ight
train
s p
er
day
Coachin
g
vehic
les p
er
day
Wag
ons p
er
day
Tonnes p
er
day
27 Bonarpara-Kaunia 12.00 4.90 240 232 1220 16.00 0.95 288 59 265 16.93 0.92 309 52 257
28 Kawnia-Lalmonirhat 18.00 5.34 229 189 813 22.00 0.35 512 35 180 23.27 0.34 550 31 175
29 Kaunia-Parbatipur 14.26 3.77 271 146 740 24.00 0.76 360 50 342 25.39 0.74 386 44 332
30 Tistamukghat-Bonarpara 8.00 5.50 293 285 1,762 -- -- -- -- -- -- -- -- -- --
31 Trimohini-Balashi -- -- -- -- -- -- -- -- -- -- -- -- -- -- --
32 Lalmonirhat-Burimari 6.00 0.47 94 9 38 12.00 0.28 184 20 110 12.69 0.27 197 17 107
33 Parbatipur-Kanchan 14.95 2.76 267 91 350 20.00 0.35 256 32 120 21.16 0.34 275 28 116
34 Kanchan-Panchagarh 6.58 3.25 120 67 238 10.00 -- 80 -- -- 10.58 -- 85 -- --
35 Tista-Ramna Bazar 6.82 0.51 90 13 57 4.00 -- 32 -- -- 4.23 -- 34 -- --
36 Kanchan-Biral 4.00 -- 38 17 48 2.00 -- 16 -- -- 2.12 -- 17 -- --
37 Parbatipur-Saidpur -- -- -- -- -- 14.00 -- -- -- -- 14.81 -- -- -- --
38 Santahar-Abdulpur -- -- -- -- -- 24.00 0.62 168 32 324 25.39 0.60 180 28 315
39 Abdulpur-Ishurdi -- -- -- -- -- 38.00 0.62 168 32 324 40.20 0.60 180 28 315
40 Ishurdi-Jamtail -- -- -- -- -- 24.00 0.62 168 32 324 25.39 0.60 180 28 315
41 Jamtail-Joydebpur -- -- -- -- -- 26.00 0.42 168 32 324 27.50 0.60 180 28 315
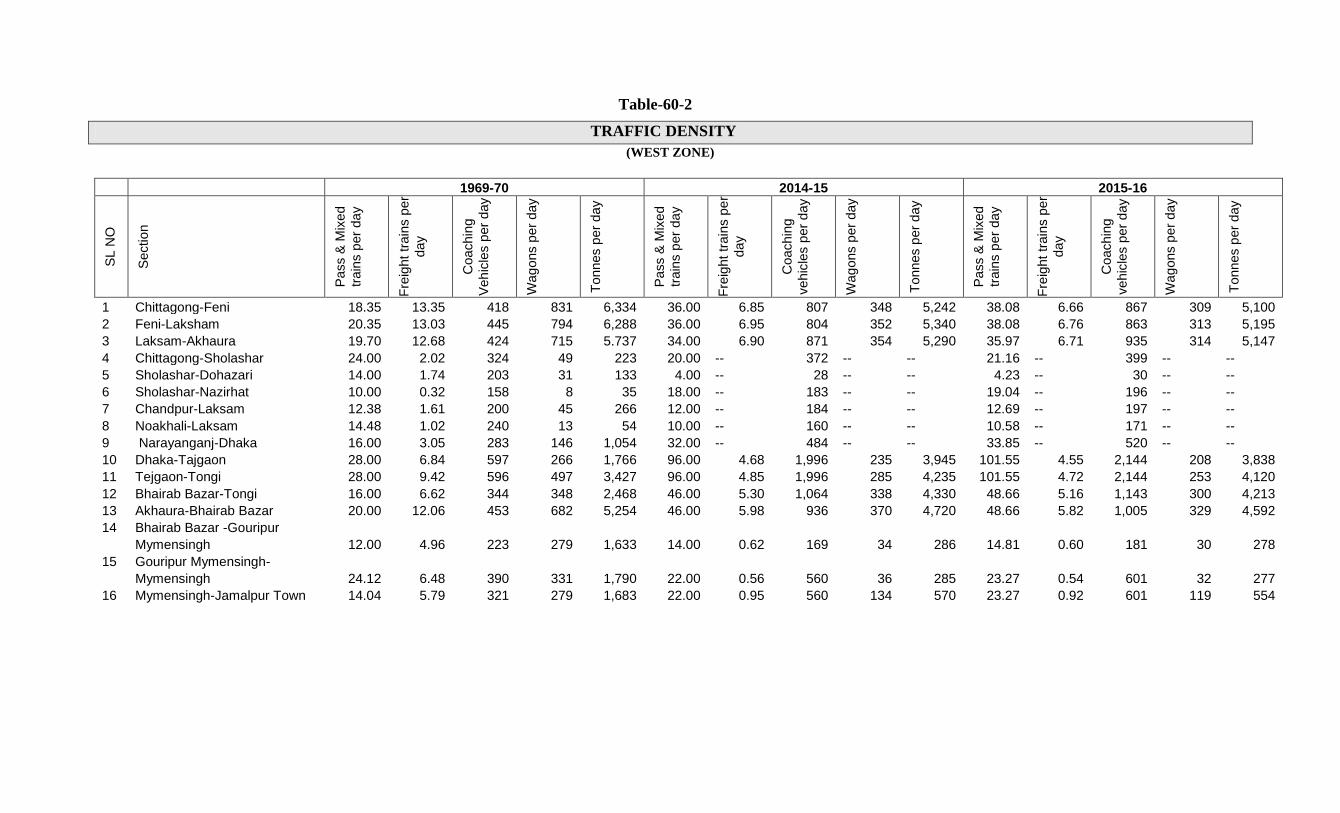
Table-60-2
TRAFFIC DENSITY
(WEST ZONE)
1969-70 2014-15 2015-16
SL N
O
Section
Pass &
Mix
ed
train
s p
er
day
Fre
ight
train
s p
er
day
Coachin
g
Veh
icle
s p
er
day
Wag
ons p
er
day
Tonnes p
er
day
Pass &
Mix
ed
train
s p
er
day
Fre
ight
train
s p
er
day
Coachin
g
vehic
les p
er
day
Wag
ons p
er
day
Tonnes p
er
day
Pass &
Mix
ed
train
s p
er
day
Fre
ight
train
s p
er
day
Coachin
g
vehic
les p
er
day
Wag
ons p
er
day
Tonnes p
er
day
1 Chittagong-Feni 18.35 13.35 418 831 6,334 36.00 6.85 807 348 5,242 38.08 6.66 867 309 5,100
2 Feni-Laksham 20.35 13.03 445 794 6,288 36.00 6.95 804 352 5,340 38.08 6.76 863 313 5,195
3 Laksam-Akhaura 19.70 12.68 424 715 5.737 34.00 6.90 871 354 5,290 35.97 6.71 935 314 5,147
4 Chittagong-Sholashar 24.00 2.02 324 49 223 20.00 -- 372 -- -- 21.16 -- 399 -- --
5 Sholashar-Dohazari 14.00 1.74 203 31 133 4.00 -- 28 -- -- 4.23 -- 30 -- --
6 Sholashar-Nazirhat 10.00 0.32 158 8 35 18.00 -- 183 -- -- 19.04 -- 196 -- --
7 Chandpur-Laksam 12.38 1.61 200 45 266 12.00 -- 184 -- -- 12.69 -- 197 -- --
8 Noakhali-Laksam 14.48 1.02 240 13 54 10.00 -- 160 -- -- 10.58 -- 171 -- --
9 Narayanganj-Dhaka 16.00 3.05 283 146 1,054 32.00 -- 484 -- -- 33.85 -- 520 -- --
10 Dhaka-Tajgaon 28.00 6.84 597 266 1,766 96.00 4.68 1,996 235 3,945 101.55 4.55 2,144 208 3,838
11 Tejgaon-Tongi 28.00 9.42 596 497 3,427 96.00 4.85 1,996 285 4,235 101.55 4.72 2,144 253 4,120
12 Bhairab Bazar-Tongi 16.00 6.62 344 348 2,468 46.00 5.30 1,064 338 4,330 48.66 5.16 1,143 300 4,213
13 Akhaura-Bhairab Bazar 20.00 12.06 453 682 5,254 46.00 5.98 936 370 4,720 48.66 5.82 1,005 329 4,592
14 Bhairab Bazar -Gouripur
Mymensingh 12.00 4.96 223 279 1,633 14.00 0.62 169 34 286 14.81 0.60 181 30 278
15 Gouripur Mymensingh-
Mymensingh 24.12 6.48 390 331 1,790 22.00 0.56 560 36 285 23.27 0.54 601 32 277
16 Mymensingh-Jamalpur Town 14.04 5.79 321 279 1,683 22.00 0.95 560 134 570 23.27 0.92 601 119 554
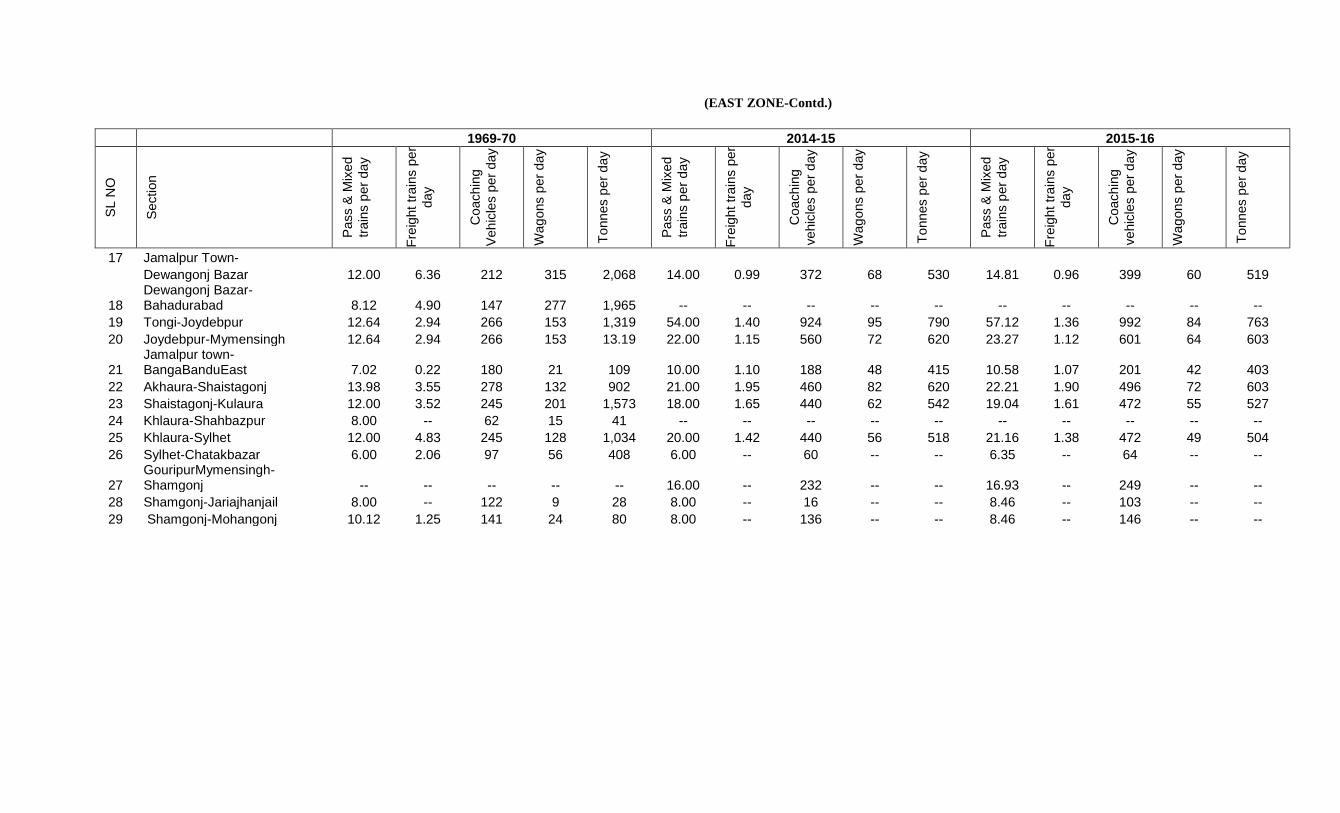
(EAST ZONE-Contd.)
1969-70 2014-15 2015-16
SL N
O
Section
Pass &
Mix
ed
train
s p
er
day
Fre
ight
train
s p
er
day
Coachin
g
Veh
icle
s p
er
day
Wag
ons p
er
day
Tonnes p
er
day
Pass &
Mix
ed
train
s p
er
day
Fre
ight
train
s p
er
day
Coachin
g
vehic
les p
er
day
Wag
ons p
er
day
Tonnes p
er
day
Pass &
Mix
ed
train
s p
er
day
Fre
ight
train
s p
er
day
Coachin
g
vehic
les p
er
day
Wag
ons p
er
day
Tonnes p
er
day
17 Jamalpur Town-
Dewangonj Bazar 12.00 6.36 212 315 2,068 14.00 0.99 372 68 530 14.81 0.96 399 60 519
18 Dewangonj Bazar-Bahadurabad 8.12 4.90 147 277 1,965 -- -- -- -- -- -- -- -- -- --
19 Tongi-Joydebpur 12.64 2.94 266 153 1,319 54.00 1.40 924 95 790 57.12 1.36 992 84 763
20 Joydebpur-Mymensingh 12.64 2.94 266 153 13.19 22.00 1.15 560 72 620 23.27 1.12 601 64 603
21 Jamalpur town-BangaBanduEast 7.02 0.22 180 21 109 10.00 1.10 188 48 415 10.58 1.07 201 42 403
22 Akhaura-Shaistagonj 13.98 3.55 278 132 902 21.00 1.95 460 82 620 22.21 1.90 496 72 603
23 Shaistagonj-Kulaura 12.00 3.52 245 201 1,573 18.00 1.65 440 62 542 19.04 1.61 472 55 527
24 Khlaura-Shahbazpur 8.00 -- 62 15 41 -- -- -- -- -- -- -- -- -- --
25 Khlaura-Sylhet 12.00 4.83 245 128 1,034 20.00 1.42 440 56 518 21.16 1.38 472 49 504
26 Sylhet-Chatakbazar 6.00 2.06 97 56 408 6.00 -- 60 -- -- 6.35 -- 64 -- --
27 GouripurMymensingh-Shamgonj -- -- -- -- -- 16.00 -- 232 -- -- 16.93 -- 249 -- --
28 Shamgonj-Jariajhanjail 8.00 -- 122 9 28 8.00 -- 16 -- -- 8.46 -- 103 -- --
29 Shamgonj-Mohangonj 10.12 1.25 141 24 80 8.00 -- 136 -- -- 8.46 -- 146 -- --
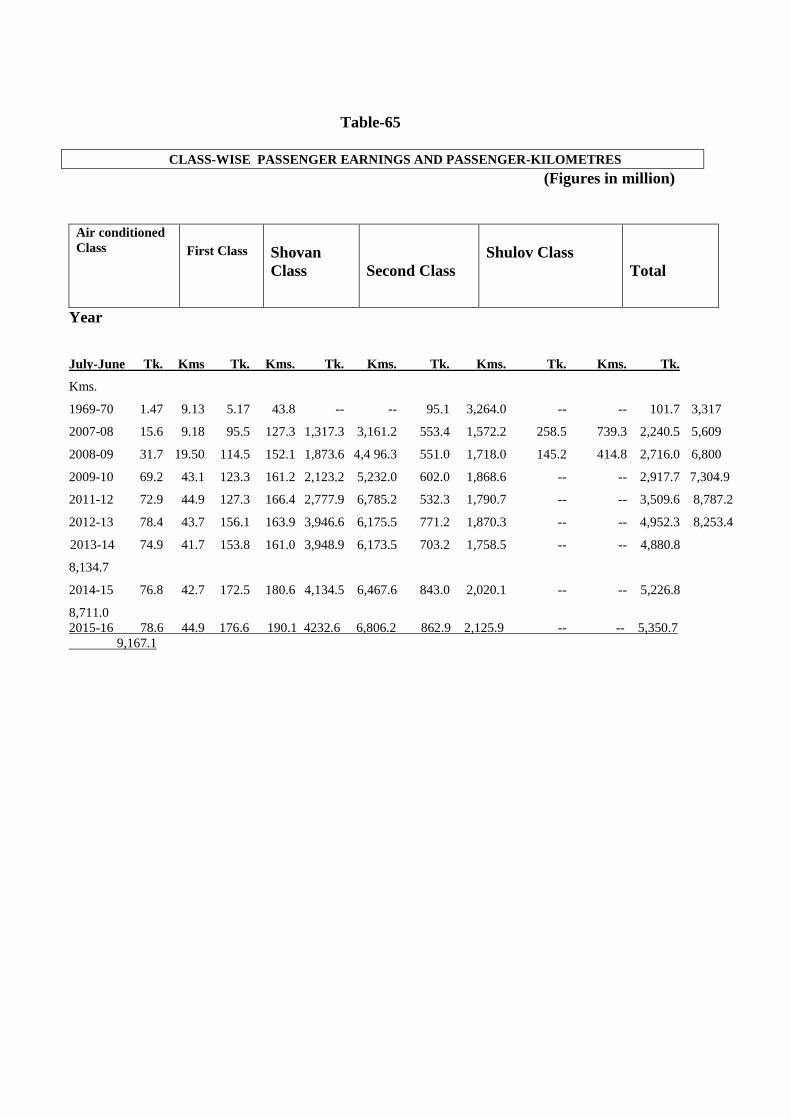
Table-65
CLASS-WISE PASSENGER EARNINGS AND PASSENGER-KILOMETRES
(Figures in million)
Air conditioned
Class
First Class
Shovan
Class
Second Class
Shulov Class
Total
Year
July-June Tk. Kms Tk. Kms. Tk. Kms. Tk. Kms. Tk. Kms. Tk.
Kms.
1969-70 1.47 9.13 5.17 43.8 -- -- 95.1 3,264.0 -- -- 101.7 3,317
2007-08 15.6 9.18 95.5 127.3 1,317.3 3,161.2 553.4 1,572.2 258.5 739.3 2,240.5 5,609
2008-09 31.7 19.50 114.5 152.1 1,873.6 4,4 96.3 551.0 1,718.0 145.2 414.8 2,716.0 6,800
2009-10 69.2 43.1 123.3 161.2 2,123.2 5,232.0 602.0 1,868.6 -- -- 2,917.7 7,304.9 2010-11 65.5 43.9 116.8 163.4 2,400.0 5,888.9 633.1 1,955.6 -- -- 3,215.5 8,051.9
2011-12 72.9 44.9 127.3 166.4 2,777.9 6,785.2 532.3 1,790.7 -- -- 3,509.6 8,787.2
2012-13 78.4 43.7 156.1 163.9 3,946.6 6,175.5 771.2 1,870.3 -- -- 4,952.3 8,253.4
2013-14 74.9 41.7 153.8 161.0 3,948.9 6,173.5 703.2 1,758.5 -- -- 4,880.8
8,134.7
2014-15 76.8 42.7 172.5 180.6 4,134.5 6,467.6 843.0 2,020.1 -- -- 5,226.8
8,711.0
2015-16 78.6 44.9 176.6 190.1 4232.6 6,806.2 862.9 2,125.9 -- -- 5,350.7
9,167.1

Table-68
OPERATING EXPENSES & THEIR PERCENTAGE
Taka in thousand
General Repaqirs and Operation Operation Operation Miscellaneous Depreciation Total
Adminis- tration Maintenance Staff fuel other than expenwses
staff& fuel
July-June Taka % Taka % Taka % Taka % Taka % Taka % Taka % Taka
2001-02 96,06,88 17.90 175,59,68 32.80 78,86,87 14.70 77,95,58 14.60 39,38,45 7.40 67,60,91 12.60 --- -- 535,48,37
2007-08 137,06,53 12.59 399,55,65 36.71 60,43,89 5.55 187,02,87 17.18 108,45,29 9.96 196,00,34 18.01 -- -- 1088,54,57
2008-09 151,44,24 12.91 397,62,87 33.91 71,35,82 6.09 221,43,13 18.88 102,54,40 8.74 228,34,48 19.47 -- -- 1172,74,94
2009-10 172,54,67 13.72 433,95,18 34.52 80,93,09 6.44 205,80,57 16.37 98,88,79 7.87 265,08,17 21.09 -- -- 1257,20,47
2010-11 234,53,51 15.72 452,92,77 30.36 83,24,56 5.58 210,40,39 14.10 127,28,55 8.53 383,42,16 25.70 -- -- 1491,81,94
2011-12 199,03,90 12.70 482,75,63 30.80 76,75,58 4.90 256,10,18 16.34 126,55,10 8.08 425,91,17 27.18 -- -- 1567,11,56
2012-13 199,73,58 12.78 489,63,62 31.34 70,29,76 4.50 297,94,23 19.07 120,84,74 7.74 383,92,21 24.57 -- -- 1562,38,14
2013-14 237,61,98 14.84 514,79,44 32.14 88,26,25 5.51 336,52,82 21.01 141,60,13 8.84 282,89,02 17.66 -- -- 1601,69,64
2014-15 277,37,37 15.34 592,85,65 32.79 94,36,27 5.22 361,59,09 20.00 146,43,13 8.10 335,68,33 18.55 -- -- 1808,29,84
2015-16 356,47,94 15.99 716,99,26 32.16 126,99,95 5.69 361,85,74 16.23 173,79,16 7.79 493,16,49 22.22 -- -- 2229,22,04
Table-75
DEPARTMENT-WISE NUMBER OF EMPLOYEES
Adminis Nirapatta Ac- Engineering Signal & Tele- Estate Mechanical Traf Electri
Medical
Stores trations Bahini counts
Communication fic cal
Year
July-June
1969-70 3,138 -- 1,440 12,019 -- -- 20,005 11,885 2,160 3,204 1,974
2007-08 1,129 2,408 1,150 5,775 1,409 195 10,409 6,481 1,814 1,332 1,409
2008-09 1,052 2,369 1,019 5,285 1,379 181 9,392 6,012 1,644 1,180 931
2009-10 998 2,273 941 4,918 1,305 170 8,519 5,361 1,493 1,132 861
2010-11 953 2,184 845 4,674 1,256 163 7,910 5,085 1,430 1,054 795
2011-12 948 2,467 1,120 4,437 1,241 170 8,134 4,838 1,353 1,024 726
2012-13 911 2,659 1,062 4,285 1,225 163 7,772 4,734 1,297 1,076 755
2013-14 939 2,533 1,058 4,322 1,220 164 7,397 4,759 1,246 1,252 756
2014-15 993 2,492 1,007 5,816 1,283 157 7,651 4,708 1,414 1,328 771
2015-16 889 2,473 879 5,793 977 137 6,642 4,312 1,456 1,434 790
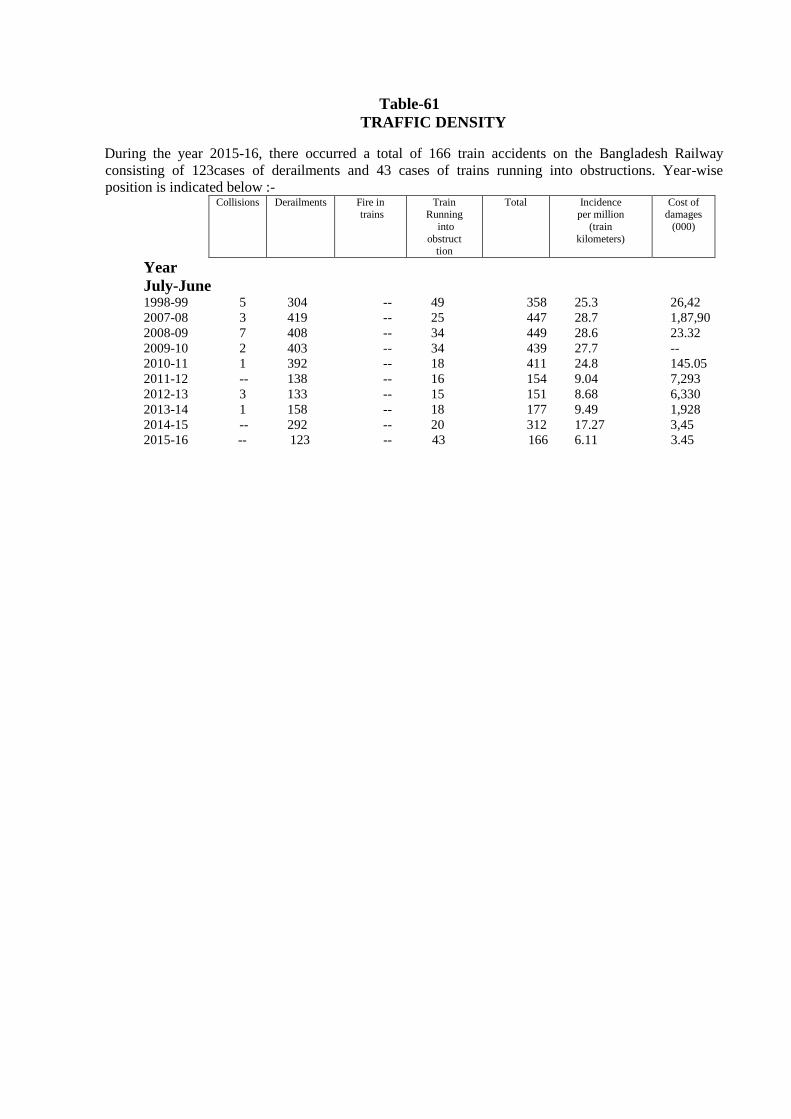
Table-61
TRAFFIC DENSITY
During the year 2015-16, there occurred a total of 166 train accidents on the Bangladesh Railway
consisting of 123cases of derailments and 43 cases of trains running into obstructions. Year-wise
position is indicated below :- Collisions Derailments Fire in
trains Train
Running
into
obstruct tion
Total Incidence per million
(train
kilometers)
Cost of damages
(000)
Year
July-June 1998-99 5 304 -- 49 358 25.3 26,42
2007-08 3 419 -- 25 447 28.7 1,87,90
2008-09 7 408 -- 34 449 28.6 23.32
2009-10 2 403 -- 34 439 27.7 --
2010-11 1 392 -- 18 411 24.8 145.05
2011-12 -- 138 -- 16 154 9.04 7,293
2012-13 3 133 -- 15 151 8.68 6,330
2013-14 1 158 -- 18 177 9.49 1,928
2014-15 -- 292 -- 20 312 17.27 3,45
2015-16 -- 123 -- 43 166 6.11 3.45

Table-62 ANALYSIS OF TRAIN ACCIDENTS
During the year 2015-16, 84.94 percent of the total train accidents were attributable to the failure of human
elements and 10.84 percent were caused by technical defects in rolling-stock, track, signaling and interlocking
apparatus. The balance 4.22 percent accidents occurred due to other miscellaneous causes. The comparative figures
for 2014-15and 2015-16 are shown below :- Collisions Derailments Fire in trains Train
Running into
obstruct
tion
Total Percent
age to
total
A. Human Elements :
(i) Breach of rules, Wrong manipulation
of block instruments and wrong setting of
points etc.
2014-15 -- 75 -- -- 75 24.04
2015-16 -- 123 -- 18 141 84,.94
(ii) Passing of signals at danger
2014-15 -- 6 -- -- 6 1.92
2015-16 -- -- -- -- -- --
(iii) Breach of rules by Master and Asstt.
Locomotive Master
2014-15 -- 20 -- -- 20 6.41
2015-16 -- -- -- -- -- --
B. Technical defects :-
(i) Engines
2014-15 -- 40 -- -- 40 12.82
2015-16 -- -- -- -- -- --
(ii) Vehicles
2014-15 -- 47 -- -- 47 15.06
2015-16 -- -- -- -- -- --
(iii) Tracks
2014-15 -- 20 -- -- 20 6.41
2015-16 -- -- -- -- -- --
(iv) Signaling and interlocking apparatus
2014-15 -- 49 -- -- 49 15.71
2015-16 -- -- -- -- -- --
v) other technical defects
2014-15 -- 15 -- 20 35 11.22
2015-16 -- -- -- 18 18 10.84
Miscellaneous causes
2014-15 -- 20 -- -- 20 6.41
2015-16 -- -- -- -- 7 4.22
Grand Total
2014-15 -- 292 -- 20 312 100.0
2015-16 -- 123 -- 43 166 100.0

Table-63
CASUALTIES
During the year 2015-16, a total of 27 persons, i.e. passengers, railway employees and
other persons were killed and 9 persons were injured in train accidents as well as in accidents
caused by the movement of railway vehicles and on railway premises. Year-wise position is
indicated below :- Passenger Railway
Employees Other
Persons Total
Casualties Casualties
of Passenger
per million
passenger originating
Compensa
tion paid to the victims
(Taka in
thousands)
Killed Injured Killed Injured Killed Injured Killed Injured
Year
July-June 1998-99 3 85 4 266 28 57 35 408 2.43 13.10
2007-08 5 10 11 38 67 85 83 133 0.28 51.51
2008-09 1 10 1 25 20 64 22 99 0.17 30.36
2009-10 -- -- -- 98 11 40 11 138 -- 88
2010-11 -- -- 7 143 10 17 17 160 -- --
2011-12 -- -- 11 94 35 56 46 150 -- 13
2012-13 -- -- 2 112 38 54 44 166 -- 1.17
2013-14 2 5 5 87 23 63 30 155 0.11 0.15
2014-15 -- 9 17 94 65 61 82 164 0.13 0.29
2015-16 -- -- -- -- 27 9 27 9 0.50 0.33
Table-64 PASSENGER AND FREIGHT REVENUE
Revenue
From passengers
carried
(Thousand Taka)
Revenue
per passengers
(Taka)
Revenue
per passenger kilometer
(Paisa)
Revenue
from freight
Tones
carried (Thousand
Taka)
Revenue
per tone
(Taka)
Revenue
per tone
kilometer
(Paisa)
Year
July-June 1969-70 10,17,11 1.38 3.04 16,38,31 33.54 12.7
2007-08 224,04,68 41.63 38.50 140,64,55 428.54 156.4
2008-09 271,59,62 41.77 38.47 131,12,36 435.63 158.4
2009-10 291,76,86 44.45 38.58 116,36,12 428.74 157.7
2010-11 321,55,03 50.61 38.60 114,36,54 447.78 158.9
2011-12 350,96,63 53.06 38.55 96,11,21 438.47 158.8
2012-13 495,23,00 79.11 57.91 109,36,61 543.84 200.3
2013-14 488,07,50 75.14 57.84 142,60,68 565.00 202.5
2014-15 522,68,36 77.62 57.92 173,93,16 680.75 238.33
2015-16 535,07,79 75.62 59.35 176,68,10 691.15 242.14
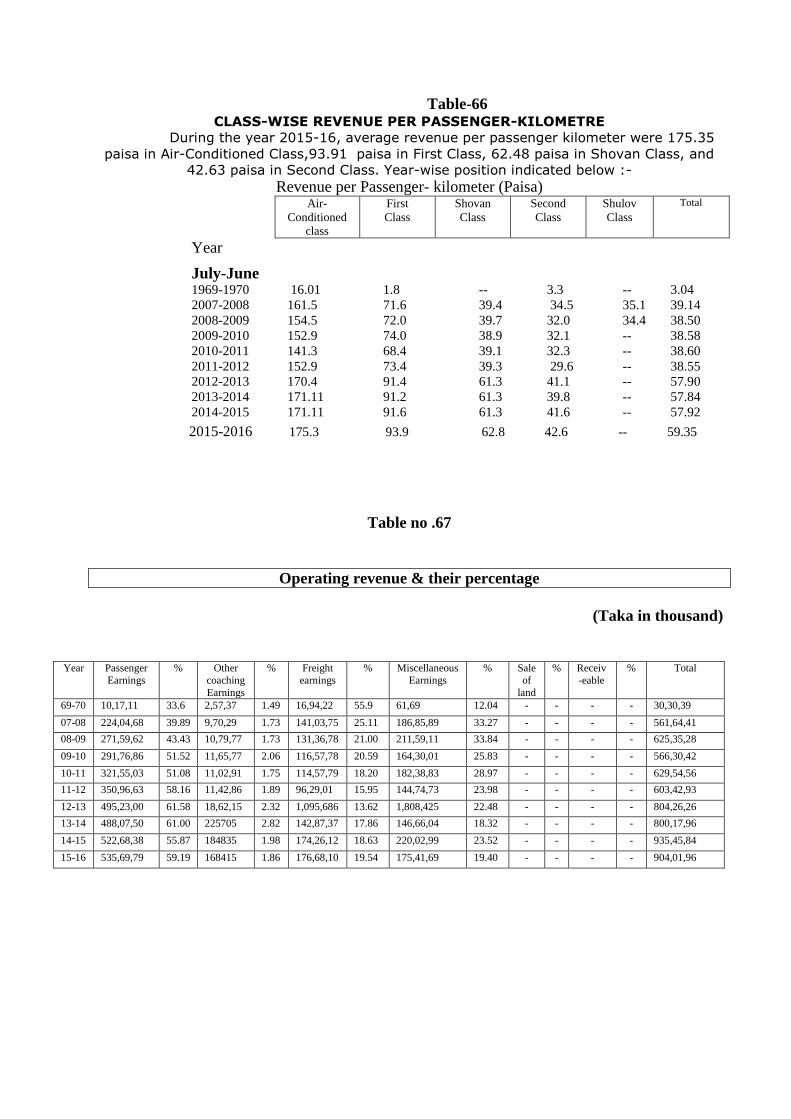
Table-66
CLASS-WISE REVENUE PER PASSENGER-KILOMETRE
During the year 2015-16, average revenue per passenger kilometer were 175.35
paisa in Air-Conditioned Class,93.91 paisa in First Class, 62.48 paisa in Shovan Class, and
42.63 paisa in Second Class. Year-wise position indicated below :-
Revenue per Passenger- kilometer (Paisa) Air-
Conditioned
class
First
Class Shovan
Class Second
Class Shulov
Class
Total
Year
July-June 1969-1970 16.01 1.8 -- 3.3 -- 3.04
2007-2008 161.5 71.6 39.4 34.5 35.1 39.14
2008-2009 154.5 72.0 39.7 32.0 34.4 38.50
2009-2010 152.9 74.0 38.9 32.1 -- 38.58
2010-2011 141.3 68.4 39.1 32.3 -- 38.60
2011-2012 152.9 73.4 39.3 29.6 -- 38.55
2012-2013 170.4 91.4 61.3 41.1 -- 57.90
2013-2014 171.11 91.2 61.3 39.8 -- 57.84
2014-2015 171.11 91.6 61.3 41.6 -- 57.92
2015-2016 175.3 93.9 62.8 42.6 -- 59.35
Table no .67
Operating revenue & their percentage
(Taka in thousand)
Year Passenger
Earnings
% Other
coaching
Earnings
% Freight
earnings
% Miscellaneous
Earnings
% Sale
of
land
% Receiv
-eable
% Total
69-70 10,17,11 33.6 2,57,37 1.49 16,94,22 55.9 61,69 12.04 - - - - 30,30,39
07-08 224,04,68 39.89 9,70,29 1.73 141,03,75 25.11 186,85,89 33.27 - - - - 561,64,41
08-09 271,59,62 43.43 10,79,77 1.73 131,36,78 21.00 211,59,11 33.84 - - - - 625,35,28
09-10 291,76,86 51.52 11,65,77 2.06 116,57,78 20.59 164,30,01 25.83 - - - - 566,30,42
10-11 321,55,03 51.08 11,02,91 1.75 114,57,79 18.20 182,38,83 28.97 - - - - 629,54,56
11-12 350,96,63 58.16 11,42,86 1.89 96,29,01 15.95 144,74,73 23.98 - - - - 603,42,93
12-13 495,23,00 61.58 18,62,15 2.32 1,095,686 13.62 1,808,425 22.48 - - - - 804,26,26
13-14 488,07,50 61.00 225705 2.82 142,87,37 17.86 146,66,04 18.32 - - - - 800,17,96
14-15 522,68,38 55.87 184835 1.98 174,26,12 18.63 220,02,99 23.52 - - - - 935,45,84
15-16 535,69,79 59.19 168415 1.86 176,68,10 19.54 175,41,69 19.40 - - - - 904,01,96
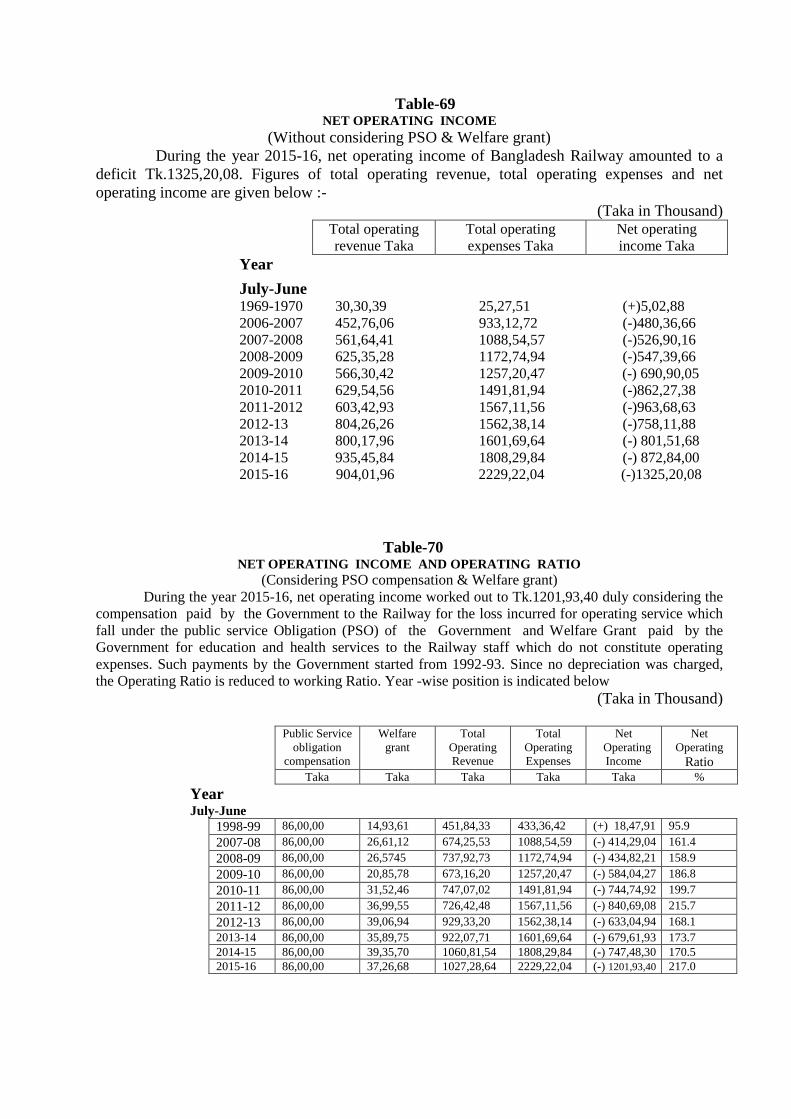
Table-69 NET OPERATING INCOME
(Without considering PSO & Welfare grant)
During the year 2015-16, net operating income of Bangladesh Railway amounted to a
deficit Tk.1325,20,08. Figures of total operating revenue, total operating expenses and net
operating income are given below :-
(Taka in Thousand) Total operating
revenue Taka Total operating
expenses Taka Net operating
income Taka
Year
July-June 1969-1970 30,30,39 25,27,51 (+)5,02,88
2006-2007 452,76,06 933,12,72 (-)480,36,66
2007-2008 561,64,41 1088,54,57 (-)526,90,16
2008-2009 625,35,28 1172,74,94 (-)547,39,66
2009-2010 566,30,42 1257,20,47 (-) 690,90,05
2010-2011 629,54,56 1491,81,94 (-)862,27,38
2011-2012 603,42,93 1567,11,56 (-)963,68,63
2012-13 804,26,26 1562,38,14 (-)758,11,88
2013-14 800,17,96 1601,69,64 (-) 801,51,68
2014-15 935,45,84 1808,29,84 (-) 872,84,00
2015-16 904,01,96 2229,22,04 (-)1325,20,08
Table-70 NET OPERATING INCOME AND OPERATING RATIO
(Considering PSO compensation & Welfare grant)
During the year 2015-16, net operating income worked out to Tk.1201,93,40 duly considering the
compensation paid by the Government to the Railway for the loss incurred for operating service which
fall under the public service Obligation (PSO) of the Government and Welfare Grant paid by the
Government for education and health services to the Railway staff which do not constitute operating
expenses. Such payments by the Government started from 1992-93. Since no depreciation was charged,
the Operating Ratio is reduced to working Ratio. Year -wise position is indicated below
(Taka in Thousand)
Public Service
obligation
compensation
Welfare
grant Total
Operating
Revenue
Total
Operating
Expenses
Net
Operating
Income
Net
Operating
Ratio Taka Taka Taka Taka Taka %
Year July-June
1998-99 86,00,00 14,93,61 451,84,33 433,36,42 (+) 18,47,91 95.9
2007-08 86,00,00 26,61,12 674,25,53 1088,54,59 (-) 414,29,04 161.4
2008-09 86,00,00 26,5745 737,92,73 1172,74,94 (-) 434,82,21 158.9
2009-10 86,00,00 20,85,78 673,16,20 1257,20,47 (-) 584,04,27 186.8
2010-11 86,00,00 31,52,46 747,07,02 1491,81,94 (-) 744,74,92 199.7
2011-12 86,00,00 36,99,55 726,42,48 1567,11,56 (-) 840,69,08 215.7
2012-13 86,00,00 39,06,94 929,33,20 1562,38,14 (-) 633,04,94 168.1
2013-14 86,00,00 35,89,75 922,07,71 1601,69,64 (-) 679,61,93 173.7
2014-15 86,00,00 39,35,70 1060,81,54 1808,29,84 (-) 747,48,30 170.5
2015-16 86,00,00 37,26,68 1027,28,64 2229,22,04 (-) 1201,93,40 217.0
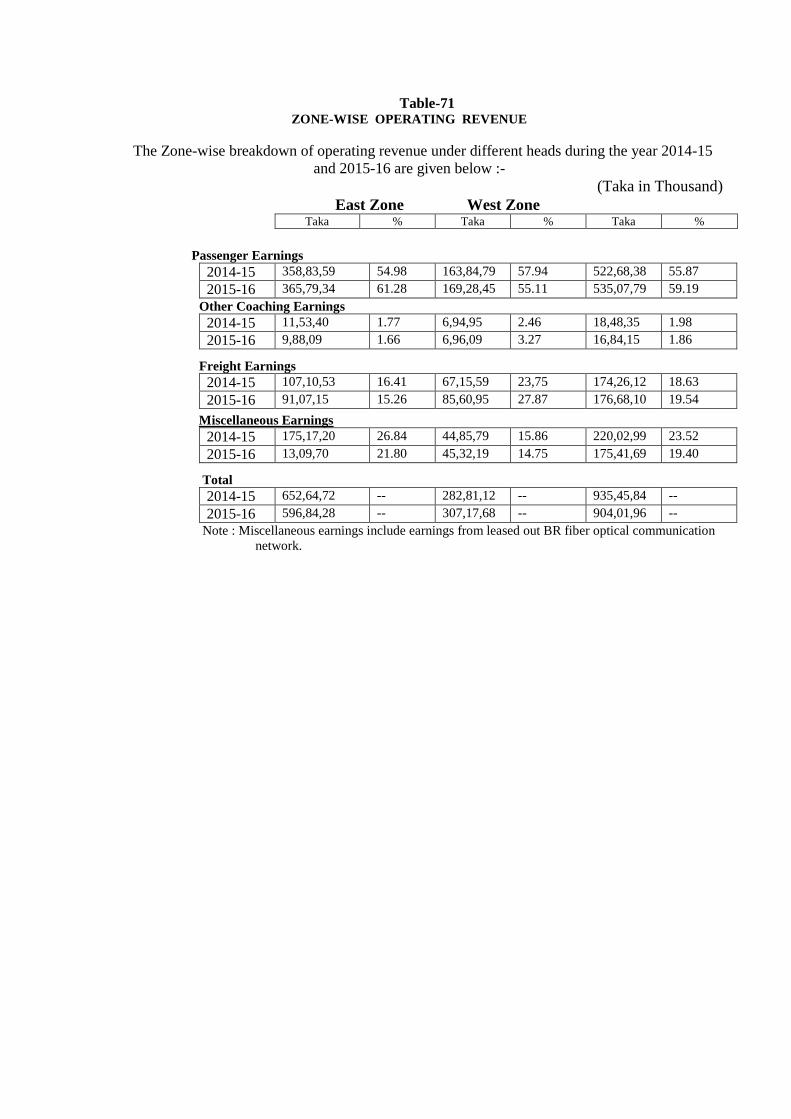
Table-71 ZONE-WISE OPERATING REVENUE
The Zone-wise breakdown of operating revenue under different heads during the year 2014-15
and 2015-16 are given below :-
(Taka in Thousand)
East Zone West Zone Taka % Taka % Taka %
Passenger Earnings
2014-15 358,83,59 54.98 163,84,79 57.94 522,68,38 55.87
2015-16 365,79,34 61.28 169,28,45 55.11 535,07,79 59.19
Other Coaching Earnings
2014-15 11,53,40 1.77 6,94,95 2.46 18,48,35 1.98
2015-16 9,88,09 1.66 6,96,09 3.27 16,84,15 1.86
Freight Earnings
2014-15 107,10,53 16.41 67,15,59 23,75 174,26,12 18.63
2015-16 91,07,15 15.26 85,60,95 27.87 176,68,10 19.54
Miscellaneous Earnings
2014-15 175,17,20 26.84 44,85,79 15.86 220,02,99 23.52
2015-16 13,09,70 21.80 45,32,19 14.75 175,41,69 19.40
Total
2014-15 652,64,72 -- 282,81,12 -- 935,45,84 --
2015-16 596,84,28 -- 307,17,68 -- 904,01,96 --
Note : Miscellaneous earnings include earnings from leased out BR fiber optical communication
network.

Table-72 ZONE-WISE OPERATING EXPENSES
The Zone-wise breakdown of operating expenses under different heads during the year
2014-15 and 2015-16 are given below :-
(Taka in
Thousand)
East Zone West Zone Total Taka % Taka % Taka %
General Administration
2014-15 161,86,53 16.21 115,50,84 14.26 277,37,37 15.34
2015-16 204,78,60 16.47 151,68,84 15.39 356,47,44 15.99
Repairs and maintenance
2014-15 292,67,56 29.31 300,18,09 37.07 592,85,65 32.79
2015-16 362,74,15 29.17 354,19,11 35.94 716,93,26 32.16
Operation Staff
2014-15 51,41,61 5.15 42,94,66 5.30 94,36,27 5.22
2015-16 68,46,23 5.51 58,53,72 5.94 126,99,95 5.70
Operation fuel
2014-15 223,28,97 22.36 138,30,12 17.08 361,59,09 20.00
2015-16 229,16,14 18.42 132,69,30 13.46 36185,74 16.23
Operation other than staff and fuel
2014-15 81,29,59 8.14 65,13,54 8.04 146,43,13 8.10
2015-16 99,17,31 7.97 74,61,85 7.57 173,79,16 7.80
Miscellaneous expenses
2014-15 187,98,22 18.83 147,70,11 18.24 335,68,33 18.55
2015-16 279,30,09 22.46 213,86,40 21.70 493,16,49 22.12
Total
2014-15 998,52,48 -- 809,77,36 -- 1808,29,84 --
2015-16 1243,62,52 -- 985,59,22 -- 2229,22,04 --
Note : Expenditure in East Zone is inclusive of Central Establishments.

Table-73 OPERATING RATIO
(Without considering PSO & Welfare grant) During the year 2015-16, net operating ratio of the Bangladesh Railway was 246.59%, i.e. total
expenses were246.59% of total earnings. Expenses on General Administration were 39.4%,
Repairs and maintenance 79.3%, Operation staff 14.0%, Operation fuel 40%, Operation other
than staff and fuel 19.2%, Miscellaneous expenses 54.5% and Depreciation Nil. Year-wise position
is indicated below :- General
Administration Repairs
and
maintenance
Operation
staff Operation
fuel Operation
other than
staff and fuel
Miscellaneous
expenses Depreciation Total
(Operating
ratio)
% % % % % % % %
Year
July-June
1969-70 13.0 25.9 13.0 14.2 3.08 4.32 9.92 83.4
2007-08 24.4 71.1 10.8 33.3 19.3 34.9 -- 193.8
2008-09 24.2 63.6 11.4 35.4 16.4 36.5 -- 187.5
2009-10 30.5 76.6 14.3 36.3 17.5 46.8 -- 222.0
2010-11 37.3 71.9 13.2 33.4 20.2 60.9 -- 236.9
2011-12 33.0 80.0 12.7 42.4 21.0 70.6 -- 259.7
2012-13 24.8 60.9 8.8 37.1 15.0 47.7 -- 194.3
2013-14 29.7 64.3 11.0 42.1 17.7 35.4 -- 200.2
2014-15 29.6 63.4 10.1 38.7 15.6 35.9 -- 193.3
2015-16 39.4 79.3 14.0 40.1 19.2 54.5 -- 246.6
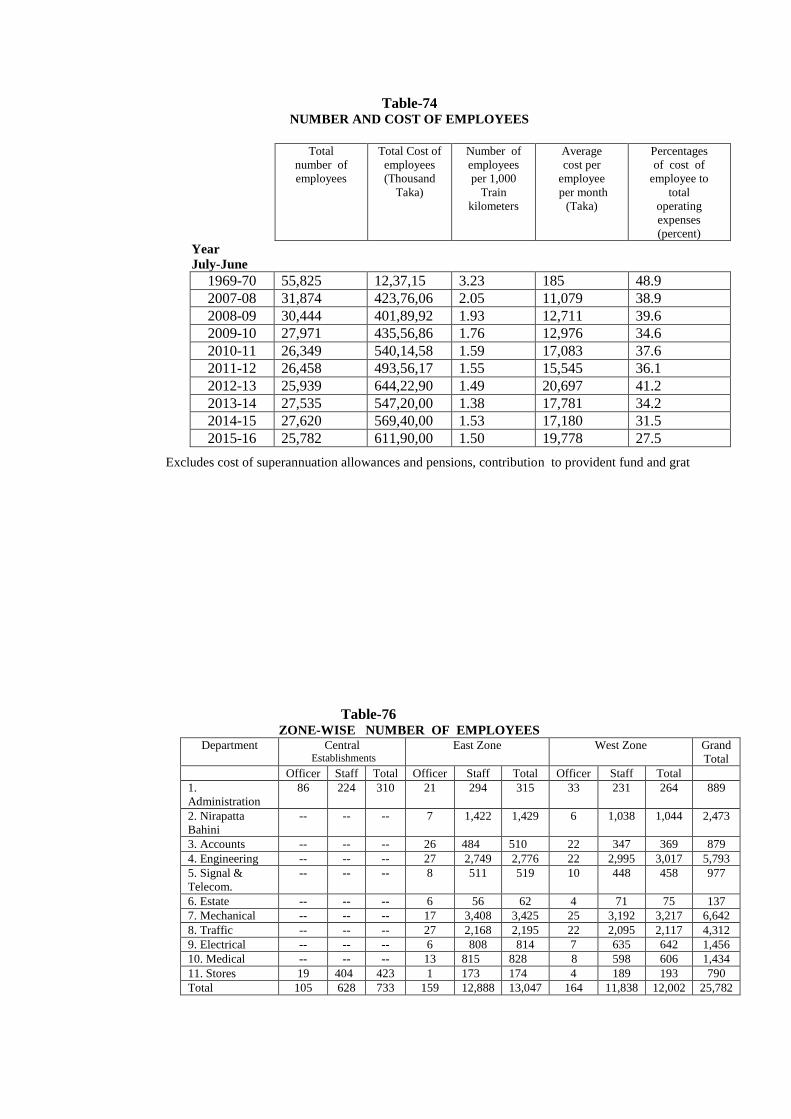
Table-74 NUMBER AND COST OF EMPLOYEES
Total
number of
employees
Total Cost of
employees
(Thousand
Taka)
Number of
employees
per 1,000
Train
kilometers
Average
cost per
employee
per month
(Taka)
Percentages
of cost of
employee to
total
operating
expenses
(percent)
Year
July-June
1969-70 55,825 12,37,15 3.23 185 48.9
2007-08 31,874 423,76,06 2.05 11,079 38.9
2008-09 30,444 401,89,92 1.93 12,711 39.6
2009-10 27,971 435,56,86 1.76 12,976 34.6
2010-11 26,349 540,14,58 1.59 17,083 37.6
2011-12 26,458 493,56,17 1.55 15,545 36.1
2012-13 25,939 644,22,90 1.49 20,697 41.2
2013-14 27,535 547,20,00 1.38 17,781 34.2
2014-15 27,620 569,40,00 1.53 17,180 31.5
2015-16 25,782 611,90,00 1.50 19,778 27.5
Excludes cost of superannuation allowances and pensions, contribution to provident fund and grat
Table-76 ZONE-WISE NUMBER OF EMPLOYEES
Department Central Establishments
East Zone West Zone Grand
Total
Officer Staff Total Officer Staff Total Officer Staff Total
1.
Administration
86 224 310 21 294 315 33 231 264 889
2. Nirapatta
Bahini
-- -- -- 7 1,422 1,429 6 1,038 1,044 2,473
3. Accounts -- -- -- 26 484 510 22 347 369 879
4. Engineering -- -- -- 27 2,749 2,776 22 2,995 3,017 5,793
5. Signal &
Telecom.
-- -- -- 8 511 519 10 448 458 977
6. Estate -- -- -- 6 56 62 4 71 75 137
7. Mechanical -- -- -- 17 3,408 3,425 25 3,192 3,217 6,642
8. Traffic -- -- -- 27 2,168 2,195 22 2,095 2,117 4,312
9. Electrical -- -- -- 6 808 814 7 635 642 1,456
10. Medical -- -- -- 13 815 828 8 598 606 1,434
11. Stores 19 404 423 1 173 174 4 189 193 790
Total 105 628 733 159 12,888 13,047 164 11,838 12,002 25,782
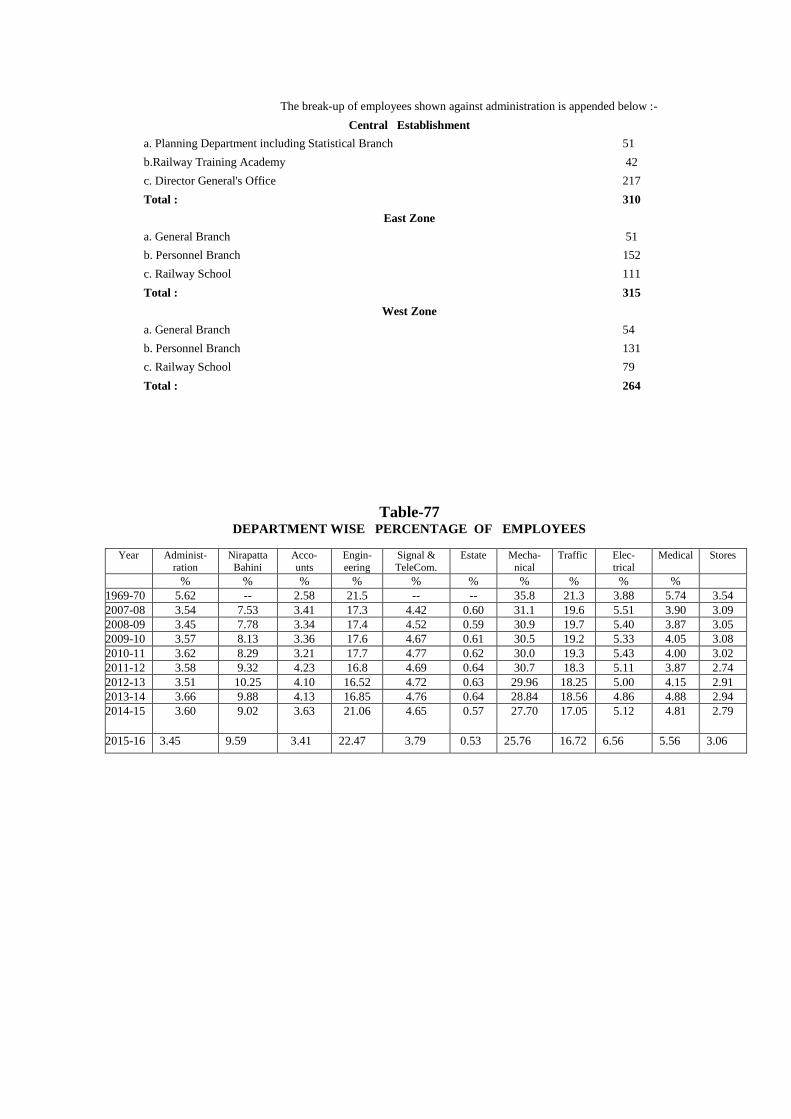
The break-up of employees shown against administration is appended below :-
Central Establishment
a. Planning Department including Statistical Branch 51
b.Railway Training Academy 42
c. Director General's Office 217
Total : 310
East Zone
a. General Branch 51
b. Personnel Branch 152
c. Railway School 111
Total : 315
West Zone
a. General Branch 54
b. Personnel Branch 131
c. Railway School 79
Total : 264
Table-77 DEPARTMENT WISE PERCENTAGE OF EMPLOYEES
Year Administ-
ration
Nirapatta
Bahini
Acco-
unts
Engin-
eering
Signal &
TeleCom.
Estate Mecha-
nical
Traffic Elec-
trical
Medical Stores
% % % % % % % % % %
1969-70 5.62 -- 2.58 21.5 -- -- 35.8 21.3 3.88 5.74 3.54
2007-08 3.54 7.53 3.41 17.3 4.42 0.60 31.1 19.6 5.51 3.90 3.09
2008-09 3.45 7.78 3.34 17.4 4.52 0.59 30.9 19.7 5.40 3.87 3.05 2009-10 3.57 8.13 3.36 17.6 4.67 0.61 30.5 19.2 5.33 4.05 3.08
2010-11 3.62 8.29 3.21 17.7 4.77 0.62 30.0 19.3 5.43 4.00 3.02 2011-12 3.58 9.32 4.23 16.8 4.69 0.64 30.7 18.3 5.11 3.87 2.74 2012-13 3.51 10.25 4.10 16.52 4.72 0.63 29.96 18.25 5.00 4.15 2.91 2013-14 3.66 9.88 4.13 16.85 4.76 0.64 28.84 18.56 4.86 4.88 2.94
2014-15 3.60 9.02 3.63 21.06 4.65 0.57 27.70 17.05 5.12 4.81 2.79
2015-16 3.45 9.59 3.41 22.47 3.79 0.53 25.76 16.72 6.56 5.56 3.06

Table-78 DEPARTMENT- WISE EMPLOYEES OF PROJECT
MANAGEMENT ORGANIZATION
The number of Officers and Staff of the Project Management Organization as on 30th June, 2014 is
appended below :
Officers Staff Total
1. Accounts 4 16 20
2. Engineering 44 45 89
Total 48 61 109
Total
LIST OF CLOSED BRANCH LINE
Statistical Section No Name of Branch Line Date of Closure
1. Faridpur. - Pukuria 15.07.90
2. Vharamara - Riota 15.07.90
3. Lalmonirhat - Moghalhat 02.10.96
4. Pachuria - Faridpur 01.02.96
5. Kalukhali - Bhatiapara ghat 19.07.97
6 Rupsa East - Bagerhat 16.08.97
7. Feni - Belonia 17.08.97
8. Habiganj - Shaistaganj 16.02.02
9. Shaistaganj - Balla 11.04.03
10. Kulaura-Shahbazpur 07.07.02
11. Serajganj Bogra-Serajgang Ghat 25.08.98
12. Kurigram- Old Kurigram 06.10.03
13. Modukhali-Kumarkhali 07.07.02
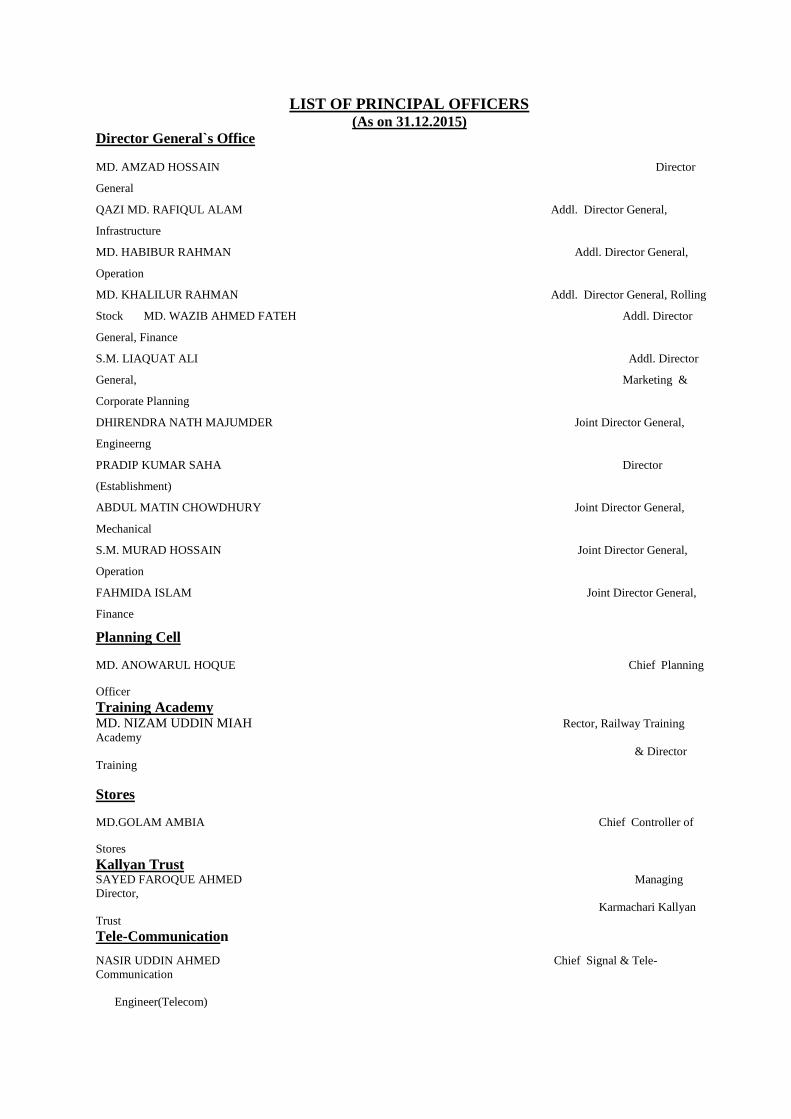
LIST OF PRINCIPAL OFFICERS
(As on 31.12.2015)
Director General`s Office
MD. AMZAD HOSSAIN Director
General
QAZI MD. RAFIQUL ALAM Addl. Director General,
Infrastructure
MD. HABIBUR RAHMAN Addl. Director General,
Operation
MD. KHALILUR RAHMAN Addl. Director General, Rolling
Stock MD. WAZIB AHMED FATEH Addl. Director
General, Finance
S.M. LIAQUAT ALI Addl. Director
General, Marketing &
Corporate Planning
DHIRENDRA NATH MAJUMDER Joint Director General,
Engineerng
PRADIP KUMAR SAHA Director
(Establishment)
ABDUL MATIN CHOWDHURY Joint Director General,
Mechanical
S.M. MURAD HOSSAIN Joint Director General,
Operation
FAHMIDA ISLAM Joint Director General,
Finance
Planning Cell
MD. ANOWARUL HOQUE Chief Planning
Officer Training Academy MD. NIZAM UDDIN MIAH Rector, Railway Training
Academy
& Director
Training
Stores
MD.GOLAM AMBIA Chief Controller of
Stores Kallyan Trust SAYED FAROQUE AHMED Managing
Director,
Karmachari Kallyan
Trust
Tele-Communication
NASIR UDDIN AHMED Chief Signal & Tele-
Communication
Engineer(Telecom)
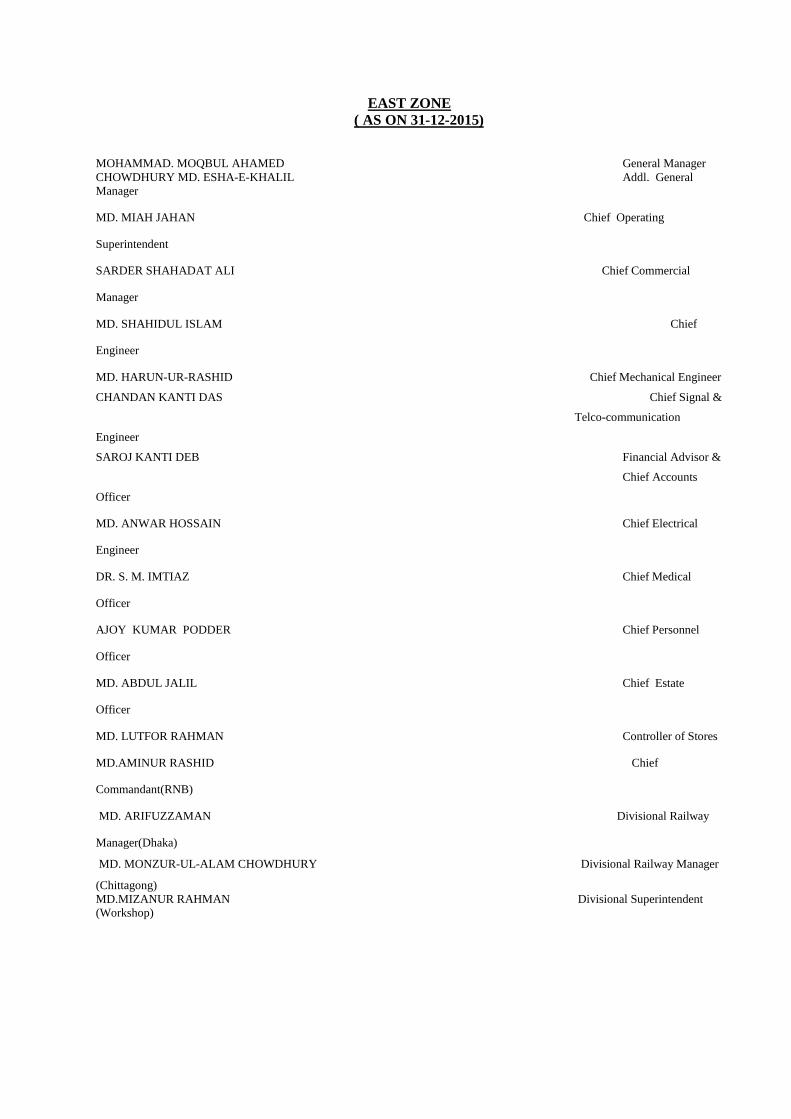
EAST ZONE
( AS ON 31-12-2015)
MOHAMMAD. MOQBUL AHAMED General Manager
CHOWDHURY MD. ESHA-E-KHALIL Addl. General
Manager
MD. MIAH JAHAN Chief Operating
Superintendent
SARDER SHAHADAT ALI Chief Commercial
Manager
MD. SHAHIDUL ISLAM Chief
Engineer
MD. HARUN-UR-RASHID Chief Mechanical Engineer
CHANDAN KANTI DAS Chief Signal &
Telco-communication
Engineer
SAROJ KANTI DEB Financial Advisor &
Chief Accounts
Officer
MD. ANWAR HOSSAIN Chief Electrical
Engineer
DR. S. M. IMTIAZ Chief Medical
Officer
AJOY KUMAR PODDER Chief Personnel
Officer
MD. ABDUL JALIL Chief Estate
Officer
MD. LUTFOR RAHMAN Controller of Stores
MD.AMINUR RASHID Chief
Commandant(RNB)
MD. ARIFUZZAMAN Divisional Railway
Manager(Dhaka)
MD. MONZUR-UL-ALAM CHOWDHURY Divisional Railway Manager
(Chittagong)
MD.MIZANUR RAHMAN Divisional Superintendent
(Workshop)


