Embed Size (px)
Citation preview
INFLUENCE OF STRATEGIC MANAGEMENT CAPABILITIES
ON THE PERFORMANCE OF COMMERCIAL BANKS IN
KENYA
CHRISTINE AKOTH OSWAGO
DOCTOR OF PHILOSOPHY
(Business Administration)
JOMO KENYATTA UNIVERSITY OF
AGRICULTURE AND TECHNOLOGY
2018
Influence of Strategic Management Capabilities on the Performance
of Commercial Banks in Kenya
Christine Akoth Oswago
A Thesis Submitted in Partial Fulfilment for the Degree of
Philosophy in Business Administration in the Jomo Kenyatta
University of Agriculture and Technology
2018
ii
DECLARATION
This thesis is my original work and has not been presented for a degree in any other
university.
Signature............................................................ Date...............................................
Christine Akoth Oswago
This thesis has been submitted for examination with our approval as university
supervisors.
Signature............................................................ Date...............................................
Prof. Gregory Namusonge, PhD
JKUAT, Kenya
Signature......................................... Date..............................................
Prof. George Orwa, PhD
JKUAT, Kenya

iii
DEDICATION
To my husband, Sylvester, who has been a constant source of support and
encouragement during the challenges of course work and writing of this thesis. I am
truly thankful for having you in my life.

iv
ACKNOWLEDGEMENT
This thesis is a product of invaluable support and guidance I received from various
organizations and individuals. It is really not possible to name all those who
participated but I wish to take this earliest opportunity to sincerely appreciate all
those who contributed in one way or the other.
I will however mention a few others who made tremendous effort towards the
realization of this study. First, I am sincerely grateful to my supervisors Prof.
Gregory S. Namusonge and Prof. George Orwa for their guidance and insightful
comments that helped in shaping this work. I also benefited a great deal from my
course lecturers, classmates and work mates who gave me the impetus to continue
with the project.
My heartfelt appreciation goes to my family especially my husband Mr. Sylvester
Odinga, children; Tracy, Xavier and Whitney and my mother Joyce who ensured that
I was fully supported through prayers, materials, discussion and reading ambience.
Your absolute sacrifice and unwavering support were quite humbling.
I would also like to thank Jomo Kenyatta University of Agriculture and Technology
(JKUAT) management for giving me an opportunity to pursue my doctoral studies at
the prestigious institution. I also wish to appreciate my field assistant Tracy chimita
for her tireless effort in data collection and entry. I am particularly grateful to her for
her ingenuity in arranging appointment with respondents and being ready to work for
long hours to ensure we met the deadlines.
I also acknowledge with utmost sincerity all respondents and officials from various
banks who participated in filling our questionnaires or assisted with discussions on
pertinent issues of the research. Finally, I wish to acknowledge that whereas it is
clear that somebody else could have made a different product out of this, it is
important that I carried out the study at this time. For that reason, I am solely
responsible for the content of this thesis including all omissions and commissions
arising therein.
v
TABLE OF CONTENTS
DECLARATION ....................................................................................................... II
DEDICATION ......................................................................................................... III
ACKNOWLEDGEMENT ....................................................................................... IV
TABLE OF CONTENTS .......................................................................................... V
LIST OF TABLES ................................................................................................ XIV
LIST OF FIGURES ............................................................................................ XVII
LIST OF APPENDICES ................................................................................... XVIII
LIST OF ABBREVIATION AND ACRONYMS .............................................. XIX
DEFINITION OF TERMS .................................................................................... XX
ABSTRACT ........................................................................................................... XXI
CHAPTER ONE ........................................................................................................ 1
INTRODUCTION ...................................................................................................... 1
1.1 Background of the Study ........................................................................................ 1
1.1.1 Strategic Management Capabilities................................................................. 2
1.1.2 Management Capabilities of Banking Industry in Kenya ............................... 3
vi
1.2 Statement of the Problem ....................................................................................... 5
1.3 Objectives of the Study .......................................................................................... 6
1.3.1 General objective ............................................................................................ 6
1.3.2 Specific objectives .......................................................................................... 6
1.4 Research Questions ................................................................................................ 7
1.5 Hypothesis of the Study ......................................................................................... 7
1.6 Significance of the Study ....................................................................................... 7
1.7 Scope of the Study ................................................................................................. 8
1.8 Limitations ............................................................................................................. 9
CHAPTER TWO ..................................................................................................... 10
LITERATURE REVIEW ........................................................................................ 10
2.1 Introduction .......................................................................................................... 10
2.2 Theoretical Framework ........................................................................................ 10
2.2.1 Resource Based Theory ................................................................................ 10
2.2.2 Agency Theory ............................................................................................. 11
2.2.3 Survival Based Theory .................................................................................. 13
2.3 Conceptual Framework ........................................................................................ 14
2.3.1 Strategic Management Capabilities to Envision ........................................... 16
vii
2.3.2 Strategic Management Capability to Strategize ............................................ 16
2.3.3 Strategic Management Capability to Monitor ............................................... 17
2.3.4 Strategic Management Capability to Evaluate .............................................. 18
2.3.5 Performance of Commercial Banks .............................................................. 19
2.4 Empirical Literature Review ................................................................................ 23
2.4.1 Strategic Management Capability to Envision and Bank Performance ........ 24
2.4.2 Strategic Management Capability to Strategize and Bank Performance ...... 27
2.4.3 Strategic Management Capability to Monitor and Performance of
Commercial Banks ................................................................................................. 29
2.4.4 Strategic Management Capability to Evaluate and Performance of
Commercial Banks ................................................................................................. 31
2.5 Critique of the Existing Literature ....................................................................... 33
2.6 Research Gaps ...................................................................................................... 35
2.7 Summary .............................................................................................................. 38
CHAPTER THREE ................................................................................................. 39
RESEARCH METHODOLOGY ........................................................................... 39
3.1 Introduction .......................................................................................................... 39
3.2 Research Design ................................................................................................... 39
viii
3.3 Target Population ................................................................................................. 40
3.4 Sampling Frame ................................................................................................... 41
3.5 Sampling Technique and Sample Size ................................................................. 42
3.5.1 Sample Size ................................................................................................... 42
3.6 Data Collection Methods and Instruments ........................................................... 43
3.7 Data Collection Procedure ................................................................................... 44
3.8 Pilot Study ............................................................................................................ 44
3.8.1 Validity of the Research Instruments ............................................................ 45
3.8.2 Reliability of Research Instruments .............................................................. 45
3.9 Data Analysis and Presentation ............................................................................ 46
3.9.1 Statistical Measurement Model ..................................................................... 47
3.9.2 Measurement of Variables ............................................................................ 48
3.9.3 Operationalization of Variables .................................................................... 49
3.9.4 Diagnostic Tests ............................................................................................ 50
3.9.5 Hypotheses Testing ....................................................................................... 51
CHAPTER FOUR .................................................................................................... 53
RESEARCH FINDINGS AND DISCUSSION ...................................................... 53
4.1 Introduction .......................................................................................................... 53
ix
4.2 Response Rate ...................................................................................................... 53
4.3 Validity and Reliability Test Results ................................................................... 54
4.3.1 Reliability Test .............................................................................................. 54
4.3.2 Validity Test .................................................................................................. 55
4.4 Demographic Characteristics of Respondents ..................................................... 56
4.4.1 Gender of Respondents ................................................................................. 56
4.4.2 Level of Education ........................................................................................ 56
4.4.3 Designation of Respondents .......................................................................... 57
4.4.4 Work Experience of Respondents ................................................................. 58
4.5 Tests for Assumptions of the Variables ............................................................... 59
4.5.1 Normality test ................................................................................................ 59
4.5.2 Multicollinearity Test .................................................................................... 59
4.5.3 Heteroscedasticity Test for Performance of Commercial Banks .................. 60
4.5.4 Auto Correlation Test .................................................................................... 61
4.6 Descriptive Analysis of Study Variables ............................................................ 62
4.7 Analysis of Performance of Commercial Banks .................................................. 62
4.7.1 Implementation of Performance Indicators and Bank Performance ............. 62
4.7.2 Implementation of Growth Strategies ........................................................... 63
4.7.3 Growth in Performance ................................................................................. 64
x
4.7.4 Rating Performance of Banks ....................................................................... 65
4.8 Strategic Management Capability to Envision ..................................................... 66
4.8.1 Performance Goals Envisaged by Vision Statement ..................................... 68
4.8.2 Possible Measures to Achieve the Objects of Vision Statement................... 69
4.8.3 Benchmark Schemes Relevant to Bank Performance ................................... 70
4.8.4 Common Benchmarks Used By Commercial Banks in Kenya ..................... 71
4.8.5 Instruments used for Decision Making ......................................................... 72
4.8.6 Current Departmental Targets ....................................................................... 74
4.8.7 Involvement of Stakeholders in Developing Mission Statements ................ 75
4.9 Strategic Management Capabilities to Strategize ................................................ 76
4.9.1 Effectiveness of the Current Strategies ......................................................... 79
4.9.2 Strategic Network.......................................................................................... 80
4.9.3 Value of Strategic Networks to the Performance of the Organization ......... 81
4.9.4 Rating the Value of Capability to Strategize................................................. 82
4.9.5 Frequency of Reviewing Implemented Strategies ........................................ 83
4.9.6 Need assessment to Establish Performance Level ........................................ 84
4.10 Strategic Management Capabilities to Monitor ................................................. 85
4.10.1 Importance of SWOT Analysis for Effective Bank Operation ................... 86
4.10.2 Strategies used to monitor and control future performance ........................ 87
4.10.3 Use of Investment Performance Reviews ................................................... 88
xi
4.11 Strategic Management Capabilities to Evaluate ................................................ 89
4.11.1 Importance of Evaluation Processes ........................................................... 90
4.11.2 Strategies of Evaluating of Achievement of the Set Objectives ................. 91
4.11.3 Evaluation of Performance and Evaluation Surveys ................................... 92
4.11.4 Bank‟s Capability to Evaluate ..................................................................... 93
4.11.5 Participation in Strategy Evaluation of the Stakeholders ............................ 94
4.11.6 Evaluation of the Success of Return on Investment.................................... 95
4.11.7 Attainment of Future Performance Goals ................................................... 96
4.12 Factor Extraction ................................................................................................ 97
4.12.1 Factor extraction for management capability to envision ........................... 97
4.12.2 Factor Extraction for Strategic Management Capability to Strategize ....... 98
4.12.3 Factor Extraction for Strategic Management Capability to Monitor .......... 98
4.12.4 Factor Extraction for Strategic Management Capability to Evaluate ......... 99
4.12.5 Factor Extraction for Performance ............................................................ 100
4.13 Total Variance Explained For the Independent and Dependent Variables ...... 101
4.13.1 Total Variance Explained for Strategic Management Capability to Envision
.............................................................................................................................. 101
4.13.2 Total variance explained for Strategic management capability to strategize
.............................................................................................................................. 102
xii
4.13.3 Total variance explained for Strategic Management Capability to Monitor
.............................................................................................................................. 102
4.13.4 Total Variance explained for Strategic Management Capability to Evaluate
.............................................................................................................................. 103
4.13.5 Total Variance explained for Performance ............................................... 104
4.14 Inferential Analysis and Hypotheses testing .................................................... 104
4.14.1 Pearson Correlation Results ...................................................................... 104
4.14.2 Overall Correlation Results ....................................................................... 105
4.14.3 Regression Results .................................................................................... 106
4.14.4 Regression Analysis of the Relationship between Strategic Management
Capability to Envision and Performance of Commercial Banks ......................... 107
4.14.5 Regression analysis of the relationship between strategic management
capability to strategize and performance of commercial banks ........................... 108
4.14.6 Regression Analysis of the Relationship between Strategic Management
Capability to Monitor and Performance of Commercial Banks........................... 108
4.14.7 Regression Analysis of the Relationship between Strategic Management
Capability to Evaluate and Performance of Commercial Banks .......................... 109
4.15 Hypotheses Testing ......................................................................................... 110
4.16 Optimal Model Summary ................................................................................. 112
xiii
CHAPTER FIVE .................................................................................................... 114
SUMMARY, CONCLUSION AND RECOMMENDATIONS .......................... 114
5.1 Introduction ........................................................................................................ 114
5.2 Summary of the Study ........................................................................................ 114
5.2.1 Strategic Management Capability to Envision ............................................ 114
5.2.2 Strategic Management Capability to Strategize .......................................... 115
5.2.3 Strategic Management Capability to Monitor ............................................. 116
5.2.4 Strategic Management Capability to Evaluate ............................................ 117
5.3 Conclusions ........................................................................................................ 117
5.4 Recommendations .............................................................................................. 118
5.4.1 Managerial Policy ....................................................................................... 118
5.4.2 Market Adaptation ...................................................................................... 119
5.5 Areas for Further Research ................................................................................ 119
REFERENCES ....................................................................................................... 120
APPENDICES ........................................................................................................ 131
xiv
LIST OF TABLES
Table 3.1: Target Population ..................................................................................... 41
Table 3.2: Sample size distribution table .................................................................. 43
Table 3.3: Measurement of variables ........................................................................ 48
Table 3.4: Operationalization of Variables ............................................................... 49
Table 3.5: Statistical Tests of Hypothesis ................................................................. 52
Table 4.1: Response Rate .......................................................................................... 54
Table 4.2: Reliability Test ......................................................................................... 55
Table 4.3: Discriminant Validity ............................................................................... 55
Table 4.4: Gender of Respondents ............................................................................ 56
Table 4.5: Level of Education ................................................................................... 57
Table 4.6: Designation of Respondents..................................................................... 57
Table 4.7: Work Experience...................................................................................... 58
Table 4.8: Normality Test ......................................................................................... 59
Table 4.9: Multicollinearity Test ............................................................................... 60
Table 4.10: Heteroscedasticity Test .......................................................................... 61
Table 4.11: Autocorrelation test ................................................................................ 61
Table 4.12: Performance Indicators .......................................................................... 62
Table 4.13: Implementation of Growth Strategies .................................................... 63
Table 4.14: Growth Performance .............................................................................. 64
Table 4.15: Rating Performance................................................................................ 66
Table 4.16: Strategic Visions .................................................................................... 67
Table 4.17: Performance Goals ................................................................................. 68
Table 4.18: Measurement of Vision Statement ......................................................... 69
xv
Table 4.19: Relevant benchmark schemes ................................................................ 70
Table 4.20: Common Benchmarks ............................................................................ 72
Table 4.21: Instruments for Decision Making .......................................................... 73
Table 4.22: Departmental Targets ............................................................................. 74
Table 4.23: Stakeholders Involvement ...................................................................... 76
Table 4.24: Strategic Management Capabilities to Strategize .................................. 78
Table 4.25: Effectiveness of Strategies ..................................................................... 79
Table 4.26: Presence of Strategic Partners ................................................................ 80
Table 4.27: Value of strategic networks.................................................................... 82
Table 4.28: Value of strategies .................................................................................. 83
Table 4.29: Frequency of Reviews ............................................................................ 84
Table 4.31: Presence of SWOT analysis ................................................................... 86
Table 4.32: Importance of SWOT Analysis .............................................................. 87
Table 4.33: Strategies for Future Performance ......................................................... 88
Table 4.34: Use of Investment Performance Reviews .............................................. 89
Table 4.35: Importance of Evaluation Process.......................................................... 90
Table 4.36: Evaluating Achievement ........................................................................ 91
Table 4.37: Evaluation of Performance..................................................................... 92
Table 4.38: Capability to evaluate............................................................................. 93
Table 4.39: Participation in Strategy Evaluation ...................................................... 94
Table 4.40: Evaluation of Return on Investment ...................................................... 95
Table 4.41: Strategies for Future Performance ......................................................... 96
Table 4.42: Factor Extraction of Capability to Envision .......................................... 97
Table 4.43: Factor Extraction for Strategic Management Capability to Strategize .. 98
xvi
Table 4.44: Factor Extraction for Strategic management Capability to Monitor ..... 99
Table 4.45: Factor Extraction Strategic Management Capability to Evaluate ........ 100
Table 4.46: Factor Extraction for Performance ....................................................... 100
Table 4.47: Total Variance Explained for Strategic Management Capability to
Envision .............................................................................................. 101
Table 4.48: Total variance explained for Strategic management capability to
strategize ............................................................................................. 102
Table 4.49: Total Variance explained for Strategic Management Capability to
Monitor ............................................................................................... 103
Table 4.50: Total Variance explained for Management to Evaluate....................... 103
Table 4.51: Total Variance explained for Performance .......................................... 104
Table 4.52: Correlation Matrix of Variables ........................................................... 105
Table 4.53: Model Summary ................................................................................... 106
Table 4.54: ANOVA .............................................................................................. 107
Table 4.55: Regression analysis for capability to envision ..................................... 107
Table 4.56: Regression Analysis for Capability to Strategize ............................... 108
Table 4.57: Regression Analysis for Capability to Monitor ................................... 109
Table 4.58: Regression Analysis for Capability to Evaluate .................................. 109
Table 4.59: Regression Coefficient ......................................................................... 113

xvii
LIST OF FIGURES
Figure 2.1: Conceptual framework ........................................................................... 15

xviii
LIST OF APPENDICES
Appendix 1: Introductory Letter ............................................................................. 131
Appendix 2: Questionnaire ..................................................................................... 132
Appendix 3: List of Commercial Banks in Kenya .................................................. 150
Appendix 4: NACOSTI Permit ............................................................................... 165
xix
LIST OF ABBREVIATION AND ACRONYMS
AVE Average Variance Extracted
CBK Central Bank of Kenya
CBs: Commercial Banks
DV Dependent Variable
EAC: East African Community
IMF: International Monetary Fund
IV Independent Variable
KCB: Kenya Commercial Bank
MBV: Market Based View
NBK National Bank of Kenya
NIM: Net Interest Margin
RBV: Resource Based View
ROA: Return on Asset
ROE: Return on Equity
SAPs Structural Adjustment Programmes
SMEs: Small and Medium Enterprises
WB World Bank
xx
DEFINITION OF TERMS
Capability to Envision: A roadmap that guides what needs to be accomplished
for achieving sustainable, quality performance
(Kavale, 2014).
Capability to Evaluate: This is an attempt to appraise the short-term and long-
term health of a business (Rugman & Verbeke, 2008).
Capability to Monitor: The practice of ensuring that business strategies meet
predetermined goals and objectives (Lipsey, 2010).
Capability to Strategize: It is the choice of the tactics and techniques by the firm
that assist in managing performance (Hill & Jones,
2009).
Management Capability: The ability of an organization‟s management team to
realize the stated objectives (Pearce & Robinson,
2007).
Organizational
performance:
Is a critical indicator of the extent to which
organizational goals have been met (Abu-jarad, Yusof,
& Nikbin, 2010).
Performance: Level of work or activity of a firm over a specific
period of time (Murerwa, 2015).
Strategic Capability: On-going process of ensuring a firm is continually able
to plan and actualize its performance (Lwova, 2013).
Strategic Management
Capability:
Knowhow to realize the achievement in the
formulation and implementation and achievement of
an organization‟s objectives (Pearce & Robinson,
2007).
Strategy: Policy direction that establishes the goals of a
company, the methods of meeting them and the level
resource allocation necessary for their
realization(Nickols, 2012)
xxi
ABSTRACT
The performance of commercial banks in the past decade has attracted substantial
interest among development economists and academicians. This is because of the
pivoted role commercial banks play in a country‟s growth and development .The
purpose of the study was to investigate the influence of strategic management
capabilities on the on performance of commercial banks in Kenya. The specific
objectives of the study were To establish the influence of strategic management
capability to envision on performance of commercial banks in Kenya; To examine
the influence of strategic management capability to strategize on performance of
commercial banks in Kenya; To evaluate the influence of strategic management
capability to monitor on performance of commercial banks in Kenya; and to
determine the influence of strategic management capability to evaluate on
performance of commercial banks in Kenya and employed a descriptive cross
sectional design. The total target population was 5432 employees in the head offices
that is middle and senior level managers from 42 commercial banks in Kenya. A total
of 358 respondents were used as the sample size for the study. The sample size was
arrived at by use of random and stratified random sampling techniques. The data
collected was then analyzed by both descriptive and inferential statistical tools.
Being that the current study was dealing with the relationship study, the study
therefore used regression model as a tool of analysis and the results generated were
presented in form of tables. The results of this study is to benefit policy makers,
managers, , researchers, consultants, scholars and trainers on the performance of
commercial banks. The study found out that appropriate application of each of the
four strategic management capabilities positively and significantly influence the
performance of commercial banks in Kenya. Of the four strategic management
capabilities, it was established that strategic management capability to evaluate has a
strong positive relationship with the performance of commercial banks. The findings
indicated that the evaluation processes is very important in the bank performances. It
was also apparent that the various banks use different strategies in the evaluation of
the level of achievement of the set targets. In addition, it was clear that, evaluation of
performance assisted in attainment of set goals with most anks indicating that their
bank usually conducted evaluation surveys to ascertain achievement of set goals. The
key aspects of bank‟s capability to evaluate were response to market changes and
dynamics, availability of corrective measures to address failures and communicating
assessment results to stakeholders. The study found out that management capabilities
to envision as a strategy allow for critical assessment of strategic planning. The study
determined that most commercial banks have monitoring strategies to enable them
seize the strategic initiatives and maintain a competitive edge in the market. The
study concluded that effective strategic management capabilities have direct
influence on the performance of commercial banks. The study recommended that
commercial banks should continuously engage in creating visions and missions
statements that spell their strategic focus in the future. The study recommends that
commercial banks should plan on effective performance strategies to evaluate the
achievement of performance targets. From the findings, the study concludes that
appropriate application of strategic management capabilities and accurate response to
market dynamics enhances the performance of commercial banks in Kenya.
1
CHAPTER ONE
INTRODUCTION
1.1 Background of the Study
A number of changes have taken place in the global economy over the past few
years. These changes have caused several challenges to the banking sector and
triggered off a flurry of activities aimed at increasing performance. The main aim of
commercial banks is to register better performance through sustained profitability
and growth (Pearce & Robinson, 2011). However, attempts to realize such successes,
are often affected by multiple operating market conditions such as the level of
competition, stakeholders management, political landscape, business legal regime,
the cost of doing business, new innovative products, internal organizational structure,
emerging technologies, and effects of globalization (Kotler & Armstrong, 2013).
A number of scholars such as Armstrong (2010); Mondy (2009), and Pearce and
Robinson (2011), argue that businesses that create competitive advantage usually
experience higher profitability and are more successful. However, not all firms
would make similar successes in individual markets. As a result, commercial banks
must adopt strategies to enable them keep afloat and attain their desired goals of
growth and development (Kotler & Armstrong, 2013).
The past two decades have witnessed increased interest by policy makers and the
Breton Wood Institutions on the performance of commercial banks. It is their
contention that a vibrant banking sector is the main driver of national and global
economic growth and development (World Bank, 2013b). The commercial banks
therefore should be managed in such a way as to continuously register better
performance.
The commercial banking sector is expected to contribute greatly in mobilizing and
allocating vital funding through savings to support trade and project implementation.
Savings is a means towards greater capital accumulation, provision of credit and
investment by the private sector. Lipsey (2009) supported by Allen and Carletti
2
(2010) argued that, commercial banks channel substantial savings into productive
activities and provide other services that include portfolio investments and risk
sharing endeavours that other financial intermediaries cannot provide. The banks also
engage in asset development for their customers and help revitalize local economies
by ensuring prudent investment by the citizenry.
Whereas it is possible for commercial banks to register growth and better
performance, this can only be achieved when market factors and other variables are
favourable. Such market factors may include political stability and readily available
skilled workforce. Allen and Carletti (2010) and Jones (2010) have identified a
number of factors contributing largely to the performance of commercial banks such
as the characteristics and type of stakeholders and their management. Since most of
the countries in the world have adapted free economies, a number of commercial
banks tend to enter into foreign markets. This has increased competition levels
among banks. Consequently, commercial banks must employ strategic management
capabilities to compete better if they are to make profits (Onuonga, 2014).
Commercial banks globally have registered some remarkable development in the
past five years. This is because of the relatively stable market factors and favourable
global political dispensations. According to World Bank (2013b), there were over
10,000 operational commercial banks spread across the globe by December 2012.
Out of these, 60% were located in developing countries which account for 80% of
the total world population. Africa accounted for about 12% of this total, Asian
country having 70%, and Latin America accounted for 17%.
1.1.1 Strategic Management Capabilities
Strategic management as a practice originated in the 1950‟s and 60‟s with significant
contributors being Chandler, Ansoff, Porter and Drucker (Freeman, 2010). Strategic
management practice is the process of examining both present and future
environments, formulating the organizations objectives, implementing and
controlling decisions focused on achieving these objectives in the present and future
environments. Strategic management is involved in deploying a firm‟s internal
3
strengths and weakness to take advantage of its external opportunities and minimize
its external threats/problems (Adeleke, Ogundele & Oyenuga, 2008).
Thompson and Strickland (2003) defined strategic management practice as the
process whereby managers establish an organization‟s long-term direction, set
specific performance objectives, develop strategies to achieve these objectives in the
light of all the relevant internal and external circumstances, and undertake to execute
the chosen action plans. According to Drucker (1974), the prime task of strategic
management is thinking through the overall mission of a business. This leads to
setting of objectives development of strategy and making of today‟s decision for
tomorrow‟s result. This should be done by balancing the present objectives and needs
against those of the future in the light of available resource (both present and future)
of men and materials.
Thompson and Strickland (2003) identified five major tasks of strategic management
capabilities that include developing a strategic vision and business mission, setting
objectives, crafting a strategy to achieve the objectives, implementing and executing
the strategy, evaluating performance. Ansoff (1979) made some of the earlier
contributions to the concept of strategic capability in terms of general management
capability and competence, logistical competence, strategic capacity and discussed
their dynamics.
While Ansoff‟s work broke new ground on the subject, certain questions still remain
unanswered. For example, the distinction between individual competence and
organizational competence is blurred, the transformation process from individual
competence to organizational competence is not explained, and further development
of the concepts was needed
1.1.2 Management Capabilities of Banking Industry in Kenya
The banking industry in Kenya is governed by the Companies Act, the Banking Act,
the Central Bank of Kenya Act and the various prudential guidelines issued by the
Central Bank of Kenya (CBK, 2013). The banking sector was liberalized in 1995 and
exchange controls lifted. The CBK, which falls under the Minister for Finance
4
docket, is responsible for formulating and implementing monetary policy and
fostering the liquidity, solvency and proper functioning of the financial system (Price
Water Coopers, 2012).
The banking sector in Kenya can be described as vibrant and growing. It compares
favourably with other developing economies in terms of contribution to economic
growth. By December 2015, Kenya had one Central Bank as a regulatory authority,
44 Commercial banking Institutions, seven Representative Offices of Foreign Banks,
nine Microfinance Banks, two Credit Reference Bureaus and 101 Forex Bureaus
(CBK, 2013). Based on their size (in terms of assets), of the 44 banking institutions,
six are classified as top commercial banks. These include Kenya Commercial Bank
Limited, Equity Bank Limited, Barclays Bank (K) Limited, Standard Chartered (K)
Limited, Cooperative Bank of Kenya and CFC Stanbic Bank (K) Limited (CBK,
2013).
Over the past few years, the banking sector in Kenya has undergone several
developments including interest deregulation, liberalized lending rates and improved
financial laws. Besides, the sector has witnessed steady influx of foreign owned
banks into the country. Equally, major world money transfer giants such as Western
Union, a host of international foreign exchange bureaus, and Islamic Hawalas have
found their way into the country. This trend has led to high competition. Through
deregulation, barriers to competition have been removed resulting to new entries
with more appealing concepts (Kotler & Armstrong, 2013).
The element of competition has brought about new innovation among commercial
banks in Kenya. Banks are thus engaging in measures to edge-out others. For
instance, CFC Bank decided to merge with Stanbic Bank so as to reduce stiff
competition and capture a wide market share (CBK, 2010). The CFC-Stanbic Bank
thereafter came up with gender based products which triggered off a flurry of
equivalent measures by other banks. Further, a number of banks were converted into
a one-stop shop, for example, the Equity Bank has acquired a stock broking license,
operates insurance, mobile money transfers, and electronic money transfer services
for its clients.
5
Globalization processes has encouraged marketers in the banking sector to take a
fresh look at the ways in which they relate with the broader world around them.
Local banks are thus challenged by skilful international marketers and products.
Commercial banks must therefore take a global look of the industry, their
competitors, and opportunities. Most local banks in Kenya, faced with this reality are
locating into global market and importing practices that appeal to global customers
(Kotler & Armstrong, 2013). For instance, the Kenya Commercial Bank (KCB)
expanded into Rwanda, Britain, South Sudan, Tanzania, Uganda, and South Africa,
while Equity bank has branches in South Sudan, Uganda, and Rwanda. This has led
customers also to demand value for their money. Commercial banks are currently
engaged in different management strategies to ensure they achieve better
performance in both their financial and non- financial development goals.
1.2 Statement of the Problem
Strategic management can assist in deploying an organization‟s internal strengths
and weakness to take advantage of its external opportunities and minimize its
external threats/problems (Tatar & Moradi, 2015). According to Melchorita (2013),
strategic management addresses the reason why some organizations succeed while
others fail. Strategic management capabilities can greatly enhance the performance
of financial organizations like commercial banks.
The Kenyan banking industry is currently facing stiff competition from new entrants
like mobile phone companies and international banks (CBK, 2015). In this regard,
incorporation of strategic management capabilities will go a long way in reducing
this competition thus enhancing performance. One way commercial banks in Kenya
have attempted to wither competition is the adoption of market expansions strategies
to realize larger customer base like opening new branches and operating beyond
Kenyan borders (Kungu, Desta, & Ngui, 2014).
In his study on the influence of firm activities on performance of commercial bank in
Kenya, Mwangi (2016) indicated a positive significant relationship between bank
activities and performance of the commercial banks in Kenya. In spite of these
performance related strategies, commercial banks in Kenya are still facing challenges
6
due to the dynamism of the environment in which they operate. Some of the
challenges include declining interest margins, global financial crisis, increasing
levels of inflation, exchange rate volatility, increased competition from banks and
non-banks, technological changes, product improvement, and new regulations
(Watuka, 2014).
Whereas, studies by have identified strategic management capabilities as critical
factors contributing largely to the performance of commercial banks in developed
countries, the same has not been fully replicated in Kenya. Failure to seek
management strategies to guarantee performance and survival of commercial banks
will lead to decline in profits and flight of critical stakeholders.
A number of studies which have been done including: Allen and Carletti (2010);
Jones (2010); Ozturk and Coskun (2014); Mulonzi, Namusonge and Mugambi
(2017); Kivuja (2011); Lwova (2013), and Mbondo (2011) do not clearly explain the
relationship between strategic management capabilities and performance of
commercial banks. It is this gap which this study sought to bridge by investigating
how strategic management capabilities adopted by commercial banks in Kenya have
influence on their performance.
1.3 Objectives of the Study
1.3.1 General objective
The general objective was to establish the influence of strategic management
capabilities on the performance of commercial banks in Kenya.
1.3.2 Specific objectives
The specific objectives of the study were:
1. To establish the influence of strategic management capability to envision on
performance of commercial banks in Kenya.
2. To examine the influence of strategic management capability to strategize on
performance of commercial banks in Kenya.
7
3. To evaluate the influence of strategic management capability to monitor on
performance of commercial banks in Kenya.
4. To determine the influence of strategic management capability to evaluate on
performance of commercial banks in Kenya.
1.4 Research Questions
The research questions of the study were:
1. To what extent does strategic management capability to envision influence
performance of commercial banks in Kenya?
2. To what extent does strategic management capability to strategize influence
performance of commercial banks in Kenya?
3. To what level does strategic management capability to monitor influence
performance of commercial banks in Kenya?
4. To what extent does strategic management capability to evaluate influence
performance of commercial banks in Kenya?
1.5 Hypothesis of the Study
1. The following null hypothesis guided the study:
2. H01: Strategic management capability to envision has no significant influence
on performance of commercial banks in Kenya.
3. H02: Strategic management capability to strategize has no significant
influence on performance of commercial banks in Kenya.
4. H03: Strategic management capability to monitor has no significant influence
on performance of commercial banks in Kenya.
5. H04: Strategic management capability to evaluate has no significant influence
on performance of commercial banks in Kenya.
1.6 Significance of the Study
The investigation to establish the underlying factors responsible for commercial
banks performance in Kenya is paramount, given the recent reforms of the
commercial banking sector. The study provided insight for bank owners and policy
8
makers, on factors that determine bank performance and efficient utilization of
resources, for sustainable competitiveness.
The study will enable commercial banks in Kenya to review the way they have been
conducting business. Understanding factors that have great impact on bank
performance is essential for survival and also useful in sustaining profitability in the
dynamic and competitive business. The study findings presented a basis for the
regulatory authorities to find a solution to persistent poor performance of domestic
commercial banks. The appropriate course of action has to be taken to strengthen the
commercial banking sector in Kenya.
The study contributes to existing knowledge on factors responsible for bank
performance and serves as a basis to provide measures and policy formulation for
stakeholders and to embark upon bank specific factors in order to enhance the quality
of bank services in Kenya. Researchers and academicians in the field of strategic
management will find this study a useful guide for carrying out further studies in the
area. The study acts as a forum of informing current scholars on the important role
strategic management capabilities play in enhancing performance of commercial
banks in Kenya. The study creates a basis of continuity for future scholars on the
field of strategic management capabilities and performance of commercial banks in
Kenya and beyond.
1.7 Scope of the Study
The study was based in Nairobi County and examined the 44 commercial banks
operating in Nairobi. The headquarters of these banks are located in Nairobi and
formed the target of this study. Nearly all banks operating in Nairobi have branches
across the whole country. For the study to arrive at viable and accurate conclusions,
it covered the period between 2012 and 2016.
Although there are many strategic management capabilities, this study specifically
explored four strategic management capabilities which include strategic management
capabilities to envision, strategize, monitor and evaluate the performance of
commercial banks in Kenya. Capability to envision in this study is taken as a guiding
9
and future principle in commercial banks that assists in achievement of sustainable
and quality performance. Capability to evaluate refers to ability to evaluate or assess
both the short and long term health of commercial banks.
Capability to monitor in this study refers to the practice of guaranteeing there is
achievement of predetermined goals and objectives in commercial banks. Capability
to strategize on the other hand refers to the techniques of enhancing management
performance in commercial banks. Four theories formed the foundation of the study,
they include the generic strategy theory, dynamic capability theory, competitive
advantage theory and resource based theory.
1.8 Limitations
A number of limitations were encountered during the study, it was quite hard to get
all historical information on aspects of performance from a number of banks that did
not keep proper documentations. The researcher however managed to extract
performance data from the Central Bank of Kenya and the Kenya Bureau of Statistics
libraries where substantial historical information on the activities of commercial
banks are documented and stored.
The study was also faced with cases of none or sometimes inaccurate responses.
Where such data was forthcoming, they were majorly in hard copies which became
very difficult to retrieve. The researcher made arrangement to engage additional
research assistants who were able to get the required information in time.
Arrangements were also made to approach alternative institutions and use key
informants to validate the information gathered.
In addition to the above, certain banks appeared to be operating in secrecy as to the
returns on their performance and were reluctant to divulge required information. This
limitation was however resolved by reassuring the managers on the basis of the
research and conduct personal interviews which proved helpful.
10
CHAPTER TWO
LITERATURE REVIEW
2.1 Introduction
This chapter presents the conceptual framework and analyses the theoretical
foundation upon which the influence of strategic management capabilities on the
performance of commercial banks is based. It also analyses the theoretical and
empirical literature to explore the contextual foundations, scholarly debates and gaps
on topical aspects of strategic management capabilities and how they might influence
performance of commercial banks. .
2.2 Theoretical Framework
The factors that determine the level of performance of commercial banks can best be
understood through key theories in strategic management within organizations.
These theories include the generic strategy theory dynamic capability theory and
resource based theory.
2.2.1 Resource Based Theory
The Resource Based Theory/View (RBT) was advanced by organizational
structuralisms (Freeman, 2010). He argued that a firm‟s competitive advantage is
gained out of firm-specific resources that are valuable, rare, imperfectly imitable, and
non-substitutable (Barney, 1991). A firm‟s resources may include various forms such
as machinery and equipment, financial capital, human capital, management team,
management systems, technology and knowledge, and intangible assets like
reputation and brand. It is the availability of these resources that provides a firm with
advantages for growth and development.
Resources should be indispensable to generate differentially greater value, leading to
better performance for the firm (Kotler & Armstrong, 2013). Whether a resource is
critical or not is determined by its superior efficiency that can provide the customers
with higher value with a given cost or can provide them with the same level of value
11
with a lower cost. The RBT also focuses on the resources controlled by a firm and to
centre on intangible resources such as capabilities, knowledge, and reputations
(Peteraf, 1993). RBT explains performance disparity across firms in a factor-based,
efficiency-oriented, and firm-level approach (Peteraf & Bergen, 2003). The theory is
based on the idea that the effective and efficient application of all useful resources
that the company can gather helps determines its competitive advantage (Dixon,
2011).
In this study, RBT sees a commercial bank as a collection of assets, or capabilities.
In the modern economy, most of these assets and management capabilities are
intangible. The success of a commercial bank is based on those of their capabilities
that are distinctive. Commercial banks with distinctive strategic management
capabilities have attributes which others cannot replicate, even after they realize the
benefit they offer to the company which originally possesses them. The intangible
resources such as strategic management capabilities held by a commercial bank play
a major role in enhancing its performance levels. Capability to envision is a resource
that assists in achievement of sustainable and quality performance by a commercial
bank through a well stated mission and vision. Capability to evaluate is a resource
that assesses both the short and long term health of commercial banks. Capability to
monitor acts as a resource that guarantees the achievement of predetermined goals
and objectives in commercial banks. Capability to strategize is a resource that
enhances management performance in commercial banks.
2.2.2 Agency Theory
The Agency theory was first mentioned by Jensen and Meckling in their 1972 article
on the „Theory of the Firm: Managerial Behaviour, Agency Costs and Ownership
Structure‟ (Lan et al., 2010, Daily et al., 2003). In the article, the theory is
established as a simple model which explains a relationship of one or more persons
(the principal) who engages another person (the agent) to perform some service on
their behalf including delegating certain decision making authority (Mitnick, 2006).
According to Alchian and Demsetz (1972), Jensen and Meckling (1972), and Kaplan
(1984), contracts are considered as an appropriate means for resource allocation
12
which in essence reveals the scope of the firm's activities. The strategic management
processes and activities that affect performance measure are explained by adapting
the "agency theory" framework.
Laffort and Marti (2016) argue that the agency theory of strategic Management is so
crucial since the action chosen by a particular individual (the agent) affects not only
one, but several other parties (the principals). In addition, the Agency Theory
suggests that there should be proper synergy between the management and its
stakeholders in order to work towards a common goal which is basically a question
of performance.
Of serious interest is Jensen and Meckling (1996) explanation of the agency theory
as a framework for strategic management in which they see the theory on
management issues such as accountability, responsibility through monitoring and
correction.
It is on this premise that I observe that the agency theory should be embraced in
strategy formulation where the principals should always co-operate with the agents in
formulating the organization‟s mission, vision and the objectives. All that is done at
the strategy formulation to strategy evaluation and control should carry the hopes,
aspirations and the values of the principals, the agents and all other stakeholders of
the firm.
The agency theory has been criticised as only showing a relationship between owners
and managers and it provides deception and misappropriation of funds by the
(Laffont, 2002). In addition, it is difficult for management of organization to exercise
substantial control or monitoring of the activities of employees (agents) as the theory
suggests.
Besides, the agency theory has been criticised Buchaman (2014) who argues that the
agents embraced by the agency theory in strategic management tend to make those
decision which best fit them without necessarily looking at the overall goal of the
firm. This is why the agency theory inherently suggests appreciate the elements of
monitoring and control by the management.
13
On the basis of our study especially on the variable of management capability to
monitor, the agency theory is useful in the formulation of the corporate strategy by
defining the parameters of the organization problem which is then passed on to the
employees to implement (James & Raposo, 2011).
In conclusion, the Agency theory is suitable in explaining the influence of strategic
management capabilities on the performance of commercial banks especially of the
options of monitoring and evaluation of programmes. Thus, the Agency Theory is
important in understanding the overall process of strategic management capabilities
as an essential element is enhancing organizational performance.
2.2.3 Survival Based Theory
The survival theory was initially introduced in the field of economics by Schumpeter
(1934), Alchian (1950), Harrod (1939) and Marshall (1949). According to Herbert
Spencer, the theory emphasise that by following the principle of nature, only the best
and the fittest of competitors will win. Those firms which survived and prospered
will adapt to their environment by engaging in ruthless business rivalry and
unprincipled strategies (Miesing & Preble, 2005).
In organization terms, the Survival Theory entails fundamental transformation of
drastic, radical, sporadic, brief and all encompassing change of organization‟s routine
activities covering most of organization‟s processing. Subsequently, those firms
which will survive must have substantial strategic management capabilities to
strategies and out do their rivals. (Murmann et al., 2003).
The survival-based view in strategic management emphasized on the assumptions
that in order to survive, organizations has to deploy strategies that should be focused
on running very efficient operations and can respond rapidly to the changing of
competitive environment (Khairuddin, 2005), since the one that survive is the one
that is the fittest and most able to adapt to the environment. Whereas this theory has
could explain the need for firms to engage in competition, it lacks the scope to fully
benchmark our study on the influence of strategic management capabilities on the
14
performance of banks. It does not explain the relationship between elements of
competition and overall performance goals.
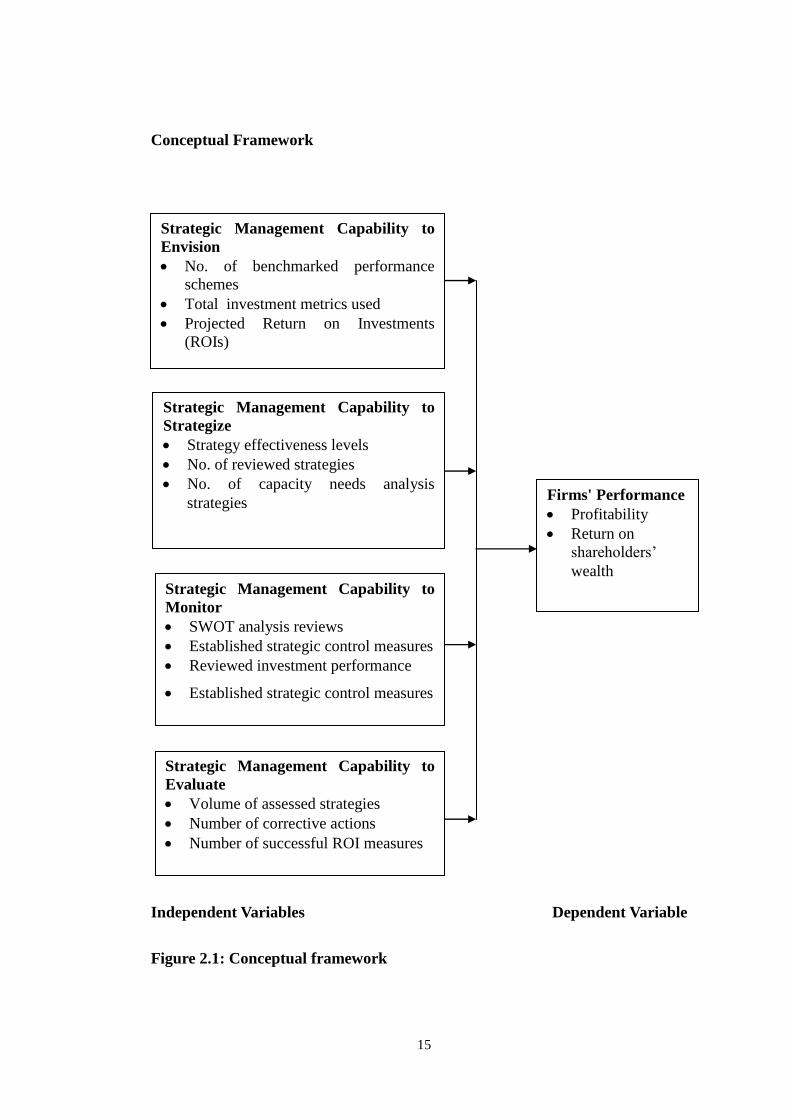
2.3 Conceptual Framework
The conceptual framework is an illustration of factors that influence the performance
of commercial banks in any country. These factors include strategic management
capabilities to: envision, strategize, monitor and evaluate. Effective application of
these factors will positively influence the level of performance within the
commercial banks. Based on the generic strategy theory, dynamic capability theory,
resource based theory and competitive advantage theory, the conceptual framework
of this study is illustrated in figure 2.1
15
Conceptual Framework
Independent Variables Dependent Variable
Figure 2.1: Conceptual framework
Strategic Management Capability to
Envision
No. of benchmarked performance
schemes
Total investment metrics used
Projected Return on Investments
(ROIs)
Strategic Management Capability to
Strategize
Strategy effectiveness levels
No. of reviewed strategies
No. of capacity needs analysis
strategies
Strategic Management Capability to
Evaluate
Volume of assessed strategies
Number of corrective actions
Number of successful ROI measures
Firms' Performance
Profitability
Return on
shareholders‟
wealth Strategic Management Capability to
Monitor
SWOT analysis reviews
Established strategic control measures
Reviewed investment performance
Established strategic control measures
Reviewed investment performance
16
2.3.1 Strategic Management Capabilities to Envision
Lodato (2014) explains that a company's vision is a transcendent ideal that represents
shared values, and which is ideological in nature. He went further to suggest that
vision results in the internalization of organizational values and goals, which
encourages individuals to adopt behaviours that add value towards the attainment of
desired performance goals.
Visioning is an important leadership capability which most organizations have
embraced as a management tool to spur their performance. Lebens and Euske (2006)
argued that the essential components of organizational performance are dependent on
clear vision statement and how the management is able to charismatically involve all
stakeholders in its application. Similar sentiments are expressed by Weber (1968)
who pointed out that organization performance is mostly influenced by a leadership
with charisma to properly articulate the vision of the organizations.
Scholes and Whittington (2008) argue that strategies in effective visioning involve
use of benchmarks and best practices from other organizations within the industry
which have recorded superlative performance. According to Jerop and Juma (2014),
benchmarks in strategic innovations encompass the use of total investment metric
and how firms will work towards their projected Return on Investment (ROIs).
While commercial banks may come up with quality products, give reasonable
interest rates and deliver banking policy that suit its clientele, positive effect of such
effort can only be realised through involvement of all stakeholders to adopt the
bank's vision statement. When clients or employees are poorly mobilized and
managed to envision, the bank performance indicators elements such as profitability,
market share, shareholders wealth and growth are likely to be depressed.
2.3.2 Strategic Management Capability to Strategize
Strategizing is a core process of strategic management which involve strategic
planning and thinking. David and David (2015) define strategic management as
the art and science of formulating, implementing and evaluating cross-
17
functional decisions that enable an organisation to achieve its objectives. This
implies that strategic management focuses on integrating management, effective
marketing, financial controls and developing information systems which are viable
and easily understood by employees and other stakeholders. Thompson et al. (2010),
argue that the act of crafting a strategy is primarily a market driven activity which
involves the identification of the desired competencies and capabilities to build a
strategy and help in achievement of competitive advantage over rival firms.
Strategic management process consists of four basic elements including
environmental scanning, strategy formulation, strategy implementation and, strategy
evaluation and control. Strategy formulation involves development of long range
plans including mission, objectives, strategies and policies (Wheelen & Hunger,
2008). A bank must therefore be aware of its environment and should put in place
strategies to address any emerging challenges or maximise on the opportunities for
better results (Cennamo et al., 2009).
Good strategies entail selection of progressive policies; periodic review and
allocation of requisite capacities available to effect individual strategy have positive
and direct influence on organizational performance (Freeman, 2010). A bank with
progressive ideas in terms of its market choice, product innovation, knowledge of
competitors and effective corporate social responsibility is likely to appeal to
majority of clients thus resulting into better performance. Commercial banks which
lack capabilities to strategise are likely to register poor performance and close down
in the long run.
2.3.3 Strategic Management Capability to Monitor
The concept of monitoring in organizational framework refers to continuous tracking
of key indicators (outputs and outcomes) throughout the implementation process of
programmes (Mondy, 2009). According to Ozturk and Coskun (2014), it involves a
regulated observation and checks on the progress or quality of programmes
implementation over a period of time. The purpose is to ensure that the strategy
being implemented is on course and meeting performance targets (Kungu et al.,
2014). The indicators in strategic management capability to monitor include regular
18
review of the strength, weakness, opportunity and threat that may face the
implementation of policies and putting in place the strategic control measures to
avert negative impact that may ensue.
Monitoring uses systematic collection of data on specific indicators to provide the
management and the main stakeholders with indications of the extent of achievement
of objectives and progress of an ongoing intervention. Effective monitoring will
directly result into better performance of organizations.
2.3.4 Strategic Management Capability to Evaluate
The term evaluation is defined as a systematic determination of the success or failure
of what was predicted or what was to be accomplished and how it was accomplished.
This includes, assessing whether deadlines were met, implementation steps and
processes are working correctly and whether the expected results were achieved.
Evaluation establishes challenges which may affect the attainment of the expected
results besides providing information on the reasons for the success. In the case of
shortcoming, the strategy that was used can be modified or reformulated (Johnson &
Scholes, 2002). When success is realised, the information obtained for such outcome
form part of the reference material for managerial decision on future performance
issues.
Evaluation is conducted by determining the volume assessed strategies, tabulation of
the corrective action taken and establishing the number of successful return on
investments made. When evaluation is done regularly, managers are provided with
opportunities to respond or intervene on the internal and external environmental
challenges that may occur during the implementation strategies. Additionally, it
allows the management to adjust to the changing business environment which
essentially is a requisite for better performance outcome.
19
2.3.5 Performance of Commercial Banks
The notion of organizational performance is very common in academic literature and
within organizational conversations. As such, people of different persuasions
understand it differently. In early 1950s, organizational performance was viewed as
the extent to which organizations systems fulfilled their set objectives (Yuchtman &
Seashore, 1967). During this period, the performance evaluation was focused on
work, people and organizational structure. The idea however changed in the 1960s
and 70s when organizations begun to explore new ways of determining their
performance.
According to Yuchtman and Seashore, (1967), performance denoted an
organization's ability to exploit its environment by accessing and using the limited
resources available. A firm would therefore claim successful performance on the
basis of maximising scarce resources to attain its objectives. Some of the measures
included underpaying workers and cutting cost on social arrangements such as
housing scheme for employees, corporate social responsibility and benevolent
support (Pearce & Robinson, 2009).
The evolution of the concept continued and in the period of 1980s and 90s a new
paradigm emerged with the realization that the identification of organizational
objectives is more complex than initially imagined. Managers began to understand
that an organization is successful if it effectively accomplishes its goals by using a
minimum of resources at its disposal. Subsequently, the organizational theories that
followed supported the idea of an organization that achieves its performance
objectives based on the constraints imposed by the limited resources (Wheelen &
Hunger, 2008). This school of thought conceived profits as the main indicator of
performance.
Today, the term organization performance is viewed as the attainment of superior
profit levels, larger market share and the level of growth registered by companies
(Lebans & Euske, 2006). This is similar to Richard (2009) contention that
organizational performance is a measure of the actual output or results of an
organization as measured against its goals and objectives. The goals include financial
20
performance (profits, return on assets, return on investment); product market
performance (sales, market share), and return on shareholders' wealth.
The performance of commercial banks, as in any other business organization, is the
extent to which the bank is able to meet its corporate objectives. These objectives are
both financial and non-financial. Financial performance depends on the level and
sustainability of profits that the bank is able to make as a firm. A firm‟s profitability
is usually a function of the size of the market the company controls, the efficiency
and effectiveness of cost reduction strategies being employed, and price of the
products offered (Jones, 2010). Organizations mainly aspire to maximise on
shareholders wealth, have stable share capital, and greatly expand into new markets.
The non-financial performance goals include delivering sound environmental
management programmes, having good corporate reputation, implementing popular
corporate social responsibility programmes, and maintaining a loyal and highly
skilled workforce. The 07attainment of these goals or its failure depends on the
prevailing market and socio-economic circumstances upon which the banks operate
(CBK, 2013).
The success of commercial banks is a measure of the level of profits that they earn
and how sustainable that profit is. Other than profits, performance of commercial
banks is also a measure of the cash available to meet operational costs, product
quality and diversification, level of market share, corporate identity, growth, and the
amount of capital base (World Bank, 2013). While commercial banks may come up
with quality products, give reasonable interest rates, and deliver banking policy that
suit its clientele, positive effects of such effort can only be realized with better
management of all stakeholders of the bank. When clients or employees are poorly
mobilized and managed, commercial banks are likely to make losses in their annual
earnings (Nicklos, 2012).
Banks which have better strategies in the management of stakeholders can achieve
immense growth. Successful performance in commercial banks is also dependent on
the type of banking policies in operation. A bank with progressive ideas in terms of
its market choice, product innovation, and corporate social responsibility is likely to
21
be appealing to many customers, thus resulting into higher sales and subsequently
better performance (Allen & Carletti, 2010). To clearly understand what constitute
the performance of commercial banks, understanding the meaning of organizational
performance is paramount. The concept of organizational performance is very
common in academic literature but its definition presents a great challenge to most
scholars. This is because of its complexities, the so many meanings that it attracts
and marked differences in its definition over time (Albrecht, 2011).
In the 1950s, performance was defined as the means through which organizations
meet their objectives (Paulo, 1957). This definition looks at performance in terms of
work, people and organization. It was interested in the amount of work each
employee does and what product is produced by the company. By 1960s through to
the 70s performance came to be seen as an organization ability to exploit its
environment which enables it to access and use limited resources it has (Seashore,
1967). The focus here was to optimize the utilization of scarce resources available to
an organization. Later, in the 1990s, organizational performance assumed a new
definition which saw it as the accomplishment of organizational goals by using
available resources in the most effective and efficient ways (Adrian, 1998). The idea
here incorporated quality and efficiency as the basis of delivering organizational
objectives.
Today however, scholars still grapples with how best to define organizational
performance. Lebans and Euske (2006) define performance results as encompassing
a set of financial and nonfinancial indicators which offer information on the degree
of achievement of objectives and results. In this view, performance focuses on the
dynamisms requiring continuous and strategic judgment and interpretation in the
functions and operation of a firm. According to Armstrong (2010), performance
refers to the actual output or results of an organization measured against its intended
outputs (goals and objectives). The position is supported by Albrecht (2011) who
points out that performance is merely the extent to which an organization achieves a
set of pre-defined targets that are unique to its mission. These target will include both
objective (numerical) and subjective (judgment) indicators.
22
From the above it can be concluded that organizational performance comprises the
ability of an organization to fulfil its mission through sound, strong governance and
persistent formulation of new strategies to achieve results (Mondy et al., 2009).
Additionally, performance depicts those operational activities which are put in place
to attain goals, monitor the progress towards these goals and make adjustment to
achieve the objectives more effectively (Richard, 2009). It can clearly be seen that
performance is a measure on the attainment of goals (success) that organizations
make. According to Pearce (2010), any output registered by an organization should
bring in benefits to the organization‟s stakeholders. As for the commercial banks,
management is expected to come up with strategies to increase output/results and
inputs/behaviour of the organization and ensue that they have clear competitive
advantage over their rivals (World Bank, 2013a). Drawing from the World Bank
position, organizational performance is exercised and attained from excellent
leadership by the executive officers.
The importance of strategic capability to evaluate has been critically evaluated
(Porter, 2008; Tatar & Moradi, 2015; Suvita & Hui, 2012). These scholars have even
stated that a strategy can neither be formulated nor adjusted to changing
circumstances without a process of strategy evaluation. However, few local scholars
have replicated similar studies especially focusing on capability to evaluate and its
application in the performance of commercial banks in Kenya.
The performance of commercial banks is looked at both in terms of financial
performance and non-financial performance. The World Bank in its annual financial
report indicated that commercial banks globally seek to increase their profit levels
and ensures higher prices for their shares capital (World Bank, 2014). Profit earnings
and its sustainability is the ultimate goal of commercial banks. As such most of their
strategies are designed and actions carried out to realize goal. Profitability is a ratio
that measures net return on assets, net return on equity and net return on interest
margin (Flamini, 2009).
23
Return on Equity (ROE) is a financial ratio that measures how much profit a
company earned compared to the total amount of shareholder equity invested or
found on the balance sheet (Khrawish, 2011). It is what the shareholders look for in
return for their investment. A bank that has a high return on its equity is likely to
generate more cash internally. ROE reflects how effectively bank management is
using shareholders‟ funds. The Return on Asset (ROA) is another major ratio that
indicates the profitability of a bank. It is a ratio of income to its total asset (Lipsey,
2010). It measures the ability of the bank management to generate income by
utilizing company assets at their disposal and shows how efficiently the resources of
the company have been used to generate the income. It is also pointed out that ROA
depicts the efficiency of the management of a company in generating net income
from all the resources available to it (Khrawish, 2011).
The Net Interest Margin (NIM) represents the difference between the interest of
income generated by banks and the amount of interest paid out to their lenders. It is
usually expressed as a percentage of what the financial institution earns on loans in a
specific time period and other assets minus the interest paid on borrowed funds
divided by the average amount of the assets on which it earned income in that time
period (CBK, 2014). Net interest margin measures the gap between the interest
income the bank receives on loans and securities and interest cost of its borrowed
funds. It reflects the cost of bank intermediation services and the efficiency of the
bank. The higher the net interest margin, the higher the bank's profit and the more
stable the bank is. Thus, it is one of the key measures of bank profitability. However,
a higher net interest margin could reflect riskier lending practices associated with
substantial loan loss provisions (Khrawish, 2011).
2.4 Empirical Literature Review
This empirical review assesses recent studies and research work by scholars on the
study aspects. The basis of this analysis is to expose gaps and concerns which exist
and might need further discourses or new approaches on various aspects of strategic
management capabilities and organizational performance.
24
2.4.1 Strategic Management Capability to Envision and Bank Performance
Mission and vision are crucial elements of strategic management. The difference
between vision and mission is in its time component; mission determines what the
company does, whereas vision shows what the company will become and do in the
future. Visions can be considered sources of energy for achievement of formulated
objectives (Porter, 2008). In order for an organization to enhance performance, the
utilization of capability to envision will ensure management‟s formulation of clear
mission and vision (Asewe, 2010). According to Nabela (2014), an organization‟s
mission is its purpose, or the reason for its existence. It states what it is providing to
society.
A well-conceived mission statement defines the fundamental, unique purpose that
sets a company apart from other firms of its types and identifies the scope of the
company‟s operation in terms of products offered and markets served. Objectives are
the end results of planned activity; they state what is to be accomplished by when
and should be quantified if possible Grant, (2005). The achievement of corporate
objectives should result in fulfilment of the corporation‟s mission. Nabela (2014)
further states that just as every product or business unit must follow a business
strategy to improve its competitive position, every corporation must decide its
orientation towards growth.
According to Kavale (2014), capability to envision serves as the framework for a
roadmap and guides every aspect of an organization by describing what needs to be
accomplished in order to continue achieving sustainable, quality growth. Capability
to envision is an essential factor in building scalable organizations that last for the
long haul and reveals how companies can stay their course, even as they grow.
Growing companies require a vision-a precise idea of their raison d‟être, strategy and
values that are both inspiring and concrete enough to guide corporate action. A
company's vision should describe a future that is more attractive than the present, and
its leaders should recognize that diverse viewpoints as debates are essential to vision
development (Johnson, Scholes & Whittington, 2008).
25
An organization‟s corporate strategy unifies the organization through the corporate
vision, which directly influences corporate growth (Thomas, Jethro, & Strickland,
2006). Capability to envision involves strategy formulation which is comprised of
developing or reviewing the organization's mission, vision, and long-term goals;
conducting internal and external assessments to identify the organization's strengths,
weaknesses, opportunities, and threats (SWOT); setting selection criteria and
selecting the strategies that will afford the organization the best strategic positioning
relative to its competitors (David, 2001).
Watuka (2014) adds that the process of strategy formulation basically involves six
main steps; first, setting organizations‟ objectives, the key component of any strategy
statement is to set the long-term objectives of the organization. Secondly, evaluating
the organizational environment by evaluating the general economic and industrial
environment in which the organization operates. Thirdly, setting quantitative targets
whereby an organization must practically fix the quantitative target values for some
of the organizational objectives. Fourthly, departments aiming to achieve the set
goals in context with the divisional plans, Which is done by the contributions made
by each department or division or product category within the organization is
identified and accordingly strategic planning is done for each sub-unit.
The fifth step comprises of Performance Analysis which includes discovering and
analyzing the gap between the planned or desired performance and lastly, Choice of
Strategy. This is the ultimate step in Strategy Formulation where the best course of
action is actually chosen after considering organizational goals, organizational
strengths, potential and limitations as well as the external opportunities (Watuka,
2014). Organizations thus scan the environment in order to understand the external
forces of change so that they may develop effective responses which secure or
improve their position in the future. They scan in order to avoid surprises, identify
threats and opportunities, gain competitive advantage and improve long –term and
short term planning (Wheelen & Hunger, 2008).
26
Ogollah (2007) investigated the strategic management practices of pharmaceutical
importers and distributors in Kenya. The study set the following singular objective,
to establish the strategic management practices being undertaken by the
pharmaceutical importers and distributors in Kenya and point out the challenges
facing this sector. The study findings showed that; most firms had a vision, a mission
statement and set objectives which were either written or implied and these governed
the day to day business operations of these firms.
There were three categories of objectives i.e. sales objectives which aimed at making
the firm to be the regional/leading distributor of pharmaceutical products, brand
objectives aimed at maintaining the quality of the product and also production of
other new products of different molecules and. those aimed at the growth of the firm
like market expansion and segmentation to other regions or countries and the
acquisition of more/new agencies (Richard, 2009). Most firms had strategies for
operation which included growth, diversification and defensive strategies. The
strategic planning process in most companies was characterized by having clearly
assigned responsibility for planning, timetables for preparation of plans formal and
informal planning processes and also the existence of a planning department in the
firm. However strategic management systems were noted to vary widely among
companies.
Whereas it is clear that many studies have been undertaken highlighting that firms
have strategies for operation which included growth, diversification and defensive
strategies (Johnson, Scholes & Whittington, 2008; Kavale, 2014; Nabela, 2014), few
have focused on strategic management capabilities. In Kenya, studies on strategic
capabilities indicating the importance of envisioning in organization performance in
varying entities are few (Ogolla, 2007: Watuka, 2014). Specifically, few studies have
been conducted in the area of strategic management capabilities and performance in
commercial banks.
27
2.4.2 Strategic Management Capability to Strategize and Bank Performance
Capability to strategize helps to exercise the choice of direction that an organization
adopts as a whole in line with the vision, mission and set objectives (Hill & Jones,
2009). It is primarily about the choice of the tactics and techniques for the firm as a
whole and managing various product lines and business units for maximum value.
Even though each product line or business unit has its own competitive or
cooperative strategy that it uses to obtain its own competitive advantage in the
marketplace, the corporation must coordinate these different business strategies so
that the corporation as a whole succeeds as a “family” (Thomas et al., 2006).
Capability to strategize answers the questions of „in which businesses should we
compete and how? And how does being in that business add to the competitive
advantage of the firm‟s portfolio, as well as the competitive advantage of the
corporation as a whole?
Capability to strategize includes decisions regarding the flow of firm resources to
and from a company‟s product lines and business units. Through a series of
coordinating activities, a company transfers skills and capabilities developed in a one
unit to other units that may need such resources. In this way, it attempts to obtain
synergies among numerous product lines and business units so that the corporate
whole is greater than the sum of its individual business unit parts. It is through
competitive techniques and tactics this is achieved (Porter, 2008; Kutllovci, Shala &
Troni, 2012).
The role of capability to strategize is to co-ordinate and directs all the resources of a
firm towards the attainment of its goals and objectives and vision. It is a statement of
strategic action. A capability to strategize states the means that will be used to
achieve long-term objectives. Examples of business strategies include; concentration
strategy, market development strategy, expansion or growth strategy, product
development strategy, innovation strategy, integration strategy, divestiture,
liquidation strategy, stability strategy and retrenchment or divestment strategy
whichever is overarching (Porter, 2008).
28
Just as every product or business unit must follow a business strategy to improve its
competitive position, every corporation must decide its orientation towards growth
by asking the following three questions: Should we expand, cut back, or continue our
operations unchanged? Should we concentrate our activities within our current
industry or should we diversify into other industries? If we want to grow and expand
nationally and/or globally, should we do so through internal development or through
external acquisitions, mergers, or strategic alliances? Firms choose expansion
strategy when their perceptions of resource availability and past financial
performance are both high (Hill & Jones, 2007).
At the core, the capability to strategize must be a clear logic of how the corporate
objectives, will be achieved. Most of the strategic choices of successful corporations
have a central economic logic that serves as the fulcrum for profit creation. Some of
the major economic reasons for choosing a particular type capability strategy are:
exploiting operational economies and financial economies of scope, uncertainty
avoidance and efficiency, possession of management skills that help create corporate
advantage, overcoming the inefficiency in factor markets and long term profit
potential of a business (Ansoff & McDonald, 2003).
According to Jerop and Juma (2014), organizations operate in two distinct
environments; internal and external. The environment under which organizations
exist is defined by a combination of market and internal factors that influence the
operation of a firm. These two environments are never static; they keep changing
depending on a variety of dynamic circumstances. The external environments
influence an organization's strategic development by creating both opportunities and
threats. The operations of a bank depend on regulation, competition laws, prevailing
political environment, the culture of the people, income per capital and amount of
disposable income, and technological advancement. The bank should be aware of
this and employ prudent strategies in managing them (CBK, 2013).
Developments within the banking sector in Kenya are strongly guided by the
medium-term objectives of the financial sector reform and development strategies
embedded in the economic development blueprint (Vision, 2030). Response
29
capability strategies are ways an organization ensures a fit into the changing
environment (Watuka, 2014). Pearce and Robinson (2011) defined response
capability strategies as the set of decisions and actions that results in the
formalization and implementation of plans designed to achieve a firm‟s objectives.
Strategic management literature suggests that a successful firm‟s strategy must be
favourably aligned with the external environment. Changing business environments
alter the way organizations fundamentally conduct business. Such adaptations made
to suit the firm may be referred to as response capability strategies. Pearce and
Robinson (2009) argued that firms adapt to economic environmental conditions by
implementing business strategies cantered on investment, innovation, and market
diversification. Such strategies lead to higher levels of business performance.
Local scholars like Jerop and Juma (2014), have identified the importance of
strategies in organizations operations in two distinct environments; internal and
external. They add that operations of a bank depend on regulation, competition laws,
prevailing political environment, the culture of the people, income per capital and
amount of disposable income, and technological advancement. However, they have
not specifically underlined the importance of capability to strategize and its overall
importance in performance of banks in Kenya.
2.4.3 Strategic Management Capability to Monitor and Performance of
Commercial Banks
Firms are unable to successfully implement their chosen strategies unless they
exercise effective capability to monitor performance strategies. This consists of two
types. First, informational control requires that the organization continually monitor
and scan the environment and respond effectively to threats and opportunities.
Second, behavioural control involves the proper balance of rewards and incentives,
culture, and boundaries (or constraints) (Flamini, 2009). Organizations that have
strong and effective cultures and reward systems typically require fewer rules and
regulations because employees tend to understand and internalize the “boundaries”
of acceptable behaviour. Two forms of control are particularly relevant. These are
strategic controls and financial controls (Thagana, 2013).
30
Financial controls are congruent with the distinctive competencies of most
conservative firms. Financial controls are clear and unambiguous, which introduces a
high degree of discipline into the control process (Johnson et al., 2008). Financial
controls also provide an opportunity for the parties involved to agree on objective
performance standards well in advance of any performance evaluation. These factors
may be particularly beneficial to conservative firms, which are firms that do not have
as salient a need to encourage creativity and innovation (Grant, 2005). Financial
controls base performance on objective financial criteria such as net income, return
on equity, and return on sales. In contrast, strategic controls base performance on
strategically relevant criteria as opposed to objective financial information (Kay,
2007). Examples of strategic control measures include customer satisfaction criteria,
new patent registrations, success in meeting target dates for new product or process
introductions, and the achievement of quality control standards.
Strategic controls and financial controls can both be present simultaneously in a firm,
they do not represent opposite ends of a conceptual continuum. These characteristics
of strategic controls are important to sustain the innovation process because long
time-lags frequently intervene between innovative initiatives and their eventual pay-
off (Kanter, 2009). A well-designed strategic control system is capable of rewarding
firm employees for incremental but substantive progress on product or process
innovations that take a long time to reach market. Conversely, for conservative firms,
strategic controls are less important. Conservative firms do not gain their competitive
advantage by pursuing opportunities through innovation. There are costs involved in
maintaining strategic controls in terms of managerial time and effort which
conservative firms can avoid (Mondy, 2009).
Scholars (Thagana, 2013; Flamini, 2009) have identified two types of controls
required by organization in order to continually monitor and scan the environment
and respond effectively to threats and opportunities. These are strategic controls and
financial controls. However, these controls have not ascertained that these crucial
controls are practiced in banking institutions and specifically in commercial banks in
Kenya.
31
2.4.4 Strategic Management Capability to Evaluate and Performance of
Commercial Banks
According to Porter (2008) a strategy can neither be formulated nor adjusted to
changing circumstances without a process of strategy evaluation. Whether performed
by an individual or as part of an organizational review procedure, strategy evaluation
forms an essential step in the process of guiding an organization. For many
executives, strategy evaluation is simply an appraisal of how well a business
performs. Has it grown? Is the profit rate normal? If the answers to these questions
are affirmative, it is argued that the firm‟s strategy must be sound.
Despite its unassailable simplicity, this line of reasoning misses the whole point of
strategy; that the critical factors determining the quality of current results are often
not directly observable or simply measured, and that by the time strategic
opportunities or threats do directly affect operating results it may well be too late for
an effective response. Thus strategy evaluation is an attempt to look beyond the
obvious facts regarding the short-term health of a business and appraise instead those
more fundamental factors and trends that govern success in the chosen field of
endeavour (Kavale, 2014). A strategy is a set of objectives, policies and plans that,
taken together, define the scope of the enterprise and its approach to business
(Rugman & Verbeke, 2008). Johnson and Scholes (2008) suggest that three questions
are central to the challenge of strategy evaluation: are the objectives of the business
appropriate? Are the major policies and plans appropriate? Do the results obtained to
date confirm or refute critical assumptions on which the strategy rests?.
He further suggests that strategy must satisfy four broad criteria: Consistency: the
strategy must not present mutually inconsistent goals and policies. Consonance: the
strategy must represent an adaptive response to the external environment and to the
critical changes occurring within it. Advantage: strategy must provide for the
creation and/or maintenance of a competitive advantage in the selected area of
activity. Feasibility: the strategy must neither overtax available resources nor create
insoluble problems. A strategy must be evaluated against each of these criteria; if it
fails to meet one or more of them, the strategy is flawed.
32
In his study on the influence of evaluation on performance of organization, Vijay
(2009) explains that evaluation is a systematic, rigorous, and meticulous application
of scientific methods to assess the design, implement and improve outcomes of a
strategy. It is a resource-intensive process, frequently requiring resources, expertise,
labour, time and a sizeable budget. The process of evaluation involves two levels,
tactical and strategic evaluation. Tactical evaluation compares performance against
the plans and detects changes that should be made to the implementation or the
strategy. It involves a review of the assumptions against what is really happening in
the environment of the firm. The objective is to expose strategic assumptions that are
no longer accurate or forecasted not to be accurate in the near future (Lodato, 2014).
Similarly, Grant (2005) contends that the process of strategy evaluation consists of
following steps: Fixing benchmark of performance: While fixing the benchmark,
strategists encounter questions such as; what benchmarks to set, how to set them and
how to express them. In order to determine the benchmark performance to be set, it is
essential to discover the special requirements for performing the main task. The
performance indicator that best identify and express the special requirements might
then be determined to be used for evaluation (Suvita & Hui, 2012).
The organization can use both quantitative and qualitative criteria for comprehensive
assessment of performance. Quantitative criteria include determination of net profit,
ROI, earning per share, cost of production, rate of employee turnover etc. Among the
qualitative factors are subjective evaluation of factors such as skills and
competencies, risk taking potential and flexibility (Ozturk & Coskun, 2014). While
measurement of performance one has to put in mind that the standard performance is
a bench mark with which the actual performance is to be compared.
The reporting and communication system help in measuring the performance. If
appropriate means are available for measuring the performance and if the standards
are set in the right manner, strategy evaluation becomes easier (Tatar & Moradi,
2015). But various factors such as manager‟s contribution are difficult to measure.
Similarly divisional performance is sometimes difficult to measure as compared to
individual performance. Thus, variable objectives must be created against which
33
measurement of performance can be done (Potter, 2008). Evaluating the performance
of an organization, financial statements like balance sheet, profit and loss account
must be prepared on an annual basis.
While evaluating the actual performance and comparing it with standard
performance there may be variances which must be analysed. The evaluation
strategists must mention the degree of tolerance limits between which the variance
between actual and standard performance may be accepted. The positive deviation
indicates a better performance but it is quite unusual exceeding the target always.
The negative deviation is an issue of concern because it indicates a shortfall in
performance. Thus in this case the strategists must discover the causes of deviation
and must take corrective action to overcome it (Grant, 2005).
Once the deviation in performance is identified, it is essential to plan for a corrective
action. If the performance is consistently less than the desired performance, the
evaluation strategists must carry a detailed analysis of the factors responsible for
such performance. Another rare and drastic corrective action is reformulating the
strategy which requires going back to the process of strategic management,
reframing of plans according to new resource allocation trend and consequent means
going to the beginning point of strategic management process, (Jackson, 2005).
The importance of strategic capability to evaluate has been critically evaluated
(Porter, 2008; Tatar & Moradi, 2015; Suvita & Hui, 2012). These scholars have even
stated that a strategy can neither be formulated nor adjusted to changing
circumstances without a process of strategy evaluation. However, few local scholars
have replicated similar studies especially focusing on capability to evaluate and its
application in the performance of commercial banks in Kenya.
2.5 Critique of the Existing Literature
The performance of commercial banks is hinged on what strategies the banks pursue
to ensure they build and accumulate competitive structures that allow them to
perform better than their rivals (Kathuni & Mugenda, 2012). The various studies
reviewed however failed to identify which uniform method could be used in efficient
34
management capability strategies and what correlation it will have on the
performance of commercial banks. There are numerous studies undertaken
highlighting that firms have strategies for operation which included growth,
diversification and defensive strategies (Johnson, Scholes & Whittington, 2008;
Kavale, 2014; Nabela, 2014). However few of these studies have focused on strategic
management capabilities. In Kenya, studies on strategic capabilities indicating the
importance of envisioning in organization performance in varying entities are few
(Ogolla, 2007: Watuka, 2014). Specifically, few studies have been conducted in the
area of strategic management capabilities to envision and performance in commercial
banks.
Local scholars like Jerop and Juma (2014), have identified the importance of
strategies in organizations operations in two distinct environments; internal and
external. They add that operations of a bank depend on regulation, competition laws,
prevailing political environment, the culture of the people, income per capital and
amount of disposable income, and technological advancement. However, they have
not specifically underlined the importance of capability to strategize and its overall
importance in performance of banks in Kenya.
Scholars such as Thagana (2013) and Flamini (2009) have identified two types of
controls required by organization in order to continually monitor and scan the
environment and respond effectively to threats and opportunities. These are strategic
controls and financial controls. However, these controls have not ascertained that
these crucial controls are practiced in banking institutions and specifically in
commercial banks in Kenya.
The importance of strategic capability to evaluate has been critically evaluated
(Porter, 2008; Tatar & Moradi, 2015; Suvita & Hui, 2012). These scholars have even
stated that a strategy can neither be formulated nor adjusted to changing
circumstances without a process of strategy evaluation. However, few local scholars
have replicated similar studies especially focusing on capability to evaluate and its
application in the performance of commercial banks in Kenya.
35
2.6 Research Gaps
An organization performance is a complex and uncertainty phenomenon and has led
to the emergence of various theories predicting the evolution of organizations.
However, no single theory has given a complete picture of the impact and evolution
of organizations‟ performance phenomenon. In the absence of a complete theory of
organization performance dynamics, an empirical approach is recommended to seek
the stylized facts (Coad, 2009). Although studies attempt to link determinants from
different perspectives or dimensions (Baum, & Wally, 2003), their explanatory power
is low due to the relatively small number of variables. It is therefore of special
interest to examine the determinants of organization performance in an integrated
way, and to identify the most important determinants of organization performance
(Davidson et al., 2006).
Mulonzi, Namusonge and Mugambi (2017) sought to establish the effect of
leadership style on the growth of commercial banks in Mombasa County. The study
adopted a cross-sectional survey assuming a concurrent triangulation method. The
study population consisted of the 43 commercial banks of which 39 commercial
banks were sampled using the Yamen formulae. Systematic sampling was used to
sample four banks whose regional managers were used for interviewing. The
instruments used for data collection were questionnaires, unstructured interviews and
document analysis. The study established that leadership style was a major
determinant of growth of commercial banks. Good management skills, staff
motivation/satisfaction and customer focus were found to be key in leadership styles
portrayed by commercial banks.
Watuka (2014) studied the influence of strategic management practices on the growth
of the commercial banks in Kenya. The study applied descriptive and Correlation
analysis methods of data analysis. The findings were that commercial banks in
Kenya have formulated various business growth strategies. These include
differentiation and cost leadership as the main strategy, and others practiced to large
extent are market penetration, market development, product development, and
diversification strategies.
36
Onuonga (2014) investigated the effects of internal determinants of profitability on
Kenya's top six commercial banks using secondary data over the period 2008 to
2013. The study found that commercial banks need to invest on efficient
management in efficient technologies to enhance performance. In addition,
commercial banks profitability on average has been erratic. Strategic management
capabilities of commercial banks are important if the banks have to survive and
grow. Commercial banks also have the role of transmitting monetary policies
implemented by the Central Bank. Thus, it is essential to investigate the strategic
management capabilities in the performance of commercial banks for growth and
stability of the financial sector of the economy.
Kungu et al. (2014) assessment the effectiveness of competitive strategies by
commercial banks: A case of Equity Bank. The study found that, for commercial
banks to achieve competitive advantage, resource accumulation plays a critical role
as a strategic capability. The level of resource accumulation is pegged to competitive
managerial processes. Banks have to continuously adapt their operations to the ever
changing business environment to improve in performance and succeed in business.
They also need to adopt strategies focused on dealing with emerging environmental
challenges accordingly. Further, the environment is also influenced by the regulatory
authorities such as the Central Bank of Kenya, the Ministry of Finace and the Kenya
Bankers Association. Prohibitive policies for entering international markets also add
to the emerging environmental challenges. The environmental factors mediate
between the strategic management capabilities and performance of commercial
banks.
Kamau and Were (2013) analyzed the driving factors behind the impressive banking
sector performance in Kenya in the last 13 years – 1997-2011. Both inferential and
descriptive statistics were used in data analysis. The results suggested that the source
of superior performance in the Kenyan banking sector is structure/collusive power
and not efficiency hence supporting SCP hypothesis. Ongore (2013) examined the
determinants of financial performance of commercial banks in Kenya.
37
Profitability was used as a measure for performance. The study tested several
variables to determine their influences on profits. It was established that ownership
of the banks does not significantly influence profitability, but asset accumulations
had positive correlations with profitability. The study concludes that capital
adequacy, asset quality, and management efficiency significantly affect the
performance of commercial banks in Kenya.
The various scholars argue that bank specific factors (factors under the control of
managers) are the most significant determinants of the financial performance of
commercial banks in Kenya. Thus, most scholars have not comprehensively analysed
strategic management capabilities which constitute non-financial determinants of
performance of commercial banks in Kenya. Watuka (2014) conducted a study to
determine the strategic management practices adopted in the banking industry in
Kenya. The key findings were that commercial banks in Kenya have formulated
various business growth strategies like cost leadership and market penetration. The
gap in this study was that the use of strategic management capabilities like
stakeholder management, competitive management strategies was not studied.
Kungu et al. (2014) examined the effectiveness of competitive strategies of
commercial banks in Kenya. The major findings were that commercial banks in
Kenya apply different strategies in response to baking services. The study gap was
that the use of available resources and stakeholders management as competitive
strategies as strategies were not studied. Wanjiru and Njeru (2014) evaluated the
impact of strategic response to change on financial performance of commercial banks
in Kenya. The major findings were that adoption and use of superior technologies is
essential for enhancing performance. The gap in this study is that the effect of
strategic management capabilities on non-financial performance of commercial
banks in Kenya was overlooked.
Onuonga (2014) investigated the impact of the internal determinants of profitability
of Kenya`s top six commercial banks over the period 2008-2013. The major findings
were that commercial banks need to invest on efficient management and in
technologies. The study gap was that the influence of corporate social
38
responsibilities, availability of resources and product innovations on performance
were studied only overlooking the importance contribution of strategic management
capabilities in determining performance. Ongore (2013) attempted to find out the
determinants of financial performance of commercial banks in Kenya.
The key finding was that capital adequacy, asset quality and their management
significantly affect performance. The study gap was that there was no examination of
the influence of strategic management capabilities on performance and this study
only focused on human resources provision and influence of banking rules and
regulations. Kamau and Were (2013) conducted an analysis of the driving factors
behind the impressive banking sector performance in Kenya in the last 13 years
(1997-2011).The major findings were that the source of superior performance in the
banking sector is as a result of structure/collusive power. The gap in the study was
that there was omission of strategic management capabilities as the driving force of
performance.
2.7 Summary
Though corporate performance is an essential indicator of prosperity and
sustainability, it is just an option. This chapter has identified the dynamic capability
theory, resource based theory, competitive advantage theory, as the theoretical
framework. Further, four determinants of strategic management capabilities on
performance of commercial banks have been reviewed vis: capability to envision;
capability to strategize; capability to monitor, and capability to evaluate.
Performance of commercial banks is the dependent variable. This chapter goes
further and points out on metrics of measuring performance of commercial banks and
has provided a critique of the existing literature. More so, this study identifies and
explains the gaps inherent in the performance of commercial banks.
39
CHAPTER THREE
RESEARCH METHODOLOGY
3.1 Introduction
This chapter presented the research design and methodology that were used in the
study. The chapter is organized under the following sections: research design, target
population, sample frame, sampling techniques, sample size, data collection
instruments and procedures, pilot testing, data analysis and presentation.
3.2 Research Design
According to Mathew and Thompson (2012) research design is a set of decision that
makes up the master plan specifying the methods and procedures for collecting and
analyzing the needed information. Research design is the most important issue after
defining the research problem. This is because research design facilitates the smooth
conduct of the various stages of research (Kothari, 2004). Cooper and Schindler
(2011) define a research design as a blueprint for conducting a study with maximum
control over factors that may interfere with the validity of the findings. Kothari
(2008) has also defined research design as an overall framework or a plan for
investigation and logical model of proof that guides the investigator in the various
stages of research (Kothari, 2008). This study employed a multi-point descriptive
survey involving both cross-sectional. A longitudinal research design is a quasi-
experimental research design that involves repeated observations of the same
variable over a period of time (Bryman & Bell, 2007). Blumberg (2008) argues that
longitudinal analysis has the potential to bring out the contribution of individual item
(programme) over the outcome of a given event. Additionally, the approach
compares variables in different years and circumstances and provides reasons for
occurrence. Therefore, elements of strategic management capabilities, which may
trigger a uniform outcome along the different studied periods are captured and
explained (Kothari, 2004). It was used in this study since it allowed the researcher to
examine different aspects in strategic management capabilities and their influence on
performance of the banks over a definite period of time.
40
On the other hand, Bryan and Bell (2007) state that descriptive cross-sectional design
or social survey design, involves data collection on several cases during the same
time frame in order to collect qualitative or quantitative data related to two or more
variables in order to determine the association between the variables. Cooper and
Schindler (2011) further added that descriptive cross-sectional design is usually
considered the best method for collecting information in order to test hypotheses
which this study was conducting. A descriptive research design is also useful in
capturing unbiased representation of perceptions and experiences of respondents
(Cooper & Schindler, 2011). In view of the current study, a descriptive cross-
sectional design enabled the researcher to fully describe the role of strategic
management capabilities in performance of commercial banks in Kenya. This study
envisaged a scenario where a group of strategic management initiatives may
influence an overall outcome such as the level of profitability of a commercial bank
simultaneously.
3.3 Target Population
Target population refers to the total number of subjects of interest to the research
(Sekaran & Bougie, 2010). Target population also constitutes the entire set of
individuals or items being considered during an inquiry (Kothari, 2004). Cooper and
Schindler (2011) add that the target population is the collection of elements about
which a researcher wishes to refer. The study investigated 42 banks although at the
time of the research there were 44 commercial banks in the country. Two banks were
never investigated since they were under statutory receivership.
The respondents were drawn from those working within the middle and senior
management positions. This was purposely done to identify respondents who are
crucial in the implementation of strategic programmes within the banking industry.
By the end of 31st December 2015, there were 42 commercial banks with a total
workforce of 36, 212 members of the staff. Of these employees, 15% or 5,432 were
deployed as middle and senior level managers (Central Bank of Kenya, 2015). The
target population therefore comprised of 42 banks and 5,432 employees. Of the 42
commercial banks, 29 are locally owned while 13 are foreign. Table 3.1 illustrates
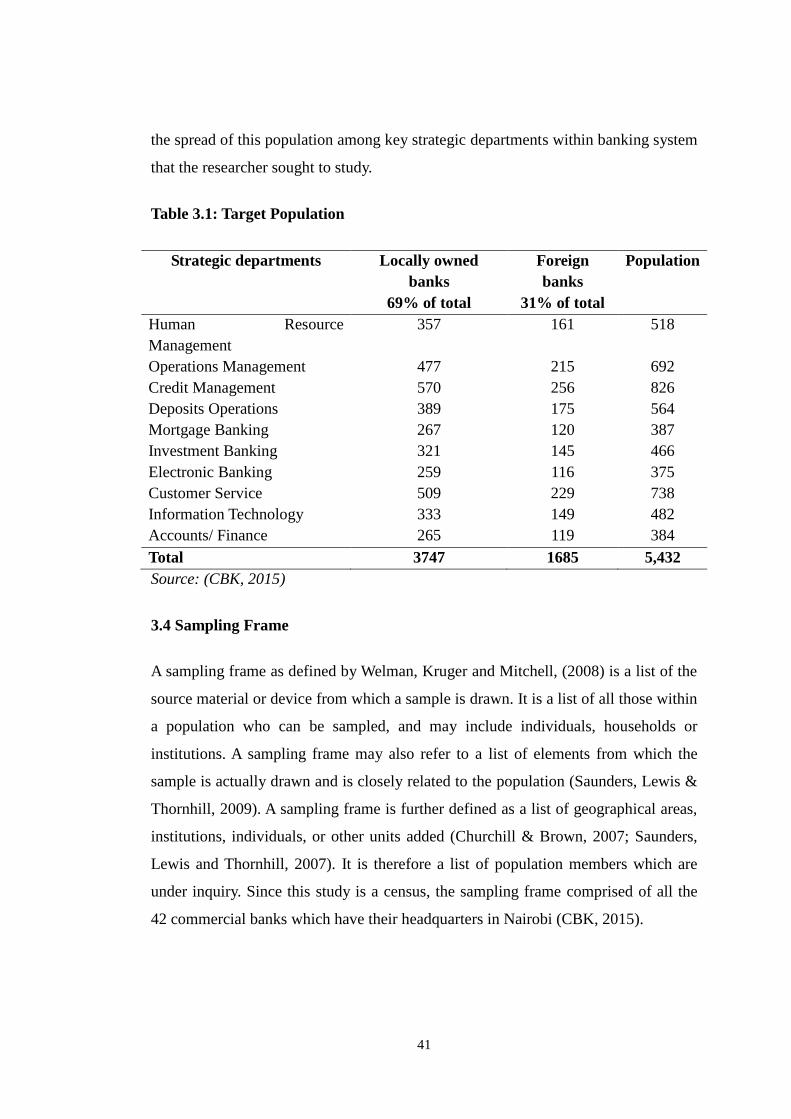
41
the spread of this population among key strategic departments within banking system
that the researcher sought to study.
Table 3.1: Target Population
Strategic departments Locally owned
banks
69% of total
Foreign
banks
31% of total
Population
Human Resource
Management
357 161 518
Operations Management 477 215 692
Credit Management 570 256 826
Deposits Operations 389 175 564
Mortgage Banking 267 120 387
Investment Banking 321 145 466
Electronic Banking 259 116 375
Customer Service 509 229 738
Information Technology 333 149 482
Accounts/ Finance 265 119 384
Total 3747 1685 5,432
Source: (CBK, 2015)
3.4 Sampling Frame
A sampling frame as defined by Welman, Kruger and Mitchell, (2008) is a list of the
source material or device from which a sample is drawn. It is a list of all those within
a population who can be sampled, and may include individuals, households or
institutions. A sampling frame may also refer to a list of elements from which the
sample is actually drawn and is closely related to the population (Saunders, Lewis &
Thornhill, 2009). A sampling frame is further defined as a list of geographical areas,
institutions, individuals, or other units added (Churchill & Brown, 2007; Saunders,
Lewis and Thornhill, 2007). It is therefore a list of population members which are
under inquiry. Since this study is a census, the sampling frame comprised of all the
42 commercial banks which have their headquarters in Nairobi (CBK, 2015).
42
3.5 Sampling Technique and Sample Size
A sample is a portion of the target population from which data is collected,
summarized, analysed and inferences about the target population from which the
sample is drawn made (Cooper & Schindler, 2011). Sampling is the process of
constructing a sample from a population as the fragment or section of the population
that is selected for the research process (Bryman & Bell, 2007).
Multi-stage sampling procedure was used in the selection of representative sample.
The first step involved the use of purposive sampling to determine the category of
employees and departments which directly implement strategic programmes of the
banks. The second step involved stratified random sampling of the commercial banks
represented into two categories; foreign owned and locally-owned banks. Stratified
random sampling is a probability sampling technique in which the defined target
population is divided into groups (Shui et al., 2009). In our case, these groups consist
of the bank management staff and the type of bank ownership. Welman and Kruger
(2001) explain that this technique eliminates the risk of the sample consisting only of
members from one particular group. The third step employed stratified random
sampling of the respondents to select various categories of managers across the
locally and foreign owned banks. Stratified random sampling was used to select
respondents based on their roles in strategic decision making that affect the
performance of individual department of the bank.
3.5.1 Sample Size
The sample size of the study was 358 respondents which was about 7% of the
universe population. This size conformed to the requirement that a good sample size
should be between 5% and 30% of the population (Bradley, 2010). This was
necessary so as to illicit representativeness, efficiency, flexibility and accuracy of
data. The spread of the sample is indicated in the Table 3.2.
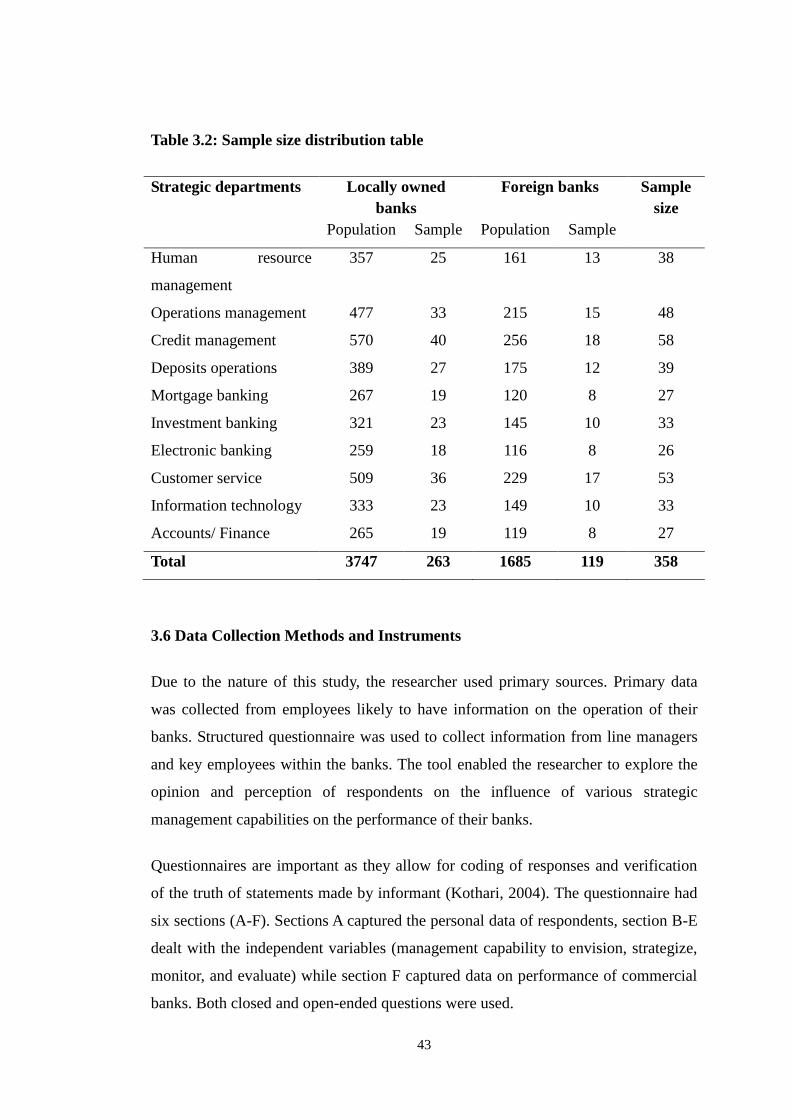
43
Table 3.2: Sample size distribution table
Strategic departments Locally owned
banks
Foreign banks Sample
size
Population Sample Population Sample
Human resource
management
357 25 161 13 38
Operations management 477 33 215 15 48
Credit management 570 40 256 18 58
Deposits operations 389 27 175 12 39
Mortgage banking 267 19 120 8 27
Investment banking 321 23 145 10 33
Electronic banking 259 18 116 8 26
Customer service 509 36 229 17 53
Information technology 333 23 149 10 33
Accounts/ Finance 265 19 119 8 27
Total 3747 263 1685 119 358
3.6 Data Collection Methods and Instruments
Due to the nature of this study, the researcher used primary sources. Primary data
was collected from employees likely to have information on the operation of their
banks. Structured questionnaire was used to collect information from line managers
and key employees within the banks. The tool enabled the researcher to explore the
opinion and perception of respondents on the influence of various strategic
management capabilities on the performance of their banks.
Questionnaires are important as they allow for coding of responses and verification
of the truth of statements made by informant (Kothari, 2004). The questionnaire had
six sections (A-F). Sections A captured the personal data of respondents, section B-E
dealt with the independent variables (management capability to envision, strategize,
monitor, and evaluate) while section F captured data on performance of commercial
banks. Both closed and open-ended questions were used.
44
3.7 Data Collection Procedure
Before collecting data, the researcher sought for an introductory letter from the Jomo
Kenyatta University of Agriculture and Technology. After acquiring the letter, the
researcher sought a permit from the National Council for Science and Technology to
undertake research in Kenya. Then, the researcher visited the selected commercial
banks, introduced herself and dropped questionnaires and agreed on the dates for
interviews with the management. The researcher fixed appropriate dates for
collecting the duly filled questionnaires and conducting the interviews which was
successfully executed.
3.8 Pilot Study
A pilot study is carried out for the following reasons: to detect possible flaws in the
measurement procedures that may include among others, aspects such as ambiguous
instructions or inadequate time limits; to identify unclear or ambiguously formulated
items; to notice non-verbal behaviour on the part of respondents (Welman, Kruger &
Mitchell, 2008). Similarly, pilot testing was done to assist in determining if there are
flaws, limitations, or other weakness within the interview design. This provided the
researcher with an opportunity to make changes where necessary. Pilot study was
done by use of instruments which were administered to select respondents. The
exercise detected a number of flaws in the measurement procedures which were aptly
addressed.
During the pilot testing, two branch managers, four operational managers, two
human resource managers and two credit managers selected from three commercial
banks were interviewed (Krejcie & Morgan). The pilot study administered fourteen
test trial questions to each of the selected respondents. This satisfied the provision
that the size of the pilot group may range from 10 to 20 subjects depending on the
method to be tested but the respondents do not have to be statistically selected
(Cooper & Schindler, 2011).
45
3.8.1 Validity of the Research Instruments
Validity refers to the extent to which the measures used in the questionnaire are
truthfully measuring the intended concept and not something else and include
internal validity and external validity (Sekaran & Bougie, 2009). Measuring validity
deals with the question of whether a measure can actually provide reality of a
concept (Bryman & Bell, 2011).
Internal validity refers to the ability of a research instrument to measure what it
purported to measure whereas external validity refers to the extent to which results or
findings of one study can be transferred to a similar situation. It also determines
whether the instrument truly measures what it is intended for and therefore an
indication of how truthful the research results will be (Lucey, 2002).
This argument is similar to Yin (2003) who adds that aspect of validity is a recourse
that guarantees truthfulness and allows for a pre-test to validate the instruments. The
researcher used this approach to modify and pre-test the questionnaire in order
capture the relevant data related to the study objectives. Based on the findings of this
study, each construct was found to be higher than the correlation among any pair of
latent construct. Thus, each construct had a different measure of the main factor of
analysis
3.8.2 Reliability of Research Instruments
Reliability of an instrument is a measure of how consistent the results of a test are
(Kombo & Tromp, 2006; Sekaran & Bougie, 2008). In our study, the reliability was
carried out by pilot test and computing Cronbach‟s Alpha. According Sekaran and
Bougie (2008) pilot test is necessary for testing the reliability of instruments where
the feedback of the pilot study is used to refine the questionnaire to make it reliable
during the study.
Cronbach‟s alpha was used to test the reliability of the measures of the instruments
(Cronbach, 1994). In addition Bryman (2011) suggests that where Cronbach Alpha is
used for reliability test, a rule of thumb is also used that states that the Cronbach
46
values of the items in the study should not be lower than 0.7. To increase the
reliability of the questionnaire, this study used Cronbach‟s Alpha for separate
domains of the questionnaire rather than the entire questionnaire.
The Cronbach values will be computed as follows:
α = K / (K - 1) [1- (Σσk2 / σtotal
2)]……………… Equation (1) (Ritter, 2010)
Where;
K is the number of items;
Σσk2 is the sum of the k item score variances, and
Σ total 2 is the variance of scores on the total measurement (Cronbach, 1994).
3.9 Data Analysis and Presentation
Data analysis usually involves reducing accumulative raw data to manageable size;
developing summaries; looking for patterns, and applying statistical techniques
(Kerlinger, 1983). This study gathered both descriptive and statistical information,
each of which were analysed differently. Descriptive information was analysed using
dominant responses technique to determine common reactions and consistencies that
cut across majority of the respondents (Yin, 2003). Descriptive measures such as
percentages and frequencies were used to draw inferences and make conclusions
(Cooper & Schindler, 2011).
Statistical information was analysed through statistical tools such as linear regression
model, correlation analysis and ANOVA to give inferences to the data obtained. In
addition, multiple regressions were used to determine the relationship between
performance and various strategic management capabilities of banks and ANOVA to
judge the significance of more than two variables. After the analysis, data was
presented using tables, charts and graphs. Blumberg (2008) explains that when
information is presented in picturesque format, it is easier to analyse and
intemperate. The research used SPSS software for synthesizing, coding, analysing
and presenting data.
47
3.9.1 Statistical Measurement Model
In the multiple regression models, analysis of variance (ANOVA) was used to test the
significance of the overall model at 95% level of significance. Coefficient of
correlation (R) was used to determine the strength of the relationship between the
dependent and independent variables. Coefficient of determination (R2) was also
used to show the percentage for which each independent variable and all independent
variables combined explained the change in the dependent variable.
In this study ,the response (criterion) variable (Y) is the performance while the
independent (predictor) variable s are Strategic management capability to envision,
Strategic management capability to strategize, Strategic management capability to
monitor, and Strategic management Capability to evaluate. The following model was
used.
Y=βo+β1X1+β2X2 +β3X3 +β4X4 + ε
Where:
Y= Represents performance
Β0............β4=Regression coefficients to be estimated
X1= Strategic management capability to envision
X2= Strategic management capability to strategize
X3= Strategic management capability to monitor
X4= Strategic management Capability to evaluate
ε = the error variability (error term). Is assumed to be normally distributed
with mean Zero and constant variance
β1, β2, β3, and β4, are model parameters which describes the direction and
strength of relationship between the dependent and the independent variables.
βo is a constant (intercept).
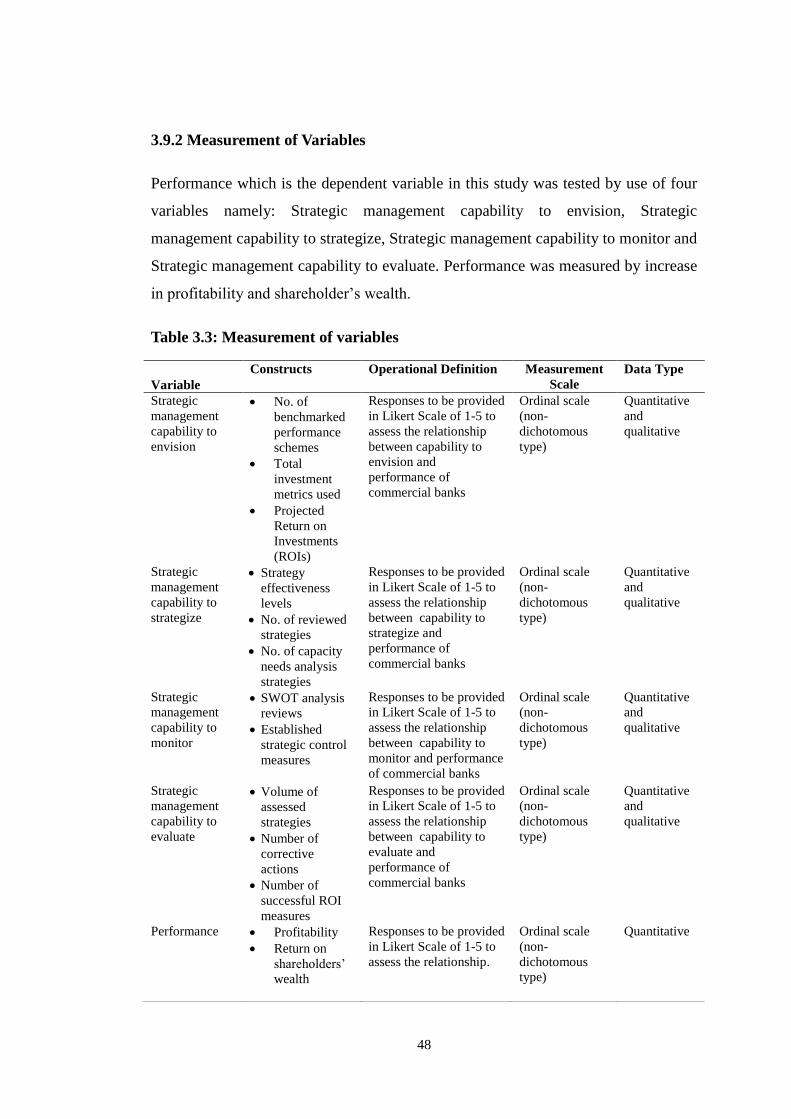
48
3.9.2 Measurement of Variables
Performance which is the dependent variable in this study was tested by use of four
variables namely: Strategic management capability to envision, Strategic
management capability to strategize, Strategic management capability to monitor and
Strategic management capability to evaluate. Performance was measured by increase
in profitability and shareholder‟s wealth.
Table 3.3: Measurement of variables
Variable
Constructs Operational Definition Measurement
Scale
Data Type
Strategic
management
capability to
envision
No. of
benchmarked
performance
schemes
Total
investment
metrics used
Projected
Return on
Investments
(ROIs)
Responses to be provided
in Likert Scale of 1-5 to
assess the relationship
between capability to
envision and
performance of
commercial banks
Ordinal scale
(non-
dichotomous
type)
Quantitative
and
qualitative
Strategic
management
capability to
strategize
Strategy
effectiveness
levels
No. of reviewed
strategies
No. of capacity
needs analysis
strategies
Responses to be provided
in Likert Scale of 1-5 to
assess the relationship
between capability to
strategize and
performance of
commercial banks
Ordinal scale
(non-
dichotomous
type)
Quantitative
and
qualitative
Strategic
management
capability to
monitor
SWOT analysis
reviews
Established
strategic control
measures
Responses to be provided
in Likert Scale of 1-5 to
assess the relationship
between capability to
monitor and performance
of commercial banks
Ordinal scale
(non-
dichotomous
type)
Quantitative
and
qualitative
Strategic
management
capability to
evaluate
Volume of
assessed
strategies
Number of
corrective
actions
Number of
successful ROI
measures
Responses to be provided
in Likert Scale of 1-5 to
assess the relationship
between capability to
evaluate and
performance of
commercial banks
Ordinal scale
(non-
dichotomous
type)
Quantitative
and
qualitative
Performance Profitability
Return on
shareholders‟
wealth
Responses to be provided
in Likert Scale of 1-5 to
assess the relationship.
Ordinal scale
(non-
dichotomous
type)
Quantitative
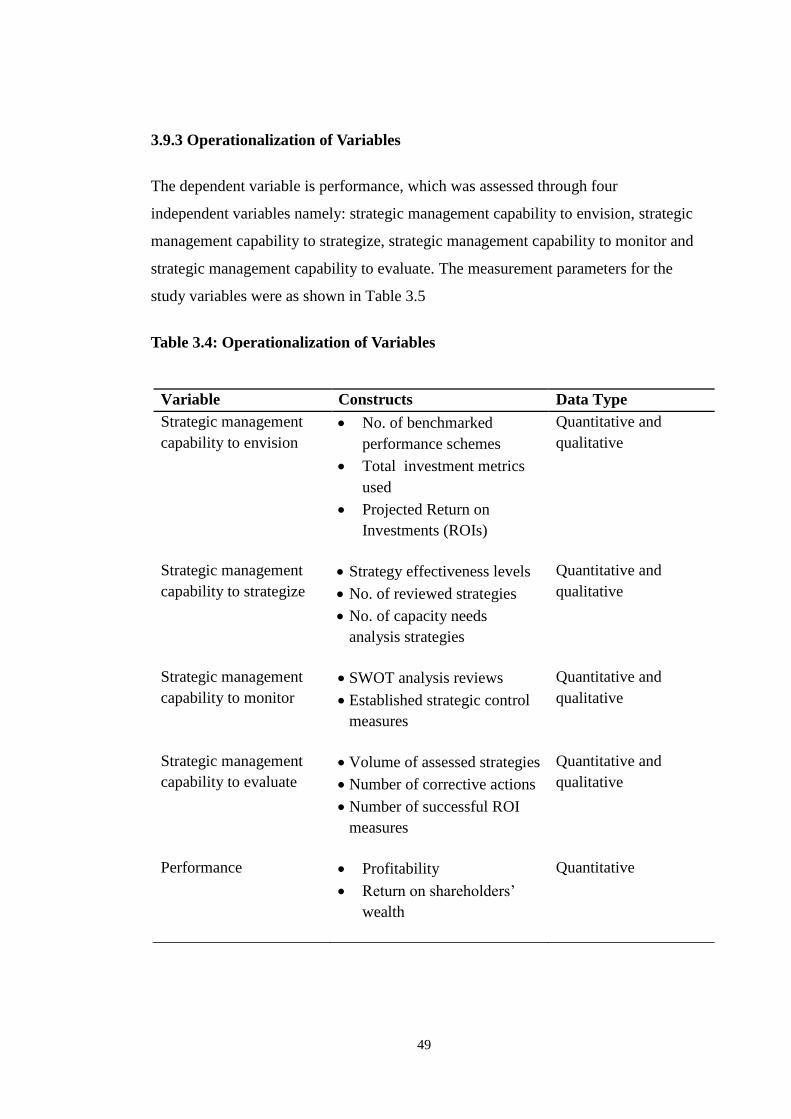
49
3.9.3 Operationalization of Variables
The dependent variable is performance, which was assessed through four
independent variables namely: strategic management capability to envision, strategic
management capability to strategize, strategic management capability to monitor and
strategic management capability to evaluate. The measurement parameters for the
study variables were as shown in Table 3.5
Table 3.4: Operationalization of Variables
Variable Constructs Data Type
Strategic management
capability to envision
No. of benchmarked
performance schemes
Total investment metrics
used
Projected Return on
Investments (ROIs)
Quantitative and
qualitative
Strategic management
capability to strategize
Strategy effectiveness levels
No. of reviewed strategies
No. of capacity needs
analysis strategies
Quantitative and
qualitative
Strategic management
capability to monitor
SWOT analysis reviews
Established strategic control
measures
Quantitative and
qualitative
Strategic management
capability to evaluate
Volume of assessed strategies
Number of corrective actions
Number of successful ROI
measures
Quantitative and
qualitative
Performance Profitability
Return on shareholders‟
wealth
Quantitative
50
3.9.4 Diagnostic Tests
Diagnostic tests which include normality test, Multicollinearity, Heteroscedasticity
and Autocorrelation
Normality Test
A normal distribution is not skewed and is defined to have a coefficient of kurtosis of
three (Brooks, 2014). This study used one-Sample Kolmogorov-Smirnov Test (KS)
to test the normality of the dependent variable. It is a test based on residuals of the
least squares regression model.
Multicollinearity
Multicollinearity was tested in the study using correlation matrix whereby the cut-off
point for severe multicollinearity is 0.8 (Gujarati, 2006; Cooper & Schindler, 2008).
Failure to account for perfect multicollinearity results into indeterminate regression
coefficients and infinite standard errors while existence of imperfect multicollinearity
results into large standard errors. Large standard errors affect the precision and
accuracy of rejection or failure to reject the null hypothesis. During estimation, the
problem is not the presence of multicollinearity but rather its severity. A correlation
coefficient greater than 0.8, thus, indicates the presence of multicollinearity.
Heteroscedasticity
Since the data for this research is a cross-section of banking organizations, this raises
concerns about the existence of heteroscedasticity. The CLRM assumes that the error
term is homoscedastic, that is, it has constant variance. If the error variance is not
constant, then there is heteroscedasticity in the data. Running a regression model
without accounting for heteroscedasticity would lead to unbiased parameter
estimates. To test for heteroscedasticity, the Breusch-Pagan/Godfrey test was used.
51
Auto Correlation Test
Since the data involves both cross section and time-series, it raises the suspicion of
the existence of serial correlation. The presence of serial correlation indicates that the
variables in the model violate the assumptions of the regression (Anderson et al.,
2007). To cater for serial correlation, the Woodridge test for autocorrelation was
employed.
3.9.5 Hypotheses Testing
For empirical conclusions to be arrived at, tests of various hypotheses were
conducted. Table 3.4 indicates the summary of the research hypotheses, type of
analysis, decision rule, and the interpretation of the results.
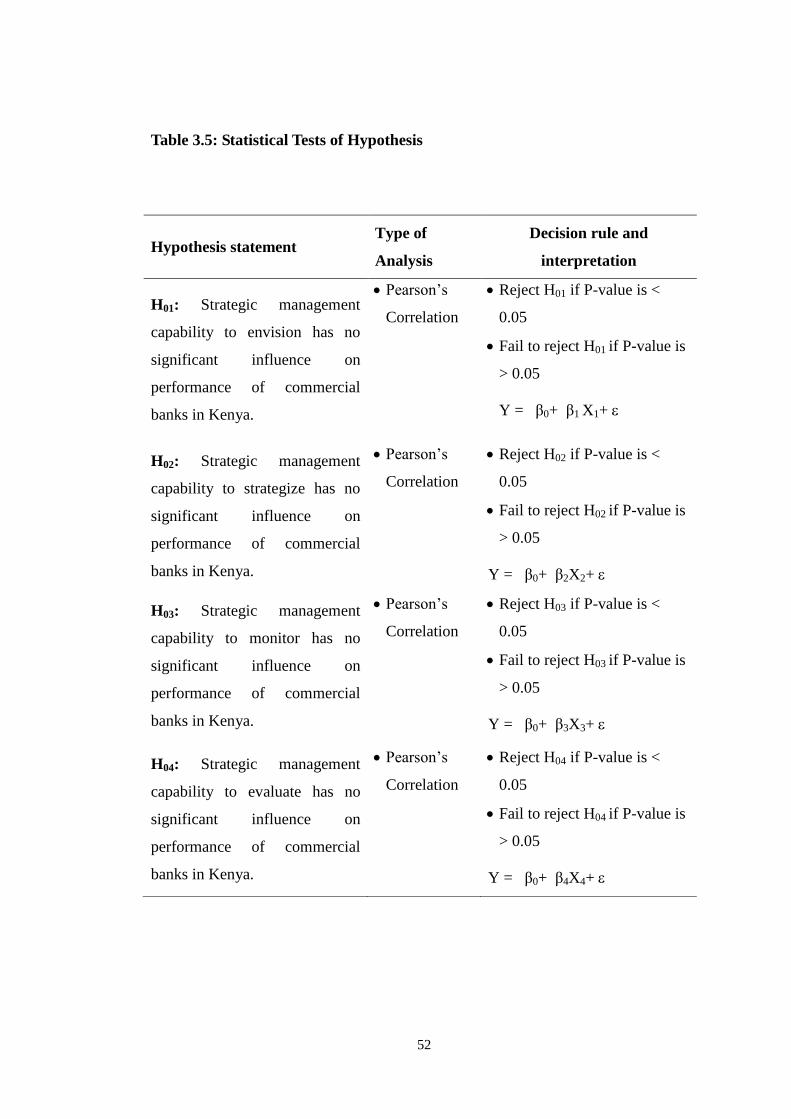
52
Table 3.5: Statistical Tests of Hypothesis
Hypothesis statement Type of
Analysis
Decision rule and
interpretation
H01: Strategic management
capability to envision has no
significant influence on
performance of commercial
banks in Kenya.
Pearson‟s
Correlation
Reject H01 if P-value is <
0.05
Fail to reject H01 if P-value is
> 0.05
Y = β0+ β1 X1+
H02: Strategic management
capability to strategize has no
significant influence on
performance of commercial
banks in Kenya.
Pearson‟s
Correlation
Reject H02 if P-value is <
0.05
Fail to reject H02 if P-value is
> 0.05
Y = β0+ β2X2+
H03: Strategic management
capability to monitor has no
significant influence on
performance of commercial
banks in Kenya.
Pearson‟s
Correlation
Reject H03 if P-value is <
0.05
Fail to reject H03 if P-value is
> 0.05
Y = β0+ β3X3+
H04: Strategic management
capability to evaluate has no
significant influence on
performance of commercial
banks in Kenya.
Pearson‟s
Correlation
Reject H04 if P-value is <
0.05
Fail to reject H04 if P-value is
> 0.05
Y = β0+ β4X4+
53
CHAPTER FOUR
RESEARCH FINDINGS AND DISCUSSION
4.1 Introduction
This chapter presents the research findings and discussions of the study. The findings
relate to the research questions and objectives that informed the study. Data analysis
was conducted for each of the specific objective to explore the role of strategic
management capabilities on the performance of commercial banks in Kenya. The
study was guided by the independent variables; capabilities to envision, strategize,
monitor and evaluate. The dependent variable was the performance of commercial
banks in Kenya. The findings and discussions on response rate, validity and
reliability tests, demographic characteristics of respondents, descriptive and
qualitative analysis, regression analysis and inferential statistics were presented.
4.2 Response Rate
The response rate of the respondents is expressed and as indicated, the number was
sufficient enough to support requisite analysis of data and could be relied upon to
make accurate findings and conclusions. As shown in Table 4.1, out of the 358
questionnaires administered, only 260 were completed and returned and therefore
used in the analysis representing 73% response rate. According to Mugenda (2003), a
response rate of above 70% is acceptable in research. Babbie (2004) asserted that
return rates of 50% are acceptable to analyze and publish, 60% is good while Fowler
(2013) stated that 70% is very good. The high response could be attributed to self-
administration of the instruments.
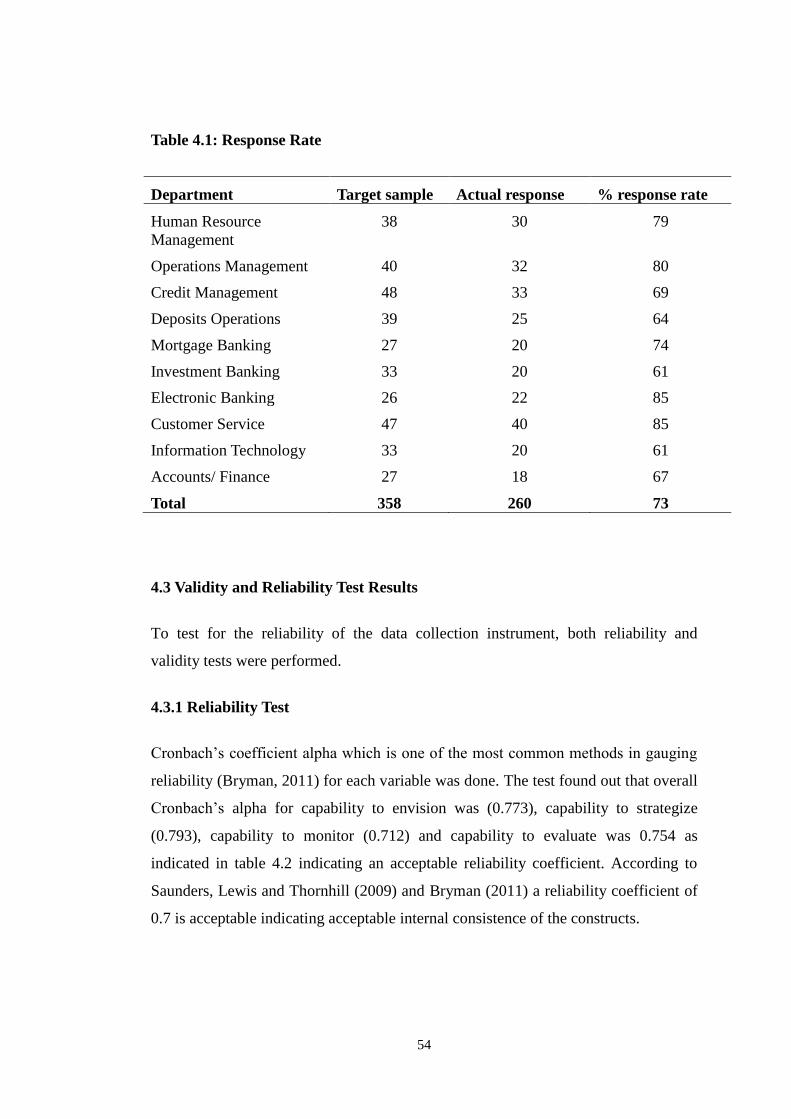
54
Table 4.1: Response Rate
Department Target sample Actual response % response rate
Human Resource
Management
38 30 79
Operations Management 40 32 80
Credit Management 48 33 69
Deposits Operations 39 25 64
Mortgage Banking 27 20 74
Investment Banking 33 20 61
Electronic Banking 26 22 85
Customer Service 47 40 85
Information Technology 33 20 61
Accounts/ Finance 27 18 67
Total 358 260 73
4.3 Validity and Reliability Test Results
To test for the reliability of the data collection instrument, both reliability and
validity tests were performed.
4.3.1 Reliability Test
Cronbach‟s coefficient alpha which is one of the most common methods in gauging
reliability (Bryman, 2011) for each variable was done. The test found out that overall
Cronbach‟s alpha for capability to envision was (0.773), capability to strategize
(0.793), capability to monitor (0.712) and capability to evaluate was 0.754 as
indicated in table 4.2 indicating an acceptable reliability coefficient. According to
Saunders, Lewis and Thornhill (2009) and Bryman (2011) a reliability coefficient of
0.7 is acceptable indicating acceptable internal consistence of the constructs.
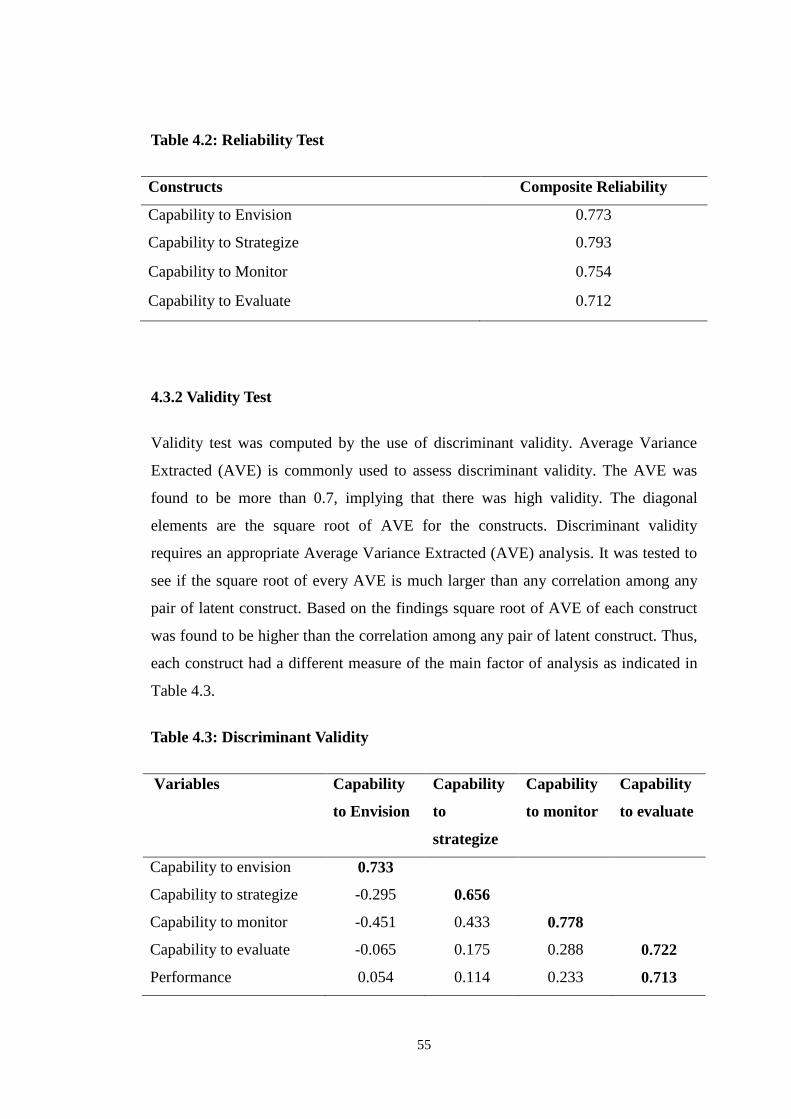
55
Table 4.2: Reliability Test
Constructs Composite Reliability
Capability to Envision 0.773
Capability to Strategize 0.793
Capability to Monitor 0.754
Capability to Evaluate 0.712
4.3.2 Validity Test
Validity test was computed by the use of discriminant validity. Average Variance
Extracted (AVE) is commonly used to assess discriminant validity. The AVE was
found to be more than 0.7, implying that there was high validity. The diagonal
elements are the square root of AVE for the constructs. Discriminant validity
requires an appropriate Average Variance Extracted (AVE) analysis. It was tested to
see if the square root of every AVE is much larger than any correlation among any
pair of latent construct. Based on the findings square root of AVE of each construct
was found to be higher than the correlation among any pair of latent construct. Thus,
each construct had a different measure of the main factor of analysis as indicated in
Table 4.3.
Table 4.3: Discriminant Validity
Variables Capability
to Envision
Capability
to
strategize
Capability
to monitor
Capability
to evaluate
Capability to envision 0.733
Capability to strategize -0.295 0.656
Capability to monitor -0.451 0.433 0.778
Capability to evaluate -0.065 0.175 0.288 0.722
Performance 0.054 0.114 0.233 0.713
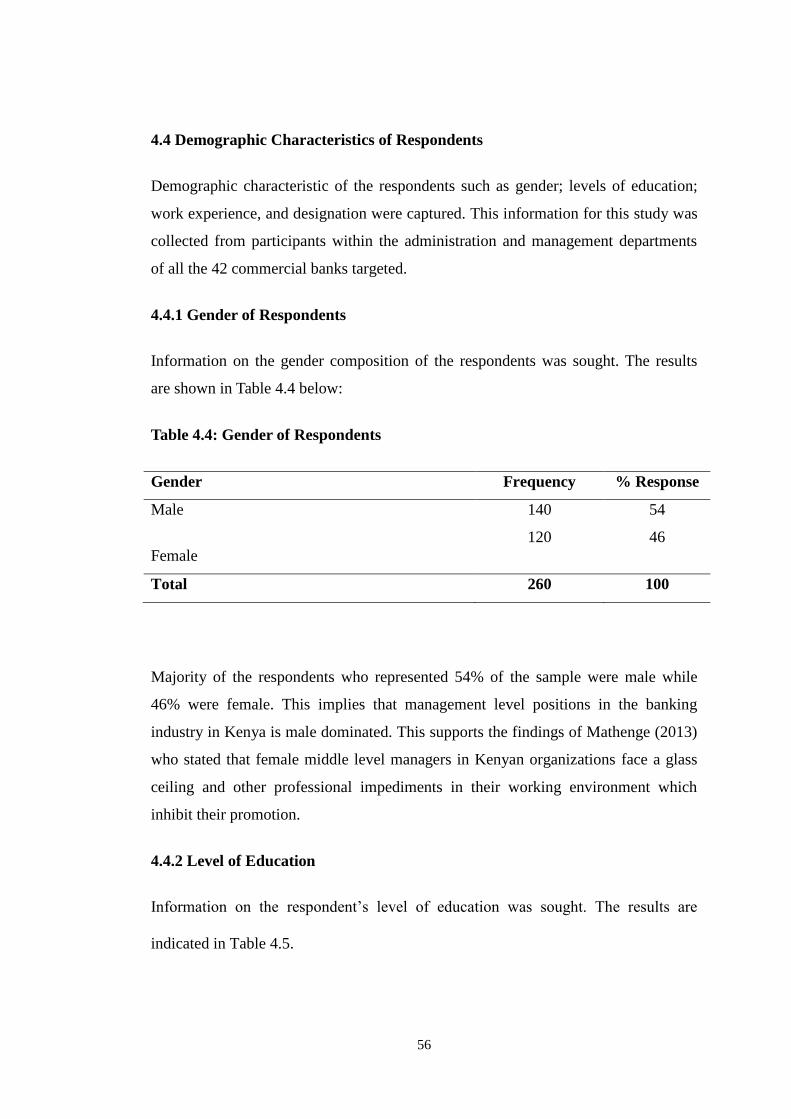
56
4.4 Demographic Characteristics of Respondents
Demographic characteristic of the respondents such as gender; levels of education;
work experience, and designation were captured. This information for this study was
collected from participants within the administration and management departments
of all the 42 commercial banks targeted.
4.4.1 Gender of Respondents
Information on the gender composition of the respondents was sought. The results
are shown in Table 4.4 below:
Table 4.4: Gender of Respondents
Gender Frequency % Response
Male
Female
140 54
120 46
Total 260 100
Majority of the respondents who represented 54% of the sample were male while
46% were female. This implies that management level positions in the banking
industry in Kenya is male dominated. This supports the findings of Mathenge (2013)
who stated that female middle level managers in Kenyan organizations face a glass
ceiling and other professional impediments in their working environment which
inhibit their promotion.
4.4.2 Level of Education
Information on the respondent‟s level of education was sought. The results are
indicated in Table 4.5.
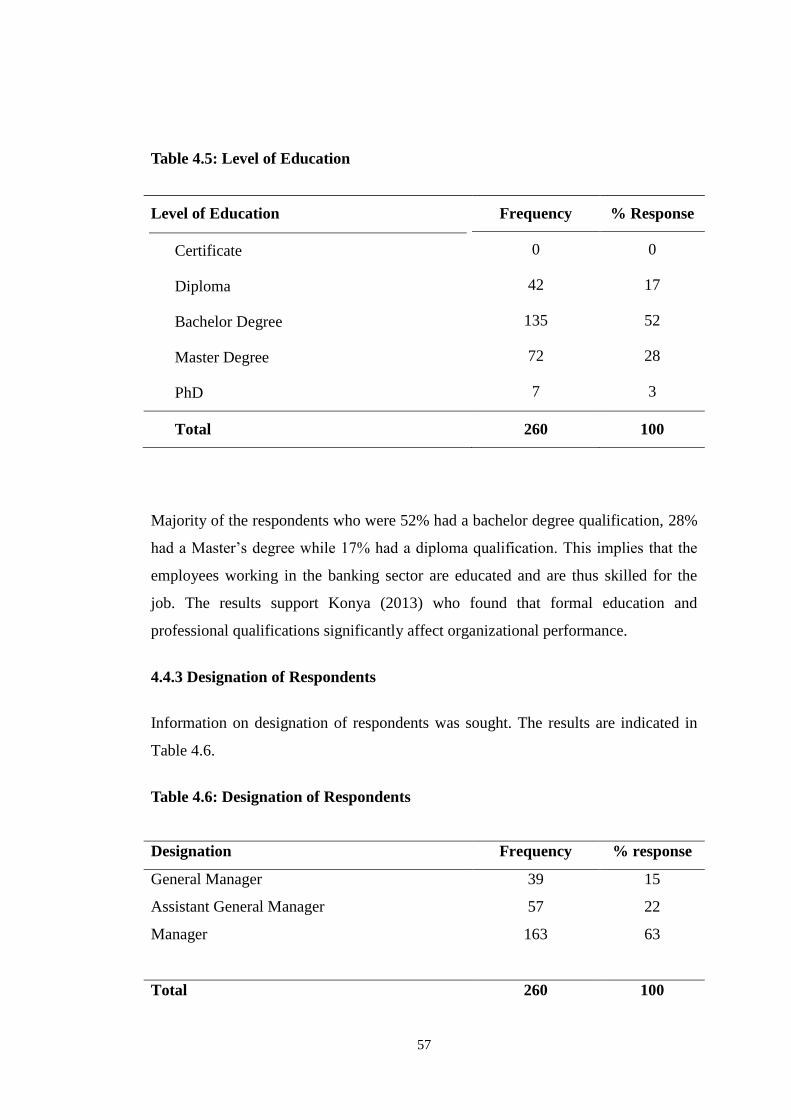
57
Table 4.5: Level of Education
Level of Education
Certificate
Diploma
Bachelor Degree
Master Degree
PhD
Frequency % Response
0 0
42 17
135 52
72 28
7 3
Total 260 100
Majority of the respondents who were 52% had a bachelor degree qualification, 28%
had a Master‟s degree while 17% had a diploma qualification. This implies that the
employees working in the banking sector are educated and are thus skilled for the
job. The results support Konya (2013) who found that formal education and
professional qualifications significantly affect organizational performance.
4.4.3 Designation of Respondents
Information on designation of respondents was sought. The results are indicated in
Table 4.6.
Table 4.6: Designation of Respondents
Designation Frequency % response
General Manager
Assistant General Manager
Manager
39 15
57 22
163 63
Total 260 100
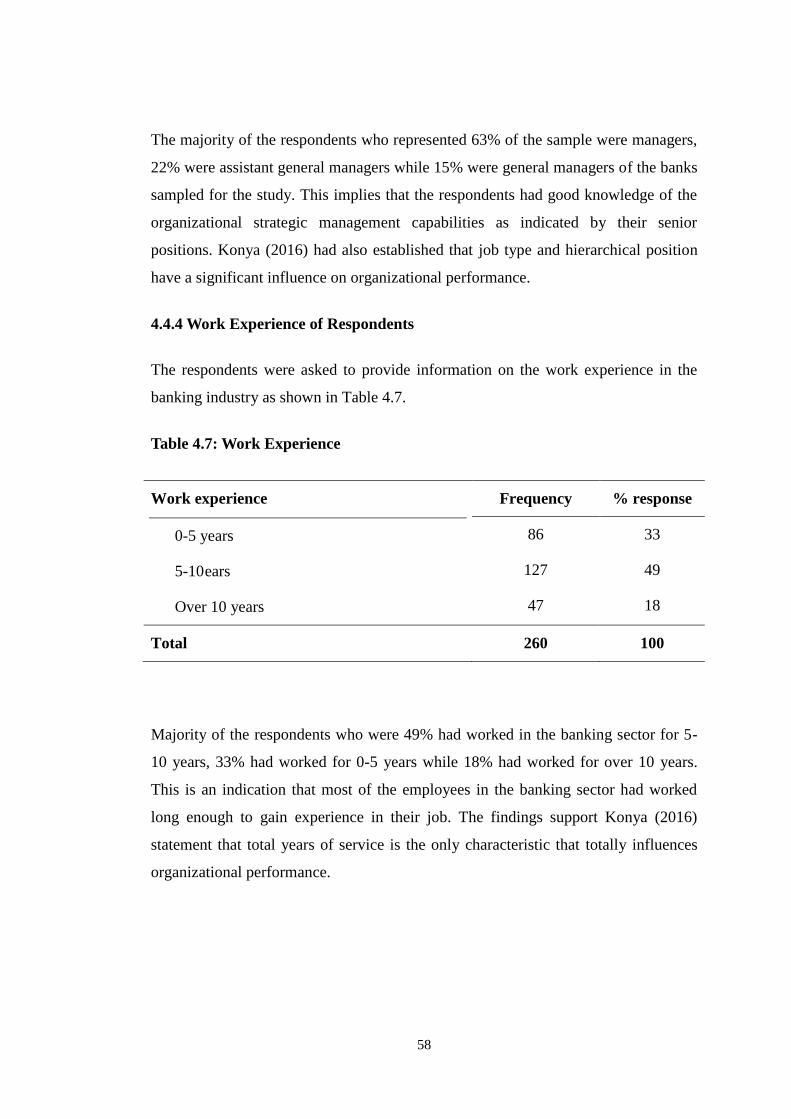
58
The majority of the respondents who represented 63% of the sample were managers,
22% were assistant general managers while 15% were general managers of the banks
sampled for the study. This implies that the respondents had good knowledge of the
organizational strategic management capabilities as indicated by their senior
positions. Konya (2016) had also established that job type and hierarchical position
have a significant influence on organizational performance.
4.4.4 Work Experience of Respondents
The respondents were asked to provide information on the work experience in the
banking industry as shown in Table 4.7.
Table 4.7: Work Experience
Work experience
0-5 years
5-10 ears
Over 10 years
Frequency % response
86 33
127 49
47 18
Total 260 100
Majority of the respondents who were 49% had worked in the banking sector for 5-
10 years, 33% had worked for 0-5 years while 18% had worked for over 10 years.
This is an indication that most of the employees in the banking sector had worked
long enough to gain experience in their job. The findings support Konya (2016)
statement that total years of service is the only characteristic that totally influences
organizational performance.
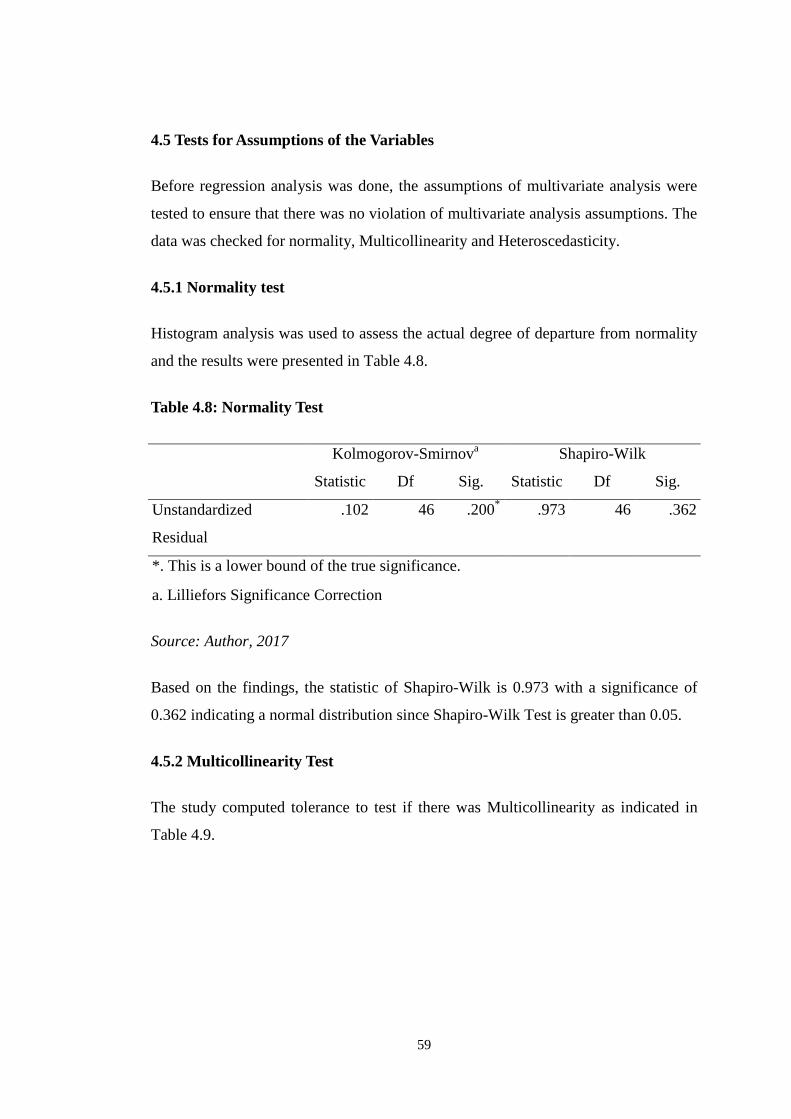
59
4.5 Tests for Assumptions of the Variables
Before regression analysis was done, the assumptions of multivariate analysis were
tested to ensure that there was no violation of multivariate analysis assumptions. The
data was checked for normality, Multicollinearity and Heteroscedasticity.
4.5.1 Normality test
Histogram analysis was used to assess the actual degree of departure from normality
and the results were presented in Table 4.8.
Table 4.8: Normality Test
Kolmogorov-Smirnova Shapiro-Wilk
Statistic Df Sig. Statistic Df Sig.
Unstandardized
Residual
.102 46 .200* .973 46 .362
*. This is a lower bound of the true significance.
a. Lilliefors Significance Correction
Source: Author, 2017
Based on the findings, the statistic of Shapiro-Wilk is 0.973 with a significance of
0.362 indicating a normal distribution since Shapiro-Wilk Test is greater than 0.05.
4.5.2 Multicollinearity Test
The study computed tolerance to test if there was Multicollinearity as indicated in
Table 4.9.
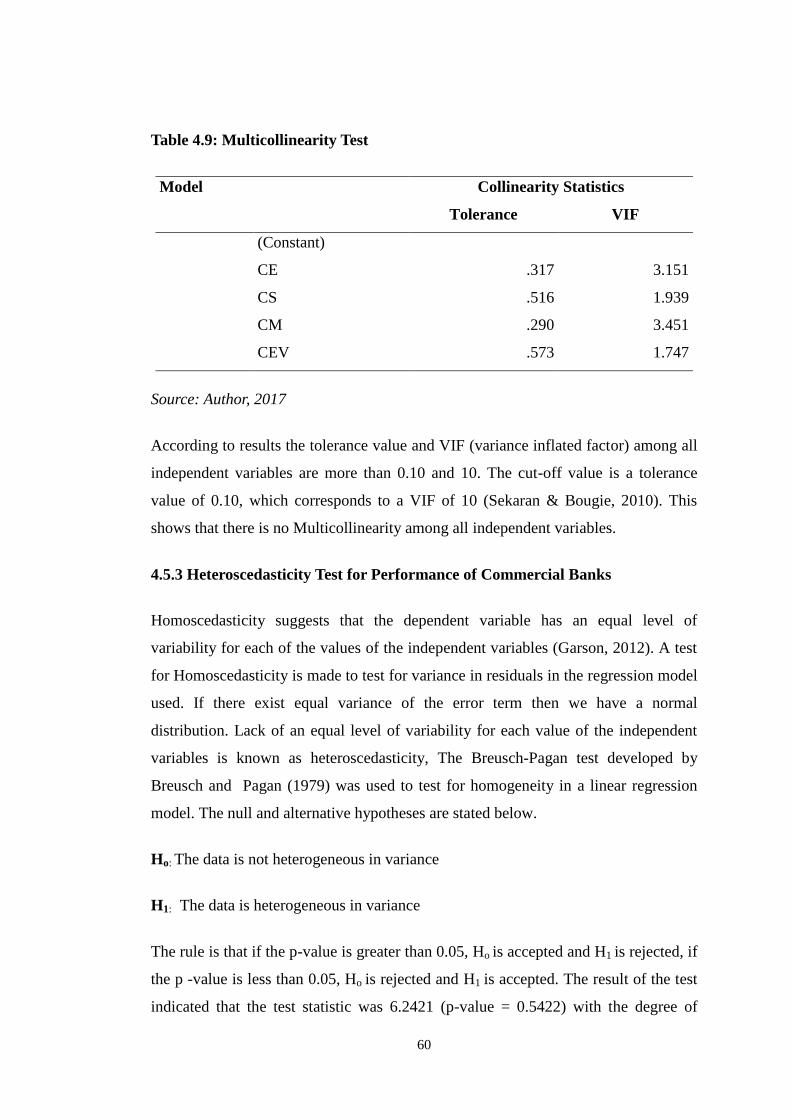
60
Table 4.9: Multicollinearity Test
Model Collinearity Statistics
Tolerance VIF
(Constant)
CE .317 3.151
CS .516 1.939
CM .290 3.451
CEV .573 1.747
Source: Author, 2017
According to results the tolerance value and VIF (variance inflated factor) among all
independent variables are more than 0.10 and 10. The cut-off value is a tolerance
value of 0.10, which corresponds to a VIF of 10 (Sekaran & Bougie, 2010). This
shows that there is no Multicollinearity among all independent variables.
4.5.3 Heteroscedasticity Test for Performance of Commercial Banks
Homoscedasticity suggests that the dependent variable has an equal level of
variability for each of the values of the independent variables (Garson, 2012). A test
for Homoscedasticity is made to test for variance in residuals in the regression model
used. If there exist equal variance of the error term then we have a normal
distribution. Lack of an equal level of variability for each value of the independent
variables is known as heteroscedasticity, The Breusch-Pagan test developed by
Breusch and Pagan (1979) was used to test for homogeneity in a linear regression
model. The null and alternative hypotheses are stated below.
Ho: The data is not heterogeneous in variance
H1: The data is heterogeneous in variance
The rule is that if the p-value is greater than 0.05, Ho is accepted and H1 is rejected, if
the p -value is less than 0.05, Ho is rejected and H1 is accepted. The result of the test
indicated that the test statistic was 6.2421 (p-value = 0.5422) with the degree of
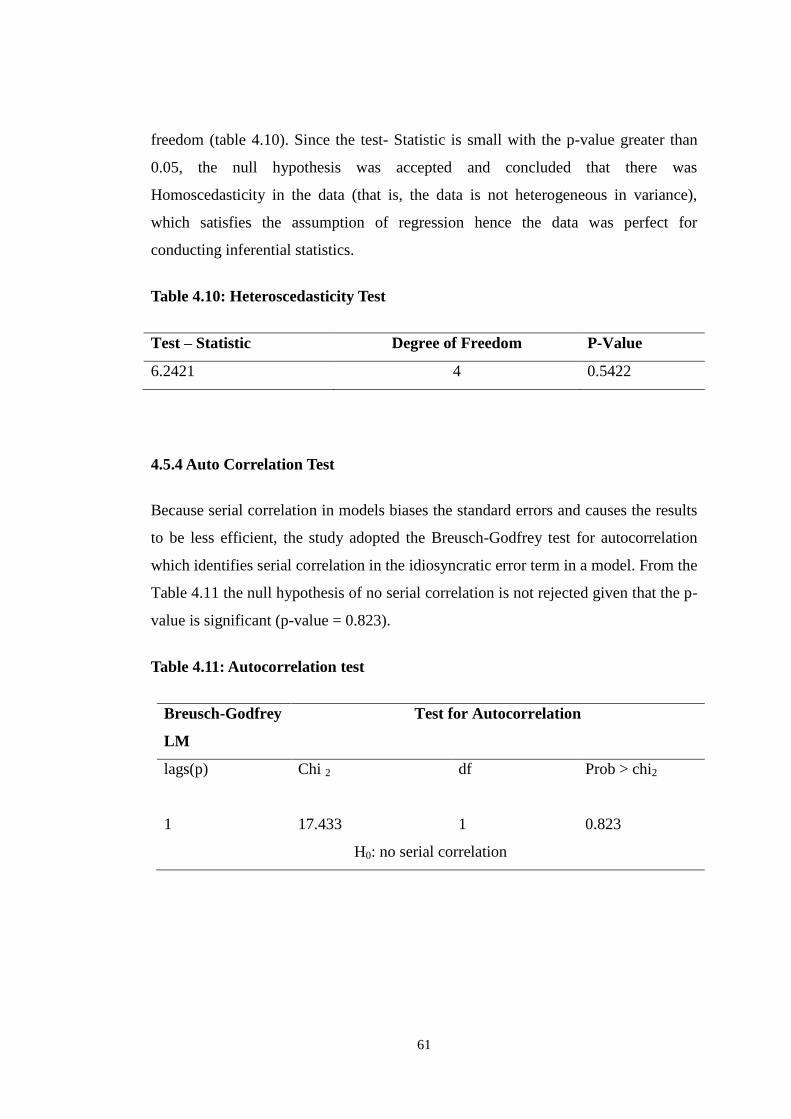
61
freedom (table 4.10). Since the test- Statistic is small with the p-value greater than
0.05, the null hypothesis was accepted and concluded that there was
Homoscedasticity in the data (that is, the data is not heterogeneous in variance),
which satisfies the assumption of regression hence the data was perfect for
conducting inferential statistics.
Table 4.10: Heteroscedasticity Test
Test – Statistic Degree of Freedom P-Value
6.2421 4 0.5422
4.5.4 Auto Correlation Test
Because serial correlation in models biases the standard errors and causes the results
to be less efficient, the study adopted the Breusch-Godfrey test for autocorrelation
which identifies serial correlation in the idiosyncratic error term in a model. From the
Table 4.11 the null hypothesis of no serial correlation is not rejected given that the p-
value is significant (p-value = 0.823).
Table 4.11: Autocorrelation test
Breusch-Godfrey
LM
Test for Autocorrelation
lags(p) Chi 2 df Prob > chi2
1 17.433 1 0.823
H0: no serial correlation
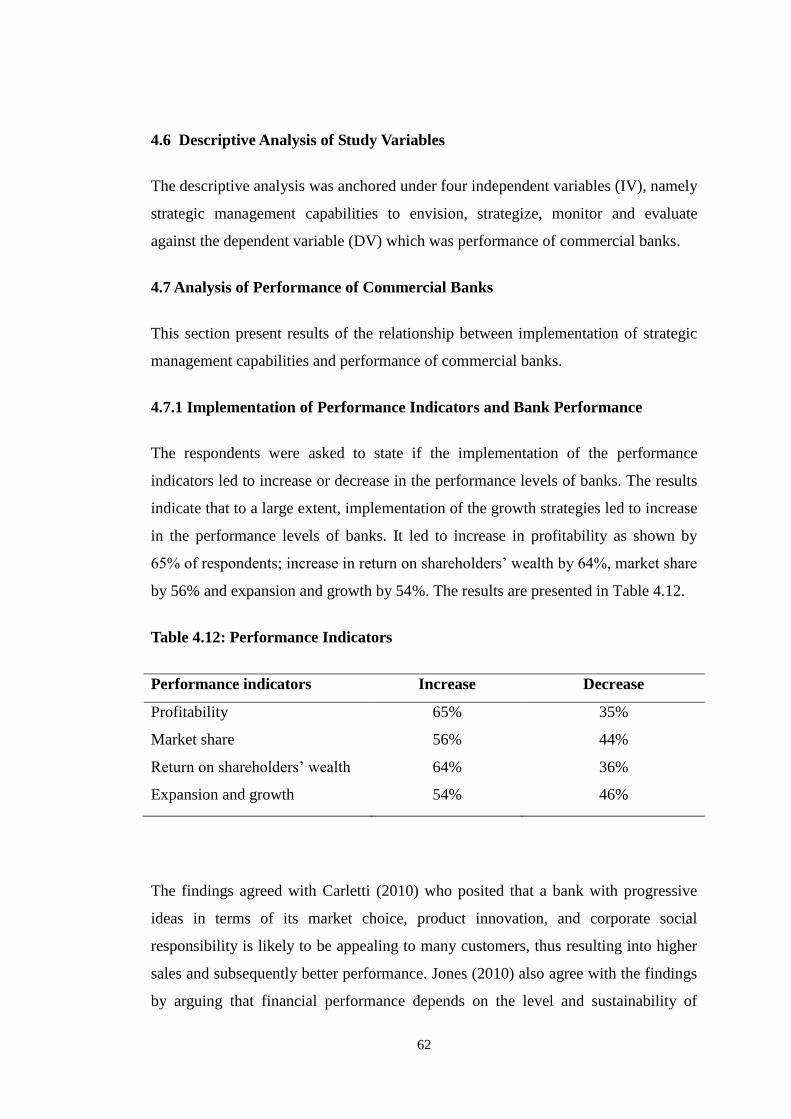
62
4.6 Descriptive Analysis of Study Variables
The descriptive analysis was anchored under four independent variables (IV), namely
strategic management capabilities to envision, strategize, monitor and evaluate
against the dependent variable (DV) which was performance of commercial banks.
4.7 Analysis of Performance of Commercial Banks
This section present results of the relationship between implementation of strategic
management capabilities and performance of commercial banks.
4.7.1 Implementation of Performance Indicators and Bank Performance
The respondents were asked to state if the implementation of the performance
indicators led to increase or decrease in the performance levels of banks. The results
indicate that to a large extent, implementation of the growth strategies led to increase
in the performance levels of banks. It led to increase in profitability as shown by
65% of respondents; increase in return on shareholders‟ wealth by 64%, market share
by 56% and expansion and growth by 54%. The results are presented in Table 4.12.
Table 4.12: Performance Indicators
Performance indicators Increase Decrease
Profitability 65% 35%
Market share 56% 44%
Return on shareholders‟ wealth 64% 36%
Expansion and growth 54% 46%
The findings agreed with Carletti (2010) who posited that a bank with progressive
ideas in terms of its market choice, product innovation, and corporate social
responsibility is likely to be appealing to many customers, thus resulting into higher
sales and subsequently better performance. Jones (2010) also agree with the findings
by arguing that financial performance depends on the level and sustainability of
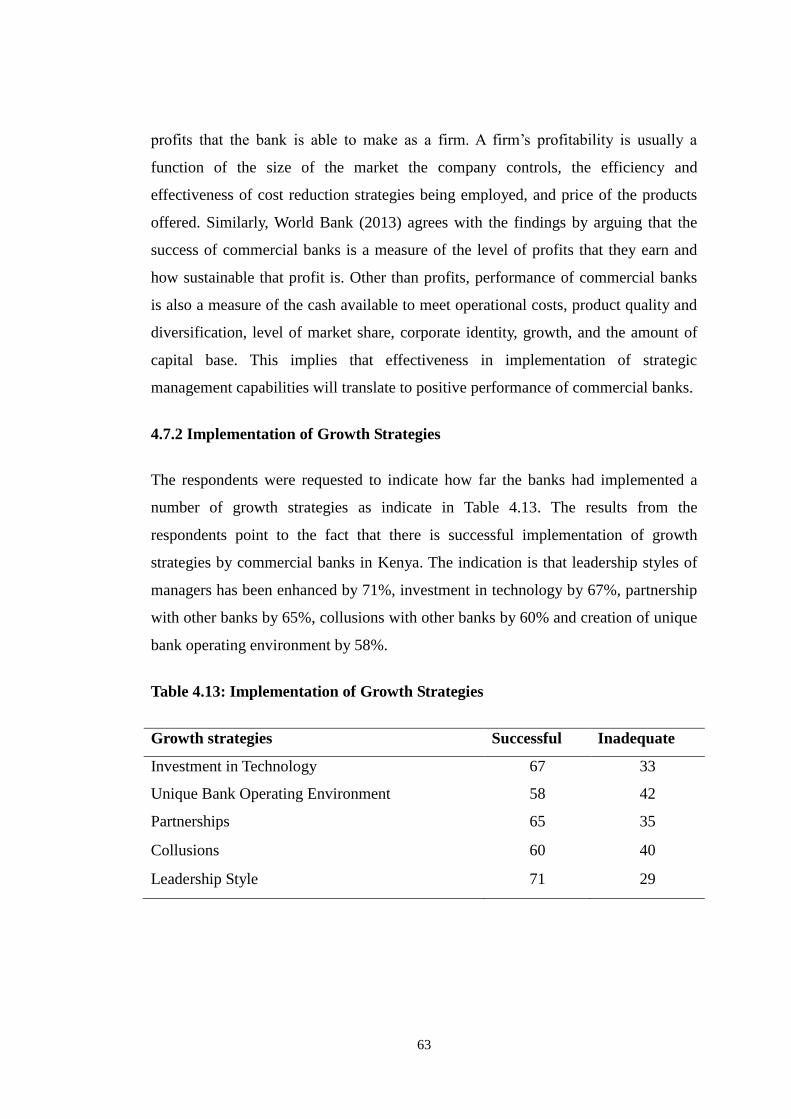
63
profits that the bank is able to make as a firm. A firm‟s profitability is usually a
function of the size of the market the company controls, the efficiency and
effectiveness of cost reduction strategies being employed, and price of the products
offered. Similarly, World Bank (2013) agrees with the findings by arguing that the
success of commercial banks is a measure of the level of profits that they earn and
how sustainable that profit is. Other than profits, performance of commercial banks
is also a measure of the cash available to meet operational costs, product quality and
diversification, level of market share, corporate identity, growth, and the amount of
capital base. This implies that effectiveness in implementation of strategic
management capabilities will translate to positive performance of commercial banks.
4.7.2 Implementation of Growth Strategies
The respondents were requested to indicate how far the banks had implemented a
number of growth strategies as indicate in Table 4.13. The results from the
respondents point to the fact that there is successful implementation of growth
strategies by commercial banks in Kenya. The indication is that leadership styles of
managers has been enhanced by 71%, investment in technology by 67%, partnership
with other banks by 65%, collusions with other banks by 60% and creation of unique
bank operating environment by 58%.
Table 4.13: Implementation of Growth Strategies
Growth strategies Successful Inadequate
Investment in Technology 67 33
Unique Bank Operating Environment 58 42
Partnerships 65 35
Collusions 60 40
Leadership Style 71 29
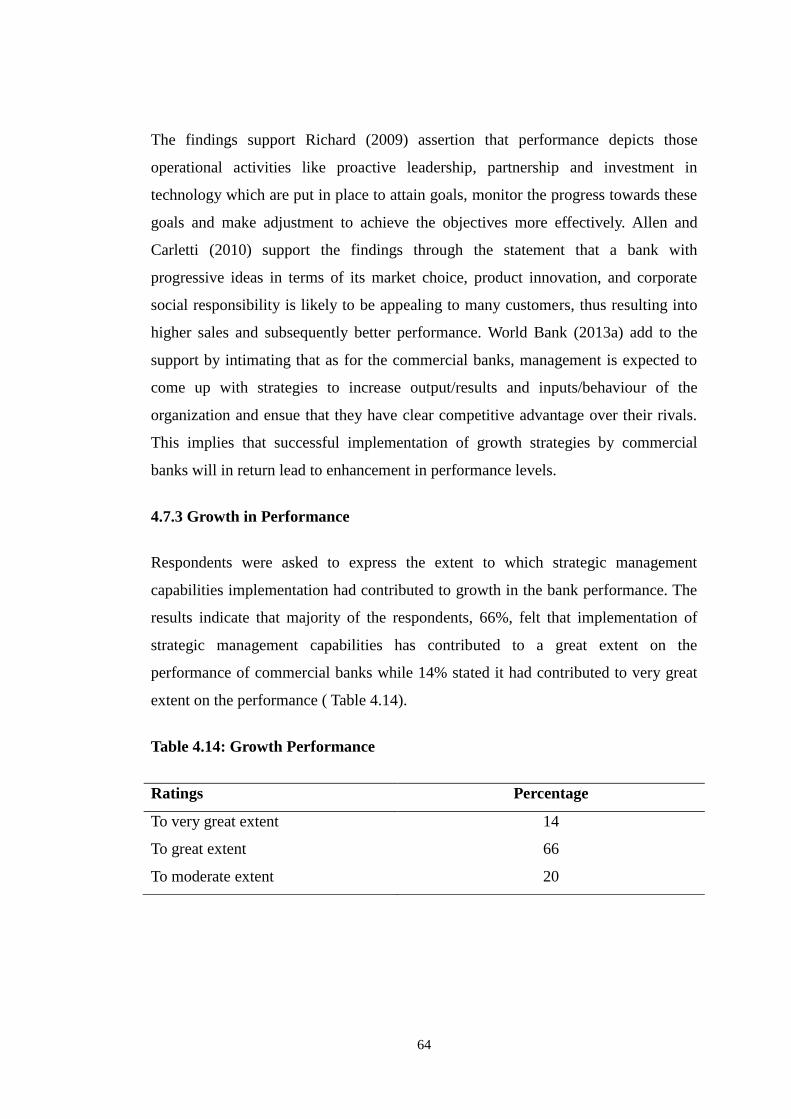
64
The findings support Richard (2009) assertion that performance depicts those
operational activities like proactive leadership, partnership and investment in
technology which are put in place to attain goals, monitor the progress towards these
goals and make adjustment to achieve the objectives more effectively. Allen and
Carletti (2010) support the findings through the statement that a bank with
progressive ideas in terms of its market choice, product innovation, and corporate
social responsibility is likely to be appealing to many customers, thus resulting into
higher sales and subsequently better performance. World Bank (2013a) add to the
support by intimating that as for the commercial banks, management is expected to
come up with strategies to increase output/results and inputs/behaviour of the
organization and ensue that they have clear competitive advantage over their rivals.
This implies that successful implementation of growth strategies by commercial
banks will in return lead to enhancement in performance levels.
4.7.3 Growth in Performance
Respondents were asked to express the extent to which strategic management
capabilities implementation had contributed to growth in the bank performance. The
results indicate that majority of the respondents, 66%, felt that implementation of
strategic management capabilities has contributed to a great extent on the
performance of commercial banks while 14% stated it had contributed to very great
extent on the performance ( Table 4.14).
Table 4.14: Growth Performance
Ratings Percentage
To very great extent 14
To great extent 66
To moderate extent 20
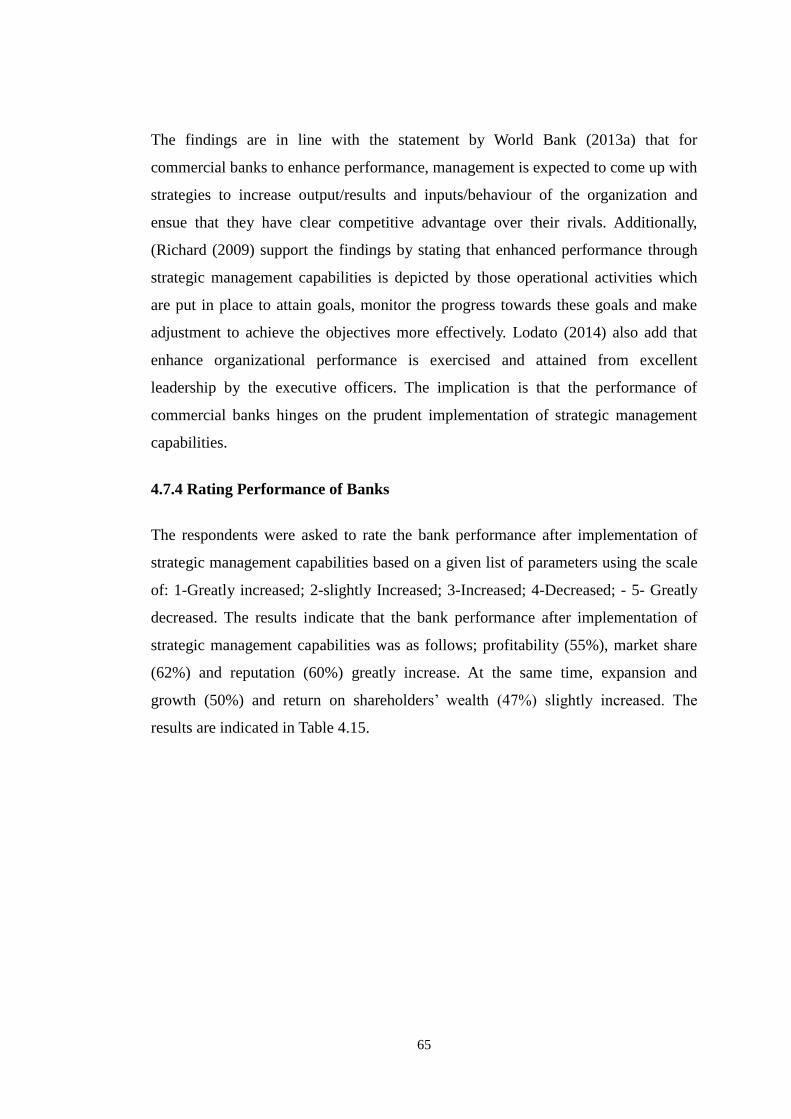
65
The findings are in line with the statement by World Bank (2013a) that for
commercial banks to enhance performance, management is expected to come up with
strategies to increase output/results and inputs/behaviour of the organization and
ensue that they have clear competitive advantage over their rivals. Additionally,
(Richard (2009) support the findings by stating that enhanced performance through
strategic management capabilities is depicted by those operational activities which
are put in place to attain goals, monitor the progress towards these goals and make
adjustment to achieve the objectives more effectively. Lodato (2014) also add that
enhance organizational performance is exercised and attained from excellent
leadership by the executive officers. The implication is that the performance of
commercial banks hinges on the prudent implementation of strategic management
capabilities.
4.7.4 Rating Performance of Banks
The respondents were asked to rate the bank performance after implementation of
strategic management capabilities based on a given list of parameters using the scale
of: 1-Greatly increased; 2-slightly Increased; 3-Increased; 4-Decreased; - 5- Greatly
decreased. The results indicate that the bank performance after implementation of
strategic management capabilities was as follows; profitability (55%), market share
(62%) and reputation (60%) greatly increase. At the same time, expansion and
growth (50%) and return on shareholders‟ wealth (47%) slightly increased. The
results are indicated in Table 4.15.
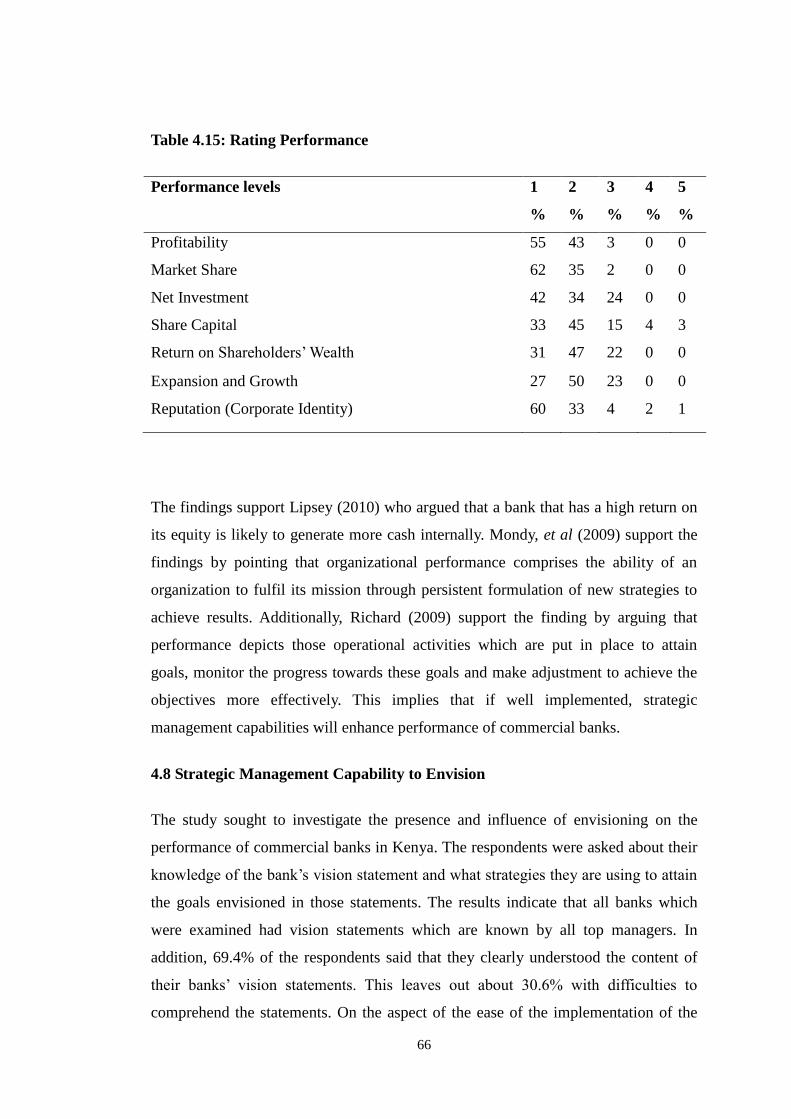
66
Table 4.15: Rating Performance
Performance levels 1 2 3 4 5
% % % % %
Profitability 55 43 3 0 0
Market Share 62 35 2 0 0
Net Investment 42 34 24 0 0
Share Capital 33 45 15 4 3
Return on Shareholders‟ Wealth 31 47 22 0 0
Expansion and Growth 27 50 23 0 0
Reputation (Corporate Identity) 60 33 4 2 1
The findings support Lipsey (2010) who argued that a bank that has a high return on
its equity is likely to generate more cash internally. Mondy, et al (2009) support the
findings by pointing that organizational performance comprises the ability of an
organization to fulfil its mission through persistent formulation of new strategies to
achieve results. Additionally, Richard (2009) support the finding by arguing that
performance depicts those operational activities which are put in place to attain
goals, monitor the progress towards these goals and make adjustment to achieve the
objectives more effectively. This implies that if well implemented, strategic
management capabilities will enhance performance of commercial banks.
4.8 Strategic Management Capability to Envision
The study sought to investigate the presence and influence of envisioning on the
performance of commercial banks in Kenya. The respondents were asked about their
knowledge of the bank‟s vision statement and what strategies they are using to attain
the goals envisioned in those statements. The results indicate that all banks which
were examined had vision statements which are known by all top managers. In
addition, 69.4% of the respondents said that they clearly understood the content of
their banks‟ vision statements. This leaves out about 30.6% with difficulties to
comprehend the statements. On the aspect of the ease of the implementation of the
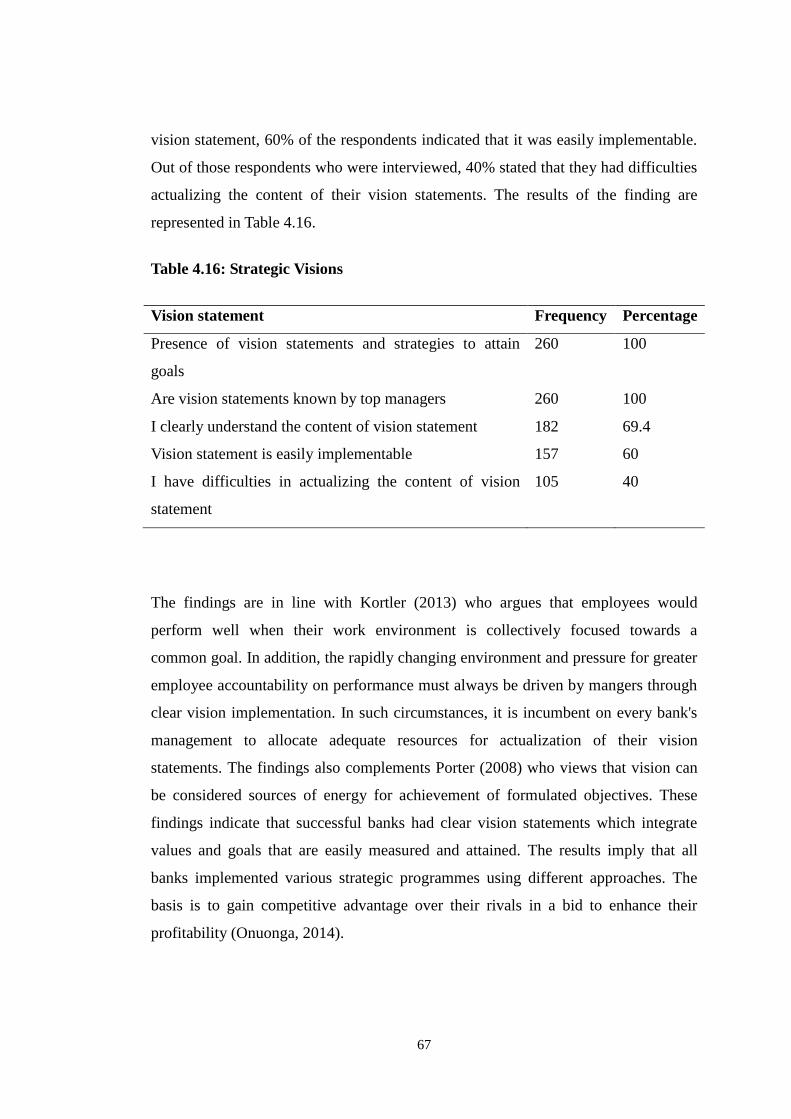
67
vision statement, 60% of the respondents indicated that it was easily implementable.
Out of those respondents who were interviewed, 40% stated that they had difficulties
actualizing the content of their vision statements. The results of the finding are
represented in Table 4.16.
Table 4.16: Strategic Visions
Vision statement Frequency Percentage
Presence of vision statements and strategies to attain
goals
260 100
Are vision statements known by top managers 260 100
I clearly understand the content of vision statement 182 69.4
Vision statement is easily implementable 157 60
I have difficulties in actualizing the content of vision
statement
105 40
The findings are in line with Kortler (2013) who argues that employees would
perform well when their work environment is collectively focused towards a
common goal. In addition, the rapidly changing environment and pressure for greater
employee accountability on performance must always be driven by mangers through
clear vision implementation. In such circumstances, it is incumbent on every bank's
management to allocate adequate resources for actualization of their vision
statements. The findings also complements Porter (2008) who views that vision can
be considered sources of energy for achievement of formulated objectives. These
findings indicate that successful banks had clear vision statements which integrate
values and goals that are easily measured and attained. The results imply that all
banks implemented various strategic programmes using different approaches. The
basis is to gain competitive advantage over their rivals in a bid to enhance their
profitability (Onuonga, 2014).
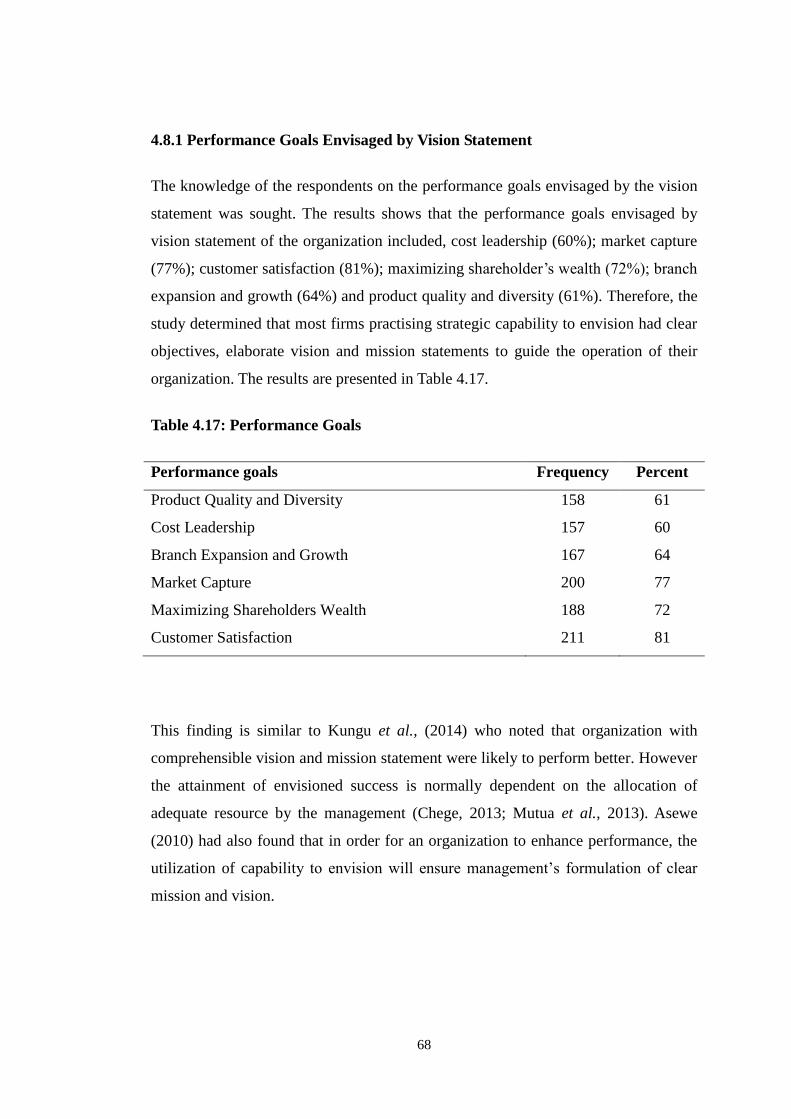
68
4.8.1 Performance Goals Envisaged by Vision Statement
The knowledge of the respondents on the performance goals envisaged by the vision
statement was sought. The results shows that the performance goals envisaged by
vision statement of the organization included, cost leadership (60%); market capture
(77%); customer satisfaction (81%); maximizing shareholder‟s wealth (72%); branch
expansion and growth (64%) and product quality and diversity (61%). Therefore, the
study determined that most firms practising strategic capability to envision had clear
objectives, elaborate vision and mission statements to guide the operation of their
organization. The results are presented in Table 4.17.
Table 4.17: Performance Goals
Performance goals Frequency Percent
Product Quality and Diversity 158 61
Cost Leadership 157 60
Branch Expansion and Growth 167 64
Market Capture 200 77
Maximizing Shareholders Wealth 188 72
Customer Satisfaction 211 81
This finding is similar to Kungu et al., (2014) who noted that organization with
comprehensible vision and mission statement were likely to perform better. However
the attainment of envisioned success is normally dependent on the allocation of
adequate resource by the management (Chege, 2013; Mutua et al., 2013). Asewe
(2010) had also found that in order for an organization to enhance performance, the
utilization of capability to envision will ensure management‟s formulation of clear
mission and vision.
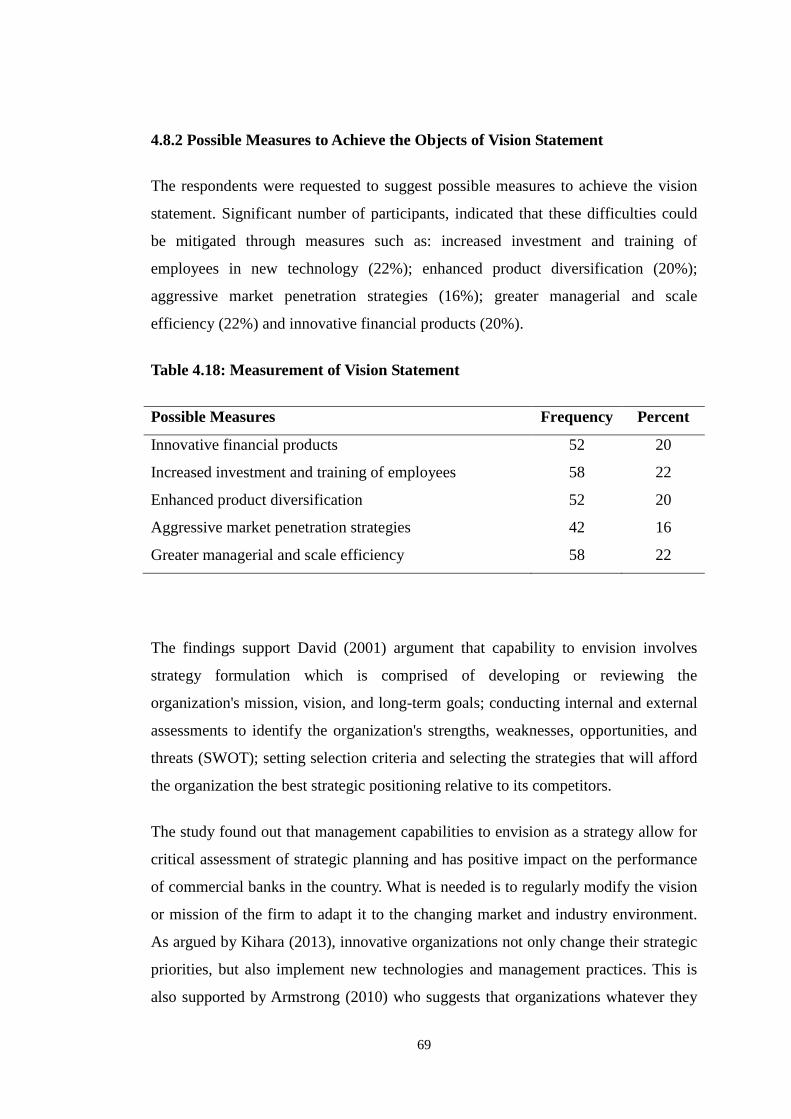
69
4.8.2 Possible Measures to Achieve the Objects of Vision Statement
The respondents were requested to suggest possible measures to achieve the vision
statement. Significant number of participants, indicated that these difficulties could
be mitigated through measures such as: increased investment and training of
employees in new technology (22%); enhanced product diversification (20%);
aggressive market penetration strategies (16%); greater managerial and scale
efficiency (22%) and innovative financial products (20%).
Table 4.18: Measurement of Vision Statement
Possible Measures Frequency Percent
Innovative financial products 52 20
Increased investment and training of employees 58 22
Enhanced product diversification 52 20
Aggressive market penetration strategies 42 16
Greater managerial and scale efficiency 58 22
The findings support David (2001) argument that capability to envision involves
strategy formulation which is comprised of developing or reviewing the
organization's mission, vision, and long-term goals; conducting internal and external
assessments to identify the organization's strengths, weaknesses, opportunities, and
threats (SWOT); setting selection criteria and selecting the strategies that will afford
the organization the best strategic positioning relative to its competitors.
The study found out that management capabilities to envision as a strategy allow for
critical assessment of strategic planning and has positive impact on the performance
of commercial banks in the country. What is needed is to regularly modify the vision
or mission of the firm to adapt it to the changing market and industry environment.
As argued by Kihara (2013), innovative organizations not only change their strategic
priorities, but also implement new technologies and management practices. This is
also supported by Armstrong (2010) who suggests that organizations whatever they
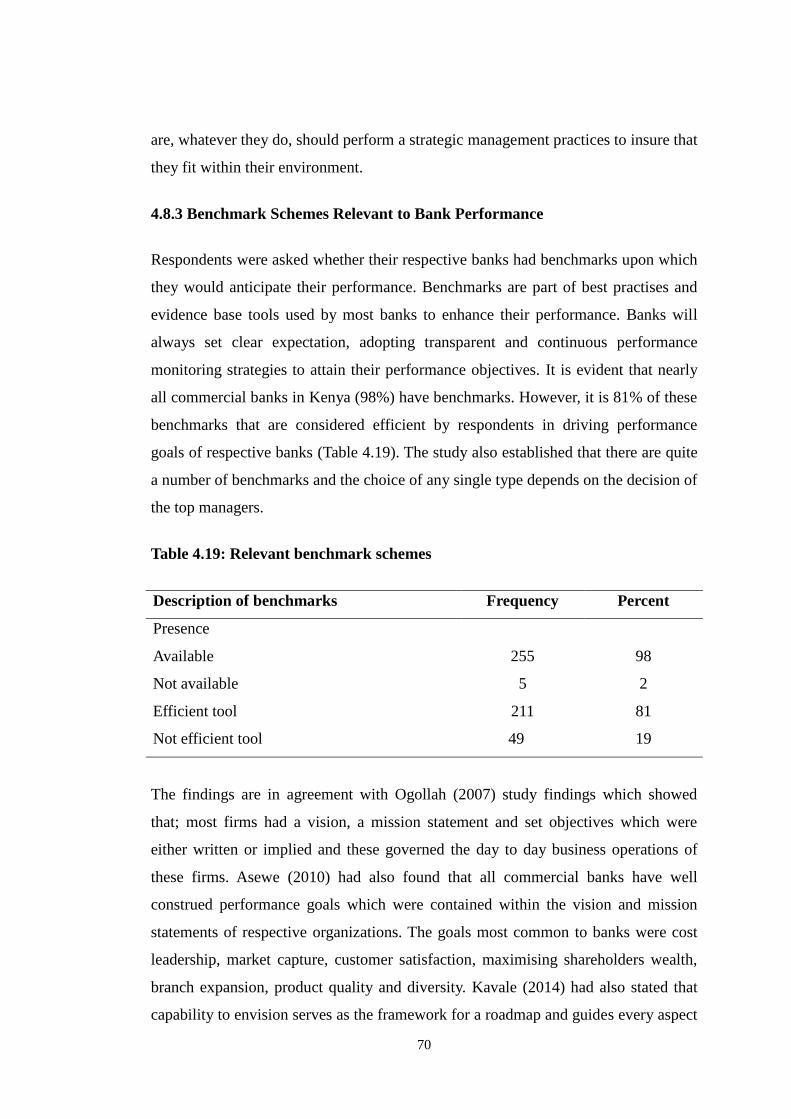
70
are, whatever they do, should perform a strategic management practices to insure that
they fit within their environment.
4.8.3 Benchmark Schemes Relevant to Bank Performance
Respondents were asked whether their respective banks had benchmarks upon which
they would anticipate their performance. Benchmarks are part of best practises and
evidence base tools used by most banks to enhance their performance. Banks will
always set clear expectation, adopting transparent and continuous performance
monitoring strategies to attain their performance objectives. It is evident that nearly
all commercial banks in Kenya (98%) have benchmarks. However, it is 81% of these
benchmarks that are considered efficient by respondents in driving performance
goals of respective banks (Table 4.19). The study also established that there are quite
a number of benchmarks and the choice of any single type depends on the decision of
the top managers.
Table 4.19: Relevant benchmark schemes
Description of benchmarks Frequency Percent
Presence
Available
Not available
255 98
5 2
Efficient tool
Not efficient tool
211 81
49 19
The findings are in agreement with Ogollah (2007) study findings which showed
that; most firms had a vision, a mission statement and set objectives which were
either written or implied and these governed the day to day business operations of
these firms. Asewe (2010) had also found that all commercial banks have well
construed performance goals which were contained within the vision and mission
statements of respective organizations. The goals most common to banks were cost
leadership, market capture, customer satisfaction, maximising shareholders wealth,
branch expansion, product quality and diversity. Kavale (2014) had also stated that
capability to envision serves as the framework for a roadmap and guides every aspect
71
of an organization by describing what needs to be accomplished by the vision and
mission in order to continue achieving sustainable, quality growth.
4.8.4 Common Benchmarks Used By Commercial Banks in Kenya
The study sought to establish which benchmark schemes are commonly used by
commercial banks in Kenya. This was meant to gauge the application of best
practices by local banks to enhance their performance. The respondents indicated
that there are 13 benchmarks commonly used by commercial banks in Kenya. It can
be deduced that performance management schemes is the most commonly used
benchmarks. This was identified by 95% of all the 260 interviewee. The least of the
13 identified benchmarks is aggressive digitization at 31%. This could explain poor
risk management of digital frauds and other challenges which are fast becoming
common in the industry.
The findings add weight to Nabela (2014) statement that just as every product or
business unit must follow a business strategy to improve its competitive position,
every corporation must decide its orientation towards growth by projecting
achievable benchmarks aimed at enhancement of performance. The study by Kavale
(2014) had noted that banks have benchmarks to assist in setting up clear
expectation, adopting transparent and continuous performance monitoring strategies
to attain their performance objectives. Consequently most banks were able to better
performance by using benchmarks which have been tested elsewhere. This is
consistent with Kungu et al. (2014) assertion that those firms which adapt evidenced
based benchmarks often register successful outputs. The perceptions of the
respondents are captured in the Table 4.20.
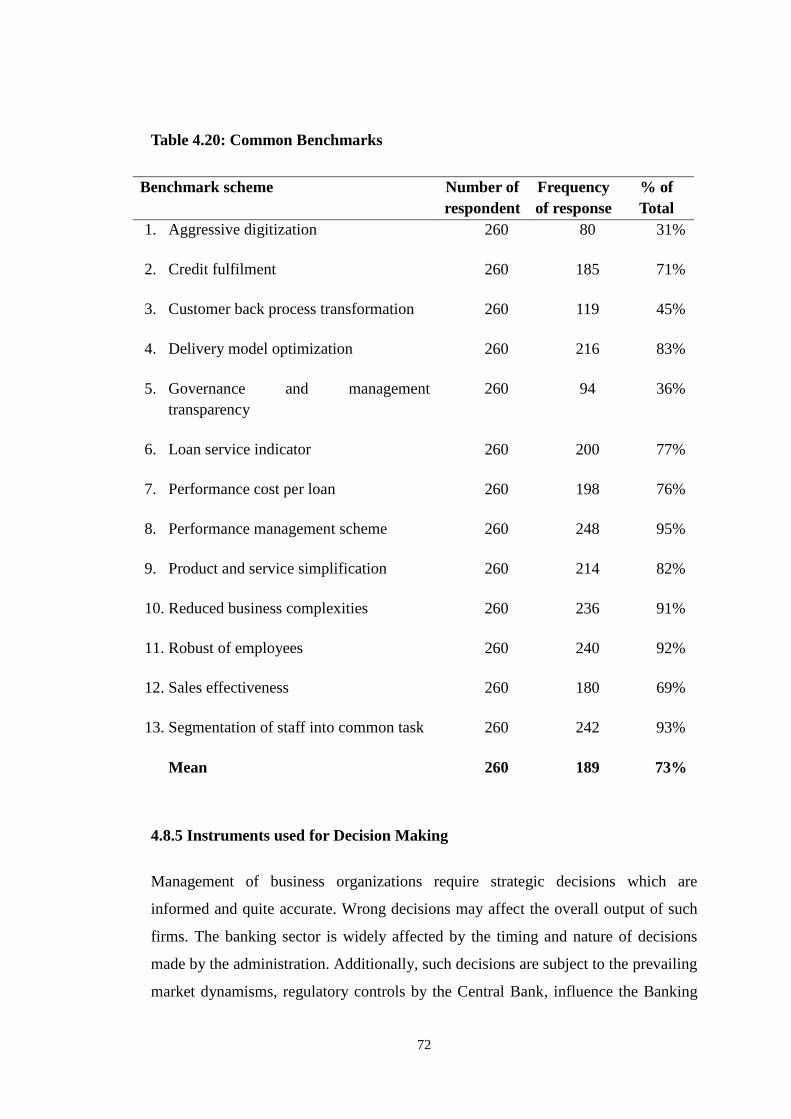
72
Table 4.20: Common Benchmarks
4.8.5 Instruments used for Decision Making
Management of business organizations require strategic decisions which are
informed and quite accurate. Wrong decisions may affect the overall output of such
firms. The banking sector is widely affected by the timing and nature of decisions
made by the administration. Additionally, such decisions are subject to the prevailing
market dynamisms, regulatory controls by the Central Bank, influence the Banking
Benchmark scheme Number of
respondent
Frequency
of response
% of
Total
1. Aggressive digitization 260 80 31%
2. Credit fulfilment 260 185 71%
3. Customer back process transformation 260 119 45%
4. Delivery model optimization 260 216 83%
5. Governance and management
transparency
260 94 36%
6. Loan service indicator 260 200 77%
7. Performance cost per loan 260 198 76%
8. Performance management scheme 260 248 95%
9. Product and service simplification 260 214 82%
10. Reduced business complexities 260 236 91%
11. Robust of employees 260 240 92%
12. Sales effectiveness 260 180 69%
13. Segmentation of staff into common task 260 242 93%
Mean 260 189 73%
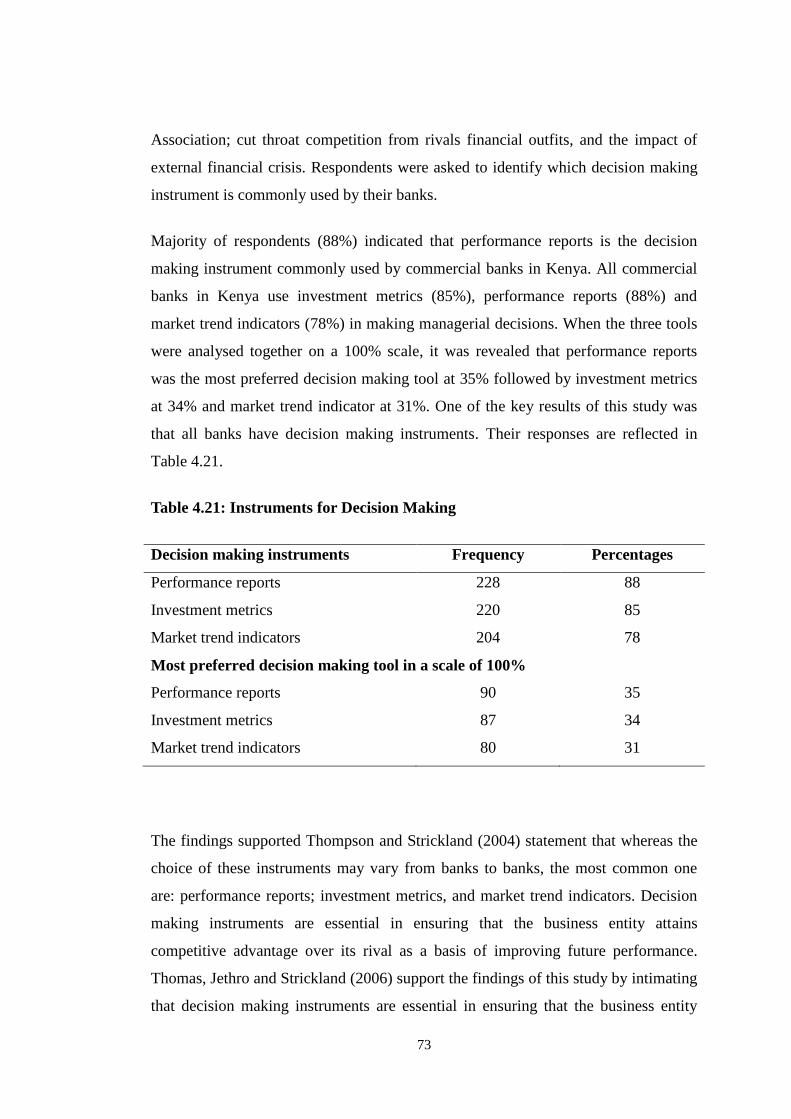
73
Association; cut throat competition from rivals financial outfits, and the impact of
external financial crisis. Respondents were asked to identify which decision making
instrument is commonly used by their banks.
Majority of respondents (88%) indicated that performance reports is the decision
making instrument commonly used by commercial banks in Kenya. All commercial
banks in Kenya use investment metrics (85%), performance reports (88%) and
market trend indicators (78%) in making managerial decisions. When the three tools
were analysed together on a 100% scale, it was revealed that performance reports
was the most preferred decision making tool at 35% followed by investment metrics
at 34% and market trend indicator at 31%. One of the key results of this study was
that all banks have decision making instruments. Their responses are reflected in
Table 4.21.
Table 4.21: Instruments for Decision Making
Decision making instruments Frequency Percentages
Performance reports 228 88
Investment metrics 220 85
Market trend indicators 204 78
Most preferred decision making tool in a scale of 100%
Performance reports 90 35
Investment metrics 87 34
Market trend indicators 80 31
The findings supported Thompson and Strickland (2004) statement that whereas the
choice of these instruments may vary from banks to banks, the most common one
are: performance reports; investment metrics, and market trend indicators. Decision
making instruments are essential in ensuring that the business entity attains
competitive advantage over its rival as a basis of improving future performance.
Thomas, Jethro and Strickland (2006) support the findings of this study by intimating
that decision making instruments are essential in ensuring that the business entity
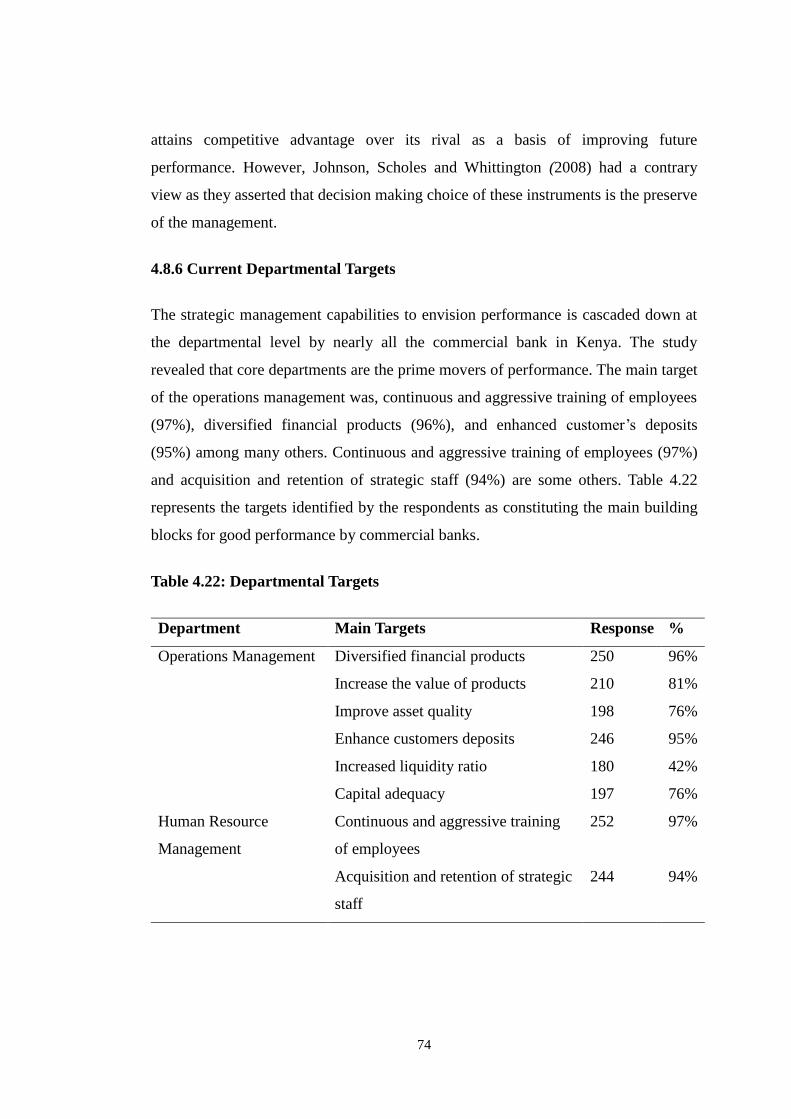
74
attains competitive advantage over its rival as a basis of improving future
performance. However, Johnson, Scholes and Whittington (2008) had a contrary
view as they asserted that decision making choice of these instruments is the preserve
of the management.
4.8.6 Current Departmental Targets
The strategic management capabilities to envision performance is cascaded down at
the departmental level by nearly all the commercial bank in Kenya. The study
revealed that core departments are the prime movers of performance. The main target
of the operations management was, continuous and aggressive training of employees
(97%), diversified financial products (96%), and enhanced customer‟s deposits
(95%) among many others. Continuous and aggressive training of employees (97%)
and acquisition and retention of strategic staff (94%) are some others. Table 4.22
represents the targets identified by the respondents as constituting the main building
blocks for good performance by commercial banks.
Table 4.22: Departmental Targets
Department Main Targets Response %
Operations Management Diversified financial products 250 96%
Increase the value of products 210 81%
Improve asset quality 198 76%
Enhance customers deposits 246 95%
Increased liquidity ratio 180 42%
Capital adequacy 197 76%
Human Resource
Management
Continuous and aggressive training
of employees
252 97%
Acquisition and retention of strategic
staff
244 94%
75
The information above specifies that commercial banks performance goals are
actualised at the departmental level. Ogollah (2007) support these sentiments by
indicating that banks lay more emphasis on human resource training as the main
driving force for attaining higher performance. Thomas, Jethro and Strickland (2006)
agree with the findings by stating that capability to envision involves cascading the
information to the departments through strategy formulation which is comprised of
developing or reviewing the organization's mission, vision, and long-term goals;
conducting internal and external assessments to identify the organization's strengths,
weaknesses, opportunities, and threats (SWOT). Watuka (2014) add on the same by
indicating that at the departmental level there is continuous and aggressive training
of employees and acquisition and retention of strategic staff through best setting
selection criteria and selecting the strategies that will afford the organization the best
strategic positioning relative to its competitors.
4.8.7 Involvement of Stakeholders in Developing Mission Statements
Respondents were asked to rate the involvement of select key stakeholders in the
development of their bank‟s mission statements. Eighty six (86%) of participants
perceived the managers being very much involved in the development of commercial
banks' mission statement while 60% felt that the employees as rarely involved. About
73% observed that customers are not involved at all in developing mission statement
even though they are the main focus of any performance aspiration of the banks.
About 54% said that the board of directors are involved alluding to the fact that in
some occasion it is the managers who come up with policies and sell them to the
board. The results are as shown in Table 4.23.
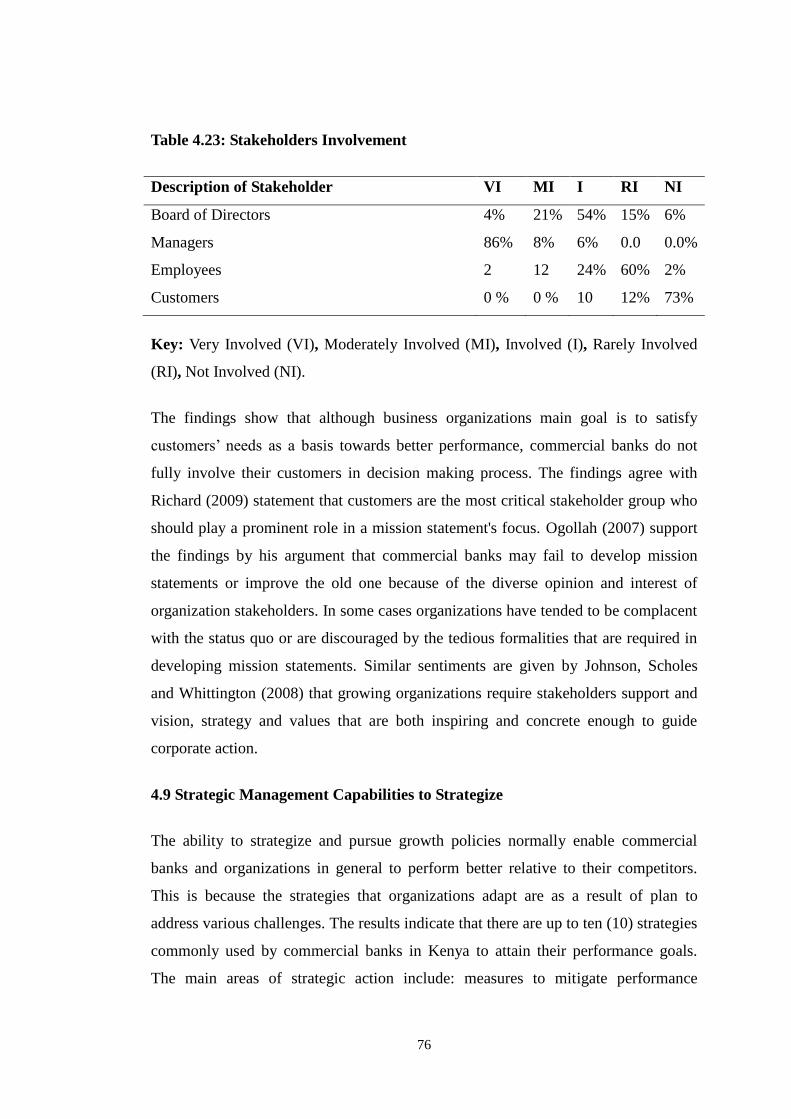
76
Table 4.23: Stakeholders Involvement
Description of Stakeholder VI MI I RI NI
Board of Directors 4% 21% 54% 15% 6%
Managers 86% 8% 6% 0.0 0.0%
Employees 2 12 24% 60% 2%
Customers 0 % 0 % 10 12% 73%
Key: Very Involved (VI), Moderately Involved (MI), Involved (I), Rarely Involved
(RI), Not Involved (NI).
The findings show that although business organizations main goal is to satisfy
customers‟ needs as a basis towards better performance, commercial banks do not
fully involve their customers in decision making process. The findings agree with
Richard (2009) statement that customers are the most critical stakeholder group who
should play a prominent role in a mission statement's focus. Ogollah (2007) support
the findings by his argument that commercial banks may fail to develop mission
statements or improve the old one because of the diverse opinion and interest of
organization stakeholders. In some cases organizations have tended to be complacent
with the status quo or are discouraged by the tedious formalities that are required in
developing mission statements. Similar sentiments are given by Johnson, Scholes
and Whittington (2008) that growing organizations require stakeholders support and
vision, strategy and values that are both inspiring and concrete enough to guide
corporate action.
4.9 Strategic Management Capabilities to Strategize
The ability to strategize and pursue growth policies normally enable commercial
banks and organizations in general to perform better relative to their competitors.
This is because the strategies that organizations adapt are as a result of plan to
address various challenges. The results indicate that there are up to ten (10) strategies
commonly used by commercial banks in Kenya to attain their performance goals.
The main areas of strategic action include: measures to mitigate performance
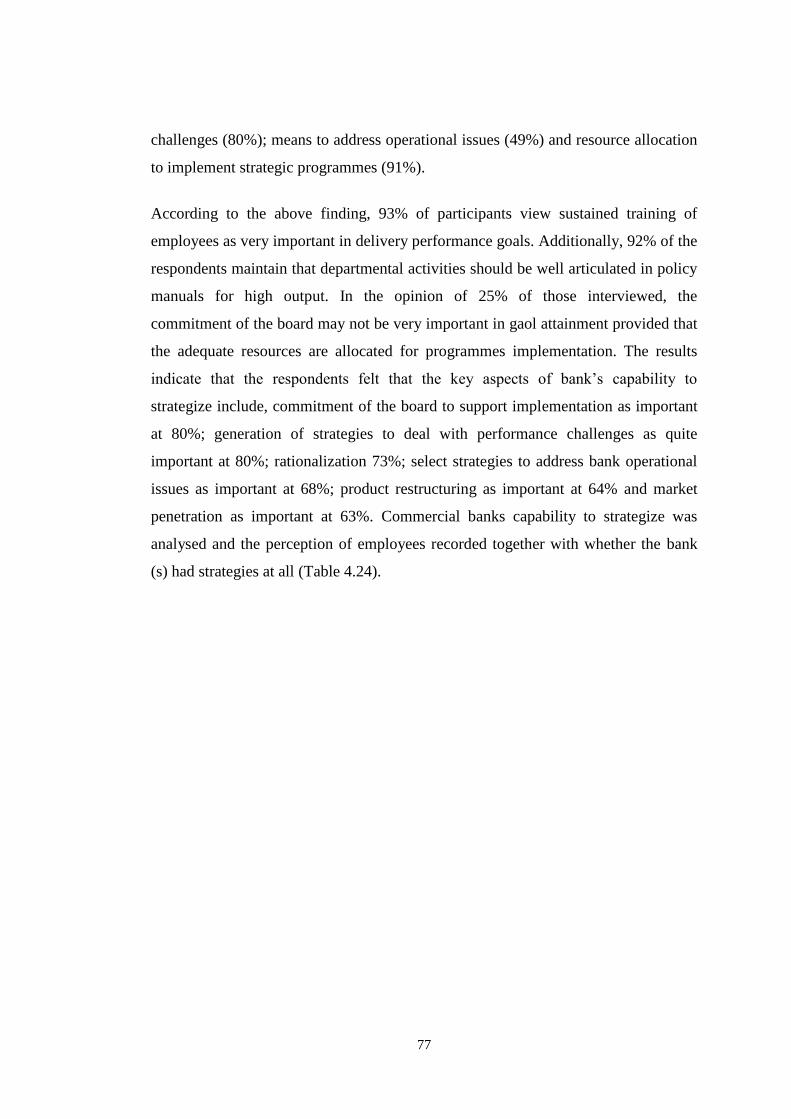
77
challenges (80%); means to address operational issues (49%) and resource allocation
to implement strategic programmes (91%).
According to the above finding, 93% of participants view sustained training of
employees as very important in delivery performance goals. Additionally, 92% of the
respondents maintain that departmental activities should be well articulated in policy
manuals for high output. In the opinion of 25% of those interviewed, the
commitment of the board may not be very important in gaol attainment provided that
the adequate resources are allocated for programmes implementation. The results
indicate that the respondents felt that the key aspects of bank‟s capability to
strategize include, commitment of the board to support implementation as important
at 80%; generation of strategies to deal with performance challenges as quite
important at 80%; rationalization 73%; select strategies to address bank operational
issues as important at 68%; product restructuring as important at 64% and market
penetration as important at 63%. Commercial banks capability to strategize was
analysed and the perception of employees recorded together with whether the bank
(s) had strategies at all (Table 4.24).
78
Table 4.24: Strategic Management Capabilities to Strategize
Strategic aspects VI QI I NI NE
1. Generate strategies to deal with performance
challenges
80% 17% 3% 0% 0%
2. Select strategies to address bank operational
issues
49% 37% 14% 0% 0%
3. Maintenance of Policy manuals for individual
departments
92% 6% 2% 0% 0%
4. Regular update of bank policies 83% 11% 6% 0% 0%
5. Allocation of adequate funding to specific bank
programmes
91% 3% 6% 0% 0%
6. The commitment of the board to support
implementation of strategic initiatives
25% 34% 41% 0% 0%
7. Rationalization 81% 11% 6% 2% 0%
8. Retraining – skills development 93 5% 2% 0% 0%
9. Product restructuring 74% 22% 0% 0% 0%
10. Market penetration 69% 31% 0% 0% 0%
Key: Very Important (VI), Quite Important (QI), Important (I), Not Important (NI)
and Not existing (NE),
The results are in contrast with Hill and Jones (2009) argument that the most vital
capability to strategize is about the choice of the tactics and techniques for the firm
as a whole, managing various product lines and business units for maximum value
regular update of bank policies and market penetration capability which helps to
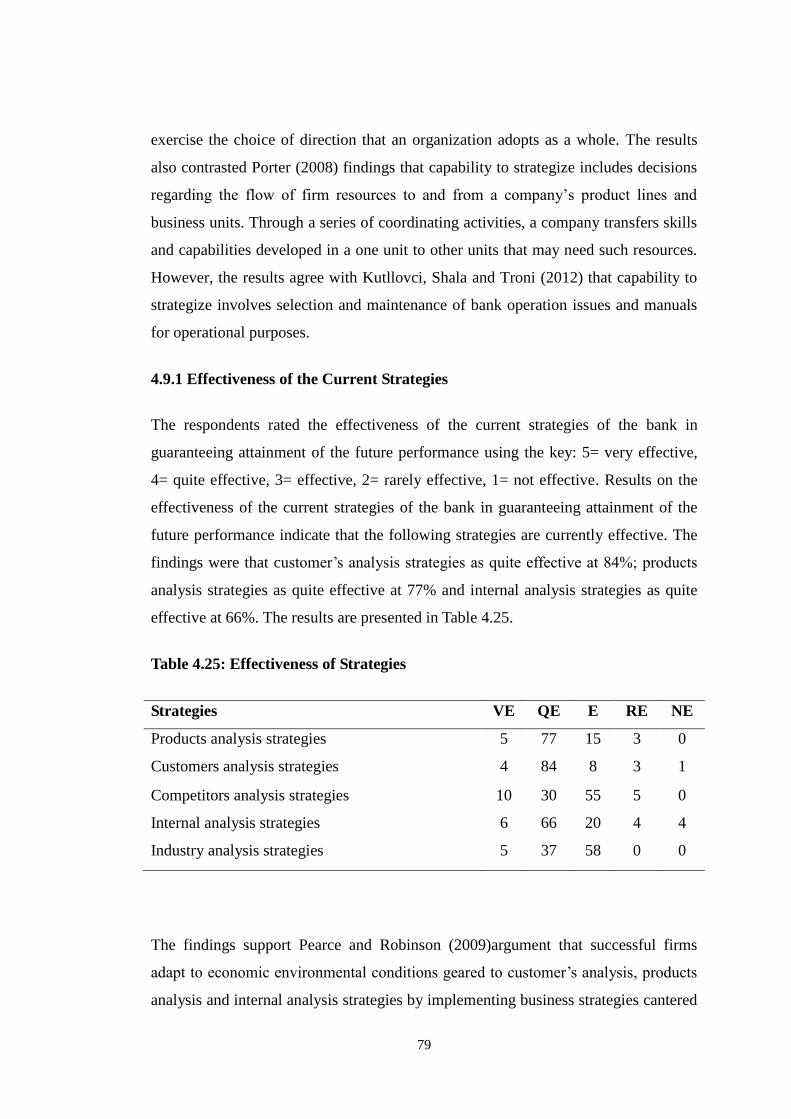
79
exercise the choice of direction that an organization adopts as a whole. The results
also contrasted Porter (2008) findings that capability to strategize includes decisions
regarding the flow of firm resources to and from a company‟s product lines and
business units. Through a series of coordinating activities, a company transfers skills
and capabilities developed in a one unit to other units that may need such resources.
However, the results agree with Kutllovci, Shala and Troni (2012) that capability to
strategize involves selection and maintenance of bank operation issues and manuals
for operational purposes.
4.9.1 Effectiveness of the Current Strategies
The respondents rated the effectiveness of the current strategies of the bank in
guaranteeing attainment of the future performance using the key: 5= very effective,
4= quite effective, 3= effective, 2= rarely effective, 1= not effective. Results on the
effectiveness of the current strategies of the bank in guaranteeing attainment of the
future performance indicate that the following strategies are currently effective. The
findings were that customer‟s analysis strategies as quite effective at 84%; products
analysis strategies as quite effective at 77% and internal analysis strategies as quite
effective at 66%. The results are presented in Table 4.25.
Table 4.25: Effectiveness of Strategies
Strategies VE QE E RE NE
Products analysis strategies 5 77 15 3 0
Customers analysis strategies 4 84 8 3 1
Competitors analysis strategies 10 30 55 5 0
Internal analysis strategies 6 66 20 4 4
Industry analysis strategies 5 37 58 0 0
The findings support Pearce and Robinson (2009)argument that successful firms
adapt to economic environmental conditions geared to customer‟s analysis, products
analysis and internal analysis strategies by implementing business strategies cantered
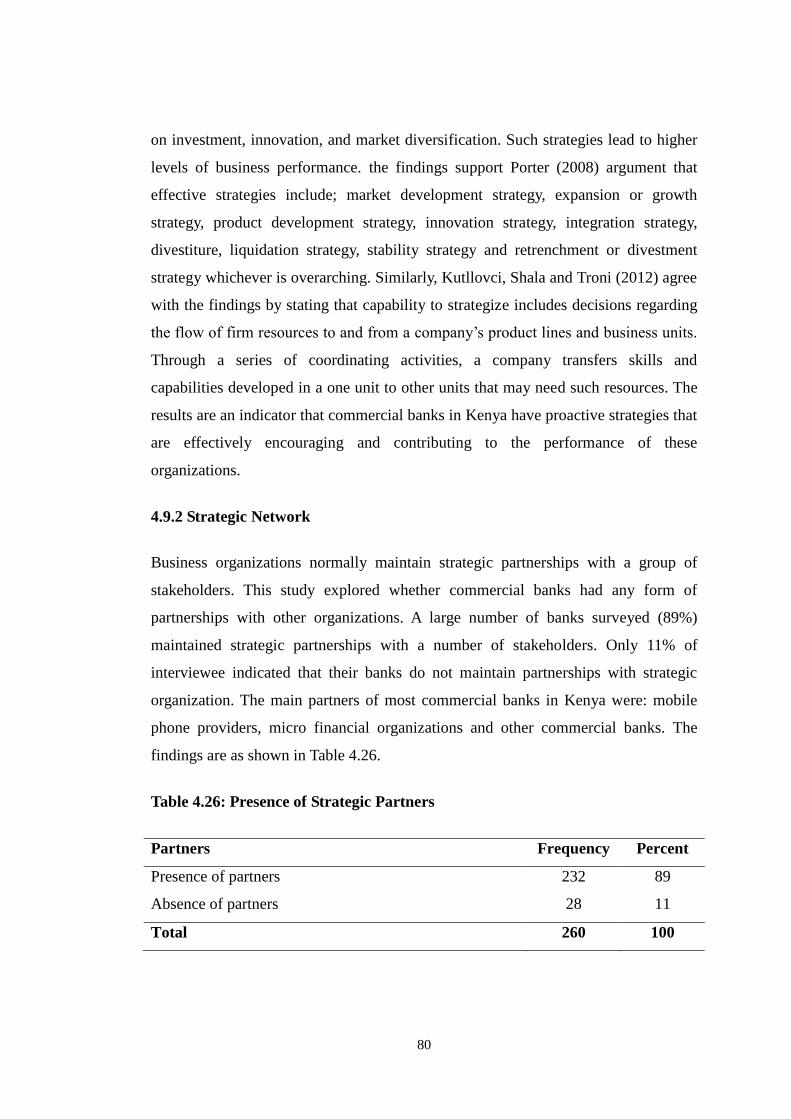
80
on investment, innovation, and market diversification. Such strategies lead to higher
levels of business performance. the findings support Porter (2008) argument that
effective strategies include; market development strategy, expansion or growth
strategy, product development strategy, innovation strategy, integration strategy,
divestiture, liquidation strategy, stability strategy and retrenchment or divestment
strategy whichever is overarching. Similarly, Kutllovci, Shala and Troni (2012) agree
with the findings by stating that capability to strategize includes decisions regarding
the flow of firm resources to and from a company‟s product lines and business units.
Through a series of coordinating activities, a company transfers skills and
capabilities developed in a one unit to other units that may need such resources. The
results are an indicator that commercial banks in Kenya have proactive strategies that
are effectively encouraging and contributing to the performance of these
organizations.
4.9.2 Strategic Network
Business organizations normally maintain strategic partnerships with a group of
stakeholders. This study explored whether commercial banks had any form of
partnerships with other organizations. A large number of banks surveyed (89%)
maintained strategic partnerships with a number of stakeholders. Only 11% of
interviewee indicated that their banks do not maintain partnerships with strategic
organization. The main partners of most commercial banks in Kenya were: mobile
phone providers, micro financial organizations and other commercial banks. The
findings are as shown in Table 4.26.
Table 4.26: Presence of Strategic Partners
Partners Frequency Percent
Presence of partners 232 89
Absence of partners 28 11
Total 260 100
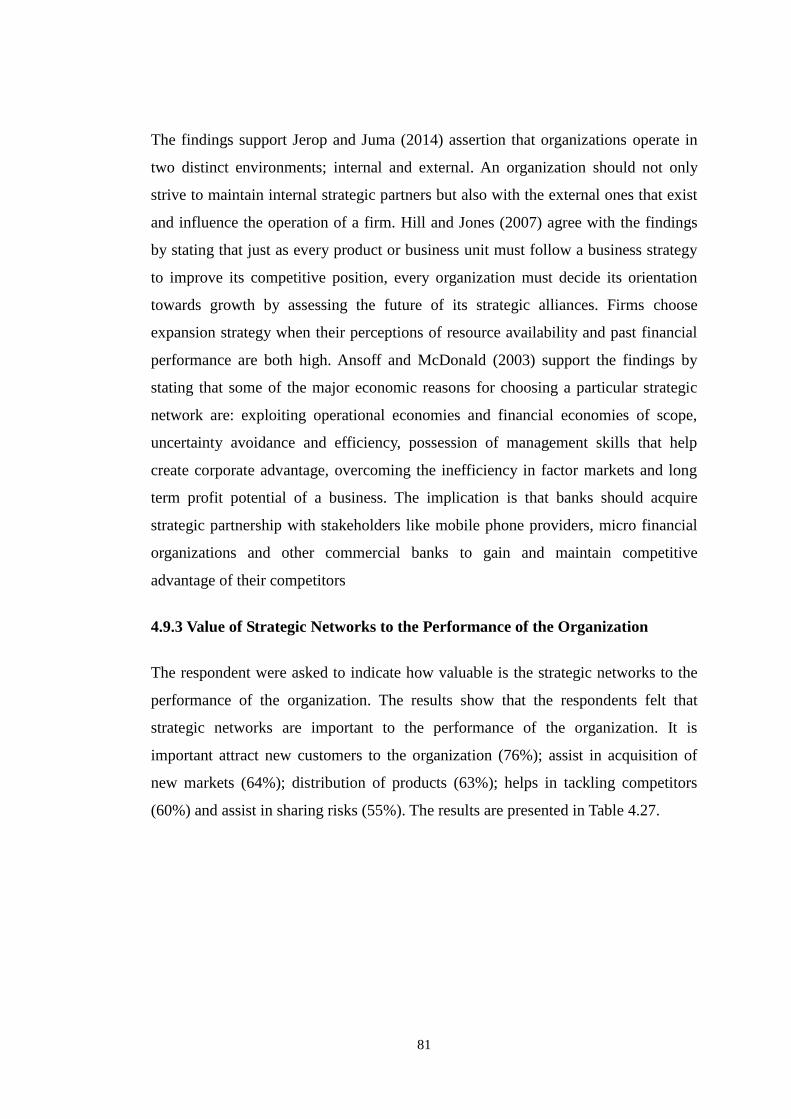
81
The findings support Jerop and Juma (2014) assertion that organizations operate in
two distinct environments; internal and external. An organization should not only
strive to maintain internal strategic partners but also with the external ones that exist
and influence the operation of a firm. Hill and Jones (2007) agree with the findings
by stating that just as every product or business unit must follow a business strategy
to improve its competitive position, every organization must decide its orientation
towards growth by assessing the future of its strategic alliances. Firms choose
expansion strategy when their perceptions of resource availability and past financial
performance are both high. Ansoff and McDonald (2003) support the findings by
stating that some of the major economic reasons for choosing a particular strategic
network are: exploiting operational economies and financial economies of scope,
uncertainty avoidance and efficiency, possession of management skills that help
create corporate advantage, overcoming the inefficiency in factor markets and long
term profit potential of a business. The implication is that banks should acquire
strategic partnership with stakeholders like mobile phone providers, micro financial
organizations and other commercial banks to gain and maintain competitive
advantage of their competitors
4.9.3 Value of Strategic Networks to the Performance of the Organization
The respondent were asked to indicate how valuable is the strategic networks to the
performance of the organization. The results show that the respondents felt that
strategic networks are important to the performance of the organization. It is
important attract new customers to the organization (76%); assist in acquisition of
new markets (64%); distribution of products (63%); helps in tackling competitors
(60%) and assist in sharing risks (55%). The results are presented in Table 4.27.
82
Table 4.27: Value of strategic networks
Value of Strategic Networks Frequency Percent
Assist in acquisition of new markets 166 64
Attract new customers to organization 197 76
Help in tackling competitors 155 60
Assist in product distribution 164 63
Assist in sharing risks 143 55
The findings support Ansoff and McDonald, (2003) who opined that some of the
major economic reasons for choosing a particular type of strategic networks are:
exploiting operational economies and financial economies of scope, uncertainty
avoidance and efficiency, possession of management skills that help create corporate
advantage, overcoming the inefficiency in factor markets and long term profit
potential of a business. Hill and Jones (2007) strategic networks enable organizations
to improve its competitive position. Similarly, Jerop and Juma (2014) support the
findings by stating that strategic networks are valuable since they influence an
organization's strategic development by creating awareness on both opportunities and
threats. Therefore commercial banks should proactively continue to scan the business
horizon to acquire more strategic partners to drive further their performance levels.
4.9.4 Rating the Value of Capability to Strategize
The results of the respondents rating of the value of capability to strategize on the
performance of the organization using the scale of (5 -very important, 4 –quite
important, 3- important, 2 –not important and 1–not important at all) are shown in
table 4.28. The results of rating of the value of capability to strategize on the
performance of the organization indicate that it improves corporate image (69%);
lead to quality management performance (68%); improves operational management
(59%) and enhances organizational excellence (50%).
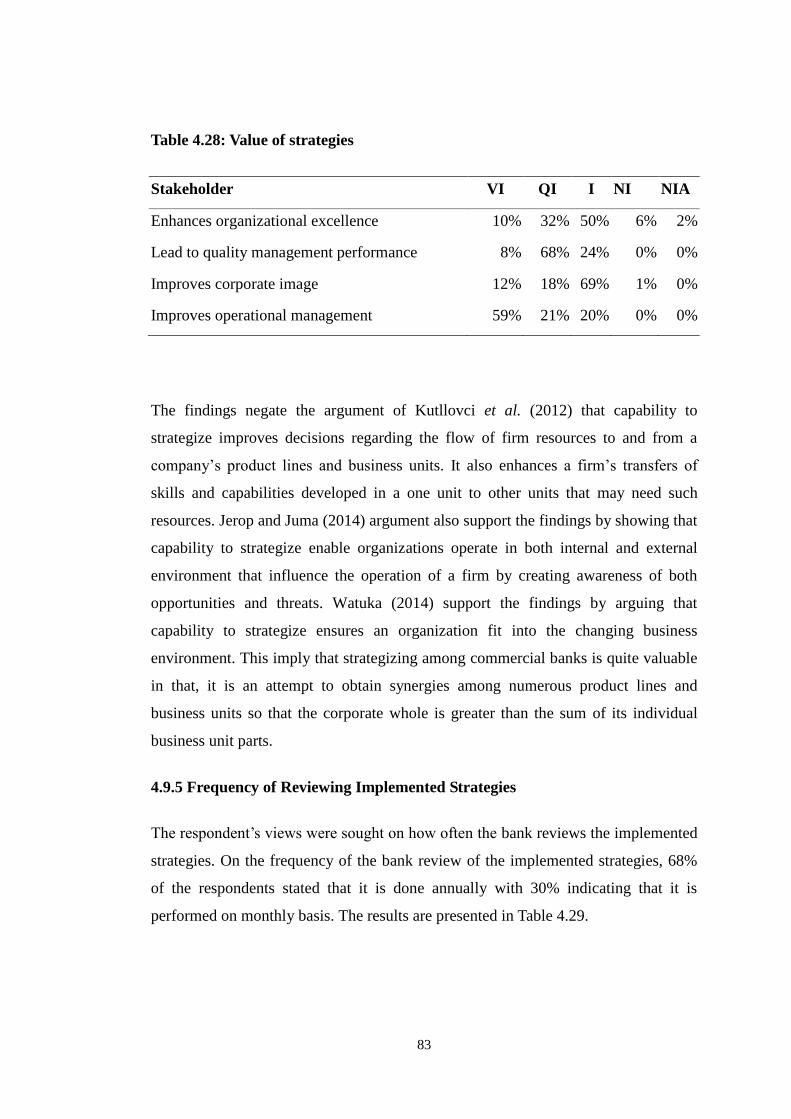
83
Table 4.28: Value of strategies
Stakeholder VI QI I NI NIA
Enhances organizational excellence 10% 32% 50% 6% 2%
Lead to quality management performance 8% 68% 24% 0% 0%
Improves corporate image 12% 18% 69% 1% 0%
Improves operational management 59% 21% 20% 0% 0%
The findings negate the argument of Kutllovci et al. (2012) that capability to
strategize improves decisions regarding the flow of firm resources to and from a
company‟s product lines and business units. It also enhances a firm‟s transfers of
skills and capabilities developed in a one unit to other units that may need such
resources. Jerop and Juma (2014) argument also support the findings by showing that
capability to strategize enable organizations operate in both internal and external
environment that influence the operation of a firm by creating awareness of both
opportunities and threats. Watuka (2014) support the findings by arguing that
capability to strategize ensures an organization fit into the changing business
environment. This imply that strategizing among commercial banks is quite valuable
in that, it is an attempt to obtain synergies among numerous product lines and
business units so that the corporate whole is greater than the sum of its individual
business unit parts.
4.9.5 Frequency of Reviewing Implemented Strategies
The respondent‟s views were sought on how often the bank reviews the implemented
strategies. On the frequency of the bank review of the implemented strategies, 68%
of the respondents stated that it is done annually with 30% indicating that it is
performed on monthly basis. The results are presented in Table 4.29.
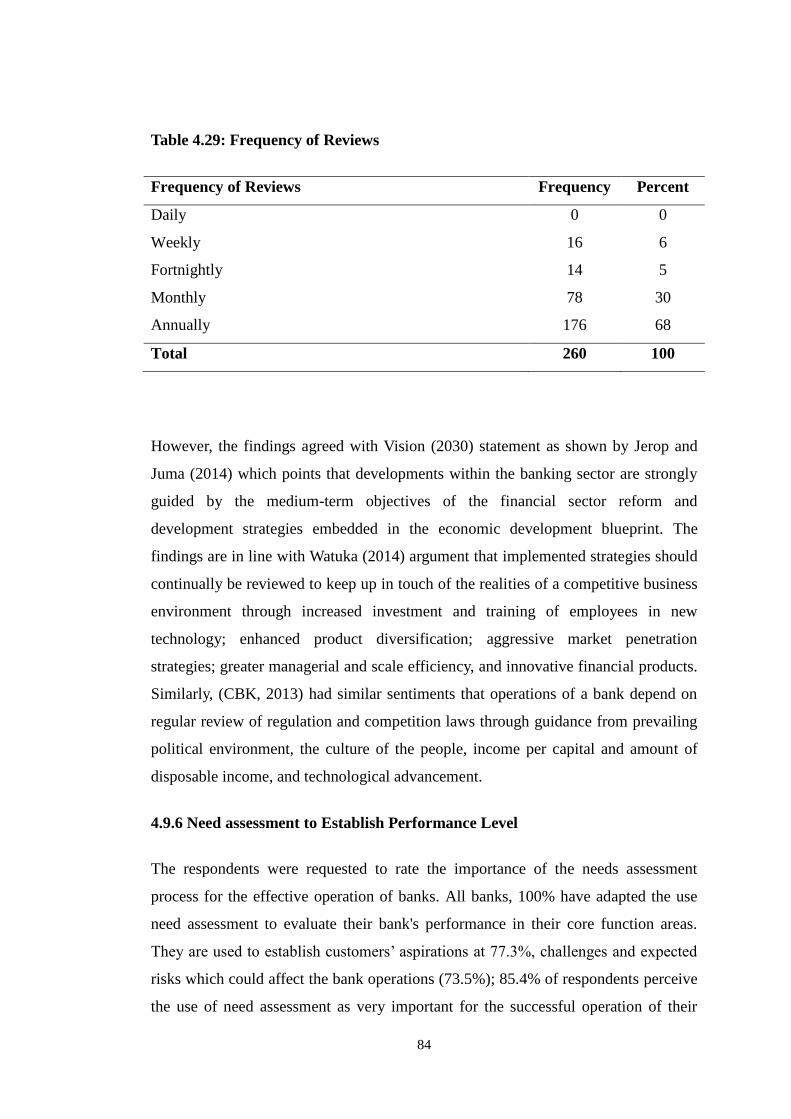
84
Table 4.29: Frequency of Reviews
Frequency of Reviews Frequency Percent
Daily 0 0
Weekly 16 6
Fortnightly 14 5
Monthly 78 30
Annually 176 68
Total 260 100
However, the findings agreed with Vision (2030) statement as shown by Jerop and
Juma (2014) which points that developments within the banking sector are strongly
guided by the medium-term objectives of the financial sector reform and
development strategies embedded in the economic development blueprint. The
findings are in line with Watuka (2014) argument that implemented strategies should
continually be reviewed to keep up in touch of the realities of a competitive business
environment through increased investment and training of employees in new
technology; enhanced product diversification; aggressive market penetration
strategies; greater managerial and scale efficiency, and innovative financial products.
Similarly, (CBK, 2013) had similar sentiments that operations of a bank depend on
regular review of regulation and competition laws through guidance from prevailing
political environment, the culture of the people, income per capital and amount of
disposable income, and technological advancement.
4.9.6 Need assessment to Establish Performance Level
The respondents were requested to rate the importance of the needs assessment
process for the effective operation of banks. All banks, 100% have adapted the use
need assessment to evaluate their bank's performance in their core function areas.
They are used to establish customers‟ aspirations at 77.3%, challenges and expected
risks which could affect the bank operations (73.5%); 85.4% of respondents perceive
the use of need assessment as very important for the successful operation of their
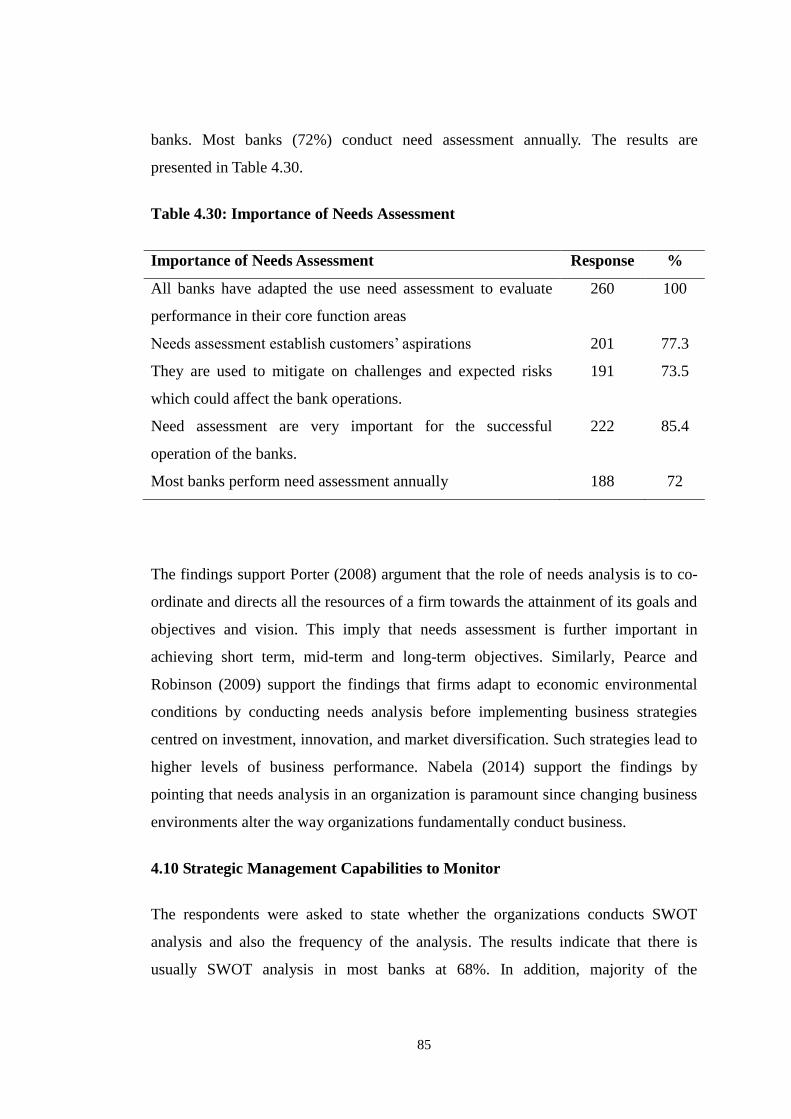
85
banks. Most banks (72%) conduct need assessment annually. The results are
presented in Table 4.30.
Table 4.30: Importance of Needs Assessment
Importance of Needs Assessment Response %
All banks have adapted the use need assessment to evaluate
performance in their core function areas
260 100
Needs assessment establish customers‟ aspirations 201 77.3
They are used to mitigate on challenges and expected risks
which could affect the bank operations.
191 73.5
Need assessment are very important for the successful
operation of the banks.
222 85.4
Most banks perform need assessment annually 188 72
The findings support Porter (2008) argument that the role of needs analysis is to co-
ordinate and directs all the resources of a firm towards the attainment of its goals and
objectives and vision. This imply that needs assessment is further important in
achieving short term, mid-term and long-term objectives. Similarly, Pearce and
Robinson (2009) support the findings that firms adapt to economic environmental
conditions by conducting needs analysis before implementing business strategies
centred on investment, innovation, and market diversification. Such strategies lead to
higher levels of business performance. Nabela (2014) support the findings by
pointing that needs analysis in an organization is paramount since changing business
environments alter the way organizations fundamentally conduct business.
4.10 Strategic Management Capabilities to Monitor
The respondents were asked to state whether the organizations conducts SWOT
analysis and also the frequency of the analysis. The results indicate that there is
usually SWOT analysis in most banks at 68%. In addition, majority of the
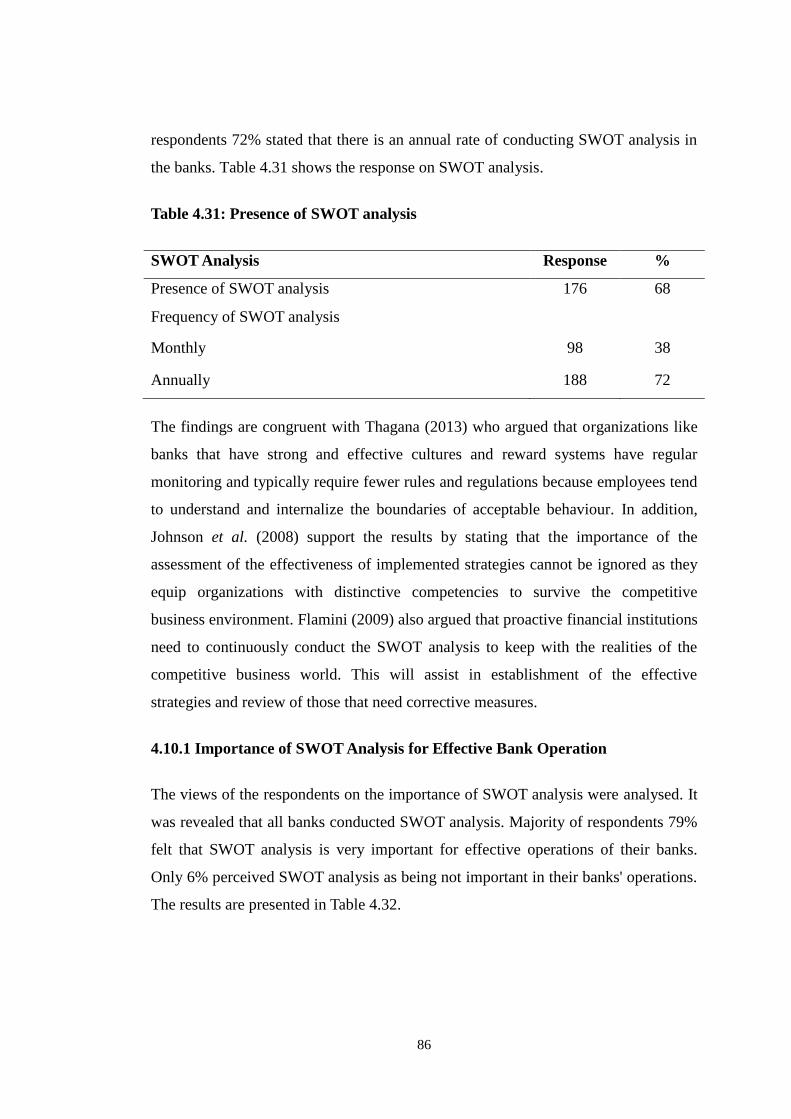
86
respondents 72% stated that there is an annual rate of conducting SWOT analysis in
the banks. Table 4.31 shows the response on SWOT analysis.
Table 4.31: Presence of SWOT analysis
SWOT Analysis Response %
Presence of SWOT analysis 176 68
Frequency of SWOT analysis
Monthly 98 38
Annually 188 72
The findings are congruent with Thagana (2013) who argued that organizations like
banks that have strong and effective cultures and reward systems have regular
monitoring and typically require fewer rules and regulations because employees tend
to understand and internalize the boundaries of acceptable behaviour. In addition,
Johnson et al. (2008) support the results by stating that the importance of the
assessment of the effectiveness of implemented strategies cannot be ignored as they
equip organizations with distinctive competencies to survive the competitive
business environment. Flamini (2009) also argued that proactive financial institutions
need to continuously conduct the SWOT analysis to keep with the realities of the
competitive business world. This will assist in establishment of the effective
strategies and review of those that need corrective measures.
4.10.1 Importance of SWOT Analysis for Effective Bank Operation
The views of the respondents on the importance of SWOT analysis were analysed. It
was revealed that all banks conducted SWOT analysis. Majority of respondents 79%
felt that SWOT analysis is very important for effective operations of their banks.
Only 6% perceived SWOT analysis as being not important in their banks' operations.
The results are presented in Table 4.32.
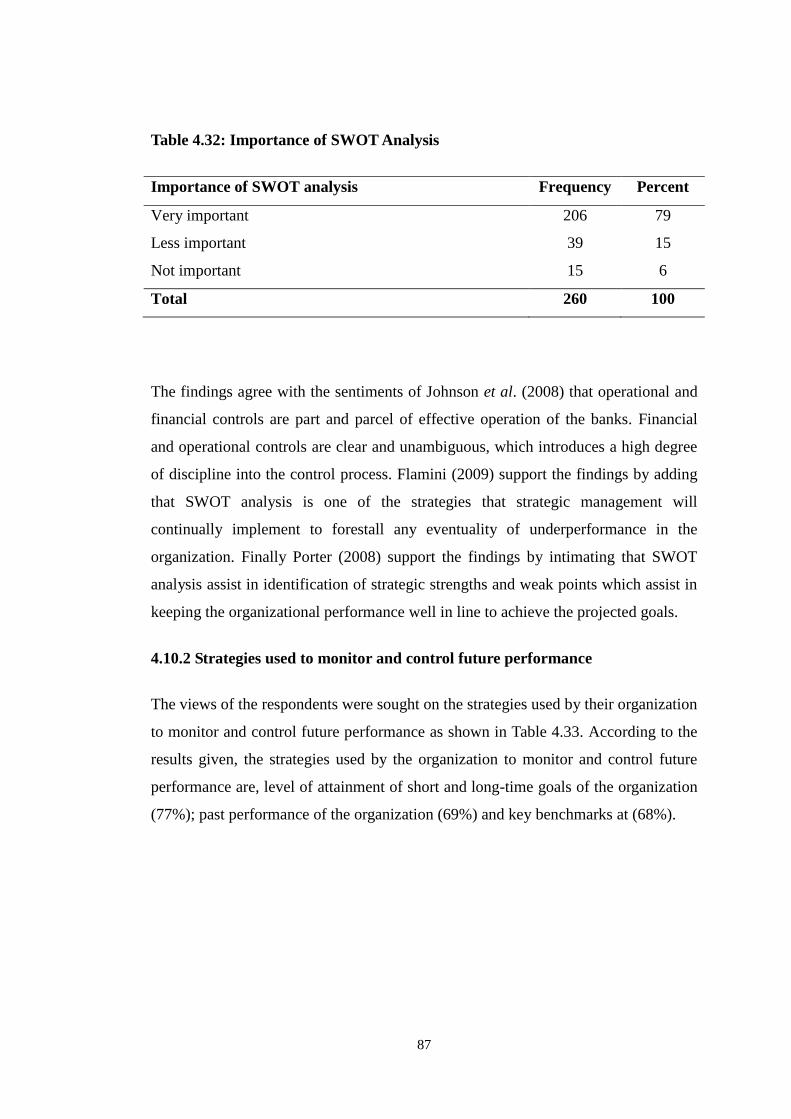
87
Table 4.32: Importance of SWOT Analysis
Importance of SWOT analysis Frequency Percent
Very important 206 79
Less important 39 15
Not important 15 6
Total 260 100
The findings agree with the sentiments of Johnson et al. (2008) that operational and
financial controls are part and parcel of effective operation of the banks. Financial
and operational controls are clear and unambiguous, which introduces a high degree
of discipline into the control process. Flamini (2009) support the findings by adding
that SWOT analysis is one of the strategies that strategic management will
continually implement to forestall any eventuality of underperformance in the
organization. Finally Porter (2008) support the findings by intimating that SWOT
analysis assist in identification of strategic strengths and weak points which assist in
keeping the organizational performance well in line to achieve the projected goals.
4.10.2 Strategies used to monitor and control future performance
The views of the respondents were sought on the strategies used by their organization
to monitor and control future performance as shown in Table 4.33. According to the
results given, the strategies used by the organization to monitor and control future
performance are, level of attainment of short and long-time goals of the organization
(77%); past performance of the organization (69%) and key benchmarks at (68%).
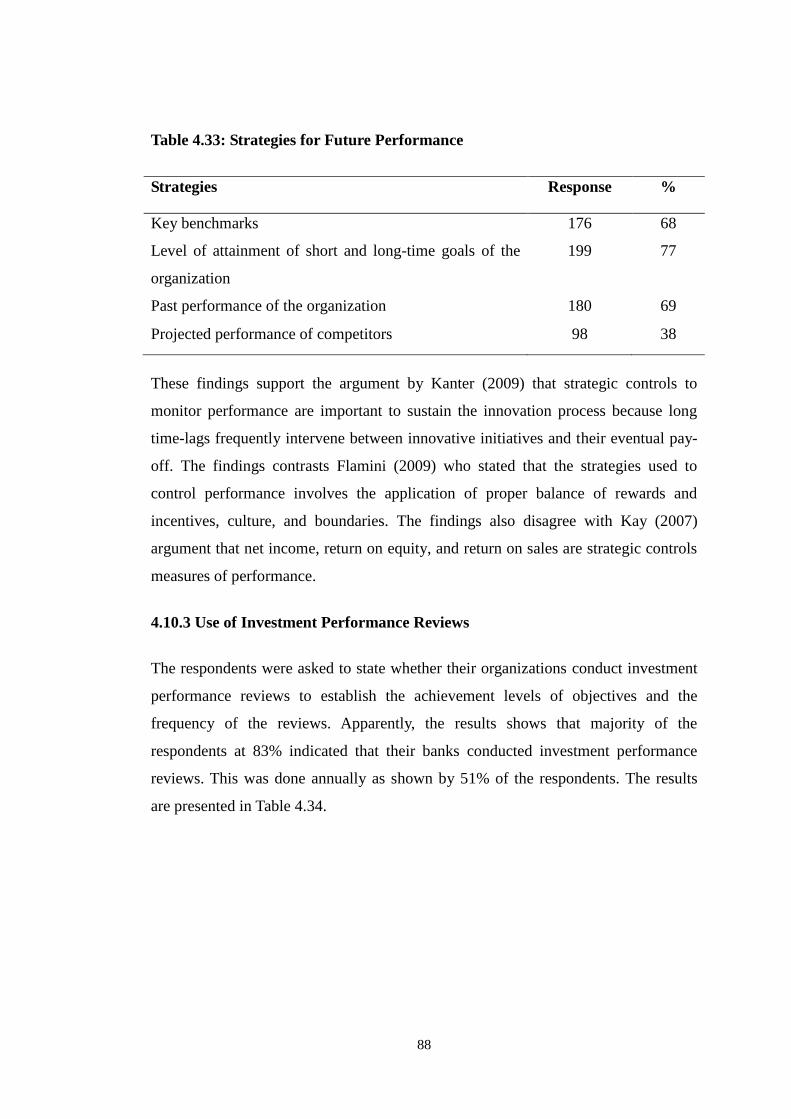
88
Table 4.33: Strategies for Future Performance
Strategies Response %
Key benchmarks 176 68
Level of attainment of short and long-time goals of the
organization
199 77
Past performance of the organization 180 69
Projected performance of competitors 98 38
These findings support the argument by Kanter (2009) that strategic controls to
monitor performance are important to sustain the innovation process because long
time-lags frequently intervene between innovative initiatives and their eventual pay-
off. The findings contrasts Flamini (2009) who stated that the strategies used to
control performance involves the application of proper balance of rewards and
incentives, culture, and boundaries. The findings also disagree with Kay (2007)
argument that net income, return on equity, and return on sales are strategic controls
measures of performance.
4.10.3 Use of Investment Performance Reviews
The respondents were asked to state whether their organizations conduct investment
performance reviews to establish the achievement levels of objectives and the
frequency of the reviews. Apparently, the results shows that majority of the
respondents at 83% indicated that their banks conducted investment performance
reviews. This was done annually as shown by 51% of the respondents. The results
are presented in Table 4.34.
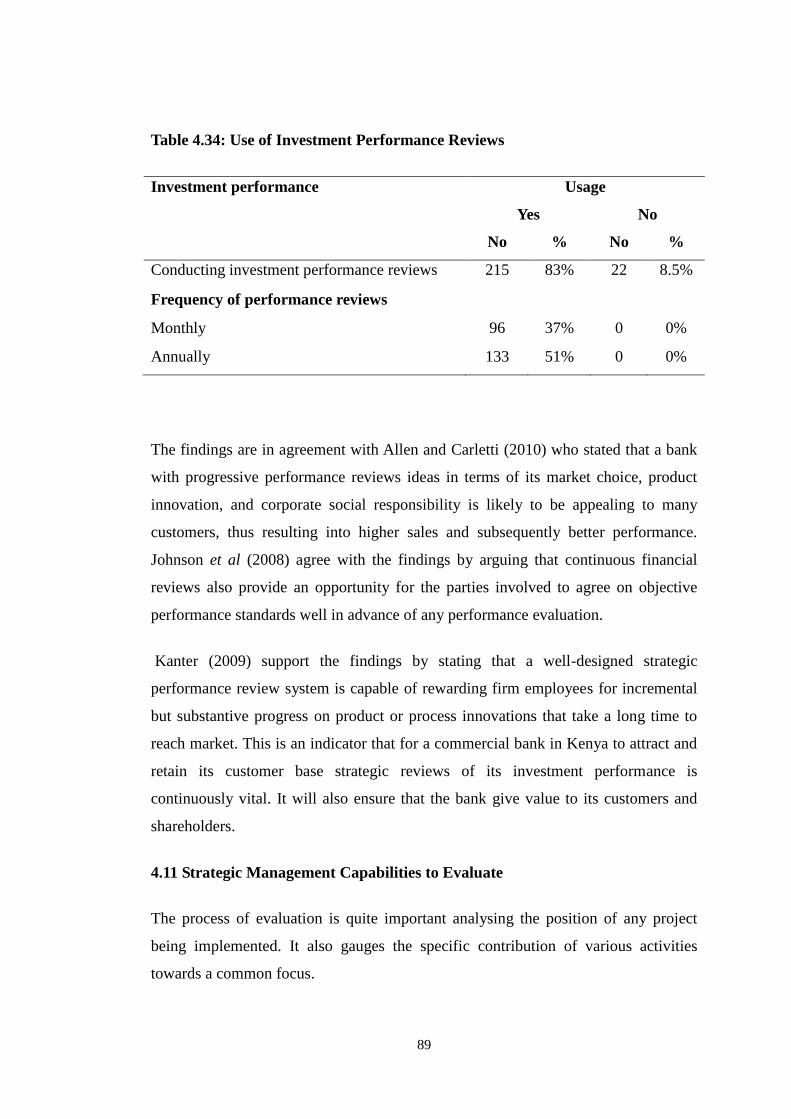
89
Table 4.34: Use of Investment Performance Reviews
Investment performance Usage
Yes No
No % No %
Conducting investment performance reviews 215 83% 22 8.5%
Frequency of performance reviews
Monthly 96 37% 0 0%
Annually 133 51% 0 0%
The findings are in agreement with Allen and Carletti (2010) who stated that a bank
with progressive performance reviews ideas in terms of its market choice, product
innovation, and corporate social responsibility is likely to be appealing to many
customers, thus resulting into higher sales and subsequently better performance.
Johnson et al (2008) agree with the findings by arguing that continuous financial
reviews also provide an opportunity for the parties involved to agree on objective
performance standards well in advance of any performance evaluation.
Kanter (2009) support the findings by stating that a well-designed strategic
performance review system is capable of rewarding firm employees for incremental
but substantive progress on product or process innovations that take a long time to
reach market. This is an indicator that for a commercial bank in Kenya to attract and
retain its customer base strategic reviews of its investment performance is
continuously vital. It will also ensure that the bank give value to its customers and
shareholders.
4.11 Strategic Management Capabilities to Evaluate
The process of evaluation is quite important analysing the position of any project
being implemented. It also gauges the specific contribution of various activities
towards a common focus.
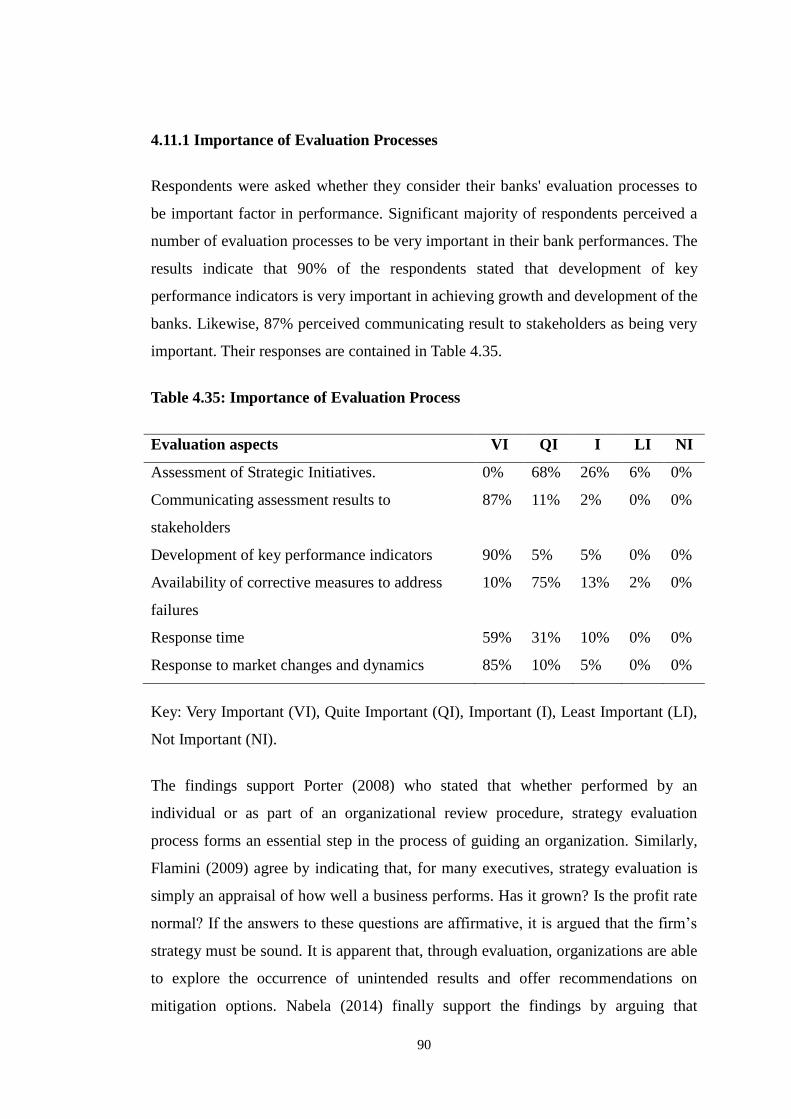
90
4.11.1 Importance of Evaluation Processes
Respondents were asked whether they consider their banks' evaluation processes to
be important factor in performance. Significant majority of respondents perceived a
number of evaluation processes to be very important in their bank performances. The
results indicate that 90% of the respondents stated that development of key
performance indicators is very important in achieving growth and development of the
banks. Likewise, 87% perceived communicating result to stakeholders as being very
important. Their responses are contained in Table 4.35.
Table 4.35: Importance of Evaluation Process
Evaluation aspects VI QI I LI NI
Assessment of Strategic Initiatives. 0% 68% 26% 6% 0%
Communicating assessment results to
stakeholders
87% 11% 2% 0% 0%
Development of key performance indicators 90% 5% 5% 0% 0%
Availability of corrective measures to address
failures
10% 75% 13% 2% 0%
Response time 59% 31% 10% 0% 0%
Response to market changes and dynamics 85% 10% 5% 0% 0%
Key: Very Important (VI), Quite Important (QI), Important (I), Least Important (LI),
Not Important (NI).
The findings support Porter (2008) who stated that whether performed by an
individual or as part of an organizational review procedure, strategy evaluation
process forms an essential step in the process of guiding an organization. Similarly,
Flamini (2009) agree by indicating that, for many executives, strategy evaluation is
simply an appraisal of how well a business performs. Has it grown? Is the profit rate
normal? If the answers to these questions are affirmative, it is argued that the firm‟s
strategy must be sound. It is apparent that, through evaluation, organizations are able
to explore the occurrence of unintended results and offer recommendations on
mitigation options. Nabela (2014) finally support the findings by arguing that
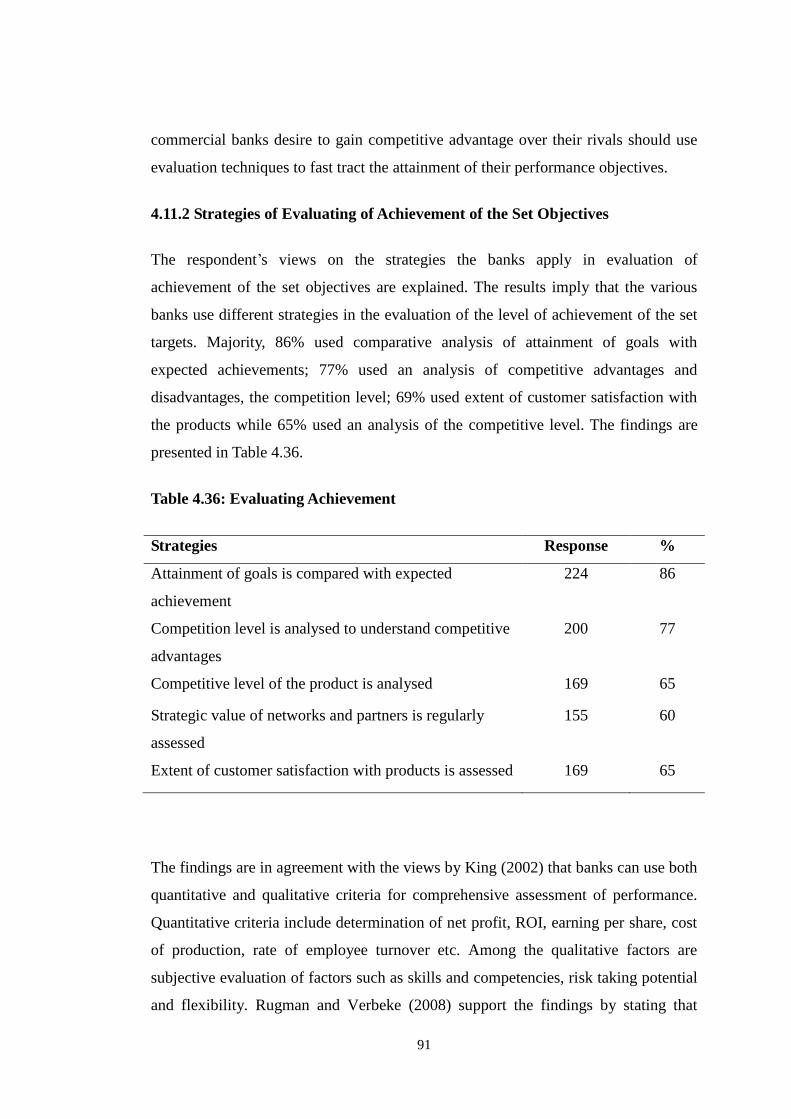
91
commercial banks desire to gain competitive advantage over their rivals should use
evaluation techniques to fast tract the attainment of their performance objectives.
4.11.2 Strategies of Evaluating of Achievement of the Set Objectives
The respondent‟s views on the strategies the banks apply in evaluation of
achievement of the set objectives are explained. The results imply that the various
banks use different strategies in the evaluation of the level of achievement of the set
targets. Majority, 86% used comparative analysis of attainment of goals with
expected achievements; 77% used an analysis of competitive advantages and
disadvantages, the competition level; 69% used extent of customer satisfaction with
the products while 65% used an analysis of the competitive level. The findings are
presented in Table 4.36.
Table 4.36: Evaluating Achievement
Strategies Response %
Attainment of goals is compared with expected
achievement
224 86
Competition level is analysed to understand competitive
advantages
200 77
Competitive level of the product is analysed 169 65
Strategic value of networks and partners is regularly
assessed
155 60
Extent of customer satisfaction with products is assessed 169 65
The findings are in agreement with the views by King (2002) that banks can use both
quantitative and qualitative criteria for comprehensive assessment of performance.
Quantitative criteria include determination of net profit, ROI, earning per share, cost
of production, rate of employee turnover etc. Among the qualitative factors are
subjective evaluation of factors such as skills and competencies, risk taking potential
and flexibility. Rugman and Verbeke (2008) support the findings by stating that
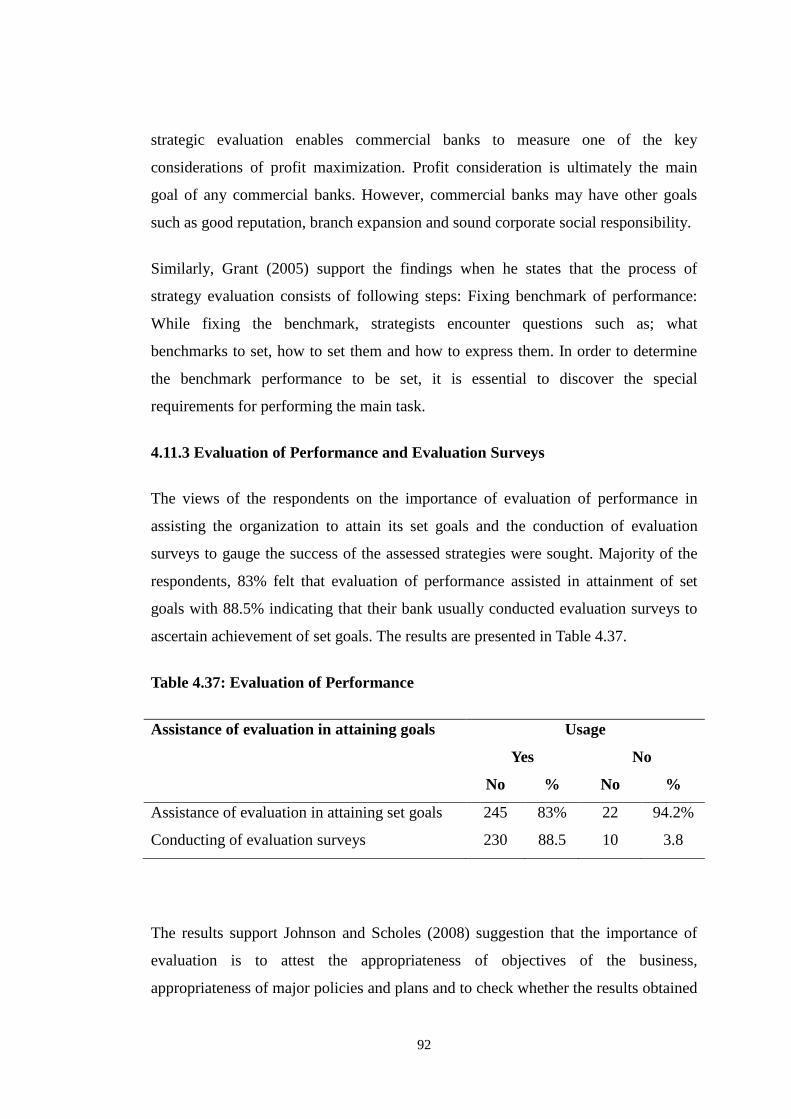
92
strategic evaluation enables commercial banks to measure one of the key
considerations of profit maximization. Profit consideration is ultimately the main
goal of any commercial banks. However, commercial banks may have other goals
such as good reputation, branch expansion and sound corporate social responsibility.
Similarly, Grant (2005) support the findings when he states that the process of
strategy evaluation consists of following steps: Fixing benchmark of performance:
While fixing the benchmark, strategists encounter questions such as; what
benchmarks to set, how to set them and how to express them. In order to determine
the benchmark performance to be set, it is essential to discover the special
requirements for performing the main task.
4.11.3 Evaluation of Performance and Evaluation Surveys
The views of the respondents on the importance of evaluation of performance in
assisting the organization to attain its set goals and the conduction of evaluation
surveys to gauge the success of the assessed strategies were sought. Majority of the
respondents, 83% felt that evaluation of performance assisted in attainment of set
goals with 88.5% indicating that their bank usually conducted evaluation surveys to
ascertain achievement of set goals. The results are presented in Table 4.37.
Table 4.37: Evaluation of Performance
Assistance of evaluation in attaining goals Usage
Yes No
No % No %
Assistance of evaluation in attaining set goals 245 83% 22 94.2%
Conducting of evaluation surveys 230 88.5 10 3.8
The results support Johnson and Scholes (2008) suggestion that the importance of
evaluation is to attest the appropriateness of objectives of the business,
appropriateness of major policies and plans and to check whether the results obtained
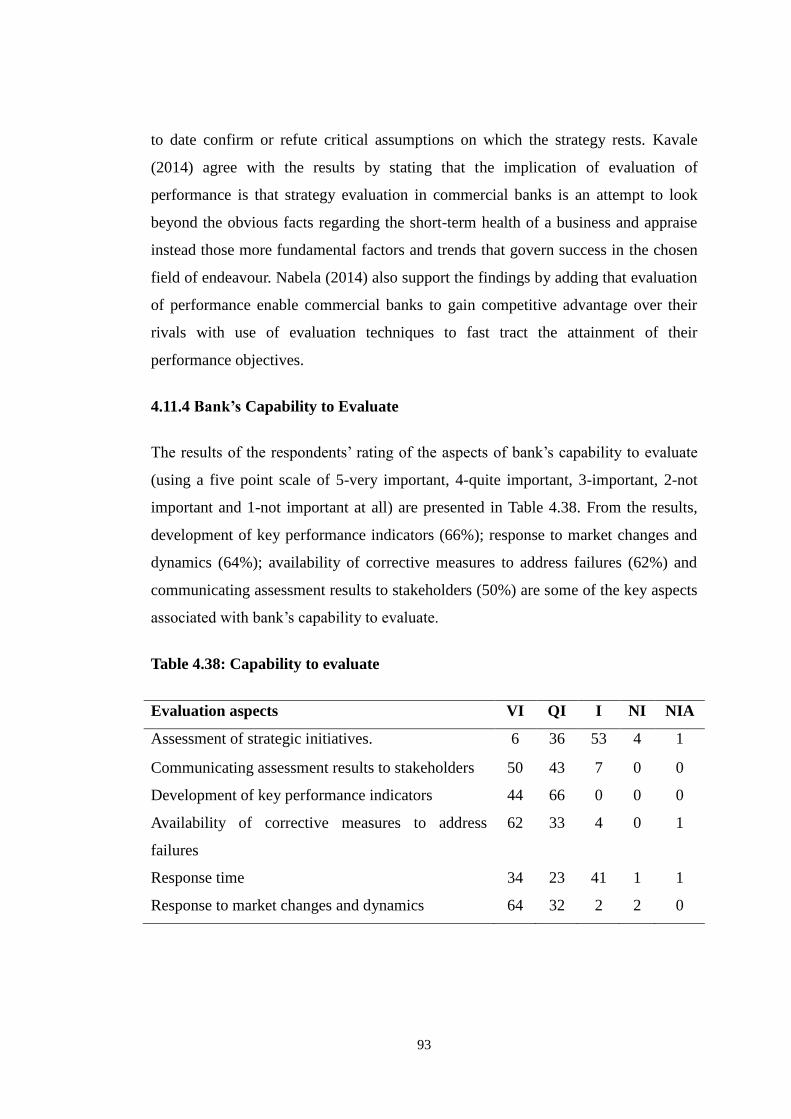
93
to date confirm or refute critical assumptions on which the strategy rests. Kavale
(2014) agree with the results by stating that the implication of evaluation of
performance is that strategy evaluation in commercial banks is an attempt to look
beyond the obvious facts regarding the short-term health of a business and appraise
instead those more fundamental factors and trends that govern success in the chosen
field of endeavour. Nabela (2014) also support the findings by adding that evaluation
of performance enable commercial banks to gain competitive advantage over their
rivals with use of evaluation techniques to fast tract the attainment of their
performance objectives.
4.11.4 Bank’s Capability to Evaluate
The results of the respondents‟ rating of the aspects of bank‟s capability to evaluate
(using a five point scale of 5-very important, 4-quite important, 3-important, 2-not
important and 1-not important at all) are presented in Table 4.38. From the results,
development of key performance indicators (66%); response to market changes and
dynamics (64%); availability of corrective measures to address failures (62%) and
communicating assessment results to stakeholders (50%) are some of the key aspects
associated with bank‟s capability to evaluate.
Table 4.38: Capability to evaluate
Evaluation aspects VI QI I NI NIA
Assessment of strategic initiatives. 6 36 53 4 1
Communicating assessment results to stakeholders 50 43 7 0 0
Development of key performance indicators 44 66 0 0 0
Availability of corrective measures to address
failures
62 33 4 0 1
Response time 34 23 41 1 1
Response to market changes and dynamics 64 32 2 2 0
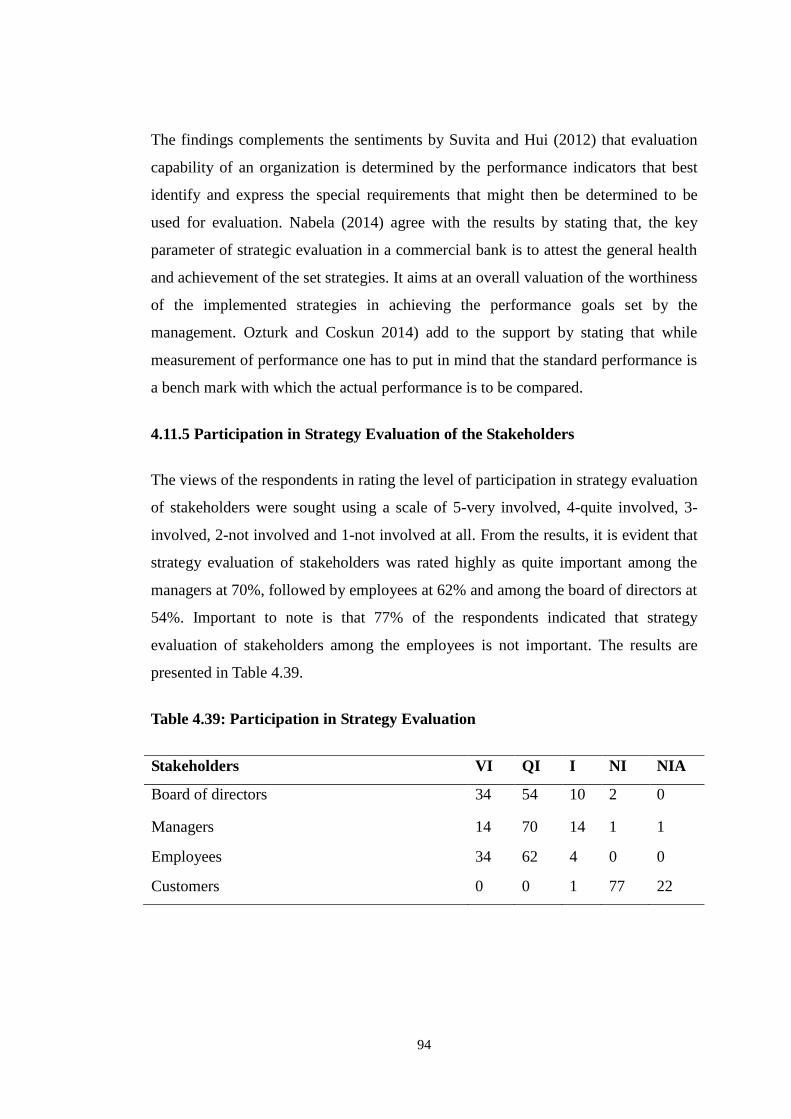
94
The findings complements the sentiments by Suvita and Hui (2012) that evaluation
capability of an organization is determined by the performance indicators that best
identify and express the special requirements that might then be determined to be
used for evaluation. Nabela (2014) agree with the results by stating that, the key
parameter of strategic evaluation in a commercial bank is to attest the general health
and achievement of the set strategies. It aims at an overall valuation of the worthiness
of the implemented strategies in achieving the performance goals set by the
management. Ozturk and Coskun 2014) add to the support by stating that while
measurement of performance one has to put in mind that the standard performance is
a bench mark with which the actual performance is to be compared.
4.11.5 Participation in Strategy Evaluation of the Stakeholders
The views of the respondents in rating the level of participation in strategy evaluation
of stakeholders were sought using a scale of 5-very involved, 4-quite involved, 3-
involved, 2-not involved and 1-not involved at all. From the results, it is evident that
strategy evaluation of stakeholders was rated highly as quite important among the
managers at 70%, followed by employees at 62% and among the board of directors at
54%. Important to note is that 77% of the respondents indicated that strategy
evaluation of stakeholders among the employees is not important. The results are
presented in Table 4.39.
Table 4.39: Participation in Strategy Evaluation
Stakeholders VI QI I NI NIA
Board of directors 34 54 10 2 0
Managers 14 70 14 1 1
Employees 34 62 4 0 0
Customers 0 0 1 77 22
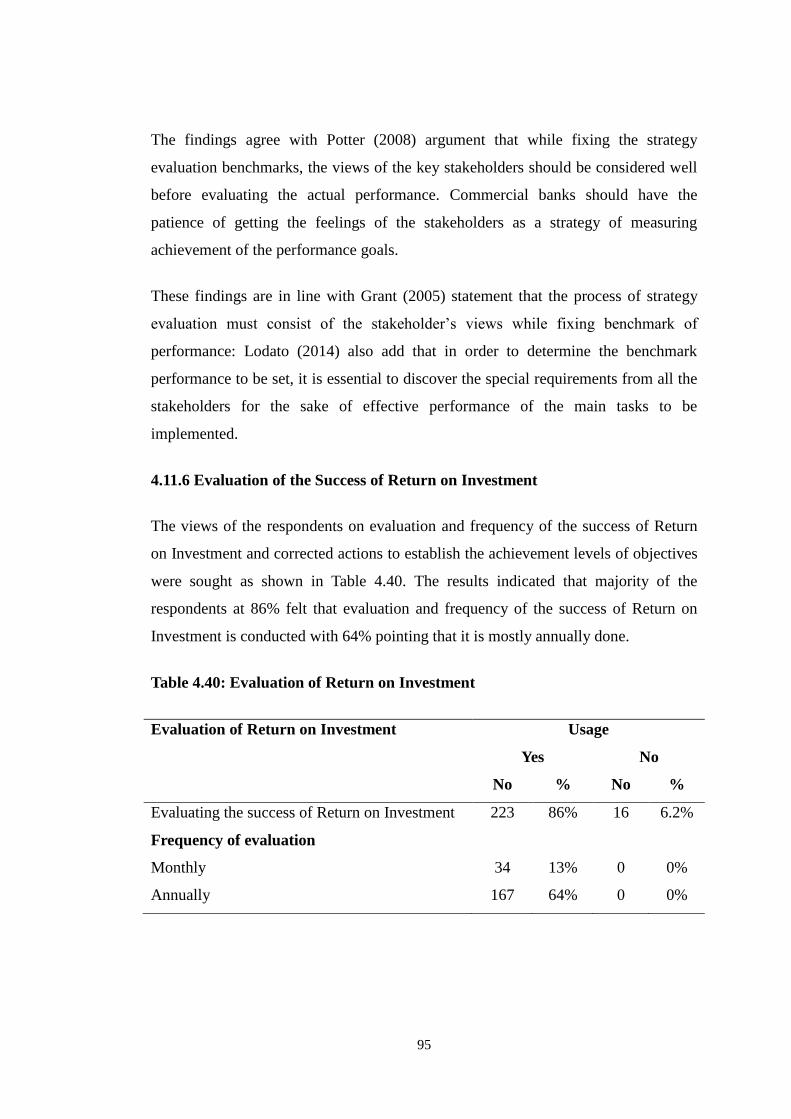
95
The findings agree with Potter (2008) argument that while fixing the strategy
evaluation benchmarks, the views of the key stakeholders should be considered well
before evaluating the actual performance. Commercial banks should have the
patience of getting the feelings of the stakeholders as a strategy of measuring
achievement of the performance goals.
These findings are in line with Grant (2005) statement that the process of strategy
evaluation must consist of the stakeholder‟s views while fixing benchmark of
performance: Lodato (2014) also add that in order to determine the benchmark
performance to be set, it is essential to discover the special requirements from all the
stakeholders for the sake of effective performance of the main tasks to be
implemented.
4.11.6 Evaluation of the Success of Return on Investment
The views of the respondents on evaluation and frequency of the success of Return
on Investment and corrected actions to establish the achievement levels of objectives
were sought as shown in Table 4.40. The results indicated that majority of the
respondents at 86% felt that evaluation and frequency of the success of Return on
Investment is conducted with 64% pointing that it is mostly annually done.
Table 4.40: Evaluation of Return on Investment
Evaluation of Return on Investment Usage
Yes No
No % No %
Evaluating the success of Return on Investment 223 86% 16 6.2%
Frequency of evaluation
Monthly 34 13% 0 0%
Annually 167 64% 0 0%
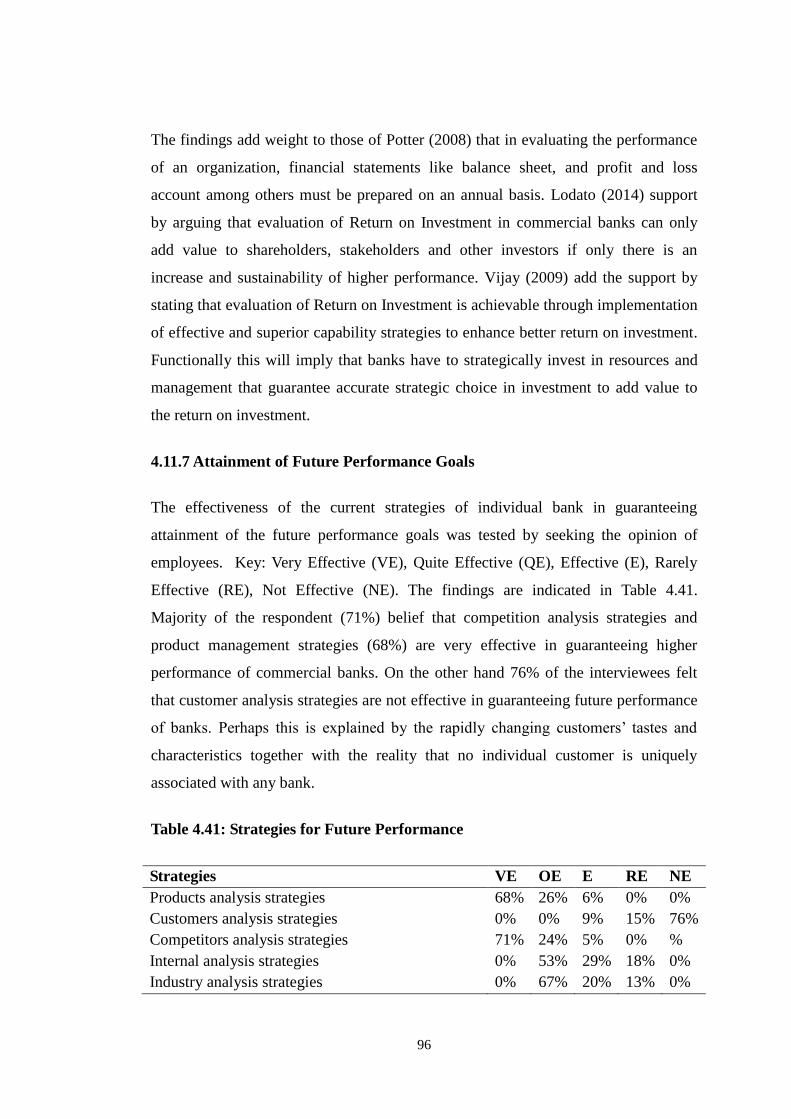
96
The findings add weight to those of Potter (2008) that in evaluating the performance
of an organization, financial statements like balance sheet, and profit and loss
account among others must be prepared on an annual basis. Lodato (2014) support
by arguing that evaluation of Return on Investment in commercial banks can only
add value to shareholders, stakeholders and other investors if only there is an
increase and sustainability of higher performance. Vijay (2009) add the support by
stating that evaluation of Return on Investment is achievable through implementation
of effective and superior capability strategies to enhance better return on investment.
Functionally this will imply that banks have to strategically invest in resources and
management that guarantee accurate strategic choice in investment to add value to
the return on investment.
4.11.7 Attainment of Future Performance Goals
The effectiveness of the current strategies of individual bank in guaranteeing
attainment of the future performance goals was tested by seeking the opinion of
employees. Key: Very Effective (VE), Quite Effective (QE), Effective (E), Rarely
Effective (RE), Not Effective (NE). The findings are indicated in Table 4.41.
Majority of the respondent (71%) belief that competition analysis strategies and
product management strategies (68%) are very effective in guaranteeing higher
performance of commercial banks. On the other hand 76% of the interviewees felt
that customer analysis strategies are not effective in guaranteeing future performance
of banks. Perhaps this is explained by the rapidly changing customers‟ tastes and
characteristics together with the reality that no individual customer is uniquely
associated with any bank.
Table 4.41: Strategies for Future Performance
Strategies VE OE E RE NE
Products analysis strategies 68% 26% 6% 0% 0%
Customers analysis strategies 0% 0% 9% 15% 76%
Competitors analysis strategies 71% 24% 5% 0% %
Internal analysis strategies 0% 53% 29% 18% 0%
Industry analysis strategies 0% 67% 20% 13% 0%
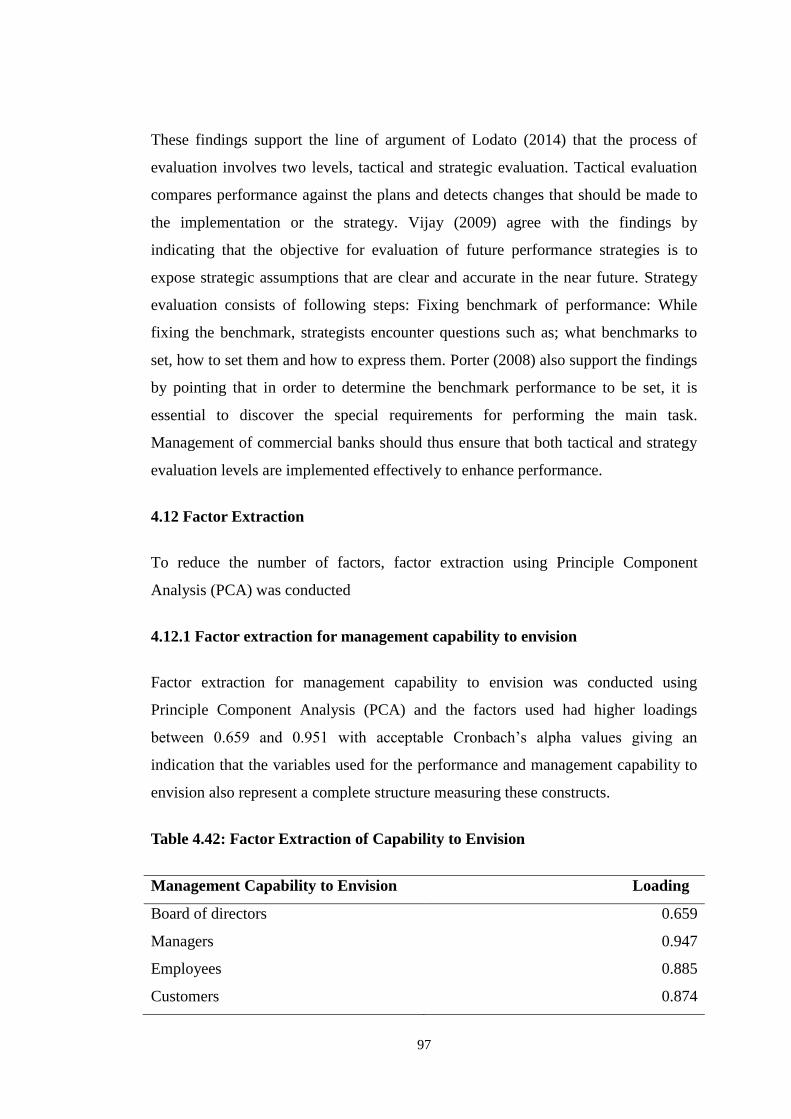
97
These findings support the line of argument of Lodato (2014) that the process of
evaluation involves two levels, tactical and strategic evaluation. Tactical evaluation
compares performance against the plans and detects changes that should be made to
the implementation or the strategy. Vijay (2009) agree with the findings by
indicating that the objective for evaluation of future performance strategies is to
expose strategic assumptions that are clear and accurate in the near future. Strategy
evaluation consists of following steps: Fixing benchmark of performance: While
fixing the benchmark, strategists encounter questions such as; what benchmarks to
set, how to set them and how to express them. Porter (2008) also support the findings
by pointing that in order to determine the benchmark performance to be set, it is
essential to discover the special requirements for performing the main task.
Management of commercial banks should thus ensure that both tactical and strategy
evaluation levels are implemented effectively to enhance performance.
4.12 Factor Extraction
To reduce the number of factors, factor extraction using Principle Component
Analysis (PCA) was conducted
4.12.1 Factor extraction for management capability to envision
Factor extraction for management capability to envision was conducted using
Principle Component Analysis (PCA) and the factors used had higher loadings
between 0.659 and 0.951 with acceptable Cronbach‟s alpha values giving an
indication that the variables used for the performance and management capability to
envision also represent a complete structure measuring these constructs.
Table 4.42: Factor Extraction of Capability to Envision
Management Capability to Envision Loading
Board of directors 0.659
Managers 0.947
Employees 0.885
Customers 0.874
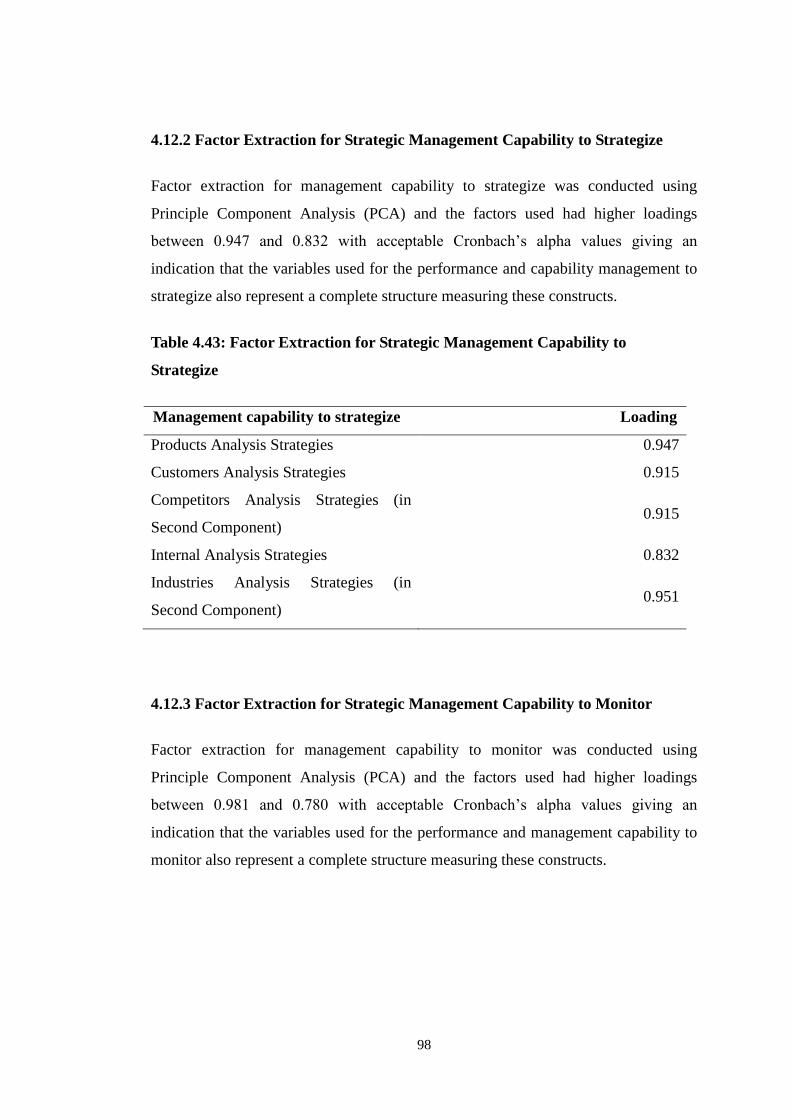
98
4.12.2 Factor Extraction for Strategic Management Capability to Strategize
Factor extraction for management capability to strategize was conducted using
Principle Component Analysis (PCA) and the factors used had higher loadings
between 0.947 and 0.832 with acceptable Cronbach‟s alpha values giving an
indication that the variables used for the performance and capability management to
strategize also represent a complete structure measuring these constructs.
Table 4.43: Factor Extraction for Strategic Management Capability to
Strategize
Management capability to strategize Loading
Products Analysis Strategies 0.947
Customers Analysis Strategies 0.915
Competitors Analysis Strategies (in
Second Component) 0.915
Internal Analysis Strategies 0.832
Industries Analysis Strategies (in
Second Component) 0.951
4.12.3 Factor Extraction for Strategic Management Capability to Monitor
Factor extraction for management capability to monitor was conducted using
Principle Component Analysis (PCA) and the factors used had higher loadings
between 0.981 and 0.780 with acceptable Cronbach‟s alpha values giving an
indication that the variables used for the performance and management capability to
monitor also represent a complete structure measuring these constructs.
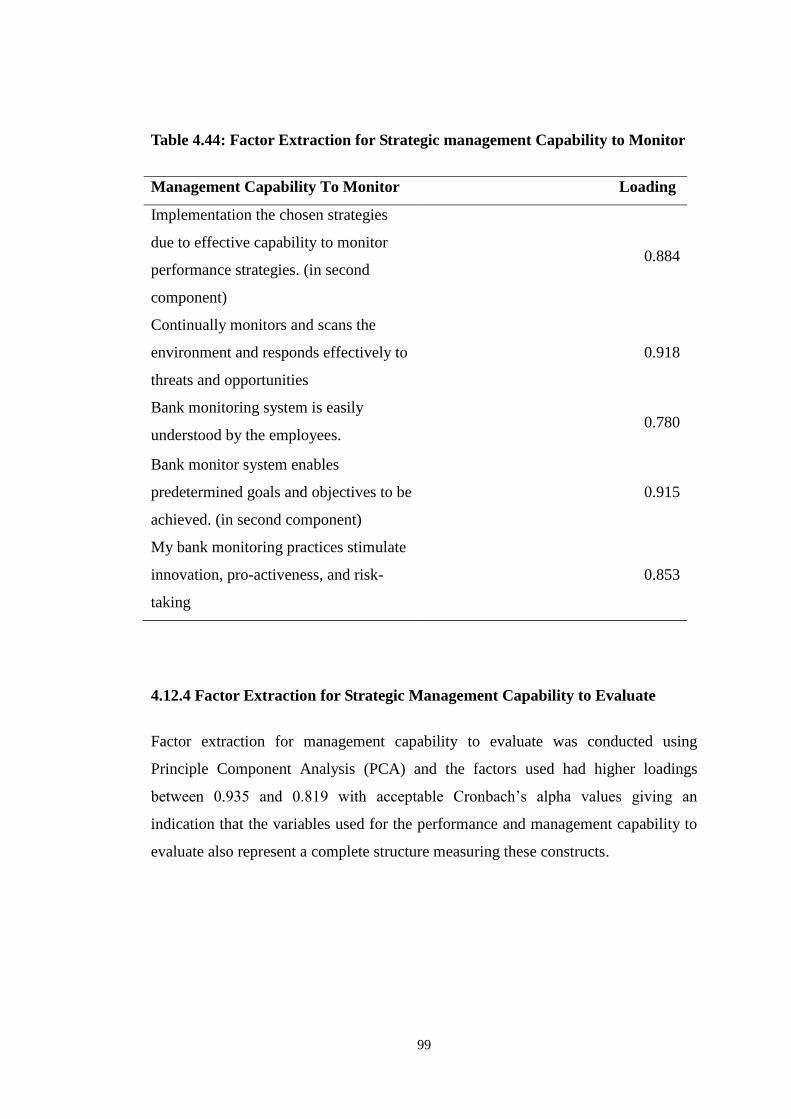
99
Table 4.44: Factor Extraction for Strategic management Capability to Monitor
Management Capability To Monitor Loading
Implementation the chosen strategies
due to effective capability to monitor
performance strategies. (in second
component)
0.884
Continually monitors and scans the
environment and responds effectively to
threats and opportunities
0.918
Bank monitoring system is easily
understood by the employees. 0.780
Bank monitor system enables
predetermined goals and objectives to be
achieved. (in second component)
0.915
My bank monitoring practices stimulate
innovation, pro-activeness, and risk-
taking
0.853
4.12.4 Factor Extraction for Strategic Management Capability to Evaluate
Factor extraction for management capability to evaluate was conducted using
Principle Component Analysis (PCA) and the factors used had higher loadings
between 0.935 and 0.819 with acceptable Cronbach‟s alpha values giving an
indication that the variables used for the performance and management capability to
evaluate also represent a complete structure measuring these constructs.
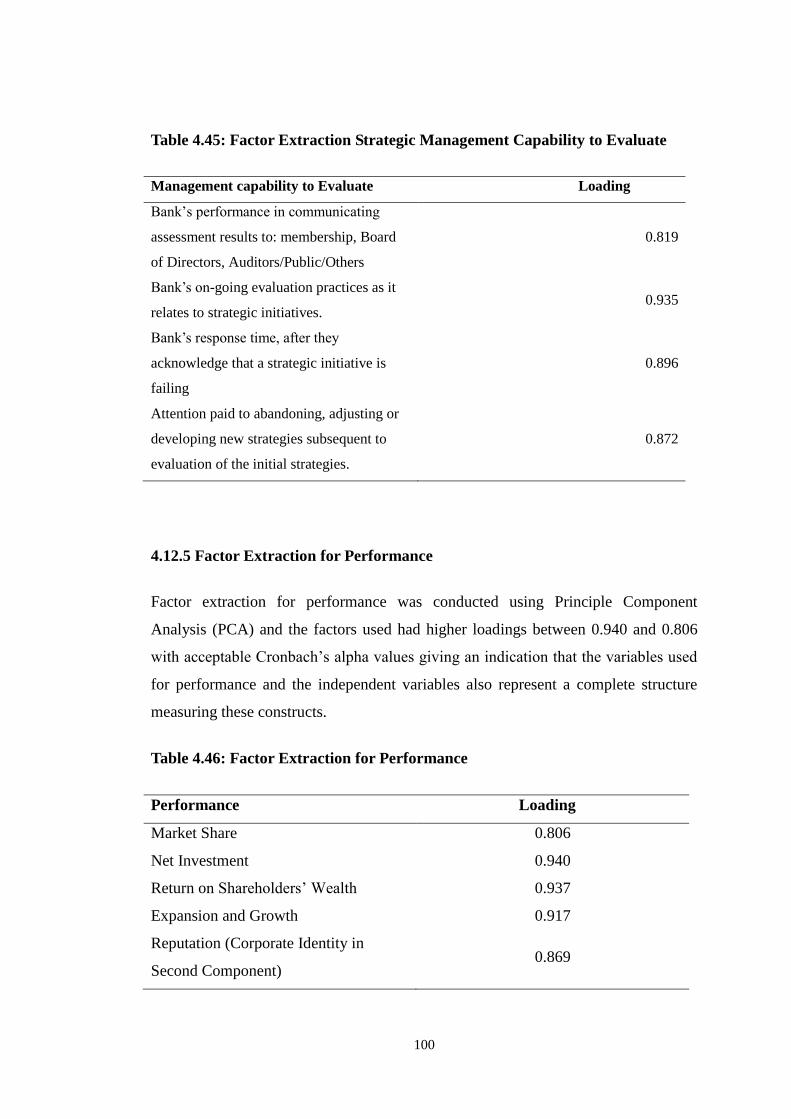
100
Table 4.45: Factor Extraction Strategic Management Capability to Evaluate
Management capability to Evaluate Loading
Bank‟s performance in communicating
assessment results to: membership, Board
of Directors, Auditors/Public/Others
0.819
Bank‟s on-going evaluation practices as it
relates to strategic initiatives. 0.935
Bank‟s response time, after they
acknowledge that a strategic initiative is
failing
0.896
Attention paid to abandoning, adjusting or
developing new strategies subsequent to
evaluation of the initial strategies.
0.872
4.12.5 Factor Extraction for Performance
Factor extraction for performance was conducted using Principle Component
Analysis (PCA) and the factors used had higher loadings between 0.940 and 0.806
with acceptable Cronbach‟s alpha values giving an indication that the variables used
for performance and the independent variables also represent a complete structure
measuring these constructs.
Table 4.46: Factor Extraction for Performance
Performance Loading
Market Share 0.806
Net Investment 0.940
Return on Shareholders‟ Wealth 0.937
Expansion and Growth 0.917
Reputation (Corporate Identity in
Second Component) 0.869
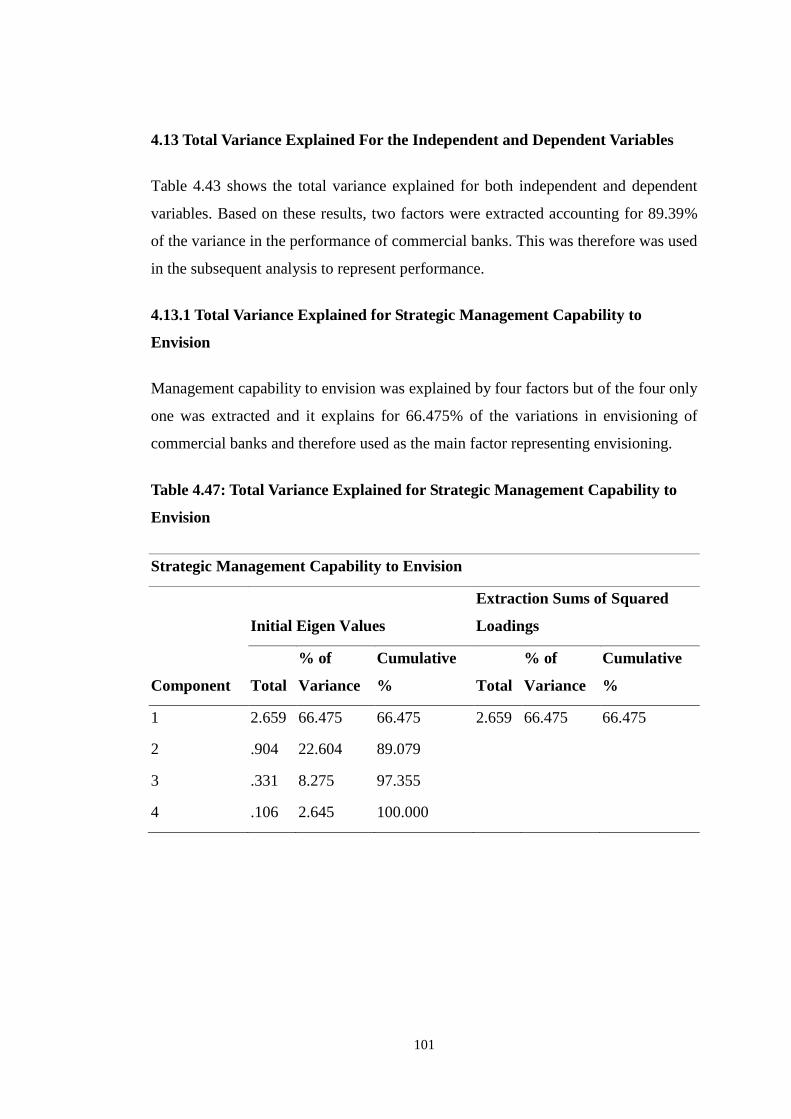
101
4.13 Total Variance Explained For the Independent and Dependent Variables
Table 4.43 shows the total variance explained for both independent and dependent
variables. Based on these results, two factors were extracted accounting for 89.39%
of the variance in the performance of commercial banks. This was therefore was used
in the subsequent analysis to represent performance.
4.13.1 Total Variance Explained for Strategic Management Capability to
Envision
Management capability to envision was explained by four factors but of the four only
one was extracted and it explains for 66.475% of the variations in envisioning of
commercial banks and therefore used as the main factor representing envisioning.
Table 4.47: Total Variance Explained for Strategic Management Capability to
Envision
Strategic Management Capability to Envision
Component
Initial Eigen Values
Extraction Sums of Squared
Loadings
Total
% of
Variance
Cumulative
% Total
% of
Variance
Cumulative
%
1 2.659 66.475 66.475 2.659 66.475 66.475
2 .904 22.604 89.079
3 .331 8.275 97.355
4 .106 2.645 100.000
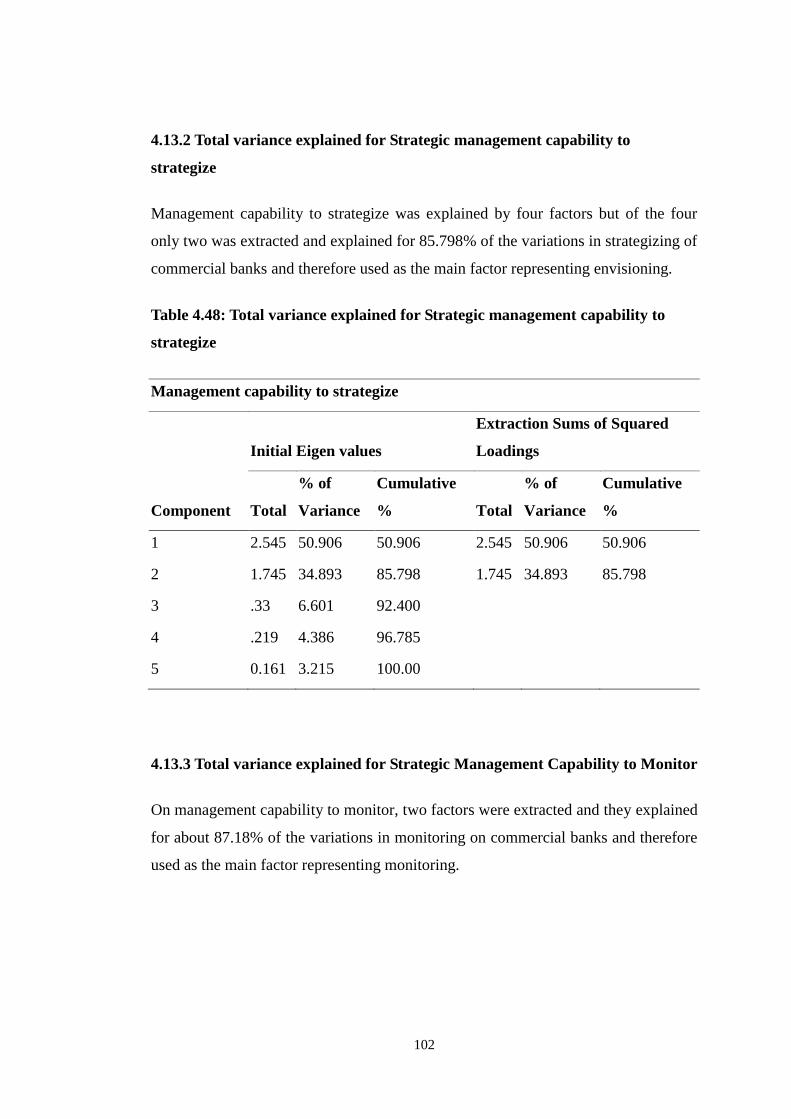
102
4.13.2 Total variance explained for Strategic management capability to
strategize
Management capability to strategize was explained by four factors but of the four
only two was extracted and explained for 85.798% of the variations in strategizing of
commercial banks and therefore used as the main factor representing envisioning.
Table 4.48: Total variance explained for Strategic management capability to
strategize
Management capability to strategize
Component
Initial Eigen values
Extraction Sums of Squared
Loadings
Total
% of
Variance
Cumulative
% Total
% of
Variance
Cumulative
%
1 2.545 50.906 50.906 2.545 50.906 50.906
2 1.745 34.893 85.798 1.745 34.893 85.798
3 .33 6.601 92.400
4 .219 4.386 96.785
5 0.161 3.215 100.00
4.13.3 Total variance explained for Strategic Management Capability to Monitor
On management capability to monitor, two factors were extracted and they explained
for about 87.18% of the variations in monitoring on commercial banks and therefore
used as the main factor representing monitoring.
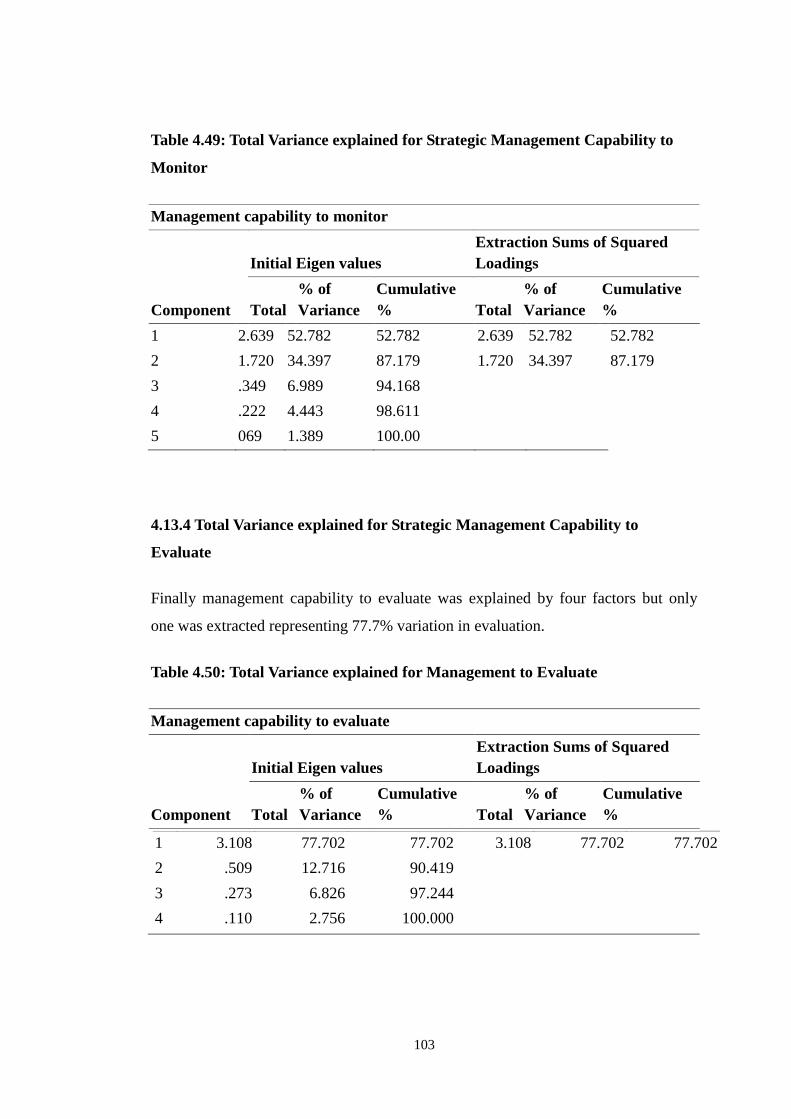
103
Table 4.49: Total Variance explained for Strategic Management Capability to
Monitor
Management capability to monitor
Component
Initial Eigen values
Extraction Sums of Squared
Loadings
Total
% of
Variance
Cumulative
% Total
% of
Variance
Cumulative
%
1 2.639 52.782 52.782 2.639 52.782 52.782
2 1.720 34.397 87.179 1.720 34.397 87.179
3 .349 6.989 94.168
4 .222 4.443 98.611
5 069 1.389 100.00
4.13.4 Total Variance explained for Strategic Management Capability to
Evaluate
Finally management capability to evaluate was explained by four factors but only
one was extracted representing 77.7% variation in evaluation.
Table 4.50: Total Variance explained for Management to Evaluate
Management capability to evaluate
Component
Initial Eigen values
Extraction Sums of Squared
Loadings
Total
% of
Variance
Cumulative
% Total
% of
Variance
Cumulative
%
1 3.108 77.702 77.702 3.108 77.702 77.702
2 .509 12.716 90.419
3 .273 6.826 97.244
4 .110 2.756 100.000
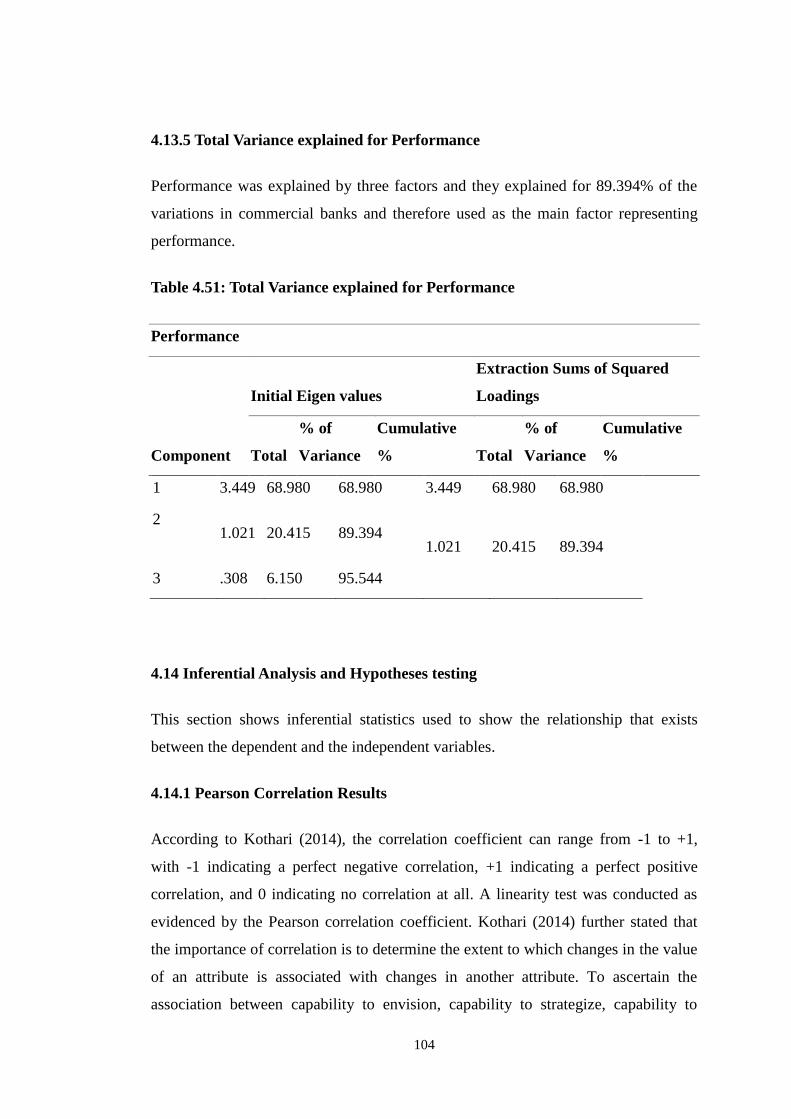
104
4.13.5 Total Variance explained for Performance
Performance was explained by three factors and they explained for 89.394% of the
variations in commercial banks and therefore used as the main factor representing
performance.
Table 4.51: Total Variance explained for Performance
Performance
Component
Initial Eigen values
Extraction Sums of Squared
Loadings
Total
% of
Variance
Cumulative
% Total
% of
Variance
Cumulative
%
1 3.449 68.980 68.980 3.449 68.980 68.980
2 1.021 20.415 89.394
1.021
20.415
89.394
3 .308 6.150 95.544
4.14 Inferential Analysis and Hypotheses testing
This section shows inferential statistics used to show the relationship that exists
between the dependent and the independent variables.
4.14.1 Pearson Correlation Results
According to Kothari (2014), the correlation coefficient can range from -1 to +1,
with -1 indicating a perfect negative correlation, +1 indicating a perfect positive
correlation, and 0 indicating no correlation at all. A linearity test was conducted as
evidenced by the Pearson correlation coefficient. Kothari (2014) further stated that
the importance of correlation is to determine the extent to which changes in the value
of an attribute is associated with changes in another attribute. To ascertain the
association between capability to envision, capability to strategize, capability to
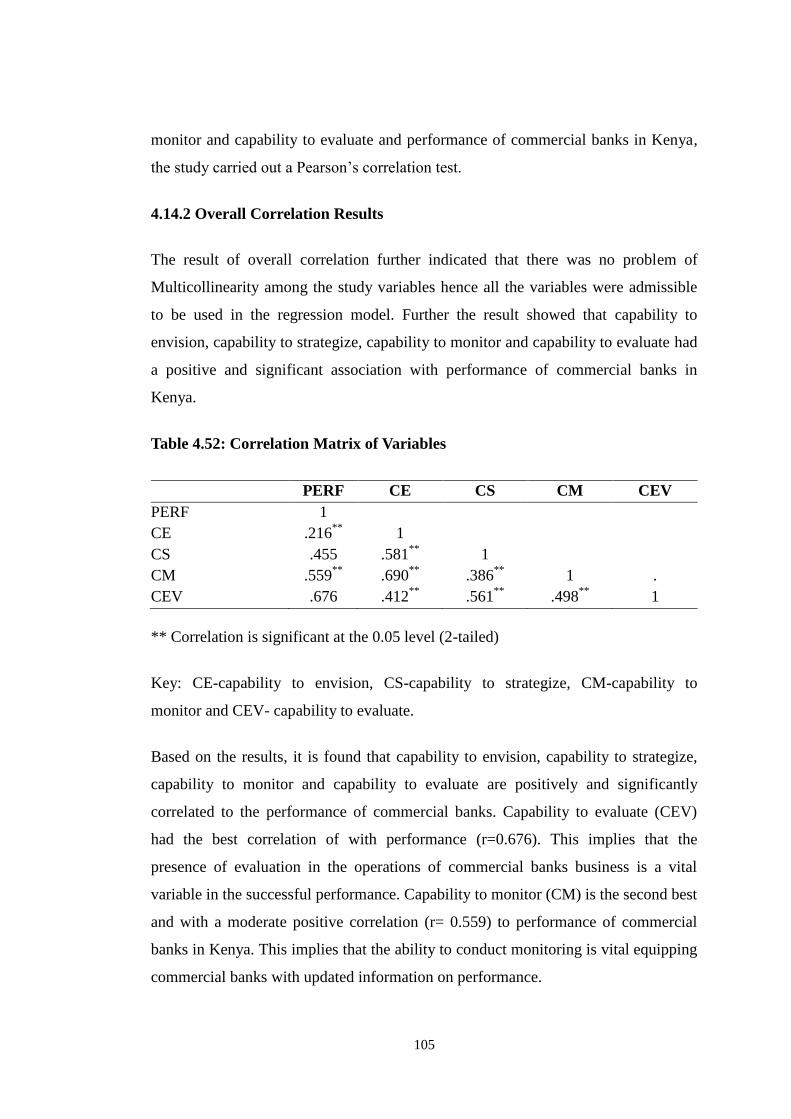
105
monitor and capability to evaluate and performance of commercial banks in Kenya,
the study carried out a Pearson‟s correlation test.
4.14.2 Overall Correlation Results
The result of overall correlation further indicated that there was no problem of
Multicollinearity among the study variables hence all the variables were admissible
to be used in the regression model. Further the result showed that capability to
envision, capability to strategize, capability to monitor and capability to evaluate had
a positive and significant association with performance of commercial banks in
Kenya.
Table 4.52: Correlation Matrix of Variables
PERF CE CS CM CEV
PERF 1
CE .216**
1
CS .455 .581**
1
CM .559**
.690**
.386**
1 .
CEV .676 .412**
.561**
.498**
1
** Correlation is significant at the 0.05 level (2-tailed)
Key: CE-capability to envision, CS-capability to strategize, CM-capability to
monitor and CEV- capability to evaluate.
Based on the results, it is found that capability to envision, capability to strategize,
capability to monitor and capability to evaluate are positively and significantly
correlated to the performance of commercial banks. Capability to evaluate (CEV)
had the best correlation of with performance (r=0.676). This implies that the
presence of evaluation in the operations of commercial banks business is a vital
variable in the successful performance. Capability to monitor (CM) is the second best
and with a moderate positive correlation (r= 0.559) to performance of commercial
banks in Kenya. This implies that the ability to conduct monitoring is vital equipping
commercial banks with updated information on performance.
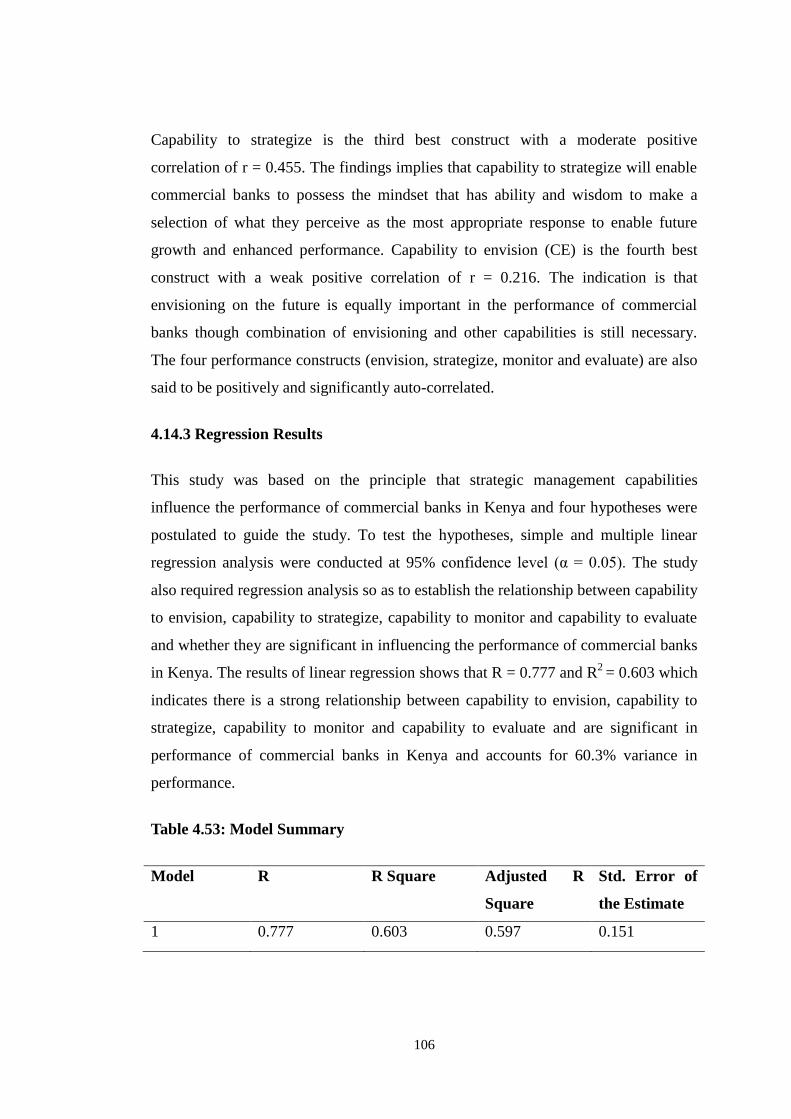
106
Capability to strategize is the third best construct with a moderate positive
correlation of r = 0.455. The findings implies that capability to strategize will enable
commercial banks to possess the mindset that has ability and wisdom to make a
selection of what they perceive as the most appropriate response to enable future
growth and enhanced performance. Capability to envision (CE) is the fourth best
construct with a weak positive correlation of r = 0.216. The indication is that
envisioning on the future is equally important in the performance of commercial
banks though combination of envisioning and other capabilities is still necessary.
The four performance constructs (envision, strategize, monitor and evaluate) are also
said to be positively and significantly auto-correlated.
4.14.3 Regression Results
This study was based on the principle that strategic management capabilities
influence the performance of commercial banks in Kenya and four hypotheses were
postulated to guide the study. To test the hypotheses, simple and multiple linear
regression analysis were conducted at 95% confidence level (α = 0.05). The study
also required regression analysis so as to establish the relationship between capability
to envision, capability to strategize, capability to monitor and capability to evaluate
and whether they are significant in influencing the performance of commercial banks
in Kenya. The results of linear regression shows that R = 0.777 and R2
= 0.603 which
indicates there is a strong relationship between capability to envision, capability to
strategize, capability to monitor and capability to evaluate and are significant in
performance of commercial banks in Kenya and accounts for 60.3% variance in
performance.
Table 4.53: Model Summary
Model R R Square Adjusted R
Square
Std. Error of
the Estimate
1 0.777 0.603 0.597 0.151
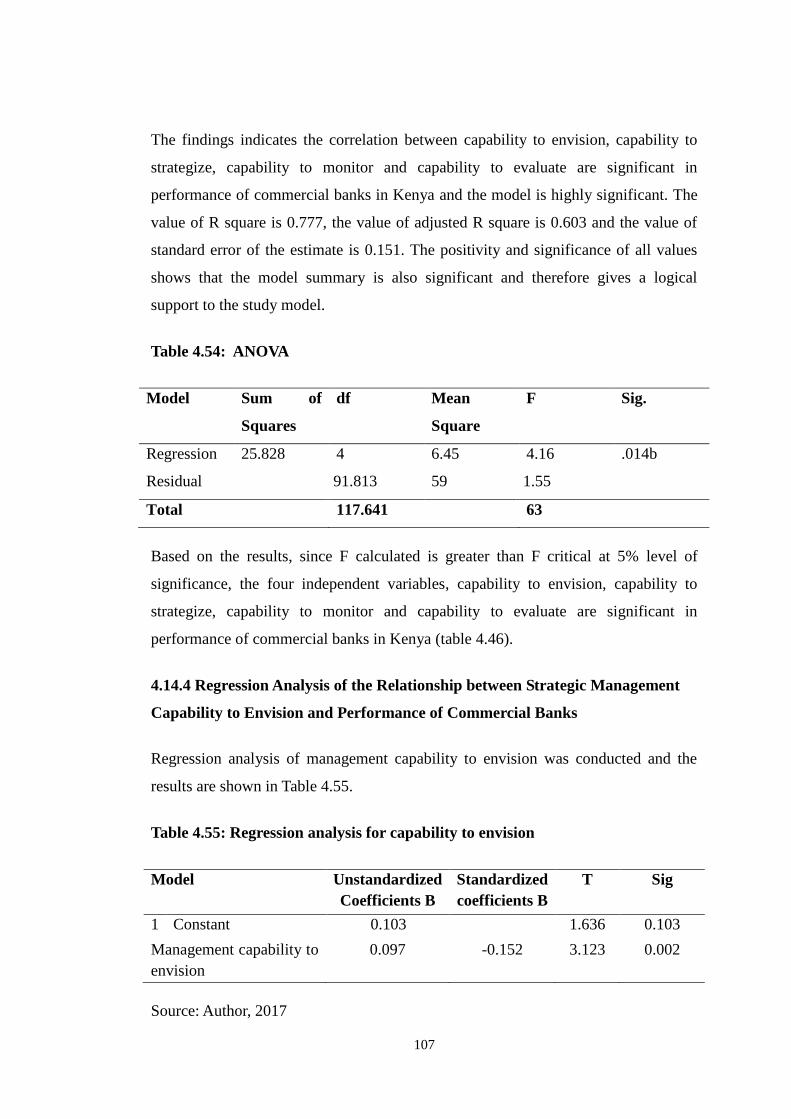
107
The findings indicates the correlation between capability to envision, capability to
strategize, capability to monitor and capability to evaluate are significant in
performance of commercial banks in Kenya and the model is highly significant. The
value of R square is 0.777, the value of adjusted R square is 0.603 and the value of
standard error of the estimate is 0.151. The positivity and significance of all values
shows that the model summary is also significant and therefore gives a logical
support to the study model.
Table 4.54: ANOVA
Model Sum of
Squares
df Mean
Square
F Sig.
Regression 25.828 4 6.45 4.16 .014b
Residual 91.813 59 1.55
Total 117.641 63
Based on the results, since F calculated is greater than F critical at 5% level of
significance, the four independent variables, capability to envision, capability to
strategize, capability to monitor and capability to evaluate are significant in
performance of commercial banks in Kenya (table 4.46).
4.14.4 Regression Analysis of the Relationship between Strategic Management
Capability to Envision and Performance of Commercial Banks
Regression analysis of management capability to envision was conducted and the
results are shown in Table 4.55.
Table 4.55: Regression analysis for capability to envision
Model Unstandardized
Coefficients B
Standardized
coefficients B
T Sig
1 Constant 0.103 1.636 0.103
Management capability to
envision
0.097 -0.152 3.123 0.002
Source: Author, 2017
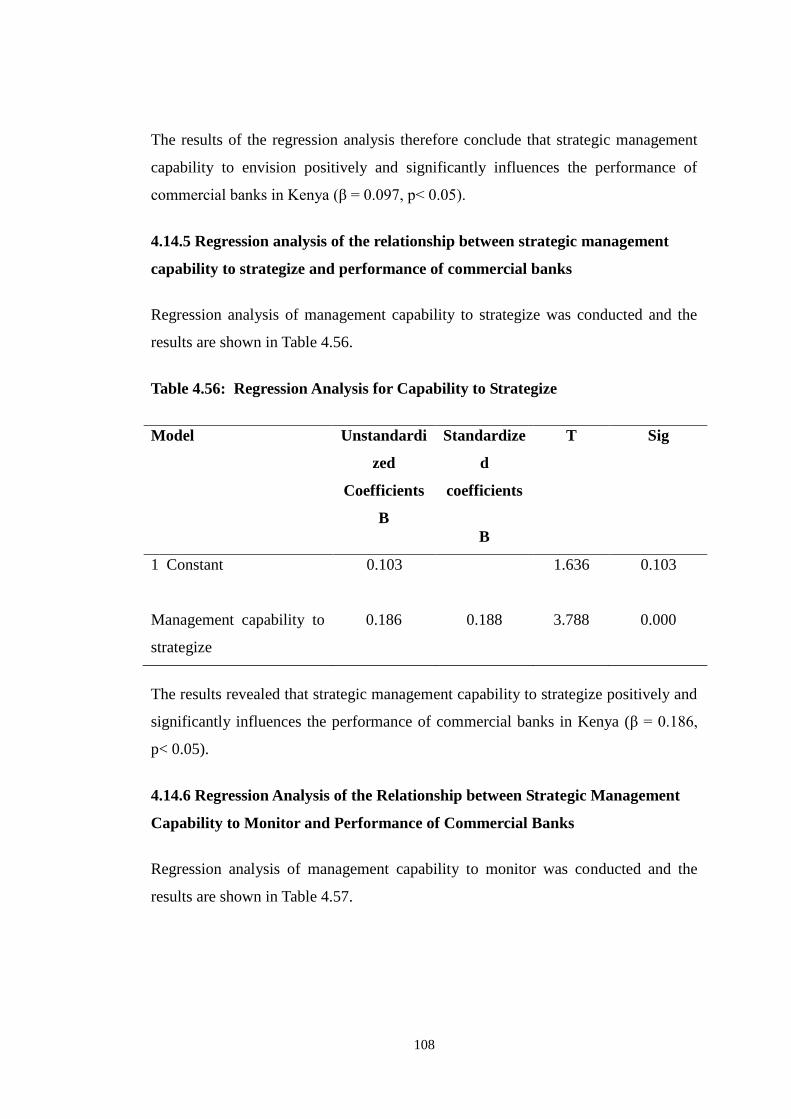
108
The results of the regression analysis therefore conclude that strategic management
capability to envision positively and significantly influences the performance of
commercial banks in Kenya (β = 0.097, p< 0.05).
4.14.5 Regression analysis of the relationship between strategic management
capability to strategize and performance of commercial banks
Regression analysis of management capability to strategize was conducted and the
results are shown in Table 4.56.
Table 4.56: Regression Analysis for Capability to Strategize
Model Unstandardi
zed
Coefficients
B
Standardize
d
coefficients
B
T Sig
1
Constant 0.103 1.636 0.103
Management capability to
strategize
0.186 0.188 3.788 0.000
The results revealed that strategic management capability to strategize positively and
significantly influences the performance of commercial banks in Kenya (β = 0.186,
p< 0.05).
4.14.6 Regression Analysis of the Relationship between Strategic Management
Capability to Monitor and Performance of Commercial Banks
Regression analysis of management capability to monitor was conducted and the
results are shown in Table 4.57.
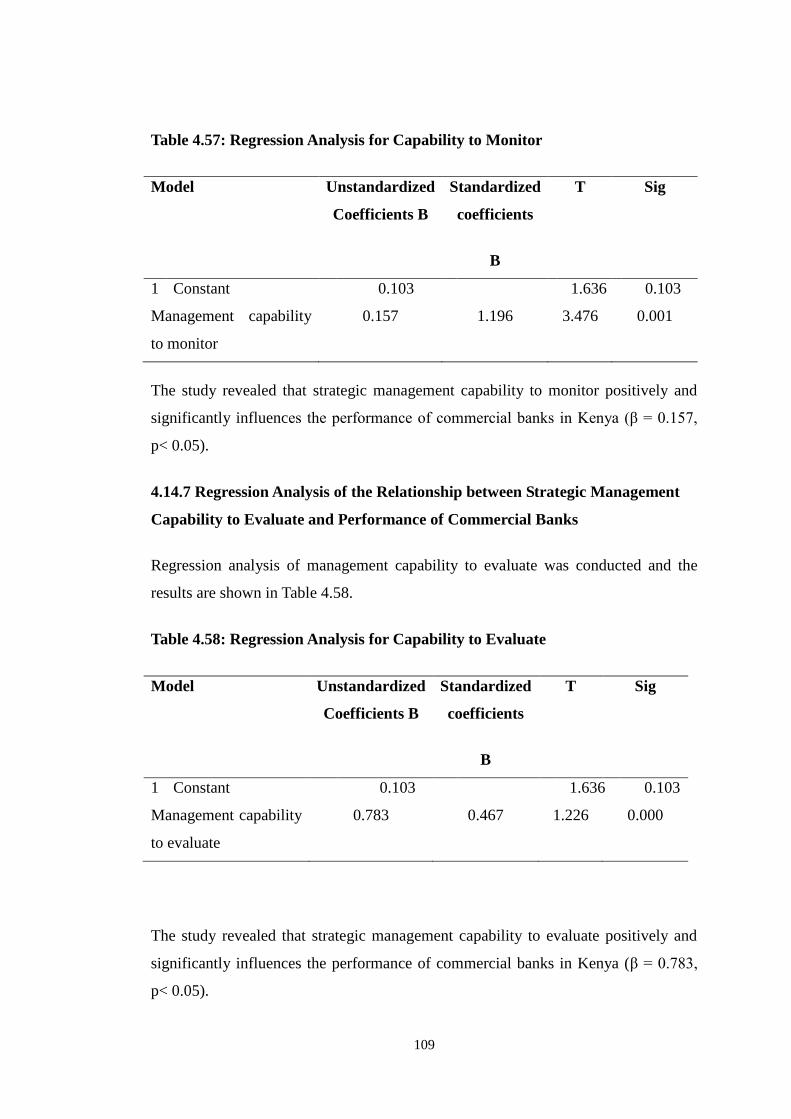
109
Table 4.57: Regression Analysis for Capability to Monitor
Model Unstandardized
Coefficients B
Standardized
coefficients
B
T Sig
1 Constant 0.103 1.636 0.103
Management capability
to monitor
0.157 1.196 3.476 0.001
The study revealed that strategic management capability to monitor positively and
significantly influences the performance of commercial banks in Kenya (β = 0.157,
p< 0.05).
4.14.7 Regression Analysis of the Relationship between Strategic Management
Capability to Evaluate and Performance of Commercial Banks
Regression analysis of management capability to evaluate was conducted and the
results are shown in Table 4.58.
Table 4.58: Regression Analysis for Capability to Evaluate
Model Unstandardized
Coefficients B
Standardized
coefficients
B
T Sig
1 Constant 0.103 1.636 0.103
Management capability
to evaluate
0.783 0.467 1.226 0.000
The study revealed that strategic management capability to evaluate positively and
significantly influences the performance of commercial banks in Kenya (β = 0.783,
p< 0.05).
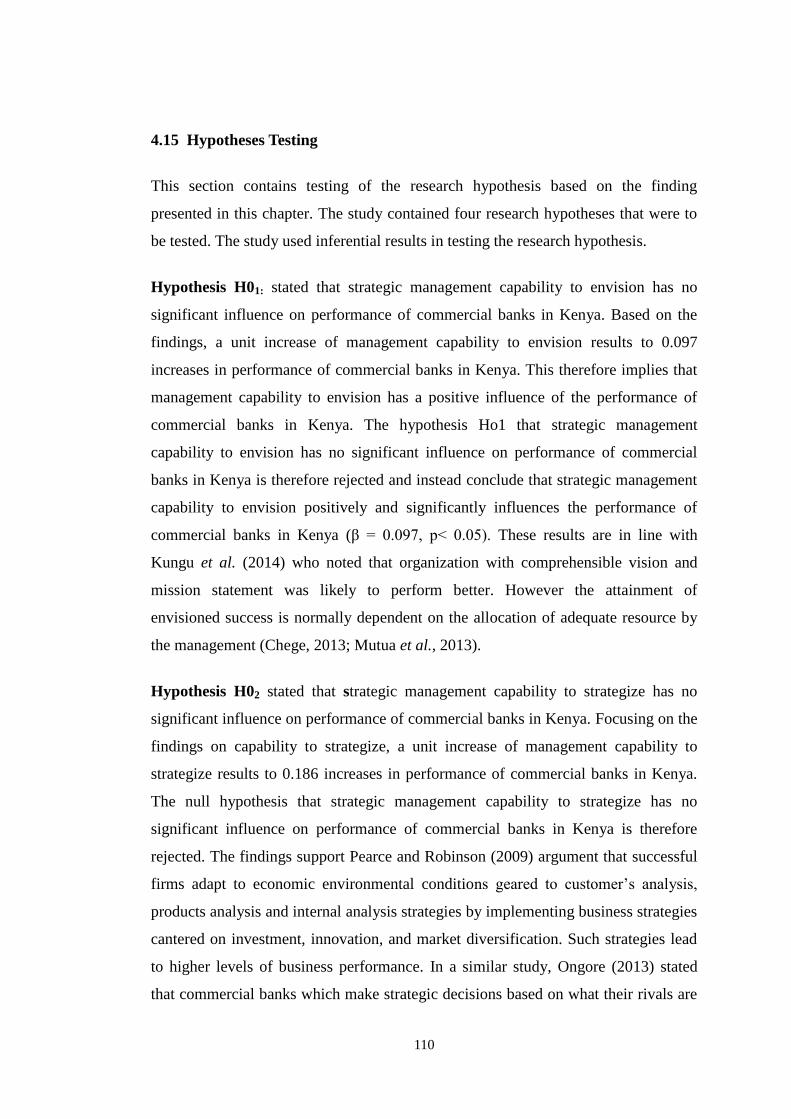
110
4.15 Hypotheses Testing
This section contains testing of the research hypothesis based on the finding
presented in this chapter. The study contained four research hypotheses that were to
be tested. The study used inferential results in testing the research hypothesis.
Hypothesis H01: stated that strategic management capability to envision has no
significant influence on performance of commercial banks in Kenya. Based on the
findings, a unit increase of management capability to envision results to 0.097
increases in performance of commercial banks in Kenya. This therefore implies that
management capability to envision has a positive influence of the performance of
commercial banks in Kenya. The hypothesis Ho1 that strategic management
capability to envision has no significant influence on performance of commercial
banks in Kenya is therefore rejected and instead conclude that strategic management
capability to envision positively and significantly influences the performance of
commercial banks in Kenya (β = 0.097, p< 0.05). These results are in line with
Kungu et al. (2014) who noted that organization with comprehensible vision and
mission statement was likely to perform better. However the attainment of
envisioned success is normally dependent on the allocation of adequate resource by
the management (Chege, 2013; Mutua et al., 2013).
Hypothesis H02 stated that strategic management capability to strategize has no
significant influence on performance of commercial banks in Kenya. Focusing on the
findings on capability to strategize, a unit increase of management capability to
strategize results to 0.186 increases in performance of commercial banks in Kenya.
The null hypothesis that strategic management capability to strategize has no
significant influence on performance of commercial banks in Kenya is therefore
rejected. The findings support Pearce and Robinson (2009) argument that successful
firms adapt to economic environmental conditions geared to customer‟s analysis,
products analysis and internal analysis strategies by implementing business strategies
cantered on investment, innovation, and market diversification. Such strategies lead
to higher levels of business performance. In a similar study, Ongore (2013) stated
that commercial banks which make strategic decisions based on what their rivals are
111
doing and how to confront market factors that faces them are more likely to register
better performance.
Hypothesis H03 stated strategic management capability to monitor has no significant
influence on performance of commercial banks in Kenya. The study revealed that
strategic management capability to monitor positively and significantly influences
the performance of commercial banks in Kenya (β = 0.157, p< 0.05). A unit increase
of management capability to monitor results to 0.157 increases in performance of
commercial banks in Kenya. This therefore led to the rejection of the hypothesis H03
which stated strategic management capability to monitor has no significant influence
on performance of commercial banks in Kenya. This support Thagana (2013) who
argued that organizations like banks that have strong and effective cultures and
reward systems have regular monitoring and typically require fewer rules and
regulations because employees tend to understand and internalize the boundaries of
acceptable behaviour. The findings further agreed with the sentiments of Johnson et
al, (2008) that operational and financial controls are part and parcel of effective
operation of the banks.
Hypothesis H04 stated that strategic management capability to evaluate has no
significant influence on performance of commercial banks in Kenya. Results
indicates that a unit increase in strategic management capability to evaluate results to
0.783 increase in the performance of commercial banks in Kenya (β = 0.783, p<
0.05). This is attributed to the fact that the importance of evaluation is to attest the
appropriateness of objectives of the business, appropriateness of major policies and
plans and to check whether the results obtained to date confirm or refute critical
assumptions on which the strategy rests as stated by Johnson and Scholes (2008).
The null hypothesis H04 which stated that strategic management capability to
evaluate has no significant influence on performance of commercial banks in Kenya
is therefore rejected and instead state that strategic management capability to
evaluate positively and significantly influence the performance of commercial banks
in Kenya. The findings supported Porter (2008) who stated that whether performed
by an individual or as part of an organizational review procedure, strategy evaluation
process forms an essential step in the process of guiding an organization. Ozturk, and
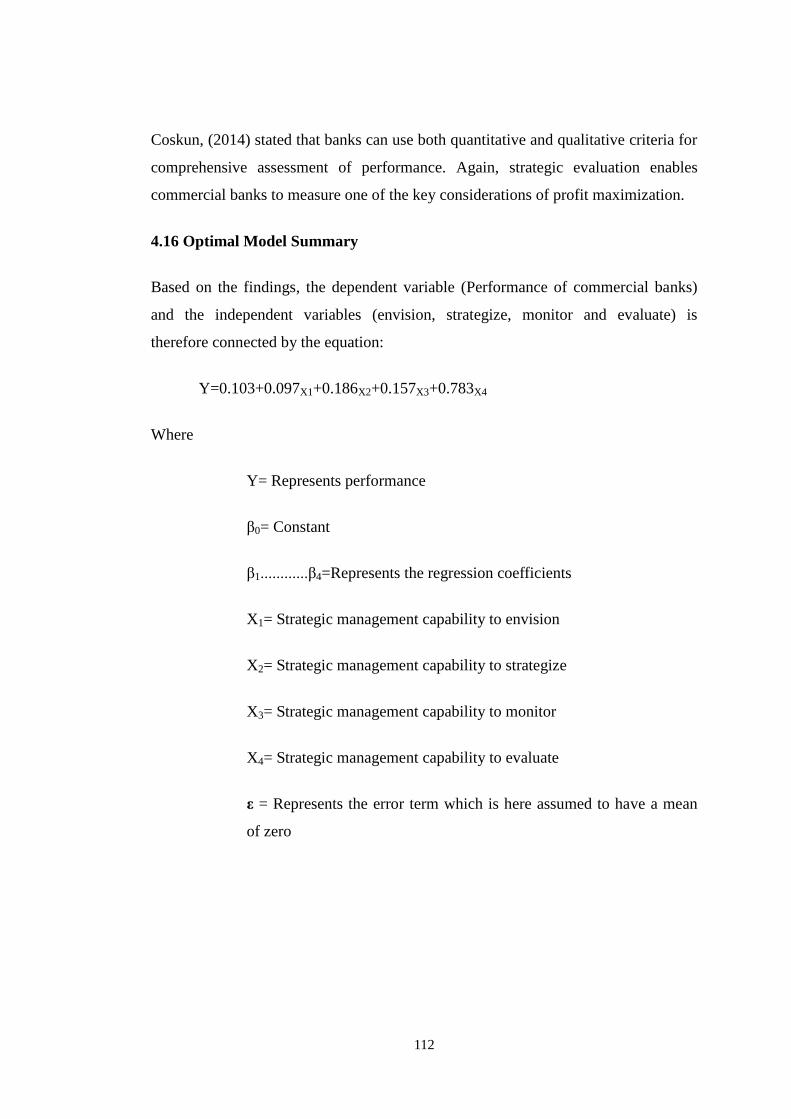
112
Coskun, (2014) stated that banks can use both quantitative and qualitative criteria for
comprehensive assessment of performance. Again, strategic evaluation enables
commercial banks to measure one of the key considerations of profit maximization.
4.16 Optimal Model Summary
Based on the findings, the dependent variable (Performance of commercial banks)
and the independent variables (envision, strategize, monitor and evaluate) is
therefore connected by the equation:
Y=0.103+0.097X1+0.186X2+0.157X3+0.783X4
Where
Y= Represents performance
β0= Constant
β1............β4=Represents the regression coefficients
X1= Strategic management capability to envision
X2= Strategic management capability to strategize
X3= Strategic management capability to monitor
X4= Strategic management capability to evaluate
ε = Represents the error term which is here assumed to have a mean
of zero
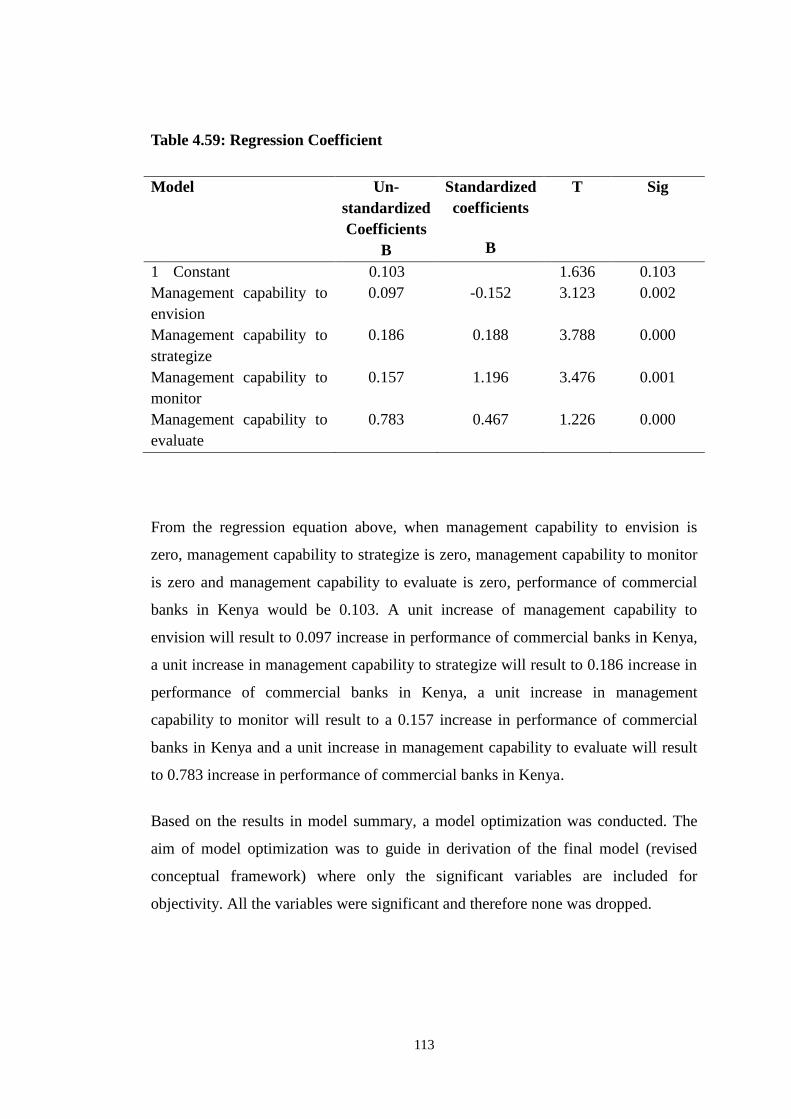
113
Table 4.59: Regression Coefficient
Model Un-
standardized
Coefficients
B
Standardized
coefficients
B
T Sig
1 Constant 0.103 1.636 0.103
Management capability to
envision
0.097 -0.152 3.123 0.002
Management capability to
strategize
0.186 0.188 3.788 0.000
Management capability to
monitor
0.157 1.196 3.476 0.001
Management capability to
evaluate
0.783 0.467 1.226 0.000
From the regression equation above, when management capability to envision is
zero, management capability to strategize is zero, management capability to monitor
is zero and management capability to evaluate is zero, performance of commercial
banks in Kenya would be 0.103. A unit increase of management capability to
envision will result to 0.097 increase in performance of commercial banks in Kenya,
a unit increase in management capability to strategize will result to 0.186 increase in
performance of commercial banks in Kenya, a unit increase in management
capability to monitor will result to a 0.157 increase in performance of commercial
banks in Kenya and a unit increase in management capability to evaluate will result
to 0.783 increase in performance of commercial banks in Kenya.
Based on the results in model summary, a model optimization was conducted. The
aim of model optimization was to guide in derivation of the final model (revised
conceptual framework) where only the significant variables are included for
objectivity. All the variables were significant and therefore none was dropped.
114
CHAPTER FIVE
SUMMARY, CONCLUSION AND RECOMMENDATIONS
5.1 Introduction
This chapter presents the conclusion reached and recommendations for policy
directions for banking practitioners and other stakeholders in the industry.
5.2 Summary of the Study
This study assessed the influence of strategic management capabilities on the
performance of commercial banks in Kenya. The specific objectives of the study
were to establish the influence of strategic management capabilities to envision,
strategize, monitor and evaluate on the performance of commercial banks in Kenya.
The study adopted a descriptive cross-sectional design where both quantitative and
qualitative data were collected. The target population was 42 banks and 5,432
employees out of which 358 respondents were selected for interviews. Sampling
involved use of stratified random sampling and random purpose sampling.
5.2.1 Strategic Management Capability to Envision
The study found out that management capabilities to envision as a strategy allow for
critical assessment of strategic planning and has positive impact on the performance
of commercial banks in the country and that most commercial banks have monitoring
strategies to enable them seize the strategic initiatives and maintain a competitive
edge in the market. It concluded that that effective strategic management capabilities
have direct influence on the performance of commercial banks in Kenya which is
reflected in capital adequacy, asset quality and customer satisfaction.
For banks to attain their desired performance goals, it is imperative that they
formulate clear objectives which should form part of their vision and mission
statement. It was established that ownership identity of banks didn‟t appear to be
viewed by bank employees as contributing to superior performance. Most employees
felt that performance is hinged on how banks managers manage competition. The
115
findings were that all banks implemented various strategic programmes using
different approaches.
The study determined that most firms practising strategic management had clear
objectives, elaborate vision and mission statements to guide the operation of their
organization. The study found that management capabilities to envision as a strategy
allow for critical assessment of strategic planning and has positive impact on the
performance of commercial banks in the country. It was established that all
commercial banks has well construed performance goals which were contained
within the vision and mission statements of respective organizations. The goals most
common to banks were cost leadership, market capture, customer satisfaction,
maximising shareholders wealth, branch expansion, product quality and diversity.
5.2.2 Strategic Management Capability to Strategize
The findings indicated that the respondents felt that the key aspects of bank‟s
capability to strategize include commitment of the board to support implementation
as important, generation of strategies to deal with performance challenges as quite
important, rationalization and selection of strategies to address bank operational
issues. It was found that commercial banks have existing strategic networks to
enhance performance. It was also felt that the key aspects of bank‟s capability to
strategize include commitment of the board to support implementation, generation of
strategies to deal with performance challenges, selection of strategies to address bank
operational issues and market penetration.
The results also indicate that the respondents felt that the key aspects of bank‟s
capability to strategize include, commitment of the board to support implementation
as important at 80%; generation of strategies to deal with performance challenges as
quite important at 80%; rationalization 73%; select strategies to address bank
operational issues as important at 68%; product restructuring as important at 64%
and market penetration as important at 63%. The results are in contrast with Hill and
Jones (2009) argument that the most vital capability to strategize is about the choice
of the tactics and techniques for the firm as a whole, managing various product lines
and business units for maximum value regular update of bank policies and market
116
penetration capability which helps to exercise the choice of direction that an
organization adopts as a whole.
5.2.3 Strategic Management Capability to Monitor
The findings agreed that financial and operational controls are clear and
unambiguous, which introduces a high degree of discipline into the control process.
SWOT analysis is one of the strategies that strategic management will continually
implement to forestall any eventuality of underperformance in the organization. The
study determined that most commercial banks have monitoring strategies to enable
them seize the strategic initiatives and maintain a competitive edge in the market.
The findings further agreed with the sentiments of Johnson et al, (2008) that
operational and financial controls are part and parcel of effective operation of the
banks.
Financial and operational controls are clear and unambiguous, which introduces a
high degree of discipline into the control process. SWOT analysis is one of the
strategies that strategic management will continually implement to forestall any
eventuality of underperformance in the organization. It will assist in keeping the
organizational performance well in line to achieve the projected goals.
The findings showed that a bank with progressive performance reviews ideas in
terms of its market choice, product innovation, and corporate social responsibility is
likely to be appealing to many customers, thus resulting into higher sales and
subsequently better performance. In addition, a well-designed strategic performance
review system is capable of rewarding firm employees for incremental but
substantive progress on product or process innovations that take a long time to reach
market. This is an indicator that for a commercial bank in Kenya to attract and retain
its customer base strategic reviews of its investment performance is continuously
vital. It will also ensure that the bank give value to its customers and shareholders.
117
5.2.4 Strategic Management Capability to Evaluate
The findings indicated that the evaluation processes is very important in the bank
performances. It was also apparent that the various banks use different strategies in
the evaluation of the level of achievement of the set targets. In addition, it was clear
that, evaluation of performance assisted in attainment of set goals with indicating that
their bank usually conducted evaluation surveys to ascertain achievement of set
goals. The key aspects of bank‟s capability to evaluate were response to market
changes and dynamics, availability of corrective measures to address failures and
communicating assessment results to stakeholders.
The findings on the importance of evaluation processes indicated that the evaluation
processes to be very important in their bank performances. The findings supported
Porter (2008) who stated that whether performed by an individual or as part of an
organizational review procedure, strategy evaluation process forms an essential step
in the process of guiding an organization. It was apparent that, through evaluation,
organizations are able to explore the occurrence of unintended results and offer
recommendations on mitigation options. Commercial banks desire to gain
competitive advantage over their rivals should use evaluation techniques to fast tract
the attainment of their performance objectives.
5.3 Conclusions
This study was exploratory and investigated the influence of strategic management
capabilities on organizational performance. The focus was on elements of strategic
management capabilities which include: envisioning, strategising, monitoring and
evaluation and how they influence the performance of commercial banks in Kenya.
Each strategic management capability was isolated and weighed against known bank
performance indicators such as profitability, market share and growth.
The study revealed positive correlations between strategising and performance of
commercial banks. It was determined that a unit increase in management capability
to strategize resulted into an increase in performance level. Subsequently, we
118
conclude that with appropriate and accurate strategies commercial banks in Kenya
are likely to register better performances.
In addition to the foregoing, the study established that commercial banks
performances in Kenya were greatly enhanced where respective banks‟ management
had provided necessary resources for monitoring programmes implementation.
Therefore, the study concludes that appropriate application of strategic management
capabilities and accurate response to market dynamics enhances the performance of
commercial banks in Kenya.
The study also concluded that where banks employ better evaluation of programmes,
the performance increases significantly. The element of evaluation had the greatest
influence on the performance of commercial banks compared to other variables.
Finally, to attain their desired performance goals, they must formulate clear
objectives which should form part of their vision and mission statements and should
deploy adequate funding, appropriate human capital, sound technology and better
evaluation and monitoring of programmes implementation.
5.4 Recommendations
The study has made the following recommendations:
5.4.1 Managerial Policy
At the policy front, the study recommends the realignment of commercial banks‟
vision and mission statements with the performances goals and makes them
adaptable to changing market dynamics. Therefore, it is equally suggested that
commercial banks should continuously engage in creating vision and mission
statements that spell out their strategic focus in the future and deploy sufficient
systems and resources in terms of funding, skilled personnel and appropriate
technology that foster their attainment.
119
The envisioning of strategies should always be inclusive and guided by the views of
all the stakeholders. In addition, the management of commercial banks should adapt
differentiation strategy whist focusing directly on their products and occasionally
reviews their market segmentation strategies to enhance their performance
5.4.2 Market Adaptation
Due to changing market structures and fast evolving technologies, the study
recommends that commercial banks should adapt and regularly review their strategic
management capabilities and implement monitoring and evaluation options to ensure
programmes are successfully implemented or adjusted as the prevailing situation
demands. It was determined that certain banks tended to be conservative in their
operational approaches and failed to change with the changing industry environment
thereby registering poor performance. In this regard, the study recommends a market
policy framework which sensitive to the action of rival banks and activities in the
financial market.
5.5 Areas for Further Research
From the study findings, it was determined that commercial banks with superior
management capabilities to envision, strategize, monitor and evaluate their policies
in the face of changing market regime are likely to register better performance
compares to those with unclear objectives and ambiguous strategies. However, it was
not possible within the scope of this study to establish which aspects and type of
ambiguities existed among commercial banks in Kenya. Subsequently, the study
recommends that further research be done on the relationship between elements of
strategic management capabilities (envisioning, strategizing, monitoring and
evaluation) and individual performance indicators.
Additionally, the study recommends that a study be conducted to establish the
relationship between quality of human resource and performance within the
commercial banking sub-sector in Kenya. Such a study will help in determining
whether it is the form or managerial strategies that are more important in the
performance of commercial banks or the prevailing external environment.
120
REFERENCES
Abu-jarad, I. Y., Yusof, N., & Nikbin, D. (2010). A Review Paper on Organizational
Culture and Organizational Performance. International Journal of
Business and Social Science, 1(3), 26–46.
Ackermann, F., & Eden, C. (2011). Strategic Management of Stakeholders: Theory
and Practice. Long Range Planning, 44(3), 179–196.
http://doi.org/10.1016/j.lrp.2010.08.001.
Abdalkrim, G. M. (2013). The Impact of Strategic Planning Activities on
Private Sector Organizations Performance in Sudan: An
Empirical Research. International Journal of Business and
Management, 8(10), 134-143. doi:10.5539/ijbm.v8n10p134.
Aigyies, N., & Mcgahan, A. M. (2002). Introduction : Michael Porter ‟ s Competitive
Strategy. Management, 16(2), 41–42.
Albrecht, L. (2009). The moderating Effect of Team Orientation Over the
Relationship Between TMT Strategic Decision Speed and Firm
Performance. Chinese Business Review, 10(9), 790–795.
Allen, F., & Carletti, E. (2010). An Overview of the Crisis: Causes, Consequences,
and Solutions. International Review of Finance, 10, 1–26.
http://doi.org/10.1111/j.1468-2443.2009.01103.x
Ansoff, I., & McDonnell, E. (1990). mplanting Strategic Management. Upper Saddle
River, NJ: Prentice-Hall.
Armstrong, M. (2010). Human Resource Management Practice (12th
ed.). London:
Kogan Page Limited.
Ayuso, A. Sababu, B. Ayub, M. (2006) Strategic Management: The Analyst
Approach, Nairobi, Jomo Kenyatta Foundation.
Bollen, K. A. (2014). Structural equations with latent variables. John Wiley & Sons.
121
Bryman, A., & Bell, E. (2007). Business Research Methods, (3rd
ed.)New
York:Oxford,University press.
Bryson, J. M. (1995).Strategic Planning for Public and Non-profit Organization; A
guide to Strengthening and Sustaining Organizational
Achievement.Jossey:Bass A Wiley Company.
CBK. (2010). Monthly Economic Review. Nairobi, Kenya.
Cennamo, A. Sirkin, H. L., Keenan, P. & Jackson, A. (2009). The hard side of
strategy management. Harvard Business Review, Harvard Business
School Press, October.
Central Bank of Kenya (2013). Bank Supervision Annual Report, Nairobi: CBK
Central Bank. (2015). Financial Review. Nairobi, Kenya.
Chandler, A. D. (1962). Strategy and Structure: Chapters in History of the Industrial
Enterprises. Cambridge, Mass: The MIT Press.
Cooper, D. R., & Schindler, P. S. (2008). Business Research Methods (10th
ed.). New
York: McGraw-Hill.
Cooper, D. R., & Schindler, S. P. (2003). Business Research Methods (8th
ed). New
York: McGraw Hill.
Coulter, M. (2005). Strategic management in Action. Pearson Education Inc.
Coplin, W. (2002). 10 Things Employers Want You to Learn in Co llege: The Know-
How You Need to Succeed. Berkeley, CA: Ten Speed Press.
David, F.R. & David, F.R. (2015). Strategic Management Concepts and Cases (5th
ed.).New York: Pearson.
122
Donaldson, T., & Preston, L. (2010). Theory the Stakeholder of the Concepts,
Evidence , Corporation and Implications. The Academy of Management
Review, 20(1), 65–91.
Drost, E. A. (2004). Validity and Reliability in Social Science Research. Education
Research and Perspectives, 38(1), 105–123.
Drucker, P. (1954). The practice of management. New York: Harper & Row.
Esty, D. C., & Porter, M. E. (1998). Industrial Ecology and Competitiveness. Journal
of Industrial Ecology, 2, 35–43. http://doi.org/10.1162/jiec.1998.2.1.35
Flamini, V., McDonald, C., & Schumacher, L. (2009). The determinants of
Commercial Bank Profitability in Sub-Saharan Africa (No. WP/09/15).
Freeman, R. E. (2010). Strategic management: A stakeholder approach. Cambridge
University Press.
Freenman, J., & Engel, J. S. (2007). Models of Innovation: Startups and Mature
Corporations. California Management Review, 50(1), 94–119.
Grant, R. (2005). Contemporary Strategy Analysis. Malden, MA: Black-wel.
Gratton Y. (2003). Encouraging successful strategy, Managing Services, 51(1), 40-
43.
Gujarati, D.N. (2006). An efficient method of estimating seemingly unrelated
regressions and tests of aggregation bias. Journal of the American
Statistical Association, 57(298), 500-509.
Guralnik, C. & David, B. (2004). W eb ster’s New World College Dictionary, New
York: John Wiley and sons.
Harrison, J. S., Bosse, D. a, & Phillips, R. A. (2010). Managing for stakholders,
stakeholder utility functions, and competitive advantage. Strategic
Management Journal, 31, 58–74.
123
Hill, C. & Jones, G., (2007). Strategic management theory, An integrated approach.
Biztantra: Wiley India.
Hill, C. & Jones, W. L. (2009). Establishing a standard: Competitive strategy and
technological standards in winner-take-all industries. Academy of
Management Perspectives, 11(2), 7–25.
http://doi.org/10.5465/AME.1997.9707132143
Hill, C. W. L. (2008). Strategic Management Theory: An Integrated Approach (9th
ed). New York: Cengage Learning.
Hill, C. W. L., & Gareth, R. J. (2010). Strategic Management Theory (9th
ed.).
Mason, USA: South Western Cengage Learning.
Hills, R., & Jones, R. (2007). Essentials of Behavioral Research: Methods and Data
Analysis (2nd
ed.). McGraw-Hill Publishing Company.
Jackson, T. M. (2005). Does stakeholder orientation matter? The relationship
between stakeholder management models and firm financial
performance. Academy of Management Journal, 42(5), 488–506.
Jerop, L., & Juma, D. (2014). Influence of Strategic Innovation on the Performance
of Commercial Banks in Kenya: The Case of Kenya Commercial Bank in
Nairobi County. European Journal of Business Management, 2(1), 1–19.
Johnson, G., Scholes, K., & Whittington, R. (2008). Exploring Corporate Strategy
(8th Ed.). Prentice Hall.
Johnson, G., & Scholes, K. (2002). Exploring corporate strategy. (6th
ed.), London:
Prentice-Hall.
Jones, M. T. (2010). Commerce. New Delhi: Cambridge University Press.
Jones, T. M. (2011). Instrumental Stakeholder Theory: A Synthesis of Ethics and
Economics. The Academy of Management Review, 20(2), 404–437.
124
Kamau, A. & Were, M. (2013). What drives banking sector performance in Kenya?
Global Business and Economics Research Journal, 2(4), 45-59.
Kathuni, L. K., & Mugenda, N. G. (2012). Direct Sales Strategy Applied by
Commercial Banks in Kenya. International Journal of Business,
Humanities and Technology, 2(7), 132–138.
Kavale, D. (2014). The Competitive Advantage of Interconnected Firms: An
Extension of the Resource-Based View. Academy of Management
Review, 31(3), 638–658.
Khrawish, H. A. (2011). Determinants of Commercial Banks Performance: Evidence
from Jordan. International Research Journal of Finance & Economics,
81(December), 148.
Kivuja, M.N (2011). Strategic management in SME’s at Kariobangi light
industries.Unpublished MBA Project, nairobi: University of Nairobi.
Kothari, C. R. (2004). Research Methodology: Methods and Techniques. New Delhi:
New Age International (P) Ltd.
Kothari, C.R (2006). Research Methodology: Methods and Techniques, New Delhi:
New Age Publications.
Kotler, P., & Armstrong, G. (2010). Principles of Marketing (14th
ed). New York:
Pearson.
Kotler, P., & Armstrong, G. (2012). Principles of Marketing (14th
ed). Pearson
Prentice Hall.
Kotler, P., & Armstrong, G. (2013). Principles of Marketing (14th
ed). London:
Pearson Prentice Hall.
Krejcie, P., & Morgan, D. (1970). Determining Sample Size for Research Activities.
Educational and Psychological Measurement. London: Oxford
University Press.
125
Kungu, G., Desta, I., & Ngui, T. (2014). An Assessment of the Effectiveness of
Competitive Strategies by Commercial Banks: A Case of Equity Bank.
International Journal of Education and Research, 2(12), 333–346.
Kutllovci, E., Shala, V. & Troni, B. (2012). Business strategy, the Key determinants
of SME growth in Kosovo. Retrieved from www.managementjournal.info
Kvale, S. (2008). Doing interviews.Thousand Oaks,CA:Sage.
Lebens, F. & Euske, R. (2006). Strategic Management: Concepts and Cases, (9th
ed.), Australia: Prentice Education Australia Pty Ltd, French‟s Forest.
Lipsey, D. (2010). A conceptual and operational delineation of performance. In
Business Performance Measurement. Cambridge: Cambridge University
Press.
Lipsey, R. G. (2009). Economic growth related to mutually interdependent
institutions and technology. Journal of Institutional Economics, 5, 259–
288.
Lodato, L. R. (2014). Business Policy and Strategic Management. New York, USA:
McGraw Hill.
Lwova, R. M. (2013). Strategic management practices of savings and credit coop
societies in Mombasa County. European Journal of Management
Sciences and Economics, 1(2), 116-127.
Mata, F. J., Fuerst, W. L., & Barney, J. B. (1995). Information technology and
sustained competitive advantage: A resource-based. MIS Quarterly,
19(4), 487–505.
Matthews, K. G. P. & Thompson, J. (2008). The economics of banking. New Jersey:
Wiley.
Mbondo, T. (2011). Strategic management practices at the Kenya police staff Sacco.
Unpublished MBA project, Nairobi: University of Nairobi.
126
Mondy, R. W. (2009). Management: Concepts and Practices (8th
ed). New York:
Allyn and Bacon.
Murerwa, C. B. (2015).Determinants of banks’ financial performance in developing
economies: evidence from Kenyan commercial banks. Unpublished
MBA project report, Nairobi: United States International University
Africa.
Mulonzi, M.N. Namusonge, G.S. & Mugambi, F. (2017). Effect of Leadership Style
on Growth of Commercial Banks in Mombasa County. Imperial Journal
of Interdisciplinary Research, 3(2), 1607.
Muogbo, U. S. (2013). The Impact of Strategic Management on Organizational
Growth and Development (A Study of Selected Manufacturing Firms in
Anambra State). IOSR Journal of Business and Management, 7(1), 24-
32.
Nickols, F. (2012). Definitions and Meanings. Distance Consulting, 200, 2-10.
Oloo, J. A. (2011). A Tri-annual Publication of the Municipal Performance
Measurement : Lessons from Ontario. OSSREA Bulletin, VIII(2).
Ongore, V. O. & Kusa, G. B. (2013). Determinants of Financial Performance of
Commercial Banks in Kenya. International Journal of Economics and
Financial Issues, 3(1), 237–252.
Onuonga, S. M. (2014). The Analysis of Profitability of Kenya ` s Top Six
Commercial Banks : Internal Factor Analysis. American International
Journal of Social Science, 3(5), 94–103.
Ozturk, E., & Coskun, A. (2014). A Strategic Approach to Performance Management
in Banks: The Balanced Scorecard. Accounting and Finance Research,
3(3), 151.
Pearce J. & Robinson B. (2007). Strategic Management-Strategy Formulation and
Implementation, (3rd
ed.). New York: A.I.T.B.S.Publishers.
127
Pearce, D. (2010) Strategy implementation – an insurmountable obstacle?,
Handbook of Business Strategy, 6(1), 141-146.
Pearce, J. A., & Robinson, R. B. (2009). Strategic Management: Formulation,
Implementation and Control (11th
ed). New York: McGraw-Hill Irwin.
Pearce, J. A., & Robinson, R. B. (2011). Strategic Management: Strategy
Formulation, Implementation, and Control (12th
ed). Chicago, IL: R. D.
Irwin, Inc.
Peteraf, M. A. (1993). The cornerstones of competitive advantage: A resource-based
view. Strategic Management Journal, 14(3), 179–191.
Peteraf, M. A., & Bergen, M. E. (2003). Scanning dynamic competitive landscapes: a
market-based and resource-based framework. Strategic Management
Journal, 24(10), 1027–1041. http://doi.org/10.1002/smj.325
Porter, M. (1980). Competitive strategy: Techniques for analyzing industries and
competitors. New York: Free Press.
Porter, M. (2008). The fi ve competitive forces that shape strategy. Harvard Business
Review, 86(1), 78–93.
Porter, M. E. (1985). Competitive advantage: creating and sustaining superior
performance. New York: Free Press.
Porter, M. E., & Leo, J. (1982). Competitive strategy: Techniques for analysing
industries and competitors Porter, Michael E. Free Press (Macmillan),
New York, 396 pages, 17.95. Industrial Marketing Management, 11(4),
318–319. http://doi.org/10.1016/0019-8501(82)90025-6.
Ion, P. (2004). Management strategic. Editura Economică, Bucureşti, 263-289.
Powell, T. C., Lovallo, D., & Fox, C. R. (2011). Behavioral strategy. Strategic
Management Journal, 32(13), 1369–1386. http://doi.org/10.1002/smj.968
128
Rai University, (2007): Strategic Management Notes-Open Source Rai University
Retrieved from: www.raifoundation.org.
Richard, P. J., Devinney, T. M., Yip, G. S., & Johnson, G. (2009). Measuring
organizational performance: Towards methodological best practice.
Journal of management, 35(3), 718-804.
Rodriguez, M. A., Ricart, J. E., & Sanchez, P. (2006). Sustainable Development and
the Sustainability of Competitive Advantage: A Dynamic and
Sustainable View of the Firm. Creativity and Innovation Management,
11(3), 135–146. http://doi.org/10.1111/1467-8691.00246
Rugman, A. M. & Verbeke, A, (2008). Corporate Strategies and Environmental
Regulations: An Organizing Framework, Strategic Management Journal
19:363-375
Saunders, M., Lewis, P and Thornhill, A (2009). Research Methods for Business
Students, (5th
ed.), Harlow, England, Prentice Hall.
Sekaran, U. (2003). Research Methods for Business: A Skill Building Approach. New
York: Wiley.
Sekaran, U., & Bougie, R. (2010). Research methods for business: A skill building
approach (5th
ed.). Chichester, West Sussex: John Wiley & Sons, Inc.
Siddiqui, M. A., & Shoaib, A. (2011). Measuring performance through capital
structure : Evidence from banking sector of Pakistan, 5(5), 1871–1879.
http://doi.org/10.5897/AJBM10.976
Suvita, J., & Hui, X. (2012). A comparison of financial performance of commercial
banks: A case study of Nepal. African Journal of Business Management,
6(25), 7601–7611. http://doi.org/10.5897/AJBM11.3073
129
Tatar, P., & Moradi, J. (2015). Investigation the Effect of Training Technology
Equipment on Organizational Intelligence. Journal of Social Science and
Technology Management, 3(2), 11–17.
Teece, A. A. (2013). Strategic Management: concepts and cases (7th
ed.). Chicago,
IL: Irwin.
Thompson, J. L., & Strickland, A. (2003). Strategic management: Concepts and
cases, (10th
ed.), Chicago: Irwin.
Thomas, A. Jethro, A., & Strickland, A. J. (2006). Strategic Management: Concepts
and Cases (13th Ed). New York: McGraw-Hi
Thompson, A. A., Strickland, A. J., & Gamble, J. E. (2007). Crafting and
executing strategy (15th
ed.). Boston: McGraw-Hill Irwin
Thompson, J., Scott, J.M & Martin, F (2014). Strategic Management
Awareness and Change (7th
ed.). London: Cengage Learning.
Thomas, L, David, J., & Krish, R. (2006). Strategic management and business
policy. Boston: Pearson Education. Van Duren, (2005). Strategic
management. Canada: Custom Publishing.
Wade, B. & Hulland, K. (2004). Structural Equations with Latent Variables.
nyu.edu. Chapel
Wanjiru, K., & Njeru, A. (2014). Impact of Strategic Response to Change on
Financial Performance of Commercial Bank in Kenya. International
Journal of Social Sciences and Entrepreneurship, 1(13), 1–22.
Watuka, J.M. (2014).Influence of strategic management practices on the growth of
the commercial banks in Kenya. Unpublished MBA project, University
of Nairobi.
Welman, J. C., Kruger, S. . J., & Mitchell, B. (2008). Research Methodology (3rd
ed.). Cape Town, South Africa; Oxford University Press.
130
Wheelen, T.L. & Hunger, J.D. (2008). Strategic Management and Business Policy.
(2nd ed)Upper Saddle River, N.J: Prentice Hall Inc.
Wheelen, T.L. & Hunger, J.D. (2008). Strategic Management and Business Policy.
(2nd ed)Upper Saddle River, N.J: Prentice Hall Inc.
World Bank. (2013a). Financial Sector Review. New York: Oxford University Press.
World Bank. (2013b). World Development Indicators. New York: Oxford University
Press.
World Bank. (2014). World Economic Outlook. New York: Oxford University Press.
Yaghmaie, C. (2003). Business statistics: Washington Business Journal.
Yuchtman, E., & Seashore, S. (1967). A System Resource Approach to
Organizational Effectiveness. American Sociological Review, 32, 891–
903.
131
APPENDICES
Appendix 1: Introductory Letter
Dear respondent,
I am the undersigned, currently undertaking a PhD in Business Administration at
Jomo Kenyatta University of Agriculture and Technology (JKUAT). I am conducting
a study involving collecting data for writing and compiling the final research thesis
as a partial requirement for the award of the degree. The research entails
investigating the influence of strategic management capabilities on the performance
of commercial banks in Kenya. The information collected will be used solely for
academic purposes and will be handled with utmost confidentiality.
Kindly fill in all the items on the questionnaire.
Please direct any enquiries to: Christine Akoth Oswago
E-mail: [email protected], Cell phone: +254 714 288 651
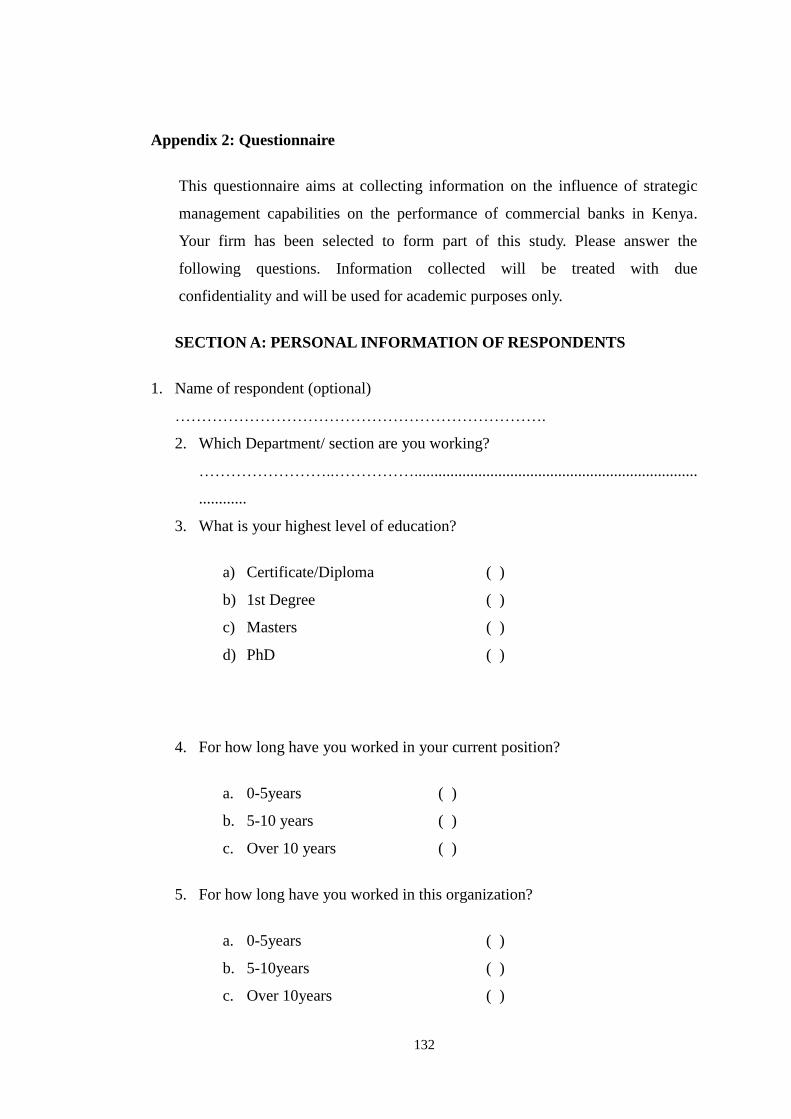
132
Appendix 2: Questionnaire
This questionnaire aims at collecting information on the influence of strategic
management capabilities on the performance of commercial banks in Kenya.
Your firm has been selected to form part of this study. Please answer the
following questions. Information collected will be treated with due
confidentiality and will be used for academic purposes only.
SECTION A: PERSONAL INFORMATION OF RESPONDENTS
1. Name of respondent (optional)
…………………………………………………………….
2. Which Department/ section are you working?
……………………..…………….......................................................................
............
3. What is your highest level of education?
a) Certificate/Diploma ( )
b) 1st Degree ( )
c) Masters ( )
d) PhD ( )
4. For how long have you worked in your current position?
a. 0-5years ( )
b. 5-10 years ( )
c. Over 10 years ( )
5. For how long have you worked in this organization?
a. 0-5years ( )
b. 5-10years ( )
c. Over 10years ( )
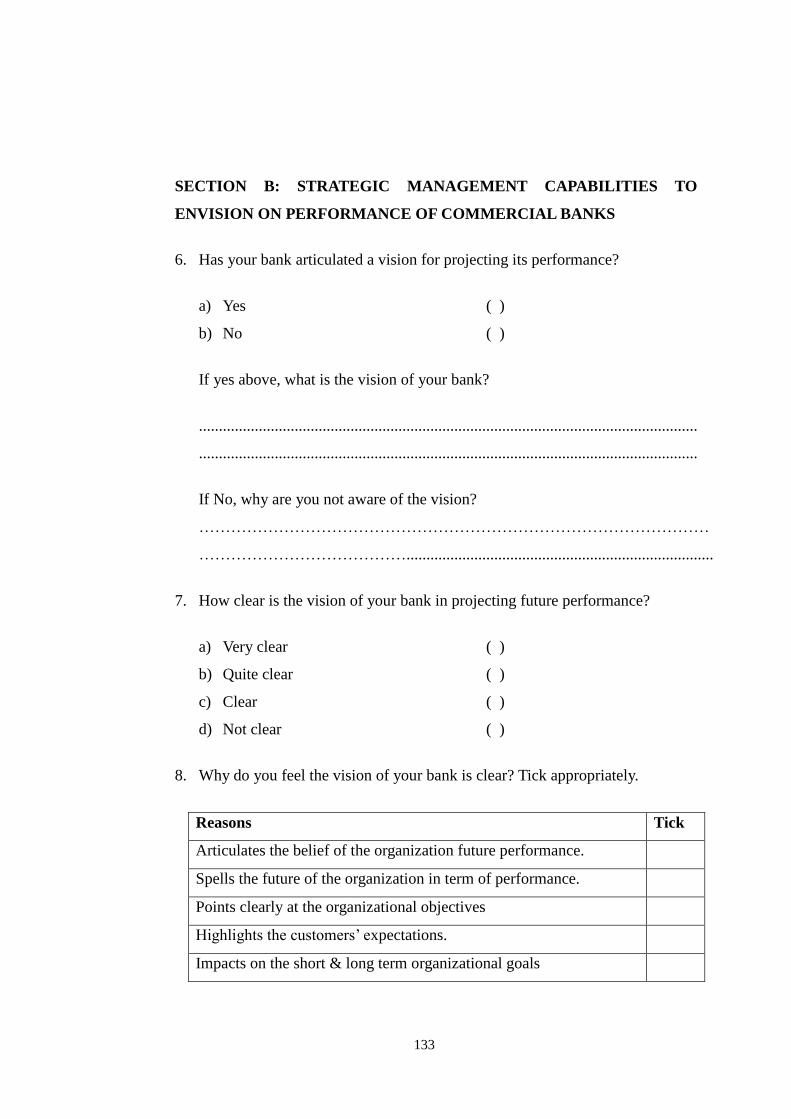
133
SECTION B: STRATEGIC MANAGEMENT CAPABILITIES TO
ENVISION ON PERFORMANCE OF COMMERCIAL BANKS
6. Has your bank articulated a vision for projecting its performance?
a) Yes ( )
b) No ( )
If yes above, what is the vision of your bank?
.............................................................................................................................
.............................................................................................................................
If No, why are you not aware of the vision?
……………………………………………………………………………………
………………………………….............................................................................
7. How clear is the vision of your bank in projecting future performance?
a) Very clear ( )
b) Quite clear ( )
c) Clear ( )
d) Not clear ( )
8. Why do you feel the vision of your bank is clear? Tick appropriately.
Reasons Tick
Articulates the belief of the organization future performance.
Spells the future of the organization in term of performance.
Points clearly at the organizational objectives
Highlights the customers‟ expectations.
Impacts on the short & long term organizational goals
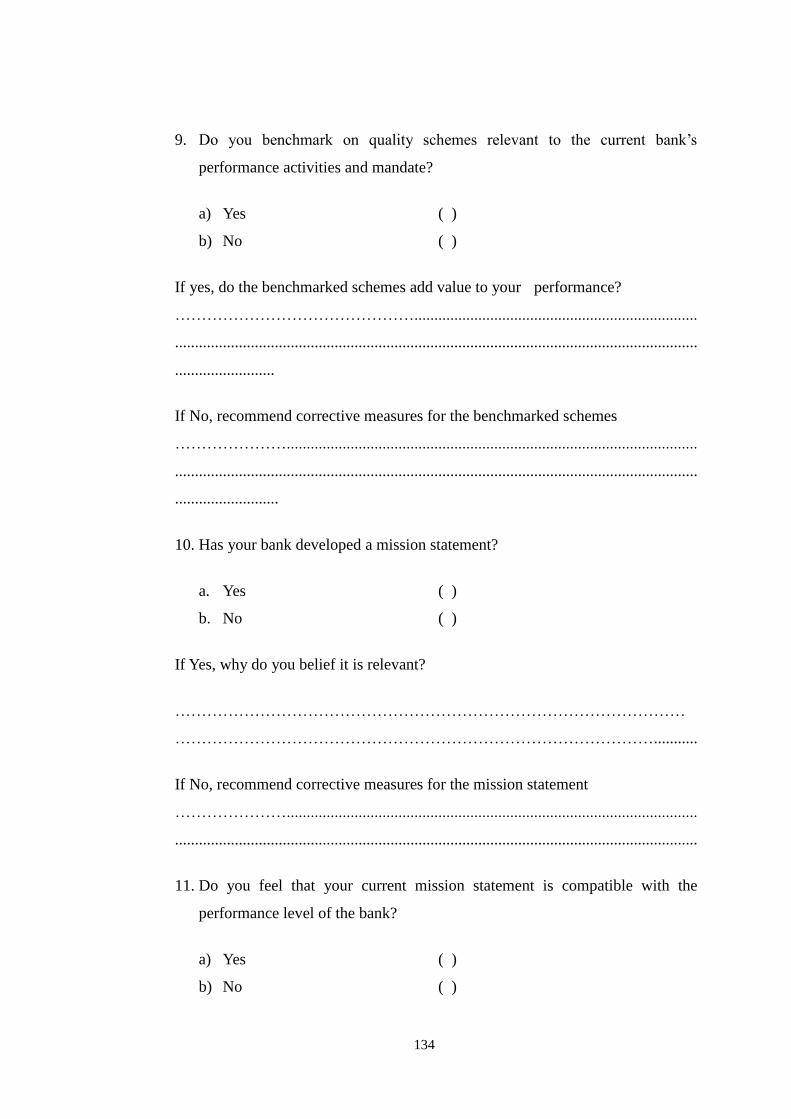
134
9. Do you benchmark on quality schemes relevant to the current bank‟s
performance activities and mandate?
a) Yes ( )
b) No ( )
If yes, do the benchmarked schemes add value to your performance?
……………………………………….......................................................................
...................................................................................................................................
.........................
If No, recommend corrective measures for the benchmarked schemes
………………….......................................................................................................
...................................................................................................................................
..........................
10. Has your bank developed a mission statement?
a. Yes ( )
b. No ( )
If Yes, why do you belief it is relevant?
……………………………………………………………………………………
………………………………………………………………………………...........
If No, recommend corrective measures for the mission statement
………………….......................................................................................................
...................................................................................................................................
11. Do you feel that your current mission statement is compatible with the
performance level of the bank?
a) Yes ( )
b) No ( )
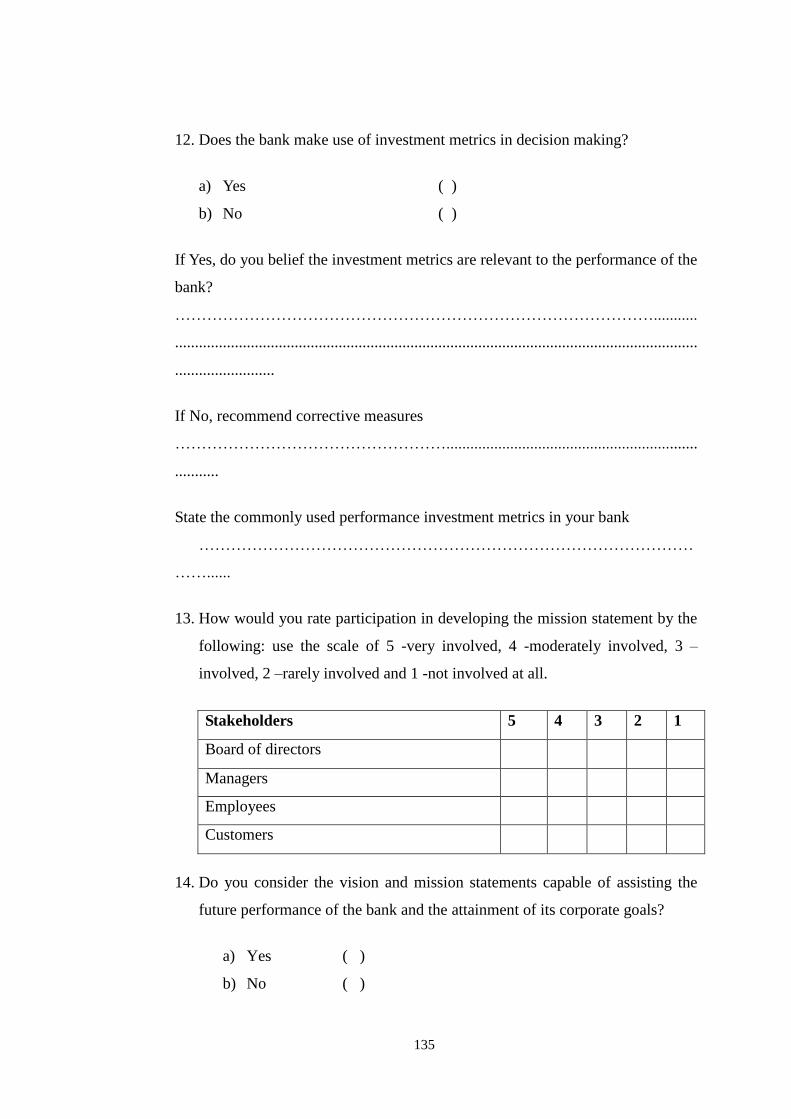
135
12. Does the bank make use of investment metrics in decision making?
a) Yes ( )
b) No ( )
If Yes, do you belief the investment metrics are relevant to the performance of the
bank?
………………………………………………………………………………...........
...................................................................................................................................
.........................
If No, recommend corrective measures
……………………………………………...............................................................
...........
State the commonly used performance investment metrics in your bank
…………………………………………………………………………………
……......
13. How would you rate participation in developing the mission statement by the
following: use the scale of 5 -very involved, 4 -moderately involved, 3 –
involved, 2 –rarely involved and 1 -not involved at all.
Stakeholders 5 4 3 2 1
Board of directors
Managers
Employees
Customers
14. Do you consider the vision and mission statements capable of assisting the
future performance of the bank and the attainment of its corporate goals?
a) Yes ( )
b) No ( )
136
If yes, please explain
.................………………………………………………………………………
…………....…...................................................................................................
...........................................................................................................................
.....................................
If No, explain
…………………………………………………………………………………
…………………………………………………………………………………
………………
15. Does your bank perform Returns on Investments (ROIs) projections for the
benchmarked schemes?
a) Yes ( )
b) No ( )
If yes, comment on their effectiveness
..............................................................................................................................
..............................................................................................................................
If No, recommend corrective measures
...........……………………………………...........................................................
...............................................................................................................................
..........................
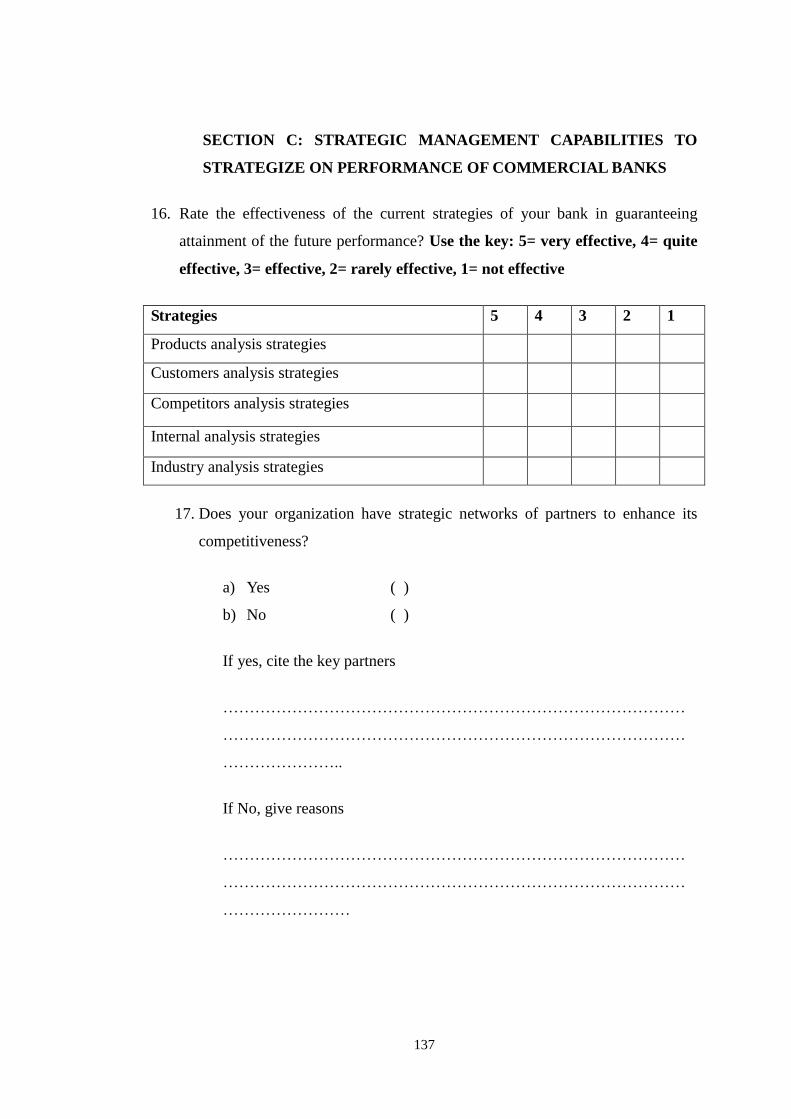
137
SECTION C: STRATEGIC MANAGEMENT CAPABILITIES TO
STRATEGIZE ON PERFORMANCE OF COMMERCIAL BANKS
16. Rate the effectiveness of the current strategies of your bank in guaranteeing
attainment of the future performance? Use the key: 5= very effective, 4= quite
effective, 3= effective, 2= rarely effective, 1= not effective
Strategies 5 4 3 2 1
Products analysis strategies
Customers analysis strategies
Competitors analysis strategies
Internal analysis strategies
Industry analysis strategies
17. Does your organization have strategic networks of partners to enhance its
competitiveness?
a) Yes ( )
b) No ( )
If yes, cite the key partners
……………………………………………………………………………
……………………………………………………………………………
…………………..
If No, give reasons
……………………………………………………………………………
……………………………………………………………………………
……………………
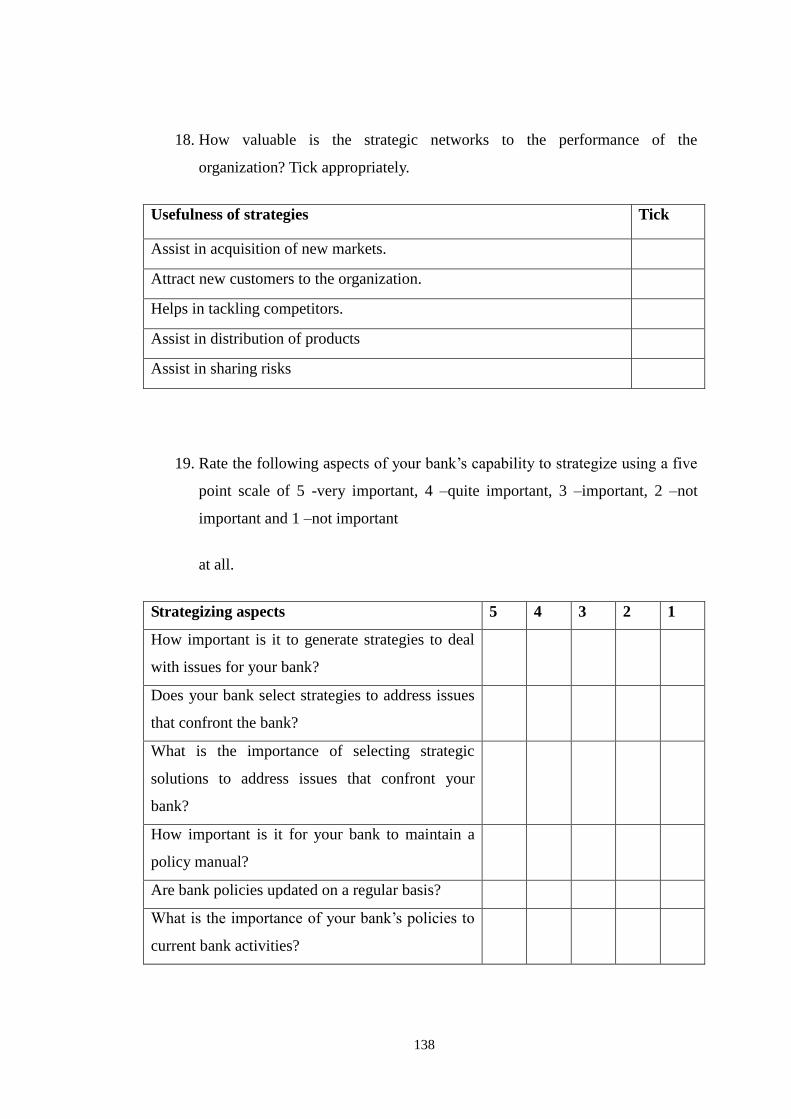
138
18. How valuable is the strategic networks to the performance of the
organization? Tick appropriately.
Usefulness of strategies Tick
Assist in acquisition of new markets.
Attract new customers to the organization.
Helps in tackling competitors.
Assist in distribution of products
Assist in sharing risks
19. Rate the following aspects of your bank‟s capability to strategize using a five
point scale of 5 -very important, 4 –quite important, 3 –important, 2 –not
important and 1 –not important
at all.
Strategizing aspects 5 4 3 2 1
How important is it to generate strategies to deal
with issues for your bank?
Does your bank select strategies to address issues
that confront the bank?
What is the importance of selecting strategic
solutions to address issues that confront your
bank?
How important is it for your bank to maintain a
policy manual?
Are bank policies updated on a regular basis?
What is the importance of your bank‟s policies to
current bank activities?
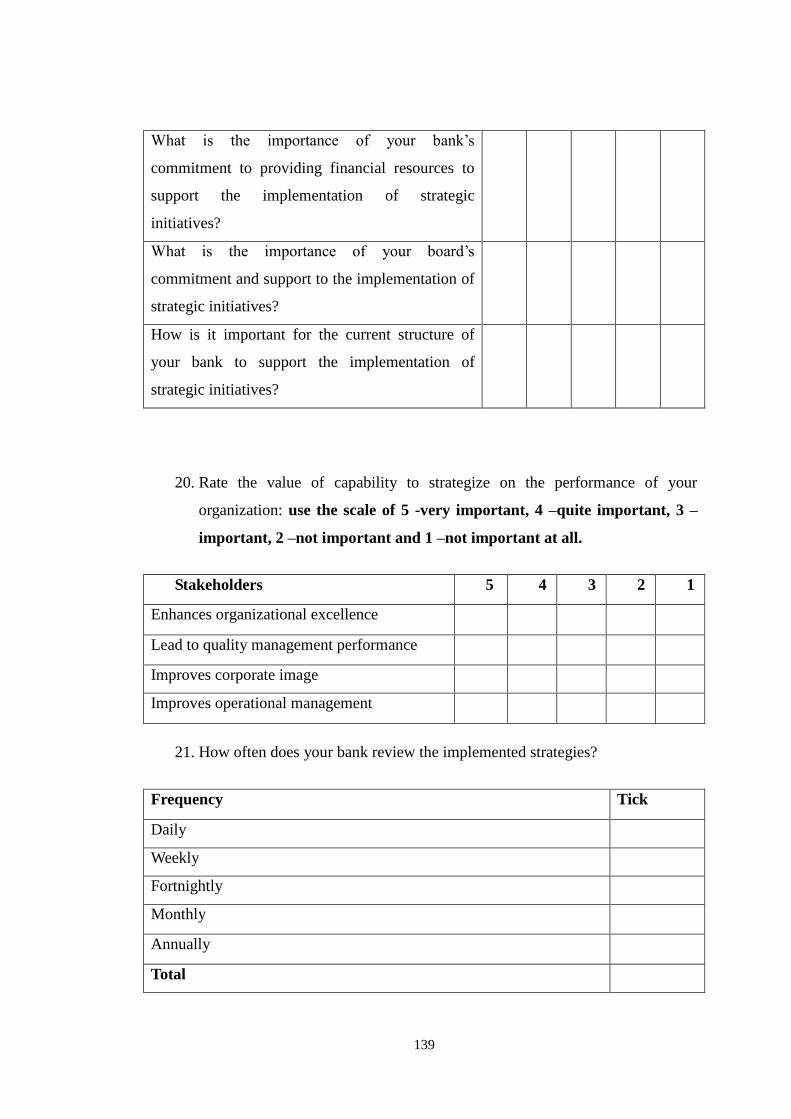
139
What is the importance of your bank‟s
commitment to providing financial resources to
support the implementation of strategic
initiatives?
What is the importance of your board‟s
commitment and support to the implementation of
strategic initiatives?
How is it important for the current structure of
your bank to support the implementation of
strategic initiatives?
20. Rate the value of capability to strategize on the performance of your
organization: use the scale of 5 -very important, 4 –quite important, 3 –
important, 2 –not important and 1 –not important at all.
Stakeholders 5 4 3 2 1
Enhances organizational excellence
Lead to quality management performance
Improves corporate image
Improves operational management
21. How often does your bank review the implemented strategies?
Frequency Tick
Daily
Weekly
Fortnightly
Monthly
Annually
Total
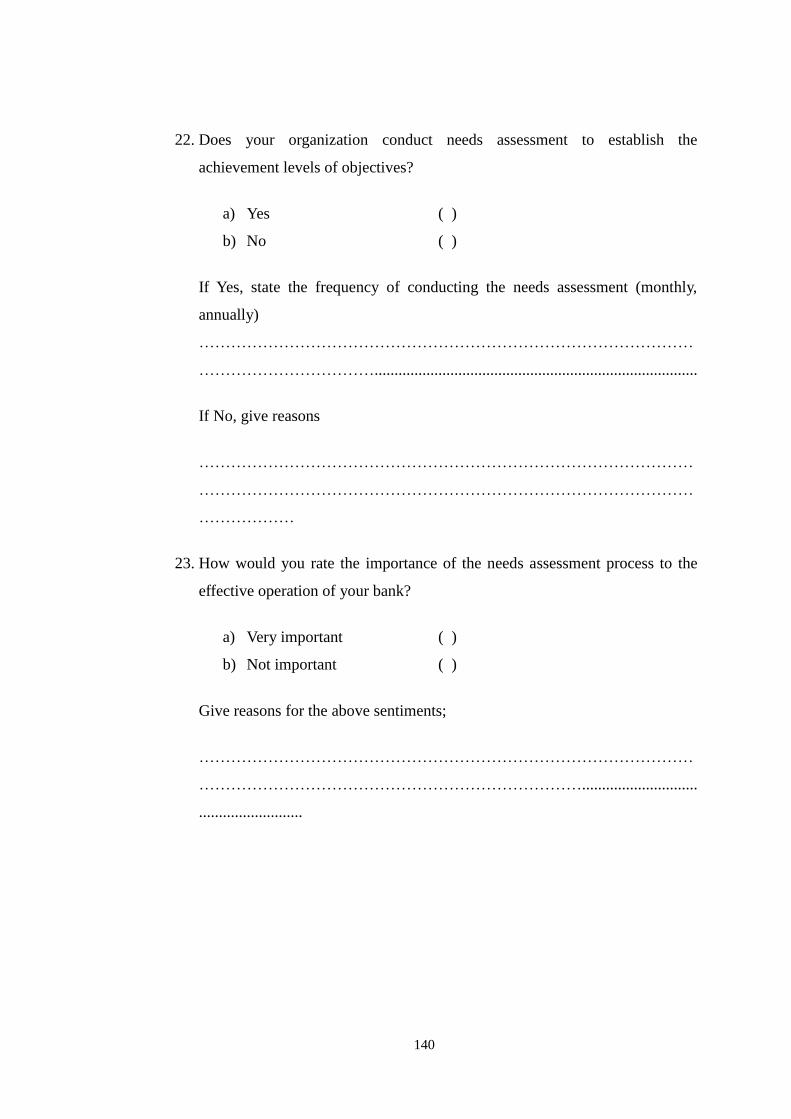
140
22. Does your organization conduct needs assessment to establish the
achievement levels of objectives?
a) Yes ( )
b) No ( )
If Yes, state the frequency of conducting the needs assessment (monthly,
annually)
…………………………………………………………………………………
…………………………….................................................................................
If No, give reasons
…………………………………………………………………………………
…………………………………………………………………………………
………………
23. How would you rate the importance of the needs assessment process to the
effective operation of your bank?
a) Very important ( )
b) Not important ( )
Give reasons for the above sentiments;
…………………………………………………………………………………
……………………………………………………………….............................
..........................
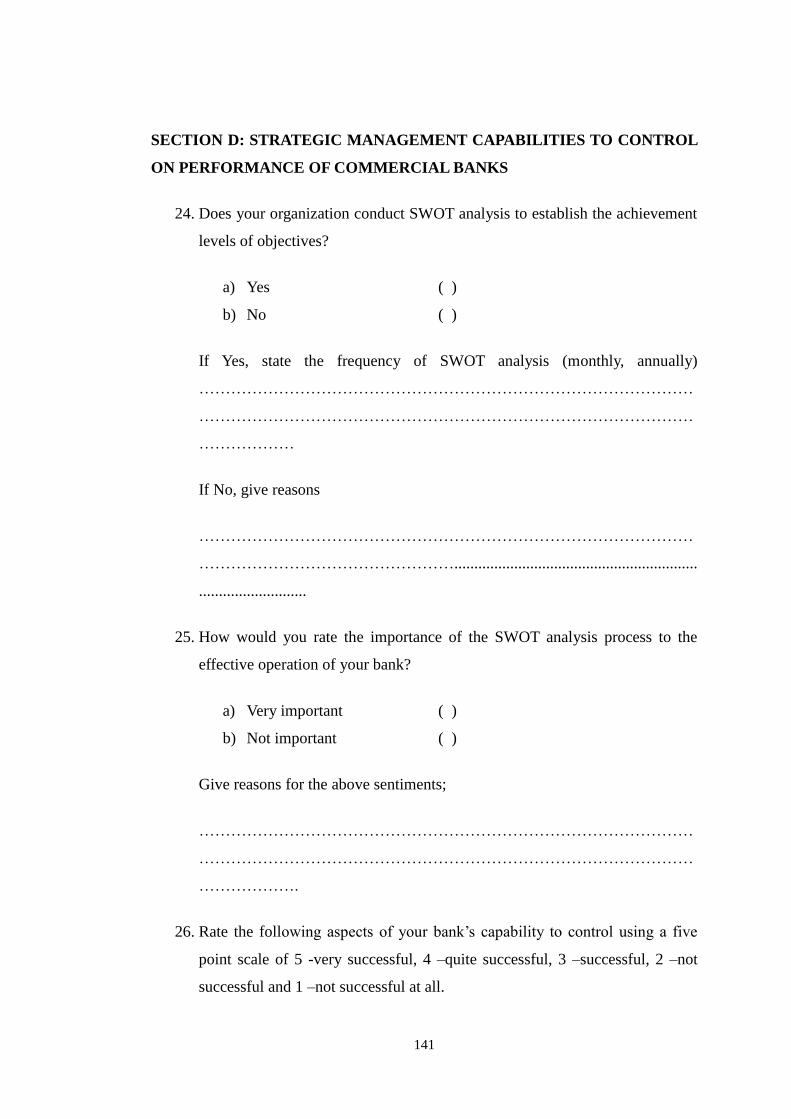
141
SECTION D: STRATEGIC MANAGEMENT CAPABILITIES TO CONTROL
ON PERFORMANCE OF COMMERCIAL BANKS
24. Does your organization conduct SWOT analysis to establish the achievement
levels of objectives?
a) Yes ( )
b) No ( )
If Yes, state the frequency of SWOT analysis (monthly, annually)
…………………………………………………………………………………
…………………………………………………………………………………
………………
If No, give reasons
…………………………………………………………………………………
………………………………………….............................................................
...........................
25. How would you rate the importance of the SWOT analysis process to the
effective operation of your bank?
a) Very important ( )
b) Not important ( )
Give reasons for the above sentiments;
…………………………………………………………………………………
…………………………………………………………………………………
……………….
26. Rate the following aspects of your bank‟s capability to control using a five
point scale of 5 -very successful, 4 –quite successful, 3 –successful, 2 –not
successful and 1 –not successful at all.
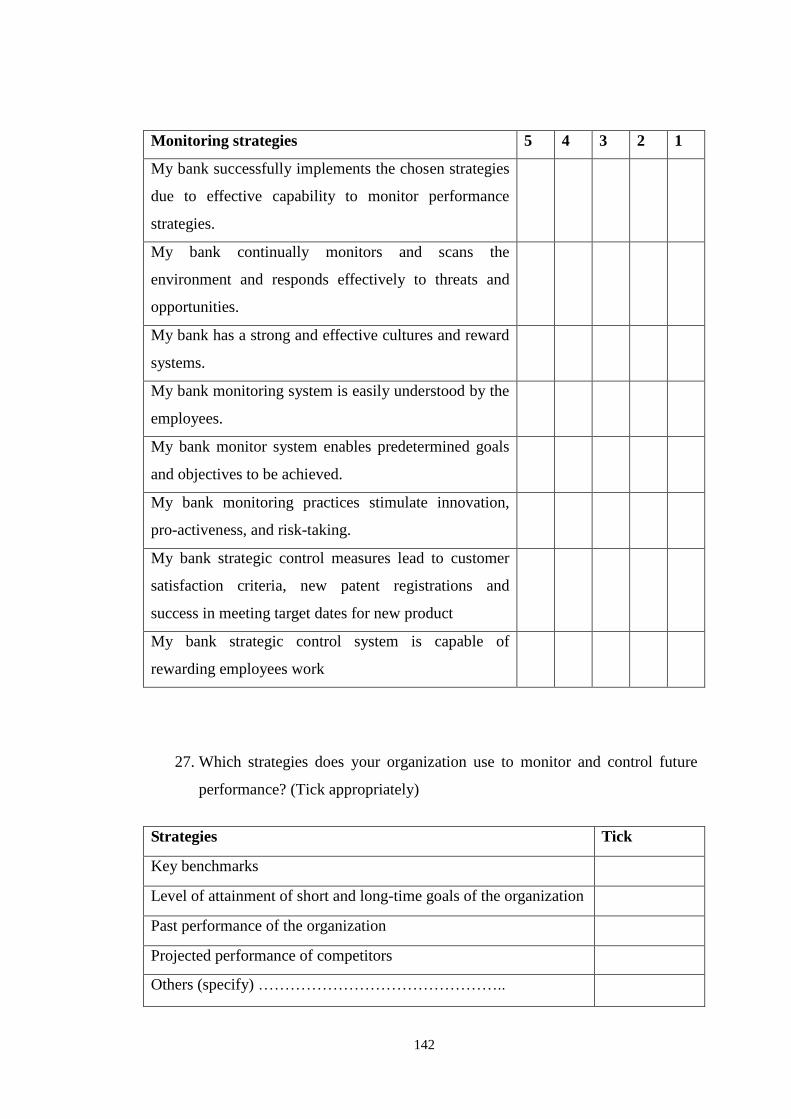
142
Monitoring strategies 5 4 3 2 1
My bank successfully implements the chosen strategies
due to effective capability to monitor performance
strategies.
My bank continually monitors and scans the
environment and responds effectively to threats and
opportunities.
My bank has a strong and effective cultures and reward
systems.
My bank monitoring system is easily understood by the
employees.
My bank monitor system enables predetermined goals
and objectives to be achieved.
My bank monitoring practices stimulate innovation,
pro-activeness, and risk-taking.
My bank strategic control measures lead to customer
satisfaction criteria, new patent registrations and
success in meeting target dates for new product
My bank strategic control system is capable of
rewarding employees work
27. Which strategies does your organization use to monitor and control future
performance? (Tick appropriately)
Strategies Tick
Key benchmarks
Level of attainment of short and long-time goals of the organization
Past performance of the organization
Projected performance of competitors
Others (specify) ………………………………………..
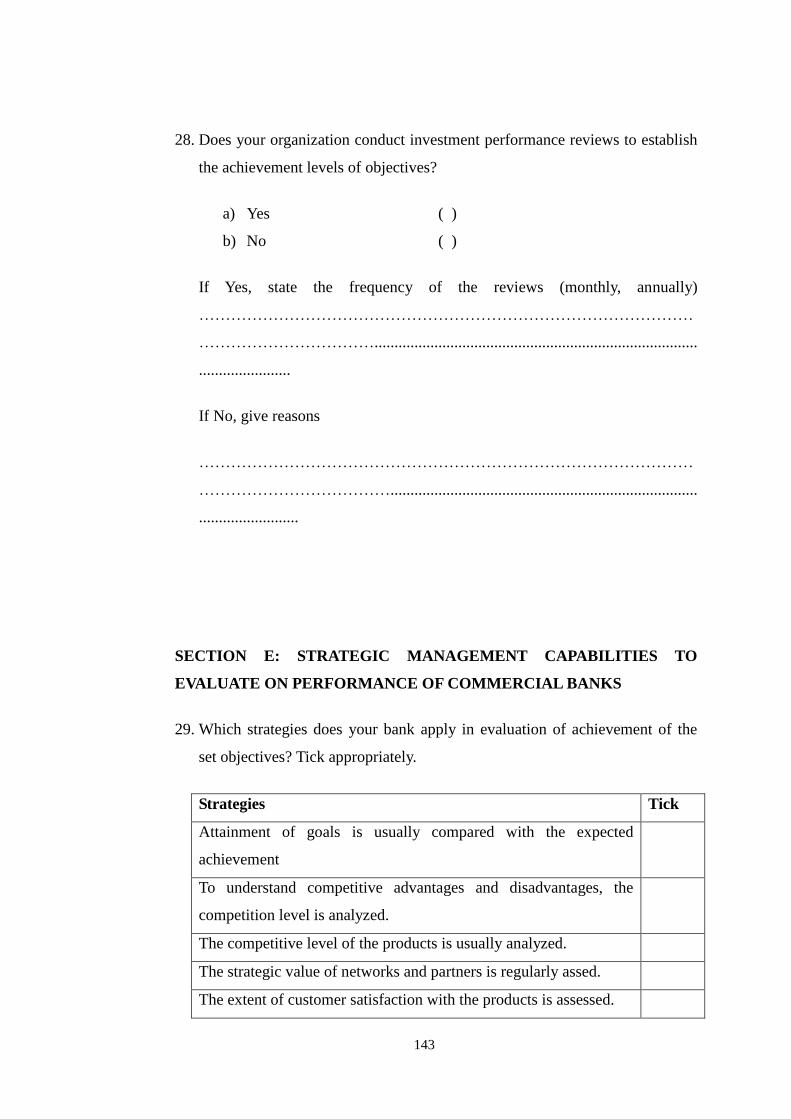
143
28. Does your organization conduct investment performance reviews to establish
the achievement levels of objectives?
a) Yes ( )
b) No ( )
If Yes, state the frequency of the reviews (monthly, annually)
…………………………………………………………………………………
…………………………….................................................................................
.......................
If No, give reasons
…………………………………………………………………………………
……………………………….............................................................................
.........................
SECTION E: STRATEGIC MANAGEMENT CAPABILITIES TO
EVALUATE ON PERFORMANCE OF COMMERCIAL BANKS
29. Which strategies does your bank apply in evaluation of achievement of the
set objectives? Tick appropriately.
Strategies Tick
Attainment of goals is usually compared with the expected
achievement
To understand competitive advantages and disadvantages, the
competition level is analyzed.
The competitive level of the products is usually analyzed.
The strategic value of networks and partners is regularly assed.
The extent of customer satisfaction with the products is assessed.
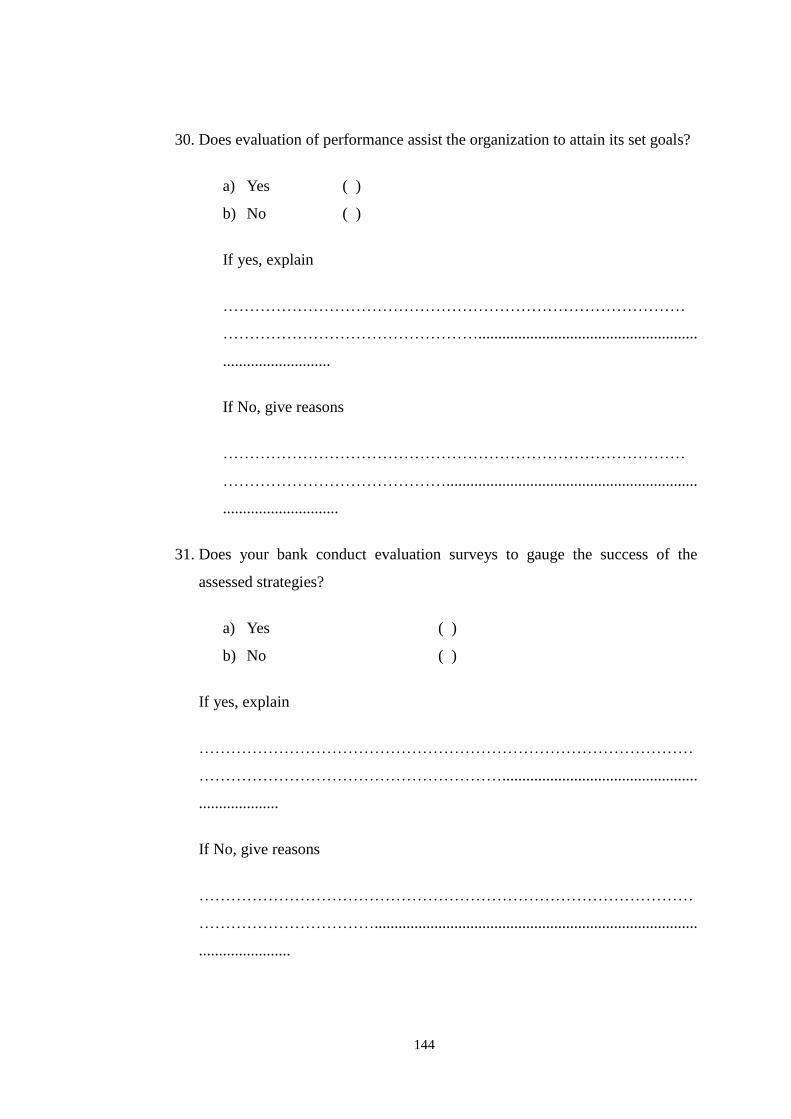
144
30. Does evaluation of performance assist the organization to attain its set goals?
a) Yes ( )
b) No ( )
If yes, explain
……………………………………………………………………………
………………………………………….......................................................
...........................
If No, give reasons
……………………………………………………………………………
……………………………………...............................................................
.............................
31. Does your bank conduct evaluation surveys to gauge the success of the
assessed strategies?
a) Yes ( )
b) No ( )
If yes, explain
…………………………………………………………………………………
………………………………………………….................................................
....................
If No, give reasons
…………………………………………………………………………………
…………………………….................................................................................
.......................
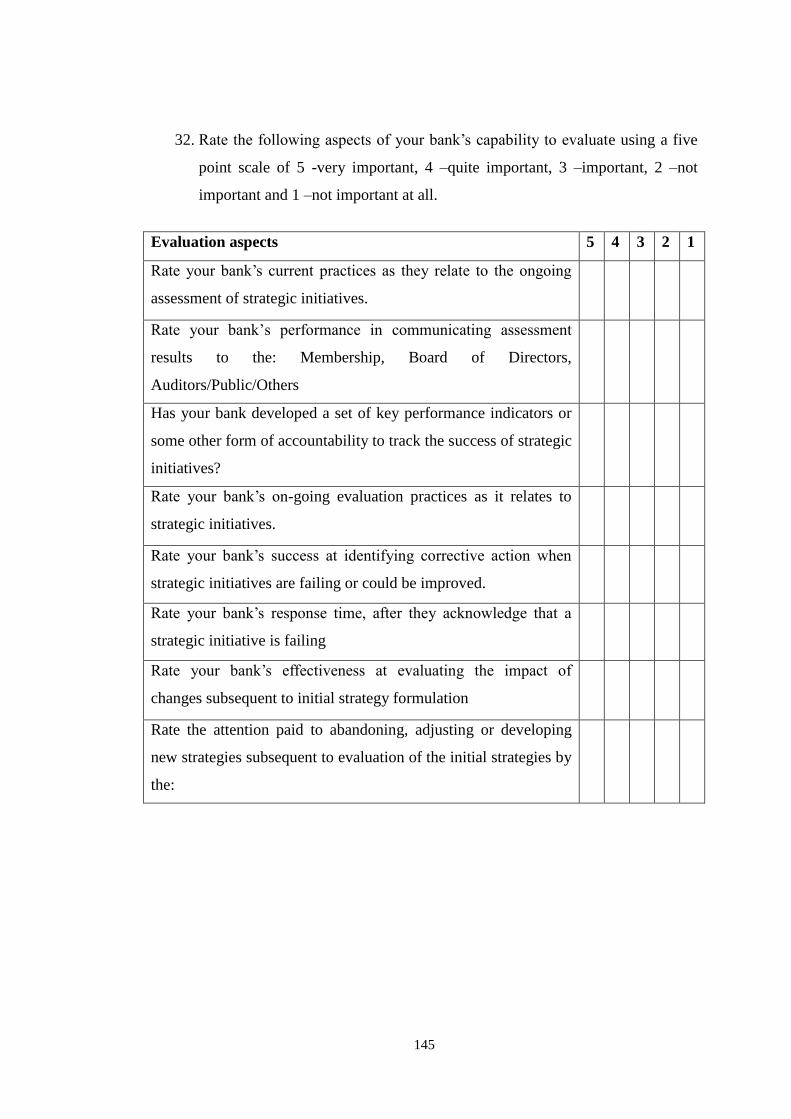
145
32. Rate the following aspects of your bank‟s capability to evaluate using a five
point scale of 5 -very important, 4 –quite important, 3 –important, 2 –not
important and 1 –not important at all.
Evaluation aspects 5 4 3 2 1
Rate your bank‟s current practices as they relate to the ongoing
assessment of strategic initiatives.
Rate your bank‟s performance in communicating assessment
results to the: Membership, Board of Directors,
Auditors/Public/Others
Has your bank developed a set of key performance indicators or
some other form of accountability to track the success of strategic
initiatives?
Rate your bank‟s on-going evaluation practices as it relates to
strategic initiatives.
Rate your bank‟s success at identifying corrective action when
strategic initiatives are failing or could be improved.
Rate your bank‟s response time, after they acknowledge that a
strategic initiative is failing
Rate your bank‟s effectiveness at evaluating the impact of
changes subsequent to initial strategy formulation
Rate the attention paid to abandoning, adjusting or developing
new strategies subsequent to evaluation of the initial strategies by
the:
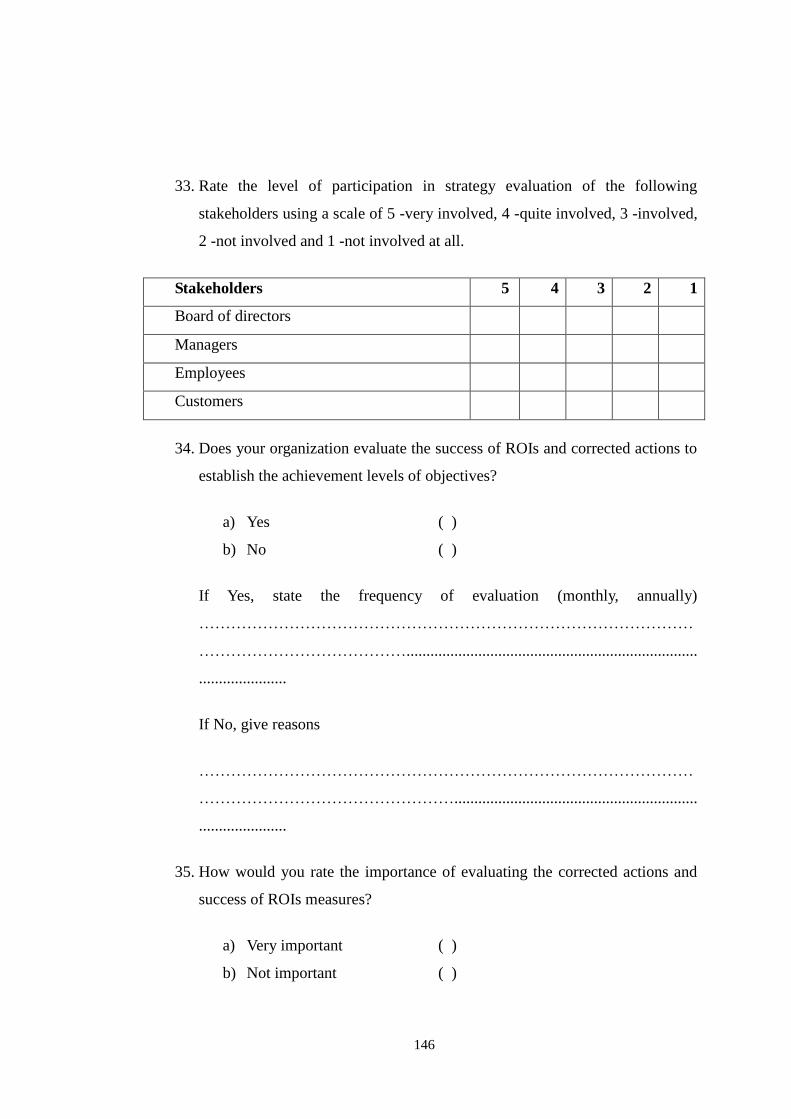
146
33. Rate the level of participation in strategy evaluation of the following
stakeholders using a scale of 5 -very involved, 4 -quite involved, 3 -involved,
2 -not involved and 1 -not involved at all.
Stakeholders 5 4 3 2 1
Board of directors
Managers
Employees
Customers
34. Does your organization evaluate the success of ROIs and corrected actions to
establish the achievement levels of objectives?
a) Yes ( )
b) No ( )
If Yes, state the frequency of evaluation (monthly, annually)
…………………………………………………………………………………
………………………………….........................................................................
......................
If No, give reasons
…………………………………………………………………………………
………………………………………….............................................................
......................
35. How would you rate the importance of evaluating the corrected actions and
success of ROIs measures?
a) Very important ( )
b) Not important ( )
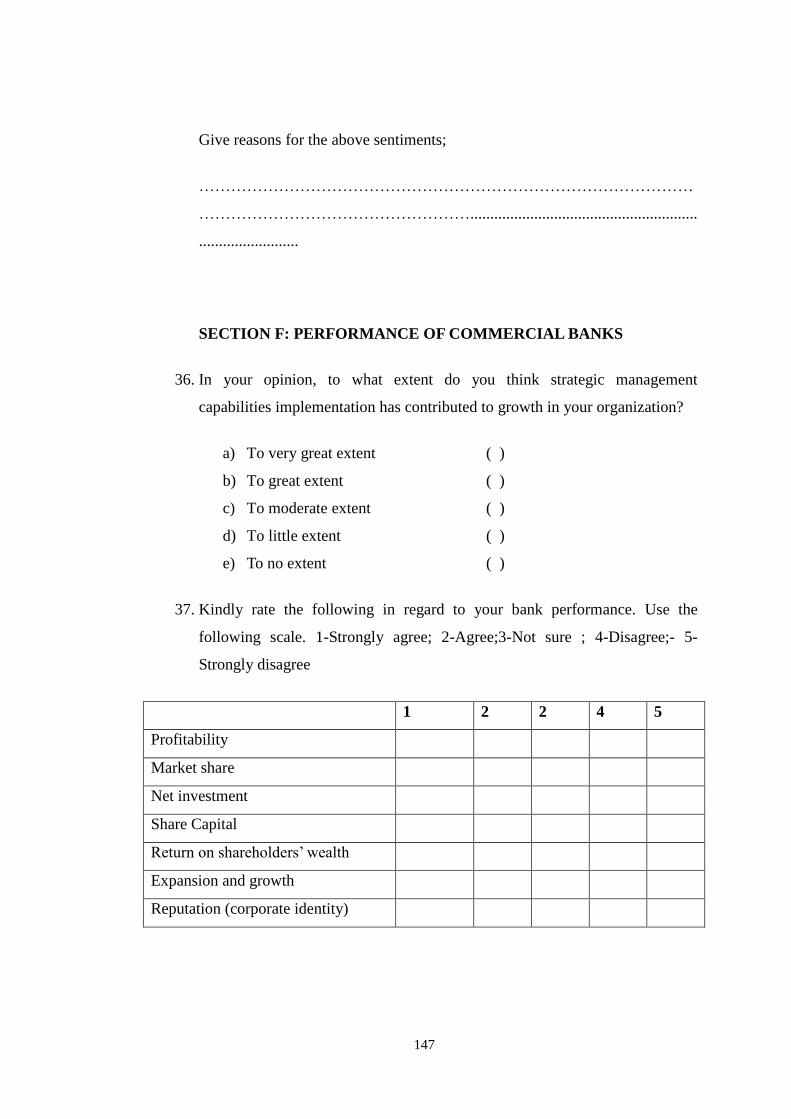
147
Give reasons for the above sentiments;
…………………………………………………………………………………
…………………………………………….........................................................
.........................
SECTION F: PERFORMANCE OF COMMERCIAL BANKS
36. In your opinion, to what extent do you think strategic management
capabilities implementation has contributed to growth in your organization?
a) To very great extent ( )
b) To great extent ( )
c) To moderate extent ( )
d) To little extent ( )
e) To no extent ( )
37. Kindly rate the following in regard to your bank performance. Use the
following scale. 1-Strongly agree; 2-Agree;3-Not sure ; 4-Disagree;- 5-
Strongly disagree
1 2 2 4 5
Profitability
Market share
Net investment
Share Capital
Return on shareholders‟ wealth
Expansion and growth
Reputation (corporate identity)
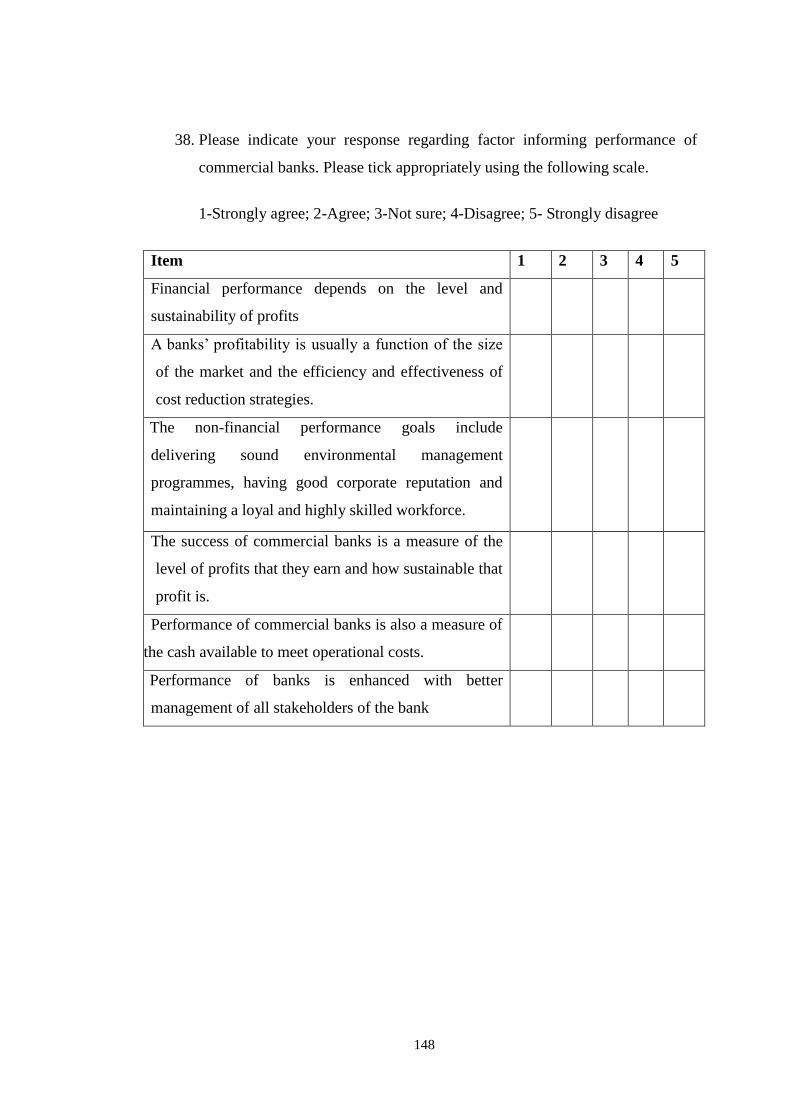
148
38. Please indicate your response regarding factor informing performance of
commercial banks. Please tick appropriately using the following scale.
1-Strongly agree; 2-Agree; 3-Not sure; 4-Disagree; 5- Strongly disagree
Item 1 2 3 4 5
Financial performance depends on the level and
sustainability of profits
A banks‟ profitability is usually a function of the size
of the market and the efficiency and effectiveness of
cost reduction strategies.
The non-financial performance goals include
delivering sound environmental management
programmes, having good corporate reputation and
maintaining a loyal and highly skilled workforce.
The success of commercial banks is a measure of the
level of profits that they earn and how sustainable that
profit is.
Performance of commercial banks is also a measure of
the cash available to meet operational costs.
Performance of banks is enhanced with better
management of all stakeholders of the bank
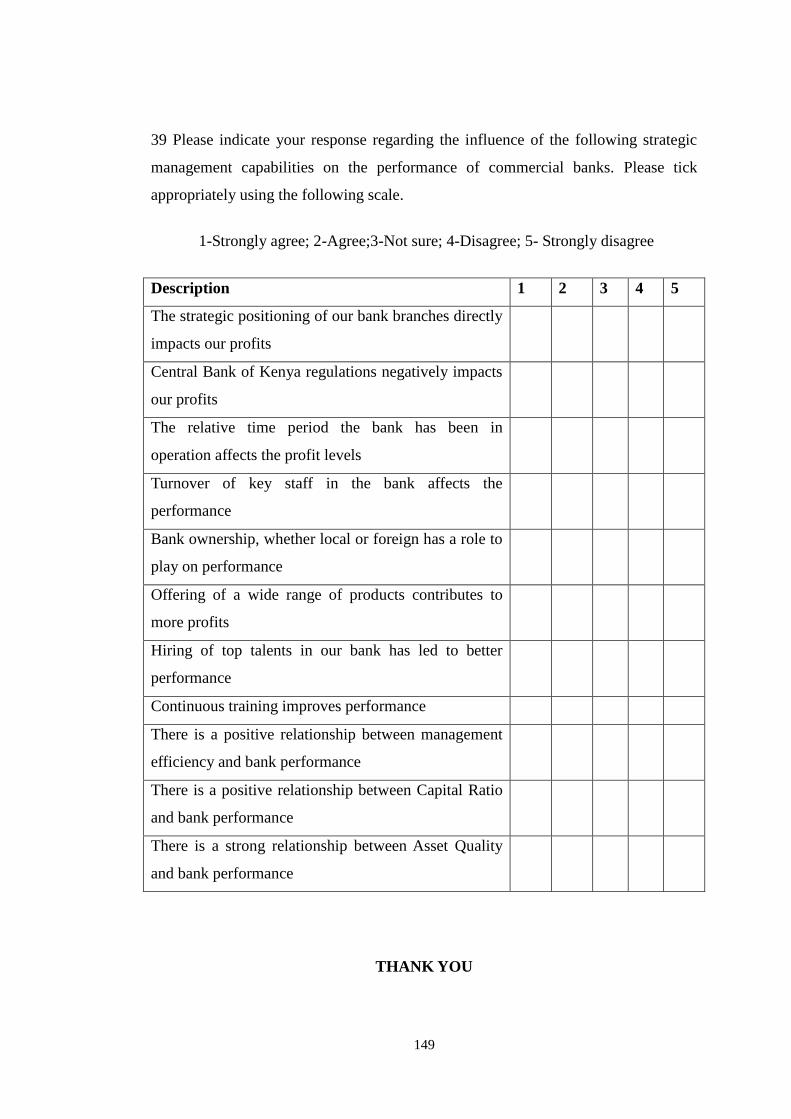
149
39 Please indicate your response regarding the influence of the following strategic
management capabilities on the performance of commercial banks. Please tick
appropriately using the following scale.
1-Strongly agree; 2-Agree;3-Not sure; 4-Disagree; 5- Strongly disagree
Description 1 2 3 4 5
The strategic positioning of our bank branches directly
impacts our profits
Central Bank of Kenya regulations negatively impacts
our profits
The relative time period the bank has been in
operation affects the profit levels
Turnover of key staff in the bank affects the
performance
Bank ownership, whether local or foreign has a role to
play on performance
Offering of a wide range of products contributes to
more profits
Hiring of top talents in our bank has led to better
performance
Continuous training improves performance
There is a positive relationship between management
efficiency and bank performance
There is a positive relationship between Capital Ratio
and bank performance
There is a strong relationship between Asset Quality
and bank performance
THANK YOU
150
Appendix 3: List of Commercial Banks in Kenya
Licensed Commercial Banks
1. African Banking Corporation Limited
Postal Address: P.O Box 38610-00800, Nairobi
Telephone: +254-20- 4263000, 4447352, 4442382, 4443482, 44447358,
22251540/1, 0722207386, 0735611223, 0719015000,
Fax: +254-20-4447354
E-mail: [email protected]
Website: www.abcthebank.com
Physical Address: ABC Bank House, Woodvale Groove, Westlands, Nairobi.
Date Licenced: 8th December, 1994
Peer Group: Small
Branches: 11
2. Bank of Africa Kenya Limited
Postal Address: P. O. Box 69562-00400 Nairobi
Telephone: +254-20- 3275000, 3275200, 0703058000
Fax: +254-20-2211477
E-mail: [email protected]
Website: www.boakenya.com
Physical Address: Re-Insurance Plaza, Ground Floor – Taifa Road, Nairobi
Date Licenced: 30th April 2004
Peer Group: Medium
3. Bank of Baroda (K) Limited
Postal Address: P. O Box 30033 – 00100 Nairobi
Telephone: +254-20-2248402/12, 2226416, 2220575, 2227869, 2248402/12,
2226416, 310439
Fax: +254-3310439
E-mail: [email protected]
4. Website: www.bankofbarodaKenya.com
Physical Address: Baroda House, Koinange Street, Nairobi.
151
Date Licenced: 1st July, 1953
Peer Group: Medium
Branches: 13
5. Bank of India
Postal Address: P. O. Box 30246 – 00100 Nairobi
Telephone: +254-20-2221414 /5 /6 /7, 0720606707, 0734636737
Fax: +254-20-2221417
E-mail: [email protected]
Website: www.bankofindia.com
Physical Address: Bank of India Building, Kenyatta Avenue, Nairobi.
Date Licenced: 5th June, 1953
Peer Group: Medium
Branches: 7
6. Barclays Bank of Kenya Limited
Postal Address: P. O. Box 30120 – 00100, Nairobi
Telephone: +254-20-4254000, 4254601
Fax: +254-20-2213915
E-mail: [email protected]
Website: www.barclayskenya.co.ke
Physical Address: Barclays Westend, Waiyaki Way, Westlands, Nairobi.
Date Licenced: 1916
Peer Group: Large
Branches: 108, Sales Centre: 1
7. CfC Stanbic Bank Limited
Postal Address: P. O. Box 72833 – 00200 Nairobi
Telephone: +254-20-3638000 /11 /17 /18 /20 /21, 3268000, 3269000, 0711-
0688000
Fax: +254-20-3752901/7
E-mail: [email protected]
Website: www.cfcstanbicbank.co.ke
Physical Address: CFC Stanbic Centre, Chiromo Road, Westlands
Date Licenced: 1st June 2008
152
Peer Group: Medium
Branches: 27
8. Charterhouse Bank Limited
UNDER – STATUTORY MANAGEMENT
Postal Address: P. O. Box 43252 -00100 Nairobi
Telephone: +254-20-2242246/47/48/49
Fax: +254-20-2219058, 2223060, 2242248
E-mail: [email protected]
Website: N/A
Physical Address: Longonot Place, 6th Floor, Kijabe Street, Nairobi
Date Licenced: 1st August 1998
Peer Group: Small
Branches: 10
9. Chase Bank (K) Limited
IN RECEIVERSHIP
Postal Address: P. O. Box 66015-00800 Nairobi
Telephone: +254-20- 2774000, 0732174100, 0703074000, 0736-432025,
0703074101.
Fax: +254-20-4454816/4454800-10
E-mail: [email protected]
Website: http://www.chasebankkenya.co.ke
Physical Address: Riverside Mews, Riverside Drive, Nairobi.
Date Licenced: 1st April, 1996
Peer Group: Medium
Branches: 44; Mini-branches: 14
10. Citibank N.A Kenya
Postal Address: P. O. Box 30711 – 00100 Nairobi
Telephone: +254-20- 2754000/ 2711221
Fax: +254-20-2714810/1
E-mail: [email protected]
Website: http://www.citibank.co.ke
Physical Address: Citibank House, Upper Hill Road, Upper Hill, Nairobi.
153
Date Licenced: 1st July, 1974
Peer Group: Medium
Branches: 3; Agencies: 1
11. Commercial Bank of Africa Limited
Postal Address: P. O. Box 30437-00100 Nairobi
Telephone: +254-20-2884000, 2884444, 0711056000, 0732156000,
0734600234, 0732156444
Fax: +254-20-2734599
E-mail: [email protected]
12. Website: www.cbagroup.com
Physical Address: CBA Building, Mara / Ragati Road, Upper Hill
Date Licenced: 1st January, 1967
Peer Group: Large
Branches: 36; Agencies: 5
13. Consolidated Bank of Kenya Limited
Postal Address: P. O. Box 51133 – 00200, Nairobi
Telephone: +254-20-340208/340836, 340551, 340298,
340747,340298,211950, 0703016000
Fax: +254-20-340836
E-mail: [email protected]
Website: www.consolidated-bank.com
Physical Address: Consolidated Bank House, 6th Floor, Koinange Street,
Nairobi.
Date Licensed: 18th December, 1989
Peer Group: Small
Branches: 17, Agencies: 1
14. Co-operative Bank of Kenya Limited
Postal Address: P. O. Box 48231 – 00100 Nairobi
Telephone: +254-20-3276000, 2776000, 0711049000, 0732106000
Fax: +254-20-2245506
E-mail: [email protected]
Website: www.co-opbank.co.ke
154
Physical Address: Co-operative House, 4th Floor Annex, Haile Selassie
Avenue, Nairobi
Date Licence: 1st July, 1968
Peer Group: Large
Branches: 142
15. Credit Bank Limited
Postal Address: P. O. Box 61064-00200 Nairobi
Telephone: +254-20-2222300/2220789/2222317, 2283000, 0728607701,
0738222300
Fax: +254-20-2216700
E-mail: [email protected]
Website: www.creditbank.co.ke
Physical Address: Mercantile House, Ground Floor, Koinange Street, Nairobi.
Date Licensed: 30th
November, 1994
Peer Group: Small
Branches: 15
16. Development Bank of Kenya Limited
Postal Address: P. O. Box 30483 – 00100, Nairobi
Telephone: +254-20-3340401 /2 /3, 3340416, 2251082, 3340198, 3340478,
3317449, 3344184, 2250143, 3317449, 3340416 0724253980/1, 0735046336
Fax: +254-20-2250399
E-mail: [email protected]
Website: www.devbank.com
Physical Address: Finance House, 16th Floor, Loita Street, Nairobi.
Date Licenced: 20th September, 1996
Peer Group: Small
Branches: 3
17. Diamond Trust Bank Kenya Limited
Postal Address: P. O. Box 61711 – 00200, Nairobi
Telephone: +254-20-2849000, 0732121000, 0719031000, 0732121000,
0719031000

155
Fax: +254-20-2245495
E-mail: [email protected]
Website: http://www.dtbafrica.com
Physical Address: DTB Centre, Mombasa Road, Nairobi.
Date Licenced: 15th November, 1994
Peer Group: Medium
Branches: 59
18. Ecobank Kenya Limited
Postal Address: P. O Box 49584- 00100 Nairobi
Telephone: +254-20-2883000, 4968000, 0719098000
Fax: +254-20-2883304, 2883815
E-mail: [email protected]
Website: www.ecobank.com
Physical Address: Ecobank Towers, Muindi Mbingu Street, Nairobi.
Date Licenced: 16th June, 2008
Peer Group: Medium
Branches: 31
19. Spire Bank Ltd
Postal Address: P. O. Box 52467-00200, Nairobi
Telephone: +254-20- 4981000, 4981202, 4981301, 4981405, 0713600724,
0733333780
E-mail: [email protected]
Website: www.spirebank.co.ke
Physical Address: Equatorial Fidelity Centre, Waiyaki Way, Westlands,
Nairobi.
Date Licenced: 23rd June, 1995
Peer Group: Small
Branches: 13
20. Equity Bank Kenya Limited
Postal Address: P. O. Box 75104-00200, Nairobi
Telephone: +254 20 2262000/2262956 /2262828, 0763026000,
07633026956, 0763026828
156
Fax: +254-020-2737276
E-mail: [email protected]
Website: www.equitybankgroup.com
Physical Address: Equity Centre, 9th Floor, Hospital Road, Upper Hill,
Nairobi.
Date Licenced: 28th December 2004
Peer Group: Large
Branches: 167 Sub-branches: 12
21. Family Bank Limited
Postal Address: P. O. Box 74145-00200 Nairobi
Telephone: +254-020- 3252000, 3318940/2/7, 2244166, 2240601,
0733332300, 0728120444/555
Fax: +254-020- 318174
E-mail: [email protected]
Website: www.familybank.co.ke
Physical Address: Family Bank Towers, 6th Floor, Muindi Mbingu Street,
Nairobi.
Date Licenced: 1st May 2007
Peer Group: Medium
Branches: 88
22. Fidelity Commercial Bank Limited
Postal Address: P. O. Box 34886-00100 Nairobi
Telephone: +254-20-2242348, 2244187, 2245369, 2220845, 2243461,
2248842, 3315917, 2240766, 0722372531, 0733911835
Fax: +254-20-2243389/2245370
E-mail: [email protected]
Website: www.fidelitybank.co.ke
Physical Address: I.P.S Building. 7th Floor, Kimathi Street, Nairobi.
Date Licenced: 1st April, 1996
Peer Group: Small
Branches: 15
157
23. First Community Bank Limited
Postal Address: P. O. Box 26219-00100., Nairobi
Telephone: +254-20-2843000-3, 07202843000, 0738-407521,
Fax: +254-20-344101
E-mail: [email protected]
Website: www.firstcommunitybank.co.ke
Physical Address: Prudential Assurance Building, 1st Floor, Wabera Street,
Nairobi.
Date Licenced: 29th April, 2008
Peer Group: Small
Branches: 18
24. Guaranty Trust Bank (K) Ltd
Postal Address: P. O. Box 20613 – 00200, Nairobi
Telephone: +254-20-3284000, 073084000
Fax: +254-20-342024
E-mail: [email protected]
Website: www.gtbank.com
Physical Address: Sky Park Plaza, Woodvale Close, Westlands, Nairobi.
Date Licenced: 13th January, 1995
Peer Group: Medium
Branches: 16
25. Giro Commercial Bank Limited
Postal Address: P. O. Box 13400-00800, Nairobi
Telephone: +254-20-4229000, 0722823684, 0722823684, 0788999044
Fax: +254-20-229300
E-mail: [email protected]
Website: www.girobankltd.com
Physical Address: Eldama Park, Eldama Ravine Road, Off Peponi Road,
Westlands, Nairobi.
Date Licenced: 17th December, 1992
Peer Group: Small
Branches: 8
158
26. Guardian Bank Limited
Postal Address: P. O. Box 67681 – 00200, Nairobi
Telephone: +254-020-2226771, 2226774, 2226341, 2226483, 0722-282213,
0733-888060
Fax: +254-020 -2216633
E-mail: [email protected]
Website: www.guardian-bank.com
Physical Address: Guardian Centre, Biashara Street, Nairobi.
Date Licenced: 20th December, 1995
Peer Group: Small
Branches: 10
27. Gulf African Bank Limited
Postal Address: P. O. Box 43683 – 00100, Nairobi
Telephone: +254-20-2740000, 2718608/9, 2740111, 0711075000
Fax: +254-20-2715655
E-mail: [email protected]
Website: www.gulfafricanbank.com
Physical Address: Geminia Insurance Plaza, Kilimanjaro Avenue, Upper Hill,
Nairobi.
Date Licenced: 1st November 2007
Peer Group: Small
Branches: 17
28. Habib Bank A.G Zurich
Postal Address: P. O. Box 30584 – 00100, Nairobi
Telephone: +254-20-3341172/76/77, 3340835, 3310694, 0720208259
Fax: +254-20-2217004 /2218699
E-mail: [email protected]
Website: www.habibbank.com
Physical Address: Habib House, Koinange Street, Nairobi.
Date Licenced: 1st July, 1978
Peer Group: Small
Branches: 6
159
29. Habib Bank Limited
Postal Address: P. O. Box 43157 – 00100, Nairobi
Telephone: +254-20-2226433, 2222786, 2226401/7
Fax: +254-20-2224636, 2214636
E-mail: [email protected]
Website: www.hbl.com
Physical Address: Exchange Building, No.17, Koinange Street, Nairobi.
Date Licenced: 2nd March, 1956
Peer Group: Small
Branches: 6
30. Imperial Bank Limited
IN RECEIVERSHIP
Postal Address: P. O. Box 44905 – 00100, Nairobi
Telephone: +254-20-2874000, 3343416, 0711-019000, 0732-119000
Fax: +254-20-2719705/2719652, 3342374, 2719498
E-mail: [email protected]
Website: www.imperialbank.co.ke
Physical Address: Imperial Court, Westlands Road, Westlands, Nairobi.
Date Licenced: 8th January, 1996
Peer Group: Medium
Branches: 26
31. I & M Bank Limited
Postal Address: P.O. Box 30238 – 00100, Nairobi
Telephone: +254-20-3221000, 3271375/27, 0719088000, 0753221000
Fax: +254-20-2711994
E-mail: [email protected]
Website: www.imbank.com
Physical Address: I & M Bank House, 2nd Ngong Avenue, Off Ngong Road,
Nairobi.
Date Licenced: 27th March, 1996
Peer Group: Medium
Branches: 34
160
32. Jamii Bora Bank Limited
Postal Address: P. O. Box 22741 – 00400, Nairobi
Telephone: +254-20- 2224238/9, 2214976, 2219626, 2210338/9, 0722-
201112, 0734600682
Fax: +254-20-341825
E-mail: [email protected]
Website: www.jamiiborabank.co.ke
Physical Address: Jamii Bora House, Koinange Street, Nairobi.
Date Licenced: 2nd March, 2010
Peer Group: Small
Branches: 27
33. KCB Bank Kenya Limited
Postal Address: P. O. Box 48400 – 00100, Nairobi
Telephone: +254-20-3270000, 2851000, 2852000, 0711012000, 0734108200
Fax: +254-20-2242408‟ 2216405
E-mail: [email protected]
Website: www.kcbbankgroup.com
Physical Address: Kencom House, 8th Floor, Moi Avenue, Nairobi.
Date Licenced: 1st January 1896
Peer Group: Large
Branches: 199
34. Middle East Bank (K) Limited
Postal Address: P. O. Box 47387 – 0100 Nairobi
Telephone: +254-20-2723120/24, 2722879, 2723124, 2723130, 0722-
205903, 0733-333441, 0731001310, 0717531448
Fax: +254-20-343776 / 2256901
E-mail: [email protected]
Website: www.mebkenya.com
Physical Address: Mebank Tower, Milimani Road, Milimani, Nairobi.
Date Licenced: 28th November, 1980
Peer Group: Small
Branches: 5
161
35. National Bank of Kenya Limited
Postal Address: P. O. Box 72866 – 00200 Nairobi
Telephone: +254-20-2828000, 0711-038000,
Fax: +254-20-311444/2223044
E-mail: [email protected]
Website: www.nationalbank.co.ke
Physical Address: National Bank Building, 2nd Floor, Harambee Avenue,
Nairobi.
Date Licenced: 1st January, 1968
Peer Group: Medium
Branches: 81
36. NIC Bank Limited
Postal Address: P. O. Box 44599 – 00100 Nairobi
Telephone: +254-20-2888000, 4849000, 0711041000, 0732141000
Fax: +254-20-2888505/13
E-mail: [email protected]
Website: www.nic-bank.com
Physical Address: N.I.C House, Masaba Road, Upper Hill, Nairobi.
Date Licenced: 28th September, 1995
Peer Group: Medium
Branches: 31
37. M-Oriental Bank Limited
Postal Address: P.O BOX 44080-00100, Nairobi
Telephone: +254-20-2228461/2, 0734333291, 0722209585
Fax: +254 20 2219469
E-mail: [email protected]
Website: www.moriental.co.ke
Physical Address:. Finance House, 7 Koinange Street, Nairobi
Date Licenced: 8th February, 1991
Peer Group: Small
Branches: 9
162
38. Paramount Bank Limited
Postal Address: P. O. Box 14001 -00800 Nairobi
Telephone: +254-20-4449266/7/8, 446106 /7, 4441528, 4441527,
0723564254, 0734258020, 0728-606652, 0735445506
Fax: +254-20-449265
E-mail: [email protected]
Website: www.paramountbank.co.ke
Physical Address: Sound Plaza Building, 4th Floor, Woodvale Grove,
Nairobi
Date licenced: 5th July, 1995
Peer Group: Small
Branches: 7
39. Prime Bank Limited
Postal Address: P. O. Box 43825 – 00100, Nairobi
Telephone: +254-20-4203000 /116 /148, 4450810, 0722205491
Fax: +254-20-4451247
E-mail: [email protected]
Website: www.primebank.co.ke
Physical Address: Prime Bank Building, Chiromo Lane/Riverside Drive.-
Junction, Westlands, Nairobi.
Date Licenced: 3rd September, 1992
Peer Group: Medium
Branches: 20
40. Sidian Bank Limited
Postal Address: P. O. Box 25363 – 00603, Nairobi
Telephone: +254-20- 3906000-7, 0711-058000-7, 0732-158000
Fax: +254-20-3568995
E-mail: [email protected]
Website: www.sidianbank.co.ke
Physical Address: 7th Floor K-Rep Centre, Wood Avenue, Kilimani, Nairobi.
Date Licenced: 23rd March, 1999
163
Peer Group: Small
Branches: 37
41. Standard Chartered Bank Kenya Limited
Postal Address: P. O. Box 30003 – 00100, Nairobi
Telephone: +254-20-3293000, 3293900, 3291000, 3294000, 0719081000,
0732104000, 0703093000
Fax: +254-20-3747880
E-mail: [email protected]
Website: www.standardchartered.com
Physical Address: Standard Chartered Building-Westlands Road- Chiromo
Lane, Westlands, Nairobi.
Date Licenced: 1910
Peer Group: Large
Branches: 38; Agencies: 3; Sales Centres: 1
42. Trans-National Bank Limited
Postal Address: P. O. Box 34353 – 00100 Nairobi
Telephone: +254-20-2252216/19, 2224235/6, 2252188/90/91, 0720-081772,
0733-505656
Fax: +254-20-2252225
E-mail: [email protected]
Website: www.tnbl.co.ke
Physical Address: Transnational Plaza, City Hall Way, Nairobi.
Date Licenced: 8th January, 1985
Peer Group: Small
Branches: 21
43. UBA Kenya Bank Limited
Postal Address: P. O. Box 34154 – 00100 Nairobi
Telephone: +254-020- 3612000/1/2,
Fax: +: +254-020-3612049, 0726-926367, 0735-500196/180/175
E-mail: [email protected]
Website: www.ubagroup.com
Physical Address: Apollo Centre, 1st Floor, Ring Road / Vale Close,
164
Westlands, Nairobi.
Date Licenced: 25th September, 2009
Peer Group: Small
Branches: 4
44. Victoria Commercial Bank Limited
Postal Address: P. O. Box 41114 – 00100 Nairobi
Telephone: +254-20-2719499, 2719815, 2710271, 2716108,
2719814.2713208, 2716196, 0721328183
Fax: +254-20-2713778/2715857
E-mail: [email protected]
Website: www.victoriabank.co.ke
Physical Address: Victoria Towers, Mezzanine Floor, Kilimanjaro Avenue,
Upper Hill, Nairobi.
Date Licenced: 11th January, 1996
Peer Group: Small
Branches: 4
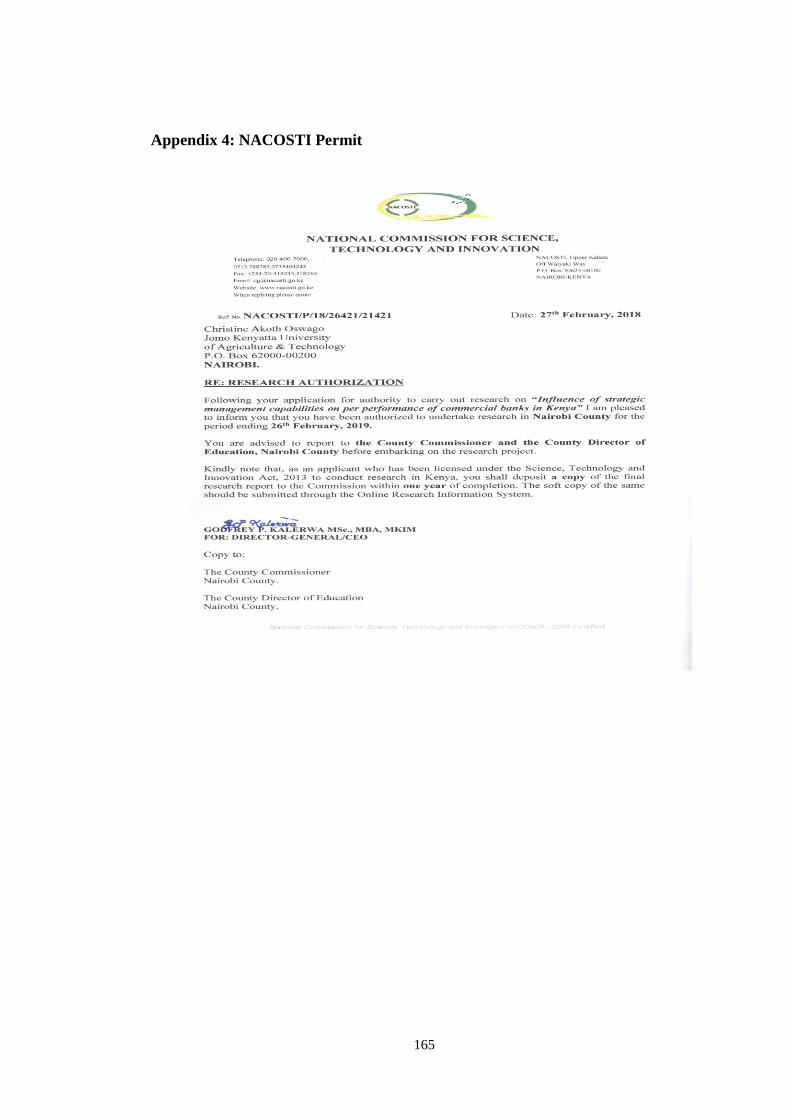
165
Appendix 4: NACOSTI Permit

166
167


