Embed Size (px)
Citation preview
Influence of Ferrochromium and
Ferromanganese Additions on
Inclusion Characteristics in Steel
Thobias Sjökvist
Doctoral Thesis
STOCKHOLMApril 2001
DEPARTMENT OF MATERIALS SCIENCE AND ENGINEERINGDIVISION OF METALLURGYROYAL INSTITUTE OF TECHNOLOGYSE - 10044 STOCKHOLM
TRITA-MET 130ISSN 1403-493XISRN KTH/MSE--01/2--SE+METU/AVHISBN 91-7283-100-6
Influence of Ferrochromium and FerromanganeseAdditions on Inclusion Characteristics in Steel
Thobias SjökvistDoctoral Thesis
Department of Materials Science and EngineeringDivision of Metallurgy
Royal Institute of TechnologySE-10044 Stockholm
Sweden
Akademisk avhandling som med tillstånd av Kungliga Tekniska Högskolan iStockholm, framlägges för offentlig granskning för avläggande av Teknologiedoktorsexamen inom Metallurgisk processvetenskap, onsdagen den 23 maj 2001,kl. 10.00 i B1, Brinellvägen 23, Kungliga Tekniska Högskolan, Stockholm.
ISSN 1403-493XISRN KTH/MSE--01/2--SE+METU/AVH
ISBN 91-7283-100-6

Influence of Ferrochromium and Ferromanganese Additions on Inclusion Characteristics in Steel
- i -
ABSTRACT
The steel industry has considerably increased the knowledge on how inclusioncharacteristics change during steelmaking in the recent years. The effect of thisnew knowledge on the demands on ferroalloys is discussed. One scenario is thatrequired inclusion characteristics of ferroalloys will be specified. In thecontinuation, the actual effect of ferroalloy additions on inclusions in steel needsto be established. The present work aims to increase this knowledge.
The inclusion characteristics of commercial ferrochromium and ferromanganesealloys have been determined. Samples of two high-carbon ferrochromium gradesand six low- and medium-carbon ferromanganese grades were studied. Theresults showed that ferromanganese contained mostly MnO but also MnS andSiO2 inclusions. The content was proportional to the carbon content in normalrefined ferromanganese. Ferrochromium contained mostly (Cr,Ti)(C,N) but alsoMnS and Al2O3 inclusions. It was also established that ferrochromium containsmore but smaller inclusions than ferromanganese.
The effect of these ferroalloys on inclusion characteristics of steel was theninvestigated in laboratory scale alloying experiments. The experiments withferromanganese showed that the difference in inclusion content between thegrades is maintained but reduced. The most common compositions in theseexperiments were MnO, MnS and/or Al2O3. Alloying experiments withferrochromium indicated no significant effect on inclusions present in the steel.The inclusion composition changed from mainly FeS and Al2O3 before additionsto mainly Al2O3 and complex sulphides after the addition.
Plant trials were also performed at a ladle furnace station with four of thestudied ferromanganese alloys. The results showed that the testedferromanganese grades resulted in the same micro-inclusion characteristics atthe end of ladle treatment. The micro-inclusion composition changed from mostlyAl2O3, MnO and MnS inclusions after three minutes to mostly Al2O3-MgO orMnS in the final steel samples. Thus, the inclusion compositions in the final steelsamples were not related to the composition of the inclusions in the usedferromanganese alloy.
The size and content of inclusions in the different samples were assessedaccording to the SS 111116 method. The inclusion composition was analysedusing a scanning electron microscope or an electron microprobe unit. Bothquantitative analyses and element mappings are included in the results. Macro-inclusion assessments of plant trial samples were carried out using immersedultrasonic testing.
KEYWORDS: Non-metallic inclusions, Ferroalloys, Ferrochromium, Microprobe,Ferromanganese, SEM, Steel, Full-scale, SS111116, Bearing Steel, LaboratoryScale
Influence of Ferrochromium and Ferromanganese Additions on Inclusion Characteristics in Steel
- ii -
DEDICATION
This thesis is dedicated to my parents,
without whom none of this would have been even possible.
It is also dedicated to my grandmother Ingrid Edsö,
and in remembrance of Rune Edsö, Ingrid Sjökvist and Ronald Sjökvist.
Influence of Ferrochromium and Ferromanganese Additions on Inclusion Characteristics in Steel
- iii -
ACKNOWLEDGEMENTS
I would like to express my deep and sincere gratitude to my supervisor and
esteemed colleague Professor Pär Jönsson for his continuous support,
encouragement and excellent guidance during the course of this work. The
numerous discussions we have had and his constructive criticism have really
helped.
I am also greatly indebted to Dr. Ole-Svein Klevan, Elkem ASA, Professor
Øystein Grong, NTNU, and Professor Seshadri Seetharaman, KTH, for all the
valuable discussions, constructive criticism and support throughout this work.
A special thanks goes to Dr. Margareta Andersson, KTH, and Dr. Peter Cowx,
Eramet Norway AS, for all our fruitful discussions during the work. Thanks are
also due to the following persons: Mia Göransson and Malin Hallberg, Ovako
Steel, for the valuable assistance during the plant trials and their critical
reviewing of parts of this work; Morten Raanes, NTNU, for the help during all
those hours at the microprobe unit; Martin Löwnertz and Peter Kling for the
help during parts of the experimental work
To all my dear colleagues and friends at the Division of Metallurgy, KTH; you
have my sincere gratitude for all the support during the work and for all the fun
that we have shared during these years. I will always remember our time
together at KTH.
I would also like to sincerely thank my friends for putting up with me during the
last few years.
This work has mainly been financed by Elkem ASA and Eramet Norway AS. The
financial support is gratefully acknowledged.
Last but not at all the least, I would like to thank my family for their unlimited
support and encouragement.
Influence of Ferrochromium and Ferromanganese Additions on Inclusion Characteristics in Steel
- iv -
SUPPLEMENTS
This thesis is based on the following supplements:
1. Future Demands on Ferroalloys from the Customers in the Steel Industry
Pär Jönsson, Thobias Sjöqvist and Öystein Grong, TRITA-MET 111
Will be presented at INFACON 9, Quebec, Canada, 4-6 June, 2001
2. Inclusions in Commercial Low and Medium Carbon Ferromanganese
Thobias Sjöqvist, Pär Jönsson and Öystein Grong, TRITA-MET 039
Metallurgical and Materials Transactions A, vol. 32A, no. 5, 2001, pp. 1049-1056
3. Inclusions in Commercial High-Carbon Ferrochromium
Thobias Sjöqvist and Pär Jönsson, TRITA-MET 090
4. Effect of Ferromanganese Additions on Inclusion Characteristics in Steel
Thobias Sjöqvist and Pär Jönsson, TRITA-MET 043
Published in: 57th Electric Furnace Conference 1999 Proceedings, Iron and Steel
Society/AIME, USA, pp. 383-392, Nov. 1999
5. Effect of Ferrochromium Additions on Inclusion Characteristics in Steel
Thobias Sjöqvist and Pär Jönsson, TRITA-MET 110
6. Influence of Ferromanganese Additions on Inclusions in Bearing Steel
Thobias Sjöqvist, Mia Göransson, Pär Jönsson and Peter Cowx, TRITA-MET 094
Submitted for publication in Ironmaking and Steelmaking, 2001

Influence of Ferrochromium and Ferromanganese Additions on Inclusion Characteristics in Steel
- v -
CONTRIBUTIONS
The author also contributed to the following papers:
Influence of Calcium Carbide Slag Additions on Inclusion
Characteristics in Steel
Thobias Sjöqvist, Soyoung Jung, Pär Jönsson and Mikael Andreasson,
TRITA-MET 044
Published in Ironmaking and Steelmaking, vol. 27, no. 5, 2000, pp. 373-380
The effect of ferromanganese cleanness on inclusions in steel
Thobias Sjöqvist, Halvard Berg and Pär Jönsson, TRITA-MET 089
Will be presented at INFACON 9, Quebec, Canada, 4-6 June, 2001
Influence of Ferrochromium and Ferromanganese Additions on Inclusion Characteristics in Steel
- vi -
TABLE OF CONTENTS
ABSTRACT i
DEDICATION ii
ACKNOWLEDGEMENTS iii
SUPPLEMENTS iv
CONTRIBUTIONS v
TABLE OF CONTENTS vi
1. INTRODUCTION 1
2. ASSESSMENT METHODS 4
2.1. Inclusion characteristics 4
2.2. SS111116 5
2.3. Scanning Electron Microscope 7
2.4. Electron Microprobe 8
3. REVIEW OF SUPPLEMENTS 9
3.1. Supplement 1 : Future Demands on Ferroalloys from the Customers inthe Steel Industry 9
3.2. Supplement 2 : Inclusions in Commercial Low and Medium CarbonFerromanganese 13
3.3. Supplement 3 : Inclusions in Commercial High-Carbon Ferrochromium 18
3.4. Supplement 4 : Effect of Ferromanganese Additions on InclusionCharacteristics in Steel 23
3.5. Supplement 5 : Effect of Ferrochromium Additions on InclusionCharacteristics in Steel 28
3.6. Supplement 6 : Influence of Ferromanganese Additions on Inclusionsin Bearing Steel 32
4. DISCUSSION 37
5. CONCLUSIONS 41
6. FUTURE WORK 43
7. REFERENCES 46
Influence of Ferrochromium and Ferromanganese Additions on Inclusion Characteristics in Steel
- 1 -
1. INTRODUCTION
Inclusions are mostly considered as being impurities and are present as very
small particles in most materials. Micro-inclusions have diameters up to
0.035 mm and larger inclusions are called macro-inclusions. This study is limited
to non-metallic inclusions, which mainly are compounds of a metallic element in
combination with carbon, nitrogen, oxygen and sulphur. Since solid steel cannot
completely dissolve these non-metallic elements, inclusions will probably always
be present in commercial steel products.
The present non-metallic micro-inclusions influence a number of material
properties. As an example, the presence of magnesium and aluminium oxide
inclusions reduces the fatigue strength of steel.[1-3] Another commonly
recognisable example is the negative effect on surface finish that brittle silicates
have on steel sheet products, for example the surface of a refrigerator.[4] Other
inclusion types can be considered as having a positive effect on the steel
properties. A typical example is manganese sulphide inclusions in machining
steels, where their presence increases the possible machining rates and extends
the tool life.[5]
As shown by the examples above, the critical material properties change with the
type of steel product, and are affected by the presence of non-metallic inclusions.
Development during the last decades has reduced the content of inclusions in
favour of the material properties. It is reasonable to assume that the
requirements on material properties of steel will continue to increase. This, in
turn, will result in demands on even cleaner steels and therefore a more
controlled steelmaking environment.
Until recently, it has not been possible to determine inclusion characteristics on-
line during production of steel. Inclusion characteristics include the statistics on
total oxygen content, composition and size of inclusions. However, it has been
possible to determine and control the content of elements dissolved in the liquid
steel as well as temperature. Luckily, new techniques for determination of
Influence of Ferrochromium and Ferromanganese Additions on Inclusion Characteristics in Steel
- 2 -
inclusion characteristics have recently been developed. One example is a
modified optical emission spectroscopy method that allows determination with
only a short delay, currently about seven minutes.[6,7] These new tools will help
steelmakers to control and optimise their steelmaking processes with respect to
inclusion characteristics. Thus, it will be easier to optimise the inclusion
characteristics with respect to material properties required for specific products.
In a more controlled steelmaking environment, it will be important to know what
effects the different additions have on the inclusions. This is essential for
additions that are made directly into the steel, such as aluminium and
ferroalloys additions, since these are likely to have a great impact on the
characteristics. The producers of clean steel, for example tool and bearing steel
grades, are to be expected to lead this evolution. These steel grades have strict
limits on the inclusion characteristics as a consequence of strict demands on, for
example, fatigue life. To meet the forthcoming demands, ferroalloys should be
characterised with respect to size, content and composition of inclusions. In
addition, the actual influence of ferroalloy additions on the inclusions in steel
should be investigated. Such investigations should first be performed in a
controlled laboratory environment and then confirmed with plant trials.
Experiments with this objective have previously been performed on
ferrochromium and ferrosilicon.[8,9]
The present work has been concentrated to parts of the above mentioned field of
study. Figure 1 illustrates the outline of the performed work. The first
supplement holds an overview of possible developments regarding requirements
on inclusion characteristics of ferroalloys. It is speculated on how the future
demands on ferroalloys will evolve with a perspective from the steel industry.
Supplement 2 and 3 includes the research performed to characterise the
inclusions that are present in commercial ferrochromium and ferromanganese.
The alloys that were studied are two grades of high-carbon ferrochromium and
six grades of low- and medium-carbon ferromanganese. The aim with these
studies were to lay a knowledge foundation upon which alloying experiments
could be planned.
Influence of Ferrochromium and Ferromanganese Additions on Inclusion Characteristics in Steel
- 3 -
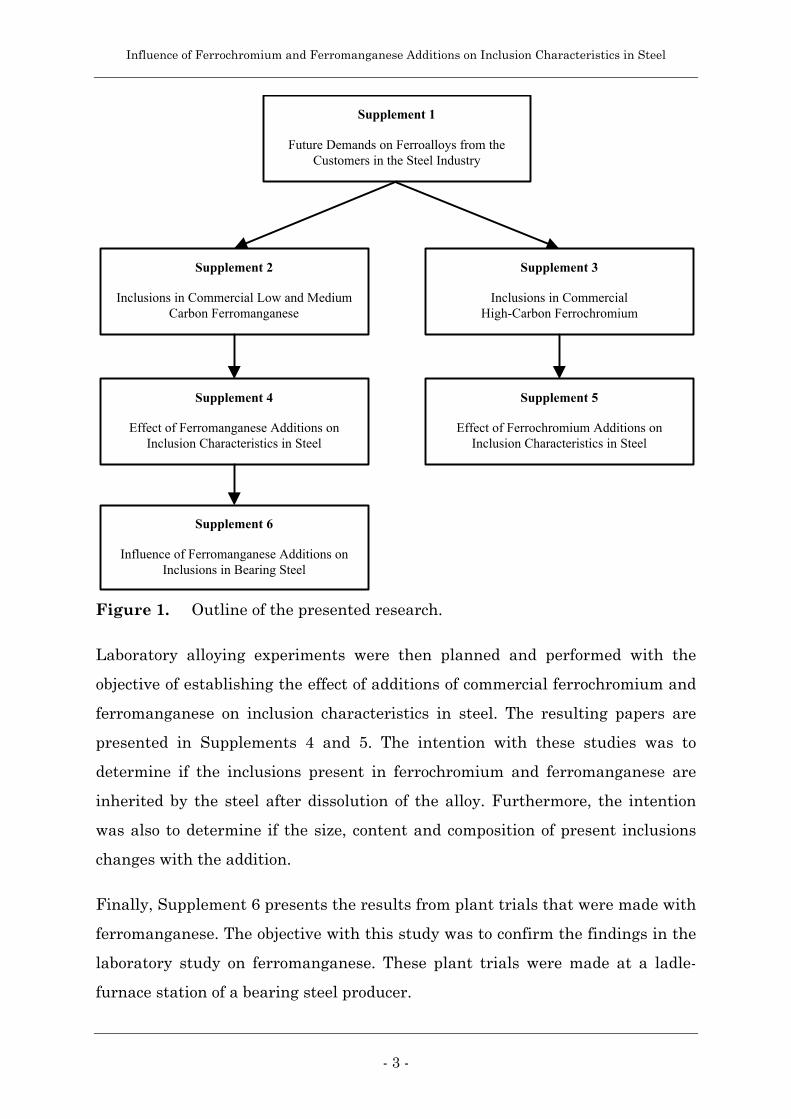
Laboratory alloying experiments were then planned and performed with the
objective of establishing the effect of additions of commercial ferrochromium and
ferromanganese on inclusion characteristics in steel. The resulting papers are
presented in Supplements 4 and 5. The intention with these studies was to
determine if the inclusions present in ferrochromium and ferromanganese are
inherited by the steel after dissolution of the alloy. Furthermore, the intention
was also to determine if the size, content and composition of present inclusions
changes with the addition.
Finally, Supplement 6 presents the results from plant trials that were made with
ferromanganese. The objective with this study was to confirm the findings in the
laboratory study on ferromanganese. These plant trials were made at a ladle-
furnace station of a bearing steel producer.
Supplement 1
Future Demands on Ferroalloys from theCustomers in the Steel Industry
Supplement 5
Effect of Ferrochromium Additions onInclusion Characteristics in Steel
Supplement 3
Inclusions in CommercialHigh-Carbon Ferrochromium
Supplement 6
Influence of Ferromanganese Additions onInclusions in Bearing Steel
Supplement 4
Effect of Ferromanganese Additions onInclusion Characteristics in Steel
Supplement 2
Inclusions in Commercial Low and MediumCarbon Ferromanganese
Figure 1. Outline of the presented research.
Influence of Ferrochromium and Ferromanganese Additions on Inclusion Characteristics in Steel
- 4 -
2. ASSESSMENT METHODS
2.1. Inclusion characteristics
The term "inclusion characteristics" is widely used in this thesis. It includes
several parameters that describes the inclusions present in a material. In the
presented studies, the following parameters are assumed to describe the
inclusion characteristics of a material:
♦ Content
♦ Size distribution
♦ Shape
♦ Composition
There are several methods available to determine the above mentioned
parameters. Content, size distribution and shape have in the presented studies
been assessed by using the method described in the Swedish Standard SS
111116.[10] The content is determined as the number per mm² or area-% of
inclusions. The concept of size distribution means that inclusions of different
sizes are separated into different size groups. In this manner a size distribution
shows how the area fraction or number of inclusions varies with the size of the
inclusion. The composition of inclusions is very important to establish since this
greatly affects the impact on material properties. When the inclusion composition
has been determined, it may also be possible, within reasonable limits, to predict
the impact of the present inclusions. Moreover, it is important to remember that,
in liquid steel samples, inclusion shape alone is not enough to predict the impact
on material properties.
Content, size distribution and shape of inclusions were determined using the SS
111116 method. The composition of the inclusions were analysed in a scanning
electron microscope or in a electron microprobe unit. These methods will be
closer described in the following sections.

Influence of Ferrochromium and Ferromanganese Additions on Inclusion Characteristics in Steel
- 5 -
2.2. SS111116
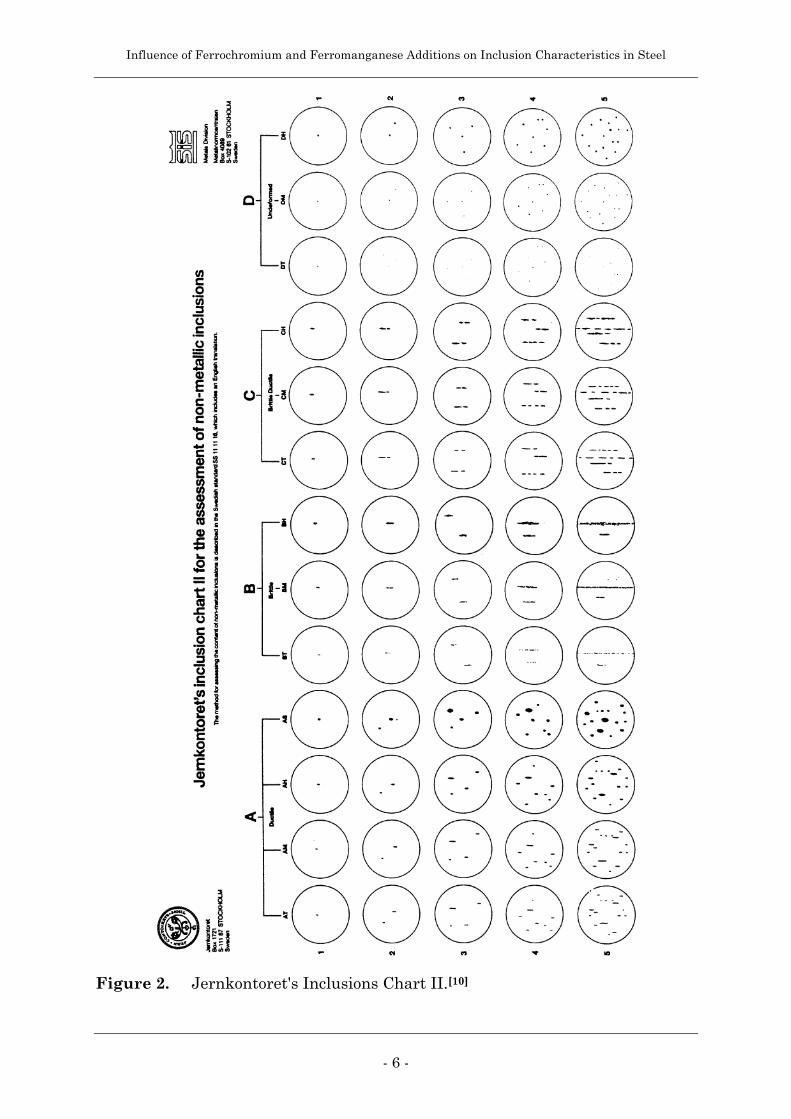
In the SS111116 method, all inclusions are divided into four types according to
Jernkontoret's inclusion chart II, presented in Figure 2. Type A are ductile, type
B are brittle stringers, type C are brittle-ductile and type D are undeformable
inclusions. These four types are further divided into four groups according to the
width or diameter of the individual inclusion, thin (T), medium (M) or heavy (H),
e.g. DT, DM or DH. The fourth group, P, is for individual particles that require
more detailed specification.[10] A more in depth descriptions of this method can be
found in publications by Johansson.[11,12] Assuming that a viewing field diameter
of 0.8 mm is used, the diameters of type D inclusions in the different size groups
are:
♦ DT 2.8 - 5.6 µm
♦ DM 5.7 - 11.2 µm
♦ DH 11.3 - 22.6 µm.
♦ DP 22.7 µm -
The SS 111116 method was originally designed to determine the area fraction of
inclusions in worked steel. However, in the studies of steel samples taken in
liquid metal, the connection between shape and type of inclusion has to be
disregarded. In other words, a spherical inclusion that is found in liquid steel
samples can have virtually any composition and is not necessarily an
undeformable inclusion.
The software PC-MIC© was used to calculate the different inclusion
characteristics, including size distribution and area fraction of inclusions. These
calculations are performed according to the algorithms described in the Swedish
standard SS 111116.
Influence of Ferrochromium and Ferromanganese Additions on Inclusion Characteristics in Steel
- 6 -
Figure 2. Jernkontoret's Inclusions Chart II.[10]

Influence of Ferrochromium and Ferromanganese Additions on Inclusion Characteristics in Steel
- 7 -
2.3. Scanning Electron Microscope
In this work, the scanning electron microscope (SEM) has been widely used to
analyse inclusions in specimens of ferroalloys and steel. It is important to
consider certain limitations that applies to analytical SEM studies before
performing these analyses. The analytical values obtained with an Energy-
Dispersive Spectrometer (EDS) or an Wavelength-Dispersive Spectrometer
(WDS) are based on the detection of X-rays that are generated by a focused
electron beam.[13] When the beam hits the surface of the specimen, an electron
diffusion field (sometimes called the electron probe) is generated beneath the
surface. Here, both electrons and X-rays are generated. The secondary electrons
and back-scattered electrons are primarily used to acquire images of the
specimen surface, while the X-rays are detected and characterised by the EDS or
WDS.
Since the electron probe is the base for analyses, the properties are necessary to
consider. The electron probe is usually shaped like a droplet, but acceleration
voltage and probe current influences the shape and size of the probe. The probe
diameter can be decreased by reducing the probe current or by lowering the
acceleration voltage. A smaller probe diameter will increase the possible
magnification and resolution. In addition, a lowered acceleration voltage reduces
the possibility of damaging the specimen. Using a high acceleration voltage will
increase the electron diffusion field. This may cause beam penetration into the
matrix, which means that it is not only the elements in the inclusion that emits
the X-ray signal but also the elements in the matrix. For that reason,
observation of low-concentration elements should be performed with low
acceleration voltages.
The acceleration voltages used in this work has been between 15 and 20 kV. At
these voltages the electron diffusion field diameter is about 1 to 2 µm. This
means that trying to analyse anything that is smaller than this will only result
in a high contribution from the elements in the matrix.

Influence of Ferrochromium and Ferromanganese Additions on Inclusion Characteristics in Steel
- 8 -
2.4. Electron Microprobe
In addition to using an SEM for analyses of the characterised inclusions, an
electron microprobe analyser (EMA) has also been used. These two microscopes
are, in principal, very similar. The main difference is that the EMA is built for
performing micro-chemical analyses while the SEM is built mainly for acquiring
images.[13] Even though the wave-length dispersive spectrometer can be used
with an SEM, it is most widely used in combination with an EMA.
The wave-length dispersive spectrometer is in fact a crystal diffraction
spectrometer. Here, the X-rays from the electron diffusion field impinge on the
surface of an analysing crystal. The X-ray photon is then diffracted towards the
detector. By using several crystals at the same time, a broad range of
wavelengths can be used for qualitative element mappings. If the EMA is
equipped with several spectrometers, a number of simultaneous quantitative
micro-chemical analyses are possible.
The use of a WDS provides a much higher sensitivity compared to an EDS. The
obtained energy resolution in WDS analyses effectively reduces the problems
with peak overlaps. The WDS also has the ability to quantitatively analyse the
contents of elements with atomic numbers from Beryllium and higher. Recent
developments has made it possible to accurately analyse even for contents below
1% assuming that a set of well characterised standards are used.[13] Considering
the analytical capabilities of an electron microprobe equipped with WD/ED
spectrometers, as many as possible of the micro-chemical analyses were made
with this unit. Even though an EMA allows for more simultaneous analyses, this
equipment is quite expensive to run compared to an SEM. As a consequence, it
was matter of how much resources that could be used for micro-chemical
analyses with the EMA.
Influence of Ferrochromium and Ferromanganese Additions on Inclusion Characteristics in Steel
- 9 -
3. REVIEW OF SUPPLEMENTS
3.1. Supplement 1 : Future Demands on Ferroalloys from the Customers in
the Steel Industry
In the first supplement, a review paper is presented. This paper discusses how
the demands on the ferroalloys industry will change in the future. It is based on
surveys and seminars with representatives from the steel and ferroalloy
industry.[4] The perspective of the discussion is concentrated to demands
concerning inclusion characteristics of ferroalloys and their effect on the steel.
To give a proper background to the subject, recent developments in the steel
industry are presented and discussed. The reason for this is that it is not possible
with traditional methods to control the inclusion characteristics during ladle
refining. The commercially available methods are not fast enough to be able to
determine the characteristics so that these can be used as on-line tools to
optimize the steelmaking processes.
Today it is possible to make on-line determination of dissolved elements, such as
the alloying elements Si, Mn, Cr and impurities such as S, H, P, and Cu. The
analyses of these elements are readily available within about 7 minutes after
sampling. Another quality parameter is temperature, which can be measured
truly in real-time. Finally, the third quality parameter is inclusion
characteristics. As previously mentioned, these are normally determined with
optical and electron microscopes. The time consumption for these analytical
methods prevents a rapid feedback to the production line, but allows for a
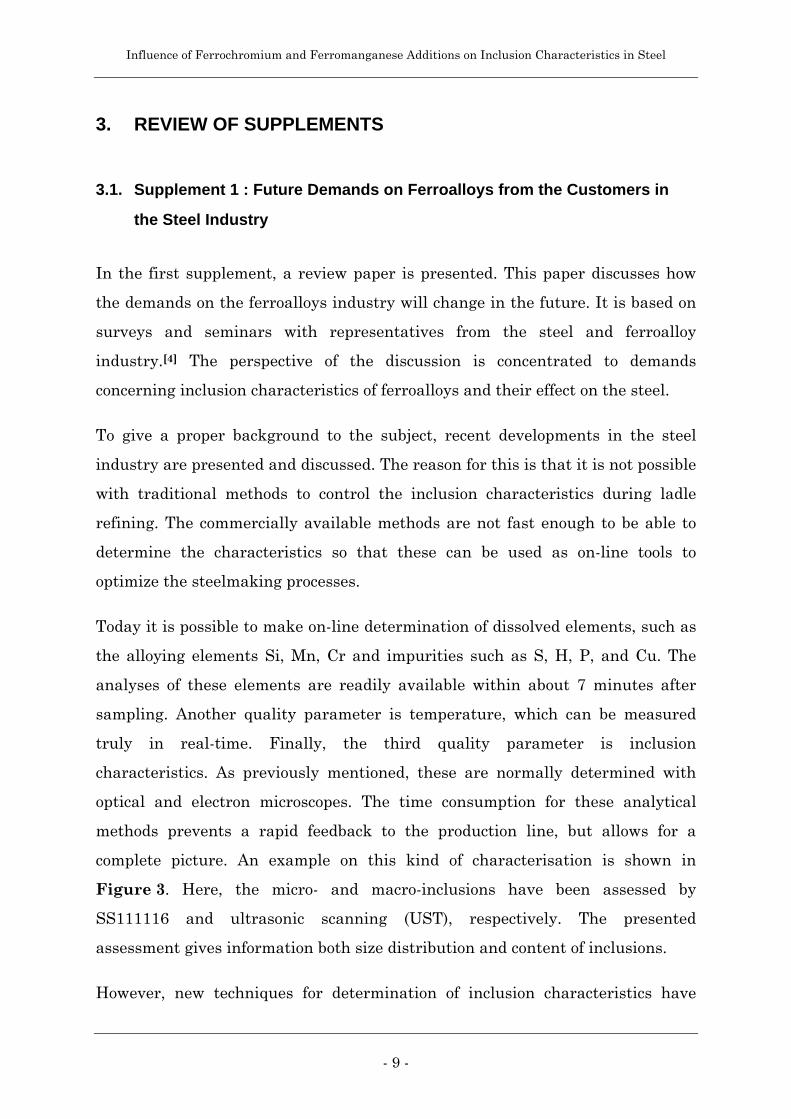
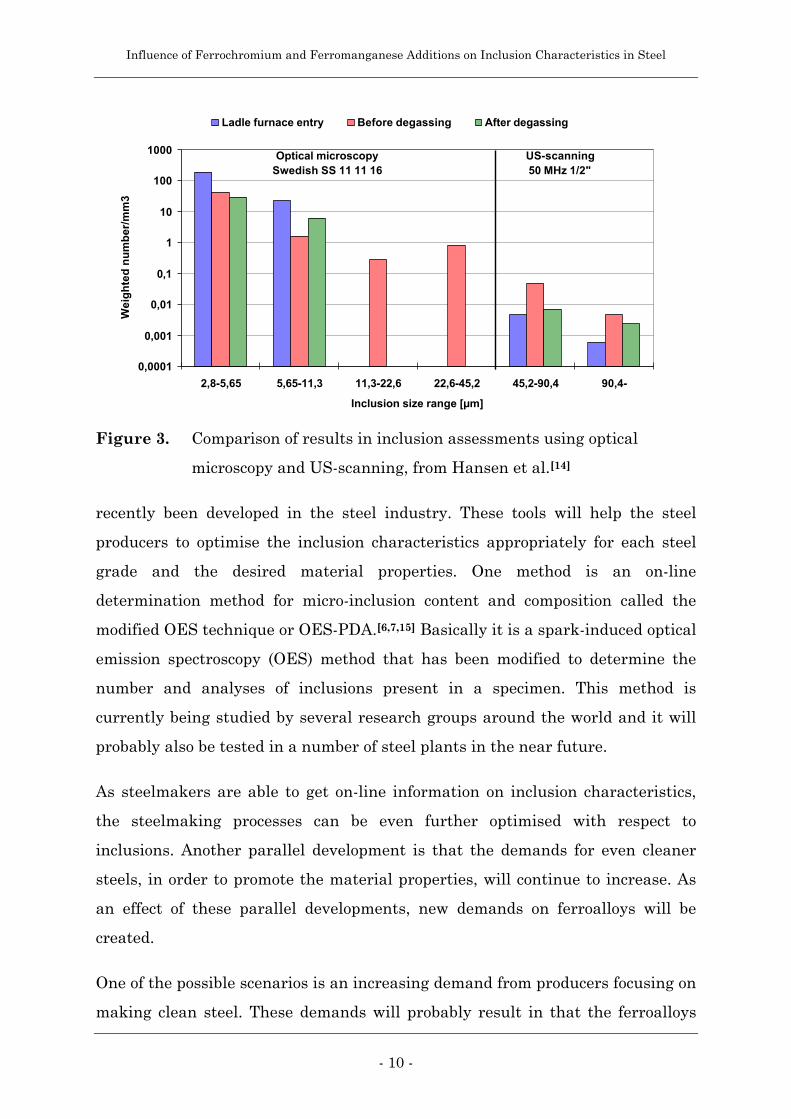
complete picture. An example on this kind of characterisation is shown in
Figure 3. Here, the micro- and macro-inclusions have been assessed by
SS111116 and ultrasonic scanning (UST), respectively. The presented
assessment gives information both size distribution and content of inclusions.
However, new techniques for determination of inclusion characteristics have
Influence of Ferrochromium and Ferromanganese Additions on Inclusion Characteristics in Steel
- 10 -
recently been developed in the steel industry. These tools will help the steel
producers to optimise the inclusion characteristics appropriately for each steel
grade and the desired material properties. One method is an on-line
determination method for micro-inclusion content and composition called the
modified OES technique or OES-PDA.[6,7,15] Basically it is a spark-induced optical
emission spectroscopy (OES) method that has been modified to determine the
number and analyses of inclusions present in a specimen. This method is
currently being studied by several research groups around the world and it will
probably also be tested in a number of steel plants in the near future.
As steelmakers are able to get on-line information on inclusion characteristics,
the steelmaking processes can be even further optimised with respect to
inclusions. Another parallel development is that the demands for even cleaner
steels, in order to promote the material properties, will continue to increase. As
an effect of these parallel developments, new demands on ferroalloys will be
created.
One of the possible scenarios is an increasing demand from producers focusing on
making clean steel. These demands will probably result in that the ferroalloys
0,0001
0,001
0,01
0,1
1
10
100
1000
2,8-5,65 5,65-11,3 11,3-22,6 22,6-45,2 45,2-90,4 90,4-
Inclusion size range [µm]
Wei
gh
ted
nu
mb
er/m
m3
Ladle furnace entry Before degassing After degassing
US-scanning50 MHz 1/2"
Optical microscopySwedish SS 11 11 16
Figure 3. Comparison of results in inclusion assessments using optical
microscopy and US-scanning, from Hansen et al.[14]
Influence of Ferrochromium and Ferromanganese Additions on Inclusion Characteristics in Steel
- 11 -
producers in the future will have to inform about the inclusion characteristics of
the ferroalloy in question. Today it is a usual requirement on the ferroalloys
producer to specify contents of dissolved elements and physical data, e.g. density,
melting range, heat capacity, and heat of melting. In the future, it is possible
that the information also have to include specifications on quantity, average size,
shape and composition of inclusions in the ferroalloy.
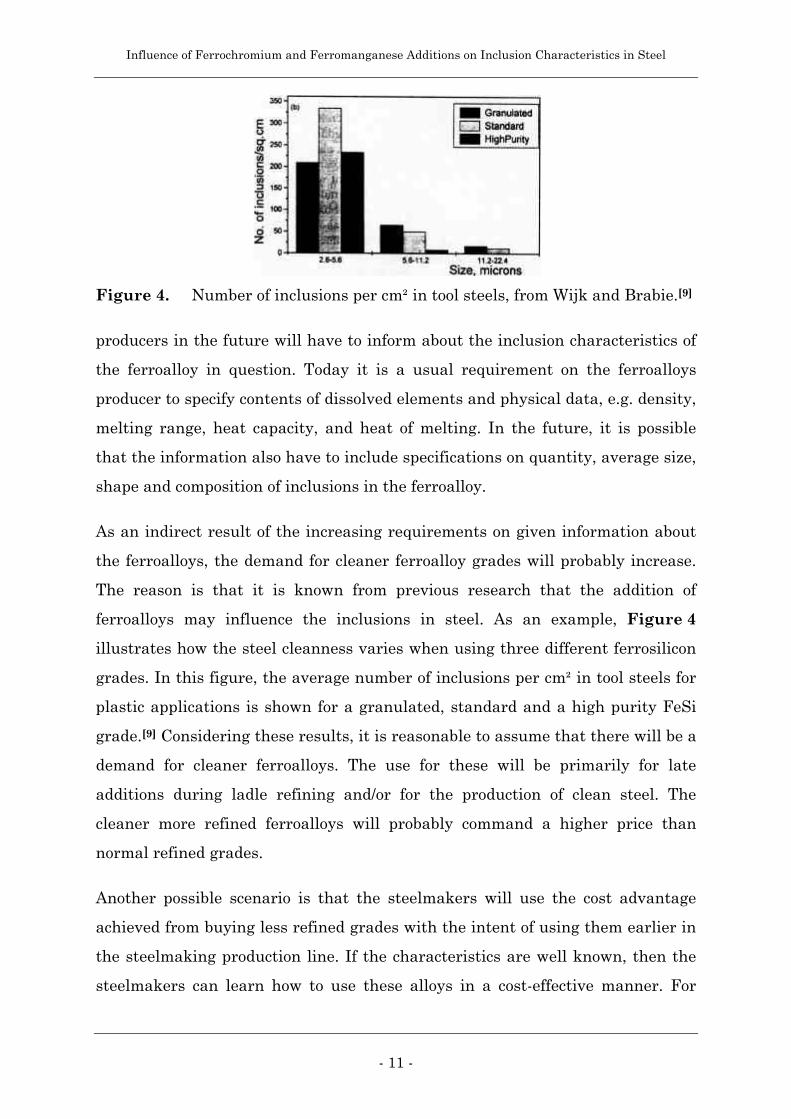
As an indirect result of the increasing requirements on given information about
the ferroalloys, the demand for cleaner ferroalloy grades will probably increase.
The reason is that it is known from previous research that the addition of
ferroalloys may influence the inclusions in steel. As an example, Figure 4
illustrates how the steel cleanness varies when using three different ferrosilicon
grades. In this figure, the average number of inclusions per cm² in tool steels for
plastic applications is shown for a granulated, standard and a high purity FeSi
grade.[9] Considering these results, it is reasonable to assume that there will be a
demand for cleaner ferroalloys. The use for these will be primarily for late
additions during ladle refining and/or for the production of clean steel. The
cleaner more refined ferroalloys will probably command a higher price than
normal refined grades.
Another possible scenario is that the steelmakers will use the cost advantage
achieved from buying less refined grades with the intent of using them earlier in
the steelmaking production line. If the characteristics are well known, then the
steelmakers can learn how to use these alloys in a cost-effective manner. For
Figure 4. Number of inclusions per cm² in tool steels, from Wijk and Brabie.[9]
Influence of Ferrochromium and Ferromanganese Additions on Inclusion Characteristics in Steel
- 12 -
example by adding more ferroalloys at the electric arc furnace instead of at the
ladle furnace station, and thereby allowing a longer period for removal or
modification of the inclusions. It should be noted that development towards using
cheaper ferroalloys has happened before. That time it was the stainless steel
industry started to use a less refined cheaper ferrochrome grade at the electric
arc furnace instead of adding a more expensive and more refined grade at the
AOD converter.
Finally, it should be pointed out that the ferroalloy industry has made some work
with characterising the ferroalloys but that even more work remains. The
performed work is outlined more in detail in Supplement 1. Most, if not all,
ferroalloy suppliers today supply information regarding trace and impurity
elements in connection to a delivery of a product or on demand. The inclusion
characteristics for some ferroalloys have also been studied but are not yet a part
of the provided information.
It is possible to find general information about total oxygen content, size
distribution and composition of inclusions for some ferroalloys in literature. The
majority of these studies have focused on determining the inclusion compositions
in ferroalloys, but very few have presented information about inclusion size
distributions. In order to meet the coming demands, the research that provides
this information should to be continued and extended to include most or all of the
commercially available ferroalloys.
There still is time to meet the expected demands since few of the steel companies
have access to the recently developed methods. One possible way to increase the
knowledge would be by co-operating with the companies that dispose over the
cutting edge technology to gather information on inclusion characteristics in
ferroalloys. This would be beneficial for both the ferroalloys industry and the
steel industry. It is probable that a majority of the steelmakers will follow the
ones that lead the development. By acting now, the ferroalloy industry can stand
prepared for the demands of the future.

Influence of Ferrochromium and Ferromanganese Additions on Inclusion Characteristics in Steel
- 13 -
3.2. Supplement 2 : Inclusions in Commercial Low and Medium Carbon
Ferromanganese
The objective with this investigation, presented in Supplement 2, was to increase
the knowledge about the microstructure of commercial low- (max. 0.5 wt-% C)
and medium-carbon (max. 1.5 wt-%-C) ferromanganese with emphasis on non-
metallic inclusions. Current knowledge on this subject includes studies that
mainly have been concentrated on commercial high-carbon ferromanganese.[16-19]
As an example, Balbi et al. investigated non-metallic inclusions present in
commercial ferromanganese containing up to 7.4 wt-% C.[18,19] They concluded
that MnO and SiO2 inclusions are the most common non-metallic inclusions in
ferromanganese.
Three normal refined grades were chosen for this study with the aim of
establishing how the inclusion characteristics changes with carbon content. As a
complement, three low-oxygen ferromanganese grades were also chosen for
comparison. The compositions of the examined grades are presented in Table 1.
Ferromanganese grades A to D are produced in Sauda, while grades E and F are
produced in Porsgrunn, Norway.
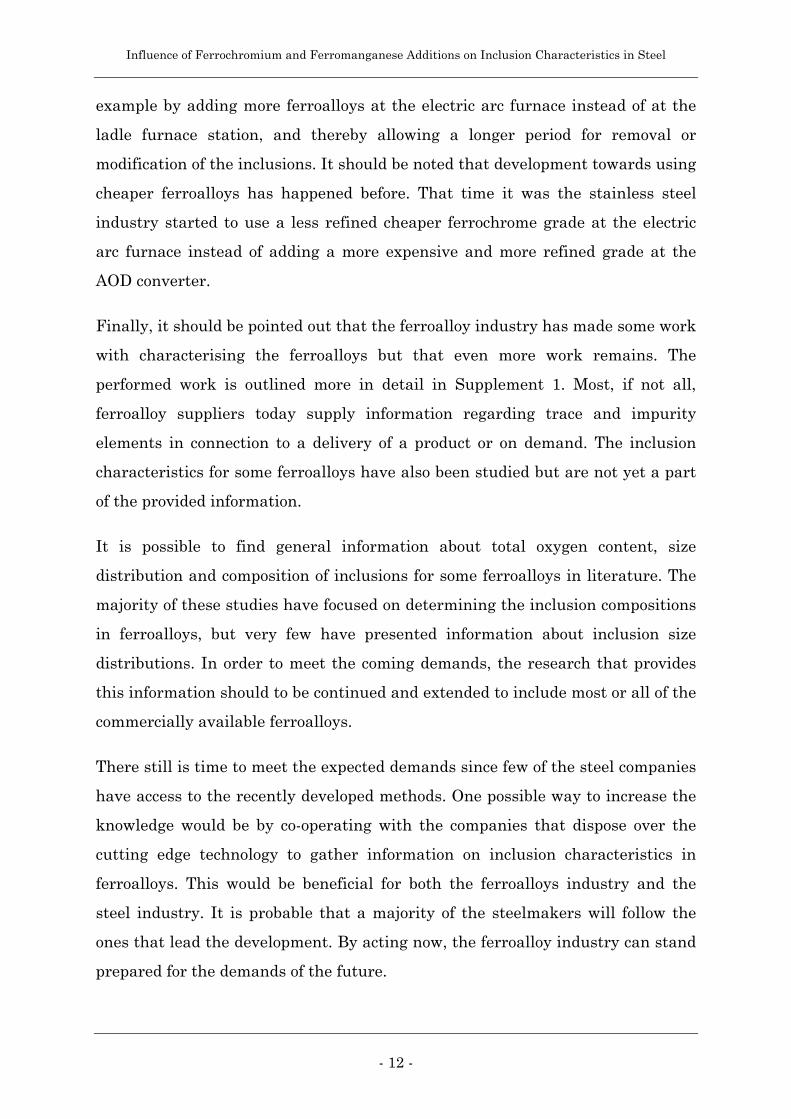
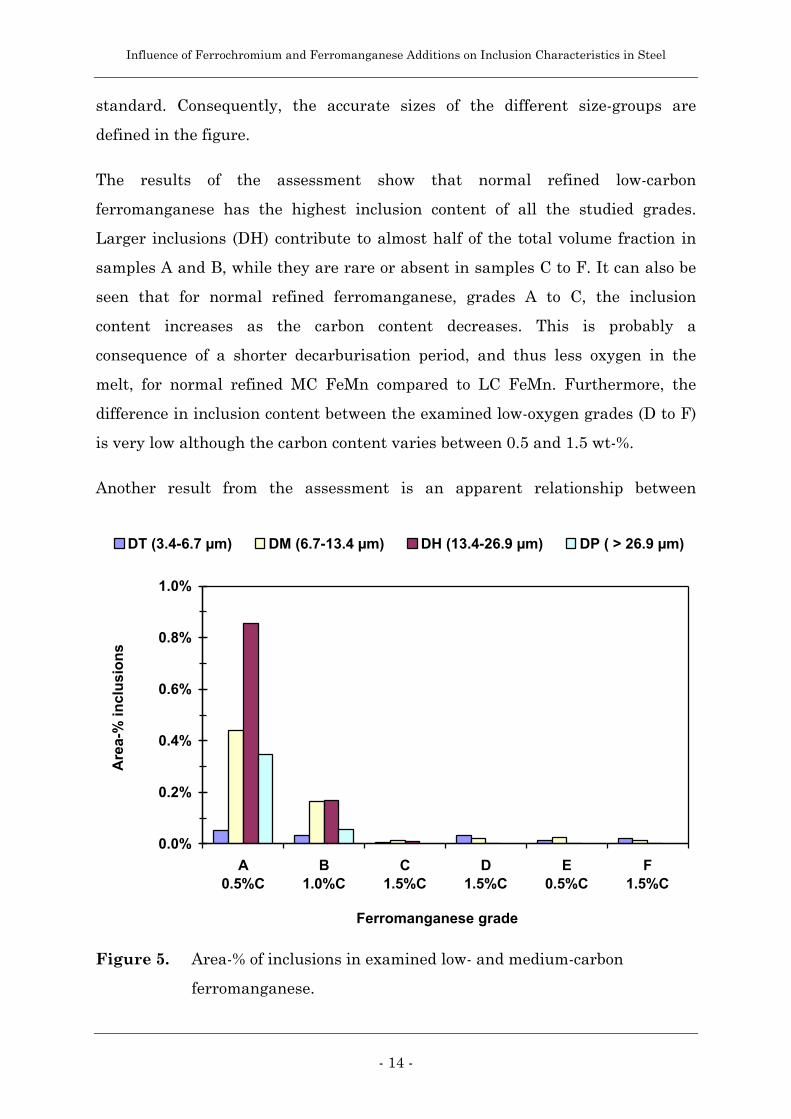
The results of the inclusion assessment in optical microscope using the SS111116
method are presented in Figure 5. Note that these assessments were made in a
microscope with a different viewing field diameter than what is stated in the
Table 1. Compositions in weight-% of examined low- and medium-carbon
ferromanganese as supplied by Eramet AS, Norway.
No. Grade Mn Fe C S O N P Si
A LC 0,5% C 79.6 17.7 0.34 0.004 1.11 0.14 0.17 0.01
B MC 1,0% C 81.1 16.5 0.77 0.005 0.89 0.06 0.17 0.12
C MC 1,5% C 81.5 15.9 1.52 0.003 0.01 0.07 0.16 0.04
D MC 1,5% C(1) 81.0 16.1 1.38 0.003 0.02 0.07 0.16 0.39
E LC 0.5% C(1) 81.4 17.3 0.48 0.003 0.04 0.04 0.16 0.32
F MC 1.5% C(1) 80.6 16.8 1.41 0.003 0.12 0.06 0.16 0.29(1) Low-oxygen ferromanganese grades.
Influence of Ferrochromium and Ferromanganese Additions on Inclusion Characteristics in Steel
- 14 -
standard. Consequently, the accurate sizes of the different size-groups are
defined in the figure.
The results of the assessment show that normal refined low-carbon
ferromanganese has the highest inclusion content of all the studied grades.
Larger inclusions (DH) contribute to almost half of the total volume fraction in
samples A and B, while they are rare or absent in samples C to F. It can also be
seen that for normal refined ferromanganese, grades A to C, the inclusion
content increases as the carbon content decreases. This is probably a
consequence of a shorter decarburisation period, and thus less oxygen in the
melt, for normal refined MC FeMn compared to LC FeMn. Furthermore, the
difference in inclusion content between the examined low-oxygen grades (D to F)
is very low although the carbon content varies between 0.5 and 1.5 wt-%.
Another result from the assessment is an apparent relationship between
0.0%
0.2%
0.4%
0.6%
0.8%
1.0%
A0.5%C
B1.0%C
C1.5%C
D1.5%C
E0.5%C
F1.5%C
Ferromanganese grade
Are
a-%
incl
usi
on
s
DT (3.4-6.7 µm) DM (6.7-13.4 µm) DH (13.4-26.9 µm) DP ( > 26.9 µm)
Figure 5. Area-% of inclusions in examined low- and medium-carbon
ferromanganese.
Influence of Ferrochromium and Ferromanganese Additions on Inclusion Characteristics in Steel
- 15 -
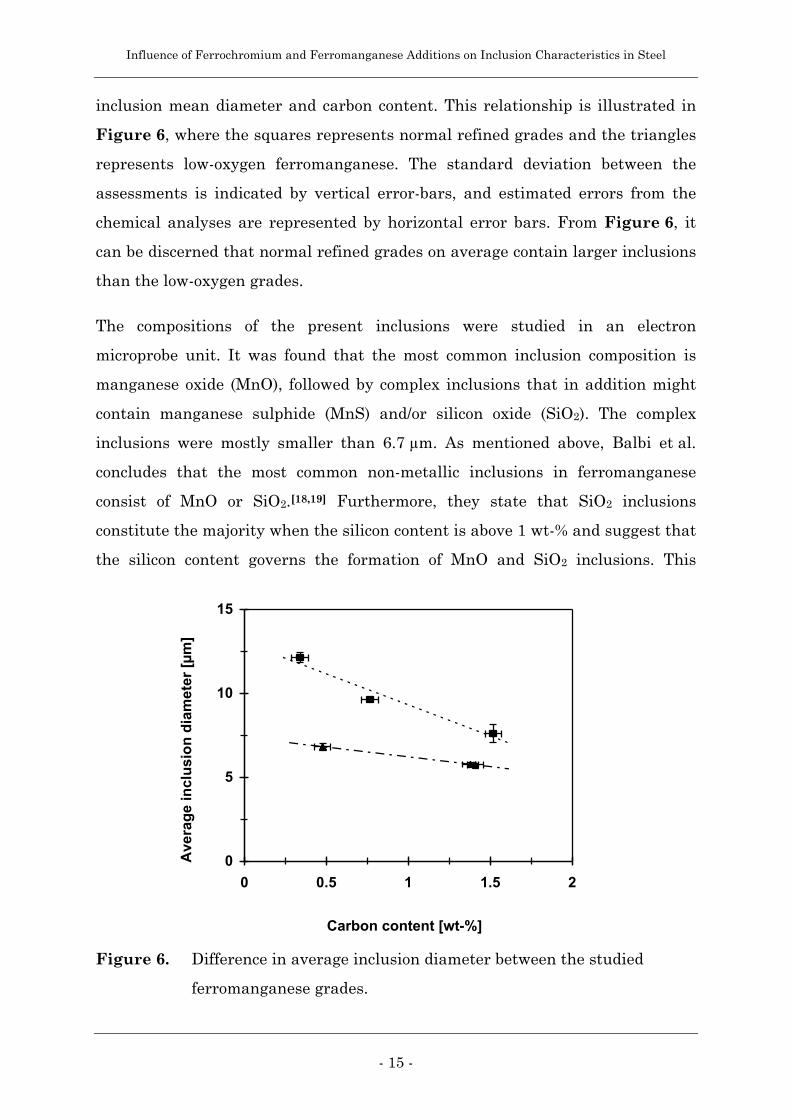
inclusion mean diameter and carbon content. This relationship is illustrated in
Figure 6, where the squares represents normal refined grades and the triangles
represents low-oxygen ferromanganese. The standard deviation between the
assessments is indicated by vertical error-bars, and estimated errors from the
chemical analyses are represented by horizontal error bars. From Figure 6, it
can be discerned that normal refined grades on average contain larger inclusions
than the low-oxygen grades.
The compositions of the present inclusions were studied in an electron
microprobe unit. It was found that the most common inclusion composition is
manganese oxide (MnO), followed by complex inclusions that in addition might
contain manganese sulphide (MnS) and/or silicon oxide (SiO2). The complex
inclusions were mostly smaller than 6.7 µm. As mentioned above, Balbi et al.
concludes that the most common non-metallic inclusions in ferromanganese
consist of MnO or SiO2.[18,19] Furthermore, they state that SiO2 inclusions
constitute the majority when the silicon content is above 1 wt-% and suggest that
the silicon content governs the formation of MnO and SiO2 inclusions. This
0
5
10
15
0 0.5 1 1.5 2
Carbon content [wt-%]
Ave
rag
e in
clu
sio
n d
iam
eter
[µm
]
Figure 6. Difference in average inclusion diameter between the studied
ferromanganese grades.

Influence of Ferrochromium and Ferromanganese Additions on Inclusion Characteristics in Steel
- 16 -
relationship could not be verified since the ferromanganese grades in the present
study at most contained about 0.4 wt-% silicon.
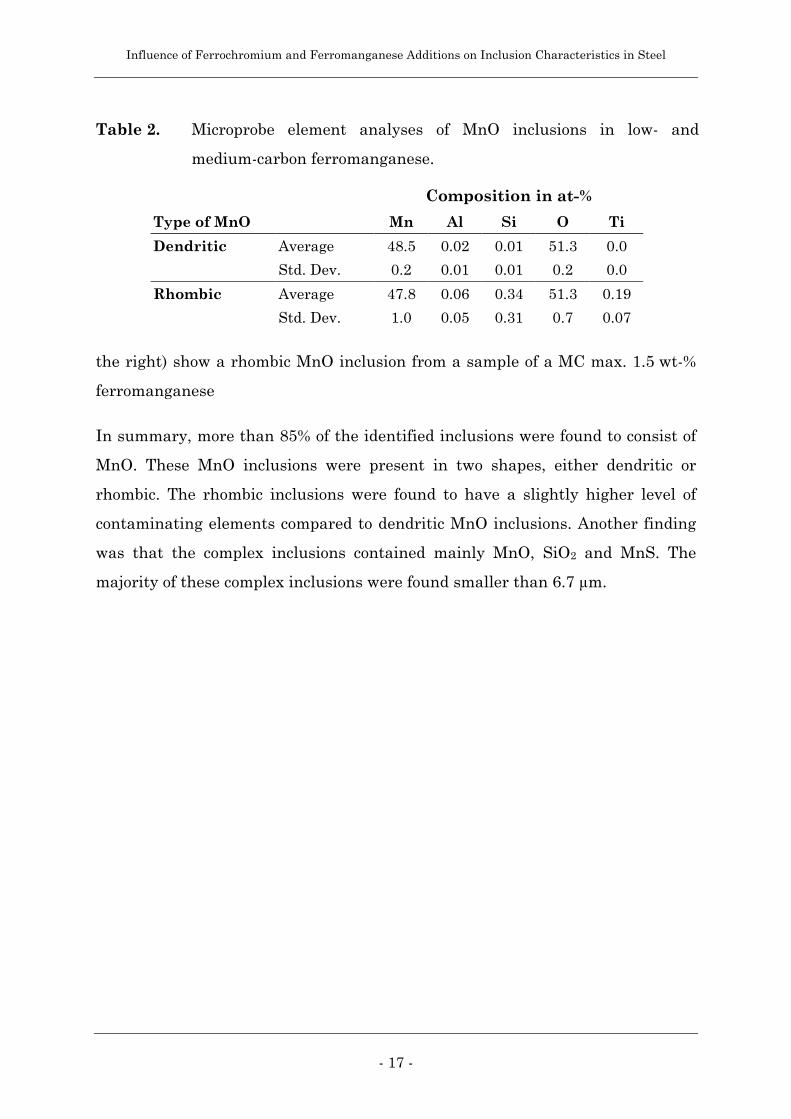
Manganese oxide inclusions were found present in two different shapes, dendritic
and rhombic. Both types were present in all of the examined samples. In an
attempt to explain the difference between these two types, several analyses were
made. A summary of these analyses is presented in Table 2. The element
analyses shows that the rhombic type of manganese oxide has a slightly higher
content of silicon and titanium. Microprobe element mappings of these two
inclusion types are presented in Figure 7a and b. The colour-scale is relative to
the content of each individual element. A high content of an element is presented
as red, and a low content as black. Visible in Figure 7a (to the left) is a dendritic
MnO inclusion present in an MC max. 1.0 wt-% ferromanganese. Figure 7b (to
Figure 7. Element mappings of inclusions in ferromanganese.
a) Dendrite shaped MnO found in grade B FeMn.
b) Rhombic shaped MnO found in grade C FeMn.
Influence of Ferrochromium and Ferromanganese Additions on Inclusion Characteristics in Steel
- 17 -
the right) show a rhombic MnO inclusion from a sample of a MC max. 1.5 wt-%
ferromanganese
In summary, more than 85% of the identified inclusions were found to consist of
MnO. These MnO inclusions were present in two shapes, either dendritic or
rhombic. The rhombic inclusions were found to have a slightly higher level of
contaminating elements compared to dendritic MnO inclusions. Another finding
was that the complex inclusions contained mainly MnO, SiO2 and MnS. The
majority of these complex inclusions were found smaller than 6.7 µm.
Table 2. Microprobe element analyses of MnO inclusions in low- and
medium-carbon ferromanganese.
Composition in at-%
Type of MnO Mn Al Si O Ti
Dendritic Average 48.5 0.02 0.01 51.3 0.0
Std. Dev. 0.2 0.01 0.01 0.2 0.0
Rhombic Average 47.8 0.06 0.34 51.3 0.19
Std. Dev. 1.0 0.05 0.31 0.7 0.07
Influence of Ferrochromium and Ferromanganese Additions on Inclusion Characteristics in Steel
- 18 -
3.3. Supplement 3 : Inclusions in Commercial High-Carbon Ferrochromium
The objective with this investigation was to increase the knowledge about
inclusion characteristics for commercial high-carbon ferrochromium. The
complete study is presented in Supplement 3. Earlier studies on high-carbon
ferrochromium have shown that there exists many different types of inclusions in
ferrochromium.[20-24] Retelsdorf et al. showed that different types of Cr-Mn
spinels were present depending on the silicon content in the alloy.[21,22]
Koloyartsev and Rusakov studied the formation of sulphides in synthetic Cr-Fe
alloys.[20] Their results were later confirmed by Metcalfe et al. in their research
on sulphides in industrial high-carbon ferrochromium.[23,24]
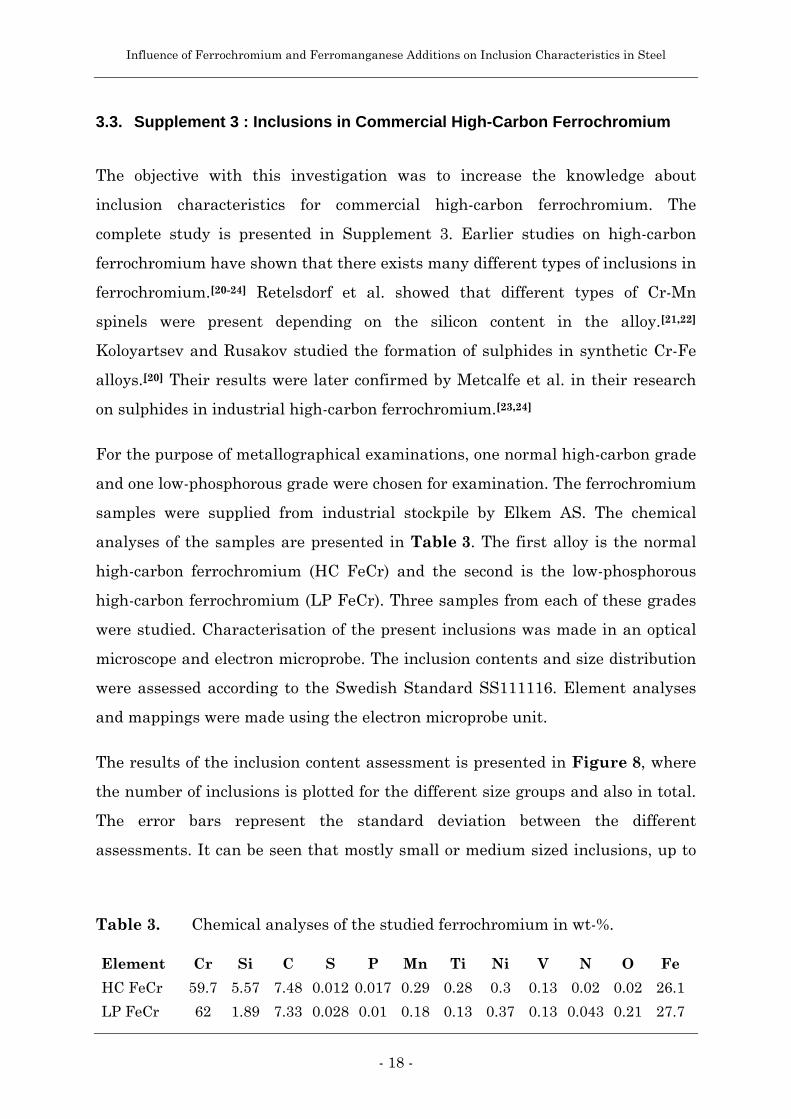
For the purpose of metallographical examinations, one normal high-carbon grade
and one low-phosphorous grade were chosen for examination. The ferrochromium
samples were supplied from industrial stockpile by Elkem AS. The chemical
analyses of the samples are presented in Table 3. The first alloy is the normal
high-carbon ferrochromium (HC FeCr) and the second is the low-phosphorous
high-carbon ferrochromium (LP FeCr). Three samples from each of these grades
were studied. Characterisation of the present inclusions was made in an optical
microscope and electron microprobe. The inclusion contents and size distribution
were assessed according to the Swedish Standard SS111116. Element analyses
and mappings were made using the electron microprobe unit.
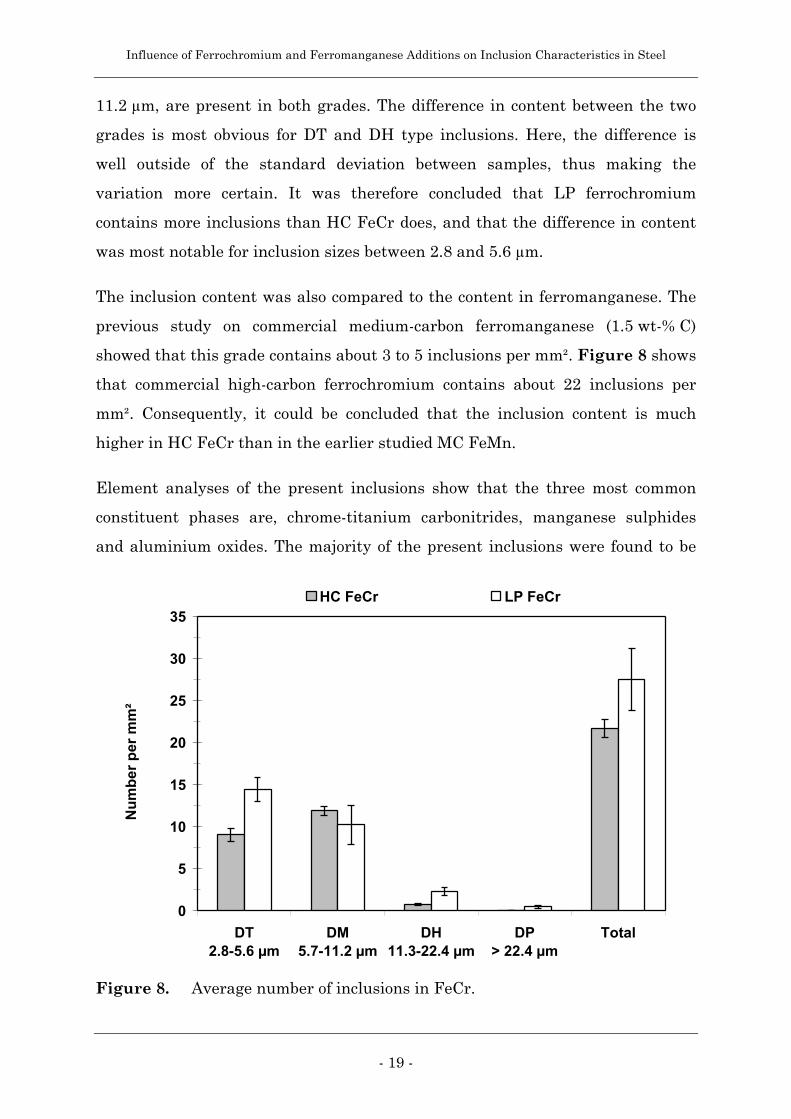
The results of the inclusion content assessment is presented in Figure 8, where
the number of inclusions is plotted for the different size groups and also in total.
The error bars represent the standard deviation between the different
assessments. It can be seen that mostly small or medium sized inclusions, up to
Table 3. Chemical analyses of the studied ferrochromium in wt-%.
Element Cr Si C S P Mn Ti Ni V N O Fe
HC FeCr 59.7 5.57 7.48 0.012 0.017 0.29 0.28 0.3 0.13 0.02 0.02 26.1
LP FeCr 62 1.89 7.33 0.028 0.01 0.18 0.13 0.37 0.13 0.043 0.21 27.7
Influence of Ferrochromium and Ferromanganese Additions on Inclusion Characteristics in Steel
- 19 -
11.2 µm, are present in both grades. The difference in content between the two
grades is most obvious for DT and DH type inclusions. Here, the difference is
well outside of the standard deviation between samples, thus making the
variation more certain. It was therefore concluded that LP ferrochromium
contains more inclusions than HC FeCr does, and that the difference in content
was most notable for inclusion sizes between 2.8 and 5.6 µm.
The inclusion content was also compared to the content in ferromanganese. The
previous study on commercial medium-carbon ferromanganese (1.5 wt-% C)
showed that this grade contains about 3 to 5 inclusions per mm². Figure 8 shows
that commercial high-carbon ferrochromium contains about 22 inclusions per
mm². Consequently, it could be concluded that the inclusion content is much
higher in HC FeCr than in the earlier studied MC FeMn.
Element analyses of the present inclusions show that the three most common
constituent phases are, chrome-titanium carbonitrides, manganese sulphides
and aluminium oxides. The majority of the present inclusions were found to be
0
5
10
15
20
25
30
35
DT2.8-5.6 µm
DM5.7-11.2 µm
DH11.3-22.4 µm
DP> 22.4 µm
Total
Nu
mb
er p
er m
m²
HC FeCr LP FeCr
Figure 8. Average number of inclusions in FeCr.
Influence of Ferrochromium and Ferromanganese Additions on Inclusion Characteristics in Steel
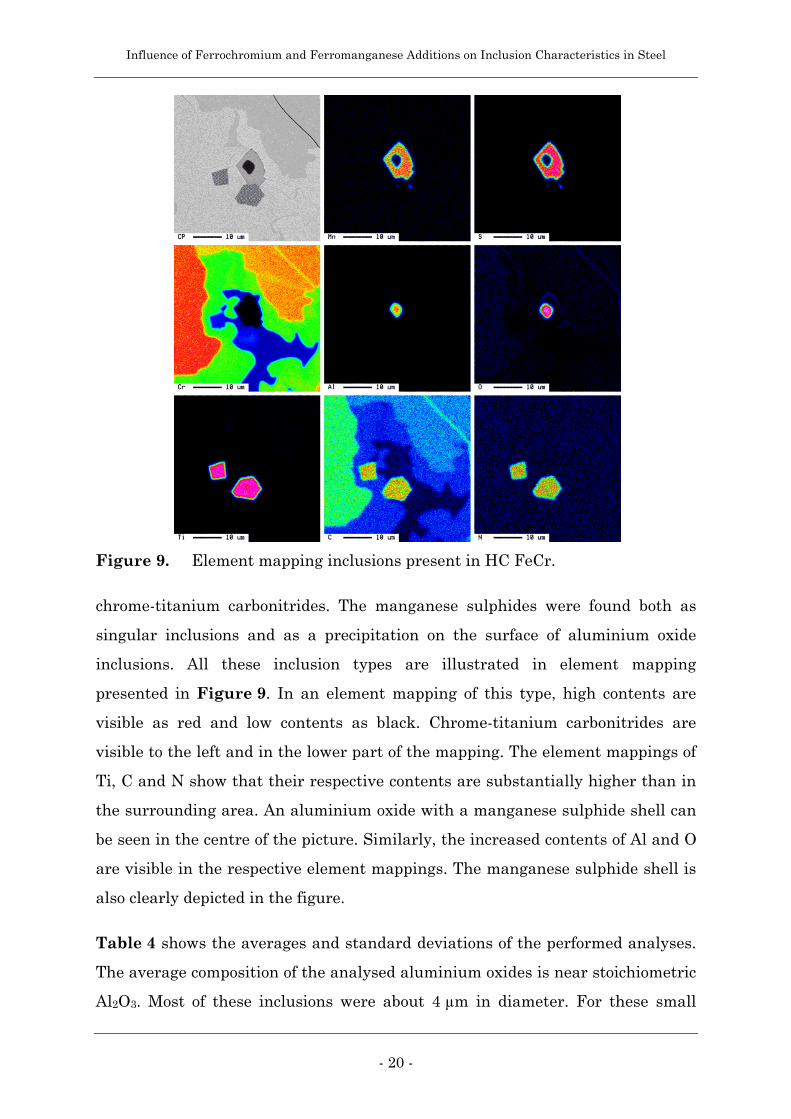
- 20 -
chrome-titanium carbonitrides. The manganese sulphides were found both as
singular inclusions and as a precipitation on the surface of aluminium oxide
inclusions. All these inclusion types are illustrated in element mapping
presented in Figure 9. In an element mapping of this type, high contents are
visible as red and low contents as black. Chrome-titanium carbonitrides are
visible to the left and in the lower part of the mapping. The element mappings of
Ti, C and N show that their respective contents are substantially higher than in
the surrounding area. An aluminium oxide with a manganese sulphide shell can
be seen in the centre of the picture. Similarly, the increased contents of Al and O
are visible in the respective element mappings. The manganese sulphide shell is
also clearly depicted in the figure.
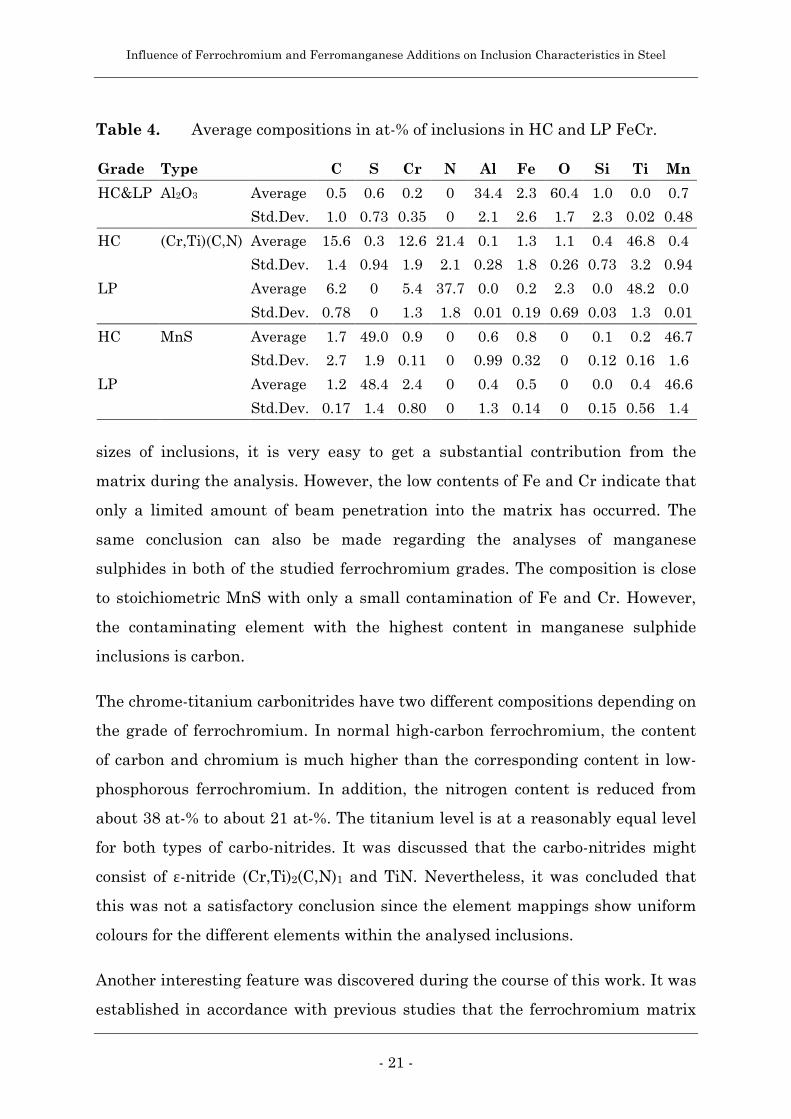
Table 4 shows the averages and standard deviations of the performed analyses.
The average composition of the analysed aluminium oxides is near stoichiometric
Al2O3. Most of these inclusions were about 4 µm in diameter. For these small
Figure 9. Element mapping inclusions present in HC FeCr.
Influence of Ferrochromium and Ferromanganese Additions on Inclusion Characteristics in Steel
- 21 -
sizes of inclusions, it is very easy to get a substantial contribution from the
matrix during the analysis. However, the low contents of Fe and Cr indicate that
only a limited amount of beam penetration into the matrix has occurred. The
same conclusion can also be made regarding the analyses of manganese
sulphides in both of the studied ferrochromium grades. The composition is close
to stoichiometric MnS with only a small contamination of Fe and Cr. However,
the contaminating element with the highest content in manganese sulphide
inclusions is carbon.
The chrome-titanium carbonitrides have two different compositions depending on
the grade of ferrochromium. In normal high-carbon ferrochromium, the content
of carbon and chromium is much higher than the corresponding content in low-
phosphorous ferrochromium. In addition, the nitrogen content is reduced from
about 38 at-% to about 21 at-%. The titanium level is at a reasonably equal level
for both types of carbo-nitrides. It was discussed that the carbo-nitrides might
consist of ε-nitride (Cr,Ti)2(C,N)1 and TiN. Nevertheless, it was concluded that
this was not a satisfactory conclusion since the element mappings show uniform
colours for the different elements within the analysed inclusions.
Another interesting feature was discovered during the course of this work. It was
established in accordance with previous studies that the ferrochromium matrix
Table 4. Average compositions in at-% of inclusions in HC and LP FeCr.
Grade Type C S Cr N Al Fe O Si Ti Mn
HC&LP Al2O3 Average 0.5 0.6 0.2 0 34.4 2.3 60.4 1.0 0.0 0.7
Std.Dev. 1.0 0.73 0.35 0 2.1 2.6 1.7 2.3 0.02 0.48
HC (Cr,Ti)(C,N) Average 15.6 0.3 12.6 21.4 0.1 1.3 1.1 0.4 46.8 0.4
Std.Dev. 1.4 0.94 1.9 2.1 0.28 1.8 0.26 0.73 3.2 0.94
LP Average 6.2 0 5.4 37.7 0.0 0.2 2.3 0.0 48.2 0.0
Std.Dev. 0.78 0 1.3 1.8 0.01 0.19 0.69 0.03 1.3 0.01
HC MnS Average 1.7 49.0 0.9 0 0.6 0.8 0 0.1 0.2 46.7
Std.Dev. 2.7 1.9 0.11 0 0.99 0.32 0 0.12 0.16 1.6
LP Average 1.2 48.4 2.4 0 0.4 0.5 0 0.0 0.4 46.6
Std.Dev. 0.17 1.4 0.80 0 1.3 0.14 0 0.15 0.56 1.4
Influence of Ferrochromium and Ferromanganese Additions on Inclusion Characteristics in Steel
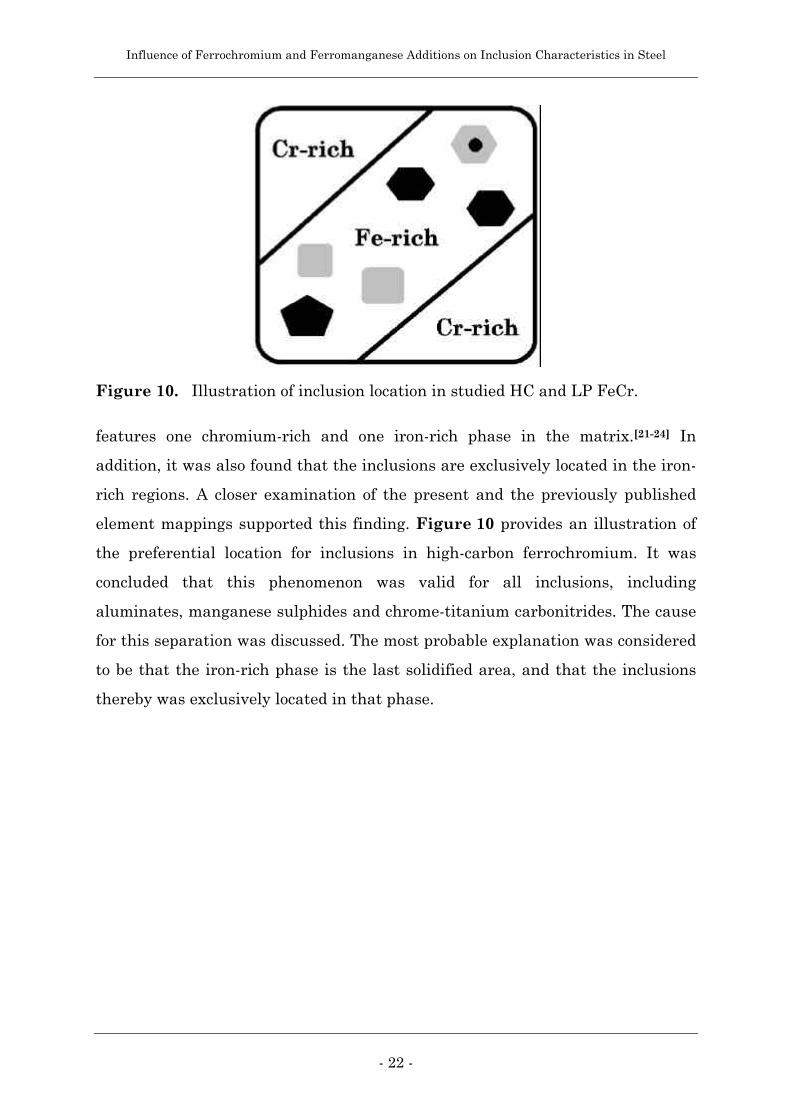
- 22 -
features one chromium-rich and one iron-rich phase in the matrix.[21-24] In
addition, it was also found that the inclusions are exclusively located in the iron-
rich regions. A closer examination of the present and the previously published
element mappings supported this finding. Figure 10 provides an illustration of
the preferential location for inclusions in high-carbon ferrochromium. It was
concluded that this phenomenon was valid for all inclusions, including
aluminates, manganese sulphides and chrome-titanium carbonitrides. The cause
for this separation was discussed. The most probable explanation was considered
to be that the iron-rich phase is the last solidified area, and that the inclusions
thereby was exclusively located in that phase.
Figure 10. Illustration of inclusion location in studied HC and LP FeCr.
Influence of Ferrochromium and Ferromanganese Additions on Inclusion Characteristics in Steel
- 23 -
3.4. Supplement 4 : Effect of Ferromanganese Additions on Inclusion
Characteristics in Steel
This study aimed to show the effect of ferromanganese additions on inclusion
characteristics in steel by means of laboratory experiments with six different
commercial ferromanganese grades. Supplement 4 presents the resulting paper.
From previous research on ferromanganese, Supplement 2, it is known that
different ferromanganese grades have different inclusion characteristics.
Therefore, efforts were made to reveal if the relationships in inclusion
characteristics found in ferromanganese could be observed in the alloyed steel.
Three grades of normal refined ferromanganese were studied. One grade of
LC FeMn with max. 0.5 wt-% C, and two grades of MC FeMn with max. 1.0 wt-%
and 1.5 wt-% C, respectively. In addition, three low-oxygen ferromanganese
grades were also chosen for studies. One of these was a LC FeMn with max.
1.0 wt-% C, and the other two were MC FeMn, both with max. 1.5 wt-% C. In
accordance with Table 1, normal refined ferromanganese are grades A to C, and
grades D to F are low oxygen ferromanganese. Two alloying experiments were
carried out for each of the six ferromanganese grades.
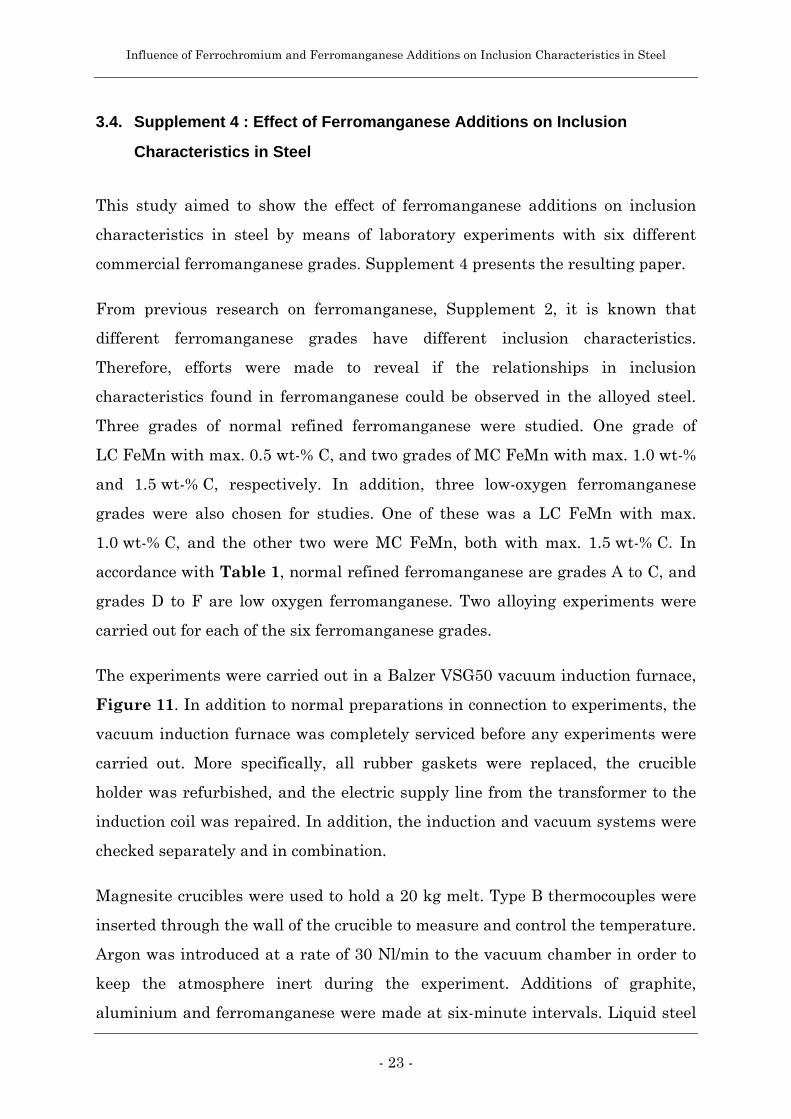
The experiments were carried out in a Balzer VSG50 vacuum induction furnace,
Figure 11. In addition to normal preparations in connection to experiments, the
vacuum induction furnace was completely serviced before any experiments were
carried out. More specifically, all rubber gaskets were replaced, the crucible
holder was refurbished, and the electric supply line from the transformer to the
induction coil was repaired. In addition, the induction and vacuum systems were
checked separately and in combination.
Magnesite crucibles were used to hold a 20 kg melt. Type B thermocouples were
inserted through the wall of the crucible to measure and control the temperature.
Argon was introduced at a rate of 30 Nl/min to the vacuum chamber in order to
keep the atmosphere inert during the experiment. Additions of graphite,
aluminium and ferromanganese were made at six-minute intervals. Liquid steel

Influence of Ferrochromium and Ferromanganese Additions on Inclusion Characteristics in Steel
- 24 -
samples were taken three minutes after each addition, followed by a final sample
six minutes after the third sample.
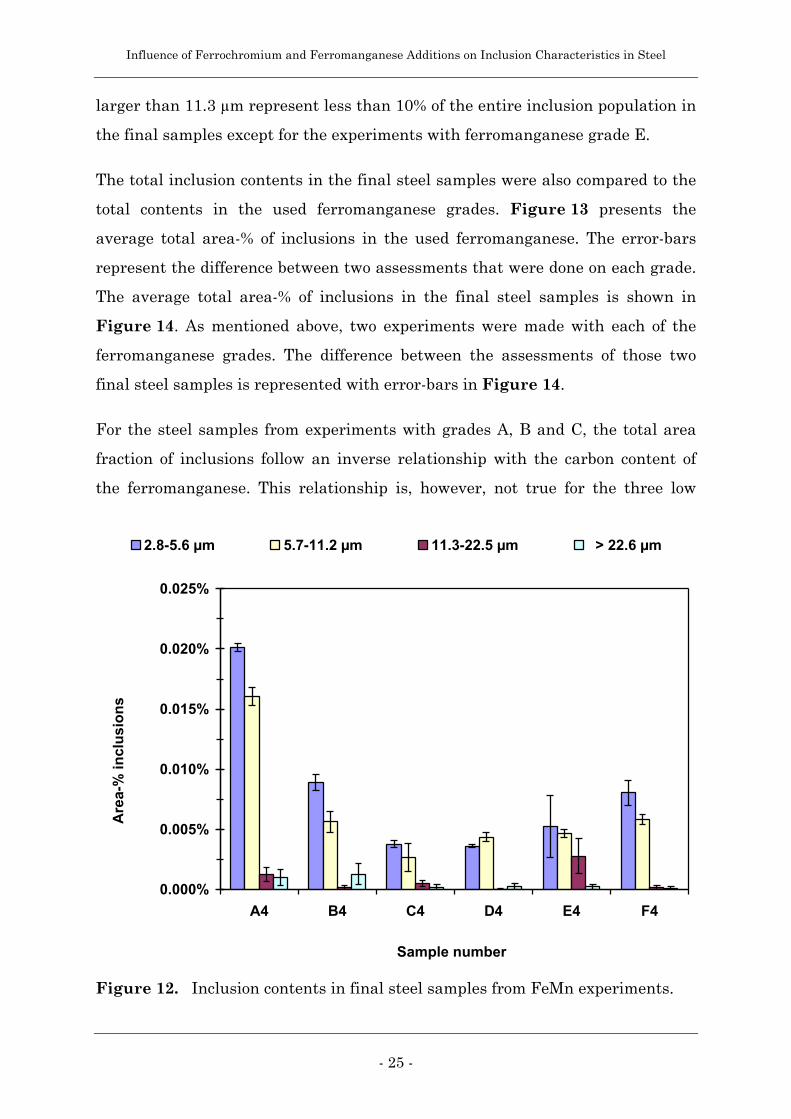
Micro-inclusion size assessments were made on the final steel samples collected
in the laboratory experiments. Since two experiments were made for each of the
grades, the average content of the assessments of the two final steel samples is
shown in Figure 12. The error-bars in the figure represent the difference of the
assessment results between the two samples. The experiments are numbered
according to the grade that was used in the experiment, i.e. grade B was used in
the experiment where sample B4 was collected.
The inclusion content in sample A4 is much higher compared to the content in
the other final steel samples. Sample A4 is from experiments with normal
refined low-carbon ferromanganese. The second highest content in the final steel
samples was found in sample B4, from experiments with MC 1.0 wt-% C FeMn.
Moreover, there is only a slight difference between either of the three low-oxygen
ferromanganese grades D to F, and the normal refined medium-carbon grade C
with max. 1.5 wt-% C. It can also be seen that the content of inclusions larger
than 11.3 µm is low compared to the content of small inclusions. Inclusions
Figure 11. Balzer Vacuum Induction Furnace VSG 50.
Influence of Ferrochromium and Ferromanganese Additions on Inclusion Characteristics in Steel
- 25 -
larger than 11.3 µm represent less than 10% of the entire inclusion population in
the final samples except for the experiments with ferromanganese grade E.
The total inclusion contents in the final steel samples were also compared to the
total contents in the used ferromanganese grades. Figure 13 presents the
average total area-% of inclusions in the used ferromanganese. The error-bars
represent the difference between two assessments that were done on each grade.
The average total area-% of inclusions in the final steel samples is shown in
Figure 14. As mentioned above, two experiments were made with each of the
ferromanganese grades. The difference between the assessments of those two
final steel samples is represented with error-bars in Figure 14.
For the steel samples from experiments with grades A, B and C, the total area
fraction of inclusions follow an inverse relationship with the carbon content of
the ferromanganese. This relationship is, however, not true for the three low
0.000%
0.005%
0.010%
0.015%
0.020%
0.025%
A4 B4 C4 D4 E4 F4
Sample number
Are
a-%
incl
usi
on
s
2.8-5.6 µm 5.7-11.2 µm 11.3-22.5 µm > 22.6 µm
Figure 12. Inclusion contents in final steel samples from FeMn experiments.

Influence of Ferrochromium and Ferromanganese Additions on Inclusion Characteristics in Steel
- 26 -
oxygen ferromanganese grades, D, E and F. Here, the contents are at an almost
equal level irrespective of which grade that was used.
It can also be seen that the difference in total inclusion content between the used
ferromanganese grades is maintained in the final steel samples. A high inclusion
0.0%
0.5%
1.0%
1.5%
2.0%
2.5%
A B C D E F
Ferromanganese grade
To
tal a
rea-
% o
f in
clu
sio
ns
Figure 13. Total area-% of inclusions in studied ferromanganese.
0.00%
0.01%
0.02%
0.03%
0.04%
0.05%
A4 B4 C4 D4 E4 F4
Steel sample number
To
tal a
rea-
% o
f in
clu
sio
ns
Figure 14. Total area-% of inclusions in final steel samples from FeMn studies.

Influence of Ferrochromium and Ferromanganese Additions on Inclusion Characteristics in Steel
- 27 -
content in the added ferromanganese obviously results in a higher content in the
final steel sample. However, the difference between the highest and lowest area
fraction of inclusions is lower for the steel samples than for the ferromanganese
samples. The conclusion from this study is that the inclusion characteristics, in
terms of total area fraction and number of inclusions per mm², is affected by the
addition of ferromanganese.
The inclusion composition was determined using a scanning electron microscope.
At least 15 inclusions from each of the final steel samples were quantitatively
analysed. Table 5 presents an overview of the analysed inclusions. The results
show that the inclusions mainly consist of MnO and MnS, or combinations of
these. In addition, there were also occasional traces (up to 15 wt-%) of CaO
and/or SiO2 in these inclusions.
The inclusions with a high content of MnO and/or MnS resemble the inclusions
found present in ferromanganese. The main inclusion composition in
ferromanganese is MnO, which has a melting point of about 1844°C. Considering
the experimental temperature of 1600°C there is a strong possibility that MnO
inclusions have been maintained through the alloying procedure.
Table 5. Number of inclusions in each composition group in final steel
samples from laboratory scale experiments with ferromanganese.
Added ferromanganese grade.Composition group
A B C D E F
80-100 % MnO + 0-20 % MnS 6 5 2 4 6
80-95 % MnS + 20-5 % MnO 9 9 7 11 11 6
70-100 % Al2O3 + 0-15 % MnO + 0-10 % SiO2 3 1 1 1
0-10 % Al2O3 + 70-80 % MnO + 10-30 % MnS 1 1 1 1
Influence of Ferrochromium and Ferromanganese Additions on Inclusion Characteristics in Steel
- 28 -
3.5. Supplement 5 : Effect of Ferrochromium Additions on Inclusion
Characteristics in Steel
The purpose with this experimental study was to establish the effect of
ferrochromium additions on the inclusion characteristics in steel. Laboratory
alloying experiments were performed using one normal and one low-phosphorous
grade of high-carbon ferrochromium. The study is fully presented in Supplement
5.
Previously presented research on ferrochromium, Supplement 3, showed that the
studied grades had different inclusion characteristics. Three types of inclusions
were present with different contents. Figure 8 illustrates the variation of
inclusion content in the used ferrochromium. The different compositions of the
present inclusions were chrome-titanium carbonitrides, manganese sulphides
and aluminium oxides. In this laboratory study, efforts were made to ascertain if
these inclusions could be inherited into the steel or if the addition of
ferrochromium would otherwise influence the inclusion characteristics of the
steel.
The studied grades were one normal high-carbon ferrochromium grade
containing about 7.5 wt-% C and a low-phosphorous grades with 7.3 wt-% C.
Their respective analyses are presented in Supplement 3, Table 3. Three
alloying experiments were performed with each of the grades using three
different amounts of ferroalloy, corresponding to about 1, 2 and 3 wt-% Cr in the
alloyed steel. The used experimental setup in this study was almost identical to
the setup in the ferromanganese study. Details are therefore not given here, but
in Supplement 5.
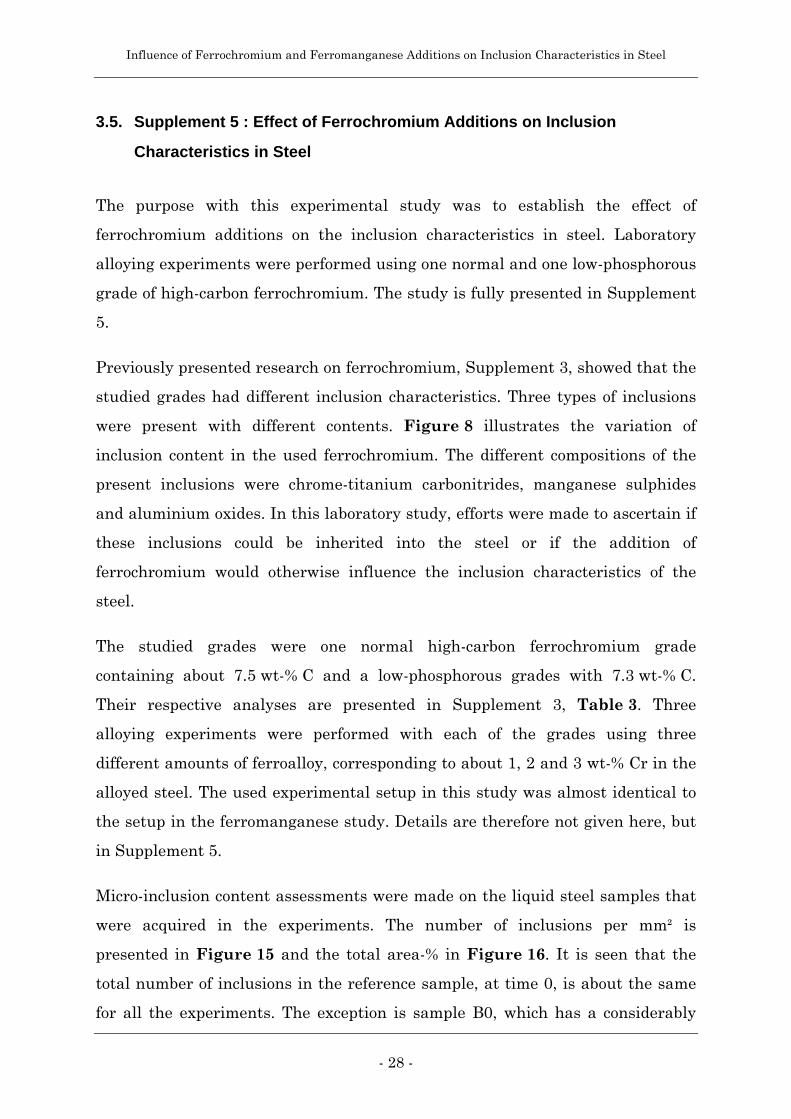
Micro-inclusion content assessments were made on the liquid steel samples that
were acquired in the experiments. The number of inclusions per mm² is
presented in Figure 15 and the total area-% in Figure 16. It is seen that the
total number of inclusions in the reference sample, at time 0, is about the same
for all the experiments. The exception is sample B0, which has a considerably
Influence of Ferrochromium and Ferromanganese Additions on Inclusion Characteristics in Steel
- 29 -
higher amount if DH and DP inclusions than the other reference samples. Later
in the experiment, the total number of inclusions is reduced at an almost equal
level in all experiments. Three minutes after the ferrochromium addition, the
number of inclusions is congregated to a level of about 0.9 inclusions per mm²
with the exception of sample D3. Finally, the average total inclusion content in
the six-minute samples is about 0.55 per mm².
Further examination of the results showed that it is mainly the number of larger
inclusions that varies between the individual experiments. For example, samples
B0 and C0 have a higher area-% of inclusions than the other assessed reference
samples does. This is mainly because more DH and DP inclusions are present
compared to the other reference samples. The conclusion is logically that the
main difference in total area-% stems from the presence of more or less DH and
DP-inclusions.
It should be noted that the assessment method SS111116 allows for two different
methods of determination for the content characteristics. One method were at
least 160 mm² is observed for inclusions, and another were at least 30 viewing
fields that contains the type of inclusion in question should be observed. The
0
0.5
1
1.5
2
2.5
0 1 2 3 4 5 6
Time [minutes]
To
tal n
o. o
f in
clu
sio
ns
[mm
-2]
A
B
C
D
E
F
Figure 15. Total number of inclusions per mm² in liquid steel samples acquired
in ferrochromium experiments.

Influence of Ferrochromium and Ferromanganese Additions on Inclusion Characteristics in Steel
- 30 -
reason for these rules is to gain a significant statistical foundation upon more
accurate conclusions may be drawn. In the current study, only a few viewing
fields contained DH or DP sized inclusions. The examined area was 185 mm² for
each of the samples. Thus, it would be necessary to assess a far larger area in
order for the number and area-% of these larger inclusions should to attain any
higher statistical significance. The difference in DH and DP inclusion contents in
the steel samples for the respective grade is therefore considered as having little
consequence on the overall results.
Micro-inclusion compositions were analysed using SEM with EDS. These
analyses were unfortunately greatly affected by beam penetration into the
matrix, and it was suggested that the analyses should be used with caution. It is,
however, possible to use these analyses in a qualitative manner. The only iron
content that should be considered as being reliable is the content in the iron
sulphides in the reference samples. Other than for those inclusions, the iron
content is probably a consequence of beam penetration. The detected inclusion
types are given in Table 6.
The results indicate that the initial inclusion composition is FeS and Al2O3. The
0
0.001
0.002
0.003
0.004
0.005
0.006
0 1 2 3 4 5 6
Time [minutes]
To
tal a
rea-
%
A
B
C
D
E
F
Figure 16. Total area-% of inclusions in liquid steel samples from
ferrochromium experiments.

Influence of Ferrochromium and Ferromanganese Additions on Inclusion Characteristics in Steel
- 31 -
presence of alumina inclusions was predicted as a direct result of the aluminium
deoxidation that was performed prior to the ferrochromium addition. In the three
minute samples, the iron sulphides have been modified to being complex
sulphides containing Cr, Fe, Mn and Ti. The content of manganese and titanium
was higher than what could be expected merely from the matrix. Typical
contents were between 1 and 10 at-%. The conclusion is that these sulphides had
the nominal composition of (Cr,Fe,Mn,Ti)S. Finally, the only inclusion type that
could be identified in the six minute samples was the complex sulphide inclusion
The inclusion that were closest to the types present in ferrochromium was the
complex sulphide, (Cr,Fe,Mn,Ti)S. In ferrochromium, MnS type inclusion are
commonly present with a near stoichiometric composition. The MnS inclusions
from ferrochromium could perhaps be inherited to the steel after the dissolution
of the ferroalloy. However, no significant difference in inclusion content could be
detected between experiments with different addition amounts and different
grades. It was therefore concluded that the MnS inclusions first are dissolved
into the liquid steel without affecting the composition of the inclusions in the
steel. It was also suggested that the detected complex sulphides had formed
during solidification.
In conclusion, the content and composition assessments of the inclusions in the
steel samples indicate no influence from the addition of ferrochromium.
Furthermore, it was suggested that supplementary analyses should be performed
in order to confirm and improve the presented results.
Table 6. Types of inclusions present in steel samples from laboratory scale
experiments with ferrochromium.
Sample Number
Type of Inclusion C0 C3 C6 F0 F3 F6
FeS Y N N Y N N
Al2O3 Y Y N Y Y N
(Cr,Fe,Mn,Ti)S N Y Y N Y Y
Influence of Ferrochromium and Ferromanganese Additions on Inclusion Characteristics in Steel
- 32 -
3.6. Supplement 6 : Influence of Ferromanganese Additions on Inclusions in
Bearing Steel
With the aim to confirm the findings presented in Supplement 4, plant trials
were carried out at Ovako Steel AB in Hofors, Sweden. This study is fully
presented in Supplement 6. Four ferromanganese grades were selected for these
trials. The grades were chosen among those that previously had been studied
metallographically and in laboratory alloying experiments. The studied grades
were A, B, E and F in accordance with Table 1. Five experiments were
performed at the ladle treatment station for each of the four grades.
The normal praxis of the ladle treatment was somewhat altered during the plant
trials. This was considered as a necessary measure considering the ambition to
confirm or refute the findings from the laboratory scale experiments.
Consequently, the primary additions were made before the addition of
ferromanganese. Reference sampling was then made before the addition of
ferromanganese. This was made as a pre-caution to ensure that any major
differences in content and composition of inclusions between the different
experiments could be determined. Up to six (6) rapid-solidification immersion
samples were taken during each experimental heat. In addition to the rapid
solidification samples, LSHR-sampling was also made during one heat for each of
the tested ferromanganese grades. All sampling were made using an automatic
sampling equipment with a given sampling time and sampling depth into the
molten steel.
Micro-inclusion contents were determined for the acquired samples. Samples
from three heats for each of the used ferromanganese grades were assessed.
Figure 17 shows the average micro-inclusion content in the examined steel
samples. For each of the ferromanganese grades, the average of three heats is
indicated. The included samples are the reference sample, the sample three
minutes after ferromanganese addition, and the final steel sample taken directly
before casting. The error-bars in the figure represent the standard deviation

Influence of Ferrochromium and Ferromanganese Additions on Inclusion Characteristics in Steel
- 33 -
between the three assessed samples. Note that only one final steel sample was
examined for each of the used ferromanganese grades. Hence, there is no
standard deviation for those results.
The variation in micro-inclusion content between the reference samples is high.
In fact, only the difference in contents between the grade A samples is larger
than the standard deviation between the samples. For the three other grades,
the difference between the reference and the 3-minute sample is well within the
standard deviation. Thus, only the addition of low-carbon ferromanganese
(grade A) is considered to have an effect on the inclusion content in production
conditions, and that effect is considered to be a short-term effect.
It is evident that the micro-inclusion contents in the samples taken immediately
before casting generally are much lower than even the reference sample. About a
third of the inclusion content in the reference sample remains after completed
treatment. The difference between the final steel samples is low compared to the
initial difference between the reference samples. The conclusion is that in the
0.000
0.001
0.002
0.003
0.004
0.005
A B E F
Used ferromanganese grade
To
tal a
rea-
% in
clu
sio
ns
Reference sample 3 minutes after addition Final sample
Figure 17. Average total area-% of inclusions in examined steel samples.
Influence of Ferrochromium and Ferromanganese Additions on Inclusion Characteristics in Steel
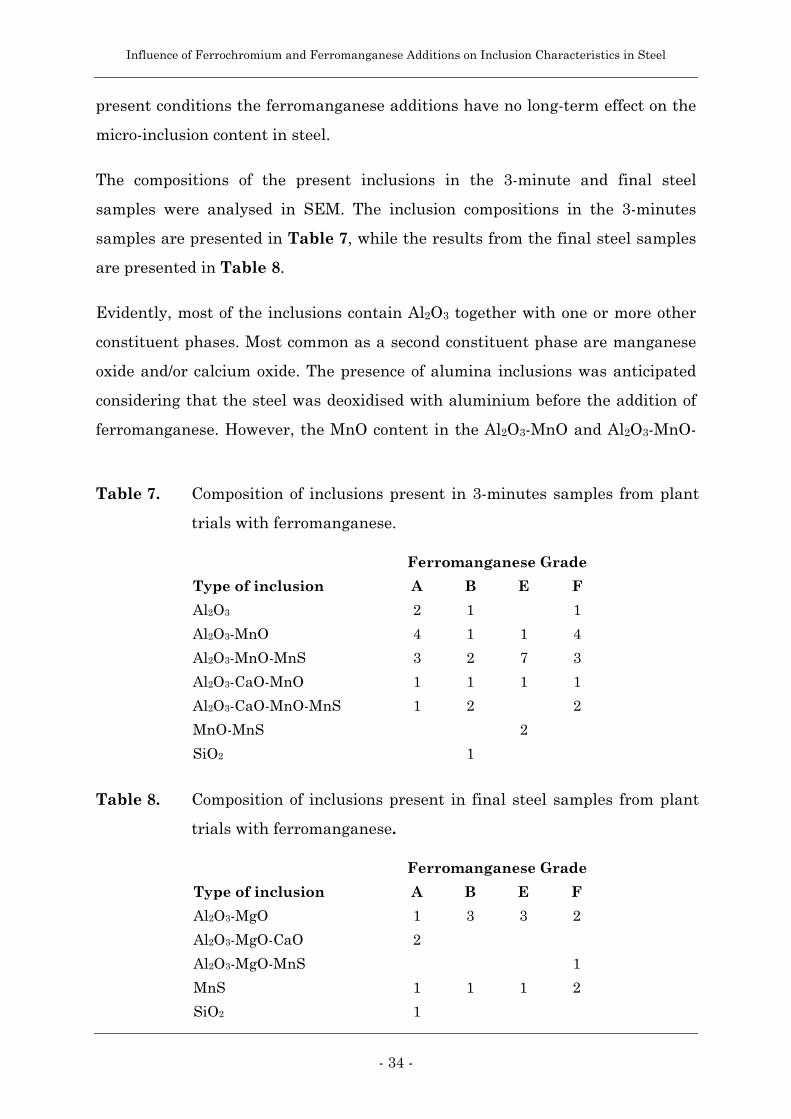
- 34 -
present conditions the ferromanganese additions have no long-term effect on the
micro-inclusion content in steel.
The compositions of the present inclusions in the 3-minute and final steel
samples were analysed in SEM. The inclusion compositions in the 3-minutes
samples are presented in Table 7, while the results from the final steel samples
are presented in Table 8.
Evidently, most of the inclusions contain Al2O3 together with one or more other
constituent phases. Most common as a second constituent phase are manganese
oxide and/or calcium oxide. The presence of alumina inclusions was anticipated
considering that the steel was deoxidised with aluminium before the addition of
ferromanganese. However, the MnO content in the Al2O3-MnO and Al2O3-MnO-
Table 7. Composition of inclusions present in 3-minutes samples from plant
trials with ferromanganese.
Ferromanganese Grade
Type of inclusion A B E F
Al2O3 2 1 1
Al2O3-MnO 4 1 1 4
Al2O3-MnO-MnS 3 2 7 3
Al2O3-CaO-MnO 1 1 1 1
Al2O3-CaO-MnO-MnS 1 2 2
MnO-MnS 2
SiO2 1
Table 8. Composition of inclusions present in final steel samples from plant
trials with ferromanganese.
Ferromanganese Grade
Type of inclusion A B E F
Al2O3-MgO 1 3 3 2
Al2O3-MgO-CaO 2
Al2O3-MgO-MnS 1
MnS 1 1 1 2
SiO2 1
Influence of Ferrochromium and Ferromanganese Additions on Inclusion Characteristics in Steel
- 35 -
MnS inclusions is about 5 to 10 at-%. With a high aluminium content in the
steel, it was considered unlikely that MnO would form during solidification. It
was concluded that the presence of MnO in the inclusions indicates that these
originate from inclusions that were introduced with the ferroalloy addition.
The inclusions in the final steel samples evidently have a different composition
compared to the 3-minute samples. Instead of Al2O3-MnO-MnS, the majority is
now represented by Al2O3-MgO. This change in inclusion composition has
previously been reported by L. Huet et al. in their investigation on deoxidation
praxis during bearing steel production.[25] Their results show that the inclusion
composition changes from complex aluminates to Al2O3-MgO after vacuum
degassing. The source of magnesia in these inclusions is believed to be the
refractory material in the ladle. At the low pressures employed during vacuum
degassing, the magnesia in the refractory is reduced which causes an increased
magnesium content in the steel. This in turn modifies the present inclusions to
magnesia containing complexes, such as the Al2O3-MgO spinel.[26] The conclusion
is that, under the present production conditions, the grade of ferromanganese
does not influence the end-composition of the inclusions in the steel.
The macro-inclusion content was determined using the Liquid Sampling - Hot
Rolling method. LSHR samples are first subjected to hot rolling prior to a heat
treatment. Then the sample is milled down to a rectangular plate with level
surfaces and the resulting specimens are then submerged into a water tank.
Ultrasonic scanning is then employed to determine the content of defects larger
than 35 µm. These defects may in some rare cases be pores but are generally
considered as being macro-inclusions since the specimens have been subjected to
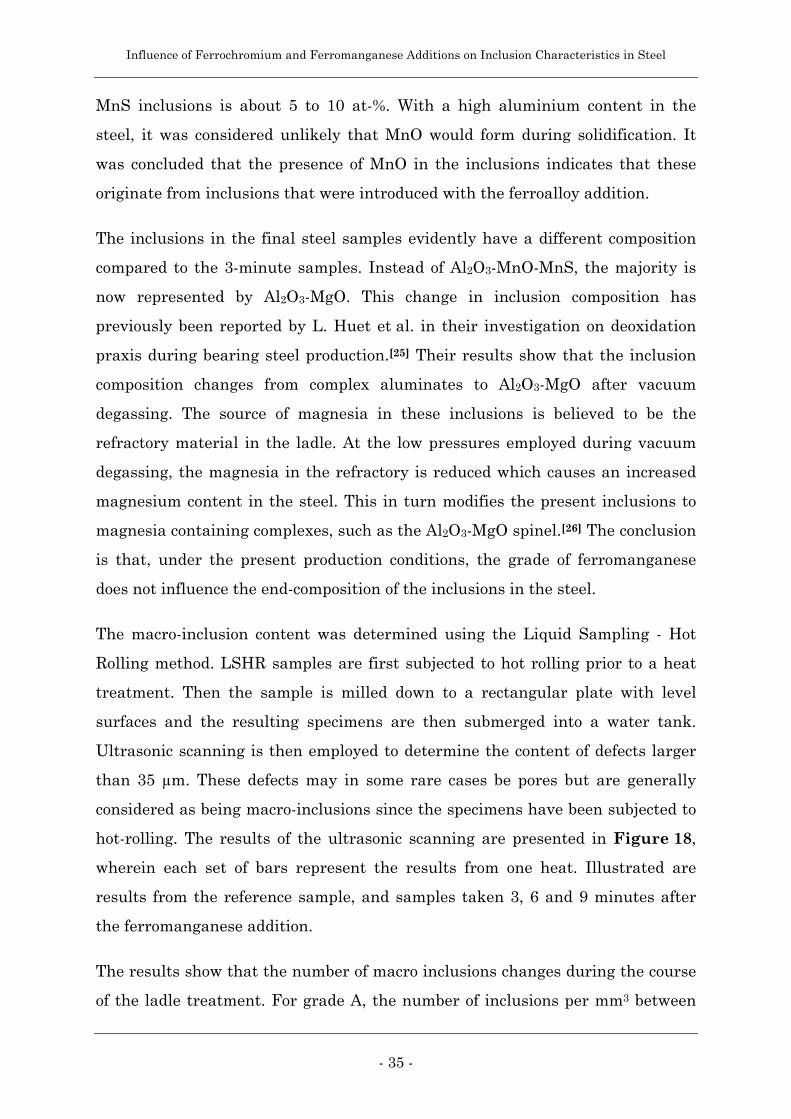
hot-rolling. The results of the ultrasonic scanning are presented in Figure 18,
wherein each set of bars represent the results from one heat. Illustrated are
results from the reference sample, and samples taken 3, 6 and 9 minutes after
the ferromanganese addition.
The results show that the number of macro inclusions changes during the course
of the ladle treatment. For grade A, the number of inclusions per mm3 between
Influence of Ferrochromium and Ferromanganese Additions on Inclusion Characteristics in Steel
- 36 -
35 and 59 µm remains unchanged throughout the treatment, while the number
of larger sized inclusions (> 60 µm) reaches a peak immediately after the
ferromanganese addition. However, 9 minutes after the addition, the macro
inclusion density is very similar to the content before the addition. For grade B
and E, Figure 18 shows that the macro inclusion density increases between the
reference sample and the samples taken 3, 6 or 9 minutes after the
ferromanganese addition.
Another interesting aspect on the macro-inclusion content is the immediate
increase after the ferromanganese addition. A relative increase in content can be
seen between the reference sample and the next sample. It was therefore
concluded that the addition of ferromanganese may lead to an increased macro-
inclusion content. However, it does not seem likely that the type of
ferromanganese grade has a large influence on the increase in macro inclusion
content. A further investigation based on a larger number of plant trials was
suggested in order to study this aspect more in detail.
0.000
0.003
0.006
0.009
A(ref) A(3) A(9) B(ref) B(3) E(ref) E(6) E(9)
No
. of
def
ects
per
mm
335 - 59 µm 60 - 85 µm 85 µm -
Figure 18. Results from ultrasonic scanning of LSHR samples from plant trials.
Influence of Ferrochromium and Ferromanganese Additions on Inclusion Characteristics in Steel
- 37 -
4. DISCUSSION
INCLUSIONS IN FERROCHROMIUM AND FERROMANGANESE
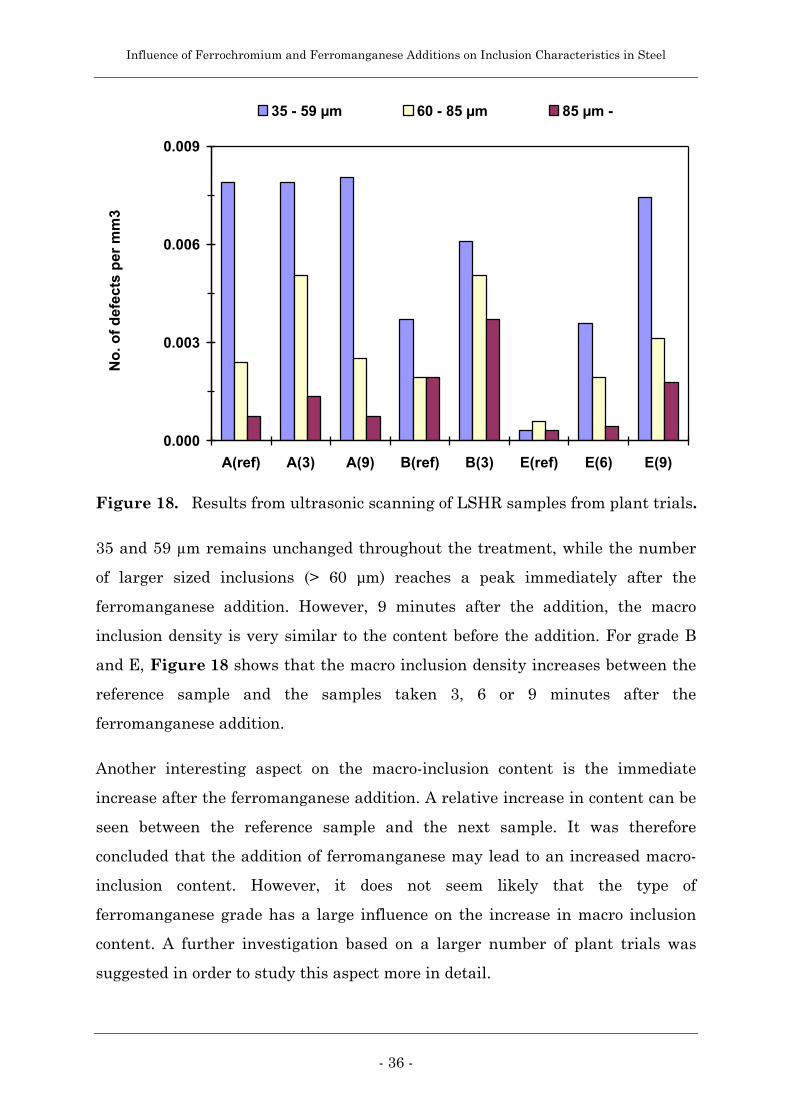
Micro-inclusion assessments have been performed for commercial ferrochromium
and ferromanganese. The results showed that ferrochromium mainly contained
DT and DM sized inclusions, while ferromanganese mainly contained DM and
DH sized inclusions. Figure 19 shows the average total area-% of inclusions and
the average total number of inclusions is presented in Figure 20. The error bars
represent the difference between the assessments of the respective grades.
It obvious that the low-oxygen grades and the normal refined 1.5 wt-% MC
ferromanganese has the lowest content of inclusions. In these grades, the oxygen
level is very low in comparison with the other grades. The total oxygen content is
about 0.01 to 0.12 wt-%. However, the total oxygen content in the studied high-
carbon ferrochromium grades is equally low, 0.02 wt-% for HC and 0.21 wt-% for
LP, but these two grades contains much more inclusions. This indicates that the
0.01%
0.10%
1.00%
10.00%
HC FeCr 7
.5% C
LP Fe
Cr 7.3%
C
LC Fe
Mn 0.5%
C
MC FeMn 1
.0% C
MC 1.5%
C
MC FeMn 1
.5% C (L
O)
LC Fe
Mn 0.5%
C (LO)
MC FeMn 1
.5% C (L
O)
Ave
rag
e ar
ea-%
incl
usi
on
s
Figure 19. Average total area-% inclusions in the studied ferroalloys.
Influence of Ferrochromium and Ferromanganese Additions on Inclusion Characteristics in Steel
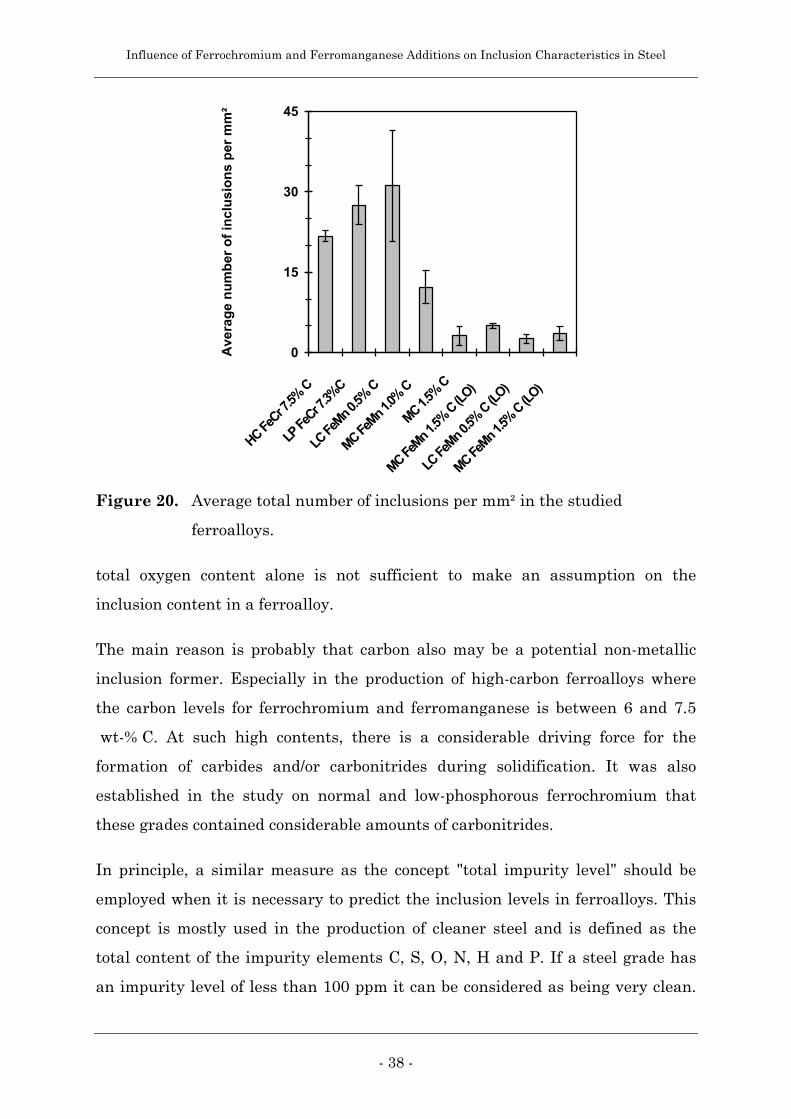
- 38 -
total oxygen content alone is not sufficient to make an assumption on the
inclusion content in a ferroalloy.
The main reason is probably that carbon also may be a potential non-metallic
inclusion former. Especially in the production of high-carbon ferroalloys where
the carbon levels for ferrochromium and ferromanganese is between 6 and 7.5
wt-% C. At such high contents, there is a considerable driving force for the
formation of carbides and/or carbonitrides during solidification. It was also
established in the study on normal and low-phosphorous ferrochromium that
these grades contained considerable amounts of carbonitrides.
In principle, a similar measure as the concept "total impurity level" should be
employed when it is necessary to predict the inclusion levels in ferroalloys. This
concept is mostly used in the production of cleaner steel and is defined as the
total content of the impurity elements C, S, O, N, H and P. If a steel grade has
an impurity level of less than 100 ppm it can be considered as being very clean.
0
15
30
45
HC FeCr 7
.5% C
LP Fe
Cr 7.3%
C
LC Fe
Mn 0.5%
C
MC FeMn 1
.0% C
MC 1.5%
C
MC FeMn 1
.5% C (L
O)
LC Fe
Mn 0.5%
C (L
O)
MC FeMn 1
.5% C
(LO)
Ave
rag
e n
um
ber
of
incl
usi
on
s p
er m
m²
Figure 20. Average total number of inclusions per mm² in the studied
ferroalloys.

Influence of Ferrochromium and Ferromanganese Additions on Inclusion Characteristics in Steel
- 39 -
As an illustration, the total impurity level in the studied ferromanganese grades
is with this measure between 7200 and 18800 ppm.
Finally, it can be noted that of all the studied grades, the studied low-carbon
normal refined ferromanganese has the highest inclusion content, closely
followed by the two studied ferrochromium grades.
LABORATORY ALLOYING EXPERIMENTS
After the assessment of the inclusion levels in the two chosen ferroalloys, both
were subject to controlled alloying experiments with the sole purpose of
investigating if the inclusions in the steel were influence by the addition. The
results from these two experimental series have been presented above.
Consider that the volume fraction of inclusions in normal refined low-carbon
ferromanganese is about 2 percent. If an addition of 400 g is made to 20 kg of
iron, then the maximum inclusion inheritance is about 0.04 volume percent. This
represents the maximum effect that this amount of alloying addition may have
on the inclusion content in the steel. The highest increase in inclusion content in
the ferromanganese study was 0.02 volume percent.
The corresponding experiments with ferrochromium indicated no such
inheritance of inclusions. In addition, the inclusion compositions in the steel were
different from the determined in the ferroalloy. This implied that the inclusions
that are present in ferrochromium, at least to a high extent, are dissolved
together with the ferroalloy.
These two separate results show that there is no easy way to discern if inclusions
are transferred from an ferroalloy to the steel. The high inclusion content in the
studied ferrochromium could have resulted in a significant contribution to the
inclusion content in the steel, but apparently, these were instead dissolved.
In conclusion, the addition of ferromanganese may have an effect on the
inclusion characteristics of steel depending on which grade that is used. If these
Influence of Ferrochromium and Ferromanganese Additions on Inclusion Characteristics in Steel
- 40 -
inclusions are present when the steel is cast, the material properties of the steel
are probably impaired.
IMPLICATIONS OF THE PLANT TRIAL RESULTS
It is important to recognise that the presented results mainly are applicable to
the studied conditions, with the investigated steel and ferromanganese grades
and in the studied steel plant. However, these results may, with caution, be used
to indicate how ferromanganese alloys will influence the inclusions in other steel
grades and under other production conditions.
The present study showed that the inclusion content increased three minutes
after the addition of normal refined low-carbon ferromanganese, both in
laboratory and in full-scale experiments. In the following samples, the content
still was elevated compared to corresponding samples in experiments using the
other ferromanganese grades. However, the plant trials included vacuum
degassing treatment of the steel. After this treatment, the inclusion contents
were at an equal level for all the studied samples.
This indicates that the effect on inclusion characteristics remain until a
sufficiently long period has elapsed or the steel is subjected to vacuum degassing.
An increased content of inclusions will in most cases result in a cast steel with an
elevated inclusion level. The effect of using ferroalloys with a high inclusion
content too late in the process will consequently be inferior material qualities.
Thus, material properties like fatigue life and tensile strength will most likely be
reduced.

Influence of Ferrochromium and Ferromanganese Additions on Inclusion Characteristics in Steel
- 41 -
5. CONCLUSIONS
Inclusions in commercially available high-carbon ferrochromium and low- and
medium-carbon ferromanganese have been characterised. The effect of the
addition of these ferroalloys was investigated in laboratory scale alloying
experiments. Finally, the influence of adding ferromanganese during ladle
treatment was studied in plant trials. The most important conclusions from these
studies are as follows:
♦ It is probable the ferroalloys industry will be required to specify the inclusion
characteristics of their products in the future. Much in the same way as parts
of the steel industry today supply the corresponding information to their
customers.
♦ The inclusion characteristics are not completely investigated for many of the
commercially available ferroalloys. This needs to be amended.
♦ Commercial low- and medium-carbon ferromanganese contains inclusions
with the compositions MnO, MnS and/or SiO2. Less than 15% of the total
number of inclusions are complex inclusions.
♦ In the studied normal refined ferromanganese, the inclusion content is
proportional to the carbon content in the ferroalloy.
♦ Commercial normal and low-phosphorous high-carbon ferrochromium
contains inclusions with the compositions Al2O3, MnS and (Cr,Ti)(C,N). The
chrome-titanium carbonitrides were in majority of the present inclusions in
both grades.
♦ The average number of inclusions per mm² in the studied high-carbon
ferrochromium grades is much higher than in the studied medium-carbon
ferromanganese. HC FeCr contains 22 per mm² compared to about 3 to 5 per
mm² in MC FeMn. The respective area fractions are, however, at a more
equal level.
Influence of Ferrochromium and Ferromanganese Additions on Inclusion Characteristics in Steel
- 42 -
♦ Laboratory scale experiments with ferromanganese show that the difference
in inclusion content between the used ferroalloys is maintained in the steel.
However, the difference between maximum and minimum level is reduced.
♦ Alloying with medium-carbon ferromanganese (max. 1.5 wt-%) resulted in a
considerably lower amount of inclusions in the steel compared to
corresponding experiments using low-carbon normal refined (max. 0.5 wt-%)
ferromanganese.
♦ Laboratory scale experiments with ferrochromium showed that the addition
did not significantly influence the inclusion content or composition in the
steel.
♦ A short-term effect on the micro-inclusion content could be observed during
plant trials when normal refined low-carbon ferromanganese was used. The
assessed inclusion contents after vacuum degassing were at an equal level for
all tested ferromanganese grades.
♦ Ferromanganese grades with low oxygen and/or inclusion contents do not
significantly influence the micro-inclusion population in steel.

Influence of Ferrochromium and Ferromanganese Additions on Inclusion Characteristics in Steel
- 43 -
6. FUTURE WORK
During the course of this work, a number of ideas for further work have been
considered. Some have been mentioned in the presented supplements in this
thesis and others still are not yet formulated. The objective with this section is to
present and discuss some of these ideas. Both general and specific suggestions
will be given.
The inclusion characteristics have not been completely investigated for many of
the commercially available ferroalloys. This field of research may become very
important for the ferroalloys industry during the coming years. As the
requirements on material properties increases, the demands on clean steel will
also increase. In order to meet these demands, the steel industry may turn
towards using cleaner ferroalloys. At least, the producers will require
specifications on the inclusion characteristics of the ferroalloys. To meet these
coming demands, further characterisation of inclusions present in commercial
ferroalloys is suggested.
It has been concluded that normal refined low-carbon ferromanganese contains
much more inclusions and, in addition, influences the inclusions in steel more
than the other studied ferromanganese grades. It can be assumed that the
content of oxide inclusions in other commercially available low-carbon
ferroalloys, without having studied them, in a similar manner is higher than in
the corresponding medium- and high-carbon grades. The reason for containing
more oxidic inclusions may be that the decarburisation of the ferroalloy is
performed directly before the casting of the material. If the specified analyses
permits, a deoxidation operation followed by a stirring and removal period should
be allowed in order to decrease the content of inclusions. This will, of course,
increase the cost per unit mass of ferroalloy. However, if the ferroalloy is
supposed to be used in for example clean steel production, a cleaner ferroalloy
will also command a higher price per unit mass. It may even be possible to
increase the margin of profit for such a special ferroalloy. This is only one

Influence of Ferrochromium and Ferromanganese Additions on Inclusion Characteristics in Steel
- 44 -
example on how cleaner ferroalloys can be achieved. In conclusion, it is proposed
to the ferroalloys industry to increase the research on how to produce cleaner
products with respect to inclusion characteristics.
Another major conclusion from this work was that the inclusions in steel are
affected for at least a shorter period. The length of this period should be very
interesting to determine. The reason is that virtually all steelmakers do last
minute additions before allowing the ladle to go to the casting station. The worst
case occurs if the additions are made within a too short period before casting. In
this case, the casted material will suffer the peak of the effect on inclusions that
this last-minute ferroalloy addition had. The laboratory scale studies performed
with ferromanganese indicated that this period may be of substantial length. It
is suggested that further studies, preferably based on a large number of plant
trials, should be made in order to determine the length of this period.
LSHR samples was in the full-scale study examined with ultrasonic scanning in
order to determine the macro-inclusions characteristics. With this method, the
nature of the inclusions is only determined with respect to size distribution and
content. The compositions of the detected inclusions remain unknown with the
current technique. To determine these compositions and to relate them to the
UST results is a very time consuming operation. It includes identifying the depth
of an individual inclusion, grinding down to this level, detecting this particular
inclusion in SEM or MEA, and then finally perform the analysis. This procedure
is easily recognised as being very time consuming, but would nonetheless be very
interesting to perform. A co-ordinated study with SEM and/or EMA on inclusions
in UST assessed LSHR samples is therefore suggested as an interesting
complement to the published studies.
During the studies on inclusions in ferrochromium, it was established in
accordance with previous studies that the matrix mainly is divided into a
chrome-rich and an iron-rich phase. Furthermore, it was also discovered that the
preferred location for inclusions irrespective of composition is in the iron-rich
phase. This was further investigated by studying previous research on
Influence of Ferrochromium and Ferromanganese Additions on Inclusion Characteristics in Steel
- 45 -
ferrochromium and it was concluded that this finding is in accordance with all
the studied element mappings. It would be interesting to study the mechanism
that governs this separation. The conclusion in the presented study was that this
probably was connected to the solidifying conditions. This conclusion needs to be
confirmed, and it is therefore suggested that this mechanism should be further
investigated.
Influence of Ferrochromium and Ferromanganese Additions on Inclusion Characteristics in Steel
- 46 -
7. REFERENCES
1. L.J.P. Ölund, T.B. Lund and B.H. Hedberg: Fatigue initiation and
Endurance in Low Oxygen Ball Bearing Steel, in Proceedings of 5th
International Conference on Clean Steel, Hungarian Mining and
Metallurgical Society , Balatonfured, Hungary, 1999, pp. 137-143.
2. S. Ionnanides, J. Beswick, H. Kuijpers, A. Voskamp and S. Lane,
Relevance of Bearing Metallurgy to Bearing Life Calculations, in
Proceedings of 5th International Symposium on Bearing Steels: Into the
21st Century, New Orleans, LA, USA, 1996.
3. T.B. Lund, S.A. Johansson and L.J.P. Ölund, Nucleation of Fatigue in
Very Low Oxygen Bearing Steels, in Proceedings of 5th International
Symposium on Bearing Steels: Into the 21st Century, New Orleans, LA,
USA, 1996.
4. F. Persson: Ferroalloys and their influence on slag cleanliness of steel,
TRITA-TPM 11/96, Div. of Process Metallurgy, Royal Institute of
Technology, Stockholm, Sweden, August 1996.
5. G.M. Faulring: Inclusion Modification in Semi-killed Steels, in Proceedings
of 56th Electric Furnace Conference, Iron and Steel Society/AIME,
New Orleans, LA, USA, 1998, pp. 87-98.
6. F. Reinholdsson, P. Jönsson, A. Lind, M. Göransson, B.M. Johansson and
R. Nilsson: Ovako Steel’s Efforts to Introduce an On-line Technique for
Determination of Inclusion Characteristics in the ASEA-SKF Ladle during
Bearing Steel Production, in Proceedings of 11th Steelmaking Seminar,
Instituto Argentino de Siderurgia, Buenos Aires, Argentina, 1997.
Influence of Ferrochromium and Ferromanganese Additions on Inclusion Characteristics in Steel
- 47 -
7. M. Göransson, F. Reinholdsson and K. Willman: Evaluation of Liquid
Steel Samples for the Determination of Microinclusion Characteristics by
Spark-Induced Optical Emission Spectroscopy, Iron and Steelmaker,
vol. 26, no. 5, 1999, pp. 53-58.
8. A. Schöberl and H Straube: Über den Einfluß oxydischer Verunreinigug-
nen im Ferrochrom auf den Reinheitsgrad chromreicher Stähle, Radex-
Rundschau, no. 1, 1966, pp. 34-50.
9. O. Wijk and V. Brabie: The purity of ferrosilicon and its influence on
inclusion cleanliness of steel, ISIJ International, Suppl. Science and
Technology of Steelmaking, vol. 36, 1996, pp. 132-135.
10. Steel - Method for assessment of the content of non-metallic inclusions,
Svensk Standard SS111116, Swedish Institute for Standards, ver. 2, June
1987, pp. 1-16.
11. S. Johansson: Computer Aided Manual Image Analysis for Assessment of
Non-Metallic Inclusions in Steel, Scandinavian Journal of Metallurgy,
vol. 19, no. 2, 1990, pp. 79-81.
12. S. Johansson: Jernkontoret Quantitative Comparative Chart, JQCC,
Scandinavian Journal of Metallurgy, vol. 14, no. 1, 1985, pp. 744-748.
13. Materials Science and Technology, Volume Editor E. Lifshin, Edited by
R.W. Cahn, P. Haasen and E.J. Kramer, Part II, vol. 2B, VCH
Verlagsgesellschaft mbH, Wernheim, Germany, 1994, pp. 351-422.
14. T. Hansen, P. Jönsson, K. Törresvoll and G. Runnsjö: The LSHR Method
for Determination of Inclusion Characteristics During Steelmaking and
Casting, in Proceedings of 83rd Steelmaking Conference, Iron and Steel
Society/AIME, Pittsburgh, PA, USA, 2000, pp. 207-217.
Influence of Ferrochromium and Ferromanganese Additions on Inclusion Characteristics in Steel
- 48 -
15. F. Reinholdsson, A. Lind, R. Nilsson, P. Sjödin and P. Jönsson: A
Metallurgical Tool for Rapid Determination of Micro Inclusion
Characteristics in Bearing Steel Production, ISIJ International, vol. 37,
no. 6, 1997, pp. 637-640.
16. L. Mihok and V. Adamus: Control of Common Ferroalloys Structure, in
Proceedings of Euromat '94, Hungarian Mining and Metallurgical Society,
Balatonszeplak, Hungary, vol. 2, 1994, pp. 621-62.
17. L. Mihok, M. Brille, M. Fröhlichova, J. Briancin, V. Adamus and M.
Hubcik: Structure and properties of manganese ferroalloys, METABK,
vol. 34, no. 3, 1995, pp. 113-118.
18. M. Balbi and G. Caironi: Non metallic inclusions in ferroalloys used in
stainless steel manufacture, Avesta Stainless Bulletin, no. 4, 1982,
pp. 14-19.
19. M. Balbi, G. Silva and R. Roja: Contribution to the knowledge about non-
metallic inclusions in ferrometallurgical products and manganese alloyed
steels, La Fonderia Italiana, no. 11, 1975, pp. 350-352.
20. V.L. Koloyartsev and L.N. Rusakov: Sulphides in High-Carbon
Ferrochromium, Russian metallurgy, vol. 3, 1970, pp. 23-25.
21. H.J. Retelsdorf, H. Reinhard, and H. Winterhager: The Nature of
Inclusions and Structure of Technically Produced Ferro-Chromium Alloys
Having High Carbon Contents, Metallwissenschaft und Technik, vol. 23,
no. 5, 1969, pp. 459-463.
22. H.J. Retelsdorf, H. Reinhard, and H. Winterhager: Type of Inclusion and
the Phase Structure of High-Carbon Iron-Chromium Alloys,
Metallwissenschaft und Technik, vol. 24, no. 1, 1970, pp. 33-40.
Influence of Ferrochromium and Ferromanganese Additions on Inclusion Characteristics in Steel
- 49 -
23. B. Metcalfe and D. Slatter: Desulphurization of High-C Ferro-Cr by
Addition of Reactive Materials, Ironmaking Steelmaking, vol. 5, no. 3,
1978, pp. 103-106.
24. B. Metcalfe, T.R.C. Fernandes, and J.T. Thirlwall: Electron Microprobe
Investigation of Sulphide Inclusions in High-Carbon Ferrochromium,
Metals Technology, vol. 7, no. 8, 1980, pp. 317-322.
25. L. Huet, P. Jonsson and F. Reinholdsson: The effect of deoxidation praxis
on inclusion characteristics in bearing steel production, in Proceedings of
80th Steelmaking Conference, Iron and Steel Society/AIME, Chicago, IL,
USA, April 1997, pp. 639-646.
26. B. Hallberg: Forming of Inclusions in the System MgO-Al2O3 During
Treatment of Al-deoxidised Steel in MgO-lined Ladles, TRITA-TPM-35,
Licentiate Thesis, Stockholm, Sweden, 1996, Royal Institute of
Technology.
TRITA-MET 111
Future Demands on Ferroalloys fromthe Customers in the Steel Industry
Pär Jönsson, Thobias Sjöqvist, and Öystein Grong
STOCKHOLMFebruary 2001
DEPARTMENT OF MATERIALS SCIENCE AND ENGINEERINGDIVISION OF METALLURGYROYAL INSTITUTE OF TECHNOLOGYSE - 10044 STOCKHOLM

Future Demands on Ferro Alloys from the Customers in the Steel Industry
- 1 -
Future Demands on Ferroalloys from the Customers in the Steel Industry
Pär Jönsson*, Thobias Sjöqvist*, and Öystein Grong***Div. of Metallurgy, KTH, SE-100 44 Stockholm, Sweden.
**Dept. of Materials Technology and Electrochemistry, NTNU, N-7491 Trondheim, Norway.
ABSTRACT
Within the steel industry an increased knowledge of how size, distribution and composition of inclusionschange during steelmaking has been gained during the recent years. Some of the reasons for this will bediscussed in the paper. One example is a new method (OES) for on-line determination of micro inclusioncharacteristics that has been developed by Ovako Steel. This enable, for the first time, the steel producersto follow the change in micro inclusion characteristics during steel making. Another example is a newmethod for determining macro inclusions during steelmaking. The method is named Liquid Samplingand Hot Rolling (LSHR), after the procedure of preparing the samples before analysis. Here, immersedultrasonic testing is used to determine the macro inclusion content in the samples. The effect of this newknowledge on the demands on ferroalloys is discussed. One possible scenario is that specifications oninclusion characteristics in ferroalloys will be a requirement from the steel producers focusing on cleansteel. Thus, specifications on average size, shape, quantity and composition might be added to theexisting specifications on dissolved element content in ferroalloys. Another scenario is that newferroalloy products will be needed in the steel industry. Examples of such products will be discussed.
1. INTRODUCTION
Recently new techniques for determination ofinclusion characteristics have been developedin the steel industry. These will give thesteelmakers tools which can help them tooptimize the inclusion characteristics so it isappropriate for each steel grade and results indesired material properties.
Today, it is not possible to control the micro-inclusion characteristics during ladle refiningusing traditional methods, when adding, forexample, ferroalloys to the steel. This is moreobvious if one studies the example in Table I.Here the three quality parameters that are usedfor control in the production of “clean steel” arecompared throughout the process.
The first quality parameter is the content ofelements dissolved in the liquid steel. These arealloying elements such as Si, Mn, Cr, etc. andimpurities such as S, H, P, Cu, etc. Thesecontents are relatively simple to determine bytaking a ladle, tundish or mold sample followedby chemical analysis. Usually, an analysis canbe ready within 7 to 10 minutes from sampling.
Thus, the operator has a chance to makeadjustments during liquid steel treatment in theladle. After the steel is solidified the chemicalcomposition does not usually change much andfurther process control is unnecessary. Thesecond quality parameter is temperature. Thiscan easily be determined with a rapid responsetime during liquid steel treatment andmetalworking. Thus, temperature can also becontrolled throughout the process. The thirdquality parameter pertains to inclusionscharacteristics. This includes total oxygencontent, composition and size. Based on size,inclusions are also normally categorized asmicro-inclusions (here defined as smaller than22 µm) and macro-inclusions (>22 µm). For themajority of steel companies, rapid feedback ofinclusion characteristics during liquid steelmaking is not available and steel cleanness cantherefore not be controlled with respect toinclusion content. The total oxygen content,composition and size are normally determinedusing melt extraction, scanning electronmicroscopy (SEM) combined with energydisperse spectroscopy (EDS), and light opticalmicroscopy (LOM) and classification accordingto a standard such as SS111116 (JK II)1,

Future Demands on Ferro Alloys from the Customers in the Steel Industry
- 2 -
respectively. None of these methods are able toprovide a rapid enough feedback to the processso that the information can be used for on-linemonitoring or control of the process. However,recently one company, Ovako Steel AB, hasreported2-4 that they are currently testing amodified OES (optical emission spectroscopy)method for on-line determination of micro-inclusion size distribution. This method is alsocurrently studied by other research groupsaround the world and will probably also betested in other steel plants in the near future.
Ladle Tundish Mold Metalworking
Elementsthatdissolvein steel
yes yes yes yes, notnecessary
Temp. yes yes yes yesMicro andmacroinclusions
no no no yes, off-line
Table 1. Possibilities to control steel qualityparameters during production.
As steelmakers are able to, for the first time, geton-line information regarding inclusioncharacteristics, new demands on ferroalloys willbe created. This paper will discuss possiblescenarios. The first part of the paper gives moredetailed information regarding the newdevelopments to achieve new information oninclusion characteristics, which have takenplace in the steelmaking community.Thereafter, the effect of these newdevelopments on the demands on ferroalloysand the ferroalloy producers are discussed.
2. DEVELOPMENTS IN THE STEELINDUSTRY
Steel is made in either an integratedsteelmaking route or a scrap-based route, wherethe raw material is iron ore and scrap,respectively. However, the finished products inboth cases have the same strict demands onmaterial properties, which, of course, varieswith application. The inclusion characteristicshas major impact on the material properties and
is therefore very important to control. Ingeneral the larger the inclusion the moreharmful effect on the material properties. Thus,macro inclusions are more important to removefrom the steel than micro inclusions.
So far the control is done on finished materialfrom the metal working mill. The total oxygencontent and size distribution are analyzed on aregular basis using melt extraction and LOM,respectively. Often also the inclusioncompositions are determined using SEMcombined with EDS. Most companies withstrict customer demands on material propertieshave carried out these inclusion determinationsfor decades. Thus, a large amount ofinformation has been gathered. This is alsoused to optimize the steelmaking process beforecasting when steel is in liquid state. However,this is difficult to do with a great accuracy sinceno information is available during thesteelmaking. Therefore, steelmakers carry outspecial investigations where samples are takenduring different parts of the process andthereafter the inclusion characteristics isdetermined.5-7 This does not provide on-lineinformation, since the determination of theinclusion characteristics for a single heat maytake weeks. However, it is the best approachavailable today for most steelmakers.
2.1 Micro Inclusion Characteristics
It represents a minor revolution in steelmakingwhen a method for determination of microinclusion characteristics is being tested on-linetoday during steelmaking. The method beingtested is the sparc-induced optical emissionspectroscopy (OES) method and it is developedat Ovako Steel.2,3 The principle is shown inFigure 1. A steel sample, taken in liquid steel(or in finished material) is hit by an electricdischarge. This creates light intensities, whichare divided by a grating into respectivewavelength and detected by separate units foreach element (Al, Mg, Ca, etc). From thisinformation it is possible to determine the totaloxygen content, size distribution andcomposition of inclusions. At the same time, itis possible to determine the dissolved elementcontents.
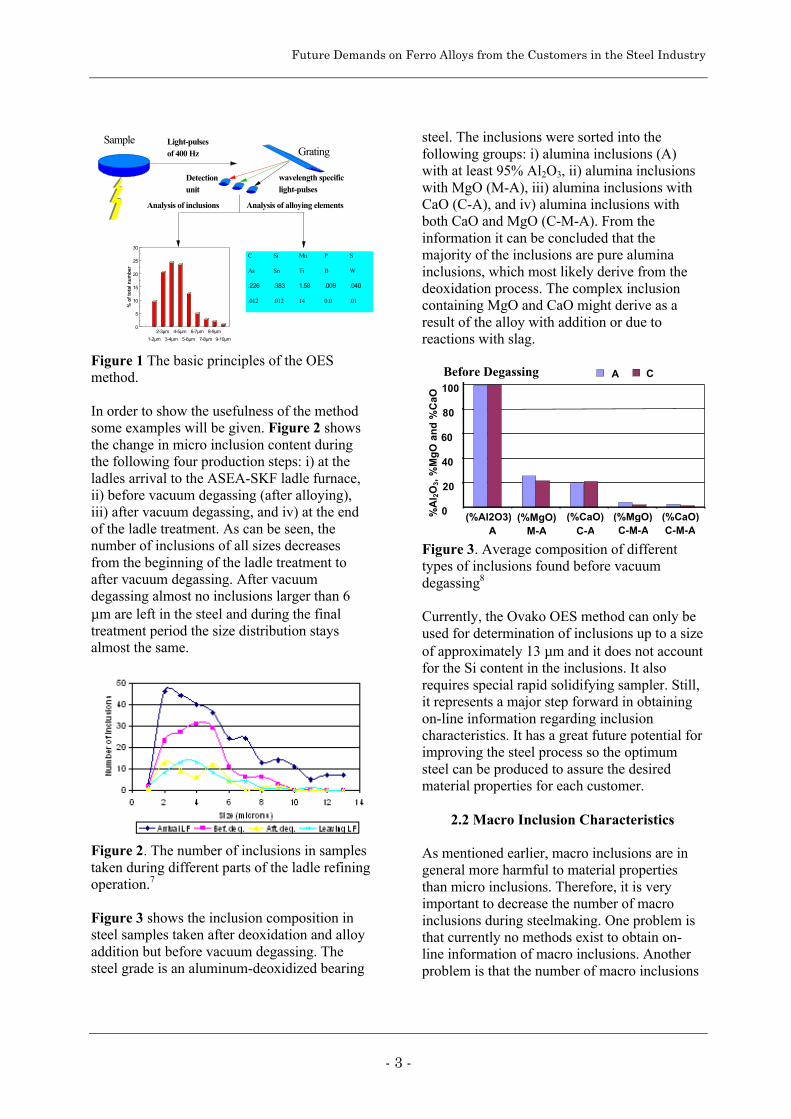
Future Demands on Ferro Alloys from the Customers in the Steel Industry
- 3 -
Sample
Analysis of alloying elementsAnalysis of inclusions
1-2µm
2-3µm
3-4µm
4-5µm
5-6µm
6-7µm
7-8µm
8-9µm
9-10µm
0
5
10
15
20
25
30
% o
f to
tal n
umbe
r
C Si Mn P S
As Sn Ti B W
.226 .383 1.58 .009 .040
.012 .012 14 0.0 .01
Grating
Detectionunit
wavelength specific light-pulses
Light-pulsesof 400 Hz
Figure 1 The basic principles of the OESmethod.
In order to show the usefulness of the methodsome examples will be given. Figure 2 showsthe change in micro inclusion content duringthe following four production steps: i) at theladles arrival to the ASEA-SKF ladle furnace,ii) before vacuum degassing (after alloying),iii) after vacuum degassing, and iv) at the endof the ladle treatment. As can be seen, thenumber of inclusions of all sizes decreasesfrom the beginning of the ladle treatment toafter vacuum degassing. After vacuumdegassing almost no inclusions larger than 6µm are left in the steel and during the finaltreatment period the size distribution staysalmost the same.
Figure 2. The number of inclusions in samplestaken during different parts of the ladle refiningoperation.7
Figure 3 shows the inclusion composition insteel samples taken after deoxidation and alloyaddition but before vacuum degassing. Thesteel grade is an aluminum-deoxidized bearing
steel. The inclusions were sorted into thefollowing groups: i) alumina inclusions (A)with at least 95% Al2O3, ii) alumina inclusionswith MgO (M-A), iii) alumina inclusions withCaO (C-A), and iv) alumina inclusions withboth CaO and MgO (C-M-A). From theinformation it can be concluded that themajority of the inclusions are pure aluminainclusions, which most likely derive from thedeoxidation process. The complex inclusioncontaining MgO and CaO might derive as aresult of the alloy with addition or due toreactions with slag.
Before Degassing
0
20
40
60
80
100
(%Al2O3)A
(%MgO)M-A
(%CaO)C-A
(%MgO)C-M-A
(%CaO)C-M-A
%A
l 2O
3, %
Mg
O a
nd
%C
aO
A C
Figure 3. Average composition of differenttypes of inclusions found before vacuumdegassing8
Currently, the Ovako OES method can only beused for determination of inclusions up to a sizeof approximately 13 µm and it does not accountfor the Si content in the inclusions. It alsorequires special rapid solidifying sampler. Still,it represents a major step forward in obtainingon-line information regarding inclusioncharacteristics. It has a great future potential forimproving the steel process so the optimumsteel can be produced to assure the desiredmaterial properties for each customer.
2.2 Macro Inclusion Characteristics
As mentioned earlier, macro inclusions are ingeneral more harmful to material propertiesthan micro inclusions. Therefore, it is veryimportant to decrease the number of macroinclusions during steelmaking. One problem isthat currently no methods exist to obtain on-line information of macro inclusions. Anotherproblem is that the number of macro inclusions
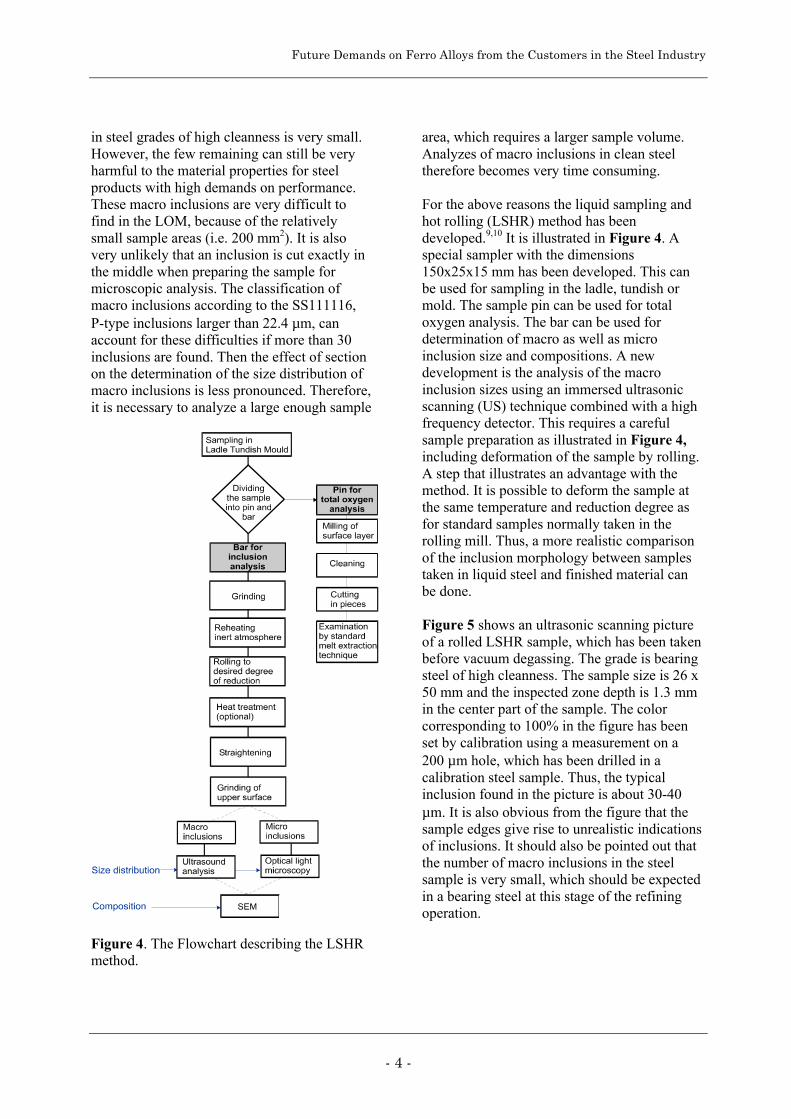
Future Demands on Ferro Alloys from the Customers in the Steel Industry
- 4 -
in steel grades of high cleanness is very small.However, the few remaining can still be veryharmful to the material properties for steelproducts with high demands on performance.These macro inclusions are very difficult tofind in the LOM, because of the relativelysmall sample areas (i.e. 200 mm2). It is alsovery unlikely that an inclusion is cut exactly inthe middle when preparing the sample formicroscopic analysis. The classification ofmacro inclusions according to the SS111116,P-type inclusions larger than 22.4 µm, canaccount for these difficulties if more than 30inclusions are found. Then the effect of sectionon the determination of the size distribution ofmacro inclusions is less pronounced. Therefore,it is necessary to analyze a large enough sample
Figure 4. The Flowchart describing the LSHRmethod.
area, which requires a larger sample volume.Analyzes of macro inclusions in clean steeltherefore becomes very time consuming.
For the above reasons the liquid sampling andhot rolling (LSHR) method has beendeveloped.9,10 It is illustrated in Figure 4. Aspecial sampler with the dimensions150x25x15 mm has been developed. This canbe used for sampling in the ladle, tundish ormold. The sample pin can be used for totaloxygen analysis. The bar can be used fordetermination of macro as well as microinclusion size and compositions. A newdevelopment is the analysis of the macroinclusion sizes using an immersed ultrasonicscanning (US) technique combined with a highfrequency detector. This requires a carefulsample preparation as illustrated in Figure 4,including deformation of the sample by rolling.A step that illustrates an advantage with themethod. It is possible to deform the sample atthe same temperature and reduction degree asfor standard samples normally taken in therolling mill. Thus, a more realistic comparisonof the inclusion morphology between samplestaken in liquid steel and finished material canbe done.
Figure 5 shows an ultrasonic scanning pictureof a rolled LSHR sample, which has been takenbefore vacuum degassing. The grade is bearingsteel of high cleanness. The sample size is 26 x50 mm and the inspected zone depth is 1.3 mmin the center part of the sample. The colorcorresponding to 100% in the figure has beenset by calibration using a measurement on a200 µm hole, which has been drilled in acalibration steel sample. Thus, the typicalinclusion found in the picture is about 30-40µm. It is also obvious from the figure that thesample edges give rise to unrealistic indicationsof inclusions. It should also be pointed out thatthe number of macro inclusions in the steelsample is very small, which should be expectedin a bearing steel at this stage of the refiningoperation.
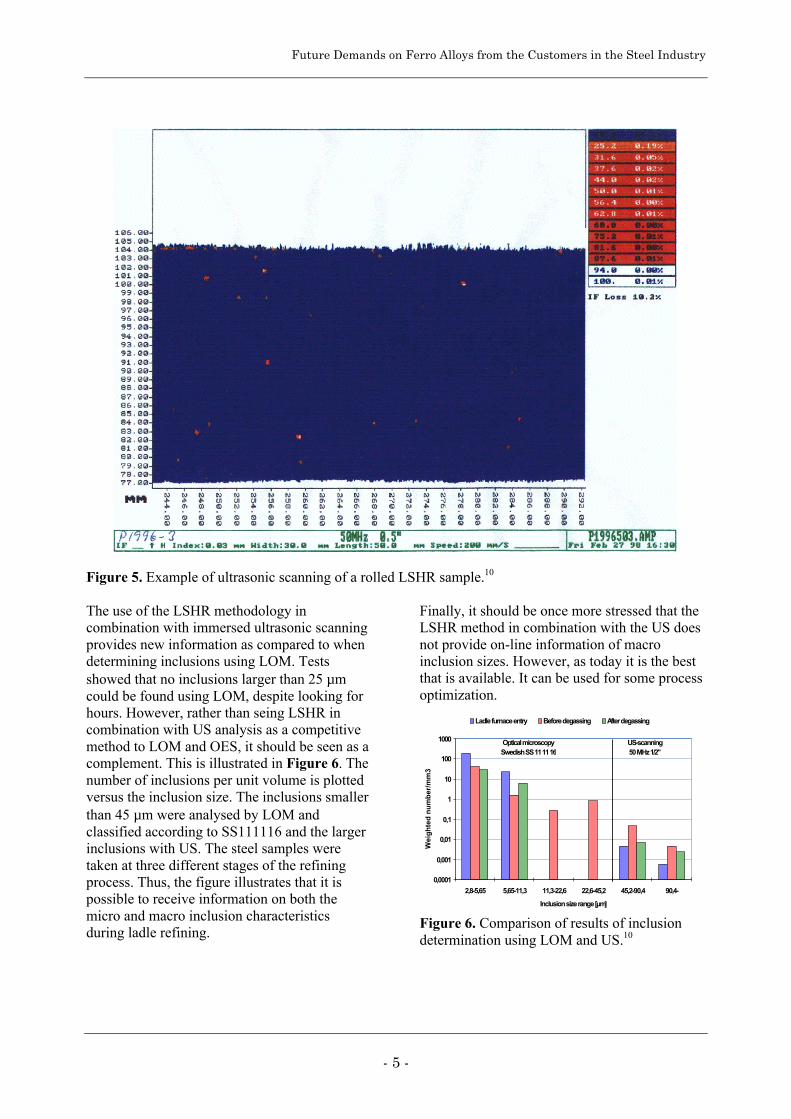
Future Demands on Ferro Alloys from the Customers in the Steel Industry
- 5 -
Figure 5. Example of ultrasonic scanning of a rolled LSHR sample.10
The use of the LSHR methodology incombination with immersed ultrasonic scanningprovides new information as compared to whendetermining inclusions using LOM. Testsshowed that no inclusions larger than 25 µmcould be found using LOM, despite looking forhours. However, rather than seing LSHR incombination with US analysis as a competitivemethod to LOM and OES, it should be seen as acomplement. This is illustrated in Figure 6. Thenumber of inclusions per unit volume is plottedversus the inclusion size. The inclusions smallerthan 45 µm were analysed by LOM andclassified according to SS111116 and the largerinclusions with US. The steel samples weretaken at three different stages of the refiningprocess. Thus, the figure illustrates that it ispossible to receive information on both themicro and macro inclusion characteristicsduring ladle refining.
Finally, it should be once more stressed that theLSHR method in combination with the US doesnot provide on-line information of macroinclusion sizes. However, as today it is the bestthat is available. It can be used for some processoptimization.
0,0001
0,001
0,01
0,1
1
10
100
1000
2,8-5,65 5,65-11,3 11,3-22,6 22,6-45,2 45,2-90,4 90,4-
Inclusion size range [µm]
Wei
gh
ted
nu
mb
er/m
m3
Ladle furnace entry Before degassing After degassing
US-scanning50 MHz 1/2"
Optical microscopySwedish SS 11 11 16
Figure 6. Comparison of results of inclusiondetermination using LOM and US.10
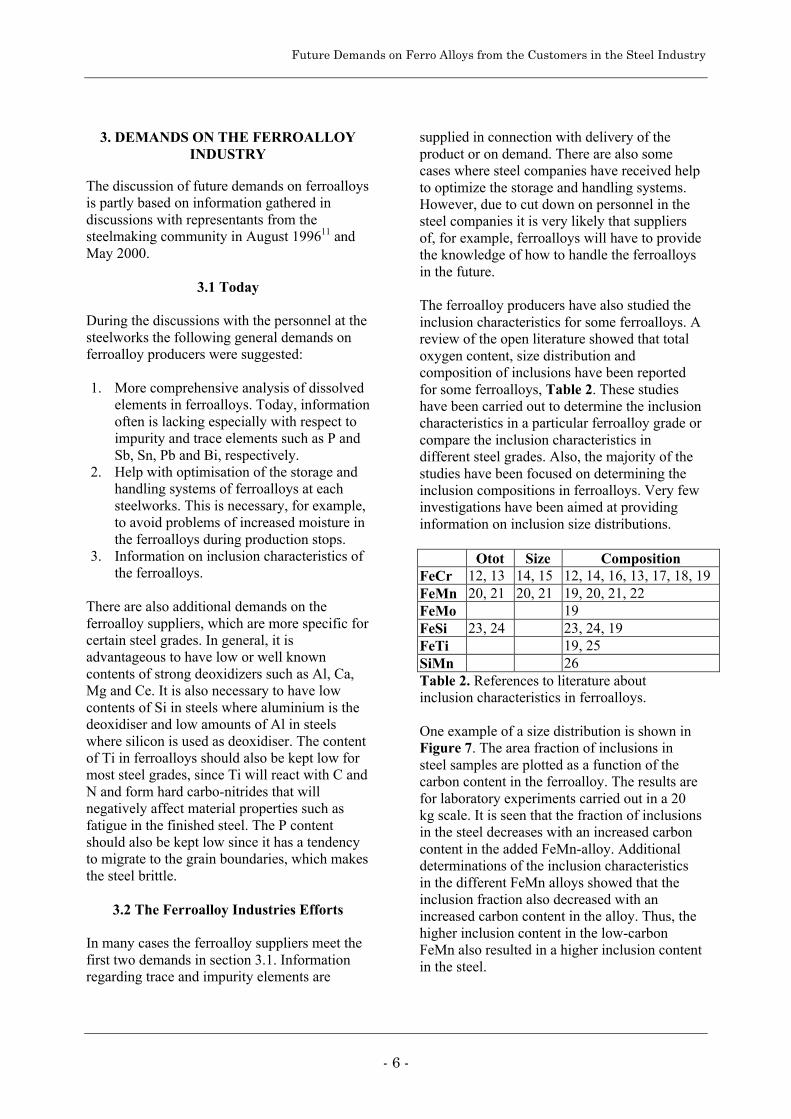
Future Demands on Ferro Alloys from the Customers in the Steel Industry
- 6 -
3. DEMANDS ON THE FERROALLOYINDUSTRY
The discussion of future demands on ferroalloysis partly based on information gathered indiscussions with representants from thesteelmaking community in August 199611 andMay 2000.
3.1 Today
During the discussions with the personnel at thesteelworks the following general demands onferroalloy producers were suggested:
1. More comprehensive analysis of dissolvedelements in ferroalloys. Today, informationoften is lacking especially with respect toimpurity and trace elements such as P andSb, Sn, Pb and Bi, respectively.
2. Help with optimisation of the storage andhandling systems of ferroalloys at eachsteelworks. This is necessary, for example,to avoid problems of increased moisture inthe ferroalloys during production stops.
3. Information on inclusion characteristics ofthe ferroalloys.
There are also additional demands on theferroalloy suppliers, which are more specific forcertain steel grades. In general, it isadvantageous to have low or well knowncontents of strong deoxidizers such as Al, Ca,Mg and Ce. It is also necessary to have lowcontents of Si in steels where aluminium is thedeoxidiser and low amounts of Al in steelswhere silicon is used as deoxidiser. The contentof Ti in ferroalloys should also be kept low formost steel grades, since Ti will react with C andN and form hard carbo-nitrides that willnegatively affect material properties such asfatigue in the finished steel. The P contentshould also be kept low since it has a tendencyto migrate to the grain boundaries, which makesthe steel brittle.
3.2 The Ferroalloy Industries Efforts
In many cases the ferroalloy suppliers meet thefirst two demands in section 3.1. Informationregarding trace and impurity elements are
supplied in connection with delivery of theproduct or on demand. There are also somecases where steel companies have received helpto optimize the storage and handling systems.However, due to cut down on personnel in thesteel companies it is very likely that suppliersof, for example, ferroalloys will have to providethe knowledge of how to handle the ferroalloysin the future.
The ferroalloy producers have also studied theinclusion characteristics for some ferroalloys. Areview of the open literature showed that totaloxygen content, size distribution andcomposition of inclusions have been reportedfor some ferroalloys, Table 2. These studieshave been carried out to determine the inclusioncharacteristics in a particular ferroalloy grade orcompare the inclusion characteristics indifferent steel grades. Also, the majority of thestudies have been focused on determining theinclusion compositions in ferroalloys. Very fewinvestigations have been aimed at providinginformation on inclusion size distributions.
Otot Size CompositionFeCr 12, 13 14, 15 12, 14, 16, 13, 17, 18, 19FeMn 20, 21 20, 21 19, 20, 21, 22FeMo 19FeSi 23, 24 23, 24, 19FeTi 19, 25SiMn 26Table 2. References to literature aboutinclusion characteristics in ferroalloys.
One example of a size distribution is shown inFigure 7. The area fraction of inclusions insteel samples are plotted as a function of thecarbon content in the ferroalloy. The results arefor laboratory experiments carried out in a 20kg scale. It is seen that the fraction of inclusionsin the steel decreases with an increased carboncontent in the added FeMn-alloy. Additionaldeterminations of the inclusion characteristicsin the different FeMn alloys showed that theinclusion fraction also decreased with anincreased carbon content in the alloy. Thus, thehigher inclusion content in the low-carbonFeMn also resulted in a higher inclusion contentin the steel.
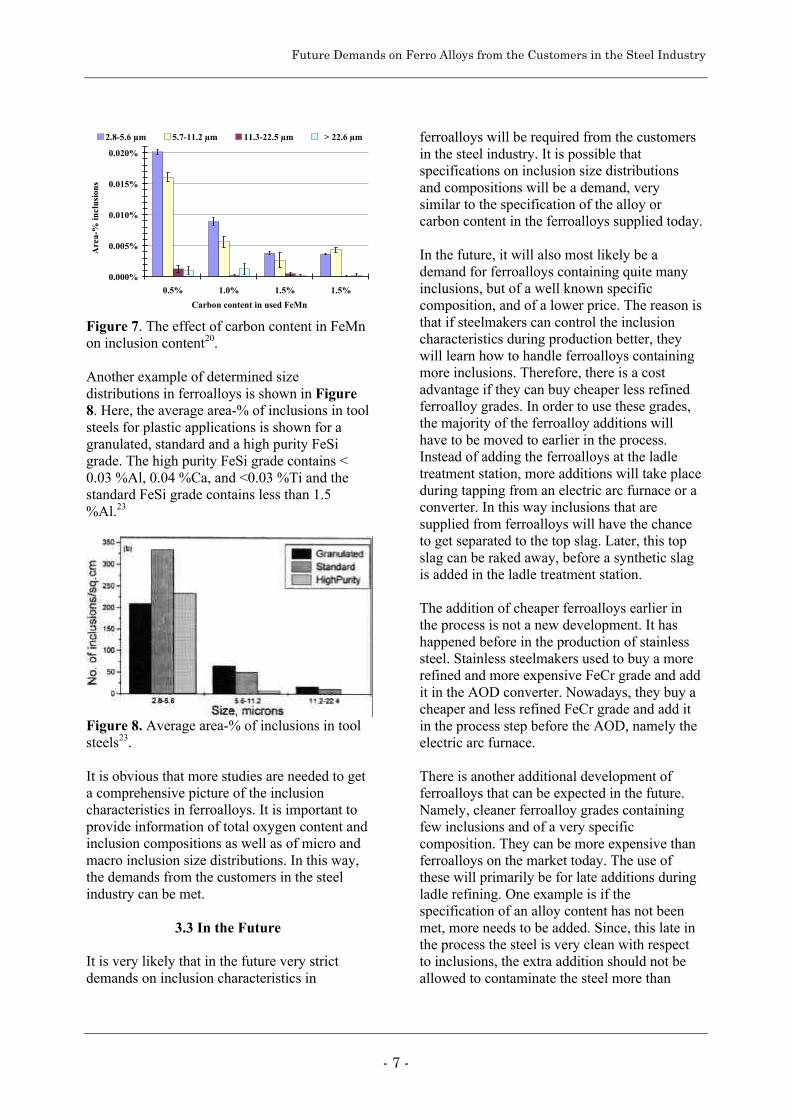
Future Demands on Ferro Alloys from the Customers in the Steel Industry
- 7 -
0.000%
0.005%
0.010%
0.015%
0.020%
0.5% 1.0% 1.5% 1.5%
Carbon content in used FeMn
Are
a-%
incl
usio
ns
2.8-5.6 µm 5.7-11.2 µm 11.3-22.5 µm > 22.6 µm
Figure 7. The effect of carbon content in FeMnon inclusion content20.
Another example of determined sizedistributions in ferroalloys is shown in Figure8. Here, the average area-% of inclusions in toolsteels for plastic applications is shown for agranulated, standard and a high purity FeSigrade. The high purity FeSi grade contains <0.03 %Al, 0.04 %Ca, and <0.03 %Ti and thestandard FeSi grade contains less than 1.5%Al.23
Figure 8. Average area-% of inclusions in toolsteels23.
It is obvious that more studies are needed to geta comprehensive picture of the inclusioncharacteristics in ferroalloys. It is important toprovide information of total oxygen content andinclusion compositions as well as of micro andmacro inclusion size distributions. In this way,the demands from the customers in the steelindustry can be met.
3.3 In the Future
It is very likely that in the future very strictdemands on inclusion characteristics in
ferroalloys will be required from the customersin the steel industry. It is possible thatspecifications on inclusion size distributionsand compositions will be a demand, verysimilar to the specification of the alloy orcarbon content in the ferroalloys supplied today.
In the future, it will also most likely be ademand for ferroalloys containing quite manyinclusions, but of a well known specificcomposition, and of a lower price. The reason isthat if steelmakers can control the inclusioncharacteristics during production better, theywill learn how to handle ferroalloys containingmore inclusions. Therefore, there is a costadvantage if they can buy cheaper less refinedferroalloy grades. In order to use these grades,the majority of the ferroalloy additions willhave to be moved to earlier in the process.Instead of adding the ferroalloys at the ladletreatment station, more additions will take placeduring tapping from an electric arc furnace or aconverter. In this way inclusions that aresupplied from ferroalloys will have the chanceto get separated to the top slag. Later, this topslag can be raked away, before a synthetic slagis added in the ladle treatment station.
The addition of cheaper ferroalloys earlier inthe process is not a new development. It hashappened before in the production of stainlesssteel. Stainless steelmakers used to buy a morerefined and more expensive FeCr grade and addit in the AOD converter. Nowadays, they buy acheaper and less refined FeCr grade and add itin the process step before the AOD, namely theelectric arc furnace.
There is another additional development offerroalloys that can be expected in the future.Namely, cleaner ferroalloy grades containingfew inclusions and of a very specificcomposition. They can be more expensive thanferroalloys on the market today. The use ofthese will primarily be for late additions duringladle refining. One example is if thespecification of an alloy content has not beenmet, more needs to be added. Since, this late inthe process the steel is very clean with respectto inclusions, the extra addition should not beallowed to contaminate the steel more than
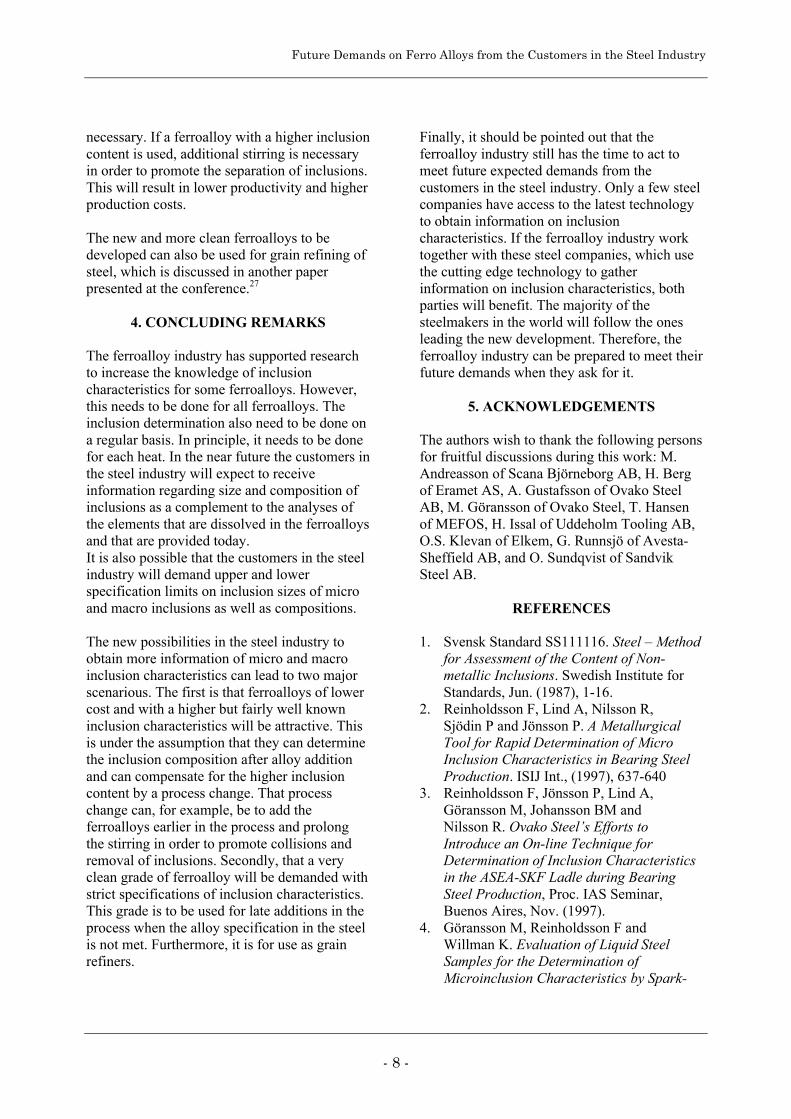
Future Demands on Ferro Alloys from the Customers in the Steel Industry
- 8 -
necessary. If a ferroalloy with a higher inclusioncontent is used, additional stirring is necessaryin order to promote the separation of inclusions.This will result in lower productivity and higherproduction costs.
The new and more clean ferroalloys to bedeveloped can also be used for grain refining ofsteel, which is discussed in another paperpresented at the conference.27
4. CONCLUDING REMARKS
The ferroalloy industry has supported researchto increase the knowledge of inclusioncharacteristics for some ferroalloys. However,this needs to be done for all ferroalloys. Theinclusion determination also need to be done ona regular basis. In principle, it needs to be donefor each heat. In the near future the customers inthe steel industry will expect to receiveinformation regarding size and composition ofinclusions as a complement to the analyses ofthe elements that are dissolved in the ferroalloysand that are provided today.It is also possible that the customers in the steelindustry will demand upper and lowerspecification limits on inclusion sizes of microand macro inclusions as well as compositions.
The new possibilities in the steel industry toobtain more information of micro and macroinclusion characteristics can lead to two majorscenarious. The first is that ferroalloys of lowercost and with a higher but fairly well knowninclusion characteristics will be attractive. Thisis under the assumption that they can determinethe inclusion composition after alloy additionand can compensate for the higher inclusioncontent by a process change. That processchange can, for example, be to add theferroalloys earlier in the process and prolongthe stirring in order to promote collisions andremoval of inclusions. Secondly, that a veryclean grade of ferroalloy will be demanded withstrict specifications of inclusion characteristics.This grade is to be used for late additions in theprocess when the alloy specification in the steelis not met. Furthermore, it is for use as grainrefiners.
Finally, it should be pointed out that theferroalloy industry still has the time to act tomeet future expected demands from thecustomers in the steel industry. Only a few steelcompanies have access to the latest technologyto obtain information on inclusioncharacteristics. If the ferroalloy industry worktogether with these steel companies, which usethe cutting edge technology to gatherinformation on inclusion characteristics, bothparties will benefit. The majority of thesteelmakers in the world will follow the onesleading the new development. Therefore, theferroalloy industry can be prepared to meet theirfuture demands when they ask for it.
5. ACKNOWLEDGEMENTS
The authors wish to thank the following personsfor fruitful discussions during this work: M.Andreasson of Scana Björneborg AB, H. Bergof Eramet AS, A. Gustafsson of Ovako SteelAB, M. Göransson of Ovako Steel, T. Hansenof MEFOS, H. Issal of Uddeholm Tooling AB,O.S. Klevan of Elkem, G. Runnsjö of Avesta-Sheffield AB, and O. Sundqvist of SandvikSteel AB.
REFERENCES
1. Svensk Standard SS111116. Steel – Methodfor Assessment of the Content of Non-metallic Inclusions. Swedish Institute forStandards, Jun. (1987), 1-16.
2. Reinholdsson F, Lind A, Nilsson R,Sjödin P and Jönsson P. A MetallurgicalTool for Rapid Determination of MicroInclusion Characteristics in Bearing SteelProduction. ISIJ Int., (1997), 637-640
3. Reinholdsson F, Jönsson P, Lind A,Göransson M, Johansson BM andNilsson R. Ovako Steel’s Efforts toIntroduce an On-line Technique forDetermination of Inclusion Characteristicsin the ASEA-SKF Ladle during BearingSteel Production, Proc. IAS Seminar,Buenos Aires, Nov. (1997).
4. Göransson M, Reinholdsson F andWillman K. Evaluation of Liquid SteelSamples for the Determination ofMicroinclusion Characteristics by Spark-
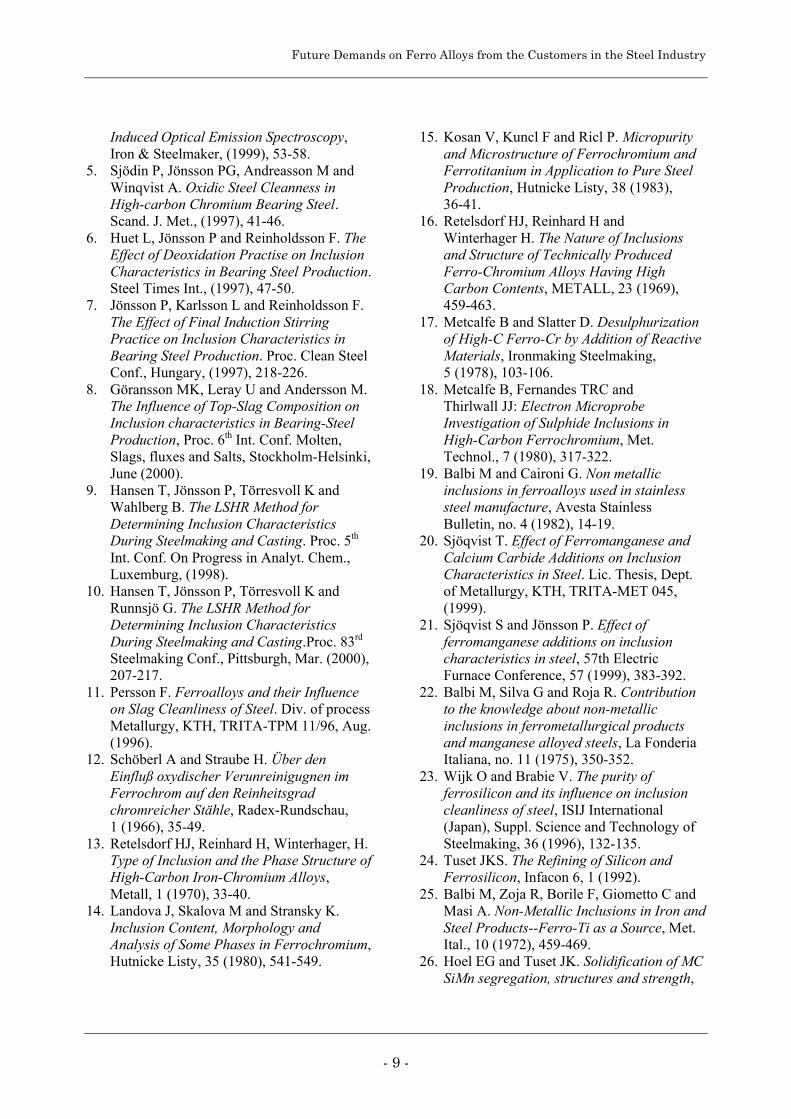
Future Demands on Ferro Alloys from the Customers in the Steel Industry
- 9 -
Induced Optical Emission Spectroscopy,Iron & Steelmaker, (1999), 53-58.
5. Sjödin P, Jönsson PG, Andreasson M andWinqvist A. Oxidic Steel Cleanness inHigh-carbon Chromium Bearing Steel.Scand. J. Met., (1997), 41-46.
6. Huet L, Jönsson P and Reinholdsson F. TheEffect of Deoxidation Practise on InclusionCharacteristics in Bearing Steel Production.Steel Times Int., (1997), 47-50.
7. Jönsson P, Karlsson L and Reinholdsson F.The Effect of Final Induction StirringPractice on Inclusion Characteristics inBearing Steel Production. Proc. Clean SteelConf., Hungary, (1997), 218-226.
8. Göransson MK, Leray U and Andersson M.The Influence of Top-Slag Composition onInclusion characteristics in Bearing-SteelProduction, Proc. 6th Int. Conf. Molten,Slags, fluxes and Salts, Stockholm-Helsinki,June (2000).
9. Hansen T, Jönsson P, Törresvoll K andWahlberg B. The LSHR Method forDetermining Inclusion CharacteristicsDuring Steelmaking and Casting. Proc. 5th
Int. Conf. On Progress in Analyt. Chem.,Luxemburg, (1998).
10. Hansen T, Jönsson P, Törresvoll K andRunnsjö G. The LSHR Method forDetermining Inclusion CharacteristicsDuring Steelmaking and Casting.Proc. 83rd
Steelmaking Conf., Pittsburgh, Mar. (2000),207-217.
11. Persson F. Ferroalloys and their Influenceon Slag Cleanliness of Steel. Div. of processMetallurgy, KTH, TRITA-TPM 11/96, Aug.(1996).
12. Schöberl A and Straube H. Über denEinfluß oxydischer Verunreinigugnen imFerrochrom auf den Reinheitsgradchromreicher Stähle, Radex-Rundschau,1 (1966), 35-49.
13. Retelsdorf HJ, Reinhard H, Winterhager, H.Type of Inclusion and the Phase Structure ofHigh-Carbon Iron-Chromium Alloys,Metall, 1 (1970), 33-40.
14. Landova J, Skalova M and Stransky K.Inclusion Content, Morphology andAnalysis of Some Phases in Ferrochromium,Hutnicke Listy, 35 (1980), 541-549.
15. Kosan V, Kuncl F and Ricl P. Micropurityand Microstructure of Ferrochromium andFerrotitanium in Application to Pure SteelProduction, Hutnicke Listy, 38 (1983),36-41.
16. Retelsdorf HJ, Reinhard H andWinterhager H. The Nature of Inclusionsand Structure of Technically ProducedFerro-Chromium Alloys Having HighCarbon Contents, METALL, 23 (1969),459-463.
17. Metcalfe B and Slatter D. Desulphurizationof High-C Ferro-Cr by Addition of ReactiveMaterials, Ironmaking Steelmaking,5 (1978), 103-106.
18. Metcalfe B, Fernandes TRC andThirlwall JJ: Electron MicroprobeInvestigation of Sulphide Inclusions inHigh-Carbon Ferrochromium, Met.Technol., 7 (1980), 317-322.
19. Balbi M and Caironi G. Non metallicinclusions in ferroalloys used in stainlesssteel manufacture, Avesta StainlessBulletin, no. 4 (1982), 14-19.
20. Sjöqvist T. Effect of Ferromanganese andCalcium Carbide Additions on InclusionCharacteristics in Steel. Lic. Thesis, Dept.of Metallurgy, KTH, TRITA-MET 045,(1999).
21. Sjöqvist S and Jönsson P. Effect offerromanganese additions on inclusioncharacteristics in steel, 57th ElectricFurnace Conference, 57 (1999), 383-392.
22. Balbi M, Silva G and Roja R. Contributionto the knowledge about non-metallicinclusions in ferrometallurgical productsand manganese alloyed steels, La FonderiaItaliana, no. 11 (1975), 350-352.
23. Wijk O and Brabie V. The purity offerrosilicon and its influence on inclusioncleanliness of steel, ISIJ International(Japan), Suppl. Science and Technology ofSteelmaking, 36 (1996), 132-135.
24. Tuset JKS. The Refining of Silicon andFerrosilicon, Infacon 6, 1 (1992).
25. Balbi M, Zoja R, Borile F, Giometto C andMasi A. Non-Metallic Inclusions in Iron andSteel Products--Ferro-Ti as a Source, Met.Ital., 10 (1972), 459-469.
26. Hoel EG and Tuset JK. Solidification of MCSiMn segregation, structures and strength,

Future Demands on Ferro Alloys from the Customers in the Steel Industry
- 10 -
8th International Ferroalloys Congress,(1998)
27. Grong Ö, Jönsson P and Klevan OS. TheFuture Role of Ferroalloys in iron andSteel. Proc. Infacon 9 Conf., Quebec.
TRITA-MET 039
Inclusions in Commercial Low andMedium Carbon Ferromanganese
Thobias Sjöqvist, Pär Jönsson and Öystein Grong
STOCKHOLMAugust 1999
DEPARTMENT OF METALLURGYROYAL INSTITUTE OF TECHNOLOGYSE - 10044 STOCKHOLM

Inclusions in Commercial Low and Medium CarbonFerromanganese
THOBIAS SJOQVIST, PAR JONSSON, and OYSTEIN GRONG
The microstructures of commercial low and medium carbon ferromanganese have been studied byoptical microscopy and electron microprobe techniques. Element analysis and mapping have beenperformed on impurities in the matrix and nonmetallic inclusions present. The results show that themost common nonmetallic inclusion is manganese oxide, followed by complex compounds of manga-nese oxide, silicon oxide, and manganese sulfide. The different inclusions have been assessed accordingto the SS 111116 method. It follows that over 85 pct of the present nonmetallic inclusions aremanganese oxides and that the amount of manganese oxide inclusions is inversely proportional tothe carbon content in standard refined ferromanganese.
I. INTRODUCTION II. METHODS AND PREPARATIONS
A. SamplingFERROALLOYS are commonly used in the steel man-ufacturing industry to alloy or deoxidize the steel. Experi- Considering that the aim of the study was to examine theence shows that the additions of ferroalloys influence the quality of ferromanganese reaching the customers, samplingcleanliness of the steel, and hence the material properties of were made from cast ferromanganese after cooling. Sam-the end product.[1] To determine the influence of different pling were made at Elkem’s production sites in Norway. Allalloys, controlled alloying experiments are necessary. Such samples were collected in the form of solid pieces fromexperiments have been performed with ferrochromium[2] and cast material.ferrosilicon,[3] but are lacking for ferromanganese. Beforeestablishing the influence of ferromanganese on steel clean-
B. Chemical Analysisness, it is essential to obtain relevant information aboutthe microstructure and, in particular, impurity elements and From each sample, three pieces were taken. One was usedinclusions present in ferromanganese. for chemical analysis and the other two for microscopic
In a study of carbide formation in commercial high carbon examination. The chemical analyses were made on 50 g offerromanganese with typically maximum 6 wt pct C, Mihok each sample using two different methods. These sampleset al.[4,5] showed that carbides mainly precipitate as small were analyzed for C and S by combustion using a LECO*irregular particles at low cooling rates. Balbi et al.[6,7] investi-
*LECO is a trademark of LECO Corporation, St. Joseph, Ml.gated nonmetallic inclusions present in commercial ferro-manganese containing up to 7.4 wt pct C, concluding that
CS444 unit with a relative accuracy of �1 and �10 pct,MnO and SiO2 inclusions are the most common ones. Fur-respectively. A LECO TC136 unit was used to analyze Othermore, they state that SiO2 inclusions are in majorityand N with a relative accuracy of about �5 pct. Thewhen the silicon content is above 1 wt pct.remaining part of the sample was crushed, ground, andThese investigations have concentrated on high carbonpressed into a disc suitable for X-ray fluorescence analysis.ferromanganese with high contents of silicon, rather thanThereafter, the contents of Mn, Fe, Al, Mg, Ca, Si, and Pon low and medium carbon ferromanganese. The present were determined.
investigation aims to extend the knowledge about the micro-structure of commercial low carbon (maximum 0.5 wt pctC), denoted LC, and medium carbon (maximum 1.5 wt pct C. Sample PreparationC), denoted MC, ferromanganese with emphasis on inclu-
After chemical analysis, the remaining pieces of eachsions present. Therefore, the presented results include char-sample were manually crushed to a size more suitable foracterization and counting of inclusions present in sixmicroscopic investigations, e.g., 10 to 15 mm. These smallerqualities of ferro-manganese.pieces were then encapsulated in cold-hardening plastic andsubsequently polished. Two different techniques of polishingwere used. Initially, silicon carbide paper was used. Thisresulted in an uneven surface; all pores were apparentlyenlarged by this technique, e.g., by chipping. Later, a dia-THOBIAS SJOQVIST, Doctoral Student, and PAR JONSSON, Professor,
are with the Department of Materials Science and Engineering, Division mond-polishing disc was used, and this resulted in a muchof Metallurgy, Royal Institute of Technology, SE-10044, Stockholm. smoother surface, with fewer large pores. Polishing wasOYSTEIN GRONG, Professor, is with the Department of Materials Tech- done down to 10 �m either on silicon carbide paper ornology and Electrochemistry, Norwegian University of Science and Tech-
diamond polishing disc. Then a textile disc and diamondnology, N-7491 Trondheim, Norway.Manuscript submitted March 13, 2000. spray was used until the surface had no marks from the
METALLURGICAL AND MATERIALS TRANSACTIONS A VOLUME 32A, MONTH 2001—1

previous polishing step. This was done down to a surface Table I presents the chemical analysis of all samples studied.The presented values for oxygen and nitrogen are averagesfinish of 3 �m. After completed polishing, the samples were
stored in a dessicator with a moisture absorbing agent. of six different analyses. All other element contents givenin Table I are averages from three analyses.
Samples A to F were taken for both the present studyD. Inclusion Assessment and a forthcoming study on the effect of ferromanganese
additions on inclusion characteristics in steel.[11] From theAssessment of the inclusions in all samples has beenperformed according to the Swedish standard SS 111116 results presented in Table I, it is obvious that the oxygen
content fluctuates considerably depending on the type ofmethod.[8] This method was developed to ensure that alloperators counting inclusions from the same sample would ferromanganese grade studied. This, in turn, suggests that
samples A and B will contain more oxide inclusions thanobtain the same results.[9,10] When using this method, allinclusions are characterized by their geometry and size samples C to F. However, it is difficult to obtain representa-
tive oxygen analyses from as-cast ferromanganese samples,according to a picture chart presented in the SS 111116.[8]
Geometrically, there are four classes, from A to D. However, as these are porous and thus have a high contribution ofoxygen from surface oxidation. Here, the oxygen data inall inclusions were noted as class D in this investigation. In
this class, all inclusions are considered spherical and their Table I do only partly reflect the inclusion level in thedifferent ferromanganese grades.respective sizes are classified into one of four size categories
according to inclusion diameter. Size category T comprises The nitrogen solubilities reported by Raghavan[12] for liq-uid and austenitic binary iron-manganese alloy with manga-diameters between 3.4 and 6.7 �m, M diameters between
6.7 and 13.4 �m, and H diameters between 13.4 and 26.9 nese content of 80 wt pct are about 0.86 wt pct N (1550�C) and 2.0 wt pct N (1200 �C), respectively. Since the�m. For inclusions with a diameter larger than 26.9 �m, a
special category, P, is used. nitrogen content in all samples is much lower, it is reasonableto assume that nitrides do not form in the present samples.A computer software named “PC MIC” was used to assess
the collected data. This program allows the user to set thevisual field diameter, the number of scale divisions within
B. Identification of Inclusionsthe visual field diameter, and magnification. Throughoutthe investigation, the light optical microscope was set to a Before assessing the area fraction and number of inclu-magnification of 100 times and 160 scale parts were used sions per square millimeter in the samples, the differentin a visual field of 1.9 mm. After the inclusions in a given types of inclusions present in the ferromanganese samplessample had been assessed, the program calculated the charac- were identified. Many of these samples contained a highteristic parameters for the different geometrical classes of degree of pores and other components, which belong toinclusions according to the algorithms presented in SS the iron-manganese matrix. While the optical microscopic111116.[8] Parameters used in this study are the number and investigation only revealed the number of inclusions present,area percentage per square millimeter of the geometrical microprobe analysis also made it possible to accuratelyclass D inclusions. Finally, the inclusions were analyzed determine the constituent elements of the different inclu-using a JEOL* JXA-8900M WD/ED combined microprobe. sions. Microprobe analysis was performed on different inclu-
sions with respect to the content of several elements. Element*JEOL is a trademark of Japan Electron Optics Ltd., Tokyo.mapping was later done for manganese, silicon, oxygen,
The analysis of the inclusions included both qualitative anal- carbon, iron, and sulfur.ysis (element mapping) and quantitative microarea analysis.
1. Manganese oxideInclusions composed of manganese and oxygen were
III. RESULTS found in all ferromanganese samples studied. In the opticalmicroscope, they appear as medium gray particles, either
A. Element Analyses with a crystalline rhombic shape or a dendritic morphology.Their size varies typically between 3 to 180 �m. Figure 1In the following, the results from studies of industrially
produced LC and MC ferromanganese will be presented. shows an element mapping of a dendritic manganese oxide
Table I. Sample Compositions of LC and MC Ferromanganese from Elkem, Norway (All Contents Are Given in WeightPercent)
Number Grade Mn Fe C S O N P Al Si Cr
A LC 0.5 pct C 79.6 17.7 0.34 0.004 1.11 0.14 0.17 0.05 0.01 0.08B MC 1.0 pct C 81.1 16.5 0.77 0.004 0.89 0.07 0.17 0.03 0.12 0.05C MC 1.5 pct C 81.5 15.9 1.52 0.003 0.01 0.07 0.16 0.03 0.04 0.06D MC 1.5 pct C* 81.0 16.1 1.38 0.003 0.02 0.07 0.16 0.03 0.39 0.04E LC 0.5 pct C* 81.4 17.3 0.48 0.003 0.04 0.04 0.16 0.04 0.32 0.17F MC 1.5 pct C* 80.6 16.8 1.41 0.003 0.12 0.06 0.16 0.02 0.29 0.10
*Low oxygen ferromanganese.The elements Ca, Mg, and Ti were detected in all samples with contents below 0.01 wt pct, while V, Ni, As, and Cu were also present,
but with contents below 0.05 wt pct.
2—VOLUME 32A, MONTH 2001 METALLURGICAL AND MATERIALS TRANSACTIONS A
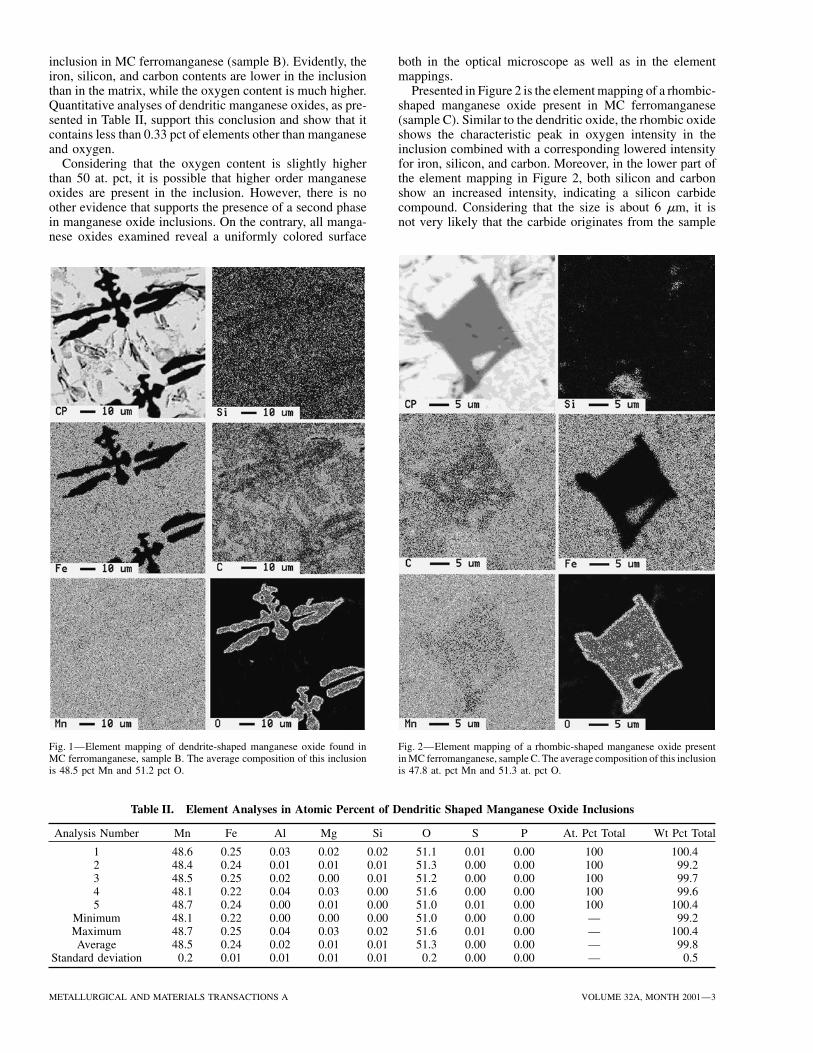
inclusion in MC ferromanganese (sample B). Evidently, the both in the optical microscope as well as in the elementmappings.iron, silicon, and carbon contents are lower in the inclusion
than in the matrix, while the oxygen content is much higher. Presented in Figure 2 is the element mapping of a rhombic-shaped manganese oxide present in MC ferromanganeseQuantitative analyses of dendritic manganese oxides, as pre-
sented in Table II, support this conclusion and show that it (sample C). Similar to the dendritic oxide, the rhombic oxideshows the characteristic peak in oxygen intensity in thecontains less than 0.33 pct of elements other than manganese
and oxygen. inclusion combined with a corresponding lowered intensityfor iron, silicon, and carbon. Moreover, in the lower part ofConsidering that the oxygen content is slightly higher
than 50 at. pct, it is possible that higher order manganese the element mapping in Figure 2, both silicon and carbonshow an increased intensity, indicating a silicon carbideoxides are present in the inclusion. However, there is no
other evidence that supports the presence of a second phase compound. Considering that the size is about 6 �m, it isnot very likely that the carbide originates from the samplein manganese oxide inclusions. On the contrary, all manga-
nese oxides examined reveal a uniformly colored surface
Fig. 1—Element mapping of dendrite-shaped manganese oxide found in Fig. 2—Element mapping of a rhombic-shaped manganese oxide presentin MC ferromanganese, sample C. The average composition of this inclusionMC ferromanganese, sample B. The average composition of this inclusion
is 48.5 pct Mn and 51.2 pct O. is 47.8 at. pct Mn and 51.3 at. pct O.
Table II. Element Analyses in Atomic Percent of Dendritic Shaped Manganese Oxide Inclusions
Analysis Number Mn Fe Al Mg Si O S P At. Pct Total Wt Pct Total
1 48.6 0.25 0.03 0.02 0.02 51.1 0.01 0.00 100 100.42 48.4 0.24 0.01 0.01 0.01 51.3 0.00 0.00 100 99.23 48.5 0.25 0.02 0.00 0.01 51.2 0.00 0.00 100 99.74 48.1 0.22 0.04 0.03 0.00 51.6 0.00 0.00 100 99.65 48.7 0.24 0.00 0.01 0.00 51.0 0.01 0.00 100 100.4
Minimum 48.1 0.22 0.00 0.00 0.00 51.0 0.00 0.00 — 99.2Maximum 48.7 0.25 0.04 0.03 0.02 51.6 0.01 0.00 — 100.4Average 48.5 0.24 0.02 0.01 0.01 51.3 0.00 0.00 — 99.8
Standard deviation 0.2 0.01 0.01 0.01 0.01 0.2 0.00 0.00 — 0.5
METALLURGICAL AND MATERIALS TRANSACTIONS A VOLUME 32A, MONTH 2001—3
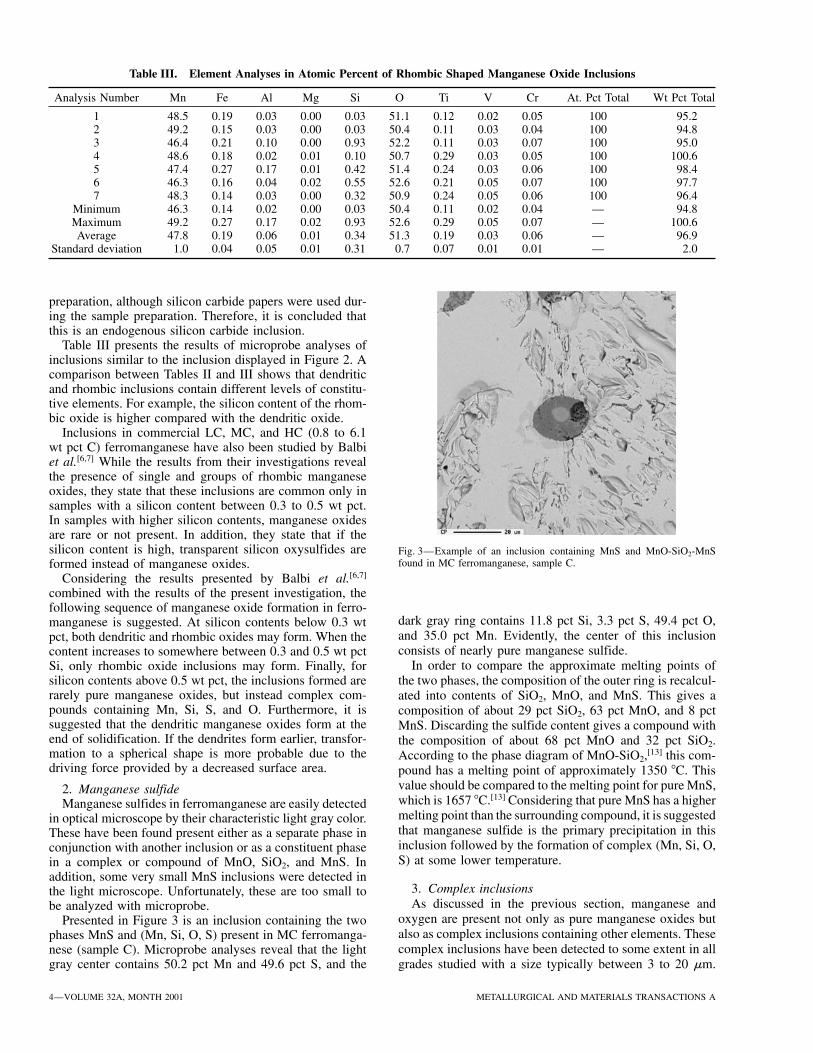
Table III. Element Analyses in Atomic Percent of Rhombic Shaped Manganese Oxide Inclusions
Analysis Number Mn Fe Al Mg Si O Ti V Cr At. Pct Total Wt Pct Total
1 48.5 0.19 0.03 0.00 0.03 51.1 0.12 0.02 0.05 100 95.22 49.2 0.15 0.03 0.00 0.03 50.4 0.11 0.03 0.04 100 94.83 46.4 0.21 0.10 0.00 0.93 52.2 0.11 0.03 0.07 100 95.04 48.6 0.18 0.02 0.01 0.10 50.7 0.29 0.03 0.05 100 100.65 47.4 0.27 0.17 0.01 0.42 51.4 0.24 0.03 0.06 100 98.46 46.3 0.16 0.04 0.02 0.55 52.6 0.21 0.05 0.07 100 97.77 48.3 0.14 0.03 0.00 0.32 50.9 0.24 0.05 0.06 100 96.4
Minimum 46.3 0.14 0.02 0.00 0.03 50.4 0.11 0.02 0.04 — 94.8Maximum 49.2 0.27 0.17 0.02 0.93 52.6 0.29 0.05 0.07 — 100.6Average 47.8 0.19 0.06 0.01 0.34 51.3 0.19 0.03 0.06 — 96.9
Standard deviation 1.0 0.04 0.05 0.01 0.31 0.7 0.07 0.01 0.01 — 2.0
preparation, although silicon carbide papers were used dur-ing the sample preparation. Therefore, it is concluded thatthis is an endogenous silicon carbide inclusion.
Table III presents the results of microprobe analyses ofinclusions similar to the inclusion displayed in Figure 2. Acomparison between Tables II and III shows that dendriticand rhombic inclusions contain different levels of constitu-tive elements. For example, the silicon content of the rhom-bic oxide is higher compared with the dendritic oxide.
Inclusions in commercial LC, MC, and HC (0.8 to 6.1wt pct C) ferromanganese have also been studied by Balbiet al.[6,7] While the results from their investigations revealthe presence of single and groups of rhombic manganeseoxides, they state that these inclusions are common only insamples with a silicon content between 0.3 to 0.5 wt pct.In samples with higher silicon contents, manganese oxidesare rare or not present. In addition, they state that if thesilicon content is high, transparent silicon oxysulfides are Fig. 3—Example of an inclusion containing MnS and MnO-SiO2-MnS
found in MC ferromanganese, sample C.formed instead of manganese oxides.Considering the results presented by Balbi et al.[6,7]
combined with the results of the present investigation, thefollowing sequence of manganese oxide formation in ferro-
dark gray ring contains 11.8 pct Si, 3.3 pct S, 49.4 pct O,manganese is suggested. At silicon contents below 0.3 wtand 35.0 pct Mn. Evidently, the center of this inclusionpct, both dendritic and rhombic oxides may form. When theconsists of nearly pure manganese sulfide.content increases to somewhere between 0.3 and 0.5 wt pct
In order to compare the approximate melting points ofSi, only rhombic oxide inclusions may form. Finally, forsilicon contents above 0.5 wt pct, the inclusions formed are the two phases, the composition of the outer ring is recalcul-rarely pure manganese oxides, but instead complex com- ated into contents of SiO2, MnO, and MnS. This gives apounds containing Mn, Si, S, and O. Furthermore, it is composition of about 29 pct SiO2, 63 pct MnO, and 8 pctsuggested that the dendritic manganese oxides form at the MnS. Discarding the sulfide content gives a compound withend of solidification. If the dendrites form earlier, transfor- the composition of about 68 pct MnO and 32 pct SiO2.mation to a spherical shape is more probable due to the According to the phase diagram of MnO-SiO2,[13] this com-driving force provided by a decreased surface area. pound has a melting point of approximately 1350 �C. This
value should be compared to the melting point for pure MnS,2. Manganese sulfidewhich is 1657 �C.[13] Considering that pure MnS has a higherManganese sulfides in ferromanganese are easily detectedmelting point than the surrounding compound, it is suggestedin optical microscope by their characteristic light gray color.that manganese sulfide is the primary precipitation in thisThese have been found present either as a separate phase ininclusion followed by the formation of complex (Mn, Si, O,conjunction with another inclusion or as a constituent phaseS) at some lower temperature.in a complex or compound of MnO, SiO2, and MnS. In
addition, some very small MnS inclusions were detected in3. Complex inclusionsthe light microscope. Unfortunately, these are too small toAs discussed in the previous section, manganese andbe analyzed with microprobe.
oxygen are present not only as pure manganese oxides butPresented in Figure 3 is an inclusion containing the twoalso as complex inclusions containing other elements. Thesephases MnS and (Mn, Si, O, S) present in MC ferromanga-complex inclusions have been detected to some extent in allnese (sample C). Microprobe analyses reveal that the light
gray center contains 50.2 pct Mn and 49.6 pct S, and the grades studied with a size typically between 3 to 20 �m.
4—VOLUME 32A, MONTH 2001 METALLURGICAL AND MATERIALS TRANSACTIONS A
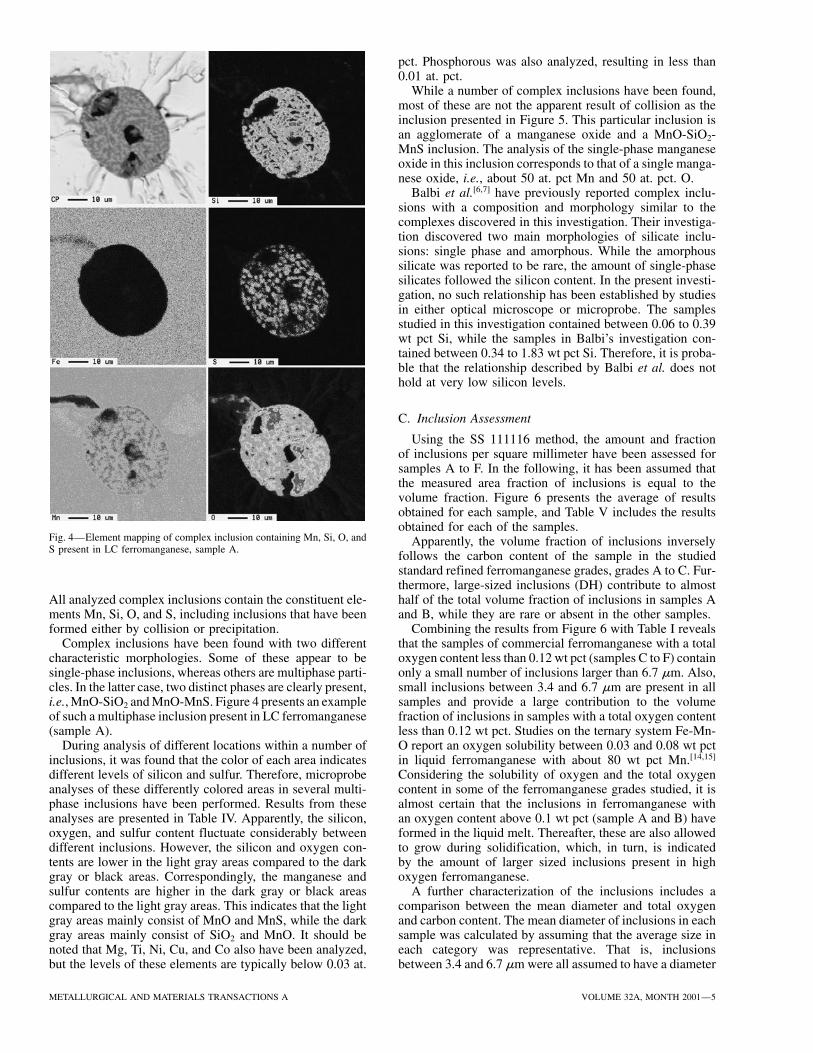
pct. Phosphorous was also analyzed, resulting in less than0.01 at. pct.
While a number of complex inclusions have been found,most of these are not the apparent result of collision as theinclusion presented in Figure 5. This particular inclusion isan agglomerate of a manganese oxide and a MnO-SiO2-MnS inclusion. The analysis of the single-phase manganeseoxide in this inclusion corresponds to that of a single manga-nese oxide, i.e., about 50 at. pct Mn and 50 at. pct. O.
Balbi et al.[6,7] have previously reported complex inclu-sions with a composition and morphology similar to thecomplexes discovered in this investigation. Their investiga-tion discovered two main morphologies of silicate inclu-sions: single phase and amorphous. While the amorphoussilicate was reported to be rare, the amount of single-phasesilicates followed the silicon content. In the present investi-gation, no such relationship has been established by studiesin either optical microscope or microprobe. The samplesstudied in this investigation contained between 0.06 to 0.39wt pct Si, while the samples in Balbi’s investigation con-tained between 0.34 to 1.83 wt pct Si. Therefore, it is proba-ble that the relationship described by Balbi et al. does nothold at very low silicon levels.
C. Inclusion Assessment
Using the SS 111116 method, the amount and fractionof inclusions per square millimeter have been assessed forsamples A to F. In the following, it has been assumed thatthe measured area fraction of inclusions is equal to thevolume fraction. Figure 6 presents the average of resultsobtained for each sample, and Table V includes the resultsobtained for each of the samples.
Fig. 4—Element mapping of complex inclusion containing Mn, Si, O, and Apparently, the volume fraction of inclusions inverselyS present in LC ferromanganese, sample A.
follows the carbon content of the sample in the studiedstandard refined ferromanganese grades, grades A to C. Fur-thermore, large-sized inclusions (DH) contribute to almosthalf of the total volume fraction of inclusions in samples AAll analyzed complex inclusions contain the constituent ele-
ments Mn, Si, O, and S, including inclusions that have been and B, while they are rare or absent in the other samples.Combining the results from Figure 6 with Table I revealsformed either by collision or precipitation.
Complex inclusions have been found with two different that the samples of commercial ferromanganese with a totaloxygen content less than 0.12 wt pct (samples C to F) containcharacteristic morphologies. Some of these appear to be
single-phase inclusions, whereas others are multiphase parti- only a small number of inclusions larger than 6.7 �m. Also,small inclusions between 3.4 and 6.7 �m are present in allcles. In the latter case, two distinct phases are clearly present,
i.e., MnO-SiO2 and MnO-MnS. Figure 4 presents an example samples and provide a large contribution to the volumefraction of inclusions in samples with a total oxygen contentof such a multiphase inclusion present in LC ferromanganese
(sample A). less than 0.12 wt pct. Studies on the ternary system Fe-Mn-O report an oxygen solubility between 0.03 and 0.08 wt pctDuring analysis of different locations within a number of
inclusions, it was found that the color of each area indicates in liquid ferromanganese with about 80 wt pct Mn.[14,15]
Considering the solubility of oxygen and the total oxygendifferent levels of silicon and sulfur. Therefore, microprobeanalyses of these differently colored areas in several multi- content in some of the ferromanganese grades studied, it is
almost certain that the inclusions in ferromanganese withphase inclusions have been performed. Results from theseanalyses are presented in Table IV. Apparently, the silicon, an oxygen content above 0.1 wt pct (sample A and B) have
formed in the liquid melt. Thereafter, these are also allowedoxygen, and sulfur content fluctuate considerably betweendifferent inclusions. However, the silicon and oxygen con- to grow during solidification, which, in turn, is indicated
by the amount of larger sized inclusions present in hightents are lower in the light gray areas compared to the darkgray or black areas. Correspondingly, the manganese and oxygen ferromanganese.
A further characterization of the inclusions includes asulfur contents are higher in the dark gray or black areascompared to the light gray areas. This indicates that the light comparison between the mean diameter and total oxygen
and carbon content. The mean diameter of inclusions in eachgray areas mainly consist of MnO and MnS, while the darkgray areas mainly consist of SiO2 and MnO. It should be sample was calculated by assuming that the average size in
each category was representative. That is, inclusionsnoted that Mg, Ti, Ni, Cu, and Co also have been analyzed,but the levels of these elements are typically below 0.03 at. between 3.4 and 6.7 �m were all assumed to have a diameter
METALLURGICAL AND MATERIALS TRANSACTIONS A VOLUME 32A, MONTH 2001—5

Table IV. Element Analysis of Different Areas in Several Different MnO-MnS-SiO2 Inclusions
Light Gray Areas in Complex Inclusions
Number Si S O Mn Al Fe At. Pct Total Wt Pct Total
1 0.15 27.52 21.41 49.69 0.88 0.34 100.0 96.292 0.16 27.44 21.51 50.20 0.50 0.19 100.0 95.733 0.49 24.12 25.52 48.55 1.07 0.24 100.0 94.934 1.11 21.32 27.69 47.79 1.81 0.28 100.0 94.815 1.67 30.96 17.29 49.67 0.14 0.21 99.9 89.906 3.33 24.61 24.58 47.16 0.16 0.17 100.0 90.847 2.87 24.41 25.35 46.90 0.18 0.23 99.9 92.18
Average 1.4 25.8 23.3 48.6 0.7 0.2 — —
Dark Gray Areas in Complex Inclusions
Number Si S O Mn Al Fe At. Pct Total Wt Pct Total
8 5.30 18.92 31.94 42.63 1.00 0.21 100.0 93.239 5.91 12.92 45.38 33.93 1.67 0.16 100.0 94.11
10 13.19 5.46 48.89 31.97 0.29 0.15 100.0 92.9311 15.71 0.70 52.37 31.00 0.02 0.21 100.0 88.54
Average 10.0 9.5 44.6 34.9 0.7 0.2 — —
Fig. 6—Volume fraction inclusions in six different grades of LC andMC FeMn.
Figure 7 is a comparison between the mean diameter ofinclusions and the total oxygen content of the sample. Thebars from each point represent the distribution of the resultsobtained from assessing the inclusions. Figure 7 shows thatthere is a direct relationship between the mean diameter andthe total oxygen content, indicating correspondence betweenthe oxygen analyses and the inclusion content.
It is also possible to observe a similar trend in a compari-son between the mean diameter of present inclusions andcarbon content of the sample. This is presented in Figure 8.These results have been divided into two groups; the lowergroup represented by a dotted line (samples D to F) hasbeen treated to decrease the oxygen content, while the uppergroup represented by a dashed line (samples A to C) hasnot. Since there is a clear difference in mean diameter
Fig. 5—Element mapping of agglomerated MnO and MnO-SiO2-MnS between treated and not treated ferromanganese, it is herebyinclusions present in MC ferromanganese, sample B. suggested that this treatment changes the composition and/
or morphology, and thereby density, of the inclusions, sothat the inclusion removal rate increases. As a result, onlysmaller sized inclusions remain in treated ferromanganese.of 5.05 �m. Subsequently, this mean diameter was multiplied
by the number of inclusions in that size category and a mean This is further supported by the results previously presentedin Figure 6, where the samples D to F represent the gradesdiameter for the entire sample was obtained. Presented in
6—VOLUME 32A, MONTH 2001 METALLURGICAL AND MATERIALS TRANSACTIONS A
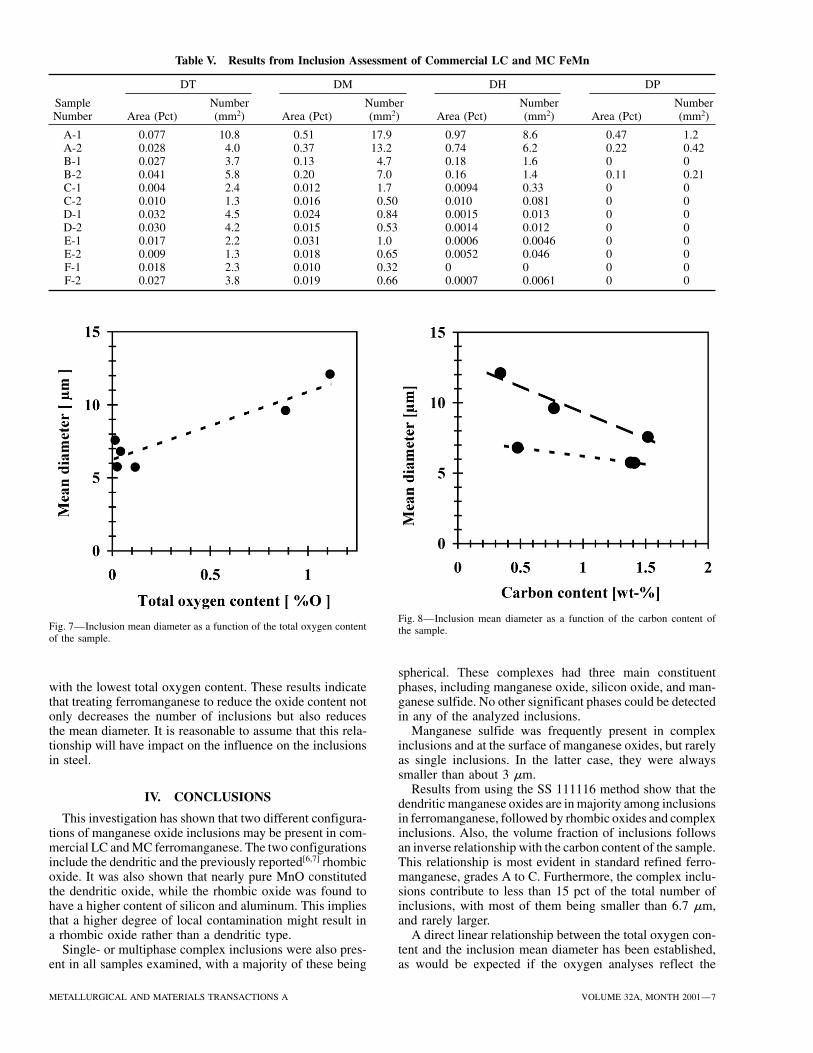
Table V. Results from Inclusion Assessment of Commercial LC and MC FeMn
DT DM DH DP
Sample Number Number Number NumberNumber Area (Pct) (mm2) Area (Pct) (mm2) Area (Pct) (mm2) Area (Pct) (mm2)
A-1 0.077 10.8 0.51 17.9 0.97 8.6 0.47 1.2A-2 0.028 4.0 0.37 13.2 0.74 6.2 0.22 0.42B-1 0.027 3.7 0.13 4.7 0.18 1.6 0 0B-2 0.041 5.8 0.20 7.0 0.16 1.4 0.11 0.21C-1 0.004 2.4 0.012 1.7 0.0094 0.33 0 0C-2 0.010 1.3 0.016 0.50 0.010 0.081 0 0D-1 0.032 4.5 0.024 0.84 0.0015 0.013 0 0D-2 0.030 4.2 0.015 0.53 0.0014 0.012 0 0E-1 0.017 2.2 0.031 1.0 0.0006 0.0046 0 0E-2 0.009 1.3 0.018 0.65 0.0052 0.046 0 0F-1 0.018 2.3 0.010 0.32 0 0 0 0F-2 0.027 3.8 0.019 0.66 0.0007 0.0061 0 0
Fig. 8—Inclusion mean diameter as a function of the carbon content ofFig. 7—Inclusion mean diameter as a function of the total oxygen content the sample.of the sample.
spherical. These complexes had three main constituentphases, including manganese oxide, silicon oxide, and man-with the lowest total oxygen content. These results indicate
that treating ferromanganese to reduce the oxide content not ganese sulfide. No other significant phases could be detectedin any of the analyzed inclusions.only decreases the number of inclusions but also reduces
the mean diameter. It is reasonable to assume that this rela- Manganese sulfide was frequently present in complexinclusions and at the surface of manganese oxides, but rarelytionship will have impact on the influence on the inclusions
in steel. as single inclusions. In the latter case, they were alwayssmaller than about 3 �m.
Results from using the SS 111116 method show that theIV. CONCLUSIONS dendritic manganese oxides are in majority among inclusions
in ferromanganese, followed by rhombic oxides and complexThis investigation has shown that two different configura-tions of manganese oxide inclusions may be present in com- inclusions. Also, the volume fraction of inclusions follows
an inverse relationship with the carbon content of the sample.mercial LC and MC ferromanganese. The two configurationsinclude the dendritic and the previously reported[6,7] rhombic This relationship is most evident in standard refined ferro-
manganese, grades A to C. Furthermore, the complex inclu-oxide. It was also shown that nearly pure MnO constitutedthe dendritic oxide, while the rhombic oxide was found to sions contribute to less than 15 pct of the total number of
inclusions, with most of them being smaller than 6.7 �m,have a higher content of silicon and aluminum. This impliesthat a higher degree of local contamination might result in and rarely larger.
A direct linear relationship between the total oxygen con-a rhombic oxide rather than a dendritic type.Single- or multiphase complex inclusions were also pres- tent and the inclusion mean diameter has been established,
as would be expected if the oxygen analyses reflect theent in all samples examined, with a majority of these being
METALLURGICAL AND MATERIALS TRANSACTIONS A VOLUME 32A, MONTH 2001—7
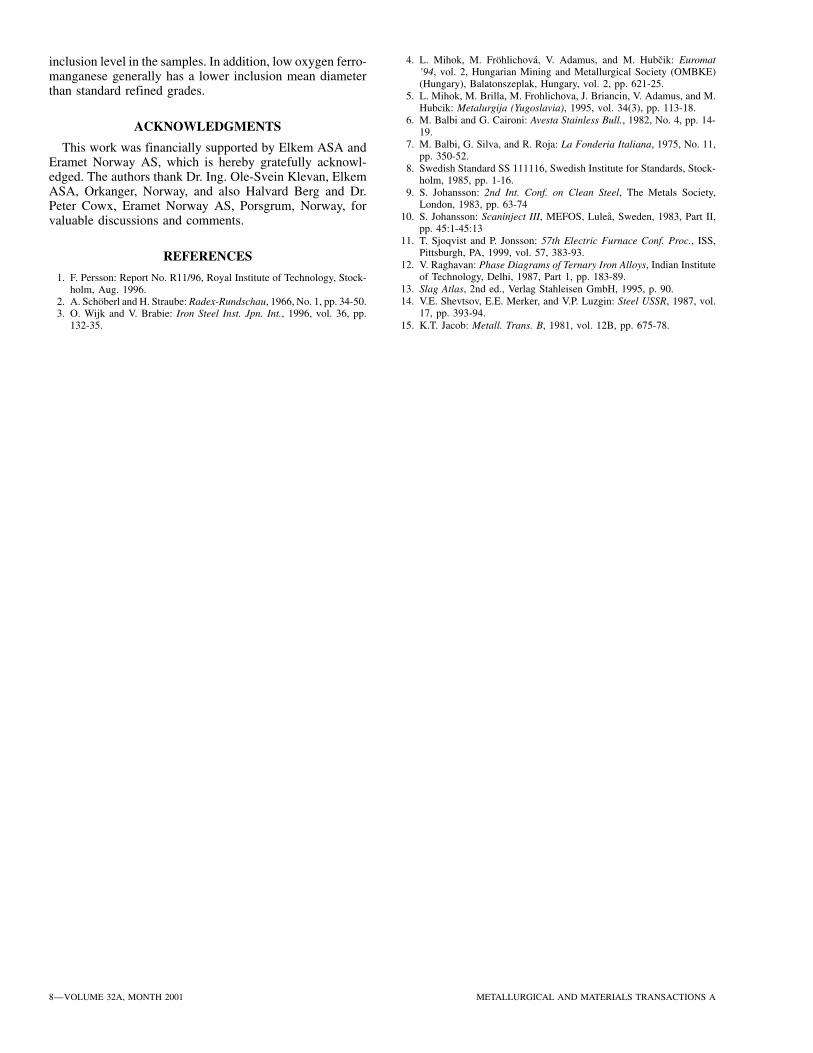
4. L. Mihok, M. Frohlichova, V. Adamus, and M. Hubcik: Euromatinclusion level in the samples. In addition, low oxygen ferro-’94, vol. 2, Hungarian Mining and Metallurgical Society (OMBKE)manganese generally has a lower inclusion mean diameter(Hungary), Balatonszeplak, Hungary, vol. 2, pp. 621-25.
than standard refined grades. 5. L. Mihok, M. Brilla, M. Frohlichova, J. Briancin, V. Adamus, and M.Hubcik: Metalurgija (Yugoslavia), 1995, vol. 34(3), pp. 113-18.
6. M. Balbi and G. Caironi: Avesta Stainless Bull., 1982, No. 4, pp. 14-ACKNOWLEDGMENTS 19.7. M. Balbi, G. Silva, and R. Roja: La Fonderia Italiana, 1975, No. 11,This work was financially supported by Elkem ASA and
pp. 350-52.Eramet Norway AS, which is hereby gratefully acknowl- 8. Swedish Standard SS 111116, Swedish Institute for Standards, Stock-edged. The authors thank Dr. Ing. Ole-Svein Klevan, Elkem holm, 1985, pp. 1-16.ASA, Orkanger, Norway, and also Halvard Berg and Dr. 9. S. Johansson: 2nd Int. Conf. on Clean Steel, The Metals Society,
London, 1983, pp. 63-74Peter Cowx, Eramet Norway AS, Porsgrum, Norway, for10. S. Johansson: Scaninject III, MEFOS, Lulea, Sweden, 1983, Part II,valuable discussions and comments.
pp. 45:1-45:1311. T. Sjoqvist and P. Jonsson: 57th Electric Furnace Conf. Proc., ISS,
Pittsburgh, PA, 1999, vol. 57, 383-93.REFERENCES12. V. Raghavan: Phase Diagrams of Ternary Iron Alloys, Indian Institute
of Technology, Delhi, 1987, Part 1, pp. 183-89.1. F. Persson: Report No. R11/96, Royal Institute of Technology, Stock-13. Slag Atlas, 2nd ed., Verlag Stahleisen GmbH, 1995, p. 90.holm, Aug. 1996.14. V.E. Shevtsov, E.E. Merker, and V.P. Luzgin: Steel USSR, 1987, vol.2. A. Schoberl and H. Straube: Radex-Rundschau, 1966, No. 1, pp. 34-50.
17, pp. 393-94.3. O. Wijk and V. Brabie: Iron Steel Inst. Jpn. Int., 1996, vol. 36, pp.132-35. 15. K.T. Jacob: Metall. Trans. B, 1981, vol. 12B, pp. 675-78.
8—VOLUME 32A, MONTH 2001 METALLURGICAL AND MATERIALS TRANSACTIONS A

TRITA-MET 090
Inclusions in CommercialHigh-Carbon Ferrochromium
Thobias Sjöqvist and Pär Jönsson
STOCKHOLMAugust 2000
DEPARTMENT OF MATERIALS SCIENCE AND ENGINEERINGDIVISION OF METALLURGYROYAL INSTITUTE OF TECHNOLOGYSE - 10044 STOCKHOLM
Inclusions In Commercial High Carbon Ferrochromium
- 1 -
Inclusions in Commercial High-Carbon Ferrochromium
Thobias Sjöqvist and Pär Jönsson
Division of Metallurgy, Department of Materials Science and Engineering,Royal Institute of Technology, SE10044 Stockholm, Sweden
ABSTRACT
Inclusions present in commercial high-carbon ferrochromium have been studied.
In addition, a standard high-carbon grade has been compared to a low
phosphorous grade. The number of inclusions per area unit was assessed
according to the Swedish Standard SS111116 using a light optical microscope.
Element analyses and mappings were made with an electron microprobe unit.
Results show that high-carbon ferrochromium contain a large amount of
inclusions compared to ferromanganese. Furthermore, the low-phosphorous
grade contained more small-sized inclusions compared to the normal high-carbon
grade. The results from element analysis show that the three most common
types of inclusions are, in order, chrome-titanium carbonitrides, manganese
sulphides and aluminium oxides. Of these three main types, the chrome-titanium
carbonitrides are in majority of the present inclusions. Although some
manganese sulphides were found as singular inclusions, most of these were
present as precipitations on the surface of another inclusion. It was also
established that ferrochromium features chromium-rich and iron-rich regions in
the matrix. In addition, the inclusions were exclusively located in the iron-rich
regions.
Inclusions In Commercial High Carbon Ferrochromium
- 2 -
LIST OF FIGURES
Figure 1. Element mapping of (Cr,Ti)(C,N) inclusion in HC FeCr 9
Figure 2. Element mapping of (Cr,Ti)(C,N) inclusion in LP FeCr 10
Figure 3. Line-scan of Al2O3 - MnS inclusion in HC FeCr 14
Figure 4. Line-scan of (Cr,Ti)(C,N) inclusion in HC FeCr 14
Figure 5. Number of inclusions in HC FeCr 16
Figure 6. Number of inclusions in LP FeCr 16
Figure 7. Average number of inclusions in FeCr 17
Figure 8. Illustration of inclusion location in studied HC and LP FeCr 23
Inclusions In Commercial High Carbon Ferrochromium
- 3 -
LIST OF TABLES
Table 1. Chemical analyses of the studied ferrochromium in wt-% 6
Table 2. Analyses of Al2O3 inclusions in HC and LP FeCr in at-% 9
Table 3. Analyses of MnS inclusions in HC and LP FeCr in at-% 12
Table 4. Analyses of (Cr,Ti)(C,N) inclusions in HC and LP FeCr in at-% 13
Table 5. Analyses of the matrix in HC FeCr in at-% 22
Inclusions In Commercial High Carbon Ferrochromium
- 4 -
1. INTRODUCTION
Ferrochromium is commonly used as an alloying agent in steel production. For
example in production of tool steel, stainless steel and bearing steel. Increasing
requirements on the material properties of the steel will in a near future result
in demands on a more controlled process environment. For producers of clean
steels this means that, for instance, alloying additions will have to be controlled
with respect to inclusion content and chemistry. Furthermore, the actual
influence of ferroalloy additions on the inclusions in steel will also have to be
investigated. These investigations should be performed in both laboratory and
production environment. The aim of this study is to lay a knowledge foundation
upon which such experiments can be done.
Earlier studies have shown that there exists many different types of inclusions in
ferrochromium.[1-11] As an example, Balbi et al. studied low-carbon grades and
reported that chromium oxides and manganese sulphides were present.[1] They
also found silicates and complex oxy-sulphides in their samples. In a study on
high-carbon ferrochromium, Retelsdorf et al.[6] showed that different types of Cr-
Mn spinels were present depending on the silicon content in the alloy. At high
silicon contents, above 0.7 wt-%, spherical Cr-Mn-Si spinels were predominant.
Formation of sulphides in synthetic Cr-Fe alloys was studied by Koloyartsev and
Rusakov.[5] They suggested that sulphide inclusions in industrial ferrochromium
should consist mainly of the Cr5S6 phase with small amounts of iron sulphide
present. If the manganese content in the alloy exceeds 5 wt-%, the sulphide
phase should instead be α -MnS. This is in agreement with the results in a study
done by Metcalfe et al.[2] on industrial high-carbon ferrochromium with a
manganese content of about 0.18 wt-%. Their results showed that the present
sulphides essentially had two different configurations, Mn2CrS3 and MnCr2S3.
The inclusion content in ferrochromium have also been investigated by Topchii et
al.[3,4] They showed that a low-carbon alloy with 0.1 wt-% Si had a lower
Inclusions In Commercial High Carbon Ferrochromium
- 5 -
inclusion content compared to an alloy with 1.5 wt-% Si.[4] Furthermore, it was
shown that the content of inclusions was highest at the top of the ingot and
lowest in the centre.
The above mentioned investigations have been concentrated on ferrochromium
with low contents of silicon, i.e. 0.1 to 1.5 wt-% Si, and mostly on low-carbon
ferrochromium. Therefore, the present study is concentrated on high-carbon
ferrochromium alloys containing 1.9 to 5.6 wt-% Si. Alloy samples have been
analysed in optical and electron microscope with respect to size distribution and
chemistry, including element mappings.

Inclusions In Commercial High Carbon Ferrochromium
- 6 -
2. METHODS AND PREPARATION
Two different industrially produced high-carbon ferrochromium grades were
sampled after casting and crushing. The chemical analysis of the samples is
presented in Table 1. The first alloy is a normal high-carbon ferrochromium
(HC FeCr) and the second is a low-phosphorous high-carbon ferrochromium
(LP FeCr). Three samples from each of these grades were studied.
Before optical and scanning electron microscope examination, the samples were
encapsulated in a conducting phenolic mounting compound, Buehler®
Konductomet® I. The surface was then grinded and subsequently polished to a
surface finish of 1 µm.
The inclusion assessment was conducted according to the Swedish Standard
SS 111116.[12-14] Since the majority of the inclusions were nearly spherical, only
class D was used in this investigation. In this class, all inclusions are considered
as being spherical. All inclusions are also categorised by size. Size category T
includes inclusions with diameters between 2.8 and 5.6 µm, M with diameters
between 5.7 and 11.2 µm, and H diameters between 11.3 and 22.6 µm. For
inclusions with a diameter larger than 22.6 µm a special category, P for
particular, is used. These are individually assessed with respect to size.
A computer software, PC-MIC©, was used to calculate the different inclusion
characteristics, including size distribution and area fraction of inclusions. These
calculations are performed according to the algorithms described in the Swedish
standard SS 111116.[12] During the present investigation the magnification was
200 times with a visual field diameter of 0.8 mm.
Table 1. Chemical analyses of the studied ferrochromium in wt-%
Element Cr Si C S P Mn Ti Ni V N O Fe
HC FeCr 59.7 5.57 7.48 0.012 0.017 0.29 0.28 0.3 0.13 0.02 0.02 26.1LP FeCr 62 1.89 7.33 0.028 0.01 0.18 0.13 0.37 0.13 0.043 0.21 27.7

Inclusions In Commercial High Carbon Ferrochromium
- 7 -
Analyses of inclusions were performed using a combined electron microprobe
unit, JEOL JXA-8900M WD/ED. WD denotes Wavelength Dispersive and ED
denotes Energy Dispersive analytical technique. These analyses included both
quantitative microarea analyses as well as qualitative element mapping analyses
of the present inclusions.
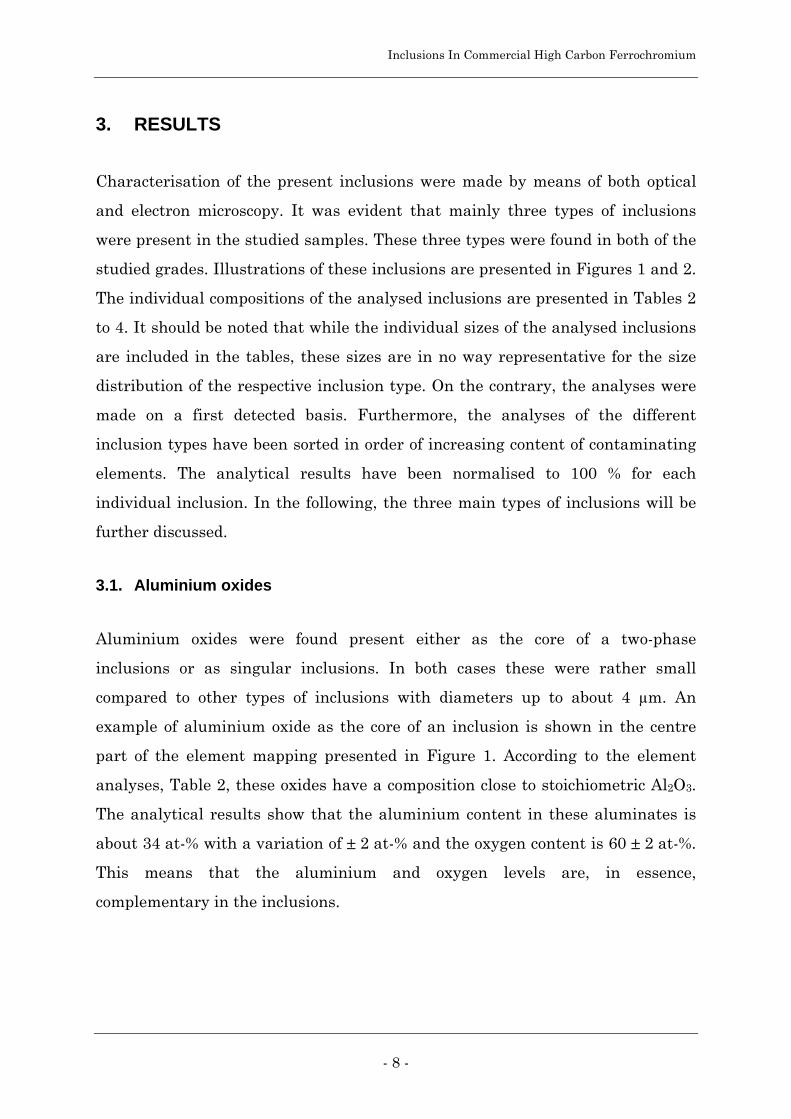
Inclusions In Commercial High Carbon Ferrochromium
- 8 -
3. RESULTS
Characterisation of the present inclusions were made by means of both optical
and electron microscopy. It was evident that mainly three types of inclusions
were present in the studied samples. These three types were found in both of the
studied grades. Illustrations of these inclusions are presented in Figures 1 and 2.
The individual compositions of the analysed inclusions are presented in Tables 2
to 4. It should be noted that while the individual sizes of the analysed inclusions
are included in the tables, these sizes are in no way representative for the size
distribution of the respective inclusion type. On the contrary, the analyses were
made on a first detected basis. Furthermore, the analyses of the different
inclusion types have been sorted in order of increasing content of contaminating
elements. The analytical results have been normalised to 100 % for each
individual inclusion. In the following, the three main types of inclusions will be
further discussed.
3.1. Aluminium oxides
Aluminium oxides were found present either as the core of a two-phase
inclusions or as singular inclusions. In both cases these were rather small
compared to other types of inclusions with diameters up to about 4 µm. An
example of aluminium oxide as the core of an inclusion is shown in the centre
part of the element mapping presented in Figure 1. According to the element
analyses, Table 2, these oxides have a composition close to stoichiometric Al2O3.
The analytical results show that the aluminium content in these aluminates is
about 34 at-% with a variation of ± 2 at-% and the oxygen content is 60 ± 2 at-%.
This means that the aluminium and oxygen levels are, in essence,
complementary in the inclusions.

Inclusions In Commercial High Carbon Ferrochromium
- 9 -
Table 2. Analyses of Al2O3 inclusions in HC and LP FeCr in at-%
No. C S Cr N Al Fe O Si Ti Mn Total otherelements Size
1 0.0 0.6 0.2 0.0 37.4 0.1 60.9 0.0 0.0 0.9 1.8 4
2 0.0 0.0 0.0 0.0 35.7 1.5 62.3 0.3 0.0 0.2 2.0 6
3 0.0 0.5 0.0 0.0 33.7 2.9 62.1 0.0 0.0 0.6 4.2 2
4 2.6 2.0 0.2 0.0 33.9 0.1 59.7 0.0 0.0 1.5 6.4 3
5 0.2 0.5 0.9 0.0 31.3 1.7 59.3 5.6 0.1 0.5 9.4 2
6 0.0 0.0 0.0 0.0 34.6 7.2 57.9 0.0 0.0 0.2 7.6 3
Average 0.5 0.6 0.2 0 34.4 2.3 60.4 1.0 0.0 0.7 5.2
Std.Dev. 1.0 0.73 0.35 0 2.1 2.6 1.7 2.3 0.02 0.48 3.0
Figure 1. Element mapping of (Cr,Ti)(C,N) inclusion in HC FeCr

Inclusions In Commercial High Carbon Ferrochromium
- 10 -
3.2. Manganese sulphides
Manganese sulphides were found either as singular inclusions or as the outer
shell on an oxide. In the case of singular inclusions, the individual diameters
were between 3 and 10 µm. Figure 1 shows an example of manganese sulphide
as the outer shell of an aluminium oxide. An example of a singular manganese
sulphide is visible in the upper right corner of the element mapping in Figure 2.
This type exhibits a variety of shapes in the different samples, the majority
having a polygonal outline.
The chemical analyses of these inclusions, Table 3, are very close to
stoichiometric MnS with a manganese content of 47 ± 2 at-% and a sulphur
content of 49 ± 2 at-%. Only a few of the analyses show a content of elements
Figure 2. Element mapping of (Cr,Ti)(C,N) inclusion in LP FeCr

Inclusions In Commercial High Carbon Ferrochromium
- 11 -
other than manganese and sulphur above > 5 at-%. Note that analyses no. 7 to
13 are from HC FeCr samples and no. 14 to 25 from LP FeCr. Other observed
features in the analytical results includes:
• Manganese and sulphur contents remain constant for all analysed inclusions.
This is indicated by the average and standard deviation of the contents in
Table 3.
• In each individual inclusion, the contents of manganese and sulphur are
complementary.
• The two most common contaminating elements are chromium followed by
carbon.
3.3. Chrome-titanium carbo-nitrides
Chrome-titanium carbonitrides was observed to be the most common inclusion
type in high-carbon ferrochromium. These were detected in the size range of 3 to
60 µm in diameter and the majority had a polygonal shape. Table 4 presents the
analyses of the individual inclusions. Analyses no. 26 to 42 are from HC FeCr
samples and no. 43 to 55 from LP FeCr. For this type of inclusion, there is a
distinct change in composition depending on whether it is present in HC or LP
FeCr. In the first case the average composition is 47 at-% Ti, 21 at-% N,
16 at-% C, and 13 at-% Cr. However, in LP FeCr the contents of carbon and
chromium are much lower, having an average composition of 48 at-% Ti,
38 at-% N, 6 at-% C, and 5 at-% Cr. For both of these groups, the typical content
of elements other than Cr, Ti, C and N were 1 to 3 at-% with few exceptions.
Examples of the carbo-nitride inclusions are presented in Figure 1 and Figure 2.
In Figure 1, two carbo-nitrides are present close to a manganese sulphide with
an aluminium oxide core. Figure 2 shows a very large carbo-nitride, about 40
§µm to the side. As can be seen in the titanium and nitrogen mapping, the
contents are reasonably uniform over the inclusion. It is also possible to notice a
distinct difference in chromium content between the upper and the lower part of
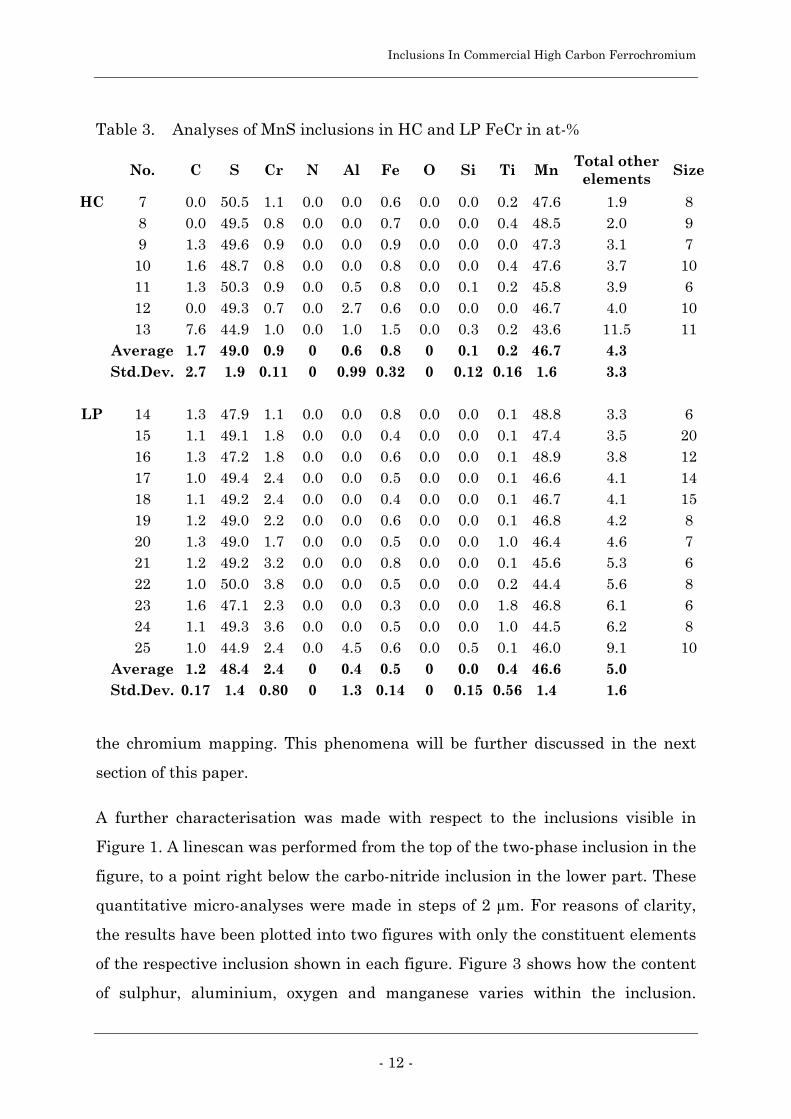
Inclusions In Commercial High Carbon Ferrochromium
- 12 -
the chromium mapping. This phenomena will be further discussed in the next
section of this paper.
A further characterisation was made with respect to the inclusions visible in
Figure 1. A linescan was performed from the top of the two-phase inclusion in the
figure, to a point right below the carbo-nitride inclusion in the lower part. These
quantitative micro-analyses were made in steps of 2 µm. For reasons of clarity,
the results have been plotted into two figures with only the constituent elements
of the respective inclusion shown in each figure. Figure 3 shows how the content
of sulphur, aluminium, oxygen and manganese varies within the inclusion.
Table 3. Analyses of MnS inclusions in HC and LP FeCr in at-%
No. C S Cr N Al Fe O Si Ti Mn Total otherelements Size
HC 7 0.0 50.5 1.1 0.0 0.0 0.6 0.0 0.0 0.2 47.6 1.9 88 0.0 49.5 0.8 0.0 0.0 0.7 0.0 0.0 0.4 48.5 2.0 99 1.3 49.6 0.9 0.0 0.0 0.9 0.0 0.0 0.0 47.3 3.1 710 1.6 48.7 0.8 0.0 0.0 0.8 0.0 0.0 0.4 47.6 3.7 1011 1.3 50.3 0.9 0.0 0.5 0.8 0.0 0.1 0.2 45.8 3.9 612 0.0 49.3 0.7 0.0 2.7 0.6 0.0 0.0 0.0 46.7 4.0 1013 7.6 44.9 1.0 0.0 1.0 1.5 0.0 0.3 0.2 43.6 11.5 11
Average 1.7 49.0 0.9 0 0.6 0.8 0 0.1 0.2 46.7 4.3Std.Dev. 2.7 1.9 0.11 0 0.99 0.32 0 0.12 0.16 1.6 3.3
LP 14 1.3 47.9 1.1 0.0 0.0 0.8 0.0 0.0 0.1 48.8 3.3 615 1.1 49.1 1.8 0.0 0.0 0.4 0.0 0.0 0.1 47.4 3.5 2016 1.3 47.2 1.8 0.0 0.0 0.6 0.0 0.0 0.1 48.9 3.8 1217 1.0 49.4 2.4 0.0 0.0 0.5 0.0 0.0 0.1 46.6 4.1 1418 1.1 49.2 2.4 0.0 0.0 0.4 0.0 0.0 0.1 46.7 4.1 1519 1.2 49.0 2.2 0.0 0.0 0.6 0.0 0.0 0.1 46.8 4.2 820 1.3 49.0 1.7 0.0 0.0 0.5 0.0 0.0 1.0 46.4 4.6 721 1.2 49.2 3.2 0.0 0.0 0.8 0.0 0.0 0.1 45.6 5.3 622 1.0 50.0 3.8 0.0 0.0 0.5 0.0 0.0 0.2 44.4 5.6 823 1.6 47.1 2.3 0.0 0.0 0.3 0.0 0.0 1.8 46.8 6.1 624 1.1 49.3 3.6 0.0 0.0 0.5 0.0 0.0 1.0 44.5 6.2 825 1.0 44.9 2.4 0.0 4.5 0.6 0.0 0.5 0.1 46.0 9.1 10
Average 1.2 48.4 2.4 0 0.4 0.5 0 0.0 0.4 46.6 5.0Std.Dev. 0.17 1.4 0.80 0 1.3 0.14 0 0.15 0.56 1.4 1.6
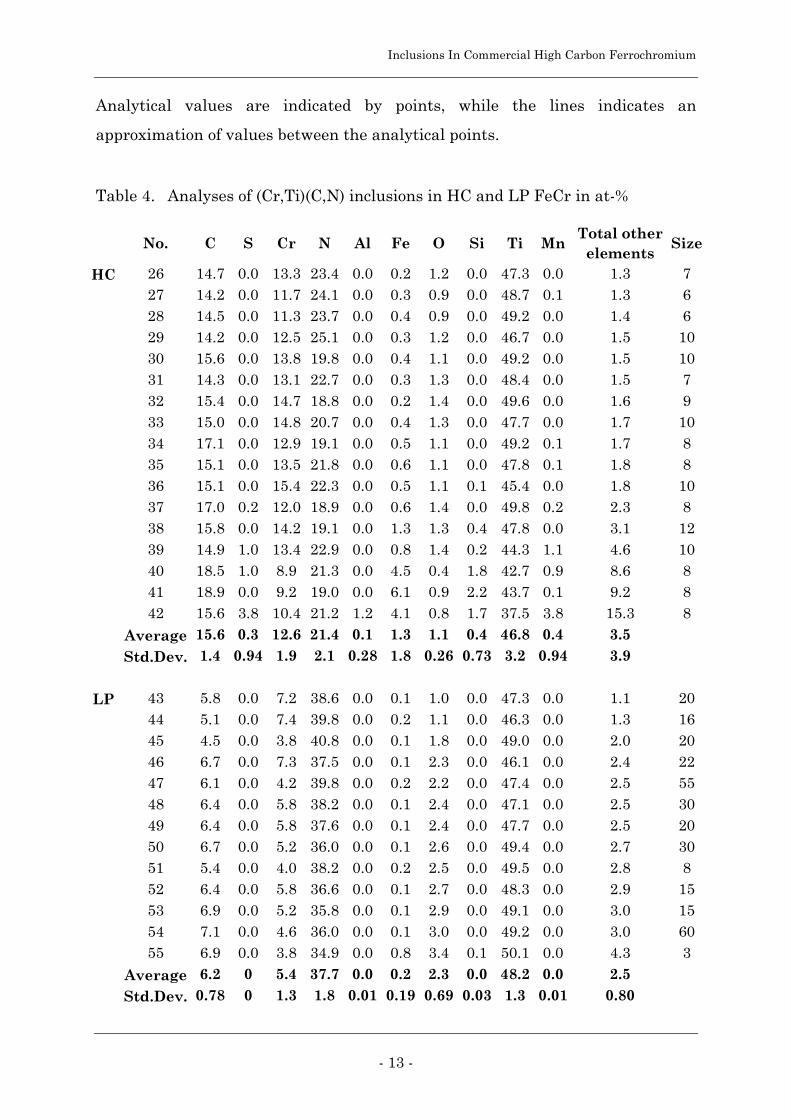
Inclusions In Commercial High Carbon Ferrochromium
- 13 -
Analytical values are indicated by points, while the lines indicates an
approximation of values between the analytical points.
Table 4. Analyses of (Cr,Ti)(C,N) inclusions in HC and LP FeCr in at-%
No. C S Cr N Al Fe O Si Ti MnTotal other
elementsSize
HC 26 14.7 0.0 13.3 23.4 0.0 0.2 1.2 0.0 47.3 0.0 1.3 727 14.2 0.0 11.7 24.1 0.0 0.3 0.9 0.0 48.7 0.1 1.3 628 14.5 0.0 11.3 23.7 0.0 0.4 0.9 0.0 49.2 0.0 1.4 629 14.2 0.0 12.5 25.1 0.0 0.3 1.2 0.0 46.7 0.0 1.5 1030 15.6 0.0 13.8 19.8 0.0 0.4 1.1 0.0 49.2 0.0 1.5 1031 14.3 0.0 13.1 22.7 0.0 0.3 1.3 0.0 48.4 0.0 1.5 732 15.4 0.0 14.7 18.8 0.0 0.2 1.4 0.0 49.6 0.0 1.6 933 15.0 0.0 14.8 20.7 0.0 0.4 1.3 0.0 47.7 0.0 1.7 1034 17.1 0.0 12.9 19.1 0.0 0.5 1.1 0.0 49.2 0.1 1.7 835 15.1 0.0 13.5 21.8 0.0 0.6 1.1 0.0 47.8 0.1 1.8 836 15.1 0.0 15.4 22.3 0.0 0.5 1.1 0.1 45.4 0.0 1.8 1037 17.0 0.2 12.0 18.9 0.0 0.6 1.4 0.0 49.8 0.2 2.3 838 15.8 0.0 14.2 19.1 0.0 1.3 1.3 0.4 47.8 0.0 3.1 1239 14.9 1.0 13.4 22.9 0.0 0.8 1.4 0.2 44.3 1.1 4.6 1040 18.5 1.0 8.9 21.3 0.0 4.5 0.4 1.8 42.7 0.9 8.6 841 18.9 0.0 9.2 19.0 0.0 6.1 0.9 2.2 43.7 0.1 9.2 842 15.6 3.8 10.4 21.2 1.2 4.1 0.8 1.7 37.5 3.8 15.3 8
Average 15.6 0.3 12.6 21.4 0.1 1.3 1.1 0.4 46.8 0.4 3.5Std.Dev. 1.4 0.94 1.9 2.1 0.28 1.8 0.26 0.73 3.2 0.94 3.9
LP 43 5.8 0.0 7.2 38.6 0.0 0.1 1.0 0.0 47.3 0.0 1.1 2044 5.1 0.0 7.4 39.8 0.0 0.2 1.1 0.0 46.3 0.0 1.3 1645 4.5 0.0 3.8 40.8 0.0 0.1 1.8 0.0 49.0 0.0 2.0 2046 6.7 0.0 7.3 37.5 0.0 0.1 2.3 0.0 46.1 0.0 2.4 2247 6.1 0.0 4.2 39.8 0.0 0.2 2.2 0.0 47.4 0.0 2.5 5548 6.4 0.0 5.8 38.2 0.0 0.1 2.4 0.0 47.1 0.0 2.5 3049 6.4 0.0 5.8 37.6 0.0 0.1 2.4 0.0 47.7 0.0 2.5 2050 6.7 0.0 5.2 36.0 0.0 0.1 2.6 0.0 49.4 0.0 2.7 3051 5.4 0.0 4.0 38.2 0.0 0.2 2.5 0.0 49.5 0.0 2.8 852 6.4 0.0 5.8 36.6 0.0 0.1 2.7 0.0 48.3 0.0 2.9 1553 6.9 0.0 5.2 35.8 0.0 0.1 2.9 0.0 49.1 0.0 3.0 1554 7.1 0.0 4.6 36.0 0.0 0.1 3.0 0.0 49.2 0.0 3.0 6055 6.9 0.0 3.8 34.9 0.0 0.8 3.4 0.1 50.1 0.0 4.3 3
Average 6.2 0 5.4 37.7 0.0 0.2 2.3 0.0 48.2 0.0 2.5Std.Dev. 0.78 0 1.3 1.8 0.01 0.19 0.69 0.03 1.3 0.01 0.80
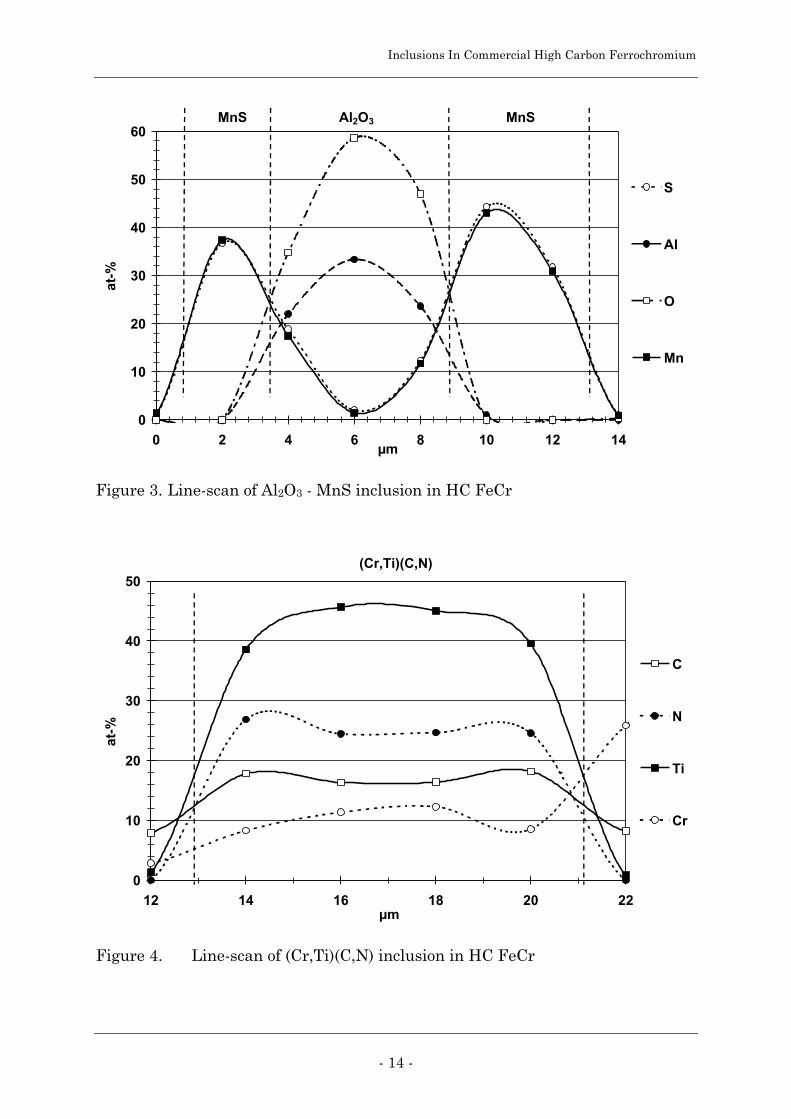
Inclusions In Commercial High Carbon Ferrochromium
- 14 -
0
10
20
30
40
50
60
0 2 4 6 8 10 12 14µm
at-%
S
Al
O
Mn
MnS Al2O3 MnS
Figure 3. Line-scan of Al2O3 - MnS inclusion in HC FeCr
(Cr,Ti)(C,N)
0
10
20
30
40
50
12 14 16 18 20 22µm
at-%
C
N
Ti
Cr
Figure 4. Line-scan of (Cr,Ti)(C,N) inclusion in HC FeCr
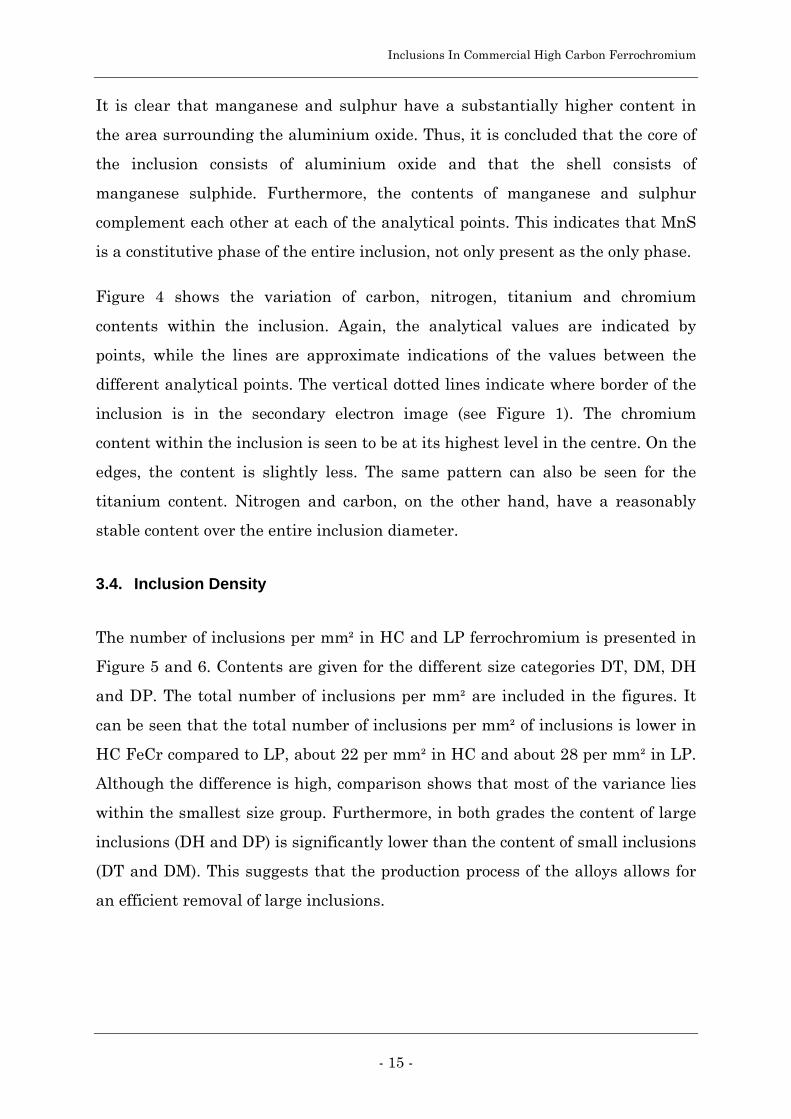
Inclusions In Commercial High Carbon Ferrochromium
- 15 -
It is clear that manganese and sulphur have a substantially higher content in
the area surrounding the aluminium oxide. Thus, it is concluded that the core of
the inclusion consists of aluminium oxide and that the shell consists of
manganese sulphide. Furthermore, the contents of manganese and sulphur
complement each other at each of the analytical points. This indicates that MnS
is a constitutive phase of the entire inclusion, not only present as the only phase.
Figure 4 shows the variation of carbon, nitrogen, titanium and chromium
contents within the inclusion. Again, the analytical values are indicated by
points, while the lines are approximate indications of the values between the
different analytical points. The vertical dotted lines indicate where border of the
inclusion is in the secondary electron image (see Figure 1). The chromium
content within the inclusion is seen to be at its highest level in the centre. On the
edges, the content is slightly less. The same pattern can also be seen for the
titanium content. Nitrogen and carbon, on the other hand, have a reasonably
stable content over the entire inclusion diameter.
3.4. Inclusion Density
The number of inclusions per mm² in HC and LP ferrochromium is presented in
Figure 5 and 6. Contents are given for the different size categories DT, DM, DH
and DP. The total number of inclusions per mm² are included in the figures. It
can be seen that the total number of inclusions per mm² of inclusions is lower in
HC FeCr compared to LP, about 22 per mm² in HC and about 28 per mm² in LP.
Although the difference is high, comparison shows that most of the variance lies
within the smallest size group. Furthermore, in both grades the content of large
inclusions (DH and DP) is significantly lower than the content of small inclusions
(DT and DM). This suggests that the production process of the alloys allows for
an efficient removal of large inclusions.

Inclusions In Commercial High Carbon Ferrochromium
- 16 -
0
5
10
15
20
25
DT2.8-5.6 µm
DM5.7-11.2 µm
DH11.3-22.4 µm
DP> 22.4 µm
Total
No
of
Incl
usi
on
s p
er m
m²
Sample 1 Sample 2 Sample 3
Figure 5. Number of inclusions in HC FeCr
0
10
20
30
40
DT2.8-5.6 µm
DM5.7-11.2 µm
DH11.3-22.4 µm
DP> 22.4 µm
Total
No
of
Incl
usi
on
s p
er m
m²
Sample 1 Sample 2 Sample 3
Figure 6. Number of inclusions in LP FeCr

Inclusions In Commercial High Carbon Ferrochromium
- 17 -
Figure 7 illustrates the average number of inclusions in both alloys. The error
bars in the figure represents the standard deviation between the studied
samples. This graph emphasises what have previously been concluded. The
difference in total inclusion content is well outside of the standard deviation
between samples, thus making the variation more certain. It can also be seen
that the largest contribution to the difference in inclusion content originate from
the smallest sized inclusions. The other variations between the two
ferrochromium grades are well within the standard deviation.
Finally, the inclusion content of ferrochromium can be compared with the
content in ferromanganese. Commercial medium-carbon ferromanganese with
1.5 wt-% has an inclusion content of about 3 to 5 inclusions per mm².[15] The
present study has shown that commercial high-carbon ferrochromium contains
about 22 inclusions per mm². It is concluded that the inclusion content is higher
than in ferromanganese.
0
5
10
15
20
25
30
35
DT2.8-5.6 µm
DM5.7-11.2 µm
DH11.3-22.4 µm
DP> 22.4 µm
Total
Nu
mb
er p
er m
m²
HC FeCr LP FeCr
Figure 7. Average number of inclusions in FeCr
Inclusions In Commercial High Carbon Ferrochromium
- 18 -
4. DISCUSSION
4.1. Manganese Sulphides
The findings in the present study concerning manganese sulphide seems to
disagree with the findings of Metcalfe et al.[2] In their study of sulphides in
HC FeCr, they found that sulphides were present with a composition close to
stoichiometric Mn2CrS3 and MnCr2S3. The first type, Mn2CrS3, was found in
standard HC FeCr while the second type, MnCr2S3, was found in desulphurised
HC FeCr. The initial ferrochromium used in their studies contained 0.063 wt-% S
and 0.18 wt-% Mn before the desulphurisation[2,9]. After desulphurisation with
commercial lime, the sulphur content in the alloy was reduced to about
0.030 wt-%.[9] In the present study, the sulphur content was lower than in
Metcalfe's study, about 0.012 wt-% in HC and 0.028 wt-% in LP FeCr.[9] In
addition, the manganese content was at about the same level as in their study,
about 0.29 wt-% in HC and 0.18 wt-% in LP FeCr.
The high contents of Mn and S in the studied ferrochromium should give a high
driving force for formation of pure manganese sulphides rather than (Cr,Mn)S.
The results presented by Metcalfe et al. shows, however, no evidence of pure
MnS inclusions present in the material. In an attempt to explain the present
sulphides, they compared the relative stabilities of different Cr, Fe and Mn
sulphides on basis of available thermodynamic data for different temperatures[16-
18]. It appeared that the most stable phase between 1100 and 1600°C was MnS
followed by CrS and FeS. This fact indicated that MnS would be the expected
sulphide phase. As an attempt to explain their analytical results, they proposed
that the high chromium content in the chromium-rich phase of the matrix would
result in such a high chemical activity of chromium that CrS is formed in
preference to MnS. However, several studies have shown that inclusions are
preferably present in the low-chromium regions of the solid chrome-iron
Inclusions In Commercial High Carbon Ferrochromium
- 19 -
matrix.[2,7,9] Consequently, the above reasoning by Metcalfe et al. is not entirely
acceptable.
In the following, another reasonable mechanism of sulphide formation in
ferrochromium is suggested. Sulphides are normally formed during solidification.
At this stage, sulphur's solubility is drastically reduced which thereby forces
sulphur to react and form a stable compound. As indicated by the values of Gibbs
energy of formation for temperatures between 1100 and 1600°C, the order of
preference is MnS followed by CrS and FeS.[16-18] In ferrochromium, manganese
levels are high enough to allow MnS to form at the beginning of solidification.
After solidification the formation and growth of sulphides is probably controlled
by diffusion rather than by chemical equilibrium. Since the diffusion rate of
manganese in a chromium-iron alloy can be assumed to be low, only manganese
in the immediate neighbourhood of the sulphide will react to form more MnS.
When the region closest to the formed sulphide is depleted with manganese, any
residual sulphur will react with chromium. In this way, the (Cr,Mn)S inclusions
will have different amounts of the constituent phases CrS and MnS depending on
the content of Mn and S in the immediate vicinity of the inclusion.
However, the suggested mechanism is insufficient to explain the results in the
this study. The present study showed that sulphide inclusions forms with a lower
CrS content in HC FeCr than in LP FeCr. This is in agreement with the
mechanism described above since the sulphur content in HC FeCr is about three
times lower than in LP FeCr. However, the CrS content in sulphur inclusions in
LP FeCr is also very low, about 5 at-%. If the suggested mechanism was
satisfactory, LP FeCr would have as much CrS in the sulphides as the
desulphurised ferrochromium in the study by Metcalfe et al.
Since the different speculations both are incomplete, it is concluded that further
work is required to discover which mechanisms that govern the formation of
sulphides in ferrochromium. However, it is concluded that the sulphides
discovered in this study are MnS inclusions.

Inclusions In Commercial High Carbon Ferrochromium
- 20 -
Finally, a low iron content was observed in the analysed sulphide inclusions.
This is concluded to be in agreement with studies performed by Metcalfe et al.
and Koloyartsev and Rusakov.[2,5]
4.2. Titanium inclusions
The analysed chrome-titanium carbonitride inclusions have many different
compositions. In an attempt to determine which constituent phases that might
be part of the inclusion, binary and ternary phase diagrams can be consulted.
Considering the binary phase diagrams for the systems C-Cr, C-Ti, Cr-N, and
N-Ti, the following nitrides and carbides might be present in the analysed
inclusions: TiC, TiN, Cr23C6 and Cr7C3.[19,20] From the ternary system C-Cr-N, it
is seen that the phases Cr2(C,N) may exist.[19] Also, the phase Cr2N can exist as
indicated by the Cr-Fe-N system. The average compositions of the chrome-
titanium carbonitride inclusions found in the present study are as follows:
• HC FeCr - 47 at-% Ti, 21 at-% N, 16 at-% C, and 13 at-% Cr
• LP FeCr - 48 at-% Ti, 38 at-% N, 6 at-% C, and 5 at-% Cr
If the analyses of the individual inclusions are taken into account, the most
probable constituent phases are Cr2N, Cr2(C,N), TiC, and TiN. The two different
chromium carbide phases, Cr23C6 and Cr7C3, are discarded because their
chrome/carbon ratio is not consistent with the present analyses. A study by
S. Hertzman on the quaternary system Fe-Cr-C-N presents the possibility of a
phase called ε-nitride consisting of (Cr,Fe)2(C,N)1.[21] This ε-nitride would in the
C-Cr-N-Ti quaternary system consist of (Cr,Ti)2(C,N)1. None of these presented
phases does, however, individually correspond with the presented analyses. This
is not entirely satisfactory since the element mappings show that carbon,
chrome, nitrogen and titanium levels are uniform within the entire inclusions.
It is possible to speculate further about the constituent phases in this type of
inclusions by, for example, reviewing the formation energies of the phases. It is
also possible to perform a more thorough thermodynamical analysis of phase
Inclusions In Commercial High Carbon Ferrochromium
- 21 -
stability and formation, similar to the study by B. Ozturk et al. on inclusion
stability in Fe-Cr-Ti-N alloys.[22] However, such calculations would be restricted
by a number of assumptions and would therefore remain speculative.
Consequently, the chrome-titanium carbonitrides that were observed in the
present study is concluded to have the nominal composition of (Cr,Ti)(C,N). It is
also concluded that additional investigations are necessary to determine the
constituent phase(s) in this type of inclusion. For this purpose, X-ray diffraction
or TEM studies might be usable techniques.
4.3. Matrix Analyses
Metcalfe and Slatter ascertained in their study that the chromium-iron matrix is
inhomogeneous.[9] Later, Metcalfe et al. confirmed these findings in their study
on manganese sulphides in high-carbon ferrochromium.[2] The results showed
that the matrix is in fact divided into two distinct phases, one chromium-rich and
the other iron-rich. A closer examination of an earlier study by Retelsdorf et al.
reveals that their results also indicates this phenomena.[7] In essence, earlier
presented results provides element mappings of different inclusions where the
chromium-rich and iron-rich regions in the matrix are visible. These results have
been confirmed in the current study. Unfortunately, it was at the time of
analyses considered as out of the scope of this study to extensively analyse the
matrix. The few analyses that were made are, however, presented in Table 5.
Most of these seems to have been performed in the iron-rich areas. It can also be
seen that analyses no. 56 to 63 shows an increased silicon content compared to
the material analysis.
In addition to the separation of the Cr-Fe matrix into two separate phases,
another very interesting feature was discovered. It seems that the inclusions are
preferably situated in the iron-rich phase and not in the chromium-rich phase.
Examples of this can be seen in Figures 1 and 2. The inclusions are without
exceptions situated in regions that have a significantly lower chromium intensity
than the chromium-rich areas. A closer examination of the results in earlier
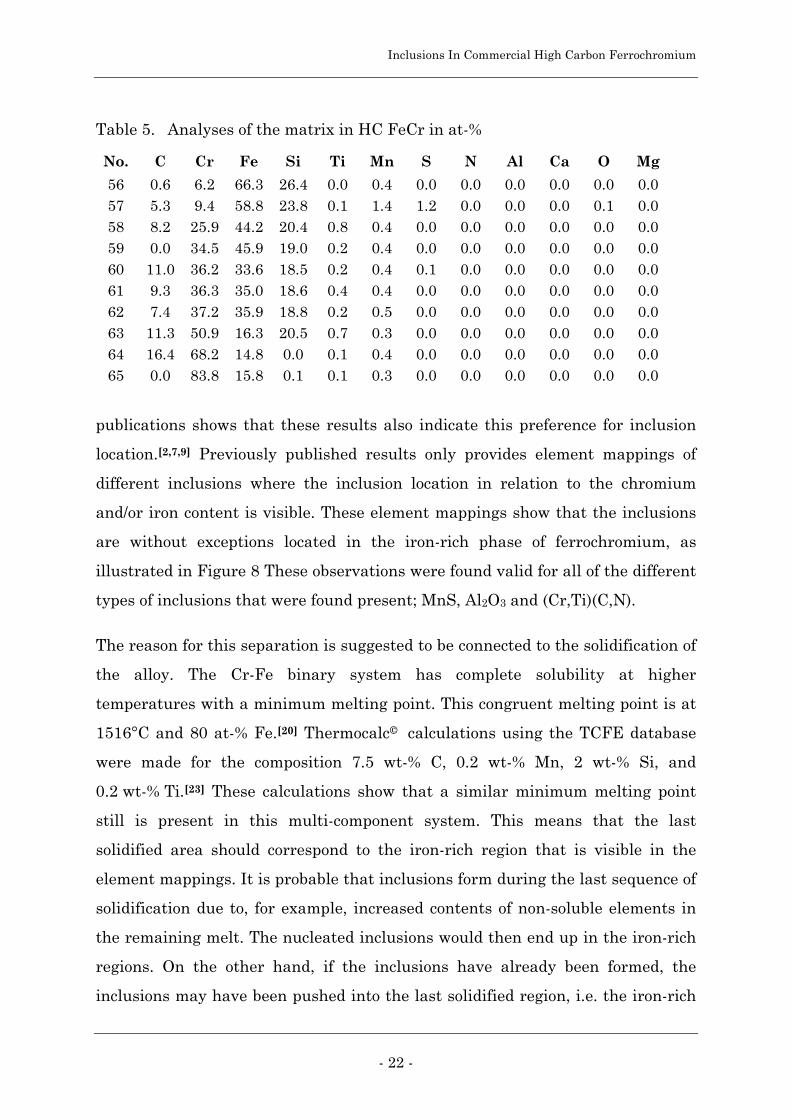
Inclusions In Commercial High Carbon Ferrochromium
- 22 -
publications shows that these results also indicate this preference for inclusion
location.[2,7,9] Previously published results only provides element mappings of
different inclusions where the inclusion location in relation to the chromium
and/or iron content is visible. These element mappings show that the inclusions
are without exceptions located in the iron-rich phase of ferrochromium, as
illustrated in Figure 8 These observations were found valid for all of the different
types of inclusions that were found present; MnS, Al2O3 and (Cr,Ti)(C,N).
The reason for this separation is suggested to be connected to the solidification of
the alloy. The Cr-Fe binary system has complete solubility at higher
temperatures with a minimum melting point. This congruent melting point is at
1516°C and 80 at-% Fe.[20] Thermocalc© calculations using the TCFE database
were made for the composition 7.5 wt-% C, 0.2 wt-% Mn, 2 wt-% Si, and
0.2 wt-% Ti.[23] These calculations show that a similar minimum melting point
still is present in this multi-component system. This means that the last
solidified area should correspond to the iron-rich region that is visible in the
element mappings. It is probable that inclusions form during the last sequence of
solidification due to, for example, increased contents of non-soluble elements in
the remaining melt. The nucleated inclusions would then end up in the iron-rich
regions. On the other hand, if the inclusions have already been formed, the
inclusions may have been pushed into the last solidified region, i.e. the iron-rich
Table 5. Analyses of the matrix in HC FeCr in at-%
No. C Cr Fe Si Ti Mn S N Al Ca O Mg
56 0.6 6.2 66.3 26.4 0.0 0.4 0.0 0.0 0.0 0.0 0.0 0.057 5.3 9.4 58.8 23.8 0.1 1.4 1.2 0.0 0.0 0.0 0.1 0.058 8.2 25.9 44.2 20.4 0.8 0.4 0.0 0.0 0.0 0.0 0.0 0.059 0.0 34.5 45.9 19.0 0.2 0.4 0.0 0.0 0.0 0.0 0.0 0.060 11.0 36.2 33.6 18.5 0.2 0.4 0.1 0.0 0.0 0.0 0.0 0.061 9.3 36.3 35.0 18.6 0.4 0.4 0.0 0.0 0.0 0.0 0.0 0.062 7.4 37.2 35.9 18.8 0.2 0.5 0.0 0.0 0.0 0.0 0.0 0.063 11.3 50.9 16.3 20.5 0.7 0.3 0.0 0.0 0.0 0.0 0.0 0.064 16.4 68.2 14.8 0.0 0.1 0.4 0.0 0.0 0.0 0.0 0.0 0.065 0.0 83.8 15.8 0.1 0.1 0.3 0.0 0.0 0.0 0.0 0.0 0.0

Inclusions In Commercial High Carbon Ferrochromium
- 23 -
region. In that case, the mechanism is compliant with a recent study performed
by Kimura et al., in which they showed that aluminate-magnesia inclusions in
low-carbon steel are pushed by the advancing solidification front.[24]
4.4. Analytical Reliability
The many electron microprobe analyses presented in this study have a certain
degree of uncertainty. These analyses have been performed with a 15 kV
excitation potential. This means that the electron beam penetrates the surface of
the specimen with between 1 and 2 µm in depth, depending on the density of the
excited material. In comparison, the dimensions of the examined inclusions
varied between 2 to 60 µm in diameter. This means that the smaller inclusions
almost are of the same size as the so called analytical volume of the excitation
beam. An indication of beam penetration into the matrix of the specimen would
be an increased content of both iron and chromium in the inclusion. Since only a
few of the presented analyses has these characteristics, it is concluded that beam
penetration has had only a limited influence on the analytical results.
Figure 8. Illustration of inclusion location in studied HC and LP FeCr
Inclusions In Commercial High Carbon Ferrochromium
- 24 -
5. CONCLUSIONS
The inclusions in high-carbon ferrochromium have been studied. The content and
composition in normal HC and in low-phosphorous ferrochromium has been
compared. Results show that both grades contain a number of different types of
inclusions. These have been identified by optical and electron microscopy. The
analyses established that the individual compositions corresponded to
aluminium oxides, manganese sulphides and chrome-titanium carbonitrides.
These findings are mainly in agreement with previous investigations. The
specific conclusions are:
• Three types of inclusions were found present in HC and LP ferrochromium.
These are Al2O3, MnS and (Cr,Ti)(C,N)
• Inclusion assessment in optical microscope established a higher content of
inclusions in LP FeCr compared to HC FeCr. The difference was most notable
among inclusions between 2.8 and 5.6 µm.
• The inclusion content is much higher than in commercial medium-carbon
ferromanganese.
• The ferrochromium matrix is inhomogeneous and divided into one chromium-
rich and one iron-rich region.
• All studied element mappings show that the inclusions are located in the iron-
rich regions.

Inclusions In Commercial High Carbon Ferrochromium
- 25 -
6. ACKNOWLEDGEMENTS
The authors thank Professor Seshadri Seetharaman, Department of Materials
Science and Engineering, Division of Metallurgy, KTH, Sweden for the valuable
discussions during the course of this work. We are also grateful to Mr. Morten
Raanes, NTNU, Norway for his help during the microprobe sessions. Finally, the
financial support from Elkem ASA is thankfully acknowledged.
Inclusions In Commercial High Carbon Ferrochromium
- 26 -
7. REFERENCES
1) M. Balbi and G. Caironi: Avesta Stainless Bulletin, 1982, no. 4, pp. 14-19.
2) B. Metcalfe, T.R.C. Fernandes, and J.T. Thirlwall: Metals Technology,
1980, vol. 7, no. 8, pp. 317-322.
3) S.F. Topchii, I.A. Garevskikh, I.V. Shilina, and V.P. Zaiko: Industrial
laboratory, 1970, vol. 36, no. 11, pp. 1743-1744.
4) S.F. Topchii, I.A. Garevskikh, and A.N. Samsonov: Industrial laboratory,
1970, vol. 36, no. 3, pp. 405-406.
5) V.L. Koloyartsev and L.N. Rusakov: Russian metallurgy, 1970, vol. 3,
pp. 23-25.
6) H.J. Retelsdorf, H. Reinhard, and H. Winterhager: Metallwissenschaft und
Technik, 1970, vol. 24, no. 1, pp. 33-40.
7) H.J. Retelsdorf, H. Reinhard, and H. Winterhager: Metallwissenschaft und
Technik, 1969, vol. 23, no. 5, pp. 459-463.
8) R. Zoja: Revue de Métallurgie, 1967, vol. 64, no. 7-8, pp. 675-679.
9) B. Metcalfe and D. Slatter: Ironmaking Steelmaking, 1978, vol. 5, no. 3,
pp. 103-106.
10) S. Landova: Hutnicke Listy, 1980, vol. 35, no. 8, pp. 541-549.
11) V. Kosan, F. Kuncl, and P. Ricl: Hutnicke Listy, 1983, vol. 38, no. 1,
pp. 36-41.
12) Swedish Standard SS 111116, Swedish Institute for Standards, P.O. Box
6455, SE11382 Stockholm, Sweden, 1985, pp. 1-16.
Inclusions In Commercial High Carbon Ferrochromium
- 27 -
13) S. Johansson: in Second International Conference on Clean Steel, The
Metals Society, London, 1983, pp. 63-74.
14) S. Johansson: in Scaninject III, part II, MEFOS, Luleå, Sweden, 1983,
pp. 45:1-13.
15) E. Fuchs and P. Jonsson: High Temperature Materials and Processes,
2000, vol. 19, no. 5, pp. 333-343.
16) E.T. Turkdogan, R.G. Olsson, and J.V. Vinters: Metallurgical and
Materials Transactions B, 1977, vol. 8B, no. 1, pp. 59-65.
17) J.P. Hager and J.F. Elliott: Transactions of AIME, 1967, vol. 239, no. 4,
pp. 513-520.
18) J.F. Elliott and M. Gleiser: "Thermochemistry for Steelmaking", Addison-
Wesley, London, UK, 1960, vol. 1.
19) "Phase Diagrams for Ceramists", general editor A.E. McHale, The
American Ceramic Society, 753 Ceramic Place, Westerville, Ohio, USA,
1994, vol. X.
20) T.B. Massalski: Binary Alloy Phase Diagrams, Edited by H. Okamota, P.R.
Subramanian, and L. Kacprzak, 2nd edition, American Society for Metals,
Metals Park, Ohio, USA, 1990, vol. 1.
21) S. Hertzman, Metallurgical and Materials Transactions, 1987, vol. 18A,
no. 10, pp. 1753-1766.
22) B. Ozturk, R. Matway, and R.J. Fruehan: Metallurgical and Materials
Transactions, 1995, vol. 26B, no. 3, pp. 563-567.
23) B. Sundman: "Thermo-Calc User's Guide", ver. M, 1999.
24) S. Kimura, Y. Nabeshima, K. Nakajima, and S. Mizoguchi: Metallurgical
and Materials Transactions, 2000, vol. 31B, no. 5, pp. 1013-1021.
TRITA-MET 043
Effect of ferromanganese additions oninclusion characteristics in steel
Thobias Sjöqvist and Pär Jönsson
STOCKHOLMAugust 1999
DEPARTMENT OF METALLURGYROYAL INSTITUTE OF TECHNOLOGYSE - 10044 STOCKHOLM
Effect of Ferromanganese Additions on Inclusion Characteristics in Steel
1999 ELECTRIC FURNACE CONFERENCE PROCEEDINGS 383
Effect of Ferromanganese Additions onInclusion Characteristics in Steel
Thobias Sjöqvist and Pär JönssonRoyal Institute of Technology
Department of MetallurgyBrinellvägen 23, SE10044 STOCKHOLM, Sweden
Tel. +4687908404, Fax. +468149338
Key Words: Ferromanganese, Ferroalloys, Steel,Inclusions, Cleanness, Laboratory Experiments,FeMn, SS 11 11 16
ABSTRACT
The effect of ferromanganese additions oninclusion characteristics in steel have been studied.The aim is to show the effect of commercial low andmedium carbon ferromanganese on the compositionand size distribution of inclusions in steel. This studyis based on laboratory experiments using six differentlow and medium carbon ferromanganese alloys.Optical microscopy, using the assessment methodSS 11 11 16, and SEM with EDS was used todetermine the inclusion characteristics in the steelsamples. The high inclusion content in standardrefined low and medium carbon ferromanganeseresults in steels with high amounts of inclusions.Alloying with low oxygen ferromanganese results infewer inclusions than with standard refinedferromanganese. Most of the analysed inclusionscontained MnO, MnS or Al2O3.
INTRODUCTION
Requirements on steel properties are continuallybecoming more rigorous as the applications becomesmore demanding. Steel properties are influenced bynon-metallic inclusions, and as solid steel cannotdissolve oxygen, inclusions will always be present incommercial steel products. Depending on thedemands on the steel, the effect of the inclusions canbe beneficial or detrimental to the steel properties. Atypical example of beneficial inclusions are
manganese sulphides in machining steels, where theirpresence facilitates a higher machining rate and/orextends the tool life(1). In contrast, detrimentalinclusions may even override any improvement inphysical and mechanical properties obtained byhaving an optimal microstructure(2). For instance,non-deformable inclusions are detrimental toproperties of deep drawing steels(1). Both rail and ballbearing steels have high demands on fatigue strengthand are thus sensitive to inclusions like magnesia-aluminates, calcia-aluminates and titanium-carbonitrides(3-5). Stainless thin sheet steels aresensitive to brittle silicates because of therequirements on surface finish, and tool steels, whichhave high demands on both fatigue strength andsurface quality, are, in essence, sensitive to all theinclusions mentioned above(6).
In recent years, research on inclusions in steel hasmainly concentrated on deoxidation practise, slag-metal reactions, inclusion removal and inclusionmodification(1,7-9). However, there is only a limitednumber of investigations concerning the effect offerroalloy additions on inclusion characteristicsduring secondary steelmaking. Two exceptions to bementioned are the work done by Wijk and Brabie(10),who studied the effect of ferrosilicon additions oninclusion cleanness in steel, and the work by Molinset al.(11) who concentrated on evaluating the effect ofimpurity elements present in different ferroalloys.Reviews in this area indicate a general need for moreinformation about the influence of ferroalloys oninclusions in steel(12,13).
The aim of this investigation was to show theeffect of ferromanganese additions on inclusioncharacteristics in steel during secondary steelmakingby means of laboratory experiments with six differentcommercial ferromanganese grades. From recentresearch on ferromanganese, it is know that differentferromanganese grades have different inclusioncharacteristics(14-18). Therefore, efforts have also beenmade to reveal if there is a relationship between theinclusion characteristics in the steel samplescompared to the ferromanganese grade used.
Effect of Ferromanganese Additions on Inclusion Characteristics in Steel
1999 ELECTRIC FURNACE CONFERENCE PROCEEDINGS 384
EXPERIMENTAL PROCEDURE
In principle three different commercial grades ofrefined ferromanganese, namely LC FeMn with max.0.5 wt-% C, and two grades of MC FeMn with max.1.0 wt-% and 1.5 wt-% C, respectively, have beenstudied. Two of the MC-grades with max 1.5 wt-% Cand one of the LC-grades used in the experiments hasgone through special treatment to reduce the oxidecontent. Hence, a total of six different types has beentested and their respective chemical compositions areshown in Table I. Grade A to D are from ErametSauda in Norway, whereas grade E and F areproduced at Eramet Porsgrunn, Norway. A total of12 experiments have been carried out, i.e. twoexperiments for each of the six ferromanganesegrades studied.
The experiments were carried out in a BalzerVSG50 vacuum induction furnace as presented inFigure 1. A magnesite crucible with an inside heightof 260 mm and inside diameter of 220 mm was used.The temperature was monitored by a thermocouple oftype B inserted through the wall of the crucible atabout 25 mm above the bottom. A PID regulator wasconnected to the thermocouple to control thetemperature within ± 1°C. At the start of eachexperiment, 20 kg of pure iron (see Table II for X-rayanalysis) was placed in the crucible and thereafter thevacuum chamber was sealed and evacuated down toabout 0.09 torr (~ 1.2·10-4 atm).
After completed evacuation, the chamber waspurged with pure argon (< 5 ppm O2 and < 5 ppmH2O) and induction heating was started. When the
temperature in the crucible reached approximately400°C, the vacuum chamber was again evacuated toabout 0.12 torr (~ 1.6·10-4 atm) to further decreasethe oxygen content in the atmosphere surrounding thecrucible. Thereafter, argon was introduced at a rate of30 Nl/min to the vacuum chamber to keep theatmosphere inert during the experiment. Aftermelting of the pure iron, the melt was heated to andkept at a temperature of 1873 K.
Figure 1. Experimental setup.
Table I. Chemical composition of studied ferromanganese grades. Element contents are given in weight-%.No. Site Grade Mn Fe Al Si O S C P NA Sauda LC 0,5% C 79.6 17.7 0.045 0.01 1.11 0.004 0.34 0.17 0.142B Sauda MC 1,0% C 81.1 16.5 0.028 0.12 0.89 0.005 0.77 0.17 0.056C Sauda MC 1,5% C 81.5 15.9 0.027 0.04 0.01 0.003 1.52 0.16 0.069D Sauda MC 1,5% C(*) 81.0 16.1 0.030 0.39 0.02 0.003 1.38 0.16 0.069E Porsgrunn LC 0.5% C(*) 81.4 17.3 0.035 0.32 0.04 0.003 0.48 0.16 0.039F Porsgrunn MC 1.5% C(*) 80.6 16.8 0.023 0.29 0.12 0.003 1.41 0.16 0.058
(*) Reduced oxide content
Effect of Ferromanganese Additions on Inclusion Characteristics in Steel
1999 ELECTRIC FURNACE CONFERENCE PROCEEDINGS 385
Table II. X-ray analysis of pure iron used in the experiments.
Element Wt-%C 0.0061Si 0.0089
Mn 0.0644P 0.0034S 0.0032Al 0.0019Ni 0.0229Cr 0.0105V 0.0000
Mo 0.0000Cu 0.0124W 0.0011Ti 0.0000
SUM 0.13
Since the additions container is evacuated andpurged with argon, additions could be made underinert atmosphere. All steel sampling was madethrough an airlock to preserve the inert atmosphereinside the vacuum chamber. The pressure andtemperature in the crucible were monitoredthroughout the whole experiment, and values fromone experiment are shown in Figure 2.
0
200
400
600
800
1000
1200
1400
1600
0 25 50 75 100 125 150
Time [minutes]
0
0.2
0.4
0.6
0.8
1
Temperature Pressure
Argonpurging
Evacuation
Argonpurging
Start of experiment
End ofexperiment
Figure 2. Typical Time-Temperature-Pressure variations during experiments.
Figure 3 presents the time schedule for additionsand sampling together with the variation of chemicalcomposition in the melt during one of theexperiments. At time zero, 37.5 ± 0.5 g pure graphite( > 99.97 wt-% C), corresponding to 0.18 wt-% C,was added. Nine minutes later, an addition of47.4 ± 0.1 g aluminium ( > 99.6 wt-% Al) was made,corresponding to 0.14 wt-% Al. At 15 minutes fromthe start of the experiment, ferromanganesecorresponding to 1.45 to 1.60 wt-% Mn was added.During the experiment, four liquid steel sampleswere taken by suction with quartz tubes with an innerdiameter of 5.8 mm. These samples were taken atsix-minute intervals, i.e. at 6, 12, 18 and 24 minutes.Each sample rod was then cut into small cylinderswith a length between 5 to 10 mm in preparation foreither chemical analysis or metallographicexamination.
0.00
0.50
1.00
1.50
0 6 12 18 24Time [minutes]
0
100
200
300
pp
m O
%Mn %C %Al ppm O
Graphite
Sample 1 Sample 2 Sample 4Sample 3
Aluminium FeMn
%M
n, %
C a
nd
%A
l
Figure 3. Additions, sampling and chemical composition during experiments
Analyses
The samples were analysed for total oxygencontent by combustion (Rosemont NOA 5003) with arelative accuracy of ± 1% and for aluminium byAtomic Absorption (Pye Unicam SP 9-Philip) with arelative accuracy of ± 5%. Carbon and sulphur wereanalysed by combustion (Rosemont CSA 5003) witha relative accuracy of ± 1% or ± 3%, respectively.
Effect of Ferromanganese Additions on Inclusion Characteristics in Steel
1999 ELECTRIC FURNACE CONFERENCE PROCEEDINGS 386
Manganese was analysed by spectrophotometry(Pye Unicam PU-8650-Philip), using the standardJernkontoret 1B (0.10 wt-% Mn) for low contentsand Domnarvet E (1.02 wt-% Mn) for high contents.The relative accuracy for low manganese contents is± 10% and for high contents ± 3%.
Seven cylinders from each sample, having a totalarea of about 185 mm², were mounted in aconducting phenolic mounting compound (Buehler®Konductomet® I) for examination in optical andscanning electron microscopes. For all samples takenduring the experiments, area fraction and number permm² of inclusions have been determined according tothe non-metallic inclusion assessment methoddefined in the Swedish Standard SS 11 11 16(19).Previously, the ferromanganese grades used in thisstudy have been assessed using the same method(18).During the assessment, all inclusions are graded intofour types according to Jernkontoret's inclusion chartII, where type A are ductile, type B are brittlestringers, type C are brittle-ductile and type D areundeformable inclusions. Type A, B and C aremeasured both in width and total length, while type Dare considered as spherical and thus measured indiameter and number of inclusions within the visualfield. These four types are then divided into fourgroups according to width/diameter, thin (T),medium (M) or heavy (H), e.g. DT, DM or DH. Thefourth group, P, is for individual particles which needa closer specification, e.g. a large brittle-ductileinclusion measuring 25 scale parts long and 16 scaleparts wide, will be denoted as "CP 25-16". A ratingfor total length, type A to C, or number of inclusions,type D, between 1 to 5 is also used. Thus, two (2)thin (T) undeformable (D) inclusions are denoted asDT2(2,20).
The SS 11 11 16 method was originally designedto determine the area fraction of inclusions in workedsteel. However, by only considering the morphologyof the inclusions, this method can also be used forliquid steel samples. This is facilitated bydisregarding the original connection betweenmorphology and typical chemical composition of the
inclusion. In other words, a spherical inclusion foundin liquid steel samples is not necessarily anundeformable calcium-aluminate inclusion.
For the present study, magnification was set to200 with a visual field diameter of 0.8 mm. A totalarea of 185 mm² was examined on each of thesamples.
A scanning electron microscope, JEOL JSM6300with EDS, was used to determine the chemicalcomposition of the inclusions present in the samples.Regular calibrations against a cobalt species weremade after each three-hour period during the analysesof the samples. When analysing inclusions withSEM, the acceleration voltage was set to 20 kV witha working distance of 25 mm. Also, the live time foreach analysis was set to 75 seconds, during which aso called dead time was allowed in the range between20 and 30%.
RESULTS AND DISCUSSION
Chemical Analyses
In order to illustrate how the content of Al, C, Mnand O typically varies during the experiments, datarelevant to FeMn grade A is presented in Figure 3.The total oxygen content follows the now classicexample from any deoxidation practise and decreasesafter the aluminium addition and reaches in the end alevel of about 35 ppm. Aluminium increases rapidlyfrom below 0.01 to 0.14 wt-% between the first andsecond sample. Thereafter, the aluminium contentdecreases slightly, which indicates that aluminium isstill being oxidised. As expected, the carbon contentis stable throughout the experiment at a level of about0.14 wt-%. The manganese content sharply increasesto a level of about 1.4 wt-% Mn after theferromanganese addition. According to predicteddissolution rates(21) and dissolution experiments(22),the ferromanganese used in the present study shouldhave been dissolved in no more than one minute afterthe addition. This should allow a homogenisationperiod of the liquid steel melt of no less than two
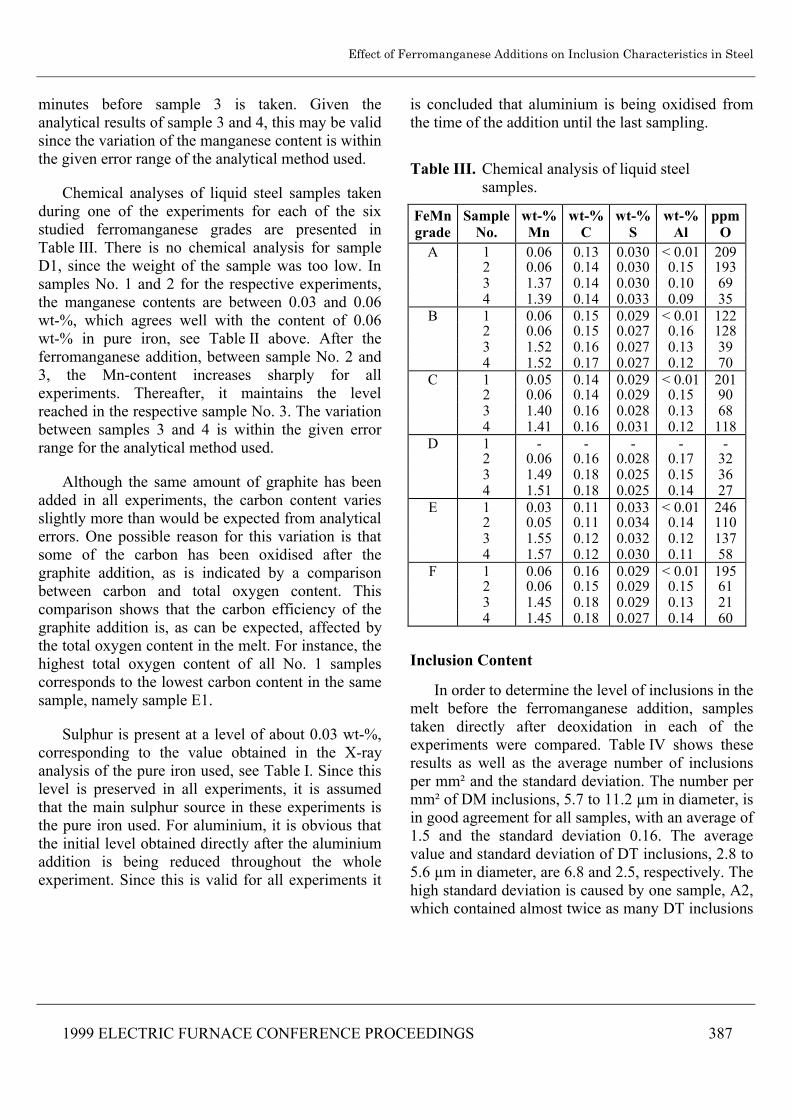
Effect of Ferromanganese Additions on Inclusion Characteristics in Steel
1999 ELECTRIC FURNACE CONFERENCE PROCEEDINGS 387
minutes before sample 3 is taken. Given theanalytical results of sample 3 and 4, this may be validsince the variation of the manganese content is withinthe given error range of the analytical method used.
Chemical analyses of liquid steel samples takenduring one of the experiments for each of the sixstudied ferromanganese grades are presented inTable III. There is no chemical analysis for sampleD1, since the weight of the sample was too low. Insamples No. 1 and 2 for the respective experiments,the manganese contents are between 0.03 and 0.06wt-%, which agrees well with the content of 0.06wt-% in pure iron, see Table II above. After theferromanganese addition, between sample No. 2 and3, the Mn-content increases sharply for allexperiments. Thereafter, it maintains the levelreached in the respective sample No. 3. The variationbetween samples 3 and 4 is within the given errorrange for the analytical method used.
Although the same amount of graphite has beenadded in all experiments, the carbon content variesslightly more than would be expected from analyticalerrors. One possible reason for this variation is thatsome of the carbon has been oxidised after thegraphite addition, as is indicated by a comparisonbetween carbon and total oxygen content. Thiscomparison shows that the carbon efficiency of thegraphite addition is, as can be expected, affected bythe total oxygen content in the melt. For instance, thehighest total oxygen content of all No. 1 samplescorresponds to the lowest carbon content in the samesample, namely sample E1.
Sulphur is present at a level of about 0.03 wt-%,corresponding to the value obtained in the X-rayanalysis of the pure iron used, see Table I. Since thislevel is preserved in all experiments, it is assumedthat the main sulphur source in these experiments isthe pure iron used. For aluminium, it is obvious thatthe initial level obtained directly after the aluminiumaddition is being reduced throughout the wholeexperiment. Since this is valid for all experiments it
is concluded that aluminium is being oxidised fromthe time of the addition until the last sampling.
Table III. Chemical analysis of liquid steel samples.
FeMngrade
SampleNo.
wt-%Mn
wt-%C
wt-%S
wt-%Al
ppmO
A 1 0.06 0.13 0.030 < 0.01 2092 0.06 0.14 0.030 0.15 1933 1.37 0.14 0.030 0.10 694 1.39 0.14 0.033 0.09 35
B 1 0.06 0.15 0.029 < 0.01 1222 0.06 0.15 0.027 0.16 1283 1.52 0.16 0.027 0.13 394 1.52 0.17 0.027 0.12 70
C 1 0.05 0.14 0.029 < 0.01 2012 0.06 0.14 0.029 0.15 903 1.40 0.16 0.028 0.13 684 1.41 0.16 0.031 0.12 118
D 1 - - - - -2 0.06 0.16 0.028 0.17 323 1.49 0.18 0.025 0.15 364 1.51 0.18 0.025 0.14 27
E 1 0.03 0.11 0.033 < 0.01 2462 0.05 0.11 0.034 0.14 1103 1.55 0.12 0.032 0.12 1374 1.57 0.12 0.030 0.11 58
F 1 0.06 0.16 0.029 < 0.01 1952 0.06 0.15 0.029 0.15 613 1.45 0.18 0.029 0.13 214 1.45 0.18 0.027 0.14 60
Inclusion Content
In order to determine the level of inclusions in themelt before the ferromanganese addition, samplestaken directly after deoxidation in each of theexperiments were compared. Table IV shows theseresults as well as the average number of inclusionsper mm² and the standard deviation. The number permm² of DM inclusions, 5.7 to 11.2 µm in diameter, isin good agreement for all samples, with an average of1.5 and the standard deviation 0.16. The averagevalue and standard deviation of DT inclusions, 2.8 to5.6 µm in diameter, are 6.8 and 2.5, respectively. Thehigh standard deviation is caused by one sample, A2,which contained almost twice as many DT inclusions

Effect of Ferromanganese Additions on Inclusion Characteristics in Steel
1999 ELECTRIC FURNACE CONFERENCE PROCEEDINGS 388
as the other samples. The most probable reason forthis deviation is that the inclusions formed duringdeoxidation have not been removed at the same rateas during the other experiments. This is alsoindicated by the total oxygen content in the sample,see Table III. However, in general, contents of DTand DM inclusions before the FeMn addition are verysimilar in all the experiments. Overall, the conclusionis that the deoxidation practise with aluminiumresulted in consistent inclusion contents in allexperiments. Thus, it is possible to compare theeffect of different FeMn grades on the inclusioncontent in the steel.
Table IV. Number of inclusions per mm² in post-deoxidation samples, DT and DM type inclusions according to SS 11 11 16.
Sample No. DT2.8-5.6 µm
DM5.7-11.2 µm
A2 12 1.6B2 5.3 1.6C2 6.7 1.5D2 5.2 1.5E2 6.2 1.4F2 5.7 1.2
Average 6.8 1.5Std.Dev. 2.5 0.16
The results of the inclusion counting of finalsamples are presented in Figure 4. For the steelsamples A4 to D4, the total area fraction ofinclusions follow an inverse relationship with thecarbon content of the ferromanganese. Thisrelationship is, however, not true for the three lowoxygen ferromanganese grades, samples D4 to F4. Inthis instance, sample F4 shows the highest areafraction of inclusions while sample D4 shows thelowest of these three. It should be noted thatinclusions of type B and C have been excluded in thepresented results since these at most represent fouroccurrences of the respective inclusion type in thesame sample. Therefore, their omission have little or
no effect on the presented results. In Figure 4, theerror bars represent the difference in result betweeninclusion counting done on final samples from twodifferent experiments for each of the ferromanganesegrades studied. Since these are in good agreement,with the exception of sample E4, it is assumed thatthese results are easily reproducible. Inclusions largerthan 11.3 µm represent less than 10% of the entireinclusion population in the final samples except forthe experiments with ferromanganese grade E. A lowarea fraction of large inclusions is expected inlaboratory experiments, since it has been shown thatlarger inclusions have a tendency to separate to thetop of melt or to the refractory due to convectioncurrents(23).
0.000%
0.005%
0.010%
0.015%
0.020%
A4 B4 C4 D4 E4 F4
Sample number
2.8-5.6 µm 5.7-11.2 µm 11.3-22.5 µm 22.6 µm -
Figure 4. Area fraction of type D inclusions in final steel samples.
Figure 5a presents the total area fraction andnumber of inclusions per mm² for eachferromanganese grade used in the present study(18),and Figure 5b provides the same information for thefinal steel samples. The presented values in bothFigure 5a and 5b, are average values from twoassessments.
From the assessment of ferromanganese grades inFigure 5a, it is evident that low carbonferromanganese have a higher area fraction of
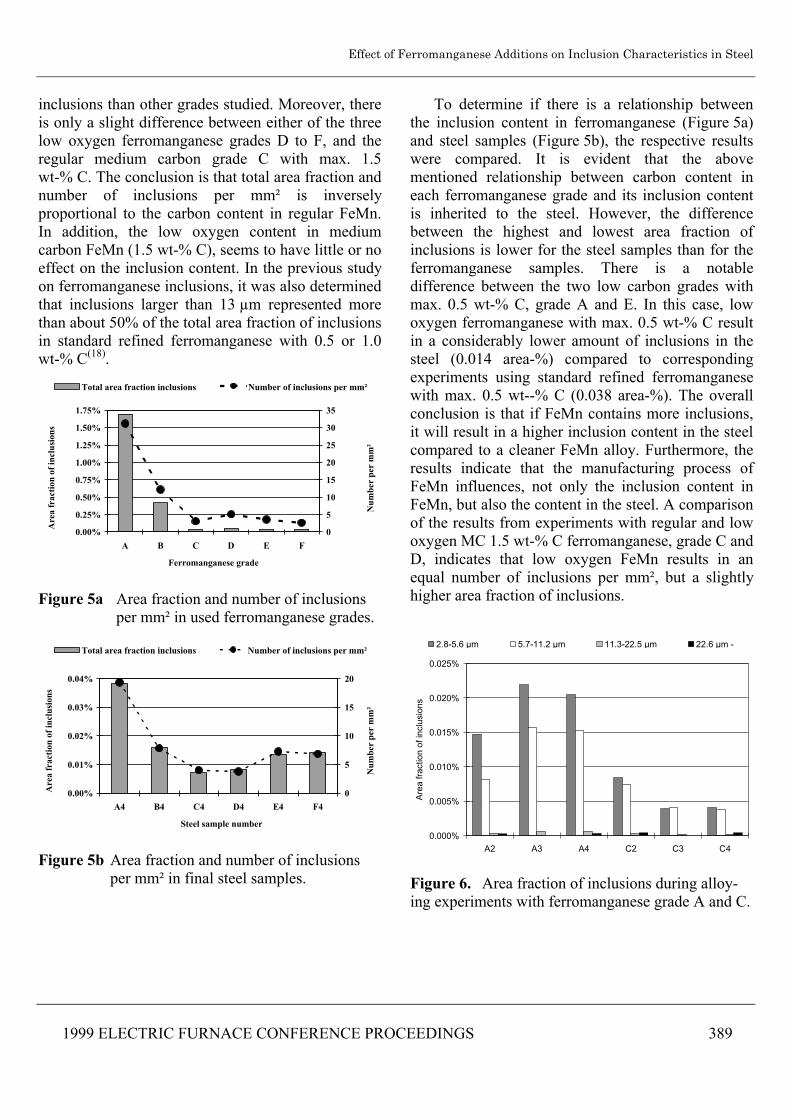
Effect of Ferromanganese Additions on Inclusion Characteristics in Steel
1999 ELECTRIC FURNACE CONFERENCE PROCEEDINGS 389
inclusions than other grades studied. Moreover, thereis only a slight difference between either of the threelow oxygen ferromanganese grades D to F, and theregular medium carbon grade C with max. 1.5wt-% C. The conclusion is that total area fraction andnumber of inclusions per mm² is inverselyproportional to the carbon content in regular FeMn.In addition, the low oxygen content in mediumcarbon FeMn (1.5 wt-% C), seems to have little or noeffect on the inclusion content. In the previous studyon ferromanganese inclusions, it was also determinedthat inclusions larger than 13 µm represented morethan about 50% of the total area fraction of inclusionsin standard refined ferromanganese with 0.5 or 1.0wt-% C(18).
0.00%
0.25%
0.50%
0.75%
1.00%
1.25%
1.50%
1.75%
A B C D E F
Ferromanganese grade
Are
a fr
acti
on o
f inc
lusi
ons
0
5
10
15
20
25
30
35
Num
ber
per
mm
²
Total area fraction inclusions Number of inclusions per mm²
Figure 5a Area fraction and number of inclusions per mm² in used ferromanganese grades.
0.00%
0.01%
0.02%
0.03%
0.04%
A4 B4 C4 D4 E4 F4
Steel sample number
Are
a fr
acti
on o
f inc
lusi
ons
0
5
10
15
20
Num
ber
per
mm
²
Total area fraction inclusions Number of inclusions per mm²
Figure 5b Area fraction and number of inclusions per mm² in final steel samples.
To determine if there is a relationship betweenthe inclusion content in ferromanganese (Figure 5a)and steel samples (Figure 5b), the respective resultswere compared. It is evident that the abovementioned relationship between carbon content ineach ferromanganese grade and its inclusion contentis inherited to the steel. However, the differencebetween the highest and lowest area fraction ofinclusions is lower for the steel samples than for theferromanganese samples. There is a notabledifference between the two low carbon grades withmax. 0.5 wt-% C, grade A and E. In this case, lowoxygen ferromanganese with max. 0.5 wt-% C resultin a considerably lower amount of inclusions in thesteel (0.014 area-%) compared to correspondingexperiments using standard refined ferromanganesewith max. 0.5 wt--% C (0.038 area-%). The overallconclusion is that if FeMn contains more inclusions,it will result in a higher inclusion content in the steelcompared to a cleaner FeMn alloy. Furthermore, theresults indicate that the manufacturing process ofFeMn influences, not only the inclusion content inFeMn, but also the content in the steel. A comparisonof the results from experiments with regular and lowoxygen MC 1.5 wt-% C ferromanganese, grade C andD, indicates that low oxygen FeMn results in anequal number of inclusions per mm², but a slightlyhigher area fraction of inclusions.
0.000%
0.005%
0.010%
0.015%
0.020%
0.025%
A2 A3 A4 C2 C3 C4
Are
a fr
actio
n of
incl
usio
ns
2.8-5.6 µm 5.7-11.2 µm 11.3-22.5 µm 22.6 µm -
Figure 6. Area fraction of inclusions during alloy-ing experiments with ferromanganese grade A and C.
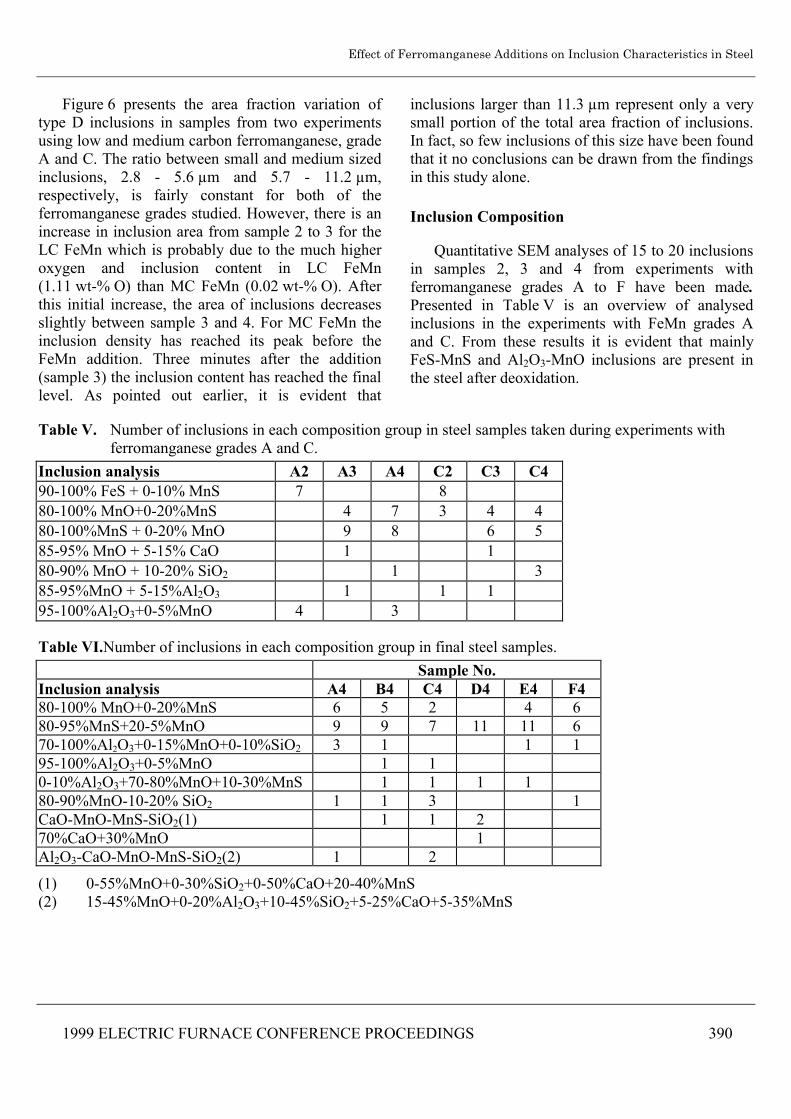
Effect of Ferromanganese Additions on Inclusion Characteristics in Steel
1999 ELECTRIC FURNACE CONFERENCE PROCEEDINGS 390
Figure 6 presents the area fraction variation oftype D inclusions in samples from two experimentsusing low and medium carbon ferromanganese, gradeA and C. The ratio between small and medium sizedinclusions, 2.8 - 5.6 µm and 5.7 - 11.2 µm,respectively, is fairly constant for both of theferromanganese grades studied. However, there is anincrease in inclusion area from sample 2 to 3 for theLC FeMn which is probably due to the much higheroxygen and inclusion content in LC FeMn(1.11 wt-% O) than MC FeMn (0.02 wt-% O). Afterthis initial increase, the area of inclusions decreasesslightly between sample 3 and 4. For MC FeMn theinclusion density has reached its peak before theFeMn addition. Three minutes after the addition(sample 3) the inclusion content has reached the finallevel. As pointed out earlier, it is evident that
inclusions larger than 11.3 µm represent only a verysmall portion of the total area fraction of inclusions.In fact, so few inclusions of this size have been foundthat it no conclusions can be drawn from the findingsin this study alone.
Inclusion Composition
Quantitative SEM analyses of 15 to 20 inclusionsin samples 2, 3 and 4 from experiments withferromanganese grades A to F have been made.Presented in Table V is an overview of analysedinclusions in the experiments with FeMn grades Aand C. From these results it is evident that mainlyFeS-MnS and Al2O3-MnO inclusions are present inthe steel after deoxidation.
Table V. Number of inclusions in each composition group in steel samples taken during experiments with ferromanganese grades A and C.
Inclusion analysis A2 A3 A4 C2 C3 C490-100% FeS + 0-10% MnS 7 880-100% MnO+0-20%MnS 4 7 3 4 480-100%MnS + 0-20% MnO 9 8 6 585-95% MnO + 5-15% CaO 1 180-90% MnO + 10-20% SiO2 1 385-95%MnO + 5-15%Al2O3 1 1 195-100%Al2O3+0-5%MnO 4 3
Table VI.Number of inclusions in each composition group in final steel samples.Sample No.
Inclusion analysis A4 B4 C4 D4 E4 F480-100% MnO+0-20%MnS 6 5 2 4 680-95%MnS+20-5%MnO 9 9 7 11 11 670-100%Al2O3+0-15%MnO+0-10%SiO2 3 1 1 195-100%Al2O3+0-5%MnO 1 10-10%Al2O3+70-80%MnO+10-30%MnS 1 1 1 180-90%MnO-10-20% SiO2 1 1 3 1CaO-MnO-MnS-SiO2(1) 1 1 270%CaO+30%MnO 1Al2O3-CaO-MnO-MnS-SiO2(2) 1 2
(1) 0-55%MnO+0-30%SiO2+0-50%CaO+20-40%MnS(2) 15-45%MnO+0-20%Al2O3+10-45%SiO2+5-25%CaO+5-35%MnS
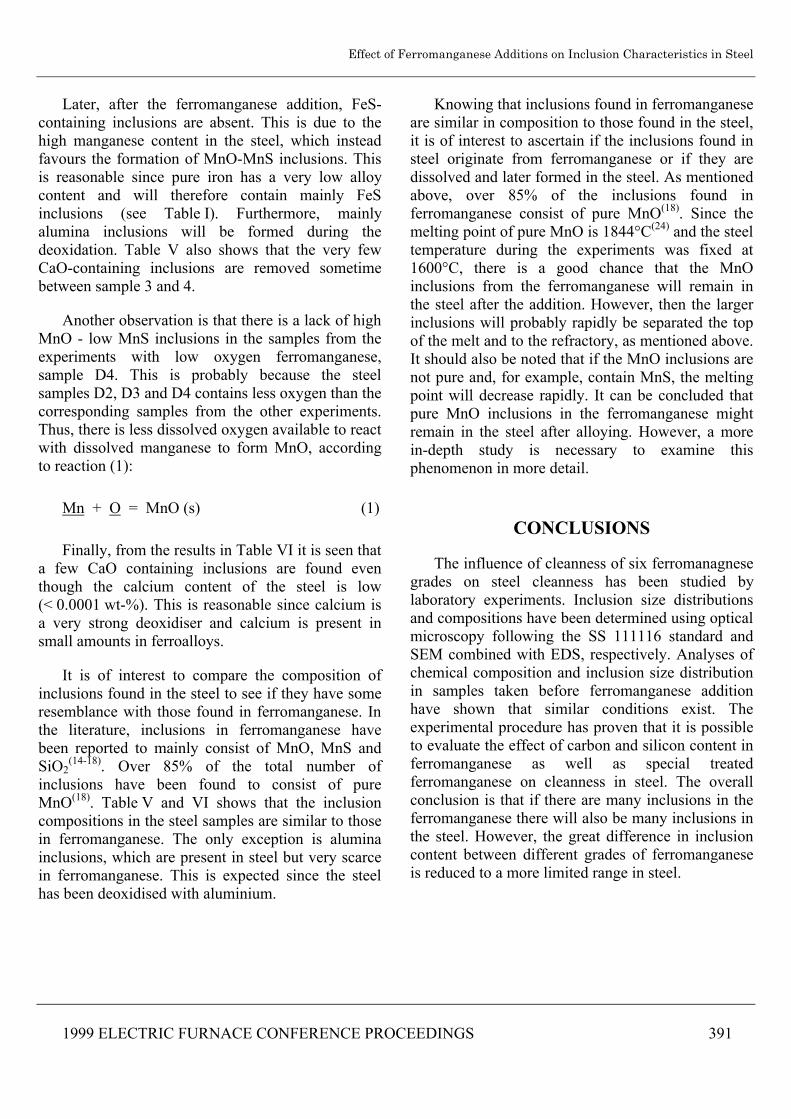
Effect of Ferromanganese Additions on Inclusion Characteristics in Steel
1999 ELECTRIC FURNACE CONFERENCE PROCEEDINGS 391
Later, after the ferromanganese addition, FeS-containing inclusions are absent. This is due to thehigh manganese content in the steel, which insteadfavours the formation of MnO-MnS inclusions. Thisis reasonable since pure iron has a very low alloycontent and will therefore contain mainly FeSinclusions (see Table I). Furthermore, mainlyalumina inclusions will be formed during thedeoxidation. Table V also shows that the very fewCaO-containing inclusions are removed sometimebetween sample 3 and 4.
Another observation is that there is a lack of highMnO - low MnS inclusions in the samples from theexperiments with low oxygen ferromanganese,sample D4. This is probably because the steelsamples D2, D3 and D4 contains less oxygen than thecorresponding samples from the other experiments.Thus, there is less dissolved oxygen available to reactwith dissolved manganese to form MnO, accordingto reaction (1):
Mn + O = MnO (s) (1)
Finally, from the results in Table VI it is seen thata few CaO containing inclusions are found eventhough the calcium content of the steel is low(< 0.0001 wt-%). This is reasonable since calcium isa very strong deoxidiser and calcium is present insmall amounts in ferroalloys.
It is of interest to compare the composition ofinclusions found in the steel to see if they have someresemblance with those found in ferromanganese. Inthe literature, inclusions in ferromanganese havebeen reported to mainly consist of MnO, MnS andSiO2
(14-18). Over 85% of the total number ofinclusions have been found to consist of pureMnO(18). Table V and VI shows that the inclusioncompositions in the steel samples are similar to thosein ferromanganese. The only exception is aluminainclusions, which are present in steel but very scarcein ferromanganese. This is expected since the steelhas been deoxidised with aluminium.
Knowing that inclusions found in ferromanganeseare similar in composition to those found in the steel,it is of interest to ascertain if the inclusions found insteel originate from ferromanganese or if they aredissolved and later formed in the steel. As mentionedabove, over 85% of the inclusions found inferromanganese consist of pure MnO(18). Since themelting point of pure MnO is 1844°C(24) and the steeltemperature during the experiments was fixed at1600°C, there is a good chance that the MnOinclusions from the ferromanganese will remain inthe steel after the addition. However, then the largerinclusions will probably rapidly be separated the topof the melt and to the refractory, as mentioned above.It should also be noted that if the MnO inclusions arenot pure and, for example, contain MnS, the meltingpoint will decrease rapidly. It can be concluded thatpure MnO inclusions in the ferromanganese mightremain in the steel after alloying. However, a morein-depth study is necessary to examine thisphenomenon in more detail.
CONCLUSIONS
The influence of cleanness of six ferromanagnesegrades on steel cleanness has been studied bylaboratory experiments. Inclusion size distributionsand compositions have been determined using opticalmicroscopy following the SS 111116 standard andSEM combined with EDS, respectively. Analyses ofchemical composition and inclusion size distributionin samples taken before ferromanganese additionhave shown that similar conditions exist. Theexperimental procedure has proven that it is possibleto evaluate the effect of carbon and silicon content inferromanganese as well as special treatedferromanganese on cleanness in steel. The overallconclusion is that if there are many inclusions in theferromanganese there will also be many inclusions inthe steel. However, the great difference in inclusioncontent between different grades of ferromanganeseis reduced to a more limited range in steel.
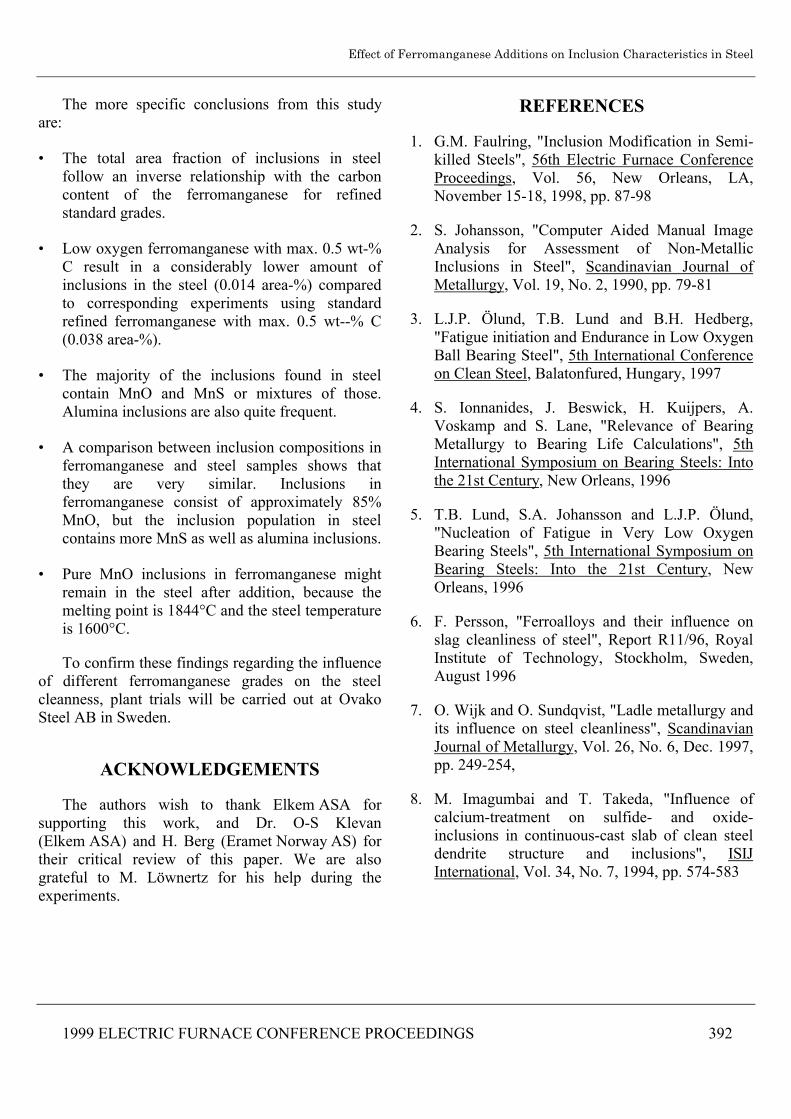
Effect of Ferromanganese Additions on Inclusion Characteristics in Steel
1999 ELECTRIC FURNACE CONFERENCE PROCEEDINGS 392
The more specific conclusions from this studyare:
• The total area fraction of inclusions in steelfollow an inverse relationship with the carboncontent of the ferromanganese for refinedstandard grades.
• Low oxygen ferromanganese with max. 0.5 wt-%C result in a considerably lower amount ofinclusions in the steel (0.014 area-%) comparedto corresponding experiments using standardrefined ferromanganese with max. 0.5 wt--% C(0.038 area-%).
• The majority of the inclusions found in steelcontain MnO and MnS or mixtures of those.Alumina inclusions are also quite frequent.
• A comparison between inclusion compositions inferromanganese and steel samples shows thatthey are very similar. Inclusions inferromanganese consist of approximately 85%MnO, but the inclusion population in steelcontains more MnS as well as alumina inclusions.
• Pure MnO inclusions in ferromanganese mightremain in the steel after addition, because themelting point is 1844°C and the steel temperatureis 1600°C.
To confirm these findings regarding the influenceof different ferromanganese grades on the steelcleanness, plant trials will be carried out at OvakoSteel AB in Sweden.
ACKNOWLEDGEMENTS
The authors wish to thank Elkem ASA forsupporting this work, and Dr. O-S Klevan(Elkem ASA) and H. Berg (Eramet Norway AS) fortheir critical review of this paper. We are alsograteful to M. Löwnertz for his help during theexperiments.
REFERENCES
1. G.M. Faulring, "Inclusion Modification in Semi-killed Steels", 56th Electric Furnace ConferenceProceedings, Vol. 56, New Orleans, LA,November 15-18, 1998, pp. 87-98
2. S. Johansson, "Computer Aided Manual ImageAnalysis for Assessment of Non-MetallicInclusions in Steel", Scandinavian Journal ofMetallurgy, Vol. 19, No. 2, 1990, pp. 79-81
3. L.J.P. Ölund, T.B. Lund and B.H. Hedberg,"Fatigue initiation and Endurance in Low OxygenBall Bearing Steel", 5th International Conferenceon Clean Steel, Balatonfured, Hungary, 1997
4. S. Ionnanides, J. Beswick, H. Kuijpers, A.Voskamp and S. Lane, "Relevance of BearingMetallurgy to Bearing Life Calculations", 5thInternational Symposium on Bearing Steels: Intothe 21st Century, New Orleans, 1996
5. T.B. Lund, S.A. Johansson and L.J.P. Ölund,"Nucleation of Fatigue in Very Low OxygenBearing Steels", 5th International Symposium onBearing Steels: Into the 21st Century, NewOrleans, 1996
6. F. Persson, "Ferroalloys and their influence onslag cleanliness of steel", Report R11/96, RoyalInstitute of Technology, Stockholm, Sweden,August 1996
7. O. Wijk and O. Sundqvist, "Ladle metallurgy andits influence on steel cleanliness", ScandinavianJournal of Metallurgy, Vol. 26, No. 6, Dec. 1997,pp. 249-254,
8. M. Imagumbai and T. Takeda, "Influence ofcalcium-treatment on sulfide- and oxide-inclusions in continuous-cast slab of clean steeldendrite structure and inclusions", ISIJInternational, Vol. 34, No. 7, 1994, pp. 574-583

Effect of Ferromanganese Additions on Inclusion Characteristics in Steel
1999 ELECTRIC FURNACE CONFERENCE PROCEEDINGS 393
9. G.J. Hassall, K.G. Bain, R.W. Young and M.S.Millman, "Studies in development of clean steels.Part I: Modelling aspects", Ironmaking andSteelmaking, Vol. 25, No. 4, 1998, pp. 273-278
10. O. Wijk and V. Brabie, "The Purity ofFerrosilicon and Its Influence on InclusionCleanliness of Steel", ISIJ International, Vol. 36,1996, Supplement, pp. S132-S135
11. J.F. Molins, J.C. Muratet, J.M. Henry and R.Botte, "The Contribution of Ferro-Alloys in theProduction of Steels With Low Impurities andClean Steels", 45th Electric Furnace ConferenceProceedings, Vol. 45, Chicago, Illinois, USA, 8-11 December 1987, pp. 209-215
12. Ø. Grong, T. Grong and T. Skaland, "Principleguidelines for new ferroalloy productdevelopments", International FerroalloysCongress 7, Norwegian Ferroalloy ResearchOrganisation (FFF), Trondheim, 1995, pp. 697-707
13. M. Subramanian and C.N. Harman, "Ferro Alloysto Meet International Quality Standards in Alloyand Special Steel Making", Tool Alloy Steels,Vol. 23, No. 10, October 1989, pp. 371-377
14. M. Balbi and G. Caironi, "Non metallicinclusions in ferroalloys used in stainless steelmanufacture", Avesta Stainless Bulletin, No. 4,1982, pp. 14-19
15. M. Balbi, G. Silva, R. Roja and F. Borile,"Contribution to the knowledge about non-metallic inclusions in ferrometallurgical productsand manganese alloyed steels", La FonderiaItaliana, No. 11, 1975, pp. 350-352
1. L. Mihok, M. Brille, M. Fröhlichova, J. Briancin,V. Adamus and M. Hubcik, "Structure andproperties of manganese ferroalloys", METABK,Vol. 34, No. 3, 1995, pp. 113-118
17. L. Mihok and V. Adamus, "Control of CommonFerroalloys Structure", Euromat '94, Vol. 2, 1994,pp. 621-62
18. T. Sjöqvist, "Characterisation of inclusions incommercial LC and MC ferromanganese",Internal Report A016, Royal Institute ofTechnology, Stockholm, Sweden, December1998.
19. "Steel - Method for assessment of the content ofnon-metallic inclusions", Svensk Standard SS 1111 16, Swedish Institute for Standards, Ver. 2,June 1987, pp. 1-16
20. Johansson, S, "Jernkontoret QuantitativeComparative Chart, JQCC", ScandinavianJournal of Metallurgy, Vol. 14, No. 1, 1985,pp. 744-48
21. S.A. Argyropoulos and R.I.L. Guthrie,"Dissolution kinetics of ferroalloys insteelmaking", 65th Steelmaking ConferenceProceedings, Vol. 65, Pittsburgh, March 28-31,1982; pp. 156-167
22. Y.E. Lee, H. Berg and B. Jensen, "DissolutionKinetics of ferroalloys in steelmaking process",Ironmaking and Steelmaking, vol. 22, 1995, pp.486-494
23. Y. Feng, "A kinetic study on the deoxidation ofliquid steel by silicon and aluminium",PhD-thesis, Royal Institute of Technology,Department of Metallurgy, May 1995, ISSN0281-8604
24. Slag Atlas, 2nd edition, Verein DeutscherEisenhüttenleute (VDEh), Düsseldorf, Germany,September 1995, pp.34.

TRITA-MET 110
Effect of Ferrochromium Additions onInclusion Characteristics in Steel
Thobias Sjöqvist and Pär Jönsson
STOCKHOLMFebruary 2001
DEPARTMENT OF MATERIALS SCIENCE AND ENGINEERINGDIVISION OF METALLURGYROYAL INSTITUTE OF TECHNOLOGYSE - 10044 STOCKHOLM

Effect of Ferrochromium Additions on Inclusion Characteristics in Steel
- 1 -
Effect of Ferrochromium Additions
on Inclusion Characteristics in Steel
Thobias Sjöqvist and Pär Jönsson
Royal Institute of Technology, Department of Materials Science and Engineering,Division of Metallurgy, Brinellvägen 23, SE10044 STOCKHOLM, Sweden
ABSTRACT
The influence of commercial high-carbon ferrochromium additions on inclusions
in steel has been studied. The study was performed on normal and low-
phosphorous high-carbon ferrochromium grades. The aim of the study was to
show if the addition of these ferroalloys had any measurable effect on the
inclusion characteristics in steel, i.e. composition, shape and size distribution.
The basis for the study is alloying experiments in a 15 kg laboratory scale.
Liquid steel was sampled during the experiments for purposes of chemical
analyses and metallographical examination. The non-metallic inclusion
assessment method SS111116 was used to determine the content and size
distribution of inclusions in the steel samples. Results from the assessment show
that a majority of the inclusions fits into the smallest size group, i.e. between 2.8
and 5.6 µm. The inclusion content in the three minute samples was about 0.004
area-%. The composition of a majority of the inclusions changed from being FeS
and Al2O3 before alloying to Al2O3 and complex sulphides after alloying. In
conclusion, there were no indications of inheritance of inclusions from the
ferrochromium to the steel.
Key Words: Ferrochromium, FeCr, Ferroalloy, Steel, Inclusions, Cleanness,
Laboratory Experiments, SS111116, Microscope

Effect of Ferrochromium Additions on Inclusion Characteristics in Steel
- 2 -
LIST OF FIGURES
Figure 1. Experimental setup. 7
Figure 2. Time-Temperature-Pressure variations during experiments. 8
Figure 3. Typical composition variation for HC and LP FeCr. 11
Figure 4. Total number of inclusions per mm² in liquid steel samples. 13
Figure 5. Total area-% of inclusions in liquid steel samples. 15
Figure 6. Number of inclusions per mm² in used ferrochromium grades 20

Effect of Ferrochromium Additions on Inclusion Characteristics in Steel
- 3 -
LIST OF TABLES
Table 1. Chemical analyses of studied ferrochromium in wt-%. 6
Table 2. Chemical analyses of addition materials in wt-%. 7
Table 3. Additions made during experiments 9
Table 4. Chemical analysis of liquid steel samples. 12
Table 5. Number of inclusions per mm² in liquid steel samples. 14
Table 6. Area-% of inclusions in liquid steel samples. 14
Table 7. Individual SEM analyses in at-%. 16
Table 8. Type of inclusions present in steel samples. 17
Effect of Ferrochromium Additions on Inclusion Characteristics in Steel
- 4 -
1. INTRODUCTION
Inclusions in steel have been a topic for investigation for many decades. Many of
these investigations have focused on inclusions in the end-product, while others
have studied how the inclusion characteristics change during the production of
steel. Most of the latter investigations have focused on areas such as slag-metal
reactions, inclusion removal and inclusions modification.[1-4] These areas have in
common that the effect on inclusion characteristics in steel is mostly intentional.
Another area of interest is the unintentional effect of additions that have another
primary objective, such as ferroalloys additions. Here, the primary objective is to
increase the content of the added element, e.g. chromium in ferrochromium. It is
not always anticipated that in addition to the wanted primary effect, this
addition may also influence the inclusions in the steel. In this field of study,
there have only been a limited number of investigations.
The effect of ferrosilicon and ferromanganese on steel cleanness has previously
been studied.[5,6] Wijk and Brabie performed a study on the effect of low-carbon
ferrosilicon additions on steel cleanness.[5] This study showed that the addition of
high-purity ferrosilicon resulted in fewer inclusions in the steel compared to
when using standard ferrosilicon. The effect of adding ferromanganese on
inclusion characteristics in steel has been studied by Sjöqvist and Jönsson.[6]
They showed that normal refined low-carbon ferromanganese gives a higher
contribution to the inclusion content in the steel compared to medium-carbon
ferromanganese. Although some research have been performed, reviews in this
field indicates an interest for further investigation concerning the effect of
ferroalloy additions on the inclusion characteristics in steel.[7,8]
The objective of the present study is to investigate the effect of commercial high-
carbon ferrochromium additions on inclusion characteristics of steel. The
intentions are to determine if the inclusions present in ferrochromium are
inherited by the steel after dissolution of the alloy, and to determine if the size
distribution and compositions of the present inclusions are changed. For this
Effect of Ferrochromium Additions on Inclusion Characteristics in Steel
- 5 -
purpose, two grades have been studied in laboratory scale alloying experiments.
These were a normal and a low-phosphorous high-carbon ferrochromium. In
order to determine the relative effect of these, three different amounts of
ferrochromium were used in the experimental series.
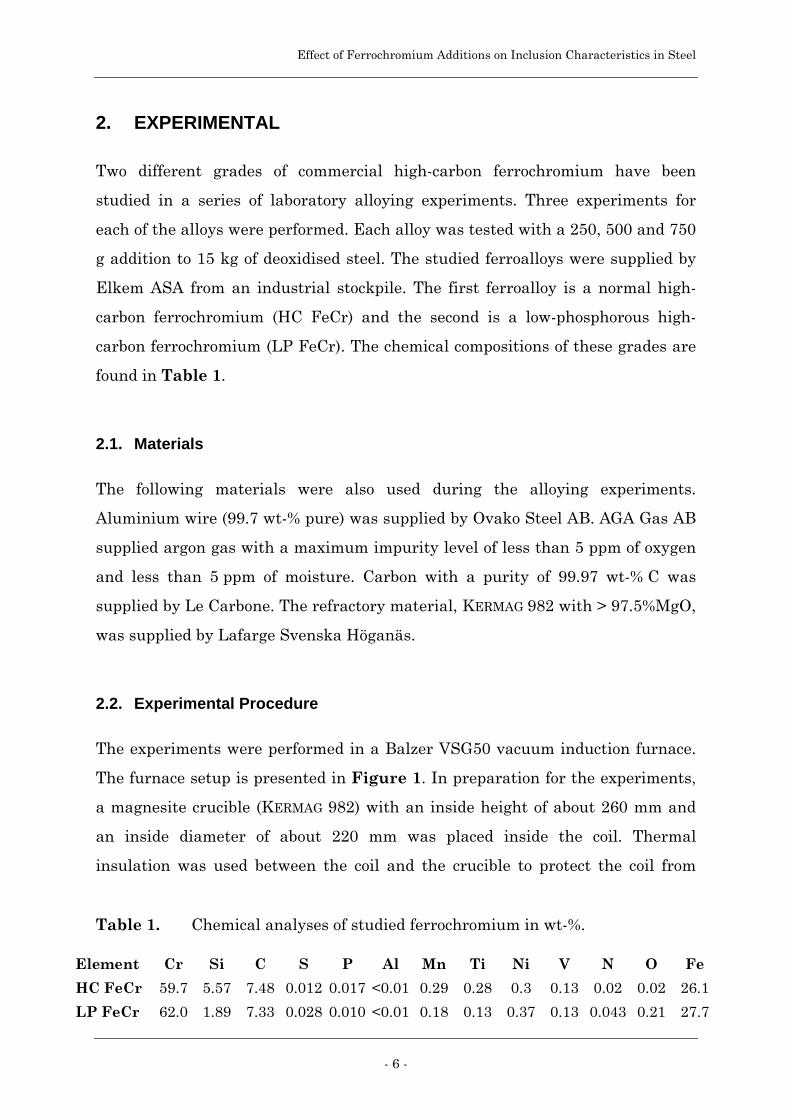
Effect of Ferrochromium Additions on Inclusion Characteristics in Steel
- 6 -
2. EXPERIMENTAL
Two different grades of commercial high-carbon ferrochromium have been
studied in a series of laboratory alloying experiments. Three experiments for
each of the alloys were performed. Each alloy was tested with a 250, 500 and 750
g addition to 15 kg of deoxidised steel. The studied ferroalloys were supplied by
Elkem ASA from an industrial stockpile. The first ferroalloy is a normal high-
carbon ferrochromium (HC FeCr) and the second is a low-phosphorous high-
carbon ferrochromium (LP FeCr). The chemical compositions of these grades are
found in Table 1.
2.1. Materials
The following materials were also used during the alloying experiments.
Aluminium wire (99.7 wt-% pure) was supplied by Ovako Steel AB. AGA Gas AB
supplied argon gas with a maximum impurity level of less than 5 ppm of oxygen
and less than 5 ppm of moisture. Carbon with a purity of 99.97 wt-% C was
supplied by Le Carbone. The refractory material, KERMAG 982 with > 97.5%MgO,
was supplied by Lafarge Svenska Höganäs.
2.2. Experimental Procedure
The experiments were performed in a Balzer VSG50 vacuum induction furnace.
The furnace setup is presented in Figure 1. In preparation for the experiments,
a magnesite crucible (KERMAG 982) with an inside height of about 260 mm and
an inside diameter of about 220 mm was placed inside the coil. Thermal
insulation was used between the coil and the crucible to protect the coil from
Table 1. Chemical analyses of studied ferrochromium in wt-%.
Element Cr Si C S P Al Mn Ti Ni V N O Fe
HC FeCr 59.7 5.57 7.48 0.012 0.017 <0.01 0.29 0.28 0.3 0.13 0.02 0.02 26.1
LP FeCr 62.0 1.89 7.33 0.028 0.010 <0.01 0.18 0.13 0.37 0.13 0.043 0.21 27.7
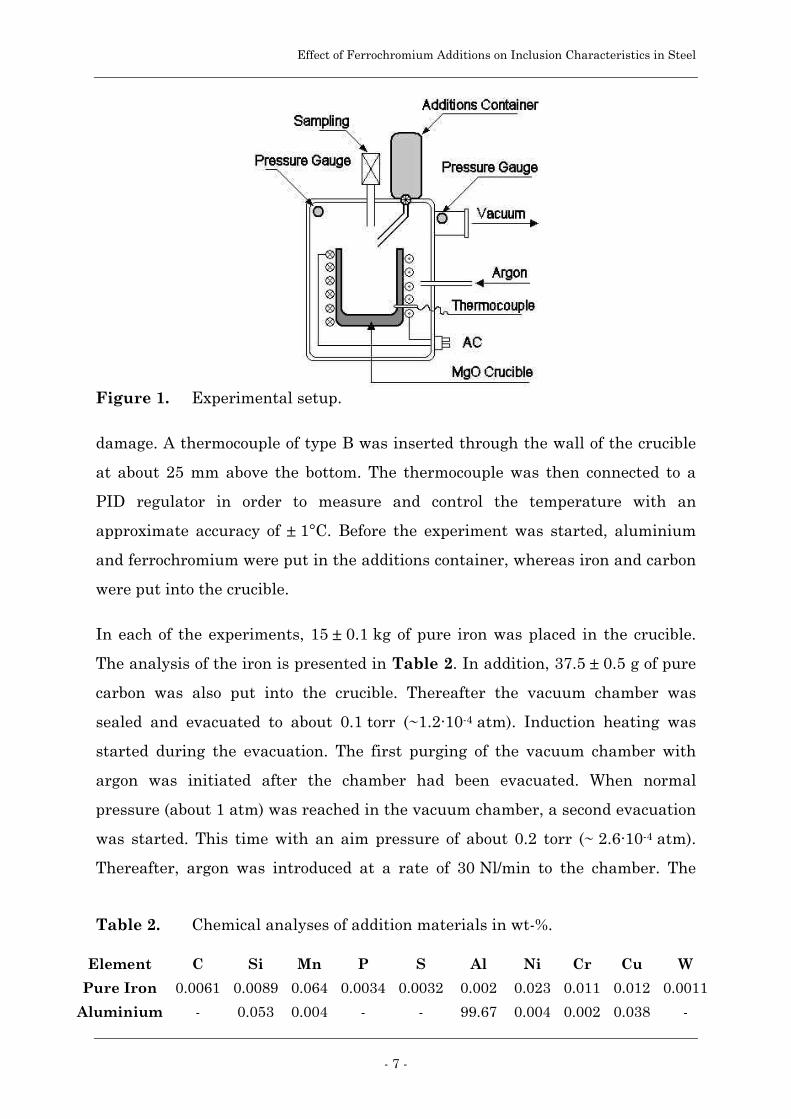
Effect of Ferrochromium Additions on Inclusion Characteristics in Steel
- 7 -
damage. A thermocouple of type B was inserted through the wall of the crucible
at about 25 mm above the bottom. The thermocouple was then connected to a
PID regulator in order to measure and control the temperature with an
approximate accuracy of ± 1°C. Before the experiment was started, aluminium
and ferrochromium were put in the additions container, whereas iron and carbon
were put into the crucible.
In each of the experiments, 15 ± 0.1 kg of pure iron was placed in the crucible.
The analysis of the iron is presented in Table 2. In addition, 37.5 ± 0.5 g of pure
carbon was also put into the crucible. Thereafter the vacuum chamber was
sealed and evacuated to about 0.1 torr (~1.2·10-4 atm). Induction heating was
started during the evacuation. The first purging of the vacuum chamber with
argon was initiated after the chamber had been evacuated. When normal
pressure (about 1 atm) was reached in the vacuum chamber, a second evacuation
was started. This time with an aim pressure of about 0.2 torr (~ 2.6·10-4 atm).
Thereafter, argon was introduced at a rate of 30 Nl/min to the chamber. The
Figure 1. Experimental setup.
Table 2. Chemical analyses of addition materials in wt-%.
Element C Si Mn P S Al Ni Cr Cu W
Pure Iron 0.0061 0.0089 0.064 0.0034 0.0032 0.002 0.023 0.011 0.012 0.0011
Aluminium - 0.053 0.004 - - 99.67 0.004 0.002 0.038 -

Effect of Ferrochromium Additions on Inclusion Characteristics in Steel
- 8 -
procedure with evacuation and purging was considered as a necessary precaution
to limit oxidation of the melted iron by reducing the oxygen content in the
atmosphere. The pressure in the chamber and the temperature in the crucible
were monitored throughout the experiments. An example of a time-temperature-
pressure cycle is shown in Figure 2.
The pure iron was melted and heated to 1600°C. Approximately 5 minutes was
allowed for the added carbon to completely mix into the melt. At this time
45.7 ± 0.5 g of aluminium wire was introduced to the melt. Six minutes after the
aluminium addition, additions of commercial ferrochromium were made. Since
the additions container also was evacuated and purged with argon, the additions
of aluminium and ferrochromium could safely be made in an inert atmosphere.
Sampling of the steel was made through an airlock to preserve the inert
atmosphere inside the vacuum chamber. A reference sample was taken about
three minutes prior to the ferrochromium addition. Samples were also taken 3, 6,
12 and 18 minutes after this addition. The different samples will hereafter be
denoted according to their respective sampling time after the ferroalloy addition,
0
400
800
1200
1600
00 30 60 90 120Time [minutes]
Tem
per
atu
re [
°C]
0
0.2
0.4
0.6
0.8
1
Pre
ssu
re [
atm
]
Temp
PressureArgon
purging
Evacuation
Argonpurging
Melting Alloy Addition
Evacuation
Figure 2. Time-Temperature-Pressure variations during experiments.
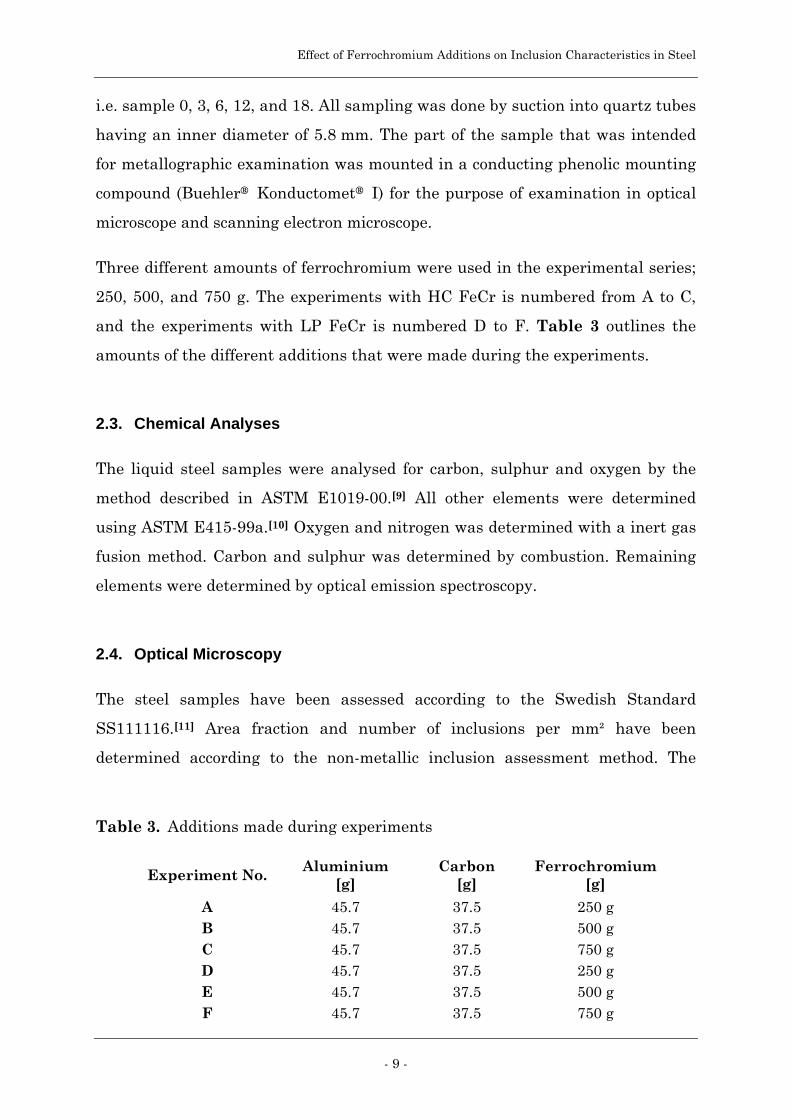
Effect of Ferrochromium Additions on Inclusion Characteristics in Steel
- 9 -
i.e. sample 0, 3, 6, 12, and 18. All sampling was done by suction into quartz tubes
having an inner diameter of 5.8 mm. The part of the sample that was intended
for metallographic examination was mounted in a conducting phenolic mounting
compound (Buehler® Konductomet® I) for the purpose of examination in optical
microscope and scanning electron microscope.
Three different amounts of ferrochromium were used in the experimental series;
250, 500, and 750 g. The experiments with HC FeCr is numbered from A to C,
and the experiments with LP FeCr is numbered D to F. Table 3 outlines the
amounts of the different additions that were made during the experiments.
2.3. Chemical Analyses
The liquid steel samples were analysed for carbon, sulphur and oxygen by the
method described in ASTM E1019-00.[9] All other elements were determined
using ASTM E415-99a.[10] Oxygen and nitrogen was determined with a inert gas
fusion method. Carbon and sulphur was determined by combustion. Remaining
elements were determined by optical emission spectroscopy.
2.4. Optical Microscopy
The steel samples have been assessed according to the Swedish Standard
SS111116.[11] Area fraction and number of inclusions per mm² have been
determined according to the non-metallic inclusion assessment method. The
Table 3. Additions made during experiments
Experiment No. Aluminium[g]
Carbon[g]
Ferrochromium[g]
A 45.7 37.5 250 gB 45.7 37.5 500 gC 45.7 37.5 750 gD 45.7 37.5 250 gE 45.7 37.5 500 gF 45.7 37.5 750 g

Effect of Ferrochromium Additions on Inclusion Characteristics in Steel
- 10 -
method prescribes that all inclusions are graded into four types according to
Jernkontoret's inclusion chart II. Here, type A inclusions are ductile, type B are
brittle stringers, type C are brittle-ductile and type D are undeformable
inclusions. Type A, B and C are measured in width, total length and number per
visual field. Type D are considered as being spherical and thus measured in
diameter and number of inclusions within the visual field.
These four types are then divided into four size groups according to their
respective width or diameter. The size groups are; thin (T), medium (M) or heavy
(H). There is also a fourth group, P, for individual particles that are larger than
the heavy inclusions. This method has been thoroughly described in previous
publications.[11-13] It should be noted that the SS111116 method was originally
designed for assessment of inclusions in wrought steel. In such specimens some
of the inclusions have been deformed into the inclusion types A, B or C. The
inclusions in liquid steel samples have naturally not been deformed and are
mostly spherical. Hence, only class D is being used for comparison in this study.
The magnification was set to 200x with a visual field diameter of 0.8 mm in the
present study. A total area of 185 mm² was examined on each of the samples.
2.5. Inclusion Composition Assessment
With the objective to characterise which compositions that was most common in
the acquired steel samples, inclusions were quantitatively analysed using SEM.
For this study, a JEOL© JSM840 with ED spectrometer was used in combination
with LINK ISIS© quantification software from Oxford Instruments.
An acceleration voltage of 20 kV was used at a working distance of 15 mm. Only
elements matching an energy peak were considered in the quantification
software. Finally, each individual analysis was ZAF-corrected and then
normalised.
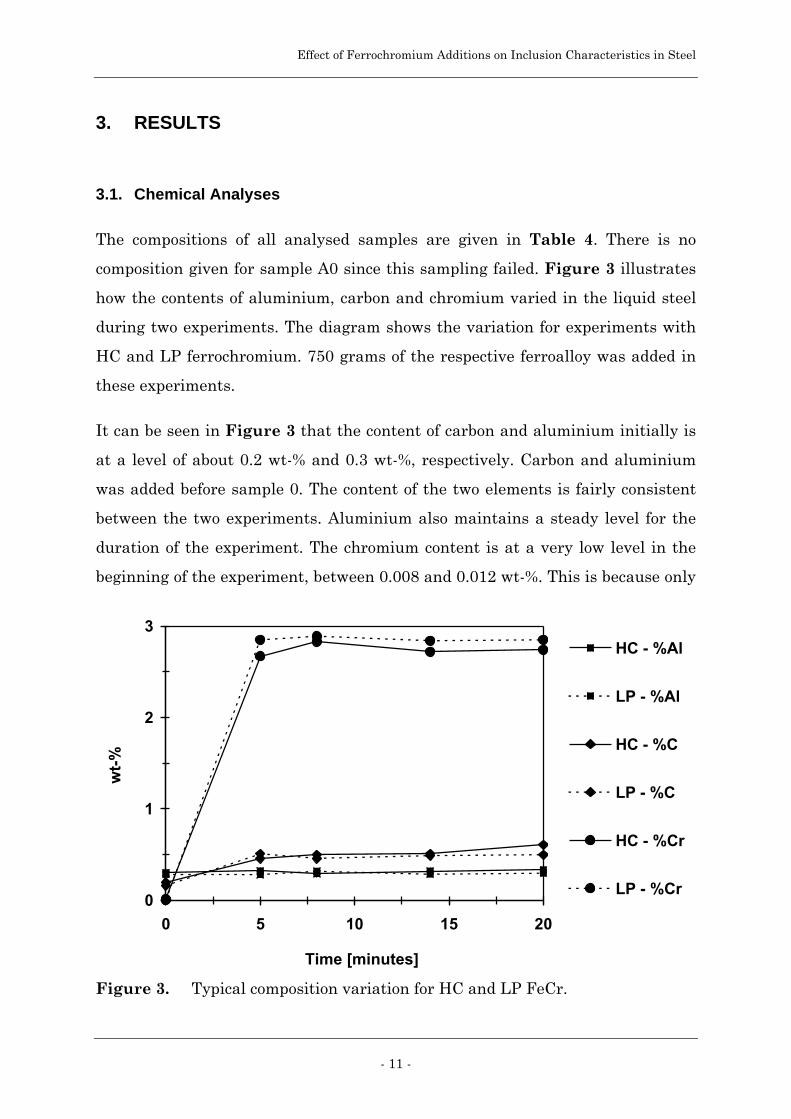
Effect of Ferrochromium Additions on Inclusion Characteristics in Steel
- 11 -
3. RESULTS
3.1. Chemical Analyses
The compositions of all analysed samples are given in Table 4. There is no
composition given for sample A0 since this sampling failed. Figure 3 illustrates
how the contents of aluminium, carbon and chromium varied in the liquid steel
during two experiments. The diagram shows the variation for experiments with
HC and LP ferrochromium. 750 grams of the respective ferroalloy was added in
these experiments.
It can be seen in Figure 3 that the content of carbon and aluminium initially is
at a level of about 0.2 wt-% and 0.3 wt-%, respectively. Carbon and aluminium
was added before sample 0. The content of the two elements is fairly consistent
between the two experiments. Aluminium also maintains a steady level for the
duration of the experiment. The chromium content is at a very low level in the
beginning of the experiment, between 0.008 and 0.012 wt-%. This is because only
0
1
2
3
0 5 10 15 20
Time [minutes]
wt-
%
HC - %Al
LP - %Al
HC - %C
LP - %C
HC - %Cr
LP - %Cr
Figure 3. Typical composition variation for HC and LP FeCr.
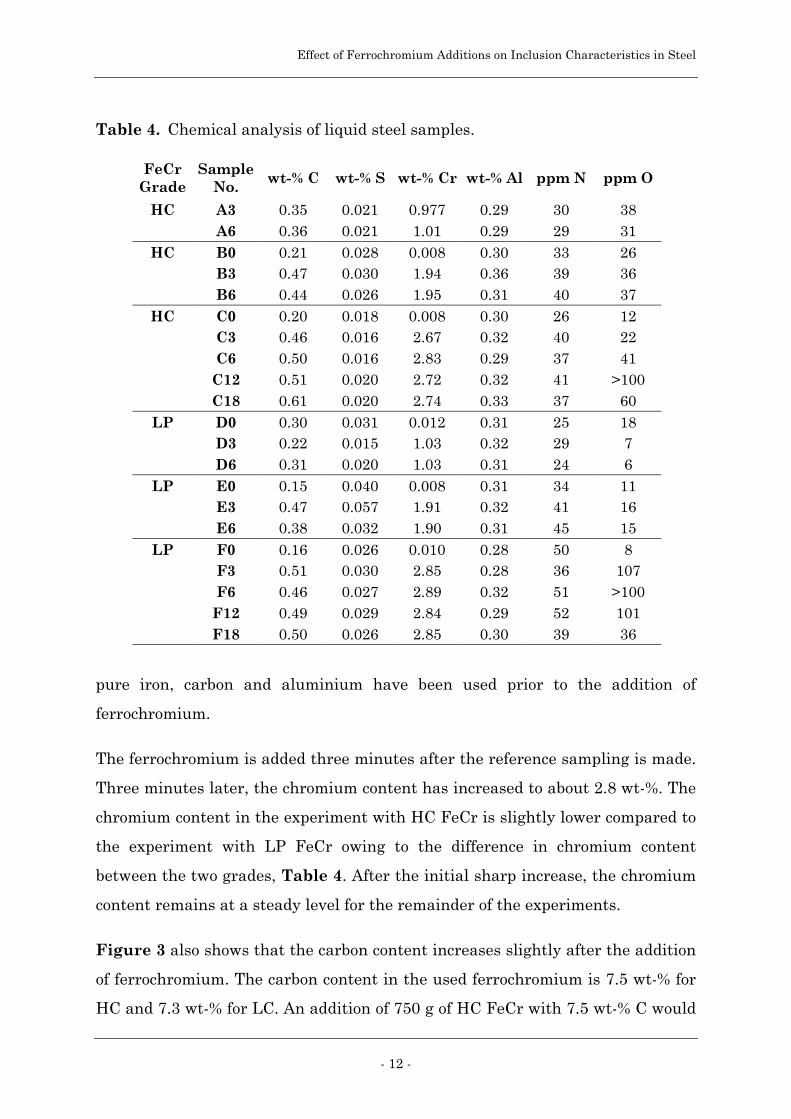
Effect of Ferrochromium Additions on Inclusion Characteristics in Steel
- 12 -
pure iron, carbon and aluminium have been used prior to the addition of
ferrochromium.
The ferrochromium is added three minutes after the reference sampling is made.
Three minutes later, the chromium content has increased to about 2.8 wt-%. The
chromium content in the experiment with HC FeCr is slightly lower compared to
the experiment with LP FeCr owing to the difference in chromium content
between the two grades, Table 4. After the initial sharp increase, the chromium
content remains at a steady level for the remainder of the experiments.
Figure 3 also shows that the carbon content increases slightly after the addition
of ferrochromium. The carbon content in the used ferrochromium is 7.5 wt-% for
HC and 7.3 wt-% for LC. An addition of 750 g of HC FeCr with 7.5 wt-% C would
Table 4. Chemical analysis of liquid steel samples.
FeCrGrade
SampleNo. wt-% C wt-% S wt-% Cr wt-% Al ppm N ppm O
HC A3 0.35 0.021 0.977 0.29 30 38A6 0.36 0.021 1.01 0.29 29 31
HC B0 0.21 0.028 0.008 0.30 33 26B3 0.47 0.030 1.94 0.36 39 36B6 0.44 0.026 1.95 0.31 40 37
HC C0 0.20 0.018 0.008 0.30 26 12C3 0.46 0.016 2.67 0.32 40 22C6 0.50 0.016 2.83 0.29 37 41
C12 0.51 0.020 2.72 0.32 41 >100C18 0.61 0.020 2.74 0.33 37 60
LP D0 0.30 0.031 0.012 0.31 25 18D3 0.22 0.015 1.03 0.32 29 7D6 0.31 0.020 1.03 0.31 24 6
LP E0 0.15 0.040 0.008 0.31 34 11E3 0.47 0.057 1.91 0.32 41 16E6 0.38 0.032 1.90 0.31 45 15
LP F0 0.16 0.026 0.010 0.28 50 8F3 0.51 0.030 2.85 0.28 36 107F6 0.46 0.027 2.89 0.32 51 >100
F12 0.49 0.029 2.84 0.29 52 101F18 0.50 0.026 2.85 0.30 39 36
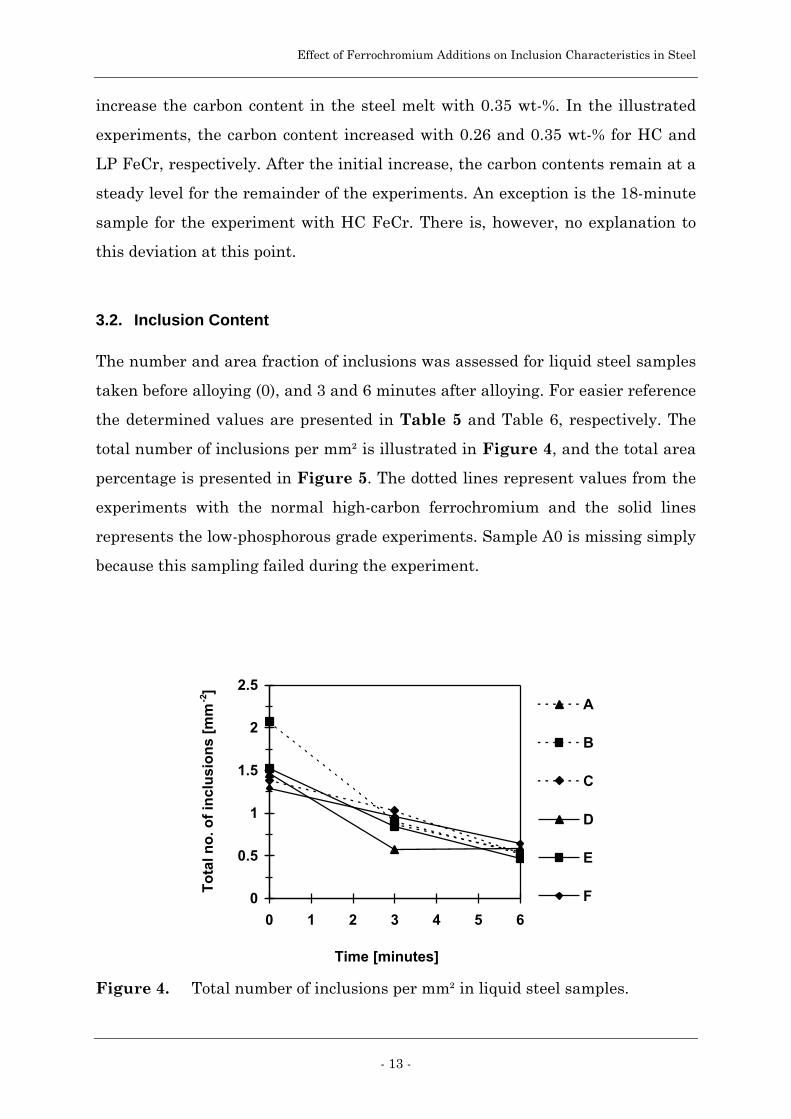
Effect of Ferrochromium Additions on Inclusion Characteristics in Steel
- 13 -
increase the carbon content in the steel melt with 0.35 wt-%. In the illustrated
experiments, the carbon content increased with 0.26 and 0.35 wt-% for HC and
LP FeCr, respectively. After the initial increase, the carbon contents remain at a
steady level for the remainder of the experiments. An exception is the 18-minute
sample for the experiment with HC FeCr. There is, however, no explanation to
this deviation at this point.
3.2. Inclusion Content
The number and area fraction of inclusions was assessed for liquid steel samples
taken before alloying (0), and 3 and 6 minutes after alloying. For easier reference
the determined values are presented in Table 5 and Table 6, respectively. The
total number of inclusions per mm² is illustrated in Figure 4, and the total area
percentage is presented in Figure 5. The dotted lines represent values from the
experiments with the normal high-carbon ferrochromium and the solid lines
represents the low-phosphorous grade experiments. Sample A0 is missing simply
because this sampling failed during the experiment.
0
0.5
1
1.5
2
2.5
0 1 2 3 4 5 6
Time [minutes]
To
tal n
o. o
f in
clu
sio
ns
[mm
-2]
A
B
C
D
E
F
Figure 4. Total number of inclusions per mm² in liquid steel samples.
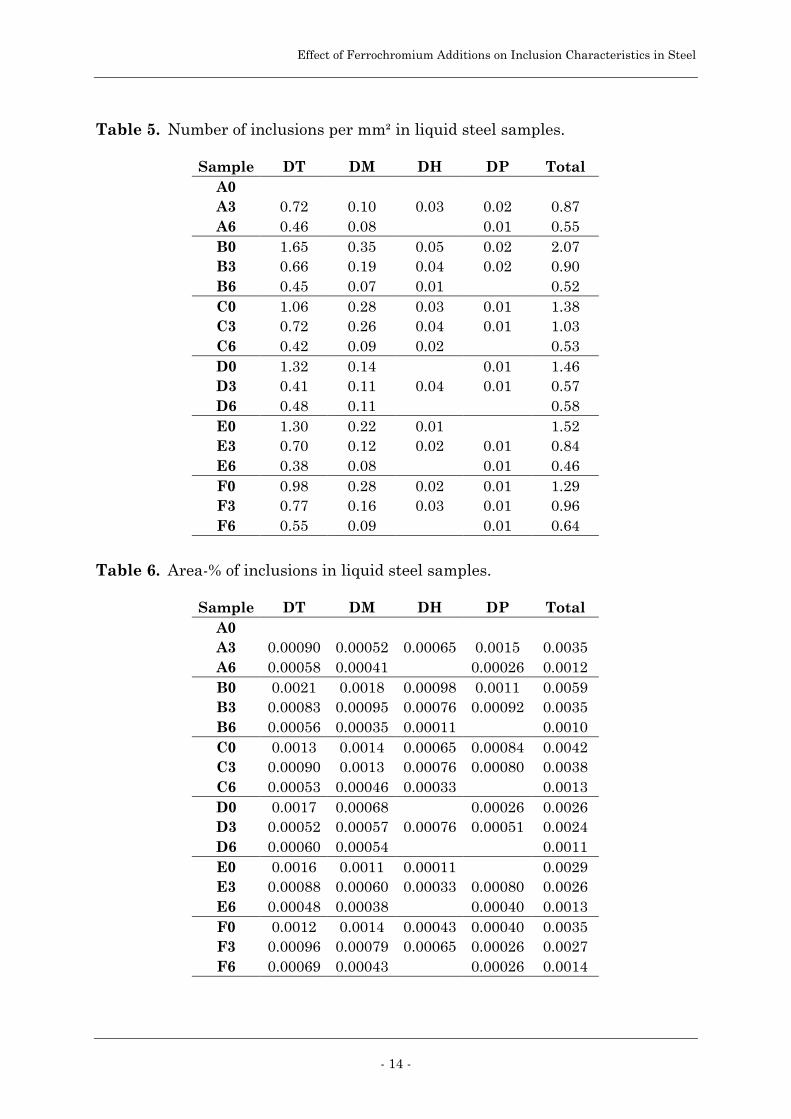
Effect of Ferrochromium Additions on Inclusion Characteristics in Steel
- 14 -
Table 5. Number of inclusions per mm² in liquid steel samples.
Sample DT DM DH DP TotalA0A3 0.72 0.10 0.03 0.02 0.87A6 0.46 0.08 0.01 0.55B0 1.65 0.35 0.05 0.02 2.07B3 0.66 0.19 0.04 0.02 0.90B6 0.45 0.07 0.01 0.52C0 1.06 0.28 0.03 0.01 1.38C3 0.72 0.26 0.04 0.01 1.03C6 0.42 0.09 0.02 0.53D0 1.32 0.14 0.01 1.46D3 0.41 0.11 0.04 0.01 0.57D6 0.48 0.11 0.58E0 1.30 0.22 0.01 1.52E3 0.70 0.12 0.02 0.01 0.84E6 0.38 0.08 0.01 0.46F0 0.98 0.28 0.02 0.01 1.29F3 0.77 0.16 0.03 0.01 0.96F6 0.55 0.09 0.01 0.64
Table 6. Area-% of inclusions in liquid steel samples.
Sample DT DM DH DP TotalA0A3 0.00090 0.00052 0.00065 0.0015 0.0035A6 0.00058 0.00041 0.00026 0.0012B0 0.0021 0.0018 0.00098 0.0011 0.0059B3 0.00083 0.00095 0.00076 0.00092 0.0035B6 0.00056 0.00035 0.00011 0.0010C0 0.0013 0.0014 0.00065 0.00084 0.0042C3 0.00090 0.0013 0.00076 0.00080 0.0038C6 0.00053 0.00046 0.00033 0.0013D0 0.0017 0.00068 0.00026 0.0026D3 0.00052 0.00057 0.00076 0.00051 0.0024D6 0.00060 0.00054 0.0011E0 0.0016 0.0011 0.00011 0.0029E3 0.00088 0.00060 0.00033 0.00080 0.0026E6 0.00048 0.00038 0.00040 0.0013F0 0.0012 0.0014 0.00043 0.00040 0.0035F3 0.00096 0.00079 0.00065 0.00026 0.0027F6 0.00069 0.00043 0.00026 0.0014
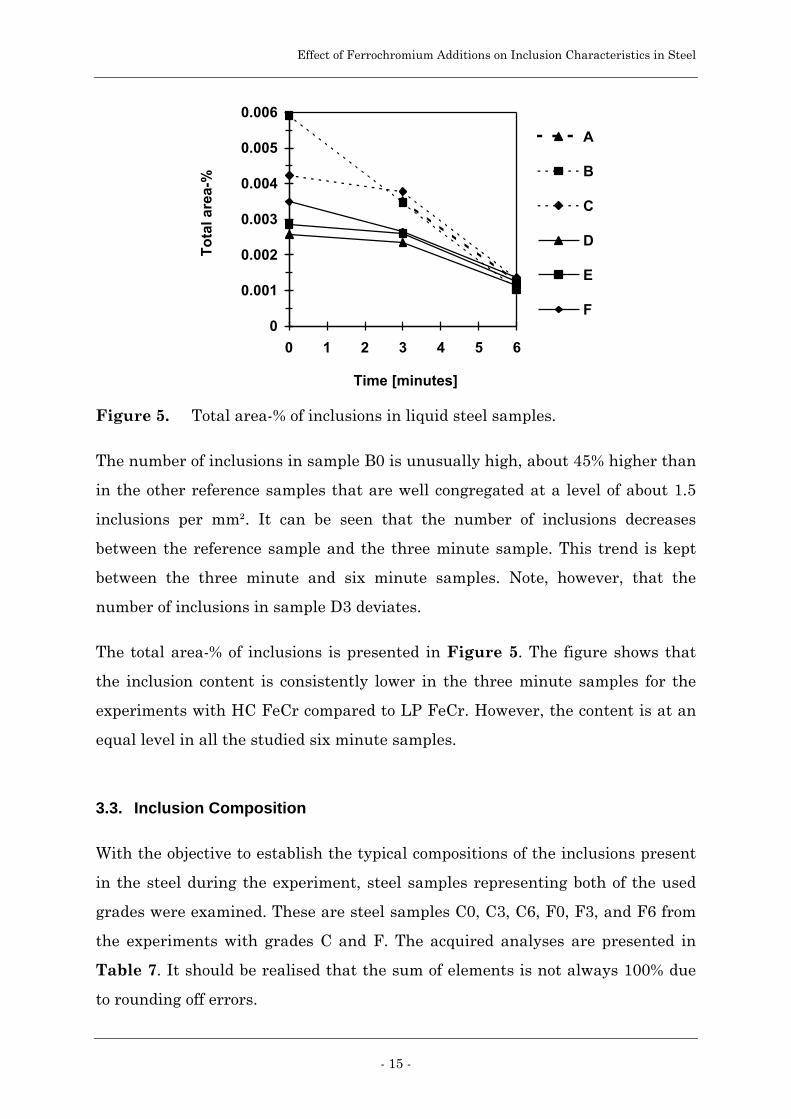
Effect of Ferrochromium Additions on Inclusion Characteristics in Steel
- 15 -
The number of inclusions in sample B0 is unusually high, about 45% higher than
in the other reference samples that are well congregated at a level of about 1.5
inclusions per mm². It can be seen that the number of inclusions decreases
between the reference sample and the three minute sample. This trend is kept
between the three minute and six minute samples. Note, however, that the
number of inclusions in sample D3 deviates.
The total area-% of inclusions is presented in Figure 5. The figure shows that
the inclusion content is consistently lower in the three minute samples for the
experiments with HC FeCr compared to LP FeCr. However, the content is at an
equal level in all the studied six minute samples.
3.3. Inclusion Composition
With the objective to establish the typical compositions of the inclusions present
in the steel during the experiment, steel samples representing both of the used
grades were examined. These are steel samples C0, C3, C6, F0, F3, and F6 from
the experiments with grades C and F. The acquired analyses are presented in
Table 7. It should be realised that the sum of elements is not always 100% due
to rounding off errors.
0
0.001
0.002
0.003
0.004
0.005
0.006
0 1 2 3 4 5 6
Time [minutes]
To
tal a
rea-
%
A
B
C
D
E
F
Figure 5. Total area-% of inclusions in liquid steel samples.
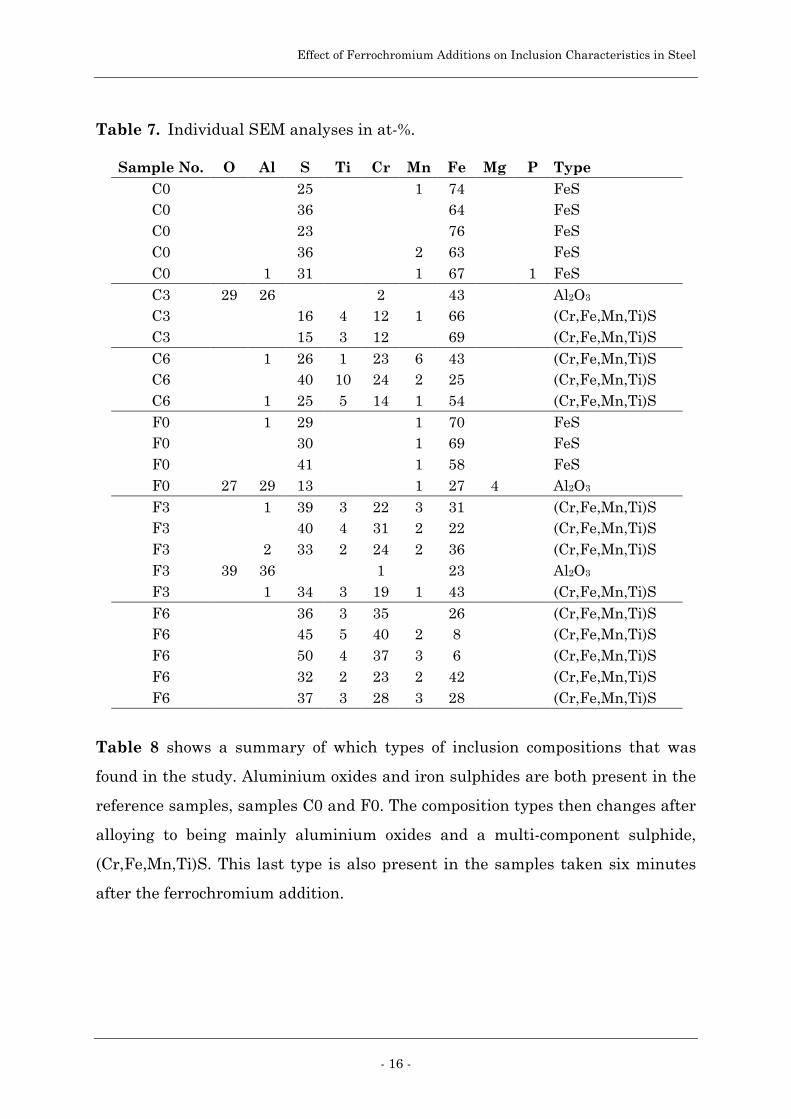
Effect of Ferrochromium Additions on Inclusion Characteristics in Steel
- 16 -
Table 8 shows a summary of which types of inclusion compositions that was
found in the study. Aluminium oxides and iron sulphides are both present in the
reference samples, samples C0 and F0. The composition types then changes after
alloying to being mainly aluminium oxides and a multi-component sulphide,
(Cr,Fe,Mn,Ti)S. This last type is also present in the samples taken six minutes
after the ferrochromium addition.
Table 7. Individual SEM analyses in at-%.
Sample No. O Al S Ti Cr Mn Fe Mg P TypeC0 25 1 74 FeSC0 36 64 FeSC0 23 76 FeSC0 36 2 63 FeSC0 1 31 1 67 1 FeSC3 29 26 2 43 Al2O3
C3 16 4 12 1 66 (Cr,Fe,Mn,Ti)SC3 15 3 12 69 (Cr,Fe,Mn,Ti)SC6 1 26 1 23 6 43 (Cr,Fe,Mn,Ti)SC6 40 10 24 2 25 (Cr,Fe,Mn,Ti)SC6 1 25 5 14 1 54 (Cr,Fe,Mn,Ti)SF0 1 29 1 70 FeSF0 30 1 69 FeSF0 41 1 58 FeSF0 27 29 13 1 27 4 Al2O3
F3 1 39 3 22 3 31 (Cr,Fe,Mn,Ti)SF3 40 4 31 2 22 (Cr,Fe,Mn,Ti)SF3 2 33 2 24 2 36 (Cr,Fe,Mn,Ti)SF3 39 36 1 23 Al2O3
F3 1 34 3 19 1 43 (Cr,Fe,Mn,Ti)SF6 36 3 35 26 (Cr,Fe,Mn,Ti)SF6 45 5 40 2 8 (Cr,Fe,Mn,Ti)SF6 50 4 37 3 6 (Cr,Fe,Mn,Ti)SF6 32 2 23 2 42 (Cr,Fe,Mn,Ti)SF6 37 3 28 3 28 (Cr,Fe,Mn,Ti)S

Effect of Ferrochromium Additions on Inclusion Characteristics in Steel
- 17 -
Table 8. Type of inclusions present in steel samples.
Sample Number
Type of Inclusion C0 C3 C6 F0 F3 F6
FeS Y N N Y N N
Al2O3 Y Y N Y Y N
(Cr,Fe,Mn,Ti)S N Y Y N Y Y
Effect of Ferrochromium Additions on Inclusion Characteristics in Steel
- 18 -
4. DISCUSSION
4.1. Chemical Analyses
The analysed aluminium content in the steel is about 0.3 wt-% for all the
analysed samples. The addition of aluminium was 45.7 ± 0.5 g, which
corresponds to 0.298 ± 0.003 wt-%. This indicates an efficiency of in some cases
over 100% of the added aluminium. Other possible sources of aluminium include
pure iron, carbon and ferrochromium. The contribution from the pure iron is
about 0.02 wt-% and the content in ferrochromium is less than 0.01 wt-%.
Unfortunately, the aluminium content in the used carbon is unknown. The
extreme content limit can be calculated for an addition of 46.2 g of Al in 14.90 kg
of pure iron together with the aluminium contribution from the used iron and
ferrochromium. In total, the maximum aluminium content should be 0.324 wt-%.
The remaining possible source of error is the chemical analyses which has a
relative accuracy of about ± 0.5%. Considering the discussed contributions and
errors, the analytical values are within the extreme limits except for sample B3.
For this case there is no explanation at this point.
Although the same amount of carbon has been added in all experiments, the
carbon content varies slightly more than would be expected from analytical and
sampling errors combined. The aimed content was 0.23 wt-% C, and with one
exception the sample 0 analyses are reasonably close to this value. A lower value
than the aimed content indicates that some oxidation of carbon has occurred in
the melt. This is to be expected since the dissolved oxygen content in the pure
iron is the region of about 0.3 wt-%.
The chromium content in sample 0 for all heats varies between 0.008 and 0.012
wt-%, as is shown in Table 4. At this stage of the experiment, the additions have
been pure iron, aluminium and carbon. The analysed chromium content is
0.011 wt-% in pure iron and 0.002 wt-% in aluminium. There is unfortunately no
chromium analysis available for the carbon. With the given analyses of iron and
Effect of Ferrochromium Additions on Inclusion Characteristics in Steel
- 19 -
ferrochromium, the variation in analyses between the reference samples is
perfectly within the analytical accuracy.
The compositions given in Table 4 also shows that the chromium content
increases sharply between sample 0 and sample 3 for each of the experiments.
After the sharp increase, the chromium content levels out and then maintains a
steady level for the duration of the experiment. This indicates that the added
ferrochromium is dissolved into the steel melt well before the sampling.
Argyropoulos and Guthrie performed a study on dissolution kinetics for a
number of ferroalloys. Among the studied ferroalloys was a low-carbon (LC)
ferrochromium with 0.25 wt-% C.[14] Their results showed that pieces of LC FeCr
smaller than 20 mm in diameter would have a dissolution time of about 40
seconds at 1600°C. According to another dissolution study performed by Lee et
al., the dissolution time for 4.85 wt-% C HC FeCr with a diameter of 16 mm is
about 20 to 25 seconds at 1600°C.[15]
Considering these data, it is predicted that the dissolution time for the
ferrochromium used in the present study should not exceed 30 seconds. This
should accordingly allow for a 150 second homogenisation period for the liquid
steel before the 3-minute sampling is made. In addition to the complete
dissolution of the ferroalloy after approximately 30 seconds, any inclusions that
can possibly be inherited by the steel have by that time been introduced to the
melt. Thereby the inclusion assessment of the 3-minute and 6-minute samples
should allow for detection of any possible inheritance of inclusions from the used
ferrochromium.
4.2. Inclusion content
The total number of inclusions in the reference samples is fairly consistent with
the exception of sample B0. However, the area-% varies between the maximum
level of 0.006% down to about 0.0025%. The values presented in Table 5 shows
that mainly the content of larger inclusions varies between the individual
experiments. Samples B0 and C0 have a considerably higher content of DH and
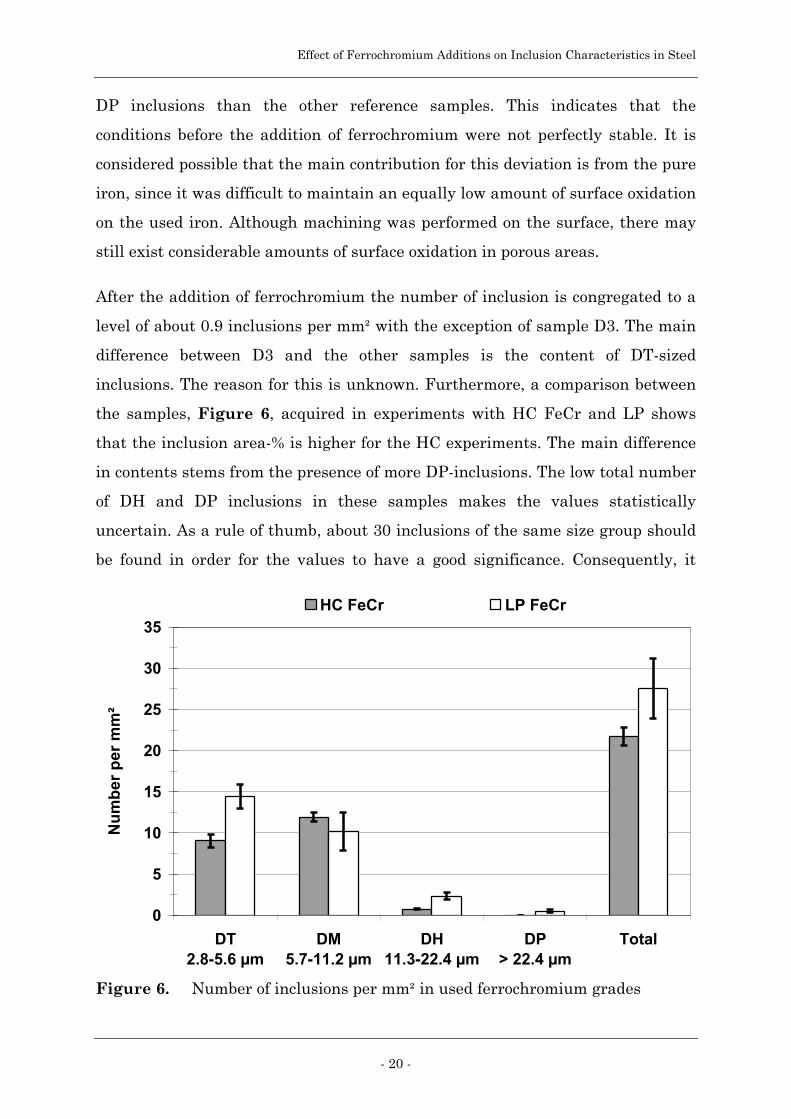
Effect of Ferrochromium Additions on Inclusion Characteristics in Steel
- 20 -
DP inclusions than the other reference samples. This indicates that the
conditions before the addition of ferrochromium were not perfectly stable. It is
considered possible that the main contribution for this deviation is from the pure
iron, since it was difficult to maintain an equally low amount of surface oxidation
on the used iron. Although machining was performed on the surface, there may
still exist considerable amounts of surface oxidation in porous areas.
After the addition of ferrochromium the number of inclusion is congregated to a
level of about 0.9 inclusions per mm² with the exception of sample D3. The main
difference between D3 and the other samples is the content of DT-sized
inclusions. The reason for this is unknown. Furthermore, a comparison between
the samples, Figure 6, acquired in experiments with HC FeCr and LP shows
that the inclusion area-% is higher for the HC experiments. The main difference
in contents stems from the presence of more DP-inclusions. The low total number
of DH and DP inclusions in these samples makes the values statistically
uncertain. As a rule of thumb, about 30 inclusions of the same size group should
be found in order for the values to have a good significance. Consequently, it
0
5
10
15
20
25
30
35
DT2.8-5.6 µm
DM5.7-11.2 µm
DH11.3-22.4 µm
DP> 22.4 µm
Total
Nu
mb
er p
er m
m²
HC FeCr LP FeCr
Figure 6. Number of inclusions per mm² in used ferrochromium grades

Effect of Ferrochromium Additions on Inclusion Characteristics in Steel
- 21 -
would be necessary to assess a far larger area if the number and area-% of
especially DP inclusions should have a high statistical significance. The
difference in inclusion contents in the steel samples for the respective grade is
therefore considered as having only a small significance. The conclusion is that
there is only a slight possibility that HC contributes to more inclusions than LP
ferrochromium.
Six minutes after the ferrochromium addition, the number and area-% of
inclusions are at an equal level for all the examined grades. This indicates that
even if the use of HC ferrochromium results in more inclusions, the difference is
eliminated six minutes after the addition.
4.3. Inclusion Composition
The evaluation of the analytical results from SEM shows that there are
considerable amounts of iron present in all of the individual analyses. This
strongly suggests that the electron beam has penetrated through the inclusion
and into the matrix although a fairly low acceleration voltage was used. The
typical sizes of the analysed inclusion were between 2 and 10 µm. Hence, it is
possible that at least some of the electron probe hit the matrix. Except for the
content in the iron sulphides (indicated in Table 7), it is concluded that it is
uncertain if iron really is present in the inclusions. Consequently, the given
analyses should be used with caution since these are considered as being merely
indicative with respect to present elements.
The ferrochromium grades contains inclusions with the typical compositions of
Al2O3, MnS and (Cr,Ti)(C,N). The analyses of the steel samples show two
different compositions, namely Al2O3 and (Cr,Fe,Mn,Ti)S. Aluminium oxide
inclusions are naturally present as a result of the aluminium deoxidation that
was performed prior to the ferroalloy addition. These are not considered as
having been inherited from the ferrochromium.

Effect of Ferrochromium Additions on Inclusion Characteristics in Steel
- 22 -
The other composition type was (Cr,Fe,Mn,Ti)S. This is a multi-component
sulphide that mainly contains chromium, but also iron and then small amounts
of manganese and titanium. These inclusions were often small with a typical size
between 2 and 10 µm in diameter. The only sulphides that were found present in
ferrochromium were MnS inclusions. However, the chromium content in the
(Cr,Fe,Mn,Ti)S inclusions is much higher compared to the content in the MnS
inclusions. In fact, the MnS inclusions in ferrochromium contained very small
amounts of elements other than Mn and S.
When the inclusions are introduced to the liquid steel together with the
ferroalloy, it is considered probable that the inclusions are dissolved into the
melt. This is supported by the inclusion content assessment, which shows no
significant difference in inclusion content between experiments with different
addition amounts and different grades. Since pure MnS has a melting point of
1657°C the present results indicate that the MnS inclusions in ferrochromium
have been dissolved together with the ferroalloy.[16] It is therefore suggested that
the complex sulphides have formed during solidification. In conclusion, the
content and composition assessments of the inclusions in the steel samples do
not indicate an inheritance directly from the ferroalloy to the steel.
Although the total oxygen content is fairly high in all of the steel samples, very
few oxidic inclusions were analysed in the SEM studies. The main reason is that
most of the oxidic inclusions that were detected in SEM were smaller than 2 µm.
At this size a considerable beam penetration into the matrix can be anticipated.
As a direct consequence, only a few of the largest detected oxide inclusions were
analysed. The content of iron in those analyses, given in Table 7, shows that
even here the beam penetration was considerable.
It is suggested that the performed analyses are repeated in an SEM or an
electron microprobe equipped with a wave-length dispersive spectrometer (WDS)
in order to get a more accurate analyses of the inclusions.
Effect of Ferrochromium Additions on Inclusion Characteristics in Steel
- 23 -
5. CONCLUSIONS
Alloying experiments with normal and low-phosphorous high-carbon
ferrochromium have been performed. Acquired liquid steel samples were
assessed in optical and electron microscope with the objective of characterising
the present inclusions and to establish if the addition influences the inclusion
characteristics in the aluminium killed steel. The results indicate that the
addition of ferrochromium does not significantly influence the inclusion
characteristics in the steel. The specific conclusions from this study are:
♦ The number and area-% of inclusions six minutes after the ferrochromium
addition is at an equal level in the studied liquid steel samples.
♦ Based on the presented experiments it is concluded that inclusions in
ferrochromium are not inherited to the steel.
♦ The inclusion composition changes from FeS and Al2O3 in the reference
samples to Al2O3 and complex sulphides in samples acquired three and six
minutes after the ferrochromium addition.
Finally, it is suggested that more inclusion analyses are performed using an
electron microprobe with WDS in the purpose of getting more accurate analyses
of the inclusions present in the steel samples.
Effect of Ferrochromium Additions on Inclusion Characteristics in Steel
- 24 -
6. ACKNOWLEDGEMENTS
The authors wish to thank Peter Kling, Department of Metallurgy, KTH for the
invaluable help with repairing the used equipment. Thanks are also due to
Anders Lind at Ovako Steel AB for the quick assistance with the chemical
analyses.

Effect of Ferrochromium Additions on Inclusion Characteristics in Steel
- 25 -
7. REFERENCES
1. M. Imagumbai and T. Takeda: Influence of calcium-treatment on sulfide-
and oxide-inclusions in continuous-cast slab of clean steel dendrite
structure and inclusions, ISIJ International, vol. 34, no. 7, 1994,
pp. 574-583.
2. O. Wijk and O. Sundqvist: Ladle metallurgy and its influence on steel
cleanliness, Scandinavian Journal of Metallurgy, vol. 26, no. 6, 1997,
pp. 249-254.
3. G.M. Faulring: Inclusion Modification in Semi-killed Steels, in 56th
Electric Furnace Conference Proceedings, Iron and Steel Society/AIME,
New Orleans, LA, USA, vol. 56, 1998, pp. 87-98.
4. G.J. Hassall, K.G. Bain, R.W. Young and M.S. Millman: Studies in
development of clean steels. Part I: Modelling aspects, Ironmaking and
Steelmaking, vol. 25, no. 4, 1998, pp. 273-278.
5. O. Wijk and V. Brabie, The Purity of Ferrosilicon and Its Influence on
Inclusion Cleanliness of Steel, ISIJ International, vol. 36, 1996,
Supplement, pp. S132-S135.
6. T. Sjöqvist and P. Jönsson: Effect of ferromanganese additions on inclusion
characteristics in steel, in 57th Electric Furnace Conference Proceedings,
Iron and Steel Society/AIME, New Orleans, LA, USA, vol. 56, 1999,
pp. 383-392.
7. Ø. Grong, T. Grong and T. Skaland: Principle guidelines for new ferroalloy
product developments, International Ferroalloys Congress 7, Norwegian
Ferroalloy Research Organisation (FFF), Trondheim, 1995, pp. 697-707.
8. M. Subramanian and C.N. Harman: Ferro Alloys to Meet International
Quality Standards in Alloy and Special Steel Making, Tool Alloy Steels,
vol. 23, no. 10, 1989, pp. 371-377.
Effect of Ferrochromium Additions on Inclusion Characteristics in Steel
- 26 -
9. ASTM E1019-00 "Standard Test Methods for Determination of Carbon,
Sulfur, Nitrogen, and Oxygen in Steel and in Iron, Nickel, and Cobalt
Alloys", American Society For Testing and Materials, 100 Barr Harbor
Drive, West Conshohocken, PA, USA 19428-2959.
10. ASTM E415-99a "Standard Test Method for Optical Emission Vacuum
Spectrometric Analysis of Carbon and Low-Alloy Steel", American Society
For Testing and Materials, 100 Barr Harbor Drive, West Conshohocken,
PA, USA 19428-2959.
11. "Steel - Method for assessment of the content of non-metallic inclusions",
Svensk Standard SS 11 11 16, Swedish Institute for Standards, Ver. 2,
June 1987, pp. 1-16.
12. S. Johansson: Computer Aided Manual Image Analysis for Assessment of
Non-Metallic Inclusions in Steel, Scandinavian Journal of Metallurgy,
vol. 19, no. 2, 1990, pp. 79-81.
13. S. Johansson: Jernkontoret Quantitative Comparative Chart, JQCC,
Scandinavian Journal of Metallurgy, vol. 14, no. 1, 1985, pp. 744-48.
14. S.A. Argyropoulos and R.I.L. Guthrie: Dissolution Kinetics of Ferroalloys
in Steelmaking, 65th Steelmaking Conference Proceedings, Pittsburgh,
PA, USA, vol. 65, 1982, pp. 156-167
15. Y.E. Lee, H. Berg and B. Jensen: Dissolution Kinetics of Ferroalloys in
Steelmaking Process, Ironmaking and Steelmaking, vol. 22, 1995,
pp. 486-494
16. Slag Atlas, 2nd ed., Verlag Stahleisen GmbH, Germany, 1995, pp.90
TRITA-MET 094
Influence of Ferromanganese Additionson Inclusions in Bearing Steel
Thobias Sjöqvist, Mia Göransson,Pär Jönsson and Peter Cowx
STOCKHOLMAugust 2000
DEPARTMENT OF MATERIALS SCIENCE AND ENGINEERINGDIVISION OF METALLURGYROYAL INSTITUTE OF TECHNOLOGYSE - 10044 STOCKHOLM
Influence of Ferromanganese Additions on Inclusions in Bearing Steel
- 1 -
Influence of Ferromanganese Additionson Inclusions in Bearing Steel
Thobias Sjöqvist1, Mia Göransson2, Pär Jönsson1 and Peter Cowx3
1) Royal Institute of Technology, Department of Materials Science and Engineering,
Division of Metallurgy, SE10044 Stockholm, Sweden2) Ovako Steel AB, SE81382 Hofors, Sweden3) Eramet Norway AS, P.O. Box 82, NO3901 Porsgrunn, Norway
Abstract
Plant trials with four different low-carbon and medium-carbon ferromanganesealloys have been performed at Ovako Steel in Hofors, Sweden. For each alloy,five experiments were made at the ladle furnace station, i.e. 20 charges in total.During the experiments, liquid steel rapid-solidification samples were taken tostudy the behaviour of inclusion formation and removal during ladle treatment.Also, samples for LSHR testing (Liquid Sampling Hot Rolling) were acquired forone heat of each of the ferromanganese containing alloys. Micro inclusionassessments were carried out according to the method described in the Swedishstandard SS111116. Macro inclusion assessments were carried out usingimmersed ultrasonic testing. Element analysis and mappings were made in ascanning electron microscope to establish the effect of the ferromanganeseaddition on the composition of inclusions present in the steel.
Steel samples taken just before casting show that all the tested ferromanganesealloys give the same result with respect to studied micro inclusion characteristicsat the end of ladle treatment. The results also show that the addition offerromanganese alloys leads to an increased amount of macro inclusions up to 9minutes after the alloy addition.
In samples taken 3 minutes after the ferromanganese addition, about 40% of theanalysed inclusions contained Al2O3, MnO and MnS. The Al2O3 content isconcluded to originate from the deoxidation practise while the MnO and MnScontent is likely to originate from the addition of ferromanganese. Finally, theinclusion composition in the final steel samples is unrelated to theferromanganese alloy used. In this case, the main compositions are Al2O3-MgOand MnS.
Influence of Ferromanganese Additions on Inclusions in Bearing Steel
- 2 -
List of Figures
Figure 1. The steelmaking process at Ovako Steel AB in Hofors, Sweden. 5
Figure 2. Cross-section of a steel mould for LSHR sampling, by courtesy of T.
Hansen.14 7
Figure 3. Manganese content in steel during experiments. 10
Figure 4. Averages of total area-% of inclusions in examined steel samples. 11
Figure 5. Average area-% of DT inclusions in steel samples. 11
Figure 6. Average area-% of DM inclusions in steel samples. 12
Figure 7. Average area-% of DH inclusions in steel samples. 12
Figure 8. Element mapping of a 3 µm Al2O3-MnO-MnS inclusion. 17
Figure 9. Dissolved oxygen equilibrium contents in liquid iron at 1600°C. 18
Figure 10. Image of ultrasonic testing of LSHR 3-minute sample from
experiment with ferromanganese grade B. 21
Figure 11. Results from ultrasonic high frequency testing (LSHR). 22
Influence of Ferromanganese Additions on Inclusions in Bearing Steel
- 3 -
List of Tables
Table 1. Chemical composition of used ferromanganese alloys (wt-%) 6
Table 2. Chemical composition of liquid steel samples (wt-%) 6
Table 3. Inclusion content in reference samples (area-%) 13
Table 4. Inclusion content in 3-minute samples (area-%) 14
Table 5. Inclusion content in final steel samples (area-%) 14
Table 6. Inclusion types in 3-minutes samples 19
Table 7. Inclusion types in final steel samples 20
Table 8. Composition of Al2O3-MnO and Al2O3-MnO-MnS inclusions in at-% 20
Influence of Ferromanganese Additions on Inclusions in Bearing Steel
- 4 -
1. Introduction
Additions of ferroalloys are usually made during steelmaking to alloy ordeoxidise the steel. However, while the main purposes are achieved, the inclusioncharacteristics of the steel are also affected. Efforts have been made in laboratoryscale tests to establish how these inclusions are influenced by the addition offerromanganese.1 These experiments were considered necessary beforeattempting to determine the possible influence of ferromanganese on inclusionsduring industrial steel production. Similar experiments have also beenperformed by other researchers on ferrochromium2 and ferrosilicon3.
The laboratory experiments on ferromanganese were performed for six qualitiesof low and medium-carbon ferromanganese with different oxygen contents.1
From the steel samples, an assessment and element analysis of the inclusionspresent in the steel was done. Results showed that low-carbon normal refinedferromanganese not only contained more inclusions, but also lead to an increasedamount of inclusions present in the steel. In addition, low-oxygenferromanganese had the lowest inclusion content and a low contribution to thetotal inclusion content of the steel. In these experiments, the most commoninclusion composition was MnO-MnS.
At the industrial scale, this study is focused on the effect of ferromanganeseadditions on inclusions in bearing steel. Four different refined ferromanganesealloys have been tested in plant-trials by addition at a ladle-furnace station.During the experiments, liquid steel rapid solidification samples were collectedduring the ladle treatment and studied using an optical microscope to determinethe content and size distribution of micro inclusions. Scanning electronmicroscope (SEM) has been used to analyse the chemistry of these inclusions. Inaddition, immersion ultrasonic testing has been used to determine the content ofmacro inclusions.

Influence of Ferromanganese Additions on Inclusions in Bearing Steel
- 5 -
2. Experiments
Four different ferromanganese grades were tested in full-scale at Ovako Steelsproduction site in Hofors, Sweden. These grades were chosen based on theresults from two preceding studies concerning the influence of ferromanganeseadditions on inclusions in steel.1,4 The composition of the four grades arepresented in Table 1. Grades A and B are normal refined ferromanganese, whileC and D are low-oxygen ferromanganese grades. In total, five experiments foreach of the ferromanganese grades were performed.
The production line at Ovako Steel is illustrated in Figure 1. Production startswith scrap melting in an electric arc furnace. The melt is tapped into 100-tonladles, then passes a deslagging unit before entering the ASEA-SKF ladlefurnace station. Here, ferroalloys, synthetic slag and aluminium are added. Aftercompleted alloying and deoxidation, the melt is subjected to vacuum degassing.After a period of final heating and stirring, the steel is cast using up-hillteaming. The experiments in this study were performed during the ladle furnacetreatment.
→ → →Scrap charging Melting Deoxidation and alloying
→ →Vacuum degassing Heating and stirring Ingot casting
Figure 1. The steelmaking process at Ovako Steel AB in Hofors, Sweden.

Influence of Ferromanganese Additions on Inclusions in Bearing Steel
- 6 -
2.1. Experimental Procedure
In order to allow any change in inclusion characteristic to be detectable, normalproduction practise was somewhat altered for the experiments. All primaryadditions were made before the addition of ferromanganese. The intent with thispractise was, if possible, to isolate the effect of the ferromanganese additions onthe inclusions in the steel. Directly after primary additions, a reference samplewas taken. A second liquid steel sample was taken about three minutes after theferromanganese addition (hereafter denoted as the 3-minute sample), followed bytwo more samples taken at three-minute intervals. The fifth sample was takendirectly after vacuum degassing and the final steel sample just before casting.
For all the experiments, immersion samples with 6-mm thickness were taken.5
In addition, during one experiment for each of the ferromanganese grades,LSHR-samples (Liquid Sampling - Hot Rolling) were taken at the same time,Figure 2. All samples, both regular immersion samples and LSHR-samples, weretaken using an automatic sampling equipment with a given sampling time andsampling depth into the molten steel. The intention with this procedure is toincrease the consistency of results by reducing errors originating from differentsampling depths and times.
Table 1. Chemical composition of used ferromanganese alloys (wt-%)
Grade Mn C Si P N OA 80.0 0.42 0.20 0.16 0.11 1.15B 80.7 0.85 0.26 0.16 0.13 0.82C 81.7 0.44 0.49 0.16 0.054 0.33D 82.2 0.92 0.38 0.18 0.058 0.17
Table 2. Chemical composition of liquid steel samples (wt-%)
FeMn: A B C DTime: ref 3 fin ref 3 fin ref 3 fin ref 3 finS (wt-%) 0.024 0.041 0.042 0.052 0.08 0.033 0.044 0.040 0.045 0.047 0.045 0.031Si (wt-%) 0.41 0.41 0.42 0.36 0.37 0.37 0.37 0.37 0.36 0.40 0.41 0.38Mn (wt-%) 0.17 1.44 1.57 0.20 1.45 1.50 0.18 1.42 1.55 0.16 1.49 1.55O (ppm) 18 19 8 26 22 6 22 26 9 20 23 11
Samples were taken before addition (ref), 3 minutes after (3) and directly before casting (fin). Onlythe final samples have been analysed for Mg. In these samples, the content is very close to thedetection limit 3 ppm. The uncertainty for the Mg analysis is about +/- 1 ppm.
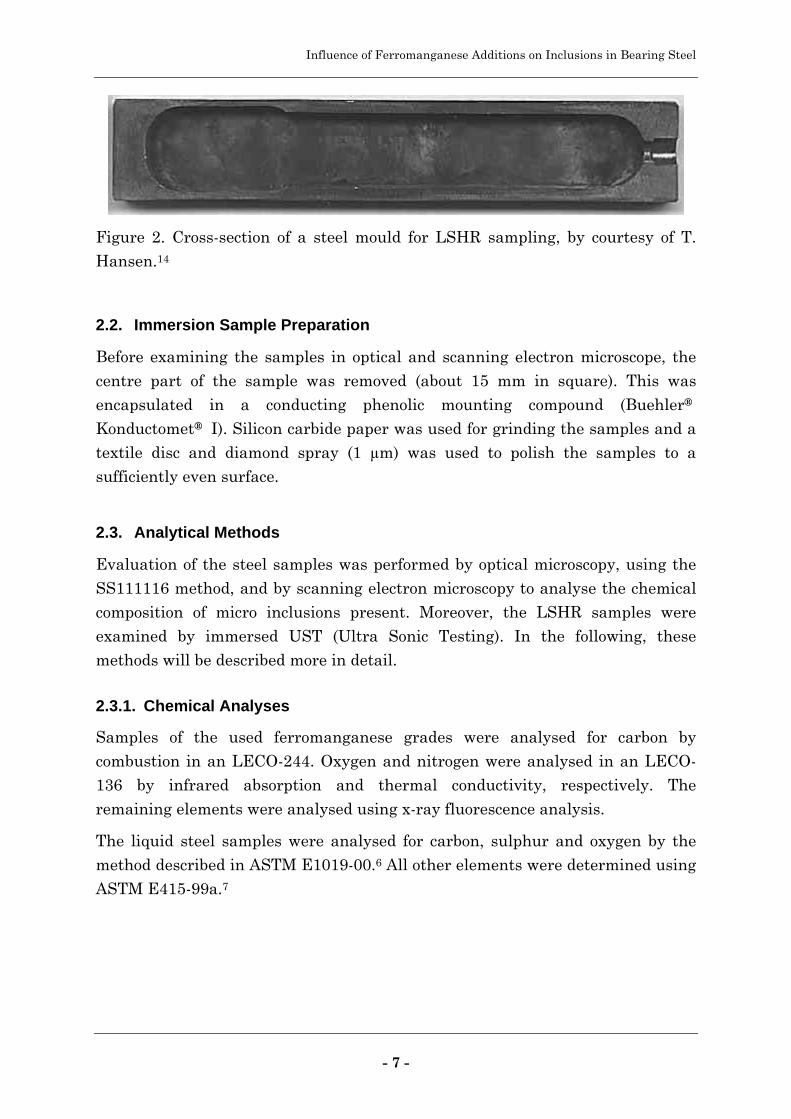
Influence of Ferromanganese Additions on Inclusions in Bearing Steel
- 7 -
Figure 2. Cross-section of a steel mould for LSHR sampling, by courtesy of T.Hansen.14
2.2. Immersion Sample Preparation
Before examining the samples in optical and scanning electron microscope, thecentre part of the sample was removed (about 15 mm in square). This wasencapsulated in a conducting phenolic mounting compound (Buehler®Konductomet® I). Silicon carbide paper was used for grinding the samples and atextile disc and diamond spray (1 µm) was used to polish the samples to asufficiently even surface.
2.3. Analytical Methods
Evaluation of the steel samples was performed by optical microscopy, using theSS111116 method, and by scanning electron microscopy to analyse the chemicalcomposition of micro inclusions present. Moreover, the LSHR samples wereexamined by immersed UST (Ultra Sonic Testing). In the following, thesemethods will be described more in detail.
2.3.1. Chemical Analyses
Samples of the used ferromanganese grades were analysed for carbon bycombustion in an LECO-244. Oxygen and nitrogen were analysed in an LECO-136 by infrared absorption and thermal conductivity, respectively. Theremaining elements were analysed using x-ray fluorescence analysis.
The liquid steel samples were analysed for carbon, sulphur and oxygen by themethod described in ASTM E1019-00.6 All other elements were determined usingASTM E415-99a.7
Influence of Ferromanganese Additions on Inclusions in Bearing Steel
- 8 -
2.3.2. Micro Inclusion Size Assessment
Assessment of the inclusions in all samples has been performed according to theSS 111116 method.8-10 In this method, all inclusions are characterised by theirgeometry and size according to a picture chart presented in the Swedishstandard SS 111116 (JK Chart II).8 Geometrically there are four classes, from Ato D. Class A for ductile inclusions, B for brittle, C for brittle-ductile, and D forundeformable. In size there are four categories: T, M, H and P. First there is thesize category T for inclusions with apparent diameter between 2.8 and 5.7 µm,then M for diameters between 5.7 and 11.3 µm and finally H for diametersbetween 11.3 and 22.6 µm. For inclusions with a diameter larger than 22.6 µm,the category for particular inclusions, P, is used.
A computer software, PC MIC©, was used to assess the collected data.11 Thisprogram allows the user to set the visual field diameter, magnification andnumber of scale divisions within the visual field diameter. After the inclusions ina given sample had been assessed, the program calculates characteristicparameters for the different geometrical classes of inclusions. Parameters usedin this study are the number of inclusions and area percentage inclusions persquare millimetre of each geometrical class of inclusions.
For each of the ferromanganese grades, samples from three of the experimentswere studied. Included are the results from the reference sample, the sampletaken three minutes after the ferromanganese addition, and the final sampletaken before casting. Since the samples examined in this study are from liquidsteel, a majority of the inclusions is spherical. Consequently, all inclusions havebeen fitted into the geometrical class D.
2.3.3. Inclusion Composition Assessment
Steel samples from two experiments of the respective ferromanganese gradeswere analysed using SEM. Analyses included both qualitative analysis (elementmapping) and quantitative microarea analysis. These analyses were performedusing a JEOL JSM840. During analysis, acceleration voltage was set to 20 kVwith a working distance of 25 mm. The live time for each analysis was set to 90seconds. Calibration against a cobalt reference was performed at two hoursinterval. Quantitative analyses were calculated by using the ZAF-method withthree iterations.
Influence of Ferromanganese Additions on Inclusions in Bearing Steel
- 9 -
2.3.4. Macro Inclusion Assessment
All LSHR samples taken at the different experiments were prepared according tothe following principle. First, the sample were hot rolled to a thickness of about 4mm, and then straightened and normalised. The middle part of the plate, asshown in Figure 2, was removed and milled down to a rectangular plate withlevel surfaces. The final measurement of the plate was 60 x 4 x 25 mm. Using aKrautkramer Branson USIP20 HR with a high frequency equipment (HFTR) asinstrument, the specimens were subject to ultrasonic high frequency testingsubmerged in a water-filled tank. By using flat bottom hole (FBH) specimens, theequipment was calibrated at two ranges of defect sizes. FBH with a diameter of50 and 70 µm was used to calibrate the unit to 41.5 and 81.5 %, respectively, ofthe maximum amplitude. This corresponds to detectable defects of approximatesizes between 35 to 59 µm and 60 to 85 µm. In addition, defects larger than 85µm are detected as amplitudes over 100 %. Further information regarding theLSHR method can be obtained from references 12 to 14.

Influence of Ferromanganese Additions on Inclusions in Bearing Steel
- 10 -
3. Results and Discussion
3.1. Micro Inclusion Size Assessment
From the plant trials with ferromanganese, samples from three heats for each ofthe ferromanganese qualities were studied. Figure 3 presents the analysedmanganese content in the steel samples through the process from two separateexperiments. Filled squares and circles correspond to experimentally determinedcontents of manganese. The dotted lines represent an estimation of the contentbetween the experimental points. This figure show that most of theferromanganese was dissolved at the time of the second sampling. It is thereforeassumed that the determined inclusion content in the second sample adequatelyrepresents full dissolution of the added ferromanganese. Consequently, inclusioncharacteristics were determined for the reference sample, the first sample afteraddition of ferromanganese and the final sample taken just before casting.
Results from the inclusion assessments are presented in Table 3 to 5. Theaverage area-fractions of inclusions in the examined steel samples are illustratedin Figure 4 to 7. The value of each bar represents the average content from threeheats using the same ferromanganese grade. Indicated in the figure are also thestandard deviations between the samples. However, please note that only oneassessment has been made on the final steel samples for each of theferromanganese grades. Consequently, there is no standard deviation or averagedata for these samples.
0.00
0.50
1.00
1.50
0 20 40 60 80
Time (minutes)
wt
pct
Man
gan
ese
Grade A Grade B
Figure 3. Manganese content in steel during experiments.

Influence of Ferromanganese Additions on Inclusions in Bearing Steel
- 11 -
0.0000
0.0010
0.0020
0.0030
0.0040
0.0050
A B C D
Are
a-%
Reference sample 3 minutes after addition Final sample
Figure 4. Averages of total area-% of inclusions in examined steel samples.
0.0000
0.0005
0.0010
0.0015
0.0020
A B C D
Are
a-%
Reference sample 3 minutes after addition Final sample
Figure 5. Average area-% of DT inclusions in steel samples.

Influence of Ferromanganese Additions on Inclusions in Bearing Steel
- 12 -
0.0000
0.0005
0.0010
0.0015
0.0020
A B C D
Are
a-%
Reference sample 3 minutes after addition Final sample
Figure 6. Average area-% of DM inclusions in steel samples.
0.0000
0.0005
0.0010
0.0015
0.0020
A B C D
Are
a-%
Reference sample 3 minutes after addition Final sample
Figure 7. Average area-% of DH inclusions in steel samples.
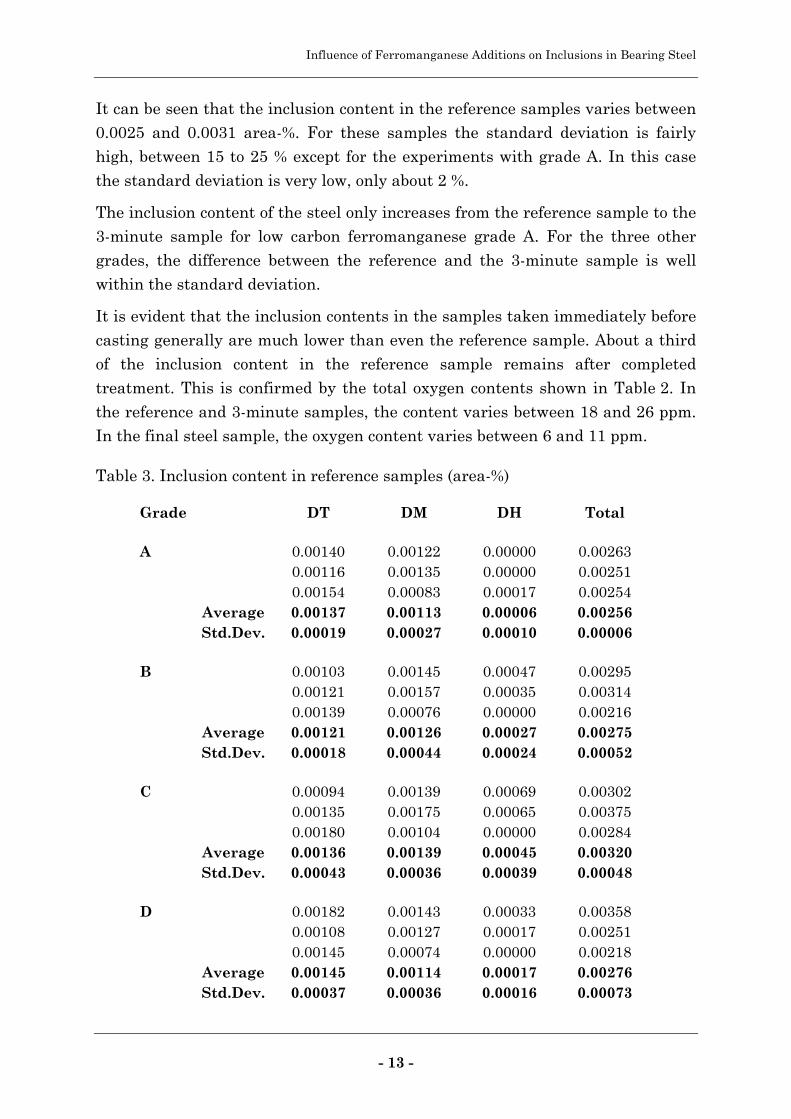
Influence of Ferromanganese Additions on Inclusions in Bearing Steel
- 13 -
It can be seen that the inclusion content in the reference samples varies between0.0025 and 0.0031 area-%. For these samples the standard deviation is fairlyhigh, between 15 to 25 % except for the experiments with grade A. In this casethe standard deviation is very low, only about 2 %.
The inclusion content of the steel only increases from the reference sample to the3-minute sample for low carbon ferromanganese grade A. For the three othergrades, the difference between the reference and the 3-minute sample is wellwithin the standard deviation.
It is evident that the inclusion contents in the samples taken immediately beforecasting generally are much lower than even the reference sample. About a thirdof the inclusion content in the reference sample remains after completedtreatment. This is confirmed by the total oxygen contents shown in Table 2. Inthe reference and 3-minute samples, the content varies between 18 and 26 ppm.In the final steel sample, the oxygen content varies between 6 and 11 ppm.
Table 3. Inclusion content in reference samples (area-%)
Grade DT DM DH Total
A 0.00140 0.00122 0.00000 0.002630.00116 0.00135 0.00000 0.002510.00154 0.00083 0.00017 0.00254
Average 0.00137 0.00113 0.00006 0.00256Std.Dev. 0.00019 0.00027 0.00010 0.00006
B 0.00103 0.00145 0.00047 0.002950.00121 0.00157 0.00035 0.003140.00139 0.00076 0.00000 0.00216
Average 0.00121 0.00126 0.00027 0.00275Std.Dev. 0.00018 0.00044 0.00024 0.00052
C 0.00094 0.00139 0.00069 0.003020.00135 0.00175 0.00065 0.003750.00180 0.00104 0.00000 0.00284
Average 0.00136 0.00139 0.00045 0.00320Std.Dev. 0.00043 0.00036 0.00039 0.00048
D 0.00182 0.00143 0.00033 0.003580.00108 0.00127 0.00017 0.002510.00145 0.00074 0.00000 0.00218
Average 0.00145 0.00114 0.00017 0.00276Std.Dev. 0.00037 0.00036 0.00016 0.00073
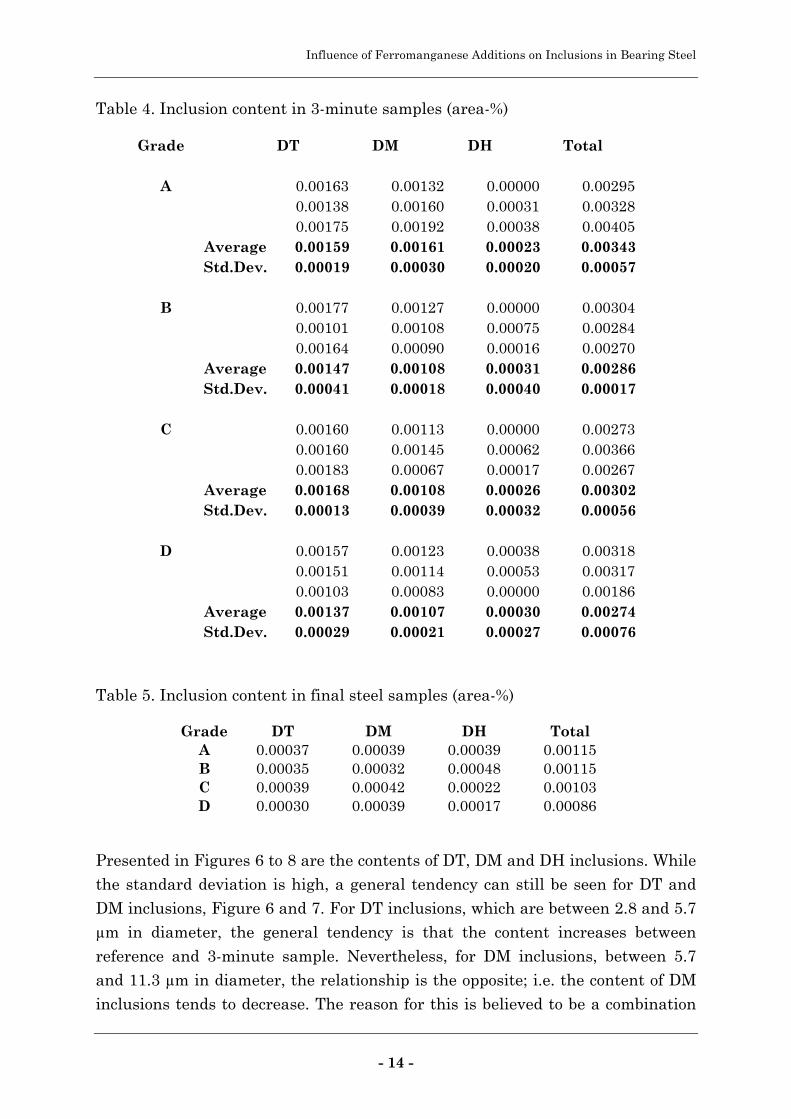
Influence of Ferromanganese Additions on Inclusions in Bearing Steel
- 14 -
Table 4. Inclusion content in 3-minute samples (area-%)
Grade DT DM DH Total
A 0.00163 0.00132 0.00000 0.002950.00138 0.00160 0.00031 0.003280.00175 0.00192 0.00038 0.00405
Average 0.00159 0.00161 0.00023 0.00343Std.Dev. 0.00019 0.00030 0.00020 0.00057
B 0.00177 0.00127 0.00000 0.003040.00101 0.00108 0.00075 0.002840.00164 0.00090 0.00016 0.00270
Average 0.00147 0.00108 0.00031 0.00286Std.Dev. 0.00041 0.00018 0.00040 0.00017
C 0.00160 0.00113 0.00000 0.002730.00160 0.00145 0.00062 0.003660.00183 0.00067 0.00017 0.00267
Average 0.00168 0.00108 0.00026 0.00302Std.Dev. 0.00013 0.00039 0.00032 0.00056
D 0.00157 0.00123 0.00038 0.003180.00151 0.00114 0.00053 0.003170.00103 0.00083 0.00000 0.00186
Average 0.00137 0.00107 0.00030 0.00274Std.Dev. 0.00029 0.00021 0.00027 0.00076
Table 5. Inclusion content in final steel samples (area-%)
Grade DT DM DH TotalA 0.00037 0.00039 0.00039 0.00115B 0.00035 0.00032 0.00048 0.00115C 0.00039 0.00042 0.00022 0.00103D 0.00030 0.00039 0.00017 0.00086
Presented in Figures 6 to 8 are the contents of DT, DM and DH inclusions. Whilethe standard deviation is high, a general tendency can still be seen for DT andDM inclusions, Figure 6 and 7. For DT inclusions, which are between 2.8 and 5.7µm in diameter, the general tendency is that the content increases betweenreference and 3-minute sample. Nevertheless, for DM inclusions, between 5.7and 11.3 µm in diameter, the relationship is the opposite; i.e. the content of DMinclusions tends to decrease. The reason for this is believed to be a combination
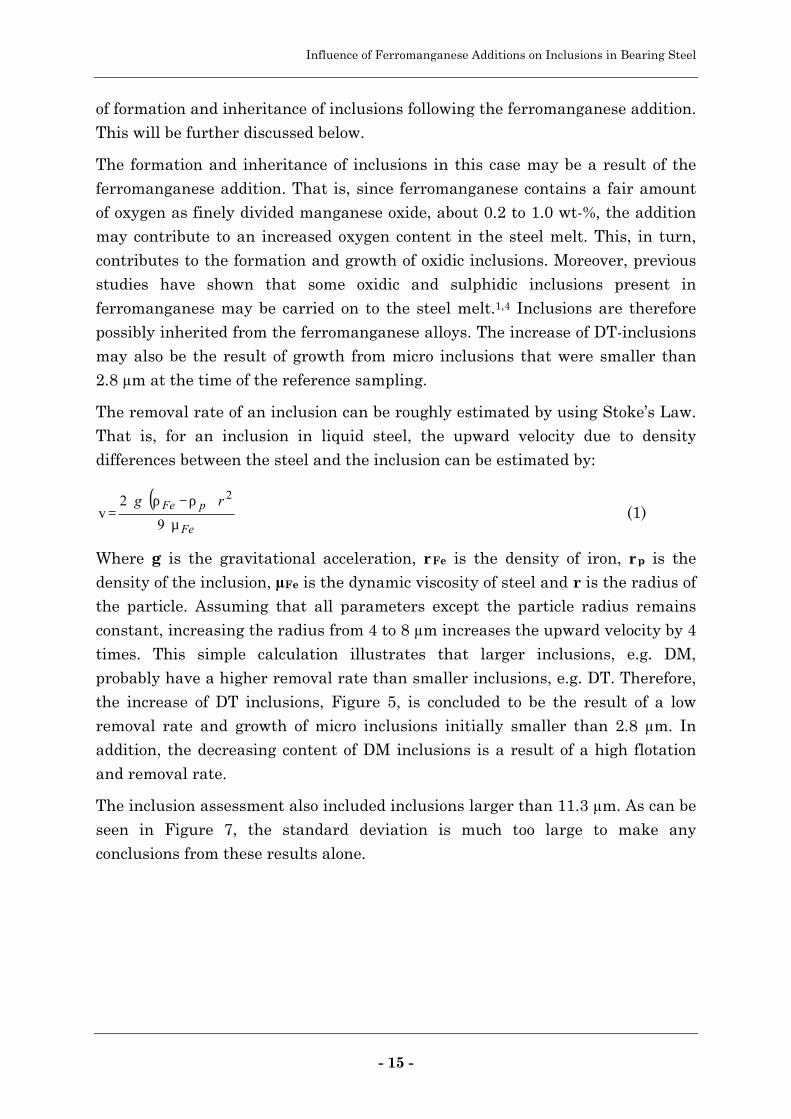
Influence of Ferromanganese Additions on Inclusions in Bearing Steel
- 15 -
of formation and inheritance of inclusions following the ferromanganese addition.This will be further discussed below.
The formation and inheritance of inclusions in this case may be a result of theferromanganese addition. That is, since ferromanganese contains a fair amountof oxygen as finely divided manganese oxide, about 0.2 to 1.0 wt-%, the additionmay contribute to an increased oxygen content in the steel melt. This, in turn,contributes to the formation and growth of oxidic inclusions. Moreover, previousstudies have shown that some oxidic and sulphidic inclusions present inferromanganese may be carried on to the steel melt.1,4 Inclusions are thereforepossibly inherited from the ferromanganese alloys. The increase of DT-inclusionsmay also be the result of growth from micro inclusions that were smaller than2.8 µm at the time of the reference sampling.
The removal rate of an inclusion can be roughly estimated by using Stoke’s Law.That is, for an inclusion in liquid steel, the upward velocity due to densitydifferences between the steel and the inclusion can be estimated by:
( )Fe
pFe rg
µ⋅
⋅ρ−ρ⋅⋅=
9
2v
2
(1)
Where g is the gravitational acceleration, ρFe is the density of iron, ρp is thedensity of the inclusion, µFe is the dynamic viscosity of steel and r is the radius ofthe particle. Assuming that all parameters except the particle radius remainsconstant, increasing the radius from 4 to 8 µm increases the upward velocity by 4times. This simple calculation illustrates that larger inclusions, e.g. DM,probably have a higher removal rate than smaller inclusions, e.g. DT. Therefore,the increase of DT inclusions, Figure 5, is concluded to be the result of a lowremoval rate and growth of micro inclusions initially smaller than 2.8 µm. Inaddition, the decreasing content of DM inclusions is a result of a high flotationand removal rate.
The inclusion assessment also included inclusions larger than 11.3 µm. As can beseen in Figure 7, the standard deviation is much too large to make anyconclusions from these results alone.
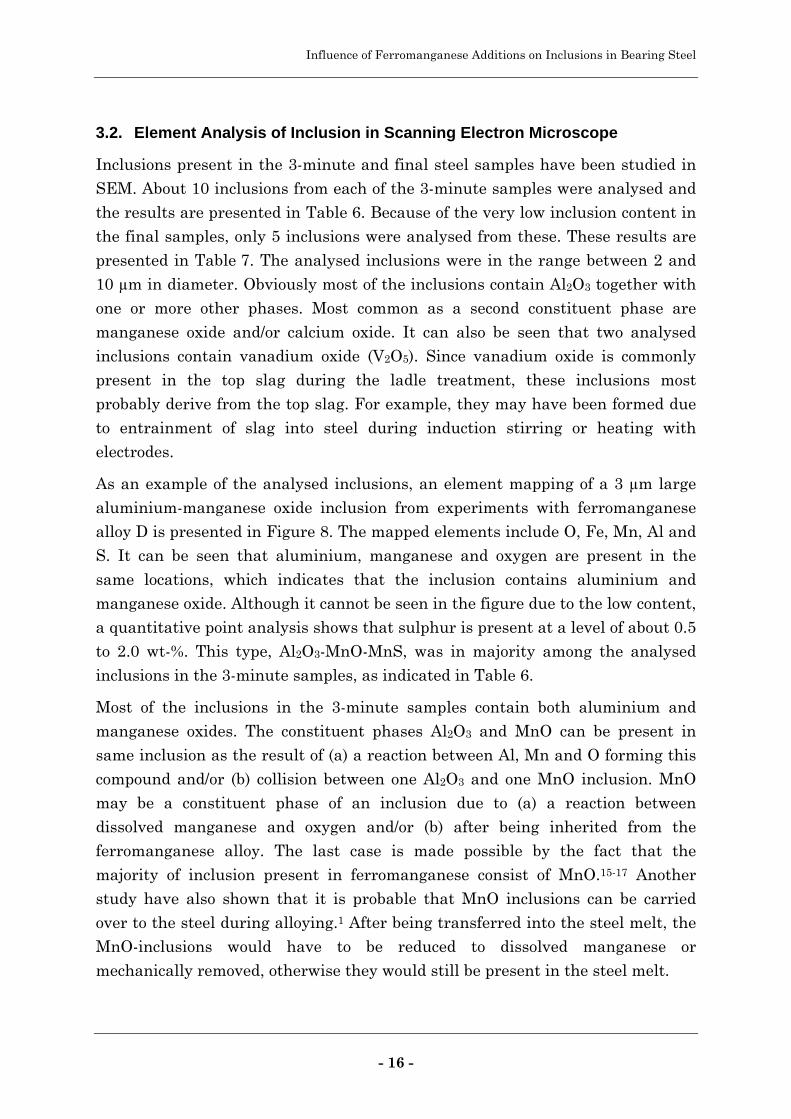
Influence of Ferromanganese Additions on Inclusions in Bearing Steel
- 16 -
3.2. Element Analysis of Inclusion in Scanning Electron Microscope
Inclusions present in the 3-minute and final steel samples have been studied inSEM. About 10 inclusions from each of the 3-minute samples were analysed andthe results are presented in Table 6. Because of the very low inclusion content inthe final samples, only 5 inclusions were analysed from these. These results arepresented in Table 7. The analysed inclusions were in the range between 2 and10 µm in diameter. Obviously most of the inclusions contain Al2O3 together withone or more other phases. Most common as a second constituent phase aremanganese oxide and/or calcium oxide. It can also be seen that two analysedinclusions contain vanadium oxide (V2O5). Since vanadium oxide is commonlypresent in the top slag during the ladle treatment, these inclusions mostprobably derive from the top slag. For example, they may have been formed dueto entrainment of slag into steel during induction stirring or heating withelectrodes.
As an example of the analysed inclusions, an element mapping of a 3 µm largealuminium-manganese oxide inclusion from experiments with ferromanganesealloy D is presented in Figure 8. The mapped elements include O, Fe, Mn, Al andS. It can be seen that aluminium, manganese and oxygen are present in thesame locations, which indicates that the inclusion contains aluminium andmanganese oxide. Although it cannot be seen in the figure due to the low content,a quantitative point analysis shows that sulphur is present at a level of about 0.5to 2.0 wt-%. This type, Al2O3-MnO-MnS, was in majority among the analysedinclusions in the 3-minute samples, as indicated in Table 6.
Most of the inclusions in the 3-minute samples contain both aluminium andmanganese oxides. The constituent phases Al2O3 and MnO can be present insame inclusion as the result of (a) a reaction between Al, Mn and O forming thiscompound and/or (b) collision between one Al2O3 and one MnO inclusion. MnOmay be a constituent phase of an inclusion due to (a) a reaction betweendissolved manganese and oxygen and/or (b) after being inherited from theferromanganese alloy. The last case is made possible by the fact that themajority of inclusion present in ferromanganese consist of MnO.15-17 Anotherstudy have also shown that it is probable that MnO inclusions can be carriedover to the steel during alloying.1 After being transferred into the steel melt, theMnO-inclusions would have to be reduced to dissolved manganese ormechanically removed, otherwise they would still be present in the steel melt.

Influence of Ferromanganese Additions on Inclusions in Bearing Steel
- 17 -
Figure 8. Element mapping of a 3 µm Al2O3-MnO-MnS inclusion.
The equilibrium between manganese and oxygen in liquid iron can be calculatedto determine if the conditions during the experiments were favourable for MnOformation. MnO is formed by the following reaction:
Mn + O ⇔ MnO(s) (2)
The standard Gibbs free energy of MnO(s) formation is:18
Taa
aRTG
OMn
MnO ⋅+−=⋅
−=∆ 64,127284900ln0 (3)
The composition that was used in the calculations was 0.13 wt-% C, 0.045 wt-%S, 0.41 wt-% Si and 4 ppm Ca. Al, Mn and O contents were used as variables andthe activity of MnO(s) was set to unity. Only first order interaction parameterswere used in the calculations.18 Using the same conditions, the equilibriumdissolved oxygen content was also calculated for the following reaction:
2 Al + 3 O ⇔ Al2O3(s) (4)
The standard free energy of Al2O3(s) formation is:18
Taa
aRTG
OAl
OAl ⋅+−=⋅
−=∆ 8.3931225000ln 320 32 (5)
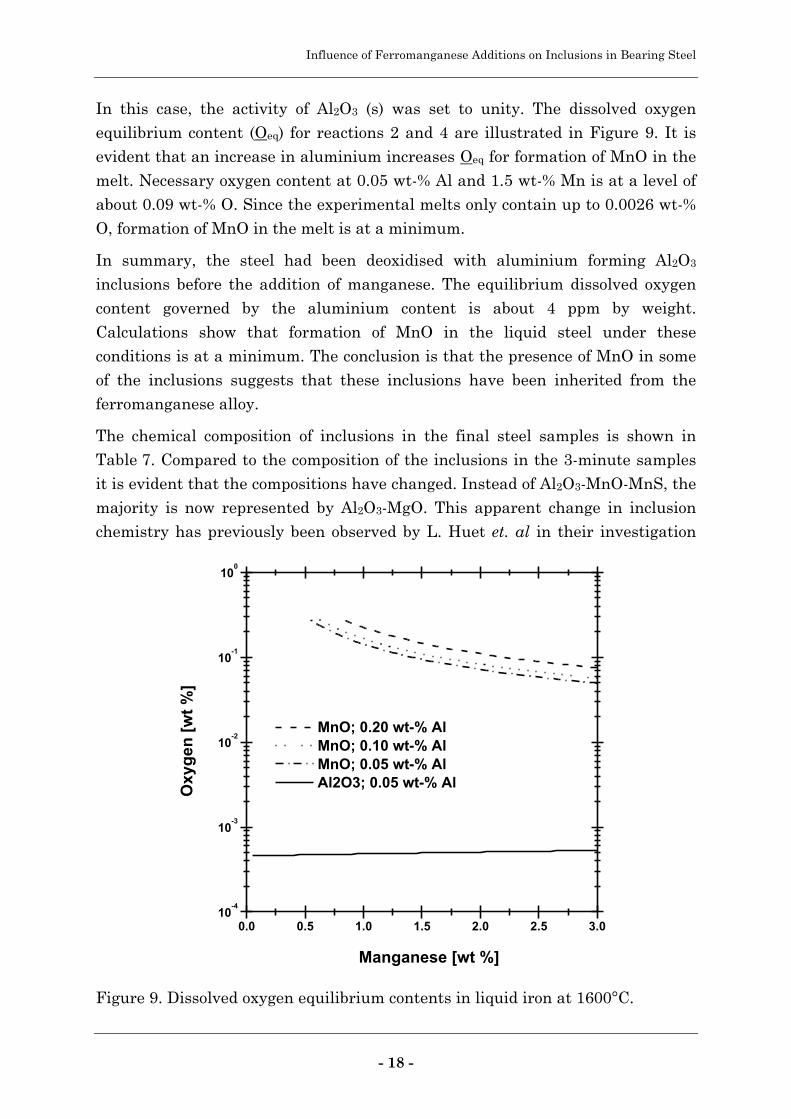
Influence of Ferromanganese Additions on Inclusions in Bearing Steel
- 18 -
In this case, the activity of Al2O3 (s) was set to unity. The dissolved oxygenequilibrium content (Oeq) for reactions 2 and 4 are illustrated in Figure 9. It isevident that an increase in aluminium increases Oeq for formation of MnO in themelt. Necessary oxygen content at 0.05 wt-% Al and 1.5 wt-% Mn is at a level ofabout 0.09 wt-% O. Since the experimental melts only contain up to 0.0026 wt-%O, formation of MnO in the melt is at a minimum.
In summary, the steel had been deoxidised with aluminium forming Al2O3
inclusions before the addition of manganese. The equilibrium dissolved oxygencontent governed by the aluminium content is about 4 ppm by weight.Calculations show that formation of MnO in the liquid steel under theseconditions is at a minimum. The conclusion is that the presence of MnO in someof the inclusions suggests that these inclusions have been inherited from theferromanganese alloy.
The chemical composition of inclusions in the final steel samples is shown inTable 7. Compared to the composition of the inclusions in the 3-minute samplesit is evident that the compositions have changed. Instead of Al2O3-MnO-MnS, themajority is now represented by Al2O3-MgO. This apparent change in inclusionchemistry has previously been observed by L. Huet et. al in their investigation
10-4
10-3
10-2
10-1
100
0.0 0.5 1.0 1.5 2.0 2.5 3.0
MnO; 0.20 wt-% Al MnO; 0.10 wt-% Al MnO; 0.05 wt-% Al Al2O3; 0.05 wt-% Al
Manganese [wt %]
Oxy
gen
[w
t %
]
Figure 9. Dissolved oxygen equilibrium contents in liquid iron at 1600°C.
Influence of Ferromanganese Additions on Inclusions in Bearing Steel
- 19 -
about deoxidation praxis in bearing steel production.19 Their results shows thatthe inclusion composition changes from complex aluminates to Al2O3-MgO aftervacuum degassing. The source of magnesia in these inclusions is the refractorymaterial in the ladle. At the low pressures used during vacuum degassing, themagnesia in the refractory is reduced, causing increased magnesium content inthe steel. This in turn modifies the present inclusions to magnesia containingcomplexes, such as the Al2O3-MgO spinel.20 The conclusion is that the grade offerromanganese does not influence the end-composition of the inclusions in thesteel.
Finally, the composition of Al2O3-MnO and Al2O3-MnO-MnS has been observedto be reasonably constant irrespective of the ferromanganese grade used. Asshown in Table 6, the majority of the inclusions are either of the type Al2O3-MnOor Al2O3-MnO-MnS. In Table 8, the aluminium and manganese content for thesetwo inclusion groups are compared. On average, the Al2O3-MnO inclusionscontained 96 wt-% aluminium and 4 wt-% manganese. The standard deviationfor aluminium and manganese were 1.9 wt-%. The Al2O3-MnO-MnS inclusionscontained on average 86 wt-% aluminium, 10 wt-% manganese and 4 wt-%sulphur. The standard deviation of these analyses were 7.5, 5.5 and 2.0,respectively. Apparently, the composition of these inclusions remains in the highaluminium area regardless of which ferromanganese grade is used.
Table 6. Inclusion types in 3-minutes samples
Type of inclusion A B C DAl2O3 2 1 1Al2O3-MnO 4 1 1 4Al2O3-MnO-MnS 3 2 7 3Al2O3-MgO-MnO-MnS 1 1Al2O3-CaO-MnO 1 1 1 1Al2O3-CaO-MnO-MnS 1 2 2Al2O3-CaO-CaS 1Al2O3-CaO-MgO-MnO-MnS 1 1Al2O3-CaO-MnO-SiO2-V2O5 1 1CaO-MgO 1CaO-MnO-SiO2 1MnO-MnS 2SiO2 1
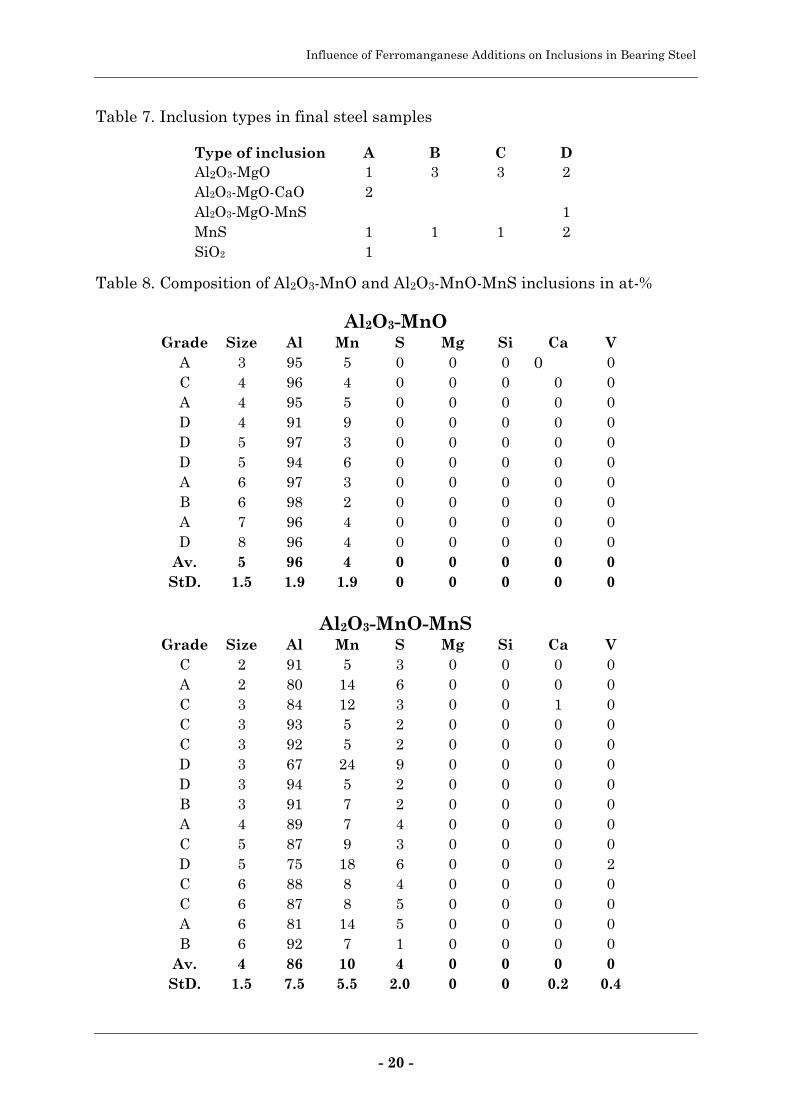
Influence of Ferromanganese Additions on Inclusions in Bearing Steel
- 20 -
Table 7. Inclusion types in final steel samples
Type of inclusion A B C DAl2O3-MgO 1 3 3 2Al2O3-MgO-CaO 2Al2O3-MgO-MnS 1MnS 1 1 1 2SiO2 1
Table 8. Composition of Al2O3-MnO and Al2O3-MnO-MnS inclusions in at-%
Al2O3-MnOGrade Size Al Mn S Mg Si Ca V
A 3 95 5 0 0 0 0 0C 4 96 4 0 0 0 0 0A 4 95 5 0 0 0 0 0D 4 91 9 0 0 0 0 0D 5 97 3 0 0 0 0 0D 5 94 6 0 0 0 0 0A 6 97 3 0 0 0 0 0B 6 98 2 0 0 0 0 0A 7 96 4 0 0 0 0 0D 8 96 4 0 0 0 0 0
Av. 5 96 4 0 0 0 0 0StD. 1.5 1.9 1.9 0 0 0 0 0
Al2O3-MnO-MnSGrade Size Al Mn S Mg Si Ca V
C 2 91 5 3 0 0 0 0A 2 80 14 6 0 0 0 0C 3 84 12 3 0 0 1 0C 3 93 5 2 0 0 0 0C 3 92 5 2 0 0 0 0D 3 67 24 9 0 0 0 0D 3 94 5 2 0 0 0 0B 3 91 7 2 0 0 0 0A 4 89 7 4 0 0 0 0C 5 87 9 3 0 0 0 0D 5 75 18 6 0 0 0 2C 6 88 8 4 0 0 0 0C 6 87 8 5 0 0 0 0A 6 81 14 5 0 0 0 0B 6 92 7 1 0 0 0 0
Av. 4 86 10 4 0 0 0 0StD. 1.5 7.5 5.5 2.0 0 0 0.2 0.4
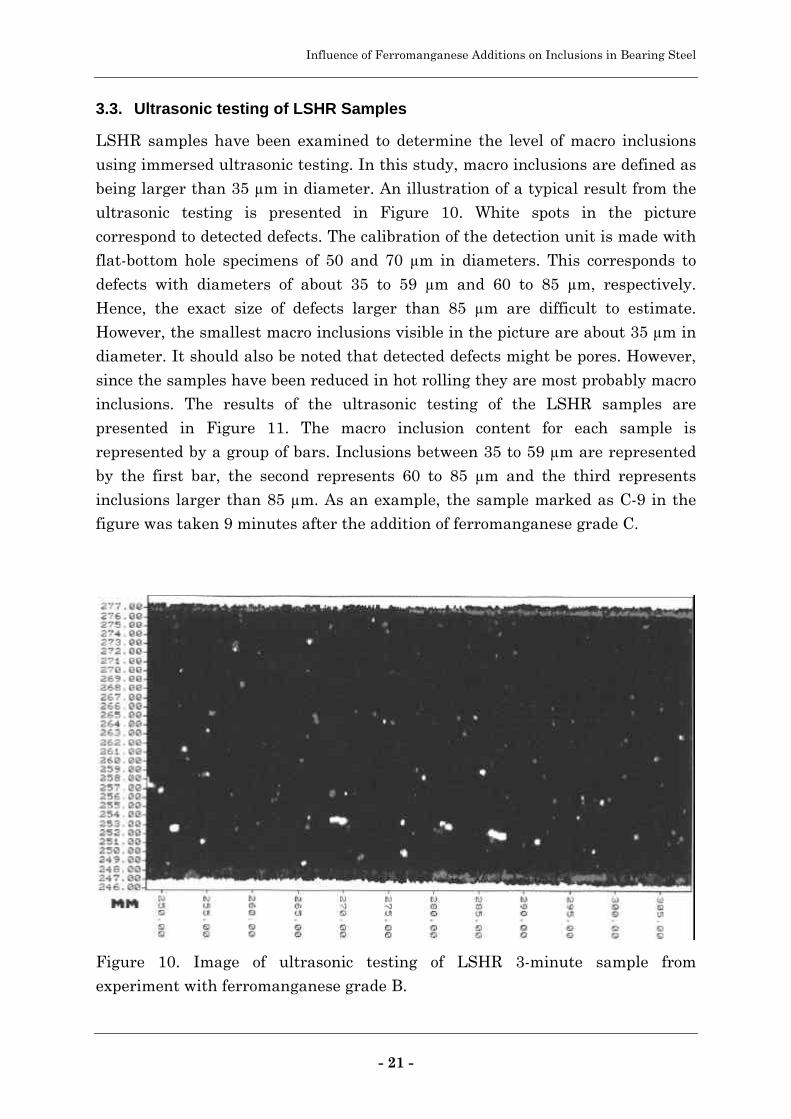
Influence of Ferromanganese Additions on Inclusions in Bearing Steel
- 21 -
3.3. Ultrasonic testing of LSHR Samples
LSHR samples have been examined to determine the level of macro inclusionsusing immersed ultrasonic testing. In this study, macro inclusions are defined asbeing larger than 35 µm in diameter. An illustration of a typical result from theultrasonic testing is presented in Figure 10. White spots in the picturecorrespond to detected defects. The calibration of the detection unit is made withflat-bottom hole specimens of 50 and 70 µm in diameters. This corresponds todefects with diameters of about 35 to 59 µm and 60 to 85 µm, respectively.Hence, the exact size of defects larger than 85 µm are difficult to estimate.However, the smallest macro inclusions visible in the picture are about 35 µm indiameter. It should also be noted that detected defects might be pores. However,since the samples have been reduced in hot rolling they are most probably macroinclusions. The results of the ultrasonic testing of the LSHR samples arepresented in Figure 11. The macro inclusion content for each sample isrepresented by a group of bars. Inclusions between 35 to 59 µm are representedby the first bar, the second represents 60 to 85 µm and the third representsinclusions larger than 85 µm. As an example, the sample marked as C-9 in thefigure was taken 9 minutes after the addition of ferromanganese grade C.
Figure 10. Image of ultrasonic testing of LSHR 3-minute sample fromexperiment with ferromanganese grade B.
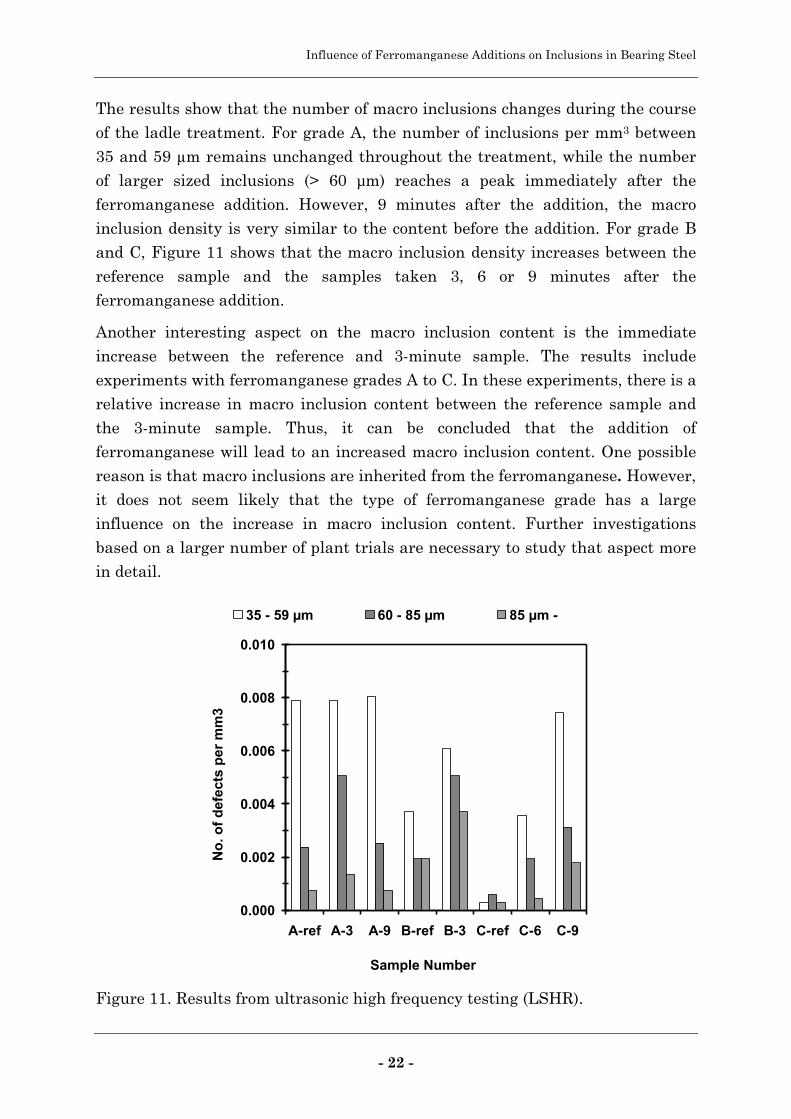
Influence of Ferromanganese Additions on Inclusions in Bearing Steel
- 22 -
The results show that the number of macro inclusions changes during the courseof the ladle treatment. For grade A, the number of inclusions per mm3 between35 and 59 µm remains unchanged throughout the treatment, while the numberof larger sized inclusions (> 60 µm) reaches a peak immediately after theferromanganese addition. However, 9 minutes after the addition, the macroinclusion density is very similar to the content before the addition. For grade Band C, Figure 11 shows that the macro inclusion density increases between thereference sample and the samples taken 3, 6 or 9 minutes after theferromanganese addition.
Another interesting aspect on the macro inclusion content is the immediateincrease between the reference and 3-minute sample. The results includeexperiments with ferromanganese grades A to C. In these experiments, there is arelative increase in macro inclusion content between the reference sample andthe 3-minute sample. Thus, it can be concluded that the addition offerromanganese will lead to an increased macro inclusion content. One possiblereason is that macro inclusions are inherited from the ferromanganese. However,it does not seem likely that the type of ferromanganese grade has a largeinfluence on the increase in macro inclusion content. Further investigationsbased on a larger number of plant trials are necessary to study that aspect morein detail.
0.000
0.002
0.004
0.006
0.008
0.010
A-ref A-3 A-9 B-ref B-3 C-ref C-6 C-9
Sample Number
No
. of
def
ects
per
mm
3
35 - 59 µm 60 - 85 µm 85 µm -
Figure 11. Results from ultrasonic high frequency testing (LSHR).
Influence of Ferromanganese Additions on Inclusions in Bearing Steel
- 23 -
It could be discussed why the macro inclusion content varies so much in thedifferent samples. The results could be affected by the sampling procedure itself,since the sampler has to pass through the top slag before being immersed intothe bath. In the way through the slag layer some slag might penetrate into themould and thus influence the results of the LSHR sampling. In fact, slag wasfound on the surface of some of the rapid solidification samples. However, inorder to be sure about actual sampling errors, detected macro inclusions wouldhave to be analysed using SEM. This very time-consuming operation includesidentifying the depth to the inclusion followed by a careful grinding down to thatposition, and finally determination of the composition using SEM. This wasconsidered as out of the scope of this paper.
Another cause for the variation is that the macro inclusion content actuallyvaries as is seen from the results. The concentration of macro inclusions in thesampling position can most likely vary during treatment. Finally, the way ofdetecting the macro inclusion inclusions may itself be a cause of the variation ofmacro inclusions in the different samples. The methodology of using the LSHRmethod together with ultrasonic testing is not fully developed. However, before itwas developed the kind of macro inclusions shown in Figure 11 were not believedto exist, simply because they could not easily be detected. The reason is that themacro inclusion content in clean steel is so low that it can not easily be detectedusing the normal procedure of determining the micro inclusion content usingLOM. The main reason is that the sampling volume in the production samples isto small to find a statistically reliable number of macro inclusions. The size of theLSHR sampler might even is to small for detecting a representative number ofinclusions during ultrasonic testing. These questions are dealt with in ongoingresearch in Sweden to develop the LSHR method in combination with ultrasonictesting. Based on the findings of that research it will with any luck be easier todetermine the macro inclusion content during ladle treatment in the future.

Influence of Ferromanganese Additions on Inclusions in Bearing Steel
- 24 -
4. Conclusions
This study has shown how the addition of normal refined and low-oxygenferromanganese influences inclusions in steel during bearing steel production.The results indicate that the micro inclusion density in the steel immediatelybefore casting will remain at an almost equal level irrespective of whichferromanganese grade that is added. When adding normal refined low-carbonferromanganese (grade A), the total micro-inclusion fraction increased withabout 30% during the first three minutes after addition. However, the inclusioncontent stabilises after vacuum degassing at an equal level for allferromanganese grades.
The macro inclusion content was found to increase due to the addition offerromanganese. No effect of grade on the macro inclusion content could befound. One plausible reason for the increase in macro inclusion content is thatinclusions are inherited from the ferroalloy, but further investigations arenecessary to confirm that.
An influence on the composition of the inclusions has also been indicated. It isconcluded that MnO inclusions present in ferromanganese may be inherited tothe steel. It should also be mentioned that 90% of the analysed inclusionscontained Al2O3, which is to be expected since the steel was deoxidised withaluminium prior to the addition of ferromanganese.
The more specific conclusions from this study are the following:
• Ferromanganese grades with low oxygen and inclusion contents do notsignificantly influence the micro inclusion population in steel.
• The results indicate that MnO inclusions are inherited from ferromanganeseto liquid steel during alloying.
• The addition of ferromanganese causes an increase of the macro inclusiondensity up to 9 minutes from the time for addition.
The results from the plant trials indicate that ferromanganese grades have onlya temporary influence on content and composition of micro inclusion in steel. It isentirely possible that this influence is important to certain steelmakers.Especially considering that low-carbon ferromanganese sometimes is added as afinal adjustment immidiately before casting. This praxis might have to be re-considered if the steel is required to be clean from inclusions.
Influence of Ferromanganese Additions on Inclusions in Bearing Steel
- 25 -
The macro inclusion content was found to increase due to the alloy addition, butthe long term influence on the macro inclusion content was not studied. Insummary, further investigations are suggested in order to gain a betterfoundation from which conclusions that are more specific can be made.

Influence of Ferromanganese Additions on Inclusions in Bearing Steel
- 26 -
5. Acknowledgements
Two of the authors (TS and PJ) wish to thank Eramet for their financial supportof this study and Ovako Steel for providing support in form of personnel,material and analyses in connection to the plant trials. A special thanks goes toMr. Ketil Törresvoll of Ovako Steel for carrying out the ultrasonic testing.
Influence of Ferromanganese Additions on Inclusions in Bearing Steel
- 27 -
6. References
1.) T. SJÖQVIST and P. JÖNSSON: Proc. Int. Conf. "57th Electric FurnaceConference", Pittsburgh, PA, USA, November 1999, Iron and SteelSociety/AIME, 383-393.
2.) A. VON SCHÖBERL and H. STRAUBE: Radex-Rundschau, 1966, 1, 35-49.
3.) O. WIJK and V. BRABIE: ISIJ Int., in suppl. "Science and Technology ofSteelmaking", 1996, 36, 132-135.
4.) T. SJÖQVIST: in "Effect of Ferromanganese and Calcium CarbideAdditions on Inclusion Characteristics in Steel", Licentiate Thesis,Supplement 1, Stockholm, Sweden, 1999, Royal Institute of Technology.
5.) H. HÄGGLUND, Electro-Nite-Rescon AB, P.O. Box 35, SE-74082Örsundsbro, Sweden.
6.) ASTM E1019-00 "Standard Test Methods for Determination of Carbon,Sulfur, Nitrogen, and Oxygen in Steel and in Iron, Nickel, and CobaltAlloys", American Society For Testing and Materials, 100 Barr HarborDrive, West Conshohocken, PA, USA 19428-2959.
7.) ASTM E415-99a "Standard Test Method for Optical Emission VacuumSpectrometric Analysis of Carbon and Low-Alloy Steel", American SocietyFor Testing and Materials, 100 Barr Harbor Drive, West Conshohocken,PA, USA 19428-2959.
8.) SWEDISH STANDARD SS 111116, Swedish Institute for Standards, P.O.Box 6455, SE-113 82 Stockholm, Sweden, 1985.
9.) S. JOHANSSON: Proc. Int. Conf. on "Second International Conference onClean Steel", London, UK, 1983, The Metals Society, London, 63-74.
10.) S. JOHANSSON: Proc. Int. Conf. "Scaninject III", part II, Luleå, Sweden,June 1983, MEFOS, 45:1 - 45:13.
11.) S. JOHANSSON, Quantmet AB, P.O. Box 99, SE-81121 Sandviken,Sweden.
12.) B. WAHLBERG, T. HANSEN, P. JÖNSSON AND K. TÖRRESVOLL:Proc. Int. Conf. "Clean Steel 5: Fifth International Conference on CleanSteel", Balatonfured, Hungary, June 1997, Hungarian Mining andMetallurgical Society, 48-57.

Influence of Ferromanganese Additions on Inclusions in Bearing Steel
- 28 -
13.) T. HANSEN, P. JÖNSSON, K. TÖRRESVOLL AND B. WAHLBERG,Proc. Conf. "5th International Conference on Progress in AnalyticalChemistry", Luxemburg, May 1998, 497-504.
14.) T. HANSEN, P. JÖNSSON, K. TÖRRESVOLL AND G. RUNNSJÖ: Proc.Int. Conf. "83rd Steelmaking Conference", Pittsburgh, PA, USA, March2000, Iron and Steel Society/AIME, 207-217.
15.) M. BALBI and G. CAIRONI: Avesta Stainless Bulletin, 1982, 4, 14-19.
16.) M. BALBI, G. SILVA and R. ROJA: La Fonderia Italiana, 1975, 11, 350-352.
17.) T. SJÖQVIST, P. JÖNSSON and Ö. GRONG: Met. Mat. Trans. A, 2001,32A
18.) "Steelmaking Data Sourcebook" (ed. Y. MATSUSHITA et al.), RevisedEdition, The Japan Society for the Promotion of Science, The 19thCommittee on Steelmaking, New York, NY, USA, 1984, Gordon andBreach Science Publishers.
19.) L. HUET, P. JONSSON and F. REINHOLDSSON: Proc. Int. Conf. "80thSteelmaking Conference ", Chicago, IL, USA, April 1997, Iron and SteelSociety/AIME, 639-646
20.) B. HALLBERG: in "Forming of Inclusions in the System MgO-Al2O3
During Treatment of Al-deoxidised Steel in MgO-lined Ladles", LicentiateThesis, Stockholm, Sweden, 1996, Royal Institute of Technology.

![Synthesis and some stereoselective radical additions of bis[(phenyldimethylsilyl)methyl]tin dihydride](https://img.dokumen.tips/doc/110x75/634f9dfe01c04712f406c7b5/synthesis-and-some-stereoselective-radical-additions-of-bisphenyldimethylsilylmethyltin.jpg)


