Embed Size (px)
Citation preview
University of South Florida University of South Florida
Scholar Commons Scholar Commons
Graduate Theses and Dissertations Graduate School
11-10-2010
Inactivation of Ascaris suum by Ammonia in Feces Simulating the Inactivation of Ascaris suum by Ammonia in Feces Simulating the
Physical-Chemical Parameters of the Solar Toilet Under Physical-Chemical Parameters of the Solar Toilet Under
Laboratory Conditions Laboratory Conditions
Ligia Maria Cruz Espinoza University of South Florida
Follow this and additional works at: https://digitalcommons.usf.edu/etd
Part of the American Studies Commons, Public Health Commons, and the Public Policy Commons
Scholar Commons Citation Scholar Commons Citation Cruz Espinoza, Ligia Maria, "Inactivation of Ascaris suum by Ammonia in Feces Simulating the Physical-Chemical Parameters of the Solar Toilet Under Laboratory Conditions" (2010). Graduate Theses and Dissertations. https://digitalcommons.usf.edu/etd/3494
This Dissertation is brought to you for free and open access by the Graduate School at Scholar Commons. It has been accepted for inclusion in Graduate Theses and Dissertations by an authorized administrator of Scholar Commons. For more information, please contact [email protected].
Inactivation of Ascaris suum by Ammonia in Feces Simulating the Physical-
Chemical Parameters of the Solar Toilet under Laboratory Conditions
by
Ligia María Cruz Espinoza
A dissertation submitted in partial fulfillment of the requirements for the degree of
Doctor of Philosophy Department of Global Health
College of Public Health University of South Florida
Major Professor: Ricardo Izurieta, M.D., Dr.P.H. Boo Kwa, Ph.D.
Azliyati Azizan, Ph.D. Jaime Corvin, Ph.D.
Linda Whiteford, Ph.D. Daniel Yeh, Ph.D.
Date of Approval: November 10, 2010
Keywords: Ascaris, inactivation, urea, ammonia, feces, solar toilet
Copyright © 2010, Ligia María Cruz Espinoza
DEDICATION
I dedicate this Doctoral dissertation to my loving Mom, Dr. Ligia Espinoza
Aguirre, for instilling the importance of hard work, tenacity and higher education.
There is no doubt in my mind that without her continued support and counsel I
could not have completed this process.
ACKNOWLEDGEMENTS
First and foremost I thank GOD for arranging all the circumstances of my
life in such a way that I could meet the wonderful professors, advisors, co-
workers, and friends that have made unique and important contributions to the
achievement of this goal. I want to solemnly express my deep gratitude to my
major professor, Dr. Ricardo Izurieta, who offered me knowledge and support
through-out my entire academic program and research. I thank my committee
members and Dr. Bjorn Vinneras for their insight and guidance. I would also like
to thank Dr. Lakshminarayan Rajaram for his assistance in data management
and statistical analysis. I acknowledge the support provided by the entire
Department of Global Health: they created the working conditions that were
essential to the accomplishment of this goal. Very special thanks to my
colleagues who helped me in the lab.
My dearest friend and roommate Ellen McCreedy, she was always there
supporting and cheering me up and stood by me through the good and bad
times. I will always appreciate her many hours of proofreading and her belief in
me. My boyfriend Max J. Moreno, I am grateful for his encouragement,
understanding, patience and love in the past few years.

Most importantly, I thank my family, for their faith in me and allowing me to
be as ambitious as I wanted. It was under their watchful eye that I gained so
much drive and an ability to tackle challenges head on.
i
TABLE OF CONTENTS LIST OF TABLES ................................................................................................. iv LIST OF FIGURES ............................................................................................... vi ABSTRACT ........................................................................................................ viii CHAPTER 1. INTRODCUTION ............................................................................. 1 1.1 Purpose of the Study ........................................................................... 1 1.2 Hypothesis ........................................................................................... 4 1.3 Main Objective ..................................................................................... 4 1.4 Specific Objectives............................................................................... 4 1.5 Research Question .............................................................................. 5 CHAPTER 2. LITERATURE REVIEW ................................................................... 6 2.1 Sanitation and Health ........................................................................... 6 2.1.1 Millennium Development Goals and target ten ....................... 7 2.1.2 Influence of sanitation in other MDGs .................................. 11 2.1.3 Monetary benefits of improved sanitation ............................. 13 2.1.4 Effects of sanitation in health ............................................... 13 2.1.4.1 Diarrhea .................................................................. 15 2.1.4.2 Schistosomiasis and soil-transmitted
helminthes .............................................................. 16 2.2 Excreta and Pathogens ...................................................................... 18 2.2.1 Characteristics of excreta ..................................................... 18 2.2.2 Types of pathogen in feces .................................................. 18 2.2.2.1 Bacteria .................................................................. 19 2.2.2.2 Viruses ................................................................... 28 2.2.2.3 Protozoa ................................................................. 34 2.2.2.4 Helminthes ............................................................. 38 2.2.3 Categories of excreta related pathogens.............................. 44 2.2.4 Pathogen survival ................................................................. 47 2.2.4.1 Survival in feces and soil ........................................ 47 2.2.4.2 Indicators of fecal contamination ............................ 48 2.3 Sanitation Systems ............................................................................ 50 2.3.1 General description of waterless system with
urine diversion ..................................................................... 51 2.3.2 Urine dry diverting toilet and Eco-san .................................. 55 2.3.3 Solar toilet prototype IV ........................................................ 58 2.3.4 Sustainable sanitation systems ............................................ 61
ii
2.3.5 Description of the community using the solar toilet .............. 63 2.4 Ammonia ............................................................................................ 66 2.4.1 Urea as a source of ammonia .............................................. 67 2.4.2 Ammonia chemistry in water ................................................ 69 2.4.3 Ammonia in wastewater ....................................................... 71 2.4.4 Ammonia in human feces ..................................................... 73 2.4.5 Ammonia toxicity .................................................................. 74 2.4.5.1 Ammonia toxicity to fecal bacteria .......................... 77 2.4.5.2 Ammonia toxicity to viruses .................................... 81 2.4.5.3 Ammonia toxicity to helminthes .............................. 87 CHAPTER 3. MORPHOLOGICAL CHANGES OF ASCARIS SPP. OVA
DURING ITS DEVELOPMENT OUT OF THE HUMAN HOST ...... 94 3.1 Abstract .............................................................................................. 94 3.2 Introduction ........................................................................................ 96 3.3 Materials and Method ........................................................................ 98 3.4 Results ............................................................................................. 100 3.4.1 Stages of development....................................................... 100 3.4.2 Viability ............................................................................... 104 3.5 Discussion ....................................................................................... 105 3.5.1 Development stages .......................................................... 105 3.5.2 Speed of development ....................................................... 106 3.5.3 Larva motility induction ....................................................... 108 3.5.4 Viability ............................................................................... 109 3.6 Conclusion ....................................................................................... 110 CHAPTER 4. INACTIVATION OF ASCARIS SUUM OVA BY AMMONIA IN
WATER SOLUTION UNDER LABORATORY CONDITIONS ..... 112 4.1 Abstract ............................................................................................ 112 4.2 Introduction ...................................................................................... 114 4.3 Methods ........................................................................................... 116 4.3.1 Materials............................................................................. 116 4.3.2 Experiment set up .............................................................. 117 4.3.3 Statistical analysis .............................................................. 119 4.4 Results ............................................................................................. 120 4.4.1 Monitoring ammonia and pH .............................................. 120 4.4.2 A. suum viability ................................................................. 121 4.4.3 Probability model of A. suum inactivation with
ammonia ............................................................................ 122 4.5 Discussion ....................................................................................... 124 CHAPTER 5. INACTIVATION OF A. SUUM OVA BY AMMONIA IN
FECES UNDER LABORATORY CONDITIONS .......................... 130 5.1 Abstract ............................................................................................ 130 5.2 Introduction ...................................................................................... 133 5.3 Methods ........................................................................................... 136 5.3.1 Materials............................................................................. 136
iii
5.3.2 Experiment set up .............................................................. 138 5.3.3 Statistical analysis .............................................................. 139 5.4 Results ............................................................................................. 141 5.4.1 Monitoring physical and chemical parameters ................... 141 5.4.2 A. suum inactivation ........................................................... 143 5.4.3 Model of A. suum ova inactivation ...................................... 145 5.6 Discussion ....................................................................................... 150 5.7 Limitations of the study .................................................................... 156 5.8 Public health implications and challenges ........................................ 156 5.9 Alternative laboratory methods ........................................................ 158 5.10 General conclusions and recommendations .................................. 158 CHAPTER 6. LIST OF REFERENCES ............................................................. 161 APPENDICES .................................................................................................. 178
Appendix A: Additional Tables .............................................................. 179 Appendix B: Additional Figures of the Physical-Chemical
Parameters and A. suum Ova Inactivation in Biosolid during 56 Days of Storage .................................. 181
ABOUT THE AUTHOR ............................................................................End Page
iv
LIST OF TABLES Table 2.1 United Nations Millennium Development Goals and Targets .......... 9 Table 2.2 Contribution of Access to Domestic Water supply and
Sanitation to other MDGs .............................................................. 12 Table 2.3 Composition of Urine and Feces Expressed as g/day and
mg/day for Metals .......................................................................... 19 Table 2.4 Main Fecal Pathogens of Concern for Public Health ..................... 20 Table 2.5 Categories of Excreta Related Pathogens .................................... 46 Table 2.6 Survival Times of Excreted Pathogens at 20-30 oC and
Decimal Reduction Values during Storage .................................... 48 Table 2.7 Detection Limits of Pathogens for Class A Biosolid....................... 49 Table 2.8 System Template for Waterless System with Urine Diversion ...... 54 Table 2.9 Nitrogen Concentration of Sludge as Percentage of Total
Solids ............................................................................................ 73 Table 2.10 Nitrogen Content in Human feces Excreted by Individual per
Day ................................................................................................ 74 Table 2.11 Tolerance of Fecal Pathogens to Ammonia Toxicity ..................... 76 Table 2.12 Summary of Published Research on Bacteria Inactivation by
Ammonia ....................................................................................... 79 Table 2.13 Viruses in Which Ammonia Toxicity Has Been Evaluated ............. 82 Table 2.14 Summary of Published Research on Virus Inactivation by
Ammonia ....................................................................................... 84 Table 2.15 Summary of Published Research on Helminth Inactivation by
Ammonia ....................................................................................... 91
v
Table 3.1 Criteria to Identify Stage of Development and Viability of Ascaris suum Ova by Microscopy ............................................... 100
Table 3.2 Developmental Stages of A. suum Ova Observed during
Incubation at 28°C....................................................................... 103 Table 4.1 Summary of Experimental Design ............................................... 117 Table 4.2 Criteria to Identify Stage of Development and Viability of
Ascaris suum Ova by Microscopy ............................................... 119 Table 4.3 Aqueous Ammonia in Samples after 72 Hours of Storage .......... 121 Table 4.4 Viability of A. suum Ova After 21 Days of Incubation in vitro....... 122 Table 4.5 Logistic Regression Analysis of A. suum Inactivation in
Solution by Ammonia .................................................................. 124 Table 5.1 Summary of Experimental Design ............................................... 138 Table 5.2 Criteria to Identify Stage of Development and Viability of
A.suum Ova by Microscopy......................................................... 140 Table 5.3 Descriptive Statistics of Physical and Chemical Parameters....... 141 Table 5.4 Logistic Regression Analysis of A. suum ova Inactivation in
Biosolid ....................................................................................... 146
vi
LIST OF FIGURES Figure 2.1 Under Five Mortality Rate and Sanitation Coverage ....................... 7 Figure 2.2 The F-Diagram .............................................................................. 14 Figure 2.3 UDDT: Squat Slab ......................................................................... 55 Figure 2.4 UDDT: Toilet Seat ......................................................................... 56 Figure 2.5 Solar Toilet Prototype IV ............................................................... 60 Figure 2.6 Hydrolysis of Urea ......................................................................... 67 Figure 2.7 Reversible Reaction between Ammonia and Ammonium Ion ....... 69 Figure 2.8 pKa Values as a Function of Temperature (0-45°C) ..................... 70 Figure 2.9 Percent of NH3 (aq) in Aqueous Solution as a Function of pH
and Temperature ........................................................................... 71 Figure 2.10 The Nitrogen Cycle ....................................................................... 72 Figure 3.1 Development of A. suum Ova during Incubation at 28°C ............ 102 Figure 3.2 Timeline of A. suum Ova Development when Incubated in
vitro at 28C° ................................................................................ 103 Figure 3.3 Photographic Documentation of A. suum Ova Development ...... 104 Figure 3.4 Viability Proportions and 95% Confidence Limits from Day 5
to Day 21 of Incubation ............................................................... 105 Figure 4.1 Probability of 100% A. suum ova Inactivation in Solution
after Three Days of Storage with 0% Ammonia .......................... 124 Figure 4.2 Probability of 100% A. suum ova Inactivation in Solution
after Three Days of Storage with 2% Ammonia .......................... 125 Figure 5.1 Ammonia Gas Variations in Biosolid during Storage ................... 142
vii
Figure 5.2 pH Variations in Biosolid during Storage ..................................... 143 Figure 5.3 Survival Curves by Treatment ..................................................... 145 Figure 5.4 Estimated probabilities of A. suum ova inactivation in
biosolid (feces + additive) with 0% urea in laboratory conditions .................................................................................... 147
Figure 5.5 Estimated probabilities of A. suum ova inactivation in
biosolid (feces + additive) treated with 1% urea in laboratory conditions .................................................................................... 148
Figure 5.6 Estimated probabilities of A. suum ova inactivation in
biosolid (feces + additive) treated with 2% urea in laboratory conditions .................................................................................... 149
viii
ABSTRACT
Access to sustainable sanitation systems is a determining factor in
human health and economic development. However, more than a third of
the world’s population lives without access to improved sanitation facilities.
To meet the sanitation United Nations Millennium Development target,
“halve, by 2015, the proportion of people without sustainable access to
safe drinking water and basic sanitation”, a wide range of non
conventional sanitation technologies have been implemented in
developing countries, including waterless systems. These systems
function by diverting urine away from feces and collecting, storing, and
dehydrating the fecal material in watertight dehydration vaults. From a
public health perspective, adequate inactivation of fecal pathogens in a
sanitation system is essential before any use or disposal of fecal material.
In rural areas of El Salvador, the solar toilet is capable of inactivating fecal
pathogens and reducing the prevalence of parasitic infections in its users
when compared to other waterless systems. Nevertheless, not all solar
toilets are able to inactivate completely Ascaris spp. ova after the
recommended storage period. Un-ionized ammonia (NH3) has the
potential to inactivate pathogens in solutions and sludge, including Ascaris
spp. ova. This study hypothesized that adding ammonia to the solar toilet
ix
will improve the technology since pathogen inactivation with ammonia
could be potentiated by the alkaline medium and high temperatures
achieved inside the toilet vaults.
To evaluate this approach, a series of experiments in solution and
biosolid were performed in a laboratory environment using physical and
chemical parameters similar to those achieved by the solar toilet. Eggs of
the swine Ascaris species, Ascaris suum, were used as model in all
experiments. In ammonia solution, the parasite ova were stored for a
period of three days and; in biosolid, the parasite ova were stored for two
months. Urea was used as the source of ammonia in biosolid. In addition
to the experiments with ammonia, normal viability and morphological
changes within the parasite ova during incubation in vitro at 28 C° were
investigated and described to complement current literature published.
Results from the experiments in ammonia solution indicated that
addition of ammonia (1% and 2%) could improve the system since the
critical parameters that significantly reduced A. suum ova viability to zero
in three days could be achieved by the solar toilet: temperature of 35°C or
higher and pH value of 9.3. Results from the experiments in biosolid
further showed that inactivation of A. suum ova was faster in samples
exposed to urea and to temperatures higher than 28°C. All samples
exposed to urea achieved 100% inactivation after 14 days (28°C), 3 days
(35°C) and 24 hours (40°C and 45°C). Survival analysis of the data
showed that there was a significant difference (p value <.0001) between
the inactivation achieved in the samples exposed to urea (1% and 2%)
x
and the samples not exposed to urea. A logistic regression analysis
estimated the effect of Urea (Treatment, OR: 25.9), Temperature (OR:
1.8), and Storage (OR: 1.17) on inactivation.
Results from the experiment with A. suum ova in normal incubation
solution showed that the ova went through clearly identified morphological
changes at different speed of development. Two new additional stages of
development were identified (Pre-larva 1 and Pre-larva 2) and no
significant statistical difference was observed among the viability reported
early in incubation and the one reported after three weeks of in vitro
incubation, indicating that early stages of development may be use as an
alternative to reduce the time to report viability.
The results of this study suggest that inactivation of Ascaris spp
ova by ammonia is possible in fecal material stored in the solar toilet or
any other dry toilet, if the following physical and chemical conditions are
met: a closed vault with a minimum temperature of 28°C; an initial pH of
8.3, minimum moisture of 27.5%, and addition of 1% urea to the biosolid.
At 28°C longer storage time would be required for 100% inactivation while
at higher temperatures less time of storage would be necessary. A
community intervention is recommended to include field conditions and
human behavior as other predictors for Ascaris spp. inactivation by
ammonia.
1
CHAPTER 1.
INTRODUCTION
1.1 Purpose of the Study
Access to adequate and safe sanitation is a precondition to improve the
health status of populations, especially children. Annually an estimated 5.4 billion
cases of diarrhoea and 1.6 million deaths could be reduced worldwide in children
less than five years of age mainly, by improving access to safe water and
sanitation (Hutton & Haller, 2004). To meet the sanitation United Nations
Millennium Development Goal at least 1.4 billion people must gain access to
improved sanitation by the year 2015 (United Nations, 2008). A wide range of
sanitation technologies are available in developing countries to help meet this
challenge (Nelson & Murray, 2008). Urine diverting dry toilet (UDDT) is a dry
sanitation technology that does not use water and diverts urine away from feces;
it is especially useful in deficient water regions, in areas with a high groundwater
table and in rocky areas where is difficult to dig (Tilley, Luthi, Morel, Zurbrugg, &
Schertenleib, 2008).
The solar toilet is a UDDT sanitation technology developed for rural areas
of El Salvador. It has been evolving since its introduction in 1994 and uses high
pH additives, a simple solar panel to increase temperature inside the chamber,
2
and six to eight weeks of storage to generate a product that meets the World
Health Organization and the USEPA fecal coliforms health target and standard: <
1000 Fecal Coliforms per gram (U.S Environmental Protection Agency, 1994;
World Health Organization, 2006a). Communities using the solar toilet have the
lowest prevalence of enteric parasitic infections, when compared with other
communities using other sanitation systems (Corrales, Izurieta, & Moe, 2006).
However, the solar toilet is not able to inactivate 100% the ova of A.
lumbricoides, which are considered among the most environmental resistant
pathogens excreted in human feces (Moe & Izurieta, 2003; World Health
Organization, 2006a).
Adequate treatment of waste in a sanitation system is important for public
health. It guarantees that fecal pathogens do not contaminate the environment
and that transmission of many infectious diseases that contributes to the main
killers of children under five year of age, including diarrhoea, pneumonia,
neonatal disorders and undernutrition, is broken (UNICEF, 2006). Un-ionized
ammonia (NH3) has the potential to inactivate pathogens in solutions and sludge,
including the Ascaris spp. ova (Bujoczek, 2001; Chefranova Iu, 1977;
Chefranova Iu, Oshevskaya, & Gushchin, 1984; Chefranova Iu, Petranovskaia, &
Khodakova, 1978; Ghiglietti, Genchi, Di Matteo, Calcaterra, & Colombi, 1997;
Ghiglietti, Rossi, Ramsan, & Colombi, 1995; Mendez, Jimenez, & Barrios, 2002;
Pecson, Barrios, Jiménez, & Nelson, 2007; Pecson & Nelson, 2005). Studies in
human feces are limited, but the results also indicate the potential of ammonia to
3
inactivate Ascaris spp. ova (Nordin, Nyberg, & Vinnerås, 2009; Vinnerås,
Holmqvist, Bagge, Albihn, & Jönsson, 2003).
Adding ammonia to the solar toilet could result in total inactivation of the
Ascaris spp. ova and others pathogens excreted in human feces by the
potentiation of the effect of ammonia by the physical and chemical parameters
achieved in the solar toilet. The purpose of the present research is to evaluate
this approach, in a lab setting, by simulating the conditions and material present
in the solar toilet and assessing the effect of ammonia on the inactivation of A.
suum ova.
This dissertation has been divided in complementary subtopics: Chapter 1
describes the purpose of the study and objectives; Chapter 2 includes the
literature review; and Chapter 3 to 5 covers the steps taken to complete this
research.
4
1.2 Hypothesis
Ammonia (1% and 2% Urea) inactivates Ascaris suum ova in biosolid at
the chemical and physical parameters present in the solar toilet
1.3 Overall Objective
To assess the inactivation of Ascaris suum ova by un-ionized ammonia in
biosolid under laboratory conditions, using the chemical and physical
parameters present in the solar toilet: alkaline pH, temperature equal or greater
than 28°C, and low moisture content.
1.4 Specific Objective
1. To describe the morphological changes of Ascaris suum ova observed
during in vitro incubation for a minimum period of three weeks and to
explore if there are differences between viability proportions reported
before and after three weeks of incubation.
2. To determine the ammonia concentration needed to inactivate Ascaris
suum ova in a solution simulating the physical-chemical parameters
achieved in the solar toilet
3. To determine the inactivation of Ascaris suum ova by urea added to feces
simulating the physical and chemical parameters of the solar toilet in a
laboratory environment
4. To compare the inactivation rate of Ascaris suum ova achieved in
ammonia solution and in feces.
5. To identify the ammonia concentration (1% vs. 2%) needed to inactivate
Ascaris suum ova in a mixture of material (feces + additive).
5
1.5 Research Question
We hypothesized that adding urea (1% and 2% urea) to the solar toilet will
inactivate the resistant Ascaris suum ova. In addition, we hypothesized that the
high temperature and pH of the solar toilet and the lower moisture content will
potentiate the inactivation of this parasite by ammonia.
6
CHAPTER 2.
LITERATURE REVIEW
2.1 Sanitation and Health
During the 19th century the leading causes of morbidity and death in
Europe and North America were attributed to lack of safe of water and sanitary
conditions. Large population density, accumulation of garbage and waste, and
crowding conditions characterized urban areas. Cholera outbreaks, diarrhea, and
typhoid were common diseases affecting negatively the health status of
populations, especially children. These negative effects were evidenced in the
United States by a decline in height average in those born in the 1820’s and
1830’s and, in Britain, by a decline in life expectancy at birth during the first half
of the 19th century. It was until the later part of the 19th century that a rise in the
health status of populations was observed as public health practices, such as
access to safe water and sewage disposal, and standards of living, such as
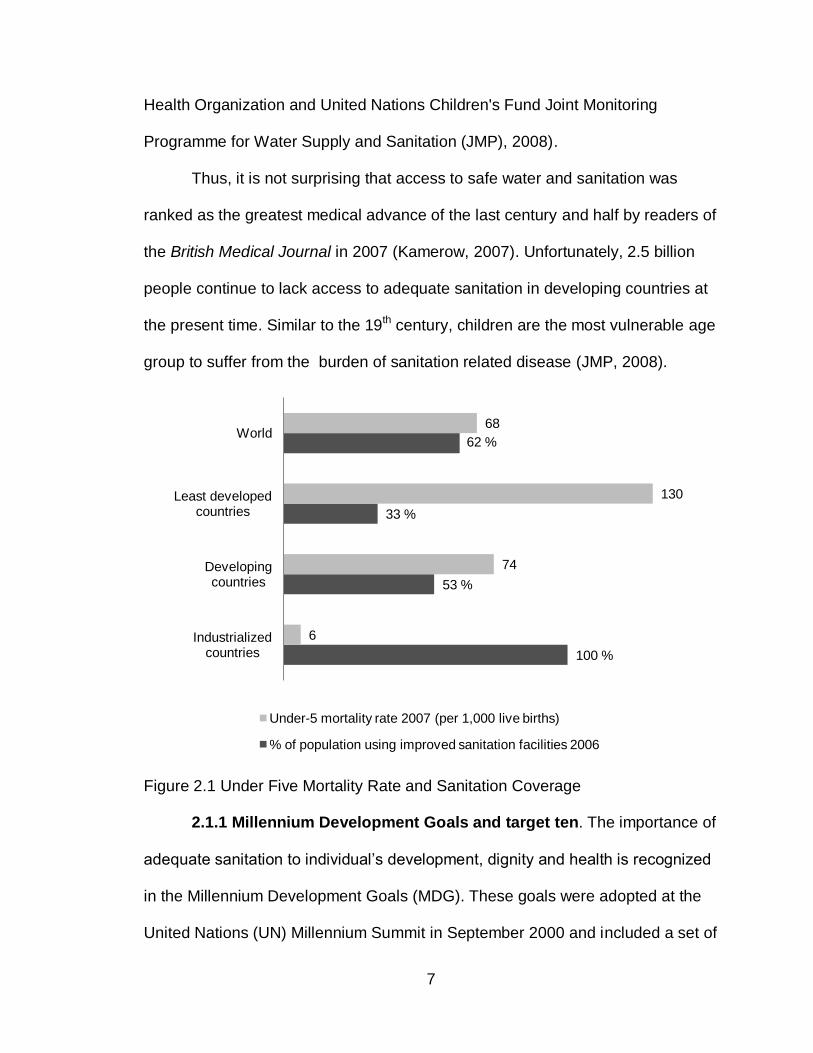
housing and nutrition, improved (Bryant, 2003). Nowadays, industrialized
countries have access to safe water and adequate sanitation coverage (99%)
with very low under-five mortality rate1 (6/1,000 live birth), when compared to
developing countries (Figure 2.1) (United Nations Children's Fund, 2009; World
1 Under-five mortality rate – Probability of dying between birth and exactly five years of age, expressed per
1,000 live births.
7
Health Organization and United Nations Children's Fund Joint Monitoring
Programme for Water Supply and Sanitation (JMP), 2008).
Thus, it is not surprising that access to safe water and sanitation was
ranked as the greatest medical advance of the last century and half by readers of
the British Medical Journal in 2007 (Kamerow, 2007). Unfortunately, 2.5 billion
people continue to lack access to adequate sanitation in developing countries at
the present time. Similar to the 19th century, children are the most vulnerable age
group to suffer from the burden of sanitation related disease (JMP, 2008).
Figure 2.1 Under Five Mortality Rate and Sanitation Coverage
2.1.1 Millennium Development Goals and target ten. The importance of
adequate sanitation to individual’s development, dignity and health is recognized
in the Millennium Development Goals (MDG). These goals were adopted at the
United Nations (UN) Millennium Summit in September 2000 and included a set of
100 %
53 %
33 %
62 %
6
74
130
68
Industrialized countries
Developing countries
Least developed countries
World
Under-5 mortality rate 2007 (per 1,000 live births)
% of population using improved sanitation facilities 2006
8
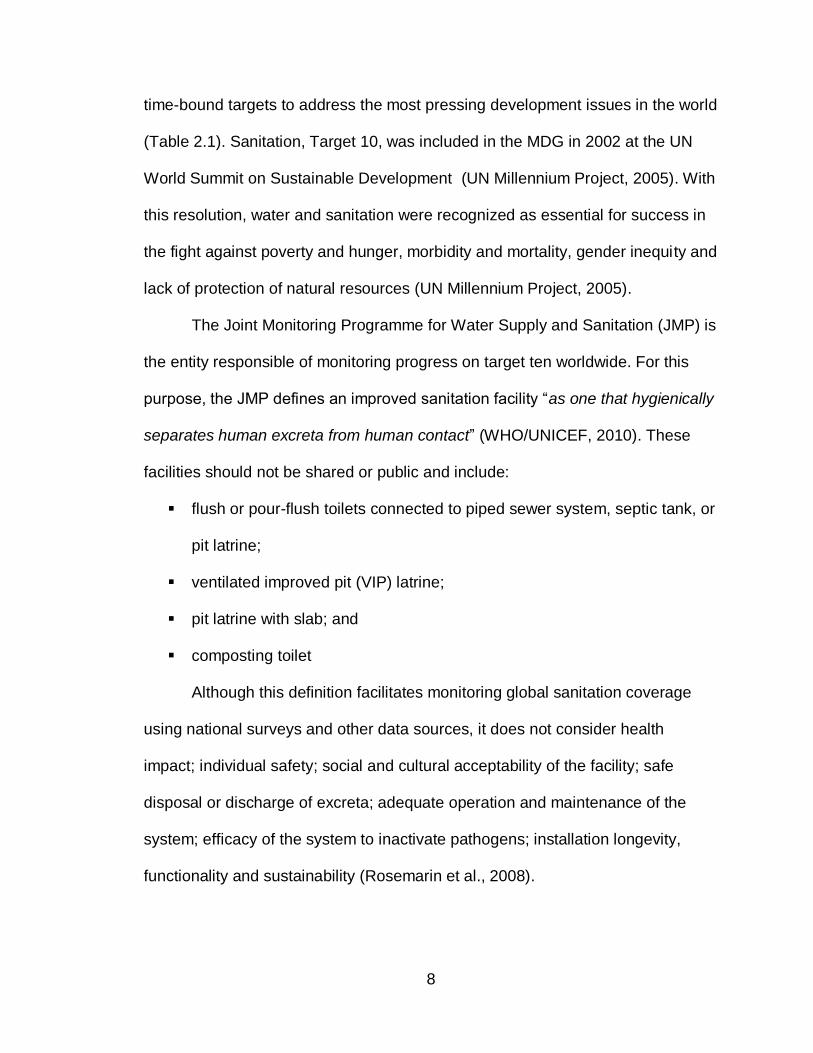
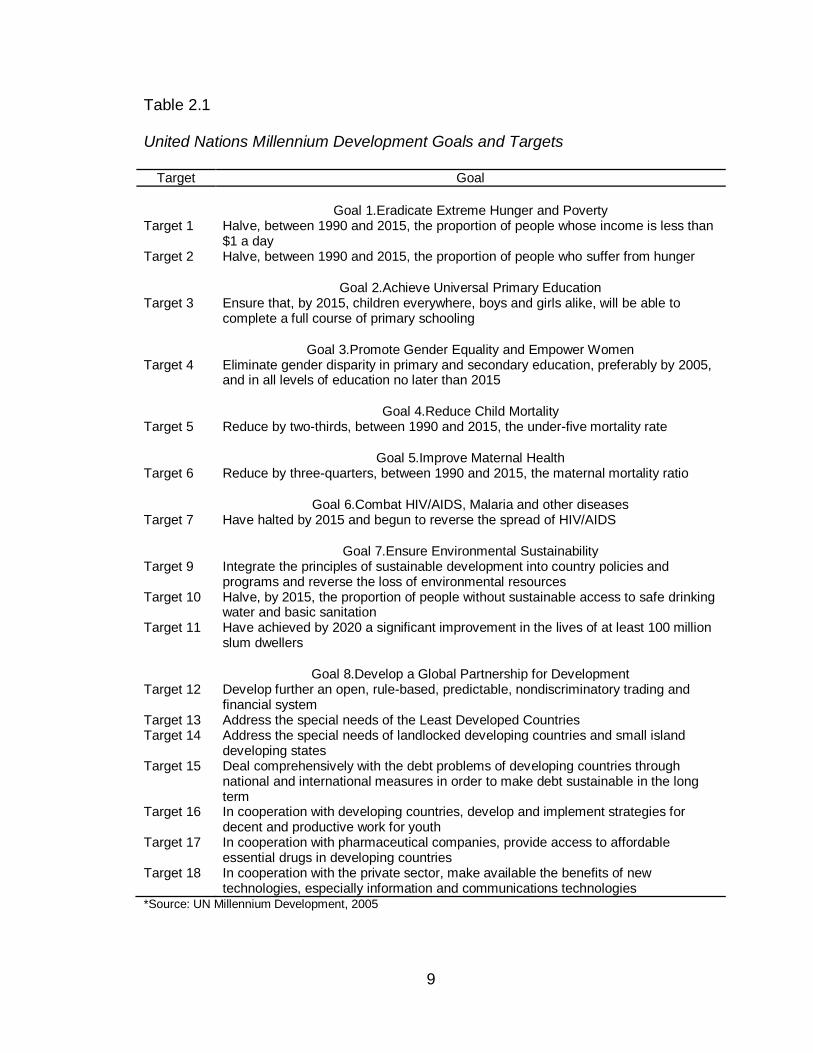
time-bound targets to address the most pressing development issues in the world
(Table 2.1). Sanitation, Target 10, was included in the MDG in 2002 at the UN
World Summit on Sustainable Development (UN Millennium Project, 2005). With
this resolution, water and sanitation were recognized as essential for success in
the fight against poverty and hunger, morbidity and mortality, gender inequity and
lack of protection of natural resources (UN Millennium Project, 2005).
The Joint Monitoring Programme for Water Supply and Sanitation (JMP) is
the entity responsible of monitoring progress on target ten worldwide. For this
purpose, the JMP defines an improved sanitation facility “as one that hygienically
separates human excreta from human contact” (WHO/UNICEF, 2010). These
facilities should not be shared or public and include:
flush or pour-flush toilets connected to piped sewer system, septic tank, or
pit latrine;
ventilated improved pit (VIP) latrine;
pit latrine with slab; and
composting toilet
Although this definition facilitates monitoring global sanitation coverage
using national surveys and other data sources, it does not consider health
impact; individual safety; social and cultural acceptability of the facility; safe
disposal or discharge of excreta; adequate operation and maintenance of the
system; efficacy of the system to inactivate pathogens; installation longevity,
functionality and sustainability (Rosemarin et al., 2008).
9
Table 2.1
United Nations Millennium Development Goals and Targets
Target Goal
Goal 1.Eradicate Extreme Hunger and Poverty Target 1 Halve, between 1990 and 2015, the proportion of people whose income is less than
$1 a day Target 2 Halve, between 1990 and 2015, the proportion of people who suffer from hunger
Goal 2.Achieve Universal Primary Education Target 3 Ensure that, by 2015, children everywhere, boys and girls alike, will be able to
complete a full course of primary schooling
Goal 3.Promote Gender Equality and Empower Women Target 4 Eliminate gender disparity in primary and secondary education, preferably by 2005,
and in all levels of education no later than 2015
Goal 4.Reduce Child Mortality Target 5 Reduce by two-thirds, between 1990 and 2015, the under-five mortality rate
Goal 5.Improve Maternal Health Target 6 Reduce by three-quarters, between 1990 and 2015, the maternal mortality ratio
Goal 6.Combat HIV/AIDS, Malaria and other diseases Target 7 Have halted by 2015 and begun to reverse the spread of HIV/AIDS
Goal 7.Ensure Environmental Sustainability Target 9 Integrate the principles of sustainable development into country policies and
programs and reverse the loss of environmental resources Target 10 Halve, by 2015, the proportion of people without sustainable access to safe drinking
water and basic sanitation Target 11 Have achieved by 2020 a significant improvement in the lives of at least 100 million
slum dwellers
Goal 8.Develop a Global Partnership for Development Target 12 Develop further an open, rule-based, predictable, nondiscriminatory trading and
financial system Target 13 Address the special needs of the Least Developed Countries Target 14 Address the special needs of landlocked developing countries and small island
developing states Target 15 Deal comprehensively with the debt problems of developing countries through
national and international measures in order to make debt sustainable in the long term
Target 16 In cooperation with developing countries, develop and implement strategies for decent and productive work for youth
Target 17 In cooperation with pharmaceutical companies, provide access to affordable essential drugs in developing countries
Target 18 In cooperation with the private sector, make available the benefits of new technologies, especially information and communications technologies
*Source: UN Millennium Development, 2005
10
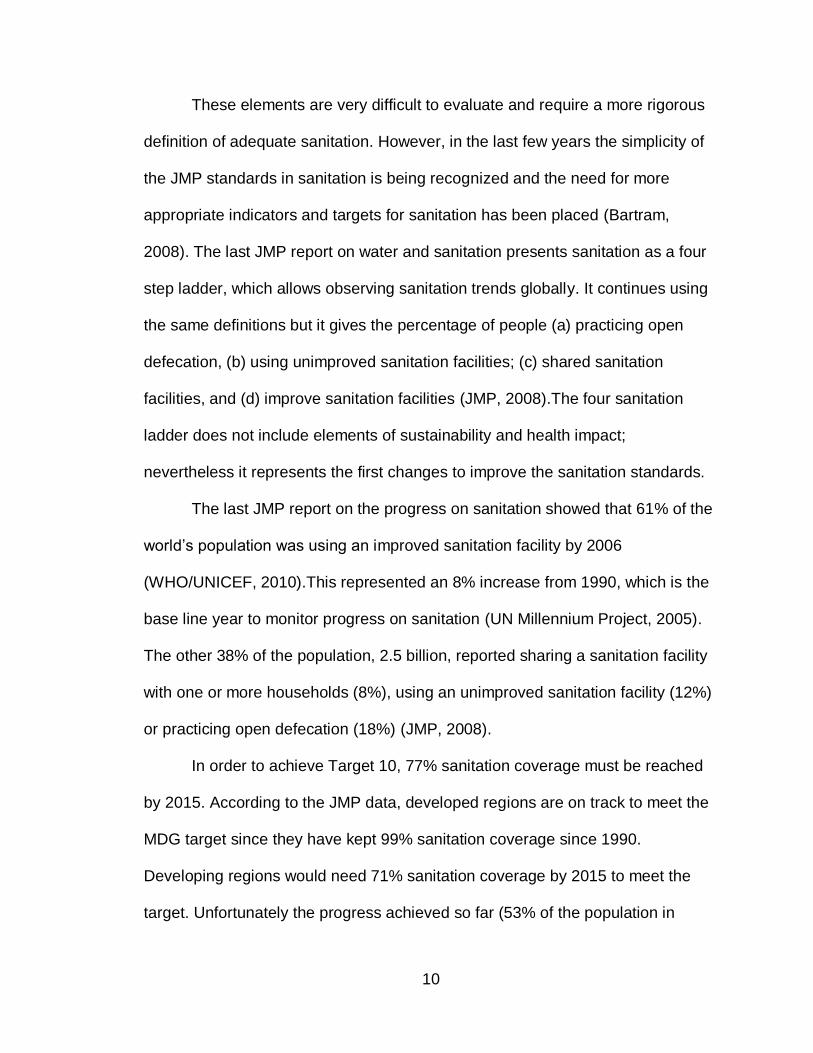
These elements are very difficult to evaluate and require a more rigorous
definition of adequate sanitation. However, in the last few years the simplicity of
the JMP standards in sanitation is being recognized and the need for more
appropriate indicators and targets for sanitation has been placed (Bartram,
2008). The last JMP report on water and sanitation presents sanitation as a four
step ladder, which allows observing sanitation trends globally. It continues using
the same definitions but it gives the percentage of people (a) practicing open
defecation, (b) using unimproved sanitation facilities; (c) shared sanitation
facilities, and (d) improve sanitation facilities (JMP, 2008).The four sanitation
ladder does not include elements of sustainability and health impact;
nevertheless it represents the first changes to improve the sanitation standards.
The last JMP report on the progress on sanitation showed that 61% of the
world’s population was using an improved sanitation facility by 2006
(WHO/UNICEF, 2010).This represented an 8% increase from 1990, which is the
base line year to monitor progress on sanitation (UN Millennium Project, 2005).
The other 38% of the population, 2.5 billion, reported sharing a sanitation facility
with one or more households (8%), using an unimproved sanitation facility (12%)
or practicing open defecation (18%) (JMP, 2008).
In order to achieve Target 10, 77% sanitation coverage must be reached
by 2015. According to the JMP data, developed regions are on track to meet the
MDG target since they have kept 99% sanitation coverage since 1990.
Developing regions would need 71% sanitation coverage by 2015 to meet the
target. Unfortunately the progress achieved so far (53% of the population in
11
developing regions reported using an improved sanitation facility by 2006) is
insufficient to meet the target. Sub-Saharan Africa and Southern Asia are of
special concern as they had the highest percentage of people practicing open
defecation (28% and 48% respectively) and the lowest sanitation coverage
recorded in 2006 (31% and 33% respectively). Of the 2.5 billion people without
access to sanitation, almost 1.8 billion live in Asia and 546 million people live in
Sub-Saharan Africa (JMP, 2008). In addition, there is large disparity among rural
and urban population sanitation coverage. In developing countries 57% of the
population lives in rural areas and only 39% of the rural population reported
having access to an improved sanitation facility in 2006. In developed regions,
both urban and rural populations have access to improved sanitation facilities
(100% and 96% respectively).
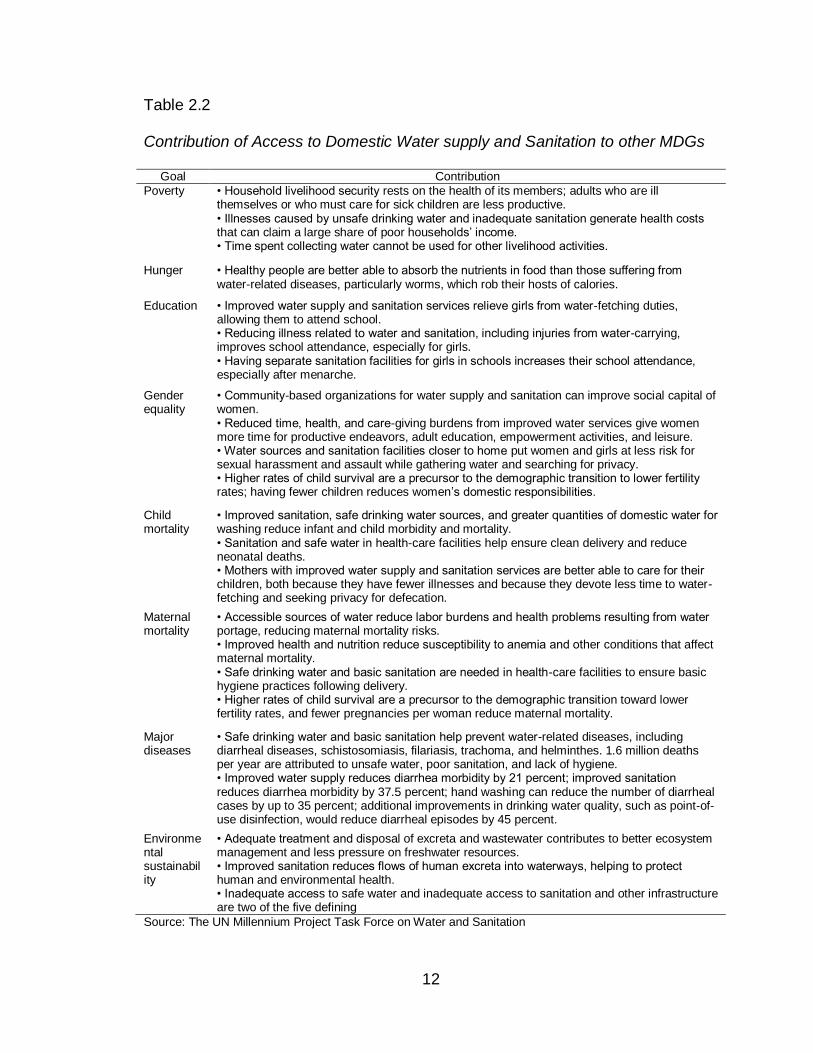
2.1.2 Influence of sanitation in other MDGs. Sanitation, which is part of
goal seven-target 10, is vital to advance in the other goals ( Table 2.2) and to
reduce the psychological burden on the mental health of parents due to the loss
of a child; and the discomfort on disable people, pregnant women, and sick
individuals lacking access to a toilet (UN Millennium Project, 2005). The United
Nations estimated that solving the problems of water and sanitation will make a
30% contribution, in average, towards meeting the other Millennium
Development Goals (MDG) including child survival, improved maternal health,
primary and secondary education, gender equality, environment, and hunger
alleviation (United Nations Secretary-General's Advisory Board on Water and
Sanitation, 2007).
12
Table 2.2
Contribution of Access to Domestic Water supply and Sanitation to other MDGs
Goal Contribution
Poverty • Household livelihood security rests on the health of its members; adults who are ill themselves or who must care for sick children are less productive. • Illnesses caused by unsafe drinking water and inadequate sanitation generate health costs that can claim a large share of poor households’ income. • Time spent collecting water cannot be used for other livelihood activities.
Hunger • Healthy people are better able to absorb the nutrients in food than those suffering from water-related diseases, particularly worms, which rob their hosts of calories.
Education • Improved water supply and sanitation services relieve girls from water-fetching duties, allowing them to attend school. • Reducing illness related to water and sanitation, including injuries from water-carrying, improves school attendance, especially for girls. • Having separate sanitation facilities for girls in schools increases their school attendance, especially after menarche.
Gender equality
• Community-based organizations for water supply and sanitation can improve social capital of women. • Reduced time, health, and care-giving burdens from improved water services give women more time for productive endeavors, adult education, empowerment activities, and leisure. • Water sources and sanitation facilities closer to home put women and girls at less risk for sexual harassment and assault while gathering water and searching for privacy. • Higher rates of child survival are a precursor to the demographic transition to lower fertility rates; having fewer children reduces women’s domestic responsibilities.
Child mortality
• Improved sanitation, safe drinking water sources, and greater quantities of domestic water for washing reduce infant and child morbidity and mortality. • Sanitation and safe water in health-care facilities help ensure clean delivery and reduce neonatal deaths. • Mothers with improved water supply and sanitation services are better able to care for their children, both because they have fewer illnesses and because they devote less time to water-fetching and seeking privacy for defecation.
Maternal mortality
• Accessible sources of water reduce labor burdens and health problems resulting from water portage, reducing maternal mortality risks. • Improved health and nutrition reduce susceptibility to anemia and other conditions that affect maternal mortality. • Safe drinking water and basic sanitation are needed in health-care facilities to ensure basic hygiene practices following delivery. • Higher rates of child survival are a precursor to the demographic transition toward lower fertility rates, and fewer pregnancies per woman reduce maternal mortality.
Major diseases
• Safe drinking water and basic sanitation help prevent water-related diseases, including diarrheal diseases, schistosomiasis, filariasis, trachoma, and helminthes. 1.6 million deaths per year are attributed to unsafe water, poor sanitation, and lack of hygiene. • Improved water supply reduces diarrhea morbidity by 21 percent; improved sanitation reduces diarrhea morbidity by 37.5 percent; hand washing can reduce the number of diarrheal cases by up to 35 percent; additional improvements in drinking water quality, such as point-of-use disinfection, would reduce diarrheal episodes by 45 percent.
Environmental sustainability
• Adequate treatment and disposal of excreta and wastewater contributes to better ecosystem management and less pressure on freshwater resources. • Improved sanitation reduces flows of human excreta into waterways, helping to protect human and environmental health. • Inadequate access to safe water and inadequate access to sanitation and other infrastructure are two of the five defining
Source: The UN Millennium Project Task Force on Water and Sanitation
13
It is estimated that 1.3 million women and girls have no access to a toilet.
Looking for some privacy, women usually wait until night or before dawn to
relieve themselves, increasing health problems such urinary tract infections and
chronic constipation, and the risk of violence and rape. Girls also have to drop
out of school when they start menstruating due to lack of sanitation facilities in
schools (UN Millennium Project, 2005).
2.1.3 Monetary benefits of improved sanitation. Hygiene and sanitation
are among the most effective public health interventions; it reduces morbidity and
mortality, especially child mortality; it reduces health related costs; results in
higher productivity and school attendance, more leisure time, convenience and
well being, advance in gender equality, and has a positive impact on economic
and poverty reduction. Every $1 dollar invested in sanitation would yield an
economic return of between $3 and $34, depending on the region (WHO &
UNICEF, 2004)
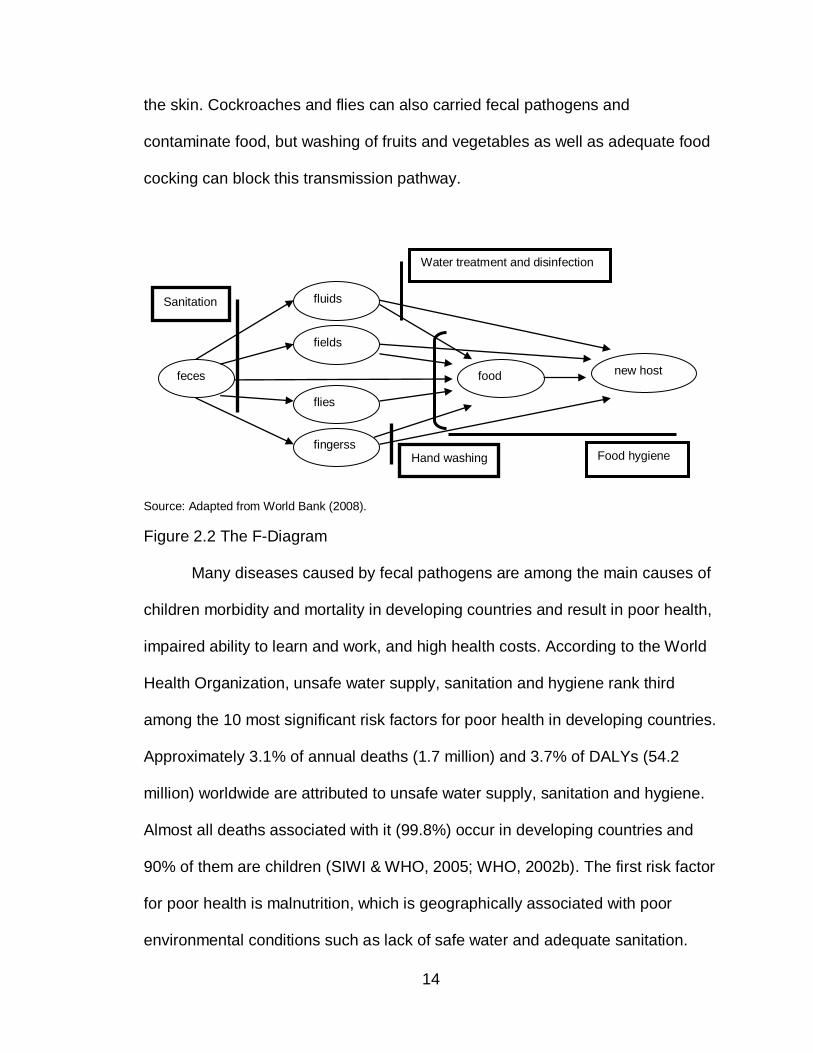
2.1.4 Effects of sanitation in health. Adequate collection, treatment, and
disposal of human excreta combined with hygiene practices are important to
break the transmission and the contamination of the environment with pathogens
present in human excreta. The main routes of pathogen transmission from
excreta to human are presented in Figure 2.2. In areas where sanitation systems
are inadequate fecal pathogens are distributed in the environment (groundwater,
surface water and soil). Once the environment is contaminated, individuals are
infected by ingesting contaminated food or water, through contact with
contaminated fingers and, in some cases (as it is the case of hookworm), through
14
the skin. Cockroaches and flies can also carried fecal pathogens and
contaminate food, but washing of fruits and vegetables as well as adequate food
cocking can block this transmission pathway.
Source: Adapted from World Bank (2008).
Figure 2.2 The F-Diagram
Many diseases caused by fecal pathogens are among the main causes of
children morbidity and mortality in developing countries and result in poor health,
impaired ability to learn and work, and high health costs. According to the World
Health Organization, unsafe water supply, sanitation and hygiene rank third
among the 10 most significant risk factors for poor health in developing countries.
Approximately 3.1% of annual deaths (1.7 million) and 3.7% of DALYs (54.2
million) worldwide are attributed to unsafe water supply, sanitation and hygiene.
Almost all deaths associated with it (99.8%) occur in developing countries and
90% of them are children (SIWI & WHO, 2005; WHO, 2002b). The first risk factor
for poor health is malnutrition, which is geographically associated with poor
environmental conditions such as lack of safe water and adequate sanitation.
feces
fluids
fields
flies
fingerss
food new host
Sanitation
Hand washing Food hygiene
Water treatment and disinfection
15
Infectious diarrhoea, schistosomiasis, ascariasis, trichuriasis, and
hookworms are among the main diseases contributing to the burden associated
with unsafe water, sanitation and hygiene (WHO, 2002b). These diseases affect
close to half the people at any given time and cause the occupancy of more than
half the hospital beds in the developing world (UN Millennium Project, 2005).
2.1.4.1 Diarrhea. Worldwide, there are 4 billion cases of diarrhea each
year causing 4% of all deaths and 5% of health loss to disability (WHO, 2000). Of
the billions of diarrhea cases, 88% are attributed to unsafe water supply or
inadequate sanitation and hygiene; and, of the millions of deaths, 90% are
children under five living in developing countries (UN Millennium Project, 2005;
UNWater, 2008). According to the World Health Organization global mortality
report, there were 2.2 million deaths due to diarrhea in 1998, 2 million deaths in
2001 and 1.8 million deaths in 2002. This data shows that the number of diarrhea
cases is decreasing, nevertheless, this disease continues to be the second
largest killer of children worldwide and poor sanitation and hygiene are either the
chief or the underlying cause (WHO, 2000, 2004a, 2004b, 2008b).
Pathogens causing diarrhea are excreta related and improving sanitation
reduces diarrhea morbidity by 37.5% (UN Millennium Project, 2005; WHO,
2008b). The health consequences of this disease are particularly severe in
children. In addition of the 5000 children dying every day due to diarrhea, those
who survive and suffer persistent diarrhea are affected by malnutrition
(associated with more than half of all under five deaths), wasting and stunting of
growth, and have an increase in their susceptibility to infectious respiratory
16
disease (pneumonia), malaria and measles (UNICEF, 2006). Malnutrition is an
underlying cause in 52% of pneumonia deaths and 60% of diarrhoea deaths.
Both diseases are the main causes of child mortality worldwide.
2.1.4.2 Schistosomiasis and soil-transmitted helminthes. Some 200
million people are infected with schistosomiasis resulting in 1.7 million DALYs
and 200,000 deaths each year. Of the people infected, 20 million have severe
disease and 120 million have symptoms. This disease is endemic in 76
countries and around 600 million people are at risk of infection making it the
second most important parasitic infection after malaria in terms of public health
and economic impact (WHO, 2001c, 2003, 2006c).
Schistosomiasis is related to lack of basic sanitation and sources of safe
water. It is estimated that access to basic sanitation reduces the disease by up to
77 % (UN Millennium Project, 2005). The disease mainly affect children from 5
to 15 years old and the health consequences vary, depending of the worm load
and the amount of time a person is infected (WHO, 2001c, 2003). In children the
disease contributes to retarded growth, affect cognitive development, and
aggravate malnutrition and anemia. If the disease is not treated and becomes
chronic and irreversible, it results in enlarged spleen, bladder and kidney failure,
liver fibrosis, bladder cancer, and nervous system pathology such as seizures,
paralysis or spinal cord inflammation (WHO, 2001c, 2003, 2006c).
Soil transmitted helminthes produce the most common infections
worldwide and the causal agents are Ascaris lumbricoides, T. trichiura, and
hookworms (Ancylostoma duodenale and Necator americanus). Around 2 billion
17
people are infected by these helminthes, 133 millions suffer from high-intensity
intestinal infections and 135,000 people are estimated to die every year from
these infections (UNICEF, 2006; WHO, 2003). The World Health Organization
estimates that A. lumbricoides infects over 1 billion people, T. trichiura infects
795 million, and hookworms 740 million individuals (WHO, 2008c). Ascaris
account for most of these infections and it is more common in children between 3
and 8 years old. It causes 60,000 deaths per year, especially in children (WHO,
2001b).
Morbidity by Ascaris lumbricoides can be reduced by 29% by providing
access to safe water, sanitation and hygiene. The health consequences of this
infection are many and depend on the worm load. They range from diarrhea,
abdominal pain, malaise and weakness to reduced cognitive capacity and impair
physical growth. A child infected by Ascaris diverts a third of the food he/she
consumes resulting in malnutrition and a cycle of infectious diseases (UN
Millennium Project, 2005; WHO, 2008b, 2008c). Hookworms cause intestinal
blood loss and produce anemia; trichuriasis cause chronic colitis (WHO, 2008b).
Once more, the population most vulnerable to these preventable
sanitation related diseases is children. Without adequate access to improved
sanitation and treatment they become physically and intellectually compromised
by anemia and malnutrition, resulting in attention deficits, learning disabilities,
school absenteeism and higher dropout rates (WHO, 2006c).

18
2.2 Excreta and Pathogens
Excreta refer to human feces and urine (WHO, 2006a). Exposure to
untreated excreta is always considered unsafe due to the presence of a high
variety of pathogens. Many of these pathogens are transmitted when excreta of
an infected individual enter in contact with the mouth of a new host by a variety of
routes (see Figure 2). This is known as the fecal oral cycle of transmission.
Adequate sanitation facilities could block these routes at their point of origin and
avoid the transmission of diseases related to excreted pathogens (Feachem,
Bradley, Garelick, & Mara, 1983; WHO, 2006b).
2.2.1 Characteristics of excreta. The frequency of defecation, volume,
consistency, moisture content and composition of feces vary among populations
and it is influenced by factors such as diet, age and climate. The volume of wet
excreted feces may vary from 20 grams to 1.5 kilograms per day, with lower
volume produced by children, adolescents and the elderly. The amount of urine
produce by an individual per day varies from 1 to 1.3 kg. The moisture content for
a wet fecal volume of 100 to150 grams per day is around 75%, increasing with
higher fecal volume. The normal frequency of defecation is 1 per day, but it also
may increase to 3 per day for vegetarian individuals (Feachem et al., 1983). The
chemical constituents of excreta and urine are presented in Table 2.3.
2.2.2 Types of pathogen in feces. Four groups of pathogens are found in
excreta: viruses, bacteria, protozoa and helminthes. These pathogens are
associated with gastrointestinal diseases giving rise to symptoms such as
diarrhea, dysentery, vomiting, and stomach cramps but could also affect other
19
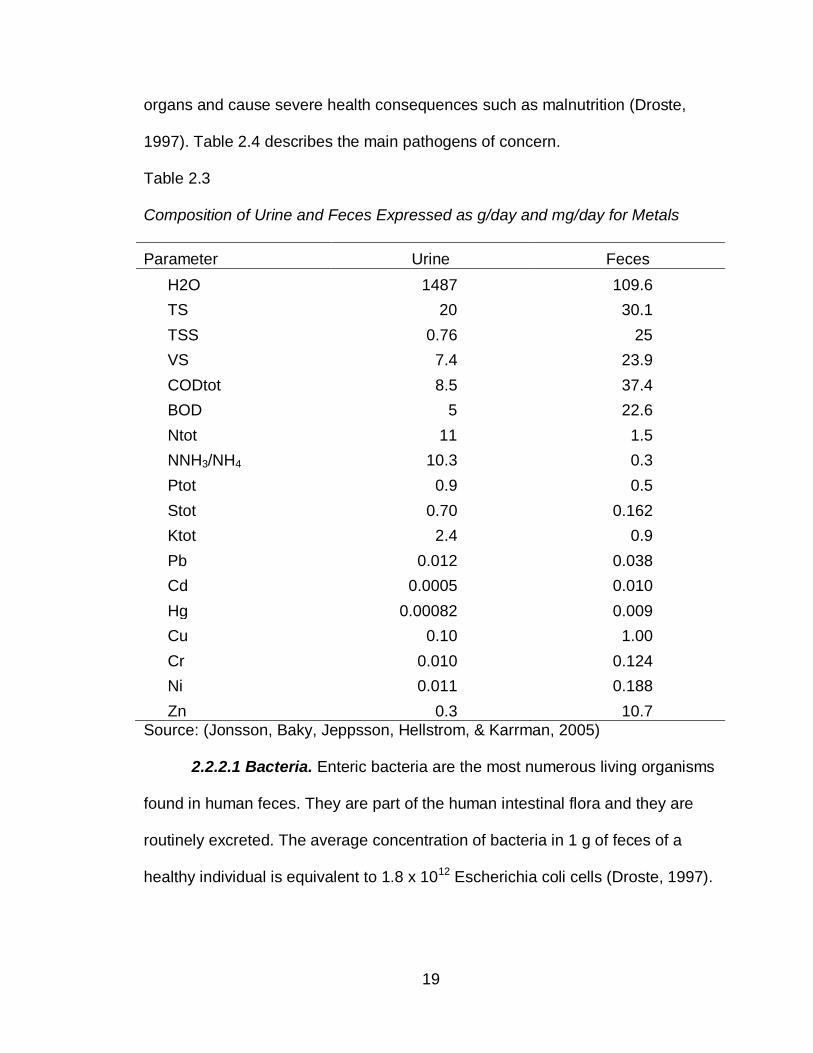
organs and cause severe health consequences such as malnutrition (Droste,
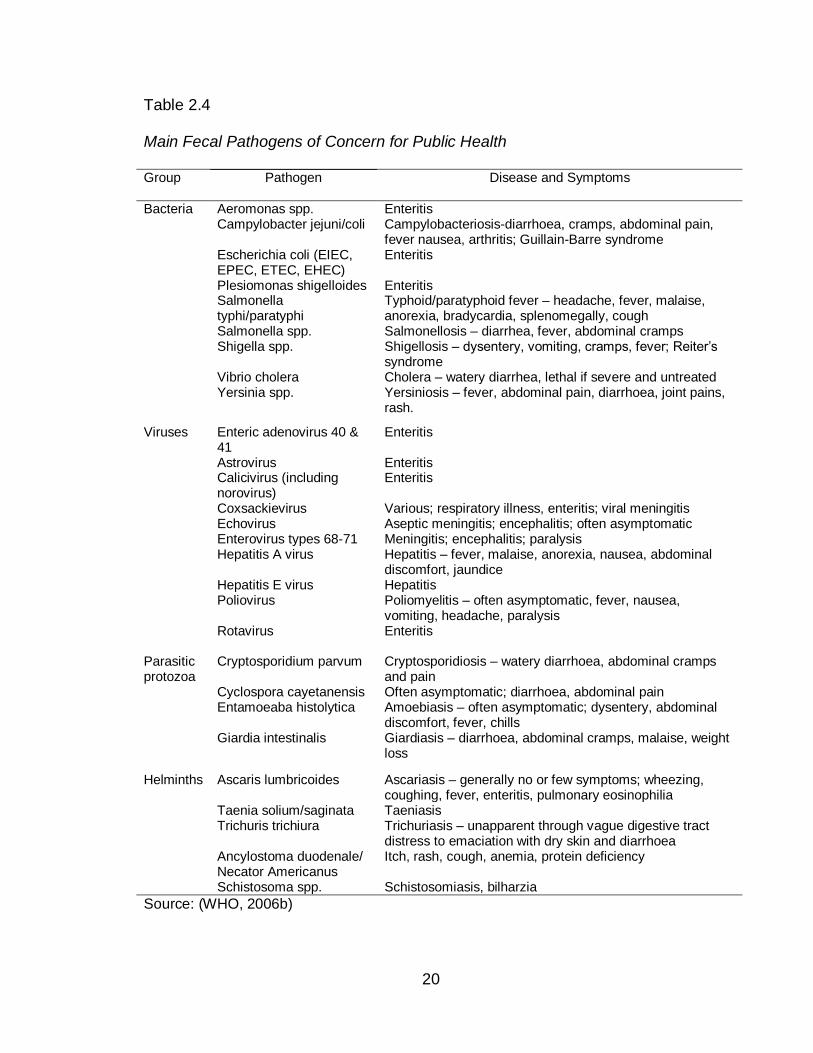
1997). Table 2.4 describes the main pathogens of concern.
Table 2.3
Composition of Urine and Feces Expressed as g/day and mg/day for Metals
Parameter Urine Feces
H2O 1487 109.6
TS 20 30.1
TSS 0.76 25
VS 7.4 23.9
CODtot 8.5 37.4
BOD 5 22.6
Ntot 11 1.5
NNH3/NH4 10.3 0.3
Ptot 0.9 0.5
Stot 0.70 0.162
Ktot 2.4 0.9
Pb 0.012 0.038
Cd 0.0005 0.010
Hg 0.00082 0.009
Cu 0.10 1.00
Cr 0.010 0.124
Ni 0.011 0.188
Zn 0.3 10.7
Source: (Jonsson, Baky, Jeppsson, Hellstrom, & Karrman, 2005)
2.2.2.1 Bacteria. Enteric bacteria are the most numerous living organisms
found in human feces. They are part of the human intestinal flora and they are
routinely excreted. The average concentration of bacteria in 1 g of feces of a
healthy individual is equivalent to 1.8 x 10¹² Escherichia coli cells (Droste, 1997).
20
Table 2.4
Main Fecal Pathogens of Concern for Public Health
Group Pathogen
Disease and Symptoms
Bacteria Aeromonas spp. Enteritis Campylobacter jejuni/coli Campylobacteriosis-diarrhoea, cramps, abdominal pain,
fever nausea, arthritis; Guillain-Barre syndrome Escherichia coli (EIEC, EPEC, ETEC, EHEC)
Enteritis
Plesiomonas shigelloides Enteritis Salmonella typhi/paratyphi
Typhoid/paratyphoid fever – headache, fever, malaise, anorexia, bradycardia, splenomegally, cough
Salmonella spp. Salmonellosis – diarrhea, fever, abdominal cramps Shigella spp. Shigellosis – dysentery, vomiting, cramps, fever; Reiter’s
syndrome Vibrio cholera Cholera – watery diarrhea, lethal if severe and untreated Yersinia spp.
Yersiniosis – fever, abdominal pain, diarrhoea, joint pains, rash.
Viruses Enteric adenovirus 40 & 41
Enteritis
Astrovirus Enteritis Calicivirus (including norovirus)
Enteritis
Coxsackievirus Various; respiratory illness, enteritis; viral meningitis Echovirus Aseptic meningitis; encephalitis; often asymptomatic Enterovirus types 68-71 Meningitis; encephalitis; paralysis Hepatitis A virus Hepatitis – fever, malaise, anorexia, nausea, abdominal
discomfort, jaundice Hepatitis E virus Hepatitis Poliovirus Poliomyelitis – often asymptomatic, fever, nausea,
vomiting, headache, paralysis Rotavirus
Enteritis
Parasitic protozoa
Cryptosporidium parvum Cryptosporidiosis – watery diarrhoea, abdominal cramps and pain
Cyclospora cayetanensis Often asymptomatic; diarrhoea, abdominal pain Entamoeaba histolytica Amoebiasis – often asymptomatic; dysentery, abdominal
discomfort, fever, chills Giardia intestinalis
Giardiasis – diarrhoea, abdominal cramps, malaise, weight loss
Helminths Ascaris lumbricoides Ascariasis – generally no or few symptoms; wheezing, coughing, fever, enteritis, pulmonary eosinophilia
Taenia solium/saginata Taeniasis Trichuris trichiura Trichuriasis – unapparent through vague digestive tract
distress to emaciation with dry skin and diarrhoea Ancylostoma duodenale/ Necator Americanus
Itch, rash, cough, anemia, protein deficiency
Schistosoma spp. Schistosomiasis, bilharzia
Source: (WHO, 2006b)
21
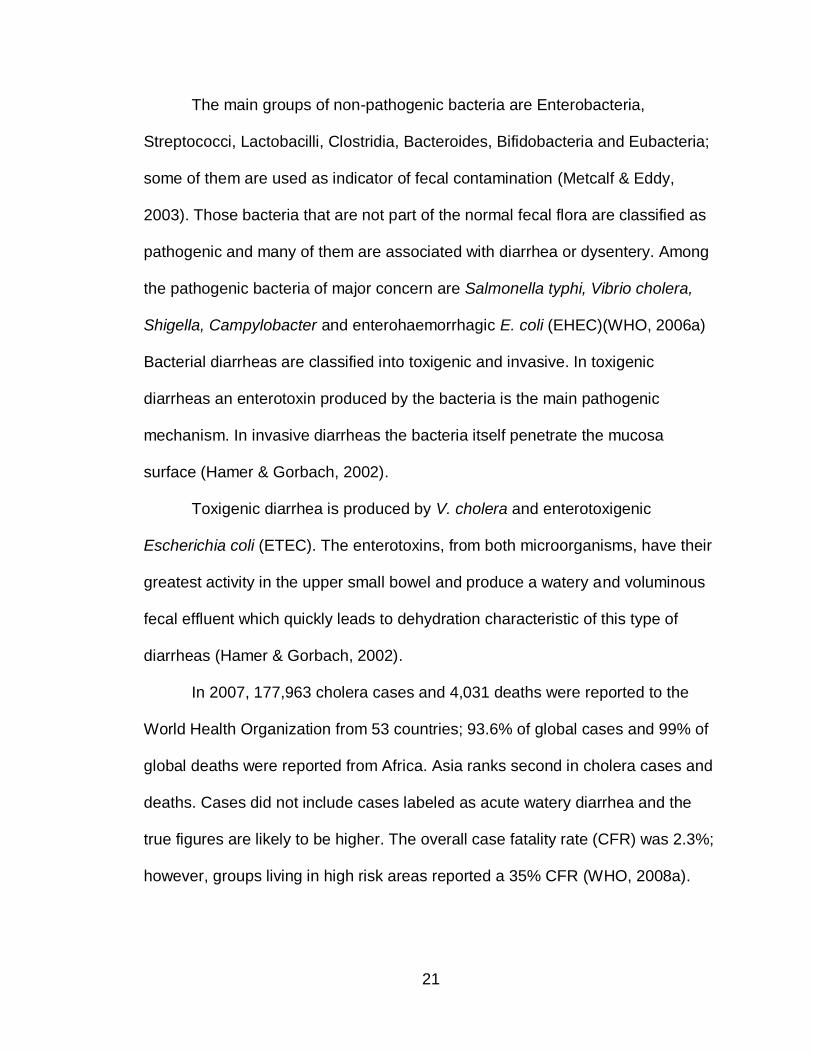
The main groups of non-pathogenic bacteria are Enterobacteria,
Streptococci, Lactobacilli, Clostridia, Bacteroides, Bifidobacteria and Eubacteria;
some of them are used as indicator of fecal contamination (Metcalf & Eddy,
2003). Those bacteria that are not part of the normal fecal flora are classified as
pathogenic and many of them are associated with diarrhea or dysentery. Among
the pathogenic bacteria of major concern are Salmonella typhi, Vibrio cholera,
Shigella, Campylobacter and enterohaemorrhagic E. coli (EHEC)(WHO, 2006a)
Bacterial diarrheas are classified into toxigenic and invasive. In toxigenic
diarrheas an enterotoxin produced by the bacteria is the main pathogenic
mechanism. In invasive diarrheas the bacteria itself penetrate the mucosa
surface (Hamer & Gorbach, 2002).
Toxigenic diarrhea is produced by V. cholera and enterotoxigenic
Escherichia coli (ETEC). The enterotoxins, from both microorganisms, have their
greatest activity in the upper small bowel and produce a watery and voluminous
fecal effluent which quickly leads to dehydration characteristic of this type of
diarrheas (Hamer & Gorbach, 2002).
In 2007, 177,963 cholera cases and 4,031 deaths were reported to the
World Health Organization from 53 countries; 93.6% of global cases and 99% of
global deaths were reported from Africa. Asia ranks second in cholera cases and
deaths. Cases did not include cases labeled as acute watery diarrhea and the
true figures are likely to be higher. The overall case fatality rate (CFR) was 2.3%;
however, groups living in high risk areas reported a 35% CFR (WHO, 2008a).
22
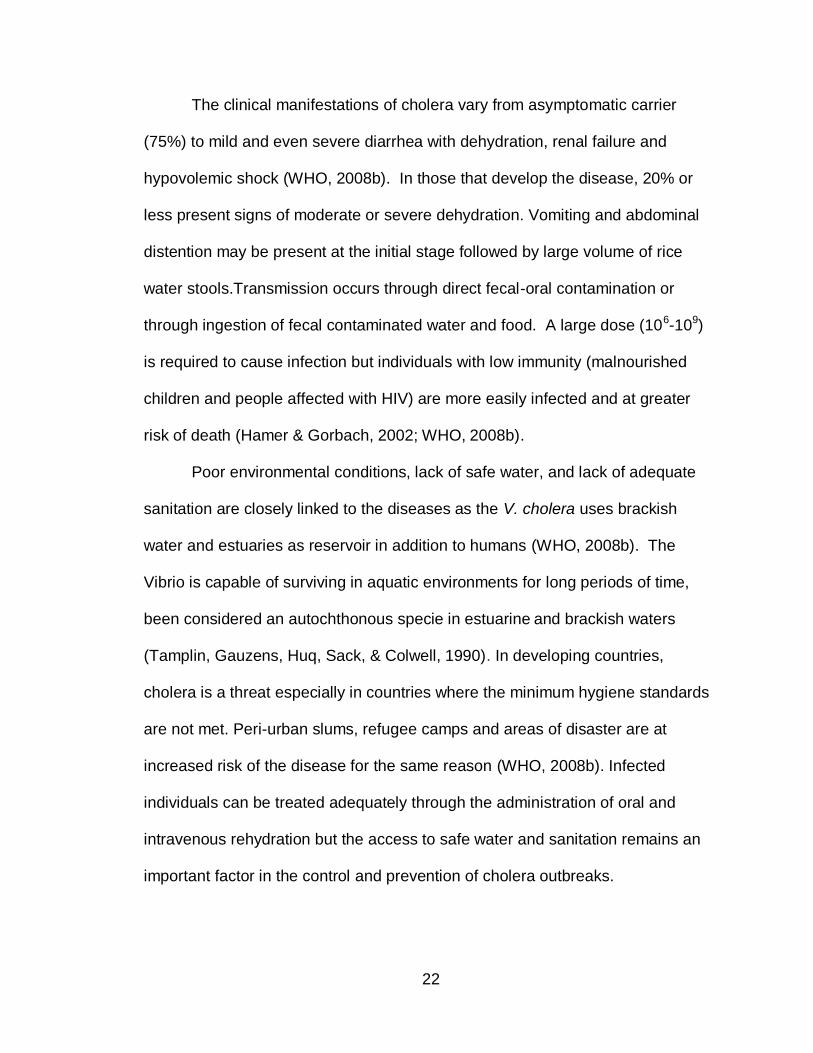
The clinical manifestations of cholera vary from asymptomatic carrier
(75%) to mild and even severe diarrhea with dehydration, renal failure and
hypovolemic shock (WHO, 2008b). In those that develop the disease, 20% or
less present signs of moderate or severe dehydration. Vomiting and abdominal
distention may be present at the initial stage followed by large volume of rice
water stools.Transmission occurs through direct fecal-oral contamination or
through ingestion of fecal contaminated water and food. A large dose (106-109)
is required to cause infection but individuals with low immunity (malnourished
children and people affected with HIV) are more easily infected and at greater
risk of death (Hamer & Gorbach, 2002; WHO, 2008b).
Poor environmental conditions, lack of safe water, and lack of adequate
sanitation are closely linked to the diseases as the V. cholera uses brackish
water and estuaries as reservoir in addition to humans (WHO, 2008b). The
Vibrio is capable of surviving in aquatic environments for long periods of time,
been considered an autochthonous specie in estuarine and brackish waters
(Tamplin, Gauzens, Huq, Sack, & Colwell, 1990). In developing countries,
cholera is a threat especially in countries where the minimum hygiene standards
are not met. Peri-urban slums, refugee camps and areas of disaster are at
increased risk of the disease for the same reason (WHO, 2008b). Infected
individuals can be treated adequately through the administration of oral and
intravenous rehydration but the access to safe water and sanitation remains an
important factor in the control and prevention of cholera outbreaks.
23
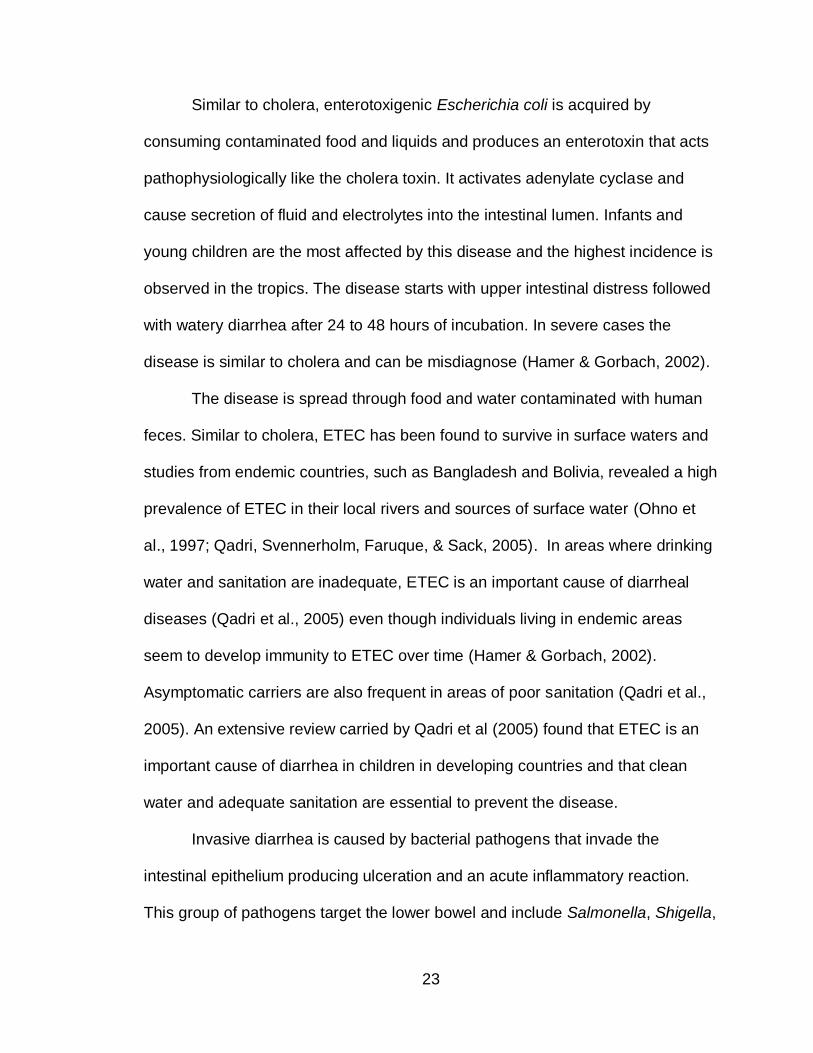
Similar to cholera, enterotoxigenic Escherichia coli is acquired by
consuming contaminated food and liquids and produces an enterotoxin that acts
pathophysiologically like the cholera toxin. It activates adenylate cyclase and
cause secretion of fluid and electrolytes into the intestinal lumen. Infants and
young children are the most affected by this disease and the highest incidence is
observed in the tropics. The disease starts with upper intestinal distress followed
with watery diarrhea after 24 to 48 hours of incubation. In severe cases the
disease is similar to cholera and can be misdiagnose (Hamer & Gorbach, 2002).
The disease is spread through food and water contaminated with human
feces. Similar to cholera, ETEC has been found to survive in surface waters and
studies from endemic countries, such as Bangladesh and Bolivia, revealed a high
prevalence of ETEC in their local rivers and sources of surface water (Ohno et
al., 1997; Qadri, Svennerholm, Faruque, & Sack, 2005). In areas where drinking
water and sanitation are inadequate, ETEC is an important cause of diarrheal
diseases (Qadri et al., 2005) even though individuals living in endemic areas
seem to develop immunity to ETEC over time (Hamer & Gorbach, 2002).
Asymptomatic carriers are also frequent in areas of poor sanitation (Qadri et al.,
2005). An extensive review carried by Qadri et al (2005) found that ETEC is an
important cause of diarrhea in children in developing countries and that clean
water and adequate sanitation are essential to prevent the disease.
Invasive diarrhea is caused by bacterial pathogens that invade the
intestinal epithelium producing ulceration and an acute inflammatory reaction.
This group of pathogens target the lower bowel and include Salmonella, Shigella,
24
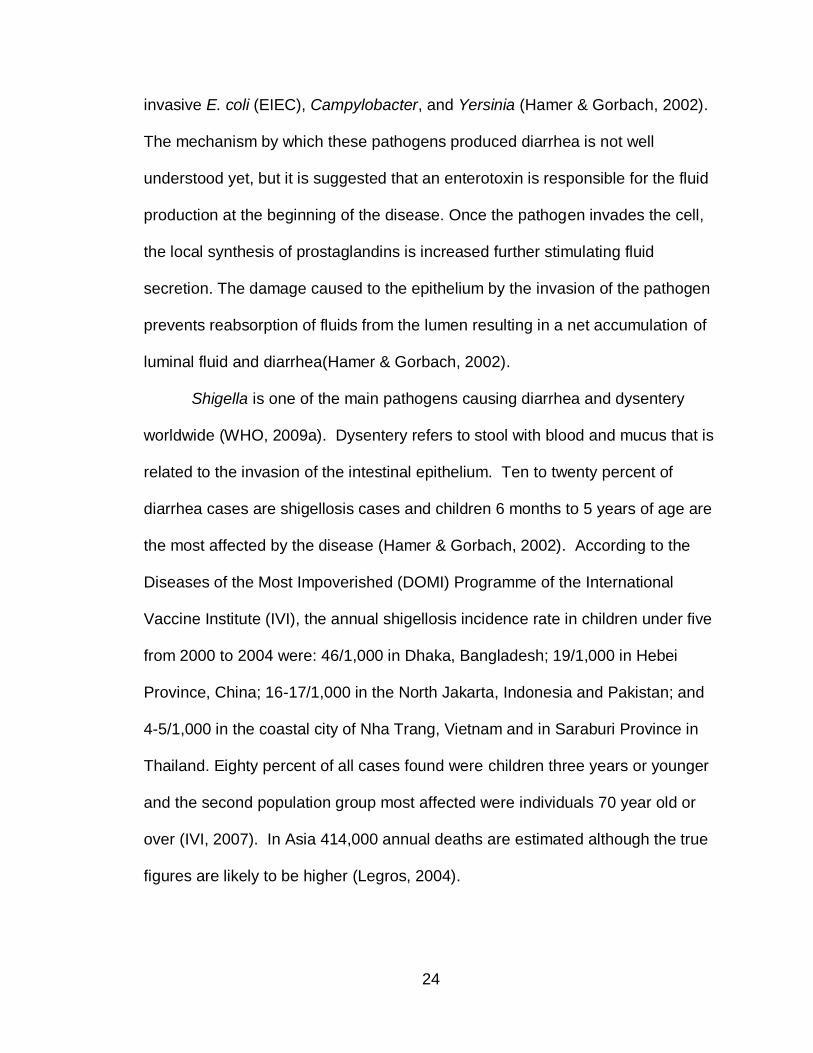
invasive E. coli (EIEC), Campylobacter, and Yersinia (Hamer & Gorbach, 2002).
The mechanism by which these pathogens produced diarrhea is not well
understood yet, but it is suggested that an enterotoxin is responsible for the fluid
production at the beginning of the disease. Once the pathogen invades the cell,
the local synthesis of prostaglandins is increased further stimulating fluid
secretion. The damage caused to the epithelium by the invasion of the pathogen
prevents reabsorption of fluids from the lumen resulting in a net accumulation of
luminal fluid and diarrhea(Hamer & Gorbach, 2002).
Shigella is one of the main pathogens causing diarrhea and dysentery
worldwide (WHO, 2009a). Dysentery refers to stool with blood and mucus that is
related to the invasion of the intestinal epithelium. Ten to twenty percent of
diarrhea cases are shigellosis cases and children 6 months to 5 years of age are
the most affected by the disease (Hamer & Gorbach, 2002). According to the
Diseases of the Most Impoverished (DOMI) Programme of the International
Vaccine Institute (IVI), the annual shigellosis incidence rate in children under five
from 2000 to 2004 were: 46/1,000 in Dhaka, Bangladesh; 19/1,000 in Hebei
Province, China; 16-17/1,000 in the North Jakarta, Indonesia and Pakistan; and
4-5/1,000 in the coastal city of Nha Trang, Vietnam and in Saraburi Province in
Thailand. Eighty percent of all cases found were children three years or younger
and the second population group most affected were individuals 70 year old or
over (IVI, 2007). In Asia 414,000 annual deaths are estimated although the true
figures are likely to be higher (Legros, 2004).
25
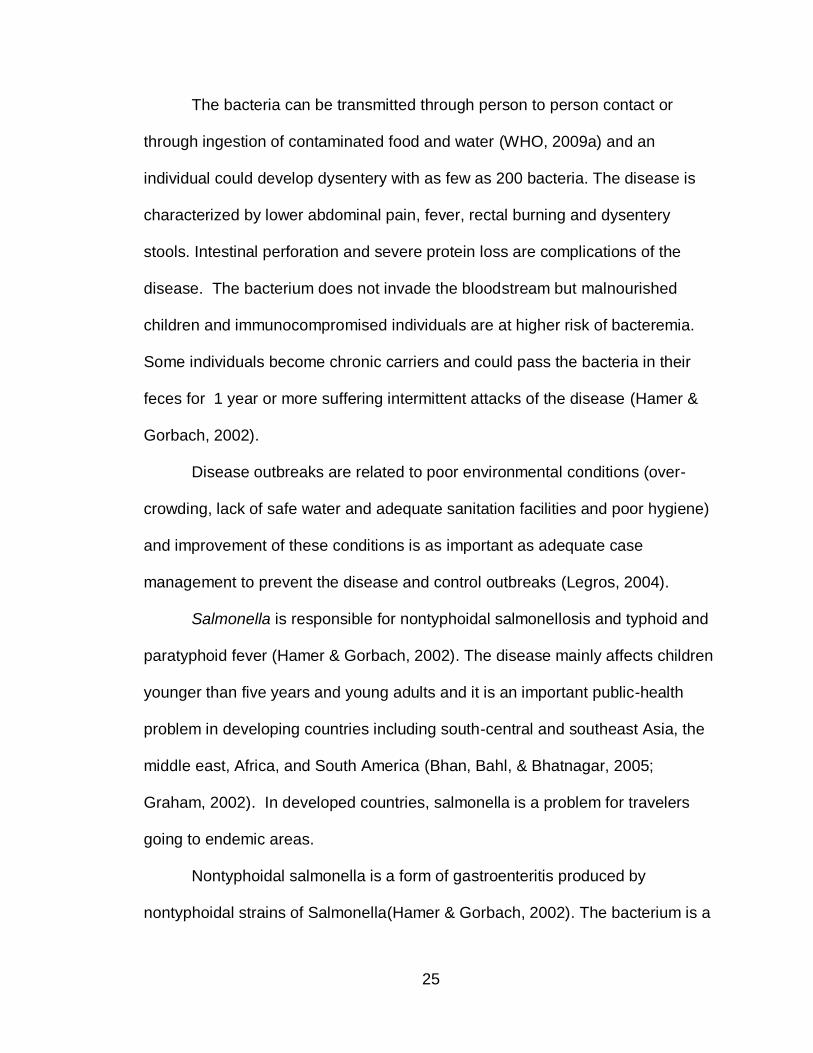
The bacteria can be transmitted through person to person contact or
through ingestion of contaminated food and water (WHO, 2009a) and an
individual could develop dysentery with as few as 200 bacteria. The disease is
characterized by lower abdominal pain, fever, rectal burning and dysentery
stools. Intestinal perforation and severe protein loss are complications of the
disease. The bacterium does not invade the bloodstream but malnourished
children and immunocompromised individuals are at higher risk of bacteremia.
Some individuals become chronic carriers and could pass the bacteria in their
feces for 1 year or more suffering intermittent attacks of the disease (Hamer &
Gorbach, 2002).
Disease outbreaks are related to poor environmental conditions (over-
crowding, lack of safe water and adequate sanitation facilities and poor hygiene)
and improvement of these conditions is as important as adequate case
management to prevent the disease and control outbreaks (Legros, 2004).
Salmonella is responsible for nontyphoidal salmonellosis and typhoid and
paratyphoid fever (Hamer & Gorbach, 2002). The disease mainly affects children
younger than five years and young adults and it is an important public-health
problem in developing countries including south-central and southeast Asia, the
middle east, Africa, and South America (Bhan, Bahl, & Bhatnagar, 2005;
Graham, 2002). In developed countries, salmonella is a problem for travelers
going to endemic areas.
Nontyphoidal salmonella is a form of gastroenteritis produced by
nontyphoidal strains of Salmonella(Hamer & Gorbach, 2002). The bacterium is a
26
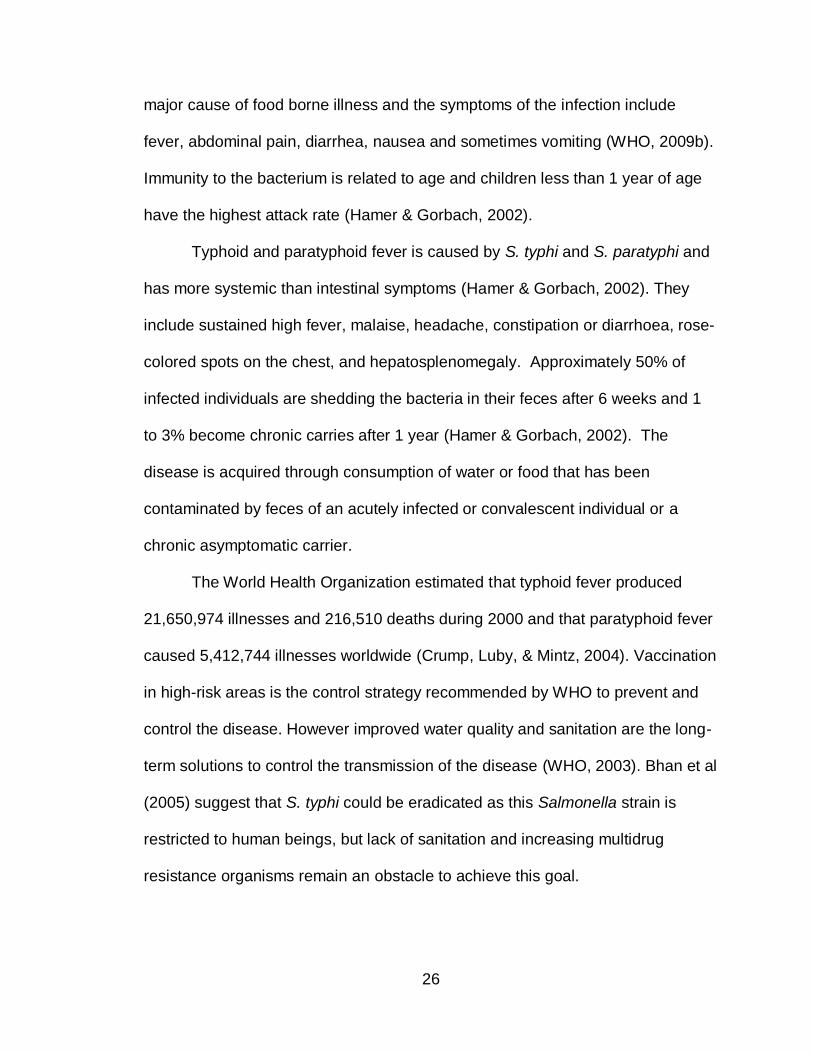
major cause of food borne illness and the symptoms of the infection include
fever, abdominal pain, diarrhea, nausea and sometimes vomiting (WHO, 2009b).
Immunity to the bacterium is related to age and children less than 1 year of age
have the highest attack rate (Hamer & Gorbach, 2002).
Typhoid and paratyphoid fever is caused by S. typhi and S. paratyphi and
has more systemic than intestinal symptoms (Hamer & Gorbach, 2002). They
include sustained high fever, malaise, headache, constipation or diarrhoea, rose-
colored spots on the chest, and hepatosplenomegaly. Approximately 50% of
infected individuals are shedding the bacteria in their feces after 6 weeks and 1
to 3% become chronic carries after 1 year (Hamer & Gorbach, 2002). The
disease is acquired through consumption of water or food that has been
contaminated by feces of an acutely infected or convalescent individual or a
chronic asymptomatic carrier.
The World Health Organization estimated that typhoid fever produced
21,650,974 illnesses and 216,510 deaths during 2000 and that paratyphoid fever
caused 5,412,744 illnesses worldwide (Crump, Luby, & Mintz, 2004). Vaccination
in high-risk areas is the control strategy recommended by WHO to prevent and
control the disease. However improved water quality and sanitation are the long-
term solutions to control the transmission of the disease (WHO, 2003). Bhan et al
(2005) suggest that S. typhi could be eradicated as this Salmonella strain is
restricted to human beings, but lack of sanitation and increasing multidrug
resistance organisms remain an obstacle to achieve this goal.
27
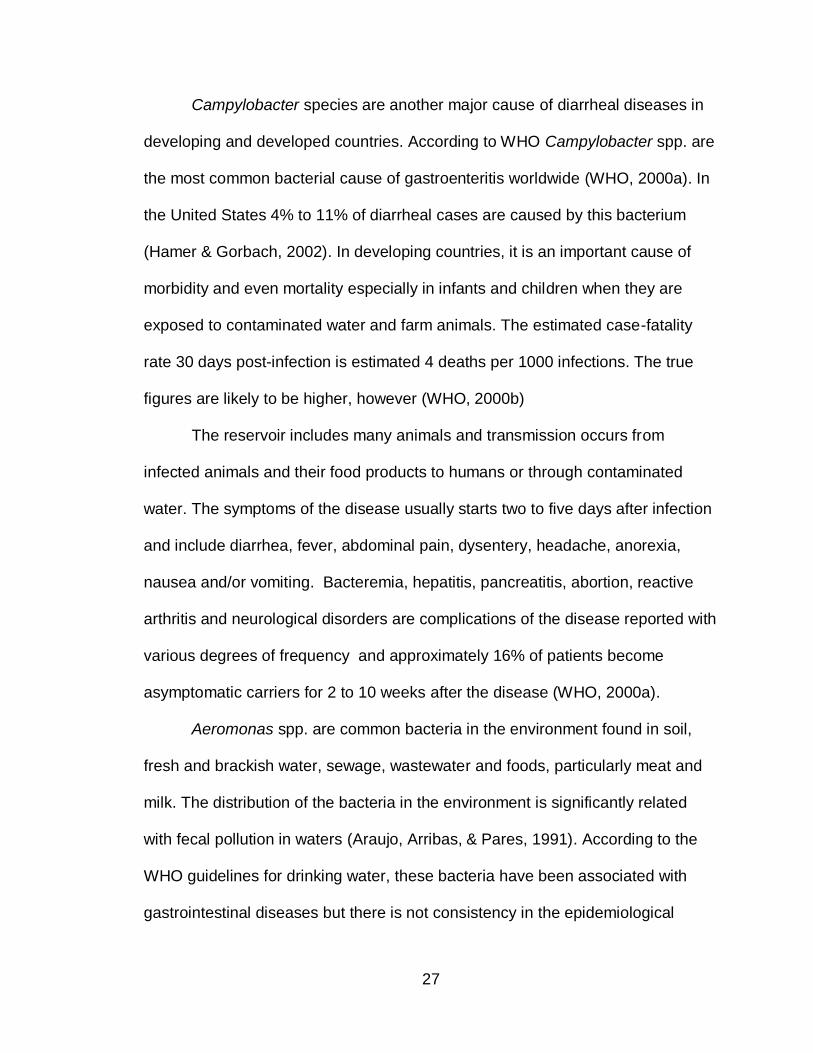
Campylobacter species are another major cause of diarrheal diseases in
developing and developed countries. According to WHO Campylobacter spp. are
the most common bacterial cause of gastroenteritis worldwide (WHO, 2000a). In
the United States 4% to 11% of diarrheal cases are caused by this bacterium
(Hamer & Gorbach, 2002). In developing countries, it is an important cause of
morbidity and even mortality especially in infants and children when they are
exposed to contaminated water and farm animals. The estimated case-fatality
rate 30 days post-infection is estimated 4 deaths per 1000 infections. The true
figures are likely to be higher, however (WHO, 2000b)
The reservoir includes many animals and transmission occurs from
infected animals and their food products to humans or through contaminated
water. The symptoms of the disease usually starts two to five days after infection
and include diarrhea, fever, abdominal pain, dysentery, headache, anorexia,
nausea and/or vomiting. Bacteremia, hepatitis, pancreatitis, abortion, reactive
arthritis and neurological disorders are complications of the disease reported with
various degrees of frequency and approximately 16% of patients become
asymptomatic carriers for 2 to 10 weeks after the disease (WHO, 2000a).
Aeromonas spp. are common bacteria in the environment found in soil,
fresh and brackish water, sewage, wastewater and foods, particularly meat and
milk. The distribution of the bacteria in the environment is significantly related
with fecal pollution in waters (Araujo, Arribas, & Pares, 1991). According to the
WHO guidelines for drinking water, these bacteria have been associated with
gastrointestinal diseases but there is not consistency in the epidemiological
28
evidence (WHO, 2008c). However, Aeromonas is described in the literature as a
diarrhea causing agent (Hamer & Gorbach, 2002).
Symptoms vary from mild diarrhea to severe illness with blood and mucus
in the stools. It affects children and adults and immunocompromised individuals
are at higher risk of bacteremia (Hamer & Gorbach, 2002). The bacteria is also
related with wound and respiratory tract infections (World Health Organization,
2008c).
The prevalence and asymptomatic carriers of Aeromonas spp. varies
among communities. Studies of acute gastroenteritis in different areas of the
world report a prevalence of Aeromonas spp. ranging from 2.5% to 6.6% in Brazil
(Guerra et al., 2007), 11. 83% in Merida, Venezuela (Longa et al., 2005); 4.5%
in Tehran, Iran (Soltan Dallal & Moezardalan, 2004); 9% in Dhaka, Bangladesh
(Haque et al., 2003); 9% in Peru (Pazzaglia et al., 1991); 2.26% in Lagos, Nigeria
(Alabi & Odugbemi, 1990); and 9% in urban Somalia (Casalino et al., 1988).
Some of these studies include adults but even in these studies the most affected
population is children. The percent of asymptomatic carriers could be as high as
27% in Thailand (Hamer & Gorbach, 2002).
Because the previous bacterial diseases involve human contact with
feces, the provision of adequate sanitation facilities, safe water and hygiene
would highly reduce their transmission.
2.2.2.2 Viruses. Viruses excreted in feces cannot multiply outside of an
adequate host cell, but they can survive for many weeks in the environment,
especially in temperature less than 15 °C. They can be isolated from water and
29
soil contaminated with human excreta and the usual load of viruses is 109
infectious virus particles per gram of human feces, regardless of whether the
individual is experiencing any disease (Feachem et al., 1983). Viral pathogens
excreted in human feces are a major cause of gastroenteritis worldwide causing
acute disease with a short incubation period (WHO, 2008c).
Rotavirus alone is a leading cause of severe diarrheal disease in infants
and children (Hamer & Gorbach, 2002) and the most important single cause of
infant death worldwide(WHO, 2008c). In 2003, it was estimated that annually
rotavirus causes 111 million episodes of diarrheal requiring home care, 25 million
clinic visits, 2 million hospitalization and about 352,000 – 592,000 deaths in
children less than five years of age. Eighty two percent of death cases occurred
in poor countries (Parashar, Hummelman, Breeze, Miller, & Glass, 2003).
The virus is transmitted by the fecal-oral route. Children aged 3 to 15
months are the most affected, while older children and adults can pass the virus
in their feces asymptomatically (Hamer & Gorbach, 2002). An infected individual
excrete up to 1011 rotaviruses per gram of feces for about 8 days; for this reason
areas with poor environmental conditions (lack of sanitation and safe water) are
at higher risk of transmission. Waterborne outbreaks have also been described
(China 1982-1983) (WHO, 2008c).
Symptoms of the infection start after 1 to 3 days of incubation and include
severe watery diarrhea, fever, abdominal pain and vomiting. They last 5 to 7
days and complications such as severe dehydration, metabolic acidosis, and
death can occur if patient is not treated adequately (Hamer & Gorbach, 2002).
30
Control measure to prevent the disease include avoiding source water
contamination by human waste and protection of drinking-water supplies from
contamination during its distribution (WHO, 2008c).
Caliciviruses are single-stranded RNA viruses that include the genera
Norovirus (Norwalk-like virus) and cause gastroenteritis in all age groups. The
morphologic and physiologic abnormalities caused by these viruses reverse in 1
to 2 weeks. Symptoms last for 24 to 48 hours and include diarrhea, nausea,
abdominal cramps, vomiting, and muscle aches (Hamer & Gorbach, 2002).
A systematic review estimated that norovirus infections causes 900,000
clinic visits and 64,000 hospitalizations each year in industrialized countries, and
up to 200,000 deaths in children less than 5 years old in developing countries
(Patel et al., 2008). During 2002, CDC received reports of 21 outbreaks of
gastroenteritis in cruise ships; four were confirmed to be associated with
noroviruses (CDC, 2002).Transmission occurs by the fecal-oral route and
therefore, the virus is passed in human feces and can pollute the environment if
adequate sanitation and safe water are lacking. Asymptomatic carriers can shed
the virus for up to two weeks, and the virus survive chlorinated water, freezing
temperature and heating temperature (60º C) as well. Person to person contact,
inhalation of contaminated aerosols and dust particles, and airborne particles of
vomitus are also common routes of transmission. Outbreaks of the disease have
been linked to contaminated water supply. Control measure to prevent the
disease include avoiding source water contamination by human waste and
31
protection of drinking-water supplies from contamination during its distribution
(WHO, 2008c).
Adenovirus (double-stranded DNA) serotypes 40 and 41 are responsible
for gastroenteritis in children less than 2 years old. The incubation period for
these viruses is of 8 to 10 days and the disease can last for up to 2 weeks
(Hamer & Gorbach, 2002). These viruses are excreted in large number in human
feces and they have been found in sewage, raw water sources and treated
drinking water supplies worldwide. However, the information regarding these
viruses is limited because they are not detectable by conventional lab methods.
Contaminated drinking water could be a source of infections and because they
are resistant to water treatment and disinfection processes, E. coli is not an
adequate indicator of their presence or absence from drinking water supplies
(WHO, 2008c).
Astroviruses are single-stranded RNA viruses responsible of diarrheal
diseases in children under five years of age. The disease is self limited and the
symptoms include watery or mucoid stools, nausea, vomiting, and fever.
Approximately 6% of the infected children develop dehydration and
underestimation of the cases is likely since the disease is usually mild (Hamer &
Gorbach, 2002). Outbreaks of diarrhea caused by this virus have been reported
in families, schools and day care centers (WHO, 2008c).
The virus is transmitted by the fecal oral route. Infected individuals pass a large
number of viruses in their feces and contamination of the environment is possible
in areas where sanitation is lacking. It has been detected in contaminated water
32
sources and drinking water supplies but transmission by drinking water has not
been confirmed (WHO, 2008c).
The genus Enterovirus is a group of single-stranded RNA viruses that
includes 69 serotypes that infect humans: poliovirus type 1-3, Coxsackievirus
types A1-A24, echovirus type 1-33 and Enterovirus types EV68-EV73 (WHO,
2008c). Humans, especially children, are commonly infected by these viruses
which are the cause of a variety of illnesses including poliomyelitis, nonspecific
febrile illnesses, herpangina, uncomplicated hand-food-and-mouth disease,
respiratory tract infections, and complications, such as meningitis, encephalitis,
paralytic disease, myocarditis, chronic or disseminated infection in
immunocompromised individuals and newborns with neonatal sepsis (Abzug,
2004).
The majority of infections are asymptomatic but in those that become ill,
severity and incidence is inversely related to age (Abzug, 2004). Infected
individual excrete the viruses in their feces for many weeks and transmission
occur mainly by the fecal-oral or by the respiratory route if a respiratory illness is
associated (WHO, 2002a). Viruses have been detected in soil, sewage, water
sources, treated drinking water supplies and food (WHO, 2008c).
Poliovirus is transmitted through contaminated food and water and affects
mainly children under five years of age. One of 200 infections leads to
irreversible paralysis and 5% to 10% of those paralyzed die. The number of polio
cases have decreased with vaccination but still there are four endemic countries:
Afghanistan, India, Nigeria and Pakistan (WHO, 2008a). A total of 839 cases of
33
polio have been reported to the WHO during the first 7 months of year 2009.
These cases include outbreaks in endemic (621 polio cases) and non-endemic
countries (218). The last outbreak of polio was reported in July 2009, in the
northern state of Nigeria with 363 cases of wild poliovirus type. Poor sanitation
and hygiene conditions facilitate the entrance of the virus in the environment and
transmission of the disease to susceptible populations (Global Polio Eradication
Initiative, 2009).
Hepatitis refers to inflammation of the liver and hepatitis A and E virus are
two of the causal agents of the disease. The transmission is from person to
person and by the fecal oral route through ingestion of contaminated water or
food. Therefore, the disease is associated with poor sanitation and hygiene and
lack of safe water. In areas where hepatitis A virus is endemic, the disease
occurs in early childhood without long term-consequences and a low mortality
(0.2%). In adults the disease is severe with a mortality of 70 to 90% and
uncommon survival in patients 50 years of age and over. Symptoms of the
disease include fever, weakness, anorexia, nausea, abdominal discomfort and
jaundice. In severe cases fulminant hepatitis leads to death (WHO, 2001a).
Hepatitis A virus is distributed worldwide and, in areas where sanitation
lacks, children become immune early in life. In areas where sanitation is
adequate, the infection occur later in life (WHO, 2008c). Hepatitis E virus has a
longer incubation period (average 40 days) than Hepatitis A virus and, it affects
young adults rather than young children. This virus is also an important cause of
viral hepatitis in developing countries including India, Nepal, central Asia, Mexico
34
and parts of Africa. Similar to Hepatitis A virus, fecal polluted water is an
important route in the transmission of the disease (WHO, 2008c).
2.2.2.3 Protozoa. Protozoa and helminthes cause a significant amount of
morbidity and mortality worldwide and many of them are transmitted by ingestion
of contaminated water and food with feces of infected humans and animals. Their
resistance to different treatment and environmental conditions (including water
treatment by wastewater treatment plants) make them more prevalent in areas
where access to safe water and adequate sanitation are limited. However, in
developed areas protozoa represent a health risk in immunocompromised
individuals and travelers going to developing countries (WHO, 2008c) .
Protozoa infections caused by Giardia spp., Cryptosporidium parvum,
Entamoeba histolytica and Cyclospora cayetanensis account for the majority of
infections caused by these group of parasites (Pierce & Kirkpatrick, 2009). Many
infected individuals remain asymptomatic and those who become ill present
dysentery and diarrhea as their main symptom (Feachem et al., 1983).
Cryptosporidium parvum is a very resistant protozoa that can survive for
weeks and even months in fresh water. It is transmitted by fecal-oral route
through contact with contaminated water (drinking or recreational water) or food.
The oocysts of the parasite are excreted in feces of infected individuals and
animals and are highly resistant to oxidizing disinfectants such as chlorine. In
addition the oocysts are very difficult to remove by conventional filtration
processes (WHO, 2008c).
35
The parasite can infect individuals with as few as 1 to 10 oocysts causing
self-limited diarrhea of 10-14 days of duration in immunocompetent individuals.
In immunocompromised individuals, the clinical presentation of diarrhea is similar
to that of cholera and can be fatal (Hutson & Guerrant, 2002). In developed
countries C. parvum is a cause of diarrhea outbreaks in hospitals and day care
centers. The most known outbreak is the waterborne outbreak in Milwaukee,
USA, in 1993, where more than 400,000 people were infected (Hutson &
Guerrant, 2002). In developing countries, C. parvum is a common cause of
acute and persistent diarrhea in children and immunocompromised individuals
(Huang, Chappell, & Okhuysen, 2004).
The prevalence of Cryptosporidium in the developing world had been
reported to be 29.6% among children with diarrhea episodes (Miller et al., 1994),
and 8.5% among children with no symptoms of the disease (Tumwine et al.,
2003). The parasite is found more frequently in children with persistent diarrhea
than in those with acute or no diarrhea and it has been significant associated with
malnutrition (Newman et al., 1999; Tumwine et al., 2003). Children with severe
dehydration, persistent diarrhea, stunted or underweight children have higher
mortality rates than those without these conditions (Tumwine et al., 2003).
Entamoeba histolytica is distributed worldwide and, as C. parvum, the
cysts are passed in the feces, survive in the environment for weeks and are very
resistant to chlorination and desiccation. It is transmitted by the fecal-oral route
mainly, although sexual transmission, particularly among male having sex with
men, has been documented (WHO, 2008c). Approximately 90 % of infected
36
individuals are asymptomatic carriers. The other 10% of infected individuals
develop dysentery and a small percentage extra intestinal disease (e.g. amebic
liver, pericarditis, lung abscess, brain abscess). Other symptoms include
abdominal pain, tenesmus and fever. Acute necrotizing colitis is a lethal
complication in 0.5% of cases if no treatment is provided (Hutson & Guerrant,
2002).
The non pathogenic E. dispar is similar in appearance to E. histolytica and
for this reason, there are large differences in the reported numbers of carriers or
infected individuals among countries (Gendrel, Treluyer, & Richard-Lenoble,
2003). The incidence is higher in developing countries where lack of sanitation
and safe water is limited. The contribution of the parasite to the burden of
diarrheal diseases in children in developing areas is substantial (Haque et al.,
2006). The prevalence in developed countries may be less than 10% (WHO,
2008c). Studies of E. histolytica in the developing world revealed a prevalence of
11.2% (Vietnam) to 13.8% (Mexico) among asymptomatic individuals
(Blessmann et al., 2003; Ramos et al., 2005). Non symptomatic carriers were 2.7
times more likely to re-infection than the general population (Blessmann et al.,
2003).
Giardia lamblia is another protozoon that can survive for weeks and
months in fresh water, very resistant to dehydration, extreme temperature and
chlorination. It is also known as Giardia intestinalis or G. duodenalis (WHO,
2008c). It is excreted in large numbers in feces and transmitted by the fecal oral
route. Ingestion of as few as 10 cysts can result in infection. The majority of
37
infections occur in infants and essentially all children have been infected by 2 to
3 years of age. Asymptomatic infections are common in children and adults.
Giardia causes a variety of symptoms, from asymptomatic infections to severe
chronic diarrhea with malabsorption. Symptoms may include fatigue, abdominal
cramps, bloating, malodorous stool, flatulence, weight loss, fever and vomiting.
Immunocompromised individuals and children less than two years old are at
higher risk of severe diarrhea and malabsorption (Hutson & Guerrant, 2002).
The parasite is distributed worldwide and is an important cause of chronic
diarrhea, malnutrition and cognitive impairment in children in developing
countries (Ali & Hill, 2003). In the United State, Giardia is a frequently indentified
intestinal parasite associated with waterborne and food borne outbreaks (WHO,
2008c). In developing countries Giardia is endemic and affects children mainly.
Lack of sanitation and safe water have been described as risk factors for
infection (Prado et al., 2003; Redlinger et al., 2002) and vulnerable population for
the disease include children with underweight, stunting and wasting (Al-Mekhlafi
et al., 2005). Persistent diarrhea and recurrent or relapsing infections are
common among symptomatic infected children (Robert et al., 2001).
Cyclospora cayetanensis has a clinical presentation similar to
Cryptosporidium but it differs in that the parasite is not immediately infective after
being passed in the feces (Hutson & Guerrant, 2002). Cyclospora requires 7 to
12 days in the environment to become infective and the oocysts are resistant to
disinfection and chlorine. It is transmitted by the fecal-oral route and the primary
source of exposure is contaminated water or food. Symptoms of the disease
38
include watery diarrhea, abdominal cramps, weight loss, anorexia, myalgia,
vomiting and/or fever, and relapse is common (WHO, 2008c).
In the Unites States and Canada, C. cayetanensis has been associated to
food borne outbreaks (Hutson & Guerrant, 2002). In the developing world
Cyclospora infections had been found to be relatively common, especially among
children 1.5 to 9 years old, and often asymptomatic. Unsafe water and contact
with soil have been found significantly associated with the disease in children
(Bern & Hernandez, 1999). A suburban community in Venezuela showed a
Cyclospora prevalence of 6.1%. Of those infected, 84.6% were asymptomatic
(Chacin-Bonilla, De Young, & Estevez, 2003). Another study in Jordan identified
a 6% prevalence of Cyclospora among symptomatic cases (Nimri, 2003).
2.2.2.4 Helminthes. Helminthes infect a large number of people and
animals. Soil transmitted helminths (Ascaris lumbricoides, Trichuris trichiura,
Ancylostoma duodenale and Necator americanus) and schistosomiasis are the
most common helminth infections around the world. These parasites cause a
high burden of disease and health consequences, especially in children in
developing countries (Feachem et al., 1983). They are concentrated in tropical
and subtropical areas and mainly affect poor populations which lack of adequate
housing, sanitation and safe water. More than 2 billion people are affected by
these parasites and co-infection with more than one parasite is not unusual
(WHO, 2009c). Between 3.9 and 4.5 million DALYs are estimated to be lost to
soil-transmitted helminthes and schistosoma respectively; and children,
39
adolescents and women of reproductive age are at the highest risk to suffer
these illnesses (WHO, 2001).
Infections with these parasites are a major public health concern since the
poorest people are the most affected and cost-effective solutions to reduce
morbidity are available (WHO, 2001). Although, these parasites rarely cause
death they have an important health impact on those chronically affected.
Chronic and high intensity infections can result in malnutrition; stunting and
cognitive impairment (Hotez et al., 2006). Repeated infections can also lead to
macronutrient and micronutrient deficiencies with adverse consequences that
can perpetuate from one generation to the next. Infants born from pregnant
undernourished women have an increase risk of been born with prematurity, low
birth weight and early death (Weigel et al., 1996). If they survive, they also have
an increased risk of poor growth and development in childhood and adolescence
(Steketee, 2003). People infected pass the parasite eggs in their feces and, in
about 2 to 3 weeks of development in the environment, the eggs are ready to
infect a new host. The transmission is by the fecal-oral route, in the case of soil-
transmitted helminthes, and by direct contact of the skin with contaminated soil,
in the case of hookworms.
A. lumbricoides infects more than one 1 billion people worldwide with 350
million cases presenting morbidity and 60,000 dying each year (WHO, 2001). It
does not produce symptoms unless an individual carries large number of worms.
Children become infected by eating dirt or by placing dirty fingers and toys in
their mouth. Once ingested, eggs hatch in the duodenum and the worm
40
penetrates the mucosa producing little damage. Larva migrates through the
lymphatics or venules to the lungs. Transplacental migration has been also
documented. The larva molts twice in the lungs, breaks into the alveoli and
ascends to the pharynx where it is swallowed and passes through the stomach to
the small intestine, where it matures. In the small intestine the worm feeds on
the liquid content of the intestinal lumen and in moderate and severe infections
can cause malnutrition, underdevelopment and cognitive impairment in small
children. Abdominal pain, asthma, rashes, eye pain, insomnia, and restlessness,
could result from the allergic responses to metabolites liberated by the worm.
Intestinal obstruction is the most common complication and fatality could result
from obstruction, intussusceptions, or volvulus, due to intestinal necrosis.
Because worms are highly motile, they could also cause biliary duct obstruction,
liver abscesses, ascending cholangitis, acalculous cholecystitis or acute
pancreatitis (Elliott, 2002; Schmidt & Roberts, 2000). Adult females may produce
200,000 ova per day which are passed in the feces and, under favorable
conditions (warm, moist, shaded soil), may become infective in 2 to 3 weeks,
completing the life cycle (John & Petri, 2006).
T. trichiura infects approximately 795 million people and its transmission is
similar to that of A. lumbricoides. Once an infective ovum is ingested, it hatches
in the intestine and the larva migrates to the cecum, mature, mate, and lay eggs
(8-12 weeks). If the individual harbor small number of worm (less than 15), the
parasite acts as commensal. Small children are predisposed to heavy infections
(200 to 1,000 worms), which could result in dysentery, anemia, growth
41
retardation, finger clubbing (odd thickening of the ends of the digits) and rectal
prolapse. Moderate to heavy infection also affect cognitive function of children.
As the anterior end of the parasite remains embedded in the colon mucosa
hemorrhage could occur resulting in anemia. Trichuriasis mimics inflammatory
bowel diseases, but is readily curable. The adult female passes 3,000 to 7,000
eggs daily in the feces; under adequate environmental conditions (warm, moist,
shaded soil), they become infective in approximately 10 days (Elliott, 2002; John
& Petri, 2006; Schmidt & Roberts, 2000).
Ancylostoma duodenale and Necator americanus (hookworms) infect
approximately 740 million people worldwide, with the majority of infections
occurring in sub-Saharan Africa (WHO, 2001). The infective stage of the parasite
is the third-stage larvae which penetrate the intact skin after exposure to
contaminated soil. Their manifestation and pathogenesis follows the migration
path in an individual through the skin, lungs, and intestine. In the cutaneous
phase the larva can produce a pruritic serpiginious rash. Once the larva enters
the blood vessels, it migrates to the right heart and the lungs. When it breaks into
the alveoli each site hemorrhages with serious consequences in massive
infections but usually the lung phase is asymptomatic. Then, the larva migrates
up the pulmonary tree and is swallowed maturing into the small intestine. The
intestinal phase is the most important period of pathogenesis as the worm attach
to the mucosa and start feeding on blood. The worm changes attaching at
multiple places in the mucosa exacerbating bleeding and blood loss. Calculated
42
blood loss is about 0.03 ml per day for N. americanus and 0.26 ml per day for A.
duodenale (Schmidt & Roberts, 2000).
Heavy infections may cause an individual to lose up to 200ml of blood per
day producing an iron-deficiency anemia as the body iron reserves are lost.
Abdominal pain, loss of appetite, and geophagy are common symptoms of
moderate infection. Heavy infections result in severe protein deficiency, edema
and potbelly in children with delayed puberty, mental dullness, heart failure and
death. The disease is usually manifested in the presence of malnutrition and
complicated with other parasites. If the young do not have an adequate diet,
losing protein and iron, causes stunted growth and below-average intelligence.
Treatment can substantially increase fitness, appetite and growth. To complete
the life cycle, adult females pass up to 10,000 (N. americanus) and 30,000 (A.
duodenale) eggs per day. These eggs developed to infective filariform larvae,
under adequate environmental conditions (warm, moist, shaded soil), in about 5
to 10 days (Elliott, 2002; John & Petri, 2006; Schmidt & Roberts, 2000).
Schistosoma spp. (Schistosoma haematobium, S. japonicum, and S.
mansoni) infect about 187 million people worldwide. This parasite requires a
water source and a snail to develop in the environment. In the body the damage
is caused primarily by the eggs of the parasite. In general, eggs are eliminated
with feces or urine and under optimal conditions they hatch and release a
miracidia. This miracidia swims and penetrates a specific snail (intermediate
host) and develops to a cercaria, which penetrates the skin of the human host
after being released from the snail. During the skin penetration cercaria loses its
43
forked tail and becomes schistosomulae. Dermatitis may develop if the individual
has been sensitized by earlier infections. The schistosomulae migrates through
several tissues to their residence in the veins. The migration phase of this
parasite is usually asymptomatic. Adult worms of S. japonicum are frequently
found in the superior mesenteric veins draining the small intestine, and S.
mansoni in the superior mesenteric veins draining the large intestine. S.
haematobium most often occurs in the venous plexus of bladder, but it can also
be found in the rectal venules. Females parasites deposit the eggs in the small
venules of the portal and perivesical systems moving progressively towards the
lumen of the intestine (S. mansoni and S. japonicum) and of the bladder and
ureters (S. haematobium), eliminated with feces or urine, respectively (Centers
for Disease Control & Prevention, 2009). The acute phase of the disease
(Katayama fever) occurs when the parasite start laying eggs and it is
characterized by chills and fever, fatigue, headache, malaise, muscle aches,
lymphadenopathy and gastrointestinal discomfort. When the eggs of the parasite
remain in the gut or bladder wall a delayed type hypersensitivity reaction occur
around the eggs. In the chronic phase, mild, chronic, bloody diarrhea with mild
abdominal pain and lethargy develop. Those affected by S. haematobium may
suffer from painful urination and blood in the urine (Schmidt & Roberts, 2000).
Those affected by S. japonicum and S. mansoni may develop egg
granulomas and fibrosis in the liver limiting the portal blood flow. As the fibrotic
reactions continue, periportal cirrhoisis, portal hypertension, splenomegaly and
ascites develop. Some eggs produce pseudotubercles in the lungs, nervous
44
system and other organs. S. japonicum is the most severe of the three species
and 60% of all neurological disease and almost all brain lesions are due to this
specie. S. haematobium is considered the least serious, but the casual relation
with bladder cancer is strong. Invasion of the female reproductive tract is also
common (Schmidt & Roberts, 2000).
The main strategy recommended by WHO to control and prevent these
helminthes infections is administration of anthelmintic drugs. This strategy
reduces morbidity in intensely infected populations in the short term (Hotez et al.,
2006). Access to adequate and safe sanitation facilities is the most important
intervention to ensure sustained reduction and elimination of these parasitic
diseases in the long term (WHO, 2006c).
2.2.3 Categories of excreta related pathogens. In order for an infection
to be transmitted, a pathogen excreted (from a patient, carrier or reservoir) needs
to enter the susceptible host by the mouth or some other route. There are several
factors influencing this pathogen transmission route (WHO, 2006b):
Epidemiologic characteristics (infectious dose, latency, intermediate host,
etc.)
Persistence in different environment outside the human body
Major transmission routes
Relative susceptibility to different treatment techniques
Management control measures
45
The excreted load2, latency3, persistence4, and multiplication of a
pathogen will influence the infective dose or dose required to infect a new host
(Feachem et al., 1983). The excreted load is determined by the infectious
prevalence and volume of feces excreted (WHO, 2006b). The latent period
depends of the organism; viruses, bacteria and the majority of protozoa have no
latent period and become infectious immediately after being excreted; soil
transmitted helminthes require completing a stage of their life cycle in the soil
before becoming infectious (Feachem et al., 1983).
The persistence of the pathogens in the environment will depend on the
receiving environment. The risk of infection will depend of the infective dose and
the vulnerability of new host (WHO, 2006b). Individuals infected with Ascaris spp.
may develop little immunity, while infections with virus or bacteria may produce
long-lasting immunity (Feachem et al., 1983). Feachem et al. (1983), created VI
categories of excreta related pathogens based on the environmental or
epidemiological characteristics: latency, infective dose, persistence, multiplication
and transmission (Table 2.5).
Category I have the lowest median infective dose (ID50 <102), spread
easily from person to person and become infective immediately after excretion.
Category II includes persistent bacteria which are less likely to spread person to
person and have a medium to high median infective dose (ID50 ≥104). Parasites
are included in Category III, IV and V. They are highly persistent and require
2 Excreted load: concentration of pathogens passed in the feces of an infected person.
3 Latency: the interval between the excretion of a pathogen and its becoming infective to a new
host. 4 Persistence: viability of the pathogen in the environment.
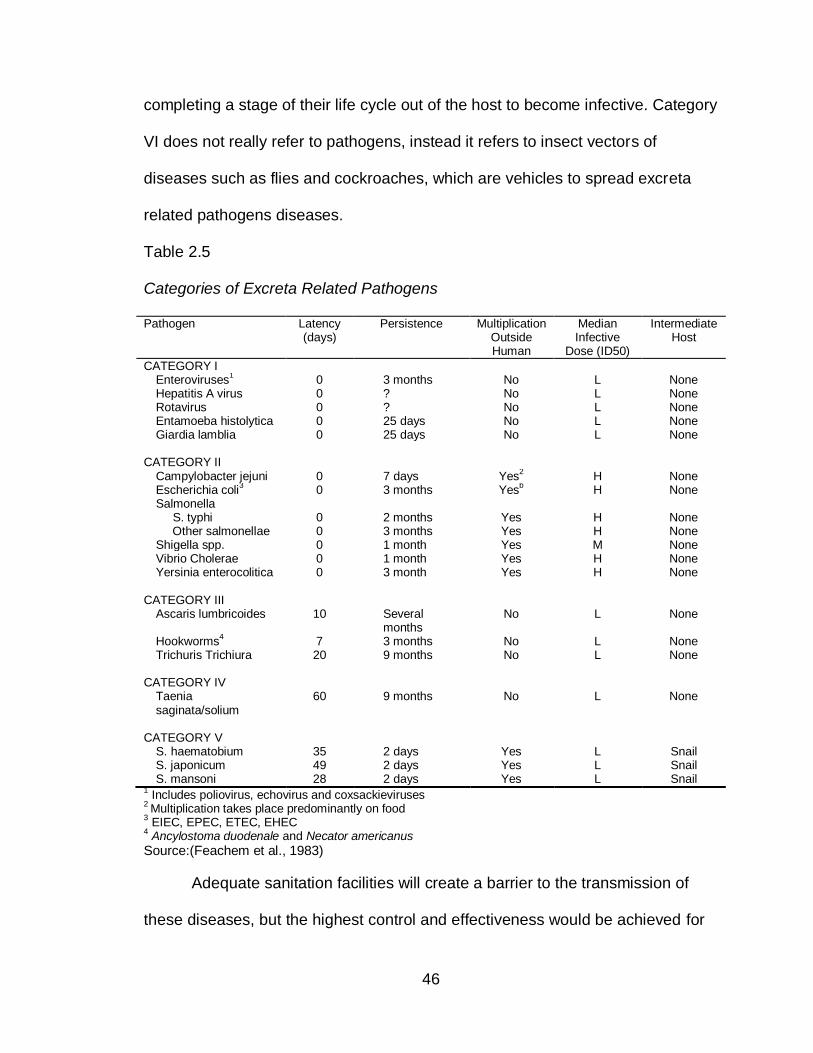
46
completing a stage of their life cycle out of the host to become infective. Category
VI does not really refer to pathogens, instead it refers to insect vectors of
diseases such as flies and cockroaches, which are vehicles to spread excreta
related pathogens diseases.
Table 2.5
Categories of Excreta Related Pathogens
Pathogen Latency (days)
Persistence Multiplication Outside Human
Median Infective
Dose (ID50)
Intermediate Host
CATEGORY I Enteroviruses
1 0 3 months No L None
Hepatitis A virus 0 ? No L None Rotavirus 0 ? No L None Entamoeba histolytica 0 25 days No L None Giardia lamblia 0 25 days No L None
CATEGORY II
Campylobacter jejuni 0 7 days Yes2 H None
Escherichia coli3 0 3 months Yes
b H None
Salmonella S. typhi Other salmonellae
0 0
2 months 3 months
Yes Yes
H H
None None
Shigella spp. 0 1 month Yes M None Vibrio Cholerae 0 1 month Yes H None Yersinia enterocolitica 0 3 month Yes H None
CATEGORY III
Ascaris lumbricoides 10 Several months
No L None
Hookworms4 7 3 months No L None
Trichuris Trichiura 20 9 months No L None CATEGORY IV
Taenia saginata/solium
60 9 months No L None
CATEGORY V
S. haematobium 35 2 days Yes L Snail S. japonicum 49 2 days Yes L Snail S. mansoni 28 2 days Yes L Snail
1 Includes poliovirus, echovirus and coxsackieviruses
2 Multiplication takes place predominantly on food
3 EIEC, EPEC, ETEC, EHEC
4 Ancylostoma duodenale and Necator americanus
Source:(Feachem et al., 1983)
Adequate sanitation facilities will create a barrier to the transmission of
these diseases, but the highest control and effectiveness would be achieved for
47
diseases in categories III, IV and V (Feachem et al., 1983). Nevertheless,
discharge of wastewater into rivers or its use in agriculture facilitate the
transmission of all fecal pathogens if the wastewater if not adequately treated
(Schonning & Stenstrom, 2004).
Providing access to sanitation facilities as well as assuring their use by all
members of the household is important to control these diseases. Most of the
excreta related diseases affect children and teenagers, who usually do not use
the toilets because is located away from the house or because of fear of falling
down the toilet. These behaviors increase their own health risk and the risk of the
neighbor. Therefore, health education is as important as an adequate sanitation
facility.
2.2.4 Pathogen survival. The main natural environmental factors limiting
pathogen survival in feces are time and temperature. After excretion, viruses and
protozoa start decreasing in number, bacteria may multiply if the environment
conditions are adequate and rich in nutrient, and helminthes may survive for long
periods of time. Low temperatures (< 5 oC) increase pathogen survival, while
most of them are inactivated at high temperatures (> 40 oC) showing an
exponential decline in population (Feachem et al., 1983).
2.2.4.1 Survival in feces and soil. The natural die-off of pathogens in
feces depends on time, type of organism and storage conditions such as
temperature, pH, moisture, and biological competition. Storage conditions and
type of pathogen influence their inactivation. Table 2.6 shows the survival time of
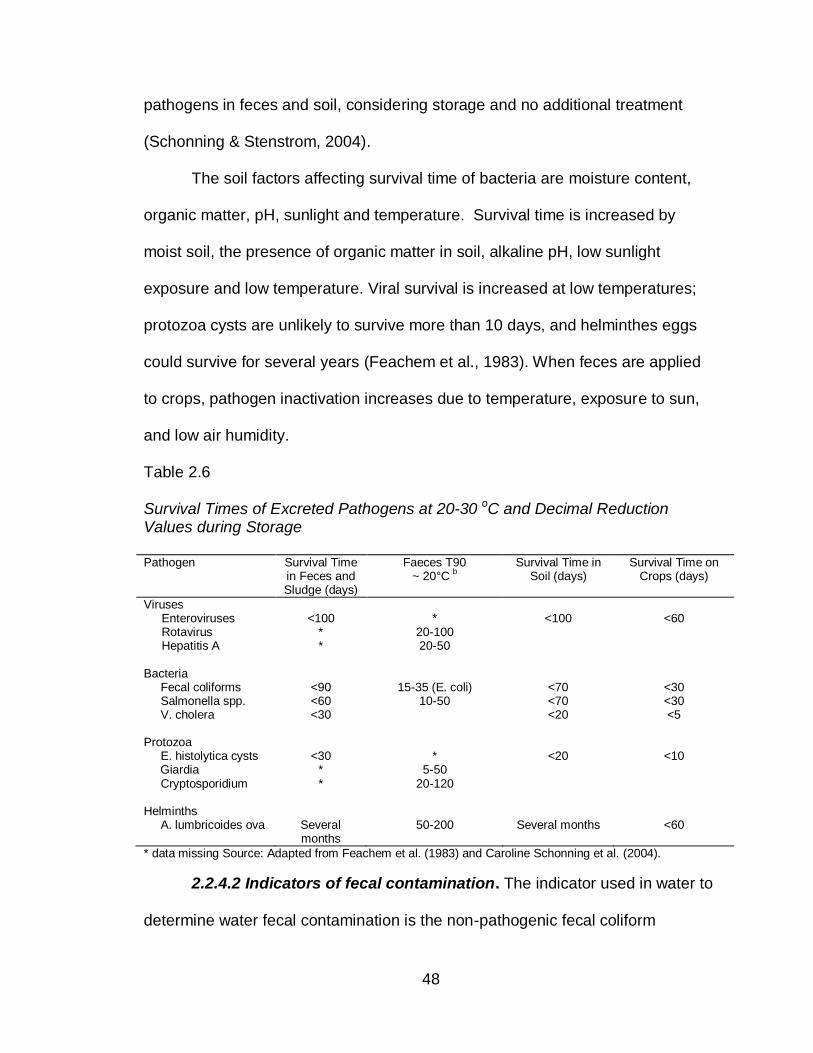
48
pathogens in feces and soil, considering storage and no additional treatment
(Schonning & Stenstrom, 2004).
The soil factors affecting survival time of bacteria are moisture content,
organic matter, pH, sunlight and temperature. Survival time is increased by
moist soil, the presence of organic matter in soil, alkaline pH, low sunlight
exposure and low temperature. Viral survival is increased at low temperatures;
protozoa cysts are unlikely to survive more than 10 days, and helminthes eggs
could survive for several years (Feachem et al., 1983). When feces are applied
to crops, pathogen inactivation increases due to temperature, exposure to sun,
and low air humidity.
Table 2.6
Survival Times of Excreted Pathogens at 20-30 oC and Decimal Reduction Values during Storage Pathogen Survival Time
in Feces and Sludge (days)
Faeces T90 ~ 20°C
b
Survival Time in Soil (days)
Survival Time on Crops (days)
Viruses Enteroviruses Rotavirus Hepatitis A
<100
* *
*
20-100 20-50
<100
<60
Bacteria Fecal coliforms Salmonella spp. V. cholera
<90 <60 <30
15-35 (E. coli)
10-50
<70 <70 <20
<30 <30 <5
Protozoa E. histolytica cysts Giardia Cryptosporidium
<30
* *
*
5-50 20-120
<20
<10
Helminths A. lumbricoides ova
Several months
50-200
Several months
<60
* data missing Source: Adapted from Feachem et al. (1983) and Caroline Schonning et al. (2004).
2.2.4.2 Indicators of fecal contamination. The indicator used in water to
determine water fecal contamination is the non-pathogenic fecal coliform
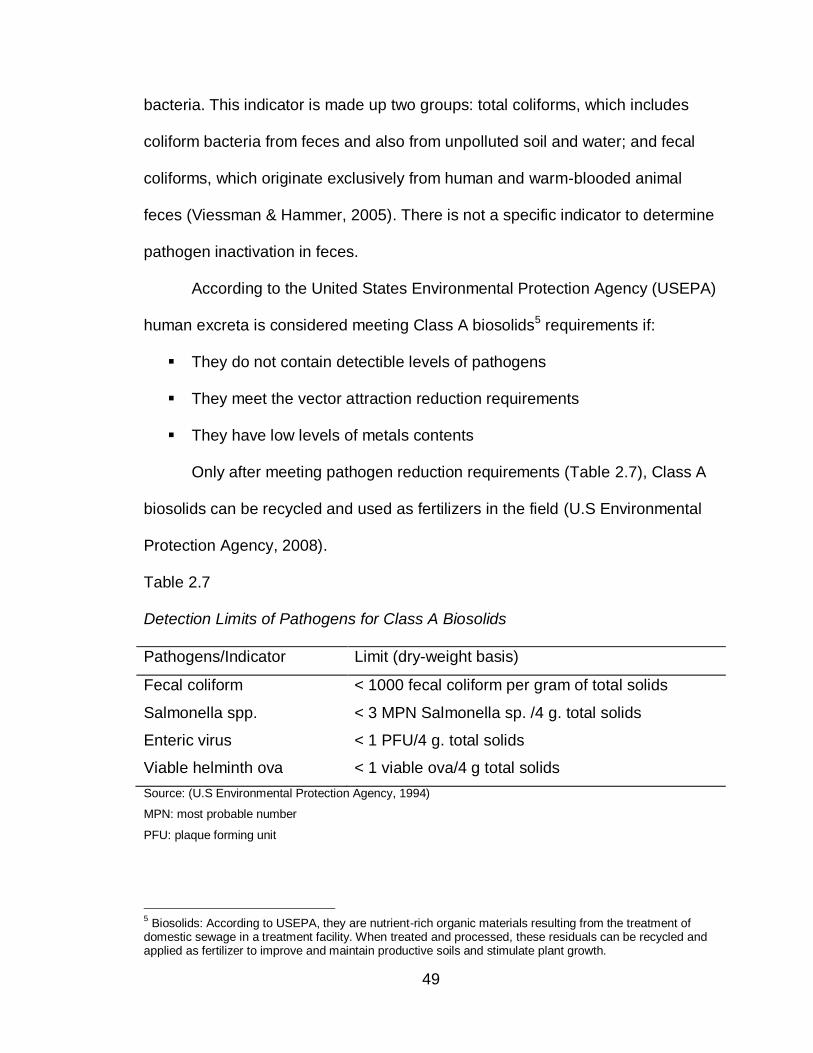
49
bacteria. This indicator is made up two groups: total coliforms, which includes
coliform bacteria from feces and also from unpolluted soil and water; and fecal
coliforms, which originate exclusively from human and warm-blooded animal
feces (Viessman & Hammer, 2005). There is not a specific indicator to determine
pathogen inactivation in feces.
According to the United States Environmental Protection Agency (USEPA)
human excreta is considered meeting Class A biosolids5 requirements if:
They do not contain detectible levels of pathogens
They meet the vector attraction reduction requirements
They have low levels of metals contents
Only after meeting pathogen reduction requirements (Table 2.7), Class A
biosolids can be recycled and used as fertilizers in the field (U.S Environmental
Protection Agency, 2008).
Table 2.7
Detection Limits of Pathogens for Class A Biosolids
Pathogens/Indicator Limit (dry-weight basis)
Fecal coliform < 1000 fecal coliform per gram of total solids
Salmonella spp. < 3 MPN Salmonella sp. /4 g. total solids
Enteric virus < 1 PFU/4 g. total solids
Viable helminth ova < 1 viable ova/4 g total solids
Source: (U.S Environmental Protection Agency, 1994)
MPN: most probable number
PFU: plaque forming unit
5 Biosolids: According to USEPA, they are nutrient-rich organic materials resulting from the treatment of
domestic sewage in a treatment facility. When treated and processed, these residuals can be recycled and applied as fertilizer to improve and maintain productive soils and stimulate plant growth.
50
The treatment alternatives to achieve Class A biosolids set by USEPA are
practiced in developed countries. In developing countries, sanitation alternatives
are different and present a challenge to public health. With the adoption of the
MDG, decentralized sanitation systems are in expansion and, other treatment
alternatives to meet Class A biosolids are being developed. To assure that these
new systems produce safe biosolids the World Health Organization developed
the “Guidelines for the safe use of wastewater, excreta and greywater”(World
Health Organization, 2006a).
The necessity of assuring a safe end-product comes from the opportunity
and value of using excreta as a fertilizer, mainly in developing countries. If
adequately managed, excreta could have a positive health impact increasing
food security, nutritional status, and income (WHO, 2006b). The next section will
describe Dry Sanitation as one of the options to on-site treatment of excreta.
2.3 Sanitation Systems
A sanitation system could be defined as the combination of technologies
involved to manage wastes from the point of generation to the point of use or
ultimate disposal. Management, operation and maintenance are important
components of any sanitation system since these components assure the
sustainability and functionality of the system (Tilley et al., 2008).
Eight sanitation system templates or models have been described by the
Compendium of Sanitation Systems and Technologies published by the Swiss
Federal Institute of Aquatic Science and Technology:
51
System 1: Single Pit System
System 2: Waterless System with Alternating Pits
System 3: Pour Flush System with Twin Pits
System 4: Waterless System with Urine Diversion
System 5: Blackwater Treatment System with Infiltration
System 6: Blackwater Treatment System with Sewerage
System 7: (Semi-) Centralized Treatment System
System 8: Sewerage System with Urine Diversion
The sanitation system models range from simple (System 1) to complex
(System 8) and each of them describes a group of compatible technology
combinations that could be used to design a sanitation system (Tilley et al.,
2008). System 4, waterless system with urine diversion, describe those
technologies that do not use water to collect and transport feces and urine and
separates urine from feces at the source point. This system embraces dry toilet
technologies and will be described further in this chapter. Please refer to the
Compendium of Sanitation Systems and Technologies for more information
about other systems (Tilley et al., 2008).
2.3.1 General description of waterless system with urine diversion.
Waterless systems with urine diversion divert urine away from feces. It does not
use water and it is especially useful in deficient water regions, in areas with a
high groundwater table and in rocky areas where is difficult to dig. The devices
used by individuals in this type of system include a urine diverting dry toilet
(UDDT) or/and a urinal. The culture of the target population (sitters, squatters,
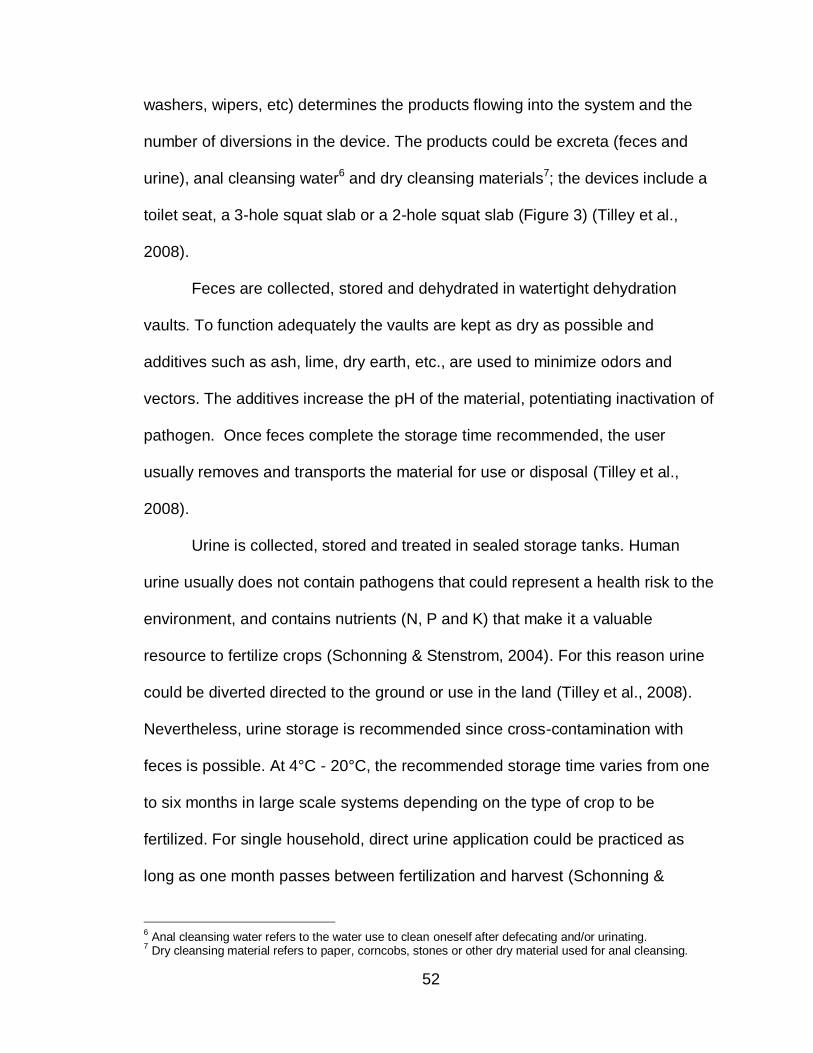
52
washers, wipers, etc) determines the products flowing into the system and the
number of diversions in the device. The products could be excreta (feces and
urine), anal cleansing water6 and dry cleansing materials7; the devices include a
toilet seat, a 3-hole squat slab or a 2-hole squat slab (Figure 3) (Tilley et al.,
2008).
Feces are collected, stored and dehydrated in watertight dehydration
vaults. To function adequately the vaults are kept as dry as possible and
additives such as ash, lime, dry earth, etc., are used to minimize odors and
vectors. The additives increase the pH of the material, potentiating inactivation of
pathogen. Once feces complete the storage time recommended, the user
usually removes and transports the material for use or disposal (Tilley et al.,
2008).
Urine is collected, stored and treated in sealed storage tanks. Human
urine usually does not contain pathogens that could represent a health risk to the
environment, and contains nutrients (N, P and K) that make it a valuable
resource to fertilize crops (Schonning & Stenstrom, 2004). For this reason urine
could be diverted directed to the ground or use in the land (Tilley et al., 2008).
Nevertheless, urine storage is recommended since cross-contamination with
feces is possible. At 4°C - 20°C, the recommended storage time varies from one
to six months in large scale systems depending on the type of crop to be
fertilized. For single household, direct urine application could be practiced as
long as one month passes between fertilization and harvest (Schonning &
6 Anal cleansing water refers to the water use to clean oneself after defecating and/or urinating.
7 Dry cleansing material refers to paper, corncobs, stones or other dry material used for anal cleansing.
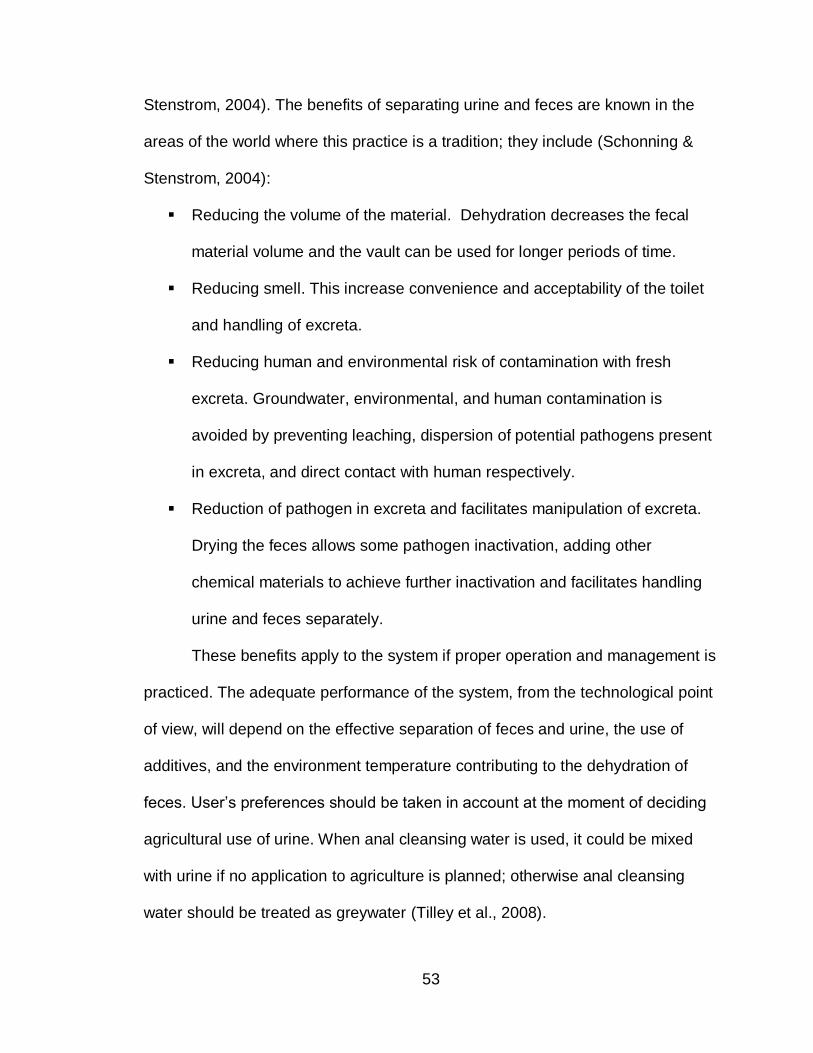
53
Stenstrom, 2004). The benefits of separating urine and feces are known in the
areas of the world where this practice is a tradition; they include (Schonning &
Stenstrom, 2004):
Reducing the volume of the material. Dehydration decreases the fecal
material volume and the vault can be used for longer periods of time.
Reducing smell. This increase convenience and acceptability of the toilet
and handling of excreta.
Reducing human and environmental risk of contamination with fresh
excreta. Groundwater, environmental, and human contamination is
avoided by preventing leaching, dispersion of potential pathogens present
in excreta, and direct contact with human respectively.
Reduction of pathogen in excreta and facilitates manipulation of excreta.
Drying the feces allows some pathogen inactivation, adding other
chemical materials to achieve further inactivation and facilitates handling
urine and feces separately.
These benefits apply to the system if proper operation and management is
practiced. The adequate performance of the system, from the technological point
of view, will depend on the effective separation of feces and urine, the use of
additives, and the environment temperature contributing to the dehydration of
feces. User’s preferences should be taken in account at the moment of deciding
agricultural use of urine. When anal cleansing water is used, it could be mixed
with urine if no application to agriculture is planned; otherwise anal cleansing
water should be treated as greywater (Tilley et al., 2008).
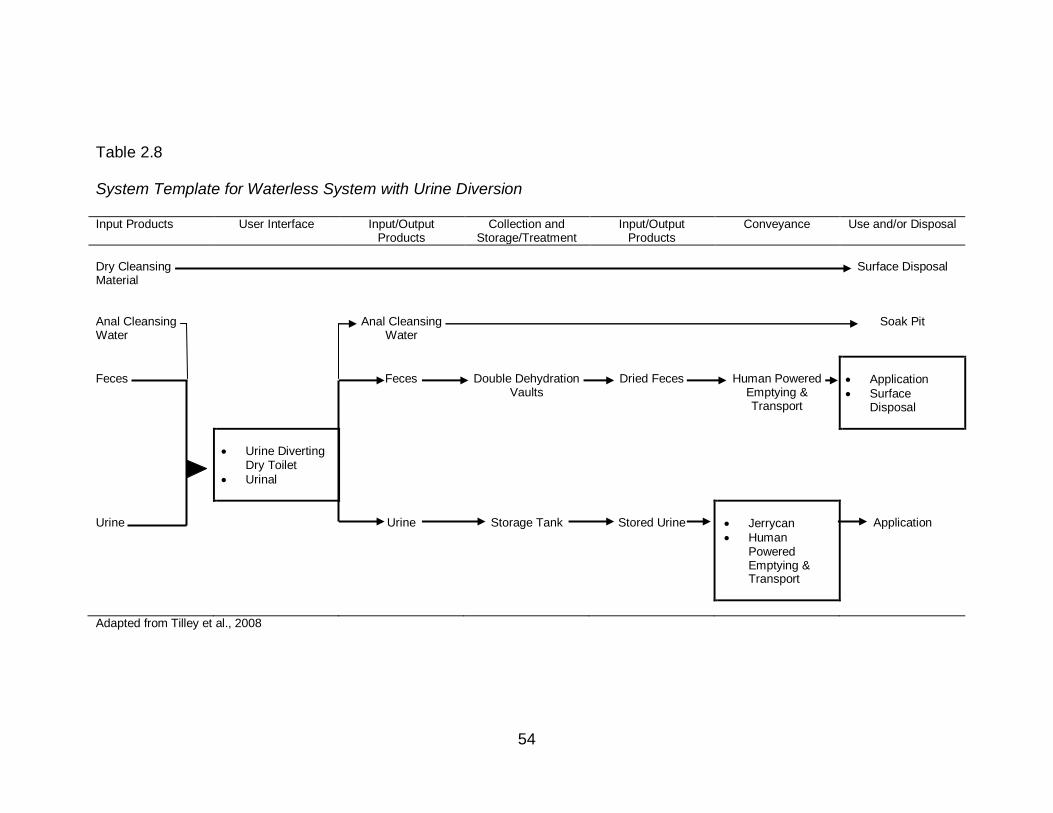
54
Table 2.8
System Template for Waterless System with Urine Diversion
Input Products User Interface Input/Output Products
Collection and Storage/Treatment
Input/Output Products
Conveyance Use and/or Disposal
Dry Cleansing Material
Surface Disposal
Anal Cleansing Water
Anal Cleansing
Water
Soak Pit
Feces
Feces
Double Dehydration
Vaults
Dried Feces
Human Powered
Emptying & Transport
Application
Surface Disposal
Urine Diverting Dry Toilet
Urinal
Urine
Urine
Storage Tank
Stored Urine
Jerrycan
Human Powered Emptying & Transport
Application
Adapted from Tilley et al., 2008
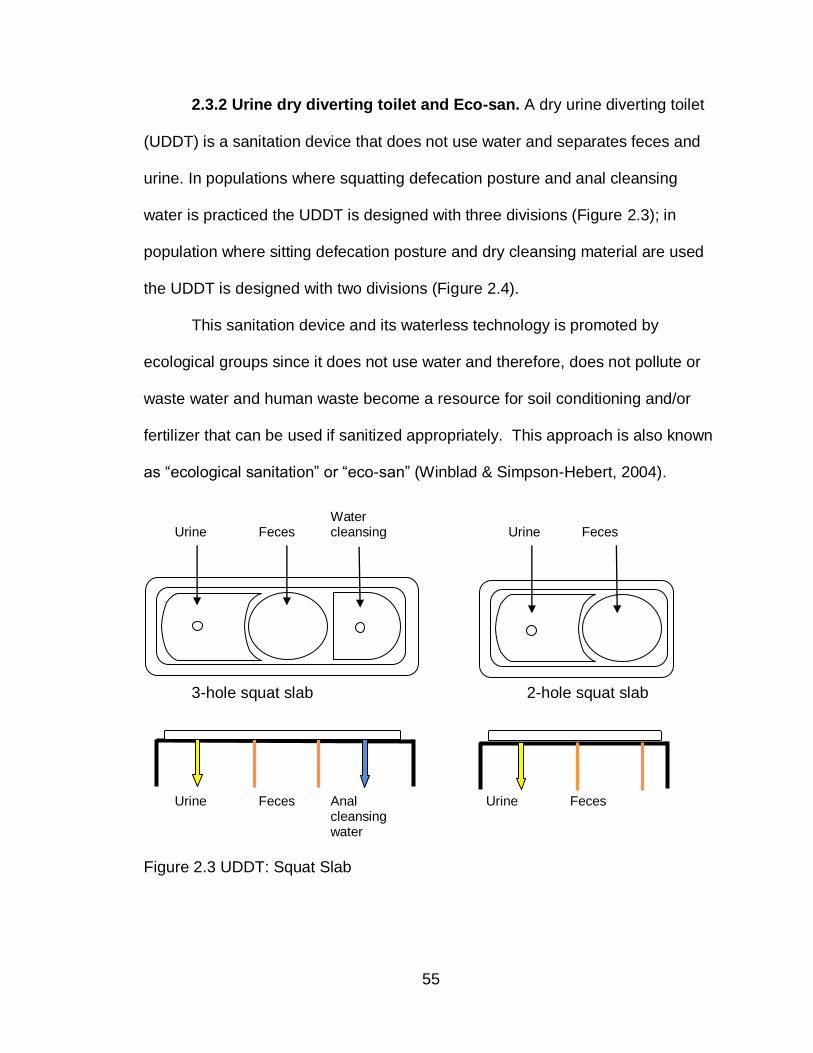
55
2.3.2 Urine dry diverting toilet and Eco-san. A dry urine diverting toilet
(UDDT) is a sanitation device that does not use water and separates feces and
urine. In populations where squatting defecation posture and anal cleansing
water is practiced the UDDT is designed with three divisions (Figure 2.3); in
population where sitting defecation posture and dry cleansing material are used
the UDDT is designed with two divisions (Figure 2.4).
This sanitation device and its waterless technology is promoted by
ecological groups since it does not use water and therefore, does not pollute or
waste water and human waste become a resource for soil conditioning and/or
fertilizer that can be used if sanitized appropriately. This approach is also known
as “ecological sanitation” or “eco-san” (Winblad & Simpson-Hebert, 2004).
Urine Feces Water cleansing Urine Feces
3-hole squat slab 2-hole squat slab
Urine Feces Anal cleansing water
Urine Feces
Figure 2.3 UDDT: Squat Slab
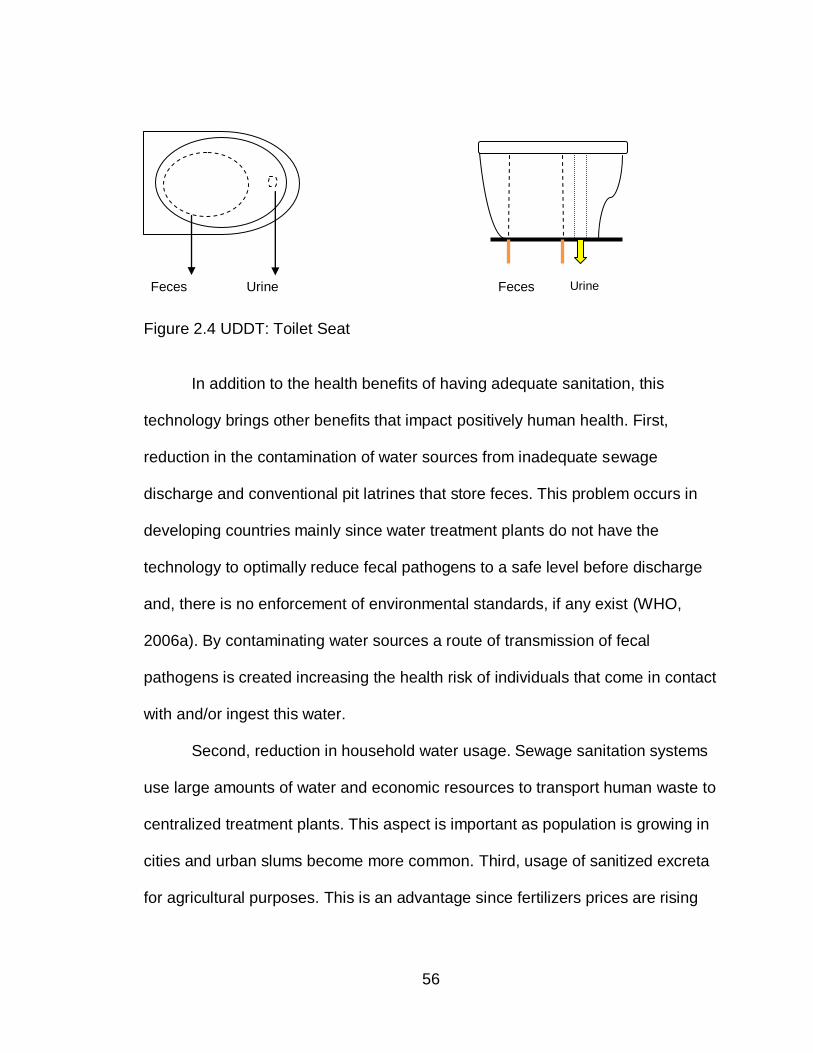
56
Feces Urine Feces Urine
Figure 2.4 UDDT: Toilet Seat
In addition to the health benefits of having adequate sanitation, this
technology brings other benefits that impact positively human health. First,
reduction in the contamination of water sources from inadequate sewage
discharge and conventional pit latrines that store feces. This problem occurs in
developing countries mainly since water treatment plants do not have the
technology to optimally reduce fecal pathogens to a safe level before discharge
and, there is no enforcement of environmental standards, if any exist (WHO,
2006a). By contaminating water sources a route of transmission of fecal
pathogens is created increasing the health risk of individuals that come in contact
with and/or ingest this water.
Second, reduction in household water usage. Sewage sanitation systems
use large amounts of water and economic resources to transport human waste to
centralized treatment plants. This aspect is important as population is growing in
cities and urban slums become more common. Third, usage of sanitized excreta
for agricultural purposes. This is an advantage since fertilizers prices are rising
57
and some components of current fertilizers are non-renewable and their sources
are been depleted.
For any of these advantages and benefits to be tangible, certain elements
must exist such as user acceptability and education, economic accessibility,
proper construction, adequate management, operation and maintenance;
effective sanitation of material; protection of the environment, and a plan
developed on the disposal and/or use of the sanitized products. Mistakes made
during the construction of the toilet and lack of understanding of its maintenance
and use could lead to inadequate functioning of the system. This is important as
acceptability and satisfaction of users is related to adequate performance of the
system and support services (Cordova & Knuth, 2005).
The inactivation of pathogens present in excreta in this type of eco-san
system is achieved in two steps. The first part of the process occurs in the
chambers below the toilet. During this period feces are stored and fecal
pathogens are reduced by storage time, decomposition, dehydration, competition
of nutrient among microorganisms and increased pH (addition of alkaline
additives). This is known as primary treatments. If needed, a secondary
treatments (further storage time; high temperature; composting and alkaline pH)
could take place out of the toilet chamber (off site) (Winblad & Simpson-Hebert,
2004). The combination of treatments will depend on the prevalence of enteric
pathogens in each community. Helminth ova are very resistant to treatment and
may requires further treatment (Winblad & Simpson-Hebert, 2004).
58
2.3.3 Solar toilet prototype IV. There are a variety of toilets functioning
today that use the eco-san approach. The solar toilets built in El Salvador are
among them and use a solar heater to increase the evaporation, temperature
and dehydration of the material contained inside the chambers. These toilets
were introduced in 1994 to El Salvador as part of a sanitation program supported
by Ministry of Public Health, UNICEF and different non-governmental
organizations. Since their introduction the solar toilets have been evolving to
increase the storage capacity and improve the physical and chemical parameters
used to sanitize the material.
The first prototype was known as Solar Toilet Prototype 1 (Tecpan) which
had a single vault. The localization of the toilet in the shadow of bushes and trees
limited its capacity to increase the temperature and inactivate pathogens,
although the toilet achieved high pH (average pH=10.4). The second prototype
was built in 1995 and was known as Tecpan II. In this model the chamber had a
partition separating fresh from stored fecal material. Despite these
improvements the overall size of the chamber was too small to allow adequate
storage time and the peak temperature (34°C) and pH (8.2) were relatively low.
The third prototype, built in 1999, had a larger chamber, allowing longer storage
time, and good solar exposure resulting in an average pH and peak temperature
of 10.3 and 42°C respectively (Moe & Izurieta, 2003).
Microbiological analysis from the three solar toilets showed their higher
pathogen inactivation capacity and effectiveness at reducing the prevalence of
enteric parasitic infections when compared to population using double-vault urine
59
diverting toilets (DVUD8), pit latrines and open defecation (Corrales et al., 2006).
Nevertheless, longer storage time were suggested as higher concentrations of
fecal coliforms, C. perfringens and coliphage were found when compared to
DVUD toilets which usually allows an average storage time of 306 days (Moe &
Izurieta, 2003).
Given this suggestion and the positive health impact in the communities
using solar toilets, the Ministry of Public Health of El Salvador developed the
solar toilet prototype IV in 2003 (Figure 2.5). This model had a larger chamber
that allows storage of fecal material for approximately 60 days with better solar
exposure and achieved a peak temperature of 41.5°C , an average pH of 9.8, a
average moisture content of 15% (after 60 days of storage), and met the USEPA
fecal coliforms standards (Izurieta et al., 2006).
A total of 23 toilets were built in a community in El Salvador. Ventilation
tubes were added to five of them and one model was built with antisysmic
design. The option of placing the toilet next to the household was given to users
since these toilets are not associated to bad odors and flies when adequately
built and maintained. The chambers and solar panel were oriented to the south
to assure the best sun exposure (Sorto, 2004).
8 The Spanish acronym for DVUD is LASF which stands for Letrine Abonera Seca Familiar or “dry fertilizer
family latrine”.
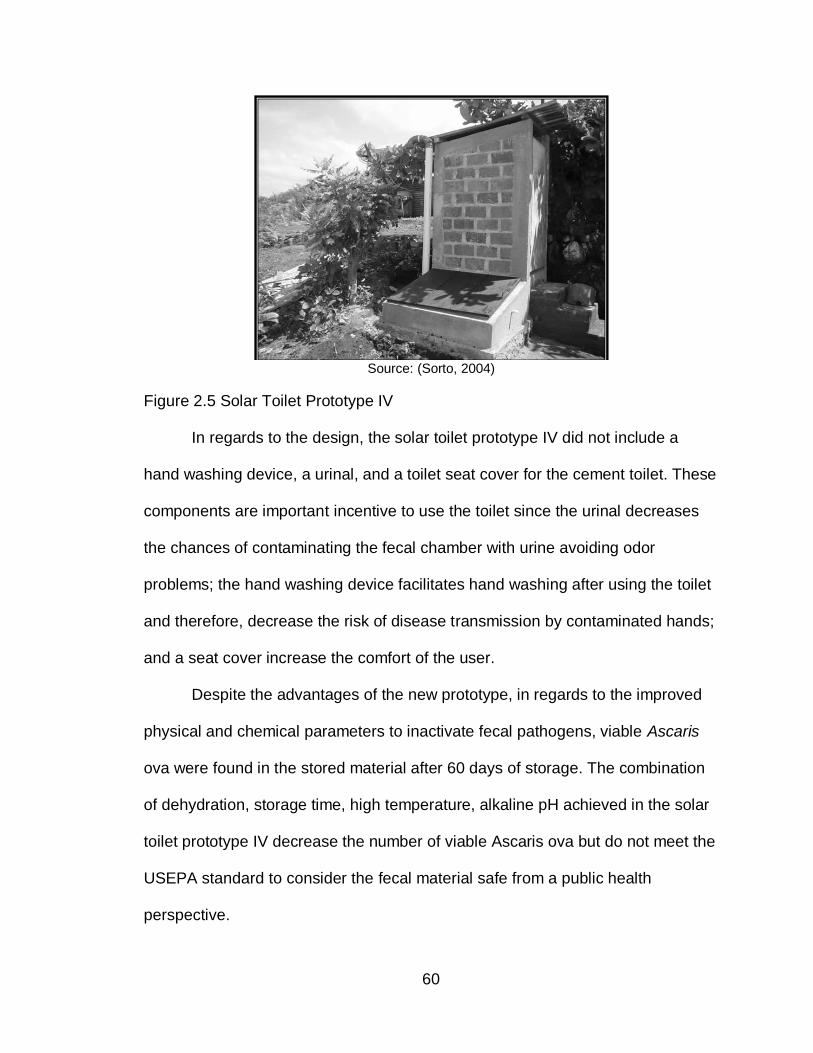
60
Source: (Sorto, 2004)
Figure 2.5 Solar Toilet Prototype IV
In regards to the design, the solar toilet prototype IV did not include a
hand washing device, a urinal, and a toilet seat cover for the cement toilet. These
components are important incentive to use the toilet since the urinal decreases
the chances of contaminating the fecal chamber with urine avoiding odor
problems; the hand washing device facilitates hand washing after using the toilet
and therefore, decrease the risk of disease transmission by contaminated hands;
and a seat cover increase the comfort of the user.
Despite the advantages of the new prototype, in regards to the improved
physical and chemical parameters to inactivate fecal pathogens, viable Ascaris
ova were found in the stored material after 60 days of storage. The combination
of dehydration, storage time, high temperature, alkaline pH achieved in the solar
toilet prototype IV decrease the number of viable Ascaris ova but do not meet the
USEPA standard to consider the fecal material safe from a public health
perspective.
61
Ammonia is another chemical that may be used to reduce fecal pathogens
in eco-san systems (Winblad & Simpson-Hebert, 2004) . In the last few years,
many studies have been done to assess the capacity of ammonia as an agent for
pathogen inactivation and the results have shown that un-ionized ammonia (NH3)
could potentially inactivate pathogens in solutions and sludge, including the
Ascaris spp. eggs (Bujoczek, 2001; Chefranova Iu, 1977; Chefranova Iu et al.,
1984; Chefranova Iu et al., 1978; Ghiglietti et al., 1997; Ghiglietti et al., 1995;
Mendez et al., 2002; Pecson et al., 2007; Pecson & Nelson, 2005). Studies in
human feces are limited, but the results also indicate a high pathogen
inactivation rate with un-ionized ammonia (Nordin et al., 2009; Vinnerås et al.,
2003). The capacity of ammonia to inactivate pathogens is described in chapter
four.
2.3.4 Sustainable sanitation systems. According to the Sustainable
Sanitation Alliance (SuSanA) (2008) “the main objective of a sanitation system is
to protect and promote human health by providing a clean environment and
breaking the cycle of disease. In order to be sustainable a sanitation system has
to be not only economically viable, socially acceptable, and technically and
institutionally appropriate, it should also protect the environment and the natural
resources.” This definition of sanitation includes different criteria important to
make a sanitation system sustainable. One of these elements, “socially
acceptable”, refers to the socio-cultural context that needs to be taken into
account when planning to introduce any sanitation system to a community.
62
The success of a sanitation project depends not only on the sanitation
system but also on changes in the hygiene behaviors of the community (Yacoob
& Whiteford, 1994). As hygiene behavior is a key determinant of the
effectiveness, use, and sustainability of a sanitation system, the World Health
Organization (WHO) recommends performing a detailed assessment of the local
social and cultural aspects of the community which vary in different parts of the
world and directly impact behavior and practices (WHO, 2006a). A sanitation
solution is not a “one-size fits all” since a system accepted in one culture does
not guaranty that it could, or will, work in another one (Rosemarin et al., 2008).
One of the basic principles to planning and implementing a sanitation system, is
to involve participation of all stakeholders, especially consumers and providers of
services (WSSCC/Sandec, 2000). Participatory community approaches have
been used with the purposes of promoting hygiene behaviors, improving
sanitation and fostering community management of water and sanitation
facilities. PHAST, (Participatory Hygiene and Sanitation Transformation), is
recommended by WHO to achieve this purpose (WHO, 2000c).
Although, there is a need for good quality evaluations of the effectiveness
of this approach in large scale projects (World Bank, 2005) , the small field
projects documented have been successful in empowering communities to
manage and control sanitation related-diseases and improve their behavior and
environmental conditions (WHO, 2000c). PHAST is a methodology of
participatory learning adapted from the SARAR (Self-esteem, Associative
strengths, Resourcefulness, Action-planning, and Responsibility) methodology. It
63
stimulates the participation of women, men and children and promotes the
capacity of individuals to be creative and to be leaders of change (WHO, 2000c).
An experience from Mexico, in the peri-urban community of San Juan
Tlacontenco, Cuernavaca, Morelos, with 30 families attributes the success of the
sanitation project to the SARAR methodology (Sawyer, 2007). This 2,000
inhabitants community is located in a mountain with volcanic soil characteristics,
practices low scale agriculture, has limited access to potable water, and uses pit
latrines and pour flush toilets. In 2005, 30 urine diverting dry toilets (UDDT) were
installed; the unit included a sink for hand washing and a waterless urinal for
men. The UDDT were chosen by the community and a non-governmental
organization (NGO) provided the technical assistance for their construction. This
system benefitted the community as it was waterless, allowed for biosolids to be
used in their agricultural activities, and did not contaminated the environment,
which was a community concern expressed through SARAR methodology. Two
years later, 28 families (90%) were still using their toilets and they expressed
their satisfaction with the system, saying they would not change the UDDT for
another system if given the chance. Although the NGO, SARAR transformacion
S.C., provided ongoing advice for the operation and maintenance of the toilets,
one family that moved into the area after the implementation period had
difficulties maintaining the toilet, emphasizing the importance of participation in
the process. After the success of this small pilot project, 126 families from the
same community requested the training to use and construct UDDT in their
64
houses (personal observation during training in Ecological alternatives in
Tepoztlan, Mexico, March 2009).
On the other hand, sanitation projects that have failed lacked the
community participation needed during planning and implementation. An
experience from a rural community in Bolivia, where UDDT were constructed,
was unsuccessful even though they were offered the same benefits previously
mentioned, including hygiene education and training on the use and maintenance
of the toilet. The difference in outcomes is a result of culture. The Bolivian
communities are part of the Quechuas and Aimaras cultures; they are an
agriculturally based society but they do not use human feces or urine as fertilizer.
An evaluation of the project revealed that 23% of the families were using the
system frequently and correctly; 30% of the families where using the latrine for
storage; and, unfortunately, open defecation was still preferred. Operation and
maintenance of the units were inadequate as the community members were
disgusted by dealing with feces. The community did not use the biosolids in their
crops because the latrines took too long to fill up (1.5 years). They perceived that
the use of feces in crops could be dangerous for their health and they could
affect the equilibrium of the “Pachamama” (mother earth) (United Nations
Children's Fund, 2008).
The previous experience exemplifies the different problems that a
sanitation project could encounter if the sociocultural aspects of the users are not
included in the planning and implementation. This also applies to the
implementation of the solar toilet in a community, as hygiene behavior, cultural
65
beliefs, and preferences are important determinants in the success of any
sanitation system.
2.5 Description of the Community Using the Solar Toilet Prototype IV.
Twenty-five Prototype IV Solar toilets were constructed in the community “Vista
Hermosa” in El Majahual, located 1.5 miles from the Pacific coast of El Salvador.
This community has about 60 families, with an average of 6 members per
household. Most adults in the community are either fishermen or masons. Living
conditions in Vista Hermosa are very poor. There is a lack of basic services such
as electricity and potable water, and some households have community pit
latrines which are shared by 3 – 4 households. Drinking water is supplied by a
water truck that is paid for by the community.
Vista Hermosa was chosen by the Ministry of Public Health for the solar
toilet intervention because of the poor socio-economic and sanitary conditions in
this community. Improved sanitary facilities were urgently needed, and the whole
community had expressed their support to the construction of the solar toilets. In
addition, the geographic and ecological characteristics of the village (dry area
with scarce vegetation) made it ideal for the construction of the toilets. Treated
biosolids from the solar toilets could be used as soil conditioner for home
gardens.
A survey was carried out in the community using the solar toilets prototype
IV. This survey describes the demographic characteristics, sanitation knowledge,
attitudes and practices of the population, including some of the households using
the toilet. Since use and maintenance are important components in the adequate
66
functioning of a sanitation system, a description of these practices among
households using the solar toilet prototype IV are included below.
Ash, lime, and soil are the additives users add to the toilet. Some users
add one to four cups every time after using the toilet. Other users add one to four
cups once every week. All users reported not placing toilet paper in the
chamber. Tierney (2002) found that households with previous training were more
likely to properly use and maintain the toilet, including mixing the vault content
(Tierney, A. 2002, not published).
According to the UNICEF training manual for solar latrines, users should
use ash only or a mixture of one part of lime and five part of dirt as additives
every time the toilet is used (Landin, Carbonell, & Soderberg, 1997). A new
manual updated in 2004 by the Ministry of Health of El Salvador, advice the
users to cover the fecal material with a cup of lime (approximately 100 grams)
after defecation (Ministerio de Salud Publica y Asistencia Social, 2004). Previous
to the last manual, it was reported that 40% of users added ash and lime to the
toilet, and approximately 29% used ash only (Tierney, A. 2002, not published).
2.4 Ammonia
Ammonia was first synthesized in 1908 by a German chemist of Jewish
origins. During this time, a rapid increase in population in Europe necessitated a
corresponding increase in food production and chemists needed to find a method
of forming nitrogen compounds to be used as fertilizers to help feeding the world.
Fritz Haber discovered the ammonia synthesis process (Haber-Bosh process) in
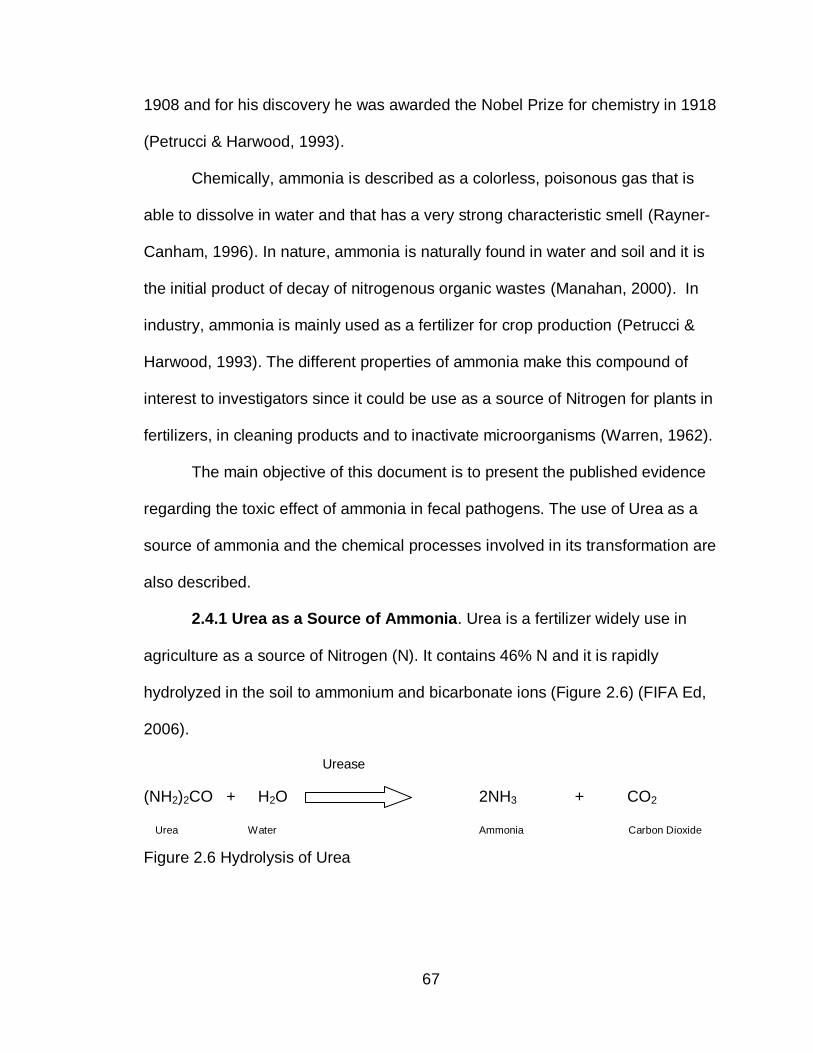
67
1908 and for his discovery he was awarded the Nobel Prize for chemistry in 1918
(Petrucci & Harwood, 1993).
Chemically, ammonia is described as a colorless, poisonous gas that is
able to dissolve in water and that has a very strong characteristic smell (Rayner-
Canham, 1996). In nature, ammonia is naturally found in water and soil and it is
the initial product of decay of nitrogenous organic wastes (Manahan, 2000). In
industry, ammonia is mainly used as a fertilizer for crop production (Petrucci &
Harwood, 1993). The different properties of ammonia make this compound of
interest to investigators since it could be use as a source of Nitrogen for plants in
fertilizers, in cleaning products and to inactivate microorganisms (Warren, 1962).
The main objective of this document is to present the published evidence
regarding the toxic effect of ammonia in fecal pathogens. The use of Urea as a
source of ammonia and the chemical processes involved in its transformation are
also described.
2.4.1 Urea as a Source of Ammonia. Urea is a fertilizer widely use in
agriculture as a source of Nitrogen (N). It contains 46% N and it is rapidly
hydrolyzed in the soil to ammonium and bicarbonate ions (Figure 2.6) (FIFA Ed,
2006).
Urease
(NH2)2CO + H2O 2NH3 + CO2
Urea Water Ammonia Carbon Dioxide
Figure 2.6 Hydrolysis of Urea
68
Urease is the enzyme that catalyses the hydrolysis of urea to carbon
dioxide and ammonia affecting the fate and performance of urea. Its presence in
soil was first indicated by Rotini in 1935 (Burns, 1978). Once urea is hydrolyzed,
significant quantities of ammonia may be loss by volatilization (FIFA Ed, 2006).
Several factors affect the hydrolysis of urea and the rate of ammonia
volatilization in soil:
Temperature: increasing soil temperature increase the rate of hydrolysis
(Fisher & Parks, 1958) while colder soil slows the hydrolysis of urea (FIFA
Ed, 2006).
Other chemicals: Some chemicals inhibit the action of the urease enzyme
and prevent urea hydrolysis when applied along with the urea: KCl
fertilizer is one of them (Troeh & Thompson, 1993).
Urea concentration: High concentrations of urea increase the rate of
hydrolysis until the amount of urea added is sufficient to saturate the
enzyme with substrate (Burns, 1978).
Urea application: Ammonia losses decrease when urea is mixed with soil
or covered with a layer of soil during application while it increase if left on
soil surface.
pH: The soil close to the area where urea is applied could reach pH values
as high as 9.2, however, hydrolysis of urea decreases with increasing soil
pH. The main reason is that activity of urease decline with increasing pH.
The optimum pH for its activity is around 6 to 8 (Burns, 1978; Overren &
Moe, 1967).
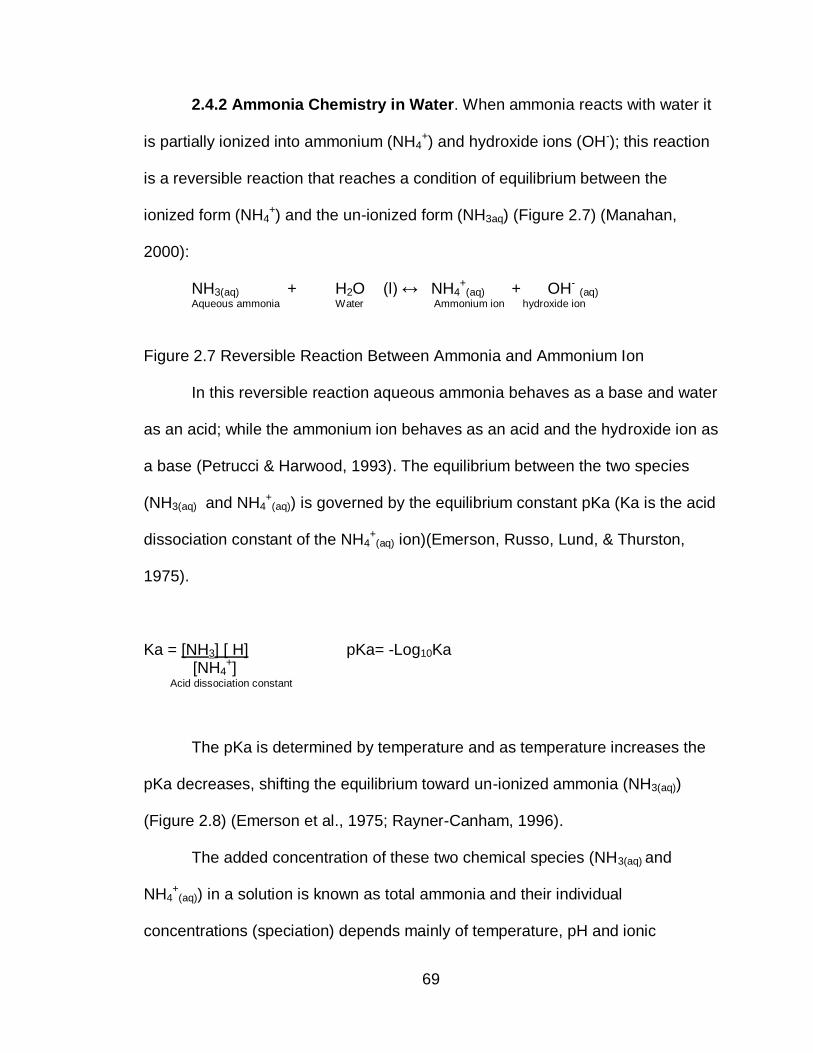
69
2.4.2 Ammonia Chemistry in Water. When ammonia reacts with water it
is partially ionized into ammonium (NH4+) and hydroxide ions (OH-); this reaction
is a reversible reaction that reaches a condition of equilibrium between the
ionized form (NH4+) and the un-ionized form (NH3aq) (Figure 2.7) (Manahan,
2000):
NH3(aq) + H2O (l) ↔ NH4+
(aq) + OH- (aq) Aqueous ammonia Water Ammonium ion hydroxide ion
Figure 2.7 Reversible Reaction Between Ammonia and Ammonium Ion
In this reversible reaction aqueous ammonia behaves as a base and water
as an acid; while the ammonium ion behaves as an acid and the hydroxide ion as
a base (Petrucci & Harwood, 1993). The equilibrium between the two species
(NH3(aq) and NH4+
(aq)) is governed by the equilibrium constant pKa (Ka is the acid
dissociation constant of the NH4+
(aq) ion)(Emerson, Russo, Lund, & Thurston,
1975).
Ka = [NH3] [ H] pKa= -Log10Ka [NH4
+] Acid dissociation constant
The pKa is determined by temperature and as temperature increases the
pKa decreases, shifting the equilibrium toward un-ionized ammonia (NH3(aq))
(Figure 2.8) (Emerson et al., 1975; Rayner-Canham, 1996).
The added concentration of these two chemical species (NH3(aq) and
NH4+
(aq)) in a solution is known as total ammonia and their individual
concentrations (speciation) depends mainly of temperature, pH and ionic
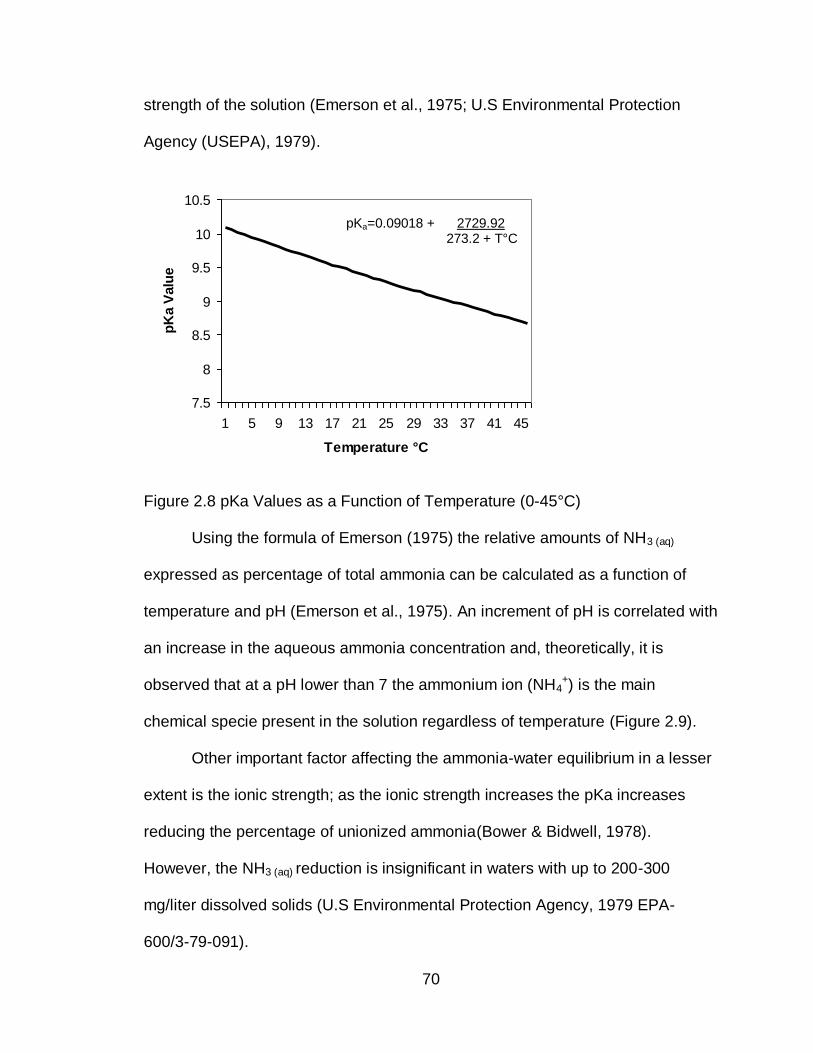
70
strength of the solution (Emerson et al., 1975; U.S Environmental Protection
Agency (USEPA), 1979).
Figure 2.8 pKa Values as a Function of Temperature (0-45°C)
Using the formula of Emerson (1975) the relative amounts of NH3 (aq)
expressed as percentage of total ammonia can be calculated as a function of
temperature and pH (Emerson et al., 1975). An increment of pH is correlated with
an increase in the aqueous ammonia concentration and, theoretically, it is
observed that at a pH lower than 7 the ammonium ion (NH4+) is the main
chemical specie present in the solution regardless of temperature (Figure 2.9).
Other important factor affecting the ammonia-water equilibrium in a lesser
extent is the ionic strength; as the ionic strength increases the pKa increases
reducing the percentage of unionized ammonia(Bower & Bidwell, 1978).
However, the NH3 (aq) reduction is insignificant in waters with up to 200-300
mg/liter dissolved solids (U.S Environmental Protection Agency, 1979 EPA-
600/3-79-091).
7.5
8
8.5
9
9.5
10
10.5
1 5 9 13 17 21 25 29 33 37 41 45
Temperature °C
pK
a V
alu
e
pKa=0.09018 + 2729.92 273.2 + T°C
71
Figure 2.9 Percent of NH3 (aq) in Aqueous Solution as a Function of pH and Temperature
2.4.3 Ammonia in Wastewater. In wastewater engineering, ammonia
(NH3) and the ammonium ion (NH4+) are considered a fraction of the different
nitrogen compounds normally present in wastewater. The added concentrations
of both chemical species are expressed as Nitrogen and known as Total
Ammonia Nitrogen (TAN). Different from water solutions, wastewater is
characterized by containing a variety of solid and organic materials that react and
affect nitrogen compounds present in this type of solution (Metcalf & Eddy,
2003).
The natural pathways of nitrogen in the aquatic and soil environment,
known as Nitrogen cycle, influence the concentration of ammonia as it is an
intermediate compound in the cycle (Figure 2.10). The atmosphere is 78%
elemental nitrogen (N2) that can not be used by living microorganisms unless it is
transformed to nitrate (NO3-) and ammonium (NH4
+) ions through the nitrogen
0
20
40
60
80
100
6 7 8 9 10 11 12 13
pH
Pe
rce
nt
of
un
-io
niz
ed
NH
3
25
30
35
40
45
f=1/(10pKa-pH + 1)
Temperature °C
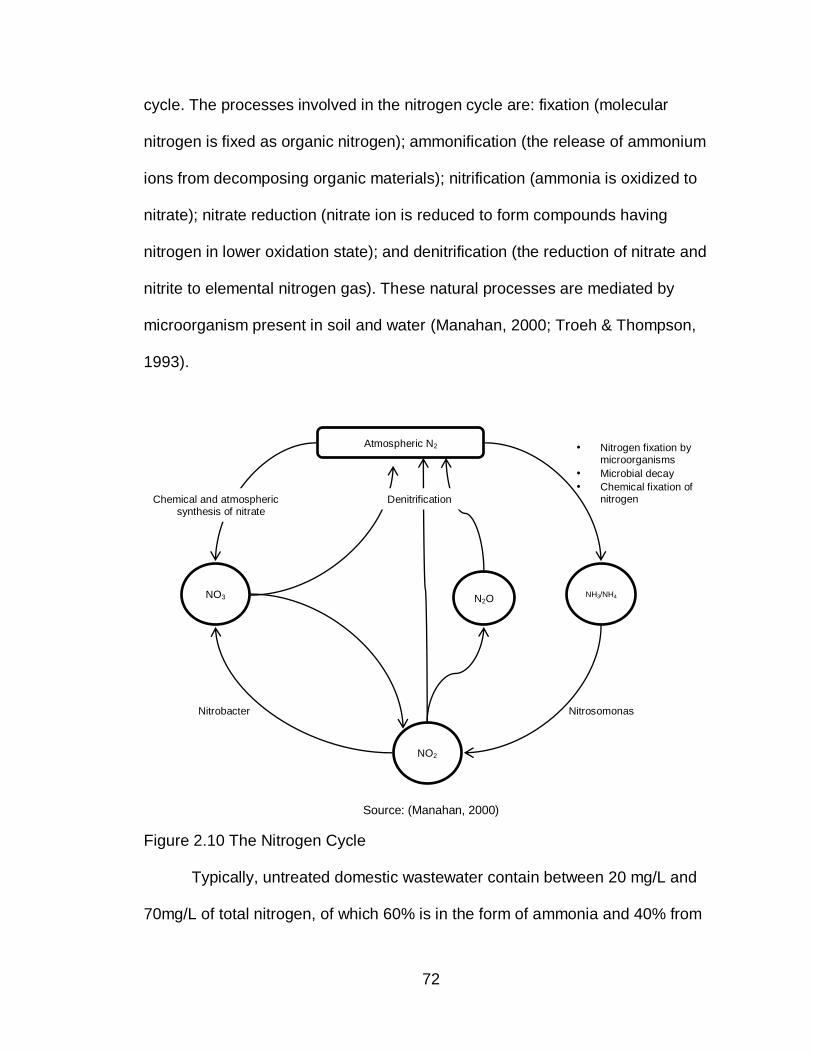
72
cycle. The processes involved in the nitrogen cycle are: fixation (molecular
nitrogen is fixed as organic nitrogen); ammonification (the release of ammonium
ions from decomposing organic materials); nitrification (ammonia is oxidized to
nitrate); nitrate reduction (nitrate ion is reduced to form compounds having
nitrogen in lower oxidation state); and denitrification (the reduction of nitrate and
nitrite to elemental nitrogen gas). These natural processes are mediated by
microorganism present in soil and water (Manahan, 2000; Troeh & Thompson,
1993).
Source: (Manahan, 2000)
Figure 2.10 The Nitrogen Cycle
Typically, untreated domestic wastewater contain between 20 mg/L and
70mg/L of total nitrogen, of which 60% is in the form of ammonia and 40% from
Nitrobacter Nitrosomonas
• Nitrogen fixation by microorganisms
• Microbial decay
• Chemical fixation of nitrogen
Atmospheric N2
NH3/NH4
NO2
NO3 N2O
Denitrification Chemical and atmospheric synthesis of nitrate
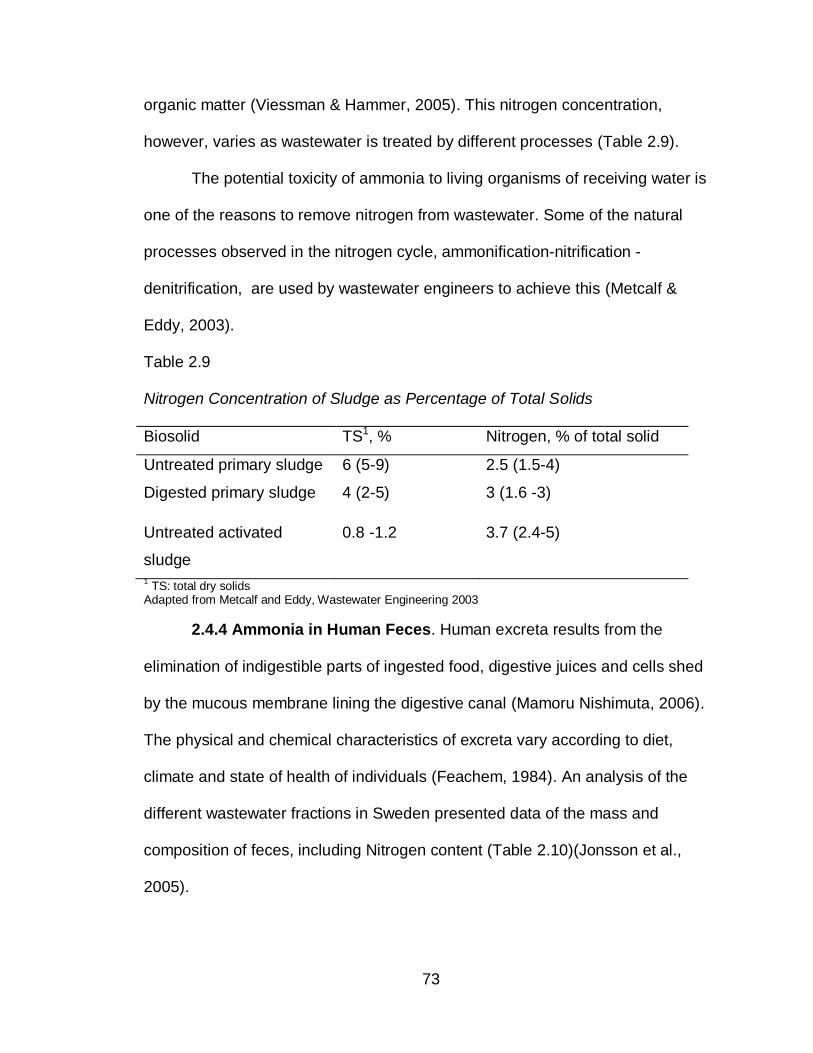
73
organic matter (Viessman & Hammer, 2005). This nitrogen concentration,
however, varies as wastewater is treated by different processes (Table 2.9).
The potential toxicity of ammonia to living organisms of receiving water is
one of the reasons to remove nitrogen from wastewater. Some of the natural
processes observed in the nitrogen cycle, ammonification-nitrification -
denitrification, are used by wastewater engineers to achieve this (Metcalf &
Eddy, 2003).
Table 2.9
Nitrogen Concentration of Sludge as Percentage of Total Solids
Biosolid TS1, % Nitrogen, % of total solid
Untreated primary sludge 6 (5-9) 2.5 (1.5-4)
Digested primary sludge 4 (2-5) 3 (1.6 -3)
Untreated activated
sludge
0.8 -1.2 3.7 (2.4-5)
1 TS: total dry solids
Adapted from Metcalf and Eddy, Wastewater Engineering 2003
2.4.4 Ammonia in Human Feces. Human excreta results from the
elimination of indigestible parts of ingested food, digestive juices and cells shed
by the mucous membrane lining the digestive canal (Mamoru Nishimuta, 2006).
The physical and chemical characteristics of excreta vary according to diet,
climate and state of health of individuals (Feachem, 1984). An analysis of the
different wastewater fractions in Sweden presented data of the mass and
composition of feces, including Nitrogen content (Table 2.10)(Jonsson et al.,
2005).
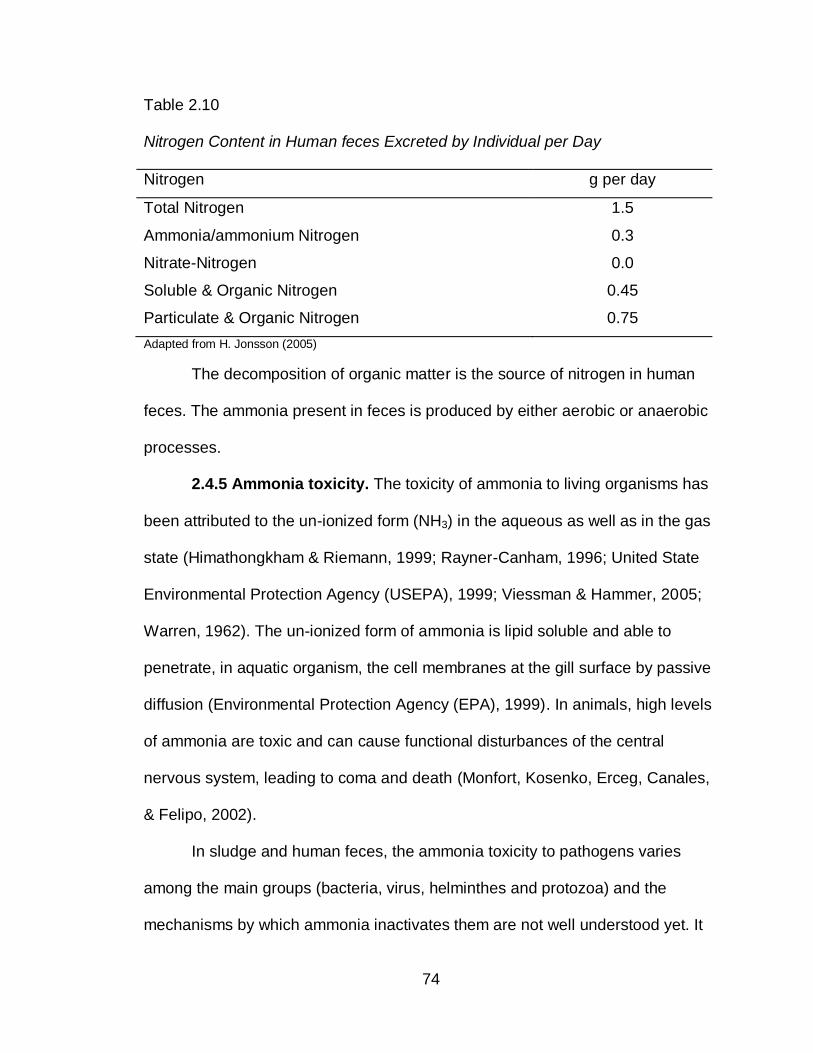
74
Table 2.10
Nitrogen Content in Human feces Excreted by Individual per Day
Nitrogen g per day
Total Nitrogen 1.5
Ammonia/ammonium Nitrogen 0.3
Nitrate-Nitrogen 0.0
Soluble & Organic Nitrogen 0.45
Particulate & Organic Nitrogen 0.75
Adapted from H. Jonsson (2005)
The decomposition of organic matter is the source of nitrogen in human
feces. The ammonia present in feces is produced by either aerobic or anaerobic
processes.
2.4.5 Ammonia toxicity. The toxicity of ammonia to living organisms has
been attributed to the un-ionized form (NH3) in the aqueous as well as in the gas
state (Himathongkham & Riemann, 1999; Rayner-Canham, 1996; United State
Environmental Protection Agency (USEPA), 1999; Viessman & Hammer, 2005;
Warren, 1962). The un-ionized form of ammonia is lipid soluble and able to
penetrate, in aquatic organism, the cell membranes at the gill surface by passive
diffusion (Environmental Protection Agency (EPA), 1999). In animals, high levels
of ammonia are toxic and can cause functional disturbances of the central
nervous system, leading to coma and death (Monfort, Kosenko, Erceg, Canales,
& Felipo, 2002).
In sludge and human feces, the ammonia toxicity to pathogens varies
among the main groups (bacteria, virus, helminthes and protozoa) and the
mechanisms by which ammonia inactivates them are not well understood yet. It
75
has been observed that elevated concentrations of un-ionized ammonia are
associated with faster inactivation of fecal pathogens; however, adequate
inactivation depends on pathogen sensitivity to ammonia, pH levels, temperature,
treatment duration, total solids, and concentration of un-ionized ammonia.
The published literature describes the tolerance of different fecal pathogens to
ammonia toxicity (Table 2.11). Bacteria have shown to be the most sensitive
microorganisms to ammonia toxicity, while some enteric viruses, especially
dsRNA and DNA viruses, have shown to be very resistant.
The experimental conditions used to assess ammonia as sanitizing agent
vary greatly in the literature published. Data related with ammonia toxicity tested
in solutions is the most abundant, followed by ammonia tested in sludge and
human feces; most of the experiments have been performed under laboratory
conditions. Sludge and human feces have multiple compounds that could affect
pathogen inactivation under experimental conditions. Carbonate and ammonia
are among the molecules contributing to microorganism inactivation in alkaline
treatments (Park & Diez-Gonzalez, 2003). To control for the effects of ammonia
while doing experiments in sludge, free-ammonia sludge would be needed to
observe the effects of ammonia in both groups.
Removing ammonia from sludge without changing the properties of sludge
is very difficult and for this reason most of the published literature report
experiments in solution, where other factors affecting inactivation could be
controlled. The tolerance and specific conditions in which fecal pathogens have
been inactivated by ammonia are described below.
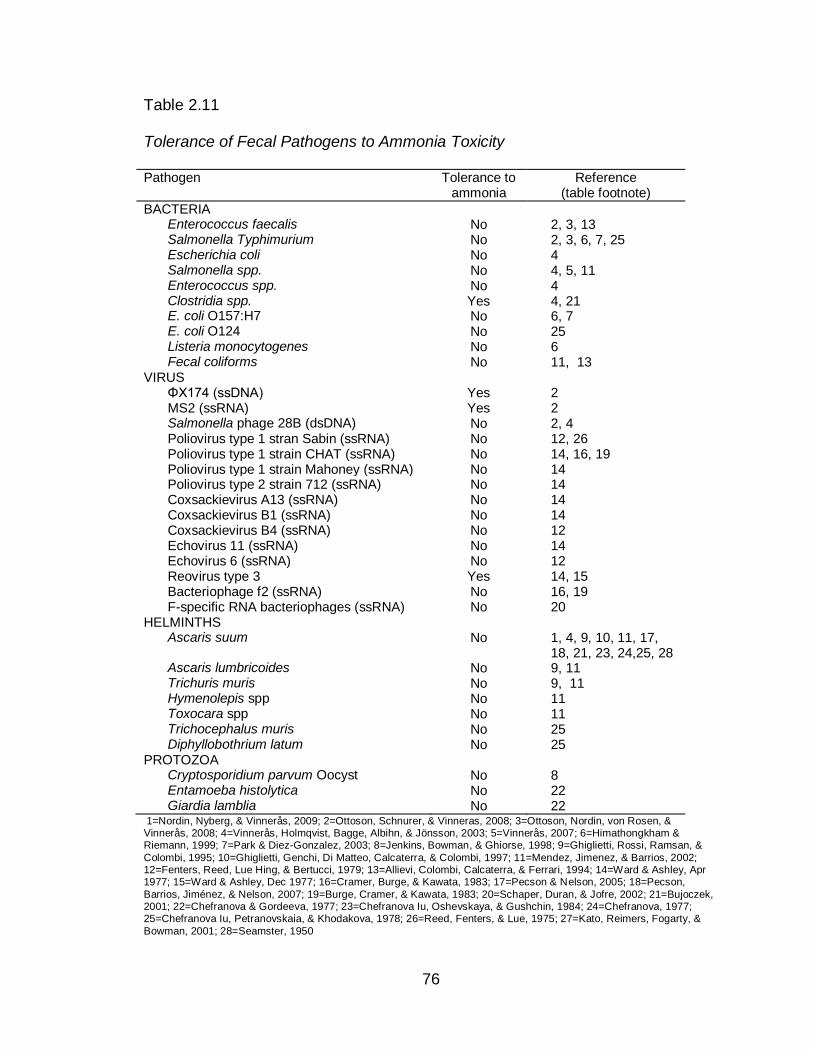
76
Table 2.11
Tolerance of Fecal Pathogens to Ammonia Toxicity
Pathogen Tolerance to ammonia
Reference (table footnote)
BACTERIA Enterococcus faecalis No 2, 3, 13 Salmonella Typhimurium No 2, 3, 6, 7, 25 Escherichia coli No 4 Salmonella spp. No 4, 5, 11 Enterococcus spp. No 4 Clostridia spp. Yes 4, 21 E. coli O157:H7 No 6, 7 E. coli O124 No 25 Listeria monocytogenes No 6 Fecal coliforms No 11, 13
VIRUS ΦX174 (ssDNA) Yes 2 MS2 (ssRNA) Yes 2 Salmonella phage 28B (dsDNA) No 2, 4 Poliovirus type 1 stran Sabin (ssRNA) No 12, 26 Poliovirus type 1 strain CHAT (ssRNA) No 14, 16, 19 Poliovirus type 1 strain Mahoney (ssRNA) No 14 Poliovirus type 2 strain 712 (ssRNA) No 14 Coxsackievirus A13 (ssRNA) No 14 Coxsackievirus B1 (ssRNA) No 14 Coxsackievirus B4 (ssRNA) No 12 Echovirus 11 (ssRNA) No 14 Echovirus 6 (ssRNA) No 12 Reovirus type 3 Yes 14, 15 Bacteriophage f2 (ssRNA) No 16, 19 F-specific RNA bacteriophages (ssRNA) No 20
HELMINTHS Ascaris suum No 1, 4, 9, 10, 11, 17,
18, 21, 23, 24,25, 28 Ascaris lumbricoides No 9, 11 Trichuris muris No 9, 11 Hymenolepis spp No 11 Toxocara spp No 11 Trichocephalus muris No 25 Diphyllobothrium latum No 25
PROTOZOA Cryptosporidium parvum Oocyst No 8 Entamoeba histolytica No 22 Giardia lamblia No 22
1=Nordin, Nyberg, & Vinnerås, 2009; 2=Ottoson, Schnurer, & Vinneras, 2008; 3=Ottoson, Nordin, von Rosen, & Vinnerås, 2008; 4=Vinnerås, Holmqvist, Bagge, Albihn, & Jönsson, 2003; 5=Vinnerås, 2007; 6=Himathongkham & Riemann, 1999; 7=Park & Diez-Gonzalez, 2003; 8=Jenkins, Bowman, & Ghiorse, 1998; 9=Ghiglietti, Rossi, Ramsan, &
Colombi, 1995; 10=Ghiglietti, Genchi, Di Matteo, Calcaterra, & Colombi, 1997; 11=Mendez, Jimenez, & Barrios, 2002; 12=Fenters, Reed, Lue Hing, & Bertucci, 1979; 13=Allievi, Colombi, Calcaterra, & Ferrari, 1994; 14=Ward & Ashley, Apr 1977; 15=Ward & Ashley, Dec 1977; 16=Cramer, Burge, & Kawata, 1983; 17=Pecson & Nelson, 2005; 18=Pecson,
Barrios, Jiménez, & Nelson, 2007; 19=Burge, Cramer, & Kawata, 1983; 20=Schaper, Duran, & Jofre, 2002; 21=Bujoczek, 2001; 22=Chefranova & Gordeeva, 1977; 23=Chefranova Iu, Oshevskaya, & Gushchin, 1984; 24=Chefranova, 1977; 25=Chefranova Iu, Petranovskaia, & Khodakova, 1978; 26=Reed, Fenters, & Lue, 1975; 27=Kato, Reimers, Fogarty, &
Bowman, 2001; 28=Seamster, 1950
77
2.4.5.1 Ammonia toxicity to fecal bacteria. Enteric bacteria are the most
numerous living organisms found in human feces. They are part of the human
intestinal flora and they are routinely excreted. The average concentration of
bacteria in 1 g of feces of a healthy individual is equivalent to 1.8 x 10¹²
Escherichia coli cells (Droste, 1997). The main groups of non-pathogenic
bacteria are Enterobacteria, Streptococci, Lactobacilli, Clostridia, Bacteroides,
Bifidobacteria and Eubacteria; some of them are used as indicators of fecal
contamination (Metcalf & Eddy, 2003). Those bacteria that are not part of the
normal fecal flora are classified as pathogenic. Among the pathogenic bacteria of
major concern are Salmonella typhi, Vibrio cholera, Shigella, Campylobacter and
enterohaemorrhagic E. coli (EHEC)(WHO, 2006a).
Different bacteria indicators are used to test for fecal contamination, but
only one is specific for human pathogens. Total coliforms bacteria include
coliforms bacteria from soil, feces or other origin. Fecal coliforms include
coliforms bacteria from human and warm blooded animals. Escherichia coli (E.
coli), normally excreted in human feces, is considered (by USEPA), as the
specific indicator of human fecal contamination and possible presence of enteric
pathogens (Metcalf & Eddy, 2003; Viessman & Hammer, 2005). To consider any
biosolid safe from a health perspective (Class A biosolid), the USEPA standards
requires less than 1000 MPN of fecal coliforms per 1 g of total sludge biosolids
(dry – weight) and less than 3 MPN of Salmonella spp. in 4 g of total sludge
biosolids (dry-weight ) (U.S Environmental Protection Agency, 1994).
78
The literature reviewed indicates that ammonia increases the inactivation
rate of bacteria when added to different material such as manure, sludge, human
feces and solutions (Table 2.12). Enterococcus faecalis and Salmonella spp. are
among the more sensitive bacteria to ammonia toxicity, even at very low
temperatures (4°C) (J. Ottoson, Nordin, von Rosen, & Vinnerås, 2008). Other
fecal indicators and bacteria (Enterococus faecalis, Salmonella spp., E. coli
O157:H7, Clostridia spp., and L. monocytogenes) have also been inactivated by
un-ionized ammonia (Allievi, Colombi, Calcaterra, & Ferrari, 1994;
Himathongkham & Riemann, 1999; Mendez, Jimenez, & Maya, 2004; Mendez et
al., 2002; J. Ottoson et al., 2008; J. R. Ottoson, Schnurer, & Vinneras, 2008;
Park & Diez-Gonzalez, 2003; Vinnerås et al., 2003).
The temperature at which ammonia toxicity to bacteria has been tested
range from 10°C to 37°C; the pH values from 7.9-10.5; the NH3 concentration
from 782 mg/l to 36 g/kg of feces, and the time of exposure to un-ionized
ammonia from 2 hours to 41 days. Most researchers reported moisture levels of
88% (sludge, human feces, etc.), but even those testing the effect of ammonia in
very dry conditions (90% TS) have reported bacteria inactivation in less than
three days (Himathongkham & Riemann, 1999). Fecal coliforms and salmonella
spp. have been the bacteria more frequently used in the experiments and no re-
growth of any bacteria have been reported after using ammonia (Mendez et al.,
2002; Vinnerås et al., 2003)..
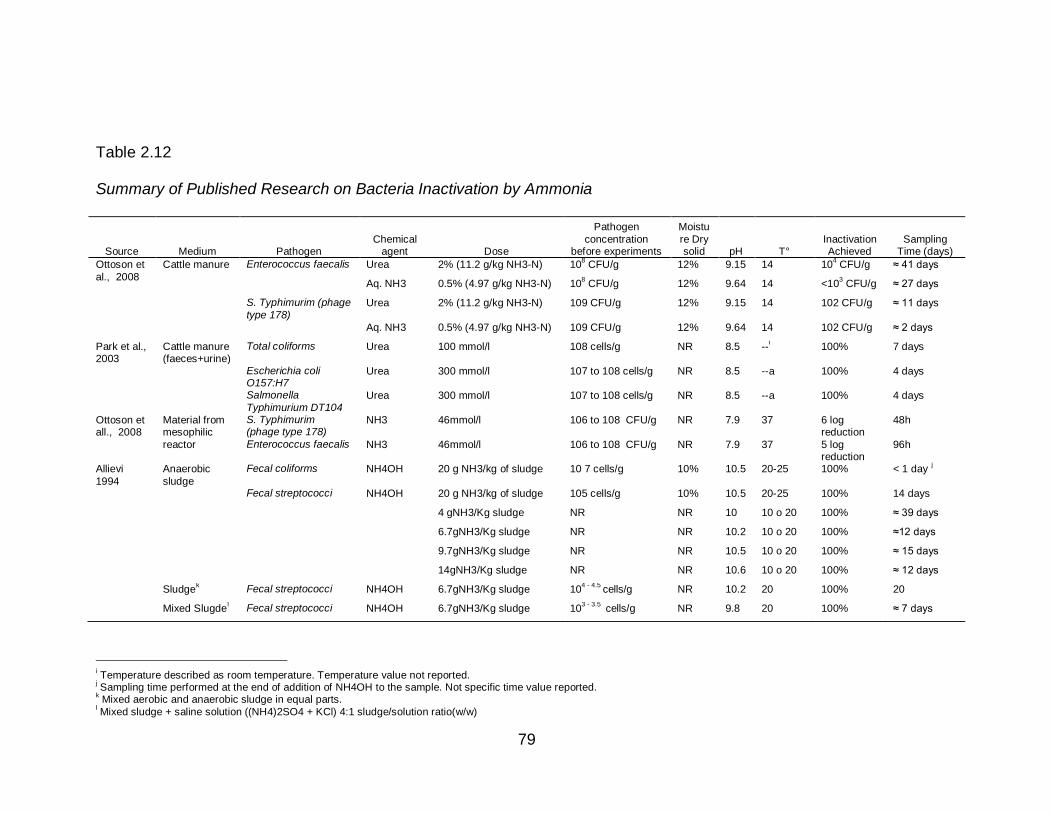
79
Table 2.12
Summary of Published Research on Bacteria Inactivation by Ammonia
Source Medium Pathogen
Chemical agent Dose
Pathogen
concentration before experiments
Moistu
re Dry solid pH T°
Inactivation Achieved
Sampling Time (days)
Ottoson et
al., 2008
Cattle manure Enterococcus faecalis Urea 2% (11.2 g/kg NH3-N) 108 CFU/g 12% 9.15 14 10
4 CFU/g ≈ 41 days
Aq. NH3 0.5% (4.97 g/kg NH3-N) 108 CFU/g 12% 9.64 14 <10
3 CFU/g ≈ 27 days
S. Typhimurim (phage
type 178) Urea 2% (11.2 g/kg NH3-N) 109 CFU/g 12% 9.15 14 102 CFU/g ≈ 11 days
Aq. NH3 0.5% (4.97 g/kg NH3-N) 109 CFU/g 12% 9.64 14 102 CFU/g ≈ 2 days
Park et al., 2003
Cattle manure (faeces+urine)
Total coliforms Urea 100 mmol/l 108 cells/g NR 8.5 --i 100% 7 days
Escherichia coli O157:H7
Urea 300 mmol/l 107 to 108 cells/g NR 8.5 --a 100% 4 days
Salmonella
Typhimurium DT104 Urea 300 mmol/l 107 to 108 cells/g NR 8.5 --a 100% 4 days
Ottoson et all., 2008
Material from mesophilic
reactor
S. Typhimurim (phage type 178)
NH3 46mmol/l 106 to 108 CFU/g NR 7.9 37 6 log reduction
48h
Enterococcus faecalis NH3 46mmol/l 106 to 108 CFU/g NR 7.9 37 5 log reduction
96h
Allievi
1994
Anaerobic
sludge
Fecal coliforms NH4OH 20 g NH3/kg of sludge 10 7 cells/g 10% 10.5 20-25 100% < 1 day j
Fecal streptococci NH4OH 20 g NH3/kg of sludge 105 cells/g 10% 10.5 20-25 100% 14 days
4 gNH3/Kg sludge NR NR 10 10 o 20 100% ≈ 39 days
6.7gNH3/Kg sludge NR NR 10.2 10 o 20 100% ≈12 days
9.7gNH3/Kg sludge NR NR 10.5 10 o 20 100% ≈ 15 days
14gNH3/Kg sludge NR NR 10.6 10 o 20 100% ≈ 12 days
Sludgek Fecal streptococci NH4OH 6.7gNH3/Kg sludge 10
4 - 4.5 cells/g NR 10.2 20 100% 20
Mixed Slugdel Fecal streptococci NH4OH 6.7gNH3/Kg sludge 10
3 - 3.5 cells/g NR 9.8 20 100% ≈ 7 days
i Temperature described as room temperature. Temperature value not reported. j Sampling time performed at the end of addition of NH4OH to the sample. Not specific time value reported. k Mixed aerobic and anaerobic sludge in equal parts.
l Mixed sludge + saline solution ((NH4)2SO4 + KCl) 4:1 sludge/solution ratio(w/w)
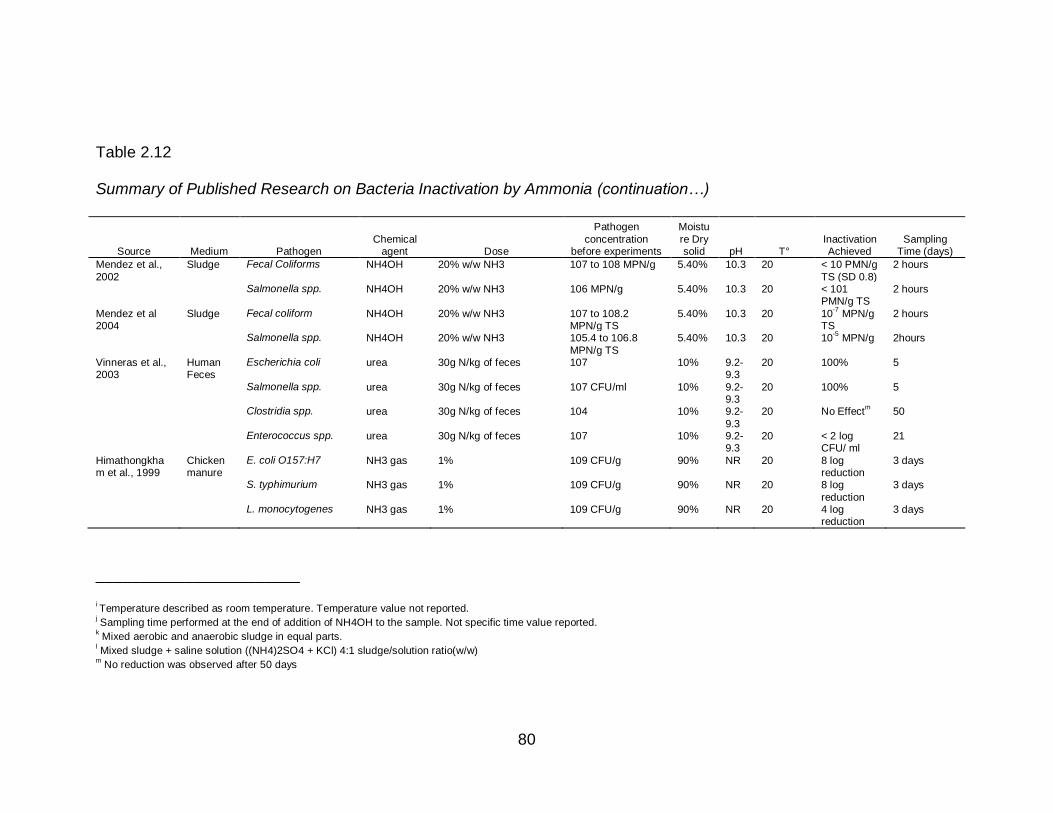
80
Table 2.12
Summary of Published Research on Bacteria Inactivation by Ammonia (continuation…)
Source Medium Pathogen Chemical
agent Dose
Pathogen
concentration before experiments
Moistu
re Dry solid pH T°
Inactivation Achieved
Sampling Time (days)
Mendez et al.,
2002
Sludge Fecal Coliforms NH4OH 20% w/w NH3 107 to 108 MPN/g 5.40% 10.3 20 < 10 PMN/g
TS (SD 0.8)
2 hours
Salmonella spp. NH4OH 20% w/w NH3 106 MPN/g 5.40% 10.3 20 < 101 PMN/g TS
2 hours
Mendez et al 2004
Sludge Fecal coliform NH4OH 20% w/w NH3 107 to 108.2 MPN/g TS
5.40% 10.3 20 10-7
MPN/g TS
2 hours
Salmonella spp. NH4OH 20% w/w NH3 105.4 to 106.8
MPN/g TS
5.40% 10.3 20 10-5
MPN/g 2hours
Vinneras et al., 2003
Human Feces
Escherichia coli urea 30g N/kg of feces 107 10% 9.2-9.3
20 100% 5
Salmonella spp. urea 30g N/kg of feces 107 CFU/ml 10% 9.2-9.3
20 100% 5
Clostridia spp. urea 30g N/kg of feces 104 10% 9.2-
9.3
20 No Effectm 50
Enterococcus spp. urea 30g N/kg of feces 107 10% 9.2-9.3
20 < 2 log CFU/ ml
21
Himathongkham et al., 1999
Chicken manure
E. coli O157:H7 NH3 gas 1% 109 CFU/g 90% NR 20 8 log reduction
3 days
S. typhimurium NH3 gas 1% 109 CFU/g 90% NR 20 8 log
reduction
3 days
L. monocytogenes NH3 gas 1% 109 CFU/g 90% NR 20 4 log reduction
3 days
_______________________
i Temperature described as room temperature. Temperature value not reported.
j Sampling time performed at the end of addition of NH4OH to the sample. Not specific time value reported. k Mixed aerobic and anaerobic sludge in equal parts.
l Mixed sludge + saline solution ((NH4)2SO4 + KCl) 4:1 sludge/solution ratio(w/w) m No reduction was observed after 50 days
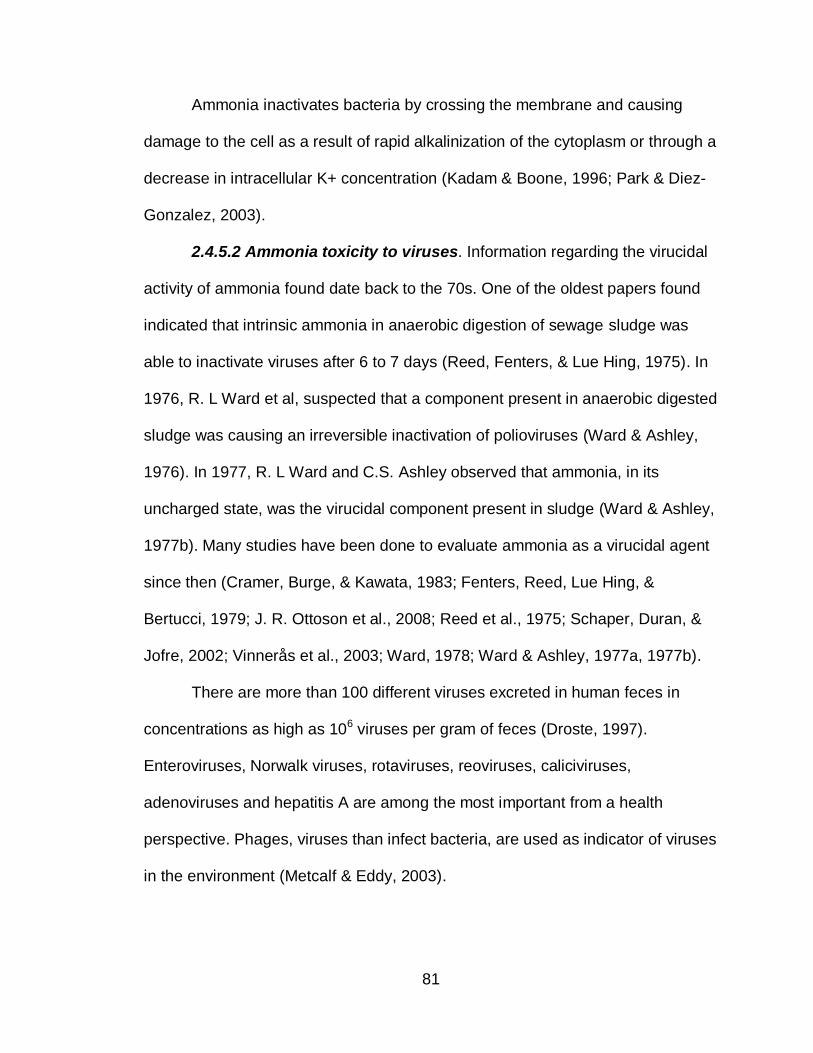
81
Ammonia inactivates bacteria by crossing the membrane and causing
damage to the cell as a result of rapid alkalinization of the cytoplasm or through a
decrease in intracellular K+ concentration (Kadam & Boone, 1996; Park & Diez-
Gonzalez, 2003).
2.4.5.2 Ammonia toxicity to viruses. Information regarding the virucidal
activity of ammonia found date back to the 70s. One of the oldest papers found
indicated that intrinsic ammonia in anaerobic digestion of sewage sludge was
able to inactivate viruses after 6 to 7 days (Reed, Fenters, & Lue Hing, 1975). In
1976, R. L Ward et al, suspected that a component present in anaerobic digested
sludge was causing an irreversible inactivation of polioviruses (Ward & Ashley,
1976). In 1977, R. L Ward and C.S. Ashley observed that ammonia, in its
uncharged state, was the virucidal component present in sludge (Ward & Ashley,
1977b). Many studies have been done to evaluate ammonia as a virucidal agent
since then (Cramer, Burge, & Kawata, 1983; Fenters, Reed, Lue Hing, &
Bertucci, 1979; J. R. Ottoson et al., 2008; Reed et al., 1975; Schaper, Duran, &
Jofre, 2002; Vinnerås et al., 2003; Ward, 1978; Ward & Ashley, 1977a, 1977b).
There are more than 100 different viruses excreted in human feces in
concentrations as high as 106 viruses per gram of feces (Droste, 1997).
Enteroviruses, Norwalk viruses, rotaviruses, reoviruses, caliciviruses,
adenoviruses and hepatitis A are among the most important from a health
perspective. Phages, viruses than infect bacteria, are used as indicator of viruses
in the environment (Metcalf & Eddy, 2003).
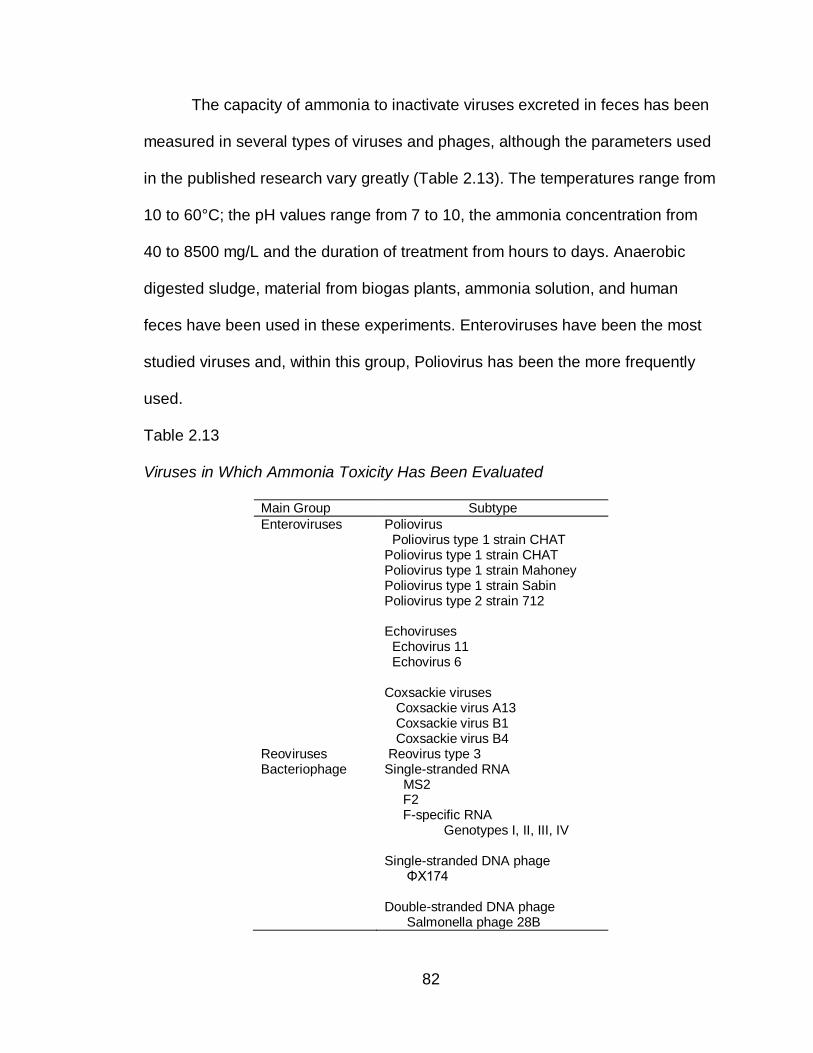
82
The capacity of ammonia to inactivate viruses excreted in feces has been
measured in several types of viruses and phages, although the parameters used
in the published research vary greatly (Table 2.13). The temperatures range from
10 to 60°C; the pH values range from 7 to 10, the ammonia concentration from
40 to 8500 mg/L and the duration of treatment from hours to days. Anaerobic
digested sludge, material from biogas plants, ammonia solution, and human
feces have been used in these experiments. Enteroviruses have been the most
studied viruses and, within this group, Poliovirus has been the more frequently
used.
Table 2.13
Viruses in Which Ammonia Toxicity Has Been Evaluated
Main Group Subtype
Enteroviruses Poliovirus Poliovirus type 1 strain CHAT Poliovirus type 1 strain CHAT Poliovirus type 1 strain Mahoney Poliovirus type 1 strain Sabin Poliovirus type 2 strain 712 Echoviruses Echovirus 11 Echovirus 6 Coxsackie viruses Coxsackie virus A13 Coxsackie virus B1 Coxsackie virus B4
Reoviruses Reovirus type 3 Bacteriophage Single-stranded RNA
MS2 F2 F-specific RNA Genotypes I, II, III, IV Single-stranded DNA phage ΦX174 Double-stranded DNA phage Salmonella phage 28B
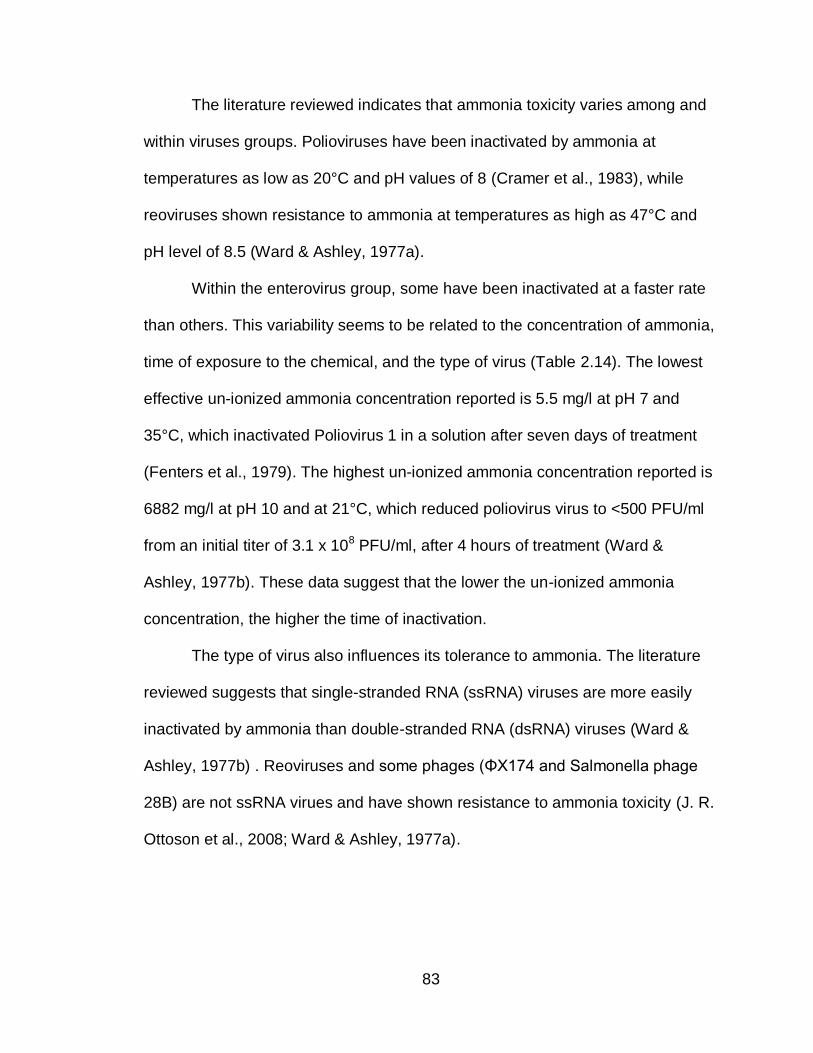
83
The literature reviewed indicates that ammonia toxicity varies among and
within viruses groups. Polioviruses have been inactivated by ammonia at
temperatures as low as 20°C and pH values of 8 (Cramer et al., 1983), while
reoviruses shown resistance to ammonia at temperatures as high as 47°C and
pH level of 8.5 (Ward & Ashley, 1977a).
Within the enterovirus group, some have been inactivated at a faster rate
than others. This variability seems to be related to the concentration of ammonia,
time of exposure to the chemical, and the type of virus (Table 2.14). The lowest
effective un-ionized ammonia concentration reported is 5.5 mg/l at pH 7 and
35°C, which inactivated Poliovirus 1 in a solution after seven days of treatment
(Fenters et al., 1979). The highest un-ionized ammonia concentration reported is
6882 mg/l at pH 10 and at 21°C, which reduced poliovirus virus to <500 PFU/ml
from an initial titer of 3.1 x 10⁸ PFU/ml, after 4 hours of treatment (Ward &
Ashley, 1977b). These data suggest that the lower the un-ionized ammonia
concentration, the higher the time of inactivation.
The type of virus also influences its tolerance to ammonia. The literature
reviewed suggests that single-stranded RNA (ssRNA) viruses are more easily
inactivated by ammonia than double-stranded RNA (dsRNA) viruses (Ward &
Ashley, 1977b) . Reoviruses and some phages (ΦX174 and Salmonella phage
28B) are not ssRNA virues and have shown resistance to ammonia toxicity (J. R.
Ottoson et al., 2008; Ward & Ashley, 1977a).
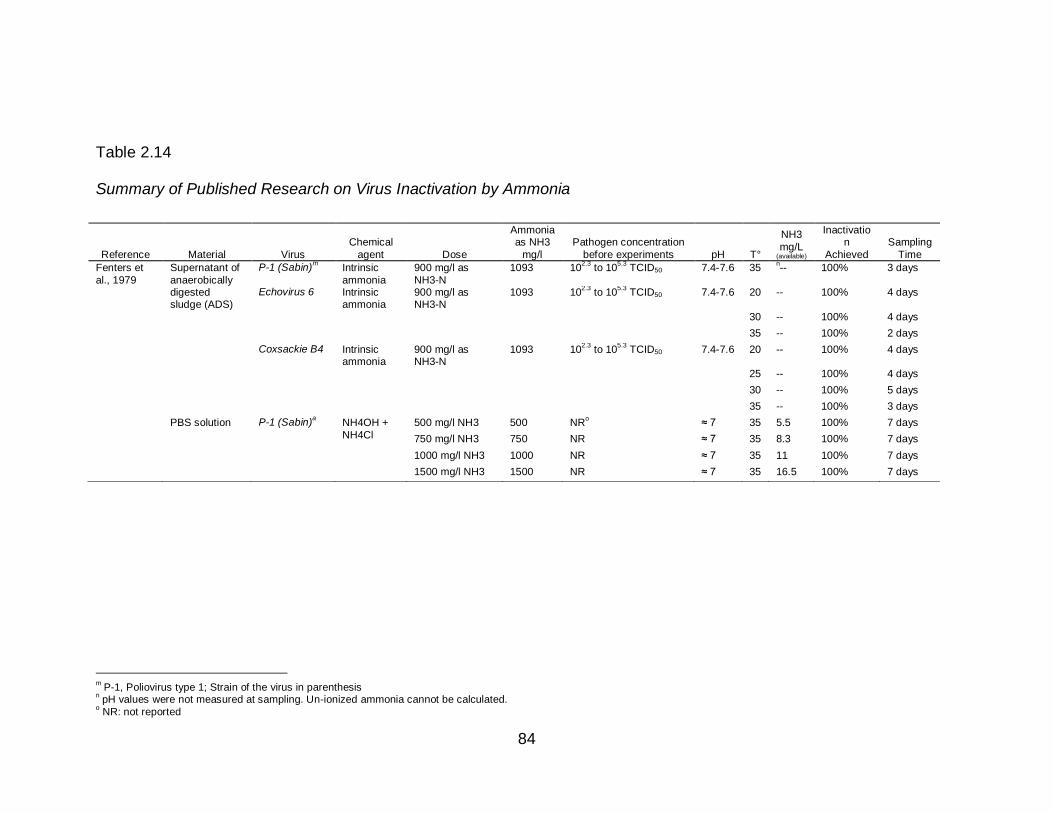
84
Table 2.14
Summary of Published Research on Virus Inactivation by Ammonia
m P-1, Poliovirus type 1; Strain of the virus in parenthesis
n pH values were not measured at sampling. Un-ionized ammonia cannot be calculated.
o NR: not reported
Reference Material Virus
Chemical
agent Dose
Ammonia as NH3
mg/l
Pathogen concentration
before experiments pH T°
NH3
mg/L (available)
Inactivation
Achieved
Sampling
Time
Fenters et
al., 1979
Supernatant of
anaerobically digested sludge (ADS)
P-1 (Sabin)m Intrinsic
ammonia
900 mg/l as
NH3-N
1093 102.3
to 105.3
TCID50 7.4-7.6 35 n-- 100% 3 days
Echovirus 6 Intrinsic ammonia
900 mg/l as NH3-N
1093 102.3
to 105.3
TCID50 7.4-7.6 20 -- 100% 4 days
30 -- 100% 4 days
35 -- 100% 2 days
Coxsackie B4 Intrinsic ammonia
900 mg/l as NH3-N
1093 102.3
to 105.3
TCID50 7.4-7.6 20 -- 100% 4 days
25 -- 100% 4 days
30 -- 100% 5 days
35 -- 100% 3 days
PBS solution P-1 (Sabin)a NH4OH +
NH4Cl
500 mg/l NH3 500 NRo ≈ 7 35 5.5 100% 7 days
750 mg/l NH3 750 NR ≈ 7 35 8.3 100% 7 days
1000 mg/l NH3 1000 NR ≈ 7 35 11 100% 7 days
1500 mg/l NH3 1500 NR ≈ 7 35 16.5 100% 7 days
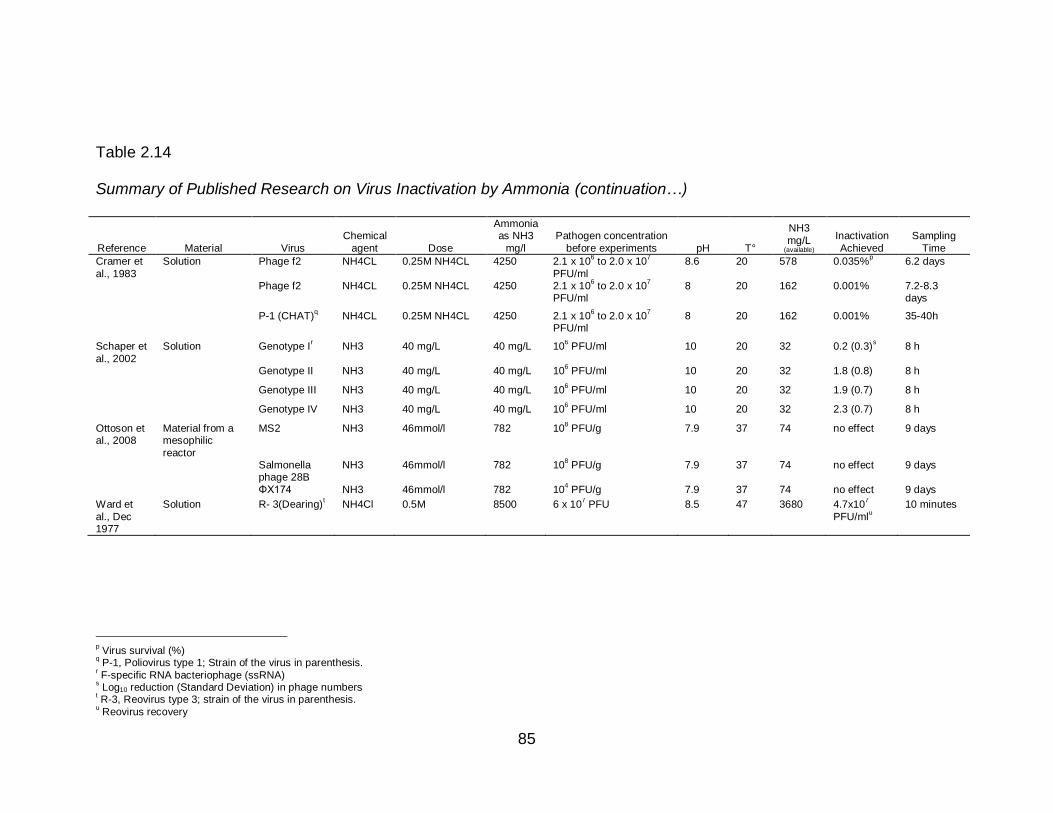
85
Table 2.14
Summary of Published Research on Virus Inactivation by Ammonia (continuation…)
Reference Material Virus
Chemical
agent Dose
Ammonia as NH3
mg/l
Pathogen concentration
before experiments pH T°
NH3
mg/L (available)
Inactivation
Achieved
Sampling
Time
Cramer et
al., 1983
Solution Phage f2 NH4CL 0.25M NH4CL 4250 2.1 x 10⁶ to 2.0 x 10
7
PFU/ml
8.6 20 578 0.035%p 6.2 days
Phage f2 NH4CL 0.25M NH4CL 4250 2.1 x 10⁶ to 2.0 x 10
7
PFU/ml 8 20 162 0.001% 7.2-8.3
days
P-1 (CHAT)q NH4CL 0.25M NH4CL 4250 2.1 x 10
6 to 2.0 x 10
7
PFU/ml 8 20 162 0.001% 35-40h
Schaper et
al., 2002
Solution Genotype Ir NH3 40 mg/L 40 mg/L 10
6 PFU/ml 10 20 32 0.2 (0.3)
s 8 h
Genotype II NH3 40 mg/L 40 mg/L 106 PFU/ml 10 20 32 1.8 (0.8) 8 h
Genotype III NH3 40 mg/L 40 mg/L 106 PFU/ml 10 20 32 1.9 (0.7) 8 h
Genotype IV NH3 40 mg/L 40 mg/L 106 PFU/ml 10 20 32 2.3 (0.7) 8 h
Ottoson et al., 2008
Material from a mesophilic
reactor
MS2 NH3 46mmol/l 782 108 PFU/g 7.9 37 74 no effect 9 days
Salmonella phage 28B
NH3 46mmol/l 782 108 PFU/g 7.9 37 74 no effect 9 days
ΦX174 NH3 46mmol/l 782 104 PFU/g 7.9 37 74 no effect 9 days
Ward et
al., Dec 1977
Solution R- 3(Dearing)t NH4Cl 0.5M 8500 6 x 10
7 PFU 8.5 47 3680 4.7x10
7
PFU/mlu
10 minutes
p Virus survival (%)
q P-1, Poliovirus type 1; Strain of the virus in parenthesis.
r F-specific RNA bacteriophage (ssRNA)
s Log10 reduction (Standard Deviation) in phage numbers
t R-3, Reovirus type 3; strain of the virus in parenthesis.
u Reovirus recovery
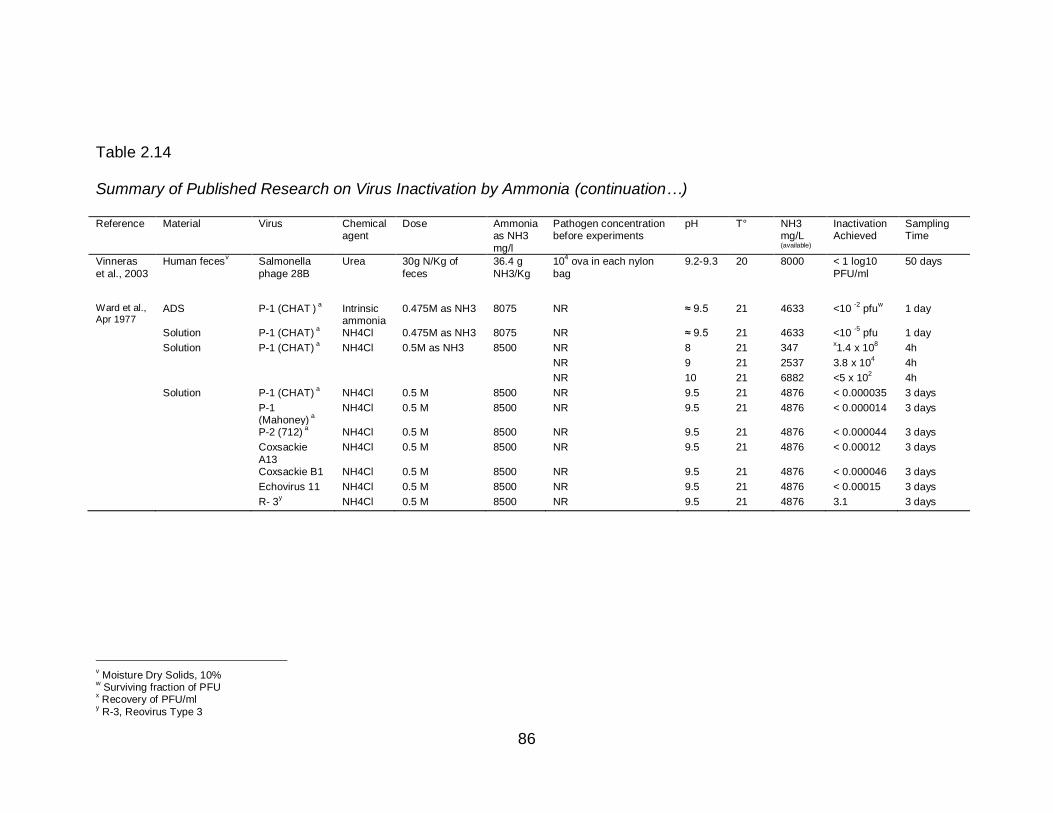
86
Table 2.14
Summary of Published Research on Virus Inactivation by Ammonia (continuation…)
Reference Material Virus Chemical agent
Dose Ammonia as NH3
mg/l
Pathogen concentration before experiments
pH T° NH3 mg/L (available)
Inactivation Achieved
Sampling Time
Vinneras
et al., 2003
Human fecesv Salmonella
phage 28B
Urea 30g N/Kg of
feces
36.4 g
NH3/Kg
104 ova in each nylon
bag
9.2-9.3 20 8000 < 1 log10
PFU/ml
50 days
Ward et al., Apr 1977
ADS P-1 (CHAT ) a Intrinsic
ammonia 0.475M as NH3 8075 NR ≈ 9.5 21 4633 <10
-2 pfu
w 1 day
Solution P-1 (CHAT) a NH4Cl 0.475M as NH3 8075 NR ≈ 9.5 21 4633 <10
-5 pfu 1 day
Solution P-1 (CHAT) a NH4Cl 0.5M as NH3 8500 NR 8 21 347
x1.4 x 10
8 4h
NR 9 21 2537 3.8 x 10⁴ 4h
NR 10 21 6882 <5 x 10² 4h
Solution P-1 (CHAT) a NH4Cl 0.5 M 8500 NR 9.5 21 4876 < 0.000035 3 days
P-1 (Mahoney)
a
NH4Cl 0.5 M 8500 NR 9.5 21 4876 < 0.000014 3 days
P-2 (712) a NH4Cl 0.5 M 8500 NR 9.5 21 4876 < 0.000044 3 days
Coxsackie
A13
NH4Cl 0.5 M 8500 NR 9.5 21 4876 < 0.00012 3 days
Coxsackie B1 NH4Cl 0.5 M 8500 NR 9.5 21 4876 < 0.000046 3 days Echovirus 11 NH4Cl 0.5 M 8500 NR 9.5 21 4876 < 0.00015 3 days R- 3
y NH4Cl 0.5 M 8500 NR 9.5 21 4876 3.1 3 days
v Moisture Dry Solids, 10%
w Surviving fraction of PFU
x Recovery of PFU/ml
y R-3, Reovirus Type 3
87
Ammonia inactivates enteroviruses (Polioviruses) by inducing cleavage of
viral RNA and, bacteriophage f2, by breakage of nucleid acid chains (Burge,
Cramer, & Kawata, 1983; Ward, 1978). More research is needed before
ammonia could be ruled out as a virucidal agent for Reoviruses and others
enteric viruses.
2.4.5.3 Ammonia Toxicity to Helminthes. Ascaris lumbricoides, may
survive wastewater and sludge disinfection procedures and environmental
stresses for many years (Metcalf & Eddy, 2003; WHO, 2006a). Due to its
resistant to different treatments, Ascaris lumbricoides, has been suggested as
index of hygiene quality (WHO, 2006a).
An infected individual could excrete up to 300,000 Ascaris lumbricoides
ova per gram of feces depending on the worm load (Feachem et al., 1983; John
& Petri, 2006). According to the United States Environmental Protection Agency
(USEPA), a density of <1 viable ova/4 g total solids (dry-weight) is required to
consider any biosolid or sludge safe for application in agriculture, either as
fertilizer or soil conditioner (U.S Environmental Protection Agency, 1994). The
World Health Organization guidelines recommends a log10 610 reduction in
pathogen concentration to ensure safe reuse of biosolids (WHO, 2006a).
The literature reviewed regarding the effect of ammonia on helminthes eggs
present in solid biological waste, especially Ascaris spp. ova, date back to the
1970’s. In 1977, a researcher from Russia, observed that ammonia inactivated
Ascaris suum eggs in solid and liquid biological wastes at 18-22°C in less than
15 days (Chefranova Iu, 1977). In subsequent studies the author reported that
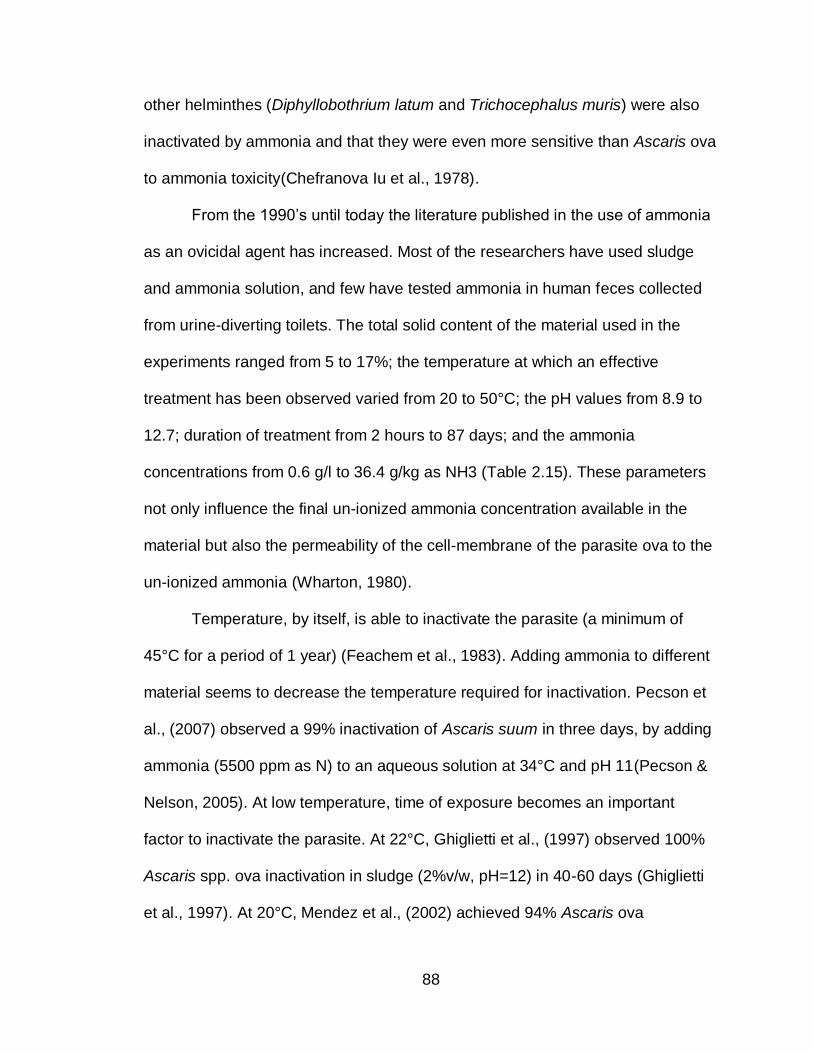
88
other helminthes (Diphyllobothrium latum and Trichocephalus muris) were also
inactivated by ammonia and that they were even more sensitive than Ascaris ova
to ammonia toxicity(Chefranova Iu et al., 1978).
From the 1990’s until today the literature published in the use of ammonia
as an ovicidal agent has increased. Most of the researchers have used sludge
and ammonia solution, and few have tested ammonia in human feces collected
from urine-diverting toilets. The total solid content of the material used in the
experiments ranged from 5 to 17%; the temperature at which an effective
treatment has been observed varied from 20 to 50°C; the pH values from 8.9 to
12.7; duration of treatment from 2 hours to 87 days; and the ammonia
concentrations from 0.6 g/l to 36.4 g/kg as NH3 (Table 2.15). These parameters
not only influence the final un-ionized ammonia concentration available in the
material but also the permeability of the cell-membrane of the parasite ova to the
un-ionized ammonia (Wharton, 1980).
Temperature, by itself, is able to inactivate the parasite (a minimum of
45°C for a period of 1 year) (Feachem et al., 1983). Adding ammonia to different
material seems to decrease the temperature required for inactivation. Pecson et
al., (2007) observed a 99% inactivation of Ascaris suum in three days, by adding
ammonia (5500 ppm as N) to an aqueous solution at 34°C and pH 11(Pecson &
Nelson, 2005). At low temperature, time of exposure becomes an important
factor to inactivate the parasite. At 22°C, Ghiglietti et al., (1997) observed 100%
Ascaris spp. ova inactivation in sludge (2%v/w, pH=12) in 40-60 days (Ghiglietti
et al., 1997). At 20°C, Mendez et al., (2002) achieved 94% Ascaris ova
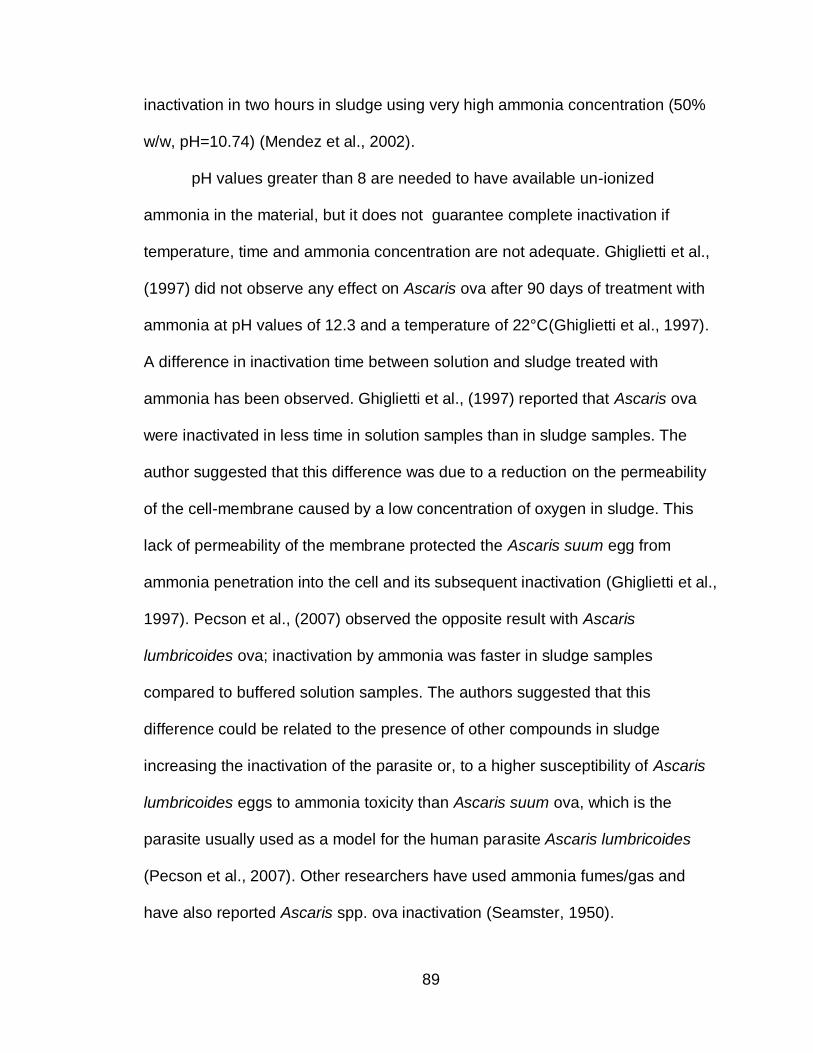
89
inactivation in two hours in sludge using very high ammonia concentration (50%
w/w, pH=10.74) (Mendez et al., 2002).
pH values greater than 8 are needed to have available un-ionized
ammonia in the material, but it does not guarantee complete inactivation if
temperature, time and ammonia concentration are not adequate. Ghiglietti et al.,
(1997) did not observe any effect on Ascaris ova after 90 days of treatment with
ammonia at pH values of 12.3 and a temperature of 22°C(Ghiglietti et al., 1997).
A difference in inactivation time between solution and sludge treated with
ammonia has been observed. Ghiglietti et al., (1997) reported that Ascaris ova
were inactivated in less time in solution samples than in sludge samples. The
author suggested that this difference was due to a reduction on the permeability
of the cell-membrane caused by a low concentration of oxygen in sludge. This
lack of permeability of the membrane protected the Ascaris suum egg from
ammonia penetration into the cell and its subsequent inactivation (Ghiglietti et al.,
1997). Pecson et al., (2007) observed the opposite result with Ascaris
lumbricoides ova; inactivation by ammonia was faster in sludge samples
compared to buffered solution samples. The authors suggested that this
difference could be related to the presence of other compounds in sludge
increasing the inactivation of the parasite or, to a higher susceptibility of Ascaris
lumbricoides eggs to ammonia toxicity than Ascaris suum ova, which is the
parasite usually used as a model for the human parasite Ascaris lumbricoides
(Pecson et al., 2007). Other researchers have used ammonia fumes/gas and
have also reported Ascaris spp. ova inactivation (Seamster, 1950).
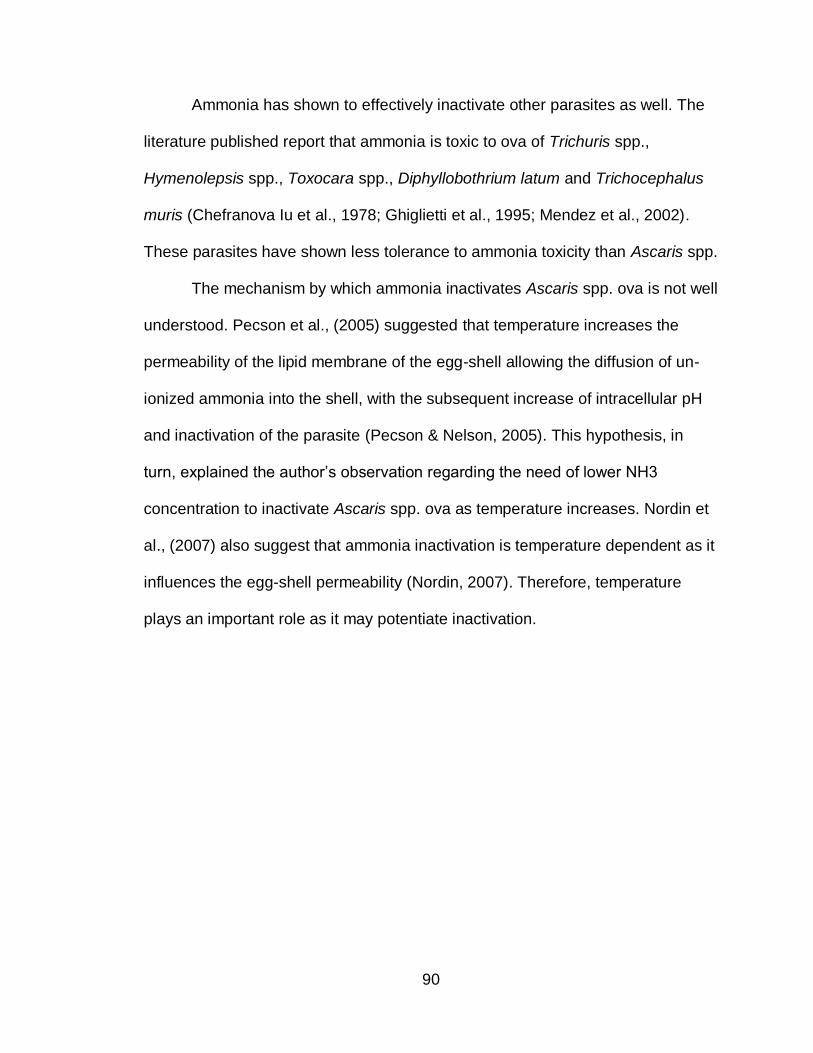
90
Ammonia has shown to effectively inactivate other parasites as well. The
literature published report that ammonia is toxic to ova of Trichuris spp.,
Hymenolepsis spp., Toxocara spp., Diphyllobothrium latum and Trichocephalus
muris (Chefranova Iu et al., 1978; Ghiglietti et al., 1995; Mendez et al., 2002).
These parasites have shown less tolerance to ammonia toxicity than Ascaris spp.
The mechanism by which ammonia inactivates Ascaris spp. ova is not well
understood. Pecson et al., (2005) suggested that temperature increases the
permeability of the lipid membrane of the egg-shell allowing the diffusion of un-
ionized ammonia into the shell, with the subsequent increase of intracellular pH
and inactivation of the parasite (Pecson & Nelson, 2005). This hypothesis, in
turn, explained the author’s observation regarding the need of lower NH3
concentration to inactivate Ascaris spp. ova as temperature increases. Nordin et
al., (2007) also suggest that ammonia inactivation is temperature dependent as it
influences the egg-shell permeability (Nordin, 2007). Therefore, temperature
plays an important role as it may potentiate inactivation.
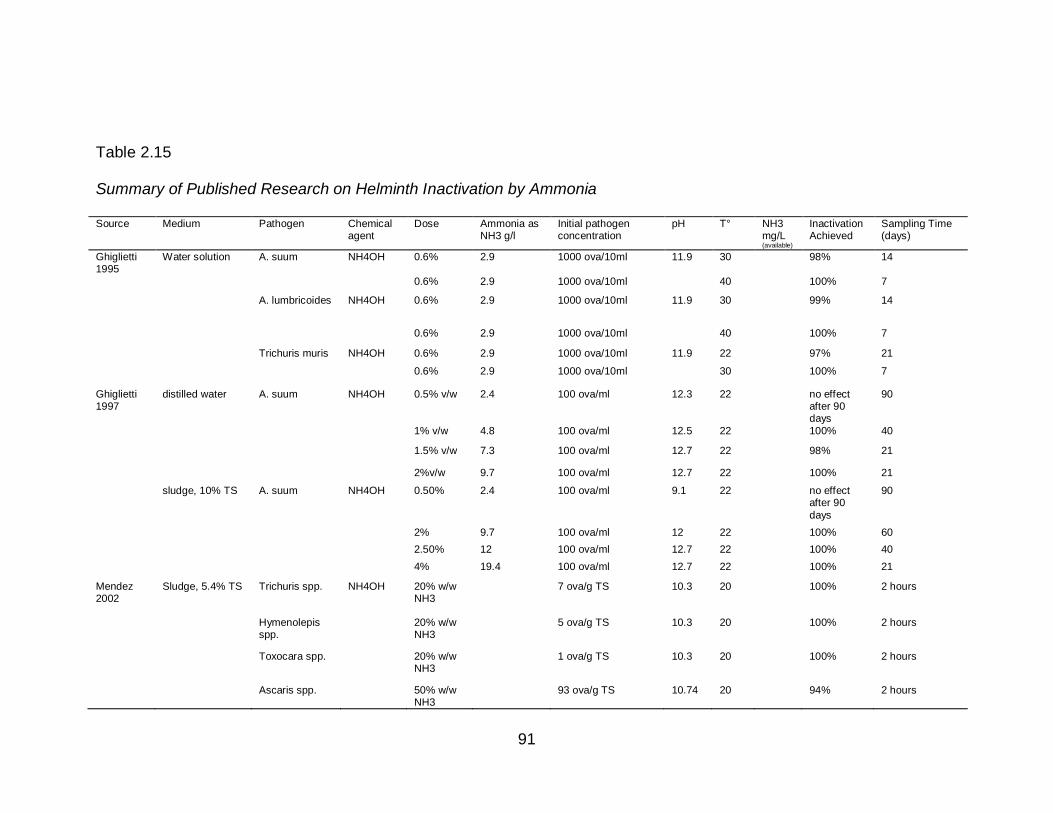
91
Table 2.15
Summary of Published Research on Helminth Inactivation by Ammonia
Source Medium Pathogen Chemical agent
Dose Ammonia as NH3 g/l
Initial pathogen concentration
pH T° NH3 mg/L (available)
Inactivation Achieved
Sampling Time (days)
Ghiglietti 1995
Water solution A. suum NH4OH 0.6% 2.9 1000 ova/10ml 11.9 30 98% 14
0.6% 2.9 1000 ova/10ml 40 100% 7
A. lumbricoides NH4OH 0.6% 2.9 1000 ova/10ml 11.9 30 99% 14
0.6% 2.9 1000 ova/10ml 40 100% 7
Trichuris muris NH4OH 0.6% 2.9 1000 ova/10ml 11.9 22 97% 21
0.6% 2.9 1000 ova/10ml 30 100% 7
Ghiglietti 1997
distilled water A. suum NH4OH 0.5% v/w 2.4 100 ova/ml 12.3 22 no effect after 90 days
90
1% v/w 4.8 100 ova/ml 12.5 22 100% 40
1.5% v/w 7.3 100 ova/ml 12.7 22 98% 21
2%v/w 9.7 100 ova/ml 12.7 22 100% 21
sludge, 10% TS A. suum NH4OH 0.50% 2.4 100 ova/ml 9.1 22 no effect after 90
days
90
2% 9.7 100 ova/ml 12 22 100% 60
2.50% 12 100 ova/ml 12.7 22 100% 40
4% 19.4 100 ova/ml 12.7 22 100% 21
Mendez 2002
Sludge, 5.4% TS Trichuris spp. NH4OH 20% w/w NH3
7 ova/g TS 10.3 20 100% 2 hours
Hymenolepis spp.
20% w/w NH3
5 ova/g TS 10.3 20 100% 2 hours
Toxocara spp. 20% w/w NH3
1 ova/g TS 10.3 20 100% 2 hours
Ascaris spp. 50% w/w NH3
93 ova/g TS 10.74 20 94% 2 hours
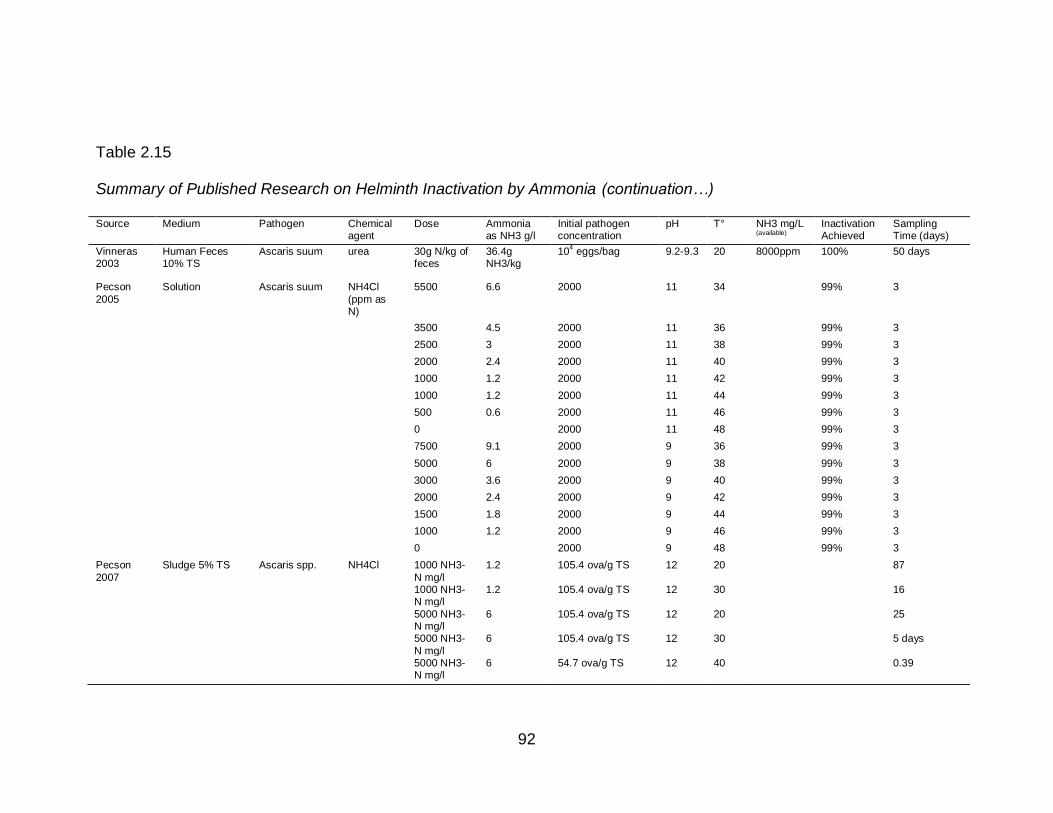
92
Table 2.15
Summary of Published Research on Helminth Inactivation by Ammonia (continuation…)
Source Medium Pathogen Chemical agent
Dose Ammonia as NH3 g/l
Initial pathogen concentration
pH T° NH3 mg/L (available)
Inactivation Achieved
Sampling Time (days)
Vinneras 2003
Human Feces 10% TS
Ascaris suum urea 30g N/kg of feces
36.4g NH3/kg
104 eggs/bag 9.2-9.3 20 8000ppm 100% 50 days
Pecson
2005
Solution Ascaris suum NH4Cl
(ppm as N)
5500 6.6 2000 11 34 99% 3
3500 4.5 2000 11 36 99% 3
2500 3 2000 11 38 99% 3
2000 2.4 2000 11 40 99% 3
1000 1.2 2000 11 42 99% 3
1000 1.2 2000 11 44 99% 3
500 0.6 2000 11 46 99% 3
0 2000 11 48 99% 3
7500 9.1 2000 9 36 99% 3
5000 6 2000 9 38 99% 3
3000 3.6 2000 9 40 99% 3
2000 2.4 2000 9 42 99% 3
1500 1.8 2000 9 44 99% 3
1000 1.2 2000 9 46 99% 3
0 2000 9 48 99% 3
Pecson
2007
Sludge 5% TS Ascaris spp. NH4Cl 1000 NH3-
N mg/l
1.2 105.4 ova/g TS 12 20 87
1000 NH3-N mg/l
1.2 105.4 ova/g TS 12 30 16
5000 NH3-N mg/l
6 105.4 ova/g TS 12 20 25
5000 NH3-
N mg/l
6 105.4 ova/g TS 12 30 5 days
5000 NH3-N mg/l
6 54.7 ova/g TS 12 40 0.39
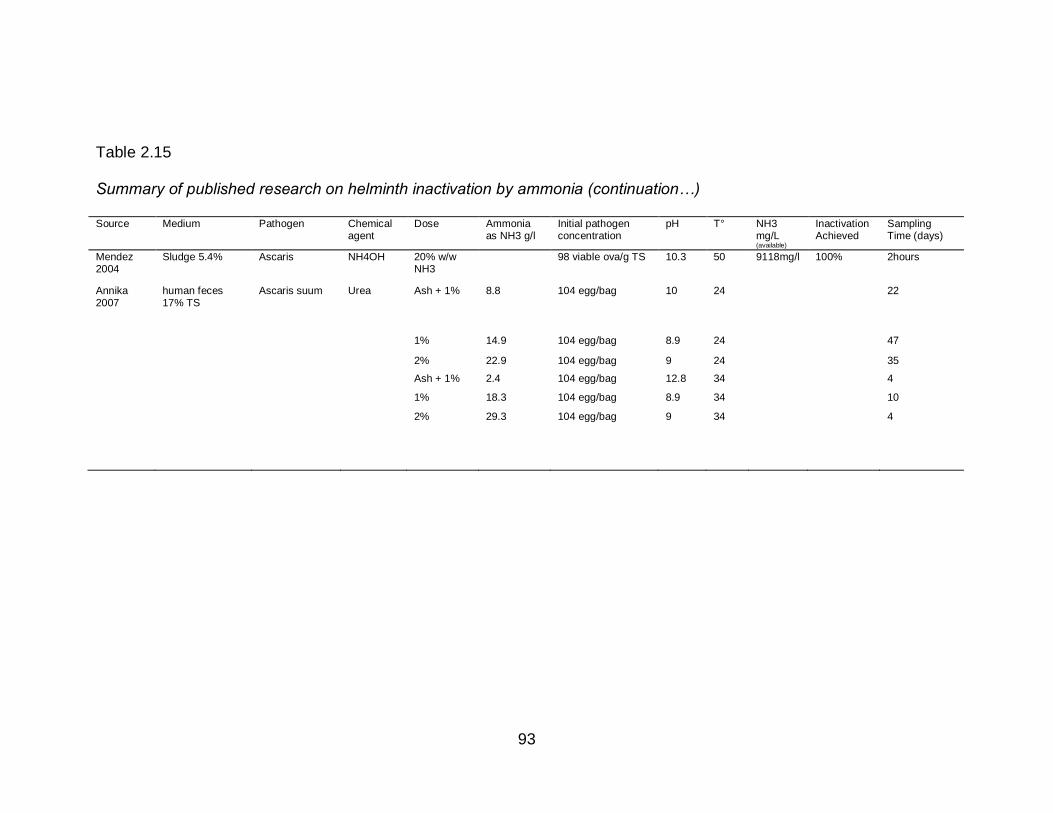
93
Table 2.15
Summary of published research on helminth inactivation by ammonia (continuation…)
Source Medium Pathogen Chemical agent
Dose Ammonia as NH3 g/l
Initial pathogen concentration
pH T° NH3 mg/L (available)
Inactivation Achieved
Sampling Time (days)
Mendez 2004
Sludge 5.4% Ascaris NH4OH 20% w/w NH3
98 viable ova/g TS 10.3 50 9118mg/l 100% 2hours
Annika 2007
human feces 17% TS
Ascaris suum Urea Ash + 1% 8.8 104 egg/bag 10 24 22
1% 14.9 104 egg/bag 8.9 24 47
2% 22.9 104 egg/bag 9 24 35
Ash + 1% 2.4 104 egg/bag 12.8 34 4
1% 18.3 104 egg/bag 8.9 34 10
2% 29.3 104 egg/bag 9 34 4
94
CHAPTER 3.
MORPHOLOGICAL CHANGES OF ASCARIS SPP. OVA DURING ITS
DEVELOPMENT OUT OF THE HUMAN HOST
3.1 Abstract
Background: Ascaris lumbricoides is of particular importance to public
health as it causes a great burden of disease in children in developing countries.
Information on the infective stage and the pathological damage caused by the
parasite is widely available in the literature; while information about early
embryonic development and its life cycle out of the host is limited.
Objective: The purpose of this study was to register and describe the
morphological changes within the parasite ova during incubation in vitro at 28 C°.
Methods: A. suum ova (4000 ova/ml), used as a model for A.
lumbricoides, were placed for incubation in 0.1N H2SO4, at 28 C°, in the dark, for
21 days. Every day, subsamples of approximately 100 Ascaris suum ova were
taken from the incubation solution for microscopic evaluation. Development,
morphological changes and viability of the first 40 ova observed were registered
in a log sheet and documented with photos.
Results: Twelve stages of development were identified within the ova: 1-
Cell, 2-Cell, 3-Cell, 4-Cell, Early Morula, Late Morula, Blastula, Gastrula, Pre-
95
larva 1, Pre-larva 2, Larva 1, and Larva 2. Each stage was observed for at least
three continuous days. By the end of the first week most ova observed were in
Late Morula stage (72.5%); on day 14 of incubation, 90% had developed to
Larva-1 stage and by day 16, 62.5% had developed to Larva-2 stage. At the end
of incubation, 100% ova were in Larva 2 stage. No difference was found between
viability recorded from day 5 to 20 of incubation, and viability reported after three
weeks of incubation (Chi-Square, p>0.05).
Conclusions: A. suum ova went through clearly identified morphological
changes at different speed of development. Two new additional stages of
development were identified: Pre-larva 1 (larva coiled creating no more than one
concentric ring) and Pre-larva 2 (larva coiled creating at least one and a half
concentric ring). No significant statistical difference was observed among the
viability reported early in incubation and the one reported after three weeks of in
vitro incubation. If viability of Ascaris spp. ova is defined as a healthy developing
ovum that will continue growing to become an infective larva under constant in
vitro incubation conditions then, observing the ova under the microscope early
during incubation, instead of waiting up to three-four weeks for the development
of a larva, could be an alternative to reduce the time to report viability.
Keywords: development, Ascaris, incubation, viability
96
3.2 Introduction
Ascaris lumbricoides causes a great burden of disease in the tropics and
subtropics, especially in areas with inadequate sanitation systems (World Health
Organization, 2009c). Around 1 billion people are infected with the parasite but
school age children (5-15 years old) are the most affected and carry the highest
intensity of infection. As a consequence of infection, infected school age children
experience a negative impact on growth, nutrition status, physical fitness and
capacity to learn in school (Hotez et al., 2006; O'Lorcain & Holland, 2000).
The parasite’s ova are excreted in feces of infected individuals. Under
adequate environmental conditions, the ova developed from one cell ova to larva
stage in approximately two to three weeks and become infective to a new host if
ingested via the fecal-oral route of transmission (Centers for Disease Control &
Prevention, 2009). The ingestion of only one embryonated ovum is enough to
cause the disease (World Health Organization, 2004). When the ova of this
parasite are present in the environment, they become very resistant to hard
environmental conditions and wastewater treatment (Metcalf & Eddy, 2003). For
this reason, detecting the presence and viability status of the parasite ova in
wastewater and excreta reused in agriculture or disposed in water surfaces is of
particular importance to public health, mainly in the developing world where
Ascariasis is highly prevalent ( World Health Organization, 2006a).
Several techniques have been described in the literature to determine
viability of Ascaris spp. ova including morphological criteria; incubation and
flotation techniques; use of dyes; larva motility induction; infectivity animal
97
models and PCR (Pecson, Barrios, Johnson, & Nelson, 2006; World Health
Organization, 2004). A combination of two or more of these techniques is
currently used to ascertain the presence and viability of these ova in wastewater,
sludge, compost, and biosolid. The most accepted procedures are the United
States Environmental Protection Agency (USEPA) method and the Tulane
method. The two methods require up to three to four weeks of incubation
respectively to report whether the parasite ova, if present, are viable or not
(Bowman, Little, & Reimers, 2003; USEPA, 2003). At the end of incubation, the
USEPA method requires reporting number of unembryonated Ascaris ova, and
the number of various larvae per gram of dry weight. The Tulane method
considers viable an ovum with a developed larva inside, and non-viable an ovum
with no larva developed within. None of the methods consider an ovum in early
stages of development as a potential infective/viable ovum.
The published literature on the early developmental stages of the parasite
from fertilized ova to infective ova is limited (Chitwood & Chitwood, 1977;
Christenson, 1935; Jaskoski & Egan, 1953; Johnson, Dixon, & Ross, 1998;
Seamster, 1950). Most parasitology books describe nematode embryology in
general and most published articles focus on the infective stages of the parasite
to the host and the life cycle of the parasite within the host (Christenson, 1935;
Douvres, Tromba, & Malakatis, 1969; Fagerholm, Nansen, Roepstorff, Frandsen,
& Eriksen, 2000; Geenen et al., 1999; Grady & Harpur, 1985; Malla, Sofi,
Ganguly, & Mahajan, 1991; Schmidt & Roberts, 2000). The few articles
describing parasite ova development outside of the host, consider some stages
98
and the periods of time required for development of those specific stages but
they fail to present comprehensive and detail information of the morphological
changes of the parasite ova from one cell to larva stages; the time at which those
changes are expected to occur during incubation; the speed of development, and
viability during incubation on a continuum.
The objective of this study was to register and describe the morphological
changes observed during three weeks of incubation in vitro at 28 C° within the
parasite ova and to explore if there were differences between viability reported
before and at completion of three weeks of incubation. Early development stages
were considered viable as they potentially could become an infective ovum.
3.3 Materials and Method
A. suum ova, obtained from the intestinal content of pigs, were used as a
model for A. lumbricoides (World Health Organization, 2004). They were
purchased from Excelsior Sentinel (Ithaca, NY) and stored in 0.5% formalin at 4
C° until used. The ova were placed in 50 ml centrifuge containing 5 milliliter of
0.1 N H2SO4 (Fisher). The final ova concentration in the tube was approximately
4000 ova/ml. The level of the solution was marked in the centrifuge tube with a
fine tip pen as a reference and de-ionized water was added if evaporation was
observed. The tube was placed in an incubator at 28 C°, open, in the dark, for 21
days. Every day the incubator’s temperature was monitored and registered and
the samples were mixed by hand to allow oxygenation.
Subsamples of approximately 100 Ascaris suum ova were taken daily and
placed in a microscope slide with a cover glass for microscopic evaluation. The
99
slide was sealed with wax on the edges to avoid evaporation during evaluation.
The development and morphological changes and viability of the first 40 ova
observed were documented with photos and registered in a log sheet. Artificial
hatching of the ova was performed according to Eriksen (1981) on incubation day
15 and 16 to facilitate identification of molt and Larva 2 stage. For these samples,
wax was not used to allow evaporation of solution and hatching of larva after 5 to
10 minutes under the microscope.
The set of criteria used during microscopic examination to classify the
stages of development and viability of the ova were created using the work of
Christenson (1935) and Caceres et al (1987) (Table 3.1). For the purpose of this
experiment any ovum found to meet any of the viability criteria was considered
viable before completing 21 days of incubation. After completing 3 weeks of
incubation, viability was calculated based on larva stages only.
For data analysis and creation of graphs, a database was created in
Microsoft Excel 2007. To test whether the proportion of viable ova observed from
day 5 to day 20 of incubation differed significantly from the proportion of viable
ova observed at three weeks of incubation (87.5%), a Chi-Square test for
proportions was used using the PROC FREQ procedure in SAS (SAS 9.2,SAS
Institute Inc.; Cary, NC). The 95 % confidence limits of the proportion were
calculated using the Binomial test.
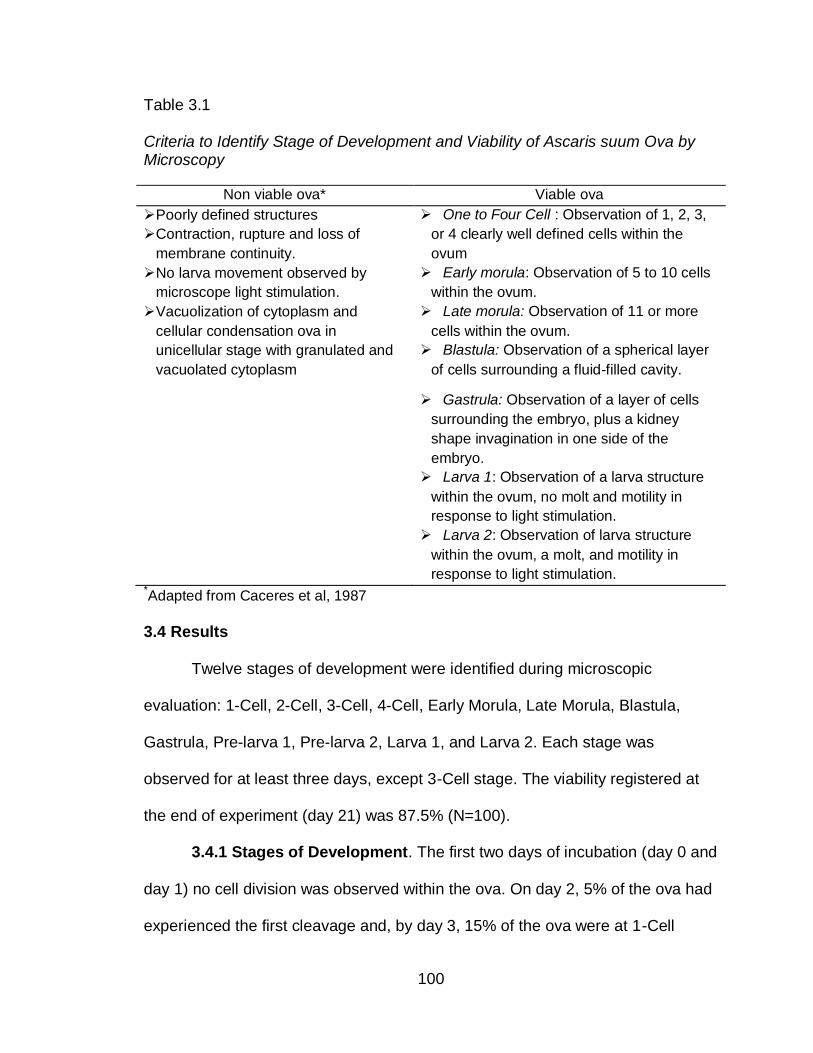
100
Table 3.1
Criteria to Identify Stage of Development and Viability of Ascaris suum Ova by Microscopy
Non viable ova* Viable ova
Poorly defined structures
Contraction, rupture and loss of
membrane continuity.
One to Four Cell : Observation of 1, 2, 3,
or 4 clearly well defined cells within the
ovum
No larva movement observed by
microscope light stimulation.
Early morula: Observation of 5 to 10 cells
within the ovum.
Vacuolization of cytoplasm and
cellular condensation ova in
unicellular stage with granulated and
vacuolated cytoplasm
Late morula: Observation of 11 or more
cells within the ovum.
Blastula: Observation of a spherical layer
of cells surrounding a fluid-filled cavity.
Gastrula: Observation of a layer of cells
surrounding the embryo, plus a kidney
shape invagination in one side of the
embryo.
Larva 1: Observation of a larva structure
within the ovum, no molt and motility in
response to light stimulation.
Larva 2: Observation of larva structure
within the ovum, a molt, and motility in
response to light stimulation. *Adapted from Caceres et al, 1987
3.4 Results
Twelve stages of development were identified during microscopic
evaluation: 1-Cell, 2-Cell, 3-Cell, 4-Cell, Early Morula, Late Morula, Blastula,
Gastrula, Pre-larva 1, Pre-larva 2, Larva 1, and Larva 2. Each stage was
observed for at least three days, except 3-Cell stage. The viability registered at
the end of experiment (day 21) was 87.5% (N=100).
3.4.1 Stages of Development. The first two days of incubation (day 0 and
day 1) no cell division was observed within the ova. On day 2, 5% of the ova had
experienced the first cleavage and, by day 3, 15% of the ova were at 1-Cell
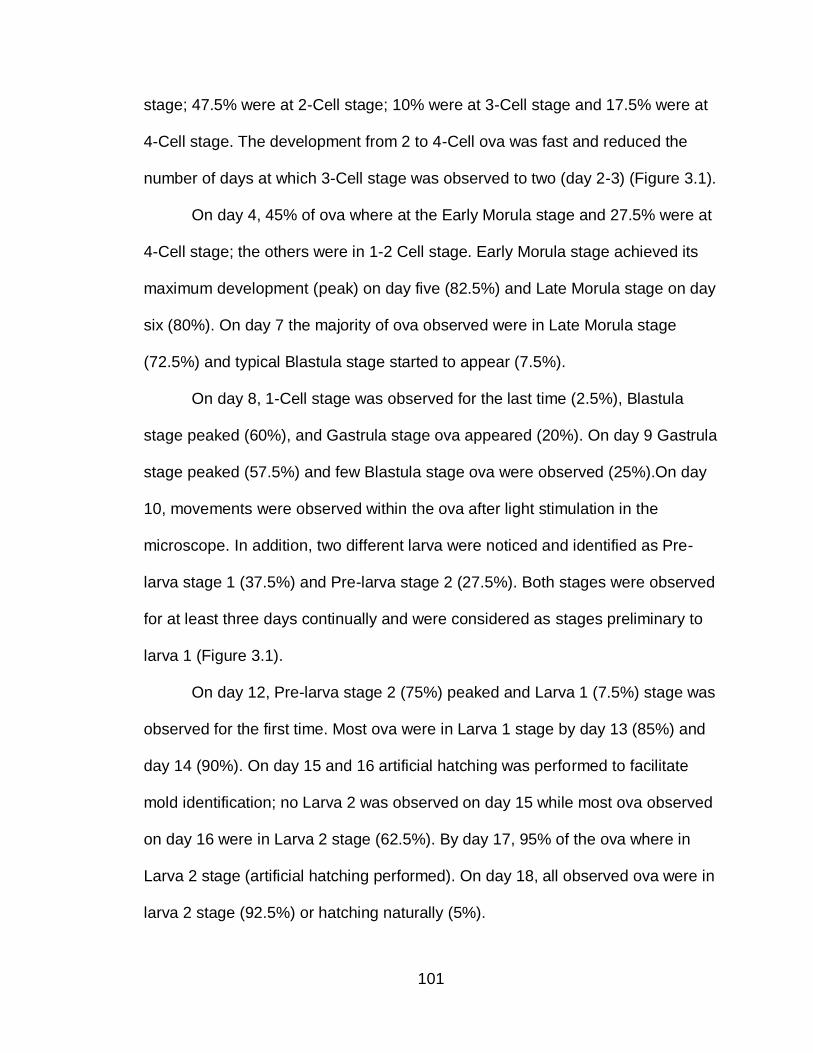
101
stage; 47.5% were at 2-Cell stage; 10% were at 3-Cell stage and 17.5% were at
4-Cell stage. The development from 2 to 4-Cell ova was fast and reduced the
number of days at which 3-Cell stage was observed to two (day 2-3) (Figure 3.1).
On day 4, 45% of ova where at the Early Morula stage and 27.5% were at
4-Cell stage; the others were in 1-2 Cell stage. Early Morula stage achieved its
maximum development (peak) on day five (82.5%) and Late Morula stage on day
six (80%). On day 7 the majority of ova observed were in Late Morula stage
(72.5%) and typical Blastula stage started to appear (7.5%).
On day 8, 1-Cell stage was observed for the last time (2.5%), Blastula
stage peaked (60%), and Gastrula stage ova appeared (20%). On day 9 Gastrula
stage peaked (57.5%) and few Blastula stage ova were observed (25%).On day
10, movements were observed within the ova after light stimulation in the
microscope. In addition, two different larva were noticed and identified as Pre-
larva stage 1 (37.5%) and Pre-larva stage 2 (27.5%). Both stages were observed
for at least three days continually and were considered as stages preliminary to
larva 1 (Figure 3.1).
On day 12, Pre-larva stage 2 (75%) peaked and Larva 1 (7.5%) stage was
observed for the first time. Most ova were in Larva 1 stage by day 13 (85%) and
day 14 (90%). On day 15 and 16 artificial hatching was performed to facilitate
mold identification; no Larva 2 was observed on day 15 while most ova observed
on day 16 were in Larva 2 stage (62.5%). By day 17, 95% of the ova where in
Larva 2 stage (artificial hatching performed). On day 18, all observed ova were in
larva 2 stage (92.5%) or hatching naturally (5%).
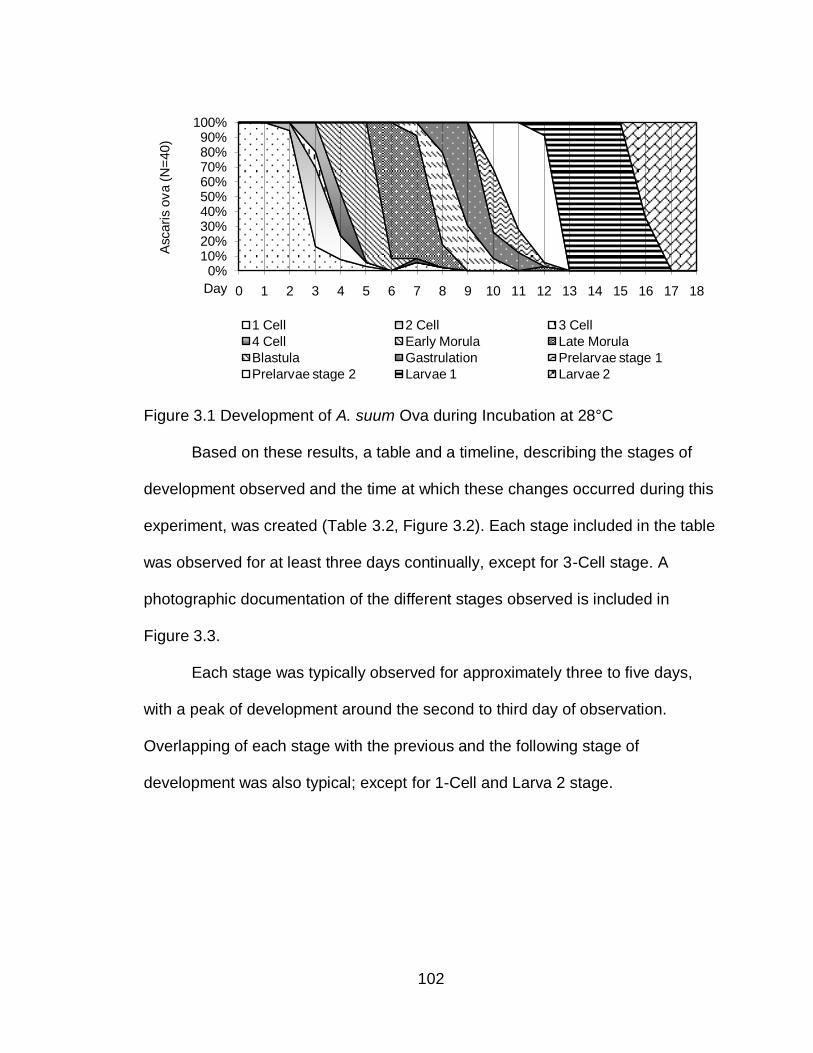
102
Figure 3.1 Development of A. suum Ova during Incubation at 28°C
Based on these results, a table and a timeline, describing the stages of
development observed and the time at which these changes occurred during this
experiment, was created (Table 3.2, Figure 3.2). Each stage included in the table
was observed for at least three days continually, except for 3-Cell stage. A
photographic documentation of the different stages observed is included in
Figure 3.3.
Each stage was typically observed for approximately three to five days,
with a peak of development around the second to third day of observation.
Overlapping of each stage with the previous and the following stage of
development was also typical; except for 1-Cell and Larva 2 stage.
0%10%20%30%40%50%60%70%80%90%
100%
0 1 2 3 4 5 6 7 8 9 10 11 12 13 14 15 16 17 18
Ascari
s o
va (
N=
40)
Day
1 Cell 2 Cell 3 Cell
4 Cell Early Morula Late Morula
Blastula Gastrulation Prelarvae stage 1
Prelarvae stage 2 Larvae 1 Larvae 2
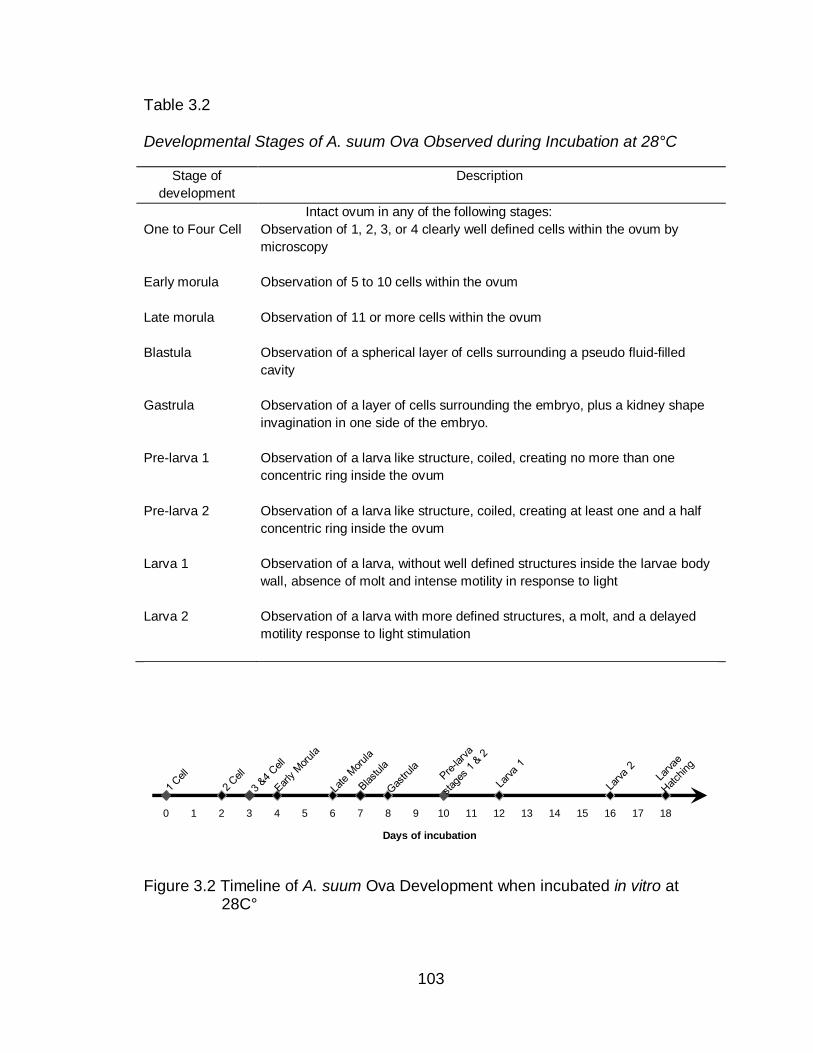
103
Table 3.2
Developmental Stages of A. suum Ova Observed during Incubation at 28°C
Stage of
development
Description
Intact ovum in any of the following stages:
One to Four Cell Observation of 1, 2, 3, or 4 clearly well defined cells within the ovum by
microscopy
Early morula Observation of 5 to 10 cells within the ovum
Late morula Observation of 11 or more cells within the ovum
Blastula Observation of a spherical layer of cells surrounding a pseudo fluid-filled
cavity
Gastrula Observation of a layer of cells surrounding the embryo, plus a kidney shape
invagination in one side of the embryo.
Pre-larva 1
Observation of a larva like structure, coiled, creating no more than one
concentric ring inside the ovum
Pre-larva 2 Observation of a larva like structure, coiled, creating at least one and a half
concentric ring inside the ovum
Larva 1 Observation of a larva, without well defined structures inside the larvae body
wall, absence of molt and intense motility in response to light
Larva 2 Observation of a larva with more defined structures, a molt, and a delayed
motility response to light stimulation
Figure 3.2 Timeline of A. suum Ova Development when incubated in vitro at 28C°
0 1 2 3 4 5 6 7 8 9 10 11 12 13 14 15 16 17 18
Days of incubation
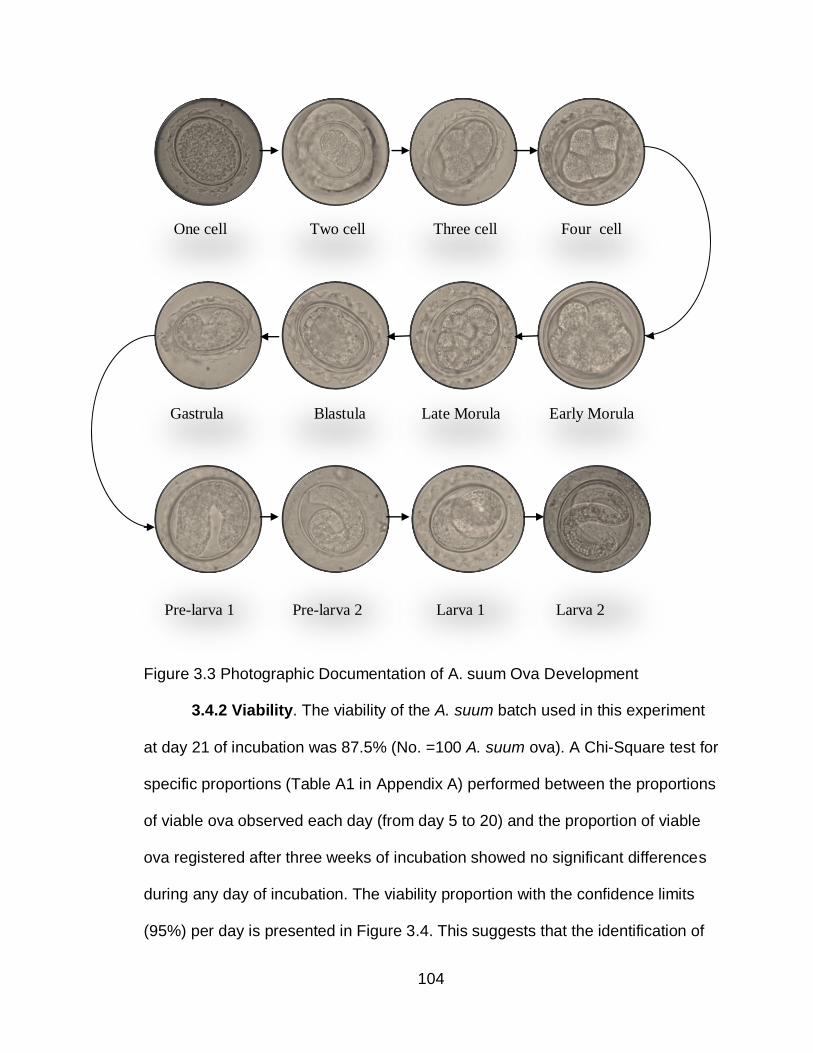
104
One cell Two cell Three cell Four cell
Gastrula Blastula Late Morula Early Morula
Pre-larva 1 Pre-larva 2 Larva 1 Larva 2
Figure 3.3 Photographic Documentation of A. suum Ova Development
3.4.2 Viability. The viability of the A. suum batch used in this experiment
at day 21 of incubation was 87.5% (No. =100 A. suum ova). A Chi-Square test for
specific proportions (Table A1 in Appendix A) performed between the proportions
of viable ova observed each day (from day 5 to 20) and the proportion of viable
ova registered after three weeks of incubation showed no significant differences
during any day of incubation. The viability proportion with the confidence limits
(95%) per day is presented in Figure 3.4. This suggests that the identification of
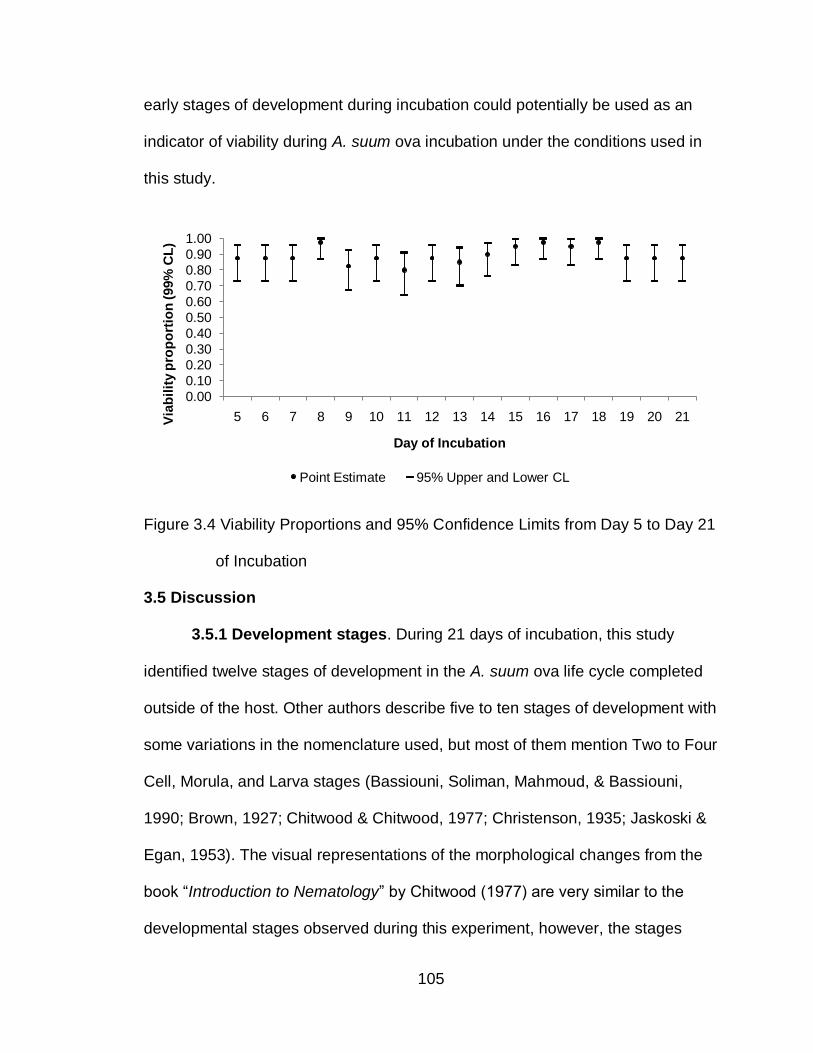
105
early stages of development during incubation could potentially be used as an
indicator of viability during A. suum ova incubation under the conditions used in
this study.
Figure 3.4 Viability Proportions and 95% Confidence Limits from Day 5 to Day 21
of Incubation
3.5 Discussion
3.5.1 Development stages. During 21 days of incubation, this study
identified twelve stages of development in the A. suum ova life cycle completed
outside of the host. Other authors describe five to ten stages of development with
some variations in the nomenclature used, but most of them mention Two to Four
Cell, Morula, and Larva stages (Bassiouni, Soliman, Mahmoud, & Bassiouni,
1990; Brown, 1927; Chitwood & Chitwood, 1977; Christenson, 1935; Jaskoski &
Egan, 1953). The visual representations of the morphological changes from the
book “Introduction to Nematology” by Chitwood (1977) are very similar to the
developmental stages observed during this experiment, however, the stages
0.00
0.10
0.20
0.30
0.40
0.50
0.60
0.70
0.80
0.90
1.00
5 6 7 8 9 10 11 12 13 14 15 16 17 18 19 20 21Via
bil
ity p
rop
ort
ion
(99%
CL
)
Day of Incubation
Point Estimate 95% Upper and Lower CL
106
presented in the book are limited to eight with no information regarding speed of
development and viability (Chitwood & Chitwood, 1977). The two additional
stages preliminary to Larva 1, Pre-larva 1 and Pre-larva 2, were considered after
observing in the microscope that each one persisted continually for at least three
days and presented unique features that differentiate them from other stages.
Both stages were observed the same day (day=10) in the microscope. It is
possible that Pre-larva 1 preceded Pre-lava 2 on day nine of experiment, not
being noticed by the authors due to small numbers of ova observed daily. Larva
2 stage, on the other hand, was observed four days after Larva 1 stage. In this
case, it is also possible that Larva 2 developed before day 16 and could have
been missed due to the small number of ova observed (N=40/day).
There is increasing evidence of an additional development stage, Larva 3,
identified by electron microscope (Fagerholm et al., 2000; Geenen et al., 1999;
Kirchgäßner, Schmahl, Al-Quraishy, Ghaffar, & Mehlhorn, 2008; Maung, 1978).
This stage could be considered as another stage of development or the infective
stage to the host in the future. In the present study, Larva 3 stage was not
reported since it is very difficult to observe by standard microscopy and longer
time of incubation may be required for its development.
3.5.2 Speed of Development. The speed of change from one stage to
another varied during incubation. It took 48 hours to observe 2-Cell ova and less
than 24 hours to notice the development to 4-Cell ova. The continuing stages,
(Early and Late Morula, Blastula and Gastrula) where observed at an
approximate constant rate of development until larvae stages were noticed.
107
There is a gap of three days between Larva 1 and Larva 2 development. As
mentioned before, Larva 2 could have passed unnoticed before day 16. This
suggests that A. suum ova incubated at 28°C require a minimum of 48 hours to
start cleavage but, once they reach this point, development initiates. This
development is fast at the beginning, slows downs and become constant in the
middle, and move more slowly at the end, during larvae development.
Figure 3.1 presents the changes in the speed of development while Figure
3.2 presents the point in time at which each stage was first observed. Both
figures were used as a tool to guide microscopy assessment of A. suum ova
viability in other studies done by the author. It is important to mention that
different factors could affect development during incubation under conditions
similar to this study; that is A. suum ova incubated in vitro with sulfuric acid.
Temperature is one of the most important factors influencing the speed of
development (Arene, 1986). Development takes longer at lower temperatures
and it is faster at higher temperatures, achieving a maximum rate of development
at 31± 1°C (Arene, 1986; Seamster, 1950). Geene et al. (1999), observed Larva
1 after 17 days of incubation at 18-22°C; this study observed Larva 1 stages at
12 days of incubation. Johnson et al. (1998), reported ova with two or more cells
at 48 hours of incubation at 32.5 C°, while this study reported Two cell ova after
72 hours of incubation. Similar to the results presented, Pecson et al., reported
the development of Larva stages at 12 days of incubation at 28°C (Pecson et al.,
2006).
108
3.5.3 Larva Motility Induction. According to the literature Larva motility
with light stimulation is an indication of viability (Caceres et al., 1987; USEPA,
2003). The microscopic evaluation during this experiment revealed different
motility intensity not only in larva but also in pre-larvae stages. Pre-Larva 1 and 2
responded to light stimulation with limited intensity of motility; Larva 1 was very
sensitive to light as it showed active motility immediately after placing the slide in
the microscope. Larva 2, on the other hand, required 5 to 10 minutes in the
microscope before any movement could be noticed. These observations are
consistent with previous research. Johnson et al., reported that some larvae
moved within few minutes of observation in the microscope while others required
5 to 10 minutes (Johnson et al., 1998). Bassiouni et al., observed continuous
motility of first larva stages of Neoascaris vitulorum, a cattle parasite, and
dormant or slight movement in the advanced larvae stages (Bassiouni et al.,
1990).
Larva motility induction is a criteria continuously used over the years to
evaluate larva of Ascaris spp ova viability. Observations in this and other studies
are consistent in the time required (5 to 10 minutes) to induce motility in
advanced larva stages. This is a time consuming criteria during microscopic
evaluation. It could be possible not to use this criterion to determine ova viability
during microscopic evaluation if the following requirements are met: the ova have
not been exposed to any treatment before in vitro incubation; and the shell and
larva inside the ovum are intact and complete.
109
3.5.4 Viability. USEPA standards require a minimum of three weeks of
incubation to report viability. Following this standard, the viability of the A. suum
batch used in this study was of 87.5%. This percentage takes in account larva
stages only. Statistical analysis showed no significant difference when early
stages of development were considered as potentially viable. One study
described similar results after comparing viability at 48 hours of incubation versus
thirty days of incubation (Johnson et al., 1998). No other studies were found
comparing early versus late viability and this is the first one using statistical
analysis to report no significant differences when considering early stages of
development observed continuously during incubation.
During microscopic evaluation, correct identification of Late Morula and
Blastula stages required more time and effort from the researchers. Early stages
and larvae stages were identified easily by microscopy at 100X magnification,
while Late Morula and Blastula stages required more time and higher
magnification as details became more important to classify the ova in the correct
stage. This is one of the limitations of using standard microscopy and a possible
reason to require at least three weeks of incubation with development of larvae to
report Ascaris spp. viability from environmental samples. Pecson et al., (2006)
described similar difficulties. As a consequence of these difficulties, he reported
five stages of development only in his study: 1 cell, 2-3 cell, 4-6 cell, 7 or more
cells, and fully larvated ova (Pecson et al., 2006).
We consider reporting viability early during incubation as a potential
alternative based on the statistical analysis results found in this study: no
110
significant difference between the viability proportions from day 5 to day 21.
Nevertheless, the potential use of early stages of development as viability
indicator would be applicable to in vitro incubation only with ova no previously
exposed to any treatment.
Faster methods, such as PCR, have been proposed as an alternative to
the incubation technique used in the USEPA and Tulane method, since the use
of Ascaris spp. ova to monitor pathogen inactivation in biosolids and wastewater
has increased. The concern with this method is that material and laboratory
equipment to implement it are expensive and the essay requires 10 days of ova
incubation prior to application (Pecson et al., 2006). According to our results,
viability could be established before 10 days of incubation. In addition, PCR has
not been considered as standard procedure by USEPA. In developing countries,
where Ascariasis is highly prevalent and access to sanitation is limited, this may
be a costly alternative for testing viability in environmental samples.
During the experiment, few ova observed presented morphological
abnormalities. These abnormal ova were observed sporadically from day 8-9
until the end of the study. It is presumed that exposure of ova to refrigerated
conditions may be related to the presence of abnormal ova that do not develop to
fully larva stages (Johnson et al., 1998). The ova used in this experiment were
stored at 4°C before utilization.
3.6 Conclusion
A. suum ova went through clearly identified morphological changes at
different speed of development. A total of 12 stages were identified including two
111
additional stages: Pre-larva 1 (larva coiled creating no more than one concentric
ring) and Pre-larva 2 (larva coiled creating at least one and a half concentric
ring).
No significant statistical difference was observed among the viability
reported early in incubation and the one reported after three weeks of in vitro
incubation. If viability of Ascaris spp. ova is defined as a healthy ovum that will
continue its development to become an infective larva under constant in vitro
incubation conditions then, observing the ova under the microscope early during
incubation, instead of waiting up to three-four weeks for the development of a
larva, could be an alternative to reduce the time to report viability.
112
CHAPTER 4.
INACTIVATION OF ASCARIS SUUM BY AMMONIA IN WATER SOLUTION
UNDER LABORATORY CONDITIONS
4.1 Abstract
Background: A wide range of nonconventional sanitation technologies
have been implemented in developing countries to help achieving the sanitation
United Nations Millennium Development Goal. In rural areas of El Salvador, a
waterless sanitation technology, the solar toilet, is a promising system accepted
by the people and national authorities. Analysis suggests that its pathogen
inactivation capacity needs to be improved. Ammonia could be added to the toilet
to improve pathogen inactivation.
Objective: This study evaluated the potential capacity of ammonia to
inactivate a resistant fecal pathogen, Ascaris spp. ova, in a water solution with
temperature and pH values achieved in the solar toilet.
Methods: Permeable Nylon bags with Ascaris suum eggs were exposed,
in triplicates samples, to different ammonia concentrations (0%,1%, 2%) in water,
pH (7.7, 9.3) and temperatures (28°C, 35°C, 40°C, and 45°C) for a period of
three days. After the treatment period pH and ammonia value were measured
and Ascaris suum ova were incubated for 21 days in 0.1N sulfuric acid at 28°C.
113
Ova viability was assessed at the end of incubation by microscopy. A minimum of
200 A. suum ova were observed and the percentage of viable ova were
calculated.
Results: The critical parameters identified to significantly reduce A. suum
ova viability to zero in three days were: temperature of 35°C or higher and 1% to
2% ammonia concentrations with a pH value of 9.3. At 28°C, not significant (X2, p
>0.01) reduction in viability was observed and, at 45°C all A. suum ova were
inactivated independently of pH and ammonia value. A logistic regression
analysis indicates that temperature (OR=1.438) and treatment with ammonia
(OR=2.7322) increase inactivation of the parasite ova.
Conclusions: The results of this study suggest that addition of ammonia to
the solar toilet may increase the pathogen inactivation capacity of the system.
For future studies, it is recommended to evaluate this approach in fecal material
with a larger sample size incorporating other parameters found in the solar toilet
(low moisture and a mixture of soil and lime as additive) before field application is
considered.
Keywords : Sanitation, Ascaris, inactivation, ammonia
114
4.2 Introduction
Access to sustainable sanitation systems is a determining factor in human
health and economic development. It has been estimated that improving access
to safe water and sanitation would reduce, annually, 5.4 billion cases of
diarrhoea and 1.6 million deaths worldwide, mostly, in children less than five
years of age (Hutton & Haller, 2004). However, more than a third of the world’s
population live without access to improved sanitation facilities(WHO/UNICEF,
2010). To meet the sanitation United Nations Millennium Development Goal,
“halve, by 2015, the proportion of people without sustainable access to safe
drinking water and basic sanitation”, at least 1.4 billion people must gain access
to basic sanitation by the year 2015 (United Nations, 2008).
In an effort to provide this basic service, a wide range of non conventional
sanitation technologies have been implemented in developing countries,
including waterless systems (Nelson & Murray, 2008). These systems present a
re-use oriented approach that considers human waste as a resource, instead of a
waste. Water is not used to transport waste and the technology can be built and
implemented in areas lacking sewage systems, deficient in water, or with a high
ground table. The systems functions by diverting urine away from feces and
collecting, storing, and dehydrating the fecal material in watertight dehydration
vaults. Subsequently, the material is removed and transported for use or disposal
by the user (Tilley et al., 2008).
From a public health perspective, adequate inactivation of fecal pathogens
in a sanitation system is essential before any use or disposal of fecal material.
115
Inadequately sanitized fecal material contributes to the spread of fecal pathogens
in the environment and causes a great burden of disease in developing
countries, especially in children (Hutton & Haller, 2004). In rural areas of El
Salvador, two different waterless sanitation technologies have been implemented
and evaluated: double-vault urine diverting toilets (DVUD) and solar toilets (Moe
& Izurieta, 2003). Analysis showed the higher capacity of the solar toilet at
inactivating fecal pathogens and, at reducing the prevalence of parasitic
infections in its users when compared to DVUD toilets and pit latrines (Corrales
et al., 2006). Nevertheless, not all solar toilets are able to inactivate completely
soil transmitted helminthes ova after the recommended storage period, limiting
the use of the treated fecal material as fertilizer/soil conditioner and, probably,
increasing the risk of environmental contamination when disposed of (Moe &
Izurieta, 2003). Increasing the pathogen inactivation capacity of the solar toilet
would improve the technology and the community public health safety.
Un-ionized ammonia (NH3) has the potential to inactivate pathogens in
solutions and sludge, including Ascaris spp. ova, which is considered the most
resistant pathogen in fecal material and a good index of hygiene quality
(Bujoczek, 2001; Chefranova Iu, 1977; Chefranova Iu et al., 1984; Chefranova Iu
et al., 1978; Ghiglietti et al., 1997; Ghiglietti et al., 1995; Mendez et al., 2002;
Metcalf & Eddy, 2003; Pecson et al., 2007; Pecson & Nelson, 2005; World Health
Organization, 2006a). Studies on the inactivation of this parasite ova by ammonia
in human feces are limited, but results from laboratory experiments suggest a
positive inactivation potential (Nordin et al., 2009; Vinnerås et al., 2003).
116
Adding ammonia to the solar toilet could be considered as a potential
approach to improve the technology since the pathogen inactivation effect of this
chemical agent could be potentiated by the alkaline medium and high
temperatures achieved inside the toilet vaults. To evaluate this approach, in the
absence of other chemical compounds present in human feces, a series of
experiments in solution were performed. This study presents the results of the
laboratory experiments using temperature and pH values similar to those
achieved by the solar toilet.
4.3 Methods
4.3.1 Materials. Eggs of the swine Ascaris species, Ascaris suum, bought
from Excelsior Sentinel Inc. (New York), were used as model of the human
species, Ascaris lumbricoides. A stock of 10,000 ova per ml, with an initial
viability of 87.5% (N=200), was prepared from the initial solution and stored at
4°C. The viability of the stock was determined by incubating the ova for a
minimum of three weeks in 0.1N sulfuric acid at 28°C. Nylon bags were created
and used to avoid dispersion of the ova in the media and to facilitate their
collection at the end of the experiments. The nylon mesh, with a 30 micron
opening (CMN-0030-D, Small Parts, Inc.), was cut (1.5” x 3”), folded and sealed
in the parallel open sides with a bag sealer (EF28264, A. Daigger & Company).
After placing one milliliter of the A. suum ova stock solution inside the bag, the
open side was completely sealed and the bag was stored in de-ionized (DI) water
until used.
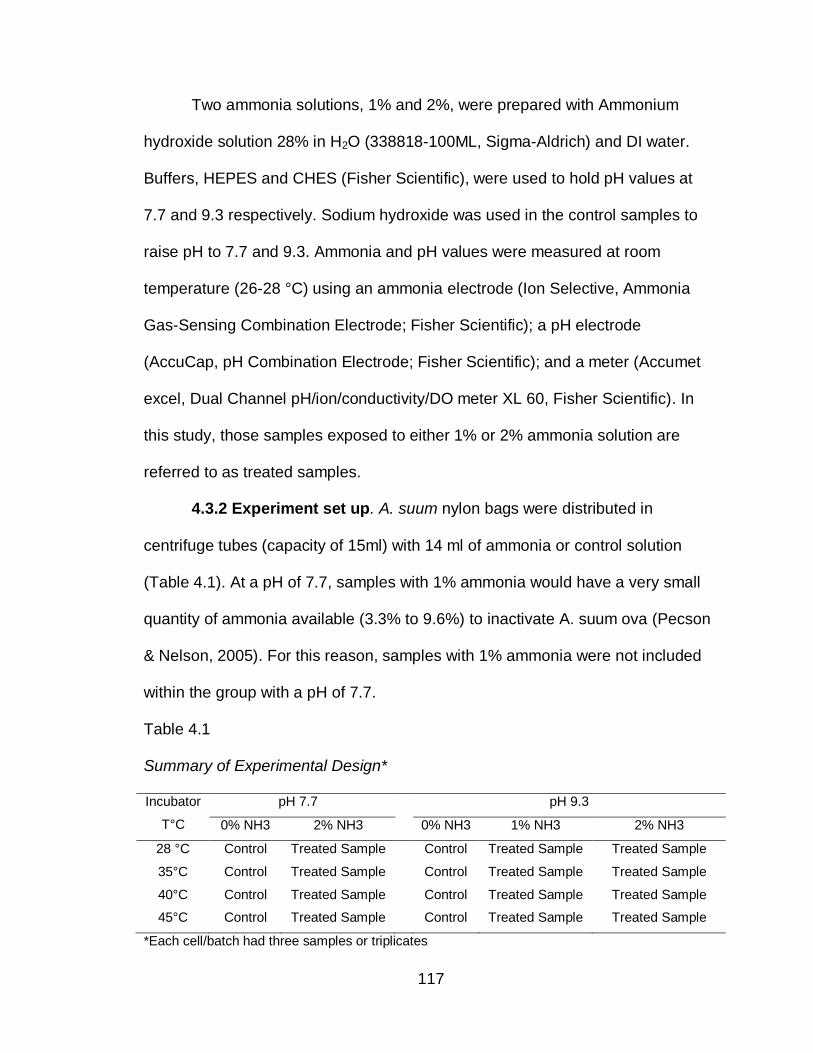
117
Two ammonia solutions, 1% and 2%, were prepared with Ammonium
hydroxide solution 28% in H2O (338818-100ML, Sigma-Aldrich) and DI water.
Buffers, HEPES and CHES (Fisher Scientific), were used to hold pH values at
7.7 and 9.3 respectively. Sodium hydroxide was used in the control samples to
raise pH to 7.7 and 9.3. Ammonia and pH values were measured at room
temperature (26-28 °C) using an ammonia electrode (Ion Selective, Ammonia
Gas-Sensing Combination Electrode; Fisher Scientific); a pH electrode
(AccuCap, pH Combination Electrode; Fisher Scientific); and a meter (Accumet
excel, Dual Channel pH/ion/conductivity/DO meter XL 60, Fisher Scientific). In
this study, those samples exposed to either 1% or 2% ammonia solution are
referred to as treated samples.
4.3.2 Experiment set up. A. suum nylon bags were distributed in
centrifuge tubes (capacity of 15ml) with 14 ml of ammonia or control solution
(Table 4.1). At a pH of 7.7, samples with 1% ammonia would have a very small
quantity of ammonia available (3.3% to 9.6%) to inactivate A. suum ova (Pecson
& Nelson, 2005). For this reason, samples with 1% ammonia were not included
within the group with a pH of 7.7.
Table 4.1
Summary of Experimental Design*
Incubator
T°C
pH 7.7 pH 9.3
0% NH3 2% NH3 0% NH3 1% NH3 2% NH3
28 °C Control Treated Sample Control Treated Sample Treated Sample
35°C Control Treated Sample Control Treated Sample Treated Sample
40°C Control Treated Sample Control Treated Sample Treated Sample
45°C Control Treated Sample Control Treated Sample Treated Sample
*Each cell/batch had three samples or triplicates
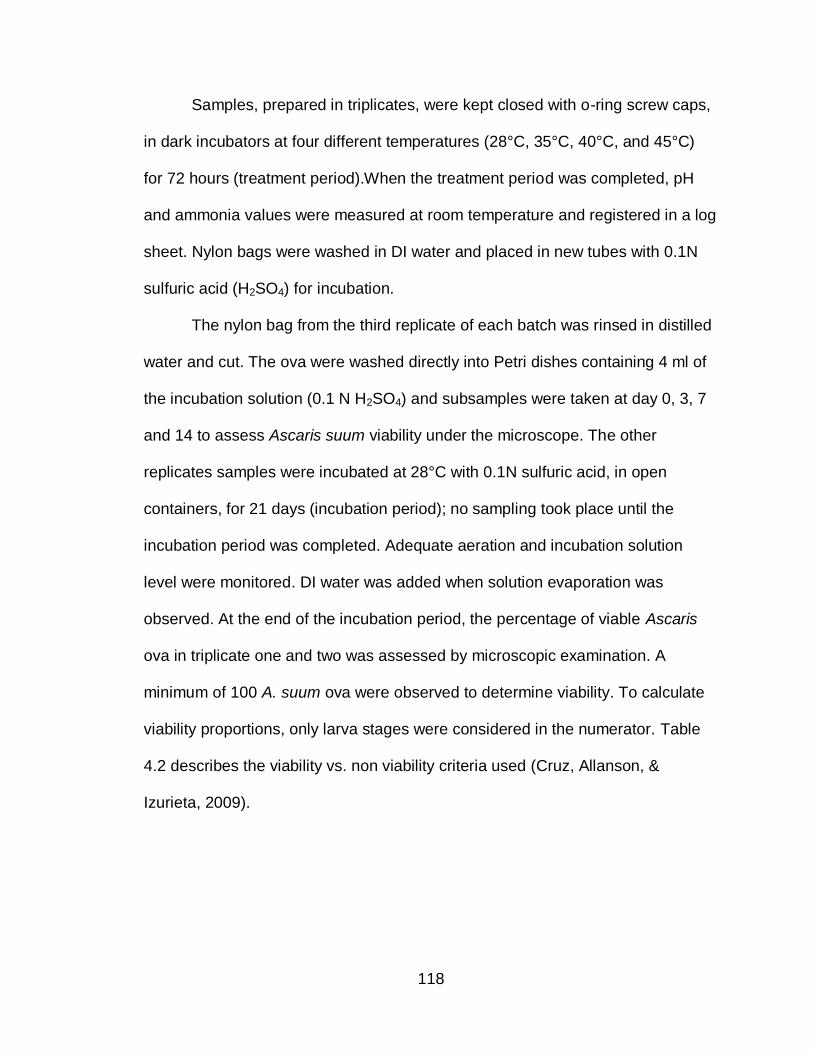
118
Samples, prepared in triplicates, were kept closed with o-ring screw caps,
in dark incubators at four different temperatures (28°C, 35°C, 40°C, and 45°C)
for 72 hours (treatment period).When the treatment period was completed, pH
and ammonia values were measured at room temperature and registered in a log
sheet. Nylon bags were washed in DI water and placed in new tubes with 0.1N
sulfuric acid (H2SO4) for incubation.
The nylon bag from the third replicate of each batch was rinsed in distilled
water and cut. The ova were washed directly into Petri dishes containing 4 ml of
the incubation solution (0.1 N H2SO4) and subsamples were taken at day 0, 3, 7
and 14 to assess Ascaris suum viability under the microscope. The other
replicates samples were incubated at 28°C with 0.1N sulfuric acid, in open
containers, for 21 days (incubation period); no sampling took place until the
incubation period was completed. Adequate aeration and incubation solution
level were monitored. DI water was added when solution evaporation was
observed. At the end of the incubation period, the percentage of viable Ascaris
ova in triplicate one and two was assessed by microscopic examination. A
minimum of 100 A. suum ova were observed to determine viability. To calculate
viability proportions, only larva stages were considered in the numerator. Table
4.2 describes the viability vs. non viability criteria used (Cruz, Allanson, &
Izurieta, 2009).
119
Table 4.2
Criteria to Identify Stage of Development and Viability of Ascaris suum Ova by Microscopy
Non viable ova* Viable ova
Ovum with:
Contraction, rupture and loss of the
ovum membrane continuity.
Poorly defined structures
Intact ovum in any of the following stages:
One to Four Cell : Observation of 1, 2, 3,
or 4 clearly well defined cells within the
ovum
Cellular condensation
Granulated or vacuolated cytoplasm
Early morula: Observation of 5 to 10 cells
within the ovum.
No larvae movement observed by
microscope light stimulation
Late morula: Observation of 11 or more
cells within the ovum.
Blastula: Observation of a spherical layer
of cells surrounding a pseudo fluid-filled
cavity.
Gastrula: Observation of a layer of cells
surrounding the embryo, plus a kidney
shape invagination in one side of the
embryo.
Pre-larva 1: Observation of a larva like
structure, coiled, creating no more than one
concentric ring inside the ovum.
Pre-larva 2: Observation of a larva like
structure, coiled, creating at least one and a
half concentric ring inside the ovum.
Larvae 1: Observation of a larvae
structure within the ovum, without well
defined structures inside the larvae wall,
absence of molt and intense motility in
response to light.
Larva 2: Observation of more defined
structures within the larva, a molt, and a
delayed motility response to light
stimulation. *Adapted from Caceres et al, 1987
4.3.3 Statistical analysis. The results of the experiments were introduced
in Excel 2007 and imported to SAS system software (version 9.2, SAS Institute
Inc., Cary, NC, USA) for analysis. Descriptive statistics (mean and standard
120
deviation) of ammonia, pH and temperature measurements were calculated. Chi-
square test for proportions was used to test viability proportions differences (p
value < 0.01) between samples. A logistic regression analysis, relating A. suum
inactivation (ovum inactivated /ovum viable) to the independent predictors, was
developed. The dependent variable, A. suum inactivation, was defined as not
inactivated when viability was greater than 0% and, inactivated, when viability
was equal to 0%. Predictor variables included Temperature (28°C, 35°C, 40°C,
and 45°C), pH (7.7, 9.3) and Treatment (0% ammonia, 1% ammonia, 2%
ammonia). Univariate and logistic regression analysis were performed and the
decision to include terms in the final model was based on the likelihood ratio test
and the adequacy of the model using the Hosmer and Lemeshow and Deviance
Goodness of Fit tests.
4.4 Results
4.4.1 Monitoring ammonia and pH. Ammonia concentration of solutions
were measured after preparing and placing the samples in the incubators. The
values registered with the ammonia probe were: 252.9 ppm for 2% NH3 solution
(pH of 7.7); 4,360.1 ppm for 1% NH3 solution (pH=9.3); and 8,392.8 ppm for 2%
NH3 solution(pH=9.3). These initial measurements were taken at room
temperature (26-28°C). After 72 hours of treatment, samples were open and
ammonia solution was measured again along with the pH value (Table 4.3).
Before the second measurement, samples were left outside the incubator to
adjust to room temperature (26.3°C ± 1.42°C).
After three days of treatment the pH value of the control samples placed at
a pH=7.7 and pH=9.3, decreased to a mean value of 5.3 (± 0.47) and 5.4
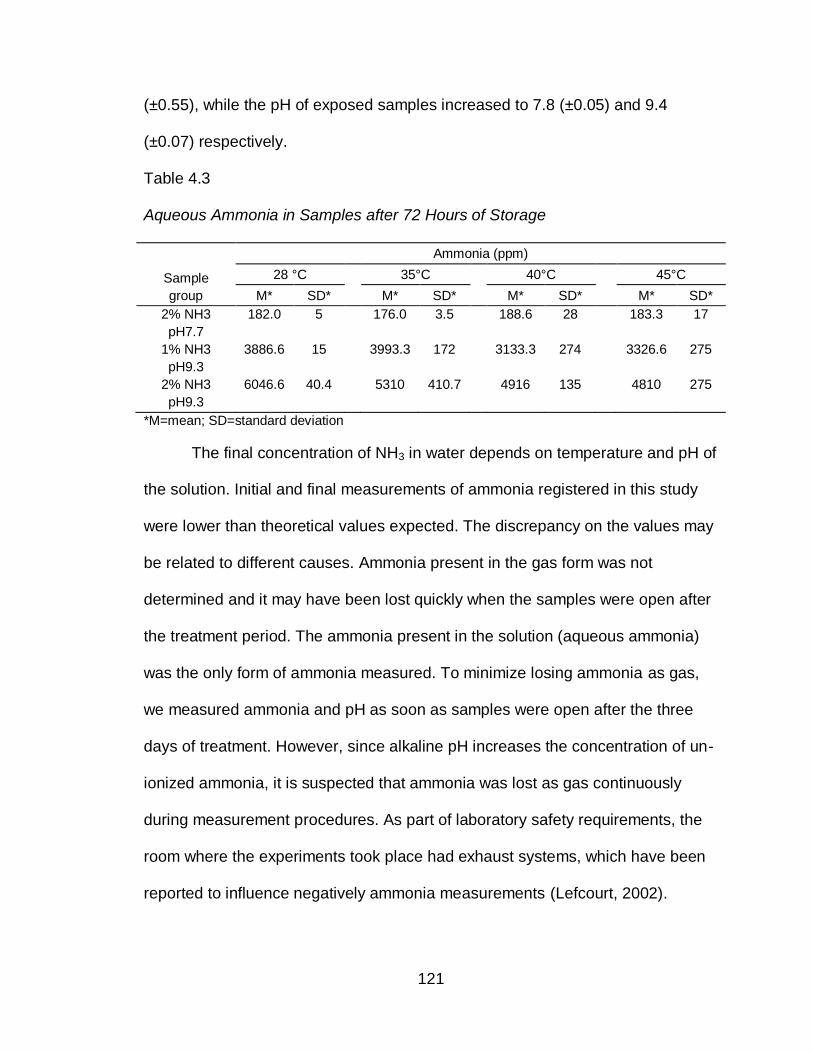
121
(±0.55), while the pH of exposed samples increased to 7.8 (±0.05) and 9.4
(±0.07) respectively.
Table 4.3
Aqueous Ammonia in Samples after 72 Hours of Storage
Sample
group
Ammonia (ppm)
28 °C 35°C 40°C 45°C
M* SD* M* SD* M* SD* M* SD*
2% NH3
pH7.7
182.0
5 176.0
3.5 188.6
28 183.3
17
1% NH3
pH9.3
3886.6 15 3993.3
172 3133.3
274 3326.6
275
2% NH3
pH9.3
6046.6 40.4 5310
410.7 4916
135 4810
275
*M=mean; SD=standard deviation
The final concentration of NH3 in water depends on temperature and pH of
the solution. Initial and final measurements of ammonia registered in this study
were lower than theoretical values expected. The discrepancy on the values may
be related to different causes. Ammonia present in the gas form was not
determined and it may have been lost quickly when the samples were open after
the treatment period. The ammonia present in the solution (aqueous ammonia)
was the only form of ammonia measured. To minimize losing ammonia as gas,
we measured ammonia and pH as soon as samples were open after the three
days of treatment. However, since alkaline pH increases the concentration of un-
ionized ammonia, it is suspected that ammonia was lost as gas continuously
during measurement procedures. As part of laboratory safety requirements, the
room where the experiments took place had exhaust systems, which have been
reported to influence negatively ammonia measurements (Lefcourt, 2002).
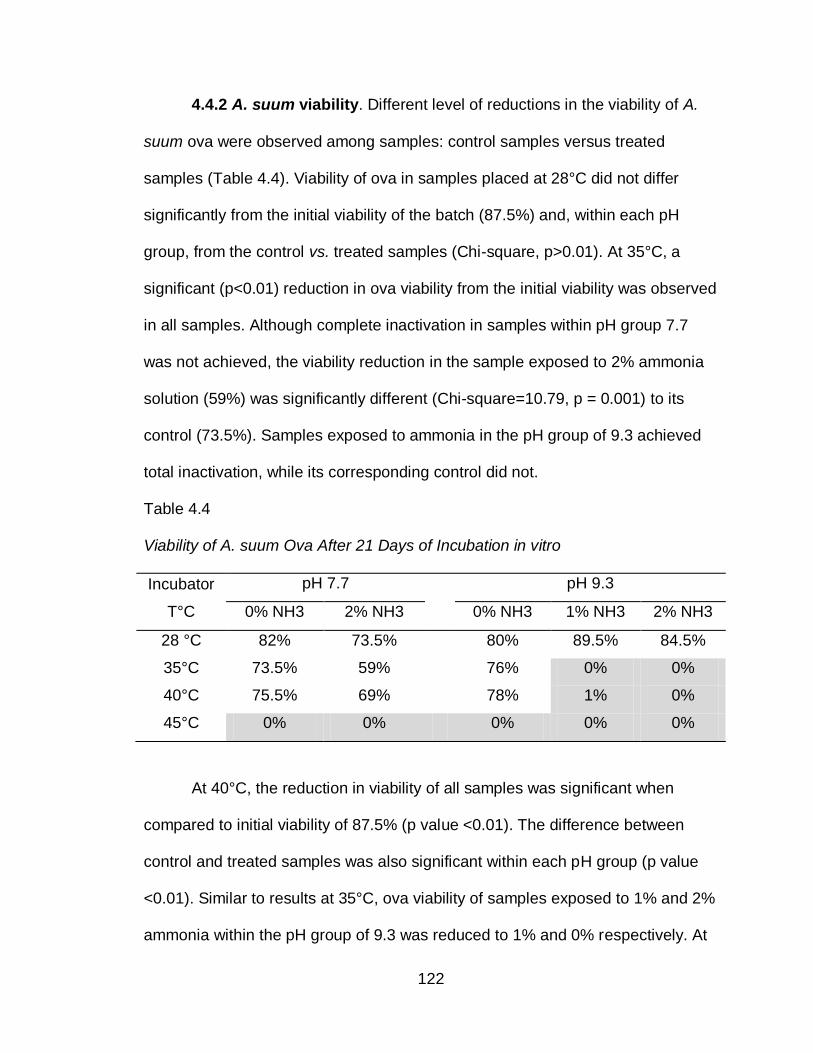
122
4.4.2 A. suum viability. Different level of reductions in the viability of A.
suum ova were observed among samples: control samples versus treated
samples (Table 4.4). Viability of ova in samples placed at 28°C did not differ
significantly from the initial viability of the batch (87.5%) and, within each pH
group, from the control vs. treated samples (Chi-square, p>0.01). At 35°C, a
significant (p<0.01) reduction in ova viability from the initial viability was observed
in all samples. Although complete inactivation in samples within pH group 7.7
was not achieved, the viability reduction in the sample exposed to 2% ammonia
solution (59%) was significantly different (Chi-square=10.79, p = 0.001) to its
control (73.5%). Samples exposed to ammonia in the pH group of 9.3 achieved
total inactivation, while its corresponding control did not.
Table 4.4
Viability of A. suum Ova After 21 Days of Incubation in vitro
Incubator
T°C
pH 7.7 pH 9.3
0% NH3 2% NH3 0% NH3 1% NH3 2% NH3
28 °C 82% 73.5% 80% 89.5% 84.5%
35°C 73.5% 59% 76% 0% 0%
40°C 75.5% 69% 78% 1% 0%
45°C 0% 0% 0% 0% 0%
At 40°C, the reduction in viability of all samples was significant when
compared to initial viability of 87.5% (p value <0.01). The difference between
control and treated samples was also significant within each pH group (p value
<0.01). Similar to results at 35°C, ova viability of samples exposed to 1% and 2%
ammonia within the pH group of 9.3 was reduced to 1% and 0% respectively. At
123
45°C, the viability of all samples was reduced to 0% independently of pH value
and ammonia concentration in the solution.
4.4.3 Probability model of A. suum inactivation with ammonia. The
logistic regression model included Temperature (28°C, 35°C, 40°C, and 45°C),
pH (7.7, 9.3) and Treatment (0%, 1%, 2% ammonia) as potential predictors.
Treatment and pH, were first removed from the model (p > 0.05). In theory, pH
and treatment are correlated since pH influences the amount of un-ionized
ammonia available (Emerson et al., 1975). Nevertheless, our analysis found that
the correlation between these two variables was not significant (p=0.09). This
finding may have been due to the small sample size of this study (N=20). When
each ovum observed in the microscope was considered as a single event in the
database, the correlation between the variables was highly significant (p <
0.0001). In spite of this, the small database (N=20) was used to estimate the
effect of each variable in the logistic regression model, since initial viability of the
A. suum batch (87.5%) evidenced the possibility of observing inactivated ova
without exposing them to any treatment.
The predictor Treatment was added back into the model after assessing
the goodness of fit test which showed a better fitted model (Deviance, p = 0.37;
Hosmer and Lemeshow Test, p=0.95) when this variable was included along with
Temperature as predictors (Table 4.5).
According to the model increasing temperature increases the probability of
inactivating 100% ova by 43%, holding other predictors constant. For treatment,
adding ammonia to the solution more than double the probability of inactivating
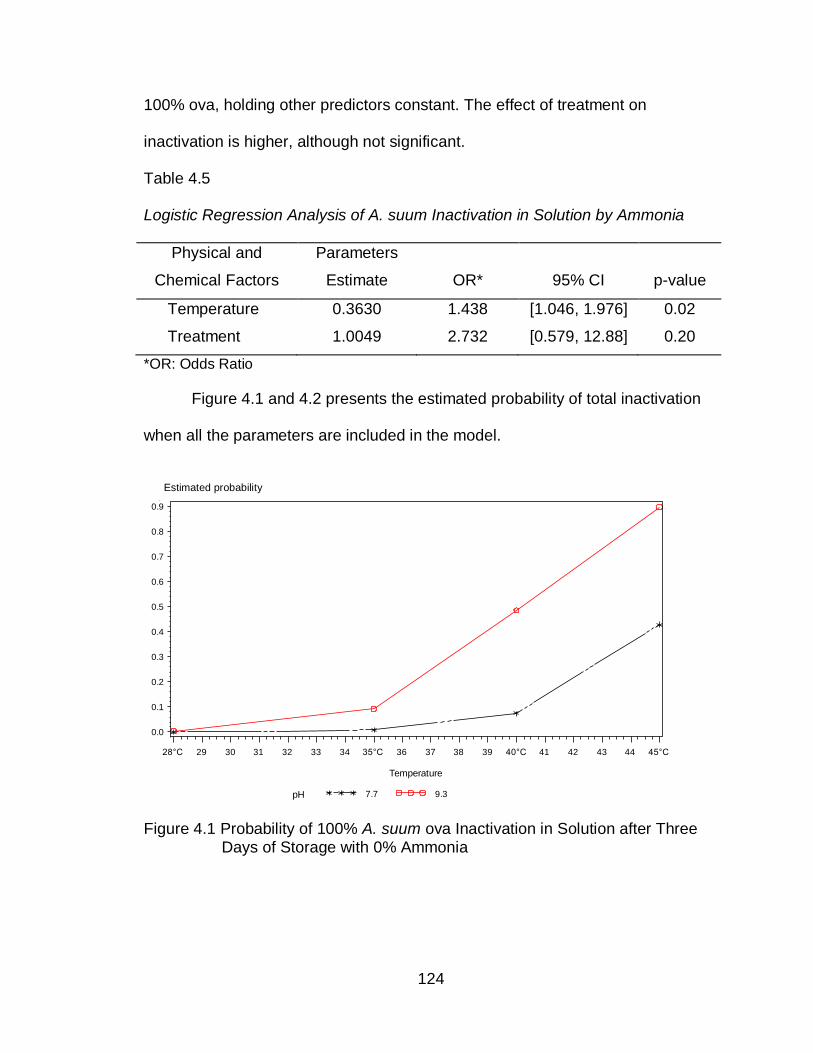
124
100% ova, holding other predictors constant. The effect of treatment on
inactivation is higher, although not significant.
Table 4.5
Logistic Regression Analysis of A. suum Inactivation in Solution by Ammonia
Physical and
Chemical Factors
Parameters
Estimate OR* 95% CI p-value
Temperature 0.3630 1.438 [1.046, 1.976] 0.02
Treatment 1.0049 2.732 [0.579, 12.88] 0.20
*OR: Odds Ratio
Figure 4.1 and 4.2 presents the estimated probability of total inactivation
when all the parameters are included in the model.
Figure 4.1 Probability of 100% A. suum ova Inactivation in Solution after Three Days of Storage with 0% Ammonia
Estimated Probability
0.0
0.1
0.2
0.3
0.4
0.5
0.6
0.7
0.8
0.9
Temperature
28°C 29 30 31 32 33 34 35°C 36 37 38 39 40°C 41 42 43 44 45°C
Logistic regression model, 20 units, all var: ph and tx not significant, model adequateTreatment=0%
pH 7.7 9.3
Estimated probability
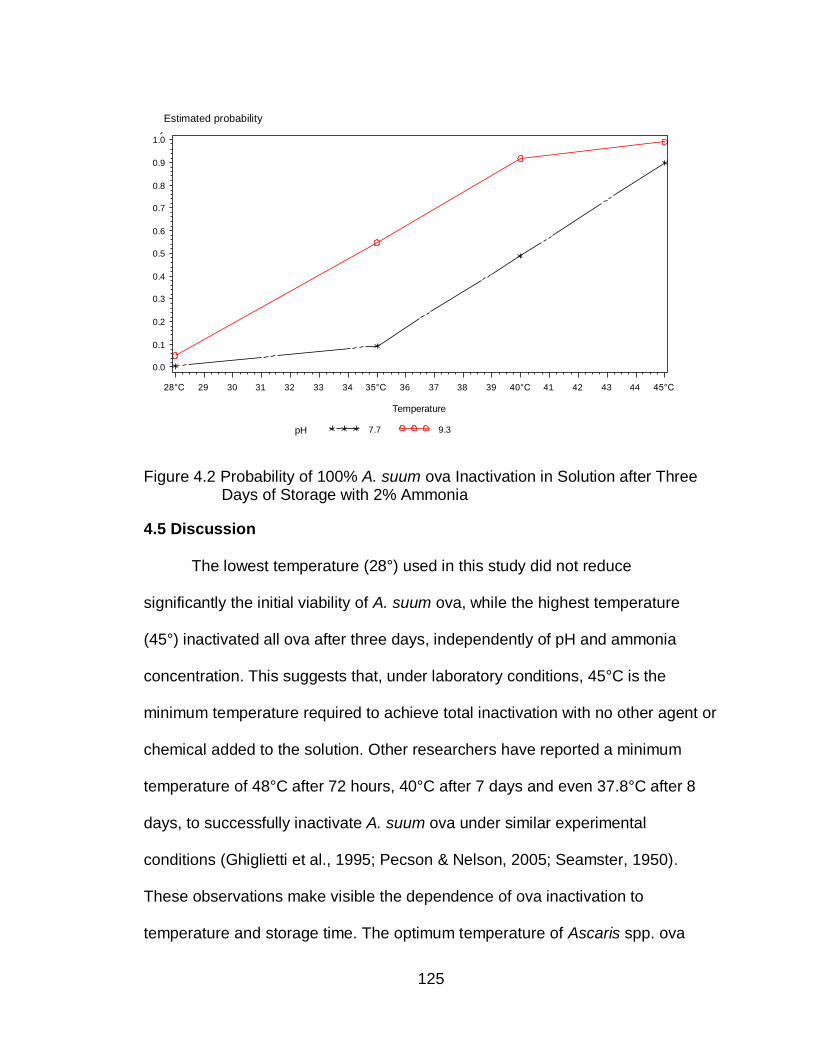
125
Figure 4.2 Probability of 100% A. suum ova Inactivation in Solution after Three Days of Storage with 2% Ammonia
4.5 Discussion
The lowest temperature (28°) used in this study did not reduce
significantly the initial viability of A. suum ova, while the highest temperature
(45°) inactivated all ova after three days, independently of pH and ammonia
concentration. This suggests that, under laboratory conditions, 45°C is the
minimum temperature required to achieve total inactivation with no other agent or
chemical added to the solution. Other researchers have reported a minimum
temperature of 48°C after 72 hours, 40°C after 7 days and even 37.8°C after 8
days, to successfully inactivate A. suum ova under similar experimental
conditions (Ghiglietti et al., 1995; Pecson & Nelson, 2005; Seamster, 1950).
These observations make visible the dependence of ova inactivation to
temperature and storage time. The optimum temperature of Ascaris spp. ova
Estimated Probability
0.0
0.1
0.2
0.3
0.4
0.5
0.6
0.7
0.8
0.9
1.0
Temperature
28°C 29 30 31 32 33 34 35°C 36 37 38 39 40°C 41 42 43 44 45°C
Logistic regression model, 20 units, all var: ph and tx not significant, model adequateTreatment=2%
pH 7.7 9.3
Estimated probability
126
development under laboratory conditions reported in the literature is 31.1°C,
while the maximum temperature at which Ascaris spp. ova have been observed
to develop is 37.2°C (Arene, 1986; Seamster, 1950)
In our study, total inactivation was achieved at 35° and 40°C in less than
three days in those samples exposed to 1% to 2% ammonia with a pH of 9.3,
with the exception of the sample exposed to 1% ammonia at 40°C. The 1%
viability registered in this sample, could have resulted from contamination when
opening the nylon bag since two of the three replicates did achieved 100%
inactivation. Samples exposed to lower pH values (7.7) but to the same
temperature and ammonia concentration (2%) did not accomplish the same
inactivation level. The pH value of the solution influences the concentration of the
ionized form (NH4+) and the un-ionized form (NH3) of ammonia available. Un-
ionized ammonia is the toxic form of ammonia to the parasite ova. An increment
of pH is correlated with an increase of the un-ionized form and, theoretically, pH
values greater than 8 are needed to have substantial amounts of un-ionized
ammonia (Emerson et al., 1975; Rayner-Canham, 1996). This indicate that
samples exposed to a pH of 7.7 and 2% ammonia had lower concentrations of
ammonia compared to samples with pH values of 9.3 and, therefore, less
capacity to inactivate the parasite ova. These observations are consistent with
the theory and with previous publications. Pecson and Nelson (2005) reported
increasing inactivation by ammonia in solution with increasing pH values from 7
to 11.
127
This is the first attempt to model inactivation of A. suum ova in solution by
ammonia, using temperature (28°C to 45°), pH (7.7, 9.3) and different ammonia
concentrations (0%, 1%, and 2%). There are some models reported in the
literature of Ascaris spp ova inactivation in sludge and biosolids (Nordin et al.,
2009). Still, only few authors have published about inactivation of Ascaris spp.
ova in solution by ammonia but no model of inactivation has been reported
(Ghiglietti et al., 1995; Pecson & Nelson, 2005). The model created in this study,
indicates that ammonia treatment and temperature have an important influence
in the probability of total inactivation of A. suum ova in solutions. The effect of
ammonia (OR = 2.7) doubles the effect of temperature (OR=1.4). As mentioned
previously, the variable pH was excluded from the model because it is correlated
with the variable Treatment. For future studies, a larger sample size is
recommended to confirm the effect of both variables in the inactivation process
and to show the co-linearity of pH and treatment with ammonia.
The mechanism by which ammonia inactivates Ascaris spp. ova is not well
understood yet. Pecson et al., (2005) suggested that temperature increases the
permeability of the lipid membrane of the egg-shell allowing the diffusion of un-
ionized ammonia into the ovum, with the subsequent increase of intracellular pH
and inactivation of the parasite (Pecson & Nelson, 2005). Nordin et al., (2007)
also suggested that ammonia inactivation depends on shell permeability
influenced by temperature. This hypothesis is consistent with our observations of
greater ova inactivation by ammonia with increasing temperature.
128
A limitation of the study is the difference found between expected and
measured ammonia values. As mentioned before, this could have been related to
different causes. The increased pH values registered in the second
measurement suggest that ammonia was not lost during the treatment period.
The amount of ammonia entering the ova parasite has not been estimated yet,
but it may have also influenced the differences in ammonia value found. For
future research, measuring ammonia as gas, in addition to measuring the
concentration in water, is recommended to obtain a better estimation of ammonia
concentration.
In this study, the critical parameters identified to significantly reduce A.
suum ova viability to 0% in three days were: temperature of 35°C or higher and
1% to 2% ammonia concentrations with a pH value of 9.3. Inside the solar toilets
vaults temperatures as high as 41.5°C have been registered with pH values of
the fecal material ranging from 8.9 to 12.4 (Izurieta et al., 2006; Moe & Izurieta,
2003). This indicates that addition of ammonia to the solar toilet may increase the
pathogen inactivation capacity of the system to a point, that even the most
resistant fecal pathogens could be inactivated before fecal material is removed
from the toilet vault. This would result in a reduction of environmental
contamination, better public health safety and the possibility to use the final
material as fertilizer or soil conditioner by the user. However, these experiments
were done in water solution and the fecal material present in the solar toilet have
moisture less than 52% (wet based). Using the critical parameters found in this
study, a small pilot test (results not shown) with fecal material (moisture < 30%
129
and urea as source of ammonia), resulted in total inactivation of A. suum ova.
For future studies, it is recommended to evaluate this approach in fecal material
with a larger sample size incorporating other parameters found in the solar toilet
(low moisture and a mixture of soil and lime as additive) before field application is
considered.
130
CHAPTER 5.
INACTIVATION OF A. SUUM OVA BY AMMONIA IN FECES UNDER
LABORATORY CONDITIONS
5.1 Abstract
Background: A variety of non conventional sanitation systems, with a re-
use oriented approach, have been implemented in developing countries. A main
safety requirement of these technologies is the fecal pathogen inactivation. In
rural-agricultural areas of El Salvador, the solar toilet has shown the
effectiveness of this non conventional system at inactivating fecal pathogens and
reducing the prevalence of parasitic infections in its users but; not all solar toilets
units are able to inactivate completely Ascaris spp. ova. Addition of ammonia
could improve the system since previous laboratory work has shown its potential
when exposed to the physical and chemical conditions achieved in the solar
toilet.
Objective: The present study evaluated the use of ammonia to sanitize
fecal material in laboratory conditions incorporating all physical and chemical
parameters of the solar toilet: low moisture; temperature values ranging from
131
28°C to 45°C; alkaline pH; additive created from a mixture of dirt and lime; 56
days of storage; and 1%-2% urea as source of ammonia.
Methods: To simulate the material inside the toilet’s vault (biosolid),
human feces were collected and mixed with the equivalent of a cup of additive.
Eggs of the swine Ascaris species, Ascaris suum, were used as model and urea
was used as the source of ammonia. Three groups of samples (biosolid with 0%
urea, biosolid with 1% urea, and biosolid with 2% urea) were placed in
duplicates, closed, at four different temperatures (28°C, 35°C, 40°C , and 45°C),
Samples were removed on day 1, 3, 7, 14, 21, 28, 35, 42, 49 and 56. pH,
ammonia and moisture were measured from each sample removed from the
incubator and, each A. suum ova nylon bag was placed for incubation in sulfuric
acid (0.1 N) for 21 days. After incubation, parasite ova viability was evaluated in
the microscope (minimum of 100 ova). Survival and logistic regression analysis
were performed in SAS 9.1.3.
Results: The inactivation of A. suum ova was faster in samples exposed to
urea and to temperatures higher than 28°C. Samples without urea never reached
a 100% inactivation at 28°C within the 56 days of storage. All samples exposed
to urea achieved 100% inactivation after 14 days (28°C), 3 days (35°C) and 24
hours (40°C and 45°C). Survival analysis of the data showed that there was a
significant difference (p value <.0001) between the inactivation achieved in the
samples exposed to urea (1% and 2%) and the samples not exposed to urea The
logistic regression model was significant (p<0.0001) and included the predictors:
Temperature (OR: 1.8), Treatment (OR: 25.9), and Storage (OR:1.17). The
132
Goodness-of-Fit tests showed that the model fitted the data (Deviance = 1.0000;
Hosmer and Lemeshow = 0.9868).
Conclusion: The results of this study suggest that inactivation of Ascaris
spp ova by ammonia is possible in fecal material stored in the solar toilet or any
other dry toilet, if the following physical and chemical conditions are met: a
closed vault with a minimum temperature of 28°C; an initial pH of 8.3, minimum
moisture of 27.5%, and addition of 1% urea to the biosolid. At 28°C longer
storage time would be required for 100% inactivation while at higher
temperatures less time of storage would be necessary. A community intervention
is recommended to include field conditions and human behavior as other
predictors for Ascaris spp. inactivation.
Keywords: ammonia, inactivation, Ascaris, sanitation, dry toilet
133
5.2 Introduction
Providing basic sanitation continues to be a challenge in the 21th century,
despite the United Nations Millennium Development Goal (MDG) of reducing by
half the proportion of people without sustainable access to safe drinking water
and basic sanitation by 2015. About 2.6 billion people lack access to basic
sanitation and 1.1 billion still practice open defecation. This situation contributes
to the spread of human pathogens in soil and water and increases the risk of
transmission of many infectious diseases (WHO/UNICEF, 2010). Among the
main diseases are water and sanitation related illnesses which account for 80%
of diseases in developing countries (Water Advocates, 2009). Diarrhoea is
directly caused by fecal pathogens and results in 4 billion cases and 1.8 million
deaths annually, most of them (90%) among children under five (UNICEF, 2005).
Fifty percent of malnutrition is associated with repeated diarrhoea episodes and
intestinal nematode infections, illnesses linked to inadequate sanitation (World
Health Organization, 2006b). In addition, the United Nations estimated that
solving the problems of water and sanitation will make a 30% contribution, on
average, towards meeting the other Millennium Development Goals (MDG)
including child survival, improved maternal health, primary and secondary
education, gender equality, environment, and hunger alleviation (United Nations
Secretary-General's Advisory Board on Water and Sanitation, 2007).
The implementation of conventional sanitation systems represent an
expensive and inappropriate option in developing countries where seven out of
10 people without improved sanitation live in rural areas (WHO/UNICEF, 2010).
134
As an alternative, a variety of non conventional sanitation systems (NCSS), with
a reuse-oriented approach, have been implemented. Many of the NCSS offer
more environmental and long-lasting technologies,align with the main objective of
sustainable sanitation, “to protect and promote human health by providing a
clean environment and breaking the cycle of disease”(Rosemarin et al., 2008).
The use of this type of technology is also driven by other issues such as
increasing water scarcity; degradation of freshwater resources; environmental
sustainability; and the potential use of biosolid nutrient content for food
production (IWMI, 2010; Rosemarin et al., 2008; World Health Organization,
2006a).
One of the main requirements of a sustainable sanitation system is the
risk reduction to fecal pathogens exposure from the point of collection of fecal
material to the point of reuse or disposal (Rosemarin et al., 2008). This criterion
is of extreme importance to public health to break the fecal-oral transmission of
diseases. In rural-agricultural areas of El Salvador, analysis of the inactivation
capacity of a waterless sanitation system, the solar toilet, have shown the
effectiveness of the toilet at inactivating fecal pathogens and reducing the
prevalence of parasitic infections in its users when compared to double-vault
urine diverting toilets (DVUD) toilets and pit latrines (Corrales et al., 2006). The
solar toilet is an improved dry toilet design that uses high pH additives, a simple
solar panel, and six weeks of storage to generate a product that meets the
United States Environmental Protection Agency fecal coliforms standard (< 1000
Fecal Coliforms per gram). Nevertheless, not all solar toilets are able to
135
inactivate completely Ascaris spp. ova after the recommended storage period,
limiting the use of the treated fecal material as fertilizer/soil conditioner and,
probably, increasing the risk of environmental contamination if dispose of
incorrectly (Moe & Izurieta, 2003). Ascaris spp. ova are one of the most resistant
pathogens present in feces (Feachem et al., 1983). This unique characteristic
has made this parasite an indicator and index of hygiene quality (World Health
Organization, 2006a).
In an effort to improve this technology, the addition of a new additive to the
solar toilet has been proposed (not published, Cruz et al., 2010). This additive,
ammonia, would allow the use of the sanitized fecal material after treated as a
soil conditioner. Ammonia (NH3) has the potential to inactivate pathogens in
solutions and sludge, including Ascaris spp. ova (Bujoczek, 2001; Chefranova Iu,
1977; Chefranova Iu et al., 1984; Chefranova Iu et al., 1978; Ghiglietti et al.,
1997; Ghiglietti et al., 1995; Mendez et al., 2002; Metcalf & Eddy, 2003; Pecson
et al., 2007; Pecson & Nelson, 2005; World Health Organization, 2006a). Studies
on the inactivation of this parasite by ammonia in human feces are limited, but
results from laboratory experiments suggest a positive inactivation potential
(Nordin et al., 2009; Vinnerås et al., 2003).
An evaluation of the inactivation capacity of this additive in solution, using
Ascaris suum ova and temperatures and pH values of the solar toilet, resulted in
100% inactivation suggesting that adding ammonia to the solar toilet may
improve the technology. An additional small pilot test, carried out by our team,
(three samples placed at 35°C for three days) with fecal material (moisture <
136
30% and urea as source of ammonia), provided further evidence of the potential
used of ammonia to inactivate A. suum ova (not published, Cruz et al., 2010).
The present study evaluated the use of ammonia to sanitize fecal material in
laboratory conditions with a larger sample size and incorporating all physical and
chemical parameters of the solar toilet: low moisture; temperature values ranging
from 28°C to 45°C; alkaline pH; additive created from a mixture of dirt and lime;
56 days of storage; and urea (as source of ammonia) at 1% and 2%
concentration.
5.3 Methods
5.3.1 Materials. To simulate the material inside the toilet’s vault, human
feces were collected in a stool container (Commode Specimen Collection
System, Fisher Scientific 02-544-208) from healthy volunteers between 21 and
60 years old. Following the practice of the solar toilet users in El Salvador, the
equivalent of a cup of additive was added by the volunteer to the container after
defecation (Ministerio de Salud Publica y Asistencia Social, 2004). Dirt and lime
(Certified Calcium Hydroxide, Fisher Scientific) were used to prepare the additive
(1:60 volume, lime to dirt). Using try and error, the combination of 1 part lime
volume to 60 part dirt volume was chosen from different combinations based on
the final pH produced after mixing the additive with fecal material: pH of 8.3 when
a cup of additive is mixed with 520 g of feces, and pH of 9.8 when a cup of
additive is mixed with 130 g if fecal material. A maximum pH of 10 has been
reported to be the breaking point for urea transformation to ammonia in feces
(Nordin et al., 2009). In the laboratory, the material of each stool container was
137
mixed to homogenize it for five minutes, clockwise, and stored at room
temperature, closed, until used. In this study we used the term biosolid to refer to
the fecal material mixed with additive.
Eggs of the swine Ascaris species, Ascaris suum, bought from Excelsior
Sentinel Inc. (New York), were used as model of Ascaris lumbricoides. The initial
viability of the ova stock, determined by incubating the ova for a minimum of
three weeks in 0.1N sulfuric acid at 28°C, was 70% (N=600). Nylon bags were
created and used to avoid dispersion of the ova in the biosolid and to facilitate
their collection at the end of the experiments. The nylon mesh (20 micron
opening; NC9252629, Fisher Scientific) was cut (1.5” x 3”), folded, and sealed in
the parallel open sides with a bag sealer (EF28264, A. Daigger & Company).
After placing 200 µl of the A. suum ova stock solution inside the nylon bag (1ml ≈
60,000 ova), the open side was completely sealed and the bag was stored in de-
ionized (DI) water at 4°C until used.
Biosolid (17,231 grams of feces mixed with additive) were placed in one
storage bin, mixed for 10 minutes with a wood stick, clockwise and distributed in
three storage bins. Urea (Certified Urea, U15500, Fisher Scientific) was added to
two of them at a concentration of 1% and 2% (weight/weight), mixed for five
minutes clockwise with a stick, and distributed in the sample containers (I-CHEM
Short wide-mouth clear Type III glass jar with Teflon®-lined, Polypropylene
closure) immediately after prepared. Each sample was prepare by adding 70
grams of biosolid (biosolid with 0% urea, biosolid with 1% urea, or biosolid with
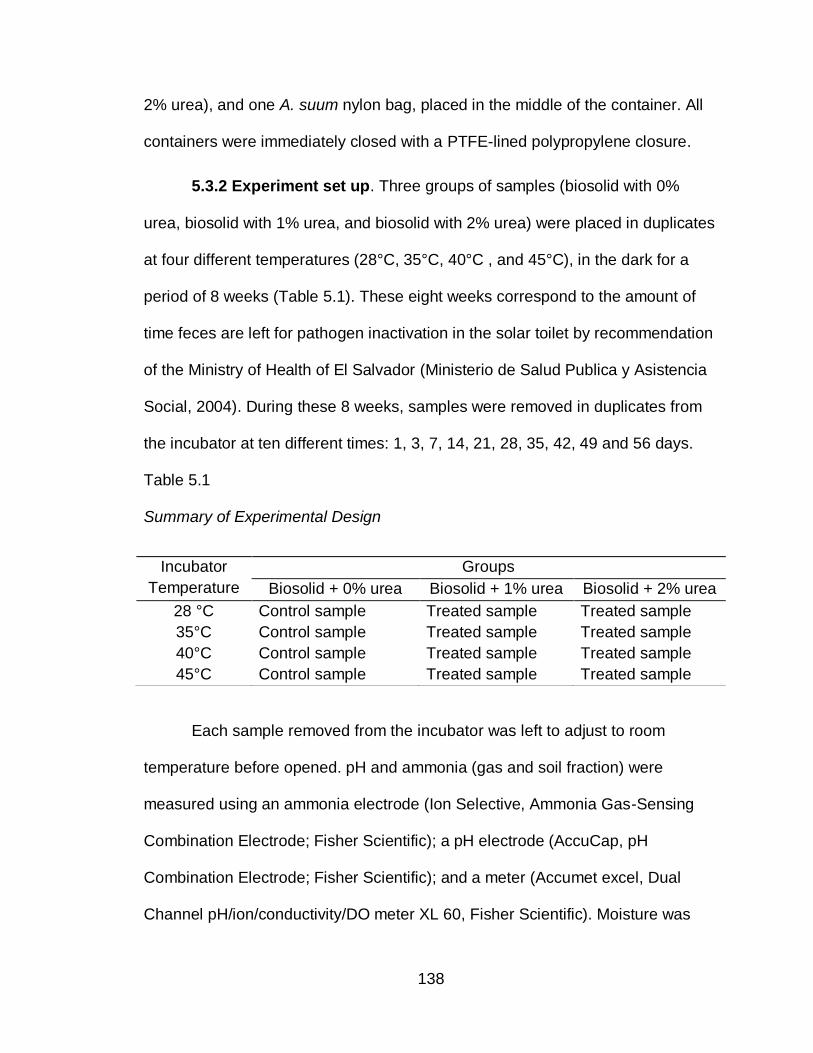
138
2% urea), and one A. suum nylon bag, placed in the middle of the container. All
containers were immediately closed with a PTFE-lined polypropylene closure.
5.3.2 Experiment set up. Three groups of samples (biosolid with 0%
urea, biosolid with 1% urea, and biosolid with 2% urea) were placed in duplicates
at four different temperatures (28°C, 35°C, 40°C , and 45°C), in the dark for a
period of 8 weeks (Table 5.1). These eight weeks correspond to the amount of
time feces are left for pathogen inactivation in the solar toilet by recommendation
of the Ministry of Health of El Salvador (Ministerio de Salud Publica y Asistencia
Social, 2004). During these 8 weeks, samples were removed in duplicates from
the incubator at ten different times: 1, 3, 7, 14, 21, 28, 35, 42, 49 and 56 days.
Table 5.1
Summary of Experimental Design
Each sample removed from the incubator was left to adjust to room
temperature before opened. pH and ammonia (gas and soil fraction) were
measured using an ammonia electrode (Ion Selective, Ammonia Gas-Sensing
Combination Electrode; Fisher Scientific); a pH electrode (AccuCap, pH
Combination Electrode; Fisher Scientific); and a meter (Accumet excel, Dual
Channel pH/ion/conductivity/DO meter XL 60, Fisher Scientific). Moisture was
Incubator
Temperature
Groups
Biosolid + 0% urea Biosolid + 1% urea Biosolid + 2% urea
28 °C Control sample Treated sample Treated sample
35°C Control sample Treated sample Treated sample
40°C Control sample Treated sample Treated sample
45°C Control sample Treated sample Treated sample
139
measured using the oven drying method (Canadian Society of Soil Science,
1993); and temperature was monitored daily during treatment and incubation
period. To analyze pH and ammonia in soil, biosolids were mixed with DI water
(1:9 dilution), covered with parafilm, stirred continuously for 10 minutes and left
stand for 5 minutes before the pH and ammonia meter electrode were immersed
into the clear supernatant (Canadian Society of Soil Science, 1993). For
ammonia gas measurement, the ammonia electrode was placed inside the
container immediately after opening and covered with parafilm to minimize
ammonia gas loses.
The Ascaris suum nylon bags from the duplicates samples removed were
washed twice in DI water and placed for incubation in a centrifuge tube with 20
milliliter of sulfuric acid (0.1 N) for 21 days. After 21 days of incubation the nylon
bags were opened directly into a Petri dish with 2ml of 0.1N sulfuric acid. A
sample (25 µl) was taken to examine viability in the microscope at 40x and 100x
magnification (Table 5.2). A minimum of 100 ova were observed from each
sample and only larva stages were used to calculate final viability.
5.3.3 Statistical analysis. A database was created in Microsoft Excel
2007 and imported to SAS 9.1.3, (SAS Institute Inc.; Cary, NC) to perform
statistical analysis: Survival and logistic regression analysis were performed. For
survival analysis the sensor variable was viability greater than 0%. For a logistic
regression model the dependent variable, A. suum inactivation, was coded 1 (not
inactivated) when viability was greater than 0% and 0 (inactivated) when viability
was equal to 0%.
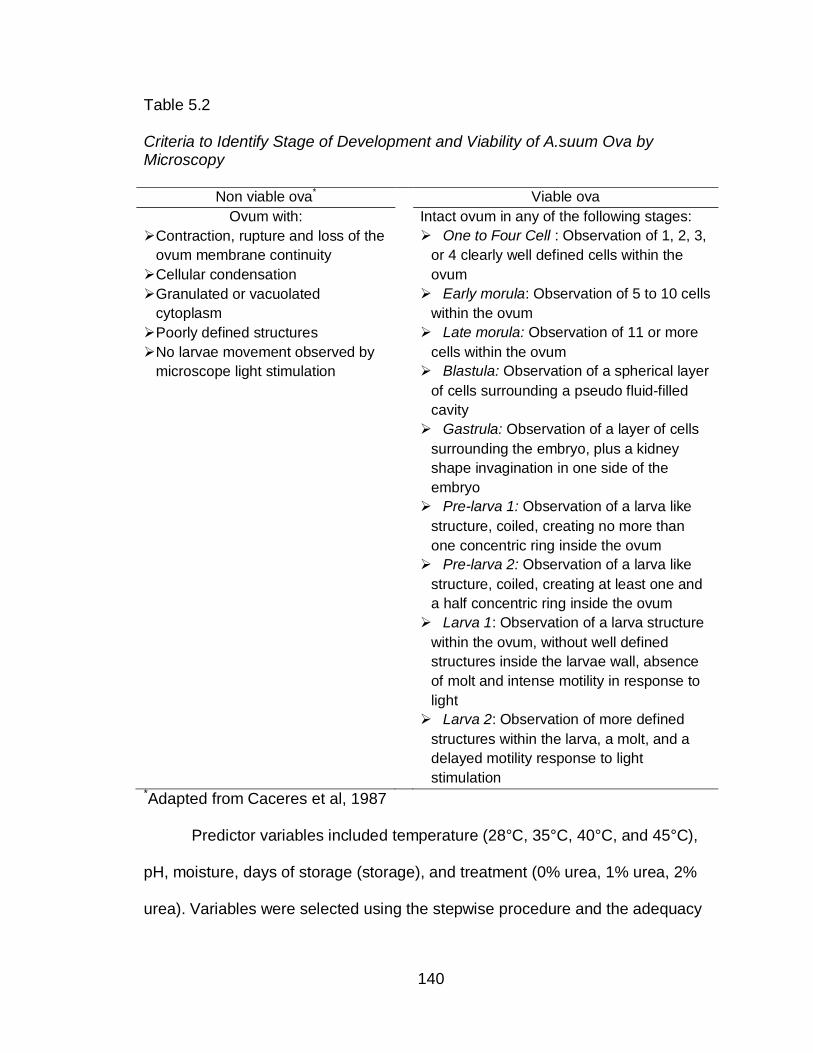
140
Table 5.2
Criteria to Identify Stage of Development and Viability of A.suum Ova by Microscopy
Non viable ova* Viable ova
Ovum with:
Contraction, rupture and loss of the
ovum membrane continuity
Cellular condensation
Intact ovum in any of the following stages:
One to Four Cell : Observation of 1, 2, 3,
or 4 clearly well defined cells within the
ovum
Granulated or vacuolated
cytoplasm
Poorly defined structures
Early morula: Observation of 5 to 10 cells
within the ovum
Late morula: Observation of 11 or more
cells within the ovum
Blastula: Observation of a spherical layer
of cells surrounding a pseudo fluid-filled
cavity
No larvae movement observed by
microscope light stimulation
Gastrula: Observation of a layer of cells
surrounding the embryo, plus a kidney
shape invagination in one side of the
embryo
Pre-larva 1: Observation of a larva like
structure, coiled, creating no more than
one concentric ring inside the ovum
Pre-larva 2: Observation of a larva like
structure, coiled, creating at least one and
a half concentric ring inside the ovum
Larva 1: Observation of a larva structure
within the ovum, without well defined
structures inside the larvae wall, absence
of molt and intense motility in response to
light
Larva 2: Observation of more defined
structures within the larva, a molt, and a
delayed motility response to light
stimulation *Adapted from Caceres et al, 1987
Predictor variables included temperature (28°C, 35°C, 40°C, and 45°C),
pH, moisture, days of storage (storage), and treatment (0% urea, 1% urea, 2%
urea). Variables were selected using the stepwise procedure and the adequacy
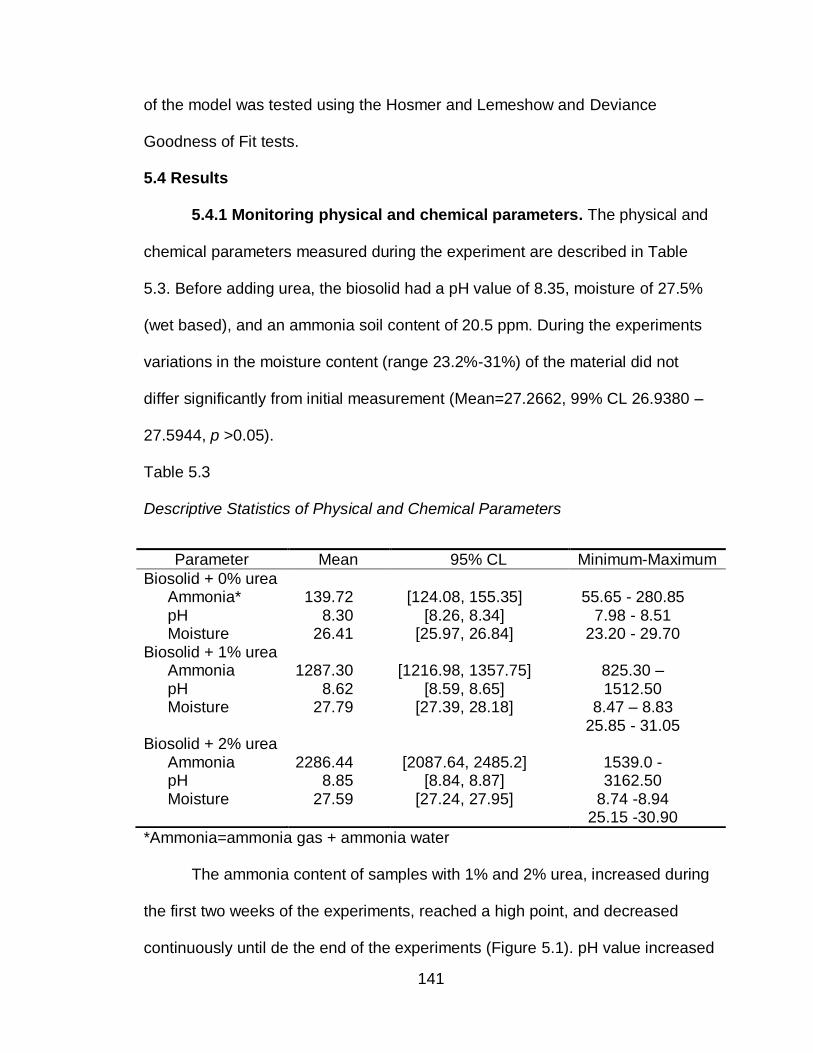
141
of the model was tested using the Hosmer and Lemeshow and Deviance
Goodness of Fit tests.
5.4 Results
5.4.1 Monitoring physical and chemical parameters. The physical and
chemical parameters measured during the experiment are described in Table
5.3. Before adding urea, the biosolid had a pH value of 8.35, moisture of 27.5%
(wet based), and an ammonia soil content of 20.5 ppm. During the experiments
variations in the moisture content (range 23.2%-31%) of the material did not
differ significantly from initial measurement (Mean=27.2662, 99% CL 26.9380 –
27.5944, p >0.05).
Table 5.3
Descriptive Statistics of Physical and Chemical Parameters
*Ammonia=ammonia gas + ammonia water
The ammonia content of samples with 1% and 2% urea, increased during
the first two weeks of the experiments, reached a high point, and decreased
continuously until de the end of the experiments (Figure 5.1). pH value increased
Parameter Mean 95% CL Minimum-Maximum
Biosolid + 0% urea Ammonia* pH Moisture
139.72 8.30
26.41
[124.08, 155.35] [8.26, 8.34]
[25.97, 26.84]
55.65 - 280.85 7.98 - 8.51
23.20 - 29.70 Biosolid + 1% urea
Ammonia pH Moisture
1287.30 8.62
27.79
[1216.98, 1357.75] [8.59, 8.65]
[27.39, 28.18]
825.30 – 1512.50
8.47 – 8.83 25.85 - 31.05
Biosolid + 2% urea Ammonia pH Moisture
2286.44 8.85
27.59
[2087.64, 2485.2] [8.84, 8.87]
[27.24, 27.95]
1539.0 - 3162.50
8.74 -8.94 25.15 -30.90
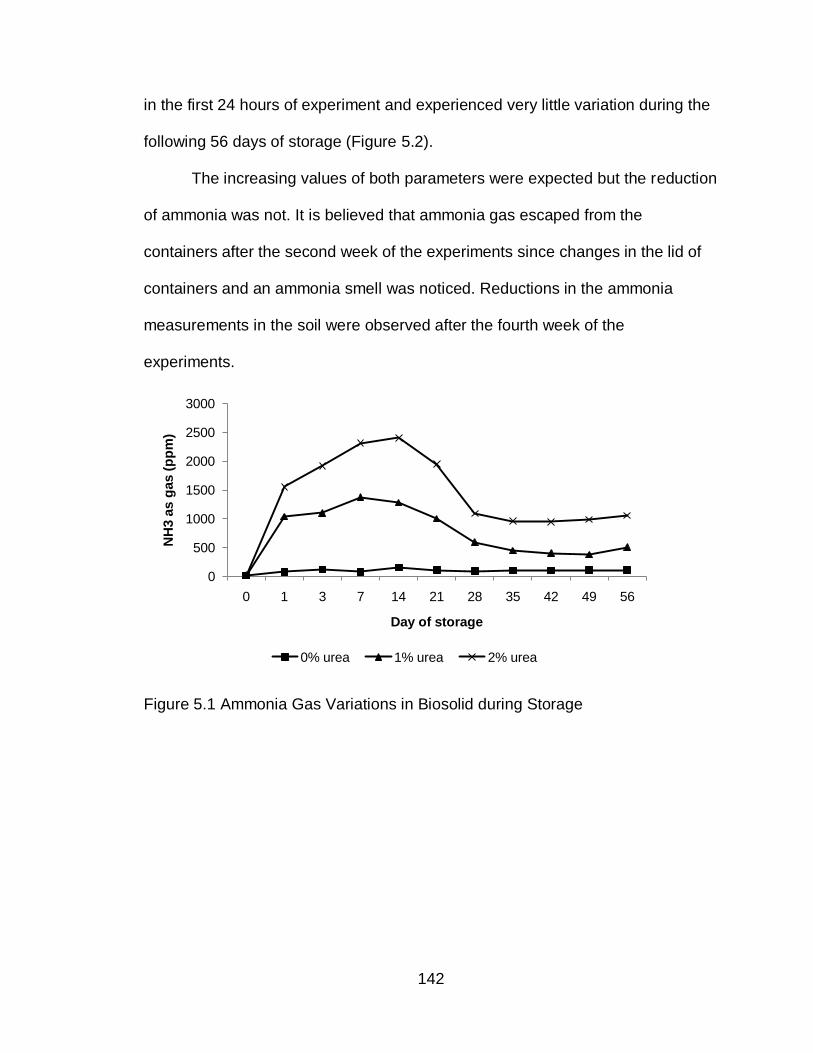
142
in the first 24 hours of experiment and experienced very little variation during the
following 56 days of storage (Figure 5.2).
The increasing values of both parameters were expected but the reduction
of ammonia was not. It is believed that ammonia gas escaped from the
containers after the second week of the experiments since changes in the lid of
containers and an ammonia smell was noticed. Reductions in the ammonia
measurements in the soil were observed after the fourth week of the
experiments.
Figure 5.1 Ammonia Gas Variations in Biosolid during Storage
0
500
1000
1500
2000
2500
3000
0 1 3 7 14 21 28 35 42 49 56
NH
3 a
s g
as (
pp
m)
Day of storage
0% urea 1% urea 2% urea
143
Figure 5.2 pH Variations in Biosolid during Storage
The increase on the pH values in the samples with 1% and 2% urea was
very similar within each treatment group, independently of incubator temperature.
In the first 24 hours the pH of the samples increased to 8.76 (samples exposed
to 1% urea) and 8.88 (samples exposed to 2% urea). After 56 days of treatment,
their pH value decreased by approximately 0.3 and 0.1 units respectively. The
pH of the control samples (0% urea) was reduced from an initial value of 8.37 to
a value of 8.2 by the end of the experiments.
5.4.2 A. suum inactivation. The inactivation of A. suum ova was faster in
samples exposed to urea and to temperatures higher than 28°C. Samples
without urea never reached a 100% inactivation at 28°C within the 56 days of
storage, while the samples exposed to 35°C, 40°C, and 45°C achieved total
inactivation after 21 days, 7 days and 24 hours of storage respectively.
All samples exposed to urea achieved 100% inactivation after 14 days
(28°C), 3 days (35°C) and 24 hours (40°C and 45°C). Ammonia leakage could
7.8
8
8.2
8.4
8.6
8.8
9
0 1 3 7 14 21 28 35 42 49 56
pH
Day of storage
0% urea 1% urea 2% urea
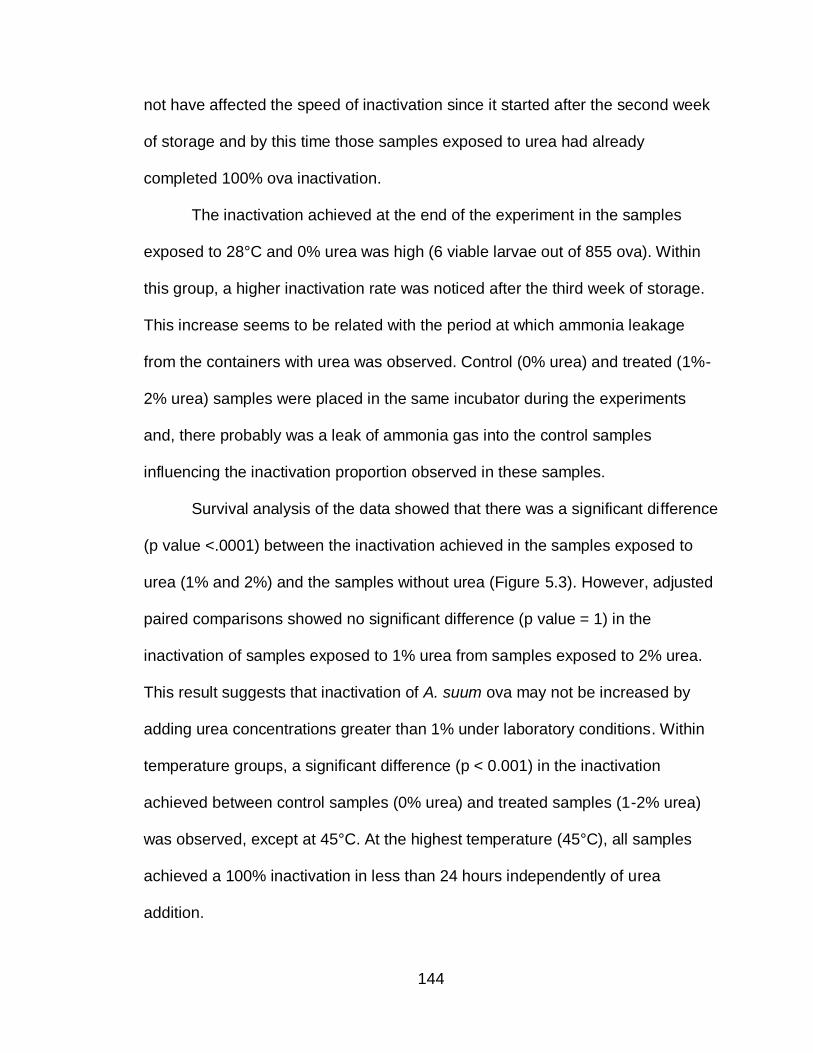
144
not have affected the speed of inactivation since it started after the second week
of storage and by this time those samples exposed to urea had already
completed 100% ova inactivation.
The inactivation achieved at the end of the experiment in the samples
exposed to 28°C and 0% urea was high (6 viable larvae out of 855 ova). Within
this group, a higher inactivation rate was noticed after the third week of storage.
This increase seems to be related with the period at which ammonia leakage
from the containers with urea was observed. Control (0% urea) and treated (1%-
2% urea) samples were placed in the same incubator during the experiments
and, there probably was a leak of ammonia gas into the control samples
influencing the inactivation proportion observed in these samples.
Survival analysis of the data showed that there was a significant difference
(p value <.0001) between the inactivation achieved in the samples exposed to
urea (1% and 2%) and the samples without urea (Figure 5.3). However, adjusted
paired comparisons showed no significant difference (p value = 1) in the
inactivation of samples exposed to 1% urea from samples exposed to 2% urea.
This result suggests that inactivation of A. suum ova may not be increased by
adding urea concentrations greater than 1% under laboratory conditions. Within
temperature groups, a significant difference (p < 0.001) in the inactivation
achieved between control samples (0% urea) and treated samples (1-2% urea)
was observed, except at 45°C. At the highest temperature (45°C), all samples
achieved a 100% inactivation in less than 24 hours independently of urea
addition.
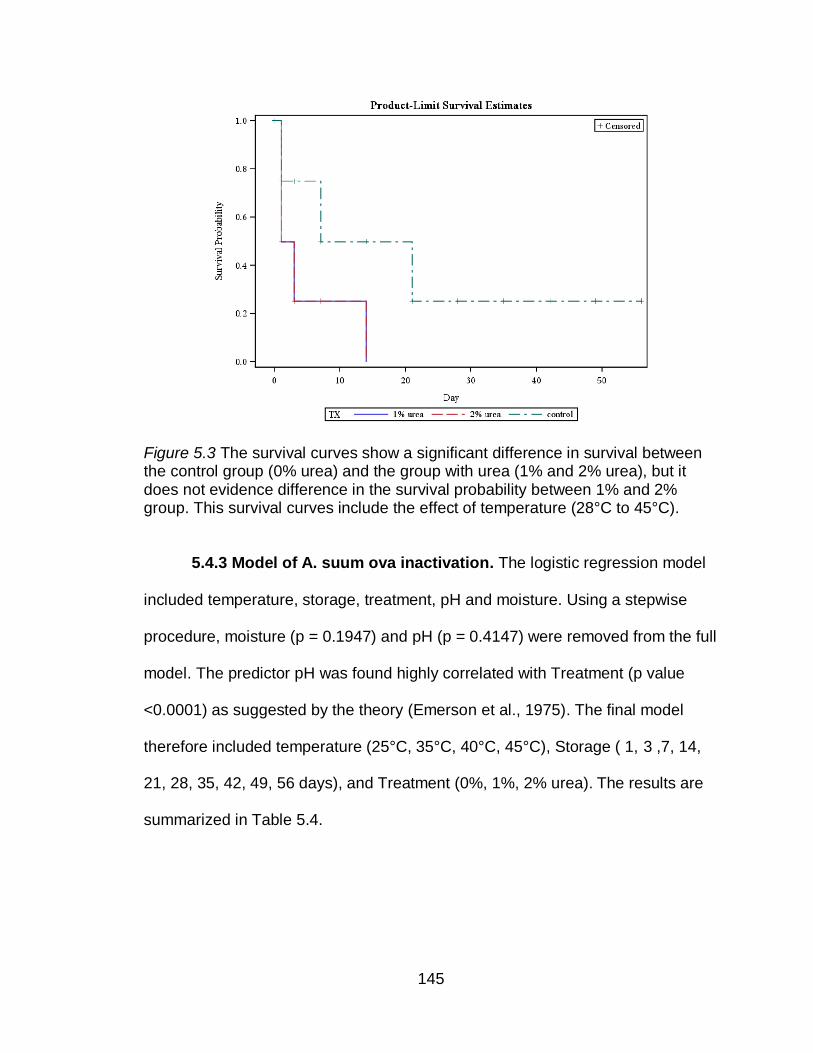
145
Figure 5.3 The survival curves show a significant difference in survival between the control group (0% urea) and the group with urea (1% and 2% urea), but it does not evidence difference in the survival probability between 1% and 2% group. This survival curves include the effect of temperature (28°C to 45°C).
5.4.3 Model of A. suum ova inactivation. The logistic regression model
included temperature, storage, treatment, pH and moisture. Using a stepwise
procedure, moisture (p = 0.1947) and pH (p = 0.4147) were removed from the full
model. The predictor pH was found highly correlated with Treatment (p value
<0.0001) as suggested by the theory (Emerson et al., 1975). The final model
therefore included temperature (25°C, 35°C, 40°C, 45°C), Storage ( 1, 3 ,7, 14,
21, 28, 35, 42, 49, 56 days), and Treatment (0%, 1%, 2% urea). The results are
summarized in Table 5.4.
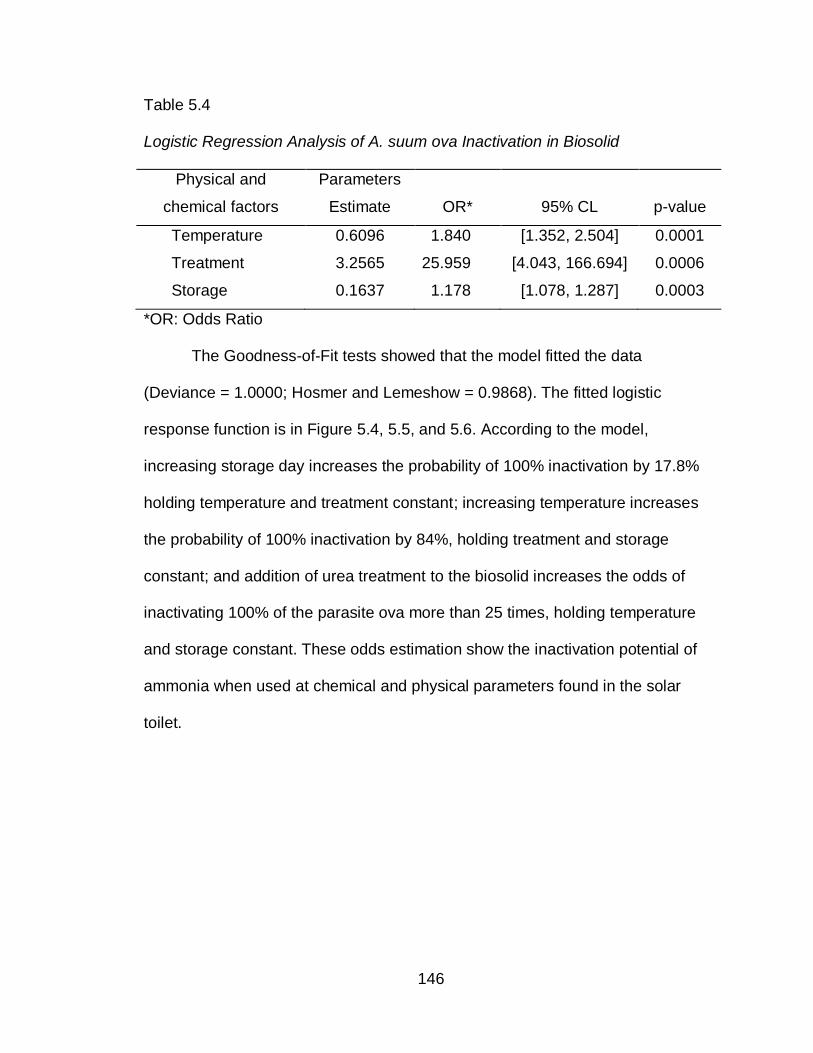
146
Table 5.4
Logistic Regression Analysis of A. suum ova Inactivation in Biosolid
Physical and
chemical factors
Parameters
Estimate OR* 95% CL p-value
Temperature 0.6096 1.840 [1.352, 2.504] 0.0001
Treatment 3.2565 25.959 [4.043, 166.694] 0.0006
Storage 0.1637 1.178 [1.078, 1.287] 0.0003
*OR: Odds Ratio
The Goodness-of-Fit tests showed that the model fitted the data
(Deviance = 1.0000; Hosmer and Lemeshow = 0.9868). The fitted logistic
response function is in Figure 5.4, 5.5, and 5.6. According to the model,
increasing storage day increases the probability of 100% inactivation by 17.8%
holding temperature and treatment constant; increasing temperature increases
the probability of 100% inactivation by 84%, holding treatment and storage
constant; and addition of urea treatment to the biosolid increases the odds of
inactivating 100% of the parasite ova more than 25 times, holding temperature
and storage constant. These odds estimation show the inactivation potential of
ammonia when used at chemical and physical parameters found in the solar
toilet.

147
Figure 5.4 Estimated probabilities of A. suum ova inactivation in biosolid (feces + additive) with 0% urea in laboratory conditions
148
Figure 5.5 Estimated probabilities of A. suum ova inactivation in biosolid (feces + additive) treated with 1% urea in laboratory conditions
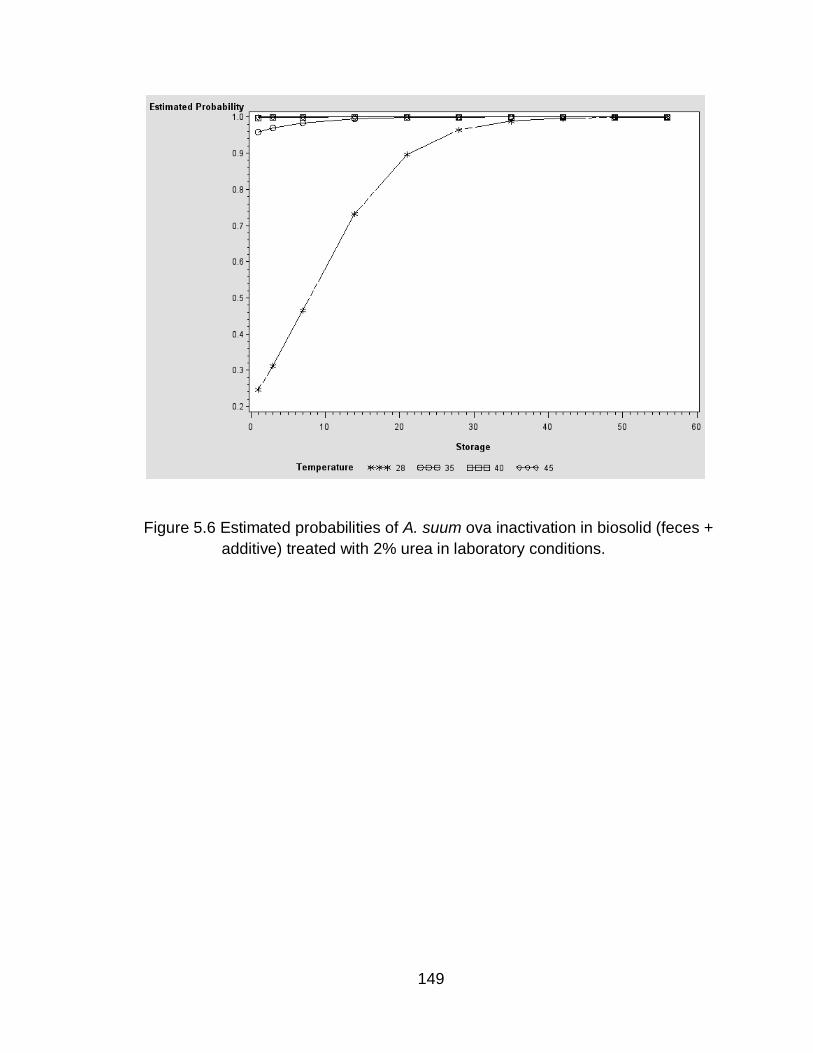
149
Figure 5.6 Estimated probabilities of A. suum ova inactivation in biosolid (feces +
additive) treated with 2% urea in laboratory conditions.
150
5.6 Discussion
The results of this study suggest that inactivation of Ascaris spp ova by
ammonia is possible in fecal material stored in the solar toilet or any other dry
toilet, if the following physical and chemical conditions are met: a closed vault
with a minimum temperature of 28°C; an initial pH of 8.3, minimum moisture of
27.5%, and addition of 1% urea to the biosolid. At 28°C longer storage time
would be required for 100% inactivation while at higher temperatures less time of
storage would be necessary. Similar temperature and time dependent
inactivation was observed by Nordin et al., (2009) after adding 1% and 2% urea
to fecal material at lower temperatures (24°C and 34°C). At 24°C they reported
viable ova in both treatments after 35 days of storage, with a higher percentage
of viable ova (78% ± 6.5%) in biosolid exposed to 1% urea compared to biosolid
exposed to 2% urea (1 larva stage ova out of 806 inactivated ova). At 34°C they
reported 100% A. suum ova inactivation after 10 days of storage with 1% urea
and, after 4 days of storage with 2% urea (Nordin et al., 2009). In our study, 14
days, 3 days, and 1 day were required to achieve 100% A. suum ova inactivation
in biosolid treated with 1% and 2% urea at 28°C, 35°C, and 40°C respectively. At
28°C we observed that some samples exposed to 2% urea had a higher number
of inactivated ova when compared to 1% urea before total inactivation was
registered at day 14 of storage. At 35°C the number of inactivated ova in treated
samples (1% versus 2% urea) was very similar (44% versus 47.5% respectively)
and, at 40°C and 45°C was the same.
151
Both results evidence the effect of increasing temperature at reducing the
number of days required for A. suum ova inactivation when using 1% and 2%
urea. They also show that as concentrations of urea increase (from 1% to 2%) in
biosolid, the time required for inactivation decrease at temperatures equal or
lower than ≤ 34°C. At 35 °C or higher, according to our results, increasing
concentrations of urea (>1%) do not reduce significantly this time.
pH levels achieved in this experiment were very similar to those achieved
by Nordin et al.,(2009) even though they did not add any additive to the samples
mixed with urea and adjusted the moisture content to 83% (wet based). In a dry
toilet, the use of additives after each defecation contributes to pathogen
inactivation by increasing dryness and pH of the fecal material (Winblad &
Simpson-Hebert, 2004). By adding the equivalent to a cup of additive to each
stool sample collected, the moisture of the biosolid used in our study was
reduced to 27.5% (wet based), which is very dry compared to the moisture level
(83%-95%, wet based) reported previously (Nordin, 2007; Pecson et al., 2007;
Vinnerås et al., 2003). In these very dry conditions, the increase of ammonia
observed during the first two weeks of the experiments indicates that urea was
chemically transformed to ammonia by the enzyme urease in our biosolid and,
that ammonia was continuously available inside the containers. Nevertheless, the
mean value of ammonia calculated (taking in account the 56 days of storage)
was low when compared to the theoretical values expected at room temperature
(26°C). Nordin et al., (2009) also registered lower ammonia measurements at the
end of their experiments. In our study, the peak ammonia values achieved during
152
the second week of storage were very close to the expected theoretical values.
Therefore, it is clear that ammonia losses after the second week of storage
influenced the mean ammonia value reported, but did not influence Ascaris suum
ova inactivation. The peak ammonia value (day 14 at 28°C and day 3 at 35°C)
corresponded with 100% inactivation of the parasite ova in samples with urea
placed to 28°C and 35°C; while samples placed at 40°C achieved total
inactivation before the peak ammonia value was observed (day 7).
Pecson et al., (2005) reported that the minimum ammonia concentration to
achieved 99% inactivation in 72 hours at 38°C in solution was 2992ppm of NH3
(pH=11). A similar study revealed that inactivation was faster in sludge (Pecson
et al., 2007). Nordin et al., (2009), reported 99% ova inactivation in 4 days (34°C)
with approximately 3814ppm of ammonia in feces. Our results showed that the
minimum ammonia concentration (as NH3) required to inactivate 100% of Ascaris
suum ova in feces were around 1350 ppm at 28°C and 35°C; and 794 ppm at
40°C. Cruz et al., (not published, 2009), did not find a significant inactivation of
the parasite ova after three days of storage in ammonia solution (2%) using
temperature and pH values similar to those achieved in the solar toilet (28°C, pH
9.3) (not published, Cruz et al., 2010). In this study there was a significant
increase in the inactivation of the parasite at the same temperature and pH in
feces amended with 2% urea after three days of storage. This data suggests that
inactivation in our samples treated with 1% and 2% urea were faster and
required less ammonia concentration than previously reported. It is suspected
that the lower moisture level of the biosolid used in this study facilitated the
153
movement of ammonia gas inside the material, promoting a faster inactivation
with less ammonia concentration. A faster bacterial inactivation by ammonia gas
in chicken manure has been reported in previous literature (Himathongkham &
Riemann, 1999).
Inactivation of the parasite ova in samples with 0% urea was achieved at
35°C and 40°C, at 21 and 7 days of storage respectively. Nordin et al., (2009)
reported a 50% ova viability reduction in feces stored for 35 days and no viability
reduction in ova placed in NaCl at the same temperature. While addition of
ammonia clearly reduces the storage time needed to achieve total Ascaris spp.
ova inactivation it is suggested that intrinsic ammonia and other compounds
naturally present in feces and sludge may influence inactivation of the parasite
ova in a closed system when ammonia is not added to the material (Nordin,
2007; Pecson et al., 2007).
The implications of these results are the potential use of ammonia in the
solar toilet in the field as a sanitizing agent. Ascaris suum ova were used to
evaluate this approach, but no other microbiological indicator was included in the
experiments. Previous literature reports that the solar toilet has been effective at
inactivating Fecal Coliforms (< 1000 Fecal Coliforms per gram total solid) in less
than 55 days without ammonia (Izurieta, Karpur, Moe, Cruz, & Corrales, 2008).
Studies in sludge and feces report that bacterial inactivation by ammonia has
been achieved in less than 1 week at temperatures of 37°C or lower (Allievi et al.,
1994; Mendez et al., 2004; Mendez et al., 2002; J. Ottoson et al., 2008; J. R.
Ottoson et al., 2008; Park & Diez-Gonzalez, 2003; Vinnerås et al., 2003). Since
154
the solar toilet reaches temperatures as high as 41°C it is expected that bacterial
inactivation will be achieved in less time than usual by adding ammonia without
risk of bacterial regrowth.
In regards to the virucidal effect of the solar toilet, the published literature
indicates that it is not able to inactive somatic coliphage (Moe & Izurieta, 2003).
Studies on sludge and solution have shown the capacity of ammonia to inactivate
enteroviruses and some phages at different temperatures (20°C, 35°C, 37°C and
47°C) in less than 9 days (Cramer et al., 1983; Fenters et al., 1979; J. R. Ottoson
et al., 2008; Schaper et al., 2002; Ward & Ashley, 1977a, 1977b). The
parameters at which ammonia has been reported to inactivate viruses are similar
to the solar toilet parameters, suggesting a good probability that viruses may also
be inactivated inside the toilet with the addition of ammonia.
Some solar toilets units have shown no to be effective at inactivating all
parasites (Moe & Izurieta, 2003). Our results suggest that the toilet, by itself,
would be able to inactivate the parasite ova if temperatures of 35°C or higher
were achieved inside the vault for at least 21 days continuously. If urea is added
to the vault and proper closure is secured, then, this time would be reduced to
three days. Ammonia has also been effective at inactivating other parasites ova
(Trichuris spp., Hymenolepsis spp., Toxocara spp., Diphyllobothrium latum and
Trichocephalus muris) and protozoa at a faster rate than Ascaris spp. ova,
suggesting than by inactivating Ascaris spp. ova, inactivation of other parasites
ova may be achieved (Chefranova Iu et al., 1978; Ghiglietti et al., 1995; Jenkins,
Bowman, & Ghiorse, 1998; Mendez et al., 2002).
155
The logistic regression model of inactivation presented here works well
within the physical and chemical parameters used in this study. It is consistent
with a model previously reported by the authors using a smaller sample size
(n=20) (not published, Cruz et al., 2010). The model presented here further
confirms a significant correlation between pH and treatment (urea), the effect of
increasing temperature on inactivation; the importance of time to achieve
inactivation at low temperatures and the powerful influence of adding urea to the
feces to reduce the time required to achieve total Ascaris suum ova inactivation.
Other authors have used linear regression models or shouldered inactivation
based on exponential decay to estimate the time required to achieve 99%
inactivation (Nordin, 2007; Pecson et al., 2007). In our study we wanted to
determine if the final parasite viability was 0% (total inactivation) or not and
logistic regression better estimated this dichotomous result. Probability
estimations presented in Figure 4-6 created by the model were highly significant
and showed well the effect of urea on inactivation when added to this type of
biosolid.
Therefore, although these results support the potential use of urea as a
source of ammonia to sanitize the fecal material in the solar toilet or any dry toilet
that meet the requirement mentioned at the beginning, a community intervention
is recommended to include field conditions and human behavior as other
predictors for Ascaris spp. inactivation.
156
5.7 Limitations of the study
There are some limitations based on the methodology of the study.
Leakage of ammonia after day 14 of storage is one of these limitations. The
containers used in the experiments ((I-CHEM Short wide-mouth clear Type III
glass jar with Teflon®-lined, Polypropylene closure) are used to collect soil
samples with semi-volatile materials; nevertheless, addition of urea could had
caused an increase in internal pressure subsequently cracking the containers’ lid
and producing an ammonia leakage to the environment.
The use of nylon bags is another limitation of the study that may influence
the generalizability of the results. Nylon bags concentrate the parasite ova in one
location and facilitate recuperating the ova from biosolid for analysis. In the field,
the parasite ovum is found mixed with biosolid in different locations and this
environment may or may not protect the ovum from contact with ammonia. In our
results, we observed that ova inactivation was faster in biosolid with low moisture
content when compared to material with high moisture content. This may be
related to the ability of ammonia gas to penetrate biosolid easier in dry material
than in wet material. Nevertheless, until similar results are observed in the field,
we considered the use of nylon bags as a limitation that should be taken into
account in the translation of the results of this study to practice.
5.8 Public health implications and challenges
The result of this study supports the application of urea as a sanitizing
agent in dry toilets. However, many challenges will be faced during the
translation of the results into a community setting. From a public health
157
perspective, it is important to have the community approval and understanding of
the use of urea in the toilet before any application starts. Also, urea should be
available to the community’s members participating in the project. An educational
intervention should be introduced into the community to facilitate the transition
from current to new procedures for using the toilet with urea. Including local
authorities, community leaders and community health workers in the educational
process would be key for the acceptance of the community.
Human behavior should also be taken into account when planning the
implementation of the technology. A baseline practices, knowledge and attitudes
survey would collect the information required to address common mistakes in the
educational intervention. In addition, posters with instructions on the proper use
and management of the technology could be distributed and placed in the toilet
for the user to refer when needed. A local leader or community health worker,
willing to help in the process, could also provide support to the users when
needed.
Expected challenges for the acceptance will be the strong smell that could
result from the use of urea. This fact should be addressed in the educational
intervention. In addition proper protection equipment must be provided to the
person in charge of handling and applying urea within the toilet. Procedures to
minimize exposure must be taught and given in writing to this person. Proper
mixing procedures when applying urea should be emphasized to the user since
this step is important for the success of the intervention.
158
5.9 Alternative laboratory methods
In this study microscopy was used as the main method to determine
parasite viability. This method is considered the standard method currently
recommended by the United States Environmental Protection Agency (USEPA,
2003). The advantage of this method is the ability to use it in less developed
countries. The disadvantage is the training required to adequately identify the
ova in the microscope.
PCR is another laboratory essay that could be used as an alternative to
microscopy. This is a rapid diagnostic test to detect the presence of Ascaris spp.
ova in biosolid. It could be used to separate the toilets with parasite ova from
those toilets without parasite ova, facilitating the identification of toilets that would
require a microbiological evaluation. The disadvantage of this method is the cost
of the equipment and the time of incubation of the ova needed to obtain DNA
material for the essay. In addition, this method is not considered as a standard
method by USEPA yet, limiting its use.
Development of faster and low cost laboratory techniques to determine
ova viability of the ova in the environment is needed.
5.10 General Conclusions and Recommendations
The results of this study suggest that inactivation of Ascaris spp ova by
ammonia is possible in fecal material stored in the solar toilet or any other
dry toilet, if the following physical and chemical conditions are met: a
closed vault with a minimum temperature of 28°C; an initial pH of 8.3,
minimum moisture of 27.5%, and addition of 1% urea to the biosolid.
159
The solar toilet, by itself, would be able to inactivate the parasite ova if
temperatures of 35°C or higher were achieved inside the vault for at least
21 days continuously. If urea is added to the vault and proper closure is
secured, then, this time would be reduced to three days.
There will be many challenges during the translation of the results into
practice, including but not limited to:
Continuous access of urea for the users.
Community approval and understanding of the procedures.
Support available in the community
Proper use of protecting equipment when handling biosolid with
urea
Tolerance of smell of urea
To address some of these challenges it is recommended:
Creation of partnerships with local authorities and community
leaders to secure availability of urea
Educational interventions
Adequate training of supporting individuals living in the community
Delivery of written instructions on the procedures to mix and handle
biosolids
Adequate use of protecting equipment
Continuous evaluation of the performance of the technology with
the input of users
160
Development of sensible indirect measurements techniques, such
as ammonia probe to use in the field, easy enough for the local
leaders to implement on a regular basis.
161
CHAPTER 6.
LIST OF REFERENCES
Abzug, M. J. (Writer) (2004). Presentation, Diagnosis, and Management of Enterovirus Infections in Neonates [Article], Pediatric Drugs: ADIS International Limited.
Al-Mekhlafi, M. S. H., Azlin, M., Nor Aini, U., Shaik, A., Sa'iah, A., Fatmah, M. S., et al. (2005). Giardiasis as a predictor of childhood malnutrition in Orang Asli children in Malaysia. Transactions of the Royal Society of Tropical Medicine and Hygiene, 99(9), 686-691.
Alabi, S. A., & Odugbemi, T. (1990). Occurrence of Aeromonas species and Plesiomonas shigelloides in patients with and without diarrhoea in Lagos, Nigeria. J Med Microbiol, 32(1), 45-48.
Ali, S. A. a., & Hill, D. R. a. b. (2003). Giardia intestinalis. Current Opinion in Infectious Diseases, 16(5), 453-460.
Allievi, L., Colombi, A., Calcaterra, E., & Ferrari, A. (1994). Inactivation of fecal bacteria in sewage sludge by alkaline treatment. Bioresource Technology, 49(1), 25-30.
Araujo, R. M., Arribas, R. M., & Pares, R. (1991). Distribution of Aeromonas species in waters with different levels of pollution. Journal of Applied Microbiology, 71(2), 182-186.
Arene, F. O. I. (1986). Ascaris suum: Influence of embryonation temperature on the viability of the infective larva. Journal of Thermal Biology, 11(1), 9-15.
Bartram, J. (2008). Improving on haves and have-nots. Nature, 452, 283.
Bassiouni, G. A., Soliman, A. A., Mahmoud, L. H., & Bassiouni, S. O. (1990). A study on the development of some helminthic eggs. Med. J. Cairo Univ., 58(2), 149-164.
Bern, C., & Hernandez, B. (1999). Epidemiologic Studies of Cyclospora cayetanensis in Guatemala. Emerging Infectious Diseases, 5(6), 766-774.
162
Bhan, M. K., Bahl, R., & Bhatnagar, S. (2005). Typhoid and paratyphoid fever. The Lancet, 366(9487), 749-762.
Blessmann, J., Ali, I. K. M., Ton Nu, P. A., Dinh, B. T., Ngo Viet, T. Q., Le Van, A., et al. (2003). Longitudinal Study of Intestinal Entamoeba histolytica Infections in Asymptomatic Adult Carriers. J. Clin. Microbiol., 41(10), 4745-4750.
Bower, C. E., & Bidwell, J. P. (1978). Ionization of Ammonia in Seawater: Effects of Temperature, pH and Salinity. Journal of the Fisheries Research Board of Canada, 35, 1012-1015.
Bowman, D. D., Little, M. D., & Reimers, R. S. (2003). Precision and accuracy of an assay for detecting Ascaris eggs in various biosolid matrices. Water Research, 37(9), 2063-2072.
Brown, H. W. (1927). Studies on the Rate of Development and Viability of the Eggs of Ascaris lumbricoides and Trichuris trichiura under Field Conditions. The Journal of Parasitology, 14(1), 1-15.
Bryant, C. D. (2003). Death in Social Context. In C. D. Bryant (Ed.), Handbook of Death and Dying (First ed., pp. 183-197): SAGE.
Bujoczek, G. (2001). Influence of ammonia and other abiotic factors on microbial activity and pathogen inactivation during processing of high-solid residues. University of Manitoba, Manitoba.
Burge, W. D., Cramer, W. N., & Kawata, K. (1983). Effect of heat on virus inactivation by ammonia. Applied and Environmental Microbiology, 46(2), 446-451.
Burns, R. G. (1978). Soil enzymes. London: Academic Press.
Caceres, A., Xet, A. M., & Flores, G. (1987, 15-19 June). Simplified methodology for helminth egg counts and viability in organic fertilizer. Paper presented at the Second Meeting on Use of Human Waste in Agriculture and Aquaculture, Adelboden, Switzerland.
Canadian Society of Soil Science. (1993). Soil Sampling and Methods of Analysis. Boca Raton: Lewis.
Casalino, M., Yusuf, M. W., Nicoletti, M., Bazzicalupo, P., Coppo, A., Colonna, B., et al. (1988). A two-year study of enteric infections associated with diarrhoeal diseases in children in urban Somalia. Trans R Soc Trop Med Hyg, 82(4), 637-641.
163
CDC. (2002). Outbreaks of Gastroenteritis Associated with Noroviruses on Cruise Ships --- United States, 2002. Morbidity and Mortality Weekly Report, 13(51(49)), 1112-1115.
Centers for Disease Control & Prevention. (2009). Laboratory Identification of Parasites of Public Health Concern. Retrieved July 1, 2009, from http://www.dpd.cdc.gov/dpdx/Default.htm
Chacin-Bonilla, L., De Young, M. M., & Estevez, J. (2003). PREVALENCE AND PATHOGENIC ROLE OF CYCLOSPORA CAYETANENSIS IN A VENEZUELAN COMMUNITY. Am J Trop Med Hyg, 68(3), 304-306.
Chefranova Iu, A. (1977). [Ovocidal effect of anhydrous ammonia on ascarid eggs in a laboratory experiment]. Med Parazitol (Mosk), 46(6), 688-692.
Chefranova Iu, A., Oshevskaya, Z. A., & Gushchin, P. P. (1984). Effectiveness of Ammonia in Disinfection of Biological Wastes in Ascariasis Foci. Med Parazitol (Mosk), 6, 39-42.
Chefranova Iu, A., Petranovskaia, M. R., & Khodakova, V. I. (1978). Disinfecting effect of ammonia on the eggs of helminths (Trichocephalus muris and Diphyllobothrium latum) and enterobacteria. Med Parazitol (Mosk), 47(1), 99-101.
Chitwood, B. G., & Chitwood, M. B. (1977). Introduction to Nematology (Second ed.). Baltimore: University Park Press.
Christenson, R. O. (1935). Remarques sur les differences qui existant entre les oeufs de Capillaria aerophila et de Trichuris vulpis, parasites du renard. Ann. Parasitol., 13(4), 318-321.
Cordova, A., & Knuth, B. A. (2005). User satisfaction in large-scale, urban dry sanitationprograms in Mexico. Urban Water Journal, 2(4), 227 - 243.
Corrales, L. F., Izurieta, R., & Moe, C. L. (2006). Association between intestinal parasitic infections and type of sanitation system in rural El Salvador. Trop Med Int Health., 11(12), 1821-1831.
Cramer, W. N., Burge, W. D., & Kawata, K. (1983). Kinetics of Virus Inactivation by Ammonia. Applied and Environmental Microbiology, 45(3), 760-765.
Crump, J. A., Luby, S. P., & Mintz, E. D. (2004). The global burden of typhoid fever. [Electronic Version]. Bull World Health Organ, 82, 346-353. Retrieved August 2009 from http://www.scielosp.org/scielo.php?script=sci_arttext&pid=S0042-96862004000500008&lng=en&nrm=iso.
164
Cruz, L. M., Allanson, M., & Izurieta, R. (2009). Morphological Changes and Viability of A. suum ova during Incubation. College of Public Health, University of South Florida, Unpublished Work.
Douvres, F. W., Tromba, F. G., & Malakatis, G. M. (1969). Morphogenesis and migration of Ascaris suum larvae developing to fourth stage in swine. J Parasitol, 55(4), 689-712.
Droste, R. L. (1997). Theory and Practice of Water and Wastewater Treatment: John Wiley & Sons.
Elliott, D. E. (2002). Intestinal Infections by Parasitic Worms. In M. Feldman, L. Friedman & M. Sleisenger (Eds.), Gastrointestinal and Liver Diseases: Pathophysiology, Diagnosis, and Management (Vol. II, pp. 1951-1971): Saunders.
Emerson, K., Russo, R. C., Lund, R. E., & Thurston, R. V. (1975). Aqueous Ammonia Equilibrium Calculations: Effect of pH and Temperature. Journal of the Fisheries Research Board of Canada, 32, 2379-2383.
Environmental Protection Agency (EPA). (1999). 1999 Update of Ambient Water Quality Criteria for Ammonia. Retrieved. from http://www.epa.gov/waterscience/criteria/ammonia/99update.pdf.
Eriksen, L. (1981). Host parasite relations in Ascaris suum infections in pigs and mice. Doctoral thesis Royal Veterinary and Agricultural University, Copenhagen.
Fagerholm, H.-P., Nansen, P., Roepstorff, A., Frandsen, F., & Eriksen, L. (2000). Differentiation of Cuticular Structures during the Growth of the Third-Stage Larva of Ascaris suum (Nematoda, Ascaridoidea) after Emerging from the Egg. The Journal of Parasitology, 86(3), 421-427.
Feachem, R. G. (1984). Interventions for the control of diarrhoeal diseases among young children: promotion of personal and domestic hygiene. Bulletin of the World Health Organization, 62(3), 467-476.
Feachem, R. G., Bradley, D. J., Garelick, H., & Mara, D. D. (1983). Sanitation and disease: Health aspects of excreta and wastewater management. Chichester, UK: John Wiley and Sons.
Fenters, J. D., Reed, J. M., Lue Hing, C., & Bertucci, J. (1979). Inactivation of viruses by digested sludge components. Water Pollution Control Federation, 51, 689-694.
FIFA Ed. (2006). Australian Soil Fertility Manual (Third ed.). Collingwood: CSIRO.
165
Fisher, W. B., Jr., & Parks, W. L. (1958). Influence of Soil Temperature on Urea Hydrolysis and Subsequent Nitrification (Vol. 22, pp. 247-248).
Geenen, P. L., Bresciani, J., Boes, J., Pedersen, A., Eriksen, L., Fagerholm, H. P., et al. (1999). The Morphogenesis of Ascaris suum to the Infective Third-Stage Larvae within the Egg. Journal of Parasitology 85(4), 616-622.
Gendrel, D., Treluyer, J. M., & Richard-Lenoble, D. (2003). Parasitic diarrhea in normal and malnourished children. Fundamental & Clinical Pharmacology, 17(2), 189-197.
Ghiglietti, R., Genchi, C., Di Matteo, L., Calcaterra, E., & Colombi, A. (1997). Survival of Ascaris suum eggs in ammonia-treated wastewater sludges. Bioresource Technology, 59(2-3), 195-198.
Ghiglietti, R., Rossi, P., Ramsan, M., & Colombi, A. (1995). Viability of Ascaris suum, Ascaris lumbricoides and Trichuris muris eggs to alkaline pH and different temperatures. Parassitologia, 37, 229-232.
Global Polio Eradication Initiative. (2009). The disease and the virus. Retrieved August, 2009, from http://www.polioeradication.org/disease.asp
Grady, R. T., & Harpur, R. P. (1985). Growth and form of the fourth-stage larvae and early adults of Ascaris suum Goeze, 1782 (Nematoda: Ascaridoidea) developing in pigs. Cambridge Journals Online, 59(02), 137-141.
Graham, S. M. (2002). Salmonellosis in children in developing and developed countries and populations. Current Opinion in Infectious Diseases, 15(5), 507-512.
Guerra, I. M., Fadanelli, R., Figueiro, M., Schreiner, F., Delamare, A. P., Wollheim, C., et al. (2007). Aeromonas associated diarrhoeal disease in south Brazil: prevalence, virulence factors and antimicrobial resistance [Electronic Version]. Brazilian Journal of Microbiology, 38, 638-643. Retrieved August 21 from http://www.scielo.br/scielo.php?pid=S1517-83822007000400011&script=sci_arttext&tlng=en.
Hamer, D. H., & Gorbach, S. L. (2002). Infectious Diarrhea and Bacterial Food Poisoning. In M. Feldman, L. Friedman & M. Sleisenger (Eds.), Gastrointestinal and Liver Disease: Pathophysiology, Diagnosis and Management (Seventh ed., Vol. II, pp. 1864-1913): Saunders.
Haque, R., Mondal, D., Duggal, P., Kabir, M., Roy, S., Farr, B. M., et al. (2006). Entamoeba histolytica Infection in Children and Protection from Subsequent Amebiasis. Infect. Immun., 74(2), 904-909.
Haque, R., Mondal, D., Kirkpatrick, B. D., Akther, S., Farr, B. M., Sack, R. B., et al. (2003). EPIDEMIOLOGIC AND CLINICAL CHARACTERISTICS OF
166
ACUTE DIARRHEA WITH EMPHASIS ON ENTAMOEBA HISTOLYTICA INFECTIONS IN PRESCHOOL CHILDREN IN AN URBAN SLUM OF DHAKA, BANGLADESH. Am J Trop Med Hyg, 69(4), 398-405.
Himathongkham, S., & Riemann, H. (1999). Destruction of Salmonella typhimurium, Escherichia coli O157:H7 and Listeria monocytogenes in chicken manure by drying and/or gassing with ammonia. FEMS Microbiol Lett, 171(2), 179-182.
Hotez, P. J., Bundy, D., Beegle, K., Brooker, S., Drage, L., De Silva, N. R., et al. (2006). Helminth Infections: Soil-Transmitted Helminth Infections and Schistosomiasis. In D. Jamison, J. Breman, A. Measham, G. Alleyne, M. Claeson, M. Evans, P. Jha, A. Mills & P. Musgrove (Eds.), Disease Control Priorities in Developing Countries (Second ed., pp. 467-482). Washington: Oxford University Press.
Huang, D. B., Chappell, C., & Okhuysen, P. C. (2004). Cryptosporidiosis in children. Seminars in Pediatric Infectious Diseases, 15(4), 253-259.
Hutson, C. D., & Guerrant, R. L. (2002). Intestinal Protozoa. In M. Feldman, L. Friedman & M. Sleisenger (Eds.), Gastrointestinal and Liver Disease: pathophysiology, diagnosis and management (Seventh ed., Vol. II, pp. 1933-1950): Saunders.
Hutton, G., & Haller, L. (2004). Evaluation of the Cost and Benefits of Water and Sanitation Improvements at the Global Level. . from http://www.who.int/water_sanitation_health/wsh0404.pdf
International Vaccine Institute. (2007). Vaccines, Children and a Better World: Annual Report 2006-2007. from http://www.ivi.int/publication/annual_report/2007/annual_report1_2007_5MB.pdf
IWMI. (2010). Wastewater Irrigation and Halth: Assesssing and Mitigating Risk in Low-Income Countries. London: Earthscan.
Izurieta, R., Karpur, A., Moe, C., Cruz, L., & Corrales, L. (2008). Evaluation of Solar IV Proto-type of Ecosan Latrine Models in Rural El Salvador To be published.
Izurieta, R., Saade, V., Guzman, G., Ochoa, C., Cohen, L., & Moe, C. (2006). An Evaluation of the Performance and Microbial Safety of the Solar Latrine Prototype IV in El Salvador. Unpublished Work.
Jaskoski, B. J., & Egan, T. P. (1953). Age Resistance of Swine Ascarid Eggs. Transactions of the American Microscopical Society, 72(2), 179-184.
167
Jenkins, M. B., Bowman, D. D., & Ghiorse, W. C. (1998). Inactivation of Cryptosporidium parvum Oocysts by Ammonia. Appl Environ Microbiol, 64(2), 784-788.
John, D. T., & Petri, W. A. (2006). Markell and Voge's Medical Parasitology (9th ed.). St. Luis, Missouri: Elsevier Inc.
Johnson, P. W., Dixon, R., & Ross, A. D. (1998). An in-vitro test for assessing the viability of Ascaris suum eggs exposed to various sewage treatment processes. International Journal for Parasitology, 28(4), 627-633.
Jonsson, H., Baky, A., Jeppsson, U., Hellstrom, D., & Karrman, E. (2005). Composition of urine, feces, greywater and biowaste for utilisation in the URWARE model. Gothenburg: Chalmers University of Technology.
Kadam, P. C., & Boone, D. R. (1996). Influence of pH on Ammonia Accumulation and Toxicity in Halophilic, Methylotrophic Methanogens. Applied and Environmental Microbiology, 62(12), 4486-4492.
Kamerow, D. (2007). Milestone, tombstones, and sex education. British Medical Journal 334, 7585.
Kirchgäßner, M., Schmahl, G., Al-Quraishy, S., Ghaffar, F., & Mehlhorn, H. (2008). What are the infectious larvae in Ascaris suum and Trichuris muris? Parasitology Research, 103(3), 603-607.
Landin, P., Carbonell, M. M., & Soderberg, M. (1997). La letrina solar: guia de educacion sanitaria. El Salvador: Programa de Agua y Saneamiento, componente de Educacion Sanitaria, UNICEF - El Salvador.
Lefcourt, A. M. (2002). Some potential problems for measuring ammonia emissions from farm structures. Transactions of the ASAE, 45(5), 1585-1591.
Legros, D. (2004). Shigellosis: Report of a Workshop held at ICDDR,B: Centre for Health and Population Research, Dhaka, Bangladesh, on 16-18 February 2004. Journal of Health, Population and Nutrition, 22(4), 445-449.
Longa, A., Vizcaya, L., Nieves, B., Bravo, L., Morier, L., Perez-Schael, I., et al. (2005). Factors of virulence associated with enteropathogenicity in strains of Aeromonas spp. isolated from children with diarrhea in Merida, Venezuela. Rev Cubana Med Trop, 57(2), 85-91.
Malla, N., Sofi, B. A., Ganguly, N. K., & Mahajan, R. C. (1991). In vitro effect of larval stages of Ascaris lumbricoides on human blood clotting. Journal of Helminthology, 65, 133-140.
168
Mamoru Nishimuta, N. I., Naoko Kodama, Eiko Morikuni, Yayoi H. Yoshioka, Nobue Matsuzaki, Mieko Shimada, Nanae Sato, Tamami Iwamoto, Kazuko Ohki, Hidemaro Takeyama, Hironobu Nishimuta. (2006). Moisture and Mineral Content of Human Feces - High Fecal Moisture is Associated with Increased Sodium and Decreased Potassium Content. Journal of Nutritional Science and Vitaminology, 52, 121-126.
Manahan, S. E. (2000). Environmental Chemistry (7th ed.): Lewis Publishers.
Maung, M. (1978). The occurrence of the second moult of Ascaris lumbricoides and Ascaris suum. International Journal for Parasitology, 8(5), 371-378.
Mendez, J. M., Jimenez, B., & Maya, C. (2004). Disinfection kinetics of pathogens in physicochemical sludge treated with ammonia. Water Sci Technol, 50(9), 67-74.
Mendez, J. M., Jimenez, B. E., & Barrios, J. A. (2002). Improved alkaline stabilization of municipal wastewater sludge. Water Sci Technol, 46(10), 139-146.
Metcalf, & Eddy. (2003). Wastewater Engineering: Treatment and Reuse (4 ed.). New York: McGraw-Hill.
Miller, K., Duran-Pinales, C., Cruz-Lopez, A., Morales-Lechuga, L., Taren, D., & Enriquez, F. J. (1994). Cryptosporidium Parvum in Children with Diarrhea in Mexico. Am J Trop Med Hyg, 51(3), 322-325.
Ministerio de Salud Publica y Asistencia Social. (2004). Norma Tecnica Sanitaria para la Instalacion, Uso y Mantenimiento de Letrinas Secas sin Arrastre de Agua. Retrieved. from.
Moe, C., & Izurieta, R. (2003). Longitudinal study of double vault urine diverting toilets and solar toilets in El Salvador. Paper presented at the 2nd International Symposium on Ecological Sanitation, Lubeck, Germany.
Monfort, P., Kosenko, E., Erceg, S., Canales, J.-J., & Felipo, V. (2002). Molecular mechanism of acute ammonia toxicity: role of NMDA receptors. Neurochemistry International, 41(2-3), 95-102.
Nelson, K. L., & Murray, A. (2008). Sanitation for Unserved Populations: Technologies, Implementation Challenges, and Opportunities. Annual Review of Environment and Resources, 33(1), 119-151.
Newman, Robert D., Sears, Cynthia L., Moore, Sean R., Nataro, James P., Wuhib, T., Agnew, Deborah A., et al. (1999). Longitudinal Study of Cryptosporidium Infection in Children in Northeastern Brazil. The Journal of Infectious Diseases, 180(1), 167-175.
169
Nimri, L. F. (2003). Cyclospora cayetanensis and other intestinal parasites associated with diarrhea in a rural area of Jordan. Int Microbiol, 6(2), 131-135.
Nordin, A. (2007). Ammonia Based Sanitation. Swedish University of Agricultural Sciences, Uppsala.
Nordin, A., Nyberg, K., & Vinnerås, B. (2009). Inactivation of Ascaris eggs in source-separated urine and faeces by ammonia at ambient temperatures. Appl Environ Microbiol, 75(3), 662-667.
O'Lorcain, P., & Holland, C. V. (2000). The public health importance of Ascaris lumbricoides. Parasitology, 121 Suppl(71), S51-71.
Ohno, A., Marui, A., Castro, E. S., Reyes, A. A. B., Elio-Calvo, D., Kasitani, H., et al. (1997). Enteropathogenic Bacteria in the La Paz River of Bolivia. Am J Trop Med Hyg, 57(4), 438-444.
Ottoson, J., Nordin, A., von Rosen, D., & Vinnerås, B. (2008). Salmonella reduction in manure by the addition of urea and ammonia. Bioresource Technology, 99(6), 1610-1615.
Ottoson, J. R., Schnurer, A., & Vinneras, B. (2008). In situ ammonia production as a sanitation agent during anaerobic digestion at mesophilic temperature. Lett Appl Microbiol, 46(3), 325-330.
Overren, L., & Moe, P. (1967). Factors affecting urea hydrolysis and ammonia. Soil Science Society of America, 31, 57-61.
Parashar, U. D., Hummelman, E. G., Breeze, J. S., Miller, M. A., & Glass, R. I. (2003). Global Illness and Deaths Caused by Rotavirus Disease in Children. Emerging Infectious Diseases, 9(5), 565.
Park, G. W., & Diez-Gonzalez, F. (2003). Utilization of carbonate and ammonia-based treatments to eliminate Escherichia coli O157:H7 and Salmonella Typhimurium DT104 from cattle manure. J Appl Microbiol, 94(4), 675-685.
Patel, M. M., Widdowson, M. A., Glass, R. I., Akazawa, K., Vinje, J., & Parashar, U. D. (2008). Systematic literature review of role of noroviruses in sporadic gastroenteritis. Emerg Infect Dis, 14(8), 1224-1231.
Pazzaglia, G., Sack, R. B., Salazar, E., Yi, A., Chea, E., Leon-Barua, R., et al. (1991). High frequency of coinfecting enteropathogens in Aeromonas-associated diarrhea of hospitalized Peruvian infants. J. Clin. Microbiol., 29(6), 1151-1156.
170
Pecson, B. M., Barrios, J. A., Jiménez, B. E., & Nelson, K. L. (2007). The effects of temperature, pH, and ammonia concentration on the inactivation of Ascaris eggs in sewage sludge. Water Research, 41(13), 2893-2902.
Pecson, B. M., Barrios, J. A., Johnson, D. R., & Nelson, K. L. (2006). A Real-Time PCR Method for Quantifying Viable Ascaris Eggs Using the First Internally Transcribed Spacer Region of Ribosomal DNA (Vol. 72, pp. 7864-7872).
Pecson, B. M., & Nelson, K. L. (2005). Inactivation of Ascaris suum eggs by ammonia. Environmental Science Technology, 39, 7909-7914.
Petrucci, R. H., & Harwood, W. S. (1993). General Chemistry (6th ed.): Prentice-Hall, Inc.
Pierce, K. K., & Kirkpatrick, B. D. (2009). Update on human infections caused by intestinal protozoa. Current Opinion in Gastroenterology, 25(1), 12-17.
Prado, M. S., Strina, A., Barreto, M. L., Oliveira-Assis, A. M., Uacute, Cia, et al. (2003). Risk factors for infection with Giardia duodenalis in pre-school children in the city of Salvador, Brazil. Epidemiology and Infection, 131(02), 899-906.
Qadri, F., Svennerholm, A.-M., Faruque, A. S. G., & Sack, R. B. (2005). Enterotoxigenic Escherichia coli in Developing Countries: Epidemiology, Microbiology, Clinical Features, Treatment, and Prevention. Clin. Microbiol. Rev., 18(3), 465-483.
Ramos, F., Morán, P., González, E., García, G., Ramiro, M., Gómez, A., et al. (2005). Entamoeba histolytica and Entamoeba dispar: Prevalence infection in a rural mexican community. Experimental Parasitology, 110(3), 327-330.
Rayner-Canham, G. (1996). Descriptive inorganic chemistry. New York: W. H. Freeman and Company.
Redlinger, T., Corella-Barud, V., Graham, J., Galindo, A., Avitia, R., & Cardenas, V. (2002). Hyperendemic Cryptosporidium and Giardia in households lacking municipal sewer and water on the United States-Mexico border. Am J Trop Med Hyg, 66(6), 794-798.
Reed, J. M., Fenters, J. D., & Lue Hing, C. (1975). The effect of ammonia on Polio Virus type 1. Abstracts of the annual meeting of the American Society for microbiology, 75, 206.
Robert, D. N., Sean, R. M., Aldo, A. M. L., James, P. N., Richard, L. G., & Cynthia, L. S. (2001). A longitudinal study of <i>Giardia lamblia</i>
171
infection in north-east Brazilian children. Tropical Medicine & International Health, 6(8), 624-634.
Rosemarin, A., Ekane, N., Caldwell, I., Kvarnstrom, E., McConville, J., Ruben, C., et al. (2008). Pathways for Sustainable Sanitation- Achieving the Millenium Development Goals: SEI/IWA.
Sawyer, R. (2007). Ecosan: Saneamiento Ecologico. Tepoztlan: SARAR.
Schaper, M., Duran, A. E., & Jofre, J. (2002). Comparative Resistance of Phage Isolates of Four Genotypes of F-Specific RNA Bacteriophages to Various Inactivation Processes (Vol. 68, pp. 3702-3707).
Schmidt, G. D., & Roberts, L. S. (2000). Foundations of Parasitology (6 ed.): McGraw-Hill
Schonning, C., & Stenstrom, T. A. (2004). Guidelines for the Safe Use of Urine and Faeces in Ecological Sanitation Systems. EcoSanRes [Electronic Version]. Retrieved August 30, 2007 from http://esa.un.org/iys/docs/san_lib_docs/ESR1web%5b1%5d.pdf.
Seamster, A. P. (1950). Developmental Studies Concerning the Eggs of Ascaris lumbricoides var. suum. American Midland Naturalist, 43(2), 450-470.
SIWI, & WHO. (2005). Securing Sanitation: The Compelling Case to Address the Crisis. Retrieved November 29, 2007, from http://www.siwi.org/documents/Resources/Reports/CSD_Securing_Sanitation_2005.pdf
Soltan Dallal, M. M., & Moezardalan, K. (2004). Aeromonas spp associated with children's diarrhoea in Tehran: a case-control study. Annals of Tropical Paediatrics: International Child Health, 24(1), 45-51.
Sorto, J. M. (2004). Informe sobre la construccion e instalacion de 23 letrinas solares prototipo IV en la comunidad los Angeles, Canton ElMajahual, Departamento de la Libertad: Ministerio de Salud Publica y Asistencia Socia (MSPAS) / Fondo de las Naciones Unidas para la Infancia (UNICEF).
Steketee, R. W. (2003). Pregnancy, Nutrition and Parasitic Diseases (Vol. 133, pp. 1661S-1667).
Tamplin, M. L., Gauzens, A. L., Huq, A., Sack, D. A., & Colwell, R. R. (1990). Attachment of Vibrio cholerae serogroup O1 to zooplankton and phytoplankton of Bangladesh waters. Appl. Environ. Microbiol., 56(6), 1977-1980.
172
Tilley, E., Luthi, C., Morel, A., Zurbrugg, C., & Schertenleib, R. (2008). Compendium of Sanitation Systems and Technologies. Geneva: Eawag-Sandec
Troeh, F. R., & Thompson, L. M. (1993). Soils and soil fertility. New York: Oxford University Press.
Tumwine, J. K., Kekitiinwa, A., Nabukeera, N., Akiyoshi, D. E., Rich, S. M., Widmer, G., et al. (2003). CRYPTOSPORIDIUM PARVUM IN CHILDREN WITH DIARRHEA IN MULAGO HOSPITAL, KAMPALA, UGANDA. Am J Trop Med Hyg, 68(6), 710-715.
U.S Environmental Protection Agency. (1979 EPA-600/3-79-091). Aqueous Ammonia Equilibrium - Tabulation of Percent Un-ionized Ammonia.
U.S Environmental Protection Agency. (1994). A Plain English Guide to the EPA Part 503 Biosolids Rule. Retrieved September 6, 2007, from http://www.epa.gov/OW-OWM.html/mtb/biosolids/503pe/index.htm
U.S Environmental Protection Agency. (2008). Frequently Asked Questions. Retrieved June 17, 2008, from http://www.epa.gov/OWM/mtb/biosolids/genqa.htm
U.S Environmental Protection Agency (USEPA). (1979). Aqueous Ammonia Equilibrium - Tabulation of Percent Un-ionized Ammonia. EPA-600/3-79-091. Minnesota.
UN Millennium Project. (2005). Health, Dignity, and Development: What Will it Take? Task Force on Water and Sanitation Retrieved June 6, 2008, from http://www.unmillenniumproject.org/documents/WaterComplete-lowres.pdf
UNICEF. (2005). Common water and sanitation-related diseases. Retrieved September 18, 2010, from http://www.unicef.org/wash/index_wes_related.html
UNICEF. (2006). Progress for children: A report card on water and sanitation (No. 5). Published by UNICEF, New York, USA.
United Nations. (2008). The Millennium Development Goals Report 2008. New York.
United Nations Children's Fund. (2008). Estudio Antropologico del use de letrinas ecologicas en el area rural andina de Bolivia.
United Nations Children's Fund. (2009). The state of the world's children 2009: Maternal and newborn health.
173
United Nations Secretary-General's Advisory Board on Water and Sanitation. (2007). MDGs and Water. Retrieved September 18, 2010, from http://www.unsgab.org/docs/mdgs.htm
United State Environmental Protection Agency (USEPA). (1999). 1999 Update of Ambient Water Quality Criteria for Ammonia. Retrieved. from http://www.epa.gov/waterscience/criteria/ammonia/99update.pdf.
UNWater. (2008, 2008). 10 Things you should know about sanitation. Retrieved June 7,2008, 2008, from http://www.unwater.org/worldwaterday/flashindex.html
USEPA. (2003). Environmental Regulations and Technology. Control of Pathogens and Vector Attraction in Sewage Sludge. EPA/625/R-92/013. Cincinnati.
Viessman, W., & Hammer, M. (2005). Water Supply and Pollution Control (Seventh ed.). New Jersey: Pearson Prentice Hall.
Vinnerås, B., Holmqvist, A., Bagge, E., Albihn, A., & Jönsson, H. (2003). The potential for disinfection of separated faecal matter by urea and by peracetic acid for hygienic nutrient recycling. Bioresource Technology, 89(2), 155-161.
Ward, R. L. (1978). Mechanism of poliovirus inactivation by ammonia. Journal of Virology, 26(2), 299-305.
Ward, R. L., & Ashley, C. S. (1976). Inactivation of poliovirus in digested sludge. Applied and Environmental Microbiology, 31(6), 921-930.
Ward, R. L., & Ashley, C. S. (1977a). Discovery of an agent in wastewater sludge that reduces the heat required to inactivate reovirus. Applied and Environmental Microbiology, 34(6), 681-688.
Ward, R. L., & Ashley, C. S. (1977b). Identification of the virucidal agent in wastewater sludge. Applied and Environmental Microbiology, 33(4), 860-864.
Warren, K. S. (1962). Ammonia toxicity and pH. Nature, 195, 47-49.
Water Advocates. (2009). The world's most serious health problem remains diseases caused by inadequate water, sanitation and hygiene. Retrieved September 18,, 2010, from http://www.wateradvocates.org/media/nytimesads/Sources.pdf
Weigel, M. M., Calle, A., Armijos, R. X., Vega, I. P., Bayas, B. V., & Montenegro, C. E. (1996). The effect of chronic intestinal parasitic infection on maternal
174
and perinatal outcome. International Journal of Gynecology & Obstetrics, 52(1), 9-17.
Wharton, D. (1980). Nematode egg-shells. Parasitology, 81(2), 447-463.
WHO. (2000). Water-related diseases: Diarrhoea. Retrieved June 13, 2008, from http://www.who.int/water_sanitation_health/diseases/diarrhoea/en/
WHO. (2001a). Hepatitis. Retrieved August, 2009, from http://www.who.int/water_sanitation_health/diseases/hepatitis/en/
WHO. (2001b). Water-related diseases: Ascaris. Retrieved June 13, 2008, from http://www.who.int/water_sanitation_health/diseases/ascariasis/en/
WHO. (2001c). Water-related Diseases: Schistosomiasis. Retrieved June 13, 2008, from http://www.who.int/water_sanitation_health/diseases/schisto/en/
WHO. (2002a). Enteroviruses -non polio. Fact sheet No. 174. Revised May 2002. Retrieved August 2009, from http://www.who.int/mediacentre/factsheets/fs174/en/print.html
WHO. (2002b). The World Health Report: 2002: Reducing Risks, Promoting Healthy Life. Retrieved June 3, 2008, from http://www.who.int/whr/2002/en/whr02_en.pdf
WHO. (2003). Actions against worms. Newsletter Issue 1. Retrieved May 14, 2008, from http://www.who.int/wormcontrol/en/action_against_worms.pdf
WHO. (2004a). Global Burden of Disease Estimates: Death and DALY estimates for 2002 by cause for WHO Member States. Retrieved June 13, 2008, from http://www.who.int/healthinfo/bodestimates/en/index.html
WHO. (2004b). Water, sanitation and hygiene links to health: Facts and figures. Retrieved June 12, 2008, from http://www.who.int/water_sanitation_health/publications/facts2004/en/
WHO. (2006a). Guidelines for the safe use of wastewater, excreta and greywater. Volumen IV, Excreta and greywater use in agriculture.
WHO. (2006b). Guidelines for the safe use of wastewater, excreta and greywater. Volumen IV, Excreta and greywater use in agriculture [Electronic Version]. Retrieved August 2007 from http://www.who.int/water_sanitation_health/wastewater/gsuweg4/en/index.html.
WHO. (2006c). Weekly epidemiological record: Schistosomiasis and soil-transmitted helminth infections-preliminary estimates of the number of
175
children treated with albendazole or mebendazole. No 16, 2006, 81, 145-164. . Retrieved November 5 2007, from http://www.who.int/wer/2006/wer8116.pdf
WHO. (2008a). Poliomyelitis. Fact sheet No. 114. Updated January 2008. Retrieved August, 2009, from http://www.who.int/mediacentre/factsheets/fs114/en/print.html
WHO. (2008b). Sanitation is vital for health. Factsheet No. 1. Retrieved June 13, 2008, from http://esa.un.org/iys/docs/1%20fact-sheet_health.pdf
WHO. (2008c). Soil-transmitted helminths. Retrieved June 13, 2008, from http://www.who.int/intestinal_worms/en/
WHO, & UNICEF. (2004). Meeting the MDG Drinking Water and Sanitation Target: A Mid-Term Assessment of Progress. Retrieved September 6, 2007, from http://www.unicef.org/wes/files/who_unicef_watsan_midterm_rev.pdf
WHO/UNICEF. (2010). Progress on Sanitation and Drinking-water: 2010 Update.
Winblad, U., & Simpson-Hebert, M. (2004). Ecological Sanitation-revised and enlarged edition. SEI, Stockholm, Sweden.
World Bank. (2005). State of the Art Hygiene and Sanitation Promotion: Component design for large scale rural water and sanitation projects.
World Health Organization. (2000a). Campylobacter. Fact sheet No. 255 Retrieved August, 2009, from http://www.who.int/mediacentre/factsheets/fs255/en/
World Health Organization. (2000b). The increasing incidence of human campylobacteriosis. Report and proccedings of a WHO consultation of experts. 21-25 November 2000. Retrieved August, 2009, from http://whqlibdoc.who.int/hq/2001/WHO_CDS_CSR_APH_2001.7.pdf
World Health Organization. (2000c). The PHAST initiative, a new approach to working with communities. Retrieved June 1, 2009, from http://www.who.int/water_sanitation_health/hygiene/envsan/phastep/en/
World Health Organization. (2001). Prevention and control of schistosomiasis and soil-transmitted helminthiasis: a report of the WHO expert committee. Geneva.
World Health Organization. (2003). Background document: The diagnosis, treatment and prevention of typhoid fever. Retrieved August, 2009, from http://www.who.int/vaccine_research/documents/en/typhoid_diagnosis.pdf
176
World Health Organization. (2004). Integrated guide to sanitary parasitology. Amman-Jordan.
World Health Organization. (2006a). Guidelines for the safe use of wastewater, excreta and greywater. Volumen IV, Excreta and greywater use in agriculture. Retrieved August, 2007, from http://www.who.int/water_sanitation_health/wastewater/gsuweg4/en/index.html
World Health Organization. (2006b). Preventing Disease Through Healthy Environments: Towards and estimate of the environmental burden of disease. Geneva.
World Health Organization. (2006c). Preventive Chemotherapy in humans helminthiasis. Geneva.
World Health Organization. (2008a). Cholera 2007: Weekly epidemiological record. No. 31, 2008, 83, 269-284. Retrieved August 2009, from http://www.who.int/wer/2008/wer8331.pdf
World Health Organization. (2008b). Cholera. Fact Sheet No. 107. Retrieved August 2009, from http://www.who.int/mediacentre/factsheets/fs107/en/index.html
World Health Organization. (2008c). Guidelines for drinking-water quality. Volumen 1 Recommendations. Third Edition. Retrieved August, 2009, from http://www.who.int/water_sanitation_health/dwq/fulltext.pdf
World Health Organization. (2009a). Health topics: Shigella. Retrieved August 2009, 2009, from http://www.who.int/topics/shigella/en/
World Health Organization. (2009b). Salmonella. Retrieved August, 2009, from http://www.who.int/topics/salmonella/en/
World Health Organization. (2009c). Soil-transmitted helminths. Retrieved July 3, 2009, from http://www.who.int/intestinal_worms/en/
World Health Organization and United Nations Children's Fund Joint Monitoring Programme for Water Supply and Sanitation (JMP). (2008). Progress on Drinking Water and Sanitation: Special Focus on Sanitation.: UNICEF, New York and WHO, Geneva, 2008.
WSSCC/Sandec. (2000). The Bellagio Statement on Sustainable Sanitation. Retrieved July 4, 2009, from http://www.eawag.ch/organisation/abteilungen/sandec/publikationen/publications_sesp/downloads_sesp/Report_WS_Bellagio.pdf
177
Yacoob, M., & Whiteford, L. M. (1994). Behavior in water supply and sanitation. Human Organization, 53(4), 330-335.

178
APPENDICES
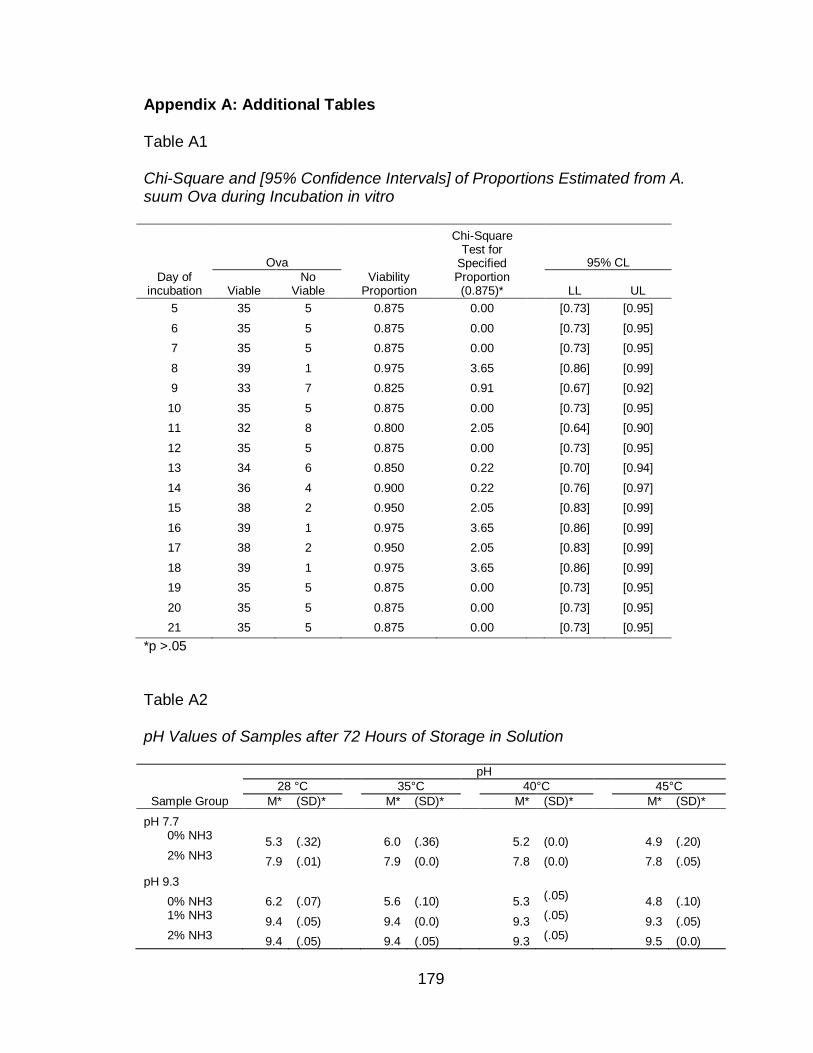
179
Appendix A: Additional Tables
Table A1
Chi-Square and [95% Confidence Intervals] of Proportions Estimated from A. suum Ova during Incubation in vitro
Day of incubation
Ova
Viability Proportion
Chi-Square Test for
Specified Proportion (0.875)*
95% CL
Viable No
Viable
LL UL
5 35 5 0.875 0.00 [0.73] [0.95]
6 35 5 0.875 0.00 [0.73] [0.95]
7 35 5 0.875 0.00 [0.73] [0.95]
8 39 1 0.975 3.65 [0.86] [0.99]
9 33 7 0.825 0.91 [0.67] [0.92]
10 35 5 0.875 0.00 [0.73] [0.95]
11 32 8 0.800 2.05 [0.64] [0.90]
12 35 5 0.875 0.00 [0.73] [0.95]
13 34 6 0.850 0.22 [0.70] [0.94]
14 36 4 0.900 0.22 [0.76] [0.97]
15 38 2 0.950 2.05 [0.83] [0.99]
16 39 1 0.975 3.65 [0.86] [0.99]
17 38 2 0.950 2.05 [0.83] [0.99]
18 39 1 0.975 3.65 [0.86] [0.99]
19 35 5 0.875 0.00 [0.73] [0.95]
20 35 5 0.875 0.00 [0.73] [0.95]
21 35 5 0.875 0.00 [0.73] [0.95]
*p >.05
Table A2
pH Values of Samples after 72 Hours of Storage in Solution
Sample Group
pH
28 °C 35°C 40°C 45°C
M* (SD)*
M* (SD)*
M* (SD)*
M* (SD)*
pH 7.7 0% NH3
5.3 (.32)
6.0 (.36)
5.2 (0.0)
4.9 (.20) 2% NH3
7.9 (.01)
7.9 (0.0)
7.8 (0.0)
7.8 (.05)
pH 9.3
0% NH3 6.2 (.07)
5.6 (.10)
5.3 (.05)
4.8 (.10) 1% NH3
9.4 (.05)
9.4 (0.0)
9.3 (.05)
9.3 (.05) 2% NH3
9.4 (.05)
9.4 (.05)
9.3 (.05)
9.5 (0.0)
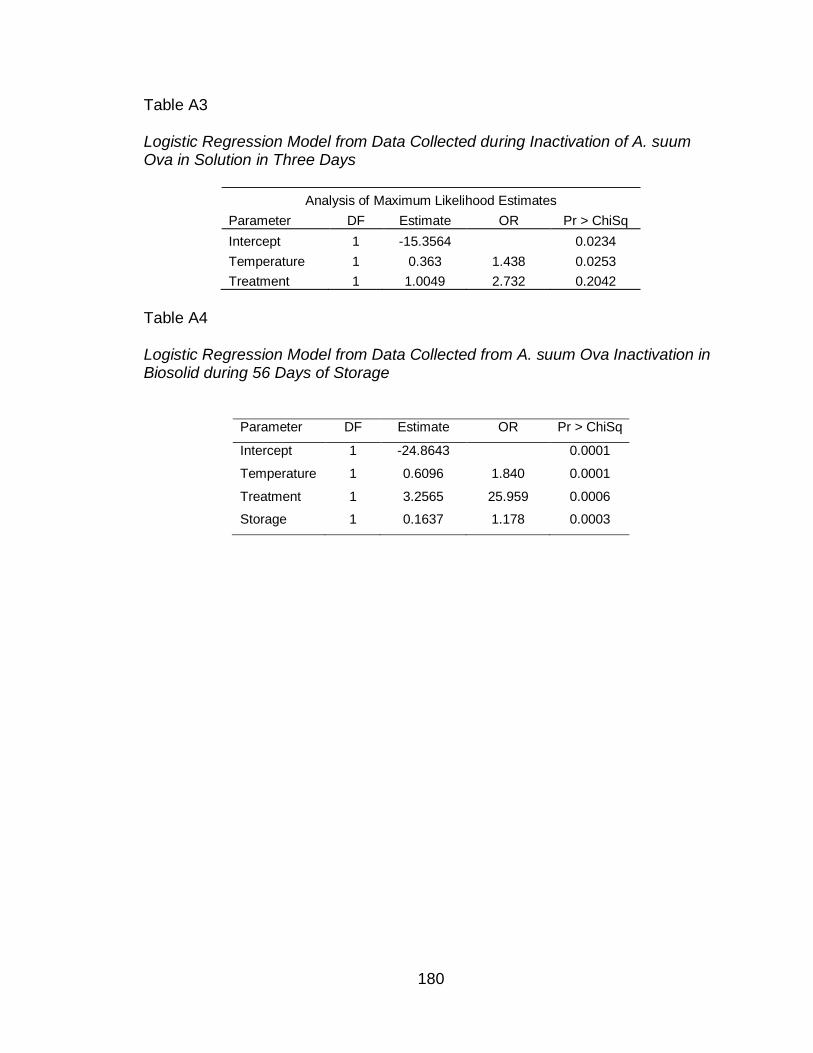
180
Table A3 Logistic Regression Model from Data Collected during Inactivation of A. suum Ova in Solution in Three Days
Analysis of Maximum Likelihood Estimates
Parameter DF Estimate OR Pr > ChiSq
Intercept 1 -15.3564
0.0234
Temperature 1 0.363 1.438 0.0253
Treatment 1 1.0049 2.732 0.2042
Table A4
Logistic Regression Model from Data Collected from A. suum Ova Inactivation in Biosolid during 56 Days of Storage
Parameter DF Estimate OR Pr > ChiSq
Intercept 1 -24.8643 0.0001
Temperature 1 0.6096 1.840 0.0001
Treatment 1 3.2565 25.959 0.0006
Storage 1 0.1637 1.178 0.0003
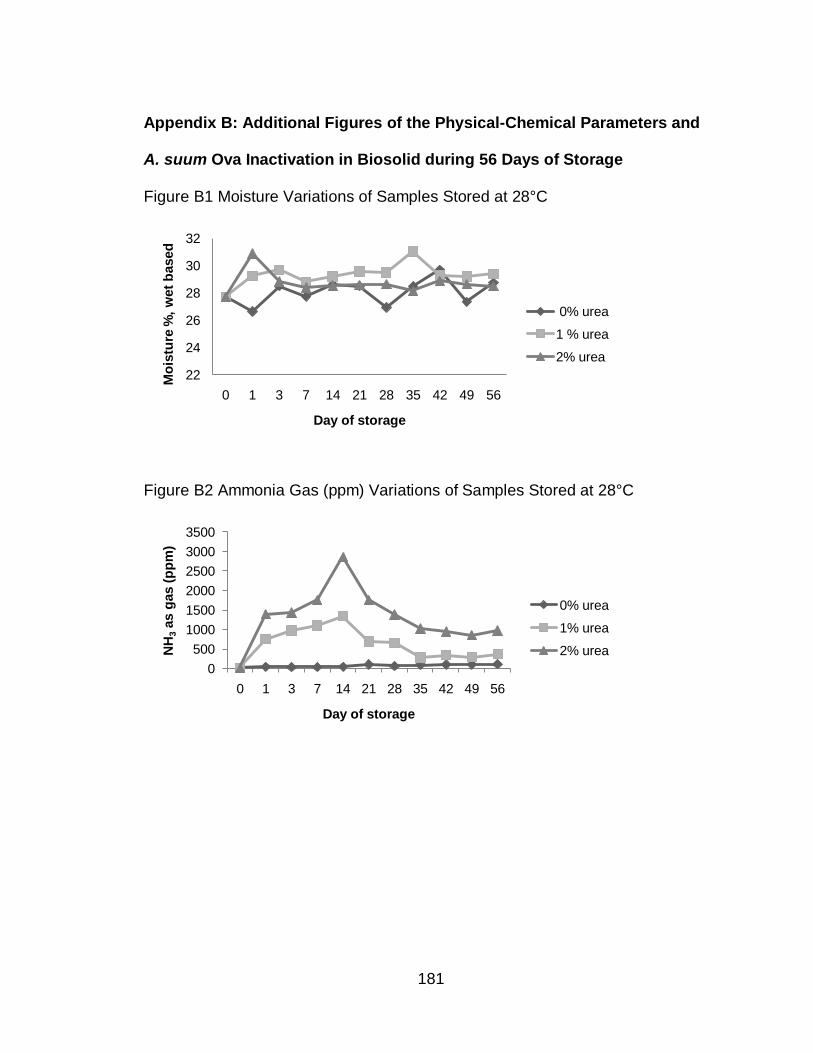
181
Appendix B: Additional Figures of the Physical-Chemical Parameters and
A. suum Ova Inactivation in Biosolid during 56 Days of Storage
Figure B1 Moisture Variations of Samples Stored at 28°C
Figure B2 Ammonia Gas (ppm) Variations of Samples Stored at 28°C
22
24
26
28
30
32
0 1 3 7 14 21 28 35 42 49 56
Mo
istu
re %
, w
et
based
Day of storage
0% urea
1 % urea
2% urea
0
500
1000
1500
2000
2500
3000
3500
0 1 3 7 14 21 28 35 42 49 56
NH
3as g
as (
pp
m)
Day of storage
0% urea
1% urea
2% urea
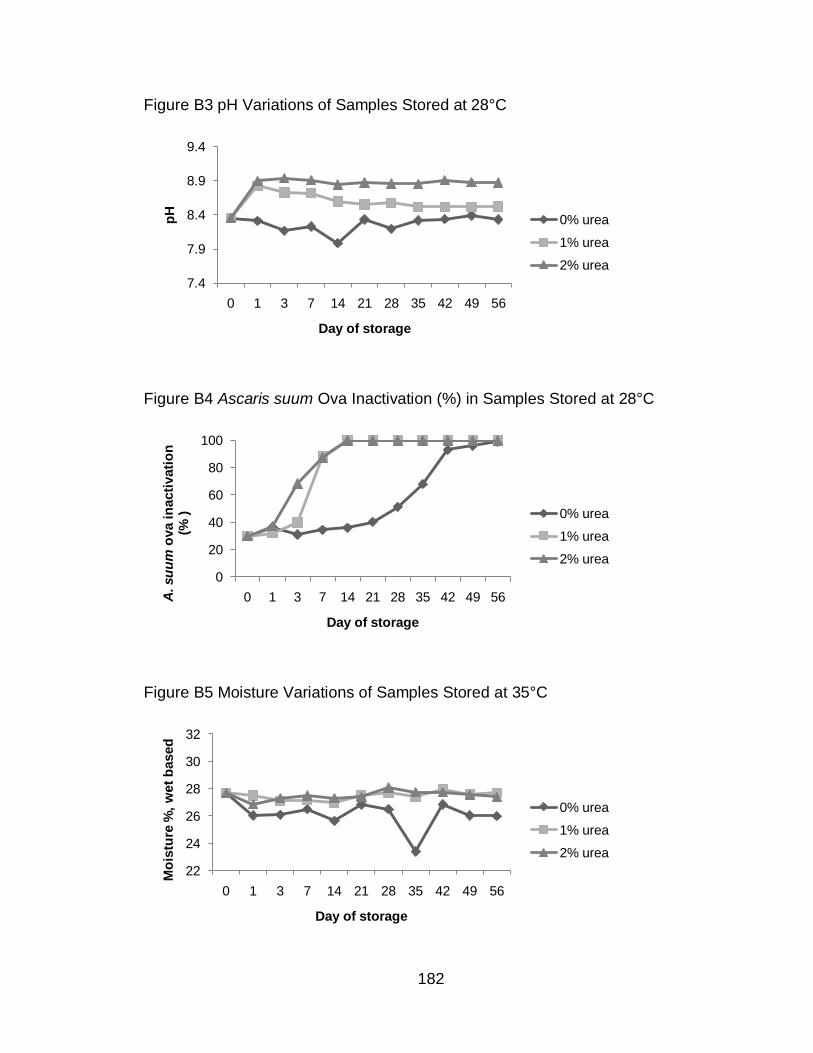
182
Figure B3 pH Variations of Samples Stored at 28°C
Figure B4 Ascaris suum Ova Inactivation (%) in Samples Stored at 28°C
Figure B5 Moisture Variations of Samples Stored at 35°C
7.4
7.9
8.4
8.9
9.4
0 1 3 7 14 21 28 35 42 49 56
pH
Day of storage
0% urea
1% urea
2% urea
0
20
40
60
80
100
0 1 3 7 14 21 28 35 42 49 56A. su
um
ova in
acti
vati
on
(%
)
Day of storage
0% urea
1% urea
2% urea
22
24
26
28
30
32
0 1 3 7 14 21 28 35 42 49 56
Mo
istu
re %
, w
et
based
Day of storage
0% urea
1% urea
2% urea
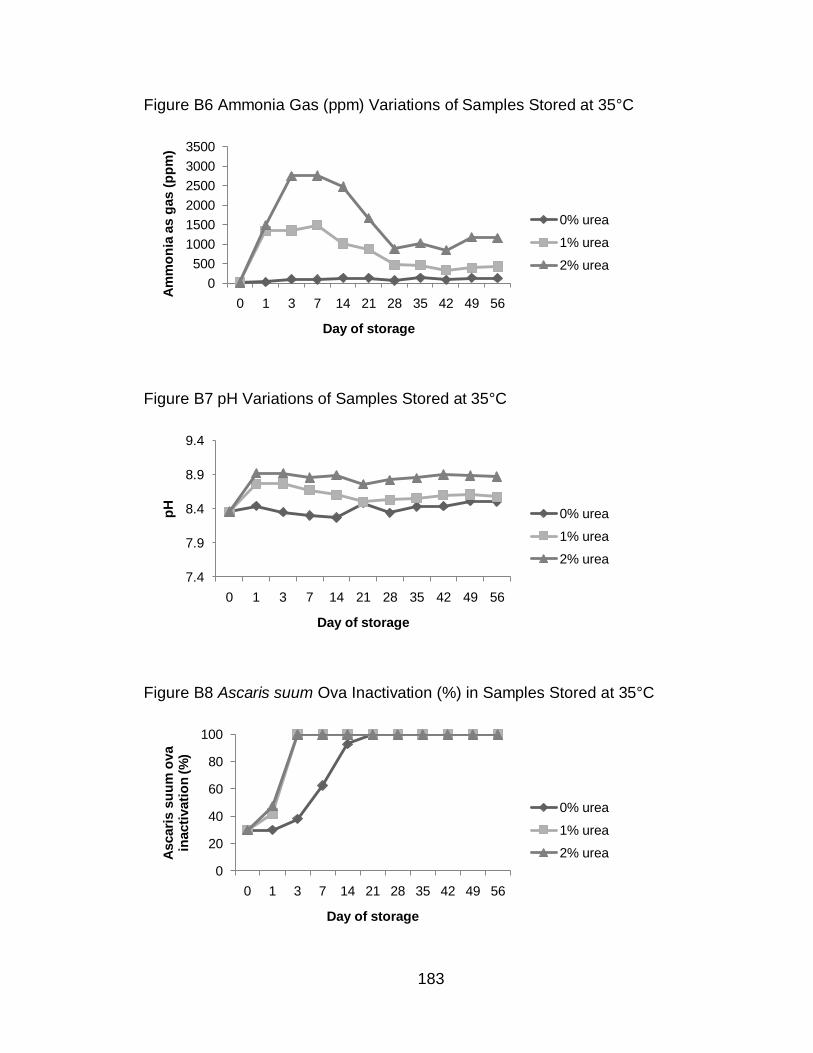
183
Figure B6 Ammonia Gas (ppm) Variations of Samples Stored at 35°C
Figure B7 pH Variations of Samples Stored at 35°C
Figure B8 Ascaris suum Ova Inactivation (%) in Samples Stored at 35°C
0
500
1000
1500
2000
2500
3000
3500
0 1 3 7 14 21 28 35 42 49 56
Am
mo
nia
as g
as (
pp
m)
Day of storage
0% urea
1% urea
2% urea
7.4
7.9
8.4
8.9
9.4
0 1 3 7 14 21 28 35 42 49 56
pH
Day of storage
0% urea
1% urea
2% urea
0
20
40
60
80
100
0 1 3 7 14 21 28 35 42 49 56
Ascari
s s
uu
m o
va
inacti
vati
on
(%
)
Day of storage
0% urea
1% urea
2% urea
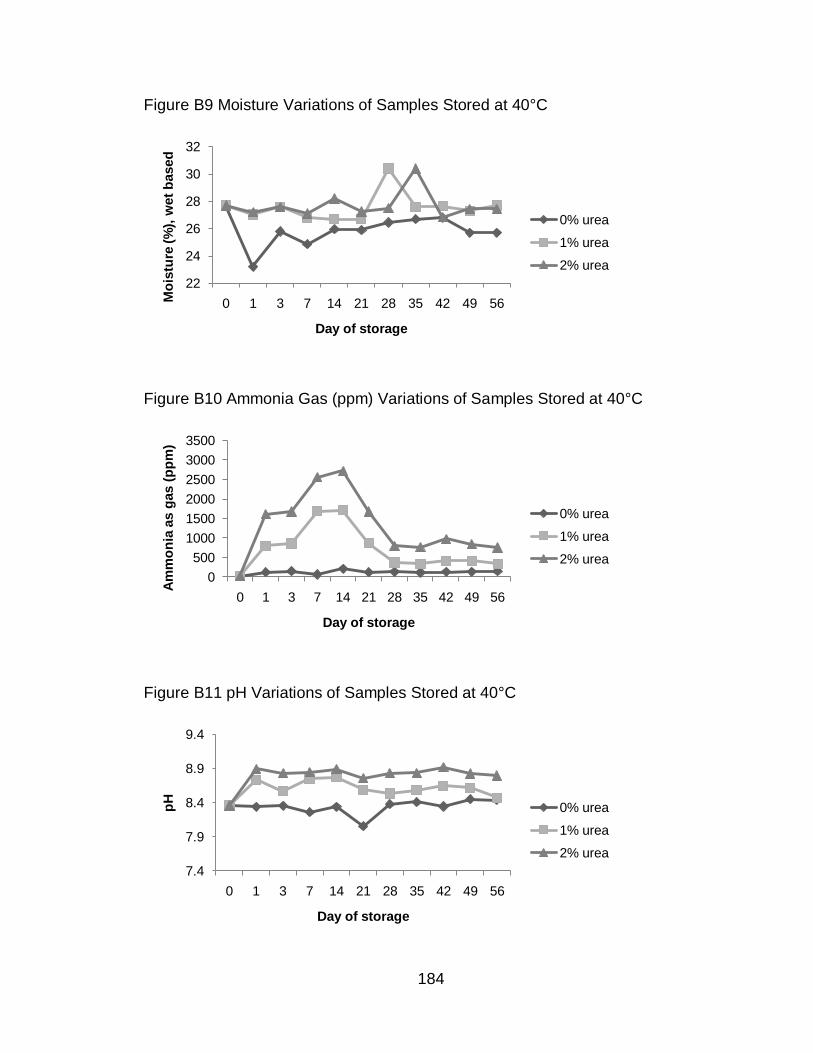
184
Figure B9 Moisture Variations of Samples Stored at 40°C
Figure B10 Ammonia Gas (ppm) Variations of Samples Stored at 40°C
Figure B11 pH Variations of Samples Stored at 40°C
22
24
26
28
30
32
0 1 3 7 14 21 28 35 42 49 56Mo
istu
re (%
), w
et
based
Day of storage
0% urea
1% urea
2% urea
0
500
1000
1500
2000
2500
3000
3500
0 1 3 7 14 21 28 35 42 49 56
Am
mo
nia
as g
as (
pp
m)
Day of storage
0% urea
1% urea
2% urea
7.4
7.9
8.4
8.9
9.4
0 1 3 7 14 21 28 35 42 49 56
pH
Day of storage
0% urea
1% urea
2% urea
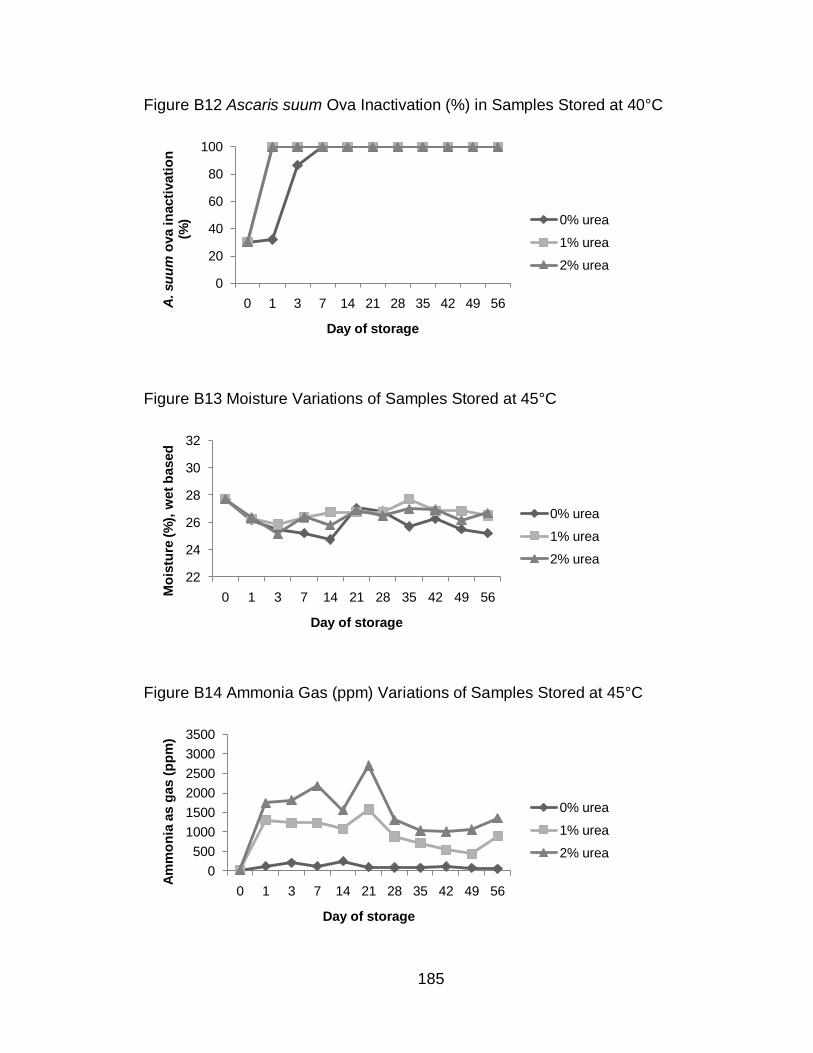
185
Figure B12 Ascaris suum Ova Inactivation (%) in Samples Stored at 40°C
Figure B13 Moisture Variations of Samples Stored at 45°C
Figure B14 Ammonia Gas (ppm) Variations of Samples Stored at 45°C
0
20
40
60
80
100
0 1 3 7 14 21 28 35 42 49 56A. su
um
ova in
acti
vati
on
(%
)
Day of storage
0% urea
1% urea
2% urea
22
24
26
28
30
32
0 1 3 7 14 21 28 35 42 49 56Mo
istu
re (%
), w
et
based
Day of storage
0% urea
1% urea
2% urea
0
500
1000
1500
2000
2500
3000
3500
0 1 3 7 14 21 28 35 42 49 56
Am
mo
nia
as g
as (
pp
m)
Day of storage
0% urea
1% urea
2% urea
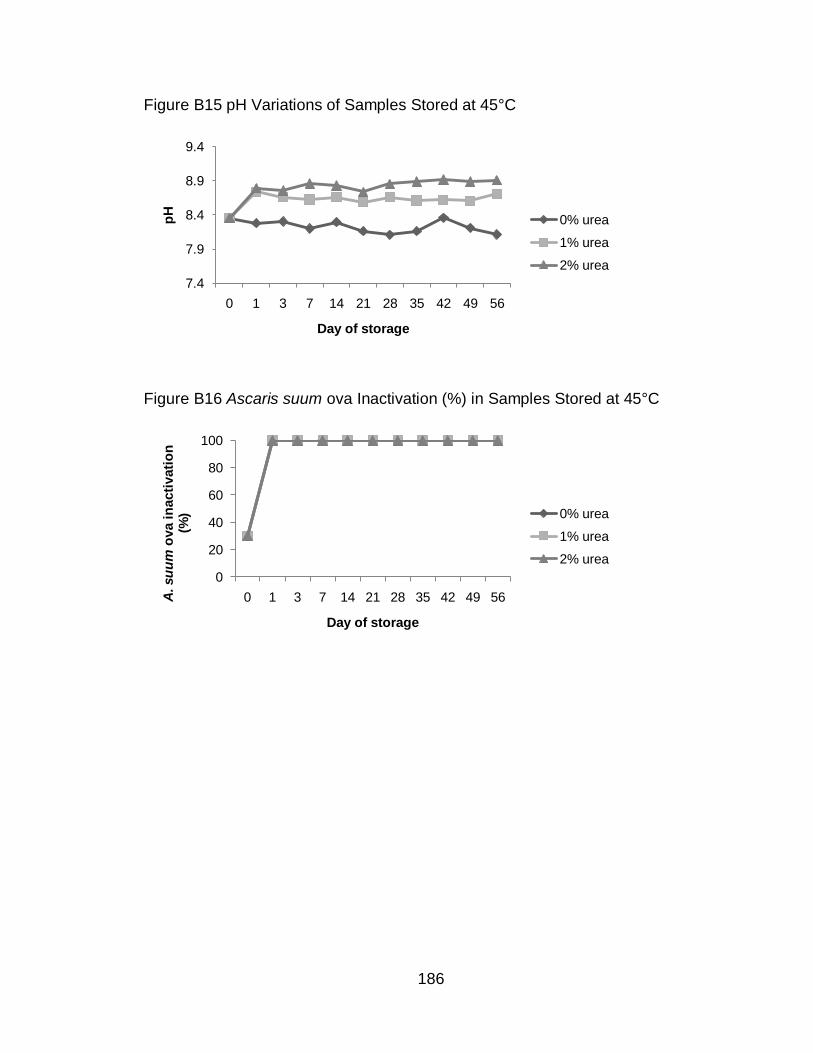
186
Figure B15 pH Variations of Samples Stored at 45°C
Figure B16 Ascaris suum ova Inactivation (%) in Samples Stored at 45°C
7.4
7.9
8.4
8.9
9.4
0 1 3 7 14 21 28 35 42 49 56
pH
Day of storage
0% urea
1% urea
2% urea
0
20
40
60
80
100
0 1 3 7 14 21 28 35 42 49 56A. su
um
ova in
acti
vati
on
(%
)
Day of storage
0% urea
1% urea
2% urea
ABOUT THE AUTHOR
Ligia María Cruz Espinoza is originally from León, Nicaragua. She graduated
from Pureza de Maria High School in 1995 as the Valedictorian of her class and
completed Medical studies at the “Universidad Nacional Autónoma de Nicaragua”,
located in León city, Nicaragua, in 2004. During her medical studies she received a
Nuffic Scholarship to study Public Health in an International Perspective at the
University of Nijmegen, in the Netherlands. After this experience, she worked and
volunteer in rural areas of León city in a program for adolescents in danger, providing
education and medical assistance. She also participated in projects evaluating the
effectiveness of vaccines at reducing diarrheal diseases in children.
In 2006, she received the Latin American and Caribbean Scholarship to complete
a Master of Public Health with a concentration in Global Health at the University of
South Florida, Tampa, USA. During this period, she volunteered in the Tobacco
Research and Intervention Program at the H. Lee Moffitt Cancer Center and Research
Institute, developing and adapting health education materials to prevent smoking
relapse in pregnant and postpartum Hispanic women. In 2007, she was awarded with
the Graduate Multidisciplinary Scholarship to continue with a PhD program in Global
Communicable Disease at the same university. Her research focuses in improving
sustainable sanitation technologies implemented in El Salvador to reduce environmental
health risks in local communities and the degradation of the environment. In 2008, she
received a scholarship from the Swedish International Development Cooperation
Agency (SIDA) to further deepen her knowledge in sanitation by completing the
International Training Program in Sweden and Mexico (Ecological Alternatives in
Sanitation) organized by the Stockholm Environment Institute and the EcoSanRes
program.
In 2009, she worked in Suriname as a consultant for the Pan American Health
Organization in the area of neglected diseases providing technical assistance to the
Bureau of Public Health of Suriname in the planning and implementation of a national
schistosomiasis and soil transmitted helminthes school survey. Next year she will
continue with a Postdoctoral program to implement the results of her study in rural
communities of El Salvador using solar dry toilets.


