Embed Size (px)
Citation preview

In Vivo Evidence for Alcohol-Induced Neurochemical Changes inRat Brain Without Protracted Withdrawal, Pronounced ThiamineDeficiency, or Severe Liver Damage
Natalie M Zahr1,2, Dirk Mayer2,3, Shara Vinco2, Juan Orduna2, Richard Luong4, Edith VSullivan1,*, and Adolf Pfefferbaum1,21 Psychiatry and Behavioral Sciences, Stanford University School of Medicine, Stanford, CA, USA2 Neuroscience Program, SRI International, Menlo Park, CA, USA3 Radiology Department, Lucas MRS/I Center, Stanford University, Stanford, CA, USA4 Department of Comparative Medicine, Stanford University School of Medicine, Stanford, CA,USA
AbstractMagnetic resonance spectroscopy (MRS) studies in human alcoholics report decreases in N-acetylaspartate (NAA) and choline-containing (Cho) compounds. Whether alterations in brainmetabolite levels are attributable to alcohol per se or to physiological effects of protractedwithdrawal or impaired nutritional or liver status remains unclear. Longitudinal effects of alcoholon brain metabolites measured in basal ganglia with single-voxel MRS were investigated insibling pairs of wild-type Wistar rats, with one rat per pair exposed to escalating doses ofvaporized alcohol, the other to vapor chamber air. MRS was conducted before alcohol exposureand twice during exposure. After 16 weeks of alcohol exposure, rats achieved average bloodalcohol levels (BALs) of ~ 293 mg per 100 ml and had higher Cho and a trend for higherglutamine + glutamate (Glx) than controls. After 24 weeks of alcohol exposure, BALs rose to ~445 mg per 100 ml, and alcohol-exposed rats had higher Cho, Glx, and glutamate than controls.Thiamine and thiamine monophosphate levels were significantly lower in the alcohol than thecontrol group but did not reach levels low enough to be considered clinically relevant.Histologically, livers of alcohol-exposed rats exhibited greater steatosis and lower glycogenosisthan controls, but were not cirrhotic. This study demonstrates a specific pattern ofneurobiochemical changes suggesting excessive membrane turnover or inflammation, indicated byhigh Cho, and alterations to glutamate homeostasis in the rat brain in response to extendedvaporized alcohol exposure. Thus, we provide novel in vivo evidence for alcohol exposure ascausing changes in brain chemistry in the absence of protracted withdrawal, pronounced thiaminedeficiency, or severe liver damage.
Keywordsrat; magnetic resonance spectroscopy; vaporized alcohol; alcoholism; thiamine; liver
*Correspondence: Dr EV Sullivan, Psychiatry and Behavioral Sciences, Stanford University School of Medicine, 401 Quarry Road,Stanford, CA 94305-5723, USA, Tel: + 1 650 859 2880, Fax: + 1 650 859 2743, E-mail: [email protected]/CONFLICT OF INTERESTThe authors have no conflict of interest, financial or otherwise.
NIH Public AccessAuthor ManuscriptNeuropsychopharmacology. Author manuscript; available in PMC 2010 May 1.
Published in final edited form as:Neuropsychopharmacology. 2009 May ; 34(6): 1427–1442. doi:10.1038/npp.2008.119.
NIH
-PA Author Manuscript
NIH
-PA Author Manuscript
NIH
-PA Author Manuscript

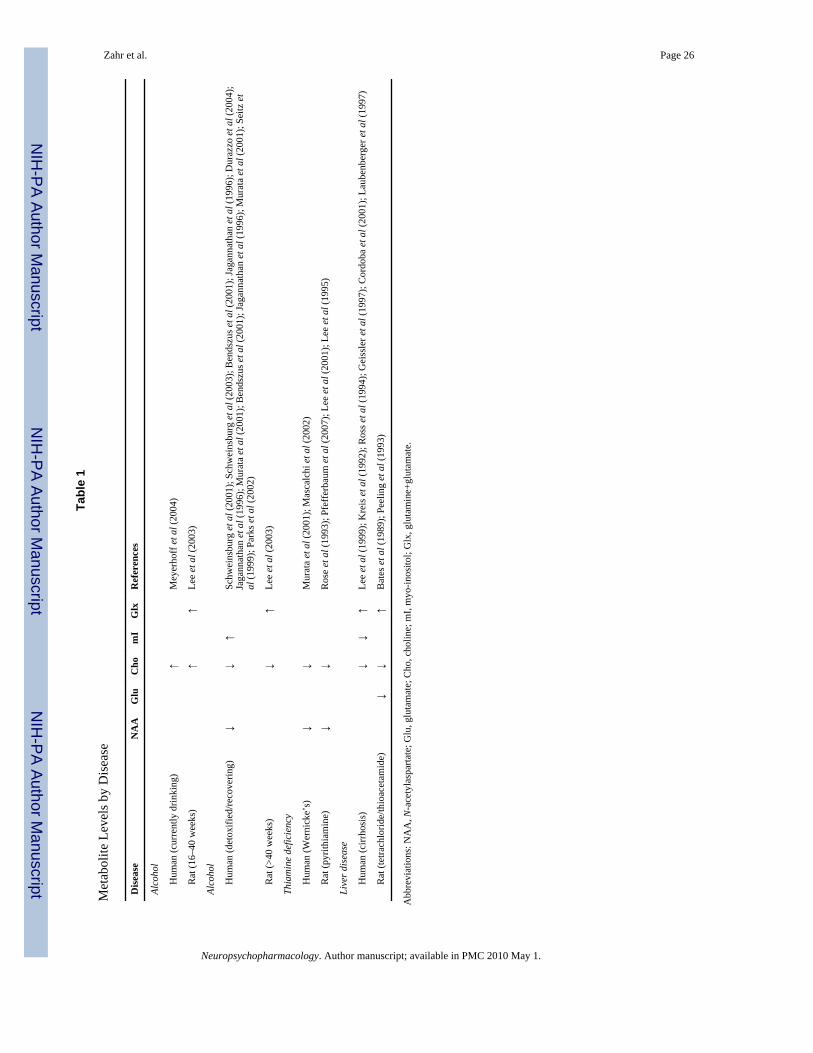
INTRODUCTIONIn vivo magnetic resonance spectroscopy (MRS) provides a noninvasive method for theidentification, visualization, and quantification of specific brain biochemical markers andneurotransmitters reflecting molecular processes. MRS thus enables the direct in vivoassessment of the neurochemical status of discrete brain structures with the potential ofidentifying mechanisms underlying selective brain pathologies and their evolution, includingthose induced by chronic alcoholism. In general, the study of chronic alcoholism in thehuman condition is hampered by the heterogeneity of alcoholic populations examined withrespect to length of sobriety, pattern of drinking, and frequency of withdrawals. Further,seldom is the nutritional or hepatic status of human alcoholics considered in MRS studies ofalcoholism, leaving ambiguity as to whether the genesis of brain metabolite differences isthe result of withdrawal, nutritional status, or alcohol per se. In contrast with the often-indeterminable natural course of alcohol use in humans, animal models allow for thedetermination of alcohol toxicity controlled for multiple factors.
The predominant MRS signal in the healthy human brain is N-acetylaspartate (NAA), foundalmost exclusively in neurons (Petroff et al, 1995; Urenjak et al, 1992) and thus considereda marker of neuronal integrity. Choline-containing (Cho) compounds, including free Cho,phosphocholine, and glycerophosphocholine, are associated with cell membrane synthesis,turnover, and metabolism (Stoll et al, 1995). Other prominent and often-reported signalsinclude myo-inositol (mI), described as a glial marker (Brand et al, 1993; Petroff et al,1995) or intracellular osmolyte (Ernst et al, 1997; Lien et al, 1990), creatine (Cr), influencedby the state of high-energy phosphate metabolism (Tedeschi et al, 1995), and a signal withcombined contributions from glutamine + glutamate (Glx). Recently, advanced MRSmethods have allowed for the isolation of the glutamate (Glu) signal, the principal excitatoryneurotransmitter of the brain (Mayer and Spielman, 2005b).
Studies of recently detoxified alcoholics (within 30 days of detoxification) show abnormallylow levels of NAA, inferred from ratios to total Cr (tCr) or amount of underlying tissue infrontal white matter (Meyerhoff et al, 2004; Schweinsburg et al, 2001, 2003), frontal graymatter (Bendszus et al, 2001; Durazzo et al, 2004; Jagannathan et al, 1996), thalamus(Jagannathan et al, 1996; Murata et al, 2001), and cerebellum (Bendszus et al, 2001;Jagannathan et al, 1996; Murata et al, 2001; Parks et al, 2002, but see O’Neill et al, 2001;Seitz et al, 1999). Likewise, Cho, whether expressed as a ratio to tCr or tissue water, islower in recently detoxified alcoholics than controls in thalamus (Durazzo et al, 2004;Murata et al, 2001), and cerebellum (Bendszus et al, 2001; Jagannathan et al, 1996; Murataet al, 2001; but see O’Neill et al, 2001; Parks et al, 2002; Seitz et al, 1999).
A potential concomitant of chronic alcoholism is thiamine deficiency. Lower levels of bothNAA and Cho compared with controls are reported in MRS case studies of thiaminedeficiency (Wernicke’s encephalopathy; Mascalchi et al, 2002; Murata et al, 2001) andmodels of severe thiamine deficiency in rats treated with pyrithiamine hydrochloride (Lee etal, 1995, 2001; Pfefferbaum et al, 2007; Rose et al, 1993). The MRS pattern of reducedNAA and Cho shared by recovering alcoholics and also humans and rats with thiaminedeficiency questions the relative importance of alcohol vs thiamine status in the genesis ofMRS observable brain alterations.
Of individuals with alcoholism 10–15% also develop cirrhosis of the liver (Anand, 1999),and of those, 67% can develop hepatic encephalopathy (Prasad et al, 2007). A reduction inCho is a key element in the MRS pattern distinguishing cirrhosis of the liver. Indeed, lowerCho and mI, and higher Glx, with no change in NAA characterize the neurospectroscopicabnormalities consistently reported in the brains of cirrhotic patients (Cordoba et al, 2001;
Zahr et al. Page 2
Neuropsychopharmacology. Author manuscript; available in PMC 2010 May 1.
NIH
-PA Author Manuscript
NIH
-PA Author Manuscript
NIH
-PA Author Manuscript
Geissler et al, 1997; Kreis et al, 1992; Laubenberger et al, 1997; Lee et al, 1999; Ross et al,1994). Hepatic encephalopathy is associated with greater abnormalities in these metabolites(Cordoba et al, 2002).
In actively drinking, long-term alcohol-dependent humans and also in rodents exposed to20% alcohol as the only source of fluid for 60 weeks, the pattern of MRS-detectable changesis different from that noted in alcoholics sober for at least 1 month. NAA (relative to tissuewater) is only 5% lower in heavy-drinking compared with light-drinking humans in frontalwhite matter (Meyerhoff et al, 2004). And in contrast to the frequent observation inrecovering, abstinent alcoholics, the levels of Cho are higher in parietal gray matter ofactively drinking humans (Meyerhoff et al, 2004) and in the thalamus of rodents betweenweeks 16 and 40 of alcohol exposure (Lee et al, 2003). In the rodent study, Glx was alsoelevated in alcohol-exposed rats relative to controls (Lee et al, 2003); the human study didnot measure Glx. Table 1 presents the neurospectroscopic patterns identified in each of thesealcohol and alcohol-related conditions.
In the present study, we used a rodent alcohol inhalation system (La Jolla Alcohol ResearchInc., La Jolla, CA) to expose rats to escalating doses of vaporized alcohol to test thehypothesis that alcohol, per se, would cause significant metabolite changes in the basalganglia of wild-type male Wistar rats. We studied the basal ganglia because of evidence forits involvement in the loss of control over alcohol consumption (Modell et al, 1990;Tabakoff, 1979; Xia et al, 2006) and because of evidence that Glu in the basal ganglia maycontribute to the neuropathology associated with alcoholism (Rossetti et al, 1999; Ulrichsenet al, 1996). The expectation was that, in the absence of severe alcohol withdrawalphenomena, pronounced thiamine deficiency, or severe liver dysfunction, the pattern ofmetabolite changes would differ from that in abstinent, recovering human alcoholics, andmore likely resemble the active drinkers and reveal increases, rather than decreases in Cho,and elevations in Glu and Glx.
MATERIALS AND METHODSSubjects
The study group comprised 10 sibling pairs of healthy, male, wild-type Wistar rats (CharlesRiver Laboratories) weighing 292.8±38.0 g at the time of reception (56 days old). Rats weresingly housed with free access to food and water, acclimated to a reversed 14-h light/10-hdark cycle (ie lights on at 1900 to 0900 hours for the rats’ sleep cycle), and weighed onceper week for 14 weeks before the first imaging session (MRS 1). The Institutional AnimalCare and Use Committees at SRI International and Stanford University approved allprocedures. This same group of rats underwent structural MRI examination (Pfefferbaum etal, 2008).
Alcohol ExposureAfter the first imaging session (MRS 1, pre-alcohol baseline scanning), one rat from eachsibling pair was exposed to a mixture of alcohol and oxygen (alcohol weight: 625.88±97.41g), the other to oxygen (control weight: 629±76.88 g, p=0.94), using a rodent alcoholinhalation system (La Jolla Alcohol Research Inc.). Rats were exposed to vaporized alcoholfor a total of 24 weeks; MRS was performed at week 16 (MRS 2) and week 24 (MRS 3).Ethanol vapor was created by dripping 95% alcohol into a 4000 ml Erlenmeyer vacuumflask kept at 50°C on a warming tray. Air was blown over the bottom of the flask at 11 l/minto vaporize alcohol. Concentrations of alcohol vapor were adjusted by varying the rate atwhich alcohol was pumped into the flask and ranged from 15 to 30 mg/l. Chambersadministering intermittent vapor were connected to a timer that would turn the chambers on
Zahr et al. Page 3
Neuropsychopharmacology. Author manuscript; available in PMC 2010 May 1.
NIH
-PA Author Manuscript
NIH
-PA Author Manuscript
NIH
-PA Author Manuscript

and off every day so that animals received alcohol vapor for 14 h at night during their sleepcycle (ie starting at 1900 hours). Previous work has demonstrated that alcohol vaporexposure is a reliable technique: animals are free to move and blood alcohol levels (BALs)can be maintained at specific levels (Roberts et al, 2000). Tail blood (~ 0.5 ml) sampled forBAL determination was collected into heparinized Eppendorf tubes. After centrifugation,the plasma was extracted and assayed for alcohol content based on direct reaction with theenzyme alcohol oxidase (Analox Instruments Ltd., UK).
MRS AcquisitionWe employed an imaging method previously described (Mayer et al, 2007a). Briefly,animals were held in an MR-invisible structure, which provided support for the radio-frequency coil and a nose cone for the delivery of isoflurane anesthesia (2–3.5%) andoxygen (1.5 l/min). Rectal temperature and oxygen saturation from the hindlimb weremonitored throughout the experiment. Heating was provided by prewarmed bags of salinesolution placed under the animal tray. Rats were scanned in sessions of ~ 2 h each.
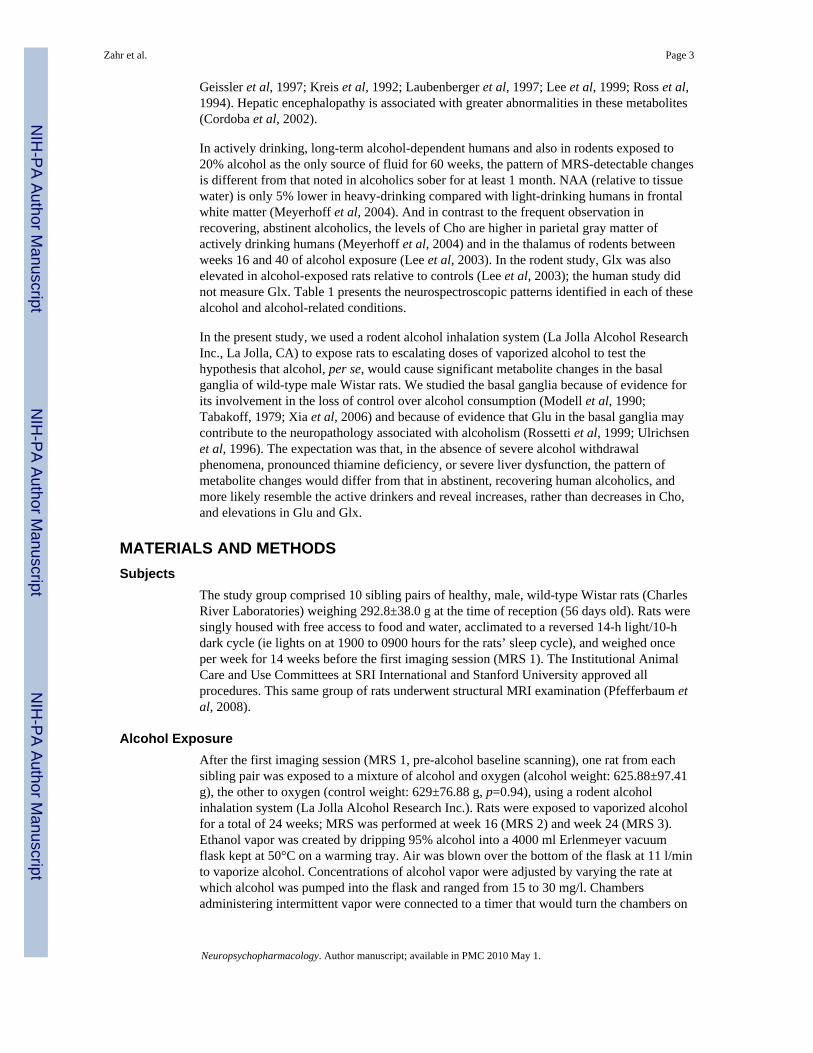
Proton MR spectra were acquired on a clinical 3 T GE human scanner equipped with a high-strength insert gradient coil (Adalsteinsson et al, 2004). Coronal fast spin-echo images (echotime (TE)1/TE2/repetition time (TR)=12.0/62.6/3000 ms, field of view=8 × 4 cm2, 256 ×128, 1mm thick) were used to prescribe an approximately 0.25mm3 brain voxel (10 × 5 ×5mm3) in the basal ganglia. The voxel was placed approximately 2.5mm anterior andposterior to bregma, 5mm to the right and left of midline, and 5mm inferior to ~ −3.10mmbregma, according to the atlas of Paxinos and Watson (2005) (Figure 1).
Spectroscopy was performed with a constant time point resolved spectroscopy (CT-PRESS)sequence (Mayer and Spielman, 2005a; Mayer et al, 2007b) consisting of modified PRESSmodule in which the position of the last refocusing pulse was shifted to encode the chemicalshift (CS) in the second time dimension (t1). The pulse was shifted in 129 steps with anincrement Δt1/2=0.8 ms corresponding to a spectral width (SW1) of 625 Hz in f1. Theaverage TE of the sequence was 139 ms optimized for the detection of Glu. To increasesignal-to-noise ratio, data acquisition (2048 complex points at SW2=5000 Hz) startedimmediately after the last crusher gradient of the second refocusing pulse. CT-PRESS waspreceded by a three-pulse CS-selective sequence for water suppression and an outer volumesuppression module using selective saturation pulses. TR was 2 s and four excitations wereperformed without data acquisition to establish a steady state. With six averages, theacquisition time per spectrum was 26: 36 min. An additional acquisition without watersuppression was carried out (17 CS encoding steps, Δt1/2=6.4 ms, two averages, Tacq=1: 16min) to measure tissue water content used to normalize the metabolite signal intensities.
The amount of cerebral spinal fluid and tissue water was estimated by fitting the dataacquired without water suppression across the 17 TEs to a biexponential model, as describedin Mayer et al (2007b). Apodization of the water-suppressed data involved multiplicationwith sine-bell functions in both time dimensions and zero filling up to 4096 × 1024 datapoints. A t1-dependent shift was applied in t2 correcting for the different start of dataacquisition. After performing a two-dimensional fast Fourier transform, effectivelydecoupled one-dimensional CT-PRESS spectra were obtained by integrating the signalalong f2 within a ±13Hz interval around the spectral diagonal. Metabolite signals in the one-dimensional spectra were evaluated by peak integration with an interval of ± 6 Hz. Thequality of the spectra allowed evaluation of signals from NAA (2.02 p.p.m.), tCr (3.03 and3.93 p.p.m.), Cho (3.24 p.p.m.), Glu (2.36 p.p.m.), Glx (3.78 p.p.m.), mI (3.58 p.p.m.), andtaurine (Tau, 3.44 p.p.m.). For comparison with published data, metabolite results were alsoanalyzed using tCr as the referent.
Zahr et al. Page 4
Neuropsychopharmacology. Author manuscript; available in PMC 2010 May 1.
NIH
-PA Author Manuscript
NIH
-PA Author Manuscript
NIH
-PA Author Manuscript

Behavioral AnalysisBefore MRS 1, all rats were trained to criterion of achieving perfect performance inmaintaining balance on a rotarod (6 r.p.m., 45 s, two consecutive trials). Performance wastested before MRS 2 (16 weeks alcohol) and MRS 3 (a total of 24 weeks alcohol).Neurological examination based on established guidelines (Becker, 2000; Pitkin and Savage,2001) was performed before MRS 2 and MRS 3, in the morning, within 1–2 h of alcoholexposure, and in the evening, within 8–10 h of alcohol exposure. Rats were rated (0=absent,1=present) for neurological signs including autonomic, sensory, and motor functions.
Thiamine AssayAfter MRS 3, plasma was collected from 17 rats (7 alcohol, an additional alcohol rat diedunexpectedly after MRS 3; 10 control), frozen, and sent to the Stanford University MassSpectrometry Laboratory where it was analyzed for concentrations of thiamine, thiaminemonophosphate (TMP) and thiamine pyrophosphate (TPP, also known as thiaminediphosphate). Samples (100 μl aliquots) were thawed and spiked with 50 pmol reserpine(used as an internal standard). Protein precipitation in cold, acidic (0.1% formic acid)acetonitrile was performed. The samples were centrifuged and the supernatant wasrecovered, dried, and resuspended in 30mM ammonium formate (pH 3). Ten μl of thesample was injected into the high-performance liquid chromatography-mass spectrometer(LC-MS) system. Samples were analyzed in duplicate. High-performance liquidchromatography (HPLC) separation of thiamine and its phosphates was achieved on anAtlantis T3 column (C18, 100 × 2.1 mm, 3 μm, 100 Å; Waters Corp., Milford, MA) usingan Agilent 1100HPLC system equipped with degasser and autosampler (Agilent, SantaClara, CA). Flow rate was 0.2 ml/min, mobile phase A was 30mM ammonium formate (pH3), and mobile phase B was acetonitrile. The analytes were separated with the linear gradientfrom 0 to 80% B in 2.8 min. Total time of LC-MS analysis was 6 min; retention times wereas follows: thiamine 2.10 min, TMP 1.96 min, and TPP 1.80 min. The Micromass QuattroPremier triple quadruple mass spectrometer (Waters Corp.) equipped with an electrospraysource was used for detection of the HPLC eluent and selective quantitation of the analytes.MS data were acquired in single reaction monitoring mode where the analytes’ uniqueprecursor ion-fragment ion transitions were monitored: thiamine 265.1>121.8, TPP345.1>121.8, and TMP 425.1>121.8. Cone voltage depended on the analyte (20–25 V),extractor voltage was 3V, source temperature was 120°C, and vaporizer temperature was350°C. Collision energy also depended on the analyte (16–20 eV). The limits ofquantification were as follows: thiamine 0.05 fmol, TMP 2.0 fmol, and TPP 20 fmol perinjection in sample buffer. For data analysis, MassLynx and QuanLynx software (WatersCorp.) were employed.
Liver HistopathologyLeft lateral lobe liver specimens from 17 rats (7 alcohol, 10 control) were quick-frozen byimmersion in isopentane at −160°C. Samples were wrapped in foil, placed in falcon tubes,and stored at −70°C until processing. For histopathology, frozen liver specimens weresimultaneously thawed and fixed in 10% buffered formalin solution at room temperature for48 h. After fixation, the specimens were prepared with a standard hematoxylin and eosinstain and a Masson’s Trichrome stain.
Cross-sectional areas of the left lateral lobe were morphologically assessed for hepaticpathologies. Specific pathologies evaluated included hepatic steatosis (intracellularaccumulation of fat in hepatocytes), alcoholic hepatitis (hepatocellular swelling and/ornecrosis, with or without a neutrophilic inflammatory reaction; presence of Mallory bodies;and presence of sinusoidal and/or portocentric fibrosis), and alcoholic cirrhosis(hepatocellular parenchymal loss with evidence of nodular hepatocellular regeneration;
Zahr et al. Page 5
Neuropsychopharmacology. Author manuscript; available in PMC 2010 May 1.
NIH
-PA Author Manuscript
NIH
-PA Author Manuscript
NIH
-PA Author Manuscript
presence of bridging fibrosis; bile ductular proliferation; and presence of portocentriclymphoplasmacytic inflammation). The veterinary pathologist (RL) assessed liver specimenspost-fixation only and blind to group. Morphological changes were graded on a 0–4 scale,where 0=no pathology, 1=minimal (affects <5% of tissue), 2=mild (affects 5–20% of tissue),3=moderate (affects 20–50% of tissue), and 4=severe (affects >50% of tissue).
Statistical AnalysisGroup differences were tested with repeated-measures analysis of variance (ANOVA),Spearman’s rank order tests corrected for ties, and paired t-tests, where appropriate. Alcoholeffects were subject to one-tailed tests because our primary hypothesis was that alcoholexposure would result in no change in NAA, and higher levels of Cho, Glu, and Glx in thealcohol than control groups. All remaining comparisons were analyzed with two-tailed t-tests.
RESULTSAfter the first 16 weeks of intermittent alcohol exposure (MRS 2), two rats diedprematurely; the remaining eight rats in the alcohol group reached average BALs of292.98±42.12mg per 100 ml (range 240.5–385.6 mg per 100 ml) and lost 1.2% body weight(alcohol: 606±83.17 g), whereas controls gained 13.4% of their baseline body weight(control: 713.69±93.97 g, p=0.02). After 8 more weeks of alcohol exposure (MRS 3), thealcohol group achieved average BALs of 444.63±24.14 mg per 100 ml (range 324.3–514.1mg per 100 ml) and weighed 567.1±107.58 g (lost 6.8% more of their body weight)whereas controls weighed 733.47±96.94 g, having gained 2.9% more of their body weightsince MRS 2 (p=0.003).
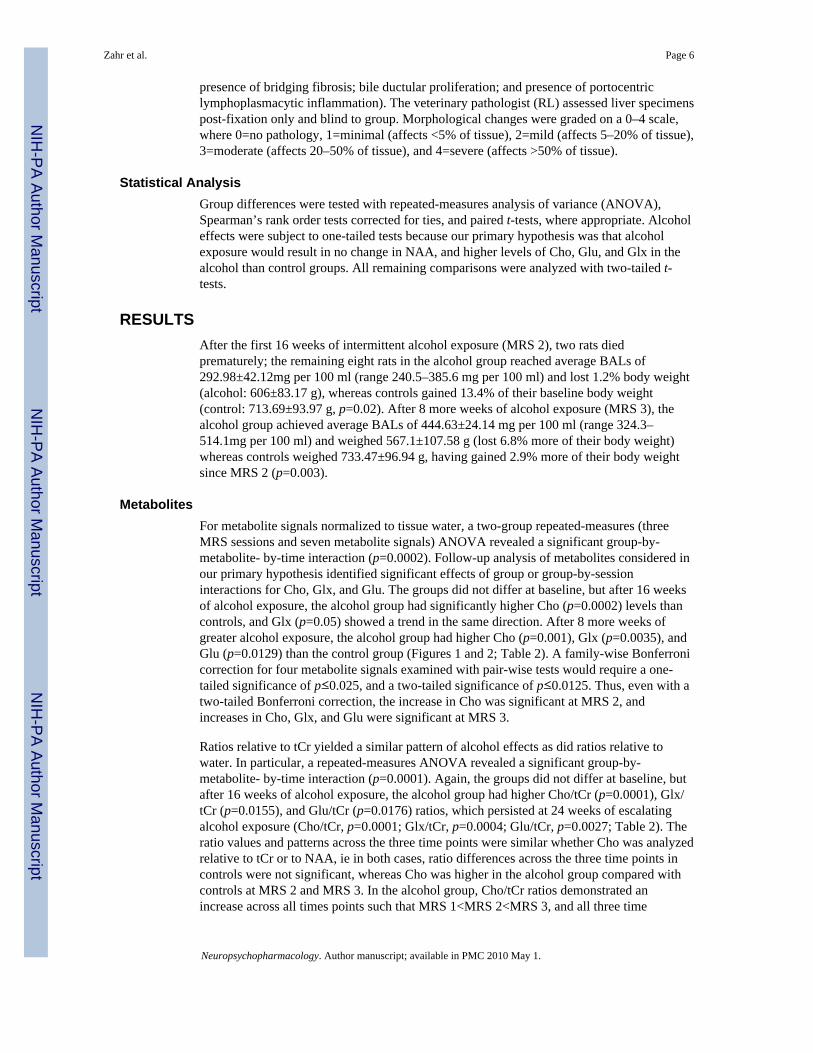
MetabolitesFor metabolite signals normalized to tissue water, a two-group repeated-measures (threeMRS sessions and seven metabolite signals) ANOVA revealed a significant group-by-metabolite- by-time interaction (p=0.0002). Follow-up analysis of metabolites considered inour primary hypothesis identified significant effects of group or group-by-sessioninteractions for Cho, Glx, and Glu. The groups did not differ at baseline, but after 16 weeksof alcohol exposure, the alcohol group had significantly higher Cho (p=0.0002) levels thancontrols, and Glx (p=0.05) showed a trend in the same direction. After 8 more weeks ofgreater alcohol exposure, the alcohol group had higher Cho (p=0.001), Glx (p=0.0035), andGlu (p=0.0129) than the control group (Figures 1 and 2; Table 2). A family-wise Bonferronicorrection for four metabolite signals examined with pair-wise tests would require a one-tailed significance of p≤0.025, and a two-tailed significance of p≤0.0125. Thus, even with atwo-tailed Bonferroni correction, the increase in Cho was significant at MRS 2, andincreases in Cho, Glx, and Glu were significant at MRS 3.
Ratios relative to tCr yielded a similar pattern of alcohol effects as did ratios relative towater. In particular, a repeated-measures ANOVA revealed a significant group-by-metabolite- by-time interaction (p=0.0001). Again, the groups did not differ at baseline, butafter 16 weeks of alcohol exposure, the alcohol group had higher Cho/tCr (p=0.0001), Glx/tCr (p=0.0155), and Glu/tCr (p=0.0176) ratios, which persisted at 24 weeks of escalatingalcohol exposure (Cho/tCr, p=0.0001; Glx/tCr, p=0.0004; Glu/tCr, p=0.0027; Table 2). Theratio values and patterns across the three time points were similar whether Cho was analyzedrelative to tCr or to NAA, ie in both cases, ratio differences across the three time points incontrols were not significant, whereas Cho was higher in the alcohol group compared withcontrols at MRS 2 and MRS 3. In the alcohol group, Cho/tCr ratios demonstrated anincrease across all times points such that MRS 1<MRS 2<MRS 3, and all three time
Zahr et al. Page 6
Neuropsychopharmacology. Author manuscript; available in PMC 2010 May 1.
NIH
-PA Author Manuscript
NIH
-PA Author Manuscript
NIH
-PA Author Manuscript

comparisons were significant. Cho/NAA ratios followed the same pattern as Cho/tCr ratios;however, Cho/NAA levels at MRS 3 were not significantly higher than those at MRS 2.
Analysis of the remaining metabolites using two-tailed t-tests revealed no significantdifferences between groups, except for an elevation in mI relative to tissue water in thecontrol compared to the alcohol group at MRS 3 (p=0.0216) that may be inaccurate becausequantitation of mI in the presence of alcohol is hampered by spectral overlap with themethylene signal of ethanol at 3.6 ppm.
A final set of analyses took advantage of the sibling pair design (Figure 3), which can reducevariance but, in this case, also reduced power because for the two rats that died, both theyand their sibling pairs had to be removed from the analysis. The results yielded a significantdifference (p≤0.05) in the Fisher’s protected least-significant difference test for Glx betweenMRS 1 and MRS 3 only.
Thiamine and Phosphate DerivativesPlasma assay for thiamine and its phosphate derivates demonstrated that thiamine(p=0.0063) and TMP (p=0.0377) levels were significantly lower in the alcohol group thancontrols (Table 3). A follow-up set of analyses taking advantage of the sibling pair design(Figure 3) confirmed the significant difference for thiamine (p=0.02). The alcohol-exposedanimals had thiamine and TMP levels approximately 30% below the level of the controls.Within the alcohol group, thiamine (r=−0.86, p=0.013; ρ=−0.96, p=0.0182) and TMP (r=−0.97, p=0.0004; ρ=−0.82, p=0.0442) levels correlated with BALs taken shortly beforeMRS 3, indicating the higher the BALs, the lower the thiamine and TMP levels (Figure 4).TMP levels also correlated with the difference in alcohol rat weights between MRS 2 andMRS 3, indicating the lower TMP levels, the more weight loss (r=0.82, p=0.024; ρ=0.89,p=0.0287). Due to the death of two alcohol-exposed animals prior to the termination of theexperiment, reduced statistical power mitigated against detecting significant correlationsbetween thiamine levels and metabolite levels or neurological status. In the combinedgroups, Cho relative to tissue water at MRS 3 correlated with TMP (r=−0.50, p=0.0427; ρ=−0.62, p=0.0124) and Cho/tCr at MRS 3 correlated with thiamine (r=−0.54, p=0.0245; ρ=−0.51, p=0.0414) and TMP (r=−0.61, p=0.0089; ρ=−0.68, p=0.0062); Glu/tCr at MRS 3correlated with TMP (r=−0.47, p=0.0542; ρ=−0.55, p=0.0267).
Liver HistopathologyNone of the rats exhibited liver morphological changes consistent with moderate (grade 3)or severe (grade 4) pathology. Indeed, none of the rats exhibited morphological hepaticchanges consistent with alcoholic cirrhosis as they lacked observable hepatocellularparenchymal loss, macro-and micronodular hepatocellular regeneration, or bridging(centrilobular, portal–portal, and central–portal) fibrosis. Hepatocellular swelling and/ornecrosis with neutrophilic inflammation (Figure 5a) is potentially indicative of alcoholichepatitis. Minimal to mild hepatocellular swelling and necrosis were noted in four of sevenalcohol-exposed rats, two of which also displayed accompanying neutrophilic inflammation.Two of ten control rats demonstrated minimal to mild hepatocellular swelling and necrosiswith secondary neutrophilic inflammation. Sinusoidal fibrosis was absent, but minimal tomild portocentric fibrosis was observed in five of seven alcoholic and five of ten controlrats. Mallory bodies were not detected. The groups did not differ significantly in thepresence or severity of hepatocellular swelling, necrosis, inflammation, or portocentricfibrosis.
Hepatic steatosis ranged in severity from minimal to mild and was noted in all sevenalcohol-exposed rats but only four of ten control rats. In the alcohol rats, hepatic steatosis
Zahr et al. Page 7
Neuropsychopharmacology. Author manuscript; available in PMC 2010 May 1.
NIH
-PA Author Manuscript
NIH
-PA Author Manuscript
NIH
-PA Author Manuscript
was microvesicular in six of seven (Figure 5c), and macrovesicular in six of seven (Figure5d) livers. In control animals, hepatic steatosis was microvesicular in 2 of 10 andmacrovesicular in 3 of 10 livers. Alcohol and control rats differed significantly for thepresence and severity of macrovesicular (p=0.0009) and microvesicular (p=0.0032)lipidosis. An additional significant difference (p=0.0007) between groups was the presenceof minimal hepatic glycogenosis in two of seven alcohol rats, whereas all ten controlanimals exhibited glycogenosis. Hepatic glycogenosis was subgrossly midzonal indistribution, and morphologically appeared as clear, negatively staining floccular materialthat displaced the normal eosinophilic cytoplasm of hepatocytes (Figure 5b).
Simple regression analysis included all rats to test relations between changes in livermorphology, metabolite levels at MRS 3, and thiamine status. Greater presence and severityof microvesicular lipidosis correlated with higher levels of Glu (ρ=0.65, p=0.0095; Figure5e) at MRS 3. Greater presence and severity of macrovesicular lipidosis correlated withhigher levels of Cho at MRS 3 (ρ=0.51, p=0.0408; Figure 5f). Higher Cho (ρ=−0.51,p=0.0412), Glx (ρ=−0.64, p=0.0105), and Glu (ρ=−0.53, p=0.0333) at MRS 3 alsocorrelated with absent or minimal glycogenosis. Macro- and microvesicular lipidosis eachcorrelated with thiamine (macrovesicular, ρ=−0.76, p=0.0025; microvesicular, ρ=−0.51,p=0.041) and TMP (macrovesicular, ρ=−0.63, p=0.0117; microvesicular, ρ=−0.61,p=0.0142) levels.
BehaviorRotarod testing of balance maintenance did not differentiate the groups at any experimentaltest session. By contrast, neurological examination revealed more signs in the alcohol thancontrol group. At MRS 2, six of eight of the alcohol rats and none of the ten controlsexhibited neurological signs on 2 consecutive days. Neurological signs persisted when ratswere again tested just before MRS 3, with all eight of the alcohol rats and none of thecontrols exhibiting signs on 2 consecutive testing days (Figure 6). Frequently observedneurological signs included altered motor (loss of righting reflex, stereotypy, tremor) andautonomic (palpebral closure, excessive lacrimation, and nasal discharge) functions.
DISCUSSIONEffects of BALs as high as ~ 445 mg per 100 ml are rarely reported in the literature. Suchhigh levels are difficult to achieve with two-bottle free-choice paradigms, would requireprohibitively high volumes by intraperitoneal or intragastric injections, or require extendedlongitudinal exposure with alcohol vapor, as BALs of ~ 250 mg per 100 ml are typicallyreported with exposure times of ~ 2 weeks (Slawecki, 2006). The group of rats used in thisexperiment also underwent structural MRI evaluation, quantified with atlas-basedparcellation, and revealed a profile of significant ventricular expansion after alcohol vaporexposure. In particular, from MRI 1 to MRI 3, ventricular volume expanded by an averageof 8.0% in the controls and by 29.5% in the alcohol-exposed rats (Pfefferbaum et al, 2008).
The discussion reviews the following key findings: higher Cho at BALs of ~ 293 mg per100 ml and higher Cho, Glx, and Glu at BALs of ~ 445 mg per 100 ml in the alcoholrelative to control group; significantly lower thiamine (28.6%) and TMP (29.7%) levels inthe alcohol than the control group; greater steatosis and lower glycogenosis in the alcoholiccompared to control groups; and relevant correlations.
MetabolitesMRS data were acquired in rats after 16 and 24 weeks of alcohol exposure and while still inan acutely intoxicated state (within 8 h of alcohol exposure). The most significant MRS
Zahr et al. Page 8
Neuropsychopharmacology. Author manuscript; available in PMC 2010 May 1.
NIH
-PA Author Manuscript
NIH
-PA Author Manuscript
NIH
-PA Author Manuscript

finding was an increase in basal ganglia Cho with escalating alcohol exposure. In cross-sectional studies, the parietal gray matter of actively drinking alcohol-dependent subjects(Meyerhoff et al, 2004), and the frontal white matter and anterior cingulate areas of socialdrinkers (Ende et al, 2006) demonstrate higher Cho levels than controls. Our data are also inagreement with the rodent study by Lee et al (2003), who showed an increase in Cho after16 weeks of forced choice alcohol exposure. Lee et al found that at week 16 of alcoholexposure, their control group had a Cho/NAA ratio of 0.44±0.04, whereas the alcohol grouphad a ratio of 0.54±0.09, 22.7% greater levels than controls. In our study, at week 16 ofexposure, the alcohol group (Cho/NAA=1.18±0.1) had 14.6% higher Cho than the controlgroup (Cho/NAA=1.03±0.06). At week 24, the alcohol group (Cho/NAA=1.26±0.05) had23.5% higher Cho than the control group (Cho/NAA=1.02±0.15). This converging evidencesuggests that alcohol per se leads to an increase in Cho. Although many human studiesreport lower Cho in alcoholics than controls (Bendszus et al, 2001; Durazzo et al, 2004;Jagannathan et al, 1996; Miese et al, 2006; Murata et al, 2001; but see O’Neill et al, 2001;Parks et al, 2002; Seitz et al, 1999), we speculate that low Cho can be explained byundetected or subclinical pathologies, including thiamine deficiency or liver cirrhosis, alsoassociated with low Cho levels (Cordoba et al, 2001; Geissler et al, 1997; Kreis et al, 1992;Ross et al, 1994). Interestingly, in an MRS study of recently detoxified alcoholics wherecare was taken to exclude patients with liver disease or malnutrition, no differences in Chowere apparent between alcoholics and controls in frontal or parietal white matter(Schweinsburg et al, 2001). As Cho is elevated in multiple sclerosis (Srinivasan et al, 2005),human immunodeficiency virus infection (Ernst et al, 2003), and normal aging (Pfefferbaumet al, 1999; Zahr et al, 2008), is higher in white than gray matter (Pfefferbaum et al, 1999),and is more highly concentrated in glial than neuronal cells (Brand et al, 1993; Urenjak etal, 1993), elevated Cho has been interpreted as indicative of demyelination, inflammation,or abnormally high glial density (De Stefano et al, 2005; Lin et al, 2005). Given the knowneffects of alcohol on membrane phospholipids (Aloia et al, 1985; Le Bourhis et al, 1986),one likely interpretation for the effects of alcohol on Cho is cell membrane disruption due tochanges in the contributions of the free Cho, phosphocholine, and glycerophosphocholine tothe MRS-detectable Cho signal (Denays et al, 1993; Griffin et al, 2001). Alternatively, arecent study indicated that the brains of alcoholic humans express higher levels of monocytechemotactic protein-1, a key proinflammatory cytokine than controls (He and Crews, 2008),suggesting that the increase in Cho could reflect alcohol-induced inflammatory processes.Mice lacking the tumor necrosis factor (TNF)α receptor 1 are resistant to the hepatotoxiceffects of chronic ethanol (eg liver steatosis and inflammation; Yin et al, 1999). Because weobserved a steatotic liver in response to chronic ethanol treatment, it may be argued thatalcoholized rats produced TNFα, ie the livers recruited an early inflammatory response(Hines and Wheeler, 2004). Given the findings of a lipopolysaccharide model (Qin et al,2004), it is suggested that systemic TNFα enters the brain to induce neuroinflammation(Crews et al, 2006). Transgenic mice with constitutively expressed brain TNFα developdemyelinating inflammation (Probert et al, 1995). As already mentioned, elevations in Choare often seen in demyelinating inflammatory diseases (eg multiple sclerosis; Mader et al,2008), and we observed elevated Cho in response to chronic vaporized ethanol. Thus,inasmuch as inflammation in the brain may be indicated by elevated levels of Cho, whichmay result from the immune cascade initiated by elevated TNFα levels in the brain, it ispossible that the Cho elevation we observed is in response to an inflammatory cascadeinstigated by ethanol’s effects in the liver.
We also demonstrated that the Glx peak increased with escalating alcohol exposure. Fewstudies note alterations to the Glx peak in uncomplicated alcoholism, although in alcohol-related liver disease, such as cirrhosis, an increase in Glx is one of the threeneurospectroscopic abnormalities reported (Geissler et al, 1997; Kreis et al, 1992; Lee et al,1999); further discussed in the section on liver histopathology).
Zahr et al. Page 9
Neuropsychopharmacology. Author manuscript; available in PMC 2010 May 1.
NIH
-PA Author Manuscript
NIH
-PA Author Manuscript
NIH
-PA Author Manuscript

A possible mechanism for the increase in Cho and Glx is alcohol-induced increase in serumosmolality, as there is a strong correlation between blood alcohol concentration and serumosmolality (Champion et al, 1975). Clinical brain spectroscopy of patients with cirrhosis-associated hyponatremia demonstrated correlations of mI, Cho, tCr, and NAA (but not Glu,the concentration of which is influenced by ammonia levels) with serum sodium levels(Restuccia et al, 2004). As with mI, Tau, which is abundant in rat brain, is also know to beinvolved in osmotic regulation (Olson and Martinho, 2006; Zwingmann et al, 2004) andincreases and decreases with serum osmolality. In the current study, it is unlikely that serumosmolality is the entire explanation for the increases in Cho and Glx, because othermetabolites affected by osmolality, notably NAA, Tau, and mI, were lower in the alcohol-treated conditions.
Thiamine and Phosphate DerivativesDespite the well-known association between alcoholism and thiamine deficiency (Harper,2006; Martin et al, 2003; Thomson, 2000), thiamine levels are difficult to evaluate andrarely reported in alcohol studies. Attempts to determine thiamine levels usingmicrobiological assays and functional estimates based on erythrocyte transketolase activitytend to be insensitive and nonspecific (Lynch and Young, 2000). The use of LC-MS allowsfor increased sensitivity and chromatographic separation of thiamine compounds, includingTMP and TPP. HPLC methods report values ranging from 4.0 (Herve et al, 1994) to 89.6nmol/l (Mancinelli et al, 2003) for thiamine concentration in healthy human blood. Thiswide range is likely related to the blood constituent sampled, ie whole blood, plasma, orerythrocytes (Herve et al, 1995; Levy et al, 2002; Lynch and Young, 2000).
TMP has been reported as similar across groups in erythrocyte samples (36 alcohol-dependent patients, 9 with liver cirrhosis; Mancinelli et al, 2003), 50% lower in serumsamples (30 alcohol-dependent patients; Tallaksen et al, 1992b), and 82% lower in plasmasamples (22 patients with alcohol-induced liver cirrhosis; Tallaksen et al, 1992a) frompatients compared with controls. The 30% reduction in TMP observed herein is closest tothe change reported in serum samples from the study including only alcohol-dependentpatients (Tallaksen et al, 1992b). Both studies reporting decreases in thiamine levelsincluded alcoholic patients with liver cirrhosis (22% decrease, Mancinelli et al, 2003; 27%decrease, Tallaksen et al, 1992a), whereas in the absence of notable liver disease, thiaminelevels in alcoholics are indistinguishable from controls (Tallaksen et al, 1992b). The 29%reduction in thiamine in our alcohol-exposed rats is in close agreement with the studies inhuman patients with cirrhosis, and may reflect the mild liver steatosis observed. Only thestudy using erythrocyte samples reports a difference in TPP levels between alcoholics andcontrols (43% lower in alcoholics; Mancinelli et al, 2003), which may be explained by thefact that TPP is found predominantly in erythrocytes (Mancinelli et al, 2003; Tallaksen et al,1997). Indeed, the lack of alcohol effects on TPP levels in this study may be because plasmarather than an erythrocyte sample was assayed and suggests that future studies measurethiamine and its derivatives in a rinsed red blood cell sample (Mancinelli et al, 2003).
A lack of correlation in the alcohol group between thiamine levels and brain metabolitesmay be explained by the relatively small changes observed in the plasma levels of thiamineand TMP. The brain has multiple homeostatic mechanisms for maintaining thiamine, TMP,and TPP levels, despite fluctuations in blood (Spector, 1976). Blood levels must fallsignificantly, for example, with pyrithiamine hydrobromide treatments in rodents (Langlaisand Savage, 1995; Lee et al, 2001; Navarro et al, 2005; Pfefferbaum et al, 2007; Savage etal, 1999) or with severe liver disease in humans (Kreis et al, 1992; Laubenberger et al,1997; Lee et al, 1999) before thiamine, TMP, and TPP levels are sufficiently altered toinfluence the brain. Indeed, neurological symptoms of thiamine deficiency are not observedin rodents treated with pyrithiamine hydrobromide until brain levels of TMP and TPP are
Zahr et al. Page 10
Neuropsychopharmacology. Author manuscript; available in PMC 2010 May 1.
NIH
-PA Author Manuscript
NIH
-PA Author Manuscript
NIH
-PA Author Manuscript

85% lower than normal values, when thiamine status as measured by the erythrocytetransketolase assay is at least 40% lower than normal values (Heroux and Butterworth, 1995,[10]).
Liver HistopathologyHistopathological assessment of alcohol-exposed rat livers revealed an absence of hepatitisor cirrhosis. Nevertheless, rats exposed to vaporized alcohol for a total 24 weeks exhibitedgreater steatosis, and lower glycogenosis relative to controls. As fatty liver is the earliest andmost common hepatic consequence of alcohol ingestion in humans, whereas hepatitis andcirrhosis require sustained, long-term ingestion (French et al, 1993; Nanji et al, 1989), theresults observed in this study suggest that the length of alcohol exposure was sufficient toproduce only mild (grade 2 steatosis) liver pathology. Previous studies have demonstratedthe presence of fatty livers in rodents given chronic intragastric ethanol and low (Tsukamotoet al, 1985) or minimal fat (Nanji et al, 1989; Walker and Gordon, 1970) diets. Liverpathologies have also been noted in studies using vaporized ethanol administration. Di Luzioand Stege (1979) demonstrated a significant elevation in liver triglycerides in rats exposed tovaporized ethanol at days 3, 6, and 9 of exposure, whereas Rouach et al (1984)demonstrated that ethanol inhalation for 2 days changes the fatty acid distribution ofmitochondrial liver phospholipids. Together, these findings suggest that ethanol may inducethe excessive accumulation of lipids in the liver (ie steatosis) directly, without primarychanges in the gut. Steatosis could result from hypoxia (Knecht et al, 1995) induced directlyby alcohol (Bode and Bode, 2005). Alternatively, as vaporized ethanol treatment has beenshown to induce P450s (nonspecified subtype; Morgan et al, 1981), the metabolism ofethanol to acetaldehyde through cytochrome P450 2E1 may be another mechanismassociated with a direct alcohol insult to the liver (Lieber, 2004). The decreasedglycogenolysis observed in the alcoholtreated animals in this study is in agreement withseveral studies demonstrating an association between chronic ethanol exposure anddecreased hepatic glycogen levels (Kaminsky and Kosenko, 1986; Nanji et al, 1995; Sumidaet al, 2007; Walker and Gordon, 1970). Indeed, an increase in hepatic triglyceride contenthas been associated with a decrease in glycogen (Walker and Gordon, 1970).
The association between glycogenolysis (lower) and Glx (higher) is notable in that humanstudies often report abnormally high Glx levels in patients with acute liver failure (Bosmanet al, 1990; Geissler et al, 1997; Gupta et al, 1993; Laubenberger et al, 1997), subclinicalhepatic encephalopathy (Ross et al, 1994), and chronic hepatic encephalopathy (Kreis et al,1990, 1992). These observations have led to the supposition that Glx levels increase inproportion to the severity of dysfunction (Ross et al, 1994). The explanation frequentlygiven for the Glx elevation is that in liver dysfunction levels of blood ammonia increase.The brain compensates for hyperammonia by increasing the production of glutaminethrough the action of glutamine synthetase (Bates et al, 1989; Cooper and Plum, 1987),located primarily in brain astrocytes, and potentially altering astrocytic morphology (Felipoand Butterworth, 2002; Laubenberger et al, 1997; Norenberg et al, 2007; Peeling et al,1993). In vitro reports regarding liver failure, however, describe an increase in glutamineand an associated decrease in Glu (Peeling et al, 1993; Swain et al, 1992; Zimmermann etal, 1989), whereas in the current study, increases in Glu and Glx were observed, militatingagainst the conclusion that brain metabolite or structural changes could be attributed to liverfailure per se.
The correlations between mild macro- and microvesicular lipidosis, thiamine, and TMPlevels are in agreement with findings that chronic liver disease alters thiamine homeostasis(Butterworth, 1995). Alcoholics with severe liver cirrhosis have a higher incidence ofthiamine deficiency as reflected by erythrocyte transketolase activation compared toalcoholics lacking hepatic abnormalities (Somogyi et al, 1980). The current findings indicate
Zahr et al. Page 11
Neuropsychopharmacology. Author manuscript; available in PMC 2010 May 1.
NIH
-PA Author Manuscript
NIH
-PA Author Manuscript
NIH
-PA Author Manuscript

that even mild liver dysfunction in the form of steatosis may alter thiamine status,suggesting a graded effect such that the degree of liver damage correlates with severity ofthiamine deficiency.
BehaviorNeurological signs present in the morning at MRS 2 when rats were intoxicated includedgait disturbances, loss of righting reflex, and circling with tail suspension. After 8–10 hwithout alcohol, these three signs were still present, although gait disturbances becameevident in more animals. At MRS 3, the frequency and number of neurological signs becamemore pronounced. While intoxicated, rats exhibited exophthalmoses, excessive nasaldischarge and lacrimation, palpebral closure, agitation and aggressiveness, catalepsy, anexaggerated startle response, tremor, stereotypy, loss of righting reflex, and gaitdisturbances. After 8–10 h without alcohol, catalepsy and gait disturbances were no longerobserved, but more rats exhibited palpebral closure and tremor. There were no correlationsbetween presence of neurological signs and any of the metabolites measured.
In humans with chronic alcohol exposure, withdrawal behaviors are expressed between 4 hand 4 days after the last dose of alcohol (Becker, 2000). Although behavioral signs andsymptoms are evident as soon as 4 h after the last dose, seizures usually occur within 48 h ofalcohol cessation, and delirium tremens within 4 days (Becker, 2000); peak intensity ofwithdrawal behavior typically occurs during the second day of abstinence. In this report, theabsence of protracted withdrawal refers to the ‘acute’ (at most 12 h) withdrawal period,before ‘severe’ withdrawal signs such as seizures or delirium tremens typically emerge.
Model of Metabolic Patterns Distinguishing Intoxication, Withdrawal, and Thiamine StatusAn ideal study to distinguish alcohol-induced MRS-detectable changes in metabolitepatterns from incidental factors would include several additional treatment groups. Forexample, a dose–response paradigm would include two groups with the same alcoholexposure time, but given two different levels of alcohol. Also, groups of animals could haveundergone a protracted withdrawal period or could have been treated with pyrithiaminehydrobromide to induce severe thiamine deficiency, or a liver toxin such as carbontetrachloride to induce liver damage. Such a study was beyond the scope of this initialinvestigation using longitudinal MRS and the vapor chamber system to expose rats to highand prolonged doses of alcohol.
Unlike previous MRS studies of rodent alcohol models, the current report monitored BALs,thiamine, and liver status. This study demonstrates significant modulation of brainmetabolites attributable to high levels of blood alcohol (~ 445 mg per 100 ml). Themetabolite pattern in detoxified, abstinent human alcoholics includes lower levels of NAAand Cho, a pattern also seen in thiamine deficiency MRS studies in both humans and rats. Inliver disease, including cirrhosis and hepatic encephalopathy, lower Cho is also noted,accompanied by lower mI and Glu and higher levels of Glx. The concurrent increase in Choand Glx observed in the current study is a pattern also reported in another study of MRS-detectable alcohol effects, the longitudinal rodent study by Lee et al (2003). The observedmodulation of brain chemistry—absent protracted withdrawal, pronounced thiaminedeficiency, or severe liver pathology—suggests that these changes are at least in part theeffects of alcohol per se.
AcknowledgmentsThis research was supported by grants to AP by the National Institute on Alcohol Abuse and Alcoholism(AA013521-INIA, AA005965).
Zahr et al. Page 12
Neuropsychopharmacology. Author manuscript; available in PMC 2010 May 1.
NIH
-PA Author Manuscript
NIH
-PA Author Manuscript
NIH
-PA Author Manuscript

ABBREVIATIONS
ANOVA analysis of variance
BALs blood alcohol levels
Cho choline
CS chemical shift
CT-PRESS constant time point resolved spectroscopy
Glu glutamate
Glx glutamine + glutamate
HPLC high-performance liquid chromatography
LC-MS liquid chromatography-mass spectrometer
mI myo-inositol
MR magnetic resonance
MRS magnetic resonance spectroscopy
NAA N-acetylaspartate
SW spectral width
Tau taurine
tCr total creatine
TE echo time
TMP thiamine monophosphate
TNF tumor necrosis factor
TPP thiamine pyrophosphate
TR repetition time
ReferencesAdalsteinsson E, Hurd RE, Mayer D, Sailasuta N, Sullivan EV, Pfefferbaum A. In vivo 2D J-resolved
magnetic resonance spectroscopy of rat brain with a 3-T clinical human scanner. Neuroimage2004;22:381–386. [PubMed: 15110030]
Aloia RC, Paxton J, Daviau JS, van Gelb O, Mlekusch W, Truppe W, et al. Effect of chronic alcoholconsumption on rat brain microsome lipid composition, membrane fluidity and Na+-K+- ATPaseactivity. Life Sciences 1985;36:1003–1017. [PubMed: 2983158]
Anand BS. Cirrhosis of liver. West J Med 1999;171:110–115. [PubMed: 10510657]Bates TE, Williams SR, Kauppinen RA, Gadian DG. Observation of cerebral metabolites in an animal
model of acute liver failure in vivo: a 1H and 31P nuclear magnetic resonance study. J Neurochem1989;53:102–110. [PubMed: 2566653]
Becker HC. Animal models of alcohol withdrawal. Alcohol Res Health 2000;24:105–113. [PubMed:11199277]
Bendszus M, Weijers HG, Wiesbeck G, Warmuth-Metz M, Bartsch AJ, Engels S, et al. Sequential MRimaging and proton MR spectroscopy in patients who underwent recent detoxification for chronicalcoholism: correlation with clinical and neuropsychological data. Am J Neuroradiol 2001;22:1926–1932. [PubMed: 11733327]
Bode C, Bode JC. Activation of the innate immune system and alcoholic liver disease: effects ofethanol per se or enhanced intestinal translocation of bacterial toxins induced by ethanol? AlcoholClin Exp Res 2005;29:166S–171S. [PubMed: 16344604]
Zahr et al. Page 13
Neuropsychopharmacology. Author manuscript; available in PMC 2010 May 1.
NIH
-PA Author Manuscript
NIH
-PA Author Manuscript
NIH
-PA Author Manuscript

Bosman DK, Deutz NE, De Graaf AA, vd Hulst RW, Van Eijk HM, Bovee WM, et al. Changes inbrain metabolism during hyperammonemia and acute liver failure: results of a comparative 1H-NMR spectroscopy and biochemical investigation. Hepatology 1990;12:281–290. [PubMed:1975248]
Brand A, Richter-Landsberg C, Leibfritz D. Multinuclear NMR studies on the energy metabolism ofglial and neuronal cells. Dev Neurosci 1993;15:289–298. [PubMed: 7805581]
Butterworth RF. Pathophysiology of alcoholic brain damage: synergistic effects of ethanol, thiaminedeficiency and alcoholic liver disease. Metab Brain Dis 1995;10:1–8. [PubMed: 7596324]
Champion HR, Baker SP, Benner C, Fisher R, Caplan YH, Long WB, et al. Alcohol intoxication andserum osmolality. Lancet 1975;1:1402–1404. [PubMed: 49562]
Cooper AJ, Plum F. Biochemistry and physiology of brain ammonia. Physiol Rev 1987;67:440–519.[PubMed: 2882529]
Cordoba J, Alonso J, Rovira A, Jacas C, Sanpedro F, Castells L, et al. The development of low-gradecerebral edema in cirrhosis is supported by the evolution of (1)H-magnetic resonanceabnormalities after liver transplantation. J Hepatol 2001;35:598–604. [PubMed: 11690705]
Cordoba J, Sanpedro F, Alonso J, Rovira A. 1H magnetic resonance in the study of hepaticencephalopathy in humans. Metab Brain Dis 2002;17:415–429. [PubMed: 12602517]
Crews FT, Bechara R, Brown LA, Guidot DM, Mandrekar P, Oak S, et al. Cytokines and alcohol.Alcohol Clin Exp Res 2006;30:720–730. [PubMed: 16573591]
De Stefano N, Bartolozzi ML, Guidi L, Stromillo ML, Federico A. Magnetic resonance spectroscopyas a measure of brain damage in multiple sclerosis. J Neurol Sci 2005;233:203–208. [PubMed:15949506]
Denays R, Chao SL, Mathur-Devre R, Jeghers O, Fruhling J, Noel P, et al. Metabolic changes in therat brain after acute and chronic ethanol intoxication: a 31P NMR spectroscopy study. MagnReson Med 1993;29:719–723. [PubMed: 8350714]
Di Luzio NR, Stege TE. Influence of chronic ethanol vapor inhalation on hepatic parenchymal andKupffer cell function. Alcohol Clin Exp Res 1979;3:240–247. [PubMed: 384834]
Durazzo TC, Gazdzinski S, Banys P, Meyerhoff DJ. Cigarette smoking exacerbates chronic alcohol-induced brain damage: a preliminary metabolite imaging study. Alcohol Clin Exp Res2004;28:1849–1860. [PubMed: 15608601]
Ende G, Walter S, Welzel H, Demirakca T, Wokrina T, Ruf M, et al. Alcohol consumptionsignificantly influences the MR signal of frontal choline-containing compounds. Neuroimage2006;32:740–746. [PubMed: 16759881]
Ernst T, Chang L, Arnold S. Increased glial metabolites predict increased working memory networkactivation in HIV brain injury. Neuroimage 2003;19:1686–1693. [PubMed: 12948723]
Ernst T, Chang L, Melchor R, Mehringer CM. Frontotemporal dementia and early Alzheimer disease:differentiation with frontal lobe H-1 MR spectroscopy. Radiology 1997;203:829–836. [PubMed:9169712]
Felipo V, Butterworth RF. Neurobiology of ammonia. Prog Neurobiol 2002;67:259–279. [PubMed:12207972]
French SW, Nash J, Shitabata P, Kachi K, Hara C, Chedid A, et al. Pathology of alcoholic liverdisease. VA Cooperative Study Group 119. Semin Liver Dis 1993;13:154–169. [PubMed:8393214]
Geissler A, Lock G, Frund R, Held P, Hollerbach S, Andus T, et al. Cerebral abnormalities in patientswith cirrhosis detected by proton magnetic resonance spectroscopy and magnetic resonanceimaging. Hepatology 1997;25:48–54. [PubMed: 8985263]
Griffin JL, Mann CJ, Scott J, Shoulders CC, Nicholson JK. Choline containing metabolites during celltransfection: an insight into magnetic resonance spectroscopy detectable changes. FEBS Lett2001;509:263–266. [PubMed: 11741600]
Gupta RK, Saraswat VA, Poptani H, Dhiman RK, Kohli A, Gujral RB, et al. Magnetic resonanceimaging and localized in vivo proton spectroscopy in patients with fulminant hepatic failure. Am JGastroenterol 1993;88:670–674. [PubMed: 8480729]
Zahr et al. Page 14
Neuropsychopharmacology. Author manuscript; available in PMC 2010 May 1.
NIH
-PA Author Manuscript
NIH
-PA Author Manuscript
NIH
-PA Author Manuscript

Harper C. Thiamine (vitamin B1) deficiency and associated brain damage is still common throughoutthe world and prevention is simple and safe! Eur J Neurol 2006;13:1078–1082. [PubMed:16987159]
He J, Crews FT. Increased MCP-1 and microglia in various regions of the human alcoholic brain. ExpNeurol 2008;210:349–358. [PubMed: 18190912]
Heroux M, Butterworth RF. Regional alterations of thiamine phosphate esters and of thiaminediphosphate-dependent enzymes in relation to function in experimental Wernicke’sencephalopathy. Neurochem Res 1995;20:87–93. [PubMed: 7739764]
Herve C, Beyne P, Delacoux E. Determination of thiamine and its phosphate esters in humanerythrocytes by high-performance liquid chromatography with isocratic elution. J Chromatogr BBiomed Appl 1994;653:217–220. [PubMed: 8205249]
Herve C, Beyne P, Letteron P, Delacoux E. Comparison of erythrocyte transketolase activity withthiamine and thiamine phosphate ester levels in chronic alcoholic patients. Clin Chim Acta1995;234:91–100. [PubMed: 7758226]
Hines IN, Wheeler MD. Recent advances in alcoholic liver disease III. Role of the innate immuneresponse in alcoholic hepatitis. Am J Physiol 2004;287:G310–G314.
Jagannathan NR, Desai NG, Raghunathan P. Brain metabolite changes in alcoholism: an in vivo protonmagnetic resonance spectroscopy (MRS) study. Magn Reson Imaging 1996;14:553–557.[PubMed: 8843367]
Kaminsky YG, Kosenko EA. Blood glucose and liver glycogen in the rat. Effects of chronic ethanolconsumption and its withdrawal on the diurnal rhythms. FEBS Lett 1986;200:217–220. [PubMed:3699162]
Knecht KT, Adachi Y, Bradford BU, Iimuro Y, Kadiiska M, Xuang QH, et al. Free radical adducts inthe bile of rats treated chronically with intragastric alcohol: inhibition by destruction of Kupffercells. Mol Pharmacol 1995;47:1028–1034. [PubMed: 7746269]
Kreis R, Farrow N, Ross BD. Diagnosis of hepatic encephalopathy by cerebral proton magneticresonance spectroscopy. Lancet 1990;336:635–636. [PubMed: 1975411]
Kreis R, Ross BD, Farrow NA, Ackerman Z. Metabolic disorders of the brain in chronic hepaticencephalopathy detected with H-1 MR spectroscopy. Radiology 1992;182:19–27. [PubMed:1345760]
Langlais PJ, Savage LM. Thiamine deficiency in rats produces cognitive and memory deficits onspatial tasks that correlate with tissue loss in diencephalon, cortex and white matter. Behav BrainRes 1995;68:75–89. [PubMed: 7619308]
Laubenberger J, Haussinger D, Bayer S, Gufler H, Hennig J, Langer M. Proton magnetic resonancespectroscopy of the brain in symptomatic and asymptomatic patients with liver cirrhosis.Gastroenterology 1997;112:1610–1616. [PubMed: 9136840]
Le Bourhis B, Beauge F, Aufrere G, Nordmann R. Membrane fluidity and alcohol dependence.Alcohol Clin Exp Res 1986;10:337–342. [PubMed: 3526960]
Lee H, Holburn GE, Price RR. In vivo and in vitro proton NMR spectroscopic studies of thiamine-deficient rat brains. J Magn Reson Imaging 2001;13:163–166. [PubMed: 11169820]
Lee H, Holburn GH, Price RR. Proton MR spectroscopic studies of chronic alcohol exposure on the ratbrain. J Magn Reson Imaging 2003;18:147–151. [PubMed: 12884325]
Lee H, Tarter J, Holbourn GE, Price RR, Weinstein DD, Martin PR. In vivo localized proton NMRspectroscopy of thiaminedeficient rat brain. Magn Reson Med 1995;34:313–318. [PubMed:7500868]
Lee JH, Seo DW, Lee YS, Kim ST, Mun CW, Lim TH, et al. Proton magnetic resonance spectroscopy(1H-MRS) findings for the brain in patients with liver cirrhosis reflect the hepatic functionalreserve. Am J Gastroenterol 1999;94:2206–2213. [PubMed: 10445551]
Levy S, Herve C, Delacoux E, Erlinger S. Thiamine deficiency in hepatitis C virus and alcohol-relatedliver diseases. Dig Dis Sci 2002;47:543–548. [PubMed: 11911339]
Lieber CS. Alcoholic fatty liver: its pathogenesis and mechanism of progression to inflammation andfibrosis. Alcohol 2004;34:9–19. [PubMed: 15670660]
Lien Y, Shapiro J, Chan L. Effects of hypernatremia on organic brain osmoles. J Clin Investig1990;85:1427–1435. [PubMed: 2332498]
Zahr et al. Page 15
Neuropsychopharmacology. Author manuscript; available in PMC 2010 May 1.
NIH
-PA Author Manuscript
NIH
-PA Author Manuscript
NIH
-PA Author Manuscript
Lin A, Ross BD, Harris K, Wong W. Efficacy of proton magnetic resonance spectroscopy inneurological diagnosis and neurotherapeutic decision making. NeuroRx 2005;2:197–214.[PubMed: 15897945]
Lynch PL, Young IS. Determination of thiamine by high-performance liquid chromatography. JChromatogr A 2000;881:267–284. [PubMed: 10905711]
Mader I, Rauer S, Gall P, Klose U. (1)H MR spectroscopy of inflammation, infection and ischemia ofthe brain. Eur J Radiol 2008;67:250–257. [PubMed: 18407447]
Mancinelli R, Ceccanti M, Guiducci MS, Sasso GF, Sebastiani G, Attilia ML, et al. Simultaneousliquid chromatographic assessment of thiamine, thiamine monophosphate and thiaminediphosphate in human erythrocytes: a study on alcoholics. J Chromatogr B Analyt TechnolBiomed Life Sci 2003;789:355–363.
Martin PR, Singleton CK, Hiller-Sturmhofel S. The role of thiamine deficiency in alcoholic braindisease. Alcohol Res Health 2003;27:134–142. [PubMed: 15303623]
Mascalchi M, Belli G, Guerrini L, Nistri M, Del Seppia I, Villari N. Proton MR spectroscopy ofWernicke encephalopathy. AJNR 2002;23:1803–1806. [PubMed: 12427642]
Mayer D, Spielman DM. Detection of glutamate in the human brain at 3 T using optimized constanttime point resolved spectroscopy. Magn Reson Med 2005a;54:439–442. [PubMed: 16032664]
Mayer D, Spielman DM. Detection of glutamate in the human brain at 3 T using optimized constanttime point resolved spectroscopy. Magn Reson Med 2005b;54:439–442. [PubMed: 16032664]
Mayer D, Zahr NM, Adalsteinsson E, Rutt B, Sullivan EV, Pfefferbaum A. In vivo fiber tracking in therat brain on a clinical 3 T MRI system using a high strength insert gradient coil. Neuroimage2007a;35:1077–1085. [PubMed: 17331742]
Mayer D, Zahr NM, Sullivan EV, Pfefferbaum A. In vivo metabolite differences between the basalganglia and cerebellum of the rat brain detected with proton MRS at 3T. Psychiatry Res 2007b;154:267–273. [PubMed: 17346948]
Meyerhoff DJ, Blumenfeld R, Truran D, Lindgren J, Flenniken D, Cardenas V, et al. Effects of heavydrinking, binge drinking, and family history of alcoholism on regional brain metabolites. AlcoholClin Exp Res 2004;28:650–661. [PubMed: 15100618]
Miese F, Kircheis G, Wittsack HJ, Wenserski F, Hemker J, Modder U, et al. 1H-MR spectroscopy,magnetization transfer, and diffusion-weighted imaging in alcoholic and nonalcoholic patientswith cirrhosis with hepatic encephalopathy. AJNR 2006;27:1019–1026. [PubMed: 16687536]
Modell JG, Mountz JM, Beresford TP. Basal ganglia/limbic striatal and thalamocortical involvementin craving and loss of control in alcoholism. J Neuropsychiatry 1990;2:123–144.
Morgan ET, Devine M, Skett P. Changes in the rat hepatic mixed function oxidase system associatedwith chronic ethanol vapor inhalation. Biochem Pharmacol 1981;30:595–600. [PubMed: 7271897]
Murata T, Fujito T, Kimura H, Omori M, Itoh H, Wada Y. Serial MRI and (1)H-MRS of Wernicke’sencephalopathy: report of a case with remarkable cerebellar lesions on MRI. Psychiatry Res2001;108:49–55. [PubMed: 11677067]
Nanji AA, Fogt F, Griniuviene B. Alterations in glucose transporter proteins in alcoholic liver diseasein the rat. Am J Pathol 1995;146:329–334. [PubMed: 7856745]
Nanji AA, Tsukamoto H, French SW. Relationship between fatty liver and subsequent development ofnecrosis, inflammation and fibrosis in experimental alcoholic liver disease. Exp Mol Pathol1989;51:141–148. [PubMed: 2806468]
Navarro D, Zwingmann C, Hazell AS, Butterworth RF. Brain lactate synthesis in thiamine deficiency:a re-evaluation using 1H-13C nuclear magnetic resonance spectroscopy. J Neurosci Res2005;79:33–41. [PubMed: 15573405]
Norenberg MD, Jayakumar AR, Rama Rao KV, Panickar KS. New concepts in the mechanism ofammonia-induced astrocyte swelling. Metab Brain Dis 2007;22:219–234. [PubMed: 17823859]
O’Neill J, Cardenas VA, Meyerhoff DJ. Effects of abstinence on the brain: quantitative magneticresonance imaging and magnetic resonance spectroscopic imaging in chronic alcohol abuse. AlcohClin Exp Res 2001;25:1673–1682.
Olson JE, Martinho E Jr. Regulation of taurine transport in rat hippocampal neurons by hypo-osmoticswelling. J Neurochem 2006;96:1375–1389. [PubMed: 16478528]
Zahr et al. Page 16
Neuropsychopharmacology. Author manuscript; available in PMC 2010 May 1.
NIH
-PA Author Manuscript
NIH
-PA Author Manuscript
NIH
-PA Author Manuscript

Parks MH, Dawant BM, Riddle WR, Hartmann SL, Dietrich MS, Nickel MK, et al. Longitudinal brainmetabolic characterization of chronic alcoholics with proton magnetic resonance spectroscopy.Alcohol Clin Exp Res 2002;26:1368–1380. [PubMed: 12351932]
Paxinos, G.; Watson, C. The Rat Brain in Stereotaxic Coordinates. Elsevier Academic Press; London:2005.
Peeling J, Shoemaker L, Gauthier T, Benarroch A, Sutherland GR, Minuk GY. Cerebral metabolic andhistological effects of thioacetamide-induced liver failure. Am J Physiol 1993;265:G572–G578.[PubMed: 8214078]
Petroff OA, Pleban LA, Spencer DD. Symbiosis between in vivo and in vitro NMR spectroscopy: thecreatine, N-acetylaspartate, glutamate, and GABA content of the epileptic human brain. MagnReson Imaging 1995;13:1197–1211. [PubMed: 8750337]
Pfefferbaum A, Adalsteinsson E, Bell RL, Sullivan EV. Development and resolution of brain lesionscaused by pyrithiamine- and dietary-induced thiamine deficiency and alcohol exposure in thealcohol-preferring rat: a longitudinal magnetic resonance imaging and spectroscopy study.Neuropsychopharmacology 2007;32:1149–1177.
Pfefferbaum A, Adalsteinsson E, Spielman D, Sullivan EV, Lim KO. In vivo spectroscopicquantification of the N-acetyl moiety, creatine and choline from large volumes of brain gray andwhite matter: effects of normal aging. Magn Reson Med 1999;41:276–284. [PubMed: 10080274]
Pfefferbaum A, Zahr NM, Mayer D, Vinco S, Orduna J, Rohlfing T, et al. Ventricular expansion inwild-type Wistar rats after alcohol exposure by vapor chamber. Alcohol Clin Exp Res. 2008 inpress.
Pitkin SR, Savage LM. Aging potentiates the acute and chronic neurological symptoms ofpyrithiamine-induced thiamine deficiency in the rodent. Behav Brain Res 2001;119:167–177.[PubMed: 11165332]
Prasad S, Dhiman RK, Duseja A, Chawla YK, Sharma A, Agarwal R. Lactulose improves cognitivefunctions and health-related quality of life in patients with cirrhosis who have minimal hepaticencephalopathy. Hepatology 2007;45:549–559. [PubMed: 17326150]
Probert L, Akassoglou K, Pasparakis M, Kontogeorgos G, Kollias G. Spontaneous inflammatorydemyelinating disease in transgenic mice showing central nervous system-specific expression oftumor necrosis factor alpha. Proc Natl Acad Sci USA 1995;92:11294–11298. [PubMed: 7479982]
Qin L, Liu Y, Wang T, Wei SJ, Block ML, Wilson B, et al. NADPH oxidase mediateslipopolysaccharide-induced neurotoxicity and proinflammatory gene expression in activatedmicroglia. J Biol Chem 2004;279:1415–1421. [PubMed: 14578353]
Restuccia T, Gomez-Anson B, Guevara M, Alessandria C, Torre A, Alayrach ME, et al. Effects ofdilutional hyponatremia on brain organic osmolytes and water content in patients with cirrhosis.Hepatology 2004;39:1613–1622. [PubMed: 15185302]
Roberts AJ, Heyser CJ, Cole M, Griffin P, Koob GF. Excessive ethanol drinking following a history ofdependence: animal model of allostasis. Neuropsychopharmacology 2000;22:581–594. [PubMed:10788758]
Rose SE, Nixon PF, Zelaya FO, Wholohan BT, Zimitat C, Moxon LN, et al. Application of high fieldlocalised in vivo 1H MRS to study biochemical changes in the thiamin deficient rat brain underglucose load. NMR Biomed 1993;6:324–328. [PubMed: 7903547]
Ross BD, Jacobson S, Villamil F, Korula J, Kreis R, Ernst T, et al. Subclinical hepatic encephalopathy:proton MR spectroscopic abnormalities. Radiology 1994;193:457–463. [PubMed: 7972763]
Rossetti ZL, Carboni S, Fadda F. Glutamate-induced increase of extracellular glutamate through N-methyl-D-aspartate receptors in ethanol withdrawal. Neuroscience 1999;93:1135–1140. [PubMed:10473277]
Rouach H, Clement M, Orfanelli MT, Janvier B, Nordmann R. Fatty acid composition of rat livermitochondrial phospholipids during ethanol inhalation. Biochimica Biophys Acta 1984;795:125–129.
Savage LM, Pitkin SR, Knitowski KM. Rats exposed to acute pyrithiamine-induced thiaminedeficiency are more sensitive to the amnestic effects of scopolamine and MK-801: examination ofworking memory, response selection, and reinforcement contingencies. Behav Brain Res1999;104:13–26. [PubMed: 11125732]
Zahr et al. Page 17
Neuropsychopharmacology. Author manuscript; available in PMC 2010 May 1.
NIH
-PA Author Manuscript
NIH
-PA Author Manuscript
NIH
-PA Author Manuscript

Schweinsburg BC, Alhassoon OM, Taylor MJ, Gonzalez R, Videen JS, Brown GG, et al. Effects ofalcoholism and gender on brain metabolism. Am J Psychiatry 2003;160:1180–1183. [PubMed:12777281]
Schweinsburg BC, Taylor MJ, Alhassoon OM, Videen JS, Brown GG, Patterson TL, et al. Chemicalpathology in brain white matter of recently detoxified alcoholics: a 1H magnetic resonancespectroscopy investigation of alcohol-associated frontal lobe injury. Alcohol Clin Exp Res2001;25:924–934. [PubMed: 11410730]
Seitz D, Widmann U, Seeger U, Nagele T, Klose U, Mann K, et al. Localized proton magneticresonance spectroscopy of the cerebellum in detoxifying alcoholics. Alcohol Clin Exp Res1999;23:158–163. [PubMed: 10029218]
Slawecki CJ. Two-choice reaction time performance in Sprague–Dawley rats exposed to alcoholduring adolescence or adulthood. Behav Pharmacol 2006;17:605–614. [PubMed: 17021393]
Somogyi JC, Kopp PM, Filippini L, Monnat A. Transketolase- TPP-effect in chronic alcoholics withvarious degrees of liver cirrhosis. J Nutr Sci Vitaminol 1980;26:221–229. [PubMed: 7441381]
Spector R. Thiamine transport in the central nervous system. Am J Physiol 1976;230:1101–1107.[PubMed: 1267006]
Srinivasan R, Sailasuta N, Hurd R, Nelson S, Pelletier D. Evidence of elevated glutamate in multiplesclerosis using magnetic resonance spectroscopy at 3 T. Brain 2005;128:1016–1025. [PubMed:15758036]
Stoll AL, Renshaw PF, Demicheli E, Wurtman R, Pillay SS, Cohen BM. Choline ingestion increasesthe resonance of choline-containing compounds in human brain: an in vivo proton magneticresonance study. Biol Psychiatry 1995;37:170–174. [PubMed: 7727625]
Sumida KD, Hill JM, Matveyenko AV. Sex differences in hepatic gluconeogenic capacity afterchronic alcohol consumption. Clin Med Res 2007;5:193–202. [PubMed: 18056029]
Swain M, Butterworth RF, Blei AT. Ammonia and related amino acids in the pathogenesis of brainedema in acute ischemic liver failure in rats. Hepatology 1992;15:449–453. [PubMed: 1544626]
Tabakoff B. Neurotransmitter function and alcoholism. Alcohol Clin Exp Res 1979;3:351–352.[PubMed: 42319]
Tallaksen CM, Bell H, Bohmer T. The concentration of thiamin and thiamin phosphate esters inpatients with alcoholic liver cirrhosis. Alcohol Alcohol 1992a;27:523–530. [PubMed: 1476555]
Tallaksen CM, Bohmer T, Bell H. Blood and serum thiamin and thiamin phosphate estersconcentrations in patients with alcohol dependence syndrome before and after thiamin treatment.Alcohol Clin Exp Res 1992b;16:320–325. [PubMed: 1317136]
Tallaksen CM, Bohmer T, Karlsen J, Bell H. Determination of thiamin and its phosphate esters inhuman blood, plasma, and urine. Methods Enzymol 1997;279:67–74. [PubMed: 9211258]
Tedeschi G, Bertolino A, Righini A, Campbell G, Raman R, Duyn JH, et al. Brain regional distributionpattern of metabolite signal intensities in young adults by proton magnetic resonancespectroscopic imaging. Neurology 1995;45:1384–1391. [PubMed: 7617201]
Thomson AD. Mechanisms of vitamin deficiency in chronic alcohol misusers and the development ofthe Wernicke–Korsakoff syndrome. Alcohol Alcohol Suppl 2000;35:2–7. [PubMed: 11304071]
Tsukamoto H, French SW, Benson N, Delgado G, Rao GA, Larkin EC, et al. Severe and progressivesteatosis and focal necrosis in rat liver induced by continuous intragastric infusion of ethanol andlow fat diet. Hepatology 1985;5:224–232. [PubMed: 3979954]
Ulrichsen J, Bech B, Ebert B, Diemer NH, Allerup P, Hemmingsen R. Glutamate and benzodiazepinereceptor autoradiography in rat brain after repetition of alcohol dependence.Psychopharmacology 1996;126:31–41. [PubMed: 8853214]
Urenjak J, Williams SR, Gadian DG, Noble M. Specific expression of N-acetylaspartate in neurons,oligodendrocyte-type- 2 astrocyte progenitors, and immature oligodendrocytes in vitro. JNeurochem 1992;59:55–61. [PubMed: 1613513]
Urenjak J, Williams SR, Gadian DG, Noble M. Proton nuclear magnetic resonance spectroscopyunambiguously identifies different neural cell types. J Neurosci 1993;13:981–989. [PubMed:8441018]
Walker JE, Gordon ER. Biochemical aspects associated with an ethanol-induced fatty liver. Biochem J1970;119:511–516. [PubMed: 4250848]
Zahr et al. Page 18
Neuropsychopharmacology. Author manuscript; available in PMC 2010 May 1.
NIH
-PA Author Manuscript
NIH
-PA Author Manuscript
NIH
-PA Author Manuscript

Xia JX, Li J, Zhou R, Zhang XH, Ge YB, Ru Yuan X. Alterations of rat corticostriatal synapticplasticity after chronic ethanol exposure and withdrawal. Alcohol Clin Exp Res 2006;30:819–824. [PubMed: 16634850]
Yin M, Wheeler MD, Kono H, Bradford BU, Gallucci RM, Luster MI, et al. Essential role of tumornecrosis factor alpha in alcohol-induced liver injury in mice. Gastroenterology 1999;117:942–952. [PubMed: 10500078]
Zahr NM, Mayer D, Pfefferbaum A, Sullivan EV. Low striatal glutamate levels underlie cognitivedecline in the elderly: evidence from in vivo molecular spectroscopy. Cereb Cortex. 2008 e-pubahead of print, 29 January 2008.
Zimmermann C, Ferenci P, Pifl C, Yurdaydin C, Ebner J, Lassmann H, et al. Hepatic encephalopathyin thioacetamide-induced acute liver failure in rats: characterization of an improved model andstudy of amino acid-ergic neurotransmission. Hepatology 1989;9:594–601. [PubMed: 2564368]
Zwingmann C, Chatauret N, Rose C, Leibfritz D, Butterworth RF. Selective alterations of brainosmolytes in acute liver failure: protective effect of mild hypothermia. Brain Res 2004;999:118–123. [PubMed: 14746928]
Zahr et al. Page 19
Neuropsychopharmacology. Author manuscript; available in PMC 2010 May 1.
NIH
-PA Author Manuscript
NIH
-PA Author Manuscript
NIH
-PA Author Manuscript

Figure 1.(a) Voxel location in axial, sagittal, and coronal planes. (b) Sample spectra from a control(red) and alcohol-exposed (blue) rat at baseline, after 16 weeks, and 24 weeks of alcoholexposure. (c) Average signal intensity of metabolites relative to tissue water, at baseline, 16weeks, and 24 weeks alcohol exposure (n (control, red)=10, n (alcohol, blue)=8).
Zahr et al. Page 20
Neuropsychopharmacology. Author manuscript; available in PMC 2010 May 1.
NIH
-PA Author Manuscript
NIH
-PA Author Manuscript
NIH
-PA Author Manuscript

Figure 2.Mean±SEM of the 7 metabolite signals quantified relative to tissue water for each of the 3MRS acquisitions for the control (open circles) and alcohol-exposed (closed circles) rats.*p≤0.05, 1-tailed. **p≤0.05, 2-tailed.
Zahr et al. Page 21
Neuropsychopharmacology. Author manuscript; available in PMC 2010 May 1.
NIH
-PA Author Manuscript
NIH
-PA Author Manuscript
NIH
-PA Author Manuscript

Figure 3.Metabolite levels plotted by sibling pairs (alcohol-exposed is in black; control is in gray) ateach MRI session for the 8 pairs that were available for the 3 scanning sessions. Thiamineand TMP levels at MRS 3, by sibling pairs, are also plotted.
Zahr et al. Page 22
Neuropsychopharmacology. Author manuscript; available in PMC 2010 May 1.
NIH
-PA Author Manuscript
NIH
-PA Author Manuscript
NIH
-PA Author Manuscript
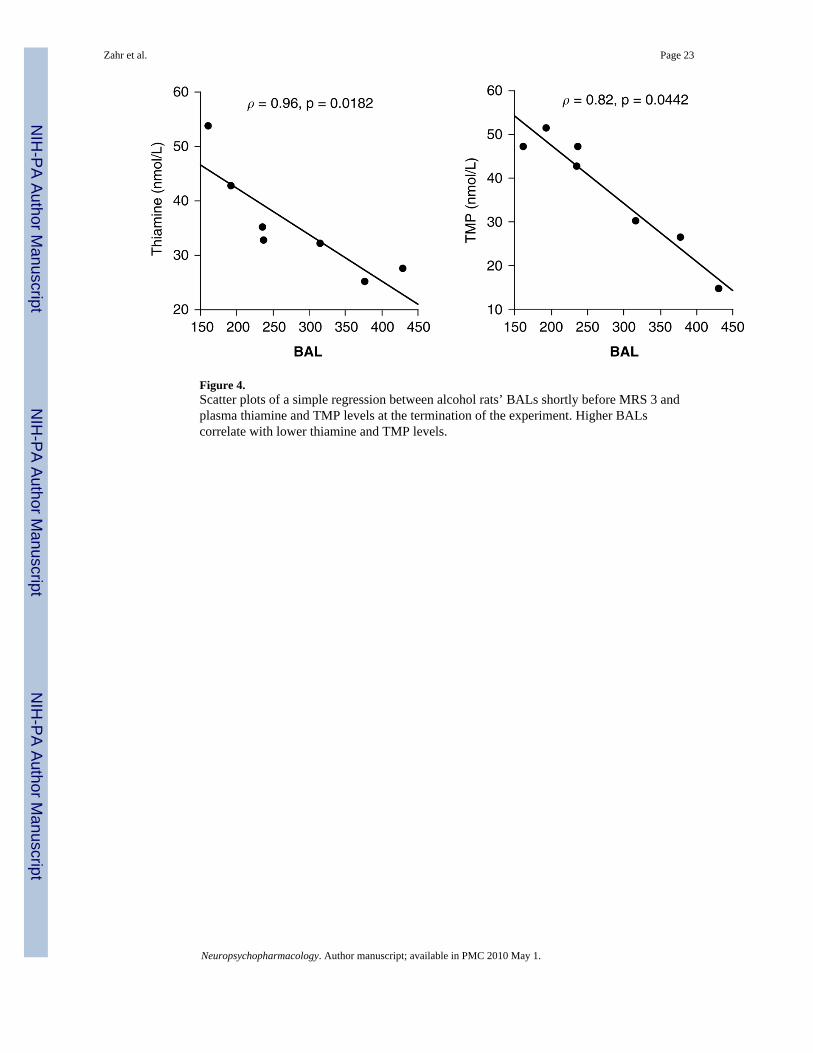
Figure 4.Scatter plots of a simple regression between alcohol rats’ BALs shortly before MRS 3 andplasma thiamine and TMP levels at the termination of the experiment. Higher BALscorrelate with lower thiamine and TMP levels.
Zahr et al. Page 23
Neuropsychopharmacology. Author manuscript; available in PMC 2010 May 1.
NIH
-PA Author Manuscript
NIH
-PA Author Manuscript
NIH
-PA Author Manuscript
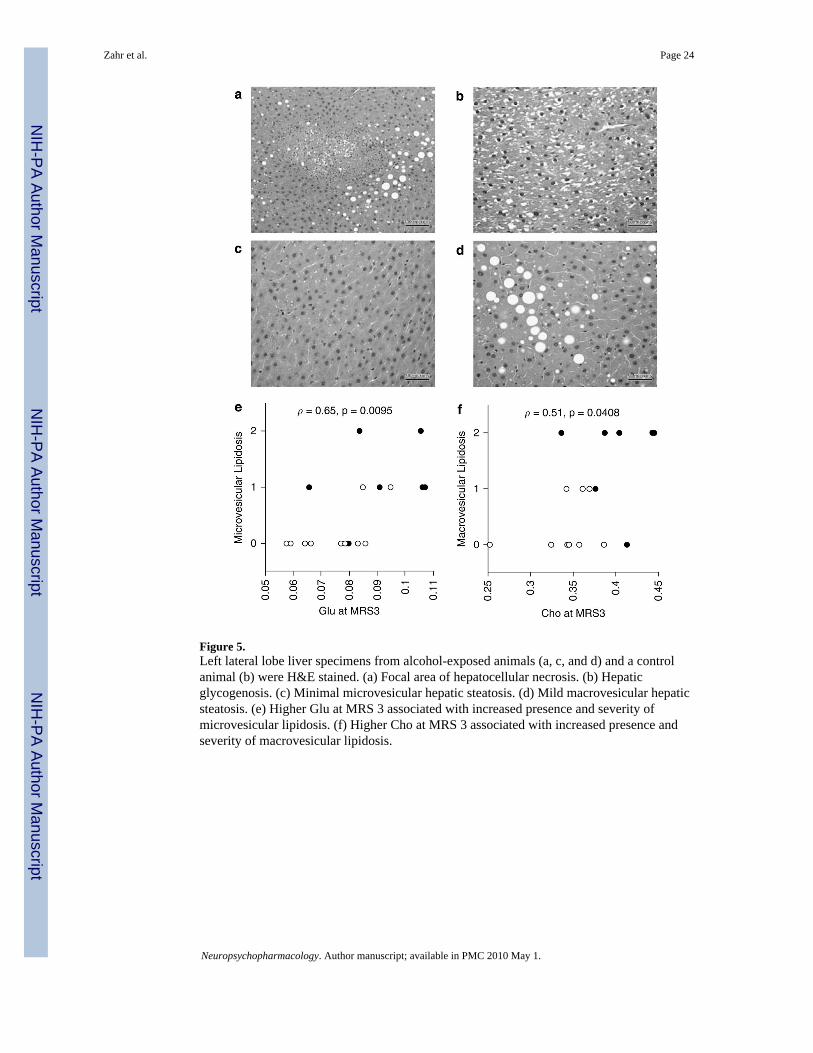
Figure 5.Left lateral lobe liver specimens from alcohol-exposed animals (a, c, and d) and a controlanimal (b) were H&E stained. (a) Focal area of hepatocellular necrosis. (b) Hepaticglycogenosis. (c) Minimal microvesicular hepatic steatosis. (d) Mild macrovesicular hepaticsteatosis. (e) Higher Glu at MRS 3 associated with increased presence and severity ofmicrovesicular lipidosis. (f) Higher Cho at MRS 3 associated with increased presence andseverity of macrovesicular lipidosis.
Zahr et al. Page 24
Neuropsychopharmacology. Author manuscript; available in PMC 2010 May 1.
NIH
-PA Author Manuscript
NIH
-PA Author Manuscript
NIH
-PA Author Manuscript

Figure 6.Frequency of neurological signs for 8 alcohol rats before MRS 2 and MRS 3.
Zahr et al. Page 25
Neuropsychopharmacology. Author manuscript; available in PMC 2010 May 1.
NIH
-PA Author Manuscript
NIH
-PA Author Manuscript
NIH
-PA Author Manuscript
NIH
-PA Author Manuscript
NIH
-PA Author Manuscript
NIH
-PA Author Manuscript
Zahr et al. Page 26
Tabl
e 1
Met
abol
ite L
evel
s by
Dis
ease
Dis
ease
NA
AG
luC
hom
IG
lxR
efer
ence
s
Alco
hol
H
uman
(cur
rent
ly d
rinki
ng)
↑M
eyer
hoff
et a
l (20
04)
R
at (1
6–40
wee
ks)
↑↑
Lee
et a
l (20
03)
Alco
hol
H
uman
(det
oxifi
ed/re
cove
ring)
↓↓
↑Sc
hwei
nsbu
rg e
t al (
2001
); Sc
hwei
nsbu
rg e
t al (
2003
); B
ends
zus e
t al (
2001
); Ja
gann
atha
n et
al (
1996
); D
uraz
zo e
t al (
2004
);Ja
gann
atha
n et
al (
1996
); M
urat
a et
al (
2001
); B
ends
zus e
t al (
2001
); Ja
gann
atha
n et
al (
1996
); M
urat
a et
al (
2001
); Se
itz e
tal
(199
9); P
arks
et a
l (20
02)
R
at (>
40 w
eeks
)↓
↑Le
e et
al (
2003
)
Thia
min
e de
ficie
ncy
H
uman
(Wer
nick
e’s)
↓↓
Mur
ata
et a
l (20
01);
Mas
calc
hi e
t al (
2002
)
R
at (p
yrith
iam
ine)
↓↓
Ros
e et
al (
1993
); Pf
effe
rbau
m e
t al (
2007
); Le
e et
al (
2001
); Le
e et
al (
1995
)
Live
r dis
ease
H
uman
(cirr
hosi
s)↓
↓↑
Lee
et a
l (19
99);
Kre
is e
t al (
1992
); R
oss e
t al (
1994
); G
eiss
ler e
t al (
1997
); C
ordo
ba e
t al (
2001
); La
uben
berg
er e
t al (
1997
)
R
at (t
etra
chlo
ride/
thio
acet
amid
e)↓
↓↑
Bat
es e
t al (
1989
); Pe
elin
g et
al (
1993
)
Abb
revi
atio
ns: N
AA
, N-a
cety
lasp
arta
te; G
lu, g
luta
mat
e; C
ho, c
holin
e; m
I, m
yo-in
osito
l; G
lx, g
luta
min
e+gl
utam
ate.
Neuropsychopharmacology. Author manuscript; available in PMC 2010 May 1.

NIH
-PA Author Manuscript
NIH
-PA Author Manuscript
NIH
-PA Author Manuscript
Zahr et al. Page 27
Tabl
e 2
Met
abol
ite L
evel
s in
Bas
al G
angl
ia V
oxel
: Mea
ns a
nd S
tand
ard
Dev
iatio
ns
NA
AC
hoG
luG
lxtC
rT
aum
I
MRS
1
Re
lativ
e to
tiss
ue w
ater
EtO
H0.
349±
0.04
30.
362±
0.04
00.
087±
0.01
70.
094±
0.01
90.
353±
0.04
80.
063±
0.01
90.
084±
0.01
8
Ctrl
0.34
8±0.
033
0.34
1±0.
013
0.07
9±0.
016
0.09
1±0.
018
0.34
5±0.
024
0.06
3±0.
011
0.08
1±0.
010
Re
lativ
e to
tCr
EtO
H0.
989±
0.02
71.
03±0
.065
0.24
5±0.
036
0.26
4±0.
028
10.
179±
0.05
80.
239±
0.04
4
Ctrl
1.01
±0.0
530.
993±
0.05
10.
229±
0.03
60.
262±
0.04
31
0.18
3±0.
026
0.23
6±0.
026
MRS
2
Re
lativ
e to
tiss
ue w
ater
EtO
H0.
324±
0.01
90.
383±
0.02
6*0.
074±
0.01
10.
101±
0.01
5*0.
320±
0.02
20.
059±
0.01
50.
087±
0.01
3
Ctrl
0.33
3±0.
026
0.34
1±0.
014
0.06
6±0.
011†
0.08
9±0.
015
0.33
8±0.
018
0.06
5±0.
012
0.08
4±0.
008
Re
lativ
e to
tCr
EtO
H1.
013±
0.04
11.
199±
0.09
8*,†
0.23
1±0.
034*
0.31
6±0.
047*
,†1
0.18
6±0.
049
0.27
3±0.
046†
Ctrl
0.98
7±0.
049
1.01
1±0.
051
0.19
6±0.
030†
0.26
4±0.
046
10.
192±
0.04
00.
248±
0.03
0
MRS
3
Re
lativ
e to
tiss
ue w
ater
EtO
H0.
323±
0.02
70.
407±
0.04
0*,‡
0.09
1±0.
015*
0.10
9±0.
015*
0.31
7±0.
022
0.05
6±0.
012
0.08
2±0.
007*
,*
Ctrl
0.33
8±0.
035
0.34
1±0.
036
0.07
5±0.
013
0.08
9±0.
013
0.33
7±0.
025
0.06
8±0.
015
0.09
5±0.
013‡
Re
lativ
e to
tCr
EtO
H1.
019±
0.05
41.
284±
0.08
9*,‡
,#0.
287±
0.04
1*,#
0.34
6±0.
047*
,‡1
0.17
7±0.
029
0.26
1±0.
028
Ctrl
1.00
6±0.
114
1.00
9±0.
077
0.22
4±0.
042
0.26
5±0.
037
10.
202±
0.03
70.
282±
0.02
4‡#
Abb
revi
atio
ns: C
trl, c
ontro
l gro
up; E
toH
, eth
anol
gro
up; N
AA
, N-a
cety
lasp
arta
te; G
lu, g
luta
mat
e; C
ho, c
holin
e; m
I, m
yo-in
osito
l; G
lx, g
luta
min
e+gl
utam
ate;
tCr,
tota
l cre
atin
e; T
au, t
aurin
e; M
RS,
mag
netic
reso
nanc
e sp
ectro
scop
y; E
tOH
, n=8
; Ctrl
, n=1
0.
* p<0.
05 b
etw
een
EtO
H a
nd C
trl, o
ne-ta
iled,
**tw
o-ta
iled.
† p<0.
05 b
etw
een
MR
S 1
and
MR
S 2,
two-
taile
d.
Neuropsychopharmacology. Author manuscript; available in PMC 2010 May 1.

NIH
-PA Author Manuscript
NIH
-PA Author Manuscript
NIH
-PA Author Manuscript
Zahr et al. Page 28‡ p<
0.05
bet
wee
n M
RS
1 an
d M
RS
3, tw
o-ta
iled.
# p<0.
05 b
etw
een
MR
S 2
and
MR
S 3,
two-
taile
d.
Neuropsychopharmacology. Author manuscript; available in PMC 2010 May 1.

NIH
-PA Author Manuscript
NIH
-PA Author Manuscript
NIH
-PA Author Manuscript
Zahr et al. Page 29
Table 3
Thiamine and Its Phosphates (in nmol/l): Means and Standard Deviations
Thiamine TMP TPP
Alcohol (n = 7) 35.63±9.79 37.16±13.56 0.872±0.06
Control (n = 10) 49.93±8.68 52.85±14.23 0.884±0.04
p-value 0.0063 0.0377 0.6409
Abbreviations: TMP, thiamine monophosphate; TPP, thiamine pyrophosphate.
Neuropsychopharmacology. Author manuscript; available in PMC 2010 May 1.


