Embed Size (px)
Citation preview

Electronic copy available at: http://ssrn.com/abstract=2011889
Impression management and Non-GAAP reporting in earnings announcements
Encarna Guillamon-Saorin
Universidad Carlos III de Madrid
Helena Isidro
Instituto Universitário de Lisboa (ISCTE-IUL), BRU UNIDE, Lisboa, Portugal
Ana Marques1
NOVA School of Business and Economics – Universidade Nova de Lisboa
January 2012
The authors appreciate the valuable comments received from the workshop participants at NOVA School of Business and Economics and at the Grenoble Ecole de Management. This study was supported by the Foundation for Science and Technology in Portugal (grant PTDC/EGE-GES/103770/2008). Encarna Guillamon-Saorin acknowledges financial contribution from the Spanish Ministry of Science and Innovation (SEJ2007-67582-C02-02/ECON, ECO2010-19314) and Comunidad Autonoma de Madrid (SEJ2008-00059-003). Ana Marques also acknowledges financial support received from Nova Forum. We are grateful for the excellent research assistance of Arash Aloosh and Luís Araújo.
1Corresponding author: NOVA School of Business and Economics, Campus de Campolide
1099-032 Lisboa, Portugal. Tel: +351.918080250. Fax: +351.21387933. Email: [email protected]
Electronic copy available at: http://ssrn.com/abstract=2011889
1
Impression management and Non-GAAP reporting in earnings announcements
Abstract
This paper analyzes whether managers combine two mechanisms capable of influencing
investors’ judgments in earnings announcements. Specifically, we study whether managers use
impression management techniques to emphasize non-GAAP earnings measures when announcing
annual results. The study is carried out on an international sample of European countries, during 2003-
2005. The method used is manual content analysis. We find evidence that managers use impression
management techniques as a complement to the disclosure of non-GAAP earnings measures.
Furthermore, our analysis of market reactions indicates that although investors recognize that non-
GAAP earnings measures have information content they penalize firms that present these figures in
combination with impression management techniques. Thus, investors seem to perceive the use of
impression management to enhance non-GAAP figures as an opportunistic strategy and consequently
inflict a penalty for this self-serving behavior.
Keywords: Non-GAAP earnings, impression management, pro forma, press releases.
JEL classification: M41

2
1. Introduction
Managers use earnings announcements to convey private information about firm’s performance
to capital market participants. When selecting information to disclose in public announcements
managers benefit from a considerable degree of discretion. In this paper, we study the link between two
discretionary mechanisms: the disclosure of non-GAAP earnings measures and the use of impression
management techniques in earnings announcements’ press releases. First, we investigate whether non-
GAAP disclosure and impression management are complementary or substitute mechanisms in
voluntarily corporate communications. Second, we assess whether short-term market reaction to the
disclosure of non-GAAP earnings measures changes when it is accompanied by impression
management techniques.
Managers frequently include in earnings announcements self-constructed earnings figures that
deviate from reported GAAP earnings (i.e. non-GAAP figures). These non-GAAP numbers often
portray a better image of firm performance than the GAAP numbers provided by audited financial
reports. Critics of this practice claim these figures aim at misleading investors. Managers, on the other
hand, claim that the self-constructed numbers represent better permanent earnings and are designed to
aid investors’ interpretation of financial results. Whatever the motivation driving the disclosure, the
manager-adjusted earnings numbers have the potential to influence investors’ decisions (Andersson and
Hellman, 2007; Bhattacharya et al., 2007).
Managers can also influence investors’ perceptions via the use of impression management
techniques (Adelberg, 1979). For example, managers can pass a positive impression of firm
performance by emphasizing the figures that portray a better image, and select only the “best” numbers

3
from the financial statements. Impression management can be operationalized in different forms
(thematic manipulation, emphasis, performance comparisons, selectivity, forward-looking disclosures
etc.) with the aim of presenting a self-serving view of corporate and management performance. Recent
studies suggest that impression management techniques are used in annual earnings’ announcement
press releases to influence investors’ judgments (Garcia Osma and Guillamon-Saorin, 2011), and to
support manipulated earnings numbers (Aerts and Cheng, 2011; Guillamon-Saorin and Garcia Osma,
2010).
An important aspect of management’s opportunistic disclosures is credibility. Prior findings
indicate that managers are successful in affecting the perception of investors and analysts using
opportunistic disclosures. For example, the increase in optimistic disclosures detected by Lang and
Lundholm (2000) is associated with increased stock prices leading up to equity offerings. Also, the level
of optimism in an earnings announcement is positively associated with the market’s short-term response
to the announcement (Davis et al., 2011; Henry, 2008). It is possible that managers attempt to enhance
credibility by combining different disclosure practices to make the content of corporate reports more
consistent and convincing.
Prior literature provides evidence of the use of causal disclosures in combination with earnings
management in the prospectus of IPOs firms (Aerts and Cheng, 2010). This behavior is seen as an
opportunistic attempt to rationalize and legitimize the corporate earnings outcomes. Similarly, Godfrey
et al. (2003) shows a positive association between manipulated earnings and the use of graphical
impression management. Thus, it is possible that managers combine the use of non-GAAP earnings
disclosures and impression management practices. If managers do so, the question arises whether users
of information are fooled by this combination or, instead, penalize it. If impression management is
successful and convinces investors that the non-GAAP measures reflect performance, the market

4
reaction to non-GAAP information will be stronger. However, if market participants perceive the
impression management surrounding non-GAAP measures as a signal that managers want to
misrepresent the firms’ performance the market reaction will be negative or non-existent.
Prior research investigating corporate opportunistic disclosures analyze formal text included in
sections of the annual reports, like chairman statements and MD&A (e.g. Abrahamson and Park, 1994;
Aerts, 2005; Schleicher and Walker, 2010; Subramanian et al., 1993; Yuthas et al., 2002) but also
earnings announcements press releases (Bowen et al., 2005; Davis et al., 2011; Demers and Vega, 2008;
Garcia Osma and Guillamon-Saorin, 2011; Henry, 2008; Henry and Leone, 2009). Press releases
announcing annual results serve other communication strategies than annual reports. They include more
expressive language and can be used as management self-serving tools (Aerts and Cormier, 2009).
Rogers et al. (2011) find evidence consistent with earnings announcements containing information that
derived into lawsuits against companies. This evidence suggests that information included in earnings
announcements press releases is, in general, relevant to investors. Investors, particularly less
sophisticated ones who rely more on public sources of information, are more likely to be misled by
opportunistic disclosures in press releases such as non-GAAP earnings (Bhattacharya et al., 2007) and
high impression management.
In our empirical tests we include hand-collected information regarding: (i) the level of
impression management used in the earnings announcement press releases as measured by a score
derived from the content analysis, and (ii) the voluntary disclosure of non-GAAP earnings measures.
Our sample consists of the largest firms in Europe and the time period analyzed includes years 2003,
2004 and 2005. The low litigation environment and absence of regulation on non-GAAP disclosure that
characterizes many European markets facilitate the use of discretionary information in earnings

5
announcements.1 Capital markets are also relatively less developed in Europe than in other countries
(such as the US), which implies that the potential markets effects of misleading disclosures to less
sophisticated investors can be high. Thus, this is an interesting setting for the analysis of the link
between impression management and non-GAAP disclosure, and the consequent market implications.
In our analysis of the relationship between the two mechanisms we find a positive association
between the use of impression management techniques and the decision to disclose non-GAAP figures
in the press releases. This indicates a complementary relation between the two disclosure practices.
Moreover, companies with a higher level of adjustments to non-GAAP measures (i.e. where non-GAAP
earnings deviates more from GAAP earnings) show higher levels of impression management techniques
in earnings announcements. This evidence suggests that managers use both disclosure strategies to
create a positive impression on readers, which is consistent with an opportunistic rather than informative
intention.
Furthermore, our market reaction tests reveal a negative market reaction to the combination of
non-GAAP disclosures and the use of impression management. This suggests that investors perceive the
use of impression management to emphasize non-GAAP numbers to be misleading and consequently
punish this practice. Although not fully comparable, our results complement those which report positive
market´ short-term responses to positive and optimistic tone in corporate reports (Davis et al., 2011;
Henry, 2008).
Capital markets, however, recognize that non-GAAP disclosures can be used by managers to
mitigate information asymmetry. Our analysis of cumulative abnormal returns for a three-day window
1 The only institutional pronouncement about this topic in Europe is the recommendation the CESR - Committee of European Securities Regulators, issued in October 2005. The objective of this recommendation is to encourage European-listed firms which chose to disclose non-GAAP financial measures to do it “in a way that is appropriate and useful for investor’s decision making”.

6
around the earnings announcement day reveals that the market reacts positively to the adjustments made
to GAAP figures, which is similar to the market reaction to an earnings surprise. Thus, the disclosure of
these alternative performance figures is only penalized when combined with the use of impression
management techniques.
This study contributes to the voluntary disclosure literature in two ways. First, it shows that non-
GAAP disclosures and impression management are used together to create an overall positive
impression of firm performance. This combination can have a substantial impact on investors’
perceptions about firm’s performance, particularly on less sophisticated investors who rely more on
earnings information conveyed through corporate communications such as press releases. Second, this
research provides evidence that the two potentially misleading voluntary disclosure mechanisms affect
capital markets. We find that investors perceive the combined use of impression management techniques
and non-GAAP disclosure as a sign of opportunistic intentions. Moreover, to the best of our knowledge,
this is the first study which documents the usage of impression management techniques in narratives in
an international context, as prior studies investigating impression management internationally focus on
the manipulation of graphs in annual reports (Beattie and Jones, 1997; 2001). Detecting potentially
misleading management disclosure practices can be important for analysts, regulators and the various
entities that interact with firms. For example, insights from this work provide valuable information to
guide standard setters when issuing recommendations or regulations related to voluntary disclosures,
particularly non-GAAP information.
The remaining of the paper is organized as follows. The next section describes previous findings
and develops our hypotheses. Section 3 discusses the sample selection and the hand-collection and
coding of the data. Section 4 explains the research design. Section 5 presents the empirical results.

7
Section 6 concludes.
2. Literature review and hypotheses development
Voluntary disclosures can be used to provide investors with valuable incremental information or
to attempt to mislead them (Core, 2001; Verrecchia, 2001). Management attempts to mislead outsiders
and influence shares prices suggests that managers believe investors are not able to see through biased
disclosures (Adelberg, 1979; Courtis, 2004). If, on the contrary, managers believe in financial markets’
efficiency and in the ability of investors to recognize misleading voluntary disclosures, they have no
economic incentives to attempt to mislead investors, as doing so can increase cost of capital and affect
their reputation (Baginski et al., 2000).
The disclosure of non-GAAP earnings metrics in earnings announcements has created
controversy because while managers argue that they provide stakeholders with a more accurate
assessment of corporate performance (Bray, 2001), policymakers and regulators alert for the potential
misleading intention behind these incomplete or even inaccurate numbers (Derby, 2001). Early studies
established that non-GAAP earnings are more highly correlated with returns than GAAP earnings
(Bhattacharya et al., 2003; Bradshaw and Sloan, 2002). This seems to indicate that these figures are
disclosed by managers to provide markets with a more useful earnings’ metric than the number obtained
following accounting standards. Another case where the managers’ intention seems to be to provide
valuable information to users of financial information is when firms report non-GAAP earnings
numbers which are lower than GAAP figures (Curtis et al., 2011). However, managers are motivated to
disclose and emphasize the measures that portray the firm in the best performance possible in an attempt
to influence stakeholders’ perceptions (Bowen et al., 2005). Consistent with this idea previous research

8
indicates that firms often disclose non-GAAP earnings figures which meet or beat earnings benchmarks
when GAAP figures fall short of the benchmark (Bhattacharya et al., 2004).
Impression management is justified by the human need to present themselves in the most
positive light (Hooghiemstra, 2000; Schlenker, 1980; 2003). In a corporate reporting setting, impression
management intends to manipulate the impression conveyed to users of accounting information
(Clatworthy and Jones, 2001). Most studies investigating the competing theories of impression
management and incremental information for voluntary disclosures find support for the impression
management interpretation. For example, Lang and Lundholm (2000), using a matched-pair design,
analyze the disclosure practices around new stock offerings and find that optimistic disclosures
increased before the equity public offerings while the pessimistic decreased around the same period.
Matsumoto et al. (2006) investigate impression management and incremental information in relation to
managerial optimism. Their results confirm that managerial optimism is neither confirmed by analysts’
opinion nor related to future financial performance suggesting manager’s engagement in self-serving
disclosures.
Managers have incentives to engage in several self-serving practices simultaneously, in order to
increase the effect of disclosures on users’ perceptions of firm performance. Evidence of this strategy
has been found in prior literature. For example, Aerts and Cheng (2011) find an association between
earnings management and impression management, using causal explanations in the prospectus of
Chinese IPO firms. Similarly, Guillamon-Saorin et al. (2011) show that impression management is used
together with real earnings management practices, and Godfrey et al. (2003) show that firms exhibiting
graphical impression management in their annual reports also engage in earnings management. These
results constitute evidence of the strong tendency to acclaim positive earnings-related outcomes and to
combine disclosure mechanisms that help to pass to outsiders the desired corporate message. Following
9
this line of research, we propose that managers may use a combined disclosure strategy where they
apply several impression management techniques and disclose non-GAAP earnings figures in earnings
announcements press releases. Therefore, we state our first hypothesis as follows:
H1: There is a positive association between the disclosure of non-GAAP earnings figures and
the use of impression management techniques.
The disclosure of manager-adjusted numbers in earnings announcement has informational effects
on capital markets (Bhattacharya et al., 2003; Bradshaw and Sloan, 2002), and influences the judgments
of both less-sophisticated investors and financial analysts (Andersson and Hellman, 2007). The use of
impression management in corporate communications has also implications for capital markets
participants. Krische (2005) uses an experimental setting to investigate the effect of strategic
inclusion/exclusion of transitory prior-period gains or losses to influence investors evaluation of current
year results. The effect found is interpreted as unintentional and due to the reader cognitive effects.
Moreover, Davis et al. (2011) find that there is a market reaction to the unexpected level of optimistic
words, using a computerized textual-analysis software to read press releases (Diction).
If managers combine the use of impression management and non-GAAP disclosures the question
arises whether and how the market participants react to this combination. If investors are positively
influenced by the use of impression management techniques and believe the information disclosed in the
press release (including the non-GAAP earnings figures) to be relevant we should observe a positive
incremental reaction to the combined use of non-GAAP measures and impression management. On the
other hand, if investors interpret the presence of impression management as an attempt to inflate firm
performance they should react negatively, punishing managers for their endeavor. This would be similar

10
to the effect found by Barton and Mercer (2005) where managers are punished for trying to justify their
bad results with external events not related to their performance. It would also be consistent with the
negative market reaction to indicator variables representing the disclosure of non-GAAP measures in the
US before Regulation G (a period when markets believe these were used for manipulating earnings
perceptions), identified in Marques (2006).2 Given the two possible scenarios, we state our second
hypothesis in the null form:
H2: Market participants’ reaction to non-GAAP earnings is not affected when impression
management is used in the same earnings announcement.
3. Sample selection procedure and hand-collection of data
We begin our sample selection process by considering all firms included in the Financial Times
2006 classification of the 500 largest European companies. This allows us to study a group of firms
which represent a significant portion of European capital markets, where the potential effects for
managers’ misleading practices is significant. Financial institutions and utilities firms, which follow
specific regulations that can affect voluntary disclosure, are excluded from the sample. Data on financial
items and market returns is obtained from Worldscope/Datastream. Data on analysts’ consensus is
obtained from I/B/E/S. After eliminating observations with missing financial information and press
releases, the final sample consists of 717 firm-year observations, for 267 firms covering fiscal years
2003, 2004 and 2005 (Table 1 provides the details).
2 This negative market reaction is present in both the short and long-term windows of tables 6 and 7. However, they are only significant in the long windows (of 63 days), which analyze the quarterly market reaction.

11
Earnings announcements’ press releases are gathered from the companies’ websites and Factiva.
We perform a manual content analysis to quantify the level of impression management in the press
release. This method is comparable to that used in prior research (Aerts, 2005; Schleicher and Walker,
2010). Most prior work analyzing disclosures tone relies on pre-specified wordlists (Davis et al., 2011;
Henry, 2008; Loughran and McDonald, 2011; Rogers et al., 2011). These studies state that this
methodology allows them to perform a systematic and objective content analysis. However, software
with integrated wordlists give rise to problems including the omission or miscoding of keywords (Henry
and Leone, 2009; Larcker and Zakolyukina, 2010). Our method, although more subjective, allows the
analysis of a diverse range of practices which cannot be coded using computer-aid techniques. Most of
the practices analysed in this study (i.e. emphasis, repetition, selectivity, performance comparisons)
cannot be analysed and coded using computer-aid methods. Manual content analysis has also been
widely used and enhanced in prior literature for allowing greater flexibility and more detailed analysis
(Conway, 2007; Linderman, 2001). Next we describe our measures of impression management and non-
GAAP information.
3.1. Measure of impression management
The level of impression management in each earnings announcement is analyzed following a
schema developed in prior work (Brennan et al., 2009; Hussainey et al., 2003). Appendix 1 shows the
method followed to examine the following five impression management disclosure techniques:
disclosure tone, adding emphasis, performance comparisons, forward-looking disclosures, and
selectivity to create an overall positive connotation in the press release. The appendix also illustrates
these practices using one of the companies included in the analysis: Ahold. The five techniques are

12
described below.
(1) Disclosure tone. This technique consists of using positive language, keyword, statements or amounts
to create a positive image of corporate results that would not be achieved using more neutral
statements. We analyze disclosure tone by coding positive and negative amounts as in prior research
(Brennan et al., 2009)3. The amounts are classified as positive (negative) if current year amount is
higher (lower) than prior year. For example, “Schering AG Group reported an organic growth in net
sales of 5% in 2004” (taken from Schering AG Group press release for 2004). This explicit
statement of increase in sales is coded as a positive tone.
(2) Emphasis. This consists of making a particular piece of information more obvious to the reader by
using two strategies: (a) placing the information strategically in the press release (emphasis by
location) and (b) repeating the same piece of information in the press release (emphasis by
repetition).4 For example, SGS company includes the same information related to revenues in the
headline “With top line growth of 17.6% to CHF 2,885 million, SGS achieved a 30.3% improvement
in operating income to CHF 391 million” as well as in the first paragraph of the press release “In an
improved trading environment, revenues for the Group increased to CHF 2,885 million, up CHF 467
3 Except for Brennan et al. (2009), Garcia Osma and Guillamon-Saorin (2011) and Guillamon-Saorin et al. (2011), no other prior work has investigated disclosure tone using quantitative information. Most of the work analysing tone of disclosures use computer developed software or algorithms that limit the analysis to the coding of keywords (e.g. Henry, 2006; 2008; Rogers et al. 2011) or basic analysis of textual complexity (e.g. Li, 2008). 4 Three sections are defined to identify emphasis by location: most-, and next most- and least emphasised. For the purpose of this study we focus on the analysis of the two first sections of the press release. The most emphasised section could be the headline (if present), subheadings (if headline not present) or first and second paragraph (if headline and subheadings not present). The next most emphasised section could be the subheadings (if present) or the second and third paragraphs (if subheadings not present).

13
million over last year in local currency terms (CHF 431 million on a reported basis).” (taken from
SGS press release for 2004).5
(3) Performance comparisons. The use of performance benchmarks as a potential misleading disclosure
practice is derived from prior literature (Lewellen et al., 1996; Schrand and Walther, 2000).
Managers may decide to include or not a benchmark to compare with current year figures depending
of the firm performance or may choose a benchmark strategically to show positive rather than
negative changes (i.e. instead of comparing this year’s decrease in earnings relatively to last year’s
earnings, the manager may compare this year´s earnings with average growth in the industry to show
a positive change). In the statement “Anglo American announces record earnings of $3.7 billion, up
39%” (taken from Anglo American press release for 2005) the percentage “39%” is emphasizing the
increase in profits in relation to prior year.
(4) Tone of forward-looking disclosures. Forward-looking is based on current expectations and beliefs
and involves anticipating future events. We use a list of forward-looking keywords developed in
prior work (Hussainey et al., 2003; Matsumoto et al., 2006) and add those words with prospective
connotation found in the press release during the coding. We code forward-looking statements as
positive or negative based on the inclusion of the keywords from the list, together with numerical
information.6 For example consider the statement “The Board of directors will propose a dividend of
CHF 9.00 per share, 50% higher than the regular 2002 dividend. The group confirms its targets for
2005 at CHF 45 earnings per share” (taken from SGS press release for 2003). The first statement
5 Although it is common that information included in the headline is also included in the main body of the press release, we consider this practice emphasis by repetition because it is up to the discretion of the manager to (1) provide the press release with a headline (2) to include the same piece of information in the headline and in the main body of the press release (Garcia Osma and Guillamon-Saorin, 2011). 6 The list of forward-looking keywords is based in prior literature (Hussainey et al., 2003; Matsumoto et al., 2006) and it is available from the authors upon request.

14
includes the forward-looking keyword “will” and the positive keyword “higher” together with
quantitative information “CHF 9.00”. Therefore, this is classified as a positive forward-looking
statement. The second statement includes the forward-looking keyword “2005” and quantitative
information “CHF 45”. This statement is considered a neutral forward-looking statement because it
does not include any positive or negative explicit connotation. 7
(5) Selectivity: The selection of figures to be included in the press release is made by managers, which
can choose the most favorable item from all the information available. Selectivity implies first, (a)
choosing a figure from the face of the profit and loss account and (b) deciding which figure to
include in the press release among those available in the profit and loss account. Depending on the
figure chosen we assign a level of selectivity to that figure (high, medium or low). This method is
developed by Brennan et al. (2009).
Figure 4 in Appendix 1 shows the weighting system followed to build our score of impression
management (IMS) using the example of Ahold company. For example, a positive/negative amount is
given a +1/-1 point. Repetition and reinforcement are awarded +0.5/-0.5 points. When the amount is
located in the most emphasized section of the press release they receive an extra +1/-1 point while if the
location is in the next most emphasized it gets +0.5/-0.5 points. Positive/negative quantitative forward-
looking disclosures get +1/-1 point. Finally, figures selected from the profit and loss account get
+1/0.5/0.0 depending on whether they are the highest/medium/lowest possible figure from the range
available on the profit and loss account. The score is based on the coding of positive and negative
amounts, repetition of amounts, performance comparisons and location of figures in the press release.
Forward-looking disclosures are also coded separately and provide a measure of optimism. Selectivity is
7 In this case the forward-looking keyword is a year “2005”. This refers to future years and it is accounted for in our list of forward-looking keywords.
15
coded by comparing the figures included in the press release with the range of figures included on the
face of the profit and loss account. The final measure is calculated as the total composite score for all
positive amounts minus the total composite score for all negative amounts, divided by the total number
of words as in prior literature (Gordon et al., 2010).8 A measure scaled by total number of words allows
comparisons between press releases sections of different lengths (Rogers et al., 2011).
3.2. Information about the disclosure of non-GAAP earnings measures
We also hand-collect and code information about the non-GAAP earnings measures disclosed
from the earnings announcement press releases. Specifically, we code the type of non-GAAP measures
and their values. We use this data to calculate the value of the adjustments made by managers i.e., how
different the non-GAAP values are from the GAAP earnings numbers. Based on the type of categories
reported for non-GAAP measures in previous papers (e.g. Marques, 2006) we identify and code the
following non-GAAP figures: (i) non-GAAP earnings per share, (ii) Non-GAAP from continuing
operations, per share, (iii) other non-GAAP per share measures, (iv) non-GAAP net income, (v) non-
GAAP income from continuing operations and (vi) other non-GAAP aggregate measures. In the
8 For the purpose of the analysis of impression management we focus on the most prominent location of the press releases. The importance of location of information has been demonstrated in prior literature (Files et al., 2009; Price et al., 1997; Zillmann et al., 2004). Information included in a prominent location of a document attracts more attention and creates a lasting first impression (Anderson, 1965; Anderson and Hubert, 1963; Bernstein and Garst, 1982). Furthermore, a recent studies report evidence of the use of misleading practices in press releases headlines (Guillamon-Saorin et al., 2011) and the first five minutes of conference calls (Hobson et al., 2011). The five disclosure practices analysed in this study and used to calculate the impression management measures are coded on the first and second sections of the press release.
16
empirical analysis we focus only on categories one, two, four and five9. Furthermore, in order to be
conservative, we exclude from our study non-GAAP financial measures with ambiguous labels.
4. Research design
Our first hypothesis is based on the proposition that managers may use a combined disclosure
strategy, associating impression management practices with the voluntary disclosure of non-GAAP
earnings measures. To test this we estimate two versions of the following model:
IMSi,t = α0 + α1NGi,t + α2LEV i,t + α3LOSSi,t + α4Change_ROAi,t + α5SIZEi,t +
ΣαkDV_Years + ΣαjDV_INDs + µi,t (1)
The dependent variable is the impression management score (IMS), defined as detailed in
Appendix 1. In the first version of equation (1) NG is NG_reporting, an indicator variable coded as one
when companies report non-GAAP figures in their press release, and zero otherwise. In the second
version of equation (1) NG is NG_Adjustment, which represents the adjustments made by managers to
the GAAP earnings measures in their definition of the non-GAAP figures. NG_Adjustment is calculated
as the difference between non-GAAP earnings and GAAP earnings, scaled by market value of equity at
the end of the previous year. A positive estimated coefficient (α1) in the first version of the equation
indicates that the decision to disclose non-GAAP measures is associated with more impression
management. A positive estimated coefficient (α1) in the second version of the equation indicates that
9 We only collect non-GAAP measures that portray a firm’s results (i.e. some type of earnings figure) and we ignore measures related with other aspects of a firm’s performance (e.g. sales, cash measures and financial ratios).

17
higher levels of exclusion of expenses (leading to non-GAAP values superior to GAAP EPS) are
associated with higher usage of impression management techniques. Both positive coefficients would
suggest that the two practices are complementary disclosure mechanisms. Alternatively, a negative
estimated coefficient would indicate a substitution role.
We consider various control variables that have been found to affect disclosure in general and
impression management in particular (Guillamon-Saorin et al., 2011). LEV is calculated as the ratio of
total debt to total assets and has been found to be positively associated with impression management
(Aerts, 2005). Thus, we expect to find a positive coefficient for this variable. LOSS is included because
firms with poor performance are more likely to have poorer reporting quality (Francis et al., 2008).
LOSS is an indicator variable coded as one when the company reports losses, and zero otherwise.
Change_ROA controls for the possible association between investors’ perception of lower quality
earnings and earnings which exhibit a high degree of variability, as discussed in Lougee and Marquadt
(2004). ROA stands for return on assets and is calculated as earnings before extraordinary items scaled
by beginning of the year total assets. We expect a positive coefficient for the variable. Firm size is a
proxy for quality of disclosure, as large firms can afford the information production costs and have less
competitive advantage costs (Lang and Lundholm, 1993). SIZE is calculated as the log of the market
capitalization of the firm, in the beginning of the year. A negative coefficient is expected for this
variable, as this would indicate that impression management is misleading and thus negatively
associated with disclosure quality. Finally, we include indicator variables to account for the fact that we
pool observations across three years, as well as across different industry sectors (which we identify via
1-digit SIC codes). All variables are for firm i and year t.
Our second hypothesis assesses whether the association of the two potentially misleading
disclosure practices (non-GAAP reporting and impression management) have a combined effect on

18
market reactions in an earnings announcement press release. We make no directional prediction for this
effect on market reactions, which we test with the following model:
CAR = β0 + β1GAAP_Surprisei,t + β2NG_Adjustmenti,t + β3IMSi,t +
β4IMS*NG_Adjustmenti,t + β5SIZEi,t + β6LEV i,t + β7Change_ROAi,t +
β8BM i,t + β9LOSSi,t + Σ βkDV_Years + ΣβjDV_INDs + εi,t (2)
We measure the market reaction as the three-day cumulative abnormal market adjusted return
(CAR), centered on the date of the earnings announcement press release. We compute its values as
follows: CAR = Πk=-1,+1(1+ARk)-1, where AR is the abnormal return based on the one-factor market
model residuals estimated over the previous 365 days ending in day k-2. Given the international nature
of the sample we use a country-specific value-weighted market index. Following the methodology in
Marques (2006), we split the total earnings surprise to non-GAAP earnings measures (i.e., the difference
between the non-GAAP figures and analysts’ consensus), into two components: GAAP_Surprise and
NG_Adjustment. GAAP_Surprise is the GAAP earnings surprise calculated as the difference between
GAAP earnings per share (before extraordinary items, on a diluted basis) and the analysts’ consensus
forecast of earnings, scaled by share price at the end of the previous year.10 The second component
represents the adjustments made by managers to the GAAP earnings measures in their calculation of the
non-GAAP figures. Thus, NG_Adjustment is calculated as the difference between non-GAAP earnings
and GAAP earnings, scaled by share price at the end of the previous year. Studies based on US data find
10 Analysts’ consensus is defined as I/B/E/S median forecast of earnings per share.

19
that non-GAAP earnings are more valuable to financial markets than GAAP earnings. If this evidence
holds for European companies the estimated coefficient (β2) should be positive.
Our focus is the coefficient of the interaction of NG_Adjustment and IMS (β4). We do not make
a directional prediction, as we establish two possible scenarios. In the first, investors continue to believe
that non-GAAP earnings contain more information that GAAP earnings and the presence of impression
management has a positive effect, increasing the market reaction to the adjustments made to GAAP
figures. This leads to a positive estimated coefficient for the interaction variable. In the second scenario,
the presence of impression management is interpreted as an attempt to mislead market participants and
leads to a negative reaction, punishing managers’ behavior.
We also include several control variables expected to affect market returns. SIZE controls for
size effects as, for a given level of “unexpected” earnings, the cumulative abnormal returns of small
firms exceed those of large firms (Freeman, 1987). Thus, we expect to find a negative coefficient for
SIZE. Based on the results of Dhaliwal et al. (1991), who find that the earnings response coefficients are
larger for all-equity and low-leverage firms we include LEV and expect to estimate a negative
coefficient for it. Change_ROA controls for firms’ financial performance. To control for risk we use
BM, the ratio of book value of equity to market value of equity (Fama and French, 1993). We include
LOSS following Hayn´s (1995) results documenting the impact of a loss report on share valuation
Finally, we include indicator variables for years and industry sectors.
5. Results
5.1. Descriptive statistics and univariate tests
Table 2 presents the descriptive statistics by country for the two voluntary disclosure practices

20
analyzed in this study, non-GAAP earnings disclosure and the use of impression management
techniques. The percentage of firms disclosing non-GAAP earnings by country ranges from 0%, in
Austria, Hungary and Portugal, to 83%, in Greece. Considering the entire sample, we find that almost
50% of the earnings announcement press releases include non-GAAP earnings measures. There is also a
great deal of variance in the impression management scores (IMS) among countries. The country with
the highest value for IMS is Turkey (0.145) and the one with the lowest is Luxembourg (0.024). The
mean score is positive which indicates an overall positive connotation of the information included in
press releases. A score of 0.145 means that in every 100 words analyzed there are 14.5 points more of
positive content than negative content. On the other hand, a score of 0.024 indicates that the positive and
negative contents are almost balanced. The table also reports the number of press releases analyzed per
country.
Table 3 presents the results of univariate tests on the means of impression management score.
The first test aims to understand whether non-GAAP disclosures and the use of impression management
techniques are complementary or substitute corporate reporting mechanisms. The mean impression
management score is 0.079 for firms that do not report non-GAAP earnings measures whilst it is 0.088
for firms reporting non-GAAP earnings measures in press releases. The difference in means is
statistically significant (p-value=0.015). This descriptive evidence suggests that the two mechanisms are
complementary, not substitutes.
The second test reported in Table 3 assesses whether the level of impression management
changes when non-GAAP earnings are lower or higher than GAAP earnings figures. As explained
earlier, managers can disclose non-GAAP figures either to inform or to mislead investors. Curtis et al.
(2011) suggest that firms making adjustments to GAAP numbers in such a way that the resulting figure
is lower than GAAP earnings per share indicate management informative intentions. Thus, this test

21
allows us to assess if there is an association between the motive of the non-GAAP disclosure and the
level of impression management used by manager. The test shows that the two means are very similar
(0.085 and 0.090) and the difference is not statistically significant (p-value=0.632) suggesting that the
use of impression management techniques does not depend on the informativeness of non-GAAP
disclosures.
Finally, we also assess whether impression management is firm specific (i.e. we look for a ‘firm
style’ in the preparation of earnings announcements press releases). To this end, we assign each firm in
every year to five, ten and 20 quantiles of impression management. Untabulated results show that only
14% of the firms belong to the same or adjacent IMS quantile in the period analyzed. Thus, we find no
evidence of the existence of a ‘firm style’.
Panel A of Table 4 presents descriptive statistics on the continuous variables included in our
models. The mean NG_adjustment is 0.023, indicating that, on average, the values of the non-GAAP
earnings disclosed are higher than the GAAP earnings figures. This is consistent with previous findings,
both in the US and in Europe, and it is the mechanical result of managers mostly excluding expenses
(Hitz, 2010). The mean GAAP_surprise is 0.005, revealing that GAAP earnings are on average, higher
than the analysts’ consensus forecasts. The mean value of IMS is 0.086 indicating that, on average,
managers present their firm achievements in a positive light. Sample firms have a median leverage ratio
of 25% and a median Change_ROA of 1.2%.
Panel B of Table 4 reports the Pearson correlations. Overall, correlations among the variables are
not statistically significant. In fact, only two correlations (between SIZE and CAR, and SIZE and
GAAP_Suprise) are statistically significant, at a 5% level of confidence. These results indicate that our
variables capture different aspects of firm characteristics and there should not be multicollinearity

22
problems.
Panel C of Table 4 presents the means of variables by IMS groups. The three IMS groups result
from splitting the sample into three terciles and represent high, medium and low level of the IMS. The
mean of non-GAAP adjustments increases as the level of IMS gets higher. In particular, the mean value
of NG_Adjustmentis increases from 0.015 for the low IMS group to 0.034 for the high IMS group (the
increment is statistically significant: p-value = 0.045). This result indicates that managers use more
impression management techniques when they make more adjustments to GAAP earnings to calculate
non-GAAP figures. This evidence reinforces our previous findings that the two mechanisms are
complementary.
5.2. Regression results
Table 5 presents the results of the two alternative estimations of equation (1), which is used to
test our hypothesis one of whether firms that report non-GAAP figures (and make more adjustments) are
also more likely to engage in impression management. In Panel A we apply an OLS estimation model.
In Panel B we use a two-stage model which assumes the existence of self-selection in non-GAAP
reporting decisions. Prior literature has identified a number of firm conditions affecting managers’
decision to disclose non-GAAP measures (e.g. Heflin and Hsu, 2008). We use these determinants in the
first-stage equation.
Both sets of estimations presented in Table 5 reveal that impression management is positively
and significantly associated with the non-GAAP reporting decision (t-statistic is 2.96 in the OLS
estimation and 2.52 in the two-stage estimation). Moreover, the coefficient estimated for
NG_Adjustment is also positive and statistically significant in both estimations (t-statistics is 2.61 in

23
the OLS estimation and 2.01 in the two-stage estimation). These findings confirm our first hypothesis
and indicate that (i) firms tend to combine the use of impression management techniques with the
disclosure of non-GAAP earnings metrics, and (ii) the level of impression management applied
increases with the level of adjustments made by managers to compute non-GAAP earnings figures.
Given the way we calculate NG_Adjustment, higher values of this association indicate that as firms
exclude more expenses they also increase the level of impression management, suggesting a combined
approach to manipulate investors’ perceptions. Only two control variables are consistently significant
(Change_ROA and SIZE) and their signs are as expected.
An alternative explanation for the association between the level of non-GAAP adjustments and
IMS would be that as firms make more adjustments when calculating their non-GAAP earnings figures
they include more positive references and explanations of them. This would create a mechanical
relationship between non-GAAP and IMS. As a robustness check, we create an alternative IMS from
which we remove disclosure tone. By eliminating “disclosure tone” from the score we remove most of
the increasing effect produced by the additional explanations related to the inclusion of larger
adjustments to non-GAAP figures. Our results, using this alternative IMS are consistent with findings in
Table 5.
Our findings also reveal that Change_ROA, CONSENSUS, INST_owner and INSIDER_owner
are statistically significant determinants of the decision to disclose non-GAAP earnings figures in the
press releases we analyze. The first two variables have a positive impact on this decision, which is
consistent with the results found for US firms by Marques (2006). On the other hand, INST_owner and
INSIDER_owner have a negative impact of the decision to disclose non-GAAP earnings, as these are
monitoring entities. This is consistent with the results found for US firms by Jennings and Marques
(2009). In order to assess the validity of our first stage we test the null hypothesis that the endogenous

24
regressor is unidentified. Results (in the last line of Table 4) indicate that our model does include
variables which are determinants of NG_reporting (p-value<0.001) and NG_adjustments (p-
value=0.038).
Before testing our second hypothesis we analyze, as a stepping stone, whether the European
markets believe that the alternative earnings measures voluntary disclosed by managers are a more
appropriate measure of earnings than GAAP figures. This has been established in the US markets, but
has never been tested for European markets. To do this, we run two regressions, whose results are
reported in columns (1) and (2) of Table 6. As expected, the first regression shows a positive and
statistically significant reaction to GAAP_surprise. The second regression reveals a positive and
statistically significant market reaction to the manager adjustments to GAAP earnings. In line with the
US findings, adjustments seem to have information content which is valued by investors. A test of
difference of coefficients reveals that the estimated coefficient of GAAP_surprise is significantly higher
than the coefficient of NG_adjustment (p-value=0.004). This evidence suggests that either (a) not all of
the adjustments made by managers are considered appropriate by investors (i.e., investors believe some
of the items managers made adjustments for to be recurring), or (b) there are situations where non-
GAAP figures are not seen as informative.
Next, we test our second hypothesis, which states (in the null form) that market participants’
reaction to non-GAAP earnings is not affected when impression management is used in the same
earnings announcement. We start by investigating the market response to impression management in
isolation and find no significant effect - column (3) of Table 6.11 The results of estimating equation (2)
11 We acknowledge that Davis et al. (2011) find a significant market reaction to positive tone in press releases. However, our results cannot be compared directly to those in Davis et al. (2011) for a number of reasons: (i) we consider several impression management techniques while they only measure disclosure tone, (ii) we use the absolute value of our impression

25
are present in column (4) of Table 6. We are especially interested in the coefficient of
IMS*NG_adjustment, as this reflects the market reaction to the combined presence of non-GAAP
disclosures and impression management. The coefficient is negative and statistically significant (t-
statistic = -2.16), which is consistent with the idea that managers combine the two disclosure practices
with the intention of misleading market participants.12 As a response, markets react negatively. It is
important to note that the estimated coefficient of NG_adjustment is still positive and statistically
significant (t-statistic = 2.43). Thus, when no impression management is present (i.e., when the positive
and negative aspects presented by managers in the press releases balance out) the overall market
reaction to the adjustments is still positive. To assess the economic significance of the results we
analyze the sensitivity of the firm’s market returns to the NG adjustments for different levels of
impression management. This sensitivity is given by ∂CAR / ∂NG_adjustment = β2 + β4IMS. For the
bottom 25% IMS (which is 0.032 as shown in Table 4) the sensitivity of the firm’s abnormal returns to
non-GAAP adjustments is 0.077 (0.095 – 0.553 x 0.032). Consequently, a one standard deviation
increase in the non-GAAP adjustments made by managers (which is 0.105 as shown in Table 4) results
in an increase in market returns of 0.008 (0.105 x 0.077). For the top 75% IMS (0.127) the sensitivity of
the firm’s abnormal returns to non-GAAP adjustments is 0.025 (0.095 – 0.553 x 0.127). An increase of
one standard deviation in non-GAAP adjustments leads to positive market reaction of only 0.003 (0.105
x 0.025) which is approximately 67% less than the reaction for the bottom 25% IMS. In summary, the
investor reaction to non-GAAP information included in earnings announcements varies with the level of
management score, while they use an unexpected value of positivism and (iii) our sample consists of European firms while they analyze press releases of US firms. 12 The models include time fixed effects, but to ensure that the negative market reaction is not concentrated on a specific year we instead include three-way interaction variables between IMS, NG_adjustment, and year indicators. The year interactions are not statistically significant in most cases and the empirical results do not change.

26
impression management used by managers in the same announcement. The market reaction to non-
GAAP adjustments is inversely affected by the level of impression management.
Finally, we test whether there is a market effect in the GAAP_suprise when impression
management is present. Results in column (5) of Table 6, indicate that the coefficient of the interaction
between IMS and GAAP_surprise, although positive, is not statistically significant. Thus, there is an
absence of an incremental market reaction to the GAAP earnings surprise when presented together with
impression management practices. For completeness, we estimate a comprehensive model including
both the GAAP and non-GAAP surprise and the two interactions effects. Results reported in the last
column of Table 6 are consistent with the findings discussed above.
6. Sensitivity analyses
Given the potential subjectivity of manually-constructed scores, we test the sensitivity of our
findings to alternative impression management measurements. We first create a more comprehensive
score adding qualitative aspects of the press releases to the score. This alternative measure, which
combines quantitative and qualitative information, is calculated in a similar way to that described in the
Appendix (Figure 3 and 4). The disclosure practices analyzed for qualitative information are: (1)
disclosure tone, (2) emphasis by a) location, b) repetition, c) reinforcement and (3) forward-looking
disclosure tone. These practices are similar to those included in our main score but focusing on
quantitative information. Untabulated results, which use this alternative score, are consistent with the
ones discussed above. In fact, the magnitude, sign and level of significance remain similar.
Second, we substitute the score by a dichotomous variable coded as one when the level
impression management is high. We perform two alternative divisions, as we split the sample into three

27
or five impression management groups before eliminating the middle group to better separate the high
and low firms. This procedure results in fewer observation to run the empirical tests but the empirical
results remain unchanged.
Third, we construct an abnormal measure of impression management in the spirit Davis et al.
(2011). We use the annual change in IMS to build a firm-adjusted score, and the change between the
firm’s IMS and the industry median IMS to obtain an industry-adjusted score. For the firm-adjusted
score the results are statistically weaker but still in line with our conclusion. In the case of industry-
adjusted score the results are robust.
7. Summary and conclusions
In this study we examine the links between managers’ use of non-GAAP disclosures and
impression management techniques in earnings announcements press releases. We first investigate
whether non-GAAP disclosure and impression management are complementary mechanisms in
voluntarily corporate communications, or instead if they substitute each other. We next assess the capital
market reaction to the disclosure of non-GAAP information that is supplemented with impression
management techniques.
Our sample consists of the largest European firms. Given that there is no regulation on non-
GAAP earnings disclosures in Europe, the potential for misleading investors in higher in Europe than in
the US (where the Securities and Exchange Commission issued Regulation G in 2003). Thus, it is
important to understand market reactions to these disclosures in a market where several institutional
differences still prevail.
Our results indicate that (1) managers combine the two disclosure mechanisms when reporting

28
earnings figures in a way consistent with opportunistic disclosure, and (2) market participants
successfully identify and associate the management disclosure strategy with self-serving behavior and
penalize these practices. Additionally, we identify a positive market reaction to the adjustments made by
managers when calculating their non-GAAP earnings measures, in Europe. This indicates that European
investors see the usefulness of these measures, something that had been shown in the US.
The findings of this study should be of interest to market participants in their assessment of the
informational value of managers’ disclosures. Our evidence is also important for regulatory bodies. As
investors seem to identify potentially misleading disclosure practices investigated in this study when
facing investment decisions, our research raises the question whether regulators need to discipline the
use of impression management and non-GAAP information in corporate communications.

29
Appendix 1: Measuring Impression Management
We illustrate these practices using a particular case of a company included in our sample. We perform manual content analysis which allows a detailed scrutiny of the press release in search of potentially misleading disclosure practices. Our analysis involves the study of three consecutive years (2003 to 2005). To illustrate the practices analyzed in this study we have selected one of the companies: Ahold company. The illustration focuses on the press release for 2003. We code manually the five potentially misleading disclosure practices investigated in the current study. Each press release is assigned two levels of emphasis (Most- and Next-most emphasized sections) and the quantitative information is coded for each section separately. For the purposes of this study we focus on the first two sections of the press release (most and next most-emphasized sections).
Ahold Reports Improved Results for 2003
Most emphasized
section 11629 words
19 April 2004
08:38
Business Wire
English
(c) 2004 Business Wire. All Rights Reserved.
ZAANDAM, The Netherlands - (BUSINESS WIRE) - April 19, 2004 -
Highlights of 2003
-- Net loss Euro 1 millionNUM+ IS
(2002: net loss of Euro 1.2 billionBench+
)
-- Operating income Euro 718 millionNUM+ IS
(2002: operating income Euro 239 millionBench+
)
-- Net sales Euro 56.1 billionNUM-
, a decrease of 10.6%Bench-
compared to 2002, but an increase of
2.7%Bench+
excluding foreign currency translation impact
-- Net loss under US GAAP Euro 747 millionNUM+
(2002: net loss Euro 4.3 billionBench+
)
-- Improved balance sheet: equity increased to Euro 4.9 billionNUM+
(2002: Euro 2.6 billionBench+
).
Net debt reduced to Euro 7.5 billionNUM+
(2002: Euro 12.3 billionBench+
)
-- Net cash before financing activities generated Euro 1.5 billionNUM+
(2002: net cash outflow
Euro 107 millionBench+
)
Next most emphasised
section
Ahold today published its 2003 results. "We are pleased to announce that we have clearly
improved results in 2003, an extremely challenging year," said Hannu Ryopponen, Chief
Financial Officer, commenting on the results. "A very turbulent period for the company was
marked by the events announced in February 2003, as well as a tough trading environment in
our key markets." Anders Moberg, CEO commented: "Months of ongoing effort resulted in a
number of achievements, specifically defining a new strategy and creating the financial platform
to move forward. At the end of last year we indicated that 2003 in many respects had been a
lost year, but today's announcement also shows that Ahold is on track with its 'Road to
Recovery' program."
...........
Least emphasised section
Key: NUM+/-=positive/negative amount, Bench+/-= positive/negative performance
comparisons, IS= figure included in the Income Statement.

30
Among the figures identified in the press release of Ahold two of them are selected from the profit and loss account. We calculate the selectivity level for these two amounts (Operating income and net income) marked with an arrow in the income statement (see Figure 1). First, figures are ranked from higher (1) to lower (6) in absolute value. Then, following the schema in Figure 2, the two figures are categorised as high selectivity (operating profit) and medium selectivity (net income).
Figure 1: Income statement 2003Ahold company
UAH 2010
(1)
(2)
(6)
(5)
(4)
(3)
Figure 2: Measuring selectivity: Assigning categories
No. amounts Ranking
1
2 }
High selectivity
3
4 }
Medium selectivity
5
6 }
Low selectivity
The impression management score is calculated following the method to measure and the method to calculate the score included in Figures 3 and 4.

31
Disclosure tone: This is operationalized by coding positive and negative amounts. Amounts are categorized into positive or negative by reference to prior year results (as reported in the actual press release). Emphasis by location: Emphasis by Repetition: Repetition occurs when the same amount is mentioned more than once in the press release. (repeated amounts are not included/counted in the positive amounts). Performance comparison: When the current year amount is accompanied by a benchmark/prior year amount showing increase/decrease in the current year amount. FL disclosure tone: based on current expectations and beliefs. It involves anticipating a future event. Selectivity: Refers to figures selected from the profit and loss account to be included in the press release. The level of selectivity is coded as high, medium or low depending on whether the figure included is the highest, medium or lowest possible (See figure 2).
Figure 3. Method to measure impression management (management positiveness and optimism) Technique Object of technique Measure (1) Disclosure tone Quantitative amounts Number of quantitative positive and negative amounts (2) Emphasis (a)Location/positioning/presentation of
amounts Most-, Next-most emphasized section
(b) Repetition of Quantitative amounts Number of positive and negative repetitions of amounts
(3) Performance comparisons
Quantitative amounts Benchmark, Prior year amount, Both
(4) FL disclosures tone Quantitative amounts Number of positive and negative FL amounts (5) Selectivity Quantitative amounts High, Medium and Low level of selectivity
Figure 4: Calculating impression management score (IMS)
Measure
Positive amount
Negative amounts
� Number of quantitative disclosures 6 1
� Impression management score (IMS) Positive
score Negative
score
(1) Disclosure of quantitative performance monetary and non-monetary amounts 6x1.0 1x1.0 (2)(a) Emphasis – Location: - Most 0.0 0.0 - Next-most 6 x 0.5 1x0.5 (2)(b) Emphasis – Repetition 0.0 0.0 (3) Performance comparisons 7x0.5 1x0.5 (4) FL disclosure tone 0.00 0.00 (5) Selectivity - highest/medium/lowest category of amounts from which selection can be made 1x1.0 1x0.5 Total impression management score 13.5 2.5 �IMS calculation 13.5Positive score –2.5 Negative score = 12Net positive score/141 Total number of words in sections coded = + 0.085
Although in this illustration we focus on the press release of Ahold for 2003 our analysis involves the study of three consecutive years (2003 to 2005). Ahold has a net loss of 1 million euro in 2003 (2002: net loss of 1.2 billion euro). In 2004 the company increases losses to 436 million euro and in 2005 goes down to 20 million euro losses. Despite this overall bad performance, the press releases for 2003, 2004 and 2005 for Ahold has a positive impression management score (IMS) as measured in this study. This reflects an overall positive tone of the quantitative information included in its press release. The IMS for Ahold is 0.08 for 2003, 0.00 for 2004 and 0.05 for 2005. This means that the IMS for Ahold press release is high in 2003 (IMS median=0.07), neutral in 2004 and medium in 2005.

32
References
Abrahamson, E., Park, C. 1994. 'Concealment of negative organizational outcomes: an Agency Theory perspective'. Academy of Management Journal, 37(5): 1302-1334.
Adelberg, A. H. 1979. 'Narrative disclosures contained in financial reports: means of communication or manipulation?'. Accounting and Business Research, 9(35): 179-189.
Aerts, W. 2005. 'Picking up the pieces: impression management in the retrospective attributional framing of accounting outcomes'. Accounting, Organizations and Society, 30(6): 493-517.
Aerts, W., Cormier, D. 2009. 'Media legitimacy and corporate environmental communication'. Accounting, Organizations and Society, 34(1): 1-27.
Aerts, W., Cheng, P. 2010. 'Causal disclosures on earnings and earnings management in an IPO setting'. Journal of Accounting and Public Policy. Forthcoming.
Aerts, W., Cheng, P. 2011. 'Causal disclosures on earnings and earnings management in an IPO setting'. Journal of Accounting and Public Policy, 30: 431-459.
Anderson, N. H., Hubert, S. 1963. 'Effects of concomitant verbal recall on order effects in personality impression formation'. Journal of Verbal Learning and Verbal Behavior, 2: 379-391.
Anderson, N. H. 1965. 'Primacy effects in personality impression formation using a generalized order effect paradigm'. Journal of Personality and Social Psychology, 2(1): 1-9.
Andersson, P., Hellman, N. 2007. 'Does Pro Forma reporting bias analyst forecasts?'. European Accounting Review, 16(2): 277-298.
Baginski, S. P., Hassell, J. M., Hillison, W. A. 2000. 'Voluntary causal disclosures: Tendencies and capital market reaction'. Review of Quantitative Accounting and Finance, 15(4): 371-389.
Barton, J., Mercer, M. 2005. 'To blame or not to blame: Analysts reactions to explanations of poor management performance'. Journal of Accounting and Economics, 39(3): 509-533.
Beattie, V. A., Jones, M. J. 1997. 'A comparative study of the use of financial graphs in the corporate annual reports of major U.S. and U.K. companies'. Journal of International Financial Management and Accounting, 8(1): 33-68.
Beattie, V. A., Jones, M. J. 2001. 'A six-country comparison of the use of graphs in annual reports'. The International Journal of Accounting, 36: 159-222.
Bernstein, M., Garst, R. E. 1982. Headlines are Deadlines: Columbia University Press, New York.
Bhattacharya, N., Black, E. L., Christensen, T. E., Larson, C. R. 2003. 'Assessing the relative informativeness and permanence of pro forma earnings and GAAP operating earnings'. Journal of Accounting and Economics, 36(1-3): 285-319.
Bhattacharya, N., Black, E., Christensen, T., Mergenthaler, R. 2004. ' Empirical evidence on recent trends in pro forma reporting. '. Accounting Horizons, 18: 27-43.
Bhattacharya, N., Black, E. L., Christensen, T., Mergenthaler, R. D. 2007. 'Who trades on pro forma earnings information?'. The Accounting Review, 82(3): 581-619.
Bowen, R. M., Davis, A. K., Matsumoto, D. A. 2005. 'Emphasis on pro forma versus GAAP earnings in quarterly press releases: determinants, SEC intervention and market reactions'. The Accounting Review, 80(4): 1011-1038.
Bradshaw, M. T., Sloan, R. G. 2002. 'GAAP versus the street: an empirical assessment of two alternative definitions of earnings'. Journal of Accounting Research, 40(1): 41-66.
Bray, C. 2001. 'SEC looking at pro forma earnings with "purpose in mind"'. Dow Jones Newswires (June18).
Brennan, N. M., Guillamon-Saorin, E., Pierce, A. 2009. 'Impression management: Developing and illustrating a scheme of analysis for narrative disclosures - A methodological note'. Accounting, Auditing & Accountability Journal, 22(5): 789-832.
Clatworthy, M., Jones, M. J. 2001. 'The effect of thematic structure on the variability of annual report readability'. Accounting, Auditing & Accountability Journal, 14(3): 311-326.
Clatworthy, M., Jones, M. J. 2003. 'Financial reporting of good news and bad news: evidence from accounting narratives'.

33
Accounting and Business Research, 33(3): 171-185.
Conway, M. 2007. 'The subjective precision of computers: a methodological comparison with human coding in content analysis'. Journalism and Mass Communication Quarterly, 83(1): 186-200.
Core, J. E. 2001. 'A review of the empirical disclosure literature: discussion'. Journal of Accounting and Economics, 31: 441-456.
Courtis, J. K. 2004. 'Corporate report obfuscation: Artefact or phenomenon?'. British Accounting Review, 36(3): 291-312.
Curtis, A., McVay, S., Whipple, B. 2011. The use of non-GAAP earnings information in the presence of transitory gains. Working paper.
Davis, A. K., Piger, J. M., Sedor, L. M. 2011. 'Beyond the numbers: Measuring the information content of earnings press release language'. Contemporary Accounting Research. Forthcoming.
Demers, E., Vega, C. 2008. Soft Information in Earnings Announcements: News or Noise?. Working paper.
Derby, M. S. 2001. 'Investors getting more data, but is it the right data?'. Dow Jones Newswires (September 3).
Dhaliwal, D., Lee, K., Fargher, N. 1991. 'The association between unexpected earnings and abnormal security returns in the presence of financial leverage'. Contemporary Accounting Research, 8: 20-41.
Fama, E. F., French, K. R. 1993. 'Common riskfFactors in the returns on stocks and bonds'. Journal of Financial Economics 33(1): 3-56.
Files, R., Swanson, E. P., Tse, S. 2009. 'Stealth disclosure of accounting restatements'. The Accounting Review, 84(5): 1495-1520.
Francis, J., Nanda, D., Olsson, P. 2008. 'Voluntary disclosure, earnings quality and cost of capital'. Journal of Accounting Research, 46(1): 53-99.
Freeman, R. N. 1987. 'The association between accounting earnings and security returns for large and small firms'. Journal of Accounting and Economics, 9: 195-228.
Garcia Osma, B., Guillamon-Saorin, E. 2011. 'Corporate governance and impression management in annual press releases'. Accounting Organizations and Society, 36(4/5): 187-208.
Godfrey, J., Mather, P., Ramsay, A. 2003. 'Earnings and impression management in financial reports: the case of CEO changes.'. Abacus, 39(1): 95-123.
Gordon, E. A., Henry, E., Peytcheva, M., Sun, L. 2010. Discretionary disclosure and market reaction to restatements: Available at http://ssrn.com/abstract=930540.
Guillamon-Saorin, E., Garcia Osma, B. 2010. Self-serving financial reporting communication: A study of the association between earnings management and impression management. Working paper: Universidad Carlos III de Madrid & Universidad Autonoma.
Guillamon-Saorin, E., Garcia Osma, B., Aerts, W. 2011. Self-serving financial reporting communication: A study of the association between earnings management and impression management. Working paper: Universidad Carlos III de Madrid & Universidad Autonoma.
Guillamon-Saorin, E., Garcia Osma, B., Jones, M. J. 2011. 'Opportunistic disclosure in press release headlines'. Accounting and Business Research forthcoming.
Hayn, C. 1995. 'The information content of losses'. Journal of Accounting and Economics, 20(2): 125-153.
Heflin, F., Hsu, C. 2008. 'The impact of the SEC’s regulation of non-GAAP disclosures'. Journal of Accounting and Economics, 46(2-3): 349-365.
Henry, E. 2008. 'Are investors influenced by how earnings press releases are written?'. Journal of Business Communication, 45(4): 363-407.
Henry, E., Leone, A. J. 2009. Measuring qualitative information in capital markets research, Working paper: University of Miami.
Hitz, J.-M. 2010. 'Press Release Disclosure of ‘Pro Forma’ Earnings Metrics by Large German Corporations – Empirical

34
Evidence and Regulatory Recommendations'. Accounting in Europe, 7(1).
Hobson, J. L., Mayew, W. J., Venkatachalam, M. 2011. 'Analyzing speech to detect financial misreporting'. Journal of Accounting Research forthcoming.
Hooghiemstra, R. 2000. 'Corporate communication and impression management'. Journal of Business Ethics, 27(1/2): 55-68.
Hussainey, K., Schleicher, T., Walker, M. 2003. 'Undertaking large-scale disclosure studies when AIMR-FAF ratings are not available: the case of prices leading earnings'. Accounting and Business Research, 33(4): 275-294.
Jennings, R., Marques, A. 2009. 'The Joint Effects of Corporate Governance and Regulation on the Disclosure of Manager-Adjusted Non-GAAP Earnings in the US'. Journal of Business Finance and Accounting, 38(3-4): 364-394.
Krische, S. D. 2005. 'Investors' evaluations of strategic prior-period benchmark disclosures in earnings announcements'. The Accounting Review, 80(1): 243-268.
Lang, M., Lundholm, R. 1993. 'Cross-sectional determinants of analyst ratings of corporate disclosures'. Journal of Accounting Research, 31(2): 246-271.
Lang, M., Lundholm, R. 2000. 'Voluntary disclosure and equity offerings: reducing information asymmetry or hyping the stock?'. Contemporary Accounting Research, 17(4): 623-662.
Larcker, D., Zakolyukina, A. 2010. Detecting deceptive discussions in conference calls. Working paper. Available at: http://papers.ssrn.com/sol3/papers.cfm?abstract_id=1572705.
Lewellen, W. G., Park, T., Ro, B. T. 1996. 'Self-serving behavior in managers' discretionary information disclosure decisions'. Journal of Accounting and Economics, 21(2): 227-251.
Li, F. 2008. 'Annual report readability, current earnings, and earnings persistence'. Journal of Accounting and Economics, 45(2-3): 221-247.
Linderman, A. 2001. Computer content analysis and manual coding techniques: a comparative analysis, Theory, Method and Practice in Computer Content Analysis: 97-109: West, M.D. (editors), Ablex, Westport CT.
Lougee, B. A., Marquardt, C. A. 2004. 'Earnings informativeness and strategic disclosure: an empirical examination of 'pro forma' net income'. The Accounting Review, 79(3): 769-795.
Loughran, T., McDonald, B. 2011. 'When is a liability not a liability? Textual analysis, dictionaries, and 10-Ks'. Journal of Finance, 66(1): 35-65.
Marques, A. 2006. 'SEC interventions and the frequency and usefulness of non-GAAP financial measures'. Review of Accounting Studies, 11: 549-574.
Matsumoto, D., Pronk, M., Roelofsen, E. 2006. Do analysts mitigate optimism by management? Working paper. University of Washington, Tilburg University and RSM/Erasmus University.
Price, V., Tewksbury, D., Powers, E. 1997. 'Switching trains of thought: The impact of news frames on readers' cognitive responses'. Communication Research, 24(5): 481-506.
Rogers, J. L., Van Buskirk, A., Zechman, S. L. C. 2011. 'Disclosure Tone and Shareholder Litigation'. The Accounting Review, 86(6).
Schleicher, T., Walker, M. 2010. 'Bias in the tone of forward-looking narratives'. Accounting and Business Research, 40(4): 1-20.
Schlenker, B. R. 1980. Impression Management: The Self-concept, Social Identity, and Interpersonal Relations. Monterrey, CA: Brooks-Cole, 1980.
Schlenker, B. R. 2003. Self-presentation. In M. Leary& J. Tangeney (Eds.), Handbook of self and identity: 492-518. New York: Guilford Press.
Schrand, C., Walther, B. R. 2000. 'Strategic benchmarks in earnings announcements: The selective disclosure of prior-period earnings components'. The Accounting Review, 75(2): 151-177.
Subramanian, R., Insley, R. G., Blackwell, R. D. 1993. 'Performance and readability: a comparison of annual reports of profitable and unprofitable corporations'. The Journal of Business Communication, 30(1): 49-61.

35
Verrecchia, R. E. 2001. 'Essays on disclosure'. Journal of Accounting and Economics, 32: 97-180.
Yuthas, K., Rogers, R., Dillard, J. F. 2002. 'Communicative action and corporate annual reports'. Journal of Business Ethics, 41(1/2): 141-157.
Zillmann, D., Chen, L., Knobloch, S., Callison, C. 2004. 'Effects of lead framing on selective exposure to internet news reports'. Communications Research, 31(1): 58-81.

36
Table 1 – Sample selection
Firm years
Financial Times 500 largest European firms, 2003-2005 1500
Financial and utility firms (552)
948
Unavailable press releases (144)
804
Missing financial and forecast data (87) Final sample
717 representing 267 firms
This table shows the sample selection details between 2003 and 2005. Numbers in parentheses are observations that are dropped.

37
Table 2 – Descriptive evidence on disclosure practices
Country N % firms disclosing non-GAAP earnings
IM mean score
Austria 6 0.0 0.056
Belgium 15 46.7 0.115
Denmark 18 22.2 0.046
Finland 18 50.0 0.042
France 133 39.8 0.090
Germany 86 23.3 0.072
Greece 6 83.3 0.118
Hungary 5 0.0 0.054
Ireland 12 66.7 0.104
Italy 18 11.1 0.053
Luxembourg 2 0.0 0.024
Netherlands 42 47.6 0.059
Norway 11 54.5 0.115
Portugal 5 0.0 0.047
Russia 13 23.1 0.070
Spain 34 29.4 0.088
Sweden 50 52.0 0.072
Switzerland 53 28.3 0.079
Turkey 1 0.0 0.145
United Kingdom 189 81.0 0.099
Total 717 47.6 0.083
This table presents the number of observations (first column), non-GAAP disclosure frequencies (second column) and impression management (IM) mean scores (third column) by country.

38
Table 3 – Univariate tests on means of impression management
Non-GAAP reporting is an indicator variable coded as one when a non-GAAP earnings figure is reported in the annual earnings announcement press release, and zero otherwise.
Mean Median Test of difference in means (p-value)
Not reporting non-GAAP 0.079 0.068
Reporting non-GAAP 0.088 0.077 0.015
Non-GAAP > GAAP EPS 0.085 0.071 Non-GAAP < GAAP EPS 0.090 0.076 0.632

39
Table 4 - Descriptive statistics and correlation matrix
Panel A: Summary statistics for non-discrete variables
Mean 1Q Median 3Q St.dev.
CAR 0.004 -0.021 -0.001 0.026 0.048
GAAP_surprise 0.005 -0.003 0.004 0.031 0.169
NG_adjustment 0.023 0.000 0.000 0.020 0.105
IMS 0.086 0.032 0.072 0.127 0.082
SIZE 8.731 8.044 8.612 9.264 1.058
LEV 0.254 0.146 0.247 0.342 0.152
Change_ROA 0.023 0.000 0.012 0.033 0.076
BM 0.473 0.256 0.413 0.655 0.292
N = 717
Panel B: Pearson correlations
CAR GAAP_ surprise
NG_ adjustment
IMS SIZE LEV Change_
ROA BM LOSS
CAR 1
GAAP_surprise 0.1043* 1
NG_adjustment 0.0293 -0.0731 1
IMS 0.0430 0.0591 0.0353 1
SIZE -0.1027* 0.1194* 0.0484 -0.0555 1
LEV -0.0475 -0.0115 -0.0280 -0.0715 -0.0257 1
Change_ ROA 0.0699 0.0502 -0.0494 0.0320 -0.0593 -0.0088 1
BM -0.0408 0.0677 0.0090 -0.1221* -0.1380* 0.0949* -0.1119* 1
LOSS -0.0314 -0.2680* 0.0523 -0.1098* -0.0543 0.0187 0.0382 0.1457* 1
Panel C: Variable means by impression management group
Panel A presents summary statistics for variables used in the regression analysis, Panel B presents Pearson correlation coefficients (* symbol indicates significance at the 5% level), and Panel C presents mean values of variables by impression management groups. CAR is the three-day cumulative market-adjusted abnormal return. GAAP_surprise is the GAAP earnings surprise calculated as the difference between GAAP earnings per share and analysts’ consensus forecast of earnings per share, scaled by share price at the end of the previous year. NG_adjustment is the adjustment made by managers to the GAAP earnings to obtain the non-GAAP earnings figures, and it is calculated as the difference between non-GAAP and GAAP earnings scaled by share price at the end of the previous year. IMS is the impression management score (see appendix 1). SIZE is the log of the market capitalization at the beginning of the year. LEV is the ratio of total debt to total assets. Change_ROA is the change of net income before extraordinary items scaled by lagged total assets. BM is book-to-market. LOSS is an indicator variable taking the value of one if the firm reports a loss and zero otherwise.
GAAP EPS
GAAP_ surprise
NG_ adjustment
3-day CAR
Low IMS 1.355 -0.013 0.015 0.000
Medium IMS 4.944 0.010 0.021 0.006
Hight IMS 2.516 0.015 0.034 0.006
P-value of test [high - low] 0.618 0.135 0.045 0.096
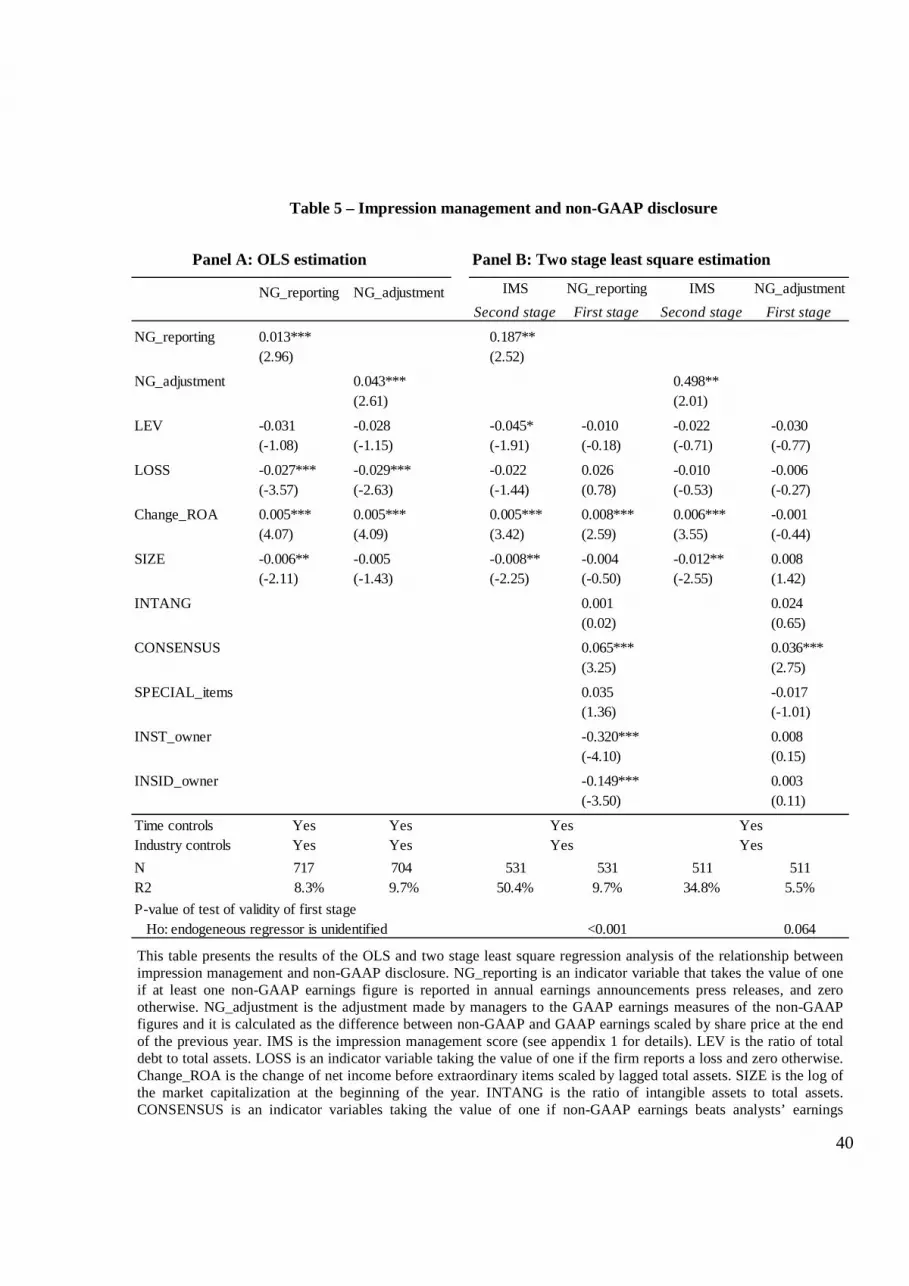
40
Table 5 – Impression management and non-GAAP disclosure
Panel A: OLS estimation Panel B: Two stage least square estimation
NG_reporting NG_adjustment IMS NG_reporting IMS NG_adjustment
Second stage First stage Second stage First stage
NG_reporting 0.013*** 0.187**(2.96) (2.52)
NG_adjustment 0.043*** 0.498**(2.61) (2.01)
LEV -0.031 -0.028 -0.045* -0.010 -0.022 -0.030(-1.08) (-1.15) (-1.91) (-0.18) (-0.71) (-0.77)
LOSS -0.027*** -0.029*** -0.022 0.026 -0.010 -0.006(-3.57) (-2.63) (-1.44) (0.78) (-0.53) (-0.27)
Change_ROA 0.005*** 0.005*** 0.005*** 0.008*** 0.006*** -0.001(4.07) (4.09) (3.42) (2.59) (3.55) (-0.44)
SIZE -0.006** -0.005 -0.008** -0.004 -0.012** 0.008(-2.11) (-1.43) (-2.25) (-0.50) (-2.55) (1.42)
INTANG 0.001 0.024(0.02) (0.65)
CONSENSUS 0.065*** 0.036***(3.25) (2.75)
SPECIAL_items 0.035 -0.017(1.36) (-1.01)
INST_owner -0.320*** 0.008(-4.10) (0.15)
INSID_owner -0.149*** 0.003(-3.50) (0.11)
Time controls Yes YesIndustry controls Yes Yes
N 717 704 531 531 511 511R2 8.3% 9.7% 50.4% 9.7% 34.8% 5.5%
P-value of test of validity of first stage Ho: endogeneous regressor is unidentified <0.001 0.064
YesYes
YesYes
This table presents the results of the OLS and two stage least square regression analysis of the relationship between impression management and non-GAAP disclosure. NG_reporting is an indicator variable that takes the value of one if at least one non-GAAP earnings figure is reported in annual earnings announcements press releases, and zero otherwise. NG_adjustment is the adjustment made by managers to the GAAP earnings measures of the non-GAAP figures and it is calculated as the difference between non-GAAP and GAAP earnings scaled by share price at the end of the previous year. IMS is the impression management score (see appendix 1 for details). LEV is the ratio of total debt to total assets. LOSS is an indicator variable taking the value of one if the firm reports a loss and zero otherwise. Change_ROA is the change of net income before extraordinary items scaled by lagged total assets. SIZE is the log of the market capitalization at the beginning of the year. INTANG is the ratio of intangible assets to total assets. CONSENSUS is an indicator variables taking the value of one if non-GAAP earnings beats analysts’ earnings

41
forecast when GAAP earnings falls short of that. SPECIAL_items is an indicator variable taking the value of one if the firm reports special or extraordinary items or discontinuing operations, and zero otherwise. INST_owner is the percentage of shares outstanding owned by institutional investors. INSID_owner is the percentage of shares outstanding owned by insider investors. The symbol *, **, *** indicate significant coefficients at the 0.10, 0.05 and 0.01 levels, respectively (two-tailed). Parameter estimates reported first followed by robust t-statistics corrected for firm-level clustering in parentheses.

42
Table 6 – Analysis of market reaction to non-GAAP disclosures and impression management
CAR3d CAR3d CAR3d CAR3d CAR3d CAR3d(1) (2) (3) (4) (5) (6)
GAAP_surprise 0.033*** 0.034*** 0.033*** 0.031** 0.032**(2.83) (2.94) (3.16) (2.26) (2.55)
NG_adjustment 0.024** 0.095** 0.094***(2.78) (2.43) (4.02)
IMS 0.009 0.012 0.002 0.009(0.39) (0.56) (0.08) (0.31)
IMS*NG_adjustment -0.553** -0.525***(-2.16) (-3.50)
IMS*GAAP_surprise 0.152 0.131(0.43) (0.37)
SIZE -0.006*** -0.006*** -0.005*** -0.006*** -0.006*** -0 .006***(-3.34) (-4.28) (-2.71) (-3.29) (-3.25) (-3.84)
LEV -0.024* -0.025** -0.025* -0.024* -0.024* -0.024**(-1.77) (-2.11) (-1.81) (-1.75) (-1.77) (-2.11)
Change_ROA 0.030 0.032 0.037 0.033 0.029 0.032(0.44) (0.37) (0.53) (0.47) (0.41) (0.36)
BM -0.010 -0.010 -0.006 -0.010 -0.010 -0.010(-1.39) (-1.47) (-0.87) (-1.41) (-1.41) (-1.64)
LOSS -0.003 -0.004 -0.009 -0.004 -0.003 -0.004(-0.28) (-0.24) (-0.82) (-0.37) (-0.23) (-0.25)
Constant 0.106*** 0.106*** 0.094*** 0.107*** 0.106*** 0.108***(3.93) (6.38) (3.27) (3.89) (3.83) (6.67)
Time controls Yes Yes Yes Yes Yes YesIndustry controls Yes Yes Yes Yes Yes YesCountry controls Yes Yes Yes Yes Yes YesN 717 717 717 717 717 717R2 8.2% 8.5% 7.1% 9.0% 8.3% 9.0%
This table presents the regression results of the market reaction to non-GAAP disclosures and impression management. CAR is the cumulative three-day market-adjusted abnormal return. GAAP_surprise is the GAAP earnings surprise calculated as the difference between GAAP earnings per share and analysts’ consensus forecast of earnings per share, scaled by share price at the end of the previous year. NG_adjustment is the adjustment made by managers to the GAAP earnings measures of the non-GAAP figures and it is calculated as the difference between non-GAAP and GAAP earnings scaled by share price at the end of the previous year. IMS is the impression management score (see appendix 1 for details). SIZE is the log of the market capitalization at the beginning of the year. LEV is the ratio of total debt to total assets. Change_ROA is the change of net income before extraordinary items scaled by lagged total assets. BM is book-to-market. LOSS is an indicator variable taking the value of one if the firm reports a loss and zero otherwise. The symbol *, **, *** indicate significant coefficients at the 0.10, 0.05 and 0.01 levels, respectively (two-tailed). Parameter estimates reported first followed by robust t-statistics corrected for firm-level clustering in parentheses.


