Embed Size (px)
Citation preview

_____________________________________________________________________________________________________ *Corresponding author: E-mail: [email protected];
Journal of Experimental Agriculture International 17(4): 1-23, 2017; Article no.JEAI.33915 Previously known as American Journal of Experimental Agriculture ISSN: 2231-0606
Impact of Fungicide Application on Taro Leaf Blight Disease in Three Regions of Cameroon
E. B. Manju 1, C. N. Fokunang 2,3*, G. A. Mbong 1,2, T. S. Tima4, C. Suh5,
E. A. Tembe-Fokunang 3 and R. Hanna 6
1Department of Plant Biology, Faculty of Sciences, The University of Dschang, Cameroon. 2Department of Biological Sciences, Faculty of Sciences, The University of Bamenda, Cameroon. 3Department of Pharmaco-Toxicology and Pharmacokinetics, Faculty of Medicine and Biomedical
Sciences, University of Yaoundé 1, Cameroon. 4Department of Crop Protection, Divisional Delegation of Agriculture, Mezam, Cameroon.
5Institute of Agronomic Research (IRAD), Bambui, Cameroon. 6Department of Plant Health, International Institute of Tropical Agricultural (IITA), Cameroon.
Authors’ contributions
This work was carried out in collaboration between all authors. Author EBM designed the study, wrote
the protocol, conducted field and laboratory work and wrote the first draft of the manuscript. Authors GAM and CNF reviewed the experimental design and drafts of the research proposal and supervised the study. Authors TST and RH managed the analyses of the study and field coordination. Author CS
performed the statistical analysis. All authors read and approved the final manuscript.
Article Information
DOI: 10.9734/JEAI/2017/33915 Editor(s):
(1) Mariusz Cycon, Department and Institute of Microbiology and Virology, School of Pharmacy, Division of Laboratoty Medicine, Medical University of Silesia, Poland.
(2) Funda Eryilmaz Acikgoz, Department of Plant and Animal Production, Vocational College of Technical Sciences, Namik Kemal University, Turkey.
(3) Daniele De Wrachien, State University of Milan, Italy. Reviewers:
(1) Amodu Umoru Simeon, Dominic Ahmadu Bello University, Nigeria. (2) W. James Grichar, Texas A & M AgriLife Research, USA.
(3) Joseph Adomako, CSIR-Crops Research Institute, Ghana. Complete Peer review History: http://www.sciencedomain.org/review-history/20899
Received 3 rd May 2017 Accepted 29 th July 2017
Published 9 th September 2017
ABSTRACT
The study was conducted in the research field sites of the Institute of Agricultural Research (IRAD), Bambui, North West Region, (IRAD), Ekona South West Region and the International Institute of Tropical Agriculture (IITA) Nkolbisson, Yaoundé, Center Region of Cameroon. Four cultivars of taro (Dark green petiole with small leaves (L1), Red petiole with small leaves (L2), Light green petiole with large leaves (L3) and Light green petiole with small leaves(L4)) were planted in four seasons,
Original Research Article
Manju et al.; JEAI, 17(4): 1-23, 2017; Article no.JEAI.33915
2
for two years, in the months of March and July 2015, March and July 2016 in all the research farms. Ninety corms of the each cultivar were treated before planting with fungiforce at 0.33% concentration while others were not treated. Fungiforce is a contact and systemic fungicide containing high levels of copper oxide (600 grams) and mild levels of metalaxyl (120 grams), various concentrations of 0.4%, 0.33%, 0.27%, at the onset of the first symptom of leaf blight on the leaves using knapsack sprayer of 15 litres at two weeks interval, while the control experiment consisted of unsprayed taro leaves. Data for the disease incidence of taro leaf blight was recorded from the onset of disease in fields and continued at two weeks interval for 6 weeks. The results of planting taro in four seasons in three experimental field sites revealed that there was a decrease in disease incidence in fields sprayed with fungiforce than in the control field. Plots sprayed with fungicide at different concentrations showed no variation on the 4 cultivars in the different field sites. The disease incidence ranged from 10% to 100% in the 4 seasons, at the three experimental field sites. The variation in disease incidence in the three planting sites is an indication of possible genotypes by environment (GXE) interaction that may have significant influence on the taro leaf blight resistance potential.
Keywords: Taro leaf blight; fungiforce; disease incidence; cultivars. 1. INTRODUCTION Taro [Colocasia esculenta (L.)Schott] is an edible aroid which belongs to the Araceae family. The family consists of approximately 110 genera and 200 species, which are mainly distributed in the tropical and subtropical regions of the world [1]. Taro is grown as an important economic food and vegetable crop in West Africa, particularly in Ghana, Nigeria and Cameroon [2]. The crop is rich in nutrients such as carbohydrates, vitamins, proteins, sugars and minerals [3,4]. All parts of the plant including corm, cormels, rhizome, stalk, leaves and flowers are edible and contain abundant starch [2,5]. Besides its nutritional value, taro is used as medicinal plant to treattooth ache and it is also an anti-cancer drug [6,7]. Taro cultivation is high in Nigeria, China, Cameroon and Ghana, where the annual rainfall exceeds 2000 mm and it grows best under hot and wet conditions, with temperatures above 21°C. Taro is cultivated in all regions of Cameroon [8].
Taro leaf blight, caused by Phytophthora colocasiae Raciborski is the most destructive disease responsible for heavy yield losses (25 to 50%) of taro in many countries [9]. It reduces corm yield of up to 50%, and leaf yield of up to 95% in susceptible genotypes [10,11].
Phytophthora colocasiae causes corms to rot both in the field and in storage, and this can lead to heavy storage loss [12]. Taro leaf blight was found for the first time in 2010 in all taro plantations in Cameroon [13] and is actually the main constraint to taro production in the country. Taro leaf blight also caused between 50-100% yield losses of taro in most of the crop growing
regions of Cameroon [14]. This led to a reduction in food, house hold income, increase poverty and some farmers abandoning their farms and switching to cultivate other crops. Taro leaf blight disease (TLBD) is characterized by large necrotic zonates spot on the leaves often coalescing to destroy large areas of leaf [15]. The margin of the lesion is marked by a white powdery band of sporangia and numerous droplets of orange or reddish exudates [16]. Phytophthora colocasiae originated from South East Asia [13,15] and is widely distributed throughout the tropical regions of the world [17,16].
The disease progresses quickly and with great severity. The highly infectious nature of the disease may exclude the use of a single control pest management practice. Integrated pest management practice appears to be the most efficient means for the effective control and management of TLBD. Taro growers need to use several complementary practices to reduce the incidence and severity of taro leaf blight to acceptable levels [5,16]. Cultural control method involving removal of all leaves with lesions would quickly lead to almost complete defoliation of the crop with consequent effects on yield. A major aspect of the breeding work is the screening of resistant lines using an appropriate method. Breeding is aimed at improving cultivar resistance in a wide range of environmental conditions for a long period [18,19]. There is also little information known on the use of fungicide and the development of biological control models in Cameroon. Due to the lack of adequate control strategies, fungicide application seems to be the fastest and effective method of control [20]. The aim of this study was therefore to assess the

Manju et al.; JEAI, 17(4): 1-23, 2017; Article no.JEAI.33915
3
impact of fungicide application on taro leaf blight in three research field sites located at three regions of Cameroon.
2. MATERIALS AND METHODS
2.1 Location and Experimental Sites This study was conducted on the research sites of the Institute of Agricultural Research (IRAD), Bambui, North West Region, (IRAD), Ekona South West Region and the International Institute of Tropical Agriculture (IITA) Nkolbisson, Yaoundé, Centre Region Cameroon. IRAD, Bambui is situated at 32°, 0627 ʹ N latitude, 0659ʹ E longitude and altitude 1262 m above sea level. Ekona is also located at latitude 32° 0537 ʹ N, longitude 0467ʹ E and altitude 411 m above sea level and IITA situated at latitude 32°86 ʹ N, longitude 270ʹ E and altitude 777 m above sea level.
2.2 Evaluation of Fungicide Application on Taro Leaf Blight
Corms from four cultivars of taro, Dark green petiole with small leaves (L1), Red petiole with small leaves (L2), Light green petiole with large leaves (L3) and Light green petiole with small leaves (L4), infected by P. Colocasiae were used for this experiment. These cultivars were grown at IITA Yaoundé, IRAD Bambui and IRAD Ekona research farms. The first year of planting was done in the months of March and July 2015, and the second year planting was done in March and July 2016 in all the research farms. Ninety corms of the each cultivar were treated before planting with fungiforce at 0.33% concentration. These corms were soaked for 30 minutes in fungiforce, air dried for 24 hours to kill fungi spores while 90 corms of each cultivar were not treated. The soil was plough to a depth of 50 cm and taro corms were planted by putting one corm per hole at 50 cm spacing between plants and ridges of 1 m apart. Each cultivar was replicated three times in a Randomized Complete Block Design (RCBD), with three plots per cultivar giving a total of 36 plots. Each plot consisted of three, 75 cm ridges, 5 m long and ten of each cultivar planted on it. Regular manual weeding of field plots was done at monthly interval after planting and mulching was done 5 weeks after planting (WAP). Disease incidence and severity was assessed using the middle plants on each ridge. The plants at the edge of the ridges were not evaluated because they were serving the role of pathogen invasion. Fungiforce applications at the various concentrations of 0.4%, 0.33%, 0.27%, (F1=
Fungiforce at 0.4% on treated cultivars, F1A = Fungiforce at 0.4% on non treated cultivars, F2 = Fungiforce at 0.33% on treated cultivars, F2A = Fungiforce at 0.33% on non treated cultivars, F3 = Fungiforce at 0.27% on treated cultivars, F3A = Fungiforce at 0.27% on non treated cultivars) was initiated at the onset of the first symptom of taro blight on the leaves using knapsack sprayer of 15 litres at two weeks interval. These application of fungiforce was done on 90 corms of each taro cultivar treated with fungiforce and also 90 corms of each cultivar not treated with fungiforce before planting. The control experiment consisted of 90 corms of each taro cultivars which was not treated with fungiforce and unsprayed. Data for disease incidence was recorded on the first day of spraying of the disease and this was done at two weeks interval for six weeks following the procedure adopted from Tarla [21]. 2.3 Determination of Disease Incidence of
P. colocasiae Percentage incidence was calculated using the standards adopted from Fokunang [20]
��������� =���� �� �������� ������
����� ���� �� ������× 100
2.4 Statistical Analysis Data collected for disease incidence for the two planting seasons, were subjected to analysis of Variance (ANOVA) using statistical software (J M P 8). Mean data were used to plot graphs for appropriate representation of the results. 3. RESULTS 3.1 Effect of Fungicide Application on
Disease Incidence during 2015 March Planting Season
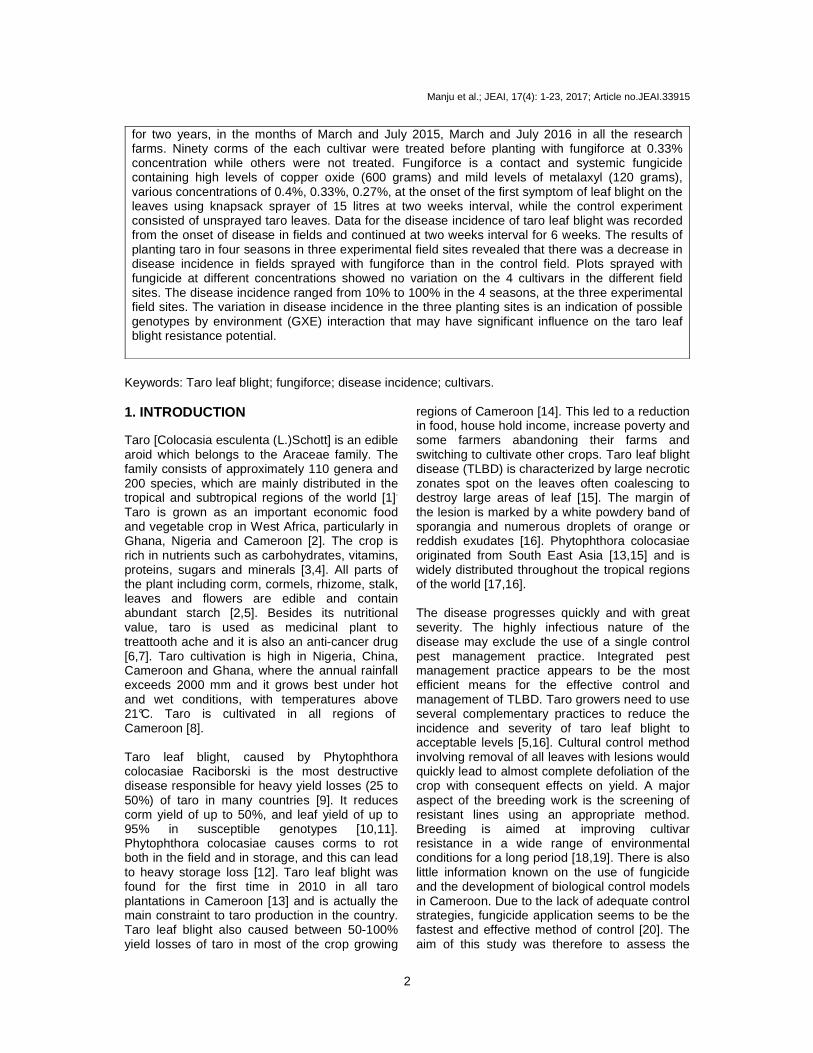
Lesions appeared on some of the cultivars planted in March season at 12 weeks after planting and 4 weeks after planting in July season in all experimental field sites except for the Yaoundé sites. Lesion had a distinctive water socked margins on newly invaded tissues bearing a white mass of sporangia and orange liquid droplets. This was observed at 2 weeks disease incidence as shown on Figs. 2 to 29. In all the experimental fields sprayed with fungiforce, lesions did not expand on leaves and stems of sprayed taro. Lesions dried off and
Manju et al.; JEAI, 17(4): 1-23, 2017; Article no.JEAI.33915
4
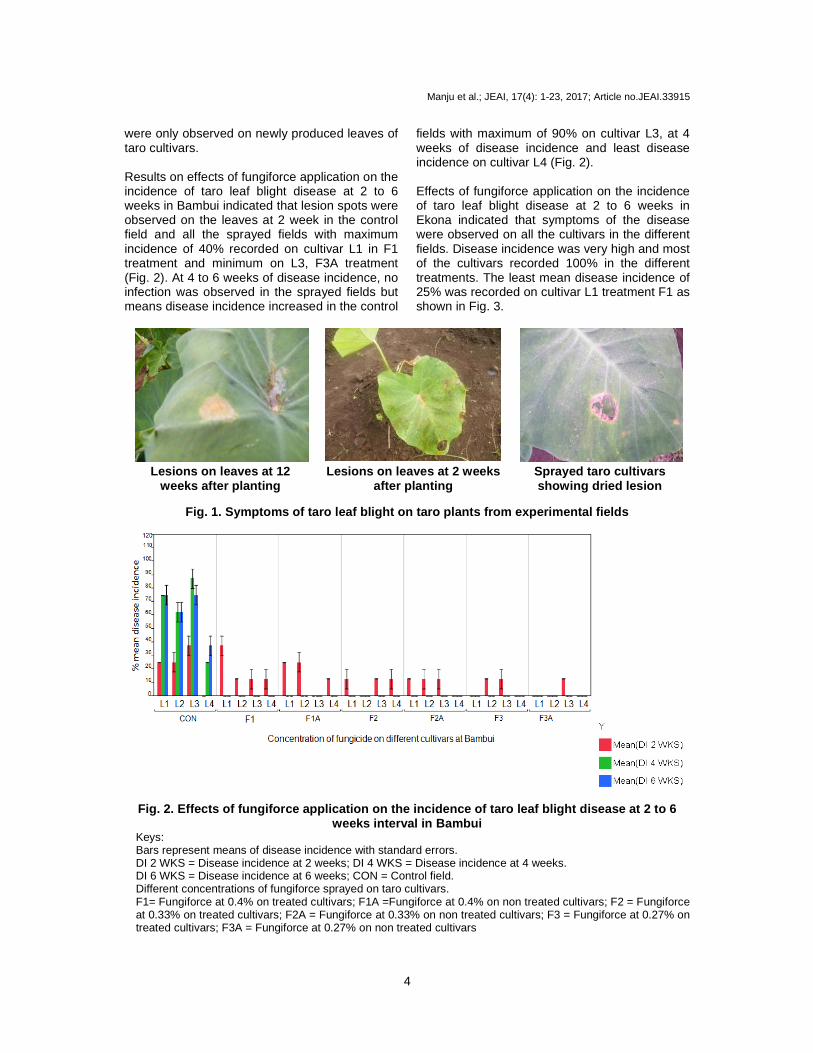
were only observed on newly produced leaves of taro cultivars. Results on effects of fungiforce application on the incidence of taro leaf blight disease at 2 to 6 weeks in Bambui indicated that lesion spots were observed on the leaves at 2 week in the control field and all the sprayed fields with maximum incidence of 40% recorded on cultivar L1 in F1 treatment and minimum on L3, F3A treatment (Fig. 2). At 4 to 6 weeks of disease incidence, no infection was observed in the sprayed fields but means disease incidence increased in the control
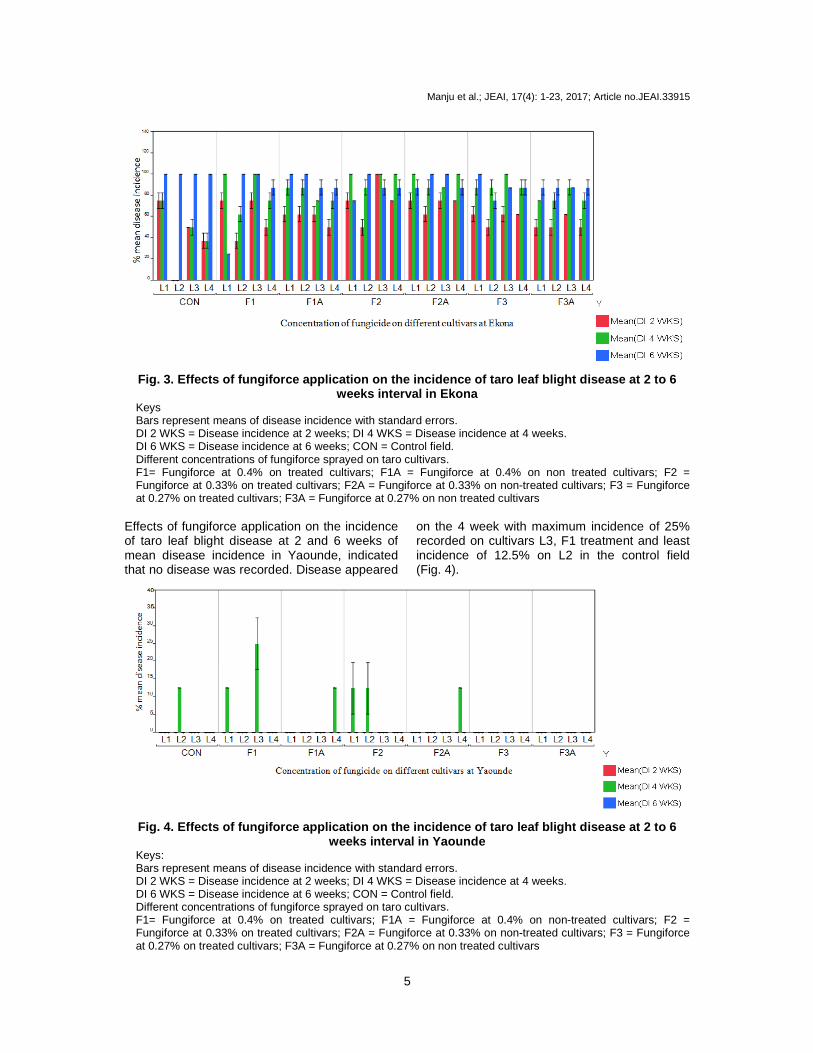
fields with maximum of 90% on cultivar L3, at 4 weeks of disease incidence and least disease incidence on cultivar L4 (Fig. 2). Effects of fungiforce application on the incidence of taro leaf blight disease at 2 to 6 weeks in Ekona indicated that symptoms of the disease were observed on all the cultivars in the different fields. Disease incidence was very high and most of the cultivars recorded 100% in the different treatments. The least mean disease incidence of 25% was recorded on cultivar L1 treatment F1 as shown in Fig. 3.
Lesions on leaves at 12
weeks after planting Lesions on leaves at 2 weeks
after planting Sprayed taro cultivars showing dried lesion
Fig. 1. Symptoms of taro leaf blight on taro plants from experimental fields
Fig. 2. Effects of fungiforce application on the in cidence of taro leaf blight disease at 2 to 6 weeks interval in Bambui
Keys: Bars represent means of disease incidence with standard errors. DI 2 WKS = Disease incidence at 2 weeks; DI 4 WKS = Disease incidence at 4 weeks. DI 6 WKS = Disease incidence at 6 weeks; CON = Control field. Different concentrations of fungiforce sprayed on taro cultivars. F1= Fungiforce at 0.4% on treated cultivars; F1A =Fungiforce at 0.4% on non treated cultivars; F2 = Fungiforce at 0.33% on treated cultivars; F2A = Fungiforce at 0.33% on non treated cultivars; F3 = Fungiforce at 0.27% on treated cultivars; F3A = Fungiforce at 0.27% on non treated cultivars
Manju et al.; JEAI, 17(4): 1-23, 2017; Article no.JEAI.33915
5
Fig. 3. Effects of fungiforce application on the in cidence of taro leaf blight disease at 2 to 6 weeks interval in Ekona
Keys Bars represent means of disease incidence with standard errors. DI 2 WKS = Disease incidence at 2 weeks; DI 4 WKS = Disease incidence at 4 weeks. DI 6 WKS = Disease incidence at 6 weeks; CON = Control field. Different concentrations of fungiforce sprayed on taro cultivars. F1= Fungiforce at 0.4% on treated cultivars; F1A = Fungiforce at 0.4% on non treated cultivars; F2 = Fungiforce at 0.33% on treated cultivars; F2A = Fungiforce at 0.33% on non-treated cultivars; F3 = Fungiforce at 0.27% on treated cultivars; F3A = Fungiforce at 0.27% on non treated cultivars
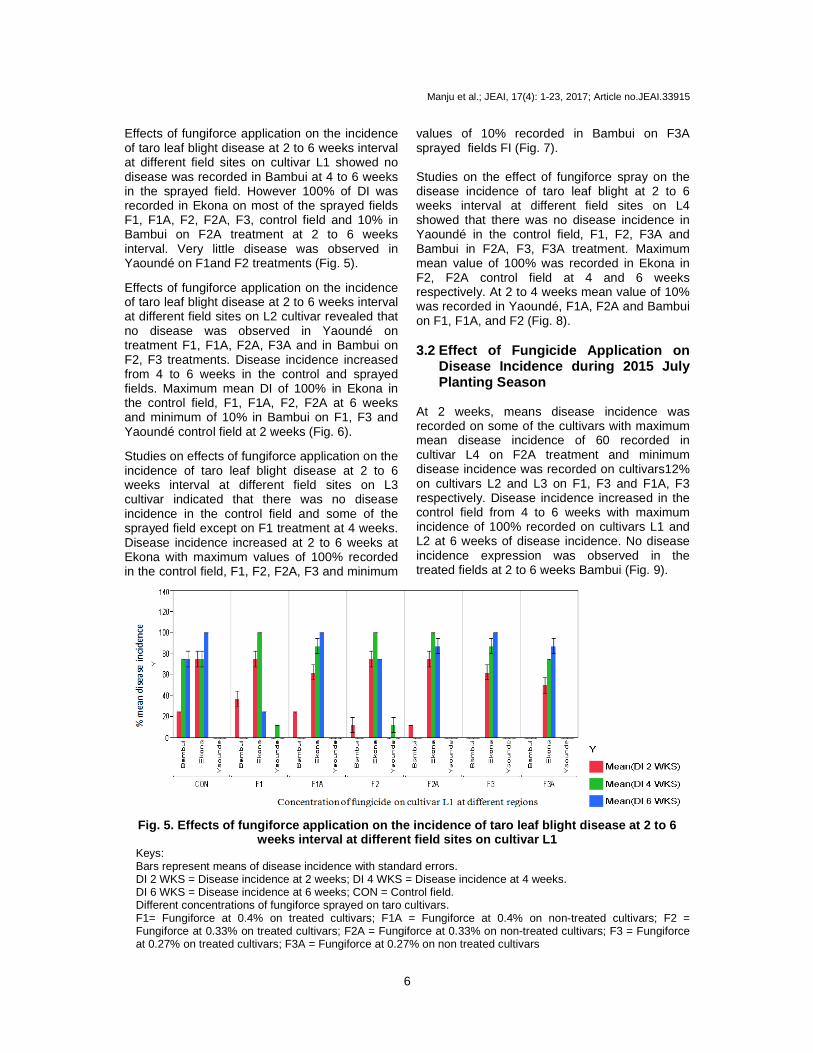
Effects of fungiforce application on the incidence of taro leaf blight disease at 2 and 6 weeks of mean disease incidence in Yaounde, indicated that no disease was recorded. Disease appeared
on the 4 week with maximum incidence of 25% recorded on cultivars L3, F1 treatment and least incidence of 12.5% on L2 in the control field (Fig. 4).
Fig. 4. Effects of fungiforce application on the in cidence of taro leaf blight disease at 2 to 6 weeks interval in Yaounde
Keys: Bars represent means of disease incidence with standard errors. DI 2 WKS = Disease incidence at 2 weeks; DI 4 WKS = Disease incidence at 4 weeks. DI 6 WKS = Disease incidence at 6 weeks; CON = Control field. Different concentrations of fungiforce sprayed on taro cultivars. F1= Fungiforce at 0.4% on treated cultivars; F1A = Fungiforce at 0.4% on non-treated cultivars; F2 = Fungiforce at 0.33% on treated cultivars; F2A = Fungiforce at 0.33% on non-treated cultivars; F3 = Fungiforce at 0.27% on treated cultivars; F3A = Fungiforce at 0.27% on non treated cultivars
Manju et al.; JEAI, 17(4): 1-23, 2017; Article no.JEAI.33915
6
Effects of fungiforce application on the incidence of taro leaf blight disease at 2 to 6 weeks interval at different field sites on cultivar L1 showed no disease was recorded in Bambui at 4 to 6 weeks in the sprayed field. However 100% of DI was recorded in Ekona on most of the sprayed fields F1, F1A, F2, F2A, F3, control field and 10% in Bambui on F2A treatment at 2 to 6 weeks interval. Very little disease was observed in Yaoundé on F1and F2 treatments (Fig. 5).
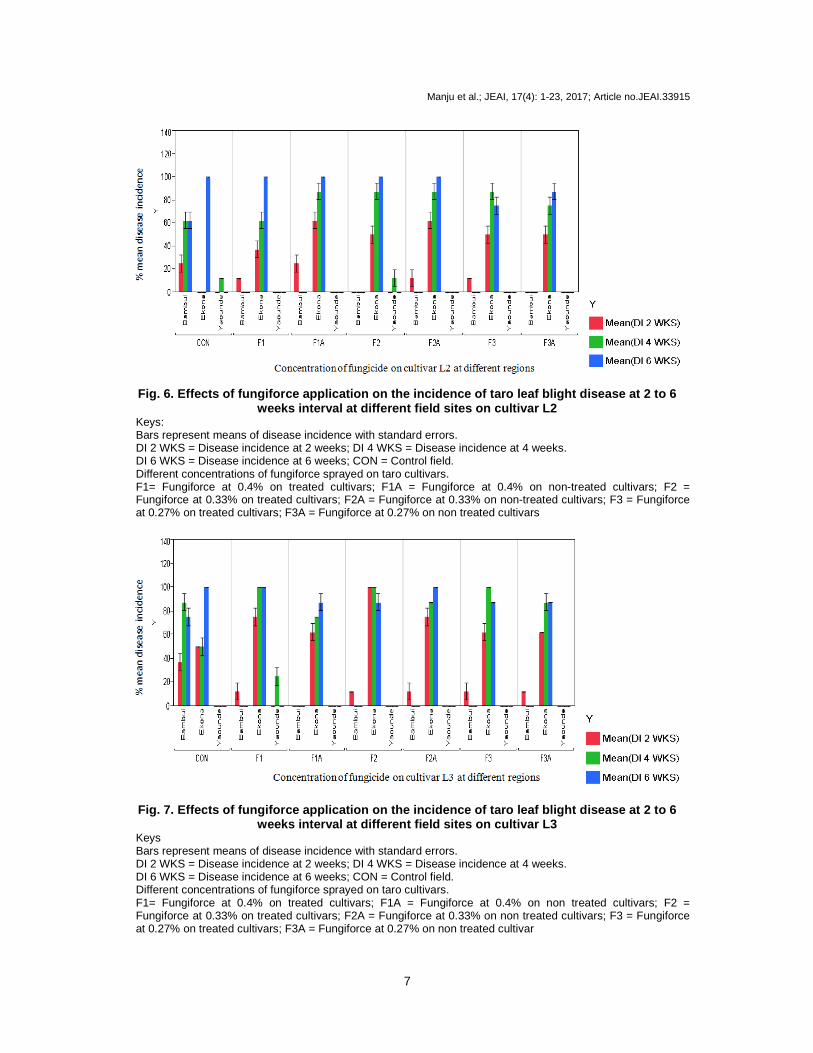
Effects of fungiforce application on the incidence of taro leaf blight disease at 2 to 6 weeks interval at different field sites on L2 cultivar revealed that no disease was observed in Yaoundé on treatment F1, F1A, F2A, F3A and in Bambui on F2, F3 treatments. Disease incidence increased from 4 to 6 weeks in the control and sprayed fields. Maximum mean DI of 100% in Ekona in the control field, F1, F1A, F2, F2A at 6 weeks and minimum of 10% in Bambui on F1, F3 and Yaoundé control field at 2 weeks (Fig. 6).
Studies on effects of fungiforce application on the incidence of taro leaf blight disease at 2 to 6 weeks interval at different field sites on L3 cultivar indicated that there was no disease incidence in the control field and some of the sprayed field except on F1 treatment at 4 weeks. Disease incidence increased at 2 to 6 weeks at Ekona with maximum values of 100% recorded in the control field, F1, F2, F2A, F3 and minimum
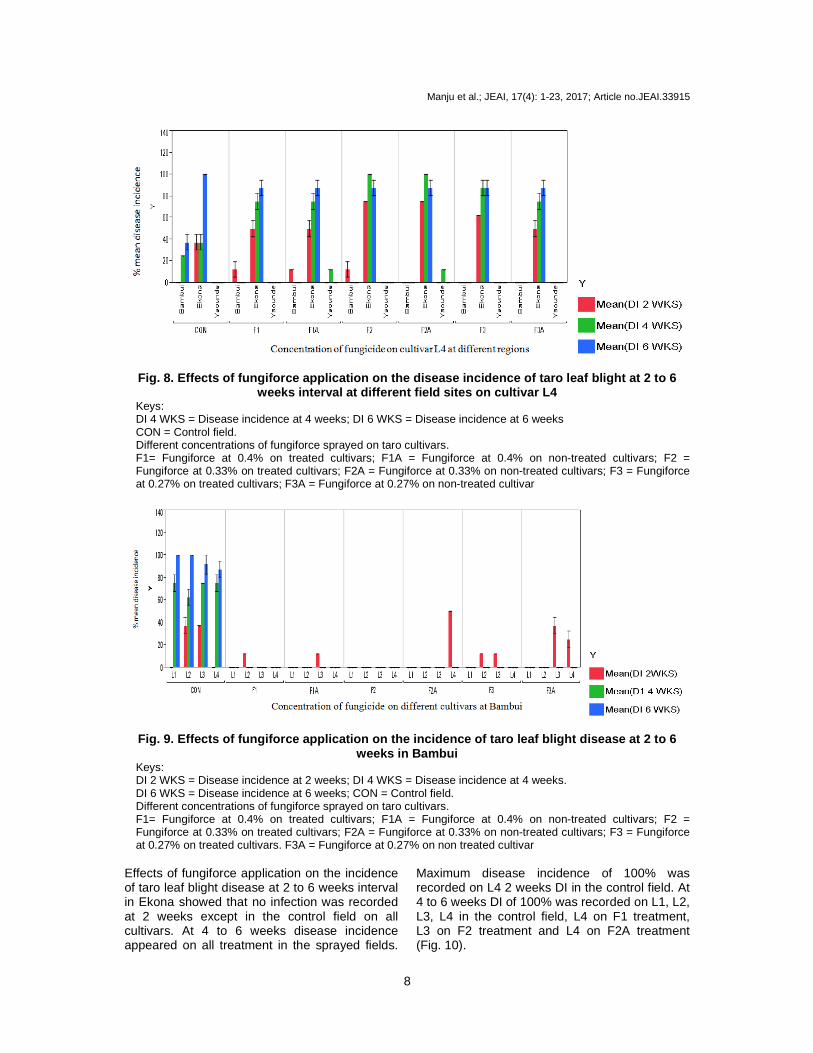
values of 10% recorded in Bambui on F3A sprayed fields FI (Fig. 7). Studies on the effect of fungiforce spray on the disease incidence of taro leaf blight at 2 to 6 weeks interval at different field sites on L4 showed that there was no disease incidence in Yaoundé in the control field, F1, F2, F3A and Bambui in F2A, F3, F3A treatment. Maximum mean value of 100% was recorded in Ekona in F2, F2A control field at 4 and 6 weeks respectively. At 2 to 4 weeks mean value of 10% was recorded in Yaoundé, F1A, F2A and Bambui on F1, F1A, and F2 (Fig. 8). 3.2 Effect of Fungicide Application on
Disease Incidence during 2015 July Planting Season
At 2 weeks, means disease incidence was recorded on some of the cultivars with maximum mean disease incidence of 60 recorded in cultivar L4 on F2A treatment and minimum disease incidence was recorded on cultivars12% on cultivars L2 and L3 on F1, F3 and F1A, F3 respectively. Disease incidence increased in the control field from 4 to 6 weeks with maximum incidence of 100% recorded on cultivars L1 and L2 at 6 weeks of disease incidence. No disease incidence expression was observed in the treated fields at 2 to 6 weeks Bambui (Fig. 9).
Fig. 5. Effects of fungiforce application on the in cidence of taro leaf blight disease at 2 to 6 weeks interval at different field sites on cultivar L1
Keys: Bars represent means of disease incidence with standard errors. DI 2 WKS = Disease incidence at 2 weeks; DI 4 WKS = Disease incidence at 4 weeks. DI 6 WKS = Disease incidence at 6 weeks; CON = Control field. Different concentrations of fungiforce sprayed on taro cultivars. F1= Fungiforce at 0.4% on treated cultivars; F1A = Fungiforce at 0.4% on non-treated cultivars; F2 = Fungiforce at 0.33% on treated cultivars; F2A = Fungiforce at 0.33% on non-treated cultivars; F3 = Fungiforce at 0.27% on treated cultivars; F3A = Fungiforce at 0.27% on non treated cultivars
Manju et al.; JEAI, 17(4): 1-23, 2017; Article no.JEAI.33915
7
Fig. 6. Effects of fungiforce application on the in cidence of taro leaf blight disease at 2 to 6 weeks interval at different field sites on cultivar L2
Keys: Bars represent means of disease incidence with standard errors. DI 2 WKS = Disease incidence at 2 weeks; DI 4 WKS = Disease incidence at 4 weeks. DI 6 WKS = Disease incidence at 6 weeks; CON = Control field. Different concentrations of fungiforce sprayed on taro cultivars. F1= Fungiforce at 0.4% on treated cultivars; F1A = Fungiforce at 0.4% on non-treated cultivars; F2 = Fungiforce at 0.33% on treated cultivars; F2A = Fungiforce at 0.33% on non-treated cultivars; F3 = Fungiforce at 0.27% on treated cultivars; F3A = Fungiforce at 0.27% on non treated cultivars
Fig. 7. Effects of fungiforce application on the in cidence of taro leaf blight disease at 2 to 6 weeks interval at different field sites on cultivar L3
Keys Bars represent means of disease incidence with standard errors. DI 2 WKS = Disease incidence at 2 weeks; DI 4 WKS = Disease incidence at 4 weeks. DI 6 WKS = Disease incidence at 6 weeks; CON = Control field. Different concentrations of fungiforce sprayed on taro cultivars. F1= Fungiforce at 0.4% on treated cultivars; F1A = Fungiforce at 0.4% on non treated cultivars; F2 = Fungiforce at 0.33% on treated cultivars; F2A = Fungiforce at 0.33% on non treated cultivars; F3 = Fungiforce at 0.27% on treated cultivars; F3A = Fungiforce at 0.27% on non treated cultivar
Manju et al.; JEAI, 17(4): 1-23, 2017; Article no.JEAI.33915
8
Fig. 8. Effects of fungiforce application on the di sease incidence of taro leaf blight at 2 to 6 weeks interval at different field sites on cultivar L4
Keys: DI 4 WKS = Disease incidence at 4 weeks; DI 6 WKS = Disease incidence at 6 weeks CON = Control field. Different concentrations of fungiforce sprayed on taro cultivars. F1= Fungiforce at 0.4% on treated cultivars; F1A = Fungiforce at 0.4% on non-treated cultivars; F2 = Fungiforce at 0.33% on treated cultivars; F2A = Fungiforce at 0.33% on non-treated cultivars; F3 = Fungiforce at 0.27% on treated cultivars; F3A = Fungiforce at 0.27% on non-treated cultivar
Fig. 9. Effects of fungiforce application on the in cidence of taro leaf blight disease at 2 to 6 weeks in Bambui
Keys: DI 2 WKS = Disease incidence at 2 weeks; DI 4 WKS = Disease incidence at 4 weeks. DI 6 WKS = Disease incidence at 6 weeks; CON = Control field. Different concentrations of fungiforce sprayed on taro cultivars. F1= Fungiforce at 0.4% on treated cultivars; F1A = Fungiforce at 0.4% on non-treated cultivars; F2 = Fungiforce at 0.33% on treated cultivars; F2A = Fungiforce at 0.33% on non-treated cultivars; F3 = Fungiforce at 0.27% on treated cultivars. F3A = Fungiforce at 0.27% on non treated cultivar
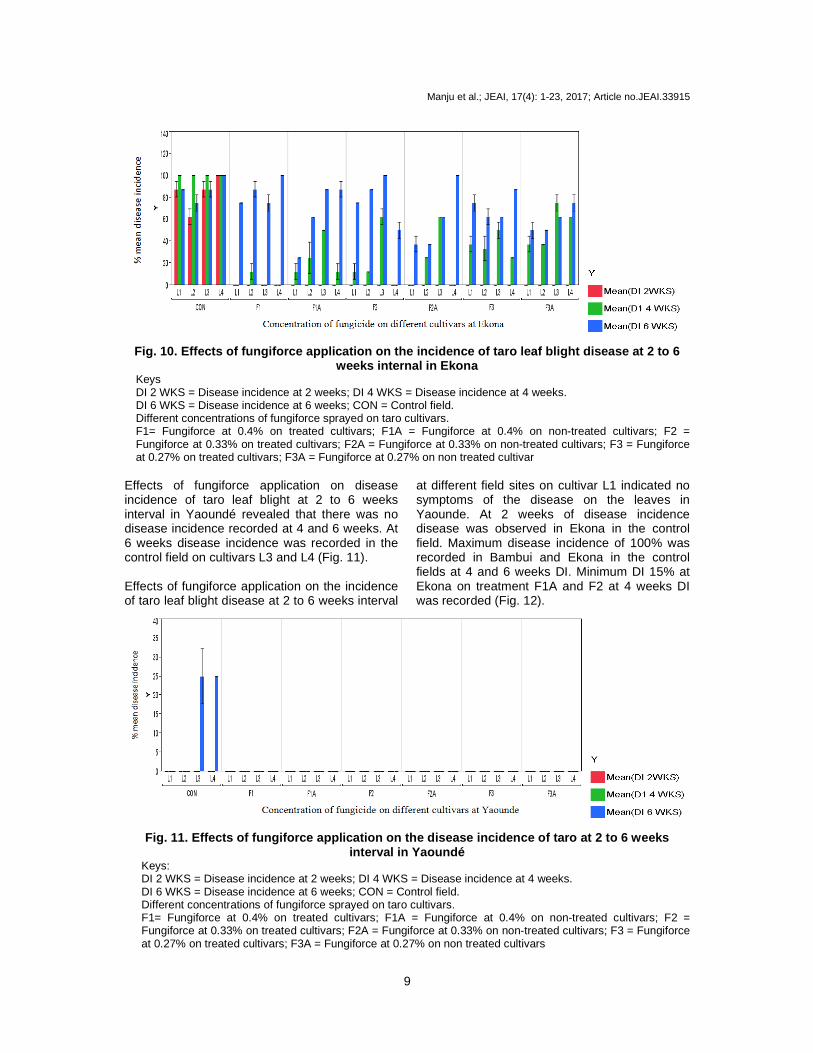
Effects of fungiforce application on the incidence of taro leaf blight disease at 2 to 6 weeks interval in Ekona showed that no infection was recorded at 2 weeks except in the control field on all cultivars. At 4 to 6 weeks disease incidence appeared on all treatment in the sprayed fields.
Maximum disease incidence of 100% was recorded on L4 2 weeks DI in the control field. At 4 to 6 weeks DI of 100% was recorded on L1, L2, L3, L4 in the control field, L4 on F1 treatment, L3 on F2 treatment and L4 on F2A treatment (Fig. 10).
Manju et al.; JEAI, 17(4): 1-23, 2017; Article no.JEAI.33915
9
Fig. 10. Effects of fungiforce application on the i ncidence of taro leaf blight disease at 2 to 6 weeks internal in Ekona
Keys DI 2 WKS = Disease incidence at 2 weeks; DI 4 WKS = Disease incidence at 4 weeks. DI 6 WKS = Disease incidence at 6 weeks; CON = Control field. Different concentrations of fungiforce sprayed on taro cultivars. F1= Fungiforce at 0.4% on treated cultivars; F1A = Fungiforce at 0.4% on non-treated cultivars; F2 = Fungiforce at 0.33% on treated cultivars; F2A = Fungiforce at 0.33% on non-treated cultivars; F3 = Fungiforce at 0.27% on treated cultivars; F3A = Fungiforce at 0.27% on non treated cultivar
Effects of fungiforce application on disease incidence of taro leaf blight at 2 to 6 weeks interval in Yaoundé revealed that there was no disease incidence recorded at 4 and 6 weeks. At 6 weeks disease incidence was recorded in the control field on cultivars L3 and L4 (Fig. 11). Effects of fungiforce application on the incidence of taro leaf blight disease at 2 to 6 weeks interval
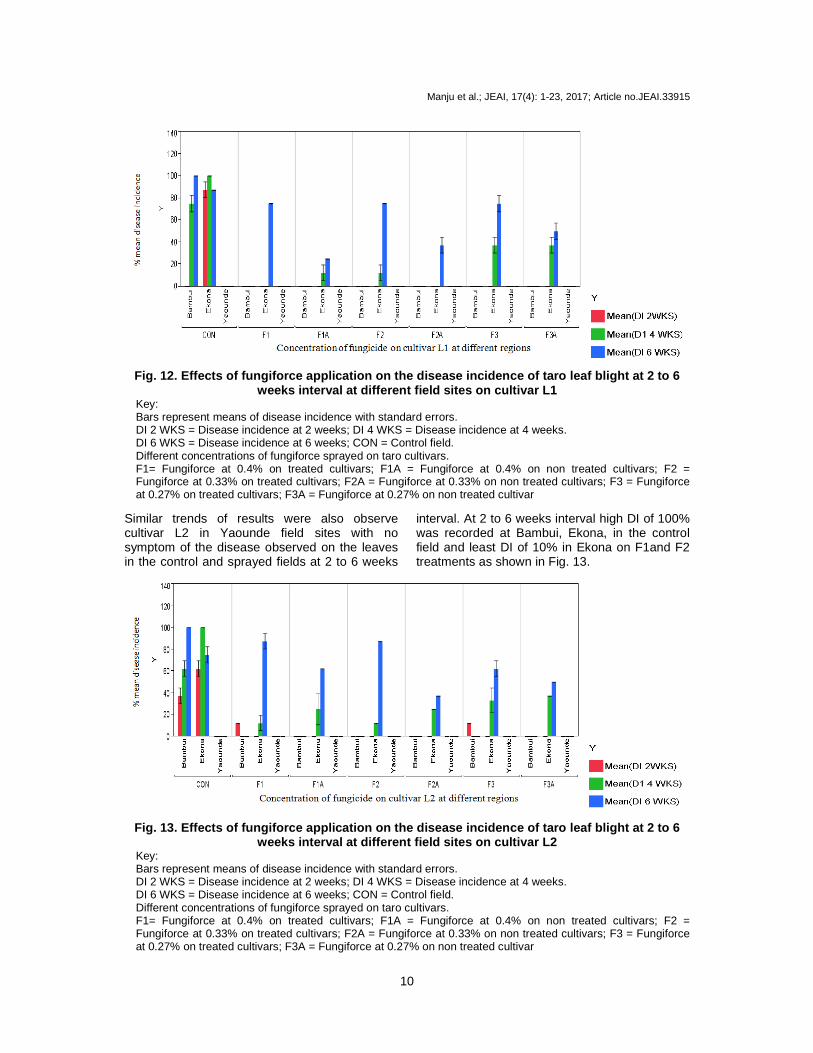
at different field sites on cultivar L1 indicated no symptoms of the disease on the leaves in Yaounde. At 2 weeks of disease incidence disease was observed in Ekona in the control field. Maximum disease incidence of 100% was recorded in Bambui and Ekona in the control fields at 4 and 6 weeks DI. Minimum DI 15% at Ekona on treatment F1A and F2 at 4 weeks DI was recorded (Fig. 12).
Fig. 11. Effects of fungiforce application on the d isease incidence of taro at 2 to 6 weeks interval in Yaoundé
Keys: DI 2 WKS = Disease incidence at 2 weeks; DI 4 WKS = Disease incidence at 4 weeks. DI 6 WKS = Disease incidence at 6 weeks; CON = Control field. Different concentrations of fungiforce sprayed on taro cultivars. F1= Fungiforce at 0.4% on treated cultivars; F1A = Fungiforce at 0.4% on non-treated cultivars; F2 = Fungiforce at 0.33% on treated cultivars; F2A = Fungiforce at 0.33% on non-treated cultivars; F3 = Fungiforce at 0.27% on treated cultivars; F3A = Fungiforce at 0.27% on non treated cultivars
Manju et al.; JEAI, 17(4): 1-23, 2017; Article no.JEAI.33915
10
Fig. 12. Effects of fungiforce application on the d isease incidence of taro leaf blight at 2 to 6 weeks interval at different field sites on cultivar L1
Key: Bars represent means of disease incidence with standard errors. DI 2 WKS = Disease incidence at 2 weeks; DI 4 WKS = Disease incidence at 4 weeks. DI 6 WKS = Disease incidence at 6 weeks; CON = Control field. Different concentrations of fungiforce sprayed on taro cultivars. F1= Fungiforce at 0.4% on treated cultivars; F1A = Fungiforce at 0.4% on non treated cultivars; F2 = Fungiforce at 0.33% on treated cultivars; F2A = Fungiforce at 0.33% on non treated cultivars; F3 = Fungiforce at 0.27% on treated cultivars; F3A = Fungiforce at 0.27% on non treated cultivar
Similar trends of results were also observe cultivar L2 in Yaounde field sites with no symptom of the disease observed on the leaves in the control and sprayed fields at 2 to 6 weeks
interval. At 2 to 6 weeks interval high DI of 100% was recorded at Bambui, Ekona, in the control field and least DI of 10% in Ekona on F1and F2 treatments as shown in Fig. 13.
Fig. 13. Effects of fungiforce application on the d isease incidence of taro leaf blight at 2 to 6 weeks interval at different field sites on cultivar L2
Key: Bars represent means of disease incidence with standard errors. DI 2 WKS = Disease incidence at 2 weeks; DI 4 WKS = Disease incidence at 4 weeks. DI 6 WKS = Disease incidence at 6 weeks; CON = Control field. Different concentrations of fungiforce sprayed on taro cultivars. F1= Fungiforce at 0.4% on treated cultivars; F1A = Fungiforce at 0.4% on non treated cultivars; F2 = Fungiforce at 0.33% on treated cultivars; F2A = Fungiforce at 0.33% on non treated cultivars; F3 = Fungiforce at 0.27% on treated cultivars; F3A = Fungiforce at 0.27% on non treated cultivar
Manju et al.; JEAI, 17(4): 1-23, 2017; Article no.JEAI.33915
11
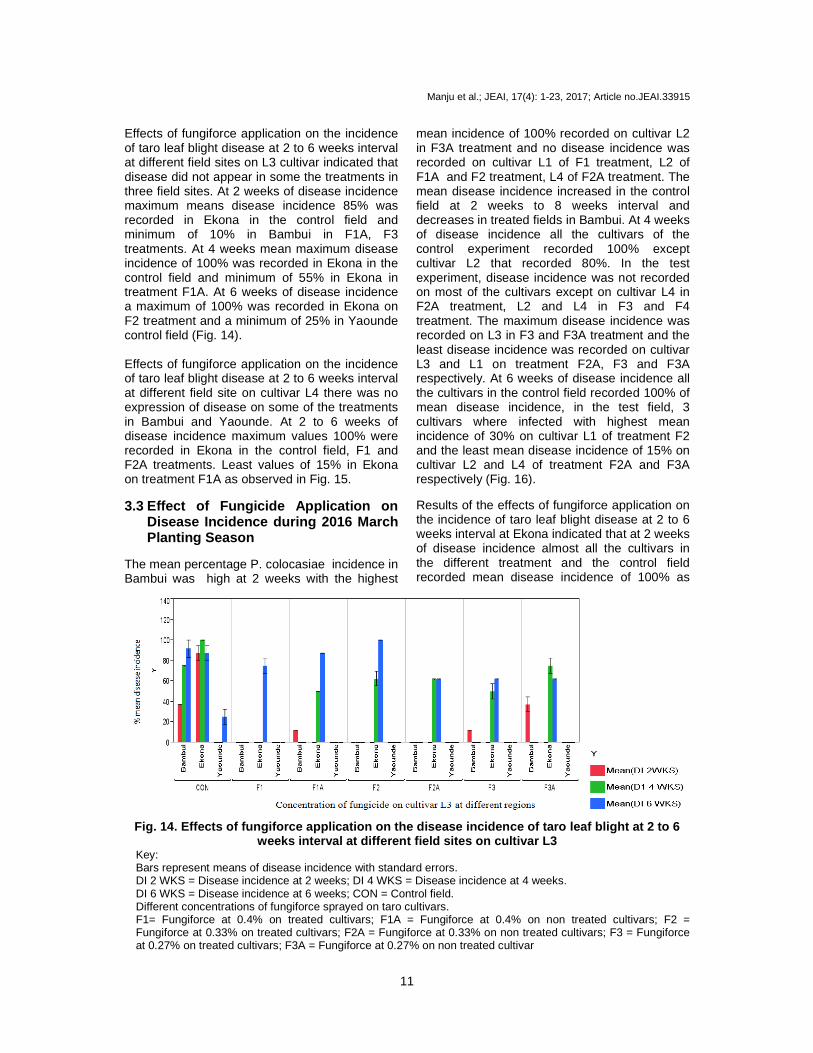
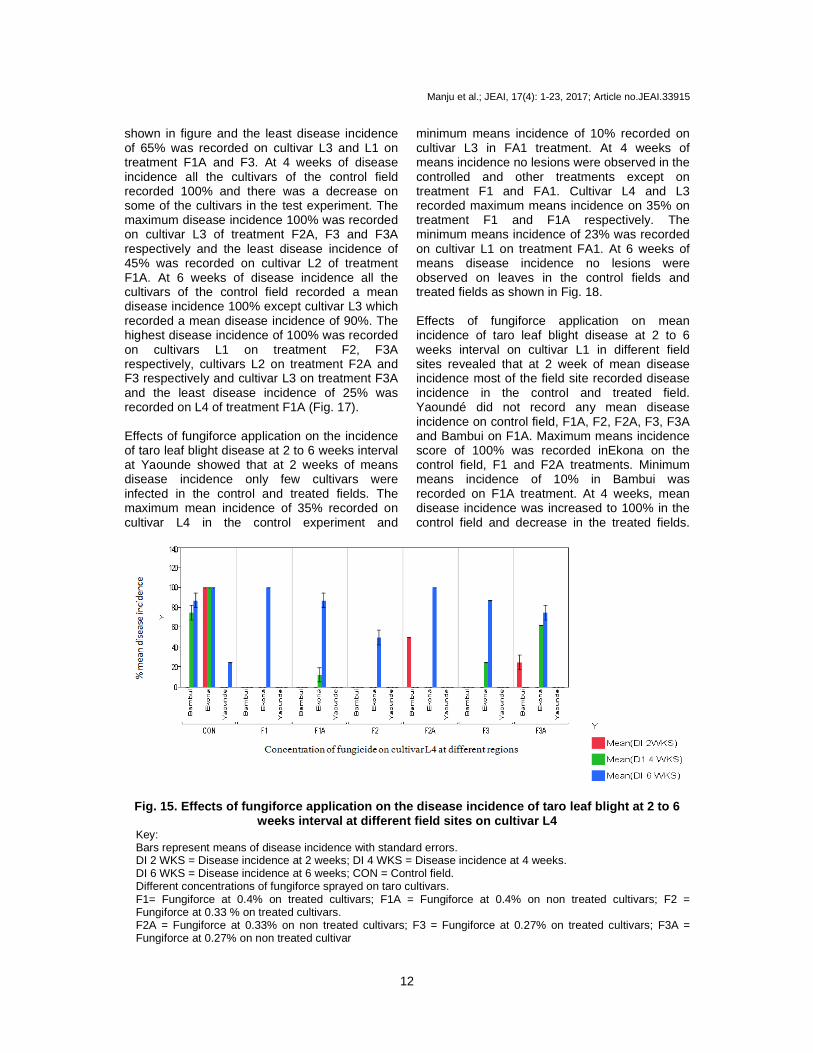
Effects of fungiforce application on the incidence of taro leaf blight disease at 2 to 6 weeks interval at different field sites on L3 cultivar indicated that disease did not appear in some the treatments in three field sites. At 2 weeks of disease incidence maximum means disease incidence 85% was recorded in Ekona in the control field and minimum of 10% in Bambui in F1A, F3 treatments. At 4 weeks mean maximum disease incidence of 100% was recorded in Ekona in the control field and minimum of 55% in Ekona in treatment F1A. At 6 weeks of disease incidence a maximum of 100% was recorded in Ekona on F2 treatment and a minimum of 25% in Yaounde control field (Fig. 14). Effects of fungiforce application on the incidence of taro leaf blight disease at 2 to 6 weeks interval at different field site on cultivar L4 there was no expression of disease on some of the treatments in Bambui and Yaounde. At 2 to 6 weeks of disease incidence maximum values 100% were recorded in Ekona in the control field, F1 and F2A treatments. Least values of 15% in Ekona on treatment F1A as observed in Fig. 15.
3.3 Effect of Fungicide Application on Disease Incidence during 2016 March Planting Season
The mean percentage P. colocasiae incidence in Bambui was high at 2 weeks with the highest
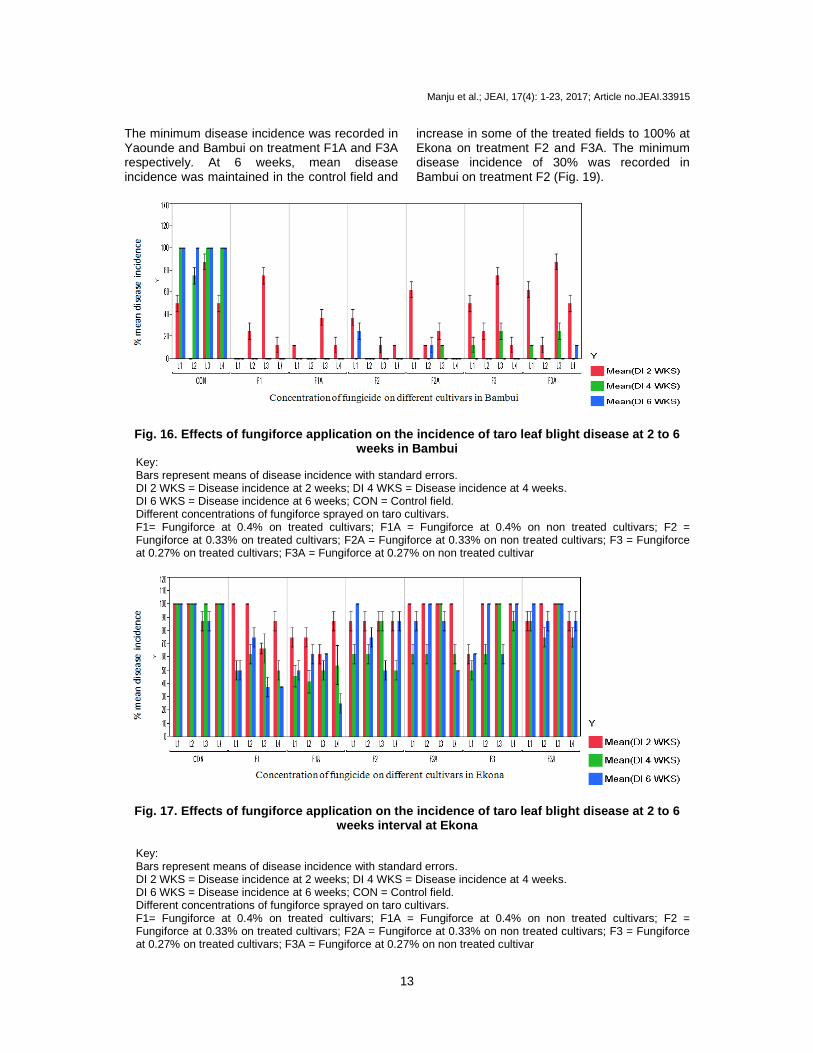
mean incidence of 100% recorded on cultivar L2 in F3A treatment and no disease incidence was recorded on cultivar L1 of F1 treatment, L2 of F1A and F2 treatment, L4 of F2A treatment. The mean disease incidence increased in the control field at 2 weeks to 8 weeks interval and decreases in treated fields in Bambui. At 4 weeks of disease incidence all the cultivars of the control experiment recorded 100% except cultivar L2 that recorded 80%. In the test experiment, disease incidence was not recorded on most of the cultivars except on cultivar L4 in F2A treatment, L2 and L4 in F3 and F4 treatment. The maximum disease incidence was recorded on L3 in F3 and F3A treatment and the least disease incidence was recorded on cultivar L3 and L1 on treatment F2A, F3 and F3A respectively. At 6 weeks of disease incidence all the cultivars in the control field recorded 100% of mean disease incidence, in the test field, 3 cultivars where infected with highest mean incidence of 30% on cultivar L1 of treatment F2 and the least mean disease incidence of 15% on cultivar L2 and L4 of treatment F2A and F3A respectively (Fig. 16). Results of the effects of fungiforce application on the incidence of taro leaf blight disease at 2 to 6 weeks interval at Ekona indicated that at 2 weeks of disease incidence almost all the cultivars in the different treatment and the control field recorded mean disease incidence of 100% as
Fig. 14. Effects of fungiforce application on the d isease incidence of taro leaf blight at 2 to 6 weeks interval at different field sites on cultivar L3
Key: Bars represent means of disease incidence with standard errors. DI 2 WKS = Disease incidence at 2 weeks; DI 4 WKS = Disease incidence at 4 weeks. DI 6 WKS = Disease incidence at 6 weeks; CON = Control field. Different concentrations of fungiforce sprayed on taro cultivars. F1= Fungiforce at 0.4% on treated cultivars; F1A = Fungiforce at 0.4% on non treated cultivars; F2 = Fungiforce at 0.33% on treated cultivars; F2A = Fungiforce at 0.33% on non treated cultivars; F3 = Fungiforce at 0.27% on treated cultivars; F3A = Fungiforce at 0.27% on non treated cultivar
Manju et al.; JEAI, 17(4): 1-23, 2017; Article no.JEAI.33915
12
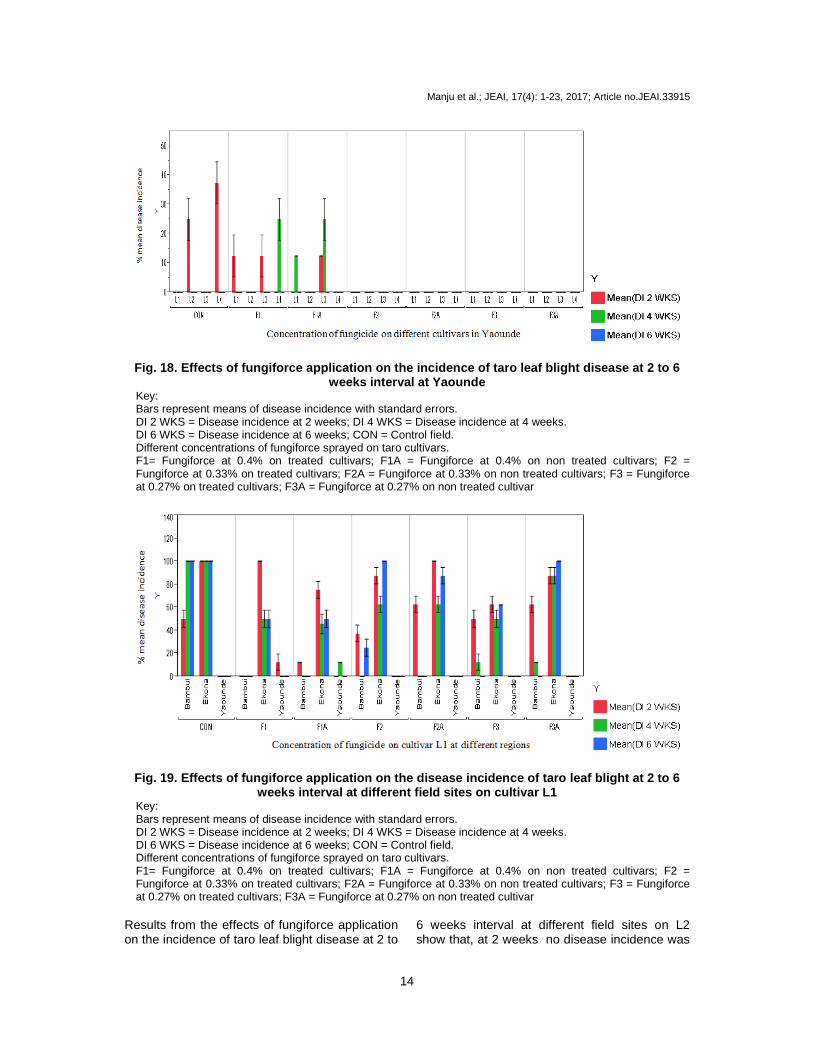
shown in figure and the least disease incidence of 65% was recorded on cultivar L3 and L1 on treatment F1A and F3. At 4 weeks of disease incidence all the cultivars of the control field recorded 100% and there was a decrease on some of the cultivars in the test experiment. The maximum disease incidence 100% was recorded on cultivar L3 of treatment F2A, F3 and F3A respectively and the least disease incidence of 45% was recorded on cultivar L2 of treatment F1A. At 6 weeks of disease incidence all the cultivars of the control field recorded a mean disease incidence 100% except cultivar L3 which recorded a mean disease incidence of 90%. The highest disease incidence of 100% was recorded on cultivars L1 on treatment F2, F3A respectively, cultivars L2 on treatment F2A and F3 respectively and cultivar L3 on treatment F3A and the least disease incidence of 25% was recorded on L4 of treatment F1A (Fig. 17). Effects of fungiforce application on the incidence of taro leaf blight disease at 2 to 6 weeks interval at Yaounde showed that at 2 weeks of means disease incidence only few cultivars were infected in the control and treated fields. The maximum mean incidence of 35% recorded on cultivar L4 in the control experiment and
minimum means incidence of 10% recorded on cultivar L3 in FA1 treatment. At 4 weeks of means incidence no lesions were observed in the controlled and other treatments except on treatment F1 and FA1. Cultivar L4 and L3 recorded maximum means incidence on 35% on treatment F1 and F1A respectively. The minimum means incidence of 23% was recorded on cultivar L1 on treatment FA1. At 6 weeks of means disease incidence no lesions were observed on leaves in the control fields and treated fields as shown in Fig. 18. Effects of fungiforce application on mean incidence of taro leaf blight disease at 2 to 6 weeks interval on cultivar L1 in different field sites revealed that at 2 week of mean disease incidence most of the field site recorded disease incidence in the control and treated field. Yaoundé did not record any mean disease incidence on control field, F1A, F2, F2A, F3, F3A and Bambui on F1A. Maximum means incidence score of 100% was recorded inEkona on the control field, F1 and F2A treatments. Minimum means incidence of 10% in Bambui was recorded on F1A treatment. At 4 weeks, mean disease incidence was increased to 100% in the control field and decrease in the treated fields.
Fig. 15. Effects of fungiforce application on the d isease incidence of taro leaf blight at 2 to 6 weeks interval at different field sites on cultivar L4
Key: Bars represent means of disease incidence with standard errors. DI 2 WKS = Disease incidence at 2 weeks; DI 4 WKS = Disease incidence at 4 weeks. DI 6 WKS = Disease incidence at 6 weeks; CON = Control field. Different concentrations of fungiforce sprayed on taro cultivars. F1= Fungiforce at 0.4% on treated cultivars; F1A = Fungiforce at 0.4% on non treated cultivars; F2 = Fungiforce at 0.33 % on treated cultivars. F2A = Fungiforce at 0.33% on non treated cultivars; F3 = Fungiforce at 0.27% on treated cultivars; F3A = Fungiforce at 0.27% on non treated cultivar
Manju et al.; JEAI, 17(4): 1-23, 2017; Article no.JEAI.33915
13
The minimum disease incidence was recorded in Yaounde and Bambui on treatment F1A and F3A respectively. At 6 weeks, mean disease incidence was maintained in the control field and
increase in some of the treated fields to 100% at Ekona on treatment F2 and F3A. The minimum disease incidence of 30% was recorded in Bambui on treatment F2 (Fig. 19).
Fig. 16. Effects of fungiforce application on the i ncidence of taro leaf blight disease at 2 to 6 weeks in Bambui
Key: Bars represent means of disease incidence with standard errors. DI 2 WKS = Disease incidence at 2 weeks; DI 4 WKS = Disease incidence at 4 weeks. DI 6 WKS = Disease incidence at 6 weeks; CON = Control field. Different concentrations of fungiforce sprayed on taro cultivars. F1= Fungiforce at 0.4% on treated cultivars; F1A = Fungiforce at 0.4% on non treated cultivars; F2 = Fungiforce at 0.33% on treated cultivars; F2A = Fungiforce at 0.33% on non treated cultivars; F3 = Fungiforce at 0.27% on treated cultivars; F3A = Fungiforce at 0.27% on non treated cultivar
Fig. 17. Effects of fungiforce application on the i ncidence of taro leaf blight disease at 2 to 6 weeks interval at Ekona
Key: Bars represent means of disease incidence with standard errors. DI 2 WKS = Disease incidence at 2 weeks; DI 4 WKS = Disease incidence at 4 weeks. DI 6 WKS = Disease incidence at 6 weeks; CON = Control field. Different concentrations of fungiforce sprayed on taro cultivars. F1= Fungiforce at 0.4% on treated cultivars; F1A = Fungiforce at 0.4% on non treated cultivars; F2 = Fungiforce at 0.33% on treated cultivars; F2A = Fungiforce at 0.33% on non treated cultivars; F3 = Fungiforce at 0.27% on treated cultivars; F3A = Fungiforce at 0.27% on non treated cultivar
Manju et al.; JEAI, 17(4): 1-23, 2017; Article no.JEAI.33915
14
Fig. 18. Effects of fungiforce application on the i ncidence of taro leaf blight disease at 2 to 6 weeks interval at Yaounde
Key: Bars represent means of disease incidence with standard errors. DI 2 WKS = Disease incidence at 2 weeks; DI 4 WKS = Disease incidence at 4 weeks. DI 6 WKS = Disease incidence at 6 weeks; CON = Control field. Different concentrations of fungiforce sprayed on taro cultivars. F1= Fungiforce at 0.4% on treated cultivars; F1A = Fungiforce at 0.4% on non treated cultivars; F2 = Fungiforce at 0.33% on treated cultivars; F2A = Fungiforce at 0.33% on non treated cultivars; F3 = Fungiforce at 0.27% on treated cultivars; F3A = Fungiforce at 0.27% on non treated cultivar
Fig. 19. Effects of fungiforce application on the d isease incidence of taro leaf blight at 2 to 6 weeks interval at different field sites on cultivar L1
Key: Bars represent means of disease incidence with standard errors. DI 2 WKS = Disease incidence at 2 weeks; DI 4 WKS = Disease incidence at 4 weeks. DI 6 WKS = Disease incidence at 6 weeks; CON = Control field. Different concentrations of fungiforce sprayed on taro cultivars. F1= Fungiforce at 0.4% on treated cultivars; F1A = Fungiforce at 0.4% on non treated cultivars; F2 = Fungiforce at 0.33% on treated cultivars; F2A = Fungiforce at 0.33% on non treated cultivars; F3 = Fungiforce at 0.27% on treated cultivars; F3A = Fungiforce at 0.27% on non treated cultivar
Results from the effects of fungiforce application on the incidence of taro leaf blight disease at 2 to
6 weeks interval at different field sites on L2 show that, at 2 weeks no disease incidence was
Manju et al.; JEAI, 17(4): 1-23, 2017; Article no.JEAI.33915
15
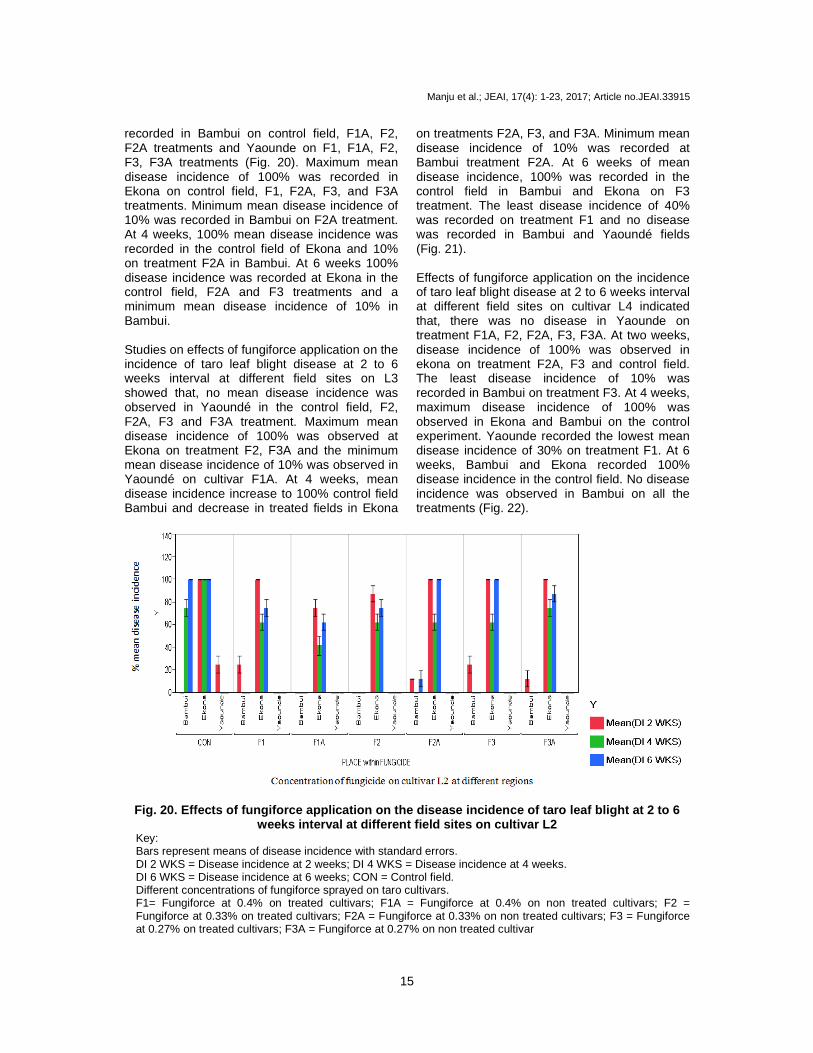
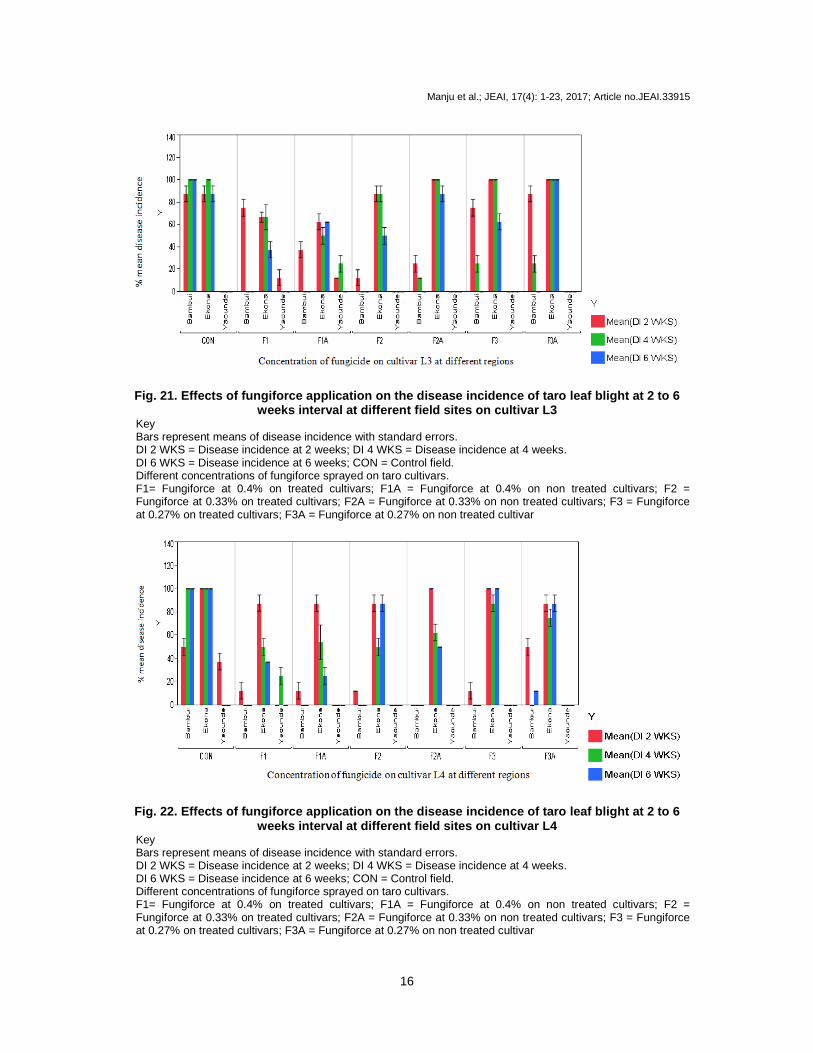
recorded in Bambui on control field, F1A, F2, F2A treatments and Yaounde on F1, F1A, F2, F3, F3A treatments (Fig. 20). Maximum mean disease incidence of 100% was recorded in Ekona on control field, F1, F2A, F3, and F3A treatments. Minimum mean disease incidence of 10% was recorded in Bambui on F2A treatment. At 4 weeks, 100% mean disease incidence was recorded in the control field of Ekona and 10% on treatment F2A in Bambui. At 6 weeks 100% disease incidence was recorded at Ekona in the control field, F2A and F3 treatments and a minimum mean disease incidence of 10% in Bambui. Studies on effects of fungiforce application on the incidence of taro leaf blight disease at 2 to 6 weeks interval at different field sites on L3 showed that, no mean disease incidence was observed in Yaoundé in the control field, F2, F2A, F3 and F3A treatment. Maximum mean disease incidence of 100% was observed at Ekona on treatment F2, F3A and the minimum mean disease incidence of 10% was observed in Yaoundé on cultivar F1A. At 4 weeks, mean disease incidence increase to 100% control field Bambui and decrease in treated fields in Ekona
on treatments F2A, F3, and F3A. Minimum mean disease incidence of 10% was recorded at Bambui treatment F2A. At 6 weeks of mean disease incidence, 100% was recorded in the control field in Bambui and Ekona on F3 treatment. The least disease incidence of 40% was recorded on treatment F1 and no disease was recorded in Bambui and Yaoundé fields (Fig. 21). Effects of fungiforce application on the incidence of taro leaf blight disease at 2 to 6 weeks interval at different field sites on cultivar L4 indicated that, there was no disease in Yaounde on treatment F1A, F2, F2A, F3, F3A. At two weeks, disease incidence of 100% was observed in ekona on treatment F2A, F3 and control field. The least disease incidence of 10% was recorded in Bambui on treatment F3. At 4 weeks, maximum disease incidence of 100% was observed in Ekona and Bambui on the control experiment. Yaounde recorded the lowest mean disease incidence of 30% on treatment F1. At 6 weeks, Bambui and Ekona recorded 100% disease incidence in the control field. No disease incidence was observed in Bambui on all the treatments (Fig. 22).
Fig. 20. Effects of fungiforce application on the d isease incidence of taro leaf blight at 2 to 6 weeks interval at different field sites on cultivar L2
Key: Bars represent means of disease incidence with standard errors. DI 2 WKS = Disease incidence at 2 weeks; DI 4 WKS = Disease incidence at 4 weeks. DI 6 WKS = Disease incidence at 6 weeks; CON = Control field. Different concentrations of fungiforce sprayed on taro cultivars. F1= Fungiforce at 0.4% on treated cultivars; F1A = Fungiforce at 0.4% on non treated cultivars; F2 = Fungiforce at 0.33% on treated cultivars; F2A = Fungiforce at 0.33% on non treated cultivars; F3 = Fungiforce at 0.27% on treated cultivars; F3A = Fungiforce at 0.27% on non treated cultivar
Manju et al.; JEAI, 17(4): 1-23, 2017; Article no.JEAI.33915
16
Fig. 21. Effects of fungiforce application on the d isease incidence of taro leaf blight at 2 to 6 weeks interval at different field sites on cultivar L3
Key Bars represent means of disease incidence with standard errors. DI 2 WKS = Disease incidence at 2 weeks; DI 4 WKS = Disease incidence at 4 weeks. DI 6 WKS = Disease incidence at 6 weeks; CON = Control field. Different concentrations of fungiforce sprayed on taro cultivars. F1= Fungiforce at 0.4% on treated cultivars; F1A = Fungiforce at 0.4% on non treated cultivars; F2 = Fungiforce at 0.33% on treated cultivars; F2A = Fungiforce at 0.33% on non treated cultivars; F3 = Fungiforce at 0.27% on treated cultivars; F3A = Fungiforce at 0.27% on non treated cultivar
Fig. 22. Effects of fungiforce application on the d isease incidence of taro leaf blight at 2 to 6 weeks interval at different field sites on cultivar L4
Key Bars represent means of disease incidence with standard errors. DI 2 WKS = Disease incidence at 2 weeks; DI 4 WKS = Disease incidence at 4 weeks. DI 6 WKS = Disease incidence at 6 weeks; CON = Control field. Different concentrations of fungiforce sprayed on taro cultivars. F1= Fungiforce at 0.4% on treated cultivars; F1A = Fungiforce at 0.4% on non treated cultivars; F2 = Fungiforce at 0.33% on treated cultivars; F2A = Fungiforce at 0.33% on non treated cultivars; F3 = Fungiforce at 0.27% on treated cultivars; F3A = Fungiforce at 0.27% on non treated cultivar
Manju et al.; JEAI, 17(4): 1-23, 2017; Article no.JEAI.33915
17
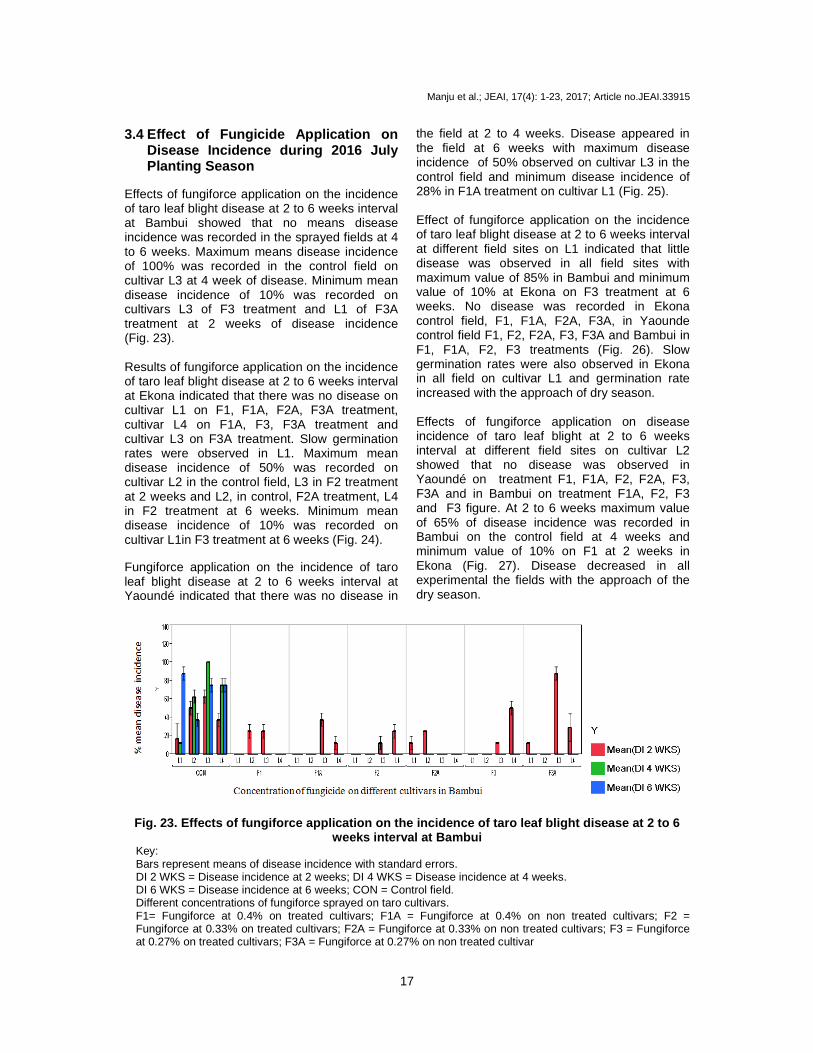
3.4 Effect of Fungicide Application on Disease Incidence during 2016 July Planting Season
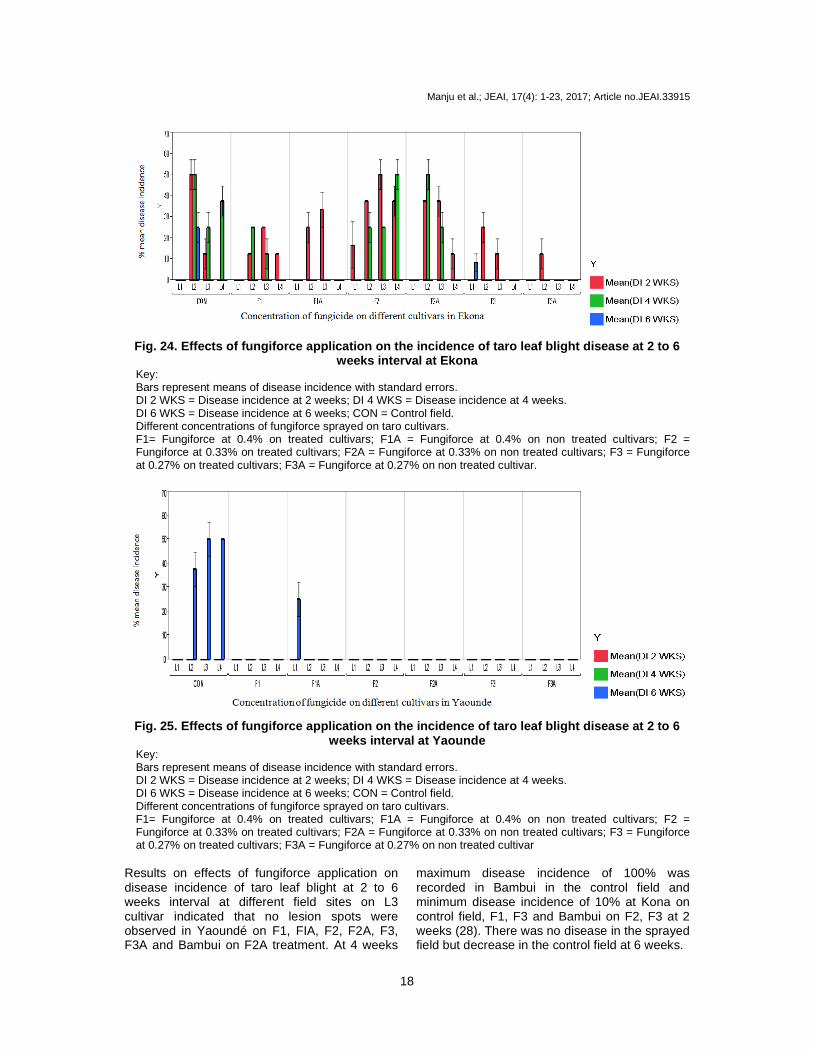
Effects of fungiforce application on the incidence of taro leaf blight disease at 2 to 6 weeks interval at Bambui showed that no means disease incidence was recorded in the sprayed fields at 4 to 6 weeks. Maximum means disease incidence of 100% was recorded in the control field on cultivar L3 at 4 week of disease. Minimum mean disease incidence of 10% was recorded on cultivars L3 of F3 treatment and L1 of F3A treatment at 2 weeks of disease incidence (Fig. 23). Results of fungiforce application on the incidence of taro leaf blight disease at 2 to 6 weeks interval at Ekona indicated that there was no disease on cultivar L1 on F1, F1A, F2A, F3A treatment, cultivar L4 on F1A, F3, F3A treatment and cultivar L3 on F3A treatment. Slow germination rates were observed in L1. Maximum mean disease incidence of 50% was recorded on cultivar L2 in the control field, L3 in F2 treatment at 2 weeks and L2, in control, F2A treatment, L4 in F2 treatment at 6 weeks. Minimum mean disease incidence of 10% was recorded on cultivar L1in F3 treatment at 6 weeks (Fig. 24). Fungiforce application on the incidence of taro leaf blight disease at 2 to 6 weeks interval at Yaoundé indicated that there was no disease in
the field at 2 to 4 weeks. Disease appeared in the field at 6 weeks with maximum disease incidence of 50% observed on cultivar L3 in the control field and minimum disease incidence of 28% in F1A treatment on cultivar L1 (Fig. 25). Effect of fungiforce application on the incidence of taro leaf blight disease at 2 to 6 weeks interval at different field sites on L1 indicated that little disease was observed in all field sites with maximum value of 85% in Bambui and minimum value of 10% at Ekona on F3 treatment at 6 weeks. No disease was recorded in Ekona control field, F1, F1A, F2A, F3A, in Yaounde control field F1, F2, F2A, F3, F3A and Bambui in F1, F1A, F2, F3 treatments (Fig. 26). Slow germination rates were also observed in Ekona in all field on cultivar L1 and germination rate increased with the approach of dry season. Effects of fungiforce application on disease incidence of taro leaf blight at 2 to 6 weeks interval at different field sites on cultivar L2 showed that no disease was observed in Yaoundé on treatment F1, F1A, F2, F2A, F3, F3A and in Bambui on treatment F1A, F2, F3 and F3 figure. At 2 to 6 weeks maximum value of 65% of disease incidence was recorded in Bambui on the control field at 4 weeks and minimum value of 10% on F1 at 2 weeks in Ekona (Fig. 27). Disease decreased in all experimental the fields with the approach of the dry season.
Fig. 23. Effects of fungiforce application on the i ncidence of taro leaf blight disease at 2 to 6 weeks interval at Bambui
Key: Bars represent means of disease incidence with standard errors. DI 2 WKS = Disease incidence at 2 weeks; DI 4 WKS = Disease incidence at 4 weeks. DI 6 WKS = Disease incidence at 6 weeks; CON = Control field. Different concentrations of fungiforce sprayed on taro cultivars. F1= Fungiforce at 0.4% on treated cultivars; F1A = Fungiforce at 0.4% on non treated cultivars; F2 = Fungiforce at 0.33% on treated cultivars; F2A = Fungiforce at 0.33% on non treated cultivars; F3 = Fungiforce at 0.27% on treated cultivars; F3A = Fungiforce at 0.27% on non treated cultivar
Manju et al.; JEAI, 17(4): 1-23, 2017; Article no.JEAI.33915
18
Fig. 24. Effects of fungiforce application on the i ncidence of taro leaf blight disease at 2 to 6 weeks interval at Ekona
Key: Bars represent means of disease incidence with standard errors. DI 2 WKS = Disease incidence at 2 weeks; DI 4 WKS = Disease incidence at 4 weeks. DI 6 WKS = Disease incidence at 6 weeks; CON = Control field. Different concentrations of fungiforce sprayed on taro cultivars. F1= Fungiforce at 0.4% on treated cultivars; F1A = Fungiforce at 0.4% on non treated cultivars; F2 = Fungiforce at 0.33% on treated cultivars; F2A = Fungiforce at 0.33% on non treated cultivars; F3 = Fungiforce at 0.27% on treated cultivars; F3A = Fungiforce at 0.27% on non treated cultivar.
Fig. 25. Effects of fungiforce application on the i ncidence of taro leaf blight disease at 2 to 6 weeks interval at Yaounde
Key: Bars represent means of disease incidence with standard errors. DI 2 WKS = Disease incidence at 2 weeks; DI 4 WKS = Disease incidence at 4 weeks. DI 6 WKS = Disease incidence at 6 weeks; CON = Control field. Different concentrations of fungiforce sprayed on taro cultivars. F1= Fungiforce at 0.4% on treated cultivars; F1A = Fungiforce at 0.4% on non treated cultivars; F2 = Fungiforce at 0.33% on treated cultivars; F2A = Fungiforce at 0.33% on non treated cultivars; F3 = Fungiforce at 0.27% on treated cultivars; F3A = Fungiforce at 0.27% on non treated cultivar
Results on effects of fungiforce application on disease incidence of taro leaf blight at 2 to 6 weeks interval at different field sites on L3 cultivar indicated that no lesion spots were observed in Yaoundé on F1, FIA, F2, F2A, F3, F3A and Bambui on F2A treatment. At 4 weeks
maximum disease incidence of 100% was recorded in Bambui in the control field and minimum disease incidence of 10% at Kona on control field, F1, F3 and Bambui on F2, F3 at 2 weeks (28). There was no disease in the sprayed field but decrease in the control field at 6 weeks.

Manju et al.; JEAI, 17(4): 1-23, 2017; Article no.JEAI.33915
19
Fig. 26. Effects of fungiforce application on the d isease incidence of taro leaf blight at 2 to 6 weeks interval at different field sites on cultivar L1
Key: Bars represent means of disease incidence with standard errors. DI 2 WKS = Disease incidence at 2 weeks; DI 4 WKS = Disease incidence at 4 weeks. DI 6 WKS = Disease incidence at 6 weeks; CON = Control field. Different concentrations of fungiforce sprayed on taro cultivars. F1= Fungiforce at 0.4% on treated cultivars; F1A = Fungiforce at 0.4% on non treated cultivars; F2 = Fungiforce at 0.33% on treated cultivars; F2A = Fungiforce at 0.33% on non treated cultivars; F3 = Fungiforce at 0.27% on treated cultivars; F3A = Fungiforce at 0.27% on non treated cultivar
Fig. 27. Effects of fungiforce application on the d isease incidence of taro leaf blight at 2 to 6 weeks interval at different field sites on cultivar L2
Key: Bars represent means of disease incidence with standard errors. DI 2 WKS = Disease incidence at 2 weeks; DI 4 WKS = Disease incidence at 4 weeks. DI 6 WKS = Disease incidence at 6 weeks; CON = Control field. Different concentrations of fungiforce sprayed on taro cultivars. F1= Fungiforce at 0.4% on treated cultivars; F1A = Fungiforce at 0.4% on non treated cultivars; F2 = Fungiforce at 0.33% on treated cultivars; F2A = Fungiforce at 0.33% on non treated cultivars; F3 = Fungiforce at 0.27% on treated cultivars; F3A = Fungiforce at 0.27% on non treated cultivar

Manju et al.; JEAI, 17(4): 1-23, 2017; Article no.JEAI.33915
20
Fig. 28. Effects of fungiforce application on the d isease incidence of taro leaf blight at 2 to 6 weeks interval at different field sites on cultivar L3
Key: Bars represent means of disease incidence with standard errors. DI 2 WKS = Disease incidence at 2 weeks; DI 4 WKS = Disease incidence at 4 weeks. DI 6 WKS = Disease incidence at 6 weeks; CON = Control field. Different concentrations of fungiforce sprayed on taro cultivars. F1= Fungiforce at 0.4% on treated cultivars; F1A = Fungiforce at 0.4% on non treated cultivars; F2 = Fungiforce at 0.33% on treated cultivars; F2A = Fungiforce at 0.33% on non treated cultivars; F3 = Fungiforce at 0.27% on treated cultivars; F3A = Fungiforce at 0.27% on non treated cultivar
Assessment of fungiforce application on the incidence of taro leaf blight disease at 2 to 6 weeks interval at different field sites on L4 showed that no disease incidence was recorded in Bambui on F1, F2A, in Ekona on F1A, F3, and F3A and on all the sprayed fields in Yaoundé. At 4 week disease incidence was recorded in
control field and F2 in the sprayed field. Maximum means value of 75% was recorded at Bambui in the control treatment at 4 and 6 weeks. Minimum disease incidence of 10% was recorded in Ekona on treatment F1, F1A, F2A. AT 6 weeks there was no disease incidence in the sprayed field (Fig. 29).
Fig. 29. Effects of fungiforce application on the d isease incidence of taro leaf blight at 2 to 6 weeks interval at different field sites on cultivar L4
Key: Bars represent means of disease incidence with standard errors. DI 2 WKS = Disease incidence at 2 weeks; DI 4 WKS = Disease incidence at 4 weeks. DI 6 WKS = Disease incidence at 6 weeks; CON = Control field. Different concentrations of fungiforce sprayed on taro cultivars. F1= Fungiforce at 0.4% on treated cultivars; F1A = Fungiforce at 0.4% on non treated cultivars; F2 = Fungiforce at 0.33% on treated cultivars; F2A = Fungiforce at 0.33% on non treated cultivars; F3 = Fungiforce at 0.27% on treated cultivars; F3A = Fungiforce at 0.27% on non treated cultivar
Manju et al.; JEAI, 17(4): 1-23, 2017; Article no.JEAI.33915
21
4. DISCUSSION The results of planting taro in four seasons in three experimental field sites revealed that there was a decrease in disease incidence in fields sprayed with fungiforce, lesions did not expand on leaves and stems of sprayed taro. Lesions dried off and were only observed on newly produced leaves of taro cultivars. In non sprayed fields the leaves had spots which were water soaked, or dry gray appearance, as spots increased in size, coalesced and quickly destroyed the leaves. These results support earlier studies by Brooks [20,22] and Mbong et al. [23] who reported that on the lower leaf surface, spots have water – soaked lesions, or dry gray appearance. As spots increased in size they coalesce and quickly destroy the leaf. Disease incidence was high in the field during the raining season. As the dry season approached, disease incidence reduced, lesions dry off, centers of lesions became papery and fell off, producing shot-hole appearance on leaves of cultivars in the control field. In the sprayed fields no lesions were observed on the leaves. Diseased leaves sprayed before the onset of the dry season dried off and no lesions were noticed on newly produced leaves. This corresponds to results obtained by Lebot et al. [23,24], who also reported that in dry weather or on some resistant cultivars, the centers of lesions become papery and fall out, producing shot-hole appearance. Many of these shot-holes did not expand any further and others resumed development under conditions of heavy rain in susceptible cultivars. The most rapid expansion of lesions occurs when cool, showery weather allows fungal growth in tissues both in the night and day. This finding suggests that the pathogen may have colonized the damaged tissue at the early stage to cause the disease development. Disease incidence was observed in all experimental field sites except Yaoundé at 4 weeks after planting in the July season. This could be due to the presence of the inoculum in the field; high humidity and rainfall during planting which favors disease development and transmission. Immediately the plant germinated it was attacked by the disease in Bambui and Ekona. In Yaoundé after 4 weeks of planting it was dry season with no rainfall and no disease was observed on plants. The fungus depends on free surface water and high relative humidity during the wet seasons, which determines the duration of surface moisture and play an
important role in disease incidence. This idea is supported by the findings of Brooks (2005) who reported that the warm humid days and cool wet nights of the tropics are ideal for the reproduction and spread of P. colocasiae. Field reports [24,25,26] have shown that early leaf infection often take place where rainfall, dew or guttation droplets accumulates. Mbong et al. [22] also reported rain wash off sporangia and zoospores from leaves into the soil or splash on to other leaves and petiole of plants causing infection. The effect of spraying plots with fungicide at different concentration showed no variation on the 4 cultivars in the different field sites. Disease incidence ranged between10% to 100% in the 4 seasons, at the three experimental field sites. High disease incidence was recorded at Ekona and low disease incidence in Yaoundé. This high disease incidence both in the sprayed and controlled field in Ekona could be due to fungicide constantly being washed by continues rains immediately it was sprayed. Cultivars that recorded 100% disease incidence in the sprayed field were not severely damaged. They had one or two lesions on newly produced leaves as compared to those in the control field with many lesions. The low disease incidence in Yaoundé could be due to the climate of this site where there are four varied seasons of two dry and two rainy seasons with less rain fall as compared to the other two experimental sites with one dry season and rainy seasons. Fungiforce is a contact and systemic fungicide which contained high levels of copper oxide (600 grams) and mild levels of metalaxyl (120 grams) were used to sprayed taro at two week interval there was a decreased in disease incidence of the sprayed fields in all the four Seasons in the three experimental field sites according to Brooks [22] and Fullerton and Tyson [27], a range of protectants and systemic fungicides containing copper, manganese, or zinc have been found to provide effective control of taro leaf blight disease. 5. CONCLUSION Taro leaf blight disease incidence decreased in all the sprayed fields during the four planting seasons in the three experimental sites. The plots sprayed with fungicide at different concentration showed no variation on the 4 cultivars in the different field sites. High disease incidence was observed in Ekona field sites in the control field and low mean disease incidence
Manju et al.; JEAI, 17(4): 1-23, 2017; Article no.JEAI.33915
22
in Yaoundé. The variations in disease incidence in the three planting sites is an indication of possible genotype by environment (G XE) interaction that may have significant influence on the taro leaf blight resistance potential. ACKNOWLEDGEMENTS The authors wish to acknowledge the International Institute of Tropical Agriculture for the technical and financial support of this study. Thanks also go to Drs Suh, Sama, Lang Patrick of IRAD for field coordination and supervision. We gladly acknowledge all those who provided assistance in manuscript preparation. COMPETING INTERESTS Authors have declared that no competing interests exist. REFERENCES 1. Chandra S. Edible Aroids. Clarendon
Press, Oxford. 1984;315. 2. Joshua SA. Identification of the major foliar
fungal disease of Colocasia esculenta (l.) Schott, and its management in the Kumasi metropolis. Kwame Nkrumah University of Science and Technology. MSc Thesis. 2010;20–21.
3. Deo PC, Anand PT, Taylor M, Becker DK, Harding RM. Improving taro (Colocasia esculenta var. esculenta) production using biotechnological approaches. South Pacific Journal of Natural Science. 2009;27:6-13.
4. FAOSTAT. Food and Agriculture Organization of United Nations. Available:http://faosta.fao.Org/ (Accessed 14 March 2011). FAO. FAOSTAT. FAO Statistics Division; 2012. Available:http://faostat.fao.org
5. Bose TK, Kabir J, Maity TK, Parthasarathy VA, Som MG. Vegetable crops. Naya Udyog Publishers, Kolkata. 2003;2:413–442.
6. Ramanatha RV, Matthews PJ, Eyzaguirre PB, Hunter D. The global diversity of Taro: Ethnobotany conservation. Biodiversity International, Rome, Italy. 2010;27.
7. Kundu N, Campbell P, Hampton B, Lin C, Ma X, Ambulos N, Zhao XF, Goloubeva O, Holt D, Fulton AM. Anti metastatic activity isolated from Colocasia esculenta (Taro). Anti-Cancer Drugs. 2012;23:200-211.
8. FAO. FAOSTAT. FAO Statistics Division; 2014. Available:http://faostat.fao.org
9. Gadre UA, Joshi MS. Influence of weather factors on the incidence of leaf blight of Colocasia. Annual of Plant Protection Science. 2003;11:168-170.
10. Singh D, Guaf J, Okpul T, Wiles G, Hunter D. Taro (Colocasia esculenta) variety release recommendations for Papua New Guinea based on multi-location trials. Crop Horticult. Sci. 2006;34:163–171.
11. Nelson S, Brooks F, Teves G. Taro leaf blight in Hawaii. Plant Diseases Bulletin. University of Hawaii: Manoa, HI, USA. New Caledonia. 2011;71.
12. Brunt J, Hunter D, Delp C. A bibliography of Taro leaf blight. Secretariat of the Pacific Community: New Caledonia. 2001;1-10.
13. Guarion L. Taro leaf blight in Cameroon. Agricultural Biodiversity. Weblog; 2010. Available:http://agro.Biodiverse/2010/07/taro-leaf- blight-in-Cameroon/ (Accessed on 15 May 2012)
14. Fontem DA, Mbong GA. A novel epidemic of taro (Colocasia esculenta) blight by Phytophthora colocasiae hits Cameroon (Abstract). In: Science de la vie et Productions Animales. Third Life Science Conference. CAFOBIOS, Université de Dschang, Cameroun. 2011;79.
15. Zhang KM, Zheng FC, Li YD, Ann PJ, Ko WH. Isolates of Phytophthora colocasiae from Hainan Island in China: Evidence suggesting an Asia origin of this species. Mycologia. 1994;86:108-112.
16. CMI. Commonwealth Mycological Institute, Distribution Maps of Plant Diseases, Map. Edition 3. Phytophthora colocasiae. Common Wealth Agricultural Bureau, Walling Ford, Oxford Shire, UK. 1997;466.
17. Bandyopadhyay R, Sarma K, Onyeka TJ, Aregbesola A, Kumar PL. First report of taro (Colocasia esculenta) leaf blight caused by Phytophthora colocasiae in Nigeria. Plant Dis. 2011;95(2):618.
18. Scot N, Brooks F, Teves G. Taro leaf blight in Hawaii I. Plant Disease. 2011;71:1-14.
19. Dey TK, Ali MS, Bhuiyan MKR, Siddique AM. Screening of Colocasia esculenta (L.) Schott lines to leaf blight. J. Root Crop. 1993;19:62-65.
20. Fokunang CN, Mbong GA, Manju E, Tembe EA, Rachid H. Screen house and field resistance of taro cultivars to taro leaf blight disease (Phytophtora colocasiae).
Manju et al.; JEAI, 17(4): 1-23, 2017; Article no.JEAI.33915
23
British Biotechnology Journal. 2016;15(1):1-15. Article no.BBJ.14317 ISSN: 2231–2927 NLM ID: 101616695. Available:www.sciencedomain.org
21. Tarla DN, Fon DE, Takumbo EN, Fontem DA. Economic evaluation of fungicide application on taro (Colocasia esculenta) leaf blight. Journal of Experiment Biology and Agricultural Science. 2014;2:2-5.
22. Brooks FE. Taro leaf blight. The Plant Health Instructor; 2005. Available:http://www.apsnet.org/edcenter/intropp/lessons/fungi/ (Accessed on 17 September 2012)
23. Mbong GA, Fokunang CN, Fontem LA, Bambot MB, Tembe EA. An overview of Phytophthora colocasiae of cocoyams: A potential economic disease of food security in Cameroon. Discourse Journal of Agri-culture and Food Sciences. 2013;1(9):140-145. Available:www.resjournals.org/JAFS
24. Lebot V, Herail C, Pardales J, Gunua T, Prana M, Thongjiem M, Viet N. Isozyme and RAPD variation among Phytophthora colocasiae isolates from South East Asia and the Pacific. Plant Pathol. 2003;52:303-313.
25. Davinder S, Grahame J, Danny H, Robert F, Vincent L, Mary T, Tolo L, Tom O, Joy T. Taro leaf blight- A threat to food security. Agriculture. 2012;182-203. DOI: 10.3390/agriculture 2031182
26. Jackson GVH. Taro leaf blight. Pest Advisory Leaflet; The Plant Protection Service of the Secretariat of the Pacific Community: Noumea, New Caledonia. 1999;3:2.
27. Fullerton RA, Tyson JL. The biology of Phytophthora colocasiae and implications for its management and control. In: Secretariat of the Pacific Community (Ed.). Third Taro Symposium, 2003. Nadi Fiji Islands. 2004;107-111.
_________________________________________________________________________________ © 2017 Manju et al.; This is an Open Access article distributed under the terms of the Creative Commons Attribution License (http://creativecommons.org/licenses/by/4.0), which permits unrestricted use, distribution, and reproduction in any medium, provided the original work is properly cited.
Peer-review history: The peer review history for this paper can be accessed here:
http://sciencedomain.org/review-history/20899


