Embed Size (px)
Citation preview
Soil & Tillage Research 124 (2012) 47–56
Impact of conventional and minimum tillage on soil hydraulic conductivity intypical cropping system in Southern Italy
Mirko Castellini *, Domenico Ventrella
Agricultural Research Council – Research Unit for Cropping Systems in Dry Environments (CRA-SCA), Via C. Ulpiani 5, 70125 Bari, Italy
A R T I C L E I N F O
Article history:
Received 17 November 2011
Received in revised form 22 April 2012
Accepted 27 April 2012
Keywords:
Soil tillage
Tension infiltrometer
Hydraulic conductivity
Effective porosity
A B S T R A C T
Soil structure is one of the most important soil characteristics that can be modified by tillage practice due
to the effects on porosity (shape, volume and continuity of pores) and soil hydraulic conductivity
contributing to create optimal conditions to plant growth and crop establishment.
Continual soil inversion can in some situations lead to a degradation of soil structure, decreasing in
available soil water, depletion of soil organic carbon, and increasing greenhouse gases emissions into the
atmosphere.
The main objective of this work was to evaluate, under semi-arid Mediterranean conditions of
Southern Italy, the effects of soil tillage on the soil hydraulic conductivity (K) evaluated for three
consecutive years in a long-term research (over 20 years) regarding a cultivation of winter durum wheat.
The effects of soil tillage on hydraulic conductivity were evaluated by means of infiltration
experiments carried out in 3 years on a clay soil submitted to conventional and minimum tillage.
Starting of measurements of single values the K functions, effective porosity (as number and volume of
pores per unit area) and contribution of macropores and mesopores were determined.
The bimodal two-line exponential functions were found to be adequate to describe K near saturation
quantifying the water flux in the macro–mesopore system, with large increases in K observed for small
increases in soil water pressure head regardless of tillage management.
Our results highlighted a significant equivalence of soil hydraulic properties between conventional
and minimum tillage. Therefore, for the case study carried out for the typical cropping system of
Southern Italy, the shallow soil tillage can be considered preferable to deepest plowing because of lower
impact in term of cost and greenhouse gases emissions in the environment.
� 2012 Elsevier B.V. All rights reserved.
Contents lists available at SciVerse ScienceDirect
Soil & Tillage Research
jou r nal h o mep age: w ww.els evier . co m/lo c ate /s t i l l
1. Introduction
Tillage is the most common way to modify the soil structure dueto the effects on porosity (shape, volume and continuity of pores)and soil hydraulic conductivity (Hillel, 1998) and, thus, itcontributes to create optimal conditions to plant growth and cropestablishment.
The term conventional tillage, CT, defines a tillage system inwhich a deep primary cultivation, such as moldboard plowing, isfollowed by a secondary cultivation to create a seedbed.
The impact of conventional and conservation tillage on near-saturated hydraulic properties has been well investigated usingtension infiltrometer, from medium-textured (Moreno et al.,1997; Miller et al., 1998; Cameira et al., 2003; Moret and Arrue,2007a,b) to moderately coarse soils (Daraghmeh et al., 2008), butfew works were carried out in fine texture soils (Miller et al.,
* Corresponding author. Tel.: +39 080 5475011; fax: +39 080 5475023.
E-mail address: [email protected] (M. Castellini).
0167-1987/$ – see front matter � 2012 Elsevier B.V. All rights reserved.
http://dx.doi.org/10.1016/j.still.2012.04.008
1998), probably because the preferential flow, that in generalcharacterizes such soils is difficult to be described (Bouma andWosten, 1984) and requires rather complex mathematicalequations.
Hendrickx and Flury (2001) defined preferential flow as ‘‘allphenomena where water and solutes move along certain path-ways, while bypassing a fraction of the porous matrix’’. Thus, animportant characteristic of preferential flow is that during wetting,part of the moisture front can propagate quickly (throughshrinkage cracks, worm channels or old root holes) to significantdepths while bypassing a large part of the matrix pore-space(Simunek et al., 2003).
The importance of macropore and mesopores to water flow insoils, particularly to infiltration and rapid movement of water,solute and pollutants through soils are well highlighted (Beven andGermann, 1982; Luxmoore et al., 1990; Ankeny et al., 1990).Macropore represents inter-aggregate porosity, characterized by alarge degree of continuity structural. However, the mesoporesystem consists of inter-aggregate pores with less continuity andhigher tortuosity (Messing and Jarvis, 1993).

M. Castellini, D. Ventrella / Soil & Tillage Research 124 (2012) 47–5648
The choice of an effective size to delimit macropores isnecessarily arbitrary and often related more to details ofexperimental technique than to considerations of flow processes(Beven and Germann, 1982). However, according to the soil poreclassification (SSSA, 2008), macroporosity and mesoporosityrepresents those pores that drain at <3 cm and between 3 and300 cm water tension, respectively (Luxmoore, 1981).
Watson and Luxmoore (1986) used the tension infiltrometertechnique to estimate the concentration of effective macro- andmesopores on soil surface, but many other examples of similarapplications can be found in the literature (Azevedo et al., 1998;Cameira et al., 2003; Bodhinayake and Si, 2004; Buczko et al., 2006;Carof et al., 2007; Moret and Arrue, 2007b; Daraghmeh et al., 2008;Schwen et al., 2011).
For two agricultural soils with different textures (sandy loamand silty loam), for example, Buczko et al. (2006) showed values ofeffectively macroporosities range for both sites between 0.001 and0.2% and highlighted that these value are very similar to thosedetermined in many other study (Bodhinayake and Si, 2004;Cameira et al., 2003; Watson and Luxmoore, 1986).
More recently, Daraghmeh et al. (2008) reported, for a sandyloam soil under long-term winter wheat cropping, a similar rangeof effective macroporosity (0.0017–0.0177%) whereas Schwenet al. (2011) found, for a silt loam soil, similar values of effectivemacroporosity (about 0.002–0.012%) over two consecutive years.
In every case, regardless to the specific characteristics of theconsidered agricultural soil (i.e. texture, soil tillage and landmanagement), relatively small values of effective macroporosity(about 0.2%), represents a large part of the total saturated flux(about 70–80%).
A possible limitation of infiltrometric techniques is that itassumes that the soil is rigid, homogeneous and isotropic, which isnot true for a vertic clay soil. Nonetheless, these techniques arecommonly applied in real soils notwithstanding that they are notperfectly rigid, homogeneous and isotropic (Bagarello et al.,2010a). For example, Gomez et al. (1999) used Wooding’s analysisto analyze steady-state tension infiltrometer data collected in avertic soil, but many other examples can be found in the literature,including those by Messing and Jarvis (1993), Potter et al. (1995),Reynolds and Zebchuk (1996), Miller et al. (1998), Ventrella et al.(2005), and Das Gupta et al. (2006).
For a clay soil, Lin and McInnes (1995) recommended the tensioninfiltrometer technique in order to characterize the effects of non-uniform flow (bypass or macropore flow) on hydraulic properties.However for the clay soils, the presence of cracking, both superficialand subsurface, usually makes difficult, if not impossible, to use thetension infiltrometers both for measuring the soil infiltration and forthe estimation of the hydraulic conductivity through the solution ofWooding’s analysis. In fact, in such cases a very fast depletion ofinfiltrometer water reserve can occur making impossible the waterinfiltration rate determination.
In any case, the hydraulic conductivity obtained by aninfiltrometric technique, when it is feasible, should be consideredas an equivalent conductivity, i.e. the conductivity of a rigid,homogeneous and isotropic porous medium characterized byinfiltration rates that are the ones actually measured on the realsoil (Bagarello et al., 2010a).
Numerical models for uniform water flow are usually based onthe Richards equation, for variable saturated water flow. Porousmedia is viewed as a series of impermeable soil particles (or soilaggregates), separated by pores through which flow takes place.The Richards equation, that requires knowledge of the unsaturatedsoil hydraulic properties, specifically u(h) and K(h) relationships,has been combined with other mathematical expressions to yieldalternative approaches accounting for different forms of nonequi-librium preferential flow (Durner, 1994).
Preferential flow in structured media can be described using avariety of models taking into account dual-porosity, dual-permeability, multi-porosity and/or multi-permeability (Simuneket al., 2003).
Dual-porosity models assume that water flow is restricted tomacropore (or inter-aggregate pores and fractures) and that waterin the matrix (intra-aggregate and soil matrix) does not move at all.This conceptualization induces to consider a two-region modelthat divides the liquid phase into mobile (flowing, interaggregate)and immobile (stagnant, intraaggregate) regions. Therefore, watercan move from the main pore system into the soil aggregates andvice versa, but not directly between themselves.
However, in real situations, water moves directly between soilaggregates. Because of this reason, dual-porosity models wereproposed, they assume that the porous media consists of twooverlapping pore domains, with water flowing relatively fast in onedomain (often called the macropore, fracture or crack), active whenthe soil is close to full saturation, and slowly in the other domain(often called the micropore or matrix). Like dual-porosity model,dual-permeability models permit the transfer of water betweenthe two pore regions (Simunek et al., 2003).
Multi-porosity and/or multi-permeability models are based onthe same concept, but include additional interaction pore region(Simunek et al., 2003).
Undisturbed soils may exhibit retention curves with more thanone inflection point, due to specific particle-size distributions or bedue to the formation of secondary pore systems (multimodal poresize distribution). Hence, the bimodal soil system has twoinflection points, whereas multimodal soil system has more thantwo (n) inflection points.
Closed-form van Genuchten type models (van Genuchten,1980) for the soil water retention and hydraulic conductivity,however, appear to be inaccurate when the soil has a bimodal ormultimodal pore size distribution (Mohanty et al., 1997).
Different composite retention and hydraulic conductivity func-tions, for two overlapping porous media, were suggested by Othmeret al. (1991), Smettem et al. (1991), Durner (1994), Mohanty et al.(1997), Ross and Smettem (2000) among others. For example,Othmer et al. (1991) described the bimodal retention and theconductivity curves as the superposition of two van Genuchten–Mualem type curves, concluding that a two-domain model is thebest for describing the bimodal water fluxes in the soil. Mohantyet al. (1997) used a van Genuchten–Mualem model for the capillary-dominated flow and an exponential function to account for the non-capillary-dominated flow domain, whereas Jarvis and Messing(1995) used a more simple two exponential function of the Gardnertype (Gardner, 1958) that accounts for a rapid increase in hydraulicconductivity near saturation (Caron and Elrick, 2005).
The main objective of this work was to determine, under semi-arid Mediterranean conditions of Southern Italy and for a clay soil,the effects of soil tillage (minimum and conventional) on the soilhydraulic conductivity evaluated for three consecutive years, in along-term research (over 20 years) regarding a cultivation ofwinter durum wheat.
2. Materials and methods
2.1. Field site
The infiltration experiments were carried out in Foggia (418270
latitude N, 158320 longitude E, 90 m above sea level), in a typical flatarea of Southern Italy, the ‘‘Apulian Tavoliere’’, at the ExperimentalFarms of the Agricultural Research Council – Research Unit forCropping Systems in Dry Environments.
The soil is a Vertisol of alluvial origin, classified as fine, mesic,Typic Haploxerert (USDA) with the surface layer (0–40 cm)

M. Castellini, D. Ventrella / Soil & Tillage Research 124 (2012) 47–56 49
containing 42.7%, 27.7% and 29.6% of clay, silt and sand,respectively. According to the USDA classification (Gee and Or,2002), the soil texture of the upper 40 cm layers was clay. As mightbe expected, the study soil shows many, deep and wide crackingfractures only in dry conditions. In particular, depending on theseasonality of rainfall and in relation to the soil water content, thecrack fractures occur in the summer period, which usually extendsfrom the first half of June until the rainy season of October or upto the soil tillage. However, no cracks were observed at thesoil surface during the time of our infiltration measurementcampaigns.
The effects of soil tillage on hydraulic conductivity wereevaluated by means of field measurements which were carried outwithin a long-term field experiment (FE), started in 1990, on a 2-year crop rotation herbaceous crops based on cultivation of winterdurum wheat and grain legumes.
In particular, we selected the plots continuously cropped withwinter durum wheat (Triticum durum Desf.). We also consideredtwo different tillage systems: conventional tillage, CT, consisting ina moldboard plowing to 40–45 cm depth, and minimum tillage,MT, consisting in a surface disc-harrowing to 20–25 cm depth. Thesize of each experimental plot was 23 m by 10 m. The differenttillage operations were performed between September andOctober. In the 3 years considered, 2005, 2006 and 2007, thegrain yield corresponding to CT-MT were 44.5–44.9, 28.0–35.5,27.3–26.8 q ha�1, respectively.
2.2. Field measurements
The infiltration experiments were performed in both treat-ments, CT and MT, during the spring 2005–2007 with six replicatesfor each plot at randomly selected locations by using tensioninfiltrometer (TI) devices manufactured by Soil MeasurementSystem (Tucson, AZ). They consist of separate water supply andbase-plate units with a 20 cm diameter disc. At each location, thesoil surface was carefully leveled and smoothed before eachexperiment and attempts were made to prevent infiltration surfacesmearing. When necessary, the plants were cut at the base with thescissors. A level was used to assure that the disc and the reservoirbase were always at the same height (zero relative distance), sothat the head between the bubbling outlet at the bottom of thewater supply tube and the disc membrane was constant.A retaining ring with a radius of 12 cm was placed on the soilsurface, and a contact layer having a thickness of 1 cm wasprepared by using dry inert sand. The pressure heads imposed atinfiltrometer membrane were corrected to account for thethickness of the contact material layer (Reynolds and Zebchuk,1996; Bagarello et al., 2005). An ascending sequence (dry-to-wet)of supply potentials, h, was adopted (h = �10, �6, �4, �2 and�1 cm). In general, a dry-to-wet sequence is recommended toexclude the effects of hysteresis on the soil hydraulic conductivitymeasured in the field with the TI (Reynolds and Elrick, 1991; Jarvisand Messing, 1995; Bagarello et al., 2005). Visual readings of thewater level in the supply tube of the infiltrometer were taken at0.5-to 2-min intervals. More details about the adopted experi-mental procedure can be found in Bagarello et al. (2005). For eachseasonal measurement, the infiltration runs were completedwithin 2 or 3 days.
Soil hydraulic conductivity, K, corresponding to each imposed h
was calculated by using the method of Ankeny et al. (1991). Twoestimates of K were obtained for each intermediate h value of theapplied sequence. In this case, the best estimate of K was obtainedas the arithmetic mean of the available estimates (Ankeny et al.,1991; Bagarello et al., 2010b).
Before each experiment, an undisturbed soil sample (5 cmin height and 5 cm in diameter) was collected in close vicinity
(i.e. less than 1 m) of the infiltration surface to determine initialsoil water content, ui, and dry bulk density, rb.
2.3. Data analysis
One the first equations about the relationship of soil-waterhydraulic conductivity was suggested by Childs and Collis-George(1950) using Euclidean geometry.
More recently, the paired data K–h, obtained from eachsequence of infiltration runs across the range of the supplypotentials, were utilized to apply a two-line-regression model, TLE(Jarvis and Messing, 1995; Ventrella et al., 2005). This approach isbased on the assumption that different exponential functions, K(h),of the Gardner type (Gardner, 1958), can be adopted for two poresystems:
KðhÞ ¼Kbexp½a1ðh � hbÞ� h > hb
Kbexp½a2ðh � hbÞ� h � hb
(
Kb ¼ Ksexpða1hbÞ
where a1 and a2 [L�1] are the slopes of the regression lines, hb [L] isthe break-point pressure head dividing the two pore systems(macropores and mesopores), Kb [LT�1] is the hydraulic conduc-tivity at hb, and Ks is the saturated hydraulic conductivityestimated by extrapolating to zero potential.
However, according to Messing and Jarvis (1993), we have alsoapplied the Mualem, MUA, model (Mualem, 1976) in order to detectthe model that provides the best description of the measurements:
KðhÞ ¼ Ksf1 � ðahÞmn½1 þ ðahÞn��mg2
½1 þ ðahÞn�ml(2)
where a, n [–] and m (m = 1–1/n) are the fitting parameters ofMualem’s model, and l [–] is a pore-connectivity parameter.
According to the references of the literature (Messing and Jarvis,1993; Ventrella et al., 2005), the performances obtained with bothmodels were evaluated in terms of mean square errors (MSE) andrelative square errors (RSE).
The minimum radius r corresponding to applied h wascalculated in agreement with the capillary theory:
r ¼ �2scosbrgh
ffi � 0:15
h(3)
where s [MT�2], b [–] r [ML�3], and g [LT�2] are, respectively,surface tension of water, contact angle between the water and thepore wall, density of water and the acceleration due to gravity,where r and h are given in cm.
According to the proposed procedure of Watson and Luxmoore(1986), in order to characterize the soil effective porosity in termsof number of pores per unit area, Np, and soil volume correspond-ing to pores, up [L3 L�3], are given by:
N p;i ¼8mðKi � Ki�1Þ
rgpr4; i ¼ 1; 2; . . . ; n (4)
u p ¼ 100ðN pr2Þ (5)
where m [ML�1 T�1] is the viscosity of water, n is the number ofmeasurements performed in a sequence, Ki and Ki�1 are thehydraulic conductivities obtained for two consecutive pressure headvalues. Eq. (4) assumes laminar flow and that macropores arecompletely full and not interconnected and that tortuosity and porenecks are negligible. Because of these assumptions, the resulting Np
is purely an equivalent value, as a reference of the whole system ofmacropores. According to the mean value of break point pressurehead (hb), measured in 2 over 3 years of measurement campaigns(see results on Table 3), soil macropores were defined as those pores

M. Castellini, D. Ventrella / Soil & Tillage Research 124 (2012) 47–5650
that drain at h > �4 cm (pore radius, r > 0.375 mm; Moret andArrue, 2007b) and mesopores as those pores draining at h between�4 and �10 cm (0.375 > r > 0.150 mm), according to the range ofmeasurements of tension infiltrometer.
The contribution of both macropores and mesopores, Fp, to thetotal saturated flux, was calculated according to the expression(Cameira et al., 2003; Moret and Arrue, 2007b):
F p;i ¼ 100Ki � Ki�1
Ks
� �; i ¼ 1; 2; . . . ; n (6)
where Ks is the saturated hydraulic conductivity.The statistical frequency distribution for the hydraulic conduc-
tivity, K, was assumed to be log-normal, which is common for thisproperty (Mohanty et al., 1994). Therefore, all statistical tests werecarried out using the natural logs of the data. Also, geometricmeans (GMs) and associated coefficients of variation (CVs) werecalculated using the appropriate ‘‘log-normal’’ equations (Lee et al.,1985):
GM ¼ expðMÞ (7)
CV ¼ 100½expðSD2Þ � 1�0:5 (8)
where M and SD are, respectively, the arithmetic mean and thestandard deviation of the log-transformed K data.
Student’s t-test was used for comparing CT to MT data for agiven observation year (2005–2006–2007), whereas the TukeyHonestly Significant Difference (THSD) test was used for compar-ing either CT or MT data measured in the three differentobservation years. A probability level, P = 0.05, was used for allstatistical analyses.
3. Results and discussion
3.1. Field conditions: rainfall, soil wetness and bulk density
The average monthly precipitations and temperatures,recorded at the weather station of the experimental farm ofFoggia for the 3 years of trial, with the average monthly values ofthe last 51 years, are reported in Fig. 1. The dry period, duringwhich the average monthly precipitation is not more than twicethe average monthly temperature, was between June and July.Such a water deficit period is extended to 4 months in the years2006–2007 (about in May–August and June–September, respec-tively) and to 7 months (April-October) in 2005.
0
20
40
60
80
100
120
140
160
FJ AM JM AJ OS DN FJ AM JM Mont
Ra
infa
ll (m
m)
Rainfall Mean Rainfall of51 years M
2005 2006
Fig. 1. Monthly temperatures and rainfall at the experimental fa
Water infiltration measurements were taken during thegrowing season between stem elongation and earing phase which,in the first year, coincided with the second decade of March. Owingto high winter precipitation, recorded in 2006 and part of 2007, K
measurements were taken with a delay of about 1 or 2 monthscompared to the first year of trial (the second decade of June in2006, and the first decade of May in 2007), according to the mostfavorable conditions of soil moisture to perform the infiltrationmeasurements and to avoid the consequences of preferential flowinto the cracks. For each year of the research, the water contentcorresponding to the initial conditions of infiltration measure-ments, ui, was always comparable between CT and MT (Table 1).The differences of ui between the 3 years have to be related to thecumulative rainfall prior to the measurements of infiltration.Taking into account the period between sowing (October) and thedate of K measurements, the cumulative rainfall over the 3 yearswas 330, 492 and 250 mm. As expected, the values of ui werehigher in 2005 and 2006 (on average, approximately 0.28 and0.35 cm3 cm�3, respectively), due to rainfall more evenly distrib-uted during winter and spring season, than those recorded in 2007(on average, approximately 0.19 cm3 cm�3). The degree of satura-tion of soil corresponding to the initial conditions of the infiltrationmeasurements is an important factor of variability that can affectthe hydraulic conductivity measurements close to saturation (Linet al., 1998; Bagarello et al., 2000, 2010b; Das Gupta et al., 2006;Bagarello and Sgroi, 2007; Zhou et al., 2008; Schwen et al., 2011).However, according to a t-test, for a given year of measurement,the differences of ui between CT and MT were not statisticallysignificant (Table 1), concluding that the initial soil water contentdid not affect appreciably the comparison in terms of hydraulicconductivity between the two tillage systems.
The dry bulk density values measured in the top layer of soil(about 10 cm) were similar in the 3 years, varying within 1.13 and1.25 g cm�3 (Table 1), without any clear dependence between thetwo tillage systems (CT and MT). According to the t-test, thedifferences of rb were not statistically significant for the selectedprobability (Table 1), concluding that this soil parameter did notaffect appreciably the comparison in terms of hydraulic conduc-tivity between the two tillage systems.
3.2. Hydraulic conductivity
Typical examples of infiltration runs, corresponding to maxi-mum and minimum values of hydraulic conductivity, carried out inthe first year of measurements (2005) on CT and MT plots, are
AJ OS DN FJ AM JM AJ OS DN
hs
0
10
20
30
40
50
60
70
80
Mea
nT
em
pe
ratu
re (°C
)
ean Temperature Mean Temperature of51 years
2007
rm compared to the mean values of the previous 51 years.

Table 1Mean and coefficient of variation, CV%, of the initial soil water content, ui (cm3 cm�3) and soil bulk density, rb (g cm�3), for each year of measurements and tillage treatment
(number of samples, N = 6).
2005 2006 2007
CT MT CT MT CT MT
ui
Mean 0.286 a*A** 0.266 aAB 0.355 aA 0.379 aA 0.198 aA 0.189 aB
CV% 11.1 10.8 13.4 11.0 12.5 13.6
rb
Mean 1.171 aA 1.131 aB 1.141 aA 1.204 aB 1.196 aA 1.250 aB
CV% 8.3 13.6 7.7 5.7 4.7 6.7
* For a given variable (ui or rb) and year, values of CT and MT followed by the same lower case letter are not statistically different at the probability level P = 0.05 according to
a t-test.** For a given variable and soil tillage (CT or MT), values of different years followed by the same capital letter are not statistically different at the probability level P = 0.05
according to a THSD test.
4.0
5.0
6.0
7.0
ln K
CT
fit CT
MT
fit MT
M. Castellini, D. Ventrella / Soil & Tillage Research 124 (2012) 47–56 51
presented in Fig. 2. The steady-state assumption was confirmed ateach pressure head value, as the average steady-state infiltrationrate ranged from 13–18 min (Fig. 2a) to 12–20 min (Fig. 2b),respectively for CT and MT.
The comparison of hydraulic conductivity measurements,obtained from the two tillage systems, CT and MT, for eachimposed pressure head in the 3 years, is reported in Fig. 3.
0
1000
2000
3000
4000
5000
300 60 90 120 150
Time (min)
Cu
mu
lati
ve in
filt
rati
on
(cm
3)
CT
MT
a)
-1 cm
-2 cm
-4 cm
-6 cm
-10 cm
0
1000
2000
3000
4000
5000
300 60 90 120 150
Time (min)
Cu
mu
lati
ve in
filt
rati
on
(cm
3)
b)
-1 cm
-2 cm
-4 cm
-6 cm
-10 cm
Fig. 2. Sample cumulative infiltration run in the pressure head sequence indicated
under conventional (CT) and minimum tillage (MT): (a) maximum and (b)
minimum values on first year of measurements (2005).
0.0
1.0
2.0
3.0
-12 -10 -8 -6 -4 -2 0
h (cm)
2005
0.0
1.0
2.0
3.0
4.0
5.0
6.0
7.0
-12 -10 -8 -6 -4 -2 0
h (cm)
ln K
2006
0.0
1.0
2.0
3.0
4.0
5.0
6.0
7.0
-12 -10 -8 -6 -4 -2 0
h (cm)
ln K
2007
Fig. 3. Geometric means of natural log hydraulic conductivity, ln K (K in cm d�1),
between CT and MT. Bars indicate standard deviation. Fitted TLE model (Eq. (1)) are
also plotted (lines).

M. Castellini, D. Ventrella / Soil & Tillage Research 124 (2012) 47–5652
In the first year (2005), the hydraulic conductivity measured forCT was on average higher than that corresponding to MT, and thisindependently of the considered h value. In particular, the ratiobetween the geometric mean, GM, corresponding to CT and MT(GM(CT)/GM(MT)) resulted to be within a factor of 1.31 forh = �10 cm and 1.63 for h = �1 cm. However, according to thet-test, the differences were not statistically significant for theselected probability (P = 0.05).
The measurements of K under CT were generally more variablethan those related to MT (Fig. 3), with values of CV equal to, atmost, about 128%. In particular, the values of CV, for CT, wereincreasing with h, while for MT they were first increasing up to theintermediate potential (h = �4 cm) and then were decreasing.
The ratio of CV corresponding to CT and MT (CV(CT)/CV(MT))instead always increased as the value of h increased, withdifferences within about a factor of 2 (for h = �10 cm) and 4 (forh = �1 cm).
In the second year of measurements (2006), similar values ofK(h) were found between the two soil tillages. The hydraulicconductivity measured for CT, was on average lower than thatcorresponding to MT for the two lowest pressure heads (h = �10and �6 cm), and for that closer to saturation (h = �1 cm), whereasit was higher for the intermediate values of pressure heads (h = �4and �2 cm). The ratio GM(CT)/GM(MT), was within a factor of 0.8for h = �6 cm and 1.34 for h = �4 cm, and showed no particulartrend. According to the t-test, the differences of K between thetillage systems were not significant for P � 0.05. The K values of2006, with values of CV close to 70% (CT at h = �6 cm) weregenerally less variable compared to the first year. Moreover, closeto saturation (i.e. h = �2 and �1 cm), the values of CV associatedwith CT were from 2 to 5 times lower than those in 2005. The ratioCV(CT)/CV(MT) was within a factor of 1.15 for h = �4 cm and 0.39(corresponding to a factor 2.56) for h = �1 cm, and it showed nonoticeable increasing or decreasing trend.
The measurements taken in 2007, showed relative highervalues of K for MT compared to the first year (Fig. 3). The ratio ofGM(CT)/GM(MT) was within a factor of 0.95 for h = �1 cm and 0.69for h = �4 cm. The values of CV were comparable to those recordedfor the first 2 years and slightly higher for MT (up to 77%). The ratioCV(CT)/CV(MT) ranged from a factor of 1.05 for h = �1 cm to 0.63for h = �2 cm. According to t-test, the differences of K between CTand MT were not statistically significant.
In general, unsaturated hydraulic conductivity is reported to behigher under CT than MT in coarse (Daraghmeh et al., 2008) andloam soils (Moreno et al., 1997; Miller et al., 1998; Cameira et al.,2003), with differences between the two treatments ranging aboutfrom a factor two or five to about one order of magnitude. On theother hand, some authors reported equal (Moret and Arrue, 2007a;Miller et al., 1998) or lower (Cameira et al., 2003) hydraulicconductivity under CT than MT.
The information available in the literature evaluating the tillageeffects on hydraulic conductivity showed that the K decreasedduring the growing season in tilled soils, due to soil structuralbreakdown and surface sealing, with root growth that progres-sively closes the pores (Messing and Jarvis, 1993; Logsdon et al.,1993).
The soil water content can influence the K measurements (orthe steady-state infiltration, is) near saturation, although theincreasing or decreasing of K values (or the is values) as a functionof ui is not very clear and/or it cannot be always generalized(Lin et al., 1998; Bagarello et al., 2000, 2010b; Das Gupta et al.,2006; Bagarello and Sgroi, 2007; Zhou et al., 2008; Schwen et al.,2011). Furthermore, such relation can vary according tothe imposed pressure head during the experiments (Das Guptaet al., 2006). Recently, Bagarello et al. (2010b), throughmeasurements of hydraulic conductivity with a concentric-disk
tension infiltrometer on a sandy loam soil and for pressure headmeasurements near saturation (�12 < h � �3 cm), observedvalues of K which are reduced by a factor 5 or 6 triplingthe value of the starting soil water content, ui (0.063–0.184 cm3 cm�3). A similar inverse relation between K and ui
was observed for both experiments at saturated (Reynolds andZebchuk, 1996; Bagarello and Sgroi, 2007) and at unsaturatedconditions (Lin et al., 1998; Bagarello et al., 2000; Zhou et al.,2008). The Authors concluded that the increase of soil hydraulicconductivity, under drier conditions, may be associated to theincrease of soil macroporosity, due to earthworm channels andsuperficial cracks (Zhou et al., 2008). Moreover, an increase of soilwater content can determine moderate swelling phenomena,weakening of soil aggregates and consequently a decrease involume of macropores (Bagarello et al., 2010b). More recentlySchwen et al. (2011), for a silt loam subjected to three differentsoil tillages (CT, reduced tillage, RT and no-tillage, NT), showed anegative relationship between the hydraulic conductivity corre-sponding to h = �10 cm (K10) and the initial soil water content(ui), with a weak correlation only for the no tilled soil. The slopeof the linear regression decreased in the order CT > RT > NT, toconfirm that the mesopores were more sensitive to changes in ui
for tilled soils (CT and RT), whereas it was more stable for NT(Schwen et al., 2011).
At high values of soil water content, interferences of water fluxfrom the infiltrometer disk are generally expected due to theinsufficient soil capillarity (Reynolds, 1993).
An opposite situation was verified by Daraghmeh et al. (2008)for a sandy loam soil subjected to CT and RT. The increasing of iswith increasing ui, in the spring-summer period, was evidentespecially near saturation (h = �1.5 and �3.0 cm), for RT treat-ment. The authors assigned this circumstance to the increase inwet stability aggregate under field moist conditions, and showing aclear association between infiltration rate and aggregate stability(�1.5 < h � �12 cm), concluding that though the relationshipcause-effect of the phenomenology is not very clear, it is generallyexpected an increase of infiltration rate to the decrease of ui and thestructural stability (Daraghmeh et al., 2008).
Relationships between K and ui both negative and positive, as afunction of the applied pressure head, were instead obtained fromDas Gupta et al. (2006). In particular, for a clay soil with a bimodalpore system, these authors highlighted negative relationships forlow values of h (�10 < h � �20 cm) and positive ones for valuesnear saturation (�5 < h � 0 cm), depending on whether themacropores system remained active or not. Moreover, theysuggested a hydrophobic effect which resulted stronger at lowerpotential values, and this when the macropores system remainedinactive and the water fluxes were lower.
Considering the obtained results and those reported in theliterature, in our case study on a vertisoil in medium-high soilmoisture conditions and limited to h = �10 cm, we hypothesize aninteraction between two physical phenomena: (i) increase instability aggregate and (ii) swelling phenomena. When we plottedK10 as a function of ui, for each of 3-year trial, we detected a positiverelationship between these two variables (Fig. 4), probably becausea wetter soil is more stable and hence more conductive than a driersoil. Moreover, even though the linear regression between K10 andui was not statistically significant in all cases (R2 � 0.162), theslopes of the linear regression decreased as the ui increased (Fig. 4).Then it is reasonable to assume that an increased soil wetnesspromoted moderate swelling phenomena and a reduction in poresvolume, especially for those with larger size to reduce the sectionhydraulically conductive. In any case, the differences of K
associated with CT and MT, during the 3-year trial, were notstatistically significant for the THSD test, and practically negligiblefor practical purposes.

R2 = 0.1582 R2 = 0.0265R2 = 0.1625
0
10
20
30
40
0.1 0.2 0. 3 0.4 0.5
i (cm3cm-3)
K1
0(c
m d
-1)
Fig. 4. Linear regressions between hydraulic conductivity corresponding to
h = �10 cm (K10) and initial soil water content (ui), for each of 3-year trial: 2007
(filled square), 2005 (open circle) and 2006 (stars), respectively.
Table 2Minimum and maximum value of square errors (MSE) and relative square errors
(RSE) for the two-line regression (TLE) model and Mualem (MUA) model fitted to
replicate infiltration runs.
TLE MUA
MSE 0.0003–0.0591 0.0030–0.6063
RSE 0.0004–0.0968 0.0070–0.1650
M. Castellini, D. Ventrella / Soil & Tillage Research 124 (2012) 47–56 53
3.3. Soil macro and mesoporosity
The double-exponential model, TLE (Messing and Jarvis, 1993),when it was applicable (77% of cases), has allowed the interpola-tion of a couple of values ln K–h in a satisfactory way (Fig. 3).
Compared to MUA model (Mualem, 1976), a preliminarycomparison between the two models has pointed out values ofthe mean squared error, MSE, lower for TLE about an order ofmagnitude (MSE within 0.0003–0.0591 for TLE and within 0.003–0.6063 for MUA). However, even if the MSE is a good estimator forlinear or nearly linear systems, RSE gave similar results (Table 2).Therefore, the TLE model was used to obtain the saturatedhydraulic conductivity estimates at zero potential (h = 0 cm), forthe determination of porosity indices (Watson and Luxmoore,1986). In the remaining 7 cases, for which it was not possible toapply the TLE model (23% of the total) due to an evident linearity ofthe ln K–h relationship, the estimate of Ks was obtained byapplying the simple linear model of Gardner (1958).
Table 3 reports the parameters of TLE model obtained throughsimultaneous fitting of K(h) measures. The value of the break-point, hb, measured in the 3 years of measurements was slightlyvariable and within a value of �3.3 and �4.4 cm. Comparableresults between CM and MT were found in 2005 and 2007(�4.2 < hb < �4.4 cm), whereas small differences were detected in2006, with higher values of hb for CT (hb = �3.3 cm) than for MT(hb = �3.8 cm).
The ratio a1/a2 was comparable in the years 2005 and 2007equal to 1.9–2.3 and 1.5–1.2 for CT and MT, respectively (Table 3).Finally, differences relatively higher between CT and MT have beenhighlighted in 2006 with values of a1/a2 equal to 1.2 and 1.9 due tothe differences of hb between the two treatments equal to about0.5 cm, with the macropores system of CT activated later than MT(Table 3).
The ratio a1/a2 can be considered as a measure of thebimodality of the soil pores system. Higher values characterize astrong bimodal pores system, with values of 10 being typical for
Table 3Estimated parameters with TLE model for each year of measurements and tillage treat
Year Tillage hb (cm) Kb (cm d�1)
2005 CT �4.2 47.2
MT �4.3 27.7
2006 CT �3.3 59.0
MT �3.8 45.3
2007 CT �4.4 33.6
MT �4.3 48.4
compacted soils with superficial cracks (Messing and Jarvis, 1993).Our soil typically shows deep cracks during the spring-summerseason. However, evident cracks were not observed during the K
measurements so as to initiate preferential draining ways and todetermine artificial values increase of the a1/a2 parameter due tothe relatively high effect of soil water content (on average higherthan 20%).
In the 3-year trial, the clay soil showed moderate characteristicsof bimodality, especially if it was compared with soils of similarcharacteristics. Values slightly higher than the ratio a1/a2 equal to3, for example, were highlighted by Messing and Jarvis (1993) for asoil with a similar clay content (about 40%), with humidityconditions comparable to those registered in 2006 (about ui = 39%)and recently tilled.
The number of pores per unit area, Np, and the effective porositycorresponding to up, calculated with Eqs. (4) and (5) for thedifferent classes of pores dimensions (macro and mesopores), arereported in Table 4. Since Np and up are calculated assuming theminimum radius for each considered interval of h, they representthe maximum value corresponding to the considered interval.
According to the capillarity theory, the value of Np for unitsurface was inversely proportional to the dimensions of poresclasses (Table 4). Generally, the ratios of Np between mesopores(0.375 > r > 0.15 mm) and macropores (0.375 > r > 0.15 mm),were comparable between CT and MT in 2005 (equal to a factorof 6 or 7, respectively), whereas they were generally differentin the remaining years with factors ranging between 7 and 14(Table 4).
Moreover, in four out of six considered cases (two pores classesfor three measurements years), the value of Np calculated for CTwas higher than the corresponding MT value (Table 4). Differencesbetween CT and MT higher than a factor of 2 were found only in2005 (equal to a factor of about 2.4 and 2.1, for macropores andmesopores, respectively), although the values of CV associatedwith those of CT were found on an average higher by a factor ofabout 2 or 4 compared with MT (Table 4). In the remaining 2 years,2006–2007, the differences between the values of Np for CT and MTwere smaller and equal at most, to a factor of 1.6 in the case ofmesopores (2006).
In general, the results reported in the literature show how theeffective porosity variability is inversely related with the porenumber. Given that the smaller pores are the result of the soilformation and structural restoration, often they show a lowerspatial variability than the large pores, which are associated withbiological activity (Cameira et al., 2003). However, our findingconfirmed such result only for MT, for which the ratio of CVbetween meso- and macropores ranged from a factor 1.6 and 2.2
ment (number of samples, N = 6).
Ks (cm d�1) a1 (cm�1) a2 (cm�1) a1/a2
259.8 0.4041 0.2099 1.9
163.2 0.4076 0.1801 2.3
174.2 0.3239 0.2608 1.2
192.9 0.3839 0.1991 1.9
150.4 0.3401 0.2207 1.5
150.0 0.2661 0.2275 1.2
2005
100 20 30 40 50 60 70 80 90 100
CT
MT
Fp (%)
2006
100 20 30 40 50 60 70 80 90 100
CT
MT
Fp (%)
2007
100 20 30 40 50 60 70 80 90 100
CT
MT
Fp (%)
macropores: r > 0.375 mm mesopores: 0.375 > r > 0.15 mm
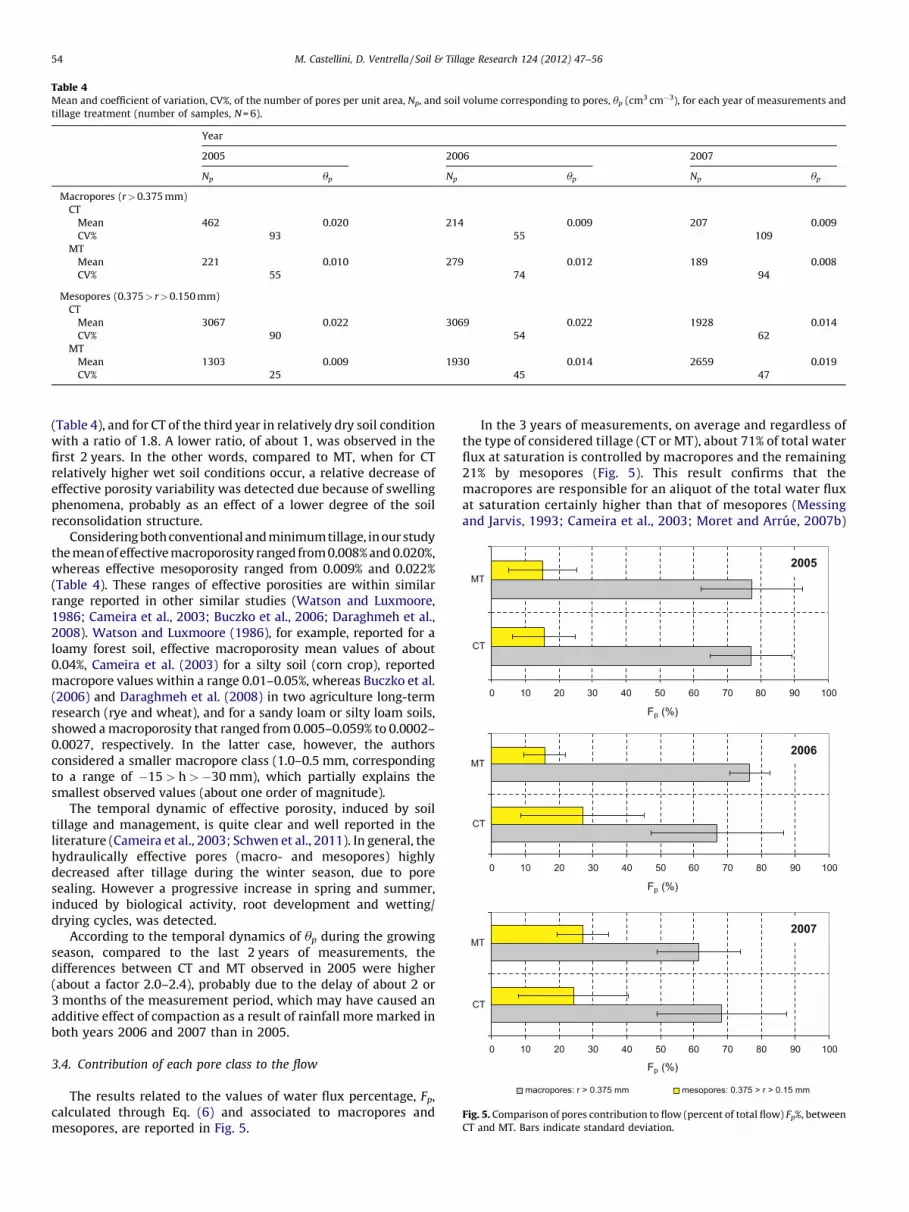
Fig. 5. Comparison of pores contribution to flow (percent of total flow) Fp%, between
CT and MT. Bars indicate standard deviation.
Table 4Mean and coefficient of variation, CV%, of the number of pores per unit area, Np, and soil volume corresponding to pores, up (cm3 cm�3), for each year of measurements and
tillage treatment (number of samples, N = 6).
Year
2005 2006 2007
Np up Np up Np up
Macropores (r > 0.375 mm)
CT
Mean 462 0.020 214 0.009 207 0.009
CV% 93 55 109
MT
Mean 221 0.010 279 0.012 189 0.008
CV% 55 74 94
Mesopores (0.375 > r > 0.150 mm)
CT
Mean 3067 0.022 3069 0.022 1928 0.014
CV% 90 54 62
MT
Mean 1303 0.009 1930 0.014 2659 0.019
CV% 25 45 47
M. Castellini, D. Ventrella / Soil & Tillage Research 124 (2012) 47–5654
(Table 4), and for CT of the third year in relatively dry soil conditionwith a ratio of 1.8. A lower ratio, of about 1, was observed in thefirst 2 years. In the other words, compared to MT, when for CTrelatively higher wet soil conditions occur, a relative decrease ofeffective porosity variability was detected due because of swellingphenomena, probably as an effect of a lower degree of the soilreconsolidation structure.
Considering both conventional and minimum tillage, in our studythe mean of effective macroporosity ranged from 0.008% and 0.020%,whereas effective mesoporosity ranged from 0.009% and 0.022%(Table 4). These ranges of effective porosities are within similarrange reported in other similar studies (Watson and Luxmoore,1986; Cameira et al., 2003; Buczko et al., 2006; Daraghmeh et al.,2008). Watson and Luxmoore (1986), for example, reported for aloamy forest soil, effective macroporosity mean values of about0.04%, Cameira et al. (2003) for a silty soil (corn crop), reportedmacropore values within a range 0.01–0.05%, whereas Buczko et al.(2006) and Daraghmeh et al. (2008) in two agriculture long-termresearch (rye and wheat), and for a sandy loam or silty loam soils,showed a macroporosity that ranged from 0.005–0.059% to 0.0002–0.0027, respectively. In the latter case, however, the authorsconsidered a smaller macropore class (1.0–0.5 mm, correspondingto a range of �15 > h > �30 mm), which partially explains thesmallest observed values (about one order of magnitude).
The temporal dynamic of effective porosity, induced by soiltillage and management, is quite clear and well reported in theliterature (Cameira et al., 2003; Schwen et al., 2011). In general, thehydraulically effective pores (macro- and mesopores) highlydecreased after tillage during the winter season, due to poresealing. However a progressive increase in spring and summer,induced by biological activity, root development and wetting/drying cycles, was detected.
According to the temporal dynamics of up during the growingseason, compared to the last 2 years of measurements, thedifferences between CT and MT observed in 2005 were higher(about a factor 2.0–2.4), probably due to the delay of about 2 or3 months of the measurement period, which may have caused anadditive effect of compaction as a result of rainfall more marked inboth years 2006 and 2007 than in 2005.
3.4. Contribution of each pore class to the flow
The results related to the values of water flux percentage, Fp,calculated through Eq. (6) and associated to macropores andmesopores, are reported in Fig. 5.
In the 3 years of measurements, on average and regardless ofthe type of considered tillage (CT or MT), about 71% of total waterflux at saturation is controlled by macropores and the remaining21% by mesopores (Fig. 5). This result confirms that themacropores are responsible for an aliquot of the total water fluxat saturation certainly higher than that of mesopores (Messingand Jarvis, 1993; Cameira et al., 2003; Moret and Arrue, 2007b)
M. Castellini, D. Ventrella / Soil & Tillage Research 124 (2012) 47–56 55
against the smallest fraction of total soil water conductiveporosity (Table 4).
Equivalent results between CT and MT were showed in the firstyear (2005) in terms of pores contribution to the total water flux atsaturation, with values of Fp equal to about 77% and 15% formacropores and mesopores, respectively (Fig. 5).
In the two following years, higher values of Fp in the macroporeswere associated with MT in 2006 (about 76.5%) and CT in 2007(about 68%). Furthermore in the third year, characterized by valuesof soil water content lower than those in the two previous years,the aliquot of flux in the mesopores was higher and equal to abouta quarter of the total flux (Fig. 5). Such differences between CT andMT corresponding to the 3 years, however, were not significant fora t-test, whereas when the comparison was done considering thesum of Fp values, corresponding to macropores and mesopores, thevalues were always higher than 92% except for the third year forwhich MT was equal to 88.5%. These total flux data were alwayshigher for CT than MT, with percentage differences between thetwo tillages that were low in the two first years (nearly equal to1.5%), and slightly higher in the third year for MT (equal to 4%).
As a final point, it can be said that the data observed in 2007 forMT, for which the values lower than ui are associated with anincrease of flux in mesopores and a corresponding decrease inmacropores, indirectly confirm a better attitude of the structuredsoils or a recovery of better soil structure during the growingseason, and thus the water can flow to the larger pores when thesoil is close to water saturation (Moret and Arrue, 2007b; Cameiraet al., 2003).
4. Conclusions
The principal aim of this study was to evaluate the differences ofsoil hydraulic properties due to the different tillage systemscharacterized by conventional and minimum plowing, in a long-term field research of a typical cropping system of Southern Italybased on cultivation of winter durum wheat. In general, the effectsof the tillage on the hydraulic conductivity of the shallow layerswere lost during the growing season due the effect of rainfall androot growth, soil structural break down, mobilization of fineparticles and surface sealing. However, it is necessary toindividuate a determined period of the crop season in order tocompare measurements carried out in different years.
For the study clay soil, for each of the 3 years of theinfiltrometric measurements done in the last part of growingseason, the differences of K near saturation between CT and MTwere always very low (lower than a factor of 1.6) and probablyirrelevant for useful purposes. The differences of hydraulicconductivity were never significant, and the two relations ofK(h) basically coincided for the higher value of soil humidity due tothe effects of swelling phenomena and decrease in volume of thelarger pores.
Considering the texture of the soil, the general variability of themeasurements can be believed relatively low (CV nearly equal to128%).
This study supported the results found by other papers withlarge increases in K (about one order of magnitude) observed forsmall increases in soil water pressure head (about 9 cm),regardless of tillage management. The bimodal two-line exponen-tial functions, when applicable, were found to be adequate todescribe K near saturation quantifying the water flux in the macro–mesopore system and describing it in terms of break-pointpressure head, slopes for two or more regression lines andhydraulic conductivity at break-point and saturation. The ratio a1/a2 may be considered a measure of the bimodality of the porenetwork, and this soil showed an appreciable bimodal behaviorwith a ratio equal, at the most, to a factor 2.4.
We also confirmed that such macroporosity is a small fractionof total porosity, but it explains a very large fraction (about 70%) ofthe water fluxes into the soil. When we considered both macro-andmesoporosity, this percentage increases about 93% for CT and 91%for MT.
The reduction of the Fp values for the macropores, associatedwith the lower conditions of soil humidity, have indirectlyconfirmed that the hydraulic conductivity near saturation ishigher in the larger pores which are characterized by betterinterconnection and continuity.
Based on the conclusions of Maiorana et al. (2003) regarding theyield analysis from 1991 to 2001 of the same research that we haveconsidered, the treatments with shallow soil tillage and cropresidues incorporation gave grain yields and protein contentssimilar to those obtained with the deepest plowing.
Our results highlighted a significant equivalence of soilhydraulic properties between conventional and minimum tillage.Therefore, for the case study that we carried out for the typicalcropping system of Southern Italy, the shallow soil tillage can beconsidered the preferable to deepest plowing because the latter ischaracterized by high-cost (about double per unit-area), higherimpact in terms of greenhouse gases emissions in the environment(+20% L/h of gas fuel) compared to shallow tillage.
Acknowledgements
We wish to sincerely thank F. Fornaro and L. Giglio for the helpin the experimental work both in the field and in the laboratory.
References
Ankeny, M.D., Kaspar, T.C., Horton, R., 1990. Characterization of tillage and trafficeffects on unconfined infiltration measurements. Soil Science Society of Amer-ica Journal 54, 837–840.
Ankeny, M.D., Ahmed, M., Kaspar, T.C., Horton, R., 1991. Simple field method fordetermining unsaturated hydraulic conductivity. Soil Science Society of Amer-ica Journal 55, 467–470.
Azevedo, A.S., Kanwar, R.S., Horton, R., 1998. Effect of cultivation on hydraulicproperties of an Iowa soil using tension infiltrometer. Soil Science 163 (1),22–29.
Bagarello, V., Iovino, M., Tusa, G., 2000. Factors affecting measurement of the nearsaturated soil hydraulic conductivity. Soil Science Society of America Journal 64,1203–1210.
Bagarello, V., Castellini, M., Iovino, M., 2005. Influence of the pressure headsequence on the soil hydraulic conductivity determined with the tensioninfiltrometer. Applied Engineering in Agriculture 21, 383–391.
Bagarello, V., Sgroi, A., 2007. Using the simplified falling head technique to detecttemporal changes in field-saturated hydraulic conductivity at the surface of asandy loam soil. Soil and Tillage Research 94, 283–294.
Bagarello, V., Di Stefano, C., Ferro, V., Iovino, M., Sgroi, A., 2010a. Physical andhydraulic characterization of a clay soil at the plot scale. Journal of Hydrology387, 54–64.
Bagarello, V., Castellini, M., Iovino, M., Sgroi, A., 2010b. Testing the concentric-disktension infiltrometer for field measurements of soil hydraulic conductivity.Geoderma 158, 427–435.
Beven, K., Germann, P., 1982. Macropores and water flow in soils. Water ResourcesResearch 18 (5), 1311–1325.
Bodhinayake, W., Si, B.C., 2004. Near-saturated surface soil hydraulic propertiesunder different land uses in the St Denis National Wildlife Area, Saskatchewan,Canada. Hydrological Processes 18, 2835–2850.
Bouma, J., Wosten, J.H.M., 1984. Characterizing ponded infiltration in a dry crackedclay soil. Journal of Hydrology 69, 297–304.
Buczko, U., Bens, O., Huttl, R.F., 2006. Tillage effects on hydraulic properties andmacroporosity in silty and sandy soils. Soil Science Society of America Journal70, 1998–2007.
Cameira, M.R., Fernando, R.M., Pereira, L.S., 2003. Soil macropore dynamics affectedby tillage and irrigation for a silty loam alluvial soil in southern Portugal. Soiland Tillage Research 70, 131–140.
Carof, M., de Tourdonnet, S., Coquet, Y., Hallaire, V., Roger-Estrade, J., 2007. Hy-draulic conductivity and porosity under conventional and no-tillage and theeffect of three species of cover crop in northern France. Soil Use and Manage-ment 23, 230–237.
Caron, J., Elrick, D., 2005. Measuring the unsaturated hydraulic conductivity ofgrowing media with a tension disc. Soil Science Society of America Journal 69,783–793.
Childs, E.C., Collis-George, N., 1950. The permeability of porous materials. Proceed-ings of the Royal Society of London Series A 201, 392–405.
M. Castellini, D. Ventrella / Soil & Tillage Research 124 (2012) 47–5656
Daraghmeh, O.A., Jensen, J.R., Petersen, C.T., 2008. Near-saturated hydraulic prop-erties in the surface layer of a sandy loam soil under conventional and reducedtillage. Soil Science Society of America Journal 72, 1728–1737.
Das Gupta, S., Mohanty, B.P., Kohne, J.M., 2006. Soil hydraulic conductivities andtheir spatial and temporal variations in a vertisol. Soil Science Society ofAmerica Journal 70, 1872–1881.
Durner, W., 1994. Hydraulic conductivity estimation for soils with heterogeneouspore structure. Water Resources Research 30, 211–233.
Gardner, W.R., 1958. Some steady-state solutions of the unsaturated moisture flowequation with application to evaporation from a water table. Soil Science 85,228–232.
Gee, G.W., Or, D., 2002. Particle-size analysis. In: Dane, J.H., Topp, G.C. (Eds.),Methods of Soil Analysis: Part 4, Physical Methods, Number 5 in the Soil ScienceSociety of America Book Series. Soil Science Society of America, Inc., Madison,WI, pp. 255–293.
Gomez, J.A., Giraldez, J.V., Pastor, M., Fereres, E., 1999. Effects of tillage method onsoil physical properties, infiltration and yield in an olive orchard. Soil and TillageResearch 52, 167–175.
Hendrickx, J.M.H., Flury, M., 2001. Uniform and preferential flow, mechanisms inthe vadose zone. In: Conceptual Models of Flow and Transport in the FracturedVadose Zone, National Research Council, National Academy Press, Washington,DC, pp. 149–187.
Hillel, D., 1998. Environmental Soil Physics. Academic Press, San Diego, CA, pp.771.Jarvis, N.J., Messing, I., 1995. Near-saturated hydraulic conductivity in soils of
contrasting texture measured by tension infiltrometers. Soil Science Societyof America Journal 59, 27–34.
Lee, D.M., Reynolds, W.D., Elrick, D.E., Clothier, B.E., 1985. A comparison of threefield methods for measuring saturated hydraulic conductivity. Canadian Journalof Soil Science 65, 563–573.
Lin, H.S., McInnes, K.J., 1995. Water flow in clay soil beneath a tension infiltrometer.Soil Science 159, 375–382.
Lin, H.S., McInnes, K.J., Wilding, L.P., Hallmark, C.T., 1998. Macroporosity and initialmoisture effects on infiltration rates in vertisols and vertic intergrades. SoilScience 163, 2–8.
Logsdon, S.D., Jordal, J.L., Karlen, D.L., 1993. Tillage and crop effects on ponded andtension infiltration rates. Soil and Tillage Research 28, 179–189.
Luxmoore, R.J., 1981. Micro-, meso-, and macroporosity of soil. Soil Science Societyof America Journal 45, 671–672.
Luxmoore, R.J., Jardine, P.M., Wilson, G.V., Jones, J.R., Zelazny, L.W., 1990. Physicaland chemical controls of preferred path flow through a forested hillslope.Geoderma 46, 139–154.
Maiorana, M., Convertini, G., Ferri, D., Montemurro, F., 2003. Effects of soil tillagedepth and crop residues incorporation on yield and quality of winter wheat(Triticum durum Desf.) in continuous cropping. In: Pullammanappallil, P., Mc-Comb, A.,Diaz, L.F.,Bidlingmaier, W. (Eds.),Proceeding of the Fourth InternationalConference of ORBIT association on Biological Processing of Organics: Advancesfor Sustainable Society, Perth, Australia, 30 April–2 May, pp. 295–303.
Messing, I., Jarvis, N.J., 1993. Temporal variation in the hydraulic conductivity of atilled clay soil as measured by tension infiltrometers. Journal of Soil Science 44,11–24.
Miller, J.J., Sweetland, N.J., Larney, F.J., Volkmar, K.M., 1998. Unsaturated hydraulicconductivity of conventional and conservation tillage soils in southern Alberta.Canadian Journal of Soil Science 78 (4), 643–648.
Mohanty, B.P., Ankeny, M.D., Horton, R., Kanwar, R.S., 1994. Spatial analysis ofhydraulic conductivity measured using disc infiltrometers. Water ResourcesResearch 30, 2489–2498.
Mohanty, B.P., Bowman, R.S., Hendrickx, J.M.H., van Genuchten, M.T., 1997. Newpiecewise-continuous hydraulic functions for modeling preferential flow in anintermittent flood-irrigated field. Water Resources Research 33, 2049–2063.
Moreno, F., Pelegrın, F., Fernandez, J.E., Murillo, J.M., 1997. Soil physical properties,water depletion and crop development under traditional and conservationtillage in southern Spain. Soil and Tillage Research 41 (1–2), 25–42.
Moret, D., Arrue, J.L., 2007a. Dynamics of soil hydraulic properties during fallow asaffected by tillage. Soil and Tillage Research 96, 103–113.
Moret, D., Arrue, J.L., 2007b. Characterizing soil water-conducting macro- andmesoporosity as influenced by tillage using tension infiltrometry. Soil ScienceSociety of America Journal 71, 500–506.
Mualem, Y., 1976. A new model predicting the hydraulic conductivity of unsatu-rated porous media. Water Resources Research 12, 513–522.
Othmer, H., Diekkruger, B., Kutilek, M., 1991. Bimodal porosity and unsaturatedhydraulic conductivity. Soil Science 152, 139–150.
Potter, K.N., Torbert, H.A., Morrison Jr., J.E., 1995. Tillage and residue effects oninfiltration and sediment losses on vertisols. Transactions of the ASAE 38 (5),1413–1419.
Reynolds, W.D., Elrick, D.E., 1991. Determination of hydraulic conductivity usingtension infiltrometer. Soil Science Society of America Journal 55, 633–639.
Reynolds, W.D., 1993. Unsaturated hydraulic conductivity: field measurement. In:Carter, M.R. (Ed.), Soil Sampling and Methods of Analysis. Lewis Publ., BocaRaton, FL, pp. 633–644.
Reynolds, W.D., Zebchuk, W.D., 1996. Use of contact material in tension infiltrom-eter measurements. Soil Technology 9, 141–159.
Ross, P.J., Smettem, K.R., 2000. A simple treatment of physical nonequilibrium waterflow in soils. Soil Science Society of America Journal 64, 1926–1930.
Schwen, A., Bodner, G., Scholl, P., Buchan, G.D., Loiskandl, W., 2011. Temporaldynamics of soil hydraulic properties and the water-conducting porosity underdifferent tillage. Soil and Tillage Research 113 (2), 89–98.
Simunek, J., Jarvis, N.J., van Genuchten, M.T., Gardenas, A., 2003. Review andcomparison of models for describing non-equilibrium and preferential flowand transport in the vadose zone. Journal of Hydrology 272, 14–35.
Smettem, K.R.J., Chettleborough, D.J., Fichards, B.G., Leaney, F.W., 1991. The influ-ence of macropores on runoff generation from a hillslope soil with a contrastingtextural class. Journal of Hydrology 122, 235–252.
SSSA, 2008. Glossary of Soil Science Terms. SSSA, Madison, WI. , www.soils.org/publications/soils-glossary.
van Genuchten, M.Th., 1980. A closed-form equation for predicting the hydraulicconductivity of unsaturated soil. Soil Science Society of America Journal 44,892–898.
Ventrella, D., Losavio, N., Vonella, V.A., Leij, F.J., 2005. Estimating hydraulic con-ductivity of a fine-textured soil using tension infiltrometer. Geoderma 124,267–277.
Watson, K., Luxmoore, R., 1986. Estimating macroporosity in a forest watershedby use of a tension infiltrometer. Soil Science Society of America Journal 50,578–582.
Zhou, X., Lin, H.S., White, E.A., 2008. Surface soil hydraulic properties in four soilseries under different land uses and their temporal changes. Catena 73 (2),180–188.


