Embed Size (px)
Citation preview
www.elsevier.com/locate/cogbrainres
Cognitive Brain Research
Research Report
Imagery of motor actions: Differential effects of kinesthetic and
visual–motor mode of imagery in single-trial EEG
Christa Neupera,b,*, Reinhold Schererc, Miriam Reinerd, Gert Pfurtschellera,c
aLudwig Boltzmann-Institute for Medical Informatics and Neuroinformatics, Graz University of Technology, Graz, AustriabDepartment of Psychology, University of Graz, Austria
cLaboratory of Brain–Computer Interface, Institute of Computer Graphics and Vision, Graz University of Technology, Graz, AustriadTechnion-Israel Institute of Technology, Haifa, Israel
Accepted 26 August 2005
Available online 19 October 2005
Abstract
Single-trial motor imagery classification is an integral part of a number of brain–computer interface (BCI) systems. The possible
significance of the kind of imagery, involving rather kinesthetic or visual representations of actions, was addressed using the following
experimental conditions: kinesthetic motor imagery (MIK), visual–motor imagery (MIV), motor execution (ME) and observation of
movement (OOM). Based on multi-channel EEG recordings in 14 right-handed participants, we applied a learning classifier, the
distinction sensitive learning vector quantization (DSLVQ) to identify relevant features (i.e., frequency bands, electrode sites) for
recognition of the respective mental states. For ME and OOM, the overall classification accuracies were about 80%. The rates
obtained for MIK (67%) were better than the results of MIV (56%). Moreover, the focus of activity during kinesthetic imagery was
found close to the sensorimotor hand area, whereas visual–motor imagery did not reveal a clear spatial pattern. Consequently, to
improve motor-imagery-based BCI control, user training should emphasize kinesthetic experiences instead of visual representations of
actions.
D 2005 Elsevier B.V. All rights reserved.
Theme: Neural basis of behavior
Topic: Cognition
Keywords: Motor imagery; Single-trial EEG; Event-related (de-)synchronization; ERD/ERS; Brain–computer interface (BCI)
1. Introduction
The use of mental imagery of motor behavior plays an
important role in motor skill learning [11] and rehabil-
itation [39]. Aside from these classical applications, motor
imagery, defined as mental simulation of a movement
[5,13], has been shown to represent an efficient mental
strategy to operate a direct brain–computer interface (BCI)
[22]. For the latter application, e.g. the control of an
0926-6410/$ - see front matter D 2005 Elsevier B.V. All rights reserved.
doi:10.1016/j.cogbrainres.2005.08.014
* Corresponding author. Department of Psychology, University of Graz,
Austria. Fax: +43 316 380 9811.
E-mail address: [email protected] (C. Neuper).
external device based on brain signals (i.e., EEG signals),
it is essential that imagery-related brain activity can be
detected in real time from the ongoing EEG. The main
goal of this research work is to establish an EEG-based
communication system that should provide an alternative
communication or control channel for patients with severe
motor impairment [40].
It has been shown that mental imagery of motor actions
can produce replicable EEG patterns over primary sensory
and motor areas [2,21]. As an example, imagery of hand
movements results in desynchronization of mu (8–12 Hz)
and central beta rhythms (13–28 Hz), very similar to
planning and execution of real movements [17]. It is even
possible to distinguish between imagined right and left
25 (2005) 668 – 677
ME Motor execution: subjects held a small ball in their right fist,
while their forearm rested on the arm rest. They were instructed to
perform continuous hand movements by clenching softly the ball
during indicated time periods as described below.
MIK Imagery of hand movement (Fkinesthetic_): subjects were
instructed to imagine clenching softly a ball with their right
hand, while their arm rested relaxed on the arm rest. They were
asked to imagine the kinesthetic experience of movement while
avoiding muscle tension.
OOM Observation of hand movement: subjects observed grasping
movements of an animated (right) hand. They were instructed
to sit relaxed and watch the presentation on the monitor in front of
them.
MIV Imagery of hand movement (Fvisual–motor_): subjects were
instructed to visualize right hand movements; specifically, they
were asked to create a Fmental video_ of the movements of the
Falien_ hand they watched in the previous condition.
C. Neuper et al. / Cognitive Brain Research 25 (2005) 668–677 669
hand movements based on single-trial EEG signals
[19,22,24]. These data strongly indicate a type of readiness
or presetting of neural networks in sensorimotor areas
during mental simulation of movement. Further evidence
in favor of matching cortical activity in the contralateral
hand area during execution and imagination of hand
movement comes from DC potential measurements [2]
and dipole source analysis of electric and magnetic fields
[14].
Even though it has been well documented that
imagination of simple movements elicits predictable
changes in the sensorimotor mu and beta bands, which
are very stable over time (i.e., small intra-subject varia-
bility), there are also conflicting results of a portion of
participants, who do not show the expected imagery-
related EEG changes [22]. Moreover, a diversity of time–
frequency patterns (i.e., high inter-subject variability),
especially with respect to the reactive frequency compo-
nents, was found when studying the dynamics of
oscillatory activity during movement imagination
[17,25,38].
The observed individual differences in imagery-related
EEG changes may be explained by varieties of motor
imagery, as described by Annett [1]. In case that there is
no specific instruction, the subject may, for example,
either imagine self-performed action with Finterior view_or, alternatively, imagine seeing himself or another person
performing actions with an exterior view (i.e., Fmental
video_) [4]. Whereas the first type of imagery is
supposed to involve kinesthetic experiences [34], the
second case may be primarily visual in character. Based
on the general idea that imagining is functionally
equivalent to and may share some of the brain processes
associated with real perception and action [1,35], the
different ways how subjects perform motor imagery are
very likely associated with dissimilar electrophysiological
activation patterns (i.e., in terms of time, frequency and
spatial domains).
In the present study, we investigated the EEG patterns
sensitive to different types of motor imagery. In particular,
the instruction how to imagine action was varied to create
(i) kinesthetic motor imagery (first-person process) and (ii)
visual–motor imagery (third-person process). For control
purposes, also Freal conditions_ were examined, i.e., the
execution and visual observation of physical hand move-
ments, respectively. The goal of this study was to identify
relevant features of the ongoing multi-channel EEG (i.e.,
electrode locations and reactive frequency components) that
represent the specific mental processes. In order to
determine the relevant features for recognizing the respec-
tive mental states, a neural network classifier, the dis-
tinction sensitive learning vector quantization (DSLVQ)
[29] algorithm, was used. This method uses a weighted
distance function and adjusts the influence of different input
features (e.g. frequency components) through supervised
learning.
2. Methods
2.1. Subjects
Fourteen healthy volunteers, aged 18–53 years (mean =
26.2, SD = 8.3), participated in the study. All were right-
handed, without any medical or psychological diseases and/
or medication and had normal or corrected to normal vision.
The participants gave informed consent after the experimen-
tal procedure had been explained to them and received a small
fee for their participation.
2.2. Experimental tasks and procedure
During the experiment, the participants were sitting
in a comfortable armchair in front of a 17W monitor at a
distance of about 1.3 m, in an electrically shielded
recording room. Four experimental tasks were performed
during EEG recording. Before each task condition, verbal
instructions were given, and a number of training trials
were presented to the participants until they felt
confident enough that they could perform the respective
task.
Besides the specific task instructions, the participants
were asked to sit relaxed with eyes open and to avoid any
eye movements and body movements other than requested.
The correct task execution was monitored using a video
system installed in the recording compartment. Subjective
ratings of the vividness of the imagined movements were
obtained by verbal report after completion of the respective
task.
For the visual stimulus presentation (in condition OOM),
a digitized video sequence of a realistic (animated) hand was
presented on the screen. The animated hand was a right
(open) hand which appeared at the beginning of the trial
(i.e., at second 2) and remained static for 1 s. Then, it began
to close (make a fist) and to open again. This action was
C. Neuper et al. / Cognitive Brain Research 25 (2005) 668–677670
presented two times in a sequence lasting 3 s; thereafter, the
hand remained in a static (open) position on the screen for
one more second (second 7).
The experiment was divided into two blocks. One started
with the visual presentation of the animated hand (OOM),
the other started with the actual execution of hand move-
ments (ME). In order to facilitate the respective imagery
task, a sequence of the conditions was chosen that both
imagery tasks were preceded by the corresponding Freal_task, that is, MIK followed ME, and MIV was performed
straight after OOM, respectively. The sequence of the 2
blocks was counterbalanced between subjects.
Each of the 4 tasks was presented in a separate run
which contained 40 trials of 8 s. Each started with the
presentation of a fixation cross at the center of the monitor
(second 0). A beep tone at second 2 indicated the
beginning of the respective task: subjects should either
watch the movements of the animated hand, or perform
movements themselves, or imagine hand movements until
a double beep tone marked the end of the task (second 7).
During the last second of the trial (second 8), there was a
blank screen. The inter-trial period until the beginning of
the next trial varied randomly between 0.5 and 2.5 s.
Between the different tasks, there were breaks of 3 to
5 min.
2.3. EEG recordings and preprocessing
Continuous EEG signals were recorded from 33 scalp
sites (Ag–AgCl electrodes, extended 10–20 system) using
an electrode cap (Easycap, Germany) fitted to the subject’s
head. A ground electrode was placed on the forehead. A
reference electrode was placed on the left mastoid, but all
EEG data were converted to common average reference
prior to analysis. EOG was recorded bipolarly between 2
electrodes diagonally placed above and below the inner
respectively the outer canthus of the right eye. Recording
and digitization were carried out using Neuroscan Synamps
amplifier with signal bandpass 0.3–50 Hz and an addi-
tional 50 Hz notch filter. The data, including trigger signals,
were sampled at 250 Hz. After triggering the data, trials of
8-s length were obtained including 2 s before the beep tone.
All trials were visually controlled for artifacts, and affected
trials were excluded from further analyses. For data
preprocessing, the software package BIOSIG [33] was
used.
2.4. Signal processing
In a first step of analysis, the EEG data were subjected
to an ERD/ERS time–frequency analysis [10] for purpose
of convenient data inspection. The resulting ERD/ERS
maps represent plots of significant ERD (percentage band
power decrease) and ERS (power increase) in 2-Hz
frequency bands within a given frequency range (e.g. 6–
36 Hz).
To overcome the problem of high interindividual
variability in ERD/ERS patterns and also according to the
main purpose of this study, the results reported below
concern data from further analyses, in which we applied a
neural network classifier to identify the most relevant
cortical regions and reactive EEG frequency components
for the different experimental tasks. To this end, we
addressed the questions (i) which of the 33 EEG deri-
vations were the most relevant for the recognition of the
respective experimental task and (ii) which of the frequency
components of interest (in the most important derivation)
were the most relevant signal features associated with a
given task.
For this selection procedure, the Fdistinction sensitive
learning vector quantization_ (DSLVQ), an extended ver-
sion of Kohonen’s Learning Vector Quantization algorithm
(LVQ), was used (for details, see [28]). LVQ uses a reduced
number of codebook vectors (labeled reference vectors) to
approximate the optimal Bayesian decision borders between
different classes. Each sample is classified to the label of its
closest codebook vector according to a distance function
(e.g. Euclidean distance); the influence of the features on
the distance function is equal. DSLVQ introduces a
weighted distance function which rates the influence of
the features for classification: most informative features are
upgraded; features that contribute to misclassification are
discarded. The LVQ codebook splits the classification
problem into sub-problems. By finding an optimal linear
approximation for the sub-problems, the relevance of the
features, which determines the correct classification, is
analyzed [28]. The major advantage of DSLVQ is that it
does not require expertise nor any a priori knowledge or
assumption about the distribution of the data. Furthermore,
not only relevant features, but also feature combinations,
are identified.
For the single-trial DSLVQ analysis from each trial,
two time segments of 1-s length were extracted, one was
taken from the reference period (i.e., 0.5–1.5 s) the other
from the task period (i.e., 3.5–4.5 s). For each segment,
14 non-overlapping frequency components between 6 and
36 Hz with a bandwidth of 2 Hz were calculated. The
frequency components were computed by digitally band-
pass filtering the EEG signal, squaring and averaging the
samples in the analyzed 1-s time window. From this
averaged value, the logarithm was calculated. The number
of features was limited to 14 because of the limited
number of trials. With the features computed from the
reference interval (labeled as class 1) and the features
extracted from the task interval (class 2) for all trials
(separately for each task and for each electrode position), a
DSLVQ classification was performed.
In order to obtain reliable values of the classification
performance and the feature relevance, the DSLVQ
method was repeated 100 times. For each run of the
DSLVQ classification, a randomly selected 50% of the
computed features were used for the training, and the

C. Neuper et al. / Cognitive Brain Research 25 (2005) 668–677 671
remaining 50% were kept to test the classifier. Each class,
represented by 3 codebook vectors, was initialized with k-
means clustering. The initial clustering was repeated when
a codebook represented less than 5% or more than 75%
of the total number of samples for a maximum of 100
retries. Finally, the classifier was fine-tuned with DSLVQ
type C training (10.000 iterations). The learning rate
decreased from an initial value of a = 0.05 to a = 0. The
DSLVQ relevance values were updated with the learning
rate aV(t) = 0.1 * a(t).
3. Results
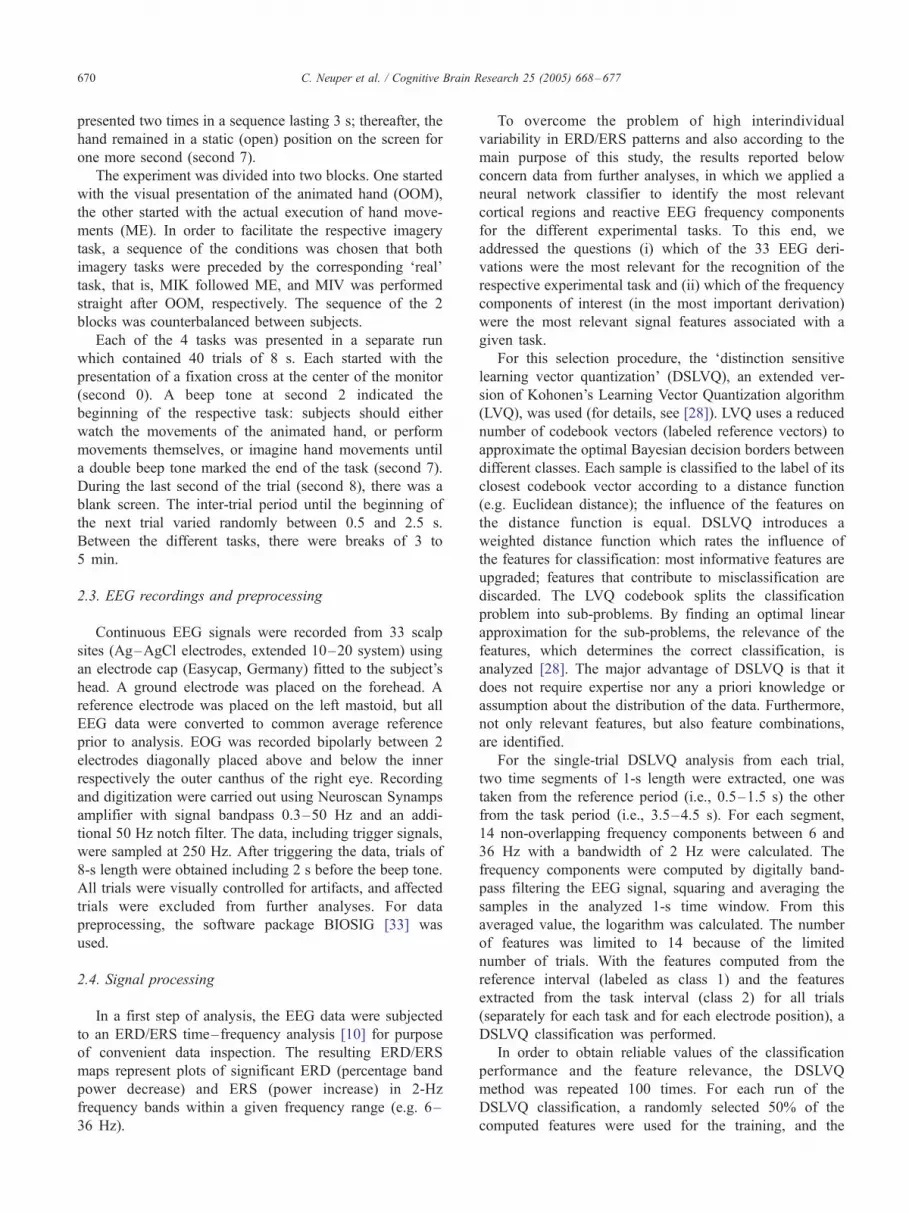
Visual inspection of the individual ERD/ERS time–
frequency maps revealed event-related EEG changes in
alpha and beta frequency bands, which differed dependent
on the experimental task; the patterns of desynchronization
and synchronization, however, varied considerably across
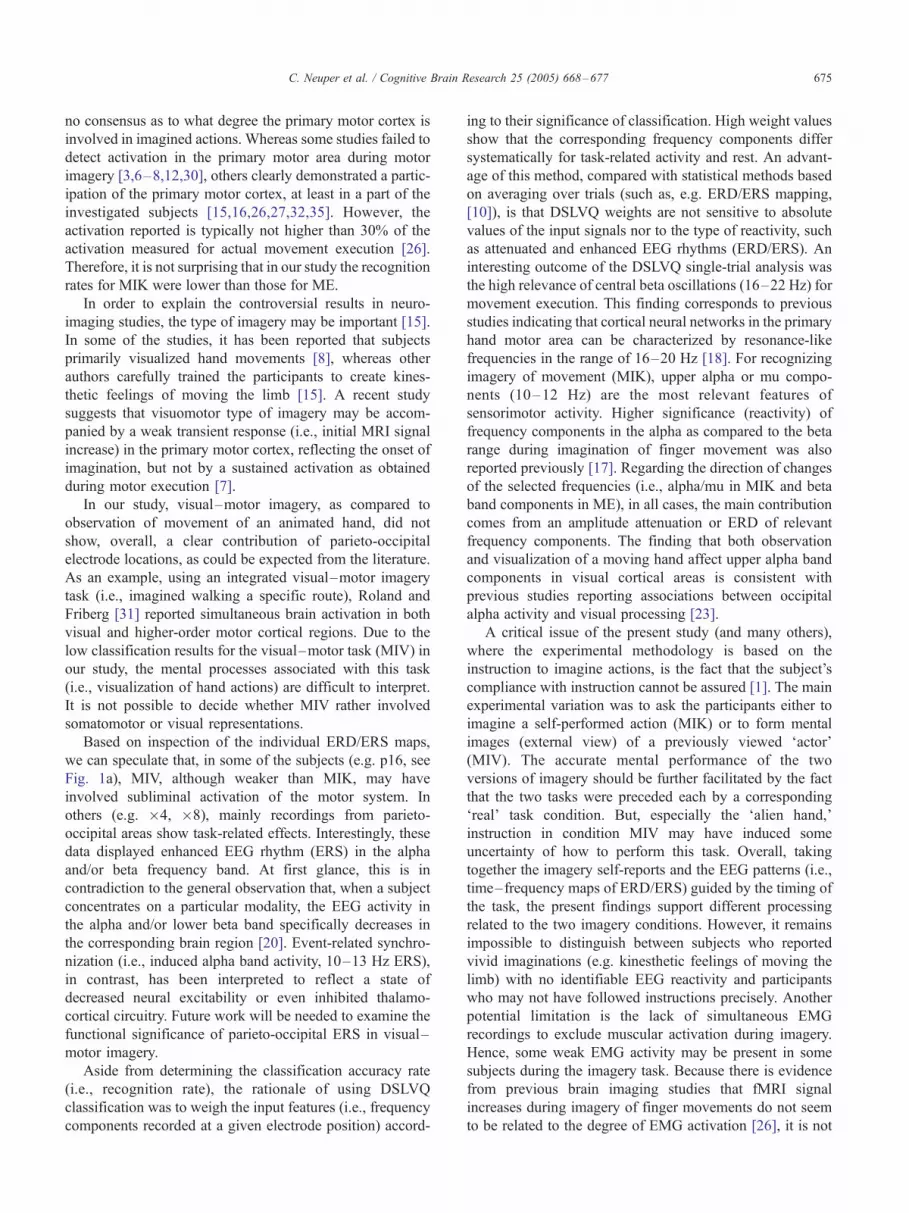
individuals. Fig. 1a illustrates such examples of various
ERD/ERS phenomena of 3 selected subjects. All of them
show clear differences between kinesthetic (MIK) and
visual–motor imagery (MIV): the first example (subject
p16) shows clear desynchronization of lower alpha and
beta band components during both kinds of imagery, even
somewhat stronger with MIV than with MIK; a crucial
difference is that, only with MIK, this desynchronization
pattern over sensorimotor areas is followed by a beta band
synchronization (beta ERS). In subject �4, we found a
clearly stronger ERD of sensorimotor alpha and beta band
components for MIK than for MIV. Also in the third case
(subject �8), MIK is associated with a clear contralateral
ERD of alpha and beta band components, whereas MIV is
rather associated with patterns of synchronized activity
(i.e., amplitude enhancement, ERS). Due to the high
interindividual variability of ERD/ERS patterns, by aver-
aging over the whole group of subjects, the observed
phenomena (i.e., ERD and ERS) would cancel each other
out, and the average data would not reveal clear ERD/ERS
differences between the tasks.
Fig. 1b gives an overview of the topographical distribu-
tion of the classification accuracy rates for the recognition of
the different tasks by means of DSLVQ analysis. The maps
show a linear interpolation of the classification accuracies
over all subjects, which have been plotted at the corre-
sponding electrode positions. Red areas indicate most
relevant electrode positions for the recognition of the
respective task, whereas recording locations coded in blue
did not provide essential information. The results show that
electrodes overlying approximately the sensorimotor hand
area (i.e., close to position C3) provide the best input
features for the recognition of both the motor execution
(ME) and the kinesthetic motor imagery (MIK) task. For the
observation of hand movement (OOM), highest classifica-
tion accuracies were achieved for electrodes overlying the
occipital cortical areas (channels O1 and O2). This is not
surprising because visual input always affects the brain
activity in occipital areas. Less clear is the topographical
picture obtained for the visual–motor type of imagery
(MIV), indicating some relevance of frontal and right
parieto-occipital areas.
Table 1 presents the results of the single-trial analysis by
DSLVQ of all subjects for two selected electrode positions,
i.e., the most important sites that are very close to the
sensorimotor (C3) and visual areas (O2) of the cortex. Each
value corresponds to the mean classification result of the
100 DSLVQ repetitions. These data show that the highest
classification accuracies, in average, were achieved for
motor execution (ME) and observation of movement
(OOM), both at the corresponding representation areas
(i.e., at positions C3 and O2, respectively). Thus, as could
be expected, the Freal_ conditions yield better classification
accuracies compared to the imagery conditions. However,
individuals are sensitive to the task conditions in different
degrees. Albeit the great variability of the classification
accuracy between the participants, the classification accu-
racies obtained for the kinesthetic type of imagery (MIK)
are in average better than the results of the visual–motor
imagery (MIV).
This observation was confirmed by statistical compa-
risons of the obtained classification results. The classifica-
tion accuracies from central (C3, C4) and occipital (O1,
O2) sites were subjected to a repeated measures ANOVA
with the factors TASK (4 levels: ME, MIK, OOM, MIV),
REGION (2 levels: central vs. occipital) and HEMI-
SPHERE (2 levels: left vs. right) as within subject
variables. The results yielded significant main effects of
TASK (F(3,39) = 15.46; P < 0.001) and HEMISPHERE
(F(1,13) = 7.9; P � 0.01) as well as significant
interactions between all involved variables. There were
significant 2-way interactions between TASK � REGION
(F(3,39) = 30.6; P < 0.001) and TASK � HEMISPHERE
(F(3,39) = 3.5; P < 0.05) and a significant 3-way
interaction TASK � REGION � HEMISPHERE
(F(3,39) = 5.52; P < 0.01). Aside from the prominent
TASK � REGION effect for the Freal_ motor versus
visual task conditions, indicating higher recognition rate
for ME in central and for OOM in occipital sites, we
found also significant differences between the 2 imagery
tasks: whereas the recognition rate of visual–motor
imagery (MIV) at any recording site was hardly above
random, the classification rate for kinesthetic motor
imagery (MIK) was clearly highest in the left central
derivation compared to right central and occipital sites.
Post-hoc comparisons of the respective means (using
paired t tests) support that the recognition rate at the left
central electrode site (electrode C3) was higher with
kinesthetic than with visual–motor imagery (i.e., 67 > 56;
P = 0.01).
Furthermore, we computed the overall relevance of the
frequency components estimated by DSLVQ (i.e., discrim-
inative features of the task period with respect to those of
C. Neuper et al. / Cognitive Brain Research 25 (2005) 668–677672
baseline period). The overall feature relevance was
computed by ranking the frequency components of each
of the 100 DSLVQ repetitions for each subject indepen-
dently and averaging the results of the DSLVQ feature
relevance estimates over all subjects afterwards. The
resulting values correspond to the percentage of DSLVQ
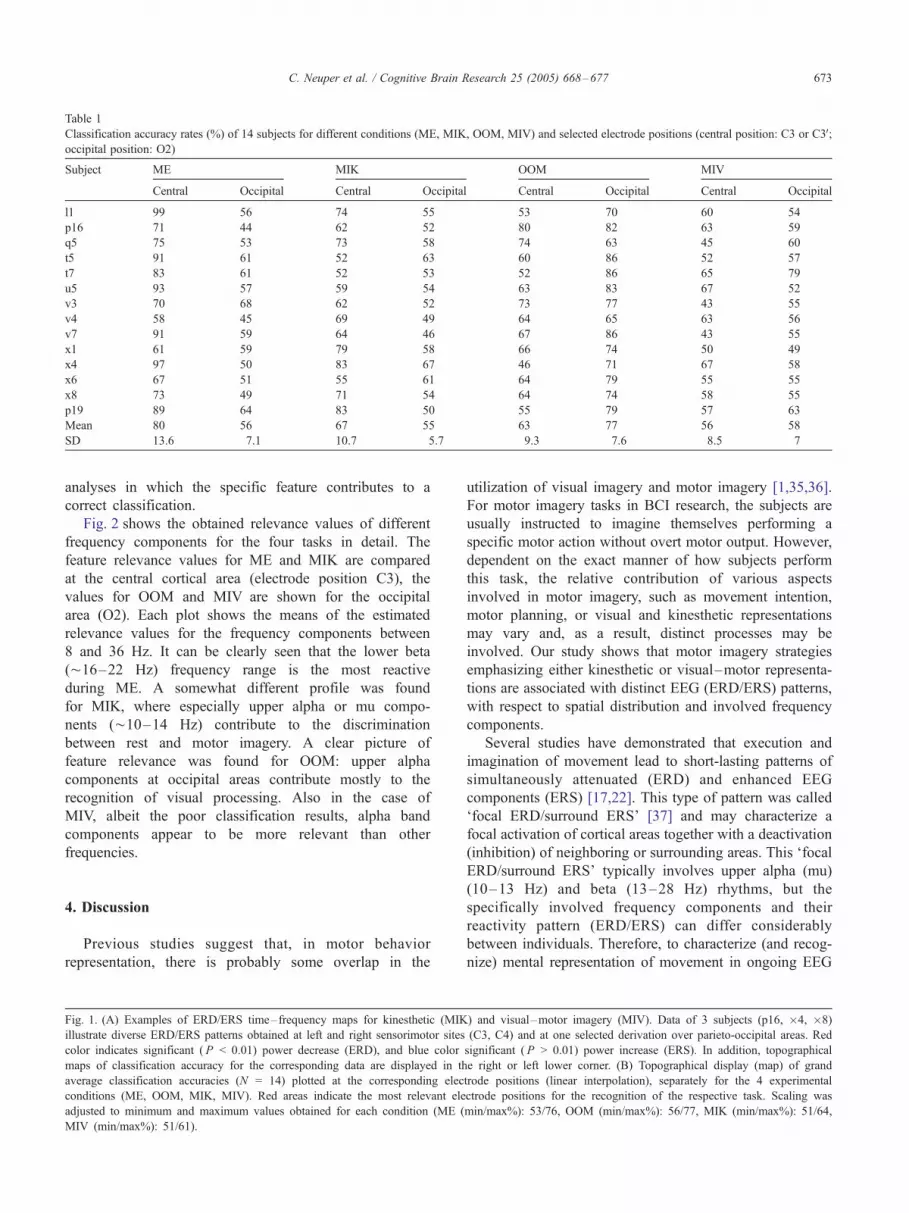
Table 1
Classification accuracy rates (%) of 14 subjects for different conditions (ME, MIK, OOM, MIV) and selected electrode positions (central position: C3 or C3V;occipital position: O2)
Subject ME MIK OOM MIV
Central Occipital Central Occipital Central Occipital Central Occipital
l1 99 56 74 55 53 70 60 54
p16 71 44 62 52 80 82 63 59
q5 75 53 73 58 74 63 45 60
t5 91 61 52 63 60 86 52 57
t7 83 61 52 53 52 86 65 79
u5 93 57 59 54 63 83 67 52
v3 70 68 62 52 73 77 43 55
v4 58 45 69 49 64 65 63 56
v7 91 59 64 46 67 86 43 55
x1 61 59 79 58 66 74 50 49
x4 97 50 83 67 46 71 67 58
x6 67 51 55 61 64 79 55 55
x8 73 49 71 54 64 74 58 55
p19 89 64 83 50 55 79 57 63
Mean 80 56 67 55 63 77 56 58
SD 13.6 7.1 10.7 5.7 9.3 7.6 8.5 7
C. Neuper et al. / Cognitive Brain Research 25 (2005) 668–677 673
analyses in which the specific feature contributes to a
correct classification.
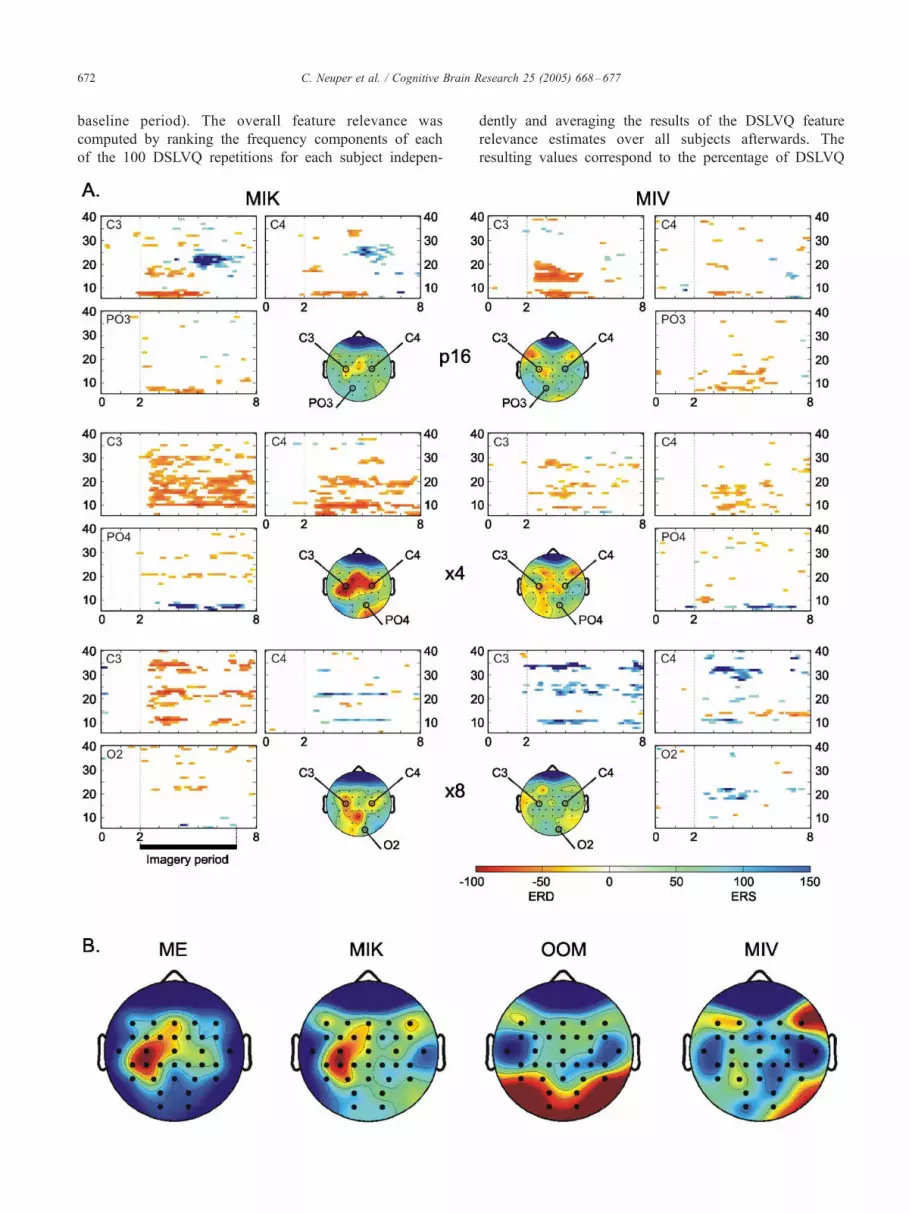
Fig. 2 shows the obtained relevance values of different
frequency components for the four tasks in detail. The
feature relevance values for ME and MIK are compared
at the central cortical area (electrode position C3), the
values for OOM and MIV are shown for the occipital
area (O2). Each plot shows the means of the estimated
relevance values for the frequency components between
8 and 36 Hz. It can be clearly seen that the lower beta
(¨16–22 Hz) frequency range is the most reactive
during ME. A somewhat different profile was found
for MIK, where especially upper alpha or mu compo-
nents (¨10–14 Hz) contribute to the discrimination
between rest and motor imagery. A clear picture of
feature relevance was found for OOM: upper alpha
components at occipital areas contribute mostly to the
recognition of visual processing. Also in the case of
MIV, albeit the poor classification results, alpha band
components appear to be more relevant than other
frequencies.
4. Discussion
Previous studies suggest that, in motor behavior
representation, there is probably some overlap in the
Fig. 1. (A) Examples of ERD/ERS time–frequency maps for kinesthetic (MIK
illustrate diverse ERD/ERS patterns obtained at left and right sensorimotor sites
color indicates significant ( P < 0.01) power decrease (ERD), and blue color
maps of classification accuracy for the corresponding data are displayed in th
average classification accuracies (N = 14) plotted at the corresponding elec
conditions (ME, OOM, MIK, MIV). Red areas indicate the most relevant ele
adjusted to minimum and maximum values obtained for each condition (ME (
MIV (min/max%): 51/61).
utilization of visual imagery and motor imagery [1,35,36].
For motor imagery tasks in BCI research, the subjects are
usually instructed to imagine themselves performing a
specific motor action without overt motor output. However,
dependent on the exact manner of how subjects perform
this task, the relative contribution of various aspects
involved in motor imagery, such as movement intention,
motor planning, or visual and kinesthetic representations
may vary and, as a result, distinct processes may be
involved. Our study shows that motor imagery strategies
emphasizing either kinesthetic or visual–motor representa-
tions are associated with distinct EEG (ERD/ERS) patterns,
with respect to spatial distribution and involved frequency
components.
Several studies have demonstrated that execution and
imagination of movement lead to short-lasting patterns of
simultaneously attenuated (ERD) and enhanced EEG
components (ERS) [17,22]. This type of pattern was called
Ffocal ERD/surround ERS_ [37] and may characterize a
focal activation of cortical areas together with a deactivation
(inhibition) of neighboring or surrounding areas. This FfocalERD/surround ERS_ typically involves upper alpha (mu)
(10–13 Hz) and beta (13–28 Hz) rhythms, but the
specifically involved frequency components and their
reactivity pattern (ERD/ERS) can differ considerably
between individuals. Therefore, to characterize (and recog-
nize) mental representation of movement in ongoing EEG
) and visual–motor imagery (MIV). Data of 3 subjects (p16, �4, �8)
(C3, C4) and at one selected derivation over parieto-occipital areas. Red
significant ( P > 0.01) power increase (ERS). In addition, topographical
e right or left lower corner. (B) Topographical display (map) of grand
trode positions (linear interpolation), separately for the 4 experimental
ctrode positions for the recognition of the respective task. Scaling was
min/max%): 53/76, OOM (min/max%): 56/77, MIK (min/max%): 51/64,
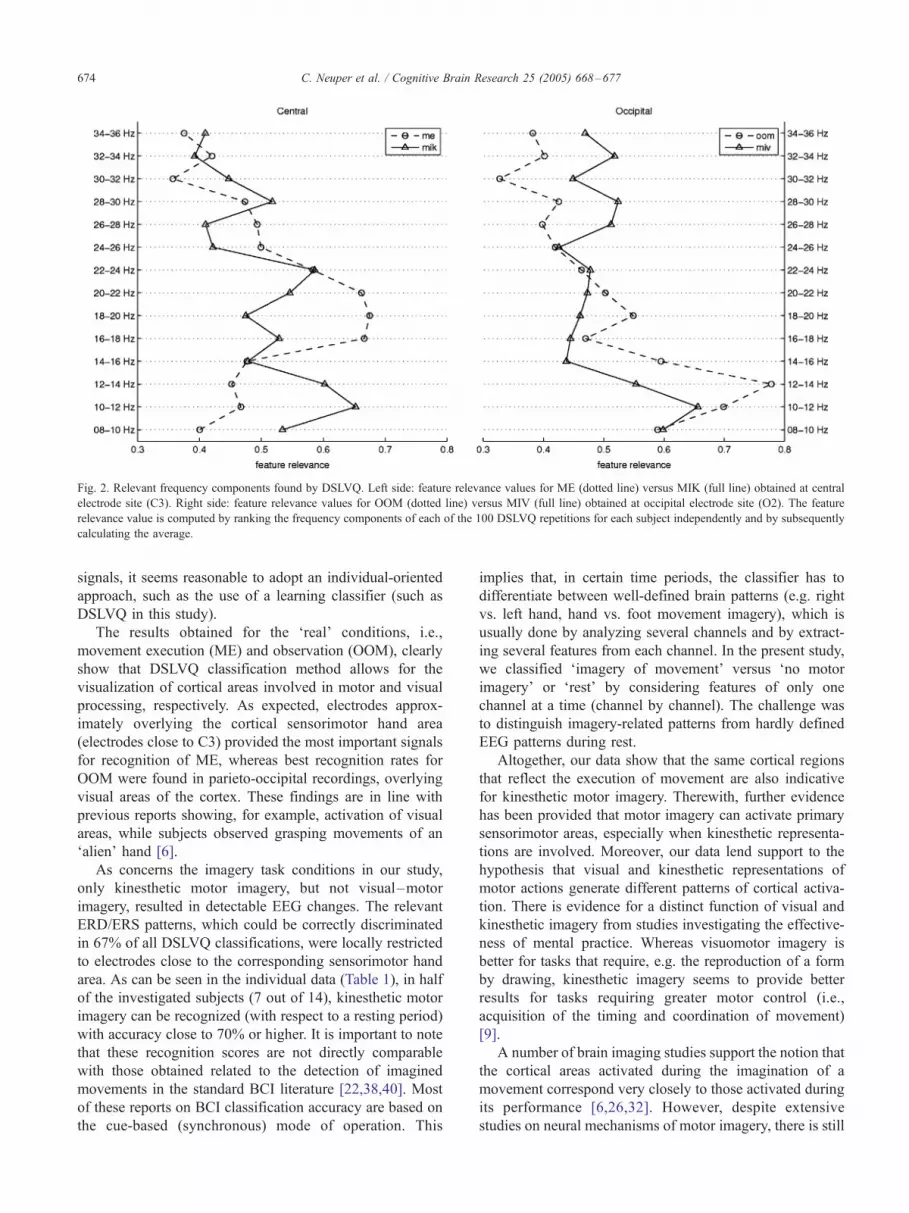
Fig. 2. Relevant frequency components found by DSLVQ. Left side: feature relevance values for ME (dotted line) versus MIK (full line) obtained at central
electrode site (C3). Right side: feature relevance values for OOM (dotted line) versus MIV (full line) obtained at occipital electrode site (O2). The feature
relevance value is computed by ranking the frequency components of each of the 100 DSLVQ repetitions for each subject independently and by subsequently
calculating the average.
C. Neuper et al. / Cognitive Brain Research 25 (2005) 668–677674
signals, it seems reasonable to adopt an individual-oriented
approach, such as the use of a learning classifier (such as
DSLVQ in this study).
The results obtained for the Freal_ conditions, i.e.,
movement execution (ME) and observation (OOM), clearly
show that DSLVQ classification method allows for the
visualization of cortical areas involved in motor and visual
processing, respectively. As expected, electrodes approx-
imately overlying the cortical sensorimotor hand area
(electrodes close to C3) provided the most important signals
for recognition of ME, whereas best recognition rates for
OOM were found in parieto-occipital recordings, overlying
visual areas of the cortex. These findings are in line with
previous reports showing, for example, activation of visual
areas, while subjects observed grasping movements of an
Falien_ hand [6].
As concerns the imagery task conditions in our study,
only kinesthetic motor imagery, but not visual–motor
imagery, resulted in detectable EEG changes. The relevant
ERD/ERS patterns, which could be correctly discriminated
in 67% of all DSLVQ classifications, were locally restricted
to electrodes close to the corresponding sensorimotor hand
area. As can be seen in the individual data (Table 1), in half
of the investigated subjects (7 out of 14), kinesthetic motor
imagery can be recognized (with respect to a resting period)
with accuracy close to 70% or higher. It is important to note
that these recognition scores are not directly comparable
with those obtained related to the detection of imagined
movements in the standard BCI literature [22,38,40]. Most
of these reports on BCI classification accuracy are based on
the cue-based (synchronous) mode of operation. This
implies that, in certain time periods, the classifier has to
differentiate between well-defined brain patterns (e.g. right
vs. left hand, hand vs. foot movement imagery), which is
usually done by analyzing several channels and by extract-
ing several features from each channel. In the present study,
we classified Fimagery of movement_ versus Fno motor
imagery_ or Frest_ by considering features of only one
channel at a time (channel by channel). The challenge was
to distinguish imagery-related patterns from hardly defined
EEG patterns during rest.
Altogether, our data show that the same cortical regions
that reflect the execution of movement are also indicative
for kinesthetic motor imagery. Therewith, further evidence
has been provided that motor imagery can activate primary
sensorimotor areas, especially when kinesthetic representa-
tions are involved. Moreover, our data lend support to the
hypothesis that visual and kinesthetic representations of
motor actions generate different patterns of cortical activa-
tion. There is evidence for a distinct function of visual and
kinesthetic imagery from studies investigating the effective-
ness of mental practice. Whereas visuomotor imagery is
better for tasks that require, e.g. the reproduction of a form
by drawing, kinesthetic imagery seems to provide better
results for tasks requiring greater motor control (i.e.,
acquisition of the timing and coordination of movement)
[9].
A number of brain imaging studies support the notion that
the cortical areas activated during the imagination of a
movement correspond very closely to those activated during
its performance [6,26,32]. However, despite extensive
studies on neural mechanisms of motor imagery, there is still
C. Neuper et al. / Cognitive Brain Research 25 (2005) 668–677 675
no consensus as to what degree the primary motor cortex is
involved in imagined actions. Whereas some studies failed to
detect activation in the primary motor area during motor
imagery [3,6–8,12,30], others clearly demonstrated a partic-
ipation of the primary motor cortex, at least in a part of the
investigated subjects [15,16,26,27,32,35]. However, the
activation reported is typically not higher than 30% of the
activation measured for actual movement execution [26].
Therefore, it is not surprising that in our study the recognition
rates for MIK were lower than those for ME.
In order to explain the controversial results in neuro-
imaging studies, the type of imagery may be important [15].
In some of the studies, it has been reported that subjects
primarily visualized hand movements [8], whereas other
authors carefully trained the participants to create kines-
thetic feelings of moving the limb [15]. A recent study
suggests that visuomotor type of imagery may be accom-
panied by a weak transient response (i.e., initial MRI signal
increase) in the primary motor cortex, reflecting the onset of
imagination, but not by a sustained activation as obtained
during motor execution [7].
In our study, visual–motor imagery, as compared to
observation of movement of an animated hand, did not
show, overall, a clear contribution of parieto-occipital
electrode locations, as could be expected from the literature.
As an example, using an integrated visual–motor imagery
task (i.e., imagined walking a specific route), Roland and
Friberg [31] reported simultaneous brain activation in both
visual and higher-order motor cortical regions. Due to the
low classification results for the visual–motor task (MIV) in
our study, the mental processes associated with this task
(i.e., visualization of hand actions) are difficult to interpret.
It is not possible to decide whether MIV rather involved
somatomotor or visual representations.
Based on inspection of the individual ERD/ERS maps,
we can speculate that, in some of the subjects (e.g. p16, see
Fig. 1a), MIV, although weaker than MIK, may have
involved subliminal activation of the motor system. In
others (e.g. �4, �8), mainly recordings from parieto-
occipital areas show task-related effects. Interestingly, these
data displayed enhanced EEG rhythm (ERS) in the alpha
and/or beta frequency band. At first glance, this is in
contradiction to the general observation that, when a subject
concentrates on a particular modality, the EEG activity in
the alpha and/or lower beta band specifically decreases in
the corresponding brain region [20]. Event-related synchro-
nization (i.e., induced alpha band activity, 10–13 Hz ERS),
in contrast, has been interpreted to reflect a state of
decreased neural excitability or even inhibited thalamo-
cortical circuitry. Future work will be needed to examine the
functional significance of parieto-occipital ERS in visual–
motor imagery.
Aside from determining the classification accuracy rate
(i.e., recognition rate), the rationale of using DSLVQ
classification was to weigh the input features (i.e., frequency
components recorded at a given electrode position) accord-
ing to their significance of classification. High weight values
show that the corresponding frequency components differ
systematically for task-related activity and rest. An advant-
age of this method, compared with statistical methods based
on averaging over trials (such as, e.g. ERD/ERS mapping,
[10]), is that DSLVQ weights are not sensitive to absolute
values of the input signals nor to the type of reactivity, such
as attenuated and enhanced EEG rhythms (ERD/ERS). An
interesting outcome of the DSLVQ single-trial analysis was
the high relevance of central beta oscillations (16–22 Hz) for
movement execution. This finding corresponds to previous
studies indicating that cortical neural networks in the primary
hand motor area can be characterized by resonance-like
frequencies in the range of 16–20 Hz [18]. For recognizing
imagery of movement (MIK), upper alpha or mu compo-
nents (10–12 Hz) are the most relevant features of
sensorimotor activity. Higher significance (reactivity) of
frequency components in the alpha as compared to the beta
range during imagination of finger movement was also
reported previously [17]. Regarding the direction of changes
of the selected frequencies (i.e., alpha/mu in MIK and beta
band components in ME), in all cases, the main contribution
comes from an amplitude attenuation or ERD of relevant
frequency components. The finding that both observation
and visualization of a moving hand affect upper alpha band
components in visual cortical areas is consistent with
previous studies reporting associations between occipital
alpha activity and visual processing [23].
A critical issue of the present study (and many others),
where the experimental methodology is based on the
instruction to imagine actions, is the fact that the subject’s
compliance with instruction cannot be assured [1]. The main
experimental variation was to ask the participants either to
imagine a self-performed action (MIK) or to form mental
images (external view) of a previously viewed Factor_(MIV). The accurate mental performance of the two
versions of imagery should be further facilitated by the fact
that the two tasks were preceded each by a corresponding
Freal_ task condition. But, especially the Falien hand,_instruction in condition MIV may have induced some
uncertainty of how to perform this task. Overall, taking
together the imagery self-reports and the EEG patterns (i.e.,
time–frequency maps of ERD/ERS) guided by the timing of
the task, the present findings support different processing
related to the two imagery conditions. However, it remains
impossible to distinguish between subjects who reported
vivid imaginations (e.g. kinesthetic feelings of moving the
limb) with no identifiable EEG reactivity and participants
who may not have followed instructions precisely. Another
potential limitation is the lack of simultaneous EMG
recordings to exclude muscular activation during imagery.
Hence, some weak EMG activity may be present in some
subjects during the imagery task. Because there is evidence
from previous brain imaging studies that fMRI signal
increases during imagery of finger movements do not seem
to be related to the degree of EMG activation [26], it is not

C. Neuper et al. / Cognitive Brain Research 25 (2005) 668–677676
very likely that differences in EMG activity apply to our
negative findings in MIV. However, additional studies to
clarify whether there are systematic differences in EMG
activation associated with kinesthetic and visuomotor
imagery will be of particular interest.
In summary, the present findings based on DSLVQ
classification confirm previous studies that motor imagery
can be used to Fproduce_ (movement-)specific and locally
restricted patterns of the oscillatory brain activity, which are
detectable in ongoing, not-averaged EEG recordings. How-
ever, good recognition rates were solely achieved when the
Fimaginer_ used the strategy of kinesthetic motor imagery
(first-person process), whereas recognition was almost
impossible when the participant formed a visual image of
another’s action (third-person process). Consequently, in
motor-imagery-based BCI systems, a careful user training
supporting Freal_ motor imagery, that is, the kinesthetic
instead of the visual form, is essential to improve BCI control.
Acknowledgments
This work was supported in part by the European
PRESENCIA project (IST-2001-37927) and the FFonds zurForderung der wissenschaftlichen Forschung_ in Austria
(FWF-P-16326-BO2). The authors are grateful to B. Bliem,
C. Keinrath and C. Brunner for help in data recording and
processing. Furthermore, we thank A. Schlogl and B.
Graimann for making generously available their software
tools.
References
[1] J. Annett, Motor imagery: perception or action? Neuropsychologia 33
(11) (1995) 1395–1417.
[2] R. Beisteiner, P. Hollinger, G. Lindinger, W. Lang, A. Berthoz, Mental
representations of movements. Brain potentials associated with
imagination of hand movements, Electroencephalogr. Clin. Neuro-
physiol. 96 (1995) 183–193.
[3] F. Binkofski, K. Amunts, K.M. Stephan, S. Posse, T. Schormann, H.J.
Freund, K. Zilles, R.J. Seitz, Broca’s region subserves imagery of
motion: a combined cytoarchitectonic and fMRI study, Hum. Brain
Mapp. 11 (2000) 273–285.
[4] E.A. Curran, M.J. Stokes, Learning to control brain activity: a review of
the production and control of EEG components for driving brain–
computer interface (BCI) systems, Brain Cogn. 51 (2003) 326–336.
[5] J. Decety, D.H. Ingvar, Brain structures participating in mental
simulation of motor behaviour: a neuropsychological interpretation,
Acta Psychol. 73 (1990) 13–34.
[6] J. Decety, D. Perani, M. Jeannerod, V. Bettinardi, B. Tadardy, R.
Woods, J. Mazziotta, F. Fazio, Mapping motor representations with
positron emission tomography, Nature 371 (1994) 6498.
[7] P. Dechent, K.D. Merboldt, J. Frahm, Is the human primary motor
cortex involved in motor imagery? Cogn. Brain Res. 19 (2) (2004)
138–144.
[8] M.P. Deiber, V. Ibanez, M. Honda, N. Sadato, R. Raman, M. Hallett,
Cerebral processes related to visuomotor imagery and generation of
simple finger movements studied with positron emission tomography,
NeuroImage 7 (1998) 73–85.
[9] Y.A. Fery, Differentiating visual and kinesthetic imagery in mental
practice, Can. J. Exp. Psychol. 57 (1) (2003) 1–10.
[10] B. Graimann, J.E. Huggins, S.P. Levine, G. Pfurtscheller, Visual-
ization of significant ERD/ERS patterns in multichannel EEG and
ECoG data, Clin. Neurophysiol. 113 (1) (2002) 43–47.
[11] C. Hall, S. Goss, Imagery results in motor learning, in: D. Goodman,
R.B. Wilberg, I.M. Franks (Eds.), Differing Perspectives in Motor
Learning, Memory and Control, Elsevier, Amsterdam, 1985.
[12] T. Hanakawa, I. Immisch, K. Toma, M.A. Dimyan, P. Van Gelderen,
M. Hallett, Functional properties of brain areas associated with motor
execution and imagery, J. Neurophysiol. 89 (2003) 989–1002.
[13] M. Jeannerod, V. Frak, Mental imaging of motor activity in humans,
Curr. Opin. Neurobiol. 9, 6 (1999) 735–739.
[14] W.Lang,D.Cheyne,P.Hollinger,W.Gerschlager,G.Lindinger,Electric
and magnetic fields of the brain accompanying internal simulation
of movement, Brain Res. Cogn. Brain Res. 3 (1996) 125–129.
[15] M. Lotze, P. Montoya, M. Erb, E. Hulsmann, H. Flor, U. Klose, N.
Birbaumer, W. Grodd, Activation of cortical and cerebellar motor
areas during executed and imagined hand movements: an fMRI study,
J. Cogn. Neurosci. 11 (1999) 491–501.
[16] D.G. Nair, K.L. Purcott, A. Fuchs, F. Steinberg, J.A.S. Kelso, Cortical
and cerebellar activity of the human brain during imagined and
executed unimanual and bimanual action sequences: a functional MRI
study, Cogn. Brain Res. 15 (2003) 250–260.
[17] C. Neuper, G. Pfurtscheller, Motor imagery and ERD, in: G.
Pfurtscheller, F.H. Lopes da Silva (Eds.), Event-related Desynchroni-
zation, Revised editionR Handbook. Electroencephalogr. Clin. Neuro-
physiol., vol. 6, Elsevier, Amsterdam, 1999, pp. 303–325.
[18] C. Neuper, G. Pfurtscheller, Evidence for distinct beta resonance
frequencies in human EEG related to specific sensorimotor cortical
areas, Clin. Neurophysiol. 112 (11) (2001) 2084–2097.
[19] C. Neuper, A. Schlogl, G. Pfurtscheller, Enhancement of left – right
sensorimotor EEG differences during feedback-regulated motor
imagery, J. Clin. Neurophysiol. 16 (4) (1999) 373–382.
[20] G. Pfurtscheller, F. Lopes da Silva, Event-related EEG/MEG synchro-
nization and desynchronization: basic principles, Clin. Neurophysiol.
110 (1990) 1842–1857.
[21] G. Pfurtscheller, C. Neuper, Motor imagery activates primary
sensorimotor area in humans, Neurosci. Lett. 239 (1997) 65–68.
[22] G. Pfurtscheller, C. Neuper, Motor imagery and direct brain–computer
communication, Neural Engineering: Merging Engineering and Neuro-
science, Proc. IEEE (Special Issue), vol. 89 (7), 2001, pp. 1123–1134.
[23] G. Pfurtscheller, C. Neuper, W. Mohl, Event-related desynchronization
(ERD) during visual processing, Int. J. Psychophysiol. 16 (2–3)
(1994) 147–153.
[24] G. Pfurtscheller, C. Neuper, D. Flotzinger, M. Pregenzer, EEG-based
discrimination between imagination of right and left hand movement,
Electroencephalogr. Clin. Neurophysiol. 103 (5) (1997) 1–10.
[25] G. Pfurtscheller, C. Neuper, C. Brunner, F. Lopes da Silva, Beta
rebound after different types of motor imagery in man, Neurosci. Lett.
378 (3) (2005) 156–159.
[26] C.A. Porro, M.P. Francescato, V. Cettolo, M.E. Diamond, P. Baraldi,
C. Zuiani, M. Bazzocchi, P.E. di Prampero, Primary motor and
sensory cortex activation during motor performance and motor
imagery. A functional magnetic resonance study, J. Neurosci. 16
(1996) 7688–7698.
[27] C.A. Porro, V. Cettolo, M.P. Francescato, P. Baraldi, Ipsilateral
involvement of primary motor cortex during motor imagery, Eur. J.
Neurosci. 12 (2000) 3059–3063.
[28] M. Pregenzer, G. Pfurtscheller, Frequency component selection of an
EEG-based brain to computer interface, IEEE Trans. Rehabil. Eng. 7
(4) (1999) 413–419.
[29] M. Pregenzer, G. Pfurtscheller, D. Flotzinger, Automated feature
selection with a distinction sensitive learning vector quantizer,
Neurocomputing 11 (1) (1996) 19–29.
[30] S.M. Rao, J.R. Binder, P.A. Bandettini, T.A. Hammeke, F.Z. Yetkin,
A. Jesmanowicz, L.M. Lisk, G.L. Morris, W.M. Mueller, L.D.

C. Neuper et al. / Cognitive Brain Research 25 (2005) 668–677 677
Estkowski, E.C. Wong, V.M. Haughton, J.S. Hyde, Functional
magnetic resonance imaging of complex human movements, Neuro-
logy 43 (1993) 2311–2318.
[31] P.E. Roland, L. Friberg, Localization of cortical areas activated by
thinking, J. Neurophysiol. 53 (1985) 1219–1243.
[32] M. Roth, J. Decety, M. Raybaudi, R. Massarelli, C. Delon-Martin, C.
Segebarth, S. Morand, A. Gemignani, M. Decorps, M. Jeannerod,
Possible involvement of primary motor cortex in mentally simulated
movement. A functional magnetic resonance imaging study, Neuro-
Report 7 (1996) 1280–1284.
[33] A. Schlogl, BIOSIG—An open source software library for biomedical
signal processing. 2003–2004. Available online: http://BIOSIG.SF.
NET <http://biosig.sourceforge.net/>.
[34] K. Sekiyama, Mental and physical movements of hands: kinesthetic
information preserved in representational systems, Jpn. Psychol. Res.
25 (1982) 95–102.
[35] A. Solodkin, P. Hlustik, E. Chen, S.L. Small, Fine modulation in
network activation during motor execution and motor imagery, Cereb.
Cortex 14 (2004) 1246–1255.
[36] J.A. Stevens, Interference effects demonstrate distinct roles for visual
and motor imagery during the mental representation of human action,
Cognition 95 (3) (2005) 329–350.
[37] P. Suffczynski, P.J.M. Pijn, G. Pfurtscheller, F.H. Lopes da Silva,
Event-related dynamics of alpha band rhythms: a neuronal network
model of focal ERD/surround ERS, in: G. Pfurtscheller, F.H. Lopes
da Silva (Eds.), Event-related Desynchronization, Revised editionRHandbook. Electroencephalogr. Clin. Neurophysiol., vol. 6, Elsevier,
Amsterdam, 1999, pp. 67–85.
[38] T. Wang, H. Deng, B. He, Classifying EEG-based motor imagery tasks
by means of time– frequency synthesized spatial patterns, Clin.
Neurophysiol. 115 (12) (2004) 2744–2753.
[39] T. Weiss, E. Hansen, R. Rost, L. Beyer, F. Merten, C. Nichelmann, C.
Zippel, Mental practice of motor skills used in poststroke rehabil-
itation has own effects on central nervous system activation, Int. J.
Neurosci. 78 (1994) 157–166.
[40] J.R. Wolpaw, N. Birbaumer, D.J. McFarland, G. Pfurtscheller, T.M.
Vaughan, Brain—Computer interfaces for communication and control,
Clin. Neurophysiol. 113, 6 (2002) 767–791.


