Embed Size (px)
Citation preview
1
Indian Journal of Accounting
Vol. XLI (1) December 2010, pp. 1-6
ACCOUNTING EDUCATION AND RESEARCH
*G.L. Dave
Economic development is essentially a dual process encompassing (i) a transition
from economic stagnation to economic progress by increasing GNP per capita over time
and (ii) transformation through initiating and sustaining a series of structural, social and
economic improvements. The analysis of and planning for such a process calls for extensive
quantitative (econometric) model building which in turn pre-requires the existence of
accounting information system. This is because accounting is an information measurement,
reporting and control system covering both micro and macro economic activities (Enthoven,
1985) that take place in our socio-economic environment. It is imperative, therefore that
accounting be fine tuned to the economic fabric and the requirement of the society in
which it operates.
In this connection it is interesting to note that present century has witnessed changes
in the international social economic arena in terms of (a) Third world economic development,
(b) Regionalization and Internationalization (c) emergence and growth of multinational
corporation (d) Involvement of the Government sector in economic operations (e) Social
responsibility awareness and (f) International communication (g) Liberalization, Privatisation
and Globalisation. Each of these changes has greatly enhanced the horizons of accounting
discipline, the significance of accounting profession the social role of the accountant and
the status and standard of accounting education in most countries.
While economic development is a sine qua non in the life of both developed and
developing economies, its urgency is more palpable is developing economies striving for
greater economic self-reliance and faster technological innovation and progress. Moreover,
since accounting serves to measure economic activities and to design and evaluate
development plans and policies, the accountant's role in such economies should be increasingly
directed toward the management of national resources by engaging in productivity
measurement, social cost-benefit analysis, pricing decisions, tax structure formulation and
administration, internal audit, national income accounting, government accounting and
budgeting, and designing decision support systems.
Unfortunately, however, in most developing countries, accounting systems suffer
from technical, operational, behavioural and socio-economic deficiencies which may be
*Presidential Address at XXXIII Conference by President, Indian Accounting Association, Former Head,Department of Accounting, Former Dean, Faculty of Commerce & Management Studies, Former SyndicateMember, Jai Narain Vyas University, Jodhpur 342001. 17-E-367, CHB, Jodhpur, Rajasthan. 342008
Indian Journal of Accounting
2
Indian Journal of Accounting
attributed to historical, cultural and educational factors. While practice tends to be
stewardship oriented, with a heavy bias toward accountability, the theory is reduced merely
to a set of rules. This 'strong enterprise/financial accounting/stewardship basis' (Enthoven,
1985) has eclipsed the growth of real accounting education. What goes by the name of
accounting 'education' has in fact been a 'training' of accountants by a ritual drilling of
established rules and procedures in many countries. In other words, 'accounting education
is presently at the cross-road demanding the collective thought of academicians and
professionals like you for a more pragmatic reorientation and improvement.
The aim of any education, vocational or otherwise, is not to make "your brain a
store house of information which runs riot there, undigested all your life" (Swami
Vivekanada). The predominant aim of any education is to inculcate qualities of mind
necessary for both individual and social progress and to develop the ability of 'expert
discernment in all things' (Samuel Johnson), so that the mind can use its own powers
rather than be crammed with the accumulation of others. The important part of teaching
is the drawing out, not the pumping in. This is equally applicable to accounting education.
The structure and activities of accounting education should support the nation's
socio-economic objectives. Mere imitation of educational system, prevalent in Anglo-
American countries without assessing their efficacy vis-à-vis the country's requirements
can hardly be beneficial. 'By imitation, other's ideas never become yours own (Swami
Vivekananda). Accounting education, in order to sub serve the needs of economic
development, should focus on the twin objectives of (i) developing human resources in
accounting commensurate with societal needs and (ii) problem solving and decision-making
at the micro and macro levels of the economy. Accounting education, therefore, needs to
be geared to the task of providing (i) 'a conceptual socio-economic foundation of accounting
discipline and training; (ii) a greater specialization in the various branches of accounting;
(iii) a closer link between the institutional, professional and educational programmes and
continuing education; and (iv) a greater focus on forecasting techniques of both an internal
and external nature' (Enthoven, 1985).
With this accounting education framework for developing countries in mind, let us
now direct our attention to the Indian scenario.
Advance in accounting education in India, either on the professional or on the
academic front, were hardly perceptible till the first half of this century. A few of the
notable developments are highlighted below:
(a) The first Commerce School was established in Madras in 1886 which incorporated
book-keeping in its curriculum.
(b) In 1913, the Sydenham College of Commerce and Economics at Bombay was
established.
(c) In 1918, the Government of Bombay initiated Government Diploma in Accountancy
(GDA).
(d) In 1932, the Indian Accountancy Board was constituted and the Auditor's certificate
Rules were promulgated.
3
(e) In 1949, Institute of Chartered Accountants of India (ICAI) was established.
(f) In 1959, the Institute of Cost & Work Accountants of India (ICWAI) came into being.
A number of changing situations have developed in the wake of globalization in the
field of accounting education & research. The professional demands are changing while the
existing courses laid emphasis upon technical knowledge at the expense of broad based
general education. Accounting education have to think whether the existing curriculum
provides professional knowledge as per the needs of the globalize business & industry.
The future of professions both the professional accountants and the academics depends on
its ability to attract new persons with high intellectual and creative abilities and prepare
them to meet all seen and unforeseen challenges.
No doubt golbalisation has changed the accounting world. Our accounting
profession has to become truly global in character. There is pressing need for the
reorientation of the prevailing nation based accounting systems in the following manner:
1. From the manual system towards the electronic system;
2. From the local reporting system towards the global reporting system;
3. From record keeping system towards the information processing system;
4. From the legalistic reporting system towards the reporting of corporate governance;
5. From national accounting standards towards global accounting standards; and
6. From tax accounting towards deferred tax accounting and tax planning.
As globalization has brought free pricing, volume trading, listing in international
stock exchanges and mutual funds, our accountants have to build up requisite skills to
cope up with this complex environment.
CREATIVITY IN ACCOUNTING
With the wide publicity accorded to the book entitled 'Accounting for Growth' by
Terry Smith, the term 'creative accounting' has become somewhat popular. It is usually
put into practice to facilitate people connected with business to look at 'things' differently.
For this, creative abilities like associative thinking, sidetracking, brain-storming,
ignoring constraints, questioning check lists etc. should be strengthened among the new
generation of accountants. So far as management accountants are concerned, creative
accounting will strengthen their decision making skills. It can also effectively contribute in
the accounting of intangibles. However, creativity in accounting should be encouraged in
only such areas where utility requires greater consideration than objectivity.
PROFESSIONAL ORIENTATION
(1) Accounting should be accorded the status of a separate department under the
auspices of the College/School of Business Studies at the post graduate level. In
this respect we should follows the pattern of Department of Accounting, J.N.V.
University, Jodhpur. The J.N.V. University, Jodhpur separate department of
Accounting is working since 1990.
Dave
4
Indian Journal of Accounting
(2) Commerce and especially Accounting programmes at the university level should
stop playing second fiddle to those of professional institutes in order to justify their
existence. Accordingly, course structure and contents should be redesigned to expose
the student to the conceptual foundation of accounting subjects, research methodology
and contemporary research findings.
(3) The Universities should start courses MBA (Accounts & Finance or Accounting for
Management). Professional institutes like the Institute of Chartered Accountants
of India and the Institute of Cost & Work Accountants of India & all institutes
involved in accounting education should sit together and reallocate their role and
responsibilities in the changed context.
PRACTICAL ORIENTATION
Accounting education, to be purposeful, must be coordinated at all levels. The
curricula up to the graduate level should be able to equip the student to meet the
requirements of professional institutes as well as the higher academic education at the
post graduate level, the emphasis should be pre-dominantly on theoretical & research
aspects.
Efforts have already been initiated to involve professionals like CAs and ICWAs to
teach students of accounting as part time or guest faculty members. However, the industry
linkage is totally absent in this sphere. Efforts should be made to involve people from
business and industry in teaching and curriculum development.
CHANGE IN PEDAGOGY
Teaching methodologies should be made more effective. Firstly, the mode of
instruction should be directed toward the infusion of technical, computational as well as
conceptual skills in the student. While the procedural aspects dwelling on the question of
'how' should not be lost sight of, a greater emphasis should be placed on the rational
aspect of 'why' and 'what ought to be'. Secondly, with regard to teaching aids, the case
study approach should be eccouraged to bring the classroom exercise closer to reality.
Group discussions, debates, workshops and seminars should be organized to provoke the
student to think independently and to express himself/herself freely. Quizzes may also be
conducted to assess one's precision and width of knowledge. Audio-visual aids, e.g.,
overhead projectors, audio-video tapes and documentary films, may supplement the learning
process to make it exciting and interesting rather than an onerous experience.
PREPARATION OF TEXTBOOKS AND TEACHING MATERIAL
Another important prerequisite for developing accounting education is the
preparation of textbooks and teaching material to meet the emerging requirement. Our
accounting texts contain old and obsolete examples. They do not have the touch of real-
life situations. Accounting standards pronounced by international and national accounting
5
bodies are only incorporated by way of appendices. These standards have become a subject
of academic interaction, rather than an issue for application to suit the requirements of
business and industry. Now the time is ripe for rewriting the principles and practice of
accounting in the light of accounting standards. Practical assignments, real life examples
and case studies should be incorporated in the revised texts. While reviewing the
fundamental principles of accounting, greater weightage should be given to relevance
rather than to objectivity.
RESEARCH CONTRIBUTION
Ladies and gentlemen, a survey of accounting education would be incomplete
without a glimpse of the state of accounting research in academic institutes. So, a few
words on this crucial aspect will not be out of context. Research in any discipline, whether
fundamental or applied, serves as the gateway to the advancement of the horizons of any
education system. With this end in view, the Indian Council of Social Science Research
(ICSSR) was established in 1969 by the Central Government, as an autonomous organization,
to foster and mobilize research talent in the social sciences and 'Accounting Theory' was
designated as one of the important disciplines where research should be directed.
According to survey made by the ICSSR, completed research projects & doctoral
thesis awarded by Indian Universities in accounting and allied areas is less in number.
Although the position has improved over the years, there is a scope for undertaking more
& more research projects in accounting in India.
There are some problems in this area too:
(i) Teachers are given very little incentive and infrastructural support. Shortage of
facility, inadequate space, non-availability of adequate funds generally stands in
the way. These can be overcome gradually over a long period of time.
(ii) Publication of these are few & far between.
(iii) There is lack of proper coordination between industry and academic institutions,
the result being that there is very little effort for application of the theory/knowledge
into practice. Industry response for supplying data and for funding research projects
is not also worth mentioning Apart from personal/institutional contacts, the
'confidence' of the industry has to be created through better research work in order
to bring about an improvement in the field of accounting & research.
The quality and quantity of accounting research is depended on several factors
such as attitude of the researchers, active role played by institutions such as UGC, IAA,
ICA and other professional bodies. The quality of accounting research can be improved
through change in the attitudes of researchers, better pay scale for unaided lecturers,
seminars at collegiate level, sanction of FIP fellowship by U.G.C. for self financing colleges,
strong theoretical and conceptual base of the researcher change in the curriculum etc. The
organizations other than U.G.C. such as IAA, ICA and educational institutions also have
an important role to play in promoting accounting research. It is nice to observe that Indian
Dave
6
Indian Journal of Accounting
Accounting Association is conducting a talent test at National level in accounting and related
areas, such voluntary initiatives from the concerned would definitely help in accounting
education and research in India.
LINKAGE WITH OTHER DISCIPLINES
The discipline of accounting should not be seen in isolation. There is a need to
establish appropriate linkages with other disciplines. Interdisciplinary studies will make
the discipline more purposeful and socially relevant. In addition to the linkage of accounting
with taxation, management, finance, economics, ethics, sociology and environment, efforts
should be made to promote interdisciplinary studies in accounting with other subjects in
social sciences and physical sciences like geology, political science, engineering, marketing
and quality control. New dimensions of accounting like export accounting, project accounting
etc need to be developed and strengthened.
INDIAN ACCOUNTING ASSOCIATION
Indian Accounting Association is now 41 years old, the life membership of Association
is 2600 and we have set 34 Branches of IAA. During last ten years, our membership has
increased tremendously more & more accounting researchers & learners are becoming
members of our association. Still there is a need to enroll more and more institutional life
members. There is a strong need to spread the message of Indian Accounting Association
far & wide.
7
Indian Journal of Accounting
Vol. XLI (1) December 2010, pp. 7-13
INDIA'S PREPAREDNESS FOR IFRS:ENVIRONMENT, PROFESSION AND
ACADEMIC AGENCIES
*Lalit Gupta
ABSTRACTThe paper aims at examining the preparedness for IFRS in Indian context and suggesting
some action plan or strategy in terms of the professional, legal and academic environment. Theexamination is against a frame of reference developed around the emergence, motive and theground-footing environmental features of the IFRS in the perspective of KE, globalization andconvergence of the IASs. The frame is supported by a brief account of the initiatives which tookplace towards preparedness for IFRS in the sphere of counterparts of accounting activity. Thefirst issue examined is that of gaps in our accounting practices and drawbacks in accountingeducation along with the generation of economic information which need to be updated in orderto ensure the input for effective convergence. The paper, therefore, justifies the demand for adifferent recognition of accounting education in India. A complementary issue to that is that ofbringing the professionals and academic bodies closer on the lines of AAA, IAASB and IFAC.India has to attend the down-stream adjustments of standard setting process and professionalperformance fairly supplemented by sector or scale specific understanding of IFRS/ASs.
GLOBALIZATION, IFRS AND INDIA
(Emergence, Eventuality, Key-features, Dilemma and Ground Footing for Convergence)
Since 2001, the IASB was expected to create a set of principles, guidelines, financial
reporting standards that may be used globally throughout the world's capital markets.
Global markets would work better once we have a single set of high quality global accounting
standards. The IFRS are an outcome of certain outrages. They are a principle-based
framework and not rule based. IFRSs have been proposed by the IASB on topics for which
there was no clear cut IAS. Prof. Navin Agrawal in his article '3 Ways in which IFRS is a
change for the better' has said "IFRS will integrate domestic businesses with the global
investor and financial community so that there is no language gap and barrier." Thus, in a
narrow sense IFRS refers to the new numbered series of pronouncements that the IASB has
issued, as distinct from the IAS. More broadly, IFRS refers to the entire body of IASB
pronouncements. The focus in IFRS is more towards getting the balance sheet right and
hence brings significant volatility in the income statement.
*Professor & Head, Department of Accounting (FCMC), J.N. Vyas University, Jodhpur
Indian Journal of Accounting
8
Indian Journal of Accounting
Convergence with IFRSs has gained impetus in India too. The Council of the ICAI
suggested the adoption of IFRSs at least for listed and other public entities like banks,
insurance companies and other large entities from accounting periods commencing on or
after 1st April 2011. How about the ground-footing for convergence? At the outset it
appears that Indian accounting standards are well aligned with IFRSs, but actually they
are drastically different in the areas of financial instruments, group accounts, share based
payments and business combinations. But even then the benefits which Indian companies
hope to reap after IFRS adoption are numerous. Indian accounting standards are fairly
closely aligned with IFRS. So the switch to IFRS will be fairly easy. The potential benefits
for us are immense. Practically foreign investors are more likely to invest in firms whose
accounting is similar to accounting of the country of the investors. Thus we can attract
more foreign capital, lower the cost of capital for our firms and increase job opportunities
for Indian accountants by adopting IFRS.
This is a period of mild economic conditions. The current shaken market confidence
globally may present significant challenges to organizations. Adoption of IFRS could result
in an added considerable volatility in reported earnings and some performance specific
measures like EPS and P/E Ratio. Entities will have to clarify reasons for this IFRS related
volatility apart from other macroeconomic factors. Some entities may completely be wiped
off of their retained earnings while for some it may add on to their retained earnings.
Nations around the world are not free from the dilemma of whether their national accounting
standards should be aligned to IFRS or take the big bang approach of adopting IFRS as
written by IASB and follow standards that are globally applied irrespective of the economic
environment. This creates a problem that IFRS with modifications by various countries
would result in multiple and probably inconsistent versions of IFRSs globally. This becomes
IFRS as applied by a specific country as opposed to IFRS as issued by IASB. The
apprehension is that, this might defeat the very purpose of global convergence, which is to
move toward a single set of high-quality accounting standards for use throughout the
world.
Present is the age of knowledge economy (KE). The KE is by definition an economy
in which knowledge is prime mover. Value added is essence of the KE where knowledge
with respect to accounting may be codification, convergence of knowledge, consolidation
of concepts and the collection or pooling of experience. Such trends in the practice could
help us assess our 'preparedness for IFRS'.
Presumably the above premises and ground-footing will serve as a frame of
references to examine our 'preparedness for IFRS'.
The global convergence of ASs should be viewed as a natural manifestation of the
spirit of globalization. Globalization includes as an inevitable consequence, the convergence
of ASs. It is, therefore, the convergence of ASs must be perceived as the manifestation of
the Knowledge Economy in the accounting profession.
Here is a brief account of the efforts made towards the preparedness for IFRS as
could be learnt by the author:
9
1. The IASB and the US FASB have worked together to promote and help in the task
of convergence of the GAAP in various countries with the IFRS. It is hoped that the
accounting language of the world may ultimately emerge to IFRS.
2. Realizing the hurdles, challenges in the convergence like the availability of trained
expertise, the KPMG in India came forward to assist the corporate India. The group
also surveyed various aspects of the convergence process affecting our
preparedness.
3. So far as the ICAI is concerned, the ASB had constituted a task-force. It has released
a 'Concept Paper on Convergence with IFRS in India' which details the strategy
and roadmap for convergence with effect from April 1, 2011. The conceptual
differences and variances in slightly greater details have been mentioned in this
concept paper. The Concept Paper does speak about various steps; the results are
yet to see. Planning is there but how much practical and effective it is, not difficult
to guess.
4. The ICAI proposed a plan for convergence for certain defined entities grouped as
large sized entities and the SMEs. The Institute also developed a simplified version
of the IFRS set. The proposed standard represents a simplified set for SMEs. As
part of its convergence strategy, the ICAI has classified IFRS into four categories
as below:
Category I: IFRS which can be adopted immediately.
Category II: IFRS which may require some time to reach a level of technical
preparedness, say a short period of two years.
Category III: IFRS which require dialogues with the IASB due to conceptual
difference, hence demand time par with category II.
Category IV: IFRS the adoption of which would require changes in law.
The ICAI examined whether a stage-wise approach to convergence should be
followed. It finally concluded that such a step-wise approach may result in several
application complexities hence opted for an approach whereby all IFRS should be
adopted for the defined entities for accounting period commencing on or after
April 1, 2011. The ICAI believed that the period would help in building the
environment supporting the adoption of IFRS.
5. The ICAI in the name of imparting training, orientation, exposure and developing
expertise in the professionals concerned has come forward with an initiative as a
part of its Continuing Education Program under which a series of programs are to
be organized at its various branches. The precise results of the plan would depend
on the pace and extent of seriousness. Should we hope the plan to reach all members
timely? The question of qualitative result has also been posed from various quarters.
There is no any such initiative from any of the bodies or agencies in academics in
this regard. And the latter world of academics has a significant role to play and rise
in response of the challenge of change in this sphere of knowledge. Where is their
preparation?
Gupta
10
Indian Journal of Accounting
THE ISSUE OF ACCOUNTING PRACTICES, AIS AND ACCOUNTING EDUCATION
The IFRS standards are significantly centered on fair-value approach for
measurement of assets and liabilities. The information input required for this fair-value
approach depend upon a variety of complex set of micro (internal) and macro (external)
variables and pieces of information. The generation and ready availability of those
information calls for advanced accounting practices or AIS coupled with production of
economic data from the government or other agencies. Mr. V.G.Narayanan of Harvard
Business School noted, "Some of the finest implementations of ABC and BSC have been in
India. While there are such pockets of excellence, the average firm in India has management
accounting systems that are about 10 or 20 years behind what is now state of art". Hardly
any considerable initiatives and efforts have been made in this direction in trade & industrial
world or by the professional or academic bodies and the concerned government machinery
etc. Any assessment of ours would reveal a desperating situation on the state of knowledge,
popularity in the practice and coverage in imparting education or training regarding the
modern accounting tools such as Target Costing, Accounting/Financial linkage of Value
Chain Management, XBRL, Resource Consumption Accounting, and Environmental
Accounting incorporating matters like carbon credit. The list of such tools and aspects of
AIS environment in India could be much bigger. Our universities largely lack-behind in
tuning up their course contents, teaching aids and production of training material. To our
great desperation, our universities have just started talking of introducing the studies on
IFRS. There are no much specific programs or packages for accounting professionals. The
preparedness of the academic world in India in this regard is highly regrettable and worries-
some. This shall be possible only when the Commerce Education and the Accounting
Education in particular in India is granted its due status as has been raised nationally by
the author in the University News (Dec. 2008).
STATE OF OPENNESS, CO-OPERATION AMONG PROFESSIONAL AND
ACADEMIC BODIES
How difficult is it to achieve co-operation among different agencies and levels of
law, tax, authorities, various professional bodies can be understood in our context from
the following : (a) The desparating result of the committee set-up as back as in 1966 by the
GOI for unification of both the premier institutes of accounting professionals in India. (b)
The need felt by the Government to streamline the governance in the ICAI through Naresh
Chandra Committee formed after the Asian Crisis of 1997-98.
We know that the chairman of IAASB (International Auditing and Assurance
Standards Board) of IFAC is Arnold Schilder who is a Professor and was the guest of
honor at the recent international conference (July, 2009) of the ICAI to speak on the strategic
steps in regard with convergence. In India, still a complexion or compartementation is
maintained by the professional wing with the academic wing of the accounting discipline
when such a recognition or liasion with the academic wing would be a matter of remote
possibility. The two counterparts of the training and learning in the area of accounting in
11
India have not come forward to work together under a co-ordinated strategy. Apparently
the preparedness for IFRS in India in terms of its nature and extent is inadequate or by
halves and half-hearted. The teachers, scholars, advanced students in academic accounting
badly need training, learing material, orientation par with professionals. There seems to
have been 'no program or strategy' from any corner including academic bodies or agencies
like the ICA, IAA and UGC. The AAA is in fact a true example for the two wings, the
professional and academic, of accounting working in unison for the cause of the growth of
discipline and enrichment of its practice for the accepted wider welfare role of accounting.
In India, we need to bring the professionals and academics in accounting activity closer on
the models of AAA, IAASB and IFAC.
PROBLEM OF DOWN-STREAM ADJUSTMENTS, STANDARD-SETTERS AND
PERFORMANCE STANDARDS
In order to be effective, convergence of ASs will require several down streams
developments like guidance, consultative services, surveillance approach. In India no such
adjustments are on the move. Further what about convergence between regulators apart
from standard setters in different countries.
As noticed in the introduction that the convergence is a natural manifestation, an
inevitable consequence and therefore a break-through for the KE in accounting profession.
Convergence is possible by adopting IFRS. Much more is involved in the process- (the
convergence process)? standard setting process, interpretation of standards and finally the
convergence in the standard of performance by professional accountants. So any enquiry
into the preparedness required an examination from all these points of view. It would
reveal that we are prepared by halves.
'INDUSTRY SCAN' OR SCALE/SECTOR ANALYSIS OVER LOOKED
The KPMG in its survey noted several concerns and challenges along the path of
IFRS adoption. Futher as noted, the experience with smaller companies was rather serious
and some special effort was felt necessary for SMEs due to the two features of the IFRS. In
the first place the IFRS are principle-based standards requiring judgment and secondly
their extensive reliance on fair?value measurements.
However with the care and intention of global application the IFRS may have been
written, each country will have to evaluate their viability under prevailing economic
environment and in the context, India could not be an exception. The experts have come
out with meticulous impacts, problems faced by individual industries in the course of
adopting the IFRS. It is doubted that sufficient exercise has been done to that much scale in
India. Each industry has its peculiarities and environmental constraints. Thus the issue of
'Industry specific scan for IFRS' is not well attended in our preparedness.
Gupta
12
Indian Journal of Accounting
A SCAN OVER LEGAL, POLITICAL, PROFESSIONAL AND USERS' COLLECTIVE
ENVIRONMENT
In India we have a multiplicity of standard setting authorities (ASB, NACAS, SEB,
Companies Act, Central Government, and the Tax Laws) and all get involved in enforcing
standards. Unless such confusion is cleared, it would be virtually pointless to hope for a
systematic and harmonious convergence of ASs. Convergence, however will not succeed
unless we take steps to ensure that there is convergence of professional standards. What
do we feel about it? Certainly hardly any preparedness is there. Do we not know that
audits in the public sector are regarded as rewards rather than responsibilities? No steps
seem to have been taken to change such attitudes. Is our entire system of appointment of
auditors in the public sector going to be par with international practice? World over the
joint auditors act together on the ground of same level of compatibility. They honor there
the principle of unitary responsibility. We in India, subscribe to the unique system of
segregating responsibility for joint auditors. We hardly have any international convergence
in various areas of professional involvement. The globalization as imagined would be
almost impossible only through the single instance of convergence of ASs. There is an
obvious absence of the co-operation of the regulators. Neither the regulators seem to be
mentally ready to give up the functions for which they are not qualified, nor to grant the
desired freedom to the accounting profession. The political environment in India as it has
stood so far would not be ready to lose or reduce its authority, dominance and interference.
This is an obvious threat to our preparedness.
Do we think mere adoption of IFRS would ensure or render by itself the credibility
to the financial reporting? The preparations of India, in joint efforts with others in this
regard have been underscored. The experts feel that we may have to pay the price of
credibility for global acceptance and transnational investment. Credibility depends not
only on knowledge but also on understanding. One cannot have convergence of knowledge
without the convergence of understanding. Could you converge the 'understanding'
authoritatively? No, it would be a slow process among all concerned and give results. This
convergence of understanding has to be parallel among all parties, users and stakeholders.
The joint responsibility therefore, to educate all concerned falls on the profession and the
academic wing of accounting in India. Both the counterparts and the latter partner in
particular in this process of preparedness do not seem to have prepared themselves for
the nation. Alas the captions like the ICAI- a Partner in Nation Building can be noticed in
the professional expressions. Accounting standards are believed to be ultimately meant
for users and not for the accountants. Astonishing instances of the gap of understanding
have come to be noted even at the level of the Supreme Court - yes just in understanding
the aim or end achievement of ASs or that ASs do not impact instead profit, they only
affect the true measurement of profit. In India, law over rides the standards while the IFRS
in spirit are more important than law or management requirements. IFRS once implemented
would overrule not only management requirement, but also the law. This requires major
changes in the system here in India. Not only company law needs immediate amendment,
13
but also IT Act and other related regulations. Inferentially, definitely the 'environmental
preparation' has lacked very much in India as regards the IFRS.
The eventual adoption of IFRS by all countries appears inevitable. Early adoption of
IFRS will give an opportunity to shape it. If we are one of the last to join the bandwagon, we
will not have any real opportunity to influence and shape the setting of international
accounting standards. Since this window of opportunity will pass fairly soon, we need the
Indian industry, government, and the accounting profession to move quickly towards
adopting IFRS. Our road-map for the adoption process has not been quite comprehensive
and effective in action. No doubts, the programs have been launched and softwares released
by the apex professional body but as the leading trainers in accounting have expressed
their strong doubts on their sufficiency or success. There is still a long way to go. We need
all the stakeholders - the industry, ICAI, government, (the ministries of direct concern like
company law in particular) RBI, SEBI, tax authorities and other regulators to fit into place
in the transition process to IFRS. A joint strategy and movement of all these including
academic agencies was badly required which is absent there. The discussion we need to
engage is to holistically review the appropriateness of every application for India and
address such issues in the transition provisions including those relating to first time adoption
and tax implications. The thought behind actions needs to be clearly articulated and debated.
We have some time ahead and can meet the deadline of 2011 but clarity of thought and
speed of action would be of essence. A quick action plan and roadmap is need of the hour.
Still, India's road to IFRS is long & could be rocky.
REFERENCES/SOURCESBhargava, V: India stepping for IFRS: A Critical Review (Journal of Accounting & Control, Jodhpur)
Vol.2008, based on a paper at the XXXI Conference of the IAA, Ahmedabad Nov. 2008.
Gupta, Lalit and Vadera, M L: Accounting deserves Recognition as Technical Education and a Brandof Management (University News, Vol. 46 No. 49 Dec. 2008, pp. 8-12
Iyer, M : IFRS Financial Statements Presentation- Present and Future ( The Chartered Accountant,Vol.57, No. 12 { June, 2009} pp 2062-2073)
Jagannath, K M: 'Impact of Accounting Standards on Harmonization: An Empirical Study of CorporateFinancial Reporting in India. (A Thesis submitted to University of Mysore for Ph.D, July2008).
Kumar, P: IFRS- Basics and Variances with Indian GAAP (The chartered Accountant, Vol, 57 No.3(sept. 2008) pp. 428-435.
Narielvala, PM : Accountancy- Convergence is the Key to the Knowledge Economy (The CharteredAccountant, Vol, 57 No.1 (July 2008) pp. 70- 77.
Report : 'IFRS: Developing a Roadmap to Convergence' by KPMG in India, March 2008.
Report on International Conference (July, 2009), the Chartered Accountant, Vol, 58 No.2 (Aug.2009)pp. 198-207.
Gupta
14
Indian Journal of Accounting
Indian Journal of Accounting
Vol. XLI (1) December 2010, pp. 14-24
AN ECONOMETRIC RELATIONSHIPBETWEEN FMCG SECTOR PRICE INDEXAND MACROECONOMIC VARIABLES
*Vishal Vyas
**D.D. Bedia
ABSTRACTThis study investigates the long-term and short-term relationships between FMCG Sector
Price Index and Macroeconomic Variables for the period of 2000:05-2009:12. Using Johansencointegration approach, we observe that the sector stock prices are negatively related to thelong-term interest rate and inflation. The sector stock prices have shown positive relationshipwith the money supply, industrial production and exchange rate. The VECM tends to indicatethat of all the variables FMCGI stands out econometrically exogenous as illustrated throughthe Granger causality tests. The VECM results imply that this variable was the initial receptorsof exogenous shocks to the long-term equilibrium relationship and all the remaining involvedvariables had to bear the burden of short-run adjustment endogenously. The results of VarianceDecomposition also indicate that the FMCGI is relatively the leading variable, being the mostexogenous of all variables because almost 93% of its own variance is explained by its own shockeven after 24 months.
INTRODUCTION
The Fast Moving Consumer Goods (FMCG) industry primarily deals with the
production, distribution and marketing of consumer-packaged goods that are consumed
at regular intervals. The industry is vast and offers a wide range of job opportunities in
functions such as sales, supply chain, finance, marketing, operations, purchasing, human
resources, product development and general management. Global leaders in the FMCG
segment are Sara Lee, Nestlé, Reckitt Benckiser, Unilever, Procter & Gamble, Coca-Cola,
Carlsberg, Kleenex, General Mills, Pepsi and Mars etc. The Rs 86,000-crore FMCG industry
is expected to witness a lot of action in 2010. With the economy showing signs of revival,
the industry is expected to register a 15% growth in 2010 as compared to the previous
year.
*Assistant Professor,Faculty of Management Studies, Mody Institute of Technology & Science, Lakshmangarh(Rajasthan)**Associate Professor, Faculty of Management Studies, Pt. Jawaharlal Nehru Institute of BusinessManagement, Vikram University, Ujjain
15
METHODOLOGY
To investigate the long-term relationships, it is important first to determine the
order of integration of each series. A variety of tests, namely the augmented Dickey-
Fuller, ADF, and Phillips and Perron (1988) and Perron (1988), PP, unit root tests are used
in this study to test the order of integration in each series.
To investigate the long-run relationships among the variables in model (1), the
Johansen (1988, 1991, 1992) and Johansen and Juselius (1990) method is used to test for the
number of cointegrating vectors.
Engle and Granger (1987) noted that if the variables are cointegrated, there always
exists a corresponding error correction representation in which the short-run dynamics of
the variables in the system are influenced by the deviation from long-term equilibrium.
Thus, the VECM is useful for detecting the long-term and short-term Granger causality
when the variables are cointegrated.
The VDC exhibits the proportion of the forecast error of each variable that is
accounted for by each of the other variables. Therefore, the VDC enables us to determine
the relative importance of each variable in generating fluctuations in other variables.
The IRF used to depict the adjustment dynamics among variables by indicating the
dynamic response of a variable to a one standard deviation shock to another variable. The
IRF can be obtained from either the unrestricted VAR form of the model or the VAR
systems with cointegrated variables.
DATA DESCRIPTION
The sample of the study consists of the Indian sector stock prices which are
represented by the index average monthly closing prices of BSE Fast Moving Consumer
Goods (FMCGI), for the period of 2000:05-2009:12. The stock prices are based on average
monthly closing prices of indices. The monthly data for all macroeconomic variables have
been acquired for the period of 2000:05-2009:12.
To reflect the impact of RBI actions and the banking system, the narrow money
supply (Ml) represents as the money supply. The first measure of money stock, M1
represents the most liquid or narrow measure of money supply. In the opinion of Mukherjee
and Naka (1995), the effect of money supply on stock prices is an empirical question. An
increase in money supply would lead to inflation, and may increase discount rate and
reduce stock prices (Fama, 1981).
The industrial production (IPI) is used as the measure of the real economic activity
because it may explain more return variation than other measures of real economic activities
such as real GNP and private investment as observed by Fama (1981,1990). The Index of
Industrial Production compares the growth in the general level of industrial activity in the
economy with reference to a comparable base year.
The inflation rate is measured by the percent change of the wholesale price index
(WPI). It is believed that, when assessing real returns on stocks, market participants are
responsive to consumer goods prices (Abdullah and Hayworth, 1993).
Vyas
16
Indian Journal of Accounting
The average interest rates (INTR) on 91-day T-bills are used for money market
proxies. The Treasury bill rates are risk free rates and these bills are liquid and always
market clearing (Siklos and Wohar, 1997).
To explore the influence of foreign countries on the Indian market, market rate of
Rupee vis-à-vis US dollar (Rs /US $) is employed to present the foreign exchange rate
(EXCR). It is average of buying and selling. These are indicative rates of Foreign Exchange
Dealers' Association, published in RBI weekly Statement.
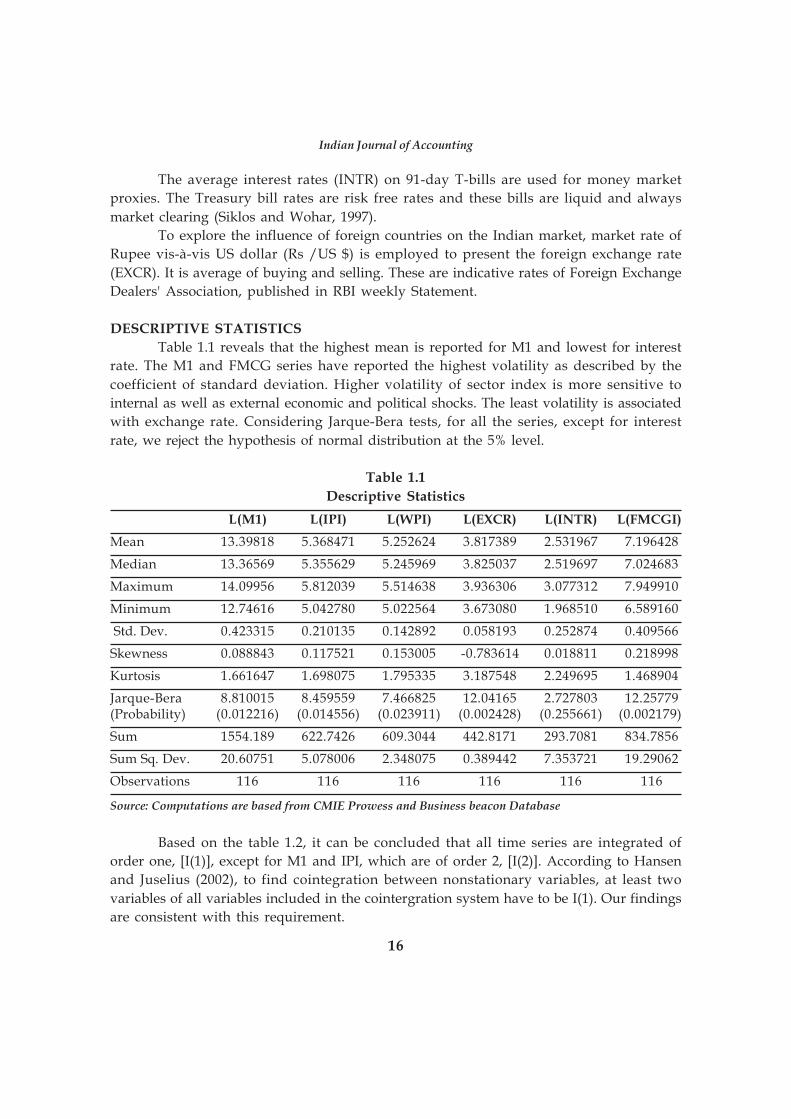
DESCRIPTIVE STATISTICS
Table 1.1 reveals that the highest mean is reported for M1 and lowest for interest
rate. The M1 and FMCG series have reported the highest volatility as described by the
coefficient of standard deviation. Higher volatility of sector index is more sensitive to
internal as well as external economic and political shocks. The least volatility is associated
with exchange rate. Considering Jarque-Bera tests, for all the series, except for interest
rate, we reject the hypothesis of normal distribution at the 5% level.
Table 1.1
Descriptive Statistics
L(M1) L(IPI) L(WPI) L(EXCR) L(INTR) L(FMCGI)
Mean 13.39818 5.368471 5.252624 3.817389 2.531967 7.196428
Median 13.36569 5.355629 5.245969 3.825037 2.519697 7.024683
Maximum 14.09956 5.812039 5.514638 3.936306 3.077312 7.949910
Minimum 12.74616 5.042780 5.022564 3.673080 1.968510 6.589160
Std. Dev. 0.423315 0.210135 0.142892 0.058193 0.252874 0.409566
Skewness 0.088843 0.117521 0.153005 -0.783614 0.018811 0.218998
Kurtosis 1.661647 1.698075 1.795335 3.187548 2.249695 1.468904
Jarque-Bera 8.810015 8.459559 7.466825 12.04165 2.727803 12.25779(Probability) (0.012216) (0.014556) (0.023911) (0.002428) (0.255661) (0.002179)
Sum 1554.189 622.7426 609.3044 442.8171 293.7081 834.7856
Sum Sq. Dev. 20.60751 5.078006 2.348075 0.389442 7.353721 19.29062
Observations 116 116 116 116 116 116
Source: Computations are based from CMIE Prowess and Business beacon Database
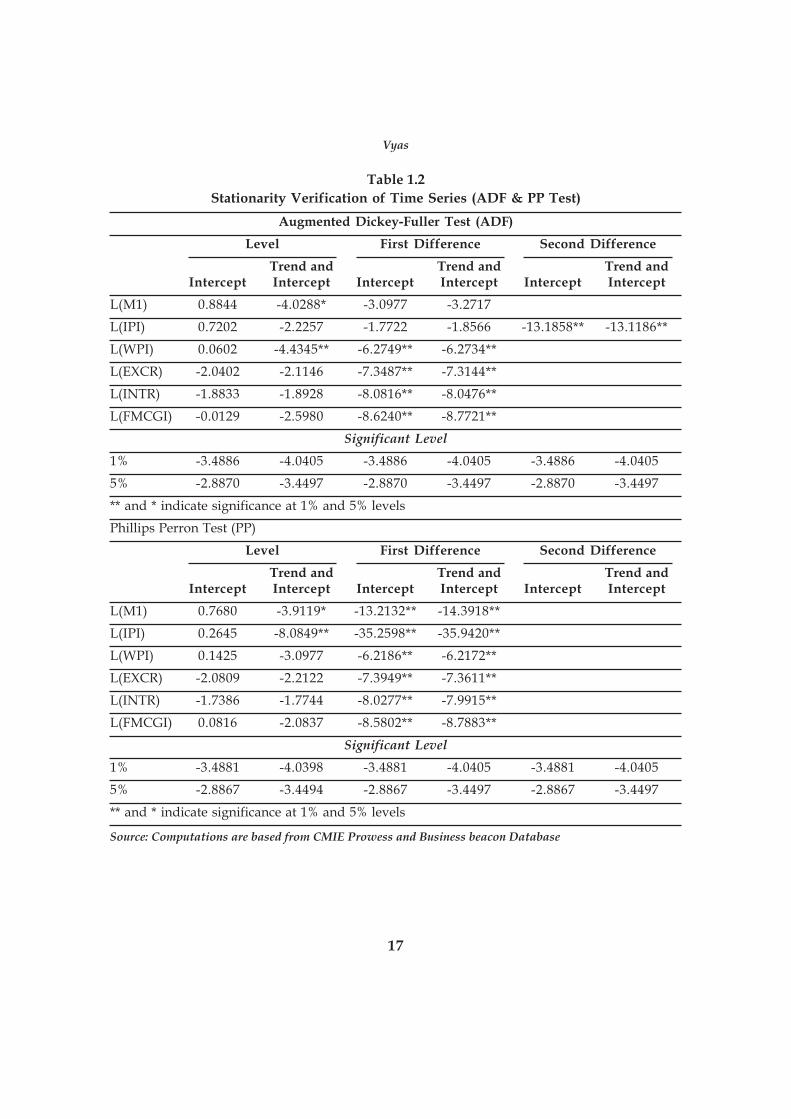
Based on the table 1.2, it can be concluded that all time series are integrated of
order one, [I(1)], except for M1 and IPI, which are of order 2, [I(2)]. According to Hansen
and Juselius (2002), to find cointegration between nonstationary variables, at least two
variables of all variables included in the cointergration system have to be I(1). Our findings
are consistent with this requirement.
17
Table 1.2
Stationarity Verification of Time Series (ADF & PP Test)
Augmented Dickey-Fuller Test (ADF)
Level First Difference Second Difference
Trend and Trend and Trend andIntercept Intercept Intercept Intercept Intercept Intercept
L(M1) 0.8844 -4.0288* -3.0977 -3.2717
L(IPI) 0.7202 -2.2257 -1.7722 -1.8566 -13.1858** -13.1186**
L(WPI) 0.0602 -4.4345** -6.2749** -6.2734**
L(EXCR) -2.0402 -2.1146 -7.3487** -7.3144**
L(INTR) -1.8833 -1.8928 -8.0816** -8.0476**
L(FMCGI) -0.0129 -2.5980 -8.6240** -8.7721**
Significant Level
1% -3.4886 -4.0405 -3.4886 -4.0405 -3.4886 -4.0405
5% -2.8870 -3.4497 -2.8870 -3.4497 -2.8870 -3.4497
** and * indicate significance at 1% and 5% levels
Phillips Perron Test (PP)
Level First Difference Second Difference
Trend and Trend and Trend andIntercept Intercept Intercept Intercept Intercept Intercept
L(M1) 0.7680 -3.9119* -13.2132** -14.3918**
L(IPI) 0.2645 -8.0849** -35.2598** -35.9420**
L(WPI) 0.1425 -3.0977 -6.2186** -6.2172**
L(EXCR) -2.0809 -2.2122 -7.3949** -7.3611**
L(INTR) -1.7386 -1.7744 -8.0277** -7.9915**
L(FMCGI) 0.0816 -2.0837 -8.5802** -8.7883**
Significant Level
1% -3.4881 -4.0398 -3.4881 -4.0405 -3.4881 -4.0405
5% -2.8867 -3.4494 -2.8867 -3.4497 -2.8867 -3.4497
** and * indicate significance at 1% and 5% levels
Source: Computations are based from CMIE Prowess and Business beacon Database
Vyas

18
Indian Journal of Accounting
Table 1.3
Long-term Cointegration Relationship between FMCGI and MEVs
Trend assumption: Linear deterministic trend (restricted)Series: L(FMCGI) L(M1) L(IPI) L(WPI) L(EXCR) L(INTR)
Lags interval (in first differences): 1 to 4
Hypothesized Trace 5 Percent 1 PercentNo. of CE(s) Eigenvalue Statistic Critical Value Critical Value
None ** 0.530308 163.8941 114.90 124.75
At most 1 0.208720 80.01374 87.31 96.58
At most 2 0.201015 54.02829 62.99 70.05
At most 3 0.145725 29.11846 42.44 48.45
At most 4 0.076892 11.63572 25.32 30.45
At most 5 0.024512 2.754691 12.25 16.26
Trace test indicates 1 cointegrating equation(s) at both 5% and 1% levels
*(**) denotes rejection of the hypothesis at the 5%(1%) level
Hypothesized Max-Eigen 5 Percent 1 PercentNo. of CE(s) Eigenvalue Statistic Critical Value Critical Value
None ** 0.530308 83.88033 43.97 49.51
At most 1 0.208720 25.98545 37.52 42.36
At most 2 0.201015 24.90983 31.46 36.65
At most 3 0.145725 17.48274 25.54 30.34
At most 4 0.076892 8.881024 18.96 23.65
At most 5 0.024512 2.754691 12.25 16.26
Max-eigenvalue test indicates 1 cointegrating equation(s) at both 5% and 1% levels
*(**) denotes rejection of the hypothesis at the 5%(1%) level
Source: Computations are based from CMIE Prowess and Business Beacon Database
Table 1.3 presents the cointegration test for FMCGI. Both X-trace statistics and X-
max statistics identifies one cointegrating vectors. According to Cheung and Lai (1993),
the X-trace statistics is more robust than the X-max statistics. Hence, the studied model is
determined to possess one cointegrating vector, and thus five common stochastic trends
among the variables. The first normalized eigenvector is:
FMCGI = -0.095034 +6.011018 M1 +11.81780 IPI -10.39262 WPI +
0.110799 EXCR -0.886009 INTR
The cointegration model is based on the vector autoregressive model (VAR) with 4
lags using the likelihood ratio (LR) test. The critical values for X-Trace and X-Max statistics
are tabulated in Table 1 of Osterwald-Lenum (1992).
19
The equilibrium relation between the FMCGI and M1 is positive and significant at
1% level. The IPI and EXCR are positively affecting the index prices, while WPI and INTR
are negatively reacting with the index prices. The relations for IPI, WPI and INTR are
significant at 1% level but insignificant for exchange rate. The results of weak exogeneity
tests, conducted within a VECM formulation indicate that the null hypothesis of weak
exogeneity cannot be rejected for LFMCGI, LM1, LEXCR and LINTR. Thus, it can be
concluded that these variables are weakly exogenous. The exclusions of the adjustment
coefficients of the variables LIPI and LWPI from the vector error correction specification
are rejected.
CAPTURING THE SHORT RUN DYNAMICS AND LONG RUN EQUILIBRIUM
RELATION FOR FMCGI AND MEVS
If the series are co-integrated, Granger representation theorem states that an error
correction model (ECM) describes the dynamic relationship. The VECM is a restricted
VAR designed for use with non-stationary series that are known to be co-integrated. The
VECM has co-integration relations built into the specification so that it restricts the long-
run behavior of the endogenous variables to converge to their co-integrating relationships
while allowing for short-run adjustment dynamics. The co-integration term is known as
the error correction term since the deviation from long-run equilibrium is corrected gradually
through a series of partial short-run adjustments. The advantage of ECM framework lies
in its strength of capturing both the short run dynamics and long run equilibrium relation
between two series.
Engle and Granger (1987) demonstrated that once a number of variables are found
to be co- integrated, there always exists a corresponding error-correction representation
which implies that changes in the dependent variable are a function of the level of
disequilibrium in the co-integrating relationship (captured by the error-correction term) as
well as changes in other explanatory variable(s). The short-term variation can be predicted
by using ECM.
Thus, the non-significance of both the t and F or Wald Chi-Square tests in the
VECM indicates econometric exogeneity of the dependent variables (Engle and Granger,
1987). In addition to indicating the direction of causality among variables, the VECM
approach allows us to distinguish between 'short-run' and 'long-run' Granger causality.
When the variables are co-integrated, in the short-term, deviations from this long-run
equilibrium will feed back on the changes in the dependent variable in order to force the
movement towards the long-run equilibrium.
The VECM is based on a uniform lag length of 4 as in the cointegration model with
linear deterministic trend (restricted). All variables are in first differences with an exception
to the lagged error-correction terms (ECTt-1) generated from Johansen order of cointegration
with the first cointegrating vector that is normalized on dependent variables.
Vyas
20
Indian Journal of Accounting
Table 1.4
Estimates for error correction model
Vector Error Correction Estimates
Cointegrating CointEq: Eq1
L(FMCGI(-1)) 1.000000
L(M1(-1)) -6.011018(1.66545)[-3.60924]
L(IPI(-1)) -11.81780(1.58631)[-7.44988]
L(WPI(-1)) 10.39262(2.25278)[ 4.61324]
L(EXCR(-1)) -0.110799(0.58852)[-0.18827]
L(INTR(-1)) 0.886009(0.22529)[ 3.93270]
@TREND 0.095034(00M05) (0.02073)
[ 4.58350]
C 74.80924
ErrorCorrection: D(L(FMCGI)) D(L(M1)) D(L(IPI)) D(L(WPI)) D(L(EXCR)) D(L(INTR))
CointEq1 0.023020 -0.000117 0.106255 -0.012640 0.007111 -0.033015(0.02723) (0.00824) (0.01744) (0.00251) (0.00640) (0.02671)[ 0.84553] [-0.01425] [ 6.09398] [-5.02668] [ 1.11041] [-1.23596]
Source: Computations are based from CMIE Prowess and Business Beacon Database
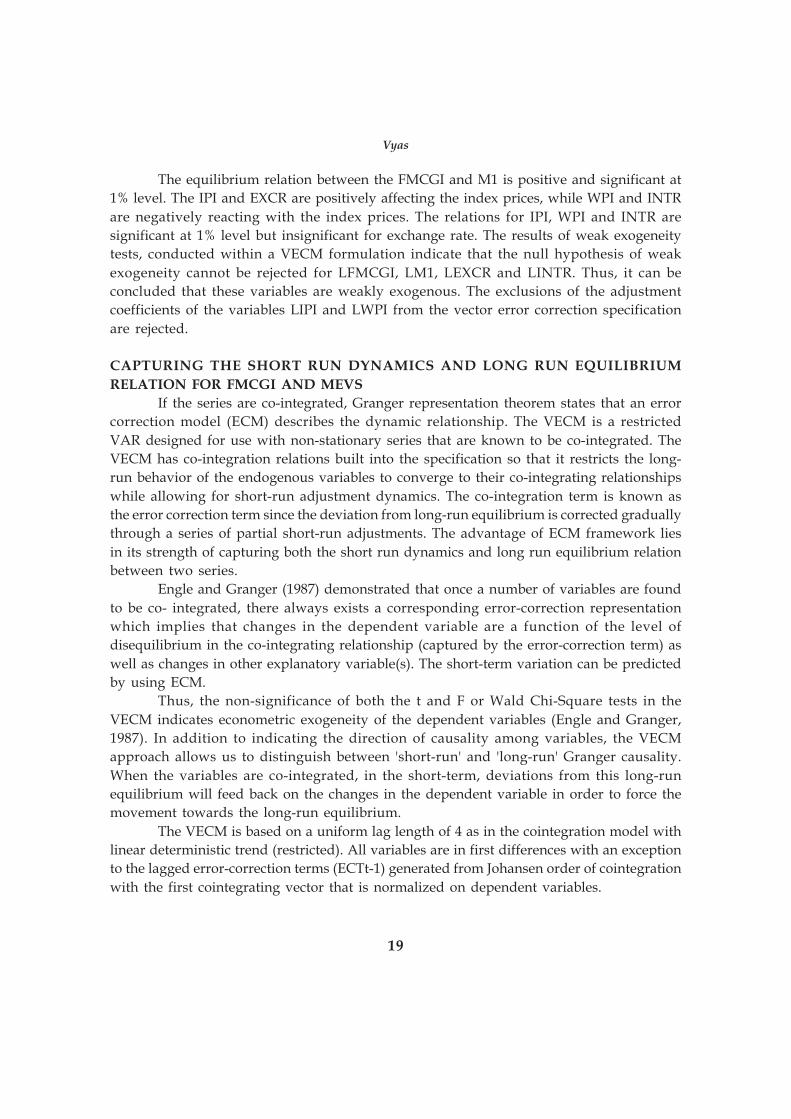
Table 1.4 presents vector error correction estimates for FMCGI. It indicates the
estimated coefficient of the ECT in the FMCGI equation. The result shows that the ECT is
not significant with a t-statistic of 0.8455, suggesting that the error correction cannot be
used to help predict changes in FMCGI prices. For IPI equation, the t-test of the ECT in
equation is statistical significant at 1%. This result suggests that each variable Granger-
cause the IPI. Hence, all variables have an impact on the IPI at least to some extent. The
similar results have been observed for the ECT in WPI equation at 1% level of significance.
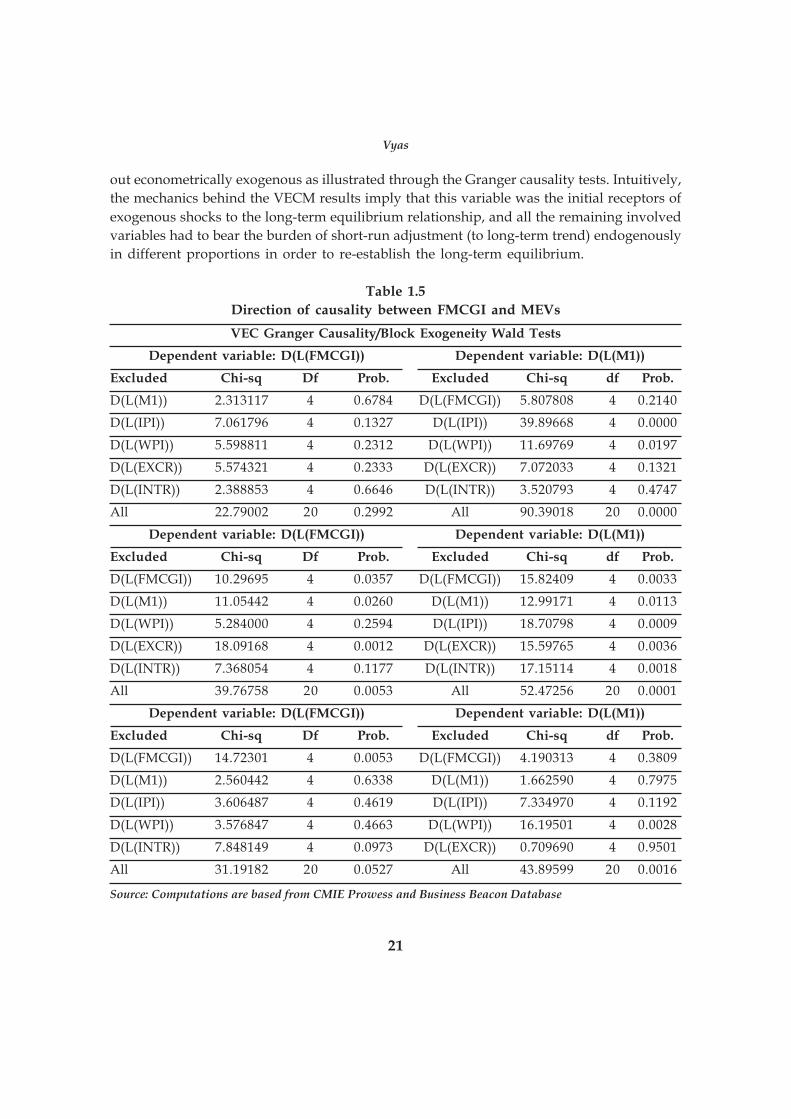
For FMCGI (Table 1.5), the VECM tends to indicate that of all the variables FMCGI stands
21
out econometrically exogenous as illustrated through the Granger causality tests. Intuitively,
the mechanics behind the VECM results imply that this variable was the initial receptors of
exogenous shocks to the long-term equilibrium relationship, and all the remaining involved
variables had to bear the burden of short-run adjustment (to long-term trend) endogenously
in different proportions in order to re-establish the long-term equilibrium.
Table 1.5
Direction of causality between FMCGI and MEVs
VEC Granger Causality/Block Exogeneity Wald Tests
Dependent variable: D(L(FMCGI)) Dependent variable: D(L(M1))
Excluded Chi-sq Df Prob. Excluded Chi-sq df Prob.
D(L(M1)) 2.313117 4 0.6784 D(L(FMCGI)) 5.807808 4 0.2140
D(L(IPI)) 7.061796 4 0.1327 D(L(IPI)) 39.89668 4 0.0000
D(L(WPI)) 5.598811 4 0.2312 D(L(WPI)) 11.69769 4 0.0197
D(L(EXCR)) 5.574321 4 0.2333 D(L(EXCR)) 7.072033 4 0.1321
D(L(INTR)) 2.388853 4 0.6646 D(L(INTR)) 3.520793 4 0.4747
All 22.79002 20 0.2992 All 90.39018 20 0.0000
Dependent variable: D(L(FMCGI)) Dependent variable: D(L(M1))
Excluded Chi-sq Df Prob. Excluded Chi-sq df Prob.
D(L(FMCGI)) 10.29695 4 0.0357 D(L(FMCGI)) 15.82409 4 0.0033
D(L(M1)) 11.05442 4 0.0260 D(L(M1)) 12.99171 4 0.0113
D(L(WPI)) 5.284000 4 0.2594 D(L(IPI)) 18.70798 4 0.0009
D(L(EXCR)) 18.09168 4 0.0012 D(L(EXCR)) 15.59765 4 0.0036
D(L(INTR)) 7.368054 4 0.1177 D(L(INTR)) 17.15114 4 0.0018
All 39.76758 20 0.0053 All 52.47256 20 0.0001
Dependent variable: D(L(FMCGI)) Dependent variable: D(L(M1))
Excluded Chi-sq Df Prob. Excluded Chi-sq df Prob.
D(L(FMCGI)) 14.72301 4 0.0053 D(L(FMCGI)) 4.190313 4 0.3809
D(L(M1)) 2.560442 4 0.6338 D(L(M1)) 1.662590 4 0.7975
D(L(IPI)) 3.606487 4 0.4619 D(L(IPI)) 7.334970 4 0.1192
D(L(WPI)) 3.576847 4 0.4663 D(L(WPI)) 16.19501 4 0.0028
D(L(INTR)) 7.848149 4 0.0973 D(L(EXCR)) 0.709690 4 0.9501
All 31.19182 20 0.0527 All 43.89599 20 0.0016
Source: Computations are based from CMIE Prowess and Business Beacon Database
Vyas
22
Indian Journal of Accounting
In addition, considering M1 equation, there are direct causalities from IPI and WPI
at 5% level of significance for the Chi-square-tests. There are direct causalities running
from FMCGI, M1 and EXCR to IPI at the 5% level of significance for the Chi-square-tests in
the IPI equation. While considering WPI equation, it is clearly evident that all involved
variables are causing this variable. In case of EXCR equation, the causality is running from
FMCGI to this variable. While considering INTR equation, the causality is running from
WPI to this variable. Thus, it can be concluded that there are various bi-directional causality
present in the system. The first bi-directional causality is between M1 and IPI, the second
causality is between M1 and WPI, and third causality has been observed between WPI and
INTR. The null hypothesis of block exogeneity is rejected for all equations (excluding
FMCGI and EXCR) indicating that all variables are jointly influenced by each other and
cannot be treated as pure exogenous.
EFFECT OF TRANSITORY AND PERSISTENT DYNAMIC RESPONSE TO VARIOUS
SHOCKS
An impulse response function traces the effect of a one-time shock to one of the
innovations on current and future values of the endogenous variables. Cholesky uses the
inverse of the Cholesky factor of the residual covariance matrix to orthogonalize the
impulses. This option imposes an ordering of the variables in the VAR and attributes all of
the effect of any common component to the variable that comes first in the VAR system.
The impulse response functions (IRF) indicate the transitory (or persistent) dynamic
response of a variable to a one standard deviation shock to another variable. Since
cointegration exists in this study, the IRF obtained from the VAR system with cointegrated
variables is more useful. Unlike the IRF derived from the unrestricted VAR model, the
permanent effect of a shock in one variable will generally not die out in the long run even
if no further shocks occur, that is, it shifts the system to a new equilibrium. On the other
hand, the transitory effect shows that the variable will return to its previous equilibrium
value after a few periods.
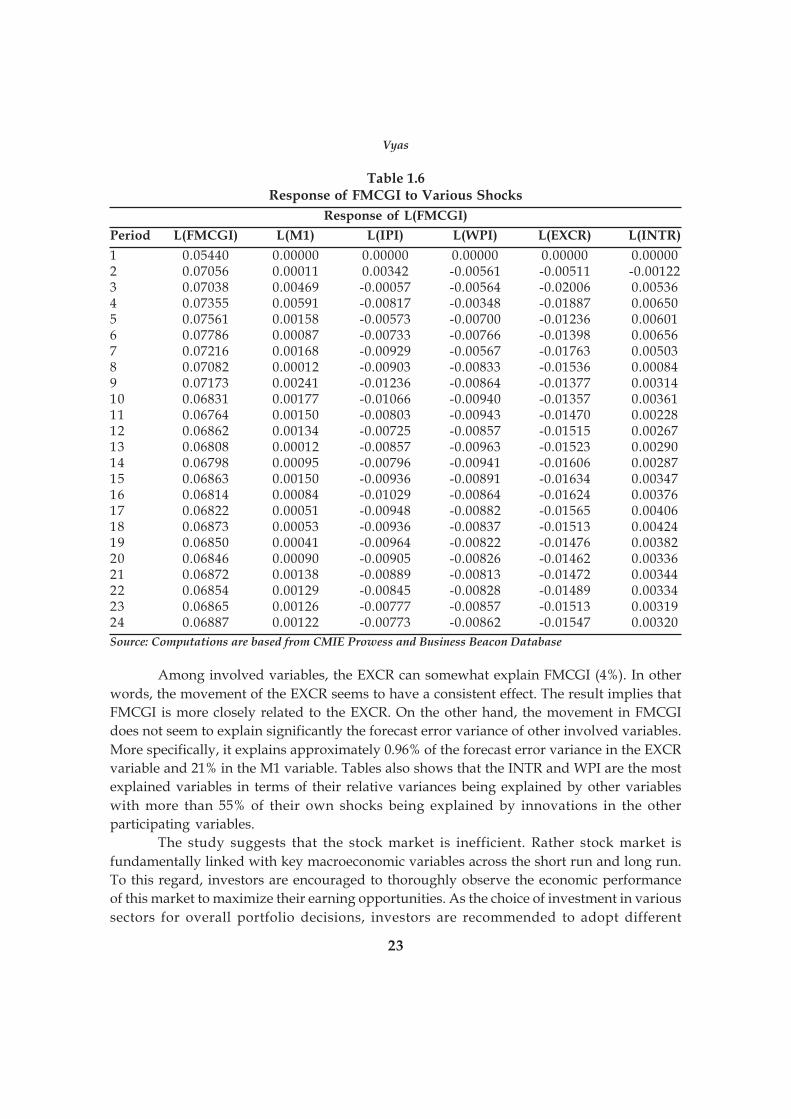
Table 1.6 presents the IRF of the FMCGI to one standard deviation innovations in
involved variables for a period of 24 months. The shocks observed in the M1 leads to a
permanent long-term increase in FMCGI variable. The shocks in WPI and EXCR lead to a
permanent long-term decrease in FMCGI variable. On the other hand, impulse responses
in the remaining variables are not permanent but transitory. At the beginning, the FMCGI
is positively reacting to innovations of IPI. Their response is in the downward direction to
hit the previous equilibrium level and staying below its equilibrium in the long-term. In
the long-term, the innovations in this variable are negatively affecting FMCGI. The similar
behavior has been observed for INTR variable but in the opposite direction. Moreover, the
IPI shocks influence FMCGI for 2 months before they return to their previous equilibrium
values. This implies that IPI factor bears the shortest time span to interact to the FMCGI.
23
Table 1.6Response of FMCGI to Various Shocks
Response of L(FMCGI)
Period L(FMCGI) L(M1) L(IPI) L(WPI) L(EXCR) L(INTR)
1 0.05440 0.00000 0.00000 0.00000 0.00000 0.000002 0.07056 0.00011 0.00342 -0.00561 -0.00511 -0.001223 0.07038 0.00469 -0.00057 -0.00564 -0.02006 0.005364 0.07355 0.00591 -0.00817 -0.00348 -0.01887 0.006505 0.07561 0.00158 -0.00573 -0.00700 -0.01236 0.006016 0.07786 0.00087 -0.00733 -0.00766 -0.01398 0.006567 0.07216 0.00168 -0.00929 -0.00567 -0.01763 0.005038 0.07082 0.00012 -0.00903 -0.00833 -0.01536 0.000849 0.07173 0.00241 -0.01236 -0.00864 -0.01377 0.0031410 0.06831 0.00177 -0.01066 -0.00940 -0.01357 0.0036111 0.06764 0.00150 -0.00803 -0.00943 -0.01470 0.0022812 0.06862 0.00134 -0.00725 -0.00857 -0.01515 0.0026713 0.06808 0.00012 -0.00857 -0.00963 -0.01523 0.0029014 0.06798 0.00095 -0.00796 -0.00941 -0.01606 0.0028715 0.06863 0.00150 -0.00936 -0.00891 -0.01634 0.0034716 0.06814 0.00084 -0.01029 -0.00864 -0.01624 0.0037617 0.06822 0.00051 -0.00948 -0.00882 -0.01565 0.0040618 0.06873 0.00053 -0.00936 -0.00837 -0.01513 0.0042419 0.06850 0.00041 -0.00964 -0.00822 -0.01476 0.0038220 0.06846 0.00090 -0.00905 -0.00826 -0.01462 0.0033621 0.06872 0.00138 -0.00889 -0.00813 -0.01472 0.0034422 0.06854 0.00129 -0.00845 -0.00828 -0.01489 0.0033423 0.06865 0.00126 -0.00777 -0.00857 -0.01513 0.0031924 0.06887 0.00122 -0.00773 -0.00862 -0.01547 0.00320
Source: Computations are based from CMIE Prowess and Business Beacon Database
Among involved variables, the EXCR can somewhat explain FMCGI (4%). In other
words, the movement of the EXCR seems to have a consistent effect. The result implies that
FMCGI is more closely related to the EXCR. On the other hand, the movement in FMCGI
does not seem to explain significantly the forecast error variance of other involved variables.
More specifically, it explains approximately 0.96% of the forecast error variance in the EXCR
variable and 21% in the M1 variable. Tables also shows that the INTR and WPI are the most
explained variables in terms of their relative variances being explained by other variables
with more than 55% of their own shocks being explained by innovations in the other
participating variables.
The study suggests that the stock market is inefficient. Rather stock market is
fundamentally linked with key macroeconomic variables across the short run and long run.
To this regard, investors are encouraged to thoroughly observe the economic performance
of this market to maximize their earning opportunities. As the choice of investment in various
sectors for overall portfolio decisions, investors are recommended to adopt different
Vyas
24
Indian Journal of Accounting
strategies across these economic markets because of the diverse relationship between stock
prices and macroeconomic variables.
REFERENCESAbeyratna Gunasekarage, Anirut Pisedtasalasai, David Power. 2004. Macroeconomic Influence on
the Stock Market: Evidence from an Emerging Market in South Asia. Journal of EmergingMarket Finance 3 (3):285-304.
Alexandra Horobet, Sorin Dumitrescu. 2009. On the causal relationships between monetary, financialand real macroeconomic variables: evidence from central and eastern Europe. EconomicComputation & Economic Cybernetics Studies & Research 43 (3):1-17.
Atsuyuki Naka, Tarun K., David R. Tufte. 2001. Microeconomic Variables and the Performance of theIndian Stock Market. In University of New Orleans, Department of Economics and Finance,Working Papers 1998-06.
Bradley T. Ewing, Shawn M. Forbes & James E. Payne. 2003. The effects of macroeconomic shocks onsector-specific returns. Applied Economics 35 (2):201-237.
Cheung Yin-Wong, Lai Kon S. 1993. Finite-Sample Sizes of Johansen's Likelihood Ratio Tests forCointegration. Oxford Bulletin of Economics and Statistics 55:313-328.
Dewan A. Abdullah, Steven C.Hayworth. 1993. Macroeconometrics of stock price fluctuations.Quarterly Journal of Business and Economics 32 (1): 50-67.
Dharmendra Dhakal, Magda Kandil, Subhash C. Sharma. 1993. Causality Between the Money Supplyand Share Prices: A VAR Investigation. Quarterly Journal of Business and Economics 32(3):52-74.
Dickey David, Fuller Wayne A. 1979. Distribution of the Estimates for Autoregressive Time Serieswith a Unit Root. Journal of the American Statistical Association 74:427-431.
25
Indian Journal of Accounting
Vol. XLI (1) December 2010, pp. 25-34
COST STRUCTURE OF POWER DISTRIBUTIONCOMPANIES IN ANDHRA PRADESH: A STUDY
*A. Sudhakar
**K. Sreelatha Reddy
ABSTRACTThe state of Andhra Pradesh is situated in the South Eastern part of India spreading over
an area of 2, 75,045 sq km, having population of 96 million, of which 73% live in rural areas.Andhra Pradesh was the first state in the country to take up comprehensive structural reformprogram with an objective of restructuring the power sector. The intellectual principle behindelectricity restructuring is that competition should be introduced wherever possible in the sector.The National Human Development Report, 2001 classifies access to electricity as a basic amenityin India, at par with other amenities like shelter, sanitation and drinking water. Moreoverelectricity is also a critical input for economic activity - industrial, agricultural and commercial,and thus has a vital role to play in economic development and wealth generation. India has achievedsignificant quantitative expansion of the electricity sector from the time of independence. TheElectricity Act 1948 envisaged creation of the State Electricity Boards i.e. SEB's for planningand implementing the power development programs in their respective states. The financialstatements have been analyzed to determine the financial position and results of operations aswell. A number of methods or devices have been used to study the relationship between differentstatements pertaining to the companies. Under the study an effort has been made to use thosedevices which clearly analyze the position of the companies which were selected. Ratio analysisand break even analysis are some of the well known methods or techniques used in analyzing thefinancial position. They are also used in the present study. To study the relationship between theoperating expenses (OE) and Net Sales, Operating Expenses Ratio (OER) has been calculated forfour companies for a period of eight years. This technique indicates that the lower the ratio,greater is the profitability; and the greater is the ratio, lower is the profitability.
INTRODUCTION
With the financial and policy support of the World Bank, Andhra Pradesh was the
first state in the country to take up comprehensive structural reform program with an
objective of restructuring the power sector. The intellectual principle behind electricity
restructuring is that competition should be introduced wherever possible in the sector. In
practice several other components of restructuring - corporatization, privatization, and
*Professor and Dean, Faculty of Commerce, Dr.B.R.Ambedkar Open University,Hyderabad-500 033.**Department of Commerce, Bhavans Vivekananda College for Humanities, Science & Commerce, Sainikpuri,Secunderabad, A.P.
Indian Journal of Accounting
26
Indian Journal of Accounting
unbundling are essential parts of the package. Thus, the three mantras of reforms -
Liberalization, Globalization and Privatization - gained ground even in the electricity sector.
The state of Andhra Pradesh is situated in the South Eastern part of India spreading
over an area of 2, 75,045 sq km, having population of 96 million, of which 73% live in rural
areas.
APSEB(Andhra Pradesh State Electricity Board) came into existence in 1956 and
started functioning with an objective of maintaining power sector efficiently, economically
and also, it simultaneously ensures that the demand meets its supply.
The APSEB had been responsible for the power generation, transmission, distribution
and the overall development of power sector in the state.
APSEB witnessed stupendous growth during the last four decades. The per capita
electricity consumption was about 470kwh per annum in financial year 1999 that reached
to 560kwh by 2008. (Source: www.aperc.com)2
Though APSEB could fulfill its primary objective, the demand for electricity
outstripped the capacity and resulted in shortages of power supply. Peak demands have
occurred which ultimately resulted in imposition of certain restriction on the power supply
to HT/LT consumers. The shortages have resulted in poor voltage profile and low
frequencies.
The imbalance of the revenues against the cost of production, no significant
reduction in technical losses and energy thefts, high cost purchases from IPPs, other SEBs
gradually worsened the financial position of APSEB.
Government of Andhra Pradesh realizing the declining trend in the financial position
of APSEB and considering the government of India's liberalized policy for attracting private
investments in power sector, set up a high level committee in January 1995, to look into
the working of APSEB and suggest remedies for improvement. Quality power at economic
rates, acts as a catalyst in transforming the state by fostering growth in agricultural, industrial
and commercial areas while meeting the increasing domestic demand.
METHODOLOGY
The present study attempts to analyses the cost structure of PDCs post reform
period and assesses the impact of various cost and revenue parameters on the average
revenue and the average cost incurred by PDCs
By taking time series data related to financial information consisting of Operating
Income and Operating Expenses, Net Sales, Average Revenue and Average Cost, Total
Revenue and Total Cost and Net Profits of the four companies covering a post reform
period, that is from 2000-01 to 2007-2008, the data has been analyzed .To study the strength
of the relationship between Average Revenue and Average Cost the technique of Simple
Regression Analysis has been used. The use of this technique helps in assessing which of
the four companies has a very high operational efficiency.
This paper presents results of a comprehensive study undertaken to assess the
impact of revenue realized from seven different categories of High Tension (HT) on Average
27
Revenue, and on Average Cost. For this, Multiple Regression Analysis technique has been
used. In this analysis Average Revenue has been taken as the dependent variable and
revenue from seven different categories as independent variables. Multiple Regression
Analysis helps in assessing which category shows a significant impact on Average Revenue
by keeping all other variables as constant. Similarly, revenue realized from nine categories
of Low Tension (LT) on AR, keeping AR as the dependent variable and revenue from nine
categories as independent variables, the Multiple Regression Analysis technique has been
used.
In the present study, ANOVA results support the conclusions drawn with the help
of simple Regression Analysis in OLS form for Average Revenue and Average Cost as
well as Total Revenue and Total Cost. Even in the case of Multiple Regression Analysis,
ANOVA has been used to find the impact of revenue from various categories on Average
Revenue in the case of both HT and LT.
Analysis and interpretation of financial statements has been used to determine the
financial position and results of operations as well. A number of methods or devices have
been used to study the relationship between different statements pertaining to the
companies. Under the study, an effort has been made to use those devices which clearly
analyze the position of the companies which were selected. Ratio analysis and break even
analysis are some of the well known methods or techniques used in analyzing the financial
position. They are also used in the present study. To study the relationship between the
Operating Expenses and Net Sales, Operating Expenses Ratio has been calculated for four
companies for a period of eight years. This ratio indicates that, the lower the ratio, greater
is the profitability; and the greater is the ratio, lower is the profitability.
TRENDS IN REVENUES AND COSTS
To find the stability of the companies with respect to their revenues earned and
costs incurred, simple regression analysis technique has been applied. It was found that
the regression coefficient for SPDCL was -0.91 which is the most negative regression
coefficient compared to all four companies. This shows that as the AR increases by Re 1
for any of the four companies, the maximum decrease in AC was for SPDCL. Subsequently,
this implies that SPDCL was the most stable company and it shows a very high operational
efficiency.
Similarly taking TC and TR as the parameters to assess the stability of the companies,
it was found that the coefficient of TC for SPDCL was 1.19 which was the highest positive
regression coefficient compared to all four companies. This shows that as the TC increases
by Rs 1 crore for any of the four companies, the maximum increase in TR was for SPDCL,
which implies that SPDCL was again the most stable company
TRENDS IN OPERATING EXPENSES AND OPERATING INCOMES
The results of the Operating Expenses Ratio indicates that over a period of eight
years EPDCL was performing better because it was showing a decreasing trend.
Sudhakar and Reddy
28
Indian Journal of Accounting
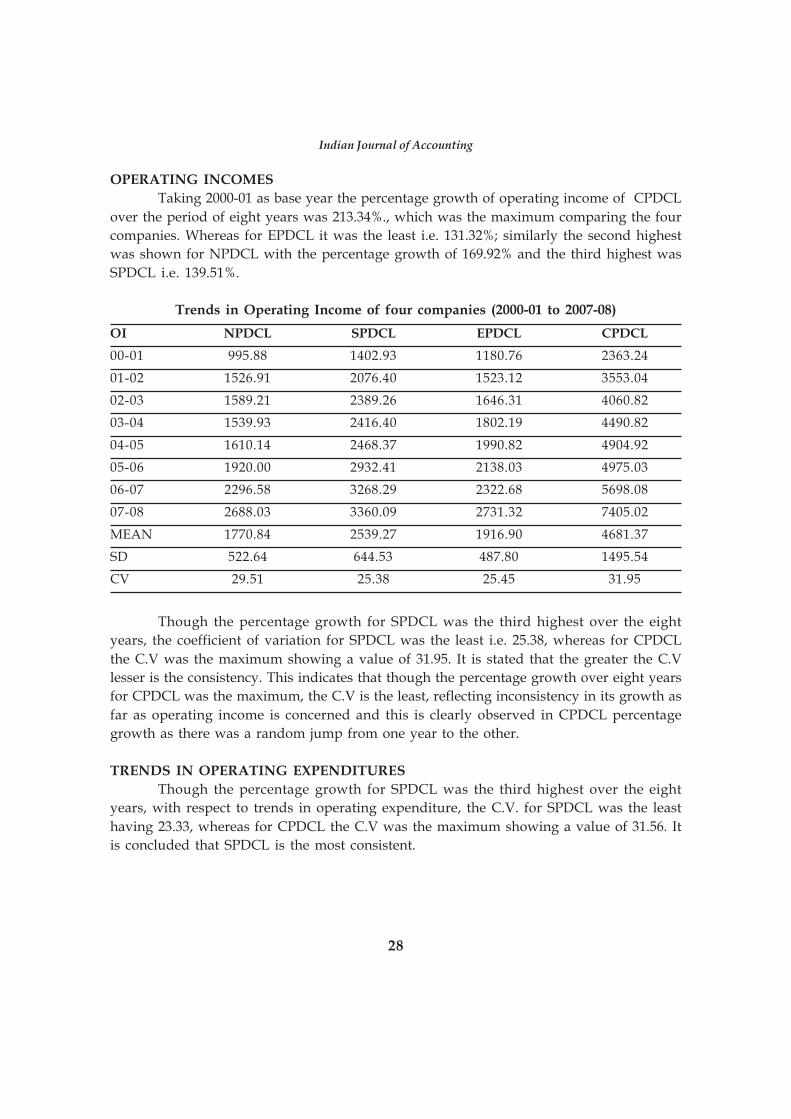
OPERATING INCOMES
Taking 2000-01 as base year the percentage growth of operating income of CPDCL
over the period of eight years was 213.34%., which was the maximum comparing the four
companies. Whereas for EPDCL it was the least i.e. 131.32%; similarly the second highest
was shown for NPDCL with the percentage growth of 169.92% and the third highest was
SPDCL i.e. 139.51%.
Trends in Operating Income of four companies (2000-01 to 2007-08)
OI NPDCL SPDCL EPDCL CPDCL
00-01 995.88 1402.93 1180.76 2363.24
01-02 1526.91 2076.40 1523.12 3553.04
02-03 1589.21 2389.26 1646.31 4060.82
03-04 1539.93 2416.40 1802.19 4490.82
04-05 1610.14 2468.37 1990.82 4904.92
05-06 1920.00 2932.41 2138.03 4975.03
06-07 2296.58 3268.29 2322.68 5698.08
07-08 2688.03 3360.09 2731.32 7405.02
MEAN 1770.84 2539.27 1916.90 4681.37
SD 522.64 644.53 487.80 1495.54
CV 29.51 25.38 25.45 31.95
Though the percentage growth for SPDCL was the third highest over the eight
years, the coefficient of variation for SPDCL was the least i.e. 25.38, whereas for CPDCL
the C.V was the maximum showing a value of 31.95. It is stated that the greater the C.V
lesser is the consistency. This indicates that though the percentage growth over eight years
for CPDCL was the maximum, the C.V is the least, reflecting inconsistency in its growth as
far as operating income is concerned and this is clearly observed in CPDCL percentage
growth as there was a random jump from one year to the other.
TRENDS IN OPERATING EXPENDITURES
Though the percentage growth for SPDCL was the third highest over the eight
years, with respect to trends in operating expenditure, the C.V. for SPDCL was the least
having 23.33, whereas for CPDCL the C.V was the maximum showing a value of 31.56. It
is concluded that SPDCL is the most consistent.
29
Trends in operating expenses of four companies (2000-01 to 2007-08)
OE NPDCL SPDCL EPDCL CPDCL
00-01 897.26 1291.91 1131.64 2246.27
01-02 1484.01 1945.73 1505.18 3521.39
02-03 1540.15 2225.11 1577.92 3885.79
03-04 1394.35 2245.29 1716.61 4371.42
04-05 1490.97 2317.80 1826.35 4559.00
05-06 1736.72 2552.18 1910.80 4519.41
06-07 2095.20 2878.10 2174.82 5443.98
07-08 2414.80 2991.41 2538.39 7048.44
MEAN 1631.68 2305.94 1797.71 4449.46
SD 460.57 538.02 429.04 1404.07
CV 28.23 23.33 23.87 31.56
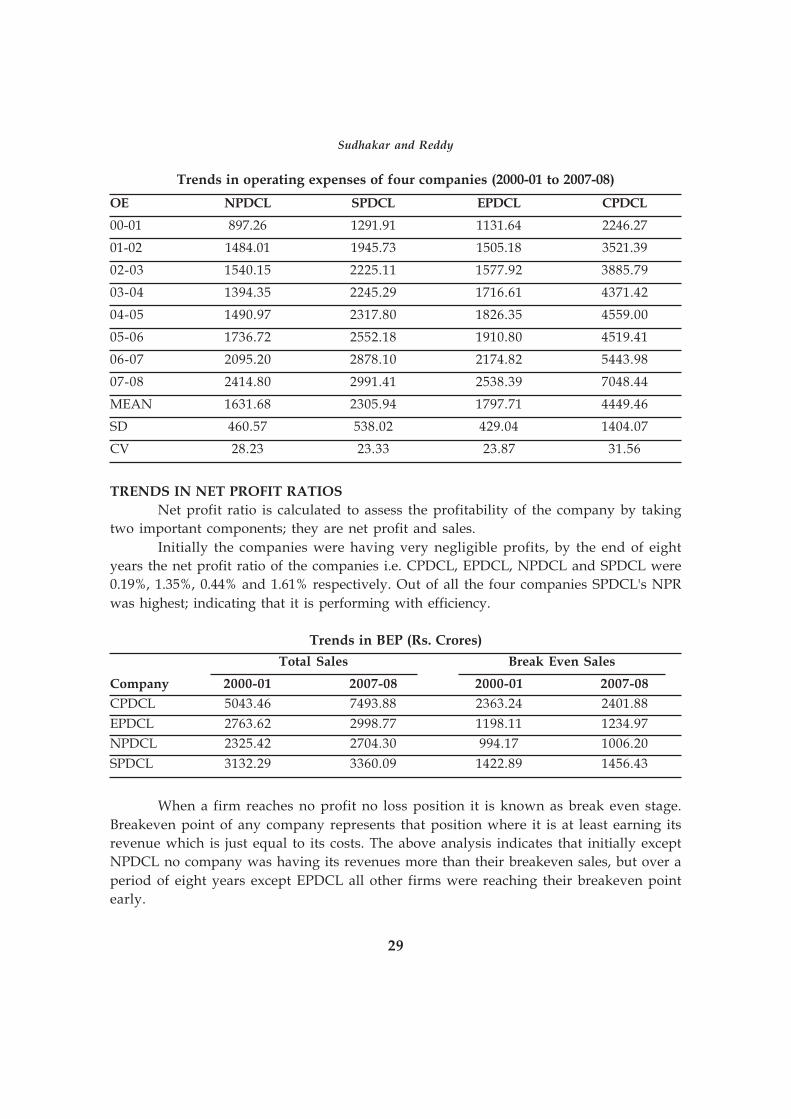
TRENDS IN NET PROFIT RATIOS
Net profit ratio is calculated to assess the profitability of the company by taking
two important components; they are net profit and sales.
Initially the companies were having very negligible profits, by the end of eight
years the net profit ratio of the companies i.e. CPDCL, EPDCL, NPDCL and SPDCL were
0.19%, 1.35%, 0.44% and 1.61% respectively. Out of all the four companies SPDCL's NPR
was highest; indicating that it is performing with efficiency.
Trends in BEP (Rs. Crores)
Total Sales Break Even Sales
Company 2000-01 2007-08 2000-01 2007-08
CPDCL 5043.46 7493.88 2363.24 2401.88
EPDCL 2763.62 2998.77 1198.11 1234.97
NPDCL 2325.42 2704.30 994.17 1006.20
SPDCL 3132.29 3360.09 1422.89 1456.43
When a firm reaches no profit no loss position it is known as break even stage.
Breakeven point of any company represents that position where it is at least earning its
revenue which is just equal to its costs. The above analysis indicates that initially except
NPDCL no company was having its revenues more than their breakeven sales, but over a
period of eight years except EPDCL all other firms were reaching their breakeven point
early.
Sudhakar and Reddy
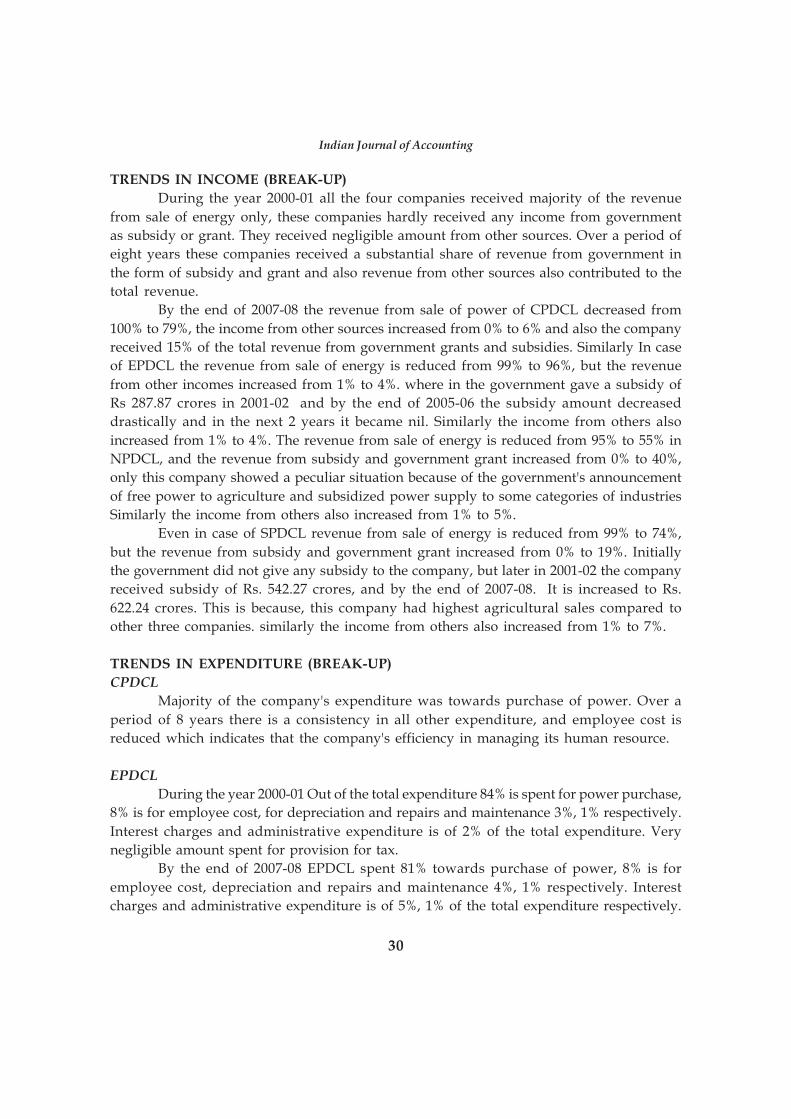
30
Indian Journal of Accounting
TRENDS IN INCOME (BREAK-UP)
During the year 2000-01 all the four companies received majority of the revenue
from sale of energy only, these companies hardly received any income from government
as subsidy or grant. They received negligible amount from other sources. Over a period of
eight years these companies received a substantial share of revenue from government in
the form of subsidy and grant and also revenue from other sources also contributed to the
total revenue.
By the end of 2007-08 the revenue from sale of power of CPDCL decreased from
100% to 79%, the income from other sources increased from 0% to 6% and also the company
received 15% of the total revenue from government grants and subsidies. Similarly In case
of EPDCL the revenue from sale of energy is reduced from 99% to 96%, but the revenue
from other incomes increased from 1% to 4%. where in the government gave a subsidy of
Rs 287.87 crores in 2001-02 and by the end of 2005-06 the subsidy amount decreased
drastically and in the next 2 years it became nil. Similarly the income from others also
increased from 1% to 4%. The revenue from sale of energy is reduced from 95% to 55% in
NPDCL, and the revenue from subsidy and government grant increased from 0% to 40%,
only this company showed a peculiar situation because of the government's announcement
of free power to agriculture and subsidized power supply to some categories of industries
Similarly the income from others also increased from 1% to 5%.
Even in case of SPDCL revenue from sale of energy is reduced from 99% to 74%,
but the revenue from subsidy and government grant increased from 0% to 19%. Initially
the government did not give any subsidy to the company, but later in 2001-02 the company
received subsidy of Rs. 542.27 crores, and by the end of 2007-08. It is increased to Rs.
622.24 crores. This is because, this company had highest agricultural sales compared to
other three companies. similarly the income from others also increased from 1% to 7%.
TRENDS IN EXPENDITURE (BREAK-UP)
CPDCL
Majority of the company's expenditure was towards purchase of power. Over a
period of 8 years there is a consistency in all other expenditure, and employee cost is
reduced which indicates that the company's efficiency in managing its human resource.
EPDCL
During the year 2000-01 Out of the total expenditure 84% is spent for power purchase,
8% is for employee cost, for depreciation and repairs and maintenance 3%, 1% respectively.
Interest charges and administrative expenditure is of 2% of the total expenditure. Very
negligible amount spent for provision for tax.
By the end of 2007-08 EPDCL spent 81% towards purchase of power, 8% is for
employee cost, depreciation and repairs and maintenance 4%, 1% respectively. Interest
charges and administrative expenditure is of 5%, 1% of the total expenditure respectively.
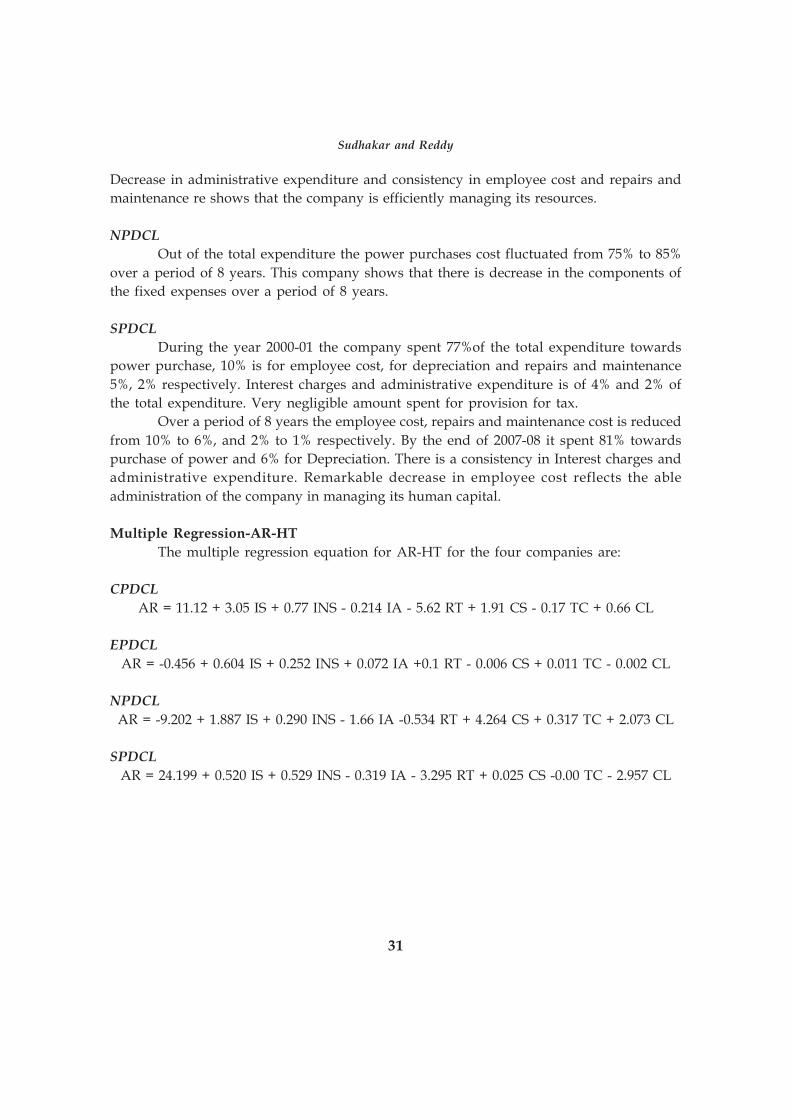
31
Decrease in administrative expenditure and consistency in employee cost and repairs and
maintenance re shows that the company is efficiently managing its resources.
NPDCL
Out of the total expenditure the power purchases cost fluctuated from 75% to 85%
over a period of 8 years. This company shows that there is decrease in the components of
the fixed expenses over a period of 8 years.
SPDCL
During the year 2000-01 the company spent 77%of the total expenditure towards
power purchase, 10% is for employee cost, for depreciation and repairs and maintenance
5%, 2% respectively. Interest charges and administrative expenditure is of 4% and 2% of
the total expenditure. Very negligible amount spent for provision for tax.
Over a period of 8 years the employee cost, repairs and maintenance cost is reduced
from 10% to 6%, and 2% to 1% respectively. By the end of 2007-08 it spent 81% towards
purchase of power and 6% for Depreciation. There is a consistency in Interest charges and
administrative expenditure. Remarkable decrease in employee cost reflects the able
administration of the company in managing its human capital.
Multiple Regression-AR-HT
The multiple regression equation for AR-HT for the four companies are:
CPDCL
AR = 11.12 + 3.05 IS + 0.77 INS - 0.214 IA - 5.62 RT + 1.91 CS - 0.17 TC + 0.66 CL
EPDCL
AR = -0.456 + 0.604 IS + 0.252 INS + 0.072 IA +0.1 RT - 0.006 CS + 0.011 TC - 0.002 CL
NPDCL
AR = -9.202 + 1.887 IS + 0.290 INS - 1.66 IA -0.534 RT + 4.264 CS + 0.317 TC + 2.073 CL
SPDCL
AR = 24.199 + 0.520 IS + 0.529 INS - 0.319 IA - 3.295 RT + 0.025 CS -0.00 TC - 2.957 CL
Sudhakar and Reddy
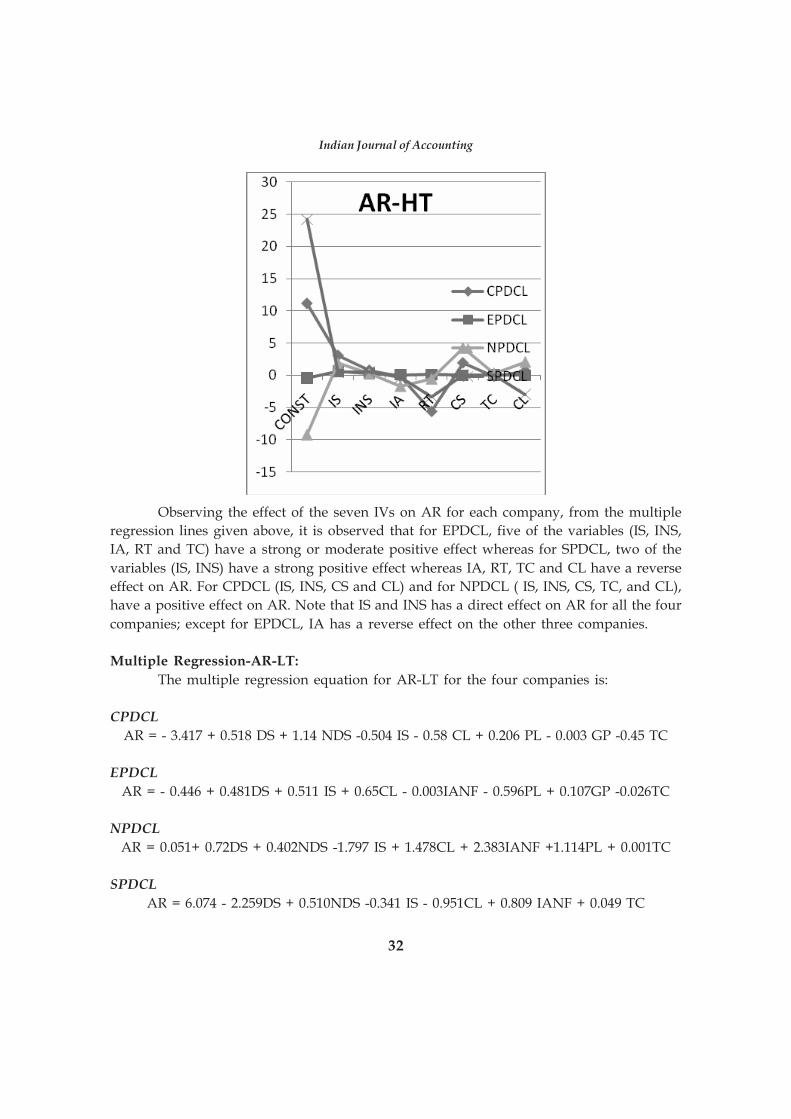
32
Indian Journal of Accounting
Observing the effect of the seven IVs on AR for each company, from the multiple
regression lines given above, it is observed that for EPDCL, five of the variables (IS, INS,
IA, RT and TC) have a strong or moderate positive effect whereas for SPDCL, two of the
variables (IS, INS) have a strong positive effect whereas IA, RT, TC and CL have a reverse
effect on AR. For CPDCL (IS, INS, CS and CL) and for NPDCL ( IS, INS, CS, TC, and CL),
have a positive effect on AR. Note that IS and INS has a direct effect on AR for all the four
companies; except for EPDCL, IA has a reverse effect on the other three companies.
Multiple Regression-AR-LT:
The multiple regression equation for AR-LT for the four companies is:
CPDCL
AR = - 3.417 + 0.518 DS + 1.14 NDS -0.504 IS - 0.58 CL + 0.206 PL - 0.003 GP -0.45 TC
EPDCL
AR = - 0.446 + 0.481DS + 0.511 IS + 0.65CL - 0.003IANF - 0.596PL + 0.107GP -0.026TC
NPDCL
AR = 0.051+ 0.72DS + 0.402NDS -1.797 IS + 1.478CL + 2.383IANF +1.114PL + 0.001TC
SPDCL
AR = 6.074 - 2.259DS + 0.510NDS -0.341 IS - 0.951CL + 0.809 IANF + 0.049 TC
33
Observing the effect of the nine IVs on AR for each company from the multiple
regression lines given above, it is observed that IS has a reverse effect on AR for all
companies except for EPDCL for which it has a direct effect. CL has a positive effect on AR
for EPDCL and NPDCL and a reverse effect for CPDCL and SPDCL. TC has a direct effect
on AR for NPDCL and SPDCL but a reverse effect for CPDCL and EPDCL. IANF has a
direct effect on AR for NPDCL and SPDCL but a reverse effect for EPDCL.
Multiple Regression-AFC
The multiple regression equation for AFC for the four companies are:
CPDCL
AFC = -0.004 + 0.965RM + 1.037EC + 1.008AC + 1.074 DEP + 0.897IFC + 0.191ED
EPDCL
AFC = 0.002 + 0.889RM + 0.974 EC + 0.907AC + 0.974 DEP + 1.026IFC + 0.276ED
NPDCL
AFC = 0.233 + 0.199RM + 1.110 EC - 1.263AC + 0.708DEP + 1.265IFC - 7.484ED
SPDCL
AFC = 0.12 + 1.27RM + 0.871EC + 0.917AC + 0.62DEP + 1.25IFC - 2.533ED
Observing the effect of the six IVs on AFC for each company, from the multiple
regression lines given above, it is observed that for CPDCL, EPDCL all the variables have
a strong or moderate positive effect on AFC, whereas for SPDCL and NPDCL, ED has a
reverse effect. For NPDCL, AC also has a reverse effect on AFC.
The financial statements have been analyzed to determine the financial position
and results of operations as well. A number of methods or devices have been used to
study the relationship between different statements pertaining to the companies. Under
the study an effort has been made to use those devices which clearly analyze the position
of the companies which were selected. Ratio analysis and break even analysis are some of
the well known methods or techniques used in analyzing the financial position. They are
also used in the present study. To study the relationship between the operating expenses
(OE) and Net Sales, Operating Expenses Ratio (OER) has been calculated for four companies
for a period of eight years. This technique indicates that the lower the ratio, greater is the
profitability; and the greater is the ratio, lower is the profitability.
CONCLUSION
An analysis of AR, AC,TR, and TC of the four PDCs for eight years establishes that
SPDCL is the most stable company as it shows a very high operational efficiency. However
in terms operating expenses and operating incomes EPDCL stood first.
Sudhakar and Reddy
34
Indian Journal of Accounting
Observing the trends in operating incomes of all four companies ,though the percentage
growth for SPDCL was the third highest over the eight years, the coefficient of variation for
SPDCL was the least i.e. 25.38, whereas for CPDCL the C.V was the maximum showing a
value of 31.95. It is stated that the greater the C.V lesser is the consistency. This indicates
that though the percentage growth over eight years for CPDCL was the maximum, the C.V
is the least, indicating inconsistency in its growth as far as operating income is concerned
and this is clearly observed in CPDCL as well.
REFERENCES
All India Electricity Statistics- 2008.
Reports from Central Electricity Authority.
Ministry of Power, Government of India.
Annual Reports of APCPDCL 2000- 01 to 2007-08.
Annual Reports of APEPDCL 2000- 01 to 2007-08.
Annual Reports of APSPDCL 2000- 01 to 2007-08..
Annual Reports of APTRANSCO 2000- 01 to 2007-08
Annual Reports of NPDCL 2000- 01 to 2007-08.
(The Indian Power Sector: Emerging Trends, www.prayaspune.org)
www.aperc.com
http/www. IndiaCore.com
www.apcpdcl.com
www.apepdcl.com
www.apgenco.com
www.apnpdcl.com
www.apspdcl.com
35
Indian Journal of Accounting
Vol. XLI (1) December 2010, pp. 35-44
EFFECTIVENESS OFCORPORATE GOVERNANCE PRACTICES -A STUDY OF INDIAN BANKING SYSTEM
*Hemal Pandya
**Chetana Parmar
ABSTRACTThe impact of banks' organization structure on performance and corporate governance
practices has been discussed for a number of years, mainly in developed countries such as UK andUS. This paper chooses to address above-mentioned issue in Indian context. It investigates twocategory of banks namely government banks and private banks. This paper adopts the Tobin's Q,and Return on Capital Employed (ROCE) as bank performance indicators. The following boardgovernance variables are used such as Board Committees, Board Directors, CEO as a chairman,Board meetings, and Women Executive and Executive-Director ratio. Multiple regression analysisresults show that board governance variables like board committees, board directors and womendirector are statistically significant to performance for banks where government has considerablestake. In addition, government banks are older and also have better market valuation than privatebanks.
The liberalization reforms initiated by the Indian government during last decade
have considerable impact on the Indian financial sector. Prior to 1991, Indian banking
sector was under control of Indian government with exception of 22 private sector banks
and few foreign banks (source: RBI). Since 1991, the Indian financial system moving from a
unilateral administered sector to market driven system. After the economic crisis, there
have been a number of initiatives to implement governance and disclosures practices in
the Indian banking sector. In the recent past, overall corporate governance in Indian banks
has improved steadily. Internationally, the influence of board governance on performance
has been discussed for a number of years, but it is relatively new to Indian scenario, where
corporate governance norms are implemented in the recent past. Board governance is a
subset of corporate governance in determining financial performance of the bank.
*Asst.Professor, S.D. School of commerce, Gujrat University, Ahmedabad**Asst. Professor, S.D. School of Commerce, Gujrat University, Ahemdabad
Indian Journal of Accounting
36
Indian Journal of Accounting
PRESENT PROFILE
This paper describes bank structure in two ways namely government banks and
private banks. The reason for two way classifications of banks, government banks tend to
have different approaches to control, board size, board chairman, board meeting, outsider
to be board etc, as compared to private banks. This paper investigates whether board
governance is positively related to performance in government banks or in private banks.
Apart from above mentioned variables, this paper uses Tobin's Q and Return on Capital
Employed (ROCE) as bank performance indicators. Most of the corporate governance
literatures have used these variables as proxy for the bank performance. This paper chooses
to address the effectiveness of one set of corporate governance mechanisms (board
governance) influence on bank performance. This paper is organized in the following way.
The following section reviews the literature on corporate governance and also presents
board governance (Board committees, Board directors, Women executive, CEO as a
chairman, Board meetings, and Director ratio), and firm performance indicators (Tobin's Q
and Return on Capital Employed). The section thereafter presents data sample and
description of variables followed by a section that describes methodology. The section,
before last section explains analysis of data. In the last section summarizes the findings of
the study.
RESEARCH METHODOLOGY
Hypotheses
With reference to review of literature of corporate governance, and different types
of banks, this paper develops the following hypotheses for study.
H1: Public sector banks are older and have better valuation than private sector banks
H2: Corporate governance practices have significantly influenced the performance in
the Indian domestic banks
H3: Public sector banks' corporate governance practices significantly different than
private sector banks.
DATA SAMPLE AND DESCRIPTION OF VARIABLES
The data that have been used in this paper has been obtained from bank websites
and annual reports and the website of Reserve Bank of India (RBI). The initial data sample
collected as on 31st march 2009. The same sample is divided into two sets namely public
sector banks and private sector banks. Hence, The final sample consisted of 16 listed
banks, in which public sector has 8 banks, the private sector consists of 8 banks. In India,
the implementation of corporate governance practices is directly linked with Security
Exchange Board India (SEBI) under clause 49 listing agreement. According to SEBI, the
corporate governance practices applicable only to banks that are listed in the Indian stock
exchanges.
37
BANK PERFORMANCE INDICATORS
A bank performance indicator consists of two variables namely Tobin's Q, and
Return on Capital Employed. Most of the past literature on financial institutions has used
accounting measure as a proxy for performance. In this paper, both accounting and market
valuation measure are used to account corporate governance practices intervention.
a) Tobin's Q: Tobin's Q is a very widely used measure of corporate performance. It is
defined as the ratio of market value of the firm to replacement value of the assets.
Interestingly, original definition of Q has few practical limitations such as availability
of timely and accurate Q date. It is understood that even computational procedure
also is difficult to employ. Kee and Prulti (1994) found approximation for original
Q value and it is computed as book value of debt plus market value of equity plus
book value of preference shares over book value of total asset.
b) Return on Capital Employed (ROCE): The profitability of an organization is measured
through ROCE. It indicates the effectiveness and efficiency of an organization in
generating earnings. It is calculated by dividing earnings before interest and taxes
(EBIT) by capital employed.
INDEPENDENT VARIABLES
Board directors: It is defined as the number of directors both executive and non-
executive directors in the bank, it is denoted by FBd. Director Ratio: It is defined as the
ratio of executive director to non-executive directors on the board, it is denoted by FDr.
CEO as Chairman of the Board: This measure uses the dummy coded variable. If bank has
CEO as a chairman of the board then it is coded as (1) and if not, it is coded as (0). It is
denoted by FCeo. Board Meetings: Total number of board meetings held in a year, it is
denoted by FBm. Board Committees: it measure number of committees in the banks, it is
denoted by FBc. Women executive: it is dummy coded variable where bank employs women
executive in the board, it is coded as (1) or else, it is coded (0). This measure denotes by
FWe. In addition, the bank dummy is used to account the corporate governance practices
differences between public and private sector banks. This bank dummy is coded by (1), if
it is public sector bank, or else, it is coded as (0). The bank dummy is denoted by FBank
dummy.
CONTROL VARIABLES
This paper employs the following control variable for the study
Log Age: It is a difference between the current year and the year in which the bank
was incorporated. Age is measured by the logarithm of the number of years since the
banks were set up. Due to effect of learning curve and survival bias, older banks are
largely to be more efficient than the younger banks. It is used in firm value related studies
(Ang, Cole, And Lin, 2000). It is denoted by Fage.
Pandya and Parmar
38
Indian Journal of Accounting
METHODOLOGY
Corporate governance influence on bank performance is measured through multiple
regression analysis. Multiple regression analysis is widely used multivariate technique,
which uses to predict dependent variables from known independent variables. In this
paper, multiple regression analysis is used to find out independent variables influence on
dependent variables after controlling firm age. There are two multiple regression analysis
model is constructed. The first model is based on all the banks listed in the stock markets.
The second model uses a bank dummy to account the public sector banks' corporate
governance practices influence on performance over private sector banks. Pearson
correlation coefficient is also used to find out Multicolinearity problem among independent
variables. The correlation matrices determine whether Multicolinearity problem is present
in the independent variables or not. Correlation coefficient value is more than 0.80, where
the Multicolinearity problem exists (Ingrid Bonn, 2004). In addition, the descriptive statistics
has employed to analyze the relationship between banks age and profitability. In equation
form, multiple regression models are expressed as:
Model - 1
Tobin's Q = á + â1 × FBd + â2 × FBc + â3 × FCeo + â4 × FBm + â5 × FWd + â6 × FDr + â7
× F Log Age + •
Model - 2
ROCE = á +â1 × FBd +â2 × FBc +â3 ×FCeo+â4 ×FBm+â5 ×FWd+â6 ×FDr +â7 ×F Log
Age +•
Model - 3
Tobin’s Q = á + â1 × FBd + â2 × FBc + â3 × FCeo + â4 × FBm + â5 × FWd + â6 × FDr +
â7 × F Log Age + â8 × F Bank dummy + • (with bank classification dummy)
Model - 4
ROCE = á + â1 × FBd + â2 × FBc + â3 × FCeo + â4 × FBm + â5 × FWd + â6 × FDr + â7 ×
F Log Age + â8 × F Bank dummy + • (with bank classification dummy)
ANALYSIS
Analysis is done on financial data collected from Annual Reports of the Banks,
Bank Websites and RBI Website. The following section presents descriptive statistics,
correlation matrix and multiple regression analysis on sample banks.
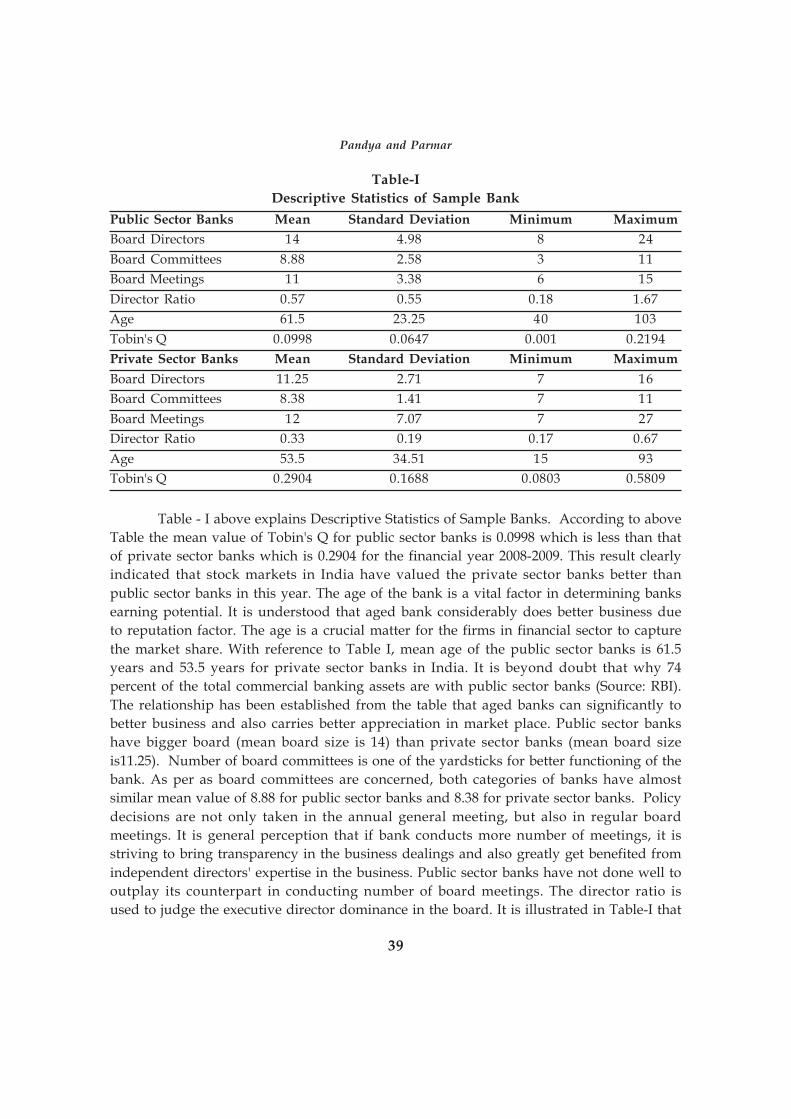
39
Table-I
Descriptive Statistics of Sample Bank
Public Sector Banks Mean Standard Deviation Minimum Maximum
Board Directors 14 4.98 8 24
Board Committees 8.88 2.58 3 11
Board Meetings 11 3.38 6 15
Director Ratio 0.57 0.55 0.18 1.67
Age 61.5 23.25 40 103
Tobin's Q 0.0998 0.0647 0.001 0.2194
Private Sector Banks Mean Standard Deviation Minimum Maximum
Board Directors 11.25 2.71 7 16
Board Committees 8.38 1.41 7 11
Board Meetings 12 7.07 7 27
Director Ratio 0.33 0.19 0.17 0.67
Age 53.5 34.51 15 93
Tobin's Q 0.2904 0.1688 0.0803 0.5809
Table - I above explains Descriptive Statistics of Sample Banks. According to above
Table the mean value of Tobin's Q for public sector banks is 0.0998 which is less than that
of private sector banks which is 0.2904 for the financial year 2008-2009. This result clearly
indicated that stock markets in India have valued the private sector banks better than
public sector banks in this year. The age of the bank is a vital factor in determining banks
earning potential. It is understood that aged bank considerably does better business due
to reputation factor. The age is a crucial matter for the firms in financial sector to capture
the market share. With reference to Table I, mean age of the public sector banks is 61.5
years and 53.5 years for private sector banks in India. It is beyond doubt that why 74
percent of the total commercial banking assets are with public sector banks (Source: RBI).
The relationship has been established from the table that aged banks can significantly to
better business and also carries better appreciation in market place. Public sector banks
have bigger board (mean board size is 14) than private sector banks (mean board size
is11.25). Number of board committees is one of the yardsticks for better functioning of the
bank. As per as board committees are concerned, both categories of banks have almost
similar mean value of 8.88 for public sector banks and 8.38 for private sector banks. Policy
decisions are not only taken in the annual general meeting, but also in regular board
meetings. It is general perception that if bank conducts more number of meetings, it is
striving to bring transparency in the business dealings and also greatly get benefited from
independent directors' expertise in the business. Public sector banks have not done well to
outplay its counterpart in conducting number of board meetings. The director ratio is
used to judge the executive director dominance in the board. It is illustrated in Table-I that
Pandya and Parmar
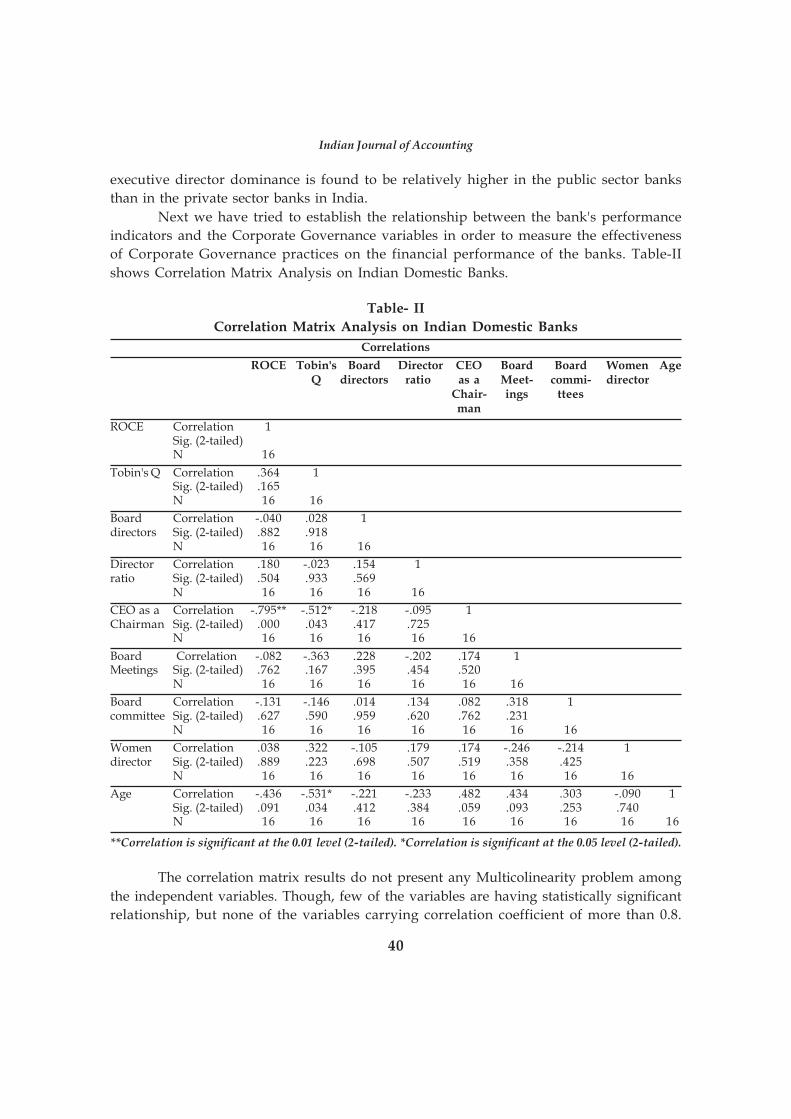
40
Indian Journal of Accounting
executive director dominance is found to be relatively higher in the public sector banks
than in the private sector banks in India.
Next we have tried to establish the relationship between the bank's performance
indicators and the Corporate Governance variables in order to measure the effectiveness
of Corporate Governance practices on the financial performance of the banks. Table-II
shows Correlation Matrix Analysis on Indian Domestic Banks.
Table- II
Correlation Matrix Analysis on Indian Domestic Banks
Correlations
ROCE Tobin's Board Director CEO Board Board Women AgeQ directors ratio as a Meet- commi- director
Chair- ings tteesman
ROCE Correlation 1Sig. (2-tailed)N 16
Tobin's Q Correlation .364 1Sig. (2-tailed) .165N 16 16
Board Correlation -.040 .028 1directors Sig. (2-tailed) .882 .918
N 16 16 16
Director Correlation .180 -.023 .154 1ratio Sig. (2-tailed) .504 .933 .569
N 16 16 16 16
CEO as a Correlation -.795** -.512* -.218 -.095 1Chairman Sig. (2-tailed) .000 .043 .417 .725
N 16 16 16 16 16
Board Correlation -.082 -.363 .228 -.202 .174 1Meetings Sig. (2-tailed) .762 .167 .395 .454 .520
N 16 16 16 16 16 16
Board Correlation -.131 -.146 .014 .134 .082 .318 1committee Sig. (2-tailed) .627 .590 .959 .620 .762 .231
N 16 16 16 16 16 16 16
Women Correlation .038 .322 -.105 .179 .174 -.246 -.214 1director Sig. (2-tailed) .889 .223 .698 .507 .519 .358 .425
N 16 16 16 16 16 16 16 16
Age Correlation -.436 -.531* -.221 -.233 .482 .434 .303 -.090 1Sig. (2-tailed) .091 .034 .412 .384 .059 .093 .253 .740N 16 16 16 16 16 16 16 16 16
**Correlation is significant at the 0.01 level (2-tailed). *Correlation is significant at the 0.05 level (2-tailed).
The correlation matrix results do not present any Multicolinearity problem among
the independent variables. Though, few of the variables are having statistically significant
relationship, but none of the variables carrying correlation coefficient of more than 0.8.
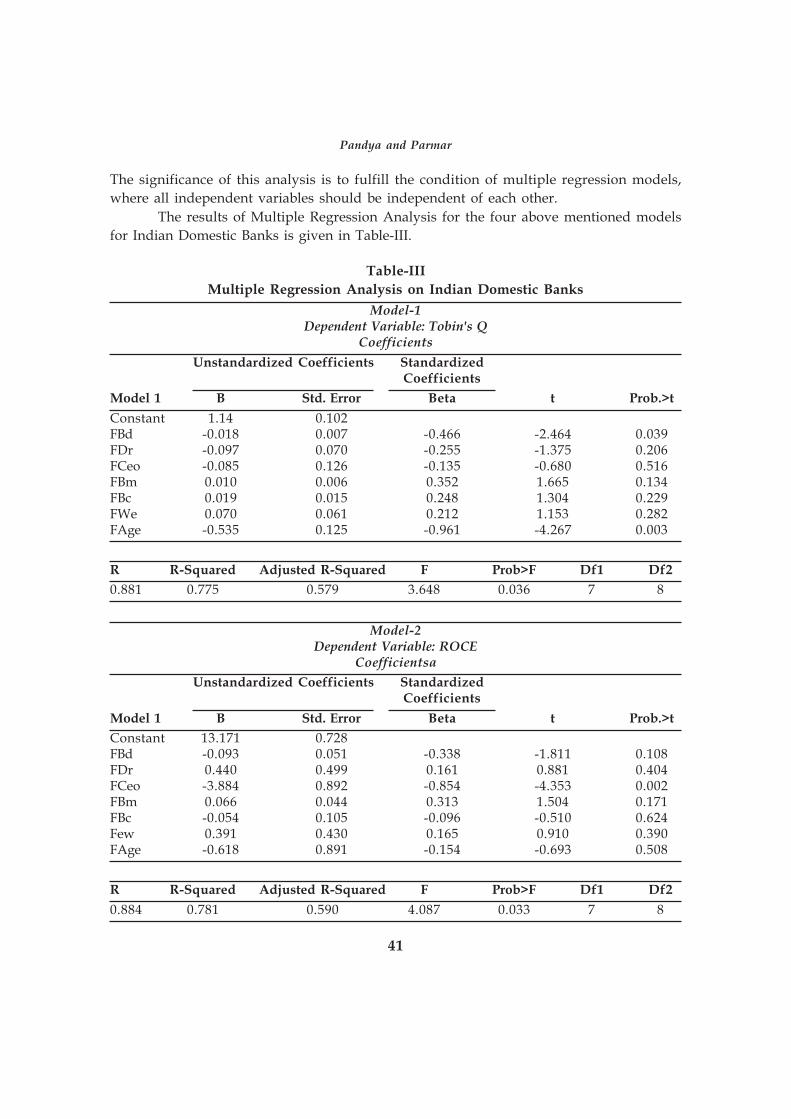
41
The significance of this analysis is to fulfill the condition of multiple regression models,
where all independent variables should be independent of each other.
The results of Multiple Regression Analysis for the four above mentioned models
for Indian Domestic Banks is given in Table-III.
Table-III
Multiple Regression Analysis on Indian Domestic Banks
Model-1Dependent Variable: Tobin's Q
Coefficients
Unstandardized Coefficients StandardizedCoefficients
Model 1 B Std. Error Beta t Prob.>t
Constant 1.14 0.102FBd -0.018 0.007 -0.466 -2.464 0.039FDr -0.097 0.070 -0.255 -1.375 0.206FCeo -0.085 0.126 -0.135 -0.680 0.516FBm 0.010 0.006 0.352 1.665 0.134FBc 0.019 0.015 0.248 1.304 0.229FWe 0.070 0.061 0.212 1.153 0.282FAge -0.535 0.125 -0.961 -4.267 0.003
R R-Squared Adjusted R-Squared F Prob>F Df1 Df2
0.881 0.775 0.579 3.648 0.036 7 8
Model-2Dependent Variable: ROCE
Coefficientsa
Unstandardized Coefficients StandardizedCoefficients
Model 1 B Std. Error Beta t Prob.>t
Constant 13.171 0.728FBd -0.093 0.051 -0.338 -1.811 0.108FDr 0.440 0.499 0.161 0.881 0.404FCeo -3.884 0.892 -0.854 -4.353 0.002FBm 0.066 0.044 0.313 1.504 0.171FBc -0.054 0.105 -0.096 -0.510 0.624Few 0.391 0.430 0.165 0.910 0.390FAge -0.618 0.891 -0.154 -0.693 0.508
R R-Squared Adjusted R-Squared F Prob>F Df1 Df2
0.884 0.781 0.590 4.087 0.033 7 8
Pandya and Parmar
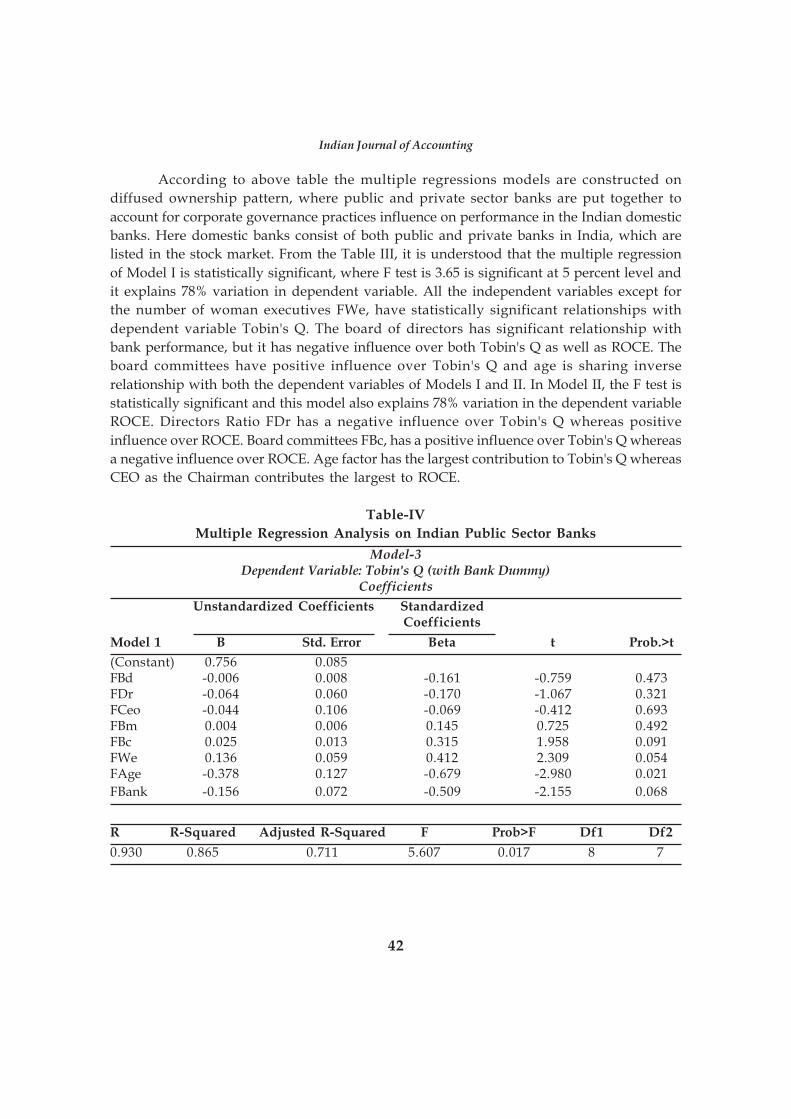
42
Indian Journal of Accounting
According to above table the multiple regressions models are constructed on
diffused ownership pattern, where public and private sector banks are put together to
account for corporate governance practices influence on performance in the Indian domestic
banks. Here domestic banks consist of both public and private banks in India, which are
listed in the stock market. From the Table III, it is understood that the multiple regression
of Model I is statistically significant, where F test is 3.65 is significant at 5 percent level and
it explains 78% variation in dependent variable. All the independent variables except for
the number of woman executives FWe, have statistically significant relationships with
dependent variable Tobin's Q. The board of directors has significant relationship with
bank performance, but it has negative influence over both Tobin's Q as well as ROCE. The
board committees have positive influence over Tobin's Q and age is sharing inverse
relationship with both the dependent variables of Models I and II. In Model II, the F test is
statistically significant and this model also explains 78% variation in the dependent variable
ROCE. Directors Ratio FDr has a negative influence over Tobin's Q whereas positive
influence over ROCE. Board committees FBc, has a positive influence over Tobin's Q whereas
a negative influence over ROCE. Age factor has the largest contribution to Tobin's Q whereas
CEO as the Chairman contributes the largest to ROCE.
Table-IV
Multiple Regression Analysis on Indian Public Sector Banks
Model-3Dependent Variable: Tobin's Q (with Bank Dummy)
Coefficients
Unstandardized Coefficients StandardizedCoefficients
Model 1 B Std. Error Beta t Prob.>t
(Constant) 0.756 0.085FBd -0.006 0.008 -0.161 -0.759 0.473FDr -0.064 0.060 -0.170 -1.067 0.321FCeo -0.044 0.106 -0.069 -0.412 0.693FBm 0.004 0.006 0.145 0.725 0.492FBc 0.025 0.013 0.315 1.958 0.091FWe 0.136 0.059 0.412 2.309 0.054FAge -0.378 0.127 -0.679 -2.980 0.021
FBank -0.156 0.072 -0.509 -2.155 0.068
R R-Squared Adjusted R-Squared F Prob>F Df1 Df2
0.930 0.865 0.711 5.607 0.017 8 7
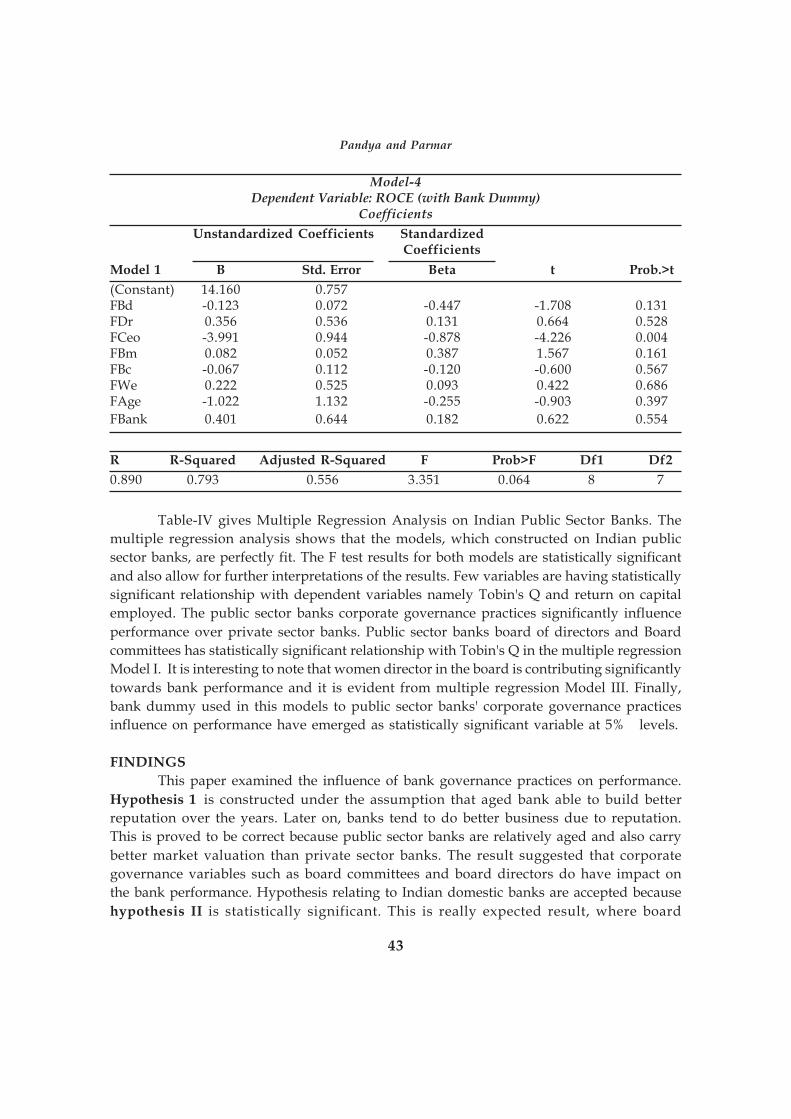
43
Model-4Dependent Variable: ROCE (with Bank Dummy)
Coefficients
Unstandardized Coefficients StandardizedCoefficients
Model 1 B Std. Error Beta t Prob.>t
(Constant) 14.160 0.757FBd -0.123 0.072 -0.447 -1.708 0.131FDr 0.356 0.536 0.131 0.664 0.528FCeo -3.991 0.944 -0.878 -4.226 0.004FBm 0.082 0.052 0.387 1.567 0.161FBc -0.067 0.112 -0.120 -0.600 0.567FWe 0.222 0.525 0.093 0.422 0.686FAge -1.022 1.132 -0.255 -0.903 0.397
FBank 0.401 0.644 0.182 0.622 0.554
R R-Squared Adjusted R-Squared F Prob>F Df1 Df2
0.890 0.793 0.556 3.351 0.064 8 7
Table-IV gives Multiple Regression Analysis on Indian Public Sector Banks. The
multiple regression analysis shows that the models, which constructed on Indian public
sector banks, are perfectly fit. The F test results for both models are statistically significant
and also allow for further interpretations of the results. Few variables are having statistically
significant relationship with dependent variables namely Tobin's Q and return on capital
employed. The public sector banks corporate governance practices significantly influence
performance over private sector banks. Public sector banks board of directors and Board
committees has statistically significant relationship with Tobin's Q in the multiple regression
Model I. It is interesting to note that women director in the board is contributing significantly
towards bank performance and it is evident from multiple regression Model III. Finally,
bank dummy used in this models to public sector banks' corporate governance practices
influence on performance have emerged as statistically significant variable at 5% levels.
FINDINGS
This paper examined the influence of bank governance practices on performance.
Hypothesis 1 is constructed under the assumption that aged bank able to build better
reputation over the years. Later on, banks tend to do better business due to reputation.
This is proved to be correct because public sector banks are relatively aged and also carry
better market valuation than private sector banks. The result suggested that corporate
governance variables such as board committees and board directors do have impact on
the bank performance. Hypothesis relating to Indian domestic banks are accepted because
hypothesis II is statistically significant. This is really expected result, where board
Pandya and Parmar
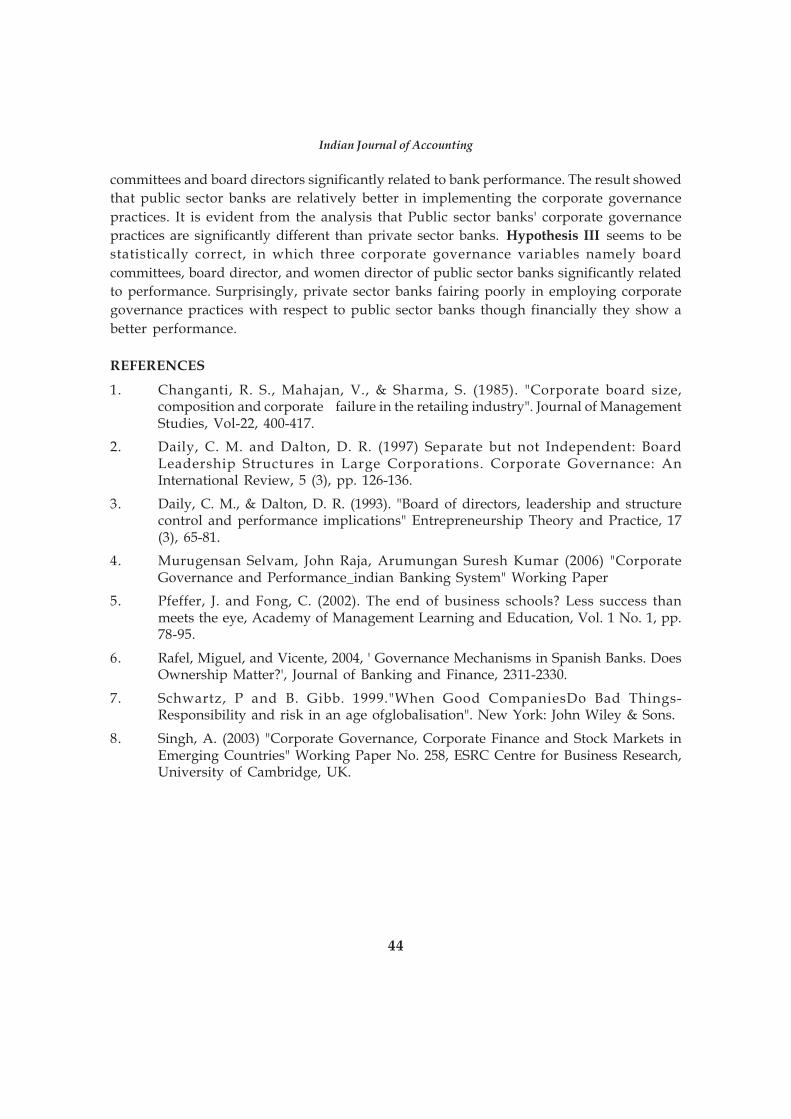
44
Indian Journal of Accounting
committees and board directors significantly related to bank performance. The result showed
that public sector banks are relatively better in implementing the corporate governance
practices. It is evident from the analysis that Public sector banks' corporate governance
practices are significantly different than private sector banks. Hypothesis III seems to be
statistically correct, in which three corporate governance variables namely board
committees, board director, and women director of public sector banks significantly related
to performance. Surprisingly, private sector banks fairing poorly in employing corporate
governance practices with respect to public sector banks though financially they show a
better performance.
REFERENCES
1. Changanti, R. S., Mahajan, V., & Sharma, S. (1985). "Corporate board size,composition and corporate failure in the retailing industry". Journal of ManagementStudies, Vol-22, 400-417.
2. Daily, C. M. and Dalton, D. R. (1997) Separate but not Independent: BoardLeadership Structures in Large Corporations. Corporate Governance: AnInternational Review, 5 (3), pp. 126-136.
3. Daily, C. M., & Dalton, D. R. (1993). "Board of directors, leadership and structurecontrol and performance implications" Entrepreneurship Theory and Practice, 17(3), 65-81.
4. Murugensan Selvam, John Raja, Arumungan Suresh Kumar (2006) "CorporateGovernance and Performance_indian Banking System" Working Paper
5. Pfeffer, J. and Fong, C. (2002). The end of business schools? Less success thanmeets the eye, Academy of Management Learning and Education, Vol. 1 No. 1, pp.78-95.
6. Rafel, Miguel, and Vicente, 2004, ' Governance Mechanisms in Spanish Banks. DoesOwnership Matter?', Journal of Banking and Finance, 2311-2330.
7. Schwartz, P and B. Gibb. 1999."When Good CompaniesDo Bad Things-Responsibility and risk in an age ofglobalisation". New York: John Wiley & Sons.
8. Singh, A. (2003) "Corporate Governance, Corporate Finance and Stock Markets inEmerging Countries" Working Paper No. 258, ESRC Centre for Business Research,University of Cambridge, UK.
45
Indian Journal of Accounting
Vol. XLI (1) December 2010, pp. 45-50
STOCK SPLIT PRACTICES IN INDIA
*Satyajit Dhar
**Sweta Chhaochharia
ABSTRACTStock splits remain one of the most popular and least understood phenomena in capital
market. Stock split practice gained momentum in India after the approval of Securities andExchange Board of India (SEBI) in 1999. The study explores the stock split practice of Indianlisted companies comprising BSE 500 index. The paper also describes the concept of stock splitsand gives a comparison between stock split and bonus issue. The paper concludes that there isscope of fine tuning in the existing stock split regulations in India to minimize the scope ofmarket manipulation and to prevent exploitation of gullible investors by unscrupulous promoters.
In finance literature stock split is termed as a cosmetic event and such a corporate
action is not likely to have any direct valuation implication. Another similar corporate
event is bonus issue. Empirical research suggests that there are valuation effects of stock
split/bonus announcements. The evidence that announcement of stock split is associated
with positive abnormal return is supportive to the semi-strong form of Efficient Market
Hypothesis (EMH).In India, stock splits become popular from 2001 following the SEBI
abolition of fixed face value concept in 1999. .
Efficient Market Hypothesis (EMH) states that all relevant information is fully and
immediately reflected in a security's market price, thereby assuming that an investor will
obtain an equilibrium rate of return. In other words, an investor should not expect to earn
an abnormal return. Fama (1970) identified three forms of market efficiency namely, the
weak, semi-strong and strong form. The weak from of efficiency suggests that current
share prices fully reflect any past information contained within past share prices. The semi-
strong form extends the notion of efficiency a little further and describes the situation where
any published information relating to a company will be reflected in its share price. The
strong form describes the situation where all relevant information, whether it is within the
public domain or outside the public domain, will be reflected in the price of a share.
The EMH of near perfect capital markets that renders only fleeting and non-systematic
gain and loss opportunities to investors has been criticized in recent years by the behavioral
finance literature. According to the behavioral finance literature, stock transactions are often
*Reader, Dept. of Business Administration,University of Kalyani.**Dept. of Business Administration,University of Kalyani.
Indian Journal of Accounting
46
Indian Journal of Accounting
executed (in relation to known events such as stock issues, stock split, share buy-back) at
price levels that imply predictably high or low risk-adjusted return. If these findings are
factually correct, they pose a challenge to the EMH, which predicts a lack of capital market
profit or loss opportunities due to the ability of investors' rapidly and unbiased interpretation
of information according to correct assessments of the underlying economic process.
STOCK SPLIT PRACTICES IN INDIA
Data and Sample
The sample consists of all stock splits of the firms that form part of BSE (Bombay
Stock Exchange) 500 index during the period April 2001 to March 2007. All of the splits in
the sample used in our study are taken from CMIE PROWESS. Information about split
ratio and event dates (e.g., announcement date, ex-date and record date) is also extracted
from the PROWESS. BSE website is referred to cross-check the event dates. The data
related to stock prices used in this study are obtained through Bombay Stock Exchange.
There are two data sets related to stock prices that are used in this research: the daily stock
prices and the daily index (BSE 500) value. The daily stock prices are based on daily
closing prices and similarly, index value at the close of the trading day is used. Stock
prices after the effective dates of stock splits are adjusted with the split ratio to maintain
consistency. In some cases where bonus has also occurred with stock splits, or during the
study period, adjustments are made in the share prices.
Results & Discussion
In Table 1 we present the frequency distribution of splits across different split ratio
for the entire sample period (Table 1). As seen in our sample of 91 splits, 37 (41%) splits
were clustered in the year 2005-2006, and that was a 138% rise than the previous year.
Results indicate that in India, the 1:5 split ratio is most popular, as 60% of the sample
companies had split their shares in the ratio of 1:5. This was similar to the findings in the
Portuguese market (Farinha and Basilio, 2006). The next popular ratios are 1:10 and 1:2.
The frequency distribution of the sample is a pointer towards the fact that splits are recent
phenomena and was not a common practice before the year 2004. However, in recent
years, more and more companies have resorted to that practice.
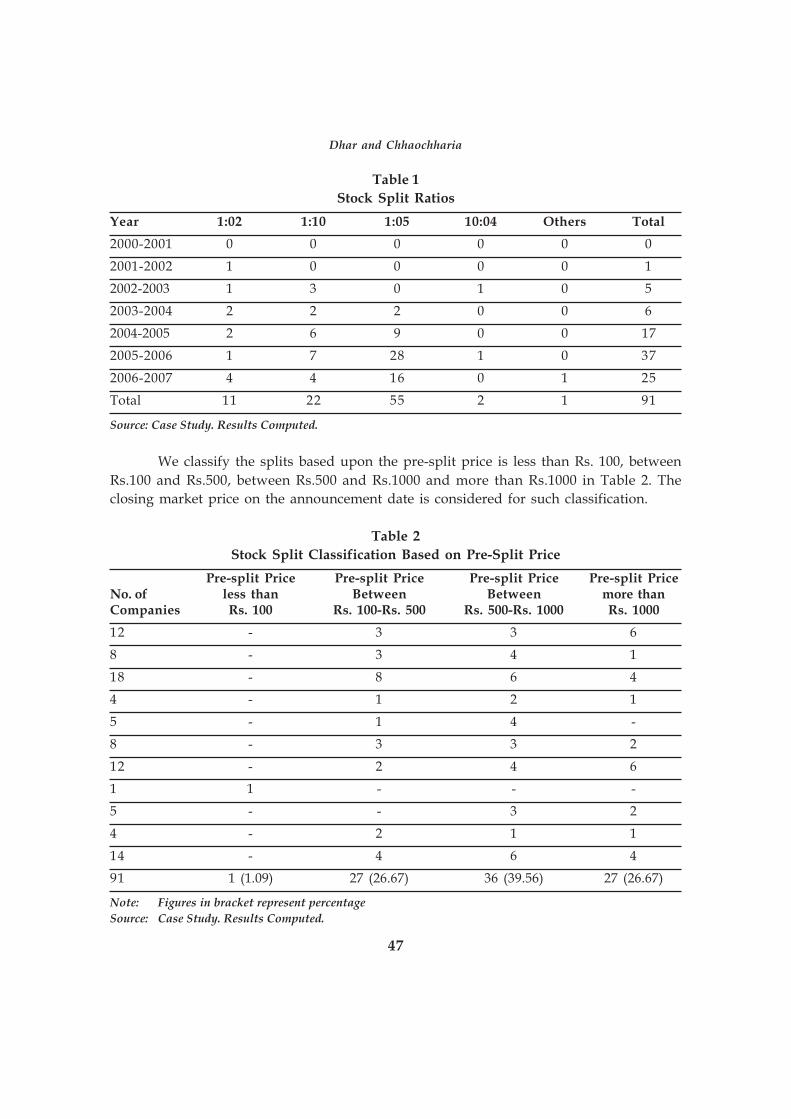
47
Table 1
Stock Split Ratios
Year 1:02 1:10 1:05 10:04 Others Total
2000-2001 0 0 0 0 0 0
2001-2002 1 0 0 0 0 1
2002-2003 1 3 0 1 0 5
2003-2004 2 2 2 0 0 6
2004-2005 2 6 9 0 0 17
2005-2006 1 7 28 1 0 37
2006-2007 4 4 16 0 1 25
Total 11 22 55 2 1 91
Source: Case Study. Results Computed.
We classify the splits based upon the pre-split price is less than Rs. 100, between
Rs.100 and Rs.500, between Rs.500 and Rs.1000 and more than Rs.1000 in Table 2. The
closing market price on the announcement date is considered for such classification.
Table 2
Stock Split Classification Based on Pre-Split Price
Pre-split Price Pre-split Price Pre-split Price Pre-split PriceNo. of less than Between Between more thanCompanies Rs. 100 Rs. 100-Rs. 500 Rs. 500-Rs. 1000 Rs. 1000
12 - 3 3 6
8 - 3 4 1
18 - 8 6 4
4 - 1 2 1
5 - 1 4 -
8 - 3 3 2
12 - 2 4 6
1 1 - - -
5 - - 3 2
4 - 2 1 1
14 - 4 6 4
91 1 (1.09) 27 (26.67) 36 (39.56) 27 (26.67)
Note: Figures in bracket represent percentage
Source: Case Study. Results Computed.
Dhar and Chhaochharia
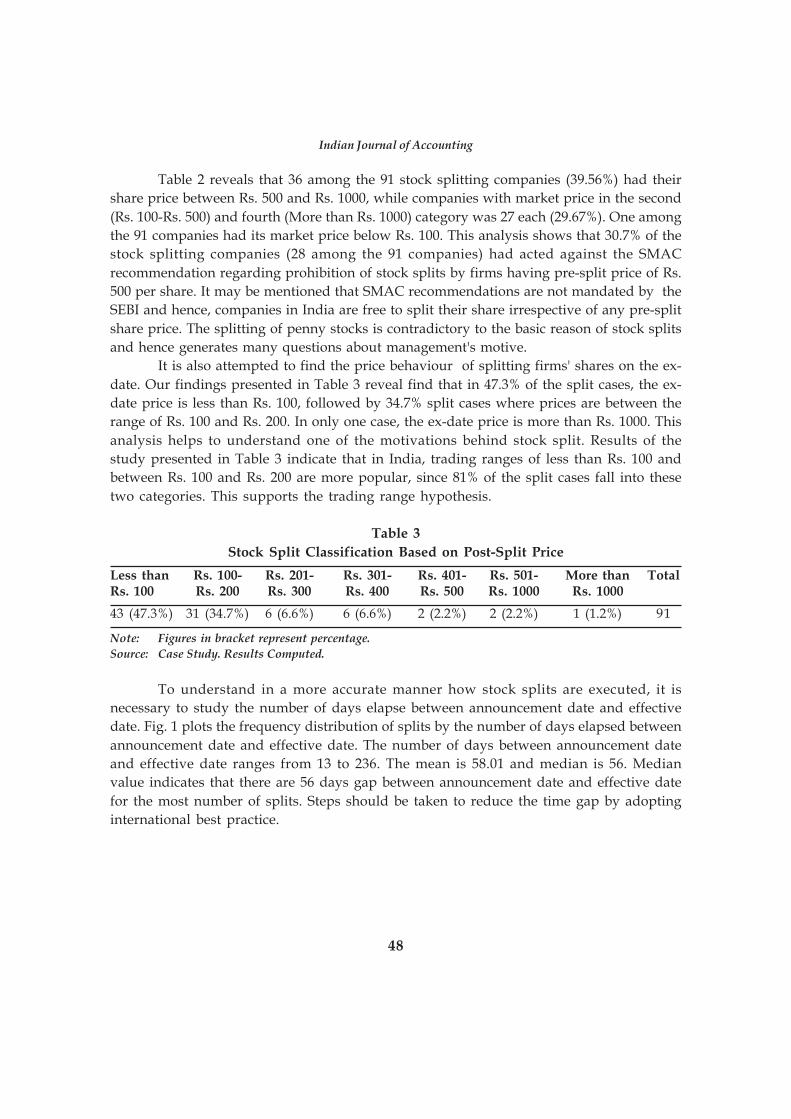
48
Indian Journal of Accounting
Table 2 reveals that 36 among the 91 stock splitting companies (39.56%) had their
share price between Rs. 500 and Rs. 1000, while companies with market price in the second
(Rs. 100-Rs. 500) and fourth (More than Rs. 1000) category was 27 each (29.67%). One among
the 91 companies had its market price below Rs. 100. This analysis shows that 30.7% of the
stock splitting companies (28 among the 91 companies) had acted against the SMAC
recommendation regarding prohibition of stock splits by firms having pre-split price of Rs.
500 per share. It may be mentioned that SMAC recommendations are not mandated by the
SEBI and hence, companies in India are free to split their share irrespective of any pre-split
share price. The splitting of penny stocks is contradictory to the basic reason of stock splits
and hence generates many questions about management's motive.
It is also attempted to find the price behaviour of splitting firms' shares on the ex-
date. Our findings presented in Table 3 reveal find that in 47.3% of the split cases, the ex-
date price is less than Rs. 100, followed by 34.7% split cases where prices are between the
range of Rs. 100 and Rs. 200. In only one case, the ex-date price is more than Rs. 1000. This
analysis helps to understand one of the motivations behind stock split. Results of the
study presented in Table 3 indicate that in India, trading ranges of less than Rs. 100 and
between Rs. 100 and Rs. 200 are more popular, since 81% of the split cases fall into these
two categories. This supports the trading range hypothesis.
Table 3
Stock Split Classification Based on Post-Split Price
Less than Rs. 100- Rs. 201- Rs. 301- Rs. 401- Rs. 501- More than TotalRs. 100 Rs. 200 Rs. 300 Rs. 400 Rs. 500 Rs. 1000 Rs. 1000
43 (47.3%) 31 (34.7%) 6 (6.6%) 6 (6.6%) 2 (2.2%) 2 (2.2%) 1 (1.2%) 91
Note: Figures in bracket represent percentage.
Source: Case Study. Results Computed.
To understand in a more accurate manner how stock splits are executed, it is
necessary to study the number of days elapse between announcement date and effective
date. Fig. 1 plots the frequency distribution of splits by the number of days elapsed between
announcement date and effective date. The number of days between announcement date
and effective date ranges from 13 to 236. The mean is 58.01 and median is 56. Median
value indicates that there are 56 days gap between announcement date and effective date
for the most number of splits. Steps should be taken to reduce the time gap by adopting
international best practice.
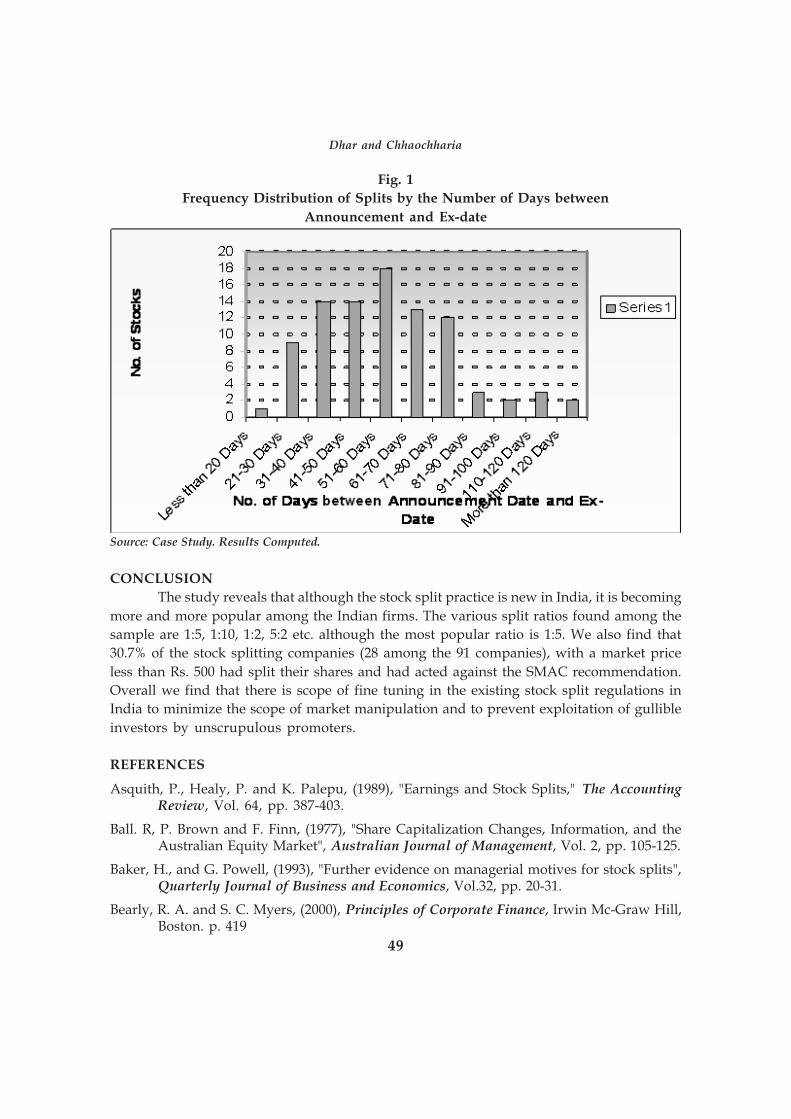
49
Fig. 1
Frequency Distribution of Splits by the Number of Days between
Announcement and Ex-date
Source: Case Study. Results Computed.
CONCLUSION
The study reveals that although the stock split practice is new in India, it is becoming
more and more popular among the Indian firms. The various split ratios found among the
sample are 1:5, 1:10, 1:2, 5:2 etc. although the most popular ratio is 1:5. We also find that
30.7% of the stock splitting companies (28 among the 91 companies), with a market price
less than Rs. 500 had split their shares and had acted against the SMAC recommendation.
Overall we find that there is scope of fine tuning in the existing stock split regulations in
India to minimize the scope of market manipulation and to prevent exploitation of gullible
investors by unscrupulous promoters.
REFERENCES
Asquith, P., Healy, P. and K. Palepu, (1989), "Earnings and Stock Splits," The AccountingReview, Vol. 64, pp. 387-403.
Ball. R, P. Brown and F. Finn, (1977), "Share Capitalization Changes, Information, and theAustralian Equity Market", Australian Journal of Management, Vol. 2, pp. 105-125.
Baker, H., and G. Powell, (1993), "Further evidence on managerial motives for stock splits",Quarterly Journal of Business and Economics, Vol.32, pp. 20-31.
Bearly, R. A. and S. C. Myers, (2000), Principles of Corporate Finance, Irwin Mc-Graw Hill,Boston. p. 419
Dhar and Chhaochharia
50
Indian Journal of Accounting
Dhar and Chhaochharia, (2006), "Stock Splits in India: Conceptual and Regulatory Issues",Portfolio Organizer, August, pp. 27-33.
Fama, E. F., L. Fisher, M. Jensen and R. Roll, (1969), "The Adjustments of Stock Prices toNew Information," International Economic Review, Vol. 10, pp. 1-21.
Fama, F.E., (1970), "Efficient Capital Markets: A Review of Theory and Empirical Work",Journal of Finance, Vol. 25, No. 2, pp. 383-417.
Farinha, J. and N. Basilio, (2006), "Stock Splits: Real Effects or Just a Question of Maths?An Empirical Analysis of the Portuguese Case", Cadernos do Mercado de ValoresMobiliários, Vol. 24, pp. 99-143.
Grinblatt, M. S., Masulis, R. W. and S. Titman, (1984), "The Valuation Effects of StockSplits and Stock Dividends," Journal of Financial Economics, Vol. 13, No. 4, pp.461-490.
Lakonishok, J. and B. Lev, (1987), "Stock Splits and Stock dividends: Why, Who and When,"The Journal of Finance, Vol. 42, pp. 913-932.
Muscarella, C. and M. Vetsuypens, (1996), "Stock Splits: Signaling or Liquidity? The Caseof ADR "Solo-Splits", Journal of Financial Economics, Vol. 42, pp. 3-26.
Rankine, G. and E. Stice, (1997), "The Market Reaction to the Choice of Accounting Methodfor Stock Splits and Large Stock Dividends", Journal of Financial and QuantitativeAnalysis, Vol. 32, No. 2, pp. 161-182.
51
Indian Journal of Accounting
Vol. XLI (1) December 2010, pp. 51-58
INDIA VERSUS OMANACCOUNTING EDUCATION SYSTEM AT
UNDERGRADUATE LEVEL: A COMPARISON
*K.V. Achalapathi
**Tamanna Dalwai
***Sweetline
ABSTRACTThe purpose of this study is to gauge the accounting degrees offered to students in their
Undergraduate Study in Oman and India. Accounting education should lead to development of skillsthat can enhance the employability of students. This research has uses of the secondary sources andexperiences of the authors to identify the transferable skills in the accounting education of Oman andIndia. The study has compared the accounting education system on the basis of assessment systems,practical exposure, roles and responsibilities of the institutions. For comparison purpose Muscat Collegein Oman and Gujarat Technological University, Ahmadabad was selected.
India has a long history of imparting Accounting Education at Undergraduate level,
its graduates are eagerly looking to get employed not only in India but also abroad including
the GCC. People in India therefore are eagerly interested to know the skill requirements of
Employers in foreign countries. An attempt is made in this paper to present a comparison of
Accounting Education system in India and Oman at undergraduate level so that Educational
institutions in India will review their curriculum to suit the job requirements at Gulf. Similarly,
Government of Oman would be interested in knowing the Accounting Education system in
India at undergraduate level to adopt good policies if any to provide more opportunities to
the Oman citizens that would lead to Omanization.
The study is based on secondary data collected from the colleges in Oman and India
respectively and is supported by the diversified experiences of the authors in both the
countries. The first author had first hand experience in establishing equivalence to the course
content in B.Com I year of Osmania University (OU) to that of Diploma in Commercial
practice course offered in Polytechnic colleges in the capacity of Chairman Board of Studies
**Professor of Commerce, Osmania University, Hyderabad India, presently on lien on his post and workingat Muscat College, Muscat Sultanate of Oman.**MBA from California State University, Hayward, USA and lecturer in Muscat College, Muscat, Sultanateof Oman***M.Com., MBA from Madurai Kamaraj University and senior lecturer in Muscat College moving shortlyto Higher College of Technology, Government of Oman.
Indian Journal of Accounting
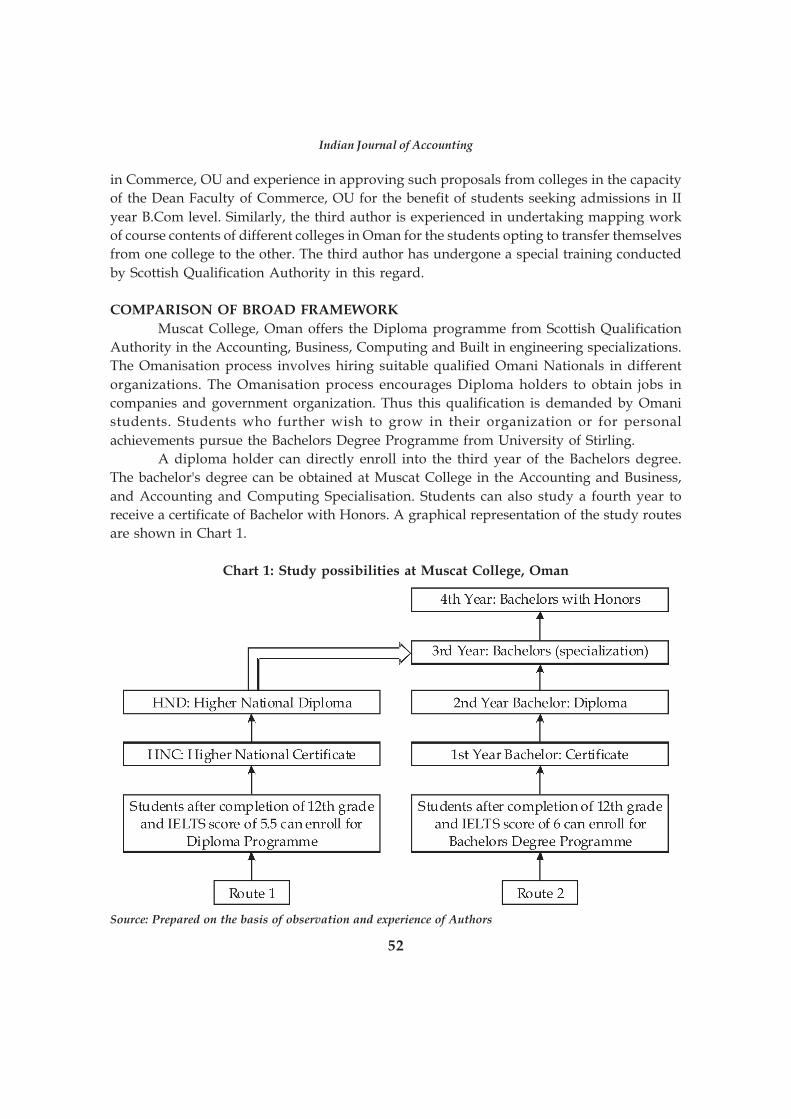
52
Indian Journal of Accounting
in Commerce, OU and experience in approving such proposals from colleges in the capacity
of the Dean Faculty of Commerce, OU for the benefit of students seeking admissions in II
year B.Com level. Similarly, the third author is experienced in undertaking mapping work
of course contents of different colleges in Oman for the students opting to transfer themselves
from one college to the other. The third author has undergone a special training conducted
by Scottish Qualification Authority in this regard.
COMPARISON OF BROAD FRAMEWORK
Muscat College, Oman offers the Diploma programme from Scottish Qualification
Authority in the Accounting, Business, Computing and Built in engineering specializations.
The Omanisation process involves hiring suitable qualified Omani Nationals in different
organizations. The Omanisation process encourages Diploma holders to obtain jobs in
companies and government organization. Thus this qualification is demanded by Omani
students. Students who further wish to grow in their organization or for personal
achievements pursue the Bachelors Degree Programme from University of Stirling.
A diploma holder can directly enroll into the third year of the Bachelors degree.
The bachelor's degree can be obtained at Muscat College in the Accounting and Business,
and Accounting and Computing Specialisation. Students can also study a fourth year to
receive a certificate of Bachelor with Honors. A graphical representation of the study routes
are shown in Chart 1.
Chart 1: Study possibilities at Muscat College, Oman
Source: Prepared on the basis of observation and experience of Authors
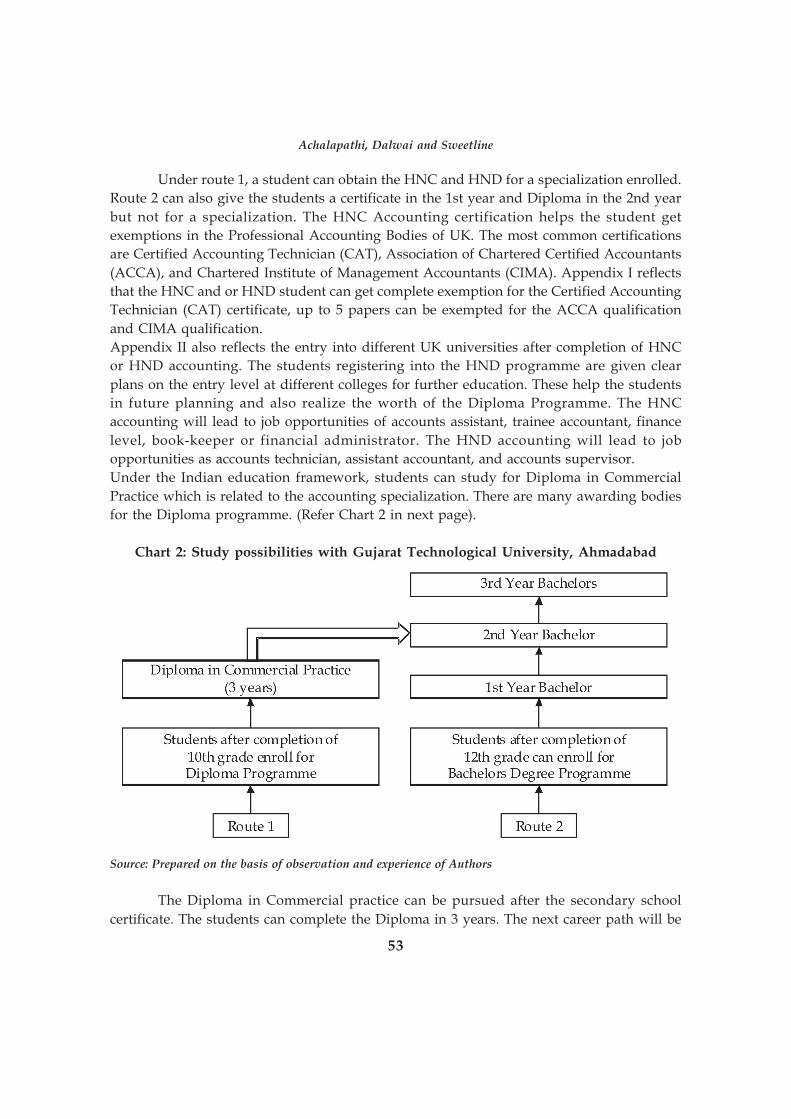
53
Under route 1, a student can obtain the HNC and HND for a specialization enrolled.
Route 2 can also give the students a certificate in the 1st year and Diploma in the 2nd year
but not for a specialization. The HNC Accounting certification helps the student get
exemptions in the Professional Accounting Bodies of UK. The most common certifications
are Certified Accounting Technician (CAT), Association of Chartered Certified Accountants
(ACCA), and Chartered Institute of Management Accountants (CIMA). Appendix I reflects
that the HNC and or HND student can get complete exemption for the Certified Accounting
Technician (CAT) certificate, up to 5 papers can be exempted for the ACCA qualification
and CIMA qualification.
Appendix II also reflects the entry into different UK universities after completion of HNC
or HND accounting. The students registering into the HND programme are given clear
plans on the entry level at different colleges for further education. These help the students
in future planning and also realize the worth of the Diploma Programme. The HNC
accounting will lead to job opportunities of accounts assistant, trainee accountant, finance
level, book-keeper or financial administrator. The HND accounting will lead to job
opportunities as accounts technician, assistant accountant, and accounts supervisor.
Under the Indian education framework, students can study for Diploma in Commercial
Practice which is related to the accounting specialization. There are many awarding bodies
for the Diploma programme. (Refer Chart 2 in next page).
Chart 2: Study possibilities with Gujarat Technological University, Ahmadabad
Source: Prepared on the basis of observation and experience of Authors
The Diploma in Commercial practice can be pursued after the secondary school
certificate. The students can complete the Diploma in 3 years. The next career path will be
Achalapathi, Dalwai and Sweetline
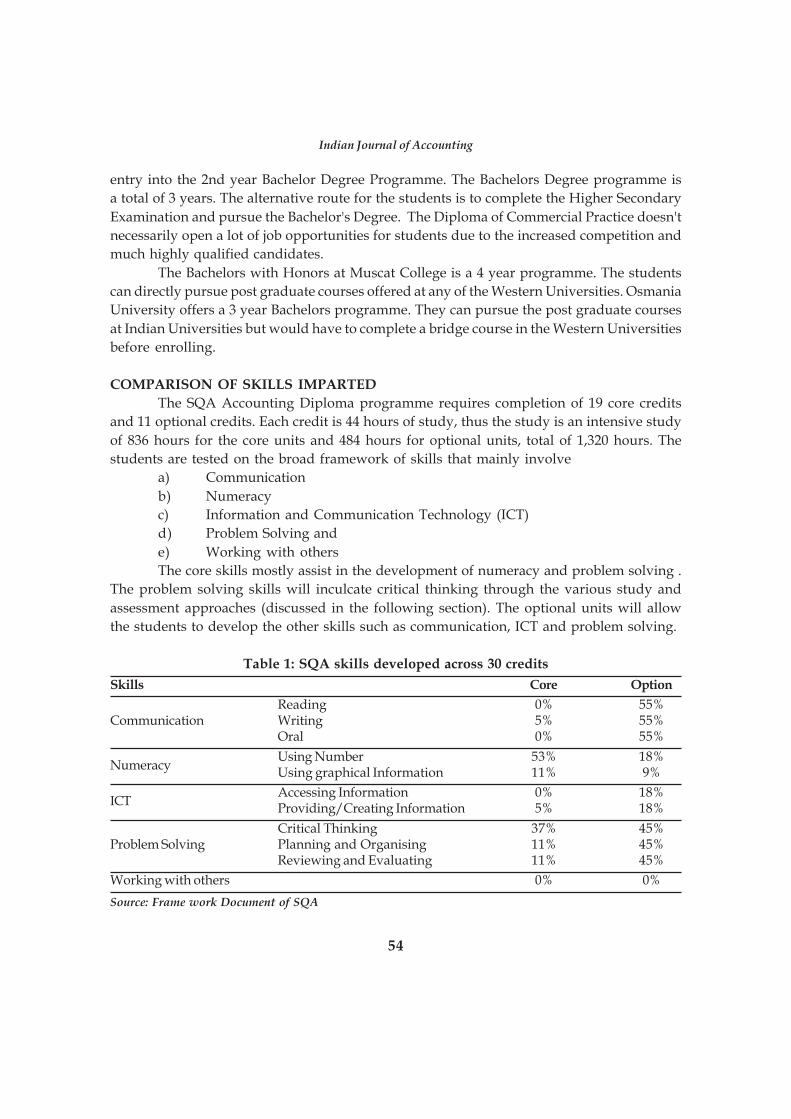
54
Indian Journal of Accounting
entry into the 2nd year Bachelor Degree Programme. The Bachelors Degree programme is
a total of 3 years. The alternative route for the students is to complete the Higher Secondary
Examination and pursue the Bachelor's Degree. The Diploma of Commercial Practice doesn't
necessarily open a lot of job opportunities for students due to the increased competition and
much highly qualified candidates.
The Bachelors with Honors at Muscat College is a 4 year programme. The students
can directly pursue post graduate courses offered at any of the Western Universities. Osmania
University offers a 3 year Bachelors programme. They can pursue the post graduate courses
at Indian Universities but would have to complete a bridge course in the Western Universities
before enrolling.
COMPARISON OF SKILLS IMPARTED
The SQA Accounting Diploma programme requires completion of 19 core credits
and 11 optional credits. Each credit is 44 hours of study, thus the study is an intensive study
of 836 hours for the core units and 484 hours for optional units, total of 1,320 hours. The
students are tested on the broad framework of skills that mainly involve
a) Communication
b) Numeracy
c) Information and Communication Technology (ICT)
d) Problem Solving and
e) Working with others
The core skills mostly assist in the development of numeracy and problem solving .
The problem solving skills will inculcate critical thinking through the various study and
assessment approaches (discussed in the following section). The optional units will allow
the students to develop the other skills such as communication, ICT and problem solving.
Table 1: SQA skills developed across 30 credits
Skills Core Option
Reading 0% 55%Communication Writing 5% 55%
Oral 0% 55%
NumeracyUsing Number 53% 18%Using graphical Information 11% 9%
ICTAccessing Information 0% 18%Providing/Creating Information 5% 18%
Critical Thinking 37% 45%Problem Solving Planning and Organising 11% 45%
Reviewing and Evaluating 11% 45%
Working with others 0% 0%
Source: Frame work Document of SQA
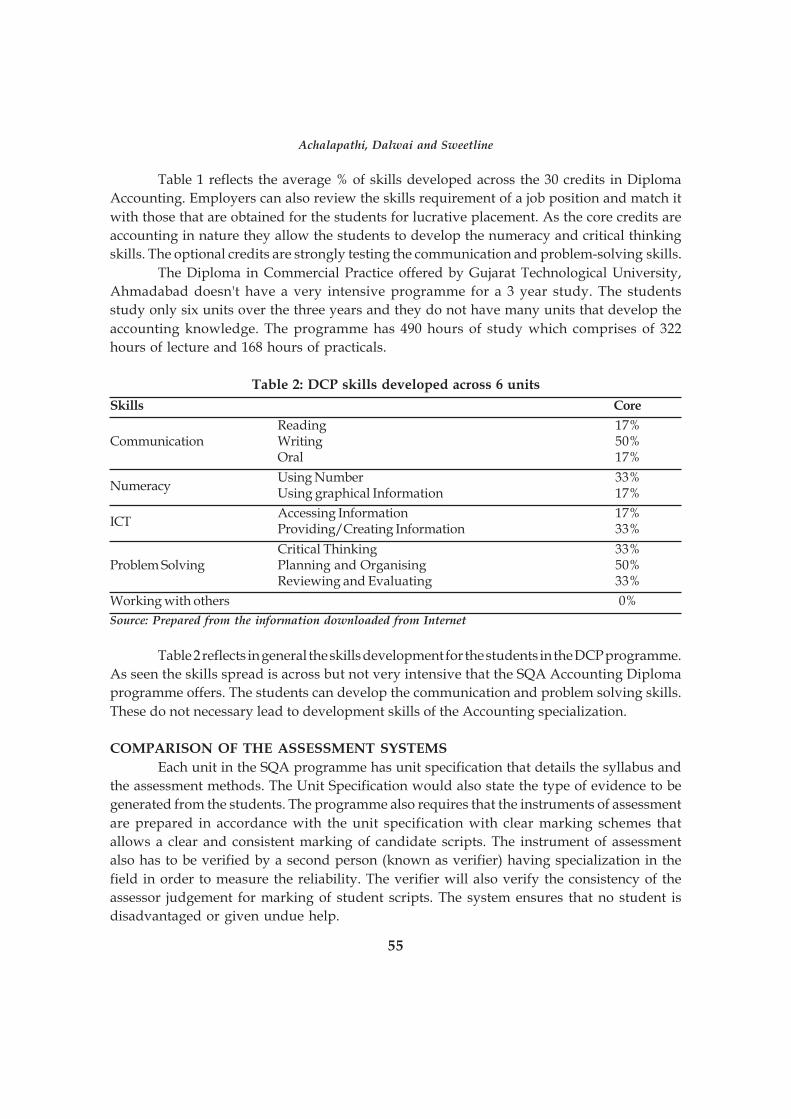
55
Table 1 reflects the average % of skills developed across the 30 credits in Diploma
Accounting. Employers can also review the skills requirement of a job position and match it
with those that are obtained for the students for lucrative placement. As the core credits are
accounting in nature they allow the students to develop the numeracy and critical thinking
skills. The optional credits are strongly testing the communication and problem-solving skills.
The Diploma in Commercial Practice offered by Gujarat Technological University,
Ahmadabad doesn't have a very intensive programme for a 3 year study. The students
study only six units over the three years and they do not have many units that develop the
accounting knowledge. The programme has 490 hours of study which comprises of 322
hours of lecture and 168 hours of practicals.
Table 2: DCP skills developed across 6 units
Skills Core
Reading 17%Communication Writing 50%
Oral 17%
NumeracyUsing Number 33%Using graphical Information 17%
ICTAccessing Information 17%Providing/Creating Information 33%
Critical Thinking 33%Problem Solving Planning and Organising 50%
Reviewing and Evaluating 33%
Working with others 0%
Source: Prepared from the information downloaded from Internet
Table 2 reflects in general the skills development for the students in the DCP programme.
As seen the skills spread is across but not very intensive that the SQA Accounting Diploma
programme offers. The students can develop the communication and problem solving skills.
These do not necessary lead to development skills of the Accounting specialization.
COMPARISON OF THE ASSESSMENT SYSTEMS
Each unit in the SQA programme has unit specification that details the syllabus and
the assessment methods. The Unit Specification would also state the type of evidence to be
generated from the students. The programme also requires that the instruments of assessment
are prepared in accordance with the unit specification with clear marking schemes that
allows a clear and consistent marking of candidate scripts. The instrument of assessment
also has to be verified by a second person (known as verifier) having specialization in the
field in order to measure the reliability. The verifier will also verify the consistency of the
assessor judgement for marking of student scripts. The system ensures that no student is
disadvantaged or given undue help.
Achalapathi, Dalwai and Sweetline
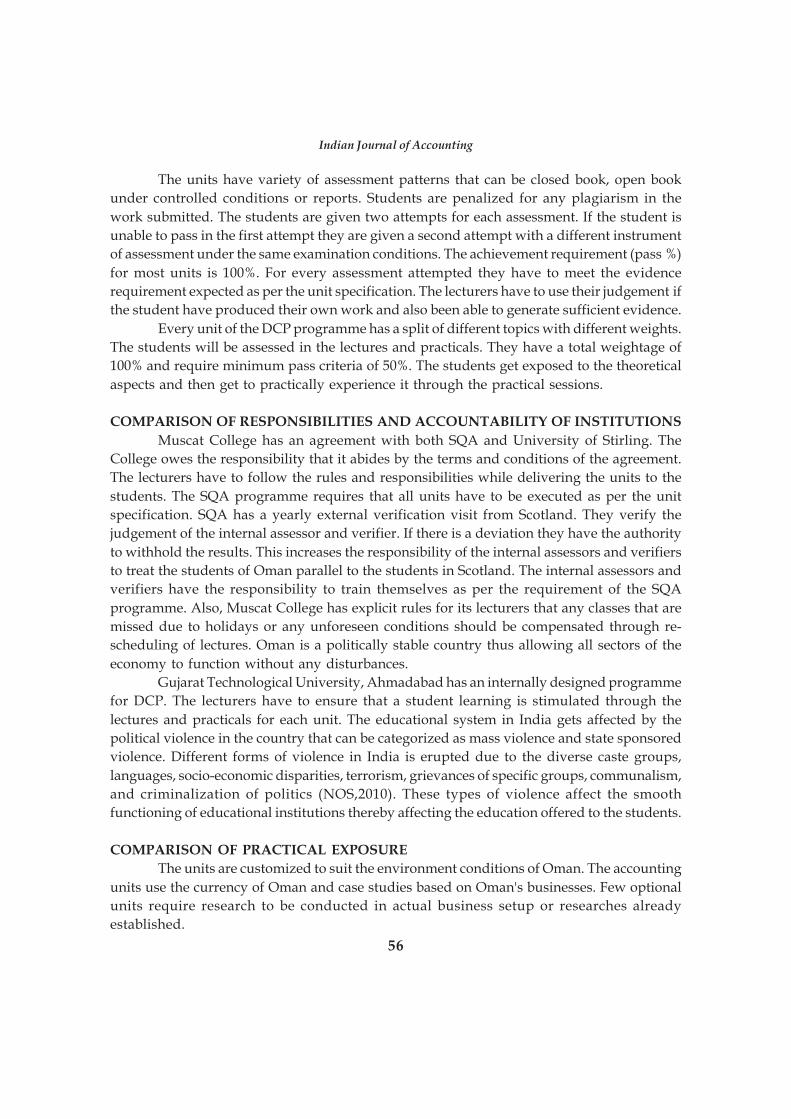
56
Indian Journal of Accounting
The units have variety of assessment patterns that can be closed book, open book
under controlled conditions or reports. Students are penalized for any plagiarism in the
work submitted. The students are given two attempts for each assessment. If the student is
unable to pass in the first attempt they are given a second attempt with a different instrument
of assessment under the same examination conditions. The achievement requirement (pass %)
for most units is 100%. For every assessment attempted they have to meet the evidence
requirement expected as per the unit specification. The lecturers have to use their judgement if
the student have produced their own work and also been able to generate sufficient evidence.
Every unit of the DCP programme has a split of different topics with different weights.
The students will be assessed in the lectures and practicals. They have a total weightage of
100% and require minimum pass criteria of 50%. The students get exposed to the theoretical
aspects and then get to practically experience it through the practical sessions.
COMPARISON OF RESPONSIBILITIES AND ACCOUNTABILITY OF INSTITUTIONS
Muscat College has an agreement with both SQA and University of Stirling. The
College owes the responsibility that it abides by the terms and conditions of the agreement.
The lecturers have to follow the rules and responsibilities while delivering the units to the
students. The SQA programme requires that all units have to be executed as per the unit
specification. SQA has a yearly external verification visit from Scotland. They verify the
judgement of the internal assessor and verifier. If there is a deviation they have the authority
to withhold the results. This increases the responsibility of the internal assessors and verifiers
to treat the students of Oman parallel to the students in Scotland. The internal assessors and
verifiers have the responsibility to train themselves as per the requirement of the SQA
programme. Also, Muscat College has explicit rules for its lecturers that any classes that are
missed due to holidays or any unforeseen conditions should be compensated through re-
scheduling of lectures. Oman is a politically stable country thus allowing all sectors of the
economy to function without any disturbances.
Gujarat Technological University, Ahmadabad has an internally designed programme
for DCP. The lecturers have to ensure that a student learning is stimulated through the
lectures and practicals for each unit. The educational system in India gets affected by the
political violence in the country that can be categorized as mass violence and state sponsored
violence. Different forms of violence in India is erupted due to the diverse caste groups,
languages, socio-economic disparities, terrorism, grievances of specific groups, communalism,
and criminalization of politics (NOS,2010). These types of violence affect the smooth
functioning of educational institutions thereby affecting the education offered to the students.
COMPARISON OF PRACTICAL EXPOSURE
The units are customized to suit the environment conditions of Oman. The accounting
units use the currency of Oman and case studies based on Oman's businesses. Few optional
units require research to be conducted in actual business setup or researches already
established.
57
The units of the DCP programme are more general and have a more theoretical
approach. The unit exposes the students to concepts and knowledge for different topics.
Each unit has practical sessions that allow the practical application of what is learnt.
EPILOGUE
After reviewing both the programmes it is of the view that the Diploma Programme
in India should try to bring about certain changes. The Indian Universities should be
synchronized in the syllabus of the Diploma programme. The syllabus should be parallel
with the programmes in the West. This will give an advantage to the Indian students for
getting recognition of their Indian degree and pursue jobs or education without any additional
requirement. The SQA programme can try to have fewer units for a diploma achievement
which can reduce the stress on students. In order to provide better employment opportunities
to the student across the globe, it is necessary to update the framework of Accounting
Education at undergraduate level. While the professional bodies are doing the job,
Universities and government institutions are missing the bus.
REFERENCES
Singh, Gurdip (2004). Emerging Dimensions of Accounting Education and research in India.(Online). Available at: http://dspace.xmu.edu.cn:8080/dspace/handle/2288/411accessed on 21st September 2010.
Gujarat Technological University, Ahmadabad. (2010). Diploma in Commercial Practice.(Online). Available at http://www.gtu.ac.in/syllabus/DipEngg/DipFirstSem/DCP.pdf
Ministry of Higher Education (2008). Inclusive Education in the Sultanate of Oman. NationalReport of the Sultanate of Oman. Published by Ministry of Higher Education.
Ministry of Higher Education (2004). National report on Quality Education on Oman. (Online).Available at: http://www.ibe.unesco.org/International/ICE47/English/Natreps/reports/oman_part_1.pdf . Accessed on 21st September 2010.
Ministry of Human Resource Development (2005-2006). Guidelines for the scheme ofscholarship for college and university students. (Online). Available http://education.nic.in/scholarship/Guidelines-Collegestdnts.pdf .
National Institute of Open Learning (2010). Political Violence. (Online) Available at: http://nos.org/317courseE/L-36%20POLITICAL%20VIOLENCE.pdf
Shaibany, Saleh (2010). Poor students want scholarship quota. Times of Oman. 3rd October2010.
Yunus, H. (1990b), Provision of Continuing Professional Education in Accounting with thecase in Indonesia, Indonesian Institute of Accountants
Achalapathi, Dalwai and Sweetline
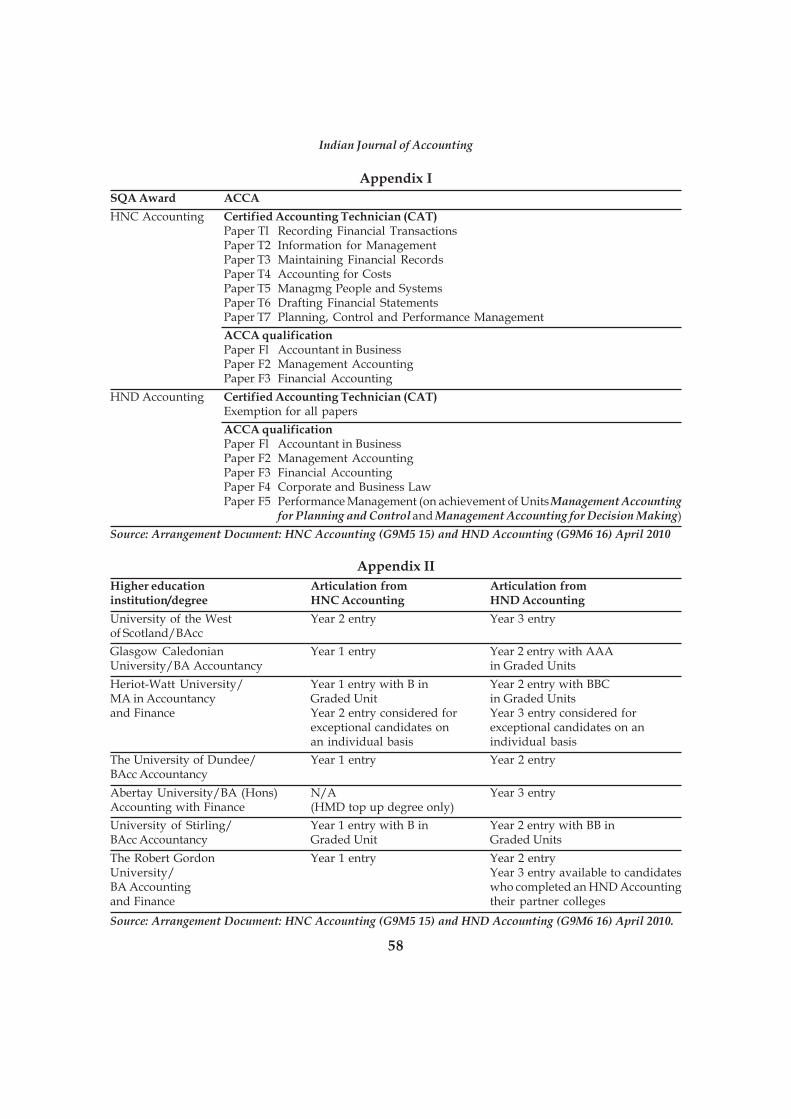
58
Indian Journal of Accounting
Appendix I
SQA Award ACCA
HNC Accounting Certified Accounting Technician (CAT)Paper Tl Recording Financial TransactionsPaper T2 Information for ManagementPaper T3 Maintaining Financial RecordsPaper T4 Accounting for CostsPaper T5 Managmg People and SystemsPaper T6 Drafting Financial StatementsPaper T7 Planning, Control and Performance Management
ACCA qualificationPaper Fl Accountant in BusinessPaper F2 Management AccountingPaper F3 Financial Accounting
HND Accounting Certified Accounting Technician (CAT)Exemption for all papers
ACCA qualificationPaper Fl Accountant in BusinessPaper F2 Management AccountingPaper F3 Financial AccountingPaper F4 Corporate and Business LawPaper F5 Performance Management (on achievement of Units Management Accounting
for Planning and Control and Management Accounting for Decision Making)
Source: Arrangement Document: HNC Accounting (G9M5 15) and HND Accounting (G9M6 16) April 2010
Appendix II
Higher education Articulation from Articulation frominstitution/degree HNC Accounting HND Accounting
University of the West Year 2 entry Year 3 entryof Scotland/BAcc
Glasgow Caledonian Year 1 entry Year 2 entry with AAAUniversity/BA Accountancy in Graded Units
Heriot-Watt University/ Year 1 entry with B in Year 2 entry with BBCMA in Accountancy Graded Unit in Graded Unitsand Finance Year 2 entry considered for Year 3 entry considered for
exceptional candidates on exceptional candidates on anan individual basis individual basis
The University of Dundee/ Year 1 entry Year 2 entryBAcc Accountancy
Abertay University/BA (Hons) N/A Year 3 entryAccounting with Finance (HMD top up degree only)
University of Stirling/ Year 1 entry with B in Year 2 entry with BB inBAcc Accountancy Graded Unit Graded Units
The Robert Gordon Year 1 entry Year 2 entryUniversity/ Year 3 entry available to candidatesBA Accounting who completed an HND Accountingand Finance their partner colleges
Source: Arrangement Document: HNC Accounting (G9M5 15) and HND Accounting (G9M6 16) April 2010.
59
Indian Journal of Accounting
Vol. XLI (1) December 2010, pp. 59-65
INVESTORS' SATISFACTIONAND CREDIT RATING
*Kuljeet Kaur
**Rajinder Kaur
ABSTRACTThe resent paper aimed to access the level of satisfaction regarding credit rating among the
investors, to highlight the level of importance given to various rating attributes by the respondents andto access the factors affecting the level of satisfaction of investors regarding credit rating. Primarydata in the form of pre-designed questionnaire has been collected from various districts of Punjab.Various suitable statistical tools have been used for the achievement of objectives. The study resultsshow that maximum respondents are satisfied with the guidance of credit rating agencies and variousrating attributes including the rating accuracy, quality of analysts, timeliness of upgrades anddowngrades and transparency of methodology are very important for the investors.
Credit rating inspired encouragement to investors to inflow their savings into the
capital market activities, which resulted in the productive use of funds and thus enhancing
production. Azhagaiah, R. (2004) studied the perceptions of Indian investors regarding credit
rating and revealed that 35% of respondents depend on credit rating for their investment
decision. The analyses also revealed that majority of respondents (50%) depend on CRISIL
ratings followed by those of ICRA (30.43%). Further the author suggested that proper steps
should be taken to make the working of credit rating agencies more accountable. Vepa, S.
(2006) revealed the presence of multiple credit rating agencies instigated issuers to approach
more than one credit rating agency with a hope to secure better ratings. The author
highlighted that when credit rating became mandatory in 1992-1993 in India, private
placements of debentures gained importance as a preferred route of financing as credit
rating was not mandatory for private placements but in spite of that, the debentures or
issues which were rated were more safe and reliable than the unrated ones by the investors.
Bheemanagauda and J. Madegowda (2010) made an attempt to evaluate the performance of
credit rating agencies in India. The analysis of the study brings to the fore that during the
given period the maximum percentage of instruments rated are assigned the investment
grade rating. As far as rating revisions are concerned, the study depicts that the downgrades
are more than double the upgrades both in terms of number of instruments and the volume
*Senior Research Fellow, Department of Commerce, Punjabi University, Patiala.**Reader, Department of Commerce, Punjabi University, Patiala.
Indian Journal of Accounting
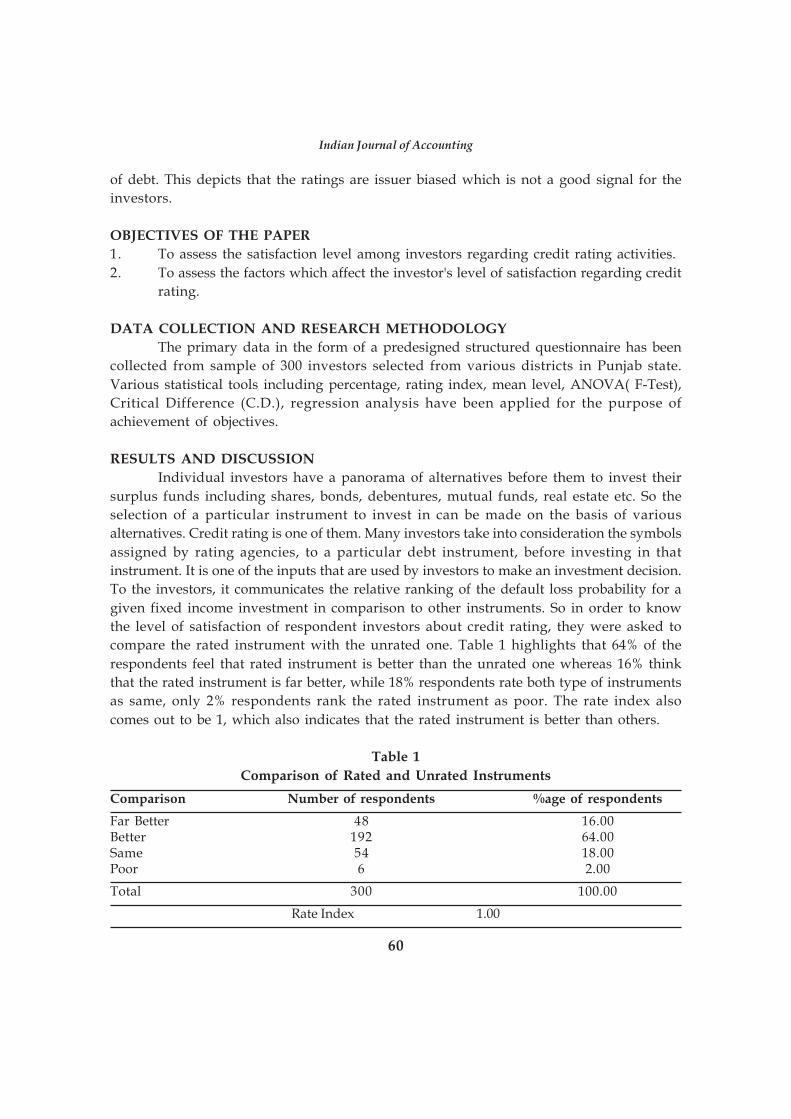
60
Indian Journal of Accounting
of debt. This depicts that the ratings are issuer biased which is not a good signal for the
investors.
OBJECTIVES OF THE PAPER
1. To assess the satisfaction level among investors regarding credit rating activities.
2. To assess the factors which affect the investor's level of satisfaction regarding credit
rating.
DATA COLLECTION AND RESEARCH METHODOLOGY
The primary data in the form of a predesigned structured questionnaire has been
collected from sample of 300 investors selected from various districts in Punjab state.
Various statistical tools including percentage, rating index, mean level, ANOVA( F-Test),
Critical Difference (C.D.), regression analysis have been applied for the purpose of
achievement of objectives.
RESULTS AND DISCUSSION
Individual investors have a panorama of alternatives before them to invest their
surplus funds including shares, bonds, debentures, mutual funds, real estate etc. So the
selection of a particular instrument to invest in can be made on the basis of various
alternatives. Credit rating is one of them. Many investors take into consideration the symbols
assigned by rating agencies, to a particular debt instrument, before investing in that
instrument. It is one of the inputs that are used by investors to make an investment decision.
To the investors, it communicates the relative ranking of the default loss probability for a
given fixed income investment in comparison to other instruments. So in order to know
the level of satisfaction of respondent investors about credit rating, they were asked to
compare the rated instrument with the unrated one. Table 1 highlights that 64% of the
respondents feel that rated instrument is better than the unrated one whereas 16% think
that the rated instrument is far better, while 18% respondents rate both type of instruments
as same, only 2% respondents rank the rated instrument as poor. The rate index also
comes out to be 1, which also indicates that the rated instrument is better than others.
Table 1
Comparison of Rated and Unrated Instruments
Comparison Number of respondents %age of respondents
Far Better 48 16.00Better 192 64.00Same 54 18.00Poor 6 2.00
Total 300 100.00
Rate Index 1.00
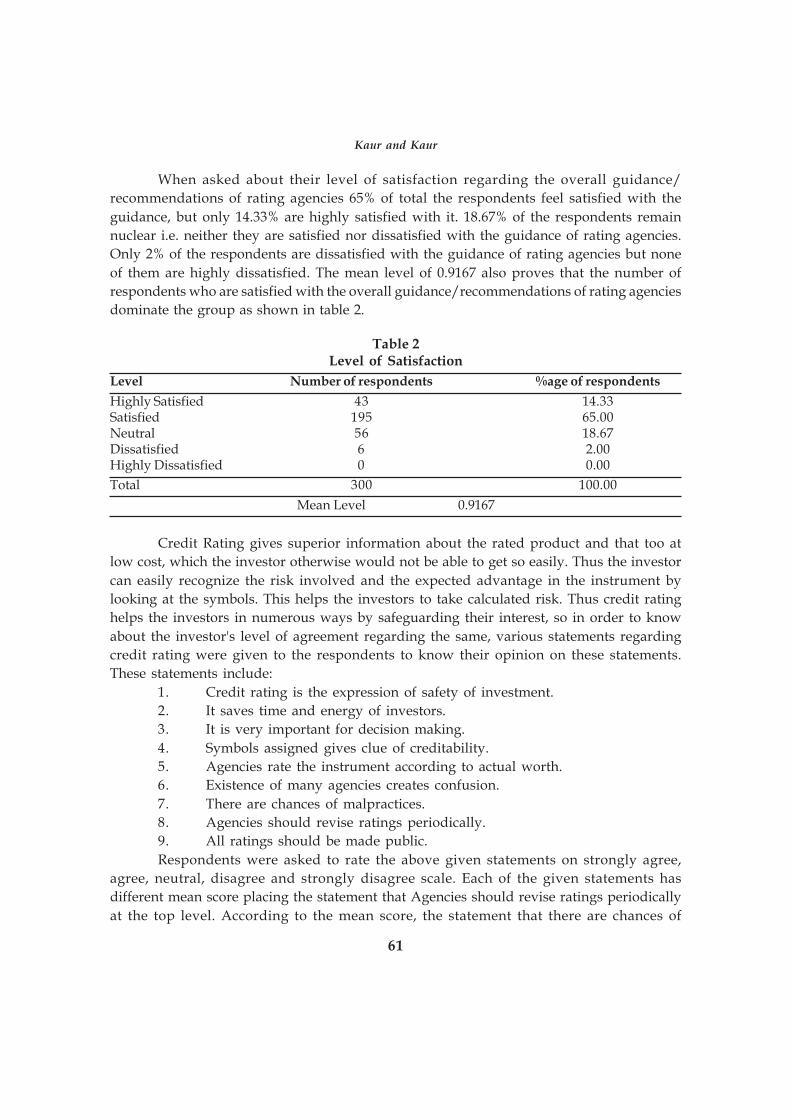
61
When asked about their level of satisfaction regarding the overall guidance/
recommendations of rating agencies 65% of total the respondents feel satisfied with the
guidance, but only 14.33% are highly satisfied with it. 18.67% of the respondents remain
nuclear i.e. neither they are satisfied nor dissatisfied with the guidance of rating agencies.
Only 2% of the respondents are dissatisfied with the guidance of rating agencies but none
of them are highly dissatisfied. The mean level of 0.9167 also proves that the number of
respondents who are satisfied with the overall guidance/recommendations of rating agencies
dominate the group as shown in table 2.
Table 2Level of Satisfaction
Level Number of respondents %age of respondents
Highly Satisfied 43 14.33Satisfied 195 65.00Neutral 56 18.67Dissatisfied 6 2.00Highly Dissatisfied 0 0.00
Total 300 100.00
Mean Level 0.9167
Credit Rating gives superior information about the rated product and that too at
low cost, which the investor otherwise would not be able to get so easily. Thus the investor
can easily recognize the risk involved and the expected advantage in the instrument by
looking at the symbols. This helps the investors to take calculated risk. Thus credit rating
helps the investors in numerous ways by safeguarding their interest, so in order to know
about the investor's level of agreement regarding the same, various statements regarding
credit rating were given to the respondents to know their opinion on these statements.
These statements include:
1. Credit rating is the expression of safety of investment.
2. It saves time and energy of investors.
3. It is very important for decision making.
4. Symbols assigned gives clue of creditability.
5. Agencies rate the instrument according to actual worth.
6. Existence of many agencies creates confusion.
7. There are chances of malpractices.
8. Agencies should revise ratings periodically.
9. All ratings should be made public.
Respondents were asked to rate the above given statements on strongly agree,
agree, neutral, disagree and strongly disagree scale. Each of the given statements has
different mean score placing the statement that Agencies should revise ratings periodically
at the top level. According to the mean score, the statement that there are chances of
Kaur and Kaur
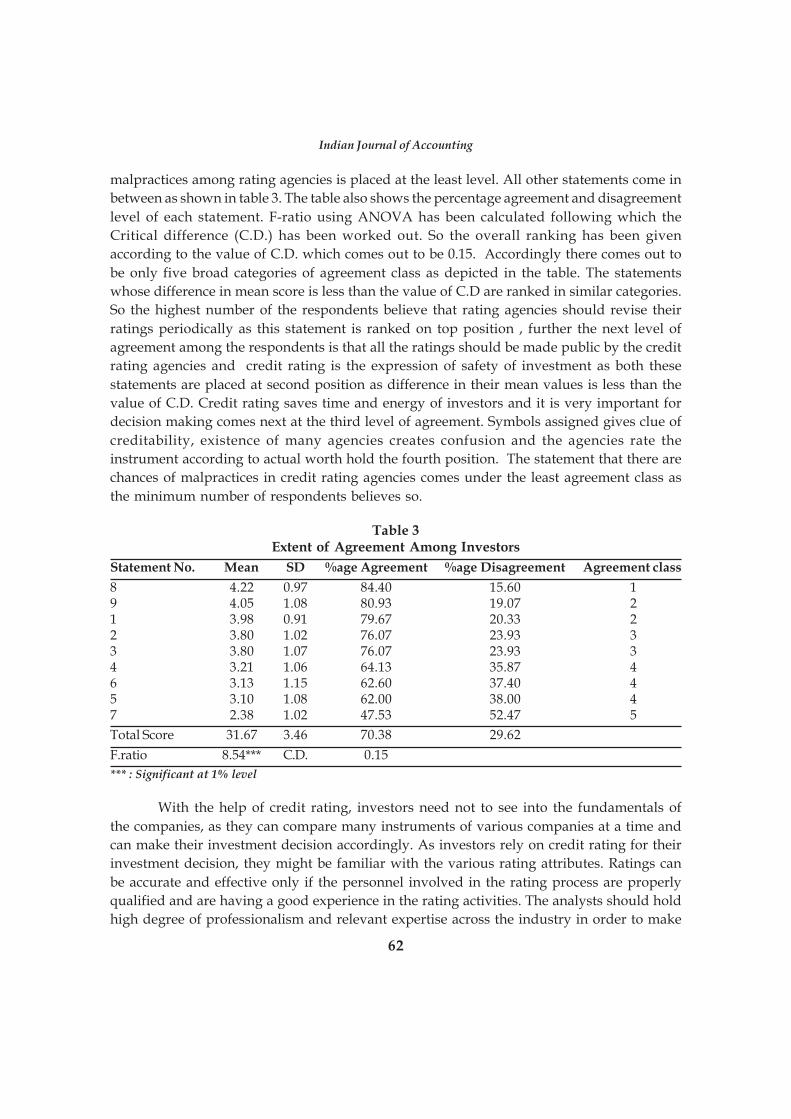
62
Indian Journal of Accounting
malpractices among rating agencies is placed at the least level. All other statements come in
between as shown in table 3. The table also shows the percentage agreement and disagreement
level of each statement. F-ratio using ANOVA has been calculated following which the
Critical difference (C.D.) has been worked out. So the overall ranking has been given
according to the value of C.D. which comes out to be 0.15. Accordingly there comes out to
be only five broad categories of agreement class as depicted in the table. The statements
whose difference in mean score is less than the value of C.D are ranked in similar categories.
So the highest number of the respondents believe that rating agencies should revise their
ratings periodically as this statement is ranked on top position , further the next level of
agreement among the respondents is that all the ratings should be made public by the credit
rating agencies and credit rating is the expression of safety of investment as both these
statements are placed at second position as difference in their mean values is less than the
value of C.D. Credit rating saves time and energy of investors and it is very important for
decision making comes next at the third level of agreement. Symbols assigned gives clue of
creditability, existence of many agencies creates confusion and the agencies rate the
instrument according to actual worth hold the fourth position. The statement that there are
chances of malpractices in credit rating agencies comes under the least agreement class as
the minimum number of respondents believes so.
Table 3Extent of Agreement Among Investors
Statement No. Mean SD %age Agreement %age Disagreement Agreement class
8 4.22 0.97 84.40 15.60 19 4.05 1.08 80.93 19.07 21 3.98 0.91 79.67 20.33 22 3.80 1.02 76.07 23.93 33 3.80 1.07 76.07 23.93 34 3.21 1.06 64.13 35.87 46 3.13 1.15 62.60 37.40 45 3.10 1.08 62.00 38.00 47 2.38 1.02 47.53 52.47 5
Total Score 31.67 3.46 70.38 29.62
F.ratio 8.54*** C.D. 0.15
*** : Significant at 1% level
With the help of credit rating, investors need not to see into the fundamentals of
the companies, as they can compare many instruments of various companies at a time and
can make their investment decision accordingly. As investors rely on credit rating for their
investment decision, they might be familiar with the various rating attributes. Ratings can
be accurate and effective only if the personnel involved in the rating process are properly
qualified and are having a good experience in the rating activities. The analysts should hold
high degree of professionalism and relevant expertise across the industry in order to make
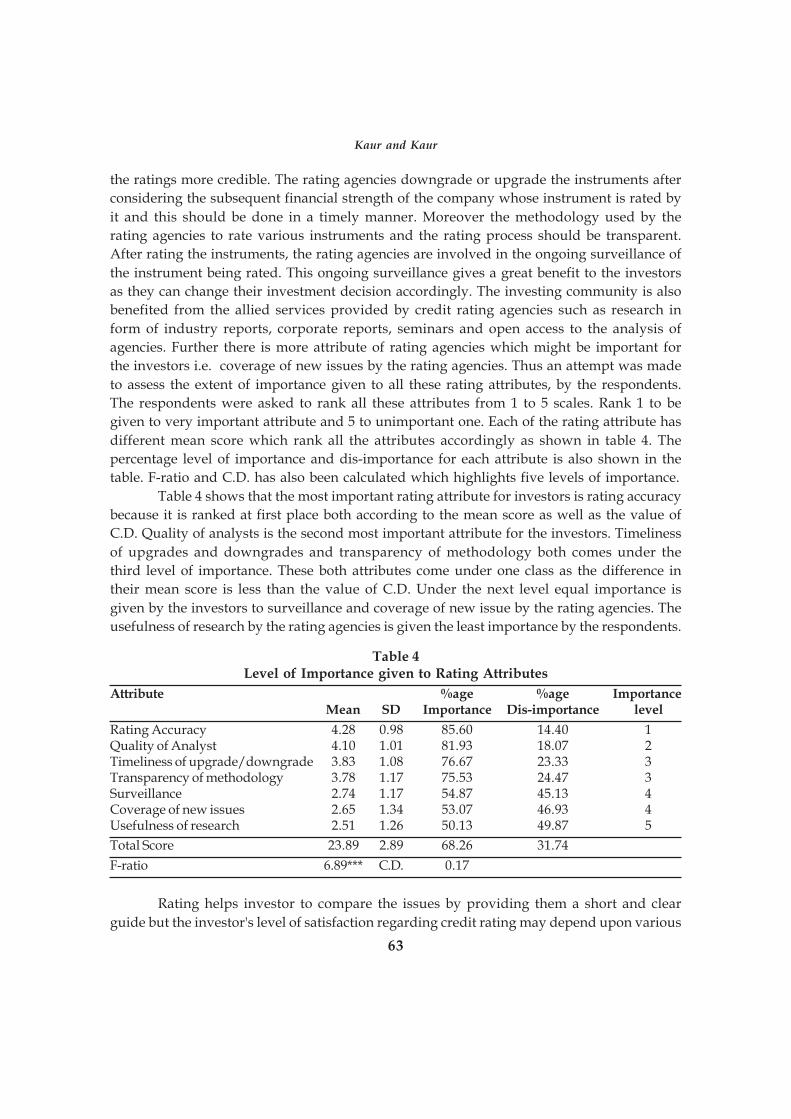
63
the ratings more credible. The rating agencies downgrade or upgrade the instruments after
considering the subsequent financial strength of the company whose instrument is rated by
it and this should be done in a timely manner. Moreover the methodology used by the
rating agencies to rate various instruments and the rating process should be transparent.
After rating the instruments, the rating agencies are involved in the ongoing surveillance of
the instrument being rated. This ongoing surveillance gives a great benefit to the investors
as they can change their investment decision accordingly. The investing community is also
benefited from the allied services provided by credit rating agencies such as research in
form of industry reports, corporate reports, seminars and open access to the analysis of
agencies. Further there is more attribute of rating agencies which might be important for
the investors i.e. coverage of new issues by the rating agencies. Thus an attempt was made
to assess the extent of importance given to all these rating attributes, by the respondents.
The respondents were asked to rank all these attributes from 1 to 5 scales. Rank 1 to be
given to very important attribute and 5 to unimportant one. Each of the rating attribute has
different mean score which rank all the attributes accordingly as shown in table 4. The
percentage level of importance and dis-importance for each attribute is also shown in the
table. F-ratio and C.D. has also been calculated which highlights five levels of importance.
Table 4 shows that the most important rating attribute for investors is rating accuracy
because it is ranked at first place both according to the mean score as well as the value of
C.D. Quality of analysts is the second most important attribute for the investors. Timeliness
of upgrades and downgrades and transparency of methodology both comes under the
third level of importance. These both attributes come under one class as the difference in
their mean score is less than the value of C.D. Under the next level equal importance is
given by the investors to surveillance and coverage of new issue by the rating agencies. The
usefulness of research by the rating agencies is given the least importance by the respondents.
Table 4Level of Importance given to Rating Attributes
Attribute %age %age ImportanceMean SD Importance Dis-importance level
Rating Accuracy 4.28 0.98 85.60 14.40 1Quality of Analyst 4.10 1.01 81.93 18.07 2Timeliness of upgrade/downgrade 3.83 1.08 76.67 23.33 3Transparency of methodology 3.78 1.17 75.53 24.47 3Surveillance 2.74 1.17 54.87 45.13 4Coverage of new issues 2.65 1.34 53.07 46.93 4Usefulness of research 2.51 1.26 50.13 49.87 5
Total Score 23.89 2.89 68.26 31.74
F-ratio 6.89*** C.D. 0.17
Rating helps investor to compare the issues by providing them a short and clear
guide but the investor's level of satisfaction regarding credit rating may depend upon various
Kaur and Kaur

64
Indian Journal of Accounting
factors. Their level of satisfaction may depend upon their personal profile including their
age, qualification, their annual investments and their experience in the investment activities.
Other factors which might affect the level of satisfaction of investors regarding credit rating
include their faith in various rating attributes. A few among them include credit rating is
the expression of safety, it saves time and energy of investors, it helps the investors in
decision making, the rating symbols are the clue of credibility of the instrument, the rating
agencies rate the instruments according to their actual worth, existence of many rating
agencies creates confusion, there are chances of malpractices, rating agencies should revise
ratings periodically and all ratings should be made public. The other important rating
attributes include overall quality of the analysts, rating accuracy, timeliness of upgrades/
downgrades, transparency of methodology, surveillance, usefulness of research, coverage
of new issues which might affect the investors' level of satisfaction regarding credit rating.
Linear step regression model has been employed to identify the factors (independent
variables) affecting level of satisfaction of investor respondents regarding overall guidance/
recommendations (dependent variable) of the rating agency. The model used is as under in
its algebraic form:
Y = á + â1X
1+â
2X
2+ â
3X
3+…………………. â
nX
n+ ì
Where Y = Level of satisfaction
á = a constant term
X1 to Xn are the independent variables
â1 to ân are the regression coefficients of X1 to Xn
Under this step regression model, different variables have been used to access their
values or impact on the model. Various variables which contribute to the model or leaves
significant impact are taken in the final run equation, all other variables which have not
contributed significantly got removed in the process. It means that the variables which have
been selected have been found significant to explain the variation in the satisfaction level of
investors regarding credit rating, while the factors which are not selected do not explain
this variation.
The beta values or coefficients indicate the strength of relationship between
independent variable and dependent variable. The positive regression coefficients of
independent variable indicate a positive relationship with the dependent variable and
negative regression coefficients show a negative association between the dependent and
independent variables.
The analysis given in table 5 indicates that various rating attributes including credit
rating is the expression of safety, it saves time and energy of investors, it helps the investors
in decision making, the rating agencies rate the instruments according to their actual worth
and the revision of rating by the rating agencies has positive impact on the satisfaction level
of the investors. Whereas the attributes which negatively affect the satisfaction level of
investors include: selection of long term portfolio by the investors and involvement of rating
agencies in research. All other variables have turned out to be insignificant.
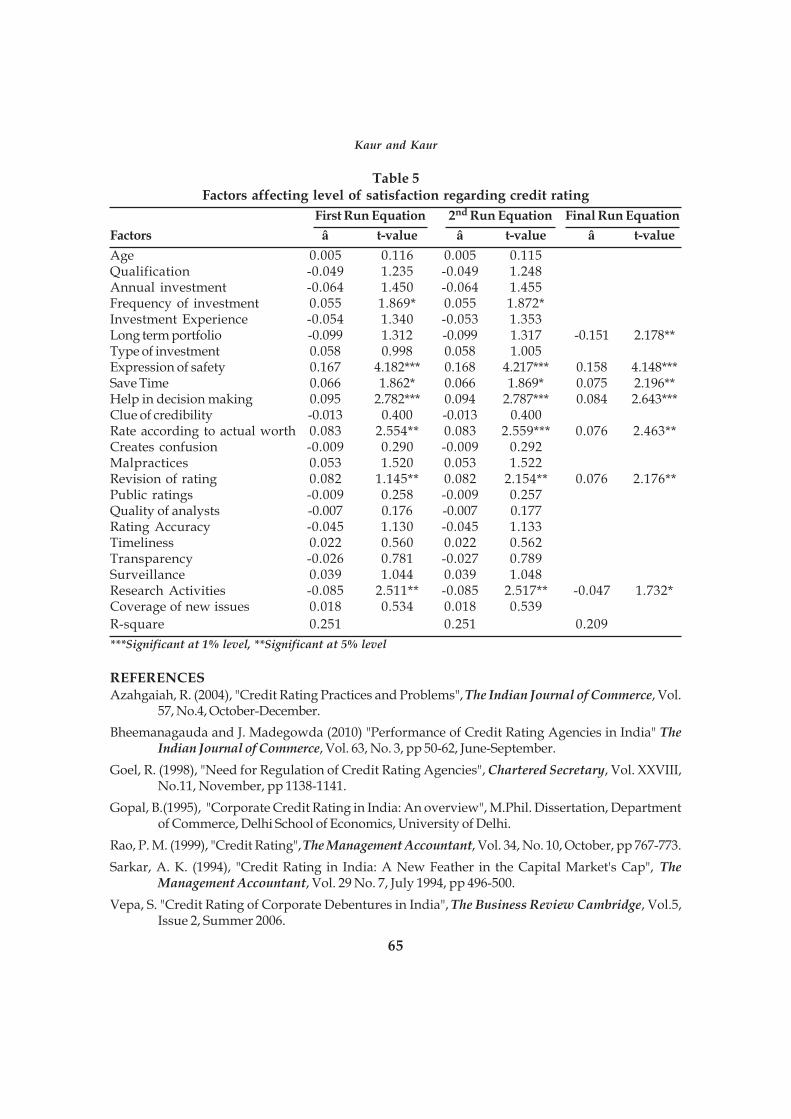
65
Table 5Factors affecting level of satisfaction regarding credit rating
First Run Equation 2nd Run Equation Final Run Equation
Factors â t-value â t-value â t-value
Age 0.005 0.116 0.005 0.115Qualification -0.049 1.235 -0.049 1.248Annual investment -0.064 1.450 -0.064 1.455Frequency of investment 0.055 1.869* 0.055 1.872*Investment Experience -0.054 1.340 -0.053 1.353Long term portfolio -0.099 1.312 -0.099 1.317 -0.151 2.178**Type of investment 0.058 0.998 0.058 1.005Expression of safety 0.167 4.182*** 0.168 4.217*** 0.158 4.148***Save Time 0.066 1.862* 0.066 1.869* 0.075 2.196**Help in decision making 0.095 2.782*** 0.094 2.787*** 0.084 2.643***Clue of credibility -0.013 0.400 -0.013 0.400Rate according to actual worth 0.083 2.554** 0.083 2.559*** 0.076 2.463**Creates confusion -0.009 0.290 -0.009 0.292Malpractices 0.053 1.520 0.053 1.522Revision of rating 0.082 1.145** 0.082 2.154** 0.076 2.176**Public ratings -0.009 0.258 -0.009 0.257Quality of analysts -0.007 0.176 -0.007 0.177Rating Accuracy -0.045 1.130 -0.045 1.133Timeliness 0.022 0.560 0.022 0.562Transparency -0.026 0.781 -0.027 0.789Surveillance 0.039 1.044 0.039 1.048Research Activities -0.085 2.511** -0.085 2.517** -0.047 1.732*Coverage of new issues 0.018 0.534 0.018 0.539
R-square 0.251 0.251 0.209
***Significant at 1% level, **Significant at 5% level
REFERENCESAzahgaiah, R. (2004), "Credit Rating Practices and Problems", The Indian Journal of Commerce, Vol.
57, No.4, October-December.
Bheemanagauda and J. Madegowda (2010) "Performance of Credit Rating Agencies in India" TheIndian Journal of Commerce, Vol. 63, No. 3, pp 50-62, June-September.
Goel, R. (1998), "Need for Regulation of Credit Rating Agencies", Chartered Secretary, Vol. XXVIII,No.11, November, pp 1138-1141.
Gopal, B.(1995), "Corporate Credit Rating in India: An overview", M.Phil. Dissertation, Departmentof Commerce, Delhi School of Economics, University of Delhi.
Rao, P. M. (1999), "Credit Rating", The Management Accountant, Vol. 34, No. 10, October, pp 767-773.
Sarkar, A. K. (1994), "Credit Rating in India: A New Feather in the Capital Market's Cap", TheManagement Accountant, Vol. 29 No. 7, July 1994, pp 496-500.
Vepa, S. "Credit Rating of Corporate Debentures in India", The Business Review Cambridge, Vol.5,Issue 2, Summer 2006.
Kaur and Kaur
66
Indian Journal of Accounting
Indian Journal of Accounting
Vol. XLI (1) December 2010, pp. 66-71
IMPACT OF GST ON CONSUMERS
*V. Usha Kiran
***M.V. Karunasri
ABSTRACTThis paper highlights the impact of the proposed major change in the indirect taxation in India
i.e. introduction of Goods and Service Tax. A dual tax system (Central GST and State GST) will beestablished in India which aims to be economically efficient, simple to administer and neutral in itsapplication. An attempt is made in this paper to bring out consumption patterns of consumers, theirawareness levels on consumption tax payments and impact of proposed GST on prices and budgets.
Since the introduction of GST involves restructuring of Central as well as State taxes,
the process calls for an extensive process of consultation between the Centre and the States.
A well designed destination-based GST is the most elegant method of eliminating distortions
and taxing consumption as all different stages of production and distribution can be
interpreted as a mere tax pass through; and the tax essentially 'sticks' on final consumption
within the taxing jurisdiction. (The Economic Times, 26 February 2009). Successful
implementation of the GST can give a trillion-dollar boost to the economy, taking the total
output to $2 trillion in a short span of time. The gain from GST will propel the country from
one-trillion dollar economy to two trillion-dollar economy in a short span of time. The
strength of the GST lies in avoiding the continuous levying of taxes from producer to
consumer. If the producers and distributors are refunded the taxes paid on inputs, service
providers, they will see a significant dip in costs. Also, the supply chain structures will
become more efficient. Consumers stand to gain if these cost benefits for producers translate
into lower prices (The Economic Times, 22 July 2010). Historically, economies which embraced
the GST have seen a rise in tax revenues- this incremental tax revenue is coughed up essentially
by the consumer.
This study is empirical in nature and is attempted with an aim to explain the major
change in the indirect taxation in India i.e. introduction of GST. It also studies the awareness
levels of consumers on taxes with reference to goods, services and others. It brings out the
consumption patterns and impact of GST on prices.
*Associate Professor and Head, Department of Commerce, Osmania University College for Women, Koti,Hyderabad.**Faculty, Department of Commerce, Osmania University College for Women, Koti, Hyderabad
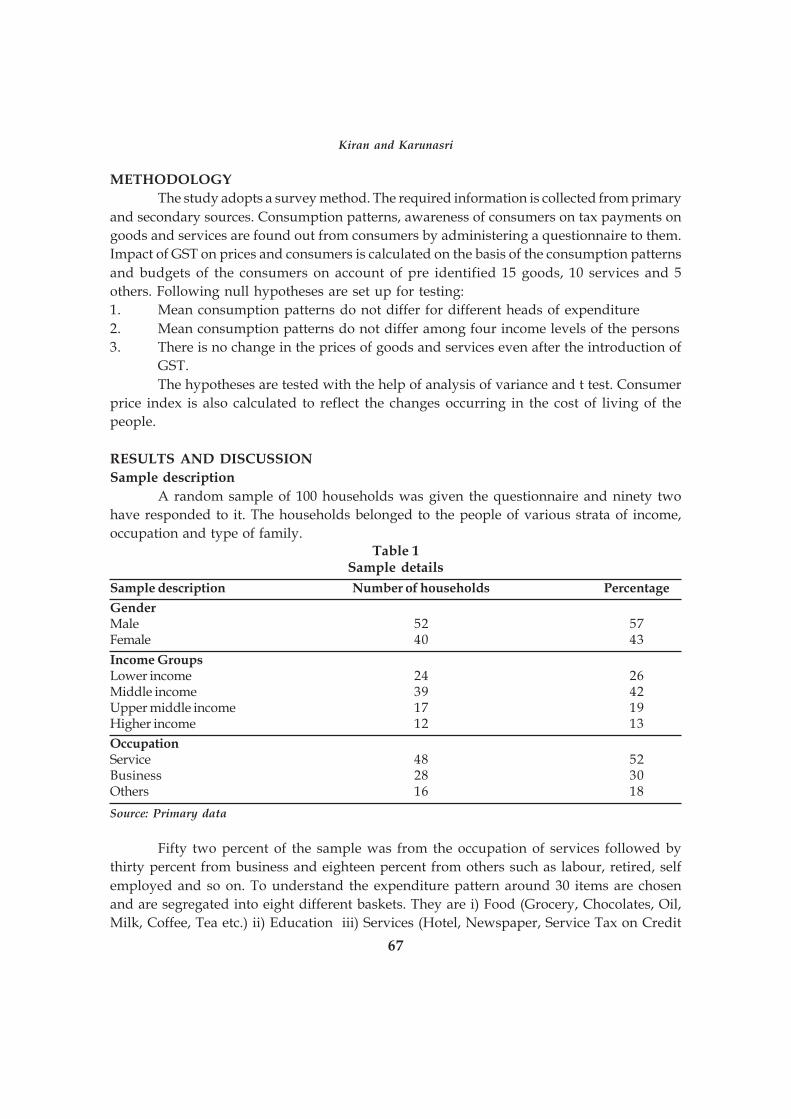
67
METHODOLOGY
The study adopts a survey method. The required information is collected from primary
and secondary sources. Consumption patterns, awareness of consumers on tax payments on
goods and services are found out from consumers by administering a questionnaire to them.
Impact of GST on prices and consumers is calculated on the basis of the consumption patterns
and budgets of the consumers on account of pre identified 15 goods, 10 services and 5
others. Following null hypotheses are set up for testing:
1. Mean consumption patterns do not differ for different heads of expenditure
2. Mean consumption patterns do not differ among four income levels of the persons
3. There is no change in the prices of goods and services even after the introduction of
GST.
The hypotheses are tested with the help of analysis of variance and t test. Consumer
price index is also calculated to reflect the changes occurring in the cost of living of the
people.
RESULTS AND DISCUSSION
Sample description
A random sample of 100 households was given the questionnaire and ninety two
have responded to it. The households belonged to the people of various strata of income,
occupation and type of family.Table 1
Sample details
Sample description Number of households Percentage
GenderMale 52 57Female 40 43
Income GroupsLower income 24 26Middle income 39 42Upper middle income 17 19Higher income 12 13
OccupationService 48 52Business 28 30Others 16 18
Source: Primary data
Fifty two percent of the sample was from the occupation of services followed by
thirty percent from business and eighteen percent from others such as labour, retired, self
employed and so on. To understand the expenditure pattern around 30 items are chosen
and are segregated into eight different baskets. They are i) Food (Grocery, Chocolates, Oil,
Milk, Coffee, Tea etc.) ii) Education iii) Services (Hotel, Newspaper, Service Tax on Credit
Kiran and Karunasri
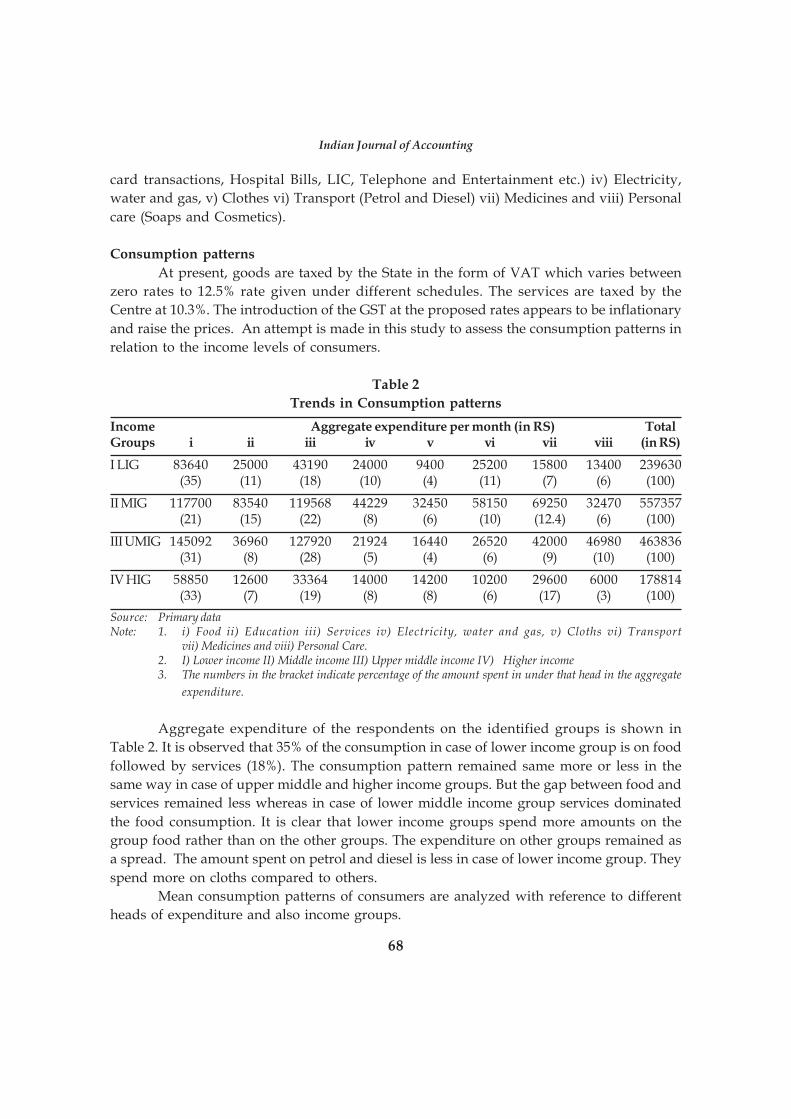
68
Indian Journal of Accounting
card transactions, Hospital Bills, LIC, Telephone and Entertainment etc.) iv) Electricity,
water and gas, v) Clothes vi) Transport (Petrol and Diesel) vii) Medicines and viii) Personal
care (Soaps and Cosmetics).
Consumption patterns
At present, goods are taxed by the State in the form of VAT which varies between
zero rates to 12.5% rate given under different schedules. The services are taxed by the
Centre at 10.3%. The introduction of the GST at the proposed rates appears to be inflationary
and raise the prices. An attempt is made in this study to assess the consumption patterns in
relation to the income levels of consumers.
Table 2
Trends in Consumption patterns
Income Aggregate expenditure per month (in RS) TotalGroups i ii iii iv v vi vii viii (in RS)
I LIG 83640 25000 43190 24000 9400 25200 15800 13400 239630(35) (11) (18) (10) (4) (11) (7) (6) (100)
II MIG 117700 83540 119568 44229 32450 58150 69250 32470 557357(21) (15) (22) (8) (6) (10) (12.4) (6) (100)
III UMIG 145092 36960 127920 21924 16440 26520 42000 46980 463836(31) (8) (28) (5) (4) (6) (9) (10) (100)
IV HIG 58850 12600 33364 14000 14200 10200 29600 6000 178814(33) (7) (19) (8) (8) (6) (17) (3) (100)
Source: Primary dataNote: 1. i) Food ii) Education iii) Services iv) Electricity, water and gas, v) Cloths vi) Transport
vii) Medicines and viii) Personal Care.2. I) Lower income II) Middle income III) Upper middle income IV) Higher income3. The numbers in the bracket indicate percentage of the amount spent in under that head in the aggregate
expenditure.
Aggregate expenditure of the respondents on the identified groups is shown in
Table 2. It is observed that 35% of the consumption in case of lower income group is on food
followed by services (18%). The consumption pattern remained same more or less in the
same way in case of upper middle and higher income groups. But the gap between food and
services remained less whereas in case of lower middle income group services dominated
the food consumption. It is clear that lower income groups spend more amounts on the
group food rather than on the other groups. The expenditure on other groups remained as
a spread. The amount spent on petrol and diesel is less in case of lower income group. They
spend more on cloths compared to others.
Mean consumption patterns of consumers are analyzed with reference to different
heads of expenditure and also income groups.
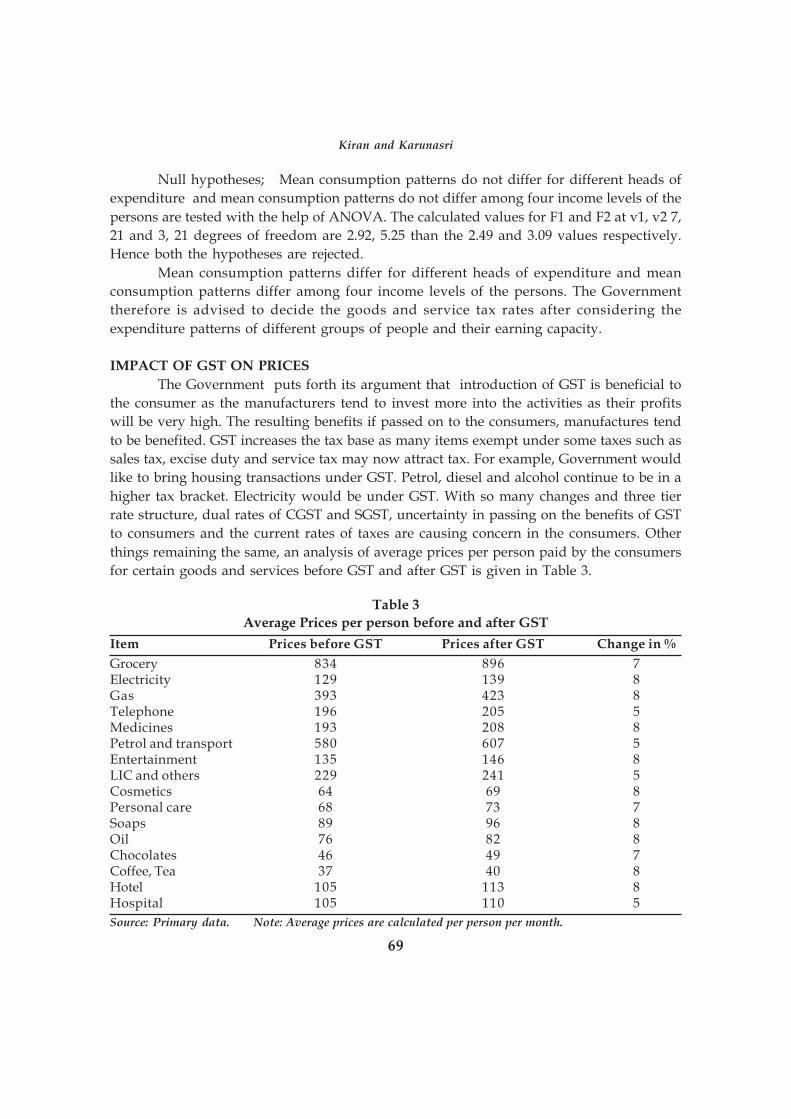
69
Null hypotheses; Mean consumption patterns do not differ for different heads of
expenditure and mean consumption patterns do not differ among four income levels of the
persons are tested with the help of ANOVA. The calculated values for F1 and F2 at v1, v2 7,
21 and 3, 21 degrees of freedom are 2.92, 5.25 than the 2.49 and 3.09 values respectively.
Hence both the hypotheses are rejected.
Mean consumption patterns differ for different heads of expenditure and mean
consumption patterns differ among four income levels of the persons. The Government
therefore is advised to decide the goods and service tax rates after considering the
expenditure patterns of different groups of people and their earning capacity.
IMPACT OF GST ON PRICES
The Government puts forth its argument that introduction of GST is beneficial to
the consumer as the manufacturers tend to invest more into the activities as their profits
will be very high. The resulting benefits if passed on to the consumers, manufactures tend
to be benefited. GST increases the tax base as many items exempt under some taxes such as
sales tax, excise duty and service tax may now attract tax. For example, Government would
like to bring housing transactions under GST. Petrol, diesel and alcohol continue to be in a
higher tax bracket. Electricity would be under GST. With so many changes and three tier
rate structure, dual rates of CGST and SGST, uncertainty in passing on the benefits of GST
to consumers and the current rates of taxes are causing concern in the consumers. Other
things remaining the same, an analysis of average prices per person paid by the consumers
for certain goods and services before GST and after GST is given in Table 3.
Table 3
Average Prices per person before and after GST
Item Prices before GST Prices after GST Change in %
Grocery 834 896 7Electricity 129 139 8Gas 393 423 8Telephone 196 205 5Medicines 193 208 8Petrol and transport 580 607 5Entertainment 135 146 8LIC and others 229 241 5Cosmetics 64 69 8Personal care 68 73 7Soaps 89 96 8Oil 76 82 8Chocolates 46 49 7Coffee, Tea 37 40 8Hotel 105 113 8Hospital 105 110 5
Source: Primary data. Note: Average prices are calculated per person per month.
Kiran and Karunasri
70
Indian Journal of Accounting
A null hypothesis is set to test that there is no difference in prices before and after
GST. The calculated value of t is 3.7 and the table value of t 0.05 for v 15 is 2.13. Since the
calculated value is higher than the table value, the null hypothesis is rejected. The prices
have increased after the GST. However the conclusion holds well only on the assumption
that the cascading effect has been taken care while adjusting for VAT. The Government can
realize its dream only when the benefits accruing to the manufacturers are strictly passed
on to the consumers. The administrative mechanism should work properly to implement
the dispensation of GST in supply chain. It should borrow the experiences of other countries
in implementation of GST.
INTERNATIONAL EXPERIENCE IN IMPLEMENTATION OF GST
The rates of GST adopted in various countries are differing. These rates are normally
fixed up taking in to account the existing sales tax, excise duty, VAT etc. Singapore and
Thailand have adopted 7%, Indonesia, Australia and USA taxing on their consumers at 10%
and New Zealand at 12.5%.
EXPERIENCE OF NEW ZEALAND
New Zealand experience is a good lesson in consumer fear of the GST creating bad
spending decisions. When the GST was first introduced in that country, a lot of people were
under the impression that all prices were going to go up by 10%. As a result, many consumers
made large purchases, particularly on items such as fridges, washing machines and other
electronic items. However the introduction of the GST actually led to a reduction in the
prices of these goods leaving some consumers up to a few hundred dollars out of pocket.
AUSTRALIAN INITIATIVE
The Australian Government has taken some initiatives while introducing GST. Penalty
was prescribed for price exploitation or misleading and deceptive conduct. The Government
also conducted nationwide consumer awareness campaign on how GST would affect prices.
Another school of thought proposed that the Government should not seek to dictate or
regulate price and that entities should be allowed to make pricing decisions based on market
demand and supply equilibrium.
INDIAN EXPERIENCE
While introducing VAT the governments have faced severe criticism from the public
and industry. The prices of some commodities came down but in case of a few they increased.
The Government should remember that the prices of items that are currently sales tax exempt
could increase; the price of goods that are currently subject to sales tax may drop depending
on the extent of reduction in retail mark up and passing of the benefits to consumers. The
price of services may increase by some percentage as the proposed GST rates are higher
than the current rates of service taxes.
71
CONCLUSION
The GST is no doubt a major structural reform from the point of view of all the stake
holders. However the Government could not include the consumers in the consultation
process. Its failure to notify the exact time of the commencement of GST and non release of
the list of goods and services and their applicable rates caused confusion in the minds of the
consumers. There is no initiative from the Government on educating the consumers in this
regard. The Government and the industries are very silent about the passing of benefits of
this reform in the supply chain to the consumers. The impact of GST always depends upon
the actual out come of the market forces and the extent to which selling can influence the
prices.
REFERENCES1. APVAT Act and Rules, Asia Law House.
2. Balachandran, Indirect Taxation, Sultan Chand Publishers, New Delhi.
3. Dr.V. UshaKiran and Ms.M.V. Karunasree, Structural Changes in Indirect Taxes - VAT vsGST, ANU Journal of Commerce and Management , V.No 1, June 2009, Acharya NagarjunaUniversity, Guntur.
4. Vijay Kelkar, Chairman, Finance Commission , Report on GST, National Conference on "GSTfor Accelerated Economic Growth and Competitiveness"- 29th June 2009.
5. V.P. Gaur & Narang, Taxation, Kalyani Publishers, Hyderabad.
6. The Economic Times, 11th Feb 2009, 23rd Feb 2009, 26thFeb 2009, 16th June 2009, 18th June2009 , 23rd June 2009, 29th June 2009, 9th July 2009, 4th Sept 2009, 22 July 2010.
7. The Hindu Business Lines, 15th July 2006.
8. GST Reforms - various files from Websites.
Kiran and Karunasri
72
Indian Journal of Accounting
Indian Journal of Accounting
Vol. XLI (1) December 2010, pp. 72-77
AN EVALUATION OF SOCIAL ACCOUNTINGDISCLOSURE IN CORPORATEANNUAL REPORTS IN INDIA
*Rechanna
**B. Mahadevappa
ABSTRACTThis paper aims to examine the extent of social accounting disclosure in corporate annual
reports in India and to ascertain the differences, if any, between social accounting disclosurepractices by public sector and private sector companies. A sample of ten listed companies ofNIFTY index of National Stock Exchange was chosen and they were stratified into public andprivate. An Index of Social Accounting Disclosure was constructed for data collection throughcontent analysis from the annual reports. The results of the study revealed that social accountinginformation were disclosed in company's annual reports, web sites, chairman's speech, notes toaccounts, schedule to accounts and auditors report. The extent of corporate social accountingdisclosure in annual reports of public sector companies was better than private sector companiesin India. The National Association of Accountants (NAA) committee on 'Accounting for CorporateSocial Performance' (1974) has designed a four-pronged social reporting system. The four areasidentified are: Community development; Physical Resources and Environmental contribution;Human resource development and Product or Service contribution.
OBJECTIVES OF THE STUDY
This study aims to:
(i) examine the extent of social accounting disclosure in corporate annual reports in
India, and
(ii) ascertain the differences, if any, between social accounting disclosures practices by
public sector and private sector companies.
HYPOTHESIS OF THE STUDY
The following hypothesis was formulated and tested in this study:
H0 : The extent of social accounting disclosure in public sector companies is same as
that of private sector companies in India.
H1 : The extent of social accounting disclosure in public sector companies is better than
private sector companies in India.
*Research Scholar, Department of Studies in Commerce University of Mysore, Mysore.**Associate Professor, Department of Studies in Commerce University of Mysore, Mysore.
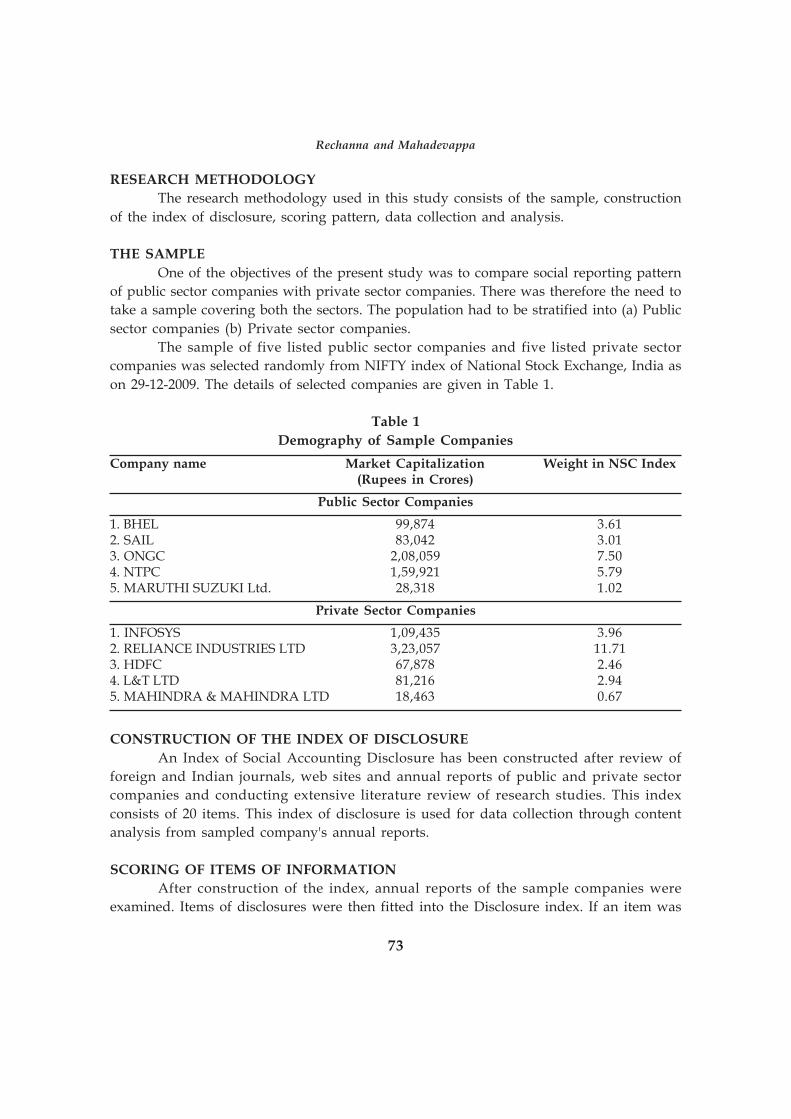
73
RESEARCH METHODOLOGY
The research methodology used in this study consists of the sample, construction
of the index of disclosure, scoring pattern, data collection and analysis.
THE SAMPLE
One of the objectives of the present study was to compare social reporting pattern
of public sector companies with private sector companies. There was therefore the need to
take a sample covering both the sectors. The population had to be stratified into (a) Public
sector companies (b) Private sector companies.
The sample of five listed public sector companies and five listed private sector
companies was selected randomly from NIFTY index of National Stock Exchange, India as
on 29-12-2009. The details of selected companies are given in Table 1.
Table 1
Demography of Sample Companies
Company name Market Capitalization Weight in NSC Index(Rupees in Crores)
Public Sector Companies
1. BHEL 99,874 3.612. SAIL 83,042 3.013. ONGC 2,08,059 7.504. NTPC 1,59,921 5.795. MARUTHI SUZUKI Ltd. 28,318 1.02
Private Sector Companies
1. INFOSYS 1,09,435 3.962. RELIANCE INDUSTRIES LTD 3,23,057 11.713. HDFC 67,878 2.464. L&T LTD 81,216 2.945. MAHINDRA & MAHINDRA LTD 18,463 0.67
CONSTRUCTION OF THE INDEX OF DISCLOSURE
An Index of Social Accounting Disclosure has been constructed after review of
foreign and Indian journals, web sites and annual reports of public and private sector
companies and conducting extensive literature review of research studies. This index
consists of 20 items. This index of disclosure is used for data collection through content
analysis from sampled company's annual reports.
SCORING OF ITEMS OF INFORMATION
After construction of the index, annual reports of the sample companies were
examined. Items of disclosures were then fitted into the Disclosure index. If an item was
Rechanna and Mahadevappa
74
Indian Journal of Accounting
disclosed, anywhere in the annual report, the item was assigned score 1 and in the case of
non-disclosure, score 0 was given. The score for each annual report was then summed up,
representing the score of the company.
DATA COLLECTION AND ANALYSIS
The secondary data on social accounting disclosure has been collected through
annual reports. Descriptive and inferential studies were used to analyse the data. The
results of the study include enumerated information about disclosure of items of social
accounting and comparison between public sector and private sector organizations.
RESULTS AND DISCUSSION
Results of disclosure of Social Accounting Information by type of item stratified
into Public Sector and Private Sector are presented in Table 2 and 3. Public Sector companies
have disclosed more social accounting information items in their annual reports than private
sector companies. 85 items were disclosed by Pubic Sector companies while only 53 items
were disclosed by Private Sector companies. Overall, 138 items were disclosed by both
Public Sector and Private Sector companies. Social Accounting Information Disclosure level
among all Public Sector companies is equal to and more than 75 per cent while that of
Private Sector companies is equal to and less than 70 per cent as shown in Table 3.
Social Accounting Disclosure Gap is presented in Table 4. Gap is the difference
between Expected Disclosure Score and Actual Disclosure Score. Gap is less in case of
Public Sector (15 per cent) while it is more in case of Private Sector (47 per cent). Overall,
the Gap is 69 per cent.
The results of the t-test reveals that there is a statistically significant difference in
the extent of Social Accounting Disclosure in Public Sector Companies and Private Sector
Companies. As the p-value associated with the t-value is statistically significant at < 0.05,
so that research hypothesis is accepted and null hypothesis is rejected. The study concludes
that the extent of social accounting disclosure in public sector companies is better than
private sector companies in India.
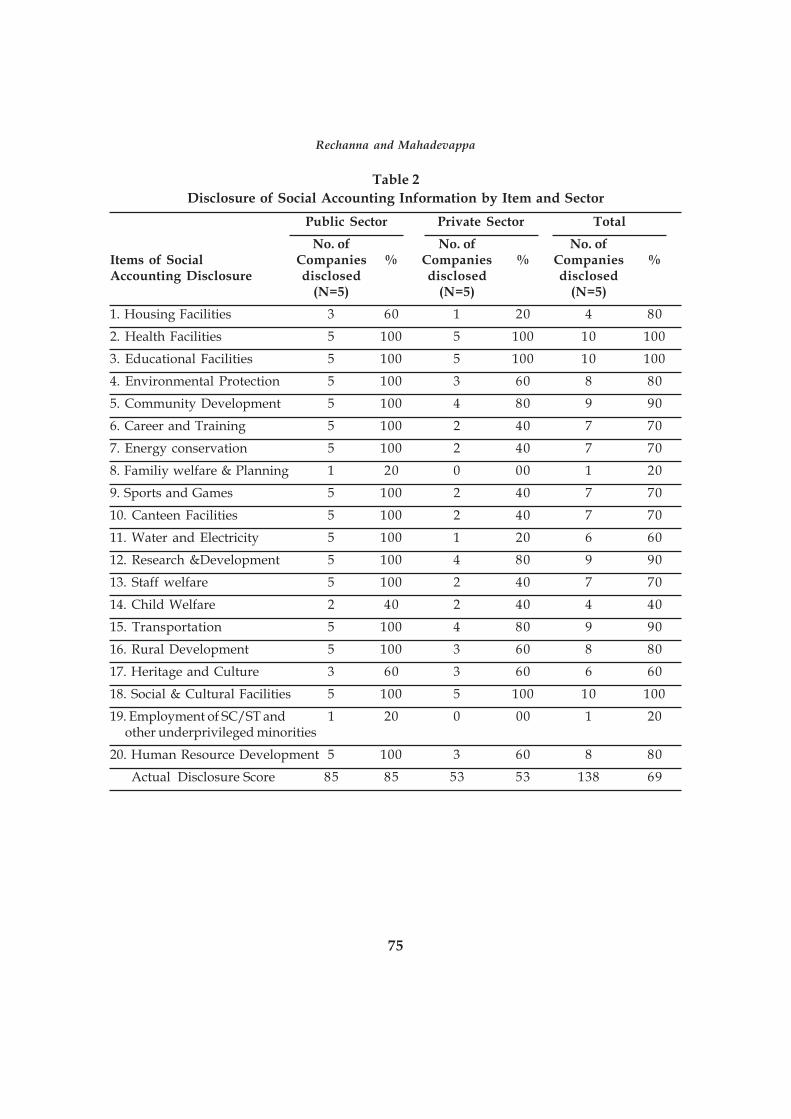
75
Table 2
Disclosure of Social Accounting Information by Item and Sector
Public Sector Private Sector Total
No. of No. of No. ofItems of Social Companies % Companies % Companies %Accounting Disclosure disclosed disclosed disclosed
(N=5) (N=5) (N=5)
1. Housing Facilities 3 60 1 20 4 80
2. Health Facilities 5 100 5 100 10 100
3. Educational Facilities 5 100 5 100 10 100
4. Environmental Protection 5 100 3 60 8 80
5. Community Development 5 100 4 80 9 90
6. Career and Training 5 100 2 40 7 70
7. Energy conservation 5 100 2 40 7 70
8. Familiy welfare & Planning 1 20 0 00 1 20
9. Sports and Games 5 100 2 40 7 70
10. Canteen Facilities 5 100 2 40 7 70
11. Water and Electricity 5 100 1 20 6 60
12. Research &Development 5 100 4 80 9 90
13. Staff welfare 5 100 2 40 7 70
14. Child Welfare 2 40 2 40 4 40
15. Transportation 5 100 4 80 9 90
16. Rural Development 5 100 3 60 8 80
17. Heritage and Culture 3 60 3 60 6 60
18. Social & Cultural Facilities 5 100 5 100 10 100
19. Employment of SC/ST and 1 20 0 00 1 20 other underprivileged minorities
20. Human Resource Development 5 100 3 60 8 80
Actual Disclosure Score 85 85 53 53 138 69
Rechanna and Mahadevappa
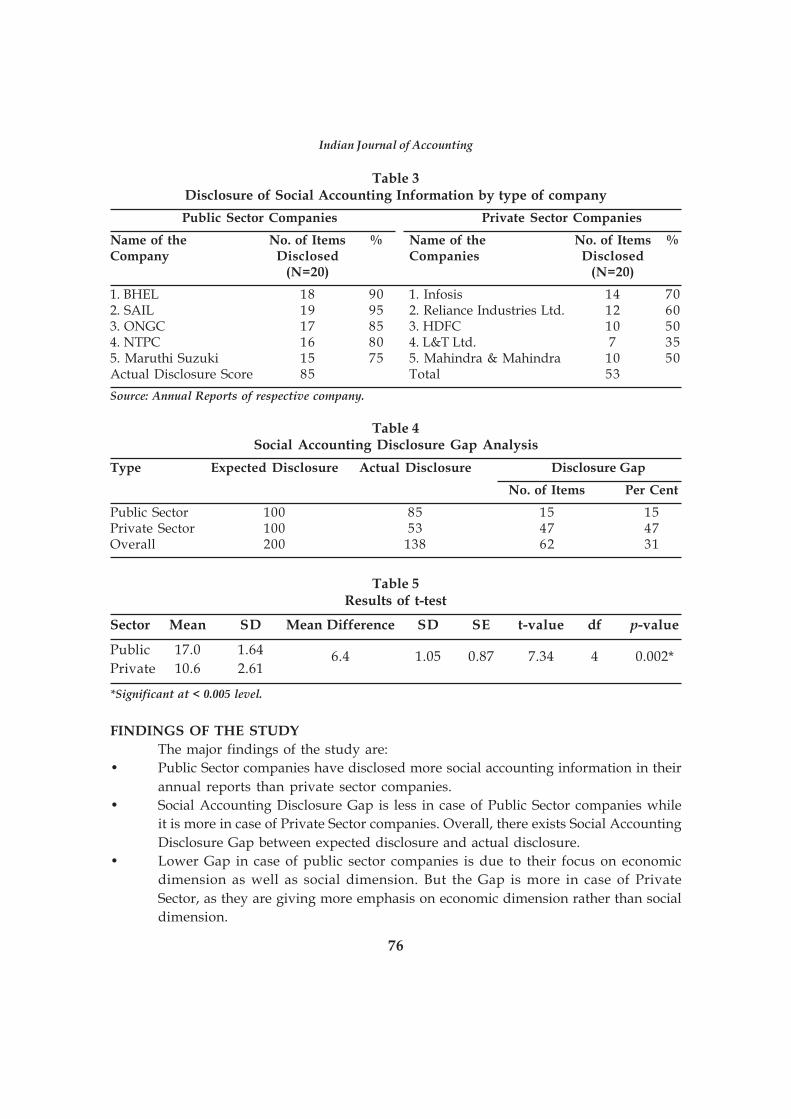
76
Indian Journal of Accounting
Table 3Disclosure of Social Accounting Information by type of company
Public Sector Companies Private Sector Companies
Name of the No. of Items % Name of the No. of Items %Company Disclosed Companies Disclosed
(N=20) (N=20)
1. BHEL 18 90 1. Infosis 14 702. SAIL 19 95 2. Reliance Industries Ltd. 12 603. ONGC 17 85 3. HDFC 10 504. NTPC 16 80 4. L&T Ltd. 7 355. Maruthi Suzuki 15 75 5. Mahindra & Mahindra 10 50Actual Disclosure Score 85 Total 53
Source: Annual Reports of respective company.
Table 4Social Accounting Disclosure Gap Analysis
Type Expected Disclosure Actual Disclosure Disclosure Gap
No. of Items Per Cent
Public Sector 100 85 15 15Private Sector 100 53 47 47Overall 200 138 62 31
Table 5Results of t-test
Sector Mean SD Mean Difference SD SE t-value df p-value
Public 17.0 1.64 6.4 1.05 0.87 7.34 4 0.002*Private 10.6 2.61
*Significant at < 0.005 level.
FINDINGS OF THE STUDY
The major findings of the study are:
• Public Sector companies have disclosed more social accounting information in their
annual reports than private sector companies.
• Social Accounting Disclosure Gap is less in case of Public Sector companies while
it is more in case of Private Sector companies. Overall, there exists Social Accounting
Disclosure Gap between expected disclosure and actual disclosure.
• Lower Gap in case of public sector companies is due to their focus on economic
dimension as well as social dimension. But the Gap is more in case of Private
Sector, as they are giving more emphasis on economic dimension rather than social
dimension.
77
• Public sector companies are complying with full disclosure in eighteen items while
in only two items the study found partial disclosure.
• Private sector companies are complying with full disclosure in only three items while
in the remaining seventeen items they are disclosing partially.
• The results of t-test supports the hypothesis formulated in this study that the
extent of social accounting disclosure in public sector companies is better than
private sector companies in India.
RECOMMENDATIONS OF THE STUDY
• Private sector companies are required to discharge more of their corporate social
responsibilities by undertaking activities listed in this study.
• Private sector companies are required to disclose social accounting information in
their annual reports.
• Public sector companies can also improve their social accounting disclosure level by
reducing their disclosure gap.
REFERENCES
Canadian Democracy and Accountability Commission, (2001) An Overview of Issues: ExecutiveSummary. Retrieved April 17, 2001 from the world-wide=web at: www.corporateaccountability.ca.
Epstein. M., Flamholtz.E., & McDonough.J.J (1976). Corporate Social Accounting in the United statesof America: State of the art and future prospects. Accounting Organization and Society. 1.23-42.
Gildea. R.L.(1994) Consumer survey confirms corporate action affects buying decisions. PublicRelations Quarterly. 39. April. 20-22.
National Association of Accountants. (1974). Report to the committee on accounting for corporatesocial performance. Management Accounting, 55(1). 39-41.
Prahalad. M.C. & Hamel.G.(1994). Strtategy as a field of study: Why search for a new paradigm?Strategic Management Journal. 15. 1-16.
Sachar Committee, (1978), 'Social Responsibility of Companies" Chapter XII Sachar Committee Reporton MRTP, pp.114-119.
S&P CNX Nifty from Wikipedia, the free encyclopedia- Official Homepage (http://www.nse-india.com/content/indices/ind_nifty.htm).
Annual Reports of Sampled companies.
Rechanna and Mahadevappa
78
Indian Journal of Accounting
Indian Journal of Accounting
Vol. XLI (1) December 2010, pp. 78-83
CORPORATE GOVERNANCE PRACTICES OFNON GOVERNMENTAL ORGANIZATIONS IN
WEST BENGAL: AN EVALUATION
*Bhaskar Bagchi
**Dhrubaranjan Dandapat
ABSTRACTThe trustworthiness of an organization can be improved by adherence to the principles
and practices of good corporate governance. The Non Governmental Organization (NGO) sectoris now being viewed as a candidate for the same type of governance standards as the privateprofit-seeking sector. In a highly competitive, globalized and digitized operating environmentcharacterized by reduced donor flight and a myriad of questions by government and otherstakeholders on accountability, transparency, value addition, legitimacy and overall credibilityof NGOs, good corporate governance has emerged not only as a tool to enhance professionalism,but more importantly, to ensure that NGO interventions are effective, sustainable, efficient andpositively perceived by all stakeholders including governments, target communities and donors.For NGOs to deliver services effectively, the importance of good governance needs to beemphasized. In expanding on these themes, this paper scrutinizes how good governance practicesare being followed by the NGOs operating in the selected districts of West Bengal and offersome ideas for improvement of NGO governance.
INTRODUCTION
Indian NGOs vary enormously in their approach and orientation, in their size and
location of operation, in their physical, financial, and technical resources, in the scale of
their interventions and in the degree of support they receive from government, and, last
but by no means the least, in the socio-political context in which their interventions are
located (Green and Matthias, 1997). They range from small localized NGOs working in a
handful of villages in a single locality, to large NGOs working at a regional or national
level, for the most part with funds from external sources. In addition to these local NGOs,
there are also large international NGOs (often working with local representation) providing
funding and support to indigenous NGOs (ibid).
The main objective of this paper is to:
• examine empirically how far the NGOs have adopted good governance principles in
the selected districts of West Bengal; and
*Assistant Professor, Department of Commerce, Alipurduar College, P.O. Alipurduar Court, Dist. Jalpaiguri**Professor, Department of Commerce, University of Calcutta, 87/1, College Street, Kolkata - 700 073 (W.B.)
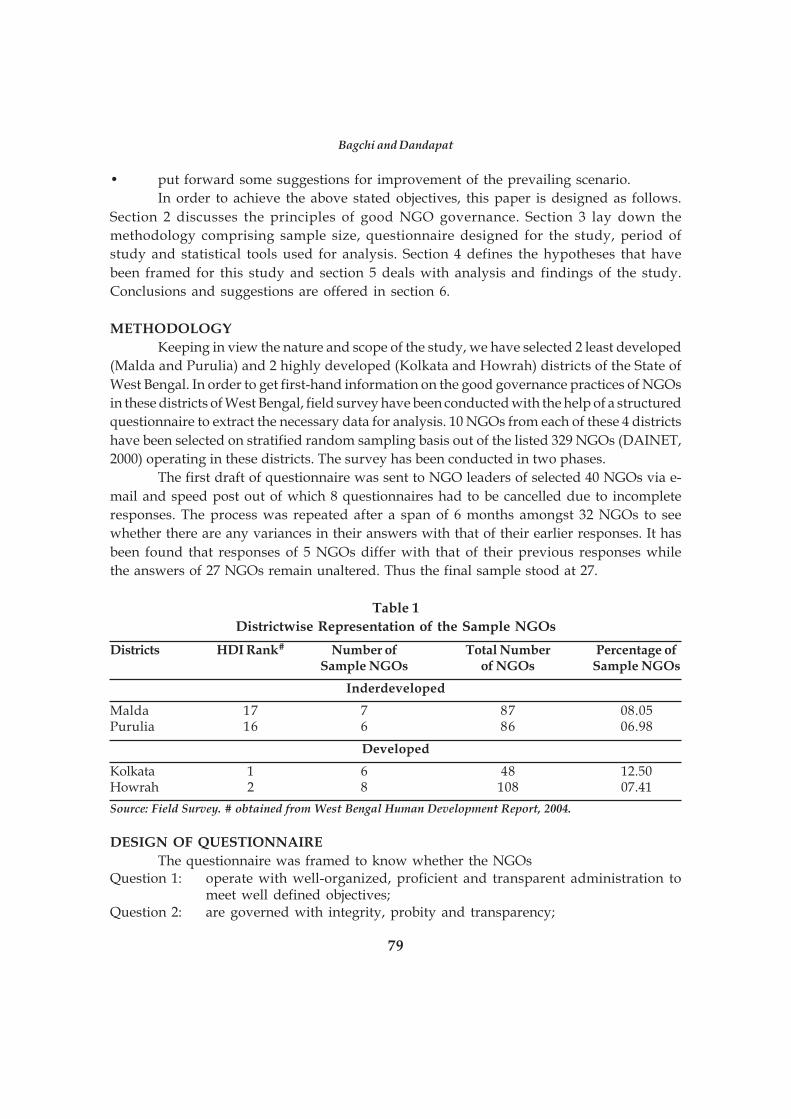
79
• put forward some suggestions for improvement of the prevailing scenario.
In order to achieve the above stated objectives, this paper is designed as follows.
Section 2 discusses the principles of good NGO governance. Section 3 lay down the
methodology comprising sample size, questionnaire designed for the study, period of
study and statistical tools used for analysis. Section 4 defines the hypotheses that have
been framed for this study and section 5 deals with analysis and findings of the study.
Conclusions and suggestions are offered in section 6.
METHODOLOGY
Keeping in view the nature and scope of the study, we have selected 2 least developed
(Malda and Purulia) and 2 highly developed (Kolkata and Howrah) districts of the State of
West Bengal. In order to get first-hand information on the good governance practices of NGOs
in these districts of West Bengal, field survey have been conducted with the help of a structured
questionnaire to extract the necessary data for analysis. 10 NGOs from each of these 4 districts
have been selected on stratified random sampling basis out of the listed 329 NGOs (DAINET,
2000) operating in these districts. The survey has been conducted in two phases.
The first draft of questionnaire was sent to NGO leaders of selected 40 NGOs via e-
mail and speed post out of which 8 questionnaires had to be cancelled due to incomplete
responses. The process was repeated after a span of 6 months amongst 32 NGOs to see
whether there are any variances in their answers with that of their earlier responses. It has
been found that responses of 5 NGOs differ with that of their previous responses while
the answers of 27 NGOs remain unaltered. Thus the final sample stood at 27.
Table 1
Districtwise Representation of the Sample NGOs
Districts HDI Rank# Number of Total Number Percentage ofSample NGOs of NGOs Sample NGOs
Inderdeveloped
Malda 17 7 87 08.05Purulia 16 6 86 06.98
Developed
Kolkata 1 6 48 12.50Howrah 2 8 108 07.41
Source: Field Survey. # obtained from West Bengal Human Development Report, 2004.
DESIGN OF QUESTIONNAIRE
The questionnaire was framed to know whether the NGOsQuestion 1: operate with well-organized, proficient and transparent administration to
meet well defined objectives;Question 2: are governed with integrity, probity and transparency;
Bagchi and Dandapat
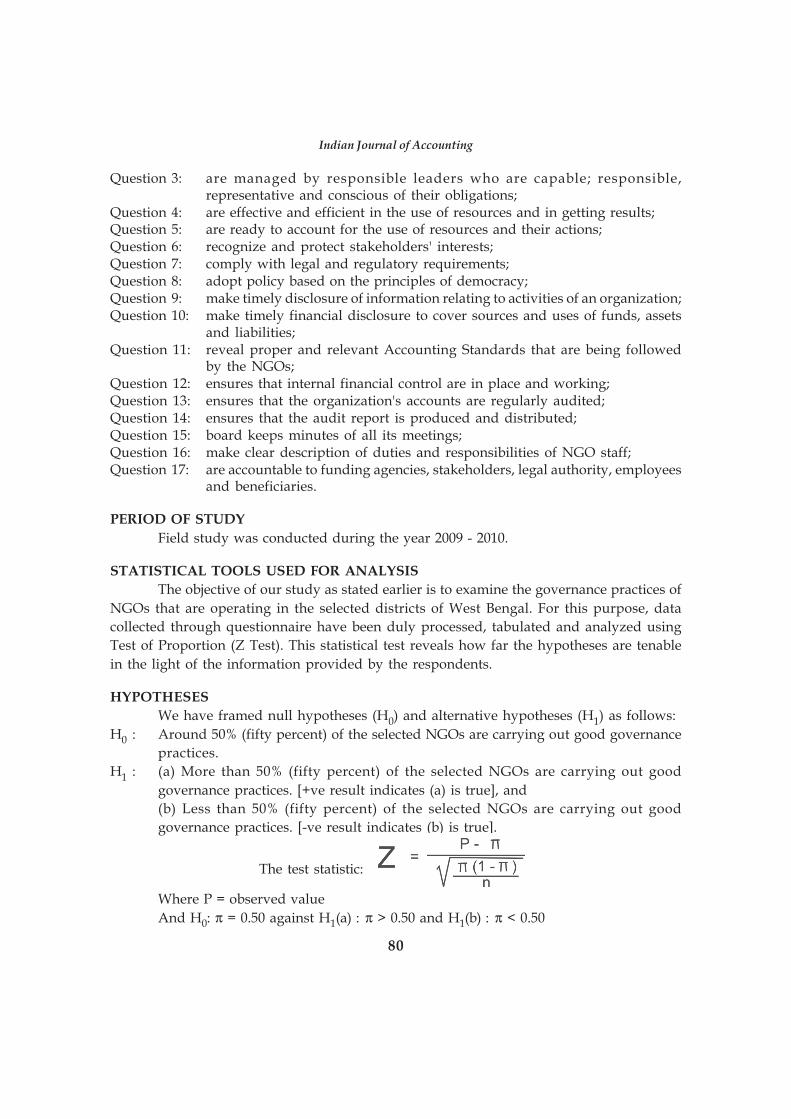
80
Indian Journal of Accounting
Question 3: are managed by responsible leaders who are capable; responsible,representative and conscious of their obligations;
Question 4: are effective and efficient in the use of resources and in getting results;Question 5: are ready to account for the use of resources and their actions;Question 6: recognize and protect stakeholders' interests;Question 7: comply with legal and regulatory requirements;Question 8: adopt policy based on the principles of democracy;Question 9: make timely disclosure of information relating to activities of an organization;Question 10: make timely financial disclosure to cover sources and uses of funds, assets
and liabilities;Question 11: reveal proper and relevant Accounting Standards that are being followed
by the NGOs;Question 12: ensures that internal financial control are in place and working;Question 13: ensures that the organization's accounts are regularly audited;Question 14: ensures that the audit report is produced and distributed;Question 15: board keeps minutes of all its meetings;Question 16: make clear description of duties and responsibilities of NGO staff;Question 17: are accountable to funding agencies, stakeholders, legal authority, employees
and beneficiaries.
PERIOD OF STUDY
Field study was conducted during the year 2009 - 2010.
STATISTICAL TOOLS USED FOR ANALYSIS
The objective of our study as stated earlier is to examine the governance practices of
NGOs that are operating in the selected districts of West Bengal. For this purpose, data
collected through questionnaire have been duly processed, tabulated and analyzed using
Test of Proportion (Z Test). This statistical test reveals how far the hypotheses are tenable
in the light of the information provided by the respondents.
HYPOTHESES
We have framed null hypotheses (H0) and alternative hypotheses (H1) as follows:
H0 : Around 50% (fifty percent) of the selected NGOs are carrying out good governance
practices.
H1 : (a) More than 50% (fifty percent) of the selected NGOs are carrying out good
governance practices. [+ve result indicates (a) is true], and
(b) Less than 50% (fifty percent) of the selected NGOs are carrying out good
governance practices. [-ve result indicates (b) is true].
The test statistic:
Where P = observed value
And H0: π = 0.50 against H1(a) : π > 0.50 and H1(b) : π < 0.50
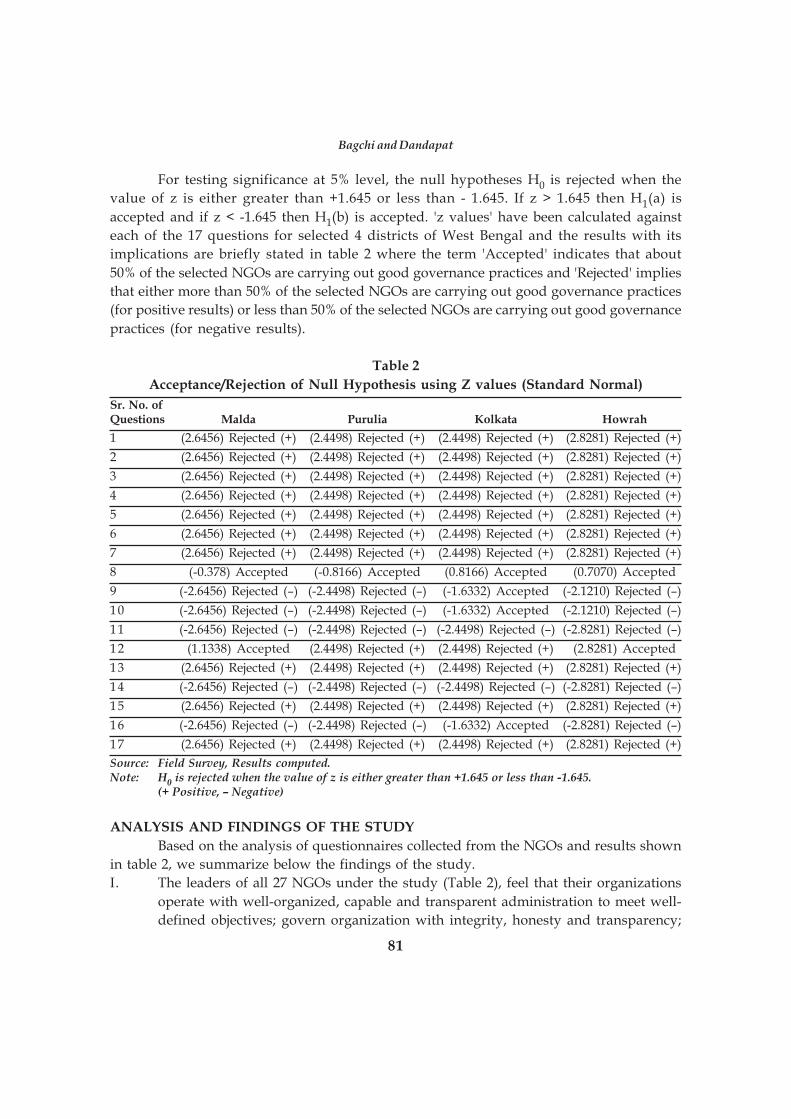
81
Bagchi and Dandapat
For testing significance at 5% level, the null hypotheses H0 is rejected when the
value of z is either greater than +1.645 or less than - 1.645. If z > 1.645 then H1(a) is
accepted and if z < -1.645 then H1(b) is accepted. 'z values' have been calculated against
each of the 17 questions for selected 4 districts of West Bengal and the results with its
implications are briefly stated in table 2 where the term 'Accepted' indicates that about
50% of the selected NGOs are carrying out good governance practices and 'Rejected' implies
that either more than 50% of the selected NGOs are carrying out good governance practices
(for positive results) or less than 50% of the selected NGOs are carrying out good governance
practices (for negative results).
Table 2
Acceptance/Rejection of Null Hypothesis using Z values (Standard Normal)
Sr. No. ofQuestions Malda Purulia Kolkata Howrah
1 (2.6456) Rejected (+) (2.4498) Rejected (+) (2.4498) Rejected (+) (2.8281) Rejected (+)
2 (2.6456) Rejected (+) (2.4498) Rejected (+) (2.4498) Rejected (+) (2.8281) Rejected (+)
3 (2.6456) Rejected (+) (2.4498) Rejected (+) (2.4498) Rejected (+) (2.8281) Rejected (+)
4 (2.6456) Rejected (+) (2.4498) Rejected (+) (2.4498) Rejected (+) (2.8281) Rejected (+)
5 (2.6456) Rejected (+) (2.4498) Rejected (+) (2.4498) Rejected (+) (2.8281) Rejected (+)
6 (2.6456) Rejected (+) (2.4498) Rejected (+) (2.4498) Rejected (+) (2.8281) Rejected (+)
7 (2.6456) Rejected (+) (2.4498) Rejected (+) (2.4498) Rejected (+) (2.8281) Rejected (+)
8 (-0.378) Accepted (-0.8166) Accepted (0.8166) Accepted (0.7070) Accepted
9 (-2.6456) Rejected (–) (-2.4498) Rejected (–) (-1.6332) Accepted (-2.1210) Rejected (–)
10 (-2.6456) Rejected (–) (-2.4498) Rejected (–) (-1.6332) Accepted (-2.1210) Rejected (–)
11 (-2.6456) Rejected (–) (-2.4498) Rejected (–) (-2.4498) Rejected (–) (-2.8281) Rejected (–)
12 (1.1338) Accepted (2.4498) Rejected (+) (2.4498) Rejected (+) (2.8281) Accepted
13 (2.6456) Rejected (+) (2.4498) Rejected (+) (2.4498) Rejected (+) (2.8281) Rejected (+)
14 (-2.6456) Rejected (–) (-2.4498) Rejected (–) (-2.4498) Rejected (–) (-2.8281) Rejected (–)
15 (2.6456) Rejected (+) (2.4498) Rejected (+) (2.4498) Rejected (+) (2.8281) Rejected (+)
16 (-2.6456) Rejected (–) (-2.4498) Rejected (–) (-1.6332) Accepted (-2.8281) Rejected (–)
17 (2.6456) Rejected (+) (2.4498) Rejected (+) (2.4498) Rejected (+) (2.8281) Rejected (+)
Source: Field Survey, Results computed.Note: H0 is rejected when the value of z is either greater than +1.645 or less than -1.645.
(+ Positive, – Negative)
ANALYSIS AND FINDINGS OF THE STUDY
Based on the analysis of questionnaires collected from the NGOs and results shown
in table 2, we summarize below the findings of the study.
I. The leaders of all 27 NGOs under the study (Table 2), feel that their organizations
operate with well-organized, capable and transparent administration to meet well-
defined objectives; govern organization with integrity, honesty and transparency;
82
Indian Journal of Accounting
are managed by competent, responsible and conscious leaders; use organization's
resources effectively and efficiently; are ready to account for the use of resources
and their actions; recognize and protect stakeholders' interests; conforms to the
legal and regulatory requirements; ensure that the organizations accounts are
regularly audited; are accountable to funding agencies, stakeholders, legal authority,
employees and beneficiaries; and maintain minutes of all its meetings. It has been
observed that not even a single NGO prepared and distributed audit report.
II. From the study it has been found that in the district of Purulia (Table 2), the null
hypotheses is accepted in 1 case which is the lowest ever acceptance in the State. On
the other hand, in the district of Kolkata, alternative hypotheses H1(b) [i.e. less than
50% of the selected NGOs are carrying out good governance practices] is true for
only 2 cases which is the lowest among the selected districts and null hypotheses Ho
is found to be tenable for 4 cases which is highest amongst the selected districts. So
it may be concluded that the NGOs operating in Kolkata are the best performer as
far as 'carrying out good governance practices' is concerned.
III. It has been observed (Table 2) that the board of 14 (51.86%) NGOs adopt policy
based on the principles of democracy; 2 (7.41%) NGOs make timely disclosure of
information relating to activities of an organization; 2 (7.41%) NGOs make timely
financial disclosure to cover sources and uses of funds, assets and liabilities; and not
even a single NGO reveal proper and relevant Accounting Standards that are being
followed by them. The study also reveals that only 1 (3.70%) NGO make clear
description of duties and responsibilities of NGO staff.
CONCLUSION AND SUGGESTIONS
It has been observed that while most of the NGOs are expected to be community
friendly and have in place reliable arrangements for receiving and redressing people's
grievances, in reality access to such means tend to be available to a very small section of
people. The large number of illiterate and downtrodden people living at the margins of
the society still suffer in silence. Ideologically the NGOs are expected to have foolproof
arrangements for not only redressing people's grievances but also for directly involving
people in specific policy making, including developmental planning. But in practice very
few NGOs work through mechanisms that enable ordinary people to participate in decision-
making process of the organizations and for most of the NGOs policy-making continues to
be looked upon as bureaucratic task with no or little transparency.
Considering the results of the findings of the study, we venture to offer some
suggestions for improvement of the current scenario.
• There should be instruction-manual/handbook for governing bodies of NGOs. The
handbook would address roles and functions of board versus management, values,
philosophy, vision and mission, procedures for board operations, criteria for board
appointments, principles of good governance and evaluation mechanisms;
• Good governance begins with empowering the top management - the board of
83
directors/ governors/ trustees, whatever be the nomenclature. In most of the NGOs,
governing bodies including executive and advisory boards exist with varied
effectiveness and some function without clear and distinct roles and responsibilities
and do not have complete independence from management processes. Thus, there
is need to focus on understanding the roles of boards, dealing with potential conflicts
between founder members and younger professionals, code of conduct for boards,
leadership development, sustainability and appropriate management models;
• The governance of NGOs should cover both conformance dimension as well as
performance dimension, i.e., it should consider the whole picture of the organization
to ensure that strategic goals are aligned and good management is achieved. While the
conformance dimension takes an historic view, the performance dimension is forward
looking. Strategic plans, financial plans, performance measurement, control systems
and stakeholders satisfaction are under the coverage of performance dimensions;
• It is important to strengthen the accounting and reporting practices as well as audit
standards and regulations. Audit quality control process must ensure that the audit
effectiveness is raised;
• The performance of projects, activities or operations of the NGOs should conform
to the parameters of the purpose of the grant, manner in which it should be utilized
and the time frame, etc. It is recommended that the donors and funding agencies
should critically examine the effectiveness of the NGOs in utilization of resources
and in achieving results through Performance Audit;
• For better transparency and accountability to the target groups as well as to the
society at large, the NGOs may publish their accounts in a newspaper or they may
put their financial statements on their websites.
REFERENCES
A Situation Analysis of NGO Governance and Leadership in Eastern, Southern, Central and WesternAfrica, Centre for African Family Studies, November, (2001).
Batten, J. R. (2006), NGOs and Good Governance, Capacity Building for the Not-for-Profit Sector inEast Africa, Poverty Eradication Network.
Burwell, B. and Mankins, M. C. (2002), Improving Corporate Governance from the Inside, MarakonAssociates.
DAINET NGO Directory (2000), Development Alternatives Information Network, New Delhi.
Enterprise Governance: Getting the Balance Right (2004), CIMA, IFAC.
Green, A. and Matthias, A. (1997), Non-Governmental Organizations and Health in DevelopingCountries, Macmillan Press Limited, London.
Levin, R. I. (1979), Statistics for Management, Prentice Hall of India, New Delhi.
Vibert, F. (2006), International NGOs: An International Code of Conduct: An Approach Paper, EuropeanPolicy Forum.
Bagchi and Dandapat
84
Indian Journal of Accounting
BOOK REVIEW
International BusinessAuthor: Dr. P.C. Jain, Third Edition, year: 2010-11, Price: Rs. 285, Pages: 18.34
Publisher: RBD Professional Publications, Jaipur
At the time when Globalisation has changed the entire world into global village andcreating a concept of global market, academicians and management practioners are anxiouslylooking for the adoption of new changes in the arena of international horizon. The thoroughlyrevised 3rd edition of International Business by Dr. P.C. Jain will update the skills andknowledge of the teachers, professionals, students and the readers. The book examinesboth theoretical and strategical areas of International Business in lucid style.
The scanning of environment, collection of variety of data, impact of global recession,indicators of world development, and current status of India's foreign trade have made thebook reader friendly. The book is divided into 18 chapters. The evaluation of various EXIMpolicies of last few years has also been made. The book is presented in simple language andcontents are cohesive. Hence the book is useful to policy makers, research scholars andsociety at large.
Devesh Ranjan TripathiAssistant Professor
School of Management StudiesU.P. Rajarshi Tandon Open University, Allahabad
Media Management (Newspaper)Author: Ram Pravesh Rai, year: 2011, Price: Rs. 750, Pages: 239
Publisher: Gaur Publishers and Distributers, New Delhi
Now a days, the field of media has expanded and playing significant role in thesociety. This is on account of management principles and techniques. The management ofelectronic and print media is quite different and it has to be studied separately. The authorhas covered various aspects of news paper management. The book is divided into eightchapters. The book focuses on history of print media management, its mission, professionand business, traditional forms of newspaper management, new techniques of newspapermanagement etc. The book has also included marketing policies of newspapers and thefactors affecting them. To have wider coverage to Hindi speaking readers the author haspresented contents in simple Hindi language. The incorporation of new ideas like crossmedia ownership, mobile newspaper, internet edition and website management have madethis book valuable for general readers. The book will be useful to academicians, scholars,media professionals, policy makers, general students and society at large.
Sugan Chandra JainPast President, Indian Accounting Association
and Retd. Professor and Head, Deptt. of Accounting,University of Rajasthan, Jaipur
85
IAA NEWS
Report on the XXXIII All India Accounting Conference andInternational Seminar of the Indian Accounting Association
Kerala University, Trivandrum(India)Nov 13-14, 2010
The XXXIII All India Accounting Conference and International Seminar on AccountingEducation and Research was held at Kerala University, Trivandrum, during Nov 13-14,2010, under the auspices of IAA Kerala Branch and Kerala University's Faculty of Commerce& Management. Prof. K.Sasi Kumar, the Conference Secretary and Prof. D. Prabhakara Rao,the General Secretary cordially invited all the members and delegates to the Conference.Prof. D. Prabhakara Rao explained the comfortable position of IAA in terms of Finances andHuman Resources, while profoundly thanking all the people responsible for the mileagecovered so far, specially the Past Presidents, EC Members and Office Bearers. He announcedthat new branches will be formed shortly in Pandichery and Jammu & Kashmir, whilereferring to the phenomenal growth of IAA from Kashmir to Kanyakumari. The Conferencewas inaugurated by Prof.Prabhat Patnaick, Vice Chairman of the Kerala Government PlanningBoard on 13th Nov.2010. Honorable Finance Minister Prof. Thomas Isaac greeted the delegatesfrom all over India, while sharing his experiences on the Goods and Services tax and fiscaladministration. Prof. Prof. GL Dave, the President of IAA addressed the members on avariety of issues relating to Accounting Standards and Corporate Governance. TheInternational Seminar on Accounting Education and Research was chaired by Prof. MB Shuklaof the Kasi Vidya Peet University, Varanasi. A number of thought provoking research paperswere presented followed by deep discussion on some of the interesting research areas inAccounting Education and Research. The three technical sessions took place concurrentlywith rich deliberations under the chairmanship of Prof. Sugan Chand Jain of Jaipur, Prof.Ranjan K Bal of Bhubaneswar and Sri KChAVSN Murthy of Hyderabad respectively.
A good number of delegates came from Muscat under the leadership of Prof.KVAchalapathy, who is presently in Muscat. Mr. Bharat Moyal of Kolkata got the BestPerformance Award in the IAA Talent Search 2009-10. The Papers of (i) Dr.KV RamanaMurthy & Dr.Vanishree of Hyderabad; (ii) Prof. Promod Kumar of Agra; (iii) Dr.UshaKiran & Dr.Karuna shri and (iv) Dr.ST Gadade & DR.SS Yadav of New Panvel are adjudgedto be best among the presented papers in the International Seminar and three TechnicalSessions. Dr. (Ms) Tarika Sikarwar of Gwalior got the IAA Young Researcher Aware-2010.Prof. D.Obul Reddy of Hyderabad and Prof Shirin Rathore of Delhi were conferred withIAA Fellowship Award-2010 for their life time dedication to the Accounting Education andResearch. Prof. M. Sulochana of Hyderabad has announced to donate a sum of Rupees OneLakh as an endowment for YRA Award. The Interest on this amount will be used to givethe YRA Award Prize every year.
Prof. Harish S Oza of Gujarat University has become the President of IAA whileProf. Umesh Holani of Jiwaji University and Prof. K. Sasi Kumar of Kerala University havebecome the Sr.Vice President and Jr. Vice President respectively. Prof. D. Prabhakara Rao ofAndhra University Prof.Pratap S Chouhan of Sourashtra University and Prof. NageshwarRao of Allahabad Open University are unanimously elected as General Secretary, Treasurer
Indian Journal of Accounting
86
Indian Journal of Accounting
and Chief Editor for a period of three years. Sri AS Durga Prasad of the Institute of Cost &Works Accountants of India and Prof G Soral of ML Sukhadia University are nominated asEx-Officia members to the Executive in their capacity as IAA Website Coordinator and IAATalent Search Coordinator respectively. Prof. Ramachandra Gouda of Bangalore University,Prof. J.L. Gupta of Delhi University, Prof. Sailesh Parmar of Sourashtra University, Dr. MLVadera of Jai Narayan Vyas University and Prof. C. Ganesh of Kerala University are electedto the Executive for a period of three years. Dr.Muniraj of Bangalore University was electedto the executive for the remaining one year period of Prof.SS Mody. Dr. Lalit Gupta of JaiNarayan Vyas University; Dr.KChAVSN Murthy of the Institute of Cost & WorksAccountants of India; Dr. Anil Kumar of Sri Ram College of Commerce, Dr. PK Bhandgar ofMumbai, Prof. M. Sulochana of Osmania University, Dr.Sanjay Bhayani of SourashtraUniversity , Prof. Arindam Gupta of Vidya Sagar University, Dr. LK Karangade of Akolaand Prof. SS Mody of the University of Rajasthan (the 34th Conference Secretary) are cooptedto the EC for a period of one year. Dr. Bhavesh A Lakhani of Gujarat University and Dr.Apparao of Osmania University, Prof. JK Jain of Harish Gaur Central University and ProfMR Sahu of Jiwaji University are also coopted to the EC as special invitees.
Members expressed full satisfaction at the arrangements made by the ConferenceSecretariat while profoundly thanking the Conference Secretary Prof. K Sasi Kumar and hisdedicated team of faculty and administration supported by the scholars and students. Prof.Mody heartily invited all the members to the Pink City on this pleasant occasion to celebratethe 34th All India Accounting Conference.
Dr. D. Prabhakar RaoGeneral Secretary - IAA
34th All India Accounting ConferenceProf. S.S. Mody as the Conference Secretary
The topics and Chairpersons for the 34th IAA conference to be held at Jaipur aregiven below:
Conference Dates 17th and 18th Dec 2010International Seminar on Accounting Education and Research
with Prof. GL Dave of Jodhpur as ChairmanTechnical Session I
E-Accounting: Problems and Prospects, Chairman: Prof. B. Banerjee of CalcuttaTechnical Session II
Carbon Credit Accoiunting, Chairman: Prof. K. Eresi of BangaloreTechnical Session III
Impact of Direct Tax Code, Chairman: Prof. Daxa Chauhan of Rajkot
Dr. D. Prabhakar RaoGeneral Secretary - IAA
87
One-Day State Level Seminar andAnnual General Meeting of The IAA Midnapore Branch
A one day state-level seminar was hosted by the Department of Commerce, Universityof Burdwan, W.B. in association with the I.A.A., Midnapore Branch on 4th December, 2010on the eve of the latter's Annual General Meeting at the Directorate of Distance Educationbuilding of the university at Golapbag, Barddhaman (Burdwan). The seminar was inauguratedby Prof. Amit Kr. Mallik, former Vice Chancellor of the university and hon'ble President ofthe Branch. The key-note address was delivered by Prof. Ratan Khasnabis, Retired Professorof Business Management, University of Calcutta, Kolkata and an eminent Economist on"Global Economic Crisis and Problem of Foreign Exchange Management". The seminar wasattended by nearly one hundred delegates from all parts of the state.
Later, in the afternoon session, the 3rd Annual General Meeting of the Branch washeld. Prof. Jaydeb Sarkhel, a very senior Professor of Economics in the Department ofCommerce of the University of Burdwan was elected President of the Branch after Prof.Amit Kr. Mallik had cited his personal difficulties to continue Presidentship for anotheryear. All the members highly appreciated the role of the outgoing President in guiding theBranch from the time of its starting till recent times to achieve a significant position like this.
Prof. Arindam Gupta, Professor of Commerce, Vidyasagar University, Midnaporeand Dr. Anupam Parua, Assistant Professor in Commerce, K. D. College of Commerce andGeneral Studies, Midnapore were reelected respectively as the Secretary and Treasurer ofthe Branch. Prof. Sudipti Banerjea, Professor, Department of Commerce, University ofCalcutta, Kolkata, Dr. Abhash Kr. Basu, Assistant Professor, Dept. of Commerce,Raghunathpur College, Purulia, Ms. Arundhati Basu, Proprietress, A. Basu & Co., CostAccountants, FE - 130, Sector - III, Salt Lake, Kolkata, Dr. Debabrata Mitra, Reader,Department of Commerce, University of North Bengal, North Bengal, Darjeeling, Dr. KajalBaran Jana, Assistant Professor, Dept. of Commerce, Tamralipta Mahavidyalaya, Tamluk,Purba Medinipur, Mr. Koushik Kr. Dutta, Assistant Professor, Dept. of Commerce, SuriVidyasagar College, Birbhum, Dr. Manas Kr. Hazra, Talit Goureshwar Institution, Talit,Burdwan, Dr. Partha Sarkar, Senior Lecturer & Teacher-in-Charge, MBA (HR), Centre forManagement Studies, The University of Burdwan, Prof. Prithul Chakraborty, Centre forManagement Studies, JIS College of Engineering, Kalyani, Nadia, Dr. Prabodh Kr. Mishra,Reader, Department of Commerce, Kidderpore College, Kidderpore, Kolkata, Dr. SiddharthaSankar Saha, Reader, Dept. of Accounting and Finance, St. Xaviers' College (Autonomous),Kolkata, and Dr. Swarup Kr. Jana, Assistant Professor, Dept. of Commerce, RamanandaCollege, Bishnupur, Bankura, were elected as the twelve other members of the ExecutiveCommittee of the Branch for the next year.
The members in general appreciated the present strength of the Branch with 138 lifemembers thus becoming the fourth largest branch of the association. They also appreciatedthe Branch's initiatives in organizing a 10-day Workshop on Research Methodology inassociation with the Department of Commerce with Farm Management of VidyasagarUniversity to start on and from 4th January, 2011, and publication of an E-journal. On thisoccasion, the Branch's website, www.iaamidnaporebranch.in was also inaugurated by Prof.Amit Kr. Mallik.
Prof. Arindam Gupta, Hony. Secretary, I.A.A., Midnapore Branch
IAA News
88
Indian Journal of Accounting
INDIAN ACCOUNTING ASSOCIATIONPAST SECRETARIES
Late Prof. H.S. Kulshreshtha Late Prof. Mukund Lal Dr. S.K. Singh(1969-78) (1978-1993) (1993-94)
BRANCH SECRETARIESAHMEDABAD BRANCH AJMER BRANCH BANGALORE BRANCH
Prof. Ajay Soni Dr. N.M. Singhvi Dr. M. Ramchandra GowdaFaculty, M.M. Gandhi HCM Rajasthan State Deptt. of Commerce and Mgmt.Arts & Commerce College Institute of Public Admn. Bangalore UniversityKalol Jaipur - 302 017 Bangalore - 560 001
BAREILY BRANCH BHUSAWAL BRANCH BHUVANESHWAR BRANCH
Dr. N.L. Sharma Dr. A.M. Agrawal Prof. R.K. BalDept. of Commerce North Mahl Branch Dept. of Comm., Utkal UniversityBarreily College, Bareily (U.P.) Bhusawal (Maharashtra) Bhuvaneshwar (Orissa)
CHANDIGARH BRANCH DIBRUGARH BRANCH GOA BRANCH
Dr. Karamjeet Singh Dr. A.B. Saha Dr. B. RameshHouse No. 837, Phase - 7 Dept. of Commerce Staff QuartersMohali (Punjab) Dibrugarh University, Dibrugarh Goa University, Goa
GUWAHATI BRANCH GWALIOR BRANCH HYDERABAD BRANCH
Dr. Sujit Sidkhar Dr. Umesh Holani Dr. K.Ch. AVSN MurthyCommerce Department B-10, 20, Pandit Vihar Hyd. Chap. of Cost Acctts, 5th StreetGuwahati University, Guwahati Gola Ka Mandir, Gwalior Himayat Nagar, Hyderabad
JABALPUR BRANCH JAIPUR BRANCH JODHPUR BRANCH
Dr. N.C. Tripathi Prof. S.C. Jain Dr. M.L. Vadera1036, Sanjeevani Nagar 4, Ma-22, Jawahar Nagar Dept. of Accounts, J.N. VyasJabalpur (M.P.) Jaipur University, Jodhpur-342 008
JORHAT BRANCH KOLKATA BRANCH LUCKNOW BRANCH
Dr. B.C. Saikia Prof. Malyendra Saha Prof. J.N. ShuklaC.K.B. College 87/1, College Street 75, Sundar BaghJorhat - 785 001 (Assam) Kolkata - 700 073 Lucknow - 302 004
MIDNAPUR BRANCH MUMBAI BRANCH PUNE BRANCH
Dr. Arindam Gupta Dr. P.G. Gopalakrishnan Dr. Anil PanditProfessor, Deptt. of Commerce 110, 'Saideep', N.G. Acharya Marg Commerce DepartmentVidyasagar University, Midnapur Chembur, Mumbai - 400 074 University for Women
Karve Road, Pune - 411 038
PATIALA BRANCH RAJKOT BRANCH SALEM BRANCH
Dr. G.S. Batra Dr. Pratap Sinh Chauhan Prof. S.S. Sundaram828, Tripuri Town Dept. of Bus. Mgmt., Saurashtra Commerce Dept., Madras UniversityPatiala - 147 001 (Punjab) University, Rajkot-360 005 P.G. Center, Salem - 636 011 (TN)
TIRUPATI BRANCH UDAIPUR BRANCH VARANASI BRANCH
Dr. Suresh Babu Dr. S.L. Manaria Dr. M.B. ShuklaDept. of Commerce BNPG College Director and Dean, Institute of Mgmt.S.V. University Tirupathi Udaipur - 313 002 (Rajasthan) M.G. Kashi Vidyapeeth, Varanasi
VISHAKHAPATNAM BRANCH
Prof. D. Prabhakar Rao2, Shanmukha Apts.,Andhra University Road,Vishakhapatnam - 530 017
89
EDITORIAL
Creativity and interdisciplinary approach is better way to utilise both
implicit and explicit knowledge of human resources. Dr. G.L. Dave in his
presidential address has sketched an outline of interdisciplinary approach and
creativity in accounting education system. International Financial Reporting
Standard (IFRS) is a new concept in this global scenario. Dr. Lalit Gupta has
presented an analytical study of India's Preparedness for IFRS. Risk Management
is a rapidly growing area in financial sector and credit rating plays a vital role.
Kuljeet Kaur and Dr. Rajinder Kaur have presented an empirical analysis of Credit
Rating. Non Government Organisations are adopting corporate governance
measures. This has been analysed by Dr. Bhaskar Bagchi and Prof. Dhrubaranjan
Dandapat. The relationship of price index and macroeconomic variables is
presented by Dr. Vishal Vyas and Dr.D.D.Bedia. Governance practices in Indian
banking has analysed by Dr. Hemal Pandya and Dr. Chetana Parmar. A comparative
study of accounting education system of India and Oman has been empirically
tested by Dr. K.V.Achalapathi, Ms. Tamanna Dalwai and Ms. Sweetline. The issues
of social accounting, impact of GST, cost management of power sector companies
and stock split practices have also been included in this issue of journal and have
given useful inferences.
December 31, 2010 Professor Nageshwar RaoChief Editor
Indian Journal of Accounting
A
INDIAN ACCOUNTING ASSOCIATIONPAST PRESIDENTS
• Shri Raghunath Rai, Chartered Accountant, Varanasi• Dr. S.N. Sen (Late), Former Vice Chancellor, Calcutta University, Kolkata• Dr. S.K.R. Bhandari, Former Dean Faculty of Management Studies, Banaras Hindu
University, Varanasi• Dr. G.D. Roy (Late), Former Professor, Calcutta University, Kolkata• Shri M.C. Bhandari (Late), Chartered Accountant, Kolkata• Dr. K.S. Mathur, Former Professor, University of Rajasthan, Jaipur• Dr. R. Rajagopalan, Former Addl. Secretary, Government of India, New Delhi• Dr. L.S. Porwal, Retd. Pofessor in Commerce, Delhi University, Delhi• Dr. H.C. Mehrotra, Ex Dean, Faculty of Commerce, Agra University, Agra• Shri S.M. Dugar, Ex-Member, Company Law Board, Government of India, New Delhi• Dr. S.P. Gupta, Retd. Dean, Faculty of Commerce, Rohikhand University, Barelly• Shri Sukumar Bhattacharya, Chartered Accountant, Kolkata• Dr. Dool Singh, Retd. Dean Management, Kurukshetra University, Kurukshetra• Dr. M.C. Khandelwal, Retd. Professor, Faculty of Commerce, University of Rajasthan,
Jaipur• Dr. B. Banerjee, Professor of Commerce, Calcutta University, Kolkata• Dr. Chhote Lal, Retd. Dean and Professor of Management, B.H.U., Varanasi• Dr. N.M. Khandelwal, Rtd. Dean, Faculty of Management Studies, M.D.S. University,
Ajmer• Dr. U.L. Gupta (Late), Faculty of Commerce, J.N.V. University, Jodhpur• Dr. K.R. Sharma, Retd. Dean, P.G. Studies, M.L.S. University, Udaipur• Dr. Bhagwati Prasad, Retd. Director, Kausali Institute of Mgmt., Karnataka University,
Dharwar• Dr. Nageshwar Rao, Professor and Dean, Faculty of Management Studies, Ex Dean,
Faculty of Information Technology & Director, J.L. Nehru Institute of BusinessManagement, Vikram University, Ujjain
• Dr. B. Ramesh, Professor, Deptt. of Commerce, Goa University, Goa• Prof. K. Eresi, Professor & Chairman, Faculty of Commerce, Bangalore University,
Bangalore• Dr. S.C. Jain, Retd. Professor & Head, Deptt. of Accounting, University of Rajasthan,
Jaipur• Dr. N.M. Singhvi, HDM Rajasthan State Institute of Public Administration, Jaipur• Prof. B. Mohan, Department of Commerce, S.V. University, Tirupathi• Prof. B.S. Rajpurohit, Department of Accounting, J.N.V. University, Jodhpur• Prof. M.B. Shukla, Prof, Head and Director, Institute of Management Studies, M.B.
Kashi Vidyapeeth, Varanasi• Prof. Ranjan K. Bal, Professor, Department of Commerce, Utkal University,
Bhuvaneshwar• Prof. K.V. Achalapati, Dean, Faculty of Commerce, Osmania University, Hyderabad• Prof. Shirin Rathore, Advisor (Planning), Delhi University & Former Dean, Faculty of
Commerce, Delhi University, Delhi• Prof. G.L.Dave, Former Professor and Dean, Faculty of Commerce, Jainarain Vyas
University, Jodhpur
B
Indian Journal of Accounting
PRESIDENT'S SPEAKS
Dear Members,Happy New Year 2011.It is indeed a matter of great pleasure and honour to be the President of Indian
Accounting Association for the year 2011. I express my sincere thanks and convey mygratitude to all the members, executive committee and past presidents of the Associationfor the confidence reposed in me. I personally request you to give your kind support andco-operation in developing our Association to greater heights.
The discipline of accounting is passing through a very challenging phase. Recentlyas the accountants, we have three major challenges-(i) Implementation of Direct Tax Code(ii) Adoption of International Financial Reporting Standards in India and (iii) Good CorporateGovernance. We have to play an important role in creating awareness and understandingfor both the challenges amongst teachers and students. It is my earnest request to all thebranches of IAA to organize seminar, conference, workshop or panel discussion at earlieston these emerging issues in accounting and taxation. Accordingly, IAA-Gujarat Branchhas taken initiative in conducting International Seminar on such issues during February12-13, 2011.
Now-a-days, we have seen many scandals through out the world. This is very badsign for the profession. What we required is the acceptance of Ethics in Accounting.According to Robin Matthews, "Once we create mindset where the role of honesty in oursocial contracts becomes significant, the very threat of "losing honour" within societybecomes a preventive measure for greed". It was observed that greediness led to theundue growth in all the sectors of the economy. Therefore, we require more transparencyand full disclosure in accounting system to remove greediness from the society.
Further, it is interesting to note that modern society afflicted by "Moral Pollution"which is not confined to the corporate sector alone, but is all pervasive. In such climate,more gimmicks of reforming the corporate sector would not automatically guarantee goodaccounting. What is required is an evolution of a "Culture of Conscience". Without ethics/morals/dharma human beings are just like animals. Therefore, it should be our mission todevelop culture of conscience in the society and such change will brings fairness, justiceand truthfulness in accounting reporting.
We have excellent past records and have contributed a lot in promoting healthyaccounting practices, education and research in India. In the era of globalization, let us tryfor global recognition of our association.
I would like to draw kind attention of the Branch Secretaries to up-date their LifeMembership List and sent it to the Chief Editor of IJA for proper posting of journal.Further, I request branch secretaries to submit audited annual branch accounts to theTreasurer of IAA. All the members are requested to send their email addresses to me [email protected]. Your suggestions and observations regarding working of ourassociation are solicited for the better performance in the future.
Prof. (Dr.) Harish S. OzaPresident
Indian Accounting AssociationAhmedabad (Gujarat - India)
Indian Journal of Accounting
C
Indian Journal of Accounting
D
CONTENTSPage
Accounting Education and Research 1- G.L. Dave
India's Preparedness for IFRS: Environment, 7Profession and Academic Agencies- Lalit Gupta
An Econometric Relationship between FMCG Sector Price Index 14and Macroeconomic Variables- Vishal Vyas and D.D. Bedia
Cost Structure of Power Distribution Companies in Andhra Pradesh: 25A Study- A. Sudhakar and K. Sreelatha Reddy
Effectiveness of Corporate Governance Practices: 35A Study of Indian Banking System- Hemal Pandya and Chetana Parmar
Stock Split Practices in India 45- Satyajit Dhar and Sweta Chhaochharia
Accounting Aducation System at Undergraduate Level: A Comparision 51- K.V. Achalapathi, Tamanna Dalwai and Sweetline
Investor’s Satisfaction and credit Rating 59- Kuljeet Kaur and Rajinder Kaur
Impact of GST on Consumers 66- V. Usha Kiran and M.V. Karunasri
An Evaluation of Social Accounting Disclosure in Corporate 72- Rechanna and B. Mahadevappa
Corporate Governance Practices of Non Governmental Organizations in 78West Bengal: An Evaluation- Bhaskar Bagchi and Dhrubaranjan Dandapat
Book Review 84
IAA News 85
Cover Page 1
Cover Page 2
EDITORIAL BOARDCHIEF EDITOR
Dr. Nageshwar RaoVice Chancellor
U.P. Rajarshi Tandon Open University, Allahabad
EDITORS
Dr. M.B. Shukla Dr. S.C. JainProfessor, Dean and Director Past President
Faculty of Commerce and Management, Indian Accounting Association, JaipurM.G. Kashi Vidyapeeth, Varanasi
ASSOCIATE EDITORS
Mr. A.S. Durga Prasad Dr. Daxa C. Gohil Dr. Arindam GuptaExecutive Director Professor and Head Department of CommerceProtech Solutions Ltd. Dept. of Commerce Vidyasagar UniversityHyderabad Saurashtra University, Rajkot Midnapur
Prof. Lalit Gupta Dr. R.P. Das Dr. J.K. JainProfessor Professor, Head & Dean Professor and HeadJ.N.V. University Institute of Management Department of CommerceJodhpur Ravishankar University, Raipur Dr. H.S. Gaur University, Sagar
ADVISORS
Dr. P. Edirisuriya Prof. B. Banerjee Prof. Bhagirath PrasadMonash Universty, Victoria Ex-President IAA, Kolkata VC, M.D.S. University, Ajmer
A.J. Stagliano Prof. Y.P. Singh Dr. Amit Kumar MullickKa Haub School of Busi., Erivan Delhi University, Delhi Burdwan
Prof. G.C. Maheshwari Prof. K.V. Sivayya Pelama RajapakreM.S. University, Vadodara Formerly, Clarkson University Giffith University, Brisbane
Prof. Mahendra K. Goyal Prof. K. Eresi Prof. B. MohanMonash Universty, Melbourne Ex-President IAA, Bangalore Ex-President IAA, Tirupati
Prof. Arvind Kumar Prof. B.S. Rajpurohit Dr. Ramendu RoyLucknow University, Lucknow Ex-President, IAA, Jodhpur Allahabad University
Dr. B. Ramesh Prof. Subhash Sharma Prof. P.K. MishraEx-President IAA and President ICA G.N. Dev University, Amritsar V.C., DAVV, Indore
Prof. R.K. Mittal Prof. I.V. Trivedi Chris PatelKurukshetra University VC, M.L.S. University, Udaipur Macquarie University, Australia
Prof. Vinod Shankar Singh Prof. G .L. Dave Prof. Jeffery KantorBanaras Hindu University Ex President, IAA University of Windsor, Canada
Prof. Michael J.R. Gaffikin Prof. D.D. Arora Prof. Sudipti BanarjeeUniv. of Wollongong, Australia Kurukshetra University Calcutta University
Prof. A.J. Stagliano Prof. D.K. Gupta Prof. Ashton C. BishopSaint Joseph's Philadelphia's Punjab University, Chandigarh James Medison UniversityJesuit Univ., Pennsylvania, U.S.A. U.S.A.
Prof. Douglas K. Barney Dr. O.P. Rai Dr. B.P. SaraswatIndiana University, Indiana Banaras Hindu University MDS University, Ajmer
Dr. Bhagwati Prasad Prof. B.M.L. Nigam Dr. A.K. SaxenaEx-President IAA, Delhi Delhi University Bundelkhand University
Cover Page 3
IAA EXECUTIVE COMMITTEE - 2010
PRESIDENTDr. H.S. Ojha
Director and ProfessorS.D. School of Commerce
Gujrat University, Ahmedabad - 380009
VICE PRESIDENT (Sr.) VICE PRESIDENT (Jr.)Dr. Umesh Holani Prof. K. Sasi Kumar
Dean, Faculty of Commerce & Mgmt. Head, Dept of CommerceInstitute of Commerce & Management Kerala University
Jiwajee University, Gwalior Trivandarum-695 034
GENERAL SECRETARY TREASURER CHIEF EDITORProf. D. Prabhakar Rao Prof. Pratap Sinh Chauhan Prof. Nageshwar Rao
Dept. of Com. & Mgmt. Studies, Director, Smt. RDG Dept. of Bus. Mngmt. Vice Chancellor,Andhra University, Saurashtra University U.P. Rajarshi Tandon Open
Visakhapatnam Rajkot University, Allahabad
Member (Ex-Officio) Member (Ex-Officio) Member (Ex-Officio)Prof. B. Banerjee Prof. G. Soral Shri A.S. Durga Prasad
President, IAA Res. Found. Coordinator, IAA Talent Search Exam Coordinator, IAA Website164/78 Lake Gardens, B10 M.L. Sukhadia University Hyderabad
Kolkata - 700 045 Udaipur-313 002
MEMBERS ELECTEDDr. Sailesh Paramar Prof. C. Ganesh Dr. Ramchandra GowdaRajkot Trivandarum Bangalore
Dr. M.L. Vadera Prof. J.L. Gupta Dr. S.K. SinghJodhpur Delhi Gwalior
Dr. M. Basva Raj Prof. V. Krishna Mohan Dr. Muni RajHyderabad Visakhapatnam Bangalore
Prof. Hitesh J. Shukla Dr. Ajay Soni Dr. G. SimonRajkot Kalol Trivandarum
Dr. Malayendu Saha Dr. P.K. Pradhan Dr. G.S. RathoreKolkata Bhubaneswar Varanasi
MEMBERS CO-OPTEDProf. Arindam Gupta Prof. M. Sulochana Dr. Sanjay BhayaniMidnapore Hyderabad Rajkot
Dr. P.K. Bhandgar Dr. Lalit Gupta Dr. Anil KumarMumbai Jodhpur Delhi
Dr. K. Ch. AVSN Murthy DR. L.K.Karangade Prof. S.S. ModiHyderabad Akola Jaipur
SPECIAL INVITEESProf. J.K. Jain Dr. Appa Rao Dr. Bhavesh A. Lakhani Prof. M.R. SahuSagar Hyderabad Ahmedabad Gwalior
INDIAN JOURNAL OF ACCOUNTING
Indian Journal of Accounting is an official publication of Indian Accounting
Association. It is published twice a year, in June and December respectively. The scope of
journal encompasses all areas of Accounting including Auditing, Taxation, Management
Accounting, Cost Accounting and Information System. Two copies of the manuscript for
publication should be submitted by the author(s) along with summary has to be typed in
double space. The article should not normally exceed 1500 words. Authors are requested
to submit articles on disc (using any well known word-processing packages-Word Perfect,
MS-Word etc.). Papers submitted for consideration in Indian Journal of Accounting should
be accompanied by a declaration by the authors that they have not been published or
submitted for publication elsewhere. Editorial decision regarding publication of articles
will be communicated in 90 days' time. The name of the author(s) should not appear on
the manuscript to facilitate blind review. Indian Journal of Accounting owns no
responsibility for the views expressed by the author(s). For the book review to be included
in the Journal, text books, reference books and research publications are considered. Two
copies of each such publication should be submitted. All submissions and editorial enquiries
should be addressed to The Chief Editor, Dr. Nageshwar Rao, MI/8, Vikram, University
Campus, Ujjain - 456010. Membership of the Indian Accounting Association (set up in
1970 vide reg. no. 429/68-69) is open to academics and professionals. Members are entitled
to participate in the activities of the Association and receive a free copy of Indian Journal
of Accounting and selected research publications. The membership subscription and rates
of subscription of Journal are as under:
INDIA ABROAD
Individual : Annual Rs. 300 US $ 50Life Rs. 2000 US $ 200
Institutional : Annual Rs. 1000 US$150Permanent Rs. 5000 US £ 500
The subscription of the Journal may be sent through Draft either to "IAA - Chief
Editor, Indian Journal of Accounting", payable at Ujjain addressed to Dr. Nageshwar
Rao, Vice-Chancellor, M-I/ 8, Vikram University Campus, Ujjain-456010 or "Treasurer,Indian Accounting Association Rajkot" addressed to Dr. Pratap Sinh Chauhan, Director,
Smt. R.D. Gardi Dept. of Business Management, Saurashtra University, Rajkot - 360 005.
This Journal is sent free of charge to all the members of Indian Accounting Association
Printed in India by Dr. D. Prabhakar Rao at Neha Graphics, Ujjain and published byhim on behalf of the Indian Accounting Association, Udaipur - 313 001.
Cover Page 4


