Embed Size (px)
Citation preview

II II 1 III II
II
II
III 1 II
Cont ol Number: 48371
11111 111 111111 11 11
Item Number: 280
Addendum StartPage: 0

SOAH DOCKET NO. 473-18-3733 PVC DOCKET NO. 48371
20:6 -1 Pil f: 45
APPLICATION OF ENTERGY TEXAS, § BEFORE THE STATE OFFICE
' 4
INC. FOR AUTHORITY TO CHANGE § OF RATES § ADMINISTRATIVE HEARINGS
DIRECT TESTIMONY
OF
CYNTHIA L. ZAMORA
ON BEHALF OF THE
OFFICE OF PUBLIC UTILITY COUNSEL
AUGUST 1, 2018
REVENUE REQUIREMENT PHASE
;„'L'

SOAH DOCKET NO. 473-18-3733 PUC DOCKET NO. 48371
DIRECT TESTIMONY OF CYNTHIA L. ZAMORA
TABLE OF CONTENTS
Page
I. WITNESS IDENTIFICATION AND SCOPE OF TESTIMONY 3
II. SUMMARY OF RECOMMENDATIONS 6
III. RATE OF RETURN 8
A. FRAMEWORK 8
B. CURRENT MARKET ENVIRONMENT 11
C. CREDIT PROFILE 17
D. TAX CUTS AND JOBS ACT OF 2017 21
IV. SELECTION OF PROXY GROUP 24
V. COST OF EQUITY 26
A. DISCOUNTED CASH FLOW 26
B. BOND YIELD PLUS RISK PREMIUM 33
C. CAPITAL ASSET PRICING MODEL 36
D. COST OF EQUITY RECOMMENDATION 39
VI. COST OF CAPITAL 40
A. CAPITAL STRUCTURE 40
B. WEIGHTED AVERAGE COST OF CAPITAL 41
VII. SUMMARY OF COST OF CAPITAL RECOMMENDATIONS 41
SCHEDULES 43
EXHIBITS 49
Direct Testimony of Cynthia L. Zamora On Behalf of the Office of Public Utility Counsel
SOAH Docket No. 473-18-3733; PUC Docket No. 48371 Page 2 of 53

1 I. WITNESS IDENTIFICATION AND SCOPE OF TESTIMONY
2 Q. PLEASE STATE YOUR NAME AND BUSINESS ADDRESS.
3 A. My name is Cynthia L. Zamora. My business address is 1701 North Congress Avenue,
4 Suite 9-180, Austin, Texas 78701.
5 Q. BY WHOM ARE YOU EMPLOYED AND IN WHAT CAPACITY?
6 A. I am employed by the Office of Public Utility Counsel (OPUC) as a Financial Examiner.
7 Q. PLEASE DESCRIBE YOUR EDUCATIONAL BACKGROUND.
8 A. In May 2010, I graduated from the University of Texas at El Paso with a Bachelor of
9 Business Administration degree in Finance. In May 2014, I graduated from New Mexico
10 State University (NMSU) with a Master of Business Administration with a Finance
11 Specialization and a Graduate Certificate in Public Utility Regulation and Economics.
12 The NMSU Public Utility Regulation and Economics program included studies of
13 regulatory theory, policy, and application in the electric, natural gas, and water utility
14 industries. The program emphasized revenue requirement, cost allocation, rate design,
15 energy efficiency policies, as well as rate case procedures, testimony, and tatiffs.
16 Q. PLEASE DESCRIBE YOUR PROFESSIONAL BACKGROUND.
17 A. I began working at OPUC in May 2014. A summary of my education and professional
18 background is attached to this testimony as Exhibit CLZ-A.
19 Q. HAVE YOU PREVIOUSLY SUBMITTED WRITTEN TESTIMONY BEFORE
20 ANY REGULATORY AUTHORITY?
21 A. Yes. I have submitted written testimony before the Public Utility Commission of Texas
22 (Commission) on behalf of OPUC in the Application of Entergy Texas, Inc. for Authority
Direct Testimony of Cynthia L. Zamora On Behalf of the Office of Public Utility Counsel
SOAH Docket No. 473-18-3733; PUC Docket No. 48371 Page 3 of 53

1 to Implement a Distribution Cost Recovery Factor, Docket No. 43111, the Application of
2 Southwestern Public Service Company for Authority to Change Rates, Docket No. 43695,
3 the Application of Southwestern Public Service Company for Authority to Change Rates,
4 Docket No. 45524, the Joint Report and Application of Oncor Electric Delivery Company
5 LLC and NextEra Energy, Inc. for Regulatory Approvals Pursuant to PURA §§ 14.101,
6 39.262 and 39.915, Docket No. 46238, the Application of Southwestern Electric Power
7 Company for Authority to Change Rates, Docket No. 46449, and the Application of
8 Southwestern Public Service Company for Authority to Change Rates, Docket No. 47527.
9 Q. WHAT IS THE PURPOSE OF YOUR TESTIMONY?
10 A. The purpose of my testimony is to provide OPUC's recommendations regarding a
11 reasonable rate of return, capital structure, return on equity, and cost of long-term debt to
12 be used in the calculation of Entergy Texas, Inc.'s (ETI s) rates.
13 Q. HOW IS YOUR TESTIMONY ORGANIZED?
14 A. My testimony is divided into seven sections. This first section provides my background
15 information and scope of testimony. In Sections II and III, I summarize OPUC's
16 recommendations regarding a reasonable rate of return for ETI, discuss the framework
17 used to determine a reasonable rate of return, the current market environment, the current
18 credit ratings for ETI, and the Tax Cuts and Jobs Act of 2017 (TCJA). In Sections IV
19 and V, I discuss the criteria used to select a proxy group of companies for comparison,
20 present my constant-growth discounted cash flow (DCF) analysis, bond yield plus risk
21 premium analysis, capital asset pricing model (CAPM), and provide my cost of equity
22 recommendation. In Section VI, I discuss my recommended capital structure, cost of
Direct Testimony of Cynthia L. Zamora On Behalf of the Office of Public Utility Counsel
SOAH Docket No. 473-18-3733; PUC Docket No. 48371 Page 4 of 53

1
2
long-term debt and the weighted average cost of capital (WACC) for ETI. Finally, in
Section VII, I present my cost of capital recommendation for ETI.
3 Q. HAVE YOU PREPARED ANY SCHEDULES IN SUPPORT OF YOUR
4 TESTIMONY?
5 A. Yes. I have prepared four schedules, attached as Schedules CLZ-1 through CLZ-4.
6 Schedules CLZ-1 to CLZ-4 presents the results from my constant-growth DCF, bond
7 yield plus risk premium, and CAPM analyses.
8 Q. DO YOU ALSO HAVE WORKPAPERS SUPPORTING YOUR TESTIMONY?
9 A. Yes. My workpapers will be provided as a separate filing.
10 Q. CONCERNING ISSUES FOR WHICH YOU HAVE MADE NO
1 1 RECOMMENDATIONS IN YOUR TESTIMONY, SHOULD THE COMMISSION
12 PRESUME YOUR CONCURRENCE WITH THE COMPANY'S REQUESTS OR
13 METHODOLOGY?
14 A. No. My review did not extend to all issues discussed in ETF s application. I make no
15 implied assurances with regard to issues that I do not specifically address in my
16 testimony.
Direct Testimony of Cynthia L. Zamora On Behalf of the Office of Public Utility Counsel
SOAH Docket No. 473-18-3733; PUC Docket No. 48371 Page 5 of 53

1 II. SUMMARY OF RECOMMENDATIONS
2 Q. PLEASE SUMMARIZE YOUR RECOMMENDATION REGARDING A
3 REASONABLE RATE OF RETURN FOR ETI.
4 A. I recommend a rate of return (ROR) of 7.59%, based on a return on equity (ROE) of
5 9.40%, long-term cost of debt of 5.73%, and a capital structure of 49.10% long-term debt,
6 and 50.90% equity. My results are summarized in the table below:
7 Table CLZ-1: OPUC's Recommended Rate of Return
- % of
Capitalization Cost
Weighted Cost
Long-Term Debt 49.10% 5.73% 2.81%
Common Equity 50.90% 9.40% 4.78%
TOTAL 100% 7.59%
8 Q. WHAT FACTORS DID YOU CONSIDER IN DETERMINING YOUR
9 RECOMMENDED RETURN ON EQUITY?
10 A. My recommended return on equity for ETI is based on the results from my constant-
11 growth DCF analysis, bond yield plus risk premium analysis, and CAPM analysis. These
12 analyses estimate a fair return on equity based on observable market information and will
13 be reasonably sufficient for ETI to continue to provide safe and reliable service, attract
14 invested capital on reasonable terms, and maintain its financial integrity.
Direct Testimony of Cynthia L. Zamora On Behalf of the Office of Public Utility Counsel
SOAH Docket No. 473-18-3733; PUC Docket No. 48371 Page 6 of 53
1 Q. DID YOU ALSO CONSIDER THE CURRENT MARKET ENVIRONMENT
2 WHEN DETERMINING YOUR RECOMMENDED RETURN ON EQUITY?
3 A. Yes. Utility equities continue to be valued for their defensive characteristics because
4 they are seen as less risky and less volatile than non-utility equities, especially by income
5 investors looking for yield in the form of dividend payments. In fact, Edison Electric
6 Institute's (EEI) Annual Report states that the percentage of EEI Index utilities that raised
7 or reinstated their dividend in 2017 was 88%, the second-highest on record after 2016s
8 91%.1 Further, the industry's dividend payout ratio (54.3% as of December 31, 2017)
9 remains among the highest of all U.S. business sectors.2 As current market conditions
10 continue to be accommodating, due to the low interest rate environment and a need for
11 yield (i.e., income) by investors, electric utilities will continue to have access to capital
12 under reasonable terms and conditions, and at relatively low costs. This access to capital
13 is confirmed by the continued surge of capital expenditures in the utility industry, which
14 has grown from $74.3 billion in 2010 to a new record high of $113.6 billion in 2017, and
15 industry capex is expected to remain at elevated levels for at least the next few years.3
I Edison Electric Institute, 2017 Financial Review — Annual Report of the U.S. Investor Owned Electric Utility Industry at 17.
2 Id. at 19.
3 Id. at 67.
Direct Testimony of Cynthia L. Zamora On Behalf of the Office of Public Utility Counsel
SOAH Docket No. 473-18-3733; PUC Docket No. 48371 Page 7 of 53

1 III. RATE OF RETURN
2 A. FRAMEWORK
3 Q. PLEASE EXPLAIN THE LEGAL FRAMEWORK USED TO DETERMINE A
4 REASONABLE RATE OF RETURN FOR A REGULATED UTILITY.
5 A. The legal framework used to determine a reasonable rate of return is guided by two U.S.
6 Supreme Court decisions that established a minimum constitutional standard for
7 determining a fair rate of return for a regulated utility. In Bluefield Water Works &
8 Improvement Co. v. Public Service Commission of West Virginia, 262 U.S. 679, 693
9 (1923), the Supreme Court stated:
10 The return should be reasonably sufficient to assure confidence in the
11 financial soundness of the utility and should be adequate, under efficient
12 and economical management, to maintain and support its credit and enable
13 it to raise the money necessary for the proper discharge of its public
14 duties.
15 In Federal Power Commission v. Hope Natural Gas Co., 320 U.S. 591, 603 (1944), the
16 Supreme Court stated:
17 The return to the equity owner should be commensurate with returns on
18 investment in other enterprises having corresponding risks. That return,
19 moreover, should be sufficient to assure confidence in the financial
20 integrity of the enterprise so as to maintain its credit and to attract capital.
21 These two decisions establish the guiding framework in which utility investors are given
22 the opportunity to earn returns that are sufficient to attract capital, assure confidence in
23 the utility's financial integrity, and are comparable to other investments of similar risk.
Direct Testimony of Cynthia L. Zamora On Behalf of the Office of Public Utility Counsel
SOAH Docket No. 473-18-3733; PUC Docket No. 48371 Page 8 of 53

1 Q. DO YOU RELY ON ANY OTHER STANDARDS TO RECOMMEND A
2 REASONABLE RATE OF RETURN?
3 A. Yes. I am also relying on the Commission's rule, 16 TAC § 25.231(c)(1)(A), which
4 states:
5 The return should be reasonably sufficient to assure confidence in the
6 fmancial soundness of the electric utility and should be adequate, under
7 efficient and economical management, to maintain and support its credit
8 and enable it to raise the money necessary for the proper discharge of its
9 public duties. A rate of return may be reasonable at one time and become
10 too high or too low because of changes affecting opportunities for
11 investment, the money market, and business conditions generally.
12 Q. WHAT IS COST OF CAPITAL?
13 A. Cost of capital is the rate of return that the market requires to attract funds to a particular
14 investment, given the expected level of risk. The cost of capital is the price charged by
15 investors for bearing the risk that the company's future cash flows may differ from what
16 they anticipated. Cost of capital is based on investors expectations of what will happen
17 in the future, and it is therefore "forward-looking."4
18 Q. HOW DO YOU CALCULATE A UTILITY COMPANY'S RATE OF RETURN?
19 A. A utility company's rate of return (ROR) is also known as its weighted average cost of
20 capital (WACC). WACC is a compilation of the company's long-term debt, and equity
21 (in the form of common stock, and preferred stock, if any), with each of these
4 Duff & Phelps, 2016 Valuation Handbook-Guide to Cost of Capital at 1-20 (2016).
Direct Testimony of Cynthia L. Zamora On Behalf of the Office of Public Utility Counsel
SOAH Docket No. 473-18-3733; PUC Docket No. 48371 Page 9 of 53

1 components being assigned a "weight" or percentage of the total capital structure.5
2 Combined, the percentages of the debt and equity components will equal 100%. In the
3 competitive marketplace, the cost of debt and cost of equity are set by supply and
4 demand, and are influenced by the relationship between risk and expected return.
5 Q. IS A COMPANY'S COST OF EQUITY DIRECTLY OBSERVABLE TO
6 INVESTORS?
7 A. No. Unlike the cost of debt, which is based on objective inputs, such as the interest rate
8 or yield on debt securities, investors cannot directly observe a company's cost of equity.
9 Instead, a company's cost of equity is determined in the capital markets by the individual
10 investors expectations and requirements. Investment decisions are also driven by the
11 U.S. and global economies and reflect the risk and return opportunities available in the
12 capital markets. Therefore, the cost of equity is a function of the state of the economy,
13 including such factors like economic growth, interest rates and inflation. For this reason,
14 estimates are used in developing a cost of equity for a company's capital structure.
15 Q. DO FINANCIAL ANALYSTS HAVE DIFFERING ESTIMATES REGARDING A
16 COMPANY'S COST OF EQUITY?
17 A. Yes. Analysts often have differing estimates regarding a company's cost of equity due to
18 differences in how they weight the financial models, data inputs and sources, and in
19 interpreting the results. Additionally, analysts consider qualitative factors in making
20 estimates, including the company, industry and sector, along with the current state of the
Direct Testimony of Cynthia L. Zamora On Behalf of the Office of Public Utility Counsel
SOAH Docket No. 473-18-3733; PUC Docket No. 48371 Page 10 of 53

1 economy and financial markets. As such, analysts rely on both quantitative and
2 qualitative analyses.
3 Q. WHAT METHODS DID YOU USE TO ESTIMATE THE COST OF EQUITY?
4 A. I used three different methods to estimate ETI's cost of equity. The first is the constant-
5 growth DCF approach, which uses financial data for a group of regulated utilities with
6 comparable risk characteristics, i.e., a proxy group. The second is the bond yield plus
7 risk premium approach, which uses historical annual averages of authorized ROEs for
8 regulated utilities and historical yields on public utility bonds. The third is the CAPM
9 approach, which calculates a risk premium that is then added to the yield of a risk-free
10 security to compensate an investor for the systematic risk, i.e., market risk, of holding
11 that security.
12 B. CURRENT MARKET ENVIRONMENT
13 Q. WHAT COST OF EQUITY IS ETI REQUESTING?
14 A. ETI witness Robert B. Hevert is recommending a cost of equity (also referred to as a
15 return on equity or ROE) in the range of 10.25% to 10.75%, and states that a reasonable
16 ROE for ETI is 10.65%.6
17 Q. HOW HAS THE UTILITY INDUSTRY PERFORMED IN THE MARKET OVER
18 THE LAST SEVERAL YEARS?
19 A. The utility industry has exhibited robust utility stock valuations over the last several
20 years, which is a strong indicator that utilities have access to capital under reasonable
21 terms and conditions, and at relatively low costs. In fact, EEI's Annual Report states that
6 Direct Testimony of Robert B. Hevert at 4:15-18.
Direct Testimony of Cynthia L. Zamora On Behalf of the Office of Public Utility Counsel
SOAH Docket No. 473-18-3733; PUC Docket No. 48371 Page 11 of 53

1 the $5.7 billion in proceeds from issuance of common equity in 2017 was near the middle
2 of the $3.5 billion to $8.6 billion range of utility equity issuances, which includes most
3 years since 2007, due to the industry's strong stock market performance over the last
4 decade.7 The market continues to embrace the regulated utility industry as a safe-haven
5 investment and views utility equity and debt as low-risk securities. Although electric
6 utility equities have retreated slightly in price this year, in contrast to their strong
7 showing in 2017, this does not mean that utility stocks are inexpensive.8 Even after the
8 price declines, most of the electric utility stocks are still trading within their 2021-2023
9 Value Line Target Price Range, including ETI's parent company Entergy Corporation
10 (Entergy).9
11 Q. IS THE MARKET CURRENTLY EXPERIENCING INCREASED VOLATILITY?
12 A. Yes. The prospect of potential trade wars between the United States, China, and Europe
13 has become a focus for investors this year and has spurred increased volatility in financial
14 markets. A slowdown in trade could hinder business confidence, weigh on financial
15 markets, and reverse a recent synchronized upturn in global growth.1° This recent
16 escalation in trade tensions has left some investors more anxious. As investors become
17 more anxious they reallocate their funds to safer assets such as utility stocks and bonds
7 Edison Electric Institute, 2017 Financial Review — Annual Report of the U.S. Investor Owned Electric Utility Industry at 16.
8 Value Line Investment Survey's Electric Utility (Central) Industry, June 15, 2018.
9 Value Line Investment Survey's Electric Utility (West) Industry, July 27, 2018. The Value Line Target Price Range represents the band in which the expected average price of the stock is likely to fall in the next 3 to 5 years. Because utility stocks are performing strongly in the market this indicates that there is continued investor demand for utility stocks.
10 Timiraos, Nick, "Fed Expects to Keep Raising Rates, Ending Years of Stimulus," Wall Street Journal, July 5, 2018.
Direct Testimony of Cynthia L. Zamora On Behalf of the Office of Public Utility Counsel
SOAH Docket No. 473-18-3733; PUC Docket No. 48371 Page 12 of 53
1 and away from more risky assets such as emerging market bonds and some growth
2 stocks.11
3 Q. HOW DOES AN INCREASE IN MARKET VOLATIITY AFFECT UTILITY
4 STOCKS?
5 A. As trade tensions continue to weigh on market sentiment, investors are pouring more
6 funds into the S&P 500 utilities sector, which is considered a safer bet because of its
7 relatively big dividend payouts, with the sector rising 8.1% over the past four weeks.12
8 As volatility increases in the market, income investors will continue to purchase safe
9 assets, such as utility stocks, and this is confirmed by electric utility stocks trading within
10 their 2021-2023 Value Line Target Price Range.
11 Q. DID YOU ALSO CONSIDER RECENT ACTIONS BY THE FEDERAL
12 RESERVE IN DETERMINING YOUR RECOMMENDED RATE OF RETURN?
13 A. Yes.
14 Q. WHAT DID THE FEDERAL RESERVE BANK OPEN MARKET COMMITTEE
15 DECIDE AT ITS LATEST MEETING?
16 A. The latest press release issued on June 13, 2018 from the Federal Reserve Bank Open
17 Market Committee (FOMC) indicates that the labor market has continued to strengthen
18 and that economic activity has been rising at a solid rate. The FOMC raised the target
19 range for the federal funds rate by a quarter-percentage point to the range of "1-374 percent
11 Kruger, Daniel, "Behind the Flattening Yield Curve: Fed Rate Increases and Tariff Fights," Wall Street Journal, July 5, 2018.
12 Otani, Akane and Eisen, Ben, U.S. Stocks Resilient in Trade Spat, Sparking Complacency Fears," Wall Street Journal, July 16, 2018.
Direct Testimony of Cynthia L. Zamora On Behalf of the Office of Public Utility Counsel
SOAH Docket No. 473-18-3733; PUC Docket No. 48371 Page 13 of 53

1 to 2 percent." The June 13, 2018 FOMC press release, attached as Exhibit CLZ-B,
2 includes the following explanation for the additional increase in the target range:
3 Information received since the Federal Open Market Committee
4 met in May indicates that the labor market has continued to strengthen and
5 that economic activity has been rising at a solid rate. Job gains have been
6 strong, on average, in recent months, and the unemployment rate has
7 declined. Recent data suggest that growth of household spending has
8 picked up, while business fixed investment has continued to grow
9 strongly. On a 12-month basis, both overall inflation and inflation for
10 items other than food and energy have moved close to 2 percent.
11 Indicators of longer-term inflation, expectations are little changed, on
12 balance.
13 In view of realized and expected labor market conditions and
14 inflation, the Committee decided to raise the target range for the federal
15 funds rate to 1-3/4 percent to 2 percent. The stance of monetary policy
16 remains accommodative, thereby supporting strong labor market
17 conditions and a sustained return to 2 percent inflation.
18 Q. IS THE LASTEST FOMC STATEMENT CONSISTENT WITH PREVIOUS
19 ACTIONS BY THE FEDERAL RESERVE TO CONTINUE THE PROCESS OF
20 NORMALIZING RATES?
21 A. Yes. Because of the Great Recession, the FOMC held rates near zero percent from the
22 end of 2008 through most of 2015, before lifting the benchmark rate once in late 2015
23 and once in late 2016. During 2017 the FOMC raised rates three times each by a quarter-
24 percentage point during the year. The FOMC released new economic projections
25 showing a narrow majority of officials favored raising rates a total of at least four times
Direct Testimony of Cynthia L. Zamora On Behalf of the Office of Public Utility Counsel
SOAH Docket No. 473-18-3733; PUC Docket No. 48371 Page 14 of 53

1 this year, up from the three increases anticipated in March.13 Further, the FOMC minutes
2 show that officials must now determine the neutral setting for the federal funds rate, the
3 level that neither spurs nor slows growth, now that they expect the economy to grow
4 faster than is sustainable over the long mn.14 Federal official's June projections show
5 most expect the federal funds rate to settle over the long run between 2.75% and 3%,
6 which is an approximation of neutral rates.15
7 Q. HOW DO THESE ACTIONS BY THE FEDERAL RESERVE TO CONTINUE
8 THE PROCESS OF NORMALIZING RATES AFFECT SHORT- AND LONG-
9 TERM RATES?
10 A. It is expected that the Federal Reserve will continue to raise short-term interest rates over
11 the next year to a level that no longer seeks to stimulate growth, formally ending a post-
12 crisis chapter in which the central bank unleashed unprecedented stimulus campaigns.16
13 However, even with the FOMC gradually raising short-term rates over the last several
14 years, it has not resulted in a corresponding increase to long-term rates in the U.S. The
15 gap between yields on short- and longer-term Treasuries has narrowed to nearly an 11-
16 year low. Analysts note that this narrowing of the yield curve signals to investors that
13 Timiraos, Nick, "What to Watch 5, 2018.
14 Timiraos, Nick, "Fed Expects to 5, 2018.
15 Id.
16 Id.
in the Federal Reserve's June Meeting Minutes," Wall Street Journal, July
Keep Raising Rates, Ending Years of Stimulus," Wall Street Journal, July
Direct Testimony of Cynthia L. Zamora On Behalf of the Office of Public Utility Counsel
SOAH Docket No. 473-18-3733; PUC Docket No. 48371 Page 15 of 53

1 future econoinic growth could slow and possibly lead to a recession if the yield curve
2 inverts.17
3 Q. WOULD YOU NORMALLY EXPECT INCREASES IN SHORT-TERM RATES
4 TO LEAD TO CORRESPONDING INCREASES IN LONG-TERM RATES?
5 A. Yes.
6 Q. PLEASE EXPLAIN WHY LONG-TERM RATES ARE NOT RISING AS A
7 RESULT FROM THE FEDERAL RESERVE ACTIONS TO RAISE SHORT-
8 TERM RATES.
9 A. Although short-term rates are rising, it has not had a corresponding effect on long-term
10 rates. Long-term treasury yields remain historically low because these yields are still
11 highly attractive to foreign investors because interest rates in Japan and Europe are still
12 either negative or close to zero percent.18 Because interest rates around the globe remain
13 close to zero, this has led to a ceiling on how high long-term yields for Treasuries are
14 expected to increase in the near-term in the U.S.
15 Q. HOW ARE CURRENT MARKET CONDITIONS AFFECTING UTILITY
16 BONDS?
1 7 A. The combination of the increase in volatility in the market, coupled with the suppression
18 of long-term rates, has led investors to find utility bonds an attractive investment.
19 Because U.S. utilities are regulated entities, investors can earn an additional yield on top
17 Kruger, Daniel, "Behind the Flattening Yield Curve: Fed Rate Increases and Tariff Fights," Wall Street Journal, July 5, 2018.
18 Edison Electric Institute, 2017 Financial Review — Annual Report of the U.S. Investor Owned Electric Utility Industry at 9-10. The long-term yields remain suppressed in Japan and Europe due to lethargic economies and aggressive asset purchase programs at both the Bank of Japan and the European Central Bank.
Direct Testimony of Cynthia L. Zamora On Behalf of the Office of Public Utility Counsel
SOAH Docket No. 473-18-3733; PUC Docket No. 48371 Page 16 of 53

1
of long-term U.S. treasuries, without having to increase the level of risk as compared to
2
other non-regulated corporate peers.19 Thus, U.S. electric utilities continue to issue long-
3
term debt at favorable rates, and are able to take advantage of strong investor demand. It
4
is expected that long-term rates will remain depressed for the near term and utilities will
5
continue to have access to financial markets.
6 C. CREDIT PROFILE
7 Q. PLEASE DESCRIBE THE BUSINESS OPERATIONS OF ETI AND ENTERGY.
8 A. ETI is a Texas corporation and is a subsidiary of Entergy Corporation, a Delaware
9 corporation. ETI provides fully bundled electric delivery services to approximately
10 434,000 customers across 27 counties in Southeast Texas.2° Entergy operates primarily
11 through two business segments: Utility and Entergy Wholesale Commodities.21 The
12 utility business segment includes the generation, transmission, distribution, and sale of
13 electric power in portions of Arkansas, Mississippi, Texas, and Louisiana; and the
14 operation of a small natural gas distribution business.22 The wholesale commodities
15 business segment includes the ownership, operation, and decommissioning of nuclear
16 power plants located in the northern U.S. and the sale of the electric power produced by
17 its operating plants to wholesale customers.23
39 Id. at 9.
29 ETI Application at 1-5.
21 Entergy Form 10-Q dated March 31, 2018 at 1.
22 Id.
23 Id.
Direct Testimony of Cynthia L. Zamora On Behalf of the Office of Public Utility Counsel
SOAH Docket No. 473-18-3733; PUC Docket No. 48371 Page 17 of 53

1 Q. BRIEFLY DESCRIBE WHAT CREDIT RATINGS ARE AND HOW THEY ARE
2 USED IN THE FINANCIAL MARKETS.
3 A. A credit rating reflects the general credit risk of the company, and its ability to pay its
4 financial obligations when due, and is reflected in the amount of interest charged by
5 lenders. Investment grade credit ratings indicate that the company has access to capital
6 markets on reasonable terms, has demonstrated the capacity and capability to meet its
7 financial obligations, and has a stable or low risk of credit default.
8 Q. WHAT ARE ETI'S CURRENT CORPORATE CREDIT RATINGS?
9 A. ETI's current corporate and senior secured credit ratings are listed below:
10 Table CLZ-2: ETI's Current Corporate Credit Ratings24
Rating Agency Corporate
Credit Rating Senior Secured Credit Rating Outlook
Standard and Poor's (S&P)
BBB+ A Stable
Moody's Investors Service (Moody's)
Baa3 Baal Stable
11 Q. WHAT DO THESE CORPORATE CREDIT RATINGS INDICATE FOR ETI?
12 A. ETI's current corporate and senior secured credit ratings are considered investment grade
13 by S&P and Moody's.
24 See ETI's Response to TIEC RFI No. 4-10.
Direct Testimony of Cynthia L. Zamora On Behalf of the Office of Public Utility Counsel
SOAH Docket No. 473-18-3733; PUC Docket No. 48371 Page 18 of 53

1 Q. HOW DOES S&P CURRENTLY VIEW ETI'S CREDIT PROFILE?
2 A. The latest S&P credit report dated August 9, 2017,25 states that ETI's business risk is
3 strong based on its lower-risk, regulated utility operations, with above-average growth,
4 partially offset by its regulatory challenges. ETI's business risk profile is at the higher
5 end of its category, which is one rating below the excellent business risk profile. S&P
6 states that ETI's financial risk is aggressive and applies more liberal benchmarks than is
7 used with the typical corporate issuer, reflecting the company's more stable rate-
8 regulated utility business and relatively higher operating risk of regulated generation.26
9 S&P states that ETI's liquidity is adequate and believes it can more than cover its needs
10 for the next 12 months, even if EBITDA declines by 10%, and expects ETI's liquidity
11 sources will exceed its uses by more than 1.1x.27 S&P further notes that it views
12 Entergy's plans to successfully exit its higher-risk merchant nuclear generation and grow
13 its lower-risk, rate-regulated utility business as positive for ETI.28
14 Q. HOW DOES MOODY CURRENTLY VIEW ETI'S CREDIT PROFILE?
15 A. The latest Moody's credit report dated September 22, 2017,29 states that ETI's credit
16 profile reflects the company's operations as a vertically integrated, rate regulated electric
17 utility, with strong financial metrics that are partially offset by below average consistency
18 and predictability of regulatory decisions, and an elevated capital plan over the medium-
25 See ETI's Response to OPUC RFI No. 1-2 at BB381-BB388. 26 Id. 27 Id.
28 Id.
29 See ETI's Response to OPUC RFI No. 1-2 at BB422-BB428.
Direct Testimony of Cynthia L. Zamora On Behalf of the Office of Public Utility Counsel
SOAH Docket No. 473-18-3733; PUC Docket No. 48371 Page 19 of 53

1
term. ETI currently has robust cash flow metrics for its current credit profile and reflects
2
a stronger credit profile than Baa3 peers.3° Moody's rates ETI s liquidity as adequate,
3
based on its projections that ETI will maintain its current capital expenditure plan for at
4 least the next two years without exhausting committed facilities. Moody's credit
5 strengths for ETI include sustainable cash flow to debt metrics and prospects for growing
6 rate base over the near-term; credit challenges include regulatory outcomes and a service
7 territory that is exposed to storm activity.31
8 Q. WHAT DO THESE INVESTMENT GRADE CREDIT RATINGS ISSUED BY
9 S&P AND MOODY'S INDICATE FOR ETI?
10 A. ETI has investment grade corporate credit ratings and senior secured credit ratings, along
11 with stable outlooks issued by both S&P and Moody's. ETI continues to have access to
12 the credit markets, which is confirmed by ETI' s investment of approximately $1.4 billion
13 dollars of additional capital improvements placed into rate base since its last rate case32
14 (test year ended March 31, 2013).33 Both S&P and Moody's state that ETI has adequate
15 liquidity and that ETI can maintain its current capital expenditure plan for at least the
16 next two years without exhausting committed facilities. ETI also participates in the
17 Entergy money pool for most of its liquidity and short-term funding needs, and also has
18 the ability to draw upon its own credit facility and Entergy's credit facility, if needed.
30 Id.
31 Id.
32 Application of Entergy Texas, Inc. for Authority to Change Rates and Reconcile Fuel Costs, Docket No. 41791.
33 Direct Testimony of Sallie T. Rainer at 8:7-11.
Direct Testimony of Cynthia L. Zamora On Behalf of the Office of Public Utility Counsel
SOAH Docket No. 473-18-3733; PUC Docket No. 48371 Page 20 of 53

1 With regard to ETI's credit challenges, S&P and Moody's both recognize that Texas has
2 in place recovery mechanisms that allow ETI to recover its prudent hurricane storm costs.
3 D. TAX CUTS AND JOBS ACT OF 2017
4 Q. HAS THERE BEEN A SIGNIFICANT CHANGE IN FEDERAL INCOME TAX
5 RATES?
6 A. Yes. The Tax Cuts and Jobs Act of 2017 (TCJA) was passed by Congress on December
7 20, 2017 and was signed into law by President Trump on December 22, 2017. The
8 Commission established Project No. 4794534 to investigate and address the effects of the
9 TCJA on rates of Texas investor-owned utility companies.
10 Q. PLEASE BRIEFLY DESCRIBE HOW•THE TCJA WILL IMPACT REGULATED
11 UTILITIES.
12 A. The Tax Cuts and Job Act of 2017 impacts regulated utilities in three primary ways: (1) it
13 reduces a utility's corporate tax rate from 35% to 21%; (2) it affects the treatment of
14 accumulated deferred income taxes (ADIT); and (3) it eliminates the right of utilities to
15 calculate taxes using bonus depreciation.35 The net effect is that it could reduce the cash
16 flows of regulated utilities. However, even after the passage of the TCJA, Moody's
17 incorporates a view that U.S. investor owned regulated utilities will still maintain
34 Proceeding to Investigate and Address the Effects of Tax Cuts and Jobs Act of 2017 on the Rates of Texas Investor-Owned Utility Companies, Project No. 47945, Amended Order Related to Changes in Federal Income Tax Rates (Feb. 13, 2018).
35 Maloney, Peter, "For Utilities, the New Corporate Tax Cuts are a Double-Edged Sword," Utility Dive, February 1, 2018.
Direct Testimony of Cynthia L. Zamora On Behalf of the Office of Public Utility Counsel
SOAH Docket No. 473-18-3733; PUC Docket No. 48371 Page 21 of 53
1 unfettered access to the capital markets, and continues to view regulated utilities as a
2 defensive investment.36
3 Q. HAS MOODY'S RECENTLY ISSUED AN ANNOUNCEMENT REGARDING
4 RECENT CHANGES TO THE U.S. REGULATED UTILITY SECTOR
5 OUTLOOK?
6 A. Yes. On June 18, 2018, Moody's issued an announcement changing the U.S. regulated
7 utility sector outlook37 to negative from stable, reflecting the TCJA impacts on cash flow
8 ratios and the general uncertainty on how regulators will address these impacts.38
9 Q. DESPITE MOODY'S RECENT RATINGS ACTION, HOW DOES MOODY'S
10 GENERALLY VIEW THE U.S. REGULATED UTILITY SECTOR?
1 1 A. Moody's states that U.S. regulated utilities continue to be viewed as critical infrastructure
12 assets, which mean they have roughly a 3x lower probability of default than their non-
13 financial corporate peers.39 Moody's incornorates a view that U.S. investor owned
14 regulated utilities will maintain unfettered access to the capital markets, and continues to
15 view regulated utilities as a defensive investment alternative in the event of a wide-
16 spread, short-duration financial market shock. These factors provide the sector with a
36 See Moody's Announcement: Moody's Changes the U.S. Regulated Utility Sector Outlook to Negative from Stable, June 18, 2018. See ETI's Response to TIEC RFI No. 4-9 at LC358-LC376 for a copy of Moody's Report.
37 A negative credit outlook is not the same as a negative credit watch, which indicates significant uncertainty about future credit worthiness.
38 See Moody's Announcement: Moody s Changes the U.S. Regulated Utility Sector Outlook to Negative from Stable, June 18, 2018.
39 Id.
Direct Testimony of Cynthia L. Zamora On Behalf of the Office of Public Utility Counsel
SOAH Docket No. 473-18-3733; PUC Docket No. 48371 Page 22 of 53

1 strong, investment grade credit profile, which continues to be the case, notwithstanding
2 the negative sector outlook.4°
3 Q. HOW DOES S&P VIEW THE IMPACTS OF THE TCJA ON THE U.S.
4 REGULATED UTILITY SECTOR?
5 A. S&P issued a Report on January 24, 2018 titled U.S. Tax Reform: For Utilities Credit
6 Quality, Challenges Abound."41 S&P states that to the extent tax reform has some one-
7 time, up-front effects on earnings or prompts write-offs, S&P is likely to look past that
8 and concentrate on any ongoing, forward-looking impact on cash flow ratios. S&P
9 further states it will probably take the remainder of this year to fully assess the financial
10 impact on each issuer from the change in tax liabilities, the regulatory response, and the
11 company's ultimate response.42
12 Q. IS THERE A WAY TO MITIGATE THE IMPACT ON ETI'S CASH FLOWS
13 FROM FLOWING BACK THE "UNPROTECTED" EXCESS ADIT TO
14 RATEPAYERS?
15 A. Yes. OPUC witness Constance Cannady is recommending that the Commission require
16 ETI to flow back the "unprotectee excess ADIT to ratepayers over a five-year
17 amortization period.43 ETI would flow back approximately $29.26 million over five-
18 years instead of $146.32 million over two years.44 By increasing the amortization period
40 Id. 41 Direct Testimony of Ellen Lapson at Attachment EL-8. 42 Id.
43 Direct Testimony of Constance T. Cannady at 31:3-34:10.
44 Id at 32:20-33:3. A five-year amortization of the $146.32 unprotected EDIT results in an annual tax refund of $29.26 grossed up for taxes at a rate of 1.266.
Direct Testimony of Cynthia L. Zamora On Behalf of the Office of Public Utility Counsel
SOAH Docket No. 473-18-3733; PUC Docket No. 48371 Page 23 of 53

1 from two years to five years this will have a positive impact on ETI's cash flow, which
2 will further strengthen ETI's cash flow ratios. OPUC witness Cannady further discusses
3 OPUC's TCJA recommendations in her direct testimony.
4 IV. SELECTION OF PROXY GROUP
5 Q. WHY DO ANALYSTS SELECT A PROXY GROUP?
6 A. Analysts select a proxy group of publicly traded companies with similar risk profiles to
7 estimate a company's cost of equity, especially if that company, like ETI, is not publicly
8 traded. However, a proxy group is important even if the company is publicly traded, to
9 smooth out any short-term market fluctuations over a group of companies with similar
10 risk profiles. This is because, as I mentioned earlier, a company's cost of equity is not
11 directly observable.
12 Q. WHAT CRITERIA DID ETI WITNESS MR. HEVERT USE IN SELECTING HIS
13 PROXY GROUP?
14 A. Mr. Hevert starts with the electric utilities included in Value Line, and applies his
15 screening criteria to exclude companies that in his opinion do not have comparable risk to
16 ETI. Mr. Hevert excludes companies that: (1) do not pay consistent quarterly cash
17 dividends; (2) are not covered by at least two utility industry equity analysts; (3) do not
18 have investment grade senior unsecured and/or corporate credit ratings; (4) are not
19 vertically integrated utilities; (5) have regulated operating income less than 60% of total
20 operating income; (6) have regulated electric operating income less than 60% of total
21 regulated operating income; and (7) are currently known to be a party to a merger or
Direct Testimony of Cynthia L. Zamora On Behalf of the Office of Public Utility Counsel
SOAH Docket No. 473-18-3733; PUC Docket No. 48371 Page 24 of 53

1 other significant transaction.45 Mr. Hevert's proxy group includes 20 utility companies,
2 which are listed in his Table 2: Proxy Group Screening Results.46
3 Q. PLEASE DESCRIBE YOUR PROXY GROUP.
4 A. My proxy group is similar to Hevert's proxy group, except that I included ETI' s parent
5 company, Entergy in my proxy group because it meets the screening criteria described
6 above and is similar in risk to ETI. The 21 comparable companies included in my proxy
7 group are listed in the table below:
8 Table CLZ-3: OPUC's Proxy Group
Company Ticker
Allete, Inc. ALE Alliant Energy Corp. LNT Ameren Corporation AEE American Electric Power Company, Inc. AEP Black Hills Corporation BKH CMS Energy Corporation CMS DTE Energy Company DTE Duke Energy, Inc. DUK El Paso Electric Company EE Entergy Corporation ETR Hawaiian Electric Industries, Inc. HE IDACORP, Inc. IDA NorthWestern Corporation NWE OGE Energy Corp. OGE Otter Tail Corporation OTTR Pinnacle West Capital Corporation PNW PNM Resources, Inc. PNM Portland General Electric Company POR Southern Company SO WEC Energy Group, Inc. WEC Xcel Energy, Inc. XEL
45 Hevert Direct at 10:9-11:2.
46 Id. at 11 (Table 2).
Direct Testimony of Cynthia L. Zamora On Behalf of the Office of Public Utility Counsel
SOAH Docket No. 473-18-3733; PUC Docket No. 48371 Page 25 of 53

where Po = D. = ki, = Pn = n =
14
15 16 17 18 19
1 V. COST OF EQUITY
2 A. DISCOUNTED CASH FLOW
3 Q. PLEASE DESCRIBE THE FIRST METHODOLOGY YOU USED IN
4 DETERMINING THE COST OF EQUITY FOR ETI.
5 A. I first used the constant-growth discounted cash flow (DCF) model, also known as the
6 dividend discount model and the Gordon growth mode1.47 The DCF model is based on
7 the concept that the price an investor is willing to pay for a share of common stock is
8 equal to the present value of all future income streams. The income stream includes
9 dividend payments and the final price appreciation once the share of common stock is
10 sold. The rate at which the expected income stream is discounted reflects the investor's
11 perception of the risk associated with the future income stream. In other words, the
12 greater the likelihood that actual future returns will be below required returns, the larger
13 the discount rate investors will require. The DCF model is expressed as follows:
Di D2 Pn = + +
(1+ k)1 (1 +102 (1 +100
current share price expected dividend in each future year discount rate or the market cost of common equity market price of a share of common stock in "If year year of expected share price realized
47 Jordan, Bradford D. and Miller Jr., Thomas W., Fundamentals of Investments Valuation and Management at 167-170 (Fifth Edition, 2009).
Direct Testimony of Cynthia L. Zamora On Behalf of the Office of Public Utility Counsel
SOAH Docket No. 473-18-3733; PUC Docket No. 48371 Page 26 of 53

where 13„ = D„ = kn =
11 12 13
1 Q. WHAT FACTORS DETERMINE THE CASH FLOWS OR STREAM OF
2 FUTURE DIVIDENDS?
3 A. The amount of dividends paid to investors will depend on the company's earnings. The
4 portion of earnings not paid to investors as dividends is retained and reinvested, which
5 then generates additional growth in earnings and dividends because the utility earns a
6 return on the newly invested capital placed into rate base. The DCF model incorporates
7 this growth by discounting the future stream of dividends. The expected growth of future
8 dividends will depend on the Company's earnings retention ratio, as well as the sale of
9 new common stock. The standard DCF formula can then be expressed as follows:
D„
10 Pn =
market price of a share of common stock current dividend discount rate or the market cost of common equity, with k > g
14 gh . expected growth rate in dividends per share
15 Q. IS THE MARKET COST OF EQUITY A FAIR RETURN ON EQUITY?
16 A. Yes. If the investor feels that the current market price is an adequate reflection of the risk
17 in holding the stock, the investor will purchase at that price. If not, the price of the stock
18 will either be bid up or down until the expected return sufficiently compensates for the
19 risk. Since a company's stock must compete with other investment opportunities, the
20 market cost of common stock will be the rate of return necessary for an investor to buy or
21 hold the stock. By rearranging the above formula, the fair rate of return on equity can be
22 expressed as:
Direct Testimony of Cynthia L. Zamora On Behalf of the Office of Public Utility Counsel
SOAH Docket No. 473-18-3733; PUC Docket No. 48371 Page 27 of 53
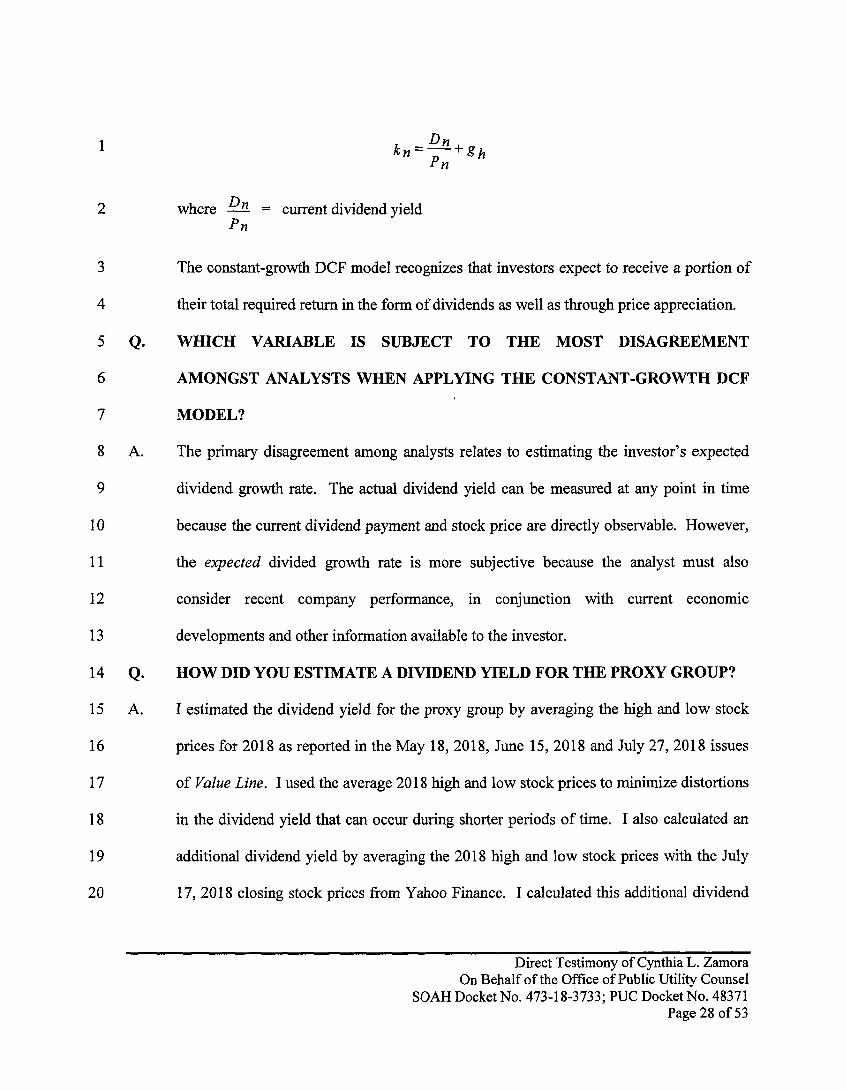
k„— gh
1
2 where Dn = current dividend yield P n
3 The constant-growth DCF model recognizes that investors expect to receive a portion of
4 their total required return in the form of dividends as well as through price appreciation.
5 Q. VVHICH VARIABLE IS SUBJECT TO THE MOST DISAGREEMENT
6 AMONGST ANALYSTS WHEN APPLYING THE CONSTANT-GROWTH DCF
7 MODEL?
8 A. The primary disagreement among analysts relates to estimating the investor's expected
9 dividend growth rate. The actual dividend yield can be measured at any point in time
10 because the current dividend payment and stock price are directly observable. However,
11 the expected divided growth rate is more subjective because the analyst must also
12 consider recent company performance, in conjunction with current economic
13 developments and other information available to the investor.
14 Q. HOW DID YOU ESTIMATE A DIVIDEND YIELD FOR THE PROXY GROUP?
15 A. I estimated the dividend yield for the proxy group by averaging the high and low stock
16 prices for 2018 as reported in the May 18, 2018, June 15, 2018 and July 27, 2018 issues
17 of Value Line. I used the average 2018 high and low stock prices to minimize distortions
18 in the dividend yield that can occur during shorter periods of time. I also calculated an
19 additional dividend yield by averaging the 2018 high and low stock prices with the July
20 17, 2018 closing stock prices from Yahoo Finance. I calculated this additional dividend
Direct Testimony of Cynthia L. Zamora On Behalf of the Office of Public Utility Counsel
SOAH Docket No. 473-18-3733; PUC Docket No. 48371 Page 28 of 53

1 yield as a spot check to my first dividend yield to ensure that it continues to be a
2 reasonable estimate. The calculated dividend yields for each utility are shown in
3 Schedule CLZ-1. The average 2019 dividend yield for my proxy group using Value
4 Line's 2018 high and low stock prices is 3.76% and 3.67%, when including the July 17,
5 2018 closing stock prices.
6 Q. ARE THE CALCULATED DIVIDEND YIELDS CONSISTENT WITH CURRENT
7 MARKET CONDITIONS?
8 A. Yes. My estimated 2019 dividend yield range for the proxy group results in a dividend
9 yield of 3.76%, using the average 2018 high and low stock prices, and has trended
10 downwards by 9 basis points to 3.67%, using the average 2018 high and low stock prices
11 and the July 17, 2018 closing stock prices. My dividend yield results are consistent with
12 current market conditions because of the inverse relationship between stock prices and
13 dividend yields. Since electric utility equities have gained back some of their earlier
14 losses from the beginning of the year, it would be expected that the dividend yield would
15 decrease as utility stocks increase in price.
16 Q. WHY ARE DIVIDEND YIELDS FOR THE ELECTRIC UTILITY INDUSTRY AT
17 HISTORICAL LOWS?
18 A. The average dividend yield for the electric industry as reported by Value Line is currently
19 3.40%, which is low by historical standards.48 The defensive characteristics of electric
20 utility stocks have attracted income-oriented investors worried about market volatility
21 and looking for stable dividend income. As the electric utility industry attracts investors,
48 Value Line Investment Survey's Electric Utility (West) Industry, July 27, 2018.
Direct Testimony of Cynthia L. Zamora On Behalf of the Office of Public Utility Counsel
SOAH Docket No. 473-18-3733; PUC Docket No. 48371 Page 29 of 53

1 it will continue to put downward pressure on dividend yields. But even with the current
2 low dividend yield, it is still larger than current yields on U.S. Treasuries, which has
3 increased the appeal and value of utility stocks. The ongoing demand for low-risk
4 investments can reasonably be expected to continue to provide attractive low-cost capital
5 for regulated utilities.
6 Q. HOW DID YOU DETERMINE THE EXPECTED DIVIDEND GROWTH RATE
7 FOR YOUR PROXY GROUP?
8 A. I first determined the growth in book value per share for the proxy companies, and then
9 determined the sustainable retained earnings growth rate. The sustainable retained
10 earnings growth rate is calculated by taking the expected retention ratio and multiplying
11 it by the expected rate of return on book value common equity. The retained earnings
12 growth rate is also termed the BR gowth rate, where B equals the retention ratio and R
13 equals the return on common equity.
14 The retention ratio is the proportion of earnings kept back in the company as
15 retained earnings, rather than being paid out as dividends to shareholders. On a per share
16 basis, the retention ratio can be expressed as: B = 1 — (DPS/EPS). The return on
17 common equity can be expressed as: R = EPS/BVPS. The formula for the BR growth
18 rate can then be expressed as:
DPS) EPS BR = (1 — —
EPS x BVPS
19 where DPS = dividend per share
20 EPS = earnings per share
21 BVPS = book value per share
Direct Testimony of Cynthia L. Zamora On Behalf of the Office of Public Utility Counsel
SOAH Docket No. 473-18-3733; PUC Docket No. 48371 Page 30 of 53

1 The BR growth rate is the long-term expected dividend growth rate. I calculated
2 the 2019 BR growth rate for each utility in the proxy group using Value Line's 2019
3 projected earnings, dividends, and book value.
4 Q. WHY IS IT APPROPRIATE TO ALSO CALCULATE A SUSTAINABLE
5 RETAINED EARNINGS GROWTH RATE, RATHER THAN RELYING SOLELY
6 ON EARNINGS GROWTH RATES, WHEN ESTIMATING A LONG-TERM
7 DIVIDEND GROWTH RATE?
8 A. It is appropriate to also calculate a sustainable retained earnings growth rate (i.e., BR
9 growth rate) when estimating a long-term dividend growth rate because earnings that are
10 not paid out as dividends to shareholders are reinvested by the utility. As additional plant
11 is funded by retained earnings, the utility is allowed to earn its authorized rate of return
12 on the additional plant in rate base, which leads to future growth in earnings and
13 dividends. The BR growth rate helps gauge whether investors current long-term
14 dividend growth rates can be sustained in future periods. Growth in earnings and
15 dividends alone generally do not provide reliable estimates of growth, particularly since
16 year-to-year changes in earnings and dividends can be unduly influenced by changes in
17 earned returns and/or dividend payout ratios.
18 Q. WHY IS IT APPROPRIATE TO CONSIDER HISTORICAL GROWTH RATES
19 FOR THE PROXY GROUP?
20 A. The historical growth rates for the proxy group should be considered because the
21 regulatory ratemaking framework results in fewer fluctuations and more stable revenues
22 and earnings. In addition, investors attach more significance to past financial results of
Direct Testimony of Cynthia L. Zamora On Behalf of the Office of Public Utility Counsel
SOAH Docket No. 473-18-3733; PUC Docket No. 48371 Page 31 of 53

1 utilities than for other sectors of the economy due to this more stable environment. Also,
2 since historical and projected data is easily accessible to investors, it is •likely that
3 investors rely on both when making investment decisions in utility stocks.
4 Q. WHAT ARE THE HISTORICAL GROWTH RATES FOR YOUR PROXY
5 GROUP?
6 A. In Schedule CLZ-2, I provide a summary chart of the average 5-year and 10-year
7 historical growth rates for the proxy group. The 5-year average historical growth in
8 earnings, dividends and book value for the proxy group are 6.03%, 6.13% and 4.53%,
9 respectively. The 10-year average historical growth in earnings, dividends and book
10 value for the proxy group are 4.63%, 5.24% and 4.33%, respectively. I used Value Line's
11 5-year and 10-year historical growth statistics to calculate the average for the proxy
12 group. I did not include any negative or missing values in the calculation of the proxy
13 group average.
14 Q. WHAT ARE THE PROJECTED GROWTH RATES FOR YOUR PROXY
15 GROUP?
16 A. In Schedule CLZ-2, I also provide a summary chart of the 5-year projected growth in
17 earnings, dividends, and book value, the 2019 BR growth rate, and the 5-year projected
18 BR growth rate for the proxy group. The 5-year projected growth in earnings, dividends
19 and book value for the proxy group are 5.31%, 5.33% and 4.29%, respectively. The 2019
20 BR growth rate for the proxy group is 3.55% and the 5-year projected BR growth rate is
21 3.75%. I used Value Line's projected growth statistics to calculate the average for the
22 proxy group.
Direct Testimony of Cynthia L. Zamora On Behalf of the Office of Public Utility Counsel
SOAH Docket No. 473-18-3733; PUC Docket No. 48371 Page 32 of 53

1 Q. WHAT DCF RANGE DO YOU CALCULATE FOR THE PROXY GROUP?
2 A. Based on my review, a reasonable (historical and projected) growth rate expectation for
3 the proxy group is 3.55% to 6.13%. This range incorporates my calculated 2019 BR
4 growth rate, 5-year projected BR growth rate, Value Line's 5-year and 10-year historical
5 dividend, earnings and book value growth, and Value Line's 5-year projected dividend,
6 earnings and book value growth. I calculated my recommended DCF range by:
7 • Adding my calculated 2019 average dividend yield of 3.76% (using Value Line's
8 2018 high and low stock prices) to my growth rate range above, which results in a
9 DCF estimate range of 7.31% to 9.89%;
10 • Adding my calculated 2019 average dividend yield of 3.67% (using Value Line's
11 2018 high and low stock prices and the July 17, 2018 closing stock prices) to my
12 growth rate range above, which results in a DCF range of 7.22% to 9.80%;
13 • Adding Value Line's average dividend yield of 3.40% to my growth rate range
14 above, which results in a DCF estimate range of 6.95% to 9.53%; and
15 • Results in my overall recommended DCF range of 6.95% to 9.89%.
16 B. BOND YIELD PLUS RISK PREMIUM
17 Q. PLEASE EXPLAIN MR. HEVERT'S BOND YIELD PLUS RISK PREMIUM
18 MODEL.
19 A. The bond yield plus risk premium model is based on the principle that an equity
20 investment is risker than a bond investment, and equity investors therefore require a risk
21 premium over and above the return they would earn on a less risky debt instrument. Mr.
22 Hevert defines his risk premium as the difference between authorized ROEs and the then-
Direct Testimony of Cynthia L. Zamora On Behalf of the Office of Public Utility Counsel
SOAH Docket No. 473-18-3733; PUC Docket No. 48371 Page 33 of 53

1 prevailing level of 30-year U.S. Treasury yields. Mr. Hevert gathered data for electric
2 utility rate proceedings between January 1980 and April 13, 2018.49 Mr. Hevert
3 calculated the average 30-year Treasury yield over the average lag period of
4 approximately 200 days to reflect the prevailing level of interest rates during the
5 pendency of the rate proceedings.5° Mr. Hevert calculated the average risk premium to
6 be 4.63%.51
7 Q. PLEASE DESCRIBE YOUR BOND YIELD PLUS RISK PREMIUM MODEL.
8 A. To calculate an annual average authorized ROE, I used the data Mr. Hevert gathered from
9 SNL Financial. However, instead of using the average 30-year Treasury yields
10 (including the 200-day lag period) and his projected near-term and long-term 30-year
11 Treasury yields, I used Moody's Average Public Utility Bond Yields, as reported in
12 Mergent Bond Records. I used average public utility bond yields, instead of 30-year
13 historical and projected Treasury yields, because these bonds are issued in the same
14 industry as ETI and, thus provides a more comparable and reasonable estimate of investor
15 risk premium expectations for ETI. I also used a more current period (January 2000 to
16 June 2018) instead of Mr. Hevert's approximate 38-year period. The shorter time period
17 effectively captures the trend in authorized ROEs, while still being long enough to
18 encompass the last two recessions. The average risk premium I calculated during this
19 period is 4.65%, as shown on Schedule CLZ-3, which is 2 basis points higher than Mr.
20 Hevert's risk premium.
49 Hevert Direct at 30:3-12.
" Id.
51 Id. at 31:18.
Direct Testimony of Cynthia L. Zamora On Behalf of the Office of Public Utility Counsel
SOAH Docket No. 473-18-3733; PUC Docket No. 48371 Page 34 of 53

1 Q. WHAT ARE YOUR BOND YIELD PLUS RISK PREMIUM RESULTS?
2 A. The current yield on July 18, 2018 for BBB utility bonds is 4.55%.52 Adding my 4.65%
3 risk premium to the 4.55% BBB utility bond yield, results in an ROE of 9.20%. I have
4 calculated the average 2018 Moody's utility bond yields to be 4.21%. Adding my risk
5 premium to the 4.21% Moody's utility bond yields, results in an ROE of 8.86%. My
6 bond yield plus risk premium approach results in a recommended ROE range of 8.86% to
7 9.20%.
8 Q. WHAT ARE THE RESULTS FOR MR. HEVERT'S BOND YIELD PLUS RISK
9 PREMIUM ANALYSIS?
10 A. If you take Mr. Hevert's 4.63% risk premium and add it to his then-current (3.07%),
11 near-term projected (3.52%) and long-term projected (4.20%) 30-year Treasury yields, it
12 results in ROEs of 7.70%, 8.15%, and 8.83%, respectively.53 However, Mr. Hevert states
13 that simply applying his long-term average risk premium of 4.63% would significantly
14 understate the cost of equity and produce results well below any reasonable estimate.54
15 Instead, Mr. Hevert makes an upward adjustment to his risk premium based on the results
16 of his regression analysis. Mr. Hevert adjusts his resulting ROE range of 7.70% - 8.83%
17 upward to recommend a range of 9.97% - 10.25%.55
52 Value Line Investment Survey's Selection & Opinion, July 27, 2018.
53 Hevert Direct at 32 (Table 8).
54 Id. at 31:17-32:1.
55 Id. at 32:1-2.
Direct Testimony of Cynthia L. Zamora On Behalf of the Office of Public Utility Counsel
SOAH Docket No. 473-18-3733; PUC Docket No. 48371 Page 35 of 53

1 Q. DO YOU AGREE WITH MR. HEVERT'S UPWARD ADJUSTMENT TO HIS
2 RISK PREMIUM?
3 A. No. Mr. Hevert adjusts his risk premium upwards an additional 142 to 227 basis points
4 based on his regression analysis. Mr. Hevert adjusts his risk premium on the premise that
5 equity risk premiums are inversely related to the level of interest rates. In other words,
6 when interest rates are high the risk premium is lower and when interest rates are low the
7 risk premium is higher. However, Mr. Hevert uses a 38-year time period of historical
8 data for his risk premium, which incorporates various periods of very high, medium, and
9 very low interest rates. This makes it unnecessary to adjust his risk premium upwards
10 because Mr. Hevert's risk premium already incorporates the tendency of an inverse
11 relationship between interest rates and risk premiums during periods of high, medium,
12 and low interest rates. Further, risk premiums can fluctuate over time because they are
13 also dependent on current market conditions, changing investor risk perceptions between
14 equity and debt securities, and changing demand and supply in each capital market
15 segment.
16 C. CAPITAL ASSET PRICING MODEL
17 Q. HOW IS THE CAPITAL ASSET PRICING MODEL (CAPM) USED TO
18 DETERMINE THE APPROPRIATE RATE OF RETURN ON COMMON
19 EQUITY?
20 A. The CAPM is a risk premium model that describes the relationship between risk and
21 expected return when pricing a security. CAPM estimates the cost of equity as the sum
Direct Testimony of Cynthia L. Zamora On Behalf of the Office of Public Utility Counsel
SOAH Docket No. 473-18-3733; PUC Docket No. 48371 Page 36 of 53

where K = ß = rf = rm =
14 15 16 17
1 of the interest rate on a risk-free security plus a market risk premium.56 The yield on
2 long-tenn U.S. Treasury bonds is typically used as the risk-free rate. The market risk
3 premium represents the investor-expected incentive for holding the stock instead of a
4 risk-free security, and it can be measured in a number of ways.
5 There are two types of risk associated with holding a stock. The first type of risk
6 is company-specific or unsystematic risk, and the second type of risk is market or
7 systematic risk. Systematic risk is measured by a company's beta (f3). Investors receive
8 a return only for bearing systematic risk. The market has a beta of 1.0. A company with
9 a beta greater than 1.0 is considered riskier than the market and its price movement will
10 be more volatile than that of the market. A company with a beta less than 1.0 is
11 considered less risky than the market and its price movement will be less volatile than
12 that of the market. The utility companies in the proxy group all have betas less than 1.0.
13 The CAPM formula can be expressed as:
K =rf +Arm—rf)
required rate of return risk of the individual security risk free rate market return
18 Q. WHAT RISK-FREE RATE DID YOU INCORPORATE IN YOUR CAPM?
19 A. I calculated the three-month average yield (April 2018 to June 2018) for the 20-year U.S.
20 Treasury bonds. As shown on Schedule CLZ-4, the average three-month yield is 3.00%.
56 Duff & Phelps, 2016 Valuation Handbook-Guide to Cost of Capital at 2-1 (2016).
Direct Testimony of Cynthia L. Zamora On Behalf of the Office of Public Utility Counsel
SOAH Docket No. 473-18-3733; PUC Docket No. 48371 Page 37 of 53

1 Q. WHAT BETA DID YOU INCORPORATE IN YOUR CAPM?
2 A. I am using the betas for the proxy group as reported in Value Line. The average Value
3 Line beta for the proxy group is 0.69, which is 4 basis points larger than the 0.65 beta for
4 ETI's parent company, Entergy.
5 Q. WHAT MARKET RISK PREMIUM DO YOU USE IN YOUR CAPM?
6 A. I am using 6.00% for the market risk premium. This market risk premium is the
7 arithmetic mean return value between common stocks and long-term government bonds
8 from 1926 through the end of 2017 as published by Duff & Phelps in its 2018 Valuation
9 Handbook — Guide to Cost of Capital. Duff & Phelps uses the yield on 20-year constant
10 maturity U.S. government bonds as the proxy for the risk-free rate in its 2018 Valuation
11 Handbook.
12 Q. WHAT ARE YOUR CAPM RESULTS?
13 A. My CAPM produces an ROE of 7.14% as shown on Schedule CLZ-4.
14 Q. PLEASE EXPLAIN WHY THE CAPM RESULTS IN A LOWER COST OF
15 EQUITY.
16 A. The CAPM results in a lower cost of equity for ETI because of the current low interest
17 rate environment. Since 20-year Treasury bond yields remain low, even after the Federal
18 Reserve started raising interest rates, and because electric utility stocks have betas less
19 than 1.0 (from their lower risk compared to the overall market), the CAPM produces a
20 low cost of equity. I have not directly incorporated my CAPM results into my
21 recommended ROE for ETI because the results are much lower than any authorized
22 ROEs previously approved by the Commission. However, my CAPM results do serve as
Direct Testimony of Cynthia L. Zamora On Behalf of the Office of Public Utility Counsel
SOAH Docket No. 473-18-3733; PUC Docket No. 48371 Page 38 of 53

1
a qualitative check and show that a lower authorized ROE for ETI is appropriate
2
compared to ETI's requested 10.65% ROE, given the continued low interest rate
3
environment.
4 D. COST OF EQUITY RECOMMENDATION
5 Q. WHAT IS YOUR COST OF EQUITY RECOMMENDATION?
6 A. I recommend a 9.40% cost of equity for ETI. In recognition of ETI' s specific facts, I
7 chose an ROE from the top of my constant-growth DCF range, which is also above my
8
calculated bond yield plus risk premium range.57 My results are summarized in the table
9 below:
10 Table CLZ-4: Summary of OPUC's ROE Results
Methodology Range
Discounted Cash Flow 6.95% to 9.89%
Bond Yield Plus Risk Premium 8.86% to 9.20%
Capital Asset Pricing Model 7.14%
11
My ROE calculations produce results that align with current market conditions, as well as
12
the current outlook for electric utility stocks. Electric utilities continue to have access to
13
large amounts of capital under reasonable terms and conditions, and at relatively low
14
costs. Given current market conditions, ETI's regulated utility operations, its credit
15 strengths and challenges, an ROE of 9.40% is reasonable and will allow ETI to continue
57 My recommended ROE of 9.40% for ETI is in the 80th percentile of my recommended DCF range.
Direct Testimony of Cynthia L. Zamora On Behalf of the Office of Public Utility Counsel
SOAH Docket No. 473-18-3733; PUC Docket No. 48371 Page 39 of 53

1 to provide safe and reliable service, attract invested capital on reasonable terms, and
2 maintain its financial integrity.
3 VI. COST OF CAPITAL
4 A. CAPITAL STRUCTURE
5 Q. WHAT IS A CAPITAL STRUCTURE?
6 A. As discussed in Section III.A., a capital structure is how the company finances its overall
7 operations and growth by using different sources of funds, including debt from bond
8 issuances and/or long-term notes payable, and equity classified as common stock,
9 preferred stock (if any) and retained earnings.
10 Q. WHAT CAPITAL STRUCTURE IS THE COMPANY REQUESTING?
11 A. ETI is requesting that its actual test year capital structure be used in this proceeding,
12 which is composed of 49.10% long-term debt, and 50.90% common equity.58
13 Q. WHAT CAPITAL STRUCTURE DO YOU RECOMMEND FOR ETI?
14 A. I am incorporating the capital structure as requested by ETI in its Application. This
15 capital structure is consistent with recent Commission decisions in other litigated base-
16 rate proceedings for vertically integrated Texas utilities.59 Further, this capital structure
17 reflects a reasonably prudent balance sheet during this period of low-cost debt because a
18 capital structure that is weighted too heavily in common equity than is necessary to
58 Direct Testimony of Abigail B. Weaver at 3:16.
• 59 Application of Southwestern Public Service Company for Authority to Change Rates, Docket No. 43695, Order on Rehearing (Feb. 23, 2016).
Direct Testimony of Cynthia L. Zamora On Behalf of the Office of Public Utility Counsel
SOAH Docket No. 473-18-3733; PUC Docket No. 48371 Page 40 of 53

1
2
attract financial capital will unjustly increase the utility's revenue requirement and rates
charged to customers.
3 B. WEIGHTED AVERAGE COST OF CAPITAL
4 Q. WHEN CALCULATING ETI'S WACC, DID YOU MAKE ANY ADJUSTMENTS
5 TO ETI'S EMBEDDED COST OF DEBT?
6 A. No, I did not. I am using ETI's calculated long-term cost of debt of 5.73% in my WACC
7 calculation.6°
8 Q. WHAT IS YOUR RECOMMENDED WEIGHTED AVERAGE COST OF
9 CAPITAL?
10 A. I recommend a WACC of 7.59%. My results are summarized in the table below:
11 Table CLZ-5: OPUC's Weighted Average Cost of Capital
- % of
Capitalization Cost
Weighted Cost
Long-Term Debt 49.10% 5.73% 2.81%
Common Equity 50.90% 9.40% 4.78%
TOTAL 100% 7.59%
12 VII. SUMMARY OF COST OF CAPITAL RECOMMENDATIONS
13 Q. PLEASE SUMMARIZE YOUR RECOMMENDATIONS.
14 A. I recommend a rate of return of 7.59% for ETI, based on an ROE of 9.40%, long-term
15 cost of debt of 5.73%, and a capital structure of 49.10% long-term debt, and 50.90%
60 Weaver Direct at 3:16.
Direct Testimony of Cynthia L. Zamora On Behalf of the Office of Public Utility Counsel
SOAH Docket No. 473-18-3733; PUC Docket No. 48371 Page 41 of 53

1 equity. Given the continued low interest rate environment coupled with high stock
2 valuations for utility equities means that capital costs continue to be at relatively low
3 levels. Since regulated utilities also offer safety, and stable dividend yields, utility stocks
4 continue to be attractive to investors looking for income and defensive characteristics.
5 This is confirmed by ETI's and Entergy's ability to recently issue debt61 in the capital
6 markets and Entergy's current stock price trading in its 2021-2023 Value Line Target
7 Price Range. My recommended ROE of 9.40% is based on the results from my constant-
8 growth DCF analysis, bond yield plus risk premium analysis, and CAPM analysis. These
9 analyses estimate a fair return on equity based on observable market information and will
10 be reasonably sufficient for ETI to continue to provide safe and reliable service, attract
11 invested capital on reasonable terms, and maintain its financial integrity.
12 Q. DOES THIS CONCLUDE YOUR TESTIMONY?
13 A. Yes.
61 See ETI's Response to OPUC No. 1-3.
Direct Testimony of Cynthia L. Zamora On Behalf of the Office of Public Utility Counsel
SOAH Docket No. 473-18-3733; PUC Docket No. 48371 Page 42 of 53

Schedules

Schedule CLZ-1
PROXY GROUP FINANCIAL DATA
Page 1 of 2
2018 High/Low Stock Price
Ele
ctri
c U
tility
5 Y
ear H
isto
rica
l Gro
wth
in
Ear
n ing
s -
%
5 Y
ear
His
tori
cal Gro
wth
In
Div
iden
ds -
%
5 Y
ear
His
tori
cal Gro
wth
In
Boo
k V
alue
- %
10
Yea
r H
isto
rical Gro
wth
In
Eam
ing s
- %
10 Y
ear
His
tori
cal Gro
wth
In
Div
iden
ds
- %
10 Y
ear
His
tori
cal G
row
th
In B
ook
Val
u e -
%
5 Y
ear
Pro
ject
ed G
row
th In
E
amin
gs - %
5 Y
ear
Pro
ject
ed G
row
th In
D
ivid
ends
- %
5 Y
ear
Pro
ject
ed G
row
th In
B
ook
Val
ue -
%
2019
Pro
ject
ed E
arni
ngs
P
er S
hare
2019
Pro
ject
ed Div
iden
d
Per
Sha
re
2019 P
roje
cted
Boo
k V
alue
P
er S
hare
2018
Hig
h/Lo
w S
tock
Pric
e
2018
Hig
h/Lo
w &
7/1
7118
Y
ahoo
Clo
sing
Sto
ck P
rice
2019
Div
iden
d Y
ield
with
2
01
8 H
igh
/Low
Sto
ck P
rice
2019
Div
iden
d Y
ield
with
20
18 H
igh/
Low
& 7
/17/
18
Yah
oo C
losi
ng S
tock
Pric
e
2019
BR
Gro
wth
Rat
e
2021
-202
3 P
roje
cted
E
amin
gs P
er S
har
e
2021
-202
3 P
roje
cted
D
ivid
end
Per
Sha
re
2021
-202
3 Pro
ject
ed B
ook
V
alue
Per
Sha
re
5 Y
ear P
roje
cted
BR
G
rowth
Rat
e
ALLETE, INC. 5.50% 3.00% 6.00% 1.50% 3.50% 6.00% 5.00% 4.50% 3.50% $ 3.60 $ 2.34 $ 43.00 $ 73.25 $ 75.35 3.19% 3.11% 2.93% $ 4.25 $ 2.70 $ 47.25 3.28%
ALLIANT ENERGY CORP. 6.50% 6.50% 4.50% 5.00% 7.50% 4.00% 6.50% 6.00% 5.00% $ 2.25 $ 1.42 $ 20.25 $ 40.15 $ 41.52 3.54% 3.42% • 4.10% $ 2.60 $ 1.66 $ 22.85 4.11%
AMEREN CORP. 0.50% 2.00% neg neg neg neg 7.50% 5.50% 4.50% $ 3.25 $ 1.94 $ 32.50 $ 55.85 $ 58.56 3.47% 3.31% 4.03% $ 4.00 $ 2.35 $ 37.50 4.40%
AMERICAN ELECTRIC 5.50% 4.50% 4.00% 3.00% 4.00% 4.00% _ 4.50% 5.00% 4.00% $ 4.10 $ 2.63 $ 40.20 $ 68.35 $ 69.40 3.85% 3.79% • 3.66% $ 5.00 $ 3.05 $ 46.50 4.19%
BLACK HILLS CORP. 14.00% 3.00% 1.50% 2.50% 2.50% _ 2.50% 6.50% 6.00% 6.00% $ 3.55 $ 2.02 $ 37.60 $ 57.30 $ 59.10 3.53%, 3.42% 4.07% $ 4.25 $ 2.45 $ 42.75 4.21%
CMS ENERGY CORP. 7.00% 8.50% 5.00% 10.00%_ 4.00% 7.00% 7.00% 6.50% $ 2.50 $ 1.53 $ 18.20 $ 44.00 $ 45.80 3.48% 3.34% - 5.33% $ 3.00 $ 1.85 $ 22.25 5.17%
DTE ENERGY COMPANY 6.00% 6.00% 4.00% 6.00% 4.00% 4.00% 7.00% 6.50% 5.50% $ 6.20 $ 3.84 $ 60.10 $ 104.10 $ 105.24 3.69% 3.65% 3.93% $ 7.50 $ 4.55 $ 69.00 4.28%
DUKE EN ERGY 0.50% 2.50% 2.00% 2.50% 10.00% _ 0.50% 5.50% 4.50% 2.00% $ 5.00 $ 3.80_ $ 62.35 $ 78.65 $ 79.65 , 4.83% 4.77% 1.92% $ 5.50 $ 4.40 $ 66.00 1.67%
EL PASO ELECTRIC 18.00% 6.50% 6.50% 7.50% _ 4.50% 7.00% 4.00% $ 2.60 $ 1.52 $ 30.25 $ 54.55 $ 57.43 2.79% 2.65% 3.57% $ 3.00 $ 1.85 $ 33.75 3.41%
ENTERGY CORP. neg 1.00% neg 1.50% 4.00% _ 2.00% 2.00% 2.00% 3.00% $ 5.30 $ 3.66 $ 48.70 $ 77.45 _ $ 79.58 4.73% 4.60% 3.37% $ 6.75 $ 3.90 $ 56.00 5.09% -1
HAWAIIAN ELECTRIC 4.50% 3.50% 3.50% 2.50% 3.50% 2.00% 4.00% $ 2.00 $ 1.24 $ 20.80 $ 33.95 $ 34.26 3.65% 3.62% 3.65% $ 2.25 $ 1.40 $ 23.75 3.58%
I DACORP, INC. 4.50% 10.50% 5.50% 7.50% 5.50% 5.50% 3.00% 6.50% 4.00% $ 4.35 $ 2.56 $ 48.25 $ 87.80 $ 90.14 2.92% 2.84% 3.71% $ 4.75 $ 3.05 $ 53.25 3.19%
NORTH WESTERN CORP. 7.00% 7.00% 8.00% 8.00% 5.50% • 5.50%_, 3.50% 4.50% 3.50% $ 3.55 $ 2.30 $ 39.45 $ 54.90 $ 56.51 4.19% 4.07% 3.17% $ 4.00 $ 2.60 $ 43.25 3.24%
OGE ENERGY CORP. 1.00% 8.50% 6.50% 4.50% 5.50% 7.50% 6.00% 8.00% 4.00% $ 2.15 $ 1.54 _ $ 20.50 $ 32.50 $ 33.87 4.74% 4.55% 2.98% $ 2.50 $ 1.85 $ 22.75 2.86%
01TER TAIL CORP. 21.50% 1.00% 1.00% neg 1.00% 7.50% 3.50% 6.50% $ 2.15 $ 1.38 _$ 19.75 $ 43.65 $ 46.05 3.16% 3.00% 3.90% $ 2.60 $ 1.55 $ 24.45 4.29%
PIN NACLE WEST 5.00% 2.50% 4.00% 4.00% 2.50% 2.00% 5.00% 5.50% 4.00% $ 4.70_ $ 3.02 $ 48.00 $ 79.50 _$ 79.87 3.80% 3.78% 3.50% $ 5.50 $ 3.50 $ 54.00 3.70%
PNM RESOURCES, INC. 8.50% 11.50% 2.00% 2.00% 0.50% 7.50% 7.00% _ 4.50% $ 2.10 $ 1.14 _$ 22.80 $ 37.25 $ 37.63 3.06% 3.03% 4.21% $ 2.50 $ 1.35 $ 27.00 4.26%
PORTLAND GENERAL 3.50% 3.50% 3.50% 4.00% 9.00% _ 3.00% 4.00% 6.00% 3.00% $ 2.35 $ 1.52 $ 28.65 $ 42.30 $ 42.66 3.59% 3.56% •2.90% $ 2.75 $ 1.80 $ 31.25 3.04%
SOUTHERN CO. _ 3.00% 3.50% 3.50% 3.00% 4.00% _ 4.50% _ 3.00% 3.50% _ 3.50% $ 3.05 $ 2.46 $ 26.05 $ 45.25 $ 46.45 5.44% 5.30% 2.26% $ 3.50 $ 2.70 $ 29.75 2.69%
WEC ENERGY GROUP 5.50% 14.00% 10.50% 7.50% 15.50%_ 8.50% 7.00% 6.00% 4.00% $ 3.45 $ 2.34 $ 31.95 $ 62.65 $ 63.79 • 3.74% 3.67% 3A7% $ 4.25 $ 2.75 $ 35.75 4.20%
XCEL ENERGY, INC. 5.00% 5.50% 4.50% 5.50% 4.50% 4.50% 5.50% 5.50% 5.00% $ 2.55 $ 1.60 $ 24.85 $ 44.95 $ 45.41 3.56% 3.52% • 3.82% $ 3.00 $ 1.90 $ 28.00 3.93%
AVERAGE 6.03% 6.13% 4.53% 4.63% 5.24% 4.33% 5.31% 5.33% 4.29% $ 3.37_ $ 2.18 ,_$ 34.49_ $ 58.02 $ 59.44 3.76% 3.67% 3.55% $ 3.97 $ 2.53 $ 38.91 3.75%
Sources: Value Line Investment Survey, May 18, 2018, June 15, 2018 and July 27, 2018, and Yahoo Finance
SOAH Docket No. 473-18-3733 PUC Docket No. 48371

Schedule CLZ-1 Page 2 of 2
DMDEND YIELD CALCULATIONS 2018 High/Low Stock Price
Proxy Group Company 2019 Projected
Dividend Per Share 2018 High/Low
Stock Price
2019 Dividend Yield with 2018 High/Low
Stock Price
07117/18 Yahoo Closing Stock Price
2018 High/Low & 07/17/18 Yahoo
Closing Stock Price
2019 Dividend Yield with 2018 High/Low
& 07/17/18 Yahoo Closing Stock Price
ALLETE, INC. $ 2.34 $ 73.25 3.19% $ 77.44 $ 75.35 3.11%
ALLIANT ENERGY CORP. $ 1.42 $ 40.15 3.54% $ 42.88 $ 41.52 3.42%
AMEREN CORP. $ 1.94 $ 55.85 3.47% _$ 61.27 $ 58.56 3.31%
AMERICAN ELECTRIC POWER $ 2.63 $ 68.35 3.85% $ 70.44 $ 69.40 3.79%
BLACK HILLS CORP. $ 2.02 $ 57.30 3.53% $ 60.89 $ 59.10 3.42%
CMS ENERGY CORP. $ 1.53 $ 44.00 3.48% $ 47.60 $ 45.80 3.34%
DTE ENERGY COMPANY $ 3.84 $ 104.10 3.69% $ 106.38 $ 105.24 3.65%
DUKE ENERGY $ 3.80 $ 78.65 4.83% $ 80.65 $ 79.65 4.77%
EL PASO ELECTRIC $ 1.52 $ 54.55 •2.79% _$ 60.30 $ 57.43 2.65%
ENTERGY CORP. $ 3.66 $ 77.45 4.73% _$ 81.70 $ 79.58 4.60%
HAWAIIAN ELECTRIC $ 1.24 $ 33.95 3.65% $ 34.56 $ 34.26 3.62%
IDACORP, INC. $ 2.56 $ 87.80 2.92% $ 92.48 $ 90.14 2.84%
NORTH WESTERN CORP. $ 2.30 $ 54.90 4.19% __$ 58.11 $ 56.51 4.07%
OGE ENERGY CORP. $ 1.54 $ 32.50 4.74% $ 35.24 $ 33.87 4.55%
OTTER TAIL CORP. $ 1.38 $ 43.65 3.16% _$ 48.45 $ 46.05 3.00%
PINNACLE WEST $ 3.02 $ 79.50 3.80% $ 80.24 $ 79.87 3.78%
PNM RESOURCES, INC. $ 1.14 $ 37.25 3.06% $ 38.00 $ 37.63 3.03%
PORTLAND GENERAL $ 1.52 $ 42.30 3.59% $ 43.02 $ 42.66 3.56%
SOUTHERN CO. $. 2.46 $ 45.25 5.44% $ 47.65 $ 46.45 5.30%
WEC ENERGY GROUP $ 2.34 $ 62.65 3.74% $ 64.92 $ 63.79 3.67%
XCEL ENERGY $ 1.60 $ 44.95 3.56% $ 45.86 $ 45.41 3.52%
AVERAGE $ 2.18 $ 58.02 3.76% $ 60.86 $ 59.44 3.67%
Sources: Value Line Investment Survey, May 18, 2018, June 15, 2018 and July 27, 2018, and Yahoo Finance
SOAH Docket No. 473-18-3733 PUC Docket No. 48371
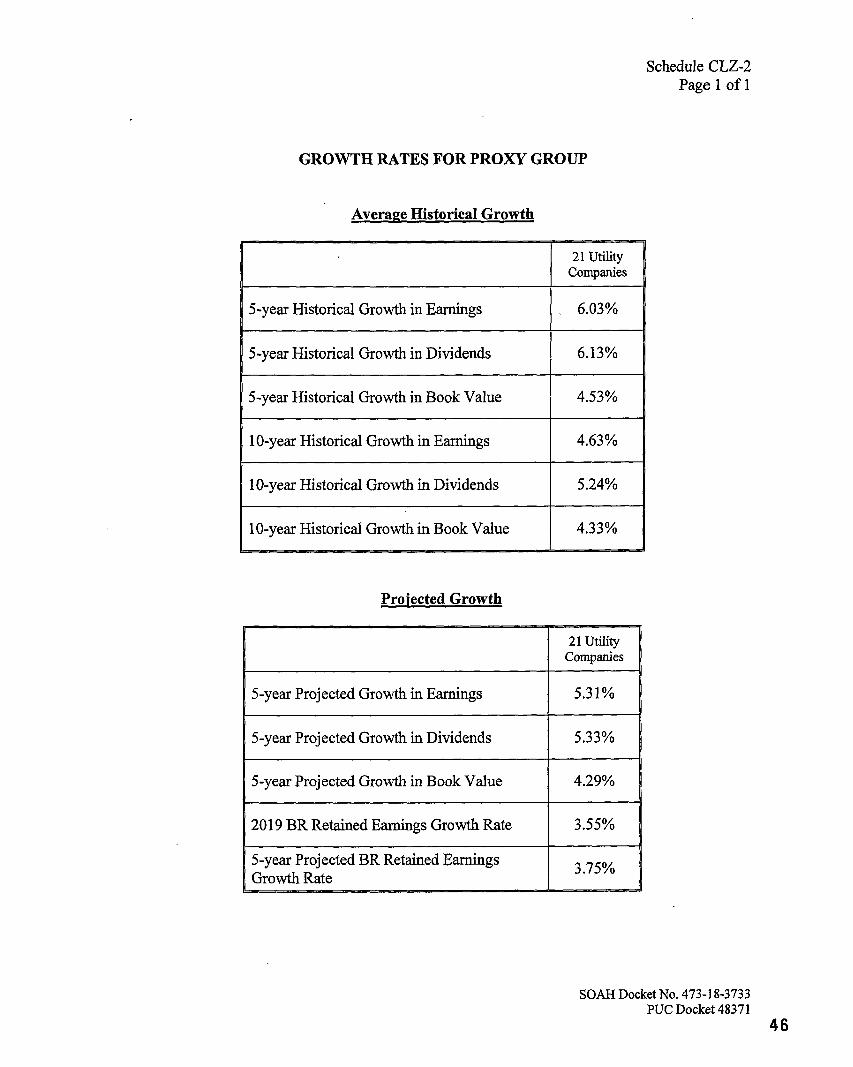
Schedule CLZ-2 Page 1 of 1
GROWTH RATES FOR PROXY GROUP
Average Historical Growth
_ 21 Utility
Companies
5-year Historical Growth in Earnings 6.03%
5-year Historical Growth in Dividends 6.13%
5-year Historical Growth in Book Value 4.53%
10-year Historical Growth in Earnings 4.63%
10-year Historical Growth in Dividends 5.24%
10-year Historical Growth in Book Value 4.33%
Projected Growth
21 Utility Companies
5-year Projected Growth in Earnings 5.31%
5-year Projected Growth in Dividends 5.33%
5-year Projected Growth in Book Value 4.29%
2019 BR Retained Earnings Growth Rate 3.55%
5-year Projected BR Retained Earnings Growth Rate
3.75%
SOAH Docket No. 473-18-3733 PUC Docket 48371
4 6

Schedule CLZ-3 Page 1 of 1
BOND YIELD PLUS RISK PREMIUM
Rate Case Year
Average Authorized ROE
1
Moodys Average Public
Utility Bond
Yields2 Risk Premium
2000 11.58 8.22 3.36
2001 11.07 7.79 3.28
2002 11.21 7.53 3.68
2003 10.96 6.61 4.36
2004 10.81 6.20 4.61
2005 10.51 5.67 4.84
2006 10.34 6.07 4.27
2007 10.31 6.12 4.20
2008 10.37 6.65 3.71
2009 10.52 6.28 4.24
2010 10.29 5.55 4.74
2011 10.19 5.13 5.06
2012 10.01 4.27 5.74
2013 9.81 4.57 5.24
2014 9.75 4.42 5.33
2015 9.60 4.38 5.22
2016 9.60 4.11 5.48
2017 9.68 4.07 5.61
2018** 9.64 4.21 5.43
Average 4.65
Sources:
lExhibit RBH-6 to Mr. Hevert's Direct Testimony. Mr. Hevert uses SNL Financial data for the Yearly Average Authorized ROE.
2 Mergent Bond Record , data from January 2006, January 2012 and July 2018 issues.
** 2018 Risk Premium is calculated using January 2018 through April 2018 Average Authorized ROEs and Moody's Average Public Utility Bond Yields from January
2018 to June 2018.
SOAH Docket No. 473-18-3733 PUC Docket No. 483417

Schedule CLZ-4 Page 1 of 1
CAPITAL ASSET PRICING MODEL
Company
Risk Free Rate (20-Yr Treasury
Yield)l Beta2 Risk Premium3 CAPM Rate with 20-Yr
Treasury
ALLETE, INC. 3.00% 0.75 6.00% 7.50% ALLIANT ENERGY CORP. 3.00% 0.70 . 6.00% 7.20% AMEREN CORP. 3.00% 0.65 6.00% 6.90% AMERICAN ELECTRIC POWER 3.00% 0.65 6.00% 6.90% BLACK HILLS CORP. 3.00% 0.85 6.00% 8.10% CMS ENERGY CORP. 3.00% 0.65 6.00% 6.90% DTE ENERGY COMPANY 3.00% 0.65 6.00% 6.90% DUKE ENERGY 3.00% • 0.60 6.00% 6.60% EL PASO ELECTRIC 3.00% 0.75 6.00% 7.50% ENTERGY CORP. 3.00% 0.65 6.00% 6.90% HAWAIIAN ELECTRIC 3.00% 0.65 6.00% 6.90% - IDACORP, INC. 3.00% 0.65 6.00% 6.90% NORTH WESTERN CORP. 3.00% 0.65 6.00% 6.90% OGE ENERGY CORP. 3.00% 0.95 6.00% 8.70% OTTER TAIL CORP. 3.00% 0.85 6.00% 8.10% PINNACLE WEST 3.00% 0.65 6.00% 6.90% PNM RESOURCES, INC. 3.00% 0.75 6.00% 7.50% PORTLAND GENERAL 3.00% 0.65 6.00% 6.90% SOUTHERN COMPANY 3.00% 0.55 6.00% 6.30% WEC ENERGY GROUP 3.00% 0.60 6.00% 6.60% XCEL ENERGY 3.00% 0.60 6.00% 6.60%
Average 3.00% 0.69 6.00% 7.13%
Sources:
ihttps://www.treasury.goy/resource-center/data-chart-center/interest-rates/Pages/TextView.aspx?data=yieldYear&year=2018
2Value Line Investment survey, May 18, 2018, June 15, 2018 and July 27, 2018
3Duff& Phelps, 2018 Valuation Handbook, Summary Statistics of Annual Total Returns of Basic U.S. Asset Classes 1926 to 2017
SOAH Docket No. 473-18-3733 PUC Docket No. 48371
48

Exhibits

Exhibit CLZ-A
Qualifications

EXHIBIT CLZ-A
EDUCATION AND EMPLOYMENT HISTORY
CYNTHIA L. ZAMORA
Education & Certifications
New Mexico State University • Master of Business Administration, May 2014
• Specialization in Finance
• Graduate Certificate in Public Utility Regulation and Economics
University of Texas at El Paso • Bachelor of Business Administration, May 2010
• Major in Finance
National Association of Legal Assistants • Certified Paralegal, 2007 — Present
• El Paso Community College • Associates in Applied Science, May 2006
• Major in Paralegal Studies
Employment
Gordon Davis Johnson & Shane, P.C. El Paso, Texas
Financial Examiner May 2014 to Present
Paralegal Coordinator Regulatory Department February 2012 to May 2012
Certified Paralegal Real Estate/Estate Planning October 2006 to May 2011
Office of Public Utility Counsel Austin, Texas
El Paso Electric Company El Paso, Texas
51

Exhibit CLZ-B
Federal Reserve Press Release

FEDERAL RESERVE ress release
For release at 2 p.m. EDT
June 13, 2018
Information received since the Federal Open Market Committee met in May indicates
that the labor market has continued to strengthen and that economic activity has been rising at a
solid rate. Job gains have been strong, on average, in recent months, and the unemployment rate
has declined. Recent data suggest that growth of household spending has picked up, while
business fixed investment has continued to grow strongly. On a 12-month basis, both overall
inflation and inflation for items other than food and energy have moved close to 2 percent.
Indicators of longer-term inflation expectations are little changed, on balance.
Consistent with its statutory mandate, the Committee seeks to foster maximum
employment and price stability. The Committee expects that further gradual increases in the
target range for the federal funds rate will be consistent with sustained expansion of economic
activity, strong labor market conditions, and inflation near the Committees symmetric 2 percent
objective over the medium term. Risks to the economic outlook appear roughly balanced.
In view of realized and expected labor market conditions and inflation, the Committee
decided to raise the target range for the federal funds rate to 1-3/4 to 2 percent. The stance of
monetary policy remains accommodative, thereby supporting strong labor market conditions and
a sustained return to 2 percent inflation.
In determining the timing and size of figure adjustments to the target range for the federal
funds rate, the Committee will assess realized and expected economic conditions relative to its
maximum employment objective and its symmetric 2 percent inflation objective. This
assessment will take into account a wide range of information, including measures of labor
market conditions, indicators of inflation pressures and inflation expectations, and readings on
financial and international developments.
Voting for the FOMC monetary policy action were Jerome H. Powell, Chairman;
William C. Dudley, Vice Chairman; Thomas I. Barkin; Raphael W. Bostic; Lael Brainard;
Loretta J. Mester; Randal K. Quarles; and John C. Williams.
- 0 -
53


![Antropologie I [III, 2010 (II)]](https://img.dokumen.tips/doc/110x75/635d3240fd007d475b0309ce/antropologie-i-iii-2010-ii.jpg)


