Embed Size (px)
Citation preview
DOI: 10.1002/cssc.201200817
Hydrothermal Carbons from Hemicellulose-DerivedAqueous Hydrolysis Products as Electrode Materials forSupercapacitorsCamillo Falco,*[a, b] Juan Manuel Sieben,[c] Nicolas Brun,[b] Marta Sevilla,[d]
Torbjorn van der Mauelen,[e] Emilia Morall�n,[c] Diego Cazorla-Amor�s,[f] andMaria-Magdalena Titirici[b]
Introduction
The progressive depletion of fossil fuel resources and the needfor carbon-neutral alternatives are increasingly fostering the re-search on biofuels. First-generation biofuels have beendeemed to be an unfeasible long-term solution as they are incompetition with the food supply chain. On the other hand,lignocellulosic biomass-derived biofuels bypass such a problem.
For this reason, in the recent past they have been the subjectof intense investigations, which have led to several positive de-velopments towards their large-scale utilization.[1–6]
Ethanol production through cellulose-derived glucose micro-bial fermentation is certainly one of the most investigated bio-fuel synthesis routes. This biological conversion process re-quires as a first step either enzymatic or acid hydrolysis of thecellulosic substrate into its sugar building units. For thisreason, lignocellulosic biomass is typically pretreated to makethe cellulose fraction more accessible for the subsequent hy-drolysis step. This can be accomplished by various techniques,such as steam or ammonia fiber explosion and hydrolysisusing concentrated or diluted acids.[7–12]
All these methods generate considerable amounts of by-products, such as the isolated lignin fraction and hemicellu-lose-derived aqueous hydrolysis products. Together, these canaccount for approximately half of the starting feedstock massdepending on the type of biomass utilized. Despite their abun-dance, these by-products have so far found very limiteduse[13–18] as there are far less research efforts focusing on find-ing new possibilities for effective exploitation than on aimingat the development of new synthesis routes for cellulose-de-rived biofuels or on increasing the efficiency of existing bio-fuels. However, the effective utilization of these by-products ispotentially crucial for the efficiency enhancement of the overallbiomass-conversion process to value-added products and forthe development of fully sustainable biorefinery schemes. For
Acid pretreatment of lignocellulosic biomass, required for bio-ethanol production, generates large amounts of by-products,such as lignin and hydrolyzed hemicellulose fractions, whichhave found so far very limited applications. In this work, wedemonstrate how the recovered hemicellulose hydrolysis prod-ucts can be effectively utilized as a precursor for the synthesisof functional carbon materials through hydrothermal carboni-zation (HTC). The morphology and chemical structure of thesynthesized HTC carbons are thoroughly characterized to high-light their similarities with glucose-derived HTC carbons.Furthermore, two routes for introducing porosity within theHTC carbon structure are presented: i) silica nanoparticle hard-
templating, which is shown to be a viable method for the syn-thesis of carbonaceous hollow spheres; and ii) KOH chemicalactivation. The synthesized activated carbons (ACs) show anextremely high porosity (pore volume�1.0 cm3 g�1) mostlycomposed of micropores (90 % of total pore volume). Becauseof their favorable textural properties, the ACs are furthertested as electrodes for supercapacitors, yielding very promis-ing results (300 F g�1 at 250 mA g�1) and confirming the highsuitability of KOH-activated HTC carbons derived from spruceand corncob hydrolysis products as materials for electricdouble layer supercapacitors.
[a] Dr. C. FalcoIASS - Institute for Advanced Sustainability StudiesBerlinerStrasse 130, 14467, Potsdam (Germany)Fax: (+ 49) 331-288-22-404E-mail : [email protected]
[b] Dr. C. Falco, Dr. N. Brun, Dr. M.-M. TitiriciColloid Chemistry, Max-Planck Institute for Colloids and InterfacesAm M�hlenberg 1, 14476, Potsdam (Germany)
[c] Dr. J. M. Sieben, Prof. E. Morall�nDepartamento de Qu�mica F�sica and Instituto Universitario de MaterialesUniversidad de Alicante, Ap. 99 Alicante (Spain)
[d] Dr. M. SevillaInstituto Nacional del Carb�n (CSIC)P.O. Box 73, 33080 Oviedo (Spain)
[e] Dr. T. van der MauelenSEKAB E-TechnologyPO Box 286, 891 26 �rnskçldsvik (Sweden)
[f] Prof. D. Cazorla-Amor�sDepartamento de Qu�mica Inorg�nica andInstituto Universitario de Materiales
Universidad de Alicante, Ap. 99. Alicante (Spain)
Supporting Information for this article is available on the WWW underhttp://dx.doi.org/10.1002/cssc.201200817.
� 2013 Wiley-VCH Verlag GmbH & Co. KGaA, Weinheim ChemSusChem 2013, 6, 374 – 382 374
CHEMSUSCHEMFULL PAPERS
this reason, the aim of this study is to investigate the use ofhemicellulose-derived aqueous hydrolysis products as potentialcarbon precursors for the hydrothermal carbonization (HTC)process aimed at the production of high-value functionalcarbon materials for energy storage applications (e.g. , superca-pacitors). The hemicellulose-derived by-products were generat-ed during the dilute-acid pretreatment of lignocellulosic bio-mass (corncobs, spruce) in the cellulosic ethanol demonstra-tion plant in �rnskçldsvik run by SEKAB (Sweden).
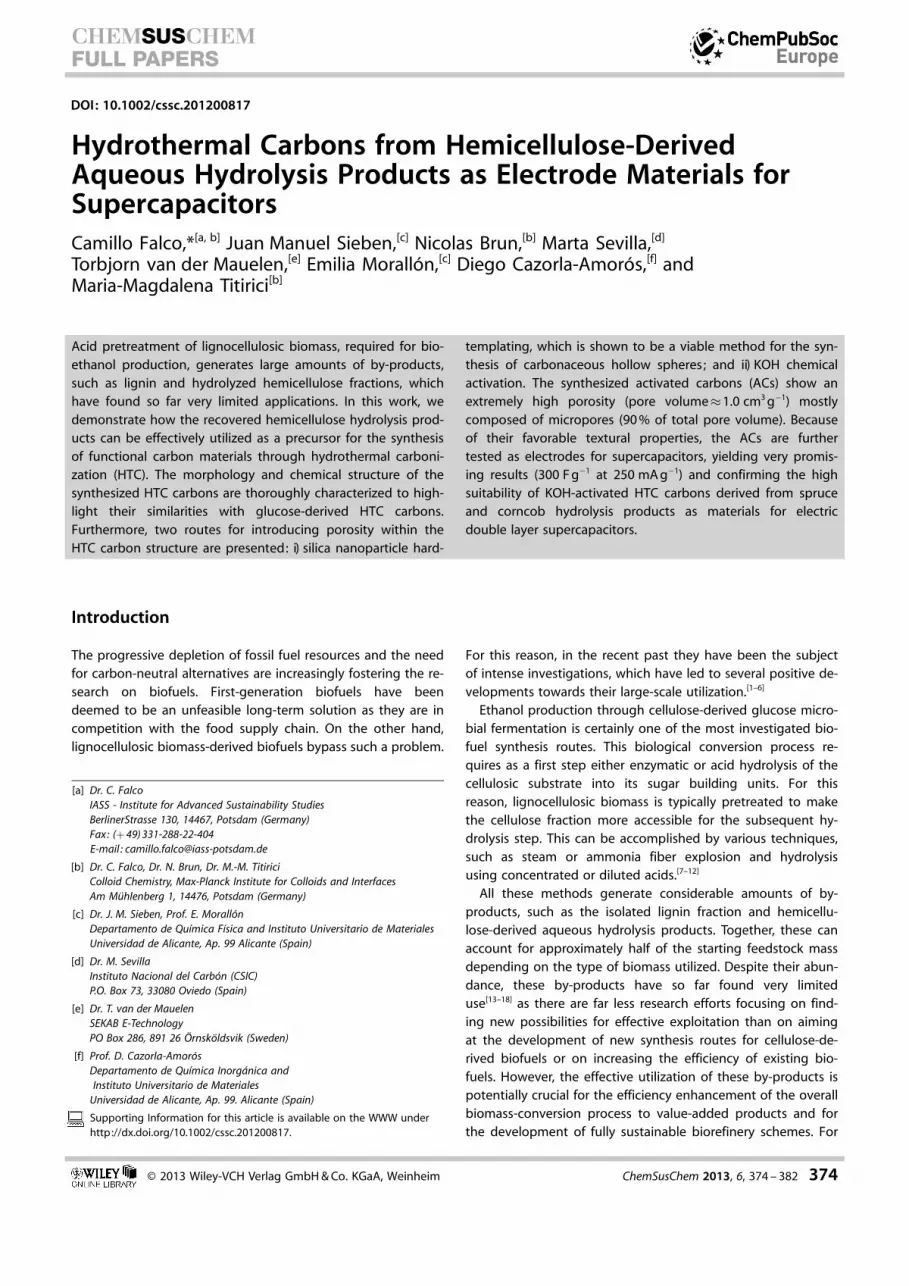
During the pretreatment step, the lignocellulosic biomass isimpregnated with a diluted acid solution and heated by steam(Figure 1). At these processing conditions (i.e. , high tempera-ture, low pH), hemicellulose is readily hydrolyzed to monomer-
ic carbohydrates. Exiting the reactor, the biomass-containingaqueous stream undergoes a rapid change of pressure leadingto further disruption of the biomass fibrous structure and tothe formation of a slurry-like effluent, which is then filtered toseparate the solids (lignin and cellulose) from the aqueousphase. The latter contains predominantly carbohydrates origi-nating from the biomass hemicellulose fraction. Depending onthe biomass used, the filtrate composition may be character-ized by slight variations (Table 1). Currently the main use of
this by-product involves its fermentation to ethanol to increasethe overall process yield. However, this process poses severalchallenges due to the fact that pentose-sugar fermentation re-quires a modified culture of yeast, the effectiveness of whichcan be very easily inhibited by other components presentwithin the aqueous mixture [e.g. , furfural, 5-hydroxymethylfur-fural (5-HMF)].[19–21]
HTC has been demonstrated to be an effective syntheticroute for the production of functional carbonaceous materialsfrom simple monosaccharides, such as glucose and xylose.[22–27]
As these sugars are the main components of the hydrolysis-product streams, it is foreseeable that these hemicellulose-de-rived by-products may be a suitable carbon precursor for thesynthesis of high-value carbon-negative functional HTC materi-als. To confirm the feasibility of this hypothesis, this study com-pares the carbonaceous materials obtained from the hydro-thermal treatment of the hemicellulose-derived hydrolysisproducts with those obtained from glucose HTC. Furthermore,it also shows the possibility of adopting hard-templating strat-egies or post-synthesis processing steps (e.g. , KOH chemicalactivation) to obtain HTC carbon material with improved tex-tural properties (e.g. , specific ordered morphology, high sur-face area; Table 4). Promising preliminary results in relation tothe use of the chemically activated HTC carbons as supercapa-citors electrode materials are lastly presented, showing the ef-fectiveness of this synthesis strategy in converting a low-valuebiomass-derived industrial by-product into a functional carbonmaterial with evident energy storage applications.
Results and Discussion
The first part of this study focuses on the HTC of hydrolysisproducts derived from the diluted acid pretreatment of spruceand corncobs during ethanol production described above. Thequestion whether such waste by-products are suitable precur-sors for the synthesis of hydrothermal carbon is addressed bycomparing the carbonaceous materials obtained from hydro-thermal treatment of these two feedstocks with those derivedfrom glucose in terms of morphology and chemical structure.In the second part of this study the produced HTC carbons arechemically activated using KOH and then tested as electrodematerials. Furthermore, a templating approach able to gener-ate well-defined nano-sized hollow carbon spheres with con-trolled pore walls is also described. Such hollow spheres arepromising candidates as electrodes materials in either Li+ , Na+ ,or even Li–S batteries.[28–30]
Hemicellulose-derived by-product HTCs
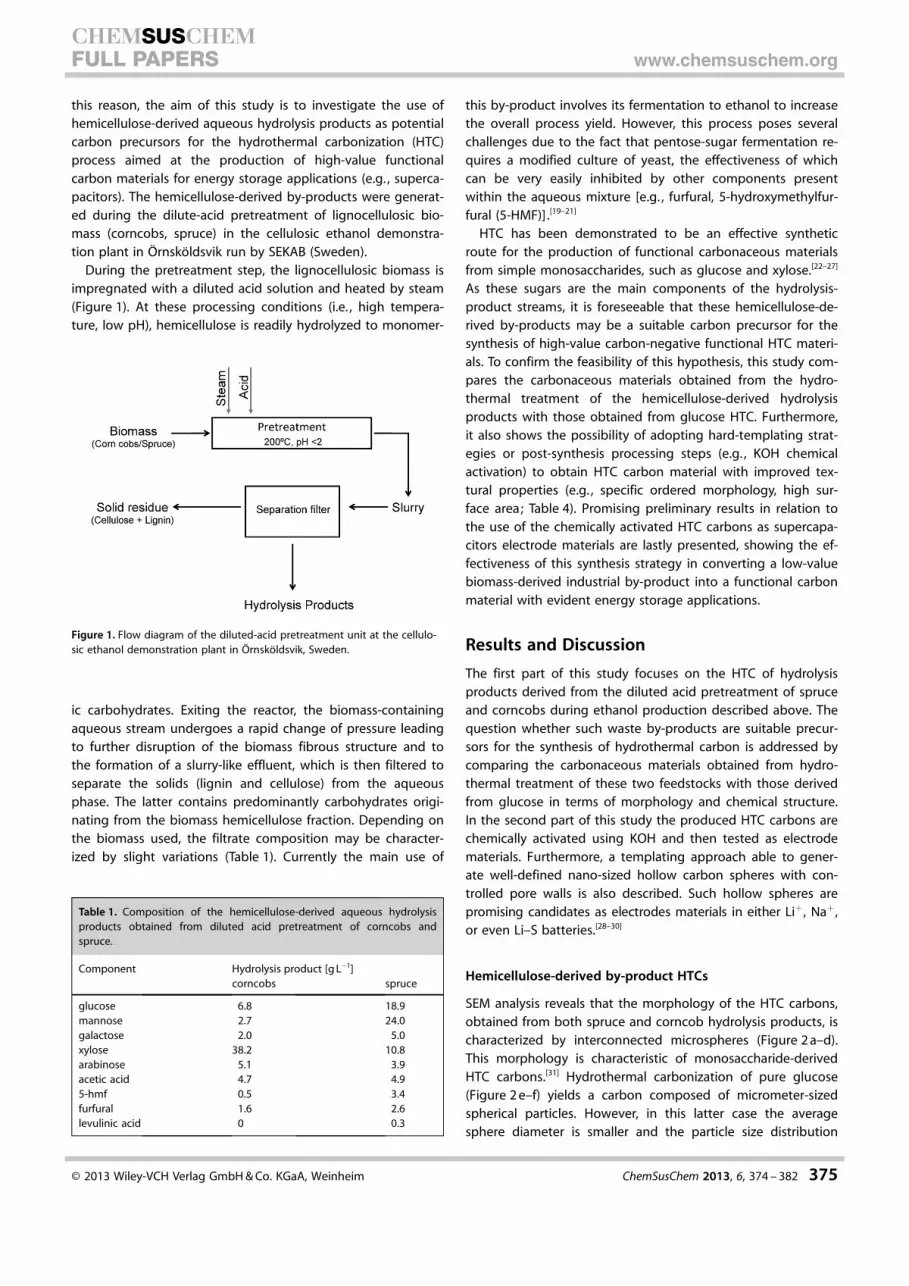
SEM analysis reveals that the morphology of the HTC carbons,obtained from both spruce and corncob hydrolysis products, ischaracterized by interconnected microspheres (Figure 2 a–d).This morphology is characteristic of monosaccharide-derivedHTC carbons.[31] Hydrothermal carbonization of pure glucose(Figure 2 e–f) yields a carbon composed of micrometer-sizedspherical particles. However, in this latter case the averagesphere diameter is smaller and the particle size distribution
Figure 1. Flow diagram of the diluted-acid pretreatment unit at the cellulo-sic ethanol demonstration plant in �rnskçldsvik, Sweden.
Table 1. Composition of the hemicellulose-derived aqueous hydrolysisproducts obtained from diluted acid pretreatment of corncobs andspruce.
Component Hydrolysis product [g L�1]corncobs spruce
glucose 6.8 18.9mannose 2.7 24.0galactose 2.0 5.0xylose 38.2 10.8arabinose 5.1 3.9acetic acid 4.7 4.95-hmf 0.5 3.4furfural 1.6 2.6levulinic acid 0 0.3
� 2013 Wiley-VCH Verlag GmbH & Co. KGaA, Weinheim ChemSusChem 2013, 6, 374 – 382 375
CHEMSUSCHEMFULL PAPERS www.chemsuschem.org
narrower. A possible explanation for this observation is thatthe spruce and corncob hydrolysis products contain severaldifferent carbohydrates generated from hemicellulose hydroly-sis (i.e. , mannose, galactose, arabinose, xylose), which, as dem-onstrated by Titirici et al. , affect the final particle size.[31]
Elemental analysis (EA) of the HTC carbons synthesized fromboth, hydrolysis products and pure glucose, shows very similarvalues (Table 2). This evidence suggests that the HTC of spruce
and corncob hydrolysis products generates a carbonaceousmaterial whose chemical composition and structure can beclosely related to the one obtained from pure monosacchar-ides. Conversely, analysis of HTC yields underlines that this pa-rameter varies considerably depending on the carbon precur-sor (Table 2). The HTC yields measured for the HTC carbons de-rived from spruce and corncob hydrolysis products are higherin comparison to those obtained for pure glucose. This differ-ence is presumably caused by the presence of pentose sugarswithin the lignocellulosic-biomass hydrolysis products (Table 1),which are known to generate HTC carbon through dehydrationto furfural.[31] Contrarily, 5-HMF is produced if glucose or gener-
ally hexoses are treated under hydrothermal conditions.[32] Thislatter reaction intermediate has a pronounced tendency toform degradation products (e.g. , levulinic acid, formic acid,and dihydroxyacetone), especially under acidic conditions.[33, 34]
A higher extent of degradation-product formation of hexosesugars might be the cause of lower HTC yields. Further evi-dence for such a hypothesis is that the highest recorded yieldcorresponds to the HTC carbon obtained from corncob hydrol-ysis products, which is the feedstock with the largest fractionof pentose sugars (Table 1).
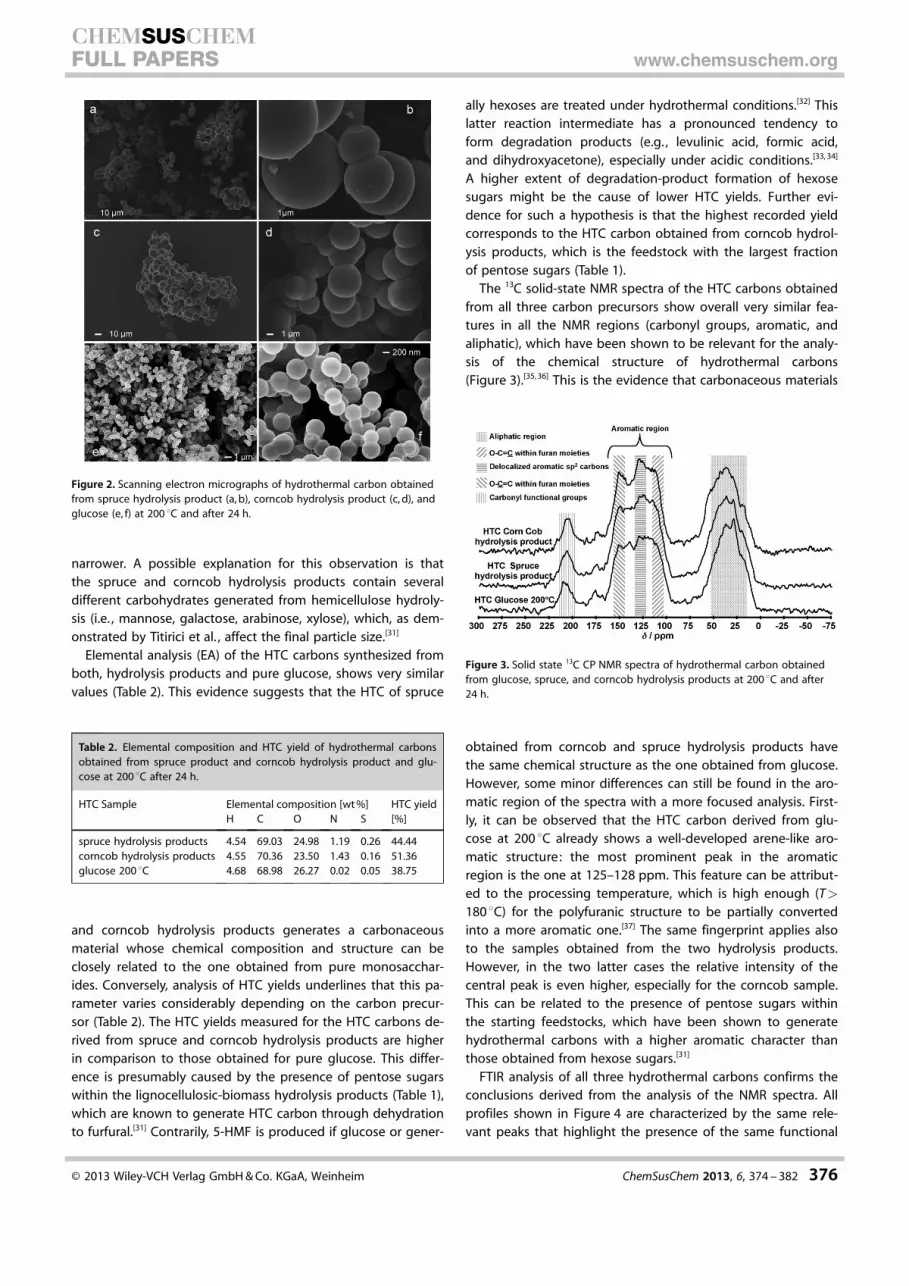
The 13C solid-state NMR spectra of the HTC carbons obtainedfrom all three carbon precursors show overall very similar fea-tures in all the NMR regions (carbonyl groups, aromatic, andaliphatic), which have been shown to be relevant for the analy-sis of the chemical structure of hydrothermal carbons(Figure 3).[35, 36] This is the evidence that carbonaceous materials
obtained from corncob and spruce hydrolysis products havethe same chemical structure as the one obtained from glucose.However, some minor differences can still be found in the aro-matic region of the spectra with a more focused analysis. First-ly, it can be observed that the HTC carbon derived from glu-cose at 200 8C already shows a well-developed arene-like aro-matic structure: the most prominent peak in the aromaticregion is the one at 125–128 ppm. This feature can be attribut-ed to the processing temperature, which is high enough (T>180 8C) for the polyfuranic structure to be partially convertedinto a more aromatic one.[37] The same fingerprint applies alsoto the samples obtained from the two hydrolysis products.However, in the two latter cases the relative intensity of thecentral peak is even higher, especially for the corncob sample.This can be related to the presence of pentose sugars withinthe starting feedstocks, which have been shown to generatehydrothermal carbons with a higher aromatic character thanthose obtained from hexose sugars.[31]
FTIR analysis of all three hydrothermal carbons confirms theconclusions derived from the analysis of the NMR spectra. Allprofiles shown in Figure 4 are characterized by the same rele-vant peaks that highlight the presence of the same functional
Figure 2. Scanning electron micrographs of hydrothermal carbon obtainedfrom spruce hydrolysis product (a, b), corncob hydrolysis product (c, d), andglucose (e, f) at 200 8C and after 24 h.
Table 2. Elemental composition and HTC yield of hydrothermal carbonsobtained from spruce product and corncob hydrolysis product and glu-cose at 200 8C after 24 h.
HTC Sample Elemental composition [wt %] HTC yieldH C O N S [%]
spruce hydrolysis products 4.54 69.03 24.98 1.19 0.26 44.44corncob hydrolysis products 4.55 70.36 23.50 1.43 0.16 51.36glucose 200 8C 4.68 68.98 26.27 0.02 0.05 38.75
Figure 3. Solid state 13C CP NMR spectra of hydrothermal carbon obtainedfrom glucose, spruce, and corncob hydrolysis products at 200 8C and after24 h.
� 2013 Wiley-VCH Verlag GmbH & Co. KGaA, Weinheim ChemSusChem 2013, 6, 374 – 382 376
CHEMSUSCHEMFULL PAPERS www.chemsuschem.org
groups within all the obtained samples. However, one maindifference can be observed. The ratio of the n(C=O) to then(C=C) peaks is lower for the HTC carbons obtained from thehydrolysis products. A possible explanation might be that thepH value of these two sample solutions is lower because ofthe presence of H2SO4 remaining from the pretreatment stage.Therefore, the acid might enhance the degree of decarbonyla-tion of the obtained HTC carbons, thus reducing the relativeintensity of the carbonyl peak.
Introducing porosity in hydrolysis-product-derived HTCcarbons
As generally observed for HTC carbons, the hydrolysis productshave no relevant porosity, which hinders their potential utiliza-tion for energy storage applications. To introduce porositywithin their structure, an attempt was made to obtain hollowspheres by templating silica nanoparticles. TEM micrographs ofthe HTC carbons replicating the silica particles show that thetemplating strategy represents a viable alternative to producecarbon hollow spheres (Figure 5). Tang et al. have recentlydemonstrated that HTC carbons, characterized by such mor-phology, show very promising performances as anode materi-als for Na and Li batteries.[28, 29] As a consequence, it is possiblethat the templated hydrolysis-product-derived HTC carbons
may be also successfully employed for such an end appli-cation.
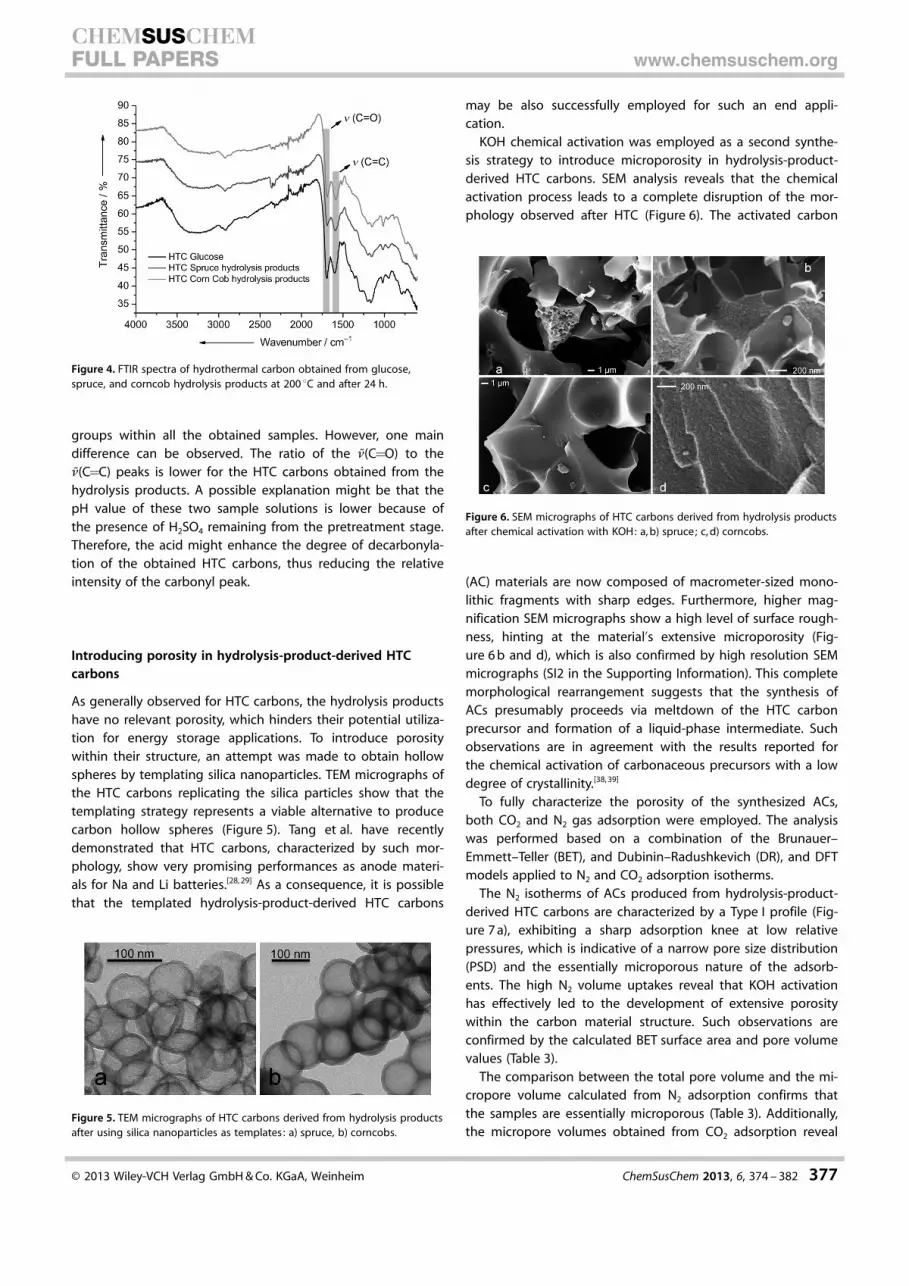
KOH chemical activation was employed as a second synthe-sis strategy to introduce microporosity in hydrolysis-product-derived HTC carbons. SEM analysis reveals that the chemicalactivation process leads to a complete disruption of the mor-phology observed after HTC (Figure 6). The activated carbon
(AC) materials are now composed of macrometer-sized mono-lithic fragments with sharp edges. Furthermore, higher mag-nification SEM micrographs show a high level of surface rough-ness, hinting at the material’s extensive microporosity (Fig-ure 6 b and d), which is also confirmed by high resolution SEMmicrographs (SI2 in the Supporting Information). This completemorphological rearrangement suggests that the synthesis ofACs presumably proceeds via meltdown of the HTC carbonprecursor and formation of a liquid-phase intermediate. Suchobservations are in agreement with the results reported forthe chemical activation of carbonaceous precursors with a lowdegree of crystallinity.[38, 39]
To fully characterize the porosity of the synthesized ACs,both CO2 and N2 gas adsorption were employed. The analysiswas performed based on a combination of the Brunauer–Emmett–Teller (BET), and Dubinin–Radushkevich (DR), and DFTmodels applied to N2 and CO2 adsorption isotherms.
The N2 isotherms of ACs produced from hydrolysis-product-derived HTC carbons are characterized by a Type I profile (Fig-ure 7 a), exhibiting a sharp adsorption knee at low relativepressures, which is indicative of a narrow pore size distribution(PSD) and the essentially microporous nature of the adsorb-ents. The high N2 volume uptakes reveal that KOH activationhas effectively led to the development of extensive porositywithin the carbon material structure. Such observations areconfirmed by the calculated BET surface area and pore volumevalues (Table 3).
The comparison between the total pore volume and the mi-cropore volume calculated from N2 adsorption confirms thatthe samples are essentially microporous (Table 3). Additionally,the micropore volumes obtained from CO2 adsorption reveal
Figure 4. FTIR spectra of hydrothermal carbon obtained from glucose,spruce, and corncob hydrolysis products at 200 8C and after 24 h.
Figure 5. TEM micrographs of HTC carbons derived from hydrolysis productsafter using silica nanoparticles as templates : a) spruce, b) corncobs.
Figure 6. SEM micrographs of HTC carbons derived from hydrolysis productsafter chemical activation with KOH: a, b) spruce; c, d) corncobs.
� 2013 Wiley-VCH Verlag GmbH & Co. KGaA, Weinheim ChemSusChem 2013, 6, 374 – 382 377
CHEMSUSCHEMFULL PAPERS www.chemsuschem.org
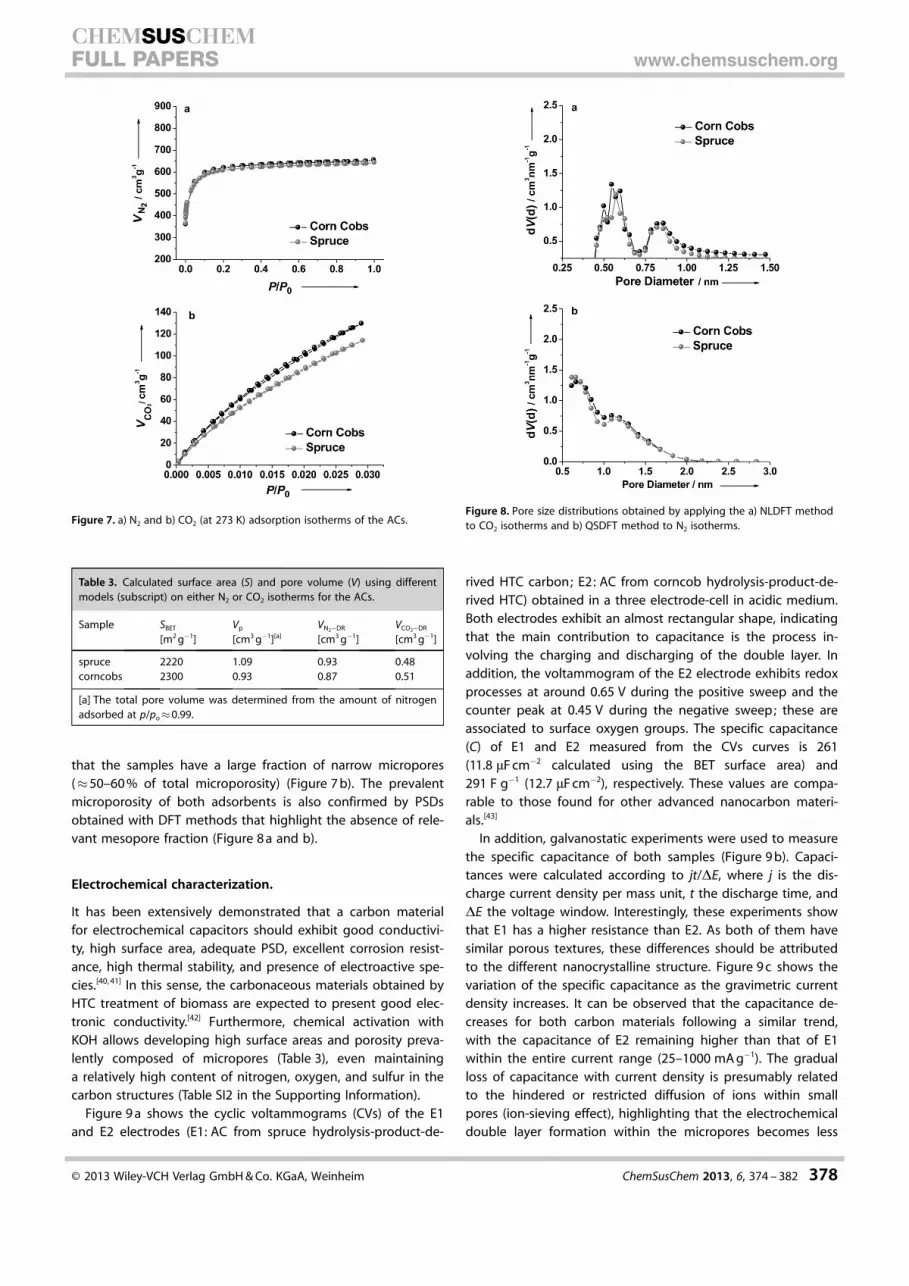
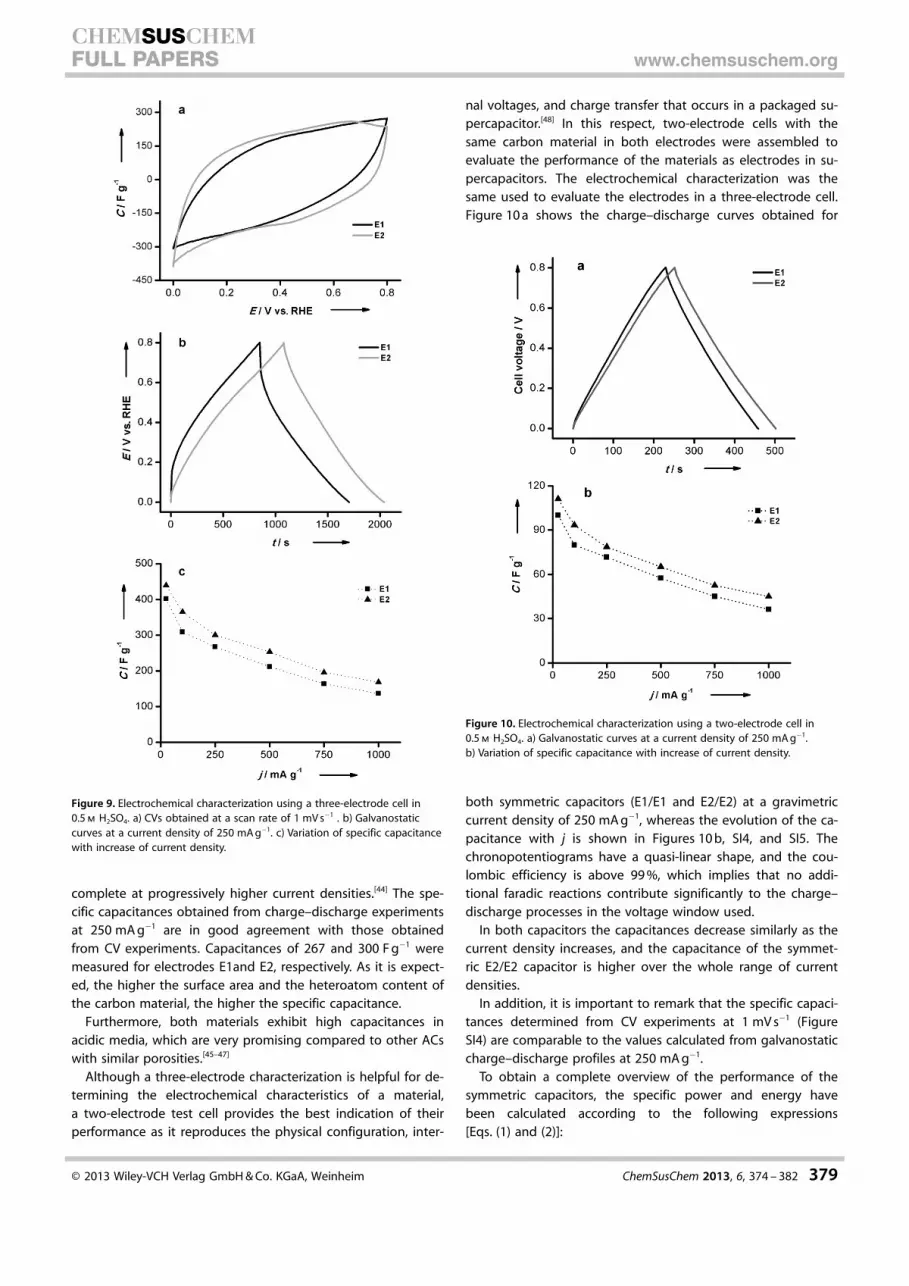
that the samples have a large fraction of narrow micropores(�50–60 % of total microporosity) (Figure 7 b). The prevalentmicroporosity of both adsorbents is also confirmed by PSDsobtained with DFT methods that highlight the absence of rele-vant mesopore fraction (Figure 8 a and b).
Electrochemical characterization.
It has been extensively demonstrated that a carbon materialfor electrochemical capacitors should exhibit good conductivi-ty, high surface area, adequate PSD, excellent corrosion resist-ance, high thermal stability, and presence of electroactive spe-cies.[40, 41] In this sense, the carbonaceous materials obtained byHTC treatment of biomass are expected to present good elec-tronic conductivity.[42] Furthermore, chemical activation withKOH allows developing high surface areas and porosity preva-lently composed of micropores (Table 3), even maintaininga relatively high content of nitrogen, oxygen, and sulfur in thecarbon structures (Table SI2 in the Supporting Information).
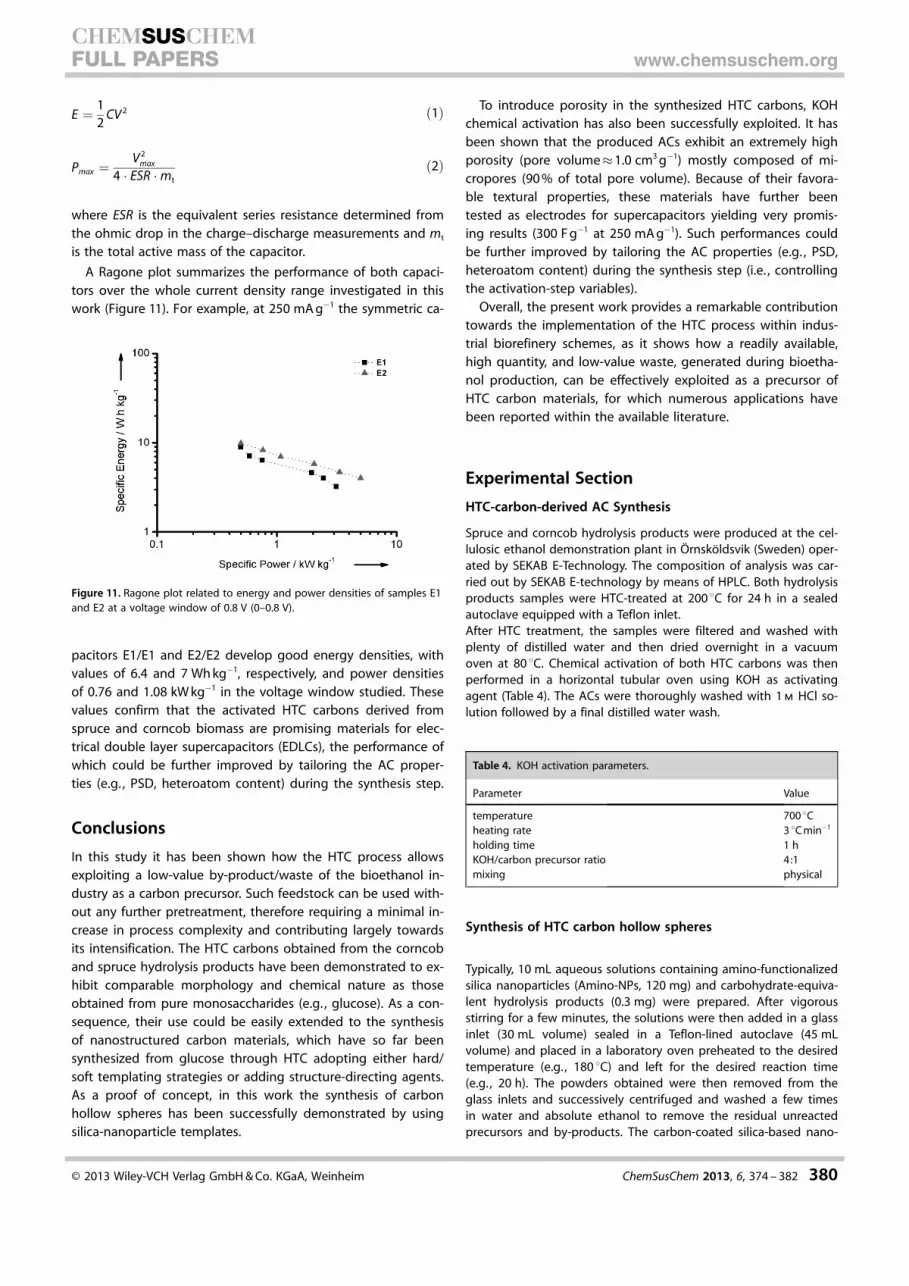
Figure 9 a shows the cyclic voltammograms (CVs) of the E1and E2 electrodes (E1: AC from spruce hydrolysis-product-de-
rived HTC carbon; E2: AC from corncob hydrolysis-product-de-rived HTC) obtained in a three electrode-cell in acidic medium.Both electrodes exhibit an almost rectangular shape, indicatingthat the main contribution to capacitance is the process in-volving the charging and discharging of the double layer. Inaddition, the voltammogram of the E2 electrode exhibits redoxprocesses at around 0.65 V during the positive sweep and thecounter peak at 0.45 V during the negative sweep; these areassociated to surface oxygen groups. The specific capacitance(C) of E1 and E2 measured from the CVs curves is 261(11.8 mF cm�2 calculated using the BET surface area) and291 F g�1 (12.7 mF cm�2), respectively. These values are compa-rable to those found for other advanced nanocarbon materi-als.[43]
In addition, galvanostatic experiments were used to measurethe specific capacitance of both samples (Figure 9 b). Capaci-tances were calculated according to jt/DE, where j is the dis-charge current density per mass unit, t the discharge time, andDE the voltage window. Interestingly, these experiments showthat E1 has a higher resistance than E2. As both of them havesimilar porous textures, these differences should be attributedto the different nanocrystalline structure. Figure 9 c shows thevariation of the specific capacitance as the gravimetric currentdensity increases. It can be observed that the capacitance de-creases for both carbon materials following a similar trend,with the capacitance of E2 remaining higher than that of E1within the entire current range (25–1000 mA g�1). The gradualloss of capacitance with current density is presumably relatedto the hindered or restricted diffusion of ions within smallpores (ion-sieving effect), highlighting that the electrochemicaldouble layer formation within the micropores becomes less
Figure 7. a) N2 and b) CO2 (at 273 K) adsorption isotherms of the ACs.
Table 3. Calculated surface area (S) and pore volume (V) using differentmodels (subscript) on either N2 or CO2 isotherms for the ACs.
Sample SBET
[m2 g�1]Vp
[cm3 g�1][a]
VN2�DR
[cm3 g�1]VCO2�DR
[cm3 g�1]
spruce 2220 1.09 0.93 0.48corncobs 2300 0.93 0.87 0.51
[a] The total pore volume was determined from the amount of nitrogenadsorbed at p/po�0.99.
Figure 8. Pore size distributions obtained by applying the a) NLDFT methodto CO2 isotherms and b) QSDFT method to N2 isotherms.
� 2013 Wiley-VCH Verlag GmbH & Co. KGaA, Weinheim ChemSusChem 2013, 6, 374 – 382 378
CHEMSUSCHEMFULL PAPERS www.chemsuschem.org
complete at progressively higher current densities.[44] The spe-cific capacitances obtained from charge–discharge experimentsat 250 mA g�1 are in good agreement with those obtainedfrom CV experiments. Capacitances of 267 and 300 F g�1 weremeasured for electrodes E1and E2, respectively. As it is expect-ed, the higher the surface area and the heteroatom content ofthe carbon material, the higher the specific capacitance.
Furthermore, both materials exhibit high capacitances inacidic media, which are very promising compared to other ACswith similar porosities.[45–47]
Although a three-electrode characterization is helpful for de-termining the electrochemical characteristics of a material,a two-electrode test cell provides the best indication of theirperformance as it reproduces the physical configuration, inter-
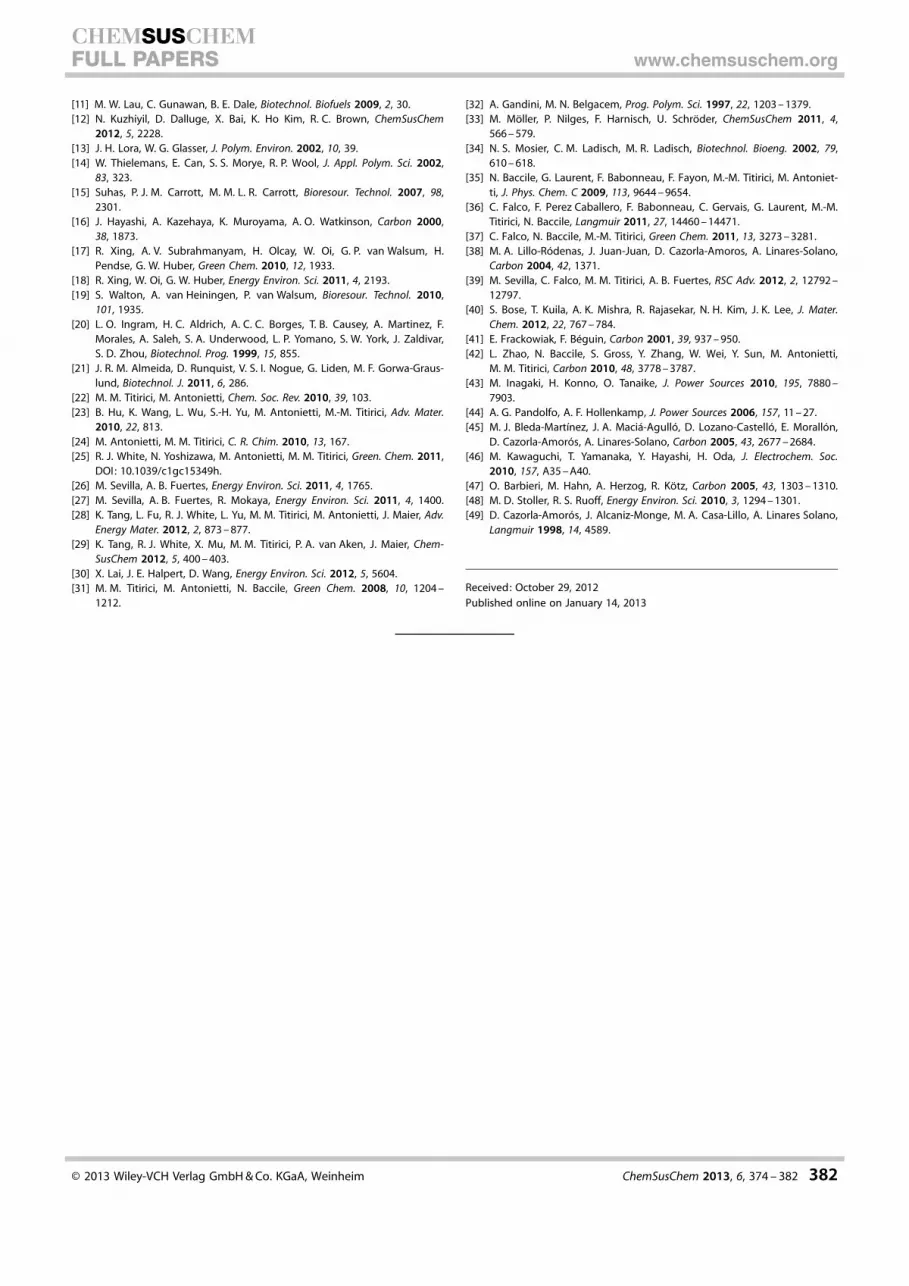
nal voltages, and charge transfer that occurs in a packaged su-percapacitor.[48] In this respect, two-electrode cells with thesame carbon material in both electrodes were assembled toevaluate the performance of the materials as electrodes in su-percapacitors. The electrochemical characterization was thesame used to evaluate the electrodes in a three-electrode cell.Figure 10 a shows the charge–discharge curves obtained for
both symmetric capacitors (E1/E1 and E2/E2) at a gravimetriccurrent density of 250 mA g�1, whereas the evolution of the ca-pacitance with j is shown in Figures 10 b, SI4, and SI5. Thechronopotentiograms have a quasi-linear shape, and the cou-lombic efficiency is above 99 %, which implies that no addi-tional faradic reactions contribute significantly to the charge–discharge processes in the voltage window used.
In both capacitors the capacitances decrease similarly as thecurrent density increases, and the capacitance of the symmet-ric E2/E2 capacitor is higher over the whole range of currentdensities.
In addition, it is important to remark that the specific capaci-tances determined from CV experiments at 1 mV s�1 (FigureSI4) are comparable to the values calculated from galvanostaticcharge–discharge profiles at 250 mA g�1.
To obtain a complete overview of the performance of thesymmetric capacitors, the specific power and energy havebeen calculated according to the following expressions[Eqs. (1) and (2)]:
Figure 9. Electrochemical characterization using a three-electrode cell in0.5 m H2SO4. a) CVs obtained at a scan rate of 1 mV s�1 . b) Galvanostaticcurves at a current density of 250 mA g�1. c) Variation of specific capacitancewith increase of current density.
Figure 10. Electrochemical characterization using a two-electrode cell in0.5 m H2SO4. a) Galvanostatic curves at a current density of 250 mA g�1.b) Variation of specific capacitance with increase of current density.
� 2013 Wiley-VCH Verlag GmbH & Co. KGaA, Weinheim ChemSusChem 2013, 6, 374 – 382 379
CHEMSUSCHEMFULL PAPERS www.chemsuschem.org
E ¼ 12
CV 2 ð1Þ
Pmax ¼V2
max
4 � ESR �mt
ð2Þ
where ESR is the equivalent series resistance determined fromthe ohmic drop in the charge–discharge measurements and mt
is the total active mass of the capacitor.
A Ragone plot summarizes the performance of both capaci-tors over the whole current density range investigated in thiswork (Figure 11). For example, at 250 mA g�1 the symmetric ca-
pacitors E1/E1 and E2/E2 develop good energy densities, withvalues of 6.4 and 7 Wh kg�1, respectively, and power densitiesof 0.76 and 1.08 kW kg�1 in the voltage window studied. Thesevalues confirm that the activated HTC carbons derived fromspruce and corncob biomass are promising materials for elec-trical double layer supercapacitors (EDLCs), the performance ofwhich could be further improved by tailoring the AC proper-ties (e.g. , PSD, heteroatom content) during the synthesis step.
Conclusions
In this study it has been shown how the HTC process allowsexploiting a low-value by-product/waste of the bioethanol in-dustry as a carbon precursor. Such feedstock can be used with-out any further pretreatment, therefore requiring a minimal in-crease in process complexity and contributing largely towardsits intensification. The HTC carbons obtained from the corncoband spruce hydrolysis products have been demonstrated to ex-hibit comparable morphology and chemical nature as thoseobtained from pure monosaccharides (e.g. , glucose). As a con-sequence, their use could be easily extended to the synthesisof nanostructured carbon materials, which have so far beensynthesized from glucose through HTC adopting either hard/soft templating strategies or adding structure-directing agents.As a proof of concept, in this work the synthesis of carbonhollow spheres has been successfully demonstrated by usingsilica-nanoparticle templates.
To introduce porosity in the synthesized HTC carbons, KOHchemical activation has also been successfully exploited. It hasbeen shown that the produced ACs exhibit an extremely highporosity (pore volume�1.0 cm3 g�1) mostly composed of mi-cropores (90 % of total pore volume). Because of their favora-ble textural properties, these materials have further beentested as electrodes for supercapacitors yielding very promis-ing results (300 F g�1 at 250 mA g�1). Such performances couldbe further improved by tailoring the AC properties (e.g. , PSD,heteroatom content) during the synthesis step (i.e. , controllingthe activation-step variables).
Overall, the present work provides a remarkable contributiontowards the implementation of the HTC process within indus-trial biorefinery schemes, as it shows how a readily available,high quantity, and low-value waste, generated during bioetha-nol production, can be effectively exploited as a precursor ofHTC carbon materials, for which numerous applications havebeen reported within the available literature.
Experimental Section
HTC-carbon-derived AC Synthesis
Spruce and corncob hydrolysis products were produced at the cel-lulosic ethanol demonstration plant in �rnskçldsvik (Sweden) oper-ated by SEKAB E-Technology. The composition of analysis was car-ried out by SEKAB E-technology by means of HPLC. Both hydrolysisproducts samples were HTC-treated at 200 8C for 24 h in a sealedautoclave equipped with a Teflon inlet.After HTC treatment, the samples were filtered and washed withplenty of distilled water and then dried overnight in a vacuumoven at 80 8C. Chemical activation of both HTC carbons was thenperformed in a horizontal tubular oven using KOH as activatingagent (Table 4). The ACs were thoroughly washed with 1 m HCl so-lution followed by a final distilled water wash.
Synthesis of HTC carbon hollow spheres
Typically, 10 mL aqueous solutions containing amino-functionalizedsilica nanoparticles (Amino-NPs, 120 mg) and carbohydrate-equiva-lent hydrolysis products (0.3 mg) were prepared. After vigorousstirring for a few minutes, the solutions were then added in a glassinlet (30 mL volume) sealed in a Teflon-lined autoclave (45 mLvolume) and placed in a laboratory oven preheated to the desiredtemperature (e.g. , 180 8C) and left for the desired reaction time(e.g. , 20 h). The powders obtained were then removed from theglass inlets and successively centrifuged and washed a few timesin water and absolute ethanol to remove the residual unreactedprecursors and by-products. The carbon-coated silica-based nano-
Table 4. KOH activation parameters.
Parameter Value
temperature 700 8Cheating rate 3 8C min�1
holding time 1 hKOH/carbon precursor ratio 4:1mixing physical
Figure 11. Ragone plot related to energy and power densities of samples E1and E2 at a voltage window of 0.8 V (0–0.8 V).
� 2013 Wiley-VCH Verlag GmbH & Co. KGaA, Weinheim ChemSusChem 2013, 6, 374 – 382 380
CHEMSUSCHEMFULL PAPERS www.chemsuschem.org

particles were then placed in a ceramic crucible in a carbonizationoven and heated to the desired temperature (e.g. , 950 8C) underan inert atmosphere (i.e. , N2 at a flow rate of 10 mL min�1). The fol-lowing heating program was used: a first ramp to reach 350 8C ata speed of 5 8C min�1, a second ramp to reach 950 8C at 2 8C min�1
and an isothermal step of 2 h. Samples were then allowed to coolto ambient conditions, removed from the oven, and washed twiceovernight in a solution of ammonium hydrogen difluoride(4 mol %) to remove the silica template. The as-synthesized hollowspheres were then washed in distilled water and dried overnight.
Characterization of HTC carbons
Elemental Analysis (EA) was performed by using an Elementarvario MICRO cube. SEM images were acquired using a LEO 1550/LEO GmbH Oberkochen equipped with an Everhard Thornley sec-ondary electron and in-lens detectors. FTIR spectra of the materialswere recorded in attenuated total reflectance (ATR) geometry ona Varian 1000 FTIR spectrometer, Scimitar Series (FTS1000).13C solid-state magic angle spinning (MAS) NMR spectra were ac-quired by using a Bruker Avance 300 MHz (7 T) spectrometer using4 mm zirconia rotors as sample holders, spinning at MAS ratenMAS = 14 kHz. The chemical shift reference was tetramethylsilane(TMS; d= 0 ppm).The 1H t1 relaxation time was set to 3 s. Proton-to-carbon cross polarization (CP) MAS was used to enhance carbonsensitivity by using a CP time equal to 1 ms.
Porosity Characterization
The characterization of the porous texture was assessed by per-forming gas adsorption experiments, N2 (77 K) and CO2 (273 K) ad-sorption, in a QUADRASORB SI apparatus equipped with an auto-mated surface-area and pore-size analyzer. The specific surfacearea and the micropore volume were calculated by fitting nitrogenadsorption data to BET and DR equation, respectively.[49] Narrowmicropore volume (mean pore size lower than about 0.7 nm) wasobtained by fitting DR equation to CO2 isotherm data. PSDs wereevaluated from both adsorptive by using the quenched solid-statedensity functional theory (QSDFT) method for N2 and the non-localdensity functional theory (NLDFT) method for CO2 (QUADRAWINsoftware). TEM was carried out by using a Carl Zeiss Omega 912Xat an acceleration voltage of 120 kV.
Electrochemical experiments
Suprapure sulfuric acid was purchased from Merck, acetylene blackfrom Strem Chemicals, and the binder (polytetrafluoroethylene,PTFE) from Sigma–Aldrich. The electrolyte solution was preparedwith purified water obtained from an Elga Labwater Purelabsystem (18.2 MW cm).For the electrode preparation, the carbon materials were mixedwith the binder PTFE (60 wt %) and acetylene black (Strem Chemi-cals) in a ratio 80:10:10 (wt %). The materials were mixed andpressed up to 1 ton for 10 min. The total electrode weight (HTCcarbon, binder, and acetylene black) used for the measurements inthe three-electrode cell was about 40 mg. After that, the electrodewas placed on a stainless steel mesh (1 cm width and 6 cmheight), which was used as current collector, by pressing the elec-trode onto the mesh under 1 ton for 10 min.The electrochemical characterization of the electrodes was per-formed by using a standard three-electrode cell configuration. Thecounter electrode was a platinum wire, and a reversible hydrogen
electrode (RHE) served as reference. All potentials mentioned inthis work are referred to this electrode. An inert nitrogen atmos-phere was maintained over the electrolyte. An aqueous electrolytesolution of 0.5 m H2SO4 was used. The measurements were carriedout with an EG&G Potentiostat/Galvanostat model 273 and an Au-tolab PGSTAT302. The electrochemical behavior of the samples wasassessed by CV at 1 mV s�1 and galvanostatic charge–discharge ex-periments. Capacitances were calculated from the scanning rangebetween 0 and 0.8 V by dividing the imposed current with theslope of the linear chronopotentiograms plot, taking the averagevalue between charge and discharge processes. The capacitance isexpressed in F g�1 taking into account the weight of the activepart of the electrode.Experiments were also performed in a two-electrode cell usinga sandwich-type construction (electrode/separator/electrode) witha nylon membrane (0.45 mm pore size) between the electrodes.Gold was used as the current collector and a 0.5 m H2SO4 solutionas the electrolyte. Electrode discs with 10 mm diameter and about0.25 mm thickness were cut from carbon pastes. The values of spe-cific capacitances of the two-electrode cell were determined bygalvanostatic charge–discharge measurements at different currentdensities and CV at 1 mV s�1. ESR was calculated from the voltagedrop (DV) observed in the discharge curve according to DV = I �ESR.
Acknowledgements
The authors would like to thank SEKAB for making the hydrolysisproduct samples available and, therefore, for allowing the devel-opment of the work presented within this manuscript. The techni-cal staff of the Colloids department at the Max Planck Instituteof Colloids and Interfaces is thanked for all the help providedwith analytical measurements. The Laboratoire de Chimie de laMatiere Condensee de Paris Centre ’and especially Dr. Niki Bac-cile, Prof. Florence Babonneau, and Ing. Guillaume Laurent arethanked for their help and assistance during NMR measurements.C.F. thanks Dr. Luca Bertinetti for the help provided with high-res-olution SEM measurements. Financial support by the Ministeriode Ciencia e Innovaci�n (MAT2010-15273 and CTQ2009-10813)and Generalitat Valenciana and FEDER (PROMETEO/2009/047and ACOMP2012/133) projects are gratefully acknowledged.J.M.S. thanks Ministerio de Educaci�n (SB2010-132).
Keywords: biomass · carbon · green chemistry · microporousmaterials · supercapacitors
[1] G. W. Huber, S. Iborra, A. Corma, Chem. Rev. 2006, 106, 4044.[2] J. N. Chheda, G. W. Huber, J. A. Dumesic, Angew. Chem. 2007, 119, 7298;
Angew. Chem. Int. Ed. 2007, 46, 7164.[3] R. Palkovits, Angew. Chem. 2010, 122, 4434; Angew. Chem. Int. Ed. 2010,
49, 4336.[4] M. Stçcker, Angew. Chem. 2008, 120, 9340; Angew. Chem. Int. Ed. 2008,
47, 9200.[5] A. A. Peterson, F. Vogel, R. P. Lachance, M. Froling, M. J. Antal, J. W.
Tester, Energy Environ. Sci. 2008, 1, 32.[6] K. Tajvidi, K. Pupovac, M. Kukrek, R. Palkovits, ChemSusChem 2012, 5,
2139 – 2142.[7] P. Kumar, D. M. Barrett, M. J. Delwiche, P. Stroeve, Ind. Eng. Chem. Res.
2009, 48, 3713.[8] J. C. Serrano-Ruiz, J. A. Dumesic, Energy Environ. Sci. 2011, 4, 83 – 99.[9] B. Yang, C. E. Wyman, Biofuels Bioprod. Biorefin. 2008, 2, 26.
[10] A. T. W. M. Hendriks, G. Zeeman, Bioresour. Technol. 2009, 100, 10.
� 2013 Wiley-VCH Verlag GmbH & Co. KGaA, Weinheim ChemSusChem 2013, 6, 374 – 382 381
CHEMSUSCHEMFULL PAPERS www.chemsuschem.org
[11] M. W. Lau, C. Gunawan, B. E. Dale, Biotechnol. Biofuels 2009, 2, 30.[12] N. Kuzhiyil, D. Dalluge, X. Bai, K. Ho Kim, R. C. Brown, ChemSusChem
2012, 5, 2228.[13] J. H. Lora, W. G. Glasser, J. Polym. Environ. 2002, 10, 39.[14] W. Thielemans, E. Can, S. S. Morye, R. P. Wool, J. Appl. Polym. Sci. 2002,
83, 323.[15] Suhas, P. J. M. Carrott, M. M. L. R. Carrott, Bioresour. Technol. 2007, 98,
2301.[16] J. Hayashi, A. Kazehaya, K. Muroyama, A. O. Watkinson, Carbon 2000,
38, 1873.[17] R. Xing, A. V. Subrahmanyam, H. Olcay, W. Oi, G. P. van Walsum, H.
Pendse, G. W. Huber, Green Chem. 2010, 12, 1933.[18] R. Xing, W. Oi, G. W. Huber, Energy Environ. Sci. 2011, 4, 2193.[19] S. Walton, A. van Heiningen, P. van Walsum, Bioresour. Technol. 2010,
101, 1935.[20] L. O. Ingram, H. C. Aldrich, A. C. C. Borges, T. B. Causey, A. Martinez, F.
Morales, A. Saleh, S. A. Underwood, L. P. Yomano, S. W. York, J. Zaldivar,S. D. Zhou, Biotechnol. Prog. 1999, 15, 855.
[21] J. R. M. Almeida, D. Runquist, V. S. I. Nogue, G. Liden, M. F. Gorwa-Graus-lund, Biotechnol. J. 2011, 6, 286.
[22] M. M. Titirici, M. Antonietti, Chem. Soc. Rev. 2010, 39, 103.[23] B. Hu, K. Wang, L. Wu, S.-H. Yu, M. Antonietti, M.-M. Titirici, Adv. Mater.
2010, 22, 813.[24] M. Antonietti, M. M. Titirici, C. R. Chim. 2010, 13, 167.[25] R. J. White, N. Yoshizawa, M. Antonietti, M. M. Titirici, Green. Chem. 2011,
DOI: 10.1039/c1gc15349h.[26] M. Sevilla, A. B. Fuertes, Energy Environ. Sci. 2011, 4, 1765.[27] M. Sevilla, A. B. Fuertes, R. Mokaya, Energy Environ. Sci. 2011, 4, 1400.[28] K. Tang, L. Fu, R. J. White, L. Yu, M. M. Titirici, M. Antonietti, J. Maier, Adv.
Energy Mater. 2012, 2, 873 – 877.[29] K. Tang, R. J. White, X. Mu, M. M. Titirici, P. A. van Aken, J. Maier, Chem-
SusChem 2012, 5, 400 – 403.[30] X. Lai, J. E. Halpert, D. Wang, Energy Environ. Sci. 2012, 5, 5604.[31] M. M. Titirici, M. Antonietti, N. Baccile, Green Chem. 2008, 10, 1204 –
1212.
[32] A. Gandini, M. N. Belgacem, Prog. Polym. Sci. 1997, 22, 1203 – 1379.[33] M. Mçller, P. Nilges, F. Harnisch, U. Schrçder, ChemSusChem 2011, 4,
566 – 579.[34] N. S. Mosier, C. M. Ladisch, M. R. Ladisch, Biotechnol. Bioeng. 2002, 79,
610 – 618.[35] N. Baccile, G. Laurent, F. Babonneau, F. Fayon, M.-M. Titirici, M. Antoniet-
ti, J. Phys. Chem. C 2009, 113, 9644 – 9654.[36] C. Falco, F. Perez Caballero, F. Babonneau, C. Gervais, G. Laurent, M.-M.
Titirici, N. Baccile, Langmuir 2011, 27, 14460 – 14471.[37] C. Falco, N. Baccile, M.-M. Titirici, Green Chem. 2011, 13, 3273 – 3281.[38] M. A. Lillo-R�denas, J. Juan-Juan, D. Cazorla-Amoros, A. Linares-Solano,
Carbon 2004, 42, 1371.[39] M. Sevilla, C. Falco, M. M. Titirici, A. B. Fuertes, RSC Adv. 2012, 2, 12792 –
12797.[40] S. Bose, T. Kuila, A. K. Mishra, R. Rajasekar, N. H. Kim, J. K. Lee, J. Mater.
Chem. 2012, 22, 767 – 784.[41] E. Frackowiak, F. B�guin, Carbon 2001, 39, 937 – 950.[42] L. Zhao, N. Baccile, S. Gross, Y. Zhang, W. Wei, Y. Sun, M. Antonietti,
M. M. Titirici, Carbon 2010, 48, 3778 – 3787.[43] M. Inagaki, H. Konno, O. Tanaike, J. Power Sources 2010, 195, 7880 –
7903.[44] A. G. Pandolfo, A. F. Hollenkamp, J. Power Sources 2006, 157, 11 – 27.[45] M. J. Bleda-Mart�nez, J. A. Maci�-Agull�, D. Lozano-Castell�, E. Morall�n,
D. Cazorla-Amor�s, A. Linares-Solano, Carbon 2005, 43, 2677 – 2684.[46] M. Kawaguchi, T. Yamanaka, Y. Hayashi, H. Oda, J. Electrochem. Soc.
2010, 157, A35 – A40.[47] O. Barbieri, M. Hahn, A. Herzog, R. Kçtz, Carbon 2005, 43, 1303 – 1310.[48] M. D. Stoller, R. S. Ruoff, Energy Environ. Sci. 2010, 3, 1294 – 1301.[49] D. Cazorla-Amor�s, J. Alcaniz-Monge, M. A. Casa-Lillo, A. Linares Solano,
Langmuir 1998, 14, 4589.
Received: October 29, 2012
Published online on January 14, 2013
� 2013 Wiley-VCH Verlag GmbH & Co. KGaA, Weinheim ChemSusChem 2013, 6, 374 – 382 382
CHEMSUSCHEMFULL PAPERS www.chemsuschem.org


