Embed Size (px)
Citation preview


Hamburg Contemporary Economic Discussions University of Hamburg Faculty Economics and Social Science Chair for Economic Policy Von-Melle-Park 5 D-20146 Hamburg | Germany Tel +49 40 42838 - 4622 Fax +49 40 42838 - 6251 http://www.uni-hamburg.de/economicpolicy/ Editor: Wolfgang Maennig
Arne Feddersen University of Hamburg Faculty Economics and Social Science Chair for Economic Policy Von-Melle-Park 5 D-20146 Hamburg | Germany Tel +49 40 42838 - 4628 Fax +49 40 42838 - 6251 [email protected] Wolfgang Maennig University of Hamburg Faculty Economics and Social Science Chair for Economic Policy Von-Melle-Park 5 D-20146 Hamburg | Germany Tel +49 40 42838 - 4622 Fax +49 40 42838 - 6251 [email protected] Philipp Zimmermann [email protected]
ISSN 1865 - 2441 (Print) ISSN 1865 - 7133 (Online)
ISBN 978 - 3 - 940369 - 18 - 5 (Print) ISBN 978 - 3 - 940369 - 19 - 2 (Online)

Arne Feddersen, Wolfgang Maennig & Philipp Zimmermann
The Empirics of Key Factors in the Success of Bids for Olympic Games
Abstract: This paper examines the probability of the success of city bid campaigns on the basis of quantified determinants for a total of 48 bids for the Summer Olympic Games between 1992 and 2012. Using a model comprising the distance of sporting venues from the Olympic Village, local temperatures and unemployment rates, we can correctly predict the decision for 100% of failed bids and 50% of successful bids.
Keywords: Olympic Games, Bidding process, Key success factors, Binary logistical regression
JEL classification: L83, C25
Version: September 2007
1 Introduction
Hosting of the Olympic Games supposedly affects the regions involved in
different ways – politically, psychologically, sociologically and culturally, as well
as economically.1 Applications to host the Olympic Games (or other so-called
mega-events2) by cities and regions are based, in as much as rational decision-
1 See RITCHIE & YANGZHOU (1987), HOTCHKISS, MOORE & ZOBEY (2003), BAADE & MATHESON (2002), and JASMAND & MAENNIG (forthcoming) for ex post analysis of the economics of the Games of Munich 1972, Los Angeles 1984, and Atlanta 1996, and the literature quoted therein for the corresponding ex-ante analysis. See STERKEN (2006) for a generalised empirical analysis of Olympic Games.
2 ”Throughout the 1980s, World's Fairs and Olympic organizers turned to the mega-event as a panacea, a solution to the myriad of problems caused by economic hard times” (TEWS, 1993, p. 3).
HDEC 02 – How to Win the Olympic Games 2
making may be presupposed, on the expectation that the corresponding benefits
will exceed the costs.3
As for members of the International Olympic Committee (IOC) who decide which
cities will host the Olympic Games, in recent years they have at least received an
evaluation report that compares the most important characteristics of the
candidate cities.
In spite of the assumed rationality on the part of both the applicants and the
decision-makers, the process of deciding who will host the Olympic Games has so
far attracted relatively little attention in economic analyses. SCHAUENBERG
(1992) analyses the voting procedure for the 1996 Olympic Games and reveals
some irrationalities. SWART & BOB (2004) identify factors such as accountability,
political support, relationship marketing, ability, infrastructure, bid team
composition, communication and exposure, and existing facilities as decisive for
a successful bid. However, these determinants are not submitted to any empirical
test. WESTERBEEK, TURNER & INGERSON (2002), after asking 135 respondents
about the importance of 69 items, identify by factor analysis decisive factors that
they (also) call accountability, political support, relationship marketing, ability,
infrastructure, bid team composition, communication and exposure, and existing
facilities. The problem, which is a general problem with factor analysis, is that the
naming of such factors is somewhat arbitrary. For example, the WESTERBEEK,
TURNER & INGERSON (2002) “accountability“ factor includes the “ability to
identify key target markets of importance to the event owners” and “to have an
established and recognized presence in the marketplace as a bidding
organization”. The “political support“ factor includes “financial stability of the
city”. Beside the problem of interpreting factors, it is hardly possible to quantify
the items they encompass. Thus, if an applicant city wishes to enhance its
3 See SPILLING (1996, p. 321). For an overview of ex ante studies on the costs and benefits of the Olympics see PREUSS (2004, p. 45). Benefits may also occur in the case of failed applications. Thus, the international application campaign may in part be viewed as a relatively cheap form of image campaign (ANDRANOVICH, BURBANK, & HEYING, 2001, p. 127). For example, the value of Birmingham’s unsuccessful bid has been estimated at 25 million BP, although it only cost 5 million BP (ROCHE, 2001).
HDEC 02 – How to Win the Olympic Games 3
competitive position, it remains unclear which items should be ameliorated.
Furthermore, having spent effort on improvements, it is hard to measure whether
the city’s ranking for that item has really appreciated.
The limited academic attention to date is astonishing because – presumably as a
consequence of the expected benefits – both the number of applicant cities and
the related expenditure have increased significantly.
This paper examines, in our opinion for the first time, the probability of success of
application campaigns to host the Olympic Summer Games4 on the basis of
quantified determinants. The analysis is based on a total of 48 bids to host the
Olympic Summer Games between 1992 and 2012. Section 2 sketches the history
of the bids and the awarding of the Games. Section 3 presents the data, the
estimation model and the results of the econometric analysis. Section 4 closes
with a conclusion.
2 Elements of the history of Olympic bids
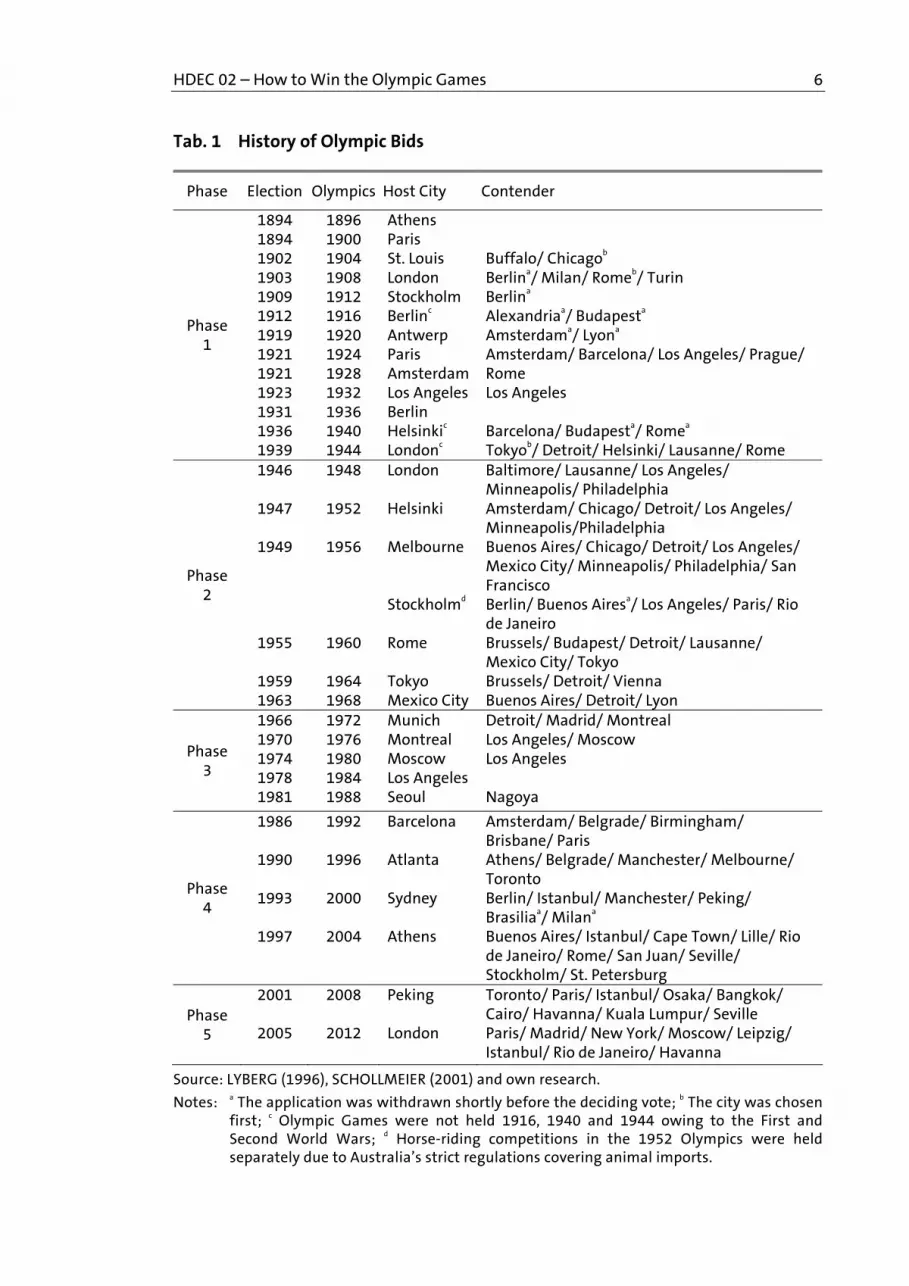
Table 1 provides an overview of the years and locations in which the Summer
Olympic Games have been held, the year of the IOC’s bid decision and
unsuccessful applicant cities. The figures are taken from LYBERG (1996, pp. 252-
260) and from our own research, in which the cities considered as applicants are
only those that actually featured in the voting process (or that withdrew their
application for whatever reasons shortly before voting took place). SCHERER
(1995, p. 401), by contrast, departs from this approach and defines as an
applicant every city that expressed interest to the IOC in hosting the Olympics,
and thus arrives at considerably higher numbers of applicants.
With regard to the following analysis, it appears meaningful to systematize the
history of Olympic bids, particularly according to the criterion of the absolute
4 The Olympic Winter Games have to be analysed separately given their particular climatic and topographic requirements.
HDEC 02 – How to Win the Olympic Games 4
number of applicant cities (and the changes to this number) in the various
phases, even if other systems, e.g. according to political and/or historical
principles, also appear possible.5
In an initial phase from 1886 to the end of World War II, awarding of the Games
was largely determined by the influence of the founders of the modern Olympics.
A total of 39 cities applied to host the 14 Olympic Games in this period. The
second phase, which began after World War II and lasted until 1968, shows a
significant increase in the numbers of applicant cities6 and, with the decision in
favor of Tokyo’s bid to host the 1964 Games, also includes for the first time an
opening up of the club of host cities that had previously been limited to those
from western cultural circles. The awarding of the 1968 Games to Mexico City is
partly regarded as an attempt by the IOC to avoid both the effects of the East–
West conflict that had intensified during the 1950s and increasing damage due to
boycotts.7 The 1964 Olympic Games in Tokyo, which were used to improve
sporting and general infrastructure to a previously unheard of degree and
entailed considerable costs, initiated a process of rethinking among applicant
cities (GREENBERG, 2003, p. 36).
The third phase from 1972 up to and including 19888 accordingly displays a
decreasing trend for the number of applicants, which almost exclusively came
from the industrially more developed countries. Twelve bids by eight different
5 See, for example, GUTTMANN (1992).
6 A total of 37 cities applied to host the six Olympic Games held in this phase.
7 See LIU (1998, p. 85). The Montreal Games were boycotted by the teams of 20 black African states in protest against the participation of New Zealand, whose national rugby team had visited South Africa (GREENBERG, 2003, p. 43). Following the Soviet Union’s invasion of Afghanistan, 36 countries boycotted the 1980 Games in Moscow; a further 20 National Olympic Committees did not comment on the invitation (SCHOLLMEIER, 2001, p. 23). Finally, seven socialist states refused to participate in the Los Angeles Games. For an overview of boycotts and exclusions as a means of political pressure that heavily influenced the Olympic Games from 1956 onwards, see RIORDAN, LOWE & NIKISHKINOV (1980).
8 The period of time between the vote on the host city and the hosting of the Games, which is not constant over the history of the Games and can be up to seven years, should be taken into account here and in the following.
HDEC 02 – How to Win the Olympic Games 5
cities were made for the five Olympic Games of this phase. This third phase can
be characterized as displaying limited intensity of competition to host the
Olympic Games. The third phase did, however, influence competitive behavior in
phase 4, since the Games in Los Angeles and Seoul were regarded as financially
successful and induced an increase in the number of applicants. The end of the
East–West conflict from the late 1980s onwards meant that the Olympic Games
have since hardly been used as a political instrument at all. Applicant cities have
thus once again been able to hope for greater image gains from the Olympics.
Phase 5 begins with the revelation of the IOC corruption scandal of Salt Lake City
and awarding of the 2008 Olympic Games in 2001. The repercussions of the
scandal led to fundamental changes9 that, with division of the application
process into two phases (the “applicant city phase” and the “candidate city
phase”), were intended to provide greater transparency. In addition, the IOC,
under its new president Jacques Rogge, has set itself the target of reducing the
costs and size of the Olympic Games. A further increase in the numbers of
applicants hoping to host the two Olympic Games in this fifth phase from 2008 to
– so far – 2012 is evident in comparison to the previous phases. The nineteen bids
for the two Olympic Summer Games indicate that the Olympic Games are
currently enjoying greater popularity than ever before among applicant cities.
Illustration 1 summarises the development of the numbers of applicants in the
five phases. The upward trend in applicant numbers in the second phase is clearly
evident, with more than double the number of applicants per Olympic Games
than in the first phase. The decrease in bid numbers in the third phase and the
renewed increase in bid numbers since the fourth phase are also clearly apparent.
9 For a description and an economic analysis of the corruption involved in the Salt Lake City scandal and the institutional changes afterwards, see MAENNIG (2002).
HDEC 02 – How to Win the Olympic Games 6
Tab. 1 History of Olympic Bids
Phase Election Olympics Host City Contender
Phase 1
1894 1894 1902 1903 1909 1912 1919 1921 1921 1923 1931 1936 1939
1896 1900 1904 1908 1912 1916 1920 1924 1928 1932 1936 1940 1944
Athens Paris St. Louis London Stockholm Berlinc Antwerp Paris AmsterdamLos AngelesBerlin Helsinkic
Londonc
Buffalo/ Chicagob Berlina/ Milan/ Romeb/ Turin Berlina Alexandriaa/ Budapesta Amsterdama/ Lyona Amsterdam/ Barcelona/ Los Angeles/ Prague/ Rome Los Angeles Barcelona/ Budapesta/ Romea Tokyob/ Detroit/ Helsinki/ Lausanne/ Rome
Phase 2
1946
1947
1949
1955
1959 1963
1948
1952
1956
1960
1964 1968
London Helsinki Melbourne Stockholmd
Rome Tokyo Mexico City
Baltimore/ Lausanne/ Los Angeles/ Minneapolis/ Philadelphia Amsterdam/ Chicago/ Detroit/ Los Angeles/ Minneapolis/Philadelphia Buenos Aires/ Chicago/ Detroit/ Los Angeles/ Mexico City/ Minneapolis/ Philadelphia/ San Francisco Berlin/ Buenos Airesa/ Los Angeles/ Paris/ Rio de Janeiro Brussels/ Budapest/ Detroit/ Lausanne/ Mexico City/ Tokyo Brussels/ Detroit/ Vienna Buenos Aires/ Detroit/ Lyon
Phase 3
1966 1970 1974 1978 1981
1972 1976 1980 1984 1988
Munich Montreal Moscow Los Angeles Seoul
Detroit/ Madrid/ Montreal Los Angeles/ Moscow Los Angeles Nagoya
Phase 4
1986
1990
1993
1997
1992
1996
2000
2004
Barcelona Atlanta Sydney Athens
Amsterdam/ Belgrade/ Birmingham/ Brisbane/ Paris Athens/ Belgrade/ Manchester/ Melbourne/ Toronto Berlin/ Istanbul/ Manchester/ Peking/ Brasiliaa/ Milana Buenos Aires/ Istanbul/ Cape Town/ Lille/ Rio de Janeiro/ Rome/ San Juan/ Seville/ Stockholm/ St. Petersburg
Phase 5
2001
2005
2008
2012
Peking London
Toronto/ Paris/ Istanbul/ Osaka/ Bangkok/ Cairo/ Havanna/ Kuala Lumpur/ Seville Paris/ Madrid/ New York/ Moscow/ Leipzig/ Istanbul/ Rio de Janeiro/ Havanna
Source: LYBERG (1996), SCHOLLMEIER (2001) and own research.
Notes: a The application was withdrawn shortly before the deciding vote; b The city was chosen first; c Olympic Games were not held 1916, 1940 and 1944 owing to the First and Second World Wars; d Horse-riding competitions in the 1952 Olympics were held separately due to Australia’s strict regulations covering animal imports.

HDEC 02 – How to Win the Olympic Games 7
Fig. 1 Bids per Olympic Games
0
1
2
3
4
5
6
7
8
9
10
Phase 1 Phase 2 Phase 3 Phase 4 Phase 5
Bid
s pe
r Oly
mpi
c G
ame
Source: Own calculations.
3 Data, methods, and results
3.1 Data
Analysis of the characteristics of successful Olympic bids is based on bids for the
six Olympic Games from 1992 to 2012.10 Data for the empirical analysis are taken
from the bid books of the cities in question and from the reports of the IOC
Evaluation Commission and relate to the year in which the IOC made its decision.
In the case of incomplete data or macroeconomic data not included in the bid
documentation, data from the World Bank were used. In cases in which data
provided by the bid books and the IOC Evaluation Commission differed, the latter
10 Bids prior to the 1992 Games provide a significantly lower amount of information.

HDEC 02 – How to Win the Olympic Games 8
source was used, since bid books sometimes tend to provide “embellished”
information.11
The following empirical analysis makes use of the factors for a successful bid
identified by SWART & BOB (2004), which can be quantified using the available
data. To measure political support, the results of public opinion polls conducted in
the cities in question were used (SUPPORT). These data are taken from the bid
books and/or the IOC Evaluation Commission reports. Quantification of existing
facilities took into account the extent to which construction of the sporting
venues had progressed. The proportions of completed venues requiring no further
modification (VENUES EXISTING), venues requiring substantial reconstruction
work or still under construction (VENUES CONSTRUCTION), and planned venues
that would only be built on approval of the bid (VENUES PLANNED) were
calculated in relation to the total Olympic sporting facilities mentioned in the bid
books and the IOC reports. The number of available hotel beds within 50 minutes
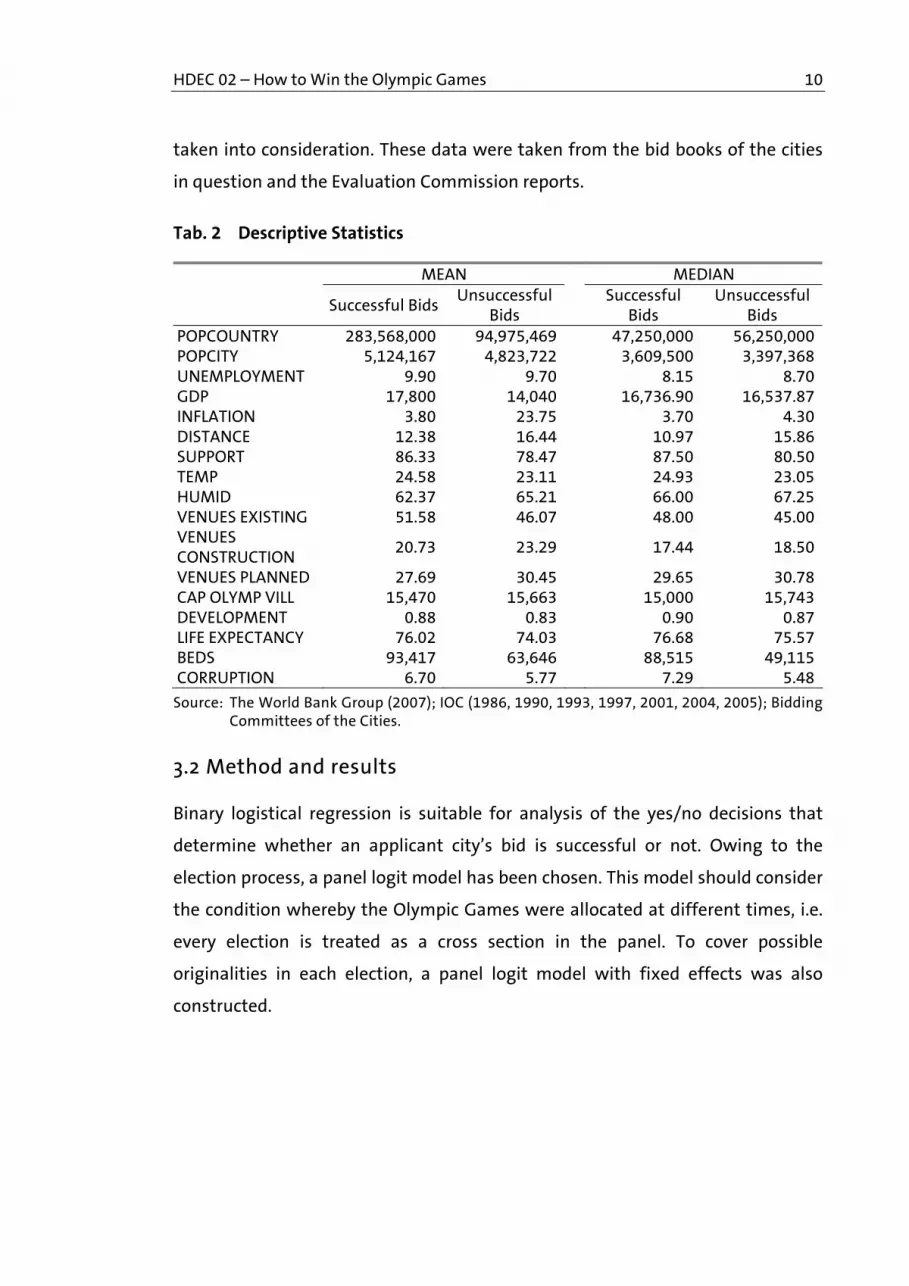
of travelling time (BEDS) was taken from the bid books.12 Table 2 presents the
average and median values of the data used.
Following the data requested by the IOC (2004), the influencing factors were
supplemented by additional variables on the sporting venue concept, the climatic
situation and a number of socioeconomic determinants. Quantified variables for
the sporting concept of the applicant cities were added. The average distance of
sporting venues from the Olympic Village in kilometres (DISTANCE), the number
of planned Olympic Villages (NO OLYMP VILL) and the planned accommodation
11 “What is written in the bid documents soon turns out to be pretty irrelevant” (N.N. 2004), who also points out one of the most recent cases of a failure to keep promises made in the bid book: shortly after approval of its bid for the 2010 Games, Vancouver decided to relocate the speed skating oval – initially planned for the city centre – to the waterfront. The International Broadcast Center was also to be relocated. Assuming rational decision-making on the part of the IOC members, the reduced validity of the bid book data should tend to lead to a limitation in the information content of the data, which has to be taken into account below when interpreting the results.
12 The IOC demands a minimum capacity of 40,000 beds (IOC, 2004, p. 57). In cases for which the accommodation capacities in bid books were cited as numbers of hotel rooms, this figure was multiplied by a factor of 1.8; see LEXINGTON CONSULTING (2002, p. 91) for a justification of this conversion factor.

HDEC 02 – How to Win the Olympic Games 9
capacity of the Olympic Villages (CAP OLYMP VILL) were taken from the bid books
and/or IOC reports.
The national purchasing-power-adjusted per capita GDP (GDP) as defined by the
World Bank was included as a socioeconomic determinant and adjusted for
inflation based on the year 1995 in US$. In addition, the unemployment rate
(UNEMPLOYMENT) and inflation rate (INFLATION) were also tested. The
population size of the applicant country (POPCOUNTRY) and the population size
of the applicant city (POPCITY) were also included, which can be regarded as an
indicator of its political power.
To cover some socio-demographic influences, the development status of the
applicant country was considered. First, the Human Development Index (HDI) as
provided by the United Nations Development Program (UNDP) was used as a
proxy of the development of a country (DEVELOPMENT). Second, the life
expectancy of citizens of the applicant country can be used to measure the
development status. Third, the level of corruption in an applicant country –
possibly an indicator for corruptive attacks of the relevant city during the bidding
process – should be considered. Therefore, the Corruption Perceptions Index (CPI)
from Transparency International was used (CORRUPTION).
One often-discussed determinant in the election process of a host city is the
“rotation of continents”: Since the 1952 Olympic Games in Helsinki, the Games
have not been held on the same continent for two consecutive Games. To cover
the form of “implicit” continent rotation, two dummy variables were tested. The
first dummy variable takes a value of 1 if a bidding city is located on the same
continent as the host city of the previous Games. The second dummy variable
counts the number of Games held on continents other than the applicant’s
continent. In addition, a dummy variable that takes a value of 1 if a city applied
consecutive times was included.
Finally, to take climatic aspects into account, the average temperature (TEMP) and
relative humidity (HUMID) during the period envisaged for the Games were also
HDEC 02 – How to Win the Olympic Games 10
taken into consideration. These data were taken from the bid books of the cities
in question and the Evaluation Commission reports.
Tab. 2 Descriptive Statistics
MEAN MEDIAN
Successful BidsUnsuccessful
Bids
Successful Bids
Unsuccessful Bids
POPCOUNTRY 283,568,000 94,975,469 47,250,000 56,250,000POPCITY 5,124,167 4,823,722 3,609,500 3,397,368UNEMPLOYMENT 9.90 9.70 8.15 8.70GDP 17,800 14,040 16,736.90 16,537.87INFLATION 3.80 23.75 3.70 4.30DISTANCE 12.38 16.44 10.97 15.86SUPPORT 86.33 78.47 87.50 80.50TEMP 24.58 23.11 24.93 23.05HUMID 62.37 65.21 66.00 67.25VENUES EXISTING 51.58 46.07 48.00 45.00VENUES CONSTRUCTION
20.73 23.29 17.44 18.50
VENUES PLANNED 27.69 30.45 29.65 30.78CAP OLYMP VILL 15,470 15,663 15,000 15,743DEVELOPMENT 0.88 0.83 0.90 0.87LIFE EXPECTANCY 76.02 74.03 76.68 75.57BEDS 93,417 63,646 88,515 49,115CORRUPTION 6.70 5.77 7.29 5.48
Source: The World Bank Group (2007); IOC (1986, 1990, 1993, 1997, 2001, 2004, 2005); Bidding Committees of the Cities.
3.2 Method and results
Binary logistical regression is suitable for analysis of the yes/no decisions that
determine whether an applicant city’s bid is successful or not. Owing to the
election process, a panel logit model has been chosen. This model should consider
the condition whereby the Olympic Games were allocated at different times, i.e.
every election is treated as a cross section in the panel. To cover possible
originalities in each election, a panel logit model with fixed effects was also
constructed.

HDEC 02 – How to Win the Olympic Games 11
Tab. 3 Empirical Results
Panel Logit Model Panel Logit Model with FE
Constant -4.266
(-1.080) –
DISTANCE -0.285 * -0.497 **
(-1.910) (-1.977)
TEMP 0.213 0.534 *
(1.340) (1.880)
BEDS 0.015 0.032 *
(1.540) (1.802)
McFadden R² 0.226 0.364
LR statistic 8.154 ** 13.173 *
Notes: ** p<0.05; * p<0.10.
All variables defined in section 3.1 were included in the regression. Most of the
variables proved to be insignificant. In particular, the economic determinants (e.g.
GDP, INFLATION, and UNEMPLOYMENT) showed no influence. Only the average
distance of sporting venues from the Olympic Village, the average temperature
during the planned period of the Games, and the number of hotel beds within a
50-km radius were significantly different from zero. While the variable DISTANCE
is statistically significant in both models, the variables TEMP and BEDS are only
significant in the fixed effects model. The McFadden pseudo R² has a value of
0.226 in the basic model and 0.364 in the fixed effects model. The LR statistic is
significant, at least at the 10% level, for both models.
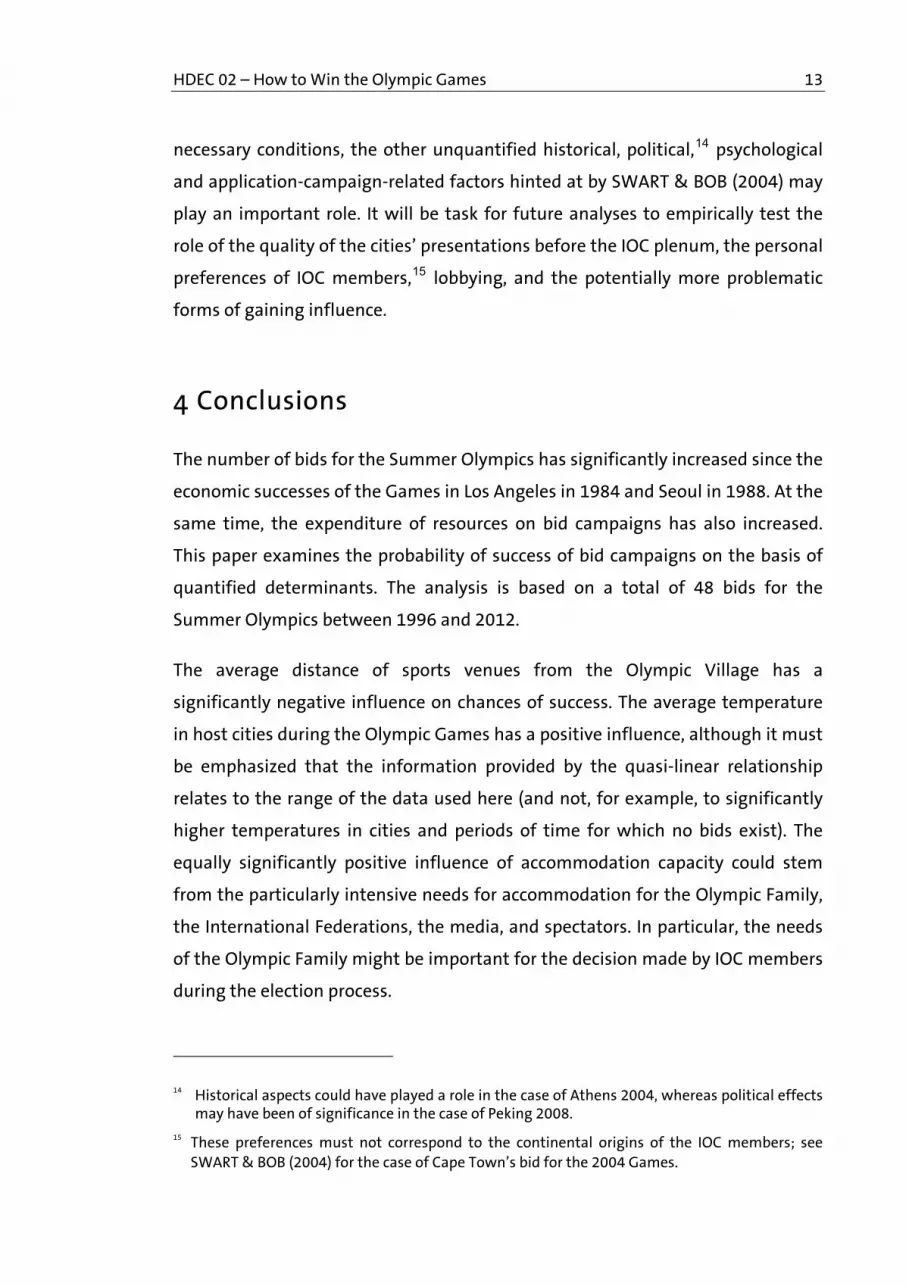
A further test of the goodness of fit of an estimated logistical model is provided
by evaluation of the success of the prognosis. The classification table shown in
Tables 4 and 5 illustrate the overall explanatory power provided by the current
regression model. The fixed effects and basic models correctly predict the result
of the application process in 93.75% and 91.67% of cases, respectively. These high
results, however, are relativized by the fact that whereas the models were able to
predict failure in all cases, they could only correctly predict success in 50% and
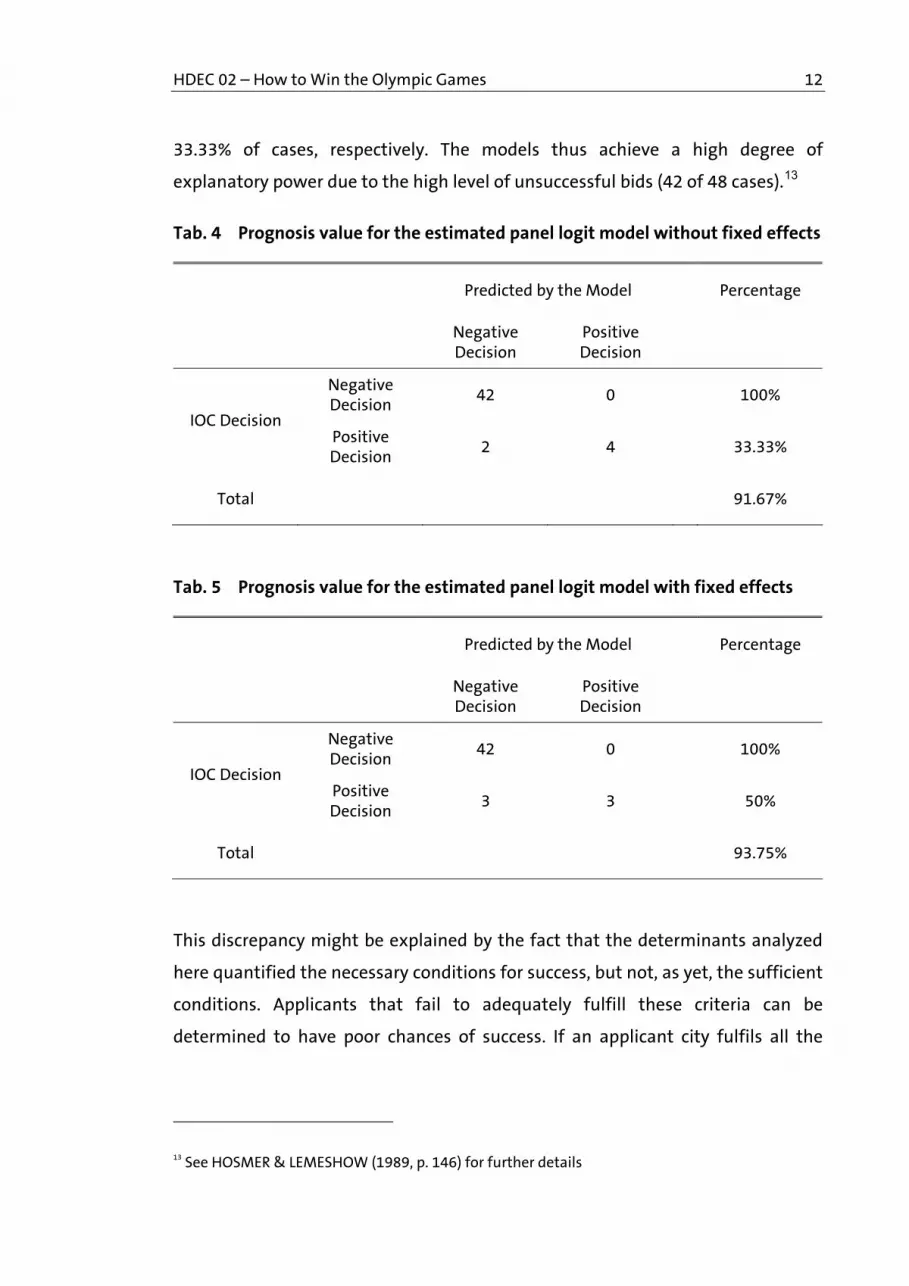
HDEC 02 – How to Win the Olympic Games 12
33.33% of cases, respectively. The models thus achieve a high degree of
explanatory power due to the high level of unsuccessful bids (42 of 48 cases).13
Tab. 4 Prognosis value for the estimated panel logit model without fixed effects
Predicted by the Model Percentage
Negative Decision
Positive Decision
Negative Decision
42 0
100%
IOC Decision Positive Decision
2 4
33.33%
Total
91.67%
Tab. 5 Prognosis value for the estimated panel logit model with fixed effects
Predicted by the Model Percentage
Negative Decision
Positive Decision
Negative Decision
42 0
100%
IOC Decision Positive Decision
3 3
50%
Total
93.75%
This discrepancy might be explained by the fact that the determinants analyzed
here quantified the necessary conditions for success, but not, as yet, the sufficient
conditions. Applicants that fail to adequately fulfill these criteria can be
determined to have poor chances of success. If an applicant city fulfils all the
13 See HOSMER & LEMESHOW (1989, p. 146) for further details
HDEC 02 – How to Win the Olympic Games 13
necessary conditions, the other unquantified historical, political,14 psychological
and application-campaign-related factors hinted at by SWART & BOB (2004) may
play an important role. It will be task for future analyses to empirically test the
role of the quality of the cities’ presentations before the IOC plenum, the personal
preferences of IOC members,15 lobbying, and the potentially more problematic
forms of gaining influence.
4 Conclusions
The number of bids for the Summer Olympics has significantly increased since the
economic successes of the Games in Los Angeles in 1984 and Seoul in 1988. At the
same time, the expenditure of resources on bid campaigns has also increased.
This paper examines the probability of success of bid campaigns on the basis of
quantified determinants. The analysis is based on a total of 48 bids for the
Summer Olympics between 1996 and 2012.
The average distance of sports venues from the Olympic Village has a
significantly negative influence on chances of success. The average temperature
in host cities during the Olympic Games has a positive influence, although it must
be emphasized that the information provided by the quasi-linear relationship
relates to the range of the data used here (and not, for example, to significantly
higher temperatures in cities and periods of time for which no bids exist). The
equally significantly positive influence of accommodation capacity could stem
from the particularly intensive needs for accommodation for the Olympic Family,
the International Federations, the media, and spectators. In particular, the needs
of the Olympic Family might be important for the decision made by IOC members
during the election process.
14 Historical aspects could have played a role in the case of Athens 2004, whereas political effects may have been of significance in the case of Peking 2008.
15 These preferences must not correspond to the continental origins of the IOC members; see SWART & BOB (2004) for the case of Cape Town’s bid for the 2004 Games.

HDEC 02 – How to Win the Olympic Games 14
Analysis of the goodness of fit showed that with around 94% of predictions
correct, the fixed effects model was considerably more accurate in predicting
unsuccessful bids (100%) than successful ones (50%). Future works that provide
better models of successful bids could also quantify and take into consideration
historical, political, psychological and bid-campaign-related factors.
Literature ANDRANOVICH, G., BURBANK, M. J., & HEYING, C. H. (2001). Olympic Cities: Lessons
Learned from Mega-Event Politics. Journal of Urban Affairs, 23(2), 113-131.
BAADE, R. A., & MATHESON, V. (2002). Bidding for the Olympics: Fool's Gold? In C. P. BARROS, M. IBRAHIMO & S. SZYMANSKI (Eds.), Transatlantic Sport: The Comparative Economics of North American and European Sports (pp. 127-151). Cheltenham, U.K. and Northampton, Mass.: Edward Elgar.
BIDDING COMMITTEE AMSTERDAM 1992 (1985). Bid book (Vol. 1-3). Amsterdam.
BIDDING COMMITTEE ATHENS 1996 (1989). Bid book (Vol. 1-3). Athens.
BIDDING COMMITTEE ATHENS 2004 (1995). Bid book (Vol. 1-3). Athens.
BIDDING COMMITTEE ATLANTA 1996 (1989). Bid book (Vol. 1-3). Atlanta.
BIDDING COMMITTEE BARCELONA 1992 (1984). Bid book (Vol. 1-3). Barcelona.
BIDDING COMMITTEE BEIJING 2000 (1993). Bid book (Vol. 1-3). Peking.
BIDDING COMMITTEE BEIJING 2008 (2001). Candidature File (Vol. 1-3). Peking.
BIDDING COMMITTEE BELGRADE 1992 (1985). Bid book (Vol. 1-3). Belgrade.
BIDDING COMMITTEE BELGRADE 1996 (1989). Bid book (Vol. 1-3). Belgrade.
BIDDING COMMITTEE BERLIN 2000 (1993). Bid book (Vol. 1-3). Berlin.
BIDDING COMMITTEE BIRMINGHAM 1992 (1985). Bid book (Vol. 1-3). Birmingham.
BIDDING COMMITTEE BRASILIA 2000 (1993). Bid book (Vol. 1-3). Brasilia.
BIDDING COMMITTEE BRISBANE 1992 (1985). Bid book (Vol. 1-3). Brisbane.
BIDDING COMMITTEE BUENOS AIRES 2004 (1995). Bid book (Vol. 1-3). Buenos Aires.
BIDDING COMMITTEE CAPE TOWN 2004 (1997). Bid book (Vol. 1-3). Kapstadt.
BIDDING COMMITTEE HAVANA 2012 (2003). Applicant City Report for the 2012 Olympic Games. Havana.
BIDDING COMMITTEE ISTANBUL 2000 (1993). Bid book (Vol. 1-3). Istanbul.
BIDDING COMMITTEE ISTANBUL 2004 (1996). Bid book (Vol. 1-3). Istanbul.
BIDDING COMMITTEE ISTANBUL 2008 (2001). Candidature File (Vol. 1-3). Istanbul.
BIDDING COMMITTEE ISTANBUL 2012 (2003). The Meeting of Continents - Istanbul 2012 Applicant City. Istanbul.

HDEC 02 – How to Win the Olympic Games 15
BIDDING COMMITTEE LEIPZIG 2012 (2003). Applicant City Report for the 2012 Olympic Games. Leipzig.
BIDDING COMMITTEE LILLE 2004 (1996). Bid book (Vol. 1-3). Lille.
BIDDING COMMITTEE MANCHESTER 1996 (1989). Bid book (Vol. 1-3). Manchester.
BIDDING COMMITTEE MANCHESTER 2000 (1993). Bid book (Vol. 1-3). Manchester.
BIDDING COMMITTEE MELBOURNE 1996 (1989). Bid book (Vol. 1-3). Melbourne.
BIDDING COMMITTEE OSAKA 2008 (2001). Candidature File (Vol. 1-3). Osaka.
BIDDING COMMITTEE PARIS 1992 (1985). Bid book (Vol. 1-3). Paris.
BIDDING COMMITTEE PARIS 2008 (2001). Candidature File (Vol. 1-3). Paris.
BIDDING COMMITTEE RIO DE JANEIRO 2004 (1995). Bid book (Vol. 1-3). Rio de Janeiro.
BIDDING COMMITTEE RIO DE JANEIRO 2012 (2003). Applicant City Report for the 2012 Olympic Games. Rio de Janeiro.
BIDDING COMMITTEE ROMA 2004 (1995). Bid book (Vol. 1-3). Rom.
BIDDING COMMITTEE SAN JUAN 2004 (1996). Bid book (Vol. 1-3). San Juan.
BIDDING COMMITTEE SEVILLA 2004 (1996). Bid book (Vol. 1-3). Sevilla.
BIDDING COMMITTEE ST. PETERSBURG 2004 (1996). Bid book (Vol. 1-3). St. Petersburg.
BIDDING COMMITTEE STOCKHOLM 2004 (1995). Bid book (Vol. 1-3). Stockholm.
BIDDING COMMITTEE SYDNEY 2000 (1991). Bid book (Vol. 1-3). Sydney.
BIDDING COMMITTEE TORONTO 1996 (1990). Bid book (Vol. 1-3). Toronto.
BIDDING COMMITTEE TORONTO 2008 (2001). Candidature File (Vol. 1-3). Toronto.
GREENBERG, S. (2003). Whitaker's Olympic Almanack: The Essential Guide to the Olympic Games. London: A & C Black Publishers Ltd.
GUTTMANN, A. (1992). The Olympics: A History of the Modern Games. Chicago: University of Illinois Press.
HOSMER, D. W., & LEMESHOW, S. (1989). Applied Logistic Regression. New York: John Wiley & Sons.
HOTCHKISS, J. L., MOORE, R. E., & ZOBAY, S. M. (2003). Impact of the 1996 Summer Olympic Games on Employment and Wages in Georgia. Southern Economic Journal, 69(3), 691-704.
IOC (1986). Report, Study and Evaluation Commission for the Preparation of the Games of the XXVth Olympiad - 1992. Lausanne: IOC.
IOC (1990). Report, Study and Evaluation Commission for the Preparation of the Games of the XXVIth Olympiad - 1996. Lausanne: IOC.
IOC (1993). Report - IOC Enquiry Commission for the Games of the XXVII Olympiad 2000. Lausanne: IOC.
IOC (1997). Report of the IOC Evaluation Commission for the Games of the XXVIII Olympiad in 2004. Lausanne: IOC.
IOC (2001). Report of the IOC Evaluation Commission for the Games of the XXIX Olympiad in 2008. Lausanne: IOC.

HDEC 02 – How to Win the Olympic Games 16
IOC (2004). Games of the XXX Olympiad in 2012 – Report by the IOC Candidature Acceptance Working Group to the IOC Executive Board. Lausanne: IOC.
IOC (2005). Report of the IOC Evaluation Commission for the Games of the XXX Olympiad in 2012. Lausanne: IOC.
JASMAND, S., & MAENNIG, W. (forthcoming). Regional Income and Employment Effects of the 1972 Munich Olympic Summer Games. Regional Studies.
LEXINGTON CONSULTING (2002). Zentrale Wirtschaftlichkeitsaspekte der Bewerbung Hamburgs um die Olympischen Spiele im Jahr 2012. Hamburg: Lexington Consulting.
LIU, X. (1998). Der Weg der Dritten Welt in die Olympische Bewegung. Sankt Augustin: Academia Verlag.
LYBERG, W. (1996). Fabulous 100 Years of IOC. Facts, Figures & Much, Much More. Lausanne: IOC.
MAENNIG, W. (2002). On the Economics of Doping and Corruption in International Sports. Journal of Sports Economics, 3(1), 61-89.
PREUSS, H. (2004). The Economics of Staging the Olympics: A Comparison of the Games 1972-2008. Cheltenham, U.K. and Northampton, Mass.: Edward Elgar.
RIORDAN, J., LOWE, B., & NIKISHKINOV, L. (1980). Soviet Commitment and the Success of the XXII Olympic Games, Moscow 1980. Review of Sport and Leisure, 5, 21-34.
RITCHIE, J. R. B., & YANGZHOU, J. (1987). The Role & Impact of Mega-events and Attractions on National and Regional Tourism Development: A Conceptual and Methodological Overview. In Proceedings of the 37th Annual Congress of the International Association of Scientific Experts in Tourism (AIEST) (pp. 17–58). Calgary.
SCHAUENBERG, B. (1992). Die Hare-Regel und das IOC. Irrationales Abstimmungsverhalten bei der Wahl von Atlanta zum Austragungsort der Olympischen Sommerspiele 1996? Schmalenbach Business Review, 44(5), 426-444.
SCHERER, K. A. (1995). 100 Jahre Olympische Spiele. Idee, Analyse und Bilanz. Dortmund: Harenberg Verlag.
SCHOLLMEIER, P. (2001). Bewerbungen um Olympische Spiele: Von Athen 1896 bis Athen 2004. Collogne: Deutsche Sporthochschule.
SPILLING, O. R. (1996). Mega-events as Strategy for Regional Development: The Case of the 1994 Lillehammer Winter Olympics. Entrepreneurship and Regional Development, 4, 321-343.
STERKEN, E. (2006). Growth Impact of Major Sporting Events. European Sport Management Quarterly, 6(4), 375 - 389.
SWART, K., & BOB, U. (2004). The Seductive Discourse of Development: The Cape Town 2004 Olympic Bid. Third World Quarterly, 25(7), 1311-1324.
TEWS, M.-K. (1993). The Mega-event as an Urban Redevelopment Strategy: Atlanta Prepares for 1996 and Beyond. New Orleans: College of Urban and Public Affairs.
THE WORLDBANK GROUP (2007). Data Query System. Retrieved 19 September 2007, from http://devdata.worldbank.org/query/
WESTERBEEK, H. M., TURNER, P., & INGERSON, L. (2002). Key Success Factors in Bidding for Hallmark Sporting Events. International Marketing Review, 19(2/3), 303.

Hamburg Contemporary Economic Discussions (Download: http://www.uni-hamburg.de/economicpolicy/discussions.html)
01/2005 FEDDERSEN, A. / MAENNIG, W.: Trends in Competitive Balance: Is there Evidence for Growing Imbalance in Professional Sport Leagues?, January 2005.
02/2005 SIEVERS, T.: Information-driven Clustering – An Alternative to the Knowledge Spillover Story, February 2005.
03/2005 SIEVERS, T.: A Vector-based Approach to Modeling Knowledge in Economics, February 2005.
04/2005 BUETTNER, N. / MAENNIG, W. / MENSSEN, M.: Zur Ableitung einfa-cher Multiplikatoren für die Planung von Infrastrukturkosten an-hand der Aufwendungen für Sportstätten – eine Untersuchung an-hand der Fußball-WM 2006, May 2005.
01/2006 FEDDERSEN, A.: Economic Consequences of the UEFA Champions League for National Championships – The Case of Germany, May 2006.
02/2006 FEDDERSEN, A.: Measuring Between-season Competitive Balance with Markov Chains, July 2006.
03/2006 FEDDERSEN, A. / VOEPEL, H.: Staatliche Hilfen für Profifußballclubs in finanziellen Notlagen? – Die Kommunen im Konflikt zwischen Imageeffekten und Moral-Hazard-Problemen, September 2006.
04/2006 MAENNIG, W. / SCHWARTHOFF, F.: Stadium Architecture and Re-gional Economic Development: International Experience and the Plans of Durban, October 2006.

Hamburg Contemporary Economic Discussions (Download: http://www.uni-hamburg.de/economicpolicy/discussions.html)
01 AHLFELDT, G. / MAENNIG, W.: The Role of Architecture on Urban Revitalization: The Case of “Olympic Arenas” in Berlin-Prenzlauer Berg, 2007.
02 FEDDERSEN, A. / MAENNIG, W. / ZIMMERMANN, P.: How to Win the Olympic Games – The Empirics of Key Success Factors of Olympic Bids, 2007.
03 AHLFELDT, G. / MAENNIG, W.: The Impact of Sports Arenas on Loca-tional Attractivity: Evidence from Berlin, 2007.
04 DU PLESSIS, S. / MAENNIG, W.: World Cup 2010: South African Eco-nomic Perspectives and Policy Challenges Informed by the Experi-ence of Germany 2006, 2007.
05 HEYNE, M. / MAENNIG, W. / SUESSMUTH, B.: Mega-sporting Events as Experience Goods, 2007.
06 DUST, L. / MAENNIG, W.: Shrinking and Growing Metropolitan Ar-eas – Asymmetric Real Estate Price Reactions? The Case of German Single-family Houses, 2007.
07 JASMAND, S. / MAENNIG, W.: Regional Income and Employment Effects of the 1972 Munich Olympic Summer Games, 2007.
08 HAGN, F. / MAENNIG W.: Labour Market Effects of the 2006 Soccer World Cup in Germany, 2007.
09 HAGN, F. / MAENNIG, W.: Employment Effects of the World Cup 1974 in Germany.
10 MAENNIG, W.: One Year Later: A Re-appraisal of the Economics of the 2006 Soccer World Cup, 2007.
11 AHLFELDT, G., MAENNIG, W.: Assessing External Effects of City Air-ports: Land Values in Berlin, 2007.


