Embed Size (px)
Citation preview
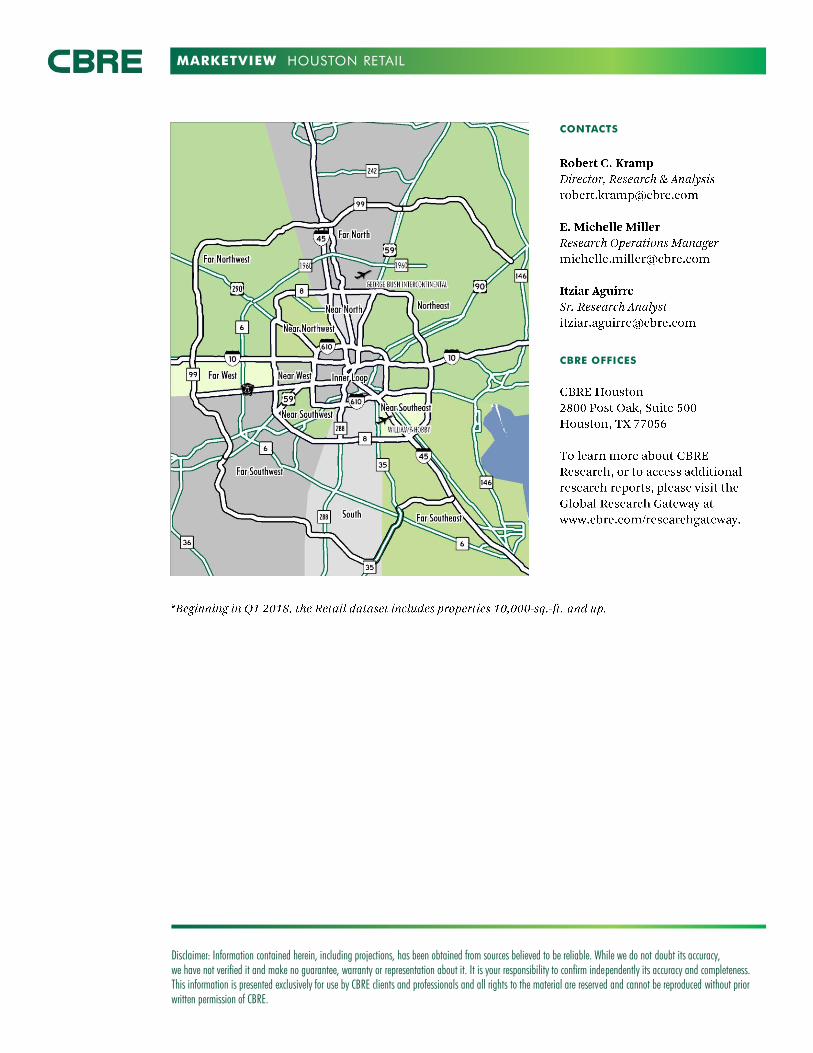
MARKETVIEW
0.026
80
82
84
86
88
90
92
94
96
(3)
(2)
(1)
0
1
2
3
4
5
2008 2009 2010 2011 2012 2013 2014 2015 2016 2017 YTD 2018
Occupancy (%)Net Absorption (MSF)
Annual Net Absorption Occupancy
Rents refuse to drop despite
notable deliveries
Houston Retail, Q3 2018
Q3 2018 CBRE Research © 2018 CBRE, Inc. | 1
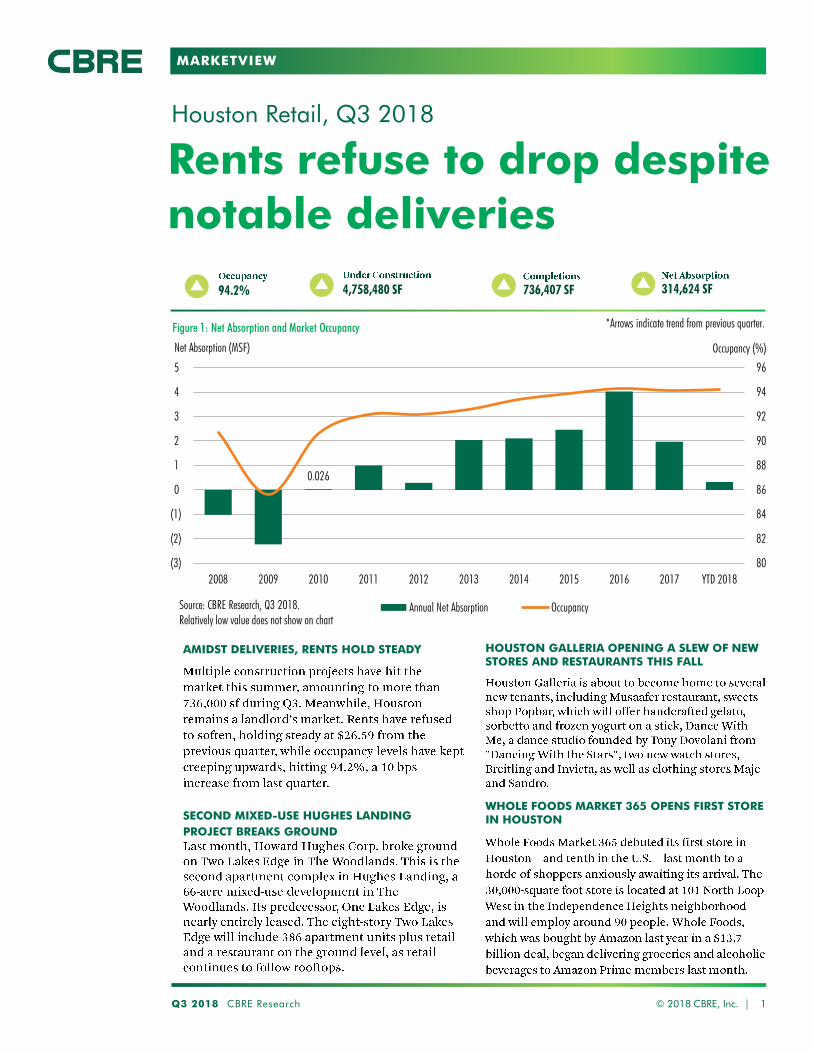
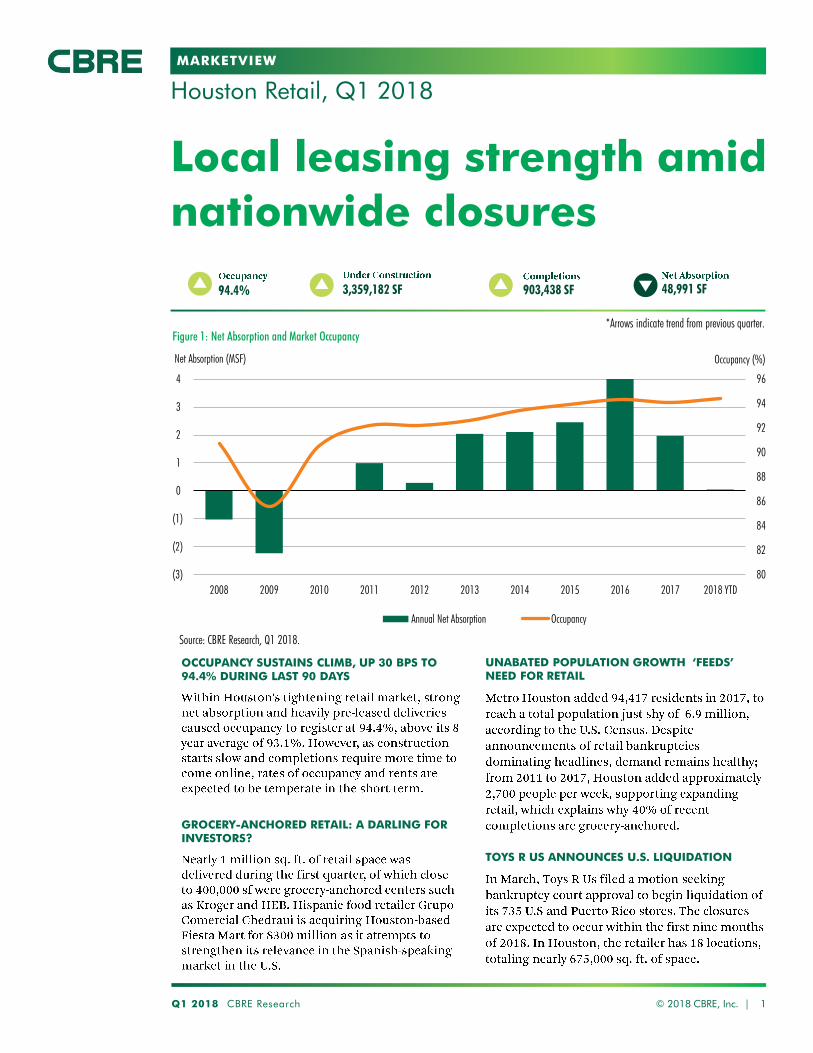
736,407 SF 314,624 SF94.2% 4,758,480 SF
Figure 1: Net Absorption and Market Occupancy
Source: CBRE Research, Q3 2018.Relatively low value does not show on chart
*Arrows indicate trend from previous quarter.
AMIDST DELIVERIES, RENTS HOLD STEADY
SECOND MIXED-USE HUGHES LANDING
PROJECT BREAKS GROUND
HOUSTON GALLERIA OPENING A SLEW OF NEW STORES AND RESTAURANTS THIS FALL
WHOLE FOODS MARKET 365 OPENS FIRST STORE IN HOUSTON
MARKETVIEW
Q3 2018 CBRE Research © 2018 CBRE, Inc. | 2
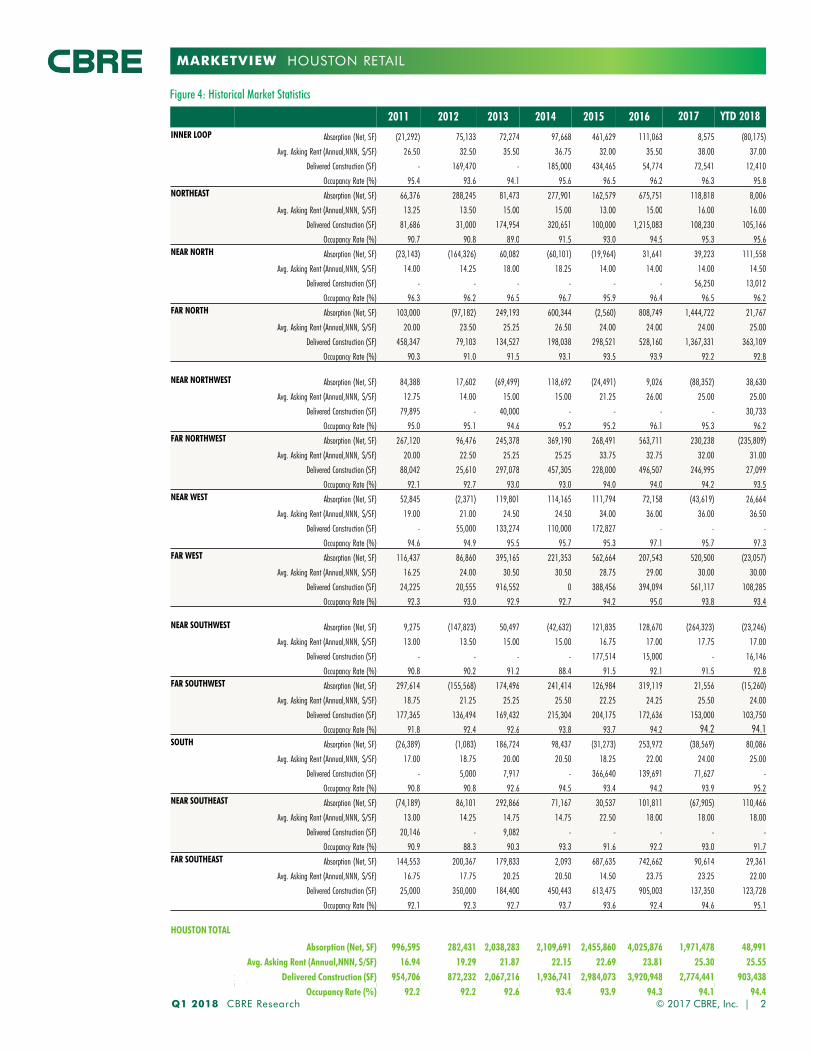
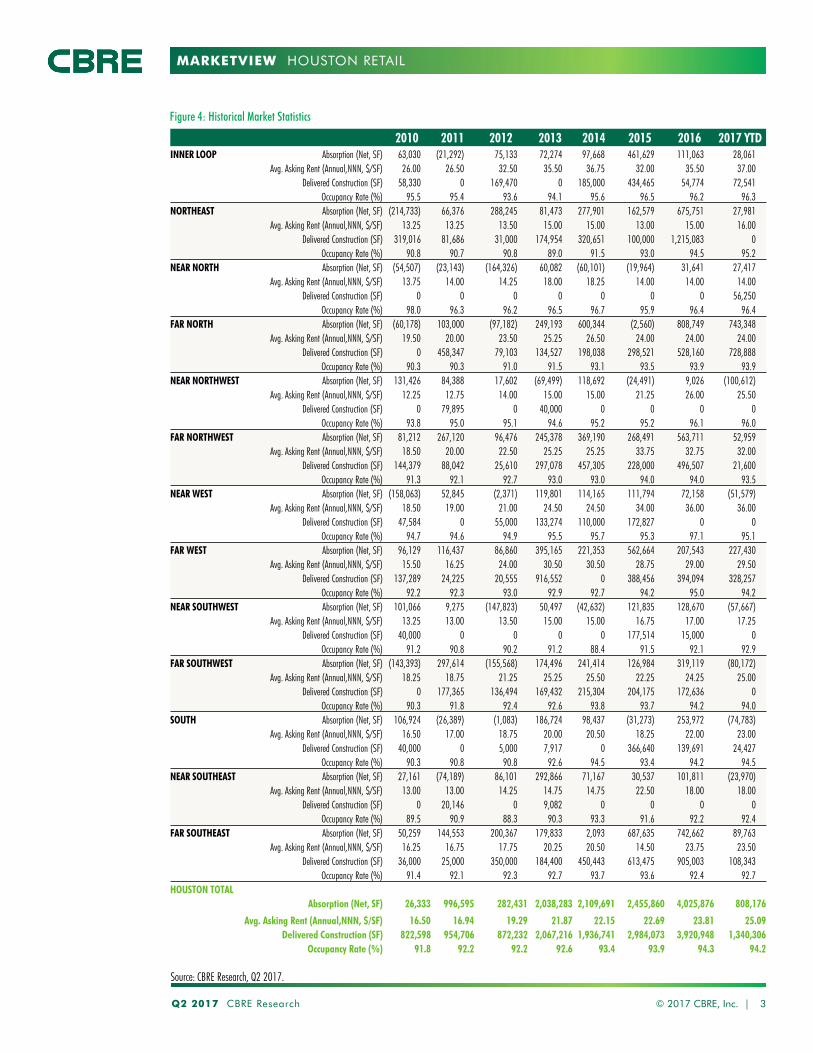
Figure 4: Historical Market Statistics
HOUSTON RETAIL
2013 2014 2015 2016 2017 Q1 2018 Q2 2018 Q3 2018 YTD 2018
INNER LOOP Absorption (Net, SF) 72,274 97,668 461,629 111,063 8,575 -80,175 -12,701 -55,181 -148,057
Avg. Asking Rent (Annual,NNN, $/SF) 35.50 36.75 32.00 35.50 38.00 37.00 37.00 37.00 37.00
Delivered Construction (SF) - 185,000 434,465 54,774 72,541 12,410 112,410 105,000 229,820
Rentable Building Area (RBA) 15,084,918 15,893,200 16,394,615 15,665,570 15,534,434 22,043,848 22,043,622 22,326,319 22,326,319
Occupancy Rate (%) 94.1 95.6 96.5 96.2 96.3 95.8 95.7 95.5 95.5
NORTHEAST Absorption (Net, SF) 81,473 277,901 162,579 675,751 118,818 8,006 95,503 -43,383 60,126
Avg. Asking Rent (Annual,NNN, $/SF) 15.00 15.00 13.00 15.00 16.00 16.00 16.00 16.00 16.00
Delivered Construction (SF) 174,954 320,651 100,000 1,215,083 108,230 105,166 123,700 97,445 326,311
Rentable Building Area (RBA) 15,339,844 15,316,323 14,797,186 15,465,885 15,595,798 23,559,249 23,713,108 24,025,773 24,025,773
Occupancy Rate (%) 89.0 91.5 93.0 94.5 95.3 95.6 95.9 95.4 95.4
NEAR NORTH Absorption (Net, SF) 60,082 -60,101 -19,964 31,641 39,223 111,558 -6,491 -47,715 57,352
Avg. Asking Rent (Annual,NNN, $/SF) 18.00 18.25 14.00 14.00 14.00 14.50 14.50 14.50 14.50
Delivered Construction (SF) - - - - 56,250 13,012 - - 13,012
Rentable Building Area (RBA) 6,107,946 6,305,769 6,434,099 6,482,919 6,405,774 8,514,689 8,480,336 8,465,772 8,465,772
Occupancy Rate (%) 96.5 96.7 95.9 96.4 96.5 96.2 96.1 96.2 96.2
FAR NORTH Absorption (Net, SF) 249,193 600,344 -2,560 808,749 1,444,722 21,767 -19,099 112,455 115,123
Avg. Asking Rent (Annual,NNN, $/SF) 25.25 26.50 24.00 24.00 24.00 25.00 25.00 25.00 25.00
Delivered Construction (SF) 134,527 198,038 298,521 528,160 1,367,331 363,109 39,880 142,901 545,890
Rentable Building Area (RBA) 30,137,456 30,459,787 30,567,503 30,869,415 32,162,397 44,175,094 44,027,162 44,342,834 44,342,834
Occupancy Rate (%) 91.5 93.1 93.5 93.9 92.2 92.8 92.0 91.8 91.8
NEAR NORTHWEST Absorption (Net, SF) -69,499 118,692 -24,491 9,026 -88,352 38,630 -23,409 47,232 62,453
Avg. Asking Rent (Annual,NNN, $/SF) 15.00 15.00 21.25 26.00 25.00 25.00 25.00 25.00 25.00
Delivered Construction (SF) 40,000 - - - - 30,733 - 30,000 60,733
Rentable Building Area (RBA) 10,717,133 10,979,066 11,085,463 10,592,514 10,641,313 15,267,916 15,394,774 15,669,558 15,669,558
Occupancy Rate (%) 94.6 95.2 95.2 96.1 95.3 96.2 96.5 97.0 97.0
FAR NORTHWEST Absorption (Net, SF) 245,378 369,190 268,491 563,711 230,238 -235,809 -60,882 11,492 -285,199
Avg. Asking Rent (Annual,NNN, $/SF) 25.25 25.25 33.75 32.75 32.00 31.00 31.00 31.00 31.00
Delivered Construction (SF) 297,078 457,305 228,000 496,507 246,995 27,099 42,750 174,400 244,249
Rentable Building Area (RBA) 27,007,753 27,356,351 27,998,959 27,488,382 27,812,651 38,681,079 38,891,533 39,652,718 39,652,718
Occupancy Rate (%) 93.0 93.0 94.0 94.0 94.2 93.5 92.9 93.3 93.3
NEAR WEST Absorption (Net, SF) 119,801 114,165 111,794 72,158 -43,619 26,664 -15,694 33,100 44,070
Avg. Asking Rent (Annual,NNN, $/SF) 24.50 24.50 34.00 36.00 36.00 36.50 40.00 40.00 40.00
Delivered Construction (SF) 133274 110,000 172,827 - - - - - -
Rentable Building Area (RBA) 14,831,277 13,256,061 13,280,728 12,641,970 12,479,830 17,842,273 17,426,645 16,997,592 16,997,592
Occupancy Rate (%) 95.5 95.7 95.3 97.1 95.7 97.3 96.9 97.4 97.4
MARKETVIEW
Q3 2018 CBRE Research © 2018 CBRE, Inc. | 3
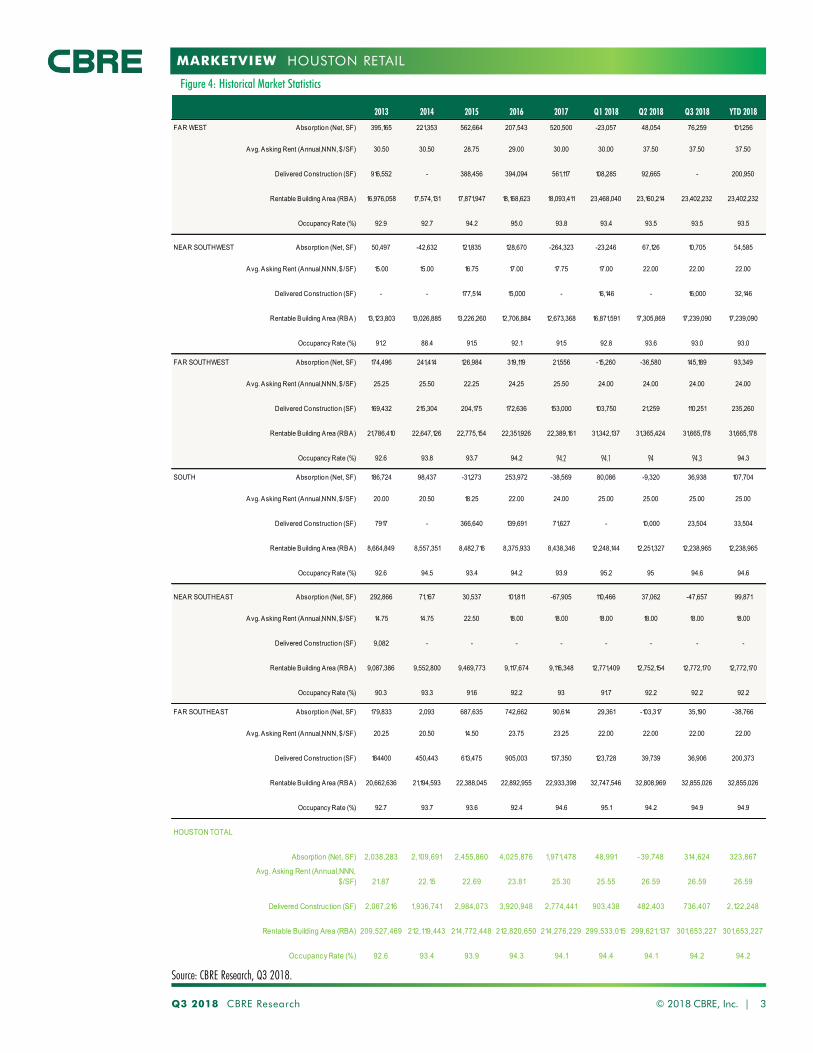
Figure 4: Historical Market Statistics
HOUSTON RETAIL
2013 2014 2015 2016 2017 Q1 2018 Q2 2018 Q3 2018 YTD 2018
FAR WEST Absorption (Net, SF) 395,165 221,353 562,664 207,543 520,500 -23,057 48,054 76,259 101,256
Avg. Asking Rent (Annual,NNN, $/SF) 30.50 30.50 28.75 29.00 30.00 30.00 37.50 37.50 37.50
Delivered Construction (SF) 916,552 - 388,456 394,094 561,117 108,285 92,665 - 200,950
Rentable Building Area (RBA) 16,976,058 17,574,131 17,871,947 18,168,623 18,093,411 23,468,040 23,160,214 23,402,232 23,402,232
Occupancy Rate (%) 92.9 92.7 94.2 95.0 93.8 93.4 93.5 93.5 93.5
NEAR SOUTHWEST Absorption (Net, SF) 50,497 -42,632 121,835 128,670 -264,323 -23,246 67,126 10,705 54,585
Avg. Asking Rent (Annual,NNN, $/SF) 15.00 15.00 16.75 17.00 17.75 17.00 22.00 22.00 22.00
Delivered Construction (SF) - - 177,514 15,000 - 16,146 - 16,000 32,146
Rentable Building Area (RBA) 13,123,803 13,026,885 13,226,260 12,706,884 12,673,368 16,871,591 17,305,869 17,239,090 17,239,090
Occupancy Rate (%) 91.2 88.4 91.5 92.1 91.5 92.8 93.6 93.0 93.0
FAR SOUTHWEST Absorption (Net, SF) 174,496 241,414 126,984 319,119 21,556 -15,260 -36,580 145,189 93,349
Avg. Asking Rent (Annual,NNN, $/SF) 25.25 25.50 22.25 24.25 25.50 24.00 24.00 24.00 24.00
Delivered Construction (SF) 169,432 215,304 204,175 172,636 153,000 103,750 21,259 110,251 235,260
Rentable Building Area (RBA) 21,786,410 22,647,126 22,775,154 22,351,926 22,389,161 31,342,137 31,365,424 31,665,178 31,665,178
Occupancy Rate (%) 92.6 93.8 93.7 94.2 94.2 94.1 94 94.3 94.3
SOUTH Absorption (Net, SF) 186,724 98,437 -31,273 253,972 -38,569 80,086 -9,320 36,938 107,704
Avg. Asking Rent (Annual,NNN, $/SF) 20.00 20.50 18.25 22.00 24.00 25.00 25.00 25.00 25.00
Delivered Construction (SF) 7917 - 366,640 139,691 71,627 - 10,000 23,504 33,504
Rentable Building Area (RBA) 8,664,849 8,557,351 8,482,716 8,375,933 8,438,346 12,248,144 12,251,327 12,238,965 12,238,965
Occupancy Rate (%) 92.6 94.5 93.4 94.2 93.9 95.2 95 94.6 94.6
NEAR SOUTHEAST Absorption (Net, SF) 292,866 71,167 30,537 101,811 -67,905 110,466 37,062 -47,657 99,871
Avg. Asking Rent (Annual,NNN, $/SF) 14.75 14.75 22.50 18.00 18.00 18.00 18.00 18.00 18.00
Delivered Construction (SF) 9,082 - - - - - - - -
Rentable Building Area (RBA) 9,087,386 9,552,800 9,469,773 9,117,674 9,116,348 12,771,409 12,752,154 12,772,170 12,772,170
Occupancy Rate (%) 90.3 93.3 91.6 92.2 93 91.7 92.2 92.2 92.2
FAR SOUTHEAST Absorption (Net, SF) 179,833 2,093 687,635 742,662 90,614 29,361 -103,317 35,190 -38,766
Avg. Asking Rent (Annual,NNN, $/SF) 20.25 20.50 14.50 23.75 23.25 22.00 22.00 22.00 22.00
Delivered Construction (SF) 184400 450,443 613,475 905,003 137,350 123,728 39,739 36,906 200,373
Rentable Building Area (RBA) 20,662,636 21,194,593 22,388,045 22,892,955 22,933,398 32,747,546 32,808,969 32,855,026 32,855,026
Occupancy Rate (%) 92.7 93.7 93.6 92.4 94.6 95.1 94.2 94.9 94.9
HOUSTON TOTAL
Absorption (Net, SF) 2,038,283 2,109,691 2,455,860 4,025,876 1,971,478 48,991 - 39,748 314,624 323,867
Avg. Asking Rent (Annual,NNN, $/SF) 21.87 22.15 22.69 23.81 25.30 25.55 26.59 26.59 26.59
Delivered Construction (SF) 2,067,216 1,936,741 2,984,073 3,920,948 2,774,441 903,438 482,403 736,407 2,122,248
Rentable Building Area (RBA) 209,527,469 212,119,443 214,772,448 212,820,650 214,276,229 299,533,015 299,621,137 301,653,227 301,653,227
Occupancy Rate (%) 92.6 93.4 93.9 94.3 94.1 94.4 94.1 94.2 94.2
Source: CBRE Research, Q3 2018.
MARKETVIEW
Q3 2018 CBRE Research 4
HOUSTON RETAIL
© 2018 CBRE, Inc. |
5.5
5.7
5.9
6.1
6.3
6.5
6.7
6.9
7.1
50
52
54
56
58
60
62
64
66
2011
2012
2013
2014
2015
2016
2017
2018
Thou
sand
s
Median HH Income Population
Figure 7: Population Growth and Purchasing Power
Population (Millions)
Source: Moody’s Analytics, Q3 2018.
HH Income ($000’s)
Source: Real Capital Analytics, Q3 2018.
1.0
1.2
1.4
1.6
1.8
2.0
2.2
Q1 2
014
Q2 2
014
Q3 2
014
Q4 2
014
Q1 2
015
Q2 2
015
Q3 2
015
Q4 2
015
Q1 2
016
Q2 2
016
Q3 2
016
Q4 2
016
Q1 2
017
Q2 2
017
Q3 2
017
Q4 2
017
Q1 2
018
Q2 2
018
Q3 2
018
($, Billions)
Figure 6: Retail Investment Sales Volume
0
5
10
15
20
25
30
35
Q2 2015 Q4 2015 Q2 2016 Q4 2016 Q2 2017 Q4 2017 Q2 2018
Asking Rates ($/SF)
Community Neighborhood Strip Power Lifestyle
12
15
18
21
24
27
2011
2012
2013
2014
2015
2016
2017
YTD
2018
Asking Rates ($/SF)
0
1
2
3
4
2011
2012
2013
2014
2015
2016
2017
YTD
2018
Millions
Source: CBRE Research, Q3 2018.
Figure 5: Asking Annual Rents by Center Type, NNN Avg.
Figure 3: Asking Annual Rents, NNN Avg. Figure 4: Deliveries
Source: CBRE Research, Q3 2018.
Source: CBRE Research, Q3 2018.
MARKETVIEW
Disclaimer: Information contained herein, including projections, has been obtained from sources believed to be reliable. While we do not doubt its accuracy, we have not verified it and make no guarantee, warranty or representation about it. It is your responsibility to confirm independently its accuracy and completeness. This information is presented exclusively for use by CBRE clients and professionals and all rights to the material are reserved and cannot be reproduced without prior written permission of CBRE.
CONTACTS
CBRE OFFICES
HOUSTON RETAIL
MARKETVIEW
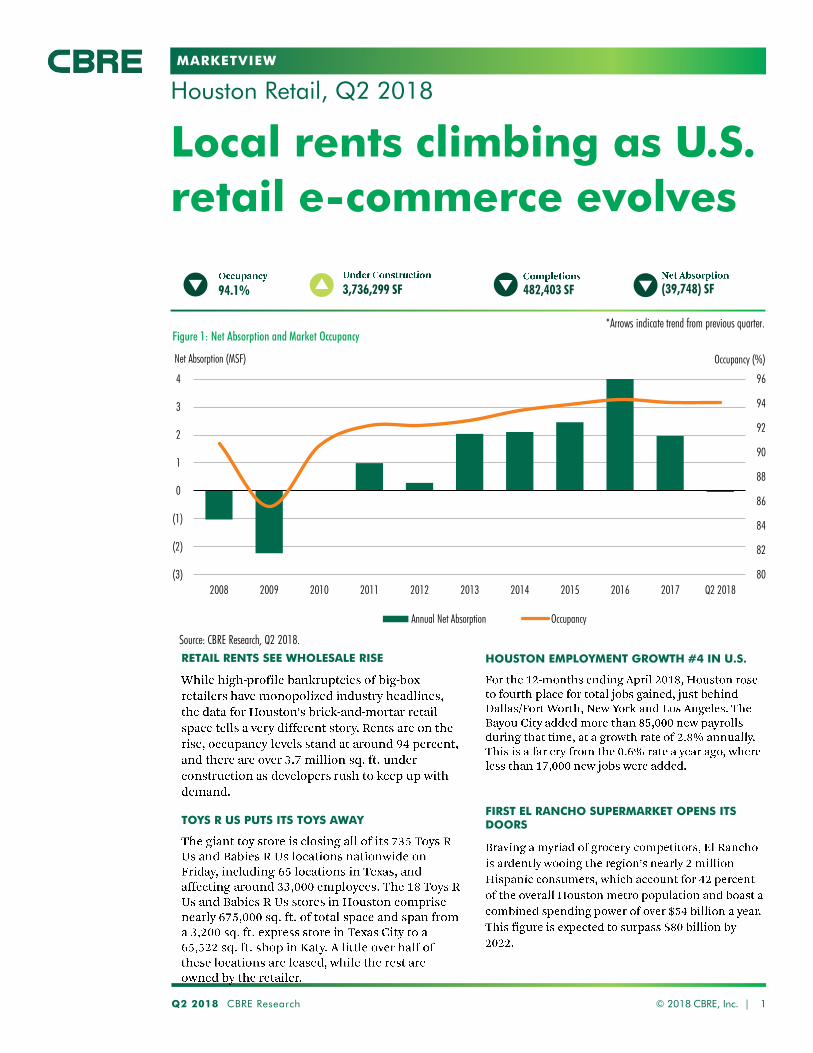
Local rents climbing as U.S.
retail e-commerce evolves
Houston Retail, Q2 2018
Q2 2018 CBRE Research © 2018 CBRE, Inc. | 1
482,403 SF (39,748) SF94.1% 3,736,299 SF
Figure 1: Net Absorption and Market Occupancy
Source: CBRE Research, Q2 2018.
*Arrows indicate trend from previous quarter.
80
82
84
86
88
90
92
94
96
(3)
(2)
(1)
0
1
2
3
4
2008 2009 2010 2011 2012 2013 2014 2015 2016 2017 Q2 2018
Occupancy (%)Net Absorption (MSF)
Annual Net Absorption Occupancy
RETAIL RENTS SEE WHOLESALE RISE
TOYS R US PUTS ITS TOYS AWAY
HOUSTON EMPLOYMENT GROWTH #4 IN U.S.
FIRST EL RANCHO SUPERMARKET OPENS ITS DOORS
MARKETVIEW
Q2 2018 CBRE Research © 2018 CBRE, Inc. | 2
Source: CBRE Research, Q4 2017.
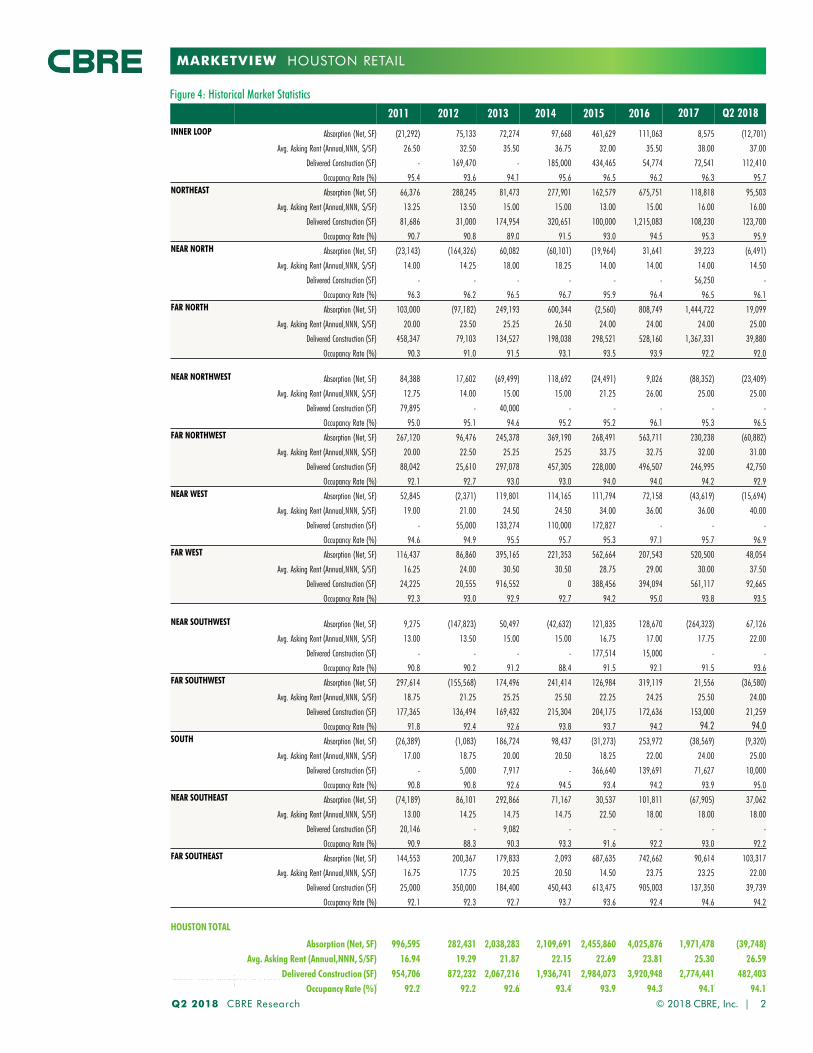
Figure 4: Historical Market Statistics
HOUSTON RETAIL
2011 2012 2013 2014 2015 2016 2017 Q2 2018
INNER LOOP Absorption (Net, SF) (21,292) 75,133 72,274 97,668 461,629 111,063 8,575 (12,701)
Avg. Asking Rent (Annual,NNN, $/SF) 26.50 32.50 35.50 36.75 32.00 35.50 38.00 37.00
Delivered Construction (SF) - 169,470 - 185,000 434,465 54,774 72,541 112,410
Occupancy Rate (%) 95.4 93.6 94.1 95.6 96.5 96.2 96.3 95.7
NORTHEAST Absorption (Net, SF) 66,376 288,245 81,473 277,901 162,579 675,751 118,818 95,503
Avg. Asking Rent (Annual,NNN, $/SF) 13.25 13.50 15.00 15.00 13.00 15.00 16.00 16.00
Delivered Construction (SF) 81,686 31,000 174,954 320,651 100,000 1,215,083 108,230 123,700
Occupancy Rate (%) 90.7 90.8 89.0 91.5 93.0 94.5 95.3 95.9
NEAR NORTH Absorption (Net, SF) (23,143) (164,326) 60,082 (60,101) (19,964) 31,641 39,223 (6,491)
Avg. Asking Rent (Annual,NNN, $/SF) 14.00 14.25 18.00 18.25 14.00 14.00 14.00 14.50
Delivered Construction (SF) - - - - - - 56,250 -
Occupancy Rate (%) 96.3 96.2 96.5 96.7 95.9 96.4 96.5 96.1
FAR NORTH Absorption (Net, SF) 103,000 (97,182) 249,193 600,344 (2,560) 808,749 1,444,722 19,099
Avg. Asking Rent (Annual,NNN, $/SF) 20.00 23.50 25.25 26.50 24.00 24.00 24.00 25.00
Delivered Construction (SF) 458,347 79,103 134,527 198,038 298,521 528,160 1,367,331 39,880
Occupancy Rate (%) 90.3 91.0 91.5 93.1 93.5 93.9 92.2 92.0
NEAR NORTHWEST Absorption (Net, SF) 84,388 17,602 (69,499) 118,692 (24,491) 9,026 (88,352) (23,409)
Avg. Asking Rent (Annual,NNN, $/SF) 12.75 14.00 15.00 15.00 21.25 26.00 25.00 25.00
Delivered Construction (SF) 79,895 - 40,000 - - - - -
Occupancy Rate (%) 95.0 95.1 94.6 95.2 95.2 96.1 95.3 96.5
FAR NORTHWEST Absorption (Net, SF) 267,120 96,476 245,378 369,190 268,491 563,711 230,238 (60,882)
Avg. Asking Rent (Annual,NNN, $/SF) 20.00 22.50 25.25 25.25 33.75 32.75 32.00 31.00
Delivered Construction (SF) 88,042 25,610 297,078 457,305 228,000 496,507 246,995 42,750
Occupancy Rate (%) 92.1 92.7 93.0 93.0 94.0 94.0 94.2 92.9
NEAR WEST Absorption (Net, SF) 52,845 (2,371) 119,801 114,165 111,794 72,158 (43,619) (15,694)
Avg. Asking Rent (Annual,NNN, $/SF) 19.00 21.00 24.50 24.50 34.00 36.00 36.00 40.00
Delivered Construction (SF) - 55,000 133,274 110,000 172,827 - - -
Occupancy Rate (%) 94.6 94.9 95.5 95.7 95.3 97.1 95.7 96.9
FAR WEST Absorption (Net, SF) 116,437 86,860 395,165 221,353 562,664 207,543 520,500 48,054
Avg. Asking Rent (Annual,NNN, $/SF) 16.25 24.00 30.50 30.50 28.75 29.00 30.00 37.50
Delivered Construction (SF) 24,225 20,555 916,552 0 388,456 394,094 561,117 92,665
Occupancy Rate (%) 92.3 93.0 92.9 92.7 94.2 95.0 93.8 93.5
NEAR SOUTHWEST Absorption (Net, SF) 9,275 (147,823) 50,497 (42,632) 121,835 128,670 (264,323) 67,126
Avg. Asking Rent (Annual,NNN, $/SF) 13.00 13.50 15.00 15.00 16.75 17.00 17.75 22.00
Delivered Construction (SF) - - - - 177,514 15,000 - -
Occupancy Rate (%) 90.8 90.2 91.2 88.4 91.5 92.1 91.5 93.6
FAR SOUTHWEST Absorption (Net, SF) 297,614 (155,568) 174,496 241,414 126,984 319,119 21,556 (36,580)
Avg. Asking Rent (Annual,NNN, $/SF) 18.75 21.25 25.25 25.50 22.25 24.25 25.50 24.00
Delivered Construction (SF) 177,365 136,494 169,432 215,304 204,175 172,636 153,000 21,259
Occupancy Rate (%) 91.8 92.4 92.6 93.8 93.7 94.2 94.2 94.0SOUTH Absorption (Net, SF) (26,389) (1,083) 186,724 98,437 (31,273) 253,972 (38,569) (9,320)
Avg. Asking Rent (Annual,NNN, $/SF) 17.00 18.75 20.00 20.50 18.25 22.00 24.00 25.00
Delivered Construction (SF) - 5,000 7,917 - 366,640 139,691 71,627 10,000
Occupancy Rate (%) 90.8 90.8 92.6 94.5 93.4 94.2 93.9 95.0
NEAR SOUTHEAST Absorption (Net, SF) (74,189) 86,101 292,866 71,167 30,537 101,811 (67,905) 37,062
Avg. Asking Rent (Annual,NNN, $/SF) 13.00 14.25 14.75 14.75 22.50 18.00 18.00 18.00
Delivered Construction (SF) 20,146 - 9,082 - - - - -
Occupancy Rate (%) 90.9 88.3 90.3 93.3 91.6 92.2 93.0 92.2
FAR SOUTHEAST Absorption (Net, SF) 144,553 200,367 179,833 2,093 687,635 742,662 90,614 103,317
Avg. Asking Rent (Annual,NNN, $/SF) 16.75 17.75 20.25 20.50 14.50 23.75 23.25 22.00
Delivered Construction (SF) 25,000 350,000 184,400 450,443 613,475 905,003 137,350 39,739
Occupancy Rate (%) 92.1 92.3 92.7 93.7 93.6 92.4 94.6 94.2
HOUSTON TOTAL
Absorption (Net, SF) 996,595 282,431 2,038,283 2,109,691 2,455,860 4,025,876 1,971,478 (39,748)
Avg. Asking Rent (Annual,NNN, $/SF) 16.94 19.29 21.87 22.15 22.69 23.81 25.30 26.59
Delivered Construction (SF) 954,706 872,232 2,067,216 1,936,741 2,984,073 3,920,948 2,774,441 482,403
Occupancy Rate (%) 92.2 92.2 92.6 93.4 93.9 94.3 94.1 94.1
MARKETVIEW
Q2 2018 CBRE Research 3
HOUSTON RETAIL
© 2018 CBRE, Inc. |
5,500
5,750
6,000
6,250
6,500
6,750
7,000
7,250
50,000
52,000
54,000
56,000
58,000
60,000
62,000
64,000
66,000
2011
2012
2013
2014
2015
2016
2017
2018
Median HH Income Population (000s)
Figure 7: Population Growth and Purchasing PowerPopulation (000s)
Source: Moody’s Analytics, Q2 2018.
HH Income ($)
Source: Real Capital Analytics, Q2 2018.
0
500
1,000
1,500
2,000
2,500
Q1 2
014
Q2 2
014
Q3 2
014
Q4 2
014
Q1 2
015
Q2 2
015
Q3 2
015
Q4 2
015
Q1 2
016
Q2 2
016
Q3 2
016
Q4 2
016
Q1 2
017
Q2 2
017
Q3 2
017
Q4 2
017
Q1 2
018
Q2 2
018
($, Millions)
Figure 6: Retail Investment Sales Volume
0.00
5.00
10.00
15.00
20.00
25.00
30.00
35.00
Q2 2015 Q4 2015 Q2 2016 Q4 2016 Q2 2017 Q4 2017 Q2 2018
Asking Rates ($/SF)
Community Neighborhood Strip Power Lifestyle
12.50
14.50
16.50
18.50
20.50
22.50
24.50
26.50
28.50
2011
2012
2013
2014
2015
2016
2017
Q2 2
018
Asking Rates ($/SF)
0
500
1,000
1,500
2,000
2,500
3,000
3,500
4,000
4,500
2011
2012
2013
2014
2015
2016
2017
Q2 2
018
SF (000s)
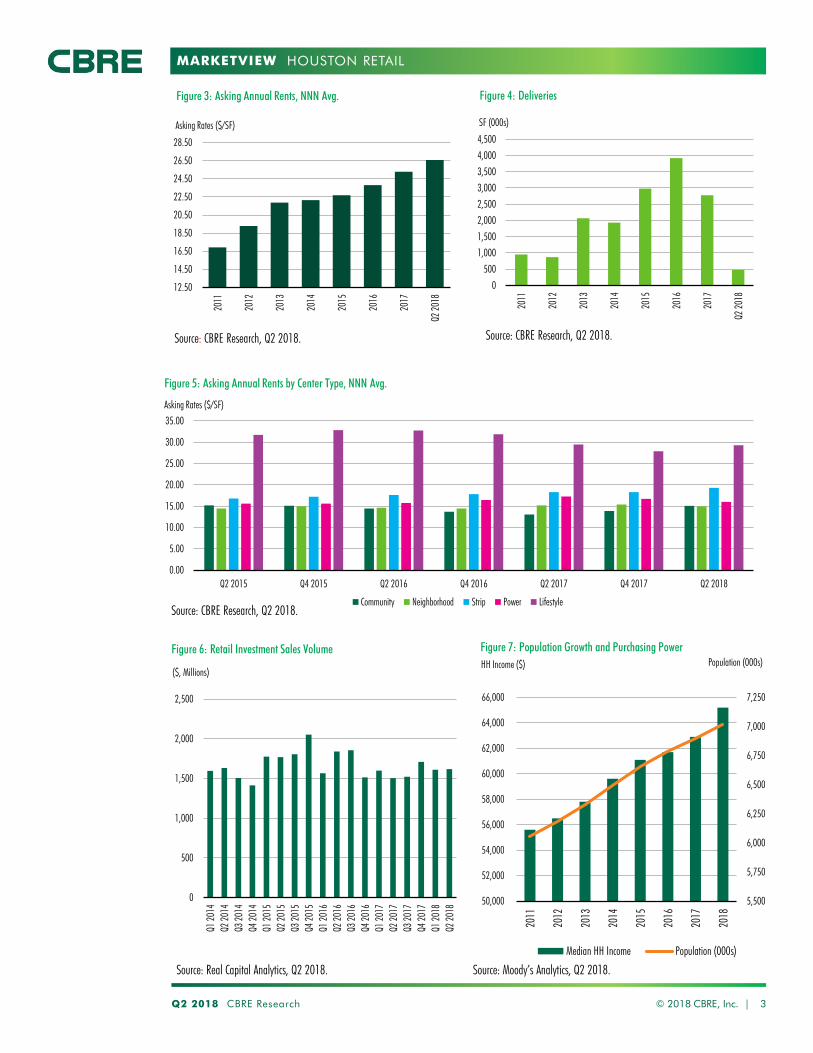
Source: CBRE Research, Q2 2018.
Figure 5: Asking Annual Rents by Center Type, NNN Avg.
Figure 3: Asking Annual Rents, NNN Avg. Figure 4: Deliveries
Source: CBRE Research, Q2 2018.
Source: CBRE Research, Q2 2018.
MARKETVIEW
Disclaimer: Information contained herein, including projections, has been obtained from sources believed to be reliable. While we do not doubt its accuracy, we have not verified it and make no guarantee, warranty or representation about it. It is your responsibility to confirm independently its accuracy and completeness. This information is presented exclusively for use by CBRE clients and professionals and all rights to the material are reserved and cannot be reproduced without prior written permission of CBRE.
CONTACTS
CBRE OFFICES
HOUSTON RETAIL
MARKETVIEW
Local leasing strength amid
nationwide closures
Houston Retail, Q1 2018
Q1 2018 CBRE Research © 2018 CBRE, Inc. | 1
903,438 SF 48,991 SF94.4% 3,359,182 SF
Figure 1: Net Absorption and Market Occupancy
Source: CBRE Research, Q1 2018.
*Arrows indicate trend from previous quarter.
80
82
84
86
88
90
92
94
96
(3)
(2)
(1)
0
1
2
3
4
2008 2009 2010 2011 2012 2013 2014 2015 2016 2017 2018 YTD
Occupancy (%)Net Absorption (MSF)
Annual Net Absorption Occupancy
OCCUPANCY SUSTAINS CLIMB, UP 30 BPS TO 94.4% DURING LAST 90 DAYS
GROCERY-ANCHORED RETAIL: A DARLING FOR INVESTORS?
UNABATED POPULATION GROWTH ‘FEEDS’ NEED FOR RETAIL
TOYS R US ANNOUNCES U.S. LIQUIDATION
MARKETVIEW
Q1 2018 CBRE Research © 2017 CBRE, Inc. | 2
Source: CBRE Research, Q4 2017.
Figure 4: Historical Market Statistics
HOUSTON RETAIL
2011 2012 2013 2014 2015 2016 2017 YTD 2018
INNER LOOP Absorption (Net, SF) (21,292) 75,133 72,274 97,668 461,629 111,063 8,575 (80,175)
Avg. Asking Rent (Annual,NNN, $/SF) 26.50 32.50 35.50 36.75 32.00 35.50 38.00 37.00
Delivered Construction (SF) - 169,470 - 185,000 434,465 54,774 72,541 12,410
Occupancy Rate (%) 95.4 93.6 94.1 95.6 96.5 96.2 96.3 95.8
NORTHEAST Absorption (Net, SF) 66,376 288,245 81,473 277,901 162,579 675,751 118,818 8,006
Avg. Asking Rent (Annual,NNN, $/SF) 13.25 13.50 15.00 15.00 13.00 15.00 16.00 16.00
Delivered Construction (SF) 81,686 31,000 174,954 320,651 100,000 1,215,083 108,230 105,166
Occupancy Rate (%) 90.7 90.8 89.0 91.5 93.0 94.5 95.3 95.6
NEAR NORTH Absorption (Net, SF) (23,143) (164,326) 60,082 (60,101) (19,964) 31,641 39,223 111,558
Avg. Asking Rent (Annual,NNN, $/SF) 14.00 14.25 18.00 18.25 14.00 14.00 14.00 14.50
Delivered Construction (SF) - - - - - - 56,250 13,012
Occupancy Rate (%) 96.3 96.2 96.5 96.7 95.9 96.4 96.5 96.2
FAR NORTH Absorption (Net, SF) 103,000 (97,182) 249,193 600,344 (2,560) 808,749 1,444,722 21,767
Avg. Asking Rent (Annual,NNN, $/SF) 20.00 23.50 25.25 26.50 24.00 24.00 24.00 25.00
Delivered Construction (SF) 458,347 79,103 134,527 198,038 298,521 528,160 1,367,331 363,109
Occupancy Rate (%) 90.3 91.0 91.5 93.1 93.5 93.9 92.2 92.8
NEAR NORTHWEST Absorption (Net, SF) 84,388 17,602 (69,499) 118,692 (24,491) 9,026 (88,352) 38,630
Avg. Asking Rent (Annual,NNN, $/SF) 12.75 14.00 15.00 15.00 21.25 26.00 25.00 25.00
Delivered Construction (SF) 79,895 - 40,000 - - - - 30,733
Occupancy Rate (%) 95.0 95.1 94.6 95.2 95.2 96.1 95.3 96.2
FAR NORTHWEST Absorption (Net, SF) 267,120 96,476 245,378 369,190 268,491 563,711 230,238 (235,809)
Avg. Asking Rent (Annual,NNN, $/SF) 20.00 22.50 25.25 25.25 33.75 32.75 32.00 31.00
Delivered Construction (SF) 88,042 25,610 297,078 457,305 228,000 496,507 246,995 27,099
Occupancy Rate (%) 92.1 92.7 93.0 93.0 94.0 94.0 94.2 93.5
NEAR WEST Absorption (Net, SF) 52,845 (2,371) 119,801 114,165 111,794 72,158 (43,619) 26,664
Avg. Asking Rent (Annual,NNN, $/SF) 19.00 21.00 24.50 24.50 34.00 36.00 36.00 36.50
Delivered Construction (SF) - 55,000 133,274 110,000 172,827 - - -
Occupancy Rate (%) 94.6 94.9 95.5 95.7 95.3 97.1 95.7 97.3
FAR WEST Absorption (Net, SF) 116,437 86,860 395,165 221,353 562,664 207,543 520,500 (23,057)
Avg. Asking Rent (Annual,NNN, $/SF) 16.25 24.00 30.50 30.50 28.75 29.00 30.00 30.00
Delivered Construction (SF) 24,225 20,555 916,552 0 388,456 394,094 561,117 108,285
Occupancy Rate (%) 92.3 93.0 92.9 92.7 94.2 95.0 93.8 93.4
NEAR SOUTHWEST Absorption (Net, SF) 9,275 (147,823) 50,497 (42,632) 121,835 128,670 (264,323) (23,246)
Avg. Asking Rent (Annual,NNN, $/SF) 13.00 13.50 15.00 15.00 16.75 17.00 17.75 17.00
Delivered Construction (SF) - - - - 177,514 15,000 - 16,146
Occupancy Rate (%) 90.8 90.2 91.2 88.4 91.5 92.1 91.5 92.8
FAR SOUTHWEST Absorption (Net, SF) 297,614 (155,568) 174,496 241,414 126,984 319,119 21,556 (15,260)
Avg. Asking Rent (Annual,NNN, $/SF) 18.75 21.25 25.25 25.50 22.25 24.25 25.50 24.00
Delivered Construction (SF) 177,365 136,494 169,432 215,304 204,175 172,636 153,000 103,750
Occupancy Rate (%) 91.8 92.4 92.6 93.8 93.7 94.2 94.2 94.1SOUTH Absorption (Net, SF) (26,389) (1,083) 186,724 98,437 (31,273) 253,972 (38,569) 80,086
Avg. Asking Rent (Annual,NNN, $/SF) 17.00 18.75 20.00 20.50 18.25 22.00 24.00 25.00
Delivered Construction (SF) - 5,000 7,917 - 366,640 139,691 71,627 -
Occupancy Rate (%) 90.8 90.8 92.6 94.5 93.4 94.2 93.9 95.2
NEAR SOUTHEAST Absorption (Net, SF) (74,189) 86,101 292,866 71,167 30,537 101,811 (67,905) 110,466
Avg. Asking Rent (Annual,NNN, $/SF) 13.00 14.25 14.75 14.75 22.50 18.00 18.00 18.00
Delivered Construction (SF) 20,146 - 9,082 - - - - -
Occupancy Rate (%) 90.9 88.3 90.3 93.3 91.6 92.2 93.0 91.7
FAR SOUTHEAST Absorption (Net, SF) 144,553 200,367 179,833 2,093 687,635 742,662 90,614 29,361
Avg. Asking Rent (Annual,NNN, $/SF) 16.75 17.75 20.25 20.50 14.50 23.75 23.25 22.00
Delivered Construction (SF) 25,000 350,000 184,400 450,443 613,475 905,003 137,350 123,728
Occupancy Rate (%) 92.1 92.3 92.7 93.7 93.6 92.4 94.6 95.1
HOUSTON TOTAL
Absorption (Net, SF) 996,595 282,431 2,038,283 2,109,691 2,455,860 4,025,876 1,971,478 48,991
Avg. Asking Rent (Annual,NNN, $/SF) 16.94 19.29 21.87 22.15 22.69 23.81 25.30 25.55
Delivered Construction (SF) 954,706 872,232 2,067,216 1,936,741 2,984,073 3,920,948 2,774,441 903,438
Occupancy Rate (%) 92.2 92.2 92.6 93.4 93.9 94.3 94.1 94.4

MARKETVIEW
Q1 2018 CBRE Research 3
HOUSTON RETAIL
© 2018 CBRE, Inc. |
5,500
5,750
6,000
6,250
6,500
6,750
7,000
50,000
52,000
54,000
56,000
58,000
60,000
62,000
64,000
2011
2012
2013
2014
2015
2016
2017
Median HH Income Population (000s)
Figure 7: Population Growth and Purchasing PowerPopulation (000s)
Source: Moody’s Analytics, Q1 2018.
HH Income ($)
Source: Real Capital Analytics, Q1 2018.
0
500
1,000
1,500
2,000
2,500
Q1 2
014
Q2 2
014
Q3 2
014
Q4 2
014
Q1 2
015
Q2 2
015
Q3 2
015
Q4 2
015
Q1 2
016
Q2 2
016
Q3 2
016
Q4 2
016
Q1 2
017
Q2 2
017
Q3 2
017
Q4 2
017
Q1 2
018
($, Millions)
Figure 6: Retail Investment Sales Volume
0.00
5.00
10.00
15.00
20.00
25.00
30.00
35.00
Q2 2015 Q4 2015 Q2 2016 Q4 2016 Q2 2017 Q4 2017
Asking Rates ($/SF)
Community Neighborhood Strip Power Lifestyle
12.50
14.50
16.50
18.50
20.50
22.50
24.50
26.50
2011
2012
2013
2014
2015
2016
2017
2018
YTD
Asking Rates ($/SF)
0
500
1,000
1,500
2,000
2,500
3,000
3,500
4,000
4,500
2011
2012
2013
2014
2015
2016
2017
2018
YTD
SF (000s)
Source: CBRE Research, Q1 2018.
Figure 5: Asking Annual Rents by Center Type, NNN Avg.
Figure 3: Asking Annual Rents, NNN Avg. Figure 4: Deliveries
Source: CBRE Research, Q1 2018.
Source: CBRE Research, Q1 2018.
MARKETVIEW
Disclaimer: Information contained herein, including projections, has been obtained from sources believed to be reliable. While we do not doubt its accuracy, we have not verified it and make no guarantee, warranty or representation about it. It is your responsibility to confirm independently its accuracy and completeness. This information is presented exclusively for use by CBRE clients and professionals and all rights to the material are reserved and cannot be reproduced without prior written permission of CBRE.
CONTACTS
CBRE OFFICES
HOUSTON RETAIL
MARKETVIEW
Tenant demand stabilizes at year-end following slow start
Houston Retail, Q4 2017
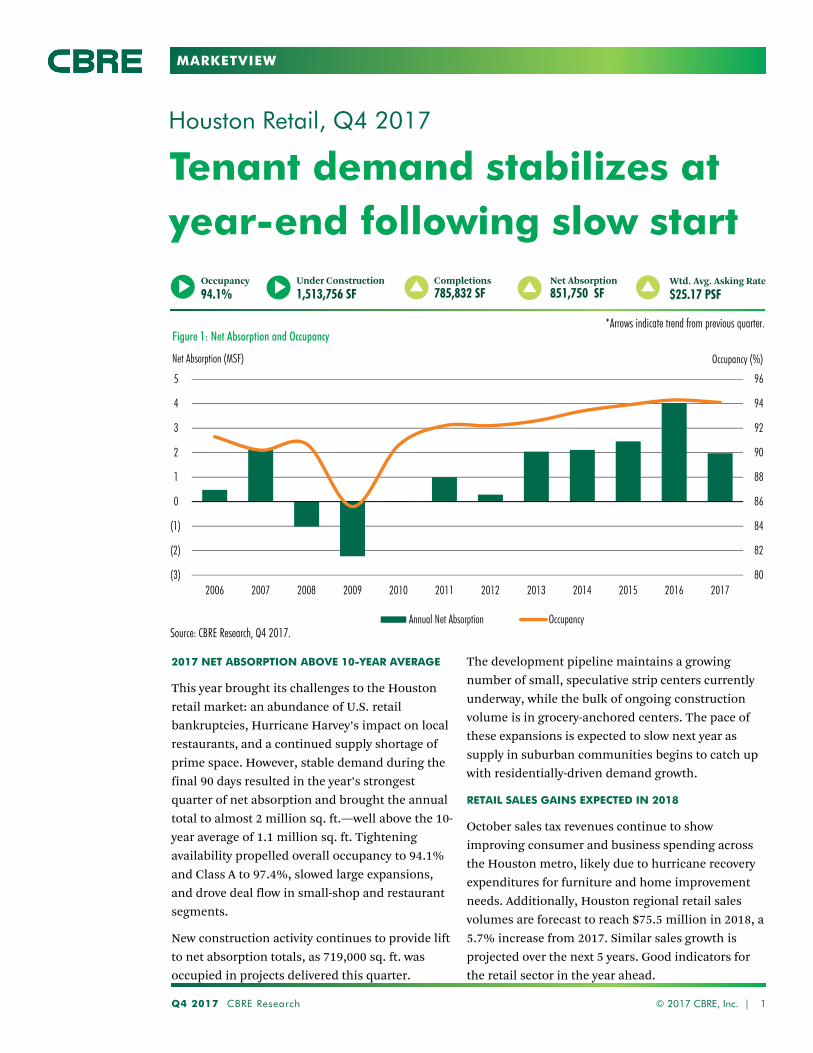
2017 NET ABSORPTION ABOVE 10-YEAR AVERAGE
This year brought its challenges to the Houston
retail market: an abundance of U.S. retail
bankruptcies, Hurricane Harvey’s impact on local
restaurants, and a continued supply shortage of
prime space. However, stable demand during the
final 90 days resulted in the year’s strongest
quarter of net absorption and brought the annual
total to almost 2 million sq. ft.—well above the 10-
year average of 1.1 million sq. ft. Tightening
availability propelled overall occupancy to 94.1%
and Class A to 97.4%, slowed large expansions,
and drove deal flow in small-shop and restaurant
segments.
New construction activity continues to provide lift
to net absorption totals, as 719,000 sq. ft. was
occupied in projects delivered this quarter.
Q4 2017 CBRE Research © 2017 CBRE, Inc. | 1
Completions
785,832 SFNet Absorption
851,750 SFOccupancy
94.1%Under Construction
1,513,756 SFWtd. Avg. Asking Rate
$25.17 PSF
Figure 1: Net Absorption and Occupancy
Source: CBRE Research, Q4 2017.
The development pipeline maintains a growing
number of small, speculative strip centers currently
underway, while the bulk of ongoing construction
volume is in grocery-anchored centers. The pace of
these expansions is expected to slow next year as
supply in suburban communities begins to catch up
with residentially-driven demand growth.
RETAIL SALES GAINS EXPECTED IN 2018
October sales tax revenues continue to show
improving consumer and business spending across
the Houston metro, likely due to hurricane recovery
expenditures for furniture and home improvement
needs. Additionally, Houston regional retail sales
volumes are forecast to reach $75.5 million in 2018, a
5.7% increase from 2017. Similar sales growth is
projected over the next 5 years. Good indicators for
the retail sector in the year ahead.
*Arrows indicate trend from previous quarter.
80
82
84
86
88
90
92
94
96
(3)
(2)
(1)
0
1
2
3
4
5
2006 2007 2008 2009 2010 2011 2012 2013 2014 2015 2016 2017
Occupancy (%)Net Absorption (MSF)
Annual Net Absorption Occupancy
MARKETVIEW
Q4 2017 CBRE Research 2
HOUSTON RETAIL
© 2017 CBRE, Inc. |
Source: CBRE Research, Q4 2017.
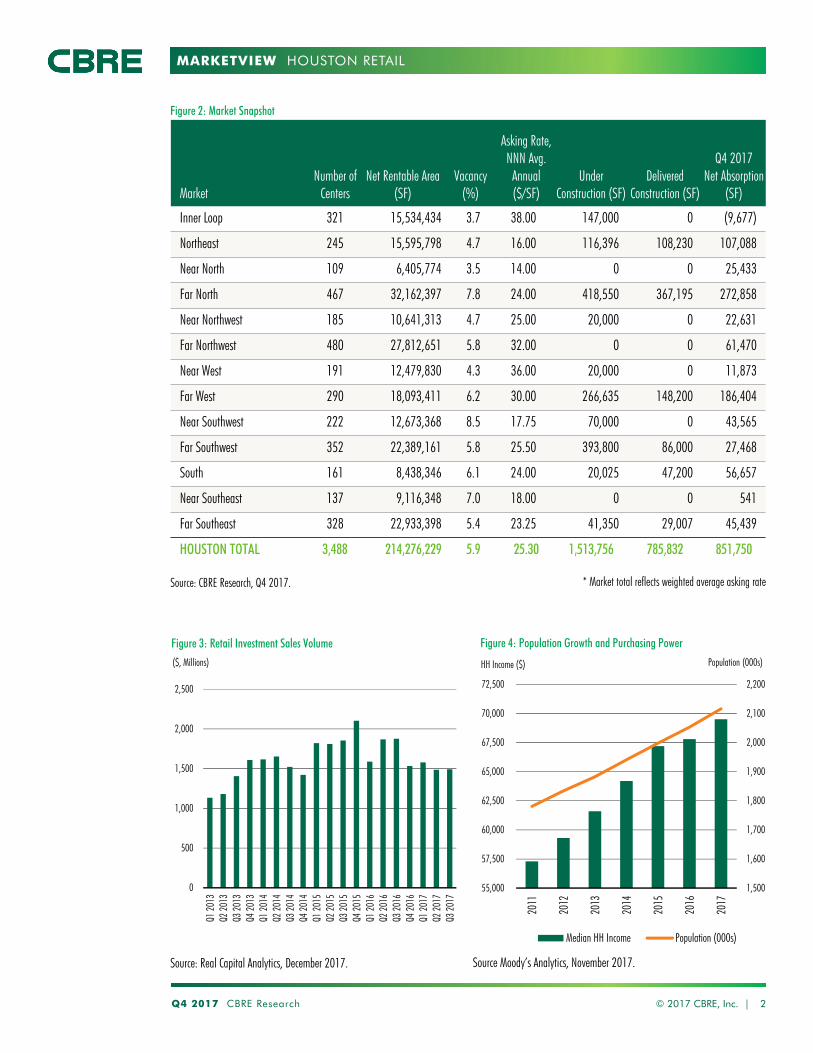
Figure 2: Market Snapshot
* Market total reflects weighted average asking rate
MarketNumber of
CentersNet Rentable Area
(SF)Vacancy
(%)
Asking Rate,NNN Avg.
Annual($/SF)
Under Construction (SF)
Delivered Construction (SF)
Q4 2017Net Absorption
(SF)
Inner Loop 321 15,534,434 3.7 38.00 147,000 0 (9,677)
Northeast 245 15,595,798 4.7 16.00 116,396 108,230 107,088
Near North 109 6,405,774 3.5 14.00 0 0 25,433
Far North 467 32,162,397 7.8 24.00 418,550 367,195 272,858
Near Northwest 185 10,641,313 4.7 25.00 20,000 0 22,631
Far Northwest 480 27,812,651 5.8 32.00 0 0 61,470
Near West 191 12,479,830 4.3 36.00 20,000 0 11,873
Far West 290 18,093,411 6.2 30.00 266,635 148,200 186,404
Near Southwest 222 12,673,368 8.5 17.75 70,000 0 43,565
Far Southwest 352 22,389,161 5.8 25.50 393,800 86,000 27,468
South 161 8,438,346 6.1 24.00 20,025 47,200 56,657
Near Southeast 137 9,116,348 7.0 18.00 0 0 541
Far Southeast 328 22,933,398 5.4 23.25 41,350 29,007 45,439
HOUSTON TOTAL 3,488 214,276,229 5.9 25.30 1,513,756 785,832 851,750
1,500
1,600
1,700
1,800
1,900
2,000
2,100
2,200
55,000
57,500
60,000
62,500
65,000
67,500
70,000
72,500
2011
2012
2013
2014
2015
2016
2017
Median HH Income Population (000s)
Figure 4: Population Growth and Purchasing PowerPopulation (000s)
Source Moody’s Analytics, November 2017.
HH Income ($)
Source: Real Capital Analytics, December 2017.
0
500
1,000
1,500
2,000
2,500
Q1 20
13Q2
2013
Q3 20
13Q4
2013
Q1 20
14Q2
2014
Q3 20
14Q4
2014
Q1 20
15Q2
2015
Q3 20
15Q4
2015
Q1 20
16Q2
2016
Q3 20
16Q4
2016
Q1 20
17Q2
2017
Q3 20
17
($, Millions)
Figure 3: Retail Investment Sales Volume
MARKETVIEW
Q4 2017 CBRE Research © 2017 CBRE, Inc. | 3
Source: CBRE Research, Q4 2017.
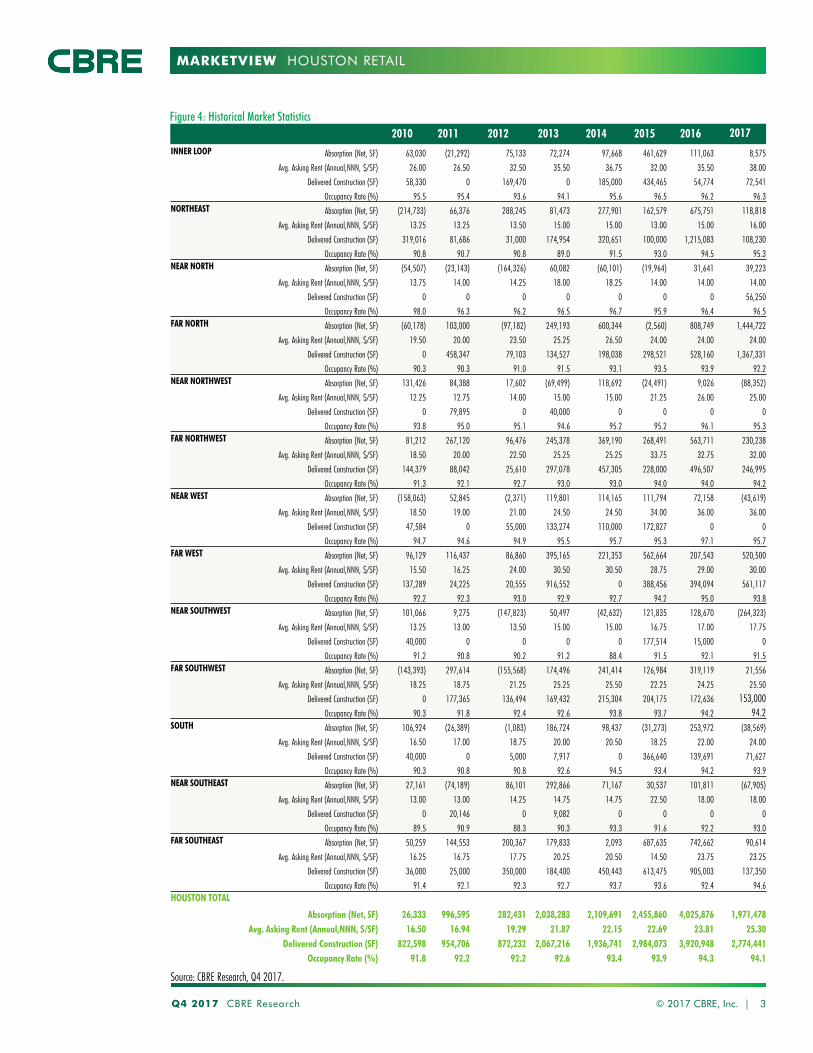
Figure 4: Historical Market Statistics
HOUSTON RETAIL
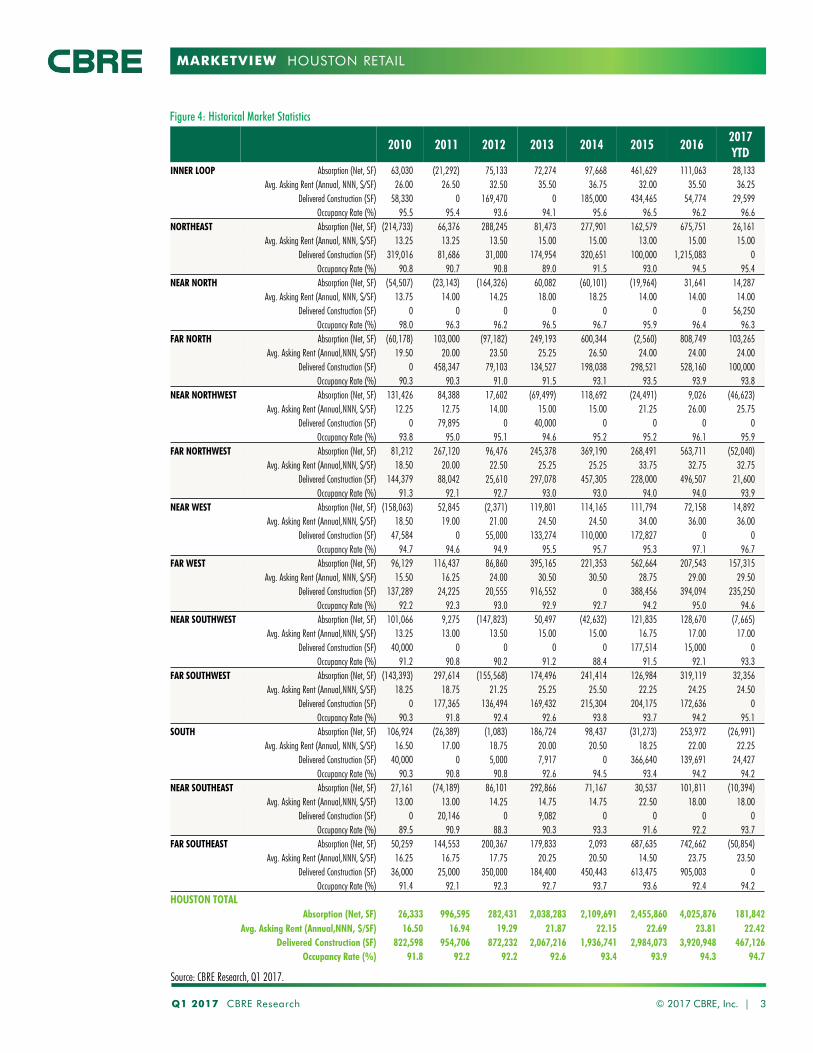
2010 2011 2012 2013 2014 2015 2016 2017INNER LOOP Absorption (Net, SF) 63,030 (21,292) 75,133 72,274 97,668 461,629 111,063 8,575
Avg. Asking Rent (Annual,NNN, $/SF) 26.00 26.50 32.50 35.50 36.75 32.00 35.50 38.00
Delivered Construction (SF) 58,330 0 169,470 0 185,000 434,465 54,774 72,541
Occupancy Rate (%) 95.5 95.4 93.6 94.1 95.6 96.5 96.2 96.3NORTHEAST Absorption (Net, SF) (214,733) 66,376 288,245 81,473 277,901 162,579 675,751 118,818
Avg. Asking Rent (Annual,NNN, $/SF) 13.25 13.25 13.50 15.00 15.00 13.00 15.00 16.00
Delivered Construction (SF) 319,016 81,686 31,000 174,954 320,651 100,000 1,215,083 108,230
Occupancy Rate (%) 90.8 90.7 90.8 89.0 91.5 93.0 94.5 95.3NEAR NORTH Absorption (Net, SF) (54,507) (23,143) (164,326) 60,082 (60,101) (19,964) 31,641 39,223
Avg. Asking Rent (Annual,NNN, $/SF) 13.75 14.00 14.25 18.00 18.25 14.00 14.00 14.00
Delivered Construction (SF) 0 0 0 0 0 0 0 56,250
Occupancy Rate (%) 98.0 96.3 96.2 96.5 96.7 95.9 96.4 96.5FAR NORTH Absorption (Net, SF) (60,178) 103,000 (97,182) 249,193 600,344 (2,560) 808,749 1,444,722
Avg. Asking Rent (Annual,NNN, $/SF) 19.50 20.00 23.50 25.25 26.50 24.00 24.00 24.00
Delivered Construction (SF) 0 458,347 79,103 134,527 198,038 298,521 528,160 1,367,331
Occupancy Rate (%) 90.3 90.3 91.0 91.5 93.1 93.5 93.9 92.2NEAR NORTHWEST Absorption (Net, SF) 131,426 84,388 17,602 (69,499) 118,692 (24,491) 9,026 (88,352)
Avg. Asking Rent (Annual,NNN, $/SF) 12.25 12.75 14.00 15.00 15.00 21.25 26.00 25.00
Delivered Construction (SF) 0 79,895 0 40,000 0 0 0 0
Occupancy Rate (%) 93.8 95.0 95.1 94.6 95.2 95.2 96.1 95.3FAR NORTHWEST Absorption (Net, SF) 81,212 267,120 96,476 245,378 369,190 268,491 563,711 230,238
Avg. Asking Rent (Annual,NNN, $/SF) 18.50 20.00 22.50 25.25 25.25 33.75 32.75 32.00
Delivered Construction (SF) 144,379 88,042 25,610 297,078 457,305 228,000 496,507 246,995
Occupancy Rate (%) 91.3 92.1 92.7 93.0 93.0 94.0 94.0 94.2NEAR WEST Absorption (Net, SF) (158,063) 52,845 (2,371) 119,801 114,165 111,794 72,158 (43,619)
Avg. Asking Rent (Annual,NNN, $/SF) 18.50 19.00 21.00 24.50 24.50 34.00 36.00 36.00
Delivered Construction (SF) 47,584 0 55,000 133,274 110,000 172,827 0 0
Occupancy Rate (%) 94.7 94.6 94.9 95.5 95.7 95.3 97.1 95.7FAR WEST Absorption (Net, SF) 96,129 116,437 86,860 395,165 221,353 562,664 207,543 520,500
Avg. Asking Rent (Annual,NNN, $/SF) 15.50 16.25 24.00 30.50 30.50 28.75 29.00 30.00
Delivered Construction (SF) 137,289 24,225 20,555 916,552 0 388,456 394,094 561,117
Occupancy Rate (%) 92.2 92.3 93.0 92.9 92.7 94.2 95.0 93.8NEAR SOUTHWEST Absorption (Net, SF) 101,066 9,275 (147,823) 50,497 (42,632) 121,835 128,670 (264,323)
Avg. Asking Rent (Annual,NNN, $/SF) 13.25 13.00 13.50 15.00 15.00 16.75 17.00 17.75
Delivered Construction (SF) 40,000 0 0 0 0 177,514 15,000 0
Occupancy Rate (%) 91.2 90.8 90.2 91.2 88.4 91.5 92.1 91.5FAR SOUTHWEST Absorption (Net, SF) (143,393) 297,614 (155,568) 174,496 241,414 126,984 319,119 21,556
Avg. Asking Rent (Annual,NNN, $/SF) 18.25 18.75 21.25 25.25 25.50 22.25 24.25 25.50
Delivered Construction (SF) 0 177,365 136,494 169,432 215,304 204,175 172,636 153,000Occupancy Rate (%) 90.3 91.8 92.4 92.6 93.8 93.7 94.2 94.2
SOUTH Absorption (Net, SF) 106,924 (26,389) (1,083) 186,724 98,437 (31,273) 253,972 (38,569)
Avg. Asking Rent (Annual,NNN, $/SF) 16.50 17.00 18.75 20.00 20.50 18.25 22.00 24.00
Delivered Construction (SF) 40,000 0 5,000 7,917 0 366,640 139,691 71,627
Occupancy Rate (%) 90.3 90.8 90.8 92.6 94.5 93.4 94.2 93.9NEAR SOUTHEAST Absorption (Net, SF) 27,161 (74,189) 86,101 292,866 71,167 30,537 101,811 (67,905)
Avg. Asking Rent (Annual,NNN, $/SF) 13.00 13.00 14.25 14.75 14.75 22.50 18.00 18.00
Delivered Construction (SF) 0 20,146 0 9,082 0 0 0 0
Occupancy Rate (%) 89.5 90.9 88.3 90.3 93.3 91.6 92.2 93.0FAR SOUTHEAST Absorption (Net, SF) 50,259 144,553 200,367 179,833 2,093 687,635 742,662 90,614
Avg. Asking Rent (Annual,NNN, $/SF) 16.25 16.75 17.75 20.25 20.50 14.50 23.75 23.25
Delivered Construction (SF) 36,000 25,000 350,000 184,400 450,443 613,475 905,003 137,350
Occupancy Rate (%) 91.4 92.1 92.3 92.7 93.7 93.6 92.4 94.6HOUSTON TOTAL
Absorption (Net, SF) 26,333 996,595 282,431 2,038,283 2,109,691 2,455,860 4,025,876 1,971,478 Avg. Asking Rent (Annual,NNN, $/SF) 16.50 16.94 19.29 21.87 22.15 22.69 23.81 25.30
Delivered Construction (SF) 822,598 954,706 872,232 2,067,216 1,936,741 2,984,073 3,920,948 2,774,441Occupancy Rate (%) 91.8 92.2 92.2 92.6 93.4 93.9 94.3 94.1

MARKETVIEW
Disclaimer: Information contained herein, including projections, has been obtained from sources believed to be reliable. While we do not doubt its accuracy, we have not verified it and make no guarantee, warranty or representation about it. It is your responsibility to confirm independently its accuracy and completeness. This information is presented exclusively for use by CBRE clients and professionals and all rights to the material are reserved and cannot be reproduced without prior written permission of CBRE.
CONTACTS
Robert C. Kramp
Director, Research & Analysis
E. Michelle Miller
Research Operations Manager
Analee Bivins Micheletti
Sr. Research Analyst
CBRE OFFICES
CBRE Houston
2800 Post Oak, Suite 2300
Houston, TX 77056
To learn more about CBRE
Research, or to access additional
research reports, please visit the
Global Research Gateway at
www.cbre.com/researchgateway.
HOUSTON RETAIL
MARKETVIEW
New construction captures bulk of tenant demand
Houston Retail, Q3 2017
FUNDAMENTALS STRONG HEADING INTO THE
STORM
Hurricane Harvey struck the Houston region in
August dropping an unprecedented 1.2 trillion
gallons of rainwater. While the damage to retail
product was minimal, effects will not be visible in
Q3 2017 statistics but could influence Q4 2017
data. The largest hurdle for the Houston Retail
market post-Harvey is the continuing lack of
space. Heading into the storm availability was very
tight—even with large-scale national retail
closures/bankruptcies disrupting big-box and
small shop demand. A dwindling pipeline,
temporary requirements, increased demand from
home improvement tenants, and sustained
organic retail demand will keep this market in very
tight conditions. In fact, CBRE Research
Q3 2017 CBRE Research © 2017 CBRE, Inc. | 1
Completions
648,303 SFNet Absorption
311,552 SFOccupancy
94.1%Under Construction
1,539,973 SFWtd. Avg. Asking Rate
$25.17 PSF
Figure 1: Net Absorption and Occupancy
Source: CBRE Research, Q3 2017.
anticipates Class A occupancy will increase by
approximately 35 basis points in Q4 2017.
LIMITED AVAILABILITY CONSTRICTS ABSORPTION
Leasing demand continues to decline—almost all of
the 311,552 sq. ft. of new absorption was taken up by
newly delivered centers, including the Grand Parkway
Marketplace located in the Far North submarket.
Year-to-date over 2 million sq. ft. was absorbed in
new development—counterbalancing national
closures and bankruptcies.
While absorption volume has slowed across the city,
demand for space is still high as evidenced by tight
occupancy rates at 94.1%, and rising Class A
occupancy at 97.3%. Tightening availability is
hindering large expansions, and thus deal flow is
heaviest in small shop and restaurant segments.
*Arrows indicate trend from previous quarter.
80
82
84
86
88
90
92
94
96
(3)
(2)
0
2
3
5
2006 2007 2008 2009 2010 2011 2012 2013 2014 2015 2016 2017 YTD
Occupancy (%)Net Absorption (MSF)
Annual Net Absorption Occupancy
MARKETVIEW
Q3 2017 CBRE Research 2
HOUSTON RETAIL
© 2017 CBRE, Inc. |
Source: CBRE Research, Q3 2017.
Figure 2: Market Snapshot
* Market total reflects weighted average asking rate
Source: CBRE Research, Q3 2017.
Figure 3: Historical Completions and Occupancy Rate
92.0
92.5
93.0
93.5
94.0
94.5
95.0
0
200
400
600
800
1,000
1,200
1,400
Q3 20
12
Q4 20
12
Q1 20
13
Q2 20
13
Q3 20
13
Q4 20
13
Q1 20
14
Q2 20
14
Q3 20
14
Q4 20
14
Q1 20
15
Q2 20
15
Q3 20
15
Q4 20
15
Q1 20
16
Q2 20
16
Q3 20
16
Q4 20
16
Q1 20
17
Q2 20
17
Q3 20
17
Occupancy Rate (%)(000s)
Delivered Construction Occupancy Rate
MarketNumber of
CentersNet Rentable Area
(SF)Vacancy
(%)
Asking Rate,NNN Avg.
Annual($/SF)
Under Construction (SF)
Delivered Construction (SF)
Q3 2017Net Absorption
(SF)
Inner Loop 322 15,646,919 3.8 37.25 147,000 0 (9,809)
Northeast 243 15,493,300 5.3 16.00 132,080 0 (16,251)
Near North 109 6,396,605 3.8 14.00 0 0 (13,627)
Far North 461 31,831,155 6.7 24.00 566,670 271,248 428,516
Near Northwest 185 10,644,491 4.4 25.50 0 0 (10,371)
Far Northwest 478 27,787,350 6.7 32.00 0 225,395 115,809
Near West 191 12,483,225 4.4 36.00 45,000 0 (3,913)
Far West 287 17,894,867 5.2 29.50 330,673 84,660 106,666
Near Southwest 223 12,767,563 9.2 17.25 70,000 0 (250,221)
Far Southwest 350 22,341,525 5.9 25.00 207,200 67,000 74,260
South 159 8,452,887 6.2 23.25 0 0 (20,443)
Near Southeast 136 9,093,153 7.6 18.00 0 0 (44,476)
Far Southeast 327 22,910,061 5.7 23.50 41,350 0 (44,588)
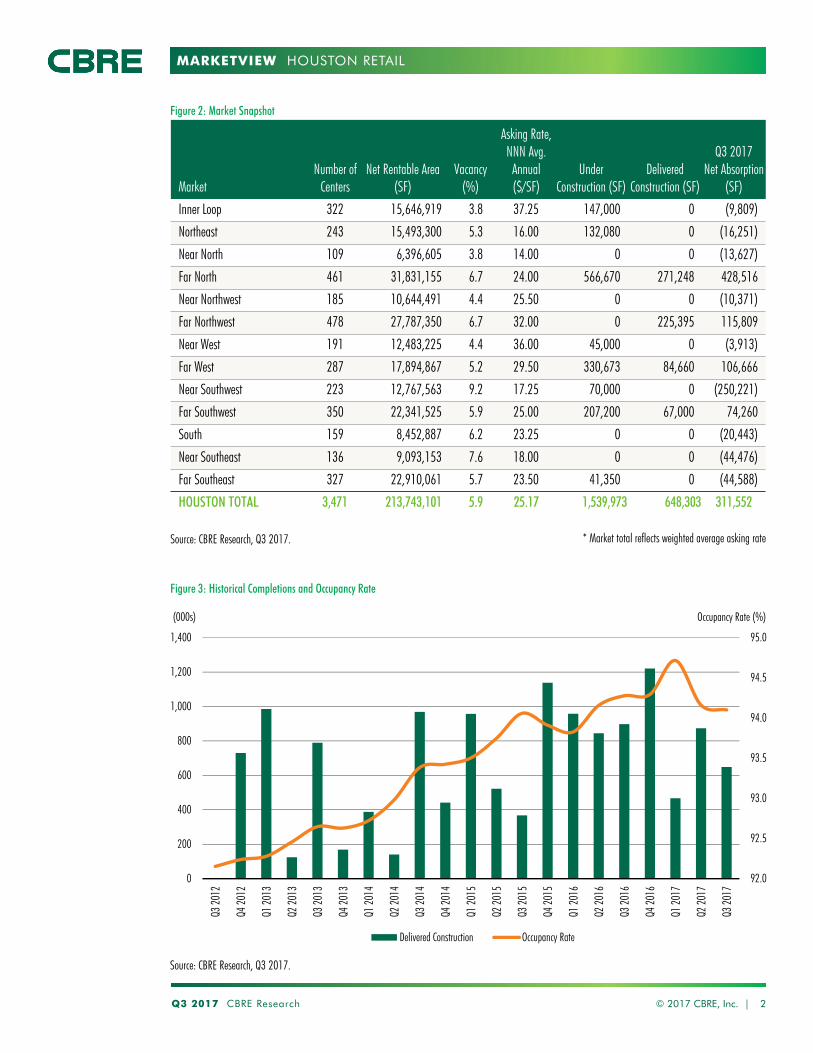
HOUSTON TOTAL 3,471 213,743,101 5.9 25.17 1,539,973 648,303 311,552
MARKETVIEW
Q3 2017 CBRE Research © 2017 CBRE, Inc. | 3
Source: CBRE Research, Q3 2017.
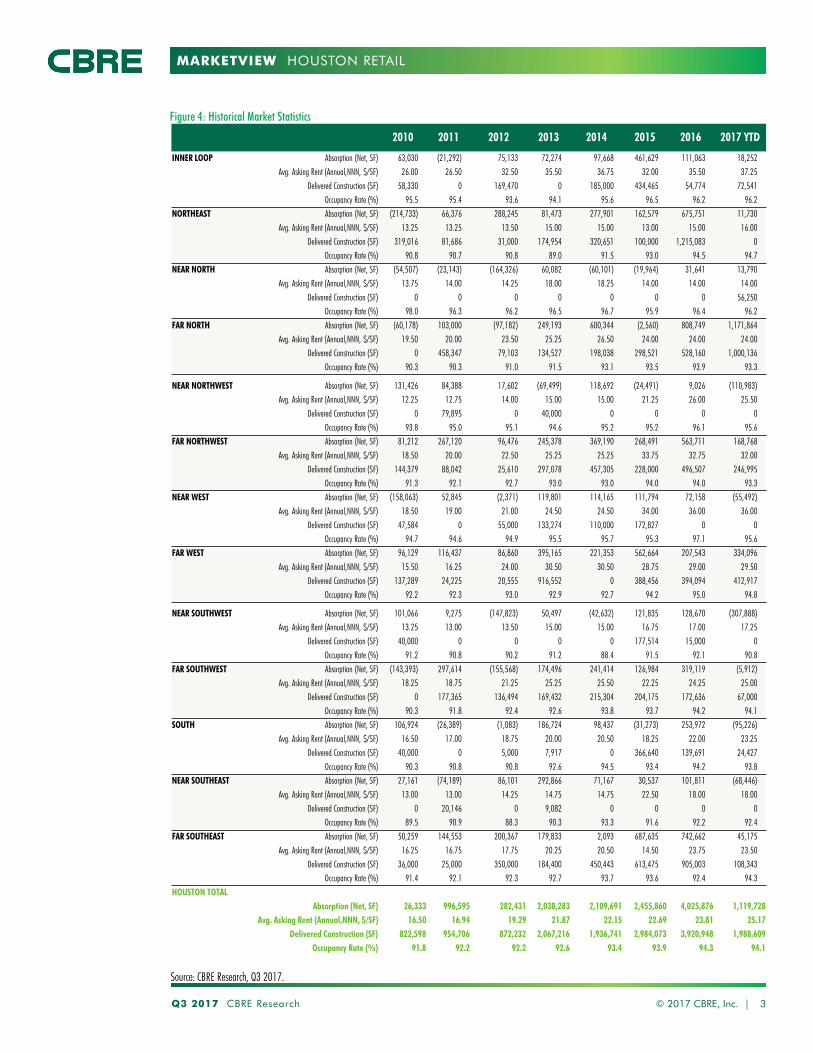
Figure 4: Historical Market Statistics
HOUSTON RETAIL
2010 2011 2012 2013 2014 2015 2016 2017 YTD
INNER LOOP Absorption (Net, SF) 63,030 (21,292) 75,133 72,274 97,668 461,629 111,063 18,252 Avg. Asking Rent (Annual,NNN, $/SF) 26.00 26.50 32.50 35.50 36.75 32.00 35.50 37.25
Delivered Construction (SF) 58,330 0 169,470 0 185,000 434,465 54,774 72,541Occupancy Rate (%) 95.5 95.4 93.6 94.1 95.6 96.5 96.2 96.2
NORTHEAST Absorption (Net, SF) (214,733) 66,376 288,245 81,473 277,901 162,579 675,751 11,730 Avg. Asking Rent (Annual,NNN, $/SF) 13.25 13.25 13.50 15.00 15.00 13.00 15.00 16.00
Delivered Construction (SF) 319,016 81,686 31,000 174,954 320,651 100,000 1,215,083 0Occupancy Rate (%) 90.8 90.7 90.8 89.0 91.5 93.0 94.5 94.7
NEAR NORTH Absorption (Net, SF) (54,507) (23,143) (164,326) 60,082 (60,101) (19,964) 31,641 13,790 Avg. Asking Rent (Annual,NNN, $/SF) 13.75 14.00 14.25 18.00 18.25 14.00 14.00 14.00
Delivered Construction (SF) 0 0 0 0 0 0 0 56,250Occupancy Rate (%) 98.0 96.3 96.2 96.5 96.7 95.9 96.4 96.2
FAR NORTH Absorption (Net, SF) (60,178) 103,000 (97,182) 249,193 600,344 (2,560) 808,749 1,171,864 Avg. Asking Rent (Annual,NNN, $/SF) 19.50 20.00 23.50 25.25 26.50 24.00 24.00 24.00
Delivered Construction (SF) 0 458,347 79,103 134,527 198,038 298,521 528,160 1,000,136Occupancy Rate (%) 90.3 90.3 91.0 91.5 93.1 93.5 93.9 93.3
NEAR NORTHWEST Absorption (Net, SF) 131,426 84,388 17,602 (69,499) 118,692 (24,491) 9,026 (110,983)Avg. Asking Rent (Annual,NNN, $/SF) 12.25 12.75 14.00 15.00 15.00 21.25 26.00 25.50
Delivered Construction (SF) 0 79,895 0 40,000 0 0 0 0Occupancy Rate (%) 93.8 95.0 95.1 94.6 95.2 95.2 96.1 95.6
FAR NORTHWEST Absorption (Net, SF) 81,212 267,120 96,476 245,378 369,190 268,491 563,711 168,768 Avg. Asking Rent (Annual,NNN, $/SF) 18.50 20.00 22.50 25.25 25.25 33.75 32.75 32.00
Delivered Construction (SF) 144,379 88,042 25,610 297,078 457,305 228,000 496,507 246,995Occupancy Rate (%) 91.3 92.1 92.7 93.0 93.0 94.0 94.0 93.3
NEAR WEST Absorption (Net, SF) (158,063) 52,845 (2,371) 119,801 114,165 111,794 72,158 (55,492)Avg. Asking Rent (Annual,NNN, $/SF) 18.50 19.00 21.00 24.50 24.50 34.00 36.00 36.00
Delivered Construction (SF) 47,584 0 55,000 133,274 110,000 172,827 0 0Occupancy Rate (%) 94.7 94.6 94.9 95.5 95.7 95.3 97.1 95.6
FAR WEST Absorption (Net, SF) 96,129 116,437 86,860 395,165 221,353 562,664 207,543 334,096 Avg. Asking Rent (Annual,NNN, $/SF) 15.50 16.25 24.00 30.50 30.50 28.75 29.00 29.50
Delivered Construction (SF) 137,289 24,225 20,555 916,552 0 388,456 394,094 412,917Occupancy Rate (%) 92.2 92.3 93.0 92.9 92.7 94.2 95.0 94.8
NEAR SOUTHWEST Absorption (Net, SF) 101,066 9,275 (147,823) 50,497 (42,632) 121,835 128,670 (307,888)Avg. Asking Rent (Annual,NNN, $/SF) 13.25 13.00 13.50 15.00 15.00 16.75 17.00 17.25
Delivered Construction (SF) 40,000 0 0 0 0 177,514 15,000 0Occupancy Rate (%) 91.2 90.8 90.2 91.2 88.4 91.5 92.1 90.8
FAR SOUTHWEST Absorption (Net, SF) (143,393) 297,614 (155,568) 174,496 241,414 126,984 319,119 (5,912)Avg. Asking Rent (Annual,NNN, $/SF) 18.25 18.75 21.25 25.25 25.50 22.25 24.25 25.00
Delivered Construction (SF) 0 177,365 136,494 169,432 215,304 204,175 172,636 67,000Occupancy Rate (%) 90.3 91.8 92.4 92.6 93.8 93.7 94.2 94.1
SOUTH Absorption (Net, SF) 106,924 (26,389) (1,083) 186,724 98,437 (31,273) 253,972 (95,226)Avg. Asking Rent (Annual,NNN, $/SF) 16.50 17.00 18.75 20.00 20.50 18.25 22.00 23.25
Delivered Construction (SF) 40,000 0 5,000 7,917 0 366,640 139,691 24,427Occupancy Rate (%) 90.3 90.8 90.8 92.6 94.5 93.4 94.2 93.8
NEAR SOUTHEAST Absorption (Net, SF) 27,161 (74,189) 86,101 292,866 71,167 30,537 101,811 (68,446)Avg. Asking Rent (Annual,NNN, $/SF) 13.00 13.00 14.25 14.75 14.75 22.50 18.00 18.00
Delivered Construction (SF) 0 20,146 0 9,082 0 0 0 0Occupancy Rate (%) 89.5 90.9 88.3 90.3 93.3 91.6 92.2 92.4
FAR SOUTHEAST Absorption (Net, SF) 50,259 144,553 200,367 179,833 2,093 687,635 742,662 45,175 Avg. Asking Rent (Annual,NNN, $/SF) 16.25 16.75 17.75 20.25 20.50 14.50 23.75 23.50
Delivered Construction (SF) 36,000 25,000 350,000 184,400 450,443 613,475 905,003 108,343Occupancy Rate (%) 91.4 92.1 92.3 92.7 93.7 93.6 92.4 94.3
HOUSTON TOTALAbsorption (Net, SF) 26,333 996,595 282,431 2,038,283 2,109,691 2,455,860 4,025,876 1,119,728
Avg. Asking Rent (Annual,NNN, $/SF) 16.50 16.94 19.29 21.87 22.15 22.69 23.81 25.17Delivered Construction (SF) 822,598 954,706 872,232 2,067,216 1,936,741 2,984,073 3,920,948 1,988,609
Occupancy Rate (%) 91.8 92.2 92.2 92.6 93.4 93.9 94.3 94.1

MARKETVIEW
Disclaimer: Information contained herein, including projections, has been obtained from sources believed to be reliable. While we do not doubt its accuracy, we have not verified it and make no guarantee, warranty or representation about it. It is your responsibility to confirm independently its accuracy and completeness. This information is presented exclusively for use by CBRE clients and professionals and all rights to the material are reserved and cannot be reproduced without prior written permission of CBRE.
CONTACTS
Robert C. Kramp
Director, Research & Analysis
E. Michelle Miller
Research Operations Manager
Analee Bivins Micheletti
Sr. Research Analyst
CBRE OFFICES
CBRE Houston
2800 Post Oak, Suite 2300
Houston, TX 77056
To learn more about CBRE
Research, or to access additional
research reports, please visit the
Global Research Gateway at
www.cbre.com/researchgateway.
HOUSTON RETAIL
MARKETVIEW
Tight market hampers available leasing activity
Houston Retail, Q2 2017
centers and mixed-use developments dominate the
projects under construction. As a result, only 1.2
million sq. ft. of construction is currently
underway, and only one third are grocery-anchored
developments.
CONSUMER SPENDING SEES IMPROVEMENT
Houston MSA gross retail sales registered
significant improvement in 2016, according to
data released from the Texas Comptroller. Gross
sales dropped 7.1% in 2015, yet increased by 7.0%
last year, returning to 2014 highs. While retail
sales data is on a delay, sales tax revenues reflect
recent taxable sales and show improvement as
well. The strongest gains in tax revenues are within
Houston’s suburban counties as population
growth is strongest in the outlying areas.
Q2 2017 CBRE Research © 2017 CBRE, Inc. | 1
Completions
873,180 SFNet Absorption
626,334 SFOccupancy
94.2%Under Construction
1,250,726 SFWtd. Avg. Asking Rate
$25.09 PSF
Figure 1: Net Absorption and Occupancy
Source: CBRE Research, Q2 2017.
NO ROOM ON THE SHOW FLOOR: NET ABSORPTION
SLOWS FROM RECORD PACE DUE TO DEARTH OF SPACE
Leasing activity is struggling to maintain the pace
set in 2016 but not because tenant demand is
suffering. A deficit of quality space impeded leasing
causing Houston retailers to take down only 808,000
sq. ft. so far in 2017, which is still double the 10-year
average, but nearly half of the space absorbed in H1
2016. New developments continue to absorb big box
and junior box retailers: in Q2 2017 approximately
774,000 sq. ft. was occupied in new projects. As the
development pipeline slows, Houston will see net
absorption continue to taper.
FEWER LARGE PROJECTS IN DEVELOPMENT PIPELINE
As grocery expansions decline, the development
pipeline will also slow as small, speculative strip
*Arrows indicate trend from previous quarter.
80
82
84
86
88
90
92
94
96
(3)
(2)
0
2
3
5
2006 2007 2008 2009 2010 2011 2012 2013 2014 2015 2016 2017 YTD
Occupancy (%)Net Absorption (MSF)
Annual Net Absorption H1 Net Absorption Occupancy
MARKETVIEW
Q2 2017 CBRE Research 2
HOUSTON RETAIL
© 2017 CBRE, Inc. |
Source: CBRE Research, Q2 2017.
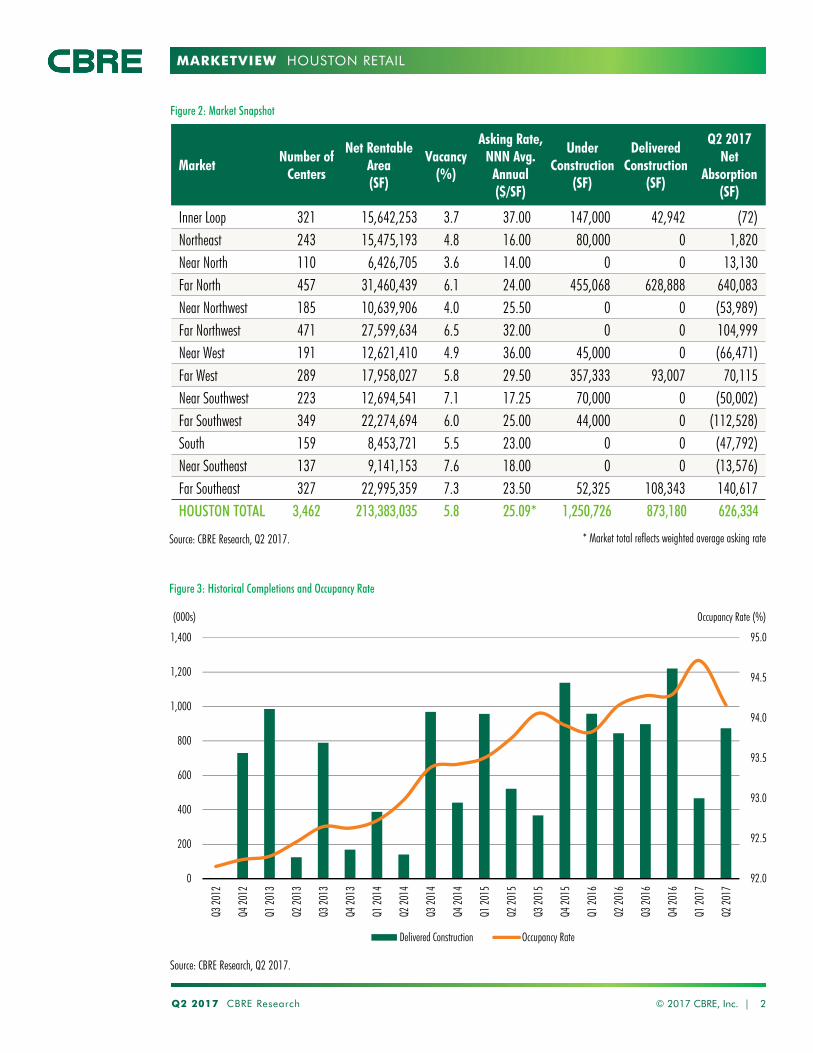
Figure 2: Market Snapshot
* Market total reflects weighted average asking rate
Source: CBRE Research, Q2 2017.
MarketNumber of
Centers
Net Rentable Area(SF)
Vacancy(%)
Asking Rate,NNN Avg.
Annual($/SF)
Under Construction
(SF)
Delivered Construction
(SF)
Q2 2017Net
Absorption(SF)
Inner Loop 321 15,642,253 3.7 37.00 147,000 42,942 (72)Northeast 243 15,475,193 4.8 16.00 80,000 0 1,820 Near North 110 6,426,705 3.6 14.00 0 0 13,130 Far North 457 31,460,439 6.1 24.00 455,068 628,888 640,083 Near Northwest 185 10,639,906 4.0 25.50 0 0 (53,989)Far Northwest 471 27,599,634 6.5 32.00 0 0 104,999 Near West 191 12,621,410 4.9 36.00 45,000 0 (66,471)Far West 289 17,958,027 5.8 29.50 357,333 93,007 70,115 Near Southwest 223 12,694,541 7.1 17.25 70,000 0 (50,002)Far Southwest 349 22,274,694 6.0 25.00 44,000 0 (112,528)South 159 8,453,721 5.5 23.00 0 0 (47,792)Near Southeast 137 9,141,153 7.6 18.00 0 0 (13,576)Far Southeast 327 22,995,359 7.3 23.50 52,325 108,343 140,617 HOUSTON TOTAL 3,462 213,383,035 5.8 25.09* 1,250,726 873,180 626,334
Figure 3: Historical Completions and Occupancy Rate
92.0
92.5
93.0
93.5
94.0
94.5
95.0
0
200
400
600
800
1,000
1,200
1,400
Q3 20
12
Q4 20
12
Q1 20
13
Q2 20
13
Q3 20
13
Q4 20
13
Q1 20
14
Q2 20
14
Q3 20
14
Q4 20
14
Q1 20
15
Q2 20
15
Q3 20
15
Q4 20
15
Q1 20
16
Q2 20
16
Q3 20
16
Q4 20
16
Q1 20
17
Q2 20
17
Occupancy Rate (%)(000s)
Delivered Construction Occupancy Rate
MARKETVIEW
Q2 2017 CBRE Research © 2017 CBRE, Inc. | 3
Source: CBRE Research, Q2 2017.
Figure 4: Historical Market Statistics
HOUSTON RETAIL
2010 2011 2012 2013 2014 2015 2016 2017 YTDINNER LOOP Absorption (Net, SF) 63,030 (21,292) 75,133 72,274 97,668 461,629 111,063 28,061
Avg. Asking Rent (Annual,NNN, $/SF) 26.00 26.50 32.50 35.50 36.75 32.00 35.50 37.00Delivered Construction (SF) 58,330 0 169,470 0 185,000 434,465 54,774 72,541
Occupancy Rate (%) 95.5 95.4 93.6 94.1 95.6 96.5 96.2 96.3NORTHEAST Absorption (Net, SF) (214,733) 66,376 288,245 81,473 277,901 162,579 675,751 27,981
Avg. Asking Rent (Annual,NNN, $/SF) 13.25 13.25 13.50 15.00 15.00 13.00 15.00 16.00Delivered Construction (SF) 319,016 81,686 31,000 174,954 320,651 100,000 1,215,083 0
Occupancy Rate (%) 90.8 90.7 90.8 89.0 91.5 93.0 94.5 95.2NEAR NORTH Absorption (Net, SF) (54,507) (23,143) (164,326) 60,082 (60,101) (19,964) 31,641 27,417
Avg. Asking Rent (Annual,NNN, $/SF) 13.75 14.00 14.25 18.00 18.25 14.00 14.00 14.00Delivered Construction (SF) 0 0 0 0 0 0 0 56,250
Occupancy Rate (%) 98.0 96.3 96.2 96.5 96.7 95.9 96.4 96.4FAR NORTH Absorption (Net, SF) (60,178) 103,000 (97,182) 249,193 600,344 (2,560) 808,749 743,348
Avg. Asking Rent (Annual,NNN, $/SF) 19.50 20.00 23.50 25.25 26.50 24.00 24.00 24.00Delivered Construction (SF) 0 458,347 79,103 134,527 198,038 298,521 528,160 728,888
Occupancy Rate (%) 90.3 90.3 91.0 91.5 93.1 93.5 93.9 93.9NEAR NORTHWEST Absorption (Net, SF) 131,426 84,388 17,602 (69,499) 118,692 (24,491) 9,026 (100,612)
Avg. Asking Rent (Annual,NNN, $/SF) 12.25 12.75 14.00 15.00 15.00 21.25 26.00 25.50Delivered Construction (SF) 0 79,895 0 40,000 0 0 0 0
Occupancy Rate (%) 93.8 95.0 95.1 94.6 95.2 95.2 96.1 96.0FAR NORTHWEST Absorption (Net, SF) 81,212 267,120 96,476 245,378 369,190 268,491 563,711 52,959
Avg. Asking Rent (Annual,NNN, $/SF) 18.50 20.00 22.50 25.25 25.25 33.75 32.75 32.00Delivered Construction (SF) 144,379 88,042 25,610 297,078 457,305 228,000 496,507 21,600
Occupancy Rate (%) 91.3 92.1 92.7 93.0 93.0 94.0 94.0 93.5NEAR WEST Absorption (Net, SF) (158,063) 52,845 (2,371) 119,801 114,165 111,794 72,158 (51,579)
Avg. Asking Rent (Annual,NNN, $/SF) 18.50 19.00 21.00 24.50 24.50 34.00 36.00 36.00Delivered Construction (SF) 47,584 0 55,000 133,274 110,000 172,827 0 0
Occupancy Rate (%) 94.7 94.6 94.9 95.5 95.7 95.3 97.1 95.1FAR WEST Absorption (Net, SF) 96,129 116,437 86,860 395,165 221,353 562,664 207,543 227,430
Avg. Asking Rent (Annual,NNN, $/SF) 15.50 16.25 24.00 30.50 30.50 28.75 29.00 29.50Delivered Construction (SF) 137,289 24,225 20,555 916,552 0 388,456 394,094 328,257
Occupancy Rate (%) 92.2 92.3 93.0 92.9 92.7 94.2 95.0 94.2NEAR SOUTHWEST Absorption (Net, SF) 101,066 9,275 (147,823) 50,497 (42,632) 121,835 128,670 (57,667)
Avg. Asking Rent (Annual,NNN, $/SF) 13.25 13.00 13.50 15.00 15.00 16.75 17.00 17.25Delivered Construction (SF) 40,000 0 0 0 0 177,514 15,000 0
Occupancy Rate (%) 91.2 90.8 90.2 91.2 88.4 91.5 92.1 92.9FAR SOUTHWEST Absorption (Net, SF) (143,393) 297,614 (155,568) 174,496 241,414 126,984 319,119 (80,172)
Avg. Asking Rent (Annual,NNN, $/SF) 18.25 18.75 21.25 25.25 25.50 22.25 24.25 25.00Delivered Construction (SF) 0 177,365 136,494 169,432 215,304 204,175 172,636 0
Occupancy Rate (%) 90.3 91.8 92.4 92.6 93.8 93.7 94.2 94.0SOUTH Absorption (Net, SF) 106,924 (26,389) (1,083) 186,724 98,437 (31,273) 253,972 (74,783)
Avg. Asking Rent (Annual,NNN, $/SF) 16.50 17.00 18.75 20.00 20.50 18.25 22.00 23.00Delivered Construction (SF) 40,000 0 5,000 7,917 0 366,640 139,691 24,427
Occupancy Rate (%) 90.3 90.8 90.8 92.6 94.5 93.4 94.2 94.5NEAR SOUTHEAST Absorption (Net, SF) 27,161 (74,189) 86,101 292,866 71,167 30,537 101,811 (23,970)
Avg. Asking Rent (Annual,NNN, $/SF) 13.00 13.00 14.25 14.75 14.75 22.50 18.00 18.00Delivered Construction (SF) 0 20,146 0 9,082 0 0 0 0
Occupancy Rate (%) 89.5 90.9 88.3 90.3 93.3 91.6 92.2 92.4FAR SOUTHEAST Absorption (Net, SF) 50,259 144,553 200,367 179,833 2,093 687,635 742,662 89,763
Avg. Asking Rent (Annual,NNN, $/SF) 16.25 16.75 17.75 20.25 20.50 14.50 23.75 23.50Delivered Construction (SF) 36,000 25,000 350,000 184,400 450,443 613,475 905,003 108,343
Occupancy Rate (%) 91.4 92.1 92.3 92.7 93.7 93.6 92.4 92.7HOUSTON TOTAL
Absorption (Net, SF) 26,333 996,595 282,431 2,038,283 2,109,691 2,455,860 4,025,876 808,176
Avg. Asking Rent (Annual,NNN, $/SF) 16.50 16.94 19.29 21.87 22.15 22.69 23.81 25.09Delivered Construction (SF) 822,598 954,706 872,232 2,067,216 1,936,741 2,984,073 3,920,948 1,340,306
Occupancy Rate (%) 91.8 92.2 92.2 92.6 93.4 93.9 94.3 94.2
MARKETVIEW
Disclaimer: Information contained herein, including projections, has been obtained from sources believed to be reliable. While we do not doubt its accuracy, we have not verified it and make no guarantee, warranty or representation about it. It is your responsibility to confirm independently its accuracy and completeness. This information is presented exclusively for use by CBRE clients and professionals and all rights to the material are reserved and cannot be reproduced without prior written permission of CBRE.
CONTACTS
Robert C. Kramp
Director, Research & Analysis
E. Michelle Miller
Research Operations Manager
Analee Bivins Micheletti
Sr. Research Analyst
CBRE OFFICES
CBRE Houston
2800 Post Oak, Suite 2300
Houston, TX 77056
To learn more about CBRE
Research, or to access additional
research reports, please visit the
Global Research Gateway at
www.cbre.com/researchgateway.
HOUSTON RETAIL
MARKETVIEW
92.0
92.5
93.0
93.5
94.0
94.5
95.0
0
500
1,000
1,500
2,000
Q1 2015 Q2 2015 Q3 2015 Q4 2015 Q1 2016 Q2 2016 Q3 2016 Q4 2016 Q1 2017
Occupancy (%) SF (000s)
Net Absorption Occupancy
Local demand insulated from
national retail bankruptcies
Houston Retail, Q1 2017
represented 363,000 sq. ft. This movement
coupled with strong urban demand has led to
climbing occupancy which increased by 40 basis
points this quarter.
Despite announcements of retail bankruptcies
dominating headlines and lower net absorption in
Q1 2017, retail demand remains healthy and big
box vacancies were quickly backfilled by Dick’s
Sporting Goods, Total Wine, and discount/off-price
retailers. Future shadow risks include bankrupt
Gander Mountain, as well as troubled Payless
ShoeSource and Radio Shack, all of which will give
back space this year. Locally, however, growing
demographics continue to translate into retail
demand; from 2010 to 2016, Houston added
approximately 2,600 people per week supporting
expanding retail.
Q1 2017 CBRE Research © 2017 CBRE, Inc. | 1
Completions
467,126 SF Net Absorption
181,842 SF Occupancy
94.7% Under Construction
1,605,810 SF Wtd. Avg. Asking Rate
$22.42 PSF
Figure 1: Net Absorption and Occupancy
Source: CBRE Research, Q1 2017.
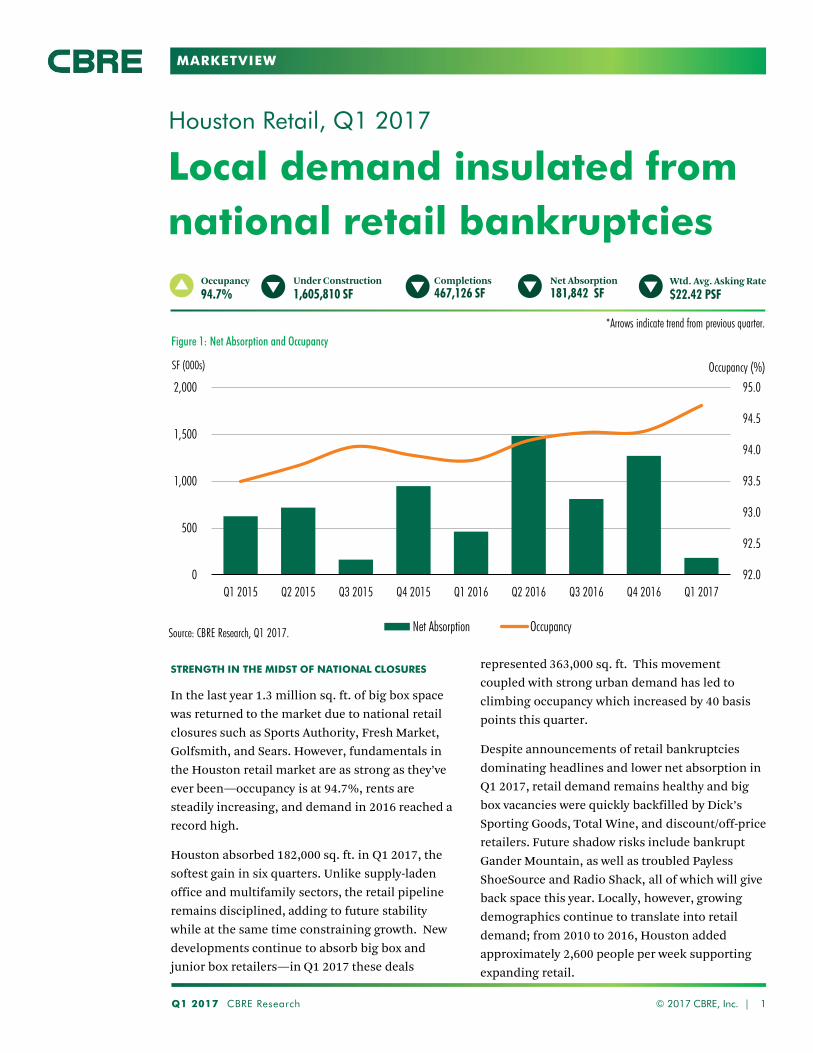
STRENGTH IN THE MIDST OF NATIONAL CLOSURES
In the last year 1.3 million sq. ft. of big box space
was returned to the market due to national retail
closures such as Sports Authority, Fresh Market,
Golfsmith, and Sears. However, fundamentals in
the Houston retail market are as strong as they’ve
ever been—occupancy is at 94.7%, rents are
steadily increasing, and demand in 2016 reached a
record high.
Houston absorbed 182,000 sq. ft. in Q1 2017, the
softest gain in six quarters. Unlike supply-laden
office and multifamily sectors, the retail pipeline
remains disciplined, adding to future stability
while at the same time constraining growth. New
developments continue to absorb big box and
junior box retailers—in Q1 2017 these deals
*Arrows indicate trend from previous quarter.
MARKETVIEW
Q1 2017 CBRE Research 2
HOUSTON RETAIL
© 2017 CBRE, Inc. |
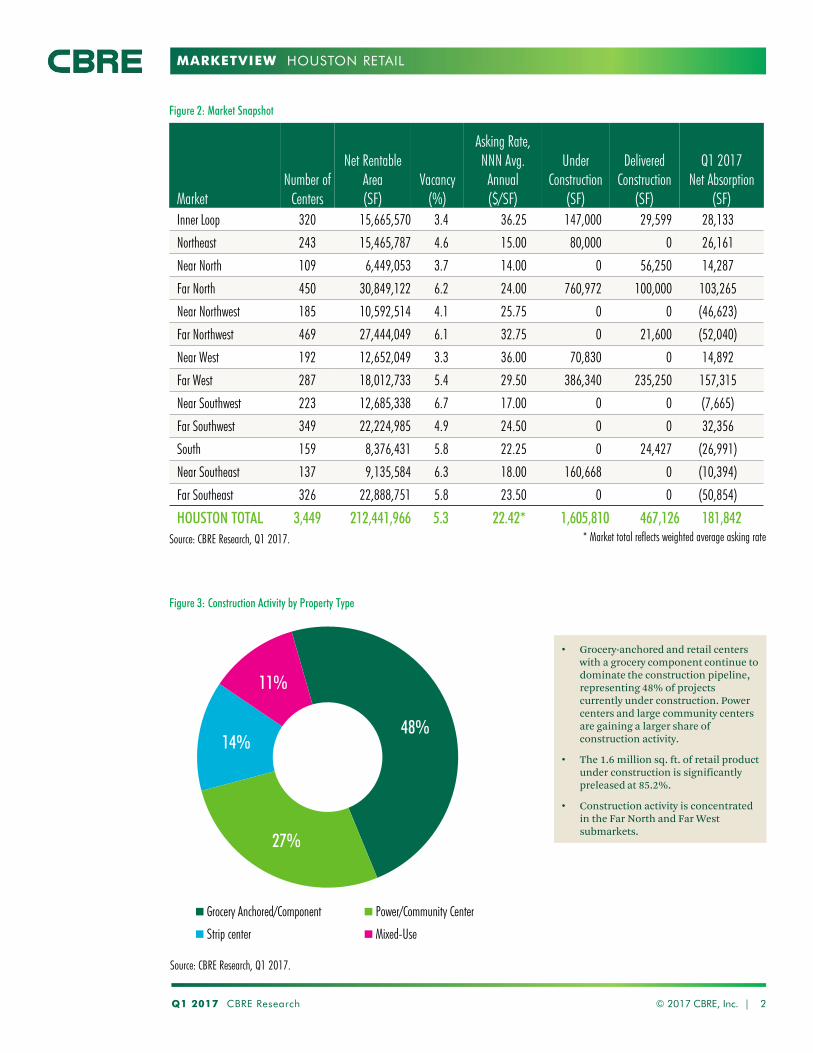
Source: CBRE Research, Q1 2017.
Figure 2: Market Snapshot
* Market total reflects weighted average asking rate
Market Number of
Centers
Net Rentable Area (SF)
Vacancy (%)
Asking Rate, NNN Avg.
Annual ($/SF)
Under Construction
(SF)
Delivered Construction
(SF)
Q1 2017 Net Absorption
(SF)
Inner Loop 320 15,665,570 3.4 36.25 147,000 29,599 28,133
Northeast 243 15,465,787 4.6 15.00 80,000 0 26,161
Near North 109 6,449,053 3.7 14.00 0 56,250 14,287
Far North 450 30,849,122 6.2 24.00 760,972 100,000 103,265
Near Northwest 185 10,592,514 4.1 25.75 0 0 (46,623)
Far Northwest 469 27,444,049 6.1 32.75 0 21,600 (52,040)
Near West 192 12,652,049 3.3 36.00 70,830 0 14,892
Far West 287 18,012,733 5.4 29.50 386,340 235,250 157,315
Near Southwest 223 12,685,338 6.7 17.00 0 0 (7,665)
Far Southwest 349 22,224,985 4.9 24.50 0 0 32,356
South 159 8,376,431 5.8 22.25 0 24,427 (26,991)
Near Southeast 137 9,135,584 6.3 18.00 160,668 0 (10,394)
Far Southeast 326 22,888,751 5.8 23.50 0 0 (50,854)
HOUSTON TOTAL 3,449 212,441,966 5.3 22.42* 1,605,810 467,126 181,842
48%
27%
14%
11%
Grocery Anchored/Component Power/Community Center
Strip center Mixed-Use
Source: CBRE Research, Q1 2017.
Figure 3: Construction Activity by Property Type
• Grocery-anchored and retail centers with a grocery component continue to dominate the construction pipeline, representing 48% of projects currently under construction. Power centers and large community centers are gaining a larger share of construction activity.
• The 1.6 million sq. ft. of retail product under construction is significantly preleased at 85.2%.
• Construction activity is concentrated in the Far North and Far West submarkets.
MARKETVIEW
Q1 2017 CBRE Research © 2017 CBRE, Inc. | 3
Source: CBRE Research, Q1 2017.
Figure 4: Historical Market Statistics
HOUSTON RETAIL
2010 2011 2012 2013 2014 2015 2016 2017 YTD
INNER LOOP Absorption (Net, SF) 63,030 (21,292) 75,133 72,274 97,668 461,629 111,063 28,133
Avg. Asking Rent (Annual, NNN, $/SF) 26.00 26.50 32.50 35.50 36.75 32.00 35.50 36.25
Delivered Construction (SF) 58,330 0 169,470 0 185,000 434,465 54,774 29,599
Occupancy Rate (%) 95.5 95.4 93.6 94.1 95.6 96.5 96.2 96.6
NORTHEAST Absorption (Net, SF) (214,733) 66,376 288,245 81,473 277,901 162,579 675,751 26,161
Avg. Asking Rent (Annual, NNN, $/SF) 13.25 13.25 13.50 15.00 15.00 13.00 15.00 15.00
Delivered Construction (SF) 319,016 81,686 31,000 174,954 320,651 100,000 1,215,083 0
Occupancy Rate (%) 90.8 90.7 90.8 89.0 91.5 93.0 94.5 95.4
NEAR NORTH Absorption (Net, SF) (54,507) (23,143) (164,326) 60,082 (60,101) (19,964) 31,641 14,287
Avg. Asking Rent (Annual, NNN, $/SF) 13.75 14.00 14.25 18.00 18.25 14.00 14.00 14.00
Delivered Construction (SF) 0 0 0 0 0 0 0 56,250
Occupancy Rate (%) 98.0 96.3 96.2 96.5 96.7 95.9 96.4 96.3
FAR NORTH Absorption (Net, SF) (60,178) 103,000 (97,182) 249,193 600,344 (2,560) 808,749 103,265
Avg. Asking Rent (Annual,NNN, $/SF) 19.50 20.00 23.50 25.25 26.50 24.00 24.00 24.00
Delivered Construction (SF) 0 458,347 79,103 134,527 198,038 298,521 528,160 100,000
Occupancy Rate (%) 90.3 90.3 91.0 91.5 93.1 93.5 93.9 93.8
NEAR NORTHWEST Absorption (Net, SF) 131,426 84,388 17,602 (69,499) 118,692 (24,491) 9,026 (46,623)
Avg. Asking Rent (Annual,NNN, $/SF) 12.25 12.75 14.00 15.00 15.00 21.25 26.00 25.75
Delivered Construction (SF) 0 79,895 0 40,000 0 0 0 0
Occupancy Rate (%) 93.8 95.0 95.1 94.6 95.2 95.2 96.1 95.9
FAR NORTHWEST Absorption (Net, SF) 81,212 267,120 96,476 245,378 369,190 268,491 563,711 (52,040)
Avg. Asking Rent (Annual,NNN, $/SF) 18.50 20.00 22.50 25.25 25.25 33.75 32.75 32.75
Delivered Construction (SF) 144,379 88,042 25,610 297,078 457,305 228,000 496,507 21,600
Occupancy Rate (%) 91.3 92.1 92.7 93.0 93.0 94.0 94.0 93.9
NEAR WEST Absorption (Net, SF) (158,063) 52,845 (2,371) 119,801 114,165 111,794 72,158 14,892
Avg. Asking Rent (Annual,NNN, $/SF) 18.50 19.00 21.00 24.50 24.50 34.00 36.00 36.00
Delivered Construction (SF) 47,584 0 55,000 133,274 110,000 172,827 0 0
Occupancy Rate (%) 94.7 94.6 94.9 95.5 95.7 95.3 97.1 96.7
FAR WEST Absorption (Net, SF) 96,129 116,437 86,860 395,165 221,353 562,664 207,543 157,315
Avg. Asking Rent (Annual, NNN, $/SF) 15.50 16.25 24.00 30.50 30.50 28.75 29.00 29.50
Delivered Construction (SF) 137,289 24,225 20,555 916,552 0 388,456 394,094 235,250
Occupancy Rate (%) 92.2 92.3 93.0 92.9 92.7 94.2 95.0 94.6
NEAR SOUTHWEST Absorption (Net, SF) 101,066 9,275 (147,823) 50,497 (42,632) 121,835 128,670 (7,665)
Avg. Asking Rent (Annual,NNN, $/SF) 13.25 13.00 13.50 15.00 15.00 16.75 17.00 17.00
Delivered Construction (SF) 40,000 0 0 0 0 177,514 15,000 0
Occupancy Rate (%) 91.2 90.8 90.2 91.2 88.4 91.5 92.1 93.3
FAR SOUTHWEST Absorption (Net, SF) (143,393) 297,614 (155,568) 174,496 241,414 126,984 319,119 32,356
Avg. Asking Rent (Annual,NNN, $/SF) 18.25 18.75 21.25 25.25 25.50 22.25 24.25 24.50
Delivered Construction (SF) 0 177,365 136,494 169,432 215,304 204,175 172,636 0
Occupancy Rate (%) 90.3 91.8 92.4 92.6 93.8 93.7 94.2 95.1
SOUTH Absorption (Net, SF) 106,924 (26,389) (1,083) 186,724 98,437 (31,273) 253,972 (26,991)
Avg. Asking Rent (Annual, NNN, $/SF) 16.50 17.00 18.75 20.00 20.50 18.25 22.00 22.25
Delivered Construction (SF) 40,000 0 5,000 7,917 0 366,640 139,691 24,427
Occupancy Rate (%) 90.3 90.8 90.8 92.6 94.5 93.4 94.2 94.2
NEAR SOUTHEAST Absorption (Net, SF) 27,161 (74,189) 86,101 292,866 71,167 30,537 101,811 (10,394)
Avg. Asking Rent (Annual,NNN, $/SF) 13.00 13.00 14.25 14.75 14.75 22.50 18.00 18.00
Delivered Construction (SF) 0 20,146 0 9,082 0 0 0 0
Occupancy Rate (%) 89.5 90.9 88.3 90.3 93.3 91.6 92.2 93.7
FAR SOUTHEAST Absorption (Net, SF) 50,259 144,553 200,367 179,833 2,093 687,635 742,662 (50,854)
Avg. Asking Rent (Annual,NNN, $/SF) 16.25 16.75 17.75 20.25 20.50 14.50 23.75 23.50
Delivered Construction (SF) 36,000 25,000 350,000 184,400 450,443 613,475 905,003 0
Occupancy Rate (%) 91.4 92.1 92.3 92.7 93.7 93.6 92.4 94.2
HOUSTON TOTAL
Absorption (Net, SF) 26,333 996,595 282,431 2,038,283 2,109,691 2,455,860 4,025,876 181,842
Avg. Asking Rent (Annual,NNN, $/SF) 16.50 16.94 19.29 21.87 22.15 22.69 23.81 22.42
Delivered Construction (SF) 822,598 954,706 872,232 2,067,216 1,936,741 2,984,073 3,920,948 467,126
Occupancy Rate (%) 91.8 92.2 92.2 92.6 93.4 93.9 94.3 94.7
MARKETVIEW
Disclaimer: Information contained herein, including projections, has been obtained from sources believed to be reliable. While we do not doubt its accuracy, we have not verified it and make no guarantee, warranty or representation about it. It is your responsibility to confirm independently its accuracy and completeness. This information is presented exclusively for use by CBRE clients and professionals and all rights to the material are reserved and cannot be reproduced without prior written permission of CBRE.
CONTACTS
Robert C. Kramp
Director, Research & Analysis
E. Michelle Miller
Research Operations Manager
Analee Micheletti
Research Analyst
CBRE OFFICES
CBRE Houston
2800 Post Oak, Suite 2300
Houston, TX 77056
To learn more about CBRE
Research, or to access additional
research reports, please visit the
Global Research Gateway at
www.cbre.com/researchgateway.
HOUSTON RETAIL
MARKETVIEW
92
93
94
95
96
97
98
99
(3)
(2)
0
2
3
5
2006 2007 2008 2009 2010 2011 2012 2013 2014 2015 2016
Occupancy (%)Net Absorption (MSF)
Net Absorption Class A Occupancy
2016 demand claims record; annual net absorption climbs above 4 MSF
Houston Retail, Q4 2016
In 2017, Houston will see construction kick off
more stacked power centers and the city’s first two-
story grocery store as land prices and availability
combined with climbing construction costs play a
larger role in changing the urban retail landscape.
FUNDAMENTALS ARE STRONG, BUT CONSUMER
SPENDING SOFTENS
Retail sales could not hold off the softening
economy for the entire year, seeing further
declines of 4.7% in the recently released second
quarter data. Strongest spending declines were
recorded in home furnishings, general
merchandise, and electronics/appliances, an
indication of waning consumer confidence. The
most recent sales tax data from October shows a
Q4 2016 CBRE Research © 2016 CBRE, Inc. | 1
Completions
1,220,706 SFNet Absorption
1,269,373 SFVacancy
5.7%Under Construction
1,637,246 SFWtd. Avg. Asking Rate
$23.81 PSF
Figure 1: Historical Net Absorption and Class A Occupancy
Source: CBRE Research, Q4 2016.
DEMAND OUTPACES SUPPLY CYCLE LEADING TO TIGHT
OCCUPANCY
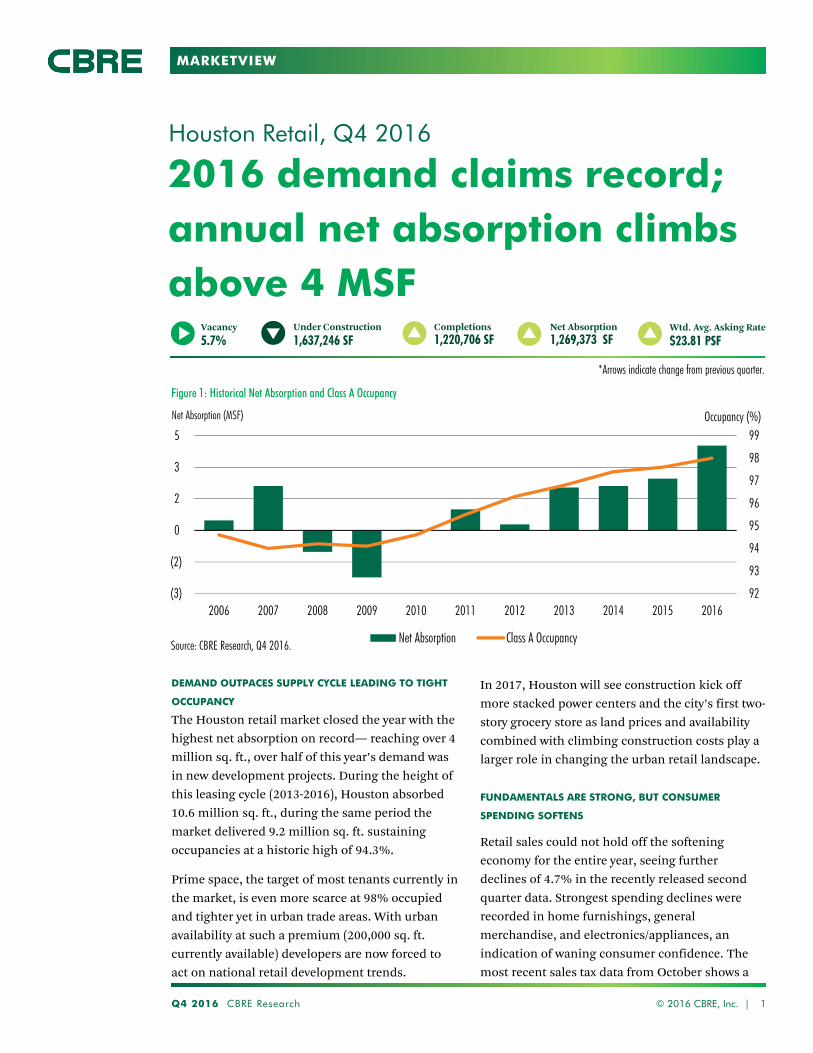
The Houston retail market closed the year with the
highest net absorption on record— reaching over 4
million sq. ft., over half of this year’s demand was
in new development projects. During the height of
this leasing cycle (2013-2016), Houston absorbed
10.6 million sq. ft., during the same period the
market delivered 9.2 million sq. ft. sustaining
occupancies at a historic high of 94.3%.
Prime space, the target of most tenants currently in
the market, is even more scarce at 98% occupied
and tighter yet in urban trade areas. With urban
availability at such a premium (200,000 sq. ft.
currently available) developers are now forced to
act on national retail development trends.
*Arrows indicate change from previous quarter.
MARKETVIEW
Q4 2016 CBRE Research 2
HOUSTON RETAIL
continuing decline in retail and business spending
in the Houston MSA, with collections down 2.3%
from last year.
Given the significant lag in data, and the consensus
among local economists that the worst of the
downturn is behind Houston, the metro could see
retail sales flatten out in the first half of 2017, a
positive considering the layoffs experienced in
high-paying jobs this year. These economic factors
combined with the maturing retail cycle led to
some large big box tenants and grocers to slow
their planned rate of expansion in Houston.
RETAIL YEAR AHEAD—NEW IMAGE FOR HOUSTON TO
FUEL MORE EXPANSIONS
The high levels of demand experienced throughout
this year were due to pent up demand from five
years of population growth. As net migrations
taper, the retail market could see moderating
demand and construction levels in 2017. The recent
influx of new residents continues to shift Houston’s
© 2016 CBRE, Inc. |
Source: CBRE Research, Q4 2016.
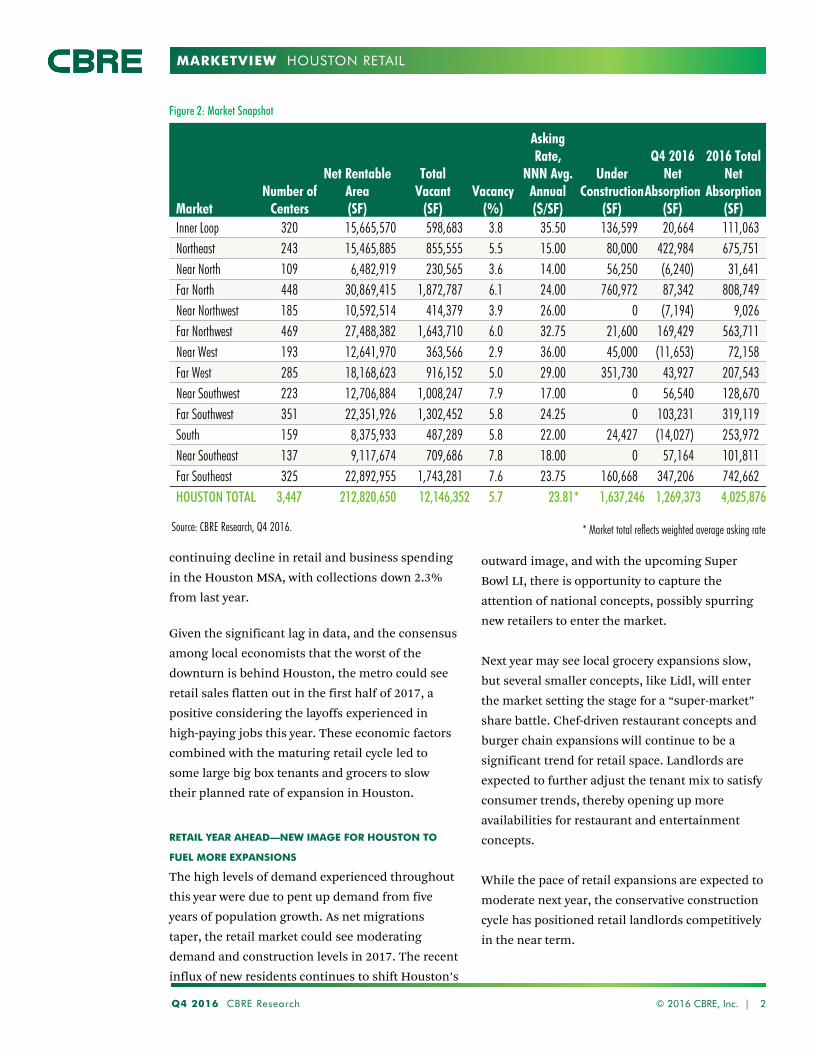
Figure 2: Market Snapshot
* Market total reflects weighted average asking rate
outward image, and with the upcoming Super
Bowl LI, there is opportunity to capture the
attention of national concepts, possibly spurring
new retailers to enter the market.
Next year may see local grocery expansions slow,
but several smaller concepts, like Lidl, will enter
the market setting the stage for a “super-market”
share battle. Chef-driven restaurant concepts and
burger chain expansions will continue to be a
significant trend for retail space. Landlords are
expected to further adjust the tenant mix to satisfy
consumer trends, thereby opening up more
availabilities for restaurant and entertainment
concepts.
While the pace of retail expansions are expected to
moderate next year, the conservative construction
cycle has positioned retail landlords competitively
in the near term.
MarketNumber of
Centers
Net Rentable Area(SF)
TotalVacant
(SF)Vacancy
(%)
Asking Rate,
NNN Avg. Annual($/SF)
Under Construction
(SF)
Q4 2016Net
Absorption(SF)
2016 Total Net
Absorption (SF)
Inner Loop 320 15,665,570 598,683 3.8 35.50 136,599 20,664 111,063 Northeast 243 15,465,885 855,555 5.5 15.00 80,000 422,984 675,751 Near North 109 6,482,919 230,565 3.6 14.00 56,250 (6,240) 31,641 Far North 448 30,869,415 1,872,787 6.1 24.00 760,972 87,342 808,749 Near Northwest 185 10,592,514 414,379 3.9 26.00 0 (7,194) 9,026 Far Northwest 469 27,488,382 1,643,710 6.0 32.75 21,600 169,429 563,711 Near West 193 12,641,970 363,566 2.9 36.00 45,000 (11,653) 72,158 Far West 285 18,168,623 916,152 5.0 29.00 351,730 43,927 207,543 Near Southwest 223 12,706,884 1,008,247 7.9 17.00 0 56,540 128,670 Far Southwest 351 22,351,926 1,302,452 5.8 24.25 0 103,231 319,119 South 159 8,375,933 487,289 5.8 22.00 24,427 (14,027) 253,972 Near Southeast 137 9,117,674 709,686 7.8 18.00 0 57,164 101,811 Far Southeast 325 22,892,955 1,743,281 7.6 23.75 160,668 347,206 742,662 HOUSTON TOTAL 3,447 212,820,650 12,146,352 5.7 23.81* 1,637,246 1,269,373 4,025,876
MARKETVIEW
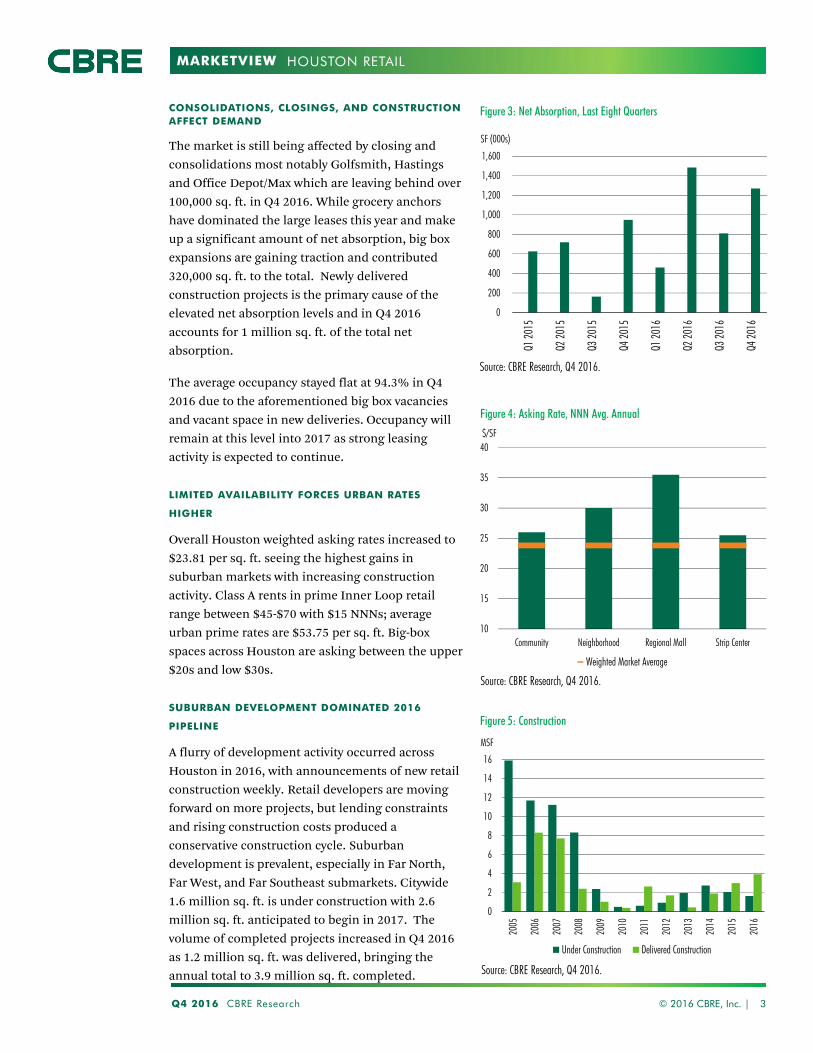
CONSOLIDATIONS, CLOSINGS, AND CONSTRUCTION AFFECT DEMAND
The market is still being affected by closing and
consolidations most notably Golfsmith, Hastings
and Office Depot/Max which are leaving behind over
100,000 sq. ft. in Q4 2016. While grocery anchors
have dominated the large leases this year and make
up a significant amount of net absorption, big box
expansions are gaining traction and contributed
320,000 sq. ft. to the total. Newly delivered
construction projects is the primary cause of the
elevated net absorption levels and in Q4 2016
accounts for 1 million sq. ft. of the total net
absorption.
The average occupancy stayed flat at 94.3% in Q4
2016 due to the aforementioned big box vacancies
and vacant space in new deliveries. Occupancy will
remain at this level into 2017 as strong leasing
activity is expected to continue.
LIMITED AVAILABILITY FORCES URBAN RATES
HIGHER
Overall Houston weighted asking rates increased to
$23.81 per sq. ft. seeing the highest gains in
suburban markets with increasing construction
activity. Class A rents in prime Inner Loop retail
range between $45-$70 with $15 NNNs; average
urban prime rates are $53.75 per sq. ft. Big-box
spaces across Houston are asking between the upper
$20s and low $30s.
SUBURBAN DEVELOPMENT DOMINATED 2016
PIPELINE
A flurry of development activity occurred across
Houston in 2016, with announcements of new retail
construction weekly. Retail developers are moving
forward on more projects, but lending constraints
and rising construction costs produced a
conservative construction cycle. Suburban
development is prevalent, especially in Far North,
Far West, and Far Southeast submarkets. Citywide
1.6 million sq. ft. is under construction with 2.6
million sq. ft. anticipated to begin in 2017. The
volume of completed projects increased in Q4 2016
as 1.2 million sq. ft. was delivered, bringing the
annual total to 3.9 million sq. ft. completed.
Q4 2016 CBRE Research © 2016 CBRE, Inc. | 3
HOUSTON RETAIL
0
200
400
600
800
1,000
1,200
1,400
1,600
Q1 20
15
Q2 20
15
Q3 20
15
Q4 20
15
Q1 20
16
Q2 20
16
Q3 20
16
Q4 20
16
SF (000s)
Source: CBRE Research, Q4 2016.
10
15
20
25
30
35
40
Community Neighborhood Regional Mall Strip Center
$/SF
Weighted Market Average
Source: CBRE Research, Q4 2016.
0
2
4
6
8
10
12
14
16
2005
2006
2007
2008
2009
2010
2011
2012
2013
2014
2015
2016
Under Construction Delivered Construction
MSF
Source: CBRE Research, Q4 2016.
Figure 3: Net Absorption, Last Eight Quarters
Figure 4: Asking Rate, NNN Avg. Annual
Figure 5: Construction
MARKETVIEW INSERT
Q4 2016 CBRE Research © 2016 CBRE, Inc. | 1
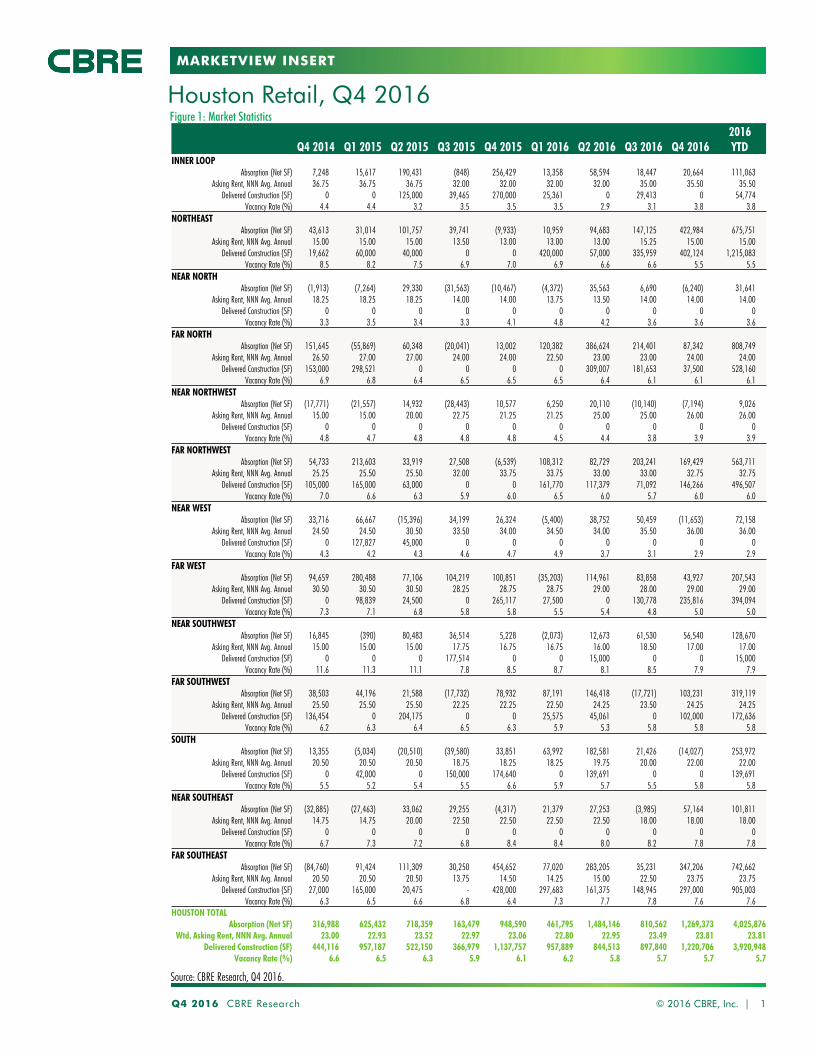
Source: CBRE Research, Q4 2016.
Figure 1: Market StatisticsHouston Retail, Q4 2016
Q4 2014 Q1 2015 Q2 2015 Q3 2015 Q4 2015 Q1 2016 Q2 2016 Q3 2016 Q4 20162016YTD
INNER LOOPAbsorption (Net SF) 7,248 15,617 190,431 (848) 256,429 13,358 58,594 18,447 20,664 111,063
Asking Rent, NNN Avg. Annual 36.75 36.75 36.75 32.00 32.00 32.00 32.00 35.00 35.50 35.50Delivered Construction (SF) 0 0 125,000 39,465 270,000 25,361 0 29,413 0 54,774
Vacancy Rate (%) 4.4 4.4 3.2 3.5 3.5 3.5 2.9 3.1 3.8 3.8NORTHEAST
Absorption (Net SF) 43,613 31,014 101,757 39,741 (9,933) 10,959 94,683 147,125 422,984 675,751 Asking Rent, NNN Avg. Annual 15.00 15.00 15.00 13.50 13.00 13.00 13.00 15.25 15.00 15.00
Delivered Construction (SF) 19,662 60,000 40,000 0 0 420,000 57,000 335,959 402,124 1,215,083Vacancy Rate (%) 8.5 8.2 7.5 6.9 7.0 6.9 6.6 6.6 5.5 5.5
NEAR NORTH Absorption (Net SF) (1,913) (7,264) 29,330 (31,563) (10,467) (4,372) 35,563 6,690 (6,240) 31,641
Asking Rent, NNN Avg. Annual 18.25 18.25 18.25 14.00 14.00 13.75 13.50 14.00 14.00 14.00Delivered Construction (SF) 0 0 0 0 0 0 0 0 0 0
Vacancy Rate (%) 3.3 3.5 3.4 3.3 4.1 4.8 4.2 3.6 3.6 3.6FAR NORTH
Absorption (Net SF) 151,645 (55,869) 60,348 (20,041) 13,002 120,382 386,624 214,401 87,342 808,749 Asking Rent, NNN Avg. Annual 26.50 27.00 27.00 24.00 24.00 22.50 23.00 23.00 24.00 24.00
Delivered Construction (SF) 153,000 298,521 0 0 0 0 309,007 181,653 37,500 528,160Vacancy Rate (%) 6.9 6.8 6.4 6.5 6.5 6.5 6.4 6.1 6.1 6.1
NEAR NORTHWESTAbsorption (Net SF) (17,771) (21,557) 14,932 (28,443) 10,577 6,250 20,110 (10,140) (7,194) 9,026
Asking Rent, NNN Avg. Annual 15.00 15.00 20.00 22.75 21.25 21.25 25.00 25.00 26.00 26.00Delivered Construction (SF) 0 0 0 0 0 0 0 0 0 0
Vacancy Rate (%) 4.8 4.7 4.8 4.8 4.8 4.5 4.4 3.8 3.9 3.9FAR NORTHWEST
Absorption (Net SF) 54,733 213,603 33,919 27,508 (6,539) 108,312 82,729 203,241 169,429 563,711 Asking Rent, NNN Avg. Annual 25.25 25.50 25.50 32.00 33.75 33.75 33.00 33.00 32.75 32.75
Delivered Construction (SF) 105,000 165,000 63,000 0 0 161,770 117,379 71,092 146,266 496,507Vacancy Rate (%) 7.0 6.6 6.3 5.9 6.0 6.5 6.0 5.7 6.0 6.0
NEAR WESTAbsorption (Net SF) 33,716 66,667 (15,396) 34,199 26,324 (5,400) 38,752 50,459 (11,653) 72,158
Asking Rent, NNN Avg. Annual 24.50 24.50 30.50 33.50 34.00 34.50 34.00 35.50 36.00 36.00Delivered Construction (SF) 0 127,827 45,000 0 0 0 0 0 0 0
Vacancy Rate (%) 4.3 4.2 4.3 4.6 4.7 4.9 3.7 3.1 2.9 2.9FAR WEST
Absorption (Net SF) 94,659 280,488 77,106 104,219 100,851 (35,203) 114,961 83,858 43,927 207,543 Asking Rent, NNN Avg. Annual 30.50 30.50 30.50 28.25 28.75 28.75 29.00 28.00 29.00 29.00
Delivered Construction (SF) 0 98,839 24,500 0 265,117 27,500 0 130,778 235,816 394,094Vacancy Rate (%) 7.3 7.1 6.8 5.8 5.8 5.5 5.4 4.8 5.0 5.0
NEAR SOUTHWESTAbsorption (Net SF) 16,845 (390) 80,483 36,514 5,228 (2,073) 12,673 61,530 56,540 128,670
Asking Rent, NNN Avg. Annual 15.00 15.00 15.00 17.75 16.75 16.75 16.00 18.50 17.00 17.00Delivered Construction (SF) 0 0 0 177,514 0 0 15,000 0 0 15,000
Vacancy Rate (%) 11.6 11.3 11.1 7.8 8.5 8.7 8.1 8.5 7.9 7.9FAR SOUTHWEST
Absorption (Net SF) 38,503 44,196 21,588 (17,732) 78,932 87,191 146,418 (17,721) 103,231 319,119 Asking Rent, NNN Avg. Annual 25.50 25.50 25.50 22.25 22.25 22.50 24.25 23.50 24.25 24.25
Delivered Construction (SF) 136,454 0 204,175 0 0 25,575 45,061 0 102,000 172,636Vacancy Rate (%) 6.2 6.3 6.4 6.5 6.3 5.9 5.3 5.8 5.8 5.8
SOUTHAbsorption (Net SF) 13,355 (5,034) (20,510) (39,580) 33,851 63,992 182,581 21,426 (14,027) 253,972
Asking Rent, NNN Avg. Annual 20.50 20.50 20.50 18.75 18.25 18.25 19.75 20.00 22.00 22.00Delivered Construction (SF) 0 42,000 0 150,000 174,640 0 139,691 0 0 139,691
Vacancy Rate (%) 5.5 5.2 5.4 5.5 6.6 5.9 5.7 5.5 5.8 5.8NEAR SOUTHEAST
Absorption (Net SF) (32,885) (27,463) 33,062 29,255 (4,317) 21,379 27,253 (3,985) 57,164 101,811 Asking Rent, NNN Avg. Annual 14.75 14.75 20.00 22.50 22.50 22.50 22.50 18.00 18.00 18.00
Delivered Construction (SF) 0 0 0 0 0 0 0 0 0 0Vacancy Rate (%) 6.7 7.3 7.2 6.8 8.4 8.4 8.0 8.2 7.8 7.8
FAR SOUTHEASTAbsorption (Net SF) (84,760) 91,424 111,309 30,250 454,652 77,020 283,205 35,231 347,206 742,662
Asking Rent, NNN Avg. Annual 20.50 20.50 20.50 13.75 14.50 14.25 15.00 22.50 23.75 23.75Delivered Construction (SF) 27,000 165,000 20,475 - 428,000 297,683 161,375 148,945 297,000 905,003
Vacancy Rate (%) 6.3 6.5 6.6 6.8 6.4 7.3 7.7 7.8 7.6 7.6HOUSTON TOTAL
Absorption (Net SF) 316,988 625,432 718,359 163,479 948,590 461,795 1,484,146 810,562 1,269,373 4,025,876 Wtd. Asking Rent, NNN Avg. Annual 23.00 22.93 23.52 22.97 23.06 22.80 22.95 23.49 23.81 23.81
Delivered Construction (SF) 444,116 957,187 522,150 366,979 1,137,757 957,889 844,513 897,840 1,220,706 3,920,948Vacancy Rate (%) 6.6 6.5 6.3 5.9 6.1 6.2 5.8 5.7 5.7 5.7
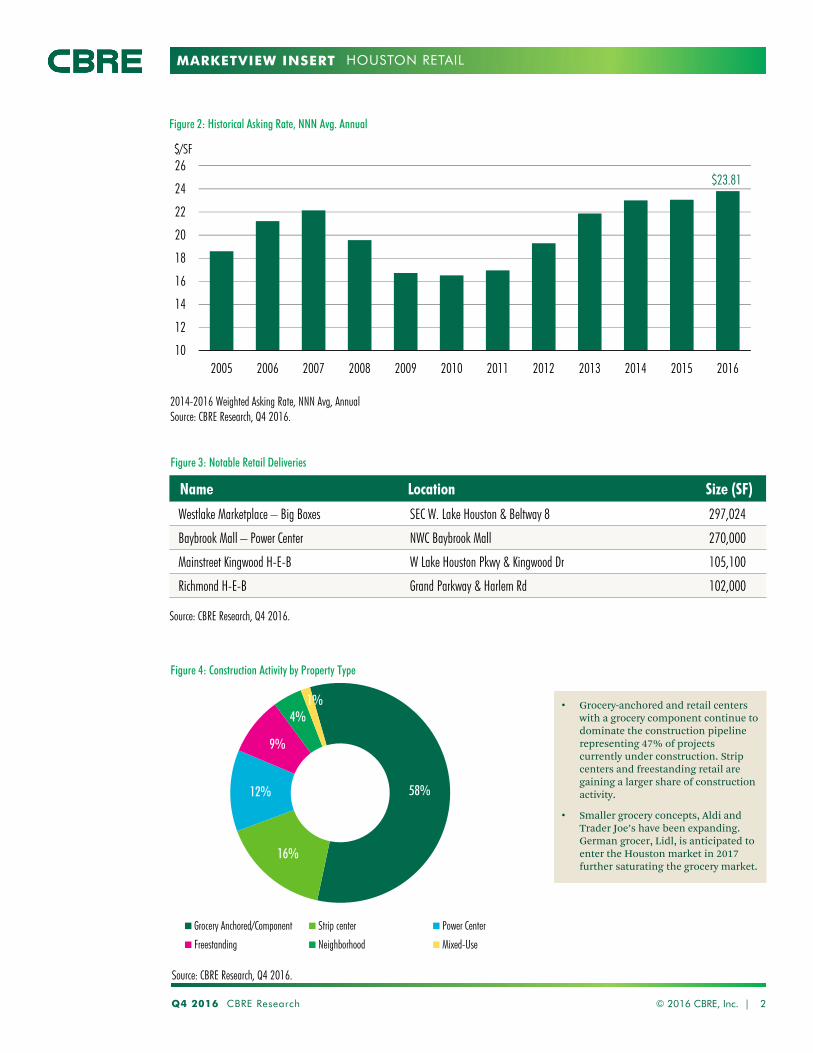
MARKETVIEW INSERT
58%
16%
12%
9%
4%1%
Grocery Anchored/Component Strip center Power Center
Freestanding Neighborhood Mixed-Use
Q4 2016 CBRE Research 2
HOUSTON RETAIL
© 2016 CBRE, Inc. |
Figure 3: Notable Retail Deliveries
Source: CBRE Research, Q4 2016.
$23.81
10
12
14
16
18
20
22
24
26
2005 2006 2007 2008 2009 2010 2011 2012 2013 2014 2015 2016
$/SF
Figure 2: Historical Asking Rate, NNN Avg. Annual
2014-2016 Weighted Asking Rate, NNN Avg, AnnualSource: CBRE Research, Q4 2016.
Name Location Size (SF)
Westlake Marketplace – Big Boxes SEC W. Lake Houston & Beltway 8 297,024
Baybrook Mall – Power Center NWC Baybrook Mall 270,000
Mainstreet Kingwood H-E-B W Lake Houston Pkwy & Kingwood Dr 105,100
Richmond H-E-B Grand Parkway & Harlem Rd 102,000
Figure 4: Construction Activity by Property Type
Source: CBRE Research, Q4 2016.
• Grocery-anchored and retail centers with a grocery component continue to dominate the construction pipeline representing 47% of projects currently under construction. Strip centers and freestanding retail are gaining a larger share of construction activity.
• Smaller grocery concepts, Aldi and Trader Joe’s have been expanding. German grocer, Lidl, is anticipated to enter the Houston market in 2017 further saturating the grocery market.
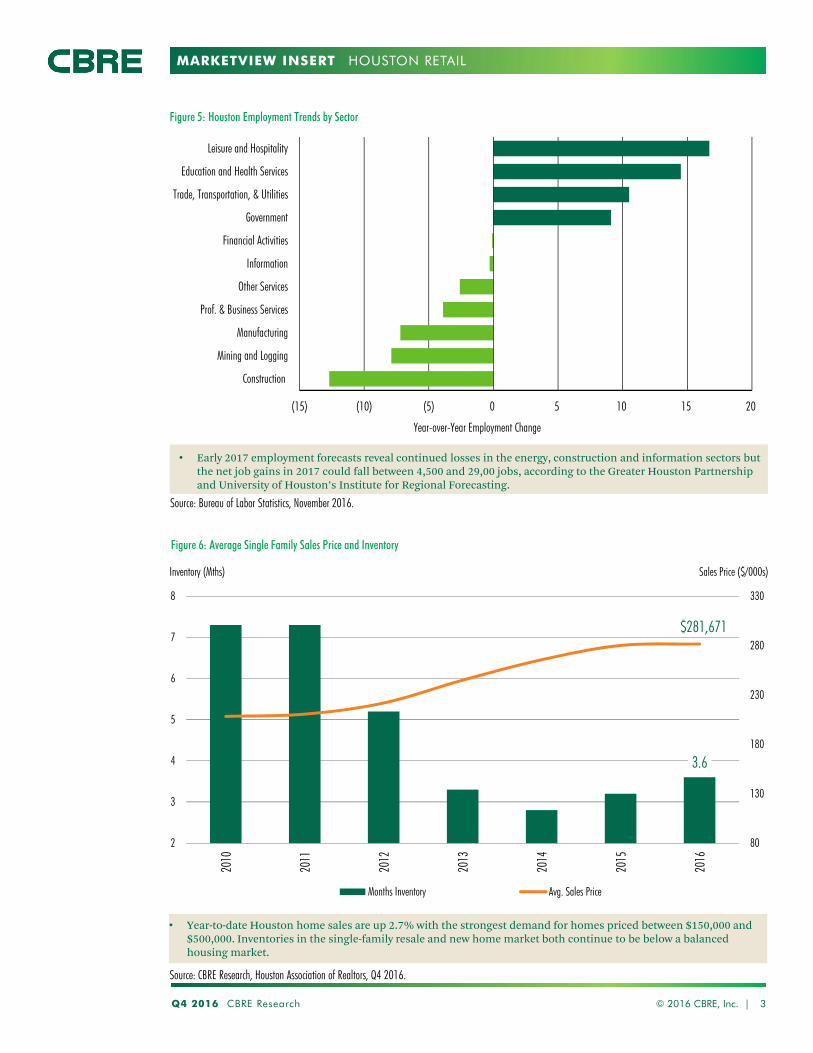
MARKETVIEW INSERT
Q4 2016 CBRE Research © 2016 CBRE, Inc. | 3
HOUSTON RETAIL
Figure 5: Houston Employment Trends by Sector
3.6
$281,671
80
130
180
230
280
330
2
3
4
5
6
7
8
2010
2011
2012
2013
2014
2015
2016
Months Inventory Avg. Sales Price
Sales Price ($/000s)Inventory (Mths)
Figure 6: Average Single Family Sales Price and Inventory
Source: CBRE Research, Houston Association of Realtors, Q4 2016.
Source: Bureau of Labor Statistics, November 2016.
• Year-to-date Houston home sales are up 2.7% with the strongest demand for homes priced between $150,000 and $500,000. Inventories in the single-family resale and new home market both continue to be below a balanced housing market.
(15) (10) (5) 0 5 10 15 20
Construction
Mining and Logging
Manufacturing
Prof. & Business Services
Other Services
Information
Financial Activities
Government
Trade, Transportation, & Utilities
Education and Health Services
Leisure and Hospitality
Year-over-Year Employment Change
• Early 2017 employment forecasts reveal continued losses in the energy, construction and information sectors but the net job gains in 2017 could fall between 4,500 and 29,00 jobs, according to the Greater Houston Partnership and University of Houston’s Institute for Regional Forecasting.
Disclaimer: Information contained herein, including projections, has been obtained from sources believed to be reliable. While we do not doubt its accuracy, we have not verified it and make no guarantee, warranty or representation about it. It is your responsibility to confirm independently its accuracy and completeness. This information is presented exclusively for use by CBRE clients and professionals and all rights to the material are reserved and cannot be reproduced without prior written permission of CBRE.
MARKETVIEW INSERT HOUSTON RETAIL
CONTACTS
Robert C. Kramp
Director, Research & Analysis
E. Michelle Miller
Research Operations Manager
Analee Micheletti
Research Analyst
CBRE OFFICES
CBRE Houston
2800 Post Oak, Suite 2300
Houston, TX 77056
To learn more about CBRE
Research, or to access additional
research reports, please visit the
Global Research Gateway at
www.cbre.com/researchgateway.
MARKETVIEW
Disclaimer: Information contained herein, including projections, has been obtained from sources believed to be reliable. While we do not doubt its accuracy, we have not verified it and make no guarantee, warranty or representation about it. It is your responsibility to confirm independently its accuracy and completeness. This information is presented exclusively for use by CBRE clients and professionals and all rights to the material are reserved and cannot be reproduced without prior written permission of CBRE.
CONTACTS
Robert C. Kramp
Director, Research & Analysis
E. Michelle Miller
Research Operations Manager
Analee Micheletti
Research Analyst
CBRE OFFICES
CBRE Houston
2800 Post Oak, Suite 2300
Houston, TX 77056
To learn more about CBRE
Research, or to access additional
research reports, please visit the
Global Research Gateway at
www.cbre.com/researchgateway.
HOUSTON RETAIL
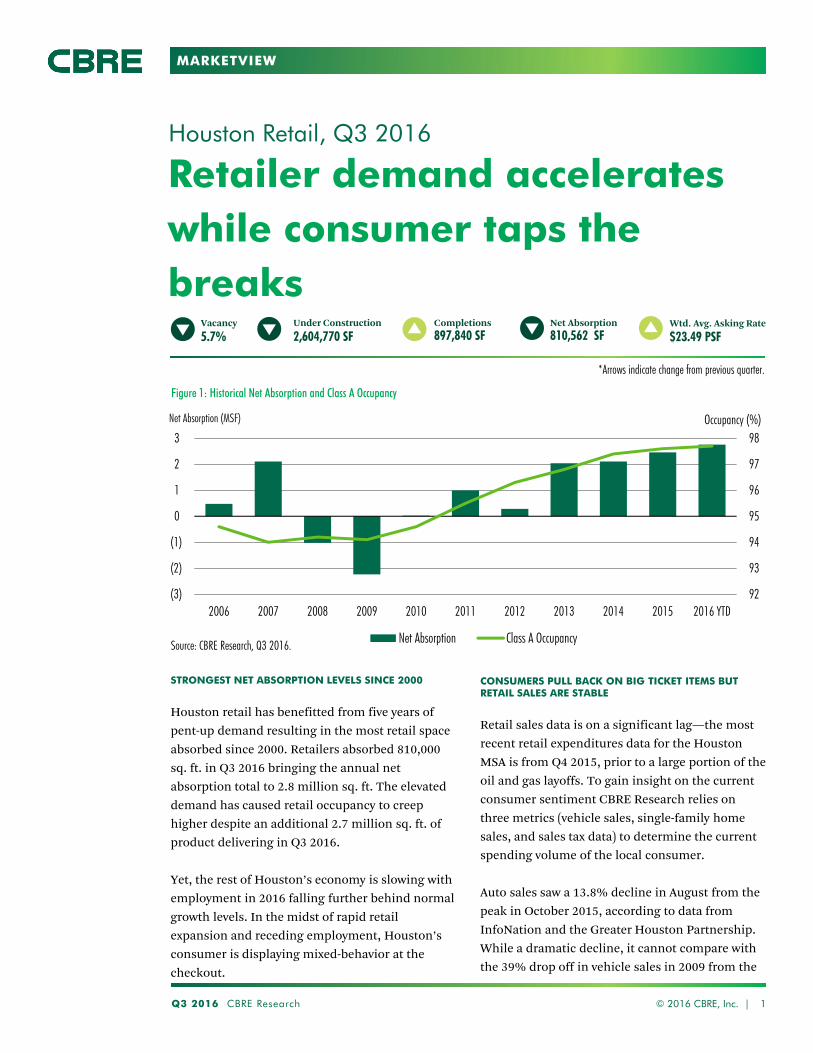
MARKETVIEW
92
93
94
95
96
97
98
(3)
(2)
(1)
0
1
2
3
2006 2007 2008 2009 2010 2011 2012 2013 2014 2015 2016 YTD
Occupancy (%)Net Absorption (MSF)
Net Absorption Class A Occupancy
Retailer demand accelerates while consumer taps the breaks
Houston Retail, Q3 2016
CONSUMERS PULL BACK ON BIG TICKET ITEMS BUT RETAIL SALES ARE STABLE
Retail sales data is on a significant lag—the most
recent retail expenditures data for the Houston
MSA is from Q4 2015, prior to a large portion of the
oil and gas layoffs. To gain insight on the current
consumer sentiment CBRE Research relies on
three metrics (vehicle sales, single-family home
sales, and sales tax data) to determine the current
spending volume of the local consumer.
Auto sales saw a 13.8% decline in August from the
peak in October 2015, according to data from
InfoNation and the Greater Houston Partnership.
While a dramatic decline, it cannot compare with
the 39% drop off in vehicle sales in 2009 from the
Q3 2016 CBRE Research © 2016 CBRE, Inc. | 1
Completions
897,840 SFNet Absorption
810,562 SFVacancy
5.7%Under Construction
2,604,770 SFWtd. Avg. Asking Rate
$23.49 PSF
Figure 1: Historical Net Absorption and Class A Occupancy
Source: CBRE Research, Q3 2016.
STRONGEST NET ABSORPTION LEVELS SINCE 2000
Houston retail has benefitted from five years of
pent-up demand resulting in the most retail space
absorbed since 2000. Retailers absorbed 810,000
sq. ft. in Q3 2016 bringing the annual net
absorption total to 2.8 million sq. ft. The elevated
demand has caused retail occupancy to creep
higher despite an additional 2.7 million sq. ft. of
product delivering in Q3 2016.
Yet, the rest of Houston’s economy is slowing with
employment in 2016 falling further behind normal
growth levels. In the midst of rapid retail
expansion and receding employment, Houston’s
consumer is displaying mixed-behavior at the
checkout.
*Arrows indicate change from previous quarter.

MARKETVIEW
Q3 2016 CBRE Research 2
HOUSTON RETAIL
2007 peak. Yet, declining vehicle sales are a telling
indicator of waning consumer confidence
confirmed by Q1 2016 sales and use tax figures.
These metrics indicate a decline in large
expenditures like furniture and vehicles,
historically the first category to reflect consumer
spending changes.
With large purchases slowing, the single-family
market was expected to have a slow summer sales
season. However, in August Houston saw the most
home sales ever for a single month. Additionally,
it was the first time in a year higher-priced homes
saw an increase in sales volumes. The healthy
pace for the single-family home market indicates
the buyer’s willingness to make strategic large
purchases.
Despite some industries seeing sustained growth,
there has been a consistent 2% decline in
Houston MSA sales tax revenues through the first
half of the year. Moderating the impact of the
© 2016 CBRE, Inc. |
Source: CBRE Research, Q3 2016.
Figure 2: Market Snapshot
* Market total reflects weighted average asking rate
decline, however, is the fact that the decrease
comes off of peak consumer and business
spending in 2015—revenues are still 5% higher
than 2014 levels, evidence of sustained long-term
growth. So while business spending in oil and gas,
manufacturing, and business services is down,
retail sales in general merchandise and food &
beverage are up 3.5% and 1.9% respectively. The
categories registering the largest increases in sales
align with the current tenant demand from
grocery, restaurants, home improvement, and soft
goods retailers.
The bottom line is while spending on large
purchases is down, sales tax data reveals business
spending is the main source of revenue declines
and the average consumer has not stopped
spending. Pent-up demand from population
growth and a stable national economy will sustain
the retail expansions in Houston, especially
grocery and restaurant growth, across the metro.
MarketNumber of
Centers
Net Rentable Area(SF)
TotalVacant
(SF)Vacancy
(%)
Asking Rate,NNN Avg.
Annual($/SF)
Under Construction
(SF)
Q3 2016Net
Absorption(SF)
2016 Total Net
Absorption (SF)
Inner Loop 328 16,550,103 515,956 3.1 35.00 136,599 18,447 90,399 Northeast 238 15,059,056 996,792 6.6 15.25 537,024 147,125 252,767 Near North 109 6,401,619 232,225 3.6 14.00 0 6,690 37,881 Far North 457 31,213,370 1,901,010 6.1 23.00 583,500 214,401 721,407 Near Northwest 191 11,019,803 415,499 3.8 25.00 0 (10,140) 16,220 Far Northwest 469 27,786,919 1,593,633 5.7 33.00 123,266 203,241 394,282 Near West 203 13,372,179 412,013 3.1 35.50 45,000 50,459 83,811 Far West 285 18,282,344 874,222 4.8 28.00 646,713 83,858 163,616 Near Southwest 226 12,842,422 1,091,253 8.5 18.50 0 61,530 72,130 Far Southwest 353 22,414,881 1,296,372 5.8 23.50 102,000 (17,721) 215,888 South 160 8,594,051 471,425 5.5 20.00 0 21,426 267,999 Near Southeast 143 9,417,296 769,906 8.2 18.00 0 (3,985) 44,647 Far Southeast 326 22,637,156 1,770,415 7.8 22.50 430,668 35,231 395,456 HOUSTON TOTAL 3,488 215,591,199 12,340,721 5.7 23.49* 2,604,770 810,562 2,756,503
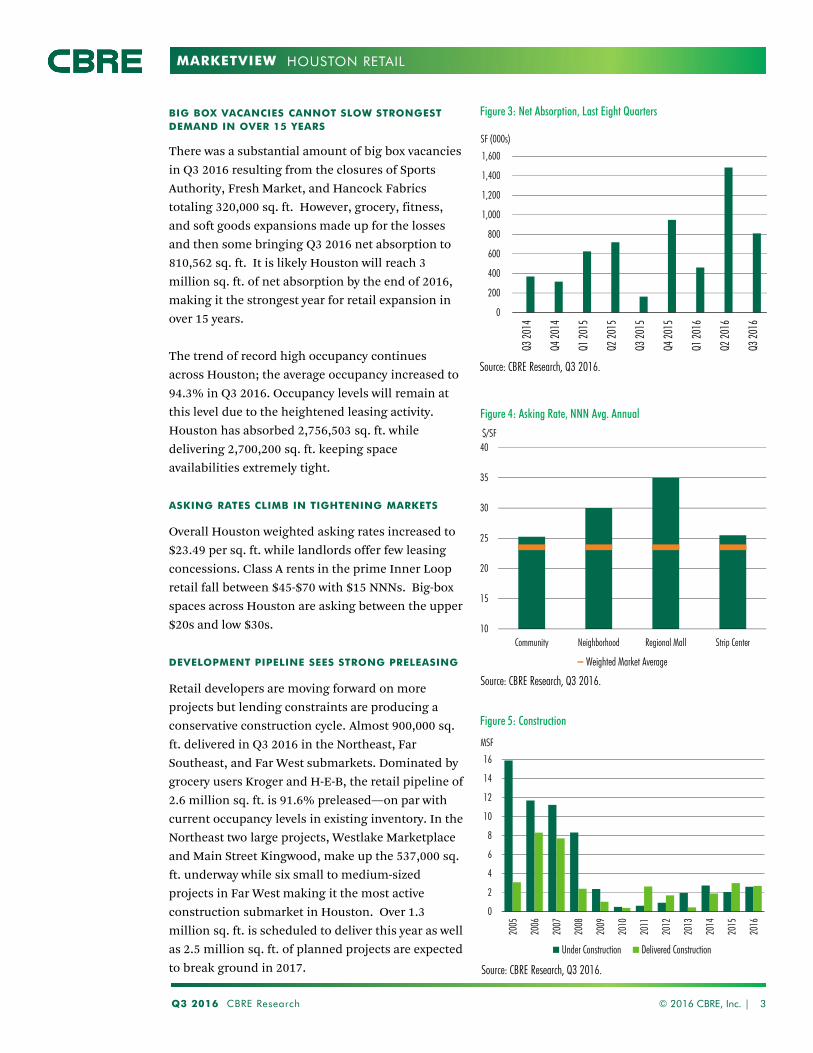
MARKETVIEW
BIG BOX VACANCIES CANNOT SLOW STRONGEST DEMAND IN OVER 15 YEARS
There was a substantial amount of big box vacancies
in Q3 2016 resulting from the closures of Sports
Authority, Fresh Market, and Hancock Fabrics
totaling 320,000 sq. ft. However, grocery, fitness,
and soft goods expansions made up for the losses
and then some bringing Q3 2016 net absorption to
810,562 sq. ft. It is likely Houston will reach 3
million sq. ft. of net absorption by the end of 2016,
making it the strongest year for retail expansion in
over 15 years.
The trend of record high occupancy continues
across Houston; the average occupancy increased to
94.3% in Q3 2016. Occupancy levels will remain at
this level due to the heightened leasing activity.
Houston has absorbed 2,756,503 sq. ft. while
delivering 2,700,200 sq. ft. keeping space
availabilities extremely tight.
ASKING RATES CLIMB IN TIGHTENING MARKETS
Overall Houston weighted asking rates increased to
$23.49 per sq. ft. while landlords offer few leasing
concessions. Class A rents in the prime Inner Loop
retail fall between $45-$70 with $15 NNNs. Big-box
spaces across Houston are asking between the upper
$20s and low $30s.
DEVELOPMENT PIPELINE SEES STRONG PRELEASING
Retail developers are moving forward on more
projects but lending constraints are producing a
conservative construction cycle. Almost 900,000 sq.
ft. delivered in Q3 2016 in the Northeast, Far
Southeast, and Far West submarkets. Dominated by
grocery users Kroger and H-E-B, the retail pipeline of
2.6 million sq. ft. is 91.6% preleased—on par with
current occupancy levels in existing inventory. In the
Northeast two large projects, Westlake Marketplace
and Main Street Kingwood, make up the 537,000 sq.
ft. underway while six small to medium-sized
projects in Far West making it the most active
construction submarket in Houston. Over 1.3
million sq. ft. is scheduled to deliver this year as well
as 2.5 million sq. ft. of planned projects are expected
to break ground in 2017.
Q3 2016 CBRE Research © 2016 CBRE, Inc. | 3
HOUSTON RETAIL
0
200
400
600
800
1,000
1,200
1,400
1,600
Q3 20
14
Q4 20
14
Q1 20
15
Q2 20
15
Q3 20
15
Q4 20
15
Q1 20
16
Q2 20
16
Q3 20
16
SF (000s)
Source: CBRE Research, Q3 2016.
10
15
20
25
30
35
40
Community Neighborhood Regional Mall Strip Center
$/SF
Weighted Market Average
Source: CBRE Research, Q3 2016.
0
2
4
6
8
10
12
14
16
2005
2006
2007
2008
2009
2010
2011
2012
2013
2014
2015
2016
Under Construction Delivered Construction
MSF
Source: CBRE Research, Q3 2016.
Figure 3: Net Absorption, Last Eight Quarters
Figure 4: Asking Rate, NNN Avg. Annual
Figure 5: Construction
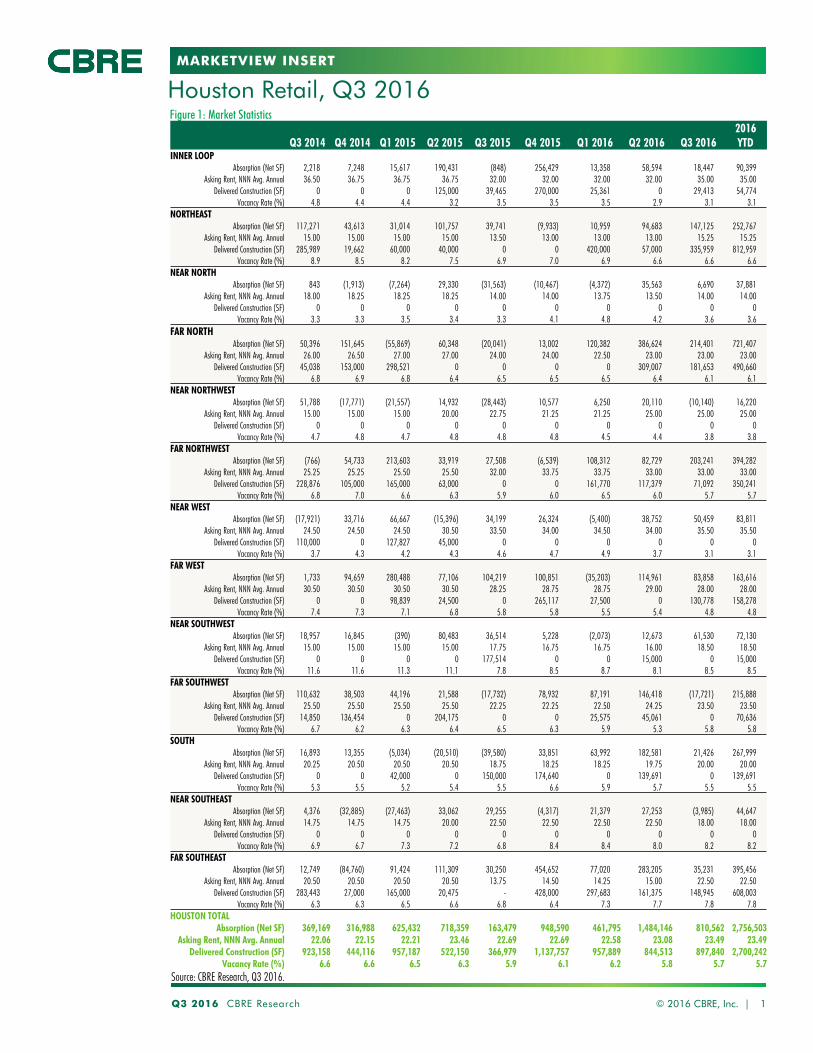
MARKETVIEW INSERT
Q3 2016 CBRE Research © 2016 CBRE, Inc. | 1
Source: CBRE Research, Q3 2016.
Figure 1: Market Statistics
Houston Retail, Q3 2016
Q3 2014 Q4 2014 Q1 2015 Q2 2015 Q3 2015 Q4 2015 Q1 2016 Q2 2016 Q3 20162016YTD
INNER LOOPAbsorption (Net SF) 2,218 7,248 15,617 190,431 (848) 256,429 13,358 58,594 18,447 90,399
Asking Rent, NNN Avg. Annual 36.50 36.75 36.75 36.75 32.00 32.00 32.00 32.00 35.00 35.00Delivered Construction (SF) 0 0 0 125,000 39,465 270,000 25,361 0 29,413 54,774
Vacancy Rate (%) 4.8 4.4 4.4 3.2 3.5 3.5 3.5 2.9 3.1 3.1NORTHEAST
Absorption (Net SF) 117,271 43,613 31,014 101,757 39,741 (9,933) 10,959 94,683 147,125 252,767 Asking Rent, NNN Avg. Annual 15.00 15.00 15.00 15.00 13.50 13.00 13.00 13.00 15.25 15.25
Delivered Construction (SF) 285,989 19,662 60,000 40,000 0 0 420,000 57,000 335,959 812,959Vacancy Rate (%) 8.9 8.5 8.2 7.5 6.9 7.0 6.9 6.6 6.6 6.6
NEAR NORTH Absorption (Net SF) 843 (1,913) (7,264) 29,330 (31,563) (10,467) (4,372) 35,563 6,690 37,881
Asking Rent, NNN Avg. Annual 18.00 18.25 18.25 18.25 14.00 14.00 13.75 13.50 14.00 14.00Delivered Construction (SF) 0 0 0 0 0 0 0 0 0 0
Vacancy Rate (%) 3.3 3.3 3.5 3.4 3.3 4.1 4.8 4.2 3.6 3.6FAR NORTH
Absorption (Net SF) 50,396 151,645 (55,869) 60,348 (20,041) 13,002 120,382 386,624 214,401 721,407 Asking Rent, NNN Avg. Annual 26.00 26.50 27.00 27.00 24.00 24.00 22.50 23.00 23.00 23.00
Delivered Construction (SF) 45,038 153,000 298,521 0 0 0 0 309,007 181,653 490,660Vacancy Rate (%) 6.8 6.9 6.8 6.4 6.5 6.5 6.5 6.4 6.1 6.1
NEAR NORTHWESTAbsorption (Net SF) 51,788 (17,771) (21,557) 14,932 (28,443) 10,577 6,250 20,110 (10,140) 16,220
Asking Rent, NNN Avg. Annual 15.00 15.00 15.00 20.00 22.75 21.25 21.25 25.00 25.00 25.00Delivered Construction (SF) 0 0 0 0 0 0 0 0 0 0
Vacancy Rate (%) 4.7 4.8 4.7 4.8 4.8 4.8 4.5 4.4 3.8 3.8FAR NORTHWEST
Absorption (Net SF) (766) 54,733 213,603 33,919 27,508 (6,539) 108,312 82,729 203,241 394,282 Asking Rent, NNN Avg. Annual 25.25 25.25 25.50 25.50 32.00 33.75 33.75 33.00 33.00 33.00
Delivered Construction (SF) 228,876 105,000 165,000 63,000 0 0 161,770 117,379 71,092 350,241Vacancy Rate (%) 6.8 7.0 6.6 6.3 5.9 6.0 6.5 6.0 5.7 5.7
NEAR WESTAbsorption (Net SF) (17,921) 33,716 66,667 (15,396) 34,199 26,324 (5,400) 38,752 50,459 83,811
Asking Rent, NNN Avg. Annual 24.50 24.50 24.50 30.50 33.50 34.00 34.50 34.00 35.50 35.50Delivered Construction (SF) 110,000 0 127,827 45,000 0 0 0 0 0 0
Vacancy Rate (%) 3.7 4.3 4.2 4.3 4.6 4.7 4.9 3.7 3.1 3.1FAR WEST
Absorption (Net SF) 1,733 94,659 280,488 77,106 104,219 100,851 (35,203) 114,961 83,858 163,616 Asking Rent, NNN Avg. Annual 30.50 30.50 30.50 30.50 28.25 28.75 28.75 29.00 28.00 28.00
Delivered Construction (SF) 0 0 98,839 24,500 0 265,117 27,500 0 130,778 158,278Vacancy Rate (%) 7.4 7.3 7.1 6.8 5.8 5.8 5.5 5.4 4.8 4.8
NEAR SOUTHWESTAbsorption (Net SF) 18,957 16,845 (390) 80,483 36,514 5,228 (2,073) 12,673 61,530 72,130
Asking Rent, NNN Avg. Annual 15.00 15.00 15.00 15.00 17.75 16.75 16.75 16.00 18.50 18.50Delivered Construction (SF) 0 0 0 0 177,514 0 0 15,000 0 15,000
Vacancy Rate (%) 11.6 11.6 11.3 11.1 7.8 8.5 8.7 8.1 8.5 8.5FAR SOUTHWEST
Absorption (Net SF) 110,632 38,503 44,196 21,588 (17,732) 78,932 87,191 146,418 (17,721) 215,888 Asking Rent, NNN Avg. Annual 25.50 25.50 25.50 25.50 22.25 22.25 22.50 24.25 23.50 23.50
Delivered Construction (SF) 14,850 136,454 0 204,175 0 0 25,575 45,061 0 70,636Vacancy Rate (%) 6.7 6.2 6.3 6.4 6.5 6.3 5.9 5.3 5.8 5.8
SOUTHAbsorption (Net SF) 16,893 13,355 (5,034) (20,510) (39,580) 33,851 63,992 182,581 21,426 267,999
Asking Rent, NNN Avg. Annual 20.25 20.50 20.50 20.50 18.75 18.25 18.25 19.75 20.00 20.00Delivered Construction (SF) 0 0 42,000 0 150,000 174,640 0 139,691 0 139,691
Vacancy Rate (%) 5.3 5.5 5.2 5.4 5.5 6.6 5.9 5.7 5.5 5.5NEAR SOUTHEAST
Absorption (Net SF) 4,376 (32,885) (27,463) 33,062 29,255 (4,317) 21,379 27,253 (3,985) 44,647 Asking Rent, NNN Avg. Annual 14.75 14.75 14.75 20.00 22.50 22.50 22.50 22.50 18.00 18.00
Delivered Construction (SF) 0 0 0 0 0 0 0 0 0 0Vacancy Rate (%) 6.9 6.7 7.3 7.2 6.8 8.4 8.4 8.0 8.2 8.2
FAR SOUTHEASTAbsorption (Net SF) 12,749 (84,760) 91,424 111,309 30,250 454,652 77,020 283,205 35,231 395,456
Asking Rent, NNN Avg. Annual 20.50 20.50 20.50 20.50 13.75 14.50 14.25 15.00 22.50 22.50Delivered Construction (SF) 283,443 27,000 165,000 20,475 - 428,000 297,683 161,375 148,945 608,003
Vacancy Rate (%) 6.3 6.3 6.5 6.6 6.8 6.4 7.3 7.7 7.8 7.8HOUSTON TOTAL
Absorption (Net SF) 369,169 316,988 625,432 718,359 163,479 948,590 461,795 1,484,146 810,562 2,756,503 Asking Rent, NNN Avg. Annual 22.06 22.15 22.21 23.46 22.69 22.69 22.58 23.08 23.49 23.49
Delivered Construction (SF) 923,158 444,116 957,187 522,150 366,979 1,137,757 957,889 844,513 897,840 2,700,242Vacancy Rate (%) 6.6 6.6 6.5 6.3 5.9 6.1 6.2 5.8 5.7 5.7
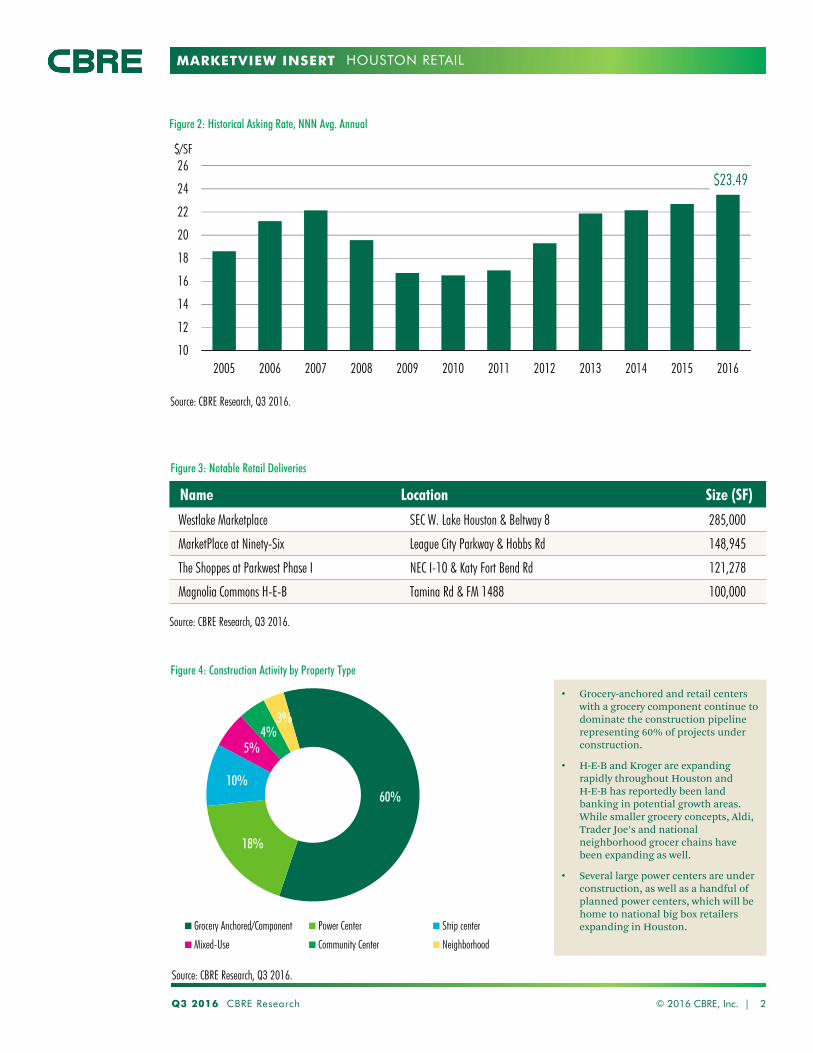
MARKETVIEW INSERT
60%
18%
10%
5%4%
3%
Grocery Anchored/Component Power Center Strip center
Mixed-Use Community Center Neighborhood
Q3 2016 CBRE Research 2
HOUSTON RETAIL
© 2016 CBRE, Inc. |
Figure 3: Notable Retail Deliveries
Source: CBRE Research, Q3 2016.
$23.49
10
12
14
16
18
20
22
24
26
2005 2006 2007 2008 2009 2010 2011 2012 2013 2014 2015 2016
$/SF
Figure 2: Historical Asking Rate, NNN Avg. Annual
Source: CBRE Research, Q3 2016.
Name Location Size (SF)
Westlake Marketplace SEC W. Lake Houston & Beltway 8 285,000
MarketPlace at Ninety-Six League City Parkway & Hobbs Rd 148,945
The Shoppes at Parkwest Phase I NEC I-10 & Katy Fort Bend Rd 121,278
Magnolia Commons H-E-B Tamina Rd & FM 1488 100,000
Figure 4: Construction Activity by Property Type
Source: CBRE Research, Q3 2016.
• Grocery-anchored and retail centers with a grocery component continue to dominate the construction pipeline representing 60% of projects under construction.
• H-E-B and Kroger are expanding rapidly throughout Houston and H-E-B has reportedly been land banking in potential growth areas. While smaller grocery concepts, Aldi, Trader Joe’s and national neighborhood grocer chains have been expanding as well.
• Several large power centers are under construction, as well as a handful of planned power centers, which will be home to national big box retailers expanding in Houston.
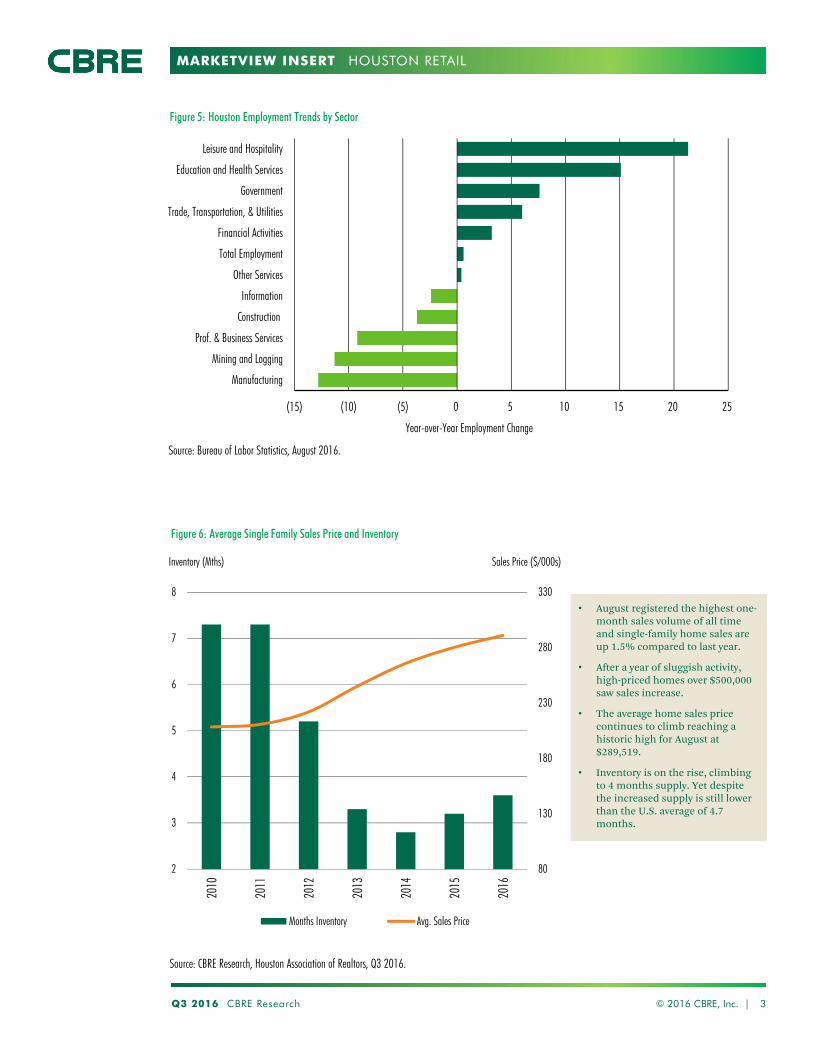
MARKETVIEW INSERT
Q3 2016 CBRE Research © 2016 CBRE, Inc. | 3
HOUSTON RETAIL
Figure 5: Houston Employment Trends by Sector
80
130
180
230
280
330
2
3
4
5
6
7
8
2010
2011
2012
2013
2014
2015
2016
Months Inventory Avg. Sales Price
Sales Price ($/000s)Inventory (Mths)
Figure 6: Average Single Family Sales Price and Inventory
Source: CBRE Research, Houston Association of Realtors, Q3 2016.
Source: Bureau of Labor Statistics, August 2016.
• August registered the highest one-month sales volume of all time and single-family home sales are up 1.5% compared to last year.
• After a year of sluggish activity, high-priced homes over $500,000 saw sales increase.
• The average home sales price continues to climb reaching a historic high for August at $289,519.
• Inventory is on the rise, climbing to 4 months supply. Yet despite the increased supply is still lower than the U.S. average of 4.7 months.
(15) (10) (5) 0 5 10 15 20 25
Manufacturing
Mining and Logging
Prof. & Business Services
Construction
Information
Other Services
Total Employment
Financial Activities
Trade, Transportation, & Utilities
Government
Education and Health Services
Leisure and Hospitality
Year-over-Year Employment Change

MARKETVIEW
Disclaimer: Information contained herein, including projections, has been obtained from sources believed to be reliable. While we do not doubt its accuracy, we have not verified it and make no guarantee, warranty or representation about it. It is your responsibility to confirm independently its accuracy and completeness. This information is presented exclusively for use by CBRE clients and professionals and all rights to the material are reserved and cannot be reproduced without prior written permission of CBRE.
CONTACTS
Robert C. Kramp
Director, Research & Analysis
E. Michelle Miller
Research Operations Manager
Analee Micheletti
Research Analyst
CBRE OFFICES
CBRE Houston
2800 Post Oak, Suite 2300
Houston, TX 77056
To learn more about CBRE
Research, or to access additional
research reports, please visit the
Global Research Gateway at
www.cbre.com/researchgateway.
HOUSTON RETAIL
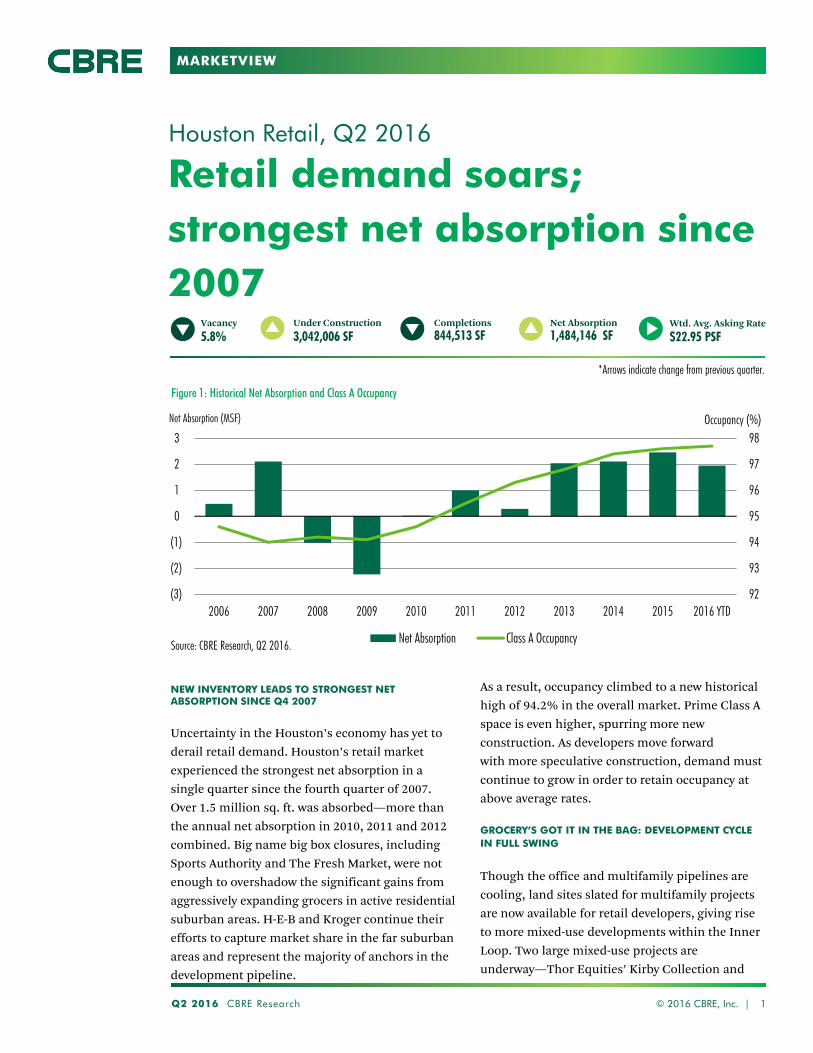
MARKETVIEW
92
93
94
95
96
97
98
(3)
(2)
(1)
0
1
2
3
2006 2007 2008 2009 2010 2011 2012 2013 2014 2015 2016 YTD
Occupancy (%)Net Absorption (MSF)
Net Absorption Class A Occupancy
Retail demand soars; strongest net absorption since 2007
Houston Retail, Q2 2016
As a result, occupancy climbed to a new historical
high of 94.2% in the overall market. Prime Class A
space is even higher, spurring more new
construction. As developers move forward
with more speculative construction, demand must
continue to grow in order to retain occupancy at
above average rates.
GROCERY’S GOT IT IN THE BAG: DEVELOPMENT CYCLE IN FULL SWING
Though the office and multifamily pipelines are
cooling, land sites slated for multifamily projects
are now available for retail developers, giving rise
to more mixed-use developments within the Inner
Loop. Two large mixed-use projects are
underway—Thor Equities’ Kirby Collection and
Q2 2016 CBRE Research © 2016 CBRE, Inc. | 1
Completions
844,513 SFNet Absorption
1,484,146 SFVacancy
5.8%Under Construction
3,042,006 SFWtd. Avg. Asking Rate
$22.95 PSF
Figure 1: Historical Net Absorption and Class A Occupancy
Source: CBRE Research, Q2 2016.
NEW INVENTORY LEADS TO STRONGEST NET ABSORPTION SINCE Q4 2007
Uncertainty in the Houston’s economy has yet to
derail retail demand. Houston’s retail market
experienced the strongest net absorption in a
single quarter since the fourth quarter of 2007.
Over 1.5 million sq. ft. was absorbed—more than
the annual net absorption in 2010, 2011 and 2012
combined. Big name big box closures, including
Sports Authority and The Fresh Market, were not
enough to overshadow the significant gains from
aggressively expanding grocers in active residential
suburban areas. H-E-B and Kroger continue their
efforts to capture market share in the far suburban
areas and represent the majority of anchors in the
development pipeline.
*Arrows indicate change from previous quarter.
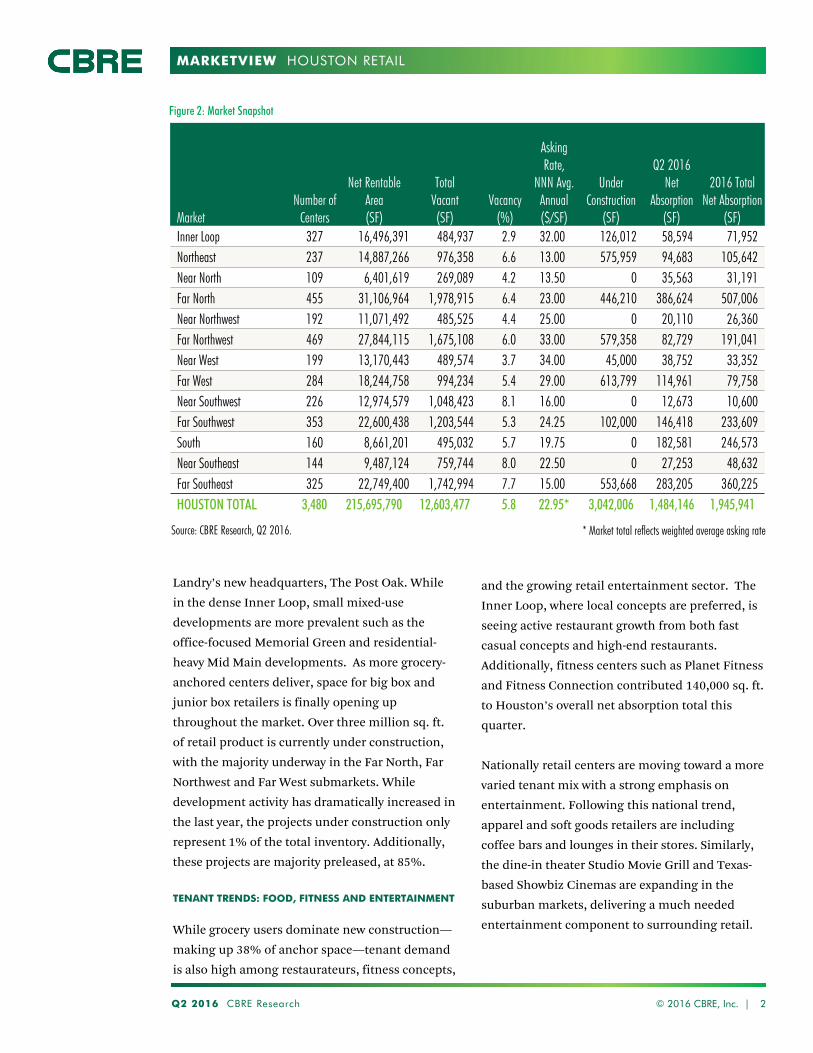
MARKETVIEW
Q2 2016 CBRE Research 2
HOUSTON RETAIL
Landry’s new headquarters, The Post Oak. While
in the dense Inner Loop, small mixed-use
developments are more prevalent such as the
office-focused Memorial Green and residential-
heavy Mid Main developments. As more grocery-
anchored centers deliver, space for big box and
junior box retailers is finally opening up
throughout the market. Over three million sq. ft.
of retail product is currently under construction,
with the majority underway in the Far North, Far
Northwest and Far West submarkets. While
development activity has dramatically increased in
the last year, the projects under construction only
represent 1% of the total inventory. Additionally,
these projects are majority preleased, at 85%.
TENANT TRENDS: FOOD, FITNESS AND ENTERTAINMENT
While grocery users dominate new construction—
making up 38% of anchor space—tenant demand
is also high among restaurateurs, fitness concepts,
© 2016 CBRE, Inc. |
Source: CBRE Research, Q2 2016.
Figure 2: Market Snapshot
* Market total reflects weighted average asking rate
and the growing retail entertainment sector. The
Inner Loop, where local concepts are preferred, is
seeing active restaurant growth from both fast
casual concepts and high-end restaurants.
Additionally, fitness centers such as Planet Fitness
and Fitness Connection contributed 140,000 sq. ft.
to Houston’s overall net absorption total this
quarter.
Nationally retail centers are moving toward a more
varied tenant mix with a strong emphasis on
entertainment. Following this national trend,
apparel and soft goods retailers are including
coffee bars and lounges in their stores. Similarly,
the dine-in theater Studio Movie Grill and Texas-
based Showbiz Cinemas are expanding in the
suburban markets, delivering a much needed
entertainment component to surrounding retail.
MarketNumber of
Centers
Net Rentable Area(SF)
TotalVacant(SF)
Vacancy(%)
Asking Rate,
NNN Avg. Annual($/SF)
Under Construction
(SF)
Q2 2016Net
Absorption(SF)
2016 Total Net Absorption
(SF)Inner Loop 327 16,496,391 484,937 2.9 32.00 126,012 58,594 71,952 Northeast 237 14,887,266 976,358 6.6 13.00 575,959 94,683 105,642 Near North 109 6,401,619 269,089 4.2 13.50 0 35,563 31,191 Far North 455 31,106,964 1,978,915 6.4 23.00 446,210 386,624 507,006 Near Northwest 192 11,071,492 485,525 4.4 25.00 0 20,110 26,360 Far Northwest 469 27,844,115 1,675,108 6.0 33.00 579,358 82,729 191,041 Near West 199 13,170,443 489,574 3.7 34.00 45,000 38,752 33,352 Far West 284 18,244,758 994,234 5.4 29.00 613,799 114,961 79,758 Near Southwest 226 12,974,579 1,048,423 8.1 16.00 0 12,673 10,600 Far Southwest 353 22,600,438 1,203,544 5.3 24.25 102,000 146,418 233,609 South 160 8,661,201 495,032 5.7 19.75 0 182,581 246,573 Near Southeast 144 9,487,124 759,744 8.0 22.50 0 27,253 48,632 Far Southeast 325 22,749,400 1,742,994 7.7 15.00 553,668 283,205 360,225 HOUSTON TOTAL 3,480 215,695,790 12,603,477 5.8 22.95* 3,042,006 1,484,146 1,945,941
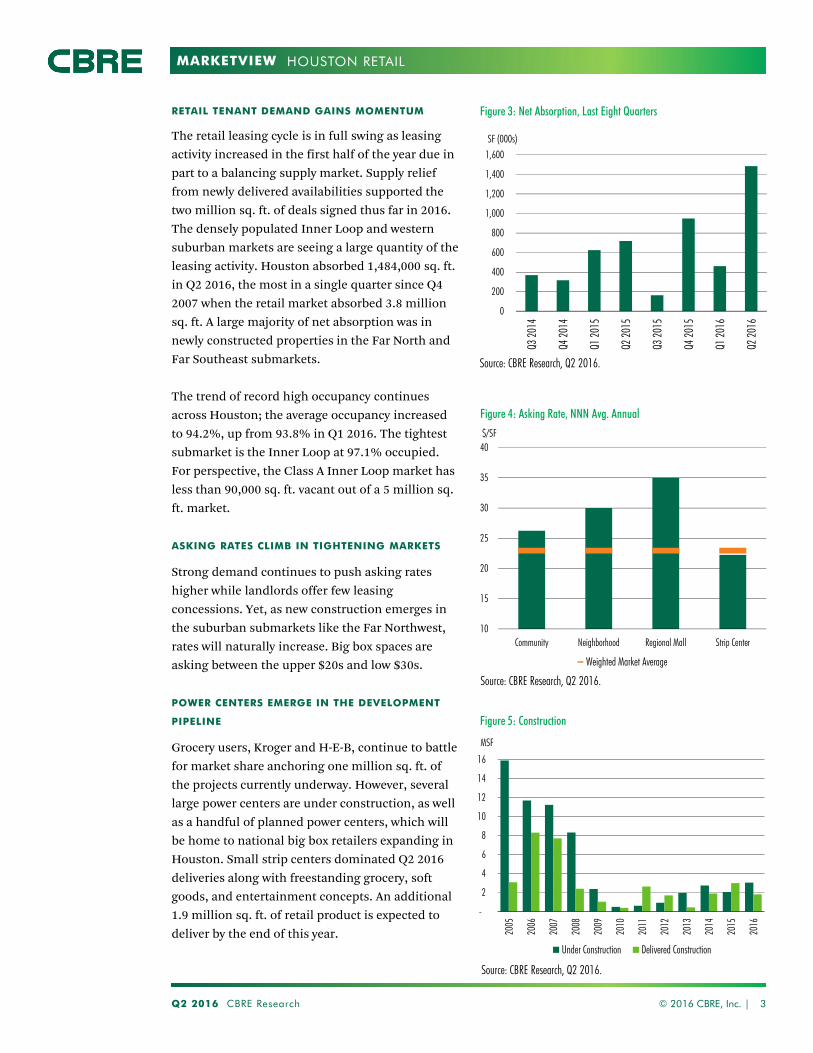
MARKETVIEW
RETAIL TENANT DEMAND GAINS MOMENTUM
The retail leasing cycle is in full swing as leasing
activity increased in the first half of the year due in
part to a balancing supply market. Supply relief
from newly delivered availabilities supported the
two million sq. ft. of deals signed thus far in 2016.
The densely populated Inner Loop and western
suburban markets are seeing a large quantity of the
leasing activity. Houston absorbed 1,484,000 sq. ft.
in Q2 2016, the most in a single quarter since Q4
2007 when the retail market absorbed 3.8 million
sq. ft. A large majority of net absorption was in
newly constructed properties in the Far North and
Far Southeast submarkets.
The trend of record high occupancy continues
across Houston; the average occupancy increased
to 94.2%, up from 93.8% in Q1 2016. The tightest
submarket is the Inner Loop at 97.1% occupied.
For perspective, the Class A Inner Loop market has
less than 90,000 sq. ft. vacant out of a 5 million sq.
ft. market.
ASKING RATES CLIMB IN TIGHTENING MARKETS
Strong demand continues to push asking rates
higher while landlords offer few leasing
concessions. Yet, as new construction emerges in
the suburban submarkets like the Far Northwest,
rates will naturally increase. Big box spaces are
asking between the upper $20s and low $30s.
POWER CENTERS EMERGE IN THE DEVELOPMENT
PIPELINE
Grocery users, Kroger and H-E-B, continue to battle
for market share anchoring one million sq. ft. of
the projects currently underway. However, several
large power centers are under construction, as well
as a handful of planned power centers, which will
be home to national big box retailers expanding in
Houston. Small strip centers dominated Q2 2016
deliveries along with freestanding grocery, soft
goods, and entertainment concepts. An additional
1.9 million sq. ft. of retail product is expected to
deliver by the end of this year.
Q2 2016 CBRE Research © 2016 CBRE, Inc. | 3
HOUSTON RETAIL
0
200
400
600
800
1,000
1,200
1,400
1,600
Q3 20
14
Q4 20
14
Q1 20
15
Q2 20
15
Q3 20
15
Q4 20
15
Q1 20
16
Q2 20
16
SF (000s)
Source: CBRE Research, Q2 2016.
10
15
20
25
30
35
40
Community Neighborhood Regional Mall Strip Center
$/SF
Weighted Market Average
Source: CBRE Research, Q2 2016.
-
2
4
6
8
10
12
14
16
2005
2006
2007
2008
2009
2010
2011
2012
2013
2014
2015
2016
Under Construction Delivered Construction
MSF
Source: CBRE Research, Q2 2016.
Figure 3: Net Absorption, Last Eight Quarters
Figure 4: Asking Rate, NNN Avg. Annual
Figure 5: Construction
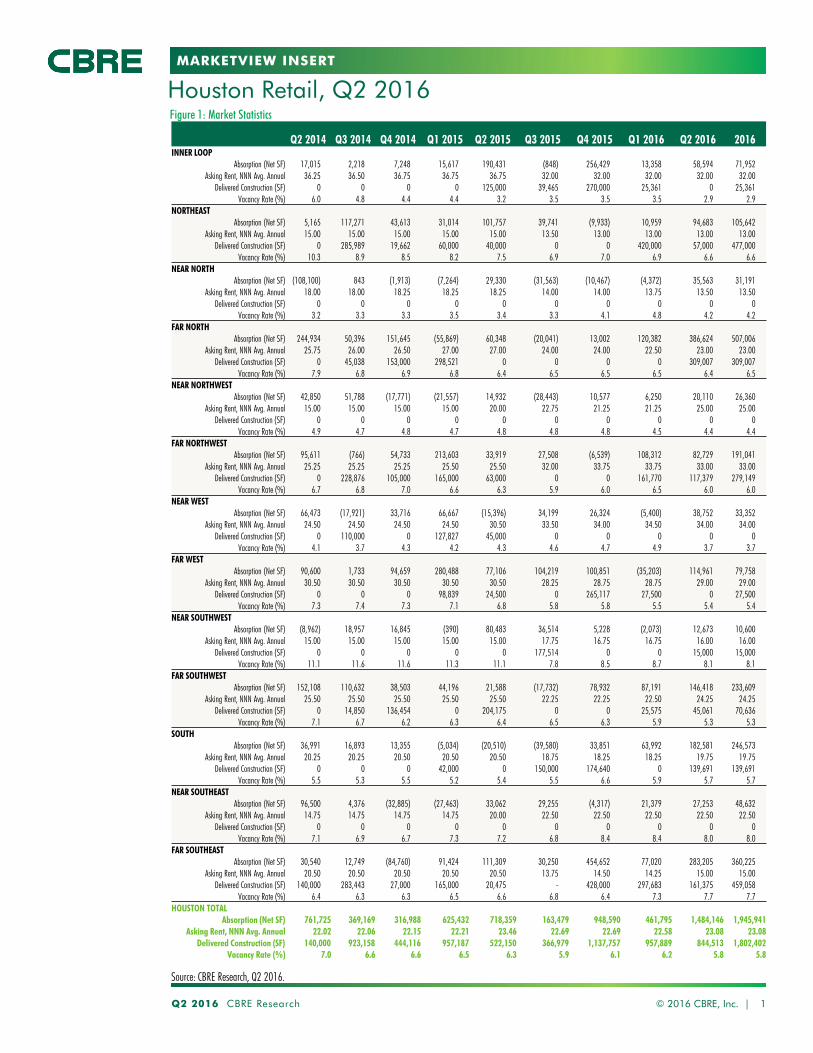
MARKETVIEW INSERT
Q2 2016 CBRE Research © 2016 CBRE, Inc. | 1
Source: CBRE Research, Q2 2016.
Figure 1: Market Statistics
Houston Retail, Q2 2016
Q2 2014 Q3 2014 Q4 2014 Q1 2015 Q2 2015 Q3 2015 Q4 2015 Q1 2016 Q2 2016 2016INNER LOOP
Absorption (Net SF) 17,015 2,218 7,248 15,617 190,431 (848) 256,429 13,358 58,594 71,952 Asking Rent, NNN Avg. Annual 36.25 36.50 36.75 36.75 36.75 32.00 32.00 32.00 32.00 32.00
Delivered Construction (SF) 0 0 0 0 125,000 39,465 270,000 25,361 0 25,361Vacancy Rate (%) 6.0 4.8 4.4 4.4 3.2 3.5 3.5 3.5 2.9 2.9
NORTHEASTAbsorption (Net SF) 5,165 117,271 43,613 31,014 101,757 39,741 (9,933) 10,959 94,683 105,642
Asking Rent, NNN Avg. Annual 15.00 15.00 15.00 15.00 15.00 13.50 13.00 13.00 13.00 13.00Delivered Construction (SF) 0 285,989 19,662 60,000 40,000 0 0 420,000 57,000 477,000
Vacancy Rate (%) 10.3 8.9 8.5 8.2 7.5 6.9 7.0 6.9 6.6 6.6NEAR NORTH
Absorption (Net SF) (108,100) 843 (1,913) (7,264) 29,330 (31,563) (10,467) (4,372) 35,563 31,191 Asking Rent, NNN Avg. Annual 18.00 18.00 18.25 18.25 18.25 14.00 14.00 13.75 13.50 13.50
Delivered Construction (SF) 0 0 0 0 0 0 0 0 0 0Vacancy Rate (%) 3.2 3.3 3.3 3.5 3.4 3.3 4.1 4.8 4.2 4.2
FAR NORTHAbsorption (Net SF) 244,934 50,396 151,645 (55,869) 60,348 (20,041) 13,002 120,382 386,624 507,006
Asking Rent, NNN Avg. Annual 25.75 26.00 26.50 27.00 27.00 24.00 24.00 22.50 23.00 23.00Delivered Construction (SF) 0 45,038 153,000 298,521 0 0 0 0 309,007 309,007
Vacancy Rate (%) 7.9 6.8 6.9 6.8 6.4 6.5 6.5 6.5 6.4 6.5NEAR NORTHWEST
Absorption (Net SF) 42,850 51,788 (17,771) (21,557) 14,932 (28,443) 10,577 6,250 20,110 26,360 Asking Rent, NNN Avg. Annual 15.00 15.00 15.00 15.00 20.00 22.75 21.25 21.25 25.00 25.00
Delivered Construction (SF) 0 0 0 0 0 0 0 0 0 0Vacancy Rate (%) 4.9 4.7 4.8 4.7 4.8 4.8 4.8 4.5 4.4 4.4
FAR NORTHWESTAbsorption (Net SF) 95,611 (766) 54,733 213,603 33,919 27,508 (6,539) 108,312 82,729 191,041
Asking Rent, NNN Avg. Annual 25.25 25.25 25.25 25.50 25.50 32.00 33.75 33.75 33.00 33.00Delivered Construction (SF) 0 228,876 105,000 165,000 63,000 0 0 161,770 117,379 279,149
Vacancy Rate (%) 6.7 6.8 7.0 6.6 6.3 5.9 6.0 6.5 6.0 6.0NEAR WEST
Absorption (Net SF) 66,473 (17,921) 33,716 66,667 (15,396) 34,199 26,324 (5,400) 38,752 33,352 Asking Rent, NNN Avg. Annual 24.50 24.50 24.50 24.50 30.50 33.50 34.00 34.50 34.00 34.00
Delivered Construction (SF) 0 110,000 0 127,827 45,000 0 0 0 0 0 Vacancy Rate (%) 4.1 3.7 4.3 4.2 4.3 4.6 4.7 4.9 3.7 3.7
FAR WESTAbsorption (Net SF) 90,600 1,733 94,659 280,488 77,106 104,219 100,851 (35,203) 114,961 79,758
Asking Rent, NNN Avg. Annual 30.50 30.50 30.50 30.50 30.50 28.25 28.75 28.75 29.00 29.00Delivered Construction (SF) 0 0 0 98,839 24,500 0 265,117 27,500 0 27,500
Vacancy Rate (%) 7.3 7.4 7.3 7.1 6.8 5.8 5.8 5.5 5.4 5.4NEAR SOUTHWEST
Absorption (Net SF) (8,962) 18,957 16,845 (390) 80,483 36,514 5,228 (2,073) 12,673 10,600 Asking Rent, NNN Avg. Annual 15.00 15.00 15.00 15.00 15.00 17.75 16.75 16.75 16.00 16.00
Delivered Construction (SF) 0 0 0 0 0 177,514 0 0 15,000 15,000Vacancy Rate (%) 11.1 11.6 11.6 11.3 11.1 7.8 8.5 8.7 8.1 8.1
FAR SOUTHWESTAbsorption (Net SF) 152,108 110,632 38,503 44,196 21,588 (17,732) 78,932 87,191 146,418 233,609
Asking Rent, NNN Avg. Annual 25.50 25.50 25.50 25.50 25.50 22.25 22.25 22.50 24.25 24.25Delivered Construction (SF) 0 14,850 136,454 0 204,175 0 0 25,575 45,061 70,636
Vacancy Rate (%) 7.1 6.7 6.2 6.3 6.4 6.5 6.3 5.9 5.3 5.3SOUTH
Absorption (Net SF) 36,991 16,893 13,355 (5,034) (20,510) (39,580) 33,851 63,992 182,581 246,573 Asking Rent, NNN Avg. Annual 20.25 20.25 20.50 20.50 20.50 18.75 18.25 18.25 19.75 19.75
Delivered Construction (SF) 0 0 0 42,000 0 150,000 174,640 0 139,691 139,691 Vacancy Rate (%) 5.5 5.3 5.5 5.2 5.4 5.5 6.6 5.9 5.7 5.7
NEAR SOUTHEASTAbsorption (Net SF) 96,500 4,376 (32,885) (27,463) 33,062 29,255 (4,317) 21,379 27,253 48,632
Asking Rent, NNN Avg. Annual 14.75 14.75 14.75 14.75 20.00 22.50 22.50 22.50 22.50 22.50Delivered Construction (SF) 0 0 0 0 0 0 0 0 0 0
Vacancy Rate (%) 7.1 6.9 6.7 7.3 7.2 6.8 8.4 8.4 8.0 8.0FAR SOUTHEAST
Absorption (Net SF) 30,540 12,749 (84,760) 91,424 111,309 30,250 454,652 77,020 283,205 360,225 Asking Rent, NNN Avg. Annual 20.50 20.50 20.50 20.50 20.50 13.75 14.50 14.25 15.00 15.00
Delivered Construction (SF) 140,000 283,443 27,000 165,000 20,475 - 428,000 297,683 161,375 459,058 Vacancy Rate (%) 6.4 6.3 6.3 6.5 6.6 6.8 6.4 7.3 7.7 7.7
HOUSTON TOTALAbsorption (Net SF) 761,725 369,169 316,988 625,432 718,359 163,479 948,590 461,795 1,484,146 1,945,941
Asking Rent, NNN Avg. Annual 22.02 22.06 22.15 22.21 23.46 22.69 22.69 22.58 23.08 23.08Delivered Construction (SF) 140,000 923,158 444,116 957,187 522,150 366,979 1,137,757 957,889 844,513 1,802,402
Vacancy Rate (%) 7.0 6.6 6.6 6.5 6.3 5.9 6.1 6.2 5.8 5.8
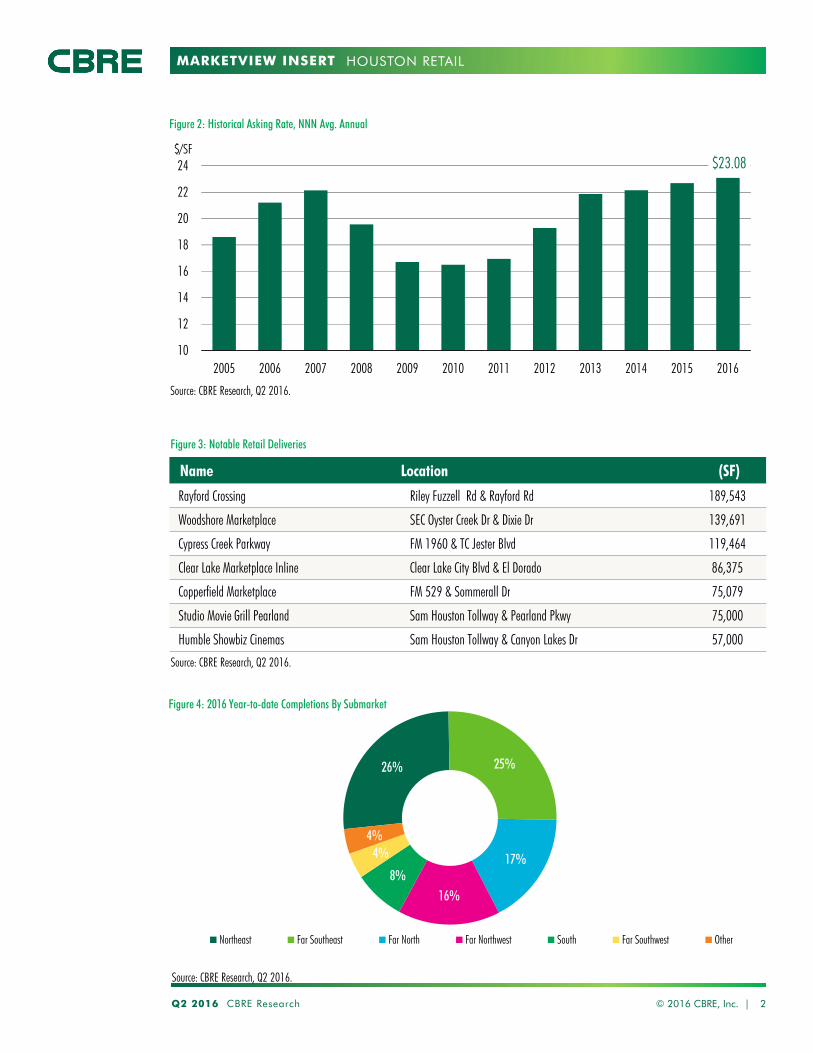
MARKETVIEW INSERT
26% 25%
17%
16%8%
4%4%
Northeast Far Southeast Far North Far Northwest South Far Southwest Other
Q2 2016 CBRE Research 2
HOUSTON RETAIL
© 2016 CBRE, Inc. |
Figure 3: Notable Retail Deliveries
Source: CBRE Research, Q2 2016.
$23.08
10
12
14
16
18
20
22
24
2005 2006 2007 2008 2009 2010 2011 2012 2013 2014 2015 2016
$/SF
Figure 2: Historical Asking Rate, NNN Avg. Annual
Source: CBRE Research, Q2 2016.
Name Location (SF)
Rayford Crossing Riley Fuzzell Rd & Rayford Rd 189,543
Woodshore Marketplace SEC Oyster Creek Dr & Dixie Dr 139,691
Cypress Creek Parkway FM 1960 & TC Jester Blvd 119,464
Clear Lake Marketplace Inline Clear Lake City Blvd & El Dorado 86,375
Copperfield Marketplace FM 529 & Sommerall Dr 75,079
Studio Movie Grill Pearland Sam Houston Tollway & Pearland Pkwy 75,000
Humble Showbiz Cinemas Sam Houston Tollway & Canyon Lakes Dr 57,000
Figure 4: 2016 Year-to-date Completions By Submarket
Source: CBRE Research, Q2 2016.
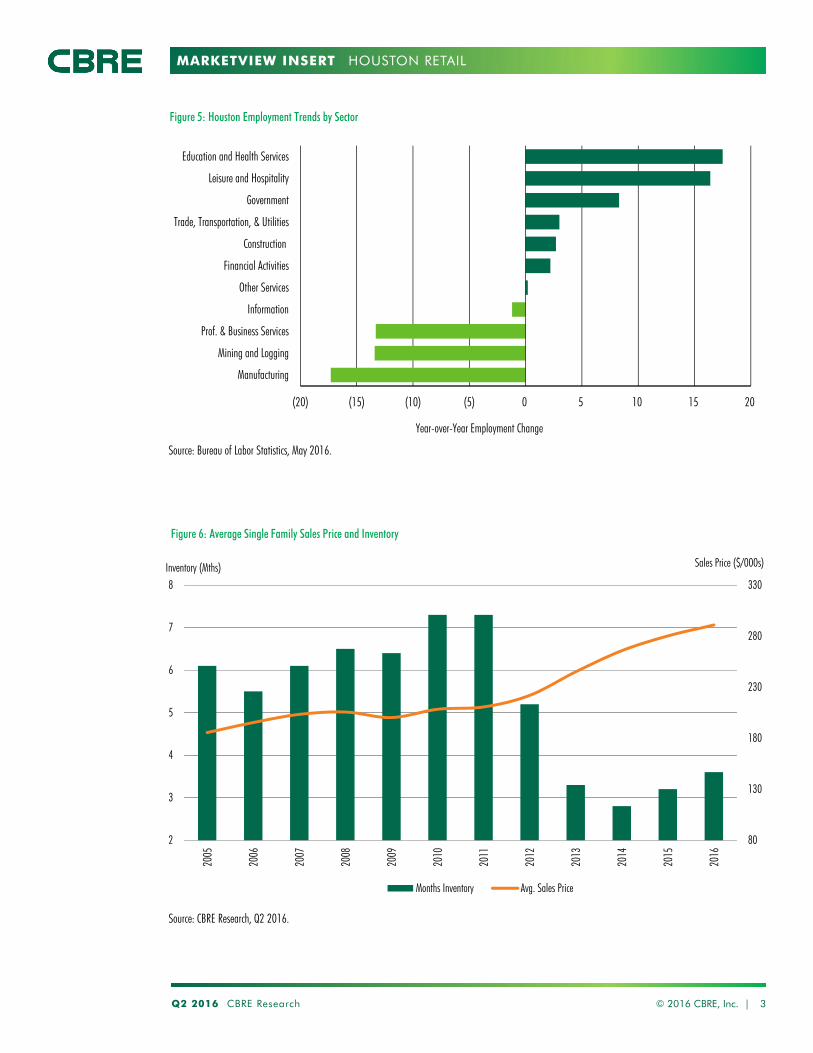
MARKETVIEW INSERT
Q2 2016 CBRE Research © 2016 CBRE, Inc. | 3
HOUSTON RETAIL
Figure 5: Houston Employment Trends by Sector
80
130
180
230
280
330
2
3
4
5
6
7
8
2005
2006
2007
2008
2009
2010
2011
2012
2013
2014
2015
2016
Months Inventory Avg. Sales Price
Sales Price ($/000s)Inventory (Mths)
Figure 6: Average Single Family Sales Price and Inventory
Source: CBRE Research, Q2 2016.
(20) (15) (10) (5) 0 5 10 15 20
Manufacturing
Mining and Logging
Prof. & Business Services
Information
Other Services
Financial Activities
Construction
Trade, Transportation, & Utilities
Government
Leisure and Hospitality
Education and Health Services
Year-over-Year Employment Change
Source: Bureau of Labor Statistics, May 2016.
Disclaimer: Information contained herein, including projections, has been obtained from sources believed to be reliable. While we do not doubt its accuracy, we have not verified it and make no guarantee, warranty or representation about it. It is your responsibility to confirm independently its accuracy and completeness. This information is presented exclusively for use by CBRE clients and professionals and all rights to the material are reserved and cannot be reproduced without prior written permission of CBRE.
MARKETVIEW INSERT HOUSTON RETAIL
CONTACTS
Robert C. Kramp
Director, Research & Analysis
E. Michelle Miller
Research Operations Manager
Analee Micheletti
Research Analyst
CBRE OFFICES
CBRE Houston
2800 Post Oak, Suite 2300
Houston, TX 77056
To learn more about CBRE
Research, or to access additional
research reports, please visit the
Global Research Gateway at
www.cbre.com/researchgateway.
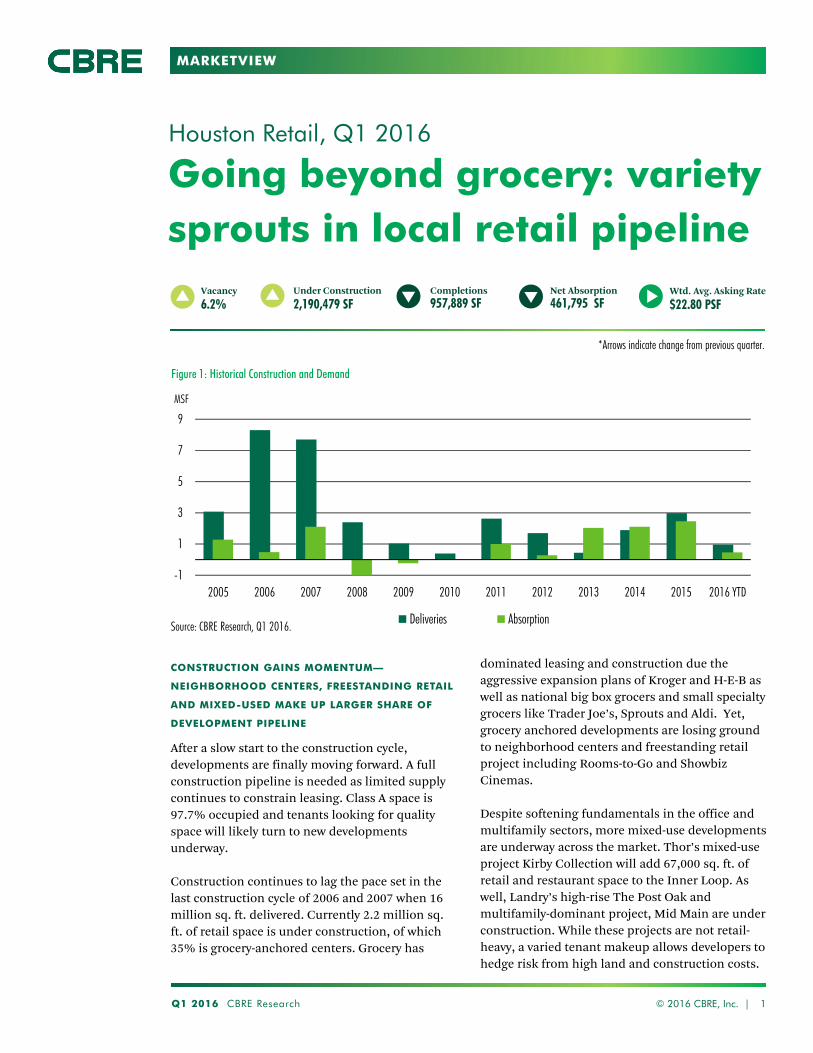
MARKETVIEW
-1
1
3
5
7
9
2005 2006 2007 2008 2009 2010 2011 2012 2013 2014 2015 2016 YTD
MSF
Deliveries Absorption
Going beyond grocery: variety sprouts in local retail pipeline
Houston Retail, Q1 2016
dominated leasing and construction due the
aggressive expansion plans of Kroger and H-E-B as
well as national big box grocers and small specialty
grocers like Trader Joe’s, Sprouts and Aldi. Yet,
grocery anchored developments are losing ground
to neighborhood centers and freestanding retail
project including Rooms-to-Go and Showbiz
Cinemas.
Despite softening fundamentals in the office and
multifamily sectors, more mixed-use developments
are underway across the market. Thor’s mixed-use
project Kirby Collection will add 67,000 sq. ft. of
retail and restaurant space to the Inner Loop. As
well, Landry’s high-rise The Post Oak and
multifamily-dominant project, Mid Main are under
construction. While these projects are not retail-
heavy, a varied tenant makeup allows developers to
hedge risk from high land and construction costs.
Q1 2016 CBRE Research © 2016 CBRE, Inc. | 1
Completions
957,889 SFNet Absorption
461,795 SFVacancy
6.2%Under Construction
2,190,479 SFWtd. Avg. Asking Rate
$22.80 PSF
Figure 1: Historical Construction and Demand
Source: CBRE Research, Q1 2016.
CONSTRUCTION GAINS MOMENTUM—
NEIGHBORHOOD CENTERS, FREESTANDING RETAIL
AND MIXED-USED MAKE UP LARGER SHARE OF
DEVELOPMENT PIPELINE
After a slow start to the construction cycle,
developments are finally moving forward. A full
construction pipeline is needed as limited supply
continues to constrain leasing. Class A space is
97.7% occupied and tenants looking for quality
space will likely turn to new developments
underway.
Construction continues to lag the pace set in the
last construction cycle of 2006 and 2007 when 16
million sq. ft. delivered. Currently 2.2 million sq.
ft. of retail space is under construction, of which
35% is grocery-anchored centers. Grocery has
*Arrows indicate change from previous quarter.
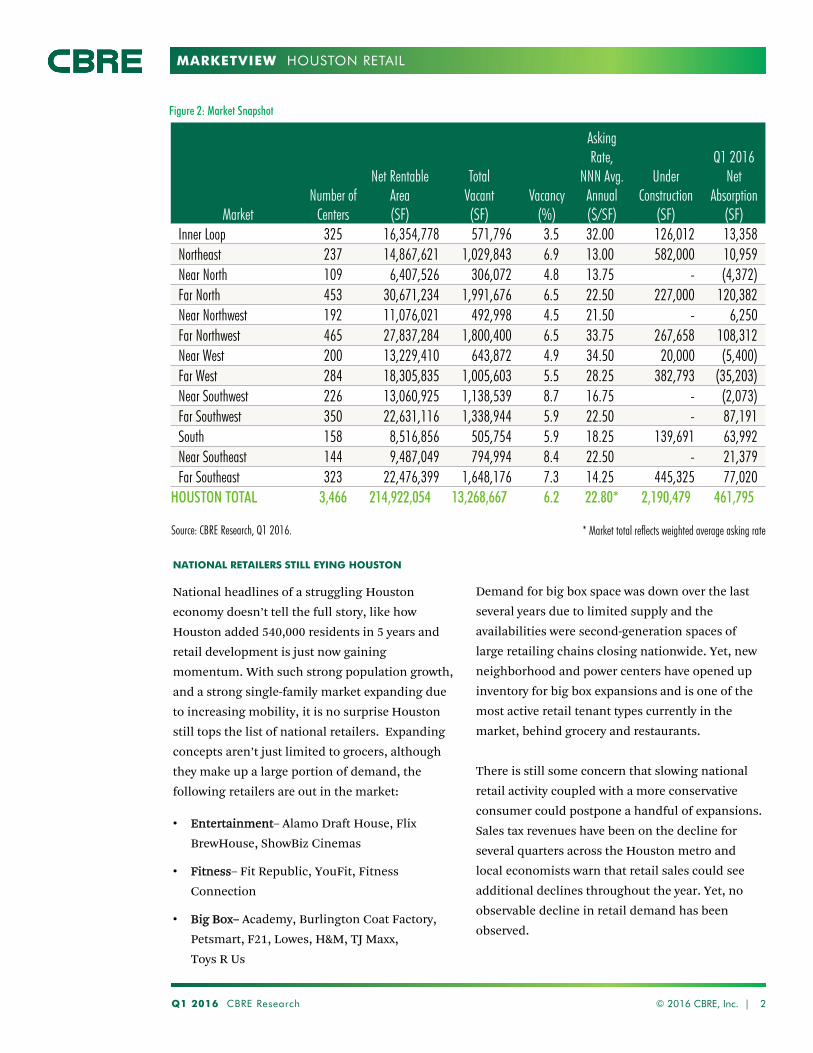
MARKETVIEW
Q1 2016 CBRE Research 2
HOUSTON RETAIL
NATIONAL RETAILERS STILL EYING HOUSTON
National headlines of a struggling Houston
economy doesn’t tell the full story, like how
Houston added 540,000 residents in 5 years and
retail development is just now gaining
momentum. With such strong population growth,
and a strong single-family market expanding due
to increasing mobility, it is no surprise Houston
still tops the list of national retailers. Expanding
concepts aren’t just limited to grocers, although
they make up a large portion of demand, the
following retailers are out in the market:
• Entertainment– Alamo Draft House, Flix
BrewHouse, ShowBiz Cinemas
• Fitness– Fit Republic, YouFit, Fitness
Connection
• Big Box– Academy, Burlington Coat Factory,
Petsmart, F21, Lowes, H&M, TJ Maxx,
Toys R Us
© 2016 CBRE, Inc. |
Source: CBRE Research, Q1 2016.
Figure 2: Market Snapshot
* Market total reflects weighted average asking rate
MarketNumber of
Centers
Net Rentable Area(SF)
TotalVacant(SF)
Vacancy(%)
Asking Rate,
NNN Avg. Annual($/SF)
Under Construction
(SF)
Q1 2016Net
Absorption(SF)
Inner Loop 325 16,354,778 571,796 3.5 32.00 126,012 13,358 Northeast 237 14,867,621 1,029,843 6.9 13.00 582,000 10,959 Near North 109 6,407,526 306,072 4.8 13.75 - (4,372)Far North 453 30,671,234 1,991,676 6.5 22.50 227,000 120,382 Near Northwest 192 11,076,021 492,998 4.5 21.50 - 6,250 Far Northwest 465 27,837,284 1,800,400 6.5 33.75 267,658 108,312 Near West 200 13,229,410 643,872 4.9 34.50 20,000 (5,400)Far West 284 18,305,835 1,005,603 5.5 28.25 382,793 (35,203)Near Southwest 226 13,060,925 1,138,539 8.7 16.75 - (2,073)Far Southwest 350 22,631,116 1,338,944 5.9 22.50 - 87,191 South 158 8,516,856 505,754 5.9 18.25 139,691 63,992 Near Southeast 144 9,487,049 794,994 8.4 22.50 - 21,379 Far Southeast 323 22,476,399 1,648,176 7.3 14.25 445,325 77,020
HOUSTON TOTAL 3,466 214,922,054 13,268,667 6.2 22.80* 2,190,479 461,795
Demand for big box space was down over the last
several years due to limited supply and the
availabilities were second-generation spaces of
large retailing chains closing nationwide. Yet, new
neighborhood and power centers have opened up
inventory for big box expansions and is one of the
most active retail tenant types currently in the
market, behind grocery and restaurants.
There is still some concern that slowing national
retail activity coupled with a more conservative
consumer could postpone a handful of expansions.
Sales tax revenues have been on the decline for
several quarters across the Houston metro and
local economists warn that retail sales could see
additional declines throughout the year. Yet, no
observable decline in retail demand has been
observed.
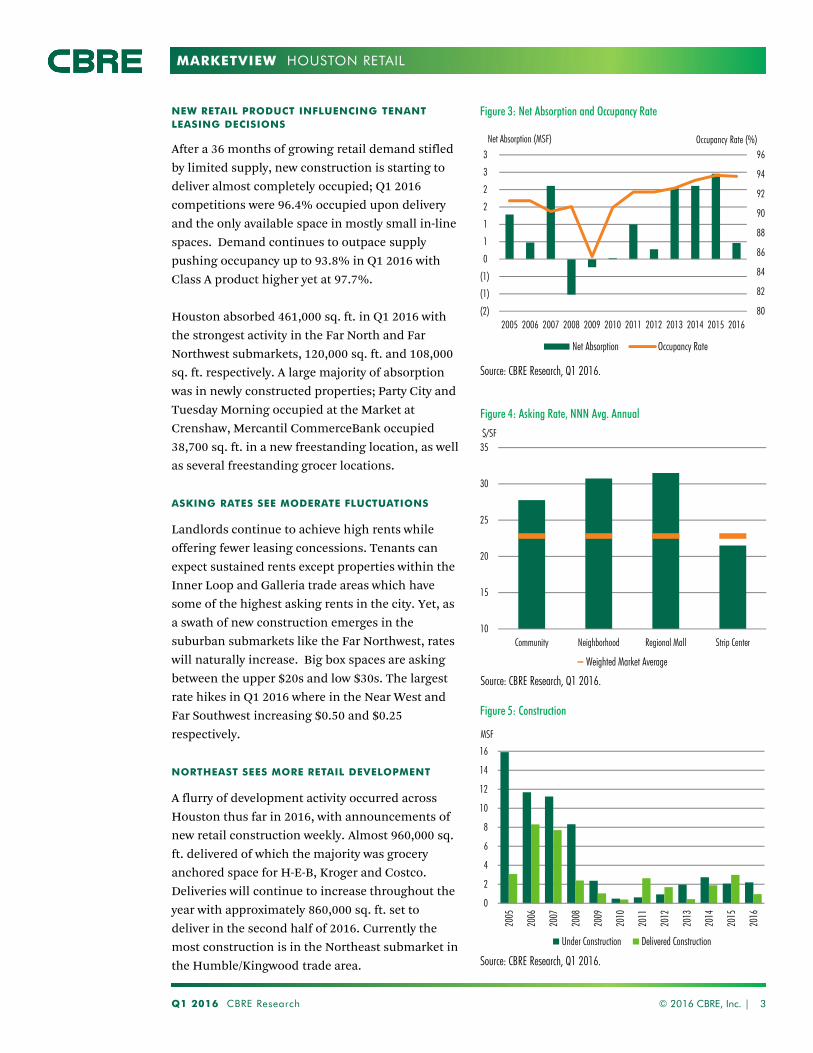
MARKETVIEW
NEW RETAIL PRODUCT INFLUENCING TENANT LEASING DECISIONS
After a 36 months of growing retail demand stifled
by limited supply, new construction is starting to
deliver almost completely occupied; Q1 2016
competitions were 96.4% occupied upon delivery
and the only available space in mostly small in-line
spaces. Demand continues to outpace supply
pushing occupancy up to 93.8% in Q1 2016 with
Class A product higher yet at 97.7%.
Houston absorbed 461,000 sq. ft. in Q1 2016 with
the strongest activity in the Far North and Far
Northwest submarkets, 120,000 sq. ft. and 108,000
sq. ft. respectively. A large majority of absorption
was in newly constructed properties; Party City and
Tuesday Morning occupied at the Market at
Crenshaw, Mercantil CommerceBank occupied
38,700 sq. ft. in a new freestanding location, as well
as several freestanding grocer locations.
ASKING RATES SEE MODERATE FLUCTUATIONS
Landlords continue to achieve high rents while
offering fewer leasing concessions. Tenants can
expect sustained rents except properties within the
Inner Loop and Galleria trade areas which have
some of the highest asking rents in the city. Yet, as
a swath of new construction emerges in the
suburban submarkets like the Far Northwest, rates
will naturally increase. Big box spaces are asking
between the upper $20s and low $30s. The largest
rate hikes in Q1 2016 where in the Near West and
Far Southwest increasing $0.50 and $0.25
respectively.
NORTHEAST SEES MORE RETAIL DEVELOPMENT
A flurry of development activity occurred across
Houston thus far in 2016, with announcements of
new retail construction weekly. Almost 960,000 sq.
ft. delivered of which the majority was grocery
anchored space for H-E-B, Kroger and Costco.
Deliveries will continue to increase throughout the
year with approximately 860,000 sq. ft. set to
deliver in the second half of 2016. Currently the
most construction is in the Northeast submarket in
the Humble/Kingwood trade area.
Q1 2016 CBRE Research © 2016 CBRE, Inc. | 3
HOUSTON RETAIL
80
82
84
86
88
90
92
94
96
(2)
(1)
(1)
0
1
1
2
2
3
3
2005 2006 2007 2008 2009 2010 2011 2012 2013 2014 2015 2016
Net Absorption Occupancy Rate
Net Absorption (MSF) Occupancy Rate (%)
Source: CBRE Research, Q1 2016.
10
15
20
25
30
35
Community Neighborhood Regional Mall Strip Center
$/SF
Weighted Market Average
Source: CBRE Research, Q1 2016.
0
2
4
6
8
10
12
14
16
2005
2006
2007
2008
2009
2010
2011
2012
2013
2014
2015
2016
Under Construction Delivered Construction
MSF
Source: CBRE Research, Q1 2016.
Figure 3: Net Absorption and Occupancy Rate
Figure 4: Asking Rate, NNN Avg. Annual
Figure 5: Construction
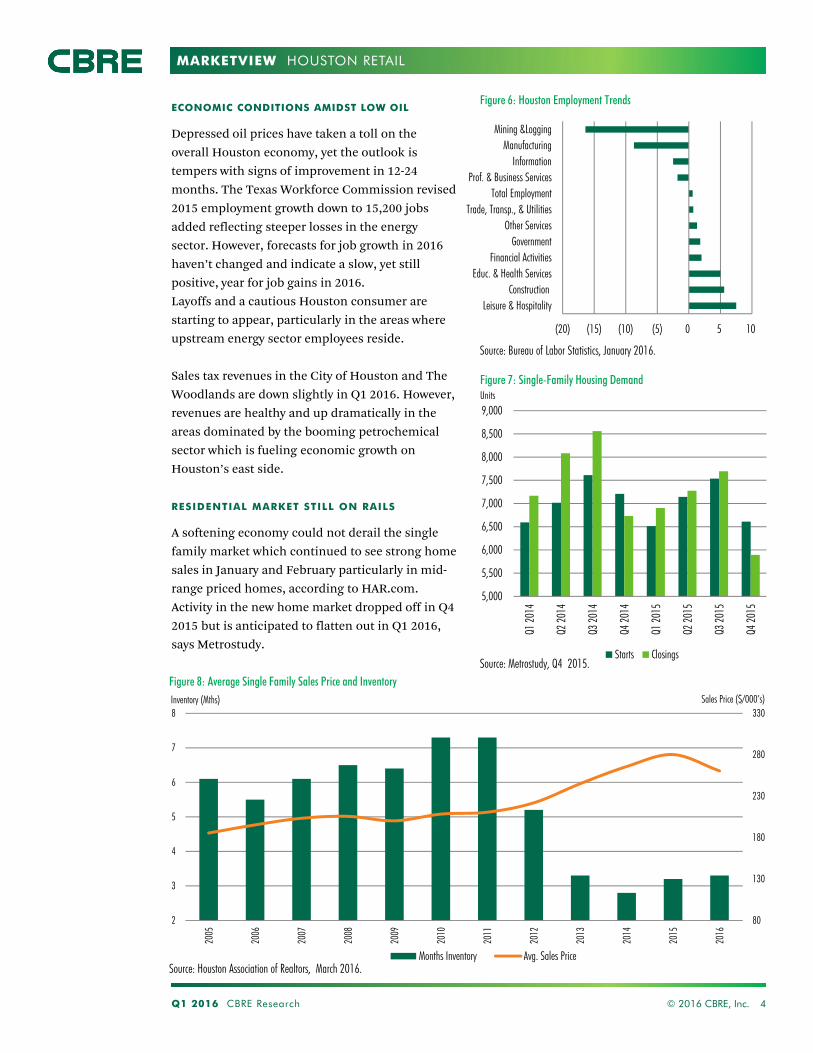
MARKETVIEW
5,000
5,500
6,000
6,500
7,000
7,500
8,000
8,500
9,000
Q1 20
14
Q2 20
14
Q3 20
14
Q4 20
14
Q1 20
15
Q2 20
15
Q3 20
15
Q4 20
15
Starts Closings
(20) (15) (10) (5) 0 5 10
Leisure & HospitalityConstruction
Educ. & Health ServicesFinancial Activities
GovernmentOther Services
Trade, Transp., & UtilitiesTotal Employment
Prof. & Business ServicesInformation
ManufacturingMining &Logging
Q1 2016 CBRE Research © 2016 CBRE, Inc. 4
HOUSTON RETAIL
ECONOMIC CONDITIONS AMIDST LOW OIL
Depressed oil prices have taken a toll on the
overall Houston economy, yet the outlook is
tempers with signs of improvement in 12-24
months. The Texas Workforce Commission revised
2015 employment growth down to 15,200 jobs
added reflecting steeper losses in the energy
sector. However, forecasts for job growth in 2016
haven’t changed and indicate a slow, yet still
positive, year for job gains in 2016.
Layoffs and a cautious Houston consumer are
starting to appear, particularly in the areas where
upstream energy sector employees reside.
Sales tax revenues in the City of Houston and The
Woodlands are down slightly in Q1 2016. However,
revenues are healthy and up dramatically in the
areas dominated by the booming petrochemical
sector which is fueling economic growth on
Houston’s east side.
RESIDENTIAL MARKET STILL ON RAILS
A softening economy could not derail the single
family market which continued to see strong home
sales in January and February particularly in mid-
range priced homes, according to HAR.com.
Activity in the new home market dropped off in Q4
2015 but is anticipated to flatten out in Q1 2016,
says Metrostudy.
Source: Metrostudy, Q4 2015.
80
130
180
230
280
330
2
3
4
5
6
7
8
2005
2006
2007
2008
2009
2010
2011
2012
2013
2014
2015
2016
Months Inventory Avg. Sales PriceSource: Houston Association of Realtors, March 2016.
Sales Price ($/000’s)Inventory (Mths)
Figure 6: Houston Employment Trends
Figure 8: Average Single Family Sales Price and Inventory
Figure 7: Single-Family Housing DemandUnits
Source: Bureau of Labor Statistics, January 2016.

MARKETVIEW
Disclaimer: Information contained herein, including projections, has been obtained from sources believed to be reliable. While we do not doubt its accuracy, we have not verified it and make no guarantee, warranty or representation about it. It is your responsibility to confirm independently its accuracy and completeness. This information is presented exclusively for use by CBRE clients and professionals and all rights to the material are reserved and cannot be reproduced without prior written permission of CBRE.
CONTACTS
Robert C. Kramp
Director, Research & Analysis
E. Michelle Miller
Research Operations Manager
Analee Micheletti
Research Analyst
CBRE OFFICES
CBRE Houston
2800 Post Oak, Suite 2300
Houston, TX 77056
To learn more about CBRE
Research, or to access additional
research reports, please visit the
Global Research Gateway at
www.cbre.com/researchgateway.
HOUSTON RETAIL
MARKETVIEW
0
1
2
3
4
5
6
7
8
9
2005 2006 2007 2008 2009 2010 2011 2012 2013 2014 2015 2016
Deliveries (MSF)
Supply and demand find balance; deliveries up 2/3rds
and 90% leased upon delivery
Houston Retail, Q4 2015
CONSUMERS MAINTAIN HEALTHY SPENDING
HABITS THROUGHOUT 2015
Extra cash from savings at the pump was in play this
holiday shopping season. Retail sales in Texas
increased 35.6% from November to December,
according to Retail Outlook Survey from The Federal
Reserve Bank of Dallas.
However, the outlook for the next six months is not as
strong. While retail respondents to said sales will be
increasing capital expenditures and prices will remain
flat. Restaurants are seeing an increase in sales but note
food and costs are rising limiting future capital
expenditures.
In the Houston MSA sales tax revenues have remained
stable throughout the year increasing about 3.4%
monthly.
The retail market is comfortable going into 2016 as
it is insulated from some of the contraction within
the energy industry.
Steady demand is a result of the strongest
population growth in the nation even during
previous recessionary periods. According to
Moody’s Analytics, the Houston metro area
population is forecast to reach 10.9 million by
2045. All of which point to a strong and growing
consumer base.
The strong demand from new consumers and
expanding residential development will continue
to drive retail employment growth as well. The
Greater Houston Partnership forecasts retail will
help bolster employment growth in 2016 adding
4,000 jobs. While the total employment forecast
calls for 21,900 jobs to be added with the largest
growth sectors being healthcare, construction and
government.
Q4 2015 CBRE Research © 2016 CBRE, Inc. | 1
Completions
1,137,757 SFNet Absorption
948,590 SFVacancy
6.1%Under Construction
2,061,058 SFWtd. Avg. Asking Rate
$17.97 PSF
Figure 1: Historical Completions
Source: CBRE Research, Q4 2015.
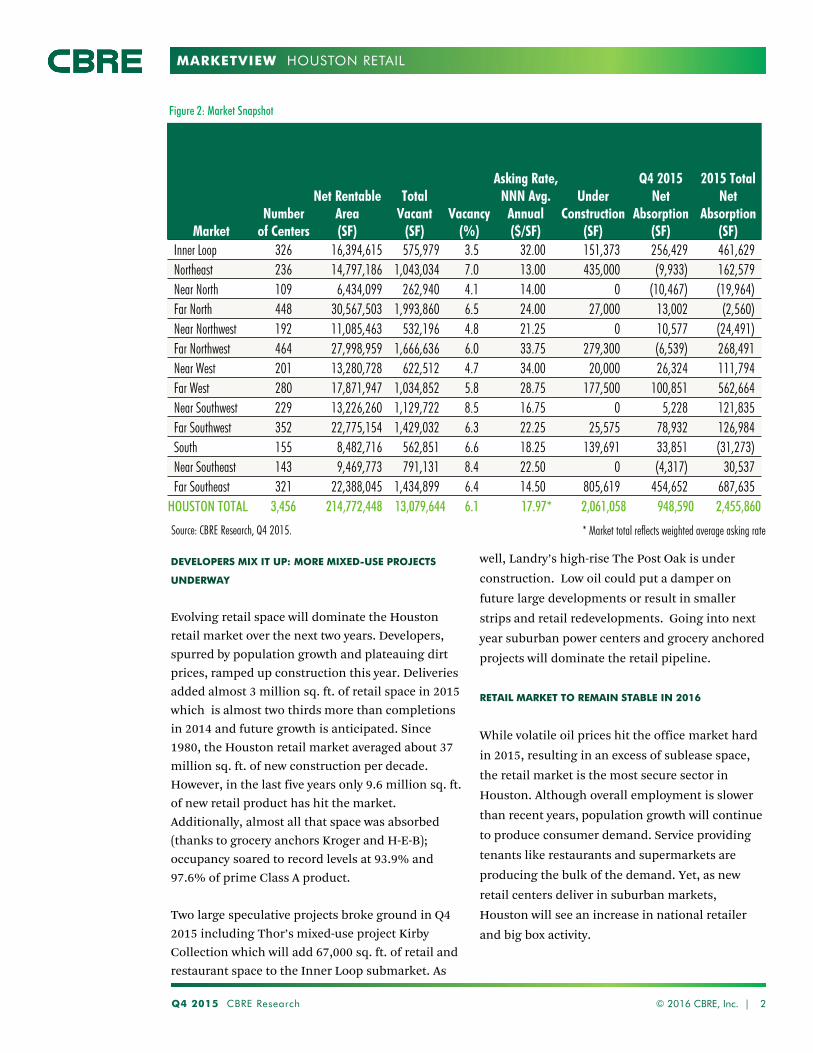
MARKETVIEW
Q4 2015 CBRE Research 2
HOUSTON RETAIL
DEVELOPERS MIX IT UP: MORE MIXED-USE PROJECTS
UNDERWAY
Evolving retail space will dominate the Houston
retail market over the next two years. Developers,
spurred by population growth and plateauing dirt
prices, ramped up construction this year. Deliveries
added almost 3 million sq. ft. of retail space in 2015
which is almost two thirds more than completions
in 2014 and future growth is anticipated. Since
1980, the Houston retail market averaged about 37
million sq. ft. of new construction per decade.
However, in the last five years only 9.6 million sq. ft.
of new retail product has hit the market.
Additionally, almost all that space was absorbed
(thanks to grocery anchors Kroger and H-E-B);
occupancy soared to record levels at 93.9% and
97.6% of prime Class A product.
Two large speculative projects broke ground in Q4
2015 including Thor’s mixed-use project Kirby
Collection which will add 67,000 sq. ft. of retail and
restaurant space to the Inner Loop submarket. As
well, Landry’s high-rise The Post Oak is under
construction. Low oil could put a damper on
future large developments or result in smaller
strips and retail redevelopments. Going into next
year suburban power centers and grocery anchored
projects will dominate the retail pipeline.
RETAIL MARKET TO REMAIN STABLE IN 2016
While volatile oil prices hit the office market hard
in 2015, resulting in an excess of sublease space,
the retail market is the most secure sector in
Houston. Although overall employment is slower
than recent years, population growth will continue
to produce consumer demand. Service providing
tenants like restaurants and supermarkets are
producing the bulk of the demand. Yet, as new
retail centers deliver in suburban markets,
Houston will see an increase in national retailer
and big box activity.
© 2016 CBRE, Inc. |
Source: CBRE Research, Q4 2015.
Figure 2: Market Snapshot
* Market total reflects weighted average asking rate
MarketNumber
of Centers
Net Rentable Area(SF)
TotalVacant
(SF)Vacancy
(%)
Asking Rate,NNN Avg.
Annual($/SF)
Under Construction
(SF)
Q4 2015Net
Absorption(SF)
2015 Total Net
Absorption (SF)
Inner Loop 326 16,394,615 575,979 3.5 32.00 151,373 256,429 461,629 Northeast 236 14,797,186 1,043,034 7.0 13.00 435,000 (9,933) 162,579 Near North 109 6,434,099 262,940 4.1 14.00 0 (10,467) (19,964)Far North 448 30,567,503 1,993,860 6.5 24.00 27,000 13,002 (2,560)Near Northwest 192 11,085,463 532,196 4.8 21.25 0 10,577 (24,491)Far Northwest 464 27,998,959 1,666,636 6.0 33.75 279,300 (6,539) 268,491 Near West 201 13,280,728 622,512 4.7 34.00 20,000 26,324 111,794 Far West 280 17,871,947 1,034,852 5.8 28.75 177,500 100,851 562,664 Near Southwest 229 13,226,260 1,129,722 8.5 16.75 0 5,228 121,835 Far Southwest 352 22,775,154 1,429,032 6.3 22.25 25,575 78,932 126,984 South 155 8,482,716 562,851 6.6 18.25 139,691 33,851 (31,273)Near Southeast 143 9,469,773 791,131 8.4 22.50 0 (4,317) 30,537 Far Southeast 321 22,388,045 1,434,899 6.4 14.50 805,619 454,652 687,635
HOUSTON TOTAL 3,456 214,772,448 13,079,644 6.1 17.97* 2,061,058 948,590 2,455,860
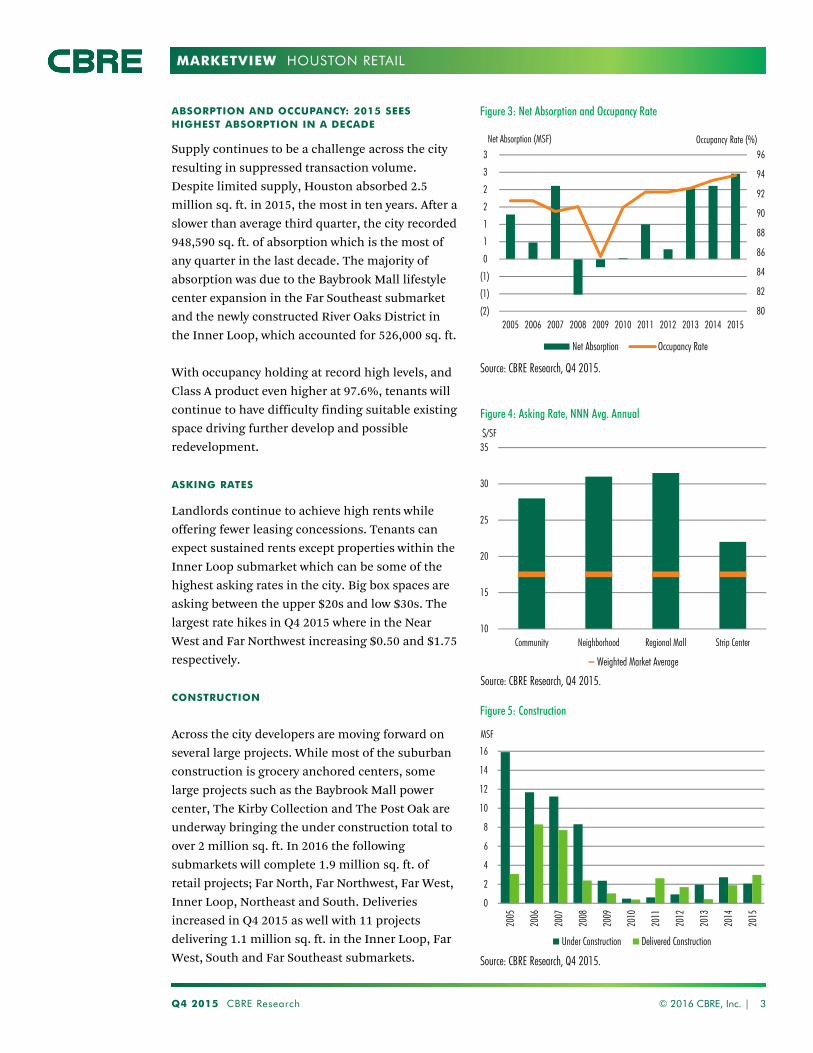
MARKETVIEW
ABSORPTION AND OCCUPANCY: 2015 SEES HIGHEST ABSORPTION IN A DECADE
Supply continues to be a challenge across the city
resulting in suppressed transaction volume.
Despite limited supply, Houston absorbed 2.5
million sq. ft. in 2015, the most in ten years. After a
slower than average third quarter, the city recorded
948,590 sq. ft. of absorption which is the most of
any quarter in the last decade. The majority of
absorption was due to the Baybrook Mall lifestyle
center expansion in the Far Southeast submarket
and the newly constructed River Oaks District in
the Inner Loop, which accounted for 526,000 sq. ft.
With occupancy holding at record high levels, and
Class A product even higher at 97.6%, tenants will
continue to have difficulty finding suitable existing
space driving further develop and possible
redevelopment.
ASKING RATES
Landlords continue to achieve high rents while
offering fewer leasing concessions. Tenants can
expect sustained rents except properties within the
Inner Loop submarket which can be some of the
highest asking rates in the city. Big box spaces are
asking between the upper $20s and low $30s. The
largest rate hikes in Q4 2015 where in the Near
West and Far Northwest increasing $0.50 and $1.75
respectively.
CONSTRUCTION
Across the city developers are moving forward on
several large projects. While most of the suburban
construction is grocery anchored centers, some
large projects such as the Baybrook Mall power
center, The Kirby Collection and The Post Oak are
underway bringing the under construction total to
over 2 million sq. ft. In 2016 the following
submarkets will complete 1.9 million sq. ft. of
retail projects; Far North, Far Northwest, Far West,
Inner Loop, Northeast and South. Deliveries
increased in Q4 2015 as well with 11 projects
delivering 1.1 million sq. ft. in the Inner Loop, Far
West, South and Far Southeast submarkets.
Q4 2015 CBRE Research © 2016 CBRE, Inc. | 3
HOUSTON RETAIL
80
82
84
86
88
90
92
94
96
(2)
(1)
(1)
0
1
1
2
2
3
3
2005 2006 2007 2008 2009 2010 2011 2012 2013 2014 2015
Net Absorption Occupancy Rate
Net Absorption (MSF) Occupancy Rate (%)
Source: CBRE Research, Q4 2015.
10
15
20
25
30
35
Community Neighborhood Regional Mall Strip Center
$/SF
Weighted Market Average
Source: CBRE Research, Q4 2015.
0
2
4
6
8
10
12
14
16
2005
2006
2007
2008
2009
2010
2011
2012
2013
2014
2015
Under Construction Delivered Construction
MSF
Source: CBRE Research, Q4 2015.
Figure 3: Net Absorption and Occupancy Rate
Figure 4: Asking Rate, NNN Avg. Annual
Figure 5: Construction
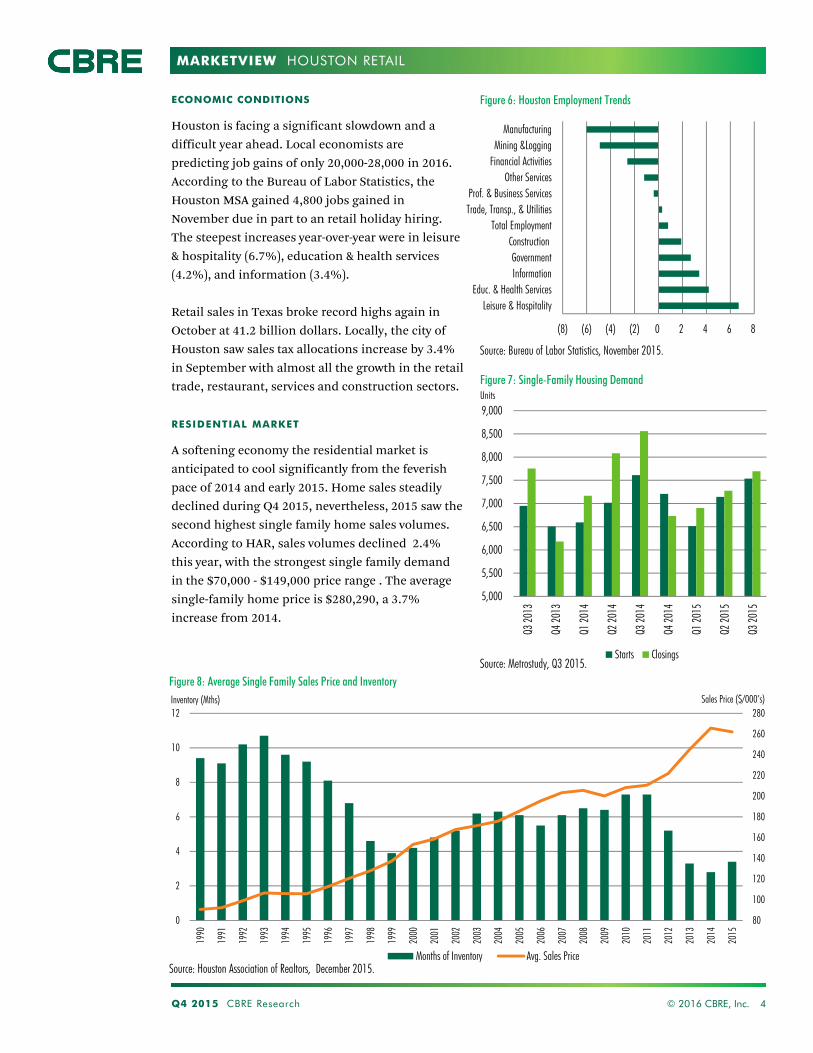
MARKETVIEW
5,000
5,500
6,000
6,500
7,000
7,500
8,000
8,500
9,000
Q3 20
13
Q4 20
13
Q1 20
14
Q2 20
14
Q3 20
14
Q4 20
14
Q1 20
15
Q2 20
15
Q3 20
15
Starts Closings
(8) (6) (4) (2) 0 2 4 6 8
Leisure & HospitalityEduc. & Health Services
InformationGovernment
ConstructionTotal Employment
Trade, Transp., & UtilitiesProf. & Business Services
Other ServicesFinancial ActivitiesMining &Logging
Manufacturing
Q4 2015 CBRE Research © 2016 CBRE, Inc. 4
HOUSTON RETAIL
ECONOMIC CONDITIONS
Houston is facing a significant slowdown and a
difficult year ahead. Local economists are
predicting job gains of only 20,000-28,000 in 2016.
According to the Bureau of Labor Statistics, the
Houston MSA gained 4,800 jobs gained in
November due in part to an retail holiday hiring.
The steepest increases year-over-year were in leisure
& hospitality (6.7%), education & health services
(4.2%), and information (3.4%).
Retail sales in Texas broke record highs again in
October at 41.2 billion dollars. Locally, the city of
Houston saw sales tax allocations increase by 3.4%
in September with almost all the growth in the retail
trade, restaurant, services and construction sectors.
RESIDENTIAL MARKET
A softening economy the residential market is
anticipated to cool significantly from the feverish
pace of 2014 and early 2015. Home sales steadily
declined during Q4 2015, nevertheless, 2015 saw the
second highest single family home sales volumes.
According to HAR, sales volumes declined 2.4%
this year, with the strongest single family demand
in the $70,000 - $149,000 price range . The average
single-family home price is $280,290, a 3.7%
increase from 2014.
Source: Metrostudy, Q3 2015.
80
100
120
140
160
180
200
220
240
260
280
0
2
4
6
8
10
12
1990
1991
1992
1993
1994
1995
1996
1997
1998
1999
2000
2001
2002
2003
2004
2005
2006
2007
2008
2009
2010
2011
2012
2013
2014
2015
Months of Inventory Avg. Sales PriceSource: Houston Association of Realtors, December 2015.
Sales Price ($/000’s)Inventory (Mths)
Figure 6: Houston Employment Trends
Figure 8: Average Single Family Sales Price and Inventory
Figure 7: Single-Family Housing DemandUnits
Source: Bureau of Labor Statistics, November 2015.

MARKETVIEW
Disclaimer: Information contained herein, including projections, has been obtained from sources believed to be reliable. While we do not doubt its accuracy, we have not verified it and make no guarantee, warranty or representation about it. It is your responsibility to confirm independently its accuracy and completeness. This information is presented exclusively for use by CBRE clients and professionals and all rights to the material are reserved and cannot be reproduced without prior written permission of CBRE.
CONTACTS
Robert C. Kramp
Director, Research & Analysis
E. Michelle Miller
Research Operations Manager
Analee Micheletti
Research Analyst
CBRE OFFICES
CBRE Houston
2800 Post Oak, Suite 2300
Houston, TX 77056
To learn more about CBRE
Research, or to access additional
research reports, please visit the
Global Research Gateway at
www.cbre.com/researchgateway.
HOUSTON RETAIL
MARKETVIEW
89
90
91
92
93
94
95
96
97
98
Near North Inner Loop Near West NearNorthwest
South Far West FarNorthwest
Houston Far North FarSouthwest
NearSoutheast
FarSoutheast
Northeast NearSouthwest
Occupancy (%)
Occupancy surges 70 bps as
population gains boost
budding demand
Houston Retail, Q3 2015
DIFFICULTY FINDING RETAIL SPACE – IT’S CROWDED
AT THE TOP
Pent up demand continues to produce strong demand
across the city both in the far suburban areas and
urban core. Occupancy increased 70 basis points (bps)
from Q3 2014, and at 94.1% is the highest market-
wide occupancy on record.
This includes all submarkets and center types, but when
examining prime properties (High-Street and Class A)
occupancy is even higher; across the city prime centers
are 97.6% occupied.
With more national retailers entering the Houston
market and a focus on luxury retailers in the Inner Loop
and Galleria area, high quality space will remain hard
to find.
Despite reports of Houston’s economic slowdown,
the retail market isn’t fazed by the dropping oil
prices. In fact, construction has increased, national
retailers are bullish on the Bayou City, and five
years of the strongest population gains in the
nation is driving healthy retail growth.
The delayed retail construction cycle has created
pent up demand for the retail market to satisfy the
larger consumer base. Likewise, the residential
market continues to be strong, including new
home growth in the west and northwest
submarkets and multifamily construction in the
same areas. Suburban sprawl will fuel retail
expansion, where as in dense urban areas retail
centers will begin to evolve following national
retailing trends.
Q3 2015 CBRE Research © 2015 CBRE, Inc. | 1
Completions
366,979 SF Net Absorption
163,479 SF Vacancy
5.9% Under Construction
2,439,747 SF Wtd. Avg. Asking Rate
$17.53 PSF
Figure 1: Occupancy by Submarket
Source: CBRE Research, Q3 2015.
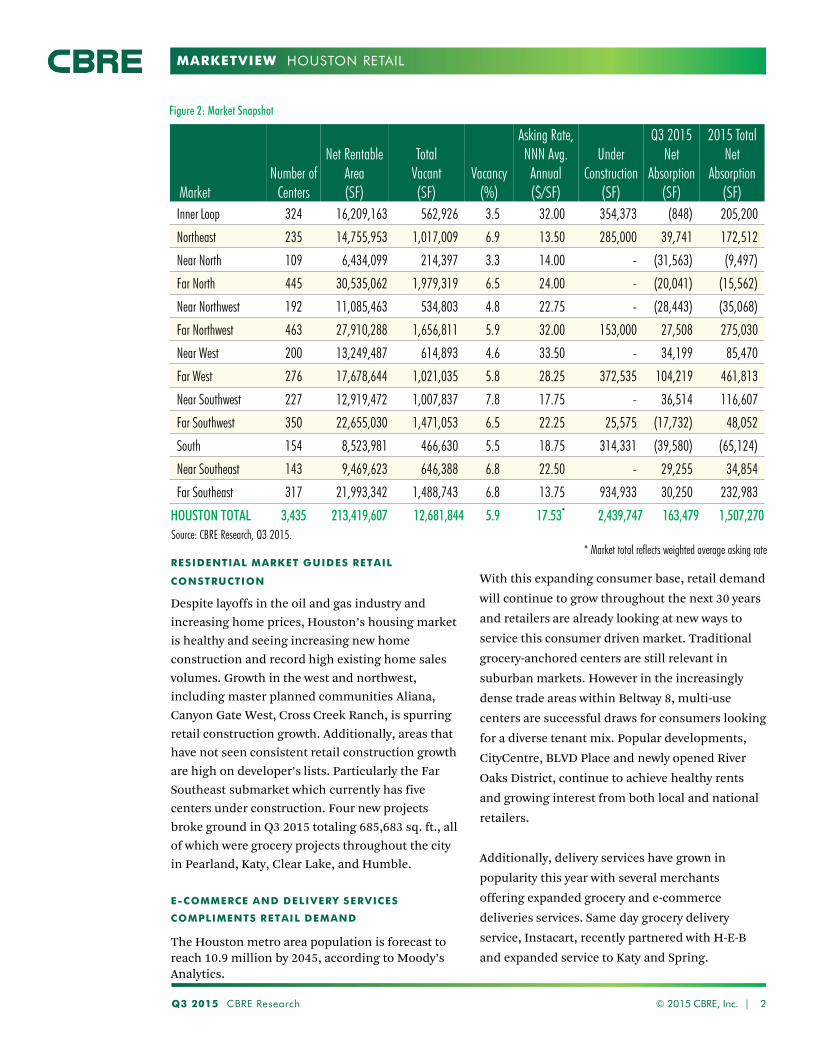
MARKETVIEW
Q3 2015 CBRE Research 2
HOUSTON RETAIL
RESIDENTIAL MARKET GUIDES RETAIL
CONSTRUCTION
Despite layoffs in the oil and gas industry and
increasing home prices, Houston’s housing market
is healthy and seeing increasing new home
construction and record high existing home sales
volumes. Growth in the west and northwest,
including master planned communities Aliana,
Canyon Gate West, Cross Creek Ranch, is spurring
retail construction growth. Additionally, areas that
have not seen consistent retail construction growth
are high on developer’s lists. Particularly the Far
Southeast submarket which currently has five
centers under construction. Four new projects
broke ground in Q3 2015 totaling 685,683 sq. ft., all
of which were grocery projects throughout the city
in Pearland, Katy, Clear Lake, and Humble.
E-COMMERCE AND DELIVERY SERVICES
COMPLIMENTS RETAIL DEMAND
The Houston metro area population is forecast to
reach 10.9 million by 2045, according to Moody’s
Analytics.
With this expanding consumer base, retail demand
will continue to grow throughout the next 30 years
and retailers are already looking at new ways to
service this consumer driven market. Traditional
grocery-anchored centers are still relevant in
suburban markets. However in the increasingly
dense trade areas within Beltway 8, multi-use
centers are successful draws for consumers looking
for a diverse tenant mix. Popular developments,
CityCentre, BLVD Place and newly opened River
Oaks District, continue to achieve healthy rents
and growing interest from both local and national
retailers.
Additionally, delivery services have grown in
popularity this year with several merchants
offering expanded grocery and e-commerce
deliveries services. Same day grocery delivery
service, Instacart, recently partnered with H-E-B
and expanded service to Katy and Spring.
© 2015 CBRE, Inc. |
Source: CBRE Research, Q3 2015. * Market total reflects weighted average asking rate
Figure 2: Market Snapshot
Market Number of
Centers
Net Rentable Area (SF)
Total Vacant (SF)
Vacancy (%)
Asking Rate, NNN Avg.
Annual ($/SF)
Under Construction
(SF)
Q3 2015 Net
Absorption (SF)
2015 Total Net
Absorption (SF)
Inner Loop 324 16,209,163 562,926 3.5 32.00 354,373 (848) 205,200
Northeast 235 14,755,953 1,017,009 6.9 13.50 285,000 39,741 172,512
Near North 109 6,434,099 214,397 3.3 14.00 - (31,563) (9,497)
Far North 445 30,535,062 1,979,319 6.5 24.00 - (20,041) (15,562)
Near Northwest 192 11,085,463 534,803 4.8 22.75 - (28,443) (35,068)
Far Northwest 463 27,910,288 1,656,811 5.9 32.00 153,000 27,508 275,030
Near West 200 13,249,487 614,893 4.6 33.50 - 34,199 85,470
Far West 276 17,678,644 1,021,035 5.8 28.25 372,535 104,219 461,813
Near Southwest 227 12,919,472 1,007,837 7.8 17.75 - 36,514 116,607
Far Southwest 350 22,655,030 1,471,053 6.5 22.25 25,575 (17,732) 48,052
South 154 8,523,981 466,630 5.5 18.75 314,331 (39,580) (65,124)
Near Southeast 143 9,469,623 646,388 6.8 22.50 - 29,255 34,854
Far Southeast 317 21,993,342 1,488,743 6.8 13.75 934,933 30,250 232,983
HOUSTON TOTAL 3,435 213,419,607 12,681,844 5.9 17.53* 2,439,747 163,479 1,507,270
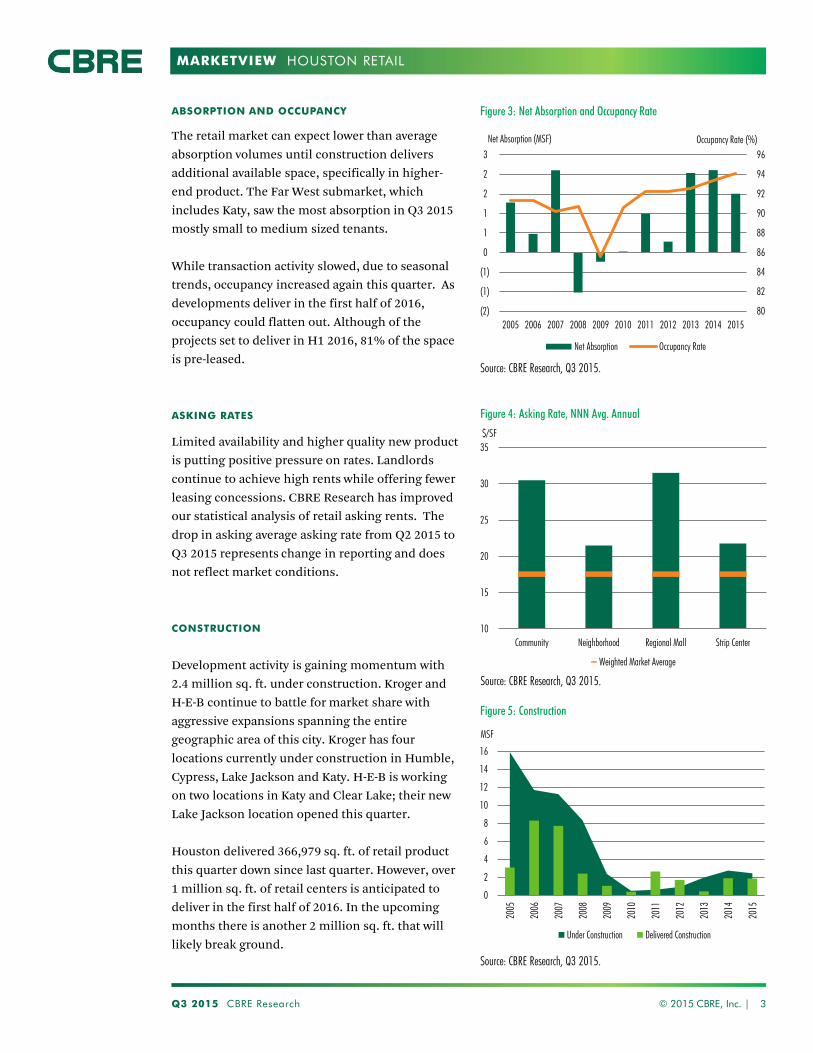
MARKETVIEW
ABSORPTION AND OCCUPANCY
The retail market can expect lower than average
absorption volumes until construction delivers
additional available space, specifically in higher-
end product. The Far West submarket, which
includes Katy, saw the most absorption in Q3 2015
mostly small to medium sized tenants.
While transaction activity slowed, due to seasonal
trends, occupancy increased again this quarter. As
developments deliver in the first half of 2016,
occupancy could flatten out. Although of the
projects set to deliver in H1 2016, 81% of the space
is pre-leased.
ASKING RATES
Limited availability and higher quality new product
is putting positive pressure on rates. Landlords
continue to achieve high rents while offering fewer
leasing concessions. CBRE Research has improved
our statistical analysis of retail asking rents. The
drop in asking average asking rate from Q2 2015 to
Q3 2015 represents change in reporting and does
not reflect market conditions.
CONSTRUCTION
Development activity is gaining momentum with
2.4 million sq. ft. under construction. Kroger and
H-E-B continue to battle for market share with
aggressive expansions spanning the entire
geographic area of this city. Kroger has four
locations currently under construction in Humble,
Cypress, Lake Jackson and Katy. H-E-B is working
on two locations in Katy and Clear Lake; their new
Lake Jackson location opened this quarter.
Houston delivered 366,979 sq. ft. of retail product
this quarter down since last quarter. However, over
1 million sq. ft. of retail centers is anticipated to
deliver in the first half of 2016. In the upcoming
months there is another 2 million sq. ft. that will
likely break ground.
Q3 2015 CBRE Research © 2015 CBRE, Inc. | 3
HOUSTON RETAIL
80
82
84
86
88
90
92
94
96
(2)
(1)
(1)
0
1
1
2
2
3
2005 2006 2007 2008 2009 2010 2011 2012 2013 2014 2015
Net Absorption Occupancy Rate
Net Absorption (MSF) Occupancy Rate (%)
Source: CBRE Research, Q3 2015.
10
15
20
25
30
35
Community Neighborhood Regional Mall Strip Center
$/SF
Weighted Market Average
Source: CBRE Research, Q3 2015.
0
2
4
6
8
10
12
14
16
2005
2006
2007
2008
2009
2010
2011
2012
2013
2014
2015
Under Construction Delivered Construction
MSF
Source: CBRE Research, Q3 2015.
Figure 3: Net Absorption and Occupancy Rate
Figure 4: Asking Rate, NNN Avg. Annual
Figure 5: Construction
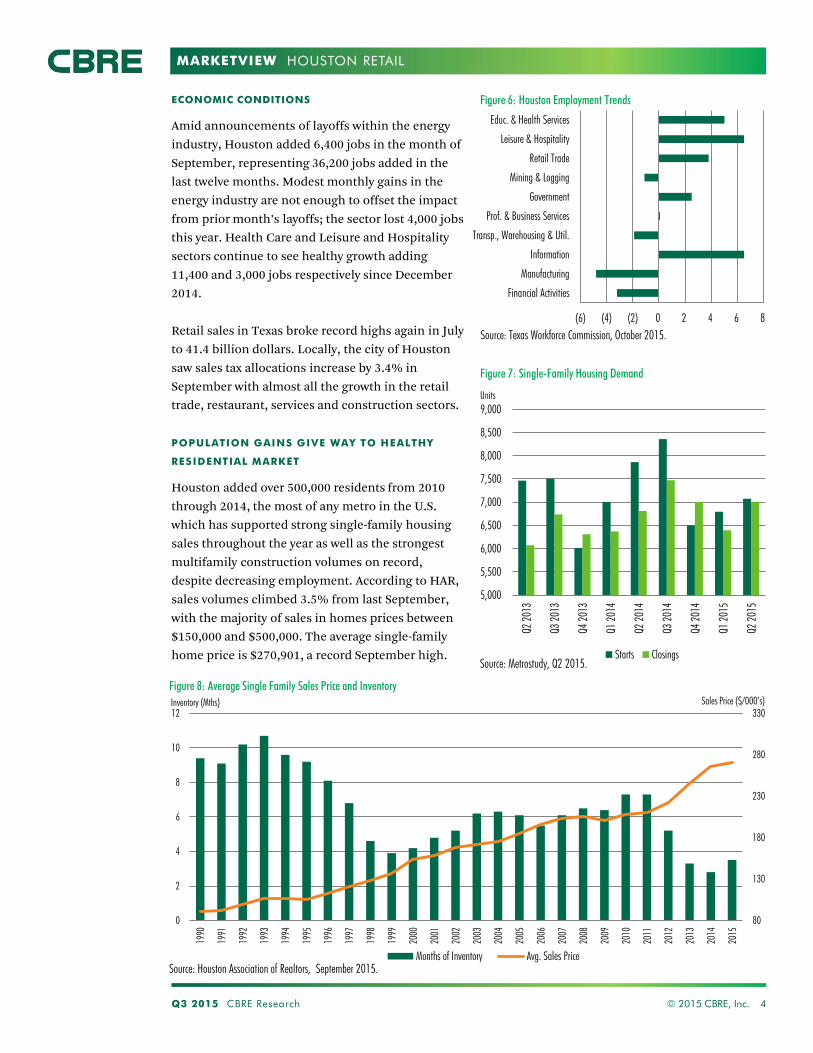
MARKETVIEW
5,000
5,500
6,000
6,500
7,000
7,500
8,000
8,500
9,000
Q2 2
013
Q3 2
013
Q4 2
013
Q1 2
014
Q2 2
014
Q3 2
014
Q4 2
014
Q1 2
015
Q2 2
015
Starts Closings
(6) (4) (2) 0 2 4 6 8
Financial Activities
Manufacturing
Information
Transp., Warehousing & Util.
Prof. & Business Services
Government
Mining & Logging
Retail Trade
Leisure & Hospitality
Educ. & Health Services
Q3 2015 CBRE Research © 2015 CBRE, Inc. 4
HOUSTON RETAIL
ECONOMIC CONDITIONS
Amid announcements of layoffs within the energy
industry, Houston added 6,400 jobs in the month of
September, representing 36,200 jobs added in the
last twelve months. Modest monthly gains in the
energy industry are not enough to offset the impact
from prior month’s layoffs; the sector lost 4,000 jobs
this year. Health Care and Leisure and Hospitality
sectors continue to see healthy growth adding
11,400 and 3,000 jobs respectively since December
2014.
Retail sales in Texas broke record highs again in July
to 41.4 billion dollars. Locally, the city of Houston
saw sales tax allocations increase by 3.4% in
September with almost all the growth in the retail
trade, restaurant, services and construction sectors.
POPULATION GAINS GIVE WAY TO HEALTHY
RESIDENTIAL MARKET
Houston added over 500,000 residents from 2010
through 2014, the most of any metro in the U.S.
which has supported strong single-family housing
sales throughout the year as well as the strongest
multifamily construction volumes on record,
despite decreasing employment. According to HAR,
sales volumes climbed 3.5% from last September,
with the majority of sales in homes prices between
$150,000 and $500,000. The average single-family
home price is $270,901, a record September high. Source: Metrostudy, Q2 2015.
80
130
180
230
280
330
0
2
4
6
8
10
12
1990
1991
1992
1993
1994
1995
1996
1997
1998
1999
2000
2001
2002
2003
2004
2005
2006
2007
2008
2009
2010
2011
2012
2013
2014
2015
Months of Inventory Avg. Sales PriceSource: Houston Association of Realtors, September 2015.
Sales Price ($/000’s) Inventory (Mths)
Figure 6: Houston Employment Trends
Figure 8: Average Single Family Sales Price and Inventory
Figure 7: Single-Family Housing Demand
Units
Source: Texas Workforce Commission, October 2015.

MARKETVIEW
Disclaimer: Information contained herein, including projections, has been obtained from sources believed to be reliable. While we do not doubt its accuracy, we have not verified it and make no guarantee, warranty or representation about it. It is your responsibility to confirm independently its accuracy and completeness. This information is presented exclusively for use by CBRE clients and professionals and all rights to the material are reserved and cannot be reproduced without prior written permission of CBRE.
CONTACTS
Robert C. Kramp
Director, Research & Analysis
E. Michelle Miller
Research Operations Manager
Analee Micheletti
Research Analyst
CBRE OFFICES
CBRE Houston
2800 Post Oak, Suite 2300
Houston, TX 77056
To learn more about CBRE
Research, or to access additional
research reports, please visit the
Global Research Gateway at
www.cbre.com/researchgateway.
HOUSTON RETAIL
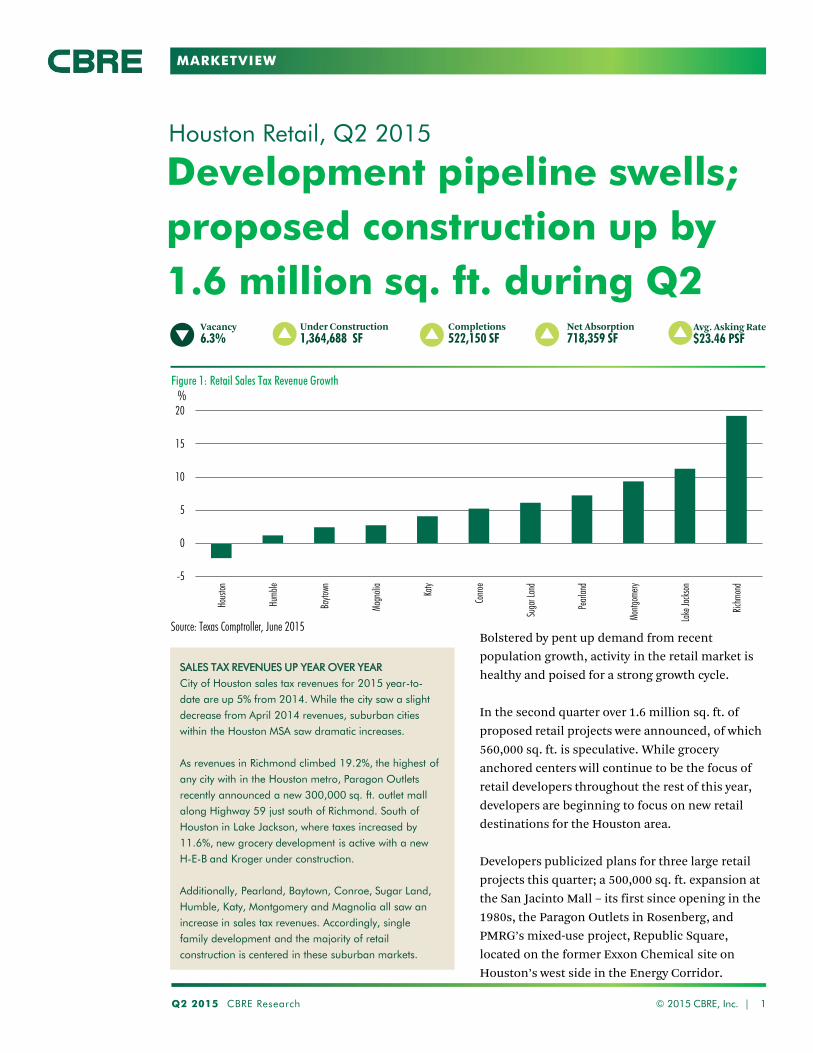
MARKETVIEW
-5
0
5
10
15
20
Hous
ton
Hum
ble
Bayt
own
Mag
nolia
Katy
Conr
oe
Suga
r Lan
d
Pear
land
Mon
tgom
ery
Lake
Jack
son
Rich
mon
d
%
Development pipeline swells;
proposed construction up by
1.6 million sq. ft. during Q2
Houston Retail, Q2 2015
SALES TAX REVENUES UP YEAR OVER YEAR
City of Houston sales tax revenues for 2015 year-to-
date are up 5% from 2014. While the city saw a slight
decrease from April 2014 revenues, suburban cities
within the Houston MSA saw dramatic increases.
As revenues in Richmond climbed 19.2%, the highest of
any city with in the Houston metro, Paragon Outlets
recently announced a new 300,000 sq. ft. outlet mall
along Highway 59 just south of Richmond. South of
Houston in Lake Jackson, where taxes increased by
11.6%, new grocery development is active with a new
H-E-B and Kroger under construction.
Additionally, Pearland, Baytown, Conroe, Sugar Land,
Humble, Katy, Montgomery and Magnolia all saw an
increase in sales tax revenues. Accordingly, single
family development and the majority of retail
construction is centered in these suburban markets.
Bolstered by pent up demand from recent
population growth, activity in the retail market is
healthy and poised for a strong growth cycle.
In the second quarter over 1.6 million sq. ft. of
proposed retail projects were announced, of which
560,000 sq. ft. is speculative. While grocery
anchored centers will continue to be the focus of
retail developers throughout the rest of this year,
developers are beginning to focus on new retail
destinations for the Houston area.
Developers publicized plans for three large retail
projects this quarter; a 500,000 sq. ft. expansion at
the San Jacinto Mall – its first since opening in the
1980s, the Paragon Outlets in Rosenberg, and
PMRG’s mixed-use project, Republic Square,
located on the former Exxon Chemical site on
Houston’s west side in the Energy Corridor.
Q2 2015 CBRE Research © 2015 CBRE, Inc. | 1
Completions
522,150 SF Net Absorption
718,359 SF Vacancy
6.3% Under Construction
1,364,688 SF Avg. Asking Rate
$23.46 PSF
Figure 1: Retail Sales Tax Revenue Growth
Source: Texas Comptroller, June 2015
MARKETVIEW
Q2 2015 CBRE Research 2
HOUSTON RETAIL
Additionally, the mixed-use project and public park
on the Midtown Superblock is underway, which
will incorporate retail and restaurant space into the
urban park.
While construction remains sluggish with only 1.3
million sq. ft. under construction, deliveries are in
line with current demand. To-date this year,
Houston has absorbed over 90% of the sq. ft.
delivered to the market forcing occupancy up to a
record high of 93.7%. Driven by low vacancy, rents
continue to climb and landlord concessions are
dwindling. Forecasted gains in consumer
spending, coupled with recent sustained
population growth, will both strengthen the
outlook for Houston's retail market, especially for
high-end development.
CONSUMER TRENDS
Strong retail sales tax revenues in the Houston
metro point to healthy consumer spending.
Unsurprisingly, the strongest demand is in
restaurants and grocery tenants due to recent
population growth. However, additional retail
expansions are in the entertainment, luxury and
fitness sectors.
Luxury urban development is thriving nationwide
and Houston is no exception. For example, The
Galleria, which hosts approximately 30 million
visitors annually, is underway with a “luxury wing”
adding high-end retailers to accompany the $250
million renovation of Saks Fifth Avenue. The River
Oaks District is also currently under construction
and will add 270,000 sf of retail space to the
market. Developed as a luxury mixed-use project,
the property will command some of the highest
rents in Houston.
© 2015 CBRE, Inc. |
Source: CBRE Research, Q2 2015.
Figure 2: Market Snapshot
Market Number of
Centers
Net Rentable Area (SF)
Total Vacant (SF)
Vacancy (%)
Asking Rate, NNN Avg.
Annual ($/SF)
Under Construction
(SF)
Q2 2015 Net
Absorption (SF)
2015 Total Net
Absorption (SF)
Inner Loop 325 16,428,296 532,675 3.2 36.75 393,838 190,431 206,048
Northeast 235 14,804,943 1,105,173 7.5 15.00 - 101,757 132,771
Near North 109 6,434,099 221,415 3.4 18.25 - 29,330 22,066
Far North 446 30,849,271 1,986,839 6.4 27.00 - 60,348 4,479
Near Northwest 188 10,760,105 514,638 4.8 20.00 - 14,932 (6,625)
Far Northwest 459 27,700,368 1,738,285 6.3 25.50 30,000 33,919 247,522
Near West 200 13,240,987 565,279 4.3 30.50 - (15,396) 51,271
Far West 278 17,823,731 1,212,420 6.8 30.50 169,446 77,106 357,594
Near Southwest 226 12,960,071 1,432,654 11.1 15.00 177,514 80,483 80,093
Far Southwest 349 22,671,489 1,459,114 6.4 25.50 - 21,588 65,784
South 151 8,336,005 453,300 5.4 20.50 314,640 (20,510) (25,544)
Near Southeast 142 9,430,797 682,374 7.2 20.00 - 33,062 5,599
Far Southeast 317 22,130,390 1,450,998 6.6 20.50 279,250 111,309 202,733
HOUSTON TOTAL 3,425 213,570,552 13,355,164 6.3 23.46 1,364,688 718,359 1,343,791
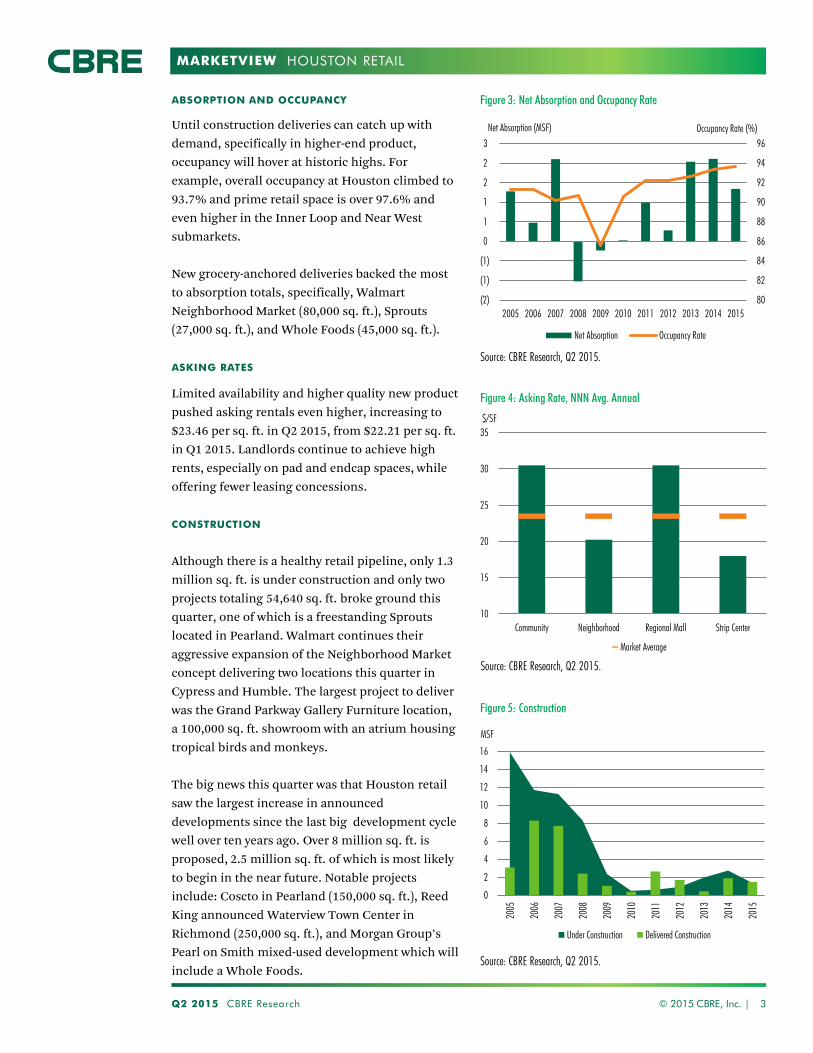
MARKETVIEW
ABSORPTION AND OCCUPANCY
Until construction deliveries can catch up with
demand, specifically in higher-end product,
occupancy will hover at historic highs. For
example, overall occupancy at Houston climbed to
93.7% and prime retail space is over 97.6% and
even higher in the Inner Loop and Near West
submarkets.
New grocery-anchored deliveries backed the most
to absorption totals, specifically, Walmart
Neighborhood Market (80,000 sq. ft.), Sprouts
(27,000 sq. ft.), and Whole Foods (45,000 sq. ft.).
ASKING RATES
Limited availability and higher quality new product
pushed asking rentals even higher, increasing to
$23.46 per sq. ft. in Q2 2015, from $22.21 per sq. ft.
in Q1 2015. Landlords continue to achieve high
rents, especially on pad and endcap spaces, while
offering fewer leasing concessions.
CONSTRUCTION
Although there is a healthy retail pipeline, only 1.3
million sq. ft. is under construction and only two
projects totaling 54,640 sq. ft. broke ground this
quarter, one of which is a freestanding Sprouts
located in Pearland. Walmart continues their
aggressive expansion of the Neighborhood Market
concept delivering two locations this quarter in
Cypress and Humble. The largest project to deliver
was the Grand Parkway Gallery Furniture location,
a 100,000 sq. ft. showroom with an atrium housing
tropical birds and monkeys.
The big news this quarter was that Houston retail
saw the largest increase in announced
developments since the last big development cycle
well over ten years ago. Over 8 million sq. ft. is
proposed, 2.5 million sq. ft. of which is most likely
to begin in the near future. Notable projects
include: Coscto in Pearland (150,000 sq. ft.), Reed
King announced Waterview Town Center in
Richmond (250,000 sq. ft.), and Morgan Group’s
Pearl on Smith mixed-used development which will
include a Whole Foods.
Q2 2015 CBRE Research © 2015 CBRE, Inc. | 3
HOUSTON RETAIL
80
82
84
86
88
90
92
94
96
(2)
(1)
(1)
0
1
1
2
2
3
2005 2006 2007 2008 2009 2010 2011 2012 2013 2014 2015
Net Absorption Occupancy Rate
Net Absorption (MSF) Occupancy Rate (%)
Source: CBRE Research, Q2 2015.
10
15
20
25
30
35
Community Neighborhood Regional Mall Strip Center
$/SF
Market Average
Source: CBRE Research, Q2 2015.
0
2
4
6
8
10
12
14
16
2005
2006
2007
2008
2009
2010
2011
2012
2013
2014
2015
Under Construction Delivered Construction
MSF
Source: CBRE Research, Q2 2015.
Figure 3: Net Absorption and Occupancy Rate
Figure 4: Asking Rate, NNN Avg. Annual
Figure 5: Construction
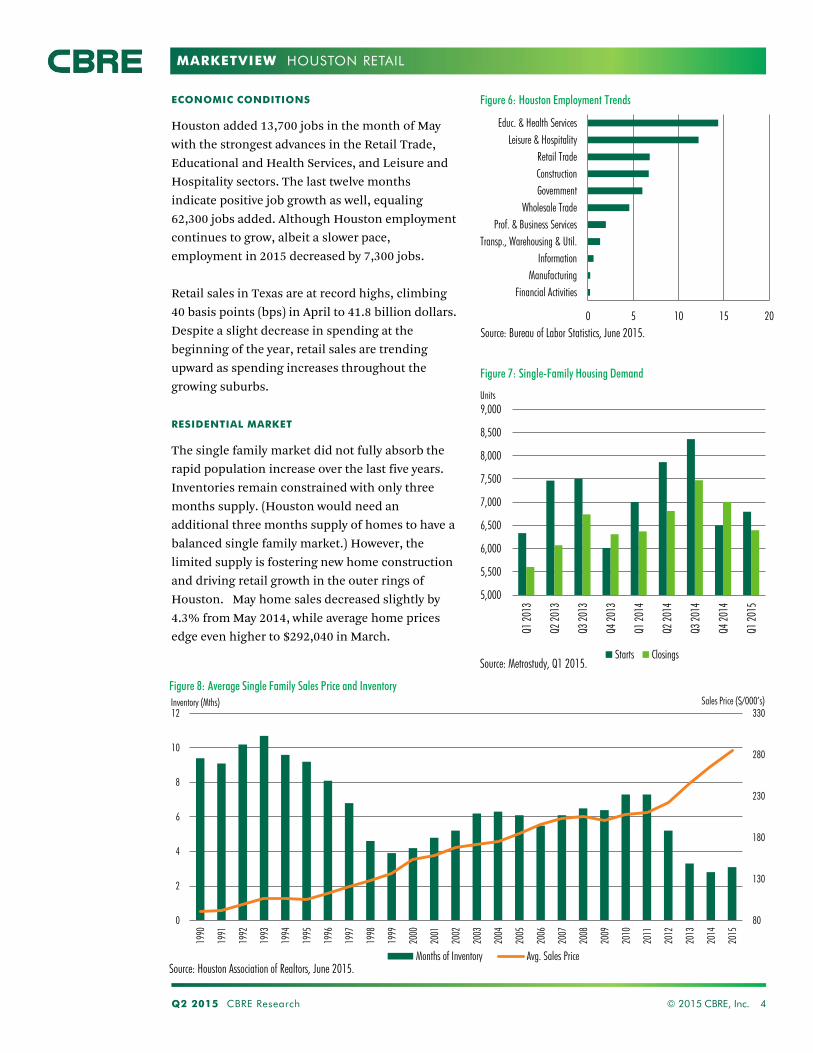
MARKETVIEW
5,000
5,500
6,000
6,500
7,000
7,500
8,000
8,500
9,000
Q1 2
013
Q2 2
013
Q3 2
013
Q4 2
013
Q1 2
014
Q2 2
014
Q3 2
014
Q4 2
014
Q1 2
015
Starts Closings
0 5 10 15 20
Financial Activities
Manufacturing
Information
Transp., Warehousing & Util.
Prof. & Business Services
Wholesale Trade
Government
Construction
Retail Trade
Leisure & Hospitality
Educ. & Health Services
Q2 2015 CBRE Research © 2015 CBRE, Inc. 4
HOUSTON RETAIL
ECONOMIC CONDITIONS
Houston added 13,700 jobs in the month of May
with the strongest advances in the Retail Trade,
Educational and Health Services, and Leisure and
Hospitality sectors. The last twelve months
indicate positive job growth as well, equaling
62,300 jobs added. Although Houston employment
continues to grow, albeit a slower pace,
employment in 2015 decreased by 7,300 jobs.
Retail sales in Texas are at record highs, climbing
40 basis points (bps) in April to 41.8 billion dollars.
Despite a slight decrease in spending at the
beginning of the year, retail sales are trending
upward as spending increases throughout the
growing suburbs.
RESIDENTIAL MARKET
The single family market did not fully absorb the
rapid population increase over the last five years.
Inventories remain constrained with only three
months supply. (Houston would need an
additional three months supply of homes to have a
balanced single family market.) However, the
limited supply is fostering new home construction
and driving retail growth in the outer rings of
Houston. May home sales decreased slightly by
4.3% from May 2014, while average home prices
edge even higher to $292,040 in March.
Source: Metrostudy, Q1 2015.
80
130
180
230
280
330
0
2
4
6
8
10
12
1990
1991
1992
1993
1994
1995
1996
1997
1998
1999
2000
2001
2002
2003
2004
2005
2006
2007
2008
2009
2010
2011
2012
2013
2014
2015
Months of Inventory Avg. Sales PriceSource: Houston Association of Realtors, June 2015.
Sales Price ($/000’s) Inventory (Mths)
Figure 6: Houston Employment Trends
Figure 8: Average Single Family Sales Price and Inventory
Figure 7: Single-Family Housing Demand
Units
Source: Bureau of Labor Statistics, June 2015.
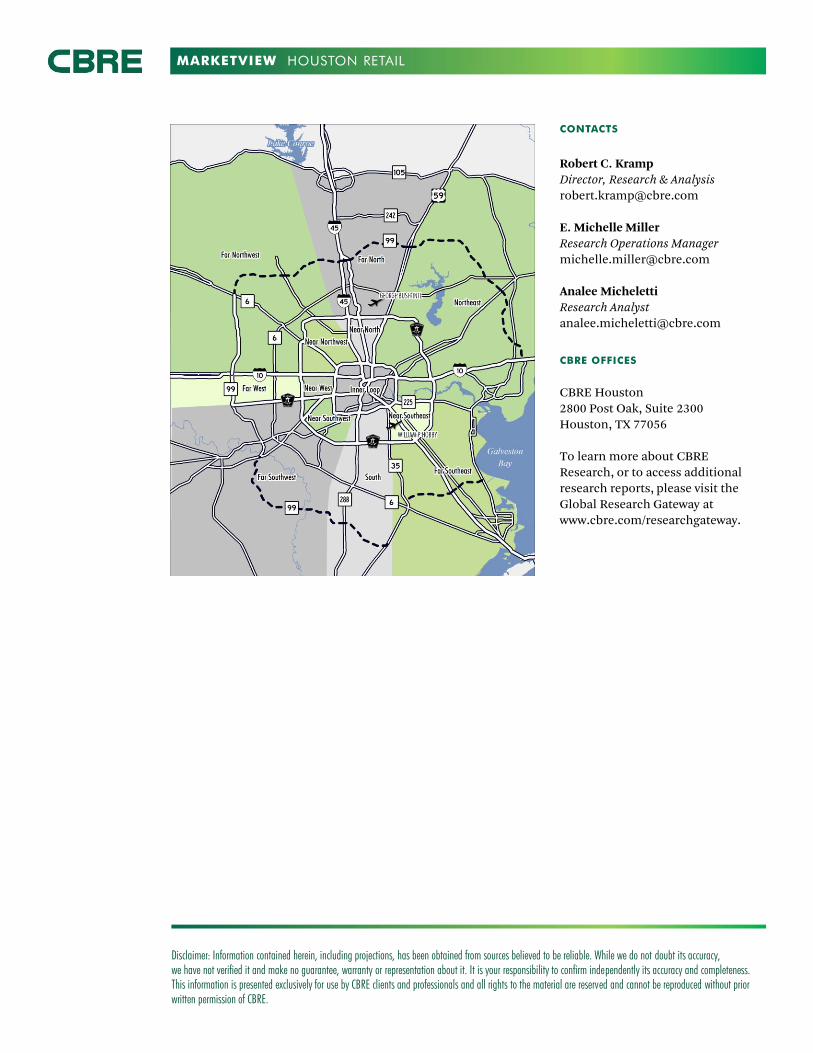
MARKETVIEW
Disclaimer: Information contained herein, including projections, has been obtained from sources believed to be reliable. While we do not doubt its accuracy, we have not verified it and make no guarantee, warranty or representation about it. It is your responsibility to confirm independently its accuracy and completeness. This information is presented exclusively for use by CBRE clients and professionals and all rights to the material are reserved and cannot be reproduced without prior written permission of CBRE.
CONTACTS
Robert C. Kramp
Director, Research & Analysis
E. Michelle Miller
Research Operations Manager
Analee Micheletti
Research Analyst
CBRE OFFICES
CBRE Houston
2800 Post Oak, Suite 2300
Houston, TX 77056
To learn more about CBRE
Research, or to access additional
research reports, please visit the
Global Research Gateway at
www.cbre.com/researchgateway.
HOUSTON RETAIL
MARKETVIEW
Retail waiting for construction to catch up with demand
Houston Retail, Q1 2015
HOUSTON IS FASTEST GROWING METRO IN THE
NATION
Since 2010, Houston has grown by 9.1% or 541,104
residents, more than any other metro area in the nation.
In the last year, Houston added 156,371 new residents,
trailing only Austin which grew by 3% from 2013 to
2014. Last year there were 98,133 net migrations to the
Houston metro. The Greater Houston Partnership
estimates Houston’s population to reach 6.6 million by
the middle of 2015.
HOW SLOW IS RETAIL CONSTRUCTION?
Since 1980, the Houston retail market averaged about
37 million sq. ft. of new construction per decade.
However, in the last five years only 5 million sq. ft. of
new retail product has hit the market. The last decade
to deliver less than 30 million sq. ft. was the 1970’s,
which only added 5.2 million sq. ft. But with office and
multifamily construction slowing, more sites will become
available for retail developers as land prices begin to
decrease.
Pent up demand and constrained construction
market drove occupancy to a new record high of
93.5% in Q1 2015.
Tight supply in prime high street space is limiting
retailers current leasing decisions. Tenants,
restaurants in particular, struggling to find
available high end space are transitioning to
smaller concepts following a growing national
trend of fast casual concepts. Currently restaurants
and grocers make up a large part of the expanding
retailers in Houston. However, discount stores are
the only tenant type looking for larger spaces.
While national retailers ramp up expansions due to
improving economic conditions across the nation,
leasing activity in Houston slowed about 20% in
the last two quarters. Yet, absorption levels remain
steady attributed mostly to grocery expansions and
tenants occupying new construction. The overall
retail market absorbed 625,432 sq. ft. in Q1 2015,
with the Far West and Far Northwest submarkets
being the most active.
Nationally consumers, now less encumbered by
debt and benefiting from lower gasoline prices, are
expected to bolster retail activity. According to the
Energy Information Administration, lower oil
prices will save consumers more than $700 this
year. Houston consumers are not immune to these
benefits, despite predictions of a softening local
economy. And there are more consumers in
Houston than ever before due to dramatic
population growth.
Q1 2015 CBRE Research © 2015 CBRE, Inc. | 1
Completions
957, 187 SFNet Absorption
625,432 SFVacancy
6.5%Under Construction
1,680,214 SFAvg. Asking Rate
22.21 $/SF
Construction Cycles Deliveries (MSF) Occupancy(%)
1980 - 1989 35.3 75.9
1993 - 1996 17.1 86.9
1999 - 2002 21.9 87.0
2006 - 2009 20.2 86.0
2012 - 2015 5.6 93.5
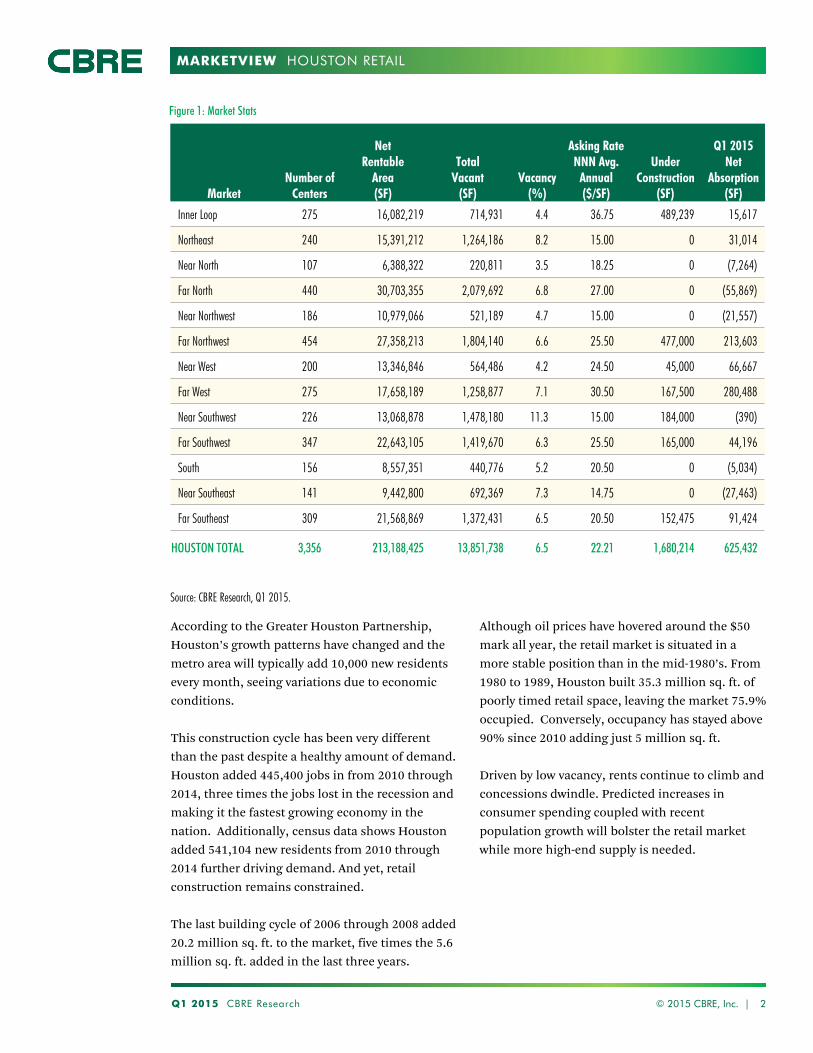
MARKETVIEW
Q1 2015 CBRE Research 2
HOUSTON RETAIL
According to the Greater Houston Partnership,
Houston’s growth patterns have changed and the
metro area will typically add 10,000 new residents
every month, seeing variations due to economic
conditions.
This construction cycle has been very different
than the past despite a healthy amount of demand.
Houston added 445,400 jobs in from 2010 through
2014, three times the jobs lost in the recession and
making it the fastest growing economy in the
nation. Additionally, census data shows Houston
added 541,104 new residents from 2010 through
2014 further driving demand. And yet, retail
construction remains constrained.
The last building cycle of 2006 through 2008 added
20.2 million sq. ft. to the market, five times the 5.6
million sq. ft. added in the last three years.
Although oil prices have hovered around the $50
mark all year, the retail market is situated in a
more stable position than in the mid-1980’s. From
1980 to 1989, Houston built 35.3 million sq. ft. of
poorly timed retail space, leaving the market 75.9%
occupied. Conversely, occupancy has stayed above
90% since 2010 adding just 5 million sq. ft.
Driven by low vacancy, rents continue to climb and
concessions dwindle. Predicted increases in
consumer spending coupled with recent
population growth will bolster the retail market
while more high-end supply is needed.
© 2015 CBRE, Inc. |
Source: CBRE Research, Q1 2015.
Figure 1: Market Stats
MarketNumber of
Centers
Net Rentable
Area(SF)
TotalVacant
(SF)Vacancy
(%)
Asking RateNNN Avg.
Annual($/SF)
Under Construction
(SF)
Q1 2015Net
Absorption(SF)
Inner Loop 275 16,082,219 714,931 4.4 36.75 489,239 15,617
Northeast 240 15,391,212 1,264,186 8.2 15.00 0 31,014
Near North 107 6,388,322 220,811 3.5 18.25 0 (7,264)
Far North 440 30,703,355 2,079,692 6.8 27.00 0 (55,869)
Near Northwest 186 10,979,066 521,189 4.7 15.00 0 (21,557)
Far Northwest 454 27,358,213 1,804,140 6.6 25.50 477,000 213,603
Near West 200 13,346,846 564,486 4.2 24.50 45,000 66,667
Far West 275 17,658,189 1,258,877 7.1 30.50 167,500 280,488
Near Southwest 226 13,068,878 1,478,180 11.3 15.00 184,000 (390)
Far Southwest 347 22,643,105 1,419,670 6.3 25.50 165,000 44,196
South 156 8,557,351 440,776 5.2 20.50 0 (5,034)
Near Southeast 141 9,442,800 692,369 7.3 14.75 0 (27,463)
Far Southeast 309 21,568,869 1,372,431 6.5 20.50 152,475 91,424
HOUSTON TOTAL 3,356 213,188,425 13,851,738 6.5 22.21 1,680,214 625,432
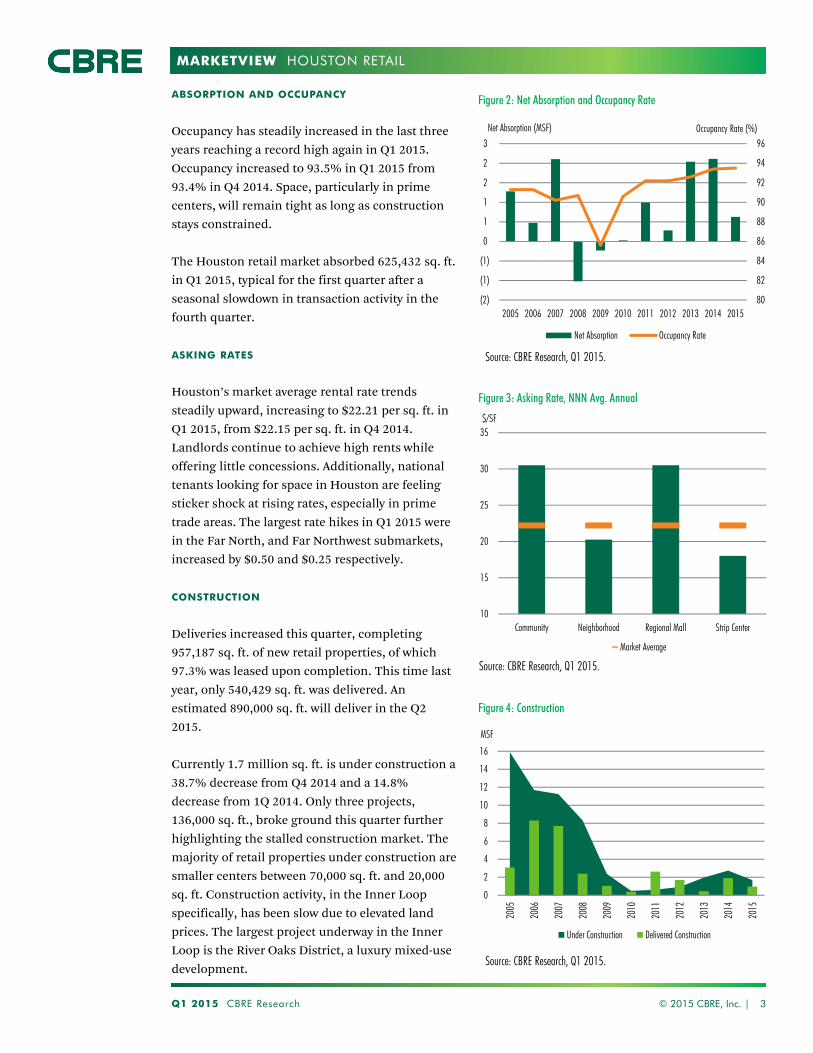
MARKETVIEW
ABSORPTION AND OCCUPANCY
Occupancy has steadily increased in the last three
years reaching a record high again in Q1 2015.
Occupancy increased to 93.5% in Q1 2015 from
93.4% in Q4 2014. Space, particularly in prime
centers, will remain tight as long as construction
stays constrained.
The Houston retail market absorbed 625,432 sq. ft.
in Q1 2015, typical for the first quarter after a
seasonal slowdown in transaction activity in the
fourth quarter.
ASKING RATES
Houston’s market average rental rate trends
steadily upward, increasing to $22.21 per sq. ft. in
Q1 2015, from $22.15 per sq. ft. in Q4 2014.
Landlords continue to achieve high rents while
offering little concessions. Additionally, national
tenants looking for space in Houston are feeling
sticker shock at rising rates, especially in prime
trade areas. The largest rate hikes in Q1 2015 were
in the Far North, and Far Northwest submarkets,
increased by $0.50 and $0.25 respectively.
CONSTRUCTION
Deliveries increased this quarter, completing
957,187 sq. ft. of new retail properties, of which
97.3% was leased upon completion. This time last
year, only 540,429 sq. ft. was delivered. An
estimated 890,000 sq. ft. will deliver in the Q2
2015.
Currently 1.7 million sq. ft. is under construction a
38.7% decrease from Q4 2014 and a 14.8%
decrease from 1Q 2014. Only three projects,
136,000 sq. ft., broke ground this quarter further
highlighting the stalled construction market. The
majority of retail properties under construction are
smaller centers between 70,000 sq. ft. and 20,000
sq. ft. Construction activity, in the Inner Loop
specifically, has been slow due to elevated land
prices. The largest project underway in the Inner
Loop is the River Oaks District, a luxury mixed-use
development.
Q1 2015 CBRE Research © 2015 CBRE, Inc. | 3
HOUSTON RETAIL
80
82
84
86
88
90
92
94
96
(2)
(1)
(1)
0
1
1
2
2
3
2005 2006 2007 2008 2009 2010 2011 2012 2013 2014 2015
Net Absorption Occupancy Rate
Net Absorption (MSF) Occupancy Rate (%)
Source: CBRE Research, Q1 2015.
10
15
20
25
30
35
Community Neighborhood Regional Mall Strip Center
$/SF
Market Average
Source: CBRE Research, Q1 2015.
0
2
4
6
8
10
12
14
16
2005
2006
2007
2008
2009
2010
2011
2012
2013
2014
2015
Under Construction Delivered Construction
MSF
Source: CBRE Research, Q1 2015.
Figure 2: Net Absorption and Occupancy Rate
Figure 3: Asking Rate, NNN Avg. Annual
Figure 4: Construction
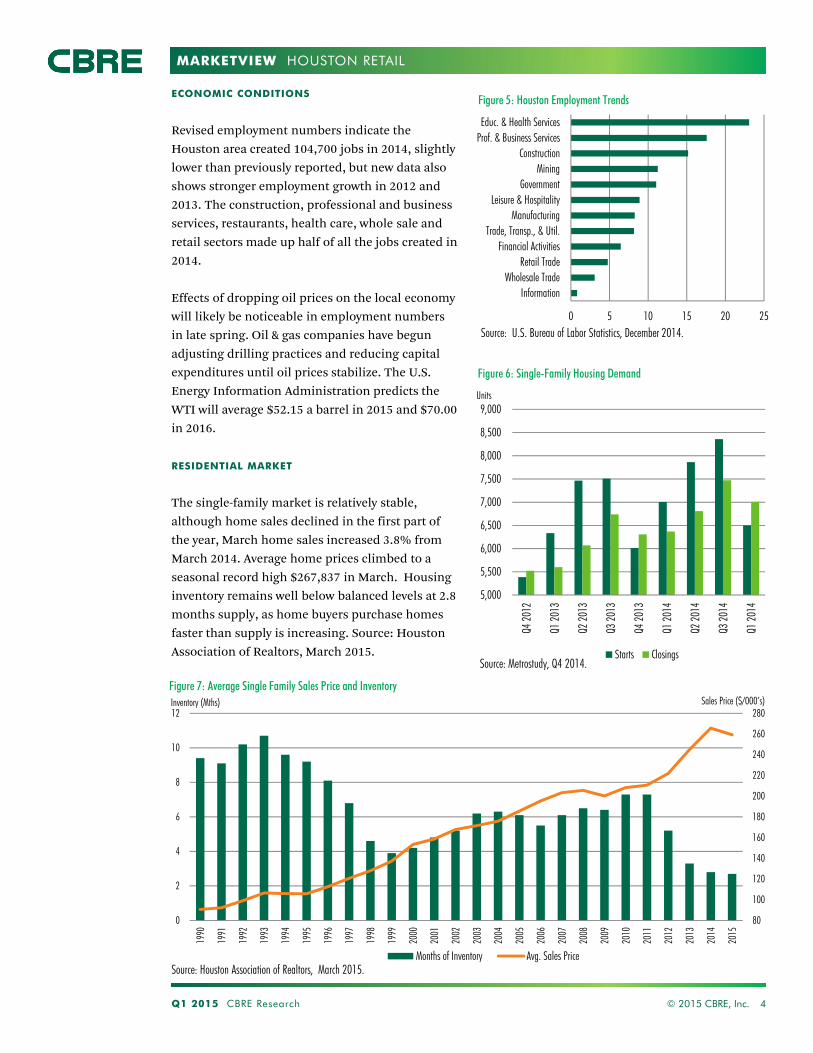
MARKETVIEW
5,000
5,500
6,000
6,500
7,000
7,500
8,000
8,500
9,000
Q4 20
12
Q1 20
13
Q2 20
13
Q3 20
13
Q4 20
13
Q1 20
14
Q2 20
14
Q3 20
14
Q1 20
14
Starts Closings
0 5 10 15 20 25
InformationWholesale Trade
Retail TradeFinancial Activities
Trade, Transp., & Util.Manufacturing
Leisure & HospitalityGovernment
MiningConstruction
Prof. & Business ServicesEduc. & Health Services
Q1 2015 CBRE Research © 2015 CBRE, Inc. 4
HOUSTON RETAIL
ECONOMIC CONDITIONS
Revised employment numbers indicate the
Houston area created 104,700 jobs in 2014, slightly
lower than previously reported, but new data also
shows stronger employment growth in 2012 and
2013. The construction, professional and business
services, restaurants, health care, whole sale and
retail sectors made up half of all the jobs created in
2014.
Effects of dropping oil prices on the local economy
will likely be noticeable in employment numbers
in late spring. Oil & gas companies have begun
adjusting drilling practices and reducing capital
expenditures until oil prices stabilize. The U.S.
Energy Information Administration predicts the
WTI will average $52.15 a barrel in 2015 and $70.00
in 2016.
RESIDENTIAL MARKET
The single-family market is relatively stable,
although home sales declined in the first part of
the year, March home sales increased 3.8% from
March 2014. Average home prices climbed to a
seasonal record high $267,837 in March. Housing
inventory remains well below balanced levels at 2.8
months supply, as home buyers purchase homes
faster than supply is increasing. Source: Houston
Association of Realtors, March 2015.Source: Metrostudy, Q4 2014.
80
100
120
140
160
180
200
220
240
260
280
0
2
4
6
8
10
12
1990
1991
1992
1993
1994
1995
1996
1997
1998
1999
2000
2001
2002
2003
2004
2005
2006
2007
2008
2009
2010
2011
2012
2013
2014
2015
Months of Inventory Avg. Sales Price
Source: U.S. Bureau of Labor Statistics, December 2014.
Source: Houston Association of Realtors, March 2015.
Sales Price ($/000’s)Inventory (Mths)
Figure 5: Houston Employment Trends
Figure 7: Average Single Family Sales Price and Inventory
Figure 6: Single-Family Housing Demand
Units

MARKETVIEW
Disclaimer: Information contained herein, including projections, has been obtained from sources believed to be reliable. While we do not doubt its accuracy, we have not verified it and make no guarantee, warranty or representation about it. It is your responsibility to confirm independently its accuracy and completeness. This information is presented exclusively for use by CBRE clients and professionals and all rights to the material are reserved and cannot be reproduced without prior written permission of CBRE.
CONTACTS
Lynn Cirillo
Research Operations Manager
Analee Micheletti
Research Analyst
+1 713 5771792
CBRE OFFICES
CBRE Houston
2800 Post Oak, Suite 2300
Houston, TX 77056
To learn more about CBRE
Research, or to access additional
research reports, please visit the
Global Research Gateway at
www.cbre.com/researchgateway.
HOUSTON RETAIL
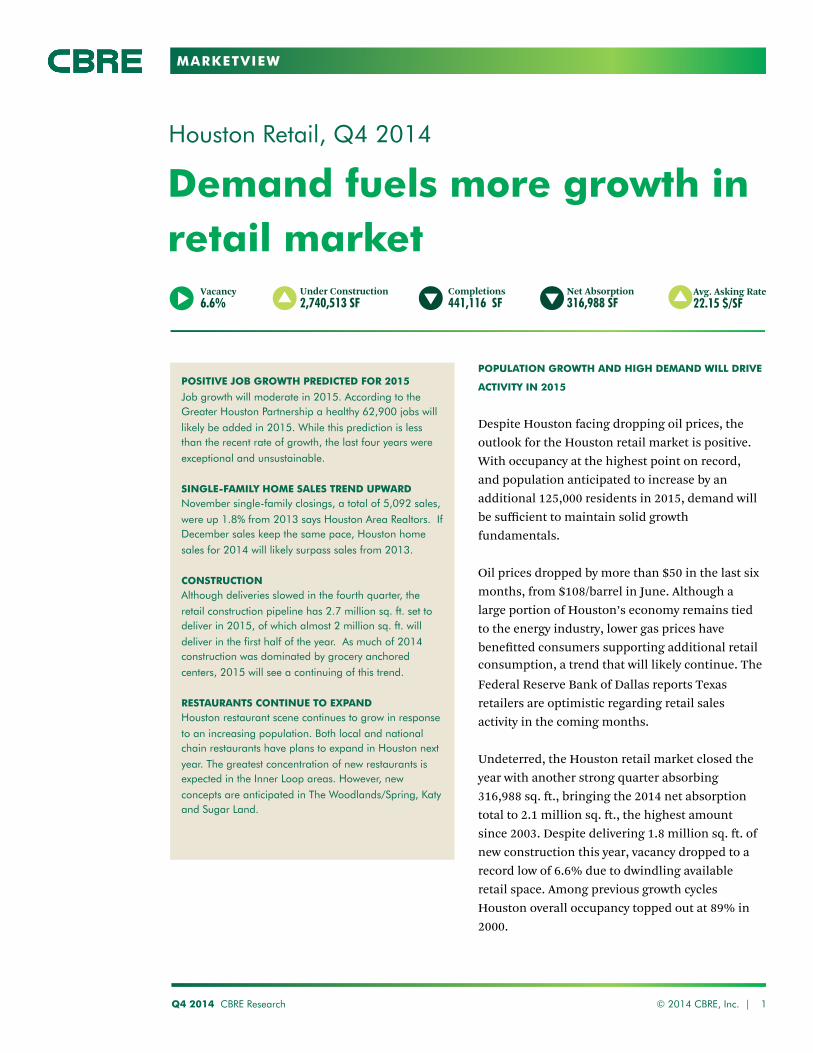
MARKETVIEW
Demand fuels more growth in retail market
Houston Retail, Q4 2014
POSITIVE JOB GROWTH PREDICTED FOR 2015
Job growth will moderate in 2015. According to the Greater Houston Partnership a healthy 62,900 jobs will
likely be added in 2015. While this prediction is less than the recent rate of growth, the last four years were
exceptional and unsustainable.
SINGLE-FAMILY HOME SALES TREND UPWARD November single-family closings, a total of 5,092 sales,
were up 1.8% from 2013 says Houston Area Realtors. If December sales keep the same pace, Houston home
sales for 2014 will likely surpass sales from 2013.
CONSTRUCTION Although deliveries slowed in the fourth quarter, the
retail construction pipeline has 2.7 million sq. ft. set to deliver in 2015, of which almost 2 million sq. ft. will
deliver in the first half of the year. As much of 2014 construction was dominated by grocery anchored
centers, 2015 will see a continuing of this trend.
RESTAURANTS CONTINUE TO EXPAND Houston restaurant scene continues to grow in response
to an increasing population. Both local and national chain restaurants have plans to expand in Houston next
year. The greatest concentration of new restaurants is expected in the Inner Loop areas. However, new
concepts are anticipated in The Woodlands/Spring, Katy and Sugar Land.
POPULATION GROWTH AND HIGH DEMAND WILL DRIVE
ACTIVITY IN 2015
Despite Houston facing dropping oil prices, the outlook for the Houston retail market is positive. With occupancy at the highest point on record, and population anticipated to increase by an additional 125,000 residents in 2015, demand will be sufficient to maintain solid growth fundamentals. Oil prices dropped by more than $50 in the last six months, from $108/barrel in June. Although a large portion of Houston’s economy remains tied to the energy industry, lower gas prices have benefitted consumers supporting additional retail consumption, a trend that will likely continue. The Federal Reserve Bank of Dallas reports Texas retailers are optimistic regarding retail sales activity in the coming months. Undeterred, the Houston retail market closed the year with another strong quarter absorbing 316,988 sq. ft., bringing the 2014 net absorption total to 2.1 million sq. ft., the highest amount since 2003. Despite delivering 1.8 million sq. ft. of new construction this year, vacancy dropped to a record low of 6.6% due to dwindling available retail space. Among previous growth cycles Houston overall occupancy topped out at 89% in 2000.
Q4 2014 CBRE Research © 2014 CBRE, Inc. | 1
Completions 441,116 SF
Net Absorption 316,988 SF
Vacancy 6.6%
Under Construction 2,740,513 SF
Avg. Asking Rate 22.15 $/SF
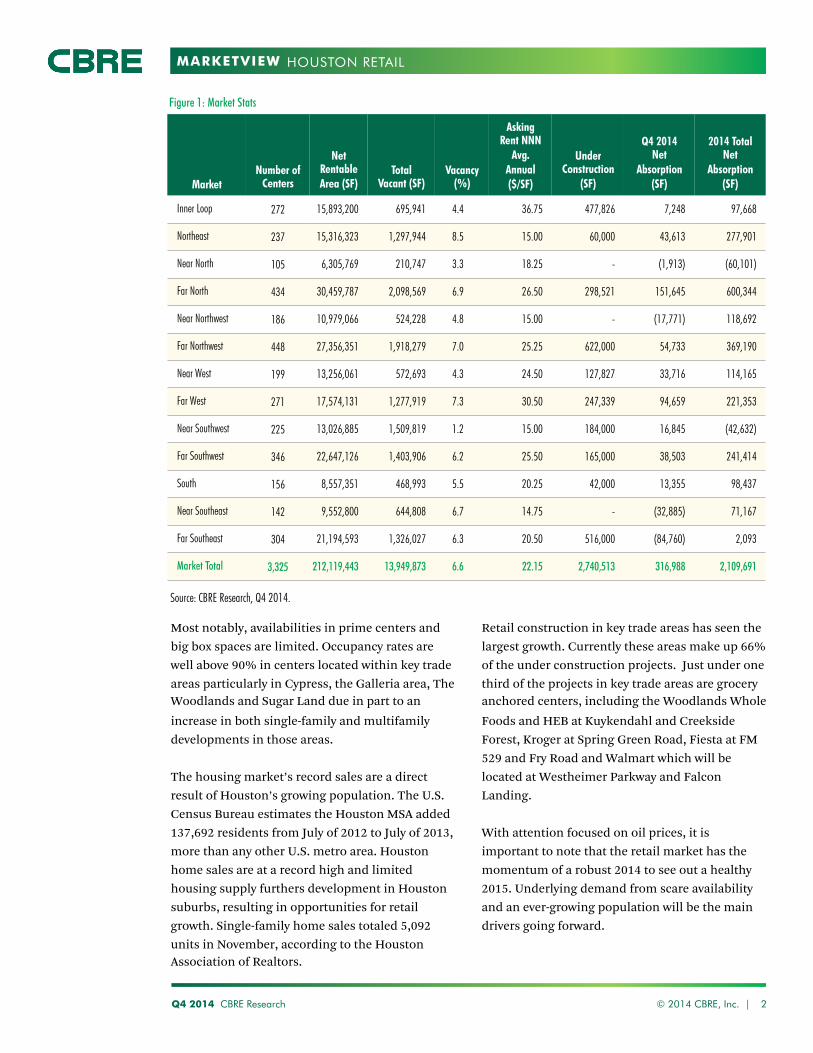
MARKETVIEW
Q4 2014 CBRE Research 2
HOUSTON RETAIL
Market Number of
Centers
Net Rentable Area (SF)
Total Vacant (SF)
Vacancy (%)
Asking Rent NNN
Avg. Annual ($/SF)
Under Construction
(SF)
Q4 2014 Net
Absorption (SF)
2014 Total Net
Absorption (SF)
Inner Loop 272 15,893,200 695,941 4.4 36.75 477,826 7,248 97,668
Northeast 237 15,316,323 1,297,944 8.5 15.00 60,000 43,613 277,901
Near North 105 6,305,769 210,747 3.3 18.25 - (1,913) (60,101)
Far North 434 30,459,787 2,098,569 6.9 26.50 298,521 151,645 600,344
Near Northwest 186 10,979,066 524,228 4.8 15.00 - (17,771) 118,692
Far Northwest 448 27,356,351 1,918,279 7.0 25.25 622,000 54,733 369,190
Near West 199 13,256,061 572,693 4.3 24.50 127,827 33,716 114,165
Far West 271 17,574,131 1,277,919 7.3 30.50 247,339 94,659 221,353
Near Southwest 225 13,026,885 1,509,819 1.2 15.00 184,000 16,845 (42,632)
Far Southwest 346 22,647,126 1,403,906 6.2 25.50 165,000 38,503 241,414
South 156 8,557,351 468,993 5.5 20.25 42,000 13,355 98,437
Near Southeast 142 9,552,800 644,808 6.7 14.75 - (32,885) 71,167
Far Southeast 304 21,194,593 1,326,027 6.3 20.50 516,000 (84,760) 2,093
Market Total 3,325 212,119,443 13,949,873 6.6 22.15 2,740,513 316,988 2,109,691
Most notably, availabilities in prime centers and big box spaces are limited. Occupancy rates are well above 90% in centers located within key trade areas particularly in Cypress, the Galleria area, The Woodlands and Sugar Land due in part to an increase in both single-family and multifamily developments in those areas. The housing market’s record sales are a direct result of Houston’s growing population. The U.S. Census Bureau estimates the Houston MSA added 137,692 residents from July of 2012 to July of 2013, more than any other U.S. metro area. Houston home sales are at a record high and limited housing supply furthers development in Houston suburbs, resulting in opportunities for retail growth. Single-family home sales totaled 5,092 units in November, according to the Houston Association of Realtors.
Retail construction in key trade areas has seen the largest growth. Currently these areas make up 66% of the under construction projects. Just under one third of the projects in key trade areas are grocery anchored centers, including the Woodlands Whole Foods and HEB at Kuykendahl and Creekside Forest, Kroger at Spring Green Road, Fiesta at FM 529 and Fry Road and Walmart which will be located at Westheimer Parkway and Falcon Landing. With attention focused on oil prices, it is important to note that the retail market has the momentum of a robust 2014 to see out a healthy 2015. Underlying demand from scare availability and an ever-growing population will be the main drivers going forward.
© 2014 CBRE, Inc. |
Source: CBRE Research, Q4 2014.
Figure 1: Market Stats
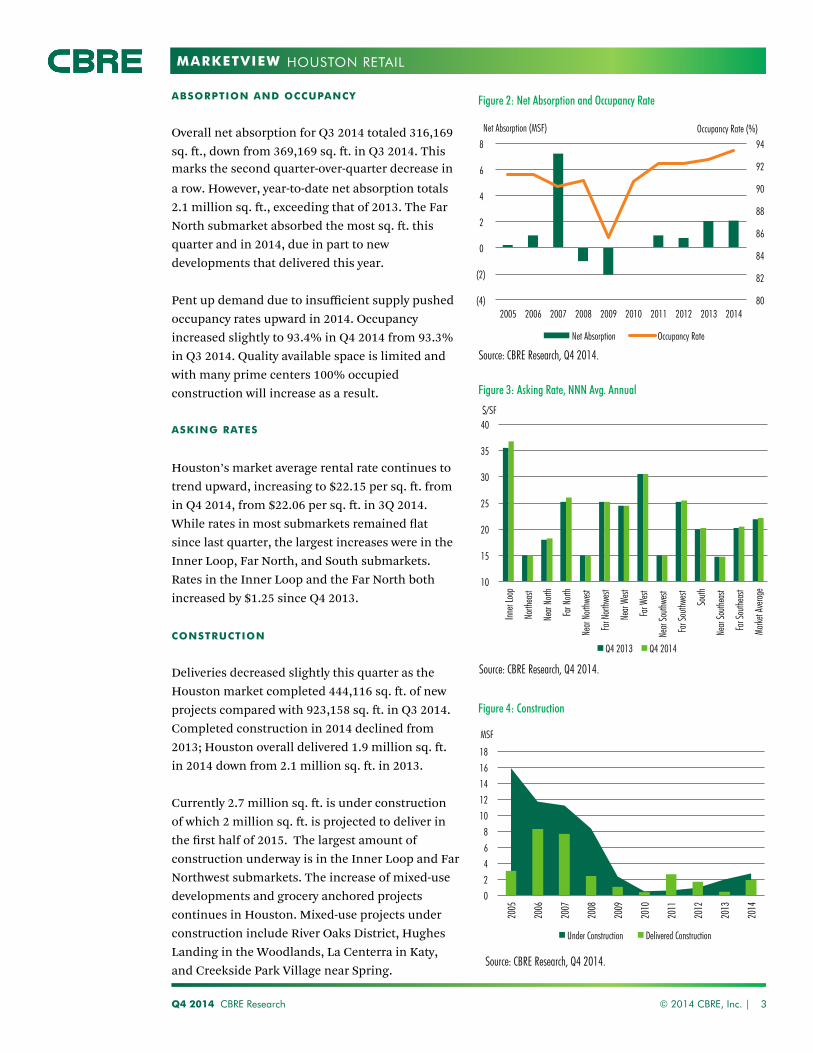
MARKETVIEW
ABSORPTION AND OCCUPANCY
Overall net absorption for Q3 2014 totaled 316,169 sq. ft., down from 369,169 sq. ft. in Q3 2014. This marks the second quarter-over-quarter decrease in a row. However, year-to-date net absorption totals 2.1 million sq. ft., exceeding that of 2013. The Far North submarket absorbed the most sq. ft. this quarter and in 2014, due in part to new developments that delivered this year. Pent up demand due to insufficient supply pushed occupancy rates upward in 2014. Occupancy increased slightly to 93.4% in Q4 2014 from 93.3% in Q3 2014. Quality available space is limited and with many prime centers 100% occupied construction will increase as a result. ASKING RATES
Houston’s market average rental rate continues to trend upward, increasing to $22.15 per sq. ft. from in Q4 2014, from $22.06 per sq. ft. in 3Q 2014. While rates in most submarkets remained flat since last quarter, the largest increases were in the Inner Loop, Far North, and South submarkets. Rates in the Inner Loop and the Far North both increased by $1.25 since Q4 2013. CONSTRUCTION
Deliveries decreased slightly this quarter as the Houston market completed 444,116 sq. ft. of new projects compared with 923,158 sq. ft. in Q3 2014. Completed construction in 2014 declined from 2013; Houston overall delivered 1.9 million sq. ft. in 2014 down from 2.1 million sq. ft. in 2013. Currently 2.7 million sq. ft. is under construction of which 2 million sq. ft. is projected to deliver in the first half of 2015. The largest amount of construction underway is in the Inner Loop and Far Northwest submarkets. The increase of mixed-use developments and grocery anchored projects continues in Houston. Mixed-use projects under construction include River Oaks District, Hughes Landing in the Woodlands, La Centerra in Katy, and Creekside Park Village near Spring.
Q4 2014 CBRE Research © 2014 CBRE, Inc. | 3
HOUSTON RETAIL
80
82
84
86
88
90
92
94
(4)
(2)
0
2
4
6
8
2005 2006 2007 2008 2009 2010 2011 2012 2013 2014
Net Absorption Occupancy Rate
Net Absorption (MSF) Occupancy Rate (%)
Source: CBRE Research, Q4 2014.
10
15
20
25
30
35
40
Inner
Loop
North
east
Near
North
Far N
orth
Near
North
west
Far N
orthw
est
Near
West
Far W
est
Near
South
west
Far S
outhw
est
South
Near
South
east
Far S
outhe
ast
Marke
t Ave
rage
$/SF
Q4 2013 Q4 2014
Source: CBRE Research, Q4 2014.
0
2
4
6
8
10
12
14
16
18
2005
2006
2007
2008
2009
2010
2011
2012
2013
2014
Under Construction Delivered Construction
MSF
Source: CBRE Research, Q4 2014.
Figure 2: Net Absorption and Occupancy Rate
Figure 3: Asking Rate, NNN Avg. Annual
Figure 4: Construction
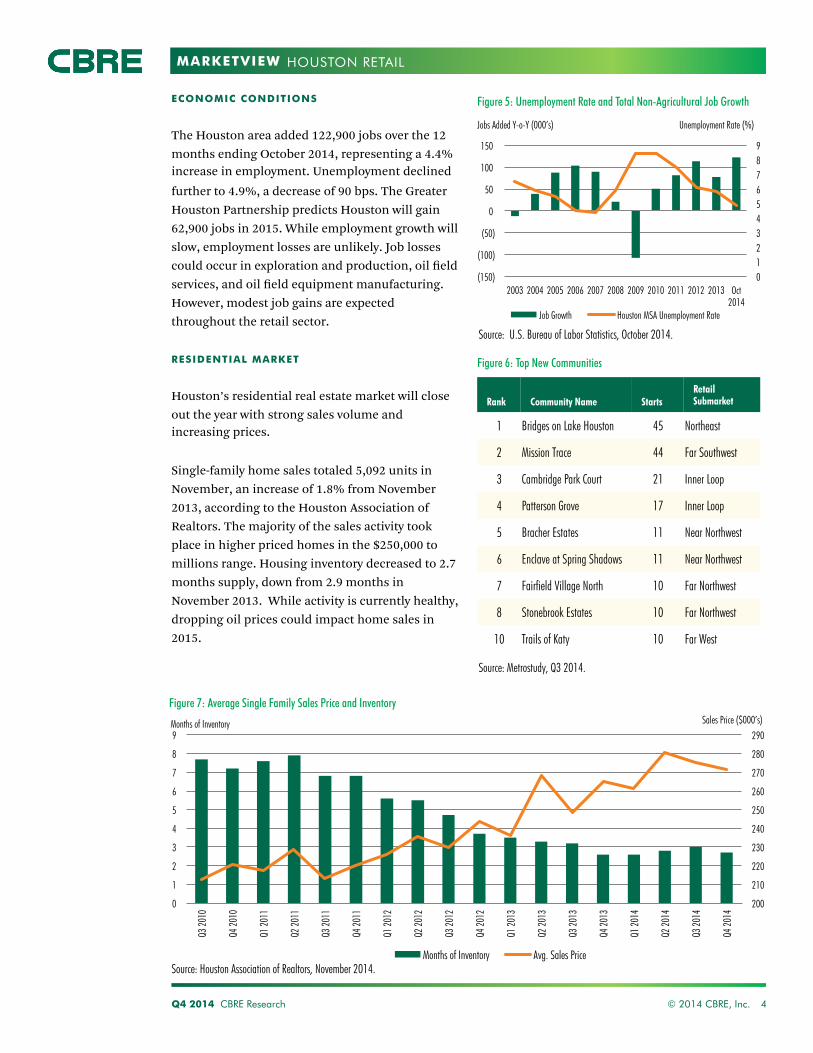
MARKETVIEW
Q4 2014 CBRE Research © 2014 CBRE, Inc. 4
HOUSTON RETAIL
Rank Community Name Starts Retail Submarket
1 Bridges on Lake Houston 45 Northeast
2 Mission Trace 44 Far Southwest
3 Cambridge Park Court 21 Inner Loop
4 Patterson Grove 17 Inner Loop
5 Bracher Estates 11 Near Northwest
6 Enclave at Spring Shadows 11 Near Northwest
7 Fairfield Village North 10 Far Northwest
8 Stonebrook Estates 10 Far Northwest
10 Trails of Katy 10 Far West
ECONOMIC CONDITIONS
The Houston area added 122,900 jobs over the 12 months ending October 2014, representing a 4.4% increase in employment. Unemployment declined further to 4.9%, a decrease of 90 bps. The Greater Houston Partnership predicts Houston will gain 62,900 jobs in 2015. While employment growth will slow, employment losses are unlikely. Job losses could occur in exploration and production, oil field services, and oil field equipment manufacturing. However, modest job gains are expected throughout the retail sector.
RESIDENTIAL MARKET
Houston’s residential real estate market will close out the year with strong sales volume and increasing prices. Single-family home sales totaled 5,092 units in November, an increase of 1.8% from November 2013, according to the Houston Association of Realtors. The majority of the sales activity took place in higher priced homes in the $250,000 to millions range. Housing inventory decreased to 2.7 months supply, down from 2.9 months in November 2013. While activity is currently healthy, dropping oil prices could impact home sales in 2015.
Figure 5: Unemployment Rate and Total Non-Agricultural Job Growth
0 1 2 3 4 5 6 7 8 9
(150)
(100)
(50)
0
50
100
150
2003 2004 2005 2006 2007 2008 2009 2010 2011 2012 2013 Oct 2014
Job Growth Houston MSA Unemployment Rate
Jobs Added Y-o-Y (000’s) Unemployment Rate (%)
Source: Metrostudy, Q3 2014.
Figure 6: Top New Communities
200
210
220
230
240
250
260
270
280
290
0
1
2
3
4
5
6
7
8
9
Q3 20
10
Q4 20
10
Q1 20
11
Q2 20
11
Q3 20
11
Q4 20
11
Q1 20
12
Q2 20
12
Q3 20
12
Q4 20
12
Q1 20
13
Q2 20
13
Q3 20
13
Q4 20
13
Q1 20
14
Q2 20
14
Q3 20
14
Q4 20
14
Months of Inventory Avg. Sales Price
Source: U.S. Bureau of Labor Statistics, October 2014.
Figure 7: Average Single Family Sales Price and Inventory
Source: Houston Association of Realtors, November 2014.
Sales Price ($000’s) Months of Inventory
MARKETVIEW
Disclaimer: Information contained herein, including projections, has been obtained from sources believed to be reliable. While we do not doubt its accuracy, we have not verified it and make no guarantee, warranty or representation about it. It is your responsibility to confirm independently its accuracy and completeness. This information is presented exclusively for use by CBRE clients and professionals and all rights to the material are reserved and cannot be reproduced without prior written permission of CBRE.
CONTACTS
Lynn Cirillo Research Operations Manager [email protected] Analee Micheletti Research Analyst +1 713 5771792 [email protected]
CBRE OFFICES
CBRE Houston 2800 Post Oak, Suite 2300 Houston, TX 77056 To learn more about CBRE Research, or to access additional research reports, please visit the Global Research Gateway at www.cbre.com/researchgateway.
HOUSTON RETAIL
Houston Retail MarketView
CBRE Global Research and Consulting Q3 2014
© 2014, CBRE, Inc.
LANDLORD’S MARKET: INCREASE IN DELIVERIES BRINGS LITTLE RELIEF AGAINST DWINDLING RETAIL VACANCY RATES IN HOUSTON.
*Arrows indicate change from previous quarter.
In Q3 2014, the Houston retail market was characterized by increasingly tight vacancy rates despite an influx of completed retail projects.
Available retail space is becoming increasingly difficult to find as the local economy contin-ues to perform well and businesses expand. The average vacancy rate across the metro dropped 60 basis points (bps), to 6.4% in Q3 2014. This represents the largest quarter-over-quarter decline in vacancy in over 2 years for Houston. Occupancy rates are well above 90% in centers located within key trade areas in Cypress, The Woodlands, Galleria and Sugar Land. Many of these centers are 100% oc-cupied and others have only a handful of small spaces available. Available big box spaces in prime centers are also few and far in between.
Q3 2014 net absorption was 369,169 sq. ft. in Q2 2014, down from 761,725 sq. ft. in the previous quarter. Notable move-ins in Q3 2014 included Floor & Decor Outlets’ occupancy of a 64,000-sq.-ft. former Kroger in Sugar Land, over 42,000 sq. ft. for Bravo Ranch Supermarket in Pasadena, and Char-lotte Russe’s move-in to a 41,000-sq.-ft. space in Memorial City Mall.
Average rental rates continue to trend very slightly upward amid the scarcity of space in desirable retail centers. Rates in most submar-kets remained relatively flat versus Q2 2014. Q3 2014 average retail asking rental rates across the metro averaged $22.06 per sq. ft., up slightly from $22.02 per sq. ft. in Q2 2014. Asking rates in well-located, established centers typically exceed $20 per sq. ft., not including triple nets, while asking rates for first-
generation space in new, grocery-anchored centers range between $30 and $50 per sq. ft.
Nearly 1 million sq. ft. of new retail space hit the market as a number of new retail centers were completed this quarter. Whole Foods opened a new store in Champions in late June and is expected to open a location in the BLVD Place development in the Galleria area later this year. Kroger, Houston’s leading grocer in terms market-share according to the Hou-ston Business Journal, also opened two new stores this quarter, one located in Humble and the other in the Cypress’ Towne Lake master planned community. A new Walmart, HEB, and several non-grocery centers also delivered in Q3 2014. This brings year-to-date retail completions to 1,450,587 sq. ft., which is slightly down from last year at this time when 1,898,416 sq. ft. delivered. Over 2 million sq. ft. of retail space remains under construction, nearly 800,000 sq. ft. of which is projected to deliver in Q4 2014. If this projection holds true, Houston could deliver more new retail space in 2014 than it has since 2009.
Amid growing rental rates, rising occupancy and a rising, yet historically light construction pipeline, conditions remain favorable for retail landlords and developers in Houston. The local economy is expected to remain strong as growth broadens and the energy sector expansion continues. Up to this point, grocery-anchored developments have been the main driver of retail development in Houston. As the retail real estate market continues to strength-en, the next question is when Houston will begin to see more expansion from traditional retailers and an increase in the development of large non-grocery anchored centers.
Figure 1: Quick Stats
Q3 2014 Q-o-Q Y-o-Y
Vacancy Rate 6.6%
Under Construction 2,070,971 SF
Delivered Construction 968,196 SF
Net Absorption 369,169 SF
Annual Asking Rates $22.06 per SF
Unemployment Rate 5.0%
Grocery Development Over 700,000 sq. ft. of new grocery-an-chored retail space delivered in Q3 2014. HEB, Kroger, Sprouts, Walmart and Whole Foods opened new stores..
ConstructionConstruction permitting in Houston is at a record high. Permits for the 12 months ending in July 2014 totaled $7.6 billion, up 31% from the previous year. Grocery-anchored centers continue to dominate retail construction in Houston.
Restaurant Concepts Expanding in the Inner LoopDozens of new restaurant concepts are flock-ing to the Inner loop in response to rapid residential construction in neighborhoods such as the Heights, Montrose, Midtown, Downtown and the Museum District.
Mixed-Use TrendMixed-use developments are becoming a more prevalent trend in Houston as demand for a work-live-play lifestyle grows.
Rental Rates The dwindling supply of space has pushed rental rates upward, especially on prime pad and end cap spaces. Net retail rates in excess of $40 per sq. ft. are not uncommon in new centers.
CONSTRUCTION2,070,971 Sq. Ft.
DELIVERIES968,196 Sq. Ft.
NET ABSORPTION369,169 Sq. Ft.
ANNUAL ASKING RATE $22.06 per Sq. Ft.
UNEMPLOYMENT RATE5.0%
VACANCY RATE6.6%
Source: CBRE Research, Q3 2014.
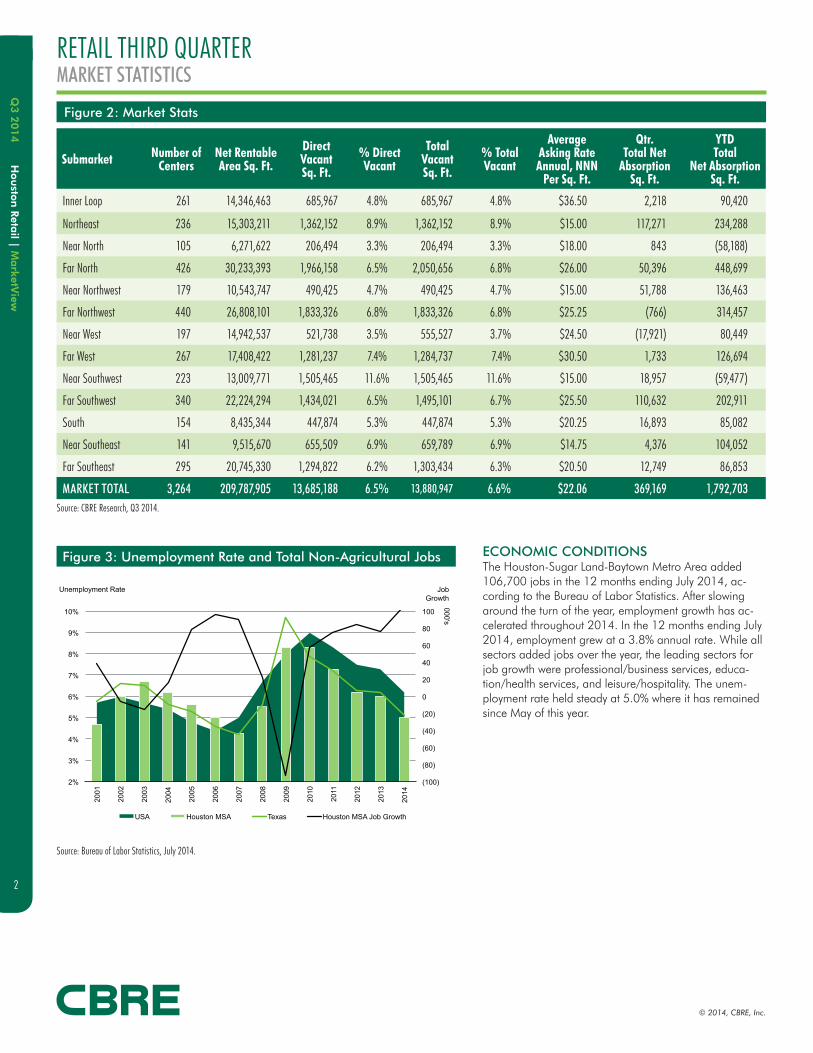
Hou
ston
Retail | M
arketV
iewQ
3 2
014
2
RETAIL THIRD QUARTERMARKET STATISTICS
Figure 2: Market Stats
ECONOMIC CONDITIONSThe Houston-Sugar Land-Baytown Metro Area added 106,700 jobs in the 12 months ending July 2014, ac-cording to the Bureau of Labor Statistics. After slowing around the turn of the year, employment growth has ac-celerated throughout 2014. In the 12 months ending July 2014, employment grew at a 3.8% annual rate. While all sectors added jobs over the year, the leading sectors for job growth were professional/business services, educa-tion/health services, and leisure/hospitality. The unem-ployment rate held steady at 5.0% where it has remained since May of this year.
Submarket Number of Centers
Net Rentable Area Sq. Ft.
Direct Vacant Sq. Ft.
% Direct Vacant
Total Vacant Sq. Ft.
% Total Vacant
Average Asking Rate Annual, NNN
Per Sq. Ft.
Qtr. Total Net
Absorption Sq. Ft.
YTD Total
Net Absorption Sq. Ft.
Inner Loop 261 14,346,463 685,967 4.8% 685,967 4.8% $36.50 2,218 90,420
Northeast 236 15,303,211 1,362,152 8.9% 1,362,152 8.9% $15.00 117,271 234,288
Near North 105 6,271,622 206,494 3.3% 206,494 3.3% $18.00 843 (58,188)
Far North 426 30,233,393 1,966,158 6.5% 2,050,656 6.8% $26.00 50,396 448,699
Near Northwest 179 10,543,747 490,425 4.7% 490,425 4.7% $15.00 51,788 136,463
Far Northwest 440 26,808,101 1,833,326 6.8% 1,833,326 6.8% $25.25 (766) 314,457
Near West 197 14,942,537 521,738 3.5% 555,527 3.7% $24.50 (17,921) 80,449
Far West 267 17,408,422 1,281,237 7.4% 1,284,737 7.4% $30.50 1,733 126,694
Near Southwest 223 13,009,771 1,505,465 11.6% 1,505,465 11.6% $15.00 18,957 (59,477)
Far Southwest 340 22,224,294 1,434,021 6.5% 1,495,101 6.7% $25.50 110,632 202,911
South 154 8,435,344 447,874 5.3% 447,874 5.3% $20.25 16,893 85,082
Near Southeast 141 9,515,670 655,509 6.9% 659,789 6.9% $14.75 4,376 104,052
Far Southeast 295 20,745,330 1,294,822 6.2% 1,303,434 6.3% $20.50 12,749 86,853
MARKET TOTAL 3,264 209,787,905 13,685,188 6.5% 13,880,947 6.6% $22.06 369,169 1,792,703
Figure 3: Unemployment Rate and Total Non-Agricultural Jobs
Source: CBRE Research, Q3 2014.
Source: Bureau of Labor Statistics, July 2014.
© 2014, CBRE, Inc.
(100)
(80)
(60)
(40)
(20)
0
20
40
60
80
100
2%
3%
4%
5%
6%
7%
8%
9%
10%
2001
2002
2003
2004
2005
2006
2007
2008
2009
2010
2011
2012
2013
2014
Job Growth
000's
Unemployment Rate
USA Houston MSA Texas Houston MSA Job Growth
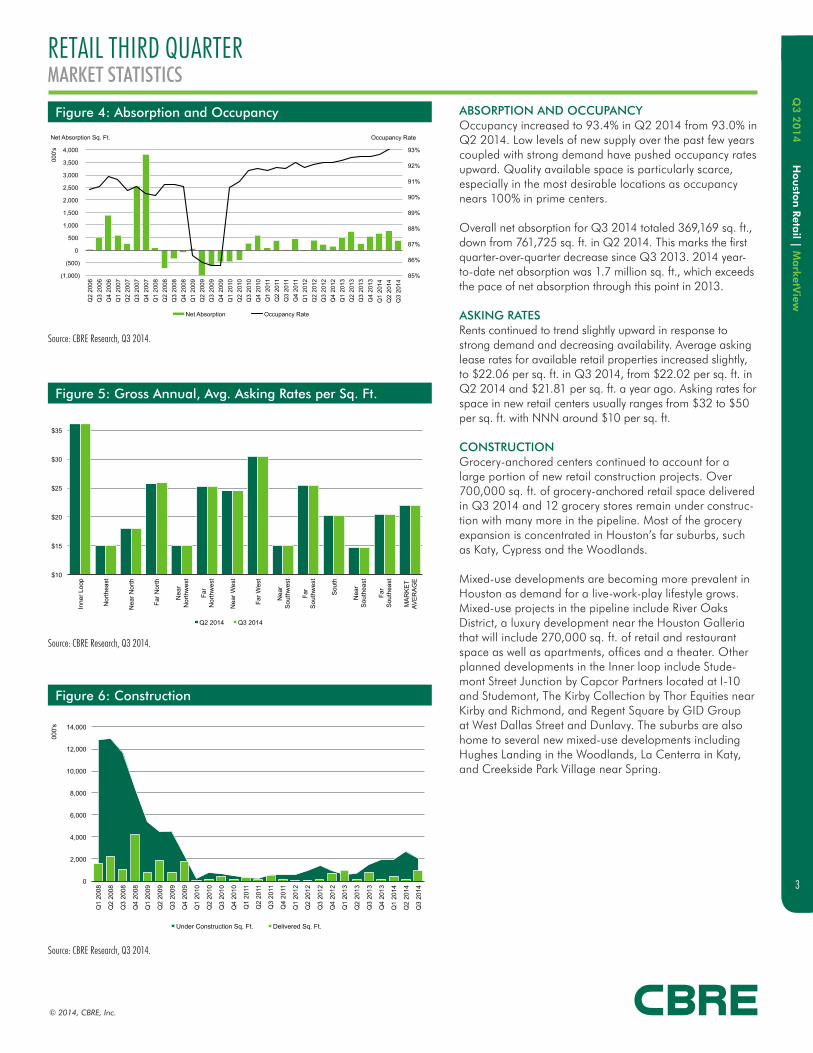
Hou
ston
Retail | M
arketV
iewQ
3 2
014
3
RETAIL THIRD QUARTERMARKET STATISTICS
© 2014, CBRE, Inc.
$10
$15
$20
$25
$30
$35
Inne
r Loo
p
Nor
thea
st
Nea
r Nor
th
Far N
orth
Nea
r N
orth
wes
t
Far
Nor
thw
est
Nea
r Wes
t
Far W
est
Nea
r S
outh
wes
t
Far
Sou
thw
est
Sou
th
Nea
r S
outh
east
Far
Sou
thea
st
MA
RK
ET
AVE
RA
GE
Source: CBRE Research, Q3 2014. Q2 2014 Q3 2014
ABSORPTION AND OCCUPANCY Occupancy increased to 93.4% in Q2 2014 from 93.0% in Q2 2014. Low levels of new supply over the past few years coupled with strong demand have pushed occupancy rates upward. Quality available space is particularly scarce, especially in the most desirable locations as occupancy nears 100% in prime centers.
Overall net absorption for Q3 2014 totaled 369,169 sq. ft., down from 761,725 sq. ft. in Q2 2014. This marks the first quarter-over-quarter decrease since Q3 2013. 2014 year-to-date net absorption was 1.7 million sq. ft., which exceeds the pace of net absorption through this point in 2013. ASKING RATES Rents continued to trend slightly upward in response to strong demand and decreasing availability. Average asking lease rates for available retail properties increased slightly, to $22.06 per sq. ft. in Q3 2014, from $22.02 per sq. ft. in Q2 2014 and $21.81 per sq. ft. a year ago. Asking rates for space in new retail centers usually ranges from $32 to $50 per sq. ft. with NNN around $10 per sq. ft.
CONSTRUCTIONGrocery-anchored centers continued to account for a large portion of new retail construction projects. Over 700,000 sq. ft. of grocery-anchored retail space delivered in Q3 2014 and 12 grocery stores remain under construc-tion with many more in the pipeline. Most of the grocery expansion is concentrated in Houston’s far suburbs, such as Katy, Cypress and the Woodlands.
Mixed-use developments are becoming more prevalent in Houston as demand for a live-work-play lifestyle grows. Mixed-use projects in the pipeline include River Oaks District, a luxury development near the Houston Galleria that will include 270,000 sq. ft. of retail and restaurant space as well as apartments, offices and a theater. Other planned developments in the Inner loop include Stude-mont Street Junction by Capcor Partners located at I-10 and Studemont, The Kirby Collection by Thor Equities near Kirby and Richmond, and Regent Square by GID Group at West Dallas Street and Dunlavy. The suburbs are also home to several new mixed-use developments including Hughes Landing in the Woodlands, La Centerra in Katy, and Creekside Park Village near Spring.
Figure 4: Absorption and Occupancy
Figure 5: Gross Annual, Avg. Asking Rates per Sq. Ft.
Figure 6: Construction
Source: CBRE Research, Q3 2014.
Source: CBRE Research, Q3 2014.
Source: CBRE Research, Q3 2014.
85%
86%
87%
88%
89%
90%
91%
92%
93%
(1,000)
(500)
0
500
1,000
1,500
2,000
2,500
3,000
3,500
4,000
Q2
2006
Q
3 20
06
Q4
2006
Q
1 20
07
Q2
2007
Q
3 20
07
Q4
2007
Q
1 20
08
Q2
2008
Q
3 20
08
Q4
2008
Q
1 20
09
Q2
2009
Q
3 20
09
Q4
2009
Q
1 20
10
Q2
2010
Q
3 20
10
Q4
2010
Q
1 20
11
Q2
2011
Q
3 20
11
Q4
2011
Q
1 20
12
Q2
2012
Q
3 20
12
Q4
2012
Q
1 20
13
Q2
2013
Q
3 20
13
Q4
2013
Q
1 20
14
Q2
2014
Q
3 20
14
Occupancy Rate
000'
s
Source: CBRE Research, Q3 2014.
Net Absorption Sq. Ft.
Net Absorption Occupancy Rate
0
2,000
4,000
6,000
8,000
10,000
12,000
14,000
Q1
2008
Q2
2008
Q3
2008
Q4
2008
Q1
2009
Q2
2009
Q3
2009
Q4
2009
Q1
2010
Q2
2010
Q3
2010
Q4
2010
Q1
2011
Q2
2011
Q3
2011
Q4
2011
Q1
2012
Q2
2012
Q3
2012
Q4
2012
Q1
2013
Q2
2013
Q3
2013
Q4
2013
Q1
2014
Q2
2014
Q3
2014
000'
s
Source: CBRE Research, Q3 2014. Under Construction Sq. Ft. Delivered Sq. Ft.
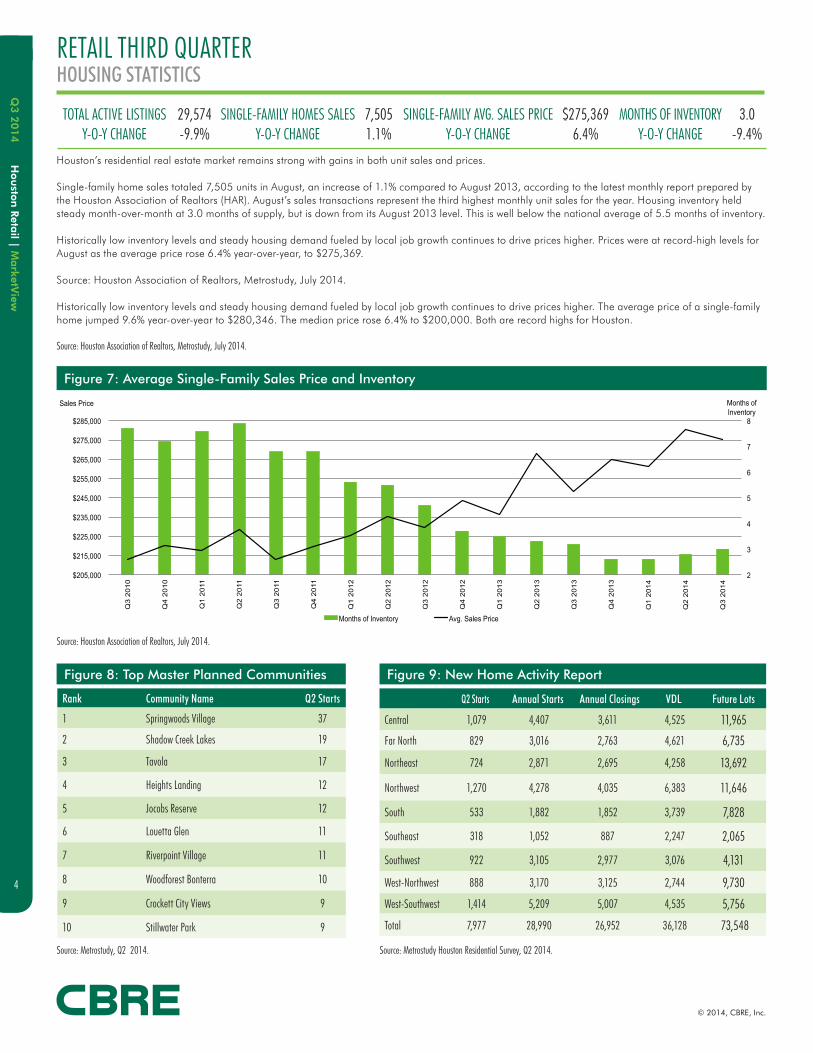
Hou
ston
Retail | M
arketV
iewQ
3 2
014
4
RETAIL THIRD QUARTERHOUSING STATISTICS
© 2014, CBRE, Inc.
Figure 7: Average Single-Family Sales Price and Inventory
Source: Houston Association of Realtors, July 2014.
Houston’s residential real estate market remains strong with gains in both unit sales and prices.
Single-family home sales totaled 7,505 units in August, an increase of 1.1% compared to August 2013, according to the latest monthly report prepared by the Houston Association of Realtors (HAR). August’s sales transactions represent the third highest monthly unit sales for the year. Housing inventory held steady month-over-month at 3.0 months of supply, but is down from its August 2013 level. This is well below the national average of 5.5 months of inventory.
Historically low inventory levels and steady housing demand fueled by local job growth continues to drive prices higher. Prices were at record-high levels for August as the average price rose 6.4% year-over-year, to $275,369.
Source: Houston Association of Realtors, Metrostudy, July 2014.
Historically low inventory levels and steady housing demand fueled by local job growth continues to drive prices higher. The average price of a single-family home jumped 9.6% year-over-year to $280,346. The median price rose 6.4% to $200,000. Both are record highs for Houston.
Source: Houston Association of Realtors, Metrostudy, July 2014.
Rank Community Name Q2 Starts
1 Springwoods Village 37
2 Shadow Creek Lakes 19
3 Tavola 17
4 Heights Landing 12
5 Jocobs Reserve 12
6 Louetta Glen 11
7 Riverpoint Village 11
8 Woodforest Bonterra 10
9 Crockett City Views 9
10 Stillwater Park 9
Figure 8: Top Master Planned Communities
Source: Metrostudy, Q2 2014.
Q2 Starts Annual Starts Annual Closings VDL Future Lots
Central 1,079 4,407 3,611 4,525 11,965
Far North 829 3,016 2,763 4,621 6,735
Northeast 724 2,871 2,695 4,258 13,692
Northwest 1,270 4,278 4,035 6,383 11,646
South 533 1,882 1,852 3,739 7,828
Southeast 318 1,052 887 2,247 2,065
Southwest 922 3,105 2,977 3,076 4,131
West-Northwest 888 3,170 3,125 2,744 9,730
West-Southwest 1,414 5,209 5,007 4,535 5,756
Total 7,977 28,990 26,952 36,128 73,548
Figure 9: New Home Activity Report
Source: Metrostudy Houston Residential Survey, Q2 2014.
2
3
4
5
6
7
8
$205,000
$215,000
$225,000
$235,000
$245,000
$255,000
$265,000
$275,000
$285,000
Q3
2010
Q4
2010
Q1
2011
Q2
2011
Q3
2011
Q4
2011
Q1
2012
Q2
2012
Q3
2012
Q4
2012
Q1
2013
Q2
2013
Q3
2013
Q4
2013
Q1
2014
Q2
2014
Q3
2014
Months of Inventory
Sales Price
Months of Inventory Avg. Sales Price
TOTAL ACTIVE LISTINGS 29,574 SINGLE-FAMILY HOMES SALES 7,505 SINGLE-FAMILY AVG. SALES PRICE $275,369 MONTHS OF INVENTORY 3.0Y-O-Y CHANGE -9.9% Y-O-Y CHANGE 1.1% Y-O-Y CHANGE 6.4% Y-O-Y CHANGE -9.4%

Hou
ston
Retail | M
arketV
iewQ
3 2
014
5
© 2014, CBRE, Inc.
CONTACTSFor more information about this Houston Retail MarketView, please contact:
Lynn CirilloResearch Operations ManagerCBRE Americas Research2800 Post Oak, Suite 2300Houston, TX 77056 e: [email protected]
Eric HimariosResearch Analyst, RetailCBRE Houston Research2800 Post Oak, Suite 2300Houston, TX 77056t: +1 713 577 1792 e: [email protected]
TEXAS RESEARCH
FOLLOW CBRE
GLOBAL RESEARCH AND CONSULTING This report was prepared by the CBRE U.S. Research Team which forms part of CBRE Global Research and Consulting – a network of preeminent researchers and consultants who collaborate to provide real estate market research, econometric forecasting and consulting solutions to real estate investors and occupiers around the globe. Additional U.S. research produced by Global Research and Consulting can be found at www.cbre.us/research.
DISCLAIMER
Information contained herein, including projections, has been obtained from sources believed to be reliable. While we do not doubt its accuracy, we
have not verified it and make no guarantee, warranty or representation about it. It is your responsibility to confirm independently its accuracy and
completeness. This information is presented exclusively for use by CBRE clients and professionals and all rights to the material are reserved and cannot be
reproduced without prior written permission of CBRE.
Houston Retail MarketView
CBRE Global Research and Consulting Q2 2014
© 2014, CBRE, Inc.
WITH GROCERS LEADING THE CHARGE, HOUSTON RETAIL DEVELOPMENT IS INCREASING. RETAIL SPACE REMAINS SCARCE.
*Arrows indicate change from previous quarter.
In Q2 2014, modest gains in occupancy and lease rates along with increased construction signaled continued growth in Houston’s retail market.
Net absorption was 761,725 sq. ft. in Q2 2014 for an increase of 99,916 sq. ft. from Q1 2014, when overall net absorption was 661,809 sq. ft. Net absorption increased for four consecutive quarters and increased quarter-over-quarter in six of the past seven quarters. The occupancy rate ticked up 30 basis points (bps) to 93.0% in Q2 2014.
Q2 2014 retail asking rental rates across the metro were estimated at $22.02 per sq. ft., up slightly from $21.94 per sq. ft. in Q1 2014. The lack of available space caused a shift towards a landlord-driven market, which is placing upward pressure on retail rental rates.
In Q2 2014, 140,000 sq. ft. of new retail space delivered, down from 387,429 sq. ft. in Q1 2014. At the end of the quarter, 2.7 million sq. ft. of retail space was under construction, up from 1.9 million sq. ft. in Q1 and 733,756 sq. ft. in Q2 2013. 2.6 million sq. ft. of this space is expected to deliver in 2014 and at least that much should deliver in 2015. Large retail projects expected to deliver in 2015 include River Oaks District, Hughes Landing, and the Baybrook Mall expansion. Among those breaking ground next year are
a new HEB in Cypress, a Walmart in Cinco Ranch and Kroger in Cinco Ranch.
Grocery expansion remained a strong driver of new construction, with roughly 2 million sq. ft. of grocery space across 14 stores under construction. Grocers from all segments of the market, ranging from Aldi to Whole Foods, are expanding. Most of this grocery expansion is being driven by housing and population growth in the Far West, Far Northwest and Far North submarkets of Houston. Meanwhile, construction continued on mixed-use develop-ments in the Galleria area, The Woodlands and Cinco Ranch. Several big box users, including Gallery Furniture, also broke ground on new stores. On the horizon, Baybrook Mall will undergo a 500,000 sq. ft. expansion and the Galleria will complete a major renovation.
Strong local economic indicators encouraged national tenants to seek space in Houston. Leasing activity was strongest from Katy in the Far West submarket to The Woodlands in the Far North. Attracted by the affluent and densely populated master planned communi-ties in these areas, retail tenants faced strong competition in leasing space. Most leasing is occurring in new space located in grocery-anchored centers and pad sides while good second-generation space is very scarce.
Figure 1: Quick Stats
Q2 2014 Q-o-Q Y-o-Y
Vacancy Rate 7.0%
Under Construction 2.7 million sq. ft.
Delivered Construction 140,000 sq. ft.
Net Absorption 761,725 sq. ft.
Annual Asking Rates $22.02 per sq. ft.
Unemployment Rate 5.1%
Grocery Development One new grocery store opened in Q2 2014 and 14 more totaling roughly 2 million sq. ft. were under construction. Expanding grocers include Kroger, HEB, Walmart, and Whole Foods.
MallsSeveral Houston-area malls have big changes in store, another sign that the retail market is gaining momentum. Baybrook Mall, The Galleria, and Memorial City Mall have announced plans to expand, renovate or add new tenants before the end of 2014.
DowntownDevelopment is picking up in the CBD - an area where retail has struggled historically in Houston. With several thousand residential units being built there, prospects for future retail development are improving.
ConstructionRoughly 2.7 million sq. ft. of retail space is currently under construction. While grocery-anchored centers still account for the bulk of new projects, non-grocery retail develop-ment has increased in 2014.
Rental Rates The dwindling supply of space has pushed rental rates upward, especially on prime pad and endcap spaces. Rental rates have been steadily increasing over the past few years.
CONSTRUCTION2,694,574 Sq. Ft.
DELIVERIES140,000 Sq. Ft.
NET ABSORPTION761,725 Sq. Ft.
ANNUAL ASKING RATE $22.02 per Sq. Ft.
UNEMPLOYMENT RATE5.1%
VACANCY RATE7.0%
Source: CBRE Research, Q2 2014.
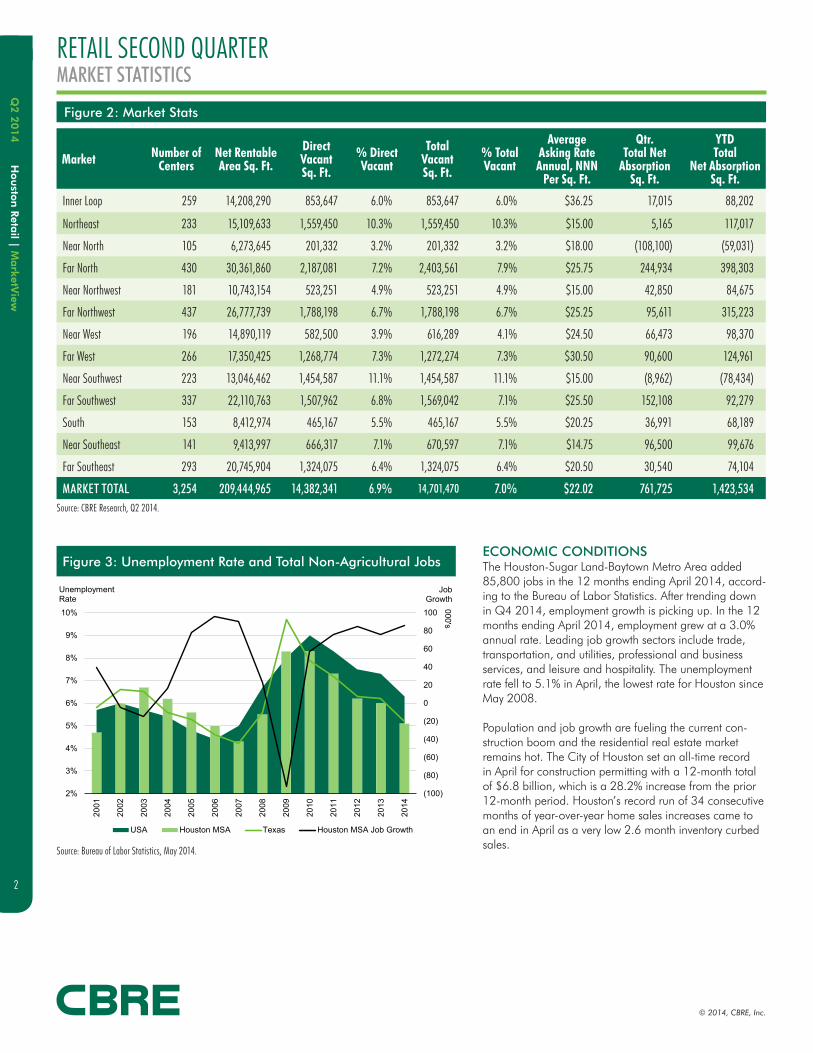
Hou
ston
Retail | M
arketV
iewQ
2 2
014
2
RETAIL SECOND QUARTERMARKET STATISTICS
Figure 2: Market Stats
ECONOMIC CONDITIONSThe Houston-Sugar Land-Baytown Metro Area added 85,800 jobs in the 12 months ending April 2014, accord-ing to the Bureau of Labor Statistics. After trending down in Q4 2014, employment growth is picking up. In the 12 months ending April 2014, employment grew at a 3.0% annual rate. Leading job growth sectors include trade, transportation, and utilities, professional and business services, and leisure and hospitality. The unemployment rate fell to 5.1% in April, the lowest rate for Houston since May 2008.
Population and job growth are fueling the current con-struction boom and the residential real estate market remains hot. The City of Houston set an all-time record in April for construction permitting with a 12-month total of $6.8 billion, which is a 28.2% increase from the prior 12-month period. Houston’s record run of 34 consecutive months of year-over-year home sales increases came to an end in April as a very low 2.6 month inventory curbed sales.
Market Number of Centers
Net Rentable Area Sq. Ft.
Direct Vacant Sq. Ft.
% Direct Vacant
Total Vacant Sq. Ft.
% Total Vacant
Average Asking Rate Annual, NNN
Per Sq. Ft.
Qtr. Total Net
Absorption Sq. Ft.
YTD Total
Net Absorption Sq. Ft.
Inner Loop 259 14,208,290 853,647 6.0% 853,647 6.0% $36.25 17,015 88,202
Northeast 233 15,109,633 1,559,450 10.3% 1,559,450 10.3% $15.00 5,165 117,017
Near North 105 6,273,645 201,332 3.2% 201,332 3.2% $18.00 (108,100) (59,031)
Far North 430 30,361,860 2,187,081 7.2% 2,403,561 7.9% $25.75 244,934 398,303
Near Northwest 181 10,743,154 523,251 4.9% 523,251 4.9% $15.00 42,850 84,675
Far Northwest 437 26,777,739 1,788,198 6.7% 1,788,198 6.7% $25.25 95,611 315,223
Near West 196 14,890,119 582,500 3.9% 616,289 4.1% $24.50 66,473 98,370
Far West 266 17,350,425 1,268,774 7.3% 1,272,274 7.3% $30.50 90,600 124,961
Near Southwest 223 13,046,462 1,454,587 11.1% 1,454,587 11.1% $15.00 (8,962) (78,434)
Far Southwest 337 22,110,763 1,507,962 6.8% 1,569,042 7.1% $25.50 152,108 92,279
South 153 8,412,974 465,167 5.5% 465,167 5.5% $20.25 36,991 68,189
Near Southeast 141 9,413,997 666,317 7.1% 670,597 7.1% $14.75 96,500 99,676
Far Southeast 293 20,745,904 1,324,075 6.4% 1,324,075 6.4% $20.50 30,540 74,104
MARKET TOTAL 3,254 209,444,965 14,382,341 6.9% 14,701,470 7.0% $22.02 761,725 1,423,534
Figure 3: Unemployment Rate and Total Non-Agricultural Jobs
Source: CBRE Research, Q2 2014.
Source: Bureau of Labor Statistics, May 2014.
© 2014, CBRE, Inc.
(100)
(80)
(60)
(40)
(20)
0
20
40
60
80
100
2%
3%
4%
5%
6%
7%
8%
9%
10%
2001
2002
2003
2004
2005
2006
2007
2008
2009
2010
2011
2012
2013
2014
JobGrowth
000's
Unemployment Rate
USA Houston MSA Texas Houston MSA Job Growth
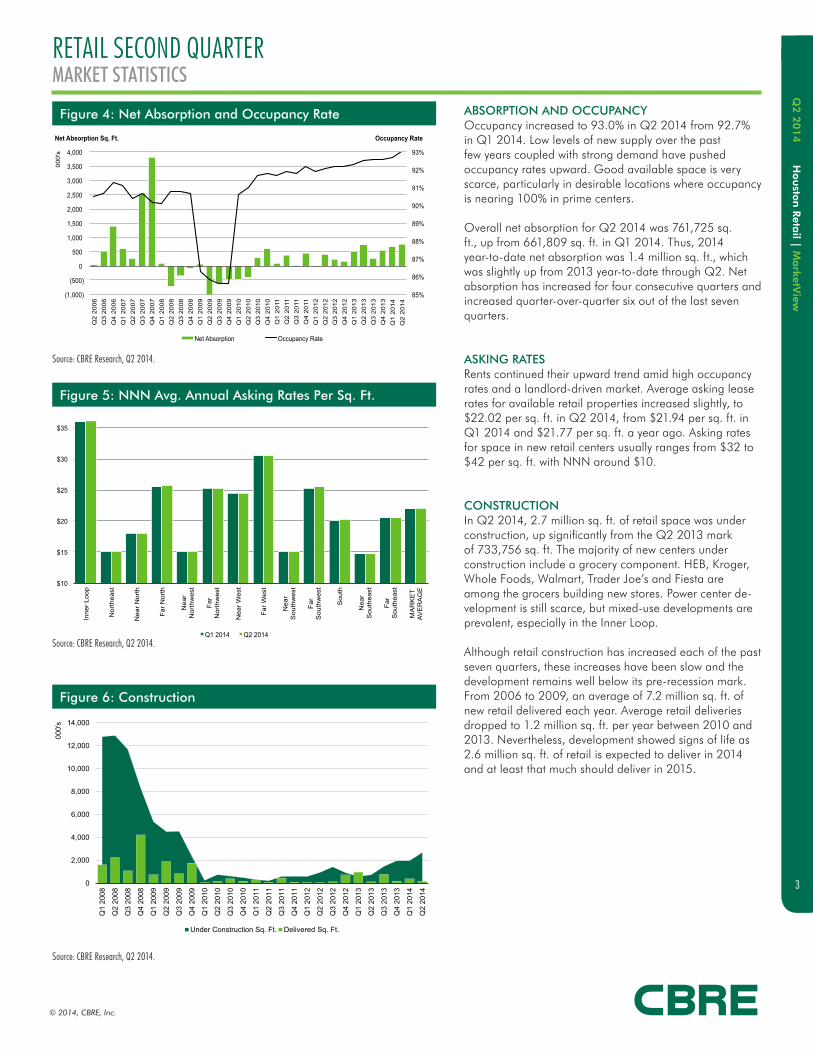
Hou
ston
Retail | M
arketV
iewQ
2 2
014
3
RETAIL SECOND QUARTERMARKET STATISTICS
© 2014, CBRE, Inc.
$10
$15
$20
$25
$30
$35
Inne
r Loo
p
Nor
thea
st
Nea
r Nor
th
Far N
orth
Nea
r N
orth
wes
t
Far
Nor
thw
est
Nea
r Wes
t
Far W
est
Nea
r S
outh
wes
t
Far
Sou
thw
est
Sou
th
Nea
r S
outh
east
Far
Sou
thea
st
MA
RK
ET
AVE
RA
GE
Source: CBRE Research, Q2 2014. Q1 2014 Q2 2014
ABSORPTION AND OCCUPANCY Occupancy increased to 93.0% in Q2 2014 from 92.7% in Q1 2014. Low levels of new supply over the past few years coupled with strong demand have pushed occupancy rates upward. Good available space is very scarce, particularly in desirable locations where occupancy is nearing 100% in prime centers.
Overall net absorption for Q2 2014 was 761,725 sq. ft., up from 661,809 sq. ft. in Q1 2014. Thus, 2014 year-to-date net absorption was 1.4 million sq. ft., which was slightly up from 2013 year-to-date through Q2. Net absorption has increased for four consecutive quarters and increased quarter-over-quarter six out of the last seven quarters.
ASKING RATESRents continued their upward trend amid high occupancy rates and a landlord-driven market. Average asking lease rates for available retail properties increased slightly, to $22.02 per sq. ft. in Q2 2014, from $21.94 per sq. ft. in Q1 2014 and $21.77 per sq. ft. a year ago. Asking rates for space in new retail centers usually ranges from $32 to $42 per sq. ft. with NNN around $10.
CONSTRUCTIONIn Q2 2014, 2.7 million sq. ft. of retail space was under construction, up significantly from the Q2 2013 mark of 733,756 sq. ft. The majority of new centers under construction include a grocery component. HEB, Kroger, Whole Foods, Walmart, Trader Joe’s and Fiesta are among the grocers building new stores. Power center de-velopment is still scarce, but mixed-use developments are prevalent, especially in the Inner Loop.
Although retail construction has increased each of the past seven quarters, these increases have been slow and the development remains well below its pre-recession mark. From 2006 to 2009, an average of 7.2 million sq. ft. of new retail delivered each year. Average retail deliveries dropped to 1.2 million sq. ft. per year between 2010 and 2013. Nevertheless, development showed signs of life as 2.6 million sq. ft. of retail is expected to deliver in 2014 and at least that much should deliver in 2015.
Figure 5: NNN Avg. Annual Asking Rates Per Sq. Ft.
Figure 6: Construction
Source: CBRE Research, Q2 2014.
Source: CBRE Research, Q2 2014.
Source: CBRE Research, Q2 2014.
85%
86%
87%
88%
89%
90%
91%
92%
93%
(1,000)
(500)
0
500
1,000
1,500
2,000
2,500
3,000
3,500
4,000
Q2
2006
Q
3 20
06
Q4
2006
Q
1 20
07
Q2
2007
Q
3 20
07
Q4
2007
Q
1 20
08
Q2
2008
Q
3 20
08
Q4
2008
Q
1 20
09
Q2
2009
Q
3 20
09
Q4
2009
Q
1 20
10
Q2
2010
Q
3 20
10
Q4
2010
Q
1 20
11
Q2
2011
Q
3 20
11
Q4
2011
Q
1 20
12
Q2
2012
Q
3 20
12
Q4
2012
Q
1 20
13
Q2
2013
Q
3 20
13
Q4
2013
Q
1 20
14
Q2
2014
Occupancy Rate
000'
s
Source: CBRE Research, Q2 2014.
Figure 4: Net Absorption and Occupancy Rate
Net Absorption Sq. Ft.
Net Absorption Occupancy Rate
0
2,000
4,000
6,000
8,000
10,000
12,000
14,000
Q1
2008
Q2
2008
Q3
2008
Q4
2008
Q1
2009
Q2
2009
Q3
2009
Q4
2009
Q1
2010
Q2
2010
Q3
2010
Q4
2010
Q1
2011
Q2
2011
Q3
2011
Q4
2011
Q1
2012
Q2
2012
Q3
2012
Q4
2012
Q1
2013
Q2
2013
Q3
2013
Q4
2013
Q1
2014
Q2
2014
000'
s
Source: CBRE Research, Q2 2014.Under Construction Sq. Ft. Delivered Sq. Ft.
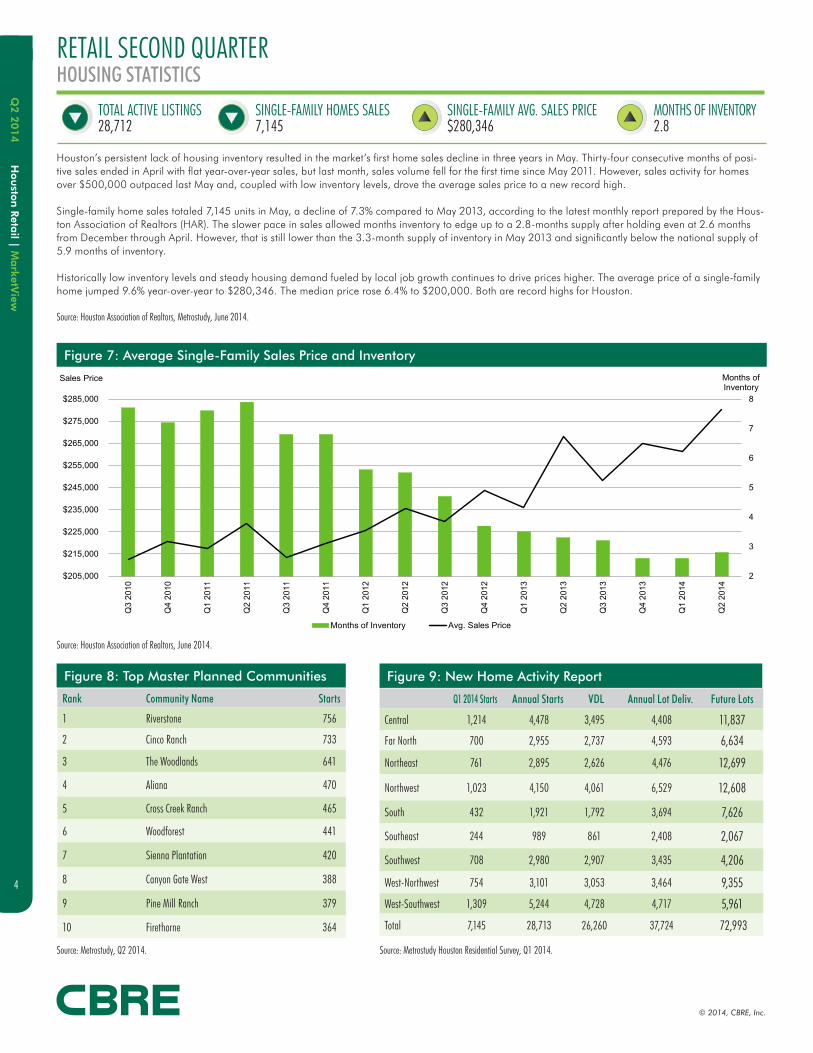
Hou
ston
Retail | M
arketV
iewQ
2 2
014
4
RETAIL SECOND QUARTERHOUSING STATISTICS
© 2014, CBRE, Inc.
Figure 7: Average Single-Family Sales Price and Inventory
Source: Houston Association of Realtors, June 2014.
SINGLE-FAMILY HOMES SALES7,145
SINGLE-FAMILY AVG. SALES PRICE$280,346
MONTHS OF INVENTORY2.8
TOTAL ACTIVE LISTINGS28,712
Houston’s persistent lack of housing inventory resulted in the market’s first home sales decline in three years in May. Thirty-four consecutive months of posi-tive sales ended in April with flat year-over-year sales, but last month, sales volume fell for the first time since May 2011. However, sales activity for homes over $500,000 outpaced last May and, coupled with low inventory levels, drove the average sales price to a new record high.
Single-family home sales totaled 7,145 units in May, a decline of 7.3% compared to May 2013, according to the latest monthly report prepared by the Hous-ton Association of Realtors (HAR). The slower pace in sales allowed months inventory to edge up to a 2.8-months supply after holding even at 2.6 months from December through April. However, that is still lower than the 3.3-month supply of inventory in May 2013 and significantly below the national supply of 5.9 months of inventory.
Historically low inventory levels and steady housing demand fueled by local job growth continues to drive prices higher. The average price of a single-family home jumped 9.6% year-over-year to $280,346. The median price rose 6.4% to $200,000. Both are record highs for Houston.
Source: Houston Association of Realtors, Metrostudy, June 2014.
Rank Community Name Starts
1 Riverstone 756
2 Cinco Ranch 733
3 The Woodlands 641
4 Aliana 470
5 Cross Creek Ranch 465
6 Woodforest 441
7 Sienna Plantation 420
8 Canyon Gate West 388
9 Pine Mill Ranch 379
10 Firethorne 364
Figure 8: Top Master Planned Communities
Source: Metrostudy, Q2 2014.
Q1 2014 Starts Annual Starts VDL Annual Lot Deliv. Future Lots
Central 1,214 4,478 3,495 4,408 11,837
Far North 700 2,955 2,737 4,593 6,634
Northeast 761 2,895 2,626 4,476 12,699
Northwest 1,023 4,150 4,061 6,529 12,608
South 432 1,921 1,792 3,694 7,626
Southeast 244 989 861 2,408 2,067
Southwest 708 2,980 2,907 3,435 4,206
West-Northwest 754 3,101 3,053 3,464 9,355
West-Southwest 1,309 5,244 4,728 4,717 5,961
Total 7,145 28,713 26,260 37,724 72,993
Figure 9: New Home Activity Report
Source: Metrostudy Houston Residential Survey, Q1 2014.
2
3
4
5
6
7
8
$205,000
$215,000
$225,000
$235,000
$245,000
$255,000
$265,000
$275,000
$285,000
Q3
2010
Q4
2010
Q1
2011
Q2
2011
Q3
2011
Q4
2011
Q1
2012
Q2
2012
Q3
2012
Q4
2012
Q1
2013
Q2
2013
Q3
2013
Q4
2013
Q1
2014
Q2
2014
Months of Inventory
Sales Price
Months of Inventory Avg. Sales Price
Hou
ston
Retail | M
arketV
iewQ
2 2
014
5
© 2014, CBRE, Inc.
CONTACTSFor more information about this Houston Retail MarketView, please contact:
Lynn CirilloResearch Operations ManagerCBRE Americas Research2800 Post Oak, Suite 2300Houston, TX 77056 e: [email protected]
Eric HimariosResearch Analyst, RetailCBRE Houston Research2800 Post Oak, Suite 2300Houston, TX 77056t: +1 713 577 1792 e: [email protected]
TEXAS RESEARCH
FOLLOW CBRE
GLOBAL RESEARCH AND CONSULTING This report was prepared by the CBRE U.S. Research Team which forms part of CBRE Global Research and Consulting – a network of preeminent researchers and consultants who collaborate to provide real estate market research, econometric forecasting and consulting solutions to real estate investors and occupiers around the globe. Additional U.S. research produced by Global Research and Consulting can be found at www.cbre.us/research.
DISCLAIMER
Information contained herein, including projections, has been obtained from sources believed to be reliable. While we do not doubt its accuracy, we
have not verified it and make no guarantee, warranty or representation about it. It is your responsibility to confirm independently its accuracy and
completeness. This information is presented exclusively for use by CBRE clients and professionals and all rights to the material are reserved and cannot be
reproduced without prior written permission of CBRE.
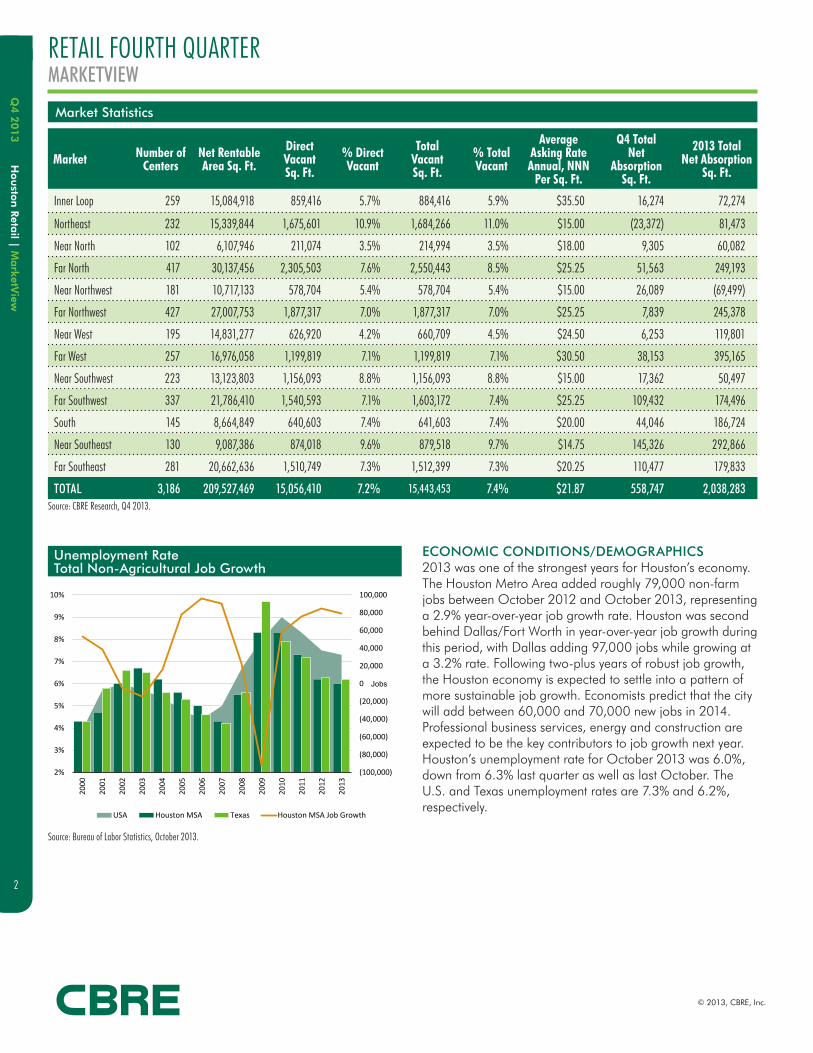
Hou
ston
Retail | M
arketV
iewQ
4 2
013
2
Market Statistics
ECONOMIC CONDITIONS/DEMOGRAPHICS2013 was one of the strongest years for Houston’s economy. The Houston Metro Area added roughly 79,000 non-farm jobs between October 2012 and October 2013, representing a 2.9% year-over-year job growth rate. Houston was second behind Dallas/Fort Worth in year-over-year job growth during this period, with Dallas adding 97,000 jobs while growing at a 3.2% rate. Following two-plus years of robust job growth, the Houston economy is expected to settle into a pattern of more sustainable job growth. Economists predict that the city will add between 60,000 and 70,000 new jobs in 2014. Professional business services, energy and construction are expected to be the key contributors to job growth next year. Houston’s unemployment rate for October 2013 was 6.0%, down from 6.3% last quarter as well as last October. The U.S. and Texas unemployment rates are 7.3% and 6.2%, respectively.
Market Number of Centers
Net Rentable Area Sq. Ft.
Direct Vacant Sq. Ft.
% Direct Vacant
Total Vacant Sq. Ft.
% Total Vacant
Average Asking Rate Annual, NNN
Per Sq. Ft.
Q4 Total Net
Absorption Sq. Ft.
2013 Total Net Absorption
Sq. Ft.
Inner Loop 259 15,084,918 859,416 5.7% 884,416 5.9% $35.50 16,274 72,274
Northeast 232 15,339,844 1,675,601 10.9% 1,684,266 11.0% $15.00 (23,372) 81,473
Near North 102 6,107,946 211,074 3.5% 214,994 3.5% $18.00 9,305 60,082
Far North 417 30,137,456 2,305,503 7.6% 2,550,443 8.5% $25.25 51,563 249,193
Near Northwest 181 10,717,133 578,704 5.4% 578,704 5.4% $15.00 26,089 (69,499)
Far Northwest 427 27,007,753 1,877,317 7.0% 1,877,317 7.0% $25.25 7,839 245,378
Near West 195 14,831,277 626,920 4.2% 660,709 4.5% $24.50 6,253 119,801
Far West 257 16,976,058 1,199,819 7.1% 1,199,819 7.1% $30.50 38,153 395,165
Near Southwest 223 13,123,803 1,156,093 8.8% 1,156,093 8.8% $15.00 17,362 50,497
Far Southwest 337 21,786,410 1,540,593 7.1% 1,603,172 7.4% $25.25 109,432 174,496
South 145 8,664,849 640,603 7.4% 641,603 7.4% $20.00 44,046 186,724
Near Southeast 130 9,087,386 874,018 9.6% 879,518 9.7% $14.75 145,326 292,866
Far Southeast 281 20,662,636 1,510,749 7.3% 1,512,399 7.3% $20.25 110,477 179,833
TOTAL 3,186 209,527,469 15,056,410 7.2% 15,443,453 7.4% $21.87 558,747 2,038,283
Unemployment RateTotal Non-Agricultural Job Growth
RETAIL FOURTH QUARTERMARKETVIEW
Source: CBRE Research, Q4 2013.
Source: Bureau of Labor Statistics, October 2013.
(100,000)
(80,000)
(60,000)
(40,000)
(20,000)
0
20,000
40,000
60,000
80,000
100,000
2%
3%
4%
5%
6%
7%
8%
9%
10%
2000
2001
2002
2003
2004
2005
2006
2007
2008
2009
2010
2011
2012
2013
Jobs
USA Houston MSA Texas Houston MSA Job Growth
© 2013, CBRE, Inc.


