Embed Size (px)
Citation preview

I N S I D E T H I S
I S S U E :
Inside Story 2
Inside Story 2
Inside Story 2
Inside Story 3
Inside Story 4
Inside Story 5
Inside Story 6
Background
Mounting concerns about individual and community preparedness for disasters are
being voiced, in part because natural disasters are increasing. In Canada, circumstances
such as pine beetle infestations, reduced precipitation coupled with above normal tem-
peratures, and an increased number of homes in forested areas contribute to the in-
creased occurrence of wildfires and their impact on humans. In order to understand
community responses to wildfires, a mixed method study was conducted (2008-2010) in
two communities in western Canada: Barriere, British Columbia and La Ronge, Sas-
katchewan (ruralwildfire.ca). These two communities were selected since they had en-
dured wildfires that resulted in community evacuation with significant loss of property
(McClure fire in BC, 2003; and, Mallard fire in SK, in 1999).
Specifically, the study was developed to determine the types of local social dynam-
ics and institutional structures which contribute to resiliency in rural settlements that
have experienced disasters and to determine how resiliency is manifested under these
circumstance at: a) an individual or household level; and, b) a collective level. Local advi-
sory boards were created and local individuals were hired to work as research assis-
tants. Qualitative interviews were initially conducted with the simultaneous development
of community profiles of the participating communities. Household surveys were also
conducted in each community and another community which did not experience a wild-
fire (Coaldale, Alberta). This technical report presents the findings from the household
survey that was conducted in Barriere, BC and the surrounding area.
THE HOUSEHOLD SURVEY
S P E C I A L
P O I N T S O F
I N T E R E S T :
B r i e f l y h i g h l i g h t y o u r p o i n t o f i n t e r e s t h e r e .
B r i e f l y h i g h l i g h t y o u r p o i n t o f i n t e r e s t h e r e .
B r i e f l y h i g h l i g h t y o u r p o i n t o f i n t e r e s t h e r e .
B r i e f l y h i g h l i g h t y o u r p o i n t o f i n t e r e s t h e r e .
T H E R U R A L W I L D F I R E S T U D Y G R O U P
H O U S E H O L D S U R V E Y R E S U L T S
B A R R I E R E , B C , 2 0 1 0
Technical Report
Investigators:
Judith C. Kulig , University of Lethbridge William (Bill) Reimer, Concordia University Ivan Townshend, University of Lethbridge Dana Edge, Queen‟s University Nancy Lightfoot, Laurentian University
Research Advisory Members:
Mike Barnett,
Office of Congressman Patrick Kennedy
Andrew Coghlan,
Australian Red Cross
John Claque,
Simon Fraser University
Murray McKay,
Alberta Health & Wellness
Community Advisory Board Members:
Rhonda Kershaw
Donna Kibble
Research Assistants:
Jill Hayward, Sylvia Chivers, June Bush,
D‟Arcy Bach, Tyson Schlepper, Cailynn
Fraser
Student Research Assistants:
Emma Hosgood, Public Health Under-
graduate student
Ambra Gullacher, Nurse Graduate
Phillip Layton, Nurse Graduate
Ainslee Kimmel, Graduate Assistant
Ruralwildfire.ca Figure 1
Page 2 T E C H N I C A L R E P O R T
H O U S E H O L D S U R V E Y R E S U L T S , B A R R I E R E B C , 2 0 1 0
“Our local people are taking the wisdom that they received from the fire and are working with it to try and develop stuff that is going to make a difference”
Community Member
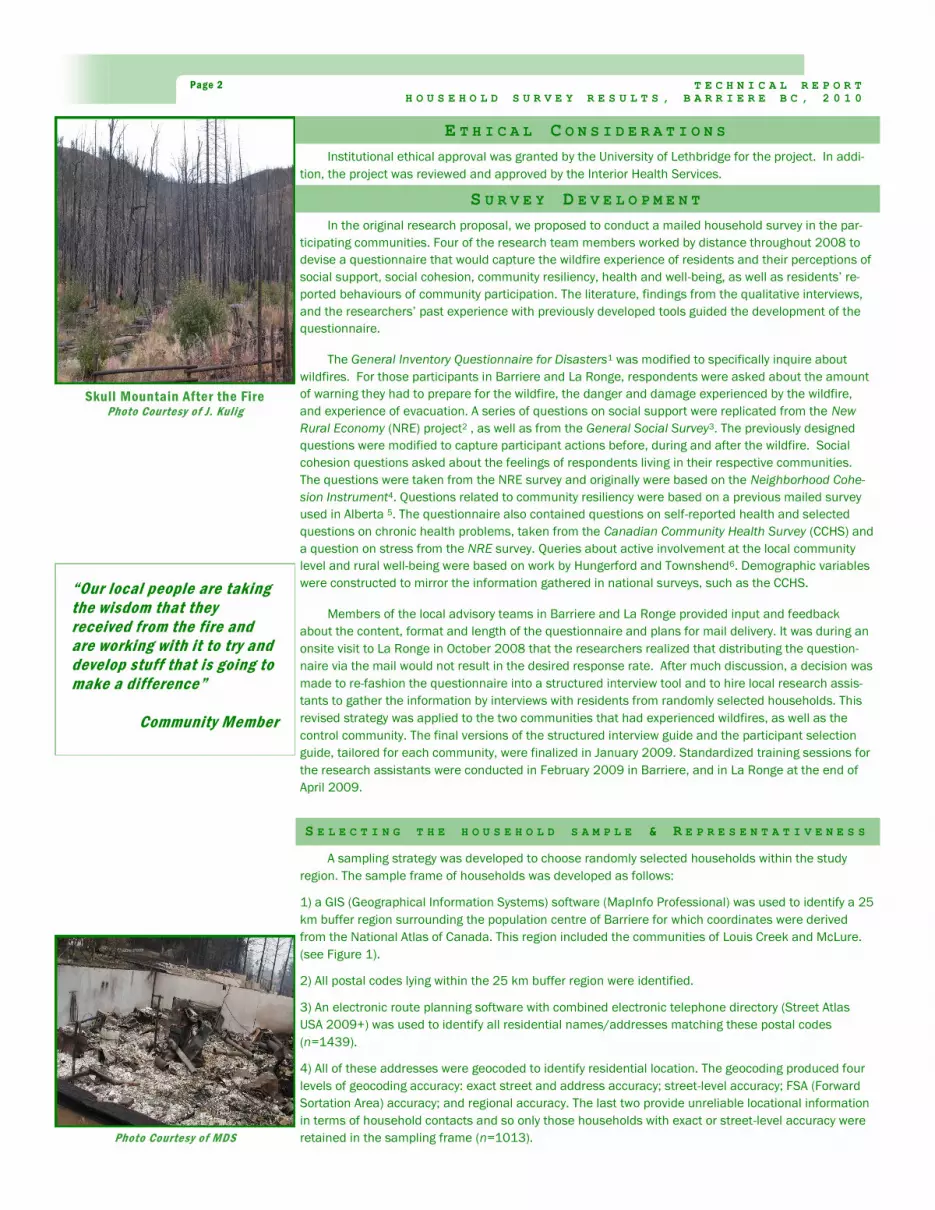
Skull Mountain After the Fire Photo Courtesy of J. Kulig
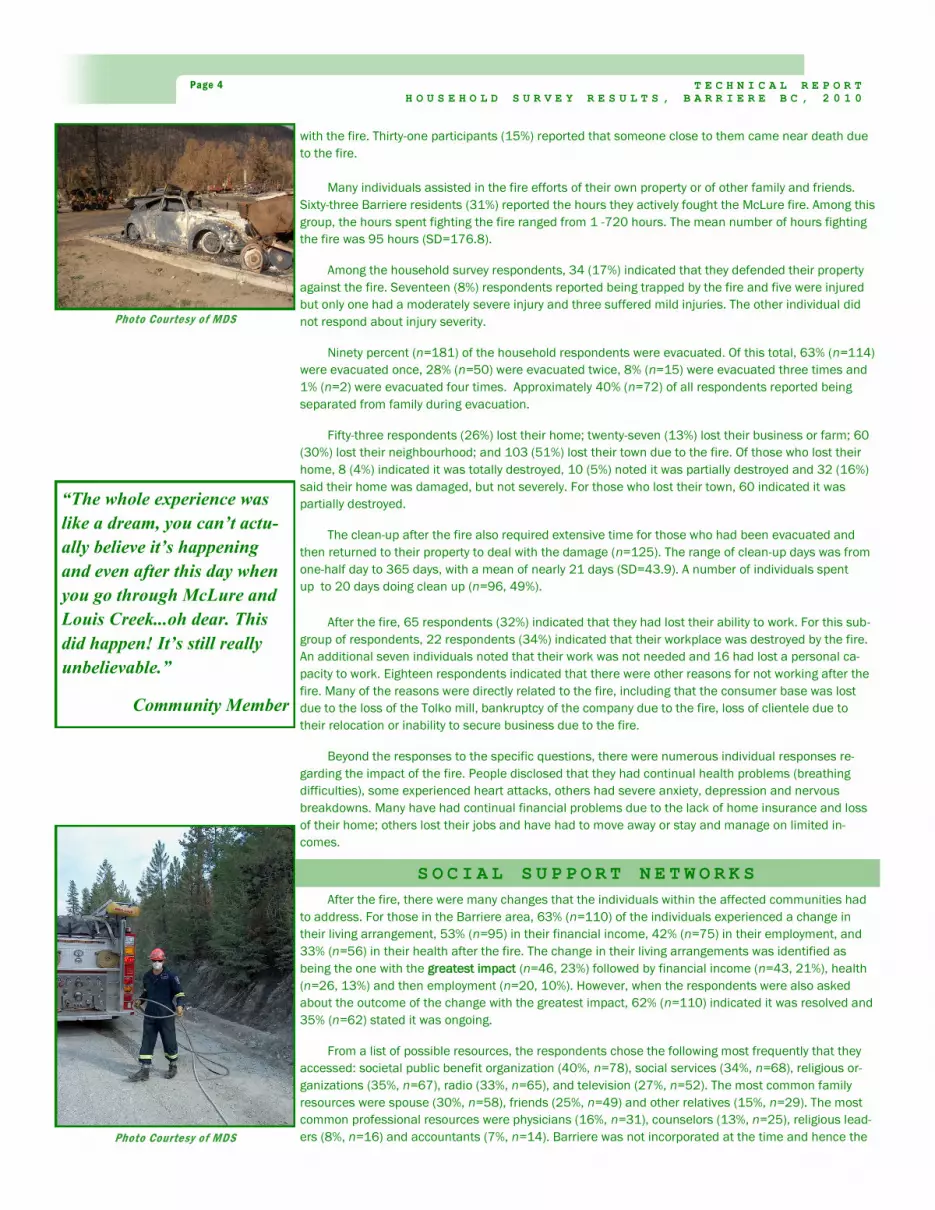
Photo Courtesy of MDS
A sampling strategy was developed to choose randomly selected households within the study
region. The sample frame of households was developed as follows:
1) a GIS (Geographical Information Systems) software (MapInfo Professional) was used to identify a 25
km buffer region surrounding the population centre of Barriere for which coordinates were derived
from the National Atlas of Canada. This region included the communities of Louis Creek and McLure.
(see Figure 1).
2) All postal codes lying within the 25 km buffer region were identified.
3) An electronic route planning software with combined electronic telephone directory (Street Atlas
USA 2009+) was used to identify all residential names/addresses matching these postal codes
(n=1439).
4) All of these addresses were geocoded to identify residential location. The geocoding produced four
levels of geocoding accuracy: exact street and address accuracy; street-level accuracy; FSA (Forward
Sortation Area) accuracy; and regional accuracy. The last two provide unreliable locational information
in terms of household contacts and so only those households with exact or street-level accuracy were
retained in the sampling frame (n=1013).
S E L E C T I N G T H E H O U S E H O L D S A M P L E & R E P R E S E N T A T I V E N E S S
E T H I C A L C O N S I D E R A T I O N S
Institutional ethical approval was granted by the University of Lethbridge for the project. In addi-
tion, the project was reviewed and approved by the Interior Health Services.
S U R V E Y D E V E L O P M E N T
In the original research proposal, we proposed to conduct a mailed household survey in the par-
ticipating communities. Four of the research team members worked by distance throughout 2008 to
devise a questionnaire that would capture the wildfire experience of residents and their perceptions of
social support, social cohesion, community resiliency, health and well-being, as well as residents‟ re-
ported behaviours of community participation. The literature, findings from the qualitative interviews,
and the researchers‟ past experience with previously developed tools guided the development of the
questionnaire.
The General Inventory Questionnaire for Disasters1 was modified to specifically inquire about
wildfires. For those participants in Barriere and La Ronge, respondents were asked about the amount
of warning they had to prepare for the wildfire, the danger and damage experienced by the wildfire,
and experience of evacuation. A series of questions on social support were replicated from the New
Rural Economy (NRE) project2 , as well as from the General Social Survey3. The previously designed
questions were modified to capture participant actions before, during and after the wildfire. Social
cohesion questions asked about the feelings of respondents living in their respective communities.
The questions were taken from the NRE survey and originally were based on the Neighborhood Cohe-
sion Instrument4. Questions related to community resiliency were based on a previous mailed survey
used in Alberta 5. The questionnaire also contained questions on self-reported health and selected
questions on chronic health problems, taken from the Canadian Community Health Survey (CCHS) and
a question on stress from the NRE survey. Queries about active involvement at the local community
level and rural well-being were based on work by Hungerford and Townshend6. Demographic variables
were constructed to mirror the information gathered in national surveys, such as the CCHS.
Members of the local advisory teams in Barriere and La Ronge provided input and feedback
about the content, format and length of the questionnaire and plans for mail delivery. It was during an
onsite visit to La Ronge in October 2008 that the researchers realized that distributing the question-
naire via the mail would not result in the desired response rate. After much discussion, a decision was
made to re-fashion the questionnaire into a structured interview tool and to hire local research assis-
tants to gather the information by interviews with residents from randomly selected households. This
revised strategy was applied to the two communities that had experienced wildfires, as well as the
control community. The final versions of the structured interview guide and the participant selection
guide, tailored for each community, were finalized in January 2009. Standardized training sessions for
the research assistants were conducted in February 2009 in Barriere, and in La Ronge at the end of
April 2009.

Page 3 T E C H N I C A L R E P O R T
H O U S E H O L D S U R V E Y R E S U L T S , B A R R I E R E B C , 2 0 1 0
“Tragedy draws people together, it’s not that that has to be the way it happens. As far as restoring this community, I think there’s more of a chance for resiliency now in the community than ever before”
Community Member
“The Valley” Photo Courtesy of MDS
Photo Courtesy of MDS
From the sample frame of 1013 households with reasonable location accuracy, three sets of 250
randomly selected (without replacement) households were identified. Each set was mapped over a
series of 1 km by 1 km grids using the GIS to check for adequate sample coverage throughout the
study area. Each sample set functioned as the primary, secondary, and tertiary sampling lists for the
researchers conducting the face-to-face interviews.
A day-long training session was held in Barriere during February 2009 for locally hired interview-
ers by one of the researchers (I. Townshend). Research procedures, including use of the sampling
lists, issues of confidentiality, and practice using the structured questionnaire guide occurred during
the training session.
Face-to-face structured interviews were carried out by a team of local research assistants: each
was assigned a share of the primary, secondary, and tertiary sample lists. Households on the primary
list were approached and to ensure random selection of male and female respondents, an adult with
the most recent birthday was invited to participate in the survey. Members of the household were ineli-
gible to participate if they did not reside in the community during the wildfire. If ineligible, unoccupied,
or if no response or contact after three visits, an address from the secondary sample list (or tertiary list
if required) was used as a substitute. Household contacts continued in this manner from February 27
to August 7, 2009. Weekly teleconferences were held with research assistants and one of the re-
searchers (D. Edge) to discuss data collection issues. In total, 429 contact attempts were made, yield-
ing 202 useable responses and a response rate of 47%. Assuming a population of 1439 households
in the area, the sample data provides a margin of error of +/- 6% at the 95% confidence level and +/-
5% at the 90% confidence level.
In the Barriere household survey, the largest proportion of respondents were female (n=122,
61%) . Females are over-represented among Barriere respondents by approximately 10% compared to
the proportion of Barriere females reported in the 2006 Census (50% female). The households ranged
in size from 1-6 persons with 48% composed of 2 people. The vast majority of responding households
had no minors living with them (n=160, 80%). Forty-four percent of the respondents were between the
ages of 45 and 64 (n=89) (See Figure 2), which is consistent with the census information from 2006
(n=1060, 42%). Slightly more married people participated in the survey compared to the total Barriere
population in 2006 (57% vs. 52%). The majority of respondents (58%) had a high school diploma or
less, with 5% reporting being unemployed, 38% were employed and the majority of respondents (46%)
reported being retired. Annual household income for 42% of respondents was reported to be between
$20,000 and $39,000, which is comparable to the median reported earnings of $15,681 and average
earnings for full time workers of $38,192 in Barriere in the 2006 census.
W H O W E R E T H E P A R T I C I P A N T S ?
Figure 2: Age Structuren=199
0
20
40
60
80
<18-19 20-29 30-39 40-49 50-59 60-69 70-79 80+
Pe
rce
nt
(%)
Male
Female
E V A C U A T I O N E X P E R I E N C E S
Of the 201 individuals who responded, 57% (n=115) did not have a chance to prepare for the
evacuation. Of the 84 respondents who reported having a chance to prepare, nearly 30% (n=25) had
more than 12 hours of warning time regarding the fire, whereas 15% had less than one hour to pre-
pare. Those who reported having time to prepare were asked about their preparation to deal with the
fire and 82 responded. Of these, 27% (n=22) had previous training, 37% (n=30) had previous knowl-
edge and 29% (n=24) had previous experience dealing with fires. Of the total sample, 68% (n=136)
were overwhelmed by the suddenness of the fire and 77% (n=154) were overwhelmed by the severity
of the disaster. Despite the severity of the fire, only 7% (n=15) came near death and of this group only
one individual thought they would die and four thought it was possible they would die while dealing
Page 4 T E C H N I C A L R E P O R T
H O U S E H O L D S U R V E Y R E S U L T S , B A R R I E R E B C , 2 0 1 0
Photo Courtesy of MDS
Photo Courtesy of MDS
“The whole experience was
like a dream, you can’t actu-
ally believe it’s happening
and even after this day when
you go through McLure and
Louis Creek...oh dear. This
did happen! It’s still really
unbelievable.”
Community Member
After the fire, there were many changes that the individuals within the affected communities had
to address. For those in the Barriere area, 63% (n=110) of the individuals experienced a change in
their living arrangement, 53% (n=95) in their financial income, 42% (n=75) in their employment, and
33% (n=56) in their health after the fire. The change in their living arrangements was identified as
being the one with the greatest impact (n=46, 23%) followed by financial income (n=43, 21%), health
(n=26, 13%) and then employment (n=20, 10%). However, when the respondents were also asked
about the outcome of the change with the greatest impact, 62% (n=110) indicated it was resolved and
35% (n=62) stated it was ongoing.
From a list of possible resources, the respondents chose the following most frequently that they
accessed: societal public benefit organization (40%, n=78), social services (34%, n=68), religious or-
ganizations (35%, n=67), radio (33%, n=65), and television (27%, n=52). The most common family
resources were spouse (30%, n=58), friends (25%, n=49) and other relatives (15%, n=29). The most
common professional resources were physicians (16%, n=31), counselors (13%, n=25), religious lead-
ers (8%, n=16) and accountants (7%, n=14). Barriere was not incorporated at the time and hence the
S O C I A L S U P P O R T N E T W O R K S
with the fire. Thirty-one participants (15%) reported that someone close to them came near death due
to the fire.
Many individuals assisted in the fire efforts of their own property or of other family and friends.
Sixty-three Barriere residents (31%) reported the hours they actively fought the McLure fire. Among this
group, the hours spent fighting the fire ranged from 1 -720 hours. The mean number of hours fighting
the fire was 95 hours (SD=176.8).
Among the household survey respondents, 34 (17%) indicated that they defended their property
against the fire. Seventeen (8%) respondents reported being trapped by the fire and five were injured
but only one had a moderately severe injury and three suffered mild injuries. The other individual did
not respond about injury severity.
Ninety percent (n=181) of the household respondents were evacuated. Of this total, 63% (n=114)
were evacuated once, 28% (n=50) were evacuated twice, 8% (n=15) were evacuated three times and
1% (n=2) were evacuated four times. Approximately 40% (n=72) of all respondents reported being
separated from family during evacuation.
Fifty-three respondents (26%) lost their home; twenty-seven (13%) lost their business or farm; 60
(30%) lost their neighbourhood; and 103 (51%) lost their town due to the fire. Of those who lost their
home, 8 (4%) indicated it was totally destroyed, 10 (5%) noted it was partially destroyed and 32 (16%)
said their home was damaged, but not severely. For those who lost their town, 60 indicated it was
partially destroyed.
The clean-up after the fire also required extensive time for those who had been evacuated and
then returned to their property to deal with the damage (n=125). The range of clean-up days was from
one-half day to 365 days, with a mean of nearly 21 days (SD=43.9). A number of individuals spent
up to 20 days doing clean up (n=96, 49%).
After the fire, 65 respondents (32%) indicated that they had lost their ability to work. For this sub-
group of respondents, 22 respondents (34%) indicated that their workplace was destroyed by the fire.
An additional seven individuals noted that their work was not needed and 16 had lost a personal ca-
pacity to work. Eighteen respondents indicated that there were other reasons for not working after the
fire. Many of the reasons were directly related to the fire, including that the consumer base was lost
due to the loss of the Tolko mill, bankruptcy of the company due to the fire, loss of clientele due to
their relocation or inability to secure business due to the fire.
Beyond the responses to the specific questions, there were numerous individual responses re-
garding the impact of the fire. People disclosed that they had continual health problems (breathing
difficulties), some experienced heart attacks, others had severe anxiety, depression and nervous
breakdowns. Many have had continual financial problems due to the lack of home insurance and loss
of their home; others lost their jobs and have had to move away or stay and manage on limited in-
comes.
Page 5 T E C H N I C A L R E P O R T
H O U S E H O L D S U R V E Y R E S U L T S , B A R R I E R E B C , 2 0 1 0
Photo Courtesy of MDS
Photo Courtesy of MDS
“Then again, that speaks to
the bottom line of rural com-
munity and rural gentry.
They do what it takes to get
things done and will do it as
long as it takes to get it
done.”
Community Member
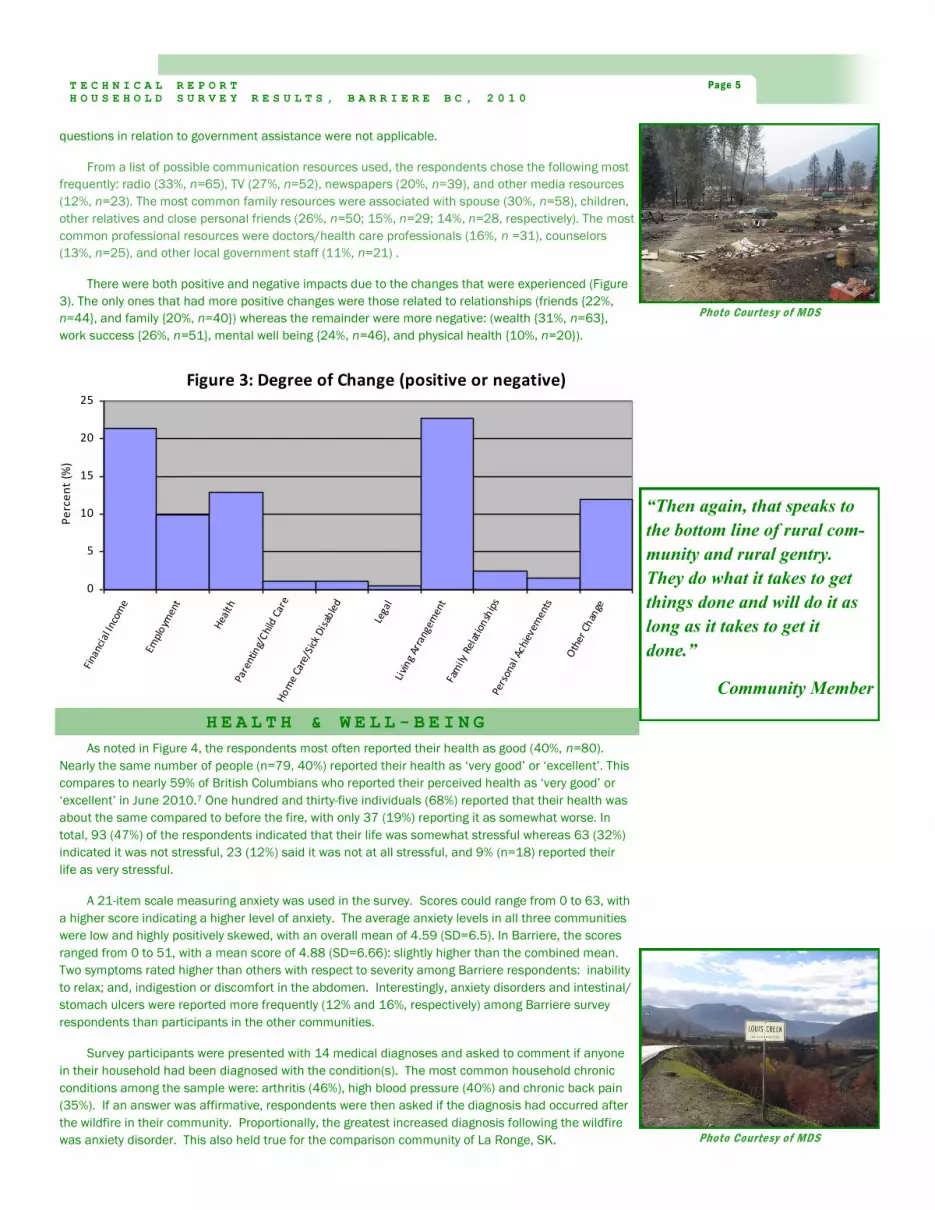
Figure 3: Degree of Change (positive or negative)
0
5
10
15
20
25
Fina
ncia
l Inc
ome
Empl
oym
ent
Hea
lth
Pare
ntin
g/C
hild
Car
eH
om
e Ca
re/S
ick
Dis
able
d
Lega
lLi
vin
g Ar
rang
emen
tFa
mily
Rel
atio
nsh
ips
Pers
onal
Ach
ieve
men
ts
Oth
er C
han
ge
Pe
rce
nt
(%)
questions in relation to government assistance were not applicable.
From a list of possible communication resources used, the respondents chose the following most
frequently: radio (33%, n=65), TV (27%, n=52), newspapers (20%, n=39), and other media resources
(12%, n=23). The most common family resources were associated with spouse (30%, n=58), children,
other relatives and close personal friends (26%, n=50; 15%, n=29; 14%, n=28, respectively). The most
common professional resources were doctors/health care professionals (16%, n =31), counselors
(13%, n=25), and other local government staff (11%, n=21) .
There were both positive and negative impacts due to the changes that were experienced (Figure
3). The only ones that had more positive changes were those related to relationships (friends {22%,
n=44}, and family {20%, n=40}) whereas the remainder were more negative: (wealth {31%, n=63},
work success {26%, n=51}, mental well being {24%, n=46}, and physical health {10%, n=20}).
H E A L T H & W E L L - B E I N G
As noted in Figure 4, the respondents most often reported their health as good (40%, n=80).
Nearly the same number of people (n=79, 40%) reported their health as „very good‟ or „excellent‟. This
compares to nearly 59% of British Columbians who reported their perceived health as „very good‟ or
„excellent‟ in June 2010.7 One hundred and thirty-five individuals (68%) reported that their health was
about the same compared to before the fire, with only 37 (19%) reporting it as somewhat worse. In
total, 93 (47%) of the respondents indicated that their life was somewhat stressful whereas 63 (32%)
indicated it was not stressful, 23 (12%) said it was not at all stressful, and 9% (n=18) reported their
life as very stressful.
A 21-item scale measuring anxiety was used in the survey. Scores could range from 0 to 63, with
a higher score indicating a higher level of anxiety. The average anxiety levels in all three communities
were low and highly positively skewed, with an overall mean of 4.59 (SD=6.5). In Barriere, the scores
ranged from 0 to 51, with a mean score of 4.88 (SD=6.66): slightly higher than the combined mean.
Two symptoms rated higher than others with respect to severity among Barriere respondents: inability
to relax; and, indigestion or discomfort in the abdomen. Interestingly, anxiety disorders and intestinal/
stomach ulcers were reported more frequently (12% and 16%, respectively) among Barriere survey
respondents than participants in the other communities.
Survey participants were presented with 14 medical diagnoses and asked to comment if anyone
in their household had been diagnosed with the condition(s). The most common household chronic
conditions among the sample were: arthritis (46%), high blood pressure (40%) and chronic back pain
(35%). If an answer was affirmative, respondents were then asked if the diagnosis had occurred after
the wildfire in their community. Proportionally, the greatest increased diagnosis following the wildfire
was anxiety disorder. This also held true for the comparison community of La Ronge, SK.

Page 6 T E C H N I C A L R E P O R T
H O U S E H O L D S U R V E Y R E S U L T S , B A R R I E R E B C , 2 0 1 0
Photo Courtesy of MDS
Photo Courtesy of MDS
Figure 5: Community Sense of Identity
0
20
40
60
80
100
Common
Identity
Distinctive
Lifestyle
Sense of
Rural not
Urban
Appearance
Similarity
Ethnic
Similarity
Overall
People
Similarity
Pe
rce
nt
(%)
Agree or
Strongly
Agree
Disagree or
Strongly
Disagree
The participants were all asked to respond to questions about living in the Valley. The re-
sponses reinforce their satisfaction with living in this rural area. For example, 91% (n=181)
strongly agreed or agreed that they were attracted to living in the Valley and 89% (n=176) felt like
they belonged in the community. Furthermore, the respondents strongly agreed or agreed that the
Valley gave them a sense of community (n=167; 84%), there was fellowship between themselves
and their neighbors (n=140, 71%) and they had a sense of rootedness (n=147, 74%) in the area.
Only 29 (15%) strongly agreed or agreed that they would move out of the Valley if given the oppor-
tunity. In total, 170 (86%) strongly agreed or agreed that they would remain a resident in the Val-
ley for a number of years in the future.
Having positive connections with their neighbors was clearly evident in their strongly agree
and agree responses shown below:
141 (71%) indicated that they visit with their neighbors
178 (90%) noted that the friendships and associations they have in their community mean a lot to them
195 (98%) said that neighbors help in emergencies
168 (84%) would go to someone in their community if they needed advice
164 (83%) felt loyal to the people in their community
182 (91%) regularly stop and talk with the people in their community
121 (61%) noted that they borrow and exchange favours with the neighbors
107 (54%) strongly disagreed or disagreed that they rarely have neighbors over
58 (29%) agreed that they rarely had neighbors over
The respondents also strongly agreed or agreed that they share with their fellow residents
about what was most important in their life (n=134, 67%) and that they saw themselves as most
similar to others in the Valley (n=151, 76%).
Any planning in the community is seen as a process that involves “we” rather than
“they” (strongly agree and agree: n=107, 54%), however 35% (n=70) had a neutral response to
this question. In addition, 180 (90%) strongly agreed and agreed that they would be willing to
work on things together with their fellow residents.
S O C I A L R E L A T I O N S
Figure 4: Self-Reported Healthn=200
0
10
20
30
40
50
poor fair good very good excellent
Pe
rce
nt
(%)

Page 7 T E C H N I C A L R E P O R T
H O U S E H O L D S U R V E Y R E S U L T S , B A R R I E R E B C , 2 0 1 0
Wildfire Monument, McLure BC Photo Courtesy of J. Kulig
Figure 6: Feel Like I Belong in Barrieren=199
0
10
20
30
40
50
60
strongly disagree disagree neutral agree strongly agree
Pe
rce
nt
(%)
Figure 7: Community Desirabilityn= 198
0
5
10
15
20
25
30
35
much less desirable a lit t le less
desirable
no more or no less
desirable
a lit t le more
desirable
the most desirable not applicable
Pe
rce
nt
(%)
C O M M U N I T Y R E S I L I E N C Y
All the participants were asked to respond to the 15 item Community Resiliency Scale. Over a
third did not feel isolated from the rest of the province (strongly disagree and disagree: 40%, n=80)
although 37% (n=74) felt neutral in this regard. Ninety percent (n=179) either strongly agreed or
agreed that people in the community helped one another. The majority of the participants also felt that
the people in the community helped one another. Most participants agreed that people in the commu-
nity shared similar values (strongly agree and agree: 56%, n=112). 47% (n=11) strongly agreed that
people in their community were open to new ideas whereas 41% (n=82) were neutral in regards to this
statement.
The participants also indicated that:
The changes in their community were positive (strongly agree and agree: 65%, n=130),
They believed that residents of the community participated in community events (strongly agree and agree: 85%, n=169),
There is strong community leadership (strongly agree and agree: 57%, n=114) and that leaders listen to the residents (53%, n=105),
There is a sense of community pride (strongly agree and agree: 76%, n=152),
Community members are able to deal with problems (strongly agree and agree: 71%, n=141),
There is satisfaction with the quality of current health care services in their community (strongly
agree and agree: 77%, n=154)
As individuals, they did not believe that the physical environment negatively affected their lives
(strongly disagree and disagree: 73%, n=148). Most do things to stay healthy (strongly agree and
agree: 94%, n=190), have support from others to stay healthy (strongly agree and agree: 88%, n=178)
and believe they can deal with problems in their life (strongly agree and agree: 92%, n=185).
Photo Courtesy of J. Kulig

Page 8 T E C H N I C A L R E P O R T
H O U S E H O L D S U R V E Y R E S U L T S , B A R R I E R E B C , 2 0 1 0
Several statements were included that focused on community identity. When asked about how
similar people are in the community, 36% (n=72) agreed or strongly agreed that their ten nearest
neighbors were similar to them but 39% (n=77) either disagreed or strongly disagreed with this state-
ment. They did not believe that people in their community were easily recognizable by their ethnic
background (53%, n=105) or by their clothing (51%, n=120). There was a strong agreement that their
community was more rural than urban (strongly agree and agree: 92%, n=182) and that a rural life-
style is more distinctive than an urban lifestyle (88%, n=175). Finally, 48% (n=95) felt that there was a
common sense of identity among the residents.
Most of the participants indicated that their community was trusting, welcoming, supportive and
friendly (See Figure 9) and noted that they would feel sad if they had to move away. Thirty six percent
(n=71) noted that they were much more satisfied living in The Valley than elsewhere, and 33% (n=65)
felt it was the most desirable place to live. They also believed that outsiders would see their commu-
nity as struggling (54%, n=107) or average (41%, n=81). Finally, when asked about what percentage of
visiting with their neighbors involves their family, almost 50% indicated zero and almost 20% indicated
half of their visiting with neighbors involved their own family members.
C O M M U N I T Y I D E N T I T Y
F I G U R E 9 : C O M M U N I T Y I D E N T I T Y
0% 10% 20% 30% 40% 50% 60% 70% 80% 90% 100%
'friendly unfriendly'
'supportive indifferent'
'welcoming distant'
'trusting nontrusting'
1 % (Non-trusting)
2%
3%
4%
5%
6%
7 % (Trusting)
Photo Courtesy of MDS
C O M M U N I T Y & P O L I T I C A L P A R T I C I P A T I O N
The majority of the respondents noted that they always voted in municipal/local (n=121, 61%),
provincial (n=160, 80%) and federal (n=158, 79%) elections (See Figure 8).
The respondents were also asked to identify how often they used community facilities. For the
following facilities, the largest response was “never”: sport facility (n=90, 45%), library (n=90, 45%),
church (n=129, 65%), day care (n=176, 88%) and convenience store (n=45, 23%). They accessed the
medical clinic, pharmacy and restaurants less than once a month (n=115, 58%; n=89, 45%; n=43,
22% respectively), and the gas station twice a month (n=50; 25%).
Figure 8: My Community Has Strong Leadershipn=199
0
10
20
30
40
50
strongly disagree disagree neutral agree strongly agree
Pe
rce
nt
(%)

T E C H N I C A L R E P O R T
H O U S E H O L D S U R V E Y R E S U L T S , B A R R I E R E B C , 2 0 1 0
Page 9
McLure Ferry
Tolko Mill after
the fire
The Valley after the fire
Destruction by the fire
McLure Fire Photos courtesy of Judith C Kulig

Additional electronic copies may be obtained from:
www.ruralwildfire.ca
Or a hard copy may be obtained from:
Judith C. Kulig, RN, DNSc
Professor
Faculty of Health Sciences
University of Lethbridge
4401 University Drive
Lethbridge AB T1K 3M4
Email: [email protected]
Printed in Canada, University of Lethbridge Printing Services
S U G G E S T E D C I T A T I O N F O R M A T :
Kulig, J., Reimer, W., Townshend, I., Edge, D., Lightfoot, N., Kimmel, A., Hosgood, E. (2010). Report of the
Household Survey: Barriere, BC. Lethbridge, Alberta. University of Lethbridge.
Acknowledgment and Funding: The Rural Wildfire Study Group thanks the community members of the participating
communities (Barriere, i.e., The Valley, British Columbia; La Ronge, Saskatchewan and Coaldale, Alberta for their
participation in this study. The agencies, leaders, local community advisory board members and research assistants
all contributed to the final product. Funding for the research was provided by the Social Sciences and Humanities
Research Council of Canada. Both Ambra Gullacher and Phillip Layton were Canadian Institutes of Health Research
(CIHR) Health Professional Student Research Award recipients; Ambra also received a Summer Studentship from
the Alberta Heritage Foundation for Medical Research while Phillip received a Chinook Research Summer Award.
Thank you to Mennonite Disaster Services (MDS) for allowing us to reprint their photographs.
References:
1Raphael, B., Lundin, T., & Weisaeth, L. (1989). A research method for the study of psychological and psychiatric
aspects of disaster. Acta Psychiatrica Scandinavia, 80 (S343), 1-75.
2Reimer, B. et al. (2001) NRE Household survey form, Summer 2001. Retrieved from http://nre.concordia.ca/
survey_forms.htm
3Statistics Canada. (2006). General Social Survey (GSS). Retrieved from http://www.statcan.gc.ca/bsolc/olc-cel/
olc-cel?catno=89F0115X&CHROPG=1&lang=eng
4Buckner, J.C. (1988). The development of an instrument to measure neighbourhood cohesion. American Journal
of Community Psychology, 16(6), 771-790.
5Kulig, J., Edge, D., & Joyce, B. (2008). Community resiliency as a measure of collective health status. Perspectives
from rural communities. Canadian Journal of Nursing Research. 40(4), 92-110.
6Hungerford, L. & Townshend, I. (2006). Survey tool: Community social life and well-being: a survey of rural commu-
nities. Lethbridge, AB: University of Lethbridge.

RESOURCES TO ACCESS
GROUPS PROVIDING INFORMATION TO INDIVIDUALS AND COMMUNITIES INTERESTED IN DISASTER PLANNING
GOVERNMENT OF SASKATCHEWAN - WILDFIRE RISK ASSESSMENT
http://www.environment.gov.sk.ca/Default.aspx?DN=548bb226-240e-4bde-a71c-1461e72b78a6
WHAT YOU NEED TO KNOW ABOUT WILDFIRE
http://www.environment.gov.sk.ca/Default.aspx?DN=548bb226-240e-4bde-a71c-1461e72b78a6
CANADIAN RED CROSS– DISASTER PREPAREDNESS
http://www.redcross.ca/article.asp?id=000005&tid=003
AUSTRALIAN RED CROSS– DISASTER PREPAREDNESS
http://www.redcross.org.au/default.asp
Follow the “disaster and emergency services” quick link
THE CANADIAN CENTRE FOR EMERGENCY PREPAREDNESS
www.ccep.ca
UNIVERSITY OF CALIFORNIA
HOMEOWNER’S WILDFIRE MITIGATION GUIDE
http://groups.ucanr.org/HWMG/
LIVING WITH FIRE– A GUIDE FOR THE HOMEOWNER
EVACUATION PREPARATION AND CHECKLIST
http://www.scribd.com/doc/19381124/Living-With-Fire-A-Guide-for-the-Homeowner
IS YOUR FAMILY PREPARED?
http://www.getprepared.gc.ca/index-eng.aspx
SALVATION ARMY– EMERGENCY DISASTER SERVICES
http://www.salvationarmy.ca/eds/
Page 11 T E C H N I C A L R E P O R T
H O U S E H O L D S U R V E Y R E S U L T S , B A R R I E R E B C , 2 0 1 0