Embed Size (px)
Citation preview
Hotel Online Booking Decisions Based on Price Complexity, Alternative
Attractiveness, and Confusion
by
Pengsongze Xue
A Thesis
presented to
The University of Guelph
In partial fulfilment of requirements
for the degree of
Master of Science
in
Tourism and Hospitality
Guelph, Ontario, Canada
© Pengsongze Xue, May, 2019
ABSTRACT
HOTEL ONLINE BOOKING DECISIONS BASED ON PRICE COMPLEXITY,
ALTERNATIVE ATTRACTIVENESS, AND CONFUSION
Pengsongze Xue Advisor:
University of Guelph, 2019 Dr. WooMi Jo
The goal of this research is to investigate customer confusion and its antecedents,
specifically price complexity and alternative attractiveness, and to validate a link between
confusion and postponing decisions about booking a hotel online. Price complexity and
alternative attractiveness cause three types of confusion: overload confusion, similarity
confusion, and ambiguity confusion. Moreover, these three types of confusion cause customers
to defer purchase decisions. An online survey was used to collect data from customers who
booked hotels online during the past six months in both the United States and Canada.
Keywords: Online travel agency; Online hotel booking; Price complexity; Alternative
attractiveness; Confusion; Decision postponement; Purchase intention
iii
ACKNOWLEDGEMENT
First, my greatest and sincerest gratitude go to my advisor, Dr. WooMi Jo, for all your
precious guidance, support, and encouragement during my two years of study. In addition to
helping me to discover my interest in research and motivating me to acquire deeper knowledge
of the hotel industry, you have been supported and guided me to achieve a higher level of
professionalism in academic research. Without your patience and excellent feedback, this thesis
would not have been possible. Beyond just my academic studies, you have also been a spiritual
mentor, providing me with advice on many aspects of my life. Under your teachings, I was able
to learn a number of valuable philosophies which I can take with me and incorporate into my
daily life.
Second, I thank my committee members, Professors Bruce McAdams and Mark Holmes.
Thank you for taking time to review my thesis and provide me with detailed feedback. Your
efforts and perspectives improved my thesis immensely. Also, many thanks to Dr. Marion Joppe
for chairing my thesis defense and Professor Joan Flaherty for serving as my external committee
member. Your wisdom and academic knowledge are treasures for which I am grateful.
Third, my gratitude goes to everyone in the School of Hospitality, Food and Tourism
Management (HFTM). I would like to express my great appreciation to faculty and staff
members, namely Dr. Statia Elliot, Dr. Chris Choi, Dr. William Murray, Professor Kathleen
Rodenburg, Barb Piccoli, Amy Tyszka, and Cori Wells for all your support. In addition, my
sincere gratitude is extended to all the graduate students of the program, but I would especially
like to thank Michael Lever, Jingen Liang, Ye Shen, Brittany Lutes, Yiting Zhao, and Tianyue

iv
Yue. Thank you for your feedback and insightful suggestions on my pre-test survey. It has been a
memorable experience to study and work with you during the past two years.
Last, but not least, my deepest gratitude goes to my family. Even though you are all living
in China, you have provided me continuous support. Thank you for offering me this chance to
come to Canada and study. Without your unconditional love and support, I would not have
overcome the difficulties I have faced during my time in Canada. Your trust and encouragement
have been fundamental for me to complete my Masters of Science.
v
TABLE OF CONTENTS
ABSTRACT ................................................................................................................................................ ii
ACKNOWLEDGEMENT ....................................................................................................................... iii
TABLE OF CONTENTS .......................................................................................................................... v
LIST OF TABLES AND FIGURES ..................................................................................................... vii
CHAPTER 1: INTRODUCTION ............................................................................................................ 1
CHAPTER 2: LITERATURE REVIEW AND HYPOTHESIS DEVELOPMENT ......................... 6
2.1. Price complexity .............................................................................................................................. 6
2.2. Confusion ......................................................................................................................................... 7
2.2.1. Overload confusion ................................................................................................................... 9
2.2.2. Similarity confusion ................................................................................................................. 9
2.2.3. Ambiguity confusion .............................................................................................................. 10
2.2.4. Price complexity and confusion ............................................................................................ 11
2.3. Alternative attractiveness ............................................................................................................. 13
2.3.1. Alternative attractiveness and confusion ............................................................................. 14
2.4. Decision postponement and purchase intention ........................................................................ 16
2.4.1. Confusion and related outcomes ........................................................................................... 17
CHAPTER 3: METHODOLOGY ......................................................................................................... 20
3.1. Study population and sample ....................................................................................................... 20
3.2. Sample size ..................................................................................................................................... 20
3.3. Data collection ............................................................................................................................... 21
3.4. Measurement scales ...................................................................................................................... 22
CHAPTER 4: RESULTS ........................................................................................................................ 24
4.1. Demographic profile of the sample ............................................................................................. 24
4.2. Confirmatory factor analysis ........................................................................................................ 26
4.3. Structural model analysis ............................................................................................................. 30
CHAPTER 5: DISCUSSION ................................................................................................................. 33
vi
CHAPTER 6: IMPLICATIONS ............................................................................................................ 38
6.1. Theoretical implications ............................................................................................................... 38
6.2. Practical implications .................................................................................................................... 40
CHAPTER 7: LIMITATIONS AND FUTURE STUDIES ................................................................ 45
CHAPTER 8: CONCLUSION ............................................................................................................... 48
REFERENCES ......................................................................................................................................... 49
APPENDICES .......................................................................................................................................... 60
Appendix 1: Questionnaire .................................................................................................................. 60
Appendix 2: Research Ethics Boards Approval ................................................................................ 66
vii
LIST OF TABLES AND FIGURES
Table 1. Respondents profile (n=453) .......................................................................................... 25
Table 2. Results of CFA (n=453) .................................................................................................. 26
Table 3. Correlation matrix ........................................................................................................... 29
Table 4. Results for structural model (n=453) .............................................................................. 31
Figure 1. Proposed conceptual model ........................................................................................... 19
Figure 2. Structural Model ............................................................................................................ 31
1
CHAPTER 1: INTRODUCTION
Computer reservation and global distribution systems arrived in the late 1980s and early
1990s (Gretzel & Fesenmaier, 2009) and have provided a link between the suppliers and
customers using new distribution channels (Buhalis, 1998; Law, Leung, & Wong, 2004;
Morrison, Jing, O’Leary, & Cai, 2001). As online travel agencies (OTAs) like Expedia.com
engaged in online marketing during the second half of the 1990s (Amaro & Duarte, 2013),
travelers used the Internet to search for information and plan travel using online booking
channels (Litvin, Goldsmith, & Pan, 2008). Global digital travel sales on the Internet generated
more than 560 billion United States dollars (USD) in 2016, and worldwide online travel sales
should reach 817.54 billion USD in 2020 (Statista, 2016).
With so many distribution channels other than their own websites to sell rooms, hotels now
compete with the OTAs and thus work both competitively and cooperatively. OTAs become a
double-edged sword for hotels. Hotels pay commissions to OTAs to sell their rooms, but hotels
also compete for customers on their own. The commission fees range from 18-36% of the cost of
each room sold (Clampet, 2016). Moreover, OTAs offer slightly lower prices than what hotels
post on their own websites for the same hotel rooms. Compared to direct booking with hotel
websites, hotels show lower profits when customers use OTAs channels. Attracting customers to
their own sites is difficult for hotels. Using available hotel room options based on individual
search criteria, OTAs provide some advantages to customers: reduced search costs and easy
comparisons among options (Scheibehenne, Greifeneder, & Todd, 2010). Although customers
enjoy more choices using OTAs for comparisons, their search criteria contribute to a complex
2
price structure. Additionally, OTAs offer membership programs very similar to hotel loyalty
programs as a way to retain customers. Customers have many more booking site options for
similar hotel and room types, often with better benefits and price. However, more online booking
choices may create confusion for customers than if fewer choices are available.
Confusion may be one side effect so many online distribution channels (Lu, Gursoy, & Lu,
2016). Customers search through hotel official websites, OTAs, Airbnb, and other distribution
sites for trip accommodations. Most published information systems research investigated the
decision process under varying information loads and focused on how manipulating changes in
the number of available choices affected that process, but the number of attributes from which to
choose did not (Tan, Teo, & Benbasat, 2010).
To better understand customer confusion, it is important to investigate both alternative-
based and attribute-based evaluation approaches. Excessive information from distribution
channels may affect customer decisions, especially considering how massive amounts of
information cause confusion (Mai, Hoffmann, Schwarz, Niemand, & Seidel, 2014). Price may be
the primary determinant of purchase intention and an important attribute of the product or service,
so complexity in pricing may cause confusion. More comparable options may also lead to more
confusion. Customers make decisions using their evaluations of many booking sites. Such
overall evaluations reflect alternative attractiveness, which measures the number of attractive
options. Even though attribute-based evaluation (or price) may lead to more indecision and
uncertainty about preferences than alternative-based evaluations (Dhar, 1996), customers
3
generally do not make decisions based on single attribute when it comes to booking hotel rooms
online. Previous studies do suggest that more choice is better (Benartzi & Thaler, 2001).
However, from a different perspective, people become less satisfied with their decisions
once the number of alternatives reaches a certain level (Iyengar & Lepper, 2000; Scheibehenne
et al., 2009). Customers might be confused among all available online channels to find
accommodation that optimally meets their needs. Room price is the most frequently used
criterion for hotel room choices. Among all available booking options, customers will compare
the prices from different booking sites, and some online distribution channels allow customers to
easily compare prices among vendors and find the best offers. If price is perceived as reasonable,
customers may have higher purchase intentions (Grewal, Krishnan, Baker, & Borin, 1998;
Guillet, Liu, & Law, 2014; Ramanathan & Ramanathan, 2011). Hotel customers, however,
usually face complex prices because they frequently must calculate additional fees or other
extras beyond the room rate. The cognitive effort involved in evaluating prices among various
booking sites affects the final choice (Estelami, 2003; Herrmann & Wricke, 1998; Kim &
Kramer, 2006). Thus, price complexity makes it harder for customers to decide on a hotel room,
especially when they have overloaded choice sets, which may lead to negative outcomes
(Dellaert & Stremersch, 2005; Scheibehenne et al., 2010).
Examining the effects of abundant booking choices and complex prices should allow the
industry to better understand customer confusion. Academics have heavily researched the
unfavorable consequences of customer confusion: decision postponement, negative word-of-
4
mouth, dissatisfaction, dissonance, shopping fatigue, decreased brand loyalty, decreased trust,
product misuse, and reduced self-confidence (Foxman, Berger, & Cote, 1992; Foxman,
Muehling, & Berger, 1990; Jacoby & Morrin, 1998; Matzler & Waiguny, 2005; Mitchell &
Papavassiliou, 1997; 1999; Shiu, 2017; Walsh, Henning-Thurau, & Mitchell, 2007; Turnbull,
Leek, & Ying, 2000). Among these, decision postponement is among the most damaging
outcomes because it directly affects business profitability (Hallowell, 1996). In addition, many
customers who postpone their decisions report insufficient time to search and compare options
(Walsh et al., 2007) and, as a result, have no time to wait for better options. Confused customers
use different strategies in responding to confusion (Shukla, Banerjee, & Adidam, 2010). Instead
of postponing their decisions, some confused customers adopt habitual purchasing behaviors to
reduce time spent processing the volume and diversity of information (Shiu, 2017).
This study seeks to provide insight into customer confusion stemming from so many
available hotel booking sites and prices. To the authors’ best knowledge, no research has
examined the relationships among alternative booking options, price complexity, and customer
confusion. Moreover, few studies have investigated customer confusion in the hotel online
booking environment (Matzler & Waiguny, 2005). Therefore, to further investigate these
existing research gaps and customer confusion in online hotel booking, this study seeks to
answer the following key research questions:
1. Are customers confused by the variety of hotel booking sites and prices?
2. How do abundant attractive booking options affect customer choices?
3. How do complex prices affect online hotel booking?
5
To fill the gaps in research on the relationships among online booking site alternatives,
price complexity, and customer confusion and to explore the process by which customer use
evaluation in attribute and alternative approaches, the purpose of this study is to investigate price
complexity and alternative attractiveness as two antecedents of confusion and to validate the link
between confusion and decision postponement in online hotel booking. Based on this
conceptualization, a structured model is proposed: 1) price complexity and alternative
attractiveness lead to three types of customer confusion; and 2) the three types of confusion
motivate customers to defer their purchase decisions and repurchase decisions.
6
CHAPTER 2: LITERATURE REVIEW AND HYPOTHESIS
DEVELOPMENT
2.1. Price complexity
Traditionally, price complexity is viewed by its degree of price partition (Xia, Monroe, &
Cox, 2004). Customers must calculate the total price of a particular offer based on the total
number of price elements; the package price comprises different components with different
charges. Two additional drivers of price complexity correspond to two facets of heterogeneity
(Homburg, Totzek, & Krämer, 2014). The first aspect of heterogeneity is the variety of number
format (even versus odd number), while the second aspect is the difficulty in calculating the total
price of a choice. These three distinct causes of price complexity (degree of price partition,
variety of number format, and calculation difficulty) are in line with system theory (Luhmann,
1996), and the number of components within the system, as well as the interrelationships of these
components, compose the system structure. Organizational theory also suggests that both the
number of elements in the decision and the heterogeneity of each element determine the
organizational decision complexity (Homburg et al., 2014). Moreover, Layer, Feurer, and
Jochem (2017) have provided empirical evidence of antecedents of perceived price complexity
using the perspective of price framing in the context of energy. Tariff type, price ending of
consumption, dependent price components, and discount presentation format influence, to a high
degree, perceived price complexity. Specifically, various dynamic tariff types require customers
to devote cognitive effort to calculating the final payment. When examining the price ending
format effect, prior studies have found that a format of even price endings are easier for
customers to use in making purchase decisions instead of odd price endings (Choi, Rangan,
Chatterjee, & Singh, 2014). The discount format, as Estelami (2003) states, is more difficult if
7
customers must multiply (or divide) instead of adding (or subtracting), making an evaluation of
the outcome of an offer more difficult for customers.
In online hotel booking, the total price consists of basic price, tax, and fees, as well as
currency exchange for international travelers. These price components result in a high degree of
price partitioning. Broadly speaking, different star-ratings or brands of hotels have a wide range
of prices. Online booking channels use different ways, or formats, of representing discounts to
attract customers. For instance, some websites prefer to present discounts in a format stated as
dollars off while other websites prefer to use a percentage. Such different pricing formats
account for the first facet of heterogeneity. As hoteliers implement dynamic pricing, listed room
prices will change in response to supply and demand in the market. Hotels may, for example,
increase prices during the high season and decrease prices during the off season to maximize
occupancy rates and RevPAR. Moreover, strict policies (e.g., fencing condition, cancellation
policy, promotion, and refund policy) provide additional pieces of price-related information, so
customers can compute their final payment. Inconsistency and variability in the hotel room price
show the difficulty in calculating that final price and causes additional price complexity.
2.2. Confusion
Perceived confusion is customer “failure to develop a correct interpretation of various
facets of a product/service, during the information processing procedure. As a result, this creates
misunderstanding or misinterpretation of the market” (Turnbull et al., 2000, p.145). The
asymmetry between the product/service information and customer interpretation disorients
8
customers, making them feel unable to make a purchase decision. Research on confusion has
examined overchoice (Fasolo, McClelland, & Todd, 2007; Scheibehenne et al., 2009; Gourville
& Soman, 2005; Mogilner, Rudnick, & Iyengar, 2008), misleading information (Golodner, 1993),
or brand confusion (Morrin & Jacoby, 2000; Mitchell & Kearney, 2002). Customer confusion
could be viewed as a separate construct based on three distinct antecedents: “too similar, too
many or unclear stimuli” (Mitchell, Walsh, & Yamin, 2005, p.143). Six stimuli of customer
confusion have been identified in the shopping environment: stimuli variety, stimuli novelty,
stimuli complexity, stimuli conflict, stimuli comfort, and stimuli reliability (Schweizer, Kotouc,
& Wagner, 2006). The first four stimuli (variety, novelty, complexity, and conflict) are
recognized in psychological studies. Stimuli variety reflects the number of choices, which causes
uncertainty about the trade off between option and individual needs. Stimuli novelty refers to not
recognizing cognitive patterns when presented with unknown stimuli (Schweizer et al., 2006).
Stimuli complexity arises from unclear perceptions of a product or service, where not only
quantity but also quality of the objects enhances the subjective perception of complexity. Stimuli
conflict refers to “two or more similar distinct stimuli” (Schweizer et al., 2006, p.186). For
instance, both the listed price and discount are related to monetary value. Customers could infer
the final payment based on these two price elements. However, listed price might affect customer
perception directly, where discount has indirect influence through calculations. The last two
stimuli (comfort and reliability) are subsumed from respondent ratings in the qualitative analyses.
Stimuli comfort is strongly relevant to shopping environment (e.g., waiting time). On the other
hand, stimuli reliability corresponds to customer trustworthiness. Price change or vague
information might arouse suspicions among sensitive customers.
9
2.2.1. Overload confusion
Overload confusion is “difficulty when confronted with more product information and
alternatives than customers can process in order to get to know, to compare and to comprehend
alternatives” (Walsh et al., 2007, p.704). Confusion is related to bounded-rationality, which
indicates individual cognitive capacity is not infinitely expandable (Simon, 1962). Individuals
are more likely to retain decision-relevant information, which can increase decision accuracy, but
choices are not usually based on only one characteristic. The more characteristics evaluated, the
more difficult the decision will be (Shugan, 1980). Customers also experience information
anxiety when confronted with sufficiently abundant information (Wurman, 1990). These
negative emotions may make customers feel less confident of their decisions (Allan, Chieh, &
Dogan, 2015). In online hotel booking, overload confusion could occur just from the exponential
growth of online websites, the many brands displayed on OTAs, and the large number of online
advertisements. Even website design can affect customers; OTA websites often put too much
information into a small space (i.e., hotel names, price, and amenities). Such designs also cause
overload confusion (Walsh, Mitchell, & Frenze, 2004).
2.2.2. Similarity confusion
Similarity confusion refers to not understanding a choice or an incorrect brand evaluation
resulting from perceived physical similarity of products or services (Mitchell et al., 2005, p.143).
Similarity confusion can come from either the marketer domain or customer domain (Walsh et
al., 2007). Marketers create similar shopping environments, similar packaging of products, or
similar advertisements even as competitors. All marketing, however, causes confusion among
10
customers, who feel perplexed by the similarities among similarly marketed brands. Confusion is
also created during interpersonal communication. The salesperson introduces a product or
service to the customer. If the salesperson fails to explicitly explain product attributes, customers
could suffer similarity confusion. The necessary precondition for similarity confusion is two or
more products. Without a reference product, comparisons are impossible. Moreover, sub-
branding pushes customers to incorrectly perceive a brand difference. Customers who are
familiar with Best Western Inn, may not be familiar with Best Western Premier or Best Western
Plus. In this situation, customers could infer that the price or quality of an affiliated brand is the
same as the parent brand. In fact, these brands share a reputation but operate separately.
Customers are likely to consider these two similar brands the same, leading to confusion.
2.2.3. Ambiguity confusion
Ambiguity confusion is “a lack of understanding during which customers are forced to re-
evaluate and revise current beliefs or assumptions about products or the purchasing environment”
(Mitchell et al., 2005, p.143). Ambiguity confusion is caused by uncertainty about “unclear,
incongruent, or misleading information” (Wang & Shukla, 2013, p.296) and usually happens
when information contradicts existing knowledge (Gursoy, 2003). Lack of credibility or
unreliable information are the main causes of ambiguity confusion (Wiedmann, Walsh, & Klee,
2001). Customers with ambiguity confusion may infer that perceived product characteristics will
differ from actual product characteristics (Walsh et al., 2007). As with similarity confusion,
ambiguity confusion also happens in both the marketer and customer domains. Marketers use
stimuli with a stronger influence because marketers often offer information “inconsistent with
the customer’s prior beliefs and knowledge” (Walsh et al, 2007, p.705). When customers search
11
for hotels in OTAs, they usually notice “sold out soon” warnings. Customers cannot then clearly
identify how many rooms are available. Hence, ambiguity confusion is triggered.
2.2.4. Price complexity and confusion
Past research indicates price complexity affects buyer confusion, because customers find
price differences and price levels interfere with making decisions (Kalayci, 2015). The number
of price elements is one cause of price complexity (Homburg et al., 2014). More price
components lead to more price complexity. Overload confusion can also be attributed to
increasing numbers of price elements involved in a particular offer. Even though more price
information can make the price frame more comprehensive for customers, excessive price
information may also negatively affect customer decision-making (Decrop & Snelders, 2005).
Hotel rates are determined by the base price, tax, promotion, type of room, and other price
related factors. However, the number of price components varies depending on customer needs.
Generally, customers must clearly define their budget prior to searching for information. For
example, amenities and facilities can enhance customer satisfaction during hotel stays. Each
individual amenity or facility service is listed on the final statement, even if those services are
free. Thus, more categories lead to more overload confusion because customers see so many
additional charges beyond base price.
Because confusion is influenced by the price complexity, customers may differentiate the
degree of complexity from actual complexity. That means, customers could find themselves
confused even if the number of stimuli is small (Huffman & Kahn, 1998). Therefore, price
12
complexity may lead to similarity confusion. Similarity confusion is another consequence of too
much price-related information. Customers may also be confused by inadequate differentiation
of product or service (O’Connor, 2002). When customers make online hotel reservations, they
may acquire two or more similar base price options from different information channels. Notably,
OTAs may provide the exact same price as hotel official websites because hotels have paid
commissions to OTAs to help resell rooms. This makes evaluation more difficult for customers
because similar prices contribute to price complexity and cause similarity confusion.
Price complexity may also affect ambiguity confusion. Ambiguity confusion is more likely
with increasing choices (Lloyd & Jankowski, 1999) because each dimension of confusion is
interrelated with other dimensions (Walsh et al., 2007). When price information becomes more
complex, customers may confront ambiguity confusion. Thus, although amenity charges are one
type of price element, some hotels fail to inform customers about extra charges for amenities,
while some hotels simply say “additional charges may apply”. Customers may think an amenity
is included in the purchase price or think additional, unknown charges will accrue depending on
what they use during their stay at a hotel (Burman, Albinsson, & Hyatt, 2016). For example, 34%
of hotel guests in Las Vegas are unaware that resort fees in addition to the room rate will be
applied (Roe & Repetti, 2014). Unclear price information leads to price complexity, which, in
turn, leads to ambiguity confusion.
Based on the literature, the following hypotheses are proposed;
Hypothesis 1 a: Price complexity has a significant positive relationship with overload confusion.
Hypothesis 1 b: Price complexity has a significant positive relationship with similarity confusion.
Hypothesis 1 c: Price complexity has a significant positive relationship with ambiguity confusion.
13
2.3. Alternative attractiveness
Alternative attractiveness is conceptualized as customer evaluation of likely satisfaction
from another provider (Jones, Motherbaugh, & Beatty, 2002; Patterson & Smith, 2003; Ping,
1993; Rusbult, 1980). Alternative attractiveness is one of three switching barriers (in addition to
switching cost and relationship investment) (Colgate & Lang, 2001; Jones et al., 2000).
Marketing research on offline marketing suggests that alternative attractiveness is influenced by
the “existence of alternatives, heterogeneity among alternatives, and high switching costs
between alternatives” (Ghazali, Nguyen, Mutum, & Mohd-Any, 2016) and represents customer
assessment of the ratio between acquired and sacrificed benefits. If the relative merits of an
alternative outweigh the sacrifice, customers are more likely to choose the alternative. For
example, better prices, diverse choices, and high-quality service contribute to strengthening
customer perception of alternative attractiveness (Goode & Harris, 2007).
The literature in hospitality and retailing offers two views of alternative attractiveness. One
considers alternative attractiveness as a unidimensional construct (Chuah, Marimuthu,
Kandampully, & Bilgihan, 2017; Kim, Ok, & Canter, 2010; Shukla, Banerjee, & Singh, 2016;
Temerak, 2016), and in the other, researchers view alternative attractiveness as multi-
dimensional with retailer indifference, alternative awareness, and alternative preference as the
dimensions (Balabanis, Reynolds, & Simintiras, 2006; Li, Browne, & Chau, 2006; Rusbult,
Martz, & Agnew, 1998). This study uses the unidimensional approach of alternative
attractiveness because, first, the multidimensional approach includes switching cost, and this
study focuses on the number of hotel options, not the switching costs. Second, many brands can
14
be easily researched on the internet. Thus, the indifference of a retailer may not be significant in
online hotel bookings. Third, both alternative awareness and alternative preferences are part of
alternative attractiveness because customers are aware of the choices and choose the retailer that
most satisfies them.
2.3.1. Alternative attractiveness and confusion
Alternative attractiveness could affect all three types of confusion. Alternative
attractiveness can cause overload confusion. As the number of attractive hotel choices increases,
customers are more likely to hesitate in making their choices. In addition to room price,
customers must use other criteria in deciding on online hotel reservations: service quality, review,
website quality, method of payment, convenience, and safety (Liu & Zhang, 2014). All these
factors affect the overall customer evaluation of each alternative. In destination tourism, travelers
who choose their destinations from large choice-sets are more confused than those who choose
from small choice-sets (Thai & Yuksel, 2017). As an alternative booking channel, OTAs display
many hotel options while hotels focus only on their own brand. This means customers should be
more confused when choosing hotels from OTAs than hotel websites. Thus, more attractive
alternatives lead to more overload confusion.
Alternative attractiveness can also cause similarity confusion. Similarities among attractive
options increase as choice size grows (Sela, Berger, & Liu, 2009). Attractive alternatives often
share similar overall evaluations. OTAs increase choice size for customers, so similar attractive
options are more likely to appear on their websites. For instance, business travelers may be
15
attracted by location because they prefer quiet and convenient locations for business meetings,
but leisure travelers favor lower prices. Thus, location will be the key determinant for hotel
selection among business travelers, and other factors may have less effect on their overall
evaluations of hotels. Therefore, business travelers would suffer similarity confusion from hotel
options all located in the same area. On the other hand, leisure travelers will also suffer similarity
confusion for hotel options that quote lower prices. To sum up, more attractive alternatives will
result in more similarity confusion.
Alternative attractiveness may also cause ambiguity confusion. Ambiguity confusion
occurs either in an uncertain purchase environment or because of individual interpretation of
information. As with lowest price guarantees, customers often make bookings motivated by
“sold out soon” warnings. High-pressure sales mislead customers by giving them a false sense of
urgency. Thus, customers may book a room because they are afraid of losing reservations.
However, customers cannot know exactly how many rooms are available to book. Because of
this, high-pressure sales tactics mistakenly lead customers to false perceptions of alternative
attractiveness, which, in turn, triggers ambiguity confusion.
Based on the literature, the following hypotheses are proposed:
Hypothesis 2 a: Alternative attractiveness has a significant positive relationship with overload
confusion.
Hypothesis 2 b: Alternative attractiveness has a significant positive relationship with similarity
confusion.
Hypothesis 2 c: Alternative attractiveness has a significant positive relationship with ambiguity
confusion.
16
2.4. Decision postponement and purchase intention
Decision postponement refers to “a delay to better deal with confusing circumstances
surrounding the purchase” (Allan et al., 2015, p.1331). This concept, also called choice deferral,
originated from conflict research in psychology (Tversky & Shafir, 1992). When customers are
aware of high conflict in a choice, they may opt to delay a decision (Walsh et al., 2007). In the
conceptual framework of customer confusion (Mitchell et al., 2005), six coping strategies can
reduce confusion: clarify buying goals, seek additional information, narrow down the set of
alternatives, share or delegate the purchase, do nothing, postpone purchase. Only the last four
strategies are relevant to all three types of confusion. Most importantly, decision postponement
may also involve deploying other confusion reduction strategies (Allan et al., 2015). Therefore,
decision postponement may be a behavioral consequence of customer confusion, which is a point
of view accepted in this study.
Besides decision postponement, customers may make repeat purchases relying on previous
experience (Huang & Hsu, 2009). Customers consciously continue a buying behavior to avoid
choice conflict even though they see that the decision may not necessarily be the best (Barnes,
Gartland, & Stack, 2004). However, the essential assumption of this particular repurchase
behavior is that brands or products familiar to customers must be in the searched choice set. If
they are not, confused customers might struggle to make purchase decisions. In this study,
purchase intention represents immediate decisions within an initial searched choice set.
17
2.4.1. Confusion and related outcomes
Other studies have indicated that the three types of confusion are related to decision
postponement (Shiu, 2017; Walsh et al., 2007). Overloaded choices or information make
decisions harder because confused customers cannot process information satisfactorily (Shanka,
Cherrier, & Canniford, 2006). Moreover, although more alternatives would seem to increase
customer freedom of choice (Reibstein, Youngblood, & Fromkin, 1975), the options customers
do not choose may be more attractive in a larger set of choices, which may lead to customer
regret over lost benefits (Scheibehenne et al., 2010). Such dissatisfaction or regret caused by
excessive information decreases customer confidence in choosing an option, which can result in
postponing a decision (Chernev, 2003). During the information communication process,
confused customers might delay their decision if they receive suggestions not congruent with
what they think, so customers with overload confusion will not make a purchase decision until
they feel confident even though a decision heuristic might be triggered by information overload
or overloaded alternatives (Loudon & Della Bitta, 1993).
Decision postponement can be an option for customers who have similarity confusion.
When customers are confused by two equally desirable options, they may delay the decision to
avoid choice conflicts (Tversky & Shafir, 1992). The similarity may be in functionality,
symbolic value, or monetary value. Therefore, customers often view similar brands or products
as substitutable. In our study, similarity confusion should create decision postponement. First,
OTAs are reselling rooms identical to the ones on hotel websites. The rooms have no functional
differences. Second, symbolic value does not change across channels from brand name
perspective. Thus, confused customers will delay their decisions to clarify any differences
18
between channels and evaluate which options can provide more benefits. When the decision
situation provides many equally attractive options and none are easily seen as best, customers
experience similarity confusion, which leads to a reluctance to act (Scholnick & Wing, 1988).
Such non-commitment would have a direct negative effect on customer purchase decisions
(Shukla et al., 2010). Therefore, confused customers will be less likely to make decisions until
differences among similar options are identified.
Ambiguity confusion could also contribute to decision postponement. Dhar (1997) explains
that customers with ambiguity confusion postpone decisions because the options cannot be
compared. Because ambiguity confusion originates in unfamiliarity or lack of clarity, confused
customers cannot see the benefits of the offered options. Seeking additional information helps
confused customers better understand the purchase environment. This appears to indicate that
more thought or more comparisons may cause decision postponement (Dhar, 1997). Customers
who are prone to ambiguity confusion want to confirm reliable and credible information, and
“lowest price guarantee” or “sold out soon” are sources of ambiguous information. Customers
may delay their purchases to keep searching for confirmation that the current price is the lowest
or exactly how many rooms are available and must continue searching and delaying the purchase
until their confusion is reduced to a tolerable level. If all information is ambiguous and uncertain,
customers will be even less likely to make a purchase immediately.
19
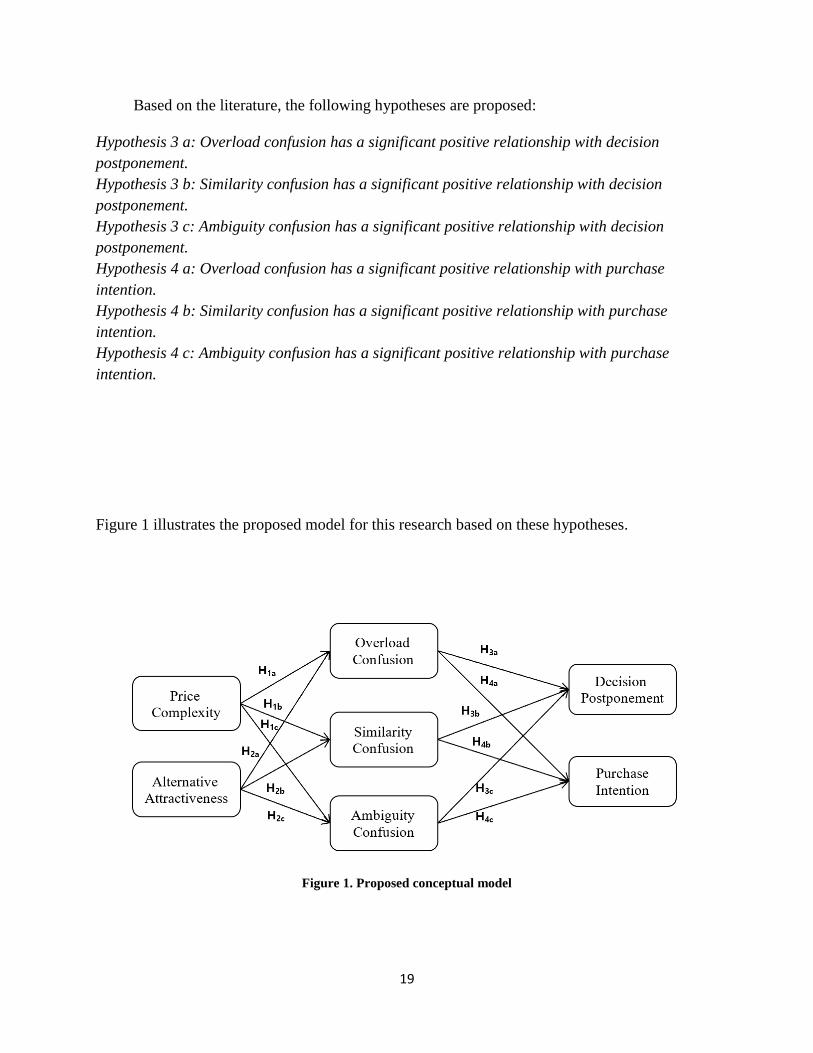
Based on the literature, the following hypotheses are proposed:
Hypothesis 3 a: Overload confusion has a significant positive relationship with decision
postponement.
Hypothesis 3 b: Similarity confusion has a significant positive relationship with decision
postponement.
Hypothesis 3 c: Ambiguity confusion has a significant positive relationship with decision
postponement.
Hypothesis 4 a: Overload confusion has a significant positive relationship with purchase
intention.
Hypothesis 4 b: Similarity confusion has a significant positive relationship with purchase
intention.
Hypothesis 4 c: Ambiguity confusion has a significant positive relationship with purchase
intention.
Figure 1 illustrates the proposed model for this research based on these hypotheses.
Figure 1. Proposed conceptual model
20
CHAPTER 3: METHODOLOGY
3.1. Study population and sample
The target population of this study was current residents in Canada and the United States.
All respondents must have booked hotel through either hotel official websites or OTAs within
the past 6 months and must have been older than 18 years. These criteria helped screen out
unqualified respondents. Convenience sampling using online panel data was adopted to collect
data. An online survey company, Qualtrics, recruited qualified respondents and conducted the
survey. Specifically, this company shared the survey link to potential participants interested in
this research. An incentive was given to respondents who completed the survey; they received
points for their membership account.
3.2. Sample size
As suggested by previous studies, the confidence interval approach was used to determine
the sample size (Burns & Brush, 1995); the formula (Krejcie & Morgan, 1970) is as follows:
Sample size = Z2*p*(1-p)
E2
where Z = z-value for desired confidence level 95%;
P = estimated population proportion of 50%;
E = the degree of accuracy expressed as a proportion of ±5%.
21
The confidence interval was 95%, representing a z-value of 1.96. The estimated population
of 50% was selected to generate the maximum sample size to adapt to a worst-case scenario.
Also, this equation generated a ±5% margin of error as recommended for a survey (Krejcie &
Morgan, 1970). Thus, the estimated sample size was 385. On the other hand, a larger sample size
would allow better generalization of the study results to the population of interest (Biau, Kernéis,
& Porcher, 2008). Also, Kline (2011) suggests a large sample size reduces the possibility of
statistical issues (e.g., inaccurate margin of error, high level of uncertainty, low power, and small
effect size). Taking these suggestions into consideration, a minimum target sample of 400 was
chosen.
3.3. Data collection
This study used a self-administrated online survey to collect data through a quantitative
approach. Qualtrics helped develop and publish the online survey. The data was collected from
online panels owned by Qualtrics. The targeted panels were Canadian and American residents
exclusively. Screening questions were posted at the beginning of the survey to screen out
unqualified respondents. Specifically, the screening questions were consent form, respondent age,
country of residence, and the question “How many times have you booked hotel rooms online in
the last 6 months?” Demographic profile questions were included at the end of survey.
After two weeks of survey distribution, 1236 panels participated in this project with a
response rate of 42.2%. Therefore, 521 respondents fully completed the online survey after
22
filtering out unqualified respondents by screening questions. After data cleaning, 453 usable
surveys were retained for analysis.
3.4. Measurement scales
A thorough literature review was conducted to gain a better understanding of constructs
used in this study. All measurement items were adopted and modified from previous empirical
studies. The adopted measurement item was modified as needed to fit the current study setting
and to avoid double-barreled questions. A pre-test was conducted with 10 graduate students;
some potential issues with wording, layout, order, and ambiguous questions were improved. The
survey was then distributed online to the panels.
In the structural model, the seven variables are price complexity, alternative attractiveness,
overload confusion, similarity confusion, ambiguity confusion, decision postponement, and
purchase intention. All measurement items used a 7-point Likert scale allowing respondents to
rate each statement from 1 = “Strongly disagree” to 7 = “Strongly agree”.
Price complexity was measured using Homburg et al.’s (2014) study and included 11 items
in total. To measure alternative attractiveness, three items were adapted from Kim et al.’s (2010)
study. The confusion construct was built using Walsh et al.’s (2007) study. A three-dimensional
approach was adapted to measure confusion: overload confusion, similarity confusion, and
ambiguity confusion. Overload confusion was measured by four items, similarity confusion by
three items, and ambiguity confusion by five items. Decision postponement was also adopted

23
from Walsh et al.’s (2007) study using four items for measurement. Purchase intention’s five
measurement items were taken from Lin and Lekhawipat’s (2015) study. The full list of refined
measurement items is in Appendix 1.
24
CHAPTER 4: RESULTS
This chapter provides the results of the data analysis and how the results related to the
hypotheses. The first section shows the demographic profiles of the sample using frequency
analysis. The second section shows the results of confirmatory factor analysis (CFA) to evaluate
the validity and reliability of each measurement item. The third section provides the results of
structural equation modelling (SEM) testing the relationships between variables and the fit of the
proposed model.
4.1. Demographic profiles of the sample
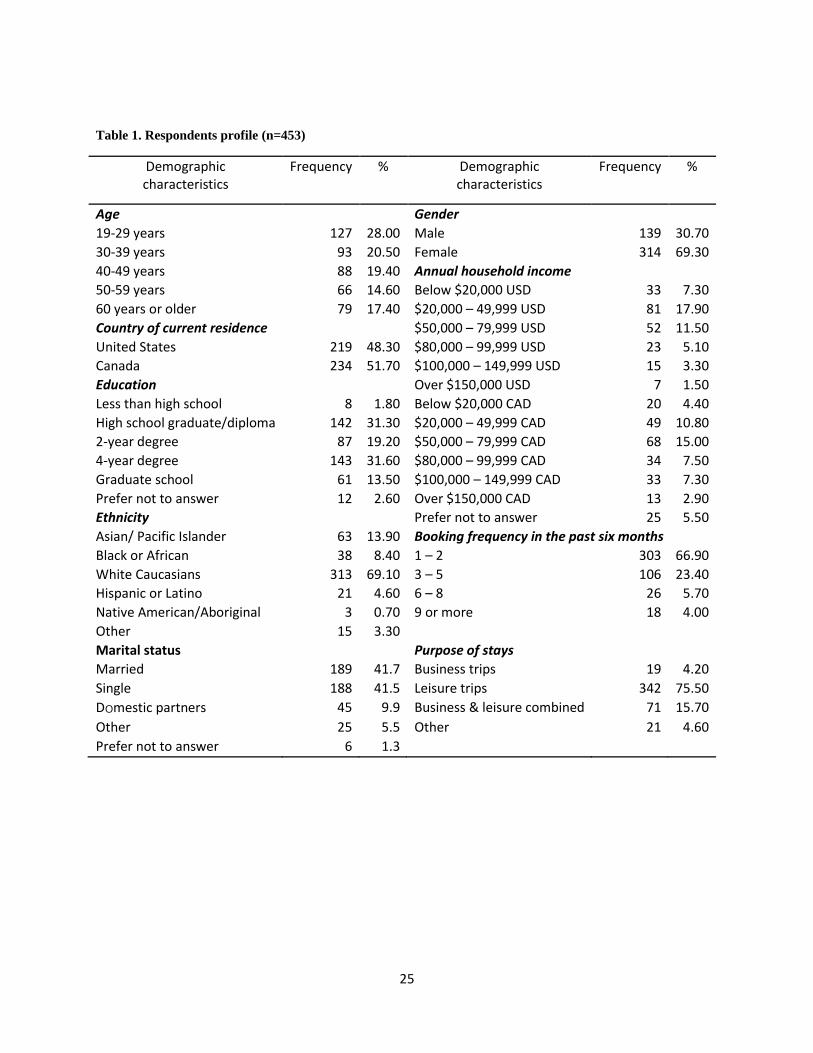
Table 1 shows the demographic profile information of qualified respondents collected from
the online panels. More than two-thirds of the respondents were between 19 and 49. Female
respondents numbered approximately twice as many as male respondents. The ratio between
married respondents and single respondents was around 50/50, and both groups account for
83.20% of all respondents. Canadian respondents numbered 234, slightly more than American
respondents. Almost two-thirds of the participants have high school diplomas or 4-year degrees.
Respondents were requested to choose Canadian dollars or U.S dollars for annual household
income. More than a third of the Canadians had an annual household income of less than
$79,999. Approximately a third of the American respondents reported a similar income. Most
participants were white Caucasians, and two-thirds of the respondents had booked hotel rooms
online one or two times in the past six months. As expected, three-fourths of the respondents
booked their rooms for leisure travel.
25
Table 1. Respondents profile (n=453)
Demographic characteristics
Frequency % Demographic characteristics
Frequency %
Age Gender
19-29 years 127 28.00 Male 139 30.70
30-39 years 93 20.50 Female 314 69.30
40-49 years 88 19.40 Annual household income
50-59 years 66 14.60 Below $20,000 USD 33 7.30
60 years or older 79 17.40 $20,000 – 49,999 USD 81 17.90
Country of current residence $50,000 – 79,999 USD 52 11.50
United States 219 48.30 $80,000 – 99,999 USD 23 5.10
Canada 234 51.70 $100,000 – 149,999 USD 15 3.30
Education Over $150,000 USD 7 1.50
Less than high school 8 1.80 Below $20,000 CAD 20 4.40
High school graduate/diploma 142 31.30 $20,000 – 49,999 CAD 49 10.80
2-year degree 87 19.20 $50,000 – 79,999 CAD 68 15.00
4-year degree 143 31.60 $80,000 – 99,999 CAD 34 7.50
Graduate school 61 13.50 $100,000 – 149,999 CAD 33 7.30
Prefer not to answer 12 2.60 Over $150,000 CAD 13 2.90
Ethnicity Prefer not to answer 25 5.50
Asian/ Pacific Islander 63 13.90 Booking frequency in the past six months
Black or African 38 8.40 1 – 2 303 66.90
White Caucasians 313 69.10 3 – 5 106 23.40
Hispanic or Latino 21 4.60 6 – 8 26 5.70
Native American/Aboriginal 3 0.70 9 or more 18 4.00
Other 15 3.30
Marital status Purpose of stays
Married 189 41.7 Business trips 19 4.20
Single 188 41.5 Leisure trips 342 75.50
Domestic partners 45 9.9 Business & leisure combined 71 15.70
Other 25 5.5 Other 21 4.60
Prefer not to answer 6 1.3
26
4.2. Confirmatory factor analysis
CFA was performed to examine the relationships between observed variables and latent
constructs in the measurement model, which would then be used in an SEM analysis. Anderson
and Gerbing (1988) suggest theory testing and assessment of construct validity from different
estimations provides more information for analysis. Therefore, a two-step procedure was used to
analyze the measurement model: construct validity and model fit.
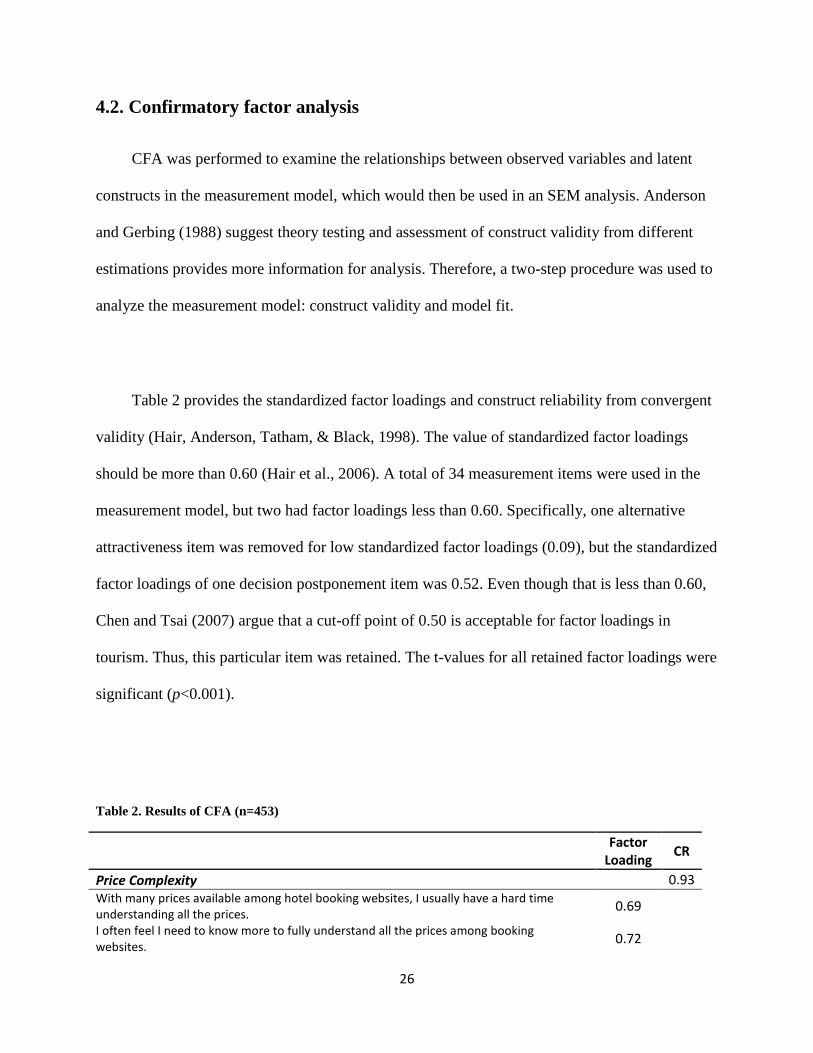
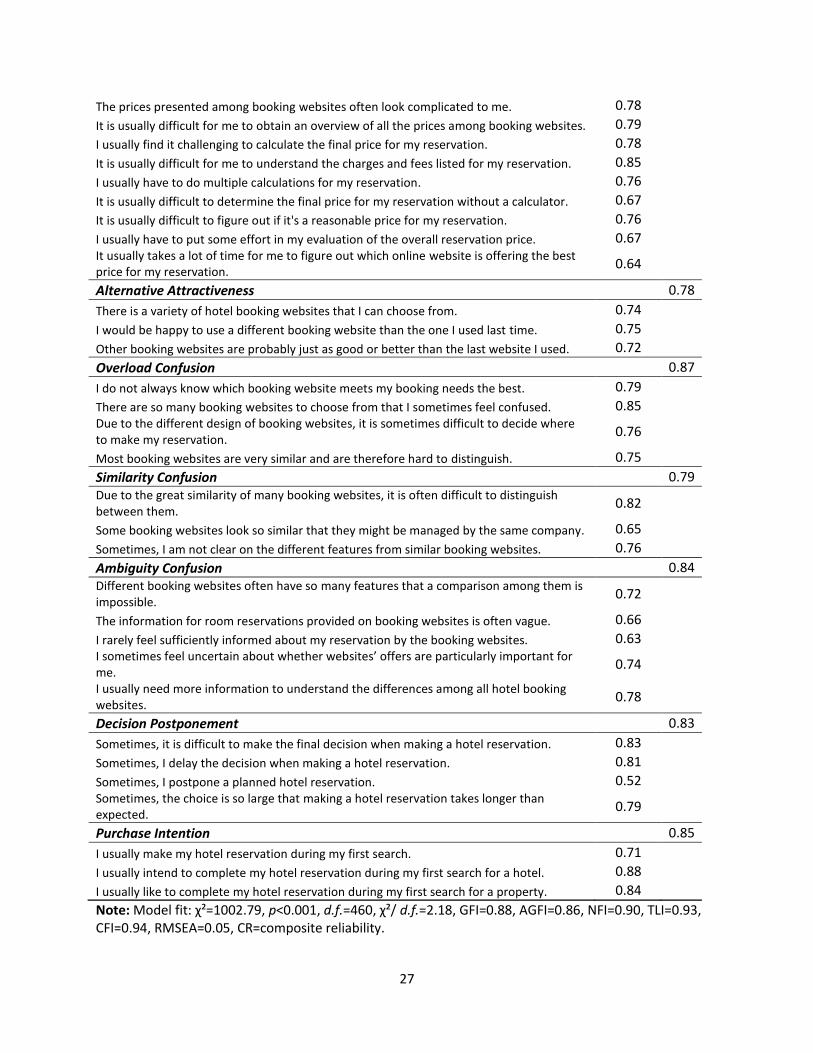
Table 2 provides the standardized factor loadings and construct reliability from convergent
validity (Hair, Anderson, Tatham, & Black, 1998). The value of standardized factor loadings
should be more than 0.60 (Hair et al., 2006). A total of 34 measurement items were used in the
measurement model, but two had factor loadings less than 0.60. Specifically, one alternative
attractiveness item was removed for low standardized factor loadings (0.09), but the standardized
factor loadings of one decision postponement item was 0.52. Even though that is less than 0.60,
Chen and Tsai (2007) argue that a cut-off point of 0.50 is acceptable for factor loadings in
tourism. Thus, this particular item was retained. The t-values for all retained factor loadings were
significant (p<0.001).
Table 2. Results of CFA (n=453)
Factor Loading
CR
Price Complexity 0.93 With many prices available among hotel booking websites, I usually have a hard time understanding all the prices.
0.69
I often feel I need to know more to fully understand all the prices among booking websites.
0.72
27
The prices presented among booking websites often look complicated to me. 0.78
It is usually difficult for me to obtain an overview of all the prices among booking websites. 0.79
I usually find it challenging to calculate the final price for my reservation. 0.78
It is usually difficult for me to understand the charges and fees listed for my reservation. 0.85
I usually have to do multiple calculations for my reservation. 0.76
It is usually difficult to determine the final price for my reservation without a calculator. 0.67
It is usually difficult to figure out if it's a reasonable price for my reservation. 0.76
I usually have to put some effort in my evaluation of the overall reservation price. 0.67
It usually takes a lot of time for me to figure out which online website is offering the best price for my reservation.
0.64
Alternative Attractiveness 0.78
There is a variety of hotel booking websites that I can choose from. 0.74
I would be happy to use a different booking website than the one I used last time. 0.75
Other booking websites are probably just as good or better than the last website I used. 0.72
Overload Confusion 0.87
I do not always know which booking website meets my booking needs the best. 0.79
There are so many booking websites to choose from that I sometimes feel confused. 0.85
Due to the different design of booking websites, it is sometimes difficult to decide where to make my reservation.
0.76
Most booking websites are very similar and are therefore hard to distinguish. 0.75
Similarity Confusion 0.79 Due to the great similarity of many booking websites, it is often difficult to distinguish between them.
0.82
Some booking websites look so similar that they might be managed by the same company. 0.65
Sometimes, I am not clear on the different features from similar booking websites. 0.76
Ambiguity Confusion 0.84 Different booking websites often have so many features that a comparison among them is impossible.
0.72
The information for room reservations provided on booking websites is often vague. 0.66
I rarely feel sufficiently informed about my reservation by the booking websites. 0.63
I sometimes feel uncertain about whether websites’ offers are particularly important for me.
0.74
I usually need more information to understand the differences among all hotel booking websites.
0.78
Decision Postponement 0.83
Sometimes, it is difficult to make the final decision when making a hotel reservation. 0.83
Sometimes, I delay the decision when making a hotel reservation. 0.81
Sometimes, I postpone a planned hotel reservation. 0.52
Sometimes, the choice is so large that making a hotel reservation takes longer than expected.
0.79
Purchase Intention 0.85
I usually make my hotel reservation during my first search. 0.71
I usually intend to complete my hotel reservation during my first search for a hotel. 0.88
I usually like to complete my hotel reservation during my first search for a property. 0.84
Note: Model fit: χ²=1002.79, p<0.001, d.f.=460, χ²/ d.f.=2.18, GFI=0.88, AGFI=0.86, NFI=0.90, TLI=0.93, CFI=0.94, RMSEA=0.05, CR=composite reliability.
28
For the goodness-fit indices for the measurement model, Kline (2005) recommends using
more than one index to evaluate model fit. Therefore, the key indices examined (Hu & Bentler,
1999) were Chi-square (χ²), the Chi-square to degrees of freedom (χ²/ d.f.), Goodness of Fit Index
(GFI), Adjusted Goodness of Fit Index (AGFI), Normed Fit Index (NFI), Tucker-Lewis Index
(TLI), Comparative Fit Index (CFI), and Root Mean Square Error of Approximation (RMSEA).
Chi-square to degrees of freedom, which was between one and three, indicated a satisfactory
adjustment of sensitivity for Chi-square to a large sample size (Bentler, 1995). The values for
GFI and AGFI, which were higher than 0.80, were an acceptable fit (Forza & Filippine, 1998;
Greenspoon & Saklofske, 1998). The cut-off value for NFI is 0.90 (Awang, 2012; Bentler &
Bonett, 1980). The values for TLI and CFI should be higher than 0.90 (Awang, 2012; Forza &
Filippini, 1998; Hair et al., 2010; Hu & Bentler, 1999). An RMSEA value of 0.08 or less
indicates an acceptable fit (Awang, 2012; Hair et al., 1998). The CFA result indicated that the
measurement model has adequate fit: χ²=1002.79, d.f.=460, p<0.001, χ²/ d.f.=2.18, GFI=0.88,
AGFI=0.86, NFI=0.90, TLI=0.93, CFI=0.94, RMSEA=0.05.
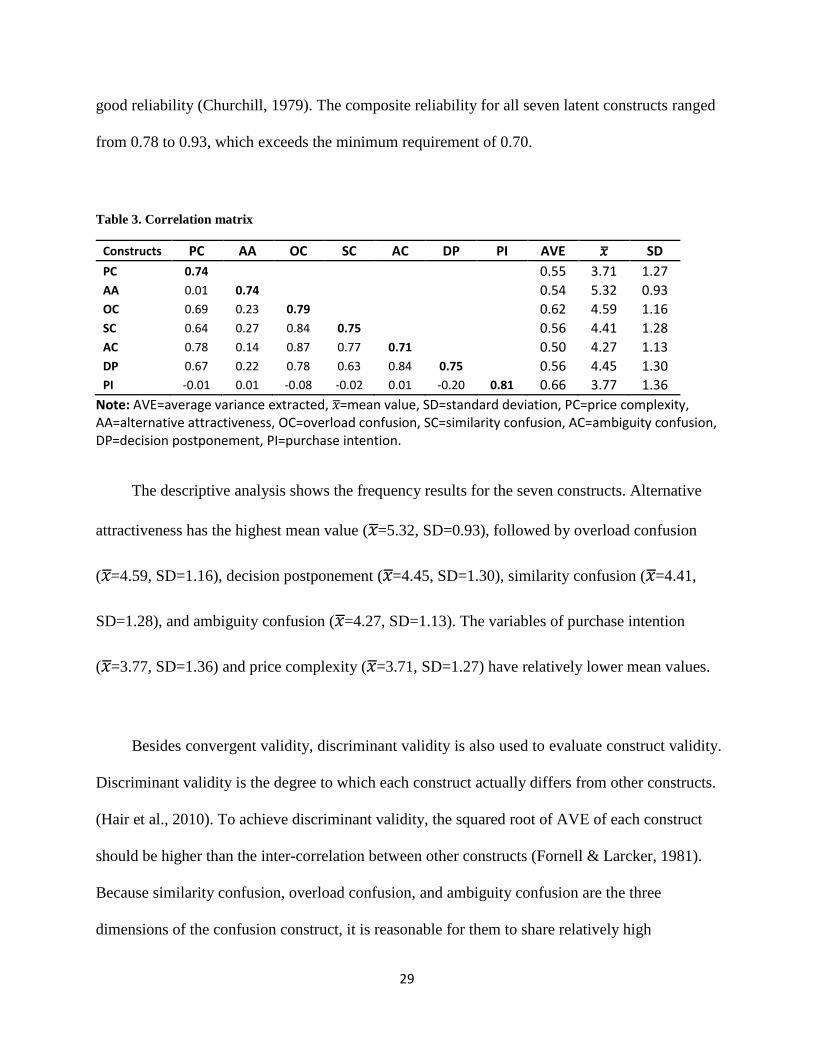
Table 3 shows the results of correlation, average variance extracted (AVE), mean value (𝑥 ̅)
and standard deviation (SD) among the seven constructs. Convergent validity measures whether
measurement items of each construct share a high degree of variance (Hair et al., 2010). To
ensure the convergent validity of the measurement model, composite reliability and AVE were
also calculated and evaluated. The AVEs were higher than the threshold value of 0.50 (Fornell &
Larcker, 1981; Hair et al., 2010), ranging from 0.50 to 0.66. Composite reliability reflects the
internal consistency of the constructs. A composite reliability value of 0.70 or higher suggests
29
good reliability (Churchill, 1979). The composite reliability for all seven latent constructs ranged
from 0.78 to 0.93, which exceeds the minimum requirement of 0.70.
Table 3. Correlation matrix
Constructs PC AA OC SC AC DP PI AVE �̅� SD
PC 0.74 0.55 3.71 1.27
AA 0.01 0.74 0.54 5.32 0.93
OC 0.69 0.23 0.79 0.62 4.59 1.16
SC 0.64 0.27 0.84 0.75 0.56 4.41 1.28
AC 0.78 0.14 0.87 0.77 0.71 0.50 4.27 1.13
DP 0.67 0.22 0.78 0.63 0.84 0.75 0.56 4.45 1.30
PI -0.01 0.01 -0.08 -0.02 0.01 -0.20 0.81 0.66 3.77 1.36
Note: AVE=average variance extracted, �̅�=mean value, SD=standard deviation, PC=price complexity, AA=alternative attractiveness, OC=overload confusion, SC=similarity confusion, AC=ambiguity confusion, DP=decision postponement, PI=purchase intention.
The descriptive analysis shows the frequency results for the seven constructs. Alternative
attractiveness has the highest mean value (�̅�=5.32, SD=0.93), followed by overload confusion
(�̅�=4.59, SD=1.16), decision postponement (�̅�=4.45, SD=1.30), similarity confusion (�̅�=4.41,
SD=1.28), and ambiguity confusion (�̅�=4.27, SD=1.13). The variables of purchase intention
(�̅�=3.77, SD=1.36) and price complexity (�̅�=3.71, SD=1.27) have relatively lower mean values.
Besides convergent validity, discriminant validity is also used to evaluate construct validity.
Discriminant validity is the degree to which each construct actually differs from other constructs.
(Hair et al., 2010). To achieve discriminant validity, the squared root of AVE of each construct
should be higher than the inter-correlation between other constructs (Fornell & Larcker, 1981).
Because similarity confusion, overload confusion, and ambiguity confusion are the three
dimensions of the confusion construct, it is reasonable for them to share relatively high
30
correlations. However, the high correlations among price complexity, ambiguity confusion, and
decision postponement statistically indicate multicollinearity. Thus, the linear regression analysis
was performed. The results showed that values of all variance inflation factors (VIF) were below
10, ranging from 1.07 to 2.99. Thus, these constructs do not have multicollinearity issues even
though they share high correlations (Stevens, 2002).
4.3. Structural model analysis
SEM was performed to examine proposed hypotheses via SPSS AMOS 24. The analysis
indicated that the proposed model achieved a reasonably acceptable overall fit to the data:
χ²=1081.3, d.f.=460, p<0.001, χ²/ d.f.=2.35, GFI=0.87, AGFI=0.84, NFI=0.89, TLI=0.92,
CFI=0.93, RMSEA=0.06. All indices achieved the threshold suggested by previous literature
other than NFI. The value of NFI is slightly below the cut-off value of 0.90. Because NFI is
sensitive to sample size, the value of NFI increases as sample size becomes larger. In addition,
the proposed model was simple, so NNFI would be more appropriate to evaluate model fit
(Hooper, Coughlan, & Mullen, 2008).
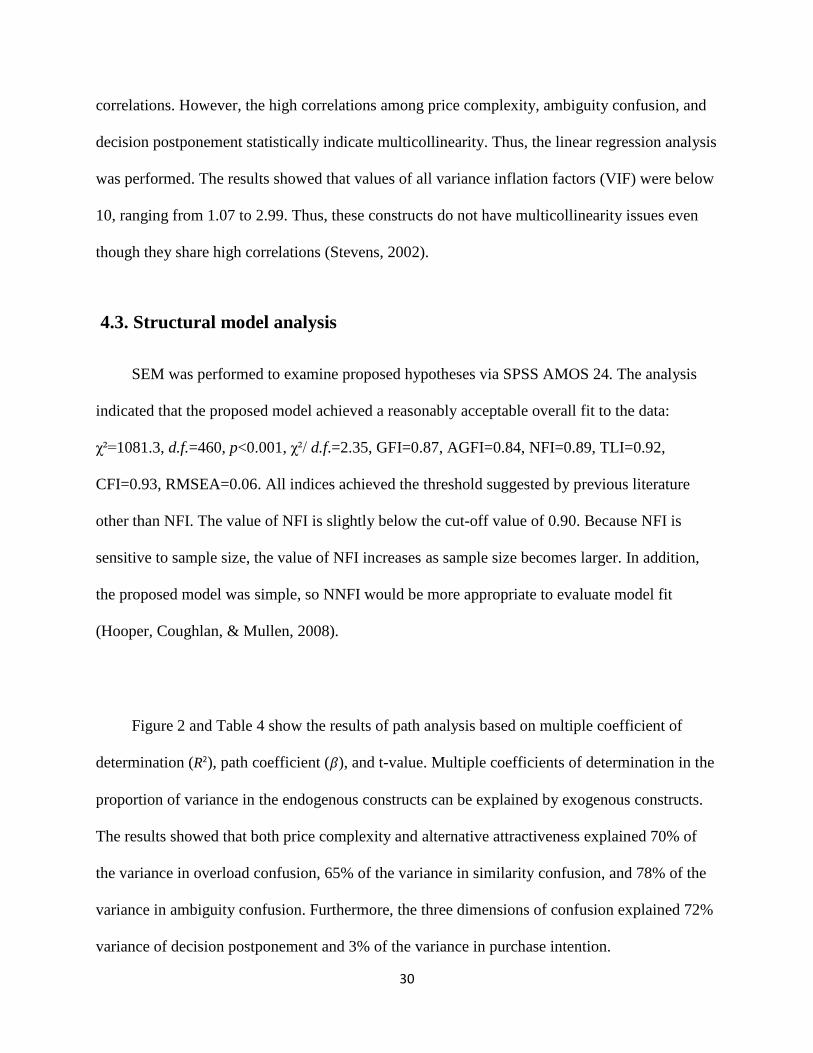
Figure 2 and Table 4 show the results of path analysis based on multiple coefficient of
determination (R2), path coefficient (𝛽), and t-value. Multiple coefficients of determination in the
proportion of variance in the endogenous constructs can be explained by exogenous constructs.
The results showed that both price complexity and alternative attractiveness explained 70% of
the variance in overload confusion, 65% of the variance in similarity confusion, and 78% of the
variance in ambiguity confusion. Furthermore, the three dimensions of confusion explained 72%
variance of decision postponement and 3% of the variance in purchase intention.
31
Figure 2. Structural Model
Note: ***statistically significant at p<0.001, **statistically significant at p<0.01, R2=multiple coefficient of determination, numbers on top=standardized coefficient, numbers on bottom=t-value.
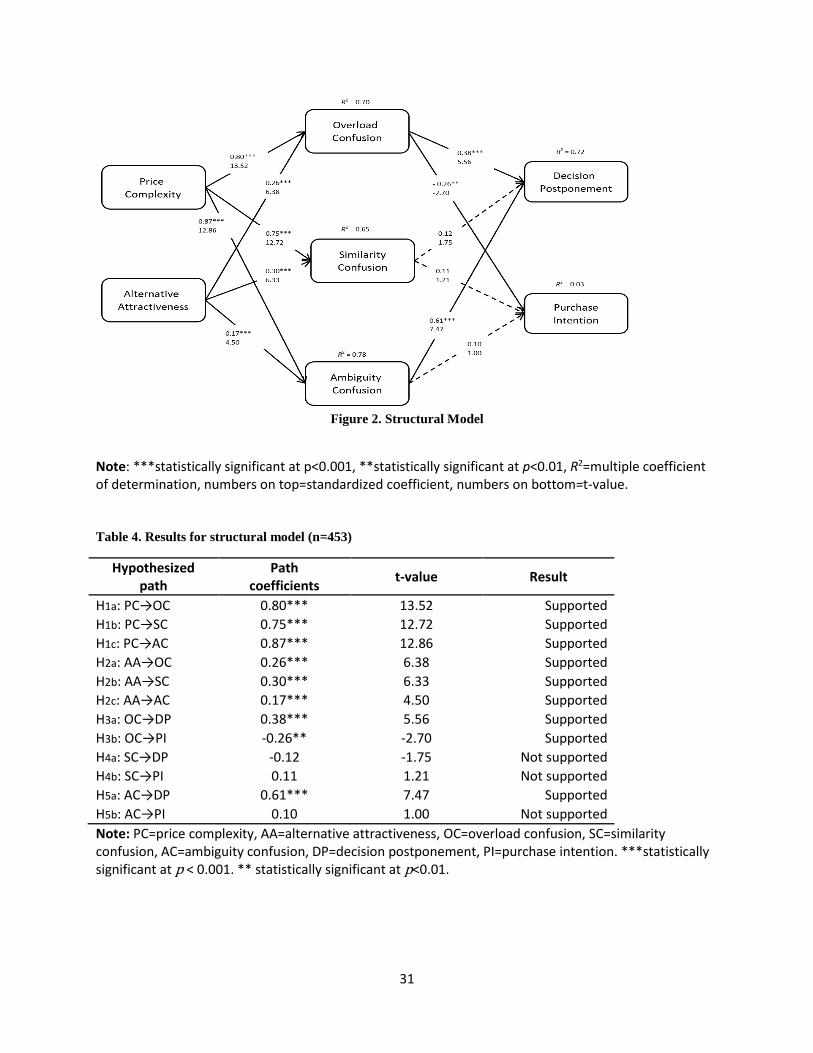
Table 4. Results for structural model (n=453)
Hypothesized path
Path coefficients
t-value Result
H1a: PC→OC 0.80*** 13.52 Supported
H1b: PC→SC 0.75*** 12.72 Supported
H1c: PC→AC 0.87*** 12.86 Supported
H2a: AA→OC 0.26*** 6.38 Supported
H2b: AA→SC 0.30*** 6.33 Supported
H2c: AA→AC 0.17*** 4.50 Supported
H3a: OC→DP 0.38*** 5.56 Supported
H3b: OC→PI -0.26** -2.70 Supported
H4a: SC→DP -0.12 -1.75 Not supported
H4b: SC→PI 0.11 1.21 Not supported
H5a: AC→DP 0.61*** 7.47 Supported
H5b: AC→PI 0.10 1.00 Not supported
Note: PC=price complexity, AA=alternative attractiveness, OC=overload confusion, SC=similarity confusion, AC=ambiguity confusion, DP=decision postponement, PI=purchase intention. ***statistically significant at p < 0.001. ** statistically significant at p<0.01.
32
The path coefficient indicates how strong the direct causal effect of one variable is on
another variable. The results show that all hypotheses are supported except H4a, H4b, and H5b. As
expected, positive path coefficients are significant between two antecedents (price complexity
and alternative attractiveness) of confusion and three dimensions of confusion (overload
confusion, similarity confusion and ambiguity confusion), including H1a: PC→OC (𝛽=0.80,
t=13.52, p <0.001), H1b: PC→SC(𝛽=0.75, t=12.72, p<0.001), H1c: PC→AC(𝛽=0.87, t=12.86, p
<0.001), H2a: PC→OC(𝛽=0.26, t=6.38, p <0.001), H2b: AA→SC(𝛽=0.30, t=6.33, p <0.001),
H2c:AA→AC(𝛽=0.17, t=4.50, p <0.001). Specifically, price complexity has the strongest effect
on ambiguity confusion, and alternative attractiveness has the strongest effect on similarity
confusion. However, the results demonstrated only overload confusion has significant effect on
both decision postponement (𝛽=0.38, t=5.56, p <0.001) and purchase intention (𝛽=-0.26, t=-2.70,
p <0.01), indicating H3a and H3b are supported. The relationship between similarity confusion
and decision postponement (𝛽=-0.12, t=-1.75, p >0.05) and purchase intention (𝛽=0.11, t=1.21,
p >0.05) are not significant, indicating that hypotheses 4a and 4b are not supported. Ambiguity
confusion has a significant effect only on decision postponement (𝛽=0.61, t=7.47, p <0.001),
while the relationship between ambiguity confusion and purchase intention is not significant
(𝛽=0.10, t=1.00, p >0.01). Thus, H5a is supported, and H5b is not supported.
33
CHAPTER 5: DISCUSSION
This study investigated potential antecedents and behavioral outcomes of three-dimensional
confusion in the context of online hotel booking. More specifically, the proposed model and
relationships among seven constructs are tested, including price complexity, alternative
attractiveness, overload confusion, similarity confusion, ambiguity confusion, decision
postponement, and purchase intention.
According to the test results, the findings demonstrate that both price complexity and
alternative attractiveness are two significant causes of three different types of confusion. That is,
customers are more likely to become confused when they face complex prices and abundant
hotel choices. Generally, price complexity has a stronger effect on the three types of confusion
than alternative attractiveness. This indicates that attribute-based evaluations could cause more
indecision than alternative-based evaluations (Dhar, 1996). Decision heuristics, however, help
customers solve such complex problems by focusing on the most important aspects across
alternatives. Customer mental shortcuts can compensate for overwhelming attribute information.
Price complexity has the strongest influence on ambiguity confusion. The complexity in
price causes confusion through ambiguous or unclear information. If a more complex price
structure is presented, customers perceive more ambiguous information, leading to more
confusion. During online searches for hotels, customers may see unclear information provided by
distribution channels, which causes difficulty in evaluating prices; they thus become confused.
Ambiguity confusion is followed by overload confusion as the second most important
34
consequence of price complexity. Because the number of price elements is the primary
determinant of price complexity, confusion occurs while reviewing too many prices. For a
particular quoted price, customers must consider taxes, promotions, and other price related
factors, not just the basic room rate. Bounded-rationality suggests that individual cognitive
capacity is finite, so customers cannot thoroughly assess every observed price component. If the
amount of price information exceeds customer cognitive capacity, overload confusion could be
triggered by the increased mental effort required to evaluate price. Unlike in ambiguity confusion
and overload confusion, price complexity does not affect similarity confusion as much. If
customers frequently see similar prices while searching, they may treat these similar prices as a
reference price. Decision confidence increases if the price information is reliable, leading to less
similarity confusion.
From the perspective of alternative-based evaluation, alternative attractiveness measures
the number of choices in the customer decision-making process. This study found the strongest
relationship between alternative attractiveness and similarity confusion. Hotel guests are more
likely to be confused by similar options when they see increasing numbers of other options
across channels. Because of the intrinsic nature of alternative attractiveness, the focal option
should share a high degree of similarity with other attractive options. For example, customers
may capture exactly same hotel room sold on two different venues (an official hotel website and
an OTA). Slight differences may exist, among them promotion or membership benefits. As a
result, similar choices would cause problems for customers in making decisions when many
other choices are appealing. As with price complexity, overload confusion is the second most
influential consequence of alternative attractiveness. Customers may feel more confused while
35
considering so many choices. In addition to the single attribute of a hotel offer, other factors are
also subtle influences on the final decision. Thus, customers must perform a vertical analysis to
evaluate attractive offers by comparing each component in detail (e.g., brand, location, or service
quality). Finally, alternative attractiveness has the weakest effect on ambiguity confusion. When
they face many attractive options, customers will experience confusion caused by ambiguous
information. Because customers may not be familiar with the purchase environment, they may be
misled by high-pressure sales. Customers may also find it harder to perceive the inventory in an
online shopping environment than traditional retailing environment. For example, customers can
easily infer an inventory count by noting the number of products on shelves in grocery stores.
However, some hotel online booking websites use “sold out soon” to push customers into
making reservations quickly. In addition, the website may inform a customer how many other
customers are viewing this hotel offer now, but this does not mean that other viewers will accept
this hotel offer. Therefore, customers remain uncertain about the exact number of hotel rooms
left and are misled by high-pressure tactics. Ambiguity confusion is then triggered by misleading
information about appealing hotel offers.
In behavioral consequences, decision postponement and purchase intentions measure
purchase decisions but are distinguished by temporal distance. Indeed, these two constructs
explain the same logic in two different ways. Because the survey does not ask respondents actual
past experience, the measurement items of these two constructs aim to reflect customers’
propensity to make instant purchases or to delay their decisions. As hypothesized, the results
suggest that overload confusion has a significant positive effect on propensity of decision
postponement (Shiu, 2017; Walsh et al., 2007) and a significant negative effect on propensity of
36
purchase intention. If customers are confused by too much price information or too many
attractive hotel options, they will be more prone to delay any decisions and be less willing to
decide immediately. Decision postponement can be interpreted as an attempt to obtain additional
processing time by delaying the decision (Walsh et al., 2007). When customers perceive they do
not have sufficient time, they may make lower-quality decisions that not meet their needs.
Customers do not make purchase decisions immediately if they suffer from overload confusion.
Interestingly, similarity confusion is not related to these two behavioral outcomes in this
study. This lack of a relationship between similarity confusion and propensity of decision
postponement suggests that while delaying purchase decisions provides sufficient processing
time, it may not be an effective strategy to reduce similarity confusion. Also, there is no evidence
for a significant relationship between similarity confusion and propensity of purchase intention.
Instant purchase decisions may not help customers confused by too much similar information. In
conclusion, similarity confusion may not be a significant influence on customers booking hotels
online. One explanation for this is customers prone to similarity confusion discard similar hotel
offers and seek unique options within their choice set. Moreover, the relationships between
similarity confusion and propensity of decision postponement in this study is not same as
hypothesized. If the relationships were significant, customers would more likely purchase
instantly rather than delay purchases. The significant negative relationship between similarity
confusion and propensity of decision postponement has been mentioned in the literature (Walsh
et al., 2007). Conceivably, the habit of purchasing familiar or trusted brands is important when
customers must choose from similar options. As explained earlier, a frequently observed similar
37
price can be adopted as a reference price. This phenomenon increases customer confidence, and
hence additional time is unnecessary.
Ambiguity confusion more strongly influences customers’ propensity of decision
postponement than overload confusion. This significant and positive relationship indicates that
customers who suffer from ambiguity confusion cannot clarify products or services using varied
distribution channels. Even though this finding contradicts prior studies (Shiu, 2017; Walsh et al,
2007), it is reasonable to assume that the online shopping environment differs from the
traditional shopping environment, so customers can easily search for sufficient information to
clarify products or services. Another explanation could be customer motivation to make rational
decisions. Once conflicting or ambiguous information is processed, customers should be more
confident of their final decisions. Moreover, the proposed model does not include the effect of
ambiguity confusion on purchase intention, indicating that making an instance purchase is not an
option for customers experiencing ambiguity confusion, possibly because customers with
ambiguity confusion may become frustrated and stop shopping. As a result, shopping fatigue
causes customers to abandon purchase decisions.
38
CHAPTER 6: IMPLICATIONS
6.1. Theoretical implications
This study shows the importance of an integrated understanding of customer confusion.
Customer confusion is an important issue in the consumer behavior literature, but it is a new
construct, and few studies have examined it using a comprehensive model (Shiu, 2017). The
need for an adequate foundation for research into customer confusion further limits researchers
exploring the effects of confusion. Building on the previous literature on customer confusion
(Matzler & Waiguny, 2005; Walsh & Mitchell, 2010; Walsh et al, 2007), this study proposed an
integrated model of customer confusion that includes a comprehensive look at the antecedents
and consequences of customer confusion. The study results provide evidence that three
dimensions of confusion are significantly influenced by price complexity and alternative
attractiveness. Shiu (2017) identified the determinants of confusion in retailing: inefficient
stimuli (e.g., promotion activities, store environment, and interpersonal communication) and
insufficient store knowledge (e.g., prior consumption experience). Present study findings
extended the antecedents of confusion to price complexity and alternative attractiveness. In
addition, this study tested the effect of confusion in the online hotel booking environment. To the
author’s best knowledge, only one other study examined customer confusion in online hotel
booking, emphasizing four confusion reduction strategies (Matzler & Waiguny, 2005). Customer
confusion, however, has different effects on customer behavioral intentions in online shopping
environments than in traditional retailing shopping environments.
39
Another theoretical contribution is finding the effects of confusion through an integrated
approach probing customer information processing. Most researchers have examined the direct
effect of attribute factors and alternative factors on behavioral consequences to explain customer
decision-making (Jang & Yoon, 2016; Mourali & Pons, 2009), but some essential psychological
reactions or decision-making styles remain unresearched. Customer decision-making is a
complex process that includes many psychological stages. To fill the gap between finding
information and final behavioral choices, this study highlights confusion as an important
intermedium during information processing. Therefore, the information processing literature is
enriched with this deeper understanding of confusion. Furthermore, a few studies have
investigated the customer evaluation process focusing on both attributes and alternatives (Dhar,
1996; Jang & Yoon, 2016; Pizzi, Scarpi, & Marzocchi, 2014). This study used price and
attractive options as the most important attributes of hotel choice. According to the study
findings, price complexity reflects attribute-based evaluation, and alternative attractiveness
reflects alternative-based evaluation. Attributes had a stronger effect on hotel online booking.
This study also used two behavioral outcomes of customer confusion. Although decision
postponement and purchase decisions have been examined in past studies (Shiu, 2017; Walsh et
al., 2007), inertia and brand loyalty are slightly different from instance purchase used in this
study. More specifically, both inertia and brand loyalty focus mainly on repeated purchase of a
brand or familiar products or services. Decision postponement and purchase intention in this
study measured the same choice, but they are distinguished by the time perspective. According to
the general perception of these two behavioral outcomes, the three dimensions of confusion
should have antithetical effects on decision postponement and purchase intention. Simply stated,
40
confused customers should be more prone to delay decisions, not make decisions immediately.
Surprisingly, the three types of confusion have asymmetric effects on decision postponement and
purchase intention. Such findings suggest that customers will use different strategies to deal with
confusion.
6.2. Practical implication
This study also has several managerial implications for practitioners. The study results
suggest that price complexity and alternative attractiveness are two determinants of the three
types of confusion (overload confusion, similarity confusion, and ambiguity confusion). Based
on the findings, price presentation and number of choices change customer perceptions and
affect the level of confusion. In particular, hotels should avoid making prices more complex than
they must be and focus on uniqueness when collaborating with OTAs.
The results first imply that understanding price complexity is important for hotel
practitioners as they plan price presentation tactics. Following accounting logic, hotel room price
comprises variable costs and fixed costs. Variable costs include basic rate, discounts,
cancellation fees, and consumed amenities during stays, while fixed costs include federal and
provincial taxes and value added tax resort fees. These fixed costs cannot be changed because
they are a fixed percentage of room price. Thus, to reduce customer perceptions of price
complexity, hotel practitioners could focus on price presentation and customer interactivity. First,
booking websites must simplify price presentation instead of including too many rates.
Specifically, official hotel websites (e.g., Hilton) can distinguish rates using membership
41
discounts while OTAs (e.g., Hotel.com) can set different rates based on cancellation fees. The
hotel industry could learn something from the unbundling strategies of the airline industry.
Unbundling gives customers more flexibility to customize their reservations based on their own
needs. In the airline industry, the ticket price varies depending on pre-selected seats, how much
luggage is checked, and so on. Hotel booking websites can provide the basic rack rate. If
customers have memberships or wish to use certain cancellation policies, they can learn the
various prices after selecting these criteria. Secondly, hotel practitioners can optimize usage of
customer communication. Most hotel booking websites encourage customers to leave online
reviews or feedback, but none of them allow customers to leave comments on other customer
reviews. One strategy for reducing confusion is sharing or delegating the purchase, so customers
may seek help from their friends, family, or other acquaintances. Because of the perceived risks
in online shopping, hotel customers may trust someone they know or other customers, especially
those with more purchase experience, more than hotels. Therefore, website designers could offer
a communication function, similar to a blog or other social media, to help confused customers
find additional information from other customers. To increase the effectiveness of this function,
booking websites may give incentives or rewards to customers who can explicitly explain price
related terms and policy.
To overcome the challenges of attractive alternatives, hotel managers could rethink their
cooperation with OTAs. OTAs are paid by hotels to boost sales, but this cooperation may not be
worthwhile for hotels offer their rooms across different distribution avenues, thus requiring more
effort on the part of customers to evaluate repeated information. Instead, hotel practitioners must
put more emphasis on their uniqueness. Marketing differentiated products or services could offer
42
an opportunity for hotels to achieve a larger market share. Clearly presenting attractive selling
points (e.g., service quality, unique facility) can help hotels distinguish themselves from
competitors.
Overload confusion leading to decision postponement and less propensity to purchase
instantly implies that booking websites should recognize customer needs and provide help in
decision making. Most booking websites have filter functions to help customers narrow down
their choice size. With help of big data, both official hotel and OTA websites can store choices
that interest customers, if only for membership customers. First time users, however, must still
invest more time and effort to search again. Thus, website designers could use big data for all
online customers. If booking websites can collect privacy information with customer permission,
hotels can encourage purchases based on customer searching frequency. Therefore, hotels can
not only become better acquainted with customer preferences but also prevent delayed purchases
by recommending the best alternative.
The effect of ambiguity confusion yields another managerial implication for delayed
purchases. Many researchers have concluded that customer purchase intention is determined by
perceived quality of provided information (Bai, Law, & Wen, 2008; Liu, Arnett, & Litecky,
2000). With a fixed amount of information, perceived quality of information could increase the
propensity of customers to make effective decisions (Chen, Shang, & Kao, 2009). Besides
avoiding misleading words, terms, and descriptions in content, hotels should also provide
important links to direct customers to other information needed for purchase decisions. For
43
example, full explanations could be placed on pop-up pages using these links. However, hotel
websites should also improve their designs so frequently asked questions can be found easily.
Instead of putting too much information in the limited space on websites, sorting and combining
similar or related information is more efficient in achieving simplicity and further reducing
ambiguity confusion. Modifying a website should leave customers less confused, spending less
time clarifying ambiguous information needed for purchase decisions.
Finally, of the effect of similarity confusion suggests some managerial implications even
though it has little to no effect on either decision postponement or purchase intention. As
explained earlier, customers rely on familiar or trusted products or services, purchasing out of
habit or voluntarily inferring frequently used reference prices under conditions of similarity
confusion. Price parity across distribution avenues is important in any highly competitive
marketing segment. Many OTAs claim price guarantees, offering lower prices than direct
booking with hotels. If hotels can match prices as well, customers may be more willing to choose
hotel official websites because they might be able to get more benefits like free upgrades or extra
points toward their loyalty programs (Thompson, 2018).
To sum up, hotel practitioners must identify sources of confusion before they cause
customer confusion if the hotels want to gain competitive advantages. This study proposes that
hotel practitioners should first investigate how customers perceive complexity in price
presentation and overwhelming numbers of attractive alternatives that could cause overload
confusion, similarity confusion, and ambiguity confusion. Furthermore, confusion related

44
consequences discussed in this study could serve as a guide for hotel practitioners to develop
more effective and efficient marketing strategies, eventually motivating faster purchases from
accurately targeted segments.
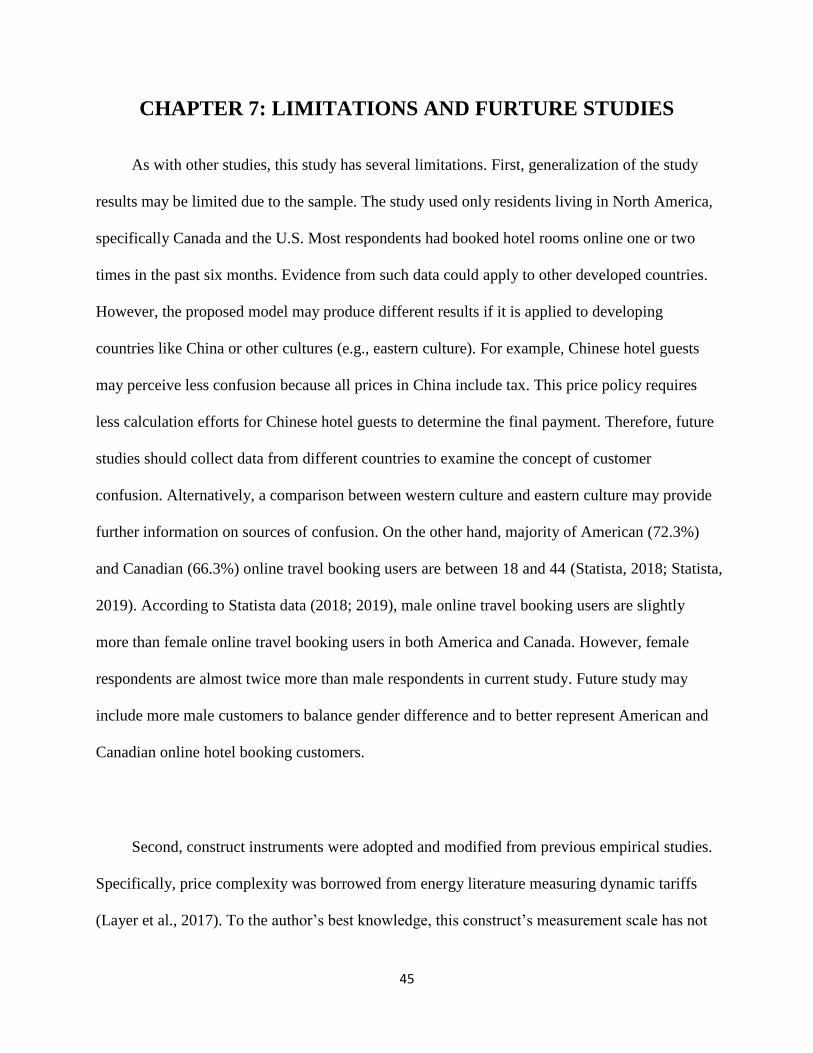
45
CHAPTER 7: LIMITATIONS AND FURTURE STUDIES
As with other studies, this study has several limitations. First, generalization of the study
results may be limited due to the sample. The study used only residents living in North America,
specifically Canada and the U.S. Most respondents had booked hotel rooms online one or two
times in the past six months. Evidence from such data could apply to other developed countries.
However, the proposed model may produce different results if it is applied to developing
countries like China or other cultures (e.g., eastern culture). For example, Chinese hotel guests
may perceive less confusion because all prices in China include tax. This price policy requires
less calculation efforts for Chinese hotel guests to determine the final payment. Therefore, future
studies should collect data from different countries to examine the concept of customer
confusion. Alternatively, a comparison between western culture and eastern culture may provide
further information on sources of confusion. On the other hand, majority of American (72.3%)
and Canadian (66.3%) online travel booking users are between 18 and 44 (Statista, 2018; Statista,
2019). According to Statista data (2018; 2019), male online travel booking users are slightly
more than female online travel booking users in both America and Canada. However, female
respondents are almost twice more than male respondents in current study. Future study may
include more male customers to balance gender difference and to better represent American and
Canadian online hotel booking customers.
Second, construct instruments were adopted and modified from previous empirical studies.
Specifically, price complexity was borrowed from energy literature measuring dynamic tariffs
(Layer et al., 2017). To the author’s best knowledge, this construct’s measurement scale has not
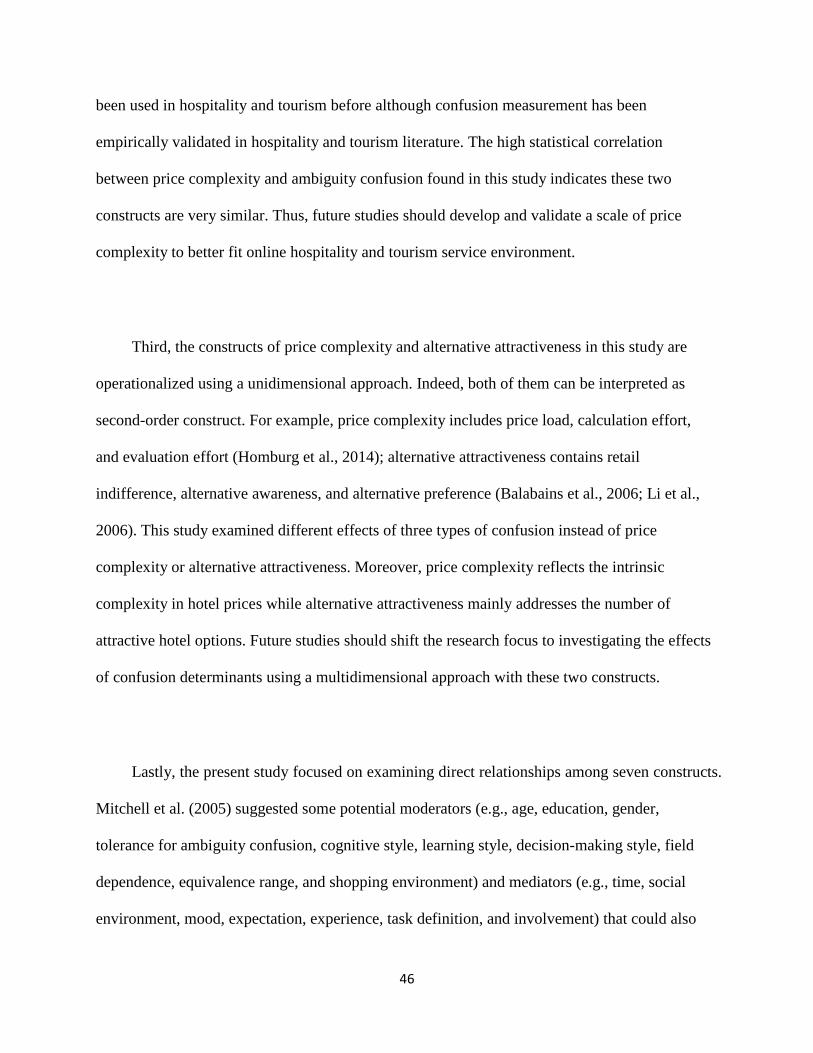
46
been used in hospitality and tourism before although confusion measurement has been
empirically validated in hospitality and tourism literature. The high statistical correlation
between price complexity and ambiguity confusion found in this study indicates these two
constructs are very similar. Thus, future studies should develop and validate a scale of price
complexity to better fit online hospitality and tourism service environment.
Third, the constructs of price complexity and alternative attractiveness in this study are
operationalized using a unidimensional approach. Indeed, both of them can be interpreted as
second-order construct. For example, price complexity includes price load, calculation effort,
and evaluation effort (Homburg et al., 2014); alternative attractiveness contains retail
indifference, alternative awareness, and alternative preference (Balabains et al., 2006; Li et al.,
2006). This study examined different effects of three types of confusion instead of price
complexity or alternative attractiveness. Moreover, price complexity reflects the intrinsic
complexity in hotel prices while alternative attractiveness mainly addresses the number of
attractive hotel options. Future studies should shift the research focus to investigating the effects
of confusion determinants using a multidimensional approach with these two constructs.
Lastly, the present study focused on examining direct relationships among seven constructs.
Mitchell et al. (2005) suggested some potential moderators (e.g., age, education, gender,
tolerance for ambiguity confusion, cognitive style, learning style, decision-making style, field
dependence, equivalence range, and shopping environment) and mediators (e.g., time, social
environment, mood, expectation, experience, task definition, and involvement) that could also

47
influence customer confusion. Future studies may shed light on the indirect effects of these
variables on customer confusion.
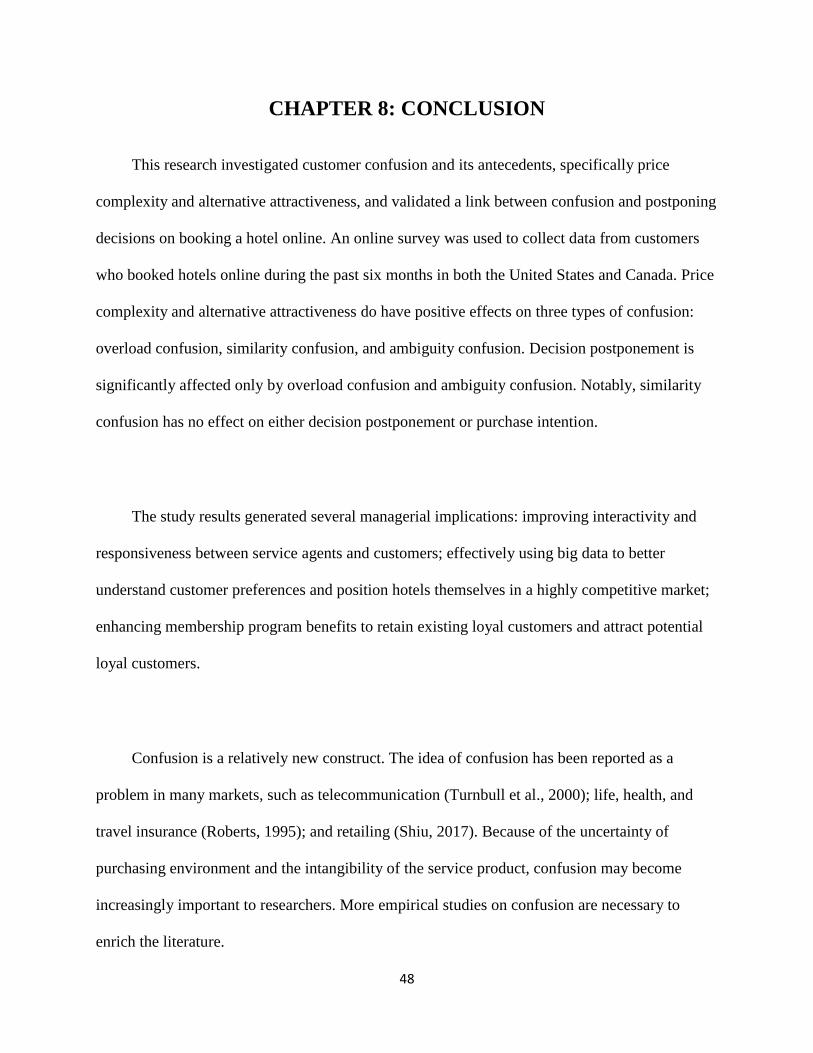
48
CHAPTER 8: CONCLUSION
This research investigated customer confusion and its antecedents, specifically price
complexity and alternative attractiveness, and validated a link between confusion and postponing
decisions on booking a hotel online. An online survey was used to collect data from customers
who booked hotels online during the past six months in both the United States and Canada. Price
complexity and alternative attractiveness do have positive effects on three types of confusion:
overload confusion, similarity confusion, and ambiguity confusion. Decision postponement is
significantly affected only by overload confusion and ambiguity confusion. Notably, similarity
confusion has no effect on either decision postponement or purchase intention.
The study results generated several managerial implications: improving interactivity and
responsiveness between service agents and customers; effectively using big data to better
understand customer preferences and position hotels themselves in a highly competitive market;
enhancing membership program benefits to retain existing loyal customers and attract potential
loyal customers.
Confusion is a relatively new construct. The idea of confusion has been reported as a
problem in many markets, such as telecommunication (Turnbull et al., 2000); life, health, and
travel insurance (Roberts, 1995); and retailing (Shiu, 2017). Because of the uncertainty of
purchasing environment and the intangibility of the service product, confusion may become
increasingly important to researchers. More empirical studies on confusion are necessary to
enrich the literature.
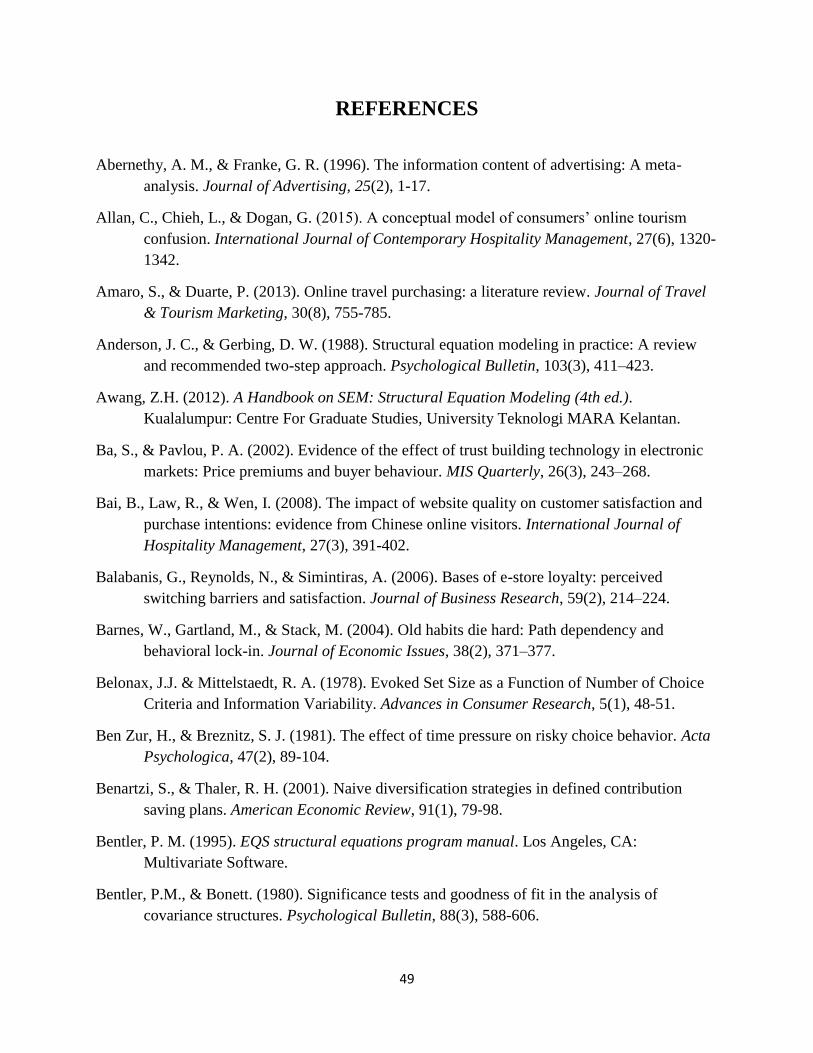
49
REFERENCES
Abernethy, A. M., & Franke, G. R. (1996). The information content of advertising: A meta-
analysis. Journal of Advertising, 25(2), 1-17.
Allan, C., Chieh, L., & Dogan, G. (2015). A conceptual model of consumers’ online tourism
confusion. International Journal of Contemporary Hospitality Management, 27(6), 1320-
1342.
Amaro, S., & Duarte, P. (2013). Online travel purchasing: a literature review. Journal of Travel
& Tourism Marketing, 30(8), 755-785.
Anderson, J. C., & Gerbing, D. W. (1988). Structural equation modeling in practice: A review
and recommended two-step approach. Psychological Bulletin, 103(3), 411–423.
Awang, Z.H. (2012). A Handbook on SEM: Structural Equation Modeling (4th ed.).
Kualalumpur: Centre For Graduate Studies, University Teknologi MARA Kelantan.
Ba, S., & Pavlou, P. A. (2002). Evidence of the effect of trust building technology in electronic
markets: Price premiums and buyer behaviour. MIS Quarterly, 26(3), 243–268.
Bai, B., Law, R., & Wen, I. (2008). The impact of website quality on customer satisfaction and
purchase intentions: evidence from Chinese online visitors. International Journal of
Hospitality Management, 27(3), 391-402.
Balabanis, G., Reynolds, N., & Simintiras, A. (2006). Bases of e-store loyalty: perceived
switching barriers and satisfaction. Journal of Business Research, 59(2), 214–224.
Barnes, W., Gartland, M., & Stack, M. (2004). Old habits die hard: Path dependency and
behavioral lock-in. Journal of Economic Issues, 38(2), 371–377.
Belonax, J.J. & Mittelstaedt, R. A. (1978). Evoked Set Size as a Function of Number of Choice
Criteria and Information Variability. Advances in Consumer Research, 5(1), 48-51.
Ben Zur, H., & Breznitz, S. J. (1981). The effect of time pressure on risky choice behavior. Acta
Psychologica, 47(2), 89-104.
Benartzi, S., & Thaler, R. H. (2001). Naive diversification strategies in defined contribution
saving plans. American Economic Review, 91(1), 79-98.
Bentler, P. M. (1995). EQS structural equations program manual. Los Angeles, CA:
Multivariate Software.
Bentler, P.M., & Bonett. (1980). Significance tests and goodness of fit in the analysis of
covariance structures. Psychological Bulletin, 88(3), 588-606.
50
Biau, D., Kernéis, S., & Porcher, R. (2008). Statistics in brief: The importance of sample size in
the planning and interpretation of medical research. Clinical Orthopaedics and Related
Research, 466(9), 2282-2288.
Biswas, D., & Grau, S. L. (2008). Consumer choices under product option framing: Loss
aversion principles or sensitivity to price differentials? Psychology and Marketing, 25(5),
399-415.
Buhalis, D. (1998). Strategic use of information technologies in the tourism industry. Tourism
Management, 19(5), 409-421.
Buhalis, D., & Law, R. (2008). Progress in information technology and tourism management: 20
years on and 10 years after the internet-the state of eTourism research. Tourism
Management, 29(4), 609-623.
Burman, B., Albinsson, P. A., & Hyatt, E. (2016). One night or many? effects of amenity charge
transparency on consumer reaction. Journal of Hospitality Marketing &
Management, 25(8), 1010-1033.
Carroll, B., & Sigauw, J. (2003). The evolution of electronic distribution: Effects on hotels and
intermediaries. Cornell Hotel and Restaurant Administration Quarterly, 44(4), 38–50.
Chen, C. F., & Tsai, D. (2007). How destination image and evaluative factors affect behavioral
intentions?. Tourism Management, 28(4), 1115-1122.
Chernev, A. (2003). When More Is Less and Less Is More: The Role of Ideal Point Availability
and Assortment in Consumer Choice. Journal of Consumer Research, 30(2), 170-183.
Choi, J., Li, Y., Rangan, P., Chatterjee, P., & Singh, S. (2014). The odd-ending price justification
effect: The influence of price-endings on hedonic and utilitarian consumption. Journal of
the Academy of Marketing Science, 42(5), 545-557.
Chuah, S. H., Marimuthu, M., Kandampully, J., & Bilgihan, A. (2017). What drives gen Y
loyalty? understanding the mediated moderating roles of switching costs and alternative
attractiveness in the value-satisfaction-loyalty chain. Journal of Retailing and Consumer
Services, 36, 124-136.
Clampet, J. (2016). Everything You Wanted to Know About the Hotel Industry's Gripes Against
OTAs. Retrieved from https://skift.com/2016/04/25/everything-you-ever-wanted-to-
know-about-hotel-industrys-complaints-against-otas/.
Colgate, M., & Lang, B. (2001). Switching barriers in consumer markets: An investigation of the
financial services industry. Journal of Consumer Marketing, 18(4), 332–347.
Crosby, F., & Crosby, F. (1976). A model of egoistical relative deprivation. Psychological
Review, 83(2), 85-113.
51
Decrop, A. & Snelders, D. (2005). A Grounded Typology of Vacation Decision-Making.
Tourism Management, 26(2), 121-132.
Dellaert, B., & Stremersch, S. (2005). Marketing Mass-Customized Products: Striking a Balance
between Utility and Complexity. Journal of Marketing Research, 42(2), 219-227.
Denton, F. (1994). The dynamism of personal timestyle: How we do more in less time. Advances
in Consumer Research, 21, 132-137.
Dhar, R. (1996). The effect of decision strategy on deciding to defer choice. Journal of
Behavioral Decision Making, 9(4), 256–281.
Dhar, R. (1997). Consumer Preference for a No‐Choice Option. Journal of Consumer
Research, 24(2), 215-231.
Dortyol, I. T., Varinli, I., & Kitapci, O. (2014). How do international tourists perceive hotel
quality? International Journal of Contemporary Hospitality Management, 26(3), 470-495.
Ermeç Sertoğlu, A., & Kavak, B. (2017). A more comprehensive view of consumer confusion:
Scale development. Journal of International Consumer Marketing, 29(4), 265-276.
Estelami, H. (2003). The effect of price presentation tactics on consumer evaluation effort of
multi-dimensional prices. Journal of Marketing Theory and Practice, 11(2), 1-16.
Fasolo, B., McClelland, G., & Todd, P. (2007). Escaping the tyranny of choice: When fewer
attributes make choice easier. Marketing Theory, 7(1), 13-26.
Fornell, C., & Larcker, D.F. (1981). Evaluating structural equation models with unobservable
variables and measurement error. Journal of Marketing Research, 18(1), 39-50.
Forza, C., & Filippini, R. (1998). TQM impact on quality conformance and customer satisfaction:
A causal model. International Journal of Production Economics, 55(1998), 1-20.
Foxman, E. R., Berger, P. W., & Cote, J. A. (1992). Consumer brand confusion: A conceptual
framework. Psychology and Marketing, 9(2), 123-141.
Foxman, E. R., Muehling, D. D., & Berger, P. W. (1990). An investigation of factors
contributing to consumer brand confusion. The Journal of Consumer Affairs, 24(1), 170.
Ghazali, E., Nguyen, B., Mutum, D., & Mohd-Any, A. (2016). Constructing online switching
barriers: Examining the effects of switching costs and alternative attractiveness on e-store
loyalty in online pure-play retailers. Electronic Markets, 26(2), 157-171.
Golodner, L. (1993). Healthy Confusion for Consumers. Journal of Public Policy &
Marketing, 12(1), 130-132.
Goode, M. & Harris, L.C. (2007). Online behavioral intentions: an empirical investigation of
antecedents and moderators. European Journal of Marketing, 41(5), 512-536.
52
Gourville, J. T., & Soman, D. (2005). Overchoice and assortment type: When and why variety
backfires. Marketing Science, 24(3), 382-395.
Greenspoon, P.J., & Saklofske, D.H. (1998). Confirmatory factor analysis of the
multidimensional Students’ Life Satisfaction Scale. Personality and Individual
Differences, 25(1998), 965-971.
Gretzel, U., & Fesenmaier, D. R. (2009). Information technology: shaping the past, present, and
future of tourism. In T. Jamal, & M. Robinson (Eds.), The SAGE handbook of tourism
studies (pp. 558-580). London: Sage.
Grewal, D., Krishnan, R., Beaker, J., & Borin, N. (1998). The effect of store name, brand name
and price discounts on consumers’ evaluation and purchase intentions. Journal of
Retailing, 74(3), 331-352.
Guillet, B. D., Liu, W., & Law, R. (2014). Can setting hotel rate restrictions help balance the
interest of hotels and customers? International Journal of Contemporary Hospitality
Management, 26(6), 948-973.
Gursoy, D. (2003). Prior product knowledge and its influence on the traveler's information
search behavior. Journal of Hospitality & Leisure Marketing, 10(3-4), 113-131.
Hair, J., Anderson, R., Tatham, R., & Black, W. (1998), Multivariate data analysis (5th ed.).
Upper Saddle River, NJ: Prentice Hall.
Hair, J. F., Black, W. C., Babin, B. J., & Anderson, R. E. (2010). Multivariate data analysis (7th
ed.). Upper Saddle River, NY: Prentice Hall.
Hair, J., Black, W., Babin, B., Anderson, R., & Tatham, R. (2006). Multivariate data analysis.
Upper Saddle River, NJ: Prentice Hall.
Hallowell, R. (1996). The relationships of customer satisfaction, customer loyalty, and
profitability: An empirical study. International Journal of Service Industry
Management, 7(4), 27-42.
Herrmann, A., & Wricke, M. (1998). Evaluating multidimensional prices. Journal of Product &
Brand management, 7(2), 161-169.
Holbrook, M., & Hirschman, E. (1982). The experiential aspects of consumption: Consumer
fantasies, feelings, and fun. Journal of Consumer Research, 9(2), 132-140.
Homburg, C., Totzek, D., & Krämer, M., (2014). How price complexity takes its toll: the
neglected role of a simplicity bias and fairness in price evaluations. Journal of Business
Research. 67(6), 1114–1122.
Hooper, D., Coughlan, J., Mullen, M. R. (2008). Structural equation modeling: Guidelines for
determining model fit. Electronic Journal of Business Research Methods, 6(1), 53–60.
53
Hu, L.T., & Bentler, P.M. (1999). Cut-off criteria for fit indexes in covariance structure analysis:
Conventional criteria versus new alternatives. Structural Equation Modeling, 6(1), 1-55.
Huang, S., & Hsu, C. H. C. (2009). Effects of travel motivation, past experience, perceived
constraint, and attitude on revisit intention. Journal of Travel Research, 48(1), 29-44.
Huffman, C., & Kahn, B. E. (1998). Variety for sale: Mass customization or mass
confusion? Journal of Retailing, 74(4), 491-513.
Iyengar, S. S., & Lepper, M. R. (2000). When choice is demotivating: Can one desire too much
of a good thing? Journal of Personality and Social Psychology, 79(6), 995-1006.
Jacoby, J., & Morrin, M. (1998). "Not manufactured or authorized by ...": Recent federal cases
involving trademark disclaimers. Journal of Public Policy & Marketing, 17(1), 97-107.
Jang, J., & Yoon, S. (2016). The effect of attribute-based and alternative-based processing on
consumer choice in context. Marketing Letters, 27(3), 511-524.
Jones, M. A., Mothersbaugh, D. L., & Beatty, S. E. (2000). Switching barriers and repurchase
intentions in services. Journal of Retailing, 76(2), 259–274.
Jones, M. A., Mothersbaugh, D. L., & Beatty, S. E. (2002). Why customers stay: measuring the
underlying dimensions of services switching costs and managing their differential
strategic outcomes. Journal of Business Research, 55(6), 441-450.
Kahneman, D., & Kahneman, D. (2003). A perspective on judgment and choice: Mapping
bounded rationality. American Psychologist, 58(9), 697-720.
Kalayci, K. (2015). Price complexity and buyer confusion in markets. Journal of Economic
Behavior and Organization, 111, 154-168.
Kim, H. M., & Kramer, T. (2006). The moderating effects of need for cognition and cognitive
effort on responses to multi-dimensional prices. Marketing Letters, 17(3), 193-203.
Kim, W., Ok, C., & Canter, D. D. (2010). Contingency variables for customer share of visits to
full-service restaurant. International Journal of Hospitality Management, 29(1), 136-147.
Kim, H., Xu, Y., & Gupta, S. (2012). Which is more important in internet shopping, perceived
price or trust? Electronic Commerce Research and Applications, 11(3), 241-252.
Kline, R.B. (2011). Principles and practice of structural equation modelling (2nd ed.). New
York: The Guilford Press.
Krejcie, R. V., & Morgan, D. W. (1970). Determining sample size for research activities.
Educational and Psychological Measurement, 30(3), 607-610.
Krishna, A., Briesch, R., Lehmann, D. R., & Yuan, H. (2002). A meta-analysis of the impact of
price presentation on perceived savings. Journal of Retailing, 78(2), 101-118.
54
Konuş, U., Verhoef, P. C., & Neslin, S. A. (2008). Multichannel shopper segments and their
covariates. Journal of Retailing, 84(4), 398-413
Layer, P., Feurer, S., & Jochem, P. (2017). Perceived price complexity of dynamic energy tariffs:
An investigation of antecedents and consequences. Energy Policy, 106, 244-254.
Landman, J. (1987). Regret and elation following action and inaction: Affective responses to
positive versus negative outcomes. Personality and Social Psychology Bulletin, 13(4),
524-536.
Langer, E.J., & Rodin, J. (1976). The effects of choice and enhanced personal responsibility for
the aged: a field experiment in an institutional setting. Journal of Personality and Social
Psychology, 34(2), 191-198.
Law, R., Leung, K., & Wong, J. (2004). The impact of the internet on travel agencies.
International Journal of Contemporary Hospitality Management, 16(2), 100-107.
Li, D., Browne, G. J., & Chau, P. Y. K. (2006). An empirical investigation of web site use using
a commitment-based model. Decision Sciences, 37(3), 427–444.
Lloyd, K. B., & Jankowski, D. J. (1999). A cognitive information processing and information
theory approach to diagram clarity: A synthesis and experimental investigation. Journal
of Systems and Software, 45(3), 203-214.
Lin, C., & Lekhawipat, W. (2014). Factors affecting online repurchase intention. Industrial
Management & Data Systems, 114(4), 597-611.
Liu, C., Arnett, K.P., & Litecky, C. (2000). Design quality of websites for electronic commerce:
fortune 1000 webmasters’ evaluations. Electronic Markets, 10(2), 120-129.
Litvin, S., Goldsmith, R., & Pan, B. (2008). Electronic word-of-mouth in hospitality and tourism
management. Tourism Management, 29(3), 458-468.
Liu, J. N. K., & Zhang, E. Y. (2014). An investigation of factors affecting customer selection of
online hotel booking channels. International Journal of Hospitality Management, 39, 71-
83.
Loker-Murphy, L. (1997). Backpackers in Australia: Journal of Travel & Tourism
Marketing, 5(4), 23-45.
Loker-Murphy, L., & Perdue, R. (1992). A benefit-based segmentation of a nonresident summer
travel market. Journal of Travel Research, 31(2), 30-35.
Loudon, D. L., & Della Bitta, A. J. (1993). Consumer Behavior, 4th Edition. NewYork:
McGraw-Hill.
55
Lu, A. C. C., Gursoy, D., & Lu, C. Y. R. (2016). Antecedents and outcomes of consumers’
confusion in the online tourism domain. Annals of Tourism Research, 57(Complete), 76-
93.
Luhmann, N. (1996). Social systems. Stanford, CA: Stanford University Press.
Maheswaran, D., & Sternthal, B. (1990). The effects of knowledge, motivation, and type of
message on ad processing and product judgments. Journal of Consumer Research, 17(1),
66-73.
Mai, R., Hoffmann, S., Schwarz, U., Niemand, T., & Seidel, J. (2014). The shifting range of
optimal web site complexity. Journal of Interactive Marketing, 28(2), 101-116.
Mansfeld, Y. (1992). From motivation to actual travel. Annals of Tourism Research, 19(3), 399-
419.
Matzler, K., & Waiguny, M. (2005). Consequences of customer confusion in online hotel
booking. Information and Communication Technologies in Tourism, 10, 306-317.
Medvec, V. H., Madey, S. F., & Gilovich, T. (1995). When less is more: counterfactual thinking
and satisfaction among Olympic medalists. Journal of Personality and Social Psychology,
69(4), 603-610.
Miller, G.A. (1956). The magical number seven, plus or minus two: some limits on our capacity
for processing information. Psychological Review, 63(2), 81-97.
Mitchell, V., & Kearney, Í. (2002). A critique of legal measures of brand confusion. Journal of
Product & Brand Management, 11(6), 357-379.
Mitchell, V., & Papavassiliou, V. (1997). Exploring the concept of consumer confusion. Market
Intelligence & Planning, 15(4), 164-169.
Mitchell, V., & Papavassiliou, V. (1999). Marketing causes and implications of consumer
confusion. Journal of Product and Band Management, 8(4), 319–342.
Mitchell, V., Walsh, G., & Yamin, M. (2005). Towards a conceptual model of consumer
confusion. Advances In Consumer Research, 32, 143-150.
Mogilner, C., Rudnick, T., & Iyengar, S.S. (2008). The mere categorization effect: how the
presence of categories increases choosers’ perceptions of assortment variety and outcome
satisfaction. Journal of Consumer Research, 35(2), 202-215.
Morrin, M., & Jacoby, J. (2000). Trademark Dilution: Empirical Measures for an Elusive
Concept. Journal of Public Policy & Marketing, 19(2), 265-276.
Morrison, A. M., Jing, S., O'Leary, J. T., & Cai, L. A. (2001). Predicting usage of the internet for
travel bookings: an exploratory study. Information Technology & Tourism, 4(1), 15-30.
56
Money, R. B., & Crotts, J. C. (2003). The effect of uncertainty avoidance on information search,
planning, and purchases of international travel vacations. Tourism Management, 24(2),
191-202.
Mourali, M., & Pons, F. (2009). Regulatory fit from attribute-based versus alternative-based
processing in decision making. Journal of Consumer Psychology, 19(4), 643-651.
Moutinho, L. (1987). Consumer behavior in tourism. European Journal of Marketing, 21(10), 3-
44.
Nicolau, J.L., & Mas, F.J. (2008). Sequential choice behavior: going on vacation and type of
destination. Tourism Management, 29(5), 1023-1034.
O’Connor, P. (2002). An empirical analysis of hotel chain online pricing strategies, Cognizant
Communication Corporation. Information Technology and Tourism, 5(2), 65–72.
O'Connor, P., & Murphy, J. (2004). Research on information technology in the hospitality
industry. International Journal of Hospitality Management, 23(5), 473-484.
Oppewal, H., & Koelemeijer, K. (2005). More choice is better: effects of assortment size and
composition on assortment evaluation. International Journal of Research in Marketing,
22(1), 45-60.
Park, D.B., & Yoon, Y.S. (2009). Segmentation by motivation in rural tourism: a Korean case
study. Tourism Management, 30(1), 99-108.
Patterson, P.G., & Smith, T., (2003). A cross cultural study of switching barriers and propensity
to stay with service providers. Journal of Retailing, 7 (2), 107–120.
Ping Jr., R.A., (1993). The effects of satisfaction and structural constraints on retailer exiting,
voice, loyalty, opportunism, and neglect. Journal of Retailing, 69(3), 321–349.
Pizzi, G., Scarpi, D., & Marzocchi, G. L. (2014). Showing a tree to sell the forest: The impact of
attribute- and alternative-based information presentation on consumers’ choices. Journal
of Economic Psychology, 42, 41-51.
Polites, G., & Karahanna, E. (2012). Shackled to the Status Quo: The Inhibiting Effects of
Incumbent System Habit, Switching Costs, and Inertia on New System Acceptance. MIS
Quarterly,36(1), 21-42.
Ramanathan, U., & Ramanathan, R. (2011). Guests' perceptions on factors influencing customer
loyalty. International Journal of Contemporary Hospitality Management, 23(1), 7-25.
Reibstein, D. J., Youngblood, S. A., & Fromkin, H. L. (1975). Number of choices and perceived
decision freedom as a determinant of satisfaction and consumer behavior. Journal of
Applied Psychology, 60(4), 434-437.
57
Richins, M. (1997). Measuring Emotions in the Consumption Experience. Journal of Consumer
Research, 24(2), 127-146.
Roberts. L. (1995). OFT to probe policies 'confusion. The Independent. 20 May.
Roe, S. J., & Repetti, T. (2014). Consumer perceptions of resort fees and their impact on hotel
selection. Journal of Hospitality Marketing & Management, 23(5), 564–578.
Rohlfs, K. V., & Kimes, S. E. (2007). Customers’ perceptions of best available hotel rates.
Cornell Hotel and Restaurant Administration Quarterly, 48(2), 151–162.
Rusbult, C.E., (1980). Commitment and satisfaction in romantic associations: a test of the
investment model. Journal of Experimental and Social Psychology, 16(2), 172–186.
Rusbult, C. E., Martz, J. M., & Agnew, C. R. (1998). The investment model scale: measuring
commitment level, satisfaction level, quality of alternatives, and investment size.
Personal Relationships, 5(4), 357–387.
Scheibehenne, B., Greifeneder, R., & Todd, P. M. (2009). What moderates the too-much-choice
effect? Psychology and Marketing, 26(3), 229-253.
Scheibehenne, B., Greifeneder, R., & Todd, P. (2010). Can there ever be too many options? A
meta‐analytic review of choice overload. Journal of Consumer Research, 37(3), 409-425.
Scholnick, E. K., & Wing, C. S. (1988). Knowing when you Don’t know: Developmental and
situational considerations. Developmental Psychology, 24(2), 190-196.
Schweizer, M., Kotouc, A. J., & Wagner, T. (2006). Scale development for consumer
confusion. Advances in Consumer Research, 33 (1). 184-190.
Sela, A., Berger, J., & Liu, W. (2009). Variety, vice, and virtue: How assortment size influences
option choice. Journal of Consumer Research, 35(6), 941-951.
Shankar, A., Cherrier, H., & Canniford, R. (2006). Consumer empowerment: A Foucauldian
interpretation. European Journal of Marketing, 40(9/10), 1013-1030.
Shugan, S. (1980). The cost of thinking. Journal of Consumer Research, 7(2), 99-111.
Shukla, P., Banerjee, M., & Adidam, P. T. (2010). Antecedents and consequences of consumer
confusion: Analysis of the financial services industry. Advances In Consumer
Research, 37, 292-297.
Shukla, P., Banerjee, M., & Singh, J. (2016). Customer commitment to luxury brands:
Antecedents and consequences. Journal of Business Research, 69(1), 323-331.
Shiu, J. Y. (2017). Investigating consumer confusion in the retailing context: The causes and
outcomes. Total Quality Management & Business Excellence, 28(7-8), 746-764.
58
Simon, H. (1962). The architecture of complexity. Proceedings of the American Philosophical
Society, 106(6), 467-482.
Statista. (2016). Global digital travel sales 2014-2020. Retrieved from
https://www.statista.com/statistics/499694/forecast-of-online-travel-sales-worldwide/.
Statista. (2018). Online Travel Booking Canada. Retrieved from
https://www.statista.com/outlook/262/108/online-travel-booking/canada#market-
globalRevenue.
Statista. (2019). eTravel Report 2019. Retrieved from
https://www.statista.com/study/49302/etravel-report/.
Stevens, J. (2002). Applied multivariate statistics for the social sciences. Mahwah, NJ: Lawrence
Erlbaum.
Svenson, O., & Edland, A. (1987). Change of preferences under time pressure: Choices and
judgements. Scandinavian Journal of Psychology, 28(4), 322-330.
Tan, C., Teo, H., & Benbasat, I. (2010). Assessing Screening and Evaluation Decision Support
Systems: A Resource-Matching Approach. Information Systems Research, 21(2), 305-
326.
Temerak, M. S. (2016). Examining the impact of the attractiveness of alternatives on customers’
perceptions of price tolerance: Moderation and mediation analyses. Journal of Financial
Services Marketing, 21(4), 284-297.
Thai, N. T., & Yuksel, U. (2017). Choice overload in holiday destination choices. International
Journal of Culture, Tourism and Hospitality Research, 11(1), 53-66.
Thompson, C. (2018). What you should know about 3rd party hotel booking websites. Retrieved
from https://komonews.com/news/consumer/what-you-should-know-about-3rd-party-
hotel-booking-websites.
Turnbull, P. W., Leek, S., & Ying, G. (2000). Customer confusion: The mobile phone
market. Journal of Marketing Management, 16(1-3), 143-163.
Tversky, A., & Shafir, E. (1992). Choice under conflict: The dynamics of deferred
decision. Psychological Science, 3(6), 358-361.
Walsh, G., Hennig-Thurau, T., & Mitchell, V. (2007). Consumer confusion proneness: Scale
development, validation, and application. Journal of Marketing Management, 23(7-8),
697-721.
Walsh, G., Mitchell, V. W., & Frenze, T. (2004). Consumer e-confusion on the Internet. Thexis-
Fachzeitschrift für Marketing, 21(4), 17–22.
59
Wang, Q., & Shukla, P. (2013). Linking sources of consumer confusion to decision satisfaction:
The role of choice goals. Psychology & Marketing, 30(4), 295-304.
Wiedmann, K., Walsh, G., & Klee, A. (2001). Consumer confusion: Construct and marketing
policy implications. Journal of Research and Management, 23(2), 83-99.
Wurman, R. S. (1990). Information anxiety: What to do when information doesn't tell you what
you need to know. New York: Bantam.
Xia, L., Monroe, K. B., & Cox, J. L. (2004). The price is unfair! A conceptual framework of
price fairness perceptions. The Journal of Marketing, 68(4), 1-15
60
APPENDICES
Appendix 1: Questionnaire
Dear participants,
The purpose of this study is to better understand customers’ online hotel booking decisions. The
findings will provide hotel industry operators with an in-depth understanding of the factors
affecting customers’ online hotel booking decisions.
The survey will take approximately 20 minutes to complete. Your response is very important to
this study. Your participation is strictly voluntary, and you can withdraw from the study at any
time without consequence. This is an anonymous survey; no individual information will be
reported, and only aggregated results will be presented.
Thank you for your participation.
Sincerely,
WooMi Jo
Principal Investigator
Pengsongze Xue
Student Investigator
University of Guelph
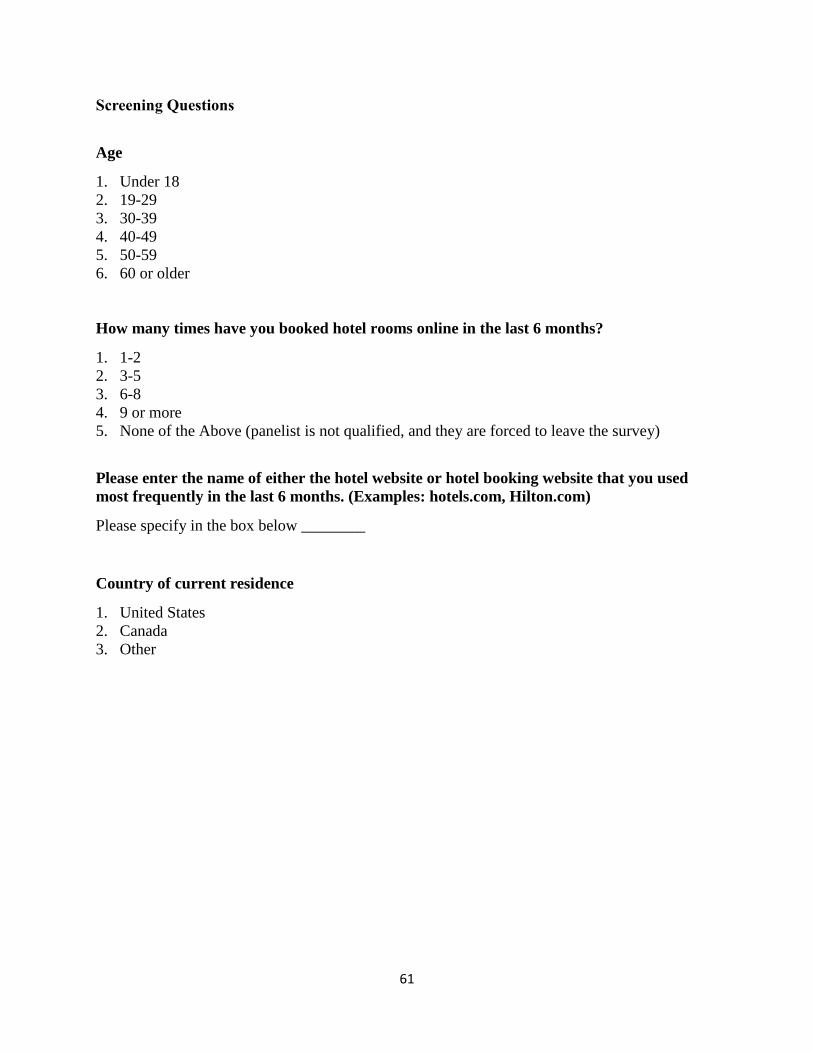
61
Screening Questions
Age
1. Under 18
2. 19-29
3. 30-39
4. 40-49
5. 50-59
6. 60 or older
How many times have you booked hotel rooms online in the last 6 months?
1. 1-2
2. 3-5
3. 6-8
4. 9 or more
5. None of the Above (panelist is not qualified, and they are forced to leave the survey)
Please enter the name of either the hotel website or hotel booking website that you used
most frequently in the last 6 months. (Examples: hotels.com, Hilton.com)
Please specify in the box below ________
Country of current residence
1. United States
2. Canada
3. Other
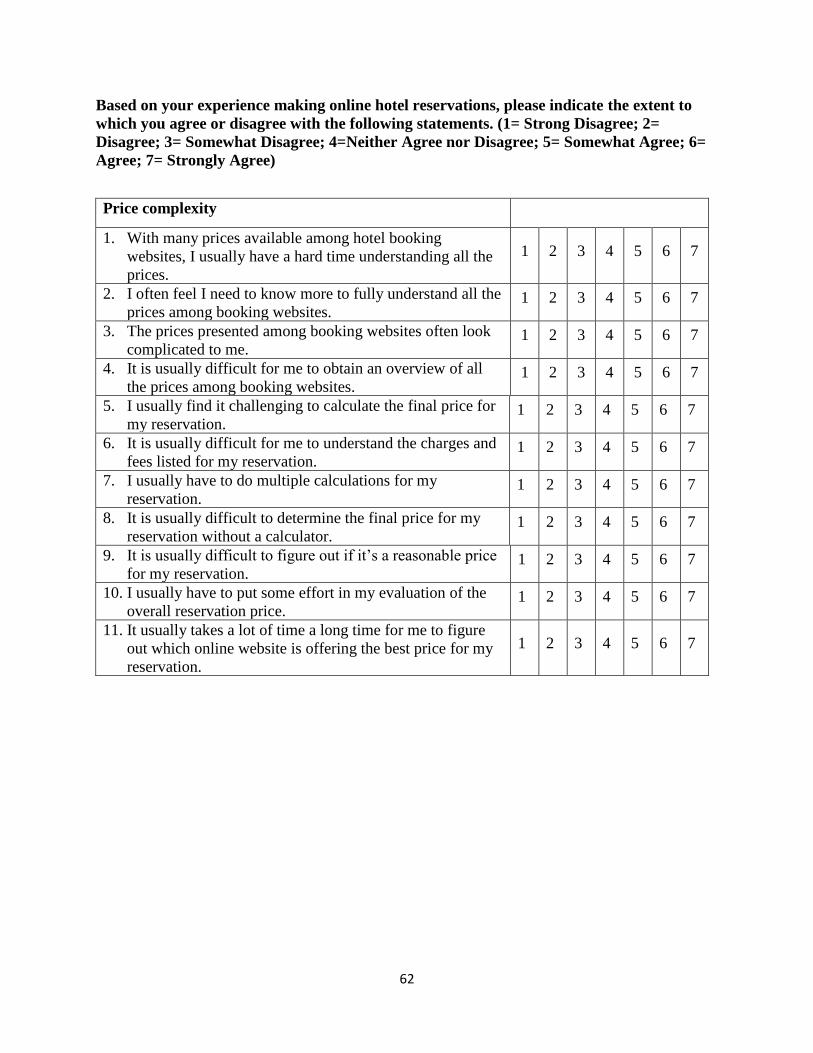
62
Based on your experience making online hotel reservations, please indicate the extent to
which you agree or disagree with the following statements. (1= Strong Disagree; 2=
Disagree; 3= Somewhat Disagree; 4=Neither Agree nor Disagree; 5= Somewhat Agree; 6=
Agree; 7= Strongly Agree)
Price complexity
1. With many prices available among hotel booking
websites, I usually have a hard time understanding all the
prices.
1 2 3 4 5 6 7
2. I often feel I need to know more to fully understand all the
prices among booking websites. 1 2 3 4 5 6 7
3. The prices presented among booking websites often look
complicated to me. 1 2 3 4 5 6 7
4. It is usually difficult for me to obtain an overview of all
the prices among booking websites. 1 2 3 4 5 6 7
5. I usually find it challenging to calculate the final price for
my reservation. 1 2 3 4 5 6 7
6. It is usually difficult for me to understand the charges and
fees listed for my reservation. 1 2 3 4 5 6 7
7. I usually have to do multiple calculations for my
reservation. 1 2 3 4 5 6 7
8. It is usually difficult to determine the final price for my
reservation without a calculator. 1 2 3 4 5 6 7
9. It is usually difficult to figure out if it’s a reasonable price
for my reservation. 1 2 3 4 5 6 7
10. I usually have to put some effort in my evaluation of the
overall reservation price. 1 2 3 4 5 6 7
11. It usually takes a lot of time a long time for me to figure
out which online website is offering the best price for my
reservation.
1 2 3 4 5 6 7
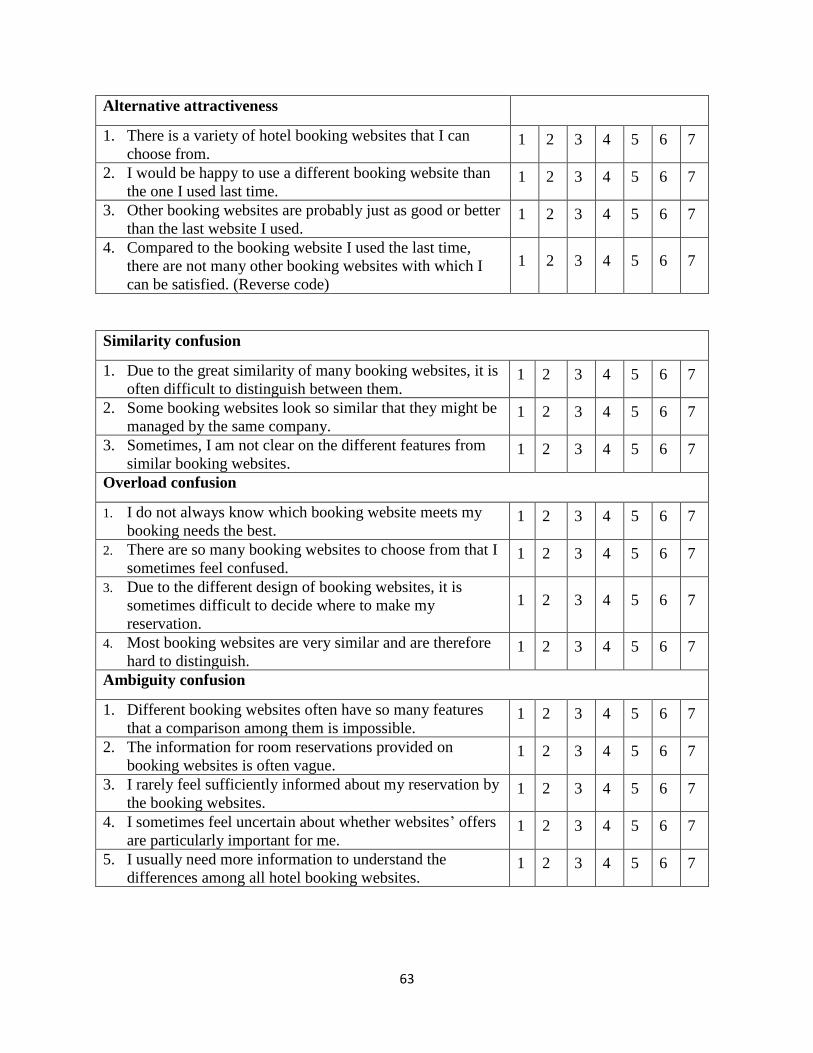
63
Alternative attractiveness
1. There is a variety of hotel booking websites that I can
choose from. 1 2 3 4 5 6 7
2. I would be happy to use a different booking website than
the one I used last time. 1 2 3 4 5 6 7
3. Other booking websites are probably just as good or better
than the last website I used. 1 2 3 4 5 6 7
4. Compared to the booking website I used the last time,
there are not many other booking websites with which I
can be satisfied. (Reverse code)
1 2 3 4 5 6 7
Similarity confusion
1. Due to the great similarity of many booking websites, it is
often difficult to distinguish between them. 1 2 3 4 5 6 7
2. Some booking websites look so similar that they might be
managed by the same company. 1 2 3 4 5 6 7
3. Sometimes, I am not clear on the different features from
similar booking websites. 1 2 3 4 5 6 7
Overload confusion
1. I do not always know which booking website meets my
booking needs the best. 1 2 3 4 5 6 7
2. There are so many booking websites to choose from that I
sometimes feel confused. 1 2 3 4 5 6 7
3. Due to the different design of booking websites, it is
sometimes difficult to decide where to make my
reservation.
1 2 3 4 5 6 7
4. Most booking websites are very similar and are therefore
hard to distinguish. 1 2 3 4 5 6 7
Ambiguity confusion
1. Different booking websites often have so many features
that a comparison among them is impossible. 1 2 3 4 5 6 7
2. The information for room reservations provided on
booking websites is often vague. 1 2 3 4 5 6 7
3. I rarely feel sufficiently informed about my reservation by
the booking websites. 1 2 3 4 5 6 7
4. I sometimes feel uncertain about whether websites’ offers
are particularly important for me. 1 2 3 4 5 6 7
5. I usually need more information to understand the
differences among all hotel booking websites. 1 2 3 4 5 6 7
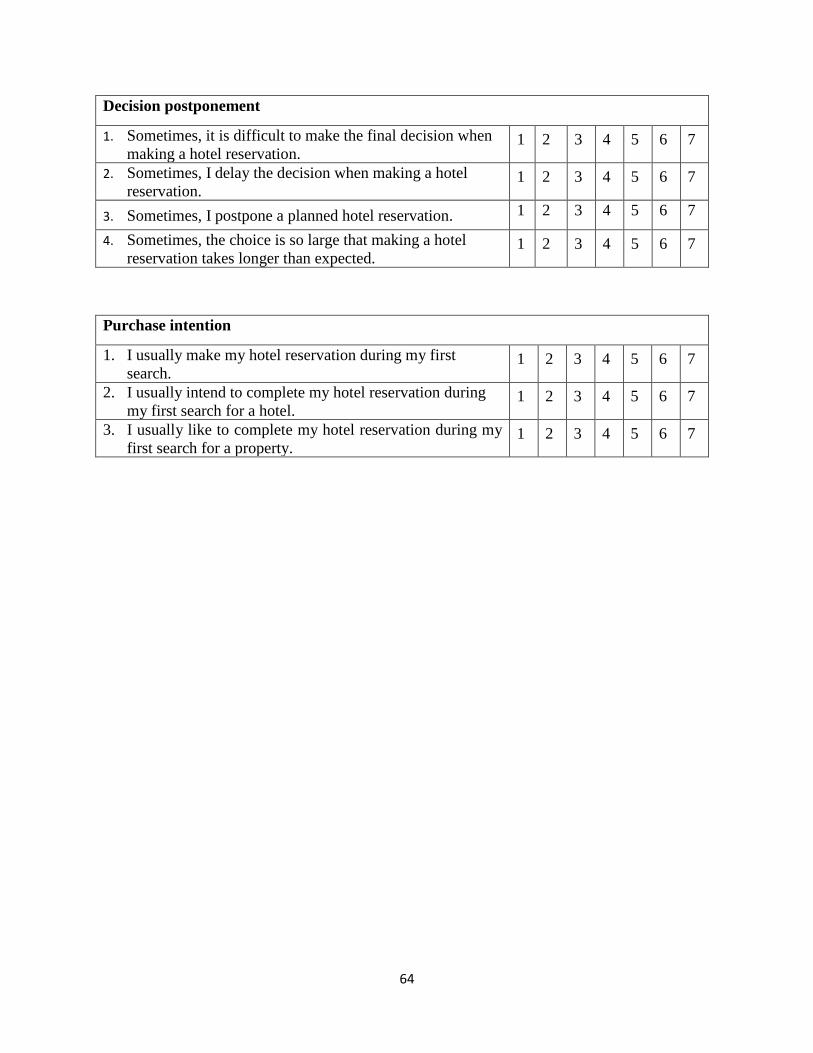
64
Decision postponement
1. Sometimes, it is difficult to make the final decision when
making a hotel reservation. 1 2 3 4 5 6 7
2. Sometimes, I delay the decision when making a hotel
reservation. 1 2 3 4 5 6 7
3. Sometimes, I postpone a planned hotel reservation. 1 2 3 4 5 6 7
4. Sometimes, the choice is so large that making a hotel
reservation takes longer than expected. 1 2 3 4 5 6 7
Purchase intention
1. I usually make my hotel reservation during my first
search. 1 2 3 4 5 6 7
2. I usually intend to complete my hotel reservation during
my first search for a hotel. 1 2 3 4 5 6 7
3. I usually like to complete my hotel reservation during my
first search for a property. 1 2 3 4 5 6 7
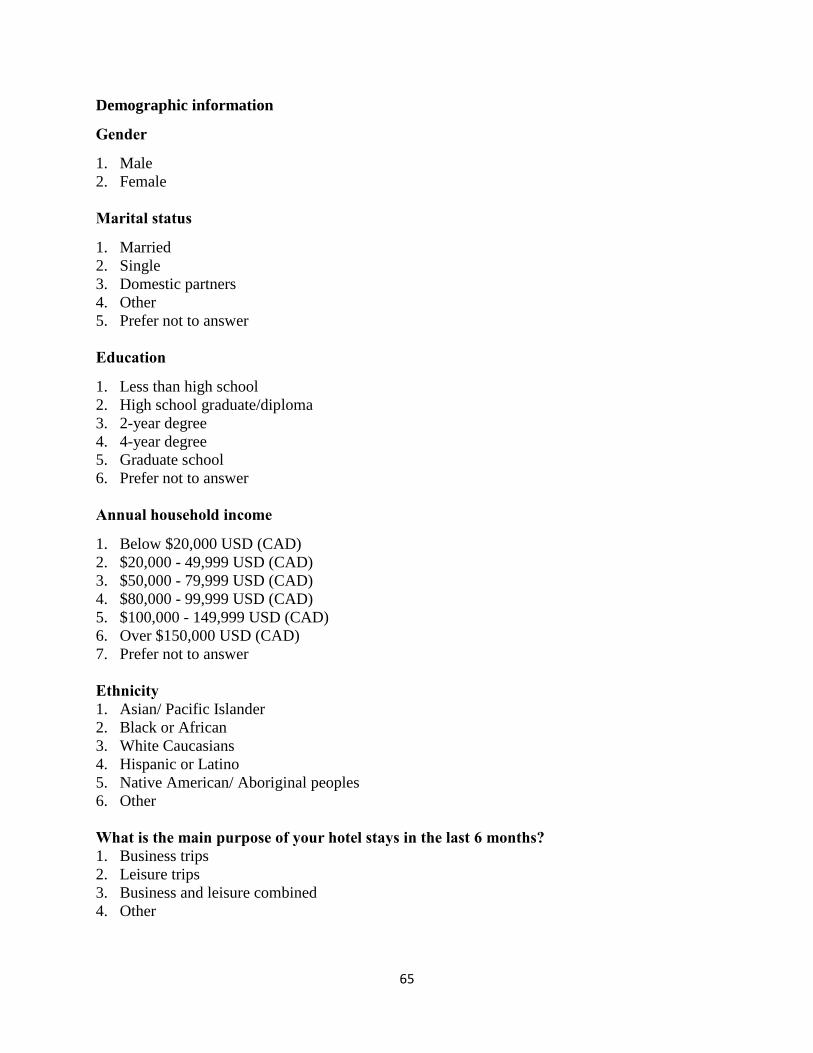
65
Demographic information
Gender
1. Male
2. Female
Marital status
1. Married
2. Single
3. Domestic partners
4. Other
5. Prefer not to answer
Education
1. Less than high school
2. High school graduate/diploma
3. 2-year degree
4. 4-year degree
5. Graduate school
6. Prefer not to answer
Annual household income
1. Below $20,000 USD (CAD)
2. $20,000 - 49,999 USD (CAD)
3. $50,000 - 79,999 USD (CAD)
4. $80,000 - 99,999 USD (CAD)
5. $100,000 - 149,999 USD (CAD)
6. Over $150,000 USD (CAD)
7. Prefer not to answer
Ethnicity
1. Asian/ Pacific Islander
2. Black or African
3. White Caucasians
4. Hispanic or Latino
5. Native American/ Aboriginal peoples
6. Other
What is the main purpose of your hotel stays in the last 6 months?
1. Business trips
2. Leisure trips
3. Business and leisure combined
4. Other
66
Appendix 2: Research Ethics Boards Approval
RESEARCH ETHICS BOARDS Certification of Ethical Acceptability of Research Involving Human Participants
APPROVAL PERIOD: EXPIRY DATE: REB: REB NUMBER: TYPE OF REVIEW: PRINCIPAL INVESTIGATOR: DEPARTMENT: SPONSOR(S): TITLE OF PROJECT:
November 30, 2018 November 29, 2019 G 18-11-015 Delegated Jo, WooMi ([email protected]) School of Hospitality & Tourism Management
N / A Choose now or later? An examination of decision postponement and repurchase intention based on price complexity, alternative attractiveness, and confusion in hotel online booking
The members of the University of Guelph Research Ethics Board have examined the protocol which
describes the participation of the human participants in the above-named research project and considers
the procedures, as described by the applicant, to conform to the University's ethical standards and the
Tri-Council Policy Statement, 2nd Edition.
The REB requires that researchers: • Adhere to the protocol as last reviewed and approved by the REB. • Receive approval from the REB for any modifications before they can be implemented. • Report any change in the source of funding. • Report unexpected events or incidental findings to the REB as soon as possible with an
indication of how these events affect, in the view of the Principal Investigator, the safety of the participants, and the continuation of the protocol.
• Are responsible for ascertaining and complying with all applicable legal and regulatory requirements with respect to consent and the protection of privacy of participants in the jurisdiction of the research project.
The Principal Investigator must:
• Ensure that the ethical guidelines and approvals of facilities or institutions involved in the
research are obtained and filed with the REB prior to the initiation of any research protocols. • Submit an Annual Renewal to the REB upon completion of the project. If the research is a multi-
year project, a status report must be submitted annually prior to the expiry date. Failure to submit an annual status report will lead to your study being suspended and potentially terminated.
The approval for this protocol terminates on the EXPIRY DATE , or the term of your appointment or employment at the University of Guelph whichever comes first.
Signature: Date: November 30, 2018
Stephen P. Lewis Chair, Research Ethics Board-General