Embed Size (px)
Citation preview
A
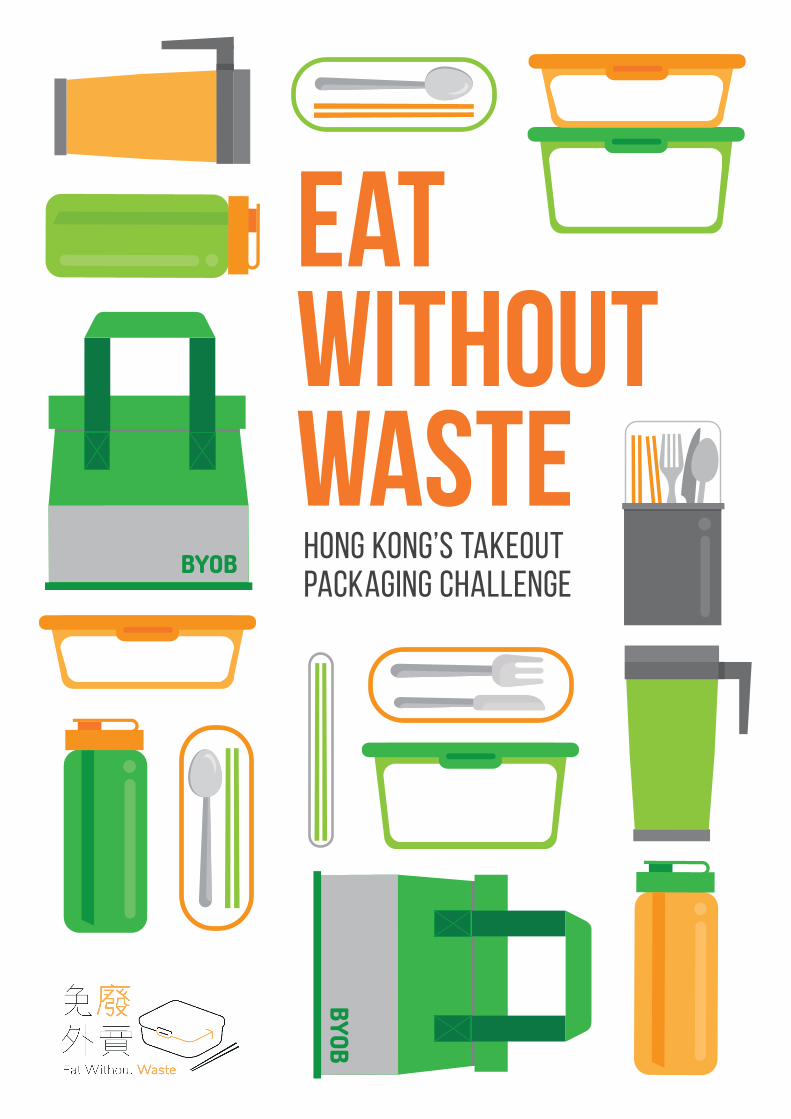
Eat Without WASTEHong Kong’s Takeout Packaging Challenge
1
Research Team
Ashley HY BangData Scientist, ADM Capital Foundation
Helga VanthournoutSenior Advisor, ADM Capital Foundation
Eat Without Waste Steering Committee
Hannah ChungSenior Sustainability Manager, Melco Resorts & Entertainment;Advisor, Muuse Hong Kong
Lisa GenasciManaging Director, Sustainability, ADM Capital
Sophie le ClueCEO, ADM Capital Foundation
Gina LittlefairSustainability Manager, The Hong Kong Jockey Club
Hilde-Gunn VestadHead of Sustainability, DFI Retail Group
Dana WinogradDirector-Operations, Plastic Free Seas
About Eat Without Waste
The Eat Without Waste initiative was founded in 2020 by ADM Capital Foundation to address the growing issue of takeout packaging waste in Hong Kong. By establishing a granular view of Hong Kong’s takeout waste landscape, this report sets the foundation to inform and implement a suite of solutions along the circular economy spectrum. In parallel, the initiative fosters change by facilitating communication and mobilisation across various stakeholder groups, from Government agencies to consumers, and from food & beverage operators to service providers.
Suggested citationVanthournout H & Bang AHY (2021) Eat Without Waste: Hong Kong’s Takeout Packaging Challenge. ADM Capital Foundation, Hong Kong.
1
2
CONTENTSForeword .....................................................................................................................................................................4In Support of Eat Without Waste ................................................................................................................................5Executive Summary ....................................................................................................................................................7Glossary ....................................................................................................................................................................11
1. Introduction ......................................................................................................................................................12
2. Choking On Takeout Waste ..............................................................................................................................14 2.1 No end to our appetite .............................................................................................................................14 2.2 A container for every taste .......................................................................................................................15 2.3 Projecting to 2030 ....................................................................................................................................16 2.4 Wasteful habits with a bitter aftertaste ..................................................................................................17
3. A Viable Pathway ..............................................................................................................................................20 3.1 The solution space ...................................................................................................................................20 3.2 Analytical approach: diverting containers from landfills ........................................................................20 3.3 Comparative advantage ...........................................................................................................................22 3.4 Eating without waste, starting now .........................................................................................................22
4. Recycling ...........................................................................................................................................................25 4.1 How it works .............................................................................................................................................25 4.2 2030 potential ..........................................................................................................................................25 4.3 Driving the Recycling solution .................................................................................................................28
5. Bring Your Own .................................................................................................................................................30 5.1 How it works .............................................................................................................................................30 5.2 2030 potential ..........................................................................................................................................30 5.3 Driving the BYO solution ..........................................................................................................................32
6. Composting .......................................................................................................................................................33 6.1 How it works .............................................................................................................................................33 6.2 2030 potential ..........................................................................................................................................36 6.3 Driving the Composting solution .............................................................................................................38
7. Reuse Systems .................................................................................................................................................40 7.1 How it works ............................................................................................................................................ 40 7.2 2030 potential ..........................................................................................................................................42 7.3 Driving the Reuse solution .......................................................................................................................45
8. Scaling Up Solutions ........................................................................................................................................47 8.1 Behavioural sciences offer food for thought ...........................................................................................47 8.2 Scaling up Recycling................................................................................................................................ 48 8.3 Fostering BYO behaviours ........................................................................................................................49 8.4 Enabling Composting at scale ..................................................................................................................50 8.5 Accelerating Reuse systems ....................................................................................................................51 8.6 A note on peripherals ...............................................................................................................................53
9. A New Approach For Hong Kong ....................................................................................................................... 55 9.1 Conclusion ................................................................................................................................................55 9.2 Recommendations ...................................................................................................................................56
Appendix A: Methodology ........................................................................................................................................60Appendix B: System Assumptions And Parameters ............................................................................................... 64Endnotes ...................................................................................................................................................................68Contributors ..............................................................................................................................................................72
2

3
List of figuresFigure 1 The EPD’s consultation on regulation of disposable plastic tableware ............................................12Figure 2 Number of single-use food and drink containers used in Hong Kong ...............................................15Figure 3 Projected growth in Hong Kong’s usage of single-use takeout containers ......................................16Figure 4 MSW generated per capita in Hong Kong, Seoul, Taipei, and Tokyo ................................................17Figure 5 Cost of operating Hong Kong’s waste infrastructure ........................................................................17Figure 6 SFP littering in Hong Kong..................................................................................................................18Figure 7 SFP solution framework .....................................................................................................................20Figure 8 Defining 2030 potential: Methodology .............................................................................................21Figure 9 Costs associated with each solution archetype ................................................................................22Figure 10 Greenhouse gas emissions associated with each solution archetype .............................................22Figure 11 Water consumption associated with each solution archetype .........................................................22Figure 12 Hot food containers have the greatest opportunity for impact ........................................................23Figure 13 Full landfill diversion potential in Hong Kong under three modelled scenarios ...............................23Figure 14 Schematic diagram of a typical SFP recycling system .......................................................................25Figure 15 GREEN@COMMUNITY recycling store and recycling point ...............................................................26Figure 16 Recycling system costs ......................................................................................................................26Figure 17 Demands on stakeholders in the recycling solution .........................................................................27Figure 18 Schematic diagram of the BYO system ..............................................................................................30Figure 19 BYO system costs ...............................................................................................................................31Figure 20 Takeaway meal in a single-use bento container ................................................................................31Figure 21 Demands on stakeholders in the BYO solution .................................................................................32Figure 22 Cupfy single-use cup charge ..............................................................................................................32Figure 23 Schematic diagram of the composting system .................................................................................33Figure 24 Types of compostable packaging on the market ...............................................................................34Figure 25 The difference between biodegradable and bio-based ....................................................................34Figure 26 EPD food waste composter provided to Hong Kong schools ............................................................35Figure 27 Composting system costs ..................................................................................................................36Figure 28 Demands on stakeholders in the composting solution .....................................................................37Figure 29 Schematic diagram of the reuse system .......................................................................................... 40Figure 30 Ben don go! Reusable food container pilot .......................................................................................42Figure 31 Reuse system costs............................................................................................................................43Figure 32 Demands on stakeholders in the reuse solution .............................................................................. 44Figure 33 Catchment-specific branding of reusables at a mall food court ....................................................... 46Figure 34 Use of disposable vs. reusable lunch containers at Hong Kong construction sites .........................52Figure 35 Hong Kong construction workers on lunch break .............................................................................52Figure 36 Using both reusable and single-use foodservice items ....................................................................53
List of tablesTable 1 Types and estimated prices of food and drink containers on the Hong Kong market ......................15Table 2 Summary of solution feasibility under 2030 advanced mobilisation scenario ................................22Table 3 Advantages and disadvantages of food packaging material types ..................................................41Table 4 Applying habit theory to SFP recycling ............................................................................................. 48Table 5 Six strategies to build BYO habits .....................................................................................................49Table 6 Solution systems for an average-sized construction site .................................................................52Table 7 System costs for SFP alternatives at Hong Kong construction sites .................................................53Table 8 The system components of recycling, BYO, composting, and reuse systems ..................................62 Table 9 Baseline SFP consumption: assumptions and parameters ............................................................. 64Table 10 Cost and environmental impacts: system assumptions and parameters .........................................65Table 11 Construction site case study: system assumptions and parameters ...............................................67
3

4
Foreword
Witness the daily waves of people streaming out of their offices for lunch, to return minutes later with a plastic bag containing a polystyrene lunch box, covered drink cup, chopsticks, stirrer, and plastic sauce pot. Fifteen minutes later, bags are neatly tied to ensure leftovers do not spill out. Whisked away by cleaners, compactor trucks collect and deposit the contaminated packaging into landfills where they will stay forever. Poorly disposed along the road and raided by wildlife, food packaging also finds its way into our seas. ‘Drink Without Waste’ was initiated to address beverage containers. ‘Eat Without Waste’ is to address the madness of one-off tableware. The solutions are clear. Making it convenient is the challenge.
4
Eating without waste was the norm during my childhood. I recall my grandma liking to order takeaway wonton noodles whenever she played mah-jong at home. Several bowls of hot noodles kept in ceramics would be delivered by a man using a metal carrier. I was tasked with gathering the empty bowls and used chopsticks, ready for collection later that night or the following day.
Today, huge amounts of single-use tableware and cutlery cause public rubbish bins to overflow. They litter our beaches and are carelessly tossed along hiking trails.
Eco-friendly reuse practices seem to be forgotten by most people as well as the catering industry. However, by adopting the reuse approach, we can rid the city of hundreds of tonnes of takeaway debris every day, and prevent them from harming the ecosystem.
This report will tell you more about the harm brought about by our deep addiction to single-use tableware, and outlines how we can change course.
Edwin Lau, MHFounder and Executive DirectorThe Green Earth
每逢午飯時段見到同事出外用膳,幾分鐘後便拿着膠袋返回公司,當中有即棄塑膠餐盒、有蓋飲品杯、筷子、攪拌棒和塑膠醬汁盒。轉眼間已過十五分鐘,同事把膠袋包得非常緊,確保剩餘的食物不會漏出。不久,污糟的食物包裝隨之被清潔人員清理,再經垃圾車送去一個永遠不會離開的地方—堆填區。食物包裝不但被隨處丟棄,被野生動物踐踏,更會落入大海。發起「免廢暢飲」的原意是要處理飲品包裝。「免廢外賣」則皆在應對已近失控程度的即棄餐具。解決方案非常清晰。最大的挑戰是把方案設計得方便快捷。
司馬文創建香港免廢暢飲
「零廢」食飯是我兒時的日常。還記得祖母每當在家打麻雀時都會訂購外賣雲吞麵。外賣送遞員用鐵籃送上熱熱的雲吞麵,食物全都用瓦碗盛載。我當時負責收集用過的碗和筷子,以便當晚或翌日進行的回收重用。
今時今日,大量即棄餐具和容器導致垃圾桶爆滿,污染我們美麗的海灘,更被隨處丟棄在山徑上。
很多人及飲食業好像已經忘記大自然友善的重用措施。可是,當我們重用餐具,便可以避免每日製造過百噸的外賣包裝垃圾和生態污染。
這份報告提醒我們使用即棄餐具的行為已成病態,亦概述如何作出改變。
劉祉鋒 創辦人兼總幹事綠惜地球
Paul ZimmermanDesigning Hong KongDrink Without Waste
5
In support of Eat Without Waste
FAIRWOOD HOLDINGS LTD.Peggy Lee, Chief Marketing Officer
Across our operations, Fairwood is committed to adopting more sustainable solutions wherever possible. This includes eliminating all single-use plastic tableware from on-site dining. The Eat Without Waste report provides valuable research and tangible pathways to facilitate the F&B industry’s transition to a less wasteful future.
大快活Peggy Lee (市務首席主管)
在運營過程中,大快活致力採用更環保的方案。「免廢外賣」報告提供了寶貴的觀點和具體途徑,促進餐飲業邁向減少浪費的未來。
GREENERS ACTIONAngus Ho, Executive Director
Early on in the pandemic, Greeners Action found a 55% increase of single-use plastic cutlery. This report provides important insights to help our society find a way to shift from single-use
items to reusable and sustainable habits.
綠領行動何漢威 (總幹事)
綠領行動喺疫症初期發現即棄餐具使用量升幅了55%,我期望呢份報告能給予社會新思維去幫助社會由即棄變成重用文化。
THE HONGKONG AND SHANGHAI HOTELS, LTD.Joshua Wong, Manager, Corporate Responsibility and Sustainability
Aside from technical and logistical considerations when implementing waste management solutions, there is also the challenge of building a culture around these practices. To achieve the level of circularity we’re hoping for, we need to leverage community-level engagement with regards to recycling, composting, or using reusable containers — and this may well be our biggest challenge, even with a comprehensive group-wide waste management strategy, dedicated colleagues, and informed guests. The Eat Without Waste initiative provides the opportunity to bring together stakeholders and collectively
address our city’s waste issue.
香港上海大酒店有限公司Joshua Wong (企業責任及可持續發展經理)
要實行廢物管理方案,除了技術及物流上的考慮外,還需要建立減廢文化。要達到我們期望的循環性,我們需要大大提升社區在不同範疇上的參與,包括循環再用、廚餘回收及使用可重用器皿等。即使我們有全面的廢物管理方案、盡心盡力的員工及了解計劃的客戶,社區參與仍可能是我們最大的挑戰。『免廢外賣』提供了機會,將各持分者聚集在一起,並共同處理本港的廢物問題。
5

6
In support of Eat Without Waste
KIN FOOD HALLSMatt Reid, Co-founder & CEO
Developing an innovative new F&B concept with sustainability at the forefront definitely has its challenges. From costs and procurement to adoption, the decisions we make now have an impact on not just the environment, but also the ecosystem in which we operate. The Eat Without Waste initiative is a critical research piece that bridges a knowledge gap by providing important insights supported by data and research, and explores potential solutions to the waste problem here in Hong Kong.
SWIRE PROPERTIESDr. Amie Lai, Senior Sustainable Development Manager
As we work to implement waste reduction solutions across Swire Properties’ portfolios, the Eat Without Waste initiative and its research will help unpack complexities and identify potentially impactful actions for consumers, property developers, F&B operators, and policymakers. The report findings will provide insights to inform our circularity strategies and help enhance our reduce, reuse and recycle initiatives.
THE GREEN EARTHEdwin Lau, MH, Founder & Director
For too long, the extent of the environmental impacts of disposable takeout packaging waste have been unclear. The Eat Without Waste initiative unveils the complexity of this issue and sheds light on workable solutions.
KIN FOOD HALLSMatt Reid (聯合創辦人兼行政總裁)
發展一套以可持續發展為首要目標的創新餐飲概念必定有其挑戰—從成本、採購到正式採用,我們做的每個決定都不只對環境有影響,更會影響我們管理的生態系統。「免廢外賣」是一個關鍵的研究項目。此研究提出以數據支持的觀點及意見、彌補我們的知識上的不足,並探究不同解決香港固體廢物問題的潛在方案。
太古地產黎戈 博士 (太古地產高級可持續發展經理)
太古地產投資項目正向實踐減廢方案前進。在此過程中,「免廢外賣」及其研究可以為顧客、地產發展商、餐飲營運商及政策制定者拆解減廢議題上錯綜複雜的問題,並辨認出潛在的有效行動。此報告的結果可有助改善我們循環策略,以及提升我們「減少使用」、「廢物重用』及「循環再用」的措施。
綠惜地球劉祉鋒 (創辦人兼總幹事)
外賣使用的即棄包裝帶來頗多且未知的環保問題。「免廢外賣」拆解複集的問題亦建議可行方案給公眾參考。
6

7
Executive summary
2019Hong Kong’s disposable foodservice packaging usage
3.9 billion
Introduction
Hong Kong’s prolific use of disposable foodservice packaging is tied to its character as a densely populated city with a culture of convenience.
An estimated 3.9 billion such items were used and discarded by Hong Kong consumers in 2019, even before the onset of the COVID-19 pandemic. Since then, takeout habits have only proliferated, with many market estimates suggesting that consumption patterns will continue. The associated packaging has a detrimental effect on our environment: overflowing landfills, litter on our streets and beaches, and resource wastage. Addressing this unnecessary scourge calls for a deep understanding along three dimensions:
Baseline. A detailed understanding of the current situation and its causes.
Solutions. A critical analysis of the various solutions in operation or under development in Hong Kong and around the world.
Full potential. The formulation of viable pathways that cater to Hong Kong’s specific needs to maximise landfill diversion.
To kickstart effective policy interventions and broad stakeholder engagement, ADM Capital Foundation (ADMCF) undertook extensive research along these three axes. The analysis focused on lidded disposable food containers and to-go drink cups — hereon referred to as single-use foodservice packaging (SFP). Many of the resulting recommendations, however, are also valid for other single-use items related to foodservice, such as straws, stirrers, cutlery, chopsticks, and the plastic or paper bags used to carry takeout meals.

FULL POTENTIAL
• The set of container types/applications for which each solution can be deployed (e.g., cold drink cups) and the relative market size of that container type/application were then used to scale up solutions and determine each solution’s full landfill diversion potential.
• This 2030 potential was determined under three different implementation scenarios, driven by Hong Kong’s ability to mobilise the relevant stakeholders.
BASELINE
• A baseline of single-use foodservice packaging (SFP) usage in Hong Kong was derived from data on local consumption patterns prior to the COVID-19 pandemic.
• It also includes a projection to 2030 to form an estimate of future SFP consumption patterns.
Analytical process and findings
Executive summary
Number of single-use food and drink containers used in Hong Kong(2019 estimate, pre-COVID-19 pandemic)
Total3.94 billion
69%
14%
9%
5%3%
Container type:Hot food Hot drinksCold foodCold drinksOthers (uncategorised)
8
Represents a degree of social and behavioural change due to a higher awareness of environmental challenges and possible responses. This scenario assumes no evolution in policy or system-level investment.
Limited Mobilisation (LM) Refers to a medium level of effort and investment through the different solution types. This may take shape in the form of increased public education on SFP waste generation from takeout and delivery meals, small-scale incentivisation to encourage the use of reusable containers, or the optimisation of alternative waste collection streams (e.g., plastics recycling).
Moderate Mobilisation (MM)
Represents a major commitment by both Government and private institutions to invest in relevant policy, education, and infrastructure to shift away from sending SFP to landfills. This could involve steps such as banning certain SFP packaging materials (e.g., EPS) or constructing and operating an industrial composting facility.
Advanced Mobilisation (AM)
SOLUTIONS- feasibility - cost - impact
• Four main solution archetypes along the circular economy spectrum were identified: Recycling, Bringing your own container (BYO), Composting, and Reuse systems.
• Each archetype was evaluated for a suite of environmental, economic, and social metrics: water usage, greenhouse gas emissions, financial costs, the technical performance of the container, and implementation efforts for involved stakeholders.
Solution pathway
Feasibility
Technical limitations
Effort to implement
Recycle100% 76%
BYO90% 80%
Compost90% 55%
Reuse80% 39%
Summary of solution feasibility and environmental impact under 2030 advanced mobilisation scenario
Total solution impact in Hong Kong under three modelled scenarios*
* The composting solution is shown in grey under the limited and moderate scenario, where no adjustment or construction of industrial organics processing facilities in Hong Kong is assumed, and hence its diversion impact is only theoretical.
Hot food Hot drinks Cold food Cold drinks % Percentage of total
What we established
How we did it
What we found
Under each implementation scenario, BYO and Recycling are projected to deliver the strongest outcomes. The Reuse opportunity is smaller but, under the conditions of an Advanced Mobilisation (AM) scenario, could nevertheless reduce up to one-third of Hong Kong’s projected SFP use. Composting cannot keep containers out of landfills unless composting infrastructure is in place or existing, and planned anaerobic digestion infrastructure is modified, and therefore would not contribute under a Limited (LM) or Moderate Mobilisation (MM) scenario until these investments are made. Under an AM scenario, however, where collection and processing infrastructure is in place, we project that the Composting solution could potentially keep half of Hong Kong’s SFP containers out of its landfills.
4.5
4.0
3.5
3.0
2.5
2.0
1.5
1.0
0.5
0Recycle BYO Compost Reuse
2030 total baseline: 4.15bn
Moderate scenario Advanced scenarioLimited scenario
Landfill diversion potential (billion containers)
0.46
2.38
1.18
2.03
0.63
2.54
1.59
2.44
1.36
2.87
2.10
2.89
Recycle BYO Compost Reuse Recycle BYO Compost Reuse
11%
49%
28%
57%
15%
59%
38%
61%
33%
70%
51%
69%
Each column breaks down the results of prior analyses on the relative feasibility, cost, and environmental impacts of each solution under an advanced mobilisation scenario
more feasible (100%)
less feasible(0%)
highest cost/impact
lowest cost/impact
Solution pathway
Cost and Environmental Impacts
Affordable Greenhouse gas emissions
Water usage
Recycle
BYO
Compost
Reuse

9
The time is right
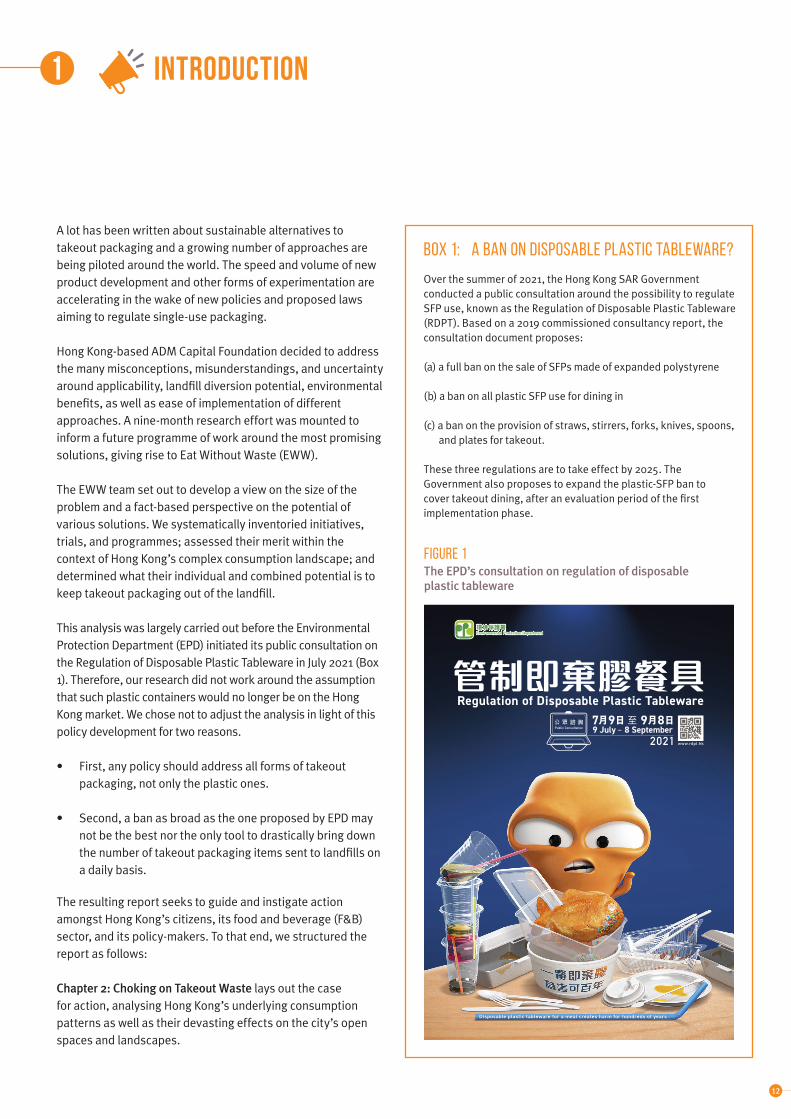
Over the summer of 2021, the Hong Kong SAR Government conducted a public consultation on regulating SFP use (Regulation of Disposable Plastic Tableware, RDPT). Based on a 2019 commissioned consultancy report, the consultation document proposes:
(a) a full ban on the sale of SFPs made of expanded polystyrene (EPS) by 2025;
(b) a ban on all plastic SFP use for dining in by 2025;(c) a ban on the provision of straws, stirrers, forks, knives,
spoons, and plates for takeout by 2025; and (d) expanding the all-plastic-SFP ban to cover takeout as well,
after an evaluation period.
Rather than considering the problem solved now that regulatory action is underway, ADMCF instead compared its research findings findings to the key elements of the government proposal. Our analysis offers three essential complements to the policy proposal:
• Firstly, any policy should address all forms of takeout packaging, not only plastic.
• Secondly, a ban as broad as the one proposed by the Environmental Protection Department (EPD) may not be the best or the only tool to drastically bring down the quantity of takeout packaging sent to landfills.
• Thirdly, the timeline needs to be more nuanced than what is currently proposed.
These three elements are further elaborated in the next section.
Recommendations
Based on our analysis and taking reference to the current policy proposal, we can summarise our recommendations as follows:
Tackle all single-use foodservice packaging, not just plastics. Use a portfolio of tools. Start now.
Tackle all single-use foodservice packaging
The Government’s RDPT proposals primarily aim to shift the food and beverage (F&B) sector away from plastics. This raises multiple concerns.
Trying to eliminate just one type of SFP will inevitably cause a shift to other SFPs. As a result, the contribution made to the landfill diversion goals set out in the Government’s latest Waste Blueprint may be limited. For example, without collection and
processing infrastructure in place, the use of plant-based materials, could reduce our reliance on fossil resources, but this solution would not contribute to keeping containers out of landfills.
Littering will also not be addressed, since that behaviour will not lessen for other materials. On the contrary, materials deemed ‘natural’ and biodegradable may mislead consumers to think they can be left behind in parks and on beaches without further consequences.
This is linked to another concern. No SFP type is without environmental impacts. Throughout the supply chain, resources are always required and strong demands on performance may be met through undesirable solutions, such as thin plastic layers or PFAS chemicals. Moreover, F&B operators and their suppliers might shift to even less sustainable solutions, such as paper foil bags. These bags are resource-intensive to manufacture, and there is no technology currently available to recycle them.
Government policy, as well as initiatives of F&B operators and NGOs, should focus on all single-use foodservice packaging rather than just those made of plastics.
Use a portfolio of tools
We investigated recycling single-use containers (Recycling), bringing one’s own containers (BYO), composting single-use containers (Composting), and creating a — more or less — centralised reuse system (Reuse). Our analysis shows that Hong Kong and its F&B operators will have to tap into more than one solution to reach the best waste reduction outcome, as no one solution can single-handedly cover all of the cups and containers in scope.
In all scenarios, the Recycling and BYO archetypes show the most promise. Since these solutions are applicable and accessible to a large segment of the Hong Kong market, they have the potential to keep the largest amount of SFP out of landfills with limited environmental impacts. Importantly, both solutions can be dialled up and down relatively easily. This means that they can be encouraged and stimulated for the containers on today’s market, without creating a barrier to a future implementation of more complex solutions like Composting or Reuse.
While Reuse systems show the highest potential from an environmental impact perspective, the solution is hindered by its comparatively high cost and logistical demands that make it feasible for only certain segments of the Hong Kong market. Because of its very strong environmental performance, there is value in identifying the locations and configurations where the Reuse solution could be more readily implemented.
Executive summary
10
Compostable containers are, at present, an unsuitable solution given the lack of infrastructure that can break down this type of waste in Hong Kong. Even if such infrastructure were to be established in the future, compostable containers still produce the most greenhouse gas emissions (per use) compared to other solution types. But with the right collection and processing infrastructure in place and if scaled up, Composting could displace a large share of SFP volumes.
Since hot food containers make up the large majority of single-use foodservice packaging on the Hong Kong market, applying solutions to address this segment offers a stronger potential impact than addressing hot/cold beverage containers or cold food containers. Therefore, to maximise the number of containers that can be kept from landfills, our analysis shows that applying Recycling and BYO containers to address hot food containers offers the most optimal solution/segment combination.
This diversified approach needs to be reflected in Government policies. Policy support is critical because no environmentally beneficial solution archetype can fully compete with SFP usage in terms of cost and convenience. The Government’s proposed ban — while administratively efficient — cannot be the sole tool for dealing with Hong Kong’s SFP challenges. Education and engagement with consumers and hospitality stakeholders, incentives for reusable container usage, regulation of harmful packaging materials, and investments in waste management infrastructure need to be part of the policy agenda. Moreover, firm decisions on the infrastructure trajectory must be made soon if Composting and Reuse are to play a meaningful role in the future.
Start now
Hong Kong should not wait for a hard-hitting piece of legislation that will take time to build consensus around. The work to keep SFP waste out of landfills must start today — this is both necessary and possible.
It is necessaryHong Kong is drowning in waste from takeout meals and drinks. Hongkongers are some of the region’s highest spenders on prepared food and eating out, and also have a strong propensity towards takeout meals. Takeout habits only intensified with the onset of COVID-19, with some Hong Kong hospitality groups and delivery platforms experiencing up to 50% more takeout orders in 2020, the first year of lockdowns and restrictions. Takeout and delivered meals are more packaging-intense than dine-in meals, but many meals consumed on-site are also served in disposable packaging.
It could be argued that, in terms of weight, plastic and other single-use foodservice items make only a relatively small contribution to Hong Kong’s massive per capita waste. This is, however, due to their density, which is very low in comparison to the much denser food waste that dominates Hong Kong’s municipal solid waste.
Moreover, these items are persistent in the litter that plagues Hong Kong’s streets, beaches, and country parks. In addition to the potential damage to land and sea animals, ecosystems and landscapes, SFP littering results in direct and indirect costs to society.
Recent research has shown that delaying intervention by even five years is not an option if we are to reach a global goal of near-zero leakage of waste into the environment. Hong Kong needs to do its part and make addressing its single-use foodservice packaging challenge a priority.
It is possibleThe Government’s proposed RDPT timeline is for a full EPS and plastic ban to be implemented by 2025. This timeline is suitable for addressing certain elements of the proposed scope, such as EPS containers or most dine-in uses. However, the afforded time for a full-scale ban may not be sufficient to develop sustainable, affordable, and functional alternatives — materials and systems — to the plastic containers currently on the market. Without such alternatives, F&B operators may feel compelled to switch to suboptimal solutions that inadvertently enhance the city’s waste issue in different ways.
On the other hand, the volume of single-use foodservice items going to landfills could already be meaningfully reduced before 2025 if, for example, broad outreach and support for Recycling were to be initiated right away. Similarly, individual F&B operators or their property managers could be educated on the benefits and feasibility of BYO and Reuse to complement their current single-use practices. The timeline for an all-inclusive, abrupt regulatory tool like the proposed RDPT ban must include more considerations surrounding what can and cannot be implemented with desirable outcomes.
Outlook
This research sets the stage to drive further change and move beyond small-scale and incremental initiatives — both through action on the ground and in the form of high-level policies. To achieve a systemic shift towards truly sustainable takeout packaging solutions, the Eat Without Waste initiative will continue to foster communication and mobilisation across these stakeholders through both structured and ad-hoc interventions. We hope you will join us on our path to Eating Without Waste.
Executive summary
11
GLOSSARY
Anaerobic digestion (AD) The process by which organic material, such as food waste, is broken down by microorganisms under non-oxygenated conditions. The output is biogas and digestate that can be further processed for agricultural fertiliser use.
Bagasse A fibrous material that remains after the sugars and juices have been extracted from sugarcane or sorghum stalks. Considered an agricultural waste by-product with low nutritional value, bagasse can be transformed into pulps or board materials to form packaging products. Bagasse has a variety of others uses, such as for structural particleboards, bio-ethanol production, and cement-based products.
Bring-your-own (BYO) The practice by which a consumer brings their own container (e.g., reusable lunch box or coffee tumbler) for takeout food/drink orders.
Business-as-usual (BAU) A state describing an unchanged continuation of current practices.
Carbon dioxide equivalent (CO2e) A standard unit that collectively represents greenhouse gas emissions, commonly used
to measure carbon footprints.
Composting The process by which organic matter, such as food waste, is broken down by microorganisms under oxygenated conditions. The output is water, CO2, and compost.
End-of-life (EOL) The last phase of a product’s life cycle that involves the retirement, disposal, or recycling of its materials.
Environmental Protection Department (EPD)
The Hong Kong Government department responsible for waste management, air and water quality management, and nature conservation.
Expanded polystyrene (EPS) A thermoplastic foam material formed from solid beads of polystyrene, commonly used for takeout food containers.
Food and beverage (F&B) operators Stakeholders involved with the operation and management of F&B outlets.
Greenhouse gases (GHG) Gases in the Earth’s atmosphere that trap heat (e.g., carbon dioxide, methane, nitrous oxide, water vapour, ozone). An excessive emission of these gases from human sources accelerates the effects of global warming.
Life cycle assessment (LCA) An analytical methodology used for determining the environmental impacts of a product, process, or service. It considers all stages of a life cycle and quantifies a wide range of environmental impacts, e.g., global warming potential, primary energy demand, human toxicity potential, etc.
Municipal solid waste (MSW) Solid waste produced from domestic, commercial, and industrial sources.
Plastic-paper composite cups Disposable beverage cups that are made of plastic-lined paper, made for on-the-go consumption.
Polyethylene terephthalate (PET) A clear thermoplastic polymer commonly used for food and beverage containers.
Polypropylene (PP) A clear thermoplastic polymer, lower in density than PET plastic, that is commonly used for food and beverage containers.
Recycling The action or process of converting waste into reusable material.
Recycling stream The flow of recyclable material from its source through to processing.
Reuse systems A system that allows a product, in this case a food or beverage container, to be repetitively used for multiple cycles.
Radio-frequency identification (RFID) A digital tagging system that uses radio waves to identify and track the labelled product.
Single-use foodservice packaging (SFP)
Single-use packaging and peripherals used for food and beverages to be consumed in a ready-to-eat fashion. These items are packaged onsite and are destined for consumption on-the-go or onsite. For the purposes of this report, we specifically refer to food and beverage containers, with and without lids, and do not focus on peripherals such as cutlery, napkins, or bags.
Solution archetype A system that serves as a solution model to address a defined problem. In this report, the solution archetypes describe systems that prevent single-use takeout packaging waste from reaching landfills.
Standard operating procedure (SOP) An established set of instructions compiled by an organisation to help workers or employees carry out routine operations.
Takeout Ready-to-eat food and beverages that are purchased for off-site consumption. Takeout can either be delivered, or picked up at the point of sale by the customer.
12
INTRODUCTION
A lot has been written about sustainable alternatives to takeout packaging and a growing number of approaches are being piloted around the world. The speed and volume of new product development and other forms of experimentation are accelerating in the wake of new policies and proposed laws aiming to regulate single-use packaging.
Hong Kong-based ADM Capital Foundation decided to address the many misconceptions, misunderstandings, and uncertainty around applicability, landfill diversion potential, environmental benefits, as well as ease of implementation of different approaches. A nine-month research effort was mounted to inform a future programme of work around the most promising solutions, giving rise to Eat Without Waste (EWW).
The EWW team set out to develop a view on the size of the problem and a fact-based perspective on the potential of various solutions. We systematically inventoried initiatives, trials, and programmes; assessed their merit within the context of Hong Kong’s complex consumption landscape; and determined what their individual and combined potential is to keep takeout packaging out of the landfill.
This analysis was largely carried out before the Environmental Protection Department (EPD) initiated its public consultation on the Regulation of Disposable Plastic Tableware in July 2021 (Box 1). Therefore, our research did not work around the assumption that such plastic containers would no longer be on the Hong Kong market. We chose not to adjust the analysis in light of this policy development for two reasons.
• First, any policy should address all forms of takeout packaging, not only the plastic ones.
• Second, a ban as broad as the one proposed by EPD may not be the best nor the only tool to drastically bring down the number of takeout packaging items sent to landfills on a daily basis.
The resulting report seeks to guide and instigate action amongst Hong Kong’s citizens, its food and beverage (F&B) sector, and its policy-makers. To that end, we structured the report as follows:
Chapter 2: Choking on Takeout Waste lays out the case for action, analysing Hong Kong’s underlying consumption patterns as well as their devasting effects on the city’s open spaces and landscapes.
1
Box 1: A ban on disposable plastic tableware?
Over the summer of 2021, the Hong Kong SAR Government conducted a public consultation around the possibility to regulate SFP use, known as the Regulation of Disposable Plastic Tableware (RDPT). Based on a 2019 commissioned consultancy report, the consultation document proposes:
(a) a full ban on the sale of SFPs made of expanded polystyrene (b) a ban on all plastic SFP use for dining in
(c) a ban on the provision of straws, stirrers, forks, knives, spoons, and plates for takeout.
These three regulations are to take effect by 2025. The Government also proposes to expand the plastic-SFP ban to cover takeout dining, after an evaluation period of the first implementation phase.
Figure 1The EPD’s consultation on regulation of disposable plastic tableware

13
Chapter 3: A Viable Pathway starts out by synthesising the universe of solutions into four ‘archetypes’: recycling the containers that we currently use, bringing one’s own reusable container, switching to compostable containers, and creating a reuse system to provide, recover, and recirculate containers. The chapter continues with a description of the analytical methods and key assumptions. It closes with the report’s most important set of insights: each solution’s projected potential to keep takeout containers out of the landfill by 2030.
Chapters 4: Recycling, 5: Bring Your Own, 6: Composting, and 7: Reuse Systems offer a deep dive into each solution type. Each chapter starts with a general and then Hong Kong-specific description of the solution mechanism. This is followed by a detailed description of what the solution could deliver in its optimised state. This section looks into the financial and environmental costs of the solution, and the technical performance of the relevant containers. It critically analyses the demands placed on every stakeholder group and system element, and concludes with the projected landfill diversion potential — the objective function of our analysis.
Chapter 8: Scaling up Solutions revisits critical drivers for each solution and offers additional insights as to how to create those conditions for success, based on international best practice.
Chapter 9: A New Approach for Hong Kong translates our findings and insights into recommendations for each relevant stakeholder group — F&B operators, Government and policymakers, and citizens and households. These recommendations are organised along three time-horizons because, while immediate action is necessary and feasible, some interventions and new habits will take more time to develop.
The appendices close off this report with ample details on the methodology (Appendix A) and a comprehensive set of analytical assumptions (Appendix B).
INTRODUCTION

14
Single-use foodservice packaging (SFP) is defined as disposable packaging for food and beverage to be consumed in a ready-to-eat fashion. The SFPs included within our scope are those that are filled at the point of sale, excluding pre-packaged food.
Our evaluation of packaging use in Hong Kong focuses on food and beverage containers, with or without lids. Peripheral packaging material such as cutlery, napkins, condiment packaging, bags, or other were not included in the scope of our analysis. This choice was made to draw specific boundaries for the analysis and is not meant to discount the significance of single-use peripherals in their contribution to packaging waste.
Our study includes both the pick-up and delivery channels of SFP usage, hereon collectively referred to as ‘takeout’. Prior to the onset of the COVID-19 pandemic in 2019, a survey showed that 75% of the Hong Kong market consumed takeout meals by picking up from the F&B outlet, with the remaining 25% opting for door-to-door delivery services.1
2.1 No end to our appetite
The underlying driver for the city’s growing pile of SFP waste is the large number of meals prepared outside of the home. Hong Kong is renowned for its diverse cuisine and food scene, with annual restaurants sales amounting to HKD 141 billion in 2019.2 In the Asia Pacific region, Hong Kong consumers are consistently ranked as the highest spenders on food prepared at a restaurant, with nearly double the regional average
monthly spending.3 This food consumption pattern leads to Hong Kong’s disproportionately high SFP use in two ways: a strong propensity towards takeout and the use of disposables even when dining in.
Compared to 10 other East and Southeast Asian economies, Hong Kong has the highest proportion of consumers that express a high preference for takeout meals.4 In 2019, a local NGO estimated, based on its survey, that the Hong Kong population consumes approximately 27.1 million takeout meals weekly.5 This amounts to about three to four weekly takeout meals per person.6 In a densely populated city where space is limited, not all households have access to kitchens. Tenants of public housing commonly share kitchen, laundry, and bathroom facilities, with some subdivided flat units having no kitchen facilities at all.7 With more than 200,000 Hong Kong residents living in subdivided flats (as of 2016) and 2.2 million people living in public housing (as of 2020), dining out and ordering takeout is therefore a common practice.8
The SFP problem in Hong Kong extends beyond its takeout culture. It is not uncommon for canteens, small-scale restaurants, casual eateries and coffeeshops to utilise SFPs for on-site dining. Interviews with F&B staff and operators indicate that this happens for a variety of reasons: convenience, lack of washing facilities, perceived hygiene improvement, or lack of licensing to fully operate catered, on-site dining. Moreover, where both single-use and reusable options are offered for on-site consumption, the reusable option is not systematically prioritised (Box 2).
Choking on takeaway waste
Box 2: Disposable coffee cups at cafes
Reasons vary:• Porcelain or ceramic cups were not always
visibly located, so customers may not have been aware they were available.
• At some coffeeshops, baristas offered single-use cups as the default. Only when customers specifically requested a reusable cup, one was given. In contrast, baristas at other coffeeshops proactively asked each customer whether they were sitting in or taking away their beverage, therefore only allowing single-use cups to be provided when necessary.
• Several customers thought they would run out of time to finish their drink on-site. When probed, many agreed that they usually are fine on time and could have asked for a single-use cup the moment they had to leave the coffee shop.
• Over 75% of coffee shops allowed customers to bring their own cups for takeout beverages. Many of those that did not allow BYO cited that it was a temporary measure in response to COVID-19, and that they would allow BYO containers again “after the pandemic”.
In July 2021, the Eat Without Waste team surveyed 19 coffee shops in Hong Kong that offer reusable cups for on-site consumption. On average, more than one-third of customers were seen using single-use cups while enjoying their beverage on-site.9 Furthermore, a survey of 223 coffee shops across six chains, prior to the COVID-19 pandemic, showed that 67% of customers consumed from disposable coffee cups on-site.
2

15
Material and size Price (per unit, HKD)*
Food containers
Polypropylene (PP)500mL
0.31
Expanded polystyrene (EPS) 500mL
0.38
Bagasse clamshell~700mL
2.86
Reusable glass500mL
33.00
Silicon600mL
40.00
Polypropylene (PP)500mL
19.90
Cups with lid
Paper-plastic composite 265mL
0.25
Polyethylene terephthalate (PET)355mL
0.37
Polypropylene400mL
1.05
Stainless steel ~500mL
157.80
* Price averaged from Hong Kong suppliers and online retailers, supplemented with surveys of local restaurants when possible. Single-use items are based on wholesale prices and reusable items on retail prices (i.e., assumes that reusables are purchased individually by consumers).
2.2 A container for every taste
An estimate for the number of SFP items placed on the Hong Kong market was derived from a combination of data collection and extrapolation from existing sources. The baseline estimate considered all channels through which meals are served in SFPs: quick- and full-service restaurants, coffee and snack shops, cafeterias, construction sites, etc. Data were obtained for 2018 and 2019, which encompasses the most recent annualised data prior to the onset of the COVID-19 pandemic.
In Hong Kong, an estimated 3.94 billion single-use food and drink containers were used in 2019. The majority of those containers would have been used for hot food (Figure 2). The large variety of containers currently on the market is illustrated in Table 1.
An interview with the chair of a Hong Kong restaurant association confirmed that most local fast food and lower-end F&B outlets use expanded polystyrene (EPS) containers for takeout meals. The key drivers behind that choice are their heat-retaining qualities and low cost, although the price difference between EPS and polypropylene (PP) plastic containers from Hong Kong packaging suppliers is actually negligible.10 The majority (60%) of customers at these establishments place takeout orders rather than dining in.
Hong Kong’s mid- to high-end establishments, particularly those serving Chinese cuisine, typically use PP plastic containers for takeout meals.11 A 2021 survey of 25 high-end establishments that identify as ‘environmentally friendly’ showed that all utilised at least some packaging that comes with a compostability claim, with many also opting for paper-based packaging.12
Figure 2 Number of single-use food and drink containers used in Hong Kong(2019 estimate, pre-COVID-19 pandemic)
Table 1 Types and estimated prices of food and drink containers on the Hong Kong market
Choking on takeaway waste
Total3.94 billion
Container type:
69%
14%
9%5%
3%
Hot food
Hot drinks
Cold food
Cold drinks
Others (uncategorised)

16
Figure 3 Projected growth in Hong Kong’s usage of single-use takeout containers
Choking on takeaway waste
2.3 Projecting to 2030
If we scale the 2019 baseline with Hong Kong population growth projections for 2030, that results in a total consumption of 4.15 billion containers per year (Figure 3 and Appendix A).
The year 2030 was selected as a timeline benchmark because it aligns with local as well as global milestone targets for other environmental action plans involving waste management and decarbonisation. For instance, Hong Kong’s 2017 Climate Action Plan, the most recent report at the time of our analysis, outlines emission reduction targets for 2030. Hong Kong is also part of the global effort by United Nations Member States to reach 17 target Sustainable Development Goals (SDGs) by 2030.14
Due to the COVID-19 pandemic, consumer takeout habits have grown (Box 3). The associated use of SFP is thus anticipated to be even higher than our current estimates for 2030. To maintain the consistency, quality, and transparency of the analysis in this report, however, impacts of the pandemic have not been
Box 3: Impact of COVID-19 on takeaway habits
platform in the Hong Kong market, observed a 50% increase in demand for delivery meals.20
Implications for SFP useThe shift in takeout habits during the pandemic takes its toll on SFP consumption. Greeners Action noted a tripling in the number of customers that frequently use such containers (defined as more than five single-use plastic containers each week).21 Other COVID-19-related developments drove up SFP usage, too. For much of the pandemic, the Government has imposed hotel-based quarantine requirements for nearly all incoming travellers. Hospitality groups that offered quarantine services at their hotels recorded a significant increase in SFP usage.
One hospitality group that operates several restaurants within their hotel noted that they hardly ever used SFPs prior to the pandemic. In September 2020, their monthly order of SFPs consisted solely of cake boxes (n=6,500) for their pastry store. After starting to offer quarantine services, their monthly order of SFPs grew tenfold to 66,300 (January 2021), most of which were plastic containers to cater to meals for quarantined guests.22
The shift in consumer and F&B attitudes towards hygiene also influences SFP usage. Due to initial concerns around viral transmission through surfaces, a heavy focus was placed on not only frequently sterilising common surfaces, but also on reducing shared contact points altogether. As a result, several
F&B operators halted their ‘BYO’ programmes, where they previously allowed or even encouraged customers to bring their own cups or containers for takeout. Moreover, out of hygiene concerns, Hong Kong consumers personally clean and disinfect table surfaces and opt for single-use products, which often come individually wrapped and are perceived as ‘more sterile’.
Enduring changes?Studies of consumer behaviour in the F&B industry suggest that the increase in takeout habits will be lasting, even after the COVID-19 pandemic has settled. Nielsen Hong Kong, the market study firm, for example, forecasts that old habits such as eating out will permanently be replaced by new habits, such as ordering takeout — even after the pandemic.23 SwissRe, a reinsurance company, deems the use of food delivery apps as one of the most permanent pandemic-induced behaviours amongst digital adoption habits.24
Even after the pandemic has subsided, Hongkongers’ heightened concern for hygiene may continue to pervade daily personal and commercial routines. For example, well after the 2003 SARS epidemic, anti-bacterial soaps are still promoted and used widely. Consumers and F&B outlets alike may show greater hesitancy in adopting or re-introducing shared or BYO container programmes or even in returning to reusable tableware for on-site dining.
Shift in consumption patternsAround the world, takeout meal habits have proliferated during the COVID-19 pandemic. One survey shows that the number of consumers who ate takeout meals at least once a week in Poland, Austria, and the UK increased from an average of 17.8% prior to the pandemic to 24.7% by late 2020, mid-pandemic.15 From April to September 2020, when many parts of the United States were placed under ‘shelter-in-place’ restrictions, the four largest U.S. food delivery apps (Doordash, Uber Eats, Grubhub, and Postmates) had a combined revenue of HKD 42.9 billion — more than twice that of the same period in 2019.16 Similarly, South Korea’s food delivery industry sales, by value, increased by 180% from 2019 to 2020, when the country underwent multiple degrees of pandemic-induced lockdown.17 Several surveys, although different in scope and timing, point towards similar trends for Hong Kong. A survey of over 2,000 consumers by Greeners Action, a Hong Kong NGO, identified a 5% increase in the number of takeout meals between April 2019 and April 2020 (the initial stages of pandemic lockdown).18 This initial increase subsisted and intensified throughout various levels of COVD-19-related restrictions on F&B operations. A survey of 21 F&B outlets across nine hospitality groups estimated a 30-50% increase in delivery orders from the onset of the COVID-19 pandemic in March 2020 to April 2021.19 Similarly, foodpanda, a leading delivery
3.9 billion 4.2 billion
5.3%
2019 2030

17
Choking on takeaway waste
included; with the pandemic still ongoing, reliable projections of the long-term effects on societal habits, public health, and consumption trends are yet to be established.
2.4 Wasteful habits with a bitter aftertaste
2.4.1 Waste generation on the rise
Total solid waste disposal in Hong Kong has risen from 4–5 million tonnes per year in the 1990s to 5.7 million tonnes per year in 2019, of which 4 million tonnes were municipal solid waste (MSW). 25 On a per-capita basis, waste disposal has also increased in recent years, diverging from the Government’s waste goals. The Environment Bureau’s Blueprint for Sustainable Use of Resources 2013-2022 outlined the goal of reducing per-capita waste disposal from 1.27 kg per day in 2011 to 0.8 kg by 2022.26
Others in the region, such as Taiwan and South Korea, have seen year-on-year reductions in per-capita waste disposal, changes that have been aided by municipal waste charging schemes.27 Hong Kong’s per-capita daily MSW disposal, however, increased from 1.27 kg to 1.47 kg between 2011 and 2019. This daily volume far exceeds what citizens generate in Seoul, Taipei, and Tokyo (Figure 4).
Hong Kong’s latest Waste Blueprint, released in 2021, outlined three goals: waste reduction, resources circulation, and ‘zero landfill’.29 The waste reduction goal is to be addressed through
Figure 4MSW generated per capita in Hong Kong, Seoul, Taipei, and Tokyo (2017)28
Hong Kong Seoul Taipei Tokyo
1.6
1.4
1.2
1.0
0.8
0.6
0.4
0.2
0
the implementation of Producer Responsibility Schemes (PRS), an increase in funding and support to the recycling industry, and the organisation of public education campaigns for waste separation.
The blueprint outlines the waste management infrastructure that is currently operating or in development to increase ‘resources circulation’ and decrease reliance on landfills. These facilities and associated budgets are outlined in Figure 5.
T PARK
HKD 263 million32
O PARK 1
HKD 47 million32
WEEE PARK
HKD 220 million32
Landfill and Refuse-transfer Stations34
HKD 1.1 billion
1 tonne of MSW
HKD 520 to dispose
HKD 446 million allocated to
GREEN@COMMUNITY Recycling Stations, Stores,
and Spots
Hong Kong Government Recycling Fund33
HKD 600 millionfrom Oct. 2015 to Jan. 2021
HKD 1 billionfrom 2021 to 2027
Figure 5Cost of operating Hong Kong’s waste infrastructure
Planned:
Y PARK treatment of yard waste
I PARK
O PARK 2
waste-to-energy incineration facility
2019
2014
organic waste treatment facility
(kg/person/
day)1.45
0.91 0.92 0.93

18
Choking on takeaway waste
2.4.2 Recycling on a downward trajectory
The increase in MSW disposal has been accompanied by a decrease in recycling rates, especially in the last decade.35 Whereas in 2015 one quarter of Hong Kong consumers seldom or never recycled plastics, nearly one third is now disengaged. A similar trend is true for paper, with the number of disengaged consumers evolving from one fifth to one quarter over the 2015–2020 period.36 Survey respondents cited the insufficiency and inconvenience of current recycling facilities as the primary challenge for successful waste separation at the household level.
The decrease in recycling habits has also been driven, in part, by a distrust in the recycling system. In a survey commissioned by Drink Without Waste, the Hong Kong Public Opinion Research Institute found that one-fifth of respondents who do not recycle beverage packaging do not believe that the bottles are actually recycled.37 A 2020 investigation of the plastic bottles collected in the three-coloured waste separation bins at housing estates found indeed that bottles from two-thirds of the estates were sent to landfills instead of being recycled.38
A lack of education, peer pressure, and enforcement can combine into sub-standard practices amongst those that do participate in recycling. A different study of the three-coloured
waste bins showed that more than 60% of the contents were not recyclable, aligning with another 2020 survey revealing that only 40% of people separate out non-recyclables when recycling.39 Such high degrees of contamination further erode the already low profit margins of collecting and processing recyclables and may result in underfunding and ultimately the retreat of recycling service suppliers from the Hong Kong market.
2.4.3 Littering and pollution persists
Hong Kong’s open spaces and landscapes are vulnerable to degradation from takeout food containers (Figure 6). They are strewn around its city parks, streets, and gutters. They are abundant in its country parks too, especially in frequently visited rest and recreation spots, but also in the farthest reaches of the wilderness. In 2019, more than 2,500 tonnes of litter was collected across the country parks. This number does not even account for litter that had blown off trails or out of reach of collectors.40 Takeout containers and peripherals are also a scourge on Hong Kong’s beaches and in coastal waters. A 2020 study of microplastic pollution on Hong Kong beaches found that amongst the most common types of plastic were polypropylene, and polystyrene — which are also some of the most common plastics used for SFPs.41
Figure 6SFP littering in Hong Kong
19
Such littering is not without consequences. Discarded SFP items that end up outside of the recycling or waste bin can do significant damage to ecosystems and have direct and indirect costs associated with them.
Globally, takeout food containers and cutlery have been found to be the most prevalent type of plastic pollution in rivers, negatively impacting ecosystems and human food security.42 In marine ecosystems, it is estimated that millions of animals are killed by plastics each year through entanglement in plastic items or starvation due to digestive track blockages.43 Coastal clean-up efforts in Hong Kong showed that one-fifth of all items found were single-use tableware, the large majority made of plastic.44 This number does not include bags for takeout beverages and meals, which are a significant contributor to these direct impacts on marine and coastal wildlife. Over time, plastics such as takeout packaging degrade to particles smaller than 50mm and spread throughout marine food webs as microplastics. Microplastics have been found in more than 100 marine species, many of which are commercially important for human consumption.45
A study by the World Wide Fund for Nature (WWF) estimates that globally, the plastic produced in 2019 will collectively incur a cost of HKD 24.2 trillion throughout its lifetime through pollution to marine ecosystems.46 “The rise of food takeout during the pandemic has led to a staggering amount of disposable tableware waste being generated in the city. The more plastic waste we produce, the more we pollute our oceans,” says June Wong, Manager of WWF-Hong Kong’s Marine Pollution programme. “Plastic doesn’t belong in nature. We have to keep it out of our ecosystems and within a circular economy.”
In addition to the risk of ecosystem damage, SFP littering results in direct and indirect costs. Litter removal is more time-consuming and hence costly than collecting waste or recyclables from bins. Recyclables that are littered also result in foregone materials revenue. Moreover, the collected litter must be disposed of as general waste, which means that it will incur an MSW disposal fee. Finally, storm drain impairment by litter and the resulting risk of flood damage carry an indirect but measurable cost.47
2.4.4 Hidden carbon emissions
Hong Kong’s per-capita greenhouse gas (GHG) emissions dropped by 28.6% between 2009 and 2018, but fall short of the reduction targets outlined for 2020 and 2030 in the Government’s climate action plans.48 Emissions in 2018 were still 18% higher than 2020 emission targets (5.4 vs. 4.5 tonnes CO
2e per capita).49 These reported numbers do not include
so-called embedded or embodied emissions, the emissions associated with the production of everything we use and consume in Hong Kong — much of which is produced abroad. Single-use food packaging, from its production to its disposal, contributes to this true carbon footprint in multiple ways, most importantly through its production and disposal.
Plastics are made of natural gas or oil, both of which are associated with GHG leakages during exploitation and processing. The agricultural materials and tree fibres for paperboard and other packaging alternatives are associated with GHG emissions from fuels, fertiliser, and soil disruption. The amount of end-of-life carbon emissions from SFP depends on the material and the pathway. Hongkongers have a habit of disposing of their meal-related packaging waste in its entirety, without attempting to recover the reusable or recyclable parts. As a result, the majority of fibre-based materials end up in the landfill, where their anaerobic degradation results in the production of landfill gas, which contains methane, a powerful greenhouse gas. Even with best-in-class infrastructure to capture and utilise landfill gas, no landfill is completely leak-free.
In the landfill, plastics are inert and will not release greenhouse gases. But when the plans to develop waste incinerator capacity — as outlined in the latest Waste Blueprint and Climate Action Plan — go ahead, the plastics ending up in the incinerator will produce a far worse carbon outcome than if they had been recycled.50
The next chapter outlines the analyses undertaken to evaluate solutions for Hong Kong’s takeout packaging challenge and how these solutions shape future pathways.
Choking on takeaway waste

20
There is no silver-bullet solution to reduce single-use takeout packaging waste in Hong Kong. Amongst the variety of solutions that can be collectively implemented, we identified four main solution archetypes: Recycling, Bring-your-own, Composting, and Loaned Reusables (hereon ‘Reuse systems’). Each was critically analysed for system costs, impacts, and feasibility. This assessment allowed us to quantify the full, scaled-up impact that each solution archetype could have under various scenarios of societal mobilisation and investment. The outcomes of this evaluation pave the way for a realistic and effective prioritisation of different solutions according to their applicability and their potential to create meaningful impacts.
3.1 The solution space
While all four solution archetypes are distinctly different, they do have common traits (Figure 7). They share certain aspects in functionality and system operations. Some solutions, such as loaned reusable container systems, require additional development or investment, whereas others, such as recycling, can immediately start creating impact — although this does not imply that they do not need further optimisation (See Chapters 4 and 5).
The archetypes also differ in the nature of their solution mechanisms. Some keep containers out of landfills through the recovery of raw materials, such as in composting. Others avoid waste altogether through a shift towards reusables that are used for multiple cycles — as in the ‘Bring Your Own’ (BYO) solution archetype.
In addition to these four archetypes, other creative solutions exist that are potentially impactful on a per-container basis. For example, the Seeds of Art Charity Foundation reuses cleaned PP containers to distribute free meals to the elderly, while social enterprise FoodCycle+ repurposes used, cleaned containers into non-food-grade product packaging, like the Lunchbox Garden Kit. Such solutions, however, are often hard to scale because of implementation barriers like labour cost or food safety regulations, or because the scale of supply and demand do not match.
A Viable Pathway
Figure 7SFP solution framework
Bring Your Own
Ready to go
ReuseRecover
Needs development
Recycling
Loaned reusables
Composting
3.2 Analytical approach: diverting containers from landfills
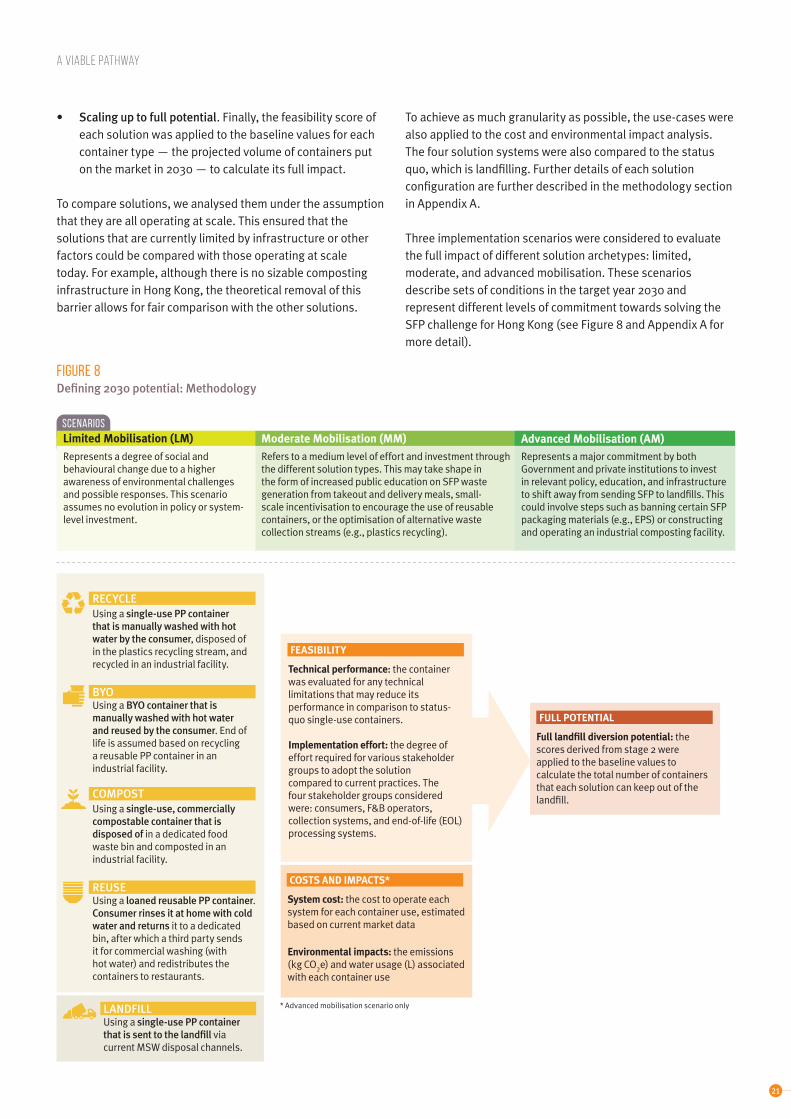
We set out to evaluate the overall potential that each solution archetype has for reducing SFP landfill waste under the environmental, social, and infrastructure components of each system. The analytical process is schematically represented in Figure 8.
The landfill divergence potential was determined in three steps.
• Use-case. For each solution, a specific container type was chosen to represent the most common use-case on the market (for example, ‘bagasse containers for hot foods’ in the Composting solution). This was complemented with a set of assumptions around usage and EOL parameters.
• Feasibility. Each solution was scored for (a) how well the proposed container meets the various demands placed on it (its ‘technical performance’); and (b) the effort required from stakeholders (‘implementation effort’). Each solution was assessed for its ability to address five SFP types commonly used today: polypropylene and EPS hot food containers, polypropylene cold food containers, PET cold beverage cups, and paper-plastic composite hot beverage cups. Appendix A.3 offers more details of that analysis and Table 2 summarises its results).
3
21
A Viable Pathway
• Scaling up to full potential. Finally, the feasibility score of each solution was applied to the baseline values for each container type — the projected volume of containers put on the market in 2030 — to calculate its full impact.
To compare solutions, we analysed them under the assumption that they are all operating at scale. This ensured that the solutions that are currently limited by infrastructure or other factors could be compared with those operating at scale today. For example, although there is no sizable composting infrastructure in Hong Kong, the theoretical removal of this barrier allows for fair comparison with the other solutions.
To achieve as much granularity as possible, the use-cases were also applied to the cost and environmental impact analysis.The four solution systems were also compared to the status quo, which is landfilling. Further details of each solution configuration are further described in the methodology section in Appendix A.
Three implementation scenarios were considered to evaluate the full impact of different solution archetypes: limited, moderate, and advanced mobilisation. These scenarios describe sets of conditions in the target year 2030 and represent different levels of commitment towards solving the SFP challenge for Hong Kong (see Figure 8 and Appendix A for more detail).
Figure 8Defining 2030 potential: Methodology
RECYCLE Using a single-use PP container that is manually washed with hot water by the consumer, disposed of in the plastics recycling stream, and recycled in an industrial facility.
BYOUsing a BYO container that is manually washed with hot water and reused by the consumer. End of life is assumed based on recycling a reusable PP container in an industrial facility.
COMPOST Using a single-use, commercially compostable container that is disposed of in a dedicated food waste bin and composted in an industrial facility.
REUSEUsing a loaned reusable PP container. Consumer rinses it at home with cold water and returns it to a dedicated bin, after which a third party sends it for commercial washing (with hot water) and redistributes the containers to restaurants.
Technical performance: the container was evaluated for any technical limitations that may reduce its performance in comparison to status-quo single-use containers.
Implementation effort: the degree of effort required for various stakeholder groups to adopt the solution compared to current practices. The four stakeholder groups considered were: consumers, F&B operators, collection systems, and end-of-life (EOL) processing systems.
FEASIBILITY
LANDFILLUsing a single-use PP container that is sent to the landfill via current MSW disposal channels.
FULL POTENTIAL
Full landfill diversion potential: the scores derived from stage 2 were applied to the baseline values to calculate the total number of containers that each solution can keep out of the landfill.
* Advanced mobilisation scenario only
SCENARIOS
Represents a degree of social and behavioural change due to a higher awareness of environmental challenges and possible responses. This scenario assumes no evolution in policy or system-level investment.
Limited Mobilisation (LM)
Refers to a medium level of effort and investment through the different solution types. This may take shape in the form of increased public education on SFP waste generation from takeout and delivery meals, small-scale incentivisation to encourage the use of reusable containers, or the optimisation of alternative waste collection streams (e.g., plastics recycling).
Moderate Mobilisation (MM)
Represents a major commitment by both Government and private institutions to invest in relevant policy, education, and infrastructure to shift away from sending SFP to landfills. This could involve steps such as banning certain SFP packaging materials (e.g., EPS) or constructing and operating an industrial composting facility.
Advanced Mobilisation (AM)
COSTS AND IMPACTS*
System cost: the cost to operate each system for each container use, estimated based on current market data
Environmental impacts: the emissions (kg CO
2e) and water usage (L) associated
with each container use

22
A Viable Pathway
3.3 Comparative advantage
The cost and environmental impacts associatedwith every container use cycle were calculated for each solution archetype. In the comparative charts on this page, each solution is assumed to be operating at scale and with the relevant infrastructure in place (i.e., under an advanced mobilisation scenario). The landfilling pathway was included for reference.
Which solution archetypes have the most merit? Recycling and BYO are the cheapest of the investigated solution archetypes and cost less than HKD 0.50 per use (Figure 9). Reuse solutions cost over HKD 6.00 per use but have the least amount of GHG emissions and lowest water consumption associated with each use. (Figure 10 and Figure 11). In comparison, the BYO and Recycling solutions come with the highest water usage, assuming they are hand-washed. The GHG emissions are the highest for the Composting solution, with costs and water usage being mid-range in comparison to the other solution archetypes.
Figure 9Costs associated with each solution archetype (for hot food containers)Full 2030 landfill diversion potential for BYO, advanced mobilisation scenario
Cost per container use (HKD)
7
6
5
4
3
2
1
0Recycle BYO Compost Reuse Landfill
Production
Purchase
Cleaning
Drop-off point
Transport
Processing
Figure 11Water consumption associated with each solution archetype (for hot food containers)
Water usage per container
use (L)
6
5
4
3
2
1
0Recycle BYO Compost Reuse Landfill
Figure 10Greenhouse gas emissions associated with each solution archetype (for hot food containers)
0.20
0.15
0.10
0.05
0Recycle BYO Compost Reuse Landfill
GHG emissions
per container use
(kg CO2e)
Table 2 Summary of solution feasibility under 2030 advanced mobilisation scenario
Solution pathway Feasibility
Technical limitations Effort to implement
Recycle 100% 76%
BYO 90% 80%
Compost 90% 55%
Reuse 80% 39%
more feasible (100%)
less feasible(0%)
3.4 Eating without waste, starting now
3.4.1 Drivers
Two factors drive the full landfill diversion potential of each solution. The first is a solution’s potential to drive change for a given container usage (e.g., ‘hot food’ or ‘cold drink’). The second is the size of the market for each container usage to which the solution type is applicable.
Given that hot food containers constitute 69% of all containers on the Hong Kong market, focusing efforts on this segment is a high priority to maximise impact. In the LM scenario, the Recycling solution offers the highest impact out of the four solutions, feasibly addressing 58% of all hot food containers (40% of all SFPs).
Each column breaks down the results of prior analyses on the relative feasibility, cost, and environmental impacts of each solution under an advanced mobilisation scenario
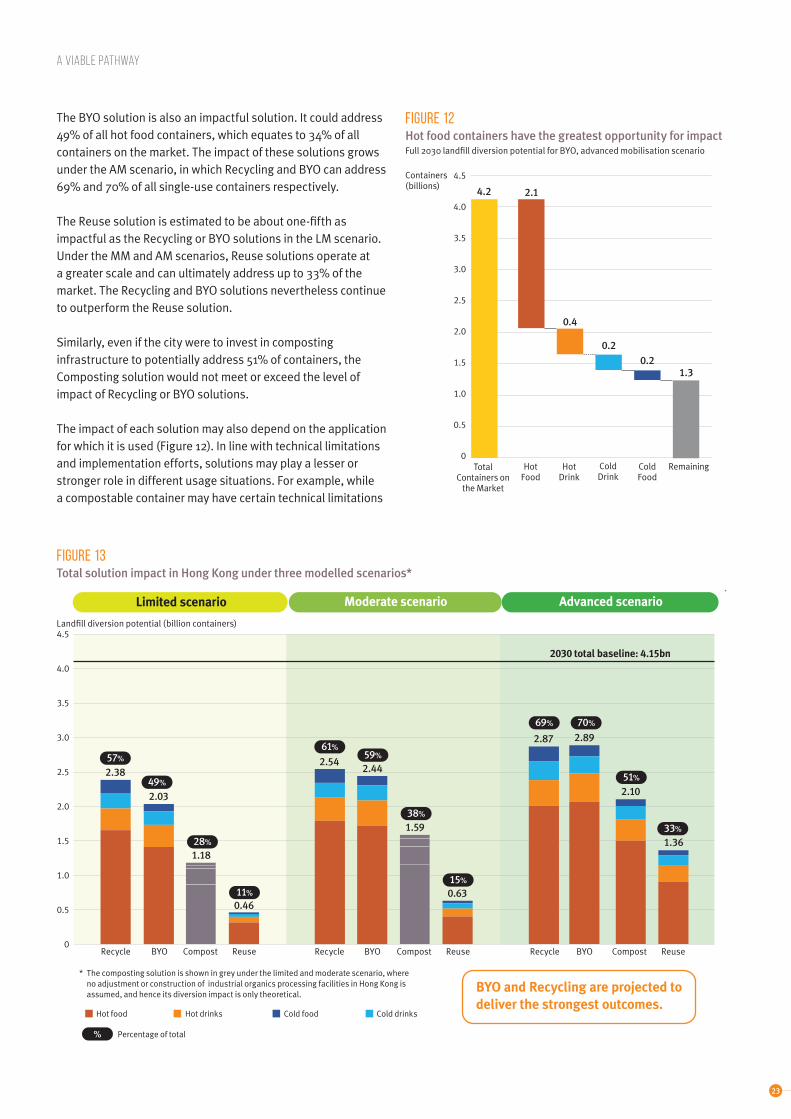
23
4.5
4.0
3.5
3.0
2.5
2.0
1.5
1.0
0.5
0
Containers (billions)
A Viable Pathway
The BYO solution is also an impactful solution. It could address 49% of all hot food containers, which equates to 34% of all containers on the market. The impact of these solutions grows under the AM scenario, in which Recycling and BYO can address 69% and 70% of all single-use containers respectively.
The Reuse solution is estimated to be about one-fifth as impactful as the Recycling or BYO solutions in the LM scenario. Under the MM and AM scenarios, Reuse solutions operate at a greater scale and can ultimately address up to 33% of the market. The Recycling and BYO solutions nevertheless continue to outperform the Reuse solution.
Similarly, even if the city were to invest in composting infrastructure to potentially address 51% of containers, the Composting solution would not meet or exceed the level of impact of Recycling or BYO solutions.
The impact of each solution may also depend on the application for which it is used (Figure 12). In line with technical limitations and implementation efforts, solutions may play a lesser or stronger role in different usage situations. For example, while a compostable container may have certain technical limitations
Figure 13Total solution impact in Hong Kong under three modelled scenarios*
* The composting solution is shown in grey under the limited and moderate scenario, where no adjustment or construction of industrial organics processing facilities in Hong Kong is assumed, and hence its diversion impact is only theoretical.
Hot food Hot drinks Cold food Cold drinks
BYO and Recycling are projected to deliver the strongest outcomes.
Figure 12Hot food containers have the greatest opportunity for impactFull 2030 landfill diversion potential for BYO, advanced mobilisation scenario
Hot Food
Hot Drink
Cold Drink
Cold Food
RemainingTotal Containers on
the Market
2.1
0.4
0.20.2
1.3
4.2
4.5
4.0
3.5
3.0
2.5
2.0
1.5
1.0
0.5
0Recycle BYO Compost Reuse
2030 total baseline: 4.15bn
Moderate scenario Advanced scenarioLimited scenario
Landfill diversion potential (billion containers)
0.46
2.38
1.18
2.03
0.63
2.54
1.59
2.44
1.36
2.87
2.10
2.89
Recycle BYO Compost Reuse Recycle BYO Compost Reuse
11%
49%
28%
57%
15%
59%
38%
61%
33%
70%
51%
69%
% Percentage of total
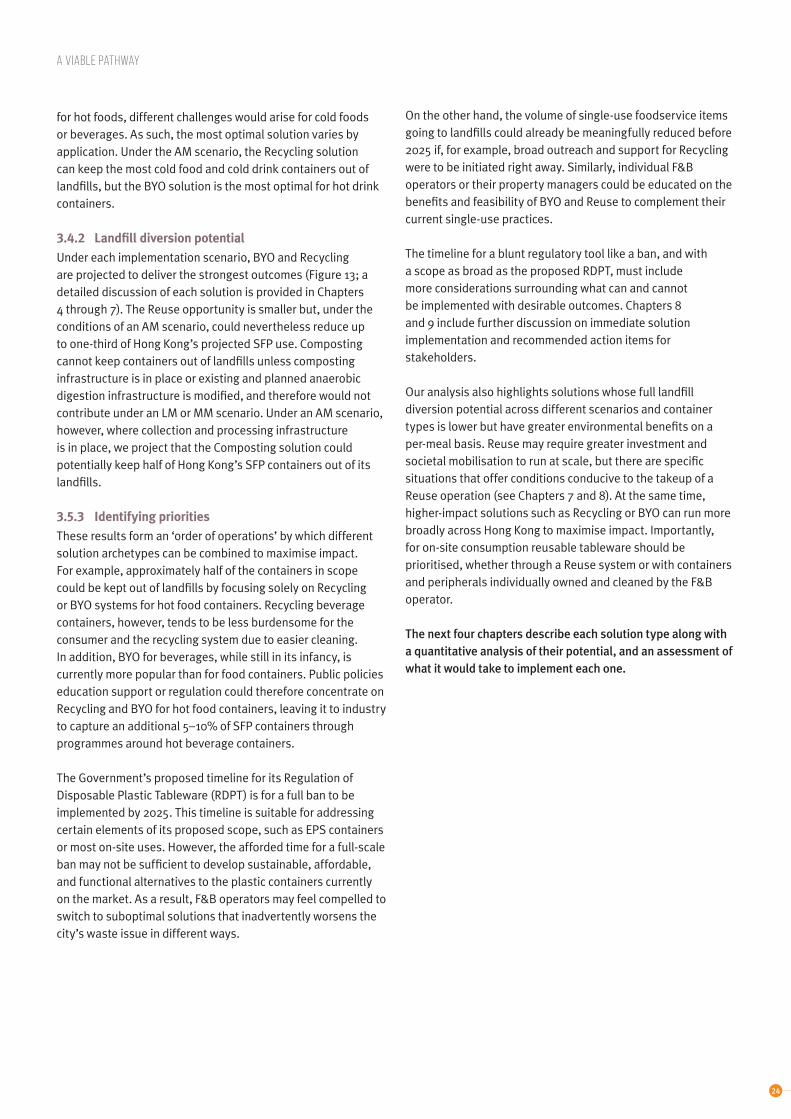
24
A Viable Pathway
On the other hand, the volume of single-use foodservice items going to landfills could already be meaningfully reduced before 2025 if, for example, broad outreach and support for Recycling were to be initiated right away. Similarly, individual F&B operators or their property managers could be educated on the benefits and feasibility of BYO and Reuse to complement their current single-use practices.
The timeline for a blunt regulatory tool like a ban, and with a scope as broad as the proposed RDPT, must include more considerations surrounding what can and cannot be implemented with desirable outcomes. Chapters 8 and 9 include further discussion on immediate solution implementation and recommended action items for stakeholders.
Our analysis also highlights solutions whose full landfill diversion potential across different scenarios and container types is lower but have greater environmental benefits on a per-meal basis. Reuse may require greater investment and societal mobilisation to run at scale, but there are specific situations that offer conditions conducive to the takeup of a Reuse operation (see Chapters 7 and 8). At the same time, higher-impact solutions such as Recycling or BYO can run more broadly across Hong Kong to maximise impact. Importantly, for on-site consumption reusable tableware should be prioritised, whether through a Reuse system or with containers and peripherals individually owned and cleaned by the F&B operator. The next four chapters describe each solution type along with a quantitative analysis of their potential, and an assessment of what it would take to implement each one.
for hot foods, different challenges would arise for cold foods or beverages. As such, the most optimal solution varies by application. Under the AM scenario, the Recycling solution can keep the most cold food and cold drink containers out of landfills, but the BYO solution is the most optimal for hot drink containers.
3.4.2 Landfill diversion potential
Under each implementation scenario, BYO and Recycling are projected to deliver the strongest outcomes (Figure 13; a detailed discussion of each solution is provided in Chapters 4 through 7). The Reuse opportunity is smaller but, under the conditions of an AM scenario, could nevertheless reduce up to one-third of Hong Kong’s projected SFP use. Composting cannot keep containers out of landfills unless composting infrastructure is in place or existing and planned anaerobic digestion infrastructure is modified, and therefore would not contribute under an LM or MM scenario. Under an AM scenario, however, where collection and processing infrastructure is in place, we project that the Composting solution could potentially keep half of Hong Kong’s SFP containers out of its landfills.
3.5.3 Identifying priorities
These results form an ‘order of operations’ by which different solution archetypes can be combined to maximise impact. For example, approximately half of the containers in scope could be kept out of landfills by focusing solely on Recycling or BYO systems for hot food containers. Recycling beverage containers, however, tends to be less burdensome for the consumer and the recycling system due to easier cleaning. In addition, BYO for beverages, while still in its infancy, is currently more popular than for food containers. Public policies education support or regulation could therefore concentrate on Recycling and BYO for hot food containers, leaving it to industry to capture an additional 5–10% of SFP containers through programmes around hot beverage containers.
The Government’s proposed timeline for its Regulation of Disposable Plastic Tableware (RDPT) is for a full ban to be implemented by 2025. This timeline is suitable for addressing certain elements of its proposed scope, such as EPS containers or most on-site uses. However, the afforded time for a full-scale ban may not be sufficient to develop sustainable, affordable, and functional alternatives to the plastic containers currently on the market. As a result, F&B operators may feel compelled to switch to suboptimal solutions that inadvertently worsens the city’s waste issue in different ways.

25
RecyclingEnsuring proper collection and recycling practices
4.1 How it works
Recycling is the recovery of useful material from the MSW and other waste streams to make new products.51 Such materials include paper, plastic, glass, and metal. The most common forms of SFP materials in Hong Kong are the plastic resins polypropylene (PP), polyethylene terephthalate (PET), and expanded polystyrene (EPS), all of which are technically recyclable.
4.1.1 System description
The food or beverage is prepared at the point of sale and packaged in a recyclable SFP. For most recycling streams, users must clean the container after consuming their takeout product. Depending on the material, the container can be dropped into a mixed recyclables (e.g., mixed plastics) collection bin, which requires sorting the materials before processing them at a recycling plant. Alternatively, the container is returned to a designated recycling bin for materials of that specific type, to be sent to the processing facility without further sorting. After processing, the secondary materials are then sold locally or exported.
4.1.2 Recycling in Hong Kong
To recycle plastic food containers in Hong Kong, consumers must first wash the container. This is necessary for removing food residue that would otherwise contaminate the recycled material, especially in the case of oily and to avoid pests and odours in the collection stage.
After washing, PP containers can be dropped in designated ‘mixed plastics’ collection bins throughout the Environmental Protection Department’s (EPD) GREEN@COMMUNITY recycling network (Figure 15).52 This is also where PET containers, such as bubble tea and other cold drink cups, must be dropped off, since they, too, are not accepted in the plastic bottle collection bins (‘three coloured bins’) found on many street corners.
The plastics collected through the designated mixed plastic collection bins are sorted, aggregated, and delivered to processors, who turn the PP and PET into flakes or pellets for export.
Figure 14Schematic diagram of a typical SFP Recycling system
Container drop-off
Container collection
Container washing
Recycling: sorting
Recycling: processing
Delivery
Pick-upConsumption
Recycled plastic second use
Food/beverage is packaged for takeout
4

26
EPS containers are mainly recycled at one facility in Hong Kong, but are accepted through the mixed-plastics collection bins at the GREEN@COMMUNITY recycling network. Hong Kong recyclers have noted, however, that PP plastic is much easier to recycle than EPS plastic.53
To-go hot beverage cups, which are mostly made of paper-plastic composites, can be disposed of through dedicated collection bins in the GREEN@COMMUNITY network.54 Alternatively, they can be dropped at one of the 124 public liquid carton collection bins or 116 privately-funded liquid carton collection bins,55 such as the programme funded by local beverage manufacturer Vitasoy at some school campuses, offices, and other city locations.56
Currently one, privately-operated pulp mill in Hong Kong, Mil Mill, is able to handle these cups.57 At this facility, the inner plastic lining is separated from the fibre portion of the cup or container. The resulting high-quality (long-fibre) pulp is sold to paper mills abroad. At the moment, the plastic component of the plastic-paper composite, usually consisting of polyethylene, is still discarded and ultimately landfilled. As the Hong Kong Government will start charging households and businesses
RECYCLING
Figure 16Recycling system costs(Advanced mobilisation scenario, 2030)
Purchase HKD0.31
Drop-off point HKD0.06
Processing HKD0.03
Cleaning HKD0.02
Transport <HKD0.01
Overall cost per container use
HKD 0.4373%
15%
7%5%
<0.5%
Cost per container use:
for disposing municipal solid waste by weight in the next 18 months (‘MSW charging’), disposal of this unrecovered residue in landfills may become a financial burden for the recycling operation.
While beverage cups usually require less cleaning than food containers, because their contents are less sticky and oily, it is recommended they are rinsed and dried to maintain hygiene and preserve fibre quality — particularly if they are being stored for long periods of time before being processed.
4.2 2030 potential
The following recycling solution analysis was conducted for a single-use PP food container. Our baseline analysis shows that PP is the most common type of plastic used for containers in Hong Kong, the majority of which are used to serve hot foods.
4.2.1 Financial costs
The system cost of using and recycling one PP container is an estimated HKD 0.43 (Figure 16). This is the lowest amongst all four solution archetypes.
• Per container, approximately three-quarters of the system cost is driven by the container purchase.
• Treatment and transportation costs are comparatively small for each container because the costs of operating the recycling system are shared by many other recyclable items.
• Another small portion (5%) of the overall cost is incurred by the hot water required to clean the container prior to recycling — and hence shouldered by the consumer.
• About 15% of the cost goes to rental space for collection bins, procuring and maintaining collection bins, and retrieving containers from drop-off points.
Figure 15GREEN@COMMUNITY recycling store (top) and recycling point (bottom)
To recycle PP food containers in Hong Kong, consumers must first wash the container.
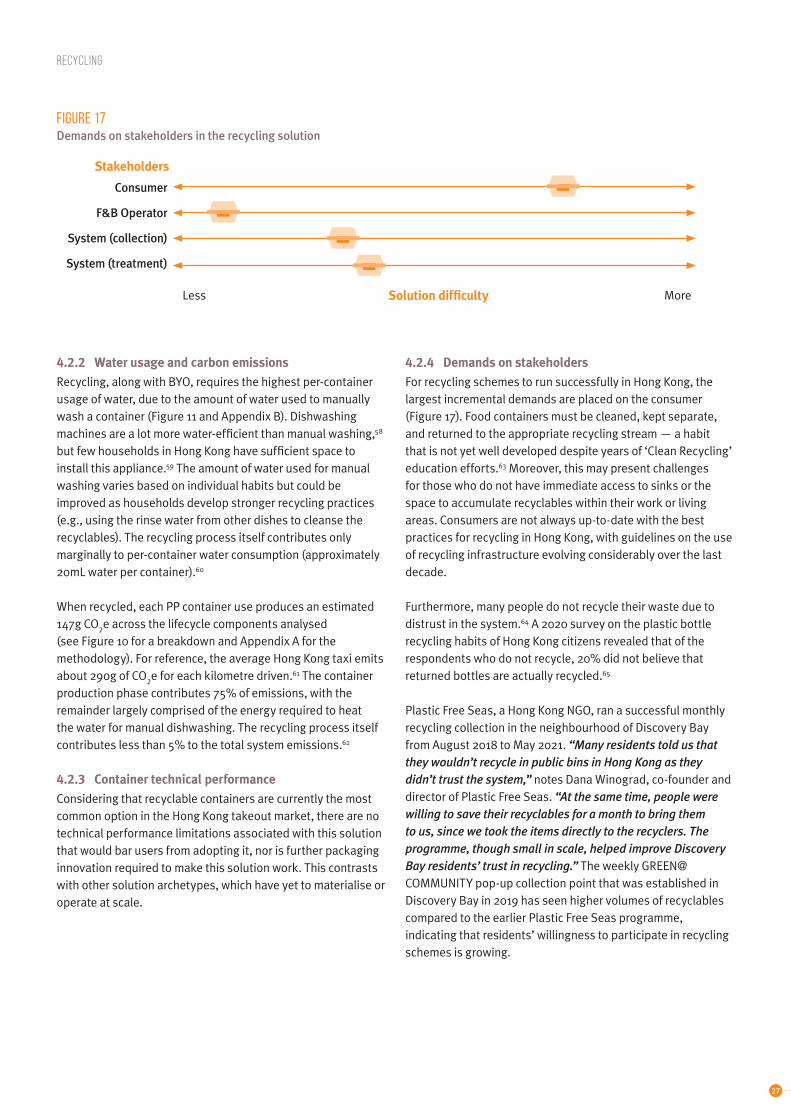
27
4.2.2 Water usage and carbon emissions
Recycling, along with BYO, requires the highest per-container usage of water, due to the amount of water used to manually wash a container (Figure 11 and Appendix B). Dishwashing machines are a lot more water-efficient than manual washing,58 but few households in Hong Kong have sufficient space to install this appliance.59 The amount of water used for manual washing varies based on individual habits but could be improved as households develop stronger recycling practices (e.g., using the rinse water from other dishes to cleanse the recyclables). The recycling process itself contributes only marginally to per-container water consumption (approximately 20mL water per container).60
When recycled, each PP container use produces an estimated 147g CO
2e across the lifecycle components analysed
(see Figure 10 for a breakdown and Appendix A for the methodology). For reference, the average Hong Kong taxi emits about 290g of CO
2e for each kilometre driven.61 The container
production phase contributes 75% of emissions, with the remainder largely comprised of the energy required to heat the water for manual dishwashing. The recycling process itself contributes less than 5% to the total system emissions.62
4.2.3 Container technical performance
Considering that recyclable containers are currently the most common option in the Hong Kong takeout market, there are no technical performance limitations associated with this solution that would bar users from adopting it, nor is further packaging innovation required to make this solution work. This contrasts with other solution archetypes, which have yet to materialise or operate at scale.
RECYCLING
4.2.4 Demands on stakeholders
For recycling schemes to run successfully in Hong Kong, the largest incremental demands are placed on the consumer (Figure 17). Food containers must be cleaned, kept separate, and returned to the appropriate recycling stream — a habit that is not yet well developed despite years of ‘Clean Recycling’ education efforts.63 Moreover, this may present challenges for those who do not have immediate access to sinks or the space to accumulate recyclables within their work or living areas. Consumers are not always up-to-date with the best practices for recycling in Hong Kong, with guidelines on the use of recycling infrastructure evolving considerably over the last decade.
Furthermore, many people do not recycle their waste due to distrust in the system.64 A 2020 survey on the plastic bottle recycling habits of Hong Kong citizens revealed that of the respondents who do not recycle, 20% did not believe that returned bottles are actually recycled.65
Plastic Free Seas, a Hong Kong NGO, ran a successful monthly recycling collection in the neighbourhood of Discovery Bay from August 2018 to May 2021. “Many residents told us that they wouldn’t recycle in public bins in Hong Kong as they didn’t trust the system,” notes Dana Winograd, co-founder and director of Plastic Free Seas. “At the same time, people were willing to save their recyclables for a month to bring them to us, since we took the items directly to the recyclers. The programme, though small in scale, helped improve Discovery Bay residents’ trust in recycling.” The weekly GREEN@COMMUNITY pop-up collection point that was established in Discovery Bay in 2019 has seen higher volumes of recyclables compared to the earlier Plastic Free Seas programme, indicating that residents’ willingness to participate in recycling schemes is growing.
Figure 17Demands on stakeholders in the recycling solution
Stakeholders
Consumer
F&B Operator
System (collection)
System (treatment)
Less MoreSolution difficulty

28
RECYCLING
Since plastic single-use containers are already more or less the standard in the Hong Kong takeout market, there is little effort required from F&B operators to adopt this solution. However, F&B operators must play a role in educating their consumer base on best practices for recycling the plastic containers offered. They can also facilitate recycling, for example by offering dedicated bins where customers can return their take-out containers, as a complement to the existing network of collection points.
In comparison to other solutions, Recycling puts relatively few incremental demands on collection and treatment systems because the relevant infrastructure is already in place in Hong Kong. Further expansion and optimisation of the processing infrastructure would, however, be beneficial to Hong Kong’s SFP recycling outcomes. Similarly, while collection networks for SFP materials such as PP, PET, and plastic-paper composites exist in Hong Kong, they are not yet dense and expansive enough to readily take up a large share of the volumes on the market.
4.2.5 Impact on landfilling
By 2030, the Recycling solution archetype may have the potential to address 69% of the containers on the market (see Figure 13). This, however, is contingent on a commitment to increasing consumer education on recycling habits and further optimising the collection, sorting, and recycling systems (AM scenario).
Without a major shift in behaviour or significant technological advances, the recycling system is still projected to addresses 57% of the containers on the market (LM scenario; see Appendix A for more details on scenario projection). This is the highest total potential impact that can be delivered by a single solution with the current-day level of technology and infrastructure, largely due to the recycling system already in place.
4.3 Driving the Recycling solution
Although most SFP materials can technically be recycled today in Hong Kong, doing so is not always straightforward or convenient. System improvements to increase the scale and effectiveness of this solution archetype include: educating consumers and businesses to improve recycling habits; widening collection networks to increase accessibility; and expanding recycling infrastructure to handle higher recyclable volumes and diverse material types. Collaborations and demand stimuli can further drive investments in these improvements.
Education. The success of SFP recycling is contingent on consumers’ willingness to develop strong recycling habits. While this undoubtedly involves behaviour change and willingness to invest time and effort into recycling, it also necessitates clearer and more consistent education on best practices, such as the need to clean containers. Consumers must be taught exactly how and where they can recycle different container types, rather than being expected to seek out the information. To rebuild consumer trust in the recycling system, facilities must be more transparent about their processing protocols and the destination of the materials that enter their facility.
Widening collection networks. Hong Kong’s recycling collection system is not optimised for convenience, further posing a barrier to consumers. While plastic bottles (e.g., from pre-packaged beverages, body care products, detergents) can be dropped in recycling bins available on the street, there are far fewer locations in the city where a consumer can recycle other types of plastics and pack formats.
• Most types of clean plastic food and beverage containers can be returned through privately run services, set up by NGOs and commercial entities. For example, social enterprise V Cycle operates plastic recycling programmes in offices. In addition to facilitating collection logistics, V Cycle provides education for office staff on source separation and clean recycling. However, many programmes are highly localised and may be difficult to sustain or scale up. Effective systems such as V Cycle’s could theoretically be expanded to F&B tenants, but would require food containers to be cleaned either by tenants prior to collection, or after collection at the sorting facility.
• Some building managers offer mixed plastics recycling bins to residents, although not all have contracted trustworthy recyclers who ensure that collected waste actually ends up as secondary material. In some cases, the recyclables collection contract is too narrowly scoped to allow for non-bottle plastics to be picked up.
• In 2020 and 2021, the Government introduced a number of pilots and programmes to try to address these gaps in the collection network (See Box 4).
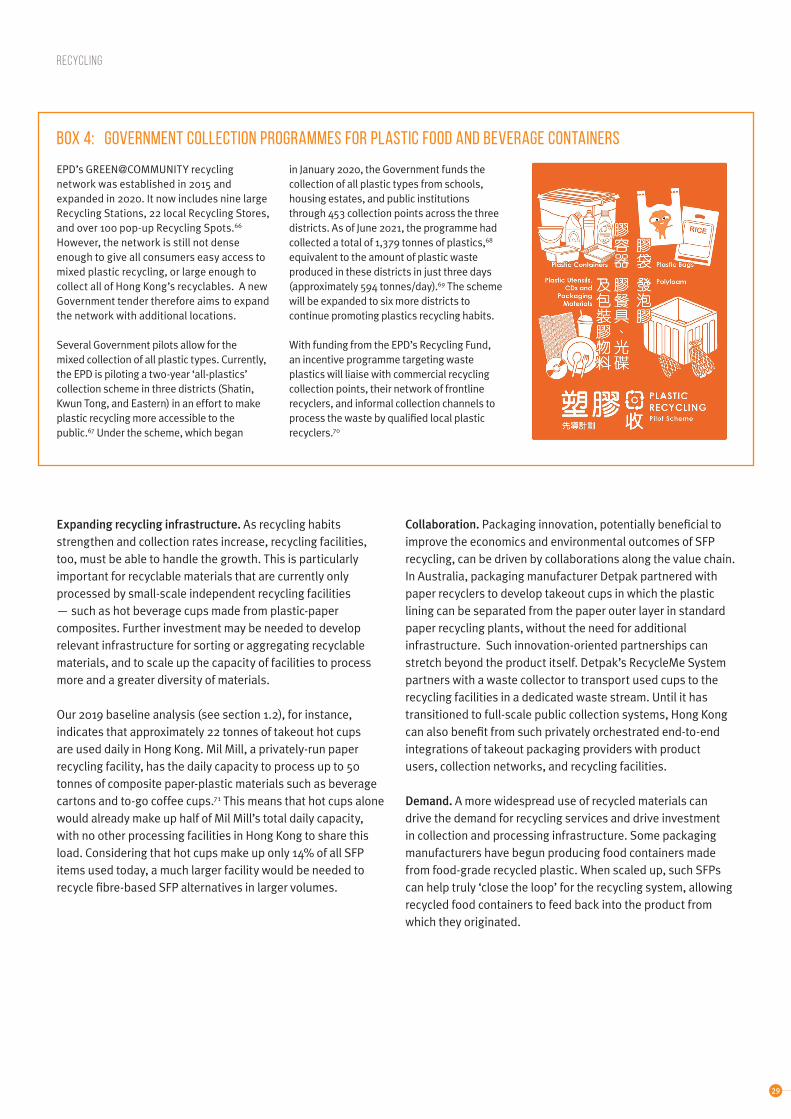
29
Box 4: Government collection programmes for plastic food and beverage containers
in January 2020, the Government funds the collection of all plastic types from schools, housing estates, and public institutions through 453 collection points across the three districts. As of June 2021, the programme had collected a total of 1,379 tonnes of plastics,68 equivalent to the amount of plastic waste produced in these districts in just three days (approximately 594 tonnes/day).69 The scheme will be expanded to six more districts to continue promoting plastics recycling habits.
With funding from the EPD’s Recycling Fund, an incentive programme targeting waste plastics will liaise with commercial recycling collection points, their network of frontline recyclers, and informal collection channels to process the waste by qualified local plastic recyclers.70
EPD’s GREEN@COMMUNITY recycling network was established in 2015 and expanded in 2020. It now includes nine large Recycling Stations, 22 local Recycling Stores, and over 100 pop-up Recycling Spots.66 However, the network is still not dense enough to give all consumers easy access to mixed plastic recycling, or large enough to collect all of Hong Kong’s recyclables. A new Government tender therefore aims to expand the network with additional locations.
Several Government pilots allow for the mixed collection of all plastic types. Currently, the EPD is piloting a two-year ‘all-plastics’ collection scheme in three districts (Shatin, Kwun Tong, and Eastern) in an effort to make plastic recycling more accessible to the public.67 Under the scheme, which began
RECYCLING
Expanding recycling infrastructure. As recycling habits strengthen and collection rates increase, recycling facilities, too, must be able to handle the growth. This is particularly important for recyclable materials that are currently only processed by small-scale independent recycling facilities — such as hot beverage cups made from plastic-paper composites. Further investment may be needed to develop relevant infrastructure for sorting or aggregating recyclable materials, and to scale up the capacity of facilities to process more and a greater diversity of materials.
Our 2019 baseline analysis (see section 1.2), for instance, indicates that approximately 22 tonnes of takeout hot cups are used daily in Hong Kong. Mil Mill, a privately-run paper recycling facility, has the daily capacity to process up to 50 tonnes of composite paper-plastic materials such as beverage cartons and to-go coffee cups.71 This means that hot cups alone would already make up half of Mil Mill’s total daily capacity, with no other processing facilities in Hong Kong to share this load. Considering that hot cups make up only 14% of all SFP items used today, a much larger facility would be needed to recycle fibre-based SFP alternatives in larger volumes.
Collaboration. Packaging innovation, potentially beneficial to improve the economics and environmental outcomes of SFP recycling, can be driven by collaborations along the value chain. In Australia, packaging manufacturer Detpak partnered with paper recyclers to develop takeout cups in which the plastic lining can be separated from the paper outer layer in standard paper recycling plants, without the need for additional infrastructure. Such innovation-oriented partnerships can stretch beyond the product itself. Detpak’s RecycleMe System partners with a waste collector to transport used cups to the recycling facilities in a dedicated waste stream. Until it has transitioned to full-scale public collection systems, Hong Kong can also benefit from such privately orchestrated end-to-end integrations of takeout packaging providers with product users, collection networks, and recycling facilities.
Demand. A more widespread use of recycled materials can drive the demand for recycling services and drive investment in collection and processing infrastructure. Some packaging manufacturers have begun producing food containers made from food-grade recycled plastic. When scaled up, such SFPs can help truly ‘close the loop’ for the recycling system, allowing recycled food containers to feed back into the product from which they originated.
30
Bring Your OwnEncouraging consumers to supply their own containers
Figure 18Schematic diagram of the BYO system
Container is washedConsumptionFood/beverage is packaged for takeout
Container is storedContainer is brought
to F&B outlet
5.1 How it works
‘Bring your own’ (BYO), in the context of this report, is the practice of consumers bringing their own food or beverage containers when purchasing takeout meals. This practice has been encouraged globally to eliminate the need for SFPs altogether, building upon the larger packaging-free movement in supermarkets and other retail outlets.73
5.1.1 System description
Customers bring their own containers to F&B outlets, where prepared food or beverage is directly placed into the customers’ containers. Since the containers belong to the consumers, it is their responsibility to clean them for continued use. F&B employees commonly conduct a quick visual inspection to ensure hygiene is maintained, and may refuse containers if they are not deemed clean or if the size or quality is deemed inappropriate for the food or beverage served.
5.1.2 BYO in Hong Kong
A few F&B establishments in Hong Kong actively promote and even incentivise BYO habits to their customers (see Box 5). A much larger proportion of eateries, particularly small independent operators permit customers to bring their own containers, without public signage or advertisement.74
Box 5: Encouraging BYO in Hong Kong
SaladStop!, a Singapore-based salad chain with three outlets in Hong Kong, runs various BYO programmes. Its first BYO campaign in 2019 incentivised customers to bring their own containers or borrow a reusable container from the eatery.75 Today still, customers are given discounts on beverages and free salad toppings when they bring their own lunch bowls.
Chickpea, a to-go chain based in Hong Kong, debuted its ‘eco-merch’ programme in June 2021.76 Customers can bring their own containers for takeout meals or purchase a collapsible reusable silicone bowl. The repeated use of reusable containers is encouraged through a loyalty programme with rewards such as free meals and side dishes.
5.2 2030 potential
To assess the potential of the BYO solution, we based our analysis on a reusable PP food container, one of the many options available. We chose food containers because they make up the majority of containers on the market, and specifically focused on PP containers as a popular choice for consumers. Light-weight yet durable, these containers also seal well, can store hot foods, and are what many people already have in their homes for at-home food preparation and storage.
5

31
5.2.1 Financial costs
The BYO system cost per container use is an estimated HKD 0.45 across an assumed 50 use cycles (Figure 19). This is only slightly (HKD 0.02) more than the Recycling solution.
• This cost is almost completely driven by the purchasing cost of the container. Consequently, each further use cycle helps drive down the overall solution cost.
• As is the case for the recycling solution, the consumer pays a small amount for the hot water required to clean the container.
• The end-of-life costs, assuming that the container is recycled, only contribute marginally to the per-container costs because they are spread across many uses of the same container.
Purchase HKD0.43
Cleaning HKD0.02
Processing <HKD0.01
Cost per container use:
Figure 19BYO system costs(Advanced mobilisation scenario, 2030)
94%
5%
1%
Overall cost per container use
HKD 0.45
5.2.2 Water usage and carbon emissions
BYO containers utilise the most water during washing (see Figure 11). The water consumption of this system could be lowered if households employed more efficient techniques for manual washing, or if they used dishwashing machines. The water used for recycling the BYO container at the end of its lifespan is nearly negligible, especially when accounting for the many reuse cycles of the container.
The emissions associated with each BYO container use is an estimated 35g of CO
2e. This value is much lower than the
footprint of single-use recyclable or compostable containers because the higher emissions associated with container production are divided over the multiple uses of the container.77 The majority of greenhouse gas emissions associated with the BYO system comes from the energy used to wash the container with hot water (see Figure 10).
BRING YOUR OWN
Figure 20Takeaway meal in a single-use bento container
5.2.3 Container technical performance
The BYO solution is advantageous in that the container has a high utility in the consumer’s household — it can be used to store home-cooked leftovers or produce, in between uses for takeout. Plus, most households already have reusable containers.
The main technical performance issue is the lack of standardised sizes and shapes, which may not be compatible with the beverage or food being served at different outlets. For example, some meals in Hong Kong require separation or partitions — such as soups where the broth is kept separate from noodles or dumplings, or bento-style meals that require several partitions for different meal components (Figure 20). If the customers’ containers do not fit the dimensions or characteristics of what is being served, they may have to opt for a single-use option. This limitation may be mitigated over time, as consumers start planning ahead and bring the appropriate container. As such, they may consider purchasing additional containers that specifically suit the requirements of different meals or beverages.
5.2.4 Demands on stakeholders
The BYO solution archetype is consumer-driven. Consumers need to bring containers from home, and even plan in advance what type of containers they need when setting out for the day. Over time, however, this habit may become as natural as leaving home with one’s keys, wallet, and phone. Consumers are also responsible for carrying or storing their containers until they can clean them for the next use.
Though most of the BYO system is handled by the consumer, F&B operators must also adapt in various ways. While some geographies place legal restrictions on handling customers’ containers, this decision is left up to individual F&B operators in Hong Kong.78 As such, Hong Kong’s F&B operators may need to adjust standard operating procedures (SOPs) to accept outside containers.
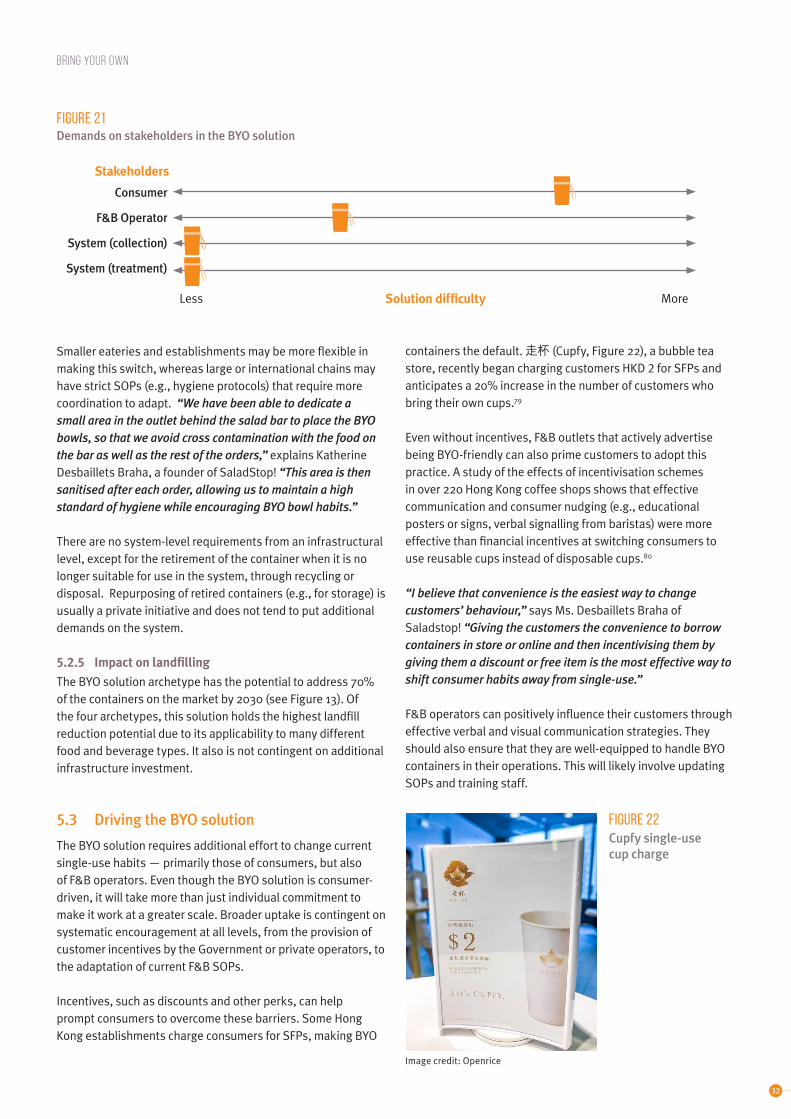
32
Figure 21Demands on stakeholders in the BYO solution
Stakeholders
Consumer
F&B Operator
System (collection)
System (treatment)
BRING YOUR OWN
Smaller eateries and establishments may be more flexible in making this switch, whereas large or international chains may have strict SOPs (e.g., hygiene protocols) that require more coordination to adapt. “We have been able to dedicate a small area in the outlet behind the salad bar to place the BYO bowls, so that we avoid cross contamination with the food on the bar as well as the rest of the orders,” explains Katherine Desbaillets Braha, a founder of SaladStop! “This area is then sanitised after each order, allowing us to maintain a high standard of hygiene while encouraging BYO bowl habits.”
There are no system-level requirements from an infrastructural level, except for the retirement of the container when it is no longer suitable for use in the system, through recycling or disposal. Repurposing of retired containers (e.g., for storage) is usually a private initiative and does not tend to put additional demands on the system.
5.2.5 Impact on landfilling
The BYO solution archetype has the potential to address 70% of the containers on the market by 2030 (see Figure 13). Of the four archetypes, this solution holds the highest landfill reduction potential due to its applicability to many different food and beverage types. It also is not contingent on additional infrastructure investment.
5.3 Driving the BYO solution
The BYO solution requires additional effort to change current single-use habits — primarily those of consumers, but also of F&B operators. Even though the BYO solution is consumer-driven, it will take more than just individual commitment to make it work at a greater scale. Broader uptake is contingent on systematic encouragement at all levels, from the provision of customer incentives by the Government or private operators, to the adaptation of current F&B SOPs.
Incentives, such as discounts and other perks, can help prompt consumers to overcome these barriers. Some Hong Kong establishments charge consumers for SFPs, making BYO
Less MoreSolution difficulty
containers the default. 走杯 (Cupfy, Figure 22), a bubble tea store, recently began charging customers HKD 2 for SFPs and anticipates a 20% increase in the number of customers who bring their own cups.79
Even without incentives, F&B outlets that actively advertise being BYO-friendly can also prime customers to adopt this practice. A study of the effects of incentivisation schemes in over 220 Hong Kong coffee shops shows that effective communication and consumer nudging (e.g., educational posters or signs, verbal signalling from baristas) were more effective than financial incentives at switching consumers to use reusable cups instead of disposable cups.80
“I believe that convenience is the easiest way to change customers’ behaviour,” says Ms. Desbaillets Braha of Saladstop! “Giving the customers the convenience to borrow containers in store or online and then incentivising them by giving them a discount or free item is the most effective way to shift consumer habits away from single-use.”
F&B operators can positively influence their customers through effective verbal and visual communication strategies. They should also ensure that they are well-equipped to handle BYO containers in their operations. This will likely involve updating SOPs and training staff.
Figure 22Cupfy single-use cup charge
Image credit: Openrice

33
CompostingClosing the loop with composting infrastructure
6.1 How it works
Composting is the process by which organic matter, such as food waste, is naturally broken down by microorganisms under oxygenated conditions.81 The output of this biological process is water, CO
2, and compost, which serves as a natural fertiliser to
enrich soil.
While composting can be done at home, industrial composting centres optimise and expedite the process by providing ideal temperature and oxygen levels.82 All composting systems require aerobic (oxygenated) conditions to allow for the natural breakdown of the organic waste. Alternatively, certain microorganisms can carry out this process in anaerobic (non-oxygenated) conditions in an anaerobic digester. In a landfill, however, the conditions are unsuitable to facilitate this breakdown process. Compostable packaging therefore cannot be truly ‘closed loop’ unless this end-of-life phase is correctly executed.
The term ‘composting’ will hereon refer to both the aerobic and anaerobic processes by which organic waste can be metabolised (i.e., aerobic composting, anaerobic digestion), unless explicitly stated otherwise.
6.1.1 System description
The food or beverage prepared on-site is served in a compostable SFP. After consumption, the consumer disposes of the compostable packaging into a compostable waste
stream. This may take the form of a) a generic organic waste compost bin, which combines all organic types; b) a dedicated packaging compost bin.
The organic waste is processed at a composting facility, which can be either small-scale (e.g., on-site at a school) or at an industrial level. Depending on the quality of the waste materials and the level of process control, the resulting compost can be used as agricultural fertiliser.
6.1.2 Composting in Hong Kong
Hong Kong does not have scaled-up processing facilities equipped to handle compostable packaging. It has an organic waste treatment facility (O-PARK) that is, at the moment, focusing on commercial organic waste from F&B operators, wet markets and food processors. This facility uses anaerobic digestion technology rather than composting under aerobic conditions.87
The current process configuration is not able to treat compostable packaging as a raw input. While anaerobic digestion could in theory convert compostable packaging waste into energy and compost, this waste must be pre-treated through a shredding or maceration process before being sent into the anaerobic digestor.88
Without the addition of this pre-treatment infrastructure to O-PARK or the construction of an industrial composting facility, compostable packaging cannot be treated at scale in Hong Kong.
6
Figure 23Schematic diagram of the composting system
Delivery
Pick-upConsumption
Food/beverage is packaged for takeout
Container collection
Container drop-offComposting
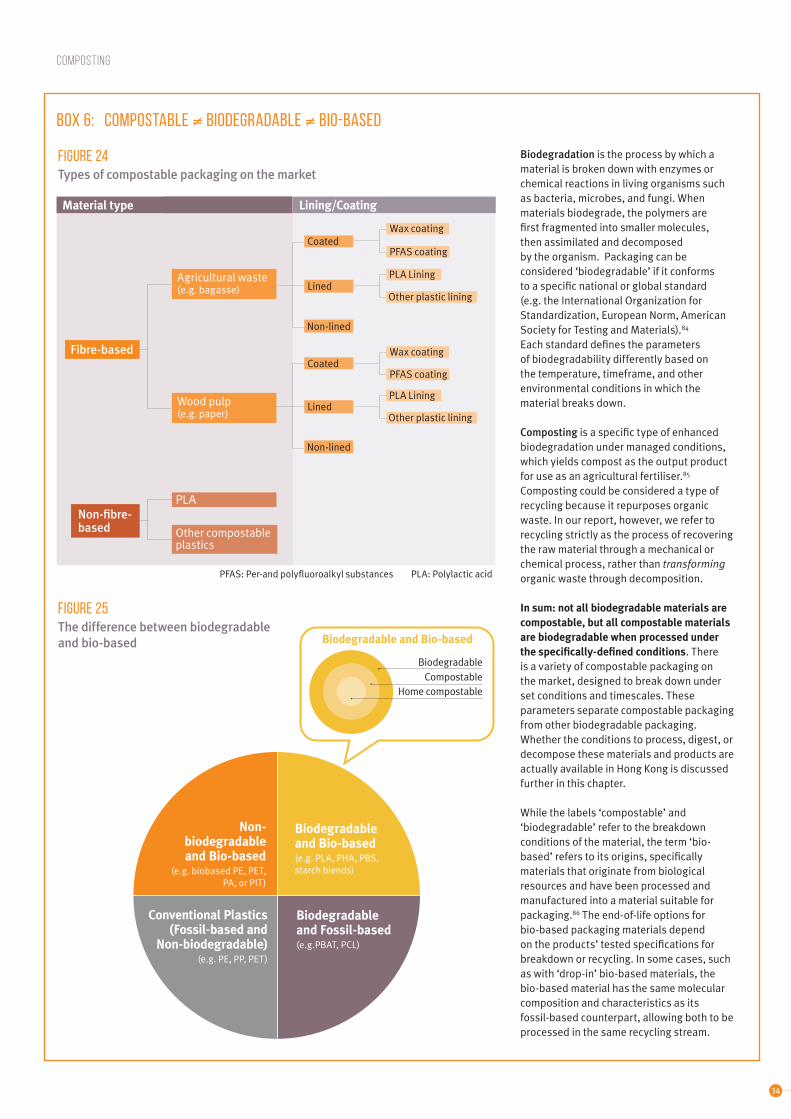
34
BiodegradableCompostable
Home compostable
Biodegradable and Bio-based
COMPOSTING
Box 6: Compostable ≠ biodegradable ≠ bio-based
Biodegradation is the process by which a material is broken down with enzymes or chemical reactions in living organisms such as bacteria, microbes, and fungi. When materials biodegrade, the polymers are first fragmented into smaller molecules, then assimilated and decomposed by the organism. Packaging can be considered ‘biodegradable’ if it conforms to a specific national or global standard (e.g. the International Organization for Standardization, European Norm, American Society for Testing and Materials).84 Each standard defines the parameters of biodegradability differently based on the temperature, timeframe, and other environmental conditions in which the material breaks down.
Composting is a specific type of enhanced biodegradation under managed conditions, which yields compost as the output product for use as an agricultural fertiliser.85 Composting could be considered a type of recycling because it repurposes organic waste. In our report, however, we refer to recycling strictly as the process of recovering the raw material through a mechanical or chemical process, rather than transforming organic waste through decomposition.
In sum: not all biodegradable materials are compostable, but all compostable materials are biodegradable when processed under the specifically-defined conditions. There is a variety of compostable packaging on the market, designed to break down under set conditions and timescales. These parameters separate compostable packaging from other biodegradable packaging. Whether the conditions to process, digest, or decompose these materials and products are actually available in Hong Kong is discussed further in this chapter.
While the labels ‘compostable’ and ‘biodegradable’ refer to the breakdown conditions of the material, the term ‘bio-based’ refers to its origins, specifically materials that originate from biological resources and have been processed and manufactured into a material suitable for packaging.86 The end-of-life options for bio-based packaging materials depend on the products’ tested specifications for breakdown or recycling. In some cases, such as with ‘drop-in’ bio-based materials, the bio-based material has the same molecular composition and characteristics as its fossil-based counterpart, allowing both to be processed in the same recycling stream.
PFAS: Per-and polyfluoroalkyl substances PLA: Polylactic acid
Non- biodegradable and Bio-based
(e.g. biobased PE, PET, PA, or PIT)
Biodegradable and Bio-based(e.g. PLA, PHA, PBS, starch blends)
Conventional Plastics (Fossil-based and
Non-biodegradable)(e.g. PE, PP, PET)
Biodegradable and Fossil-based(e.g.PBAT, PCL)
Wax coating
PFAS coating
PLA Lining
Other plastic lining
Wax coating
PFAS coating
PLA Lining
Other plastic lining
Agricultural waste(e.g. bagasse)
Wood pulp(e.g. paper)
Fibre-based
PLA
Other compostable plastics
Non-fibre-based
Figure 24Types of compostable packaging on the market
Figure 25The difference between biodegradable and bio-based
Coated
Lined
Non-lined
Coated
Lined
Non-lined
Material type Lining/Coating
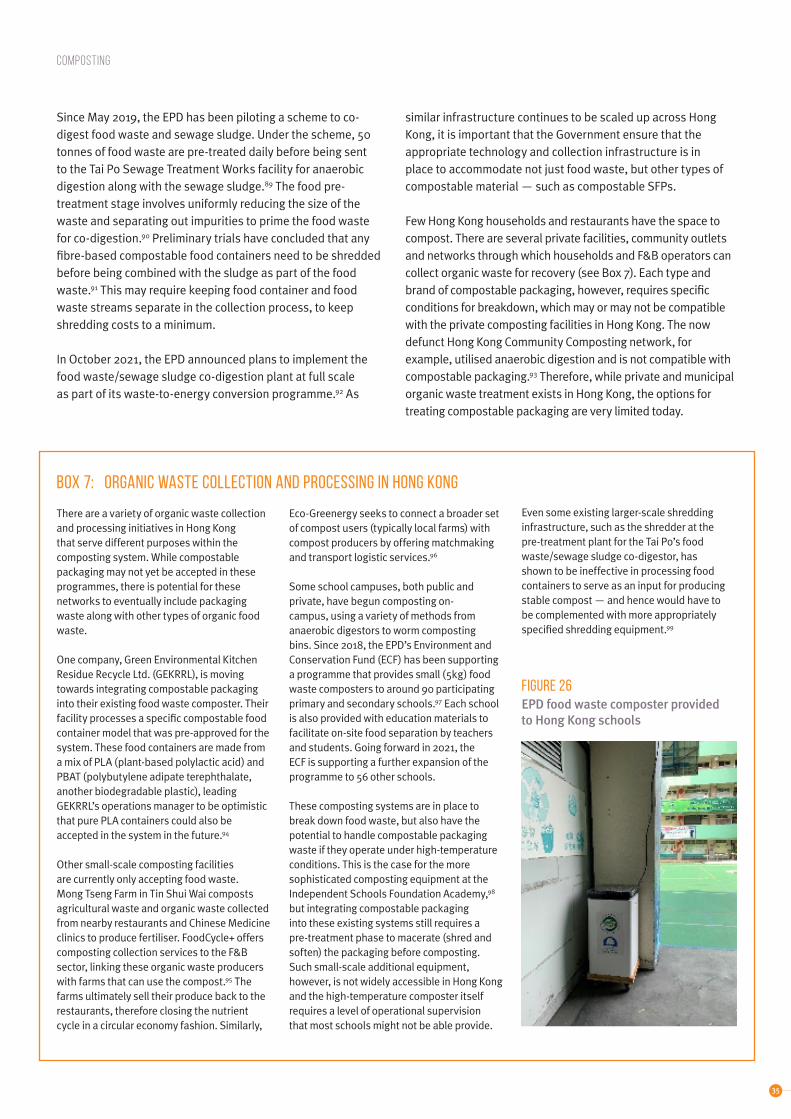
35
Since May 2019, the EPD has been piloting a scheme to co-digest food waste and sewage sludge. Under the scheme, 50 tonnes of food waste are pre-treated daily before being sent to the Tai Po Sewage Treatment Works facility for anaerobic digestion along with the sewage sludge.89 The food pre-treatment stage involves uniformly reducing the size of the waste and separating out impurities to prime the food waste for co-digestion.90 Preliminary trials have concluded that any fibre-based compostable food containers need to be shredded before being combined with the sludge as part of the food waste.91 This may require keeping food container and food waste streams separate in the collection process, to keep shredding costs to a minimum.
In October 2021, the EPD announced plans to implement the food waste/sewage sludge co-digestion plant at full scale as part of its waste-to-energy conversion programme.92 As
similar infrastructure continues to be scaled up across Hong Kong, it is important that the Government ensure that the appropriate technology and collection infrastructure is in place to accommodate not just food waste, but other types of compostable material — such as compostable SFPs.
Few Hong Kong households and restaurants have the space to compost. There are several private facilities, community outlets and networks through which households and F&B operators can collect organic waste for recovery (see Box 7). Each type and brand of compostable packaging, however, requires specific conditions for breakdown, which may or may not be compatible with the private composting facilities in Hong Kong. The now defunct Hong Kong Community Composting network, for example, utilised anaerobic digestion and is not compatible with compostable packaging.93 Therefore, while private and municipal organic waste treatment exists in Hong Kong, the options for treating compostable packaging are very limited today.
COMPOSTING
Box 7: Organic waste collection and processing in Hong Kong
Eco-Greenergy seeks to connect a broader set of compost users (typically local farms) with compost producers by offering matchmaking and transport logistic services.96
Some school campuses, both public and private, have begun composting on-campus, using a variety of methods from anaerobic digestors to worm composting bins. Since 2018, the EPD’s Environment and Conservation Fund (ECF) has been supporting a programme that provides small (5kg) food waste composters to around 90 participating primary and secondary schools.97 Each school is also provided with education materials to facilitate on-site food separation by teachers and students. Going forward in 2021, the ECF is supporting a further expansion of the programme to 56 other schools.
These composting systems are in place to break down food waste, but also have the potential to handle compostable packaging waste if they operate under high-temperature conditions. This is the case for the more sophisticated composting equipment at the Independent Schools Foundation Academy,98 but integrating compostable packaging into these existing systems still requires a pre-treatment phase to macerate (shred and soften) the packaging before composting. Such small-scale additional equipment, however, is not widely accessible in Hong Kong and the high-temperature composter itself requires a level of operational supervision that most schools might not be able provide.
Even some existing larger-scale shredding infrastructure, such as the shredder at the pre-treatment plant for the Tai Po’s food waste/sewage sludge co-digestor, has shown to be ineffective in processing food containers to serve as an input for producing stable compost — and hence would have to be complemented with more appropriately specified shredding equipment.99
There are a variety of organic waste collection and processing initiatives in Hong Kong that serve different purposes within the composting system. While compostable packaging may not yet be accepted in these programmes, there is potential for these networks to eventually include packaging waste along with other types of organic food waste.
One company, Green Environmental Kitchen Residue Recycle Ltd. (GEKRRL), is moving towards integrating compostable packaging into their existing food waste composter. Their facility processes a specific compostable food container model that was pre-approved for the system. These food containers are made from a mix of PLA (plant-based polylactic acid) and PBAT (polybutylene adipate terephthalate, another biodegradable plastic), leading GEKRRL’s operations manager to be optimistic that pure PLA containers could also be accepted in the system in the future.94
Other small-scale composting facilities are currently only accepting food waste. Mong Tseng Farm in Tin Shui Wai composts agricultural waste and organic waste collected from nearby restaurants and Chinese Medicine clinics to produce fertiliser. FoodCycle+ offers composting collection services to the F&B sector, linking these organic waste producers with farms that can use the compost.95 The farms ultimately sell their produce back to the restaurants, therefore closing the nutrient cycle in a circular economy fashion. Similarly,
Figure 26EPD food waste composter provided to Hong Kong schools
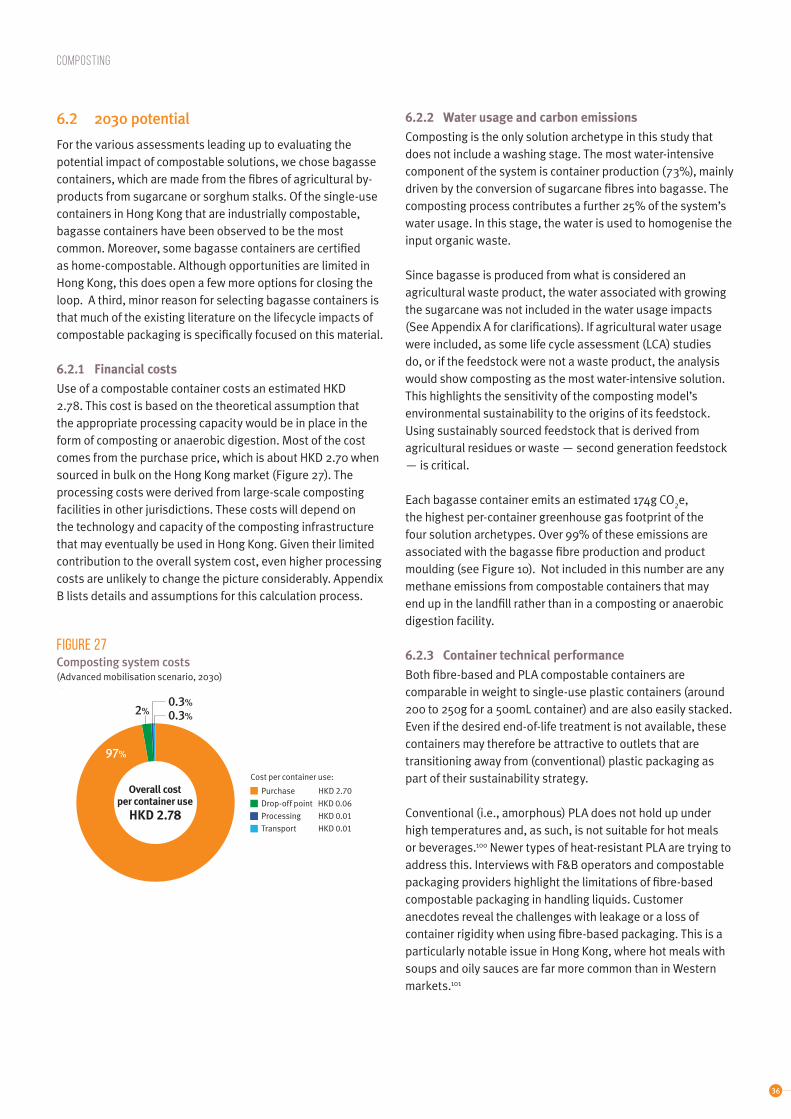
36
COMPOSTING
Figure 27Composting system costs(Advanced mobilisation scenario, 2030)
Purchase HKD 2.70
Drop-off point HKD 0.06
Processing HKD 0.01
Transport HKD 0.01
97%
2% 0.3%
Cost per container use:
Overall cost per container use
HKD 2.78
0.3%
6.2 2030 potential
For the various assessments leading up to evaluating the potential impact of compostable solutions, we chose bagasse containers, which are made from the fibres of agricultural by-products from sugarcane or sorghum stalks. Of the single-use containers in Hong Kong that are industrially compostable, bagasse containers have been observed to be the most common. Moreover, some bagasse containers are certified as home-compostable. Although opportunities are limited in Hong Kong, this does open a few more options for closing the loop. A third, minor reason for selecting bagasse containers is that much of the existing literature on the lifecycle impacts of compostable packaging is specifically focused on this material.
6.2.1 Financial costs
Use of a compostable container costs an estimated HKD 2.78. This cost is based on the theoretical assumption that the appropriate processing capacity would be in place in the form of composting or anaerobic digestion. Most of the cost comes from the purchase price, which is about HKD 2.70 when sourced in bulk on the Hong Kong market (Figure 27). The processing costs were derived from large-scale composting facilities in other jurisdictions. These costs will depend on the technology and capacity of the composting infrastructure that may eventually be used in Hong Kong. Given their limited contribution to the overall system cost, even higher processing costs are unlikely to change the picture considerably. Appendix B lists details and assumptions for this calculation process.
6.2.2 Water usage and carbon emissions
Composting is the only solution archetype in this study that does not include a washing stage. The most water-intensive component of the system is container production (73%), mainly driven by the conversion of sugarcane fibres into bagasse. The composting process contributes a further 25% of the system’s water usage. In this stage, the water is used to homogenise the input organic waste.
Since bagasse is produced from what is considered an agricultural waste product, the water associated with growing the sugarcane was not included in the water usage impacts (See Appendix A for clarifications). If agricultural water usage were included, as some life cycle assessment (LCA) studies do, or if the feedstock were not a waste product, the analysis would show composting as the most water-intensive solution. This highlights the sensitivity of the composting model’s environmental sustainability to the origins of its feedstock. Using sustainably sourced feedstock that is derived from agricultural residues or waste — second generation feedstock — is critical.
Each bagasse container emits an estimated 174g CO2e,
the highest per-container greenhouse gas footprint of the four solution archetypes. Over 99% of these emissions are associated with the bagasse fibre production and product moulding (see Figure 10). Not included in this number are any methane emissions from compostable containers that may end up in the landfill rather than in a composting or anaerobic digestion facility.
6.2.3 Container technical performance
Both fibre-based and PLA compostable containers are comparable in weight to single-use plastic containers (around 200 to 250g for a 500mL container) and are also easily stacked. Even if the desired end-of-life treatment is not available, these containers may therefore be attractive to outlets that are transitioning away from (conventional) plastic packaging as part of their sustainability strategy.
Conventional (i.e., amorphous) PLA does not hold up under high temperatures and, as such, is not suitable for hot meals or beverages.100 Newer types of heat-resistant PLA are trying to address this. Interviews with F&B operators and compostable packaging providers highlight the limitations of fibre-based compostable packaging in handling liquids. Customer anecdotes reveal the challenges with leakage or a loss of container rigidity when using fibre-based packaging. This is a particularly notable issue in Hong Kong, where hot meals with soups and oily sauces are far more common than in Western markets.101

37
COMPOSTING
Fibre-based packaging providers trying to overcome this limitation typically either add a PLA lining, or a coating with per- and polyfluoroalkyl substances (PFAS).102 Neither is a satisfying solution. Not all industrial composting facilities — in Hong Kong and elsewhere — operate under the rigorous temperature requirements and processing times required to fully compost PLA.103 PLA does not biodegrade in home composting conditions, as it requires temperatures of at least 50˚C, which are hard to maintain in home composting systems.104
The use of PFAS introduces its own set of challenges as this group of chemicals has been associated with liver damage, harm to the immune system, developmental toxicity, and cancer. Fidra, a UK charity focused on plastic waste and chemical pollution, recommends phasing out PFAS from food packaging. It also recommends lowering the accepted PFAS content in compostability standards, so that the level is no more than what could be considered background contamination.
Innovators in the compostable packaging sector are specifically addressing functionality challenges. They aim to improve the containers’ ability to handle liquid and oily foods and beverages without resorting to potentially harmful chemicals. “Typically, packaging that is made entirely from plant fibres will leak or lose functionality when serving hot or oily foods,” describes George Chen of Ecoinno, a Hong Kong-based packaging company that focuses on the use of biotechnology to develop cellulose-based food containers. “It is important that fibre-based containers do not sacrifice these qualities in the consumer’s experience. However, it is still crucial that the container is made entirely from plant cellulose and does not contain any types of PFAS, or PLA, which may disrupt the composting process.”
F&B outlets and consumers may have to adapt to other characteristics when migrating from single-use plastic containers to compostable fibre-based packaging.
• The use of an opaque compostable cup for cold beverages, which are typically served in a clear cup, may affect the aesthetic quality of the drink. This is particularly relevant to dessert-drinks (e.g., bubble tea). Some bubble tea stores, however, already serve beverages in paper-plastic composite cups, successfully turning the opaque optics into an iconic element of their brand.
• From an F&B operator standpoint, switching to opaque containers may also increase the likelihood of mixing up orders, particularly during peak hours. Many high-volume F&B operators have overcome this challenge through pre-printed check lists on cups, or customised labels that are linked to their point-of-sale (POS) software.
• Fibre-based lids on compostable cups and bowls may also not be leakproof. This may present challenges for customers who do not consume the beverage or soup straight away or opt for delivery. This issue is traditionally addressed by using PLA lids, but the two materials require different processing conditions.
6.2.4 Demands on stakeholders
Industrial composting facilities are pivotal to implementing this solution. Without them, the composting solution does not keep any containers from being sent to landfills.
If a suitable composting facility were available in Hong Kong, it would not demand an unreasonable effort from the consumer to implement the solution. Consumers do, however, need to separate their compostable packaging from general waste.
Depending on the network of composting bins, this habit can be easily integrated into daily patterns by consumers after the initial effort of seeking out a convenient bin location. If F&B operators serve as publicly or customer-accessible collection points for compostable packaging waste, staff, too, must be educated on waste sorting practices.
Figure 28Demands on stakeholders in the composting solution
Stakeholders
Consumer
F&B Operator
System (collection)
System (treatment)
Less MoreSolution difficulty

38
COMPOSTING
From the F&B operators’ perspective, for those who already separate food waste from general waste, compostable packaging could be a sensible solution, provided that collection and processing systems that can accept containers along with food waste are developed.
Customers and F&B operators may have to adapt to the aforementioned differences in packaging characteristics, such as containers that do not seal as tightly or soften when carrying hot foods.
6.2.5 Impact on landfilling
If, by 2030, sufficient capacity for industrial composting or packaging-capable anaerobic digestion can be developed, the composting solution could replace 51% of the SFPs placed on the market (see Figure 13). Without this infrastructure in place, the use of plant-based materials could reduce our reliance on fossil resources, but this solution would not contribute to keeping containers out of landfills.
6.3 Driving the Composting solution
6.3.1 Infrastructure
While the use of plant-based materials could reduce our reliance on fossil resources, this solution cannot yet contribute to keeping containers out of landfills in absence of composting or modified anaerobic digestion technology.
“For the development of infrastructure for any material, that material has to be in circulation in sufficient volumes to make collection and processing viable. We anticipate that the further growth of compostables in the market in Hong Kong will build a business case for infrastructure development,” asserts Eilidh Brunton, Senior Waste Management Consultant at Vegware United Kingdom. “If the Government’s proposal to ban plastic tableware is passed and introduced by the proposed timeline,107 we would expect to see a significant rise in the marketing, use, and hence disposal of compostables in Hong Kong. In that case, the Government would have to plan for and develop the infrastructure to collect and process it.”
Specifically for bagasse material, however, Hong Kong may be in a position to offer recycling until the appropriate composting facilities are brought online. Early-stage testing at Mil Mill shows that lightly-stained bagasse and (plastic-lined) paperboard food and drink containers can be processed in their recycling stream, which targets hard-to-recycle paper and cardboard. “We have over 450 collection points around Hong Kong for our beverage carton recycling system. We are now also partnering with some suppliers of composite paper products — like those used in F&B — to integrate them into our recycling scheme,” explains
Harold Yip, one of Mil Mill’s founders. “In this way, they are able to leverage our existing collection network and offer a recycling avenue to their customers.”
6.3.2 Collection
The collection challenge is two-fold: ensuring sufficient and conveniently-located collection points, and determining whether containers can be collected together with other organic waste.
Currently, Hong Kong’s O-PARK food waste treatment system does not collect from individual households. The system consists of two anaerobic digestion facilities: O-PARK 1, which has a 200 tonne/day capacity, and O-PARK 2, which is set to begin operations in 2022 with a 300 tonne/day capacity.108 Composting takeout containers at scale would ideally utilise household-oriented collection services rather than, or in addition to, drop-off points at F&B operators.
If future organic waste treatment facilities can handle compostable packaging, the collection system must be adapted accordingly. If, for example, a composting facility is eventually constructed to operate in parallel with traditional waste systems, there may need to be separate collection streams depending on what can be accepted in each system. Furthermore, the practical placement of bins in public or private spaces must also be planned if composting systems are to be operated at scale.
Outside of Hong Kong, compostable packaging companies have successfully integrated their products with composting streams in municipalities where there is existing composting infrastructure. In Australia, compostable packaging company Biopak offers F&B operators that use their products the option to join a compost collection service that feeds into a network of municipal composting operators.109
6.3.3 Communication
In the UK, compostable packaging brand Vegware partnered with waste collectors and composting facilities to form collection programmes for F&B operators. The success of these programmes was largely dependent on the education and engagement with consumers to ensure that the packaging was properly separated from recyclable and general waste.110
“Composting is particularly sensitive to contamination. Consumer engagement is vital in ensuring the correct materials make it into the right bin and onwards to be accepted at the composting facility,” confirms Vegware’s Ms Brunton. “Delivering value-added services such as bespoke bin signage and tailored communications materials ensures our products can be truly composted after use.”
39
COMPOSTING
that opt for private composting networks, it is crucial for them to confirm that the composter offers the conditions required to break down their specific type of packaging.
Simultaneously, false claims about a packaging’s compostability characteristics must be penalised. Under Hong Kong’s Trade Descriptions Ordinance (Cap. 362), the practice of advertising false trade descriptions is prohibited.111 The implementation challenge is two-fold, however: both labelling standards and technical standards are not available for the Hong Kong market. Inconsistent labelling causes confusion for F&B operators, consumers, and waste management operators.112 Furthermore, there is no control over whether any compostability claims are truthful in Hong Kong, since there are no official standards that uniformly define the conditions required for packaging that is labelled ‘compostable’ or ‘biodegradable’ to actually break down in either commercial or at at-home composting facilities.113
Education and communication requirements are not limited to instructions for consumers and F&B operators on how to dispose of compostable containers correctly. It is paramount that communication and education for F&B operators, especially those in procurement roles, include facts on actual compostability in Hong Kong — in terms of both available processing infrastructure and packaging characteristics.
Until public or private investors develop adequate collection and processing capacity, F&B operators and consumers need to be aware of the true fate of what may be perceived as more sustainable packaging: compostable packaging in a market without the necessary infrastructure will still end up in landfills.
Clarity on packaging characteristics is critical. Any facility operator will need to determine and communicate what product types can be accepted in their facility, and what compostable certifications will be required, to steer both container procurement practices and disposal behaviours. For consumers

40
7.1 How it works
Reuse systems broadly refer to the practice of eliminating single-use packaging and instead utilising containers that can be used for many lifecycles. While the BYO container practice is a type of reuse, we refer to a Reuse system as one where reusable containers are loaned to consumers and typically managed by a third party on a system level — as with shared bikes or library books. Durable, reusable substitutes for SFPs keep an SFP container out of the landfill with each use. Globally, converting 20% of all plastic packaging into reusable packaging is estimated to create a HKD 46.8 billion opportunity through savings in material, transport, and reprocessing costs alone.114
7.1.1 System description
The reuse system is logistically one of the more complex solution archetypes, because the SFP needs to move between various parties in the system. It allows customers to borrow containers for their takeout food or beverage and requires them to return the container after use. The return process can take shape in two primary forms: the customer returns it to a dedicated collection bin or point, or the container is picked up from the consumer at a pre-arranged time.
Used containers are cleaned (a) by the F&B operator, (b) at acentralised wash facility, or (c) at the site of one participating F&B operator on behalf of other participants. In the latter two models, the containers must be redistributed to participating points of sale for the next use cycle.
Reuse systems can vary on other dimensions, like the use of technology and financial incentives. Technology such as QR codes or Radio Frequency Identification (RFID), can facilitate the tracking and accountability of containers within the system.115 Monetary incentives can be used to motivate customers to return containers within an allotted period, or to maximise use. Customers may also be charged subscription or use fees, which help finance the reuse system. Reuse systems deploy a wide variety of material types such as stainless steel, silicone, glass, bamboo, and a range of plastic resins. Each material type has its own advantages and disadvantages with respect to the container’s technical performance, marketability, affordability, and environmental impact (see non-exhaustive list provided by the Institute of Food Technologists116 in Table 3). Ultimately, however, the choice of container material and design primarily depends on the requirements of the food or beverage that it caters to.
Reuse systemsFacilitating reuse at the community-level
Figure 29Schematic diagram of the reuse system
Container collection
Container washing
Container drop-off
Delivery
Pick-upConsumption
Container redistribution
Food/beverage is packaged for takeout
Container pick-up
Container rinsing
7
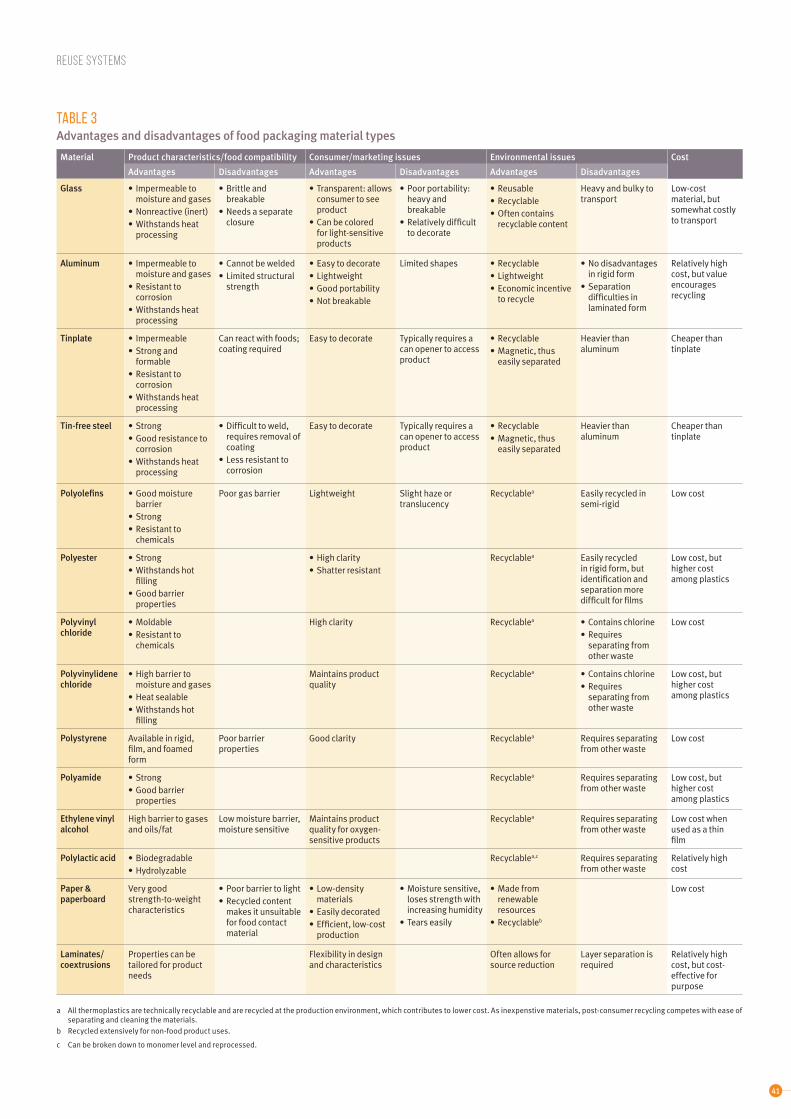
41
Reuse systems
TABLE 3Advantages and disadvantages of food packaging material types
Material Product characteristics/food compatibility Consumer/marketing issues Environmental issues Cost
Advantages Disadvantages Advantages Disadvantages Advantages Disadvantages
Glass • Impermeable to moisture and gases
• Nonreactive (inert) • Withstands heat
processing
• Brittle and breakable
• Needs a separate closure
• Transparent: allows consumer to see product
• Can be colored for light-sensitive products
• Poor portability: heavy and breakable
• Relatively difficult to decorate
• Reusable• Recyclable• Often contains
recyclable content
Heavy and bulky to transport
Low-cost material, but somewhat costly to transport
Aluminum • Impermeable to moisture and gases
• Resistant to corrosion
• Withstands heat processing
• Cannot be welded• Limited structural
strength
• Easy to decorate• Lightweight• Good portability• Not breakable
Limited shapes • Recyclable• Lightweight• Economic incentive
to recycle
• No disadvantages in rigid form
• Separation difficulties in laminated form
Relatively high cost, but value encourages recycling
Tinplate • Impermeable• Strong and
formable• Resistant to
corrosion• Withstands heat
processing
Can react with foods; coating required
Easy to decorate Typically requires a can opener to access product
• Recyclable• Magnetic, thus
easily separated
Heavier than aluminum
Cheaper than tinplate
Tin-free steel • Strong• Good resistance to
corrosion• Withstands heat
processing
• Difficult to weld, requires removal of coating
• Less resistant to corrosion
Easy to decorate Typically requires a can opener to access product
• Recyclable• Magnetic, thus
easily separated
Heavier than aluminum
Cheaper than tinplate
Polyolefins • Good moisture barrier
• Strong• Resistant to
chemicals
Poor gas barrier Lightweight Slight haze or translucency
Recyclablea Easily recycled in semi-rigid
Low cost
Polyester • Strong• Withstands hot
filling• Good barrier
properties
• High clarity• Shatter resistant
Recyclablea Easily recycled in rigid form, but identification and separation more difficult for films
Low cost, but higher cost among plastics
Polyvinyl chloride
• Moldable• Resistant to
chemicals
High clarity Recyclablea • Contains chlorine• Requires
separating from other waste
Low cost
Polyvinylidene chloride
• High barrier to moisture and gases
• Heat sealable• Withstands hot
filling
Maintains product quality
Recyclablea • Contains chlorine• Requires
separating from other waste
Low cost, but higher cost among plastics
Polystyrene Available in rigid, film, and foamed form
Poor barrier properties
Good clarity Recyclablea Requires separating from other waste
Low cost
Polyamide • Strong• Good barrier
properties
Recyclablea Requires separating from other waste
Low cost, but higher cost among plastics
Ethylene vinyl alcohol
High barrier to gases and oils/fat
Low moisture barrier, moisture sensitive
Maintains product quality for oxygen-sensitive products
Recyclablea Requires separating from other waste
Low cost when used as a thin film
Polylactic acid • Biodegradable• Hydrolyzable
Recyclablea,c Requires separating from other waste
Relatively high cost
Paper & paperboard
Very good strength-to-weight characteristics
• Poor barrier to light• Recycled content
makes it unsuitable for food contact material
• Low-density materials
• Easily decorated• Efficient, low-cost
production
• Moisture sensitive, loses strength with increasing humidity
• Tears easily
• Made from renewable resources
• Recyclableb
Low cost
Laminates/ coextrusions
Properties can be tailored for product needs
Flexibility in design and characteristics
Often allows for source reduction
Layer separation is required
Relatively high cost, but cost-effective for purpose
a All thermoplastics are technically recyclable and are recycled at the production environment, which contributes to lower cost. As inexpenstive materials, post-consumer recycling competes with ease of separating and cleaning the materials.
b Recycled extensively for non-food product uses.
c Can be broken down to monomer level and reprocessed.

42
7.1.2 Reuse in Hong Kong
Globally, reusable container systems are still an emerging solution. In Hong Kong, a handful of small-scale pilots have trialled reuse systems for both food and beverage items (Box 8).
Insights from organisers of reuse system pilots highlight the various Hong Kong-specific considerations that narrow choices for specific system parameters. For many F&B outlets, space is highly limited and necessitates containers that can be compactly stacked, hence the continued use of EPS containers in many eateries.
Space is also an important consideration in the return process. The pick-up collection method requires several containers to fit in the delivery rider’s motorbike storage at a time. On-foot
delivery staff would be even more constrained in terms of how many containers they can return on one journey. If containers are dropped off by consumers at a collection bin, the bin must be able to store many containers at a time without taking up too much space in the restaurant or public space.
Unlike in most other cities, not all Hong Kong F&B outlets have their own dishwashing facilities.121 Many eateries outsource to commercial wash kitchens because of space restrictions and the high labour costs of hiring dishwashers, which are high in demand and short in supply in Hong Kong.122 The lack of dishwashing facilities both in restaurants and as dedicated commercial services poses another challenge to reuse systems in Hong Kong.
Box 8: Reuse systems in Hong Kong
The Hong Kong Government’s Environmental Campaign Committee piloted a reusable lunch box service, ben don go!, over a 50-day period in summer of 2021.118 The pilots ran in two locations: a Government office building in Wan Chai and the D-PARK shopping mall in Tsuen Wan. Users paid a HKD 20 deposit with their Octopus card and received a loaned food container for ordering takeout (Figure 30). Customers were refunded the deposit upon returning the container, without having to wash or rinse the container first. The container was then washed by an externally contracted washing company.
Events. In 2019, the EPD also launched a ‘Reusable Tableware Lending Programme for Large-scale Events’, offering free reusable tableware delivery, collection, and cleaning services for large-scale event organisers. Other reusable tableware initiatives are being trialled in different event settings, such as sporting events, music festivals, and banquets. We Use is one such tableware rental company that has been operating since 2015. It coordinates the delivery, on-site facilitation, collection, and washing of
tableware in return for a rental and logistics fee.119 Similarly, the Hong Kong Rugby Sevens purchased 250,000 reusable cups for Hong Kong Stadium in 2019 and hired the reusable tableware company BottLess to facilitate the off-site cleaning in commercial washing facilities.120
Cups. Muuse, a Singapore- and Hong Kong-based reusable coffee cup company, has been piloting a reusable coffee cup system in Hong Kong since November 2020. Across five coffee shops within the Taikoo Place commercial complex, the pilot currently has an average monthly uptake of about 850 uses. Since the summer of 2021, Circular City has been trialling a reusable cup system for hot and cold drinks in both Discovery Bay ferry terminals. In its 17th week, the trial saw an average of 200 uses per week.
Food containers. Several private and public sector trials are planned or under way. The Black Sheep Restaurant Group, which operates over 25 mid- to high-end restaurants of diverse cuisines, began piloting a reusable container programme in July 2021 to complement its in-house delivery food service. The delivery platform foodpanda aims to incentivise customers to bring their own cups and container for pick-up orders, and will trial a reusable packaging model for delivery orders for launch in 2022.117
Reuse systems
Figure 30ben don go! Reusable food container pilot
Source: ben don go! Facebook page
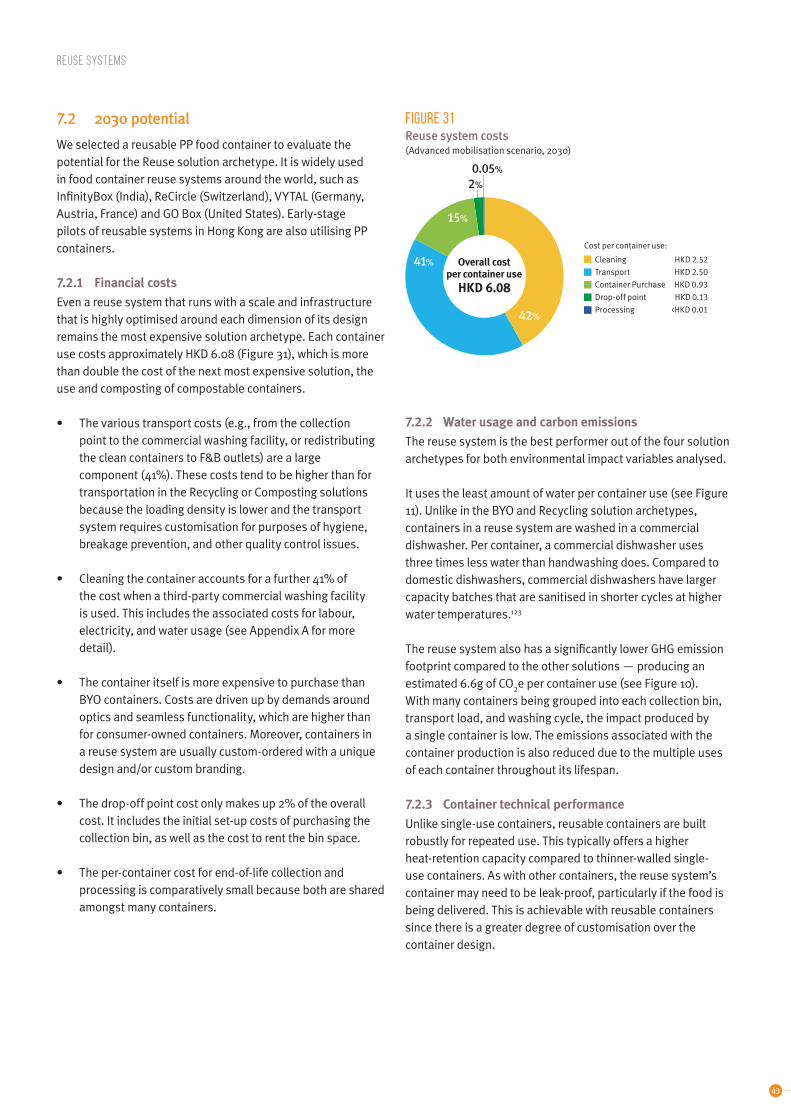
43
7.2 2030 potential
We selected a reusable PP food container to evaluate the potential for the Reuse solution archetype. It is widely used in food container reuse systems around the world, such as InfinityBox (India), ReCircle (Switzerland), VYTAL (Germany, Austria, France) and GO Box (United States). Early-stage pilots of reusable systems in Hong Kong are also utilising PP containers. 7.2.1 Financial costs
Even a reuse system that runs with a scale and infrastructure that is highly optimised around each dimension of its design remains the most expensive solution archetype. Each container use costs approximately HKD 6.08 (Figure 31), which is more than double the cost of the next most expensive solution, the use and composting of compostable containers.
• The various transport costs (e.g., from the collection point to the commercial washing facility, or redistributing the clean containers to F&B outlets) are a large component (41%). These costs tend to be higher than for transportation in the Recycling or Composting solutions because the loading density is lower and the transport system requires customisation for purposes of hygiene, breakage prevention, and other quality control issues.
• Cleaning the container accounts for a further 41% of the cost when a third-party commercial washing facility is used. This includes the associated costs for labour, electricity, and water usage (see Appendix A for more detail).
• The container itself is more expensive to purchase than BYO containers. Costs are driven up by demands around optics and seamless functionality, which are higher than for consumer-owned containers. Moreover, containers in a reuse system are usually custom-ordered with a unique design and/or custom branding.
• The drop-off point cost only makes up 2% of the overall cost. It includes the initial set-up costs of purchasing the collection bin, as well as the cost to rent the bin space.
• The per-container cost for end-of-life collection and processing is comparatively small because both are shared amongst many containers.
Reuse systems
Figure 31Reuse system costs(Advanced mobilisation scenario, 2030)
Cleaning HKD 2.52
Transport HKD 2.50
Container Purchase HKD 0.93
Drop-off point HKD 0.13
Processing <HKD 0.0142%
2%
Cost per container use:
Overall cost per container use
HKD 6.08
41%
15%
0.05%
7.2.2 Water usage and carbon emissions
The reuse system is the best performer out of the four solution archetypes for both environmental impact variables analysed.
It uses the least amount of water per container use (see Figure 11). Unlike in the BYO and Recycling solution archetypes, containers in a reuse system are washed in a commercial dishwasher. Per container, a commercial dishwasher uses three times less water than handwashing does. Compared to domestic dishwashers, commercial dishwashers have larger capacity batches that are sanitised in shorter cycles at higher water temperatures.123
The reuse system also has a significantly lower GHG emission footprint compared to the other solutions — producing an estimated 6.6g of CO
2e per container use (see Figure 10).
With many containers being grouped into each collection bin, transport load, and washing cycle, the impact produced by a single container is low. The emissions associated with the container production is also reduced due to the multiple uses of each container throughout its lifespan.
7.2.3 Container technical performance
Unlike single-use containers, reusable containers are built robustly for repeated use. This typically offers a higher heat-retention capacity compared to thinner-walled single-use containers. As with other containers, the reuse system’s container may need to be leak-proof, particularly if the food is being delivered. This is achievable with reusable containers since there is a greater degree of customisation over the container design.

44
In the other solution archetypes, customers (BYO) and/or F&B operators (Recycling and Composting) may choose from a variety of container designs and select the one most suitable to a particular meal type or delivery model. Containers in a reuse pool, however, require more standardisation across all uses, for reasons of scale and logistics. Consequently, a single or limited set of designs must be able to handle a wide variety of foods. Due to its repeated use, the reusable container must be resistant to retaining odours, oils, and colour staining — no small task in Hong Kong with its range of local and international cuisines. This combined need for versatility and durability puts extraordinary demands on the technical characteristics of the container.
Other challenges may be easier to overcome. For example, if the container is opaque, operators may need to compensate for any perceived loss of aesthetics — as discussed with the compostable container. Another potential barrier identified by F&B operators is the loss of fill level indicators, but there are ample precedents for durable food service items that have such markers, e.g., beer glasses.
7.2.4 Demands on stakeholders
The Reuse system requires a sizeable shift from current practices on the part of consumers, F&B operators, collection systems, and treatment infrastructure alike.
Consumers are responsible for rinsing the loaned container and returning it in a timely manner, by arranging a pick-up time or seeking out a designated drop-off bin. While not all consumers have immediate access to washing facilities, a small survey of office workers in various commercial buildings shows that the vast majority (88%) have access to pantries with sinks in their workplace.124 If consumers are allowed to rent multiple
Reuse systems
containers at a time, they must also have the adequate space to store the containers until they return them.
As with BYO containers, F&B operators may require a new set of standard operating procedures as well as staff training. Reusable cups and food containers are typically considerably less stackable than their single-use counterparts. Given that space is such a limiting factor in the Hong Kong market, F&B operators will likely require frequent deliveries of clean containers — more so than in geographies where operators have better access to on-site storage. F&B outlets may also be container collection points or serve as cleaning stations if they possess washing facilities. This, too, will necessitate updates to standard operating procedures. Moreover, staff must be equipped to encourage and educate customers, and troubleshoot when needed.
The collection infrastructure is dependent on how consumers return the containers. Unless containers are picked up directly from the consumer, bins must be placed in locations that are convenient enough to encourage repeated use. The ‘five-minute walk’ range, equal to about 400 meters, has been suggested as the range in which a reuse system should design its collection point network.125
Collection bins may also attract pests or develop odours, especially in Hong Kong’s subtropical climate. This necessitates a systematic and expedient collection system that operates with a daily frequency at a minimum. Some systems have used participating F&B outlets as return collection points, whereas others have worked with Government agencies or property developers to place bins in commonly-accessed public and commercial spaces.
Figure 32Demands on stakeholders in the Reuse solution
The reuse system requires a sizeable shift from current practices on the part of consumers, F&B operators, collection systems, and treatment infrastructure alike.
Stakeholders
Consumer
F&B Operator
System (collection)
System (treatment)
Less MoreSolution difficulty

45
In both cases, containers must be aggregated and brought to the washing facility on a regular basis to prevent the remaining food residue from attracting pests or developing excessive odours. Pick-up services facilitated by the collection operator also require an aggregation centre to store the used containers before they are sent to the washing facility.
The washing infrastructure poses a unique set of challenges to be addressed in the Reuse solution: facilities are lacking; those that exist struggle to survive; equipment is not suited for the variety of containers; and demands on washing performance are high.
As mentioned prior, one of the primary barriers to implementing reuse systems in Hong Kong is the lack of commercial washing infrastructure. For example, there are hardly any such facilities on Hong Kong Island, despite the high density of key business districts that may serve as ideal communities for reuse systems. The daily transportation to and from wash facilities off Hong Kong Island incurs a sizable cost barrier, particularly for reuse systems that are in their early stages of operation.
Furthermore, several centralised washing facilities have scaled down or closed altogether from 2020 onwards due to the economic impacts of the COVID-19 pandemic. Phoebe Leung, who manages circularity and waste diversion strategies at Swire Properties, explains that it is a chicken-and-egg situation. “Commercial wash kitchens find it uneconomical to offer their services if product volumes are too low, but it’s not possible to achieve greater scales without these washing logistics,” she said.
Even with commercial washing facilities available, containers from the reuse system are not as easy to clean compared to regular dishware. “Commercial dishwashing machines are not always equipped to handle containers or tumblers of materials or shapes that vary from typical restaurant dishware such as plastic or melamine and porcelain plates, bowls, and cups,” describes Hannah Chung, who helped test and develop the ongoing Muuse reusable cup pilot.
Since containers may sit for several hours or days in collection bins before being washed, food or beverage residue becomes harder to remove. Depending on the level of soiling, containers may require a soaking stage prior to being run through the dishwasher. With consumers placing high demands on real and perceived hygiene, optics matter a lot. “It is a given that the cup needs to be clean, but it also must appear clean for customers to trust in the loaned cup system. This means that we had to pay extra to manually remove any water stains on our tumblers after they were run through the industrial dishwasher — even though these cups were technically already sanitised,” Ms Chung explains. Some F&B operators
also choose not to outsource to commercial wash kitchens because the sanitisation procedure has yet to be regulated by the Government and may not meet the standards of the F&B operator.126
Coordination is critical. The reuse system requires a high level of system-wide coordination across various stakeholders. Operators of the reuse system must monitor the whereabouts of each container and its condition upon each use cycle. Some systems rely on customers to keep track of their containers by charging refundable deposits, which holds the consumer accountable. Other systems utilise technology by pairing QR-coded or RFID-tagged products with a smartphone app. While this approach alleviates the burden for accountability placed on consumers, it requires a higher input investment for initial development.
7.2.5 Impact on landfilling
If the reuse system can reach an optimised scale of operation by 2030, the solution is projected to eliminate 33% of the SFP containers on the market (see Figure 13). While this is the lowest projected full impact of the four solution archetypes, there are specific use-cases and segments within the market in which a reuse system would be highly effective (see Box 9).
7.3 Driving the Reuse solution
Reuse systems offer considerable potential to offset SFP waste, and produce the least environmental impacts out of the four solution systems. Of all solution archetypes, however, Reuse is the most nascent — globally, not just in Hong Kong. Moreover, there is no one-size-fits-all reuse model. Every successful application requires a significant amount of trial and error to tailor the components to its specific use-case. There is no existing, proven model that can be replicated for the Hong Kong market. These models need to be designed, more or less from scratch, for Hong Kong communities. This process necessitates multiple iterations on the system design to produce and apply insights on best practices. Hong Kong’s early adopters, such as the Black Sheep Restaurant Group, are testing various phases of this iterative design process.
The reuse system’s many layers of complexity make it considerably more costly to operate than the other solution archetypes. The implementation considerations listed below aim to drive down cost and improve stakeholders’ overall acceptance and adoption.
Infrastructure. Cleaning costs can be optimised by improving commercial wash kitchens. More capacity is needed, and their ability to handle diverse dishware must be improved. At the moment, containers have to travel far to reach a wash kitchen and a lot of manual labour is required, driving up the cost.
Reuse systems

46
System scale. Per-container transport costs can also be reduced if the system operated at a greater scale — thus establishing more efficient transport routes. Generally, the system costs will diminish as more users in an area participate in the programme. Support from district councils to scale up reuse pilots and accommodate washing facilities closer to F&B outlets could be instrumental in improving the cost competitiveness of reuse systems (further discussion on scaling provided in Chapter 8).
Product scale and customisation. There are various scale aspects that must be addressed and balanced. The development of containers that can last for more use cycles is crucial in driving down per-usage cost and reaping larger environmental benefits. It is also important to develop low-cost options for container customisation that do not negatively affect container longevity. This customisation should not negatively affect scaling up across a catchment area, nor the actual retention and reuse of containers in the system. Catchment-specific branding may be more flexible and scalable than branding referring to the specific F&B-operator (Figure 33). Event-specific branding may, however, increase the risk of consumers keeping containers as souvenirs — resulting in accelerated shrinkage of the container pool. Similarly, branding that includes a date may prevent event operators from carrying over the pool to the next season or year.127
Location. While reuse systems may be more complex to implement than other solutions, there are specific environments that lend well to facilitating reuse habits. Semi-closed systems, such as buildings, construction sites, or campuses, offer a catchment area and controlled environment where tenants, workers, or regular visitors can incorporate reusable systems into their regular routines more easily. For example, a cup of coffee from a kiosk in an office tower lobby can be returned to the same place at lunchtime or the end of the day. Distribution logistics for the containers, too, can be simplified when the system area is contained within specific boundaries. This is the case for the Muuse pilot in Taikoo Place, with five closely-located cafes.
Coordination. Reuse systems require coordination to connect participating stakeholders and facilitate trial iterations. Many of the parameters described in this chapter cannot be fully determined or fixed ahead of a new reuse scheme. The availability of dishware, pickup frequency, signage, and other forms of communication all should be fine-tuned and even overhauled to maximise F&B operator and consumer participation. Feedback from various users must be collected to drive further optimisation after the initial setup. As MIT Sloan
Reuse systems
Figure 33Catchment-specific branding of reusables at a food court located in a Hong Kong mall
professor Pierre Azoulay noted in a 2017 article on platform strategies, “[This] is, in some sense, one of the most ambitious ways of entering a market you could have, because it requires coordinating the behaviours of multiple parties that might not know each other, that might not even want to know each other. You’re sort of this orchestra conductor, and as a result of being very ambitious, it also fails very often.” 128 For this reason, too, semi-closed systems can be beneficial for reuse. As Dr. Lai, who oversees the Taikoo Place reusable cup programme for Swire Properties, points out, “Property developers and management companies can help reuse systems run smoothly by connecting F&B tenants, consumers, and logistics partners.”
Even when all optimisation levers are pulled, the per-meal cost of a reuse system may never drop to the exceedingly low cost of disposables. While the Government’s planned introduction of Municipal Solid Waste charging will bridge some of the gap, the reuse system will likely remain premium-priced. Unless the Government facilitates and even co-funds such systems at scale, this solution will likely remain limited to select catchment areas and applications where the property manager, F&B operators, or consumers are willing to pick up the bill for reasons of placemaking, quality of the consumption experience, or enhanced sustainability. Following the analysis of each solution system’s merits and challenges in Chapters 4–7, the next chapter discusses critical implementation dimensions.
47
In a 2018 report on the opportunity for Reuse and BYO systems in Sydney’s Central Business District, the authors caution that food outlets would likely try to manage BYO containers on an exception basis, if uptake was limited and growing slowly.129 Anything that is managed as a concession rather than as the rule, however, does not offer a good basis for long-term sustainability and growth.
The key, then, is to scale any solution quickly. Growth in demand drives interest and investment on the supply side, while growth in supply drives convenience and normalisation.
This is the case for all aspects of solutions systems, from recycling bins to F&B operators’ BYO container acceptance. In addition to the solution chapters’ more comprehensive discussion of all that is needed for a solution to thrive, this chapter highlights some of the key aspects of facilitating this accelerated maturation for the four solutions analysed in this report.
8.1 Behavioural sciences offer food for thought
The behavioural sciences can offer clues for how to scale up the behaviours that are required to make each of the studied solutions work. It is worthwhile to review the most recent insights from a theoretical perspective before offering some examples of how to apply these insights and principles practically in the next sections.
Most studies, and hence many public and private interventions emphasise the role of values, norms, attitudes, intentions, and motivation in driving behaviours.130 This is evident in the growing emphasis on environmental education in Hong Kong and across the world. The hope is that a better understanding of, for instance, the ecological and resource-driven imperative to recycle (‘our beaches are full of plastics, what a waste’), will result in shifting intentions (‘I will recycle my drink bottles’) as well as an actual behavioural shift (individual recycles their drink bottles).
Scaling up solutions
However, while interventions based on so-called attitude–behaviour models131 can be pragmatic and effective, people often fail to align their knowledge and internal motivations with sustainable actions. Even though individuals possess intrinsic motivation, they will not necessarily translate this into pro-environmental behaviours. Consumers may understand why recycling is necessary and become determined to recycle, but they may not actually change their behaviour.
Scientists believe these limitations can be overcome if we look at sustainable behaviours through a habit lens.132 Habit theory lays out how habits matter in improving environmental outcomes: 133
Behaviour is heavily reliant on automatic processes. If individuals can develop true recycling habits that rely on their ‘impulsive system’, rather than having to muster conviction and reasoned motivation every time a behaviour is called for, recycling behaviours should expand in terms of participation, frequency, and scope.
Social and physical contexts set boundary conditions for environmental behaviour. Contexts shape habits and cue action responses. For a habit to develop, the surrounding context must provide a possibility for that habit. Importantly, if such an environment is designed to make a sustainable behaviour (like bringing a reusable cup) the easiest option, that behaviour is likely to take shape regardless of the underlying attitudes or intentions of the individual.
Conversely, contexts that have shaped non-environmental habits for a long time can also overpower people’s ability to act according to their new or existing environmental values and convictions. If everyone in the team or office throws their coffee cups in the rubbish bin, it is hard for an individual to change that habit, even after learning that cups collected in the dedicated recyclables bin will, in fact, get recycled in Hong Kong.
8

48
Scaling up solutions
Our habits and past behaviour shape our values and self-identity. Self-perception theory argues that some of our attitudes and preferences may be determined through the interpretation of our past actions. In other words, an individual’s repeated recycling behaviour might lead to adopting a more sustainability-oriented identity. Based on attitude–behaviour models, this in turn may stimulate further recycling behaviours: ‘Because I see myself as ‘green’ based on my recycling of plastic drink bottles, I will start bringing my own coffee cup, as this is aligned with my values.’ It can also act as a buffer against relapsing into former disposal habits when new, more sustainable practices are not yet fully anchored.
8.2 Scaling up Recycling
In Hong Kong, as in many other jurisdictions, there is an ongoing discussion around the causes of poor recycling outcomes. It could be argued that there is little point in expanding, refining, or upgrading recycling infrastructure if
Table 4Applying habit theory to SFP Recycling
Principle Implications for the Recycling solution
Habitat architecture
Design the waste and recycling infrastructure to transform waste-related habits, making recycling an easier option than disposing to landfills.
• Achieve this by developing a sufficiently dense network of all-plastic collection points.
• Make sure these points are clean and accessible (suitably positioned both in- and outdoors, adequate signage, sufficient opening hours, and available capacity).
Reinforce the physical environment with cues from the social environment. V Cycle’s Eric Swinton offers this example: “An office environment is one setting where consumers are more readily educated, especially since colleagues end up encouraging one another.”
Consistency Reinforce the formation of recycling habits by creating consistency in the look and feel of the collection points, as well as in the rules for usage (e.g., the scope of what is collected). “Communication surrounding clean recycling needs to be both memorable and consistent over time,” Mr Swinton suggests.
Such consistency allows for Recycling habits to be carried across into all areas of life: home, work, school, leisure, and transport.
Undoing poor habits
Avoid appeals for behavioural change without context change.
For example: simply relabelling a bin from ‘any plastics’ to ‘plastic bottles’ without changing location or form factor will not disrupt the context sufficiently to effectively change the habit.
citizens display poor recycling behaviours and underutilise or abuse existing infrastructure. Others may argue that citizens will not increase recycling participation if the available infrastructure is not convenient, accessible, and trustworthy.
Behavioural science offers insights to address this chicken-and-egg argument through the right type of interventions. Based on Section 8.1, we conclude that both education and infrastructure are necessary to facilitate the behavioural changes that are required to obtain better recycling outcomes. The former helps in conveying values and developing attitudes, with the aim of prompting intent. The latter facilitates the transition from reflective (i.e., goal-oriented) to impulsive (i.e., cue-driven) behaviours — an absolute necessity when anchoring and scaling recycling practices.
The principles discussed in Section 8.1 also carry practical implications for improving Hong Kong’s recycling of single-use foodservice containers (Table 4).
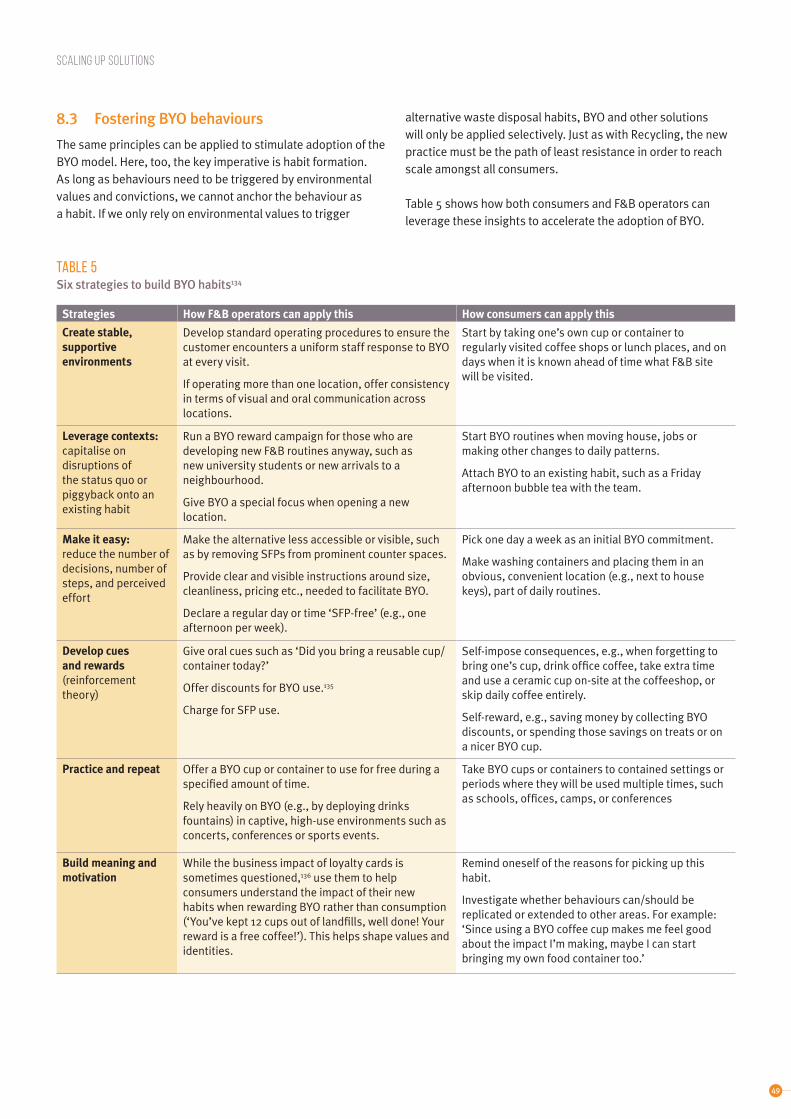
49
Scaling up solutions
Table 5Six strategies to build BYO habits134
Strategies How F&B operators can apply this How consumers can apply this
Create stable, supportive environments
Develop standard operating procedures to ensure the customer encounters a uniform staff response to BYO at every visit.
If operating more than one location, offer consistency in terms of visual and oral communication across locations.
Start by taking one’s own cup or container to regularly visited coffee shops or lunch places, and on days when it is known ahead of time what F&B site will be visited.
Leverage contexts: capitalise on disruptions of the status quo or piggyback onto an existing habit
Run a BYO reward campaign for those who are developing new F&B routines anyway, such as new university students or new arrivals to a neighbourhood.
Give BYO a special focus when opening a new location.
Start BYO routines when moving house, jobs or making other changes to daily patterns.
Attach BYO to an existing habit, such as a Friday afternoon bubble tea with the team.
Make it easy: reduce the number of decisions, number of steps, and perceived effort
Make the alternative less accessible or visible, such as by removing SFPs from prominent counter spaces.
Provide clear and visible instructions around size, cleanliness, pricing etc., needed to facilitate BYO.
Declare a regular day or time ‘SFP-free’ (e.g., one afternoon per week).
Pick one day a week as an initial BYO commitment.
Make washing containers and placing them in an obvious, convenient location (e.g., next to house keys), part of daily routines.
Develop cues and rewards (reinforcement theory)
Give oral cues such as ‘Did you bring a reusable cup/container today?’
Offer discounts for BYO use.135
Charge for SFP use.
Self-impose consequences, e.g., when forgetting to bring one’s cup, drink office coffee, take extra time and use a ceramic cup on-site at the coffeeshop, or skip daily coffee entirely.
Self-reward, e.g., saving money by collecting BYO discounts, or spending those savings on treats or on a nicer BYO cup.
Practice and repeat Offer a BYO cup or container to use for free during a specified amount of time.
Rely heavily on BYO (e.g., by deploying drinks fountains) in captive, high-use environments such as concerts, conferences or sports events.
Take BYO cups or containers to contained settings or periods where they will be used multiple times, such as schools, offices, camps, or conferences
Build meaning and motivation
While the business impact of loyalty cards is sometimes questioned,136 use them to help consumers understand the impact of their new habits when rewarding BYO rather than consumption (‘You’ve kept 12 cups out of landfills, well done! Your reward is a free coffee!’). This helps shape values and identities.
Remind oneself of the reasons for picking up this habit.
Investigate whether behaviours can/should be replicated or extended to other areas. For example: ‘Since using a BYO coffee cup makes me feel good about the impact I’m making, maybe I can start bringing my own food container too.’
8.3 Fostering BYO behaviours
The same principles can be applied to stimulate adoption of the BYO model. Here, too, the key imperative is habit formation. As long as behaviours need to be triggered by environmental values and convictions, we cannot anchor the behaviour as a habit. If we only rely on environmental values to trigger
alternative waste disposal habits, BYO and other solutions will only be applied selectively. Just as with Recycling, the new practice must be the path of least resistance in order to reach scale amongst all consumers.
Table 5 shows how both consumers and F&B operators can leverage these insights to accelerate the adoption of BYO.

50
8.4 Enabling Composting at scale
The habit-forming conditions set out in the previous sections are also valid for the consumer side of the Composting solution. For it to deliver on its potential, however, four further requirements must be met in other parts of the value chain. Functional yet compostable packaging must exist, and that packaging should be identifiable. Treatment facilities must exist, and it has to be possible to get the discarded packaging there in a cost-effective way.
Driving packaging innovation. The use of compostable packaging at scale necessitates the expansion of available products on the market. Their technical performance must be improved without resorting to solutions that require plastics or chemicals that compromise the health of factory workers, F&B staff, or consumers.
Communicating clearly. Packaging nomenclature and labelling should be consistent and unambiguous. Materials should be detailed correctly. For example, containers with a very thin layer of plastics should not be labelled as ‘plastic-free’, as can currently be found on the market. End-of-life claims must be specific; compostability claims should explicitly state whether the product is home-compostable or industrially compostable. Certification of such characteristics can help avoid misunderstandings, build confidence, and hence accelerate uptake.
Developing treatment infrastructure. For the highly significant impact potential of Composting to become a reality, new infrastructure must be put in place or existing facilities must be upgraded. The infrastructure roadmap set out in the latest Waste Blueprint must be detailed and, where necessary, modified to ensure that facilities can receive pre-specified compostable packaging types.
Expanding and improving collection infrastructure. As some restaurants turn to compostable packaging, most of these items will be discarded outside F&B facilities: at home, in the office, and on the go. It is therefore paramount to expand the scope of the organic waste collection programmes beyond F&B sites, food processors, and wet markets. Households, building managers, and consumers on-the-go must also gain access to convenient collection facilities.
The Government’s proposed ban on plastic single-use foodservice packaging, RDPT, will affect the first dimension described above, packaging design. F&B operators that cannot or will not fully switch to reusables may initially rely on the non-plastic single-use solutions already in the market. The demand for packaging products that meet Hong Kong-specific needs in
Scaling up solutions
terms of oil- and heat resistance or format functionality (e.g., to keep wontons separate from soup) will drive innovation from local and international manufacturers.
Until a ban or similar regulation is in place, Hong Kong’s many small-scale restaurants may not be able to drive such innovation on their own. Aggregating that collective buying power could help expedite the process. For example, “foodpanda has been working directly with a compostable packaging supplier to provide plastic-free, bagasse packaging to our partner restaurants,” says Woody Chan, foodpanda’s CSR & Sustainability Manager. “The main challenge is getting the cost to be fully competitive with current plastic or EPS containers.”
Bagasse is a relative newcomer to the SFP materials market. Its growing uptake warrants a further look at the material’s sourcing, in terms of both quantity and quality. The sugarcane industry (a source of bagasse feedstock) is the second largest agro-industry in the world, suggesting that bagasse feedstock supplies are ample.137 Dr. Meike Sauerwein, from the Hong Kong University of Science and Technology’s Division of Environment and Sustainability, cautions: “The alternative use of bagasse, such as for bio-ethanol production, cement production, or structural particleboards, may increase the price of bagasse food containers or limit the available supply, especially if these alternative uses are higher in value.”
Given that bagasse is derived from an agricultural feedstock, there could be unaddressed health concerns associated with pesticide residues that contribute to the toxicity of the bagasse product — especially those that are used for food and beverage packaging. While the European Union, for example, strictly regulates such residues in food and feed products, food contact materials are currently more of a grey area. “The use of pesticides and other chemicals during the production and processing of bioplastics and other plant-based materials is a concern,” notes Dr. Shauhrat S. Chopra, whose research has focused on the life cycle assessments (LCAs) for emerging materials and technologies at the City University of Hong Kong. “It must be brought to the attention of the public as well as the manufacturers of the alternative plastic materials.”
A ban on certain types of containers might affect product communication. F&B operators, keen to remain compliant, will want to assure that the products they use are effectively plastic-free. If frivolous product claims lead to fines or the revoking of licensing due to packaging non-compliance, F&B operators may start requiring more formalised, harmonised, or even certified product content statements. Dominic Dubois, Corporate Responsibility and Sustainability Officer at The Hong Kong and Shanghai Hotels, illustrates this: “As we continue to

51
search for sustainable packaging alternatives, we come across a myriad of ‘eco-friendly’ solutions. Yet, even with a dedicated sustainability team, we continue being challenged when comparing environmental benefits, costs, practicality and ease-of-use, and fostering guest behaviour. With so many new materials and alternatives, it is imperative that brands make informed decisions.”
The search for transparently-marketed compostable packaging might prove even harder for small- and medium-sized F&B operations, who might lack access to specialised information or additional manpower to devote to this topic. “Currently, information on sustainable or alternative packaging is scattered across the market and difficult for F&B operators to access, particularly if they are small-scale,” confirms Aditi Deodhar, CEO and Co-Founder of Planeteers. Creating a centralised directory of ‘sustainable’ packaging suppliers available to F&B operators in Hong Kong, with details on the type of solution or the certifications it possesses (e.g., compostable, FSC-certified), would be a productive first step to address this issue.
It is unlikely that the Government’s proposed ban would immediately lead to better communication around actual compostability. Because the RDPT ban would focus on the nature of the materials rather than on its end-of-life performance, compostability claims are irrelevant to F&B compliance and may not receive much scrutiny from F&B operators or Government agencies.
Unaccompanied, the proposed ban also cannot address collection and treatment infrastructure needs: compliance with the ban does not require the packaging or the packaging user to meet any end-of-life considerations and hence the use of non-plastic packaging in itself may not necessarily drive demand for composting solutions. Separate, additional policy tools are needed, such as a more explicit translation of the Blueprint’s zero landfill target into a detailed masterplan for all of Hong Kong’s organic waste.
8.5 Accelerating Reuse systems
Reuse systems are, in essence, platforms. Much like online platforms, the success of such systems is largely — but not solely — driven by the number of participants. Depending on the level of centralisation of the Reuse system, those
Scaling up solutions
participants include either users (in a decentralised, operator-based system) or both users and suppliers (in a centralised system with multiple operators). Thought needs to be given as to how to increase participation in both of these operation models. Here, too, the behavioural sciences can offer valuable insights.
As MIT Sloan Professor Catherine Tucker expressed in a 2017 article on platform strategies, rather than having a feature mindset, one needs to have a seeding mindset.138 Platforms require three key steps to increase both supplier and user rates: exposing many people to a new idea like Reuse, encouraging them to give it serious consideration, and convincing them to try it out. Since Reuse systems involve a material and handling component — as opposed to the simple mouse-clicks required in many online platforms — these platforms require even more thought as to lowering the threshold for participant experimentation.
Garnering the attention of potential new participants is only the beginning. Kate Daly, the Managing Director of the Center for the Circular Economy at Closed Loop Partners, explains: “It is important to consider not just the customer’s first use of a reusable, which might be driven by curiosity, the search for sustainable alternatives, or a reward programme, but also what incentivises them to continue opting out of single-use.” Customer retention and frequent usage requires not only convenience, but also trust. There is a lot to learn from digital markets in this regard. The early days of eBay, Uber, and AirBnB, experts point out, were riddled with fraud and abuse that the platform operators did not interfere with, let alone offer protections against.139 In the meantime, mechanisms such as supplier and user vetting, disagreement resolution, buyer protection plans, and even compensation, have increased trust, and hence, participation of both new and existing suppliers and users.
Overcoming this lack of trust comes down to creating a new way for F&B operators and customers to interact and grow comfortable with the addition of a third partner, the platform operator. MIT Sloan’s Azoulay elaborates: “There are a lot of non-pricing rules involved. Who can join, what kind of information you get to have on what’s happening on the other side, how open the data that’s generated by your platform is to others, how easy it is for others to play with that data. All of that needs to be decided, and it needs to be decided very early on.” 140

52
Scaling up solutions
Box 9: Takeout AT Construction Sites
Hong Kong’s construction sites are an example of a semi-closed system that would lend itself well to the use of reusable or compostable containers. In a 2019 survey of construction sites that engaged a total of 10,224 construction workers, over half of the surveyed workers (52%) were reported to eat their lunches at on-site or nearby restaurants and canteens, which use reusable tableware (Figure 34).141 Not all construction sites have such amenities nearby. In these cases, construction workers who do not bring their own lunches buy pre-packed lunchboxes from roadside food vendors that are either centralised caterers or small, independent vendors. These lunches are typically sold in EPS or PP containers and come with disposable cutlery and plastic bags.
Figure 34Use of disposable vs. reusable lunch containers at Hong Kong construction sites
Reusable, dine-in
Disposable,roadside independent vendor
Disposable, roadside centralised caterer
Reusable, BYO
Disposable, dine-in
52.4%
37%
5.5%
0.5%
4.5%
Table 6Solution systems for an average-sized Hong Kong construction site
Solution System
Initial investment Daily operation
Reuse • Two 200L foamboard collection bins• 273 reusable PP containers, custom-ordered
• Transport of containers to washing facility • Container washing (third-party facility)
Compost • 240L plastic collection bin• Composter (TidyPlanet A700 model, 100L daily capacity)
• Electricity and labour to run the composter• 273 compostable containers (500mL)
Recycle • 240L plastic collection bin• Three 24L plastic crates for container rinsing
• Transport of containers to recycling facility• Labour to facilitate rinsing and transport• Water and dishwashing detergent for rinsing• 273 polypropylene containers (500mL)
At some large, multi-year construction sites, canteens are set up on-site. These establishments serve with reusable tableware and have washing facilities operated by a licensed commercial canteen vendor. However, the licensing process takes close to one year, and the canteens often need to operate for a timeframe of one or two years before seeing sufficient returns on investment.142
To overcome these challenges and make on-site canteens a more accessible option for construction sites, some construction contractors have suggested a modular approach to canteen operations — pre-constructed modules fitted with a kitchen and serving area that would be attached to on-site water and electricity supplies143. Though this proposal has yet to be trialled, it serves as a potential reuse system that is well-suited to short-term or small construction sites.
Given that Hong Kong already has a city-wide plastics collection system in operation (see Chapter 4), the containers used for construction site lunches can already be collected and washed on-site at the end of the lunch break and sent for recycling. However, additional personnel would need to be deployed to facilitate this process.
A construction site offers a real opportunity to operate a reusable container programme or an on-site composting machine because
only one point of collection is needed. This eliminates the need to arrange for costly and complex collection and redistribution across various locations.
We compared the costs of implementing recyclable, compostable, or loaned reusable container solutions at a construction site. The costs were calculated to cater to 273 construction workers, which is the average workforce size based on a survey of Hong Kong sites.145 The costs were composed of a) initial investment costs for infrastructure or container procurement; and b) daily running costs to facilitate the solution system (Table 6). Further system assumptions and cost details are in Appendix B.
Table 7 provides a summary of the system costs incurred when implementing reusable, compostable, or recyclable container systems at an average Hong Kong construction site.
• The daily and per-meal cost numbers include both running and the initial investment cost, averaged over the period of a year (excluding Sundays and public holidays).
• No capital expenditure for maintenance was included.
• Charges under the upcoming MSW charging scheme were not included as the Waste Disposal (Charging for Municipal Solid Waste) (Amendment) Bill 2018 had not been passed yet by the Legislative Council at the time of the analysis. MSW charging could, however, work towards levelling the playing field for alternatives to simple disposal in general waste. This requires two conditions: for construction sites to be mandated to keep food and packaging waste separate from the construction waste stream, and for site operators to pass on the benefit of avoided MSW charges to the workers.
Figure 35Hong Kong construction workers on lunch break144

53
Scaling up solutions
Box 9: Takeout in Construction Sites (continued)
Consistent with the results of the cost analysis conducted for these solutions in prior chapters, the Recycling solution was the cheapest. Both initial investment costs and daily running costs were the lowest for recycling, largely because the containers are sent off-site to be recycled. Any costs associated with the recycling process itself, such as gate fees,146 were not included. This market is highly fluid, and the scope of this project did not allow for the additional analysis that would be required to arrive at reasonable assumptions on this cost. Even if such costs were included, however, Recycling would likely remain the cheapest solution system for construction sites.
For the Composting solution, the upfront investment costs for the composter are the biggest barrier for implementation. The use of an on-site composter allows for compostable containers to be used without dependency on industrial
Table 7System costs for SFP alternatives at Hong Kong construction sites (HKD)
Solution System Initial investment Running cost, daily Running cost, per meal Daily cost, averaged out over 1 year
Per-meal cost averaged out over 1 year
Reuse 18,030.00 1,365.00 5.00 1,425.91 5.22
Compost 157,600.00 897.95 3.29 1,430.38 5.24
Recycle 680.34 657.24 2.41 659.54 2.42
composting facilities, which has previously been discussed as the main barrier to implementing this solution. Spread over a year, the per-container costs resemble that of the Reuse system (both of which are twice as costly as the Recycle solution).
The construction site must, however, have adequate space and access to water and electricity outlets to operate the composter. Site management procedures must also include measures to keep hygine up and rodents and other pests at bay.
A Reuse system also requires a higher upfront investment cost compared to the Recycle system, but it is significantly lower than the composter costs. However, due to the labour and logistics involved with washing the containers for each daily use cycle, the Reuse system has the highest daily running costs.
Our holistic analysis of the four solution archetypes showed that reusable container systems have the lowest environmental footprints per container use, both from a water use and greenhouse gas emissions perspective. When applied to a semi-closed system like a construction site, the logistical complexities associated with this system are greatly alleviated.
This leaves cost as the only but important barrier to implementing what is otherwise the optimal solution, particularly from an environmental sustainability angle. These additional costs need not be solely shouldered by construction workers: construction companies could choose to make the initial investment and the Government could offer subsidies.
8.6 A note on peripherals
While peripheral single-use takeout packaging items (e.g., cutlery, condiment cups, napkins, bags) have not been included in the scope of this study, they still must be addressed in the broader effort to eliminate SFP waste. Based on the number of takeout meals consumed by Hongkongers in 2019, an estimated 9.8 billion sets of disposable cutlery were used that year.147 This does not include the usage of single-use peripherals for many on-site dining occasions. The latter include the many fast casual operators (e.g., burger restaurants) that rely entirely on single-use foodservice items, from cutlery to containers. It also counts a considerable number of restaurants that serve with reusable plates, bowls and cups, and nevertheless use single-use peripherals such as chop sticks, spoons, and straws (Figure 36).
The initiatives in Box 10 illustrate some options F&B operators have available to eliminate SFP peripherals.
Figure 36Using both reusable and single-use foodservice items
54
Scaling up solutions
The next chapter offers a realistic and effective action plan for each stakeholder group. This can help prioritise the roll-out of different solutions according to their applicability and potential to create meaningful impacts.
Replacing disposable peripherals with reusable ones can pay off. Rethink Disposable, a California-based organisation focused on helping organisations transition from disposables to reusables, tracked the costs of disposables to the F&B operators it works with. Cups and containers constituted the biggest cost factor. Depending on the cuisine or meal style, however, peripherals accounted for a quarter to a third of the cost of disposables.152
Box 10: Eliminating single-use foodservice peripherals in Hong Kong
On-site. Hong Kong’s Fairwood restaurant group has completely removed SFP from their premises in all but two of their restaurants. While many customers see individually wrapped SFP as a convenient way to address hygiene concerns, Fairwood — which cleans all its foodservice items to strict legal and corporate standards — tackles this concern differently. It now makes unlimited hot water available so customers can rinse the provided utensils to satisfy their individual hygiene standards — as is customary in many restaurants around Hong Kong.
Delivery. Efforts have also been made to reduce single-use cutlery waste in Hong Kong’s food delivery industry. In 2020, WWF established the Plastic ACTion initiative (PACT) in efforts to reduce single-use plastic
cutlery and packaging.148 At its launch, delivery platforms foodpanda and Deliveroo — which collectively comprise over 90% of Hong Kong’s food delivery industry — pledged to engage with network restaurants and consumers to ‘remove all unsustainable packaging by 2025’.149 As a result, both platforms added a disposable cutlery opt-in button to their user interfaces and now only provide cutlery to orders that explicitly specify it. Since the implementation of the ‘opt-in’ feature, foodpanda has seen 50% of its customers forgo disposable cutlery in their orders, saving up to 32 million sets of cutlery over two years.150 Takeaway. SaladStop!’s ‘Borrow Tree’ initiative lets customers contribute and borrow carrier bags free of charge, via a prominently placed bag hanger in each
outlet. Similar to reusable container systems, the ‘Borrow Tree’ simultaneously reduces single-use consumption and increases the life cycle of each product.151
F&B staff can be instructed to ask customers whether they need a bag, utensils, a napkin, etc. rather than offering it automatically.
Government. EPD’s 2018-19 ‘Plastic-Free Takeaway, Use Reusable Tableware’ campaign in collaboration with about 700 eateries and canteens across Hong Kong encouraged the community to reduce the use of disposable utensils. Earlier in 2018, EPD’s ‘Plastic-Free Takeaway, Use Reusable Tableware’ campaign focused on fast food kiosks and restaurants at and near public beaches to avoid plastic straws, utensils, and bags.

55
A new approach for Hong Kong
9.1 Conclusion
What would need to happen for the solutions’ potential to be captured and the steady stream of SFP heading to the landfill to be stemmed?
No solution is completely straightforward to implement, and all require commitment and effort from multiple parties. As with many, if not most, solutions based in the circular economy, system-level thinking and coordination is required — extending and integrating upstream (the supply chain), consumption/usage, and downstream (end-of-life).
We propose an approach that can be summarised as follows:
Tackle all single-use foodservice packaging, not just plastics. Use a portfolio of tools. Start now.
9.1.1 Tackle all single-use foodservice packaging
Importantly, our analysis and recommendations are not restricted to plastic items only. In contrast, the Government’s proposals for the Regulation of Disposable Plastic Tableware primarily aim to shift the food and beverage (F&B) sector away from plastics. This raises multiple concerns.
Trying to eliminate just one type of SFP will inevitably cause a shift to other SFPs. As a result, no contribution will be made to the waste reduction goals set out in the Government’s latest Waste Blueprint. Moreover, without collection and processing infrastructure in place, the use of plant-based materials could reduce our reliance on fossil resources, but would not contribute to keeping containers out of landfills , in line with the Blueprint’s zero landfill goal.
Littering concerns will also not be addressed, since littering behaviours do not subside with the use of other materials. On the contrary, materials that are deemed ‘natural’ and biodegradable may mislead consumers to think they can be left behind in parks and on beaches without further consequences.
This is linked to another concern: no SFP type is completely without environmental impact. Resources are always required, and strong demands on performance may be met through undesirable solutions like thin plastic layers or PFAS chemicals. Moreover, F&B operators and their suppliers might shift to even less sustainable solutions, such as paper foil bags. Not only are such bags resource-intensive to produce, but there is also currently no technology available to recycle them.
For all these reasons, Government policy as well as initiatives by F&B operators and NGOs should focus on all single-use foodservice packaging rather than just those made of plastics.
9.1.2 Use a portfolio of tools
Our analysis shows that Hong Kong will have to tap into more than one solution. None of the four solution types we investigated can cover the entire load of cups and containers in scope, and none can fit the bill for all F&B operators or all customer groups.
In all scenarios, the Recycling and BYO archetypes show the most promise. Since these solutions are applicable and accessible to a large segment of the Hong Kong market, they have the potential to keep the largest amount of SFP out of landfills. Importantly, both solutions can be dialled up and down relatively easily. This means that they can be encouraged and stimulated for the containers on today’s market, without creating a barrier to the future implementation of more complex solutions like Composting or Reuse.
While Reuse systems show the highest potential from an environmental impact perspective, the solution is hindered by its comparatively high cost and logistical demands that make it feasible for only certain segments of the Hong Kong market. Because of its very strong environmental performance, there is value in identifying the locations and configurations where the Reuse solution could be more readily implemented.
With the right collection and processing infrastructure in place and scaled up, Composting could displace a large share of SFP volumes. Without it, however, Composting remains an unsuitable solution. And even with such infrastructure in place, compostable containers would still produce the most greenhouse gas emissions (per use) compared to other solution types.
Since hot food containers make up the large majority of single-use foodservice packaging on the Hong Kong market, applying solutions to address this segment offers a stronger potential impact than addressing hot/cold beverage containers or cold food containers. Therefore, to maximise the number of containers that can be kept from landfills, our analysis shows that applying Recycling and BYO containers to address hot food containers is the most optimal single solution application.
9

56
This diversified approach needs to be reflected in Government policies. Policy support is necessary because no environmentally-beneficial solution can currently compete with the cost and convenience of SFP use and disposal. However, the proposed ban — while administratively efficient — cannot be the sole tool for dealing with Hong Kong’s SFP challenges. Education and engagement with consumers and hospitality stakeholders, incentives for reusable container usage, regulation of harmful packaging materials, and investments in waste management infrastructure need to be part of the policy agenda. Moreover, firm decisions on the infrastructure trajectory must be made soon if Composting and Reuse are to play a meaningful role in the future.
9.1.3 Start now
Hong Kong should not wait for a hard-hitting piece of legislation that will take time to build consensus around. The work to keep SFP waste out of landfills must start today — this is both necessary and possible.
It is necessaryHong Kong is drowning in waste from takeout meals and beverages. Not only are Hongkongers some of the region’s highest spenders on prepared food and eating out, but they also have a strong propensity towards takeout meals. Takeout habits only intensified with the onset of COVID-19, with some Hong Kong hospitality groups and delivery platforms experiencing up to 50% more takeout orders in 2020, the first year of pandemic-related lockdowns and restrictions. Takeout and delivered meals are more packaging-intense than dine-in meals, but many meals consumed on-site are also served in disposable foodservice packaging.
By weight, plastic and other SFP items make a relatively small contribution to Hong Kong’s massive per capita problem. This is, however, due to their density, which is very low in comparison to the far denser food waste that dominates Hong Kong’s municipal solid waste. Moreover, these packaging items are persistent in the litter that plagues Hong Kong’s streets, beaches, and country parks. In addition to the potential damage to animals, ecosystems and landscapes, SFP littering results in direct and indirect costs. Litter removal is more time-consuming and costly than collecting waste or recyclables from bins. Recyclables that are littered also result in foregone materials revenue. Furthermore, the collected litter must be disposed of as general waste, which means that it will incur an MSW disposal fee. Finally, storm drain impairment by litter and the resultant risk of flood damage carry an indirect but measurable cost.153
Importantly, regardless of the size of Hong Kong’s plastic waste problem, and regardless of the specific contribution of SFP to the overall waste problem, these volumes do add up and so does their risk to our oceans. The PEW Charitable Trusts found in their 2020 analysis that delaying implementation by five years could result in 80 million metric tonnes more plastic stock in the ocean by 2040. They also pointed out that delays in implementing the system interventions could take the world off its critical path towards a long-term goal of near-zero leakage.154
It is possibleThe Government’s proposed RDPT timeline is for a full ban to be implemented by 2025. This timeline is suitable for addressing certain elements of the proposed scope, such as EPS containers or most on-site uses of SFP. However, the afforded time for a full-scale ban may not be sufficient to develop sustainable, affordable, and functional alternatives to the plastic containers currently on the market. As a result, F&B operators may feel compelled to switch to suboptimal solutions that inadvertently enhance the city’s waste issue in different ways.
On the other hand, the volume of single-use foodservice items going to landfills could already be meaningfully reduced before 2025 if, for example, broad outreach and support for Recycling were to be initiated right away. Similarly, individual F&B operators or their property managers could be educated on the benefits and feasibility of BYO and Reuse to complement their current single-use practices. The timeline for an abrupt regulatory tool like a ban, and with a scope as broad as the proposed RDPT, requires more considerations surrounding what can and cannot be implemented with desirable outcomes.
9.2 Recommendations
To facilitate and accelerate the development and ultimately the realisation of the landfill diversion potential, we need to take action in a number of areas without delay, while also designing future strategy and actions. To this end, we formulated a set of recommendations across three time horizons. We organised them by stakeholder group for ease of use but, again, each solution requires extensive coordination amongst these groups.
The hospitality industry needs to lead by example: instead of waiting for policy change. F&B operators can encourage widespread shifts in consumption and takeout habits by improving consumer communication, adjusting SOPs to accommodate reusable containers, and carefully evaluating the full lifecycle of any single-use products offered by their establishments.
A new approach for Hong Kong

57
Government and policymakers are required to intervene since no environmentally beneficial solution archetype can fully compete with the SFP-laden status quo in terms of cost and convenience. In July 2021, the EPD took the possibility of introducing a ban on single-use plastic tableware to the public. The identified solutions require further policy support, such as education and engagement with consumers and hospitality stakeholders, incentives for reusable container usage, regulation of harmful packaging materials, and investments in waste management infrastructure.
The individual, daily choices that citizens and households make can collectively instigate a societal shift away from disposal and landfills. Consumers should opt for reusable containers whenever possible and recycle single-use products if the infrastructure is in place. It is also important for households to signal their interest in systemic adjustments and infrastructure upgrades to Government and hospitality stakeholders.
A new approach for Hong Kong
HOSPITALITY INDUSTRY: DITCH THE DISPOSABLES!Short-term Mid-term Long-term
For any on-site consumption, encourage guests to choose available reusable options.
For takeout consumption, • Allow and encourage customers to
bring their own containers wherever possible. Train staff and adjust SOPs as needed.
• If reusable/BYO options are not (yet) feasible, exclusively use containers that are readily recyclable in the Hong Kong system and educate customers on why, how, and where to recycle the containers.
Train staff and use customer nudging to maximise the effectiveness of BYO, Reuse, and Recycling programmes.
Investigate the business case for on-site reusables. Consider shared services like external wash kitchens.
Cut out single-use takeout packaging altogether for on-site use and use it judiciously for takeout applications.
For takeout consumption, • If existing channels prove to be ineffective
for the SFP materials offered, offer support for dedicated recycling channels (e.g., placing a collection bin, organising back-hauling with suppliers, giving communications support)
• Consider joining a centralised reuse scheme if available; several ones may need to be tried out to ensure best fit with the operations and the client base.
• Consider switching to compostable containers if the customer base has access to a composting pathway (e.g., where home composting is an option).

58
A new approach for Hong Kong
POLICYMAKERS AND GOVERNMENT: DRIVE THE CHANGE!Short-term Short-/Mid-term Mid-/Long-term
Provide information to consumers about environmental and health challenges related to the use of plastic and other single-use takeout packaging, and about their alternatives.
Enact legislation to regulate SFPs, e.g.,• Narrowly defined ban (e.g., on
expanded polystyrene), with mitigating/transition measures for small F&B operators.
• Producer Responsibility Scheme for all other single-use takeout packaging, not just plastic. Differentiation between plastic packaging and more sustainable alternatives could be achieved through fee modulation (e.g., higher fees for plastic items).
• A prohibition on PFAS in all food contact materials (including fibre-based ones) in shops, restaurants, and their associated supply chains to ensure both their primary use and subsequent reuse, recycling, and/or composting are safe.
Improve collection infrastructure for recyclable single-use foodservice packaging. This must consist of a convenient network of collection points, adequate service contracts, sustainable funding, and substantial citizen education.
Develop and/or support infrastructure for centralised Reuse schemes: • Offer attractive leases for
centralised washing facilities
• Provide convenient locations for collection bins
Develop and/or support infrastructure for composting:• Develop a masterplan and
roadmap for all organics material in Hong Kong
• If compostable packaging is a sustainable alternative that the Government accepts under its proposed disposable plastic tableware ban, consider filling in some of the required treatment capacity with anaerobic digestion equipped for handling compostable containers, or with composting infrastructure
• Expand organics collection programme to make it accessible for households. Depending on the organics treatment infrastructure portfolio, create dedicated channels for organic waste, or have them go through the existing ‘purple bin’ organic waste channel.
Encourage consumers to avoid the unnecessary use of any disposable food packaging and favour reusable containers wherever appropriate, in order to lower their exposure to PFAS and minimise environmental impacts.
Provide information to F&B operators, caterers, and those procuring their services about alternatives to and options for single-use takeout packaging.
Encourage F&B operators to voluntarily reduce and eliminate PFAS in all food contact materials in their shops/restaurants and supply chain.
Make sustainable takeout packaging part and parcel of Government procurement procedures — at a minimum for their own catering, but possibly/increasingly as part of qualifying conditions for contracts and funding proposals as well.
Provide incentives for parties procuring catering services to opt for more sustainable options. An existing example is the subsidies provided to schools for organising on-campus food preparation to avoid single-use takeout packaging.

59
A new approach for Hong Kong
CITIZENS AND HOUSEHOLDS: EAT WITHOUT WASTE!Short-term Short-/Mid-term
(if centralised reuse systems are being developed in Hong Kong)
Mid-/Long-term (if composting collection and treatment infrastructure is developed in Hong Kong)
For any meals enjoyed outside of the home, consume them on-site as much as possible to avoid any need to package the food and/or beverage. This usually also benefits the quality of both the meal and the experience.
Use reusable options when available, instead of accepting single-use takeout packaging. Consumers may wish to adopt such habits first for those uses where they find reusable containers most convenient, e.g., first for their frequent hot drinks, and and then for food at a later stage.
Encourage F&B outlets to participate in such reuse schemes.
Keep compostable food containers along with food waste separate and dispose of waste food and containers through dedicated channels rather than through general waste streams.
Offices and residential property management companies can facilitate this by providing appropriate bins and signage and contracting private collectors to increase convenience for employees and tenants.
If on-site consumption is not an option, consider bringing your own reusable cup or food container.
Employers can further facilitate this by:• Making reusable takeout cups and containers
available to employees.
• Making washing facilities (sinks ideally with hot water) available so that employees do not have to carry dirty containers home to wash them.
If bringing a reusable container is not an option, but the single-use containers provided by the F&B outlet are recyclable, rinse the container so it can be disposed of in a suitable recycling channel.
Signal support for regulation of every type of single-use foodservice packaging. Even after Government’s public consultation is closed, feedback channels remain open and useful — the Government does not anticipate this scheme coming into force before 2025.

60
Appendix A: Methodology
A.1 Quantifying single-use foodservice packaging consumption in Hong Kong
The annual quantity of SFP put on the market was derived from data on food and beverage packaging usage by Hong Kong consumers. We chose to use pre-pandemic datasets, which are more complete and stable. Where available, 2019 data was used. In a few cases, we used 2018 data — this is clearly indicated.
A.1.1 Single-use food containers
One estimate for SFP associated with takeout foods was produced from survey data collected in 2019 by the NGO Greeners Action, prior to the onset of the COVID-19 pandemic. The survey gathered detailed statistics on the frequency of takeout consumption and amount of single-use food containers used by Hong Kong consumers on a weekly basis. A second estimate for takeout food SFP was calculated from a market report by Nielsen on Hong Kong consumers, which provided data on the average number of weekly takeout orders in 2019.
Whenever possible, the input parameters and assumptions for the initial baseline estimates were validated by cross-referencing with distributors, food and beverage (F&B) operations managers, and first-hand data collection in the Hong Kong market. Examples of such parameters include the number of SFP containers used in each meal, and were derived from anecdotal surveys and interviews of local F&B stakeholders.
A.1.2 Single-use cups
Takeout beverage consumption, namely for coffee, tea, and dessert drinks, was estimated through the use of consumer survey data for both Hong Kong and neighbouring markets (see Appendix B). These values were further segmented by estimating proportions of hot and cold beverages, which are typically served in different types of takeout cups (further details on assumptions and parameters in Appendix B).
A.1.3 Limitations
Consumption patterns in Hong Kong differ from other markets where SFP research has been extensively conducted, such as in the United States or European Union. Expanded polystyrene (EPS), for instance, is far more prevalent in Hong Kong compared to other more economically developed countries (MEDCs). Hong Kong’s local cuisine and meal preferences skew much more heavily toward hot food such as noodles, soups,
or stir-fried dishes, rather than to cold foods such as pastries, sandwiches, and salads. For these reasons, we acknowledge the limitations to deriving numbers on SFP usage in Hong Kong from internationally sourced data. We have taken steps to utilise locally-specific data whenever possible, or at least verify the suitability of non-local data sources with local market experts.
Though our study portrays SFP consumption patterns between 2018-2019, the considerable impact of the ongoing COVID-19 pandemic on F&B takeout and delivery must be acknowledged. Many early findings, both anecdotal and empirical, have noted the increase in single-use plastics used as a result of city-wide lockdowns that restrict typical dining habits and increase the frequency of ordering takeout and delivery food.155 Very few of these distribution systems have non-single-use options in place, contributing to a large increase in total SFP use from 2020 onwards. During the majority of the pandemic up to the time of writing, travellers arriving in Hong Kong have been subjected to 7–21-day quarantine procedures, mostly in designated hotel facilities. All the meals provided for hotel quarantine guests come in single-use containers, further amplifying the amount of SFPs used at present.
A.1.4 2030 extrapolation
The baseline number of SFPs put on the market was extrapolated to the 2030 Hong Kong population size.156 It is established by Engel’s Law that households spend a smaller percentage of their total income on food as incomes rise.157 Above a certain GDP per capita threshold reached by higher-income countries, this proportion remains relatively unchanged with ~7-12% of household income spent on food. With a GDP per capita of HKD 380,000, Hong Kong is classified as high-income economy. The per-capita share of income spent on food in Hong Kong is comparable to countries such as Canada, the UK, and Germany.158 Having already surpassed the threshold that ties household spending on food to income, Hong Kong’s rate of food consumption will likely remain unchanged by future economic development. Therefore, extrapolation for 2030 SFP consumption was based solely from population projections rather than economic factors.
After the COVID-19 pandemic subsides, changes in consumer behaviour and dining habits may become permanent in many cases. However, we chose not to include any potential long-term impacts in the extrapolation because the pandemic is still ongoing and there is insufficient analysis available to

61
make reasonable assumptions. In the assessment of solution pathways, we also did not take into account potentially lasting impacts on the standards for hygiene that consumers place on the F&B industry.
A.2 Costs and environmental impacts
To compare the financial costs and environmental impacts associated with each of the four solution archetypes, these were calculated for each on a per-container unit and per-tonne basis. Time and team resources did not allow us to conduct a full life cycle assessment (LCA). The calculations did not include every component of the product lifecycle (i.e., they were not cradle-to-cradle). Rather, relevant data from existing LCAs and market analyses were applied to produce evaluations of the financial and environmental impacts for the key components of each system. This allowed for the prioritisation of components that highlighted insightful differences across the systems.
The four solution archetypes were evaluated under a theoretical scenario in which all were operating at scale with the relevant infrastructure in place, regardless of whether they are available today. For solution systems such as composting, in which the end-of-life infrastructure has yet to be established in Hong Kong, the theoretical removal of this barrier allows for fair comparison with the other solution systems. It was also assumed that consumer behaviour is optimised and conducive to the operation of each system (e.g., consumers will clean out a plastic container prior to recycling). However, the assessment was still conducted under the parameters of present-day technology with respect to the availability of processing technology, container materials, and other areas of potential future innovation.
The primary environmental impacts of the four systems were quantified through two metrics: greenhouse gas (GHG) emissions and water usage. The GHG emissions metric represents the emissions associated with each lifecycle stage, measured in kilograms of CO
2 equivalent (kg CO
2e).
The main impact drivers included in this analysis, when applicable, were container production, container purchase, post-use collection, transport to the end-of-life (EOL) facility, and EOL processing (i.e., recycling or composting). The analysis did not include cost or environmental impact drivers that were uniform across all systems, including the status quo, because the assessment’s main purpose is the identification of key differences between the four solution systems. Food
preparation, for example, was not included in the impact analysis, nor were shipping and transport associated with container production and purchase or the transportation and use(s) of the processed material (e.g., recycled plastic flakes or organic compost). For solution archetypes in which the containers were reusable over multiple cycles, the impacts generated from the non-iterative phases of the lifecycle (e.g., container production, EOL processing) were divided by the number of uses.
The compostable containers were assumed to be made of bagasse, a fibrous material produced as a by-product of sugarcane processing. Many LCAs conducted for waste by-products such as bagasse do not include the emissions or water usage associated with the agricultural phase, attributing a ‘burden-free’ system boundary.159 Based on this common practice, the environmental burdens from the agricultural stage of sugarcane were not included in our analysis.
The analysis focused on hot food containers for several reasons. Firstly, hot food containers make up the majority of SFPs placed on the market (69% by our baseline estimate). They also generate greater environmental impacts and unit costs compared to other SFP types. Each food container requires more material and resources for production compared to beverage cups, posing larger costs and environmental impacts throughout the supply chain. However, these differences between container types are largely negligible on a broader scale, making hot food containers a suitable SFP representative for this analytical segment.
Even within a narrowed scope of hot food containers, a large number of configurations are possible when delivering an alternative solution. Within the reuse or BYO scenarios, for example, the container may be made from different materials: silicone, stainless steel, PP, glass, etc. The type of container material in turn affects the environmental impacts and costs associated with its production phase. A specific configuration was therefore chosen for each solution system to represent a realistic model for their application in the Hong Kong market.
The degree to which other configurations might impact the costs or environmental impacts was considered through sensitivity analyses for key system components. To compare the four solution archetypes with the status quo, a base case scenario was chosen: sending a single-use PP container to the landfill. Details of each solution configuration are below in Table 8, with the underlying assumptions and parameters described in Appendix B.
Appendix A: Methodology

62
A.3 Feasibility assessment
Each solution archetype was assessed for the technical performance of the container and the necessary implementation effort within the context of different SFP categories.
First, data and insights were collected through interviews with various stakeholders: solution providers for each solution archetype (e.g., companies running reusable container models or manufacturing compostable containers), local F&B businesses, and waste facility managers, as well as through a literature review. Next, this information was distilled into empirical scores for each metric.
A total of 20 different SFP replacement solutions were evaluated in this analysis: each of the four solution archetypes (Recycling, Bring-Your-Own, Composting, and Reuse systems) was applied to five different SFP categories: polypropylene (PP) hot food containers, EPS hot food containers, PP cold food containers, PET cold beverage containers, and plastic-lined paper cups for hot beverages.
Table 8The system components of recycling, BYO, composting, and reuse systems
The technical performance of each packaging type considers the aspects of design or function that may affect the operational performance of the container. For this analysis, a list of technical performance limitations — any features the replacement solution lacks compared to the SFP container it is replacing — was compiled for each replacement solution. For instance, replacing a PP hot food container with a compostable container may not be viable when the container must be leak-proof (e.g., when serving soups). Each limitation was translated in an estimated proportion of the market that would be excluded from implementing the solution. The total technical performance score for each SFP replacement solution thus indicates the portion of the market available to implement the solution — after accounting for technical limitations to the user experience. Some solutions, such as Recycling, entail no restrictions from a technical performance perspective — its score of 100% indicates that this solution could be applied to all meals within the scope of that SFP category.
Appendix A: Methodology
System Component
Recycle BYO Compost Reuse Landfill
Production
Purchase
Container cleaning
Drop-off point*
Transport to EOL facility
EOL processing
* Costs reflect the initial investment (i.e., the purchase of the collection bin) and do not include long-term capital expenditures for repair and replacement.
= cost (HKD), = GWP (kgCO2e), = water usage (L)

63
The implementation effort required to deviate from current practice reflects the various behavioural, infrastructural, and operational challenges imposed on key stakeholders: consumers, F&B businesses, collection/logistics systems, and treatment facilities. For each stakeholder, the 20 SFP replacement solutions received a score that reflects the level of effort required from that particular stakeholder group to implement that solution. A low score indicates a large effort for the stakeholder to implement the solution, while a high score indicates relatively little effort. A score of 0, therefore, would indicate total infeasibility, while a score of 100 indicates a complete lack of friction because there is no change from current practice. For each solution archetype, the resulting score across stakeholder groups indicates its ease in terms of deviating from current practice.
A.4 Scenario projection
Three implementation scenarios were calculated: limited mobilisation (LM), moderate mobilisation (MM) and advanced mobilisation (AM). These scenarios represent different levels of commitment towards solving the SFP challenge for Hong Kong. They describe sets of conditions in the target year 2030. In the MM and AM scenarios, it was assumed that technical performance limitations would lessen with a greater uptake of solutions. This could take shape in the form of more BYO container types made available for consumers or the reduction in compostable container prices with greater market scale. Therefore, LM technical performance scores were increased by 10 and 20 percentage points in the MM and AM scenarios, respectively.
Improvements associated with the aggressiveness of the scenario, however, could not be applied in similar, standardised fashion, to the implementation effort analysis. The nuances of mobilisation thresholds across different stakeholder groups would not allow for this. Instead, each of the 20 SFP replacement solutions were individually considered and scored, for each of the three mobilisation scenarios.
A.5 Full landfill diversion potential
The impact that each solution archetype could feasibly produce was calculated by multiplying the baseline quantity of each type of SFP, such as ‘hot food containers’ or ‘cold drink containers’, with the respective technical performance score and implementation effort score. This produced a value indicating the amount of SFP in that category that could feasibly be replaced by the particular solution archetype. For instance, one solution type involves the replacement of single-use PP hot food containers with a reusable container system, which under a LM scenario has a technical feasibility score of 30% and an implementation effort score of 20%. Given our 2030 estimate of ~2.9 million hot food containers placed on the market, we estimate the full potential of replacing single-use PP hot food containers to be ~174,000 (= 2,900,000 x 0.3 x 0.2) hot food containers kept out of the landfill annually.
Appendix A: Methodology

64
Appendix B: System assumptions and parametersTABLE 9Baseline SFP consumption: assumptions and parameters
Calculation component
Description Value Unit Notes and sources
Takeout food consumption
Hong Kong population 7,520,800 people Hong Kong’s 2019 population, reported by the HK Census and Statistics Department (2019)
Hong Kong population (above age 15)
6,654,600 people Hong Kong’s 2019 population, reported by the HK Census and Statistics Department (2019)
Frequency of takeout in HK, per individual
3.31 times/week
Reported by Nielson Hong Kong (2019). ‘Takeout’ hereon refers to both self-pickup and delivery.
Average number of containers used per takeout meal (hot food only)
2.4 containers Assumes that 40% of takeout meals consist of 3 containers (e.g. 1 box, 1 soup bowl, 1 drink) and 60% consist of 2 containers (e.g. 2 main meal bowls)
Proportion of takeout meals that is hot
0.9 Assumption, validated by interviews of industry stakeholders
Average number of containers used per takeout meal (cold food only)
1 containers Assumption, validated by interviews of industry stakeholders
Number of weekly takeout meals in Hong Kong
27,100,000 takeout meals/week
Reported by Greeners Action (2019)
Takeout beverage consumption
Annual coffee consumption outside the home
731,100,000 cups/yr Estimate 1 - derived from US and UK consumer behavior, reported by BBC (2013)
Annual per capita coffee consumption outside the home
150 cups/yr Estimate 2 - derived from HK consumer data, reported by the South China Morning Post (2013)
Proportion of coffee that is consumed takeout (not on-site)
0.75 Estimate from anecdotal surveying of HK consumers and coffee shops
Proportion of coffee that is hot
0.80 Assumption derived from anecdotal survey of HK consumers
Annual bubble tea consumption
239,565,600 cups/yr Estimate derived from bubble tea consumption in neighboring markets (Singapore, Vietnam, Malaysia)
Proportion of bubble tea that is cold
0.90 Assumption derived from anecdotal survey of HK consumers
2030 projection
Hong Kong population (2030)
7,920,100 people Hong Kong’s 2030 population projection, reported by the HK Census and Statistics Department (2020)
Takeaway food consumption (by sales channel)
Number of off-premise meals: miscellaneous
63,411,100 meals/yr Estimated from HK gov restaurant sales data, reported by the HK Census and Statistics Department (2019)
Number of off-premise meals: construction sites
16,312,300 meals/yr Estimated from an ADMCF survey data on HK construction sites, scaled to the active workforce size of approx. 70,000
Average meal price: Chinese restaurant
60.00 HKD Estimated from HK cost of living data
Average meal price: non-Chinese restaurant
90.00 HKD Estimated from HK cost of living data
Average meal price: fast food
40.00 HKD Estimated from HK cost of living data
Average meal price: miscellaneous
50.00 HKD Estimated from HK cost of living data
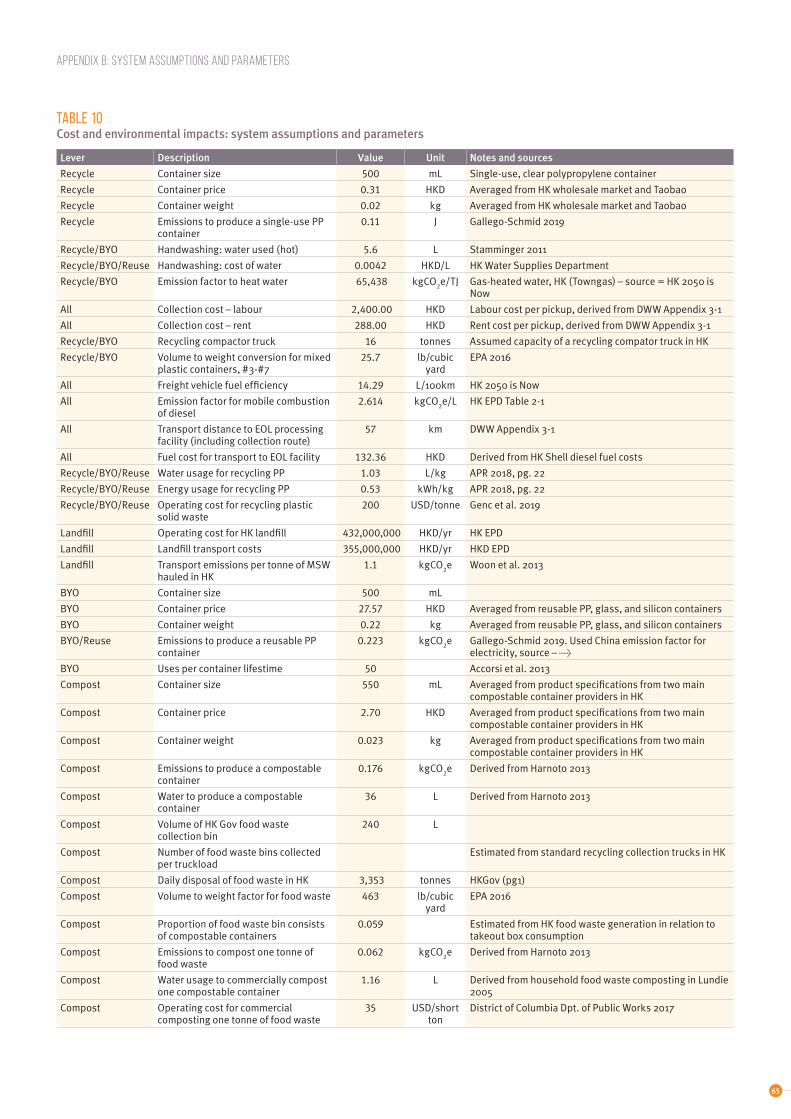
65
Appendix B: System assumptions and parameters
TABLE 10Cost and environmental impacts: system assumptions and parameters
Lever Description Value Unit Notes and sources
Recycle Container size 500 mL Single-use, clear polypropylene container
Recycle Container price 0.31 HKD Averaged from HK wholesale market and Taobao
Recycle Container weight 0.02 kg Averaged from HK wholesale market and Taobao
Recycle Emissions to produce a single-use PP container
0.11 J Gallego-Schmid 2019
Recycle/BYO Handwashing: water used (hot) 5.6 L Stamminger 2011
Recycle/BYO/Reuse Handwashing: cost of water 0.0042 HKD/L HK Water Supplies Department
Recycle/BYO Emission factor to heat water 65,438 kgCO2e/TJ Gas-heated water, HK (Towngas) – source = HK 2050 is
Now
All Collection cost – labour 2,400.00 HKD Labour cost per pickup, derived from DWW Appendix 3-1
All Collection cost – rent 288.00 HKD Rent cost per pickup, derived from DWW Appendix 3-1
Recycle/BYO Recycling compactor truck 16 tonnes Assumed capacity of a recycling compator truck in HK
Recycle/BYO Volume to weight conversion for mixed plastic containers, #3-#7
25.7 lb/cubic yard
EPA 2016
All Freight vehicle fuel efficiency 14.29 L/100km HK 2050 is Now
All Emission factor for mobile combustion of diesel
2.614 kgCO2e/L HK EPD Table 2-1
All Transport distance to EOL processing facility (including collection route)
57 km DWW Appendix 3-1
All Fuel cost for transport to EOL facility 132.36 HKD Derived from HK Shell diesel fuel costs
Recycle/BYO/Reuse Water usage for recycling PP 1.03 L/kg APR 2018, pg. 22
Recycle/BYO/Reuse Energy usage for recycling PP 0.53 kWh/kg APR 2018, pg. 22
Recycle/BYO/Reuse Operating cost for recycling plastic solid waste
200 USD/tonne Genc et al. 2019
Landfill Operating cost for HK landfill 432,000,000 HKD/yr HK EPD
Landfill Landfill transport costs 355,000,000 HKD/yr HKD EPD
Landfill Transport emissions per tonne of MSW hauled in HK
1.1 kgCO2e Woon et al. 2013
BYO Container size 500 mL
BYO Container price 27.57 HKD Averaged from reusable PP, glass, and silicon containers
BYO Container weight 0.22 kg Averaged from reusable PP, glass, and silicon containers
BYO/Reuse Emissions to produce a reusable PP container
0.223 kgCO2e Gallego-Schmid 2019. Used China emission factor for
electricity, source – >
BYO Uses per container lifestime 50 Accorsi et al. 2013
Compost Container size 550 mL Averaged from product specifications from two main compostable container providers in HK
Compost Container price 2.70 HKD Averaged from product specifications from two main compostable container providers in HK
Compost Container weight 0.023 kg Averaged from product specifications from two main compostable container providers in HK
Compost Emissions to produce a compostable container
0.176 kgCO2e Derived from Harnoto 2013
Compost Water to produce a compostable container
36 L Derived from Harnoto 2013
Compost Volume of HK Gov food waste collection bin
240 L
Compost Number of food waste bins collected per truckload
Estimated from standard recycling collection trucks in HK
Compost Daily disposal of food waste in HK 3,353 tonnes HKGov (pg1)
Compost Volume to weight factor for food waste 463 lb/cubic yard
EPA 2016
Compost Proportion of food waste bin consists of compostable containers
0.059 Estimated from HK food waste generation in relation to takeout box consumption
Compost Emissions to compost one tonne of food waste
0.062 kgCO2e Derived from Harnoto 2013
Compost Water usage to commercially compost one compostable container
1.16 L Derived from household food waste composting in Lundie 2005
Compost Operating cost for commercial composting one tonne of food waste
35 USD/short ton
District of Columbia Dpt. of Public Works 2017

66
Lever Description Value Unit Notes and sources
Reuse Container size 550 mL Averaged from various PP reusable containers
Reuse Container price 60.00 HKD Based on quote from HK-based reusable container logistics company – for a PP reusable container
Reuse Container weight 0.118 kg Averaged from various PP reusable containers
Reuse Handwashing: water used (cold) 1.75 L Calculated from 15 seconds of rinsing under a 7L/min flow rate (mid-level efficiency)
Reuse Commercial bin setup and collection system (per container)
63.33 HKD Averaged from upper and lower limits of quote from HK-based reusable container logistics company
Reuse Commercial dishwashing water usage 1.7 L/rack Averaged from a small and large capacity hood-type dishwasher commonly used by commercial wash kitchens in HK
Reuse Commercial dishwashing energy consumption
0.0725 kW/L Averaged from a small and large capacity hood-type dishwasher commonly used by commercial wash kitchens in HK
Reuse Additional handwashing water usage (hot)
2.8 L Commercial dishwashing is followed by manual dishwashing to ensure cleanliness in HK reuse systems, same emission factor used as recycle/BYO handwashing
Reuse Commercial dishwashing cost 13.50 HKD Based on quote from HK-based reusable container logistics company – for a PP reusable container
Reuse Transport distance to commercial washing facility
22 km Includes redistribution route and average cross-harbor distance in HK
Reuse Number of return crates containing used reusables per pickup load
400 crates Estimated from a 5.5 ton, mid-sized freight truck with a crate size of 40x30x20cm
Reuse Number of reusable containers per crate
24 containers/crate
Assumes that the container dimension is 19x13x6cm and that the height of each container is reduced by 50% when they are stacked in crates
Reuse Uses per container lifestime 64 Averaged from 3 sources:
All Lifespan of a plastic collection bin 10 years City of San Diego – 10yrs being the lower limit
Appendix B: System assumptions and parameters
Cost and environmental impacts: system assumptions and parameters (continued)
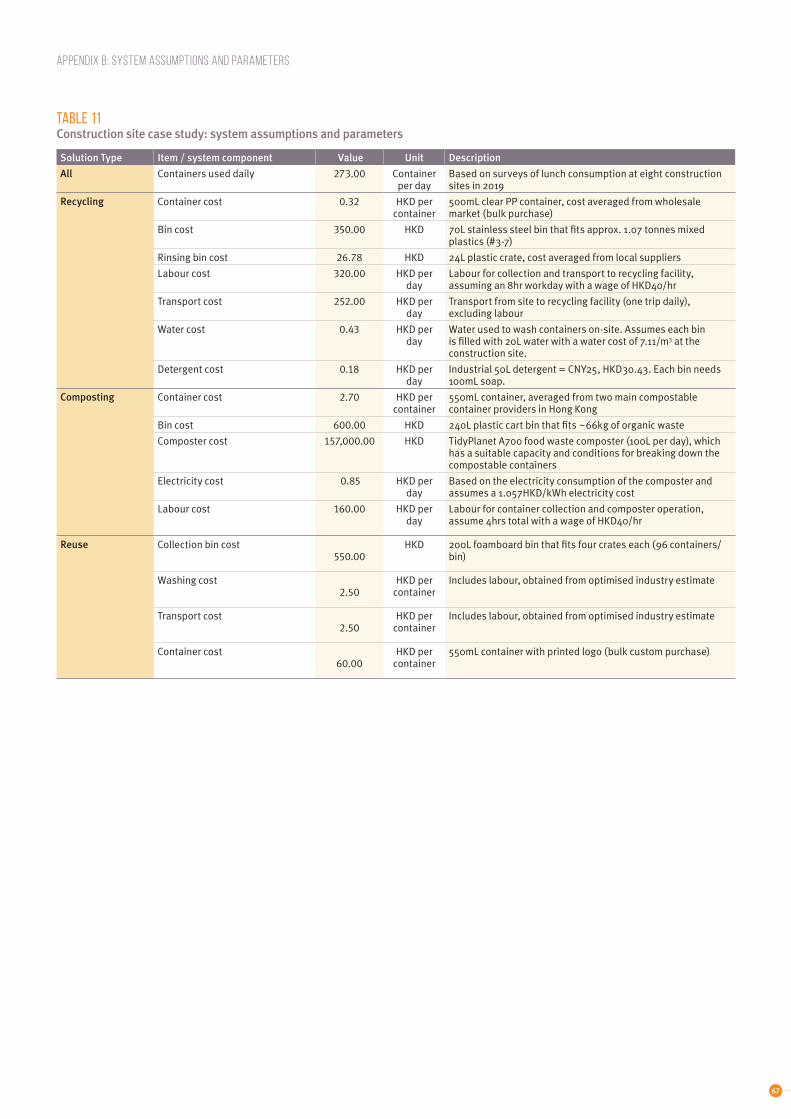
67
Appendix B: System assumptions and parameters
TABLE 11Construction site case study: system assumptions and parameters
Solution Type Item / system component Value Unit Description
All Containers used daily 273.00 Container per day
Based on surveys of lunch consumption at eight construction sites in 2019
Recycling Container cost 0.32 HKD per container
500mL clear PP container, cost averaged from wholesale market (bulk purchase)
Bin cost 350.00 HKD 70L stainless steel bin that fits approx. 1.07 tonnes mixed plastics (#3-7)
Rinsing bin cost 26.78 HKD 24L plastic crate, cost averaged from local suppliers
Labour cost 320.00 HKD per day
Labour for collection and transport to recycling facility, assuming an 8hr workday with a wage of HKD40/hr
Transport cost 252.00 HKD per day
Transport from site to recycling facility (one trip daily), excluding labour
Water cost 0.43 HKD per day
Water used to wash containers on-site. Assumes each bin is filled with 20L water with a water cost of 7.11/m3 at the construction site.
Detergent cost 0.18 HKD per day
Industrial 50L detergent = CNY25, HKD30.43. Each bin needs 100mL soap.
Composting Container cost 2.70 HKD per container
550mL container, averaged from two main compostable container providers in Hong Kong
Bin cost 600.00 HKD 240L plastic cart bin that fits ~66kg of organic waste
Composter cost 157,000.00 HKD TidyPlanet A700 food waste composter (100L per day), which has a suitable capacity and conditions for breaking down the compostable containers
Electricity cost 0.85 HKD per day
Based on the electricity consumption of the composter and assumes a 1.057HKD/kWh electricity cost
Labour cost 160.00 HKD per day
Labour for container collection and composter operation, assume 4hrs total with a wage of HKD40/hr
Reuse Collection bin cost 550.00
HKD 200L foamboard bin that fits four crates each (96 containers/bin)
Washing cost 2.50
HKD per container
Includes labour, obtained from optimised industry estimate
Transport cost 2.50
HKD per container
Includes labour, obtained from optimised industry estimate
Container cost 60.00
HKD per container
550mL container with printed logo (bulk custom purchase)

68
ENDNOTES
1. Greeners Action (2020) Plastic Disaster Caused By Pandemic, Hong Kong People Consume Over 101.8 Million Pieces of Single-use Plastics When Ordering Takeaway. Press release.
2. Hong Kong Census and Statistics Department (2020) Key Statistics on Business Performance and Operating Characteristics of the Import/Export, Wholesale and Retail Trades, and Accommodation and Food Services Sectors.
3. Mastercard (2014) Consumer Purchasing Priorities — Dining.
4. The 10 markets included the Chinese mainland, Taiwan, Japan, South Korea, Thailand, Philippines, Vietnam, Malaysia, Singapore and Indonesia; Nielsen (2020) Eating at home will remain the new reality for Asian consumers, especially Hong Kong, post COVID-19.
5. Greeners Action (2020) Plastic Disaster Caused By Pandemic, Hong Kong People Consume Over 101.8 Million Pieces of Single-use Plastics When Ordering Takeaway. Press release.
6. Ibid.
7. Hong Kong Census and Statistics Department (2016) Thematic Household Survey Report No. 60: Housing conditions of sub-divided units in Hong Kong.
8. Hong Kong Census and Statistics Department (2020) Hong Kong Annual Digest of Statistics: Section 9, Housing and Property.
9. Metta J (2020) Promoting discount schemes as a nudge strategy to enhance environmental behaviour. Working Paper, French Association of Environmental and Resource Economists.
10. Interview with Michael Leung, President, The Association for Hong Kong Catering Service Management. July 2021.
11. Ibid.
12. GREEN Hospitality (2021) Waste Deep — An exploratory study of the waste generated by the hospitality industry in Hong Kong.
13. Hong Kong Environment Bureau (2017) Hong Kong’s Climate Action Plan 2030+.
14. Hong Kong Environment Bureau (2017) Hong Kong’s Path to Becoming a Sustainable City; Environmental Report 2012–2017.
15. Puttaiah MH et al. (2020) All change: how COVID-19 is transforming consumer behaviour. SwissRe.
16. Sumagaysay, L (2020) The pandemic has more than doubled food-delivery apps’ business. Now What? Marketwatch.
17. Lee YJ et al. (2020) 코로나의 희비... 소상공인 매출은 하락, 배달앱 매출은 급증. YTN Korea.
18. Greeners Action (2020) Plastic Disaster Caused By Pandemic, Hong Kong People Consume Over 101.8 Million Pieces of Single-use Plastics When Ordering Takeaway. Press release.
19. Green Hospitality (2021) Waste Deep — An exploratory study of the waste generated by the hospitality industry in Hong Kong.
20. Hong Kong Free Press (2020) Plastic pandemic hits Hong Kong as takeaways surge under Covid-19.
21. Greeners Action (2020) Plastic Disaster Caused By Pandemic, Hong Kong People Consume Over 101.8 Million Pieces of Single-use Plastics When Ordering Takeaway. Press release.
22. GREEN Hospitality (2021) Waste Deep — An exploratory study of the waste generated by the hospitality industry in Hong Kong.
23. Nielsen (2020) Eating at home will remain the new reality for Asian consumers, especially Hong Kong, post COVID-19.
24. Puttaiah MH et al. (2020) All change: how COVID-19 is transforming consumer behaviour. SwissRe.
25. Hong Kong Environmental Protection Department (2020) Monitoring of Solid Waste in Hong Kong.
26. Hong Kong Environment Bureau (2013) Hong Kong Blueprint for Sustainable Use of Resources, 2013-2022.
27. a) Hong Kong Environmental Protection Department (2020) Monitoring of Solid Waste in Hong Kong: Waste Statistics for 2019.
b) Taiwan ROC Environmental Protection Administration (2021) Generation and Treatment of Municipal Waste.
c) Yoo KY (2016). Municipal Solid Waste Management. Seoul Institute.
28. a) Hong Kong Environmental Protection Department (2018) Monitoring of Solid Waste in Hong Kong: Waste Statistics for 2017.
b) Sung HC et al. (2020) Municipal Solid Waste and Utility Consumption in Taiwan. Sustainability, 12(8), pp. 3425.
c) Yu KY (2018) Volume Based Waste Fee (VBWF) System for Municipal Solid Waste. Seoul Solution.
d) Japan Ministry of the Environment (2017) Annual Report on Environmental Statistics 2017.
29. Hong Kong Environment Bureau (2021) Waste Blueprint for Hong Kong 2035.
30. Ibid.
31. Ibid.
32. Legislative Council of the Hong Kong SAR (2021) Public Accounts Committee Report No. 74.
33. Ibid.
34. Ibid.
35. Hong Kong Environmental Protection Department (2020) Waste Recycling Statistics. Web page: www.wastereduction.gov.hk/en/quickaccess/stat_recycle.htm. Accessed: 23 Sept. 2021.
36. Hong Kong Consumer Council (2020) Embracing Sustainable Consumption for a Happy Life: A Tracking Study on Consumer Behaviour.
37. Hong Kong Public Opinion Research Institute (2020) Survey — Plastic bottle recycling public attitudes and behaviours.
38. HK01. (2020) 【01實測】追蹤器揭白做回收 9大屋苑疑將回收膠樽 直送堆填區.
39. a. Greeners Action. (2017) 回收箱淪為垃圾桶 6成物料為錯誤或垃圾 促請「上樓」杜絕濫用.
b. Hong Kong Consumer Council (2020) Embracing Sustainable Consumption for a Happy Life: A Tracking Study on Consumer Behaviour.
40. Hong Kong SAR Government (2021) Littering problem in the countryside. Press release.
41. Li WJ et al. (2020) Heavy metals contamination of sedimentary microplastics in Hong Kong. Marine Pollution Bulletin 153, pp. 110977.
42. a. Morales-Caselles C et al. (2021) An inshore-offshore sorting system revealed from global classification of ocean litter. Nature Sustainability 4, pp. 484–493.
b. Ocean Conservancy (2020) International Coastal Cleanup 2020 Report.
43. Parker, L (2019) The world’s plastic pollution crisis explained. National Geographic.
44. a. Ocean Conservancy (2020) Hong Kong Cleanup 2019 Report.
b. Ocean Conservancy (2021) Hong Kong Cleanup 2020 Report.
45. Joint Group of Experts on the Scientific Aspects of Marine Environmental Protection (2016) Sources, Fate and Effects of Microplastics in the Marine Environment (Part 2). International Maritime Organization.
46. DeWit W et al. (2021) Plastics: The cost to society, environment, and the economy. WWF.
47. Wagner TP et al. (2016) The generation and cost of litter resulting from the curbside collection of recycling. Waste Management 50, pp. 3-9.
48. Hong Kong Consumer Council (2020) Embracing Sustainable Consumption for a Happy Life: A Tracking Study on Consumer Behaviour.
49. Ibid.

69
ENDNOTES
50. Morris, J (2005) Comparative LCAs for Curbside Recycling Versus Either Landfilling or Incineration with Energy Recovery. Int J Life Cycle Assessment 10, 273–284.
51. The U.S. Environmental Protection Agency (2021) Guide to the Facts and Figures Report about Materials, Waste and Recycling. Accessed: 8 Sept. 2021.
52. Some GREEN@COMMUNITY locations have a separate bin for each type of plastic resin.
53. Interview with Eric Swinton, Founder, V Cycle. 20 Sept. 2021.
54. GREEN@COMMUNITY. Web page: www.wastereduction.gov.hk/en/community/crn_intro.htm. Accessed: 8 Sept. 2021.
55. Personal communication with Nick Chan, Drink Without Waste Project Assistant, Designing Hong Kong. Sept. 2021.
56. Vitasoy (2021). Packaging & Recycling Program Point. Web page: https://www.vitavitasoy.com/en/packaging-recycling-program/location. Accessed: 14 Sept. 2021.
57. Mil Mill. Web page: www.milmill.hk. Accessed: 8 Sept. 2021.
58. Stamminger R (2011) Modelling resource consumption for laundry and dish treatment in individual households for various consumer segments. Energy Efficiency, 4, pp. 559–569.
59. Kuo L (2012) Death of a dishwasher: Families around the world spurn America’s favorite appliance. Quartz.
60. See Appendix B for more details on the calculation process.
61. Hong Kong Environmental Protection Department (2020) Guideline on Modelling Vehicle Emissions (Ver.4.2).
62. See Figure 10.
63. Hong Kong Consumer Council (2020) Embracing Sustainable Consumption for a Happy Life: A Tracking Study on Consumer Behaviour.
64. Fabian N et al. (2019) The Struggle for Sustainable Waste Management in Hong Kong: 1950s–2010s. Worldwide Waste: Journal of Interdisciplinary Studies, 2(1), pp.10.
65. Drink Without Waste (2020) An industry-led “Packaging Exchange” to reduce waste in Hong Kong. Press release.
66. Recycling stations: stations that offers a service network to provide recycling programmes and education activities to housing estates and other properties; Recycling stores: facilities located amongst city storefronts that provides recycling collection and education services; Recycling spots: mobile booths for recyclable collection; GREEN@COMMUNITY. Web page: www.wastereduction.gov.hk/en/community/crn_intro.htm. Accessed: 8 Sept. 2021.
67. Hong Kong Environmental Protection Department (2021) Pilot Scheme on Collection and Recycling Services of Plastic Recyclable Materials — Eastern District.
68. These statistics only refer to the collection of recyclable materials. Data regarding the amount of plastics that is actually recycled was unavailable.
69. Hong Kong Environmental Protection Department (2021) Pilot Scheme on Collection and Recycling Services of Plastic Recyclable Materials — Eastern District.
70. Recycling Fund (2021) List of Approved Projects (As of 31 March 2021) — Industry Support Programme.
71. MilMill. Web page: www.milmill.hk. Accessed: 8 Sept. 2021.
72. Smart Planet Technologies (2019) Detpak RecycleMe™ System Completes the Paper Chain.
73. a) Unpackaged. Web page: www.beunpackaged.com. Accessed: 8 Sept. 2021.
b) BYO Singapore. Web page: www.byosingapore.com. Accessed: 8 Sept. 2021.
74. Anecdotal evidence from Hong Kong consumers; Metta J (2020) Promoting discount schemes as a nudge strategy to enhance environmental behaviour. Working Paper, French Association of Environmental and Resource Economists.
75. SaladStop! (2019) Sustainability Report 2019, Hong Kong.
76. Chickpea Hong Kong. Web page: www.chickpea.hk/merch. Accessed: 8 Sept. 2021.
77. See Figure 10
78. Personal communication with Samantha De Mello, Marketing Executive, KIN Food Halls. Sept. 2021.
79. Cupfy. Web page: www.cupfy.co. Accessed: 8 Sept. 2021.
80. Metta J (2020) Promoting discount schemes as a nudge strategy to enhance environmental behaviour. Working Paper, French Association of Environmental and Resource Economists.
81. National Resources Defense Council (2021) Composting 101. Web page: www.nrdc.org/stories/composting-101. Accessed: 8 Sept. 2021.
82. Bernal MP et al. (2017) Current Approaches and Future Trends in Compost Quality Criteria for Agronomic, Environmental, and Human Health Benefits. Advances in Agronomy, 144(3) pp. 143-233.
83. Napper IE et al. (2019) Environmental Deterioration of Biodegradable, Oxo-biodegradable, Compostable, and Conventional Plastic Carrier Bags in the Sea, Soil, and Open-Air Over a 3 Year Period. Environmental Science & Technology, 53(9) pp.4775–4783.
84. Ibid.
85. Ibid.
86. Reichert et al. (2020) Bio-Based Packaging: Materials, Modifications, Industrial Applications and Sustainability. Polymers, 12(7) pp. 1558.
87. Hong Kong Environmental Protection Department (2020) O-PARK1 Process. Web Page: www.opark.gov.hk/en/process.php. Accessed: 8 Sept. 2021.
88. Interview with Eilidh Brunton, Senior Waste Management Consultant, Vegware United Kingdom. Feb. 2021.
89. Hong Kong Environmental Protection Department (2018) Food Waste/Sewage Sludge Anaerobic Co-digestion Trial Scheme.
90. Ibid.
91. Interview with a bio-based packaging manufacturer in Hong Kong. Jan. 2021.
92. Hong Kong Environment Bureau (2021) Hong Kong’s Climate Action Plan 2050.
93. Hong Kong Community Composting. Web page: www.hkcomposting.com/. Accessed: 8 Sept. 2021.
94. Green Environmental Kitchen Residue Recycle Ltd. Web page: www.gekrrl.hk/. Accessed: Sept. 2021.
95. FoodCycle+. Web page: www.foodcycleplus.wixsite.com/foodcycle-plus. Accessed: 13 Sept. 2021.
96. Eco-Greenergy: Compost Mapping Service. Web page: www.eco-greenergy.com/pages/compost-mapping-service. Accessed: 8 Sept. 2021.
97. Hong Kong Environmental Protection Department. Pilot Programme on Provision of Small Food Waste Composters at School. Web page: www.hd-sfwc.org/en. Accessed: 27 Sept. 2021.
98. a. International School Foundation Academy. Sustainability. Web page: www.academy.isf.edu.hk/index.php/about-us/sustainability/. Accessed: 27 Sept. 2021.
b. Tidy Planet. On Site Composting of Catering Compostables. Web page: www.tidyplanet.co.uk/site-composting-catering-compostables/. Accessed: 27 Sept. 2021.
99. Personal communication with a bio-based packaging manufacturer in Hong Kong. Sept. 2021.
100. Dinkel F et al. (2008) Vergleichende Ökobilanz verschiedener Bechersysteme beim Getränkeausschank an Veranstaltungen.
101. To avoid leakage when using fibre-based containers, F&B operators sometimes wrap the container in plastic cling-film. In cases where the container does leak, the carrier bag is dirtied and thrown away by the consumer. In both of these scenarios, additional waste from takeout meals is produced as an unintended consequence of fibre-based packaging that is not completely sealable or resistant to liquids.

70
ENDNOTES
102. PLA is a non-toxic plastic that can be produced from organic substances such as potato, wheat, and corn starch. PFAS are a group of synthetic chemicals that are used for fluoropolymer coatings and products that resist heat, oil, stains, grease, and water. They are commonly found in food packaging, clothing, kitchenware, and commercial household products.
103. a) Andrade MFC et al. (2016) Life Cycle Assessment of Poly(Lactic Acid) (PLA): Comparison Between Chemical Recycling, Mechanical Recycling and Composting. Journal of Polymers and the Environment, 24, pp. 372–384.
b) Ho KLG et al. (1999) Degradation of Polylactic Acid (PLA) Plastic in Costa Rican Soil and Iowa State University Compost Rows. Journal of Environmental Polymer Degradation, 7, pp. 173-177.
104. Hermann BG et al. (2011) To compost or not to compost: Carbon and energy footprints of biodegradable materials’ waste treatment. Polymer Degradation and Stability, 96(6), pp. 1159-1171.
105. U.S. Environmental Protection Agency (2021) Basic Information on PFAS. Web page: https://www.epa.gov/pfas/basic-information-pfas. Accessed: 10 Sept. 2021.
106. Dinsmore KJ (2020) Forever chemicals in the food aisle: PFAS content of UK supermarket and takeaway food packaging.
107. Hong Kong Environmental Protection Department (2021) Regulation of Disposable Plastic Tableware.
108. Hong Kong Environmental Protection Department (2020) O-Park1 Process. Web Page: www.opark.gov.hk/en/process.php. Accessed: 8 Sept. 2021.
109. Biopak Compost Service. Web page: https://www.biopak.com.au/compost-service. Accessed: 10 Sept. 2021.
110. Interview with Eilidh Brunton, Senior Waste Management Consultant, Vegware United Kingdom. Feb. 2021.
111. Hong Kong Customs and Excise Department (2012) Booklet on cases under the Trade Descriptions Ordinance (Cap. 362).
112. a) GREEN Hospitality (2020) When “Bio” Meets “Plastics”: A case study of bioplastics and their impact in Hong Kong.
b) United Nations Environment Programme & Consumers International (2020). “Can I Recycle This?” A Global Mapping and Assessment of Standards, Labels and Claims on Plastic Packaging.
113. GREEN Hospitality (2020) When “Bio” Meets “Plastics”: A case study of bioplastics and their impact in Hong Kong.
114. Ellen MacArthur Foundation (2017) The New Plastics Economy: Catalysing action.
115. Closed Loop Partners (2021) Bringing Reusable Packaging Systems to Life.
116. Marsh K et al. (2007) Food Packaging — Roles, Materials, and Environmental Issues. Institute of Food Technologists, Journal of Food Science, 72(3), pp. 39–55.
117. Personal communication with Woody Chan, CSR & Sustainability Manager, foodpanda. Jan. 2021.
118. Hong Kong Environmental Campaign Committee (2021) ‘ben don go!’. Facebook Post. www.facebook.com/121538751216826/posts/4073440986026563/. Accessed: 8 Sept 2021.
119. WeUse. Web page: www.weuse.hk/. Accessed: 21 Oct 2021.
120. Blennerhasset P (2019) Hong Kong Sevens hoping fans embrace 250,000 reusable ‘stack cups’ to cut down on waste. South China Morning Post.
121. Interview with Michael Leung, President of the Association for Hong Kong Catering Services Management, which has over 800 member restaurants. July 2021.
122. He S (2014) Kings of the kitchen sink. China Daily.
123. Kerschgens S et al. (2021) The Use of Dishwashers in Commercial Enterprises — An Initial Analysis. Tenside Surfactants Detergents, 58(3) pp. 177.
124. The survey was conducted by ADMCF in July 2021 with 34 respondents whose offices were located across Hong Kong Island and Kowloon. 80% of the pantry facilities provided dishwashing soap and sponges and 90% were regularly cleaned by pantry or janitorial staff. On average, these pantries are shared by 20 other people, usually within the same office. The facilities are not always conveniently located, however, with two-thirds of respondents noting that the pantries are located far from their desks or require card access.
125. Closed Loop Partners (2021) Bringing Reusable Packaging Systems to Life.
126. Interview with the Sustainability Manager of a large commercial F&B venue operator in Hong Kong. Sept. 2021.
127. a) Interview with Kate Daly, Managing Director, Center for the Circular Economy at Closed Loop Partners. Feb. 2021
b) Dinkel F et al. (2008) Vergleichende Ökobilanz verschiedener Bechersysteme beim Getränkeausschank.
128. Church Z (2017) Platform strategy, explained.
129. Baumann C et al. (2018) Feasibility of reusable food containers for takeaway food in the Sydney CBD [Revised], Institute for Sustainable Futures, University of Technology Sydney, Australia.
130. Linder N et al. (2021) Pro-environmental habits: An underexplored research agenda in sustainability science. Ambio.
131. Models include, for example, the theory of planned behaviour (TPB) and value-belief-norm (VBN) theory.
132. From a psychological perspective, habits can be defined as ‘memory-based propensities to respond automatically to specific cues, which are acquired by the repetition of cue-specific behaviour in stable contexts’; Verplanken B (2018) Introduction. In B. Verplanken (Ed.) The psychology of habit: Theory, Mechanisms, Change, And Contexts (pp 1–10). Springer.
133. See for example Linder N et al. (2021) Pro-environmental habits: An underexplored research agenda in sustainability science. Ambio.
134. Based on the sources listed in the previous section and on Hollingworth C et al. (2017) How to use behavioural science to build new habits. WARC Best Practice.
135. Metta observes in her research on reusable cups in Hong Kong coffee shops that “nudges have higher effects than financial instruments on consumer behavioural change even when the settings account for strong conservative behaviours.” Metta J (2020) Promoting discount schemes as a nudge strategy to enhance environmental behaviour. Working Paper, French Association of Environmental and Resource Economists.
136. For example: 5 reasons why I stay away from loyalty stamp cards. Web page: https://restaurantengine.com/5-reasons-stay-away-loyalty-stamp-cards/. Accessed 13 Sept. 2021.
137. Mandegari M et al. (2019) Sugarcane Biofuel Production in South Africa, Guatemala, the Philippines, Argentina, Vietnam, Cuba, and Sri Lanka. In: Khan M, Khan I (eds) Sugarcane Biofuels, pp. 319-346. Springer, Cham.
138. Church Z (2017) Platform strategy, explained.
139. See for example Reichling (2004) Effects of reputation mechanisms on fraud prevention in ebay auctions. Working Paper. Stanford University.
140. Church Z (2017) Platform strategy, explained.
141. The survey was conducted by ADM Capital Foundation in November 2019, prior to the COVID-19 pandemic. A total of 45 construction sites operated by nine different contractors completed surveys that tallied the number of meals consumed by their workers and various details on the type of meal (e.g., whether the container was reusable or disposable, where the meal was purchased from).
142. Interview with the Group Sustainability Manager of a Hong Kong commercial construction and engineering contractor. Dec. 2020.
143. Ibid.
144. RTHK News (2020) Government reverses daytime ban at restaurants.
145. See endnote no. 141
146. A charge levied upon a given quantity of waste received at a waste processing facility.
71
ENDNOTES
147. Calculated from: Greeners Action (2020) Plastic Disaster Caused By Pandemic, Hong Kong People Consume Over 101.8 Million Pieces of Single-use Plastics When Ordering Takeaway. Press release. It was assumed that one disposable cutlery set was used for each takeout meal.
148. WWF (2020) Leading Food Delivery Companies in Hong Kong Team Up With WWF to Combat Plastic Crisis. Press Release.
149. Ibid.
150. a. foodpanda (2021) What foodpanda is doing to reduce plastic waste. b. Interview with Woody Chan, CSR & Sustainability Manager, foodpanda.
151. SaladStop! (2019) Sustainability Report 2019, Hong Kong.
152. Clean Water Action (2020) COVID-19 pandemic precautions and recommendations for reusable food service ware.
153. Wagner TP, Broaddus N (2016) The generation and cost of litter resulting from the curbside collection of recycling. Waste Management 50, pp. 3-9.
154. Pew Charitable Trusts, SYSTEMIQ (2020) Breaking the Plastic Wave: A comprehensive assessment of pathways towards stopping ocean plastic pollution.
155. a. Wong P (2020) Coronavirus Pandemic to Boost Food Delivery Industry in the Greater Bay Area. Euromonitor International.
b. Filho WL et al. (2021) COVID-19 and waste production in households: A trend analysis. Science of the Total environment, 777, pp. 145997.
c. Vittuari M et al. (2021) Envisioning the Future of European Food Systems: Approaches and Research Priorities After COVID-19. Frontiers in Sustainable Food Systems, 5, pp. 642787.
156. Hong Kong Census and Statistics Department (2020) Hong Kong Population Projections 2020–2069.
157. a. United Nations Industrial Development Organization (2018) Household consumption patterns and the sectoral composition of growing economies: A review of the interlinkages.
b. Food and Agricultural Organization of the United Nations (2020) The convergence of food diets: characterizing consumption patterns, food diversity, and the relationship to trade.
158. a. American Farm Bureau Federation (2019) U.S. Food Expenditures at Home and Abroad.
b. Agriculture and Horticulture Development Board (2020) Why UK consumers spend 8% of their money on food.
159. a. Nogueira GP et al. (2021) Are eucalyptus harvest residues a truly burden-free biomass source for bioenergy? A deeper look into biorefinery process design and Life Cycle Assessment. Journal of Cleaner Production, 299, pp. 126956.
b. Laurin, L. (2019) Handling Recycling in Life Cycle Assessment. Earth Shift Global.

72
CONTRIBUTORSInterviewees
The Association for Hong Kong Catering Services Management Michael LeungPresident
Center for the Circular Economy at Closed Loop PartnersKate DalyManaging Director
City University of Hong KongDr. Shauhrat S. ChopraAssistant Professor
Designing Hong Kong Limited Paul Zimmerman Chief Executive OfficerChair, Drink Without Waste
EcoDriveYolanda ChoyCo-Founder
Ecoinno George ChenCEO
Fairwood HoldingsPeggy LeeChief Marketing Officer
Emily WongMarketing Director
foodpandaWoody ChanCSR & Sustainability Manager
Greeners ActionAngus HoExecutive Director
GREEN HospitalityLucia LoposovaExecutive Director
Camille FabreHead of Research
The Hongkong and Shanghai HotelsJoshua Wong Manager, Corporate Responsibility and Sustainability
Dominic DuboisCorporate Responsibility and Sustainability Officer
Hong Kong SAR Environmental Protection DepartmentRaymond WuDeputy Director
Fong Kin-WaAssistant Director, Waste Reduction and Recycling Division
Leo W.K. Wong, Senior Environmental Protection Officer, Waste Reduction and Recycling Division
Ida NgProject Coordinator, Food Waste Reduction Group
Hong Kong University of Science and TechnologyDr. Meike SauerweinLecturer
InfinityBoxShashwat GangwalFounder
KIN Food HallsMatt ReidCo-founder & CEO
Samantha De MelloMarketing Executive
LoopedinStephanie SimmonetFounder
Meraki Hospitality GroupLaura OffeFounder
Mil MillHarold YipCo-founder and Executive Director
MuuseJonathan TostevinCEO
Cyrus PowFormer General Manager, Hong Kong
PlaneteersAditi DeodharCo-founder
SaladStop!Katherine Desbaillets Braha Co-Owner & Director
SodexoBenjamin Parsons Director of Operations
Sustainabl.Richard Oliver Founder & CEO
Swire PropertiesDr. Amie LaiSenior Sustainable Development Manager
Phoebe Leung Assistant Sustainable Development Manager
The Green EarthEdwin LauFounder & Director
Vegware Ceicy WongManaging Director, Hong Kong
Eilidh Brunton Senior Waste Management Consultant, United Kingdom
WeUseLee Wing ShanFounder
WWF Hong KongKaren HoHead of Corporate and Community Sustainability
June WongMarine Pollution Manager
And the many baristas, food operators, waiting staff, and their customers that shared their time and insights with us
Communications, Production, and Additional Support
ADM Capital FoundationEd DingIntern
Clary LauIntern
Liberty McCarthyCommunications Manager
Cameron RoweIntern
Wing TsangIntern
Mandy WongSupport HK Programme Manager
Civic ExchangeFiona LauProgramme Manager
DESIGNORMAmy WooGraphic Designer
Chinese TranslationWinston OrLinguist
72

73


