Embed Size (px)
Citation preview

Holocene ice margin fluctuations of the Greenland Ice Sheet in the Disko Bugt region, West Greenland.
By:
Samuel E. Kelley
May 12, 2014
A dissertation submitted to the Faculty of the Graduate School of
the State University of New York at Buffalo in partial fulfillment of the requirements for the
degree of
Doctor of Philosophy
Department of Geology
All rights reserved
INFORMATION TO ALL USERSThe quality of this reproduction is dependent upon the quality of the copy submitted.
In the unlikely event that the author did not send a complete manuscriptand there are missing pages, these will be noted. Also, if material had to be removed,
a note will indicate the deletion.
Microform Edition © ProQuest LLC.All rights reserved. This work is protected against
unauthorized copying under Title 17, United States Code
ProQuest LLC.789 East Eisenhower Parkway
P.O. Box 1346Ann Arbor, MI 48106 - 1346
UMI 3629769
Published by ProQuest LLC (2014). Copyright in the Dissertation held by the Author.
UMI Number: 3629769
ii
DEDICATION
This dissertation is dedicated to my friends and family for their support and
understanding during my long and winding scholastic career.
I wish to thank a number of people who have made this dissertation possible. First, my
advisor Dr. Jason Briner, whose patience and guidance allowed me to not only learn a
great deal about geology, but what it takes to be a successful scientist. My dissertation
committee members: Bea Csatho, Chuck Mitchell, and Mike Kaplan. Bea’s expertise
provided invaluable contemporary context to balance my paleo-perspective on ice sheet
changes. Chuck’s contributions as a geologist and scientists helped me maintain
perspective in this project, as a well as a early career scientist. Mike’s expertise was
invaluable in regarding the larger implications of my research. My fellow graduate
students, in particular: Greg Babonis, Sarah Ogburn, Patrick Whelley, Nicolás Young,
and many others, whose intellect and camaraderie made my time at Buffalo a pleasure.
Finally, Julia, whose support and love made this undertaking possible.
This research was supported by the U.S. National Science Foundation, The Geologic
Society of America, the UB Pegrum Fund, and the Mark Diamond Research Fund.
iii
TABLE OF CONTENTS DEDICATION ..............................................................................................................................ii LIST OF FIGURES .....................................................................................................................vi LIST OF TABLES ..................................................................................................................... vii FRONTISPIECE: Map of Disko Bugt Region from Rink 1853.................................. viii ABSTRACT .................................................................................................................................ix I: INTRODUCTION ................................................................................................................................... 1 Greenland.................................................................................................................................................................4 Glacial History ..................................................................................................................................................5
Disko Bugt................................................................................................................................................................8 Deglaciation .................................................................................................................................................... 10
Research Motivation ........................................................................................................................................ 13 Methods ................................................................................................................................................................. 14 Cosmogenic-‐nuclide exposure dating ................................................................................................. 14 Radiocarbon dating ..................................................................................................................................... 19
Dissertation Structure ..................................................................................................................................... 20 References ............................................................................................................................................................ 21
II: MAXIMUM LATE HOLOCENE EXTENT OF THE WESTERN GREENLAND ICE SHEET DURING THE LATE 20TH CENTURY..................................................................................28 Abstract.................................................................................................................................................................. 28 Introduction......................................................................................................................................................... 29 Materials and Methods.................................................................................................................................... 32 Field investigation ....................................................................................................................................... 32 10Be dating....................................................................................................................................................... 34 Lake sediment coring ................................................................................................................................. 35 Radiocarbon dating ..................................................................................................................................... 38 Remote sensing ............................................................................................................................................. 38
Results and Interpretation ............................................................................................................................ 40 Qinngap Ilulialeraa – Kuussuup Tasia valley ................................................................................... 40 Tininnilik valley ............................................................................................................................................ 46 Spatial variability of ice-‐margin change............................................................................................. 48
Discussion............................................................................................................................................................. 49 Conclusion ............................................................................................................................................................ 53 Acknowledgments............................................................................................................................................. 53 References ............................................................................................................................................................ 54
III. RAPID ICE RETREAT IN DISKO BUGT SUPPORTED BY 10BE DATING OF THE LAST RECESSION OF THE WESTERN GREENLAND ICE SHEET .........................................59 Abstract.................................................................................................................................................................. 59 Introduction......................................................................................................................................................... 60 Disko Bugt............................................................................................................................................................. 63 Methods ................................................................................................................................................................. 67 Results and Interpretation ............................................................................................................................ 72 Discussion............................................................................................................................................................. 76 Deglaciation of Disko Bugt ....................................................................................................................... 76 Retreat rates................................................................................................................................................... 78
iv
Deglaciation from the continental shelf to the present ice margin ........................................ 79 Forcing mechanisms ................................................................................................................................... 82
Conclusions .......................................................................................................................................................... 84 Acknowledgements .......................................................................................................................................... 85 References ............................................................................................................................................................ 85
IV. THE INFLUENCE OF ICE MARGINAL SETTING ON LATE PLEISTOCENE RETREAT RATES IN CENTRAL WEST GREENLAND......................................................................................93 Abstract.................................................................................................................................................................. 93 Introduction......................................................................................................................................................... 94 Setting..................................................................................................................................................................... 96 West Greenland............................................................................................................................................. 96 Existing chronology: Torsukattak Fjord ............................................................................................ 98 Existing chronology: Nordenskiöld Gletscher ................................................................................. 99
Methods ...............................................................................................................................................................101 Lake Sediment Coring ..............................................................................................................................101 10Be Dating ....................................................................................................................................................102
Results: 10Be Dating ........................................................................................................................................103 Torsukattak Fjord ......................................................................................................................................103 Nordenskiöld Gletscher...........................................................................................................................104
Results: Radiocarbon .....................................................................................................................................104 Torsukattak Fjord ......................................................................................................................................104 Nordenskiöld Gletscher...........................................................................................................................105
Discussion...........................................................................................................................................................106 Greenland Ice Sheet Deglaciation........................................................................................................106 Fjord Stade Moraines................................................................................................................................110 Disko Bugt Retreat Rates ........................................................................................................................110 West Greenland Retreat Rates .............................................................................................................112
Conclusion ..........................................................................................................................................................118 Acknowledgements ........................................................................................................................................119 References ..........................................................................................................................................................119
V. VARIABLE LATE HOLOCENE ICE SHEET MARGIN FLUCTUATIONS IN WEST GREENLAND...........................................................................................................................................126 Abstract: ..............................................................................................................................................................126 Introduction.......................................................................................................................................................127 Background...................................................................................................................................................128
Study areas .........................................................................................................................................................130 Sermeq Kujatdleq.......................................................................................................................................130 Nordenskiöld Gletscher...........................................................................................................................131
Methods ...............................................................................................................................................................134 10Be Dating ....................................................................................................................................................134 Lake Sediment Coring ..............................................................................................................................135
Results and Interpretations ........................................................................................................................137 Results: Sermeq Kujatdleq 10Be Ages ................................................................................................137 Results: Igdlúuguaq...................................................................................................................................137 Results: Little Igy........................................................................................................................................140 Results: Arqataussap Tasia ....................................................................................................................141 Interpretations: Sermeq Kujatdleq.....................................................................................................141 Results: Nordenskiöld Gletscher .........................................................................................................149
v
Interpretations: Nordenskiöld Gletscher.........................................................................................152 Discussion...........................................................................................................................................................156 Comparison of middle-‐late Holocene records ...............................................................................156 Disko Bugt region Holocene ice margin fluctuations .................................................................157
Conclusion ..........................................................................................................................................................160 Acknowledgements ........................................................................................................................................161 References ..........................................................................................................................................................162
VI. Conclusion.........................................................................................................................................167 Introduction.......................................................................................................................................................167 Major Findings ..................................................................................................................................................167 Implications .......................................................................................................................................................169 Future Work ......................................................................................................................................................170 References ..........................................................................................................................................................171

vi
LIST OF FIGURES Figure 1-‐1: The plot demonstrates the rise in sea level over the past 160 years ......... 3 Figure 1-‐2: Map of Greenland and Disko Bugt.............................................................................. 7 Figure 1-‐3: Simplified bedrock geology map of the Disko Bugt region ............................ 9 Figure 1-‐4: Bathymetry of the Disko and Uummannaq areas ............................................11 Figure 1-‐5: Ideal samples for 10Be dating .....................................................................................15 Figure 1-‐6: Threshold lakes ................................................................................................................18 Figure 2-‐1: Location map.....................................................................................................................31 Figure 2-‐2: Samples for 10Be dating ................................................................................................33 Figure 2-‐3: Stratigraphy and downcore data of lake sediment core 10KT-‐2A.............36 Figure 2-‐4: Stratigraphic section at Qinngap Ilulialeraa ........................................................37 Figure 2-‐5: Photograph of historical moraine ...........................................................................39 Figure 2-‐6: Historical images of the Greenland Ice Sheet......................................................43 Figure 2-‐7: Sediment exposures from the Tininnilik basin...................................................45 Figure 2-‐8: Photograph of maximum high-‐stand shoreline a Tininnilik.........................47 Figure 2-‐9: Magnitude of recent ice margin retreat in West Greenland..........................50 Figure 3-‐1: Disko Bugt region with deglacial chronology......................................................62 Figure 3-‐2: Sample photographs from field sites ......................................................................74 Figure 3-‐3: Satellite image of the sampling transect on Sarqardîp Nuna .......................75 Figure 3-‐4: Time-‐distance diagram of GrIS margin in the Disko Bugt region...............80 Figure 3-‐5: Late Pleistocene history of the western GrIS margin ......................................81 Figure 4-‐1: Location map with transects ......................................................................................97 Figure 4-‐2: Torsukattak, and Nordenskiöld study areas with ages................................107 Figure 4-‐3: Time-‐distance diagram for early-‐mid Holocene .............................................108 Figure 4-‐4:West Greenland deglacial transects and retreat rates ..................................113 Figure 4-‐5: Compilation of retreat rates.....................................................................................117 Figure 5-‐1: Location map..................................................................................................................132 Figure 5-‐2: The Sermeq Kujatdleq study area .........................................................................136 Figure 5-‐3: The Nordenskiöld Gletscher study area .............................................................139 Figure 5-‐4: Cores from the Sermeq Kujatdleq study area ..................................................142 Figure 5-‐5: View to the north across Little Igy Lake .............................................................143 Figure 5-‐6: Arqataussap Tasia before and after the most recent draining .................145 Figure 5-‐7: Photographs from the Arqataussap Tasia basin .............................................148 Figure 5-‐8: Cores from the Nordenskiöld Gletscher study area ......................................151 Figure 5-‐9: Photograph from the terminus of Nordenskiöld Gletscher .......................155 Figure 5-‐10: Time distance diagrams for late Holocene ice margin fluctuations ....159

vii
LIST OF TABLES Table 2-‐1: 10Be sample information ................................................................................................42 Table 2-‐2: Radiocarbon sample information...............................................................................42 Table 3.1: Previously published radiocarbon ages on Disko Bugt deglaciation ..........69 Table 3-‐2: Previously published 10Be ages ..................................................................................70 Table 3-‐3: 10Be sample information ................................................................................................71 Table 4-‐1: 10Be sample information .............................................................................................100 Table 4-‐2: Radiocarbon sample information............................................................................100 Table 5-‐1: 10Be sample information .............................................................................................133 Table 5-‐2: Radiocarbon sample information............................................................................133

viii
FRONTISPIECE: Map of Disko Bugt Region from Rink 1853.

ix
ABSTRACT The current response of the Greenland Ice Sheet (GrIS) margin to climate change is
spatially and temporally variable. Understanding the mechanisms that control this
variability is crucial for accurate predictions of how the GrIS will change in the
future. One factor that appears to play a role in driving the varying response
exhibited along the margin of the GrIS is the ice margin setting (marine-‐terminating
or land-‐terminating). Recent research has demonstrated that basal melting of
marine-‐terminating glaciers may increase their vulnerability to climatic
perturbations, while their land-‐terminating counterparts may lag in their reaction
similar climatic changes. While these trends are illustrated in historic and modern
records, longer temporal records are needed to place these observations in context.
Here, I present a chronology of GrIS fluctuations within the Disko Bugt region of
West Greenland. This record spans the Holocene, and is constrained by 10Be and
radiocarbon ages. Through building this chronology, I reconstruct the pattern and
timing of Holocene ice margin fluctuations and evaluate the response of differing ice
margin types (marine-‐based or land-‐based) to regional climate forcing. From my
chronology it is apparent that, on millennial timescales early Holocene ice margin
retreat rates were synchronous within Disko Bugt. This pattern extends along the
western margin of the GrIS, with all the sections of the ice margin examined
displaying similar retreat rates despite dissimilar marginal settings. This is
strikingly different than modern trends, where marine-‐based outlet glaciers exhibit
significantly higher retreat rates than their land-‐based counterparts.
x
The record of ice margin reaction to recent warming demonstrates a distinct
pattern of asynchrony. In my late Holocene records, marine-‐based glaciers initiate
retreat much sooner than land-‐based sectors of the ice margin. I believe this feature
demonstrates a relationship between ice margin type and response time. I propose
that in West Greenland faster glaciers maintain a closer equilibrium with changing
climate than slower flowing glaciers. In total, the historic pattern of relative stability
of land-‐based sectors of the GrIS is in contrast with the longer records of Holocene
ice margin fluctuation. Additionally, a relationship between ice margin type and
response time suggests that land-‐based sectors of the ice margin lag in their
reaction to climate forcing on decadal scales. This indicates that historically stable
sectors of the ice margin may be expected to undergo significant future retreat, as a
larger percentage of the GrIS margin begins to react to 20th century warming.
1
I: INTRODUCTION Recent studies have shown that the response of ice sheets to changing climate is
complex (Bjørk et al., 2012; Kjær et al., 2012). Additionally, attempts to quantify the
amount of mass lost from ice sheets have demonstrated a complicated relationship
between climate and size of large ice masses (Meier et al., 2007; Price et al., 2011;
Jaccob et al., 2012). Because terrestrially based ice sheets have become the dominant
contributor to modern rising sea level, the melting of these features is considered one of
the most critical environmental issues facing society today (Rignot et al., 2011; Stocker et
al., 2013). The complex pattern in which rising temperatures cause to ice sheets melt and
retreat, and thus raise sea level, is exemplified through the asynchronous behavior of
various outlet glaciers along the margin of a single ice sheet (Bjørk et al., 2012; Kjær et
al., 2012). Due to relationships between ice velocity, trough geometry, basal melt, and
other ice dynamic factors, neighboring sectors with varying ice marginal settings may
exhibit a varying response in both space and time to the same climatic forcing.
The rise in global sea level due to the melting of the world’s terrestrially based ice
masses is an impending problem, and has large-scale societal impacts. At present, the
combined loss from Antarctica and Greenland accounts for ~33-50% of global sea level
rise, with the contribution from the world’s ice sheets being split nearly evenly between
the two ice masses (Milne et al., 2009; Cazenave and Llovel, 2010; Rignot et al., 2011).
In addition, increased meltwater from the Greenland Ice Sheet (GrIS) has the potential to
freshen the waters of the North Atlantic, which may result in unforeseen climatic
consequences due to the interruption of local deep-water formation and oceanic heat
transport (Dickson et al., 1996; Belkin et al., 1998; Stocker et al., 2013). Recent
observations have demonstrated rapid changes along the margins of the GrIS (Csatho et
2
al., 2008; Joughin et al., 2014; Khan et al., 2014). These observations are contributing to
an improved understanding of the ice sheet’s response to climate change (Alley et al.,
2010; Howatt and Eddy, 2011; Rignot et al., 2011). Knowledge of ice-margin
fluctuations beyond the frame of the instrumental record can greatly improve our
understanding of how the GrIS responds to changes in climate by placing recent changes
in a longer temporal context. As a result, longer records of ice sheet change can improve
our ability to forecast future changes in global sea level.
At present, estimates of the future contribution of ice sheets to rising sea level
remain varied (e.g. Meier et al., 2007; Pfeffer et al., 2008; Price et al., 2011). This
uncertainty is illustrated by the range of sea level rise by the year 2100 AD in the
published literature, ranging from the most recent IPCC report (5th assessment)
suggesting sea level rise between 0.28 -0.98 m (Stocker et al., 2013) to older estimates
ranging from 0.18-0.59 m for the same time interval of sea level rise (Solomon et al.,
2007). A significant amount of the variability is derived from our uncertainty in the
processes involved, especially those related to dynamic mass loss at outlet glaciers (Fig.
1-1). This variability in estimates of future sea level change highlights the need for
additional information about ice sheet reaction to changes in climate during a time period
analogous to the predicted future warming.

3
Figure 1-1: The plot demonstrates the rise in sea level over the past 160 years (red line) and projections of
future sea level rise by the A.D. 2100 from published studies.
4
One such archive is the geologic record of ice sheet fluctuations from the Holocene; at
times temperatures reached values ~1.6±0.8° C higher than present, an amount similar
predictions for the next century (Kaufman et al., 2004; Stocker et al., 2013).
During the early 1800’s, scientists formulated the early theories of ice ages by
making the first comparisons between the geologic record and observable glacial
behavior (Agassiz and Bettannier, 1840; De Charpentier and von Charpentier, 1841).
Since that time, the past spatial extent of ice sheets and glaciers has been identified using
the areal distribution of glacial deposits. These deposits have served as the primary
resource for examining the expansion and contraction of ice masses in the geologic past.
The understanding of past behavior of glaciers and ice sheets gleaned from these deposits
is important for placing the modern observations of glaciers and ice sheets in the context
of the geologic record.
In this dissertation I seek to explore the relationship between changes in climate
and the reaction of differing portions of the GrIS margin (land-terminating or marine-
terminating) by creating a record of the GrIS in the Disko Bugt region of West Greenland
through the Holocene. This evidence will add context to the observations of changes in
the GrIS made in recent time. These finding will thus ultimately aid in future predictions
of GrIS contribution to global sea level rise.
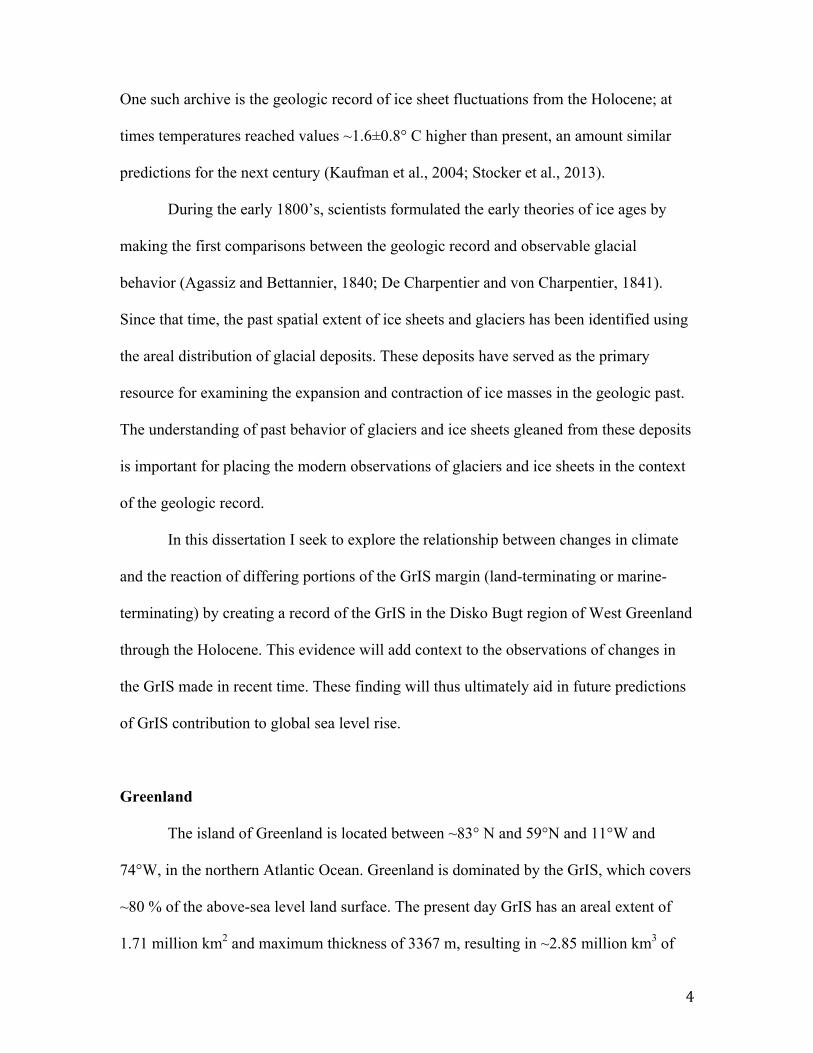
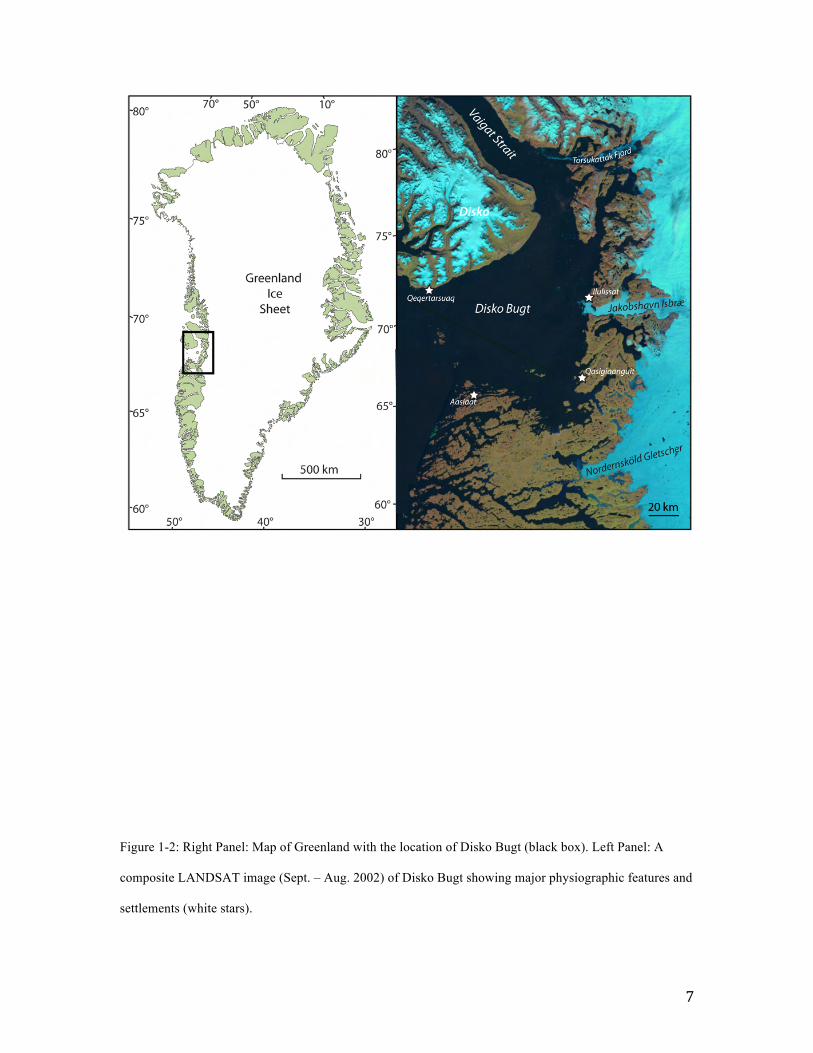
Greenland
The island of Greenland is located between ~83° N and 59°N and 11°W and
74°W, in the northern Atlantic Ocean. Greenland is dominated by the GrIS, which covers
~80 % of the above-sea level land surface. The present day GrIS has an areal extent of
1.71 million km2 and maximum thickness of 3367 m, resulting in ~2.85 million km3 of
5
ice, which is ~7.2 m of sea level equivalent (Bamber et al., 2001; Griggs and Noguer,
2002). The GrIS is underlain by bedrock that is primarily Precambrian in age, with three
major terranes: Unmodified Archean rocks of 3100-2660 million years old, Archean
rocks reworked during the early Proterozoic ~1850 million years ago, and terranes
composed of Proterozoic rocks (2000-1750 million years old). The crystalline bedrock is
overlain in places by Paleozoic and Mesozoic sediments, as well as extensive tertiary
flood basalts in central West and central East Greenland (Henriksen et al., 2013).
Glacial History
Initiation of the GrIS began in the middle Miocene, prior to 14 million years ago,
as evidenced by the earliest appearance of ice rafted debris in the Fram Strait off of
Northeast Greenland (Thiede et al., 1998). Evidence of the glaciation of the whole of
Greenland is recorded by ice rafted debris from the North Atlantic at 7 million years ago
(Thiede et al., 1998). Terrestrial signs of early glaciation of Greenland come from the
Kap København Formation in North Greenland. This marine sedimentary unit includes
reworked shells from a warmer interglacial prior to ~2.5 million years ago (Funder et al.,
2001). Numerous phases of glaciation occurred from 2.5 million years ago to present,
with increasing information known about each successive phase. Deep ice cores from low
velocity areas of the GrIS, near drainage divides, provide long-term records of past
climate spanning the past ~123,000 years (Alley et al., 2010). These ice core records
provide isotopic proxy records for many climatic factors. Of primary importance are
temperature reconstructions, which are based on ∂18O, or on interpretations of borehole
measurements (Alley et al., 2010).
6
The most recent period of significantly reduced ice cover in Greenland occurred
during the Eemian Stage (135-115 ka; MIS 5e), when modeling results suggest the ice
sheet was 25-66% smaller than present, and that the southern region of the ice sheet was
the most reduced in size (Funder et al., 2011). An ice core from northwest Greenland, the
NEEM core, recovered ice formed during the Eemian stage (Dahl-Jensen et al., 2013).
Analysis suggests that annual temperatures during that time period reached ~ 8° C
warmer than present (about -25° C; Dahl-Jensen et al., 2013). The most recent glaciation,
known locally as the Weichselian Stage, lasted from 115-11.7 ka, with numerous
fluctuations in the size of the ice sheet (Funder et al., 2011). During the last glacial
maximum (LGM; 24-16 ka) the GrIS extended far beyond the present Greenland
coastlines, reaching the edge of the continental shelf (Ó Cofaigh et al., 2013). Recession
of the ice sheet from its LGM position occurred after 21 ka, with ice retreating onto land
between 14 and 9.5 ka (Funder et al., 2011). The GrIS achieved its most-recent minimum
configuration during the middle Holocene (8,200-4,200 years ago) when the ice sheet
was ~4 % smaller than at present (Simpson et al., 2009). In the past 2000 years the GrIS
has expanded in response to Neoglacial cooling.
7
Figure 1-2: Right Panel: Map of Greenland with the location of Disko Bugt (black box). Left Panel: A
composite LANDSAT image (Sept. – Aug. 2002) of Disko Bugt showing major physiographic features and
settlements (white stars).
8
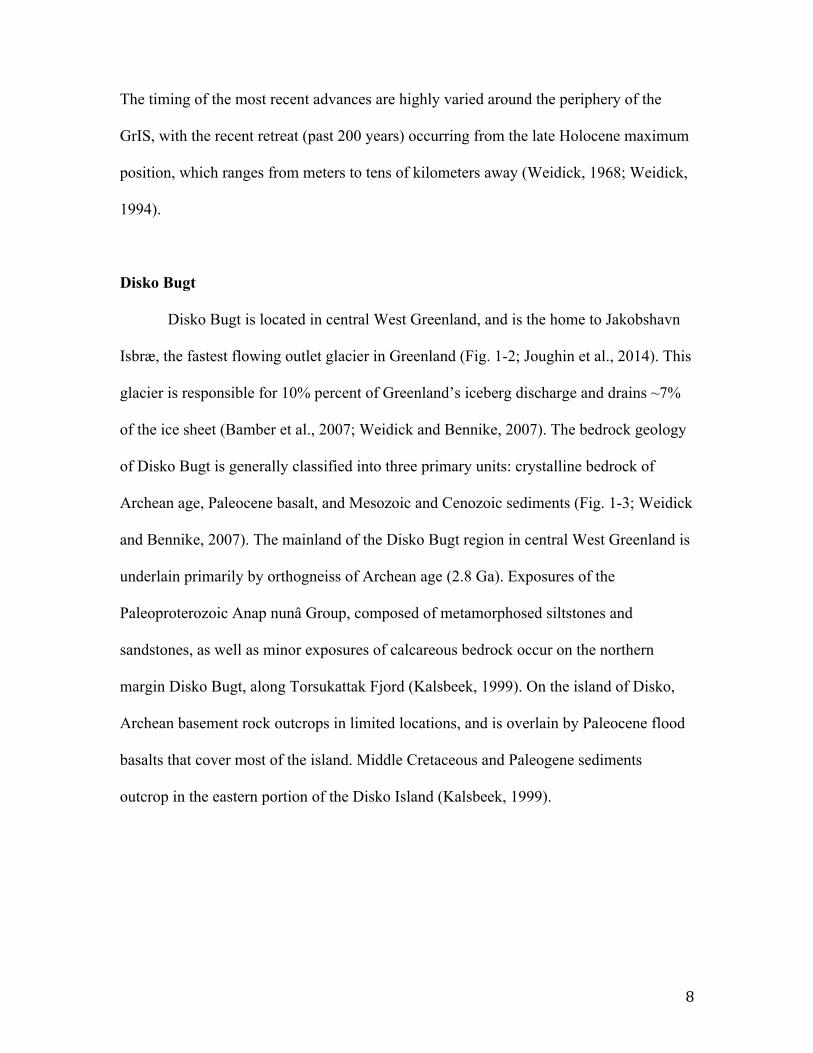
The timing of the most recent advances are highly varied around the periphery of the
GrIS, with the recent retreat (past 200 years) occurring from the late Holocene maximum
position, which ranges from meters to tens of kilometers away (Weidick, 1968; Weidick,
1994).
Disko Bugt
Disko Bugt is located in central West Greenland, and is the home to Jakobshavn
Isbræ, the fastest flowing outlet glacier in Greenland (Fig. 1-2; Joughin et al., 2014). This
glacier is responsible for 10% percent of Greenland’s iceberg discharge and drains ~7%
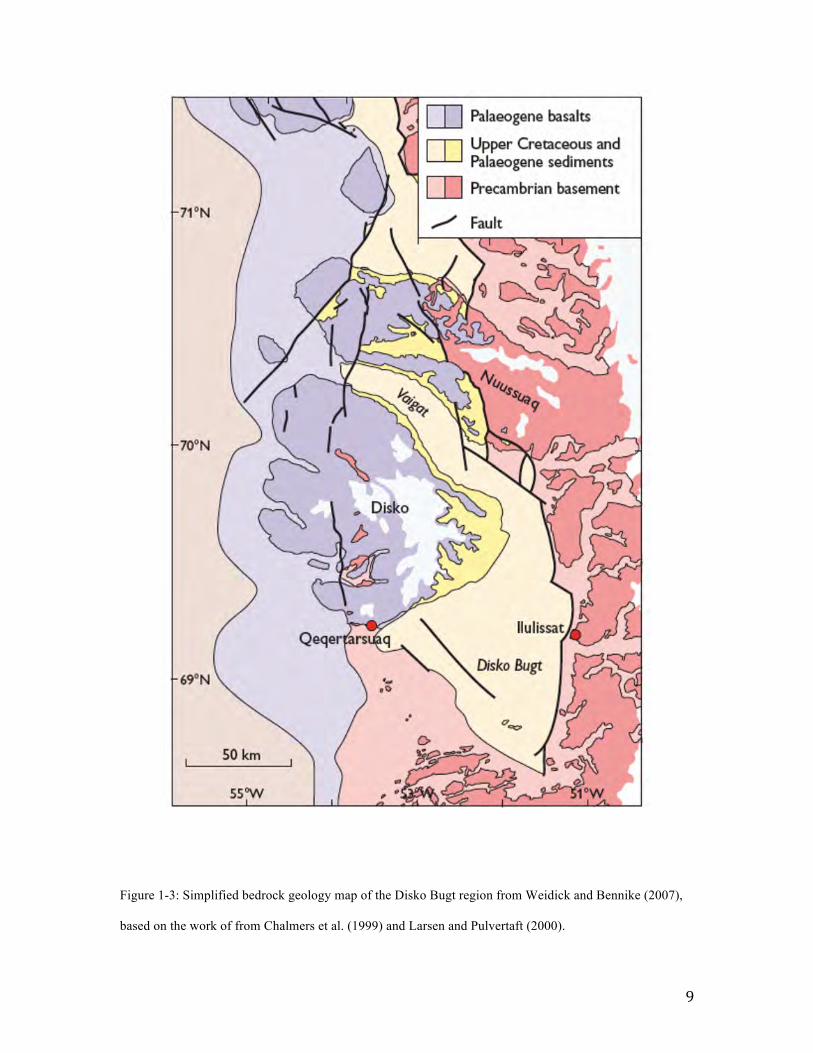
of the ice sheet (Bamber et al., 2007; Weidick and Bennike, 2007). The bedrock geology
of Disko Bugt is generally classified into three primary units: crystalline bedrock of
Archean age, Paleocene basalt, and Mesozoic and Cenozoic sediments (Fig. 1-3; Weidick
and Bennike, 2007). The mainland of the Disko Bugt region in central West Greenland is
underlain primarily by orthogneiss of Archean age (2.8 Ga). Exposures of the
Paleoproterozoic Anap nunâ Group, composed of metamorphosed siltstones and
sandstones, as well as minor exposures of calcareous bedrock occur on the northern
margin Disko Bugt, along Torsukattak Fjord (Kalsbeek, 1999). On the island of Disko,
Archean basement rock outcrops in limited locations, and is overlain by Paleocene flood
basalts that cover most of the island. Middle Cretaceous and Paleogene sediments
outcrop in the eastern portion of the Disko Island (Kalsbeek, 1999).
9
Figure 1-3: Simplified bedrock geology map of the Disko Bugt region from Weidick and Bennike (2007),
based on the work of from Chalmers et al. (1999) and Larsen and Pulvertaft (2000).
10
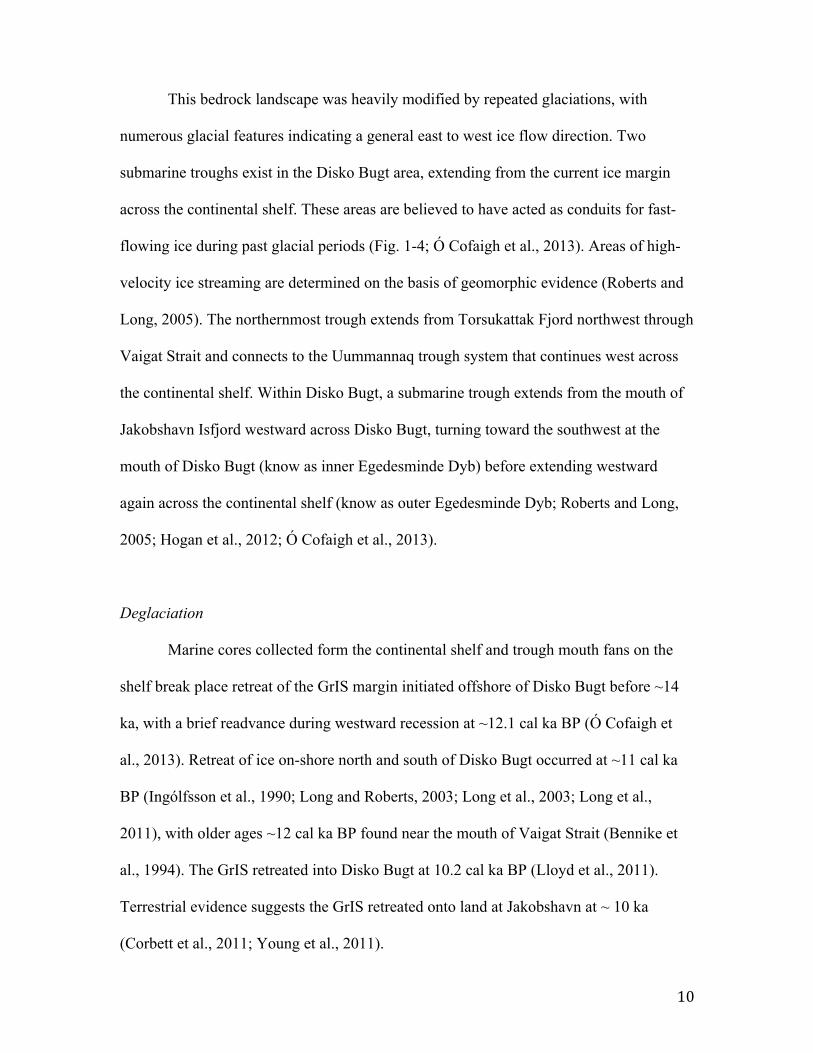
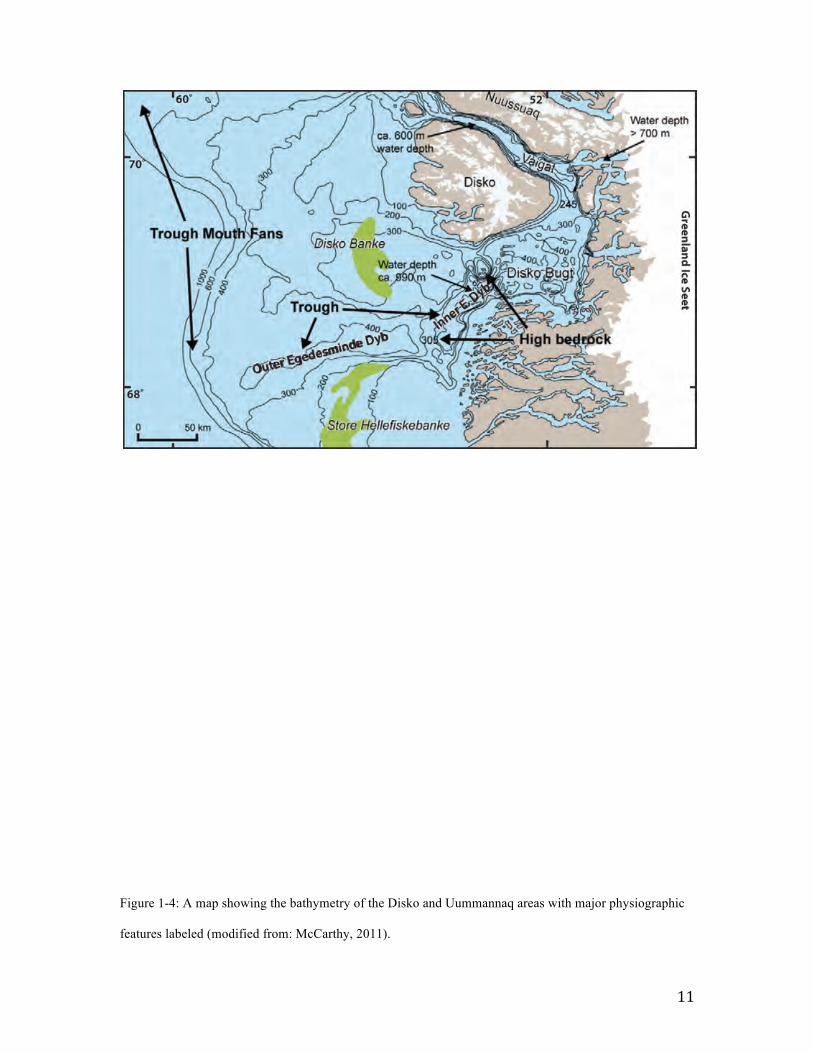
This bedrock landscape was heavily modified by repeated glaciations, with
numerous glacial features indicating a general east to west ice flow direction. Two
submarine troughs exist in the Disko Bugt area, extending from the current ice margin
across the continental shelf. These areas are believed to have acted as conduits for fast-
flowing ice during past glacial periods (Fig. 1-4; Ó Cofaigh et al., 2013). Areas of high-
velocity ice streaming are determined on the basis of geomorphic evidence (Roberts and
Long, 2005). The northernmost trough extends from Torsukattak Fjord northwest through
Vaigat Strait and connects to the Uummannaq trough system that continues west across
the continental shelf. Within Disko Bugt, a submarine trough extends from the mouth of
Jakobshavn Isfjord westward across Disko Bugt, turning toward the southwest at the
mouth of Disko Bugt (know as inner Egedesminde Dyb) before extending westward
again across the continental shelf (know as outer Egedesminde Dyb; Roberts and Long,
2005; Hogan et al., 2012; Ó Cofaigh et al., 2013).
Deglaciation
Marine cores collected form the continental shelf and trough mouth fans on the
shelf break place retreat of the GrIS margin initiated offshore of Disko Bugt before ~14
ka, with a brief readvance during westward recession at ~12.1 cal ka BP (Ó Cofaigh et
al., 2013). Retreat of ice on-shore north and south of Disko Bugt occurred at ~11 cal ka
BP (Ingólfsson et al., 1990; Long and Roberts, 2003; Long et al., 2003; Long et al.,
2011), with older ages ~12 cal ka BP found near the mouth of Vaigat Strait (Bennike et
al., 1994). The GrIS retreated into Disko Bugt at 10.2 cal ka BP (Lloyd et al., 2011).
Terrestrial evidence suggests the GrIS retreated onto land at Jakobshavn at ~ 10 ka
(Corbett et al., 2011; Young et al., 2011).
11
Figure 1-4: A map showing the bathymetry of the Disko and Uummannaq areas with major physiographic
features labeled (modified from: McCarthy, 2011).
12
Ice remained longer in southern Disko Bugt: until 9.6 ka, based on radiocarbon ages from
a lake core and 9.2 ka based on four 10Be cosmogenic nuclide exposure ages (Young et
al., 2013a).
Ice retreat across the mainland in the Disko Bugt region was punctuated by two
readvances or standstills at 9.3 ka and 8.2 ka, resulting in the deposition the Fjord Stade
moraines (Young et al., 2013a), mapped by Weidick (1968). Following Fjord Stade
moraine deposition, retreat of the GrIS margin continued eastward, passing the location
of the present ice margin at ~7.4 ka near Jakobshavn Isbræ. Evidence for the timing of
deglaciation is sparse inland of northern Disko Bugt, where the only evidence of middle
Holocene retreat is derived from dated shells that provide minimum constraints on ice
retreat to near the present configuration at 8.4 cal ka BP (Ingólfsson et al., 1990) and 7.3
cal ka BP (Rasch, 1997).
The limited geologic evidence of a smaller-than-present GrIS in the middle
Holocene is from two sources: (1) threshold lakes (explained in methods section of this
chapter) that are currently proglacial and (2) marine macrofossils incorporated into till
during the late Holocene advance. Evidence from threshold lakes by Briner et al. (2010),
demonstrates that a minimum ice configuration occurred ~15 km south of Jakobshavn
Isbrae at ~6 ka, and indicates the late Holocene advance was underway by ~2 cal ka BP
(Briner et al., 2010). Marine macrofossil fragments incorporated into till provide similar
constraints of reduced ice conditions, with radiocarbon ages ranging from ~6.1 to ~2.3
cal ka BP (Weidick and Bennike, 2007). In addition, recent research utilizing amino acid
racemization have added additional ages to shell fragments in till, finding that the GrIS
maintained a reduced configuration (with respect to present) from ~3-5 cal ka BP (Briner
et al., 2014).

13
Research Motivation
Historic records of ice margin fluctuation along the periphery of the Greenland
reveal distinct variability in the rate and magnitude of ice margin retreat since the most
recent maximum of the past few millennia (Funder et al., 2011 and refrences therein).
One pattern that emerges from studies of recent variability in GrIS retreat is that marine-
terminating glaciers have experienced significantly more retreat than their land-
terminating counterparts (Weidick, 1968; Weidick, 1994). In addition to this spatial
variability, a temporal variability exists in the timing of the late Holocene maximum.
Temporal constraints on the late Holocene maximum position range from 2,000 years ago
(Bennike and Sparrenbom, 2007; Forman et al., 2007) to glaciers that are currently
advancing toward their maximum position (Weidick et al., 2004). This variability,
coupled with a relatively short (~160 years) historic record, complicates efforts to
estimate the future behavior of the GrIS, and thus the ice sheet’s future retreat and
contribution to global sea level rise.
This dissertation will address two questions regarding the variability seen in the
historic record of GrIS retreat: 1) Is the spatial and temporal variability seen in records of
GrIS retreat a reaction to recent climate change, or is the variability present throughout
the Holocene record? 2) Does a lag exist in the reaction of land-based ice margins with
respect to their marine-based counterparts throughout the Holocene? I hypothesize that
factors such as ice dynamics, fjord topography, glacier velocity, and ocean heat transport
that are unique to marine-based glaciers drive these sectors of the ice sheet so that ice
margin fluctuations mirror changes in climate. In contrast, the more passive land-based
14
sectors of the ice margin lag in their response to changing climate. Furthermore, I
hypothesize that this asynchrony, driven by ice marginal setting, is present throughout the
Holocene.
Methods
I employed two geochonologic methods to examine the timing and pattern of
retreat of the GrIS: 1) Cosmogenic-nuclide exposure dating using 10Be concentrations
(10Be dating) in bedrock and erratic boulders, 2) radiocarbon dating of macrofossils
recovered from lake cores and sediment exposures. In tandem, these methods provide
chronologic constraints on the movement of the GrIS margin, both when it was more and
less extensive than it is at present. The combination of tools allows creation of a record of
ice margin position that spans the Holocene, and provides information to address the
questions presented in the previous section.
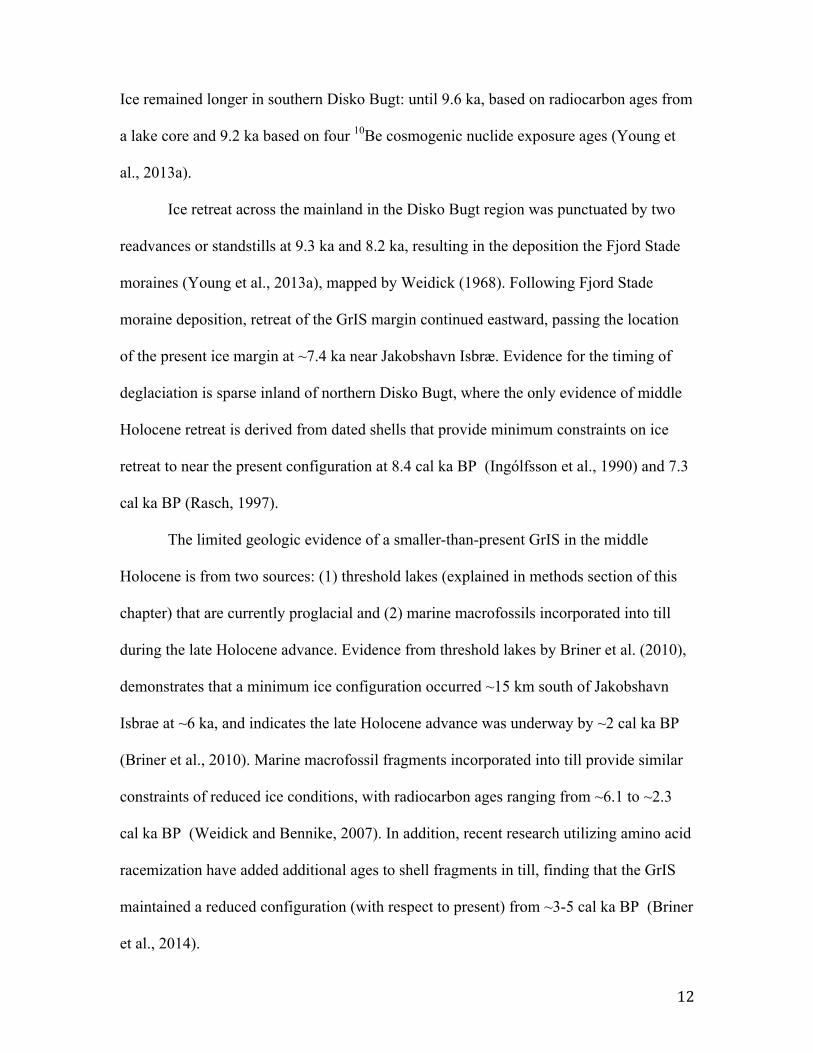
Cosmogenic-nuclide exposure dating
Cosmogenic nuclide exposure dating is based on the production of isotopes within
minerals via bombardment of secondary cosmic rays. In this dissertation I make use of
10Be produced in the crystal lattice of quartz. 10Be dating provides direct constrains on the
timing of the retreat of an ice margin based on the in situ production of 10Be in quartz-
rich bedrock and erratics following the removal of ice cover (Balco, 2011).
15
Figure 1-5: Ideal samples for 10Be dating. Top Panel: Erratic boulders resting on bedrock at the GrIS
margin at the head of Qinngap Lake. Bottom Panel: A bedrock sampling location at the head of Qinngap
Lake.

16
The production of 10Be is primarily due to spallation reactions between incoming sub-
atomic particles produced in Earth’s atmosphere via interactions with cosmic radiation
(Gosse and Phillips, 2001). The calculation of a 10Be date is derived from the
concentration of 10Be found within quartz and can be described by the equation below:
Where [Be] is the concentration of 10Be in quartz (atoms g-1), Pr is the site specific
production rate of 10Be in quartz (atoms g-1 a-1), λ is the decay constant for 10Be (4.99 x
10-7 a-1), and t is time of exposure.
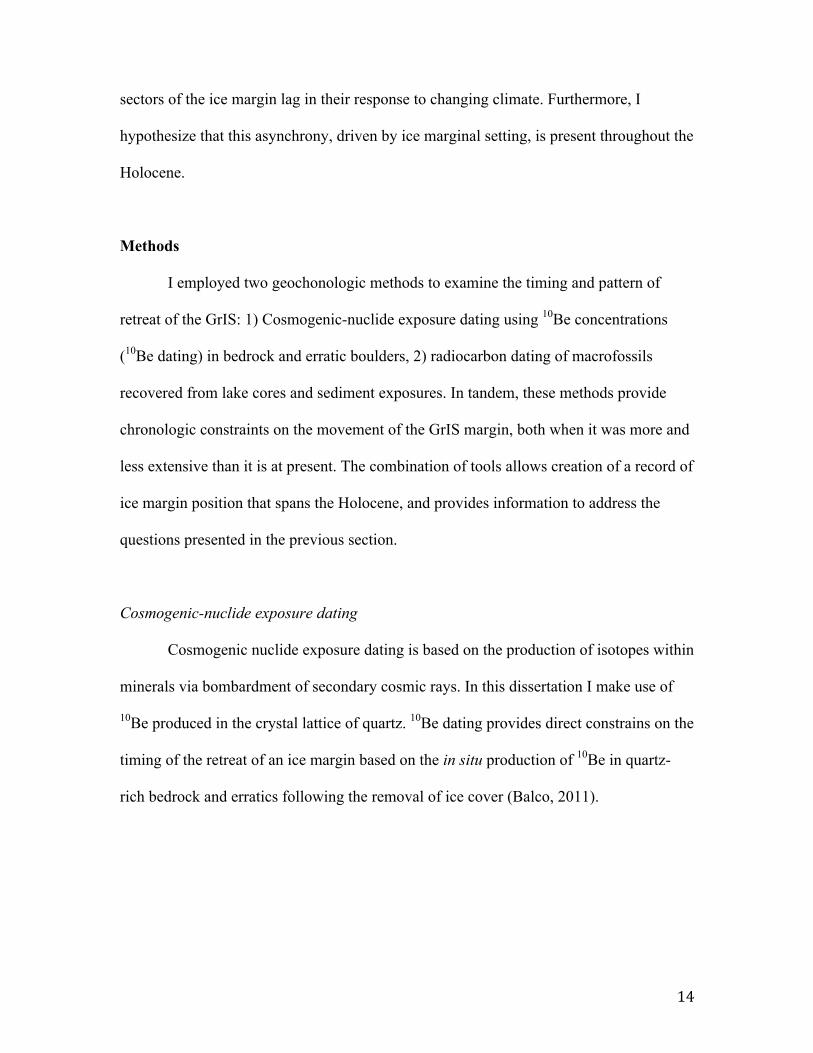
10Be dating is well suited for use in the glacially scoured bedrock landscape of
West Greenland, which has a lack of organic material available for radiocarbon dating
(Fig. 1-6). Additionally, 10Be dating has been used with great success in the Disko Bugt
region (Corbett et al., 2011; Young et al., 2011a; 2011b; 2013). Samples for 10Be dating
are collected from above the local marine limit from ice-scoured environments. Sampling
bedrock from areas that contain evidence of glacial erosion, such as striae or glacial
polish, reduces the risk of contamination from inherited 10Be that remains from a
previous period of exposure. Additionally, samples are collected from geomorphically
stable locations to ensure the sampled surface has remained in the same orientation since
the GrIS retreated from the landscape.
Following collection in Greenland, samples are processed at the University at
Buffalo to physically isolate quartz from the host rock, and then chemically isolate 10Be
following a method modified from Kohl and Nishiizumi (1992). Physical isolation of
quartz entails crushing of the rock sample using a hydraulic jaw crusher and disk mill
pulverizer. The crushed sample is sieved, isolating the 425-850 µm fraction. The sieved
€
[Be] =Prλ1− e−λt[ ]

17
sample is exposed to strong magnets to remove mafic minerals and then exposed to acids
(HF, HNO3, and HCl), to dissolve non-quartz material. Heavy liquid separation is also
performed on samples to isolate quartz by floatation. Isolated quartz is tested for purity at
the University of Colorado using inductively coupled plasma atomic emission
spectroscopy, which measures the concentrations of elements (Fe, Al, K, Mg, Ca, Na, and
Ti) within the isolated quartz sample. Samples which are sufficiently free of additional
ions are dissolved for chemical isolation of Be. In addition to the dissolution, all samples
are spiked with a known amount of 9Be for measurement purposes. The dissolved
samples experience a number of evaporation steps in addition to ion exchange
chromatography with anion and cation resins, with the purpose of removing unwanted
ions. Isolated Be is precipitated using NH3, creating a BeOH gel, which is dried in a low
boron quartz crucible and then oxidized over a flame. Extracted beryllium is packed with
Ni powder and is sent to Lawrence Livermore National Laboratory for measurement. Age
calculation is performed from ratios of 9Be/10Be, based on the known local production
rate for the Baffin Bay area (Young et al., 2013b), as well as site-specific scaling factors
such as topographic shielding, sample thickness, elevation, and geographic position.
Error calculated for the ages are analytical in nature and are based on measurement drift
in repeat analyses of an AMS standard.
18
Figure 1-6: Top Panel: Photograph showing both pro-glacial (turbid) as well non-glacial (non-turbid) lakes,
emphasizing difference in the depositional regime. Bottom Panel: A photograph of a core demonstrating
the change from mineral-rich sedimentation or organic-rich sedimentation. The top of the core is to the
right; the lake where the core is collected is currently not receiving glacial melt water.
19
Radiocarbon dating
Radiocarbon dating is a radiometric dating method that utilizes the decay of 14C
(to nitrogen) to determine the timing of death of an organism, the time when exchange of
carbon with Earth’s atmosphere ceased. The death, and subsequent deposition, of the
organism’s remains can provide constraints on geologic events based on stratigraphic
relationships. The use of radiocarbon dating in this dissertation relies on dating fossil
organisms in terrestrial and lacustrine sediments, where the deposition of the fossils is
stratigraphically linked to fluctuations in the position of the GrIS margin, with all
radiocarbon ages reported in calendar years.
In lake sediments, which are collected via a coring device, radiocarbon dating of
fossil material adds chronologic constraints to the position of the GrIS with respect to the
lake’s catchment. Many lakes in west Greenland contain sedimentary fingerprints that
record changes in past ice margin extent. Sediment cores are collected from “threshold
lakes.” Threshold lakes are those that alternate between receiving silt-rich glacial
meltwater (proglacial lake) to being primarily precipitation fed (non-glacial) as a result of
the movement of the ice margin into or out of the lake’s catchment (Fig. 1-7; Kaplan et
al., 2002; Daigle and Kaufman, 2009; Briner et al., 2010). Macrofossils or organic-rich
sediment at these contacts are radiocarbon dated to determine the timing of the change in
depositional regime. Lake sediment cores for this dissertation are collected using one of
two coring systems: a Universal Coring System (www.aquaticresearch.com) or a Nesje-
style percussion-piston coring system (Nesje, 1992) operated from a floating platform.
Cores obtained from both non-glacial and proglacial lakes are used to create a record of
ice margin movement both outboard, as well as beneath the, present ice margin limit.
20
A Garmin GPSMAP 400 series GPS receiver connected to a dual-beam echo
sounder is used to locate coring sites within a lake basin. The cores are drained of water
and packed in the field for shipment to Buffalo. At the University of Buffalo, cores are
split, logged, and photographed, with samples collected from identified contacts from
split cores for radiocarbon dating. Macrofossil samples are washed in deionized water
and freeze-dried, before submission to the National Ocean Sciences Accelerator Mass
Spectrometry Facility at Woods Hole Oceanographic Institute for measurement. Ages are
calibrated from radiocarbon years to years before present using the CALIB online
program, version 7.0 and the INTCAL13 or MARINECAL13 dataset, are presented as
cal BP or cal ka BP (Stuiver et al., 2010).
Dissertation Structure
This dissertation is written as a collection of manuscripts that were prepared for
publication in peer-reviewed journals. As such, some overlap in materials covered and
references cited will occur, especially within the introduction and methods sections of
each chapter. The chapters are presented in the order that each manuscript was written. At
present, chapters II and III have been published in the journal Quaternary Science
Reviews. In addition to the manuscript chapters, chapters I and VI “bookend” the
dissertation, and are intended to form an introduction and overall conclusion for the
dissertation.
Chapter II presents a mid-late Holocene history of a terrestrial sector of the GrIS
margin, as well a remote sensing study of late Holocene retreat along the western margin
of the GrIS. This chapter provides a pilot study for the remaining investigation of the role
ice marginal setting plays in the Holocene reaction of the GrIS to climate change. In

21
chapter II SEK the composed manuscript, participated in sample collecting and
laboratory work; JPB procured the funding, planned the field season logistics and
provided comments on the manuscript; NEY assisted in field work and laboratory work,
as well as provided useful suggestions for the manuscript; GSB and BC provided
assistance in constructing figure 9 as well as numerous useful suggestions for the
discussion and methods sections. Chapter III focuses on the early Holocene evacuation of
ice from Disko Bugt, and examines the use of retreat rates as a metric for comparing ice
margin fluctuation along various flowlines. In chapter III, SEK composed the manuscript,
as well as planned and performed the field and laboratory work; JPB provided guidance
on all aspects of this study including the construction of the manuscript; NEY assisted in
fieldwork and provided useful suggestions for the manuscript. Chapter IV expands upon
chapter III by examining early to mid Holocene ice margin retreat in two end-member ice
marginal settings: a marine system in Torsukattak Fjord and a terrestrial setting in the
Nordenskiöld Gletscher area. Retreat rates are compared between the two systems to
examine the local reaction of the ice margin to changing climate. The results from
Torsukattak Fjord and Nordenskiöld Gletscher are compared to retreat rates for transects
along the entire western margin of the GrIS for larger spatial context. Chapter V
investigates the same sectors of the ice margin as discussed in Chapter IV, but focuses on
the history of late Holocene ice margin fluctuations. Comparisons are made between the
two study areas and other well-constrained late Holocene ice margin fluctuations from
the Disko Bugt region.
References
Agassiz, L., Bettannier, J., 1840. Etudes sur les glaciers. Jent et Gassmann.
22
Alley, R.B., Andrews, J.T., Brigham-Grette, J., Clarke, G.K.C., Cuffey, K.M., Fitzpatrick, J.J., Funder, S., Marshall, S.J., Miller, G.H., Mitrovica, J.X., Muhs, D.R., Otto-Bliesner, B.L., Polyak, L., White, J.W.C., 2010. History of the Greenland Ice Sheet: paleoclimatic insights. Quaternary Science Reviews 29, 1728-1756.
Balco, G., 2011. Contributions and unrealized potential contributions of cosmogenic nuclide exposure dating to glacier chronology, 1990-2010. Quaternary Science Reviews 30, 3-27.
Bamber, J.L., Layberry, R.L., Gogineni, S., 2001. A new ice thickness and bed data set for the Greenland ice sheet: 1. Measurement, data reduction, and errors. Journal of Geophysical Research: Atmospheres (1984–2012) 106, 33773-33780.
Bamber, J.L., Alley, R.B., Joughin, I., 2007. Rapid response of modern day ice sheets to external forcing. Earth and Planetary Science Letters 257, 1-13.
Belkin, I.M., Levitus, S., Antonov, J.I., Malmberg, S.-A., 1998. ‘Great Salinity Anomalies’ in the North Atlantic. Progress in Oceanography 41, 1– 68.
Bennike, O., Hansen, K.B., Knudsen, K.L., Penney, D.N., Rasmussen, K.L., 1994. Quaternary marine stratigraphy and geochronology in central West Greenland. Boreas 23, 194-215.
Bennike, O., Sparrenbom, C.J., 2007. Dating of the Narssarssuaq stade in southern Greenland. The Holocene 17, 279-282.
Bjørk, A.A., Kjær, K.H., Korsgaard, N.J., Khan, S.A., Kjeldsen, K.K., Andresen, C.S., Larsen, N.K., Funder, S., 2012. An aerial view of 80 years of climate-related glacier fluctuations in southeast Greenland. Nature Geoscience 5, 427-432.
Briner, J., Stewart, H., Young, N., Philipps, W., Losee, S., 2010. Using proglacial-threshold lakes to constrain fluctuations of the Jakobshavn Isbræ ice margin, western Greenland, during the Holocene. Quaternary Science Reviews 29, 3861-3874.
Briner, J.P., Kaufman, D.S., Bennike, O., Kosnik, M.A., 2014. Amino acid ratios in reworked marine bivalve shells constrain Greenland Ice Sheet history during the Holocene. Geology 42, 75-78.

23
Cazenave, A., Llovel, W., 2010. Contemporary sea level rise. Annual Review of Marine Science 2, 145-173.
Corbett, L.B., Young, N.E., Bierman, P.R., Briner, J.P., Neumann, T.A., Rood, D.H., Graly, J.A., 2011. Paired bedrock and boulder 10Be concentrations resulting from early Holocene ice retreat near Jakobshavn Isfjord, western Greenland. Quaternary Science Reviews 30, 1739-1749.
Csatho, B., Schenk, T., Van der Veen, C., Krabill, W.B., 2008. Intermittent thinning of Jakobshavn Isbræ, West Greenland, since the Little Ice Age. Journal of Glaciology 54, 131-144.
Dahl-Jensen, D., Albert, M., Aldahan, A., Azuma, N., Balslev-Clausen, D., Baumgartner, M., Berggren, A.-M., Bigler, M., Binder, T., Blunier, T., 2013. Eemian interglacial reconstructed from a Greenland folded ice core. Nature 493, 489-494.
Daigle, T.A., Kaufman, D.S., 2009. Holocene climate inferred from glacier extent, lake sediment and tree rings at Goat Lake, Kenai Mountains, Alaska, USA. Journal of Quaternary Science 24, 33-45.
De Charpentier, J., von Charpentier, J., 1841. Essai sur les glaciers et sur le terrain erratique du bassin du Rhône. M. Ducloux.
Dickson, R.R., Lazier, J., Meincke, J., Rhines, P., Swift, J., 1996. Long-term coordinated changes in the convective activity of the North Atlantic. Progress in Physical Oceanography 38, 241– 295.
Forman, S.L., Marin, L., van der Veen, C.J., Tremper, C., Csatho, B., 2007. Little Ice Age and Neoglacial landforms at the Inland Ice margin, Isunguata Sermia, Kangerlussuaq, west Greenland. Boreas 36, 341-351.
Funder, S., Bennike, O., Böcher, J., Israelson, C., Peterson, K.S., Simonarson, L.A., 2001. Late Pliocene Greenland – The Kap København Formation in North Greenland. Bulletin fo the Geologic Society o Denmakr 48, 117-134.
Funder, S., Kjeldsen, K.K., Kjaer, K.H., Cofaigh, C.Ó., 2011. The Greenland Ice Sheet during the past 300,000 years: a review. In: In: Elhers, J., Gibbard, P.L. (Eds.). Quaternary Glaciations –Extent and Chronology 15, 699-713.
24
Gosse, J.C., Phillips, F.M., 2001. Terrestrial in situ cosmogenic nuclides: theory and application. Quaternary Science Reviews 20, 1457-1560.
Griggs, D.J., Noguer, M., 2002. Climate change 2001: the scientific basis. Contribution of working group I to the third assessment report of the intergovernmental panel on climate change. Weather 57, 267-269.
Henriksen, N., Higgins, A.K., Karlsbeek, F., Pulvertaft, T.C.R., 2013. Geological map of Greenland 1 : 2 500 000. Geological Survey of Denmark and Greenland, Coppenhagen.
Hogan, K., Dowdeswell, J., Cofaigh, C., 2012. Glacimarine sedimentary processes and depositional environments in an embayment fed by West Greenland ice streams. Marine Geology 311-314, 1-16.
Howatt I.M., Eddy, A.. 2011. Multi-decadal retreat of Greenland’s marine-terminating glaciers. Journal of Glaciology, 57, 389-396.
Ingólfsson, Ó., Frich, P., Funder, S., Humlum, O., 1990. Paleoclimatic implications of an early Holocene glacier advance on Disko island, West Greenland. Boreas 19, 297-311.
Jaccob, T., Wahr, J.M., Pfeffer, W.T., Swenson, S., 2012. Recent contributions of glaciers and ice caps to sea level rise. Nature 482, 514-518.
Joughin, I., Smith, B., Shean, D., Floricioiu, D., 2014. Brief Communication: Further summer speedup of Jakobshavn Isbræ. The Cryosphere 8, 209-214.
Kalsbeek, F., 1999. Precambrian geology of the Disko Bugt region, West Greenland. Geology of Greenland Survey Bulletin 181, 179.
Kaplan, M.R., Wolfe, A.P., Miller, G.H., 2002. Holocene environmental variability in southern Greenland inferred from lake sediments. Quaternary Research 58, 149-159.
Kaufman, D., Ager, T., Anderson, N., Anderson, P., Andrews, J., Bartlein, P., Brubaker, L., Coats, L., Cwynar, L.C., Duvall, M., 2004. Holocene thermal maximum in the
Khan, S.A., Kjær, K.H., Bevis, M., Bamber, J.L., Wahr, J., Kjeldsen, K.K., Bjørk, A.A., Korsgaard, N.J., Stearns, L.A., van den Broeke, M.R., 2014. Sustained mass loss of the northeast Greenland ice sheet triggered by regional warming. Nature Climate Change 4, 292–299.
25
Kjær, K.H., Khan, S.A., Korsgaard, N.J., Wahr, J., Bamber, J.L., Hurkmans, R., van den Broeke, M., Timm, L.H., Kjeldsen, K.K., Bjørk, A.A., 2012. Aerial Photographs Reveal Late–20th-Century Dynamic Ice Loss in Northwestern Greenland. Science 337, 569-573.
Kohl, C., Nishiizumi, K., 1992. Chemical isolation of quartz for measurement of in situ produced cosmogenic nuclides. Geochimica et Cosmochimica Acta 56, 3583-3587.
Larsen, J.G., Pulvertaft, T.C.R., 2000. The structure of the Cretaceous-Palaeogene sedimentary-volcanic area of Svartenhuk Halvø, central West Greenland. Geological Survey of Denmark and Greenland, Ministry of Environment and Energy.
Lloyd, J., Moros, M., Perner, K., Telford, R.J., Kuijpers, A., Jansen, E., McCarthy, D., 2011. A 100 yr record of ocean temperature control on the stability of Jakobshavn Isbrae, West Greenland. Geology 39, 867-870.
Long, A.J., Roberts, D.H., 2003. Late Weichselian deglacial history of Disko Bugt, West Greenland, and the dynamics of the Jakobshavns Isbrae ice stream. Boreas 32, 208-226.
Long, A.J., Roberts, D.H., Rasch, M., 2003. New observations on the relative sea level and deglacial history of Greenland from Innaarsuit, Disko Bugt. Quaternary Research 60, 162-171.
Long, A.J., Woodroffe, S.A., Roberts, D.H., Dawson, S., 2011. Isolation basins, sea-level changes and the Holocene history of the Greenland Ice Sheet. Quaternary Science Reviews 30, 3748-3768.
McCarthy, D.J., 2011. Late Quaternary ice-ocean interactions in central west Greenland, Deptment of Geography. Durham University, Durham, UK, p. 292.
Meier, M.F., Dyurgerov, M.B., Rick, U.K., O'Neel, S., Pfeffer, W.T., Anderson, R.S., Anderson, S.P., Glazovsky, A.F., 2007. Glaciers dominate eustatic sea-level rise in the 21st century. Science 317, 1064-1067.
Milne, G.A., Gehrels, W.R., Hughes, C.W., Tamisiea, M.E., 2009. Identifying the causes of sea-level change. Nature Geoscience 2, 471-478.
Nesje, A., 1992. A piston corer for lacustrine and marine sediments. Arctic and Alpine Research 24, 257-259.

26
Ó Cofaigh, C., Dowdeswell, J., Jennings, A., Hogan, K., Kilfeather, A., Hiemstra, J., Noormets, R., Evans, J., McCarthy, D., Andrews, J., 2013. An extensive and dynamic ice sheet on the West Greenland shelf during the last glacial cycle. Geology 41, 219-222.
Pfeffer, W.T., Harper, J.T., O'Neel, S., 2008. Kinematic constraints on glacier contributions to 21st century sea-level rise. Science 321, 1340-1343.
Price, S.F., Payne, A.J., Howat, I.M., Smith, B.E., 2011. Committed sea-level rise for the next century from Greenland ice sheet dynamics during the past decade. Proceedings of the National Academy of Sciences 108, 8978-8983.
Rasch, M., 1997. A compilation of Radiocarbon dates from Disko Bugt, central west Greenland. Feografisk Tidsskrift Bind 97, 143-152.
Rignot, E., Velicogna, I., van den Broeke, M.R., Monaghan, A., Lenaerts, J.T.M., 2011. Acceleration of the contribution of the Greenland and Antarctic ice sheets to sea level rise. Geophysical Research Letters 38, L05503.
Roberts, D.H., Long, A.J., 2005. Streamlined bedrock terrain and fast ice flow, Jakobshavns Isbrae, West Greenland: implications for ice stream and ice sheet dynamics. Boreas 34, 25-42.
Simpson, M.J., Milne, G.A., Huybrechts, P., Long, A.J., 2009. Calibrating a glaciological model of the Greenland ice sheet from the Last Glacial Maximum to present-day using field observations of relative sea level and ice extent. Quaternary Science Reviews 28, 1631-1657.
Solomon, S., Qin, D., Manning, M., Chen, Z., Marquis, M., Averyt, K.B., Tignor, M., Miller, H.L., 2007. IPCC Fourth Assessment Report: Climate Change 2007: Climate Change 2007: Working Group I: The Physical Science Basis. Cambridge University Press, New York.
Stocker, T.F., Dahe, Q., Plattner, G.-K., 2013. Climate Change 2013: The Physical Science Basis. Working Group I Contribution to the Fifth Assessment Report of the Intergovernmental Panel on Climate Change. Summary for Policymakers (IPCC, 2013).
Stuiver, M., Reimer, P., Reimer, R., 2010. CALIB 6.0, program. Queens Univ., Belfast, UK [Available at http://radiocarbon. pa. qub. ac. uk/calib/.].
27
Thiede, J., Winkler, A., Wolf-welling, T., Eldholm, O., Myhre, A.M., Baumann, K.-H., Henrich, R., Stein, R., 1998. Late Cenozoic history of the polar North Atlantic: results from ocean drilling. Quaternary Science Reviews 17, 185-208.
Weidick, A., 1968. Observations on some Holocene glacier fluctuations in west Greenland. Meddelesser om Grønland 165, 202 p.
Weidick, A., 1994. Historical fluctuations of calving glaciers in south and West Greenland. Rapport Grønlands Geologiske Undersølgelse 161, 73-79.
Weidick, A., Kelly, M., Bennike, O., 2004. Late Quaternary development of the southern sector of the Greenland Ice Sheet, with particular reference to the Qassimiut lobe. Boreas 33, 284-299.
Weidick, A., Bennike, O., 2007. Quaternary glaciation history and glaciology of Jakobshavn Isbræ and the Disko Bugt region, West Greenland: a review. Geological Survey of Denmark and Greenland.
Young, N.E., Briner, J.P., Stewart, H.A., Axford, Y., Csatho, B., Rood, D.H., Finkel, R.C., 2011. Response of Jakobshavn Isbræ, Greenland, to Holocene climate change. Geology 39, 131-134.
Young, N.E., Briner, J.P., Rood, D.H., Finkel, R.C., Corbett, L.B., Bierman, P.R., 2013a. Age of the Fjord Stade moraines in the Disko Bugt region, western Greenland, and the 9.3 and 8.2 ka cooling events. Quaternary Science Reviews 60, 76-90.
Young, N.E., Schaefer, J.M., Briner, J.P., Goehring, B.M., 2013b. A precise 10Be Production-rate calibration for the Arctic. Journal of Quaternary Science 28, 515-526.
28
II: MAXIMUM LATE HOLOCENE EXTENT OF THE WESTERN GREENLAND ICE SHEET DURING THE LATE 20TH CENTURY Samuel E. Kelley*, Jason P. Briner, Nicolás E. Young, Gregory S. Babonis, Bea
Csatho
Department of Geology, University at Buffalo, Buffalo NY 14260 USA
Published in Quaternary Science Reviews on 17 September 2012,
DOI: 10.1016/j.quascirev.2012.09.016
Kelley, S.E., Briner, J.P., Young, N.E., Babonis, G.S., Csatho, B., 2012. Maximum late
Holocene extent of the western Greenland Ice Sheet during the late 20th century.
Quaternary Science Reviews, 56, 89-98.
Abstract
The pattern of Greenland Ice Sheet margin change during the 20th century is
variable. Large-scale retreat of marine-outlet glaciers contrast with the often-negligible
retreat observed along land-terminating margins of the ice sheet. We reconstruct a
chronology of ice-margin change for two land-terminating ice margins in western
Greenland using radiocarbon and 10Be exposure dating. Our results indicate that two
land-terminating lobes attained their maximum late Holocene position in the late 20th
century. This contrasts with the nearby marine-terminating Jakobshavn Isbræ, which
achieved a maximum late Holocene position during the Little Ice Age, and has since
retreated ~40 km. In addition, we survey ice-margin change across west Greenland,
29
utilizing satellite imagery. We find that many land-terminating sectors of the ice sheet, in
addition to our study area, may have attained their maximum late Holocene extent during
the 20th century. This suggests a lagged ice-margin response to prior cooling, such as the
Little Ice Age, which would imply significant retreat of land-terminating sections of the
Greenland Ice Sheet in response to 20th and 21st century warming may be yet to come.
Keywords: Greenland Ice Sheet, Little Ice Age, 10Be exposure dating, Ice-dammed lake,
Lake sediment core
Introduction
Since the Little Ice Age (LIA; ~1250-1900 AD), most glaciers worldwide have
experienced net retreat (Lowell, 2000; Oerlemans, 2005). Glacier retreat has been driven
by a general warming trend throughout the late 19th-21st centuries, which ended the
cumulative build up of glaciers during the late Holocene (e.g. Porter, 2007). Despite local
influences on glacier change such as hypsometry, internal dynamics, and variations in lag
time that all glaciers have with respect to changing climate, most glaciers retreated in
concert with recent warming on decadal timescales (Lowell, 2000; Oerlemans, 2005).
This is best documented in alpine glacier systems, with far fewer records that gauge the
response of ice sheets to climate change on these decadal timescales.
Recent observations of the Greenland Ice Sheet (GIS) reveal dramatic changes in
thickness and surface velocity and are leading to an improved understanding of its
response to climate change (Rignot and Kanagaratnam, 2006; van den Broeke et al.,
2009; Rignot et al., 2010). First thought to be perhaps thousands of years, it appears now
that the response time of ice sheets might be much shorter (Bamber et al., 2007). This is
30
particularly true for fast-flowing outlet glaciers, which at present have response times on
the order of years to decades (Bamber et al., 2007). Indeed, in southeastern Greenland, a
relatively close coupling between glacier change and air temperature from the 1930s to
present has recently been documented (Bjørk et al., 2012). It has also been demonstrated
that the GrIS is able to respond to short-lived abrupt climate events in the past (Young et
al., 2011a).
Reconstructing ice-margin fluctuations that pre-date the instrumental record can
improve our understanding of the complex nature by which the GrIS responds to climate
change. Following expansion during the late Holocene, the GrIS margin has largely
retreated (Weidick, 1968; Rignot et al., 2008), with the most pronounced retreat
documented at large outlet glaciers such as Jakobshavn Isbræ (Joughin et al., 2004;
Weidick and Bennike, 2007; Csatho et al., 2008). However, post-LIA retreat has not been
uniform in space and time across Greenland, with some sectors experiencing no retreat or
even a net advance during the 20th century (Weidick, 1968). Recent studies in eastern
Disko Bugt place the timing of retreat of the ice sheet onto land at ~10 ka (Weidick and
Bennike, 2007; Long et al., 2011; Young et al., 2011b) and subsequent retreat resulting in
a smaller than present ice-sheet configuration by ~7 ka (Weidick and Bennike, 2007;
Briner et al., 2010; Young et al., 2011b). Ice advance occurred throughout the late
Holocene (Weidick, 1992; Briner et al., 2011), although most information on the late
Holocene ice advance is from marine ice sheet sectors.
31
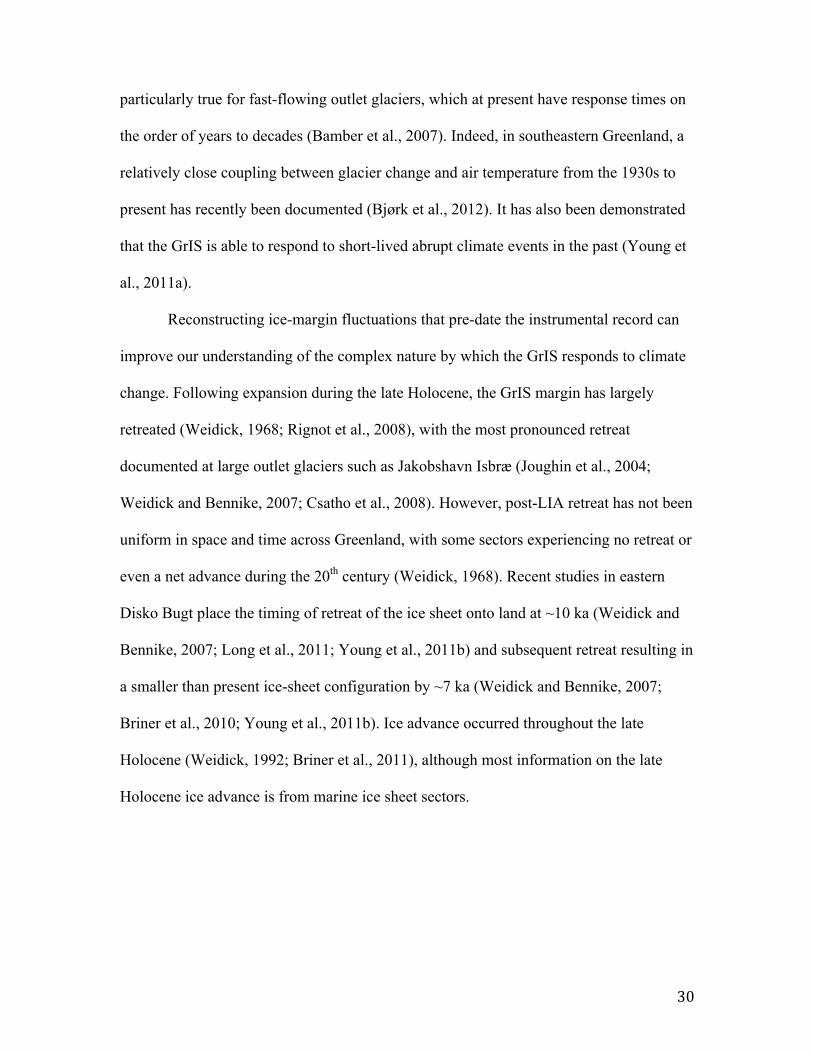
Figure 2-1: (A) Composite Landsat image (acquired on Aug. 17, 2010) showing the position of the study
area (white box) within southeastern Disko Bugt, with inset map (top left) showing the location of (A).
Note Tininnilik is at a high-stand. (B) Landsat image of the study area (acquired on Aug. 17, 2010)
showing ages (in cal yr BP) relating to early Holocene retreat (italicized bold text) and late Holocene
advance (plain text) of the Greenland Ice Sheet margin. The dotted line denotes the high-stand shoreline for
Tininnilik; the image was captured during a low-stand.
32
Here, our goal is to investigate the retreat and advance of the western GrIS ice margin
during the late Holocene in a land-terminating setting. Furthermore, we aim to place our
findings into a wider context by examining the spatial pattern of ice-margin change from
the late Holocene maximum to the present ice configuration throughout western
Greenland.
Materials and Methods
Field investigation
We visited two adjacent valleys in the southeastern Disko Bugt region, located
approximately 60 km south of Jakobshavn Isbræ, western Greenland (Fig. 2-1). The
Qinngap Ilulialeraa-Kuussuup Tasia (QK) and Tininnilik valleys each contain proglacial
lakes with contrasting physiographies. Qinngap Ilulialeraa (160 m asl) abuts the ice
margin on the lake’s eastern margin and drains into Kuussuup Tasia (136 m asl) to the
west, forming a long chain of connected basins. Tininnilik is dammed to the north by the
GrIS, and historic observations reveal that Tininnilik catastrophically drains beneath the
ice margin every ~7-10 years via the floating of the ice dam (Braithwaite and Thomsen,
1984; Weidick and Bennike, 2007; F. Nielsen, pers. comm., 2011). The filling and
draining of the lake, characterized by a slow rise and rapid lowering of ~65 m, likely
relates to water depth and the buoyancy of the ice dam (Braithwaite and Thomsen, 1984;
Furuya and Wahr, 2005). We conducted fieldwork in the QK and Tininnilik valleys in
August 2010 after a draining event at Tininnilik that occurred between June 21 and July
7, 2010. Rock samples were collected for 10Be exposure dating (hereafter termed 10Be
dating) from an island at the eastern side of Qinngap Ilulialeraa.
33
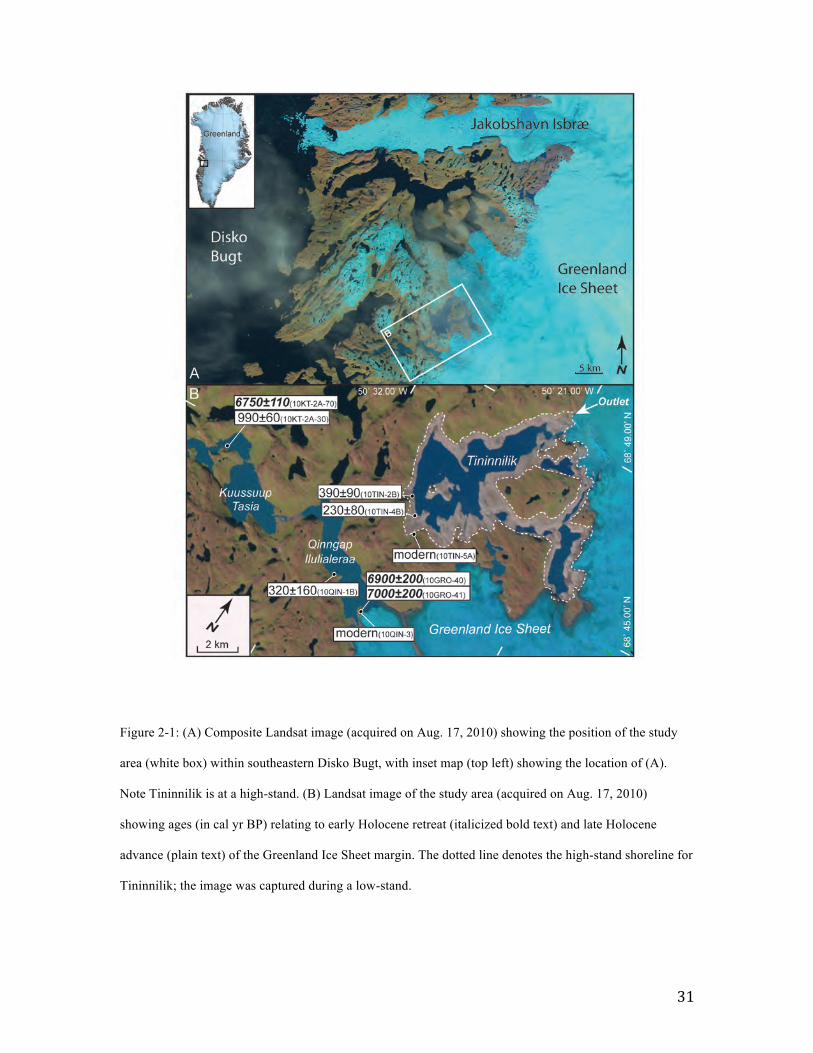
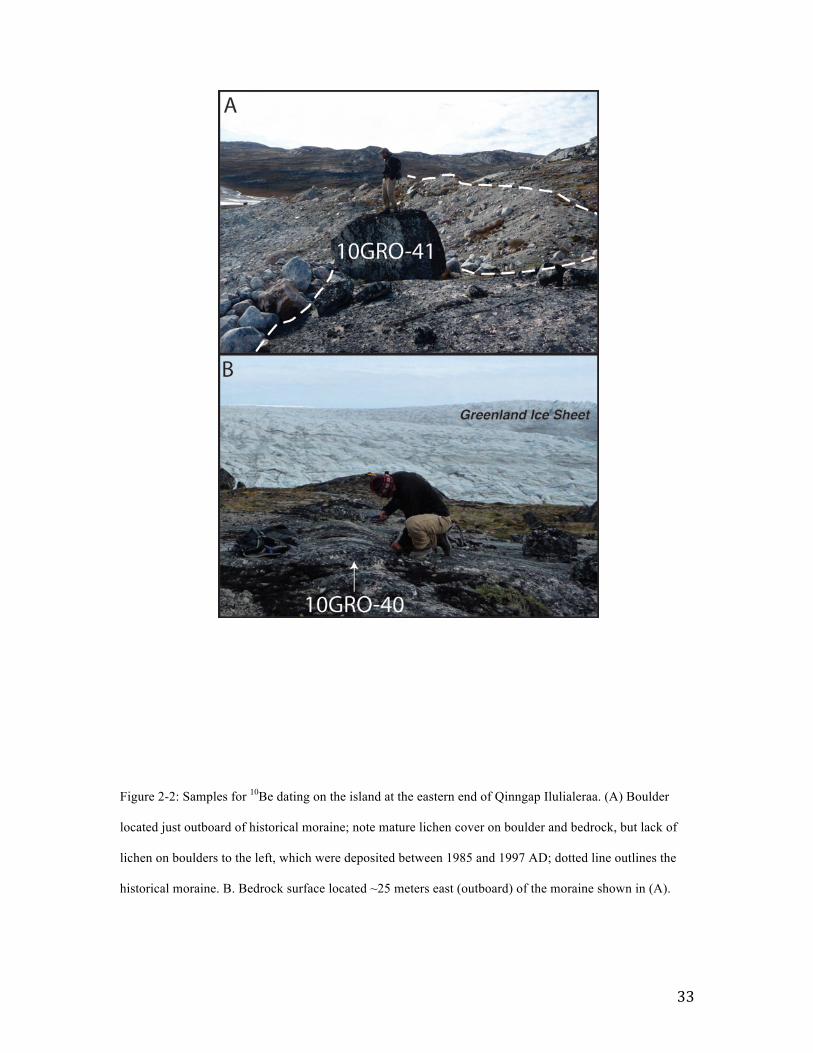
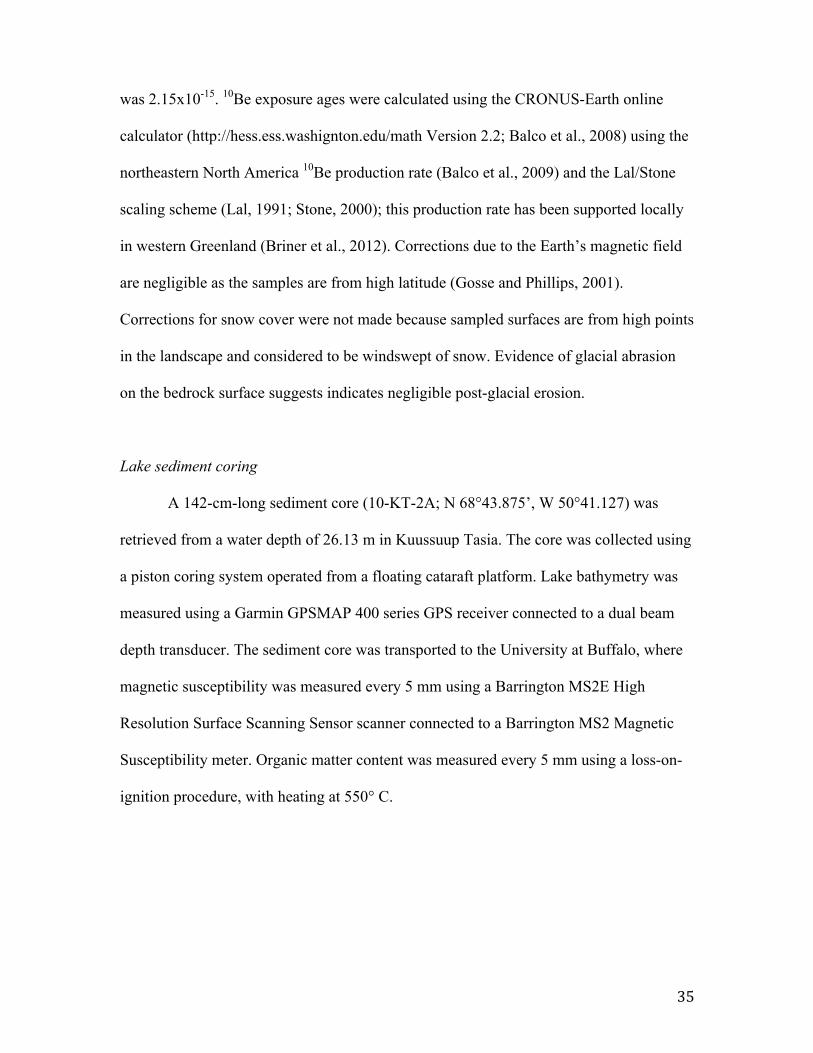
Figure 2-2: Samples for 10Be dating on the island at the eastern end of Qinngap Ilulialeraa. (A) Boulder
located just outboard of historical moraine; note mature lichen cover on boulder and bedrock, but lack of
lichen on boulders to the left, which were deposited between 1985 and 1997 AD; dotted line outlines the
historical moraine. B. Bedrock surface located ~25 meters east (outboard) of the moraine shown in (A).
34
Additionally, samples for radiocarbon dating were collected from a sediment core that
was obtained from Kuussuup Tasia and from sediment exposures in both the Tininnilik
and QK valleys.
10Be dating
Two samples were collected for 10Be dating on a small island that abuts the ice
margin at the eastern side of Qinngap Ilulialeraa (Fig. 2-2). Samples 10GRO-40 (N
68°42.156’, W 50°25.602’; 230 m asl) and 10GRO-41 (N 68°42.180’, W 50°25.728’;
230 m asl) were collected from ice-sculpted bedrock and an erratic boulder, respectively,
using a hammer and chisel. We avoided the edges of sampled surfaces, and measured
topographic shielding using a clinometer; sample sites had negligible topographic
shielding. We recorded geographic coordinates and elevation with a handheld GPS
device, estimated vertical error of ~5 m. Samples underwent physical and chemical
preparation at the University at Buffalo Cosmogenic Isotope Laboratory following
procedures modified from Kohl and Nishiizumi (1992). Samples were first crushed and
sieved to isolate the 425-850 µm size fraction and then pretreated in dilute HCl and
HNO3-HF acid baths. Quartz was isolated by heavy-liquid mineral separation followed
by additional HNO3-HF treatment in heated sonication baths. 9Be carrier (~0.4 g of 405
ppm) was added to each sample prior to dissolution in concentrated HF. Beryllium was
extracted using ion-exchange chromatography, selectively precipitated with NH4OH, and
oxidized to BeO. 10Be/9Be AMS measurements were completed at the Lawrence
Livermore National Laboratory, Center for Mass Spectrometry and normalized to the
standard 07KNSTD3110 with a reported 10Be/9Be ratio of 2.85 x 10^-12 (Table 1;
Nishiizumi et al., 2007). The ratio for the dissolution process blank in the sample batch
35
was 2.15x10⁻¹⁵. 10Be exposure ages were calculated using the CRONUS-Earth online
calculator (http://hess.ess.washignton.edu/math Version 2.2; Balco et al., 2008) using the
northeastern North America 10Be production rate (Balco et al., 2009) and the Lal/Stone
scaling scheme (Lal, 1991; Stone, 2000); this production rate has been supported locally
in western Greenland (Briner et al., 2012). Corrections due to the Earth’s magnetic field
are negligible as the samples are from high latitude (Gosse and Phillips, 2001).
Corrections for snow cover were not made because sampled surfaces are from high points
in the landscape and considered to be windswept of snow. Evidence of glacial abrasion
on the bedrock surface suggests indicates negligible post-glacial erosion.
Lake sediment coring
A 142-cm-long sediment core (10-KT-2A; N 68°43.875’, W 50°41.127) was
retrieved from a water depth of 26.13 m in Kuussuup Tasia. The core was collected using
a piston coring system operated from a floating cataraft platform. Lake bathymetry was
measured using a Garmin GPSMAP 400 series GPS receiver connected to a dual beam
depth transducer. The sediment core was transported to the University at Buffalo, where
magnetic susceptibility was measured every 5 mm using a Barrington MS2E High
Resolution Surface Scanning Sensor scanner connected to a Barrington MS2 Magnetic
Susceptibility meter. Organic matter content was measured every 5 mm using a loss-on-
ignition procedure, with heating at 550° C.

36
Figure 2-3: Stratigraphy and downcore data of lake sediment core 10KT-2A, with solid gray pattern
representing minerogenic-rich sediment and the crosshatch pattern representing organic-rich sediment
37
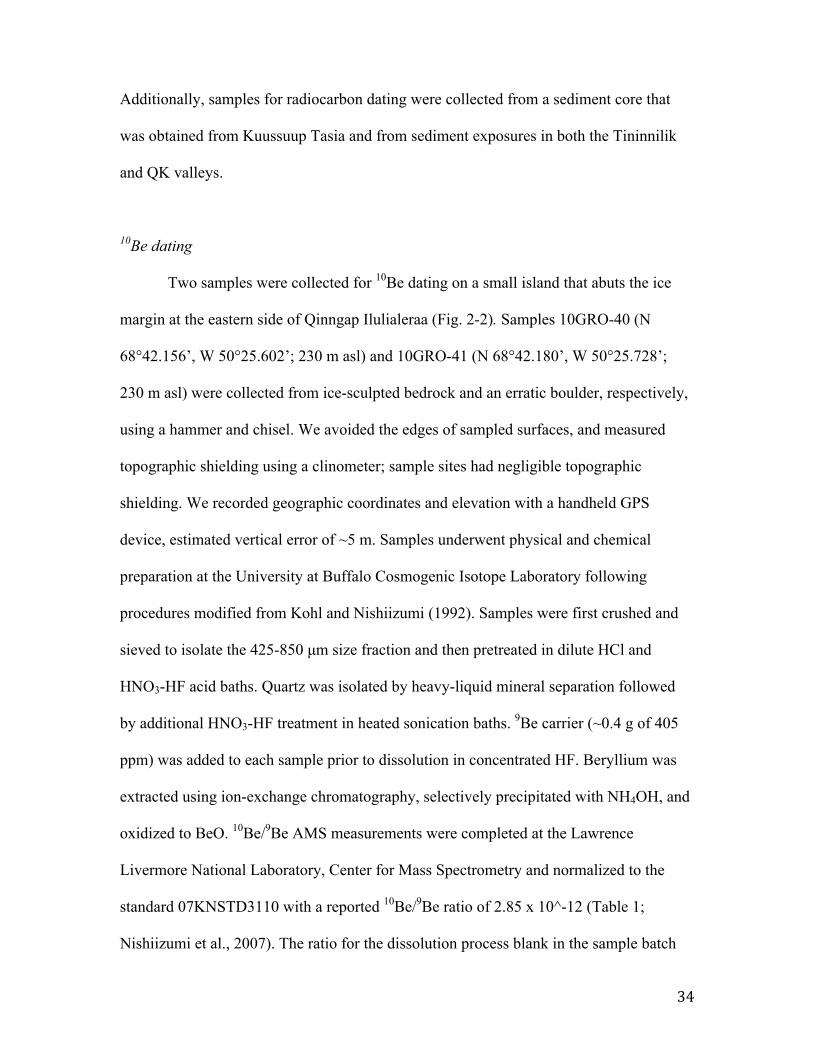
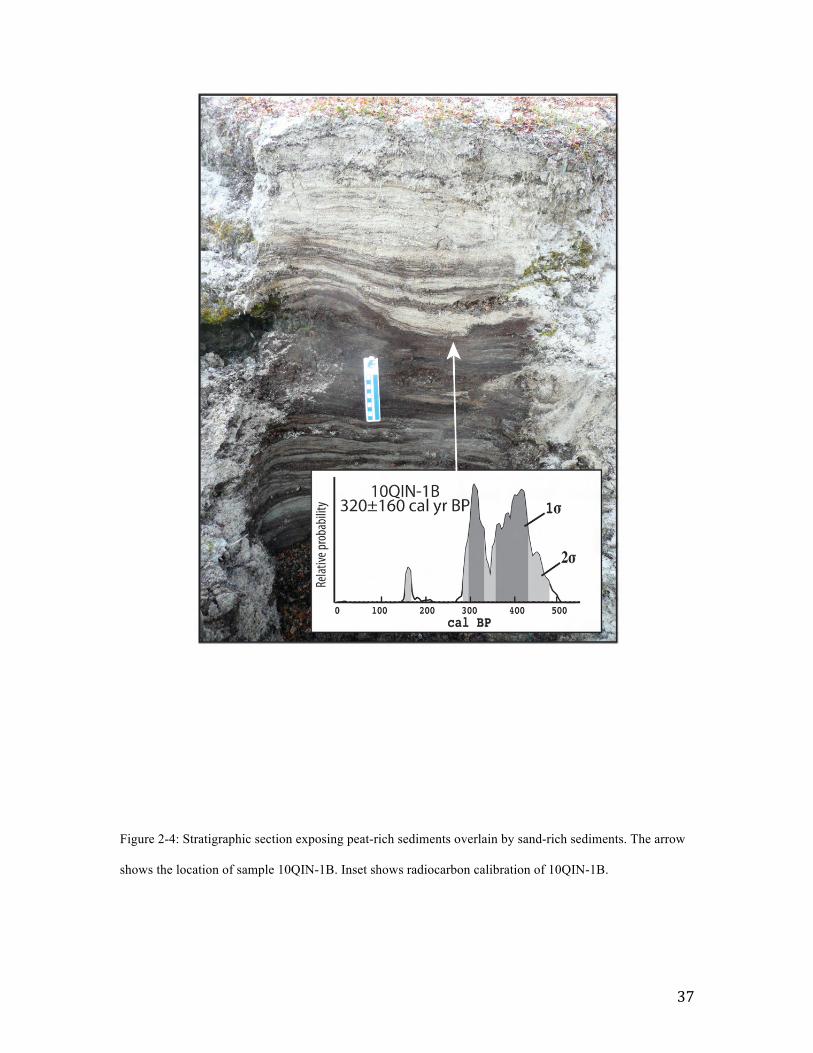
Figure 2-4: Stratigraphic section exposing peat-rich sediments overlain by sand-rich sediments. The arrow
shows the location of sample 10QIN-1B. Inset shows radiocarbon calibration of 10QIN-1B.

38
The core was sampled at two locations for radiocarbon dating; a sample (10-KT-2A-70)
of aquatic plant matter was picked from 70 cm depth and a bulk sediment sample (10-
KT-2A-30) was collected from 30 cm depth.
Radiocarbon dating
Seven samples were collected for radiocarbon dating; two samples were extracted
from core 10-KT-2A, and the remaining samples were collected from sediment exposures
in the field (Table 2). All samples were transported to the University at Buffalo where
they underwent washing with deionized water; the bulk sediment sample was freeze-
dried. Radiocarbon ages from the National Ocean Sciences Accelerator Mass
Spectrometry Facility at Woods Hole Oceanographic Institution were calibrated using the
CALIB v 6.0 (Stuiver et al., 2010) and the IntCal09 calibration curve (Table 2; Reimer et
al., 2009). Two “modern” values were converted to calendar years using the CALIBomb
program (Reimer and Reimer, 2011) with the NH_zone1 dataset compilation (Table 2;
Hua and Barbetti, 2007). All calibrated radiocarbon ages are reported in the manuscript
as the midpoint ± half of the 2σ age range.
Remote sensing
To document the spatial variability of ice-margin change over the 20th century,
we measured ice-margin retreat throughout western Greenland. We digitized the
boundary between fully vegetated landscapes and those lacking vegetation cover for the
area abutting the ice sheet from 61.10° N to 73.84° N.
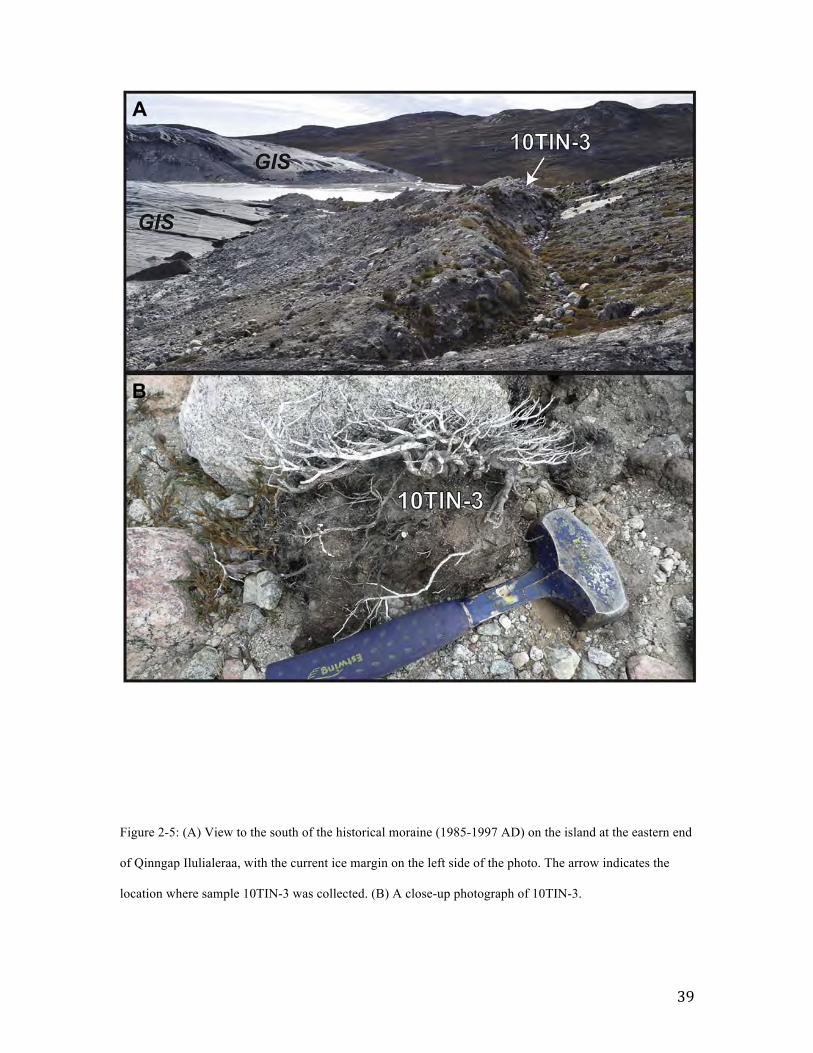
39
Figure 2-5: (A) View to the south of the historical moraine (1985-1997 AD) on the island at the eastern end
of Qinngap Ilulialeraa, with the current ice margin on the left side of the photo. The arrow indicates the
location where sample 10TIN-3 was collected. (B) A close-up photograph of 10TIN-3.
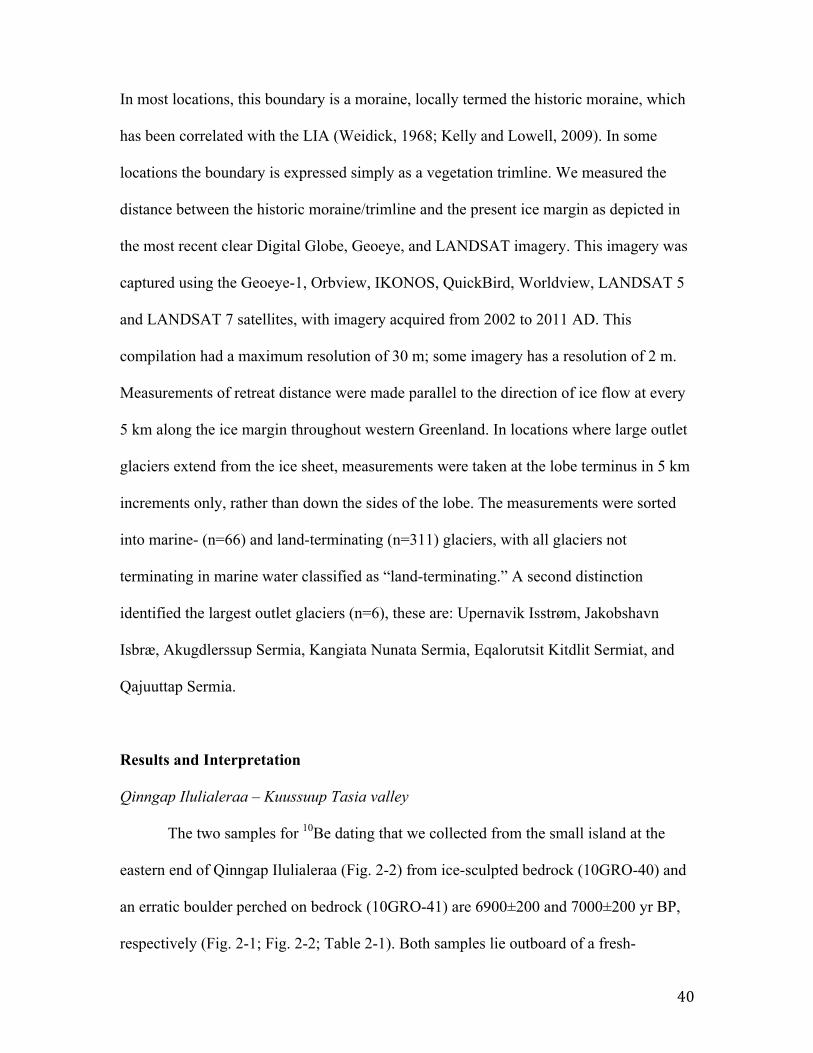
40
In most locations, this boundary is a moraine, locally termed the historic moraine, which
has been correlated with the LIA (Weidick, 1968; Kelly and Lowell, 2009). In some
locations the boundary is expressed simply as a vegetation trimline. We measured the
distance between the historic moraine/trimline and the present ice margin as depicted in
the most recent clear Digital Globe, Geoeye, and LANDSAT imagery. This imagery was
captured using the Geoeye-1, Orbview, IKONOS, QuickBird, Worldview, LANDSAT 5
and LANDSAT 7 satellites, with imagery acquired from 2002 to 2011 AD. This
compilation had a maximum resolution of 30 m; some imagery has a resolution of 2 m.
Measurements of retreat distance were made parallel to the direction of ice flow at every
5 km along the ice margin throughout western Greenland. In locations where large outlet
glaciers extend from the ice sheet, measurements were taken at the lobe terminus in 5 km
increments only, rather than down the sides of the lobe. The measurements were sorted
into marine- (n=66) and land-terminating (n=311) glaciers, with all glaciers not
terminating in marine water classified as “land-terminating.” A second distinction
identified the largest outlet glaciers (n=6), these are: Upernavik Isstrøm, Jakobshavn
Isbræ, Akugdlerssup Sermia, Kangiata Nunata Sermia, Eqalorutsit Kitdlit Sermiat, and
Qajuuttap Sermia.
Results and Interpretation
Qinngap Ilulialeraa – Kuussuup Tasia valley
The two samples for 10Be dating that we collected from the small island at the
eastern end of Qinngap Ilulialeraa (Fig. 2-2) from ice-sculpted bedrock (10GRO-40) and
an erratic boulder perched on bedrock (10GRO-41) are 6900±200 and 7000±200 yr BP,
respectively (Fig. 2-1; Fig. 2-2; Table 2-1). Both samples lie outboard of a fresh-
41
appearing moraine that delineates a boundary between a vegetated landscape and one
devoid of vegetation. Thus, the ages provide a direct constraint on the timing of post-Last
Glacial Maximum deglaciation in the QK valley.
The sediment core from Kuussuup Tasia contains three primary units, defined by
visual stratigraphy, magnetic susceptibility and organic-matter content (Fig. 2-3). The
bottom unit is a gray minerogenic-rich unit (0.75 m thick) defined by low organic-matter
content and high magnetic susceptibility values. The middle unit is a gray-brown organic-
rich unit (0.2 m thick) defined by high organic-matter content and low magnetic
susceptibility values. The upper unit is a gray mingerogenic-rich unit (0.3 m thick) with
low organic-matter content and high magnetic susceptibility values. The alternating units
of organic- and minerogenic-rich sediment with sharp contacts are typical of proglacial-
threshold lakes, and reflect periods of time when the ice margin terminated in
(minerogenic-rich sediments), or out of (organic-rich sediments) the lake’s drainage basin
(Briner et al., 2010). A radiocarbon age of 6750±110 cal yr BP (10-KT-2A-70) from just
above the lower contact between minerogenic- and organic-rich sediments constrains the
timing of ice retreat out of the catchment (Fig. 2-1; Table 2-1). A second radiocarbon age
from the core, extracted just below the upper contact between organic rich-sediment and
overlying minerogenic-rich sediment of 990±60 cal yr BP (10-KT-2A-30) suggests that
ice advanced back into the lake catchment shortly after this time (Fig. 2-1; Fig. 2-3; Table
2-2).
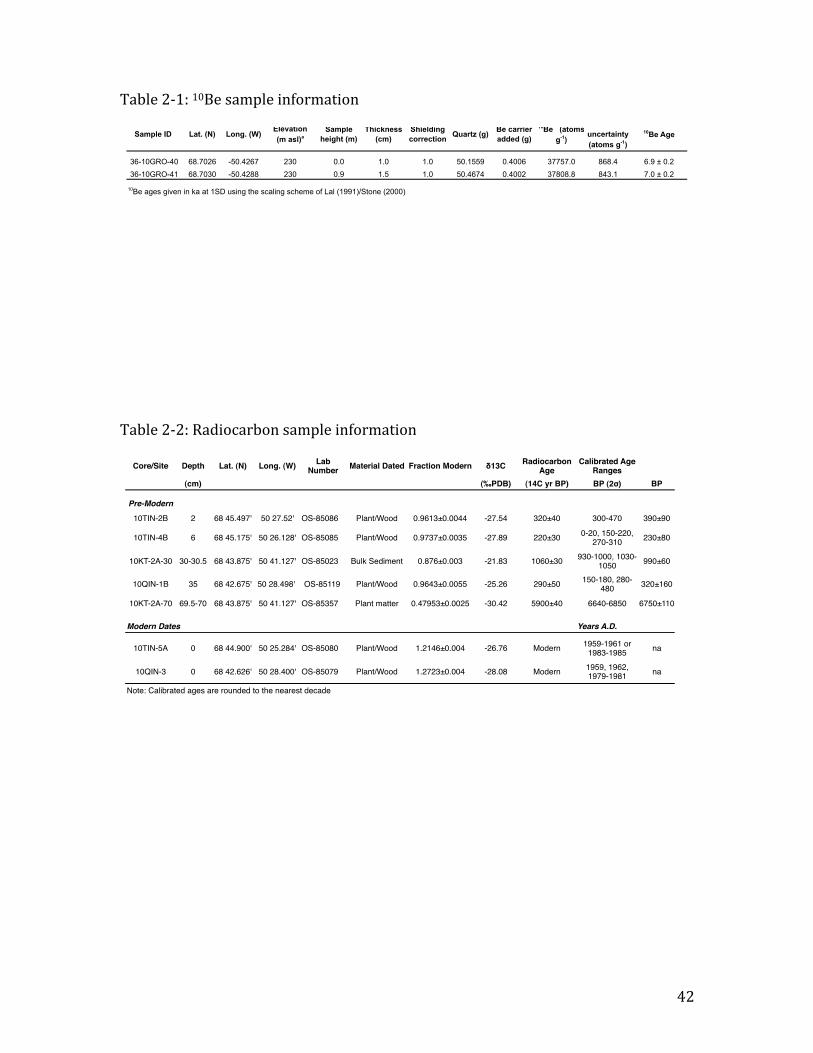
42
Table 2-‐1: 10Be sample information
Table 2-‐2: Radiocarbon sample information
Table 1. 10Be data for calculation of cosmogenic nuclide exposure ages.
Sample ID Lat. (N) Long. (W)Elevation (m asl)a
Sample height (m)
Thickness (cm)
Shielding correction
Quartz (g)Be carrier added (g)
10Be (atoms g-1)
10Be uncertainty (atoms g-1)
10Be Age
36-10GRO-40 68.7026 -50.4267 230 0.0 1.0 1.0 50.1559 0.4006 37757.0 868.4 6.9 ± 0.236-10GRO-41 68.7030 -50.4288 230 0.9 1.5 1.0 50.4674 0.4002 37808.8 843.1 7.0 ± 0.2
10Be ages given in ka at 1SD using the scaling scheme of Lal (1991)/Stone (2000)
Core/Site Depth Lat. (N) Long. (W) Lab Number Material Dated Fraction Modern δ13C Radiocarbon
AgeCalibrated Age
Ranges(cm) (‰PDB) (14C yr BP) BP (2σ) BP
Pre-Modern
10TIN-2B 2 68 45.497' 50 27.52' OS-85086 Plant/Wood 0.9613±0.0044 -27.54 320±40 300-470 390±90
10TIN-4B 6 68 45.175' 50 26.128' OS-85085 Plant/Wood 0.9737±0.0035 -27.89 220±30 0-20, 150-220, 270-310 230±80
10KT-2A-30 30-30.5 68 43.875' 50 41.127' OS-85023 Bulk Sediment 0.876±0.003 -21.83 1060±30 930-1000, 1030-1050 990±60
10QIN-1B 35 68 42.675' 50 28.498' OS-85119 Plant/Wood 0.9643±0.0055 -25.26 290±50 150-180, 280-480 320±160
10KT-2A-70 69.5-70 68 43.875' 50 41.127' OS-85357 Plant matter 0.47953±0.0025 -30.42 5900±40 6640-6850 6750±110
Modern Dates Years A.D.
10TIN-5A 0 68 44.900' 50 25.284' OS-85080 Plant/Wood 1.2146±0.004 -26.76 Modern 1959-1961 or 1983-1985 na
10QIN-3 0 68 42.626' 50 28.400' OS-85079 Plant/Wood 1.2723±0.004 -28.08 Modern 1959, 1962, 1979-1981 na
Note: Calibrated ages are rounded to the nearest decade
Table 2. Radiocarbon ages and associated sample information.
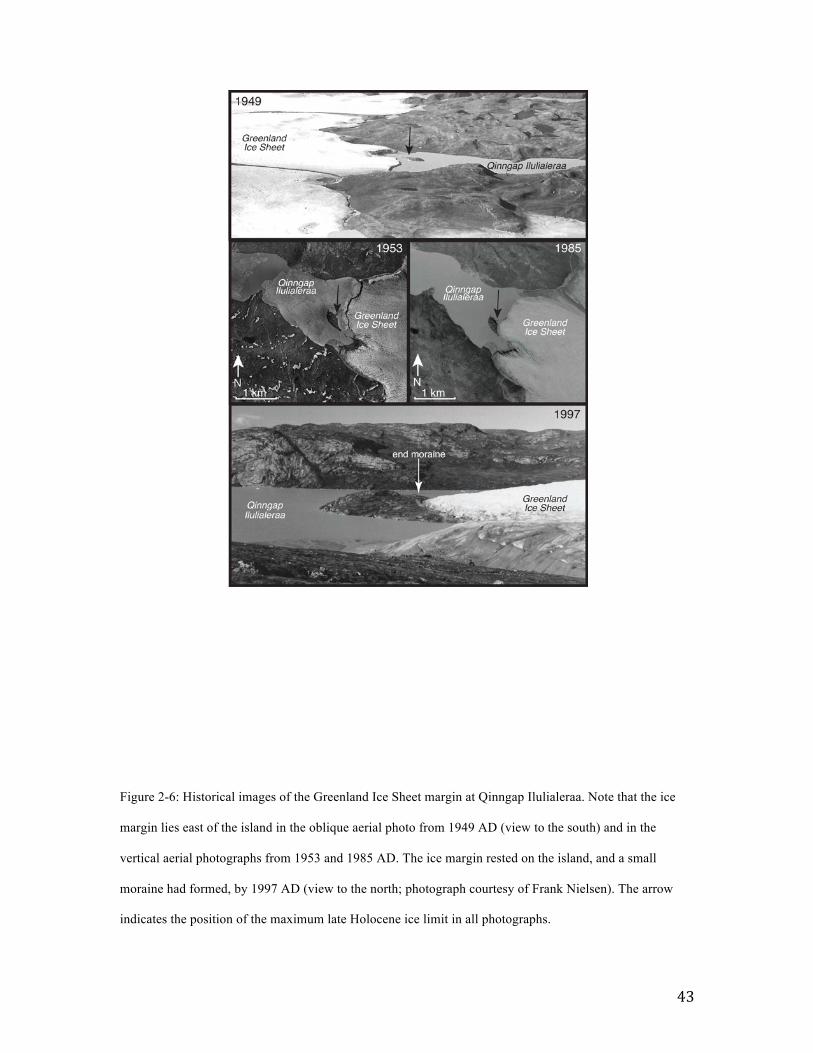
43
Figure 2-6: Historical images of the Greenland Ice Sheet margin at Qinngap Ilulialeraa. Note that the ice
margin lies east of the island in the oblique aerial photo from 1949 AD (view to the south) and in the
vertical aerial photographs from 1953 and 1985 AD. The ice margin rested on the island, and a small
moraine had formed, by 1997 AD (view to the north; photograph courtesy of Frank Nielsen). The arrow
indicates the position of the maximum late Holocene ice limit in all photographs.
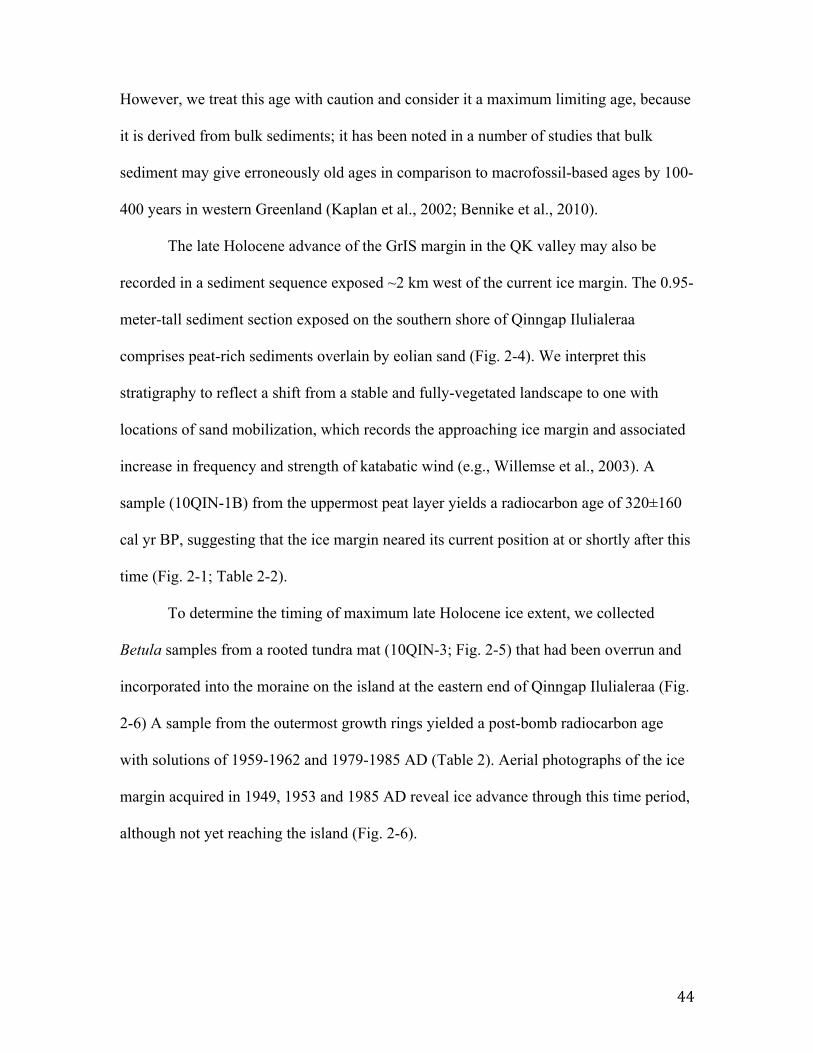
44
However, we treat this age with caution and consider it a maximum limiting age, because
it is derived from bulk sediments; it has been noted in a number of studies that bulk
sediment may give erroneously old ages in comparison to macrofossil-based ages by 100-
400 years in western Greenland (Kaplan et al., 2002; Bennike et al., 2010).
The late Holocene advance of the GrIS margin in the QK valley may also be
recorded in a sediment sequence exposed ~2 km west of the current ice margin. The 0.95-
meter-tall sediment section exposed on the southern shore of Qinngap Ilulialeraa
comprises peat-rich sediments overlain by eolian sand (Fig. 2-4). We interpret this
stratigraphy to reflect a shift from a stable and fully-vegetated landscape to one with
locations of sand mobilization, which records the approaching ice margin and associated
increase in frequency and strength of katabatic wind (e.g., Willemse et al., 2003). A
sample (10QIN-1B) from the uppermost peat layer yields a radiocarbon age of 320±160
cal yr BP, suggesting that the ice margin neared its current position at or shortly after this
time (Fig. 2-1; Table 2-2).
To determine the timing of maximum late Holocene ice extent, we collected
Betula samples from a rooted tundra mat (10QIN-3; Fig. 2-5) that had been overrun and
incorporated into the moraine on the island at the eastern end of Qinngap Ilulialeraa (Fig.
2-6) A sample from the outermost growth rings yielded a post-bomb radiocarbon age
with solutions of 1959-1962 and 1979-1985 AD (Table 2). Aerial photographs of the ice
margin acquired in 1949, 1953 and 1985 AD reveal ice advance through this time period,
although not yet reaching the island (Fig. 2-6).

45
Figure 2-7: Sediment exposures from the Tininnilik basin. Photo at left shows a 70-cm-tall-exposure
comprising till overlain by peat overlain by a thin coating of lacustrine silt; sample location for 10TIN-2B
shown with arrow. Photo at right shows a 1-m-tall exposure comprising peat overlain by stratified sand.
Sample location for 10TIN-4B shown with arrow; note marker at top for scale. Plots show radiocarbon age
calibrations.
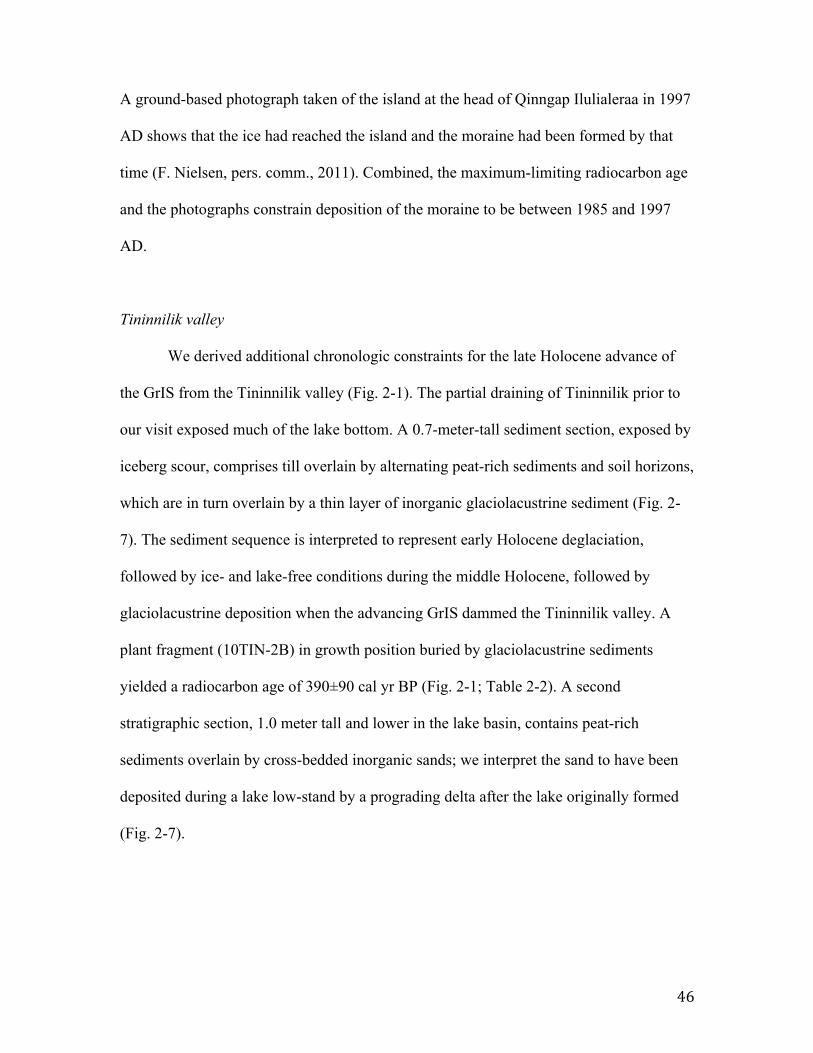
46
A ground-based photograph taken of the island at the head of Qinngap Ilulialeraa in 1997
AD shows that the ice had reached the island and the moraine had been formed by that
time (F. Nielsen, pers. comm., 2011). Combined, the maximum-limiting radiocarbon age
and the photographs constrain deposition of the moraine to be between 1985 and 1997
AD.
Tininnilik valley
We derived additional chronologic constraints for the late Holocene advance of
the GrIS from the Tininnilik valley (Fig. 2-1). The partial draining of Tininnilik prior to
our visit exposed much of the lake bottom. A 0.7-meter-tall sediment section, exposed by
iceberg scour, comprises till overlain by alternating peat-rich sediments and soil horizons,
which are in turn overlain by a thin layer of inorganic glaciolacustrine sediment (Fig. 2-
7). The sediment sequence is interpreted to represent early Holocene deglaciation,
followed by ice- and lake-free conditions during the middle Holocene, followed by
glaciolacustrine deposition when the advancing GrIS dammed the Tininnilik valley. A
plant fragment (10TIN-2B) in growth position buried by glaciolacustrine sediments
yielded a radiocarbon age of 390±90 cal yr BP (Fig. 2-1; Table 2-2). A second
stratigraphic section, 1.0 meter tall and lower in the lake basin, contains peat-rich
sediments overlain by cross-bedded inorganic sands; we interpret the sand to have been
deposited during a lake low-stand by a prograding delta after the lake originally formed
(Fig. 2-7).

47
Figure 2-8: Photograph of maximum high-stand shoreline along the southern margin of Tininnilik, with an
arrow indicating the location where sample 10TIN-5Awas collected. Note stranded iceberg in the center of
the photo, and silt cover on the landscape in the foreground, both indicative of recent (1 month prior to
photo) draining event.
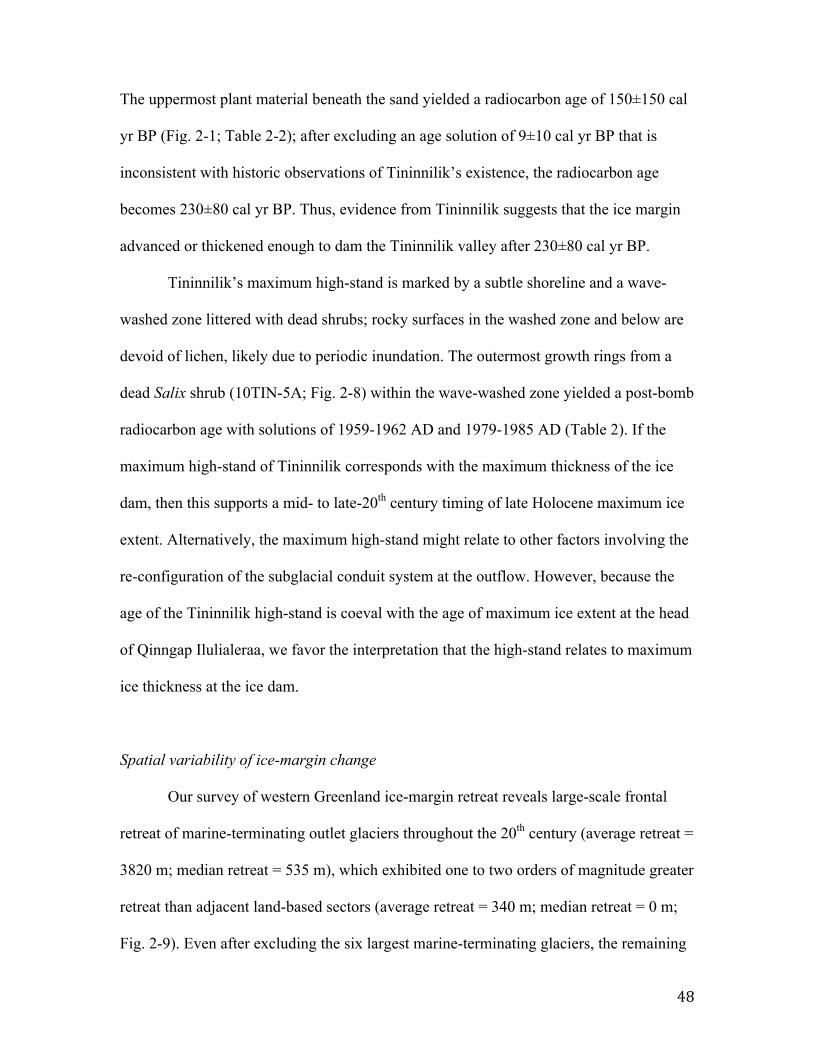
48
The uppermost plant material beneath the sand yielded a radiocarbon age of 150±150 cal
yr BP (Fig. 2-1; Table 2-2); after excluding an age solution of 9±10 cal yr BP that is
inconsistent with historic observations of Tininnilik’s existence, the radiocarbon age
becomes 230±80 cal yr BP. Thus, evidence from Tininnilik suggests that the ice margin
advanced or thickened enough to dam the Tininnilik valley after 230±80 cal yr BP.
Tininnilik’s maximum high-stand is marked by a subtle shoreline and a wave-
washed zone littered with dead shrubs; rocky surfaces in the washed zone and below are
devoid of lichen, likely due to periodic inundation. The outermost growth rings from a
dead Salix shrub (10TIN-5A; Fig. 2-8) within the wave-washed zone yielded a post-bomb
radiocarbon age with solutions of 1959-1962 AD and 1979-1985 AD (Table 2). If the
maximum high-stand of Tininnilik corresponds with the maximum thickness of the ice
dam, then this supports a mid- to late-20th century timing of late Holocene maximum ice
extent. Alternatively, the maximum high-stand might relate to other factors involving the
re-configuration of the subglacial conduit system at the outflow. However, because the
age of the Tininnilik high-stand is coeval with the age of maximum ice extent at the head
of Qinngap Ilulialeraa, we favor the interpretation that the high-stand relates to maximum
ice thickness at the ice dam.
Spatial variability of ice-margin change
Our survey of western Greenland ice-margin retreat reveals large-scale frontal
retreat of marine-terminating outlet glaciers throughout the 20th century (average retreat =
3820 m; median retreat = 535 m), which exhibited one to two orders of magnitude greater
retreat than adjacent land-based sectors (average retreat = 340 m; median retreat = 0 m;
Fig. 2-9). Even after excluding the six largest marine-terminating glaciers, the remaining
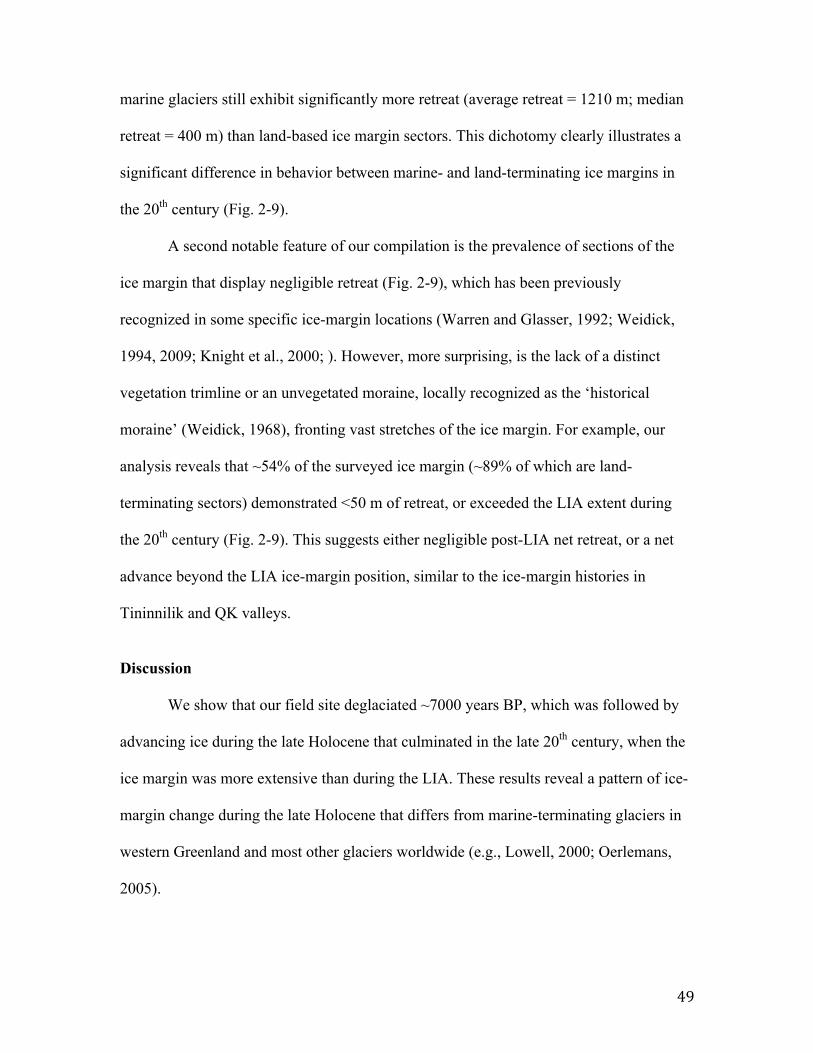
49
marine glaciers still exhibit significantly more retreat (average retreat = 1210 m; median
retreat = 400 m) than land-based ice margin sectors. This dichotomy clearly illustrates a
significant difference in behavior between marine- and land-terminating ice margins in
the 20th century (Fig. 2-9).
A second notable feature of our compilation is the prevalence of sections of the
ice margin that display negligible retreat (Fig. 2-9), which has been previously
recognized in some specific ice-margin locations (Warren and Glasser, 1992; Weidick,
1994, 2009; Knight et al., 2000; ). However, more surprising, is the lack of a distinct
vegetation trimline or an unvegetated moraine, locally recognized as the ‘historical
moraine’ (Weidick, 1968), fronting vast stretches of the ice margin. For example, our
analysis reveals that ~54% of the surveyed ice margin (~89% of which are land-
terminating sectors) demonstrated <50 m of retreat, or exceeded the LIA extent during
the 20th century (Fig. 2-9). This suggests either negligible post-LIA net retreat, or a net
advance beyond the LIA ice-margin position, similar to the ice-margin histories in
Tininnilik and QK valleys.
Discussion
We show that our field site deglaciated ~7000 years BP, which was followed by
advancing ice during the late Holocene that culminated in the late 20th century, when the
ice margin was more extensive than during the LIA. These results reveal a pattern of ice-
margin change during the late Holocene that differs from marine-terminating glaciers in
western Greenland and most other glaciers worldwide (e.g., Lowell, 2000; Oerlemans,
2005).
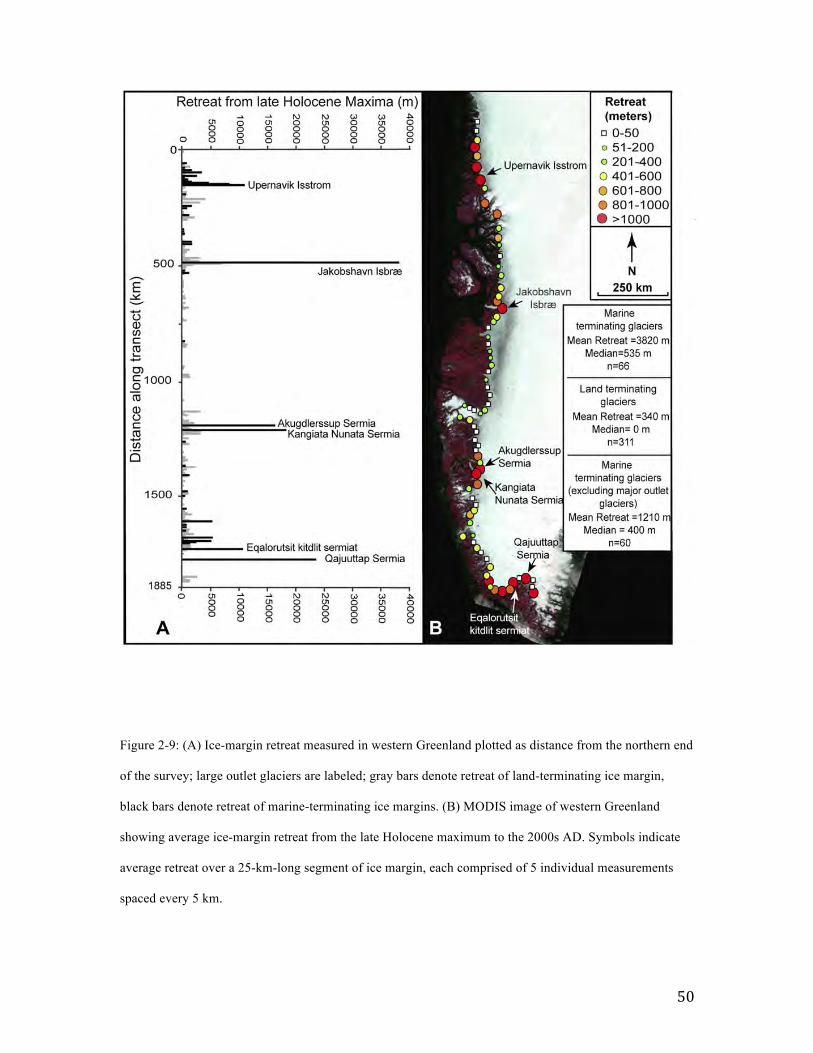
50
Figure 2-9: (A) Ice-margin retreat measured in western Greenland plotted as distance from the northern end
of the survey; large outlet glaciers are labeled; gray bars denote retreat of land-terminating ice margin,
black bars denote retreat of marine-terminating ice margins. (B) MODIS image of western Greenland
showing average ice-margin retreat from the late Holocene maximum to the 2000s AD. Symbols indicate
average retreat over a 25-km-long segment of ice margin, each comprised of 5 individual measurements
spaced every 5 km.

51
Furthermore, based on our broader survey, it appears that this unusual ice-margin history
is not isolated to these valleys, but occurred at many locations throughout western
Greenland, where negligible retreat has occurred since the LIA. Although time periods
with glacier advance during the late 20th century are not unique, the fact that ice was
more extensive during the late 20th century than any other time in the late Holocene is
remarkable for such large sectors of an ice sheet.
The spatial complexity of ice-margin change is exemplified by the disparity in the
behavior of neighboring sectors of the ice margin, which is likely due to a variety of
factors. Although our analysis did not quantify average thinning rates, we note that on the
spatial and temporal scales involved in this study, frontal retreat and thinning occur
together. Indeed, Kjær et al. (2012) revealed high correlation between frontal retreat and
thinning for the ice sheet margin throughout northwest Greenland. Thus, we suggest that
our analysis of frontal retreat is an appropriate proxy for overall ice margin behavior. In
any case, we doubt that the spatial pattern of ice-margin change that we reconstruct can
be solely explained by variable trends in climate given the proximity in which significant
differences in ice-margin change occurred (Sole et al., 2008). Rather, the contrasting
behavior probably lies in the variety of ice-dynamical processes that are unique to
marine-terminating glaciers. In addition to being affected by changes in surface mass
balance, marine-terminating glacier termini are influenced by changes at their calving
fronts (Pfeffer, 2007; Nick et al., 2009). Oceanographic conditions can act as a major
influence on the behavior of marine-terminating glaciers through sub-marine melting and
destabilization of the calving front (Holland et al., 2008; Rignot et al., 2010). Combined,
these factors can lead to larger magnitude responses at marine- versus land-terminating
glaciers. Our survey of ice-margin change in western Greenland supports this; marine-

52
terminating glaciers retreated significantly more throughout the 20th century than their
land-terminating counterparts.
An additional important difference between marine- and land-terminating sectors
of the GrIS is surface velocity. The surface velocity of marine-terminating glaciers is one
to two orders of magnitude greater than land-terminating glaciers (Joughin et al., 2010).
Surface velocity is linked to glacier response time, such that faster-flowing ice can
respond more quickly to a climate perturbation and vice versa (Bamber et al., 2007). We
suggest that short response time may help explain the seemingly close connection with
climate displayed by marine-terminating glaciers (Lloyd et al., 2011; Young et al.,
2011b), and long response time would explain the lack of correlation with climate
displayed by many land-terminating glaciers in western Greenland. Weidick (1994)
suggested that response time of some GrIS land-terminating glaciers is on the order of
centuries. Thus, it is possible that due to a long response time, the GrIS margin in the QK
and Tininnilik valleys advanced during the 20th century as a response to prior cooling,
such as during the LIA, and has yet to demonstrate frontal retreat in response to the
cumulative negative surface mass balance that has occurred since the LIA. Furthermore, a
lagged response of land-terminating ice margin sectors to prior cooling is supported by
surface mass balance data. Using an ice sheet mass balance model forced by 19th and 20th
century instrumental data, Wake et al. (2009) predict that there should have been tens to
hundreds of meters of thinning from 1866-2005 AD in western Greenland. This is in
contrast to our observations of negligible retreat in many areas, implying that vast
stretches of the southwestern GrIS are not in equilibrium with 20th century climate
change. Thus, we suggest that ice sheet response time, in addition to dynamic factors that
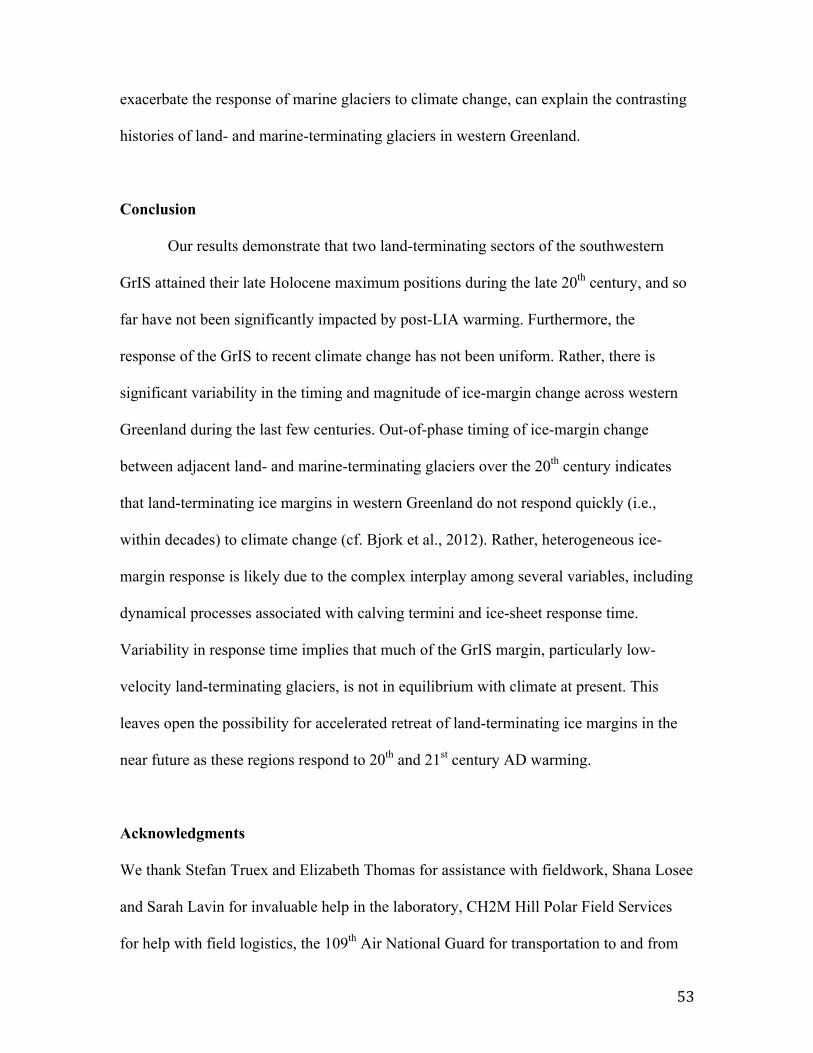
53
exacerbate the response of marine glaciers to climate change, can explain the contrasting
histories of land- and marine-terminating glaciers in western Greenland.
Conclusion
Our results demonstrate that two land-terminating sectors of the southwestern
GrIS attained their late Holocene maximum positions during the late 20th century, and so
far have not been significantly impacted by post-LIA warming. Furthermore, the
response of the GrIS to recent climate change has not been uniform. Rather, there is
significant variability in the timing and magnitude of ice-margin change across western
Greenland during the last few centuries. Out-of-phase timing of ice-margin change
between adjacent land- and marine-terminating glaciers over the 20th century indicates
that land-terminating ice margins in western Greenland do not respond quickly (i.e.,
within decades) to climate change (cf. Bjork et al., 2012). Rather, heterogeneous ice-
margin response is likely due to the complex interplay among several variables, including
dynamical processes associated with calving termini and ice-sheet response time.
Variability in response time implies that much of the GrIS margin, particularly low-
velocity land-terminating glaciers, is not in equilibrium with climate at present. This
leaves open the possibility for accelerated retreat of land-terminating ice margins in the
near future as these regions respond to 20th and 21st century AD warming.
Acknowledgments
We thank Stefan Truex and Elizabeth Thomas for assistance with fieldwork, Shana Losee
and Sarah Lavin for invaluable help in the laboratory, CH2M Hill Polar Field Services
for help with field logistics, the 109th Air National Guard for transportation to and from
54
Greenland, and Kurt Kjær at the University of Copenhagen for aerial photographs. We
thank Michael Kaplan, Elizabeth Thomas and two anonymous reviewers whose
comments improved this manuscript. This research was supported by NSF-ARC-0909334
and NSF-‐BCS 0752848/1002597 to JPB, and NNX10AV13G and NNX10AO66H to BC.
References
Balco, G., Stone, J.O., Lifton, N.A., 2008, A complete and easily accessible means of calculating surface exposure ages or erosion rates from 10Be and 26Al measurements. Quaternary Geochronology 3, 174-195.
Balco, J.G., Briner, J.P., Finkel, R.C., 2009, Regional beryllium-10 production rate calibration for northeastern North America. Quaternary Geochronology 4, 93-107.
Bamber, J.L., Alley, R.B., Joughin, I., 2007, Rapid response of modern day ice sheets to external forcing. Earth and Planetary Science Letters 257, 1-13 Bennike, O., Anderson, N.J., McGowan, S., 2010, Holocene palaeoecology of southwest Greenland inferred from macrofossils in sediments of an oligosaline lake. Journal of Paleolimnology 43, 787-798. Bjork, A.A., Kjær, K.F., Korsgaard, N.J., Khan S.A., Kjeldsen, K.K., Andresen, C.S., Box, J.E., Larsen, N.K., Funder, S., 2012, An aerial view of 80 years of climate-related glacier fluctuations in southeast Greenland. Nature Geoscience 5, 427-432. Braithwaite, R.J., Thomsen, H.H., 1984, Runoff conditions at Paakitusp Akuliarusersua, Jakobshavn, estimated by modeling. Grønlands Geologiske Undersøgelse Gletscher-hydrologiske Meddelelser 84/3, 22. Briner, J.P., Young, N.E., Goehring, B.M., Schaefer, J.M., 2012, Constraining 10Be production rates on Greenland. Journal of Quaternary Science 27, 1-5. Briner, J.P., Young, N.E., Thomas, E.K., Stewart, H.A.M., Losee, S., Truex, S., 2011, Varve and radiocarbon dating support the rapid advance of Jakobshavn Isbræ during the Little Ice Age. Quaternary Science Review 30, 2476-2486.
55
Briner, J.P., Stewart, H.A.M., Young, N.E., Philips, W., Losee, S., 2010, Using proglacial-threshold lakes to constrain fluctuations of the Jakobshavn Isbrae ice margin, western Greenland, during the Holocene. Quaternary Science Reviews 29, 3861-3874. Csatho, B., Schenk, T., van der Veen, C.J., Krabill W.B., 2008, Intermittent thinning of Jakobshavn Isbræ, west Greenland, since the Little Ice Age Journal of Glaciology 54, 131-144. Furuya, M., Wahr, J.M., 2005, Water level changes at an ice-dammed lake in west Greenland inferred from InSAR data. Geophysical Research Letters 32, L14501. Gosse, J.C., Phillips, F.M., 2001, Terrestrial in situ cosmogenic nuclides: theory and Application. Quaternary Science Reviews 20, 1475–1560. Holland, D.M., Thomas, R.H., Young, B.D., 2008, Acceleration of Jakobshavn Isbræ triggered by warm subsurface ocean waters. Nature Geoscience 1, 659–664. Hua, Q., Barbetti, M., 2004, Review of tropospheric bomb radiocarbon data for carbon cycle modeling and age calibration purposes. Radiocarbon 46, 1273-1298. Joughin, I., Abdalati, W., Fahnestock, M., 2004, Large fluctuations in speed on Greenland’s Jakobshavn Isbræ glacier. Nature 432, 608-610. Joughin, I., Smith, B.E., Howat, I.M., 2010, Greenland flow variability from ice-sheet-wide velocity mapping. Journal of Glaciology 56, 415-430. Kaplan, M.R., Wolfe, A.P., Miller, G.H., 2002, Holocene environmental variability in southern Greenland inferred from lake sediments: Quaternary Research 58, 149-159. Kelly, M.A., Lowell, T.V., 2009, Fluctuations of local glaciers in Greenland during the latest Pleistocene and Holocene time. Quaternary Science Reviews 28, 2088-2106. Kjær, K.H., Khan, S.A., Korsgaard, N.J., Wahr, J., Bamber, J.L., Hurkmans, R., van den Broeke, M., Timm, L.H., Kjeldsen, K.K., Bjørk, A.A., Larsenm N.K., Jørgensen, L.T., Færch-Jensen, A., Willerslev, E., 2012, Aerial Photographs Reveal Late20th-Century Dynamic Ice Loss in Northwestern Greenland: Science 337,569-573.

56
Knight, P.G., Walier, R.I., Paterson, C.J., 2000, Glacier advance, ice-marginal lakes and routing of meltwater and sediment: Russell Glacier, Greenland. Journal of Glaciology 46, 423- 426. Kohl, C.P., Nishiizumi, K., 1992, Chemical isolation of quartz for measurement of in-situ-produced cosmogenic nuclides. Geochimica et Cosmochimica Acta 56, 3583–3587. Lal, D., 1991, Cosmic ray labeling of erosion surfaces: in situ nuclide production rates and erosion models. Earth and Planetary Science Letters 104, 424-439. Lloyd, J., Moros, M., Perner K., Telford, R.J., Kuipers, A., Jansen E., McCarthy, D., 2011. A 100 yr record of ocean temperature control on the stability of Jakobshavn Isbrae, West Greenland. Geology 39, 867-870. Long, A.J., Woodroffe, S.A., Roberts, D.H., Dawson, S., 2011, Isolation basins, sea-level changes and the Holocene history of the Greenland Ice Sheet. Quaternary Science Reviews 30, 3748-3768. Lowell, T.V. 2000, As climate changes, so do glaciers. Proceedings of the National Academy of Sciences of the United States of America 97, 1351-1354 Nick, F.M., Vieli, A., Howat, I.M., Joughin, I., 2009, Large-scale changes in Greenland outlet glacier dynamics triggered at the terminus. Nature Geoscience 2, 110-114. Nishiizumi, K., Imamura, M., Caffee, M., Southon, J., Finkel, R., McAnich, J., 2007, Absolute calibration of 10Be AMS standards. Nuclear Instruments and Methods in Physics Research 258, 403-413. Oerlemans, J., 2005, Extracting a climate signal from 169 glacial records. Science 308, 675-677. Pfeffer, W.T., 2007, A simple mechanism for irreversible tidewater glacier retreat. Journal of Geophysical Research 112, F03S25. Porter, S.C., 2007, Glaciations: Neoglaciation in the American Cordilleras: Encyclopedia of Quaternary Science, Elsevier Inc., 1133-1142.
57
Reimer, P.J., Baillie, M.G.L., Bard, E., Bayliss, A., Beck, J.W., Blackwell, P.G., Bronk Ramsey, C., Buck, C.E., Burr, G.S., Edwards, R.L., Friedrich, M., Grootes, P.M., Guilderson, T.M., Hajdas, I., Heaton, T.J., Hogg, A.G., Hughen, K.A., Kaiser, K.F., Kromer, B., McCormac, F.G., Manning, S.W., Reimer, R.W., Richards, D.A., Southon, J.R., Talamo, S., Turney, C.S.M., van der Plicht, J., and Weyhenmeyer, C.E., 2009, IntCal09 and Marine09 Radiocarbon Age Calibration Rignot, E., Kanagaratnam, P., 2006, Changes in the velocity structure of the Greenland ice sheet. Science 311, 986-990. Rignot, E., Box, J.E., Burgess, E., Hanna E., 2008, Mass Balance of the Greenland Ice Sheet 1958 to 2007. Geophysical Research Letters 35, L20502. Rignot, E., Koppes, M., Velicogna, I., 2010, Rapid submarine melting of the calving aces of west Greenland glaciers. Nature Geoscience 3,187-191. Sole, A., Payne, T., Bamber, J., Nienow, P., Krabill, W., 2008, Testing hypotheses of the cause and peripheral thinning of the Greenland Ice Sheet: is land-terminating ice thinning at anomalously high rates?. The Cryosphere 2, 205-218. Stone, J.O., 2000, Air pressure and cosmogenic isotope production. Journal of Geophysical Research 105, 23753–23759. Stuiver, M., Reimer, P.J., Reimer, R.W., 2010, CALIB 6.0. WWW program and documentation available at http://calib.qub.ac.uk/calib/. Van den Broeke, M., Bamber, J., Ettema, J., Rignot, E., Schrama, E., Van de Bern, W.J., Van Meijgaard, E., Velicogna, I., Wouters, B., 2009, Partitioning recent Greenland mass loss. Science 13, 984-986. Wake, L.M., Huybrechts, P., Box, J.E., Hanna, E., Janssens, I., Milne, G. A., 2009, Surface mass-balance changes of the Greenland ice sheet since 1866. Annals of Glaciology, v. 50, p. 178-184. Warren, C.R., Glasser, N.F., 1992, Contrasting Response of South Greenland Glaciers to Recent Climatic Change: Arctic, Antarctic, and Alpine Research 24, 124-132.

58
Weidick, A.W., 1968, Observations on some Holocene glacier fluctuations in west Greenland.Meddelelsser Om Grønland165, 202. Weidick, A., 1992, Jakobshavn Isbræ area during the climatic optimum. Rapport Grønlands Geologiske Undersøgelse 155, 67-72. Weidick, A.W., 1994, Historical fluctuations of calving glaciers in South and West Greenland Rapport Grønlands Geologi Unders. 161, 73-79. Weidick, A.W., 2009, Johan Dahl Land, south Greenland: the end of 20th century glacier expansion. Polar Record 45, 337-350. Weidick, A., Bennike, O., 2007, Quaternary glaciation history and glaciology of Jakobshavn Isbræ and the Disko Bugt region, west Greenland: a review. Geological Survey of Denmark and Greenland Bulletin 14, 78. Willemse, N.W., Koster, E.A., Hoogakker, B., Van Tatenhove, F.G.M., 2003, A continuous record of Holocene eolian activity in West Greenland: Quaternary Research 59, 322-334. Young, N.E., Briner, J.P., Stewart, H.A.M., Axford, Y., Csatho, B., Rood, D.H., Finkel, R.C., 2011a, Response of Jakobshavn Isbræ, Greenland to Holocene climate change. Geology 39, 131-134. Young, N.E., Briner, J.P., Axford, Y., Csatho, B., Babonis, G.S., Rood, D.H., Finkel, R.C., 2011b, Response of a marine-terminating Greenland outlet glacier to abrupt cooling 8200 and 9300 years ago. Geophysical Research Letters 38, L24701.
59
III. RAPID ICE RETREAT IN DISKO BUGT SUPPORTED BY 10BE DATING OF THE LAST RECESSION OF THE WESTERN GREENLAND ICE SHEET Samuel E. Kelley1, Jason P. Briner1, Nicolás E. Young2
1Department of Geology, University at Buffalo, Cooke 411, Buffalo, NY. 14260, USA 2Lamont-Doherty Earth Observatory, Comer 217, P.O. Box 1000, Palisades, NY 10904, USA
Published in Quaternary Science Reviews on 23 September 2013,
DOI: 10.1016/j.quascirev.2013.09.018
Kelley, S.E., Briner, J.P., Young, N.E., 2013. Rapid ice retreat in Disko Bugt supported
by 10Be dating of the last recession of the western Greenland Ice Sheet. Quaternary
Science Reviews, 82, 13-22.
Abstract
Due to rising sea levels and warming ocean currents, marine-based sectors of the
Greenland and Antarctic ice sheets are particularly vulnerable to climate change.
Reconstructions of the timing of marine-based ice margin fluctuations in Greenland
during the early Holocene can provide context for historical and modern observations of
ice-sheet change. Here, we generate a 10Be chronology of ice-sheet retreat through Disko
Bugt, western Greenland. Our new chronology, consisting of twelve 10Be ages from sites
surrounding and within Disko Bugt, fills a gap in the history of the western margin of the
Greenland Ice Sheet and allows for a continuous composite record of ice-margin
recession between the continental shelf break and the current margin. We constrain the
60
onset of ice-margin retreat from outer Disko Bugt to 10.8±0.5 ka. When combined with
previous chronologies, these results place the final Greenland Ice Sheet retreat out of
Disko Bugt onto land at Jakobshavn Isfjord and Qasigiaanguit at 10.1±0.3 ka, and later at
9.2±0.1 ka in southeastern Disko Bugt. The rate of retreat during this time period is
between ~50-450 m a-1 for central Disko Bugt and ~50-70 m a-1 along the southern coast
of Disko Bugt. Deglaciation of Disko Bugt occurred ~1000 years later than in
neighboring Uummannaq Fjord to the north. This asynchrony in the timing of
deglaciation suggests that local ice dynamics played an important role in the retreat of the
Greenland Ice Sheet from large marine embayments in western Greenland.
Keywords: Greenland Ice Sheet, Disko Bugt, 10Be dating, Ice Dynamics, Retreat Rates
Introduction
Interest in the Greenland Ice Sheet (GrIS) has grown in recent years as
investigations have demonstrated drastic Arctic warming during the 20th century,
including ~2° C in western Greenland (Box, 2002; Kaufman et al., 2009 ; Fisher et al.,
2012; Perren et al., 2012). Warming in the Arctic has been shown to outpace global
temperature rise, with the warming intensified through positive feedbacks such as those
related to Arctic Ocean sea-ice cover (Serreze et al., 2009; Miller et al., 2010; Maslanik
et al., 2011). This accelerated warming is important for future sea-level rise predictions,
as the increase in mass lost from Earth’s ice sheets, such as the GrIS, is expected to
become the dominant factor in eustatic sea-level rise, soon surpassing contributions to
sea-level rise from ice caps and alpine glaciers and thermal expansion of the oceans
(Meier et al., 2007; Joughin et al., 2010; Rignot et al., 2011). Records of past glacier
61
fluctuations spanning the Holocene are necessary to place firsthand ice-margin
observations from historic accounts, aerial photographs, and satellite imagery in the
broader context of pre-historic ice margin fluctuations (e.g. Chapter 2; Weidick, 1968;
Weidick, 1994; Rignot and Kanagaratnam, 2006; Csatho et al., 2008; Bjørk et al., 2012;
Kjær et al., 2012). Recent efforts have led to increasingly robust terrestrial chronologies
for GrIS margin fluctuations during the Holocene (e.g. Chapter 2; Weidick et al., 1990;
Kaplan et al., 2002; Weidick et al., 2004b; Möller et al., 2010; Hughes et al., 2012; Levy
et al., 2012; Roberts et al., 2013a; Young et al., 2013a). Reconstructions of ice-margin
fluctuations from land have revealed the timing of multiple local re-advances or
standstills throughout the Holocene (Levy et al., 2012; Young et al., 2013a). Studies of
the latest Pleistocene and earliest Holocene recession of the GrIS from the western
continental shelf reveal asynchronous retreat of ice streams that crossed the continental
shelf (e.g. McCarthy, 2011; Ó Cofaigh et al., 2013).
Despite ice margin reconstructions at specific locations or for specific time
periods, complete records tracking the ice margin position from the Last Glacial
Maximum position to the present are lacking in Greenland. Here, we present a
cosmogenic 10Be exposure dating (hereafter 10Be dating) chronology of ice retreat
through Disko Bugt, bridging previously published ice margin chronologies from the
continental shelf and from farther inland in the Disko Bugt region (Weidick et al., 1990;
Briner et al., 2010; McCarthy, 2011; Ó Cofaigh et al., 2013; Young et al., 2013a).
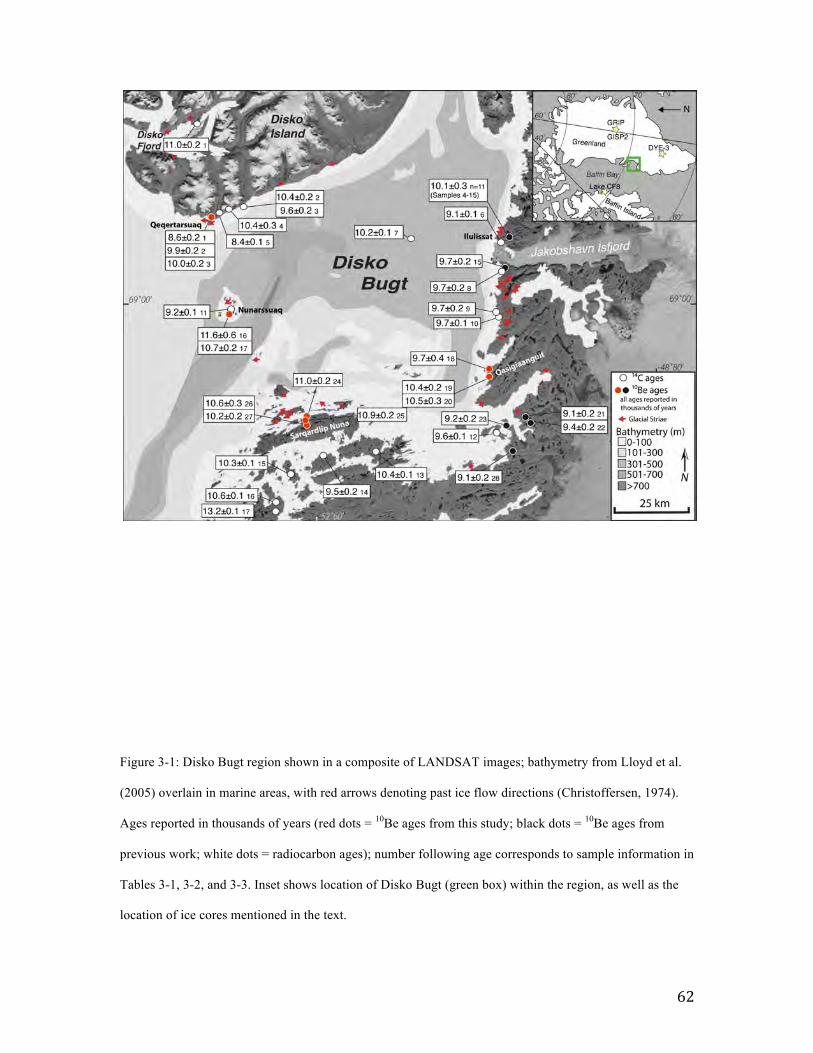
62
Figure 3-1: Disko Bugt region shown in a composite of LANDSAT images; bathymetry from Lloyd et al.
(2005) overlain in marine areas, with red arrows denoting past ice flow directions (Christoffersen, 1974).
Ages reported in thousands of years (red dots = 10Be ages from this study; black dots = 10Be ages from
previous work; white dots = radiocarbon ages); number following age corresponds to sample information in
Tables 3-1, 3-2, and 3-3. Inset shows location of Disko Bugt (green box) within the region, as well as the
location of ice cores mentioned in the text.

63
This record affords a view into past changes in the position of the GrIS in Disko Bugt
throughout the Holocene and gives insight into how an ice sheet recedes through large
marine embayments.
Disko Bugt
Disko Bugt is a large marine embayment situated on the central-west Greenland
coast bordered by Baffin Bay to the west and as wide as 50-km-widea strip of ice-free
land fringing the GrIS to its east (Fig. 3-1). At present, Disko Bugt receives ice discharge
from Jakobshavn Isbræ, an outlet glacier responsible for ~7% of mass loss and ~10% of
iceberg discharge from the GrIS (Bindschadler, 1984; Weidick and Bennike, 2007), as
well as from five other marine outlet glaciers. Water depths in Disko Bugt average 200 to
400 m, with a pronounced southwest-northeast-oriented trough crossing the center of the
bay where water depths exceed 600 m. Additionally, a bedrock controlled bathymetric
high, expressed subaerially as small island groups, spans the western margin of Disko
Bugt. The bathymetric high is bisected south of the island of Nunarssuaq by a trough
oriented southwest-northeast (Fig. 3-1). Numerous E-W streamlined bedforms on the
floor of Disko Bugt suggest fast flowing ice through Disko Bugt in the past (Ó Cofaigh et
al., 2013). This pattern is also expressed on land where glacially-streamlined landscapes
suggest the presence of a former ice stream (Roberts and Long, 2005). The landscape
south and east of Disko Bugt consists of glacially sculpted Precambrian crystalline
bedrock and landforms indicative of extensive glacial erosion (Chalmers et al., 1999;
Roberts and Long, 2005). Disko Island forms the northern boundary of Disko Bugt, and
is composed of primarily Cretaceous-Tertiary clastic-sediments overlain by Tertiary
64
flood basalts and small outcrops of Precambrian crystalline bedrock (Chalmers et al.,
1999).
Funder and Hansen (1996) proposed a two-stage model of deglaciation for the
GrIS depicting rapid initial deglaciation from the continental shelf due to rising eustatic
sea level, driving the eastward retreat of the GrIS margin to the coast by 10 ka. Following
retreat to the coast, eastward movement slowed and was driven primarily by surface
ablation. Recent work has refined the timing of deglaciation and subsequent re-advances,
though the Funder and Hansen (1996) conceptual model remains largely unmodified.
Marine cores from the continental shelf west of Disko Bugt give rise to a chronology of
retreat from the western shelf break that began by 13,860±90 cal yr BP (core VC34; Fig.
3-4; all marine radiocarbon ages are calibrated using MARINECAL09 with a ΔR of
140±25 based on http://calib.qub.ac.uk/marine/ and Lloyd et al. (2011) and are presented
as the mean ± half the 1-sigma range; Ó Cofaigh et al., 2013), with a brief, but
significant, re-advance at 12,370±210 cal yr BP (core VC20; Fig. 3-4; Ó Cofaigh et al.,
2013). Ice subsequently retreated rapidly eastward from the continental shelf by
10,920±140 cal yr BP (core MSM-343300; Fig. 3-4; McCarthy, 2011; Hogan et al.,
2012). High rates of ice-sheet ablation continued between 10.9 ka and 9.5 ka (Jennings et
al., 2014), with ice sheet recession out of Disko Bugt by 10,160±210 cal yr BP (core
POR-18; Fig. 3-1; Lloyd et al., 2005).
The terrestrial chronology constraining retreat of ice from the western margin of
Disko Bugt exhibits a wide range of ages (Fig. 3-1; Table 3-1). Much of the deglaciation
constraints are from minimum-limiting radiocarbon ages derived from marine
macrofossils and bulk sediments in lake sediment cores. The oldest of these radiocarbon
ages comes from southwest of Disko Bugt, where a minimum age of 13,220±130 cal yr
65
BP was derived from bulk sediment in a lake sediment core (Fredskild, 1996). This age
has previously been considered dubious because it is at odds with the existing
understanding of the local relative sea level history (Bennike and Björck, 2002).
Additional basal ages obtained from bulk lake sediment in the area constrain deglaciation
to before 10,550±140, 10,360±120, and 10,330±80 cal yr BP (Long and Roberts, 2003;
Long et al., 2003). Bivalves in raised marine deposits (18 m asl), south of Sarqardîp
Nuna, constrain deglaciation prior to 9510±220 cal yr BP (Donner and Jungner, 1975).
On Nunarssuaq Island, in west-central Disko Bugt, bivalves date to 9,190±130 cal yr BP
(Bennike et al., 1994), indicating the GrIS had retreated from the mouth of Disko Bugt
some time prior to this age.
To the north of Disko Bugt, the deglacial chronology from Disko Island is derived
from a basal organic sediment sample in a lake sediment core and numerous shells from
raised marine deposits. Geomorphic evidence suggests the possibility of two local
advances during what has been termed the Godhavn Stade and Disko Stade. The
Godhavn Stade is expressed as a discontinuous moraine at the mouth of major valleys
along the southwestern margin of Disko Island. The age of the Godhavn Stade is
constrained by a minimum limiting age from a shell dating to 10350±320 cal yr BP, and
is believed to represent GrIS expansion from Disko Bugt on to Disko Island during the
LGM (Ingólfsson et al., 1990). The Disko Stade is an advance of local Disko Island
glaciers expressed as a series of moraines near the valley mouth, which truncate Godhavn
Stade moraines on eastern Disko Island. The Disko Stade is dated to ~10 ka, and
theorized to be the result of changes in the predominant wind direction and moisture
source (Ingólfsson et al., 1990), while others suggest that the advance could be attributed
to surging local glaciers (Weidick and Bennike, 2007). At the eastern end of Disko Fjord,
66
on western Disko Island, the oldest age constraint of deglaciation is from bulk lake
sediments, which place deglaciation prior to 11,020±210 cal yr BP (all terrestrial
radiocarbon ages are calibrated using INTCAL09 using http://calib.qub.ac.uk/marine/;
Long et al., 2011). Four radiocarbon ages derived from bivalves along the south coast of
Disko Island indicate ice-free marine conditions by 10,350±320, 10,400±150, 9,610±150,
and 8,430±110 cal yr BP (Frich and Ingólfsson, 1990; Ingólfsson et al., 1990). Overall,
the existing chronology suggests the retreat of ice from Disko Island began at ~11 ka on
the western portion of the island, with slightly later retreat occurring along the southern
coast at ~10 ka, though it remains unclear whether the chronology pertains to the retreat
of the GrIS or retreat of locally sourced glaciers.
The deglacial chronology from eastern Disko Bugt relies on both radiocarbon
dating as well as 10Be dating. Radiocarbon ages from near the mouth of Jakobshavn
Isfjord yield minimum-limiting constraints on deglaciation of 9070±90 cal yr BP
(Weidick and Bennike, 2007) and 9690±2000 cal yr BP (Weidick, 1972). Samples
collected ~20 km south of Jakobshavn Isfjord yield similar radiocarbon ages of 9740±180
cal yr BP (Weidick, 1974) and 9710±130 cal yr BP (Weidick and Bennike, 2007). These
ages are in agreement with recent 10Be ages, which indicate the landscape near
Jakobshavn Isfjord deglaciated at 10.1±0.3 ka (n=12; Corbett et al., 2011; Young et al.,
2011a; Young et al., 2011b; Young et al., 2013a). In southeastern Disko Bugt, the timing
of deglaciation is derived from 10Be ages and radiocarbon ages from a lake sediment
core. The core yields a bulk sediment basal age of 9570±90 cal yr BP (Long and Roberts,
2002), and four 10Be ages from nearby average 9.2±0.1 ka (Fig. 3-1; Young et al., 2013a).
The existing chronology in and around Disko Bugt constrains deglaciation to ~9-
11 ka. However, in most places the timing of deglaciation has not been dated directly.
67
The majority of radiocarbon-dated material is of marine origin, and thus relies on a
marine reservoir correction based on modern ocean circulation within Disko Bugt (Lloyd
et al., 2011), which may differ from the oceanographic conditions during deglaciation. In
addition, many of the radiocarbon ages are from bulk lake sediment samples that have
been noted in a number of studies to give erroneous old ages (Kaplan et al., 2002;
Bennike et al., 2010), or are from marine organisms that colonize the seafloor some
unknown period of time following deglaciation. Here, we report twelve new 10Be ages
from four new locations around Disko Bugt, which directly date the retreat of ice from
the landscape. We compare these new ages to previously published 10Be and 14C ages to
improve the chronology of ice retreat out of Disko Bugt during the early Holocene. The
additional 10Be ages connect the comprehensive chronologies of early-to-late Holocene
ice margin fluctuation on the Greenlandic mainland to emerging records from the
continental shelf. The combined time-distance history spans from ~14 ka to present, and
from the continental shelf break to the present ice margin.
Methods
Samples for 10Be dating were collected from glacially sculpted bedrock surfaces
(n=8) and perched erratic boulders (n=4) with a hammer and chisel. Samples were
collected from the central portion of boulders and outcrops, away from non-horizontal
surfaces, edges, and corners. Latitude, longitude and elevation were collected at all
sample locations using a handheld GPS device and topographic shielding was measured
using a clinometer. Samples were collected above the local marine limit as indicated by
published relative sea level curves (Long and Roberts, 2002, 2003; Long et al., 2006,
2011), and geomorphic evidence such as the presence of raised beaches and washing

68
limits. An exception to this sampling strategy is our collection of samples KE-11-01 and
KE-11-02 at ~90 m asl from the highest point on the island of Nunarssuaq, which is
below the published marine limit of >95 m for the site (Rasch, 2000). However, local
relative sea level curves suggest that rebound was rapid at this time, and thus we expect a
negligible age difference for the actual timing of deglaciation and the age of our samples.
Nonetheless, 10Be ages from this location should be considered minimum-limiting
constraints on the timing of deglaciation.
All samples underwent physical and chemical processing following procedures
modified from Kohl and Nishiizumi (1992) at the University at Buffalo Cosmogenic
Isotope Laboratory. Samples were crushed and the 425-850 µm size fraction was
separated by sieving. Dilute HCl and HNO3-HF acid treatment and heavy liquid mineral
separation were used to isolate quartz. Quartz was digested with a known amount of 9Be
carrier and Be was isolated by ion-exchange chromatography and selective precipitation
with NH4OH. 10Be/9Be AMS measurements were performed at Lawrence Livermore
National Laboratory and normalized to standard 07KNSTD3110 with a reported ratio of
2.85 x 10⁻¹² (Nishiizumi et al., 2007; Rood et al., 2010). Ratios from process blanks were
6.19x10⁻¹⁵ and 1.49x10⁻¹⁵, with AMS precision ranging from 5.4-1.8% for blank
corrected 10Be/9Be sample ratios.
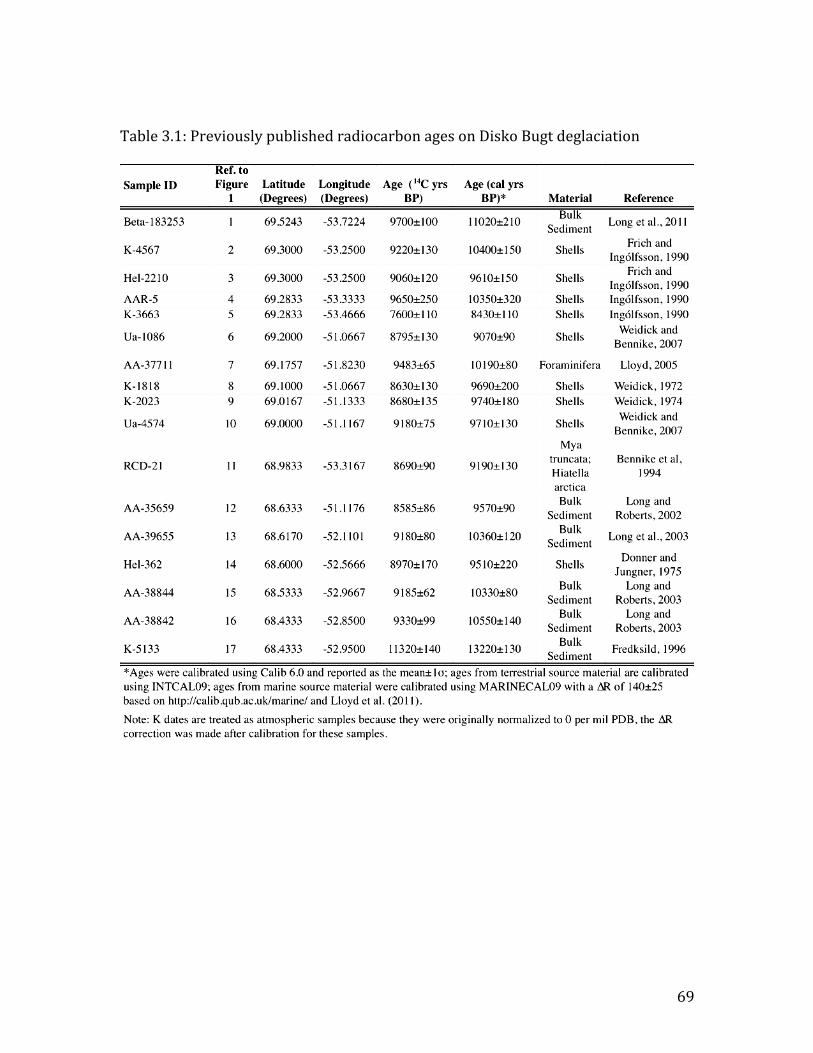
69
Table 3.1: Previously published radiocarbon ages on Disko Bugt deglaciation

70
Table 3-‐2: Previously published 10Be ages on early Holocene Disko Bugt deglaciation
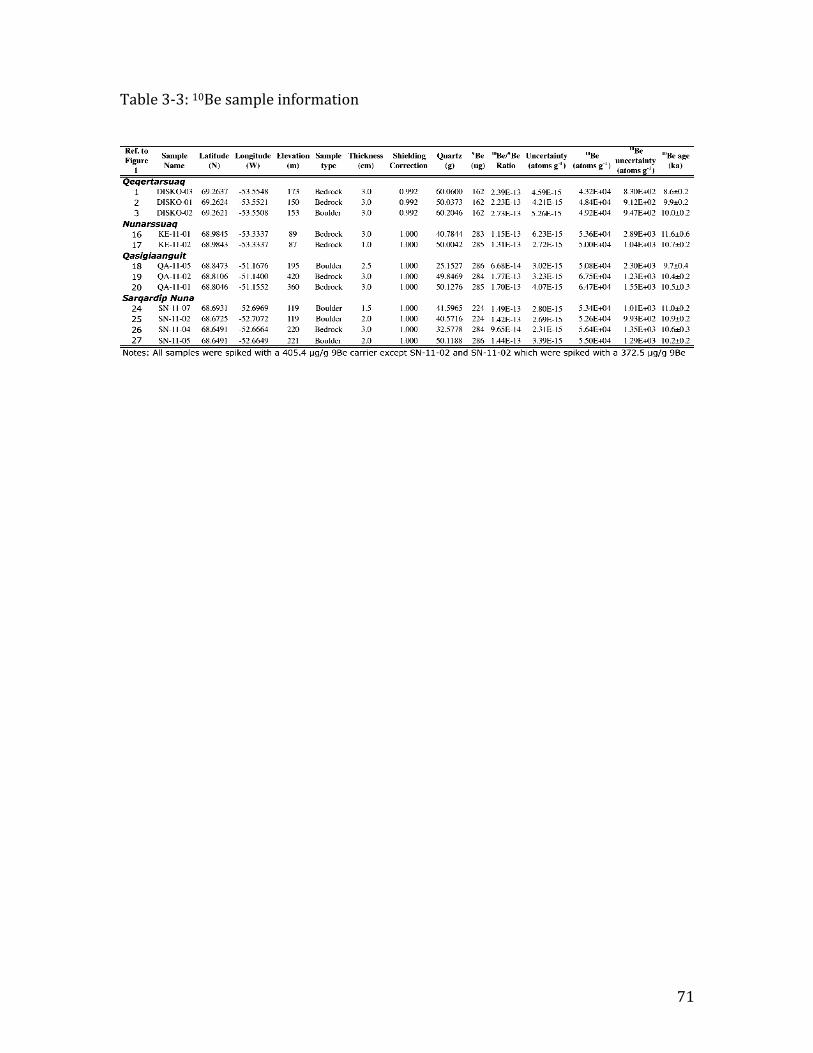
71
Table 3-‐3: 10Be sample information

72
All 10Be ages (including previously published ages) are calculated using a modified
version of the Matlab code developed for the CRONUS–Earth web-based calculator
using the regionally calibrated Baffin Bay 10Be production rate of 3.96±0.07 atoms g-1 a-1
(Young et al., 2013b) and the constant-production scheme of Lal/Stone (Lal, 1991; Stone,
2000) with no corrections made for local isostatic rebound. We use the regionally
calibrated Baffin Bay production rate (vs. NENA 10Be production rate of 3.91±0.19
atoms g-1 a-1; Balco et al., 2009) because ages calculated with the Baffin Bay rate have
been demonstrated to agree with independent local radiocarbon evidence, and the Baffin
Bay rate minimizes the systematic error contribution from production-rate uncertainties
to our 10Be ages. Sample sites are at local high points on the landscape and are inferred to
be windswept, thus no corrections for snow cover have been made. Additionally, glacial
polish and striae are abundant on bedrock surfaces throughout the field area, indicating
little erosion since ice sheet recession. Thus, we made no corrections for erosion when
calculating 10Be ages.
Results and Interpretation
We calculate twelve 10Be ages from glacially sculpted bedrock surfaces (n=8) and
perched erratic boulders (n=4). Two ages from bedrock samples collected ~10 m apart on
Nunarssuaq are 11.6±0.6 ka and 10.7±0.2 ka and average 11.1±0.7 ka (Figs. 3-1 and 3-2;
Table 3-3; all averages are the mean ± one standard deviation). Although it is possible
that the older age may reflect inherited 10Be from previous exposures, these two ages
from the same site overlap at 2-sigma so we opt to calculate their average. At
Qeqertarsuaq, southern Disko Island, one sample from a boulder yields an age of 8.6±0.2
73
ka, and two bedrock samples yield ages of 9.9±0.2 ka and 10.0±0.2 ka (Figs. 3-1 and 3-2;
Table 3). We consider the age of 8.6±0.2 ka as an outlier because it is much younger than
the other two 10Be ages, as well as a radiocarbon age of 10.4±0.3 ka derived from marine
bivalves collected ~5 km to the east (Ingólfsson et al., 1990). Thus, the two ages from the
Qeqertarsuaq site average 10.0±0.1 ka. On the southern margin of Disko Bugt, on the
island of Sarqardîp Nuna, four 10Be ages are calculated from samples collected at three
sites along transect extending 5 km to the south from the northern coast of the island (Fig.
3-3). A boulder sample from the northernmost site yields a 10Be age of 11.0±0.2 ka (Figs.
3-1 and 3-2; Table 3-3). To the south, a boulder sample collected at the middle site of the
transect provides a 10Be age of 10.9 ±0.2 ka (Figs. 3-1 and 3-2; Table 3-3). At the
southernmost transect site, bedrock and boulder samples located ~10 m apart yield 10Be
ages of 10.6±0.3 ka and 10.2±0.2 ka, respectively (Figs. 3-1 and 3-2; Table 3); the
average age from the southernmost site is 10.4±0.3 ka.
At Qasigiaanguit, in eastern Disko Bugt, 40 km south of Jakobshavn Isfjord, 10Be
ages derived from two bedrock samples and one boulder sample are 10.5±0.3 ka,
10.4±0.2 ka, and 9.7±0.4 ka respectively. The younger of these ages, 9.7±0.4 ka, is from
a sample collected at ~200 m lower in elevation than the older two samples (Table 3-3).
The difference in ages may reflect thinning of the ice margin at this location during
deglaciation. However, for an age of deglaciation of the Qasigiaanguit area we use an
average age of 10.2±0.4 ka (n=3; Figs. 3-1 and 3-2; Table 3-3).
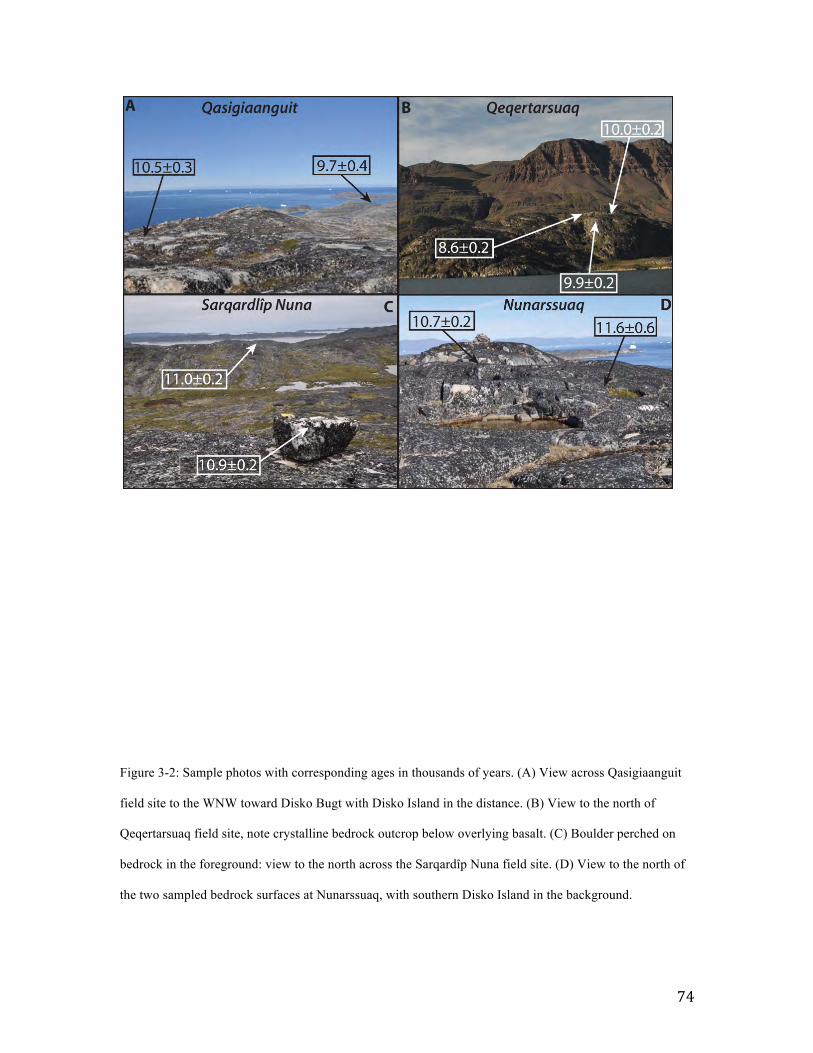
74
Figure 3-2: Sample photos with corresponding ages in thousands of years. (A) View across Qasigiaanguit
field site to the WNW toward Disko Bugt with Disko Island in the distance. (B) View to the north of
Qeqertarsuaq field site, note crystalline bedrock outcrop below overlying basalt. (C) Boulder perched on
bedrock in the foreground: view to the north across the Sarqardîp Nuna field site. (D) View to the north of
the two sampled bedrock surfaces at Nunarssuaq, with southern Disko Island in the background.
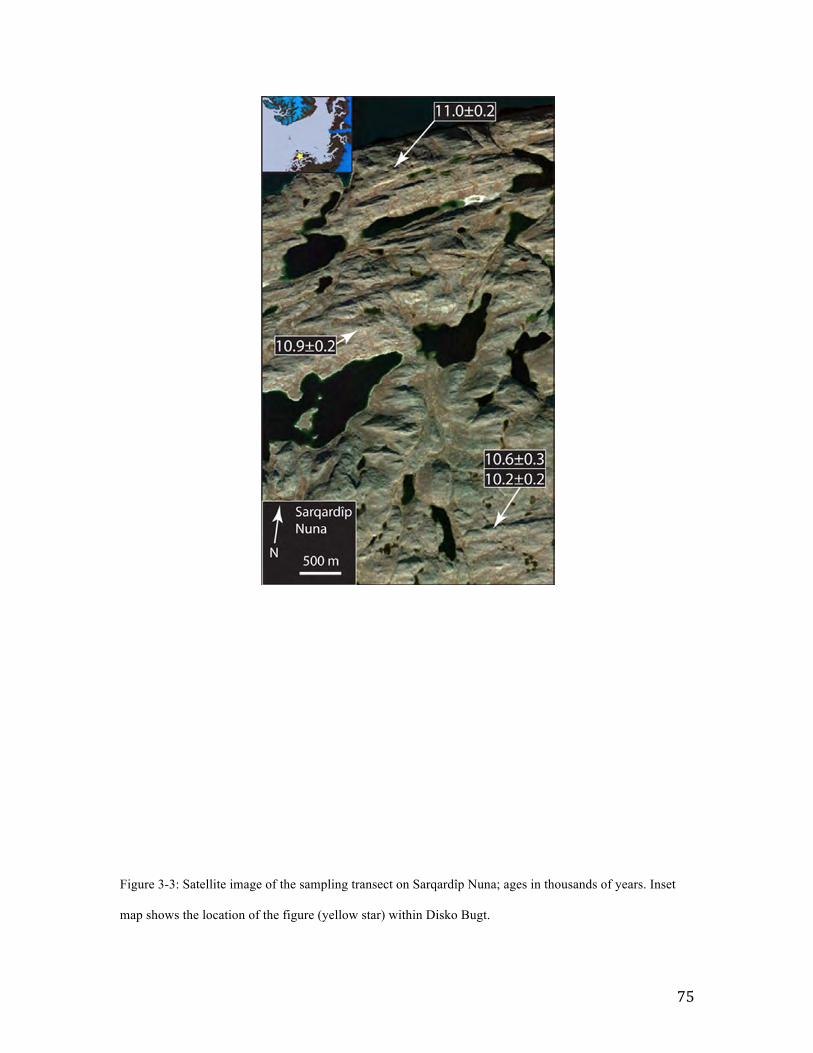
75
Figure 3-3: Satellite image of the sampling transect on Sarqardîp Nuna; ages in thousands of years. Inset
map shows the location of the figure (yellow star) within Disko Bugt.
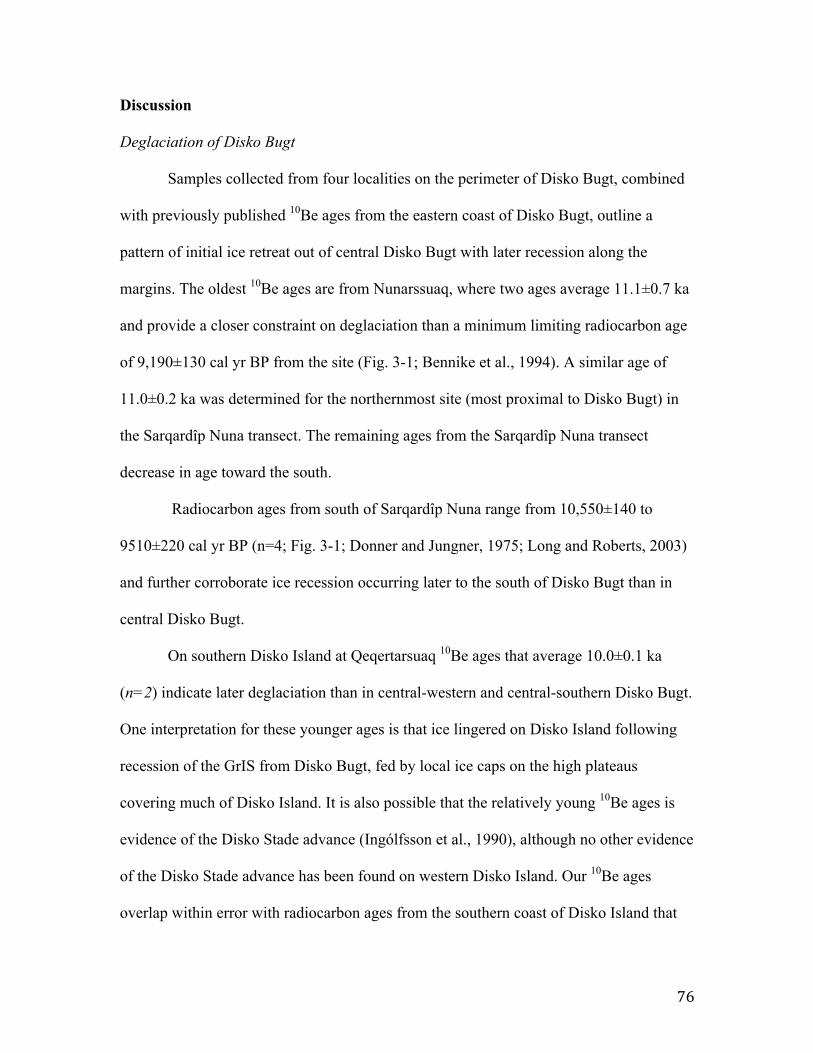
76
Discussion
Deglaciation of Disko Bugt
Samples collected from four localities on the perimeter of Disko Bugt, combined
with previously published 10Be ages from the eastern coast of Disko Bugt, outline a
pattern of initial ice retreat out of central Disko Bugt with later recession along the
margins. The oldest 10Be ages are from Nunarssuaq, where two ages average 11.1±0.7 ka
and provide a closer constraint on deglaciation than a minimum limiting radiocarbon age
of 9,190±130 cal yr BP from the site (Fig. 3-1; Bennike et al., 1994). A similar age of
11.0±0.2 ka was determined for the northernmost site (most proximal to Disko Bugt) in
the Sarqardîp Nuna transect. The remaining ages from the Sarqardîp Nuna transect
decrease in age toward the south.
Radiocarbon ages from south of Sarqardîp Nuna range from 10,550±140 to
9510±220 cal yr BP (n=4; Fig. 3-1; Donner and Jungner, 1975; Long and Roberts, 2003)
and further corroborate ice recession occurring later to the south of Disko Bugt than in
central Disko Bugt.
On southern Disko Island at Qeqertarsuaq 10Be ages that average 10.0±0.1 ka
(n=2) indicate later deglaciation than in central-western and central-southern Disko Bugt.
One interpretation for these younger ages is that ice lingered on Disko Island following
recession of the GrIS from Disko Bugt, fed by local ice caps on the high plateaus
covering much of Disko Island. It is also possible that the relatively young 10Be ages is
evidence of the Disko Stade advance (Ingólfsson et al., 1990), although no other evidence
of the Disko Stade advance has been found on western Disko Island. Our 10Be ages
overlap within error with radiocarbon ages from the southern coast of Disko Island that
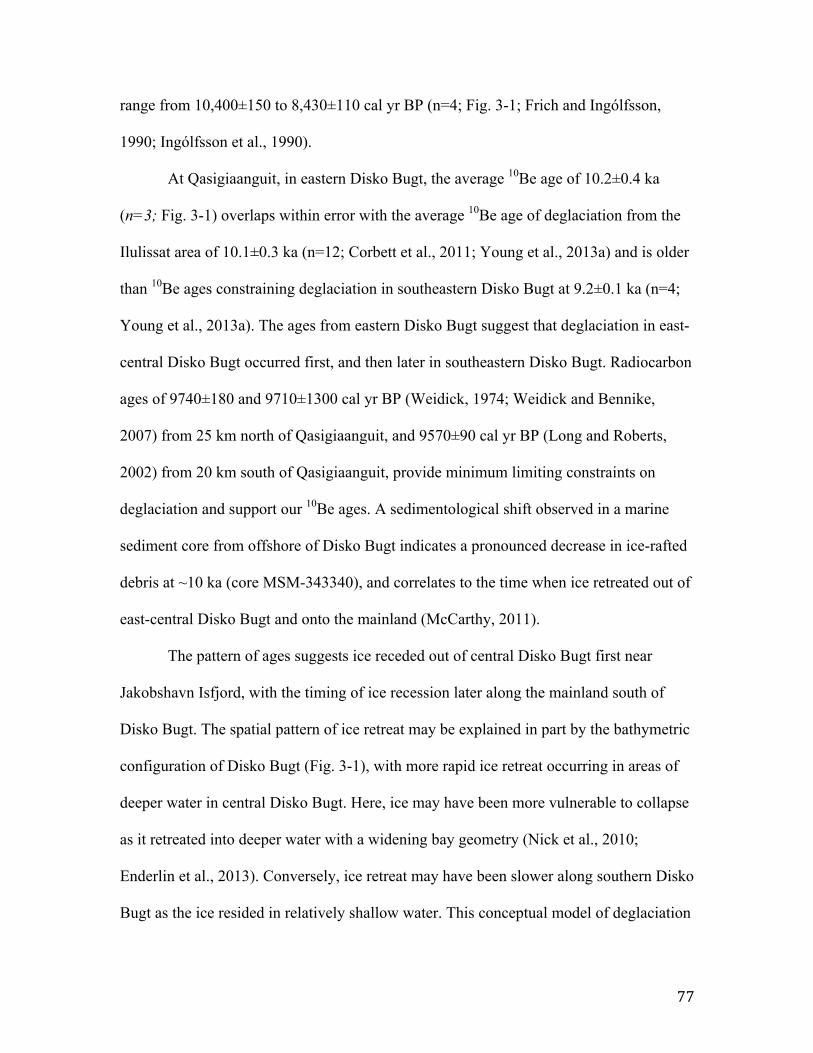
77
range from 10,400±150 to 8,430±110 cal yr BP (n=4; Fig. 3-1; Frich and Ingólfsson,
1990; Ingólfsson et al., 1990).
At Qasigiaanguit, in eastern Disko Bugt, the average 10Be age of 10.2±0.4 ka
(n=3; Fig. 3-1) overlaps within error with the average 10Be age of deglaciation from the
Ilulissat area of 10.1±0.3 ka (n=12; Corbett et al., 2011; Young et al., 2013a) and is older
than 10Be ages constraining deglaciation in southeastern Disko Bugt at 9.2±0.1 ka (n=4;
Young et al., 2013a). The ages from eastern Disko Bugt suggest that deglaciation in east-
central Disko Bugt occurred first, and then later in southeastern Disko Bugt. Radiocarbon
ages of 9740±180 and 9710±1300 cal yr BP (Weidick, 1974; Weidick and Bennike,
2007) from 25 km north of Qasigiaanguit, and 9570±90 cal yr BP (Long and Roberts,
2002) from 20 km south of Qasigiaanguit, provide minimum limiting constraints on
deglaciation and support our 10Be ages. A sedimentological shift observed in a marine
sediment core from offshore of Disko Bugt indicates a pronounced decrease in ice-rafted
debris at ~10 ka (core MSM-343340), and correlates to the time when ice retreated out of
east-central Disko Bugt and onto the mainland (McCarthy, 2011).
The pattern of ages suggests ice receded out of central Disko Bugt first near
Jakobshavn Isfjord, with the timing of ice recession later along the mainland south of
Disko Bugt. The spatial pattern of ice retreat may be explained in part by the bathymetric
configuration of Disko Bugt (Fig. 3-1), with more rapid ice retreat occurring in areas of
deeper water in central Disko Bugt. Here, ice may have been more vulnerable to collapse
as it retreated into deeper water with a widening bay geometry (Nick et al., 2010;
Enderlin et al., 2013). Conversely, ice retreat may have been slower along southern Disko
Bugt as the ice resided in relatively shallow water. This conceptual model of deglaciation
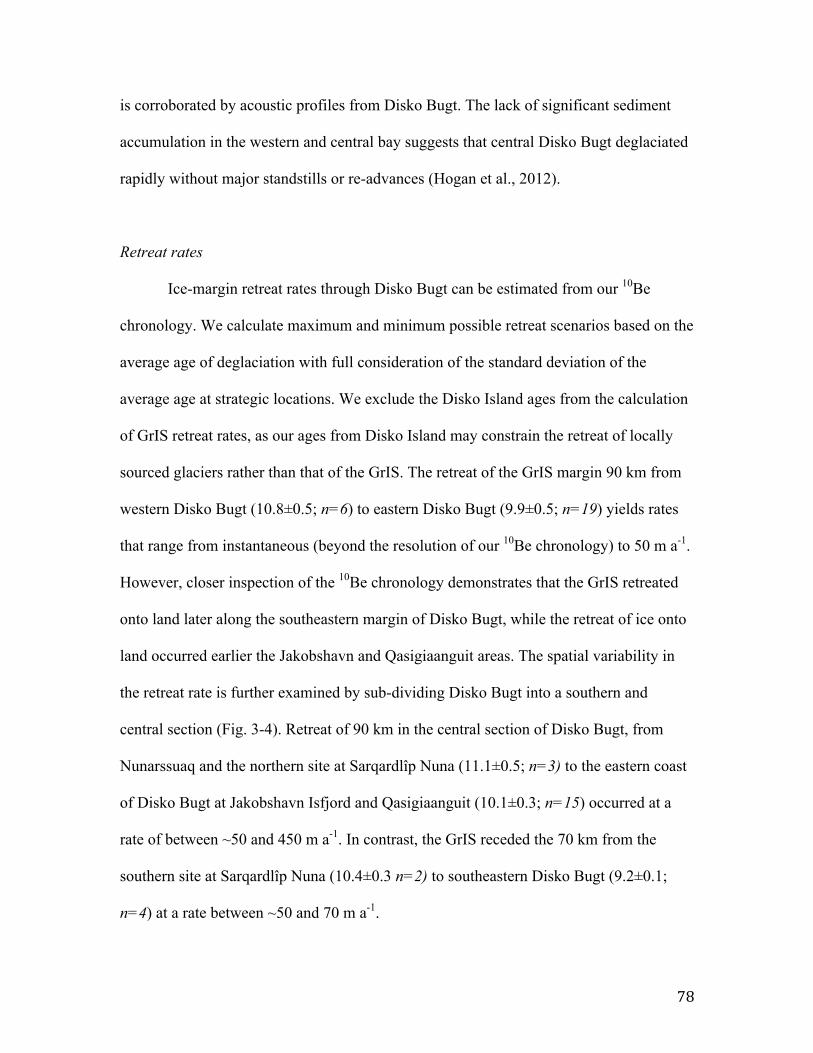
78
is corroborated by acoustic profiles from Disko Bugt. The lack of significant sediment
accumulation in the western and central bay suggests that central Disko Bugt deglaciated
rapidly without major standstills or re-advances (Hogan et al., 2012).
Retreat rates
Ice-margin retreat rates through Disko Bugt can be estimated from our 10Be
chronology. We calculate maximum and minimum possible retreat scenarios based on the
average age of deglaciation with full consideration of the standard deviation of the
average age at strategic locations. We exclude the Disko Island ages from the calculation
of GrIS retreat rates, as our ages from Disko Island may constrain the retreat of locally
sourced glaciers rather than that of the GrIS. The retreat of the GrIS margin 90 km from
western Disko Bugt (10.8±0.5; n=6) to eastern Disko Bugt (9.9±0.5; n=19) yields rates
that range from instantaneous (beyond the resolution of our 10Be chronology) to 50 m a-1.
However, closer inspection of the 10Be chronology demonstrates that the GrIS retreated
onto land later along the southeastern margin of Disko Bugt, while the retreat of ice onto
land occurred earlier the Jakobshavn and Qasigiaanguit areas. The spatial variability in
the retreat rate is further examined by sub-dividing Disko Bugt into a southern and
central section (Fig. 3-4). Retreat of 90 km in the central section of Disko Bugt, from
Nunarssuaq and the northern site at Sarqardlîp Nuna (11.1±0.5; n=3) to the eastern coast
of Disko Bugt at Jakobshavn Isfjord and Qasigiaanguit (10.1±0.3; n=15) occurred at a
rate of between ~50 and 450 m a-1. In contrast, the GrIS receded the 70 km from the
southern site at Sarqardlîp Nuna (10.4±0.3 n=2) to southeastern Disko Bugt (9.2±0.1;
n=4) at a rate between ~50 and 70 m a-1.
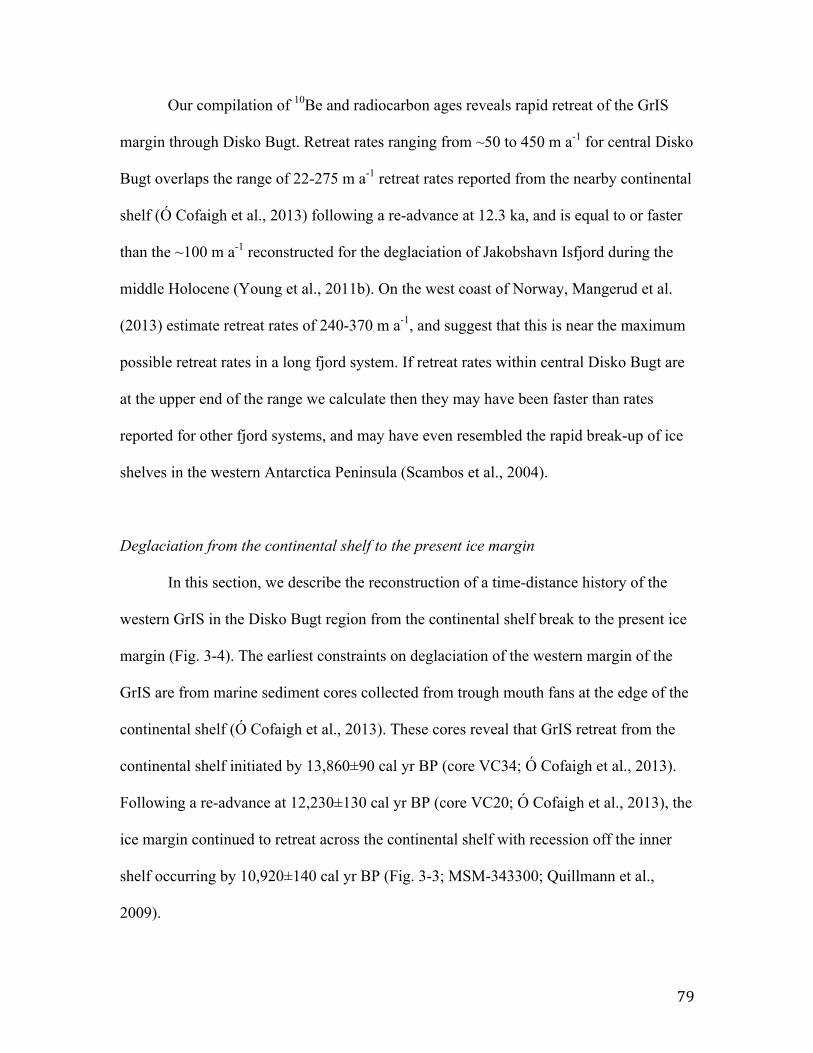
79
Our compilation of 10Be and radiocarbon ages reveals rapid retreat of the GrIS
margin through Disko Bugt. Retreat rates ranging from ~50 to 450 m a-1 for central Disko
Bugt overlaps the range of 22-275 m a-1 retreat rates reported from the nearby continental
shelf (Ó Cofaigh et al., 2013) following a re-advance at 12.3 ka, and is equal to or faster
than the ~100 m a-1 reconstructed for the deglaciation of Jakobshavn Isfjord during the
middle Holocene (Young et al., 2011b). On the west coast of Norway, Mangerud et al.
(2013) estimate retreat rates of 240-370 m a-1, and suggest that this is near the maximum
possible retreat rates in a long fjord system. If retreat rates within central Disko Bugt are
at the upper end of the range we calculate then they may have been faster than rates
reported for other fjord systems, and may have even resembled the rapid break-up of ice
shelves in the western Antarctica Peninsula (Scambos et al., 2004).
Deglaciation from the continental shelf to the present ice margin
In this section, we describe the reconstruction of a time-distance history of the
western GrIS in the Disko Bugt region from the continental shelf break to the present ice
margin (Fig. 3-4). The earliest constraints on deglaciation of the western margin of the
GrIS are from marine sediment cores collected from trough mouth fans at the edge of the
continental shelf (Ó Cofaigh et al., 2013). These cores reveal that GrIS retreat from the
continental shelf initiated by 13,860±90 cal yr BP (core VC34; Ó Cofaigh et al., 2013).
Following a re-advance at 12,230±130 cal yr BP (core VC20; Ó Cofaigh et al., 2013), the
ice margin continued to retreat across the continental shelf with recession off the inner
shelf occurring by 10,920±140 cal yr BP (Fig. 3-3; MSM-343300; Quillmann et al.,
2009).
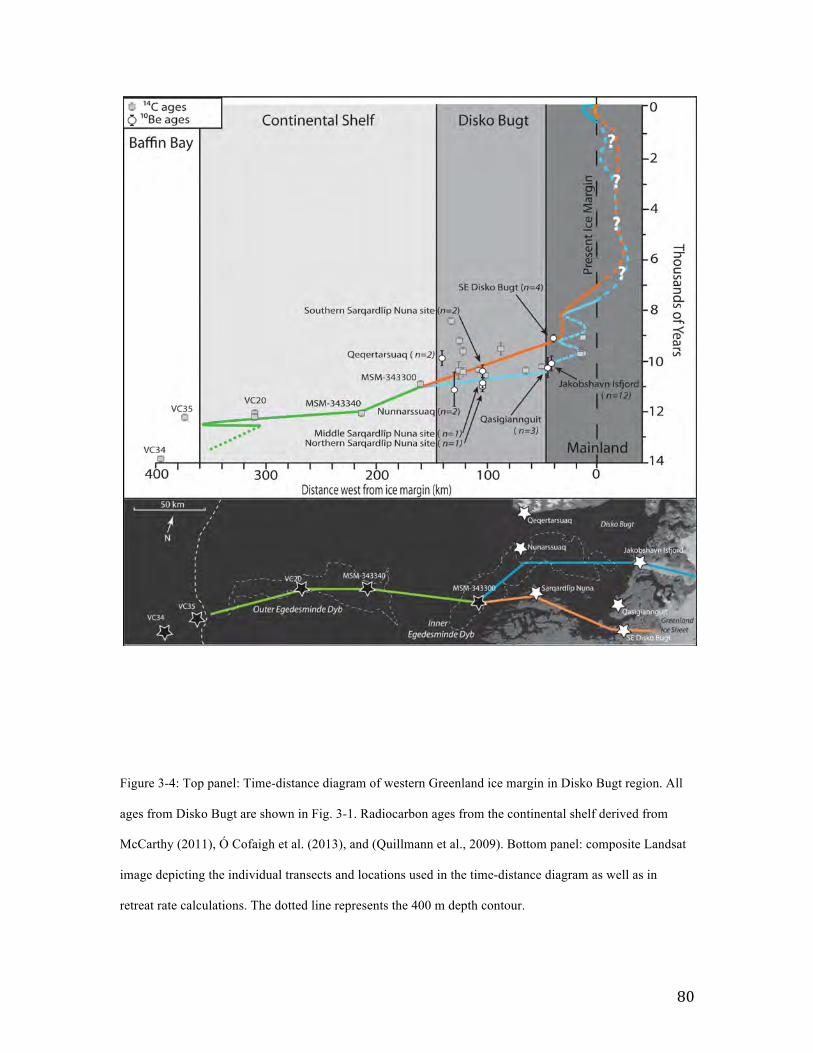
80
Figure 3-4: Top panel: Time-distance diagram of western Greenland ice margin in Disko Bugt region. All
ages from Disko Bugt are shown in Fig. 3-1. Radiocarbon ages from the continental shelf derived from
McCarthy (2011), Ó Cofaigh et al. (2013), and (Quillmann et al., 2009). Bottom panel: composite Landsat
image depicting the individual transects and locations used in the time-distance diagram as well as in
retreat rate calculations. The dotted line represents the 400 m depth contour.
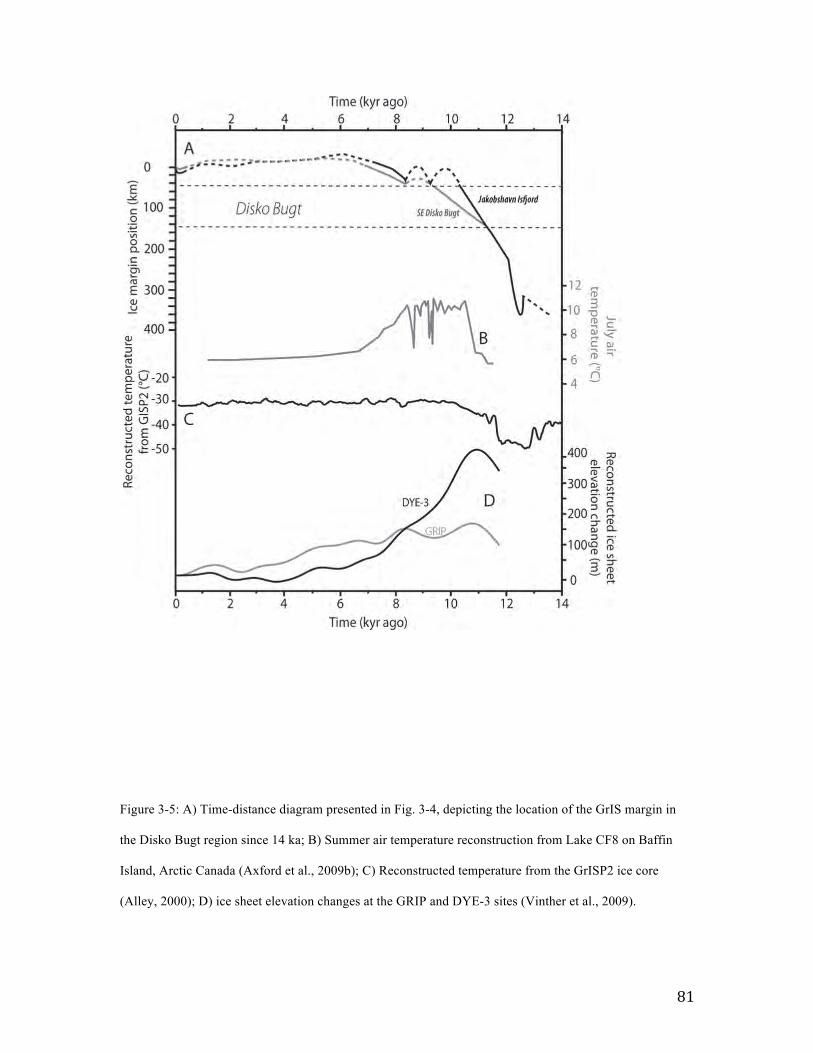
81
Figure 3-5: A) Time-distance diagram presented in Fig. 3-4, depicting the location of the GrIS margin in
the Disko Bugt region since 14 ka; B) Summer air temperature reconstruction from Lake CF8 on Baffin
Island, Arctic Canada (Axford et al., 2009b); C) Reconstructed temperature from the GrISP2 ice core
(Alley, 2000); D) ice sheet elevation changes at the GRIP and DYE-3 sites (Vinther et al., 2009).

82
The timing of western Disko Bugt deglaciation at 10.8±0.5 ka is similar to an age on
deglaciation of 10,920±140 cal yr BP from the nearby continental shelf (60 km
southwest; core MSM-343300; Quillmann et al., 2009). This similarity implies little
pause, or slowdown, during deglaciation from the western Greenland shelf and into Disko
Bugt.
Following ice retreat out of Disko Bugt, the GrIS deposited the Fjord Stade
moraines during re-advances at 9.3 and 8.2 ka (Weidick and Bennike, 2007; Young et al.,
2011a; Young et al., 2013a). Following these re-advances, the GrIS retreated to a location
at or behind its latest Holocene ice margin by ~7.4 ka near Jakobshavn Isfjord and ~7.0
ka in southeastern Disko Bugt (Young et al., 2011b; Young et al., 2013a). The GrIS
remained behind its present margin throughout the middle Holocene, and radiocarbon-
dated lake sediments from a threshold lake basin reveal that the GrIS achieved its
minimum mid-Holocene extent at or by 5770 ± 110 cal yr BP (Briner et al., 2010). At
Jakobshavn Isfjord, the GrIS was approaching the latest Holocene configuration by ~2.3
ka, achieved its late Holocene maximum around 0.4 ka (Briner et al., 2010), and began
retreating by 1850 AD (Csatho et al., 2008). In southeast Disko Bugt, the ice margin
neared its latest Holocene maximum position by ~0.3 ka, and culminated in its maximum
extent during the late 20th century (Chapter 2).
Forcing mechanisms
In evaluating possible forcing mechanisms for rapid retreat of the GrIS from
Disko Bugt, two end member scenarios are possible: 1) the retreat of the GrIS was
climatically driven by increasing air and ocean temperatures, and 2) ice dynamic factors

83
independent of climatic forcing drove the recession. Retreat of the GrIS from Disko Bugt
occurred during a period of ocean and climatic warming, as well as ice sheet thinning.
Arctic summer temperatures on Baffin Island (~600 km west) increased 2-4 °C between
11 and 10 ka (Fig. 3-5; Axford et al., 2009b). In addition, evidence of relatively warm
Atlantic-derived water reaching northern Baffin Bay just after 10.9 ka implies increased
advection of Atlantic water into Baffin Bay around the time of ice retreat from Disko
Bugt (Knudsen et al., 2008). Further evidence of a warming Baffin Bay is derived from
the presence of driftwood in southwest Greenland dated to 10.8±0.4 ka indicating ice free
conditions for part of the year (Weidick, 1975).
Estimates of ice sheet elevation change from the GRIP and DYE-3 ice cores
indicate that accelerated thinning of the GrIS occurred between 11 and 10 ka (Fig. 3-5;
Vinther et al., 2009). This evidence of ameliorating climate provides a possible
mechanism for GrIS retreat during the early Holocene.
Evidence for the role of ice dynamics on ice sheet retreat comes from a
comparison of the deglaciation of the Disko Bugt area to that of the Uummannaq Fjord
system and cross-shelf trough to the north (~220 km). A major difference between the
two glacier systems is their geometry, with Disko Bugt exhibiting a widening and
bathymetrically deepening geometry from west to east, while Uummannaq is much
narrower and bathymetrically deeper, with numerous islands (McCarthy, 2011). Recent
investigations of the Uummannaq trough suggest that deglaciation commenced from the
continental shelf at ~14.8 ka, ~1000 years earlier than offshore of Disko Bugt (Ó Cofaigh
et al., 2013; Roberts et al., 2013a). Ice sheet retreat also progressed differently between
the two systems, with the ice sheet well within the main fjord at Uummannaq by 12.4 ka,
84
into the inner fjords by 10.8 ka and likely behind its present position at Store Gletscher
by 8.7 ka (Roberts et al., 2013a). This asynchronous initiation and evolution of ice sheet
retreat between the two neighboring systems suggests a local ice dynamic influence on
ice sheet recession.
We postulate that climatic factors created a situation in Disko Bugt where the
western margin of the GrIS became more susceptible to rapid retreat driven by ice
dynamics. As the GrIS thinned, buoyancy may have increased, and was exacerbated by
basal melt due to contact with warming ocean water. As buoyancy of the marine-based
section of the GrIS increased, the margin may have lost contact with the bathymetric high
spanning the mouth of Disko Bugt, which acted as a pinning point. This change could
have led to accelerated calving as the basin geometry widens from west to east,
prompting rapid recession of the ice margin from deep, central Disko Bugt to a more
stable configuration along southern and eastern coasts of Disko Bugt (Enderlin et al.,
2013). This proposed scenario is supported by sedimentological data from the marine
cores that suggest calving was a major factor in the early Holocene retreat of the GrIS
from the continental shelf (Jennings et al., 2014).
Conclusions
New 10Be ages from around Disko Bugt, western Greenland, place the
deglaciation of western Disko Bugt at 10.8±0.5 ka, with the ice margin reaching the
eastern coast of Disko Bugt near Ilulissat at 10.1±0.3 ka and in southeastern Disko Bugt
at 9.2±0.1 ka. This chronology yields a retreat rate between ~50 and 450 m a-1 across
central Disko Bugt. This rate indicates that ~25% of the overall retreat between the shelf
85
edge and the current position occurred in as little as 100 years. We suggest this retreat
was the result of internal ice dynamics acting upon an ice sheet driven out of equilibrium
by climatic factors. These findings further emphasize the ability of marine sectors of ice
sheets to change rapidly due to ice dynamics in warming climates (e.g. Kjær et al., 2012).
Our chronology fills a gap in the current understanding of the early Holocene behavior of
the GrIS in Disko Bugt, and provides a dataset that completes a history of a western GrIS
margin spanning from the continental shelf to the present ice position, and from the latest
Pleistocene through the Holocene.
Acknowledgements
This work greatly benefitted from high precision 10Be measurements from Lawrence
Livermore National Laboratory by Susan Zimmerman and Robert Finkel. We appreciate
laboratory assistance from Michael Badding and Sarah Lavin. We are grateful for the
reviews of A. Jennings and A. Hughes, whose comments improved this manuscript. This
research was funded by a Geologic Society of America graduate student grant and grant
NSF-1156361 from the U.S. National Science Foundation Program of Geography and
Spatial Science.
References
Alley, R.B., 2000. The Younger Dryas cold interval as viewed from central Greenland. Quaternary Science Reviews 19, 213-226.
Axford, Y., Briner, J.R., Miller, G.H., Francis, D.R., 2009. Paleoecological evidence for abrupt cold reversals during peak Holocene warmth on Baffin Island, Arctic Canada. Quaternary Research 71, 142-149.
86
Balco, G., Briner, J.P., Finkel, R., Rayburn, J.A., Ridge, J.C., Schaefer, J.M., 2009. Regional beryllium-10 production rate calibration for late-glacial northeastern North America. Quaternary Geochronology 4, 93-107.
Bennike, O., Hansen, K.B., Knudsen, K.L., Penney, D.N., Rasmussen, K.L., 1994. Quaternary marine stratigraphy and geochronology in central West Greenland. Boreas 23, 194-215.
Bennike, O., Björck, S., 2002. Chronology of the last recession of the Greenland Ice Sheet. Journal of Quaternary Science 17, 211-219.
Bennike, O., Anderson, N.J., McGowan, S., 2010. Holocene palaeoecology of southwest Greenland inferred from macrofossils in sediments of an oligosaline lake. J. Paleolimn. 43, 787-798.
Bindschadler, R.A., 1984. Jakobshavns Glacier drainage basin: A balance assessment. Journal of Geophysical Research: Oceans (1978–2012) 89, 2066-2072.
Bjørk, A.A., Kjær, K.H., Korsgaard, N.J., Khan, S.A., Kjeldsen, K.K., Andresen, C.S., Larsen, N.K., Funder, S., 2012. An aerial view of 80 years of climate-related glacier fluctuations in southeast Greenland. Nature Geoscience 5, 427-432.
Box, J.E., 2002. Survey of Greenland instrumental temperature records: 1873–2001. International Journal of Climatology 22, 1829-1847.
Briner, J.P., Bini, A.C., Anderson, R.S., 2009. Rapid early Holocene retreat of a Laurentide outlet glacier through an Arctic fjord. Nature Geoscience 2, 496-499.
Briner, J., Stewart, H., Young, N., Philipps, W., Losee, S., 2010. Using proglacial-threshold lakes to constrain fluctuations of the Jakobshavn Isbræ ice margin, western Greenland, during the Holocene. Quaternary Science Reviews 29, 3861-3874.
Chalmers, J., Pulvertaft, T., Marcussen, C., Pedersen, A., 1999. New insight into the structure of the Nuussuaq Basin, central West Greenland. Marine and Petroleum Geology 16, 197-224.
Christoffersen, M., 1974. Quaternary Map of Greenland: Søndre Strømfjord-Nûgssuaq Kvartærgeologisk; Sheet 3, Quaternary Map of Greenland. Greenland Geologic Survey, Copenhagen, Denmark.
87
Corbett, L.B., Young, N.E., Bierman, P.R., Briner, J.P., Neumann, T.A., Rood, D.H., Graly, J.A., 2011. Paired bedrock and boulder 10Be concentrations resulting from early Holocene ice retreat near Jakobshavn Isfjord, western Greenland. Quaternary Science Reviews 30, 1739-1749.
Csatho, B., Schenk, T., Van der Veen, C., Krabill, W.B., 2008. Intermittent thinning of Jakobshavn Isbræ, West Greenland, since the Little Ice Age. Journal of Glaciology 54, 131-144.
Donner, J., Jungner, H., 1975. Radiocarbon dating of shells from marine Holocene deposits in the Disko Bugt area, West Greenland. Boreas 4, 25-45.
Enderlin, E., Howat, I., Vieli, A., 2013. High sensitivity of tidewater outlet glacier dynamics to shape. The Cryosphere Discussions 7, 551-572.
Fisher, D., Zheng, J., Burgess, D., Zdanowicz, C., Kinnard, C., Sharp, M., Bourgeois, J., 2012. Recent melt rates of Canadian arctic ice caps are the highest in four millennia. Global and Planetary Change 84–85, 3-7.
Fredskild, B., 1996. Holocene climatic changes in Greenland. The Paleo-eskimo cultures of Greenland. Danish Polar Center, Copenhagen, 243-251.
Frich, P., Ingólfsson, O., 1990. Det holocæne sedimentationsmiljø ved Igpik samt en model for den relative landhævning i Disko Bugt området, Vestgrønland. AÊrsskrift for Dansk Geologisk Forening 1987 89, 1-10.
Funder, S.V., Hansen, L., 1996. The Greenland ice sheet-a model for its culmination and decay during and after the last glacial maximum. Geological Society of Denmark. Bulletin 42, 137-152.
Hogan, K., Dowdeswell, J., Cofaigh, C., 2012. Glacimarine sedimentary processes and depositional environments in an embayment fed by West Greenland ice streams. Marine Geology 311-314, 1-16.
Hughes, A.L., Rainsley, E., Murray, T., Fogwill, C.J., Schnabel, C., Xu, S., 2012. Rapid response of Helheim Glacier, southeast Greenland, to early Holocene climate warming. Geology 40, 427-430.

88
Ingólfsson, Ó., Frich, P., Funder, S., Humlum, O., 1990. Paleoclimatic implications of an early Holocene glacier advance on Disko island, West Greenland. Boreas 19, 297-311.
Jennings, A., Walton, M.E., Cofaigh, C.Ó., Kilfeather, A., Andrews, J.T., Ortiz, J., De Vernal, A., Dowdeswell, J.A., 2014. Paleoenvironments during the Younger Dryas-early Holocene retreat of the Greenland Ice Sheet from outer Disko Trough, central west Greenland. Journal of Quaternary Science 29, 27-40.
Joughin, I., Smith, B.E., Howat, I.M., Scambos, T., Moon, T., 2010. Greenland flow variability from ice-sheet-wide velocity mapping. Journal of Glaciology 56, 415-430.
Kaplan, M.R., Wolfe, A.P., Miller, G.H., 2002. Holocene environmental variability in southern Greenland inferred from lake sediments. Quaternary Research 58, 149-159.
Kaufman, D.S., Schneider, D.P., McKay, N.P., Ammann, C.M., Bradley, R.S., Briffa, K.R., Miller, G.H., Otto-Bliesner, B.L., Overpeck, J.T., Vinther, B.M., 2009. Recent warming reverses long-term Arctic cooling. Science 325, 1236-1239.
Kjær, K.H., Khan, S.A., Korsgaard, N.J., Wahr, J., Bamber, J.L., Hurkmans, R., van den Broeke, M., Timm, L.H., Kjeldsen, K.K., Bjørk, A.A., 2012. Aerial Photographs Reveal Late–20th-Century Dynamic Ice Loss in Northwestern Greenland. Science 337, 569-573.
Knudsen, K.L., Stabell, B., Seidenkrantz, M.S., Eiriksson, J., Blake, W., 2008. Deglacial and Holocene conditions in northernmost Baffin Bay: sediments, foraminifera, diatoms and stable isotopes. Boreas 37, 346-376.
Lal, D., 1991. Cosmic-ray labeling of erosion surfaces: in situ nuclide production rates and erosion models. Earth and Planetary Science Letters 104, 424-439.
Levy, L.B., Kelly, M.A., Howley, J.A., Virginia, R.A., 2012. Age of the Ørkendalen moraines, Kangerlussuaq, Greenland: constraints on the extent of the southwestern margin of the Greenland Ice Sheet during the Holocene. Quaternary Science Reviews 52, 1-5.
Lloyd, J., Park, L., Kuijpers, A., Moros, M., 2005. Early Holocene palaeoceanography and deglacial chronology of Disko Bugt, west Greenland. Quaternary Science Reviews 24, 1741-1755.
89
Lloyd, J., Moros, M., Perner, K., Telford, R.J., Kuijpers, A., Jansen, E., McCarthy, D., 2011. A 100 yr record of ocean temperature control on the stability of Jakobshavn Isbrae, West Greenland. Geology 39, 867-870.
Long, A.J., Roberts, D.H., 2002. A revised chronology for the ‘Fjord Stade’moraine in Disko Bugt, west Greenland. Journal of Quaternary Science 17, 561-579.
Long, A.J., Roberts, D.H., 2003. Late Weichselian deglacial history of Disko Bugt, West Greenland, and the dynamics of the Jakobshavns Isbrae ice stream. Boreas 32, 208-226.
Long, A.J., Roberts, D.H., Rasch, M., 2003. New observations on the relative sea level and deglacial history of Greenland from Innaarsuit, Disko Bugt. Quaternary Research 60, 162-171.
Long, A., Roberts, D., Dawson, S., 2006. Early Holocene history of the west Greenland Ice Sheet and the GH-8.2 event. Quaternary Science Reviews 25, 904-922.
Long, A.J., Woodroffe, S.A., Roberts, D.H., Dawson, S., 2011. Isolation basins, sea-level changes and the Holocene history of the Greenland Ice Sheet. Quaternary Science Reviews 30, 3748-3768.
Mangerud, J., Goehring, B.M., Lohne, Ø.S., Svendsen, J.I., Gyllencreutz, R., 2013. Collapse of marine-based outlet glaciers from the Scandinavian Ice Sheet. Quaternary Science Reviews 67, 8-16.
Maslanik, J., Stroeve, J., Fowler, C., Emery, W., 2011. Distribution and trends in Arctic sea ice age through spring 2011. Geophysical Research Letters 38, L13502.
McCarthy, D.J., 2011. Late Quaternary ice-ocean interactions in central west Greenland, Deptment of Geography. Durham University, Durham, UK, p. 292.
Meier, M.F., Dyurgerov, M.B., Rick, U.K., O'Neel, S., Pfeffer, W.T., Anderson, R.S., Anderson, S.P., Glazovsky, A.F., 2007. Glaciers dominate eustatic sea-level rise in the 21st century. Science 317, 1064-1067.
Miller, G.H., Brigham-Grette, J., Alley, R.B., Anderson, L., Bauch, H.A., Douglas, M.S.V., Edwards, M.E., Elias, S.A., Finney, B.P., Fitzpatrick, J.J., Funder, S.V., Herbert, T.D., Hinzman, L.D., Kaufman, D.S., MacDonald, G.M., Polyak, L., Robock, A., Serreze, M.C., Smol, J.P., Spielhagen, R., White, J.W.C., Wolfe, A.P., Wolff, E.W.,
90
2010. Temperature and precipitation history of the Arctic. Quaternary Science Reviews 29, 1679-1715.
Möller, P., Larsen, N.K., Kjær, K.H., Funder, S., Schomacker, A., Linge, H., Fabel, D., 2010. Early to middle Holocene valley glaciations on northernmost Greenland. Quaternary Science Reviews 29, 3379-3398.
Nick, F., Van der Veen, C., Vieli, A., Benn, D., 2010. A physically based calving model applied to marine outlet glaciers and implications for the glacier dynamics. Journal of Glaciology 56, 781-794.
Nishiizumi, K., Imamura, M., Caffee, M.W., Southon, J.R., Finkel, R.C., McAninch, J., 2007. Absolute calibration of 10Be AMS standards. Nuclear Instruments and Methods in Physics Research B 258, 403-413.
Ó Cofaigh, C., Dowdeswell, J., Jennings, A., Hogan, K., Kilfeather, A., Hiemstra, J., Noormets, R., Evans, J., McCarthy, D., Andrews, J., 2013. An extensive and dynamic ice sheet on the West Greenland shelf during the last glacial cycle. Geology 41, 219-222.
Perren, B.B., Wolfe, A.P., Cooke, C.A., Kjær, K.H., Mazzucchi, D., Steig, E.J., 2012. Twentieth-century warming revives the world's northernmost lake. Geology 40, 1003-1006.
Quillmann, U., Andrews, J.T., Jennings, A.E., 2009. Radiocarbon dates from marine sediment cores of the Iceland, Greenland, and northeast Canadian Arctic shelves and Nares Strait. Institute of Arctic and Alpine Research Occasional Paper 59, 14-15.
Rasch, M., 2000. Holocene relative sea level changes in Disko Bugt, West Greenland. Journal of Coastal Research 16, 306-315.
Rignot, E., Kanagaratnam, P., 2006. Changes in the Velocity Structure of the Greenland Ice Sheet. Science 311, 986-990.
Rignot, E., Velicogna, I., van den Broeke, M.R., Monaghan, A., Lenaerts, J.T.M., 2011. Acceleration of the contribution of the Greenland and Antarctic ice sheets to sea level rise. Geophysical Research Letters 38, L05503.
91
Roberts, D.H., Long, A.J., 2005. Streamlined bedrock terrain and fast ice flow, Jakobshavns Isbrae, West Greenland: implications for ice stream and ice sheet dynamics. Boreas 34, 25-42.
Roberts, D.H., Rea, B.R., Lane, T.P., Schnabel, C., Rodés, A., 2013. New constraints on Greenland ice sheet dynamics during the last glacial cycle: evidence from the Uummannaq ice stream system. Journal of Geophysical Research: Earth Surface.
Rood, D.H., Hall, S., Guilderson, T.P., Finkel, R.C., Brown, T.A., 2010. Challenges and opportunities in high-precision Be-10 measurements at CAMS. Nuclear Instruments and Methods in Physics Research Section B: Beam Interactions with Materials and Atoms 268, 730-732.
Scambos, T.A., Bohlander, J., Shuman, C., Skvarca, P., 2004. Glacier acceleration and thinning after ice shelf collapse in the Larsen B embayment, Antarctica. Geophysical Research Letters 31, L18402.
Serreze, M.C., Barrett, A.P., J.C., S., Kindig, D.N., M.M., H., 2009. The emergence of surface-based Arctic amplification. The Cryosphere 3, 11-19.
Stone, J.O., 2000. Air pressure and cosmogenic isotope production. Journal of Geophysical Research 105, 23753-23759.
Vinther, B.M., Buchardt, S.L., Clausen, H.B., Dahl-Jensen, D., Johnsen, S.J., Fisher, D.A., Koerner, R.M., Raynaud, D., Lipenkov, V., Andersen, K.K., Blunier, T., Rasmussen, S.O., Steffensen, J.P., Svensson, A.M., 2009. Holocene thinning of the Greenland ice sheet. Nature 461, 385-388.
Weidick, A., 1968. Observations on some Holocene glacier fluctuations in west Greenland. Meddelesser om Grønland 165, 202 p.
Weidick, A., 1972. 14C Dating of survey material performed in 1971. Rapport Grønlands Geologiske Undersøgelse 41, 1-39.
Weidick, A., 1974. 14C Dating of survey material performed in 1973. Rapport Grønlands Geologiske Undersøgelse 66, 42-44.
Weidick, A., 1975. A review of Quaternary investigations in Greenland. 70, 22 p.
92
Weidick, A., Oerter, H., Reeh, N., Thomsen, H.H., Thorning, L., 1990. The recession of the Inland Ice margin during the Holocene climatic optimum in the Jakobshavn Isfjord area of West Greenland. Global and Planetary Change 2, 389-399.
Weidick, A., 1994. Historical fluctuations of calving glaciers in south and West Greenland. Rapport Grønlands Geologiske Undersølgelse 161, 73-79.
Weidick, A., Kelly, M., Bennike, O.L.E., 2004. Late Quaternary development of the southern sector of the Greenland Ice Sheet, with particular reference to the Qassimiut lobe. Boreas 33, 284-299.
Weidick, A., Bennike, O., 2007. Quaternary glaciation history and glaciology of Jakobshavn Isbræ and the Disko Bugt region, West Greenland: a review. Geological Survey of Denmark and Greenland.
Young, N.E., Briner, J.P., Axford, Y., Csatho, B., Babonis, G.S., Rood, D.H., Finkel, R.C., 2011a. Response of a marine‐terminating Greenland outlet glacier to abrupt cooling 8200 and 9300 years ago. Geophysical Research Letters 38, L24701.
Young, N.E., Briner, J.P., Stewart, H.A., Axford, Y., Csatho, B., Rood, D.H., Finkel, R.C., 2011b. Response of Jakobshavn Isbræ, Greenland, to Holocene climate change. Geology 39, 131-134.
Young, N.E., Briner, J.P., Rood, D.H., Finkel, R.C., Corbett, L.B., Bierman, P.R., 2013a. Age of the Fjord Stade moraines in the Disko Bugt region, western Greenland, and the 9.3 and 8.2 ka cooling events. Quaternary Science Reviews 60, 76-90.
Young, N.E., Schaefer, J.M., Briner, J.P., Goehring, B.M., 2013b. A precise 10Be Production-rate calibration for the Arctic. Journal of Quaternary Science 28, 515-526.
93
IV. THE INFLUENCE OF ICE MARGINAL SETTING ON LATE PLEISTOCENE RETREAT RATES IN CENTRAL WEST GREENLAND Samuel E. Kelley1*, Jason P. Briner1, Susan R. Zimmerman2 1Geology Department, University at Buffalo 2Center for AMS, Lawrence Livermore National Laboratory Anticipated submission to the Journal of Quaternary Science (Summer 2014) Abstract
A complex pattern of ice margin fluctuation has emerged from the ~170 year long
historic record of Greenland Ice Sheet change, though low velocity areas of the ice
margin, such as land-based sectors, are underrepresented in historic records. Therefore,
records from diverse ice margin settings spanning longer periods are needed assess the
reaction of the Greenland Ice Sheet to millennial-scale climatic forcing. Here we present
eighteen new cosmogenic 10Be exposure ages and five new radiocarbon ages constraining
the late Pleistocene and Holocene retreat of the Greenland Ice Sheet in two different ice
marginal environments - a marine setting and a terrestrial setting - with the purpose of
comparing the timing and rate of retreat. Results from Torsukattak Fjord (marine setting)
constrain ice retreat spanning 40 kilometers and yield a rate of 45±15 m a-1. Retreat of the
Greenland Ice Sheet south of Disko Bugt onto land from Baffin Bay occurred at 11.7±0.4
ka, and subsequent retreat spanning 80 kilometers occurred at 40±10 m a-1. This
chronology constrains the deposition of a prominent set of moraines ~5 kilometers in
front of the present ice margin between 9.6-8.3 ka. To place these results in a wider
context, we compiled seven additional early Holocene retreat chronologies from West
Greenland, which yielded retreat rates similar to those determined for our two study
94
areas. Retreat rates were found to be systematically lower in the eastern part of the
transect than net retreat rates calculated for the entire early-mid Holocene retreat, which
we attribute to ice sheet-wide standstill or re-advance in response to early Holocene
freshwater forcing (e.g., 8.2 ka event), which reduces net retreat rates. Our results
indicate that during a period of warming, the western margin of the Greenland Ice Sheet
responded by retreating in a synchronous manner and at similar rates, despite different ice
marginal settings. This suggests that climate was a more dominant factor than ice
dynamics in controlling timing and retreat rate of the Greenland Ice Sheet in the early
Holocene, and that on millennial timescales terrestrial sectors of ice sheets can retreat at
rates comparable to their marine counterparts.
Keywords: Greenland Ice Sheet; 10Be exposure dating; Holocene Introduction
Study of the changes exhibited by the present Greenland Ice Sheet (GrIS) in
response to climate has provided valuable insight into the mechanics of the GrIS‘s
reaction to recent climate change (e.g. Zwally et al., 2002; Holland et al., 2008; Pfeffer et
al., 2008). The historic record reveals a complex picture of GrIS behavior in the past two
centuries (Weidick, 1968; Weidick, 1994; Bjørk et al., 2012; Kjær et al., 2012). This
complex picture highlights the high degree of variability exhibited in ice marginal change
along the periphery of the GrIS (Chapter 2). Unfortunately, the historical records are not
able to distinguish between dynamic and climatic forcing of ice margin change.
Therefore, reconstructions of ice margin fluctuations spanning the Holocene are needed
to provide a longer-term perspective on the reaction of the GrIS to warming climate.
95
Our knowledge of fluctuations of the GrIS during the Holocene has expanded in
recent years (Weidick et al., 2004; Möller et al., 2010; Briner et al., 2014). This is
especially true along the western GrIS margin where chronologies are being constructed
that provide detailed snapshots of Holocene ice margin fluctuations (Chapter 2; Young et
al., 2011b; Levy et al., 2012), as well as some studies that track movement of the ice
margin over the latest Pleistocene (Chapter 3; Lane et al., 2013; Roberts et al., 2013b).
Despite these records advancing our knowledge of past GrIS ice margin changes, they are
dominated by marine-terminating outlet glaciers, precluding the opportunity to examine
how different ice marginal settings may behave during changes in climate.
Records of Holocene ice margin fluctuations from a variety of ice marginal
settings are important for predictions of GrIS change. Records from land-based sectors of
the ice margin can inform predictions on the validity of extrapolation current retreat
trends determined from historic observations. One such trend is the disparity in the
magnitude of retreat since the late Holocene maximum extent was achieved. Marine-
terminating glaciers have retreated an order of magnitude more than land-terminating
glaciers, likely due to differences in their sensitivity to climate forcing (Chapter 2).
Placing recent trends into a longer temporal context is important for constraining
estimates of future GrIS retreat. Here, we constrain the timing and rate of early Holocene
retreat in two contrasting glacial systems in West Greenland –one marine-based and one
dominantly terrestrial system– based on eighteen 10Be ages and five radiocarbon ages.
We use these constraints to compare the response of marine-based and terrestrial-based
GrIS margins to early Holocene warming.
96
Setting
West Greenland
Two paleo-glacier systems were selected in central West Greenland from the
northern and southern margins of Disko Bugt. The Torsukattak Fjord and Nordenskiöld
Gletscher study areas present two contrasting paleo-glacier systems, one marine-based
and one terrestrial-based respectively. We reconstruct the timing and rate of retreat of the
GrIS in response to early Holocene warming of ~2-6°C at each site (Fig. 4-1; Vinther et
al., 2009). The two field areas presently experience similar climatic conditions (Box,
2002), and are separated by a distance of ~175 kilometers.
Torsukattak Fjord is located in northernmost Disko Bugt, bounded by the
peninsula of Nuussuaq along its northern margin and a group of islands and a peninsula
along the southern margin. Presently, the GrIS drains into the fjord via Sermeq Kujatdleq
and Sermeq Avangnardleq, GrIS outlet glaciers, which are separated at the fjord head by
a nunatak. The region is characterized by high relief, with water depths exceeding 500 m
(Rignot et al., 2010), and fjord walls that rise to >600 meters above sea level (asl). The
fjord connects to Baffin Bay via Disko Bugt to the southwest and through the Vaigat
Strait to the northwest. At present, oceanographic circulation at the mouth of Torsukattak
Fjord is dominated by a limb of the warm West Greenland Current (WGC), which flows
from the SW through Disko Bugt, exiting through Vaigat Strait (Seidenkrantz et al.,
2008). Recent studies have demonstrated that warm water from the WGC penetrates into
Torsukattak Fjord, causing basal melting along glacier margins at the fjord head (Rignot
et al., 2010).
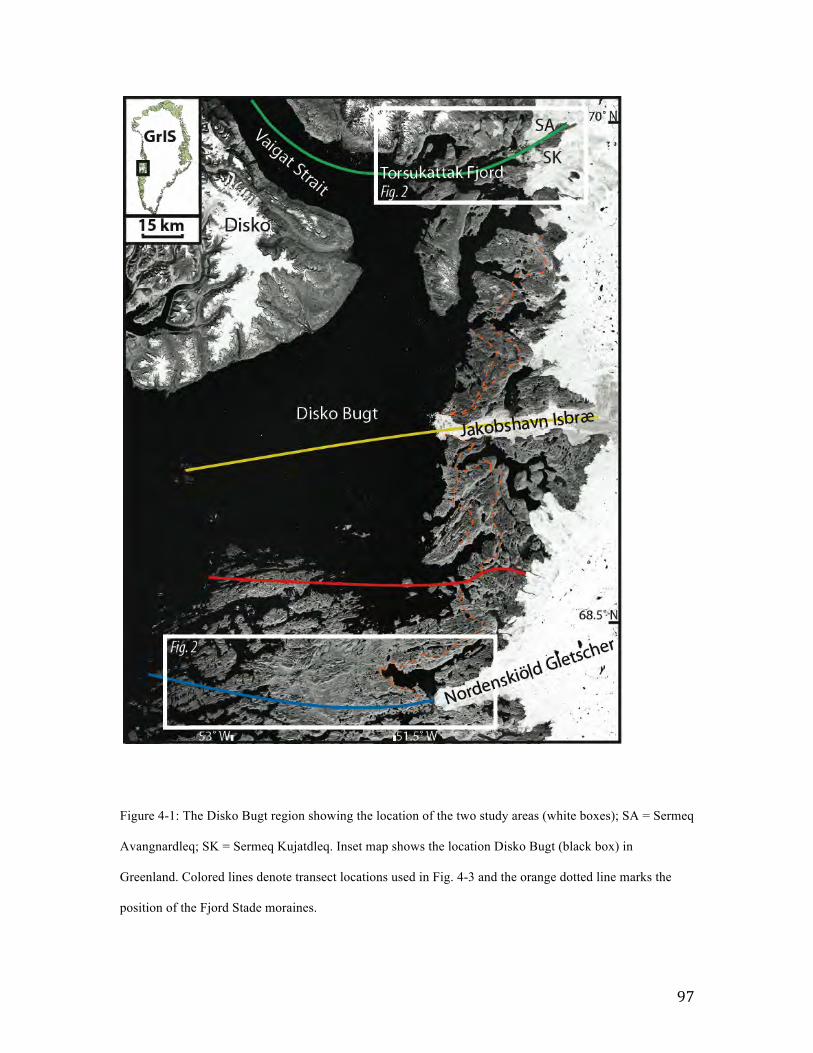
97
Figure 4-1: The Disko Bugt region showing the location of the two study areas (white boxes); SA = Sermeq
Avangnardleq; SK = Sermeq Kujatdleq. Inset map shows the location Disko Bugt (black box) in
Greenland. Colored lines denote transect locations used in Fig. 4-3 and the orange dotted line marks the
position of the Fjord Stade moraines.

98
The southern study area is located on the 90-kilometer wide fringe of land that
separates Baffin Bay from the GrIS margin at Nordenskiöld Gletscher (Fig. 4-1). The
Nordenskiöld field area is characterized by rounded bedrock hills reaching 450 meters
asl. Low-lying areas are filled by glaciomarine sediments and till (Christoffersen, 1974).
Limited ice flow indicators suggest that flow direction was roughly east-west across the
region during the early Holocene, with a possible change in flow direction occurring
during deglaciation, routing ice along a more northeasterly flowline into Disko Bugt
(Christoffersen, 1974). Crossing the field area five kilometers west and 10 km north of
Nordenskiöld Gletscher (Fig. 4-1), a belt of north-south trending moraines is mapped to
be of Fjord Stade age (Weidick, 1968; Christoffersen, 1974).
Existing chronology: Torsukattak Fjord
Limited radiocarbon dating constrains eastward retreat of the GrIS in the
Torsukattak Fjord study area [Fig. 4-2a; All radiocarbon ages are presented in calibrated
years as the mean ± half the one-sigma age range; ages are calibrated using Calib version
7.0 (http://calib.qub.ac.uk/), with marine ages using the MarineCal13 and a ∆R of 140±25
based on Lloyd et al. (2011), and terrestrial ages using the IntCal13 dataset]. An age from
one bulk lake sediment sample constrains deglaciation prior to 9,920±220 cal yr BP south
of the fjord mouth and one age of 9,93±230 cal yr BP from marine shells constrains
deglaciation west of the fjord mouth (Tauber, 1960; Weidick, 1968; Long et al., 1999).
Similar ages from the eastern island of Disko place minimum constraints on deglaciation
at 10,060±180 cal yr BP and 9,650±160 cal yr BP based on gyttja and shells respectively
(Ingólfsson et al., 1990). Radiocarbon ages related to deglaciation from the inner fjords of

99
northern Disko Bugt are also sparse, with a single minimum constraint on deglaciation
from ~15 kilometer south of Torsukattak Fjord that places local deglaciation prior to
8,300±120 cal yr BP (Ingólfsson et al., 1990). To the west, radiocarbon ages constrain
deglaciation of the outer Vaigat Strait to be >12,190±250 cal yr BP and >11,820±180 cal
yr BP (Bennike et al., 1994). At Store Glacier, 40 kilometers to the north of Torsukattak
Fjord, the ice sheet receded behind its current position at 8.7±0.5 10Be ka (all exposure
ages are calcuated using the Baffin Bay production rate [Young et al, 2013b] and the
Lal/Stone scaling scheme [Lal, 1991; Stone, 2000]; Roberts et al., 2013b). This indicates
that the Vaigat Strait/Uummannaq Fjord system deglaciated earlier than central Disko
Bugt, where 10Be ages place deglaciation at 10.8±0.5 ka (Chapter 3), with the ice margin
retreating behind the present margin at 7.5±0.2 ka at Jakobshavn (n=9; Young et al.,
2013a).
Existing chronology: Nordenskiöld Gletscher
Chronology pertaining to early Holocene deglaciation of the Nordenskiöld
Gletscher system comes from the north, along the southern margin of Disko Bugt (Fig. 4-
2b). A minimum-limiting radiocarbon age from a marine sediment core collected
offshore, to the northeast of the area, is 10,900±200 cal yr BP (Jennings et al., 2014;
Quillmann et al., 2009). The earliest radiocarbon age places deglaciation prior to
10,600±800 cal yr BP, with supporting ages from the area of 10,900±200, 10,400±300,
and 10,000±400 cal yr BP (Donner and Jungner, 1975; Fredskild, 1996; Long and
Roberts, 2002; Long et al., 2003).

100
Table 4-‐1: 10Be sample information
Table 4-‐2: Radiocarbon sample information on samples from this study
Table 1: Sample information for 10Be agesSample Name Latitude (N)
Longitude (W)
Elevation (m)
Sample type
Thickness (cm)
Shielding Correction
Quartz (g)
9Be (ug)
10Be/9Be Ratio
Uncertainty (atoms/g)
10Be (atoms/g)
10Be uncertainty (atoms g-1)
10Be age ± internal error
(ka)
Torruskatak Fjord12GRO-02 70.0952 50.0276 507 Boulder 1.0 1.0 27.9191 227.67 1.21E-13 4.04E-15 6.58E+04 2.20E+03 9.3±0.312GRO-04 70.0959 50.0315 499 Bedrock 2.0 1.0 60.0200 265.07 2.38E-13 4.49E-15 7.02E+04 1.32E+03 9.1±0.112GRO-20 69.9119 51.4045 261 Boulder 2.0 1.0 39.4933 225.81 1.52E-13 5.50E-15 5.81E+04 2.10E+03 10.5±0.412GRO-22 69.9119 51.4053 271 Bedrock 1.0 1.0 50.1602 226.11 2.09E-13 6.06E-15 6.31E+04 1.83E+03 11.2±0.312GRO-23 69.9209 50.8022 360 Boulder 2.0 1.0 47.7738 225.59 2.06E-13 4.64E-15 6.50E+04 1.46E+03 10.6±0.212GRO-24 69.9208 50.8018 352 Boulder 2.0 1.0 51.3945 226.11 2.05E-13 5.15E-15 6.03E+04 1.51E+03 9.9±0.212GRO-34 69.9783 50.3179 102 Boulder 2.0 1.0 38.0028 226.07 1.18E-13 2.66E-15 4.68E+04 1.06E+03 10.0±0.2
Nordenskiold Gletscher13GRO-04 68.4115 50.8187 240 Boulder 2.0 1.0 27.7332 226.48 8.2E-14 2.241E-15 1.24E+06 4.46E+04 8.2±0.213GRO-10 68.2454 51.8504 316 Boulder 2.0 1.0 37.4595 226.37 1.5E-13 3.939E-15 2.27E+06 6.06E+04 10.3±0.313GRO-13 68.2588 52.4822 234 Boulder 2.0 1.0 30.4955 226.00 1.2E-13 4.607E-15 1.85E+06 6.05E+04 11.1±0.413GRO-16 68.1689 53.3892 231 Boulder 2.0 1.0 35.6437 226.33 1.4E-13 3.002E-15 2.17E+06 6.09E+04 11.2±0.213GRO-17 68.1685 53.3883 224 Boulder 2.0 1.0 30.5129 227.56 1.3E-13 3.899E-15 1.96E+06 6.41E+04 11.2±0.413GRO-20 68.4493 53.1182 143 Boulder 3.0 1.0 39.0413 227.34 1.5E-13 3.916E-15 2.31E+06 5.91E+04 12.1±0.313GRO-21 68.4493 53.1182 144 Boulder 2.0 1.0 31.3651 225.70 1.2E-13 3.467E-15 1.79E+06 5.71E+04 11.6±0.413GRO-26 68.3990 52.2744 209 Boulder 2.0 1.0 27.9001 226.52 9.7E-14 3.033E-15 1.47E+06 5.27E+04 10.0±0.313GRO-28 68.2874 51.2841 77 Boulder 1.0 1.0 32.8123 225.55 8.3E-14 1.706E-15 1.26E+06 3.83E+04 8.3±0.213GRO-34 68.3165 51.3800 271 Boulder 1.0 1.0 30.7454 225.10 1.1E-13 2.643E-15 1.67E+06 5.43E+04 9.6±0.2
13GRO-35 68.3165 51.3823 266 Boulder 1.0 1.0 32.6323 222.57 1.2E-13 2.249E-15 1.76E+06 5.39E+04 9.5±0.2
Notes: All samples were spiked with a 372.5 µg/g 9Be carrier; AMS results are standardized to 07KNSTD; ratios are blank-corrected, and shown at 1-sigma uncertainty.
Table 2: Sample information for radiocarbon ages
Core/SiteLatitude
(N)Longitude
(W) Lab Number Material Dated δ13C (‰PDB)Radiocarbon Age (14C yr
BP)
Calibrated Age (cal yr BP±1σ) Depth (cm)
Torruskatak Fjord
12GRO-Shells-3 69.9793° 60.3950° OS-99413 Hiatella arctica. 0.03 7930±40 8260±60 surfaceNordenskiold Gletcher
13S3-A1 68.3031° 51.3259° OS-106904 Woody plant remains
-23.24 6580±35 7470±30 84.5-86
13S4-B1 68.3016° 51.3684° OS-107799 Mollusc NA 7660±25 7970±40 9913CAB-A3 68.4171° 50.9341° OS-106903 Daphnia sp.,
Lepidurus arctucus,
Colymbetes dolabratus, Vaccinium
uliginosus, and Drepancladus sensu lato sp.
remains
-26.16 6250±35 7200±40 62-63
13PDY-E3 (B) 68.4130° 50.8282° OS-107088 Daphnia sp.and Lepidurus arctucus remains
NA 6270±35 7210±40 190.5-101.5
13PDY-A2 68.4191° 50.9163° OS-107094 Drepanocladus sensu lato sp.
-26.77 6330±35 7250±70 126-126.5
101
A transect of 10Be ages from southwestern Disko Bugt place initial retreat of ice out of
Disko Bugt at 11.0±0.2 ka (Chapter 3). Closer to the present ice margin, 30 kilometers
north of Nordenskiöld Gletscher, radiocarbon (9,600±200 cal yr BP) and 10Be ages
(9.2±0.1 ka; n=2) are in good agreement on the timing of ice retreat onto the mainland
(Long and Roberts, 2002; Young et al., 2013a). A pair of 10Be ages from adjacent to the
ice margin ~55 kilometers to the north place ice retreat to behind the present ice margin
at 7.0±0.1 ka (n=2; Chapter 2).
Methods
Lake Sediment Coring
We collected lake sediment cores from four lakes in the Nordenskiöld Gletscher
study area to obtain basal radiocarbon constraints for deglaciation. Five macrofossil
samples from basal sediments were extracted from lake sediment cores within the
Nordenskiöld Gletscher study area (Table 4-2). Coring locations within each lake were
selected using a Garmin GPSMAP 400 series GPS receiver connected to a dual-beam
echo sounder. Coring was performed using a Universal Coring System
(www.aquaticresearch.com) and a Nesje-style percussion-piston coring system (Nesje,
1992). Cores were split, logged, and photographed at the University of Buffalo, where
samples for radiocarbon dating were extracted from, with macrofossil samples washed in
deionized water and freeze-dried, before being submitted to the National Ocean Sciences
Accelerator Mass Spectrometry Facility at Woods Hole Oceanographic Institute. All ages
were calibrated using the CALIB online program, version 7.0 and the INTCAL13 dataset
(Stuiver et al., 2010).

102
10Be Dating
We collected samples for 10Be dating from perched erratic boulders (n=16) and
ice-sculpted bedrock surfaces (n=2) using a hammer and chisel. Sampling was performed
along two transects roughly perpendicular to the present ice margin, with one transect
located along the southern margin of Torsukattak Fjord and the second spanning from
Baffin Bay to the Nordenskiöld Gletscher terminus. Samples were preferentially
collected from the centers of flat-topped boulders and raised bedrock outcrops, avoiding
edges and corners. Elevation, latitude and longitude were measured using a handheld
GPS unit (elevation accuracy 5-10 m), with topographic shielding measured with a
clinometer. All samples were collected above marine limit, as inferred from published
local sea level curves (Long et al., 1999; Long and Roberts, 2002; Long et al., 2003) and
geomorphic field evidence such as raised beaches and washing limits.
All samples went through chemical and physical processing at the University at
Buffalo Cosmogenic Isotope Laboratory following procedures modified from Kohl and
Nishiizumi (1992). Physical processing included crushing samples, and isolating the 425-
850 µm fraction by sieving. Isolation of quartz was accomplished using magnet, heavy
liquid separation, and HF-HNO3 leaching. Quartz and a known quantity of 9Be carrier
were digested followed by Be isolation using ion-exchange chromatography and selective
precipitation with NH4OH. The accelerator mass spectrometry measurement (AMS) of
10Be/9Be was performed at Lawrence Livermore National Laboratory and normalized to
the standard 07KNSTD3110 with a reported ratio of 2.85x10⁻¹⁵ (Nishiizumi et al., 2007;
Rood et al., 2010). Ratios from process blanks were 7.33x10⁻¹⁶, 5.37x10⁻¹⁶, and 1.07x10-
15 with AMS precision ranging from 3.9% to 1.9% and averaging 2.7%.
103
All 10Be ages are calculated using the CRONUS-Earth web-based calculator using
the regionally calibrated Baffin Bay production rate and the constant-production scheme
of Lal/Stone (Lal, 1991; Stone, 2000; Young et al., 2013b), with no addition corrections
made for isostatic rebound (Table 1). Corrections for snow cover were not made, as
samples are from elevated surfaces inferred to be windswept. Corrections for bedrock
surface erosion were also not made, as many boulder and bedrock surfaces in the field
area exhibit glacial polish and striae, indicating that erosion since deglaciation is
negligible.
Results: 10Be Dating
Torsukattak Fjord
We collected seven samples for 10Be dating from a west-east oriented transect
along the southern margin of Torsukattak Fjord (Fig. 4-2). Two 10Be ages from outer
Torsukattak Fjord (site T1) derived from a bedrock and boulder sample yield ages of
11.2±0.3 ka and 10.5±0.4 ka, respectively, and average 10.9±0.5 ka (Fig. 4-2a; all
averages are the mean ± one standard deviation). Two boulders from a mid-fjord location
(site T2) yield 10Be ages of 10.6±0.2 ka and 9.9±0.2 ka, which average to 10.3±0.5 ka. A
10Be age from about two kilometers west of the calving margin of Sermeq Kujatdleq (site
T3) derived from bedrock yields an age of 10.0±0.2 ka. One bedrock and one boulder
sample collected from the nunatak at the head of Torsukattak Fjord (site T4) yield ages of
9.2±0.2 ka and 9.3±0.3 ka, respectively, and average 9.3±0.1 ka.
104
Nordenskiöld Gletscher
Eleven samples were collected from boulders resting on bedrock along a west-
east oriented transect from Baffin Bay to the ice margin at Nordenskiöld Gletscher. Two
boulder samples collected from a hilltop near the Baffin Bay coast (site N1) yield ages of
11.2±0.2 ka and 11.9±0.4 ka and average 11.6±0.5 ka (Fig. 4-2b). To the north along the
coast, two boulder samples collected from site N2 yield ages of 12.1±0.3 ka and 11.6±0.3
ka and average 11.9±0.4 ka. A single boulder from site N3 yields an age of 11.1±0.4 ka.
A boulder sample collected at site N4 yields an age of 10.0±0.3 ka. A boulder sample
collected from site N5 yields an age of 10.3±0.3 ka. Two boulder samples collected at
site N6, outboard of the Fjord Stade moraines located about five kilometers west of
Nordenskiöld Gletscher, yield ages of 9.6±0.2 ka and 9.5±0.2 ka. A boulder sample
collected at site N7, ~4 kilometers inboard of the moraines, yields an age of 8.3±0.2 ka.
Finally, a sample collected ~500 meters from the present Nordenskiöld Gletscher margin,
~10 km south of the nearest Fjord Stade moraines, (site N8) yields an age of 8.2±0.2 ka.
Results: Radiocarbon
Torsukattak Fjord
In the inner Torsukattak Fjord region, raised marine deposits reach an elevation of
~30 m. A single radiocarbon age of 8,260±60 cal yr BP was obtained from a paired
mollusk shell in growth position collected from a raised-marine deposit (15 m asl), about
five kilometers west of the Sermeq Kujatdleq calving margin (Fig. 4-2a; Table 4-2). This
age places a minimum constraint on the deglaciation of the inner fjord.
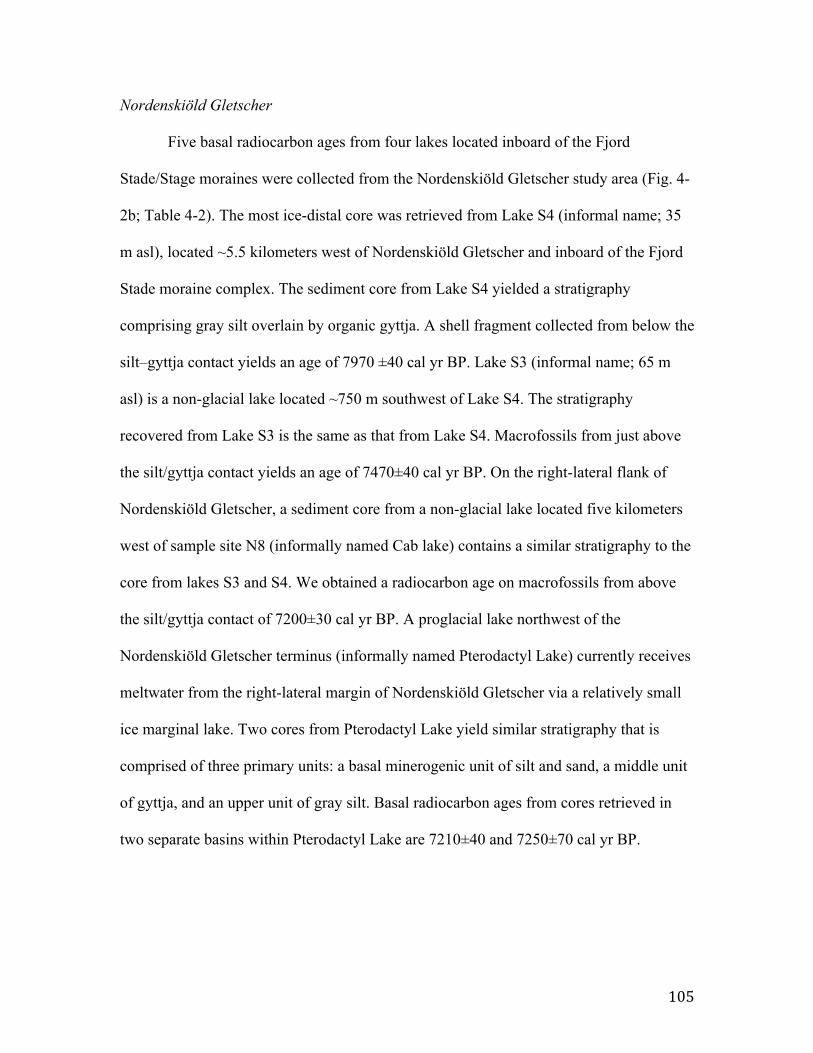
105
Nordenskiöld Gletscher
Five basal radiocarbon ages from four lakes located inboard of the Fjord
Stade/Stage moraines were collected from the Nordenskiöld Gletscher study area (Fig. 4-
2b; Table 4-2). The most ice-distal core was retrieved from Lake S4 (informal name; 35
m asl), located ~5.5 kilometers west of Nordenskiöld Gletscher and inboard of the Fjord
Stade moraine complex. The sediment core from Lake S4 yielded a stratigraphy
comprising gray silt overlain by organic gyttja. A shell fragment collected from below the
silt–gyttja contact yields an age of 7970 ±40 cal yr BP. Lake S3 (informal name; 65 m
asl) is a non-glacial lake located ~750 m southwest of Lake S4. The stratigraphy
recovered from Lake S3 is the same as that from Lake S4. Macrofossils from just above
the silt/gyttja contact yields an age of 7470±40 cal yr BP. On the right-lateral flank of
Nordenskiöld Gletscher, a sediment core from a non-glacial lake located five kilometers
west of sample site N8 (informally named Cab lake) contains a similar stratigraphy to the
core from lakes S3 and S4. We obtained a radiocarbon age on macrofossils from above
the silt/gyttja contact of 7200±30 cal yr BP. A proglacial lake northwest of the
Nordenskiöld Gletscher terminus (informally named Pterodactyl Lake) currently receives
meltwater from the right-lateral margin of Nordenskiöld Gletscher via a relatively small
ice marginal lake. Two cores from Pterodactyl Lake yield similar stratigraphy that is
comprised of three primary units: a basal minerogenic unit of silt and sand, a middle unit
of gyttja, and an upper unit of gray silt. Basal radiocarbon ages from cores retrieved in
two separate basins within Pterodactyl Lake are 7210±40 and 7250±70 cal yr BP.
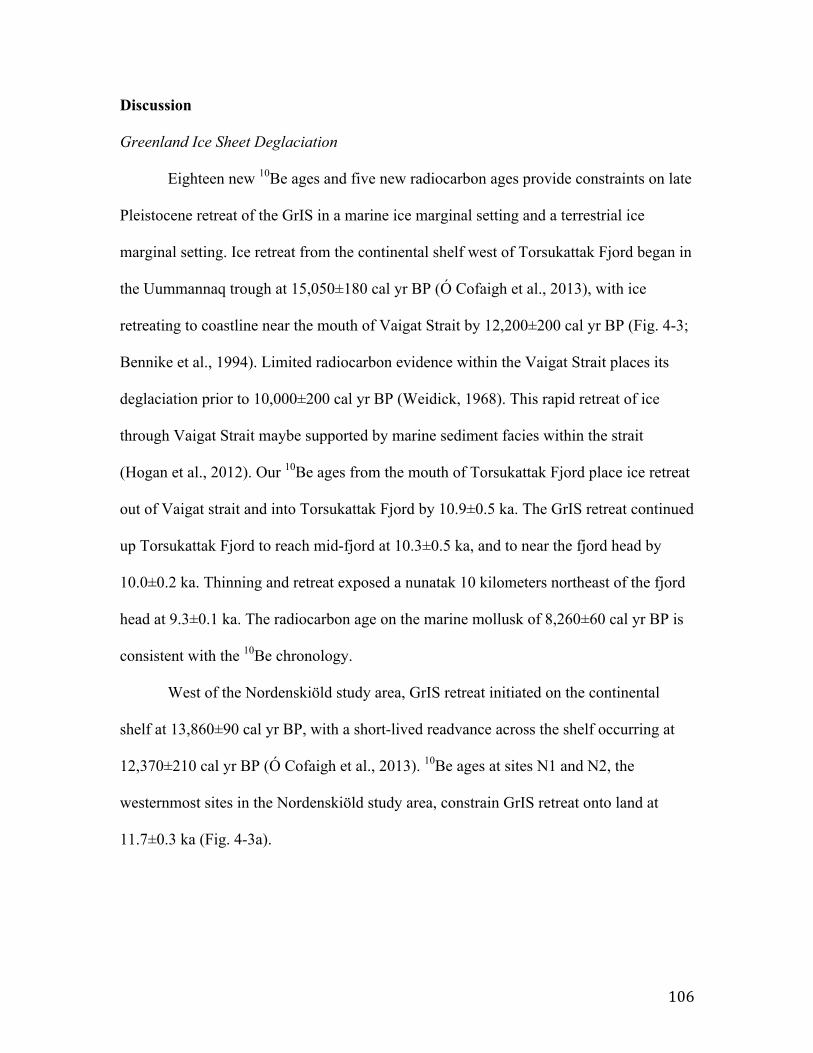
106
Discussion
Greenland Ice Sheet Deglaciation
Eighteen new 10Be ages and five new radiocarbon ages provide constraints on late
Pleistocene retreat of the GrIS in a marine ice marginal setting and a terrestrial ice
marginal setting. Ice retreat from the continental shelf west of Torsukattak Fjord began in
the Uummannaq trough at 15,050±180 cal yr BP (Ó Cofaigh et al., 2013), with ice
retreating to coastline near the mouth of Vaigat Strait by 12,200±200 cal yr BP (Fig. 4-3;
Bennike et al., 1994). Limited radiocarbon evidence within the Vaigat Strait places its
deglaciation prior to 10,000±200 cal yr BP (Weidick, 1968). This rapid retreat of ice
through Vaigat Strait maybe supported by marine sediment facies within the strait
(Hogan et al., 2012). Our 10Be ages from the mouth of Torsukattak Fjord place ice retreat
out of Vaigat strait and into Torsukattak Fjord by 10.9±0.5 ka. The GrIS retreat continued
up Torsukattak Fjord to reach mid-fjord at 10.3±0.5 ka, and to near the fjord head by
10.0±0.2 ka. Thinning and retreat exposed a nunatak 10 kilometers northeast of the fjord
head at 9.3±0.1 ka. The radiocarbon age on the marine mollusk of 8,260±60 cal yr BP is
consistent with the 10Be chronology.
West of the Nordenskiöld study area, GrIS retreat initiated on the continental
shelf at 13,860±90 cal yr BP, with a short-lived readvance across the shelf occurring at
12,370±210 cal yr BP (Ó Cofaigh et al., 2013). 10Be ages at sites N1 and N2, the
westernmost sites in the Nordenskiöld study area, constrain GrIS retreat onto land at
11.7±0.3 ka (Fig. 4-3a).
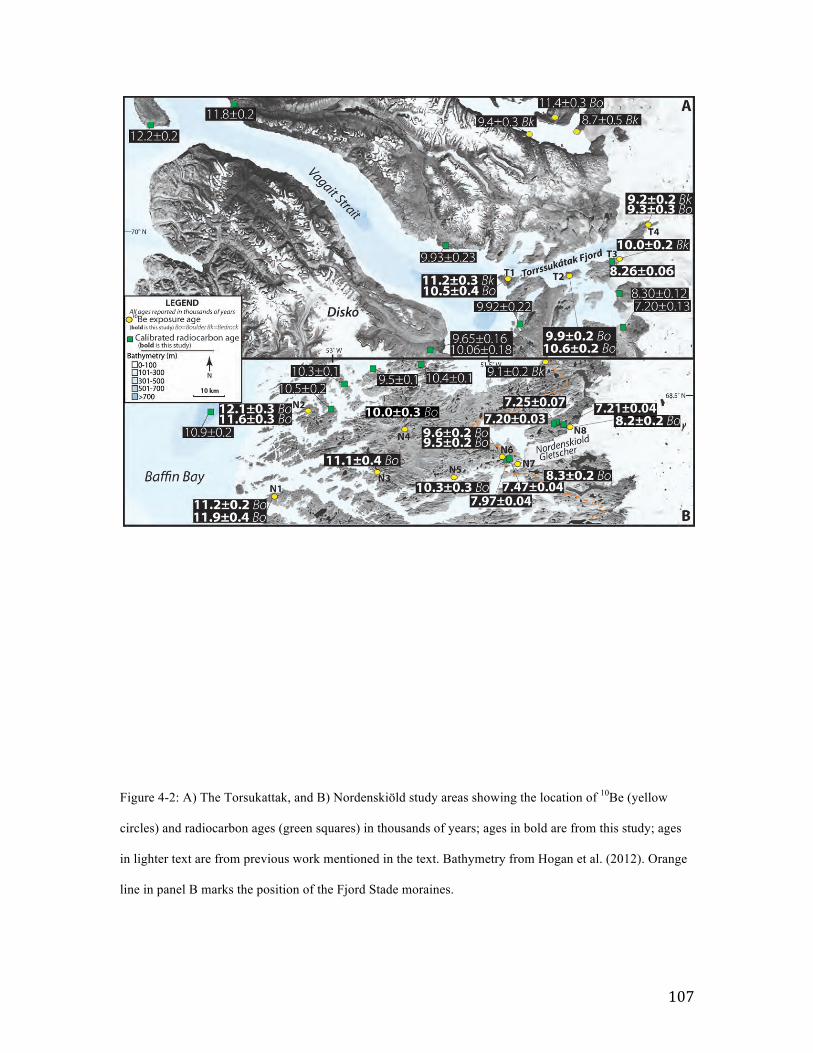
107
Figure 4-2: A) The Torsukattak, and B) Nordenskiöld study areas showing the location of 10Be (yellow
circles) and radiocarbon ages (green squares) in thousands of years; ages in bold are from this study; ages
in lighter text are from previous work mentioned in the text. Bathymetry from Hogan et al. (2012). Orange
line in panel B marks the position of the Fjord Stade moraines.
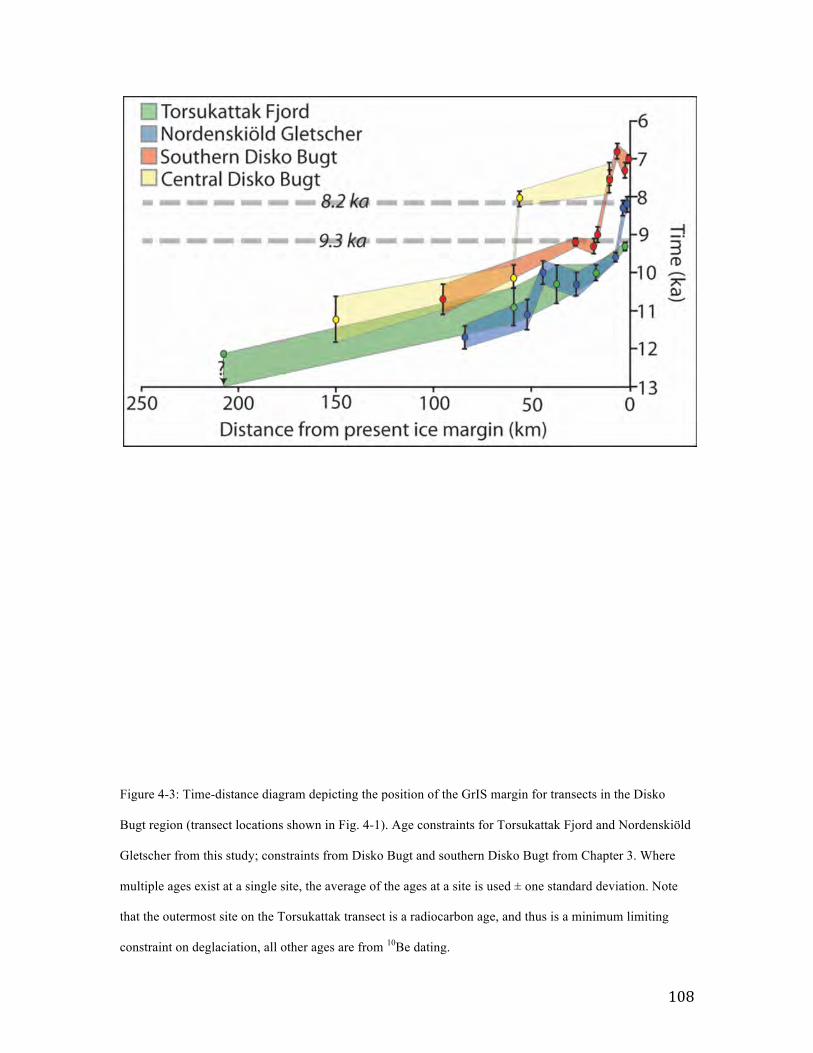
108
Figure 4-3: Time-distance diagram depicting the position of the GrIS margin for transects in the Disko
Bugt region (transect locations shown in Fig. 4-1). Age constraints for Torsukattak Fjord and Nordenskiöld
Gletscher from this study; constraints from Disko Bugt and southern Disko Bugt from Chapter 3. Where
multiple ages exist at a single site, the average of the ages at a site is used ± one standard deviation. Note
that the outermost site on the Torsukattak transect is a radiocarbon age, and thus is a minimum limiting
constraint on deglaciation, all other ages are from 10Be dating.
109
The GrIS continued eastward retreat, reaching site N3 at 11.1±0.4 ka and site N5 at
10.3±0.3 ka. Deglaciation at site N4, located farther west than site N5, occurred at
10.0±0.3 ka, indicating retreat may have been slightly slower in the center of the study
area. Deglaciation continued to the west, with ages of 9.6±0.1 ka at site N6. Finally, ages
of 8.3±0.2 ka and 8.2±0.2 ka were obtained from a site about five kilometers outboard of
the Nordenskiöld Gletscher terminus (site N7) and ~250 m from the right-lateral flank of
Nordenskiöld Gletscher (site N8), respectively.
Radiocarbon dating from five lake cores supports this 10Be chronology. Lakes
between sites N6 and N7 yield basal ages of 7970±40 and 7460±20 cal yr BP. Both
radiocarbon ages are younger than nearby 10Be ages, and thus provide minimum limiting
constraints on westward GrIS recession. On the right-lateral margin of Nordenskiöld
Gletscher, two lakes provide additional minimum limiting constraints of deglaciation.
One presently non-glacial lake provides an age of 7,200±40 cal yr BP for local
deglaciation, while radiocarbon ages from two cores from the nearby proglacial lake
constrain recession of the ice margin to a position inboard of the present GrIS at
7,210±40 and 7,250±70 cal yr BP. The difference between the 10Be age from near the ice
margin and radiocarbon ages from within the lake may indicate that GrIS meltwater
drained into the Pterodactyl Lake catchment for as long as 1000 years after it retreated
from the lake site, or perhaps a long lag exists between deglaciation and vegetation
colonizing an area.
110
Fjord Stade Moraines
Samples for 10Be dating collected at site N6, just outboard of the Fjord Stade
moraines yield an average age of 9.6±0.1 ka. The Fjord Stade moraines form a prominent
moraine belt that spans central West Greenland (Funder et al., 2011). In the Disko Bugt
region, the Fjord Stade moraines have been precisely dated and correlate with the 9.3 ka
and 8.2 ka cold events (Weidick, 1968; Young et al., 2011a). One 10Be age from site N7,
just inboard of the moraines, yields an age of 8.3±0.2 ka. The 10Be ages from sites N6
and N7 provide bracketing limiting ages on the deposition of the moraine, confirming the
earlier interpretation that they are part of the Fjord Stade moraine system (Weidick and
Bennike, 2007; Funder et al., 2011). Further age constraints on moraine deposition are
from our radiocarbon ages from sediments inboard of the moraines dating to 7970±40 cal
yr BP and 7470±20 cal yr BP. Our chronology thus constrains the moraines to have been
deposited between 9.6±0.1 and 8.3±0.2 ka, confirming that they are correlative to the
Fjord Stade moraines of Disko Bugt. This supports further the findings of Young et al.
(2011) that the moraines may be the result of cooling associated with the 9.3 and 8.2 cold
events, rather than ice sheet dynamics controlled by topography and ice-stream dynamics
(Long et al., 2006).
Disko Bugt Retreat Rates
The deglacial chronologies constructed for the Torsukattak and Nordenskiöld
study areas allow us to compare the retreat rates of the two contrasting ice margin
settings (marine-based and land-based) (Fig. 4-3). We calculate maximum and minimum
possible net retreat rates using the one-sigma 10Be age ranges from our transects. At
111
Torsukattak Fjord, the average 10Be age at sites T1 and T4 constrain net retreat rate of
45±20 m a-1. The transect within the Nordenskiöld study area encompasses the Fjord
Stade moraines. The net rate of retreat over the entire transect (average age of sites N1
and N2, and to site N7) is 25±5 m a-1. The net retreat between the coast (average age of
sites N1 and N 2) and site N6 (outboard of the Fjord Stade moraines) is 40±10m a-1.
Although both retreat rates calculated for the Nordenskiöld transect are within error of
the Torsukattak transect, it is more reasonable to compare the Torsukattak retreat rate
with the pre-FS-deposition retreat rate from the Nordenskiöld transect, thus not including
a known still-stand or readvance in retreat rate calculations at either site. In doing so, it is
apparent that the two retreat rates are remarkably similar, despite the difference in GrIS
terminus setting.
The similar rates of retreat exhibited by the two sectors of the GrIS prior to ~9 ka
is striking given the difference in ice margin setting. In marine-based glacier systems, ice
dynamics, such as increasing calving rates due to fjord geometry changes such as over-
deepened areas and widening fjord geometry in addition to ocean heat transport play
major roles in ice loss (Rignot et al., 2010; Carr et al., 2013; Enderlin et al., 2013).
Previous work has documented the ability of marine-based glaciers to rapidly retreat in
response to warming during the late Pleistocene (Briner et al., 2009; Hughes et al., 2012;
Mangerud et al., 2013), as well as during contemporary time periods (Scambos et al.,
2004). Our results indicate that on millennial timescales, land-based glaciers systems are
able to retreat as quickly as their marine-based counterparts.
Early Holocene retreat rates similar to those calculated for the Nordenskiöld
Gletscher system and Torsukattak Fjord exist from other glacier systems in Disko Bugt.
112
Net retreat of the GrIS margin in the early Holocene through southern Disko Bugt
occurred at ~60±10 m a-1, and retreat across central Disko Bugt occurred at 250±200 m a-
1 (Chapter 3). Net retreat of the GrIS within Jakobshavn Isfjord, which occurred
following deposition of the Fjord Stade moraines (9.6-8.3 ka), occurred at 65±20 m a-1
(Young et al., 2013a). This demonstrates that the retreat rates from this study are similar
to these other retreat rates of marine ice margins throughout the entire Disko Bugt region,
although the retreat rate through central Disko Bugt at ~11-10 ka is potentially much
higher.
West Greenland Retreat Rates
We place our results from the Disko Bugt region into a wider context by
calculating retreat rates for five additional transects (nine total transects) along the West
Greenland coast using previously published chronologies (Fig. 4-4; Chapter 3; Bennike et
al., 2011; Levy et al., 2012; Lane et al., 2013; Larsen et al., 2013; Roberts et al., 2013b;
Young et al., 2013a). Transects for retreat rate calculations were constructed along
estimated ice-sheet flow lines, and extend from the present ice margin to the western
coastline of Greenland. Net retreat rates were calculated for the entire transect (ice to
ocean), as well as for an eastern and western subsection of each transect as defined by a
chronologic mid-point where sufficient chronology permitted. The selection of a
chronologic mid-point was made based on the availability of published age control.
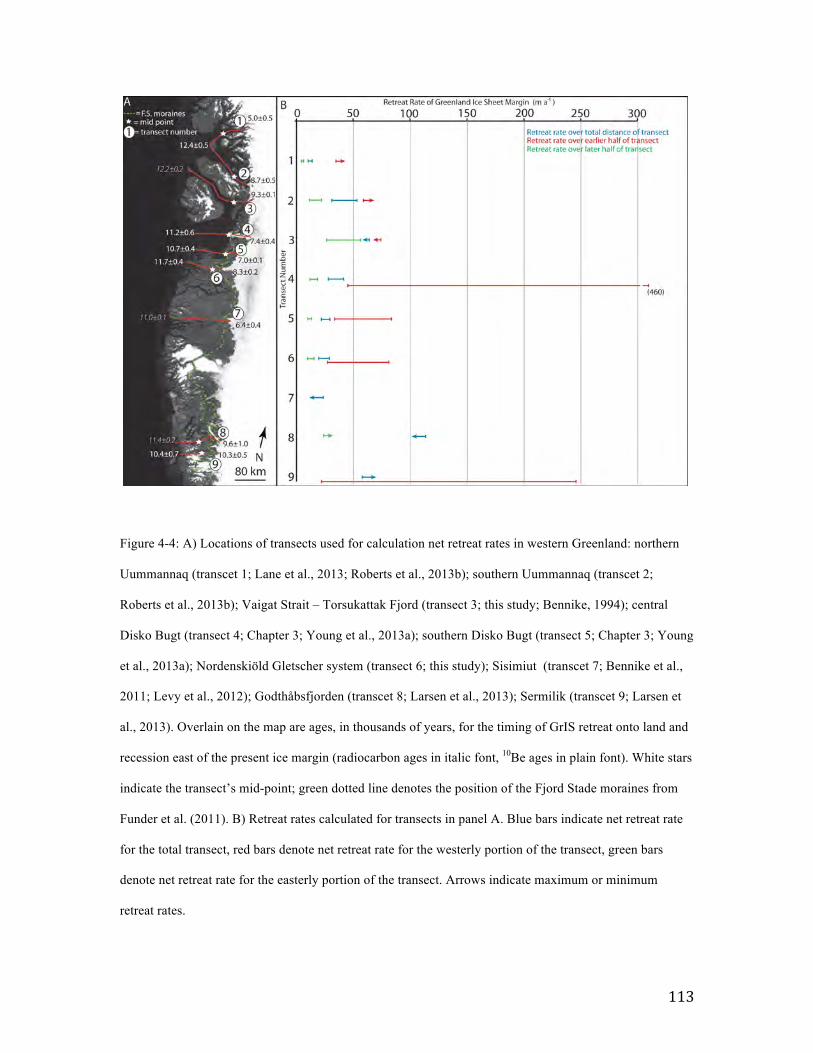
113
Figure 4-4: A) Locations of transects used for calculation net retreat rates in western Greenland: northern
Uummannaq (transcet 1; Lane et al., 2013; Roberts et al., 2013b); southern Uummannaq (transcet 2;
Roberts et al., 2013b); Vaigat Strait – Torsukattak Fjord (transect 3; this study; Bennike, 1994); central
Disko Bugt (transect 4; Chapter 3; Young et al., 2013a); southern Disko Bugt (transect 5; Chapter 3; Young
et al., 2013a); Nordenskiöld Gletscher system (transect 6; this study); Sisimiut (transcet 7; Bennike et al.,
2011; Levy et al., 2012); Godthåbsfjorden (transcet 8; Larsen et al., 2013); Sermilik (transcet 9; Larsen et
al., 2013). Overlain on the map are ages, in thousands of years, for the timing of GrIS retreat onto land and
recession east of the present ice margin (radiocarbon ages in italic font, 10Be ages in plain font). White stars
indicate the transect’s mid-point; green dotted line denotes the position of the Fjord Stade moraines from
Funder et al. (2011). B) Retreat rates calculated for transects in panel A. Blue bars indicate net retreat rate
for the total transect, red bars denote net retreat rate for the westerly portion of the transect, green bars
denote net retreat rate for the easterly portion of the transect. Arrows indicate maximum or minimum
retreat rates.

114
In all locations were a mid-point could be selected this is outboard of the Fjord Stade
moraines, thus allowing for comparisons to be made between retreat in regions where the
Fjord Stade moraines do not interest the transects (transects: 1; 2; 3) and the outboard
portions of transects including Fjord Stade moraine deposition.
Two patterns emerge from the comparison of retreat rates along the western
margin of the GrIS. First, net retreat rates for the entire transects (range of 65-10 m a-1;
average of 45±20 m a-1) are generally similar to those from our two transects near Disko
Bugt (25-45 m a-1). This similarity exists despite the high degree of variability in the ice
margin setting (e.g., marine-based, land-based) through which the ice margin retreated.
For example, retreat rates from fjord systems such as southern Uummannaq or
Torsukattak are 40±10 m a-1 and 40±15 m a-1, respectively. And, land-based systems such
as Nordenskiöld and Sisimiut are 25±5 m a-1 and < 25 m a-1, respectively. This indicates
that on millennial timescales, climate, rather than ice dynamics tied to ice marginal
setting, seems to be the dominant factor controlling ice margin fluctuations.
The second pattern, which we examine in transects that cross the Fjord Stade
moraines, is that retreat rates for the older, westerly portion of the transects are
consistently higher than the younger, easterly portion of the transects. In some cases,
such as central Disko Bugt, the rate is an order of magnitude higher in the western
portion of the transect. We believe this difference is due to climate cooling (e.g., 9.3 ka
and 8.2 ka; Kobashi et al., 2007; Rasmussen et al., 2007) that took place when the GrIS
margin was in the eastern section of the transects. The 9.3 ka and 8.2 ka events have been
linked to the deposition of the Fjord Stade moraines in the Disko Bugt region (Young et
al., 2013a), thus net retreat rates decline when retreat chronologies span this interval.
115
Weidick (1968) mapped the Fjord Stade moraines from 70°N to 64°N along western
Greenland. This finding of lower retreat rates in the eastern portion of the transects that
we compile provides further evidence that the mapping of the Fjord Stade moraines in
West Greenland is correct, and that these moraines represent an ice-sheet-wide reaction
to cooling at 9.3 and 8.2 ka (Weidick, 1968). This indicates that while the type of
response — advance or standstill— of the ice sheet may have differed between locations
(i.e. Young et al., 2013a), when integrated on millennial timescales, even short-lived
climate events can elicit a similar response from the ice sheet on the whole.
Farther abroad, retreat rates of >80 m a-1 (Hughes et al., 2012), >58 m a-1 (Briner
et al., 2009), and 240-370 m a-1 (Mangerud et al., 2013) have been determined for retreat
in other marine-based outlet glacier systems during the earliest Holocene. Land-based ice
margin retreat has also been documented, with southern Laurentide Ice Sheet recession
estimated reach as high as 360 m a-1 in central North America (Andrews, 1973), and up to
300 m a-1 along the southeastern Laurentide Ice Sheet (Fig. 4-5; Ridge et al., 2012).
Although these are just two examples of periods with high retreat rates, this evidence
supports our findings that on millennial timescales, land-based sectors of ice sheets have
the ability to retreat at rates equivalent to or faster than marine-based ice sheet sectors.
Collectively, these results from millennial-scale records contrast with what is seen in the
historic record that marine-terminating outlet glaciers retreated more rapidly than land-
based ice sheet sectors.
The juxtaposition between our millennial-scale net retreat records and historic
observations suggests that timescale is key for understanding the difference between
early Holocene retreat rates versus those in historic times. On millennial timescales, we
116
conclude that the similarity in retreat rate indicates that climate drives synchronous
retreat or advance of an ice margin. Furthermore, for the uniform driving force of climate
to elicit a synchronous response from the GrIS we believe that the ice margin is in
equilibrium with climate on millennial timescales. However, on shorter timescales, such
as the ~170 year long historic record of ice margin fluctuation in West Greenland, a
strong influence of ice dynamics creates asynchrony in the pattern of GrIS change. This
asynchronicity likely arises from the differences between marine- and land-based sectors
of the ice margin. A large difference between the two ice margin types is the velocity of
ice flow. Of the 242 Greenland glaciers classified by Rignot and Mouginot (2012), the
fastest 140 glaciers are marine-terminating, with marine terminating having a peak
velocity an order of magnitude faster than their land-terminating counterparts. The
perturbation theory proposed by Nye (1960) suggests that the local response time of a
glacier is the inverse of the local velocity, thus variability in velocity between ice margin
sectors should create varying response times to changes in climatic forcing. Additional
factors may enhance the sensitivity of marine-based outlet glaciers to climate change that
do not apply to land-based glaciers, such as effects of calving, loss of floating tongues,
and melting along of submarine ice fronts (van der Veen, 2001).
The dichotomy in the behavior of the GrIS ice margin on millennial versus
decadal/centennial timescales illustrates the influences of varying response time and
climate versus ice dynamic controls on ice sheet change. In fact, this pattern is seen in
other ice sheets: a study of marine-base outlet glaciers of the Fennoscandian ice sheet,
demonstrated retreat rates of ~ 30 m a-1 over multiple millennia, with periods of rapid
retreat (~150 m a-1) occurring over decadal time periods (Stokes et al., 2014).
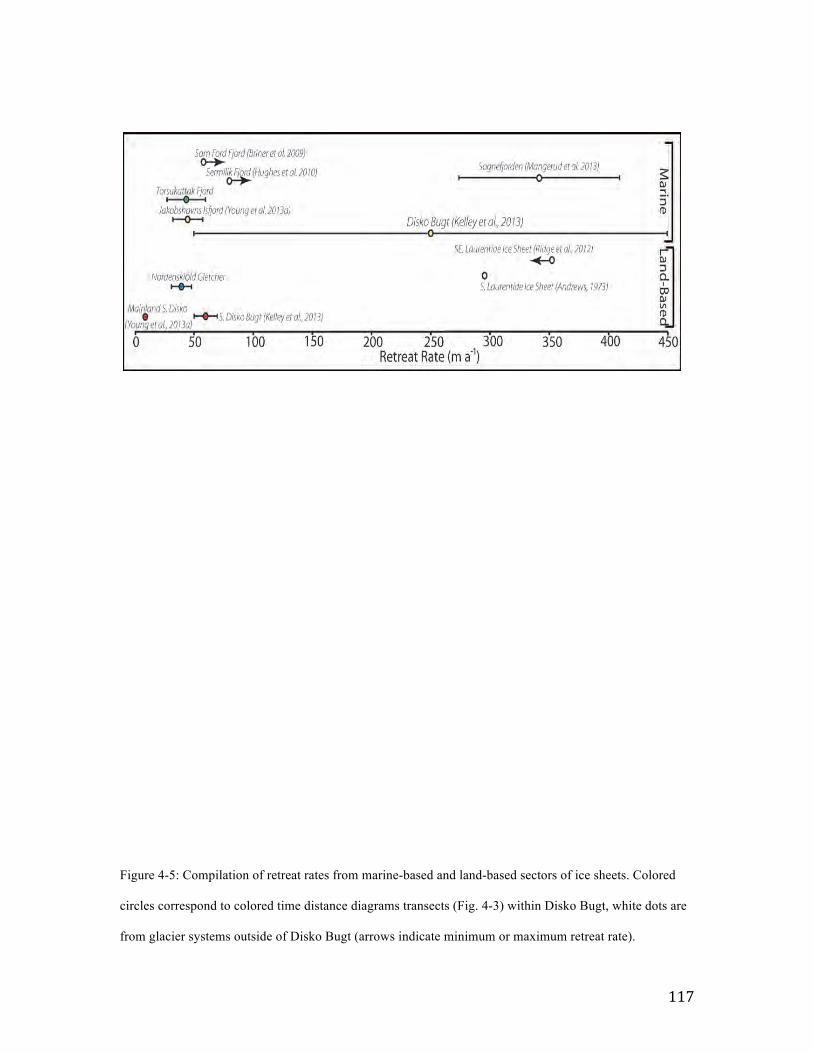
117
Figure 4-5: Compilation of retreat rates from marine-based and land-based sectors of ice sheets. Colored
circles correspond to colored time distance diagrams transects (Fig. 4-3) within Disko Bugt, white dots are
from glacier systems outside of Disko Bugt (arrows indicate minimum or maximum retreat rate).
118
Asynchronies driven by varying response time of land-based vs. marine-based ice
margins do not appear to be a significant influence on millennial timescales, at least
within the resolution of our dating methods. Furthermore, other factors that can amplify
the response of marine glaciers to climate forcing also seem less important on millennial
timescales. Therefore, predictions of future ice sheet change must reconcile lags of land-
based sectors of the ice margin on sub-millennial scales, as well as account for the
possibility of future retreat of the now stable sections of the ice margin.
Conclusion
Our results demonstrate that the GrIS retreated through Torsukattak Fjord
between 10.9 ka and 9.3 ka, at a rate of 45±20 m a-1. The GrIS retreated from Baffin Bay
onto land west of Nordenskiöld Gletscher at 11.7 ka, with retreat prior to Fjord Stade
moraine deposition occurring at a rate of 40±10 m a-1. The rate and timing of retreat is
similar, despite that the ice margin retreat occurred in a marine setting at one location and
in a terrestrial setting in the other. This demonstrates that land-based sectors of the ice
margin can retreat at rates comparable to that of marine-based glaciers, a fact that is in
contrast with present observations of GrIS margin behavior and previously published
literature. A compilation of retreat rates from West Greenland demonstrates that net GrIS
retreat occurred at rates between 25 and 45 m a-1, regardless of ice marginal environment.
Thus, on millennial timescales, climate rather than ice marginal setting seems to be the
dominant control on rate of retreat. A second point supported by our retreat rate
compilation is that relatively low net retreat rates in the easterly (younger) portion of the

119
transects is due to the GrIS response to the 9.3 and 8.2 ka cold events, resulting in a re-
advance or pause in overall retreat during the deposition of the Fjord Stade moraines.
Our finding of synchronous retreat of the GrIS margin on millennial timescales is
in contrast with historic observations of faster retreat of marine-terminating outlet
glaciers compared to significantly slower retreat of land-based sections of the ice margin.
This dichotomy in behavior of the ice margin on millennial- versus decadal/centennial-
timescales is likely due to response time of differing ice marginal settings with respect to
climatic forcing. Our findings illustrate the ability of land-based sectors of the GrIS
margin to retreat at rates comparable to marine-terminating glaciers. Finally, we conclude
that significant lags in the reaction of the GrIS to climate change, past or future, are
limited to centennial or shorter timescales.
Acknowledgements
We appreciate laboratory assistance from Sylvia Choi and Matt McClellan, and field
assistance from Sandra Cronauer. This research was funded by grant NSF-1156361 from
the U.S. National Science Foundation Program of Geography and Spatial Science.
References
Andrews, J., 1973. The Wisconsin Laurentide ice sheet: dispersal centers, problems of rates of retreat, and climatic implications. Arctic and Alpine Research, 185-199.
Axford, Y., Briner, J.P., Miller, G.H., Francis, D.R., 2009. Paleoecological evidence for abrupt cold reversals during peak Holocene warmth on Baffin Island, Arctic Canada. Quaternary Research 71, 142-149.
120
Bennike, O., Hansen, K.B., Knudsen, K.L., Penney, D.N., Rasmussen, K.L., 1994. Quaternary marine stratigraphy and geochronology in central West Greenland. Boreas 23, 194-215.
Bennike, O., Wagner, B., Richter, A., 2011. Relative sea level changes during the Holocene in the Sisimiut area, south-western Greenland. Journal of Quaternary Science 26, 353-361.
Bjørk, A.A., Kjær, K.H., Korsgaard, N.J., Khan, S.A., Kjeldsen, K.K., Andresen, C.S., Larsen, N.K., Funder, S., 2012. An aerial view of 80 years of climate-related glacier fluctuations in southeast Greenland. Nature Geoscience 5, 427-432.
Box, J.E., 2002. Survey of Greenland instrumental temperature records: 1873–2001. International Journal of Climatology 22, 1829-1847.
Briner, J.P., Bini, A.C., Anderson, R.S., 2009. Rapid early Holocene retreat of a Laurentide outlet glacier through an Arctic fjord. Nature Geoscience 2, 496-499.
Briner, J.P., Kaufman, D.S., Bennike, O., Kosnik, M.A., 2014. Amino acid ratios in reworked marine bivalve shells constrain Greenland Ice Sheet history during the Holocene. Geology 42, 75-78.
Carr, J.R., Stokes, C.R., Vieli, A., 2013. Recent progress in understanding marine-terminating Arctic outlet glacier response to climatic and oceanic forcing Twenty years of rapid change. Progress in Physical Geography 37, 436-467.
Christoffersen, M., 1974. Quaternary Map of Greenland: Søndre Strømfjord-Nûgssuaq Kvartærgeologisk; Sheet 3, Quaternary Map of Greenland. Greenland Geologic Survey, Copenhagen, Denmark.
Donner, J., Jungner, H., 1975. Radiocarbon dating of shells from marine Holocene deposits in the Disko Bugt area, West Greenland. Boreas 4, 25-45.
Enderlin, E., Howat, I., Vieli, A., 2013. High sensitivity of tidewater outlet glacier dynamics to shape. The Cryosphere Discussions 7, 551-572.
Fredskild, B., 1996. Holocene climatic changes in Greenland. The Paleo-eskimo cultures of Greenland. Danish Polar Center, Copenhagen, 243-251.
121
Funder, S., Kjeldsen, K.K., Kjaer, K.H., Cofaigh, C.Ó., 2011. The Greenland Ice Sheet during the past 300,000 years: a review. In: In: Elhers, J., Gibbard, P.L. (Eds.). Quaternary Glaciations –Extent and Chronology 15, 699-713.
Hogan, K., Dowdeswell, J., Cofaigh, C., 2012. Glacimarine sedimentary processes and depositional environments in an embayment fed by West Greenland ice streams. Marine Geology 311-314, 1-16.
Holland, D.M., Thomas, R.H., De Young, B., Ribergaard, M.H., Lyberth, B., 2008. Acceleration of Jakobshavn Isbrae triggered by warm subsurface ocean waters. Nature Geoscience 1, 659-664.
Hughes, A.L., Rainsley, E., Murray, T., Fogwill, C.J., Schnabel, C., Xu, S., 2012. Rapid response of Helheim Glacier, southeast Greenland, to early Holocene climate warming. Geology 40, 427-430.
Ingólfsson, Ó., Frich, P., Funder, S., Humlum, O., 1990. Paleoclimatic implications of an early Holocene glacier advance on Disko island, West Greenland. Boreas 19, 297-311.
Jennings, A., Walton, M.E., Cofaigh, C.Ó., Kilfeather, A., Andrews, J.T., Ortiz, J., De Vernal, A., Dowdeswell, J.A., 2014. Paleoenvironments during the Younger Dryas-early Holocene retreat of the Greenland Ice Sheet from outer Disko Trough, central west Greenland. Journal of Quaternary Science 29, 27-40.
Kjær, K.H., Khan, S.A., Korsgaard, N.J., Wahr, J., Bamber, J.L., Hurkmans, R., van den Broeke, M., Timm, L.H., Kjeldsen, K.K., Bjørk, A.A., 2012. Aerial Photographs Reveal Late–20th-Century Dynamic Ice Loss in Northwestern Greenland. Science 337, 569-573.
Kobashi, T., Severinghaus, J.P., Brook, E.J., Barnola, J.-M., Grachev, A.M., 2007. Precise timing and characterization of abrupt climate change 8200 years ago from air trapped in polar ice. Quaternary Science Reviews 26, 1212-1222.
Kohl, C., Nishiizumi, K., 1992. Chemical isolation of quartz for measurement of in situ produced cosmogenic nuclides. Geochimica et Cosmochimica Acta 56, 3583-3587.
Lal, D., 1991. Cosmic-ray labeling of erosion surfaces: in situ nuclide production rates and erosion models. Earth and Planetary Science Letters 104, 424-439.

122
Lane, T.P., Roberts, D.H., Rea, B.R., Ó Cofaigh, C., Vieli, A., Rodés, A., 2013. Controls upon the Last Glacial Maximum deglaciation of the northern Uummannaq Ice Stream System, West Greenland. Quaternary Science Reviews.
Larsen, N.K., Funder, S., Kjær, K.H., Kjeldsen, K.K., Knudsen, M.F., Linge, H., 2013. Rapid early Holocene ice retreat in West Greenland. Quaternary Science Reviews in press, http://dx.doi.org/10.1016/j.quascirev.2013.1005.1027.
Levy, L.B., Kelly, M.A., Howley, J.A., Virginia, R.A., 2012. Age of the Ørkendalen moraines, Kangerlussuaq, Greenland: constraints on the extent of the southwestern margin of the Greenland Ice Sheet during the Holocene. Quaternary Science Reviews 52, 1-5.
Lloyd, J., Moros, M., Perner, K., Telford, R.J., Kuijpers, A., Jansen, E., McCarthy, D., 2011. A 100 yr record of ocean temperature control on the stability of Jakobshavn Isbrae, West Greenland. Geology 39, 867-870.
Long, A., Roberts, D., Dawson, S., 2006. Early Holocene history of the west Greenland Ice Sheet and the GH-8.2 event. Quaternary Science Reviews 25, 904-922.
Long, A.J., Roberts, D.H., Wright, M.R., 1999. Isolation basin stratigraphy and Holocene relative sea‐level change on Arveprinsen Ejland, Disko Bugt, West Greenland. Journal of Quaternary Science 14, 323-345.
Long, A.J., Roberts, D.H., 2002. A revised chronology for the ‘Fjord Stade’moraine in Disko Bugt, west Greenland. Journal of Quaternary Science 17, 561-579.
Long, A.J., Roberts, D.H., Rasch, M., 2003. New observations on the relative sea level and deglacial history of Greenland from Innaarsuit, Disko Bugt. Quaternary Research 60, 162-171.
Mangerud, J., Goehring, B.M., Lohne, Ø.S., Svendsen, J.I., Gyllencreutz, R., 2013. Collapse of marine-based outlet glaciers from the Scandinavian Ice Sheet. Quaternary Science Reviews 67, 8-16.
Möller, P., Larsen, N.K., Kjær, K.H., Funder, S., Schomacker, A., Linge, H., Fabel, D., 2010. Early to middle Holocene valley glaciations on northernmost Greenland. Quaternary Science Reviews 29, 3379-3398.
123
Nesje, A., 1992. A piston corer for lacustrine and marine sediments. Arctic and Alpine Research 24, 257-259.
Nishiizumi, K., Imamura, M., Caffee, M.W., Southon, J.R., Finkel, R.C., McAninch, J., 2007. Absolute calibration of 10Be AMS standards. Nuclear Instruments and Methods in Physics Research B 258, 403-413.
Nye, J., 1960. The response of glaciers and ice-sheets to seasonal and climatic changes. Proceedings of the Royal Society of London. Series A. Mathematical and Physical Sciences 256, 559-584.
Ó Cofaigh, C., Dowdeswell, J., Jennings, A., Hogan, K., Kilfeather, A., Hiemstra, J., Noormets, R., Evans, J., McCarthy, D., Andrews, J., 2013. An extensive and dynamic ice sheet on the West Greenland shelf during the last glacial cycle. Geology 41, 219-222.
Pfeffer, W.T., Harper, J.T., O'Neel, S., 2008. Kinematic constraints on glacier contributions to 21st century sea-level rise. Science 321, 1340-1343.
Quillmann, U., Andrews, J.T., Jennings, A.E., 2009. Radiocarbon dates from marine sediment cores of the Iceland, Greenland, and northeast Canadian Arctic shelves and Nares Strait. Institute of Arctic and Alpine Research Occasional Paper 59, 14-15.
Rasmussen, S.O., Vinther, B.M., Clausen, H.B., Andersen, K.K., 2007. Early Holocene climate oscillations recorded in three Greenland ice cores. Quaternary Science Reviews 26, 1907-1914.
Ridge, J.C., Balco, G., Bayless, R.L., Beck, C.C., Carter, L.B., Dean, J.L., Voytek, E.B., Wei, J.H., 2012. The new North American varve chronology: A precise record of southeastern Laurentide Ice Sheet deglaciation and climate, 18.2 0 12.5 kyr BP, and correlations with Greenland ice core records. American Journal of Science 312, 685-722.
Rignot, E., Koppes, M., Velicogna, I., 2010. Rapid submarine melting of the calving faces of West Greenland glaciers. Nature Geoscience 3, 187-191.
Rignot, E., Mouginot, J., 2012. Ice flow in greenland for the international polar year 2008–2009. Geophysical Research Letters 39, DOI: 10.1029/2012GL051634.
Roberts, D.H., Rea, B.R., Lane, T.P., Schnabel, C., Rodés, A., 2013. New constraints on Greenland ice sheet dynamics during the last glacial cycle: evidence from the
124
Uummannaq ice stream system. Journal of Geophysical Research: Earth Surface 118, 519-541.
Rood, D.H., Hall, S., Guilderson, T.P., Finkel, R.C., Brown, T.A., 2010. Challenges and opportunities in high-precision Be-10 measurements at CAMS. Nuclear Instruments and Methods in Physics Research Section B: Beam Interactions with Materials and Atoms 268, 730-732.
Seidenkrantz, M.-S., Roncaglia, L., Fischel, A., Heilmann-Clausen, C., Kuijpers, A., Moros, M., 2008. Variable North Atlantic climate seesaw patterns documented by a late Holocene marine record from Disko Bugt, West Greenland. Marine Micropaleontology 68, 66-83.
Scambos, T.A., Bohlander, J., Shuman, C., Skvarca, P., 2004. Glacier acceleration and thinning after ice shelf collapse in the Larsen B embayment, Antarctica. Geophysical Research Letters 31, L18402.
Stone, J.O., 2000. Air pressure and cosmogenic isotope production. Journal of Geophysical Research 105, 23753-23759.
Stuiver, M., Reimer, P., Reimer, R., 2010. CALIB 6.0, program. Queens Univ., Belfast, UK [Available at http://radiocarbon. pa. qub. ac. uk/calib/.].
Tauber, H., 1960. Copenhagen radiocarbon dates IV. American journal of Science: Radiocarbon supplement 6, 215-225.
Van der Veen, C.J, 2001. Greenland ice sheet response to external forcing. Journal of Geophysical Research, 106, 34047-34058.
Vinther, B.M., Buchardt, S.L., Clausen, H.B., Dahl-Jensen, D., Johnsen, S.J., Fisher, D.A., Koerner, R.M., Raynaud, D., Lipenkov, V., Andersen, K.K., Blunier, T., Rasmussen, S.O., Steffensen, J.P., Svensson, A.M., 2009. Holocene thinning of the Greenland ice sheet. Nature 461, 385-388.
Weidick, A., 1968. Observations on some Holocene glacier fluctuations in west Greenland. Meddelesser om Grønland 165, 202 p.
125
Weidick, A., 1994. Historical fluctuations of calving glaciers in south and West Greenland. Rapport Grønlands Geologiske Undersølgelse 161, 73-79.
Weidick, A., Kelly, M., Bennike, O.L.E., 2004. Late Quaternary development of the southern sector of the Greenland Ice Sheet, with particular reference to the Qassimiut lobe. Boreas 33, 284-299.
Weidick, A., Bennike, O., 2007. Quaternary glaciation history and glaciology of Jakobshavn Isbræ and the Disko Bugt region, West Greenland: a review. Geological Survey of Denmark and Greenland.
Young, N.E., Briner, J.P., Axford, Y., Csatho, B., Babonis, G.S., Rood, D.H., Finkel, R.C., 2011a. Response of a marine‐terminating Greenland outlet glacier to abrupt cooling 8200 and 9300 years ago. Geophysical Research Letters 38, L24701.
Young, N.E., Briner, J.P., Stewart, H.A., Axford, Y., Csatho, B., Rood, D.H., Finkel, R.C., 2011b. Response of Jakobshavn Isbræ, Greenland, to Holocene climate change. Geology 39, 131-134.
Young, N.E., Briner, J.P., Rood, D.H., Finkel, R.C., Corbett, L.B., Bierman, P.R., 2013a. Age of the Fjord Stade moraines in the Disko Bugt region, western Greenland, and the 9.3 and 8.2 ka cooling events. Quaternary Science Reviews 60, 76-90.
Young, N.E., Schaefer, J.M., Briner, J.P., Goehring, B.M., 2013b. A precise 10Be Production-rate calibration for the Arctic. Journal of Quaternary Science 28, 515-526.
Zwally, H.J., Abdalati, W., Herring, T., Larson, K., Saba, J., Steffen, K., 2002. Surface melt-‐induced acceleration of Greenland ice-‐sheet flow. Science 297, 218-222.
126
V. VARIABLE LATE HOLOCENE ICE SHEET MARGIN FLUCTUATIONS IN WEST GREENLAND
Abstract:
Historical records reveal asynchrony in both the timing and magnitude of Greenland Ice
Sheet margin fluctuations. This asynchrony illustrates the complex manner in which ice
sheets react to climatic perturbations. In this study we reconstruct the timing and extent
of the late Holocene advance and retreat of the Greenland Ice Sheet in two study areas in
West Greenland. Our ice margin histories rely on sediment cores from proglacial-
threshold lakes and 10Be ages from erratic boulders and ice-molded bedrock. The
northern study area is located on the left-lateral margin of Sermeq Kujatdleq, at the head
of Torsukattak Fjord in northern Disko Bugt. The southern of our two study areas is
located on the right-lateral margin of Nordenskiöld Gletscher, ~30 km south of Disko
Bugt. Our results indicate local deglaciation at Sermeq Kujatdleq occurred at 7.6±0.2 ka,
with the ice margin remaining in a smaller-than-present configuration until 520±20 years
ago. The late Holocene advance continued, approaching a maximum configuration in the
past 280 years, with a culmination of the advance occurring at AD 1992-1994. We find
that retreat was underway at Sermeq Kujatdleq by AD 1999-2001. A similar pattern is
found at Nordenskiöld Gletscher, where the Greenland Ice Sheet retreated to a smaller
than present configuration at 7.2±0.1 ka and remained in a restricted state until 590±50
years ago. In contrast with our findings at Sermeq Kujatdleq, field and historic evidence
suggest that Nordenskiöld Gletscher has been advancing or stable throughout the 20th
century.
In conjunction with published Greenland Ice Sheet margin reconstructions in the
Disko Bugt region, these results indicate a relatively similar late Holocene advance of the
127
Greenland Ice Sheet, on millennial and centennial timescales, yet an asynchronous timing
the late Holocene maximum configuration and subsequent retreat. As climate is relatively
uniform across the Disko Bugt region, mechanisms beyond temperature and precipitation
must be responsible for the ice margin variability. The varying may be either due to a lag
in response driven by local ice dynamics and velocity on decadal time-scales, or to
unprecedented behavior caused by recent warming.
Keywords: Neoglacial, Greenland Ice Sheet, Lake Sediments
Introduction
Global sea level rise is a critical issue facing society in the coming years, with
studies indicating that ice sheets are the dominant contributor (Stocker et al., 2013).
While forecasts of sea level rise have been refined in recent years, estimates are still
varied (Price et al., 2011; Jacob et al., 2012). One factor that contributes to the
uncertainty in estimates of future sea level rise is the dynamic behavior of ice sheet outlet
glaciers in response to current warming trends (Pfeffer et al., 2008). This dynamic
behavior is exemplified in the variable magnitude of retreat exhibited by ice sheet
margins during recent centuries (Weidick, 1968; Weidick, 1994). Understanding past
reactions of ice sheets to warming climate during recent warming adds context to historic
observations of ice margin behavior (Kaufman et al., 2009).
The Greenland Ice Sheet (GrIS) is estimated to contribute decimeters to global sea
level rise by the end of the century (Meier et al., 2007; Pfeffer et al., 2008; Stocker et al.,
2013). Paleo-records set empirical constraints on the magnitude and rate of ice sheet
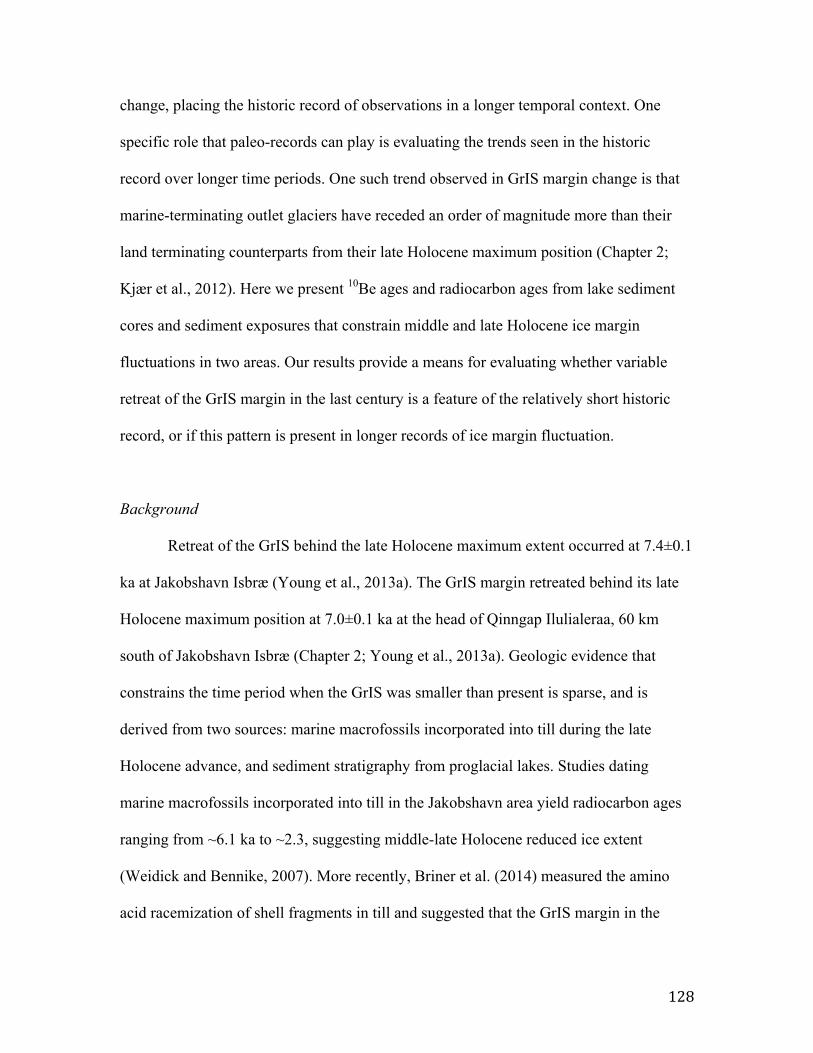
128
change, placing the historic record of observations in a longer temporal context. One
specific role that paleo-records can play is evaluating the trends seen in the historic
record over longer time periods. One such trend observed in GrIS margin change is that
marine-terminating outlet glaciers have receded an order of magnitude more than their
land terminating counterparts from their late Holocene maximum position (Chapter 2;
Kjær et al., 2012). Here we present 10Be ages and radiocarbon ages from lake sediment
cores and sediment exposures that constrain middle and late Holocene ice margin
fluctuations in two areas. Our results provide a means for evaluating whether variable
retreat of the GrIS margin in the last century is a feature of the relatively short historic
record, or if this pattern is present in longer records of ice margin fluctuation.
Background
Retreat of the GrIS behind the late Holocene maximum extent occurred at 7.4±0.1
ka at Jakobshavn Isbræ (Young et al., 2013a). The GrIS margin retreated behind its late
Holocene maximum position at 7.0±0.1 ka at the head of Qinngap Ilulialeraa, 60 km
south of Jakobshavn Isbræ (Chapter 2; Young et al., 2013a). Geologic evidence that
constrains the time period when the GrIS was smaller than present is sparse, and is
derived from two sources: marine macrofossils incorporated into till during the late
Holocene advance, and sediment stratigraphy from proglacial lakes. Studies dating
marine macrofossils incorporated into till in the Jakobshavn area yield radiocarbon ages
ranging from ~6.1 ka to ~2.3, suggesting middle-late Holocene reduced ice extent
(Weidick and Bennike, 2007). More recently, Briner et al. (2014) measured the amino
acid racemization of shell fragments in till and suggested that the GrIS margin in the
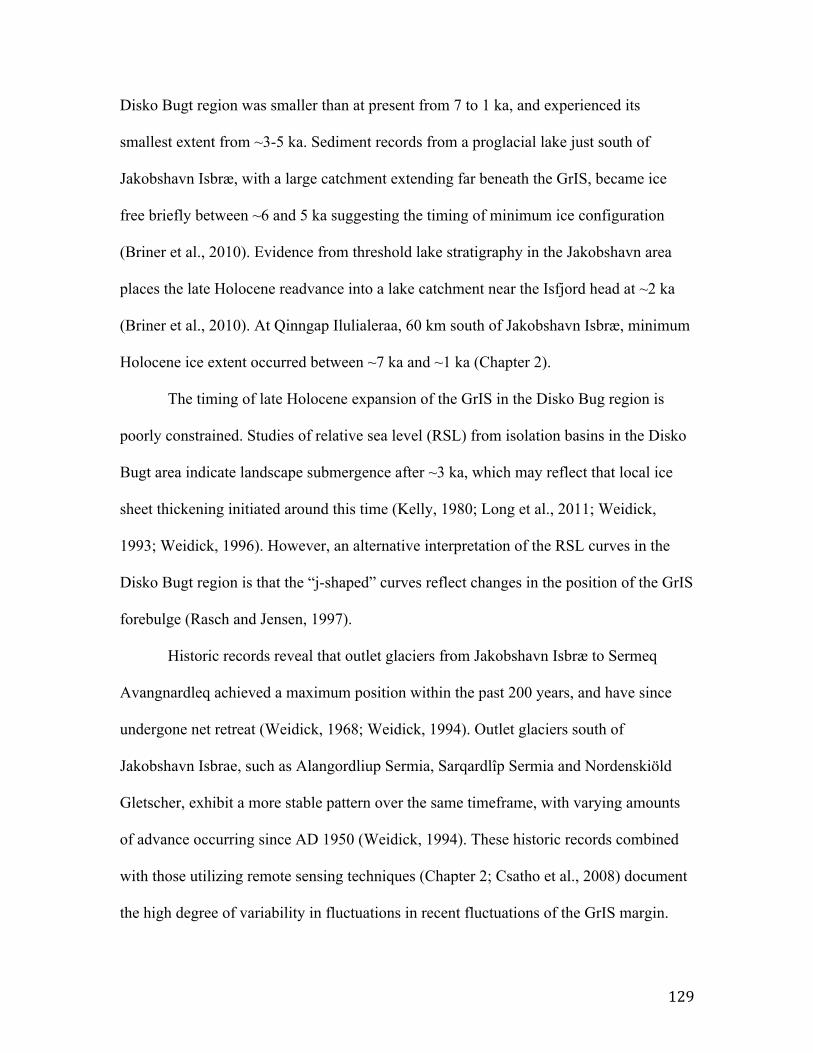
129
Disko Bugt region was smaller than at present from 7 to 1 ka, and experienced its
smallest extent from ~3-5 ka. Sediment records from a proglacial lake just south of
Jakobshavn Isbræ, with a large catchment extending far beneath the GrIS, became ice
free briefly between ~6 and 5 ka suggesting the timing of minimum ice configuration
(Briner et al., 2010). Evidence from threshold lake stratigraphy in the Jakobshavn area
places the late Holocene readvance into a lake catchment near the Isfjord head at ~2 ka
(Briner et al., 2010). At Qinngap Ilulialeraa, 60 km south of Jakobshavn Isbræ, minimum
Holocene ice extent occurred between ~7 ka and ~1 ka (Chapter 2).
The timing of late Holocene expansion of the GrIS in the Disko Bug region is
poorly constrained. Studies of relative sea level (RSL) from isolation basins in the Disko
Bugt area indicate landscape submergence after ~3 ka, which may reflect that local ice
sheet thickening initiated around this time (Kelly, 1980; Long et al., 2011; Weidick,
1993; Weidick, 1996). However, an alternative interpretation of the RSL curves in the
Disko Bugt region is that the “j-shaped” curves reflect changes in the position of the GrIS
forebulge (Rasch and Jensen, 1997).
Historic records reveal that outlet glaciers from Jakobshavn Isbræ to Sermeq
Avangnardleq achieved a maximum position within the past 200 years, and have since
undergone net retreat (Weidick, 1968; Weidick, 1994). Outlet glaciers south of
Jakobshavn Isbrae, such as Alangordliup Sermia, Sarqardlîp Sermia and Nordenskiöld
Gletscher, exhibit a more stable pattern over the same timeframe, with varying amounts
of advance occurring since AD 1950 (Weidick, 1994). These historic records combined
with those utilizing remote sensing techniques (Chapter 2; Csatho et al., 2008) document
the high degree of variability in fluctuations in recent fluctuations of the GrIS margin.

130
Study areas
The fjords of Disko Bugt are home to many marine terminating outlet glaciers of
the GrIS, including Jakobshavn Isbræ, which drains ~6.5% of the ice sheet (Rignot and
Kanagaratnam, 2006). At present, marine circulation in Disko Bugt is dominated by a
limb of the warm West Greenland Current (WGC), which enters the bay along the
western margin and exits north of the island of Disko, through the Vaigat Strait
(Seidenkrantz et al., 2008). Warm water from the WGC also penetrates the fjords within
Disko Bugt, and is linked to basal melting of marine outlet glaciers in Torsukattak Fjord
and Jakobshavn Isfjord (Holland et al., 2008; Rignot et al., 2010). Two glacier systems
were selected for this study from the Disko Bugt region: (1) Sermeq Kujatdleq, a marine-
based glacier system in Torsukattak Fjord in northern Disko Bugt, and (2) Nordenskiöld
Gletscher, an outlet glacier south of Disko Bugt.
Sermeq Kujatdleq
Sermeq Kujatdleq is the southerly of two outlet glaciers that flow into Torsukattak
Fjord (Fig. 5-1, 5-2), it drains 20,667 km2 of the GrIS, and has been shown recently to
flow with a peak velocity of 3056 m yr-1 (Rignot and Mouginot, 2012). Torsukattak Fjord
is an area of high-relief with fjord walls rising to >600 meters above sea level (asl), and
water depths exceeding 500 meters in places (Rignot et al., 2010), with Sermeq Kujatdleq
separated at the fjord head from Sermeq Avangnardleq by a nunatak. A flight of moraines
visible in aerial photographs is present on the right-lateral flank of Sermeq Kujatdleq,
with multiple vegetated and un-vegetated crests. In contrast, only two moraines are
visible on the left-lateral flank of Sermeq Kujatdleq. The most ice-distal of two moraines

131
is located ~500 meters west of the present ice margin, and is vegetated. The ice-proximal
moraine is located <100 meters west of the ice margin, and is devoid of vegetation. Our
examination of the mid-late Holocene fluctuations of Sermeq Kujatdleq was concentrated
on the left-lateral flank of the glacier. Our study utilizes sediment cores from three lake
basins: (1) Igdlúuguaq, a proglacial lake located 2 km west of the ice margin; (2) Little
Igdlúuguaq (informal name, aka Little Igy), a small lake dammed by the un-vegetated
moraine; and (3) Arqataussap Tasia, an ice-marginal lake, which had partially drained at
the time of our field investigations in August, 2012.
Nordenskiöld Gletscher
Nordenskiöld Gletscher, located ~35 km south of Disko Bugt (Fig. 5-1, 5-3),
drains 13,602 km2 of the GrIS and has been shown recently to flow with a peak velocity
of 173 m yr-1 (Rignot and Mouginot, 2012). The landscape fronting Nordenskiöld
Gletscher is characterized by rounded bedrock hills with low-lying areas filled by
glaciomarine sediments and till (Christoffersen, 1974). At present, Nordenskiöld
Gletscher terminates in an estuary with much of the glacier front resting on extensive
sand-flats. A series of channels and fjords connect the estuary at the glacier’s front to
Baffin Bay, located ~110 km to the west. A band of moraines are mapped 5-10 km
outboard of the present ice margin (Weidick, 1968), and are dated to be correlative to the
Fjord Stade moraines (Chapter 4). In addition, un-vegetated moraines, located within
~100 meters of the ice margin parallel the lateral margin of Nordenskiöld, although no
moraines are present along the glacier terminus.

132
Figure 5-1: Panel A: Map showing the location of the Disko Bugt region within Greenland. Panel B:
Composite Landsat image (Aug –Sept 1999) showing the Greenland Ice Sheet margin in the Disko Bugt
region, with outlet glaciers mentioned in the text labeled (JI=Jakobshavn Isbræ; SS=Sarqardlîp Sermia), as
well as the location of the two study areas. Panels C and D show close views of the study areas from 1985
air photographs.
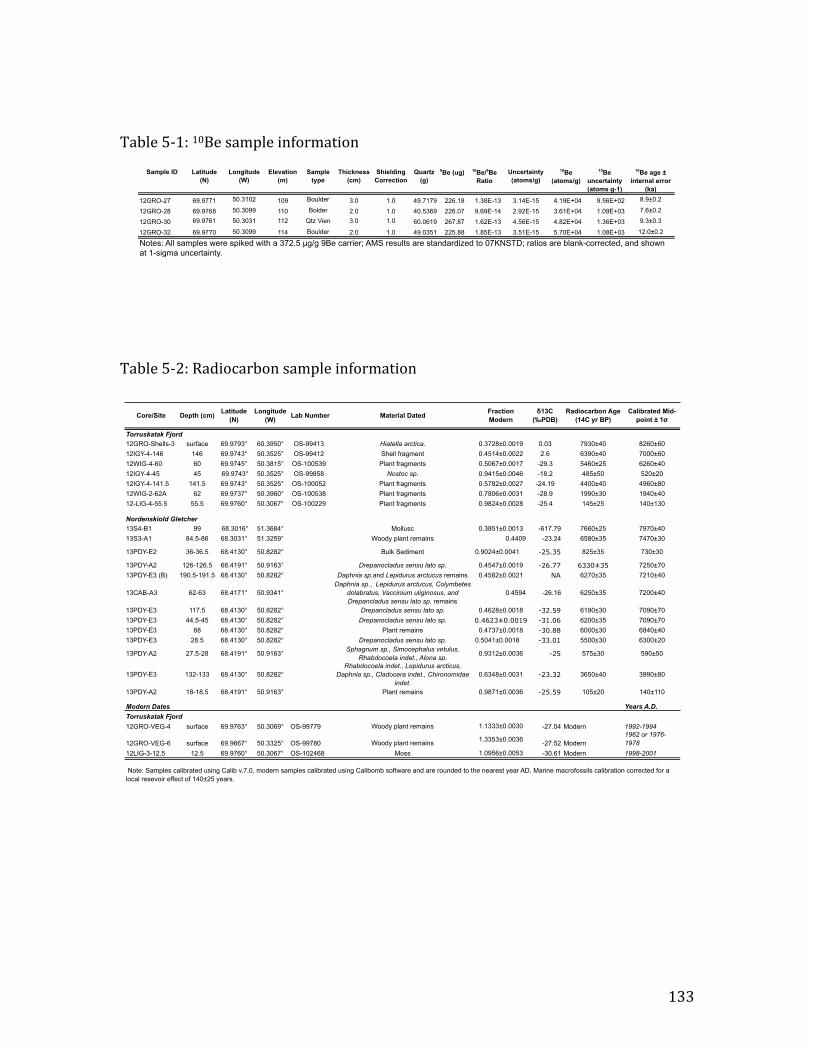
133
Table 5-‐1: 10Be sample information
Table 5-‐2: Radiocarbon sample information
Table 1: 10Be Sample information Sample ID Latitude
(N)Longitude
(W)Elevation
(m)Sample
typeThickness
(cm)Shielding Correction
Quartz (g)
9Be (ug) 10Be/9Be Ratio
Uncertainty (atoms/g)
10Be (atoms/g)
10Be uncertainty (atoms g-1)
10Be age ± internal error
(ka)
12GRO-27 69.9771 50.3102 109 Boulder 3.0 1.0 49.7179 226.18 1.38E-13 3.14E-15 4.19E+04 9.56E+02 8.9±0.2
12GRO-28 69.9768 50.3099 110 Bolder 2.0 1.0 40.5369 226.07 9.69E-14 2.92E-15 3.61E+04 1.09E+03 7.6±0.2
12GRO-30 69.9761 50.3031 112 Qtz Vien 3.0 1.0 60.0619 267.87 1.62E-13 4.56E-15 4.82E+04 1.36E+03 9.3±0.3
12GRO-32 69.9770 50.3099 114 Boulder 2.0 1.0 49.0351 225.88 1.85E-13 3.51E-15 5.70E+04 1.08E+03 12.0±0.2
Notes: All samples were spiked with a 372.5 µg/g 9Be carrier; AMS results are standardized to 07KNSTD; ratios are blank-corrected, and shown at 1-sigma uncertainty.
Core/Site Depth (cm)Latitude
(N)Longitude
(W)Lab Number Material Dated
Fraction Modern
δ13C (‰PDB)
Radiocarbon Age (14C yr BP)
Calibrated Mid-point ± 1σ
Torruskatak Fjord12GRO-Shells-3 surface 69.9793° 60.3950° OS-99413 Hiatella arctica. 0.3728±0.0019 0.03 7930±40 8260±6012IGY-4-146 146 69.9743° 50.3525° OS-99412 Shell fragment 0.4514±0.0022 2.6 6390±40 7000±6012WIG-4-60 60 69.9745° 50.3815° OS-100539 Plant fragments 0.5067±0.0017 -29.3 5460±25 6260±4012IGY-4-45 45 69.9743° 50.3525° OS-99858 Nostoc sp. 0.9415±0.0046 -18.2 485±50 520±2012IGY-4-141.5 141.5 69.9743° 50.3525° OS-100052 Plant fragments 0.5782±0.0027 -24.19 4400±40 4960±8012WIG-2-62A 62 69.9737° 50.3960° OS-100538 Plant fragments 0.7806±0.0031 -28.9 1990±30 1940±4012-LIG-4-55.5 55.5 69.9760° 50.3067° OS-100229 Plant fragments 0.9824±0.0028 -25.4 145±25 140±130
Nordenskiold Gletcher13S4-B1 99 68.3016° 51.3684° Mollusc 0.3851±0.0013 -617.79 7660±25 7970±4013S3-A1 84.5-86 68.3031° 51.3259° Woody plant remains 0.4409 -23.24 6580±35 7470±30
13PDY-E2 36-36.5 68.4130° 50.8282° Bulk Sediment 0.9024±0.0041 -25.35 825±35 730±30
13PDY-A2 126-126.5 68.4191° 50.9163° Drepanocladus sensu lato sp. 0.4547±0.0019 -26.77 6330±35 7250±7013PDY-E3 (B) 190.5-191.5 68.4130° 50.8282° Daphnia sp.and Lepidurus arctucus remains 0.4582±0.0021 NA 6270±35 7210±40
13CAB-A3 62-63 68.4171° 50.9341°Daphnia sp., Lepidurus arctucus, Colymbetes
dolabratus, Vaccinium uliginosus, and Drepancladus sensu lato sp. remains
0.4594 -26.16 6250±35 7200±40
13PDY-E3 117.5 68.4130° 50.8282° Drepancladus sensu lato sp. 0.4628±0.0018 -32.59 6190±30 7090±7013PDY-E3 44.5-45 68.4130° 50.8282° Drepanocladus sensu lato sp. 0.4623±0.0019 -31.06 6200±35 7090±7013PDY-E3 88 68.4130° 50.8282° Plant remains 0.4737±0.0018 -30.88 6000±30 6840±4013PDY-E3 28.5 68.4130° 50.8282° Drepanocladus sensu lato sp. 0.5041±0.0018 -33.01 5500±30 6300±20
13PDY-A2 27.5-28 68.4191° 50.9163° Sphagnum sp., Simocephalus vetulus, Rhabdocoela indet., Alona sp. 0.9312±0.0036 -25 575±30 590±50
13PDY-E3 132-133 68.4130° 50.8282°Rhabdocoela indet., Lepidurus arcticus,
Daphnia sp., Cladocera indet., Chironomidae indet.
0.6348±0.0031 -23.32 3650±40 3990±80
13PDY-A2 18-18.5 68.4191° 50.9163° Plant remains 0.9871±0.0036 -25.59 105±20 140±110
Modern Dates Years A.D.Torruskatak Fjord12GRO-VEG-4 surface 69.9763° 50.3069° OS-99779 Woody plant remains 1.1333±0.0030 -27.04 Modern 1992-1994
12GRO-VEG-6 surface 69.9667° 50.3325° OS-99780 Woody plant remains 1.3353±0.0036 -27.52 Modern1962 or 1976-1978
12LIG-3-12.5 12.5 69.9760° 50.3067° OS-102468 Moss 1.0956±0.0053 -30.61 Modern 1998-2001
Note: Samples calibrated using Calib v.7.0, modern samples calibrated using Calibomb software and are rounded to the nearest year AD. Marine macrofossils calibration corrected for a local resevoir effect of 140±25 years.

134
Our examination of the mid-late Holocene fluctuations of Nordenskiöld Gletscher
focuses on the right-lateral margin of the glacier. Specifically, we focus on Pterodactyl
Lake (informal name), a large proglacial lake (~ 3 km by ~2.5 km), located ~15 km
northeast of the terminus (Figure 5-3). Pterodactyl Lake receives glacial meltwater via a
smaller ice marginal lake with a bedrock-controlled threshold. The outlet is located in the
west corner of Pterodactyl Lake, and is also bedrock controlled.
Methods
10Be Dating
Four samples were collected for 10Be dating to constrain the timing of
deglaciation within a prominent moraine in the Sermeq Kujatdleq study area. A hammer
and chisel was used to collect three samples from perched erratic boulders and one
sample from a bedrock surface. Samples were preferentially collected from the centers of
flat-topped boulders and elevated bedrock outcrops, avoiding edges and corners.
Elevation, latitude and longitude were measured using a handheld GPS unit (elevation
accuracy 5-10 m), and topographic shielding was measured with a clinometer. All
samples were collected from above local marine limit, as inferred from geomorphic field
evidence such as raised beaches and washing limits. Rock samples went through
chemical and physical processing at the University at Buffalo Cosmogenic Isotope
Laboratory following procedures modified from Kohl and Nishiizumi (1992). Physical
processing included crushing samples, and isolating the 425-850 µm fraction by sieving.
Isolation of quartz was accomplished using magnets, heavy liquid separation, and HCl-
HF-HNO3 leaching. Quartz and a known quantity of 9Be carrier were digested followed
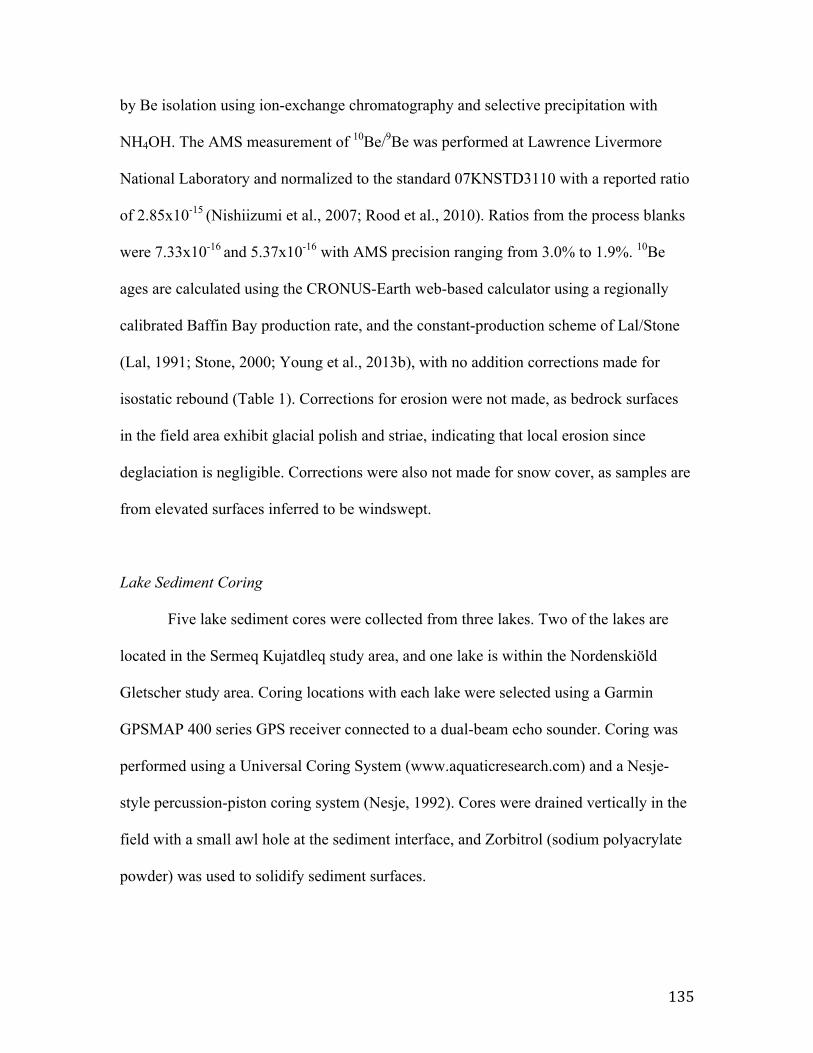
135
by Be isolation using ion-exchange chromatography and selective precipitation with
NH4OH. The AMS measurement of 10Be/9Be was performed at Lawrence Livermore
National Laboratory and normalized to the standard 07KNSTD3110 with a reported ratio
of 2.85x10⁻¹⁵ (Nishiizumi et al., 2007; Rood et al., 2010). Ratios from the process blanks
were 7.33x10⁻¹⁶ and 5.37x10⁻¹⁶ with AMS precision ranging from 3.0% to 1.9%. 10Be
ages are calculated using the CRONUS-Earth web-based calculator using a regionally
calibrated Baffin Bay production rate, and the constant-production scheme of Lal/Stone
(Lal, 1991; Stone, 2000; Young et al., 2013b), with no addition corrections made for
isostatic rebound (Table 1). Corrections for erosion were not made, as bedrock surfaces
in the field area exhibit glacial polish and striae, indicating that local erosion since
deglaciation is negligible. Corrections were also not made for snow cover, as samples are
from elevated surfaces inferred to be windswept.
Lake Sediment Coring
Five lake sediment cores were collected from three lakes. Two of the lakes are
located in the Sermeq Kujatdleq study area, and one lake is within the Nordenskiöld
Gletscher study area. Coring locations with each lake were selected using a Garmin
GPSMAP 400 series GPS receiver connected to a dual-beam echo sounder. Coring was
performed using a Universal Coring System (www.aquaticresearch.com) and a Nesje-
style percussion-piston coring system (Nesje, 1992). Cores were drained vertically in the
field with a small awl hole at the sediment interface, and Zorbitrol (sodium polyacrylate
powder) was used to solidify sediment surfaces.
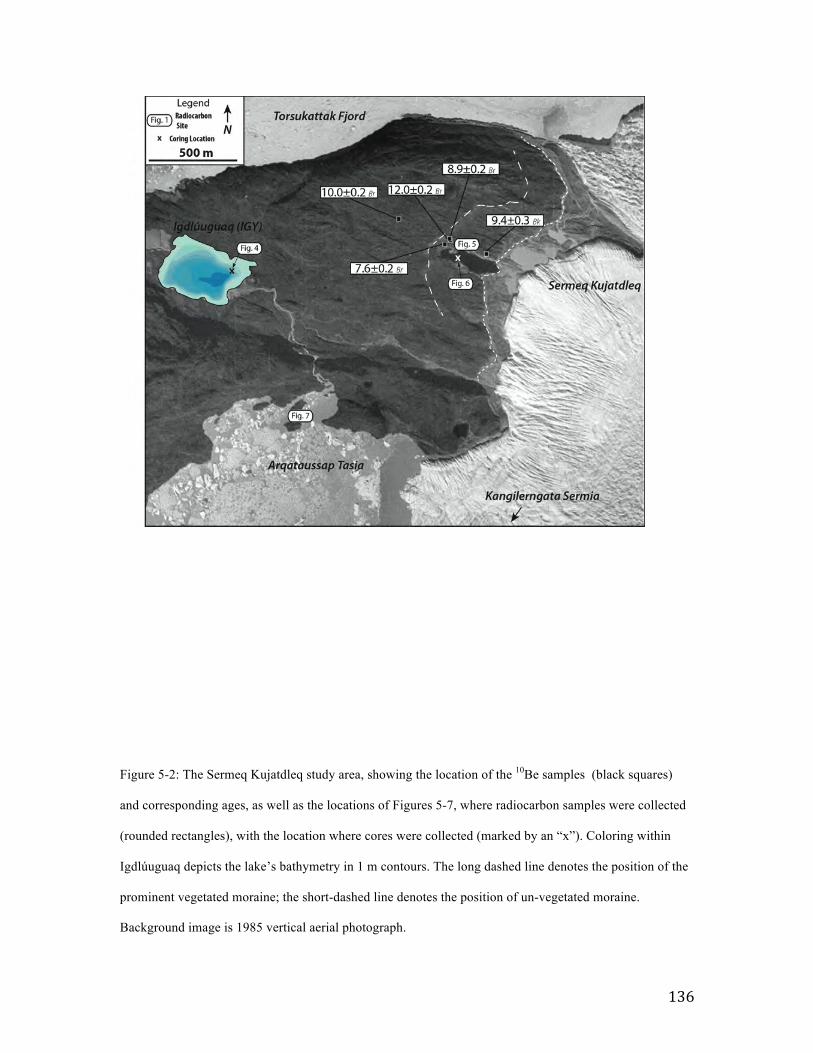
136
Figure 5-2: The Sermeq Kujatdleq study area, showing the location of the 10Be samples (black squares)
and corresponding ages, as well as the locations of Figures 5-7, where radiocarbon samples were collected
(rounded rectangles), with the location where cores were collected (marked by an “x”). Coloring within
Igdlúuguaq depicts the lake’s bathymetry in 1 m contours. The long dashed line denotes the position of the
prominent vegetated moraine; the short-dashed line denotes the position of un-vegetated moraine.
Background image is 1985 vertical aerial photograph.
137
Cores were packed with floral foam transported to the University at Buffalo for cold
storage and subsequently split, logged, and photographed. Macrofossil samples from both
sediment cores and sediment exposures were washed in deionized water, freeze-dried,
and submitted to the National Ocean Sciences Accelerator Mass Spectrometry Facility at
Woods Hole Oceanographic Institute. All ages were calibrated using the online program
CALIB version 7.0 and the INTCAL13 or MarineCal13 datasets (Table 2; Stuiver et al.,
2010).
Results and Interpretations
Results: Sermeq Kujatdleq 10Be Ages
With the purpose of constraining local deglaciation, four samples were collected
for 10Be dating inboard of a prominent, vegetated moraine, near the left-lateral margin of
Sermeq Kujatdleq. One bedrock sample and three boulder samples were collected, with
each of the boulder samples resting on bedrock, thus avoiding post-deposition alteration
(Fig. 5-2). Three boulder samples, collected ~50 m inboard of the prominent moraine,
yield an ages of 8.9±0.2 ka, 12.0±0.2 ka, and 7.6±0.2 ka. A quartz vein sample from the
ice-proximal face of a whaleback, ~300 m to the east of the prominent moraine, yields an
age of 9.3±0.3 ka. These ages average 9.5±1.8 ka (one-sigma standard deviation).
Results: Igdlúuguaq
Igdlúuguaq (2 m asl) is a proglacial lake that currently receives meltwater from
the left-lateral margin of Sermeq Kujatdleq via a ~2 km long melt-water stream (Fig. 5-
2). In addition, there is geomorphic evidence of a recently occupied outlet connecting
138
Arqataussap Tasia to Igdlúuguaq when Arqataussap Tasia is at its high-stand. Igdlúuguaq
is a single basin lake reaching a maximum depth of 6.2 m, with a bedrock-controlled
outlet on the western margin of the lake. The sediment core from Igdlúuguaq (12IGY-4;
69.9731° N, 50.35250° W) was collected in 5.2 m water depth in the northeastern side of
the lake and is 235 cm long (Fig. 5-4). The stratigraphy comprises three primary units:
(1) a basal minerogenic unit, (2) a middle unit of gyttja, and (3) an upper minerogenic
unit. Unit one, characterized by high magnetic susceptibility (MS) values, has a 28 cm
thick base of sand with silt lenses, overlain by 68 cm of massive silt. The contact between
the unit one and unit two is sharp and highlighted by a distinct dark brown layer overlain
by 5 cm of gyttja with negative MS values (Fig. 5-4). Unit two is 119 cm thick and
characterized by massive gyttja, with minor laminations, and low MS values. Unit three
is 45 cm thick and is composed of massive silt with high MS values.
Above the uppermost organic band, the minerogenic sediment changes color from
gray to tan and exhibits lower MS values and slightly higher loss on ignition (LOI) values
than the middle portion of unit two. Two macrofossils samples were collected from the
core, one sample from the top of the unit one, and one sample from the upper band of
organic material. The lower sample (44.5 cm) yields an age of 140±130 cal yr BP. The
upper sample (4 cm) yields a modern age of AD 1998-2001 (Table 2).
Three radiocarbon ages provide temporal control on the sediment core 12IGY-4
(Fig. 5-4). A shell fragment from base of the core (depth 235 cm) yields a calibrated age
of 7000±60 cal yr BP [All radiocarbon ages are presented in calibrated years as the mean
± half the 1-sigma range; ages are calibrated using Calib version 7.0
(http://calib.qub.ac.uk/); marine ages using the MarineCal13 and a ∆R of 140±25 based
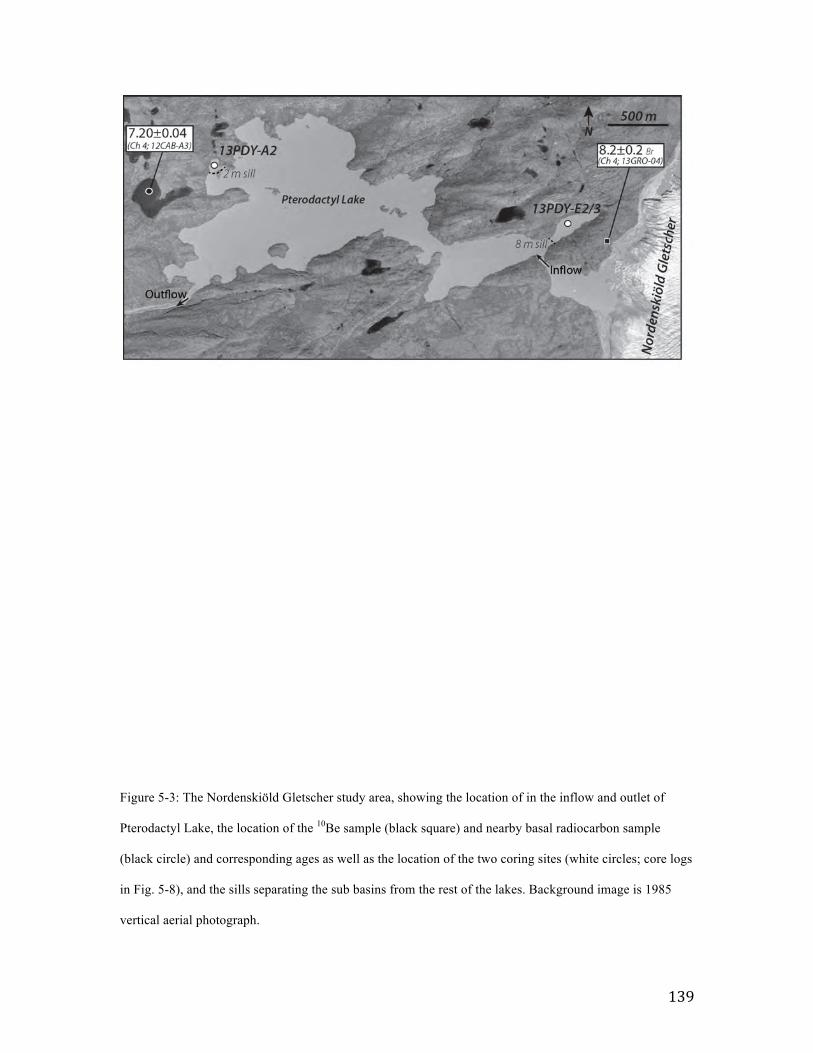
139
Figure 5-3: The Nordenskiöld Gletscher study area, showing the location of in the inflow and outlet of
Pterodactyl Lake, the location of the 10Be sample (black square) and nearby basal radiocarbon sample
(black circle) and corresponding ages as well as the location of the two coring sites (white circles; core logs
in Fig. 5-8), and the sills separating the sub basins from the rest of the lakes. Background image is 1985
vertical aerial photograph.
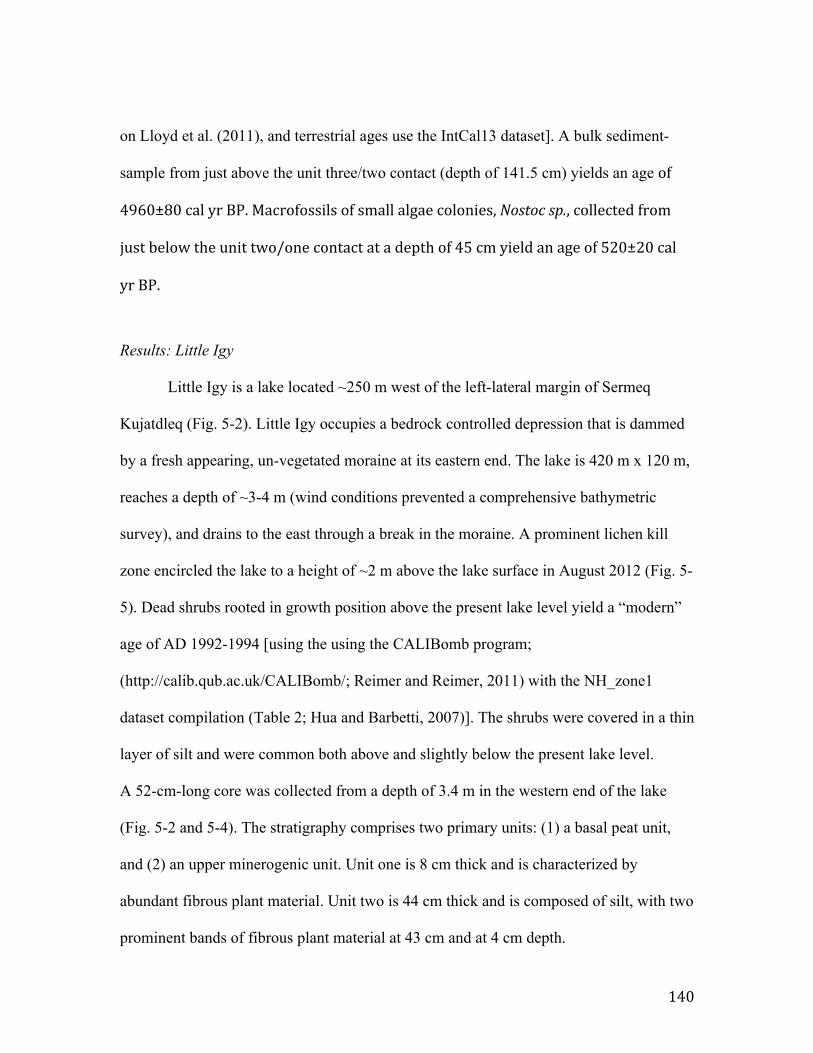
140
on Lloyd et al. (2011), and terrestrial ages use the IntCal13 dataset]. A bulk sediment-
sample from just above the unit three/two contact (depth of 141.5 cm) yields an age of
4960±80 cal yr BP. Macrofossils of small algae colonies, Nostoc sp., collected from
just below the unit two/one contact at a depth of 45 cm yield an age of 520±20 cal
yr BP.
Results: Little Igy
Little Igy is a lake located ~250 m west of the left-lateral margin of Sermeq
Kujatdleq (Fig. 5-2). Little Igy occupies a bedrock controlled depression that is dammed
by a fresh appearing, un-vegetated moraine at its eastern end. The lake is 420 m x 120 m,
reaches a depth of ~3-4 m (wind conditions prevented a comprehensive bathymetric
survey), and drains to the east through a break in the moraine. A prominent lichen kill
zone encircled the lake to a height of ~2 m above the lake surface in August 2012 (Fig. 5-
5). Dead shrubs rooted in growth position above the present lake level yield a “modern”
age of AD 1992-1994 [using the using the CALIBomb program;
(http://calib.qub.ac.uk/CALIBomb/; Reimer and Reimer, 2011) with the NH_zone1
dataset compilation (Table 2; Hua and Barbetti, 2007)]. The shrubs were covered in a thin
layer of silt and were common both above and slightly below the present lake level.
A 52-cm-long core was collected from a depth of 3.4 m in the western end of the lake
(Fig. 5-2 and 5-4). The stratigraphy comprises two primary units: (1) a basal peat unit,
and (2) an upper minerogenic unit. Unit one is 8 cm thick and is characterized by
abundant fibrous plant material. Unit two is 44 cm thick and is composed of silt, with two
prominent bands of fibrous plant material at 43 cm and at 4 cm depth.

141
Results: Arqataussap Tasia
Arqataussap Tasia is a proglacial lake that is dammed by the GrIS margin
between Kangilerngata Sermia and Sermeq Kujatdleq (Fig. 5-2). When the lake is at a
highstand, it drains to the north over a bedrock-controlled outlet. During field
investigations in August, 2012, the lake basin was partially drained of water. A ~60 m
difference existed during the time of our field investigations between the lake surface and
a well-defined shoreline, as evidenced by a transition from a fully vegetated landscape
above to one devoid of lichens and most plants below. In the northern portion of the lake
basin, near the shoreline, many woody plant fragments were found. Further investigation
revealed that many of the woody plant remains were rooted in growth position and were
draped with lake sediments (Fig. 5-7). Stratigraphic sections were dug to deglacial till,
revealing no lower occurrence of lake sediment. A radiocarbon-dated sample of woody
plant material found in growth position yields a modern age of AD 1962 or AD 1976-
1978 (Table 2).
Interpretations: Sermeq Kujatdleq
10Be ages constrain retreat of the GrIS to near the present configuration to 9.3±0.1
ka on the nunatak at left-lateral margin of Sermeq Kujatdleq and 10.0±0.2 ka on the
right-lateral margin of Sermeq Kujatdleq (Chapter 4). In both cases, 10Be ages are
outboard of prominent moraines that, based on position relative to the current ice margin
and morphology, are inferred to be correlative.
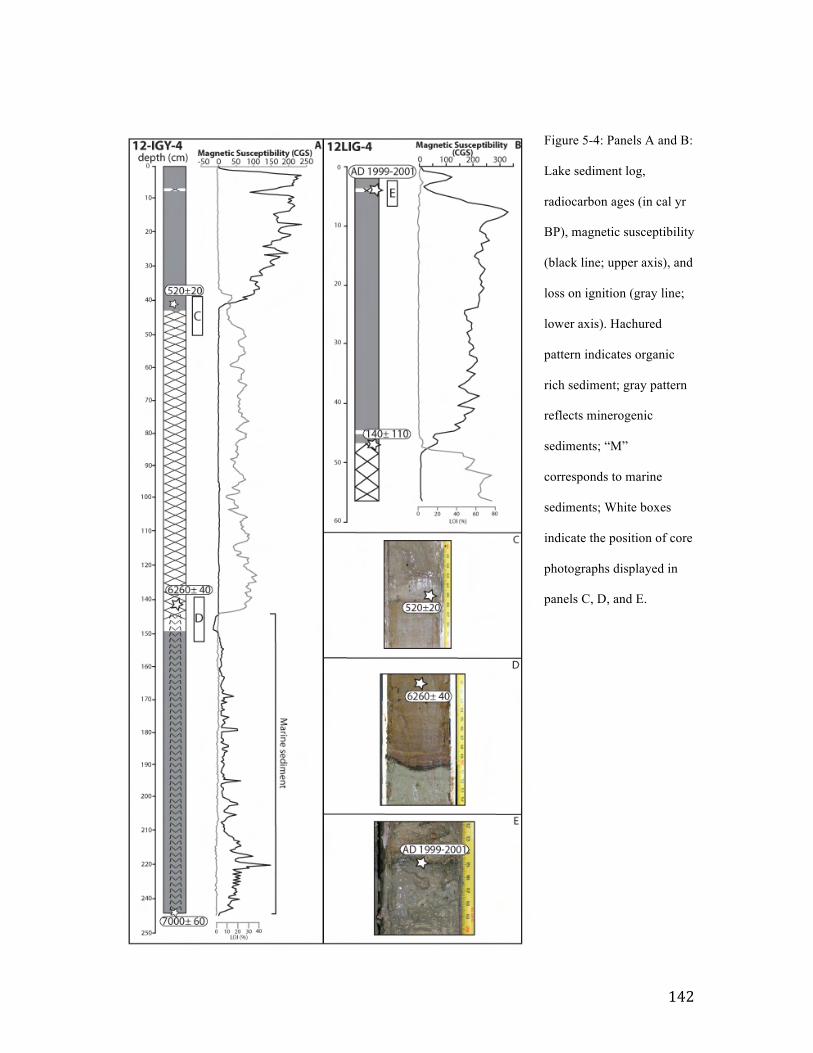
142
Figure 5-4: Panels A and B:
Lake sediment log,
radiocarbon ages (in cal yr
BP), magnetic susceptibility
(black line; upper axis), and
loss on ignition (gray line;
lower axis). Hachured
pattern indicates organic
rich sediment; gray pattern
reflects minerogenic
sediments; “M”
corresponds to marine
sediments; White boxes
indicate the position of core
photographs displayed in
panels C, D, and E.
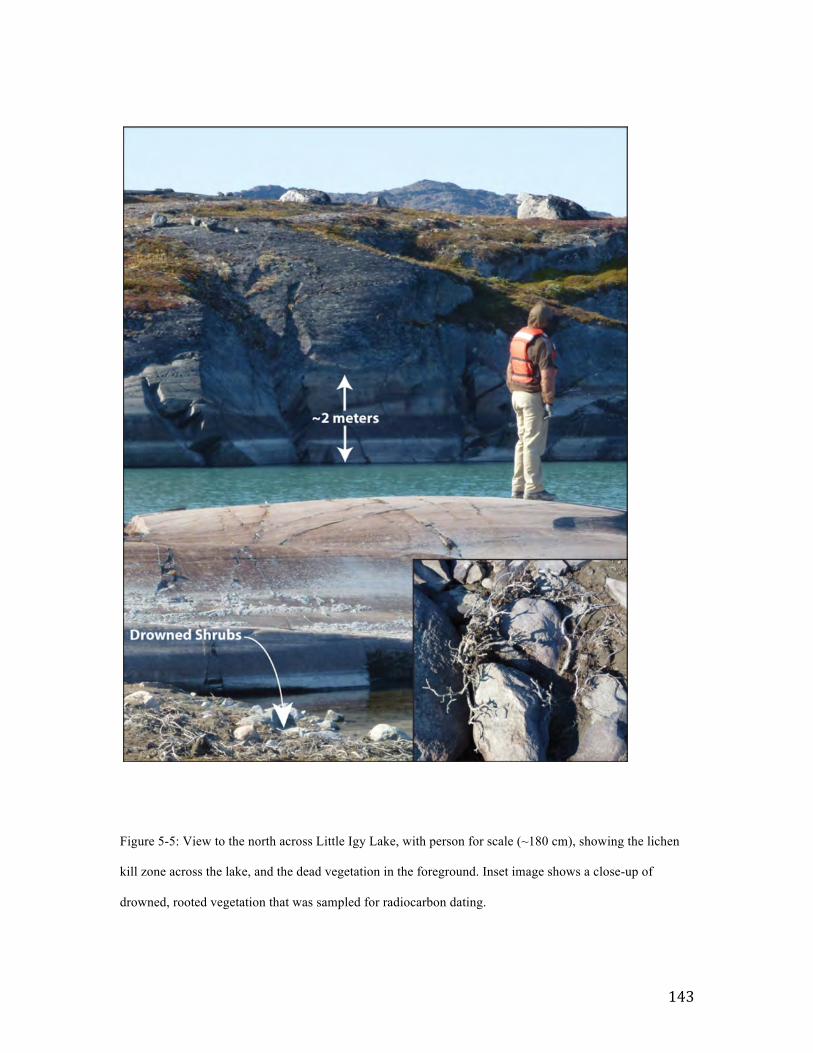
143
Figure 5-5: View to the north across Little Igy Lake, with person for scale (~180 cm), showing the lichen
kill zone across the lake, and the dead vegetation in the foreground. Inset image shows a close-up of
drowned, rooted vegetation that was sampled for radiocarbon dating.

144
Therefore, we interpret the prominent moraine to be <9.3 ka in age based on maximum
limiting 10Be ages. Four 10Be ages from inboard of the prominent moraine range from
12.0±0.2-7.6±0.2 ka (Fig. 5-2; Table 5-1). We reject the oldest age of 12.0±0.2 ka as
erroneously old, due to extensive evidence suggesting that the GrIS ice margin had not
even retreated into Torsukattak Fjord by this point (Chapter 4; Tauber, 1960; Long et al.,
1999). We believe the erroneously old age is likely due to inherited 10Be from a previous
period of exposure, though laboratory error cannot be ruled out as a possible source of
error. The three remaining ages average 8.6±0.9 ka with the age of 7.6±0.2 ka as a
minimum constraint on local deglaciation.
Additional constraints on local deglaciation come from the sediment core
retrieved from Igdlúuguaq, 12IGY-4 (Fig. 5-4). An age of 7000±60 cal yr BP from the
base of the core indicates the timing of ice margin retreat from the lake basin. A
transition from minerogenic sedimentation (from the nearby fjord) to organic
sedimentation within the lake is constrained to have occurred prior to 4960±80 cal yr BP.
We interpret this transition to be the basin’s emergence from a marine environment into a
lacustrine environment due to isostatic rebound. This interpretation is supported by local
deposits of marine sediments above the elevation of the lake, a shell fragment found in
the core, and the presence of a well-defined anoxic (dark colored) layer at a depth of 154
cm, defined by Long et al. (2011) to be a sedimentological isolation contact (Fig. 5-4).
This interpretation is also supported by a local relative sea level curve (Long et al., 1999),
which indicates that relative sea level in the area dropped to near present levels at ~5 ka.
145
Figure 5-6: Cropped oblique satellite images from Digital Globe showing Arqataussap Tasia before and
after the most recent draining. The solid white line shows the ice margin position; the dotted white line
shows the lake highstand position, and the yellow dashed line shows the lake lowstand position.
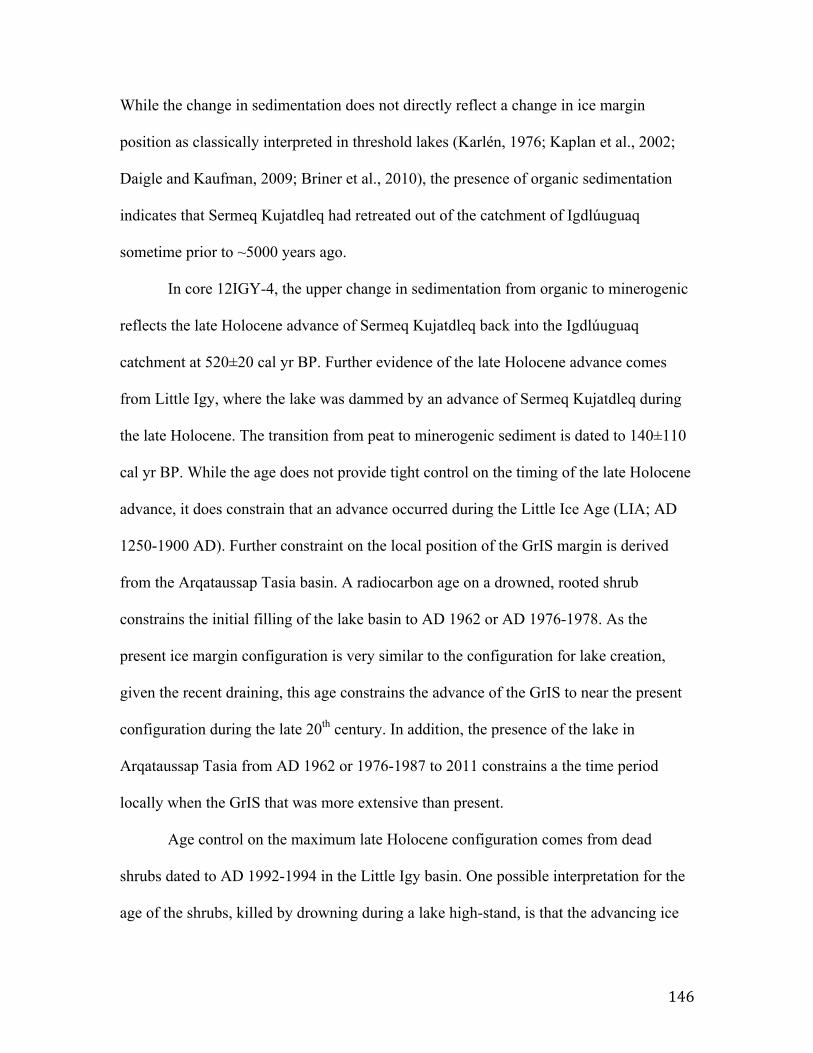
146
While the change in sedimentation does not directly reflect a change in ice margin
position as classically interpreted in threshold lakes (Karlén, 1976; Kaplan et al., 2002;
Daigle and Kaufman, 2009; Briner et al., 2010), the presence of organic sedimentation
indicates that Sermeq Kujatdleq had retreated out of the catchment of Igdlúuguaq
sometime prior to ~5000 years ago.
In core 12IGY-4, the upper change in sedimentation from organic to minerogenic
reflects the late Holocene advance of Sermeq Kujatdleq back into the Igdlúuguaq
catchment at 520±20 cal yr BP. Further evidence of the late Holocene advance comes
from Little Igy, where the lake was dammed by an advance of Sermeq Kujatdleq during
the late Holocene. The transition from peat to minerogenic sediment is dated to 140±110
cal yr BP. While the age does not provide tight control on the timing of the late Holocene
advance, it does constrain that an advance occurred during the Little Ice Age (LIA; AD
1250-1900 AD). Further constraint on the local position of the GrIS margin is derived
from the Arqataussap Tasia basin. A radiocarbon age on a drowned, rooted shrub
constrains the initial filling of the lake basin to AD 1962 or AD 1976-1978. As the
present ice margin configuration is very similar to the configuration for lake creation,
given the recent draining, this age constrains the advance of the GrIS to near the present
configuration during the late 20th century. In addition, the presence of the lake in
Arqataussap Tasia from AD 1962 or 1976-1987 to 2011 constrains a the time period
locally when the GrIS that was more extensive than present.
Age control on the maximum late Holocene configuration comes from dead
shrubs dated to AD 1992-1994 in the Little Igy basin. One possible interpretation for the
age of the shrubs, killed by drowning during a lake high-stand, is that the advancing ice
147
margin dammed the outflow of the lake. If true, the age of AD 1992-1994 constrains the
damming of Little Igy, correlating to the maximum configuration of the GrIS damming
the basin. Another possible scenario is that the change in lake level is tied to routing of
ice marginal runoff or competency of the dam controlling the Little Igy drainage. In this
scenario, changes in lake level are related to local hydrology rather than the position of
the GrIS. An organic-rich horizon in the core from Little Igy yields a modern radiocarbon
age of AD 1999-2001. Above the organic horizon, the sediment changes color, has higher
LOI values and lower magnetic susceptibility values. We interpret this change in
sediment character to be tied to the retreat of the GrIS off the moraine at the head of
Little Igy. An alternate interpretation is the change in sediment character is the result of
changes ice marginal stream systems and sediment delivery to the lake. For the later
interpretation to be true, the ice margin would have needed to recede out of the lake’s
catchment prior to AD 1992 and there is no indication of this lower in the sediment
record; thus we favor the interpretation that changes in lake level of Little Igy are tied to
the position of the GrIS margin. Therefore, we believe the GrIS margin advanced through
late 20th century, a pattern of behavior supported by historic evidence (Weidick, 1994),
and achieved a maximum position in AD 1992-1994 at Sermeq Kujatdleq, and has
undergone net retreat since.
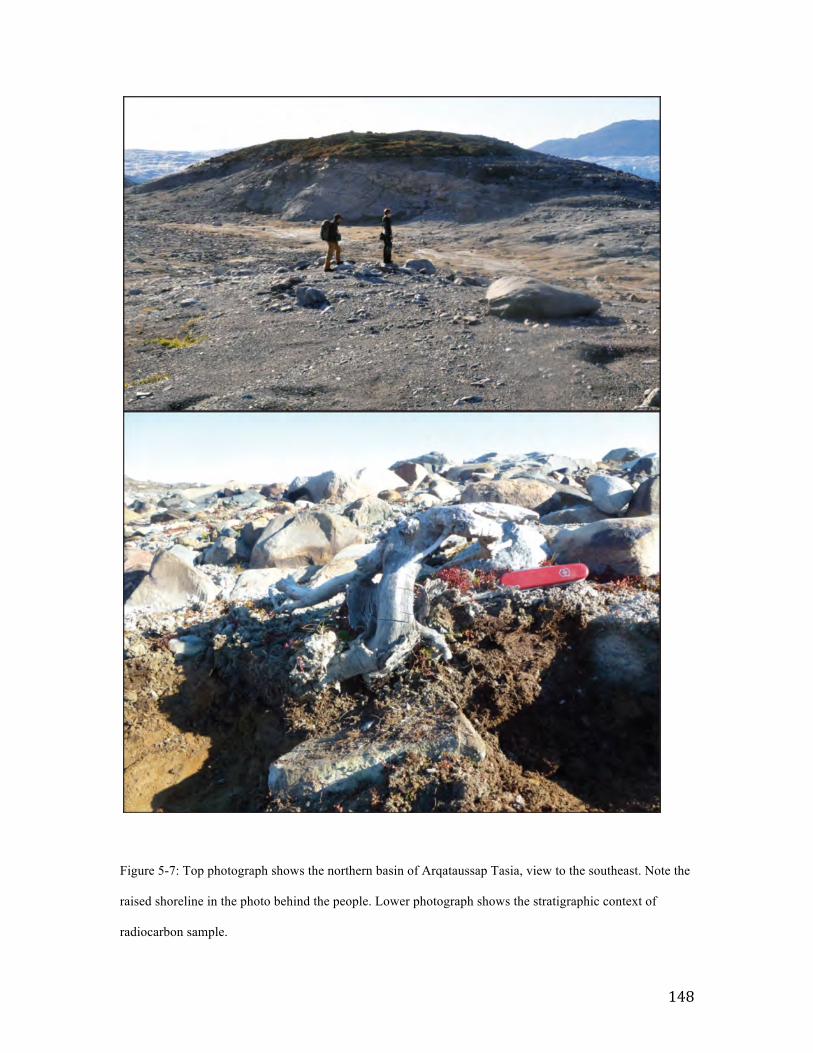
148
Figure 5-7: Top photograph shows the northern basin of Arqataussap Tasia, view to the southeast. Note the
raised shoreline in the photo behind the people. Lower photograph shows the stratigraphic context of
radiocarbon sample.
149
Results: Nordenskiöld Gletscher
Pterodactyl Lake (informal name) is a large (3.3 km by 2.7 km) multi-basin lake
on the right-lateral margin of Nordenskiöld Gletscher (Fig. 5-3). Pterodactyl Lake
currently receives glacial meltwater from Nordenskiöld Gletscher via a bedrock-
controlled threshold on a smaller ice-marginal lake. The drainage of Pterodactyl Lake is
bedrock-controlled, and located in the western part of the lake. Three cores were
collected two sub-basins in opposite corners of Pterodactyl Lake.
Two cores, 13PDY-E2 and 13PDY-E3, were collected from a depth of 18.4 m in
sub-basin near the inflow to Pterodactyl Lake. An 8 m deep sill separates the sub-basin
from the rest of Pterodactyl Lake. 12PDY-E2 was collected using a universal coring
device and is 109 cm long (Fig. 5-8). The stratigraphy comprises three primary units: (1)
a basal gyttja unit, (2) a middle unit that gradates from silt below to gyttja above, (3) an
upper minerogenic unit. Unit one is characterized by laminated gyttja, is 74 cm thick,
with ~0.5 cm layers of silt at 93 cm and 84 cm. Unit two is 35 cm thick, and comprises a
sequence that gradually changes from minerogenic sediment in the lower portion of the
unit to gyttja at the top with falling MS values marking the change in sediment. Unit
three is a 35 cm thick unit of massive silt. A single sample of organic sediment was
extracted for radiocarbon dating from the top of the gradational sequence at 31 cm depth.
The sample yields an age of 730±30 cal yr BP (Fig. 5-8).
The second core from the same sub-basin, 13PDY-E3, was collected using a Nesje-style
piston coring device and is 244 cm long (Fig. 5-8; Nesje, 1992). The stratigraphy
comprises four primary units: (1) a basal sand unit, (2) a silt unit, (3) four sequences that
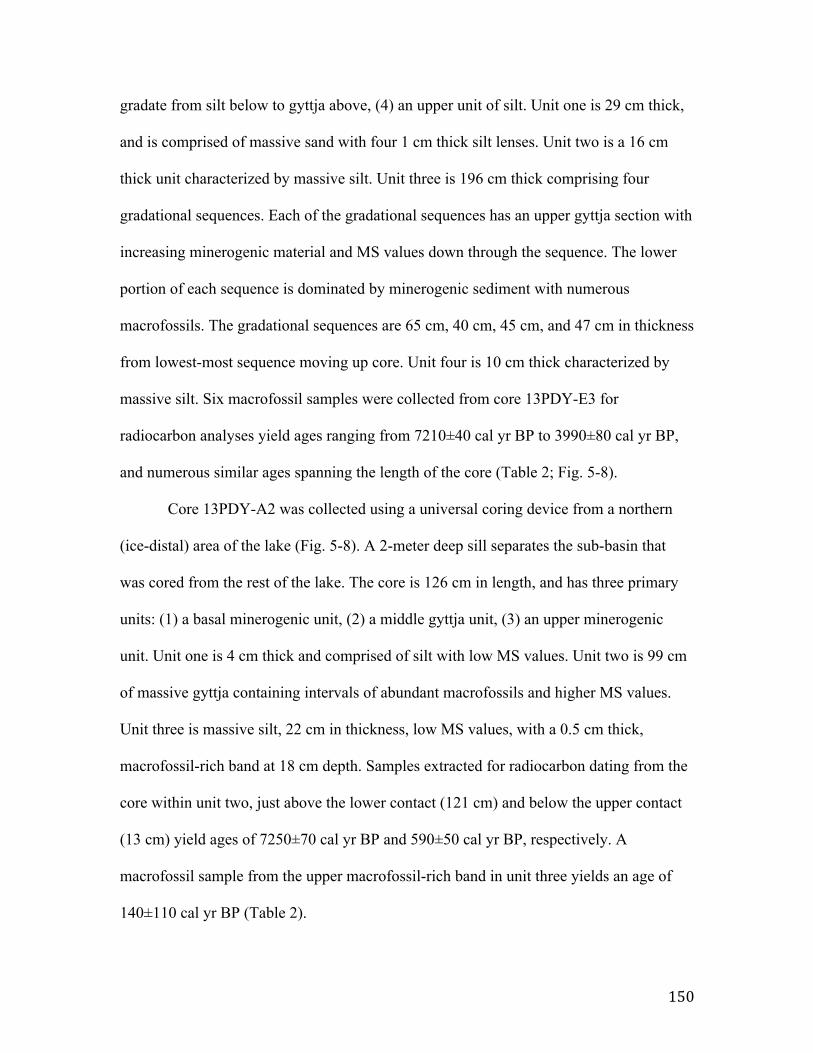
150
gradate from silt below to gyttja above, (4) an upper unit of silt. Unit one is 29 cm thick,
and is comprised of massive sand with four 1 cm thick silt lenses. Unit two is a 16 cm
thick unit characterized by massive silt. Unit three is 196 cm thick comprising four
gradational sequences. Each of the gradational sequences has an upper gyttja section with
increasing minerogenic material and MS values down through the sequence. The lower
portion of each sequence is dominated by minerogenic sediment with numerous
macrofossils. The gradational sequences are 65 cm, 40 cm, 45 cm, and 47 cm in thickness
from lowest-most sequence moving up core. Unit four is 10 cm thick characterized by
massive silt. Six macrofossil samples were collected from core 13PDY-E3 for
radiocarbon analyses yield ages ranging from 7210±40 cal yr BP to 3990±80 cal yr BP,
and numerous similar ages spanning the length of the core (Table 2; Fig. 5-8).
Core 13PDY-A2 was collected using a universal coring device from a northern
(ice-distal) area of the lake (Fig. 5-8). A 2-meter deep sill separates the sub-basin that
was cored from the rest of the lake. The core is 126 cm in length, and has three primary
units: (1) a basal minerogenic unit, (2) a middle gyttja unit, (3) an upper minerogenic
unit. Unit one is 4 cm thick and comprised of silt with low MS values. Unit two is 99 cm
of massive gyttja containing intervals of abundant macrofossils and higher MS values.
Unit three is massive silt, 22 cm in thickness, low MS values, with a 0.5 cm thick,
macrofossil-rich band at 18 cm depth. Samples extracted for radiocarbon dating from the
core within unit two, just above the lower contact (121 cm) and below the upper contact
(13 cm) yield ages of 7250±70 cal yr BP and 590±50 cal yr BP, respectively. A
macrofossil sample from the upper macrofossil-rich band in unit three yields an age of
140±110 cal yr BP (Table 2).
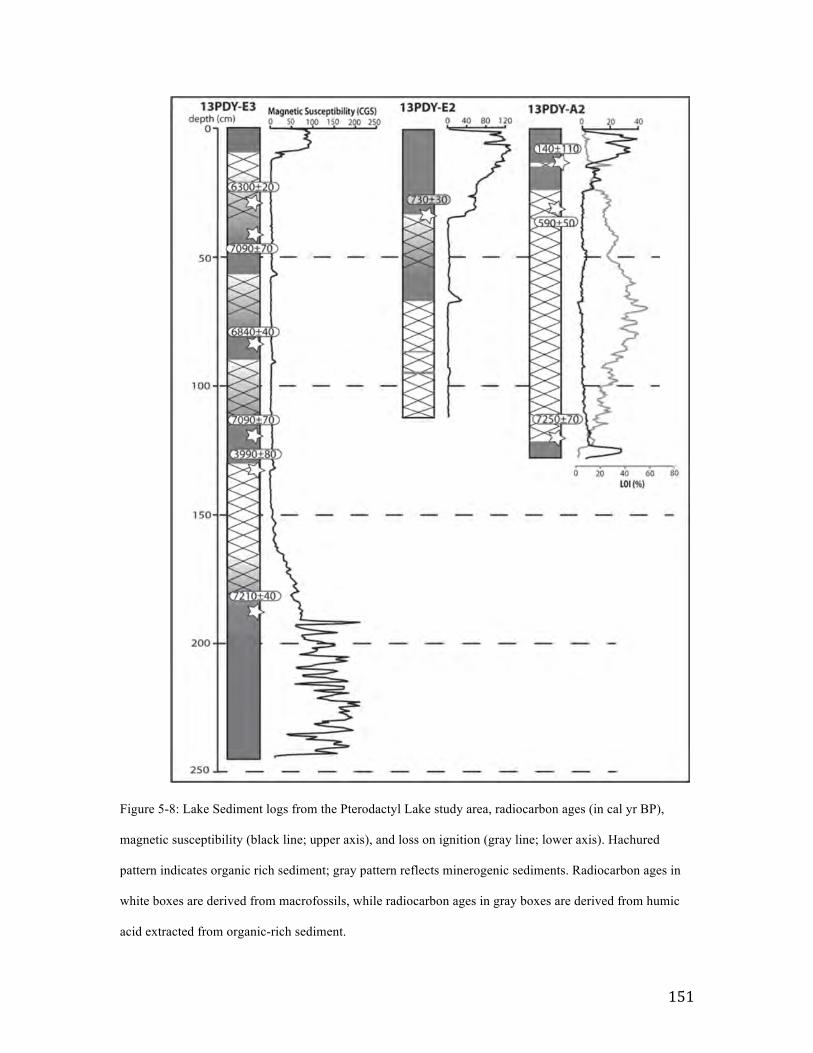
151
Figure 5-8: Lake Sediment logs from the Pterodactyl Lake study area, radiocarbon ages (in cal yr BP),
magnetic susceptibility (black line; upper axis), and loss on ignition (gray line; lower axis). Hachured
pattern indicates organic rich sediment; gray pattern reflects minerogenic sediments. Radiocarbon ages in
white boxes are derived from macrofossils, while radiocarbon ages in gray boxes are derived from humic
acid extracted from organic-rich sediment.
152
Interpretations: Nordenskiöld Gletscher
A single 10Be age constrains the retreat of Nordenskiöld Gletscher to near the
present configuration on its right-lateral margin at 8.2±02 ka, and is supported by a 10Be
age of 8.3±0.2 located 5 km west of the terminus (Chapter 4). Basal radiocarbon dates
from a nearby lake provide minimum limiting constraints the timing of local deglaciation
at 7200±40 cal yr BP (Chapter 4). Sediment cores from Pterodactyl Lake indicate that the
GrIS retreated out of the Pterodactyl drainage at 7230±20 cal yr BP (n=2; cores 13PDY-
E3 and 13PDY-A2). Cores from site E (most proximal to the ice margin) present a
complex stratigraphy. In a typical threshold lake, changes from minerogenic
sedimentation to organic sedimentation are interpreted to mark the ice margin retreating
out of a lake’s catchment, with the reverse stratigraphy indicating advance of the ice
margin into a lake’s catchment (Karlén, 1976; Kaplan et al., 2002; Daigle and Kaufman,
2009; Briner et al., 2010). If this logic were followed for core 13PDY-E3, the
interpretation would be that the GrIS fluctuated across the catchment threshold of
Pterodactyl Lake four times. However, the six radiocarbon ages from this core suggest a
more complex depositional environment (Fig. 5-8).
The numerous age reversals in 13PDY-E3, in addition to the relative homogeneity
of the ages suggest that the four sequences in unit three are in fact of similar age. Four of
the six ages are from macrofossils within the minerogenic portions of their respective
gradational sequences, with these ages falling within 370 years of each other. The
remaining two ages, located in more gyttja-rich portions of the sequence, are younger
than lower ages in the same respective sequence. We postulate that the gradational
sequences of unit three represent a subaqueous-slump, where slump blocks comprising

153
the same stratigraphy became stacked during transport and deposition. Following this
interpretation, unit three represents four sequences of the same stratigraphy ranging in
age from ~7000 to ~4000 year old.
Based on this interpretation, we believe the lowest date from core 13PDY-E3 is
undisturbed and relates to the GrIS margin retreat from the Pterodactyl Lake catchment.
We believe this point is supported by similar basal radiocarbon dates from Pterodactyl
Lake (core 13PDY-A2) as well as the near-by lake. We interpret the upper silt in the
cores to correlate to the Late Holocene, when the glacier had advanced into the
catchment. We infer the same scenario for core 13PDY-E2, with the core penetrating a
different portion of the slump deposit, thus sequence thicknesses varies between the two
cores. We treat the radiocarbon age from 13PDY-E2 with caution, as it is from bulk
sediment and consider it a maximum limiting age on the advance of the Nordenskiöld
Gletscher in the Pterodactyl Lake catchment. It has been show in studies from West
Greenland that bulk sediment may give erroneously old ages in comparison to
macrofossil-based ages by 100±400 years (Kaplan et al., 2002; Bennike et al., 2010).
We infer core 13PDY-A2 was unaffected by slumping as it was collected from a
sub-basin over 3 km away. As such, we use the classical interpretation of threshold lakes
for this core. Early Holocene retreat of the GrIS margin is observed in the core, reflected
as a sharp transition from silt below to gyttja above, and is constrained prior to 7250±70
cal yr BP. The late Holocene advance of the GrIS back into the Pterodactyl catchment is
observed in lake core 13PDY-A2 as a transition from organic gyttja below to
minerogenic sediments above. The contact is constrained by a radiocarbon date of
590±50 cal y BP below the contact. A thin organic-rich layer higher in the core suggests
154
a brief cessation of glacial-meltwater contribution to the lake at 140±110 cal yr BP,
indicating a possible short-lived recession of the Nordenskiöld Gletscher. Another
explanation for organic sedimentation at this time is that lake level dropped below the 2
meter-deep sill at the mouth of the basin due to reduction in meltwater. A lowering of
lake-level would isolate the basin from the proglacial Pterodactyl Lake, allowing for
organic deposition. Regardless, it appears likely that a minor cooling event occurred
during the late Holocene coincident with the LIA. The sediment record indicates that the
left-lateral margin of Nordenskiöld Gletscher has remained in the Pterodactyl catchment
since 590±50 cal y BP, though abandoned fresh appearing moraines along the lateral
margins of Nordenskiöld suggest minor retreat has occurred.
Historic and remote sensing record indicate advance or stability of the
Nordenskiöld Gletscher since 1950 AD (Weidick, 1968; Weidick, 1994). This evidence,
in addition to the lack of a moraine at the glacier’s terminus, infers that the system is at or
still advancing to its late Holocene maximum configuration. This is supported by
observations at the terminus of Nordenskiöld Gletscher, made in July of 2013,
documenting that the glacier terminus is currently advancing onto living tundra (Fig 5-9).
The presence of lateral moraines along the trunk of the glacier suggest some lateral
recession has occurred in the glacier system in the past ~600 years. The combination of
advance at the terminus and recession along the lateral margins is perplexing. Two
possible mechanism for scenario are: thinning of the glaciers surface or deepening of the
glacial trough through basal erosion. Regardless of englacial processes underway, the
terminus of Nordenskiöld Gletscher has yet to display a reaction to recent warming
trends.

155
Figure 5-9: Photograph from taken at the terminus of Nordenskiöld Gletscher in August, 2013. Note the
deposition of glacial sediments onto living tundra, and the lack of moraine fronting the glacier, indicating
that the ice margin is currently advancing.
156
Discussion
Comparison of middle-late Holocene records
This study demonstrates that both similarities and differences exist in the response
of GrIS outlet glaciers to middle and late Holocene climate forcing. In both sites, middle
Holocene recession of the GrIS margin to a smaller-than-present configuration occurred
between 8-7 ka, following moraine deposition. Late Holocene expansion was underway
at both sites by ~500 years ago, with the ice margin advancing into currently proglacial
lake catchments. The pattern of GrIS expansion, as well as the onset of retreat, during the
late Holocene are markedly different at the two sites (Fig. 5-10). This juxtaposition
suggests that similarity in the records maybe a factor of the time frame over which the ice
margin reaction is viewed. The change from synchronous to asynchronous response
reveals the time period over which the uniform forcing of climate ceases to be a dominant
driving mechanism. We demonstrate a relative synchronicity in the fluctuation of the
GrIS margin on millennial and centennial timescales, yet asynchronous behavior is
observed on decadal timescales. As we assume climate forcing is relatively uniform
across the region, factors inherent to one of the glacier systems must responsible for
driving the varying behavior on decadal timescales.
Previous work has postulated linkages between surface velocity and glacier
response to climate forcing (Bamber et al., 2007), with the perturbation theory suggesting
that the local response time of a glacier is the inverse of the local velocity (Nye, 1960).
Thus, higher-velocity glaciers should have a closer coupling with changes in climate
forcing than slower glaciers. If the late Holocene maximum position is the result of LIA
cooling, the correlation between ice margin setting and response time holds true to our
157
study. We demonstrate that the faster-flowing glacier, Sermeq Kujatdleq, achieved a
maximum position in the late 20th century, and the slower glacier, Nordenskiöld
Gletscher, is still advancing toward its late Holocene maximum position.
Disko Bugt region Holocene ice margin fluctuations
We place our results in a wider context by examining the records of two
additional glaciers within the Disko Bugt region where the late Holocene ice margin
behavior is well-constrained (Fig. 5-10; Chapter 2; Briner et al., 2010; Weidick and
Bennike, 2007). Jakobshavn Isbræ is currently the fastest flowing glacier in the world,
achieving a peak velocity of 17,100 m yr-1 (Joughin et al., 2014). The GrIS margin is
dated to have retreated behind the present ice margin position at 7.4±01 ka (Young et al.,
2013a), with the late Holocene expansion of Jakobshavn Isbræ approaching the late
Holocene maximum position after AD 1650 (Briner et al., 2011). Historic evidence
places the ice margin at its late Holocene maximum by AD 1850. Jakobshavn Isbrae
retreated out of the same threshold lake on the northern margin of the glacier in AD 1963
(Briner et al., 2011), with total retreat during the past ~160 yeas of ~ 40 km.
Sarqardlîp Sermia is an outlet glacier located ~50 km south of Jakobshavn Isbræ
that has achieved a peak velocity of 251 m yr-1 (Rignot and Mouginot, 2012). Middle
Holocene retreat of Sarqardlîp Sermia behind its present position occurred locally at
7.0±0.1 ka (Chapter 2). The late Holocene constraints on the past extent of Sarqardlîp
Sermia come from the Tininnilik basin, an ice-dammed lake that drains on a 7-10 year
period (Chapter 2; Weidick and Bennike, 2007). Advance of Sarqardlîp Sermia reached a
configuration similar to today, damming the Tininnilik basin, ~300 years ago. Maximum
158
ice extent is documented between AD 1985 and AD 1997, based on observations at
Tininnilik, the Sarqardlîp Sermia terminus, and the neighboring basin of Qinngap
Ilulialeraa (Chapter 2; Weidick, 1994). The records from Sarqardlîp Sermia and
Jakobshavn Isbræ illustrate similar behavior on millennial and centennial timescales to
that of Sermeq Kujatdleq and Nordenskiöld Gletscher. All glaciers retreated behind the
present ice margin position between 8-7 ka in response to warming during middle
Holocene (Axford et al., 2009b; Dahl-Jensen et al., 1998).
Late Holocene advance occurred at all sites between 600 and 300 years ago, with
the GrIS margin advancing into previously meltwater-free catchments. On decadal
timescales, the ice margin fluctuations are not synchronous in sign of ice margin change
or magnitude. Jakobshavn Isbræ retreated tens of kilometers since AD 1850, while
Sermeq Kujatdleq and Sarqardlîp Sermia retreated tens of meters since the late 20th
century, and Nordenskiöld Gletscher has been advancing since at least AD 1950
regardless of its prior history. These records demonstrate that four glaciers in the Disko
Bugt region exhibit asynchronous behavior on decadal timescales. This suggests that ice
dynamics play a prominent role in ice margin fluctuation on short (decadal) timescales,
implying any variability in response of the GrIS to climate change due to ice dynamics
also is on the order of decades rather than centuries or millennia.

159
Figure 5-10: Time-distance diagrams for late Holocene ice margin fluctuations within the Disko Bugt
region with age in years before AD 2010 on the horizontal axis and distance from late Holocene maximum
configuration on the vertical axis (note change in vertical scale for Jakobshavn Isbræ panel). The curves
based on evidence presented in Chapter 2 (red circles), historic evidence from Weidick (1994) and Weidick
and Bennike (2007; open circles), and 2010 Digital Globe imagery (blue circles). Glaciers names are listed
with maximum velocities listed below from (Rignot and Mouginot, 2012).
160
Another possible interpretation of our dataset is that asynchronous behavior of the
GrIS margin did not occur until recently and is due to warming during the Anthropocene.
Recent warming during the Anthropocene has been demonstrated to be unprecedented in
the middle-late Holocene in a number of proxies (Fisher et al., 2012; Perren et al., 2012b;
Miller et al., 2013). It is possible that warming trends, unique to recent decades, are
driving asynchronous behavior along the margin of the GrIS. Perhaps, recent warming
has driven some glaciers pasts a mass-balance threshold, which is responsible for the
recent asynchronous behavior. This behavior is not seen in our longer records of the
middle-late Holocene, because comparable forcing was not experienced during earlier
parts of the Holocene. Unfortunately, the limited resolution of our dating methods
prevents us from to examining decadal scale ice margin fluctuations prior to the onset of
the Anthropocene.
Conclusion
This study details the pattern and timing of middle to late Holocene ice margin
fluctuations at Sermeq Kujatdleq and Nordenskiöld Gletscher. In both systems, the GrIS
margin retreated to near its present configuration at ~7-8 ka following an early Holocene
readvance. Both glaciers remained in a smaller-than-present configuration until ~500
years ago, when they advanced into the catchment of currently proglacial lakes. We
document asynchronous behavior of the two outlet glaciers in the 20th century, with
Sermeq Kujatdleq achieving a maximum late Holocene configuration between AD 1992-
1994, and undergoing subsequent retreat. Nordenskiöld Gletscher has remained in the
proglacial lake’s catchment for the past 500 years, with the possible exception at
161
140±110 cal yr BP. Historic records indicate that Nordenskiöld Gletscher has been
advancing from the AD 1950’s through present.
These records, in addition to those from Sarqardlîp Sermia and Jakobshavn Isbræ,
demonstrate relative synchronicity (within resolution) in retreat and advance of the GrIS
margin on millennial and centennial timescales. Yet, the four glacier systems in the Disko
Bugt region behave asynchronously on decadal timescales. We propose that this
asynchronicity in decadal-scale ice margin fluctuation is due to one of two explanations:
(1) Variability in the response time of differing sectors of the GrIS driven by local
velocity and internal ice dynamics creating a lag in the response of slower flowing, land-
based, sectors of the ice margin; or (2) Unprecedented Anthropocene warming has driven
sectors of the GrIS out of balance with climate, a response of the GrIS that is not seen in
the Holocene record. These findings demonstrate the need for additional high-resolution
records of ice margin change beyond the scope of the historic records to aid in better
predictions of future sea level rise.
Acknowledgements
We thank Mathew McClellan, Brayton West, and Sylvia Choi for invaluable assistance in
the laboratory. This work greatly benefitted from high precision 10Be measurements from
Lawrence Livermore National Laboratory. CH2M Hill Polar Field Services for help with
field logistics, the 109th Air National Guard for transportation to and from Greenland,
and Lena Håkansson for aerial photographs.

162
References
Axford, Y., Briner, J.R., Miller, G.H., Francis, D.R., 2009. Paleoecological evidence for abrupt cold reversals during peak Holocene warmth on Baffin Island, Arctic Canada. Quaternary Research 71, 142-149.
Bamber, J.L., Alley, R.B., Joughin, I., 2007. Rapid response of modern day ice sheets to external forcing. Earth and Planetary Science Letters 257, 1-13.
Bennike, O., Anderson, N.J., McGowan, S., 2010. Holocene palaeoecology of southwest Greenland inferred from macrofossils in sediments of an oligosaline lake. J. Paleolimn. 43, 787-798.
Briner, J., Stewart, H., Young, N., Philipps, W., Losee, S., 2010. Using proglacial-threshold lakes to constrain fluctuations of the Jakobshavn Isbræ ice margin, western Greenland, during the Holocene. Quaternary Science Reviews 29, 3861-3874.
Briner, J., Young, N., Thomas, E., Stewart, H., Losee, S., Truex, S., 2011. Varve and radiocarbon dating support the rapid advance of Jakobshavn Isbræ during the Little Ice Age. Quaternary Science Reviews 30, 2476-2486.
Briner, J.P., Kaufman, D.S., Bennike, O., Kosnik, M.A., 2014. Amino acid ratios in reworked marine bivalve shells constrain Greenland Ice Sheet history during the Holocene. Geology 42, 75-78.
Christoffersen, M., 1974. Quaternary Map of Greenland: Søndre Strømfjord-Nûgssuaq Kvartærgeologisk; Sheet 3, Quaternary Map of Greenland. Greenland Geologic Survey, Copenhagen, Denmark.
Csatho, B., Schenk, T., Van der Veen, C., Krabill, W.B., 2008. Intermittent thinning of Jakobshavn Isbræ, West Greenland, since the Little Ice Age. Journal of Glaciology 54, 131-144.
Dahl-Jensen, D., Mosegaard, K., Gundestrup, N., Clow, G.D., Johnsen, S.J., Hansen, A.W., Balling, N., 1998. Past temperatures directly from the Greenland Ice Sheet. Science 282, 268-271.

163
Daigle, T.A., Kaufman, D.S., 2009. Holocene climate inferred from glacier extent, lake sediment and tree rings at Goat Lake, Kenai Mountains, Alaska, USA. Journal of Quaternary Science 24, 33-45.
Fisher, D., Zheng, J., Burgess, D., Zdanowicz, C., Kinnard, C., Sharp, M., Bourgeois, J., 2012. Recent melt rates of Canadian arctic ice caps are the highest in four millennia. Global and Planetary Change 84–85, 3-7.
Holland, D.M., Thomas, R.H., De Young, B., Ribergaard, M.H., Lyberth, B., 2008. Acceleration of Jakobshavn Isbrae triggered by warm subsurface ocean waters. Nature Geoscience 1, 659-664.
Hua, Q., Barbetti, M., 2007. Review of tropospheric bomb (super 14) C data for carbon cycle modeling and age calibration purposes. Radiocarbon 46, 1273-1298.
Jaccob, T., Wahr, J.M., Pfeffer, W.T., Swenson, S., 2012. Recent contributions of glaciers and ice caps to sea level rise. Nature 482, 514-518.
Joughin, I., Smith, B., Shean, D., Floricioiu, D., 2014. Brief Communication: Further summer speedup of Jakobshavn Isbræ. The Cryosphere 8, 209-214.
Kaplan, M.R., Wolfe, A.P., Miller, G.H., 2002. Holocene environmental variability in southern Greenland inferred from lake sediments. Quaternary Research 58, 149-159.
Karlén, W., 1976. Lacustrine sediments and tree-limit variations as indicators of Holocene climatic fluctuations in Lappland, northern Sweden. Geografiska Annaler. Series A. Physical Geography, 1-34.
Kaufman, D.S., Schneider, D.P., McKay, N.P., Ammann, C.M., Bradley, R.S., Briffa, K.R., Miller, G.H., Otto-Bliesner, B.L., Overpeck, J.T., Vinther, B.M., 2009. Recent warming reverses long-term Arctic cooling. Science 325, 1236-1239.
Kelly, M., 1980. The status of the Neoglacial in western Greenland. Grønlands geologiske undersøgelse.
Kjær, K.H., Khan, S.A., Korsgaard, N.J., Wahr, J., Bamber, J.L., Hurkmans, R., van den Broeke, M., Timm, L.H., Kjeldsen, K.K., Bjørk, A.A., 2012. Aerial Photographs Reveal Late–20th-Century Dynamic Ice Loss in Northwestern Greenland. Science 337, 569-573.

164
Kohl, C., Nishiizumi, K., 1992. Chemical isolation of quartz for measurement of in situ produced cosmogenic nuclides. Geochimica et Cosmochimica Acta 56, 3583-3587.
Lal, D., 1991. Cosmic-ray labeling of erosion surfaces: in situ nuclide production rates and erosion models. Earth and Planetary Science Letters 104, 424-439.
Lloyd, J., Moros, M., Perner, K., Telford, R.J., Kuijpers, A., Jansen, E., McCarthy, D., 2011. A 100 yr record of ocean temperature control on the stability of Jakobshavn Isbrae, West Greenland. Geology 39, 867-870.
Long, A.J., Roberts, D.H., Wright, M.R., 1999. Isolation basin stratigraphy and Holocene relative sea‐level change on Arveprinsen Ejland, Disko Bugt, West Greenland. Journal of Quaternary Science 14, 323-345.
Long, A.J., Woodroffe, S.A., Roberts, D.H., Dawson, S., 2011. Isolation basins, sea-level changes and the Holocene history of the Greenland Ice Sheet. Quaternary Science Reviews 30, 3748-3768.
Meier, M.F., Dyurgerov, M.B., Rick, U.K., O'Neel, S., Pfeffer, W.T., Anderson, R.S., Anderson, S.P., Glazovsky, A.F., 2007. Glaciers dominate eustatic sea-level rise in the 21st century. Science 317, 1064-1067.
Miller, G.H., Lehman, S.J., Refsnider, K.A., Southon, J.R., Zhong, Y., 2013. Unprecedented recent summer warmth in Arctic Canada. Geophysical Research Letters.
Nesje, A., 1992. A piston corer for lacustrine and marine sediments. Arctic and Alpine Research 24, 257-259.
Nishiizumi, K., Imamura, M., Caffee, M.W., Southon, J.R., Finkel, R.C., McAninch, J., 2007. Absolute calibration of 10Be AMS standards. Nuclear Instruments and Methods in Physics Research B 258, 403-413.
Nye, J., 1960. The response of glaciers and ice-sheets to seasonal and climatic changes. Proceedings of the Royal Society of London. Series A. Mathematical and Physical Sciences 256, 559-584.
Perren, B.B., Wolfe, A.P., Cooke, C.A., Kjær, K.H., Mazzucchi, D., Steig, E.J., 2012. Twentieth-century warming revives the world’s northernmost lake. Geology 40, 1003-1006.

165
Pfeffer, W.T., Harper, J.T., O'Neel, S., 2008. Kinematic constraints on glacier contributions to 21st century sea-level rise. Science 321, 1340-1343.
Price, S.F., Payne, A.J., Howat, I.M., Smith, B.E., 2011. Committed sea-level rise for the next century from Greenland ice sheet dynamics during the past decade. Proceedings of the National Academy of Sciences 108, 8978-8983.
Rasch, M., Jensen, J.F., 1997. Ancient Eskimo dwelling sites and Holocene relative sea‐level changes in southern Disko Bugt, central West Greenland. Polar Res. 16, 101-115.
Reimer, P., Reimer, R., 2011. CALIBomb Radiocarbon Calibration Program.
Rignot, E., Kanagaratnam, P., 2006. Changes in the Velocity Structure of the Greenland Ice Sheet. Science 311, 986-990.
Rignot, E., Koppes, M., Velicogna, I., 2010. Rapid submarine melting of the calving faces of West Greenland glaciers. Nature Geoscience 3, 187-191.
Rignot, E., Velicogna, I., van den Broeke, M.R., Monaghan, A., Lenaerts, J.T.M., 2011. Acceleration of the contribution of the Greenland and Antarctic ice sheets to sea level rise. Geophysical Research Letters 38, L05503.
Rignot, E., Mouginot, J., 2012. Ice flow in greenland for the international polar year 2008–2009. Geophysical Research Letters 39, DOI: 10.1029/2012GL051634.
Rood, D.H., Hall, S., Guilderson, T.P., Finkel, R.C., Brown, T.A., 2010. Challenges and opportunities in high-precision Be-10 measurements at CAMS. Nuclear Instruments and Methods in Physics Research Section B: Beam Interactions with Materials and Atoms 268, 730-732.
Seidenkrantz, M.-S., Roncaglia, L., Fischel, A., Heilmann-Clausen, C., Kuijpers, A., Moros, M., 2008. Variable North Atlantic climate seesaw patterns documented by a late Holocene marine record from Disko Bugt, West Greenland. Marine Micropaleontology 68, 66-83.
Stocker, T.F., Dahe, Q., Plattner, G.-K., 2013. Climate Change 2013: The Physical Science Basis. Working Group I Contribution to the Fifth Assessment Report of the Intergovernmental Panel on Climate Change. Summary for Policymakers (IPCC, 2013).
166
Stone, J.O., 2000. Air pressure and cosmogenic isotope production. Journal of Geophysical Research 105, 23753-23759.
Stuiver, M., Reimer, P., Reimer, R., 2010. CALIB 6.0, program. Queens Univ., Belfast, UK [Available at http://radiocarbon. pa. qub. ac. uk/calib/.].
Tauber, H., 1960. Copenhagen radiocarbon dates IV. American journal of Science: Radiocarbon supplement 6, 215-225.
Weidick, A., 1968. Observations on some Holocene glacier fluctuations in west Greenland. Meddelesser om Grønland 165, 202 p.
Weidick, A., 1993. Neoglacial change of ice cover and the related response of the Earth’s crust in West Greenland. Rapp. Groenl. Geol. Unders 159, 121-126.
Weidick, A., 1994. Historical fluctuations of calving glaciers in south and West Greenland. Rapport Grønlands Geologiske Undersølgelse 161, 73-79.
Weidick, A., 1996. Neoglacial changes of ice cover and sea level in Greenland–a classical enigma. The Paleo-Eskimo Cultures of Greenland, edited by B. Grønnow, 257-270.
Weidick, A., Bennike, O., 2007. Quaternary glaciation history and glaciology of Jakobshavn Isbræ and the Disko Bugt region, West Greenland: a review. Geological Survey of Denmark and Greenland.
Young, N.E., Briner, J.P., Rood, D.H., Finkel, R.C., Corbett, L.B., Bierman, P.R., 2013a. Age of the Fjord Stade moraines in the Disko Bugt region, western Greenland, and the 9.3 and 8.2 ka cooling events. Quaternary Science Reviews 60, 76-90.
Young, N.E., Schaefer, J.M., Briner, J.P., Goehring, B.M., 2013b. A precise 10Be Production-rate calibration for the Arctic. Journal of Quaternary Science 28, 515-526.

167
VI. Conclusion
Introduction
The goal of this dissertation was to develop a detailed history of Greenland Ice
Sheet (GrIS) fluctuation during the Holocene (11,700 years ago to present) in Disko
Bugt, West Greenland. The purpose of creating this chronology was to evaluate two
questions: (1) Is spatial and temporal variability seen in recent records of GrIS fluctuation
a product of recent unique climate change, or is the variability present throughout the
Holocene record? (2) Does a lag exist in the reaction of land-based ice margins with
respect to their marine based counterparts throughout the Holocene? These questions
were addressed through a series of studies in the Disko Bugt region focusing on ice
margin fluctuations during different time slices of the Holocene. While somewhat
restricted by the resolution of our dating methods, when viewed as a whole, these studies
paint a picture of an ice sheet sector that expands and contracts in step with changes in
climate on millennial timescales. In particular, the Holocene record does not appear to
exhibit the high degree of variability seen in shorter records of recent ice margin change.
Furthermore, a lag in the reaction of land-based sectors of the ice margin to changes in
climate does not appear to be a feature throughout the Holocene record. While instances
of rapid retreat of marine-based ice margins exists in the Holocene record, in general the
timing and rate of ice margin retreat is synchronous regardless of ice marginal setting.
Major Findings
This chronology of ice margin fluctuation for the Disko Bugt region contributes
greatly to our understanding of ice sheet reactions to past changes in climate. By refining

168
the existing radiocarbon-based chronology for the early Holocene retreat, we have found
that the GrIS retreated into the western-most reaches of Disko Bugt ~1000 years earlier
than previously thought (Funder et al., 2011). The increased precision of our early
Holocene chronology has allowed for the calculation of rates of retreat. These rates
indicate that evacuation of ice from the center of Disko Bugt may have been significantly
faster than retreat to the south through the shallower waters along the southern margin of
Disko Bugt. This finding illustrates the potential instability of ice-filled embayments, and
the potential for ice dynamic responses to drive ice marginal retreat out of equilibrium
with climate.
A direct comparison of late Pleistocene retreat in a marine and terrestrial setting
demonstrated similar retreat rates over multiple thousands of years. This indicates that
land-based sectors of the ice margin have the ability to recede as fast as their marine-
based counterparts. A comparison with published chronologies reveals that the net retreat
rates within the Disko Bugt region are in fact representative of late Pleistocene retreat
rates for the entire West Greenland margin and are similar to those calculated for late
Pleistocene ice sheet recession in Scandinavia and North America. Furthermore, it was
determined that climatic forcing rather than ice marginal setting was the primary factor in
controlling the rate of retreat. Retreat rates within the Disko Bugt region, as well as along
the West Greenland margin, slowed during the interval from ~9.6-8.0 ka, indicating a
regional reaction to the 9.3 and 8.2 ka climate events.
Examinations of middle and late Holocene ice margin fluctuations determined
that the pattern of synchronous retreat of the GrIS margin continued, with retreat to a
smaller-than-present ice margin configuration having occurred between 7 ka and 8 ka.
169
Late Holocene advance was broadly synchronous, with the ice margin approaching the
present configuration between 600 and 300 years ago. In the Late Holocene, where our
chronology can attain decadal resolution, the timing of recent retreat, as well as the Late
Holocene maximum extent, is varied across the Disko Bugt region. Findings in this
dissertation, in conjunction published studies, highlight a pattern of late Holocene retreat
where faster flowing, marine-terminating, glaciers initiated retreat earlier, and have
retreated farther than slower-flowing, land-based, glacier systems, This indicates that a
relationship may exist between ice marginal setting/velocity and the response time of
glaciers on decadal timescales. This pattern is confirmed using remote sensing, which
shows that the average retreat from the late Holocene maximum configuration along
marine-terminating portions of the ice margin is an order of magnitude greater than that
of land-based portions of the GrIS margin.
Implications
The new chronology of ice margin fluctuation from the Disko Bugt region
provides longer temporal context for the wealth of contemporaneous studies of ice sheet
behavior in the Disko Bugt region (Holland et al., 2008; Rignot et al., 2010; Joughin et
al., 2014), as well as around Greenland (Bjørk et al., 2012; Kjær et al., 2012; Khan et al.,
2014). Understanding the response of the GrIS to warming climate is of particular
interest, as it provides context for the future, as the GrIS becomes increasingly land-based
due to current warming. Farther abroad, insight into the pattern and speed of collapse of
ice within Disko Bugt during the early-Holocene provides an analogue for the future state
of the large ice-filled embayments, such as those in western Antarctica, a pressing topic
170
in the push to reduce uncertainties about future sea level rise. The patterns derived from
the past behavior of the GrIS have the potential to inform future modeling efforts,
sharpening predictions of future sea level change.
Furthermore, from my research it is apparent that a trend exists within Disko Bugt
glaciers between velocity and the timing of the late Holocene maximum position, with
higher velocity glaciers reaching their maximum position earlier. This suggests slower
flowing glaciers, such as the stretches of land-based ice sheet margin, have not begun to
react to recent warming. If so, slower sectors of the GrIS may have yet to react to
Anthropocene warming, and thus accelerated retreat may be forthcoming for these
historically stable sections of the ice sheet.
Future Work
I believe two avenues of research could be pursued to test and sharpen the results
of this dissertation: (1) Modeling of the Holocene evolution of the Disko Bugt sector of
the GrIS; (2) A coupling of newly emerging sub-ice DEMs with existing threshold lake
studies. This research, in conjunction with previous geochronologic studies (Weidick and
Bennike, 2007; Briner et al., 2010; Young et al., 2013a), marine geophysical
investigations (Hogan et al., 2012; Ó Cofaigh et al., 2013), and climatic proxy records
(Vinther et al., 2009; Young et al., 2011b; Axford et al., 2013) provide an excellent
framework for constraining an ice sheet model. A well-constrained model could be
employed to perform sensitivity tests on marine and atmospheric forcing mechanisms to
ascertain the role that factors such as basal melting, ablation, and calving play in driving
ice margin fluctuations. In addition, these forcing mechanisms could also be evaluated on
171
varying timescales. This would allow for determination of their relative importance in
governing ice margin fluctuations over differing time slices.
Sediment cores from proglacial threshold lakes are one of the few geologic
archives that can constrain the timing of middle Holocene retreat to a smaller-than
present-configuration. Emerging compilations of the topography below the GrIS allow
for threshold lakes to be used not only for temporal constraints on the smaller than
present GrIS, but also spatial constraints. The distance of middle Holocene GrIS retreat
could be calculated by determining the position of drainage divides, that rest below the
present ice sheet. The combination of spatial information from sub-ice DEMs and
temporal information from the radiocarbon dating of macrofossils within lake sediments
would allow for the calculation of retreat rates. These rates of retreat would lend to
interesting comparisons between middle Holocene retreat and that which is ongoing at
present.
References
Axford, Y., Losee, S., Briner, J.P., Francis, D.R., Langdon, P.G., Walker, I.R., 2013. Holocene temperature history at the western Greenland Ice Sheet margin reconstructed from lake sediments. Quaternary Science Reviews 59, 87-100.
Bjørk, A.A., Kjær, K.H., Korsgaard, N.J., Khan, S.A., Kjeldsen, K.K., Andresen, C.S., Larsen, N.K., Funder, S., 2012. An aerial view of 80 years of climate-related glacier fluctuations in southeast Greenland. Nature Geoscience 5, 427-432.
Briner, J., Stewart, H., Young, N., Philipps, W., Losee, S., 2010. Using proglacial-threshold lakes to constrain fluctuations of the Jakobshavn Isbræ ice margin, western Greenland, during the Holocene. Quaternary Science Reviews 29, 3861-3874.

172
Funder, S., Kjeldsen, K.K., Kjaer, K.H., Cofaigh, C.Ó., 2011. The Greenland Ice Sheet during the past 300,000 years: a review. In: In: Elhers, J., Gibbard, P.L. (Eds.). Quaternary Glaciations –Extent and Chronology 15, 699-713.
Hogan, K., Dowdeswell, J., Cofaigh, C.Ó., 2012. Glacimarine sedimentary processes and depositional environments in an embayment fed by West Greenland ice streams. Marine Geology 311-314, 1-16.
Holland, D.M., Thomas, R.H., De Young, B., Ribergaard, M.H., Lyberth, B., 2008. Acceleration of Jakobshavn Isbrae triggered by warm subsurface ocean waters. Nature Geoscience 1, 659-664.
Joughin, I., Smith, B., Shean, D., Floricioiu, D., 2014. Brief Communication: Further summer speedup of Jakobshavn Isbræ. The Cryosphere 8, 209-214.
Khan, S.A., Kjær, K.H., Bevis, M., Bamber, J.L., Wahr, J., Kjeldsen, K.K., Bjørk, A.A., Korsgaard, N.J., Stearns, L.A., van den Broeke, M.R., 2014. Sustained mass loss of the northeast Greenland ice sheet triggered by regional warming. Nature Climate Change 4, 292–299.
Kjær, K.H., Khan, S.A., Korsgaard, N.J., Wahr, J., Bamber, J.L., Hurkmans, R., van den Broeke, M., Timm, L.H., Kjeldsen, K.K., Bjørk, A.A., 2012. Aerial Photographs Reveal Late–20th-Century Dynamic Ice Loss in Northwestern Greenland. Science 337, 569-573.
Ó Cofaigh, C., Dowdeswell, J., Jennings, A., Hogan, K., Kilfeather, A., Hiemstra, J., Noormets, R., Evans, J., McCarthy, D., Andrews, J., 2013. An extensive and dynamic ice sheet on the West Greenland shelf during the last glacial cycle. Geology 41, 219-222.
Rignot, E., Koppes, M., Velicogna, I., 2010. Rapid submarine melting of the calving faces of West Greenland glaciers. Nature Geoscience 3, 187-191.
Vinther, B.M., Buchardt, S.L., Clausen, H.B., Dahl-Jensen, D., Johnsen, S.J., Fisher, D.A., Koerner, R.M., Raynaud, D., Lipenkov, V., Andersen, K.K., Blunier, T., Rasmussen, S.O., Steffensen, J.P., Svensson, A.M., 2009. Holocene thinning of the Greenland ice sheet. Nature 461, 385-388.
Weidick, A., Bennike, O., 2007. Quaternary glaciation history and glaciology of Jakobshavn Isbræ and the Disko Bugt region, West Greenland: a review. Geological Survey of Denmark and Greenland.
173
Young, N.E., Briner, J.P., Stewart, H.A., Axford, Y., Csatho, B., Rood, D.H., Finkel, R.C., 2011. Response of Jakobshavn Isbræ, Greenland, to Holocene climate change. Geology 39, 131-134.
Young, N.E., Briner, J.P., Rood, D.H., Finkel, R.C., Corbett, L.B., Bierman, P.R., 2013. Age of the Fjord Stade moraines in the Disko Bugt region, western Greenland, and the 9.3 and 8.2 ka cooling events. Quaternary Science Reviews 60, 76-90.


