Embed Size (px)
Citation preview
2 November 2018
Internet
LendingTree
Rating
Hold
Valuation & Risks
TMTInternet
Price at 1 Nov 2018 (USD) 250.40
Price target 270.00
52-week range 402.60 - 186.15
ResultsNorth AmericaUnited States
Company
LendingTree
Reuters Bloomberg Exchange Ticker
TREE.OQ TREE US NSM TREE
Date2 November 2018
Deutsche BankResearch
3Q18 Results: Low Hanging Fruit fromthe (Lending)TreeKey Takeaways3Q results were only modestly below Street consensus, but likely better thaninvestor expectations, and 4Q outlook was better than feared, which sparkeda relief rally that we think was compounded by short covering. However, it isunclear whether TREE is completely out of the woods yet. Mortgage revenuedeclined 25% YoY and 17% q/q. The outlook remains challenging, and we expectthe revenue to decline q/q again in 4Q for the third quarter in a row. Whilemanagement said on the call that "we absolutely expect to grow significantly nextyear," given Mortgage Bankers Association (MBA) expects total originations todecline marginally in 2019, it would be challenging for TREE to increase revenue"significantly" next year unless they improve market share or monetization, orboth. Credit Cards rebounded modestly to high single digit growth after an abruptslowdown in 2Q. The outlook remains tepid, and going forward, the companyexpects a "more stable and predictable revenue stream." For the remaining 50%of revenues (as of 3Q), Personal Loans continues to deliver robust growth. Threesmaller business lines – student loans, small business loans, and deposits –generated 100+% YoY growth, aided by recent acquisitions. The recently closedQuoteWizard acquisition (see note: TREE Branches into Insurance – link ) plugsa significant gap in TREE's portfolio, and along with Personal Loans, could bea key driver of growth in the next year. Variable Marketing Margins were thehighest since 1Q15, but the company is likely to continue to prioritize growth overmargins as it seeks to maximize Variable Marketing Dollars. The next catalystwill be the upcoming Analyst Day on Dec. 4, 2018 where we should get a bettersense of the opportunity in the Insurance vertical, the new marketing strategyalong with how the company plans to leverage its traffic and My LendingTreebase to cross-sell higher-frequency products (e.g. Deposits, Insurance, etc),2019 guide, as well as a 3-5 year outlook for the various businesses. In themeantime, the shares could remain volatile. We continue to believe in the long-term story, but we think for sustained and significant share price appreciationfrom current levels, at least one of the two largest verticals (if not both) –Mortgage and Credit Cards – likely needs to start delivering strong organicgrowth once again. As such, we maintain Hold rating and $270 TP.
Positives in the QuarterNon-Mortgage revenue grew 45% YoY to $142M, and represented 72% of totalrevenue. More importantly, the Non-Mortgage business represented more than80% of the Variable Marketing Dollars. Personal Loans grew 52% YoY to ~$39M;the company continues to see increasing demand from newer entrant non-bank
Kunal Madhukar, CFA
Research Analyst
+1-212-250-0237
Lloyd Walmsley
Research Analyst
+1-212-250-7063
Seth Gilbert
Research Associate
+1-212-250-1268
Chris Kuntarich
Research Associate
+1-904-520-4899
Greg Vlahakis
Research Associate
+1-212-250-7149
Price/price relative
LendingTree S&P 500 INDEX (Rebased)
2016 2017 20180
250
500
Performance (%) 1m 3m 12m
Absolute 14.7 5.1 -5.2
S&P 500 INDEX -6.3 -2.6 6.2Source: Deutsche Bank
Deutsche Bank Securities Inc.
Deutsche Bank does and seeks to do business with companies covered in its research reports. Thus, investors should beaware that the firm may have a conflict of interest that could affect the objectivity of this report. Investors should considerthis report as only a single factor in making their investment decision. DISCLOSURES AND ANALYST CERTIFICATIONSARE LOCATED IN APPENDIX 1. MCI (P) 091/04/2018.
Distributed on: 02/11/2018 05:18:50 GMT
7T2se3r0Ot6kwoPa
Provided for the exclusive use of Research Research at Provisional Access on 2018-11-02T05:58+00:00. DO NOT REDISTRIBUTE
2 November 2018
Internet
LendingTree
lenders and traditional banks. Several of the smaller businesses – student loans,small business loans, and deposits – more than doubled YoY, aided by recentacquisitions. Student Loans, in particular, benefitted from the July acquisitionof Student Loan Hero which resulted in broad-based revenue growth of ~230%YoY to ~$13M. Variable Marketing Dollars grew 30% YoY to ~$77M; VariableMarketing Margins or VMM was 39%, the highest since 1Q15. Nevertheless, weexpect margins to decline as the company increases spend on broadcast media tochange consumer perception that it is primarily a mortgage comparison-shoppingplatform. Adjusted EBITDA grew 31% to $45M from increasing leverage onoperating expenses, although cost of revenue, excluding the $3.6M related toadvertising inventory sales to third parties, delevered 106 bps YoY on higher callcenter expenses. The company raised its outlook for the full year across all threemetrics – revenue, Variable Marketing Dollars, and Adjusted EBITDA. The revenueguide -- up to $765-$775M from $745-$765M previously – reflects a decline inMortgage revenue, which is more than offset by the inclusion of 2 months ofcontribution from QuoteWizard where the acquisition closed on Oct. 31, 2018.
Issues to ConsiderMortgage revenue declined 25% YoY on sharp decline in refinance originations(per MBA – link ) exacerbated by a loss in market share. However, on the call,management called out several positives, including 1) "seeing some signs of life inOctober that are very encouraging," 2) mortgage-related traffic re-engaging withTREE on other products, 3) new experience expanded to purchase mortgages.Moreover, although only 6% of the traffic was exposed to the new experiencein 3Q, the company has a pipeline of more than 20 lenders waiting to use thenew platform. Additionally, the new experience is allowing TREE to engage withnew lenders that were not previously active on the marketplace. Nonetheless,Mortgage Bankers Association (MBA) is projecting mortgage originations todecline 7% in 4Q18, down from a more modest 3% decline in 3Q, and refinancevolumes are expected to decrease ~39% in the quarter versus 27% decline in3Q18. Credit Cards revenue growth rebounded modestly to 8% YoY growth from5% in 2Q18 on a more diversified issuer base and better alignment of economicswith the issuers. While the company expects "more stable and predictablerevenue stream," we think returning to the 30+% pro forma YoY growth that TREEdelivered in 2017 and in 1Q18 may be challenging unless issuance of balancetransfer cards (which has attractive economics for TREE) picks up again. MyLendingTree revenue decreased 37 ppts to 68% YoY growth on a 36 ppts toughercomps, which the company attributed to reduced marketing which has resultedin lower traffic.
Valuation & RisksThe shares are currently trading at 2.8x 2020 revenue (versus 17% top linegrowth), 14.6x Adj. EBITDA (versus 21% YoY growth), and 23.1x Adj. EPS (versus25% growth). We maintain our TP of $270, which is based on 3x EV/Revenueon 2020 estimates (previously, we used a 3.5x multiple on a blend of 2019 and2020 estimates), 15x EV/EBITDA (versus 17.5x on a blended average of 2019and 2020 expectations), 20x P/E (from 25x on a blended basis), and DCF on2020 estimates. The key risks to the upside include: 1) increasing digitizationof loan processing which can accelerate adoption, 2) growing My LendingTreebase for higher LTV, 3) disciplined model which can improve margins whengrowth is slower, and 4) seasoned management that has delivered on growthexpectations and M&A integrations. The primary risks on the downside include:1) the digitization initiative could entail a difficult transition, 2) slowdown inMyLendingTree monetization levels, 3) competition and continued challenginglandscape for Mortgages and Credit Cards, 4) limited visibility into how quickly
Key indicators (FY1)
ROE (%) 5.9
ROA (%) 3.1
Net debt/equity (%) -44.2
Book value/share (USD) 24.64
Price/book (x) 10.2
Net interest cover (x) 4.7
EBIT margin (%) 5.4Source: Deutsche Bank
Stock & option liquidity data
Market Cap (USDm) 2,991,028.0
Shares outstanding (m) 11,945.0
Free float (%) 100
Volume (1 Nov 2018) 280,034
Option volume (und. shrs., 1M avg.) –Source: Deutsche Bank
Page 2 Deutsche Bank Securities Inc.
Provided for the exclusive use of Research Research at Provisional Access on 2018-11-02T05:58+00:00. DO NOT REDISTRIBUTE

2 November 2018
Internet
LendingTree
the newer (and nascent) businesses could scale, and 5) the potential need foradditional M&A.
Deutsche Bank Securities Inc. Page 3
Provided for the exclusive use of Research Research at Provisional Access on 2018-11-02T05:58+00:00. DO NOT REDISTRIBUTE
2 November 2018
Internet
LendingTree
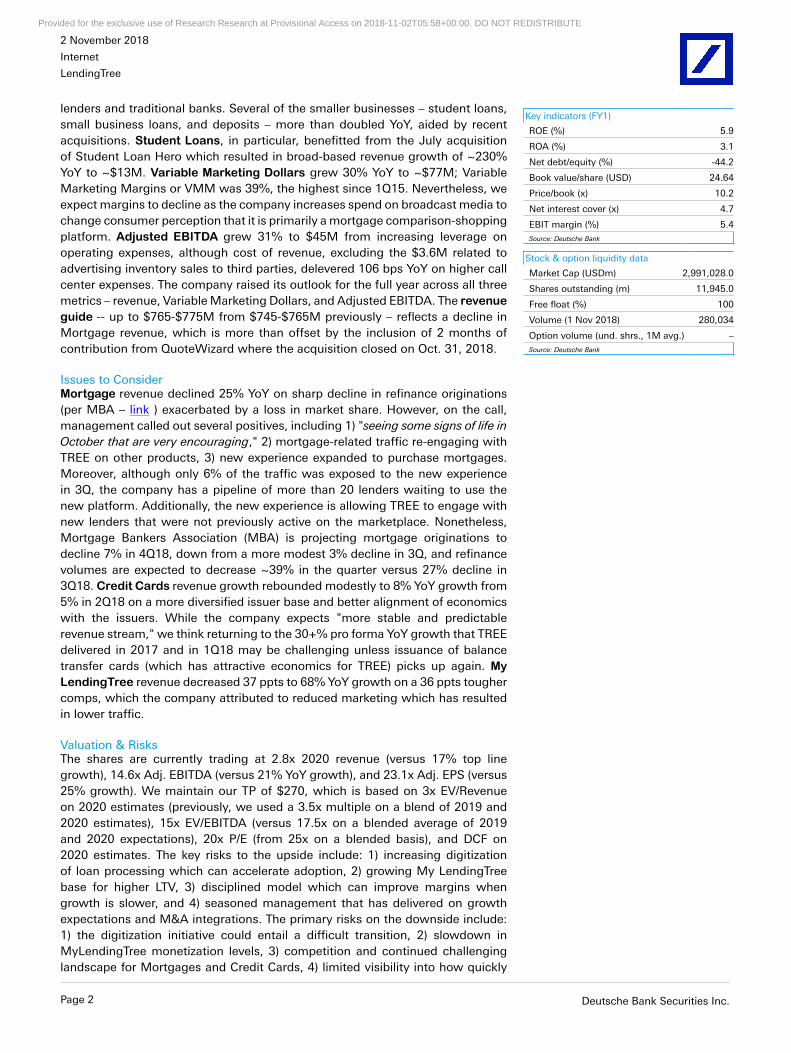
3Q18 Results
3Q results came in marginally below our/Street estimates across most metrics.
Figure 1: 3Q18 Results Versus Expectations
LendingTree, Inc. - Actuals Versus Estimates(In Millions, except per share values)
Actual DB Delta VS Street
Reported Estimates DB Consensus Amount % Amount %
MyLendingTree KPIs# of Members 9,600 9,508 1.0% 3,100 47.7% 800 9.1%
Net Adds 800 708 13.0% (800) (50.0)% (600) (42.9)%
Annualized Revenue per Member $7.69 $8.63 (10.9)% $0.80 11.7% $(0.78) (9.3)%
Revenue Contribution $18 $20 (10.4)% $7 68.4% $(0) (0.6)%
Income StatementRevenue
Mortgage
Purchase $24 $25 (3.6)% $2 7.2% $(3) (11.6)%
Refinance 31 44 (28.2)% (20) (39.0)% (8) (21.3)%
Total Mortgage $55 $69 (19.3)% $(18) (25.0)% $(12) (17.4)%
Non-Mortgage
Personal Loans $39 $38 1.3% $13 52.0% $2 6.6%
Credit Cards 43 42 0.9% 3 8.4% 4 10.1%
Home Equity 17 20 (16.4)% 3 20.0% 0 0.3%
Other 43 32 34.4% 25 131.6% 18 72.5%
Total Non-Mortgage $142 $133 6.5% $44 45.0% $25 21.0%
Total Revenue $197 $202 (2.3)% $200 $26 14.9% $13 7.0%
GAAP Costs & Expenses
Cost of Revenue $11 $7 64.1% $6 147.0% $5 79.3%
Selling and marketing expense 124 129 (3.8)% 6 4.9% 0 0.4%
General and administrative expense 23 24 (2.4)% 5 28.2% (2) (7.2)%
Product development 7 7 0.8% 2 37.5% 1 10.7%
Depreciation & Amortization 8 6 18.9% 2 35.3% 2 35.7%
Other 4 --- 2 56.7% 5 (1400.9)%
Total Operating Expenses $177 $172 2.5% $23 14.8% $11 6.5%
GAAP Operating Income $20 $29 (30.7)% $28 $3 16.2% $2 12.0%
GAAP Op Inc Margins 10.3% 14.5% 14.2%
Adjusted EBITDA $45 $46 (1.1)% $46 $11 30.4% $8 22.0%
Adj EBITDA Margins 23.0% 22.7% 22.8%
Adjusted Net Income $27 $28 (6.1)% $10 64.8% $6 27.8%
GAAP EPS $1.86 $1.26 47.7% $1.27 $1.20 180.6% $(1.15) (38.2)%
Adjusted EPS $1.92 $2.00 (3.8)% $1.79 $0.75 63.9% $0.45 30.5%
YoY Change Q/Q Change
3Q18A
Source: Company Documents; FactSet; Deutsche Bank
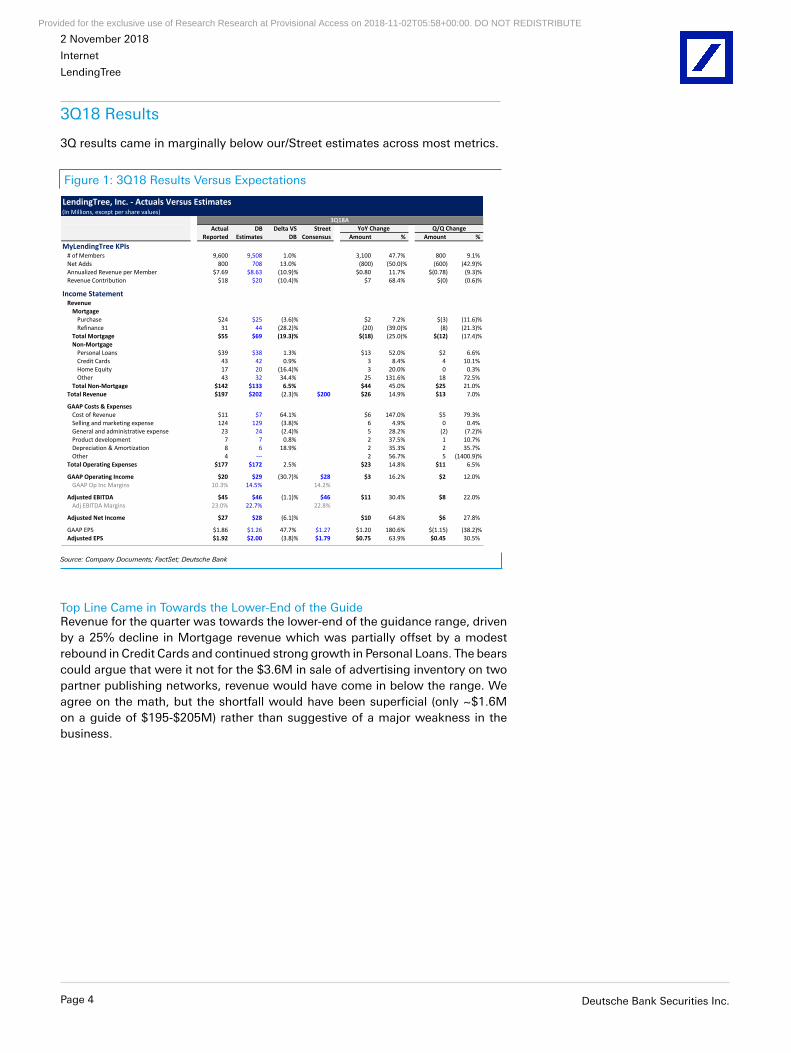
Top Line Came in Towards the Lower-End of the GuideRevenue for the quarter was towards the lower-end of the guidance range, drivenby a 25% decline in Mortgage revenue which was partially offset by a modestrebound in Credit Cards and continued strong growth in Personal Loans. The bearscould argue that were it not for the $3.6M in sale of advertising inventory on twopartner publishing networks, revenue would have come in below the range. Weagree on the math, but the shortfall would have been superficial (only ~$1.6Mon a guide of $195-$205M) rather than suggestive of a major weakness in thebusiness.
Page 4 Deutsche Bank Securities Inc.
Provided for the exclusive use of Research Research at Provisional Access on 2018-11-02T05:58+00:00. DO NOT REDISTRIBUTE
2 November 2018
Internet
LendingTree
Figure 2: Revenue Versus Guidance (In Millions)
$120
$130
$140
$150
$160
$170
$180
$190
$200
$210
$220
1Q17A 2Q17A 3Q17A 4Q17A 1Q18A 2Q18A 3Q18A 4Q18E
Guidance Range Revenue
Source: Company Documents; Deutsche Bank
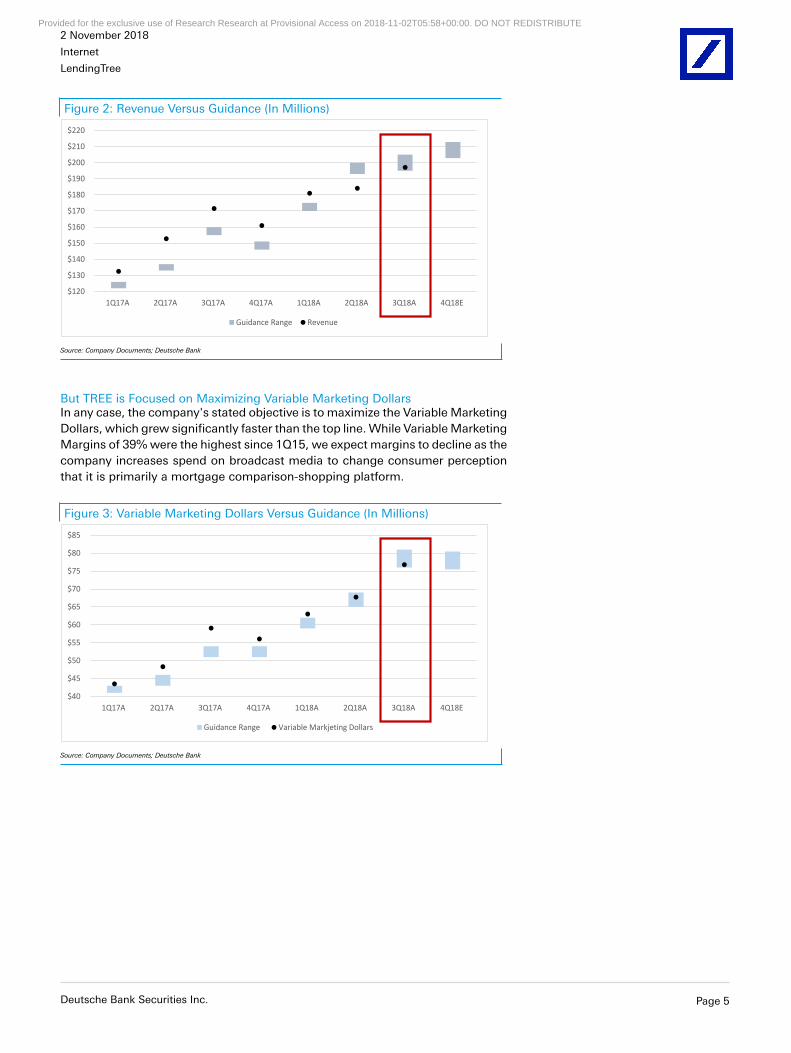
But TREE is Focused on Maximizing Variable Marketing DollarsIn any case, the company's stated objective is to maximize the Variable MarketingDollars, which grew significantly faster than the top line. While Variable MarketingMargins of 39% were the highest since 1Q15, we expect margins to decline as thecompany increases spend on broadcast media to change consumer perceptionthat it is primarily a mortgage comparison-shopping platform.
Figure 3: Variable Marketing Dollars Versus Guidance (In Millions)
$40
$45
$50
$55
$60
$65
$70
$75
$80
$85
1Q17A 2Q17A 3Q17A 4Q17A 1Q18A 2Q18A 3Q18A 4Q18E
Guidance Range Variable Markjeting Dollars
Source: Company Documents; Deutsche Bank
Deutsche Bank Securities Inc. Page 5
Provided for the exclusive use of Research Research at Provisional Access on 2018-11-02T05:58+00:00. DO NOT REDISTRIBUTE
2 November 2018
Internet
LendingTree
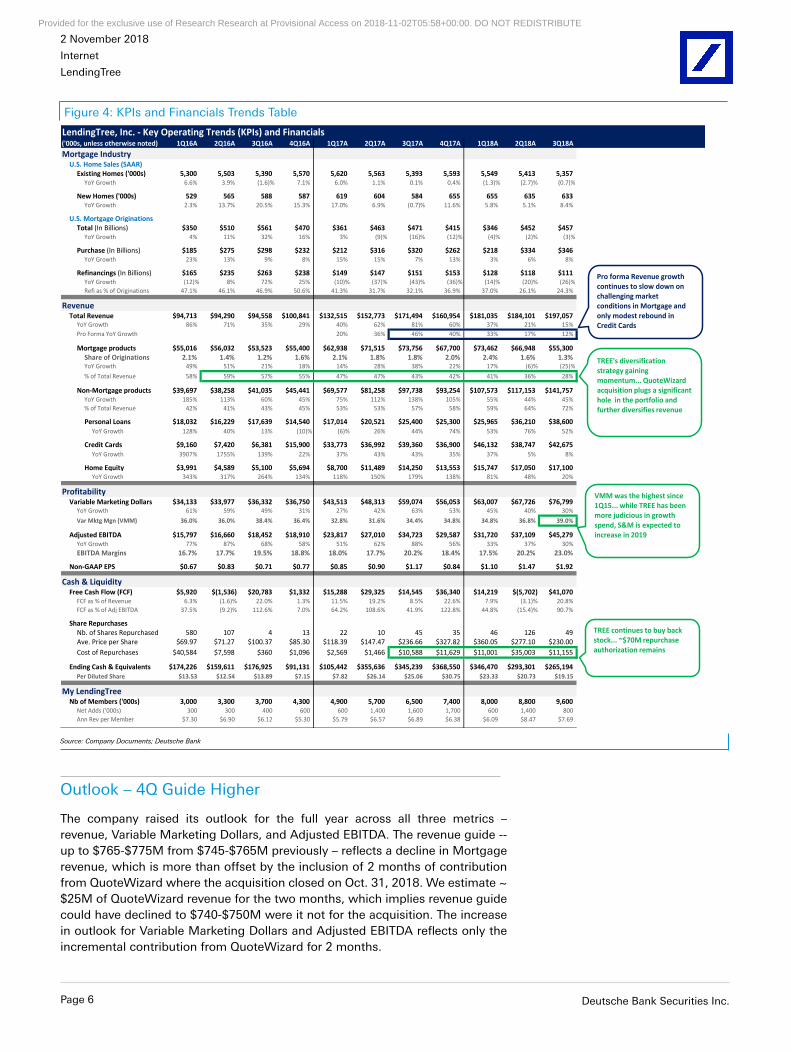
Figure 4: KPIs and Financials Trends Table
LendingTree, Inc. - Key Operating Trends (KPIs) and Financials('000s, unless otherwise noted) 1Q16A 2Q16A 3Q16A 4Q16A 1Q17A 2Q17A 3Q17A 4Q17A 1Q18A 2Q18A 3Q18A
Mortgage IndustryU.S. Home Sales (SAAR)
Existing Homes ('000s) 5,300 5,503 5,390 5,570 5,620 5,563 5,393 5,593 5,549 5,413 5,357YoY Growth 6.6% 3.9% (1.6)% 7.1% 6.0% 1.1% 0.1% 0.4% (1.3)% (2.7)% (0.7)%
New Homes ('000s) 529 565 588 587 619 604 584 655 655 635 633YoY Growth 2.3% 13.7% 20.5% 15.3% 17.0% 6.9% (0.7)% 11.6% 5.8% 5.1% 8.4%
U.S. Mortgage Originations
Total (In Billions) $350 $510 $561 $470 $361 $463 $471 $415 $346 $452 $457YoY Growth 4% 11% 32% 16% 3% (9)% (16)% (12)% (4)% (2)% (3)%
Purchase (In Billions) $185 $275 $298 $232 $212 $316 $320 $262 $218 $334 $346YoY Growth 23% 13% 9% 8% 15% 15% 7% 13% 3% 6% 8%
Refinancings (In Billions) $165 $235 $263 $238 $149 $147 $151 $153 $128 $118 $111YoY Growth (12)% 8% 72% 25% (10)% (37)% (43)% (36)% (14)% (20)% (26)%
Refi as % of Originations 47.1% 46.1% 46.9% 50.6% 41.3% 31.7% 32.1% 36.9% 37.0% 26.1% 24.3%
RevenueTotal Revenue $94,713 $94,290 $94,558 $100,841 $132,515 $152,773 $171,494 $160,954 $181,035 $184,101 $197,057
YoY Growth 86% 71% 35% 29% 40% 62% 81% 60% 37% 21% 15%
Pro Forma YoY Growth 20% 36% 46% 40% 33% 17% 12%
Mortgage products $55,016 $56,032 $53,523 $55,400 $62,938 $71,515 $73,756 $67,700 $73,462 $66,948 $55,300
Share of Originations 2.1% 1.4% 1.2% 1.6% 2.1% 1.8% 1.8% 2.0% 2.4% 1.6% 1.3%YoY Growth 49% 51% 21% 18% 14% 28% 38% 22% 17% (6)% (25)%
% of Total Revenue 58% 59% 57% 55% 47% 47% 43% 42% 41% 36% 28%
Non-Mortgage products $39,697 $38,258 $41,035 $45,441 $69,577 $81,258 $97,738 $93,254 $107,573 $117,153 $141,757YoY Growth 185% 113% 60% 45% 75% 112% 138% 105% 55% 44% 45%
% of Total Revenue 42% 41% 43% 45% 53% 53% 57% 58% 59% 64% 72%
Personal Loans $18,032 $16,229 $17,639 $14,540 $17,014 $20,521 $25,400 $25,300 $25,965 $36,210 $38,600
YoY Growth 128% 40% 13% (10)% (6)% 26% 44% 74% 53% 76% 52%
Credit Cards $9,160 $7,420 $6,381 $15,900 $33,773 $36,992 $39,360 $36,900 $46,132 $38,747 $42,675
YoY Growth 3907% 1755% 139% 22% 37% 43% 43% 35% 37% 5% 8%
Home Equity $3,991 $4,589 $5,100 $5,694 $8,700 $11,489 $14,250 $13,553 $15,747 $17,050 $17,100YoY Growth 343% 317% 264% 134% 118% 150% 179% 138% 81% 48% 20%
ProfitabilityVariable Marketing Dollars $34,133 $33,977 $36,332 $36,750 $43,513 $48,313 $59,074 $56,053 $63,007 $67,726 $76,799
YoY Growth 61% 59% 49% 31% 27% 42% 63% 53% 45% 40% 30%
Var Mktg Mgn (VMM) 36.0% 36.0% 38.4% 36.4% 32.8% 31.6% 34.4% 34.8% 34.8% 36.8% 39.0%
Adjusted EBITDA $15,797 $16,660 $18,452 $18,910 $23,817 $27,010 $34,723 $29,587 $31,720 $37,109 $45,279YoY Growth 77% 87% 68% 58% 51% 62% 88% 56% 33% 37% 30%
EBITDA Margins 16.7% 17.7% 19.5% 18.8% 18.0% 17.7% 20.2% 18.4% 17.5% 20.2% 23.0%
Non-GAAP EPS $0.67 $0.83 $0.71 $0.77 $0.85 $0.90 $1.17 $0.84 $1.10 $1.47 $1.92
Cash & LiquidityFree Cash Flow (FCF) $5,920 $(1,536) $20,783 $1,332 $15,288 $29,325 $14,545 $36,340 $14,219 $(5,702) $41,070
FCF as % of Revenue 6.3% (1.6)% 22.0% 1.3% 11.5% 19.2% 8.5% 22.6% 7.9% (3.1)% 20.8%
FCF as % of Adj EBITDA 37.5% (9.2)% 112.6% 7.0% 64.2% 108.6% 41.9% 122.8% 44.8% (15.4)% 90.7%
Share Repurchases
Nb. of Shares Repurchased 580 107 4 13 22 10 45 35 46 126 49
Ave. Price per Share $69.97 $71.27 $100.37 $85.30 $118.39 $147.47 $236.66 $327.82 $360.05 $277.10 $230.00
Cost of Repurchases $40,584 $7,598 $360 $1,096 $2,569 $1,466 $10,588 $11,629 $11,001 $35,003 $11,155
Ending Cash & Equivalents $174,226 $159,611 $176,925 $91,131 $105,442 $355,636 $345,239 $368,550 $346,470 $293,301 $265,194
Per Diluted Share $13.53 $12.54 $13.89 $7.15 $7.82 $26.14 $25.06 $30.75 $23.33 $20.73 $19.15
My LendingTreeNb of Members ('000s) 3,000 3,300 3,700 4,300 4,900 5,700 6,500 7,400 8,000 8,800 9,600
Net Adds ('000s) 300 300 400 600 600 1,400 1,600 1,700 600 1,400 800
Ann Rev per Member $7.30 $6.90 $6.12 $5.30 $5.79 $6.57 $6.89 $6.38 $6.09 $8.47 $7.69
Pro forma Revenue growth
continues to slow down on
challenging market
conditions in Mortgage and
only modest rebound in
Credit Cards
TREE continues to buy back
stock... ~$70M repurchase
authorization remains
VMM was the highest since
1Q15... while TREE has been
more judicious in growth
spend, S&M is expected to
increase in 2019
TREE's diversification
strategy gaining
momentum... QuoteWizard
acquisition plugs a significant
hole in the portfolio and
further diversifies revenue
Source: Company Documents; Deutsche Bank
Outlook – 4Q Guide Higher
The company raised its outlook for the full year across all three metrics –revenue, Variable Marketing Dollars, and Adjusted EBITDA. The revenue guide --up to $765-$775M from $745-$765M previously – reflects a decline in Mortgagerevenue, which is more than offset by the inclusion of 2 months of contributionfrom QuoteWizard where the acquisition closed on Oct. 31, 2018. We estimate ~$25M of QuoteWizard revenue for the two months, which implies revenue guidecould have declined to $740-$750M were it not for the acquisition. The increasein outlook for Variable Marketing Dollars and Adjusted EBITDA reflects only theincremental contribution from QuoteWizard for 2 months.
Page 6 Deutsche Bank Securities Inc.
Provided for the exclusive use of Research Research at Provisional Access on 2018-11-02T05:58+00:00. DO NOT REDISTRIBUTE
2 November 2018
Internet
LendingTree
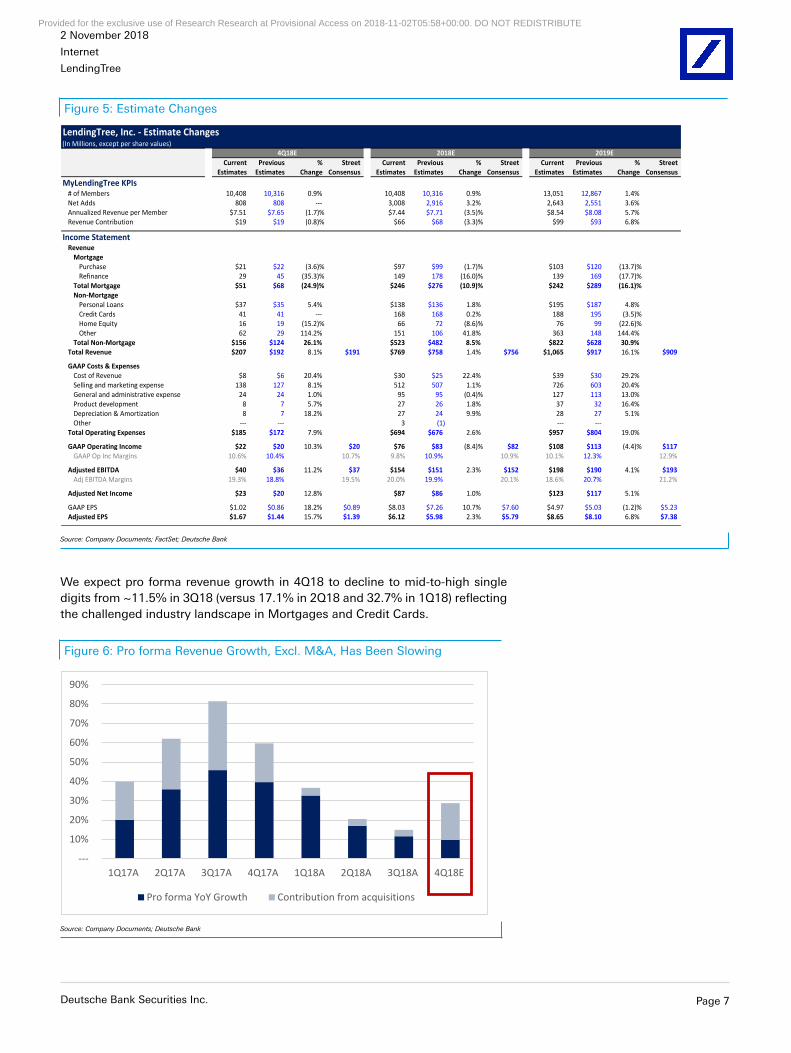
Figure 5: Estimate Changes
LendingTree, Inc. - Estimate Changes(In Millions, except per share values)
Current Previous % Street Current Previous % Street Current Previous % Street
Estimates Estimates Change Consensus Estimates Estimates Change Consensus Estimates Estimates Change Consensus
MyLendingTree KPIs# of Members 10,408 10,316 0.9% 10,408 10,316 0.9% 13,051 12,867 1.4%
Net Adds 808 808 --- 3,008 2,916 3.2% 2,643 2,551 3.6%
Annualized Revenue per Member $7.51 $7.65 (1.7)% $7.44 $7.71 (3.5)% $8.54 $8.08 5.7%
Revenue Contribution $19 $19 (0.8)% $66 $68 (3.3)% $99 $93 6.8%
Income StatementRevenue
Mortgage
Purchase $21 $22 (3.6)% $97 $99 (1.7)% $103 $120 (13.7)%
Refinance 29 45 (35.3)% 149 178 (16.0)% 139 169 (17.7)%
Total Mortgage $51 $68 (24.9)% $246 $276 (10.9)% $242 $289 (16.1)%
Non-Mortgage
Personal Loans $37 $35 5.4% $138 $136 1.8% $195 $187 4.8%
Credit Cards 41 41 --- 168 168 0.2% 188 195 (3.5)%
Home Equity 16 19 (15.2)% 66 72 (8.6)% 76 99 (22.6)%
Other 62 29 114.2% 151 106 41.8% 363 148 144.4%
Total Non-Mortgage $156 $124 26.1% $523 $482 8.5% $822 $628 30.9%
Total Revenue $207 $192 8.1% $191 $769 $758 1.4% $756 $1,065 $917 16.1% $909
GAAP Costs & Expenses
Cost of Revenue $8 $6 20.4% $30 $25 22.4% $39 $30 29.2%
Selling and marketing expense 138 127 8.1% 512 507 1.1% 726 603 20.4%
General and administrative expense 24 24 1.0% 95 95 (0.4)% 127 113 13.0%
Product development 8 7 5.7% 27 26 1.8% 37 32 16.4%
Depreciation & Amortization 8 7 18.2% 27 24 9.9% 28 27 5.1%
Other --- --- 3 (1) --- ---
Total Operating Expenses $185 $172 7.9% $694 $676 2.6% $957 $804 19.0%
GAAP Operating Income $22 $20 10.3% $20 $76 $83 (8.4)% $82 $108 $113 (4.4)% $117
GAAP Op Inc Margins 10.6% 10.4% 10.7% 9.8% 10.9% 10.9% 10.1% 12.3% 12.9%
Adjusted EBITDA $40 $36 11.2% $37 $154 $151 2.3% $152 $198 $190 4.1% $193
Adj EBITDA Margins 19.3% 18.8% 19.5% 20.0% 19.9% 20.1% 18.6% 20.7% 21.2%
Adjusted Net Income $23 $20 12.8% $87 $86 1.0% $123 $117 5.1%
GAAP EPS $1.02 $0.86 18.2% $0.89 $8.03 $7.26 10.7% $7.60 $4.97 $5.03 (1.2)% $5.23
Adjusted EPS $1.67 $1.44 15.7% $1.39 $6.12 $5.98 2.3% $5.79 $8.65 $8.10 6.8% $7.38
4Q18E 2018E 2019E
Source: Company Documents; FactSet; Deutsche Bank
We expect pro forma revenue growth in 4Q18 to decline to mid-to-high singledigits from ~11.5% in 3Q18 (versus 17.1% in 2Q18 and 32.7% in 1Q18) reflectingthe challenged industry landscape in Mortgages and Credit Cards.
Figure 6: Pro forma Revenue Growth, Excl. M&A, Has Been Slowing
---
10%
20%
30%
40%
50%
60%
70%
80%
90%
1Q17A 2Q17A 3Q17A 4Q17A 1Q18A 2Q18A 3Q18A 4Q18E
Pro forma YoY Growth Contribution from acquisitions
Source: Company Documents; Deutsche Bank
Deutsche Bank Securities Inc. Page 7
Provided for the exclusive use of Research Research at Provisional Access on 2018-11-02T05:58+00:00. DO NOT REDISTRIBUTE
2 November 2018
Internet
LendingTree
Valuation & Risks
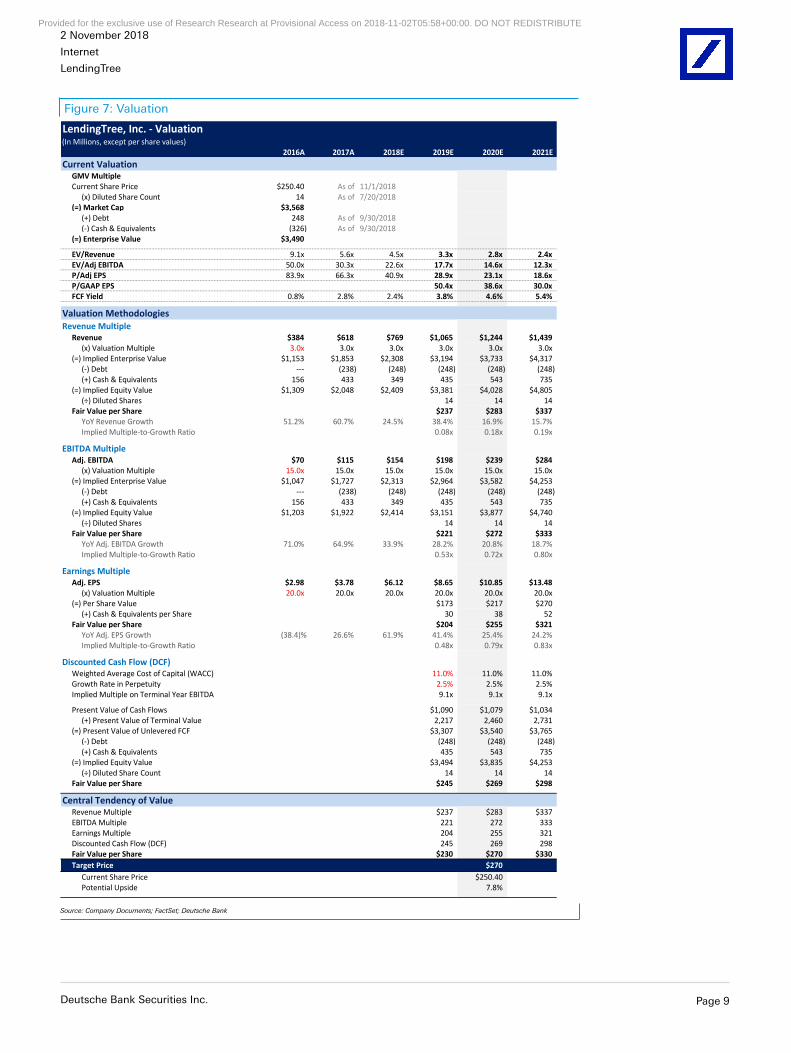
We are raising our 2019 revenue estimate to $1,065M from $917M to reflect theQuoteWizard acquisition as well as updating the outlook for other businesses.Within revenue, we expect Mortgage and Credit Cards revenue to grow at mid-single digits and for the other Non-Mortgage businesses to grow at ~27% on a proforma basis. In the process, we expect the revenue contribution from Mortgageand Credit Cards to decline to ~40% in 2019 from ~50% in 3Q18. However,our Adjusted EBITDA estimate increases only modestly to $198M from $190Mpreviously to reflect the higher marketing spend that management noted onthe call. We expect the company to issue 2019 guidance, and provide 3-5 yearoutlooks for the key business lines, at the upcoming Analyst Day.
The shares are currently trading at 2.8x 2020 revenue (versus 17% top linegrowth), 14.6x Adj. EBITDA (versus 21% YoY growth), and 23.1x Adj. EPS (versus25% growth). We maintain our TP of $270, which is based on 3x EV/Revenue on2020 estimates (previously, we used a 3.5x multiple on a blend of 2019 and 2020estimates), 15x EV/EBITDA (versus 17.5x on a blended average of 2019 and 2020expectations), 20x P/E (from 25x on a blended basis), and DCF on 2020 estimates.
The key risks to the upside include: 1) increasing digitization of loan processingwhich can accelerate adoption, 2) growing My LendingTree base for higherLTV, 3) disciplined model which can improve margins when growth is slower,and 4) seasoned management that has delivered on growth expectations andM&A integrations. The primary risks on the downside include: 1) the digitizationinitiative could entail a difficult transition, 2) slowdown in MyLendingTreemonetization levels, 3) competition and continued challenging landscape forMortgages and Credit Cards, 4) limited visibility into how quickly the newer (andnascent) businesses could scale, and 5) the potential need for additional M&A.
Page 8 Deutsche Bank Securities Inc.
Provided for the exclusive use of Research Research at Provisional Access on 2018-11-02T05:58+00:00. DO NOT REDISTRIBUTE
2 November 2018
Internet
LendingTree
Figure 7: Valuation
LendingTree, Inc. - Valuation(In Millions, except per share values)
2016A 2017A 2018E 2019E 2020E 2021E
Current ValuationGMV Multiple
Current Share Price $250.40 As of 11/1/2018
(x) Diluted Share Count 14 As of 7/20/2018
(=) Market Cap $3,568
(+) Debt 248 As of 9/30/2018
(-) Cash & Equivalents (326) As of 9/30/2018
(=) Enterprise Value $3,490
EV/Revenue 9.1x 5.6x 4.5x 3.3x 2.8x 2.4x
EV/Adj EBITDA 50.0x 30.3x 22.6x 17.7x 14.6x 12.3x
P/Adj EPS 83.9x 66.3x 40.9x 28.9x 23.1x 18.6x
P/GAAP EPS 50.4x 38.6x 30.0x
FCF Yield 0.8% 2.8% 2.4% 3.8% 4.6% 5.4%
Valuation Methodologies
Revenue Multiple
Revenue $384 $618 $769 $1,065 $1,244 $1,439
(x) Valuation Multiple 3.0x 3.0x 3.0x 3.0x 3.0x 3.0x
(=) Implied Enterprise Value $1,153 $1,853 $2,308 $3,194 $3,733 $4,317
(-) Debt --- (238) (248) (248) (248) (248)
(+) Cash & Equivalents 156 433 349 435 543 735
(=) Implied Equity Value $1,309 $2,048 $2,409 $3,381 $4,028 $4,805
(÷) Diluted Shares 14 14 14
Fair Value per Share $237 $283 $337
YoY Revenue Growth 51.2% 60.7% 24.5% 38.4% 16.9% 15.7%
Implied Multiple-to-Growth Ratio 0.08x 0.18x 0.19x
EBITDA Multiple
Adj. EBITDA $70 $115 $154 $198 $239 $284
(x) Valuation Multiple 15.0x 15.0x 15.0x 15.0x 15.0x 15.0x
(=) Implied Enterprise Value $1,047 $1,727 $2,313 $2,964 $3,582 $4,253
(-) Debt --- (238) (248) (248) (248) (248)
(+) Cash & Equivalents 156 433 349 435 543 735
(=) Implied Equity Value $1,203 $1,922 $2,414 $3,151 $3,877 $4,740
(÷) Diluted Shares 14 14 14
Fair Value per Share $221 $272 $333
YoY Adj. EBITDA Growth 71.0% 64.9% 33.9% 28.2% 20.8% 18.7%
Implied Multiple-to-Growth Ratio 0.53x 0.72x 0.80x
Earnings Multiple
Adj. EPS $2.98 $3.78 $6.12 $8.65 $10.85 $13.48
(x) Valuation Multiple 20.0x 20.0x 20.0x 20.0x 20.0x 20.0x
(=) Per Share Value $173 $217 $270
(+) Cash & Equivalents per Share 30 38 52
Fair Value per Share $204 $255 $321
YoY Adj. EPS Growth (38.4)% 26.6% 61.9% 41.4% 25.4% 24.2%
Implied Multiple-to-Growth Ratio 0.48x 0.79x 0.83x
Discounted Cash Flow (DCF)
Weighted Average Cost of Capital (WACC) 11.0% 11.0% 11.0%
Growth Rate in Perpetuity 2.5% 2.5% 2.5%
Implied Multiple on Terminal Year EBITDA 9.1x 9.1x 9.1x
Present Value of Cash Flows $1,090 $1,079 $1,034
(+) Present Value of Terminal Value 2,217 2,460 2,731
(=) Present Value of Unlevered FCF $3,307 $3,540 $3,765
(-) Debt (248) (248) (248)
(+) Cash & Equivalents 435 543 735
(=) Implied Equity Value $3,494 $3,835 $4,253
(÷) Diluted Share Count 14 14 14
Fair Value per Share $245 $269 $298
Central Tendency of ValueRevenue Multiple $237 $283 $337
EBITDA Multiple 221 272 333
Earnings Multiple 204 255 321
Discounted Cash Flow (DCF) 245 269 298
Fair Value per Share $230 $270 $330
Target Price $270
Current Share Price $250.40
Potential Upside 7.8%
Source: Company Documents; FactSet; Deutsche Bank
Deutsche Bank Securities Inc. Page 9
Provided for the exclusive use of Research Research at Provisional Access on 2018-11-02T05:58+00:00. DO NOT REDISTRIBUTE
Pag
e 10
Deu
tsche B
ank S
ecurities In
c.
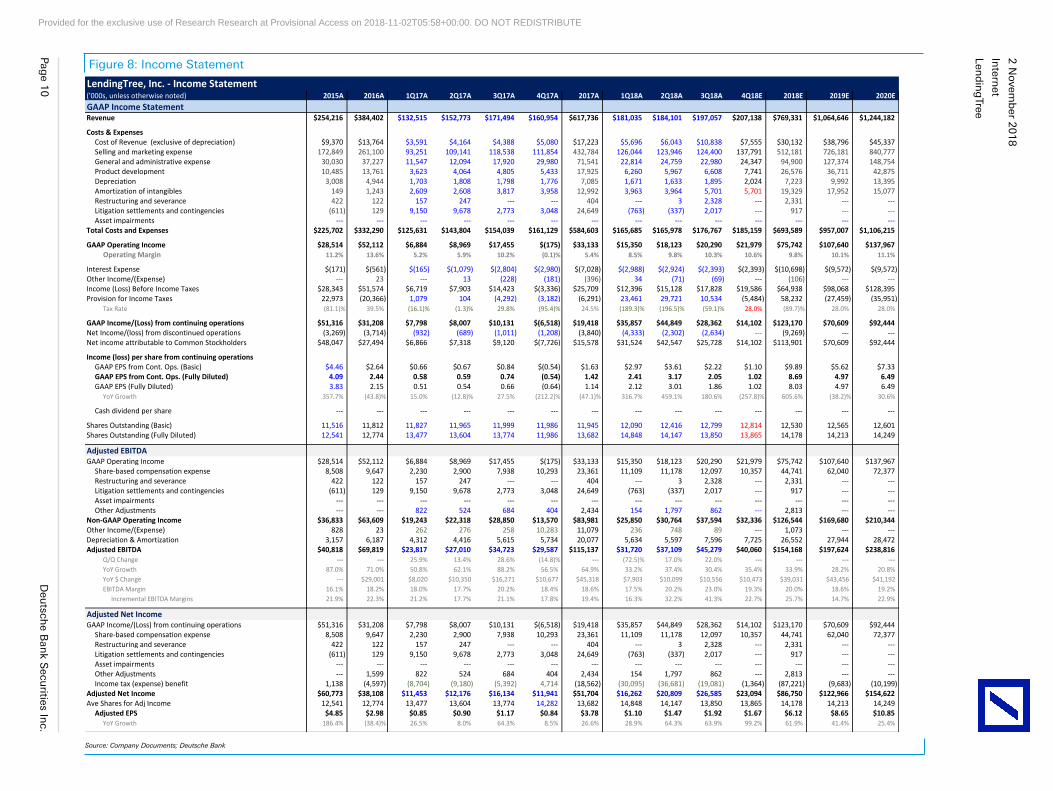
Figure 8: Income Statement
LendingTree, Inc. - Income Statement('000s, unless otherwise noted) 2015A 2016A 1Q17A 2Q17A 3Q17A 4Q17A 2017A 1Q18A 2Q18A 3Q18A 4Q18E 2018E 2019E 2020E
GAAP Income StatementRevenue $254,216 $384,402 $132,515 $152,773 $171,494 $160,954 $617,736 $181,035 $184,101 $197,057 $207,138 $769,331 $1,064,646 $1,244,182
Costs & Expenses
Cost of Revenue (exclusive of depreciation) $9,370 $13,764 $3,591 $4,164 $4,388 $5,080 $17,223 $5,696 $6,043 $10,838 $7,555 $30,132 $38,796 $45,337
Selling and marketing expense 172,849 261,100 93,251 109,141 118,538 111,854 432,784 126,044 123,946 124,400 137,791 512,181 726,181 840,777
General and administrative expense 30,030 37,227 11,547 12,094 17,920 29,980 71,541 22,814 24,759 22,980 24,347 94,900 127,374 148,754
Product development 10,485 13,761 3,623 4,064 4,805 5,433 17,925 6,260 5,967 6,608 7,741 26,576 36,711 42,875
Depreciation 3,008 4,944 1,703 1,808 1,798 1,776 7,085 1,671 1,633 1,895 2,024 7,223 9,992 13,395
Amortization of intangibles 149 1,243 2,609 2,608 3,817 3,958 12,992 3,963 3,964 5,701 5,701 19,329 17,952 15,077
Restructuring and severance 422 122 157 247 --- --- 404 --- 3 2,328 --- 2,331 --- ---
Litigation settlements and contingencies (611) 129 9,150 9,678 2,773 3,048 24,649 (763) (337) 2,017 --- 917 --- ---
Asset impairments --- --- --- --- --- --- --- --- --- --- --- --- --- ---
Total Costs and Expenses $225,702 $332,290 $125,631 $143,804 $154,039 $161,129 $584,603 $165,685 $165,978 $176,767 $185,159 $693,589 $957,007 $1,106,215
GAAP Operating Income $28,514 $52,112 $6,884 $8,969 $17,455 $(175) $33,133 $15,350 $18,123 $20,290 $21,979 $75,742 $107,640 $137,967
Operating Margin 11.2% 13.6% 5.2% 5.9% 10.2% (0.1)% 5.4% 8.5% 9.8% 10.3% 10.6% 9.8% 10.1% 11.1%
Interest Expense $(171) $(561) $(165) $(1,079) $(2,804) $(2,980) $(7,028) $(2,988) $(2,924) $(2,393) $(2,393) $(10,698) $(9,572) $(9,572)
Other Income/(Expense) --- 23 --- 13 (228) (181) (396) 34 (71) (69) --- (106) --- ---
Income (Loss) Before Income Taxes $28,343 $51,574 $6,719 $7,903 $14,423 $(3,336) $25,709 $12,396 $15,128 $17,828 $19,586 $64,938 $98,068 $128,395
Provision for Income Taxes 22,973 (20,366) 1,079 104 (4,292) (3,182) (6,291) 23,461 29,721 10,534 (5,484) 58,232 (27,459) (35,951)
Tax Rate (81.1)% 39.5% (16.1)% (1.3)% 29.8% (95.4)% 24.5% (189.3)% (196.5)% (59.1)% 28.0% (89.7)% 28.0% 28.0%
GAAP Income/(Loss) from continuing operations $51,316 $31,208 $7,798 $8,007 $10,131 $(6,518) $19,418 $35,857 $44,849 $28,362 $14,102 $123,170 $70,609 $92,444
Net Income/(loss) from discontinued operations (3,269) (3,714) (932) (689) (1,011) (1,208) (3,840) (4,333) (2,302) (2,634) --- (9,269) --- ---
Net income attributable to Common Stockholders $48,047 $27,494 $6,866 $7,318 $9,120 $(7,726) $15,578 $31,524 $42,547 $25,728 $14,102 $113,901 $70,609 $92,444
Income (loss) per share from continuing operations
GAAP EPS from Cont. Ops. (Basic) $4.46 $2.64 $0.66 $0.67 $0.84 $(0.54) $1.63 $2.97 $3.61 $2.22 $1.10 $9.89 $5.62 $7.33
GAAP EPS from Cont. Ops. (Fully Diluted) 4.09 2.44 0.58 0.59 0.74 (0.54) 1.42 2.41 3.17 2.05 1.02 8.69 4.97 6.49
GAAP EPS (Fully Diluted) 3.83 2.15 0.51 0.54 0.66 (0.64) 1.14 2.12 3.01 1.86 1.02 8.03 4.97 6.49
YoY Growth 357.7% (43.8)% 15.0% (12.8)% 27.5% (212.2)% (47.1)% 316.7% 459.1% 180.6% (257.8)% 605.6% (38.2)% 30.6%
Cash dividend per share --- --- --- --- --- --- --- --- --- --- --- --- --- ---
Shares Outstanding (Basic) 11,516 11,812 11,827 11,965 11,999 11,986 11,945 12,090 12,416 12,799 12,814 12,530 12,565 12,601
Shares Outstanding (Fully Diluted) 12,541 12,774 13,477 13,604 13,774 11,986 13,682 14,848 14,147 13,850 13,865 14,178 14,213 14,249
Adjusted EBITDA
GAAP Operating Income $28,514 $52,112 $6,884 $8,969 $17,455 $(175) $33,133 $15,350 $18,123 $20,290 $21,979 $75,742 $107,640 $137,967
Share-based compensation expense 8,508 9,647 2,230 2,900 7,938 10,293 23,361 11,109 11,178 12,097 10,357 44,741 62,040 72,377
Restructuring and severance 422 122 157 247 --- --- 404 --- 3 2,328 --- 2,331 --- ---
Litigation settlements and contingencies (611) 129 9,150 9,678 2,773 3,048 24,649 (763) (337) 2,017 --- 917 --- ---
Asset impairments --- --- --- --- --- --- --- --- --- --- --- --- --- ---
Other Adjustments --- --- 822 524 684 404 2,434 154 1,797 862 --- 2,813 --- ---
Non-GAAP Operating Income $36,833 $63,609 $19,243 $22,318 $28,850 $13,570 $83,981 $25,850 $30,764 $37,594 $32,336 $126,544 $169,680 $210,344
Other Income/(Expense) 828 23 262 276 258 10,283 11,079 236 748 89 --- 1,073 --- ---
Depreciation & Amortization 3,157 6,187 4,312 4,416 5,615 5,734 20,077 5,634 5,597 7,596 7,725 26,552 27,944 28,472
Adjusted EBITDA $40,818 $69,819 $23,817 $27,010 $34,723 $29,587 $115,137 $31,720 $37,109 $45,279 $40,060 $154,168 $197,624 $238,816
Q/Q Change --- --- 25.9% 13.4% 28.6% (14.8)% --- (72.5)% 17.0% 22.0% --- --- --- ---
YoY Growth 87.0% 71.0% 50.8% 62.1% 88.2% 56.5% 64.9% 33.2% 37.4% 30.4% 35.4% 33.9% 28.2% 20.8%
YoY $ Change --- $29,001 $8,020 $10,350 $16,271 $10,677 $45,318 $7,903 $10,099 $10,556 $10,473 $39,031 $43,456 $41,192
EBITDA Margin 16.1% 18.2% 18.0% 17.7% 20.2% 18.4% 18.6% 17.5% 20.2% 23.0% 19.3% 20.0% 18.6% 19.2%
Incremental EBITDA Margins 21.9% 22.3% 21.2% 17.7% 21.1% 17.8% 19.4% 16.3% 32.2% 41.3% 22.7% 25.7% 14.7% 22.9%
Adjusted Net Income
GAAP Income/(Loss) from continuing operations $51,316 $31,208 $7,798 $8,007 $10,131 $(6,518) $19,418 $35,857 $44,849 $28,362 $14,102 $123,170 $70,609 $92,444
Share-based compensation expense 8,508 9,647 2,230 2,900 7,938 10,293 23,361 11,109 11,178 12,097 10,357 44,741 62,040 72,377
Restructuring and severance 422 122 157 247 --- --- 404 --- 3 2,328 --- 2,331 --- ---
Litigation settlements and contingencies (611) 129 9,150 9,678 2,773 3,048 24,649 (763) (337) 2,017 --- 917 --- ---
Asset impairments --- --- --- --- --- --- --- --- --- --- --- --- --- ---
Other Adjustments --- 1,599 822 524 684 404 2,434 154 1,797 862 --- 2,813 --- ---
Income tax (expense) benefit 1,138 (4,597) (8,704) (9,180) (5,392) 4,714 (18,562) (30,095) (36,681) (19,081) (1,364) (87,221) (9,683) (10,199)
Adjusted Net Income $60,773 $38,108 $11,453 $12,176 $16,134 $11,941 $51,704 $16,262 $20,809 $26,585 $23,094 $86,750 $122,966 $154,622
Ave Shares for Adj Income 12,541 12,774 13,477 13,604 13,774 14,282 13,682 14,848 14,147 13,850 13,865 14,178 14,213 14,249
Adjusted EPS $4.85 $2.98 $0.85 $0.90 $1.17 $0.84 $3.78 $1.10 $1.47 $1.92 $1.67 $6.12 $8.65 $10.85
YoY Growth 186.4% (38.4)% 26.5% 8.0% 64.3% 8.5% 26.6% 28.9% 64.3% 63.9% 99.2% 61.9% 41.4% 25.4%
Source: Company Documents; Deutsche Bank
2 N
ovemb
er 20
18
Intern
et
Lend
ing
Tree
Provided for the exclusive use of Research Research at Provisional Access on 2018-11-02T05:58+00:00. DO NOT REDISTRIBUTE
2 November 2018
Internet
LendingTree
Appendix 1
Important Disclosures
*Other information available upon request
Disclosure checklistCompany Ticker Recent price* Disclosure
LendingTree TREE.OQ 250.40 (USD) 1 Nov 2018 2*Prices are current as of the end of the previous trading session unless otherwise indicated and are sourced from local exchanges via Reuters, Bloomberg and other vendors .Other information is sourced from Deutsche Bank, subject companies, and other sources. For disclosures pertaining to recommendations or estimates made on securities other thanthe primary subject of this research, please see the most recently published company report or visit our global disclosure look-up page on our website at https://research.db.com/Research/Disclosures/CompanySearch. Aside from within this report, important risk and conflict disclosures can also be found at https://research.db.com/Research/Topics/Equities?topicId=RB0002. Investors are strongly encouraged to review this information before investing.
Important Disclosures Required by U.S. RegulatorsDisclosures marked with an asterisk may also be required by at least one jurisdiction in addition to the United States.SeeImportant Disclosures Required by Non-US Regulators and Explanatory Notes.
2. Deutsche Bank and/or its affiliate(s) makes a market in equity securities issued by this company.
Important Disclosures Required by Non-U.S. RegulatorsDisclosures marked with an asterisk may also be required by at least one jurisdiction in addition to the United States.SeeImportant Disclosures Required by Non-US Regulators and Explanatory Notes.
2. Deutsche Bank and/or its affiliate(s) makes a market in equity securities issued by this company.
For disclosures pertaining to recommendations or estimates made on securities other than the primary subject of thisresearch, please see the most recently published company report or visit our global disclosure look-up page on our websiteat https://research.db.com/Research/Disclosures/CompanySearch
Analyst Certification
The views expressed in this report accurately reflect the personal views of the undersigned lead analyst(s) about thesubject issuer and the securities of the issuer. In addition, the undersigned lead analyst(s) has not and will not receive anycompensation for providing a specific recommendation or view in this report. Kunal Madhukar
Deutsche Bank Securities Inc. Page 11
Provided for the exclusive use of Research Research at Provisional Access on 2018-11-02T05:58+00:00. DO NOT REDISTRIBUTE
2 November 2018
Internet
LendingTree
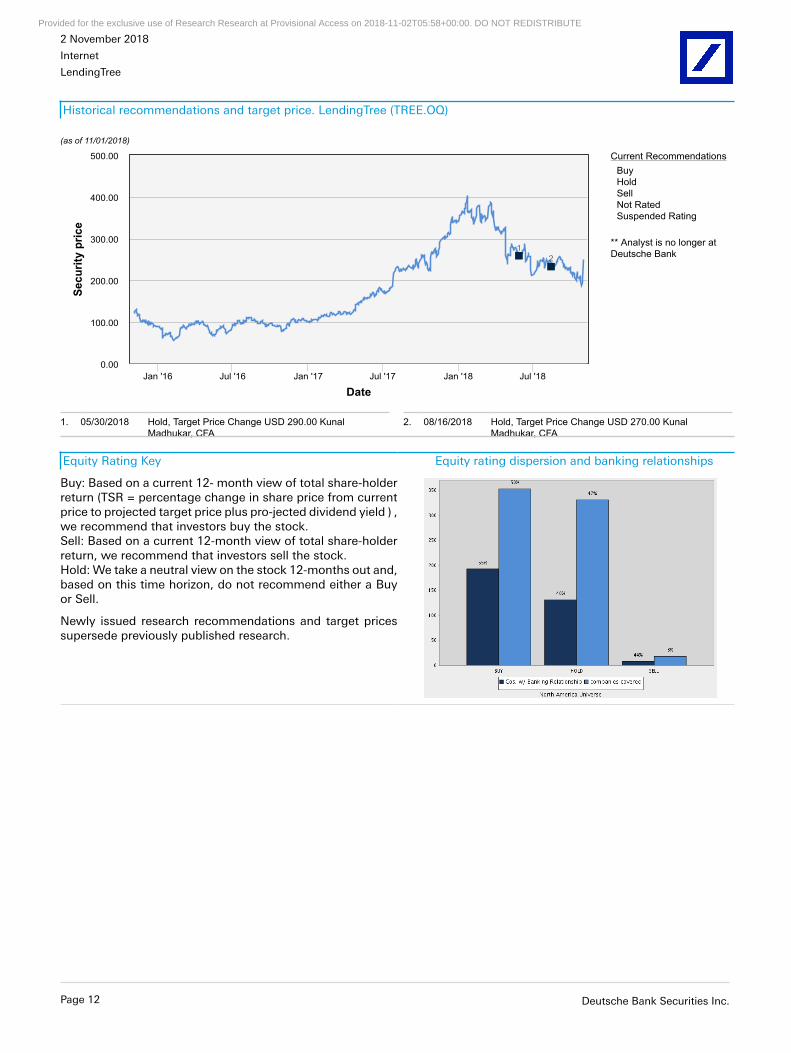
Historical recommendations and target price. LendingTree (TREE.OQ)
(as of 11/01/2018)
Current RecommendationsBuyHoldSellNot RatedSuspended Rating
** Analyst is no longer atDeutsche Bank
Date
Secu
rity
pric
e
12
Jan '16 Jul '16 Jan '17 Jul '17 Jan '18 Jul '180.00
100.00
200.00
300.00
400.00
500.00
1. 05/30/2018 Hold, Target Price Change USD 290.00 KunalMadhukar, CFA
2. 08/16/2018 Hold, Target Price Change USD 270.00 KunalMadhukar, CFA
§§§§$$$$$§§§§§
Equity Rating Key Equity rating dispersion and banking relationships
Buy: Based on a current 12- month view of total share-holderreturn (TSR = percentage change in share price from currentprice to projected target price plus pro-jected dividend yield ) ,we recommend that investors buy the stock.Sell: Based on a current 12-month view of total share-holderreturn, we recommend that investors sell the stock.Hold: We take a neutral view on the stock 12-months out and,based on this time horizon, do not recommend either a Buyor Sell.
Newly issued research recommendations and target pricessupersede previously published research.
Page 12 Deutsche Bank Securities Inc.
Provided for the exclusive use of Research Research at Provisional Access on 2018-11-02T05:58+00:00. DO NOT REDISTRIBUTE
2 November 2018
Internet
LendingTree
Additional Information
The information and opinions in this report were prepared by Deutsche Bank AG or one of its affiliates (collectively"Deutsche Bank"). Though the information herein is believed to be reliable and has been obtained from public sourcesbelieved to be reliable, Deutsche Bank makes no representation as to its accuracy or completeness. Hyperlinks to third-party websites in this report are provided for reader convenience only. Deutsche Bank neither endorses the content noris responsible for the accuracy or security controls of those websites.??If you use the services of Deutsche Bank in connection with a purchase or sale of a security that is discussed in this report,or is included or discussed in another communication (oral or written) from a Deutsche Bank analyst, Deutsche Bank mayact as principal for its own account or as agent for another person.??Deutsche Bank may consider this report in deciding to trade as principal. It may also engage in transactions, for itsown account or with customers, in a manner inconsistent with the views taken in this research report. Others withinDeutsche Bank, including strategists, sales staff and other analysts, may take views that are inconsistent with those takenin this research report. Deutsche Bank issues a variety of research products, including fundamental analysis, equity-linkedanalysis, quantitative analysis and trade ideas. Recommendations contained in one type of communication may differfrom recommendations contained in others, whether as a result of differing time horizons, methodologies, perspectivesor otherwise. Deutsche Bank and/or its affiliates may also be holding debt or equity securities of the issuers it writeson. Analysts are paid in part based on the profitability of Deutsche Bank AG and its affiliates, which includes investmentbanking, trading and principal trading revenues.??Opinions, estimates and projections constitute the current judgment of the author as of the date of this report. They donot necessarily reflect the opinions of Deutsche Bank and are subject to change without notice. Deutsche Bank providesliquidity for buyers and sellers of securities issued by the companies it covers. Deutsche Bank research analysts sometimeshave shorter-term trade ideas that may be inconsistent with Deutsche Bank's existing longer-term ratings. Some tradeideas for equities are listed as Catalyst Calls on the Research Website ( https://research.db.com/Research/ ) , and can befound on the general coverage list and also on the covered company ’ s page. A Catalyst Call represents a high-convictionbelief by an analyst that a stock will outperform or underperform the market and/or a specified sector over a time frame ofno less than two weeks and no more than three months. In addition to Catalyst Calls, analysts may occasionally discusswith our clients, and with Deutsche Bank salespersons and traders, trading strategies or ideas that reference catalysts orevents that may have a near-term or medium-term impact on the market price of the securities discussed in this report,which impact may be directionally counter to the analysts' current 12-month view of total return or investment return asdescribed herein. Deutsche Bank has no obligation to update, modify or amend this report or to otherwise notify a recipientthereof if an opinion, forecast or estimate changes or becomes inaccurate. Coverage and the frequency of changes inmarket conditions and in both general and company-specific economic prospects make it difficult to update research atdefined intervals. Updates are at the sole discretion of the coverage analyst or of the Research Department Management,and the majority of reports are published at irregular intervals. This report is provided for informational purposes only anddoes not take into account the particular investment objectives, financial situations, or needs of individual clients. It is notan offer or a solicitation of an offer to buy or sell any financial instruments or to participate in any particular trading strategy.Target prices are inherently imprecise and a product of the analyst ’ s judgment. The financial instruments discussedin this report may not be suitable for all investors, and investors must make their own informed investment decisions.Prices and availability of financial instruments are subject to change without notice, and investment transactions can leadto losses as a result of price fluctuations and other factors. If a financial instrument is denominated in a currency otherthan an investor's currency, a change in exchange rates may adversely affect the investment. Past performance is notnecessarily indicative of future results. Performance calculations exclude transaction costs, unless otherwise indicated.Unless otherwise indicated, prices are current as of the end of the previous trading session and are sourced from localexchanges via Reuters, Bloomberg and other vendors. Data is also sourced from Deutsche Bank, subject companies, andother parties.??The Deutsche Bank Research Department is independent of other business divisions of the Bank. Details regarding ourorganizational arrangements and information barriers we have to prevent and avoid conflicts of interest with respect toour research are available on our website ( https://research.db.com/Research/ ) under Disclaimer.??
Deutsche Bank Securities Inc. Page 13
Provided for the exclusive use of Research Research at Provisional Access on 2018-11-02T05:58+00:00. DO NOT REDISTRIBUTE
2 November 2018
Internet
LendingTree
Macroeconomic fluctuations often account for most of the risks associated with exposures to instruments that promiseto pay fixed or variable interest rates. For an investor who is long fixed-rate instruments (thus receiving these cashflows), increases in interest rates naturally lift the discount factors applied to the expected cash flows and thuscause a loss. The longer the maturity of a certain cash flow and the higher the move in the discount factor, thehigher will be the loss. Upside surprises in inflation, fiscal funding needs, and FX depreciation rates are among themost common adverse macroeconomic shocks to receivers. But counterparty exposure, issuer creditworthiness, clientsegmentation, regulation (including changes in assets holding limits for different types of investors), changes in taxpolicies, currency convertibility (which may constrain currency conversion, repatriation of profits and/or liquidation ofpositions), and settlement issues related to local clearing houses are also important risk factors. The sensitivity of fixed-income instruments to macroeconomic shocks may be mitigated by indexing the contracted cash flows to inflation, toFX depreciation, or to specified interest rates – these are common in emerging markets. The index fixings may – byconstruction – lag or mis-measure the actual move in the underlying variables they are intended to track. The choice ofthe proper fixing (or metric) is particularly important in swaps markets, where floating coupon rates (i.e., coupons indexedto a typically short-dated interest rate reference index) are exchanged for fixed coupons. Funding in a currency that differsfrom the currency in which coupons are denominated carries FX risk. Options on swaps (swaptions) the risks typical tooptions in addition to the risks related to rates movements.??Derivative transactions involve numerous risks including market, counterparty default and illiquidity risk. Theappropriateness of these products for use by investors depends on the investors' own circumstances, including theirtax position, their regulatory environment and the nature of their other assets and liabilities; as such, investors shouldtake expert legal and financial advice before entering into any transaction similar to or inspired by the contents of thispublication. The risk of loss in futures trading and options, foreign or domestic, can be substantial. As a result of thehigh degree of leverage obtainable in futures and options trading, losses may be incurred that are greater than theamount of funds initially deposited – up to theoretically unlimited losses. Trading in options involves risk and is notsuitable for all investors. Prior to buying or selling an option, investors must review the "Characteristics and Risks ofStandardized Options”, at http://www.optionsclearing.com/about/publications/character-risks.jsp . If you are unable toaccess the website, please contact your Deutsche Bank representative for a copy of this important document.??Participants in foreign exchange transactions may incur risks arising from several factors, including the following: (i)exchange rates can be volatile and are subject to large fluctuations; (ii) the value of currencies may be affected by numerousmarket factors, including world and national economic, political and regulatory events, events in equity and debt marketsand changes in interest rates; and (iii) currencies may be subject to devaluation or government-imposed exchange controls,which could affect the value of the currency. Investors in securities such as ADRs, whose values are affected by thecurrency of an underlying security, effectively assume currency risk.?
Unless governing law provides otherwise, all transactions should be executed through the Deutsche Bank entity inthe investor's home jurisdiction. Aside from within this report, important conflict disclosures can also be found athttps://research.db.com/Research/ on each company ’ s research page. Investors are strongly encouraged to review thisinformation before investing.
Deutsche Bank (which includes Deutsche Bank AG, its branches and affiliated companies) is not acting as a financialadviser, consultant or fiduciary to you or any of your agents (collectively, “You” or “Your”) with respect to any informationprovided in this report. Deutsche Bank does not provide investment, legal, tax or accounting advice, Deutsche Bank is notacting as your impartial adviser, and does not express any opinion or recommendation whatsoever as to any strategies,products or any other information presented in the materials. Information contained herein is being provided solely on thebasis that the recipient will make an independent assessment of the merits of any investment decision, and it does notconstitute a recommendation of, or express an opinion on, any product or service or any trading strategy.
The information presented is general in nature and is not directed to retirement accounts or any specific person or accounttype, and is therefore provided to You on the express basis that it is not advice, and You may not rely upon it in makingYour decision. The information we provide is being directed only to persons we believe to be financially sophisticated,who are capable of evaluating investment risks independently, both in general and with regard to particular transactionsand investment strategies, and who understand that Deutsche Bank has financial interests in the offering of its products
Page 14 Deutsche Bank Securities Inc.
Provided for the exclusive use of Research Research at Provisional Access on 2018-11-02T05:58+00:00. DO NOT REDISTRIBUTE
2 November 2018
Internet
LendingTree
and services. If this is not the case, or if You are an IRA or other retail investor receiving this directly from us, we askthat you inform us immediately.
In July 2018, Deutsche Bank revised its rating system for short term ideas whereby the branding has been changed toCatalyst Calls (“CC”) from SOLAR ideas; the rating categories for Catalyst Calls originated in the Americas region havebeen made consistent with the categories used by Analysts globally; and the effective time period for CCs has beenreduced from a maximum of 180 days to 90 days.
United States: Approved and/or distributed by Deutsche Bank Securities Incorporated, a member of FINRA, NFA and SIPC.Analysts located outside of the United States are employed by non-US affiliates that are not subject to FINRA regulations.??Germany: Approved and/or distributed by Deutsche Bank AG, a joint stock corporation with limited liability incorporatedin the Federal Republic of Germany with its principal office in Frankfurt am Main. Deutsche Bank AG is authorized underGerman Banking Law and is subject to supervision by the European Central Bank and by BaFin, Germany ’ s FederalFinancial Supervisory Authority.??United Kingdom: Approved and/or distributed by Deutsche Bank AG acting through its London Branch at WinchesterHouse, 1 Great Winchester Street, London EC2N 2DB. Deutsche Bank AG in the United Kingdom is authorised by thePrudential Regulation Authority and is subject to limited regulation by the Prudential Regulation Authority and FinancialConduct Authority. Details about the extent of our authorisation and regulation are available on request.??Hong Kong: Distributed by Deutsche Bank AG, Hong Kong Branch or Deutsche Securities Asia Limited (save that anyresearch relating to futures contracts within the meaning of the Hong Kong Securities and Futures Ordinance Cap. 571shall be distributed solely by Deutsche Securities Asia Limited). The provisions set out above in the "Additional Information"section shall apply to the fullest extent permissible by local laws and regulations, including without limitation the Code ofConduct for Persons Licensed or Registered with the Securities and Futures Commission. .??India: Prepared by Deutsche Equities India Private Limited (DEIPL) having CIN: U65990MH2002PTC137431 and registeredoffice at 14th Floor, The Capital, C-70, G Block, Bandra Kurla Complex Mumbai (India) 400051. Tel: + 91 22 71804444. It is registered by the Securities and Exchange Board of India (SEBI) as a Stock broker bearing registrationnos.: NSE (Capital Market Segment) - INB231196834, NSE (F&O Segment) INF231196834, NSE (Currency DerivativesSegment) INE231196834, BSE (Capital Market Segment) INB011196830; Merchant Banker bearing SEBI Registrationno.: INM000010833 and Research Analyst bearing SEBI Registration no.: INH000001741. DEIPL may have receivedadministrative warnings from the SEBI for breaches of Indian regulations. The transmission of research through DEIPLis Deutsche Bank's determination and will not make a recipient a client of DEIPL. Deutsche Bank and/or its affiliate(s)may have debt holdings or positions in the subject company. With regard to information on associates, please refer to the“Shareholdings” section in the Annual Report at: https://www.db.com/ir/en/annual-reports.htm .??Japan: Approved and/or distributed by Deutsche Securities Inc.(DSI). Registration number - Registered as a financialinstruments dealer by the Head of the Kanto Local Finance Bureau (Kinsho) No. 117. Member of associations: JSDA, TypeII Financial Instruments Firms Association and The Financial Futures Association of Japan. Commissions and risks involvedin stock transactions - for stock transactions, we charge stock commissions and consumption tax by multiplying thetransaction amount by the commission rate agreed with each customer. Stock transactions can lead to losses as a resultof share price fluctuations and other factors. Transactions in foreign stocks can lead to additional losses stemming fromforeign exchange fluctuations. We may also charge commissions and fees for certain categories of investment advice,products and services. Recommended investment strategies, products and services carry the risk of losses to principaland other losses as a result of changes in market and/or economic trends, and/or fluctuations in market value. Beforedeciding on the purchase of financial products and/or services, customers should carefully read the relevant disclosures,prospectuses and other documentation. "Moody's", "Standard & Poor's", and "Fitch" mentioned in this report are notregistered credit rating agencies in Japan unless Japan or "Nippon" is specifically designated in the name of the entity.Reports on Japanese listed companies not written by analysts of DSI are written by Deutsche Bank Group's analysts withthe coverage companies specified by DSI. Some of the foreign securities stated on this report are not disclosed accordingto the Financial Instruments and Exchange Law of Japan. Target prices set by Deutsche Bank's equity analysts are basedon a 12-month forecast period..??
Deutsche Bank Securities Inc. Page 15
Provided for the exclusive use of Research Research at Provisional Access on 2018-11-02T05:58+00:00. DO NOT REDISTRIBUTE
2 November 2018
Internet
LendingTree
Korea: Distributed by Deutsche Securities Korea Co.??South Africa: Deutsche Bank AG Johannesburg is incorporated in the Federal Republic of Germany (Branch RegisterNumber in South Africa: 1998/003298/10).??Singapore: This report is issued by Deutsche Bank AG, Singapore Branch or Deutsche Securities Asia Limited, SingaporeBranch (One Raffles Quay #18-00 South Tower Singapore 048583, +65 6423 8001), which may be contacted in respectof any matters arising from, or in connection with, this report. Where this report is issued or promulgated by DeutscheBank in Singapore to a person who is not an accredited investor, expert investor or institutional investor (as defined in theapplicable Singapore laws and regulations), they accept legal responsibility to such person for its contents.??Taiwan: Information on securities/investments that trade in Taiwan is for your reference only. Readers shouldindependently evaluate investment risks and are solely responsible for their investment decisions. Deutsche Bank researchmay not be distributed to the Taiwan public media or quoted or used by the Taiwan public media without written consent.Information on securities/instruments that do not trade in Taiwan is for informational purposes only and is not to beconstrued as a recommendation to trade in such securities/instruments. Deutsche Securities Asia Limited, Taipei Branchmay not execute transactions for clients in these securities/instruments.??Qatar: Deutsche Bank AG in the Qatar Financial Centre (registered no. 00032) is regulated by the Qatar Financial CentreRegulatory Authority. Deutsche Bank AG - QFC Branch may undertake only the financial services activities that fall withinthe scope of its existing QFCRA license. Its principal place of business in the QFC: Qatar Financial Centre, Tower, WestBay, Level 5, PO Box 14928, Doha, Qatar. This information has been distributed by Deutsche Bank AG. Related financialproducts or services are only available only to Business Customers, as defined by the Qatar Financial Centre RegulatoryAuthority.??Russia: The information, interpretation and opinions submitted herein are not in the context of, and do not constitute, anyappraisal or evaluation activity requiring a license in the Russian Federation.
Kingdom of Saudi Arabia: Deutsche Securities Saudi Arabia LLC Company (registered no. 07073-37) is regulated by theCapital Market Authority. Deutsche Securities Saudi Arabia may undertake only the financial services activities that fallwithin the scope of its existing CMA license. Its principal place of business in Saudi Arabia: King Fahad Road, Al OlayaDistrict, P.O. Box 301809, Faisaliah Tower - 17th Floor, 11372 Riyadh, Saudi Arabia.??United Arab Emirates: Deutsche Bank AG in the Dubai International Financial Centre (registered no. 00045) is regulatedby the Dubai Financial Services Authority. Deutsche Bank AG - DIFC Branch may only undertake the financial servicesactivities that fall within the scope of its existing DFSA license. Principal place of business in the DIFC: Dubai InternationalFinancial Centre, The Gate Village, Building 5, PO Box 504902, Dubai, U.A.E. This information has been distributed byDeutsche Bank AG. Related financial products or services are available only to Professional Clients, as defined by theDubai Financial Services Authority.??Australia and New Zealand: This research is intended only for "wholesale clients" within the meaning of theAustralian Corporations Act and New Zealand Financial Advisors Act, respectively. Please refer to Australia-specificresearch disclosures and related information at https://australia.db.com/australia/content/research-information.htmlWhere research refers to any particular financial product recipients of the research should consider any product disclosurestatement, prospectus or other applicable disclosure document before making any decision about whether to acquirethe product. In preparing this report, the primary analyst or an individual who assisted in the preparation of this reporthas likely been in contact with the company that is the subject of this research for confirmation/clarification of data,facts, statements, permission to use company-sourced material in the report, and/or site-visit attendance. Without priorapproval from Research Management, analysts may not accept from current or potential Banking clients the costs oftravel, accommodations, or other expenses incurred by analysts attending site visits, conferences, social events, and thelike. Similarly, without prior approval from Research Management and Anti-Bribery and Corruption (“ABC”) team, analystsmay not accept perks or other items of value for their personal use from issuers they cover.??
Page 16 Deutsche Bank Securities Inc.
Provided for the exclusive use of Research Research at Provisional Access on 2018-11-02T05:58+00:00. DO NOT REDISTRIBUTE

2 November 2018
Internet
LendingTree
Additional information relative to securities, other financial products or issuers discussed in this report is available uponrequest. This report may not be reproduced, distributed or published without Deutsche Bank's prior written consent.Copyright © 2018 Deutsche Bank AG
Deutsche Bank Securities Inc. Page 17
Provided for the exclusive use of Research Research at Provisional Access on 2018-11-02T05:58+00:00. DO NOT REDISTRIBUTE
David Folkerts-LandauGroup Chief Economist and Global Head of Research
Pam FinelliGlobal Chief Operating Officer
Research
Michael SpencerHead of APAC Research
Steve PollardHead of Americas Research
Global Head of Equity Research
Anthony KlarmanGlobal Head ofDebt Research
Kinner LakhaniHead of EMEA
Equity Research
Joe LiewHead of APAC
Equity Research
Jim ReidGlobal Head of
Thematic Research
Francis YaredGlobal Head ofRates Research
George SaravelosHead of FX Research
Peter HooperGlobal Head of
Economics Research
Andreas NeubauerHead of Germany Research
Spyros MesomerisGlobal Head of Quantitative
and QIS Research
International Production Locations
Deutsche Bank AGDeutsche Bank PlaceLevel 16Corner of Hunter & Phillip StreetsSydney, NSW 2000AustraliaTel: (61) 2 8258 1234
Deutsche Bank AGMainzer Landstrasse 11-1760329 Frankfurt am MainGermanyTel: (49) 69 910 00
Deutsche Bank AGFiliale HongkongInternational Commerce Centre,1 Austin Road West,Kowloon,Hong KongTel: (852) 2203 8888
Deutsche Securities Inc.2-11-1 NagatachoSanno Park TowerChiyoda-ku, Tokyo 100-6171JapanTel: (81) 3 5156 6770
Deutsche Bank AG London1 Great Winchester StreetLondon EC2N 2EQUnited KingdomTel: (44) 20 7545 8000
Deutsche Bank Securities Inc.60 Wall StreetNew York, NY 10005United States of AmericaTel: (1) 212 250 2500
Provided for the exclusive use of Research Research at Provisional Access on 2018-11-02T05:58+00:00. DO NOT REDISTRIBUTE


