Embed Size (px)
Citation preview
Hodgkin-Huxley type modelling and parameter
estimation of GnRH neurons
Dávid Csercsika,c,∗, Imre Farkasb, Gábor Szederkényia,c,
Erik Hrabovszkyb, Zsolt Lipositsb,c, Katalin M. Hangosa,
aProcess Control Research Group,
Computer and Automation Research Institute, Hungarian Academy of Sciences
H-1518, P.O. Box 63, Budapest, Hungary
Tel: +36 1 279 6000
Fax: +36 1 466 7503
bDepartment of Endocrine Neurobiology
Institute of Experimental Medicine, Hungarian Academy of Sciences
H-1450 Budapest, P.O. Box 67, Hungary
Tel: +36 1 210 9943
Fax: +36 1 210 9944
cFaculty of Information Technology
Pázmány Péter Catholic University,
H-1364 Budapest 4., P.O. Box 178 , Hungary
Tel: +36 1 886 47 00
Fax: +36 1 886 47 24
Preprint submitted to Elsevier Science Version of Submitted: 22 October 2010
Abstract
In this paper a simple one compartment Hodgkin-Huxley type electrophysiological model
of GnRH neurons is presented, that is able to reasonably reproduce the most important qual-
itative features of the firing pattern, such as baseline potential, depolarization amplitudes,
sub-baseline hyperpolarization phenomenon and average firing frequency in response to ex-
citatory current. In addition, the same model provides an acceptable numerical fit of voltage
clamp (VC) measurement results. The parameters of the modelhave been estimated using
averaged VC traces, and characteristic values of measured current clamp traces originating
from GnRH neurons in hypothalamic slices. The resulting parameter values show a good
agreement with literature data in most of the cases. Applying parametric changes, which
lead to the increase of baseline potential and enhance cell excitability, the model becomes
capable of bursting. The effects of various parameters to burst length have been analyzed
by simulation.
Key words: Hodgkin-Huxley type models, GnRH neuron, neuroendocrinology, parameter
estimation
1 Introduction
Central control of reproduction in vertebrates is governedby a neuronal pulse gen-
erator that controls the activity of hypothalamic neuroendocrine cells secreting
∗ Corresponding author.
Email addresses: ser siks l.sztaki.hu (Dávid Csercsik),farkaskoki.hu(Imre Farkas),szeders l.sztaki.hu (Gábor Szederkényi),hrabovszkykoki.hu(Erik Hrabovszky),lipositskoki.hu (Zsolt Liposits),hangoss l.sztaki.hu(Katalin M. Hangos).
2
Gonadotropin-releasing hormone (GnRH). The pulsatile release of GnRH, which
is closely associated with concurrent increases in multiunit electrical activity in the
mediobasal hypothalamus (Knobil, 1980, 1988; Williams et al., 1990; Wilson et al.,
1984; Conn and Freeman, 2000), is driven by the intrinsic activity of GnRH neu-
rons, characterized by bursts and prolonged episodes of repetitive action potentials
correlated with oscillatory increases in intracellular Ca2+ (Constantin and Charles,
1999, 2001).
In close relation with this, several in vitro experiments have shown that changes
in cytosolic Ca2+ concentration determine the secretory pattern of GnRH (Sto-
jilkovic et al., 1994), underlining that Ca2+ plays a central role in the signal trans-
duction processes that lead to exocytosis. Furthermore, GnRH secretion from per-
ifused GT1 and hypothalamic cells is reduced by L-type Ca2+ channel inhibitors
and augmented by activation of voltage-gated Ca2+ channels (Krsmanovic et al.,
1992).
The models of GnRH pulse generator, which can be found in literature nowadays,
use very simple generalized neuron models and networks. Furthermore, they are
neither based on the known membrane properties of GnRH neurons, nor are able to
describe the effect of gonadal hormones (Brown et al., 1994). Nevertheless, these
investigations can provide novel results about pulsatility and synchronization (Gor-
dan et al., 1998; Khadra and Li, 2006).
To increase the clinical relevance of the dynamic GnRH models, one has to use
sub-models based on as up-to-date biological information as available, and reduce
the role of empirical and phenomenological approaches everywhere the biological
knowledge makes it possible. In the field of computational neuroendocrinology, in
addition to GnRH related topics, good examples of this approach are the articles of
3
Komendantov et al. (2007) and Roper et al. (2003), which address magnocellular
neurosecretory cells.
The general aim of this work is to construct a simple dynamic model of a GnRH
neuron that reproduces some of its characteristic properties (see section 2) and the
parameters of which can be determined from measurements.
1.1 General electrophysiology and modelling of GnRH neurons
With the application of cell marking based on the green fluorescent protein (GFP)
and transgenic mice, the targeted measurements and electrophysiological exper-
iments on GnRH neurons became available (Herbison et al., 2001; Suter et al.,
2000). Another possibility for gaining measured data is theapplication of so called
"immortalized" GnRH neurons (Mellon et al., 1990; Wetsel etal., 1992). Since
these methods became widespread, the electrophysiological features of this impor-
tant neuroendocrine cell have been studied extensively both experimentally and by
constructing mathematical models to explain the underlying mechanisms of their
properties.
Sim et al. (2001) have classified GnRH neurons in intact female adult mice as
belonging to four distinct types. Herbison et al. (2001) have characterized the ba-
sic membrane properties of GnRH neurons. As mentioned in hisarticle (Herbison
et al., 2001), none of the GnRH neuron types seems to express specific electrophys-
iological ’fingerprint’ in terms of the types of the expressed ion channels. However
several recordings have demonstrated significant heterogeneity in the basic mem-
brane properties of GnRH neurons (Spergel et al., 1999; Suter et al., 2000) which
points to functional heterogeneity. Furthermore, the dynamics of GnRH neurons
4
are affected by peripherial hormones including estradiol (E2) (DeFazio and Moen-
ter, 2002; Maurer et al., 1999; Farkas et al., 2007; Herbison, 2008; Chu et al., 2009)
and progesterone (P4) (Karsch et al., 1987; Chabbert-Buffet et al., 2000).
Based mainly on data collected from immortalized GT1 cells,a couple of mathe-
matical models (LeBeau et al., 2000; Van Goor et al., 2000; Fletcher and Li, 2009)
have been proposed to explain some of the observed experimental results. These
models focus mainly on the autocrine regulation by GnRH through adenylyl cy-
clase and calcium coupled pathways (Helmreich and Bakardjieva, 1980).
However, the firing pattern of GT1 cells and that of the modelspublished in these
articles is qualitatively different compared to GFP-tagged GnRH neurons origi-
nating from hypothalamic slices. The depolarization, hyperpolarization amplitudes
and the spontaneous firing frequency are much lower in the case of GT1 cells (com-
pare eg. the data published in (Van Goor et al., 1999a,b; LeBeau et al., 2000; Van
Goor et al., 2000) and (Sim et al., 2001; Chu and Moenter, 2006; DeFazio and
Moenter, 2002)). This implies that while these models can beappropriate for ana-
lyzing the mechanism of action corresponding to GnRH and various drugs which
act through Ca2+ coupled pathways, they may be inadequate when the aim is to
describe the in vivo behavior of GnRH neurons and the GnRH pulse generator
network. Furthermore these models do not include the A-typepotassium current,
which is shown to be present in GnRH neurons (Kusano et al., 1995; Constantin
and Charles, 2001; Sim et al., 2001; Bosama, 1993; Herbison et al., 2001) and
is affected by the ovarian hormone estradiol (DeFazio and Moenter, 2002; Farkas
et al., 2007), and thus may be a key regulator of neuronal activity during the ovarian
cycle.
In order to fulfill the aim of electrophysiological model development, GFP-based
5
patch clamp recordings were carried out on mouse GnRH neurons (the transgenic
mice were available by courtesy of S. Moenter, Univ. of Virginia, Charlottesville,
VA, USA). In the present work the obtained data are used to identify a Hodgkin-
Huxley type conductance-based model (Hodgkin and Huxley, 1952) of membrane
dynamics. The elements of the model (ionic conductances of specific types of ionic
channels) were designed using literature data abut the electrophysiological proper-
ties of GnRH neurons.
The outline of this paper is as follows; In section 2 the required properties of the
model are specified, in section 3 the measurement methods andmathematical mod-
elling are described. Section 4 summarizes the simulation results of the model.
Conclusions are drawn in 5. The two appendices describe the details of model equa-
tions, the parameter estimation and its results.
2 Model specification
In this section the desired features of the model are defined,and the intended use
of the model is explained.
2.1 Characteristic features to be described by the model
The above mentioned experimental observations indicate important characteristic
features of GnRH neurons, which should be reproduced by the model. These are as
follows.
(1) The model should be able to reproduce the shape of action potentials observed
in GnRH neurons originating from hypothalamic slices (Sim et al., 2001; Chu
6
and Moenter, 2006; DeFazio and Moenter, 2002), in particular the high depo-
larization amplitudes and the characteristic sub-baseline hyperpolarization
after the action potentials (APs).
(2) The model should exhibit similarexcitability propertiesto the cells observed
during the measurement process. This means that the same current injection
which proved to be able to evoke APs during measurement should have the
same effect on the model.
(3) The model should qualitatively reproduce the typicalVC (voltage clamp) traces
of GnRH neurons originating from hypothalamic slices.
(4) The model should be capable ofbursting. Bursting properties have been de-
scribed in several articles corresponding to GnRH neurons originating from
hypothalamic slices (Kuehl-Kovarik et al., 2005; Suter et al., 2000; Chu et al.,
2009) as well as in the case of GT1 cells (Van Goor et al., 1999b; Charles
and Hales., 1995). The duration of bursts in GnRH neurons have been found
dominantly to range between 1 and 40 s with an average frequency about 10
Hz.
2.2 Intended use of the model
Several mathematical models can be found which aim at describing the hormone
levels during the menstrual cycle (Bogumil et al., 1972; Grigoliene and Svitra,
2000; Harris, 2001; Harris et al., 2006; Reinecke and Deuflhard, 2007). The GnRH
pulse generator in these models is taken into account (if it is taken into account
at all) in a rather simplified way. A more detailed, neurophysiologically relevant
model of the GnRH pulse generator network, which is based on up-to-date biolog-
ical knowledge, would surely improve the clinical significance of such models.
7
The model to be developed should be able to reproduce the dynamic properties of
GnRH neurons relevant from the point of view of the female neuroendocrine cycle.
Furthermore it should be used as an element of a hierarchicalmodel of the GnRH
pulse generator that responds to the ovarian hormone levelsand the excitation de-
livered by neighboring anatomical areas, and is able to capture the main qualitative
features of GnRH release in different phases of the ovarian cycle. A further intended
aim of this network model will be to analyze the synchronization phenomena (Di
Garbo et al., 2007) between GnRH neurons.
3 Methods
The measurement conditions and result are briefly describedin this section together
with the structure of the applied mathematical model.
3.1 Electrophysiology
3.1.1 Obtaining and preparing samples
Brains of 60-90 days old male mice were used for obtaining GnRH neurons for mea-
surements. The mouse was decapitated, and the brain was rapidly removed and placed
in ice-cold artificial cerebrospinal fluid (ACSF) oxygenated with 95%O2-5% CO2 mix-
ture. Brains were blocked and glued to the chilled stage of a Leica VT1000s vibratome,
and 250-micrometer-thick coronal slices containing the medial septum through to the pre-
optic area were cut. The slices were then incubated at room temperature for 1 hour in
oxygenated ACSF consisting of (in mM): 135 NaCl, 3.5 KCl, 26 NaHCO3, 10 D-glucose,
1.25 NaH2PO4, 1.2 MgSO4, 2.5 CaCl2., pH 7.3.
8
3.1.2 Whole-cell recording of GnRH neurons
Slices were transferred to the recording chamber, held submerged, and continuously super-
fused with oxygenized ACSF. All recordings were made at 33C.
In order to visualize GnRH neurons in the brain slices, GnRH-enhanced green fluorescent
protein (GnRH-GFP) transgenic mice (kind gift by Dr. Suzanne Moenter) were chosen
in which the GnRH promoter drives selective GFP expression in the majority of GnRH
neurons. GnRH-GFP neurons were identified in the acute brainslices by their green fluo-
rescence, typical fusiform shape and apparent topographiclocation in the preoptic area and
medial septum.
The electrodes were filled with intracellular solution (in mM): 140 KCl, 10 HEPES, 5
EGTA, 0.1 CaCl2, 4 MgATP, 0.4 NaATP, pH 7.3 with NaOH. Resistance of patch electrodes
was 2-3 MΩ. Holding potential was -70 mV, near the average resting potential of the GnRH
cells. Pipette offset potential, series resistance and capacitance were compensated before
recording.
The protocol for voltage clamp (VC) recordings was the following: twelve voltage steps
were applied starting from the holding potential. The first step was -40mV and the subse-
quent steps were increased by 10 mV. Duration of the steps was30 ms, starting at 10 ms.
During the voltage clamp measurements with prepulse, a -100mV prepulse was applied
just preceding the voltage steps (from 0.8 to 10 ms) with a duration of 9.2 ms.
The protocol for current clamp (CC) recordings to activate action potentials (APs) was: the
holding current was 0 pA. First the resting potential was measured then current step of 10
pA for 200 ms was applied to the cells. If the 10 pA current failed to evoke APs, it was
elevated by 10 pA steps till it induced 3-4 APs.
9
3.2 Measurement results
Overall 5 cells have been investigated by performing voltage clamp (VC) and cur-
rent clamp (CC) measurements.
3.2.1 Voltage clamp
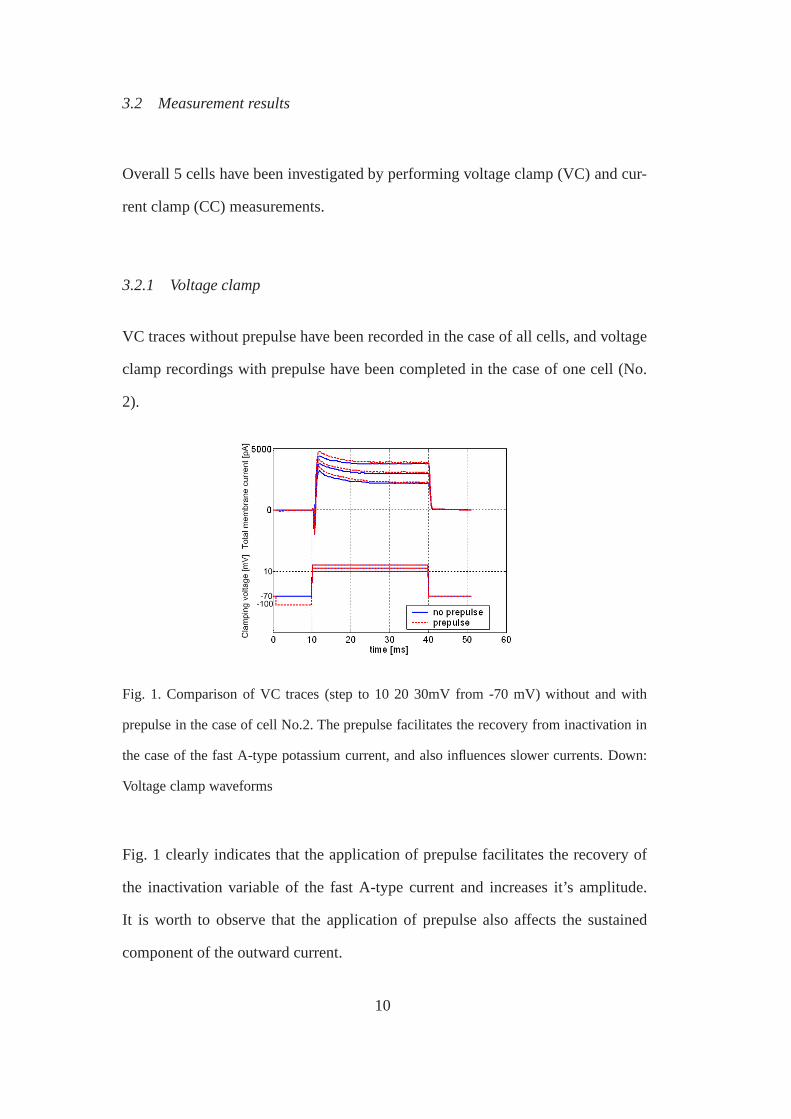
VC traces without prepulse have been recorded in the case of all cells, and voltage
clamp recordings with prepulse have been completed in the case of one cell (No.
2).
Fig. 1. Comparison of VC traces (step to 10 20 30mV from -70 mV)without and with
prepulse in the case of cell No.2. The prepulse facilitates the recovery from inactivation in
the case of the fast A-type potassium current, and also influences slower currents. Down:
Voltage clamp waveforms
Fig. 1 clearly indicates that the application of prepulse facilitates the recovery of
the inactivation variable of the fast A-type current and increases it’s amplitude.
It is worth to observe that the application of prepulse also affects the sustained
component of the outward current.
10
Since measurement data of several cells were available, butVC traces with prepulse
were not recorded in all of the cases, the averaged VC traces without prepulse
were used as basis for parameter estimation procedure. Voltage clamp traces with
prepulse were used to validate the resulting model, by comparison of the measured
and simulated effects of prepulse to VC traces.
3.2.2 Current clamp
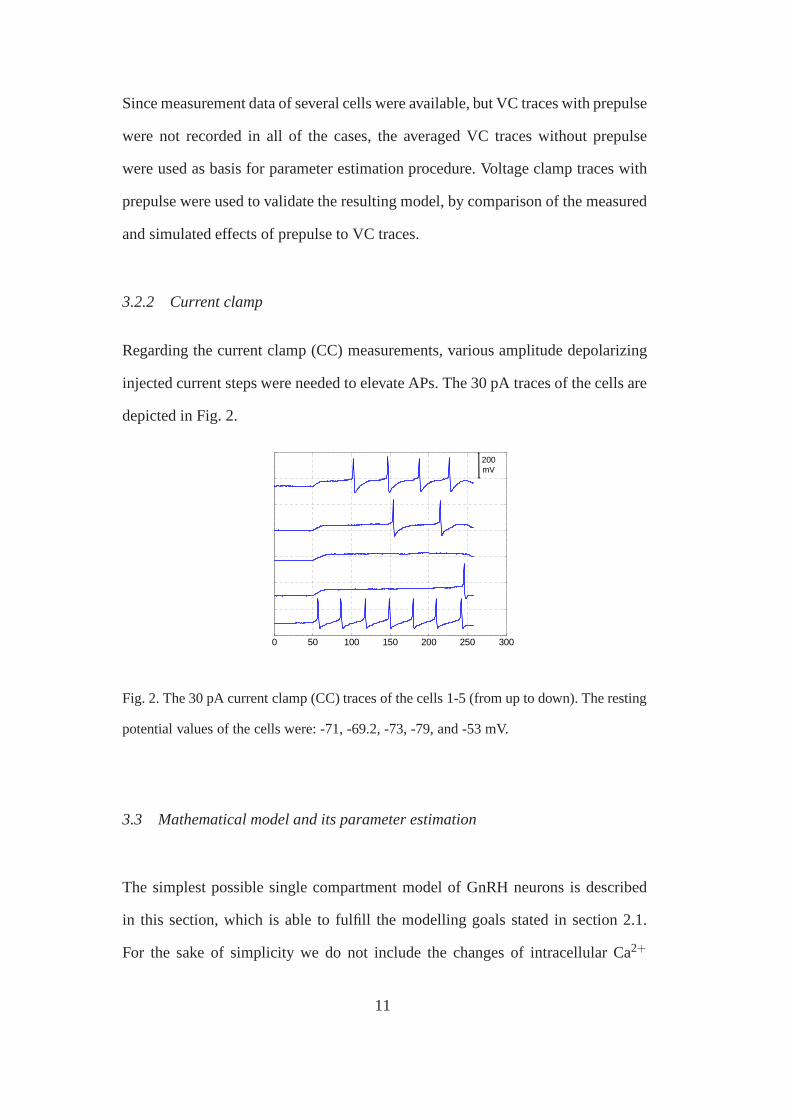
Regarding the current clamp (CC) measurements, various amplitude depolarizing
injected current steps were needed to elevate APs. The 30 pA traces of the cells are
depicted in Fig. 2.
0 50 100 150 200 250 300-100
0
100
200
300
400
500
600200 mV
Fig. 2. The 30 pA current clamp (CC) traces of the cells 1-5 (from up to down). The resting
potential values of the cells were: -71, -69.2, -73, -79, and-53 mV.
3.3 Mathematical model and its parameter estimation
The simplest possible single compartment model of GnRH neurons is described
in this section, which is able to fulfill the modelling goals stated in section 2.1.
For the sake of simplicity we do not include the changes of intracellular Ca2+
11
concentration and calcium dependent currents in the model.As a consequence we
assume a constant reversal potential of Ca2+.
3.3.1 Elements of the model
The elements of the model are presented in terms of ionic channels that are taken
into account.
• The presence of tetrodotoxin-sensitiveNa+ currentshas been experimentally
confirmed in the case of GT1 cells (Bosama, 1993) and embryonic GnRH neu-
rons (Kusano et al., 1995). Adult GnRH neurons were found to fire Na+ depen-
dent action potentials (Sim et al., 2001). The sodium current in the model will be
denoted byINa. We suppose third order activation and second order inactivation
dynamics.
• The presence ofA-type K+ transient or rapidly activating/ inactivating conduc-
tancehas been described in the case of GT1 cells (Bosama, 1993; Constantin and
Charles, 2001), in embryonic cultures (Kusano et al., 1995), and in GnRH neu-
rons originating from mice (Sim et al., 2001; Herbison et al., 2001). This current
will be denoted byIA in the model. This type of potassium current is quite widely
studied in the literature even in the case of GnRH neurons (DeFazio and Moen-
ter, 2002), and on hypothalamic neurons in general (Wang et al., 1997; Luther
and Tasker, 2000). These results provide useful initial values for the parameters
of this current. Furthermore, literature data indicated that the ovarian hormone
estradiol modulates this current in mice GnRH neurons (DeFazio and Moenter,
2002) and also in GT1 cells (Farkas et al., 2007).
• A voltage gateddelayed outward rectifier K+ channelcan be assumed, which
contributes to the more slowly activating, sustained component of the outward
12
K+ current (IK) - see (Kusano et al., 1995; Constantin and Charles, 2001; Sim
et al., 2001; Bosama, 1993; Herbison et al., 2001).
• A non-inactivating M-type K+ current (IM) is also taken into account, which is
considered a key modulator of neuronal activity in GnRH cells (Xu et al., 2007).
As stated before, the main perspective of this modeling procedure is the description
of GnRH release. Based on the results that underline the importance of calcium os-
cillations corresponding to hormone release (Stojilkovicet al., 1994; Krsmanovic
et al., 1992), we take 3 types of Ca2+ conductance into account to be able to de-
scribe the qualitatively different components of the calcium current.
Furthermore, according to the results of Beurrier et al. (1999), the interplay of dif-
ferent calcium currents can contribute to periodic bursting behavior which can be
of high importance regarding neuroendocrine functions.
• Low voltage activated (LVA) T-typeCa2+ conductance, which is activated in ear-
lier phases of depolarization (IT), has been described in the case of rat (Kato
et al., 2003) and mouse GnRH neurons (Herbison et al., 2001),as well as in GT1
cells (Van Goor et al., 1999a).
• Furthermore, based on the results of Watanabe et al. (2004) related to GT1-7
cells, and in vitro experiments (Kato et al., 2003; Nunemaker et al., 2003), we
assume ahigh voltage gated (HVA) Ca2+ channelrepresentingR and N type
conductances(IR)
• In addition, aHVA long-lasting current (L-type) Ca2+ channelis modelled (IL)
- see Krsmanovic et al. (1992); Nunemaker et al. (2003) for invitro results and
Van Goor et al. (1999a) for GT1 measurements.
13
• Lastly, two leakage currentscorresponding tosodium(IleakNa) and potassium
(IleakK) with constant conductance are taken into account.
Several other ionic currents have been shown to appear in GnRH neurons, for ex-
ample theIQ/H current (Sim et al., 2001), Ca2+ activated potassium currents (Chu
and Moenter, 2006; Fletcher and Li, 2009), which are not considered in the model.
The reason for this is that the further (especially Ca2+ dependent) currents would
significantly increase the model complexity, which would lead to a smuch harder
solvability of the parameter estimation problem. Furthermore these currents turned
out to be nonessential for the reproduction of the features determined in section 2.1.
After a simple model has been identified it can easily be extended with the currents
omitted in the first step of the modelling process, if needed.
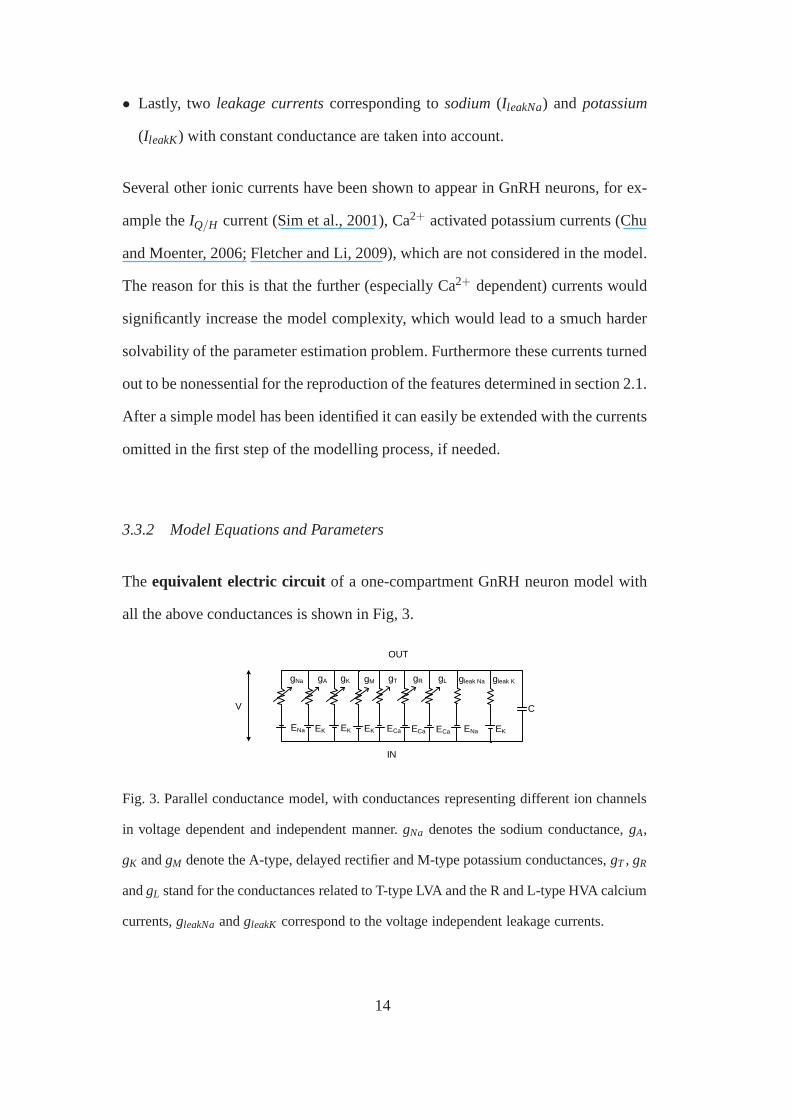
3.3.2 Model Equations and Parameters
The equivalent electric circuit of a one-compartment GnRH neuron model with
all the above conductances is shown in Fig, 3.
V
IN
OUT
C
gNa
ENa EK EK
gKgA gT
ECa
gR
ECa
gleak Na
ENa
gL
ECa
gleak K
EKEK
gM
Fig. 3. Parallel conductance model, with conductances representing different ion channels
in voltage dependent and independent manner.gNa denotes the sodium conductance,gA,
gK andgM denote the A-type, delayed rectifier and M-type potassium conductances,gT , gR
andgL stand for the conductances related to T-type LVA and the R andL-type HVA calcium
currents,gleakNa andgleakK correspond to the voltage independent leakage currents.
14
The voltage (V), which is the observed output of the system incurrent clamp mode,
is described by
dVdt
=−1C(INa+ IA+ IK + IM + IT + IR+ IL + IleakNa+ IleakK)+
1C
Iex (1)
where C is the membrane capacitance,Ii are the currents of the ionic channels
considered, i.e. the Na+, the three types ofK+ (A,K,M), the three types of Ca2+
(T,R,L) and two types of leakage currents (leakNa, leakK), while Iex is the external
(injected) current. Each ionic channel current is a function of an activationmi and
an inactivationhi variable in the form of
Ii = gimγii hµi
i (V −Ex) (2)
(except the M type K+ current that inhibits no inactivation dynamics). In Eq. 2
gi denotes the maximal conductance,γi andµi are positive integers, andEx is the
reversal potential of the corresponding ion (x∈ Na,K,Ca). γi, µi , and the reversal
potentials are assumed to be known. The detailed equations describing the time
variation ofmi andhi are given in section 7.1 of Appendix B.
The unknown model parameters to be estimated are the membrane capacitanceC in
(1), the maximal conductances ¯gi in 6 and the activation/inactivation parameters in
(5) in section 7.1. All together we have to estimate 1+9+6*12+6 = 88 parameters.
3.3.3 Parameter estimation
The parameter estimation problem of neuronal models is a widely studied area in
neuroscience literature. The diversity of models, however, implies a broad range of
approaches and solutions that are sometimes difficult to apply for other types of
15
neurons or estimation tasks. The same applies for the parameter values of various
ionic channels that are reported in the literature. These parameter values are found
to be different depending on the type of cells on which the ionic channels are op-
erating, and they may even depend on the actual functioning of a particular cell
type.
In addition, regarding membrane properties, GnRH neurons form a heterogenous
population (Sim et al., 2001), which implies that cells withdifferent functional-
ity may be described by models with the same model structure,but significantly
different parameters.
Furthermore, the complex bifurcation structure of Hodgkin-Huxley (HH) type mod-
els implies that even a slight variation of these parametersmay cause significant de-
viances in the model behavior. As a consequence, to reproduce an observed firing
pattern or excitability level, one has to carry out a parameter estimation procedure
of the applied model. An algorithmic identification process, which takes into ac-
count the most available measurement data, can significantly improve the reliability
and performance of the model.
The basic articles, which describe the parameter estimation of HH type models
have been published by Tabak et al. (2000) and Willms et al. (1999). The article of
Lee et al. (2006) analyzes the effect of simplifying assumptions on the results of
parameter estimation, and provides a promising problem-reformulation based nu-
merical method in the case of VC measurements. Haufler et al. (2007) describe a
synchronization-based method based on CC measurements. The interesting paper
of Tien and Guckenheimer (2008) focuses on bursting neural models and uses a
geometric approach. The paper of Huys et al. (2006) providesa statistical method
for the parameter estimation of multicompartmental models. Despite the existence
16
of the above valuable work, however, there is a lack of mathematically and algo-
rithmically well founded parameter estimation method for neuronal models, that is
able to take into account both the qualitative and quantitative aspects of measured
data.
In our case, a multistep recursive parameter estimation approach has been applied
that consists of the following steps:
(1) Initialization of model parameters, based on literature data and intuitive heuris-
tic considerations based on CC traces
(2) Parameter estimation by optimization based on VC and CC traces
(3) Model verification and validation
The main aim of these considerations was to avoid local minimum points of the ob-
jective functions and to reproduce those qualitative features of the model behavior,
which inhibit significant physiological importance, and, according to our obser-
vations, can not be captured well by the numerical optimization methods. These
features were the sharp action potentials and partially thesignificant hyperpolar-
izations after the APs.
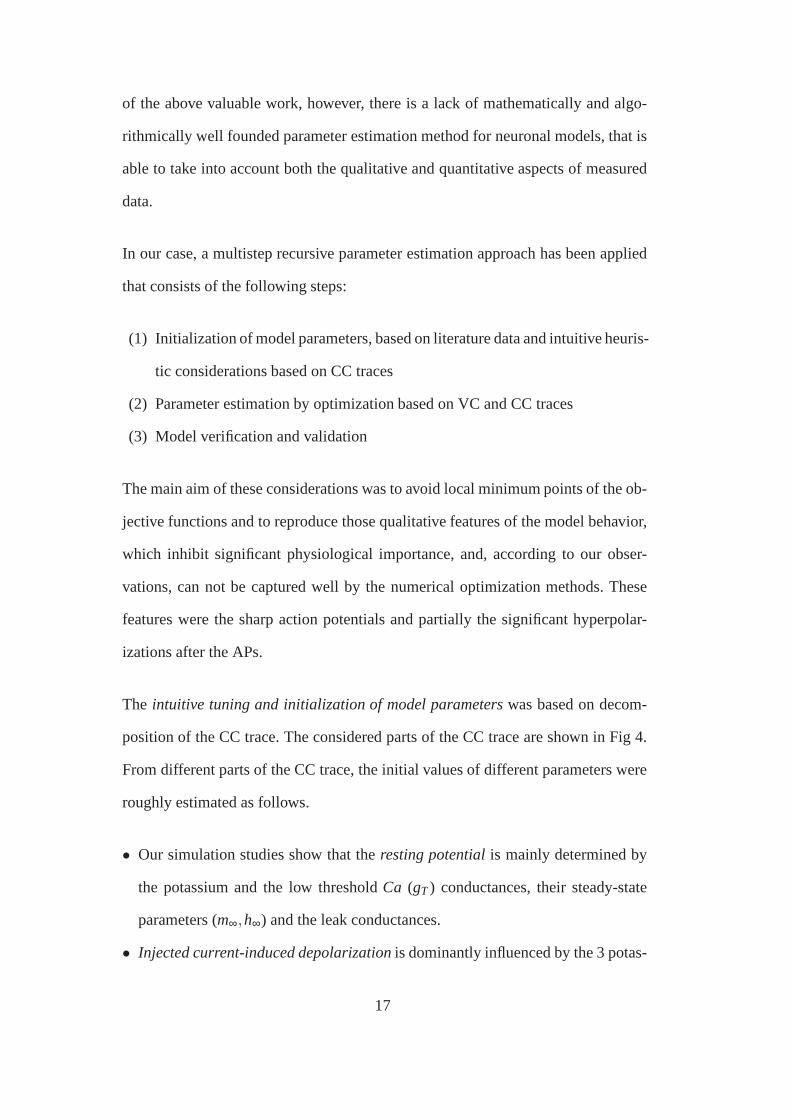
The intuitive tuning and initialization of model parameterswas based on decom-
position of the CC trace. The considered parts of the CC traceare shown in Fig 4.
From different parts of the CC trace, the initial values of different parameters were
roughly estimated as follows.
• Our simulation studies show that theresting potentialis mainly determined by
the potassium and the low thresholdCa (gT) conductances, their steady-state
parameters (m∞,h∞) and the leak conductances.
• Injected current-induced depolarizationis dominantly influenced by the 3 potas-
17
0 50 100 150 200 250 300-80
-60
-40
-20
0
20
40
60
Resting Potential
Depolarization caused by injected
current
Upstroke of AP
Downstroke of AP,
repolarization Interspike interval
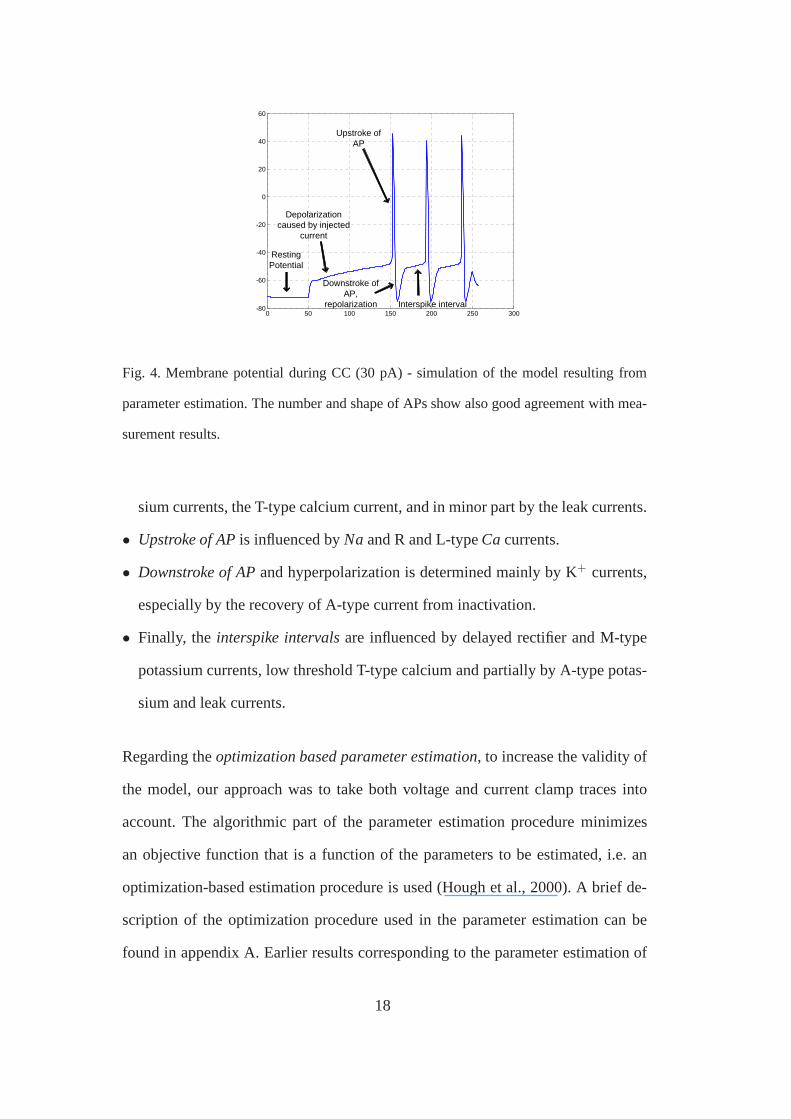
Fig. 4. Membrane potential during CC (30 pA) - simulation of the model resulting from
parameter estimation. The number and shape of APs show also good agreement with mea-
surement results.
sium currents, the T-type calcium current, and in minor partby the leak currents.
• Upstroke of APis influenced byNa and R and L-typeCacurrents.
• Downstroke of APand hyperpolarization is determined mainly by K+ currents,
especially by the recovery of A-type current from inactivation.
• Finally, the interspike intervalsare influenced by delayed rectifier and M-type
potassium currents, low threshold T-type calcium and partially by A-type potas-
sium and leak currents.
Regarding theoptimization based parameter estimation, to increase the validity of
the model, our approach was to take both voltage and current clamp traces into
account. The algorithmic part of the parameter estimation procedure minimizes
an objective function that is a function of the parameters tobe estimated, i.e. an
optimization-based estimation procedure is used (Hough etal., 2000). A brief de-
scription of the optimization procedure used in the parameter estimation can be
found in appendix A. Earlier results corresponding to the parameter estimation of
18
GnRH neurons are described in (Csercsik et al., 2009a,b).
4 Results and Discussion
The parameter set, which reproduced the most important qualitative features of the
firing patterns, and also provided a good fit of VC traces, has been obtained using
the multistep process described above in section 3.3.3, iterating steps (1) and (2).
The estimated model parameters can be found in subsection 7.2 of Appendix B.
If we compare the results with literature data, we can make the following observa-
tions.
• The activation and inactivation curves of the A-type K+ current in the model
show reasonable agreement with the results published by DeFazio and Moen-
ter (2002). Furthermore, the voltage-dependence characteristics of the activation
time constant ofτmA of IA in higher voltage ranges (above 0 mV) are in good
agreement with the results of Luther and Tasker (2000) regarding hypothalamic
cells. In the lower voltage ranges the activation time constant published in Luther
and Tasker (2000) exceeds that our model by 1-4 ms. The inactivation time con-
stants of the model show significant difference (20-30 ms) inthe lower voltage
ranges (about -40 mV) compared to this article.
• The activation and inactivation curves of R-type Ca2+ current are in good agree-
ment with the results of Kato et al. (2003). The amplitude of Ca2+ currents in the
case of VC simulations is similar to measurement results of Kato et al. (2003).
• The characteristics of the T-type LVA Ca2+ current are in good agreement with
the results of Talavera and Nilius (2006).
19
4.1 Current clamp results
It should be noted that the model parameters were estimated using both VC and CC
traces, while CC measurements were only available for one current step value (30
pA). The simulated CC trace in response to a 30 pA current stepis depicted in Fig.
4.
In contrast to the VC traces where the simulated responses were compared to the
average measured responses, in the case of CC traces the characteristic features of
the measured and simulated CC traces were compared. The characteristic values
(number of APs, depolarization and hyperpolarization values) of the simulated CC
trace are compared with the average values corresponding tothe measured CC
traces (depicted in Fig. 2) in Table 1.
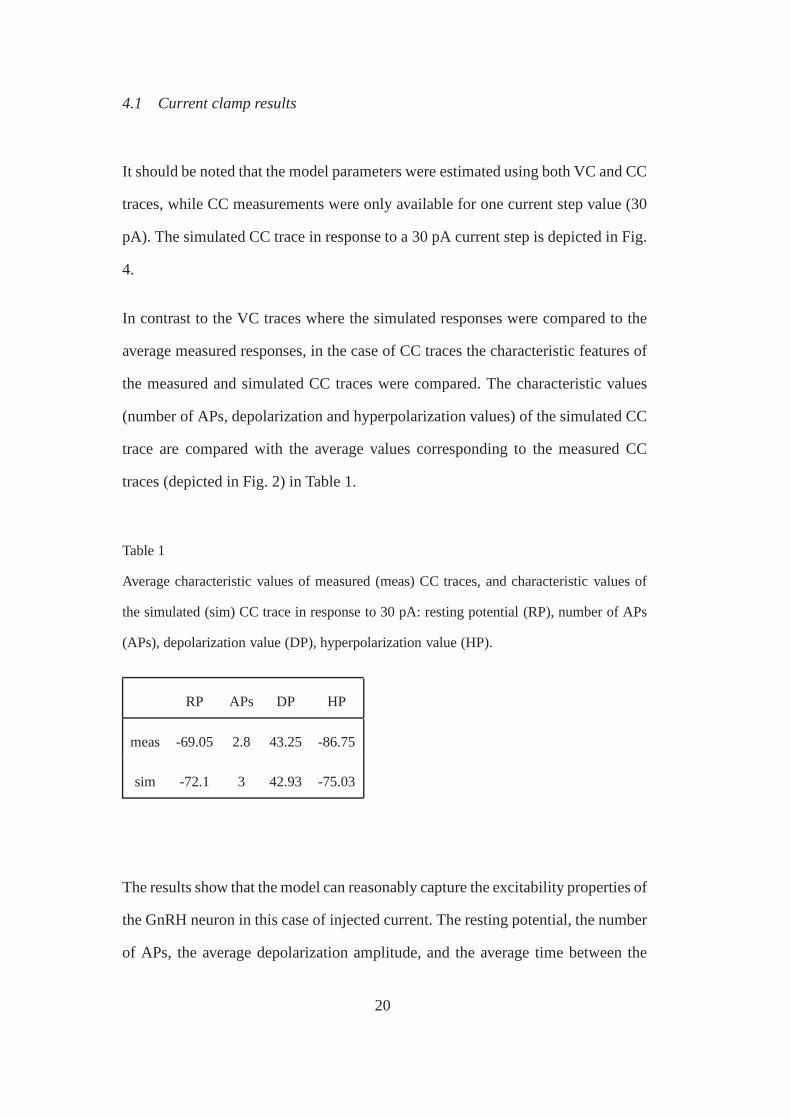
Table 1
Average characteristic values of measured (meas) CC traces, and characteristic values of
the simulated (sim) CC trace in response to 30 pA: resting potential (RP), number of APs
(APs), depolarization value (DP), hyperpolarization value (HP).
RP APs DP HP
meas -69.05 2.8 43.25 -86.75
sim -72.1 3 42.93 -75.03
The results show that the model can reasonably capture the excitability properties of
the GnRH neuron in this case of injected current. The restingpotential, the number
of APs, the average depolarization amplitude, and the average time between the
20
APs in the simulation results show also good agreement with measurement data.
On the other hand, while the model reproduces the characteristic sub-baseline hy-
perpolarization, it can not describe the hyperpolarization amplitudes well. The rea-
son for this may be the lack of Ca2+ activated K+ channels, however it is stated in
(Van Goor et al., 2000) that [Ca2+] i levels reached during spontaneous AP firing
are not sufficient to activate large and small conductance Ca2+-activated K+ chan-
nels. In the case of bursting these channels could possibly improve the description
of sub baseline hyperpolarization.
The simulations also showed, that hyperpolarization is determined dominantly by
the delayed rectifier K-type and non-inactivating M-type K+ currents, and by the
recovery of A-type K+ current from inactivation. Furthermore the deactivation and
inactivation of high voltage activated Ca2+ currents, as well as that of the Na+ cur-
rent turned out to be essential for the sub-baseline hyperpolarization. The higher
powers of the activation variables of fast Ca2+ currents - similar to the model pub-
lished by Fletcher and Li (2009) - facilitates this fast deactivation.
0 50 100 150 200 250 300-400
-350
-300
-250
-200
-150
-100
-50
0
50
30 pA
35 pA
40 pA
50 mV
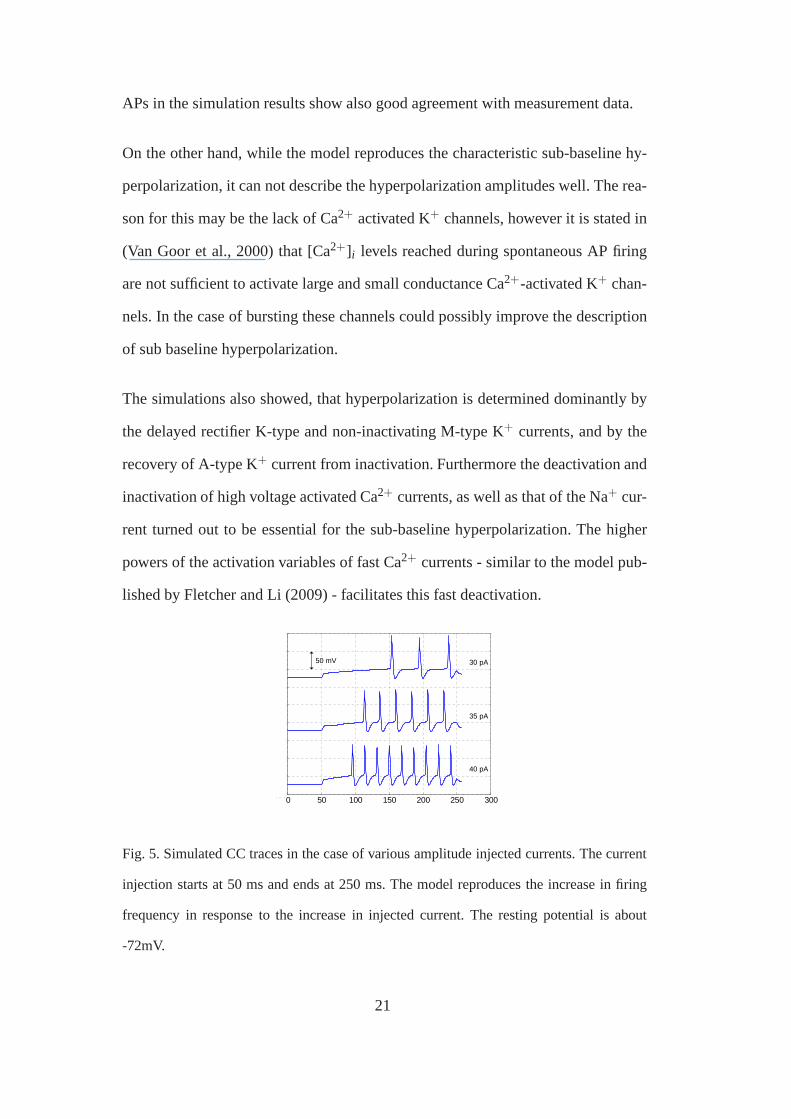
Fig. 5. Simulated CC traces in the case of various amplitude injected currents. The current
injection starts at 50 ms and ends at 250 ms. The model reproduces the increase in firing
frequency in response to the increase in injected current. The resting potential is about
-72mV.
21
Furthermore, as one increases the injected current in the simulations, the firing
frequency increases (see Fig. 5), as it could be observed in CC measurements.
4.2 Voltage clamp results
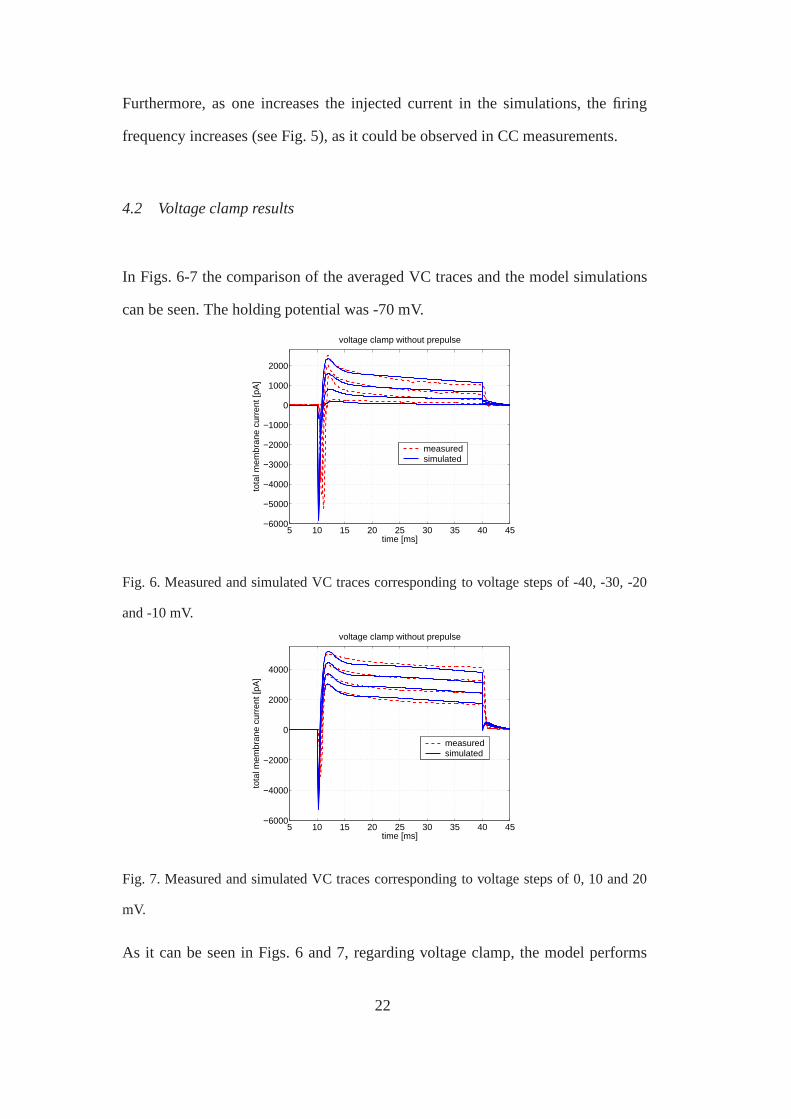
In Figs. 6-7 the comparison of the averaged VC traces and the model simulations
can be seen. The holding potential was -70 mV.
5 10 15 20 25 30 35 40 45−6000
−5000
−4000
−3000
−2000
−1000
0
1000
2000
time [ms]
tota
l mem
bran
e cu
rren
t [pA
]
voltage clamp without prepulse
measuredsimulated
Fig. 6. Measured and simulated VC traces corresponding to voltage steps of -40, -30, -20
and -10 mV.
5 10 15 20 25 30 35 40 45−6000
−4000
−2000
0
2000
4000
time [ms]
tota
l mem
bran
e cu
rren
t [pA
]
voltage clamp without prepulse
measuredsimulated
Fig. 7. Measured and simulated VC traces corresponding to voltage steps of 0, 10 and 20
mV.
As it can be seen in Figs. 6 and 7, regarding voltage clamp, themodel performs
22
better in the medium and high voltage ranges. The steady-state and pre-steady state
currents are well fit, and the dynamics of the transient currents are quite reasonably
captured in the case of approximately half of the traces. Furthermore, in some cases,
after the end of the voltage step, at 40 ms, significant tail currents appear in the
simulations, which are not confirmed by measurement results.
4.2.1 Effect of prepulse
Because VC measurements with prepulse were not available for all of the cells,
the prepulse VC data were not used for the parameter estimation process. Instead,
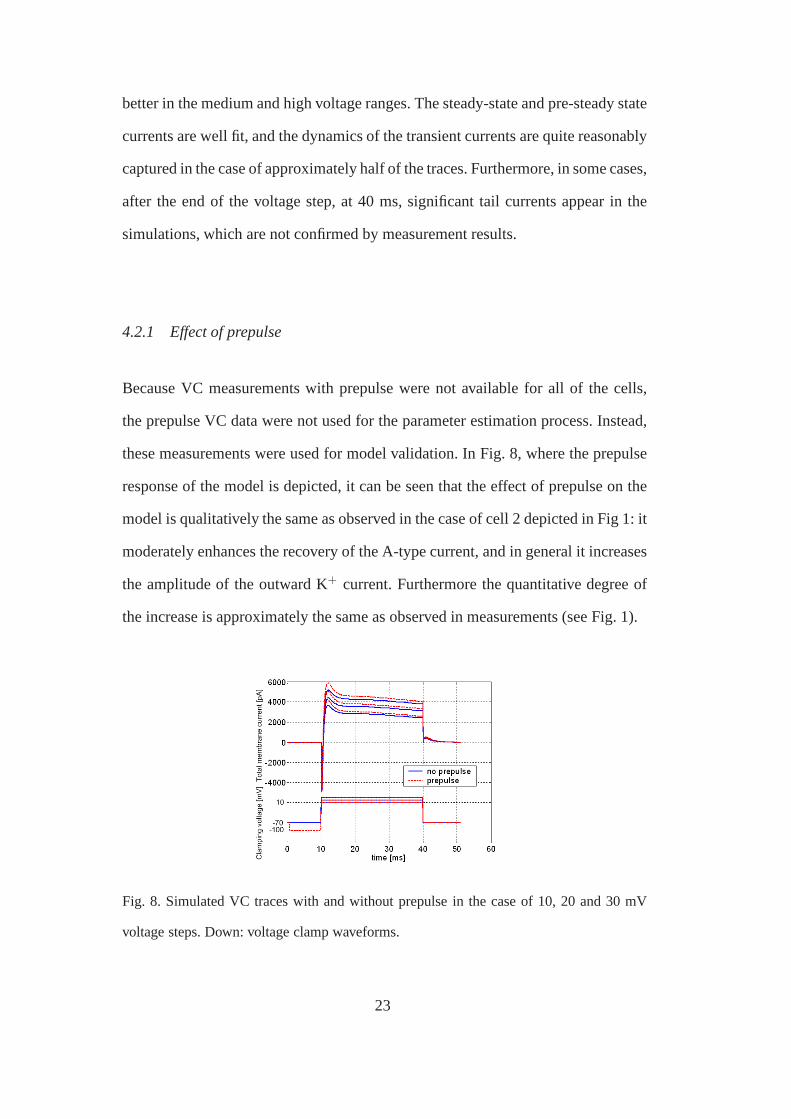
these measurements were used for model validation. In Fig. 8, where the prepulse
response of the model is depicted, it can be seen that the effect of prepulse on the
model is qualitatively the same as observed in the case of cell 2 depicted in Fig 1: it
moderately enhances the recovery of the A-type current, andin general it increases
the amplitude of the outward K+ current. Furthermore the quantitative degree of
the increase is approximately the same as observed in measurements (see Fig. 1).
Fig. 8. Simulated VC traces with and without prepulse in the case of 10, 20 and 30 mV
voltage steps. Down: voltage clamp waveforms.
23
4.3 Bursting properties of the model
As it is described in (Constantin and Charles, 1999, 2001), bursts and prolonged
episodes of repetitive action potentials contribute to oscillatory increases in intra-
cellular Ca2+, which determine the secretory pattern of GnRH (Stojilkovic et al.,
1994).
Several results support the hypothesis, that bursts in GnRHneurons are connected
with depolarizing afterpotentials (DAPs) (Kuehl-Kovariket al., 2005). The results
of Chu and Moenter (2006) show that these slow DAPs are connected with TTX
dependent sodium conductances.
As it has been described in section 2.1, our aim was to create amodel which is able
to describe bursting. The resting potential of the basic model, which showed no
bursting properties, was about -70 mV as depicted in Fig. 4. As described by Suter
et al. (2000), the average resting potential of GnRH neuronsthat generated bursts
was about -60 mV. This data served as a basic guideline in the task of parameter
modification to achieve bursting. The basic parameter set ofthe bursting model is
described in Tables 4 and 5 of subsection 7.3 in Appendix B.
In the simulations a 2 ms wide 100 pA pulse was applied at 50 ms to evoke bursting.
The simulation result of the basic bursting model is depicted as the first trace in Fig.
10.
Furthermore we have to note, that the average firing frequency in the burst simu-
lations ranged from 33 to 40 Hz, which is higher compared to the burst frequency
described in (Suter et al., 2000) and (Kuehl-Kovarik et al.,2005). In general it can
be stated that the bursting of the model is quite sensitive toparametric changes, and
24
bursting can be easily terminated or turned into a continualfiring pattern.
4.3.1 Dependence on T-type Ca2+ current
The sodium conductance of the model is not able to reproduce 400-600 ms DAPs as
described in (Kuehl-Kovarik et al., 2005) according to the observed simulation re-
sults. However, the T-type Ca2+ current in the model, which inhibits slow deactiva-
tion features, and interacts with the A-type current duringafter-hyperpolarization,
can produce short depolarizing oscillations following theAPs, which can serve as
basis for bursting.
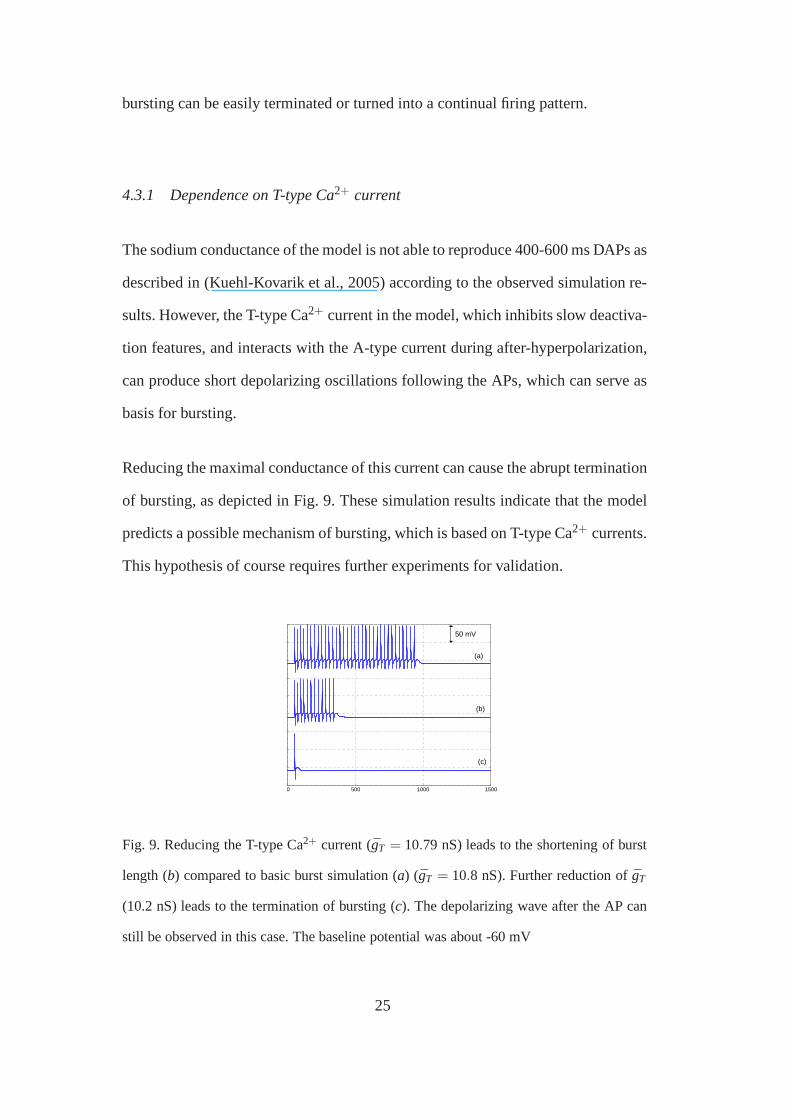
Reducing the maximal conductance of this current can cause the abrupt termination
of bursting, as depicted in Fig. 9. These simulation resultsindicate that the model
predicts a possible mechanism of bursting, which is based onT-type Ca2+ currents.
This hypothesis of course requires further experiments forvalidation.
0 500 1000 1500-400
-350
-300
-250
-200
-150
-100
-50
0
50
(a)
(b)
(c)
50 mV
Fig. 9. Reducing the T-type Ca2+ current (gT = 10.79 nS) leads to the shortening of burst
length (b) compared to basic burst simulation (a) (gT = 10.8 nS). Further reduction of ¯gT
(10.2 nS) leads to the termination of bursting (c). The depolarizing wave after the AP can
still be observed in this case. The baseline potential was about -60 mV
25
4.3.2 Influence of the Ca2+ currents on the length of burst
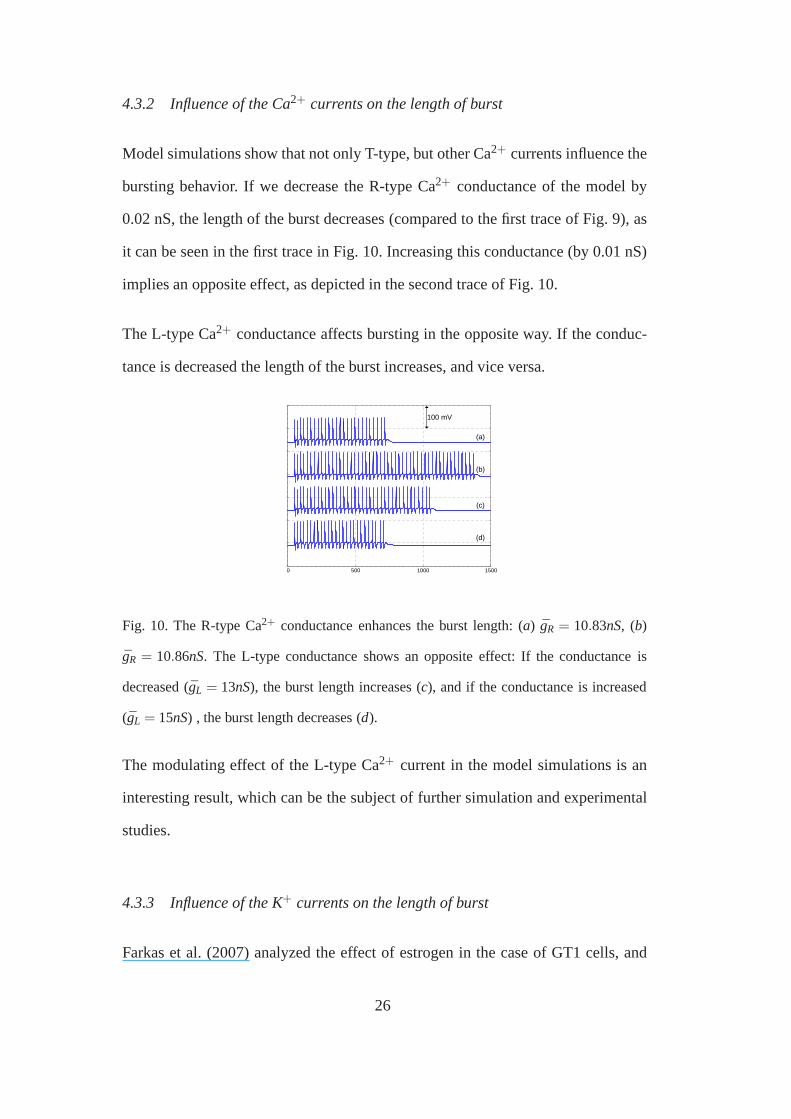
Model simulations show that not only T-type, but other Ca2+ currents influence the
bursting behavior. If we decrease the R-type Ca2+ conductance of the model by
0.02 nS, the length of the burst decreases (compared to the first trace of Fig. 9), as
it can be seen in the first trace in Fig. 10. Increasing this conductance (by 0.01 nS)
implies an opposite effect, as depicted in the second trace of Fig. 10.
The L-type Ca2+ conductance affects bursting in the opposite way. If the conduc-
tance is decreased the length of the burst increases, and vice versa.
0 500 1000 1500-600
-500
-400
-300
-200
-100
0
100
(a)
(b)
(c)
(d)
100 mV
Fig. 10. The R-type Ca2+ conductance enhances the burst length: (a) gR = 10.83nS, (b)
gR = 10.86nS. The L-type conductance shows an opposite effect: If the conductance is
decreased ( ¯gL = 13nS), the burst length increases (c), and if the conductance is increased
(gL = 15nS) , the burst length decreases (d).
The modulating effect of the L-type Ca2+ current in the model simulations is an
interesting result, which can be the subject of further simulation and experimental
studies.
4.3.3 Influence of the K+ currents on the length of burst
Farkas et al. (2007) analyzed the effect of estrogen in the case of GT1 cells, and
26
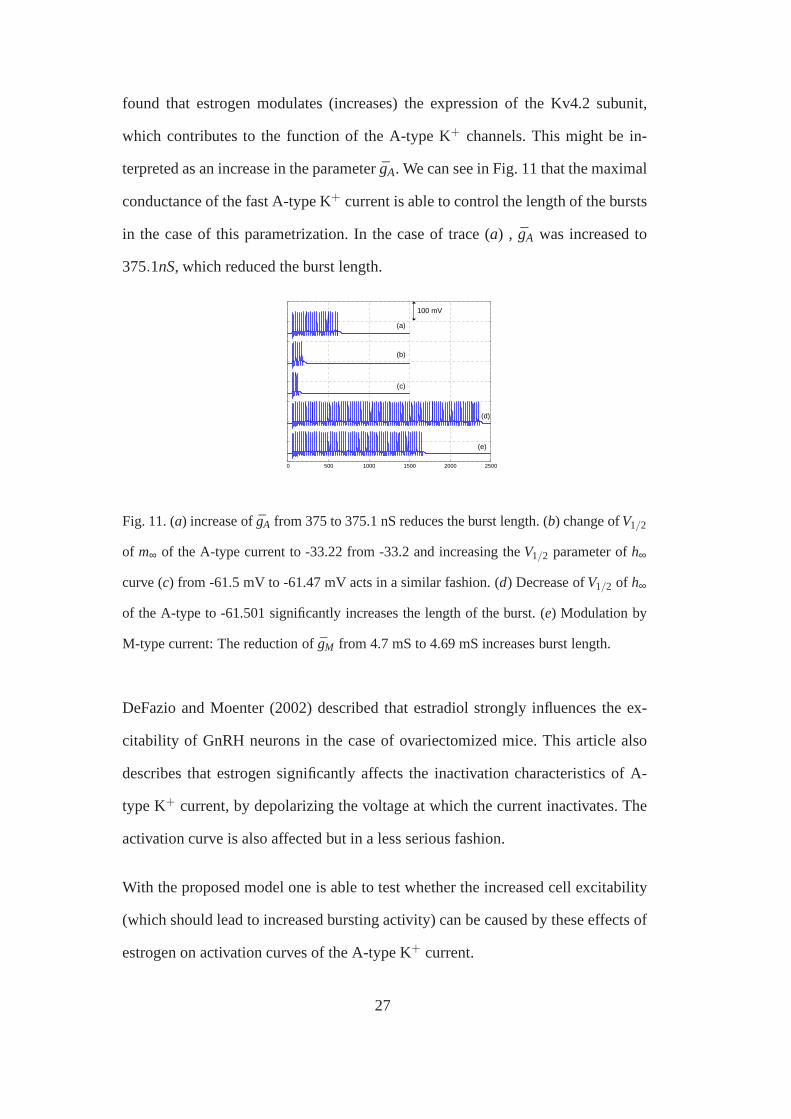
found that estrogen modulates (increases) the expression of the Kv4.2 subunit,
which contributes to the function of the A-type K+ channels. This might be in-
terpreted as an increase in the parameter ¯gA. We can see in Fig. 11 that the maximal
conductance of the fast A-type K+ current is able to control the length of the bursts
in the case of this parametrization. In the case of trace (a) , gA was increased to
375.1nS, which reduced the burst length.
0 500 1000 1500 2000 2500-700
-600
-500
-400
-300
-200
-100
0
100
(a)
(b)
(c)
(d)
(e)
100 mV
Fig. 11. (a) increase of ¯gA from 375 to 375.1 nS reduces the burst length. (b) change ofV1/2
of m∞ of the A-type current to -33.22 from -33.2 and increasing theV1/2 parameter ofh∞
curve (c) from -61.5 mV to -61.47 mV acts in a similar fashion. (d) Decrease ofV1/2 of h∞
of the A-type to -61.501 significantly increases the length of the burst. (e) Modulation by
M-type current: The reduction of ¯gM from 4.7 mS to 4.69 mS increases burst length.
DeFazio and Moenter (2002) described that estradiol strongly influences the ex-
citability of GnRH neurons in the case of ovariectomized mice. This article also
describes that estrogen significantly affects the inactivation characteristics of A-
type K+ current, by depolarizing the voltage at which the current inactivates. The
activation curve is also affected but in a less serious fashion.
With the proposed model one is able to test whether the increased cell excitability
(which should lead to increased bursting activity) can be caused by these effects of
estrogen on activation curves of the A-type K+ current.
27
In trace (b) of Fig. 11 we can see, that shifting the activation curve of the A-type
K+ current to the left (by decreasing theV1/2 parameter of the steady state curve
by 0.02 mV) decreases the length of the burst. Trace (c) depicts that increasing the
V1/2 parameter of the inactivation curve by 0.03 mV has similar effects. In contrast,
decreasing theV1/2 parameter of the inactivation curve ofIA can lead to significant
increase in burst length (trace (d) in Fig. 11 ).
It is likely that the combination of multiple effects of estrogen is necessary to in-
crease cell excitability, and this complex effect can not becaptured by manipulating
single parameters of the model. For example, the results of Farkas et al. (2007) in-
dicate that estrogen also affects the K-type potassium current.
Finally, the effect of M-type K+ current was analyzed. Decreasing the M-type con-
ductance also increases burst length, as expected (see trace (e) in Fig. 11).
In fact, further in silico, in vitro and in vivo experiments are necessary for the
reasonable description of estrogen effect on GnRH cell electrophysiology.
5 Conclusions and future work
As the first step of a bottom-up procedure to build a hierarchical model of the GnRH
pulse generator, a simple one compartment Hodgkin-Huxley type electrophysiolog-
ical model of the GnRH neuron was constructed. The parameters of the model were
estimated using both VC and CC data originating from cells inhypothalamic slices.
The initial values of parameter estimation were determinedusing literature data and
qualitative biological knowledge. The parameter estimation process itself was car-
ried out as a combination of algorithmic (APPS) and manual methods to reproduce
the voltage clamp traces and firing pattern observed in the measurement data.
28
The resulting parameter set provides a good fit in terms of thequalitative fea-
tures of neuronal behavior (resting potential, excitability, depolarization ampli-
tudes, sub-baseline hyperpolarizations), and an acceptable numerical fit of VC mea-
surement results. Further measurements are planned with specific channel blockers,
that would help in further tuning or even re-parametrization of the model.
Applying parametric changes, which lead to the increase of baseline potential and
enhance cell excitability, the model becomes capable of bursting. The properties of
bursting behavior could be of high impact regarding physiological functions cor-
responding to hormone release. The bursts experienced in model simulations are
dependent on Ca2+ currents, and are strongly affected by the parameters of the
A-type K+ current. Further experiments are necessary to test whetherthis type of
bursting can really appear in GnRH neurons, or this phenomenon is an artificial in
silico byproduct of the model.
The resulting model may be used as reference in the development of future models
for the GnRH neuron. As soon as an appropriate Hodgkin-Huxley type model of
membrane dynamics has been identified and validated, it willbe completed with
further elements influencing intracellular Ca2+ dynamics (models of intracellular
compartments such as the endoplasmic reticulum,Ca buffers (Shorten and Wall,
2000), andIP3 signaling (Young and Keizer, 1992; Tien et al., 1996)), which prob-
ably exert an important impact on hormone release.
Additionally, the model will be extended to take the complexeffects of estradiol on
the dynamics of membrane potential into account (Chu et al.,2009).
29
6 Appendix A: Parameter estimation method
The parameter estimation was carried out using the data averaged for all the 5
cells. The voltage clamp traces could be interpreted without any problem, and the
2-norm based optimization could be applied for the averagedtraces. Both voltage
and current clamp data was taken into account during the identification process.
Regarding the VC traces, the objective function of the estimation was the standard
two-norm of the difference between the measured and simulated output currents in
the case of the protocol defined in 3.1.2.
Current clamp traces were taken into account in the way that the model should have
had similar firing properties as the average cell population- see Fig. 1. This meant
that the average number of APs and the average depolarization and hyperpolariza-
tion values of the recorded CC traces in response to 30pA excitatory current were
compared to model simulation. The value of 30pA was chosen, because this CC
trace was available in the case of all the cells, and in response to this current 4 of
the 5 cells fired action potentials.
Numerical optimization was performed by the APPS algorithm(Kolda, 2005),
which is an asynchronous extension of the PPS method that efficiently handles sit-
uations when the individual objective function evaluations may take significantly
different time intervals and therefore it is very suitable to be implemented in a paral-
lel or grid environment. Furthermore, recent implementations of the APPS method
handle bound and linear constraints on the parameters. The global convergence of
APPS under standard assumptions is also proved by Kolda and Torczon (2004).
30
7 Appendix B: Model equations and estimated parameters
7.1 The mathematical model
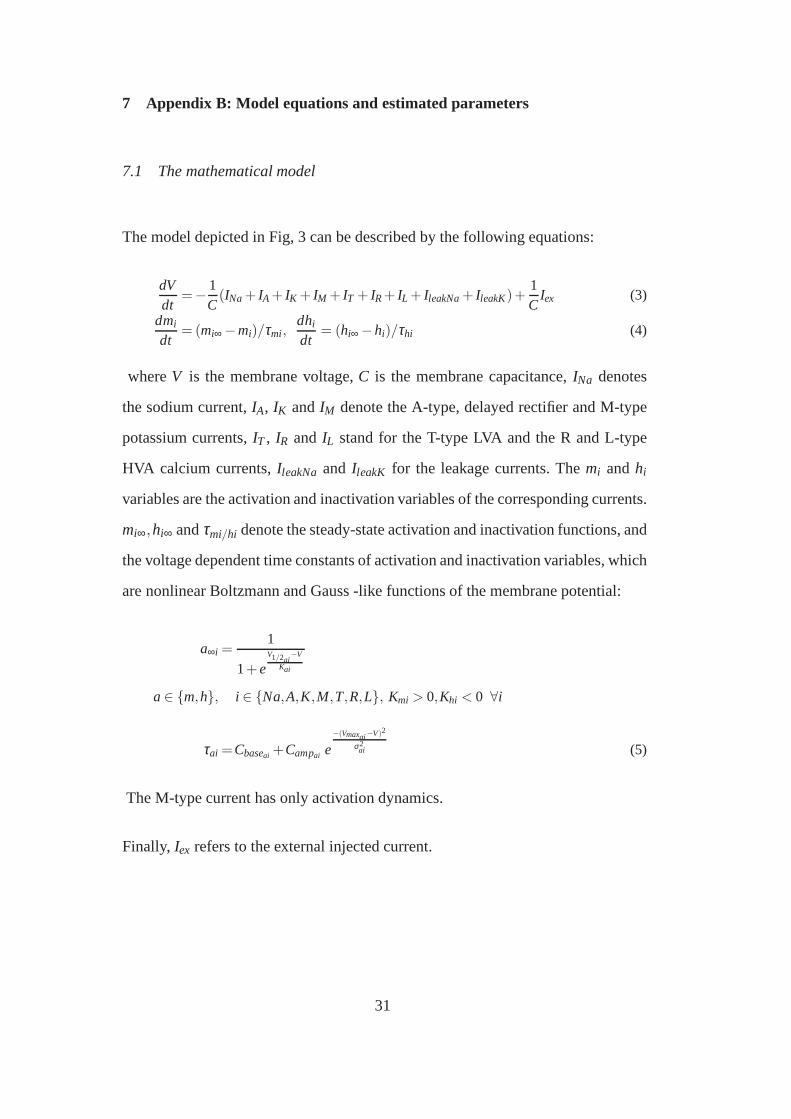
The model depicted in Fig, 3 can be described by the followingequations:
dVdt
=−1C(INa+ IA+ IK + IM + IT + IR+ IL + IleakNa+ IleakK)+
1C
Iex (3)
dmi
dt= (mi∞ −mi)/τmi,
dhi
dt= (hi∞ −hi)/τhi (4)
whereV is the membrane voltage,C is the membrane capacitance,INa denotes
the sodium current,IA, IK andIM denote the A-type, delayed rectifier and M-type
potassium currents,IT , IR and IL stand for the T-type LVA and the R and L-type
HVA calcium currents,IleakNa and IleakK for the leakage currents. Themi andhi
variables are the activation and inactivation variables ofthe corresponding currents.
mi∞,hi∞ andτmi/hi denote the steady-state activation and inactivation functions, and
the voltage dependent time constants of activation and inactivation variables, which
are nonlinear Boltzmann and Gauss -like functions of the membrane potential:
a∞i =1
1+eV1/2ai
−V
Kai
a∈ m,h, i ∈ Na,A,K,M,T,R,L, Kmi > 0,Khi < 0 ∀i
τai =Cbaseai +Campai e−(Vmaxai−V)2
σ2ai (5)
The M-type current has only activation dynamics.
Finally, Iex refers to the external injected current.
31
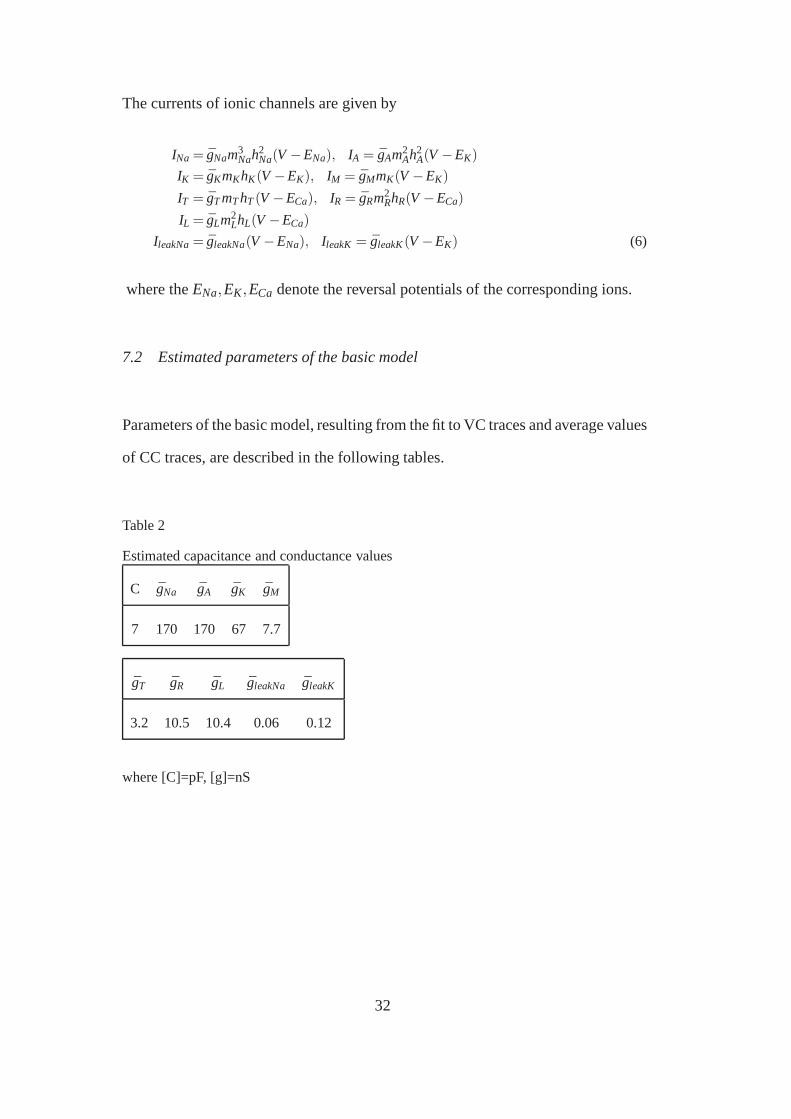
The currents of ionic channels are given by
INa= gNam3Nah
2Na(V −ENa), IA = gAm2
Ah2A(V −EK)
IK = gKmKhK(V −EK), IM = gMmK(V −EK)
IT = gTmThT(V −ECa), IR = gRm2RhR(V −ECa)
IL = gLm2LhL(V −ECa)
IleakNa= gleakNa(V −ENa), IleakK = gleakK(V −EK) (6)
where theENa,EK,ECa denote the reversal potentials of the corresponding ions.
7.2 Estimated parameters of the basic model
Parameters of the basic model, resulting from the fit to VC traces and average values
of CC traces, are described in the following tables.
Table 2
Estimated capacitance and conductance values
C gNa gA gK gM
7 170 170 67 7.7
gT gR gL gleakNa gleakK
3.2 10.5 10.4 0.06 0.12
where [C]=pF, [g]=nS
32
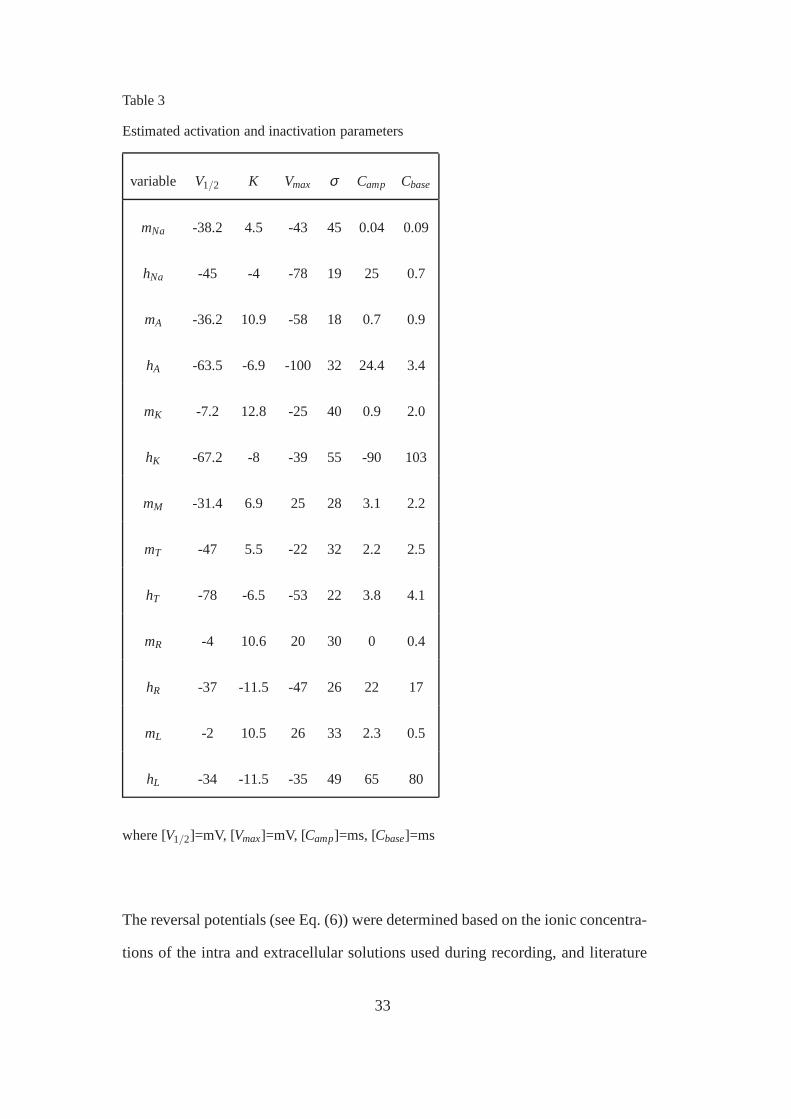
Table 3
Estimated activation and inactivation parameters
variable V1/2 K Vmax σ Camp Cbase
mNa -38.2 4.5 -43 45 0.04 0.09
hNa -45 -4 -78 19 25 0.7
mA -36.2 10.9 -58 18 0.7 0.9
hA -63.5 -6.9 -100 32 24.4 3.4
mK -7.2 12.8 -25 40 0.9 2.0
hK -67.2 -8 -39 55 -90 103
mM -31.4 6.9 25 28 3.1 2.2
mT -47 5.5 -22 32 2.2 2.5
hT -78 -6.5 -53 22 3.8 4.1
mR -4 10.6 20 30 0 0.4
hR -37 -11.5 -47 26 22 17
mL -2 10.5 26 33 2.3 0.5
hL -34 -11.5 -35 49 65 80
where [V1/2]=mV, [Vmax]=mV, [Camp]=ms, [Cbase]=ms
The reversal potentials (see Eq. (6)) were determined basedon the ionic concentra-
tions of the intra and extracellular solutions used during recording, and literature
33
data. The assumed reversal potentials are:
ENa = 100mV, EK =−94 mV, ECa= 80 mV
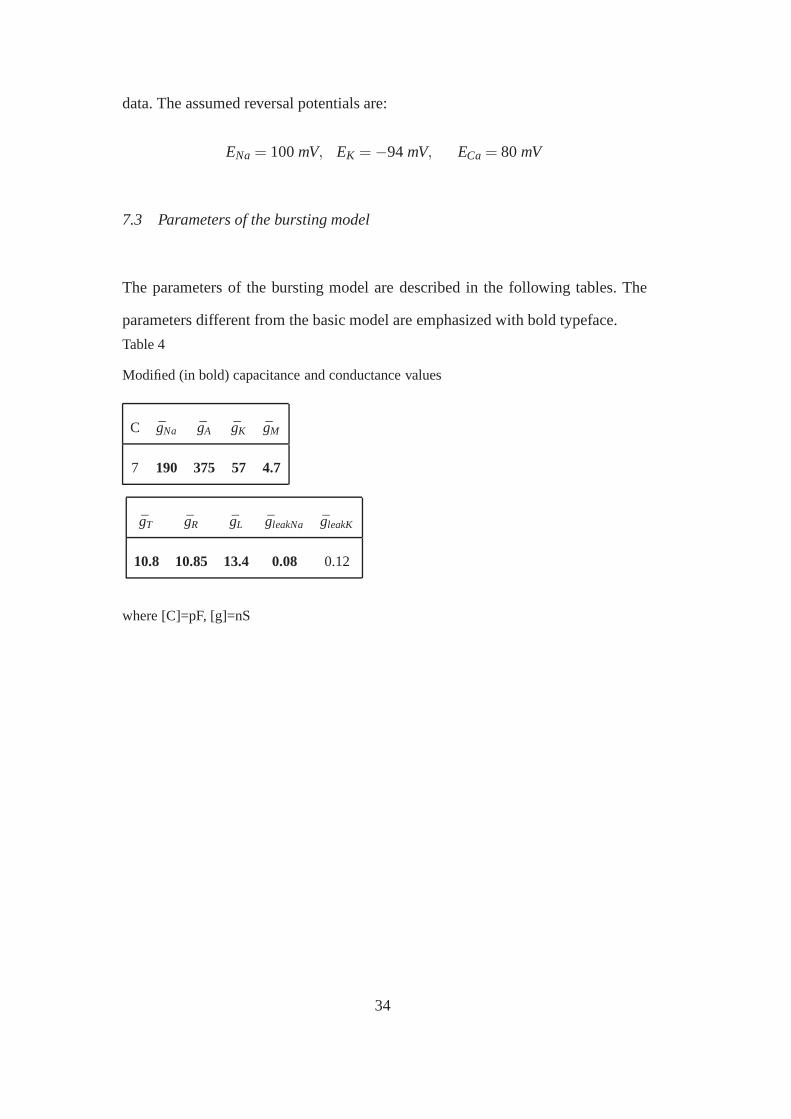
7.3 Parameters of the bursting model
The parameters of the bursting model are described in the following tables. The
parameters different from the basic model are emphasized with bold typeface.
Table 4
Modified (in bold) capacitance and conductance values
C gNa gA gK gM
7 190 375 57 4.7
gT gR gL gleakNa gleakK
10.8 10.85 13.4 0.08 0.12
where [C]=pF, [g]=nS
34
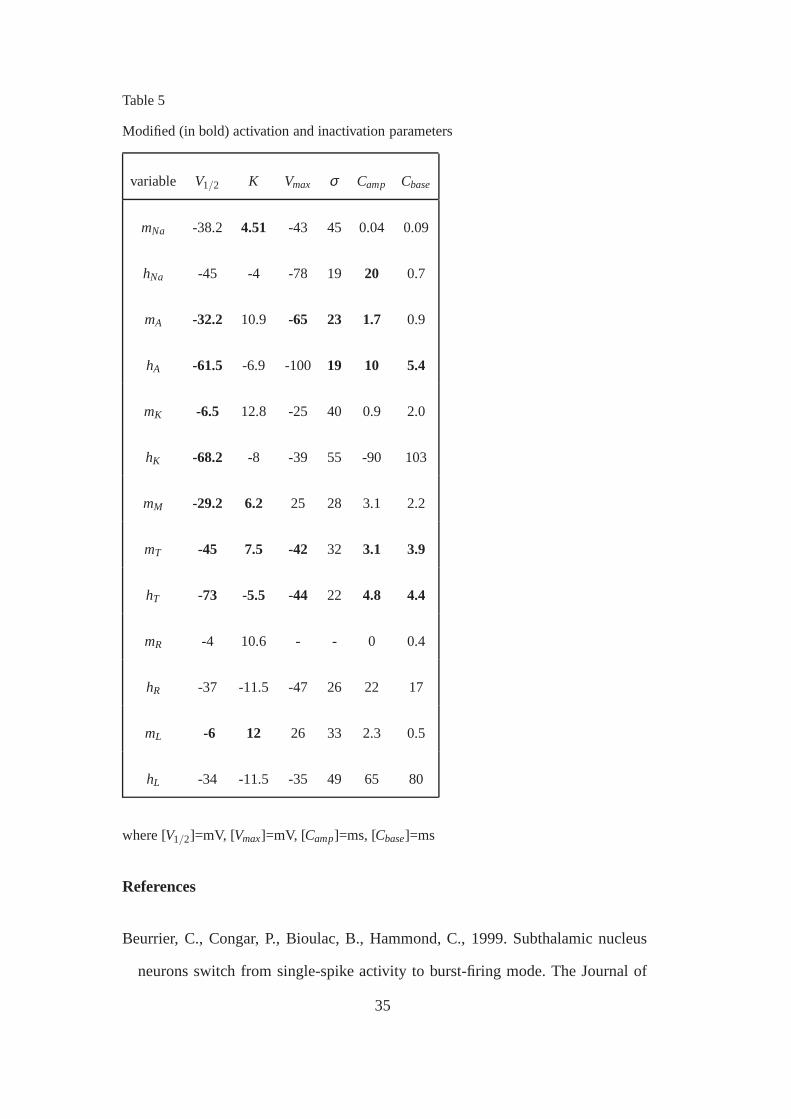
Table 5
Modified (in bold) activation and inactivation parameters
variable V1/2 K Vmax σ Camp Cbase
mNa -38.2 4.51 -43 45 0.04 0.09
hNa -45 -4 -78 19 20 0.7
mA -32.2 10.9 -65 23 1.7 0.9
hA -61.5 -6.9 -100 19 10 5.4
mK -6.5 12.8 -25 40 0.9 2.0
hK -68.2 -8 -39 55 -90 103
mM -29.2 6.2 25 28 3.1 2.2
mT -45 7.5 -42 32 3.1 3.9
hT -73 -5.5 -44 22 4.8 4.4
mR -4 10.6 - - 0 0.4
hR -37 -11.5 -47 26 22 17
mL -6 12 26 33 2.3 0.5
hL -34 -11.5 -35 49 65 80
where [V1/2]=mV, [Vmax]=mV, [Camp]=ms, [Cbase]=ms
References
Beurrier, C., Congar, P., Bioulac, B., Hammond, C., 1999. Subthalamic nucleus
neurons switch from single-spike activity to burst-firing mode. The Journal of
35
Neuroscience, 19, 599–609.
Bogumil, R., Ferin, M., Rootenberg, J., Speroff, L., vande Wiele, R., 1972. Math-
ematical studies of the human menstrual cycle. I. formulation of a mathematical
model. Journal of Clinical Endocrinology and Metabolism 35, 126–143.
Bosama, M., 1993. Ion channel properties and episodic activity in isolated immor-
talized gonadotropin-releasing hormone (GnRH) neurons. Journal of Membrane
Biology 136, 85–96.
Brown, D., Herbison, A., Robinson, J., Marrs, R., Leng, G., 1994. Modelling the
lutenizing hormone-releasing hormone pulse generator. Neuroscience 63, 869–
879.
Chabbert-Buffet, N., Skinnerb, D., Caratyb, A., Boucharda, P., 2000. Neuroen-
docrine effects of progesterone. Steroids 65, 613–620.
Charles, A., Hales., T., 1995. Mechanisms of spontaneous calcium oscillations
and action potentials in immortalized hypothalamic (GT1-7) neurons. Journal
of Neurophysiology 73, 56–64.
Chu, Z., Andrade, J., Shupnik, M., Moenter, S., 2009. Differential regulation of
gonadotropin-releasing hormone neuron activity and membrane properties by
acutely applied estradiol: Dependence on dose and estrogenreceptor subtype.
Journal of Neuroscience 29, 5616–5627.
Chu, Z., Moenter, S., 2006. Physiologic regulation of a tetrodotoxin-sensitive
sodium influx that mediates a slow afterdepolarization potential in gonadotropin-
releasing hormone neurons: possible implications for the central regulation of
fertility. Journal of Neuroscience 26, 11961–73.
Conn, P., Freeman, M., 2000. Neuroendocrinology in Physiology and Medicine.
Humana Press, 999 Riverview Drive Suite 208 Totowa New Jersey 07512.
Constantin, J., Charles, A., 1999. Spontaneous action potentials initiate rhyth-
mic intercellular calcium waves in immortalized hypothalamic (GT1-1) neurons.
36
Journal of Neurophysiology 82, 429–435.
Constantin, J., Charles, A., 2001. Modulation ofCa2+ signaling byK+ channels in
a hypothalamic neuronal cell line (GT-1). Journal of Neurophysiology 85, 295–
304.
Csercsik, D., Szederkényi, G., Hangos, K., Farkas, I., August 12-14 2009a. Dy-
namical modeling and identification of a GnRH neuron. In: Proceedings of the
MCBMS’09 7th IFAC symposium on Modelling and Control in Biomedical Sys-
tems. pp. 330–331.
Csercsik, D., Szederkényi, G., Hangos, K., Farkas, I., August 23-26 2009b. Model
synthesis and identification of a Hodgkin-Huxley-type GnRHneuron model. In:
Proceedings of the ECC’09 European Control Conference. pp.330–331.
DeFazio, R., Moenter, S., 2002. Estradiol feedback alters potassium currents and
firing properties of gonadotropin- releasing hormone neurons. Molecular En-
docrinology 16, 2255–2265.
Di Garbo, A., Barbi, M., Chillemi, S., 2007. The synchronization properties of a
network of inhibitory interneurons depend on the biophysical model. Biosystems
88, 216–227.
Farkas, I., Varju, P., Liposits, Z., 2007. Estrogen modulates potassium currents and
expression of the Kv4.2 subunit in GT1-7 cells. Neurochemistry International
50, 619–627.
Fletcher, P., Li, Y., 2009. An integrated model of electrical spiking, bursting, and
calcium oscillations in GnRH neurons. Biophysical Journal96, 4514–4524.
Gordan, J., Attardi, B., Pfaff, D., 1998. Mathematical exploration of pulsatility in
cultured gonadotropin-releasing hormone neurons. Neuroendocrinology 67, 2–
17.
Grigoliene, R., Svitra, D., 2000. The mathematical model ofthe female menstrual
cycle and its modifications. Informatica 11, 411–420.
37
Harris, L., 2001. Differential equation models for the hormonal regula-
tion of the menstrual cycle. PhD thesis, North Carolina State University,
www.lib.ncsu.edu/theses/available/etd-04222002-153727/unrestricted/etd.pdf.
Harris, L., Schlosser, P. M., Selgrade, J. F., 2006. Multiple stable periodic solutions
in a model for hormonal control of the menstrual cycle. Bulletin of Mathematical
Biology 65, 157–173.
Haufler, D., Morin, F., Lacaille, J., Skinner, F., 2007. Parameter estimation in
single-compartment neuron models using a synchronization-based method. Neu-
rocomputing 70, 1605–1610.
Helmreich, E., Bakardjieva, A., 1980. Hormonally stimulated adenylate cyclase: A
membranous multicomponent system. Biosystems 12, 295–304.
Herbison, A., 2008. Estrogen positive feedback to gonadotropin-releasing hor-
mone (GnRH) neurons in the rodent: The case for the rostral periventricu-
lar area of the third ventricle (RP3V). Brain Research Reviews 57, 277–287,
doi:10.1016/j.brainresrev.2007.05.006.
Herbison, A., Pape, J., Simonian, S., Skynner, M., Sim, J., 2001. Molecular and cel-
lular properties of GnRH neurons revealed through transgenics in mouse. Molec-
ular and Cellular Endocrinology 185, 185–194.
Hodgkin, A., Huxley, A., 1952. A quantitive description of membrane current and
application to conduction and excitation in nerve. Journalof Physiology 117,
500–544.
Hough, P. D., Kolda, T. G., Torczon, V. J., 2000. Asynchronous parallel pattern
search for nonlinear optimization. SIAM Journal on Scientific Computing 23,
134–156.
Huys, Q., Ahrens, M., Paninski, L., 2006. Efficient estimation of de-
tailed single-neuron models. Journal of Neurophysiology 96, 872–890,
doi:10.1152/jn.00079.2006.
38
Karsch, F., Cummins, J., Thomas, G., Clarke, I., 1987. Steroid feedback inhibition
of pulsatile secretion of gonadotropin-releasing hormonein the ewe. Biology of
Reproduction 36, 1207–18.
Kato, M., Ui-Tei, K., Watanabe, M., Sakuma, Y., 2003. Characterization of voltage-
gated calcium currents in gonadotropin-releasing hormoneneurons tagged with
green fluorescent protein in rats. Endocrinology 144, 5118–5125.
Khadra, A., Li, Y., 2006. A model for the pulsatile secretionof gonadotropin-
releasing hormone from synchronized hypothalamic neurons. Biophysical Jour-
nal 91, 74–83.
Knobil, E., 1980. The neuroendocrine control of the menstrual cycle. Hormone
Research 36, 53–88.
Knobil, E., 1988. The hypothalamic gonadotropin hormonr releasing hormone
(GnRH) pulse generator in the rhesus monkey and its neuroendocrine control.
Human Reproduction 3, 29–31.
Kolda, T., 2005. Revisiting asynchronous parallel patternsearch for nonlinear op-
timization. SIAM J. Optimization 16, 563–586.
Kolda, T., Torczon, V., 2004. On the convergence of asynchronous parallel pattern
search. SIAM J. Optimization 14, 939–964.
Komendantov, A., Trayanova, N., Tasker, J., 2007. Somato-dendritic mechanisms
underlying the electrophysiological properties of hypothalamic magnocellular
neuroendocrine cells: A multicompartmental model study. Journal of Computa-
tional Neuroscience 23, 143–168, dOI 10.1007/s1-827-007-0024-z.
Krsmanovic, L., Stojilkovic, S., Merelli, F., Dufour, S., Virmani, M., Catt, K., 1992.
Calcium signaling and episodic secretion of gonadotropin-releasing hormone in
hypothalamic neurons. Proceedings of the National Academyof Sciences of the
USA 89, 8462–8466.
Kuehl-Kovarik, M., K.M.Partin, Handa, R., Dudek, F., 2005.Spike-dependent de-
39
polarizing afterpotentials contribute to endogenous bursting in gonadotropin re-
leasing hormone neurons. Neuroscience 134, 295–300.
Kusano, K., Fueshko, S., Gainer, H., Wray, S., 1995. Electrical and synaptic proper-
ties of embryonic lutenizing hormone-releasing hormone neurons in explant cul-
tures. Proceedings of the National Academy of Sciences of the USA 92, 3918–
3992.
LeBeau, A., Goor, F. V., Stojilkovic, S., Sherman, A., 2000.Modeling of membrane
excitability in gonadotropin-releasing hormone-secreting hypothalamic neurons
regulated by Ca2+-mobilizing and adenylyl cyclase-coupled receptors. The Jour-
nal of Neuroscience 20, 9290–9297.
Lee, J., Smaill, B., Smith, N., 2006. Hodgkin-Huxley type ion channel characteri-
zation: An improved method of voltage clamp experiment parameter estimation.
Journal of Theoretical Biology 242, 123–134.
Luther, J., Tasker, J., 2000. Voltage-gated currents distinguish parvocellular from
magnocellular neurones in the rat hypothalamic paraventricular nucleus. Journal
of Physiology 523, 193–209.
Maurer, R., Kim, K., Schoderbek, W., Robertson, M., Glenn, D., 1999. Regula-
tion of glycoprotein hormone alpha-subunit gene expression. Recent Progress in
Hormone Research 129, 1175–82.
Mellon, P., Windle, J., Goldsmith, P., Padula, C., Roberts,J., Weiner, R., 1990.
Immortalization of hypothalamic GnRH neurons by genetically targeted tumori-
genesis. Neuron 5, 1–10.
Nunemaker, C., DeFazio, R., Moenter, S., 2003. Calcium current subtypes in GnRH
neurons. Biology of Reproduction 69, 1914–1922.
Reinecke, I., Deuflhard, P., 2007. A complex mathematical model of the human
menstrual cycle. Journal of Theoretical Biology 247, 303–330.
Roper, P., Callaway, J., Shevchenko, T., Teruyama, R., Armstrong, W., 2003.
40
AHP’s, HAP’s and DAP’s: How potassium currents regulate theexcitability of
rat supraoptic neurones. Journal of Computational neuroscience 15, 367–389.
Shorten, P., Wall, D., 2000. A Hodgkin-Huxley model exhibiting bursting oscilla-
tions. Bulletin of Mathematical Biology 62, 695–715.
Sim, J., Skynner, M., Herbison, A., 2001. Heterogeneity in the basic membrane
properties of postnatal gonadotropin-releasing hormone neurons in the mouse.
The Journal of Neuroscience 21, 1067–1075.
Spergel, D., Kruth, U., Hanley, D., Sprengel, R., Seeburg, P., 1999. Gaba- and
glutamate-activated channels in green fluorescent protein-tagged gonadotropin-
releasing hormone neurons in transgenic mice. The Journal of Neuroscience 19,
2037–2050.
Stojilkovic, S., Krsmanovic, L., Spergel, D., Catt, K., 1994. GnRH neurons: intrin-
sic pulsatility and receptor-mediated regulation. Trendsin Endocrinology and
Metabolism 5, 201–209.
Suter, K., Wuarin, J., Smith, B., Dudek, F., Moenter, S., 2000. Whole-cell record-
ings from preoptic/hypothalamic slices reveal burst firingin gonadotropin-
releasing hormone neurons identified with green fluorescentprotein in transgenic
mice. Endocrinology 141, 3731–3736.
Tabak, J., Murphey, C., Moore, L., 2000. Parameter estimation methods for single
neuron models. Journal of Computational Neuroscience 9, 215–236.
Talavera, K., Nilius, B., 2006. Biophysics and structure-function relationship of
T-typeCa2+ channels. Cell Calcium 40, 97–114.
Tien, J., Guckenheimer, J., 2008. Parameter estimation forbursting neural models.
Journal of Computational Neuroscience 24, 358–373, dOI 10.1007/s10827-007-
0060-8.
Tien, J., Lyles, D., Zeeman, M., 1996. A potential role of modulating inositol 1,4,5-
triphosphate receptor desenzitization and recovery ratesin regulating ovulation.
41
Animal Reproduction Science 42(1-4), 563–570.
Van Goor, F., Krsmanovic, L., Catt, K., Stojilkovic, S., 1999a. Control of action
potential-driven calcium influx in GT1 neurons by the activation status of sodium
and calcium channels. Molecular Endocrinology 13, 587–603.
Van Goor, F., Krsmanovic, L., Catt, K., Stojilkovic, S., 1999b. Coordinate regu-
lation of gonadotropin-releasing hormone neuronal firing patterns by cytosolic
calcium and store depletion. Proceedings of the National Academy of Sciences
of the USA 96, 4101–4106.
Van Goor, F., LeBeau, A., Krsmanovic, L., Sherman, A., Catt,K., Stojilkovic, S.,
2000. Amplitude-dependent spike-broadening and enhancedCa2+ signaling in
GnRH-secreting neurons. Biophysical Journal 79, 1310–1323.
Wang, D., Summers, C., Posner, P., Gelband, C., 1997. A-TypeK+ current in neu-
rons from neonatal rat hypothalamus and brain stem: Modulation by angiotensin
II. Journal of Neurophysiology 78, 1021–1029.
Watanabe, M., Sakuma, Y., Kato, M., 2004. High expression ofthe R-type voltage-
gatedCa2+ channel and its involvement inCa2+-dependent gonadotropin-
releasing hormone release in GT1-7 cells. Endocrinology 145, 2375–2388.
Wetsel, W., Valença, M., Merchenthaler, I., Liposits, Z., Lópeza, F., Weiner, R.,
Mellon, P., A.Negro-Villar, 1992. Intrinsic pulsatile secretory activity of immor-
talized luteinizing hormone-releasing hormone-secreting neurons. Proc. Natl.
Acad. Sci. USA 89, 4149–4153.
Williams, C., Thalabard, J., O’Byrne, K., Grosser, P., Nishiara, M., Hotchkiss,
J., Knobil, E., 1990. Duration of phasic electrical activity of the hypothala-
mic gonadotropin-releasing hormone pulse generator and dynamics of luteiniz-
ing hormone pulses in the rhesus monkey. Physiology/Pharmacology 87, 8580–
8582.
Willms, A., Baro, D., Harris-Warrick, R., Guckenheimer, J., 1999. An improved
42
parameter estimation method for Hodgkin-Huxley models. Journal of Computa-
tional Neuroscience 6, 145–168.
Wilson, R., Kesner, J., Kaufmann, J., Uemura, T., Akema, T.,Knobil, E., 1984.
Central electrtophsysiological correlates of pulsatile lutenizing hormone secre-
tion in the rhesus monkey. Neuroendocrinology 39, 256–260.
Xu, C., Roepke, T., Zhang, C., Ronnekleiv, O., Kelly, M., 2007. Gonadotropin-
releasing hormone (GnRH) activates the M-current in GnRH neurons: An au-
toregulatory negative feedback mechanism? Endocrinology149, 2459–2466.
Young, G. D., Keizer, J., 1992. A single-pool inositol 1,4,5-triphosphate-receptor-
based model for agonist-stimulated oscillations in[Ca2+] concentration. Proc.
Natl. Acad. Sci. 89, 9895–9899.
43


