Embed Size (px)
Citation preview
ABSTRACT - Information available from full cycle maizetrials regarding the inheritance of phosphorus (P) efficien-cy in tropical maize is limited. This type of information isessential to establish selection strategies for these charac-teristics. The objective of this study was to investigate theinheritance and relationships between characteristics relat-ed to phosphorus efficiency in tropical maize. Six tropicalmaize lines with contrasting P efficiency and seven F1crosses derived from these lines were used in this study.The parental lines, the F1’s, F2’s, BC1P1, BC1P2, BC2P1 andBC2P2 from each of the seven crosses were evaluated inthree low P and two high P environments. Efficiency traitsevaluated were: grain yield (GY), stover yield, (SY), grainP concentration (GPC), stover P concentration (SPC), Pacquisition efficiency (PAE), P internal utilization efficien-cy (PUTIL), P harvest index (PHI) and the quotient of Putilization (QUTIL). Anther silk interval (ASI), which hasbeen related to drought tolerance, was also determined.For each trait, the following parameters were estimated:mean effect (m), additive effects (a), dominant effects (d)and epistatic digenic effects (aa, ad, dd). A 47% meanyield reduction was observed at the low P level comparedwith the high P level in the soil. Dominance effects andepistatic effects (when detected) were more importantthan additive effects for the majority of the traits studied.A low correlation for PAE was observed between low andhigh P environments, suggesting that different mecha-
nisms of soil P acquisition occur in low and high P envi-ronments. For the PUTIL a high correlation was observedbetween low and high P environments, suggesting thatsimilar plant internal mechanisms occur in both soil P lev-els. A medium and negative correlation was observed be-tween ASI and GY at low P environments. Our resultssuggest that the selection criteria adequate to select for Pefficiency include GY under low P environments to deter-mine PAE under low P soils, and grain P concentrationunder high P environments to determine PUTIL.
KEY WORDS: Phosphorus; Efficiency; Genetics; Maize.
INTRODUCTION
Forty three percent of the tropical soils are clas-sified as Oxisols or Ultisols and 96% of these twosoil classification groups have phosphorus (P) defi-ciency as the principal yield limiting factor (SANCHES
and SALINAS, 1981). Phosphorus is the second largestconsumed nutrient in global agriculture production,being surpassed only by nitrogen (BATTEN, 1992).The nonrenewable phosphate reserves in the world,which can be economically exploited at values of40 dollars per ton, will be exhausted during the sec-ond half of this century (MURREL and FIXEN, 2006).These factors indicate that a research strategy aimedat developing P efficient cultivars will be a key fac-tor to achieve sustainable and competitive agricul-tural production systems.
Phosphours is one of the most important fertilitycomponents for maize grown in the acid savannasor “Cerrado” areas in Brazil (BALIGAR and FAGERIA,
Maydica 55 (2010): 1-15
INHERITANCE AND BREEDING STRATEGIES FOR PHOSPHORUSEFFICIENCY IN TROPICAL MAIZE (Zea Mays L.) ≠
S.N. Parentoni1,*, C.L. de Souza Jr.2, V.M. de Carvalho Alves1, E.E.G. Gama1,A.M. Coelho1, A.C. de Oliveira1, P.E.O. Guimarães1, C.T. Guimarães1, M.J.V. Vasconcelos1,
C.A. Patto Pacheco1, W.F. Meirelles1, J.V. de Magalhães1, L.J. Moreira Guimarães1,A.R. da Silva1, F. Ferreira Mendes3, R.E. Schaffert1
1 Brazilian Agriculture Research Corporation - Embrapa - Embrapa Maize and Sorghum,C.P. 151, 35701-970 Sete Lagoas, MG, Brazil
2 Escola Superior de Agricultura Luiz de Queiroz, Genetic Department, USP,C.P. 83, 13400-970 Piracicaba, SP, Brazil
3 Federal University of Lavras, Biology Department, C.P. 37, 37200-000, Lavras, MG, Brazil
Re ceived January 23, 2010
≠ This article is dedicated to Professor Ronald L. Phillips onthe occasion of his retirement from the University of Minnesotafor his brilliant contribution to science, teaching and human re-sources formation. First author of the article was one of his grad-uate students.
* For correspondence (fax: +55(31)3027 1279; e.mail: [email protected]).
2001). This nutrient has one of the lowest use effi-ciency among the plant macronutrients and a 50%yield reduction has been observed from P deficientconditions relative to the well fertilized productionfields in Oxisols (BALIGAR and FAGERIA, 1997).
Efficiency concepts in plant mineral nutritionhave been defined based on the processes in whichplants acquire, transport, store and use the nutrientto better produce dry matter or grain at low or highnutrient supply (HORST et al., 1993). The concepts ofnutrient acquisition efficiency (defined as unit ofnutrient in the plant per unit of nutrient available inthe soil) and nutrient internal utilization efficiency(defined as the internal ability of the plant to pro-duce units of grain per unit of nutrient in the plant),have been considered as the two major componentsof plant nutrient use efficiency (MOLL et al., 1982).Both components, acquisition and internal utiliza-tion efficiency, should be considered in breedingprograms to increase plant nutrient use efficiency(grain yield per unit of P in the soil). Informationon the relative importance of these two componentsis important to establish breeding strategies to in-crease nutrient use efficiency. In Brazilian tropicalOxisols, P acquisition efficiency (PAE) has been al-most two times more important than P internal uti-lization efficiency (PUTIL) to explain the variabilityobserved in P use efficiency in maize (PARENTONI
and SOUZA Jr., 2008).The PUTIL can be divided into two components:
the P harvest index (capacity of the plant to redis-tributed P from shoot to grain) and the quotient ofP utilization (grain produced per unit of P in thegrain, which is the same as the inverse of grain Pconcentration-GPC). The majority of the phenotypicvariation for PUTIL in tropical maize (80.8%) hasbeen explained by GPC. This component should re-ceive more attention than the P harvest index com-ponent in breeding programs to increase internal Putilization efficiency in tropical maize (PARENTONI
and SOUZA J., 2008).A short interval between male and female flow-
ering in maize (called anther-silk interval-ASI), hasbeen related with tolerance to environmental stress-es like drought (BOLANOS and EDMEADES, 1993), lownitrogen (LAFITTE and EDMEADES, 1995) and acid soil(WELCKER et al., 2005). The effect of P stress on ASIhas not been reported in the literature.
The genetic control of phosphorus efficiency re-ported in the literature varies, depending on the se-lection criteria used, on the crop and growing stagestudied (seedlings or adult plants) and the experi-
mental conditions, such as nutrient solution, greenhouse, or field trials. Additive, dominance, andepistatic effects have been found in different maizestudies (DUNCAN, 1994), with additive effects beingreported as more important (SILVA et al., 1992;FURLANI et al., 1998); with both additive and domi-nance effects showing importance (CHAUBEY et al.,1994), and with nonadditive effects (dominance andor epistasis) being more important than additive ef-fects (COLTMAN et al., 1987; PARENTONI et al., 2006;CHEN et al., 2009).
Breeding programs for improving P efficiency inplants have been less frequent than for other abioticstresses, such as aluminum tolerance. One of themain reasons is because phosphorus movement inthe soil is based on nutrient diffusion from soil toroots. The diffusion process makes the developmentof screening procedures using nutrient solution orgreen house evaluations that would mimic whathappens in the field very difficult. The developmentof breeding strategies to increase P use efficiency intropical maize grown until maturity requires infor-mation on: a) the type of gene action controlling Pefficiency components and related traits; b) correla-tions among these traits; c) the identification of ap-propriate selection criteria; and d) an understandingof the relationship of these selection criteria in bothlow and high P soils.
The objective of this research was to study thegene action and the relationships of field selectioncriteria for P efficiency in tropical maize to developappropriate breeding strategies for this trait.
MATERIALS AND METHODS
Genetic materialsA breeding program for phosphorus efficiency in tropical
maize has been conducted in Brazil during the past twenty years(BAHIA FILHO et al., 1997). P phenotyping sites with both low andhigh P in the top 20 cm of the soil profile have been developedat Embrapa Maize and Sorghum. These sites have a smaller spa-tial variability for P in each of the two levels, low and high P. Sixmaize inbred lines contrasting for P efficiency (evaluated as high-er yield capacity for the efficient lines compared with the ineffi-cient ones in low P environments) were used as parents in thisstudy (PARENTONI, 2008). These lines were developed at EmbrapaMaize and Sorghum Research Center and have between 7 to 15generations of self pollination (Table 1). Inbred lines L3, 228-3,and L36 were also selected based on their higher combining abil-ity for grain yield under low P.
Seven crosses between these lines were used for the geneticstudies. Four of these crosses were between a P highly efficient(L3) or a P efficient inbred (228-3) and a P inefficient inbred,such as crosses L3xL53, L3xL22, L3xCateto, and 228-3xL22. The
2S.N. PARENTONI, C.L. DE SOUZA JR., V.M. DE CARVALHO ALVES, E.E.G. GAMA, A.M. COELHO, A.C. DE OLIVEIRA,
P.E.O. GUIMARÃES, C.T. GUIMARÃES, M.J.V. VASCONCELOS, C.A. PATTO PACHECO, W.F. MEIRELLES,J.V. DE MAGALHÃES, L.J. MOREIRA GUIMARÃES, A.R. DA SILVA, F. FERREIRA MENDES, R.E. SCHAFFERT
other three crosses were: a cross between a highly efficient and amedian efficient line (L3xL36); a cross between a median effi-cient and an inefficient line (L36xCateto); and a cross betweentwo inefficient lines (CatetoxL53). During the years of 2003 and2004, the F2, the backcross one to each parent (BC1P1 andBC1P2) and backcross two to each parent (BC2P1 and BC2P2)were obtained for each cross. A minimum of 50 ears were har-vested for each generation in each cross and a balanced bulkedsample of these ears were used to represent each generation.Generation BC2P2 for the cross L3xL22 did not yield enoughseed and was not included in the study. A total of 47 treatmentswere obtained corresponding to six parental lines, seven F1’s,seven F2’s, seven BC1P1, seven BC1P2, seven BC2P1, and sixBC2P2 (due to the missing BC2P2 for the cross L3x22).
Experimental conditionsThe 47 treatments were evaluated in a randomized complete
block design with tree replications in each of five environment,three low P and two high P. A two row plot three meters longand 0.80 m apart was used for each generation, except for theF2’s, where a four row plot was used. Thirty seeds were plantedin each row and thinned to 15 plants per row. At maturity, themean stand at high P environments was 27.3 plants per plot(56875 plants.ha-1) and under low P this value was 23.2 plantsper plot (48333 plants.ha-1). Border rows were used to separatethe generations in order to avoid competition among them.
Experiments were conducted in five environments in the Pphenotyping sites, three with low levels of P in the soil and twowith high P levels at the Embrapa-Maize and Sorghum ResearchCenter in Brazil (latitude 19°27’ S and 716 meters above sea lev-el), during the summer seasons of 2004/2005 (two trials) and2005/2006. The soil is a clay, dark red oxisol under savanna veg-etation (cerrado), with contrasting P levels. In the 2004/2005 sea-son, an area with high P (named High P-01) and an area withlow P (Low P-01) were used. In the season of 2005/2006, an areawith high P (named High P-02) and two areas with low P (LowP-02 and LowP-03) were used. Low P areas had from 4.40 to 7.37mg.kg-1 P in the 0-20 cm layer and high P areas had 15.31 and16.00 mg.kg-1 P in the 0-20 cm layer (Table 3). Maize roots inthese soils are normally confined to the top 60 cm and soilanalysis in this profile (0-20 plus 20-60 cm) was used to obtaintotal available P in each area (0-60 cm) using a soil bulk densityof 1 kgdm-3. A mixture of 20 kg.ha-1 of N and 60 kg.ha-1 of K2Owas applied at planting in all five areas. The two areas with highP also received 200 kg.ha-1 of triple superphosphate at planting,corresponding to 90 kg.ha-1 of P2O5 or 39.3 kg.ha-1 of P. The soilP analyses were done using Mehlich 1 extractor. The total avail-able P in the soil (0-60 cm) was obtained based on soil analysis
and fertilizer applied. For the two high P environments the totalavailable soil P (Ps) was 81.16 and 83.30 kg.ha-1. For the threelow P environments, the total available soil P (Ps) was 16.80,25.76 and 24.82 kg.ha-1, respectively (Table 3). Thirty days afterplanting, 90 kg.ha-1 of N was applied as urea and irrigation wasprovided at all sites as needed.
The following traits were evaluated in each plot: days to 50%male flowering, days to 50% female flowering, difference be-tween female and male flowering or anther-silk interval (ASI),grain yield (GY), and stover yield (SY = leafs, stalks, ear husksand cobs). Grain yield was adjusted to a standard 150 g.kg-1
grain moisture. Samples of stover from five plants were collectedand a sample of 200 g of grain was obtained. These sampleswere dried to a constant weight in a forced-air oven at 65°C andgrain and stover dry matter content was determined. Grain sam-ples were ground in a Cyclone-Marconi mill and stover sampleswere ground in a Wiley mill to pass a 1-mm screen. The driedand ground samples were analyzed for P concentration at theEmbrapa Maize and Sorghum Foliar Analysis Laboratory, by thecolorimetric blue molybdenum spectrophotometer method (MA -LA VOLTA et al., 1989; SILVA, 1999).
Based on grain and stover dry matter yield, and on P con-centration in these plant components, the phosphorus content inthe grain (Pg) and in the stover (Pso) was calculated. These datawere used to obtain the total plant shoot P content (Pt = Pg +Pso). The P efficiency concepts defined by MOLL et al. (1982),were obtained on a plot basis, as follow: a) P acquisition effi-ciency (PAE) = Pt/Ps where Ps is total available soil P; b) P inter-nal utilization efficient (PUTIL) = GY/Pt.
Statistical analysesTreatments, locations, and the interaction treatment x loca-
tion were considered fixed effects and replications within loca-tions were considered random effects. Grain yield (GY) andstover yield (SY) were corrected for the mean stand by covari-ance, as described by STEEL and TORRIE (1960). All variance analy-sises were done using the General Linear Models procedure ofthe Statistical Analysis System (SAS, 2000). When appropriate,least square differences (LSD) values are presented in tables orfigures for comparison of treatment means.
Treatment sum of squares was decomposed in parents, F1’s,BC1’s, BC2’s and between generations. An individual ANOVA foreach trait was done for each of the five environments. A com-bined ANOVA was done for the three low P environments (Table4) for the two high P environments and for the five environ-ments (data not shown). Variance homogeneity was verified be-fore doing combined ANOVA’s. Pearson correlation coefficientswere calculated between traits, using data from generations F1,
3PHOSPHORUS EFFICIENCY IN MAIZE
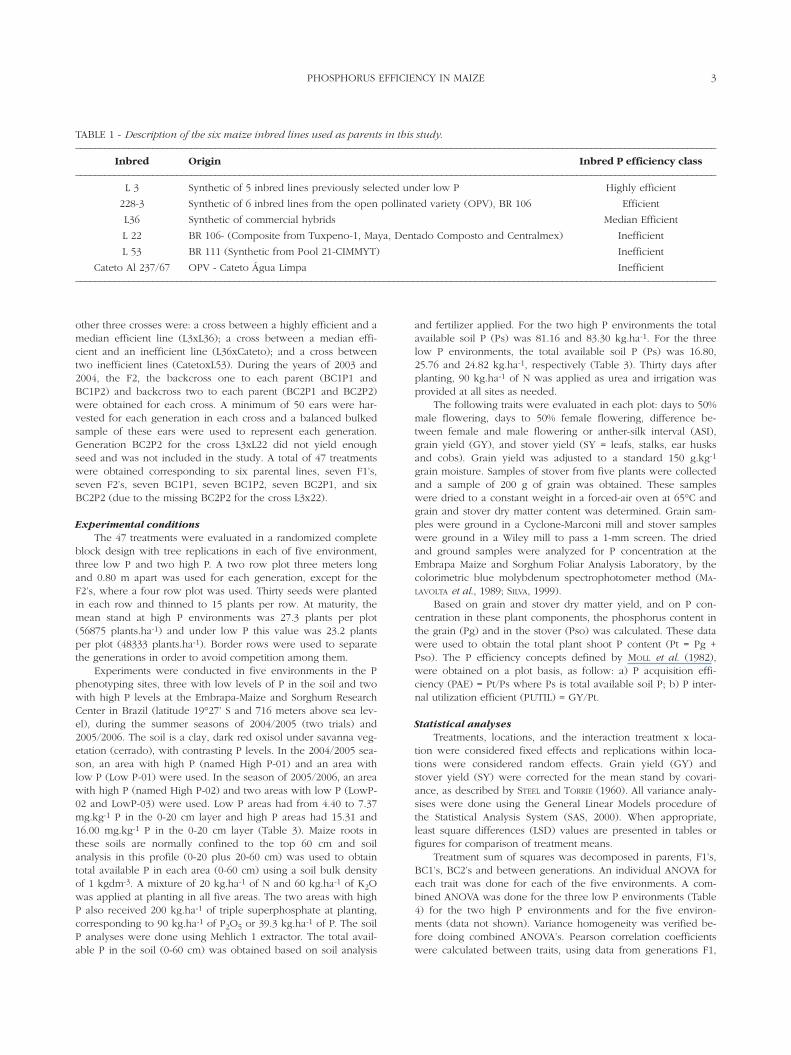
TABLE 1 - Description of the six maize inbred lines used as parents in this study.–––––––––––––––––––––––––––––––––––––––––––––––––––––––––––––––––––––––––––––––––––––––––––––––––––––––––––––––––––––––––––––––––––––
Inbred Origin Inbred P efficiency class–––––––––––––––––––––––––––––––––––––––––––––––––––––––––––––––––––––––––––––––––––––––––––––––––––––––––––––––––––––––––––––––––––––
L 3 Synthetic of 5 inbred lines previously selected under low P Highly efficient
228-3 Synthetic of 6 inbred lines from the open pollinated variety (OPV), BR 106 Efficient
L36 Synthetic of commercial hybrids Median Efficient
L 22 BR 106- (Composite from Tuxpeno-1, Maya, Dentado Composto and Centralmex) Inefficient
L 53 BR 111 (Synthetic from Pool 21-CIMMYT) Inefficient
Cateto Al 237/67 OPV - Cateto Água Limpa Inefficient–––––––––––––––––––––––––––––––––––––––––––––––––––––––––––––––––––––––––––––––––––––––––––––––––––––––––––––––––––––––––––––––––––––
F2 and BC1 from each environment. Data from inbred lines andBC2, were not included in the correlations, due to the high in-breeding coefficient of these generations, and because domi-nance effects were important in many traits studied. Data fromeach of the three low P environments and 28 treatments per en-vironment (7 F1’s, 7 F2’s and 14 BC1’s) were used to obtain thecorrelations at low P, with 84 data points per trait.
Genetic analysesThe mean of each generation in each cross and for each
group of environments (low or high P) was used to estimate thegene effects according to the MATTHER and JINKS (1971) model.The mean observed at the “k” generation, including all effects inthe model, can be described as (GAMBLE’s, 1962, notation):
gk = m + (αk)a + (δk)d + (αk2)aa + (αkδk)ad + (δk
2)dd,
where:gk: mean of the “k” generation (mean of “l” environments
and “r” replicates);m: mean of all possible homozygous, considering all locus
controlling the trait;αk, δk: coefficients determined by the resemblance between rel-
atives of the “k” generation;a: additive gene effects;d: dominance gene effects;aa: additive x additive epistatic effects;ad: additive x dominance epistatic effects;dd: dominance x dominance epistatic effects.
For each trait, the means of the three low P environmentsand the means of the two high P environments from each genera-tion within each cross was used to estimate the genetic parame-ters (m,a,d,aa,ad,dd) at low and high P, respectively. The weight-ed least squares method (ROWE and ALEXANDER, 1980) was used toestimate the parameters. A matrix notation for this model is:
β = (X’D-1X)-1 X’D-1y,
where:β: a column vector of the parameters to be estimated (m, a,
d, aa, ad, dd);X: matriz “n x p” of genetic coefficients (Table 2);X’: transposed matrix of matrix X and X-1 is the inverse of
matrix X;
D-1: inverse of the weighted matrix D which contains, on itsdiagonal, the generation variances; and
y: a column vector of the “n” generation means in a givenset of environments (low or high P).
Where n = 8 corresponds to the number of generations andp = 6 corresponds to the parameters for the full model (m, a, d,aa, ad, dd). For the cross L3x22 only six generations were usedin the analysis, since the BC2P2 was not evaluated and theBC2P1 was not included in the genetic analysis for this cross.
The variance to be used in the diagonal of matrix D for eachgeneration (Vgi) was estimated according to ARNOLD and JOSEPSON
(1975) as:
Vgi = MS(g i x e) / re
where:“i” is each of the generations; MS(gi x e) is the mean square ofthe interaction of each generation and the environment; “r” and“e” are the number of replicates (r = 3) and the number of envi-ronments (e = 3 for low P environments and e = 2 for high P en-vironments), respectively.
Following KEARSEY and POONI (1996), a reduced additive-dominance model was initially considered. The fitness of the re-duced model was verified by the R2, obtained by the predictedand observed means of each generation in a given cross. In caseof lack of fitness, the full model was obtained and the largest sig-nificant digenic epistatic effects at the full model were added oneby one, to check the fitness of the new model. The significanceof the estimative of each parameter in the model was tested bythe “t” test, as described by ROWE and ALEXANDER (1980), where:t = βi / si and,βi: estimate of the parameter in the model;si: standard error of the parameter estimative, obtained from the
diagonal of matrix Si, where: Si = [(X’D-1X)-1] ½.All genetic analyses were conducted using the IML (Interac-
tive Matrix Language) of the Statistical Analysis System (SAS INSTI-TUTE, 2000).
For each cross in each trait, the ratios a/m, d/m and epista-sis/m were calculated (calculations were done in absolute valueor all values are considered as positive ones). Only data wherethe parameter estimates (a, d and epistasis) were significant wereused in these calculations. For each trait and a given set of envi-ronments (low or high P) a general mean of the ratios a/m, d/mand epistasis/m was calculated using data from all crosses withsignificant effects.
4S.N. PARENTONI, C.L. DE SOUZA JR., V.M. DE CARVALHO ALVES, E.E.G. GAMA, A.M. COELHO, A.C. DE OLIVEIRA,
P.E.O. GUIMARÃES, C.T. GUIMARÃES, M.J.V. VASCONCELOS, C.A. PATTO PACHECO, W.F. MEIRELLES,J.V. DE MAGALHÃES, L.J. MOREIRA GUIMARÃES, A.R. DA SILVA, F. FERREIRA MENDES, R.E. SCHAFFERT
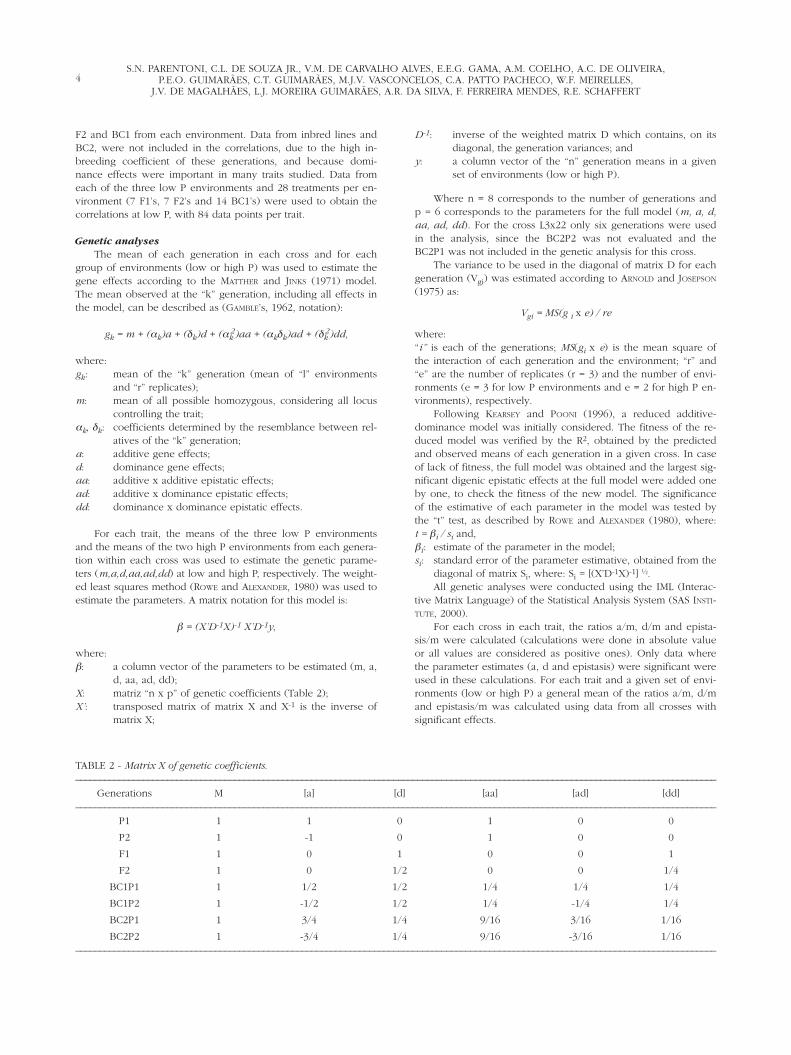
TABLE 2 - Matrix X of genetic coefficients.–––––––––––––––––––––––––––––––––––––––––––––––––––––––––––––––––––––––––––––––––––––––––––––––––––––––––––––––––––––––––––––––––––––
Generations M [a] [d] [aa] [ad] [dd]–––––––––––––––––––––––––––––––––––––––––––––––––––––––––––––––––––––––––––––––––––––––––––––––––––––––––––––––––––––––––––––––––––––
P1 1 1 0 1 0 0
P2 1 -1 0 1 0 0
F1 1 0 1 0 0 1
F2 1 0 1/2 0 0 1/4
BC1P1 1 1/2 1/2 1/4 1/4 1/4
BC1P2 1 -1/2 1/2 1/4 -1/4 1/4
BC2P1 1 3/4 1/4 9/16 3/16 1/16
BC2P2 1 -3/4 1/4 9/16 -3/16 1/16–––––––––––––––––––––––––––––––––––––––––––––––––––––––––––––––––––––––––––––––––––––––––––––––––––––––––––––––––––––––––––––––––––––
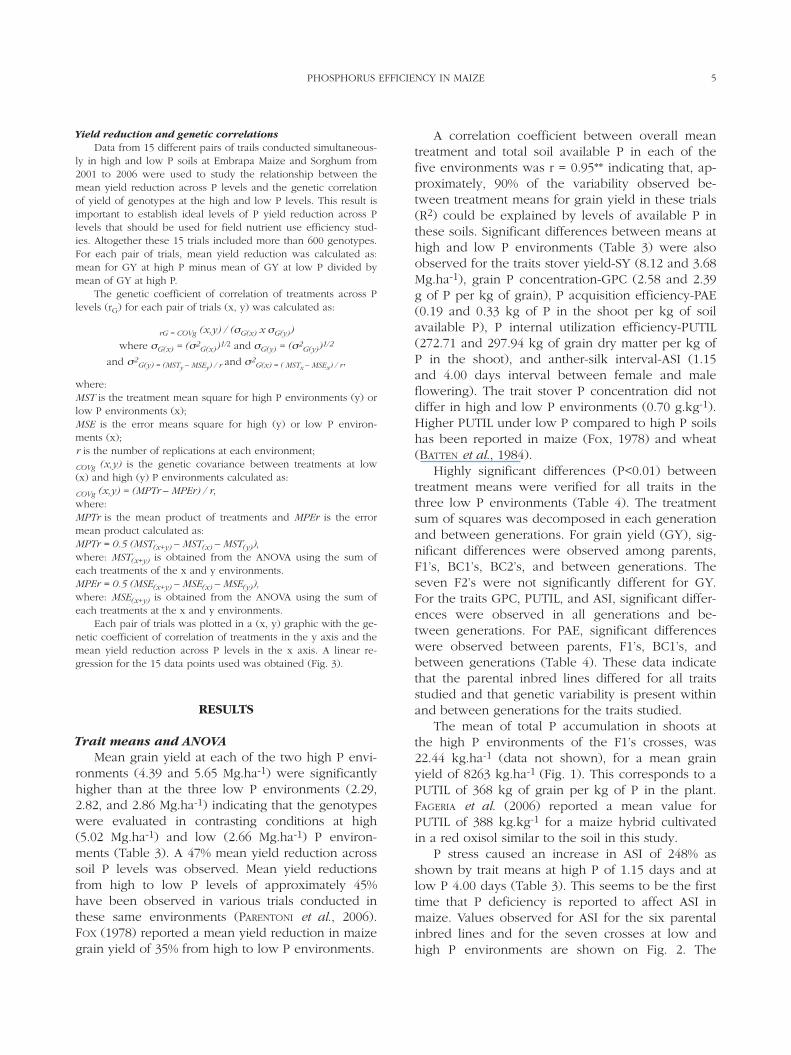
Yield reduction and genetic correlationsData from 15 different pairs of trails conducted simultaneous-
ly in high and low P soils at Embrapa Maize and Sorghum from2001 to 2006 were used to study the relationship between themean yield reduction across P levels and the genetic correlationof yield of genotypes at the high and low P levels. This result isimportant to establish ideal levels of P yield reduction across Plevels that should be used for field nutrient use efficiency stud-ies. Altogether these 15 trials included more than 600 genotypes.For each pair of trials, mean yield reduction was calculated as:mean for GY at high P minus mean of GY at low P divided bymean of GY at high P.
The genetic coefficient of correlation of treatments across Plevels (rG) for each pair of trials (x, y) was calculated as:
rG = COVg (x,y) / (σG(x) x σG(y))
where σG(x) = (σ2G(x))1/2 and σG(y) = (σ2
G(y))1/2
and σ2G(y) = (MSTy – MSEy) / r
and σ2G(x) = ( MSTx – MSEx) / r,
where:MST is the treatment mean square for high P environments (y) orlow P environments (x);MSE is the error means square for high (y) or low P environ-ments (x);r is the number of replications at each environment;
COVg (x,y) is the genetic covariance between treatments at low(x) and high (y) P environments calculated as:
COVg (x,y) = (MPTr – MPEr) / r,where:MPTr is the mean product of treatments and MPEr is the errormean product calculated as:MPTr = 0.5 (MST(x+y) – MST(x) – MST(y)),where: MST(x+y) is obtained from the ANOVA using the sum ofeach treatments of the x and y environments.MPEr = 0.5 (MSE(x+y) – MSE(x) – MSE(y)),where: MSE(x+y) is obtained from the ANOVA using the sum ofeach treatments at the x and y environments.
Each pair of trials was plotted in a (x, y) graphic with the ge-netic coefficient of correlation of treatments in the y axis and themean yield reduction across P levels in the x axis. A linear re-gression for the 15 data points used was obtained (Fig. 3).
RESULTS
Trait means and ANOVAMean grain yield at each of the two high P envi-
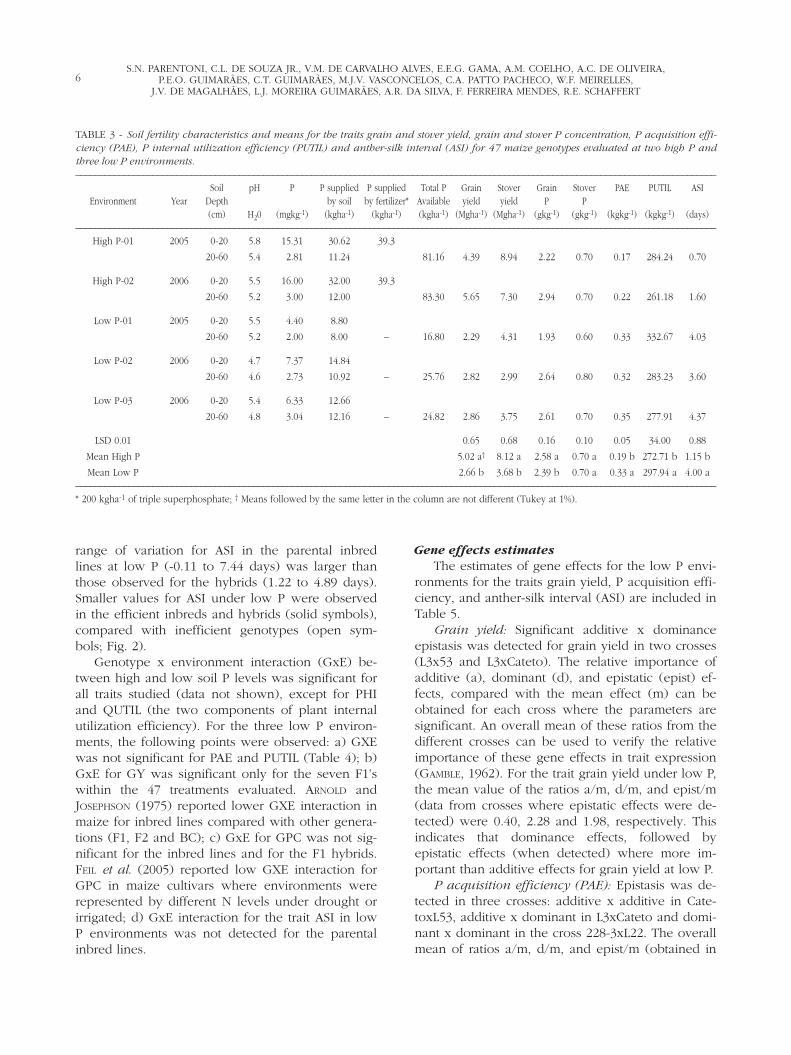
ronments (4.39 and 5.65 Mg.ha-1) were significantlyhigher than at the three low P environments (2.29,2.82, and 2.86 Mg.ha-1) indicating that the genotypeswere evaluated in contrasting conditions at high(5.02 Mg.ha-1) and low (2.66 Mg.ha-1) P environ-ments (Table 3). A 47% mean yield reduction acrosssoil P levels was observed. Mean yield reductionsfrom high to low P levels of approximately 45%have been observed in various trials conducted inthese same environments (PARENTONI et al., 2006).FOX (1978) reported a mean yield reduction in maizegrain yield of 35% from high to low P environments.
A correlation coefficient between overall meantreatment and total soil available P in each of thefive environments was r = 0.95** indicating that, ap-proximately, 90% of the variability observed be-tween treatment means for grain yield in these trials(R2) could be explained by levels of available P inthese soils. Significant differences between means athigh and low P environments (Table 3) were alsoobserved for the traits stover yield-SY (8.12 and 3.68Mg.ha-1), grain P concentration-GPC (2.58 and 2.39g of P per kg of grain), P acquisition efficiency-PAE(0.19 and 0.33 kg of P in the shoot per kg of soilavailable P), P internal utilization efficiency-PUTIL(272.71 and 297.94 kg of grain dry matter per kg ofP in the shoot), and anther-silk interval-ASI (1.15and 4.00 days interval between female and maleflowering). The trait stover P concentration did notdiffer in high and low P environments (0.70 g.kg-1).Higher PUTIL under low P compared to high P soilshas been reported in maize (Fox, 1978) and wheat(BATTEN et al., 1984).
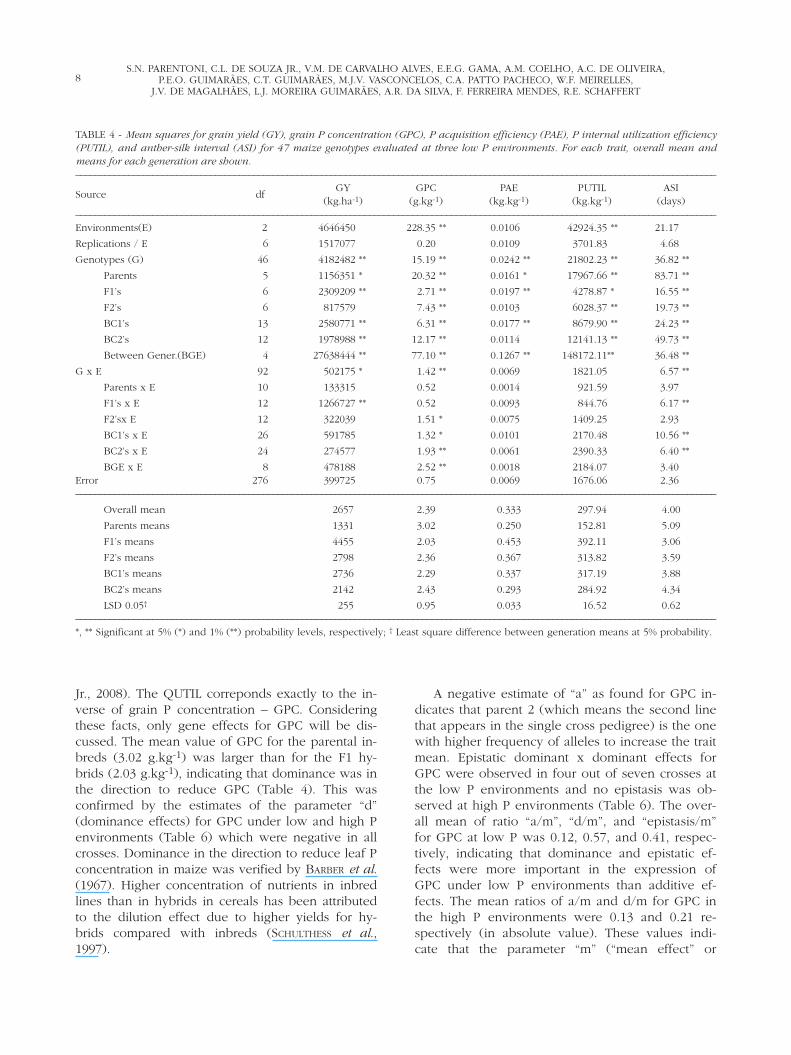
Highly significant differences (P<0.01) betweentreatment means were verified for all traits in thethree low P environments (Table 4). The treatmentsum of squares was decomposed in each generationand between generations. For grain yield (GY), sig-nificant differences were observed among parents,F1’s, BC1’s, BC2’s, and between generations. Theseven F2’s were not significantly different for GY.For the traits GPC, PUTIL, and ASI, significant differ-ences were observed in all generations and be-tween generations. For PAE, significant differenceswere observed between parents, F1’s, BC1’s, andbetween generations (Table 4). These data indicatethat the parental inbred lines differed for all traitsstudied and that genetic variability is present withinand between generations for the traits studied.
The mean of total P accumulation in shoots atthe high P environments of the F1’s crosses, was22.44 kg.ha-1 (data not shown), for a mean grainyield of 8263 kg.ha-1 (Fig. 1). This corresponds to aPUTIL of 368 kg of grain per kg of P in the plant.FAGERIA et al. (2006) reported a mean value forPUTIL of 388 kg.kg-1 for a maize hybrid cultivatedin a red oxisol similar to the soil in this study.
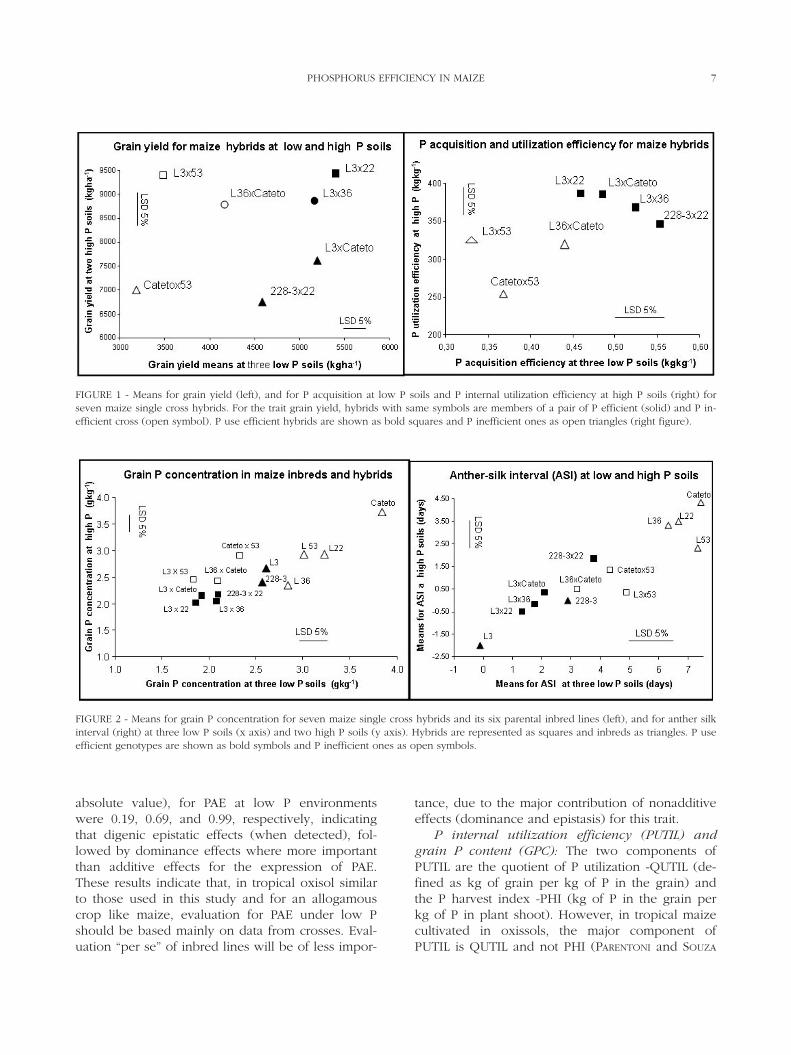
P stress caused an increase in ASI of 248% asshown by trait means at high P of 1.15 days and atlow P 4.00 days (Table 3). This seems to be the firsttime that P deficiency is reported to affect ASI inmaize. Values observed for ASI for the six parentalinbred lines and for the seven crosses at low andhigh P environments are shown on Fig. 2. The
5PHOSPHORUS EFFICIENCY IN MAIZE
range of variation for ASI in the parental inbredlines at low P (-0.11 to 7.44 days) was larger thanthose observed for the hybrids (1.22 to 4.89 days).Smaller values for ASI under low P were observedin the efficient inbreds and hybrids (solid symbols),compared with inefficient genotypes (open sym-bols; Fig. 2).
Genotype x environment interaction (GxE) be-tween high and low soil P levels was significant forall traits studied (data not shown), except for PHIand QUTIL (the two components of plant internalutilization efficiency). For the three low P environ-ments, the following points were observed: a) GXEwas not significant for PAE and PUTIL (Table 4); b)GxE for GY was significant only for the seven F1’swithin the 47 treatments evaluated. ARNOLD andJOSEPHSON (1975) reported lower GXE interaction inmaize for inbred lines compared with other genera-tions (F1, F2 and BC); c) GxE for GPC was not sig-nificant for the inbred lines and for the F1 hybrids.FEIL et al. (2005) reported low GXE interaction forGPC in maize cultivars where environments wererepresented by different N levels under drought orirrigated; d) GxE interaction for the trait ASI in lowP environments was not detected for the parentalinbred lines.
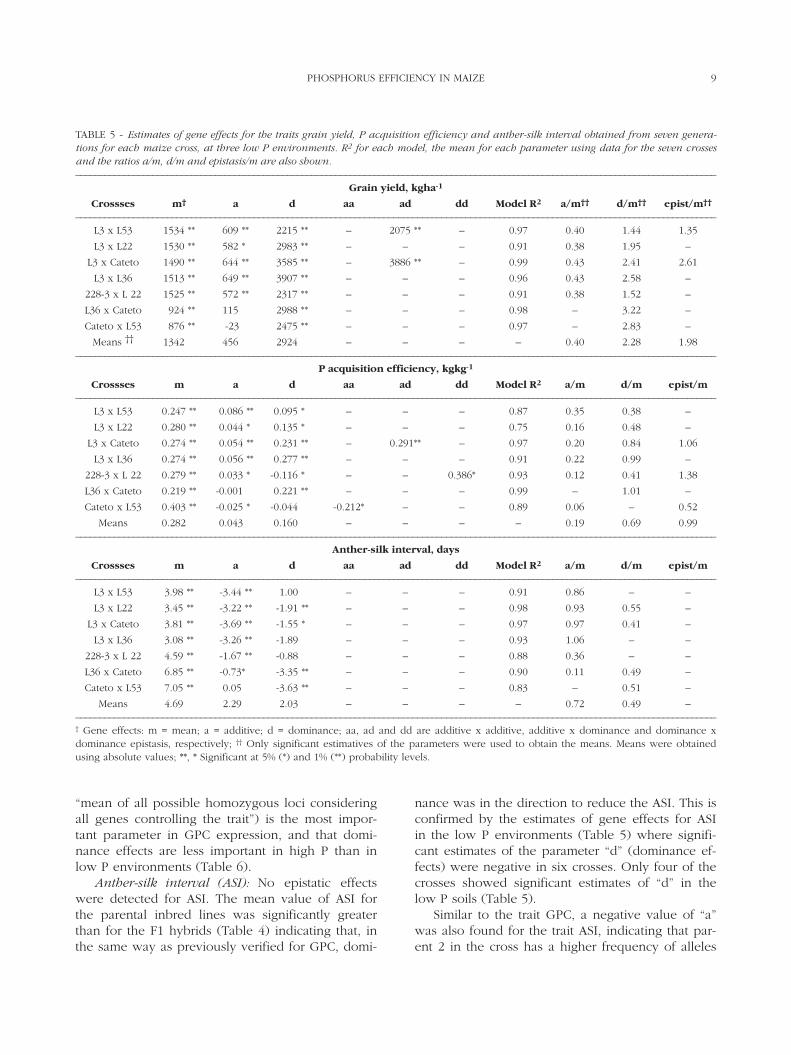
Gene effects estimatesThe estimates of gene effects for the low P envi-
ronments for the traits grain yield, P acquisition effi-ciency, and anther-silk interval (ASI) are included inTable 5.
Grain yield: Significant additive x dominanceepistasis was detected for grain yield in two crosses(L3x53 and L3xCateto). The relative importance ofadditive (a), dominant (d), and epistatic (epist) ef-fects, compared with the mean effect (m) can beobtained for each cross where the parameters aresignificant. An overall mean of these ratios from thedifferent crosses can be used to verify the relativeimportance of these gene effects in trait expression(GAMBLE, 1962). For the trait grain yield under low P,the mean value of the ratios a/m, d/m, and epist/m(data from crosses where epistatic effects were de-tected) were 0.40, 2.28 and 1.98, respectively. Thisindicates that dominance effects, followed byepistatic effects (when detected) where more im-portant than additive effects for grain yield at low P.
P acquisition efficiency (PAE): Epistasis was de-tected in three crosses: additive x additive in Cate-toxL53, additive x dominant in L3xCateto and domi-nant x dominant in the cross 228-3xL22. The overallmean of ratios a/m, d/m, and epist/m (obtained in
6S.N. PARENTONI, C.L. DE SOUZA JR., V.M. DE CARVALHO ALVES, E.E.G. GAMA, A.M. COELHO, A.C. DE OLIVEIRA,
P.E.O. GUIMARÃES, C.T. GUIMARÃES, M.J.V. VASCONCELOS, C.A. PATTO PACHECO, W.F. MEIRELLES,J.V. DE MAGALHÃES, L.J. MOREIRA GUIMARÃES, A.R. DA SILVA, F. FERREIRA MENDES, R.E. SCHAFFERT
TABLE 3 - Soil fertility characteristics and means for the traits grain and stover yield, grain and stover P concentration, P acquisition effi-ciency (PAE), P internal utilization efficiency (PUTIL) and anther-silk interval (ASI) for 47 maize genotypes evaluated at two high P andthree low P environments.–––––––––––––––––––––––––––––––––––––––––––––––––––––––––––––––––––––––––––––––––––––––––––––––––––––––––––––––––––––––––––––––––––––
Soil pH P P supplied P supplied Total P Grain Stover Grain Stover PAE PUTIL ASIEnvironment Year Depth by soil by fertilizer* Available yield yield P P
(cm) H20 (mgkg-1) (kgha-1) (kgha-1) (kgha-1) (Mgha-1) (Mgha-1) (gkg-1) (gkg-1) (kgkg-1) (kgkg-1) (days)–––––––––––––––––––––––––––––––––––––––––––––––––––––––––––––––––––––––––––––––––––––––––––––––––––––––––––––––––––––––––––––––––––––
High P-01 2005 0-20 5.8 15.31 30.62 39.3
20-60 5.4 2.81 11.24 81.16 4.39 8.94 2.22 0.70 0.17 284.24 0.70
High P-02 2006 0-20 5.5 16.00 32.00 39.3
20-60 5.2 3.00 12.00 83.30 5.65 7.30 2.94 0.70 0.22 261.18 1.60
Low P-01 2005 0-20 5.5 4.40 8.80
20-60 5.2 2.00 8.00 – 16.80 2.29 4.31 1.93 0.60 0.33 332.67 4.03
Low P-02 2006 0-20 4.7 7.37 14.84
20-60 4.6 2.73 10.92 – 25.76 2.82 2.99 2.64 0.80 0.32 283.23 3.60
Low P-03 2006 0-20 5.4 6.33 12.66
20-60 4.8 3.04 12.16 – 24.82 2.86 3.75 2.61 0.70 0.35 277.91 4.37
LSD 0.01 0.65 0.68 0.16 0.10 0.05 34.00 0.88
Mean High P 5.02 a† 8.12 a 2.58 a 0.70 a 0.19 b 272.71 b 1.15 b
Mean Low P 2.66 b 3.68 b 2.39 b 0.70 a 0.33 a 297.94 a 4.00 a–––––––––––––––––––––––––––––––––––––––––––––––––––––––––––––––––––––––––––––––––––––––––––––––––––––––––––––––––––––––––––––––––––––* 200 kgha-1 of triple superphosphate; † Means followed by the same letter in the column are not different (Tukey at 1%).
absolute value), for PAE at low P environmentswere 0.19, 0.69, and 0.99, respectively, indicatingthat digenic epistatic effects (when detected), fol-lowed by dominance effects where more importantthan additive effects for the expression of PAE.These results indicate that, in tropical oxisol similarto those used in this study and for an allogamouscrop like maize, evaluation for PAE under low Pshould be based mainly on data from crosses. Eval-uation “per se” of inbred lines will be of less impor-
tance, due to the major contribution of nonadditiveeffects (dominance and epistasis) for this trait.
P internal utilization efficiency (PUTIL) andgrain P content (GPC): The two components ofPUTIL are the quotient of P utilization -QUTIL (de-fined as kg of grain per kg of P in the grain) andthe P harvest index -PHI (kg of P in the grain perkg of P in plant shoot). However, in tropical maizecultivated in oxissols, the major component ofPUTIL is QUTIL and not PHI (PARENTONI and SOUZA
7PHOSPHORUS EFFICIENCY IN MAIZE
FIGURE 1 - Means for grain yield (left), and for P acquisition at low P soils and P internal utilization efficiency at high P soils (right) forseven maize single cross hybrids. For the trait grain yield, hybrids with same symbols are members of a pair of P efficient (solid) and P in-efficient cross (open symbol). P use efficient hybrids are shown as bold squares and P inefficient ones as open triangles (right figure).
FIGURE 2 - Means for grain P concentration for seven maize single cross hybrids and its six parental inbred lines (left), and for anther silkinterval (right) at three low P soils (x axis) and two high P soils (y axis). Hybrids are represented as squares and inbreds as triangles. P useefficient genotypes are shown as bold symbols and P inefficient ones as open symbols.
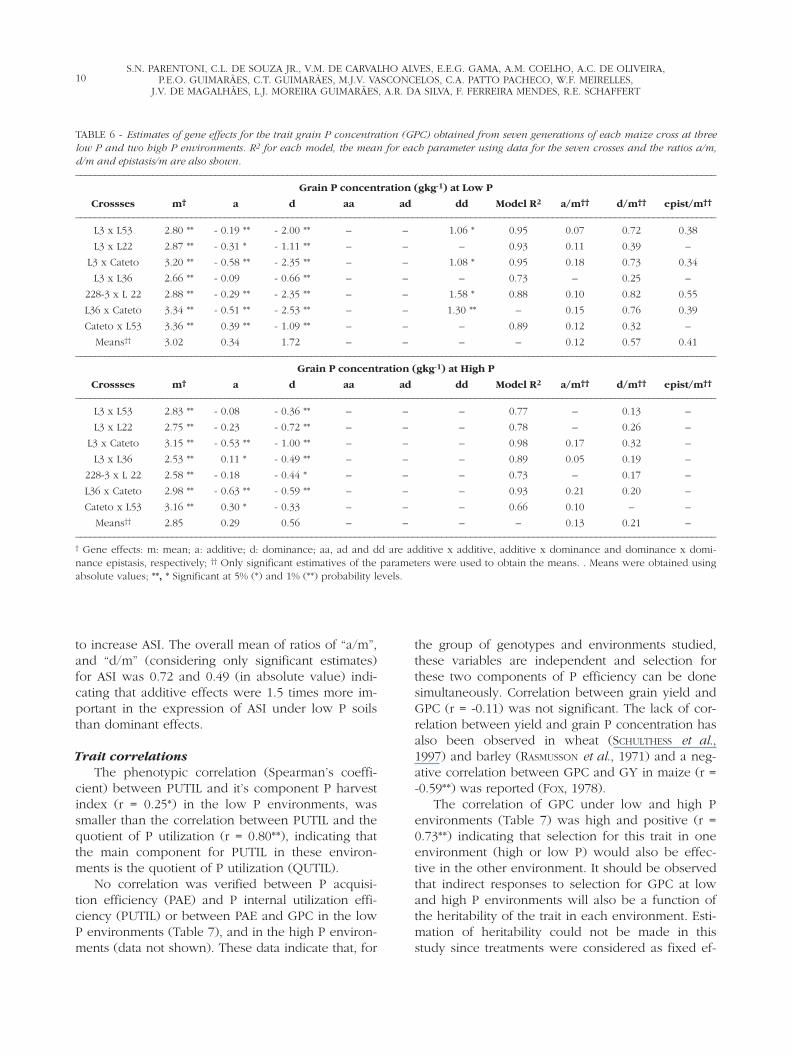
Jr., 2008). The QUTIL correponds exactly to the in-verse of grain P concentration – GPC. Consideringthese facts, only gene effects for GPC will be dis-cussed. The mean value of GPC for the parental in-breds (3.02 g.kg-1) was larger than for the F1 hy-brids (2.03 g.kg-1), indicating that dominance was inthe direction to reduce GPC (Table 4). This wasconfirmed by the estimates of the parameter “d”(dominance effects) for GPC under low and high Penvironments (Table 6) which were negative in allcrosses. Dominance in the direction to reduce leaf Pconcentration in maize was verified by BARBER et al.(1967). Higher concentration of nutrients in inbredlines than in hybrids in cereals has been attributedto the dilution effect due to higher yields for hy-brids compared with inbreds (SCHULTHESS et al.,1997).
A negative estimate of “a” as found for GPC in-dicates that parent 2 (which means the second linethat appears in the single cross pedigree) is the onewith higher frequency of alleles to increase the traitmean. Epistatic dominant x dominant effects forGPC were observed in four out of seven crosses atthe low P environments and no epistasis was ob-served at high P environments (Table 6). The over-all mean of ratio “a/m”, “d/m”, and “epistasis/m”for GPC at low P was 0.12, 0.57, and 0.41, respec-tively, indicating that dominance and epistatic ef-fects were more important in the expression ofGPC under low P environments than additive ef-fects. The mean ratios of a/m and d/m for GPC inthe high P environments were 0.13 and 0.21 re-spectively (in absolute value). These values indi-cate that the parameter “m” (“mean effect” or
8S.N. PARENTONI, C.L. DE SOUZA JR., V.M. DE CARVALHO ALVES, E.E.G. GAMA, A.M. COELHO, A.C. DE OLIVEIRA,
P.E.O. GUIMARÃES, C.T. GUIMARÃES, M.J.V. VASCONCELOS, C.A. PATTO PACHECO, W.F. MEIRELLES,J.V. DE MAGALHÃES, L.J. MOREIRA GUIMARÃES, A.R. DA SILVA, F. FERREIRA MENDES, R.E. SCHAFFERT
TABLE 4 - Mean squares for grain yield (GY), grain P concentration (GPC), P acquisition efficiency (PAE), P internal utilization efficiency(PUTIL), and anther-silk interval (ASI) for 47 maize genotypes evaluated at three low P environments. For each trait, overall mean andmeans for each generation are shown.–––––––––––––––––––––––––––––––––––––––––––––––––––––––––––––––––––––––––––––––––––––––––––––––––––––––––––––––––––––––––––––––––––––
Source dfGY GPC PAE PUTIL ASI
(kg.ha-1) (g.kg-1) (kg.kg-1) (kg.kg-1) (days)–––––––––––––––––––––––––––––––––––––––––––––––––––––––––––––––––––––––––––––––––––––––––––––––––––––––––––––––––––––––––––––––––––––Environments(E) 2 4646450 228.35 ** 0.0106 42924.35 ** 21.17
Replications / E 6 1517077 0.20 0.0109 3701.83 4.68
Genotypes (G) 46 4182482 ** 15.19 ** 0.0242 ** 21802.23 ** 36.82 **
Parents 5 1156351 * 20.32 ** 0.0161 * 17967.66 ** 83.71 **
F1’s 6 2309209 ** 2.71 ** 0.0197 ** 4278.87 * 16.55 **
F2’s 6 817579 7.43 ** 0.0103 6028.37 ** 19.73 **
BC1’s 13 2580771 ** 6.31 ** 0.0177 ** 8679.90 ** 24.23 **
BC2’s 12 1978988 ** 12.17 ** 0.0114 12141.13 ** 49.73 **
Between Gener.(BGE) 4 27638444 ** 77.10 ** 0.1267 ** 148172.11** 36.48 **
G x E 92 502175 * 1.42 ** 0.0069 1821.05 6.57 **
Parents x E 10 133315 0.52 0.0014 921.59 3.97
F1’s x E 12 1266727 ** 0.52 0.0093 844.76 6.17 **
F2’sx E 12 322039 1.51 * 0.0075 1409.25 2.93
BC1’s x E 26 591785 1.32 * 0.0101 2170.48 10.56 **
BC2’s x E 24 274577 1.93 ** 0.0061 2390.33 6.40 **
BGE x E 8 478188 2.52 ** 0.0018 2184.07 3.40Error 276 399725 0.75 0.0069 1676.06 2.36–––––––––––––––––––––––––––––––––––––––––––––––––––––––––––––––––––––––––––––––––––––––––––––––––––––––––––––––––––––––––––––––––––––
Overall mean 2657 2.39 0.333 297.94 4.00
Parents means 1331 3.02 0.250 152.81 5.09
F1’s means 4455 2.03 0.453 392.11 3.06
F2’s means 2798 2.36 0.367 313.82 3.59
BC1’s means 2736 2.29 0.337 317.19 3.88
BC2’s means 2142 2.43 0.293 284.92 4.34
LSD 0.05† 255 0.95 0.033 16.52 0.62–––––––––––––––––––––––––––––––––––––––––––––––––––––––––––––––––––––––––––––––––––––––––––––––––––––––––––––––––––––––––––––––––––––*, ** Significant at 5% (*) and 1% (**) probability levels, respectively; † Least square difference between generation means at 5% probability.
“mean of all possible homozygous loci consideringall genes controlling the trait”) is the most impor-tant parameter in GPC expression, and that domi-nance effects are less important in high P than inlow P environments (Table 6).
Anther-silk interval (ASI): No epistatic effectswere detected for ASI. The mean value of ASI forthe parental inbred lines was significantly greaterthan for the F1 hybrids (Table 4) indicating that, inthe same way as previously verified for GPC, domi-
nance was in the direction to reduce the ASI. This isconfirmed by the estimates of gene effects for ASIin the low P environments (Table 5) where signifi-cant estimates of the parameter “d” (dominance ef-fects) were negative in six crosses. Only four of thecrosses showed significant estimates of “d” in thelow P soils (Table 5).
Similar to the trait GPC, a negative value of “a”was also found for the trait ASI, indicating that par-ent 2 in the cross has a higher frequency of alleles
9PHOSPHORUS EFFICIENCY IN MAIZE
TABLE 5 - Estimates of gene effects for the traits grain yield, P acquisition efficiency and anther-silk interval obtained from seven genera-tions for each maize cross, at three low P environments. R2 for each model, the mean for each parameter using data for the seven crossesand the ratios a/m, d/m and epistasis/m are also shown.–––––––––––––––––––––––––––––––––––––––––––––––––––––––––––––––––––––––––––––––––––––––––––––––––––––––––––––––––––––––––––––––––––––
Grain yield, kgha-1
Crossses m† a d aa ad dd Model R2 a/m†† d/m†† epist/m††
–––––––––––––––––––––––––––––––––––––––––––––––––––––––––––––––––––––––––––––––––––––––––––––––––––––––––––––––––––––––––––––––––––––L3 x L53 1534 ** 609 ** 2215 ** – 2075 ** – 0.97 0.40 1.44 1.35
L3 x L22 1530 ** 582 ** 2983 ** – – – 0.91 0.38 1.95 –
L3 x Cateto 1490 ** 644 ** 3585 ** – 3886 ** – 0.99 0.43 2.41 2.61
L3 x L36 1513 ** 649 ** 3907 ** – – – 0.96 0.43 2.58 –
228-3 x L 22 1525 ** 572 ** 2317 ** – – – 0.91 0.38 1.52 –
L36 x Cateto 924 ** 115 ** 2988 ** – – – 0.98 – 3.22 –
Cateto x L53 876 ** -23** 2475 ** – – – 0.97 – 2.83 –
Means †† 1342 ** 456 ** 2924 ** – – – – 0.40 2.28 1.98–––––––––––––––––––––––––––––––––––––––––––––––––––––––––––––––––––––––––––––––––––––––––––––––––––––––––––––––––––––––––––––––––––––
P acquisition efficiency, kgkg-1
Crossses m a d aa ad dd Model R2 a/m d/m epist/m–––––––––––––––––––––––––––––––––––––––––––––––––––––––––––––––––––––––––––––––––––––––––––––––––––––––––––––––––––––––––––––––––––––
L3 x L53 0.247 ** 0.086 ** 0.095 * – – – 0.87 0.35 0.38 –
L3 x L22 0.280 ** 0.044 * 0.135 * – – – 0.75 0.16 0.48 –
L3 x Cateto 0.274 ** 0.054 ** 0.231 ** – 0.291** – 0.97 0.20 0.84 1.06
L3 x L36 0.274 ** 0.056 ** 0.277 ** – – – 0.91 0.22 0.99 –
228-3 x L 22 0.279 ** 0.033 * -0.116 * – – 0.386* 0.93 0.12 0.41 1.38
L36 x Cateto 0.219 ** -0.001 0.221 ** – – – 0.99 – 1.01 –
Cateto x L53 0.403 ** -0.025 * -0.044 -0.212* – – 0.89 0.06 – 0.52
Means 0.282 ** 0.043 0.160 – – – – 0.19 0.69 0.99–––––––––––––––––––––––––––––––––––––––––––––––––––––––––––––––––––––––––––––––––––––––––––––––––––––––––––––––––––––––––––––––––––––
Anther-silk interval, days
Crossses m a d aa ad dd Model R2 a/m d/m epist/m–––––––––––––––––––––––––––––––––––––––––––––––––––––––––––––––––––––––––––––––––––––––––––––––––––––––––––––––––––––––––––––––––––––
L3 x L53 3.98 ** -3.44 ** 1.00 – – – 0.91 0.86 – –
L3 x L22 3.45 ** -3.22 ** -1.91 ** – – – 0.98 0.93 0.55 –
L3 x Cateto 3.81 ** -3.69 ** -1.55 * – – – 0.97 0.97 0.41 –
L3 x L36 3.08 ** -3.26 ** -1.89 – – – 0.93 1.06 – –
228-3 x L 22 4.59 ** -1.67 ** -0.88 – – – 0.88 0.36 – –
L36 x Cateto 6.85 ** -0.73* -3.35 ** – – – 0.90 0.11 0.49 –
Cateto x L53 7.05 ** 0.05 -3.63 ** – – – 0.83 – 0.51 –
Means 4.69 ** 2.29 2.03 – – – – 0.72 0.49 ––––––––––––––––––––––––––––––––––––––––––––––––––––––––––––––––––––––––––––––––––––––––––––––––––––––––––––––––––––––––––––––––––––––† Gene effects: m = mean; a = additive; d = dominance; aa, ad and dd are additive x additive, additive x dominance and dominance xdominance epistasis, respectively; †† Only significant estimatives of the parameters were used to obtain the means. Means were obtainedusing absolute values; **, * Significant at 5% (*) and 1% (**) probability levels.
to increase ASI. The overall mean of ratios of “a/m”,and “d/m” (considering only significant estimates)for ASI was 0.72 and 0.49 (in absolute value) indi-cating that additive effects were 1.5 times more im-portant in the expression of ASI under low P soilsthan dominant effects.
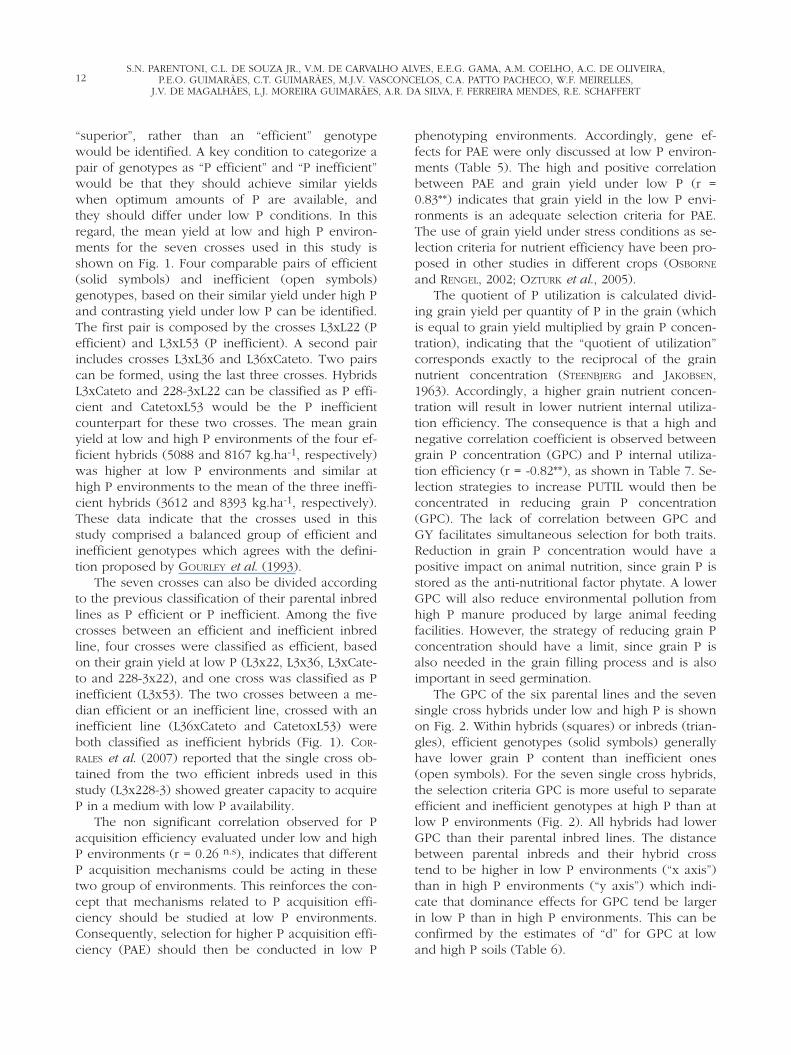
Trait correlationsThe phenotypic correlation (Spearman’s coeffi-
cient) between PUTIL and it’s component P harvestindex (r = 0.25*) in the low P environments, wassmaller than the correlation between PUTIL and thequotient of P utilization (r = 0.80**), indicating thatthe main component for PUTIL in these environ-ments is the quotient of P utilization (QUTIL).
No correlation was verified between P acquisi-tion efficiency (PAE) and P internal utilization effi-ciency (PUTIL) or between PAE and GPC in the lowP environments (Table 7), and in the high P environ-ments (data not shown). These data indicate that, for
the group of genotypes and environments studied,these variables are independent and selection forthese two components of P efficiency can be donesimultaneously. Correlation between grain yield andGPC (r = -0.11) was not significant. The lack of cor-relation between yield and grain P concentration hasalso been observed in wheat (SCHULTHESS et al.,1997) and barley (RASMUSSON et al., 1971) and a neg-ative correlation between GPC and GY in maize (r =-0.59**) was reported (FOX, 1978).
The correlation of GPC under low and high Penvironments (Table 7) was high and positive (r =0.73**) indicating that selection for this trait in oneenvironment (high or low P) would also be effec-tive in the other environment. It should be observedthat indirect responses to selection for GPC at lowand high P environments will also be a function ofthe heritability of the trait in each environment. Esti-mation of heritability could not be made in thisstudy since treatments were considered as fixed ef-
10S.N. PARENTONI, C.L. DE SOUZA JR., V.M. DE CARVALHO ALVES, E.E.G. GAMA, A.M. COELHO, A.C. DE OLIVEIRA,
P.E.O. GUIMARÃES, C.T. GUIMARÃES, M.J.V. VASCONCELOS, C.A. PATTO PACHECO, W.F. MEIRELLES,J.V. DE MAGALHÃES, L.J. MOREIRA GUIMARÃES, A.R. DA SILVA, F. FERREIRA MENDES, R.E. SCHAFFERT
TABLE 6 - Estimates of gene effects for the trait grain P concentration (GPC) obtained from seven generations of each maize cross at threelow P and two high P environments. R2 for each model, the mean for each parameter using data for the seven crosses and the ratios a/m,d/m and epistasis/m are also shown.–––––––––––––––––––––––––––––––––––––––––––––––––––––––––––––––––––––––––––––––––––––––––––––––––––––––––––––––––––––––––––––––––––––
Grain P concentration (gkg-1) at Low P
Crossses m† a d aa ad dd Model R2 a/m†† d/m†† epist/m††
–––––––––––––––––––––––––––––––––––––––––––––––––––––––––––––––––––––––––––––––––––––––––––––––––––––––––––––––––––––––––––––––––––––L3 x L53 2.80 ** - 0.19 ** - 2.00 ** – – 1.06 * 0.95 0.07 0.72 0.38
L3 x L22 2.87 ** - 0.31 * - 1.11 ** – – – 0.93 0.11 0.39 –
L3 x Cateto 3.20 ** - 0.58 ** - 2.35 ** – – 1.08 * 0.95 0.18 0.73 0.34
L3 x L36 2.66 ** - 0.09 - 0.66 ** – – – 0.73 – 0.25 –
228-3 x L 22 2.88 ** - 0.29 ** - 2.35 ** – – 1.58 * 0.88 0.10 0.82 0.55
L36 x Cateto 3.34 ** - 0.51 ** - 2.53 ** – – 1.30 ** – 0.15 0.76 0.39
Cateto x L53 3.36 ** 0.39 ** - 1.09 ** – – – 0.89 0.12 0.32 –
Means†† 3.02 ** 0.34 1.72 – – – – 0.12 0.57 0.41–––––––––––––––––––––––––––––––––––––––––––––––––––––––––––––––––––––––––––––––––––––––––––––––––––––––––––––––––––––––––––––––––––––
Grain P concentration (gkg-1) at High P
Crossses m† a d aa ad dd Model R2 a/m†† d/m†† epist/m††
–––––––––––––––––––––––––––––––––––––––––––––––––––––––––––––––––––––––––––––––––––––––––––––––––––––––––––––––––––––––––––––––––––––L3 x L53 2.83 ** - 0.08 - 0.36 ** – – – 0.77 – 0.13 –
L3 x L22 2.75 ** - 0.23 - 0.72 ** – – – 0.78 – 0.26 –
L3 x Cateto 3.15 ** - 0.53 ** - 1.00 ** – – – 0.98 0.17 0.32 –
L3 x L36 2.53 ** 0.11 * - 0.49 ** – – – 0.89 0.05 0.19 –
228-3 x L 22 2.58 ** - 0.18 - 0.44 * – – – 0.73 – 0.17 –
L36 x Cateto 2.98 ** - 0.63 ** - 0.59 ** – – – 0.93 0.21 0.20 –
Cateto x L53 3.16 ** 0.30 * - 0.33 – – – 0.66 0.10 – –
Means†† 2.85 ** 0.29 0.56 – – – – 0.13 0.21 ––––––––––––––––––––––––––––––––––––––––––––––––––––––––––––––––––––––––––––––––––––––––––––––––––––––––––––––––––––––––––––––––––––––† Gene effects: m: mean; a: additive; d: dominance; aa, ad and dd are additive x additive, additive x dominance and dominance x domi-nance epistasis, respectively; †† Only significant estimatives of the parameters were used to obtain the means. . Means were obtained usingabsolute values; **, * Significant at 5% (*) and 1% (**) probability levels.
fects in the genetic model used.A significantly negative correlation was observed
between ASI and the traits grain yield (r = -0.60**),P acquisition efficiency (r = -0.51**) and P internalutilization efficiency (r = -0.52**) in the low P envi-ronments (Table 7). The correlations between ASIand the traits grain yield (r = -0.28**) and P acquisi-tion efficiency (r = -0.04) in the high P environ-ments (data not shown), were much smaller thanthose observed at low P. Selection for short ASI, inthe low P environments, would have a positive im-pact to increase GY and PAE in these environments.
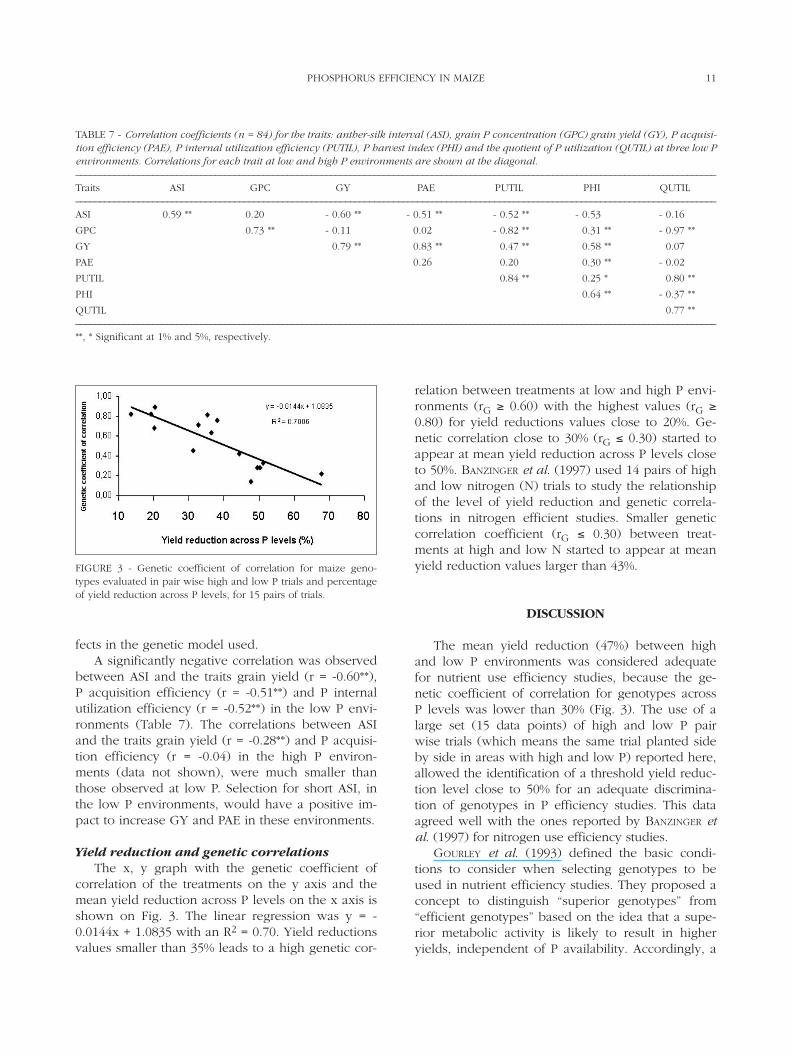
Yield reduction and genetic correlationsThe x, y graph with the genetic coefficient of
correlation of the treatments on the y axis and themean yield reduction across P levels on the x axis isshown on Fig. 3. The linear regression was y = -0.0144x + 1.0835 with an R2 = 0.70. Yield reductionsvalues smaller than 35% leads to a high genetic cor-
relation between treatments at low and high P envi-ronments (rG ≥ 0.60) with the highest values (rG ≥0.80) for yield reductions values close to 20%. Ge-netic correlation close to 30% (rG ≤ 0.30) started toappear at mean yield reduction across P levels closeto 50%. BANZINGER et al. (1997) used 14 pairs of highand low nitrogen (N) trials to study the relationshipof the level of yield reduction and genetic correla-tions in nitrogen efficient studies. Smaller geneticcorrelation coefficient (rG ≤ 0.30) between treat-ments at high and low N started to appear at meanyield reduction values larger than 43%.
DISCUSSION
The mean yield reduction (47%) between highand low P environments was considered adequatefor nutrient use efficiency studies, because the ge-netic coefficient of correlation for genotypes acrossP levels was lower than 30% (Fig. 3). The use of alarge set (15 data points) of high and low P pairwise trials (which means the same trial planted sideby side in areas with high and low P) reported here,allowed the identification of a threshold yield reduc-tion level close to 50% for an adequate discrimina-tion of genotypes in P efficiency studies. This dataagreed well with the ones reported by BANZINGER etal. (1997) for nitrogen use efficiency studies.
GOURLEY et al. (1993) defined the basic condi-tions to consider when selecting genotypes to beused in nutrient efficiency studies. They proposed aconcept to distinguish “superior genotypes” from“efficient genotypes” based on the idea that a supe-rior metabolic activity is likely to result in higheryields, independent of P availability. Accordingly, a
11PHOSPHORUS EFFICIENCY IN MAIZE
TABLE 7 - Correlation coefficients (n = 84) for the traits: anther-silk interval (ASI), grain P concentration (GPC) grain yield (GY), P acquisi-tion efficiency (PAE), P internal utilization efficiency (PUTIL), P harvest index (PHI) and the quotient of P utilization (QUTIL) at three low Penvironments. Correlations for each trait at low and high P environments are shown at the diagonal.–––––––––––––––––––––––––––––––––––––––––––––––––––––––––––––––––––––––––––––––––––––––––––––––––––––––––––––––––––––––––––––––––––––Traits ASI GPC GY PAE PUTIL PHI QUTIL–––––––––––––––––––––––––––––––––––––––––––––––––––––––––––––––––––––––––––––––––––––––––––––––––––––––––––––––––––––––––––––––––––––ASI 0.59 ** 0.20 ** - 0.60 ** - 0.51 ** - 0.52 ** - 0.53 - 0.16
GPC 0.73 ** - 0.11 0.02 - 0.82 ** 0.31 ** - 0.97 **
GY 0.79 ** 0.83 ** 0.47 ** 0.58 ** 0.07
PAE 0.26 0.20 0.30 ** - 0.02
PUTIL 0.84 ** 0.25 * 0.80 **
PHI 0.64 ** - 0.37 **
QUTIL 0.77 **–––––––––––––––––––––––––––––––––––––––––––––––––––––––––––––––––––––––––––––––––––––––––––––––––––––––––––––––––––––––––––––––––––––**, * Significant at 1% and 5%, respectively.
FIGURE 3 - Genetic coefficient of correlation for maize geno-types evaluated in pair wise high and low P trials and percentageof yield reduction across P levels, for 15 pairs of trials.
“superior”, rather than an “efficient” genotypewould be identified. A key condition to categorize apair of genotypes as “P efficient” and “P inefficient”would be that they should achieve similar yieldswhen optimum amounts of P are available, andthey should differ under low P conditions. In thisregard, the mean yield at low and high P environ-ments for the seven crosses used in this study isshown on Fig. 1. Four comparable pairs of efficient(solid symbols) and inefficient (open symbols)genotypes, based on their similar yield under high Pand contrasting yield under low P can be identified.The first pair is composed by the crosses L3xL22 (Pefficient) and L3xL53 (P inefficient). A second pairincludes crosses L3xL36 and L36xCateto. Two pairscan be formed, using the last three crosses. HybridsL3xCateto and 228-3xL22 can be classified as P effi-cient and CatetoxL53 would be the P inefficientcounterpart for these two crosses. The mean grainyield at low and high P environments of the four ef-ficient hybrids (5088 and 8167 kg.ha-1, respectively)was higher at low P environments and similar athigh P environments to the mean of the three ineffi-cient hybrids (3612 and 8393 kg.ha-1, respectively).These data indicate that the crosses used in thisstudy comprised a balanced group of efficient andinefficient genotypes which agrees with the defini-tion proposed by GOURLEY et al. (1993).
The seven crosses can also be divided accordingto the previous classification of their parental inbredlines as P efficient or P inefficient. Among the fivecrosses between an efficient and inefficient inbredline, four crosses were classified as efficient, basedon their grain yield at low P (L3x22, L3x36, L3xCate-to and 228-3x22), and one cross was classified as Pinefficient (L3x53). The two crosses between a me-dian efficient or an inefficient line, crossed with aninefficient line (L36xCateto and CatetoxL53) wereboth classified as inefficient hybrids (Fig. 1). COR-RALES et al. (2007) reported that the single cross ob-tained from the two efficient inbreds used in thisstudy (L3x228-3) showed greater capacity to acquireP in a medium with low P availability.
The non significant correlation observed for Pacquisition efficiency evaluated under low and highP environments (r = 0.26 n.s), indicates that differentP acquisition mechanisms could be acting in thesetwo group of environments. This reinforces the con-cept that mechanisms related to P acquisition effi-ciency should be studied at low P environments.Consequently, selection for higher P acquisition effi-ciency (PAE) should then be conducted in low P
phenotyping environments. Accordingly, gene ef-fects for PAE were only discussed at low P environ-ments (Table 5). The high and positive correlationbetween PAE and grain yield under low P (r =0.83**) indicates that grain yield in the low P envi-ronments is an adequate selection criteria for PAE.The use of grain yield under stress conditions as se-lection criteria for nutrient efficiency have been pro-posed in other studies in different crops (OSBORNE
and RENGEL, 2002; OZTURK et al., 2005).The quotient of P utilization is calculated divid-
ing grain yield per quantity of P in the grain (whichis equal to grain yield multiplied by grain P concen-tration), indicating that the “quotient of utilization”corresponds exactly to the reciprocal of the grainnutrient concentration (STEENBJERG and JAKOBSEN,1963). Accordingly, a higher grain nutrient concen-tration will result in lower nutrient internal utiliza-tion efficiency. The consequence is that a high andnegative correlation coefficient is observed betweengrain P concentration (GPC) and P internal utiliza-tion efficiency (r = -0.82**), as shown in Table 7. Se-lection strategies to increase PUTIL would then beconcentrated in reducing grain P concentration(GPC). The lack of correlation between GPC andGY facilitates simultaneous selection for both traits.Reduction in grain P concentration would have apositive impact on animal nutrition, since grain P isstored as the anti-nutritional factor phytate. A lowerGPC will also reduce environmental pollution fromhigh P manure produced by large animal feedingfacilities. However, the strategy of reducing grain Pconcentration should have a limit, since grain P isalso needed in the grain filling process and is alsoimportant in seed germination.
The GPC of the six parental lines and the sevensingle cross hybrids under low and high P is shownon Fig. 2. Within hybrids (squares) or inbreds (trian-gles), efficient genotypes (solid symbols) generallyhave lower grain P content than inefficient ones(open symbols). For the seven single cross hybrids,the selection criteria GPC is more useful to separateefficient and inefficient genotypes at high P than atlow P environments (Fig. 2). All hybrids had lowerGPC than their parental inbred lines. The distancebetween parental inbreds and their hybrid crosstend to be higher in low P environments (“x axis”)than in high P environments (“y axis”) which indi-cate that dominance effects for GPC tend be largerin low P than in high P environments. This can beconfirmed by the estimates of “d” for GPC at lowand high P soils (Table 6).
12S.N. PARENTONI, C.L. DE SOUZA JR., V.M. DE CARVALHO ALVES, E.E.G. GAMA, A.M. COELHO, A.C. DE OLIVEIRA,
P.E.O. GUIMARÃES, C.T. GUIMARÃES, M.J.V. VASCONCELOS, C.A. PATTO PACHECO, W.F. MEIRELLES,J.V. DE MAGALHÃES, L.J. MOREIRA GUIMARÃES, A.R. DA SILVA, F. FERREIRA MENDES, R.E. SCHAFFERT
Considering the discussion above regardingPUTIL and GPC, a possible breeding strategy to in-crease internal P utilization efficiency (PUTIL) in ox-isols similar to those used in this study, can be for-mulated. This includes selection for low grain Pconcentration (GPC) using inbred progenies (S1-S4),evaluated in high P environments. These evalua-tions could be conducted at the same time as theprogenies are being obtained (before top-cross). Animportant point to consider is that the pollen sourceeffect on grain P content (xenia), has not been de-tected in maize (WARDYN, 2004; PLESTCH-RIVERA andKAEPPLER, 2007), which would facilitate the evalua-tion of GPC.
Breeding programs called “biofortification” havebeen implemented worldwide with the goal to in-crease grain nutrient concentration and bioavailabil-ity to alleviate nutritional deficiencies in populationsthat use grain as its main staple food. It should beemphasized that the concept of increasing nutrientconcentration will produce “nutrient inefficientgenotypes”, based on what was discussed above.This strategy should not be sustainable in a longrun, since it would lead to the development ofgenotypes with high demand from soil nutrients.This would accelerate soil depletion, mainly for nu-trients where large quantities are exported in thegrains and in areas with low fertilizer use. In somecases, like iron and zinc nutrients, an increase inbioavailability can be achieved with a decrease inphytate content. This strategy of increasing nutrientbioavailability should have higher chance of successthan to increase grain nutrient concentration.
Smaller values of ASI were observed in efficientinbreds and hybrids (Fig. 2), indicating that, selec-tion for a shorter ASI in low P environments, couldbe an additional selection criteria in breeding pro-grams for P efficiency in maize. This selectionshould be done in inbreds, or inbreed progenieslike S1-S4, due to the following reasons: a) additiveeffects were more important for the expression ofthis trait than dominant effects; b) means and rangeof ASI were larger in inbreds compared with hy-brids.
Based on data from this study, a suggestedbreeding strategy to increase tropical maize phos-phorus use efficiency in environments similar tothose used in this research should be: a) screenmaize inbred progenies (S1-S4) in high P environ-ments for grain P content during progeny develop-ment. A milder intensity selection (50-60%) for low-er grain P content should be used during this stage
to guarantee enough variability for selection for Pacquisition efficiency (PAE) in the next phase; b)the selected progenies (or inbred lines) should betestcrossed with an appropriate tester(s) and thetestcrosses should be evaluated in low P phenotyp-ing sites developed for this purpose. If hand polli-nated is used during this phase, progenies with alarger anther-silk interval (ASI) should be discarded.If detasseling is used to produce the testcrosses,progenies with a later female flowering should bediscarded; c) the selected testcrosses would be eval-uated at low and high P environment in P pheno-typing sites where the main selection criteria for Pefficiency would be grain yield under low P; c) se-lection criteria for P responsiveness (if desirable)would be based on the testcross grain yield differ-ence in the high and low P environments; d) select-ed testcrosses should be re-evaluated in a larger setof environments and years.
These breeding strategies for increase P efficien-cy in maize should include an increased use ofgermplasm bank materials. In this sense, BLISS
(1981) proposed a selection strategy to transfer effi-ciency traits from unimproved to improved materi-als. It comprises the development of S1 or S2 proge-nies from BC2 families having the improved materi-al as recurrent parent. TERRY et al. (1987) successful-ly used BC2S2 and BC2S3 families to transfer thetrait P quantity in bean shoots from a donor parent(PI206002) to a recurrent parent (Sanilac).
A clear definition of selection criteria for P effi-ciency and a better understanding of their geneticcontrol can be useful in selecting target traits forQTLs mapping studies and also for the choice ofadequate mapping populations (ex. recombinant in-bred lines, would be more adequate for traits pre-dominantly additive inherited, or with additive x ad-ditive epistasis, while predominantly non-additiveinherited traits should preferentially be mapped intop-crosses or F2-F3 populations).
Studies to identify major mechanisms related toP acquisition efficiency in these genotypes are cur-rently underway (root morphology, aerenquima for-mation, and organic compounds secretion). Thesestudies will allow for the identification of new selec-tion criteria to be used in QTL mapping for P useefficiency and would also help in the search forcandidate genes controlling these traits.
ACKNOWLEDGEMENTS - To the “Fundação de Amparo àPesquisa do Estado de Minas Gerais (Fapemig)”, McKnigth Foun-dation CCRP, and Embrapa Maize and Sorghum Research Centerfor financial support for this study.
13PHOSPHORUS EFFICIENCY IN MAIZE
REFERENCES
ARNOLD J.M., L.M. JOSEPHSON, 1975 Inheritance of stalk qualitycharacteristics in maize. Crop Sci. 15: 338-340.
BAHIA FILHO A.F.C., R. MAGNAVACA, R.E. SCHAFFERT, V.M.C. ALVES,1997 Identification, utilization and economic impact ofmaize germplasm tolerant to low level of phosphorus andtoxic level of exchangeable aluminium in Brazilian Soil. pp.59-70. In: A.C. Moniz et al. (Eds.), Plant-Soil Interactions atLow pH.
BALIGAR V.C., N.K. FAGERIA, 1997 Nutrient use efficiency in acidsoils: nutrient management and plant use efficiency. pp. 75-97. In: A.C. Moniz et al. (Eds.), Plant-Soil Interactions at lowpH: sustainable agriculture and forestry production. Brazil:Brazilian Soil Science Society.
BALIGAR V.C., N.K. FAGERIA, Z.L. HE, 2001 Nutrient use efficiencyin plants. Comm. Soil Sci. Plant Analysis 32: 921-950.
BANZIGER M., F.J. BETRAN, H.R. LAFITTE, 1997 Efficiency of high-nitrogen selection environments for improving maize forlow-nitrogen target environments. Crop Sci. 37: 1103-1109.
BARBER W.D., W.I. THOMAS, D.E. BAKER, 1967 Inheritance of rela-tive phosphorus accumulation in corn (Zea mays L.). CropSci. 7: 104-107.
BATTEN G.D., 1992 A review of phosphorus efficiency in wheat.Plant Soil 146: 163-168.
BATTEN G.D., M.A. KHAN, B.R. CULLIS, 1984 Yield responses bymodern wheat genotypes to phosphate fertilizer and theirimplications for breeding. Euphytica 33: 81-89.
BLISS F.A., 1981 Utilization of vegetable germplasm. HortScience16: 129-132.
BOLANOS J., G.O. EDMEADES, 1993 Eight cycles of selection fordrought tolerance in lowland tropical maize. II. Responses inreproductive behaviour. Field Crops Res. 31: 253-268.
CHAUBEY C.N., D. SENADHIRA, G.B. GREGORIO, 1994 Geneticanalysis of tolerance for phosphorous deficiency in rice(Oryza sativa L.). Theor. Appl. Genet. 89: 313-317.
CHEN J., L. XU, Y. CAI, J. XU, 2009 Identification of QTLs for phos-phorus utilization efficiency in maize (Zea mays L.) across Plevels. Euphytica 167: 245-252.
COLTMAN R.R., W.H. GABELMAN, G.C. GERLOFF, S. BARTA, 1987 Ge-netics and physiology of low-phosphorus tolerance in a fam-ily derived from two differentially adapted strains of tomato(Lycopersicon esculentum Mill.). pp. 309-315. In: W.H.Gabelman, B.C. Loughman (Eds.), Genetic Aspects of PlantMineral Nutrition. Martinus Nijoff Publishers, Dordrecht, TheNetherlands.
CORRALES I., M. AMENOS, C. POSCHENRIEDER, J, BARCELÓ, 2007 Phos-phorous efficiency and root exudates in two contrastingmaize varieties. J. Plant Nutrition 30: 887-900.
DUNCAN R.R., 1994 Genetic Manipulation. pp. 1-38. In: R.E.Wilkinson (Ed.), Plant-environment interactions. New York:Marcel Dekker.
FAGERIA N.K., V.C. BALIGAR, Y. LI, 2006 Enhancing phosphorususe efficiency in crop plants grown on Brazilian oxisols. pp.79-80. In: V.M.C. Alves et al. (Eds.), Proc. 3rd Intl. Symposiumon Phosphorus Dynamics in the Soil-Plant Continuum, Uber-
lândia, Minas Gerais, Brazil, May 14-19 2006. Sete Lagoas:Embrapa Milho e Sorgo.
FEIL B., S.B. MOSER, S. JAMPATONG, P. STAMP, 2005 Mineral compo-sition of the grains of tropical maize varieties as affected bypre-anthesis drought and rate of nitrogen fertilization. Crop.Sci. 45: 516-523.
FOX R.H., 1978 Selection for phosphorus efficiency in corn.Comm. Soil Sci. Plant Analysis 9: 13-37.
FURLANI A.M.C., M. LIMA, L.L. NASS, 1998 Combining ability ef-fects for P-efficiency characters in maize grown in low P nu-trient solution. Maydica 43: 169-174.
GAMBLE E.E., 1962 Gene effects in corn (Zea mays, L.). I. Sepa-ration and relative importance of gene effects for yield. Can.J. Plant Sci. 42: 339-348.
GOURLEY C.J.P., D.L. ALLAN, M.P. RUSSELLE, 1993 Defining phosh-phorus efficiency in plants. Plant Soil 155/156: 289-292.
HORST W.J., M. ABDOU, F. WIESLER, 1993 Genotypic differences inphosphorus efficiency in wheat. pp. 367-370. In: N.J. Barrow(Ed.), Plant nutrition: from genetic engineering to field prac-tice. Netherlands, Kluwer Academic Publishers.
KEARSEY M.J., H. POONI, 1996 Genetic analysis of quantitativetraits. Chapman & Hall. London, 381 p.
LAFITTE H.R., G.O. EDMEADES, 1995 Stress tolerance in tropicalmaize is linked to constitutive changes in ear growth charac-teristics. Crop Sci. 35: 820-826.
MALAVOLTA E., G.C. VITTI, S.A. OLIVEIRA, 1989 Evaluation of plantnutritional status. Piracicaba: Potafos, 201 p. (in Portuguese).
MATHER K., L. JINKS, 1971 Biometrical genetics. New York, Cor-nell Univ. Press, Ithaca. p. 382.
MOLL R.H., E.J. KAMPRATH, W.A. JACKSON, 1982 Analysis and inter-pretation of factors which contribute to efficiency of nitrogenutilization. Agronomy J. 74: 562-564.
MURREL T.S., P.E. FIXEN, 2006 Improving fertilizer P effectiveness:challenges for the future. pp. 150-151. In: V.M.C. Alves et al.(Eds.), Proc. 3rd Intl. Symposium on Phosphorus Dynamics inthe Soil-Plant Continuum, Uberlândia, Minas Gerais, Brazil,May 14-19 2006, Sete Lagoas: Embrapa Milho e Sorgo.
OSBORNE L.D., Z. RENGEL, 2002 Screening cereals for genotypicvariation in efficiency of phosphorus uptake and utilization.Aust. J. Agr. Res. 53: 295-303.
OZTURK L., S. EKER, B. TORUM, I. CAKMAK, 2005 Variation in phos-phorus efficiency among 73 bread and durum wheat geno-types grown in a phosphours-deficient calcareous soil. PlantSoil 269: 69-80.
PARENTONI S.N., 2008 Estimative of gene effects for traits relatedto phosphorus efficiency and responsiveness in tropicalmaize. PhD Thesis. University of São Paulo-ESALQ- Piracica-ba, SP, January. 207 pg. (in Portuguese).
PARENTONI S.N., C.L. SOUZA JR., 2008 Phosphorus acquisition andinternal utilization efficiency in tropical maize genotypes.Pesq. Agropec. Bras. 43: 893-901.
PARENTONI S.N., V.M.C. ALVES, E.E.G. GAMA, A.M. COELHO, C.T.GUIMARÃES, P.E.O. GUIMARÃES, J.V. MAGALHÃES, M.J.V. VASCONCE-LOS, R.E. SCHAFFERT, 2006 Breeding maize for Al tolerance, Puse efficiency and acid soil adaptation for the cerrado areas
14S.N. PARENTONI, C.L. DE SOUZA JR., V.M. DE CARVALHO ALVES, E.E.G. GAMA, A.M. COELHO, A.C. DE OLIVEIRA,
P.E.O. GUIMARÃES, C.T. GUIMARÃES, M.J.V. VASCONCELOS, C.A. PATTO PACHECO, W.F. MEIRELLES,J.V. DE MAGALHÃES, L.J. MOREIRA GUIMARÃES, A.R. DA SILVA, F. FERREIRA MENDES, R.E. SCHAFFERT
of Brasil: the EMBRAPA’s experience. pp. 129-131. In: Proc.3rd Intl. Symposium on Phosphorus Dynamics in the Soil-Plant Continuum. Uberlândia, Minas Gerais, Brazil, May 14-19 2006.
PLESTCH-RIVERA L., S.M. KAEPLER, 2007 Phosphorus accumulationin maize grain is not influenced by xenia (Zea mays L.). May-dica 52: 151-158.
RASMUSSON D.C., A.J. HESTER, G.N. FICK, I. BYRNE, 1971 Breedingfor mineral content in wheat and barley. Crop Sci. 11: 623-626.
ROWE K.E., W.L. ALEXANDER, 1980 Computations for estimatingthe genetic parameters in joint-scaling tests. Crop Sci. 20:109-110.
SANCHEZ P.A., J.G. SALINAS, 1981 Low-imput technology for man-aging oxisols and ultisols in tropical America. Adv. Agrono-my 34: 279-406.
SAS INSTITUTE INC., 2000 SAS User’s Guide Statistics, Release 8.2(TS2 MO), Windows, Edition. Cary, NC: SAS Institute Inc.
SCHULTHESS U., B. FEIL, S.C. JUTZI, 1997 Yield-independent varia-tion in grain nitrogen and phosphorus concentration amongEthiopian wheats. Agronomy J. 89: 497-506.
SILVA F.C. DA, 1999 Manual of soil, plant and fertilizer chemical
analyses. First edition, Brasilia: EMBRAPA Soil Research Cen-ter, 370 p. (in portuguese).
SILVA A.E. DA, W.H. GABELMAN, J.G. COORS, 1992 Inheritance stud-ies of low-phophorus tolerance in maize (Zea mays L.),grown in a sand-alumina culture medium. Plant Soil 146:189-197.
STEEL R.G.D., J.H. TORRIE, 1960 Principles and procedures of sta-tistics. New York, Mc Grow-Hill, 481 p.
STEENBJERG F., S.T. JAKOBSEN, 1963 Plant nutrition and yieldcurves. Soil Sci. 95: 69-90.
TERRY M., M. SCHETTINI, W.H. GABELMAN, G.C. GERLOFF, 1987 In-corporation of phosphorus efficiency from exotic germplasminto agriculturally adapted germplasm of common bean(Phaseolus vulgaris L.). Plant Soil 99: 175-184.
WARDYN B.M., W.K. RUSSELL, 2004 Resource allocation in abreeding program for phosphorus concentration in maizegrain. Crop Sci. 44: 753-757.
WELCKER C., C. THÉ, B. ANDRÉAU, C. DE LEON, S.N. PARENTONI, J.BERNAL, J. FÉLICITÉ, C. ZONKENG, F. SALAZAR, L. NARRO, A. CHAR-COSSET, W.J. HORST, 2005 Heterosis and combining ability formaize adaptation to tropical acid soils: implications for futurebreeding strategies. Crop Sci. 45: 2405-2413.
15PHOSPHORUS EFFICIENCY IN MAIZE


