Embed Size (px)
Citation preview
Louisiana State University Louisiana State University
LSU Digital Commons LSU Digital Commons
LSU Master's Theses Graduate School
2005
Herbicide retention as affected by sugarcane mulch residue Herbicide retention as affected by sugarcane mulch residue
Brian J. Naquin Louisiana State University and Agricultural and Mechanical College
Follow this and additional works at: https://digitalcommons.lsu.edu/gradschool_theses
Recommended Citation Recommended Citation Naquin, Brian J., "Herbicide retention as affected by sugarcane mulch residue" (2005). LSU Master's Theses. 3120. https://digitalcommons.lsu.edu/gradschool_theses/3120
This Thesis is brought to you for free and open access by the Graduate School at LSU Digital Commons. It has been accepted for inclusion in LSU Master's Theses by an authorized graduate school editor of LSU Digital Commons. For more information, please contact [email protected].
HERBICIDE RETENTION AS AFFECTED BY SUGARCANE MULCH RESIDUE
A Thesis
Submitted to the Graduate Faculty of theLouisiana State University and
Agricultural and Mechanical CollegeIn partial fulfillment of the
Requirements for the degree ofMaster of Science
In
The Department of Agronomyand Environmental Management
byBrian J. Naquin
B. S., University of Louisiana at Lafayette, 2001May 2005

ii
ACKNOWLEDGEMENTS
First I would like to thank my major professor, Dr. H. Magdi Selim for this great
experience. None of this would have been possible without his extensive knowledge and
guidance. I would also like to thank the other members of my committee: Dr. Wang and Dr.
Southwick for their advice and suggestions during my graduate program.
I would like to thank Mr. Mike Lindsey for his continuous instruction and knowledge of
soils and his friendship. The staff of the St. Gabriel Research Station was key with field
operations. Special thanks are due to Dr. Brad Venuto and staff of the Southeast Research
Station for guidance in fiber analysis. I also would like to thank Nina Hoffstetler and Amy
Hernandez for their GC expertise.
I wish to thank the Department of Agronomy and Environmental Management for the
wonderful experience I have had during my study period I also would like to express my
appreciation for my fellow graduate students: Hua Zhang, Hongxia Zhu, and Liuzong Zhou, for
their help and friendship. Also all student workers who have spent time with me, especially the
late Elizabeth Thompson, you will always be missed.
Finally, thanks to my family, especially my amazing wife Summer for the unending
support and patience throughout my studying period.
iii
TABLE OF CONTENTS
ACKNOWLEDGEMENTS………………………………….…..…………………………..........ii
LIST OF TABLES…………………………………………………...…………………................v
LIST OF FIGURES…………………………………………………...………………….............vi
ABSTRACT……………………………………………………………..……...........................viii
CHAPTER
1. INTRODUCTION…………………………………..…………………………………...........11.1. Literature review…...……………………………...…………………………………...…11.2. Objectives…………………………………………..………………………….................8
2 MATERIALS AND METHODS…...…………………...………………..……………........102.1 Chemicals..…………...............................……………...…..............................................102.2 Sample Collection of Mulch Residue …….……………...........………..........................102.3 Herbicide Adsorption …………….………………………...….......…............................112.4 Herbicide Desorption or Release……..….......…………………………………….........122.5 Herbicide Adsorption – Desorption by sugarcane Residue…………..........……………13
2.5.1 Plant Cane…………….…………………………………………...…....………..132.5.2 First Stubble……………….……………….……………………...…....………..142.5.3 Second Stubble………………..…………………………………...…....………..14
2.6 Herbicide Adsorption by Soils ……………...…….…..……………..…....…...………..142.7 Residue Decay…….…………………………...…………………………..........………162.8 Fiber Analysis..…………………….…………………..………… ….........……………172.9 Miscible Displacement Setup..………………………...…………… ….........…………18
2.9.1 Commerce Soil and Metribuzin……………...……………………..........………192.9.2 Soil with Sugarcane Residue ………………………..……………..........………19
3 RESULTS AND DISCUSSION......……………......................................... …....................233.1 Isotherms.............…..........................................................………......... ….....................233.2 Herbicide Adsorption – Desorption by Residue…………….........…..…..……………..23
3.2.1 Plant Cane…..................…………………….......….….........…………...............233.2.2 First Stubble..........................………....................……... ….................................243.2.3 Second Stubble……………...................................…….…....…...........................30
3.3 Herbicide Adsorption by Soils …………….…………...………..………..........……….403.4 Residue Decay…….…………………………...……………….….………........………403.5 Fiber Quantification…………………………………..…….…….….…….........………443.6 Miscible Displacement………………………………...……….……….….........………47
3.6.1 Commerce Soil ……………………………..……….……..……….........………523.6.2 Soil and Residue ………..…………...…………............………………………..52
4 CONCLUSIONS……………….................…......…...........................……..….......……….60

iv
REFERENCES............ ………………….….……… ….........…………….............….…..…….62
VITA…………………………………….……...……………….......…………………………...67
v
LIST OF TABLES
Table. 2.1. Selected physical and chemical properties of the Sharkey and Commerce soils..….15
Table. 2.2. Soil properties and experimental conditions of individual columns of the miscibledisplacement experiments.……………….. ………………………..……….…………..……….22
Table. 3.1. Linear and Freundlich model parameters (with 95% confidence interval) for atrazineand metribuzin adsorption versus reaction time by the sugarcane mulch residue. The residue wassampled on March 23, 2001, following plantcane harvest………………………….……..…….25
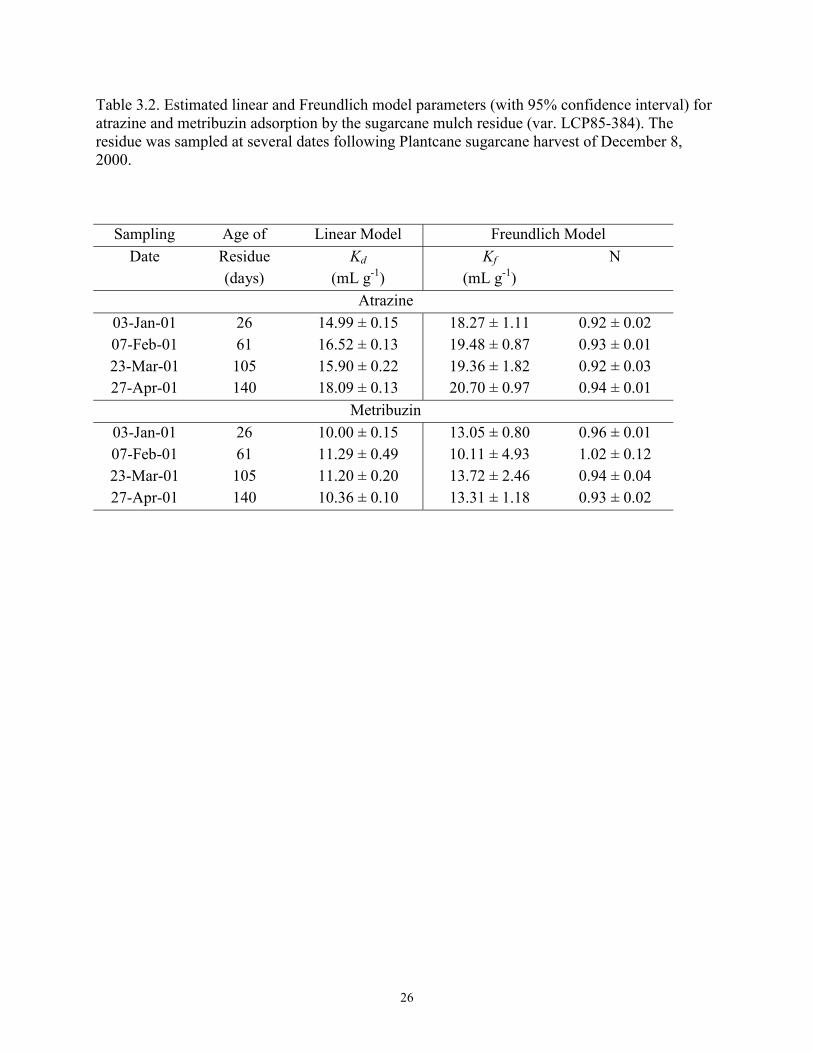
Table 3.2. Estimated linear and Freundlich model parameters (with 95% confidence interval) foratrazine and metribuzin adsorption by the sugarcane mulch residue (var. LCP85-384). Theresidue was sampled at several dates following plantcane sugarcane harvest of December 8,2000……………………………………………………………………………………………...26
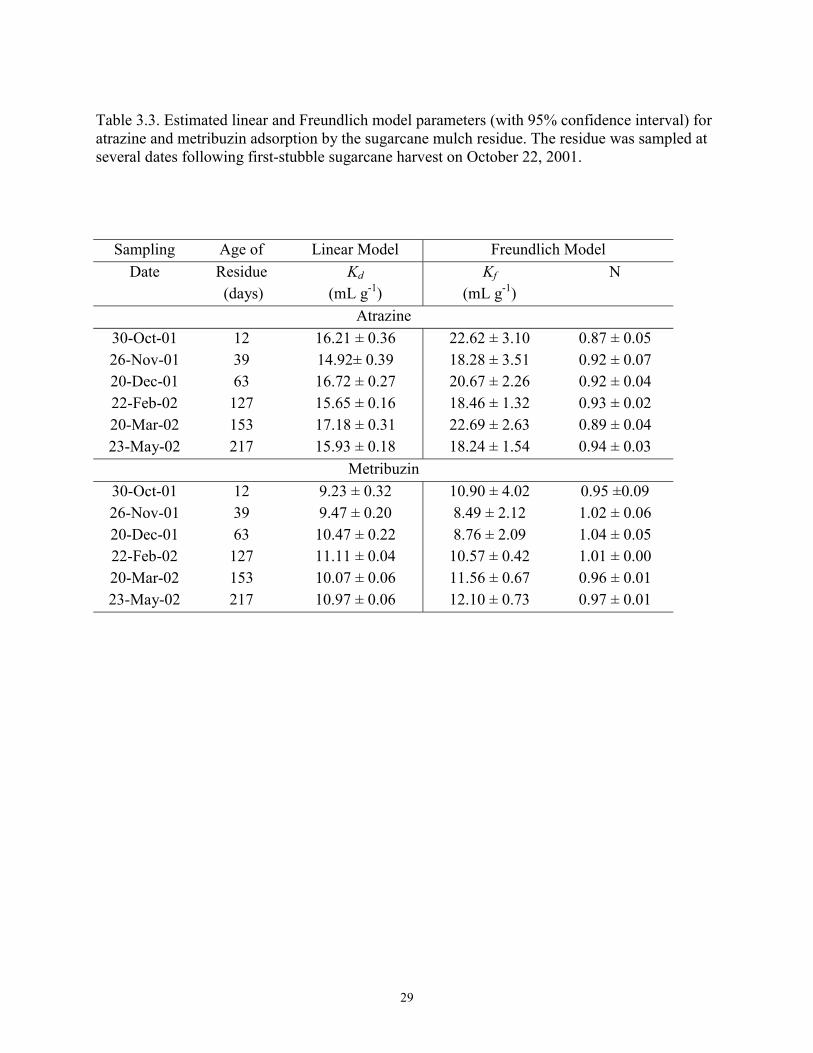
Table 3.3. Estimated linear and Freundlich model parameters (with 95% confidence interval) foratrazine and metribuzin adsorption by the sugarcane mulch residue. The residue was sampled atseveral dates following first-stubble sugarcane harvest of October 22, 2001………….…..……29
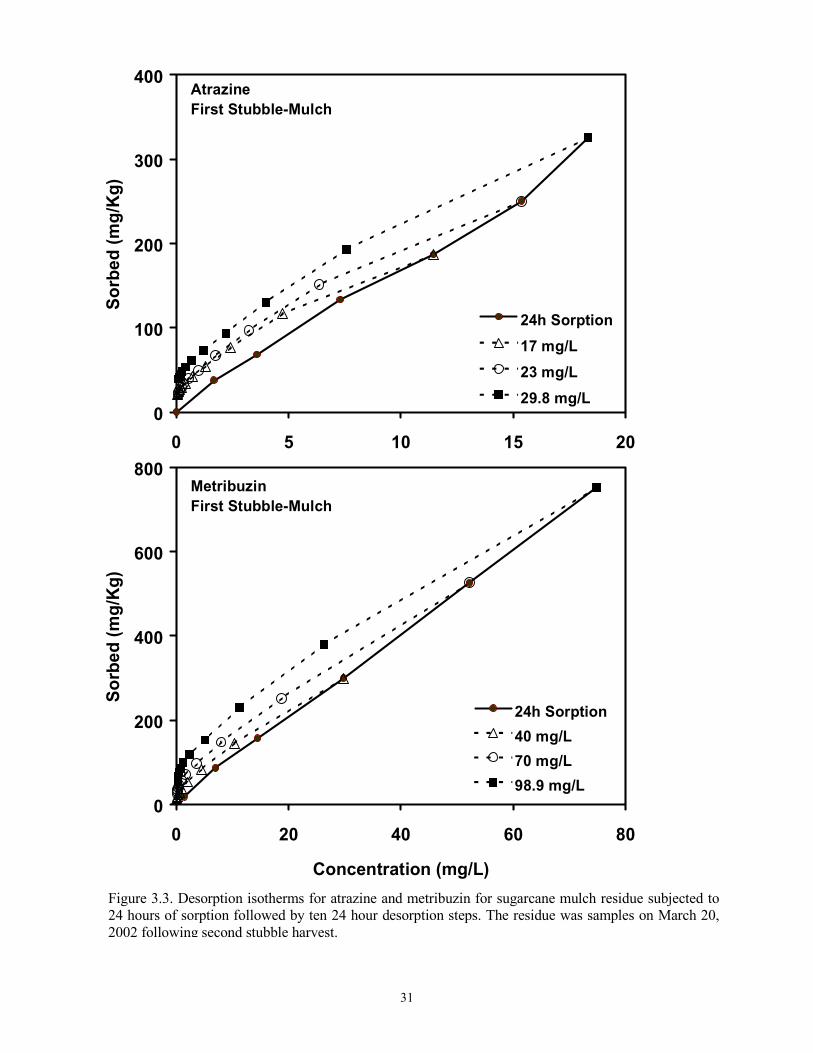
Table 3.4. Mass balance of applied atrazine and metribuzin following 24-h adsorption, tendesorptions, and methanol extraction for mulch residue collected 153 d post-harvest (March 20,2002)………………………………………………………………….…..….….……….…..…..32
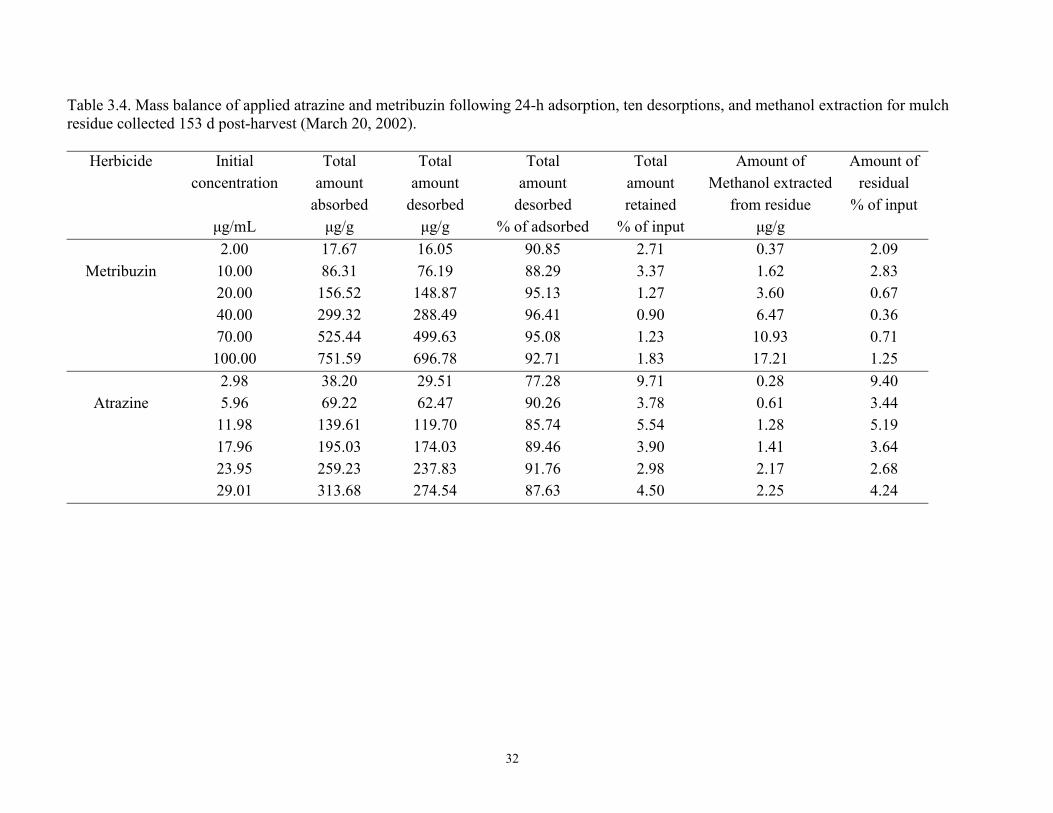
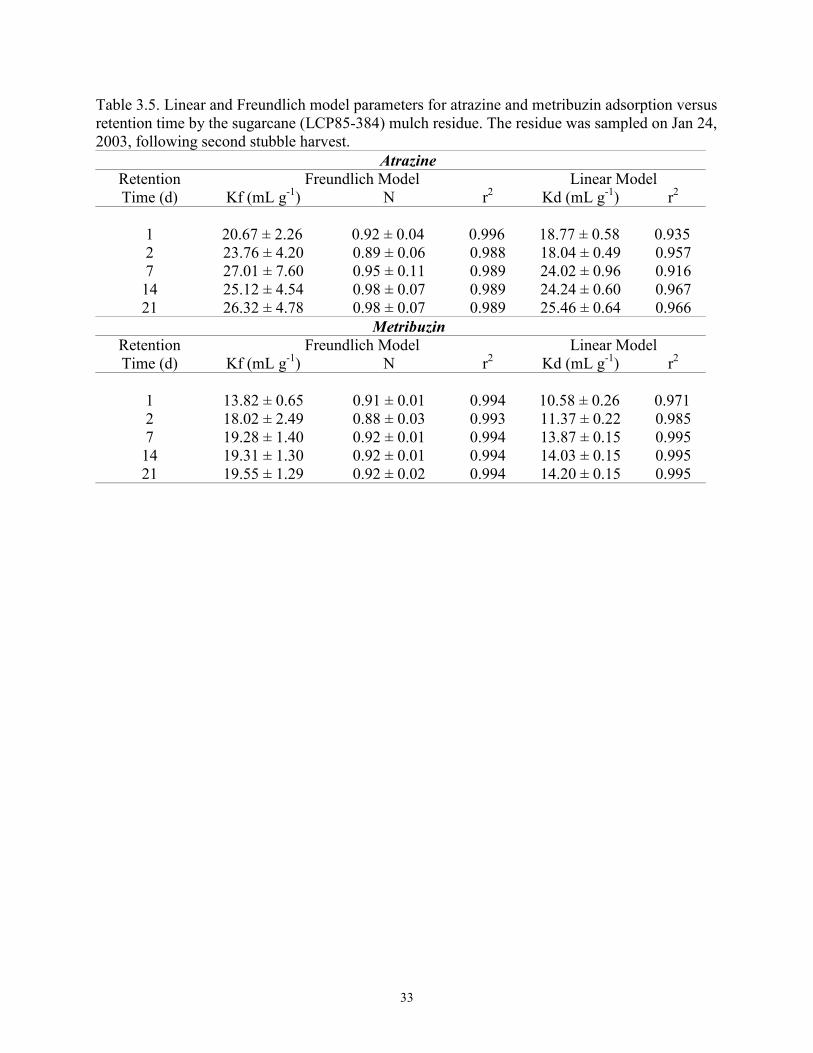
Table 3.5. Linear and Freundlich model parameters for atrazine and metribuzin adsorption versusretention time by the sugarcane (LCP85-384) mulch residue. The residue was sampled on Jan 24,2003………………………………………………………………………………..…….……….33
Table 3.6. Mass balance of applied atrazine and metribuzin following 504-h adsorption, sixdesorptions, and methanol extraction for mulch residue collected 63 d post-harvest (January 24,2003)……………………………………………………………………………..……..………..38
Table 3.7. Estimated linear and Freundlich model parameters (with 95% confidence interval) foratrazine and metribuzin adsorption by the sugarcane mulch residue (var. LCP85-384). Theresidue was sampled at several dates following harvest of second stubble November 24, 2002.…………………………………………………………………………………………………...39
Table 3.8. Estimated linear model parameters for atrazine and metribuzin adsorption by bothCommerce and Sharkey surface soils………………………….……………………….…..……41
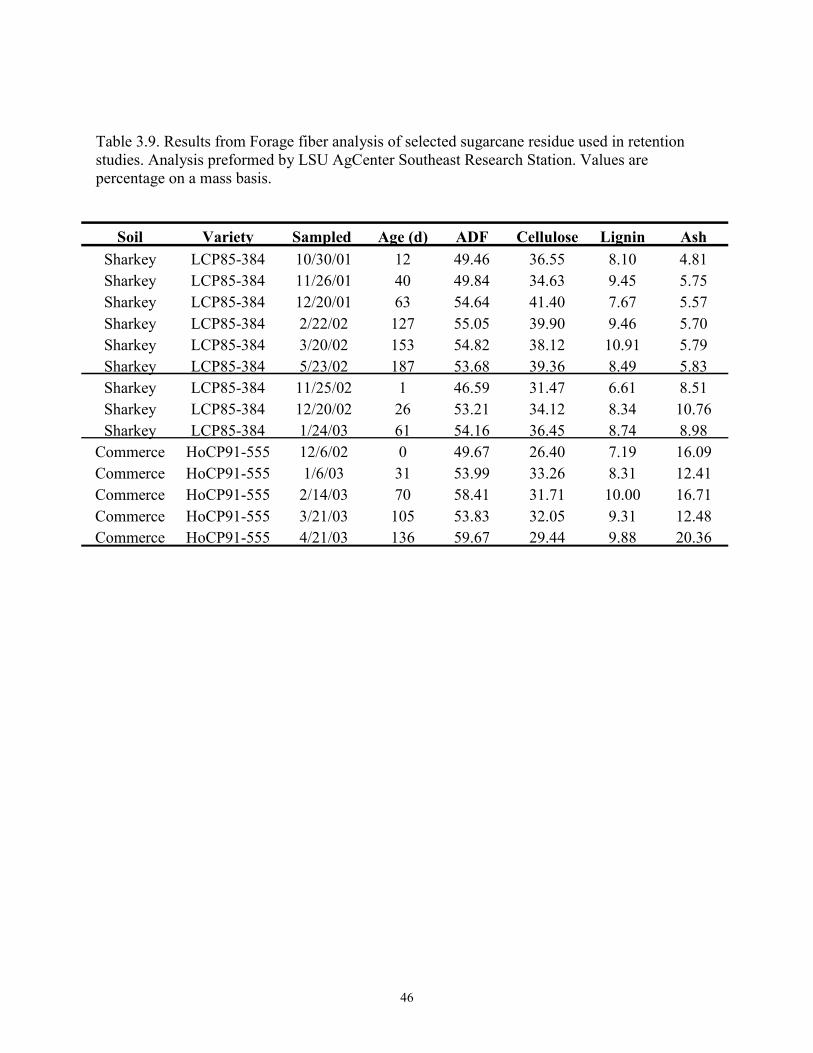
Table 3.9. Results from forage fiber analysis results of selected sugarcane residue used inretention studies. Analysis preformed by LSU AgCenter Southeast Research Station Values arepercentage on a mass basis…………………………………………...……………..……..…….46
vi
LIST OF FIGURES
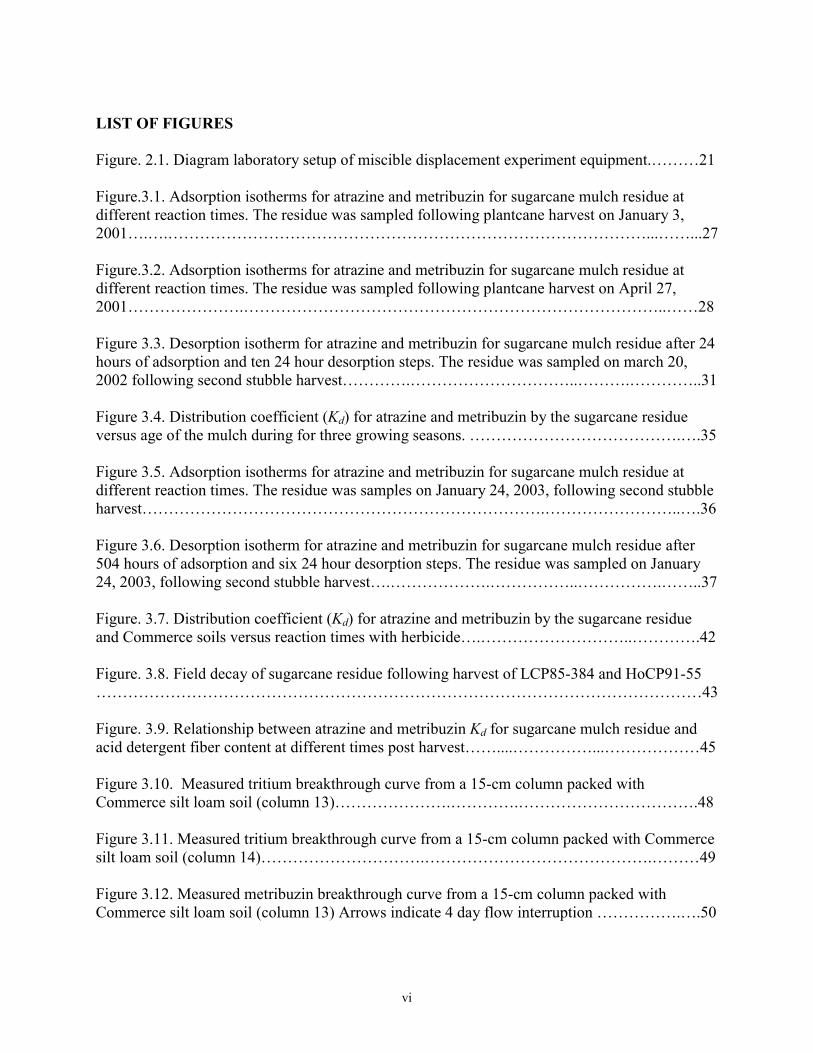
Figure. 2.1. Diagram laboratory setup of miscible displacement experiment equipment.………21
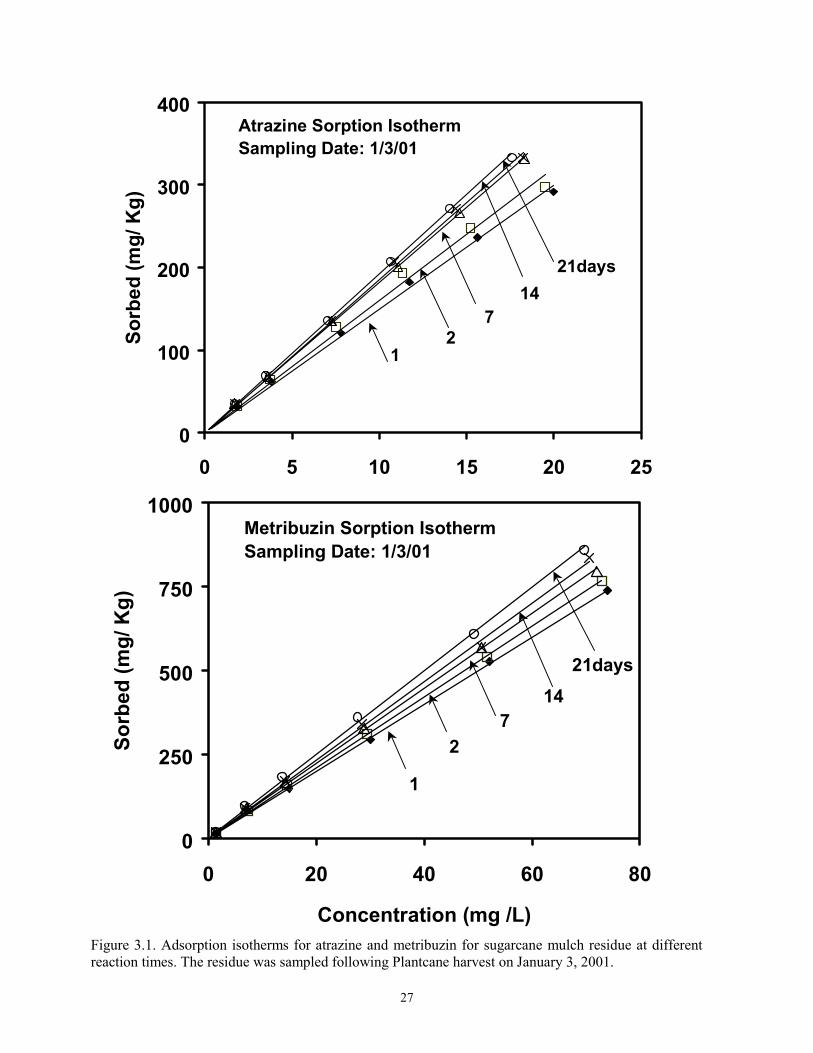
Figure.3.1. Adsorption isotherms for atrazine and metribuzin for sugarcane mulch residue atdifferent reaction times. The residue was sampled following plantcane harvest on January 3,2001….….………………………………………………………………………………...……...27
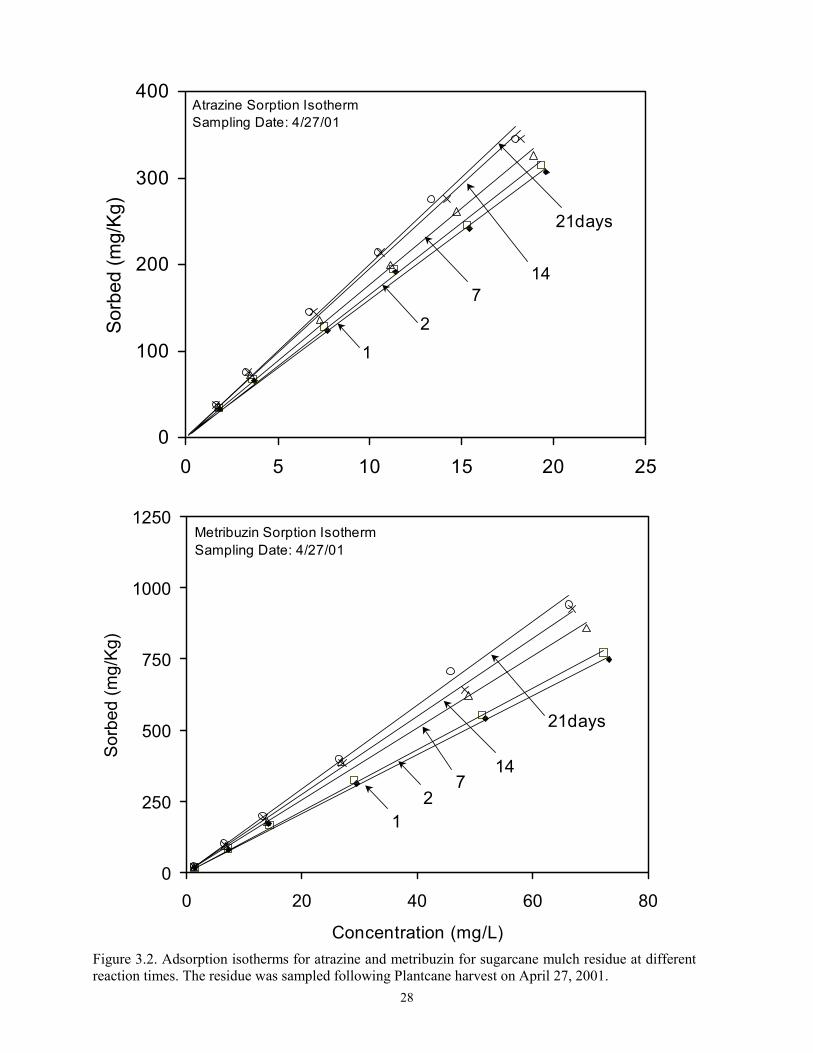
Figure.3.2. Adsorption isotherms for atrazine and metribuzin for sugarcane mulch residue atdifferent reaction times. The residue was sampled following plantcane harvest on April 27,2001………………….……………………………………………………………………..……28
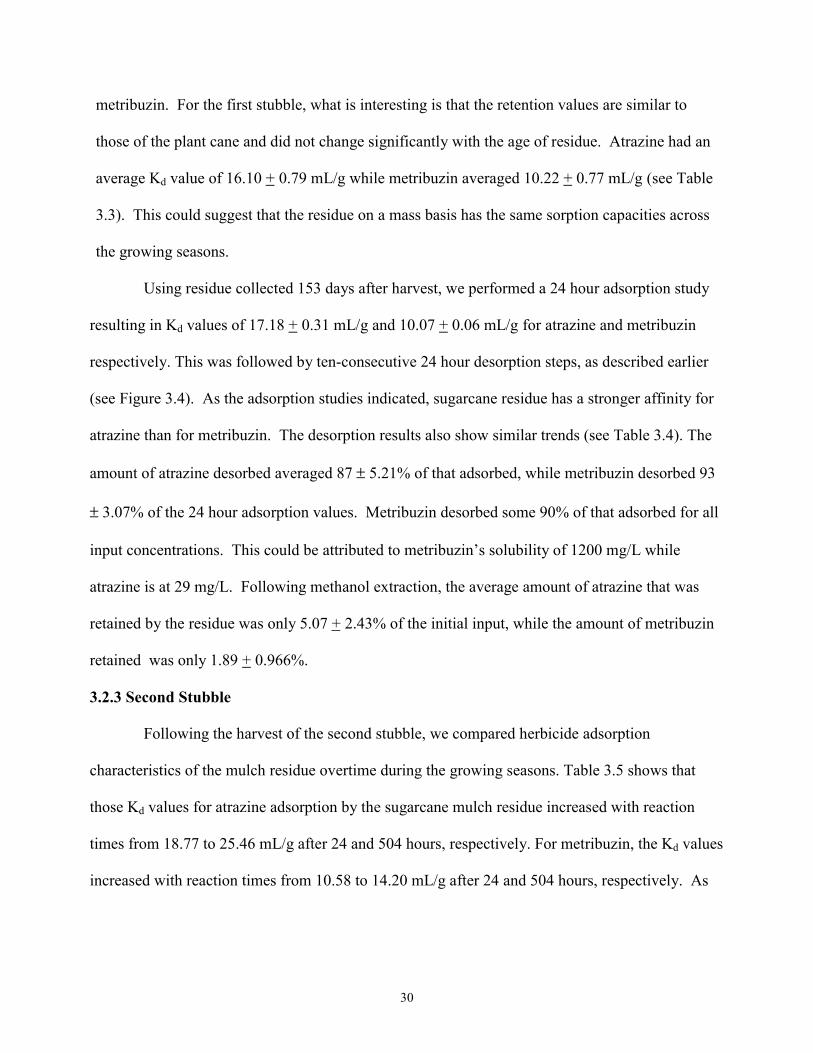
Figure 3.3. Desorption isotherm for atrazine and metribuzin for sugarcane mulch residue after 24hours of adsorption and ten 24 hour desorption steps. The residue was sampled on march 20,2002 following second stubble harvest………….…………………………..……….…………..31
Figure 3.4. Distribution coefficient (Kd) for atrazine and metribuzin by the sugarcane residueversus age of the mulch during for three growing seasons. ………………………………….….35
Figure 3.5. Adsorption isotherms for atrazine and metribuzin for sugarcane mulch residue atdifferent reaction times. The residue was samples on January 24, 2003, following second stubbleharvest………………………………………………………………….……………………..….36
Figure 3.6. Desorption isotherm for atrazine and metribuzin for sugarcane mulch residue after504 hours of adsorption and six 24 hour desorption steps. The residue was sampled on January24, 2003, following second stubble harvest….……………….……………..…………….……..37
Figure. 3.7. Distribution coefficient (Kd) for atrazine and metribuzin by the sugarcane residueand Commerce soils versus reaction times with herbicide….………………………..………….42
Figure. 3.8. Field decay of sugarcane residue following harvest of LCP85-384 and HoCP91-55……………………………………………………………………………………………………43
Figure. 3.9. Relationship between atrazine and metribuzin Kd for sugarcane mulch residue andacid detergent fiber content at different times post harvest……....……………...………………45
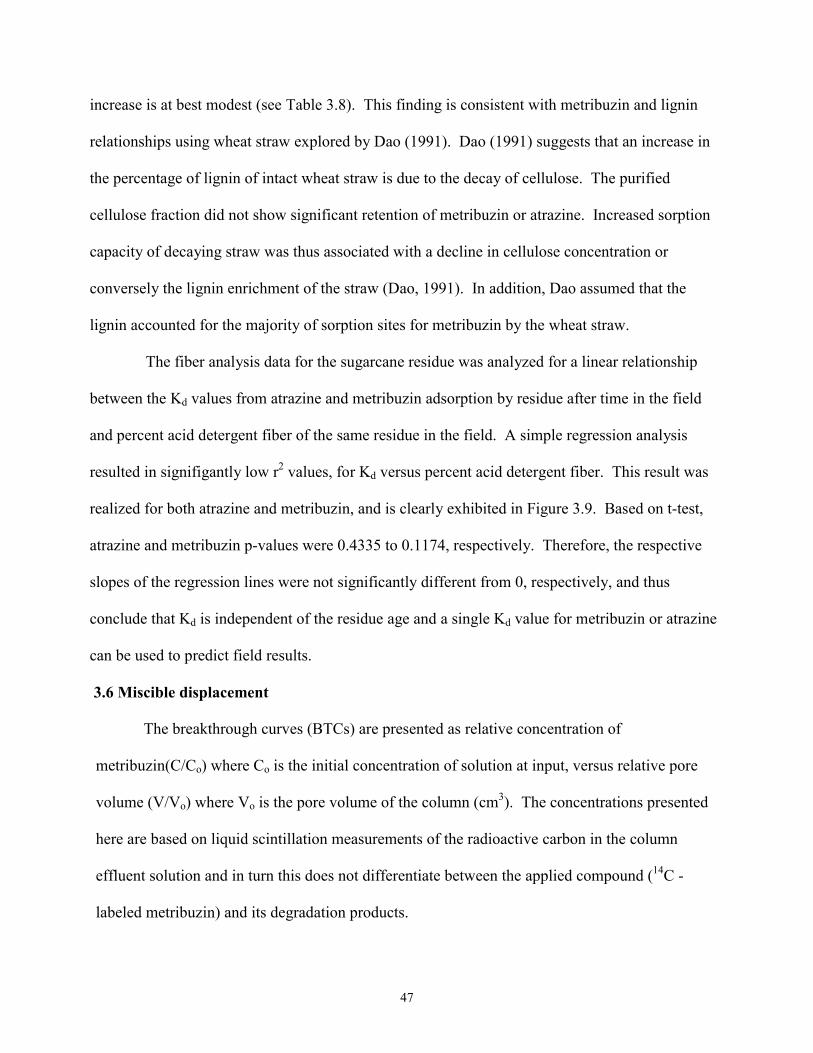
Figure 3.10. Measured tritium breakthrough curve from a 15-cm column packed withCommerce silt loam soil (column 13)………………….………….…………………………….48
Figure 3.11. Measured tritium breakthrough curve from a 15-cm column packed with Commercesilt loam soil (column 14)………………………….…………………………………….………49
Figure 3.12. Measured metribuzin breakthrough curve from a 15-cm column packed withCommerce silt loam soil (column 13) Arrows indicate 4 day flow interruption …………….….50
vii
Figure 3.13. Measured metribuzin breakthrough curve from a 15-cm column packed withCommerce silt loam soil (column 14) Arrows indicate 4 day flow interruption…….……….….51
Figure 3.14. Measured tritium breakthrough curve from a 10-cm column packed with sugarcaneresidue and acid washed sand (column 15)……………………….……………………….…….55
Figure 3.15. Measured tritium breakthrough curve from a 10-cm column packed with sugarcaneresidue and Commerce silt loam soil (column 16)………………..……………………..………56
Figure 3.16. Measured metribuzin breakthrough curve from a 10-cm column packed withsugarcane residue and acid washed sand (column 15). Arrows indicate 4 day flow interruption……………………………………………………………………………………………………57
Figure 3.17. Measured metribuzin breakthrough curve from a 10-cm column packed withsugarcane residue and Commerce silt loam soil (column 16). Arrows indicate 4 day flowinterruption……………………………………………………………………………………….58
Figure 3.18. Measured metribuzin breakthrough curve from a 10-cm column packed withsugarcane residue and Sharkey clay soil (column 17). Arrows indicate 4 day flow interruption…………………………………………………………………………………………………....59
viii
ABSTRACT
Best management practices are used by agricultural producers to control or reduce the
transport and generation of contaminants to the water resources of the state, ultimately increasing
the quality of surface and ground waters. One such practice is residue management used during
sugarcane production. The impact of sugarcane residue may have on the retention and release of
two herbicides namely; atrazine and metribuzin was the focus of this study is studied.
Adsorption-desorption and transport behavior of herbicides are important processes that
influence the amount of herbicide retained by the soil or crop residue and that which is
susceptible to runoff or movement within the soil profile. Kinetic batch experiments were used
to study the adsorption-desorption behavior of atrazine and metribuzin in sugarcane mulch
residue and two surface soils. Atrazine retention was consistently stronger than metribuzin for
both sugarcane residue and surface soils. To describe the retention of atrazine and metribuzin by
the residue as it ages and across growing seasons, only one value (Kd) was needed for each
herbicide, and this value is an order of magnitude greater then those determined for surface soils.
Miscible displacement experiments under steady flow conditions were also carried out to
examine the mobility of the metribuzin within soils.
In addition field studies quantified the decay of sugarcane residue in the field following
combine harvest. Amounts of residue cover varied with the growing season and variety. Half-
lives of 126 to 171 days were determined for sugarcane residue as it remains in the field. With
residue age mass decreases leaving greater percentages of more recalcitrant residue such as
lignin. Fiber analysis identified these changes, there were no obvious relationships between
herbicide retention distribution coefficients and percentage of lignin on a mass basis.
1
CHAPTER 1. INTRODUCTION
1.1 Literature Review
The sugarcane industry is a large part of Louisiana’s agricultural economy, with year
2002 production totaling over 1.27 million tons of sugar a year and employing almost 30,000
residents. Louisiana has a great investment in sugarcane with 198,450 hectares planted a year,
with operations this large the impacted areas are significant (USDA, 2004). Recently the
environmental effects of sugarcane production have been studied with the main concern being
the impact it has on surface and ground water resources. Among different agricultural areas,
frequencies of detection were positively correlated with nearby agricultural use for atrazine,
cyanazine, alachlor, and metolachlor (Barbash et al, 2001). Monitoring by several governmental
agencies has shown atrazine exceeding the maximum allowable level for finished drinking water
leaving a treatment plant in 34 communities around the nation, one being the Iberville Water
District #3 during late winter for several years (EPA, 2003). Solomon (1996) suggests a subset
of surface waters, particularly small reservoirs in areas with intensive use of atrazine, may be at
greater risk of exposure. This has raised concern about the applied herbicide on some 20,250
hectares of sugarcane in production that drain into this particular Louisiana water district.
Since the Clean Water Act of 1977 the EPA and related agencies have made an effort to
reduce contaminant input to surface and groundwater. This act also has requirements to set
water quality standards for all contaminants in surface waters including Maximum Contaminant
Levels for atrazine 3 µg/L and metribuzin 200 µg/L. Reducing agricultural contaminants has
brought best management programs to the forefront of environmental efforts supported by
regulating agencies. The focus of these programs, for both regulatory agencies and producers,
has been reducing the movement of sediment and agrochemicals off site while not significantly
reducing yield.
2
Residue management (NRCS Code 344) is a best management practice that has shown
the potential for reducing offsite movement of chemicals applied to the field. With the
introduction of the combine harvester, the practice of non-burning and leaving the plant residue
on the soil surface is becoming a common management practice with sugarcane producers. This
practice started in the mid to late 1990’s and now has been accepted by more than 90% of
growers in Louisiana and other parts in the world such as Australia, South Africa and Brazil.
Besides the obvious benefit of increasing organic matter of the surface soil, non-burning
can affect the physical and chemical properties of soil over long periods of time. A 59 year
sugarcane management study in South Africa suggests that burning cane before harvest results in
long term losses of available Ca, K, and P, along with decrease in cation exchange capacity and
aggregate stability (Graham et al, 2002). Also in studies in South Africa, Dominy (2002)
observed a large decline in soil organic matter and microbial biomass in two soils ranging from
sandy to clayey loam. These soils, were exposed to 50 years of pre-harvest burning of
sugarcane. In a study in Brazil by Ball-Coelho (1993) involving the pre-harvest burn of the first
ratoon crop, 2600 kg of carbon and 17 kg of nitrogen per hectare were lost by convection, while
the post-harvest burn resulted in losses of 4800 kg of carbon and 42 kg of nitrogen per hectare.
Yadav (1994) in Lucknow, India completed a study with similar results showing losses of
organic carbon and available nitrogen due to trash burning when compared with not burning,
there was also a reduction in yield. In a nine year study located in Australia, Noble (2003)
measured an increase of 4 tons per hectare of organic carbon in soils under a green trash blanket
sugarcane harvest when compared to fields which residue was burned. Similar declines were
observed with carbon fractions in Australian sugarcane production due to burning trash (Blair,
2000). Trash mulching at 6 tons per hectare led to marginal improvements in shoot population
and cane yield over no mulching (Rana et al, 2003). The losses of soil nutrients such as the ones
3
discussed above, over long time periods due to burn management, reveal how the soil can
change. These soil nutrient decreases can affect crop production in the future.
For several decades numerous studies have shown strong affinity of applied herbicides to
crop residues in comparison to mineral soils. For example, the sorptive capacity of corn residue
was 35 to 60 times greater than that for surface soils (Boyd et al, 1990), while in another study
wheat straw grown in Oklahoma exhibited a strong affinity for metribuzin (Dao, 1991). Atrazine
retained by the corn stalk residue is subject to dissipation or adsorption processes, thus reducing
the amount available for wash-off and movement into the soil by the first rain (Sigua et al, 1993).
In Louisiana, Selim (2003) has shown that extractable concentrations of atrazine were at least
one order of magnitude higher for the sugarcane mulch residue compared with that retained by a
Commerce silt loam soil. In the study presented here we will further describe the retention
characteristics of the sugarcane residue and the two herbicides described below.
Atrazine and metribuzin are both common herbicides used extensively in sugarcane
production. Atrazine garners the most attention because of the low price and effectiveness
across crops. Atrazine is a systemic triazine herbicide, which has been registered since 1958 for
the control of broadleaf weeds and grasses. At this time it is one of the two most extensively
used agricultural pesticides in the United States. Approximately 29-34 million kilograms of
active ingredient are applied per year. Annually, 75% of all field corn, 58% of all sorghum, and
76% of all sugarcane grown are treated with atrazine according to the USDA. Atrazine is
formulated as a flowable concentrate, a water dispersible granular (dry flowable), and a granular.
Maximum application rates for atrazine range from 0.448 kg to 4.48 kg of active ingredient per
hectare and may be applied by groundboom sprayer, aircraft, tractor-drawn spreader, rights of
way sprayer, low pressure handwand, backpack sprayer, lawn handgun, push-type spreader, and
bellygrinder. The number of maximum allowable applications range from 1 to 4 per season or
4
year however specified. Sugarcane herbicide treatments involve both pre and post emergence
applications. These are usually at planting (fall), in the spring after emergence, and an additional
post-emergence application (layby)(EPA, 2003). After application there are high herbicide
concentrations in the top few mm of soil which can lead to high initial runoff concentrations with
early rainfall (Southwick et al. 2003).
Though atrazine is the main focus of much research around the world, metribuzin is also
of major concern. Using a Commerce soil Kim and Feagley (1998) performed column studies
that resulted in metribuzin being readily leached, indicating the potential for groundwater and
shallow aquifer contamination. Metribuzin like atrazine is a triazine herbicide that targets
grasses and broadleaf weeds. It is a highly soluble (1200 mg/L vs. 29 mg/L) and expensive
alternative to atrazine. The higher Maximum Contaminant Level stated above is the primary
factor for metribuzin being considered an alternative to atrazine. Metribuzin is also favored
because of the smaller environmental foot print it may leave in areas applied. Moorman (1999)
observed metribuzin concentrations half of that of atrazine in groundwater after application to
corn and soybean fields. Additionally atrazine was detected in over 90% of soil surface samples
whereas metribuzin was rarely detected, almost two years after application.
Since the use of combine harvester is a new technology in Louisiana, the effect of leaving
sugarcane residues on the soil surface post harvest has not yet been fully explored. Residue
management may cause changes in the properties of the chemistry, and microclimate of soil,
therefore affecting volatilization, degradation, and uptake of pesticides. Research elsewhere has
shown that the organic matter fraction has a significant impact on the sorption of organic
chemicals. Shelton (1998) compared a 4-year no-till soil with a 4-year plow-till soil under corn
production. The increased organic matter content in the top 0 to 1.5 cm of the no-till resulted in
partitioning values that were consistently higher because of increased sorption. Considering
5
sugarcane residue provides more than 90% ground cover at masses greater than 2.68 tons per
hectare (Thorburn et al, 2001), this management practice can have a considerable impact on the
fate of herbicides in Louisiana soils. Dao (1995) found that under continuos wheat straw cover,
no-till soil had elevated organic carbon concentrations in the near-surface zone and showed a two
to fivefold increase in metribuzin retention in the 0 to 0.15 m depth. These studies have shown
the environmental changes that take place at the soil surface of residue management
implemented sites.
Previous studies have also revealed that in the presence of residue cover there is a
decrease in net runoff, when compared to no residue, which is the primary goal of residue
management. A minimum of 50% reduction in runoff effluent concentrations for atrazine and
pendimethalin was realized when the sugarcane mulch residue was not removed (Selim, 2003).
In a south Louisiana study atrazine lost 84 to 96% of the seasons losses within the first two rain
events of the season (Southwick et al. 2003). Attributed to corn residue cover left on the soil
surface, average concentration of atrazine from conventional tillage was about 17% less from no-
till (Seta et al, 1993). Dabney (2004) concluded that the resistance of erosion is not only due to
the presence of corn residue cover, but also to the improved soil quality resulting from this
practice. After conducting studies of herbicide runoff of sugarcane fields, Southwick et al.
(2002) noted crop residue management as a possible solution to decreased herbicide contribution
to south Louisiana water quality.
Residue cover, commonly known as the trash blanket, causes many changes in field
conditions that influence herbicide sorption, desorption or release and eventual fate in the
environment. One change includes the age of residue in the field and possible changes to
sorptive properties or characteristics. According to Benoit and Preston (2000) when wheat straw
was decomposed for six months prior to the introduction of 14C-labelled atrazine, herbicide
6
mineralization was enhanced to 50% of the initial 14C in contrast to 15% of the initial 14C in soil
alone and soil amended with fresh straw. Dao (1995) has shown that as wheat straw ages, lignin
on mass basis increases resulting in increased sorptive capacity of wheat straw on said mass
basis. Similar lignin based studies show measurements of desorption in respective steps
indicated that 62% of metribuzin was adsorbed irreversibly and cannot be leached over a period
of 24 hours (Ludvík and Zuman, 2000). Other studies have suggested that freshly cut cover
crops reduced leaching more than aged corn stalk residue from the previous harvest (Sigua et al,
1993).
The age of residue is not the only important time factor. The amount of time in which
the herbicide has been in contact with the environment also plays a roll in its fate. This process
is referred to as “aging”. According to Lavy et al (1996), there is increasing evidence that shortly
after herbicide application dissipation processes occur at different rates. If degradation of
atrazine does occur in the subsoil, it starts after a lag phase of five days in an unsaturated zone to
more than 25 days in a saturated zone. The disappearance of atrazine is then rapid, with a high
mineralization rate. The lag phase is due to the build-up of microbial population (Vanderheyden
et al, 1997). With time in the field herbicides bind more strongly, consequently herbicide losses
are greatly reduced when runoff events occurred later in the season because of herbicide
degradation and binding of herbicide to soil particles (Gaynor et al, 1995). Not only does residue
seem to hold the herbicide in the field longer, it may also promote microbial activity. With a
relatively high carbon to nitrogen ratio from soybean residue the imbalance of microbial appetite
results in the use of herbicide for nitrogen source, resulting in cleavage of nitrogen or sulfur, for
metribuzin (Locke and Harper 1991). One study found the proportion of bound residues
increased with the total microbial activity after addition of various organic amendments (i.e.,
glucose, straw, cellulose and humified organic matter) or organic nitrogen forms (i.e., adenine,
7
arginine, albumin, biuret and pyrazine) (Abdelhafid, 2000). A factor influencing increased
microbial and chemical degredation is temperature. Savage (1977) stated that the degradation
rate of metribuzin was significantly influenced by temperature, with more rapid degradation at
30º C than at 20º C. This can be important as the blanket of residue changes the temperature at
the soil surface where the herbicides are bound. In addition photodegradation in the soil surface
is accelerated as the percentage of organic matter increases (Konstantinou et al, 2001).
The effect of leaving residue blanket on the soil surface post harvest on the soil organic
matter of the top soil surface layer has not been fully investigated in Louisiana soils. Soil
organic matter is often considered the dominant sorptive phase for organic contaminants and
pesticides in soil-water systems (Sheng et al, 2001; Martin-Neto et al, 2001). Multiple
regression of the adsorption constants against selected soil properties indicated that organic
matter content was the best single predictor of atrazine adsorption (r2 = 0.98) followed by soil pH
(r2 = 0.82) (Jenks et al, 1998). Many different soil types have been studied with the same
conclusion, emphasizing the importance of organic matter and related fractions. Citing that the
Kd values were strongly and significantly correlated to the organic carbon content (r2 = 0.84),
Seybold (1994) concluded that the organic fraction is the most important constituent for
adsorption of atrazine in sandy soils that contain small amounts of organic matter and clay.
Studies of soils from both Iowa and South Carolina have also reported that the magnitude of
atrazine sorption was strongly and positively correlated with soil organic carbon (Novak, 1999).
Some research has focused on more specific sorption mechanisms such as organic carbon and
humic matter. Piccolo (1998) states that hydrophobic interactions and conformational flexibility
in the aliphatic portions of humic matter controlled the adsorption of atrazine in the interior of
humic self-associated aggregates and the degree of desorption found both in water and methanol.
Sorption-desorption of atrazine and simazine was more hysteretic for humic acid than for
8
montmorillonite, indicating that these herbicides desorb more difficultly from organic matter
than from montmorillonite because of the contribution of hydrophobic interactions with humic
acid (Celis et al, 1997).
Soil pH also has an influence on the fate of herbicides in the environment, and the
addition of crop residue to the soil surface may create a pH shift in the top layer. Studies are
consistent in showing the mobility and bioavailability of herbicides in soils is expected to be
lower at low pH than at high or neutral pH (Weber, 1993). While pH does have an influence on
sorption it is still organic matter that has the greatest impact. Martinezinigo and Almendros
(1992) reported the lowest pesticide retention for samples of the soil with the highest pH, where
the addition of organic matter led to the greatest enhancements. Again when the various
physical, chemical, and biological properties involved with the residue management program are
evaluated we have a delicate balance. This balance can be shifted in many different directions.
The research presented through this study can certainly contribute to the growing knowledge in
this important area of environmental and agricultural relations.
1.2 Objectives
The purpose of this study was to examine the ability of sugarcane mulch residue in
reducing non-point source contamination of applied agrochemicals namely atrazine and
metribuzin from sugarcane fields, in south Louisiana. To accomplish this goal a number of
properties characterizing the relationships between the sugarcane mulch, soil and chemicals were
quantified. Overall the objective of this work was to quantify the retention of atrazine and
metribuzin by the sugarcane mulch and to characterize their kinetic behavior in soil. Field and
laboratory studies carried out to investigate the retention kinetics of atrazine and metribuzin by
the mulch residue as well as soils. Multiple residue samples were collected post harvest ranging
from 1 day to 212 days from three growing seasons, in order to assess changes in herbicide
9
retention characteristics as a function of the age of the mulch residue as it degrades in the field.
Adsorption-desorption studies of herbicide retention by the sugarcane mulch residue were
carried out to assess atrazine and metribuzin release behavior and to quantify amounts that are
water soluble or readily desorbable herbicide phases over time.
Collectively these studies are a prerequisite to correlate the effectiveness of crop residue
remaining on the soil surface, following sugarcane harvest, as a best management practice. Such
information is also necessary to predict the ability of residue to retain applied herbicides, buffer
losses from runoff, and retard downward movement in the soil profile.
10
CHAPTER 2. MATERIALS AND METHODS
2.1 Chemicals
Two triazine herbicides were used in this study; namely atrazine (6-chloro-N2-ethyl-N4-
isopropyl-1,3,5-triazine-2,4-diamine) and metribuzin (4-amino-6-tert-butyl-4,5-dihydro-3-
methylthio-1,2,4-triazin-5-one). A stock solution containing 29.8 mg/L 99.1% pure atrazine was
prepared in 0.005 M CaCl2. 14C labeled atrazine with a specific activity of 42.6 µCi/mg was used
in this study as a tracer to monitor the extent of atrazine retention by the different residue and
soils. This radio-labeled material was provided by Syngenta, Greensboro, NC. Six 14C atrazine
spiked atrazine solutions having initial concentrations (Ci) of 2.98, 5, 11, 17, 23 and 29.8 mg/L in
0.005 M CaCl2 aqueous solution were used in our study.
Similar to atrazine as discussed above, a stock solution containing 98.9 mg/L, 99% pure
unlabeled metribuzin was prepared in 0.005 M CaCl2. 14C labeled metribuzin with a specific
activity of 150µCi/mg was used in this study. This radio-labeled material was provided by Bayer
Laboratories, Stillwater, Oklahoma. Six 14C metribuzin spiked metribuzin solutions having initial
concentrations (Ci) of 2, 10, 20, 40, 70 and 98.9 mg/L in 0.005 M CaCl2 aqueous solution were
also prepared for subsequent use in kinetic retention studies.
2.2 Sample Collection of Mulch Residue
Bulk samples of sugarcane residue variety LCP85-384 were collected from field plots at
the St. Gabriel Sugarcane Research Station. On October 2, 1999 the sugarcane was planted, in a
Sharkey clay soil (very-fine, smectitic, thermic chromic epiaquerts), at 1.8 m row spacing and 200
m in length. Harvesting was carried out on December 8, 2000 for the plantcane, October 22, 2001
for first stubble and November 24, 2002 for second stubble growing season.
11
A Cameco® (Thibodaux, LA) sugarcane harvester was used for combine harvest. The
combine cuts the standing cane stalks into billets, which are directly loaded into wagons for
transport to the mill. Extractor fans in the combine harvester separate leaf-material from billets
and the plant residue is deposited on the soil surface. This process leaves a blanket of residue on
the field post harvest averaging 6.72 tons/ha.
Mulch samples were collected multiple times following combine harvest of the crop,
generally at 30 day intervals. The residue was air dried in the laboratory and cut into 1 cm
sections for herbicide retention studies. Residue not immediately used was stored at –20 °C for
later herbicide retention and transport investigations. The surface layer of the Sharkey clay along
with a Commerce silt loam (Fine-silty, mixed, superactive, nonacid, thermic Fluvaquentic
Endoaquepts) were also sampled for this study from the St. Gabriel Research Station, located 12
miles south of Baton Rouge, LA.
2.3 Herbicide Adsorption
Adsorption by the sugarcane mulch residue was carried out using the batch equilibration
technique. This technique was described in detail by Zhu and Selim (2000) and Selim (2003).
Six 14C-atrazine/metribuzin spike samples having initial concentrations (Ci) ranging from 2.98 to
29.8 mg/L for atrazine and from 2 to 98.9 mg/L for metribuzin in 0.005 M CaCl2 were used.
Adsorption was initiated by mixing 1 g of dried and cut sugarcane residue with 30 mL of the
solutions various herbicide concentrations in a 40 mL Teflon centrifuge tube. Triplicate samples
were used. Weights of each component were recorded along with the total combined weight so
that a mass balance can be achieved. The mixtures of residue and herbicide solution were kept
continuously shaking on a Thermolyne rotator/shaker at 200 rpm. After each specific reaction
12
(sampling) time, the samples were centrifuged at 3500×g for 10 minutes on a Beckman GPR
centrifuge (Fullerton, CA) at 25°C.
A 0.5 mL aliquot was sampled from the supernatant at each reaction time ranging from 24
to 504 hours, and deposited into a 7 mL scintillation vial with foil lined cap. The slurries were
then weighed, vortex mixed and returned to the shaker after each sampling. The 0.5 mL aliquot
was subsequently mixed with 5 mL of scintillation cocktail (Packard Ultima Gold, Meriden, CT)
and analyzed using a Packard Tri-Carb 2100TR Liquid Scintillation Analyzer (LS), (Meriden,
CT). The amount of pesticide retained by the residue at each reaction time was calculated from
the difference in concentrations of the supernatant and that of the initial solution.
2.4 Herbicide Desorption or Release
Desorption of the two herbicides commenced immediately after the last adsorption time step
(504 h). Each desorption step was conducted by replacing the supernatant with herbicide free
0.005 M CaCl2 solution and shaking for 24 hours. This was accomplished by centrifuging the
slurry at 3500 rpm for 10 minutes. The weight of total solution, residue and tube was recorded in
order to keep a mass balance. The supernatant was then decanted leaving only the saturated
residue in the tube. The tube and saturated reside was then subsequently weighed. Once weighed,
25 mL of 0.005 M CaCl2 solution was added to each tube. A 0.5 mL sample was taken at each
step and herbicide in solution was analyzed using same scintillation technique from adsorption
studies. This desorption procedure was repeated for six consecutive steps for a total desorption
time of six days.
After the last desorption step the solution was decanted as described above an additional
extraction step of the amount of the residual herbicide retained by the residue was made. In this
step, the decanted solution was replaced with a 4:1 methanol/water solution and was kept on the
13
shaker for 24 hour as above. This methanol extracting solution is routinely used for herbicide
extractions from soil samples from field and laboratory experiments (Johnson and Furman, 1993;
Selim et al. 2003)
The amount of herbicide retained by the mulch residue versus time during sorption and
desorption was calculated based on mass balance and the change in herbicide concentration in the
solution phase.
2.5 Herbicide Adsorption – Desorption by Sugarcane Residue
As stated in the objectives, our primary goal of this study was to quantify the retention of
atrazine and metribuzin by the sugarcane mulch and to characterize their kinetic behavior in soil.
To achieve this objective, we quantified herbicide retention by the mulch residue following cane
harvest using the combine harvester over a 3 successive growing seasons; i.e., for plant cane, and
first and second stubbles, respectively. This was carried out during 2000 through 2003 at the St.
Gabriel Research Station. The sugarcane variety was LCP85-384 which was planted October 2,
1999 and the soil was Sharkey clay soil which is widely grown to sugarcane in south Louisiana.
Residue sampling and sorption-desorption experiments carried out during these three growing
seasons are described below.
2.5.1 Plant Cane
The sugarcane was combine harvested on December 8, 2000. Residue samples were
collected on January 3, February 7, March 23, and April 27, 2001. Batch equilibration was carried
out on the residue from each sampling date. The herbicide reaction times chosen were 24, 48,
136, 336, and 504 hours. The multiple sampling dates were used to investigate the effects of
residue aging in the field on herbicide kinetics. Residue ranging from 26 to 140 days in the field
were compared.
14
2.5.2 First Stubble
Residue samples collected following first stubble harvest on were used in 24 hour batch
equilibration. Cane harvest was carried out October 22, 2001. A 24 hour equilibration retention
for both atrazine and metribuzin was carried out for all samples collected on October 30,
November 26, December 20, of 2001, February 22, March 20, May 23, of 2002. This resulted in
24 hour retention values for atrazine and metribuzin on residue ranging in age from 12 to 187 days
post harvest.
We also focused on the desorption of both atrazine and metribuzin, for one sampling date
namely that of March 20, 2002. The residue sample used had the retention time limited to 24 hour
batch equilibration which was subsequently followed by ten consecutive 24 hour desorption steps
(10 days) for a total of eleven days. This was carried out in order to quantify the extent of release
of each herbicide after equilibrium was reached.
2.5.3 Second Stubble
The second and final stubble of variety LCP85-384 was harvested on November 24, 2002.
Residue samples were collected on November 25, December 20, 2002 and January 24, 2003.
Batch equilibration studies with reaction times of 8, 24, 48, 136, 336, and 504 hours were carried
out followed immediately by six 24 hour desorption steps, using January 24 sample. In addition
all sampling dates underwent a 24 hour adsorption study.
2.6 Herbicide Adsorption by Soils
In a separate experiment, atrazine and metribuzin retention by the Sharkey clay surface soil
where the sugarcane was grown was measured in a similar fashion as that for the mulch residue.
Furthermore, herbicide retention was also carried out on a surface Commerce silt loam soil (fine
15
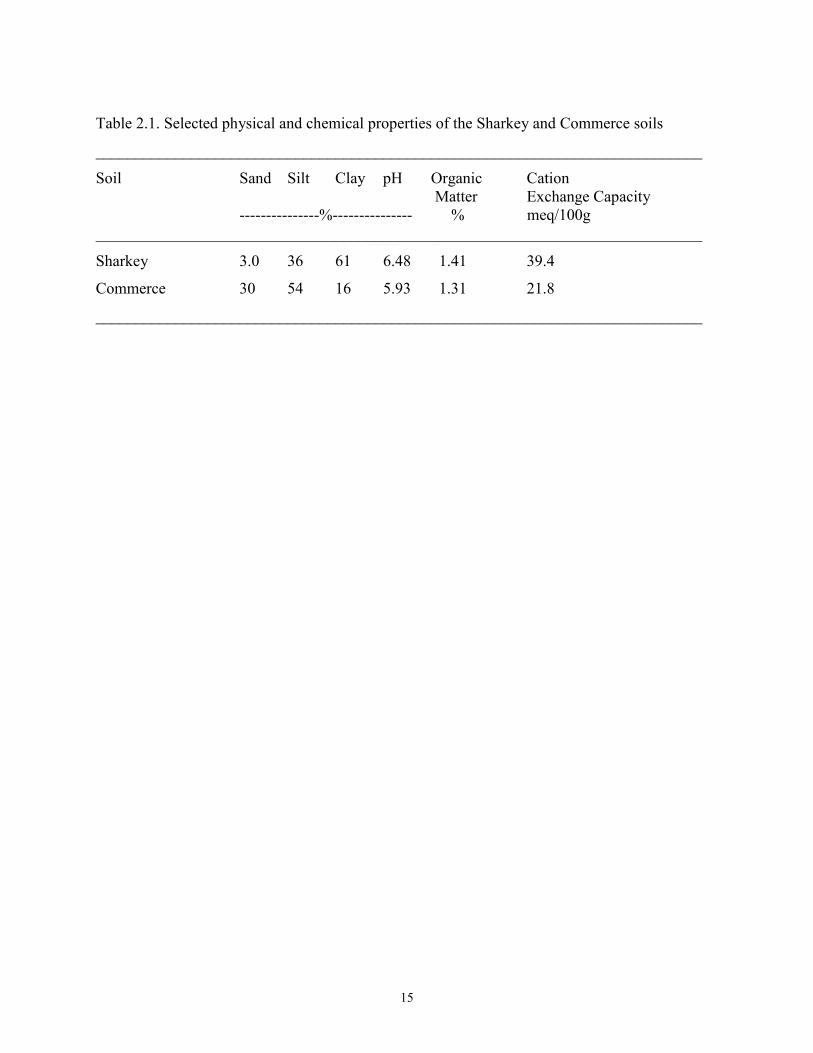
Table 2.1. Selected physical and chemical properties of the Sharkey and Commerce soils
____________________________________________________________________________
Soil Sand Silt Clay pH Organic Cation Matter Exchange Capacity
---------------%--------------- % meq/100g____________________________________________________________________________
Sharkey 3.0 36 61 6.48 1.41 39.4
Commerce 30 54 16 5.93 1.31 21.8
____________________________________________________________________________
16
silty, mixed, nonacid, thermic Aeric Fluvaquents) from an experimental site some 1 Km from the
Sharkey plots. The only exception was that in the batch study the soil-to-herbicide solution ratio
used was 15 g of air-dried soil (in triplicates) mixed with 30 mL of atrazine or metribuzin solution.
The range of input or initial atrazine and metribuzin concentrations (Ci) in 0.005 M CaCl2 as the
background solution was similar to that used for the mulch residue. Moreover, the reaction times
for sorption were 8, 24, 48, 136, 336, and 504 h. Six desorption steps were carried out following
the 504 h adsorption step with a total desorption time of six days. Following the sixth step, one
further extraction using pure methanol was carried out. The Commerce soil was selected because
of recent studies of sugarcane mulch residue and the influence on herbicide runoff (Selim et al.,
2003, 2004). Moreover, sugarcane is widely grown on both soils in south Louisiana. Table 2.1
lists soil properties of Commerce and Sharkey soils.
2.7 Residue Decay
To assess the effect of the presence of a surface mulch residue on the retention of
herbicides, the rate of decay of the sugarcane residue was quantified. Following plantcane, first
stubble and second stubble combine harvest of variety LCP85-384, the sugarcane mulch residue
was collected from the surface soil. Also collected was variety HoCP91-555 grown on a
Commerce silt loam, for the plantcane and first stubble. The sugarcane residue covers row tops
and lies in furrow, and is not uniform throughout the field.
Residue was collected randomly by measuring multiple 1 m2 areas while all visible leafy
residue within each area is collected by hand; billets were not included. Each date 6 – 8 samples
were collected to obtain an average for each field. During collection the residue was placed in
plastic bags to be weighed. A sub-sample of the residue was transferred to a smaller paper bag
and placed in the oven for 24 hours at 55°C. Weights were recorded and moisture was calculated.
17
Following the first sample collection just after harvest samples were taken roughly on a monthly
basis until fields off-barred in the spring. When approaching 200 days post harvest the residue
had decayed and mixed with the surface soil through weather events and use of field equipment.
Collecting residue past this time proved not practical.
2.8 Fiber Analysis
The sugarcane residue collected for field decay measurements were also used for fiber
analysis. This residue was air dried and ground to a powder using a Foss Tecator Cyclotec® 1093
sample mill. The ground residue then placed in glass jars and rolled for homogeneity using a New
Brunswick Scientific company RC-41 Rollacell®. The residue from the plantcane and first stubble
of both variety LCP85-384 and variety HoCP91-555 was analyzed for neutral detergent fiber
(NDF) and acid detergent fiber (ADF) which was carried out at the Louisiana State University
Agricultural Center’s Southeast Research Station at Franklin, LA.
NDF is the fraction of the plant that contains hemicellulose, cellulose and lignin. ADF is
the sub-fraction of NDF consisting of mainly lignin and cellulose. The NDF and ADF values are
used as indicators of lignin, cellulose and hemicellulose content of sugarcane residue on a mass
basis. Neutral detergent fiber and acid detergent fiber were analyzed using the methods described
by Goering and Van Soest (1970), which were modified by excluding decalin. Additionally, 2.0
mL of a 2% (w/v) "-amylase solution and 0.5 g sodium sulfite were added at the beginning of the
NDF procedure (Van Soest and Robertson, 1980). The content of lignin, cellulose and ash was
also determined using further steps. Using methods described by Goering and Van Soest (1970)
in USDA Agriculture handbook 379, the ADF fraction is additionally dissolved with 72 percent
sulfuric acid removing the cellulose. The residue undergoes ashing which leaves the crude lignin
fraction including cutin.
18
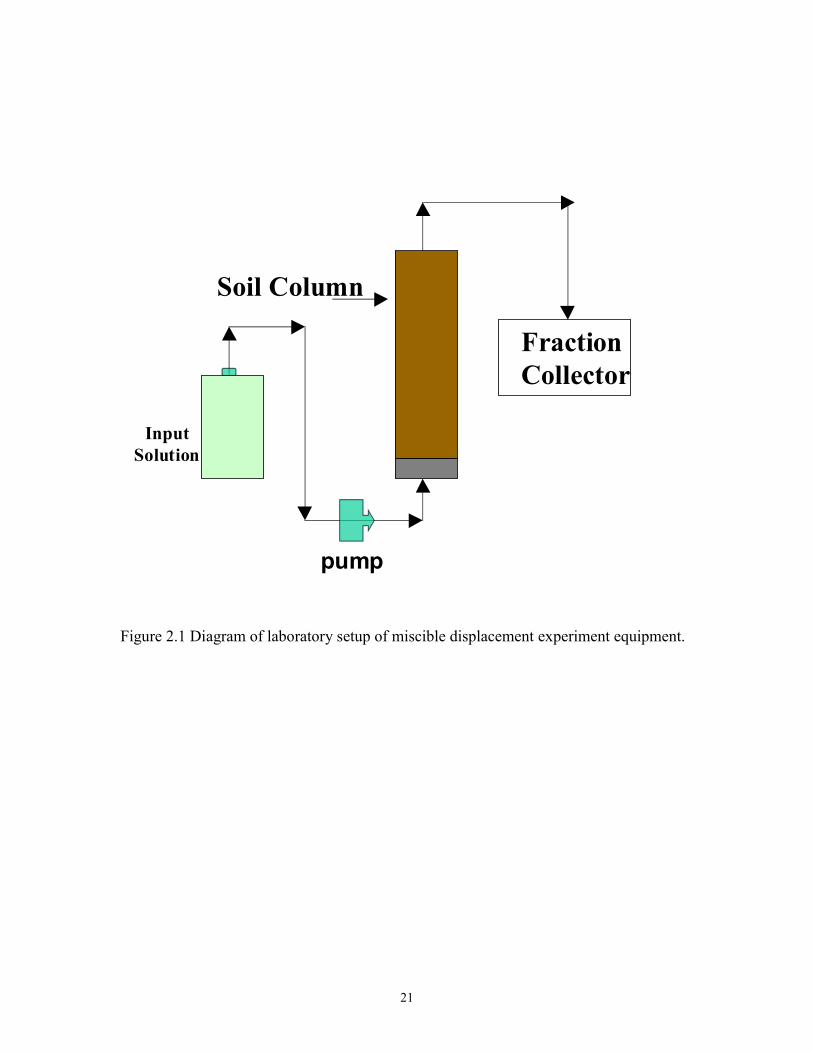
2.9 Miscible Displacement Setup
To obtain metribuzin breakthrough curves (BTCs) for various soils and soil and
sugarcane residue mixtures, we conducted several miscible displacement experiments under
steady state and saturated flow conditions (Selim and Amacher, 1997). To achieve this,
plexiglass columns (6.4 cm i.d.) were uniformly packed with air-dried media whether soil alone
or a mixture of residue and soil. Full column saturation was achieved by slowly introducing
0.005 M CaCl2 solution at the bottom of the column, where upward flow was maintained and a
constant flux was controlled by a piston pump (Figure 2.1). After saturation, each column
received approximately one pore volume of tritium (3H2O) in 0.005 M CaCl2 used as a tracer
solution. This was carried out to obtain the hydrodynamic dispersion of individual soil columns
(Selim and Zhu, 2002). Several pore volumes of the background solution (0.005 M CaCl2) was
introduced in order to flush the column of the applied tritium.
The herbicide used in all five of the column studies is a 14C-labeled metribuzin solution
having a concentration of 100 mg/L. This was the same stock solution used for the batch
experiments discussed earlier. To monitor the mobility and retention of metribuzin through the
soil column, the effluent flowing from the top of the column was collected using an ISCO
Retriever II fraction collector (Model RTRV II). During flow an average of 5.34 mL of
effluent was collected every 30 minutes in a 7 mL glass vial. Both tritium and metribuzin
samples collected from outflow were analyzed using a liquid scintillation counter which was
described earlier. This allowed a defined breakthrough curve for each pulse introduced into the
columns. Five column studies were performed in total. The various physical properties for each
of the soil columns are listed in Table 2.2. Flow interruption was implemented to maximize the
19
influence of non-equilibrium on metribuzin transport behavior (Murali and Aylmore, 1980; Ma
and Selim 2005).
2.9.1 Commerce Soil and Metribuzin
Two columns (hereafter referred to as 13 and 14) each 15-cm in length, containing
Commerce silt loam soil received a different sequence and amount of 14C-labeled metribuzin
pulse input, interruptions and leaching using CaCl2 background solution. Each column was
packed to an average bulk density of 1.18 g/cm3. Column 13 received a total of 17.7 pore
volumes of metribuzin, with a 4 day interruption following 7.9 pore volumes, and 9.8 pore
volumes. The mass of the dry packed column and the mass of the column after full saturation
was recorded used to determine the solution filled pore spaces, giving a value of one pore
volume. After each pulse of metribuzin the flow was stopped or interrupted for a 4 day
interruption. Following the last interruption the column was leached out using the 0.005 M
CaCl2.
Column 14 three metribuzin pulses were introduced. The metribuzin first pulse of was
5.25 pore volumes followed by 1.87 pore volumes of CaCl2 solution and a 4 day interruption.
The second metribuzin pulse of 5.35 pore volumes was followed by 1.64 pore volumes of CaCl2
and a 4 day interruption. The third and final pulse of metribuzin contained 4.82 pore volumes
followed by 2.12 pore volumes of CaCl2, we then paused flow for 4 days and leached out.
2.9.2 Soil with Sugarcane Residue
Three plexiglas columns (hereafter referred to as 15, 16 and 17) each 10-cm in length,
were uniformly packed with a mixture of soil and sugarcane mulch residue. Approximately 15 g
of air dried residue cut into 1 cm sections was mixed with the soil at two depths, 1.5 cm from
each end. The residue was collected 153 days after the first stubble harvest of variety LCP85-
20
384. The two surface soils used in this experiment were: Commerce silt loam (column 16) and
Sharkey clay (column 17) (see Table 2.1), in addition one column was packed with reference acid
washed sand and sugarcane residue(column 15). The reference sand was used in order to assess
the retention of residue in a media with no retention (Selim and Zhu, 2002). Bulk densities of
0.802, 0.845, and 1.15 g/cm-3 were recorded for the soil columns packed with Commerce,
Sharkey, and sand respectively. The percentage of mulch versus soil on a mass basis averaged
0.0526%. After the tritium pulse described above, each column was subjected to leaching with
0.005 M CaCl2. While the 14C-labeled metribuzin pulse was being introduced into the column an
interruption took place. This interruption occurred following pore volumes measuring 3.49, 3.82,
and 4.09 for columns 13, 14 and 15 respectively. An interruption of 4 days occurred before the .
The sand received 5.00 pore volumes while the commerce passed 3.99 pore volumes and the
Sharkey 5.24 for the second pulse. Another 4 day interruption was implemented before the final
leaching using 0.005 M herbicide free CaCl2. The average darcy velocity for the three soils was
1.15 cm/h.
21
pump
FractionCollector
Soil Column
InputSolution
Figure 2.1 Diagram of laboratory setup of miscible displacement experiment equipment.
22
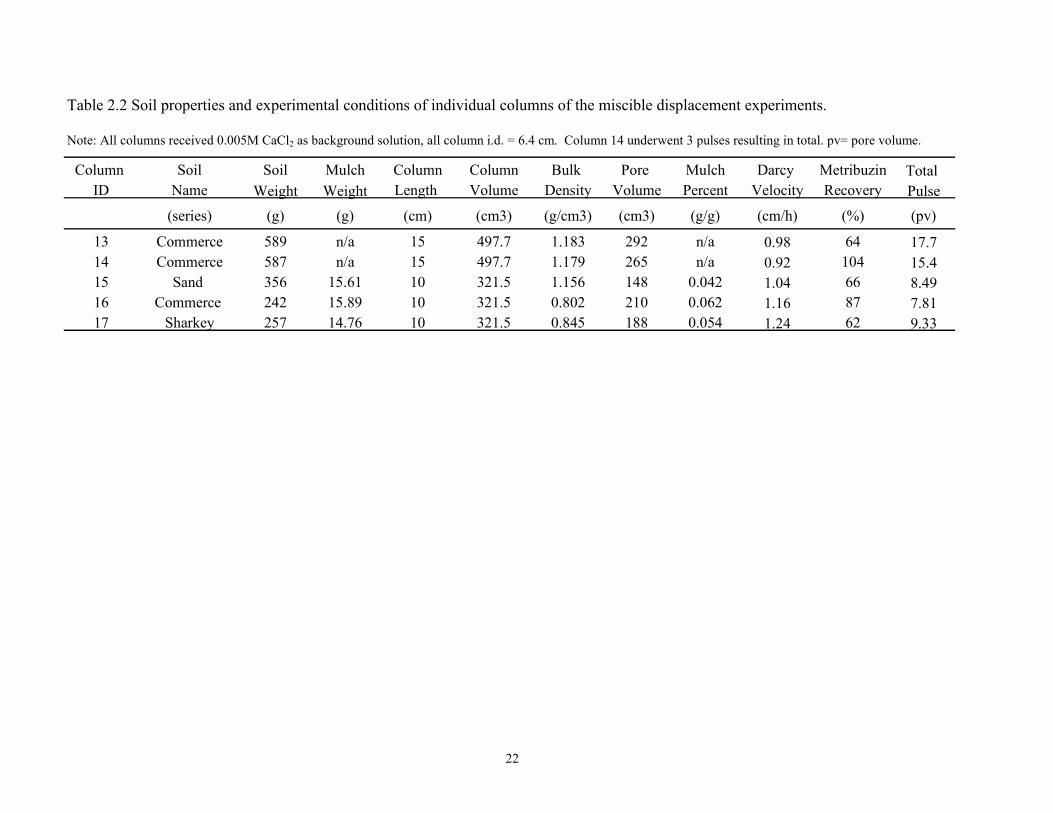
Table 2.2 Soil properties and experimental conditions of individual columns of the miscible displacement experiments.
Note: All columns received 0.005M CaCl2 as background solution, all column i.d. = 6.4 cm. Column 14 underwent 3 pulses resulting in total. pv= pore volume.
Column Soil Soil Mulch Column Column Bulk Pore Mulch Darcy Metribuzin Total ID Name Weight Weight Length Volume Density Volume Percent Velocity Recovery Pulse
(series) (g) (g) (cm) (cm3) (g/cm3) (cm3) (g/g) (cm/h) (%) (pv)
13 Commerce 589 n/a 15 497.7 1.183 292 n/a 0.98 64 17.714 Commerce 587 n/a 15 497.7 1.179 265 n/a 0.92 104 15.415 Sand 356 15.61 10 321.5 1.156 148 0.042 1.04 66 8.4916 Commerce 242 15.89 10 321.5 0.802 210 0.062 1.16 87 7.8117 Sharkey 257 14.76 10 321.5 0.845 188 0.054 1.24 62 9.33
23
CHAPTER 3. RESULTS AND DISCUSSION
3.1 Isotherms
Following the laboratory adsorption studies described above, adsorption isotherms were
created to represent the amount of herbicide sorbed by the sugarcane residue versus concentration of
the herbicide remaining in solution. These relationships clearly illustrate the affinity of atrazine and
metribuzin by the mulch residue as well as the extent of retention with time of reactions and age of
the mulch.
The relationship between the sugarcane residue and the herbicide is commonly described by
an adsorption isotherm. In this study our isotherms were described using either a linear type model,
(Selim, 2004)
S = Kd C [1.1]
or nonlinear (Freundlich) type equilibrium model, (Selim, 2004)
S = Kf CN [1.2]
where S is the amount of herbicide sorbed (mg/kg soil), C is concentration in the soil solution
(mg/L). The linear parameter Kd (mL/g) is the distribution coefficient which is widely reported in
the literature, and represents a measure of affinity of the herbicide to the matrix, in this case
residue, Kf is a Freundlich partitioning coefficient (mL/g), and N is a dimensionless parameter
commonly less than unity.
3.2 Herbicide Adsorption – Desorption by Residue
3.2.1 Plant Cane
The sugarcane residue exhibited increased adsorption with each increase in retention time
(see Table 3.1). Although the behavior of adsorption for the two herbicides was described well
by both linear and Freundlich models, the N values close to 1.0 clearly indicate that retention can
be well described as a linear mechanism. In addition, there was no obvious trend for N
24
versus retention time. In fact, such a finding was consistent for both atrazine and metribuzin as
indicated in Tables 3.1 and 3.5. The lack of nonlinear or concentration dependent behavior of
the sorption patterns is indicative of the lack of heterogeneity of sorption site energies (Selim and
Zhou, 2005). Rather, sorption by mulch residue is best regarded as homogenous or uniform.
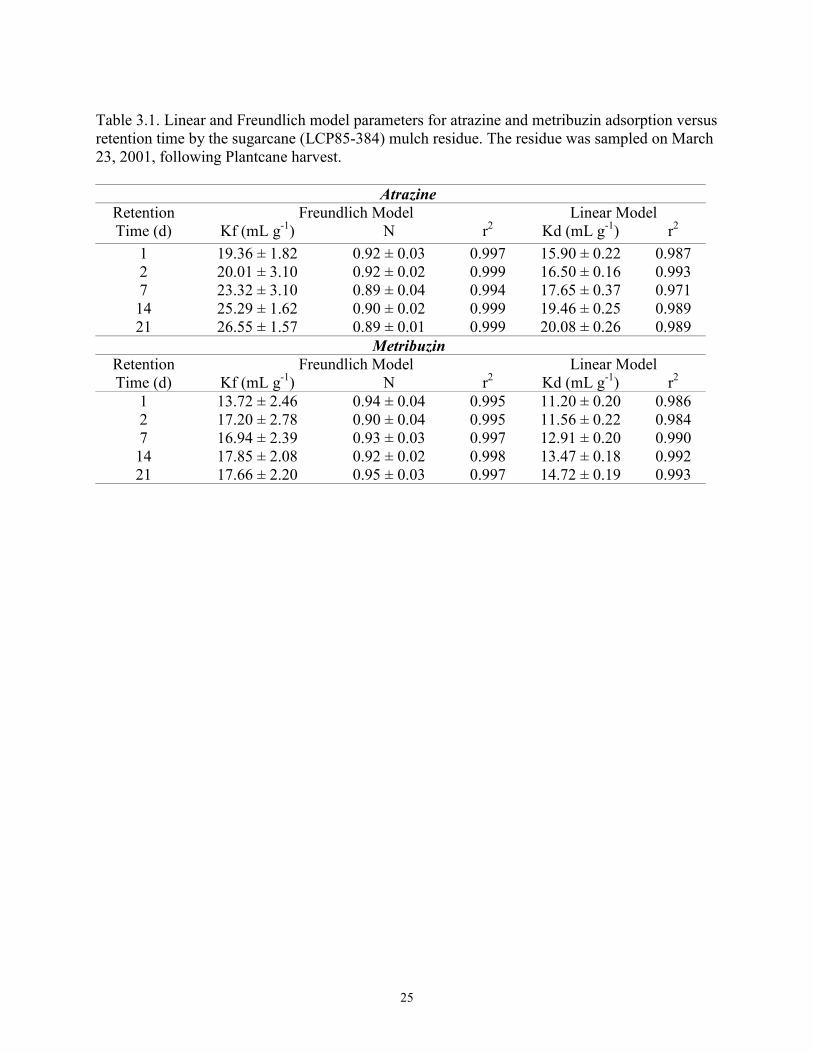
The linearity of these adsorption isotherms leads to the use of Kd values when describing the
affinity of the two herbicides by sugarcane residue. Specifically for atrazine the Kd values
increased from 15.90 to 20.08 mL/g after 24 and 504 hours, respectively, while metribuzin
increased from 11.20 to 14.72 mL/g after 24 and 504 hours, respectively. The Kd values indicate
that the kinetic behavior of metribuzin adsorption by sugarcane residue is not as strong as for
atrazine (see Table 3.1). This may be due to the higher solubility of metribuzin. Evaluating Kd
values from 24 through 504 hours we see that strong adsorption occurred during early reaction
times, and was followed by subsequent slower rates of reactions (see Figures 3.1 and 3.2).
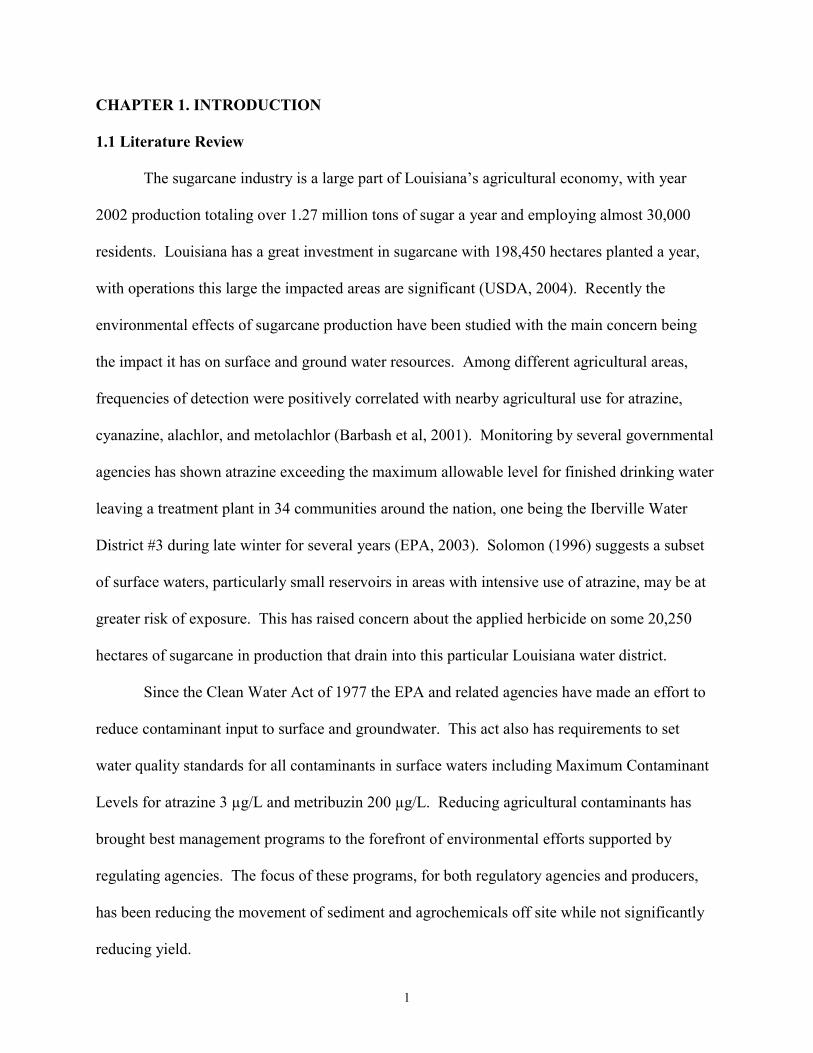
Samples collected post harvest, with ages ranging from 26 to 140 days were compared
(see Table 3.2). In the growing seasons, adsorption characteristics were compared to examine
the effect each consecutive growing season may have on adsorption of both herbicides for first
and second stubble cane. The 24 hour Kd values from each age of residue was compared over
time, average Kd values were 16.38 + 1.30 and 10.70 + 0.63 mL/g for atrazine and metribuzin
respectively. As shown in Figure 3.4 there is no obvious upward trend with time as the residue
decays in the field.
3.2.2 First Stubble
The effect of weather-induced changes and natural field degradation of the sugarcane
residue on adsorption was investigated based on 24 hour adsorption studies as discussed earlier.
The residue was sampled from 12 to 217 days in the field post-harvest (see Table 3.3). As with
the plant cane, atrazine retention by the residue from first stubble was much higher than that for
25
Table 3.1. Linear and Freundlich model parameters for atrazine and metribuzin adsorption versusretention time by the sugarcane (LCP85-384) mulch residue. The residue was sampled on March23, 2001, following Plantcane harvest.
AtrazineRetention Freundlich Model Linear ModelTime (d) Kf (mL g-1) N r2 Kd (mL g-1) r2
1 19.36 ± 1.82 0.92 ± 0.03 0.997 15.90 ± 0.22 0.9872 20.01 ± 3.10 0.92 ± 0.02 0.999 16.50 ± 0.16 0.9937 23.32 ± 3.10 0.89 ± 0.04 0.994 17.65 ± 0.37 0.97114 25.29 ± 1.62 0.90 ± 0.02 0.999 19.46 ± 0.25 0.98921 26.55 ± 1.57 0.89 ± 0.01 0.999 20.08 ± 0.26 0.989
MetribuzinRetention Freundlich Model Linear ModelTime (d) Kf (mL g-1) N r2 Kd (mL g-1) r2
1 13.72 ± 2.46 0.94 ± 0.04 0.995 11.20 ± 0.20 0.9862 17.20 ± 2.78 0.90 ± 0.04 0.995 11.56 ± 0.22 0.9847 16.94 ± 2.39 0.93 ± 0.03 0.997 12.91 ± 0.20 0.99014 17.85 ± 2.08 0.92 ± 0.02 0.998 13.47 ± 0.18 0.99221 17.66 ± 2.20 0.95 ± 0.03 0.997 14.72 ± 0.19 0.993
26
Table 3.2. Estimated linear and Freundlich model parameters (with 95% confidence interval) foratrazine and metribuzin adsorption by the sugarcane mulch residue (var. LCP85-384). Theresidue was sampled at several dates following Plantcane sugarcane harvest of December 8,2000.
Sampling Age of Linear Model Freundlich ModelDate Residue Kd Kf N
(days) (mL g-1) (mL g-1) Atrazine
03-Jan-01 26 14.99 ± 0.15 18.27 ± 1.11 0.92 ± 0.0207-Feb-01 61 16.52 ± 0.13 19.48 ± 0.87 0.93 ± 0.0123-Mar-01 105 15.90 ± 0.22 19.36 ± 1.82 0.92 ± 0.0327-Apr-01 140 18.09 ± 0.13 20.70 ± 0.97 0.94 ± 0.01
Metribuzin03-Jan-01 26 10.00 ± 0.15 13.05 ± 0.80 0.96 ± 0.0107-Feb-01 61 11.29 ± 0.49 10.11 ± 4.93 1.02 ± 0.1223-Mar-01 105 11.20 ± 0.20 13.72 ± 2.46 0.94 ± 0.0427-Apr-01 140 10.36 ± 0.10 13.31 ± 1.18 0.93 ± 0.02
27
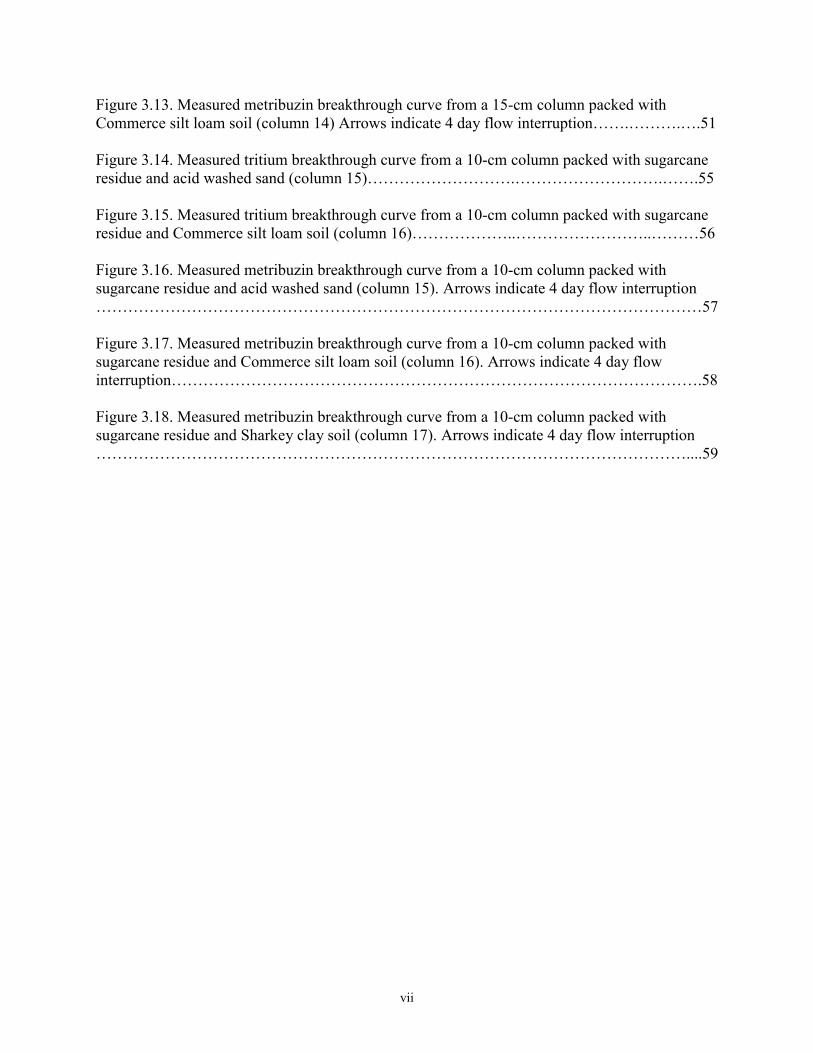
Figure 3.1. Adsorption isotherms for atrazine and metribuzin for sugarcane mulch residue at differentreaction times. The residue was sampled following Plantcane harvest on January 3, 2001.
0
250
500
750
1000
0 20 40 60 80
Concentration (mg /L)
Sorb
ed (m
g/ K
g)
Metribuzin Sorption IsothermSampling Date: 1/3/01
1
27
1421days
0
100
200
300
400
0 5 10 15 20 25
Sorb
ed (m
g/ K
g)Atrazine Sorption IsothermSampling Date: 1/3/01
12
714
21days
28
0
100
200
300
400
0 5 10 15 20 25
Sorb
ed (m
g/Kg
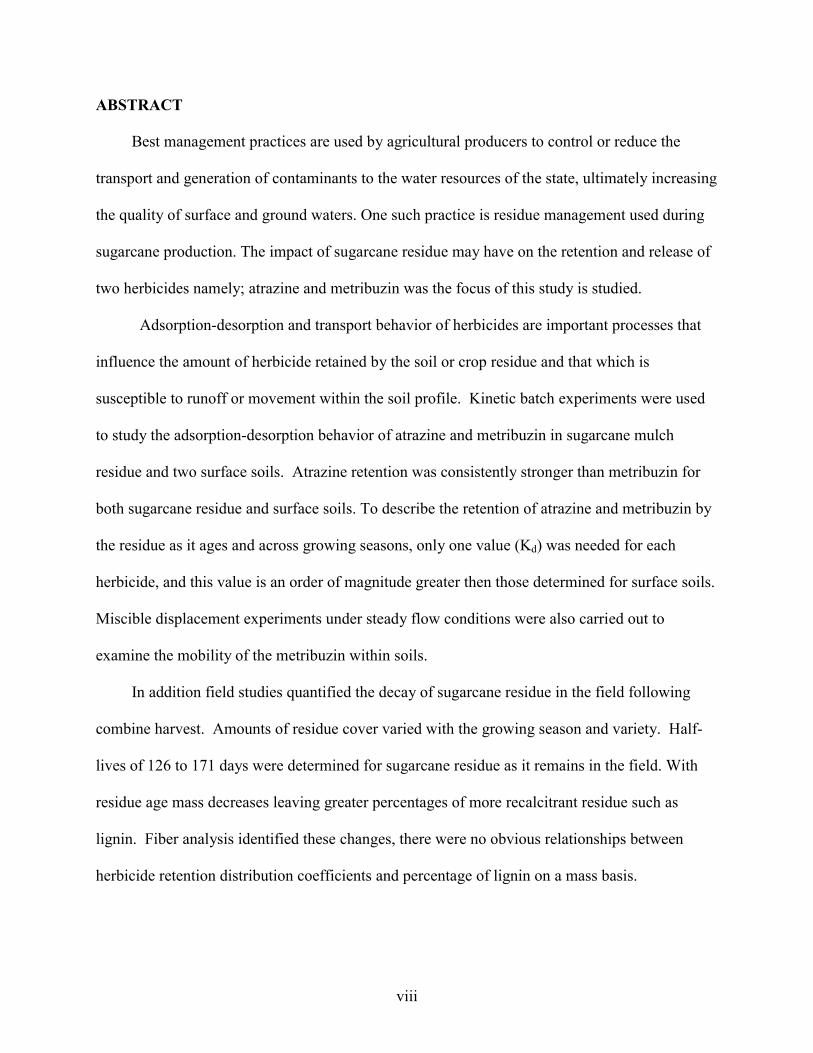
)Atrazine Sorption IsothermSampling Date: 4/27/01
12
714
21days
0
250
500
750
1000
1250
0 20 40 60 80
Concentration (mg/L)
Sorb
ed (m
g/Kg
)
Metribuzin Sorption IsothermSampling Date: 4/27/01
12
147
21days
Figure 3.2. Adsorption isotherms for atrazine and metribuzin for sugarcane mulch residue at differentreaction times. The residue was sampled following Plantcane harvest on April 27, 2001.
29
Table 3.3. Estimated linear and Freundlich model parameters (with 95% confidence interval) foratrazine and metribuzin adsorption by the sugarcane mulch residue. The residue was sampled atseveral dates following first-stubble sugarcane harvest on October 22, 2001.
Sampling Age of Linear Model Freundlich ModelDate Residue Kd Kf N
(days) (mL g-1) (mL g-1)Atrazine
30-Oct-01 12 16.21 ± 0.36 22.62 ± 3.10 0.87 ± 0.0526-Nov-01 39 14.92± 0.39 18.28 ± 3.51 0.92 ± 0.0720-Dec-01 63 16.72 ± 0.27 20.67 ± 2.26 0.92 ± 0.0422-Feb-02 127 15.65 ± 0.16 18.46 ± 1.32 0.93 ± 0.0220-Mar-02 153 17.18 ± 0.31 22.69 ± 2.63 0.89 ± 0.0423-May-02 217 15.93 ± 0.18 18.24 ± 1.54 0.94 ± 0.03
Metribuzin30-Oct-01 12 9.23 ± 0.32 10.90 ± 4.02 0.95 ±0.0926-Nov-01 39 9.47 ± 0.20 8.49 ± 2.12 1.02 ± 0.0620-Dec-01 63 10.47 ± 0.22 8.76 ± 2.09 1.04 ± 0.0522-Feb-02 127 11.11 ± 0.04 10.57 ± 0.42 1.01 ± 0.0020-Mar-02 153 10.07 ± 0.06 11.56 ± 0.67 0.96 ± 0.0123-May-02 217 10.97 ± 0.06 12.10 ± 0.73 0.97 ± 0.01
30
metribuzin. For the first stubble, what is interesting is that the retention values are similar to
those of the plant cane and did not change significantly with the age of residue. Atrazine had an
average Kd value of 16.10 + 0.79 mL/g while metribuzin averaged 10.22 + 0.77 mL/g (see Table
3.3). This could suggest that the residue on a mass basis has the same sorption capacities across
the growing seasons.
Using residue collected 153 days after harvest, we performed a 24 hour adsorption study
resulting in Kd values of 17.18 + 0.31 mL/g and 10.07 + 0.06 mL/g for atrazine and metribuzin
respectively. This was followed by ten-consecutive 24 hour desorption steps, as described earlier
(see Figure 3.4). As the adsorption studies indicated, sugarcane residue has a stronger affinity for
atrazine than for metribuzin. The desorption results also show similar trends (see Table 3.4). The
amount of atrazine desorbed averaged 87 ± 5.21% of that adsorbed, while metribuzin desorbed 93
± 3.07% of the 24 hour adsorption values. Metribuzin desorbed some 90% of that adsorbed for all
input concentrations. This could be attributed to metribuzin’s solubility of 1200 mg/L while
atrazine is at 29 mg/L. Following methanol extraction, the average amount of atrazine that was
retained by the residue was only 5.07 + 2.43% of the initial input, while the amount of metribuzin
retained was only 1.89 + 0.966%.
3.2.3 Second Stubble
Following the harvest of the second stubble, we compared herbicide adsorption
characteristics of the mulch residue overtime during the growing seasons. Table 3.5 shows that
those Kd values for atrazine adsorption by the sugarcane mulch residue increased with reaction
times from 18.77 to 25.46 mL/g after 24 and 504 hours, respectively. For metribuzin, the Kd values
increased with reaction times from 10.58 to 14.20 mL/g after 24 and 504 hours, respectively. As
31
Figure 3.3. Desorption isotherms for atrazine and metribuzin for sugarcane mulch residue subjected to24 hours of sorption followed by ten 24 hour desorption steps. The residue was samples on March 20,2002 following second stubble harvest.
0
100
200
300
400
0 5 10 15 20
Sorb
ed (m
g/Kg
)
24h Sorption17 mg/L23 mg/L29.8 mg/L
Atrazine First Stubble-Mulch
0
200
400
600
800
0 20 40 60 80
Concentration (mg/L)
Sorb
ed (m
g/Kg
)
24h Sorption40 mg/L70 mg/L98.9 mg/L
Metribuzin First Stubble-Mulch
32
Table 3.4. Mass balance of applied atrazine and metribuzin following 24-h adsorption, ten desorptions, and methanol extraction for mulchresidue collected 153 d post-harvest (March 20, 2002).
Herbicide Initial Total Total Total Total Amount of Amount ofconcentration amount amount amount amount Methanol extracted residual
absorbed desorbed desorbed retained from residue % of inputµg/mL µg/g µg/g % of adsorbed % of input µg/g2.00 17.67 16.05 90.85 2.71 0.37 2.09
Metribuzin 10.00 86.31 76.19 88.29 3.37 1.62 2.8320.00 156.52 148.87 95.13 1.27 3.60 0.6740.00 299.32 288.49 96.41 0.90 6.47 0.3670.00 525.44 499.63 95.08 1.23 10.93 0.71100.00 751.59 696.78 92.71 1.83 17.21 1.252.98 38.20 29.51 77.28 9.71 0.28 9.40
Atrazine 5.96 69.22 62.47 90.26 3.78 0.61 3.4411.98 139.61 119.70 85.74 5.54 1.28 5.1917.96 195.03 174.03 89.46 3.90 1.41 3.6423.95 259.23 237.83 91.76 2.98 2.17 2.6829.01 313.68 274.54 87.63 4.50 2.25 4.24
33
Table 3.5. Linear and Freundlich model parameters for atrazine and metribuzin adsorption versusretention time by the sugarcane (LCP85-384) mulch residue. The residue was sampled on Jan 24,2003, following second stubble harvest.
AtrazineRetention Freundlich Model Linear ModelTime (d) Kf (mL g-1) N r2 Kd (mL g-1) r2
1 20.67 ± 2.26 0.92 ± 0.04 0.996 18.77 ± 0.58 0.9352 23.76 ± 4.20 0.89 ± 0.06 0.988 18.04 ± 0.49 0.9577 27.01 ± 7.60 0.95 ± 0.11 0.989 24.02 ± 0.96 0.91614 25.12 ± 4.54 0.98 ± 0.07 0.989 24.24 ± 0.60 0.96721 26.32 ± 4.78 0.98 ± 0.07 0.989 25.46 ± 0.64 0.966
MetribuzinRetention Freundlich Model Linear ModelTime (d) Kf (mL g-1) N r2 Kd (mL g-1) r2
1 13.82 ± 0.65 0.91 ± 0.01 0.994 10.58 ± 0.26 0.9712 18.02 ± 2.49 0.88 ± 0.03 0.993 11.37 ± 0.22 0.9857 19.28 ± 1.40 0.92 ± 0.01 0.994 13.87 ± 0.15 0.99514 19.31 ± 1.30 0.92 ± 0.01 0.994 14.03 ± 0.15 0.99521 19.55 ± 1.29 0.92 ± 0.02 0.994 14.20 ± 0.15 0.995
34
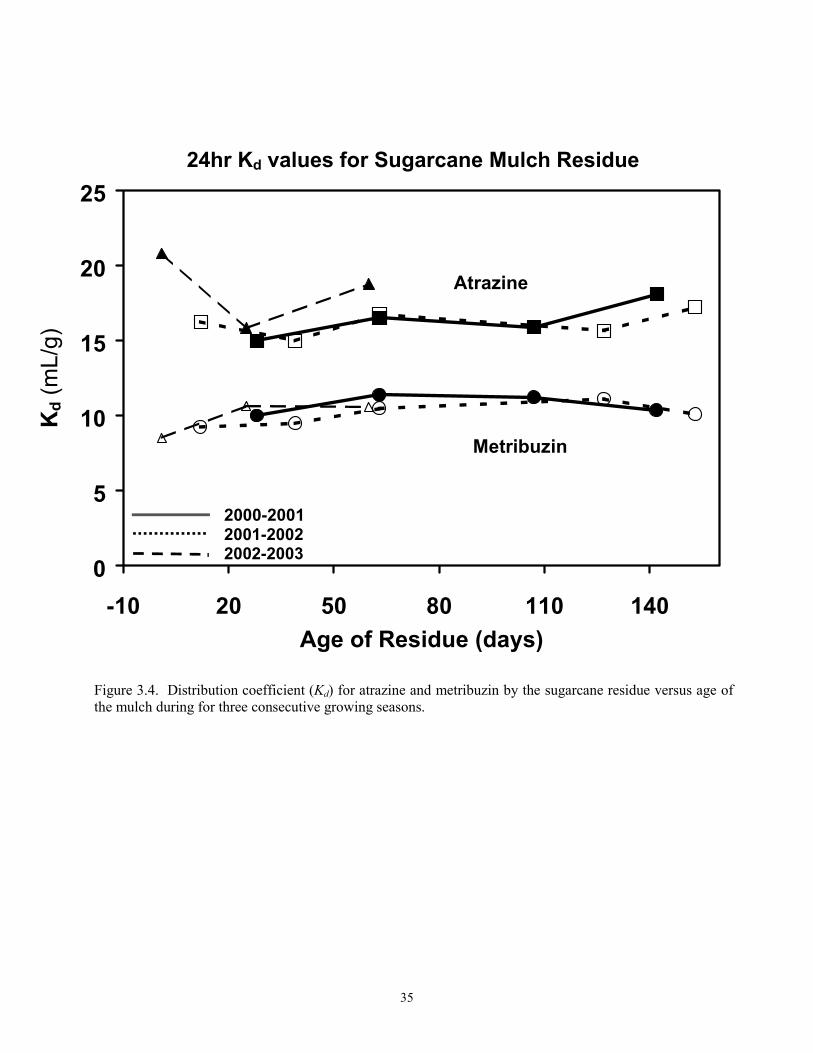
seen with the plant cane, the adsorption of both atrazine and metribuzin by sugarcane residue of
the second stubble was initially rapid, and exhibited slower retention after 24 hours of reaction
time. Also similar to the plant cane, the observed increase of Kd values with reaction time, is
representative of the strong kinetic behavior of atrazine and to a lesser extent of metribuzin
adsorption by the sugarcane mulch residue (see Figure 3.5).
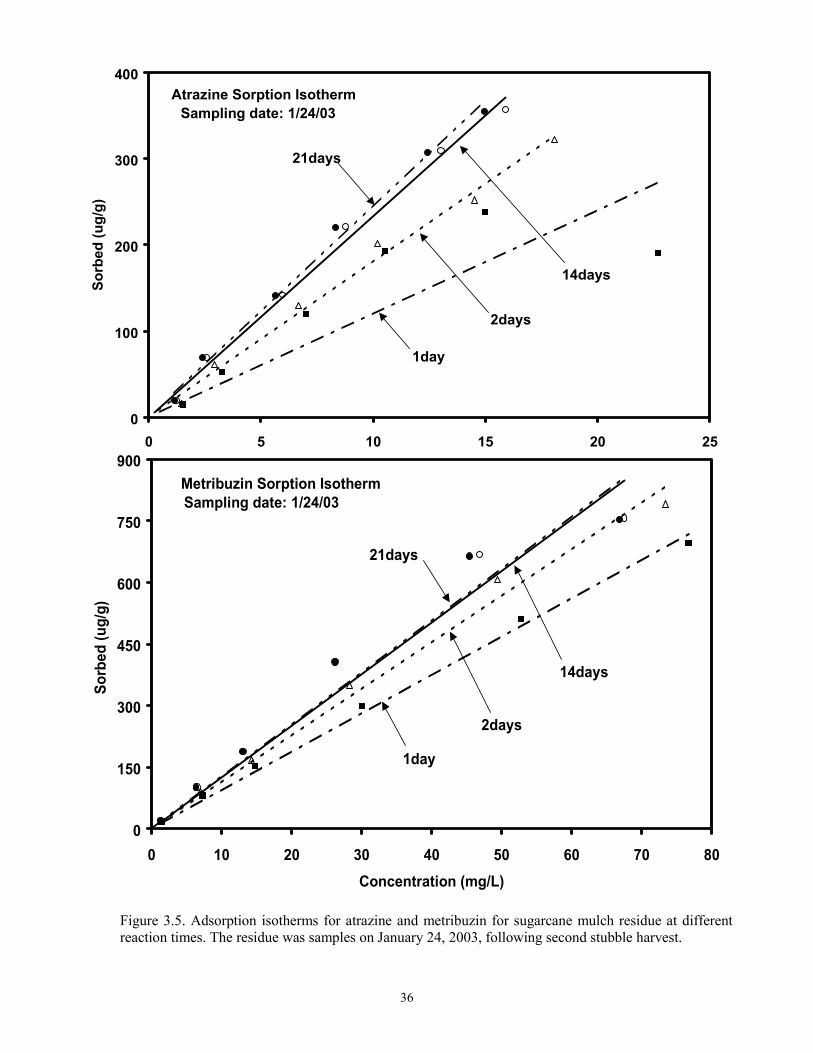
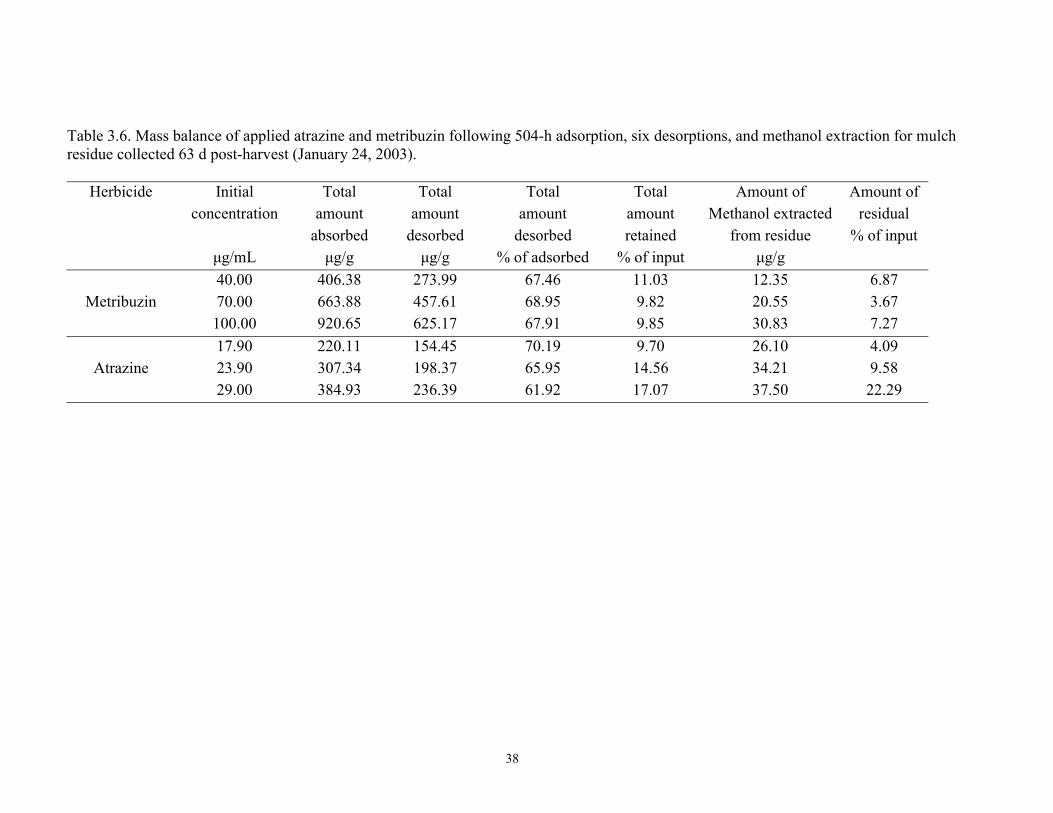
Desorption of both herbicides from the sugarcane residue following 504 hours of
adsorption resulted in successive losses in concentration as was the case with the first stubble(see
Figure 3.6). This second stubble residue was collected 64 days following harvest. 504 hour Kd
values of 25.46 + 0.64 mL/g and 14.20 + 0.15 mL/g for atrazine and metribuzin respectively, were
determined (see Table 3.5). Following the complete desorption process, retained atrazine was
13.77 + 3.74% of the initial amount applied and 10.23 + 0.69% of applied metribuzin was retained
(see Table 3.6). Atrazine desorbed some 66.02 + 4.1% of that applied while 68.10 + 0.76% of
metribuzin applied was desorbed.
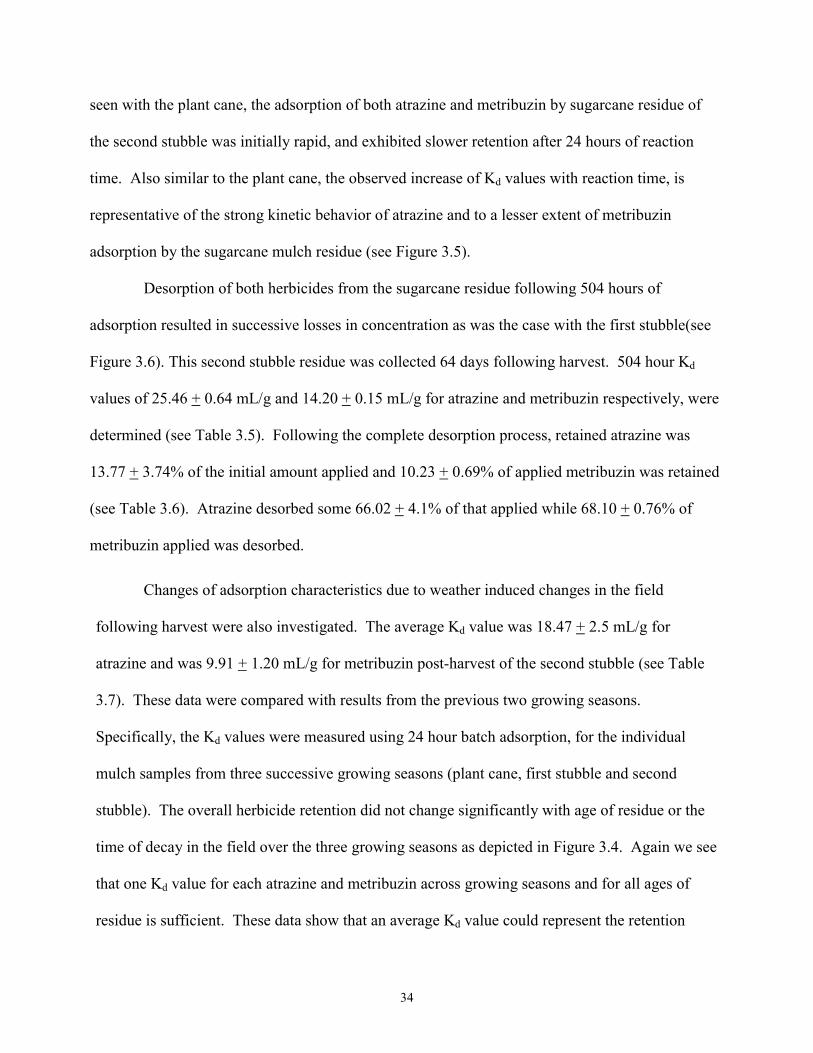
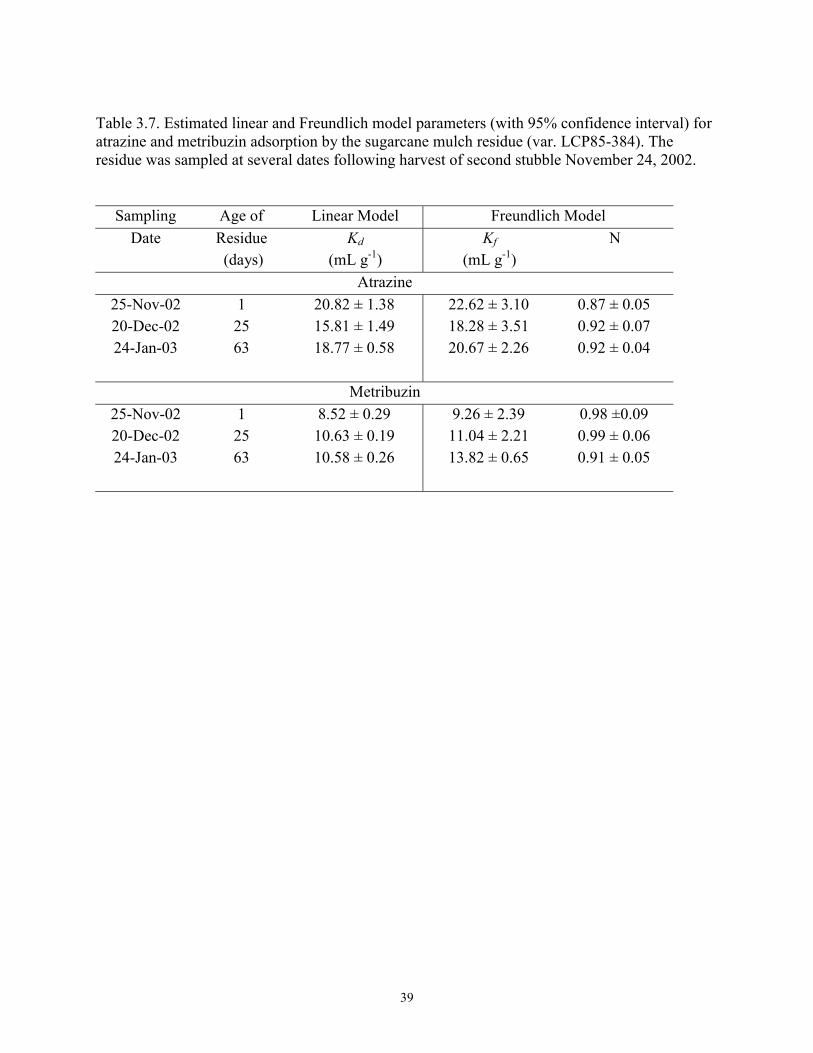
Changes of adsorption characteristics due to weather induced changes in the field
following harvest were also investigated. The average Kd value was 18.47 + 2.5 mL/g for
atrazine and was 9.91 + 1.20 mL/g for metribuzin post-harvest of the second stubble (see Table
3.7). These data were compared with results from the previous two growing seasons.
Specifically, the Kd values were measured using 24 hour batch adsorption, for the individual
mulch samples from three successive growing seasons (plant cane, first stubble and second
stubble). The overall herbicide retention did not change significantly with age of residue or the
time of decay in the field over the three growing seasons as depicted in Figure 3.4. Again we see
that one Kd value for each atrazine and metribuzin across growing seasons and for all ages of
residue is sufficient. These data show that an average Kd value could represent the retention
35
24hr Kd values for Sugarcane Mulch Residue
0
5
10
15
20
25
-10 20 50 80 110 140Age of Residue (days)
Kd (
mL/
g)
2000-20012001-20022002-2003
Atrazine
Metribuzin
Figure 3.4. Distribution coefficient (Kd) for atrazine and metribuzin by the sugarcane residue versus age ofthe mulch during for three consecutive growing seasons.
36
Atrazine Sorption Isotherm
0
100
200
300
400
0 5 10 15 20 25
Sorb
ed (u
g/g)
1day
2days
14days
21days
Sampling date: 1/24/03
Metribuzin Sorption Isotherm
0
150
300
450
600
750
900
0 10 20 30 40 50 60 70 80Concentration (mg/L)
Sorb
ed (u
g/g)
1day
2days
14days
21days
Sampling date: 1/24/03
Figure 3.5. Adsorption isotherms for atrazine and metribuzin for sugarcane mulch residue at differentreaction times. The residue was samples on January 24, 2003, following second stubble harvest.
37
Figure 3.6. Desorption isotherms for atrazine and metribuzin for sugarcane mulch residue subjected to504 hours of sorption followed by six 24 hour desorption steps. The residue was samples on January 24,2003, following second stubble harvest.
0
100
200
300
400
0 5 10 15 20
Sorb
ed (m
g/K
g)
504h Sorption17 mg/L23 mg/L29.8 mg/L
AtrazineSecond Stubble-Mulch
0
200
400
600
800
0 20 40 60 80
Concentration (mg/L)
Sorb
ed (m
g/K
g)
504h Sorption40 mg/L70 mg/L98.9 mg/L
MetribuzinSecond Stubble-Mulch
38
Table 3.6. Mass balance of applied atrazine and metribuzin following 504-h adsorption, six desorptions, and methanol extraction for mulchresidue collected 63 d post-harvest (January 24, 2003).
Herbicide Initial Total Total Total Total Amount of Amount ofconcentration amount amount amount amount Methanol extracted residual
absorbed desorbed desorbed retained from residue % of inputµg/mL µg/g µg/g % of adsorbed % of input µg/g40.00 406.38 273.99 67.46 11.03 12.35 6.87
Metribuzin 70.00 663.88 457.61 68.95 9.82 20.55 3.67100.00 920.65 625.17 67.91 9.85 30.83 7.2717.90 220.11 154.45 70.19 9.70 26.10 4.09
Atrazine 23.90 307.34 198.37 65.95 14.56 34.21 9.5829.00 384.93 236.39 61.92 17.07 37.50 22.29
39
Table 3.7. Estimated linear and Freundlich model parameters (with 95% confidence interval) foratrazine and metribuzin adsorption by the sugarcane mulch residue (var. LCP85-384). Theresidue was sampled at several dates following harvest of second stubble November 24, 2002.
Sampling Age of Linear Model Freundlich ModelDate Residue Kd Kf N
(days) (mL g-1) (mL g-1)Atrazine
25-Nov-02 1 20.82 ± 1.38 22.62 ± 3.10 0.87 ± 0.0520-Dec-02 25 15.81 ± 1.49 18.28 ± 3.51 0.92 ± 0.0724-Jan-03 63 18.77 ± 0.58 20.67 ± 2.26 0.92 ± 0.04
Metribuzin25-Nov-02 1 8.52 ± 0.29 9.26 ± 2.39 0.98 ±0.0920-Dec-02 25 10.63 ± 0.19 11.04 ± 2.21 0.99 ± 0.0624-Jan-03 63 10.58 ± 0.26 13.82 ± 0.65 0.91 ± 0.05
40
behavior of the sugarcane residue as it remains in the field. This finding obtained for both
atrazine and metribuzin.
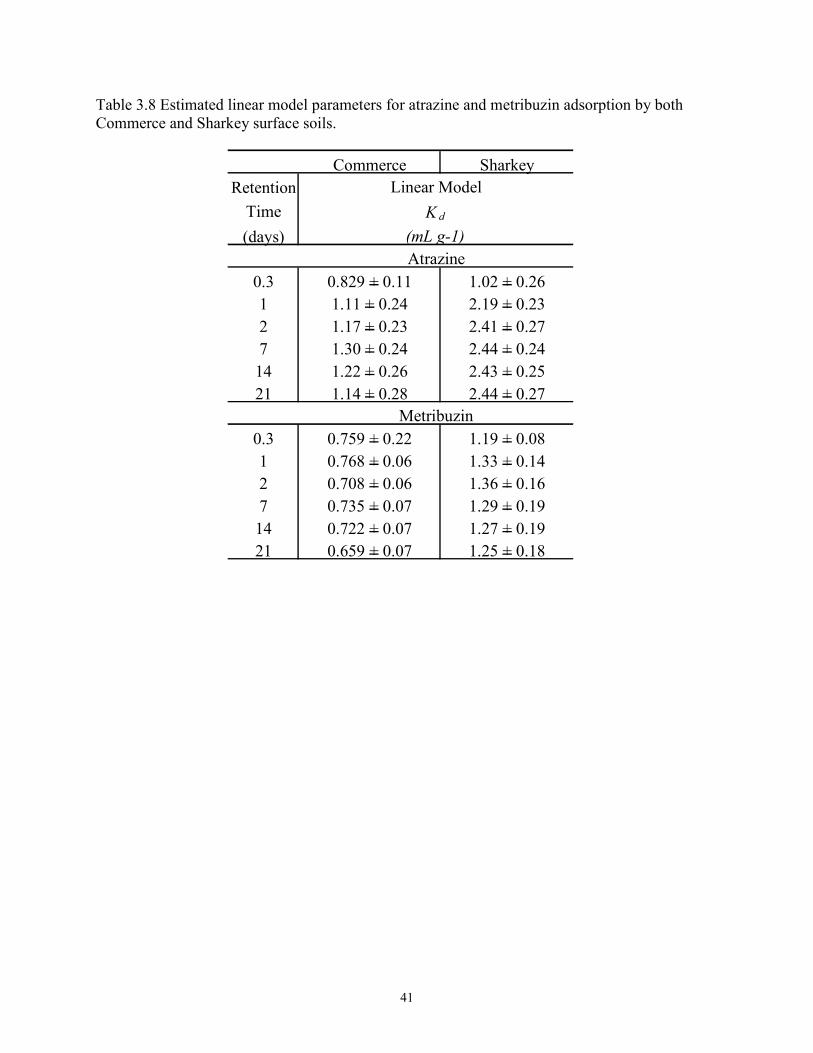
3.3 Herbicide Adsorption by Soils
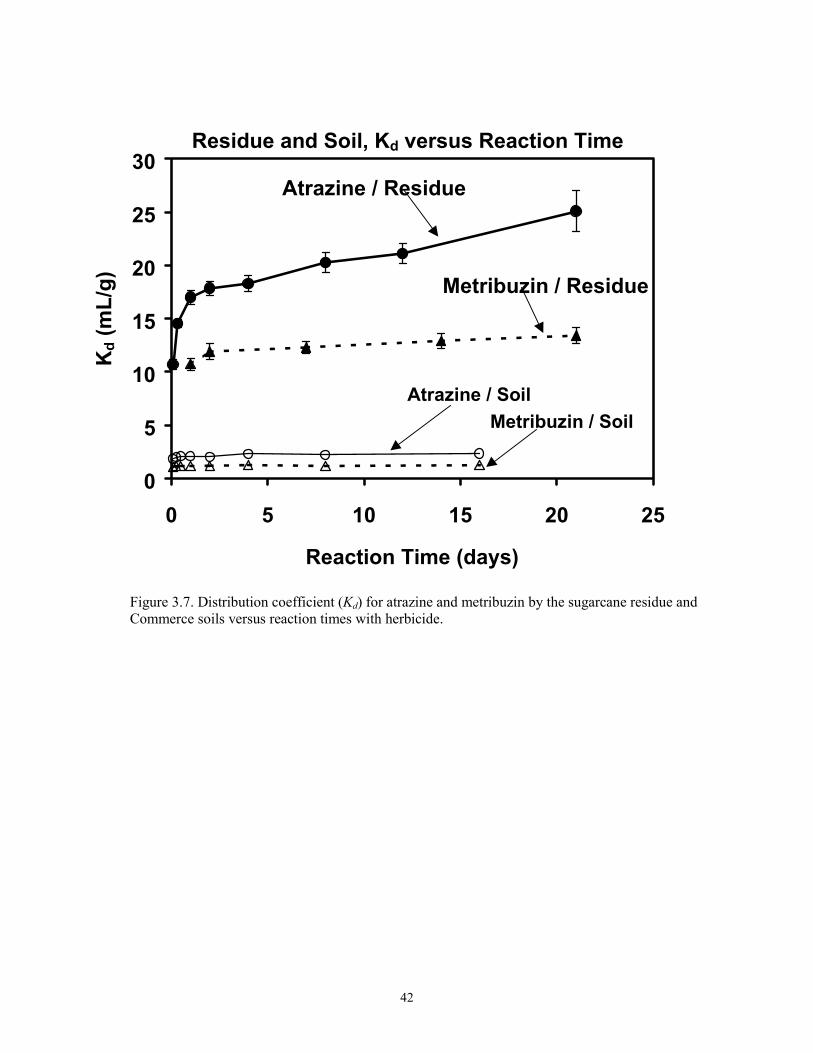
The 24 hour Kd values for atrazine were 2.15 and 1.18 mL/g for Sharkey and Commerce
soil, respectively (see Table 3.8). As described earlier the Sharkey clay soil has higher clay
content than the Commerce loam soil. Clay is often related to higher adsorption of organics,
resulting in higher herbicide retention by the Sharkey soil. The same was true with metribuzin
24 hour Kd values of 1.15 mL/g for Sharkey soil and 0.707 mL/g for Commerce soil. Selim
(2004) showed similar results for Sharkey and Commerce soils which were an order of
magnitude lower than atrazine and metribuzin Kd values for the mulch residue discussed above
(see Figure 3.7). In comparison to the mulch residue, Kd values for both soils clearly exhibited
limited kinetic behavior for both atrazine and metribuzin. Since organic matter is the principal
soil component affecting the adsorption of many herbicides in the soil environment, this can be
expected (Boyd et al. 1990).
3.4 Residue Decay
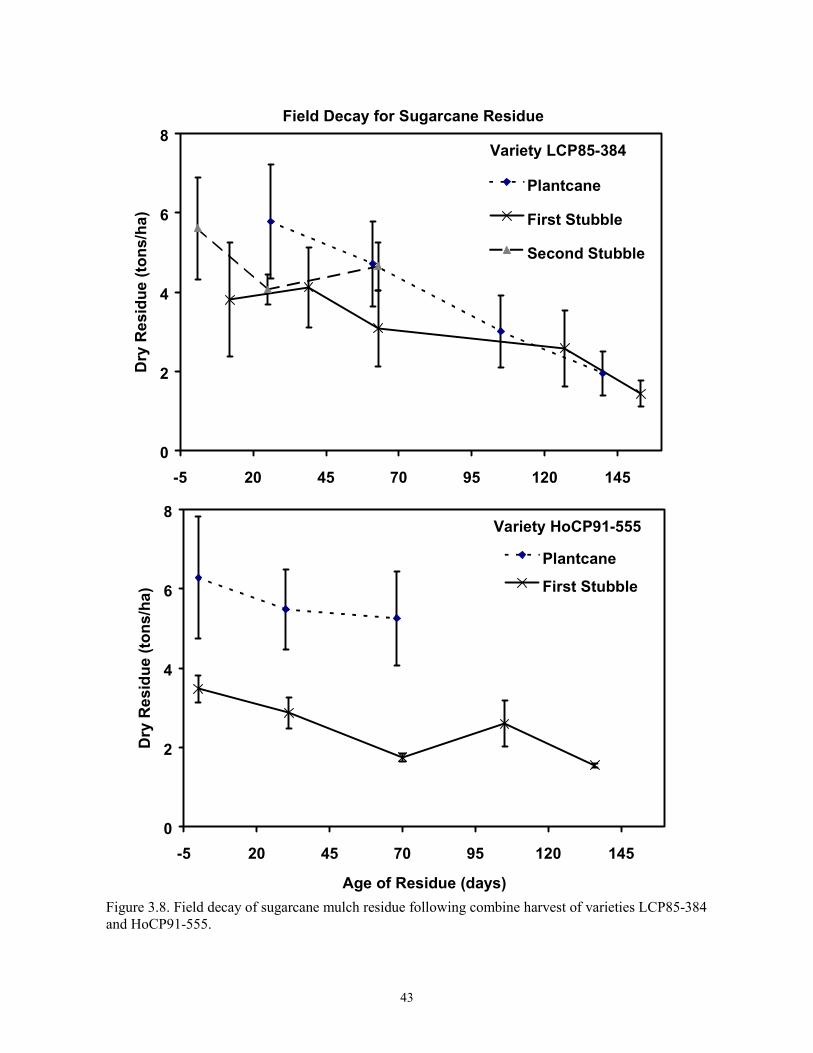
The amount of mulch residue present on the soil surface, for variety LCP85-384,
decreased from 3.80 + 0.689 to 1.43 + 0.535 tons/ha within a four-month period for the
plantcane season. Following the harvest of the first stubble, the amount of mulch decreased from
5.77 + 1.43 to 1.94 + 0.553 tons/ha in five months time. The second stubble harvest resulted in a
5.62 + 1.28 to 4.65 + 0.604 tons/ha decrease over a two-month period (Figure 3.8). Due to
plowing and other preparations of the field for a new planting the residue was not available to
collect beyond two months.
41
Table 3.8 Estimated linear model parameters for atrazine and metribuzin adsorption by bothCommerce and Sharkey surface soils.
Commerce SharkeyRetention
Time(days)
0.3 0.829 + 0.11 1.02 + 0.261 1.11 + 0.24 2.19 + 0.232 1.17 + 0.23 2.41 + 0.277 1.30 + 0.24 2.44 + 0.24 14 1.22 + 0.26 2.43 + 0.2521 1.14 + 0.28 2.44 + 0.27
0.3 0.759 + 0.22 1.19 + 0.081 0.768 + 0.06 1.33 + 0.142 0.708 + 0.06 1.36 + 0.167 0.735 + 0.07 1.29 + 0.1914 0.722 + 0.07 1.27 + 0.1921 0.659 + 0.07 1.25 + 0.18
Atrazine
Metribuzin
Linear ModelK d
(mL g-1)
42
Figure 3.7. Distribution coefficient (Kd) for atrazine and metribuzin by the sugarcane residue andCommerce soils versus reaction times with herbicide.
Residue and Soil, Kd versus Reaction Time
0
5
10
15
20
25
30
0 5 10 15 20 25
Reaction Time (days)
Kd (
mL/
g)
Atrazine / Residue
Metribuzin / Residue
Atrazine / SoilMetribuzin / Soil
43
Field Decay for Sugarcane Residue
0
2
4
6
8
-5 20 45 70 95 120 145
Dry
Res
idue
(ton
s/ha
)
Plantcane
First Stubble
Second Stubble
Variety LCP85-384
0
2
4
6
8
-5 20 45 70 95 120 145
Age of Residue (days)
Dry
Res
idue
(ton
s/ha
)
Plantcane
First Stubble
Variety HoCP91-555
Figure 3.8. Field decay of sugarcane mulch residue following combine harvest of varieties LCP85-384and HoCP91-555.
44
Plantcane harvest of variety HoCP91-555 resulted in a decrease from 6.27 + 1.74 to 5.15 + 1.19
tons/ha of residue after two months in the field. The limited two month time period for the
plantcane harvest was due to heavy rains causing a mixture of residue and mud resulting in
collection not being practical. The HoCP91-555 first stubble decayed over a five and a half-
month period with residue amounts starting at 3.47 + 0.342 and ending with 1.54 + 0.049 tons/ha
(Figure 3.8). Such differences may be attributed to differences in the variety and yields, soil
type, combine setting during harvest, and other harvest conditions.
Based on simple linear regression, a rate of residue decay was derived where the
(negative) slope represents the mass of mulch degradation per hectare over time. For variety
LCP85-384 grown on Sharkey clay, the estimated rates of degradations were 20.3 + 4.25, 16.6
+ 4.25, 13.1 + 8.73 kg/ha/day for the three growing seasons (plant cane, first and second
stubble), respectively. To describe the decay of the mulch for all growing seasons, we employed
a regression analysis, which provided a good description suggesting a linear model was
appropriate. Furthermore, there was no significant difference of the regression lines and their
respective slopes. To estimate the rate of decay we applied a nonlinear regression based on first-
order decay. We determined the half-lives for the mulch decay to be in the range of 126 to 171
days.
3.5 Fiber Quantification
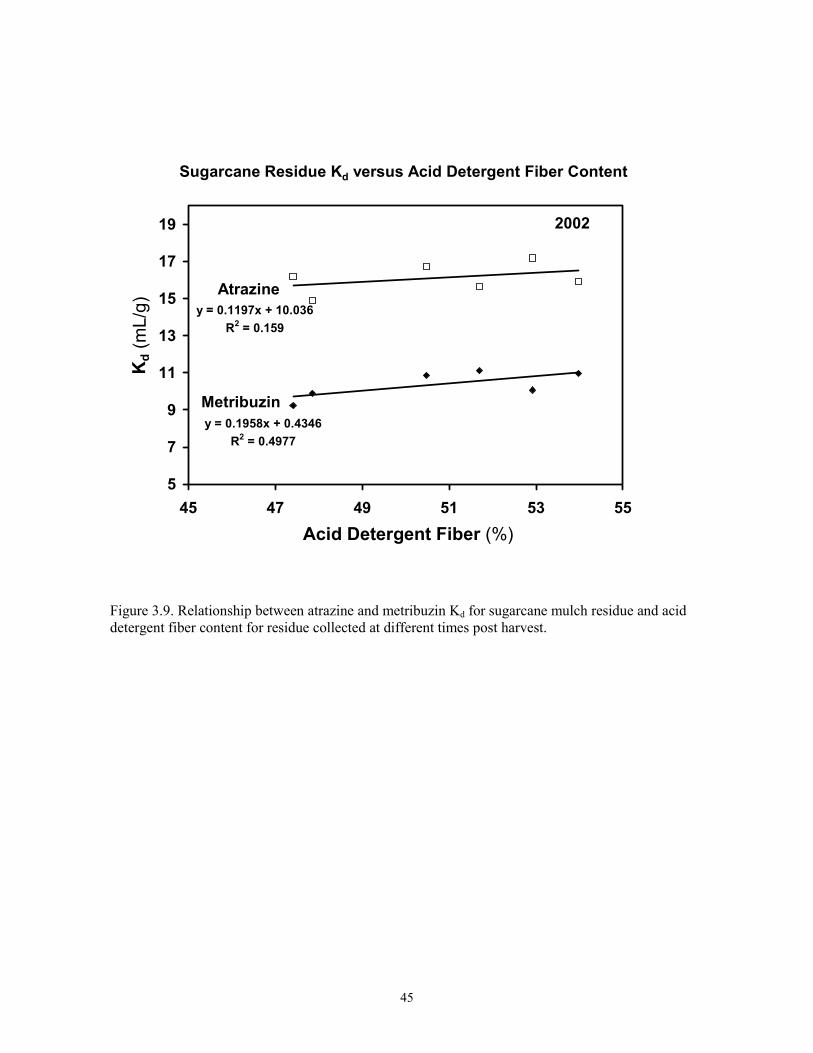
The amount of residue in the field, following harvest, decreased by an average of 3.0
tons/ha over a five month time period. The percentage of acid detergent fiber in the leafy residue
increased slightly as time in the field increased. With time of decay in the field the content of the
residue has greater amounts of lignin with a higher adsorption capacity on a mass basis. This is
due to the recalcitrant properties of lignin. Therefore with time in the field, the sugarcane residue
has the ability, on a mass basis, to adsorb increasing amounts of herbicides. However, such an
45
Sugarcane Residue Kd versus Acid Detergent Fiber Content
y = 0.1197x + 10.036R2 = 0.159
y = 0.1958x + 0.4346R2 = 0.4977
5
7
9
11
13
15
17
19
45 47 49 51 53 55 Acid Detergent Fiber (%)
Kd (
mL/
g)
Metribuzin
Atrazine
2002
Figure 3.9. Relationship between atrazine and metribuzin Kd for sugarcane mulch residue and aciddetergent fiber content for residue collected at different times post harvest.
46
Table 3.9. Results from Forage fiber analysis of selected sugarcane residue used in retentionstudies. Analysis preformed by LSU AgCenter Southeast Research Station. Values arepercentage on a mass basis.
Soil Variety Sampled Age (d) ADF Cellulose Lignin AshSharkey LCP85-384 10/30/01 12 49.46 36.55 8.10 4.81Sharkey LCP85-384 11/26/01 40 49.84 34.63 9.45 5.75Sharkey LCP85-384 12/20/01 63 54.64 41.40 7.67 5.57Sharkey LCP85-384 2/22/02 127 55.05 39.90 9.46 5.70Sharkey LCP85-384 3/20/02 153 54.82 38.12 10.91 5.79Sharkey LCP85-384 5/23/02 187 53.68 39.36 8.49 5.83Sharkey LCP85-384 11/25/02 1 46.59 31.47 6.61 8.51Sharkey LCP85-384 12/20/02 26 53.21 34.12 8.34 10.76Sharkey LCP85-384 1/24/03 61 54.16 36.45 8.74 8.98
Commerce HoCP91-555 12/6/02 0 49.67 26.40 7.19 16.09Commerce HoCP91-555 1/6/03 31 53.99 33.26 8.31 12.41Commerce HoCP91-555 2/14/03 70 58.41 31.71 10.00 16.71Commerce HoCP91-555 3/21/03 105 53.83 32.05 9.31 12.48Commerce HoCP91-555 4/21/03 136 59.67 29.44 9.88 20.36
47
increase is at best modest (see Table 3.8). This finding is consistent with metribuzin and lignin
relationships using wheat straw explored by Dao (1991). Dao (1991) suggests that an increase in
the percentage of lignin of intact wheat straw is due to the decay of cellulose. The purified
cellulose fraction did not show significant retention of metribuzin or atrazine. Increased sorption
capacity of decaying straw was thus associated with a decline in cellulose concentration or
conversely the lignin enrichment of the straw (Dao, 1991). In addition, Dao assumed that the
lignin accounted for the majority of sorption sites for metribuzin by the wheat straw.
The fiber analysis data for the sugarcane residue was analyzed for a linear relationship
between the Kd values from atrazine and metribuzin adsorption by residue after time in the field
and percent acid detergent fiber of the same residue in the field. A simple regression analysis
resulted in signifigantly low r2 values, for Kd versus percent acid detergent fiber. This result was
realized for both atrazine and metribuzin, and is clearly exhibited in Figure 3.9. Based on t-test,
atrazine and metribuzin p-values were 0.4335 to 0.1174, respectively. Therefore, the respective
slopes of the regression lines were not significantly different from 0, respectively, and thus
conclude that Kd is independent of the residue age and a single Kd value for metribuzin or atrazine
can be used to predict field results.
3.6 Miscible displacement
The breakthrough curves (BTCs) are presented as relative concentration of
metribuzin(C/Co) where Co is the initial concentration of solution at input, versus relative pore
volume (V/Vo) where Vo is the pore volume of the column (cm3). The concentrations presented
here are based on liquid scintillation measurements of the radioactive carbon in the column
effluent solution and in turn this does not differentiate between the applied compound (14C -
labeled metribuzin) and its degradation products.
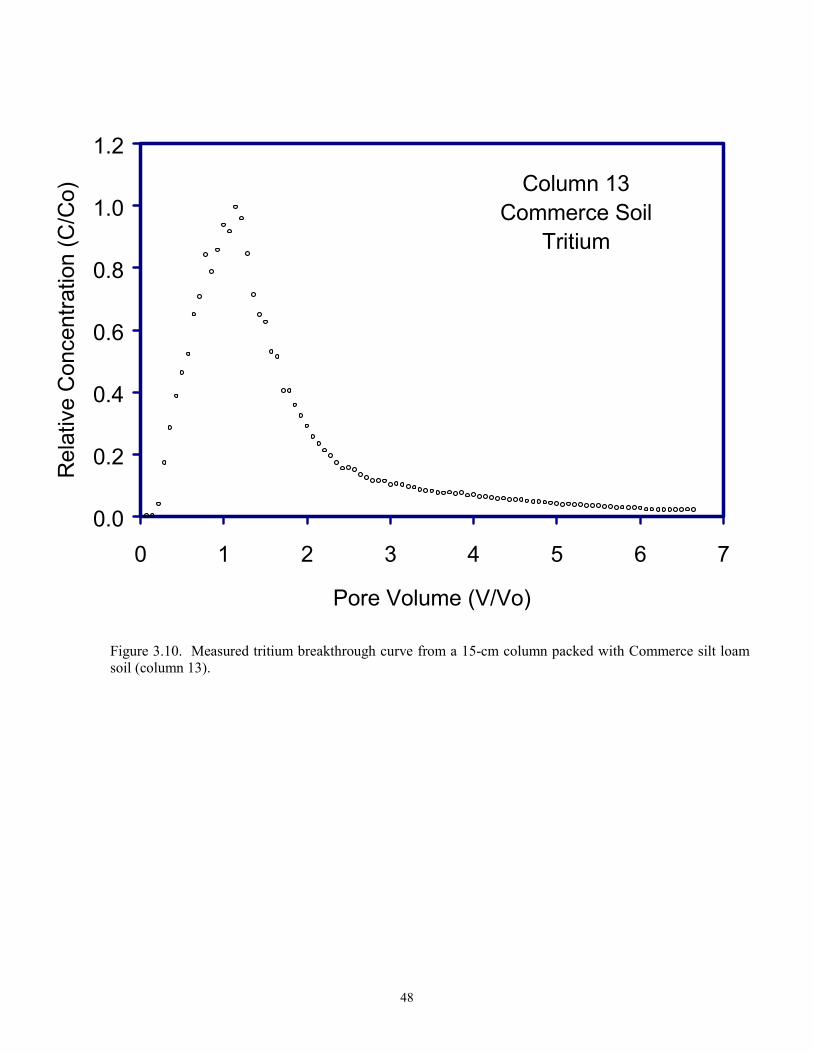
48
Figure 3.10. Measured tritium breakthrough curve from a 15-cm column packed with Commerce silt loamsoil (column 13).
Column 13Commerce Soil
Tritium
0.0
0.2
0.4
0.6
0.8
1.0
1.2
0 1 2 3 4 5 6 7
Pore Volume (V/Vo)
Rel
ativ
e C
once
ntra
tion
(C/C
o)
49
Figure 3.11. Measured tritium breakthrough curve from a 15-cm column packed with Commerce silt loamsoil (column 14).
Column 14Commerce Soil
Tritium
0.0
0.2
0.4
0.6
0.8
1.0
1.2
0 1 2 3 4 5 6 7
Pore Volume (V/Vo)
Rel
ativ
e C
once
ntra
tion
(C/C
o)
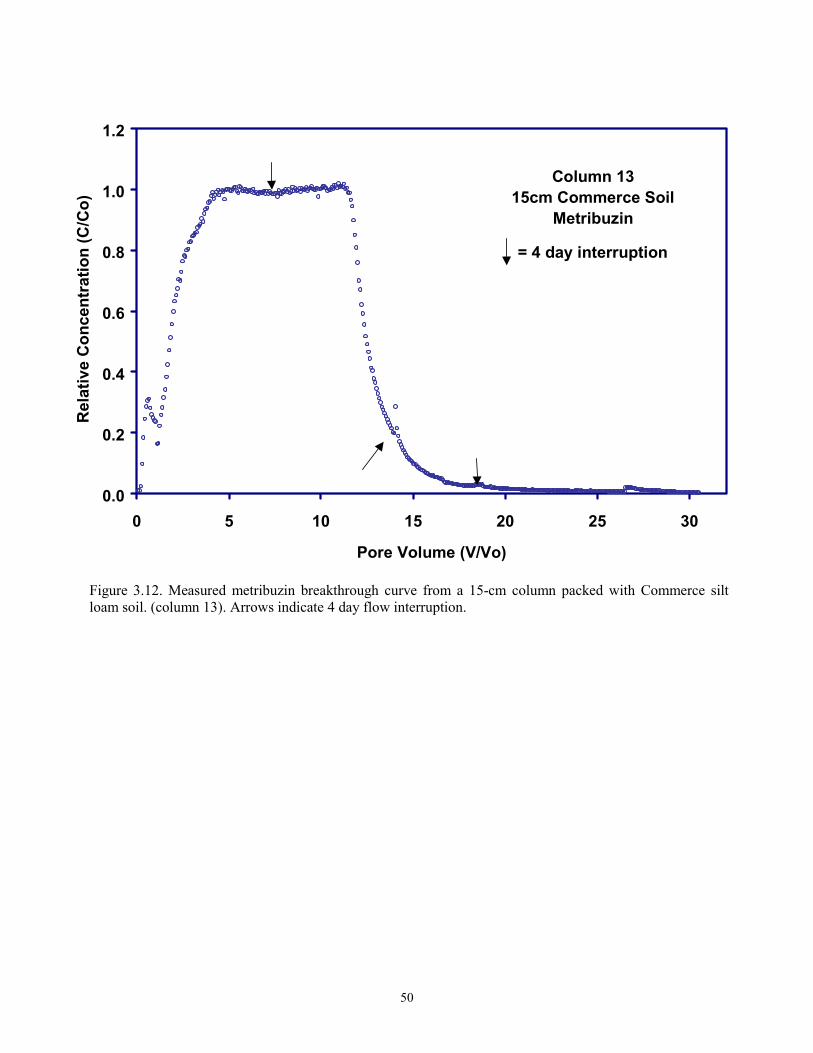
50
Figure 3.12. Measured metribuzin breakthrough curve from a 15-cm column packed with Commerce siltloam soil. (column 13). Arrows indicate 4 day flow interruption.
0.0
0.2
0.4
0.6
0.8
1.0
1.2
0 5 10 15 20 25 30
Pore Volume (V/Vo)
Rel
ativ
e C
once
ntra
tion
(C/C
o)
Column 13 15cm Commerce Soil
Metribuzin
= 4 day interruption
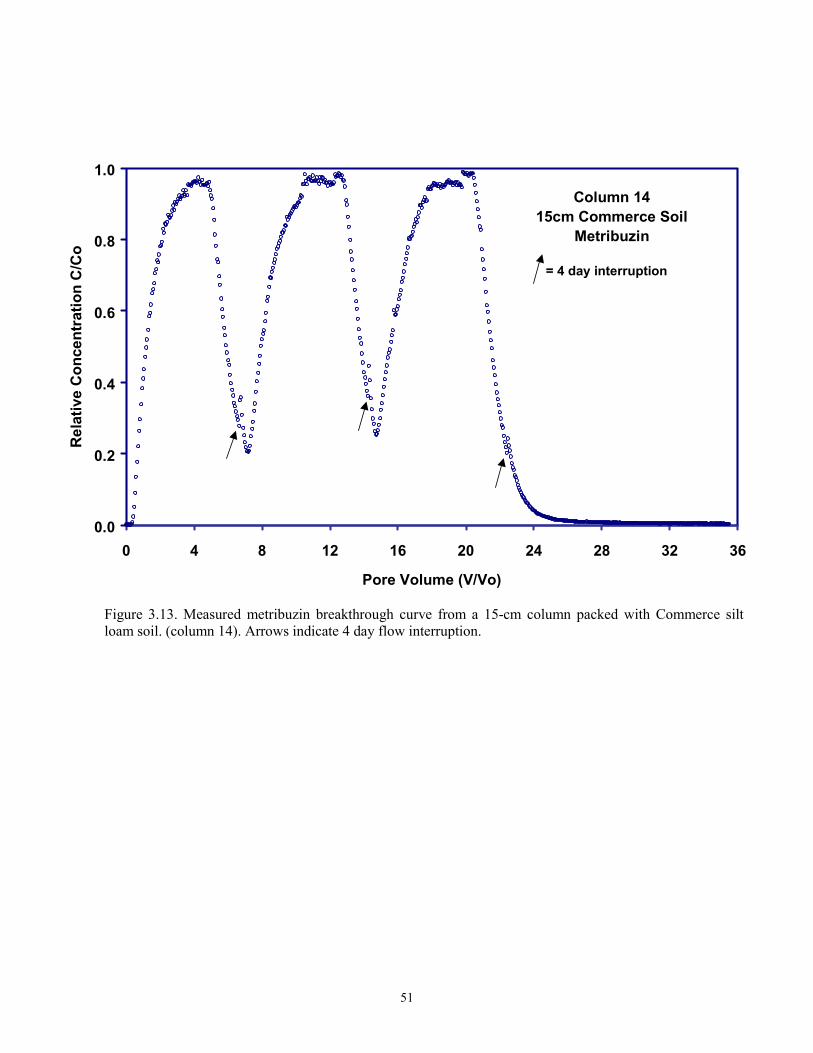
51
Figure 3.13. Measured metribuzin breakthrough curve from a 15-cm column packed with Commerce siltloam soil. (column 14). Arrows indicate 4 day flow interruption.
Column 1415cm Commerce Soil
Metribuzin
0.0
0.2
0.4
0.6
0.8
1.0
0 4 8 12 16 20 24 28 32 36
Pore Volume (V/Vo)
Rel
ativ
e C
once
ntra
tion
C/C
o
= 4 day interruption
52
The time of arrival (or number of pore volumes) of the BTC is expressive of the extent of
mobility of metribuzin in each soil column and thus in the commerce soil. The desorption side
of the BTCs show the release of tritium and metribuzin in the effluent from the soil columns.
Flow interruption provides an experimental condition to understand the non-equilibrium
phenomena associated with retention and release during the transport of chemicals (Murali and
Aylmore, 1980).
3.6.1 Commerce Soil
The column 13 with commerce soil passed 1.14 pore volumes of tritium for C/Co to 0.99,
while for column 14 tritium moved 1.92 pore volumes to reach 0.99 (see Figures 3.10 and 3.11).
Peak maximum for metribuzin occurred after 4.41 and 4.24 pore volumes for Columns 13 and 14
respectively (see Figures 3.12 and 3.13). Breakthrough times for the non-reactive tritium tracer
was significantly faster than for any of the metribuzin peak arrivals. This is expected due to
adsorption of metribuzin by the soil matrix as opposed to the relatively free flowing non-reactive
tritium. Metribuzin peak arrival times were very similar for both 15-cm columns with average
relative concentration C/Co of 0.98 at an average of 4.33 pore volumes. After 17.7 pore volumes
of metribuzin in column 13, 0.30 relative concentration was released for every pore volume of
metribuzin free 0.005 M CaCl2 solution, once leaching began. Desorption of metribuzin from
Column 14 with three separate pulses averaged 39.6% drop in relative concentration over a pore
volume of 0.005 M CaCl2 when leaching each separate pulse. These data may be referred to
during further studies involving sugarcane residue and commerce soil.
3.6.2 Soil and Residue
Earlier batch results indicated that sugarcane residue have significantly greater adsorption
capacity for metribuzin than soil alone on a mass basis (i.e., per gram or kilogram). The three
53
columns packed with soil plus residue mixtures are designed to quantify retardation of
metribuzin transport in the presence of residue in the soil. Tritium peak reached a C/Co = 0.99
of relative concentration for the sand and residue mixture (column 15) while only 0.67 and 0.65
for Commerce (column 16) and Sharkey with residue (column 17) respectively (see Figures 3.14
to 3.15). The non-uniform pore structure and possibly slower movement through the columns
may have influenced tritium flow in the soils as compared to uniform sand. The 15-cm columns
13 and 14 had tritium peak maxima C/Co of 0.99 relative concentration where the 10-cm column
16 with residue present peak C/Co of 0.67, with extensive tailing.
Metribuzin effluent following the first pulse of 3.49 and 4.09 pore volumes, resulted in
peaks reaching C/Co of 0.84 to 0.89 for Commerce and Sharkey soils respectively (see Figures
3.17 and 3.18). All three columns reached their respective metribuzin peaks almost 3 pore
volumes later than the initial tritium pulse. This can be attributed to the adsorption of metribuzin
to soil particles and sugarcane residue. The BTCs of the columns 13 and 14 occurred around one
pore volume later than the Commerce and residue mixture. The greater peak arrival times for the
columns without residue may be attributed to the 5-cm difference in column length, also the bulk
density differences.
The two 4 day interruptions applied to each soil column were used to assess the effect of
equilibrium on the retention and release of metribuzin under saturated conditions. With all three
soils, concentration of effluent decreased once flow was resumed after the first 4 day
interruption. Possibly due to incomplete adsorption within the column pore spaces, with some
sorption sites remain available during flow interruption, i.e., diffusion to such sites is the
controlling mechanism, this allowed time for adsorption and available sites to be occupied.
Conversely following the second interruption there was an increase in concentration of effluent
of almost 20% of that applied for Commerce and Sharkey, this is indicated by arrows in Figures
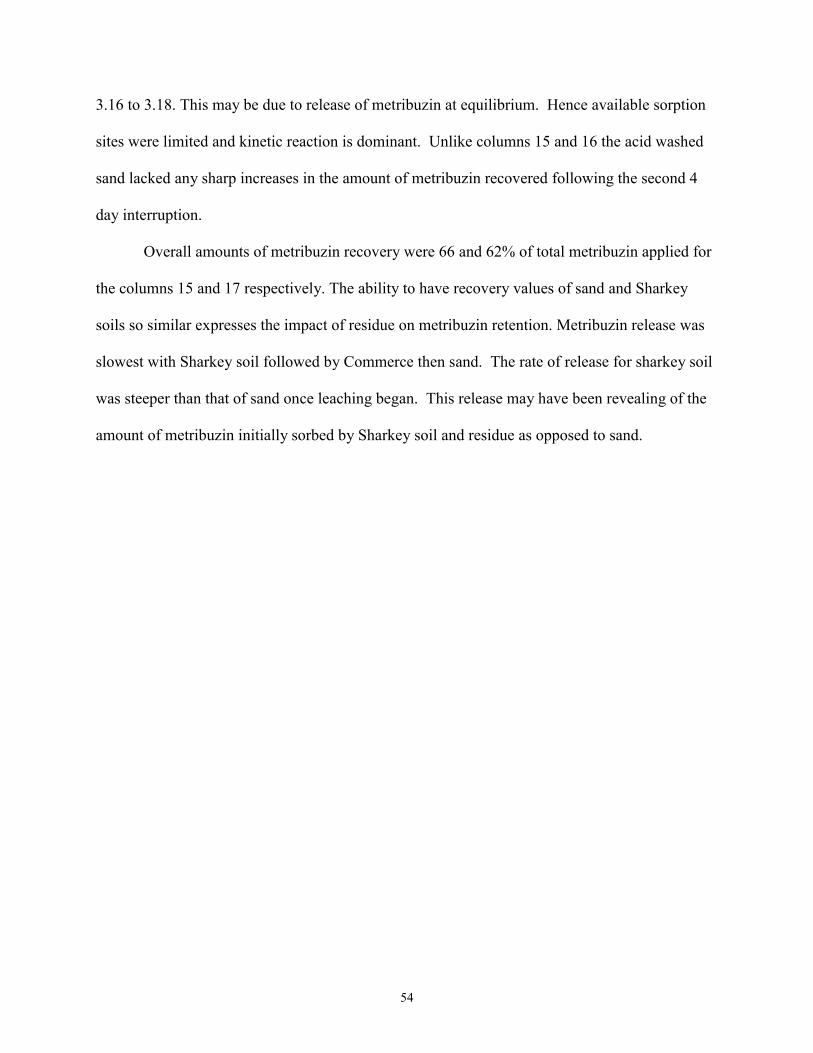
54
3.16 to 3.18. This may be due to release of metribuzin at equilibrium. Hence available sorption
sites were limited and kinetic reaction is dominant. Unlike columns 15 and 16 the acid washed
sand lacked any sharp increases in the amount of metribuzin recovered following the second 4
day interruption.
Overall amounts of metribuzin recovery were 66 and 62% of total metribuzin applied for
the columns 15 and 17 respectively. The ability to have recovery values of sand and Sharkey
soils so similar expresses the impact of residue on metribuzin retention. Metribuzin release was
slowest with Sharkey soil followed by Commerce then sand. The rate of release for sharkey soil
was steeper than that of sand once leaching began. This release may have been revealing of the
amount of metribuzin initially sorbed by Sharkey soil and residue as opposed to sand.
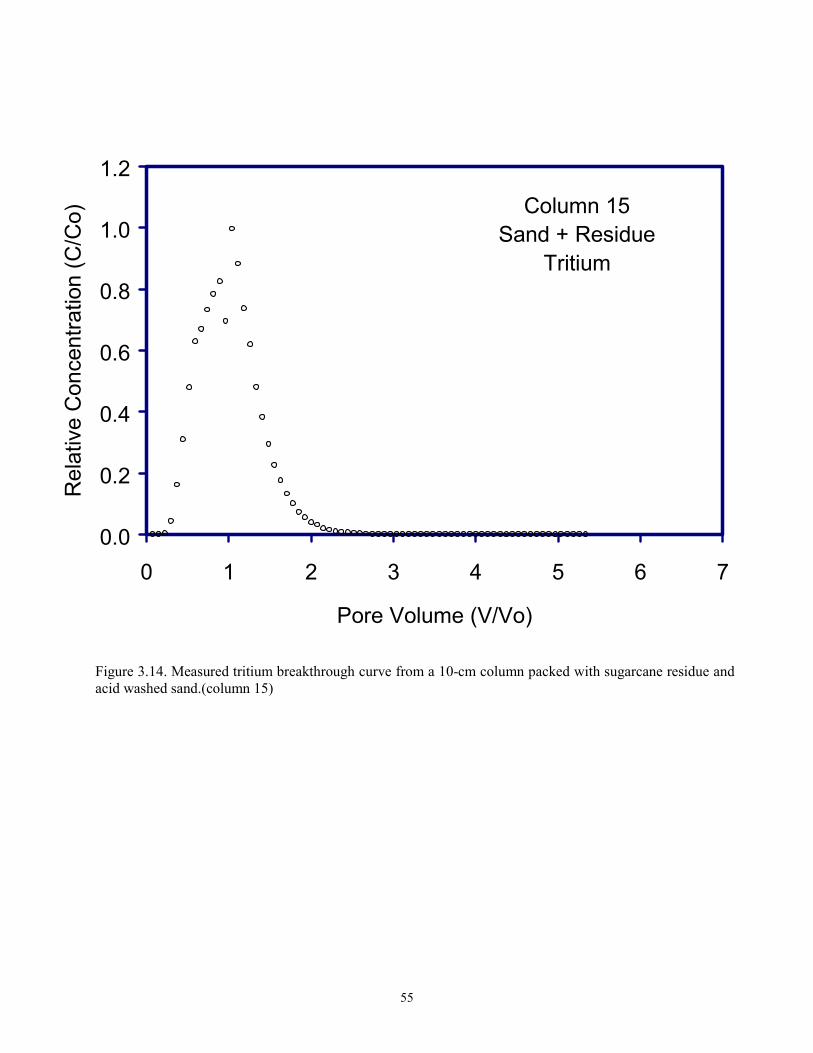
55
Figure 3.14. Measured tritium breakthrough curve from a 10-cm column packed with sugarcane residue andacid washed sand.(column 15)
Column 15Sand + Residue
Tritium
0.0
0.2
0.4
0.6
0.8
1.0
1.2
0 1 2 3 4 5 6 7
Pore Volume (V/Vo)
Rel
ativ
e C
once
ntra
tion
(C/C
o)
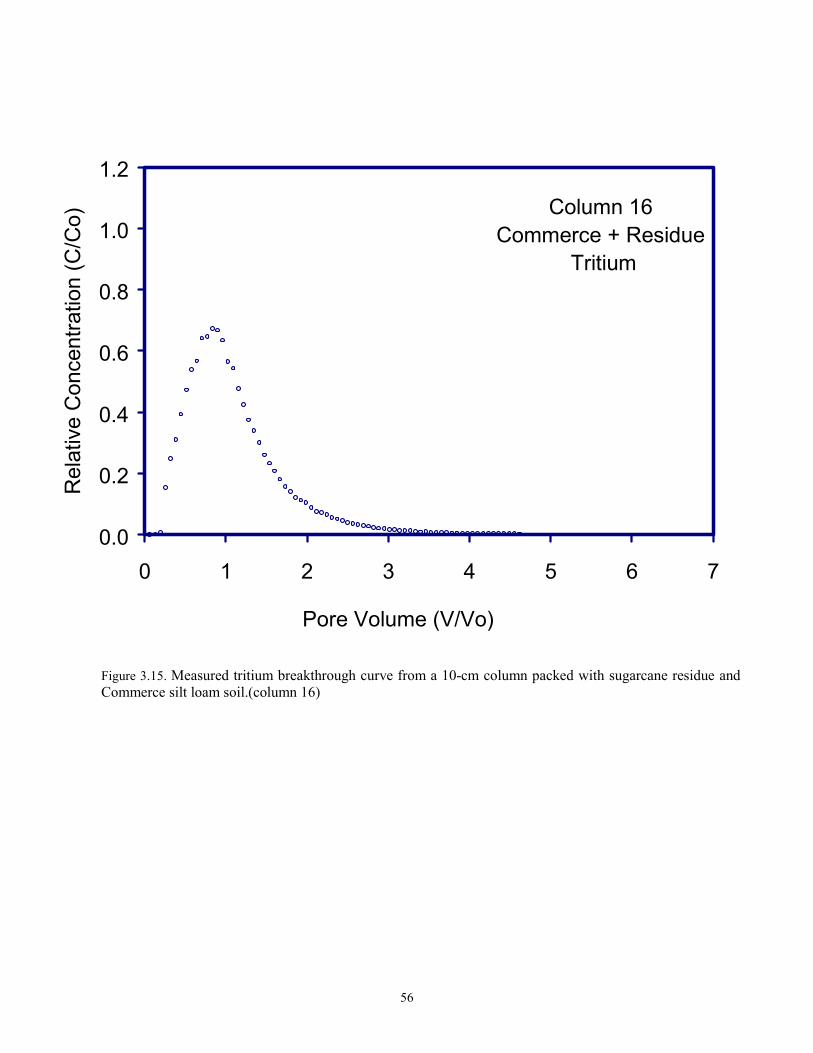
56
Figure 3.15. Measured tritium breakthrough curve from a 10-cm column packed with sugarcane residue andCommerce silt loam soil.(column 16)
Column 16Commerce + Residue
Tritium
0.0
0.2
0.4
0.6
0.8
1.0
1.2
0 1 2 3 4 5 6 7
Pore Volume (V/Vo)
Rel
ativ
e C
once
ntra
tion
(C/C
o)
57
Figure 3.16. Measured metribuzin breakthrough curve from a 10-cm column packed with sugarcane residueand acid washed sand (column 15). Arrows indicate 4 day flow interruption.
Column 15Sand + Residue
Metribuzin
0.0
0.2
0.4
0.6
0.8
1.0
1.2
0 2 4 6 8 10 12 14 16
Pore Volume (V/Vo)
Rel
ativ
e C
once
ntra
tion
(C/C
o)
= 4 day interruption
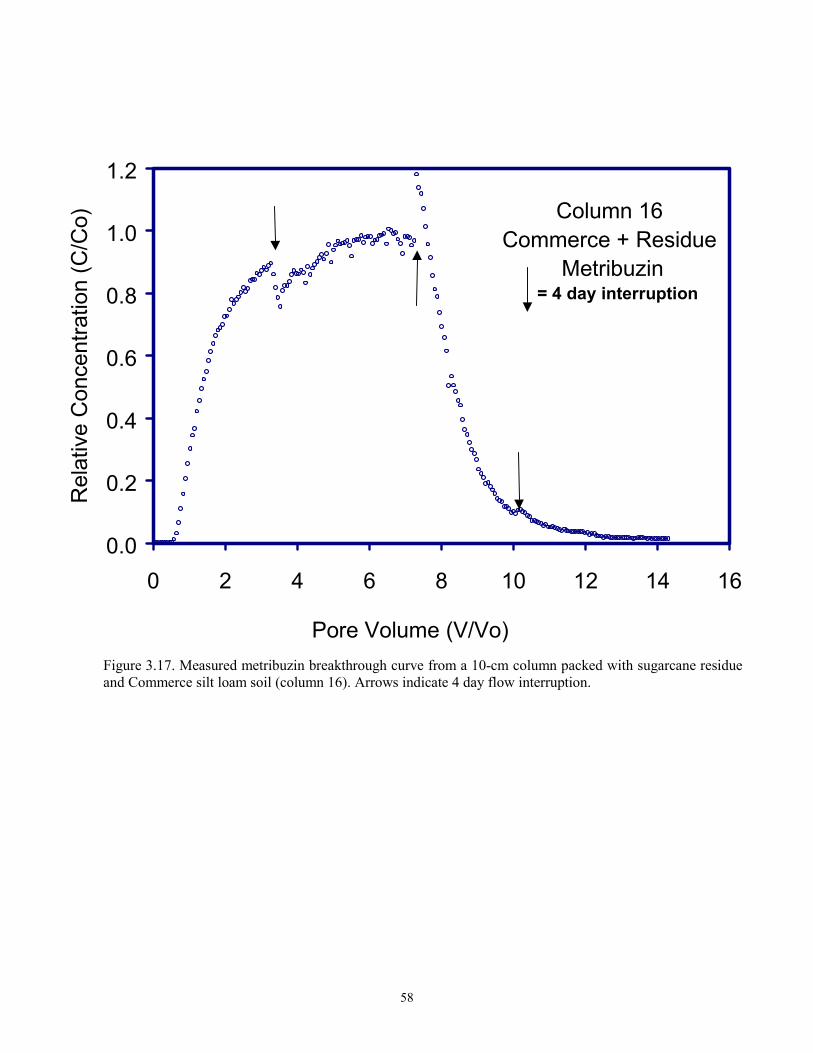
58
Figure 3.17. Measured metribuzin breakthrough curve from a 10-cm column packed with sugarcane residueand Commerce silt loam soil (column 16). Arrows indicate 4 day flow interruption.
Column 16Commerce + Residue
Metribuzin
0.0
0.2
0.4
0.6
0.8
1.0
1.2
0 2 4 6 8 10 12 14 16
Pore Volume (V/Vo)
Rel
ativ
e C
once
ntra
tion
(C/C
o)
= 4 day interruption
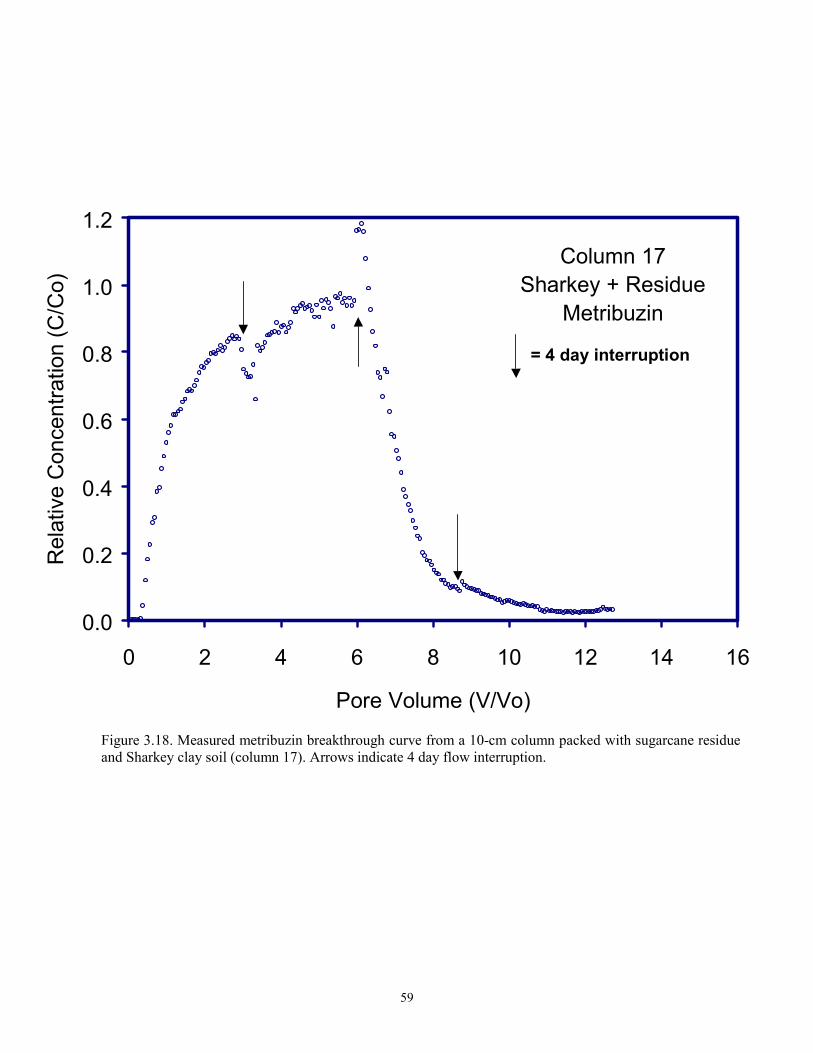
59
Figure 3.18. Measured metribuzin breakthrough curve from a 10-cm column packed with sugarcane residueand Sharkey clay soil (column 17). Arrows indicate 4 day flow interruption.
Column 17Sharkey + Residue
Metribuzin
0.0
0.2
0.4
0.6
0.8
1.0
1.2
0 2 4 6 8 10 12 14 16
Pore Volume (V/Vo)
Rel
ativ
e C
once
ntra
tion
(C/C
o)
= 4 day interruption
60
CHAPTER 4. CONCLUSIONS
Following the analysis of all experimental studies carried out in this work several
conclusions can be made. The linear relationships between the amount of herbicide sorbed and
the concentration in solution, can be explained by the presence of homogenous or uniform
sorption properties of the sugarcane residue. When comparing herbicides we found consistently
that the Kd values indicate that the kinetic behavior of metribuzin adsorption by sugarcane
residue is not as strong as that for atrazine. During batch studies, adsorption by the residue was
initially rapid, and then exhibited slower retention after 24 hours of reaction time for both
herbicides. Kd values were compared across 2002 through 2004 growing seasons and at varying
stages of residue decay. The overall herbicide retention did not change significantly with the age
of the residue or the time of decay in the field over three growing seasons. The desorption
studies verified that atrazine is more strongly sorbed than metribuzin, i.e., the mulch exhibited
stronger retention for atrazine than metribuzin. Based on comparison across growing seasons of
two desorption studies, one would conclude that with longer incubation times, hysterisis is more
pronounced. Such a finding is consistent with Ma et al. (1993) for atrazine desorption on a
Sharkey soil. Furthermore, based on all adsorption results presented here metribuzin has a
greater capacity for leaching and wash off than that for atrazine.
The soil retention of herbicides is consistent with results and conclusions from field
experiments on Commerce soil of Selim et al. (2003). They observed that the mulch residue
intercepted significant amounts of applied herbicides. This is of great importance when
considering the impact of residue management on the runoff of applied herbicides. Without the
residue cover, the soil is much weaker at sorbing the herbicides, hence allowing for offsite
movement. Transport studies revealed residue has a rate limiting effect on the transport of
metribuzin through Commerce soil.
61
Sugarcane residue decay in the field was quantified for plantcane, first stubble and
second stubble. The rates of decay were not significantly different over all three growing
seasons. The calculated half-lives of 126-171 days for the mulch decay indicate a substantial
presence for the protection of the soil surface in the months following harvest. Lignin analysis
on a percent mass basis indicated no significant changes as the residue decayed in the field.
Moreover, lignin analysis data and the corresponding Kd values also showed no obvious linear
relationship. Again this emphasizes the need for only one Kd value across growing seasons and
age of residue lying in the field post-harvest.
The overall conclusion of laboratory and field studies is that the mulch residue can sorb
an amount of atrazine and metribuzin significantly greater than that of the mineral soil. By
implementing residue management practices, the potential benefits of keeping atrazine and
metribuzin from entering surface waters below maximum containment levels should be greatly
increased. Continued research is required to assess the impact of residue management practices
and weigh the environmental benefits with sugarcane production costs. Research is underway to
evaluate the impact residue management practices have on sugarcane emergence and crop yield.
62
REFERENCES
Abdelhafid, R., Barriuso, E., and Houot, S. 2000. Dependence of atrazine degradation on C andN availability in adapted and non-adapted soils. Soil Biology & Biochemistry. 32(3):389-401.
Ball-Coelho, B., Salcedo, I.H., Sampaio, E.V.S.B., Tiessen, H., and Stewart, J.W.B. 1993.Residue management effects on sugarcane yield and soil properties in northeastern Brazil.Agronomy Journal. 85(5):1004-1008.
Barbash, J.E., Gilliom, R.J., Kolpin, D.W., and Thlin, G.P. 2001. Major herbicides in groundwater: Results from the National Water – Quality Assessment. Journal of Environmental Quality.30(3):831-845.
Benoit, P. and Preston, C.M. 2000. Transformation and binding of 13C and 14C-labelled atrazinein relation to straw decomposition in soil. European Journal of Soil Science. 51:43-54.
Blair, N. 2000. Impact of cultivation and sugar-cane green trash management on carbon fractionsand aggregate stability for a Chromic Luvisol in Queensland, Australia. Soil & Tillage Research.55(3-4):183-191.
Boyd, S.A., Lee, J.F. and Xiangcan, J. 1990. Sorption of nonionic organic compounds by cornresidues from a no-tillage field. Journal of Environmental Quality. 19:734-738.
Celis, R., Koskinen, W.C., Hermosin, M.C., and Cornejo, J. 1997. Sorption-desorption ofatrazine and simazine by model soil colloidal components. Soil Science Society of America. SoilScience Society of America Journal. 61(2):436-443.
Dabney, S.M., Foster, G.R., McGregor, K.C., and Wilson, G.V. 2004. History, residue, andtillage effects on erosion of loessial soil. Transactions of the ASAE. 47:767-775.
Dao, T.H. 1991. Field Decay of Wheat Straw and its Effects on Metribuzin and S-EthylMetribuzin Sorption and Elution from Crop Residues. Journal of Environmental Quality.20:203-208.
Dao, T.H. 1995. Subsurface Mobility of Metribuzin as Affected by Crop Residue Placement andTillage Method. Journal of Environmental Quality. 24(6):1193-1198.
Dominy, C.S., Van Antwerpen, R., and Haynes, R.J. 2002. Loss of soil organic matter andrelated soil properties under long-term sugarcane production on two contrasting soils. Biologyand Fertility of Soils. 36:350-356.
Environmental Protection Agency. 2001. Effective Date of Revisions to the Water QualityPlanning and Management Regulation and Revisions to the National Pollution DischargeElimination System Program. Federal Register : October 18, 2001. 66(202): 53043-53048.
63
Graham, M.H., Meyer, J.H., and Haynes, R.J. 2002. Changes in soil chemistry and aggregatestability induced by fertilizer applications, burning and trash retention on a long-term sugarcaneexperiment in South Africa. European Journal of Soil Science. 53:589-598.
Gaynor, J.D., Findlay, W.I., and MacTavish, D.C. 1995. Atrazine and metolachlor loss in surfaceand subsurface runoff from three tillage treatments in corn. Journal of Environmental Quality.24:246-256.
Goering,H.K.and Van Soest, P.J.1970. Forage fiber analyses (apparatus, reagents,procedures andsome applications). USDA-ARS Agricultural Handbook 379. U.S.Government PrintingOffice.,Washington,DC
Jenks, B.M., McCallister, D.L., Martin, A.R., and Roeth, F.W. 1998. Influence of surface andsubsurface soil properties on atrazine sorption and degradation. Weed Science. 46(1):132-138.
Kim, J.H., Feagley, S.E. 1998. Adsorption and leaching of trifluralin, metolacahlor, andmetribuzin in a commerce soil. Journal of Environmental Science and Health. Part B: Pesticides,food contaminants, and agricultural wastes. B33 (5): 529-546.
Konstantinou, I.K., Albanis, T.A., and Zarkadis, A.K. 2001. Photodegradation of selectedherbicides in various natural waters and soils under environmental conditions. Journal ofEnvironmental Quality. 30(1):121-130.
Lavy, T.L., Senseman, S.A., Gbur, E.E. Jr., Barrett, M.R., Mattice, J.D., Massey, J.H., andSkulman, B.W. 1996. Long-term in situ leaching and degradation of six herbicides aged insubsoils. Journal of Environmental Quality. 25:1268-1279.
Locke, M.A., and Harper, S.S. 1991 Metribuzin Degradation in Soil: I�Effects of SoybeanResidue Amendment, Metribuzin Level, and Soil Depth. Pesticide Science. 31(2): 221-237.
Louisiana Department of Agriculture and Forestry, Louisiana Department of EnvironmentalQuality, Louisiana Department of Health and Hospitals, and Louisiana State UniversityAgricultural Certer. 1998. Progress Report To The Upper Terrebonne Basin WatershedCommittee on Atrazine.
Louisiana Department of Agriculture and Forestry, Office of Pesticide and EnvironmentalPrograms. 2001 Summary of Atrazine Sales in the Upper Terrebonne Basin of Louisiana.
Louisiana State University Agricultural Center. 1997 – 2001. Louisiana Summary ofAgricultural and Natural Resources.
Ludvik, J., and Zuman, P., 2000. Adsorption of 1,2,4-triazine pesticides metamitron andmetribuzin on lignin. Microchemical Journal. 64 (1):15-20.
Ma, L., Southwick, L.M., Willis, G.H., and Selim, H.M. 1993. Hysteric Characteristics ofAtrazine Adsorption-Desorption by Sharkey Soil. Weed Science. 41:627-633.
64
Ma, L. and Selim, H.M. 2005. Predicting pesticide transport in mulch-amended soils: A two-compartment model. Soil Science Society of America Journal. 69:318–327
Martinezinigo, M., and Almendros, G., 1992. Pesticide sorption on soils treated with evergreenoak biomass at different humification Stages. Communications in Soil Science and PlantAnalysis. 23(15-16):1717-1729.
Martin-Neto, L., Crestana, S., Sposito, G., Traghetta, D.G., and Vaz, C.M.P. 2001. On theinteraction mechanisms of atrazine and hydroxyatrazine with humic substances. Journal ofEnvironmental Quality. 30(2):520-525.
Moorman, T.B., Pfeiffer, R.L., Morrow, A.J., Hatfield, J.L., Jaynes, D.B., and Cambardella, C.A.1999. Water quality in Walnut Creek Watershed: herbicides in soils, subsurface drainage, andgroundwater. Journal of Environmental Quality. 28(1):35-45.
Murali, V. and Aylmore, L.A.G. 1980. No-flow equilibration and adsorption dynamics duringionic transport in soils. Nature. 283(5746): 467-469.
Noble, A.D., Moody, P., and Berthelsen, S. 2003. Influence of changed management ofsugarcane on some soil chemical properties in the humid wet tropics of north Queensland.Australian Journal of Soil Research. 41(6):1133-1144.
Novak, J.M. 1999. Soil factors influencing atrazine sorption: implications of fate. EnvironmentalToxicology and Chemistry. 18(8):1663-1667.
Piccolo, A., Paci, M., Scheunert, I., and Conte, P. 1998. Atrazine interactions with soil humicsubstances of different molecular structure. Journal of Environmental Quality. 27(6):1324-1333.
Rana, N.S, Singh, A.K., Kumar, S., and Kumar, S. 2003. Effect of trash mulching and nitrogenapplication on growth and yield of sugarcane ratoon. Indian Journal of Agronomy. 48(2):124-126.
Sadeghi, A.M., Isensee, A.R., and Shelton, D.R. 1998. Effect of tillage age on herbicidedissipation: A side-by-side comparison using microplots. Soil Science. 163(11):883-890.
Savage, K.E. 1977. Metribuzin persistence in soil. Weed Science. 25:55-59.
Selim, H.M. and Amacher, M.C. 1997. Reactivity and transport of heavy metals in soils.CRC/Lewis Publishers. Boca Raton, FL.
Selim, H.M., and H. Zhu. 2002. Retention and mobility of deltamethrin in soils. 2. Transport.Soil Science. 167:580–589.
Selim, H.M., Zhou, L., and Zhu, H. 2003. Herbicide retention in soil as affected by sugarcanemulch residue. Journal of Environmental Quality. 32(4):1445-1454.
Selim, H.M., 2004. Modeling kinetic retention of atrazine and metribuzin in soil. Soil Science.169(1):25-34.
65
Selim, H.M., and Zhu, H. 2005. Atrazine sorption-desorption hysteresis by sugarcane mulchresidue. Journal of Environmental Quality. 34(1):325-335.
Seta, A.K., Barfield, B.J., Frye, W.W., and Blevins, R.L. 1993. Reducing soil erosion andagricultural chemical losses with conservation tillage. Journal of Environmental Quality. 22(4):661-665.
Seybold, C.A., Lowery, B., and McSweeney, K. 1994. Atrazine adsorption in sandy soils ofWisconsin. Journal of Environmental Quality. 23(6):1291-1297.
Shelton, D.R., Sadeghi, A.M., Karns, J.S., and Hapeman, C.J. 1995. Effect of wetting anddrying of soil on sorption and biodegradation of atrazine. Weed Science. 43 (2): 298-305.
Sheng, G., Boyd, S.A., Teppen, B.J., and Johnston, C.T. 2001. Potential contributions of smectiteclays and organic matter to pesticide retention in soils. Journal of Agricultural and FoodChemistry. 49(6):2899-2907.
Sigua, G.C., Isensee, A.R, and Sadeghi. A. M. 1993. Influence of rainfall intensity and cropresidue on leaching of atrazine through intact no-till soil cores. Soil Science. 156(4):225-232.
Solomon, K.R., Weisskopf, C.P., Kendall, R.J., Giesy, J.P., Giddings, J.M., La Point, T.W.,Richards, R.P., Baker, D.B., Klaine, S.J., and Dixon, K.R. 1996. Ecological risk assessment ofatrazine in North American surface waters. Environmental Toxicology and Chemistry. 15(1):31-76.
Southwick, L.M., Fouss, J.L., Kornecki, T.S., and Grigg, B.C. 2002. Potential influence ofsugarcane cultivation on estuarine water quality of Louisiana's Gulf Coast. Journal ofAgricultural and Food Chemistry. 50(15): 4393-4399.
Southwick, L.M., Kornecki, T.S., Fouss, J.L., and Grigg, B.C. 2003. Atrazine and metolachlor insurface runoff under typical rainfall conditions in southern Louisiana. Journal of Agricultural andFood Chemistry. 51:5355-5361.
Thorburn, P.J., Robertson, F.A., and Probert, M.E. 2001. Modelling decomposition of sugar canesurface residues with APSIM-Residue. Field Crops Research. 70:223-232.
U.S. Environmental Protection Agency. 2003. Interim Reregistration Eligibility Decision forAtrazine: Certified Letter of Registrants. January 31, 2003.
Vanderheyden, V., Pussemier, L., and Debongnie, P. 1997. Accelerated degradation andmineralization of atrazine in surface and subsurface soil materials. Pesticide Science. 49:237-242.
Van Soest P.J., and Robertson J.B. 1980. Systems of analysis for evaluating fibrous feeds. p.49-60. In W.J. Pigden et al. (ed.) Proc. Int. Workshop on Standardization Anal. Meth. Feeds.Ottawa, Canada. 12-14 Mar. 1979. Unipub., New York.
66
Viator, H. P. 2003. Long-term evaluation of the effects of combine trash blanket on sugarcaneyeilds. LSU AgCenter. Sugarcane Research Annual Progress Report. 130-131.
Weber, J.B. 1993. Ionization and sorption of fomesafen and atrazine by soils and soilconstituents. Pesticide Science. 39(1):31-38.
Wilson, G.V., Barkoll, B.D., McGregor, K.C., and Dabney, S.M. 2004. Tillage and residueeffects on runoff and erosion dynamics. Transactions of the ASAE. 47:119-128.
Yadav, R.L., Prasad, S.R., Singh, R., and Srivastava, V.K. 1994. Recycling sugarcane trash toconserve soil organic-carbon for sustaining yields of successive ratoon crops in sugarcane.Bioresource Technology. 49(3): 231-235.
67
VITA
Brian Naquin was born in Plano, TX on February 7, 1978 to Ronald and Wanda Naquin and
welcomed home by sisters Ronda and Amy. Soon his family moved to Baton Rouge, Louisiana,
there he spent the next years of his life schooling and enjoying south Louisiana. Following
graduation from high school he enrolled at the University of Louisiana at Lafayette, there he
completed his Bachelors degree in Environmental and Sustainable Resources. Also while in
Lafayette he happened upon the love of his life the former Summer Lynn Perault. Following
graduation from ULL, he was accepted by Louisiana State University, Graduate School on
behalf of Dr. H. M. Selim, of the Department of Agronomy and Environmental Management, to
work towards a Master’s degree. During his time at LSU, Brian had the opportunity to study
with and under many great people. Also during this time he was engaged and married to his love,
Summer. Currently Brian is a Research Associate with the LSU AgCenter and a candidate for a
Master of Science degree in the spring of 2005.


