Embed Size (px)
Citation preview
Graduate Theses and Dissertations Iowa State University Capstones, Theses andDissertations
2014
Heat stress alters animal physiology and post-absorptive metabolism during pre- and postnataldevelopmentJay Steven JohnsonIowa State University
Follow this and additional works at: https://lib.dr.iastate.edu/etd
Part of the Agriculture Commons, Animal Sciences Commons, Human and Clinical NutritionCommons, and the Physiology Commons
This Dissertation is brought to you for free and open access by the Iowa State University Capstones, Theses and Dissertations at Iowa State UniversityDigital Repository. It has been accepted for inclusion in Graduate Theses and Dissertations by an authorized administrator of Iowa State UniversityDigital Repository. For more information, please contact [email protected].
Recommended CitationJohnson, Jay Steven, "Heat stress alters animal physiology and post-absorptive metabolism during pre- and postnatal development"(2014). Graduate Theses and Dissertations. 13982.https://lib.dr.iastate.edu/etd/13982
Heat stress alters animal physiology and post-absorptive metabolism during
pre- and postnatal development
by
Jay Steven Johnson
A dissertation submitted to the graduate faculty in partial fulfillment of the requirements
for the degree of
DOCTOR OF PHILOSOPHY
Major: Nutritional Sciences
Program of Study Committee:
Lance H. Baumgard, Major Professor
Donald C. Beitz
John F. Patience
Jason W. Ross
Hongwei Xin
Iowa State University
Ames, Iowa
2014
Copyright © Jay Steven Johnson, 2014. All rights reserved.
ii
TABLE OF CONTENTS
LIST OF TABLES............................................................................................................ vi
LIST OF FIGURES.......................................................................................................... ix
LIST OF ABBREVIATIONS......................................................................................... xiii
ACKNOWLEDGEMENTS............................................................................................. xv
ABSTRACT.................................................................................................................... xvi
CHAPTER I. LITERATURE REVIEW............................................................................ 1
Introduction......................................................................................................... 1
Global Impact of Heat Stress.............................................................................. 2
Climate Change....................................................................................... 2
Economic and Food Security Impacts of Heat Stress............................. 2
Heat-Related Illnesses in Humans and Animals..................................... 3
Management Strategies to Reduce Heat Load........................................ 4
Nutritional Strategies to Reduce Heat Load........................................... 5
Direct and Indirect Effects of Heat Stress.............................................. 7
Thermoregulatory Response to Heat Stress....................................................... 9
Thermoregulation................................................................................... 9
Conductive Exchange................................................................. 10
Convective Exchange................................................................. 11
Radiative Exchange.................................................................... 12
Evaporation............................................................................................. 13
Respiration.............................................................................................. 14
Feed Intake.................................................................................................. 15
Van’t Hoff Arrhenius Equation and the Q10 Effect................................. 16
Adaptation and Acclimation................................................................... 17
Nutrient Metabolism and Partitioning................................................................ 18
Carbohydrates......................................................................................... 19
Digestion and Absorption........................................................... 19
Synthesis and Oxidation............................................................. 20
Heat Stress and Carbohydrate Metabolism............................................ 21
Protein..................................................................................................... 24
Digestion and Absorption........................................................... 24
Synthesis and Degradation.......................................................... 25
Heat Stress and Protein Metabolism....................................................... 28
Lipid........................................................................................................ 30
Digestion and Absorption........................................................... 30
Synthesis and Oxidation............................................................. 31
Heat Stress and Lipid Metabolism.......................................................... 33
Bioenergetics........................................................................................... 35
Porcine Tissue Accretion ....................................................................... 36
Prenatal Insults.................................................................................................... 37
Epigenetics.............................................................................................. 38
Maternal Heat Stress............................................................................... 39
iii
Maternal Nutrient Restriction................................................................. 41
Elevated Maternal Glucocorticoids......................................................... 43
Summary............................................................................................................. 45
Literature cited.................................................................................................... 47
CHAPTER II: EFFECTS OF MAMMALIAN IN UTERO HEAT STRESS ON
ADOLESCENT BODY TEMPERATURE...................................................................... 66
Abstract........................................................................................................................... 66
Introduction..................................................................................................................... 67
Materials and Methods.................................................................................................... 68
Gestational Environments................................................................................... 68
Adolescent Environments................................................................................... 69
Statistics.............................................................................................................. 70
Results............................................................................................................................. 71
Thermal Indices................................................................................................... 71
Regression Analysis............................................................................................ 72
Growth Parameters.............................................................................................. 72
Discussion....................................................................................................................... 73
Conclusion...................................................................................................................... 77
References....................................................................................................................... 79
CHAPTER III: IN UTERO HEAT STRESS INCREASES POSTNATAL CORE
BODY TEMPERATURE IN PIGS.................................................................................. 88
Abstract............................................................................................................................. 88
Introduction....................................................................................................................... 89
Materials and Methods...................................................................................................... 90
In utero environments........................................................................................... 90
Postnatal environments......................................................................................... 91
Blood sampling and analysis................................................................................ 93
Statistics................................................................................................................ 94
Results............................................................................................................................... 97
Thermal indices..................................................................................................... 97
Core temperature....................................................................................... 97
Respiration rate......................................................................................... 98
Skin temperature....................................................................................... 98
Growth parameters................................................................................................ 99
Blood parameters.................................................................................................. 99
Discussion....................................................................................................................... 100
Perspectives and significance......................................................................................... 105
References....................................................................................................................... 107
iv
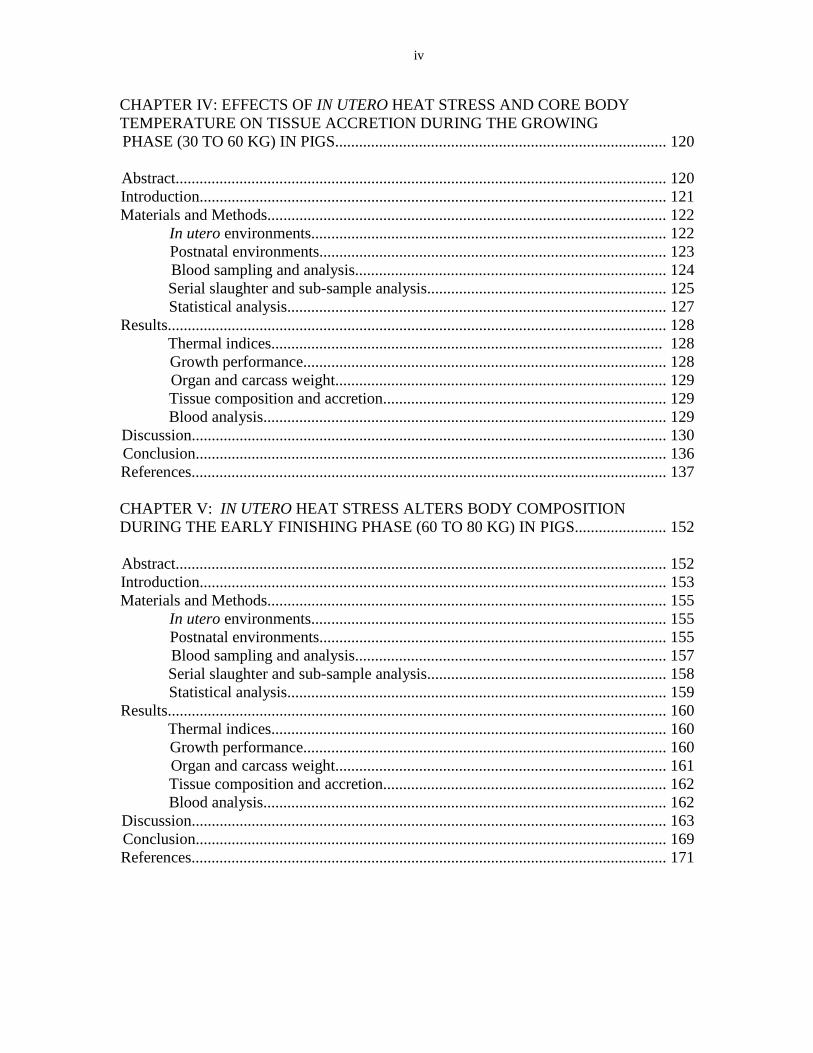
CHAPTER IV: EFFECTS OF IN UTERO HEAT STRESS AND CORE BODY
TEMPERATURE ON TISSUE ACCRETION DURING THE GROWING
PHASE (30 TO 60 KG) IN PIGS................................................................................... 120
Abstract........................................................................................................................... 120
Introduction..................................................................................................................... 121
Materials and Methods.................................................................................................... 122
In utero environments......................................................................................... 122
Postnatal environments....................................................................................... 123
Blood sampling and analysis.............................................................................. 124
Serial slaughter and sub-sample analysis............................................................ 125
Statistical analysis............................................................................................... 127
Results............................................................................................................................. 128
Thermal indices.................................................................................................. 128
Growth performance........................................................................................... 128
Organ and carcass weight................................................................................... 129
Tissue composition and accretion....................................................................... 129
Blood analysis..................................................................................................... 129
Discussion....................................................................................................................... 130
Conclusion...................................................................................................................... 136
References....................................................................................................................... 137
CHAPTER V: IN UTERO HEAT STRESS ALTERS BODY COMPOSITION
DURING THE EARLY FINISHING PHASE (60 TO 80 KG) IN PIGS....................... 152
Abstract........................................................................................................................... 152
Introduction..................................................................................................................... 153
Materials and Methods.................................................................................................... 155
In utero environments......................................................................................... 155
Postnatal environments....................................................................................... 155
Blood sampling and analysis.............................................................................. 157
Serial slaughter and sub-sample analysis............................................................ 158
Statistical analysis............................................................................................... 159
Results............................................................................................................................. 160
Thermal indices................................................................................................... 160
Growth performance........................................................................................... 160
Organ and carcass weight................................................................................... 161
Tissue composition and accretion....................................................................... 162
Blood analysis..................................................................................................... 162
Discussion....................................................................................................................... 163
Conclusion...................................................................................................................... 169
References....................................................................................................................... 171
v
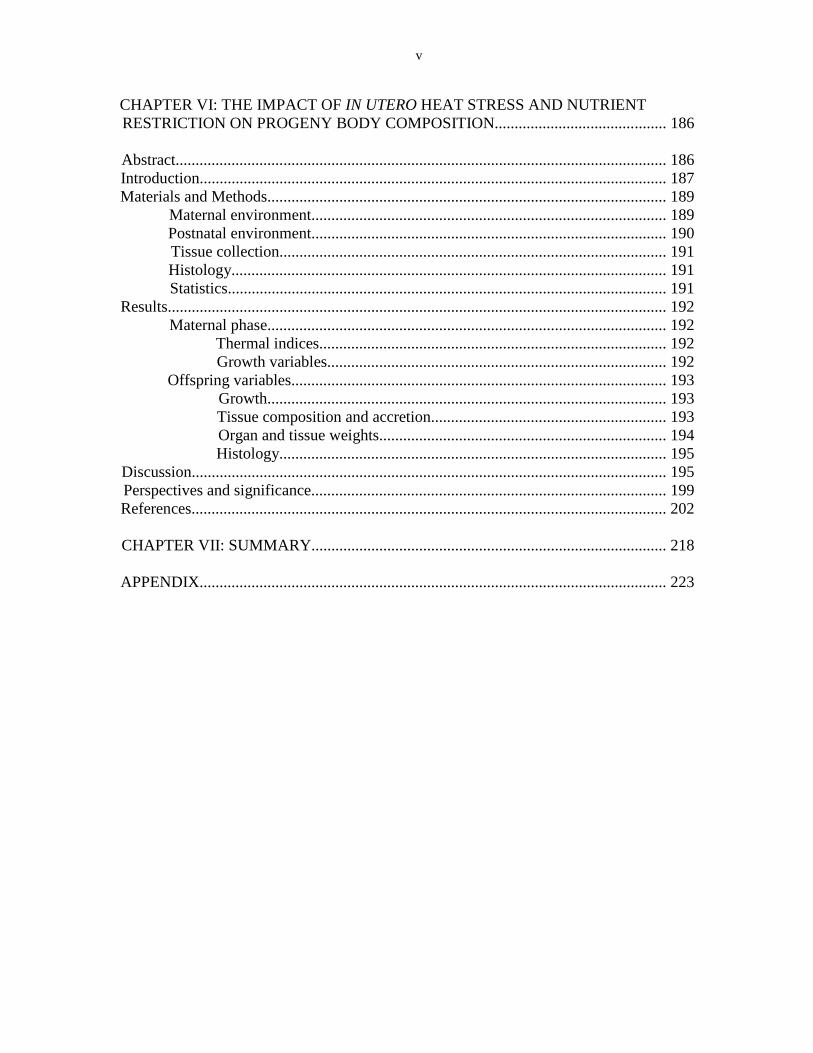
CHAPTER VI: THE IMPACT OF IN UTERO HEAT STRESS AND NUTRIENT
RESTRICTION ON PROGENY BODY COMPOSITION........................................... 186
Abstract........................................................................................................................... 186
Introduction..................................................................................................................... 187
Materials and Methods.................................................................................................... 189
Maternal environment......................................................................................... 189
Postnatal environment......................................................................................... 190
Tissue collection................................................................................................. 191
Histology............................................................................................................. 191
Statistics.............................................................................................................. 191
Results............................................................................................................................. 192
Maternal phase.................................................................................................... 192
Thermal indices....................................................................................... 192
Growth variables..................................................................................... 192
Offspring variables.............................................................................................. 193
Growth.................................................................................................... 193
Tissue composition and accretion........................................................... 193
Organ and tissue weights........................................................................ 194
Histology................................................................................................. 195
Discussion....................................................................................................................... 195
Perspectives and significance......................................................................................... 199
References....................................................................................................................... 202
CHAPTER VII: SUMMARY......................................................................................... 218
APPENDIX..................................................................................................................... 223
vi
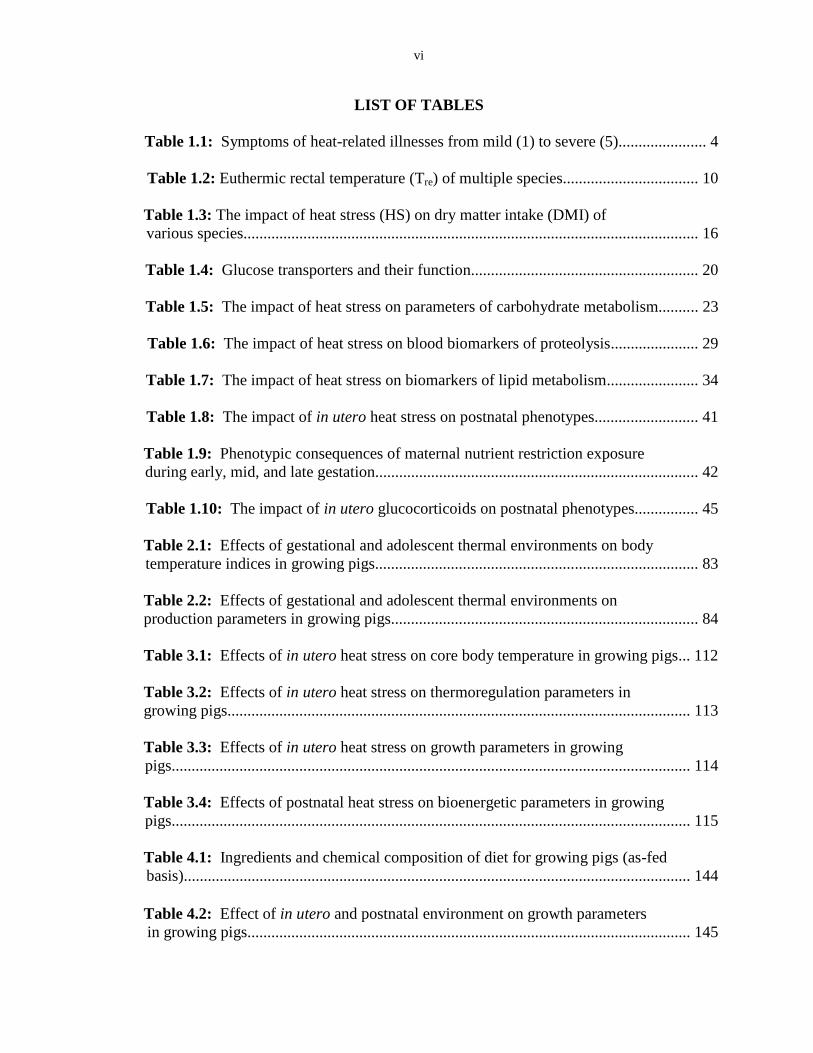
LIST OF TABLES
Table 1.1: Symptoms of heat-related illnesses from mild (1) to severe (5)...................... 4
Table 1.2: Euthermic rectal temperature (Tre) of multiple species.................................. 10
Table 1.3: The impact of heat stress (HS) on dry matter intake (DMI) of
various species.................................................................................................................. 16
Table 1.4: Glucose transporters and their function......................................................... 20
Table 1.5: The impact of heat stress on parameters of carbohydrate metabolism.......... 23
Table 1.6: The impact of heat stress on blood biomarkers of proteolysis...................... 29
Table 1.7: The impact of heat stress on biomarkers of lipid metabolism....................... 34
Table 1.8: The impact of in utero heat stress on postnatal phenotypes.......................... 41
Table 1.9: Phenotypic consequences of maternal nutrient restriction exposure
during early, mid, and late gestation................................................................................. 42
Table 1.10: The impact of in utero glucocorticoids on postnatal phenotypes................ 45
Table 2.1: Effects of gestational and adolescent thermal environments on body
temperature indices in growing pigs................................................................................. 83
Table 2.2: Effects of gestational and adolescent thermal environments on
production parameters in growing pigs............................................................................. 84
Table 3.1: Effects of in utero heat stress on core body temperature in growing pigs... 112
Table 3.2: Effects of in utero heat stress on thermoregulation parameters in
growing pigs.................................................................................................................... 113
Table 3.3: Effects of in utero heat stress on growth parameters in growing
pigs.................................................................................................................................. 114
Table 3.4: Effects of postnatal heat stress on bioenergetic parameters in growing
pigs.................................................................................................................................. 115
Table 4.1: Ingredients and chemical composition of diet for growing pigs (as-fed
basis)............................................................................................................................... 144
Table 4.2: Effect of in utero and postnatal environment on growth parameters
in growing pigs............................................................................................................... 145
vii
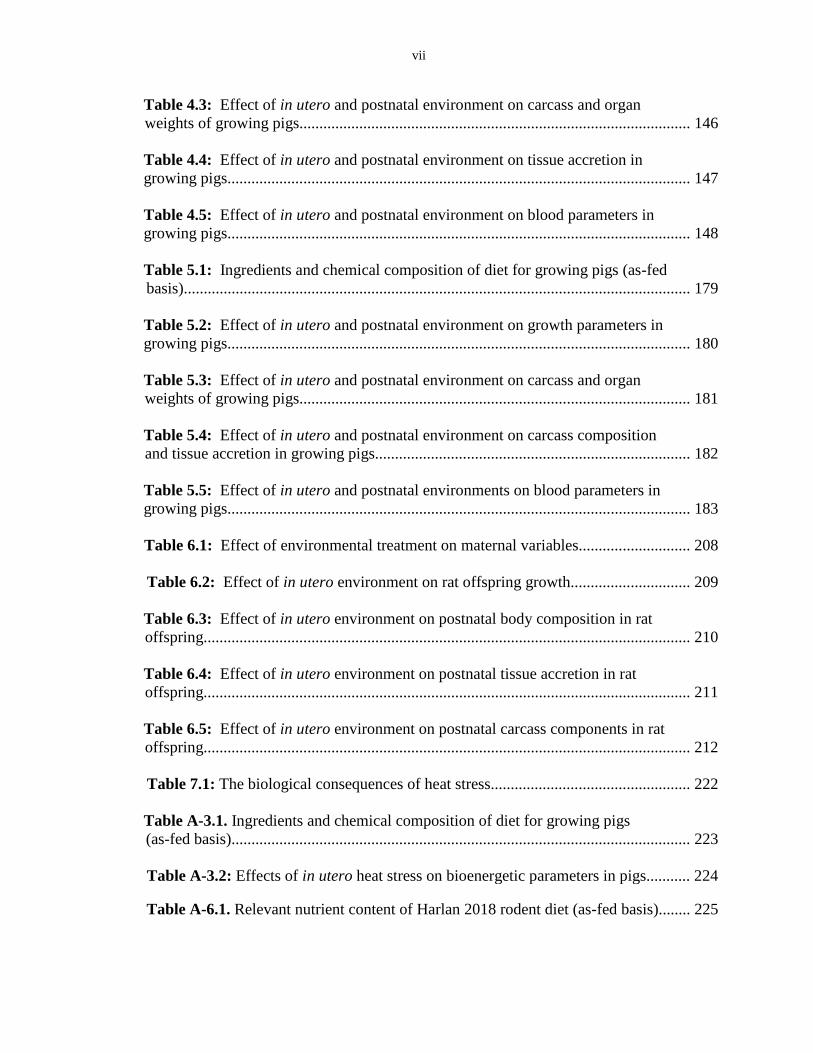
Table 4.3: Effect of in utero and postnatal environment on carcass and organ
weights of growing pigs.................................................................................................. 146
Table 4.4: Effect of in utero and postnatal environment on tissue accretion in
growing pigs.................................................................................................................... 147
Table 4.5: Effect of in utero and postnatal environment on blood parameters in
growing pigs.................................................................................................................... 148
Table 5.1: Ingredients and chemical composition of diet for growing pigs (as-fed
basis)............................................................................................................................... 179
Table 5.2: Effect of in utero and postnatal environment on growth parameters in
growing pigs.................................................................................................................... 180
Table 5.3: Effect of in utero and postnatal environment on carcass and organ
weights of growing pigs.................................................................................................. 181
Table 5.4: Effect of in utero and postnatal environment on carcass composition
and tissue accretion in growing pigs............................................................................... 182
Table 5.5: Effect of in utero and postnatal environments on blood parameters in
growing pigs.................................................................................................................... 183
Table 6.1: Effect of environmental treatment on maternal variables............................ 208
Table 6.2: Effect of in utero environment on rat offspring growth.............................. 209
Table 6.3: Effect of in utero environment on postnatal body composition in rat
offspring.......................................................................................................................... 210
Table 6.4: Effect of in utero environment on postnatal tissue accretion in rat
offspring.......................................................................................................................... 211
Table 6.5: Effect of in utero environment on postnatal carcass components in rat
offspring.......................................................................................................................... 212
Table 7.1: The biological consequences of heat stress.................................................. 222
Table A-3.1. Ingredients and chemical composition of diet for growing pigs
(as-fed basis)................................................................................................................... 223
Table A-3.2: Effects of in utero heat stress on bioenergetic parameters in pigs........... 224
Table A-6.1. Relevant nutrient content of Harlan 2018 rodent diet (as-fed basis)........ 225

viii
Table A-6.2: Effect of in utero environment on bioenergetic variables of fasted
rats.................................................................................................................................. 226
ix
LIST OF FIGURES
Figure 1.1: Protein turnover............................................................................................ 28
Figure 1.2: Lipogenesis................................................................................................... 32
Figure 1.3: Schematic of energy utilization.................................................................... 36
Figure 2.1: Effects of gestational and adolescent thermal environments on the
temporal changes in respiration rate, rectal temperature (Tre), and Tre averaged by
gestational and adolescent environment in growing pigs................................................. 85
Figure 2.2: Effects of gestational and adolescent thermal environments on the
temporal changes in ear skin temperature, shoulder skin temperature, rump skin
temperature and tail skin temperature in growing pigs................................................... 86
Figure 2.3: Linear regression (y = mx +b) of respiration rate as a function of rectal
temperature for gestational thermal neutral and gestational heat stress exposed pigs,
regardless of adolescent environment............................................................................. 87
Figure 3.1: Ambient temperature (Ta) by day of study................................................. 116
Figure 3.2: Effects of in utero environment on the temporal changes in core body
temperature (Tcore) averaged by in utero treatment and day of study in growing
pigs.................................................................................................................................. 117
Figure 3.3: Linear regression (y = mx + b) of core temperature (Tcore) as a function
of hour (0800-1500h)...................................................................................................... 118
Figure 3.4: Effects of in utero environment on the temporal changes in feed
intake (kg) averaged by in utero treatment and day of study in growing pigs............... 119
Figure 4.1: Effects of in utero and postnatal thermal environments on (A) respiration
rate (RR), and (B) rectal temperature (Tre) averaged by in utero and postnatal
environment in growing pigs.......................................................................................... 149
Figure 4.2: Effect of postnatal thermal environments on protein accretion (g/d) and
adipose accretion (g/d) in growing pigs.......................................................................... 150
Figure 4.3: Linear regression (y = mx + b) of (A) average daily gain (ADG) as
a function of feed intake (FI), (B) protein accretion (g/d) as a function of
FI, (C) adipose accretion (g/d) as a function of FI, and (D) the ratio of
adipose to protein accretion/d as a function of FI........................................................... 151
x
Figure 5.1: Effects of in utero and postnatal thermal environments on (A)
respiration rate (RR), and (B) rectal temperature (Tre) averaged by in utero and
postnatal environment in growing pigs.......................................................................... 184
Figure 5.2: Effect of in utero environments on (A) protein deposition (g/d),
(B) adipose deposition (g/d), and (C) the ratio of adipose to protein deposition
(g/g) averaged by in utero environment in growing pigs............................................... 185
Figure 6.1: Ambient temperature (˚C) by day of gestation in pregnant Sprague
Dawley rats..................................................................................................................... 213
Figure 6.2: Effects of maternal environment on the temporal changes in feed
intake (FI) in pregnant Sprague Dawley rats averaged by day of treatment.................. 214
Figure 6.3: Effects of maternal environment on the temporal changes in body
weight by day of gestation in pregnant Sprague Dawley rats......................................... 215
Figure 6.4: Effect of in utero environment on (A) percent lean tissue, and
(B) percent adipose tissue as determined by DXA scans on d26, d46, and d66
of postnatal life............................................................................................................... 216
Figure 6.5: Estimation of adipocyte size in the subcutaneous adipose tissue of rat
offspring.......................................................................................................................... 217
Figure A-1.1: Effects of heat stress on the metabolite/endocrine profile of growing
pigs.................................................................................................................................. 227
Figure A-3.1: Temporal pattern of core body temperature (Tcore) averaged by day
of study in growing pigs................................................................................................. 228
Figure A-3.2: Effects of gestational environment on the temporal changes in core
body temperature (Tcore) averaged by hour by period in growing pigs........................... 229
Figure A-3.3: Difference in core body temperature (Tcore) comparing pigs exposed
to in utero heat stress versus thermal neutral controls averaged by hour in
growing pigs.................................................................................................................... 230
Figure A-3.4: Effects of in utero environment on the temporal changes in core body
temperature (Tcore) averaged by hour by period in growing pigs.................................... 231
Figure A-3.5: Effects of in utero environment on the temporal changes in feed
intake (FI), and core body temperature (Tcore) during the second day of the
thermal neutral period (TN; constant 21.7 ± 0.7˚C) averaged by in utero
treatment and hour in growing pigs................................................................................ 232
xi
Figure A-3.6: Effects of in utero environment on the temporal changes in feed
intake (FI), and core body temperature (Tcore) during the sixth day of the first
heat stress period (HS1; 28 to 36˚C) averaged by in utero treatment
and hour in growing pigs................................................................................................ 233
Figure A-3.7: Effects of in utero environment on the temporal changes in
feed intake (FI), and core body temperature (Tcore) during the sixth day of
the second heat stress period (HS2; 28 to 36˚C) averaged by gestational
treatment and hour in growing pigs................................................................................ 234
Figure A-3.8: Hours above a threshold core temperature in growing pigs comparing
differences by period....................................................................................................... 235
Figure A-3.9: Effects of in utero environment on the temporal changes in respiration
rate (RR) averaged by in utero treatment and day of study in growing pigs.................. 236
Figure A-3.10: Effects of in utero environment on the temporal changes in (A) ear
skin temperature (Tear), (B) shoulder skin temperature (Tshoulder), (C) rump
skin temperature (Trump), and (D) tail skin temperature (Ttail) averaged by
in utero treatment and day of study in growing pigs..................................................... 237
Figure A-3.11: Circulating levels of (A) thyroxine (T4), (B) triiodothyronine (T3),
and (C) the ratio of T3 to T4 from serum obtained during the thermal neutral
period (TN), day two of the first heat stress period (HS1-D2), day five of the first
heat stress period (HS1-D5), day two of the second heat stress period (HS2-D2),
and day five of the second heat stress period (HS2-D5)................................................. 238
Figure A–4.1: Linear regression (y = mx + b) of (A) feed efficiency
(kg gain/kg feed) as a function of protein accretion (g/d), (B) feed efficiency
(kg gain/kg feed) as a function of adipose accretion (g/d), and (C) feed efficiency
(kg gain/kg feed) as a function of the ratio of adipose to protein accretion/d................ 239
Figure A-4.2: Rectal temperature (Tre) response comparing (A) sensitivity index
and (B) postnatal environment and sensitivity index interactions in growing pigs........ 240
Figure A-4.3: Effect of chronically elevated rectal temperature (Tre) on
(A) adipose accretion (g/d), (B) protein accretion (g/d), and (C) the ratio of
adipose to protein accretion (g/g), averaged by sensitivity in growing pigs................. 241
Figure A-6.1: Effects of maternal environment on the temporal changes in (A) core
body temperature (Tcore) averaged by day of treatment, and (B) tail skin temperature
(Tskin) averaged by day of treatment............................................................................... 242
Figure A-6.2: Effects of maternal environment on the temporal changes in feed
intake as a percent of BW in pregnant Sprague Dawley rats averaged by day of
treatment......................................................................................................................... 243
xii
Figure A-6.3: Effect of in utero environment on (A) epididymal fat pad weight (g),
and (B) epididymal fat pad as a percent of body weight................................................ 244
Figure A-6.4: Effect of in utero environment on (A) adipocyte number in
subcutaneous and visceral adipose samples, and (B) adipocyte size (microns2) in
subcutaneous and visceral adipose samples.................................................................... 245
Figure A-6.5: Effect of in utero environment on postnatal (A) lean tissue
accretion (g/g BW gain/d), (B) adipose tissue accretion (g/g/ BW gain/d), and
(C) the ratio of adipose to lean tissue accretion (g/g) as determined by DXA
scans on d 26 to 66 of postnatal life................................................................................ 246
xiii
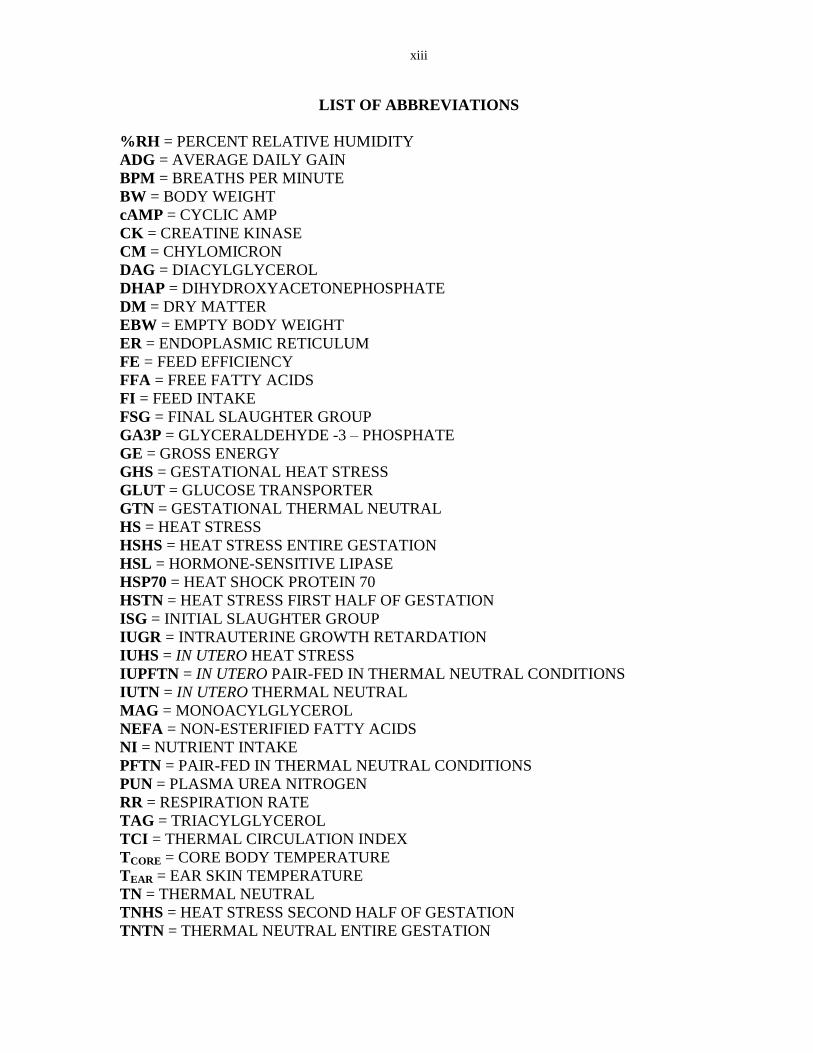
LIST OF ABBREVIATIONS
%RH = PERCENT RELATIVE HUMIDITY
ADG = AVERAGE DAILY GAIN
BPM = BREATHS PER MINUTE
BW = BODY WEIGHT
cAMP = CYCLIC AMP
CK = CREATINE KINASE
CM = CHYLOMICRON
DAG = DIACYLGLYCEROL
DHAP = DIHYDROXYACETONEPHOSPHATE
DM = DRY MATTER
EBW = EMPTY BODY WEIGHT
ER = ENDOPLASMIC RETICULUM
FE = FEED EFFICIENCY
FFA = FREE FATTY ACIDS
FI = FEED INTAKE
FSG = FINAL SLAUGHTER GROUP
GA3P = GLYCERALDEHYDE -3 – PHOSPHATE
GE = GROSS ENERGY
GHS = GESTATIONAL HEAT STRESS
GLUT = GLUCOSE TRANSPORTER
GTN = GESTATIONAL THERMAL NEUTRAL
HS = HEAT STRESS
HSHS = HEAT STRESS ENTIRE GESTATION
HSL = HORMONE-SENSITIVE LIPASE
HSP70 = HEAT SHOCK PROTEIN 70
HSTN = HEAT STRESS FIRST HALF OF GESTATION
ISG = INITIAL SLAUGHTER GROUP
IUGR = INTRAUTERINE GROWTH RETARDATION
IUHS = IN UTERO HEAT STRESS
IUPFTN = IN UTERO PAIR-FED IN THERMAL NEUTRAL CONDITIONS
IUTN = IN UTERO THERMAL NEUTRAL
MAG = MONOACYLGLYCEROL
NEFA = NON-ESTERIFIED FATTY ACIDS
NI = NUTRIENT INTAKE
PFTN = PAIR-FED IN THERMAL NEUTRAL CONDITIONS
PUN = PLASMA UREA NITROGEN
RR = RESPIRATION RATE
TAG = TRIACYLGLYCEROL
TCI = THERMAL CIRCULATION INDEX
TCORE = CORE BODY TEMPERATURE
TEAR = EAR SKIN TEMPERATURE
TN = THERMAL NEUTRAL
TNHS = HEAT STRESS SECOND HALF OF GESTATION
TNTN = THERMAL NEUTRAL ENTIRE GESTATION

xiv
TRE = RECTAL TEMPERATURE
TRUMP = RUMP SKIN TEMPERATURE
TSHOULDER = SHOULDER SKIN TEMPERATURE
TSKIN = SKIN TEMPERATURE
TTAIL = TAIL SKIN TEMPERATURE
VLDL = VERY LOW DENSITY LIPOPROTEIN
xv
ACKNOWLEDGEMENTS
I would like to thank my PhD committee for their counsel during my time at Iowa
State University; without their help and guidance the work described in this dissertation
would not have been possible. First, I express my gratitude and deep appreciation to my
major professor Dr. Lance Baumgard, who gave me the opportunity to join his laboratory and
has offered me unwavering support and motivation to better myself daily. I would also like
to thank my dissertation committee; specifically, Dr. Don Beitz for his input and mentorship
during my time at Iowa State, Dr. John Patience for his steadfast guidance and tolerance of
my constant stream of questions regarding bioenergetics, Dr. Jason Ross for his assistance in
experimental design, and Dr. Hongwei Xin for his help modeling thermal energy production
and willingness to provide assistance whenever asked.
In addition, I would like to thank my lab mates including Victoria Sanz Fernandez,
Amir Nayeri, Nathan Upah, Sara Stoakes, Mohannad Abuajamieh, Jake Seibert, Samantha
Lei, Anna Gabler, and the countless undergraduates that have been essential in the
completion of these experiments. Whether it was grinding pig carcasses, taking thermal
measurements, or simply discussing research, this dissertation would have been impossible
without your support.
I would also like to thank my parents, Steve and Mary Johnson, for instilling in me
the values of hard work and the drive to accomplish my goals. Finally, thank you to my wife
Theresa Johnson for her constant encouragement throughout our time in Ames and especially
for her continuing support as we begin a new chapter in our lives.
xvi
ABSTRACT
Heat stress (HS) is a key limiting factor to efficient animal production and negatively
impacts health and development during postnatal life. In addition, hyperthermia during in
utero development can permanently alter postnatal phenotypes and negatively impact future
animal performance. While the teratogenic effects of prenatal HS have been extensively
evaluated, the impact of in utero HS exposure on future mammalian thermoregulation,
nutrient partitioning, and bioenergetics is undefined. To determine the postnatal
consequences of in utero HS, pregnant first parity sows and rats were exposed to either
thermal neutral (TN) or HS conditions for the entire gestation, the first half, or second half of
gestation. To account for differences in maternal nutrient intake, we utilized an ad libitum
TN control group and a pair-fed TN control group of rats. Progeny were evaluated for
differences in production performance, nutrient partitioning, thermoregulation, and post-
absorptive metabolism. In a series of experiments, it was determined that prenatal HS
exposure increased postnatal adipose deposition at the expense of skeletal muscle mass and
permanently increased core body temperature during future development. When compared
with in utero HS-exposed rats, pair-fed TN exposed progeny had increased adipose tissue
and reduced lean tissue mass. In opposition to some previously published reports, postnatal
HS exposure seems to reduce maintenance costs, which may have implications toward
energy efficiency during times of thermal stress. In summary, HS modifies animal
metabolism and physiology during both pre- and postnatal development and reduces
livestock production efficiency.
1
CHAPTER I: LITERATURE REVIEW
Introduction
Environmentally induced heat stress (HS) results from the imbalance between thermal
energy flowing into and out of an animal (Kleiber, 1961), and negatively impacts health and
development. Typical responses to HS include slower and inconsistent growth, reduced milk
synthesis, poor fertility, altered metabolism, morbidity and mortality, and altered body
composition characterized by increased adiposity and reduced skeletal muscle mass (Collin
et al., 2001; Brown-Brandl et al., 2004; Baumgard and Rhoads, 2013). As climate models
predict an increase in extreme summer conditions for most U.S. animal producing areas, the
negative effects of HS will likely become more significant in the future (Luber and
McGeehin, 2008). Furthermore, because increased basal heat production is an unintended
consequence of most genetic selection programs (Brown-Brandl et al., 2004), some suggest
faster growing animals are more sensitive to HS (Nienaber and Hahn, 2007). In addition to
its aforementioned postnatal effects, HS during gestation can impact a variety of fetal
development parameters (Graham et al., 1998), and has the potential to adversely affect
animals lifetime productivity. Although primarily an animal welfare and economic issue in
developed countries, most third-world nations and small stakeholders lack the resources to
afford HS abatement strategies. Therefore, in these developing countries, climate change and
specifically HS is a food security and humanitarian concern (Baumgard and Rhoads, 2013).
Consequently, there is an urgent need to better understand the mechanisms by which HS
compromises efficient production of high quality animal protein.
2
Global Impact of Heat Stress
Climate Change
Heat stress-induced suboptimal animal performance is already a considerable
economic problem and food security issue. However, if climate change continues as
expected (Bernabucci et al., 2010), the negative consequences of HS could be a serious threat
to global animal agriculture. Climate change affects ambient temperature, weather patterns,
and sea levels, and it is thought that deforestation and green house gas emissions are a
significant contributor to the changing climate (U.S. EPA, 2013). According to the U.S.
Environmental Protection Agency (2013), average global temperatures are expected to
increase by 1.1 to 6.4˚C by 2100 and will warm at least twice as much as it has in the last 100
years. Further, an increase in the average temperature worldwide would likely cause more
frequent and intense extreme heat events with days over 32.2˚C expected to increase from 60
to 150 days annually in the U.S. alone (U.S. EPA, 2013). With increased frequency of heat
waves and periods of extreme high temperature expected, incidences of heat-related maladies
for humans and animals are likely to increase. Therefore, there is an urgent need to better
understand how hyperthermia affects physiology and ultimately productivity in agriculturally
important species.
Economic and Food Security Impacts of Heat Stress
The economic impact of HS-related maladies are estimated to account for billions of
dollars in lost revenue due to reduced production in almost every aspect of animal
agriculture. In the United States alone, estimated annual losses resulting from HS are greater
than $1.6 billion/year for dairy, beef, swine and poultry species (St-Pierre et al., 2003;
Pollman, 2010). Despite improved management practices and cooling technology (shade,
3
sprinklers, fans), animal productivity remains suboptimal during the summer months (St-
Pierre et al., 2003).
Economic losses continue to occur because animals are raised in regions and during
seasons where the ambient temperature ventures outside the zone of thermal comfort (St-
Pierre et al., 2003). During HS, efficiency is compromised because nutrients are diverted to
maintain euthermia as preserving a safe core temperature is of highest priority and product
synthesis is de-emphasized (Baumgard and Rhoads, 2013). The effects of HS are especially
evident in tropical and sub-tropical regions where many developing countries are located
(Battisti and Naylor, 2009; Muller et al., 2010). As a result, these regions may experience
extended periods of HS compared with temperate climates, making HS a significant
economic, food security, and humanitarian concern (Battisti and Naylor, 2009). Further, as
many developing countries (i.e., African nations, China, India) populations continue to
rapidly grow (Godfray et al., 2010), so will the need for increased food supply, thus
amplifying the negative consequences of economic and production losses due to HS.
Heat Related Illnesses in Humans and Animals
Elevated core temperature can negatively impact human and animal health, and in
extreme cases may result in mortality depending on the severity of the heat load (Jackson and
Rosenberg, 2010). In the U.S. from 1999 through 2003, 3,442 heat-related human deaths
were recorded where heat exposure was indicated as the cause (Jackson and Rosenberg,
2010). In addition, a California heat wave purportedly resulted in the death of more than
30,000 dairy cows (CDFA, 2006), and a recent heat wave in Iowa killed at least 4,000 head
of beef cattle (Drovers Cattle Network, 2011), illustrating that most geographical locales in
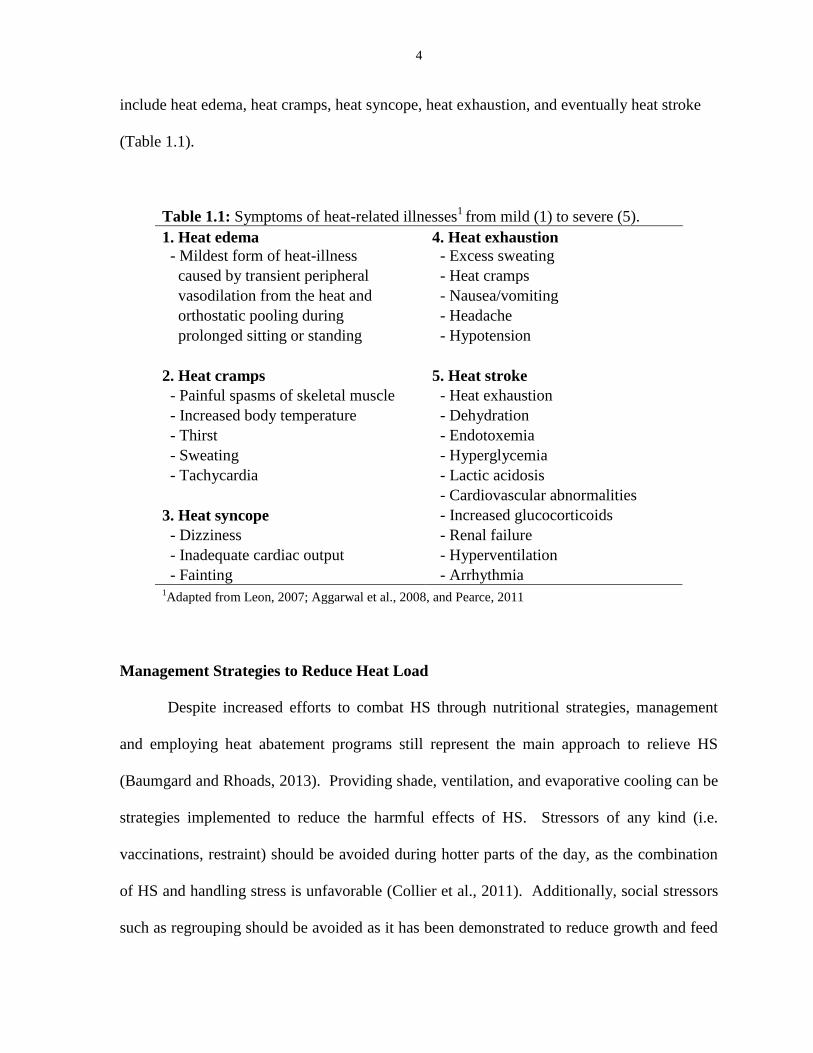
the U.S. are susceptible to extreme and lethal heat. Symptoms of heat-related illnesses
4
include heat edema, heat cramps, heat syncope, heat exhaustion, and eventually heat stroke
(Table 1.1).
Table 1.1: Symptoms of heat-related illnesses1
from mild (1) to severe (5).
1. Heat edema 4. Heat exhaustion
- Mildest form of heat-illness - Excess sweating
caused by transient peripheral - Heat cramps
vasodilation from the heat and - Nausea/vomiting
orthostatic pooling during - Headache
prolonged sitting or standing - Hypotension
2. Heat cramps 5. Heat stroke
- Painful spasms of skeletal muscle - Heat exhaustion
- Increased body temperature - Dehydration
- Thirst - Endotoxemia
- Sweating - Hyperglycemia
- Tachycardia - Lactic acidosis
- Cardiovascular abnormalities
3. Heat syncope - Increased glucocorticoids
- Dizziness - Renal failure
- Inadequate cardiac output - Hyperventilation
- Fainting - Arrhythmia 1Adapted from Leon, 2007; Aggarwal et al., 2008, and Pearce, 2011
Management Strategies to Reduce Heat Load
Despite increased efforts to combat HS through nutritional strategies, management
and employing heat abatement programs still represent the main approach to relieve HS
(Baumgard and Rhoads, 2013). Providing shade, ventilation, and evaporative cooling can be
strategies implemented to reduce the harmful effects of HS. Stressors of any kind (i.e.
vaccinations, restraint) should be avoided during hotter parts of the day, as the combination
of HS and handling stress is unfavorable (Collier et al., 2011). Additionally, social stressors
such as regrouping should be avoided as it has been demonstrated to reduce growth and feed
5
intake during HS (McGlone et al., 1987). Administration of aspirin and other non-steroidal
anti-inflammatory drugs should be avoided as they may exacerbate gastrointestinal integrity
issues (Stoakes et al., 2013). Further, although extensive engineering and animal expertise
must be considered, building design can have a significant impact on the health and well-
being of pigs and poultry, and must take into account animal heat and moisture production
responses to changing genetics, nutrition, and thermal environment (Brown-Brandl et al.,
2004).
Nutritional Strategies to Reduce Heat Load
Proper management strategies can be complemented by nutritional interventions
during periods of prolonged HS. Previous studies have demonstrated that insulin action
(Wheelock et al., 2010; Rhoads et al., 2013; Pearce et al., 2013a), heat of nutrient processing
(Curtis, 1983), and gut integrity (Lambert, 2002; Pearce et al., 2013b) can be significantly
impacted during HS, and can benefit from changes in diet composition or the addition of
nutritional supplements. Since proper insulin action is thought to be one of the key
components of successfully adapting to and surviving a heat load, enhancing insulin
sensitivity may be an effective tactic to improve animal performance during HS (Rhoads et
al., 2013). Tactics to improve sensitivity can include the addition of chromium (Mertz,
1993), lipoic acid (Diesel et al., 2007), or thiazolidinediones (Ranganathan et al., 2006) to the
diet, which are known to improve insulin sensitivity (Rhoads et al., 2013).
Dietary composition is another easily manipulated nutritional strategy that may
benefit animal health. During HS, growing pigs will reduce fasting heat production by 18%,
daily heat production by 22%, and the thermic effect of feed by 35% (Collin et al., 2001).
The reduced thermic effect of feeding is likely due to a reduction in feed intake, which while
6
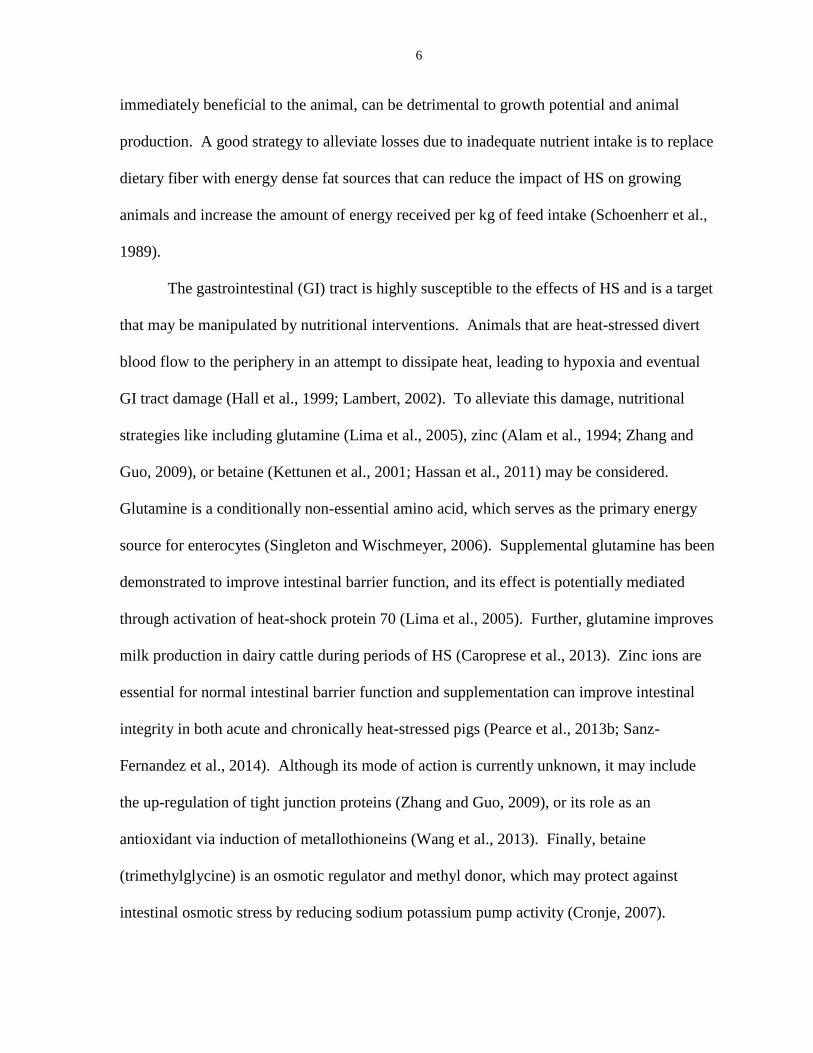
immediately beneficial to the animal, can be detrimental to growth potential and animal
production. A good strategy to alleviate losses due to inadequate nutrient intake is to replace
dietary fiber with energy dense fat sources that can reduce the impact of HS on growing
animals and increase the amount of energy received per kg of feed intake (Schoenherr et al.,
1989).
The gastrointestinal (GI) tract is highly susceptible to the effects of HS and is a target
that may be manipulated by nutritional interventions. Animals that are heat-stressed divert
blood flow to the periphery in an attempt to dissipate heat, leading to hypoxia and eventual
GI tract damage (Hall et al., 1999; Lambert, 2002). To alleviate this damage, nutritional
strategies like including glutamine (Lima et al., 2005), zinc (Alam et al., 1994; Zhang and
Guo, 2009), or betaine (Kettunen et al., 2001; Hassan et al., 2011) may be considered.
Glutamine is a conditionally non-essential amino acid, which serves as the primary energy
source for enterocytes (Singleton and Wischmeyer, 2006). Supplemental glutamine has been
demonstrated to improve intestinal barrier function, and its effect is potentially mediated
through activation of heat-shock protein 70 (Lima et al., 2005). Further, glutamine improves
milk production in dairy cattle during periods of HS (Caroprese et al., 2013). Zinc ions are
essential for normal intestinal barrier function and supplementation can improve intestinal
integrity in both acute and chronically heat-stressed pigs (Pearce et al., 2013b; Sanz-
Fernandez et al., 2014). Although its mode of action is currently unknown, it may include
the up-regulation of tight junction proteins (Zhang and Guo, 2009), or its role as an
antioxidant via induction of metallothioneins (Wang et al., 2013). Finally, betaine
(trimethylglycine) is an osmotic regulator and methyl donor, which may protect against
intestinal osmotic stress by reducing sodium potassium pump activity (Cronje, 2007).
7
Additionally, betaine ameliorates the effects of HS on weight gain, immunity and body
temperature indices in rabbits (Hassan et al., 2011), and improves milk production
parameters in dairy cattle (Peterson et al., 2012; Dunshea et al., 2013). Despite some
documentation of the positive effects of betaine supplementation, lack of sufficient evidence
in support of or against its role in HS alleviation warrants the need for further investigation
(Stoakes et al., 2013).
Direct and Indirect Effects of Heat Stress
Reduced feed intake during HS is a highly conserved response among livestock
species (Reneaudeau et al., 2008; Baumgard et al., 2012), and presumably represents an
attempt to decrease metabolic heat production (Whittow, 1971). It has traditionally been
assumed that inadequate feed intake caused by an excessive thermal load was responsible for
decreased animal production (Fuquay, 1981; Beede and Collier, 1986; Collin et al., 2001).
However, recent results challenge this dogma, as disparate slopes in feed intake and milk
yield exist in response to cyclical heat load (Shwartz et al., 2009), and growth rate of heat-
stressed pigs is increased compared to pair-fed animals despite similar reductions in nutrient
intake (Pearce et al., 2013a). These studies employ the use of a thermal neutral pair-fed
group that allows for evaluating thermal stress while eliminating the confounding effects of
dissimilar nutrient intake. Using this model, previous experiments have demonstrated that
reduced feed intake only explains 35-50% of decreased milk yield in dairy cattle during
environmentally induced hyperthermia (Rhoads et al., 2009; Wheelock et al., 2010;
Baumgard et al., 2012). Further, heat-stressed gilts do not lose as much body weight and
condition as their pair-fed counterparts (Pearce et al., 2013a), and heat-stressed lambs lose
more body weight compared to pair-fed counterparts (Mahjoubi et al., 2014). Although the
8
direct impact of HS appears to differ between monogastrics and ruminants (i.e., pigs grow
faster while lambs lose weight), these data indicate that HS imposes direct effects
independently of reduced feed intake. Furthermore, the composition of body weight gain in
HS-exposed animals is presumably skewed towards adipose production at the expense of
lean muscle mass synthesis, while pair-fed animals gain lean tissue at the expense of adipose
production (Heath, 1983; Sano et al., 1983; Geraert et al., 1996; Ronchi et al., 1999).
Although the pair-fed thermal neutral (PFTN) model attempts to separate the direct
and indirect effects of HS, some limitations should be considered. The negative
consequences of HS on productivity may be mediated by reduced intestinal integrity (Pearce
et al., 2013b; Sanz Fernandez et al., 2014), likely due to decreased intestinal blood flow
(Lambert et al., 2002). Reduced blood flow leads to hypoxia at the intestinal epithelium,
which can alter intestinal morphology, and may increase the permeability of tight junctions
(Yan et al., 2006; Pearce et al., 2013b). Enhanced intestinal permeability can increase the
risk of bacterial translocation (Baumgart and Dignass, 2002), and may decrease nutrient
digestibility and absorption in heat-stressed animals as suggested by Pearce and colleagues
(2013b), likely putting HS pigs at an even lower plane of nutrition than pair feeding can
account for. However, it is important to note that nutrient restriction may also increase
intestinal permeability (Ferraris and Carey, 2000; Pearce et al., 2013b), but it is unknown to
what extent this occurs when compared to heat-stressed animals. In addition, voluntarily
reduced FI during HS is likely a strategy to reduce basal heat production (i.e., the thermic
effect of feeding) in a concerted effort to acclimate to hyperthermia (Curtis, 1983). Whereas,
limit-feeding pigs in TN conditions may initiate a stress response resulting in increased
activity levels, abnormal behavior, and enhanced stress hormone production since nutrient
9
restriction in PFTN pigs is involuntary. Therefore, it is likely that PFTN animals are not only
nutrient restricted, but may also be under greater or differing levels of psychological stress
compared to HS counterparts. A report by our lab (Pearce et al., 2013a) indicated that pair
feeding reduces core body temperature when compared to pigs fed ad libitum and raised in
thermal neutral (TN) conditions. This core temperature decrease could result from reduced
heat production from nutrient processing (i.e., the thermic effect of feeding), and in an
attempt to maintain homeothermy, PFTN pigs may increase fasting heat production
compared to HS pigs. Increased fasting heat production would imply greater maintenance
costs, thus reducing energy efficiency in PFTN pigs compared to HS counterparts. Finally,
because PFTN pigs lose more BW when compared to heat-stressed counterparts (Pearce et
al., 2013a), nutrient restriction in HS-exposed pigs may not be as metabolically stressful
compared to PFTN pigs. Pair feeding as a percent of BW can help mitigate nutrient intake
differences due to altered rates of BW gain. However, despite its limitations the PFTN
model is currently the best method to minimize the confounding effects of dissimilar FI
during HS experiments.
Thermoregulatory Response to Heat Stress
Thermoregulation
In the short-term, an animals HS response is to increase heat loss by the body in an
attempt to remain euthermic. As a result, animals can maintain normal production within a
wide range of ambient temperatures and environments (DeShazer, 2009). Temperature
regulation can be achieved through alterations in animal physiology, behavior, and
morphology (Angilletta, 2009), and these changes serve to preserve thermal homeostasis so
10
that thermal input equals heat loss to the environment (DeShazer, 2009). Control of thermal
exchange starts at the level of the neuron and external temperature is sensed by
thermoreceptors located throughout the body (Curtis, 1983). These receptors react to
changes in ambient temperature by increasing their firing rate in reaction to either warm
(warm receptors) or cold (cold receptors) external temperatures. The rate of firing is not in
response to absolute temperature, but instead to rapid changes in temperature (Curtis, 1983).
This ability to collect temperature information from many parts of the body initiates a
physiological or behavioral response allowing for an appropriate feedback to a changing
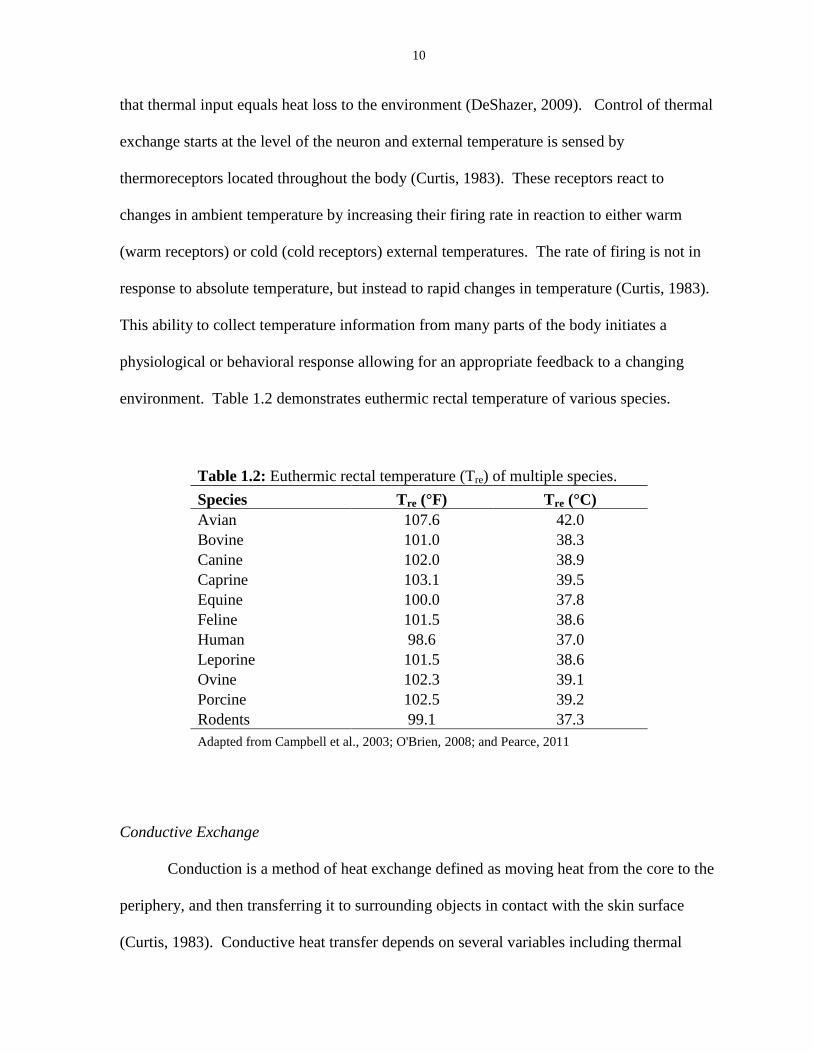
environment. Table 1.2 demonstrates euthermic rectal temperature of various species.
Table 1.2: Euthermic rectal temperature (Tre) of multiple species.
Species Tre (°F) Tre (°C)
Avian 107.6 42.0
Bovine 101.0 38.3
Canine 102.0 38.9
Caprine 103.1 39.5
Equine 100.0 37.8
Feline 101.5 38.6
Human 98.6 37.0
Leporine 101.5 38.6
Ovine 102.3 39.1
Porcine 102.5 39.2
Rodents 99.1 37.3
Adapted from Campbell et al., 2003; O'Brien, 2008; and Pearce, 2011
Conductive Exchange
Conduction is a method of heat exchange defined as moving heat from the core to the
periphery, and then transferring it to surrounding objects in contact with the skin surface
(Curtis, 1983). Conductive heat transfer depends on several variables including thermal
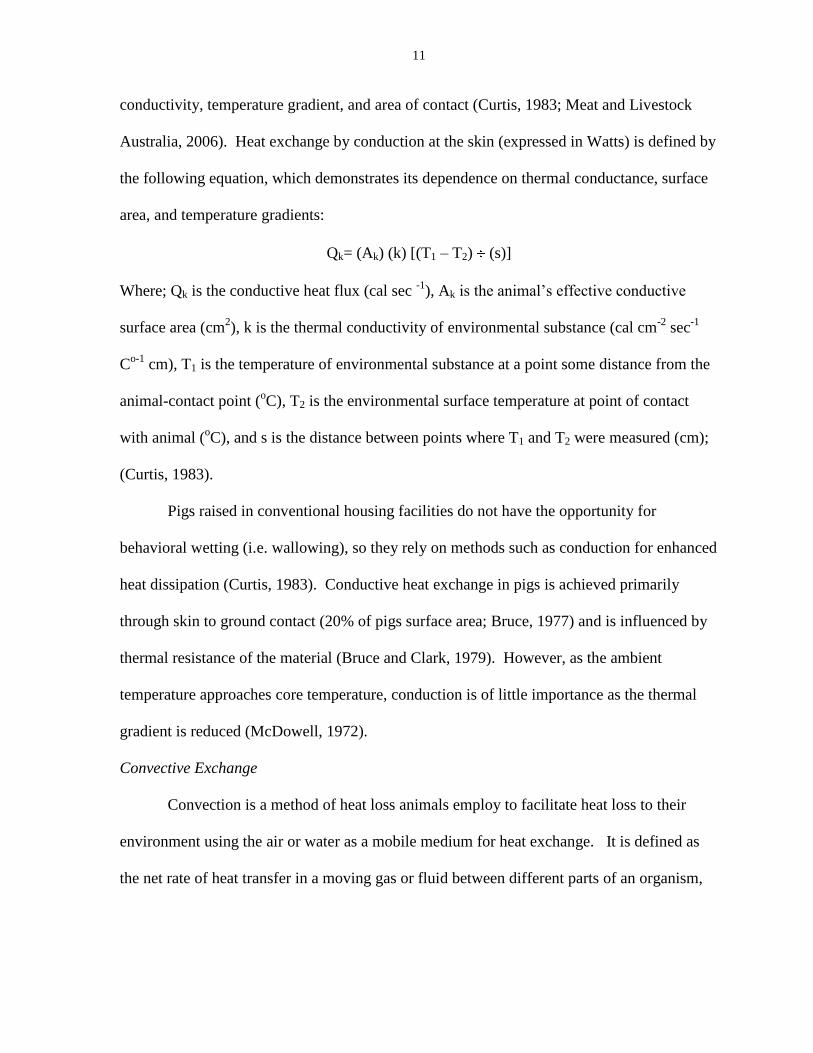
11
conductivity, temperature gradient, and area of contact (Curtis, 1983; Meat and Livestock
Australia, 2006). Heat exchange by conduction at the skin (expressed in Watts) is defined by
the following equation, which demonstrates its dependence on thermal conductance, surface
area, and temperature gradients:
Qk= (Ak) (k) [(T1 – T2) (s)]
Where; Qk is the conductive heat flux (cal sec -1
), Ak is the animal’s effective conductive
surface area (cm2), k is the thermal conductivity of environmental substance (cal cm
-2 sec
-1
Co-1
cm), T1 is the temperature of environmental substance at a point some distance from the
animal-contact point (oC), T2 is the environmental surface temperature at point of contact
with animal (oC), and s is the distance between points where T1 and T2 were measured (cm);
(Curtis, 1983).
Pigs raised in conventional housing facilities do not have the opportunity for
behavioral wetting (i.e. wallowing), so they rely on methods such as conduction for enhanced
heat dissipation (Curtis, 1983). Conductive heat exchange in pigs is achieved primarily
through skin to ground contact (20% of pigs surface area; Bruce, 1977) and is influenced by
thermal resistance of the material (Bruce and Clark, 1979). However, as the ambient
temperature approaches core temperature, conduction is of little importance as the thermal
gradient is reduced (McDowell, 1972).
Convective Exchange
Convection is a method of heat loss animals employ to facilitate heat loss to their
environment using the air or water as a mobile medium for heat exchange. It is defined as
the net rate of heat transfer in a moving gas or fluid between different parts of an organism,
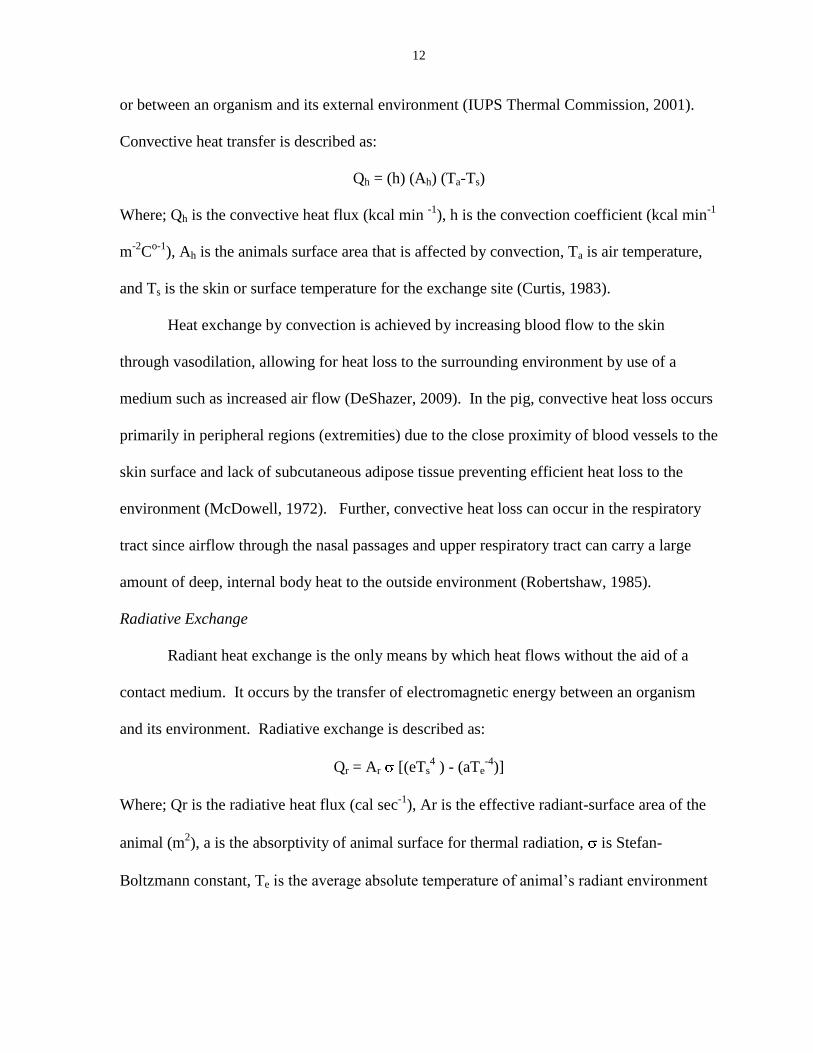
12
or between an organism and its external environment (IUPS Thermal Commission, 2001).
Convective heat transfer is described as:
Qh = (h) (Ah) (Ta-Ts)
Where; Qh is the convective heat flux (kcal min -1
), h is the convection coefficient (kcal min-1
m-2
Co-1
), Ah is the animals surface area that is affected by convection, Ta is air temperature,
and Ts is the skin or surface temperature for the exchange site (Curtis, 1983).
Heat exchange by convection is achieved by increasing blood flow to the skin
through vasodilation, allowing for heat loss to the surrounding environment by use of a
medium such as increased air flow (DeShazer, 2009). In the pig, convective heat loss occurs
primarily in peripheral regions (extremities) due to the close proximity of blood vessels to the
skin surface and lack of subcutaneous adipose tissue preventing efficient heat loss to the
environment (McDowell, 1972). Further, convective heat loss can occur in the respiratory
tract since airflow through the nasal passages and upper respiratory tract can carry a large
amount of deep, internal body heat to the outside environment (Robertshaw, 1985).
Radiative Exchange
Radiant heat exchange is the only means by which heat flows without the aid of a
contact medium. It occurs by the transfer of electromagnetic energy between an organism
and its environment. Radiative exchange is described as:
Qr = Ar [(eTs4 ) - (aTe
-4)]
Where; Qr is the radiative heat flux (cal sec-1
), Ar is the effective radiant-surface area of the
animal (m2), a is the absorptivity of animal surface for thermal radiation, is Stefan-
Boltzmann constant, Te is the average absolute temperature of animal’s radiant environment
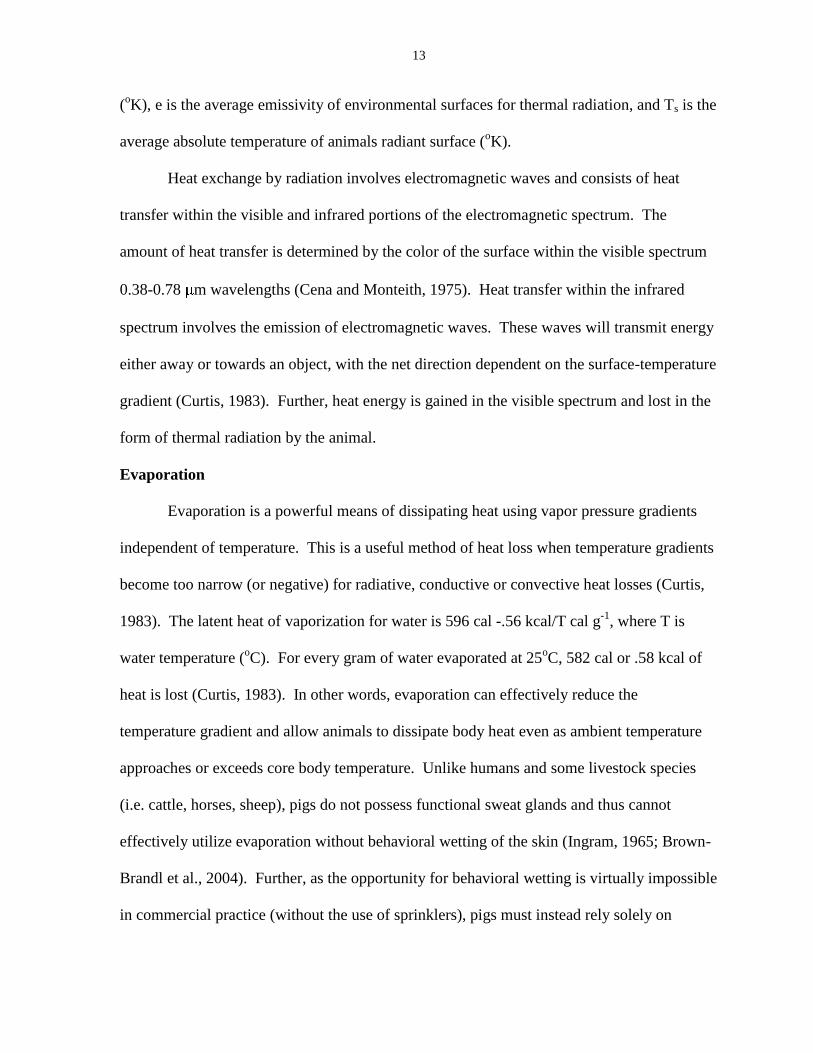
13
(oK), e is the average emissivity of environmental surfaces for thermal radiation, and Ts is the
average absolute temperature of animals radiant surface (oK).
Heat exchange by radiation involves electromagnetic waves and consists of heat
transfer within the visible and infrared portions of the electromagnetic spectrum. The
amount of heat transfer is determined by the color of the surface within the visible spectrum
0.38-0.78 m wavelengths (Cena and Monteith, 1975). Heat transfer within the infrared
spectrum involves the emission of electromagnetic waves. These waves will transmit energy
either away or towards an object, with the net direction dependent on the surface-temperature
gradient (Curtis, 1983). Further, heat energy is gained in the visible spectrum and lost in the
form of thermal radiation by the animal.
Evaporation
Evaporation is a powerful means of dissipating heat using vapor pressure gradients
independent of temperature. This is a useful method of heat loss when temperature gradients
become too narrow (or negative) for radiative, conductive or convective heat losses (Curtis,
1983). The latent heat of vaporization for water is 596 cal -.56 kcal/T cal g-1
, where T is
water temperature (oC). For every gram of water evaporated at 25
oC, 582 cal or .58 kcal of
heat is lost (Curtis, 1983). In other words, evaporation can effectively reduce the
temperature gradient and allow animals to dissipate body heat even as ambient temperature
approaches or exceeds core body temperature. Unlike humans and some livestock species
(i.e. cattle, horses, sheep), pigs do not possess functional sweat glands and thus cannot
effectively utilize evaporation without behavioral wetting of the skin (Ingram, 1965; Brown-
Brandl et al., 2004). Further, as the opportunity for behavioral wetting is virtually impossible
in commercial practice (without the use of sprinklers), pigs must instead rely solely on
14
increasing respiration rate (RR) as their primary route of latent heat loss (Baumgard et al.,
2012).
Respiration
Increasing RR is employed by nearly all heat-stressed animals and effectively
decreases a heat load through the evaporation of water from the respiratory tract
(Robertshaw, 1985). This is particularly important for pigs as they do not possess functional
sweat glands and must rely solely on heat dissipation through the skin or respiratory tract
evaporation during times of HS (Ingram, 1965). Elevated respiratory ventilation (panting)
due to heat exposure involves increased ventilation of dead space without a subsequent
change in alveolar ventilation. This is because the frequency of RR is increasing while the
tidal volume decreases (Robertshaw, 1985).
Countercurrent heat exchange occurs in the mucosa of the upper respiratory tract,
where deep body heat and moisture are provided by the blood to the nasal mucosa, while
cooled blood drains into the venous sinuses at the base of the skull. There, it joins blood
draining from the head and encircles the rete mirabile (a network of veins and arteries) to
utilize countercurrent blood flow and maintain a temperature gradient (Robertshaw, 1985).
As deep body temperature increases, RR will increase until it reaches a maximal value
(Findlay and Whittow, 1966). In mild HS, an increase in RR and minute volume (volume of
gas inhaled or exhaled) occurs with a corresponding decrease in tidal volume; however, a rise
in core body temperature will cause the RR to decrease while the tidal and minute volume
increases (Findlay and Whittow, 1966; Whittow, 1971). The transition from elevated RR
with low tidal volume to reduced RR and increased tidal volume represents a breakdown in
15
thermal polypnea as a physiological mechanism permitting maximum respiratory cooling
without disturbing blood gas homeostasis (Whittow, 1965, 1971).
Feed Intake
The primary consequence of HS on whole-body energy balance is the reductive effect
it has on feed intake (FI), and this has been well-documented in livestock species
(Reneaudeau, 2008, 2010; Baumgard and Rhoads, 2013). In general, consuming feed
increases basal heat production (i.e. the thermic effect of feeding; Curtis, 1983), which is a
disadvantage during HS and requires enhanced heat loss to maintain homeothermy (Whittow,
1971; Speakman and Krol, 2010). The thermic effect of feeding is defined as the difference
between total heat production minus fasting heat production and heat production due to
physical activity (Van Milgen and Noblet, 2000). Processes such as nutrient fermentation
and metabolism are thought to be the primary contributors to FI-induced heat production
(Curtis, 1983; Van Milgen and Noblet, 2003). Heat production by fermentation occurs due
to heat produced anaerobically by microbes in the digestive tract (Curtis, 1983). In
ruminants for example, the amount of heat produced by this process can range from about 0.8
kcal hr-1
per kg of concentrates, to about 0.4 kcal hr-1
per kg of roughages and accounts for
approximately 5% of a ruminant animals total heat production under normal conditions
(Curtis, 1983). In addition, nutrient metabolism also contributes to the thermic effect of
feeding since the bioconversion of nutrients is an inefficient process resulting in the loss of
consumed energy as heat (Van Milgen and Noblet, 2003). By reducing FI during times of
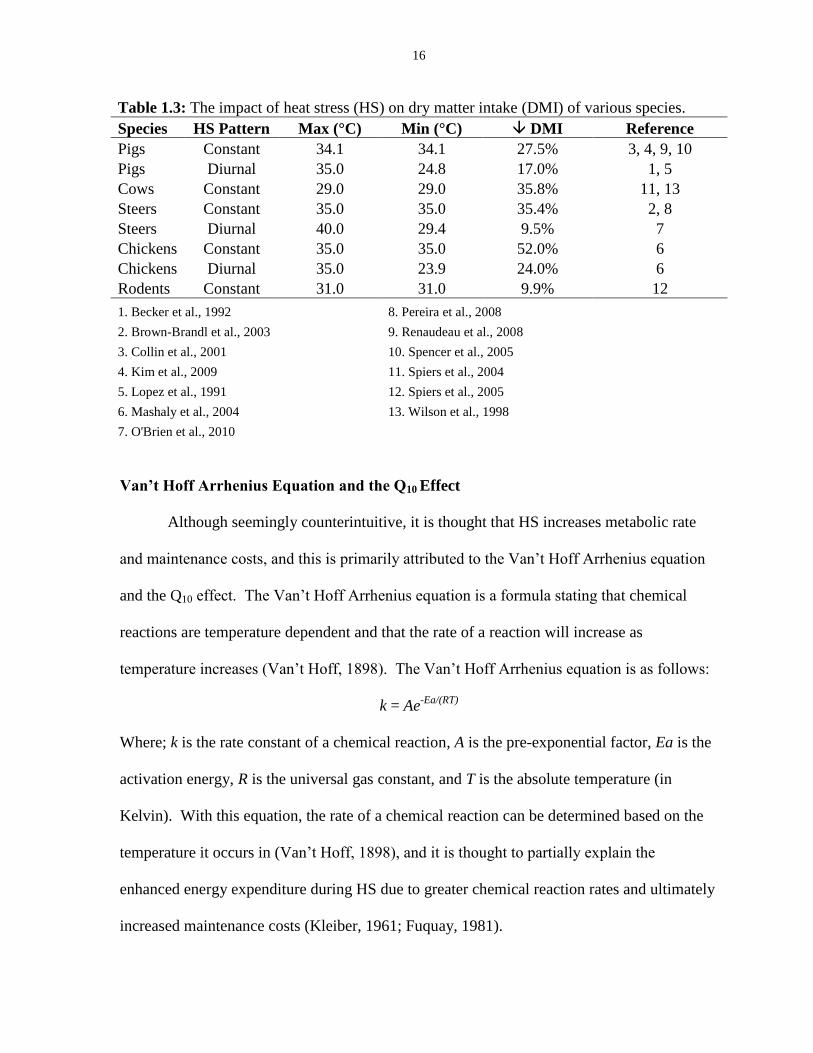
HS, pigs can help balance their heat production with their heat loss. Table 1.3 demonstrates
the impact of HS on dry matter intake of various species under constant or diurnal patterns of
HS.
16
Table 1.3: The impact of heat stress (HS) on dry matter intake (DMI) of various species.
Species HS Pattern Max (°C) Min (°C) DMI Reference
Pigs Constant 34.1 34.1 27.5% 3, 4, 9, 10
Pigs Diurnal 35.0 24.8 17.0% 1, 5
Cows Constant 29.0 29.0 35.8% 11, 13
Steers Constant 35.0 35.0 35.4% 2, 8
Steers Diurnal 40.0 29.4 9.5% 7
Chickens Constant 35.0 35.0 52.0% 6
Chickens Diurnal 35.0 23.9 24.0% 6
Rodents Constant 31.0 31.0 9.9% 12
1. Becker et al., 1992 8. Pereira et al., 2008
2. Brown-Brandl et al., 2003 9. Renaudeau et al., 2008
3. Collin et al., 2001 10. Spencer et al., 2005
4. Kim et al., 2009 11. Spiers et al., 2004
5. Lopez et al., 1991 12. Spiers et al., 2005
6. Mashaly et al., 2004 13. Wilson et al., 1998
7. O'Brien et al., 2010
Van’t Hoff Arrhenius Equation and the Q10 Effect
Although seemingly counterintuitive, it is thought that HS increases metabolic rate
and maintenance costs, and this is primarily attributed to the Van’t Hoff Arrhenius equation
and the Q10 effect. The Van’t Hoff Arrhenius equation is a formula stating that chemical
reactions are temperature dependent and that the rate of a reaction will increase as
temperature increases (Van’t Hoff, 1898). The Van’t Hoff Arrhenius equation is as follows:
k = Ae-Ea/(RT)
Where; k is the rate constant of a chemical reaction, A is the pre-exponential factor, Ea is the
activation energy, R is the universal gas constant, and T is the absolute temperature (in
Kelvin). With this equation, the rate of a chemical reaction can be determined based on the
temperature it occurs in (Van’t Hoff, 1898), and it is thought to partially explain the
enhanced energy expenditure during HS due to greater chemical reaction rates and ultimately
increased maintenance costs (Kleiber, 1961; Fuquay, 1981).
17
Alternatively, the Q10 effect states that the rate of the reaction will increase for every
10-degree rise in temperature (T; Whittow, 1971). The Q10 equation is as follows:
Q10 = (R2/R1) 10/(T
2 – T
1)
Where; R2 and R1 are the final and initial rates of the reaction, and T2 and T1 are the final and
initial temperatures at which the reaction takes place. Using this equation, it can be
determined if the rate of a reaction is temperature independent (Q10 > 1) or dependent (Q10 <
1). The more temperature dependent a physiological process is the greater its Q10 value
becomes, thus increasing the need to reduce heat production (i.e. reduced FI) and decrease
the Q10 value (Whittow, 1971).
Adaptation and Acclimation
In the long-term, the normal animal response to HS is adaptation, and this can be
achieved through both physical and physiological changes over time (Yousef, 1985).
Adaptation is defined as a change that reduces the physiological strain produced by a
stressful component of the total environment over an animal’s lifetime (Yousef, 1985). It
involves either genotypic adaptations that can occur across generations by influencing
changes in a species to favor survival in a particular environment, or phenotypic alterations
that reduce physiological strain placed on an animal within its lifetime (Yousef, 1985).
Physical adaptations often occur due to genetic selection or heritable characteristics
transferred across generations. For example, pigs (Renaudeau et al., 2008) and cattle
(Robertshaw et al., 1985) from subtropical regions are better adapted to HS than those from
temperate areas due to physical adaptations (i.e. hair coat color and consistency, limb size,
and skin thickness; Brody 1956; Robertshaw, 1985; Renaudeau et al., 2008). Physiological
adaptations can be metabolic or physiologic adjustments within the cell or tissues resulting
18
from a long-term stress exposure that improves the ability of the animal to cope with a
subsequent challenge (Young et al., 1989). Unlike physical adaptations, physiological
adaptations do not involve the passage of genetic material from one generation to the next to
allow an individual to survive (Young et al., 1989). Instead, they involve changes in
metabolism, blood flow and sweating that allow for long-term animal survival (Young et al.,
1989).
Sometimes confused with adaptation, acclimation is defined as the functional
compensation over a period of days to weeks in response to a single environmental factor as
in controlled experiments used as models to predict animal response to climate change
(Gaughan, 2012). Typically these studies are short term and do not truly reflect long-term
adaptations. Acclimation is illustrated by gradual reductions in core temperature, improved
feed intake, or reduced respiration rates in response to HS (Gaughan, 2012). Further, the
acclimation response is highly variable between individuals and may occur at different rates
or stages throughout the period of the insult (Gaughan, 2012).
Nutrient Metabolism and Partitioning
Nutrient metabolism is defined simply as the utilization of foods by living organisms
for normal growth, reproduction and maintenance of health (Slavin, 2013). Nutrients in the
organic or carbon-containing group make up the bulk of diet and provide energy and
essential organic compounds required for life. Organic macronutrients include carbohydrates
(sugar and starches), protein, and fats, which are obtained through the digestion and
metabolism of various plant and animal foods. Although many energy sources can be
19
considered nutrients, the aforementioned are generally considered the primary sources of
energy in living systems (Slavin, 2013).
Carbohydrates
Carbohydrates are the most abundant organic components in most fruits, vegetables,
legumes and cereal grains, and typically provide all the dietary glucose used by omnivore
monogastrics (Leturque and Brot-Laroche, 2013). Glucose is an essential energy source in
tissues that may be derived from the diet (sugars and starches), glycogen stores, or by
synthesis in vivo from gluconeogenic precursors such as amino acid carbon skeletons
(Leturque and Brot-Laroche, 2013). Additionally, glucose serves as a precursor for lactose in
milk production, ribose in nucleic acid synthesis, and the sugar residues found in covalently
bound constituents of glycoproteins, glycolipids, and proteoglycans in the body (Leturque
and Brot-Laroche, 2013). Although carbohydrates can be classified into available (sugar and
starch) or nonavailable (fiber) sources, most in the modern commercial pig diet fall into the
available category.
Digestion and Absorption
Digestible carbohydrates include: monosaccharides, disaccharides, oligosaccharides,
and polysaccharides (Leturque and Brot-Laroche, 2013). Digestion begins at the mouth by
action of the enzyme α-amylase (Leturque and Brot-Laroche, 2013). Production and
secretion of α-amylase is restricted to the salivary and pancreatic exocrine glands located in
the mouth and small intestines, respectively. As food is chewed and mixed with saliva, α-
amylase starts the process of carbohydrate breakdown, but its action is halted once the food
mixes with the acidic secretions of the stomach since α-amylase activity requires neutral pH
(Rosenblum et al., 1988). Once in the stomach, food is mechanically and chemically
20
digested and it enters the duodonem where pancreatic α-amylase breaks down poly- and
oligosaccharides into monosaccharides (glucose and fructose) for absorption (Leturque and
Brot-Laroche, 2013). Glucose is transported into the enterocyte by SGLT transporters that
function using a sodium-potassium pump, while fructose passes through by facilitated
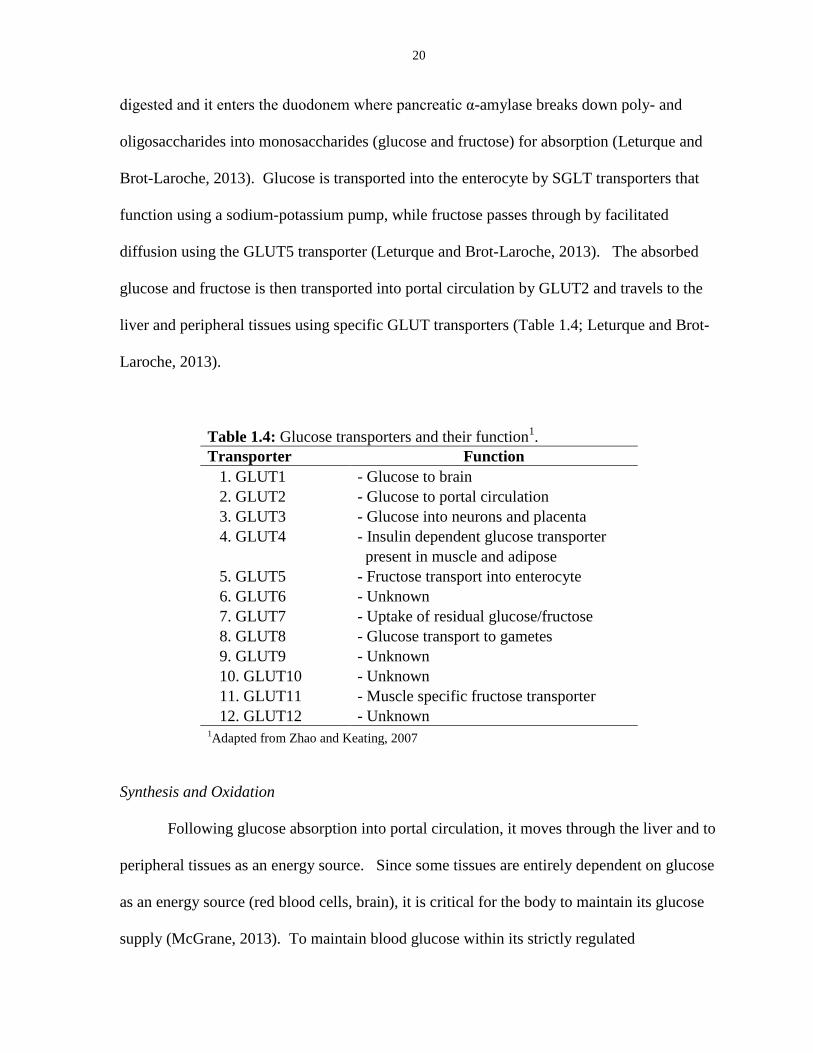
diffusion using the GLUT5 transporter (Leturque and Brot-Laroche, 2013). The absorbed
glucose and fructose is then transported into portal circulation by GLUT2 and travels to the
liver and peripheral tissues using specific GLUT transporters (Table 1.4; Leturque and Brot-
Laroche, 2013).
Table 1.4: Glucose transporters and their function1.
Transporter Function
1. GLUT1 - Glucose to brain
2. GLUT2 - Glucose to portal circulation
3. GLUT3 - Glucose into neurons and placenta
4. GLUT4 - Insulin dependent glucose transporter
present in muscle and adipose
5. GLUT5 - Fructose transport into enterocyte
6. GLUT6 - Unknown
7. GLUT7 - Uptake of residual glucose/fructose
8. GLUT8 - Glucose transport to gametes
9. GLUT9 - Unknown
10. GLUT10 - Unknown
11. GLUT11 - Muscle specific fructose transporter
12. GLUT12 - Unknown 1Adapted from Zhao and Keating, 2007
Synthesis and Oxidation
Following glucose absorption into portal circulation, it moves through the liver and to
peripheral tissues as an energy source. Since some tissues are entirely dependent on glucose
as an energy source (red blood cells, brain), it is critical for the body to maintain its glucose
supply (McGrane, 2013). To maintain blood glucose within its strictly regulated
21
concentration range (4 to 6 mmol/L in humans), the body is able to produce glucose by
breaking down hepatic glycogen stores and by endogenous biosynthesis (McGrane, 2013).
The balance among the glucose oxidation, biosynthesis, and glucose storage is dependent
upon the hormonal and nutritional state of the cell, tissue and organism.
Glycolysis begins the oxidation process of glucose. It involves the catabolism of
glucose (6 carbons) to two pyruvates (3 carbon/pyruvate) in a series of reactions (Berg et al.,
2007), and acts as an intermediate for other pathways such as lipid metabolism, the pentose
phosphate pathway, and the TCA cycle. In addition to oxidizing pyruvate, the TCA cycle is
also involved in some pathways of glucose synthesis (gluconeogenesis). Gluconeogenesis
results in the generation of glucose from non-carbohydrate carbon substrates such as
propionate, pyruvate, lactate, glycerol, and gluconeogenic amino acids (Berg et al., 2007).
Primarily, gluconeogenesis occurs in the liver during periods of fasting, starvation, low
dietary carbohydrates, and intense exercise, and is highly endergonic until ATP or GTP are
utilized, making the process exergonic (Berg et al., 2013).
Heat Stress and Carbohydrate Metabolism
During HS, carbohydrate utilization is amplified (Streffer, 1988), and this has been
demonstrated in pigs (Pearce et al., 2013a) and cattle (Wheelock et al., 2010). Acute HS was
first reported to cause hypoglycemia in cats (Lee and Scott, 1916) and originally thought to
be responsible for reduced worker productivity in summer months (Baumgard and Rhoads,
2013). Additionally, athletes exercising at high ambient temperatures have consistently
elevated hepatic glucose production and whole-body enhanced carbohydrate oxidation at the
expense of lipids (Fink et al., 1975; Febbraio, 2001). Moreover, exogenous glucose is unable
to blunt hepatic glucose output (Angus et al., 2001), likely due to increased glycogenolysis
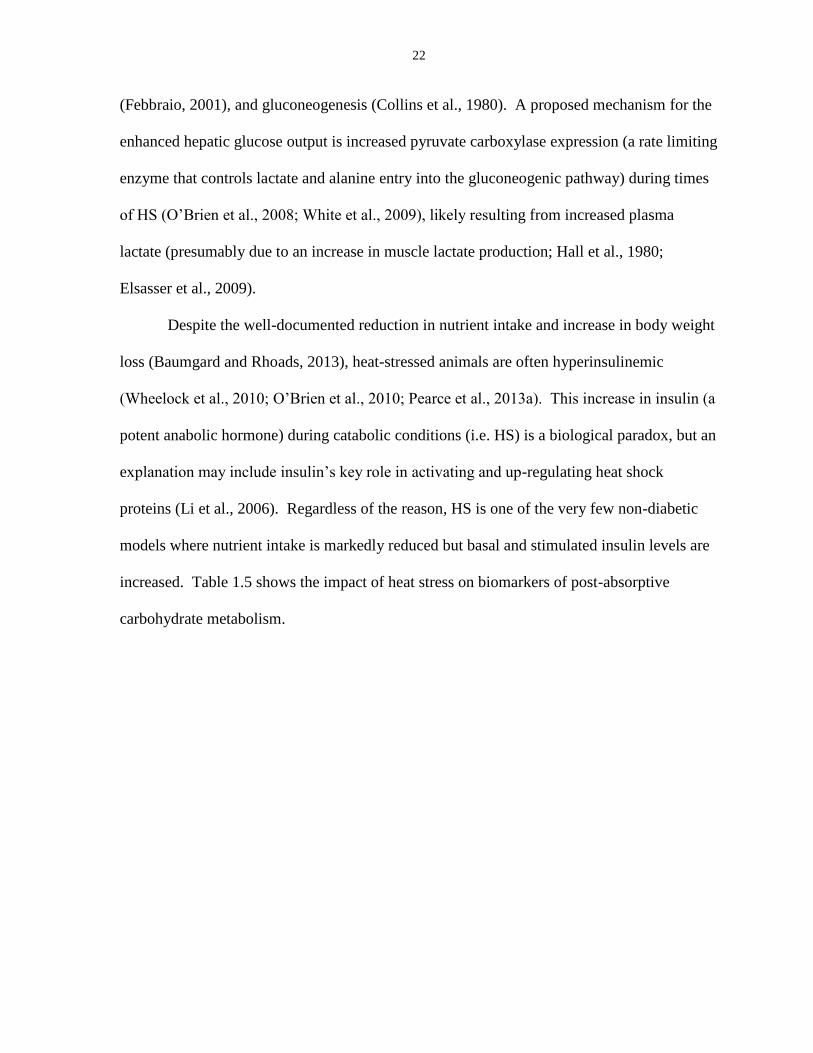
22
(Febbraio, 2001), and gluconeogenesis (Collins et al., 1980). A proposed mechanism for the
enhanced hepatic glucose output is increased pyruvate carboxylase expression (a rate limiting
enzyme that controls lactate and alanine entry into the gluconeogenic pathway) during times
of HS (O’Brien et al., 2008; White et al., 2009), likely resulting from increased plasma
lactate (presumably due to an increase in muscle lactate production; Hall et al., 1980;
Elsasser et al., 2009).
Despite the well-documented reduction in nutrient intake and increase in body weight
loss (Baumgard and Rhoads, 2013), heat-stressed animals are often hyperinsulinemic
(Wheelock et al., 2010; O’Brien et al., 2010; Pearce et al., 2013a). This increase in insulin (a
potent anabolic hormone) during catabolic conditions (i.e. HS) is a biological paradox, but an
explanation may include insulin’s key role in activating and up-regulating heat shock
proteins (Li et al., 2006). Regardless of the reason, HS is one of the very few non-diabetic
models where nutrient intake is markedly reduced but basal and stimulated insulin levels are
increased. Table 1.5 shows the impact of heat stress on biomarkers of post-absorptive
carbohydrate metabolism.
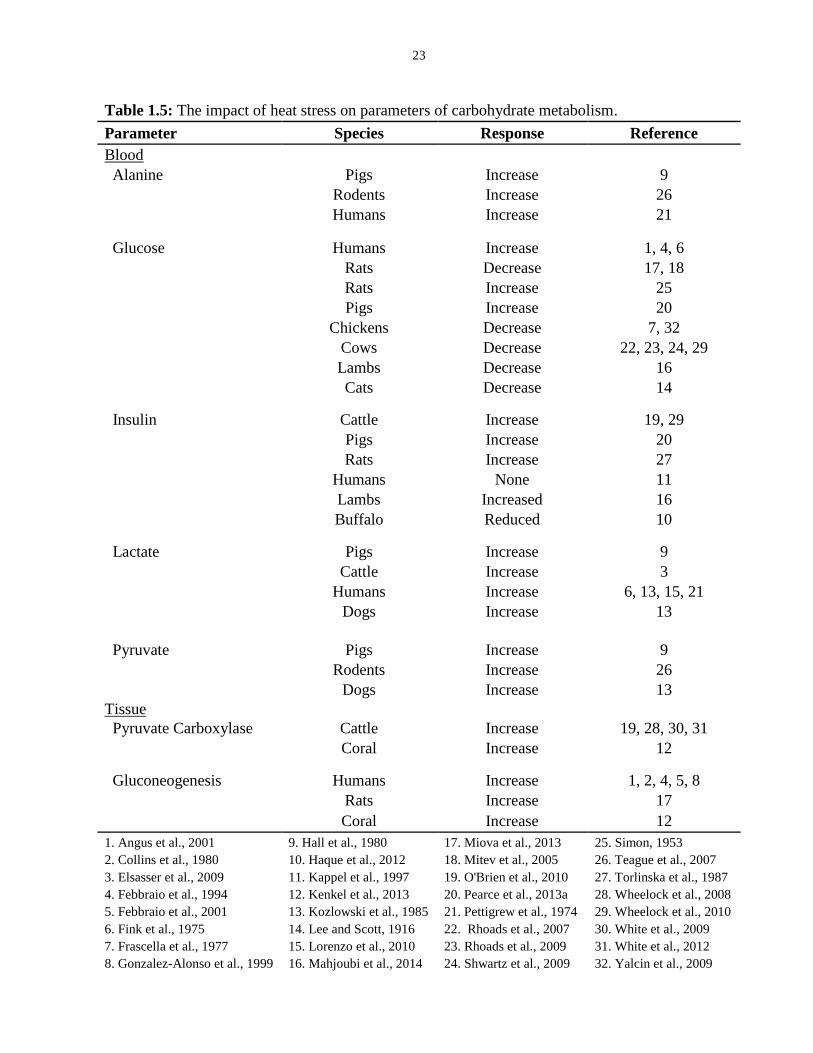
23
Table 1.5: The impact of heat stress on parameters of carbohydrate metabolism.
Parameter Species Response Reference
Blood
Alanine Pigs Increase 9
Rodents Increase 26
Humans Increase 21
Glucose Humans Increase 1, 4, 6
Rats Decrease 17, 18
Rats Increase 25
Pigs Increase 20
Chickens Decrease 7, 32
Cows Decrease 22, 23, 24, 29
Lambs Decrease 16
Cats Decrease 14
Insulin Cattle Increase 19, 29
Pigs Increase 20
Rats Increase 27
Humans None 11
Lambs Increased 16
Buffalo Reduced 10
Lactate Pigs Increase 9
Cattle Increase 3
Humans Increase 6, 13, 15, 21
Dogs Increase 13
Pyruvate Pigs Increase 9
Rodents Increase 26
Dogs Increase 13
Tissue
Pyruvate Carboxylase Cattle Increase 19, 28, 30, 31
Coral Increase 12
Gluconeogenesis Humans Increase 1, 2, 4, 5, 8
Rats Increase 17
Coral Increase 12
1. Angus et al., 2001 9. Hall et al., 1980 17. Miova et al., 2013 25. Simon, 1953
2. Collins et al., 1980 10. Haque et al., 2012 18. Mitev et al., 2005 26. Teague et al., 2007
3. Elsasser et al., 2009 11. Kappel et al., 1997 19. O'Brien et al., 2010 27. Torlinska et al., 1987
4. Febbraio et al., 1994 12. Kenkel et al., 2013 20. Pearce et al., 2013a 28. Wheelock et al., 2008
5. Febbraio et al., 2001 13. Kozlowski et al., 1985 21. Pettigrew et al., 1974 29. Wheelock et al., 2010
6. Fink et al., 1975 14. Lee and Scott, 1916 22. Rhoads et al., 2007 30. White et al., 2009
7. Frascella et al., 1977 15. Lorenzo et al., 2010 23. Rhoads et al., 2009 31. White et al., 2012
8. Gonzalez-Alonso et al., 1999 16. Mahjoubi et al., 2014 24. Shwartz et al., 2009 32. Yalcin et al., 2009
24
Protein
Proteins are a distinct class of biological molecules made of amino acid residues
linked by peptide bonds. They are involved in virtually every intracellular process and have
a wide range of functions as enzymes, transcription factors, binding proteins, transmembrane
transporters, and hormones (Stipanuk, 2013). Animals must consume proteins to meet their
essential amino acid requirements (Stipanuk, 2013). As such, protein is considered an
essential macronutrient that is vital to all life processes.
Digestion and Absorption
Enzymatic digestion of protein begins in the stomach by pepsin. Pepsin is a digestive
enzyme that begins as the zymogen pepsinogen (secreted by chief cells) and is eventually
transformed to pepsin by HCl (secreted by parietal cells; Moughan and Stevens, 2013). It
acts to hydrolyze proteins and break peptide linkages that hold together amino acid residues
(Moughan and Stevens, 2013). After transport to the duodenum, amino acids are broken into
di- and tri- peptides and free amino acids by pancreatic peptidases, which are released as
inactive zymogens from the pancreas using secretin (Moughan and Stevens, 2013). After the
release of trypsinogen, it is transformed by enterokinase to its active form trypsin. Trypsin
activates chymotrypsinogen to chymotrypsin, proelastase to elastase, and
procarboxypeptidase A and B to carboxypeptidase A and B (Moughan and Stevens, 2013).
The resulting products of protein breakdown include ogliopeptides, di- and tripeptides, and
some free amino acids.
Most absorption of free amino acids occurs at the brush border through multiple
energy dependent systems with overlapping specificity for amino acids (Moughan and
Stevens, 2013). For ogliopeptide absorption, Pept1 is used while Pept2 is used for the
25
absorption of di- and tri- peptides in a Na+ independent, proton (H+) electrochemical
potential manner (Liebach and Ganapathy, 1996). Alternatively, free amino acids (L-
stereoisomers) are absorbed through Na+ dependent pathways. Once in the enterocyte,
glutamine is extensively metabolized as an energy source to provide ATP, thus sparing
dietary glucose and fatty acids for use by other tissues (Moughan and Stevens, 2013). Amino
peptidases within the cytosol of the enterocytes hydrolyze peptides into constituent free AA
that are then transported across the basolateral membrane to provide energy and building
blocks for proteins (Moughan and Stevens, 2013).
Synthesis and Degradation
Protein synthesis and degradation encompass the interchange between body protein
and the pool of free amino acids (Figure 1.1; Anthony and McNurlan, 2013). Synthesis of
protein occurs on ribosomes located in the cytosol (either free or bound to the endoplasmic
reticulum), and is required for generation of new tissue during times of growth and
pregnancy, as well as maintenance of existing tissues (Anthony and McNurlan, 2013). The
maintenance function of synthesis encompasses the replacement of proteins that are degraded
as well as the synthesis of regulatory proteins when needed. This occurs in response to the
degradation of body proteins by intracellular enzymes, particularly by the proteolytic
subunits of protein-digesting bodies (proteosomes), and by acid hydrolyses in the lysosomes
of cells (Anthony and McNurlan, 2013). This process is known as protein turnover (Figure
1.1; Anthony and McNurlan, 2013).
Protein synthesis is initialized by the mammalian target of rapamycin (mTOR)
pathway; a protein that regulates cell growth, proliferation, motility, and protein synthesis by
integrating input from insulin, insulin like growth factors (IGF-1 and IGF-2), and amino
26
acids (particularly leucine; Anthony and McNurlan, 2013). Once activated, mTOR
phosphorylates S6K1 and 4E-BP1 to stimulate the activation of S6 ribosomal protein
(component of the ribosome), and phosphorylate 4E-BP1, respectively. Activation of the S6
ribosomal protein allows mRNA to attach to the ribosome for translation, while 4E-BP1
phosphorylation unbinds elf4E from the 5' capped mRNA’s, allowing them to be transcribed
(Anthony and McNurlan, 2013).
Transcription begins the process of protein synthesis in which an mRNA chain, is
generated with one strand of the DNA double helix within the nucleus (Anthony and
McNurlan, 2013). The DNA is “unzipped” by helicase leaving the single nucleotide chain
open to be copied. RNA polymerase reads the DNA strand from the 3' to the 5' end while
mRNA is transcribed from the 5' to 3' ends (after elF4E is unbound). The actual synthesis of
protein is known as translation, which occurs in the endoplasmic reticulum or cytosol on
ribosomes. During this phase, mRNA is decoded to produce a specific polypeptide
according to the genetic code. This uses an mRNA sequence as a template to guide the
synthesis of a chain of amino acids that form a protein. It occurs in four phases: activation,
initiation, elongation, and termination. During activation, the correct amino acid is joined to
the correct tRNA (transfer RNA). Initiation involves a small subunit of the ribosome (S6
ribosomal protein) binding to the 5' end of the mRNA. Elongation occurs when the next
aminoacyl-tRNA in line binds to the ribosome along with GTP and an elongation factor.
Termination occurs when a stop codon releases the polypeptide chain. Following translation,
proteins fold into their secondary and tertiary structures and are released to perform their
specific function.
27
Proteolysis is the breakdown of proteins into smaller polypeptides by the hydrolysis
of the peptide bond. While some proteins (collagen and hemoglobin) are relatively resistant
to degradation, those important in regulatory function or damaged are readily destroyed
(Anthony and McNurlan, 2013). Amino acid degradation involves the removal of nitrogen
from an amino acid, and the catabolism of the carbon skeleton (Anthony and McNurlan,
2013). As a result, the carbon skeleton provides energy either directly via oxidation or
through the formation of glucose and fatty acids (Anthony and McNurlan, 2013).
Additionally, amino acid carbon skeletons are recycled and used to form new amino acids.
Protein can be targeted for degradation by either the ubiquitin-proteasome pathway or by
lysosomal degradation (Anthony and McNurlan, 2013). The ubiquitin-proteasome pathway
functions by binding ubiquitin to target abnormal or regulatory proteins for degradation.
These “marked” proteins are then degraded by a large (26 subunit) multicatalytic protease
complex known as a proteosome (Anthony and McNurlan, 2013). The ubiquitin-proteosome
pathway is important in the accelerated protein degradation that accompanies many catabolic
states. Lysosomal protein degradation functions mainly to degrade hormones (i.e. insulin)
and eliminate their signal. In this process, vesicles are formed as portions of the cell
membrane enclose a portion of extracellular matrix by endocytosis. These newly formed
vesicles will then fuse with organelles (primarily lysosomes) within the cell and are
enzymatically (cathepsins B, D, L, H) degraded (Anthony and McNurlan, 2013). Although
very effective in eliminating membrane bound hormones, this process is less selective than
the ubiquitin-proteasome pathway since entire portions of the cellular membrane are
engulfed non-selectively (Anthony and McNurlan, 2013).
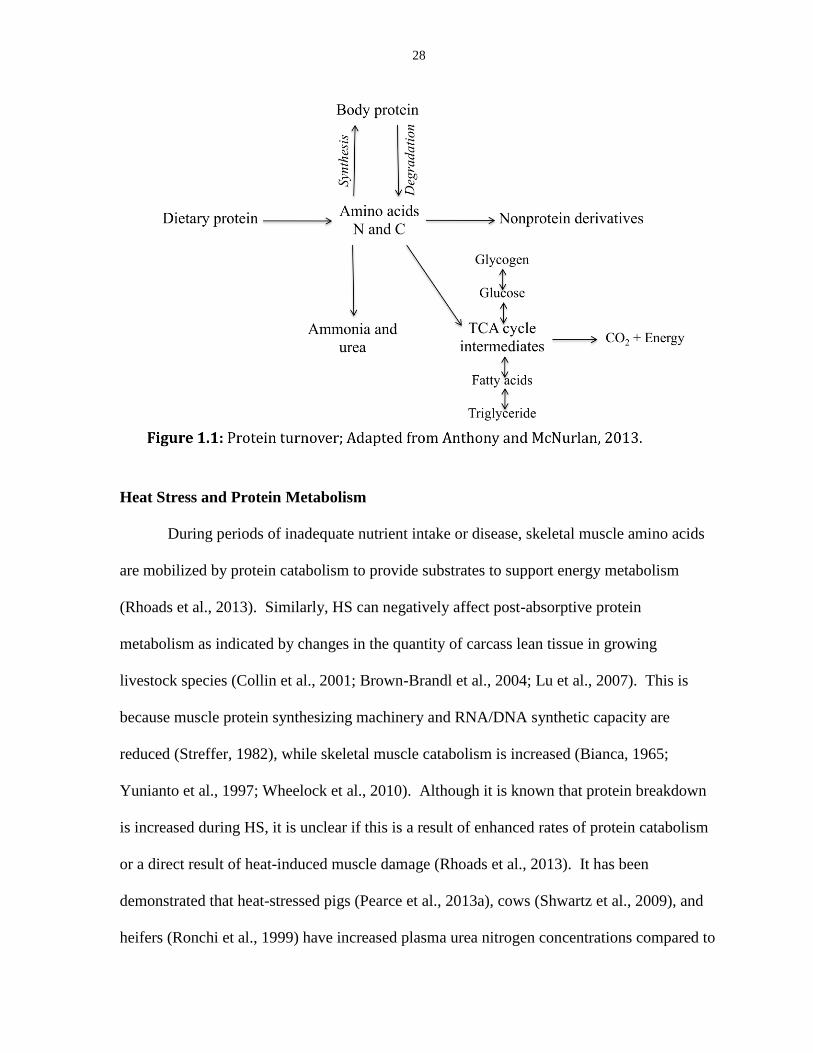
28
Heat Stress and Protein Metabolism
During periods of inadequate nutrient intake or disease, skeletal muscle amino acids
are mobilized by protein catabolism to provide substrates to support energy metabolism
(Rhoads et al., 2013). Similarly, HS can negatively affect post-absorptive protein
metabolism as indicated by changes in the quantity of carcass lean tissue in growing
livestock species (Collin et al., 2001; Brown-Brandl et al., 2004; Lu et al., 2007). This is
because muscle protein synthesizing machinery and RNA/DNA synthetic capacity are
reduced (Streffer, 1982), while skeletal muscle catabolism is increased (Bianca, 1965;
Yunianto et al., 1997; Wheelock et al., 2010). Although it is known that protein breakdown
is increased during HS, it is unclear if this is a result of enhanced rates of protein catabolism
or a direct result of heat-induced muscle damage (Rhoads et al., 2013). It has been
demonstrated that heat-stressed pigs (Pearce et al., 2013a), cows (Shwartz et al., 2009), and
heifers (Ronchi et al., 1999) have increased plasma urea nitrogen concentrations compared to
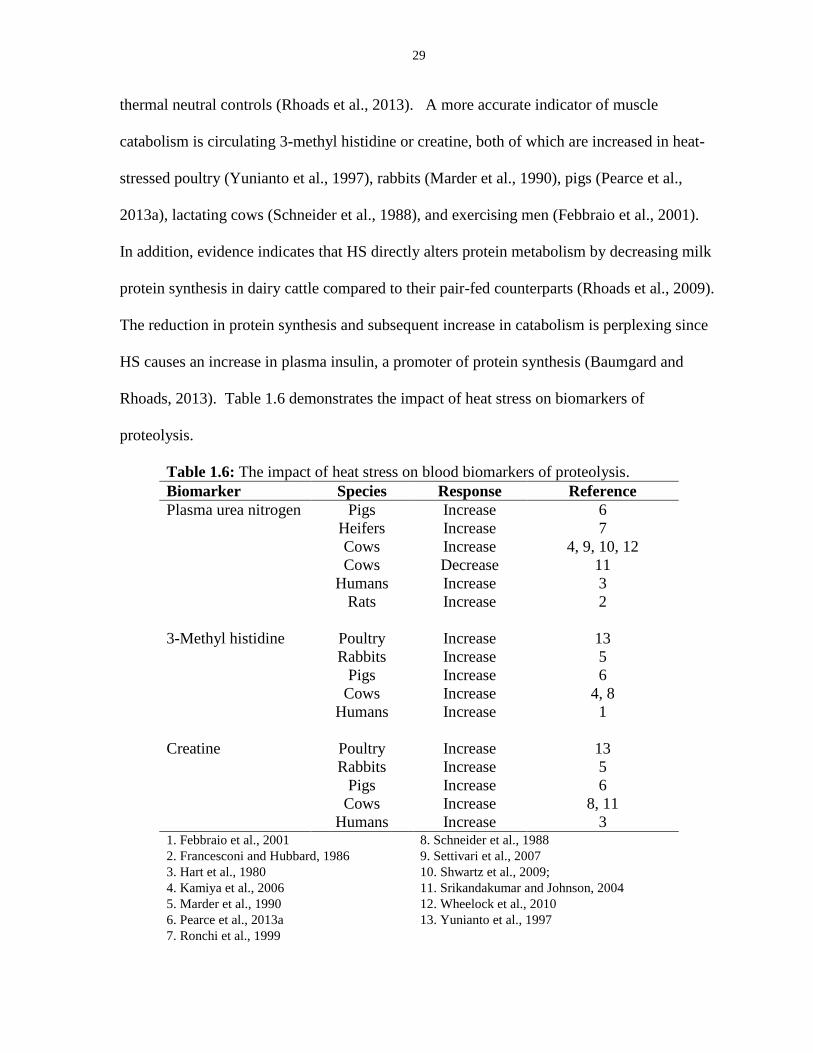
29
thermal neutral controls (Rhoads et al., 2013). A more accurate indicator of muscle
catabolism is circulating 3-methyl histidine or creatine, both of which are increased in heat-
stressed poultry (Yunianto et al., 1997), rabbits (Marder et al., 1990), pigs (Pearce et al.,
2013a), lactating cows (Schneider et al., 1988), and exercising men (Febbraio et al., 2001).
In addition, evidence indicates that HS directly alters protein metabolism by decreasing milk
protein synthesis in dairy cattle compared to their pair-fed counterparts (Rhoads et al., 2009).
The reduction in protein synthesis and subsequent increase in catabolism is perplexing since
HS causes an increase in plasma insulin, a promoter of protein synthesis (Baumgard and
Rhoads, 2013). Table 1.6 demonstrates the impact of heat stress on biomarkers of
proteolysis.
Table 1.6: The impact of heat stress on blood biomarkers of proteolysis.
Biomarker Species Response Reference
Plasma urea nitrogen Pigs Increase 6
Heifers Increase 7
Cows Increase 4, 9, 10, 12
Cows Decrease 11
Humans Increase 3
Rats Increase 2
3-Methyl histidine Poultry Increase 13
Rabbits Increase 5
Pigs Increase 6
Cows Increase 4, 8
Humans Increase 1
Creatine Poultry Increase 13
Rabbits Increase 5
Pigs Increase 6
Cows Increase 8, 11
Humans Increase 3 1. Febbraio et al., 2001 8. Schneider et al., 1988
2. Francesconi and Hubbard, 1986 9. Settivari et al., 2007
3. Hart et al., 1980 10. Shwartz et al., 2009;
4. Kamiya et al., 2006 11. Srikandakumar and Johnson, 2004
5. Marder et al., 1990 12. Wheelock et al., 2010
6. Pearce et al., 2013a 13. Yunianto et al., 1997
7. Ronchi et al., 1999
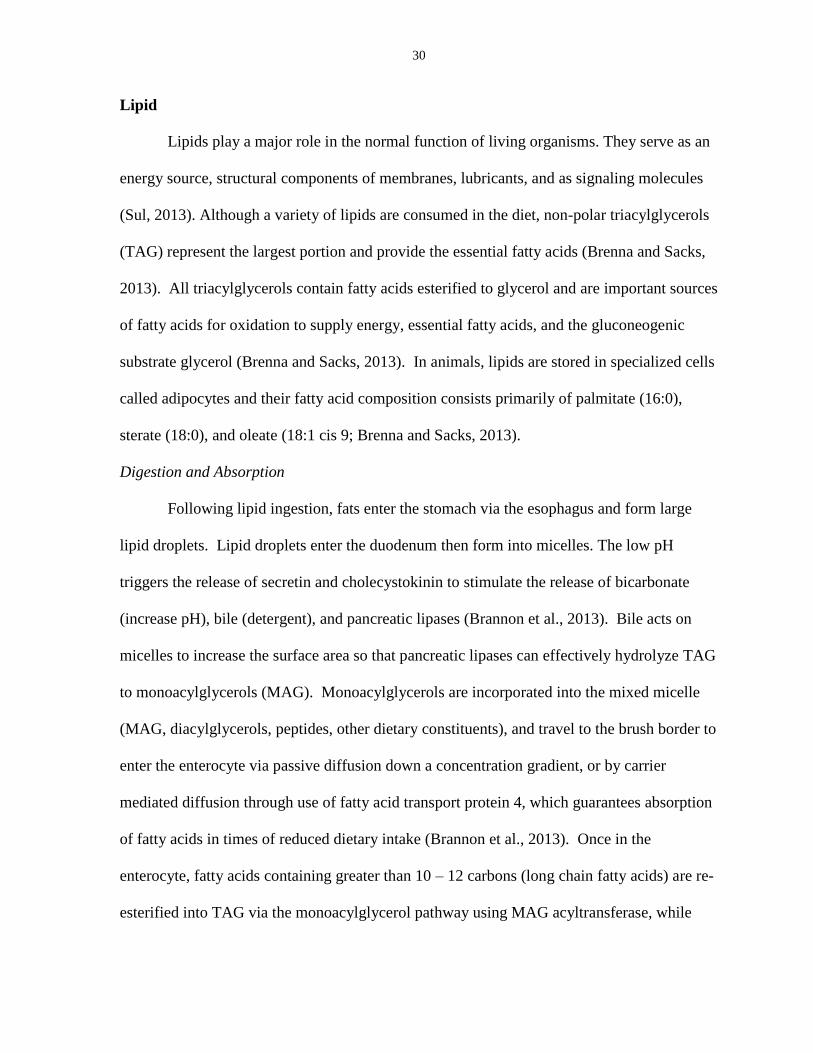
30
Lipid
Lipids play a major role in the normal function of living organisms. They serve as an
energy source, structural components of membranes, lubricants, and as signaling molecules
(Sul, 2013). Although a variety of lipids are consumed in the diet, non-polar triacylglycerols
(TAG) represent the largest portion and provide the essential fatty acids (Brenna and Sacks,
2013). All triacylglycerols contain fatty acids esterified to glycerol and are important sources
of fatty acids for oxidation to supply energy, essential fatty acids, and the gluconeogenic
substrate glycerol (Brenna and Sacks, 2013). In animals, lipids are stored in specialized cells
called adipocytes and their fatty acid composition consists primarily of palmitate (16:0),
sterate (18:0), and oleate (18:1 cis 9; Brenna and Sacks, 2013).
Digestion and Absorption
Following lipid ingestion, fats enter the stomach via the esophagus and form large
lipid droplets. Lipid droplets enter the duodenum then form into micelles. The low pH
triggers the release of secretin and cholecystokinin to stimulate the release of bicarbonate
(increase pH), bile (detergent), and pancreatic lipases (Brannon et al., 2013). Bile acts on
micelles to increase the surface area so that pancreatic lipases can effectively hydrolyze TAG
to monoacylglycerols (MAG). Monoacylglycerols are incorporated into the mixed micelle
(MAG, diacylglycerols, peptides, other dietary constituents), and travel to the brush border to
enter the enterocyte via passive diffusion down a concentration gradient, or by carrier
mediated diffusion through use of fatty acid transport protein 4, which guarantees absorption
of fatty acids in times of reduced dietary intake (Brannon et al., 2013). Once in the
enterocyte, fatty acids containing greater than 10 – 12 carbons (long chain fatty acids) are re-
esterified into TAG via the monoacylglycerol pathway using MAG acyltransferase, while
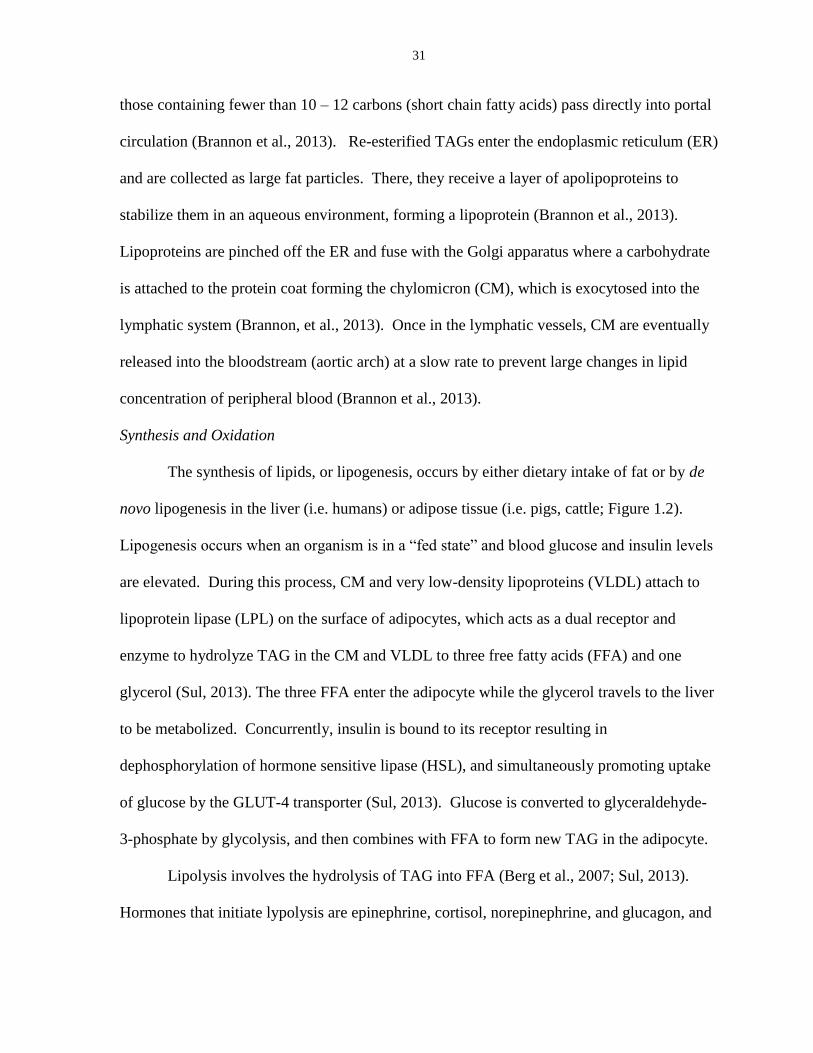
31
those containing fewer than 10 – 12 carbons (short chain fatty acids) pass directly into portal
circulation (Brannon et al., 2013). Re-esterified TAGs enter the endoplasmic reticulum (ER)
and are collected as large fat particles. There, they receive a layer of apolipoproteins to
stabilize them in an aqueous environment, forming a lipoprotein (Brannon et al., 2013).
Lipoproteins are pinched off the ER and fuse with the Golgi apparatus where a carbohydrate
is attached to the protein coat forming the chylomicron (CM), which is exocytosed into the
lymphatic system (Brannon, et al., 2013). Once in the lymphatic vessels, CM are eventually
released into the bloodstream (aortic arch) at a slow rate to prevent large changes in lipid
concentration of peripheral blood (Brannon et al., 2013).
Synthesis and Oxidation
The synthesis of lipids, or lipogenesis, occurs by either dietary intake of fat or by de
novo lipogenesis in the liver (i.e. humans) or adipose tissue (i.e. pigs, cattle; Figure 1.2).
Lipogenesis occurs when an organism is in a “fed state” and blood glucose and insulin levels
are elevated. During this process, CM and very low-density lipoproteins (VLDL) attach to
lipoprotein lipase (LPL) on the surface of adipocytes, which acts as a dual receptor and
enzyme to hydrolyze TAG in the CM and VLDL to three free fatty acids (FFA) and one
glycerol (Sul, 2013). The three FFA enter the adipocyte while the glycerol travels to the liver
to be metabolized. Concurrently, insulin is bound to its receptor resulting in
dephosphorylation of hormone sensitive lipase (HSL), and simultaneously promoting uptake
of glucose by the GLUT-4 transporter (Sul, 2013). Glucose is converted to glyceraldehyde-
3-phosphate by glycolysis, and then combines with FFA to form new TAG in the adipocyte.
Lipolysis involves the hydrolysis of TAG into FFA (Berg et al., 2007; Sul, 2013).
Hormones that initiate lypolysis are epinephrine, cortisol, norepinephrine, and glucagon, and
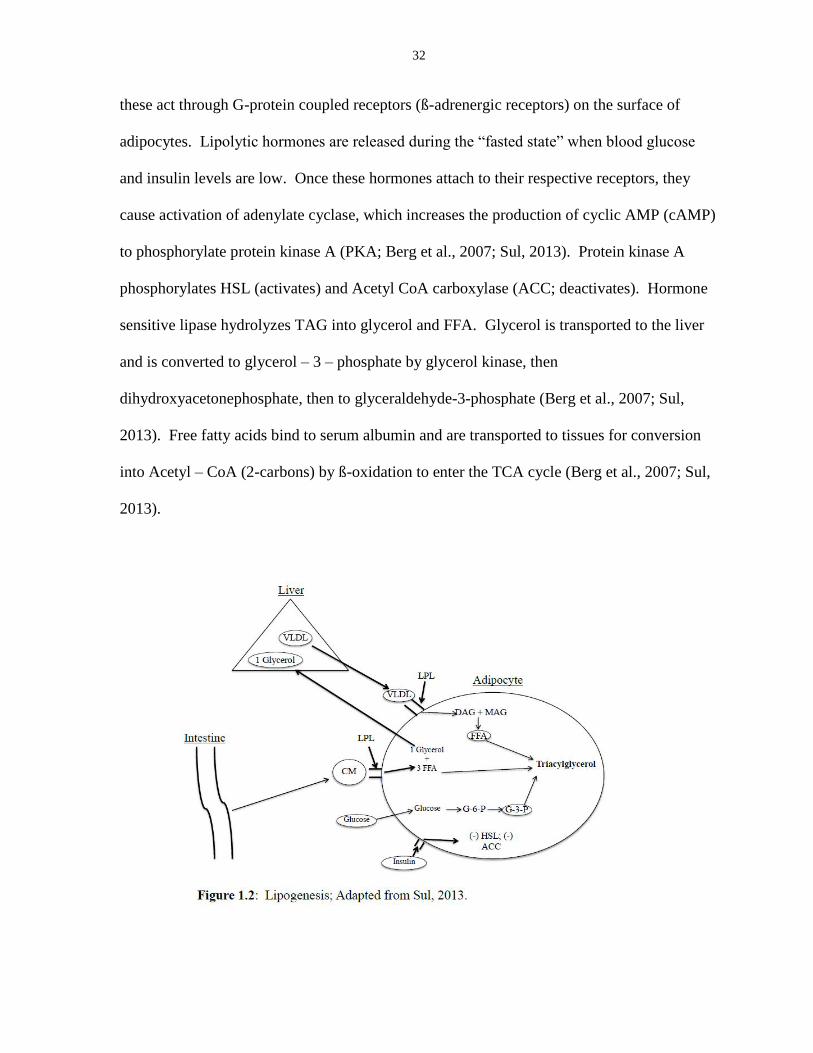
32
these act through G-protein coupled receptors (ß-adrenergic receptors) on the surface of
adipocytes. Lipolytic hormones are released during the “fasted state” when blood glucose
and insulin levels are low. Once these hormones attach to their respective receptors, they
cause activation of adenylate cyclase, which increases the production of cyclic AMP (cAMP)
to phosphorylate protein kinase A (PKA; Berg et al., 2007; Sul, 2013). Protein kinase A
phosphorylates HSL (activates) and Acetyl CoA carboxylase (ACC; deactivates). Hormone
sensitive lipase hydrolyzes TAG into glycerol and FFA. Glycerol is transported to the liver
and is converted to glycerol – 3 – phosphate by glycerol kinase, then
dihydroxyacetonephosphate, then to glyceraldehyde-3-phosphate (Berg et al., 2007; Sul,
2013). Free fatty acids bind to serum albumin and are transported to tissues for conversion
into Acetyl – CoA (2-carbons) by ß-oxidation to enter the TCA cycle (Berg et al., 2007; Sul,
2013).
33
Heat Stress and Lipid Metabolism
Production and observational data indicates that HS impacts lipid metabolism
differently than would be expected based on calculated whole body energy balance (Rhoads
et al., 2013). Additionally, carcass data indicates that both chickens (Geraert et al., 1996)
and pigs (Collin et al., 2001; Brown-Brandl et al., 2004) have increased lipid retention when
reared in HS conditions and the effects in chickens are most pronounced in the abdominal fat
depot (Yunianto et al., 1997). Interestingly, plasma non-esterified fatty acids (NEFA)
concentrations are typically reduced in HS exposed sheep and cattle, despite marked
reductions in feed intake (Sano et al., 1983; Ronchi et al., 1999; Shwartz et al., 2009) and
especially when compared to pair-fed controls (Rhoads et al., 2009). Alterations in carcass
lipid composition and serum metabolites agree with rodent results indicating that HS reduces
in vivo lipolytic rates and in vitro lipolytic enzyme activity (Torlinska et al., 1987).
Considering that HS causes a well-described increase in stress and catabolic hormones (i.e.
epinephrine, cortisol, glucagon; Beede and Collier, 1986), it is surprising that lipolytic
capacity is reduced (Baumgard and Rhoads, 2013).
Changes in lipid metabolism during HS may be a result of increased insulin
concentration and/or insulin sensitivity, as it is a potent antilipolytic and lipogenic hormone
(Vernon, 1992). In addition, reduced NEFA mobilization may allow for increased
circulating insulin as excessive NEFAs cause pancreas β-cell apoptosis (Nelson et al., 2001).
Previous studies have demonstrated enhanced insulin sensitivity in rodents (DeSouza and
Meier, 1993), pigs (Hall et al., 1980), growing steers (O’Brien et al., 2010), and lactating
cows (Wheelock et al., 2010). Moreover, HS increases adipose tissue lipoprotein lipase
(Sanders et al., 2009), suggesting that adipose tissue of hyperthermic animals has an
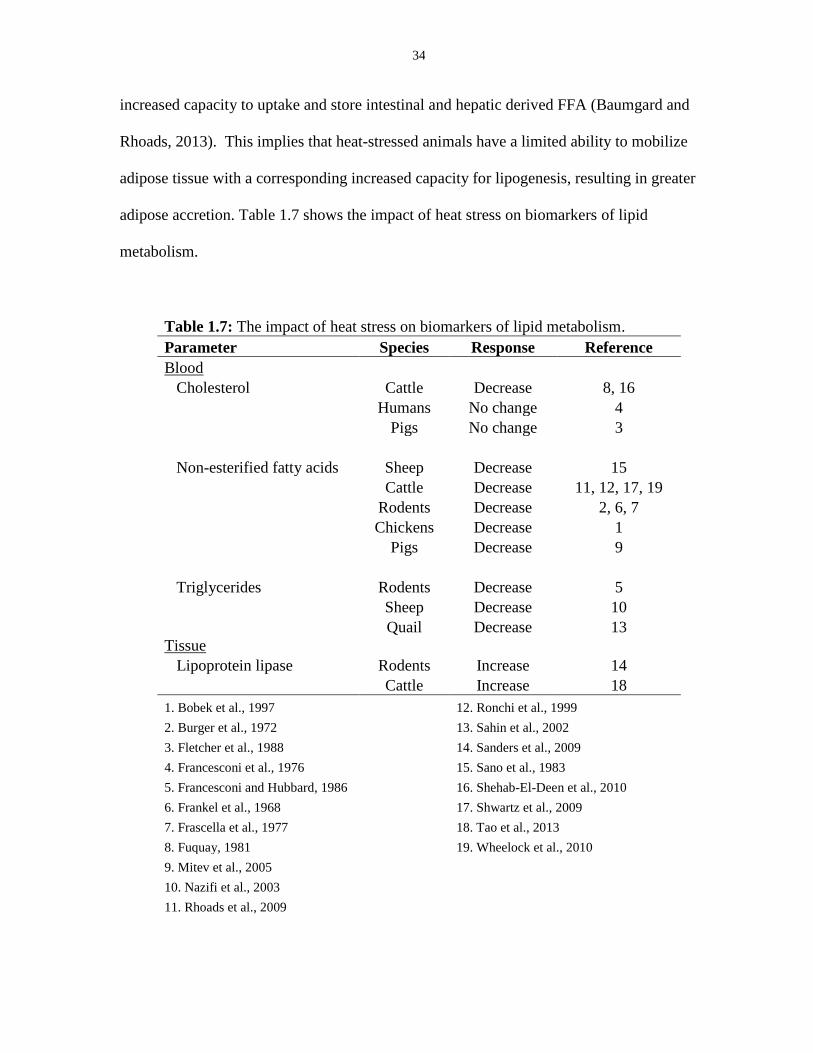
34
increased capacity to uptake and store intestinal and hepatic derived FFA (Baumgard and
Rhoads, 2013). This implies that heat-stressed animals have a limited ability to mobilize
adipose tissue with a corresponding increased capacity for lipogenesis, resulting in greater
adipose accretion. Table 1.7 shows the impact of heat stress on biomarkers of lipid
metabolism.
Table 1.7: The impact of heat stress on biomarkers of lipid metabolism.
Parameter Species Response Reference
Blood
Cholesterol Cattle Decrease 8, 16
Humans No change 4
Pigs No change 3
Non-esterified fatty acids Sheep Decrease 15
Cattle Decrease 11, 12, 17, 19
Rodents Decrease 2, 6, 7
Chickens Decrease 1
Pigs Decrease 9
Triglycerides Rodents Decrease 5
Sheep Decrease 10
Quail Decrease 13
Tissue
Lipoprotein lipase Rodents Increase 14
Cattle Increase 18
1. Bobek et al., 1997 12. Ronchi et al., 1999
2. Burger et al., 1972 13. Sahin et al., 2002
3. Fletcher et al., 1988 14. Sanders et al., 2009
4. Francesconi et al., 1976 15. Sano et al., 1983
5. Francesconi and Hubbard, 1986 16. Shehab-El-Deen et al., 2010
6. Frankel et al., 1968 17. Shwartz et al., 2009
7. Frascella et al., 1977 18. Tao et al., 2013
8. Fuquay, 1981 19. Wheelock et al., 2010
9. Mitev et al., 2005
10. Nazifi et al., 2003
11. Rhoads et al., 2009
35
Bioenergetics
Bioenergetics is the study of the flow and transformation of energy in and between
living organisms, and between living organisms and their environment. There are four forms
of energy in the living organism (chemical, mechanical, electrical, and thermal); however,
only chemical energy can be used to create mechanical energy by living organisms. Per the
first law of thermodynamics, energy cannot be created or destroyed but can only be
converted or transformed from one form to another. In other words, all consumed energy
must be partitioned towards metabolism and growth, or waste (i.e. urine, feces, and gas
production; Oresanya et al., 2005; Patience, 2012; Figure 1.3). Thermal stress and muscle
mass can influence how an animal partitions energy. When animals are cold-stressed, they
generate more thermal energy due to enhanced shivering and non-shivering thermogenesis
(Kleiber, 1961; Young, 1981), resulting in less net energy available for growth compared to
TN conditions (Figure 1.3). Conversely, HS reduces net energy for growth by presumably
increasing maintenance costs due to heat mitigation efforts (Kleiber, 1961; Fuquay, 1981),
and reducing the consumption of gross energy (Baumgard and Rhoads, 2013; Figure 1.3).
Further, lean tissue content can influence maintenance costs as muscle mass is expensive to
maintain due to constant protein turnover.
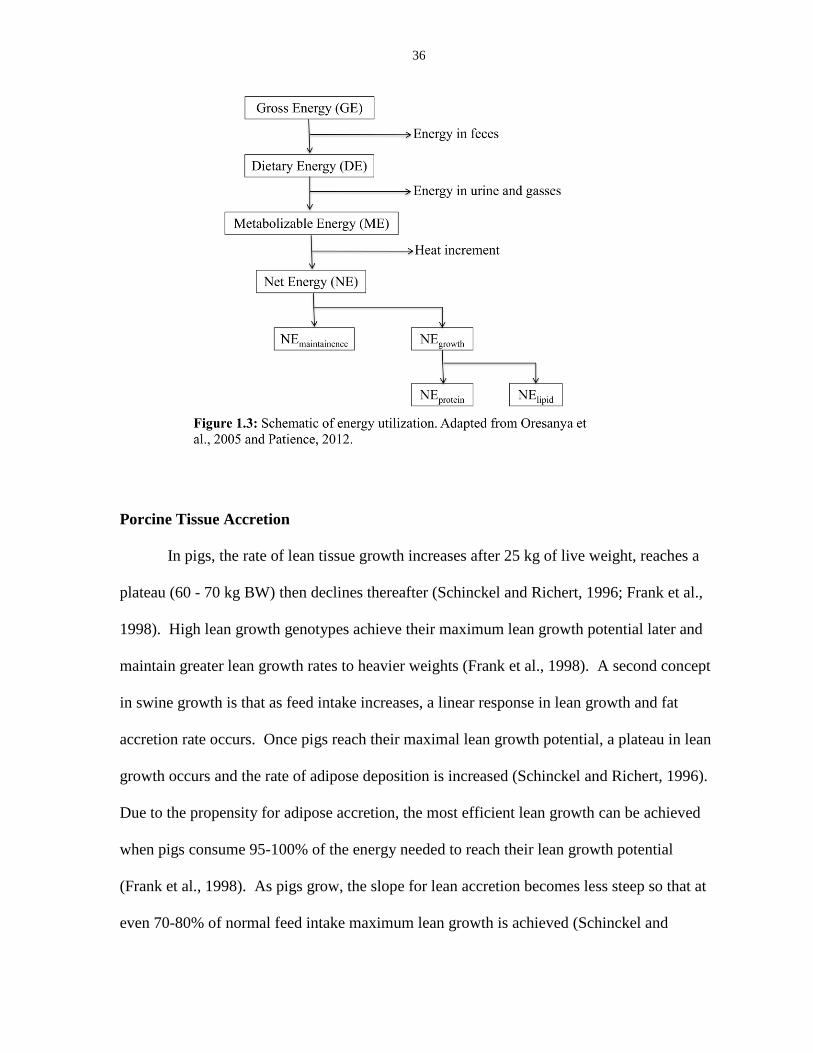
36
Porcine Tissue Accretion
In pigs, the rate of lean tissue growth increases after 25 kg of live weight, reaches a
plateau (60 - 70 kg BW) then declines thereafter (Schinckel and Richert, 1996; Frank et al.,
1998). High lean growth genotypes achieve their maximum lean growth potential later and
maintain greater lean growth rates to heavier weights (Frank et al., 1998). A second concept
in swine growth is that as feed intake increases, a linear response in lean growth and fat
accretion rate occurs. Once pigs reach their maximal lean growth potential, a plateau in lean
growth occurs and the rate of adipose deposition is increased (Schinckel and Richert, 1996).
Due to the propensity for adipose accretion, the most efficient lean growth can be achieved
when pigs consume 95-100% of the energy needed to reach their lean growth potential
(Frank et al., 1998). As pigs grow, the slope for lean accretion becomes less steep so that at
even 70-80% of normal feed intake maximum lean growth is achieved (Schinckel and
37
Richert, 1996). This suggests that as pigs reach heavier weights (68 – 110 kg), the slope of
lean gain to energy intake decreases rapidly as the slope of adipose gain to energy intake
increases (Schinckel and Richert, 1996).
Adipose tissue requires substantially more energy to deposit than lean, and the energy
cost of protein gain is less (10.03 Mcal/kg lean) than that of adipose accretion (11.65
Mcal/kg adipose; Patience, 2012). Additionally, due to the water associated with lean tissue
accretion, adipose requires three times more energy per kg than fat-free lean growth
(Schinckel and Richert, 1996). As pigs age and become heavier, their lean growth potential
is reduced while their feed intake increases above that needed for their maximum genetic
potential, resulting in a linear increase in adipose accretion (Frank et al., 1998). Further, pigs
with high lean growth potential reach their maximum lean growth at heavier weights,
maximizing their ability to accrete skeletal muscle.
Prenatal Insults
Prenatal insults can have lasting effects on offspring growth (Tao et al., 2012),
behavior (Shiota and Kayamura, 1989), metabolism (Chen et al., 2010) and can be
teratogenic (Graham et al., 1998). Experimental models such as intrauterine growth
retardation indicate that future growth parameters (Foxcroft et al., 2006; 2009), body
composition (Pinney and Simmons, 2010), and post-absorptive metabolism can be markedly
altered by gestational insults (Chen et al., 2010). Additionally, Hales and Barker (1992) first
introduced the idea of a “thrifty phenotype” in response to fetal nutrient insufficiency,
whereby fetal malnutrition causes maladaptive programming resulting in glucose-sparing
mechanisms that persist in the offspring. In utero HS may also imprint future
38
thermotolerance to a heat load, and this has been demonstrated in unicellular organisms
(Estruch, 2006), insects (Sorensen et al., 2001), and birds (Tzschentke, 2007; Piestun et al.,
2008) in response to elevated temperatures. Further, although prenatal insults can result in
negative postnatal phenotypes, they may pre-condition offspring to harsh environmental
conditions and could be beneficial to future livestock production.
Epigenetics
Epigenetics is literally defined as “above the genome,” and is the study of DNA
modifications capable of impacting gene expression, and subsequently the cellular phenotype
that is not a result of differences in DNA base pair sequence (Reik, 2007). It occurs via DNA
methylation or histone modifications during developmental progression and cellular
differentiation towards specific cell lineages (Reik, 2007). Functionally, epigenetic
modifications can improve the plasticity of the genome to improve responses to specific
environmental conditions, and may provide postnatal protection against a negative
environmental insult (Reik, 2007). Further, timing of the gestational insult relative to key
developmental events may provide a greater impact on the future performance and epigenetic
modifications in offspring (Reik, 2007).
DNA methylation is a stable, long-lasting DNA modification that can be inherited by
offspring or acquired throughout an animal’s lifetime (Jones and Takai, 2001). Methylation
occurs by the enzymatic transfer of a methyl group from the methyl donor S-adenosyl
methionine, through the action of DNA methyltransferases (Jones and Takai, 2001). This
often occurs by addition of a methyl group to the cytosine of CpG dinucleotide, the cytosine
and guanine-rich regions located upstream of gene promoters (Jones and Takai, 2001).
When these regions are hypermethylated, gene expression is typically suppressed through
39
recruitment of DNA binding proteins that interfere transcription factors (Jones and Takai,
2001). Additionally, methylation is maintained by DNA methyltransferases and is essential
for copying existing methylation patterns during replication and development (Klose and
Bird, 2006). Methylation may also occur in response to environmental stress and can
potentiate a long-term or imprinted response to stress (Baumgard et al., 2012).
Histone modifications epigenetically modify phenotypes by altering histone
interactions with DNA and control of histone structure (Turner, 2007); however, unlike DNA
methylation, histone modifications can be reversible or static (Turner, 2007). Acetylation is
catalyzed by histone acyltransferases and acts to weaken the histone-DNA bond and promote
transcription by targeting lysine residues (Turner, 2000). Histone acetylation can be
reversed by histone deacetylases to restore the interaction between DNA and histones
causing repression of transcription (Turner, 2000). Furthermore, modification of histones
can impact histone-DNA binding and further regulate histone modifications.
Maternal Heat Stress
Epigenetic programming and hormonal alterations in prenatally heat-stressed
offspring resemble phenotypes of animals affected by intrauterine growth retardation
(Baumgard et al., 2012). Phenotypic changes are likely mediated by altered metabolism and
uterine blood flow. Negative effects of maternal HS range from developmental defects
(Graham et al., 1998) to altered response to HS during future growth. In some non-
agricultural species, exposure to prenatal HS causes a reduction in birth weight, average daily
gain, and smaller brain weights that last into maturation (Jonson et al., 1976; Shiota and
Kayamura, 1989). Although the specific cause of suboptimal performance in offspring
40
exposed to prenatal HS is currently unknown, it is likely that epigenetic regulation plays a
key role in the imprinting of future phenotypes.
How prenatal HS exposure impacts postnatal performance is poorly understood, but is
likely a result of epigenetic programming. Epigenetic programming is significantly
influenced by differences in DNA methylation of CpG islands (Klose and Bird, 2006), that
when negatively impacted during development can have lasting implications on gene
expression (Bernal and Jirtle, 2010) and can have a potentially significant impact on lifetime
production (Foxcroft et al., 2009). These epigenetic modifications in chromatin structure
(which can last short periods or lifelong) influence the condensation of the DNA by reducing
the recruitment and ability of DNA binding proteins, such as RNA polymerases, to interact
with and transcribe genes from the genome. Intrauterine modifications via DNA methylation
can also occur in temporal and tissue specific manners (Schneider et al., 2010), as numerous
genes and quantitative trait loci associated with body composition, and growth and
development are subject to epigenetic regulation in mammals (Thomsen et al., 2004).
In addition to intrauterine effects, HS during early postnatal development has been
shown to cause histone modifications that extend into adulthood. This insult can imprint
thermotolerance to HS later in life, and has been demonstrated to increase survivability to a
future heat load in Drosophilia buzzatti (Sorenson et al., 2001), or improves the future ability
to remain euthermic during a thermal insult in birds (Tzschentke, 2007; Piestun et al., 2008).
In chickens, HS at 3 days of age conferred protection against acute HS-related mortality
during adulthood, presumably by increasing H3K9 acetylation and H3K9 demethylation
(Yahav and McMurtry, 2001). This epigenetic protective effect has been characterized by
analysis of histone modifications and resulting epigenetic memory (Kisliouk et al., 2010).
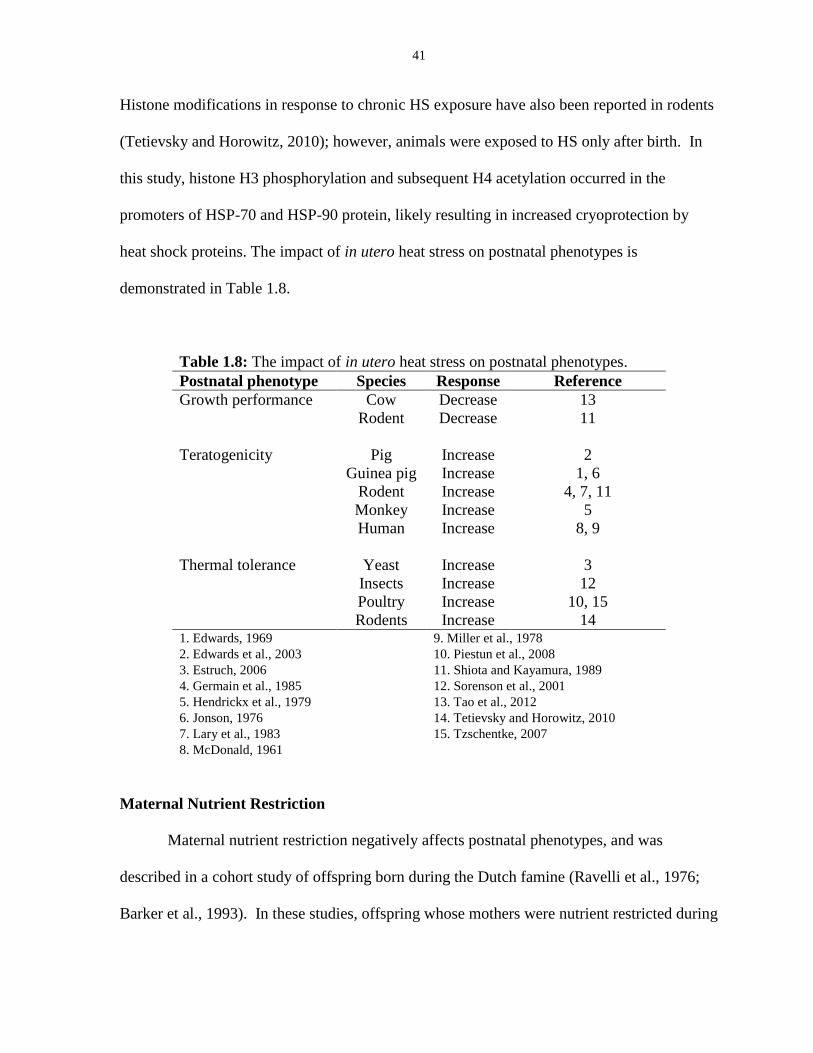
41
Histone modifications in response to chronic HS exposure have also been reported in rodents
(Tetievsky and Horowitz, 2010); however, animals were exposed to HS only after birth. In
this study, histone H3 phosphorylation and subsequent H4 acetylation occurred in the
promoters of HSP-70 and HSP-90 protein, likely resulting in increased cryoprotection by
heat shock proteins. The impact of in utero heat stress on postnatal phenotypes is
demonstrated in Table 1.8.
Table 1.8: The impact of in utero heat stress on postnatal phenotypes.
Postnatal phenotype Species Response Reference
Growth performance Cow Decrease 13
Rodent Decrease 11
Teratogenicity Pig Increase 2
Guinea pig Increase 1, 6
Rodent Increase 4, 7, 11
Monkey Increase 5
Human Increase 8, 9
Thermal tolerance Yeast Increase 3
Insects Increase 12
Poultry Increase 10, 15
Rodents Increase 14 1. Edwards, 1969 9. Miller et al., 1978
2. Edwards et al., 2003 10. Piestun et al., 2008
3. Estruch, 2006 11. Shiota and Kayamura, 1989
4. Germain et al., 1985 12. Sorenson et al., 2001
5. Hendrickx et al., 1979 13. Tao et al., 2012
6. Jonson, 1976 14. Tetievsky and Horowitz, 2010
7. Lary et al., 1983 15. Tzschentke, 2007
8. McDonald, 1961
Maternal Nutrient Restriction
Maternal nutrient restriction negatively affects postnatal phenotypes, and was
described in a cohort study of offspring born during the Dutch famine (Ravelli et al., 1976;
Barker et al., 1993). In these studies, offspring whose mothers were nutrient restricted during
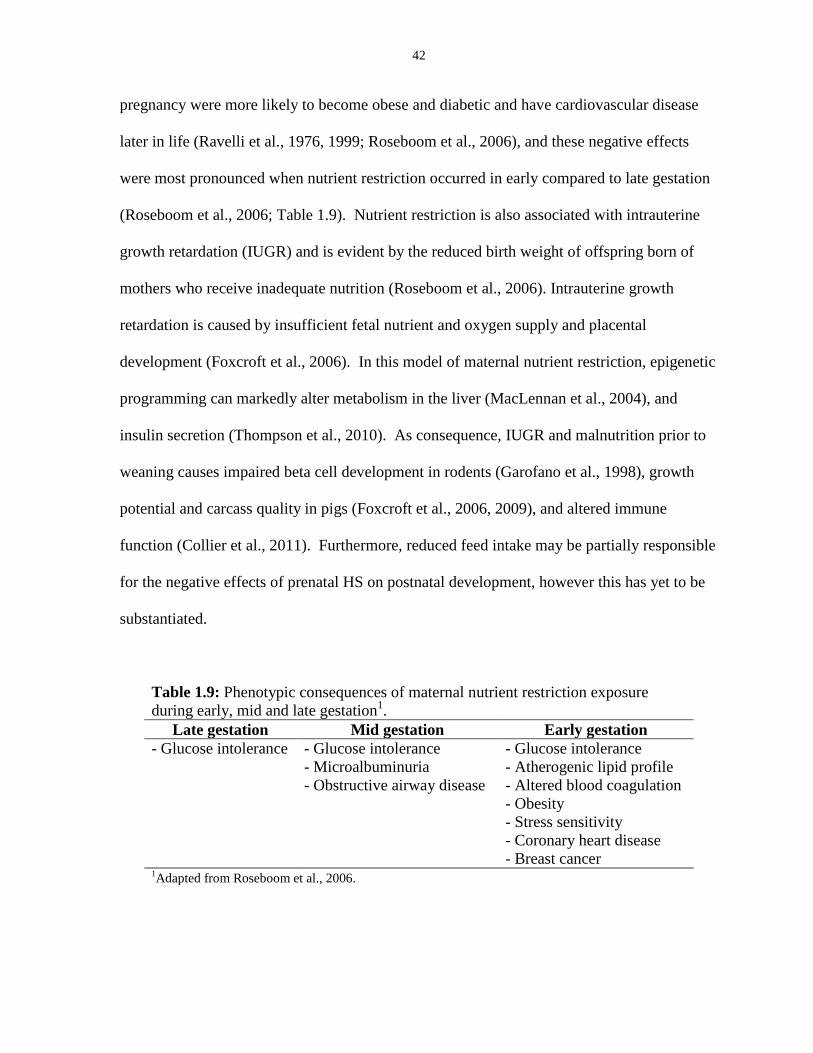
42
pregnancy were more likely to become obese and diabetic and have cardiovascular disease
later in life (Ravelli et al., 1976, 1999; Roseboom et al., 2006), and these negative effects
were most pronounced when nutrient restriction occurred in early compared to late gestation
(Roseboom et al., 2006; Table 1.9). Nutrient restriction is also associated with intrauterine
growth retardation (IUGR) and is evident by the reduced birth weight of offspring born of
mothers who receive inadequate nutrition (Roseboom et al., 2006). Intrauterine growth
retardation is caused by insufficient fetal nutrient and oxygen supply and placental
development (Foxcroft et al., 2006). In this model of maternal nutrient restriction, epigenetic
programming can markedly alter metabolism in the liver (MacLennan et al., 2004), and
insulin secretion (Thompson et al., 2010). As consequence, IUGR and malnutrition prior to
weaning causes impaired beta cell development in rodents (Garofano et al., 1998), growth
potential and carcass quality in pigs (Foxcroft et al., 2006, 2009), and altered immune
function (Collier et al., 2011). Furthermore, reduced feed intake may be partially responsible
for the negative effects of prenatal HS on postnatal development, however this has yet to be
substantiated.
Table 1.9: Phenotypic consequences of maternal nutrient restriction exposure
during early, mid and late gestation1.
Late gestation Mid gestation Early gestation
- Glucose intolerance - Glucose intolerance - Glucose intolerance
- Microalbuminuria - Atherogenic lipid profile
- Obstructive airway disease - Altered blood coagulation
- Obesity
- Stress sensitivity
- Coronary heart disease
- Breast cancer 1Adapted from Roseboom et al., 2006.
43
Elevated Maternal Glucocorticoids
During postnatal development, exposure to HS and nutrient restriction causes a
variety of endocrine disruptions. These include elevated insulin concentrations and
sensitivity (Torlinska et al., 1987; O’Brien et al., 2010; Wheelock et al., 2010; Pearce et al.,
2013a), reductions in thyroid hormone levels (Collier et al., 1982), and a marked increase in
circulating cortisol, norepinephrine and epinephrine during acute HS exposure (Collier et al.,
1982; Baumgard and Rhoads, 2013; Rhoads et al., 2013). As a result of HS or nutrient
restriction-induced maternal glucocorticoid production, gestating fetuses are at risk for
elevated exposure (Einarsson et al., 1996), resulting in detrimental effects (i.e. altered body
composition, cardiovascular disease, altered HPA-axis) during postnatal life.
Glucocorticoids act through receptors expressed in most fetal tissues and have potent effects
on development from early embryonic stages (Cole, 1996; Speirs et al., 2004), and in the
placenta where they are thought to mediate metabolic and anti-inflammatory effects (Sun et
al., 1997). Furthermore, their effects are transduced upon the genome during early
developmental stages (Seckl, 2004), and may program the metabolic traits induced by
maternal/fetal under nutrition and prenatal stress (Xita and Tsatsoulis, 2010).
Exposure to elevated glucocorticoids in utero can negatively affect future post-
absorptive metabolism. Numerous studies have discovered a correlation between lower birth
weight and the development of metabolic disorders in adult life including hypertension,
insulin resistance, and type 2-diabetes (Barker et al., 1993; Lithell et al., 1996; Table 1.10).
Interestingly, the low-birth weight syndrome associated with prenatal overexposure to
glucocorticoids resembles the rare Cushing’s syndrome of glucocorticoid excess where
affected individuals suffer disproportionately from type 2 diabetes and insulin resistance,
44
dyslipidaemia and hypertension (Seckl, 2004). Additionally, insulin resistance has been
linked to elevated lipid synthesis and increased gluconeogenesis leading to increased visceral
adiposity (Dazert and Hall, 2011), and is likely due to reduced mTOR signaling, which
reduces protein synthesis and partitions energy towards lipogenesis (Laplante and Sabatini,
2009). Furthermore, elevated glucocorticoids can cause greater expression of uncoupling
proteins 2 and 3 mRNA, which are regulated by ß3-adrenergic agonists and leptin (Gong, et
al., 1997).
In addition to low birth weight, insulin resistance, and altered mTOR signaling,
overexposure to prenatal glucocorticoids can have negative effects on brain programming
and is associated with reduced brain weight and delayed maturation of neurons (Huang et
al., 1999; Huang et al., 2001). The negative effects of glucocorticoid exposure on the brain
are particularly evident during early fetal development and are due to reduced 11 beta-
hydroxysteroid dehydrogenase type 2 (Seckl, 2004). This enzyme is highly expressed in the
placenta starting at mid-gestation and is responsible for converting active maternal
glucocorticoids into inert 11-keto forms (White et al., 1997). The hypothalamic-pituitary-
adrenal axis (HPA-axis) is particularly sensitive to glucocorticoids and their gestational
programming actions (Welberg and Seckl, 2001). Prenatal glucocorticoid exposure
permanently increases basal plasma corticosterone levels in adult rats (Levitt et al., 1996;
Welberg et al., 2001), and this is primarily due to a reduction in the density of glucocorticoid
and mineralocorticoid receptors in the hippocampus resulting in a reduction in negative
feedback (Seckl, 2004). HPA-axis disruption has also been observed in response to prenatal
environmental challenges such as maternal under nutrition, suggesting that altered HPA
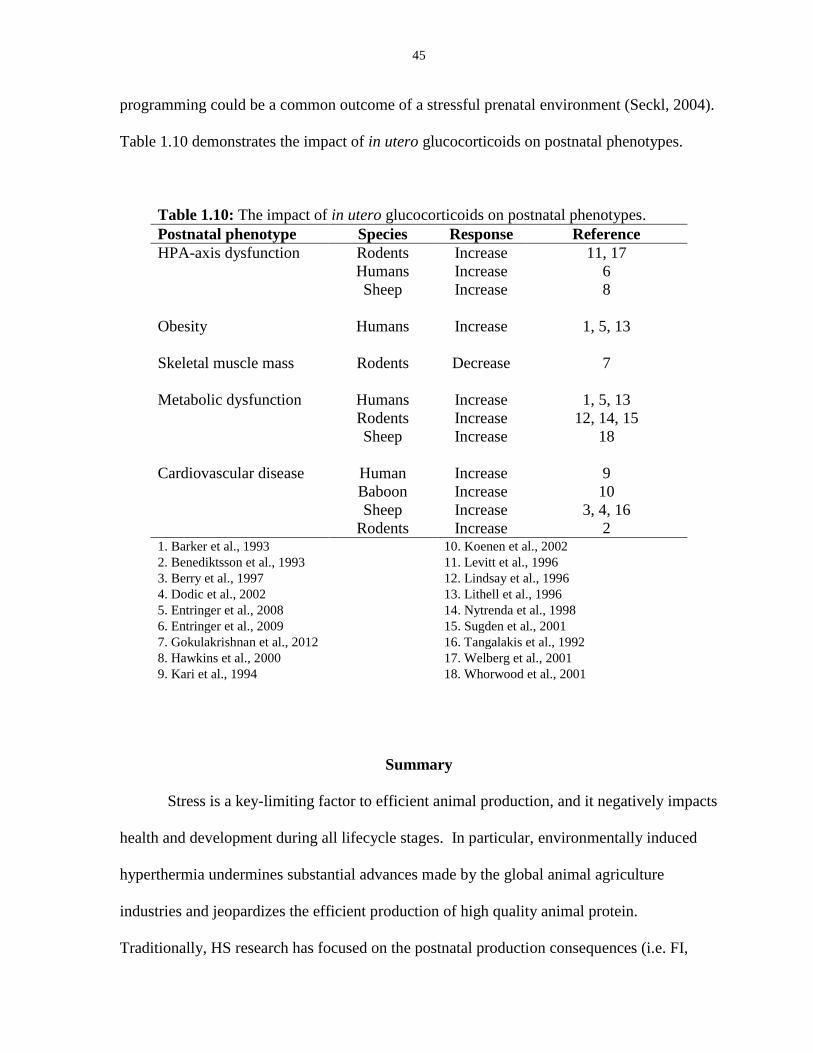
45
programming could be a common outcome of a stressful prenatal environment (Seckl, 2004).
Table 1.10 demonstrates the impact of in utero glucocorticoids on postnatal phenotypes.
Table 1.10: The impact of in utero glucocorticoids on postnatal phenotypes.
Postnatal phenotype Species Response Reference
HPA-axis dysfunction Rodents Increase 11, 17
Humans Increase 6
Sheep Increase 8
Obesity Humans Increase 1, 5, 13
Skeletal muscle mass Rodents Decrease 7
Metabolic dysfunction Humans Increase 1, 5, 13
Rodents Increase 12, 14, 15
Sheep Increase 18
Cardiovascular disease Human Increase 9
Baboon Increase 10
Sheep Increase 3, 4, 16
Rodents Increase 2 1. Barker et al., 1993 10. Koenen et al., 2002
2. Benediktsson et al., 1993 11. Levitt et al., 1996
3. Berry et al., 1997 12. Lindsay et al., 1996
4. Dodic et al., 2002 13. Lithell et al., 1996
5. Entringer et al., 2008 14. Nytrenda et al., 1998
6. Entringer et al., 2009 15. Sugden et al., 2001
7. Gokulakrishnan et al., 2012 16. Tangalakis et al., 1992
8. Hawkins et al., 2000 17. Welberg et al., 2001
9. Kari et al., 1994 18. Whorwood et al., 2001
Summary
Stress is a key-limiting factor to efficient animal production, and it negatively impacts
health and development during all lifecycle stages. In particular, environmentally induced
hyperthermia undermines substantial advances made by the global animal agriculture
industries and jeopardizes the efficient production of high quality animal protein.
Traditionally, HS research has focused on the postnatal production consequences (i.e. FI,
46
BW, ADG, milk production) of HS. Furthermore, recent reports indicate that altered post-
absorptive metabolism may be partially responsible for HS-induced decline in production
efficiency. In addition to the postnatal impact of stress, intrauterine stressors (i.e. maternal
under nutrition, intrauterine growth retardation) can have a lasting impact on offspring
performance and postnatal metabolism. While many studies of in utero HS have investigated
its teratogenic impact, there is limited knowledge of its effects on postnatal metabolism and
bioenergetics in mammalian species.
To better understand the consequences of in utero HS on production agriculture, a
series of studies were performed to determine its impact on postnatal thermal tolerance and
bioenergetics (Chapters II and III), and nutrient partitioning (Chapters IV, V and VI).
Pregnant first parity pigs and rats were exposed to either TN or HS conditions for the entire
gestation, the first half, or second half of gestation. To account for differences in maternal
nutrient intake, we utilized an ad libitum thermal neutral control group and a pair-fed thermal
neutral control group of rats. Progeny were evaluated for differences in growth performance,
nutrient partitioning, thermoregulation, and post-absorptive metabolism.
47
Literature Cited
Aggarwal, Y., B.M. Karan, B.N. Das, and R.K. Sinha. 2008. Prediction of heat-illness
symptoms with the prediction of human vascular response in a hot environment under
resting condition. J. Med. Syst. 32: 167-176.
Alam, A.N., S.A. Sarker, M.A. Wahed, M. Khatun, and M.M. Rahaman. 1994. Enteric
protein loss and intestinal permeability changes in children during acute shigellosis
and after recovery: effect of zinc supplementation. Gut. 35: 1707-1711.
Angilletta, M.J. 2009. Thermal Adaptation: A Theorical and Empirical Synthesis.
Oxford University Press. St. Joseph, Minnesota. pp. 1-6.
Angus, D.J., M.A. Febbraio, D. Lasini, and M. Hargreaves. 2001. Effect of
carbohydrate ingestion on glucose kinetics during exercise in the heat. J. Appl.
Physiol. 90: 601- 605.
Anthony, T.G., and M. McNurlan. 2013. Protein synthesis and degradation. In: Stipanuk,
M.H., and M.A. Caudill, eds. Biochemical, Physiological, and Molecular Aspects of
Human Nutrition. Elsevier Inc. St. Louis, MO. pp. 256-286.
Barker, D.J.P., K.M. Godfrey, P.D. Gluckman, J.E. Harding, J.A. Owens, and J.S.
Robinson. 1993. Fetal nutrition and cardiovascular disease in adult life.
The Lancet. 341: 938-941.
Battisti, D.S., and R.L. Naylor. 2009. Historical warnings of future food insecurity with
unprecedented seasonal heat. Science. 323: 240-244.
Baumgard L.H., R.P. Rhoads, M.L. Rhoads, N.K. Gabler, J.W. Ross, A.F. Keating,
R.L. Boddicker, S. Lenka, and V. Sejian. 2012. Impact of climate change on
livestock production. In: Sejian V, Naqvi SMK, Ezeji T, Lakritz J, Lal R, eds.
Environmental Stress and Amelioration in Livestock Production. Berlin: Springer-
Verlag. pp. 413-468.
Baumgard L.H., and R.P. Rhoads. 2013. Effects of heat stress on post-absorptive
metabolism and energetics. Annu. Rev. Anim. Bio. 1: 311-337.
Baumgart, D.C., and A.U. Dignass. 2002. Intestinal barrier function. Curr. Opinion Clin. Nutr. Met. Care. 5: 685-694. Becker, B.A., C.D. Knight, F.C. Buonomo, G.W. Jesse, H.B. Hedrick, and C.A. Baile.
1992. Effect of a hot environment on performance, carcass characteristics, and
blood hormones and metabolites of pigs treated with porcine somatotropin. J.
Anim. Sci. 70: 2732-2740.
48
Beede, D., and R. Collier. 1986. Potential nutritional strategies for intensively managed
cattle during thermal stress. J. Anim. Sci. 62: 543-554.
Benediktsson, R., R. Lindsay, J. Noble, J.R. Seckl, and C.R.W. Edwards. 1993.
Glucocorticoid exposure in utero: a new model for adult hypertension. Lancet.
341: 339–341.
Berg, J.M., J.L. Tymoczko, and L. Stryer. 2007. Biochemistry, 6th
edition. W.H. Freeman
and Company, New York, NY.
Bernabucci, U., N. Lacetera, L.H. Baumgard, R.P. Rhoads, B. Ronchi, and A.
Nardone. 2010. Metabolic and hormonal acclimation to heat stress in
domesticated ruminants. Animal. 4: 1167-1183.
Bernal, A.J., and R.J. Jirtle. 2010. Epigenomic disruption: The effects of early
developmental exposures. Birth Defects Research Part A: Clinical and Molecular
Teratology. 88: 938-944.
Berry, L.M., D.H. Polk, M. Ikegami, A.H. Jobe, J.F. Padbury, and M.G. Ervin. 1997.
Preterm newborn lamb renal and cardiovascular responses after fetal or maternal
antenatal betamethasone. Am. J. Physiol. Regul. Integr. Comp. Physiol. 41:
R1972-R1979.
Bianca, W. 1965. Reviews of the progress of dairy science. Physiology. Cattle in a hot
environment. J. Dairy Sci. 32: 291–328.
Bobek, S., A. Sechman, E. Wieczorek, D. Wronska-Fortuna, K. Koziec, and J. Niezgoda.
1997. Reverse 3, 3’, 5’-triiodothyronine (rT3) enhances hyperglycemia and lipemic
effects of heat-stress in chickens. Horm. Metab. Res. 29: 252-254.
Brannon, P.M., P. Tso, and R.J. Jandacek. 2013. Digestion and absorption of lipids. In:
Stipanuk, M.H., and M.A. Caudill, eds. Biochemical, Physiological, and Molecular
Aspects of Human Nutrition. Elsevier Inc. St. Louis, MO. pp. 179-193.
Brenna, J.T., and G.L. Sacks. 2013. Structure, nomenclature, and properties of lipids. In:
Stipanuk, M.H., and M.A. Caudill, eds. Biochemical, Physiological, and Molecular
Aspects of Human Nutrition. Elsevier Inc. St. Louis, MO. pp. 91-119.
Brody, S. 1956. Climactic Physiology of Cattle. J. Dairy Sci. 39(6): 715-725.
Brown-Brandl, T.M., J.A. Nienaber, R.A. Eigenberg, G.L. Hahn, and H. Freetly. 2003.
Thermoregulatory responses of feeder cattle. J. Thermal Biol. 28: 149-157.
Brown-Brandl TM, Nienaber JA, Xin H, Gates RS. 2004. A literature review of swine
production. Trans ASAE. 47: 259-270.
49
Bruce, J.M. 1977. Conductive heat loss from the recumbent animal. Farm Building R & D
Studies. 8: 9-15.
Bruce, J.M., and J.J. Clark. 1979. Models of heat production and critical temperature for
growing pigs. Anim. Prod. 28: 353-369.
Burger, F.J., J.P. Du Plessis, E.U. Bieler, and P.J. Lategan. 1972. Further studies on
the chemical changes in the blood and tissues of rats during hyperthermia S.
Afr. Med. J. 41: 718-721.
Campbell, J.R., M.D. Kenealy, and K.L. Campbell. 2003. Animal Sciences: The biology,
care, and production of domestic animals. McGraw Hill, San Francisco, CA.
Caroprese, M., M. Albenzio, R. Marino, A. Santillo, and A. Sevi. 2013. Dietary glutamine
enhances immune responses of dairy cows under high ambient temperature. J. Dairy
Sci. 96: 3002-3011.
CDFA. 2008. Hot topics affecting California Agriculture. An update from Sec. Kawamura.
California Department of Food Agriculture.
Cena, K. and Monteith, J.L. 1975. Transfer processes in animal coats. I. Radiative
transfer Proceeding of the Royal Society of London. Series B. Biological Sciences.
188: 377-393.
Chen, X., A.L. Fahy, A.S. Green, M.J. Anderson, R.P. Rhoads, and S.W. Limesand.
2010. ß2-Adrenergic receptor desensitization in perirenal adipose tissue in fetuses and
lambs with placental insufficiency-induced intrauterine growth restriction. J.
Physiol. 588: 3539-3549.
Cole, T.J. 1995. Cloning of the mouse 11beta-hydroxysteroid dehydrogenase
type 2 gene: tissue specific expression and localization in distal convoluted
tubules and collecting ducts of the kidney. Endocrinol. 136: 4693–4696.
Collier, R.J., S.G. Doelger, H.H. Head, W.W. Thatcher, and C.J. Wilcox. 1982. Effects of
heat stress during pregnancy on maternal hormone concentrations, calf birth
weight and postpartum milk yield of Holstein cows. J. Anim. Sci. 54: 309-319.
Collier, C.T., P.N. Williams, J.A. Carroll, T.H. Welsh Jr., and J.C. Laurenz. 2011.
Effect of maternal restraint stress during gestation on temporal lipopolysaccharide-
induced neuroendocrine and immune responses of progeny. Domest. Anim.
Endocrinol. 40: 40-50.
Collin A., J. van Milgen, S. Dubois, and J. Noblet. 2001. Effect of high temperature on
feeding behaviour and heat production in group-housed young pigs. Br. J. Nutr. 86:
63-70.
50
Collins, F.G., F.A. Matros, and J.L. Skibba. 1980. Effect of palmitate on hepatic
biosynthetic functions at hyperthermic temperatures. Metabolism. 29: 524–531.
Cronje, P. 2005. Heat stress in livestock—the role of the gut in its aetiology and a potential
role for betaine in its alleviation. Recent Advances in Animal Nutrition in Australia
15: 107-122.
Curtis, S. 1983. Environmental Management in Animal Agriculture. Iowa State University
Press. Ames, Iowa. pp 6-96.
Dazert, E., and M.N. Hall. 2011. mTOR signaling in disease. Current Opinion in Cell
Biology. 23: 744-755.
Deshazer, J.A. 2009. Livestock Energetics and Thermal Environmental Management.
American Society of Agricultural and Biological Engineers. pp. 1-35.
DeSouza, C.J., and A.H. Meier. 1993. Alterations in body fat stores and plasma insulin
levels with daily intervals of heat exposure in Holtzman rats. Am. J. Reg. Integr.
Comp. Physiol. 265: 1109-1114.
Diesel, B., S. Kulhanek-Heinze, M. Holtje, B. Brandt, H.D. Holtje, A.M. Vollmar, and
A.K. Kiemer. 2007. Alpha-lipolic acid as a directly binding activator of the
insulin receptor: protection from hepatocyte apoptosis. Biochemistry. 46: 2146-
2155.
Dodic, M., K. Moritz, I. Koukoulas, and E.M. Wintour. 2002. Programmed
hypertension: kidney, brain or both? Trends in Endocrinology and Metabolism. 13:
403–408.
Drovers Cattle Network. 2011. Heat wave kills as many as 4,000 cattle last week in
Iowa. http://www.cattlenetwork.com/cattle-resources/hot-topics/Heat-wave-
kills-as-many-as-4000-cattle-last-week-in-Iowa-126763608.html.
Dunshea, F.R., B.J. Leury, F. Fahri, K. DiGiacomo, A. Hung, S. Chauhan, I.J. Clarke, R.
Collier, S. Little, L.H. Baumgard, and J.B. Gaughan. 2013. Amelioration of
thermal stress impacts in dairy cows. Anim. Prod. Sci. 53: 965-975.
Edwards, M.J. 1969. Congenital defects in guinea pigs: Retardation of brain growth of
guinea pigs following hyperthermia during gestation. Teratology. 2: 329–336.
Edwards, M.J., R.D. Saunders, and K. Shiota. 2003. Effects of heat on embryos and
foetuses. Int. J. Hyperthermia. 19: 295-324.
Einarsson, S., A. Madej, and V. Tsuma. 1996. The influence of stress on early pregnancy in
the pig. Anim. Reprod. Sci. 42: 165-172.
51
Elsasser, T., R. Rhoads, S. Kahl, R. Collier, L.H. Baumgard, C. Li, and T. Caperna.
2009. Heat stress augments plasma tyrosine-nitrated proteins and lactate-to-
pyruvate ratio after repeated endotoxin (LPS) challenge in steers. J. Anim. Sci.
87(E-Suppl. 2): 9 (Abstr.).
Entringer, S., S. Wust, R. Kumsta, I.M. Layes, E.L. Nelson, D.H. Hellhammer, and
P.D. Wadhwa. 2008. Prenatal psychosocial stress exposure is associated with
insulin resistance in young adults. Am. J. Obstet. Gynecol. 199: 498e1–498e7.
Entringer, S., R. Kumsta, D. H. Hellhammer, P. D. Wadhwa, and S. Wust. 2009. Prenatal
exposure to maternal psychosocial stress and HPA axis regulation in young
adults. Hormon. Behav. 55: 292–298.
Estruch, F. 2006. Stress-controlled transcription factors, stress-induced genes and stress
tolerance in budding yeast. FEMS Micro. Bio. Rev. 24: 469-486.
Febbraio, M.A. R.J. Snow, C.G. Stathis, M. Hargreaves, and M.F. Carey. 1994. Effect of
heat stress on muscle energy metabolism during exercise. J. Appl. Physiol. 77:
2827-2831.
Febbraio, M.A. 2001. Alterations in energy metabolism during exercise and heat stress.
Sports Med. 31: 47–59.
Ferraris, R.P., and H.V. Carey. 2000. Intestinal transport during fasting and malnutrition.
Annu. Rev. Nutr. 20: 195–219.
Findlay, J.D. and G.C. Whittow. 1966. The role of arterial oxygen tension in the respiratory
response to localized heating of the hypothalamus and to hypothermia. J. Physiol.
186. pp. 333-346.
Fink, W.J., D.L. Costill, and P.J. Van Handel. 1975. Leg muscle metabolism during exercise
in the heat and cold. Eur. J. Appl. Physiol. Occup. Physiol. 34:183–190.
Fletcher, J.E., H. Rosenberg, K. Michaux, K.S. Cheah, and A.M. Cheah. 1988. Lipid analysis
of skeletal muscle from pigs susceptible to malignant hyperthermia. Biochemistry and
Cell Biology. 66: 917-921.
Foxcroft, G.R., W.T. Dixon, S. Novak, C.T. Putman, S.C. Town, and M.D. Vinsky. 2006.
The biological basis for prenatal programming of postnatal performance in pigs. J.
Anim. Sci. 84: E105-E112.
Foxcroft, G.R., W.T. Dixon, M.K. Dyck, S. Novak, J.C. Harding, and F.C. Almeida. 2009.
Prenatal programming of postnatal development of the pig. Soc. Reprod. Fertil.
Suppl. 66: 213-231.
52
Francesconi, R.P., B.J. Fine, and J.L. Kobrick. 1976. Heat and simulated high altitude:
effects on biochemical indices of stress and performance. Avait. Space Environ. Med.
47: 548-552.
Francesconi, R.P., and R.W. Hubbard. 1986. Dietary manipulation and exercise in the heat:
thermoregulatory and metabolic effects in rats. Aviat. Space Environ. Med. 57: 31-35.
Frank, J.W., B.T. Richert, A.P. Schinckel, B.A. Belstra, S.F. Amass, and S.A. DeCamp.
1998. Effect of environment, genotype, and health management system on pig
growth performance and carcass characteristics. Purdue University Swine Day
Report. pp. 129-140.
Frankel, H.M. 1968. Serum lipid changes during progressive hyperthermia. Life Sci.
21: 1203-1207.
Frascella, D.W., I.S. Kampa, and B.H. Francis. 1977. Metabolic effect of high environmental
temperature on non-diabetic and diabetic rats. Horm. Metab. Res. 9: 374-378.
Fuquay, J.W. 1981. Heat stress as it affects animal production. J. Anim. Sci. 52: 164-174.
Garofano, A., P. Czernichow, and B. Breant. 1998. Beta-cell mass and proliferation
following late fetal and early postnatal malnutrition in the rat. Diabetologia. 41:
1114-1120.
Gaughan, J.B. 2012. Basic principles involved in adaptation of livestock to climate
change. In: Sejian V, Naqvi SMK, Ezeji T, Lakritz J, Lal R, eds. Environmental
Stress and Amelioration in Livestock Production. Berlin: Springer-Verlag, pp. 245-
261.
Geraert, P. A., J. C. Padilha, and S. Guillaumin. 1996. Metabolic and endocrine changes
induced by chronic heat exposure in broiler chickens: Growth performance, body
composition and energy retention. Br. J. Nutr. 75: 195–204.
Germain, M.A., W.S.Webster, and M.J. Edwards. 1985. Hyperthermia as a teratogen:
Parameters determining hyperthermia-induced head defects in the rat.
Teratology. 31: 265–272.
Godfray, H.C.J., I.R. Crute, L. Haddad, D. Lawerance, J.F. Muir, N. Nisbett, J. Pretty, S.
Robinson, C. Toulmin, and R. Witeley. 2010. The future of the global food
system. Phil. Trans. R. Soc. 365:2769-2777.
Gokulakrishnan, G., I.J. Estrada, H.A. Sosa, and M.L. Fiorotto. 2012. In utero
glucocorticoid exposure reduces fetal skeletal muscle mass in rats independent of
effects on maternal nutrition. Am. J. Physiol. Regul. Integr. Comp. Physiol.
302: R1143-R1152.
53
Gong, D.W., Y. He, M. Karas, and M. Reitman. 1997. Uncoupling protein-3 is a mediator
of thermogenesis regulated by thyroid hormone, ß3-adrenergic agonists, and
leptin. J. Biol. Chem. 272: 24129-24132.
Gonzalez-Alonso, J., J.A. Calbet, and B. Nielson. 1999. Metabolic and thermodynamic
responses to dehydration-induced reductions in muscle blood flow in exercising
humans. J. Physiol. 520: 577-589.
Graham J.M., M.J. Edwards, M.J. Edwards. 1998. Teratogen update: Gestational effects of
maternal hyperthermia due to febrile illnesses and resultant patterns of effects in
humans. Teratology. 58: 209-221.
Hales CN, and Barker DJ. 1992. Type 2 (non-insulin-dependent) diabetes mellitus: the thrifty
phenotype hypothesis. Diabetologia. 35: 595-601.
Hall, G.M., J.N. Lucke, R. Lovell, and D. Lister.1980. Porcine malignant hyperthermia.VII:
hepatic metabolism. Br. J. Anaesth. 52: 11–17.
Hall, D. M., K. R. Baumgardner, T. D. Oberley, and C. V. Gisolfi. 1999. Splanchnic tissues
undergo hypoxic stress during whole body hyperthermia. Am J Physiol 276: G1195-
1203.
Hart, L.E., B.P. Egier, A.G. Shimizu, P.J. Tandan, and J.R. Sutton. 1980. External heat
stroke: the runner’s nemesis. Can. Med. Assoc. 122: 1144-1150.
Hassan, R., T. Ebeid, A. Abd El-Lateif, and N. Ismail. 2011. Effect of dietary betaine
supplementation on growth, carcass and immunity of New Zealand White rabbits
under high ambient temperature. Livestock Sci. 135: 103-109.
Haque, N., A. Ludri, S.A. Hassain, and M. Ashutosh. 2012. Alteration of metabolic
profiles in young and adult Murrah buffaloes exposed to acute heat stress. Iranian J.
Appl. Anim. Sci. 1: 23-29.
Hawkins, P., C. Steyn, H.H. McGarrigle, N.A. Calder, T. Saito, L.L. Stratford, D.E.
Noakes, and M.A. Hanson. 2000. Cardiovascular and hypothalamic-pituitary-
adrenal axis development in late gestation fetal sheep and young lambs following
modest maternal nutrient restriction in early gestation. Reprod. Fert. Development.
12: 443–456.
Heath, M.E. 1983. The effects of rearing-temperature on body composition in young
pigs. Comp. Biochem. Physiol. 76: 363-366.
Hendrickx, A.G., G.W. Stone, R.V. Hendrickson, and K. Matayoshi. 1979. Teratogenic
effects of hyperthermia in the bonnet monkey (Macaca radiata). Teratology. 19:
177–182.
54
Huang, W.L., L.D. Beazley, J.A. Quinlivan, S.F. Evans, J.P. Newnham, and S.A. Dunlop.
1999. Effect of corticosteroids on brain growth in fetal sheep. Obstetrics and
Gynecology. 94: 213–218.
Huang, W.L., C.G. Harper, S.F. Evans, J.P. Newnham, and S.A. Dunlop. 2001.
Repeated prenatal corticosteroid administration delays astrocyte and capillary
tight junction maturation in fetal sheep. Int. J. Developmental Neurosci. 19:
487–493.
Ingram, D.L. 1965. Evaporative cooling in the pig. Nature. 207: 415-416.
IUPS Thermal Commission. 2001. Glossery of terms for thermal physiology. Jap. J.
Phys. 51: 245-280.
Jackson, L.J., and H.R. Rosenberg. 2010. Preventing heat-related illness among
agricultural workers. J. Agromed. 15: 200-215.
Jones, P.A., and D. Takai. 2001. The role of DNA methylation in mammalian epigenetics.
Science. 293: 1068-1070.
Jonson, K.M., J.G. Lyle, M.J. Edwards, and R.H. Penny. 1976. Effect of prenatal heat stress
on brain growth and serial discrimination reversal learning in the guinea pig. Brain
Res. Bull. 1: 133-150.
Kamiya, M., Y. Kamiya, M. Tanaka, T. Oki, Y. Nishiba, and S. Shioya. 2006. Effects of high
ambient temperature and restricted feed intake on urinary and plasma 3-
methylhistidine in lactating Holstein cows. J. Anim. Sci. 77: 201-207.
Kappel, M., A. Gyhrs, H. Galbo, and B.K. Pedersen. 1997. The response on glucoregulatory
hormones of in vivo whole body hyperthermia. Int. J. Hyperthermia. 13: 413-421.
Kari, M.A., M. Hallman, M. Eronen, K. Teramo, M. Virtanen, M. Koivisto, and R.S.
Ikonen. 1994. Prenatal dexamethasone treatment in conjunction with rescue
therapy of human surfactant: a randomized placebo-controlled multicenter study.
Pediatrics. 93: 730–736.
Kenkel, C.D., E. Meyer, and M.V. Matz. 2013. Gene expression under chronic heat stress in
populations of the mustard hill coral (Porites astreoides) from different thermal
environments. Mol. Ecol. 22: 4322-4344.
Kettunen, H., K. Tiihonen, S. Peuranen, M. T. Saarinen, and J. C. Remus. 2001. Dietary
betaine accumulates in the liver and intestinal tissue and stabilizes the intestinal
epithelial structure in healthy and coccidia-infected broiler chicks. Comp Biochem
Physiol A Mol Integr Physiol 130: 759-769.
55
Kim, B.G., M.D. Lindemann, and G.L. Cromwell. 2009. The effects of dietary chromium
(III) picolinate on growth performance, blood measurements, and respiratory rate in
pigs kept in high and low ambient temperature. J. Anim. Sci. 87: 1695-1704.
Kisliouk, T., M. Ziv, and N. Meiri. 2010. Epigenetic control of translation regulation:
Alterations in histone H3 lysine 9 post-translation modifications are correlated
with the expression of the translation initiation factor 2B (Eif2b5) during thermal
control establishment. Dev. Neurobiol. 70: 100-113.
Kleiber M. The Fire of Life an Introduction to Animal Energetics. New York: Wiley,
1961, pp. 129-174.
Klose, R.J., and A.P. Bird. 2006 Genomic DNA methylation: the mark and its mediators.
Trends Biochem. Sci. 31: 89-97.
Koenen, S.V., C.A. Mecenas, G.S. Smith, S. Jenkins, and P.W. Nathanielsz. 2002. Effects of
maternal betamethasone administration on fetal and maternal blood pressure and heart
rate in the baboon at 0.7 of gestation. Am. J. Obstetrics and Gynecology. 186: 812–
817.
Kozlowski, S., Z. Brzezinska, B. Kruk, H. Kaciuba-Uscilko, J.E. Greenleaf, and K. Nazar.
1985. Exercise hyperthermia as a factor limiting physical performance: Temperature
effect on muscle metabolism. J. Appl. Physiol. 59: 766-773.
Lambert, G. P., C.V. Gisolfi, D.J. Berg, P.L. Moseley, L.W. Oberley, and K.C. Kregel.
2002. Selected contribution: Hyperthermia-induced intestinal permeability and the
role of oxidative and nitrosative stress. J. Appl. Physiol. 92: 1750-1761.
Laplante, M., and D.M. Sabatini. 2009. mTOR signaling at a glance. J. Cell Sci. 122:
3589-3594.
Lary, J.M., R.D.L. Conover, P.H. Johnson, and J.A. Burg. 1983. Teratogenicity of 27.12
MHz radiation in rats is related to duration of hyperthermic exposure.
Bioelectromagnetics. 4: 249–255.
Lee, F.S., and E.L. Scott. 1916. The action of temperature and humidity on the working
power of muscles and on the sugar of the blood. Am. J. Phys. 40: 486–501.
Leon, L.R. 2007. Heat stroke and cytokines. In: Progress in Brain Research vol. 162.
Elsevier. pp. 485.
Leturque, A., and E. Brot-Laroche. 2013. Digestion and absorption of carbohydrates. In:
Stipanuk, M.H., and M.A. Caudill, eds. Biochemical, Physiological, and Molecular
Aspects of Human Nutrition. Elsevier Inc. St. Louis, MO. pp. 142-161.
56
Levitt, N.S., E.V. Lambert, D. Woods, C.N. Hales, R. Andrew, and J.R. Seckl. 2000.
Impaired glucose tolerance and elevated blood pressure in low birth weight,
non-obese young South African adults: early programming of the cortisol axis. J.
Clin. Endo. Metabolism. 85: 4611–4618.
Li, G., I. Ali, and R.W. Currie. 2006. Insulin induces myocardial protection and Hsp70
localization to plasma membranes in rat hearts. Am. J. Physiol. Heart Circ.
Physiol. 291: H1709-H1721.
Liebach, F.H., and V. Ganapathy. 1996. Peptide transporters in the intestine and the kidney.
Annu. Rev. Nutr. 16: 99-119.
Lima, A.A., L.F. Brito, H.B. Ribeiro, M.C. Martins, A.P. Lustosa, E.M. Rocha, N.L. Lima,
C.M. Monte, and R.L. Guerrant. 2005. Intestinal barrier function and weight gain in
malnourished children taking glutamine supplemented enteral formula. J. Pediatr.
Gastroenterol. Nutr. 40: 28-35.
Lindsay, R.S., R.M. Lindsay, B. Waddell, and J.R. Seckl. 1996. Programming of glucose
tolerance in the rat: role of placental 11b-hydroxysteroid dehydrogenase.
Diabetologia. 39: 1299–1305.
Lithell, H.O., P.M. McKeigue, L. Berglund, R. Mohsen, U.B. Lithell, and D.A. Leon.
1996. Relation of size at birth to non-insulin dependent diabetes and insulin
concentrations in men aged 50–60 years. Br. Med. J. 312: 406–410.
Lopez, J., G.W. Jesse, B.A. Becker, and M.R. Ellersieck. 1991. Effects of temperature on the
performance of finishing swine: 1. Effects of a hot, diurnal temperature on average
daily gain, feed intake, and feed efficiency. J Anim. Sci. 69: 1843-1849.
Lorenzo, S., J.R. Halliwill, M.N. Sawka, and C.T. Minson. 2010. Heat acclimation
improves exercise performance. J. Appl. Physiol. 109: 1140-1147.
Lu, Q., J. Wen, and H. Zhang. 2007. Effect of chronic heat exposure on fat deposition and
meat quality in two genetic types of chicken. Poult. Sci. 86: 1059–1064.
Luber, G., and M. McGeehin. 2008. Climate change and extreme heat events. Am. J.
Prevent. Med. 35: 459-467.
MacLennan, N.K., S.J. James, S. Jerigan, J.L. Hsu, S.M. Janke, T.D. Pham, and R.H.
Lane. 2004. Uteroplacental insufficiency alters DNA methylation, one-carbon
metabolism, and histone acetylation in IUGR rats. Physiol. Genomics. 18: 43-50.
Marder, J., U. Eylath, E. Moskovitz, and R. Sharir. 1990. The effect of heat exposure on
blood chemistry of the hyperthermic rabbit. Comp. Biochem. Physiol. Comp.
Physiol. 97: 245–247.
57
Mahjoubi, E., H. Amanlou, H.R. Mirzaie-Alamouti, N. Aghaziarati, M. Hossein Yazdi,
G.R. Noori, K. Yuan, and L.H. Baumgard. 2014. The effect of cyclical and mild
heat stress on productivity and metabolism in Afshari lambs. J. Anim. Sci. In
Press.
Mashaly, M.M., G.L. Hendricks 3rd
, M.A. Kalama, A.E. Gehad, A.O. Abbas, and P.H.
Patterson. 2004. Effect of heat stress on production parameters and immune
responses of commercial laying hens. Poult. Sci. 83: 889-894.
McDonald, A.D. 1961. Maternal health in early pregnancy and congenital defects. Final
report on a prospective inquiry. Br. J. Prev. Soc. Med. 15: 154-166.
McDowell, R.E. 1972. Improvement of Livestock production in Warm Climates. W.H.
Freeman and Co., San Francisco, CA.
McGlone, J. J., W. F. Stansbury, and L. F. Tribble. 1987. Effects of heat and social
stressors and within-pen weight variation on young pig performance and agonistic
behavior. J. Anim. Sci. 65: 456–462.
McGrane, M.M. 2013. Carbohydrate metabolism: Synthesis and oxidation. In: Stipanuk,
M.H., and M.A. Caudill, eds. Biochemical, Physiological, and Molecular Aspects of
Human Nutrition. Elsevier Inc. St. Louis, MO. pp. 209-255.
Meat and Livestock Australia. 2006. Heat load in feedlot cattle. Available at
www.mla.com.au. Accessed 31 September 2013.
Mertz, W. 1993. Chromium in human nutrition: a review. J. Nutr. 123: 626-633.
Miller, P., D.W. Smith, and T. Shepard. 1978. Maternal hyperthermia as a possible
cause of anencephaly. Lancet. 1: 519.
Miova, B., S. Dinevska-Kjovkarovska, F. Cvetkovska, S. Mitev, A. Dzimrevska, and M.
Dimitrovska. 2013. Liver carbohydrate metabolism in rats in the period of recovery
after acute heat stress. Macedonian J. Med. Sci. 6: 16-23.
Mitev, S., S. Dinevska-Kovkarovska, and B. Miova. 2005. Effect of the acclimation to
high environmental temperature on the activity of hepatic glycogen phosphorylase
(a+ b and a), liver glycogen content and blood glucose level in rat. J. Therm. Biol.
30: 563-568.
Moughan, P.J., and B.R. Stevens. 2013. Digestion and absorption of protein. In: Stipanuk,
M.H., and M.A. Caudill, eds. Biochemical, Physiological, and Molecular Aspects of
Human Nutrition. Elsevier Inc. St. Louis, MO. pp. 162-178.
Muller C, Cramer W, Hare WL, Lotze-Campen H. 2010. Climate change risks for
African agriculture. PIC. 108: 4313-4315.
58
Nazifi, S., M. Saeb, E. Rowghani, and K. Kaveh. 2003. The influences of thermal stress on
serum biochemical parameters of Iranian fat-tailed sheep and their correlation with
triiodothyronine (T3), thyroxine (T4) and cortisol concentrations. Comp. Clin.
Path. 12: 135-139.
Nelson, E.A.S., Y. Wong, L.M. Yu, T.F. Fok, and K. Li. 2002. Effects of hyperthermia and
muramyl dipeptide on IL-Iβ, IL-6, and mortality in a neonatal rat model. Pediatr.
Res. 52: 886-891.
Nienaber, J.A., and G.L. Hahn. 2008. Livestock production system management responses
to thermal challenges. Int. J. Biometeorol. 52: 149-157.
Nyirenda, M.J., R.S. Lindsay, C.J. Kenyon, A. Burchell, and J.R. Seckl. 1998.
Glucocorticoid exposure in late gestation permanently programmes rat hepatic
phosphoenolpyruvate carboxykinase and glucocorticoid receptor expression and
causes glucose intolerance in adult offspring. J. Clin. Invest. 101: 2174 - 2181.
O’Brien, M.D., L.C. Cole, J.B. Wheelock, S.R. Sanders, G.C. Duff, L.H. Baumgard, and R.P.
Rhoads. 2008. Thermal and nutritional regulation of hepatic gluconeogenic genes in
growing beef cattle. J. Anim. Sci. 86 (E-Suppl. 2): 455 (Abstr.)
Oresanya, T. F. 2005. Energy Metabolism in the Weanling Pig: Effects of Energy
Concentration and Intake on Growth, Body Composition and Nutrient Accretion in
the Empty Body. PhD Thesis, University of Saskatchewan, Saskatoon, Canada.
Patience, J.F. 2012. The influence of dietary energy on feed efficiency in grow-finish swine.
In: Patience, J.F. ed. Feed Efficiency. Wageningen Academic, The Netherlands. pp.
101-125.
Pearce, S.C. 2011. The effects of heat stress and nutritional status on metabolism and
intestinal integrity in growing pigs. Graduate Theses and Dissertations. Paper
12065.
Pearce, S.C., N.K. Gabler, J.W. Ross, J. Escobar, J.F. Patience, R.P. Rhoads, and L.H.
Baumgard. 2013a. The effects of heat stress and plane of nutrition on metabolism in
growing pigs. J. Anim. Sci. 91: 2108-2118.
Pearce, S.C., V. Mani, R.L. Boddicker, J.S. Johnson, T.E. Weber, J.W. Ross, R.P. Rhoads,
L.H. Baumgard, and N.K. Gabler. 2013b. Heat stress reduces intestinal barrier
integrity and favors intestinal glucose transport in growing pigs. PLoS ONE. 8:
E70215.
Pereira, A.M.F., F. Baccari, Jr., E.A.L. Titto, and J.A.A. Almeida. 2008. Effect of thermal
stress on physiological parameters, feed itake and plasma thyroid hormones
concentration in Alentejana, Mertolenga, Frisian and Limousine cattle breeds. Int. J.
Biometeorol. 52: 199-208.
59
Peterson, S. E., P. Rezamand, J.E. Williams, W. Price, M. Chahine, M.A. McGuire. 2012.
Effects of dietary betaine on milk yield and milk composition of mid-lactation
Holstein dairy cows. J. Dairy Sci. 95: 6557-6562.
Pettigrew, R.T., J.M. Galt, C.M. Ludgate, D.B. Horn, and A.N. Smith. 1974. Circulatory and
biochemical effects of whole body hyperthermia. Br. J. Surgery. 61: 727-730.
Piestun, Y., D. Schinder, M. Ruzal, O. Halevy, J. Brake, and S. Yahav. 2008. Thermal
manipulations during broiler embryogenesis: Effect on the acquisition of
thermotolerance. Poult. Sci. 87: 1516-1525.
Pinney, S.E., and R.A. Simmons. 2010. Epigenetic mechanisms in the development of type 2
diabetes. Trends Endocrinol. Metab. 21: 223-229.
Pollman, D. 2010. Seasonal effects on sow herds: Industry experience and management
strategies. J. Anim. Sci. 88 (Suppl. 3): 9. (Abstr.)
Ranganathan, G., R. Unal, I. Pokrovskaya, A. Yao-Borengasser, B. Phanavanh, B. Lecka-
Czernik, N. Rasouli, and P.A. Kern. 2006. The lipogenic enzymes DGAT1, FAS,
and LPL in adipose tissue: effects of obesity, insulin resistance, and TZD treatment.
J. Lipid Res. 47: 2444–2450.
Ravelli, G.P., Z.A. Stein, and M.W. Susser. 1976. Obesity in young men after famine
exposure in utero and early infancy. N. Engl. J. Med. 295: 349-353.
Ravelli, A.C.J., J.H.P. van der Meulen, C. Osmond, D.J.P. Barker, and O.P. Bleker. 1999.
Obesity at the age of 50 y in men and women exposed to famine prenatally.
Am. J. Clin. Nutr. 70: 811-816.
Reik, W. 2007. Stability and flexibility of epigenetic gene regulation in mammalian
development. Nature. 447: 425-432.
Renaudeau D, Kerdoncuff M, Anais C, Gourdine JL. 2008. Effect of temperature on
thermal acclimation in Large White growing pigs. Anim. 2: 1619-1626.
Renaudeau D, Anais C, Tel L, Gourdine JL. 2010. Effect of temperature on thermal
acclimation in growing pigs estimated using a nonlinear function. J. Anim. Sci. 88:
3715-3724.
Rhoads, M.L., R.P. Rhoads, S.R. Sanders, S.H. Carroll, W.J. Weber, B.A. Crooker, R.J.
Collier, M.J. Van Baale, and L.H. Baumgard. 2007. Effects of heat stress on
production, lipid metabolism and somatotropin variables in lactating cows. J.
Dairy Sci. 90: 230. (Abtstr.)
60
Rhoads, M. L., R. P. Rhoads, M. J. VanBaale, R. J. Collier, S. R. Sanders, W. J. Weber, B.A.
Crooker, and L. H. Baumgard. 2009. Effects of heat stress and plane of nutrition on
lactating Holstein cows: I. Production, metabolism, and aspects of circulating
somatotropin. J. Dairy Sci. 92: 1986–1997.
Rhoads, R.P., L.H. Baumgard, J.K. Suagee, and S.R. Sanders. 2013. Nutritional interventions
to alleviate the negative consequences of heat stress. Adv. Nutr. 4: 267-276.
Robertshaw, D. 1985. Heat loss of cattle. In Volume 1: Stress Physiology in Livestock.
Basic Principles, pp 55-66. Florida: CRC Press.
Ronchi, B., U. Bernabucci, N. Lacetera, A. V. Supplizi, and A. Nardone. 1999. Distinct and
common effects of heat stress and restricted feeding on metabolic status of Holstein
heifers. Zoot. Nutr. Anim. 25: 11–20.
Roseboom, T., S. de Rooij, and R. Painter. 2006. The Dutch famine and its long-term
consequences for adult health. Early Human Devel. 82: 485-491.
Rosenblum, J.L., C.L. Irwin, and D.H. Alpers. 1988. Starch and glucose oligosaccharides
protect salivary-type amylase activity at acid pH. Am. J. Physiol. 254: G755-G780.
Sahin, K., O. Kucuk, N. Sahin, and M. Sari. 2002. Effects of vitamin C and vitamin E on
lipid peroxidation status, serum hormone, metabolite, and mineral concentrations of
Japanese quails reared under heat stress (34˚C). Int. J. Vitam. Nutr. Res. 72: 91-100.
Sanders, S.R., L.C. Cole, K.L. Flann, L.H. Baumgard, and R.P. Rhoads. 2009. Effects of
acute heat stress on skeletal muscle gene expression associated with energy metabolism
in rats. FASEB J. 23: 598.7 (Abstr.)
Sano, H., K. Takahashi, K. Ambo, and T. Tsuda. 1983. Turnover and oxidation rates of blood
glucose and heat production in sheep exposed to heat. J. Dairy Sci. 66: 856–861.
Sanz-Fernandez, M.V., S.C. Pearce, V. Mani, N.K. Gabler, J.F. Patience, M.E. Wilson,
J. Torrison, M.T. Socha, R.P. Rhoads, and L.H. Baumgard. 2014. Effects of
supplemental zinc amino acid complex on intestinal integrity in heat-stressed pigs.
Animal. 8: 43-50.
Schinckel, A.P., and B.T. Richert. 1996. Characteristics of genotypes for profitable high
health status pork production. Purdue Pork Page. Available at:
www.ansc.purdue.edu/swine/porkpage. Accessed 14 October 2013.
Schneider, P.L., D.K. Bede, and C.J. Wilcox. 1988. Nycterohemeral patterns of acid-
base status, mineral concentrations and digestive function of lactating cows in natural
or chamber heat stress environments. J. Anim. Sci. 66: 112-125.
61
Schoenherr, W.D., T.S. Stahly, and G.L. Cromwell. 1989. The effects of dietary fat or
fiber addition on yield and composition of milk from sows housed in a warm or hot
environment. J. Anim. Sci. 67: 482–495.
Seckl, J.R. 2004. Prenatal glucocorticoids and long-term programming. Eur. J. Endocrinol.
151: U49-U62.
Settivari, R.S., J.N. Spain, M.R. Ellersieck, J.C. Byatt, R.J. Collier, and D.E. Spiers. 2007.
Relationship of thermal status to productivity in heat-stressed dairy cows given
recombinant bovine somatotropin. J. Dairy Sci. 90: 1265-1280.
Shehab-El-Deen, M.A.M., J. L. Leroy, M. S. Fadel, S.Y. Saleh, D. Maes, and A. Van Soon.
2010. Biochemical changes in the follicular fluid of the dominant follicle of
high producing dairy cows exposed to heat stress early post-partum. Anim.
Repro. Sci. 117: 189-200.
Shiota, K., and T. Kayamura. 1989. Effects of prenatal heat stress on postnatal growth,
behavior and learning capacity in mice. Biol Neonate 56: 6-14.
Shwartz, G., M. Rhoads, M. VanBaale, R. Rhoads, and L. Baumgard. 2009. Effects of a
supplemental yeast culture on heat-stressed lactating Holstein cows. J. Dairy
Sci. 92: 935–942.
Simon, J.F. 1953. Effects of hyperpyrexia on the human blood count, blood chemistry and
urine. J. Lab. Clin. Med. 21: 400-402.
Singleton, K. D., and P. E. Wischmeyer. 2006. Oral glutamine enhances heat shock protein
expression and improves survival following hyperthermia. Shock. 25: 295-299.
Slavin, J.L. 2013. Structure, Nomenclature, and Properties of Carbohydrates. In: Stipanuk,
M.H., and M.A. Caudill, eds. Biochemical, Physiological, and Molecular Aspects of
Human Nutrition. Elsevier Inc. St. Louis, MO. pp. 50-68.
Sorensen, J.G., J. Dahlgaard, and V. Loeschcke. 2001. Genetic variation in thermal
tolerance among natural populations of Drosophila buzzatii: Down regulation of
Hsp70 expression and variation in heat stress resistance traits. Funct. Ecol. 15:
289-296.
Speakman, J.R., and E. Krol. 2010. Maximal heat dissipation capacity and hyperthermia risk:
neglected key factors in the ecology of endotherms. J. Anim. Ecol. 79: 726-746.
Speirs, H.J., J.R. Seckl, and R.W. Brown. 2004. Ontogeny of glucocorticoid receptor and 11
beta-hydroxysteroid dehydrogenase typr-1 gene expression identifies potential critical
periods of glucocorticoid susceptibility during development. J. Endocrinol. 181: 105-
116.
62
Spencer, J.D., A.M. Gaines, E.P. Berg, and G.L. Allee. 2005. Diet modifications to improve
finishing pig growth performance and pork quality attributes during periods of heat
stress. J. Anim. Sci. 83: 243-254.
Spiers, D.E., J.N. Spain, J.D. Sampson, and R.P. Rhoads. 2004. Use of physiological
parameters to predict milk yield and feed intake in heat-stressed dairy cows. J. Dairy
Sci. 29: 759-764.
Spiers, D.E., P.A. Eichen, and G.E. Rottinghaus. 2005. A model of fescue toxicosis:
Responses of rats to intake of endophyte-infected tall fescue. J. Anim. Sci. 83:
1423-1434.
Srikandakumar, A., and E.H. Johnson. 2004. Effect of heat stress on milk production, rectal
temperature, respiratory rate and blood chemistry in Holstein, Jersey and Australian
Milking Zebu cows. Trop. Anim. Health Prod. 36: 685-692.
St. Pierre, N., B. Cobanov, and G. Schnitkey. 2003. Economic losses from heat stress by US
livestock industries. Journal of Dairy Science 86: E52-E77.
Stipanuk, M.H. 2013. Structure, nomenclature, and properties of proteins and amino acids.
In: Stipanuk, M.H., and M.A. Caudill, eds. Biochemical, Physiological, and
Molecular Aspects of Human Nutrition. Elsevier Inc. St. Louis, MO. pp. 69-90.
Stoakes, S.K., M.V. Sanz-Fernandez, J.S. Johnson, M. Abuajamieh, J.T. Seibert, S.C. Pearce,
R.P. Rhoads, and L.H. Baumgard. 2013. Environmental heat stress and gut
integrity. MN Nutr. Conf.
Streffer, C. 1982. Aspects of biochemical effects by hyperthermia. Natl. Cancer Inst.
Monogr. 61: 11–17.
Streffer, C. 1988. Aspects of metabolic change after hyperthermia. Recent Results
Cancer Res. 107: 7–16.
Sugden. M.C., M.L. Langdown, M.J. Munns, and M.J. Holness. 2001. Maternal
glucocorticoid treatment modulates placental leptin and leptin receptor
expression and materno-fetal leptin physiology during late pregnancy and elicits
hypertension associated with hyperleptinaemia in the early-growth-retarded
adult offspring. Euro. J. Endo. 145: 529–539.
Sul, H.S., 2013. Metabolism of fatty acids, acylglycerols, and sphingolipids. In: Stipanuk,
M.H., and M.A. Caudill, eds. Biochemical, Physiological, and Molecular Aspects of
Human Nutrition. Elsevier Inc. St. Louis, MO. pp. 357-392.
Sun, K, K. Yang, and J.R.G. Challis. 1997. Differential expression of 11 beta-
hydroxysteroid dehydrogenase types 1 and 2 in human placenta and fetal
membranes. J. Clin. Endo. Metabolism. 82: 300–305.
63
Tangalakis, K., E.R. Lumbers, K.M. Moritz, M.K. Towstoless, and E.M. Wintour.
1992. Effect of cortisol on blood pressure and vascular reactivity in the ovine
fetus. Exp. Physiol. 77: 709–717.
Tao, S., A.P.A. Monteiro, I.M. Thompson, M.J. Hayen, and G.E. Dahl. 2012. Effect of late
gestation maternal heat stress on growth and immune function of dairy calves. J.
Dairy Sci. 95: 7128-7136.
Tao, S., E.E. Connor, J.W. Bubolz, I.M. Thompson, B.C. do Amaral, M.J. Hayen, and
G.E. Dahl. 2013. Short communication: Effect of heat stress during the dry
period on gene expression in mammary tissue and paripheral blood
mononuclear cells. J. Dairy Sci. 96: 378 – 383.
Teague CR, Dhabhar FS, Barton RH, Beckwith-Hall B, Powell J, et al. 2007. Metabonomic
studies on the physiological effects of acute and chronic psychological stress in
Sprague-Dawley rats. J. Proteome Res. 6: 2080–2093.
Tetievsky, A., and M. Horowitz. 2010. Posttranslational modifications in histones
underlie heat acclimation-mediated cytoprotective memory. J. Appl. Physiol.
109: 1552-1561.
Thomsen, H., H.K. Lee, M.F. Rothschild, M. Malek, and J.C.M. Dekkers. 2004.
Characterization of quantitative trait loci for growth and meat quality in a cross
between commercial breeds of swine. J. Anim. Sci. 82: 2213-2228.
Thompson, R.F., M.J. Fazzari, H. Niu, N. Barzilai, R.A. Simmons, and J.M. Greally.
2010. Experimental intrauterine growth restriction induces alterations in DNA
methylation and gene expression in pancreatic islets of rats. J. Biol. Chem. 285:
15111-15118.
Torlinska, T., R. Banach, J. Paluszak, and A. Gryczka-Dziadecka. 1987. Hyperthermia
effect on lipolytic processes in rat blood and adipose tissue. Acta Physiol. Pol. 38:
361–366.
Turner, B.M. 2000. Histone acetylation and an epigenetic code. Bioessays. 22: 836-
845.
Turner, B.M. 2007. Defining an epigenetic code. Nat. Cell Biol. 9: 2-6.
Tzschentke, B. 2007. Attainment of thermoregulation as affected by environmental
factors. Poult. Sci. 86: 1025-1036.
United States Environmental Protection Agency. 2013. www.epa.gov.
64
Van Milgen, J. and J. Noblet. 2000. Modelling energy expenditure in pigs. In: Modelling
nutrient utilization in farm animals. Eds. J.P. McNamara, J. France, and D.E.
Beever. CAB International, Oxon, U.K.
Van Milgen, J. and J. Noblet. 2003. Partitioning of energy intake to heat, protein, and fat in
growing pigs. J. Anim. Sci. 81: E86-E93.
Van’t Hoff, J.H. 1898. Lectures on theoretical and physical chemistry, Part 1, Chemical
dynamics. Edward Arnold. London, U.K.
Vernon, R.G. 1992. Effects of diet on lipolysis and its regulation. Proc. Nutr. Soc. 51:
397-408.
Wang, X., M.C. Valenzano, J.M. Mercado, E.P. Zurbach, and J.M. Mullin. 2013. Zinc
Supplementation Modifies Tight Junctions and Alters Barrier Function of CACO-2
Human Intestinal Epithelial Layers. Dig. Dis. Sci. 58: 77-87.
Welberg, L.A.M., and J.R. Seckl. 2001. Prenatal stress, glucocorticoids and the
programming of the brain. J. Neuroendocrinology. 13: 113–128.
Wheelock, J.B., A.J. La Noce, M.D. O’Brien, S.R. Sanders, and L.H. Baumgard. 2008.
The effect of heat stress and exogenous bovine somatotropin on expression of
genes associated with hepatic gluconeogenesis in lactating dairy cows. J. Dairy
Sci. 91: E-Suppl 145.
Wheelock, J.B., R.P. Rhoads, M.J. VanBaale, S.R. Sanders, and L.H. Baumgard. 2010.
Effects of heat stress on energetic metabolism in lactating Holstein cows. J. Dairy
Sci. 93: 644–655.
White, P.C., T. Mune, and A.K. Agarwal. 1997. 11 beta-Hydroxysteroid dehydrogenase
and the syndrome of apparent mineralocorticoid excess. Endo. Rev. 18: 135–
156.
White, H.M., S.L. Koser, and S.S. Donkin. 2009. Regulation of bovine pyruvate
carboxylase mRNA and promoter expression by heat stress. J. Dairy Sci. 92 (E-
Suppl. 1): 139 (Abstr.)
White, H.M., S.L. Koser, and S.S. Donkin. 2012. Regulation of bovine pyruvate carboxylase
mRNA and promoter expression by thermal stress. J. Anim. Sci. 90: 2979-2987.
Whittow, G.C. 1965. The effect of hyperthermia on the systemic and pulmonary circulation
of the ox (Bos taurus). Quart. J. Exp. Physiol. 50: 300-311.
Whittow, G.C. 1971. Comparative physiology of thermoregulation. Academic Press
Inc. New York. Volume II. pp 192-273.
65
Whorwood, C.B., K.M. Firth, H. Budge, and M.E. Symonds. 2001. Maternal undernutrition
during early to mid-gestation programs tissue specific alterations in the expression of
the glucocorticoid receptor, 11 beta-hydroxysteroid dehydrogenase isoforms and type
1 angiotensin II receptor in neonatal sheep. Endocrinol. 142: 2854–2864.
Wilson, S.J., R.S. Marion, J.N. Spain, D.E. Spiers, D.H. Keisler, and M.C. Lucy. 1998.
Effects of controlled heat stress on ovarian function of dairy cattle. 1. Lactating
cows. J. Dairy Sci. 81: 2124-2131.
Yahav, S., and J.P. McMurtry. 2001. Thermotolerance acquisition in broiler chickens by
temperature conditioning early in life: The effect of timing and ambient temperature.
J. Poult. Sci. 80: 1662-1666.
Yalcin, S., V. Bruggeman, J. Buyse, E. Decuypere, M. Cabuk, and P.B. Siegel. 2009.
Acclimation to heat during incubation: Blood hormones and metabolites in broilers
exposed to daily high temperatures. Poult. Sci. 88: 2006-2013.
Yan, Y., Y. Zhao, H. Wang, and M. Fan. 2006. Pathophysiological factors underlying
heatstroke. Med. Hypotheses. 67: 609–617.
Young, B.A. 1981. Cold stress as it affects animal production. J. Anim. Sci. 52: 154-
163.
Young, B.A., B. Walker, A.E. Dixon and V.A. Walker. 1989. Physiological adaptation to
the environment. J. Anim. Sci. 67: 2426-2432.
Yousef, M. 1985. Stress physiology in livestock, First ed. Florida: CRC Press, Inc.
Yunianto, V.D., K. Hayashi, S. Kaneda, A. Ohtsuka, and Y. Tomita.1997. Effect of
environmental temperature on muscle protein turnover and heat production in
tubed broiler chickens. Br. J. Nutr. 77: 897–909.
Xita, N., and A. Tsatsoulis. 2010. Fetal origins of the metabolic syndrome. Womens
Health and Disease. 1205: 148-155.
Zhang, B., and Y. Guo. 2009. Supplemental zinc reduced intestinal permeability by
enhancing occludin and zonula occludens protein-1 (ZO-1) expression in weaning
piglets. Br. J. Nutr. 102: 687-693.
Zhao, F.Q., and A.F. Keating. 2007. Functional properties and genomics of glucose
transporters. Curr. Genomics. 8: 113-128.
66
CHAPTER II: EFFECTS OF MAMMALIAN IN UTERO HEAT STRESS ON
ADOLESCENT BODY TEMPERATURE
A paper published in 2013 by The International Journal of Hyperthermia
29(7): 696-702
J.S. Johnson1, R.L. Boddicker
1, M.V. Sanz-Fernandez
1, J.W. Ross
1, J.T. Selsby
1,
M.C. Lucy2, T.J. Safranski
2, R.P. Rhoads
3, L.H. Baumgard
1
1Department of Animal Science, Iowa State University, Ames, IA, 50011
2Division of Animal Sciences, University of Missouri, Columbia, MO, 65211
3Department of Animal and Poultry Sciences, Virginia Tech, Blacksburg, VA, 24061
Abstract
In-utero hyperthermia can cause a variety of developmental issues, but how it alters
mammalian body temperature during adolescence is not well-understood. Study objectives
were to determine the extent to which in-utero hyperthermia affects future phenotypic
responses to a heat load. Pregnant first parity pigs were exposed to thermal neutral (TN;
cyclical 15 to 22°C; n = 8) or heat stress (HS; cyclical 27 to 37°C; n = 7) conditions during
the entire gestation. Of the resultant offspring, 12 males (n=6, gestational TN (GTN)
conditions; n = 6, gestational HS (GHS) conditions) were housed in TN conditions (constant
22.7 ± 2.5°C), and 12 males (n = 6 GTN, n = 6 GHS) were maintained in HS conditions
(constant 34.7 ± 2.3°C) for 15 d. Adolescent pigs in HS conditions had increased (P < 0.01)
rectal temperature (∆Tre; 0.33˚C) and respiration rate (∆RR; 44 bpm) compared to TN pigs,
regardless of gestational treatment. Within the HS environment, no gestational difference in
RR was detected; however, GHS pigs had increased (0.26°C; P < 0.01) Tre compared to GTN
pigs. As Tre increased, GTN pigs had a more rapid increase in RR (12 bpm/1°C; P < 0.01)
compared to the GHS pigs. Adolescent HS decreased nutrient intake (25%; P < 0.01), and
67
body weight gain (34%; P = 0.04), but neither variable was statistically influenced by
gestational treatments. In summary, in-utero HS compromises the future thermoregulatory
response to a thermal insult.
Key words: heat stress, mammals, and epigenetics
Introduction
Environmentally induced hyperthermia or heat stress (HS), results from the
imbalance between thermal energy flowing into and out of an animal [1], and negatively
impacts health and development in all mammalian species studied. Typical HS responses
include slower growth rates, altered metabolism, mortality and altered body composition
characterized primarily by increased adipose tissue and reduced skeletal muscle mass [2-4].
Moreover, swine genetic selection for lean tissue accretion rates further compromises HS
tolerance as synthesizing and maintaining enhanced muscle mass generates increased
metabolic heat [5, 6]. Consequently, HS is likely one of the primary factors limiting animal
protein production and if the frequency of severe hot weather increases as predicted [7] food
security will continue to be compromised during the warm summer months, especially in
developing countries [4].
In-utero hyperthermia negatively impacts a variety of fetal development parameters
and can be teratogenic [8]. Furthermore, maternal hyperthermia can have a lasting imprint
on offspring growth, behavior [9], and metabolism [10]. Heat stress during embryonic
development either increases survivability to a future heat load in Drosophilia buzzatti [11]
or improves the future ability to remain euthermic during a thermal insult in birds [12, 13].
Further, thermal conditioning immediately following birth can imprint long-term
68
thermotolerance in rodents [14]. In the aforementioned reports, thermotolerance is defined as
the ability to maintain a lower or safe body temperature in response to a future heat load.
However, the extent to which in-utero HS affects future body temperature indices in
mammals lacks thorough exploration. Study objectives were to characterize HS-induced
body temperature indices in adolescent pigs exposed to differing in-utero thermal
environments. We hypothesized that mammalian gestational HS would imprint future
thermotolerance to a heat load.
Materials and Methods
Gestational Environments
The University of Missouri – Columbia Animal Care and Use Committee approved
all animal procedures. Fifteen first parity crossbred females (Large White x Landrace) were
exposed to thermal neutral (TN; cyclical 15°C nighttime and 22°C daytime; 55% RH; n = 8),
or HS (cyclical 27°C nighttime and 37°C daytime; 67.5% RH; n = 7) conditions in the Brody
environmental chambers at the University of Missouri – Columbia as previously described by
Lucy and colleagues [15]. The environmental treatments began six days after insemination
and continued until birth (114 d gestation) and resulted in a sustained increase (0.30°C) in
body temperature in pregnant first parity pigs [15]. After parturition, all piglets were
exposed to the same environmental conditions (26 to 32˚C) as recommended for neonatal
pigs [16]. At weaning, offspring from both TN and HS exposed pregnant first parity pigs
were transported in an environmentally controlled trailer to Iowa State University for
postnatal experiments.
69
Adolescent Environments
Iowa State University Institutional Animal Care and Use Committee approved all
animal procedures. Between weaning and 15 wks of age all animals were co-mingled and
fed ad libitum in thermal neutral conditions [based upon body weight; 16]. At 15 wks of age,
adolescent pigs from gestational TN (GTN; n = 12; 67.9 ± 5.3 kg BW), and gestational HS
(GHS; n = 12; 64.9 ± 3.7 kg BW) exposed pregnant first parity pigs were housed in
individual pens (0.61 x 2.43 m; no wallowing access) in one of two environmentally-
controlled rooms (TN and HS). Castrated males were selected to reduce the body
temperature variability associated with gonadal steroids. In each room, relative humidity
(%RH) and ambient temperature (Ta) were recorded every 30 minutes using two mounted
data loggers (El – WIN – USB, Lascar Electronics Ltd.) for the length of the experiment.
Data loggers were positioned in opposite ends of the rooms to confirm that temperature was
uniform throughout each room.
Twelve adolescent males (n = 6 GTN, and n = 6 GHS) were housed in constant TN
conditions, and 12 adolescent males (n = 6 GTN, and n = 6 GHS) were maintained in
constant HS conditions for 15 d. The TN room was maintained at 22.7 ± 2.5°C and 71.1 ±
10.0 % RH, while the HS room was maintained at a constant 34.7 ± 2.3°C and 50.4 ± 9.7 %
RH. All pigs were fed a standard commercial diet ad libitum consisting primarily of corn
and soybean meal formulated to meet or exceed nutritional requirements [17]. Nutrient
intake was determined on d 7 and 15, while BW was determined on d -1, 7, and 15. Body
weights were used to calculated average daily gain (ADG). Unrestrained respiration rate
(RR), skin temperature, and rectal temperature (Tre), were measured four times daily (0800,
1200, 1600, 2000 h) on all animals. Respiration rate (breaths per minute: BPM) was
70
determined by counting flank movement over a one-minute interval. Skin temperature (Tskin)
was determined by calculating the mean temperature of four sites measured at the ear (Tear),
shoulder (Tshoulder), rump (Trump) and tail (Ttail) using a calibrated infrared thermometer
(Model 42505, Extech Instruments, Waltham, MA). Rectal temperature was determined with
a calibrated and lubricated thermistor thermometer (Welch Allyn SureTemp®Plus,
Skaneateles Falls, NY) inserted approximately 10 cm into the rectum of unrestrained pigs.
Due to the constant heat load, and lack of statistical hourly differences the hourly body
temperature indices (RR, Tskin, Tre) were condensed into daily averages. A thermal
circulation index (TCI) was calculated using Tre, temperature at one of the skin sites or Tskin,
and Ta, and was used as an indicator of blood and heat transfer to a particular area of the skin
under steady state thermal conditions described for agricultural species [18]:
TCI = (Tskin – Ta) / (Tre – Tskin).
Statistics
All data were analyzed using the PROC MIXED procedure in SAS 9.3 (SAS Institute
Inc., Cary, NC). Statistical model components included gestational environment (GTN;
GHS), adolescent environment (TN; HS), day (1 – 15), and all possible interactions. All
interactions, regardless of significance level were included in the model and pregnant first
parity pig was used as a random effect. Initial body weight was used as a covariate for
analysis of final body weight and body weight gain. For repeated analyses, each pig’s
respective parameter was analyzed using repeated measures with an auto-regressive
covariance structure with day as the repeated effect. Data are presented as least squares
means and statistical significance was defined as P ≤ 0.05, and a tendency was defined as
0.05 < P ≤ 0.10.
71
Linear (y = mx + b) and quadratic models were created using JMP (SAS Institute
Inc., Cary, NC) to determine the relationship between RR (y – axis) and Tre (x – axis). Slope
and correlation coefficient values from each model were similar, so the linear regression was
used for analysis. Slope was obtained for individual animals using all collected data points
and analyzed using the mixed procedure in SAS 9.3 (SAS Institute Inc., Cary, NC), with
slope as the dependent variable, and gestational environment (GTN; GHS), adolescent
environment (TN; HS) and the interaction of gestational environment and adolescent
environment as fixed effects. Pregnant first parity pig was used as a random effect. All
interactions, regardless of significance level were kept in the model. Data are presented as
least squares means and statistical significance was defined as P ≤ 0.05, and a tendency was
defined as 0.05 < P ≤ 0.10.
Results
Thermal Indices
There were no gestational differences detected in overall RR (P > 0.14), but there was
a large RR increase (~2 fold; P < 0.01) for adolescent pigs in HS conditions compared to TN
controls (Table I; Figure 1A). Regardless of gestational treatment, adolescent pigs in HS
conditions had increased Tre (P < 0.01; 0.33°C; Table I) compared to TN-housed pigs (Figure
1B). An overall gestational by adolescent interaction (P < 0.01) indicated that GHS pigs had
a larger increase in Tre during adolescent HS compared to GTN pigs (0.50 vs. 0.16°C; Table
I; Figure 1C). A gestational environment by adolescent environment by day interaction was
not observed for Tre (Figure 1B).
72
No overall differences were detected at any specific skin temperature site or Tskin
when comparing gestational treatments; however, all were increased for adolescent pigs
housed in HS conditions compared to TN conditions by 17 to 19% (Table I; Figure 2). There
were also no gestational by adolescent interactions detected for Tear, Tshoulder, Trump, Ttail or
Tskin. Thermal circulation index was similar in adolescent pigs from differing environments
when measured at the ear and tail. However, TCI was increased 50 to 52% at the rump and
Tskin in heat-stressed pigs compared to pigs in TN conditions. Overall, pigs from GHS had
increased TCItail (P = 0.03; 16%) compared to GTN pigs, but this was primarily due to the
gestational by adolescent interaction (P = 0.02) indicating that the GHS pigs had a larger
increase (150%) during HS compared to GTN pigs (Table I). Adolescent HS tended (P <
0.06) to increase TCIshoulder (32%; Table I). There was no gestational effect or gestational by
adolescent environment interaction detected for TCIshoulder, TCIrump, TCIear, or TCIskin.
Regression Analysis
With regards to the relationship between Tre and RR, GTN pigs had a steeper slope
(12 bpm/1°C) compared to GHS pigs (P < 0.01; Figure 3). No gestational environment by
adolescent environment interaction differences were detected for this relationship (P = 0.15).
Growth Parameters
Overall nutrient intake did not differ between gestational treatments (2.52 kg/d), but it
was reduced by 25% (P < 0.01) in the adolescent HS conditions compared to the TN controls
(Table II). Animal growth was not affected by gestational thermal treatments (0.70 kg/d),
but decreased 34% (P = 0.04) in HS pigs compared to those in TN conditions (Table II).
There were no gestational or adolescent treatment effects (P > 0.16) detected for feed
efficiency (0.27 kg gain/kg feed; Table II).
73
Discussion
Although HS is a serious economic burden and negatively impacts human health and
animal welfare, it is also a primary constraint to efficient livestock growth and development.
While this is the case in most geographical areas of North America, it is particularly true in
tropical and sub-tropical regions of the world where many developing countries are located
[19, 20]. As a result, these regions experience extended periods of HS compared to
temperate climates (i.e., pigs could be exposed to HS during both gestation and the growing
phase), making HS not only an economic issue, but also a serious food security and
humanitarian concern [19]. Despite the fact that HS constitutes a well-documented
physiological insult with global implications, understanding the epigenetic impact of HS
during gestation on future progeny is not well-defined in mammalian species.
A variety of prenatal insults can have permanent effects on postnatal phenotypes and
has been evaluated with regard to metabolic dysfunction [10] and teratogenicity [8].
Experimental models like intrauterine growth retardation indicate that future growth
parameters [21, 22], body composition [23], and post-absorptive metabolism can be
markedly altered by in-utero insults [10]. Hales and Barker [24] first introduced the idea of a
“thrifty phenotype,” whereby fetal malnutrition causes maladaptive programming, which
results in glucose-sparing metabolism that persists in the offspring. Similar effects can be
observed during thermal stress where exposure of unicellular organisms [25], insects [11]
and birds [12, 13, 26, 27] to elevated temperatures in previous generations or in-ovo alters
postnatal survivability and/or body temperature indices. This “thermal conditioning” has
also been demonstrated in rodents exposed to HS conditions shortly after birth [14]. This is
particularly true for imprinting thermotolerance; defined as the enhanced ability to maintain a
74
lower or safer body temperature in response to a future heat load. However, the degree to
which in-utero HS affects thermotolerance in mammals during adolescence is not well-
understood. Herein, we demonstrate that in-utero HS impairs the future HS response in a
mammalian model, which was contrary to our hypothesis that thermotolerance would have
been imprinted.
No overall gestational differences were detected in any body temperature variable
during adolescent TN conditions. However, during adolescent HS, pigs derived from heat-
stressed first parity pigs had an increase in a variety of body temperature indices, most
notably, core temperature (Tre). That gestational differences were only detected in HS
conditions is not surprising, as epigenetic alterations impacting body temperature likely need
a thermal insult to be expressed. This sort of HS-induced phenotype is similar to what has
been reported in poultry [13]. In stark contrast to the aforementioned literature that suggests
thermal “imprinting” increases future temperature tolerance, gestationally heat-stressed pigs
actually became more hyperthermic during a future HS compared to GTN pigs (Figure 1B).
Reasons for the species difference is not clear but of obvious biological and practical interest.
Further, given the physiological and phylogenetic similarities between humans and pigs,
these data could predict the human response to in utero HS.
The gestation difference in Tre during adolescent HS averaged 0.26°C and suggests
that pigs originating from chronically heat-stressed pregnant first parity pigs are less able to
adapt to a future HS compared to pigs derived from TN dams (Figure 1B). The increase in
Tre observed in GHS pigs during adolescent HS is corroborated by numerical, but not
statistically significant differences in Tskin (Figure 2). The primary numerical gestational
treatment differences in Tskin occurred between the 4th
and 9th
day of the experiment, which
75
temporally coincides with the largest difference in Tre (Figure 1B). As expected, constant
adolescent HS markedly increased RR as pigs (in the absence of opportunity for behavioral
wetting) utilize panting is their primary route of latent heat loss [3, 28]. Despite GHS pigs
having increased Tre during HS conditions, RR was similar between gestational treatments
within the adolescent HS group. Regardless of the lack of gestation RR differences, the
overall relationship (specifically the slope relationship) between Tre and RR was steeper
(33%) for GTN compared to GHS pigs. In other words, the RR response to increasing Tre
occurred more rapidly in the GTN pigs than for GHS pigs (Figure 3). The overall blunted
respiratory response in GHS animals may have compromised the effectiveness of heat
dissipation and resulted in a higher Tre. This may also be due to epigenetic modification(s)
that produce an increase in their body temperature “set-point” where the GHS pigs
experience a rise in Tre without a subsequent increase in RR or other heat dissipating
mechanisms to mitigate the effect. An alternative explanation may be that GHS animals are
more tolerant to a higher body temperature and do not need to initiate respiratory cooling
mechanisms as quickly as controls.
Consistent with previous reports [3, 5, 29, 30], adolescent HS in this study caused a
reduction in a variety of growth variables compared to TN conditions. Specifically, HS
reduced final BW (6%), nutrient intake (25%), and BW gain (34%); however, gestational
treatment did not statistically impact these variables. Feed efficiency was not influenced by
gestational conditions, and surprisingly not affected by adolescent HS. However, this
measure is based upon gross body weight change and does not take into account body
composition differences, which are important since HS reorganizes nutrient partitioning
priorities and the hierarchy of tissue synthesis [4].
76
The Tre increase in the GHS pigs may imply that gestational hyperthermia results in
increased susceptibility to future heat loads. Further, the relationship between Tre and RR
(Figure 3) suggests that GHS were less effective at utilizing enhanced respiration as a means
to dissipate excess heat. Consequently, based upon typical measures of thermoregulation, it
could be argued that gestational HS compromises tolerance to a future heat load. Yet,
despite the increased Tre in response to adolescent HS, pigs derived from in-utero HS had
similar nutrient intake compared to GTN pigs, suggesting that GHS pigs may have tolerated
higher body temperatures better than controls (potentially programmed prenatally).
Although no nutrient intake differences were observed for GHS and GTN pigs, ADG was
numerically but not statistically reduced (P > 0.15) in GHS compared to GTN pigs by 215
g/d, regardless of adolescent environment. This reduction combined with a possible increase
in core temperature set-point has many bioenergetic implications, which if maintained
throughout life could result in significant economic losses for the swine industry. If GHS
animals are prenatally programmed to maintain an increased core temperature set-point
during a future heat load, this would theoretically increase maintenance costs which would
have implications to nutrient partitioning, feed efficiency, feed intake, and barn throughput.
Although it is tempting to speculate that GHS animals have an increase in
maintenance costs due to a greater body temperature (at least during HS), we only measured
growth variables to provide a context for the body temperature measurements. Accordingly,
the growth data needs to be interpreted with care, as determining the effects of gestational HS
on future production was not a primary objective and would certainly require more
measurements and animals per treatments to make meaningful conclusions. Additionally,
whether or not these temperature differences are maintained (or augmented) during a diurnal
77
heat pattern compared to a constant heat load would be of significant interest. Clearly this
experiment needs to be repeated with more of an emphasis placed on continuous body
temperature indices obtained in both TN and HS conditions. Regardless, the results suggest
that the well-documented decrease in nutrient intake and increase in RR associated with
increased core body temperature [2, 3, 5, 28, 29, 31] may be partially influenced by fetal
programming. Furthermore, the phenotypic responses to HS are variable [31, 32], and it is
tempting to hypothesize that a portion of this variation may be due to epigenetic imprinting
[28].
Conclusion
Maternal hyperthermia can have lasting effects on developmental patterns. Further, it
can alter future growth and behavior and we have now demonstrated that it alters the body
temperature response to a heat load. Specifically, animals that experienced in-utero HS
became more hyperthermic in response to a future heat load. This has obvious bioenergetic
implications in both human health and animal agriculture. A prerequisite to developing HS
mitigation strategies is a better understanding of how HS epigenetically alters physiological
responses throughout all stages of the life cycle. Further, how this compromised
thermoregulatory response during HS influences metabolic function, future development, and
bioenergetics is unknown and will be the focus of upcoming investigations.
78
Acknowledgements
The authors would like to acknowledge the assistance of Levi Long, Emily Ullrich,
and Wesley Schweer in collecting temperature and production data, and Anna Gabler for
organizing animal care and maintenance of facilities.
Declaration of Interest
Results described here within were supported by the Agriculture and Food Research
Initiative Competitive Grant no. 2011-67003-30007 from the USDA National Institute of
Food and Agriculture. Any opinion, findings, conclusions or recommendations expressed in
this publication are those of the authors and do not necessarily reflect the view of the U.S.
Department of Agriculture. No conflicts of interest, financial or otherwise are declared by the
author (s).
Author Contributions
J.S. Johnson and L.H Baumgard were responsible for experimental design and
manuscript preparation. R.L. Boddicker, M.V. Sanz Fernandez, J.W. Ross, and R.P. Rhoads
provided assistance with statistical analysis and experimental design. M.C. Lucy and T.J.
Safranski performed maternal phase experiments.
79
References
[1] Kleiber M. The Fire of Life an Introduction to Animal Energetics. New York: Wiley,
1961, pp. 129-174.
[2] Collin A, van Milgen J, Dubois S, Noblet J. Effect of high temperature on feeding
behaviour and heat production in group-housed young pigs. Br J Nutr 2001; 86: 63-
70.
[3] Brown-Brandl TM, Nienaber JA, Xin H, Gates RS. A literature review of swine
production. Trans ASAE 2004; 47: 259-270.
[4] Baumgard LH, and Rhoads RP. Effects of heat stress on post-absorptive
metabolism and energetics. Annu Rev Anim Bio 2013; 1: 311-337.
[5] Brown-Brandl TM, Eigenberg RA, Nienaber JA, Kachman SD. Thermoregulatory
profile of a newer genetic line of pigs. J Livestock Prod Sci 2001; 71: 253-260.
[6] Renaudeau D, Giorgi M, Silou F, Weisbecker JL. Effect of breed (lean or fat pigs) and
sex on performance and feeding behaviour of group housed growing pigs in a tropical
climate. Asian-Aus J Anim Sci 2006; 19: 593-601.
[7] McGeehin MA, and Mirabelli M. The potential impacts of climate variability and
change on temperature-related morbidity and mortality in the United States.
Environ Health Perspect 2001; 109: 185-189.
[8] Graham JM, Edwards MJ, Edwards MJ. Teratogen update: Gestational effects of
maternal hyperthermia due to febrile illnesses and resultant patterns of defects in
humans. Teratology 1998; 58: 209-221.
[9] Shiota K, and Kayamura T. Effects of prenatal heat stress on postnatal growth,
behavior and learning capacity in mice. Biol Neonate 1989; 56: 6-14.
80
[10] Chen X, Fahy AL, Green AS, Anderson MJ, Rhoads RP, Limesand SW. ß2-Adrenergic
receptor desensitization in perirenal adipose tissue in fetuses and lambs with placental
insufficiency-induced intrauterine growth restriction. J Physiol 2010; 588: 3539-
3549.
[11] Sorensen JG, Dahlgaard J, Loeschcke V. Genetic variation in thermal tolerance
among natural populations of Drosophila buzzatii: Down regulation of Hsp70
expression and variation in heat stress resistance traits. Funct Ecol 2001; 15:
289-296.
[12] Tzschentke B. Attainment of thermoregulation as affected by environmental factors.
Poult Sci 2007; 86: 1025-1036.
[13] Piestun Y, Schinder D, Ruzal M, Halevy O, Brake J, Yahav S. Thermal
manipulations during broiler embryogenesis: Effect on the acquisition of
thermotolerance. Poult Sci 2008; 87: 1516-1525.
[14] Tetievsky A, and Horowitz M. Posttranslational modifications in histones underlie
heat acclimation-mediated cytoprotective memory. J Appl Physiol 2010; 109:
1552-1561.
[15] Lucy MC, Safranski TJ, Rhoades JN, Ross JW, Gabler NK, Rhoads RP, et al.
Litter characteristics and thermoregulatory behavior of first parity sows exposed to a
controlled heat stress (HS) during gestation. J Anim Sci 2012; 90: 731.
[16] Federation of Animal Science Societies. Guide for the care and use of agricultural
animals in research and teaching. 3rd
ed. Fed. Champaign, IL: Anim Sci Soc,
2010, Chapter 11.
81
[17] National Research Council. Nutrient Requirements of Swine, 11th
ed. Washington,
D.C.: National Academy Press, 2012, pp. 101-129.
[18] Curtis S. Environmental Management in Animal Agriculture. Ames, IA: Iowa
State University Press, 1983, pp. 6-96.
[19] Battisti DS, and Naylor RL. Historical warnings of future food insecurity with
unprecedented seasonal heat. Science 2009; 323: 240-244.
[20] Muller C, Cramer W, Hare WL, Lotze-Campen H. Climate change risks for African
agriculture. PIC 2010; 108: 4313-4315.
[21] Foxcroft GR, Dixon WT, Novak S, Putman CT, Town SC, Vinsky MD. The biological
basis for prenatal programming of postnatal performance in pigs. J Anim Sci 2006;
84: E105-E112.
[22] Foxcroft GR, Dixon WT, Dyck MK, Novak S, Harding JC, Almeida FC. Prenatal
programming of postnatal development of the pig. Soc Reprod Fertil 2009;
Suppl 66: 213-231.
[23] Pinney SE, and Simmons RA. Epigenetic mechanisms in the development of type 2
diabetes. Trends Endocrinol Metab 2010; 21: 223-229.
[24] Hales CN, and Barker DJ. Type 2 (non-insulin-dependent) diabetes mellitus: the
thrifty phenotype hypothesis. Diabetologia 1992; 35: 595-601.
[25] Estruch F. Stress-controlled transcription factors, stress-induced genes and stress
tolerance in budding yeast. FEMS Micro Bio Rev 2006; 24: 469-486.
[26] Yahav S. Effect of early-age thermal conditioning and food restriction on
performance and thermotolerance of male broiler chickens. Br Poult Sci 1999; 40:
120-126.
82
[27] Yahav S, and McMurtry JP. Thermotolerance acquisition in broiler chickens by
temperature conditioning early in life: The effect of timing and ambient
temperature. J Poult Sci 2001; 80: 1662-1666.
[28] Baumgard LH, Rhoads RP, Rhoads ML, Gabler NK, Ross JW, Keating AF, et al.
Impact of climate change on livestock production. In: Sejian V, Naqvi SMK,
Ezeji T, Lakritz J, Lal R, eds. Environmental Stress and Amelioration in Livestock
Production. Berlin: Springer-Verlag, 2012, pp. 413-468.
[29] Renaudeau D, Kerdoncuff M, Anais C, Gourdine JL. Effect of temperature on
thermal acclimation in Large White growing pigs. Anim 2008; 2: 1619-1626.
[30] Renaudeau D, Anais C, Tel L, Gourdine JL. Effect of temperature on thermal
acclimation in growing pigs estimated using a nonlinear function. J Anim Sci
2010; 88: 3715-3724.
[31] Collin A, van Milgen J, Le Dividich J. Modeling the effect of high, constant
temperature on food intake in young growing pigs. Anim Sci 2001; 72: 519527.
[32] Angilletta MJ. Thermal Adaptation: A Theoretical and Empirical Synthesis. St. Joseph,
MN: Oxford University Press, 2009, pp. 1-6.
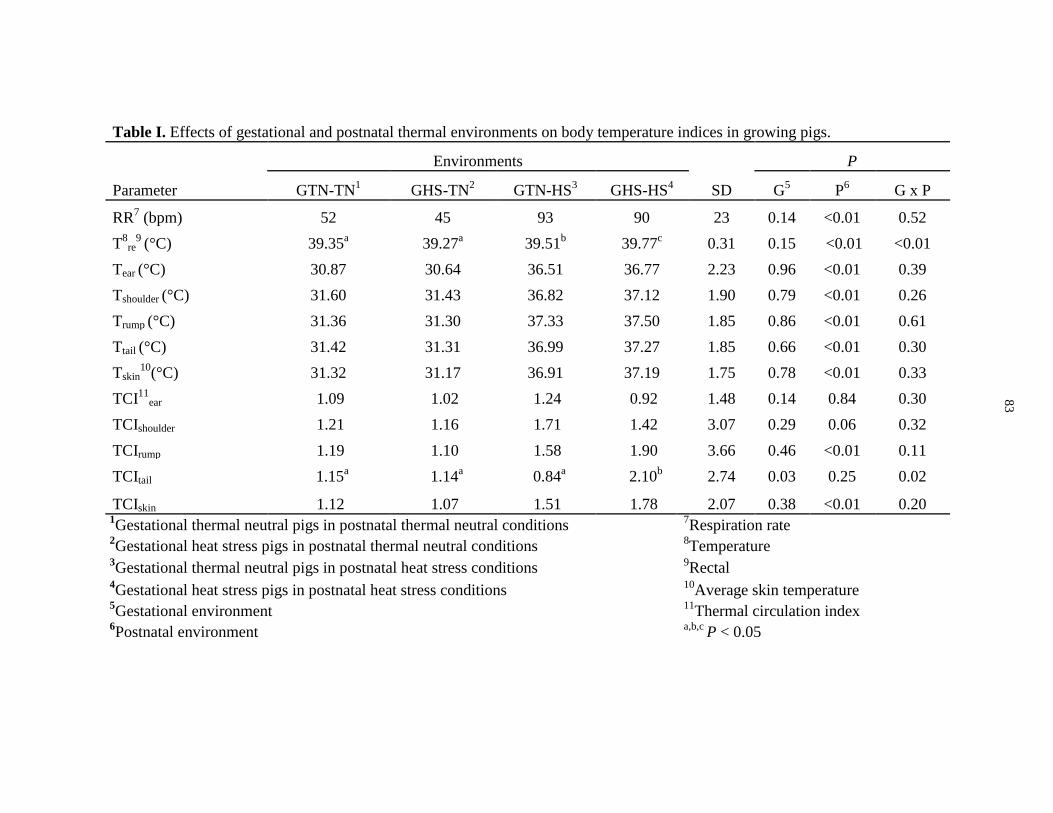
83
Table I. Effects of gestational and postnatal thermal environments on body temperature indices in growing pigs.
Environments P
Parameter GTN-TN1
GHS-TN2
GTN-HS3
GHS-HS4
SD G5
P6
G x P
RR7 (bpm) 52
45
93
90
23 0.14 <0.01 0.52
T8
re9
(°C) 39.35a
39.27a
39.51b
39.77c
0.31 0.15 <0.01 <0.01
Tear (°C) 30.87
30.64
36.51
36.77
2.23 0.96 <0.01 0.39
Tshoulder (°C) 31.60
31.43
36.82
37.12
1.90 0.79 <0.01 0.26
Trump (°C) 31.36
31.30
37.33
37.50
1.85 0.86 <0.01 0.61
Ttail (°C) 31.42
31.31
36.99
37.27
1.85 0.66 <0.01 0.30
Tskin10
(°C) 31.32
31.17
36.91
37.19
1.75 0.78 <0.01 0.33
TCI11
ear 1.09 1.02 1.24 0.92 1.48 0.14 0.84 0.30
TCIshoulder 1.21 1.16 1.71 1.42 3.07 0.29 0.06 0.32
TCIrump 1.19 1.10 1.58 1.90 3.66 0.46 <0.01 0.11
TCItail 1.15a
1.14a
0.84a
2.10b
2.74 0.03 0.25 0.02
TCIskin 1.12 1.07 1.51 1.78 2.07 0.38 <0.01 0.20 1Gestational thermal neutral pigs in postnatal thermal neutral conditions
7Respiration rate
2Gestational heat stress pigs in postnatal thermal neutral conditions
8Temperature
3Gestational thermal neutral pigs in postnatal heat stress conditions
9Rectal
4Gestational heat stress pigs in postnatal heat stress conditions
10Average skin temperature
5Gestational environment
11Thermal circulation index
6Postnatal environment
a,b,c P < 0.05
83
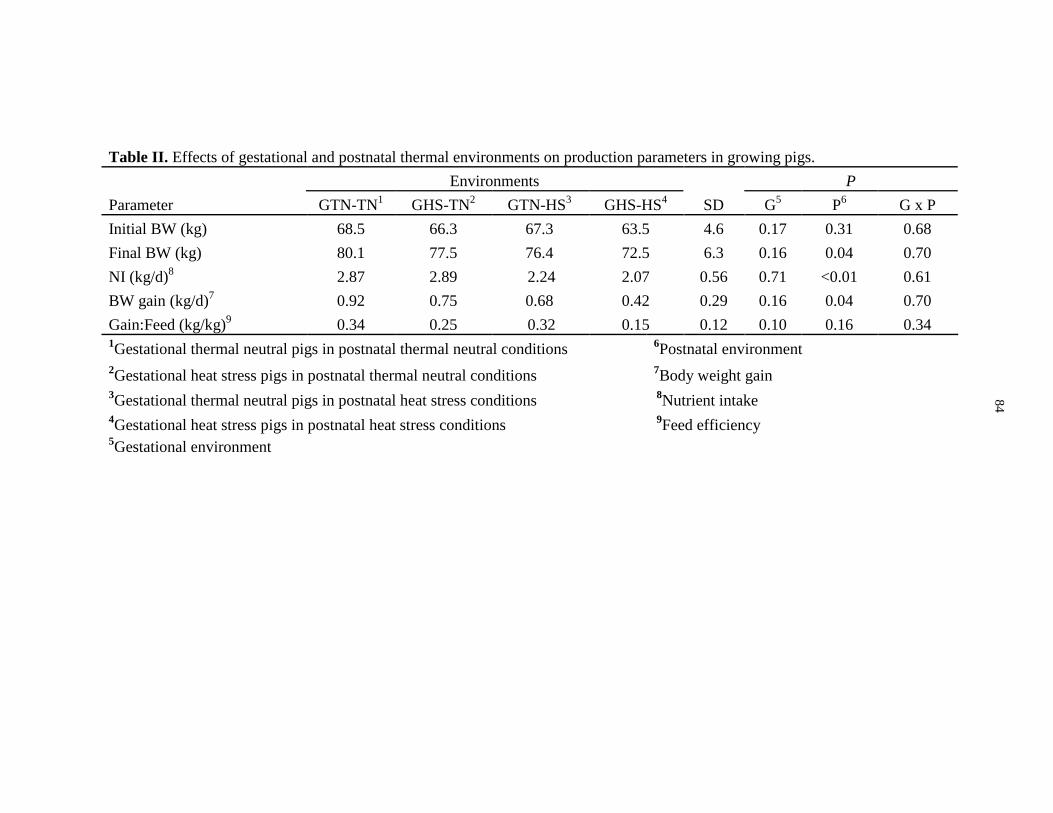
84
Table II. Effects of gestational and postnatal thermal environments on production parameters in growing pigs.
Environments P
Parameter GTN-TN1
GHS-TN2
GTN-HS3
GHS-HS4
SD G5
P6
G x P
Initial BW (kg) 68.5 66.3 67.3 63.5 4.6 0.17 0.31 0.68
Final BW (kg) 80.1
77.5
76.4
72.5
6.3 0.16 0.04 0.70
NI (kg/d)8
2.87 2.89 2.24 2.07 0.56 0.71 <0.01 0.61
BW gain (kg/d)7
0.92 0.75 0.68 0.42 0.29 0.16 0.04 0.70
Gain:Feed (kg/kg)9
0.34 0.25 0.32 0.15 0.12 0.10 0.16 0.34 1Gestational thermal neutral pigs in postnatal thermal neutral conditions
6Postnatal environment
2Gestational heat stress pigs in postnatal thermal neutral conditions
7Body weight gain
3Gestational thermal neutral pigs in postnatal heat stress conditions
8Nutrient intake
4Gestational heat stress pigs in postnatal heat stress conditions
9Feed efficiency
5Gestational environment
84
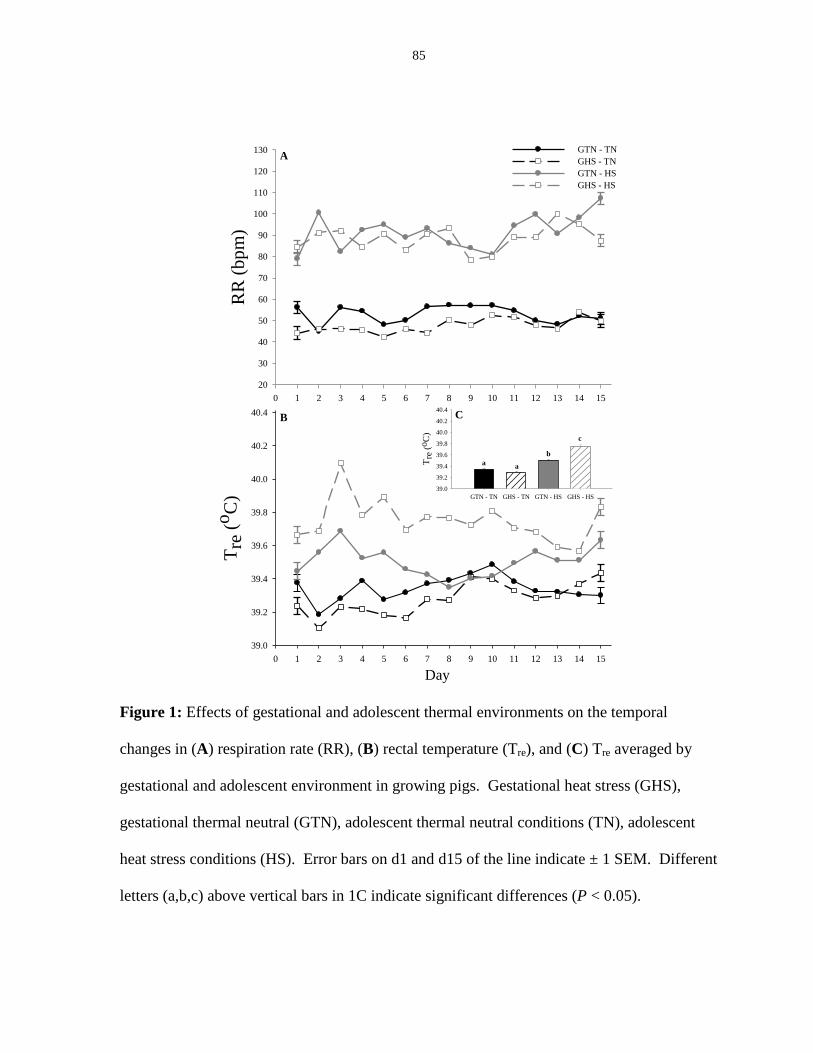
85
Figure 1: Effects of gestational and adolescent thermal environments on the temporal
changes in (A) respiration rate (RR), (B) rectal temperature (Tre), and (C) Tre averaged by
gestational and adolescent environment in growing pigs. Gestational heat stress (GHS),
gestational thermal neutral (GTN), adolescent thermal neutral conditions (TN), adolescent
heat stress conditions (HS). Error bars on d1 and d15 of the line indicate ± 1 SEM. Different
letters (a,b,c) above vertical bars in 1C indicate significant differences (P < 0.05).
0 1 2 3 4 5 6 7 8 9 10 11 12 13 14 15
Tre
(o
C)
39.0
39.2
39.4
39.6
39.8
40.0
40.2
40.4
0 1 2 3 4 5 6 7 8 9 10 11 12 13 14 15
RR
(b
pm
)
20
30
40
50
60
70
80
90
100
110
120
130 GTN - TN
GHS - TN
GTN - HS
GHS - HS
Day
A
GTN - TN GHS - TN GTN - HS GHS - HS
Tre
(o
C)
39.0
39.2
39.4
39.6
39.8
40.0
40.2
40.4CB
aa
b
c
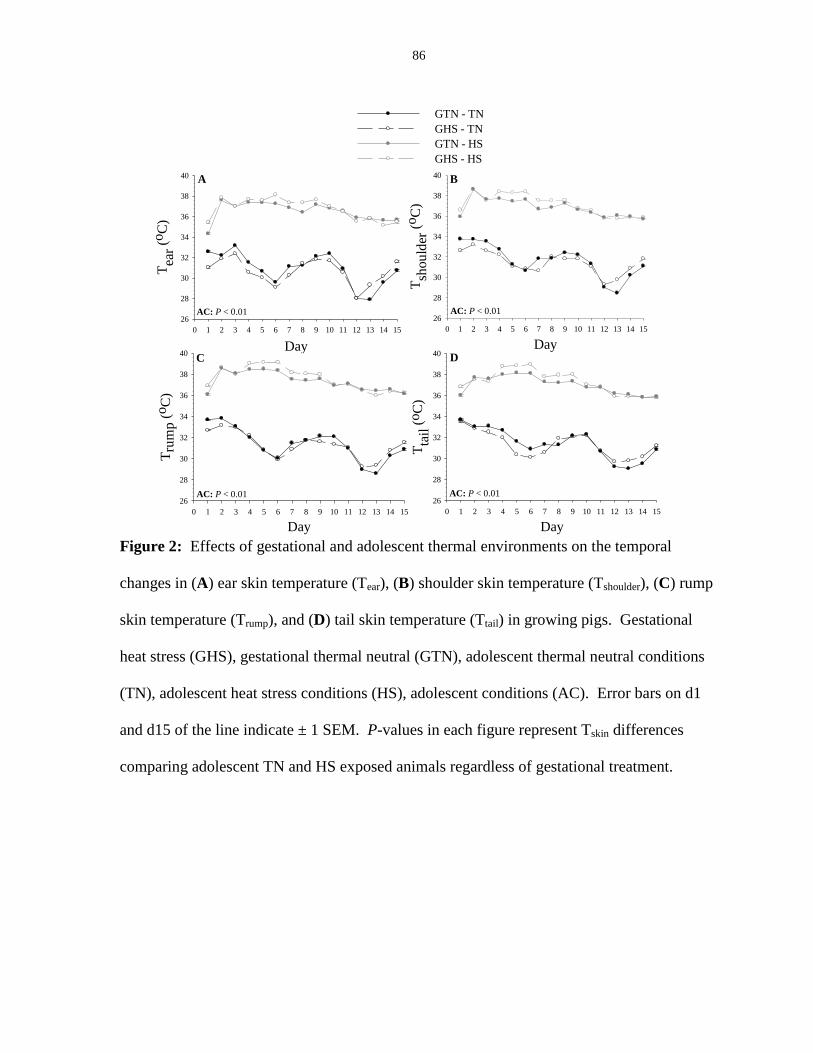
86
Figure 2: Effects of gestational and adolescent thermal environments on the temporal
changes in (A) ear skin temperature (Tear), (B) shoulder skin temperature (Tshoulder), (C) rump
skin temperature (Trump), and (D) tail skin temperature (Ttail) in growing pigs. Gestational
heat stress (GHS), gestational thermal neutral (GTN), adolescent thermal neutral conditions
(TN), adolescent heat stress conditions (HS), adolescent conditions (AC). Error bars on d1
and d15 of the line indicate ± 1 SEM. P-values in each figure represent Tskin differences
comparing adolescent TN and HS exposed animals regardless of gestational treatment.
Day
0 1 2 3 4 5 6 7 8 9 10 11 12 13 14 15
Tea
r (o
C)
26
28
30
32
34
36
38
40
GTN - TN
GHS - TN
GTN - HS
GHS - HS
Day
0 1 2 3 4 5 6 7 8 9 10 11 12 13 14 15
Tta
il (o
C)
26
28
30
32
34
36
38
40
Day
0 1 2 3 4 5 6 7 8 9 10 11 12 13 14 15
Tru
mp
(oC
)
26
28
30
32
34
36
38
40Day
0 1 2 3 4 5 6 7 8 9 10 11 12 13 14 15
Tsh
ou
lder
(oC
)
26
28
30
32
34
36
38
40A B
C D
AC: P < 0.01
AC: P < 0.01AC: P < 0.01
AC: P < 0.01
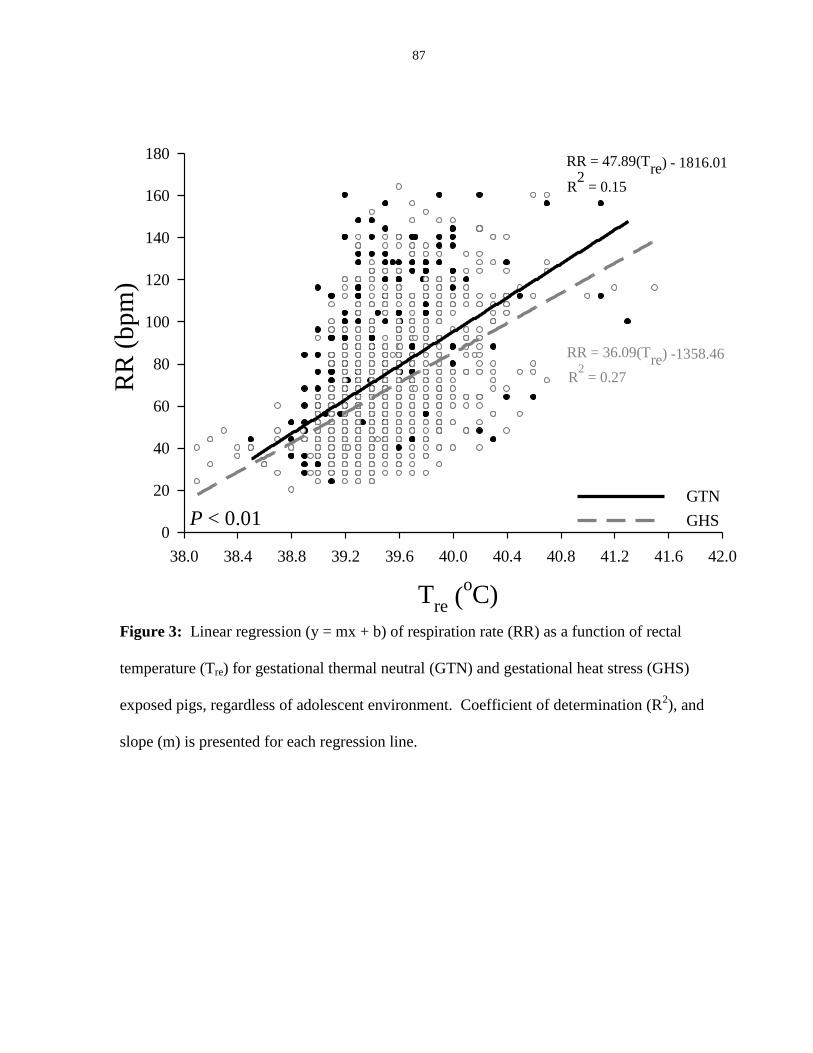
87
Figure 3: Linear regression (y = mx + b) of respiration rate (RR) as a function of rectal
temperature (Tre) for gestational thermal neutral (GTN) and gestational heat stress (GHS)
exposed pigs, regardless of adolescent environment. Coefficient of determination (R2), and
slope (m) is presented for each regression line.
Tre (
oC)
38.0 38.4 38.8 39.2 39.6 40.0 40.4 40.8 41.2 41.6 42.0
RR
(b
pm
)
0
20
40
60
80
100
120
140
160
180
GTN
GHS
RR = 47.89(Tre) - 1816.01
R2
= 0.15
RR = 36.09(Tre) -1358.46
R2 = 0.27
P < 0.01
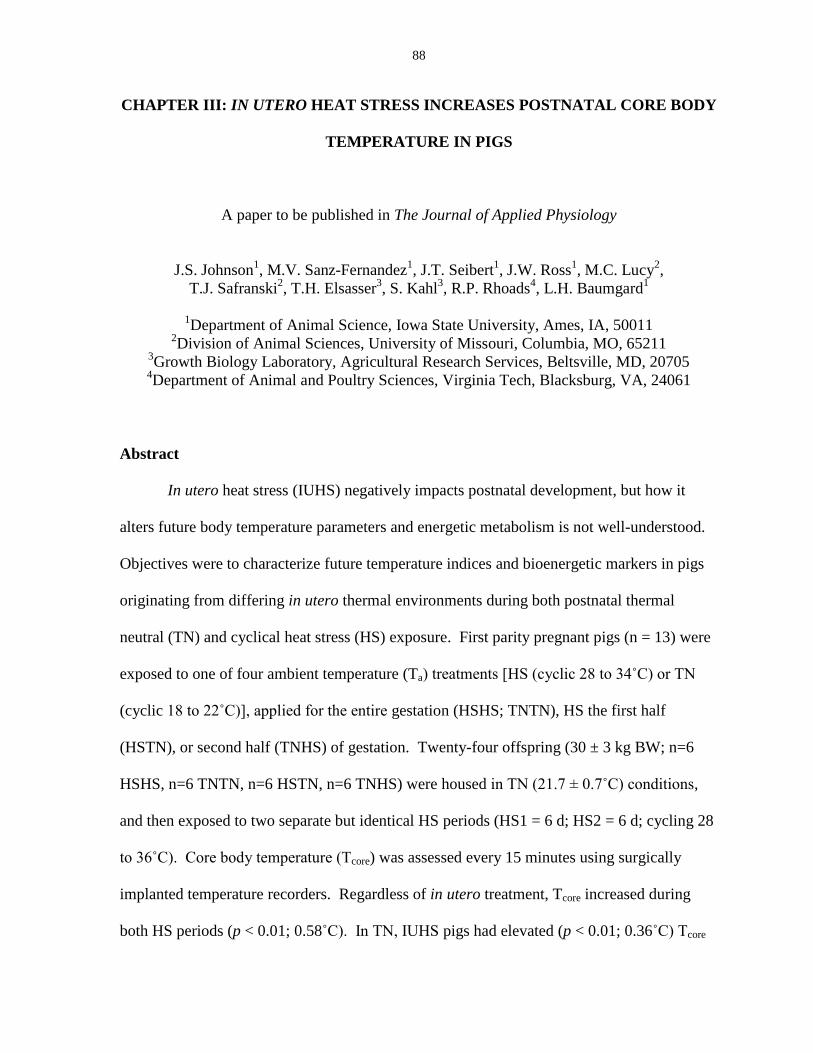
88
CHAPTER III: IN UTERO HEAT STRESS INCREASES POSTNATAL CORE BODY
TEMPERATURE IN PIGS
A paper to be published in The Journal of Applied Physiology
J.S. Johnson1, M.V. Sanz-Fernandez
1, J.T. Seibert
1, J.W. Ross
1, M.C. Lucy
2,
T.J. Safranski2, T.H. Elsasser
3, S. Kahl
3, R.P. Rhoads
4, L.H. Baumgard
1
1Department of Animal Science, Iowa State University, Ames, IA, 50011
2Division of Animal Sciences, University of Missouri, Columbia, MO, 65211
3Growth Biology Laboratory, Agricultural Research Services, Beltsville, MD, 20705
4Department of Animal and Poultry Sciences, Virginia Tech, Blacksburg, VA, 24061
Abstract
In utero heat stress (IUHS) negatively impacts postnatal development, but how it
alters future body temperature parameters and energetic metabolism is not well-understood.
Objectives were to characterize future temperature indices and bioenergetic markers in pigs
originating from differing in utero thermal environments during both postnatal thermal
neutral (TN) and cyclical heat stress (HS) exposure. First parity pregnant pigs (n = 13) were
exposed to one of four ambient temperature (Ta) treatments [HS (cyclic 28 to 34˚C) or TN
(cyclic 18 to 22˚C)], applied for the entire gestation (HSHS; TNTN), HS the first half
(HSTN), or second half (TNHS) of gestation. Twenty-four offspring (30 ± 3 kg BW; n=6
HSHS, n=6 TNTN, n=6 HSTN, n=6 TNHS) were housed in TN (21.7 ± 0.7˚C) conditions,
and then exposed to two separate but identical HS periods (HS1 = 6 d; HS2 = 6 d; cycling 28
to 36˚C). Core body temperature (Tcore) was assessed every 15 minutes using surgically
implanted temperature recorders. Regardless of in utero treatment, Tcore increased during
both HS periods (p < 0.01; 0.58˚C). In TN, IUHS pigs had elevated (p < 0.01; 0.36˚C) Tcore

89
compared to TNTN controls. During HS1 and HS2, IUHS pigs had increased Tcore (p < 0.04;
0.20 and 0.16˚C, respectively) compared to TNTN controls. No in utero area under the Tcore
response curve differences were detected within either HS1 or HS2 (p > 0.35). Although
unaffected by in utero environments, the ratio of total plasma thyroxine to triiodothyronine
was reduced (p < 0.01) during HS1 and HS2 (39 and 29%, respectively) compared to TN. In
summary, pigs originating from IUHS maintained an increased body temperature compared
to TNTN controls regardless of external ambient temperature, and this thermal differential
may have practical implications in animal agriculture.
Keywords: in utero heat stress, pigs, thermal imprinting, thermal regulation
Introduction
Although advances in technology (i.e. cooling systems and management practices)
have partially ameliorated the negative effects of heat stress (HS), growth performance
continues to be reduced while morbidity and mortality are increased in almost all
agriculturally important species during the warm summer months (4, 9, 12, 21). Further,
genetic selection for traditional production traits (i.e. enhanced lean tissue accretion)
compromises HS-tolerance as synthesizing and maintaining muscle mass generates increased
metabolic heat (8). Consequently, HS is one of the primary factors limiting profitable animal
protein production and if the frequency of severe hot weather increases as predicted (29), the
sustainability of some animal industries may be regionally threatened. Although primarily an
economic concern in developed countries, HS and future climate change are food security
and humanitarian issues in third-world nations (4).
90
While in utero HS (IUHS) negatively impacts fetal development and can be
teratogenic (18), it either increases survivability to a future heat load in unicellular organisms
(13) and Drosophilia buzzatti (40), or improves the future ability to remain euthermic during
a thermal insult in birds (35, 42). In contrast to the apparent improved thermoregulatory
imprinting in the aforementioned reports, we recently reported that in utero HS actually
increased future core body temperature (Tcore) in pigs during exposure to a constant postnatal
heat-load (21). Since this initial experiment utilized a constant HS challenge and Tcore was
only monitored four times daily, it is unknown whether this body temperature differential
remains expressed during a diurnal HS-pattern or when Tcore is monitored more frequently.
Further, the mechanism(s) by which this temperature differential occurs are unknown and
may be linked to an altered postnatal metabolite/endocrine profile. Therefore, study
objectives were to fully characterize circadian body temperature indices and key bioenergetic
metabolite/endocrine profiles in pigs exposed to differing in utero thermal environments
during both postnatal TN and cyclical HS. Based on our previous research, we hypothesized
that in utero HS would imprint an increase in the future Tcore of mammalian offspring.
Materials and Methods
In utero environments
The University of Missouri Animal Care and Use Committee approved all animal
procedures involving pregnant first parity pigs (protocol #6815). Thirteen pregnant first
parity pigs (Large White x Landrace; GPK1 x GPK4; Choice Genetics USA; Des Moines,
IA) were housed in the Brody Environmental Chambers at the University of Missouri and
exposed to one of four ambient temperature (Ta) treatments. Thermal environments were
91
applied as either TN (cyclical 18°C nighttime and 22°C daytime; 62.4% RH), or HS (cyclical
28°C nighttime and 34°C daytime; 77.0% RH) conditions beginning six days after
insemination (Duroc; Swine Genetics International; Cambridge, IA) and continued for most
of gestation (108 d gestation; HSHS; TNTN), HS for the first half (54 d gestation; HSTN), or
second half (54 d gestation; TNHS) of gestation. Although HS treatment increased (p < 0.01;
0.11˚C) dam body temperature, maternal feed intake (FI) did not differ between in utero
environments (p > 0.42; TNTN: 6.33 ± 0.19 kg/d, HSHS: 6.91 ± 0.11 kg/d, HSTN: 6.20 ±
0.19 kg/d, TNHS: 6.81 ± 0.09 kg/d) as all dams were limit-fed to prevent excessive maternal
weight gain (standard industry practice; (7)). After parturition, all offspring were exposed to
the same environmental conditions (26 to 32˚C) as recommended for neonatal pigs (14).
After weaning, offspring were transported in an aluminum livestock trailer with wood
shavings (standard practice; 6 h) to Iowa State University.
Postnatal environments
Iowa State University Institutional Animal Care and Use Committee approved all
animal procedures (protocol #7431-S). Between weaning and eight weeks of age all
offspring were co-mingled and given water and feed ad libitum (based primarily on corn and
soybean meal) in TN conditions (based upon body weight; (14)). At eight weeks of age, 24
male pigs from in utero TNTN (n = 6; 30.8 ± 1.0 kg BW), HSHS (n = 6; 27.9 ± 1.3 kg BW),
HSTN (n = 6; 30.7 ± 0.7 kg BW), and TNHS (n = 6; 29.4 ± 1.4 kg BW) were housed in
individual pens (0.76 x 1.82 m; no wallowing access) inside one of six (6.10 x 3.05 m)
environmentally-controlled chambers (one pig/treatment/chamber) at the ISU Zumwalt
Station Climate Change research facility. Castrated males were selected to reduce the body
temperature variability associated with gonadal steroid production. In each chamber, relative

92
humidity (%RH) and ambient temperature (Ta) were recorded every five minutes using two
mounted data loggers (El – WIN – USB; accuracy: ±1.0˚C; Lascar Electronics Ltd.; Erie,
PA) for the duration of the experiment. Although Ta was controlled and evenly dispersed
throughout each chamber, %RH was ungoverned.
Twenty-four males (n = 6 per treatment) were subjected to the following postnatal
environmental conditions for 16 d. From d 1 – 2, all pigs were in TN conditions (constant
22.0 ± 0.1°C; 22.5 ± 4.3%RH; Fig. 1) to establish baseline body temperature measurements.
All pigs were then exposed to cycling HS for six days (HS1; d 3 – 8; 28.0°C nighttime and
36.0°C daytime; 23.2 ± 9.5%RH), followed by two days of TN (washout; d 9 – 10; 22.3 ±
0.1°C; 38.0 ± 3.7%RH), and then a second cycling HS period for six days (HS2; d 11 – 16;
28.0°C nighttime and 36.0°C daytime; 30.5 ± 8.2%RH; Fig. 1). Data from the washout
period were not included in the final analyses. All pigs were fed a standard commercial diet
ad libitum consisting primarily of corn and soybean meal formulated to meet or exceed
nutritional requirements (33). Feed intake was measured daily, and body weight (BW) was
determined on d -1, 2, 9, and 16. Body weights were used to calculate average daily BW
gain (ADG). Unrestrained respiration rate (RR) and skin temperatures were obtained four
times daily (0800, 1300, 1600, and 2000 h). Respiration rate (breaths per minute: BPM) was
determined by counting flank movement over one minute. Skin temperature (Tskin) was
determined by calculating the mean temperature of four-shaved sites measured at the ear
(Tear), shoulder (Tshoulder), rump (Trump) and tail (Ttail) using a calibrated infrared thermometer
(Model 42505; accuracy: ±5.0˚C; Extech Instruments; Waltham, MA). Core temperature
(Tcore) was determined every 15 minutes using calibrated sterile thermochron temperature
recorders (iButton; accuracy: ±0.1˚C; Dallas Semiconductor; Maxim®; Irving, TX) implanted
93
within the intraperitoneal cavity of individual pigs using sterile non-absorbable polyamide
suture (Braunamid; B. Braun Medical Ltd., Sheffield, UK) seven days prior to HS treatment.
For implantation, pigs were anesthetized by an intramuscular injection of a telazol (500 mg),
ketamine (250 mg), and xylazine (250 mg) cocktail, administered at 1 mL per 23 kg BW.
Following anesthesia, a six cm incision was made on the abdomen, five cm lateral to the
linea alba, and sterile temperature recorders were sutured intraperitoneally to the abdominal
muscle wall. Following surgery, pigs were administered an antibiotic (Excede®, Zoetis,
Florham Park, NJ) every three days per manufacturer’s instructions. At the conclusion of the
experiment, pigs were humanely euthanized by captive-bolt and thermochron temperature
recorders were removed.
Blood sampling and analysis
Blood (10 mL) was obtained on all pigs via jugular venipuncture (BD® vacutainers;
Franklin Lakes, NJ; K3EDTA; lithium heparin) on d 2 of TN (1500 h), and at peak heat
(1500 h) on d 2 and d 5 of both the HS1 and HS2 periods. Plasma was harvested by
centrifugation at 4ºC and 2500 x g, aliquoted and stored at -80°C. Glucose concentration
was immediately determined from whole blood collected in lithium heparin tubes using a Vet
Scan iStat® C68+ cartridge (Abaxis, Inc.; Union City, CA). An ELISA kit was used to
determine plasma insulin (Mercodia Porcine Insulin ELISA; Mercodia AB; Uppsala,
Sweden) and plasma heat shock protein 70 (HSP-70) concentrations (Porcine HSP 70 ELISA
Kit; NEO Biolab; Cambridge, MA), following the manufacturer’s instructions.
Commercially available kits were used to determine plasma non-esterified fatty acid (NEFA;
Autokit NEFA; Wako Chemicals USA, Richmond, VA) and plasma urea nitrogen (PUN;
Urea Nitrogen Reagent; TECO Diagnostics, Anaheim, CA) concentrations. Total plasma
94
thyroxine (T4) and triiodothyronine (T3) concentrations were determined using a
commercially available radioimmunoassay kit (ICN Biomedical Inc., Carson, CA). The
intra-assay coefficients of variation were 4.7, 7.7, 5.5, 3.4, 4.1, and 3.7%, for insulin, NEFA,
PUN, HSP-70, T4, and T3, respectively. The inter-assay coefficients of variation were and
5.2, 3.1, 9.6, and 7.2% for insulin, NEFA, PUN, and HSP-70, respectively. Systemic insulin
sensitivity was estimated by the homeostatic model assessment of insulin resistance (HOMA-
IR; (glucose (mmol/L) * insulin (mg/L))/450; 19)
Statistics
The magnitude of the daily Tcore increase was determined by calculating area under
the Tcore curve (AUC) for individual pigs during every day of HS1 and HS2 using average
Tcore of individual pigs during TN as a baseline. The AUC was calculated as a linear
trapezoidal summation between successive Tcore measurements and time coordinates after
correcting for the mean baseline Tcore during TN (calculations described by Baumgard et al.,
2002 (3)). Rate of the daily Tcore increase was determined using the slope of Tcore as a
function of hour (0800 – 1500 h) by linear regression (y = mx + b), and was calculated for
individual pigs on every day of HS1 and HS2. Time to peak Tcore was calculated from 0800 h
to the time point when daily maximum Tcore was the greatest, and was determined for
individual pigs during every day of HS1 and HS2. Average Tcore from 0800 – 2000 h and
2100 – 0700 h was calculated for individual pigs daily during HS1 and HS2. Hours that Tcore
of individual pigs remained above a threshold body temperature (e.g. 39.0, 39.5, 40.0, 40.5,
and 41.0°C) were calculated during HS1 and HS2.
All data were analyzed using the PROC MIXED procedure in SAS 9.3 (SAS Institute
Inc., Cary, NC). When analyzing all data within the TN period, only in utero environment

95
(TNTN; HSHS; HSTN; TNHS) was included as a statistical model component. The
statistical model for the TN period was: Yij = μ + IUi + eij. Where, Y = parameter of interest,
μ = mean, IU = in utero environment, and e = residual. Data analyses within the HS1 and
HS2 periods were conducted with statistical model components including in utero
environment (TNTN; HSHS; HSTN; TNHS), days within a HS period (d 1 – 6) and all
possible interactions. The statistical model for HS1 and HS2 was: Yijk = μ + IUi + Dj +
IU*Dij + eijk. Where, Y = parameter of interest, μ = mean, IU = in utero environment, D =
days within a HS period, and e = residual. For each of the TN, HS1 and HS2 period
analyses, preplanned statistical comparisons were conducted for TNTN controls vs. pigs that
received in utero HS during the first half of gestation (HSHS and HSTN pigs), and TNTN
controls vs. all in utero HS (IUHS) treatments combined (HSHS, HSTN, and TNHS) using
the CONTRAST statement of SAS. All interactions, regardless of significance level were
included in the model, and dam was used as a random effect. For repeated analyses of HS1
and HS2 data, each pig’s respective parameter was analyzed using repeated measures with an
auto-regressive covariance structure with days within HS1 or HS2 as the repeated effect.
To compare data across periods, data within each period were averaged for individual
pigs and statistical model components included in utero environment (TNTN; HSHS; HSTN;
TNHS), period (TN; HS1; HS2), and all possible interactions. The statistical model for
period analyses was: Yijk = μ + IUi + Pj + IU*Pij + eijk. Where, Y = parameter of interest, μ =
mean, IU = in utero environment, P = period, and e = residual. Preplanned statistical
comparisons were conducted for TNTN controls vs. pigs that received in utero HS during the
first half of gestation (HSHS and HSTN pigs), and TNTN controls vs. all IUHS treatments
combined (HSHS, HSTN, and TNHS) using the CONTRAST statement of SAS. All
96
interactions, regardless of significance level were included in the model, and dam was used
as a random effect.
Linear (y = mx + b) and quadratic (y = mx + mx2 + b) models were created using
JMP (SAS Institute Inc., Cary, NC) to determine the relationship between Tcore (y - axis) and
time (x - axis). Slope and correlation coefficient values from each model were similar, so the
linear regression was used for analysis. Slope was obtained for individual animals using all
collected data points and analyzed using PROC MIXED in SAS 9.3 (SAS Institute Inc.,
Cary, NC), with slope as the dependent variable, and in utero environment (TNTN; HSHS;
HSTN; TNHS), period (TN; HS1; HS2) and the interaction of in utero environment and
period as fixed effects. The statistical model for linear regression analyses was: Yijk = μ +
IUi + Pj + IU*Pij + eijk. Where, Y = parameter of interest, μ = mean, IU = in utero
environment, P = period, and e = residual. Preplanned statistical comparisons were
conducted for TNTN controls vs. pigs that received in utero HS during the first half of
gestation (HSHS and HSTN pigs), and TNTN controls vs. all IUHS treatments combined
(HSHS, HSTN, TNHS) using the CONTRAST statement of SAS. Dam was used as a
random effect. All interactions, regardless of significance level were kept in the model. Data
are presented as least squares means and statistical significance was defined as p ≤ 0.05, and
a tendency was defined as 0.05 < p ≤ 0.10.
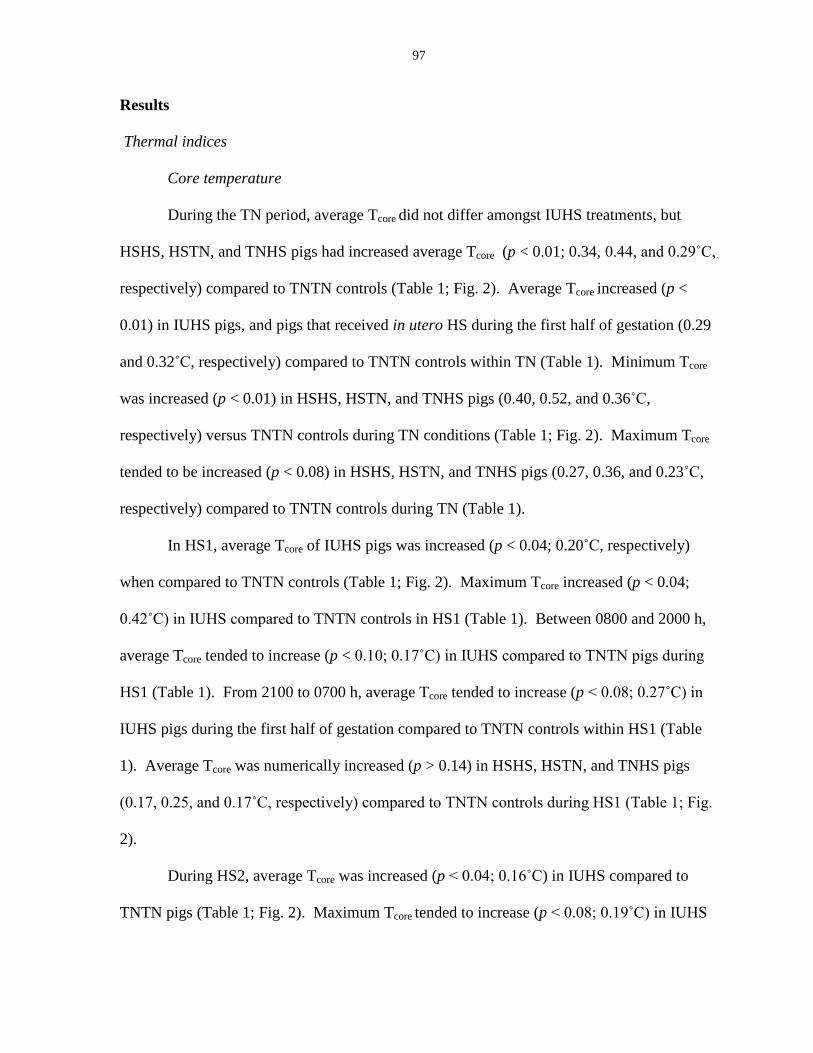
97
Results
Thermal indices
Core temperature
During the TN period, average Tcore did not differ amongst IUHS treatments, but
HSHS, HSTN, and TNHS pigs had increased average Tcore (p < 0.01; 0.34, 0.44, and 0.29˚C,
respectively) compared to TNTN controls (Table 1; Fig. 2). Average Tcore increased (p <
0.01) in IUHS pigs, and pigs that received in utero HS during the first half of gestation (0.29
and 0.32˚C, respectively) compared to TNTN controls within TN (Table 1). Minimum Tcore
was increased (p < 0.01) in HSHS, HSTN, and TNHS pigs (0.40, 0.52, and 0.36˚C,
respectively) versus TNTN controls during TN conditions (Table 1; Fig. 2). Maximum Tcore
tended to be increased (p < 0.08) in HSHS, HSTN, and TNHS pigs (0.27, 0.36, and 0.23˚C,
respectively) compared to TNTN controls during TN (Table 1).
In HS1, average Tcore of IUHS pigs was increased (p < 0.04; 0.20˚C, respectively)
when compared to TNTN controls (Table 1; Fig. 2). Maximum Tcore increased (p < 0.04;
0.42˚C) in IUHS compared to TNTN controls in HS1 (Table 1). Between 0800 and 2000 h,
average Tcore tended to increase (p < 0.10; 0.17˚C) in IUHS compared to TNTN pigs during
HS1 (Table 1). From 2100 to 0700 h, average Tcore tended to increase (p < 0.08; 0.27˚C) in
IUHS pigs during the first half of gestation compared to TNTN controls within HS1 (Table
1). Average Tcore was numerically increased (p > 0.14) in HSHS, HSTN, and TNHS pigs
(0.17, 0.25, and 0.17˚C, respectively) compared to TNTN controls during HS1 (Table 1; Fig.
2).
During HS2, average Tcore was increased (p < 0.04; 0.16˚C) in IUHS compared to
TNTN pigs (Table 1; Fig. 2). Maximum Tcore tended to increase (p < 0.08; 0.19˚C) in IUHS
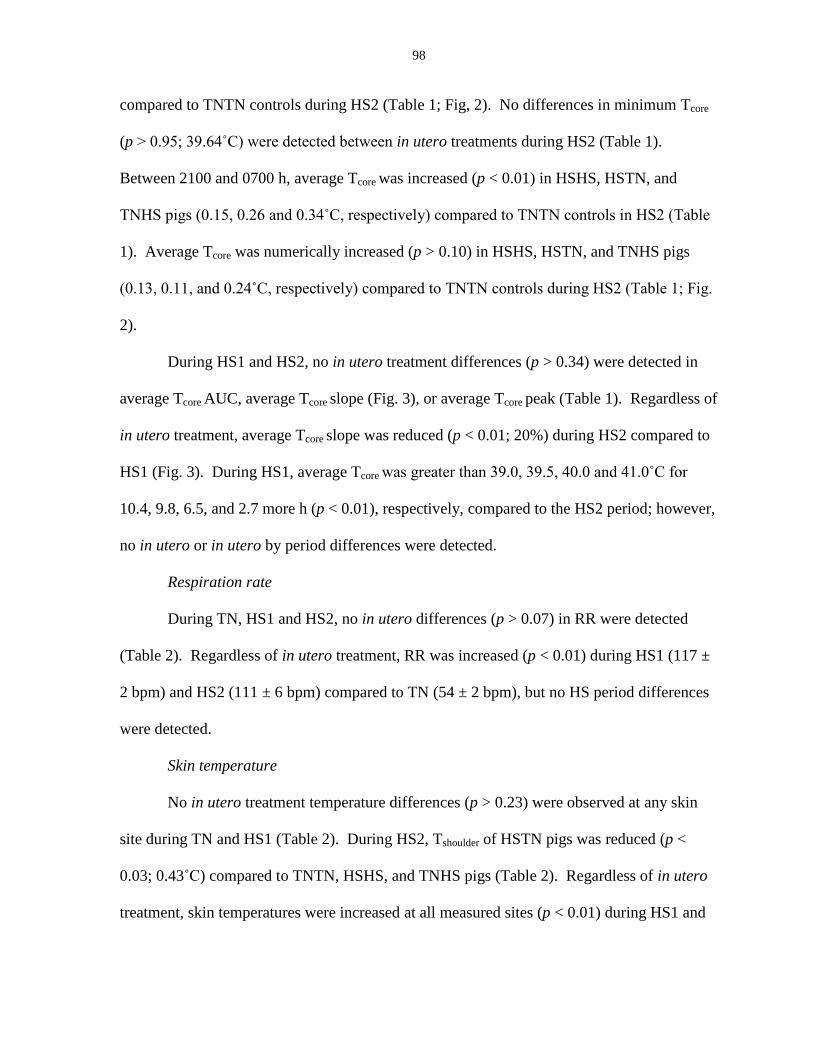
98
compared to TNTN controls during HS2 (Table 1; Fig, 2). No differences in minimum Tcore
(p > 0.95; 39.64˚C) were detected between in utero treatments during HS2 (Table 1).
Between 2100 and 0700 h, average Tcore was increased (p < 0.01) in HSHS, HSTN, and
TNHS pigs (0.15, 0.26 and 0.34˚C, respectively) compared to TNTN controls in HS2 (Table
1). Average Tcore was numerically increased (p > 0.10) in HSHS, HSTN, and TNHS pigs
(0.13, 0.11, and 0.24˚C, respectively) compared to TNTN controls during HS2 (Table 1; Fig.
2).
During HS1 and HS2, no in utero treatment differences (p > 0.34) were detected in
average Tcore AUC, average Tcore slope (Fig. 3), or average Tcore peak (Table 1). Regardless of
in utero treatment, average Tcore slope was reduced (p < 0.01; 20%) during HS2 compared to
HS1 (Fig. 3). During HS1, average Tcore was greater than 39.0, 39.5, 40.0 and 41.0˚C for
10.4, 9.8, 6.5, and 2.7 more h (p < 0.01), respectively, compared to the HS2 period; however,
no in utero or in utero by period differences were detected.
Respiration rate
During TN, HS1 and HS2, no in utero differences (p > 0.07) in RR were detected
(Table 2). Regardless of in utero treatment, RR was increased (p < 0.01) during HS1 (117 ±
2 bpm) and HS2 (111 ± 6 bpm) compared to TN (54 ± 2 bpm), but no HS period differences
were detected.
Skin temperature
No in utero treatment temperature differences (p > 0.23) were observed at any skin
site during TN and HS1 (Table 2). During HS2, Tshoulder of HSTN pigs was reduced (p <
0.03; 0.43˚C) compared to TNTN, HSHS, and TNHS pigs (Table 2). Regardless of in utero
treatment, skin temperatures were increased at all measured sites (p < 0.01) during HS1 and
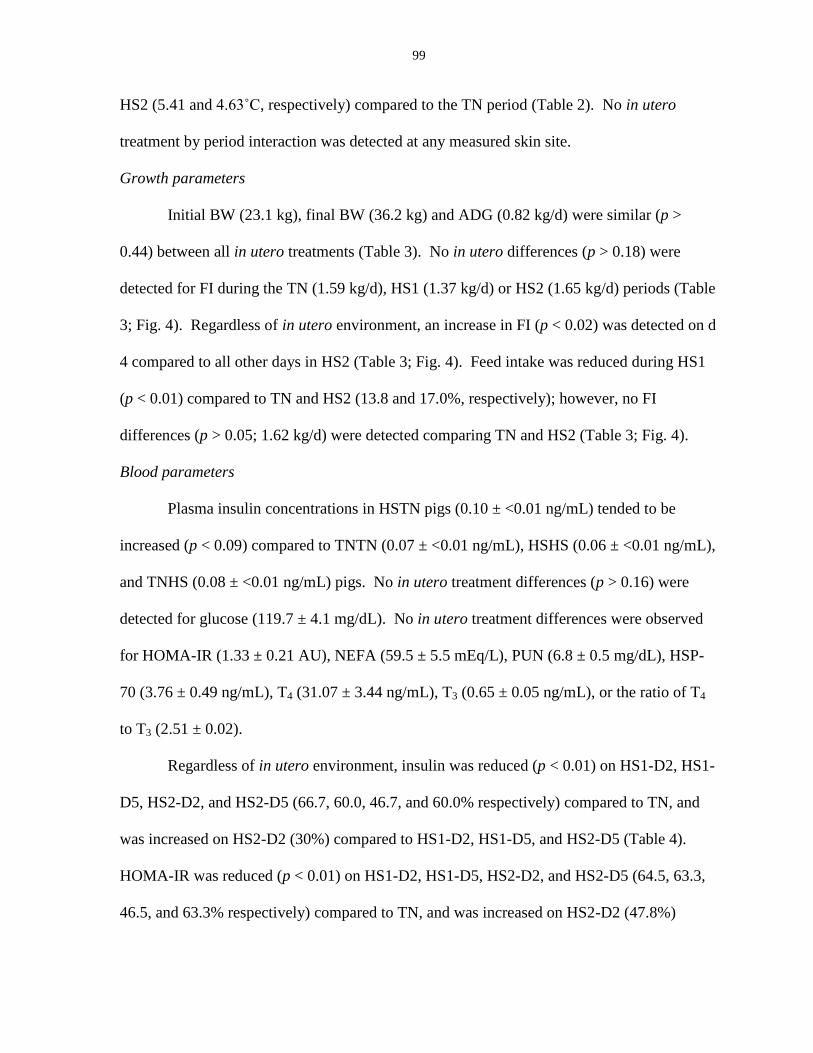
99
HS2 (5.41 and 4.63˚C, respectively) compared to the TN period (Table 2). No in utero
treatment by period interaction was detected at any measured skin site.
Growth parameters
Initial BW (23.1 kg), final BW (36.2 kg) and ADG (0.82 kg/d) were similar (p >
0.44) between all in utero treatments (Table 3). No in utero differences (p > 0.18) were
detected for FI during the TN (1.59 kg/d), HS1 (1.37 kg/d) or HS2 (1.65 kg/d) periods (Table
3; Fig. 4). Regardless of in utero environment, an increase in FI (p < 0.02) was detected on d
4 compared to all other days in HS2 (Table 3; Fig. 4). Feed intake was reduced during HS1
(p < 0.01) compared to TN and HS2 (13.8 and 17.0%, respectively); however, no FI
differences (p > 0.05; 1.62 kg/d) were detected comparing TN and HS2 (Table 3; Fig. 4).
Blood parameters
Plasma insulin concentrations in HSTN pigs (0.10 ± <0.01 ng/mL) tended to be
increased (p < 0.09) compared to TNTN (0.07 ± <0.01 ng/mL), HSHS (0.06 ± <0.01 ng/mL),
and TNHS (0.08 ± <0.01 ng/mL) pigs. No in utero treatment differences (p > 0.16) were
detected for glucose (119.7 ± 4.1 mg/dL). No in utero treatment differences were observed
for HOMA-IR (1.33 ± 0.21 AU), NEFA (59.5 ± 5.5 mEq/L), PUN (6.8 ± 0.5 mg/dL), HSP-
70 (3.76 ± 0.49 ng/mL), T4 (31.07 ± 3.44 ng/mL), T3 (0.65 ± 0.05 ng/mL), or the ratio of T4
to T3 (2.51 ± 0.02).
Regardless of in utero environment, insulin was reduced (p < 0.01) on HS1-D2, HS1-
D5, HS2-D2, and HS2-D5 (66.7, 60.0, 46.7, and 60.0% respectively) compared to TN, and
was increased on HS2-D2 (30%) compared to HS1-D2, HS1-D5, and HS2-D5 (Table 4).
HOMA-IR was reduced (p < 0.01) on HS1-D2, HS1-D5, HS2-D2, and HS2-D5 (64.5, 63.3,
46.5, and 63.3% respectively) compared to TN, and was increased on HS2-D2 (47.8%)
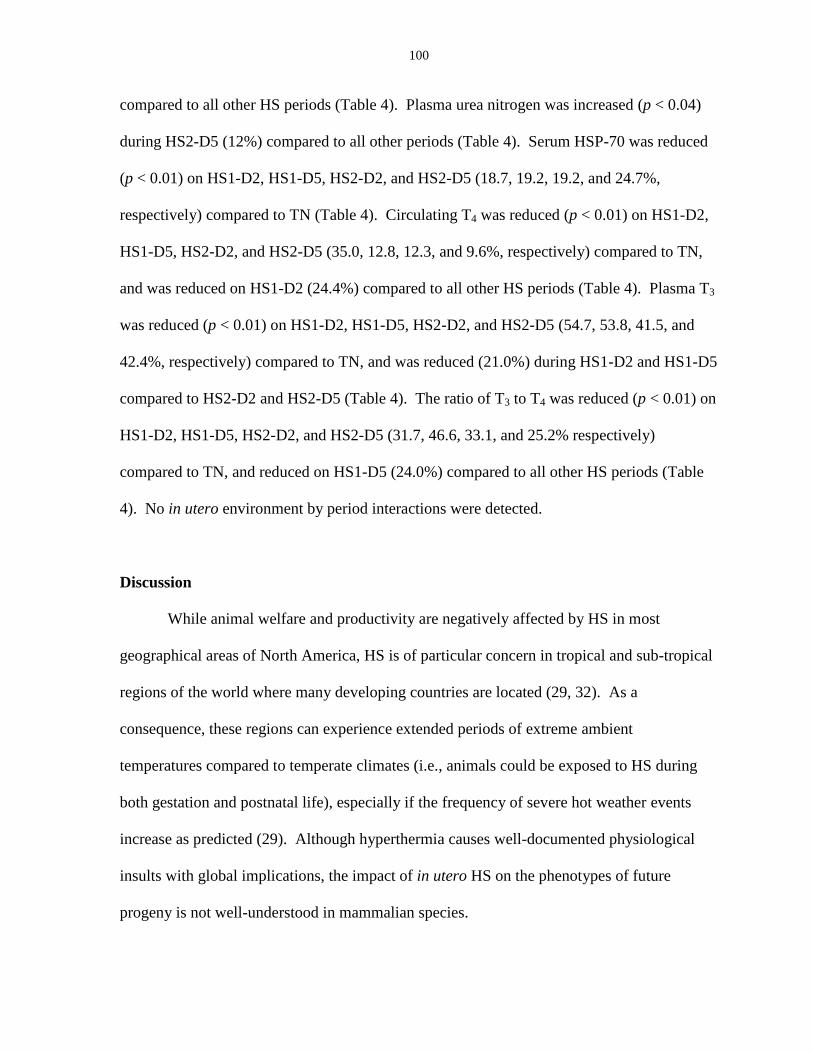
100
compared to all other HS periods (Table 4). Plasma urea nitrogen was increased (p < 0.04)
during HS2-D5 (12%) compared to all other periods (Table 4). Serum HSP-70 was reduced
(p < 0.01) on HS1-D2, HS1-D5, HS2-D2, and HS2-D5 (18.7, 19.2, 19.2, and 24.7%,
respectively) compared to TN (Table 4). Circulating T4 was reduced (p < 0.01) on HS1-D2,
HS1-D5, HS2-D2, and HS2-D5 (35.0, 12.8, 12.3, and 9.6%, respectively) compared to TN,
and was reduced on HS1-D2 (24.4%) compared to all other HS periods (Table 4). Plasma T3
was reduced (p < 0.01) on HS1-D2, HS1-D5, HS2-D2, and HS2-D5 (54.7, 53.8, 41.5, and
42.4%, respectively) compared to TN, and was reduced (21.0%) during HS1-D2 and HS1-D5
compared to HS2-D2 and HS2-D5 (Table 4). The ratio of T3 to T4 was reduced (p < 0.01) on
HS1-D2, HS1-D5, HS2-D2, and HS2-D5 (31.7, 46.6, 33.1, and 25.2% respectively)
compared to TN, and reduced on HS1-D5 (24.0%) compared to all other HS periods (Table
4). No in utero environment by period interactions were detected.
Discussion
While animal welfare and productivity are negatively affected by HS in most
geographical areas of North America, HS is of particular concern in tropical and sub-tropical
regions of the world where many developing countries are located (29, 32). As a
consequence, these regions can experience extended periods of extreme ambient
temperatures compared to temperate climates (i.e., animals could be exposed to HS during
both gestation and postnatal life), especially if the frequency of severe hot weather events
increase as predicted (29). Although hyperthermia causes well-documented physiological
insults with global implications, the impact of in utero HS on the phenotypes of future
progeny is not well-understood in mammalian species.
101
Prenatal HS increases survivability to a future heat load in unicellular organisms (13)
and Drosophilia buzzatti (40), or improves the future ability to remain euthermic during a
thermal insult in birds (35, 42). In addition, “thermal conditioning” has been demonstrated in
rodents exposed to HS shortly after birth (41). In contrast to the aforementioned reports, we
recently reported that exposure to in utero HS increased future Tcore in pigs exposed to
constant postnatal HS (21). Whether this Tcore differential remains during exposure to a
diurnal HS pattern or when Tcore is monitored more frequently is unknown. In the present
study, an average Tcore increase of 0.24˚C was detected in IUHS pigs compared to TNTN
controls that was sustained during the TN (0.36˚C), HS1 (0.20˚C), and HS2 (0.16˚C) periods.
This altered phenotype is similar to what we have reported in pigs (21); however, the present
experiment demonstrates that Tcore differences exist regardless of external ambient
temperature. Reasons for the reduced Tcore differential between IUHS and TNTN pigs during
HS1 and HS2 compared to TN are unclear, but may be due to increased efforts by all
treatments to reduce their body temperature (i.e., RR increased in all treatments during HS1
and HS2 compared to TN; data in text in Results section) in response to thermal stress. In
addition, the average Tcore increase (compared to TNTN controls) was more pronounced
(35% increase) during the TN period in pigs exposed to HS during the first half of gestation
(HSHS and HSTN) compared to those exposed to HS during the last half of gestation
(TNHS; Table 1; Fig. 2). That in utero differences were most evident in HSTN and HSHS
pigs (i.e., early gestation HS) is not surprising, as most prenatal imprinting likely occurs in
early pregnancy when rapid embryonic cellular differentiation occurs (1, 36). While
mechanism(s) responsible for the increased Tcore in IUHS pigs are not apparent, it may be due
to increased heat production resulting from an increase in mitochondrial uncoupling protein
102
activity (37) and futile cycling (28), or increased whole-body adipose tissue observed in
IUHS pigs (22) that may insulate against efficient heat dissipation. Further, since reduced
head and brain size are associated with in utero HS (18), and has been observed in IUHS pigs
by our lab (22, 23), augmented hypothalamic function may be an alternative explanation as it
is thought to tightly control body temperature in mammalian species (6, 10).
Despite the increased average Tcore in IUHS pigs, RR and skin temperatures were
similar amongst all in utero treatments. Although it is counterintuitive that pigs with
increased Tcore would have similar RR and skin temperature as those with a reduced Tcore in
HS conditions, these results agree with our previous observations (21), and could be
indicative of similar hyperthermic response as both the magnitude and rate of the daily Tcore
increase was similar in all in utero treatments during HS1 and HS2 (Table 1). While no
statistically significant increase was observed, the increase in Tcore in IUHS pigs was
corroborated by a numerical increase in Tskin during TN (Table 2). Since the numerical Tskin
increase (0.36˚C) was the same as the average Tcore differential (0.36˚C) in IUHS pigs
compared to TNTN controls during TN, it could indicate that body heat produced by IUHS
pigs was sufficiently dissipated through the skin surface since increased skin temperature is
associated with enhanced body heat dissipation (5). However, because no significant
differences were observed, it cannot be said with certainty that heat dissipation remained
uncompromised in IUHS pigs.
No metabolite/endocrine profile differences were detected when comparing in utero
treatments. Serum HSP-70 and total plasma thyroid hormone concentrations were similar in
IUHS pigs and TNTN controls, which is slightly surprising since elevated HSP-70 gene
expression is often associated with increased Tcore (16, 30, 31, 34), and thyroid hormones are
103
key regulators of energy metabolism (2, 24) and thermogenesis (39). Although these
observations may imply that IUHS and TNTN pigs share a similar stress response (as
indicated by serum HSP-70 levels), a lack of thyroid hormone differences may suggest that
basal metabolic rate and heat production are similar amongst in utero treatments. However,
body heat production is not solely dependent on thyroid hormone secretion (25), and there
are a variety of other mechanisms (e.g., protein turnover, futile cycling, uncoupling protein
activation, subcutaneous adipose tissue, etc.) that may be responsible for increased Tcore.
While no in utero differences were detected, total circulating T4, T3 and the ratio of active T3
to inactive T4 were reduced during all HS periods compared to TN (Table 4). The reduction
in total circulating thyroid hormones may indicate a decrease in metabolic rate (2, 24) and
thermogenesis (39), and could signify HS-induced reductions in maintenance costs as
suggested in a previous study by our lab (22, 23). We previously determined that HSP-70
gene expression in muscle tissue is increased in heat-stressed pigs (34), and others have
described increased HSP-70 gene expression in epithelial cells (27) and liver tissue (38) in
response to HS. In addition, although the function of circulating HSP-70 is not well-
understood, a recent study by Gaughan and colleagues (16) determined that circulating HSP-
70 concentrations are increased in response to chronically elevated Tcore in cattle, and HSP-
70 is released into extracellular fluid by cultured rat embryo cells in response to thermal
stress (20). However, in the present study, serum HSP-70 concentrations were reduced in
both postnatal HS periods compared to TN conditions, regardless of in utero treatment.
Reasons for this reduction are unclear, but may result from increased intracellular use of heat
shock proteins to perform their cytoprotective function during periods of acute (e.g., current
study) versus chronic (16) thermal stress (as reviewed by Kregel (26)). An alternative
104
explanation is that a blood collection-induced stress response may have artificially elevated
circulating HSP-70 concentrations during TN (first blood collection), since HSP-70 levels are
increased in response to stressful stimuli (e.g., hypoxia, energy depletion; as reviewed by
Kregel (26)), and act as “danger signals” to initiate stress response programs in surrounding
cells (17).
Heat stress causes a well-documented decrease in FI and growth parameters of
agriculturally important livestock species (15). In the present study, FI was reduced (14%)
during HS1 compared to TN in all treatments; however, in HS2, FI was similar to TN levels.
The lack of a FI reduction during HS2 is likely an indication of HS acclimation as indicated
by a reduced Tcore response (i.e., decreased slope of the line) to increasing ambient
temperature in all in utero treatments during HS2 compared to HS1 (Fig. 3). Although no in
utero treatment differences in feed efficiency (FE) were detected in the present study (Table
3), we recently reported a reduction in FE in IUHS pigs compared to IUTN controls (22).
Reasons for this discrepancy are unclear, but it is possible that FE differences may have been
detected if the current experiment had more animals per treatment.
In accordance with our previous report (21), chronically elevated Tcore was detected in
IUHS pigs compared to TNTN controls (Table 1; Fig. 2). In contrast to the aforementioned
report (21), increased Tcore in the current study was observed regardless of postnatal
environment, and while implementing a diurnal pattern of HS. The Tcore increase, regardless
of external ambient temperature could verify that in utero HS imprints a permanent elevation
in postnatal body temperature, and if this differential were maintained throughout the pig’s
life, the consequences are presumably to increase basal metabolic rate (11) and potentially
lifetime maintenance costs as previously suggested (21). However, the specific
105
mechanism(s) of the Tcore increase are currently unknown and any implications towards
greater fasting heat production and increased maintenance costs would need to be confirmed
by indirect calorimetry.
Perspectives and Significance
In utero hyperthermia can permanently impact postnatal phenotypes and alter future
growth and behavior. We have now demonstrated that it can impact future mammalian body
temperature, regardless of postnatal environment. Specifically, animals experiencing in
utero HS maintained a greater Tcore during the entire experiment, and this was especially true
for pigs heat-stressed in the first half of gestation. Reasons for the time-point difference are
unclear but may be due to genomic imprinting that likely occurs in early pregnancy during
the period of rapid cellular differentiation. Chronically increased Tcore has obvious
bioenergetic implications in animal agriculture, and adds to our knowledge of how HS alters
physiological responses throughout all stages of the lifecycle. Further, how this augmented
body temperature influences metabolism and future development is unknown and will be the
focus of future investigations.
Acknowledgements
The authors would like to acknowledge the assistance of Mohannad Abuajamieh,
Sarah Stoakes, Wesley Schweer, Mateus Zucato, Sarah Edwards, and Matt King in collecting
temperature and production data, and Anna Gabler and Samantha Lei for organizing animal
care and maintenance of facilities.
106
Declaration of Interest
Results described here within were supported by the Agriculture and Food Research
Initiative Competitive Grant no. 2011-67003-30007 from the USDA National Institute of
Food and Agriculture. Any opinion, findings, conclusions or recommendations expressed in
this publication are those of the authors and do not necessarily reflect the view of the U.S.
Department of Agriculture. No conflicts of interest, financial or otherwise are declared by the
author (s).
Author Contributions
J.S. Johnson and L.H Baumgard were responsible for experimental design and
manuscript preparation. M.V. Sanz Fernandez, J.T. Seibert, J.W. Ross, and R.P. Rhoads
provided assistance with statistical analysis, lab work, and experimental design. M.C. Lucy
and T.J. Safranski performed maternal phase experiments. T.H. Elsasser and S. Kahl
analyzed thyroid hormone concentration.
107
References
1. Banek CT, Bauer AJ, Gingery A, and Gilbert JS. Timing of ischemic insult alters
fetal growth trajectory, maternal angiogenic balance, and markers of renal oxidative
stress in the pregnant rat. Am J Physiol Reg Int Comp Physiol 303: R658-R664, 2012.
2. Barker SB. Mechanism of action of the thyroid hormone. Physiol Rev 31: 205-243,
1951.
3. Baumgard LH, Corl BA, Dwyer DA, and Bauman DE. Effects of conjugated
linoleic acid (CLA) on lipid metabolism of lactating dairy cows. J Anim Sci 80:1285–
1293, 2002.
4. Baumgard LH, and Rhoads RP. Effects of heat stress on post-absorptive
metabolism and energetics. Annu Rev Anim Bio 1: In Press, 2013.
5. Blatteis, CM. Body Temperature. In: Physiology and Pathophysiology of
Temperature Regulation edited by CM Blatteis, 1998, p. 13-22.
6. Boulant JA. Hypothalamic neurons regulating body temperature. In: Comprehensive
Physiology, 2011, p. 105-126.
7. Brendemuhl J, and Myer B. 2009. Types of swine diets. Gainesville, FL: University
of Florida, IFAS Extension. Available at: http://edis.ifas.ufl.edu/an036. Accessed
October 30, 2013.
8. Brown-Brandl TM, Eigenberg RA, Nienaber JA, Kachman SD.
Thermoregulatory profile of a newer genetic line of pigs. J Livestock Prod Sci 71:
253-260, 2001.
9. Brown-Brandl TM, Nienaber JA, Xin H, Gates RS. A literature review of swine
production. Trans ASAE 47: 259-270, 2004.
108
10. Clark G, Magoun HW, Ranson SW. Hypothalamic regulation of body temperature.
AJP – JN Physiol 2:61-80, 1939.
11. Clarke A, Rothery P, Isaac NJB. Scaling of basal metabolic rate with body mass
and temperature in mammals. J Anim Ecol 79: 610-619, 2010.
12. Collin A, van Milgen J, Dubois S, Noblet J. Effect of high temperature on feeding
behaviour and heat production in group-housed young pigs. Br J Nutr 86: 63-70,
2001.
13. Estruch F. Stress-controlled transcription factors, stress-induced genes and stress
tolerance in budding yeast. FEMS Micro Bio Rev 24: 469-486, 2006.
14. Federation of Animal Science Societies. Guide for the care and use of agricultural
animals in research and teaching. 3rd
ed. Fed. Champaign, IL: Anim Sci Soc Chapter
11, 2010.
15. Fuquay JW. Heat stress as it affects animal production. J Anim Sci 52:164-174,
1981.
16. Gaughan JB, Bonner Sl, Loxton I, and Mader TL. Effects of chronic heat stress on
plasma concentrations of secreted heat shock protein 70 in growing feedlot cattle. J
Anim Sci 91: 120-129, 2013.
17. Giuliano JS Jr., Lahni PM, Wong HR, Wheeler DS. Pediatric sepsis- Part V:
Extracellular heat shock proteins: Alarmins for the host immune system. Open
Inflamm J 4: 49-60, 2014.
18. Graham JM, Edwards MJ, Edwards MJ. Teratogen update: Gestational effects of
maternal hyperthermia due to febrile illnesses and resultant patterns of defects in
humans. Teratology 58: 209-221, 1998.
109
19. Haffner SM, Gonzalez C, Miettinen H, Kennedy E, and Stern MP. A prospective
analysis of the HOMA model: The Mexico City diabetes study. Diabetes 19: 1138-
1141, 1996.
20. Hightower LE, Guidon PTJ. Selective release from cultured mammalian cells of
heat-shock (stress) proteins that resemble glia-axon transfer proteins. J Cell Physiol
138:257-266, 1989.
21. Johnson JS, Boddicker RL, Sanz-Fernandez MV, Ross JW, Selsby JT, Lucy
MC, Safranski TJ, Rhoads RP, Baumgard LH. Effects of in utero heat stress on
mammalian postnatal body temperature. Int J Hyperthermia 29: 696-702, 2013.
22. Johnson JS, Sanz Fernandez MV, Patience JF, Ross JW, Gabler NK, Lucy MC,
Safranski TJ, Rhoads RP, and Baumgard LH. In utero heat stress alters body
composition during the early finishing phase (60 to 80 kg) in pigs. J Anim Sci. In
Press, 2014a.
23. Johnson JS, Sanz Fernandez MV, Cespedes Gutierrez NA, Patience JF, Ross
JW, Gabler NK, Lucy MC, Safranski TJ, Rhoads RP, and Baumgard LH.
Effects of in utero heat stress on tissue accretion during the growing phase (30 to 60
kg) in pigs. J Anim Sci. In Press, 2014b.
24. Kim B. Thyroid hormone as a determinant of energy expenditure and the basal
metabolic rate. Thyroid 18:141-144, 2008.
25. Kleiber M. The Fire of Life an Introduction to Animal Energetics. New York:
Wiley, 1961, p. 129-174.
26. Kregel KC. Heat shock proteins: modifying factors in physiological stress responses
and acquired thermotolerance. J Appl Physiol 92:2177-2186, 2002.
110
27. Lele Z, Engel S, and Krone PH. hsp47 and hsp70 gene expression is differentially
regulated in a stress- and tissue-specific maner in zebrafish embryos J Genetics and
Devel 21: 123-133, 1998.
28. Lowell BB, and Spiegelman BM. Towards a molecular understanding of adaptive
thermogenesis. Nature 404: 652-660, 2000.
29. McGeehin MA, and Mirabelli M. The potential impacts of climate variability and
change on temperature-related morbidity and mortality in the United States. Environ
Health Perspect 109: 185-189, 2001.
30. Milne KJ, Wolff S, and Noble EG. Myocardial accumulation and localization of the
inducible 70-kDa heat shock protein, HSP-70 following exercise. J Appl Physiol
113:853-860, 2012.
31. Mizzen LA, and Welsh WJ. Characterization of the thermotolerant cell. I. Effects on
protein synthesis activity and the regulation of heat-shock protein 70 expression. J
Cell Biol 106:1105-1116, 1998.
32. Muller C, Cramer W, Hare WL, Lotze-Campen H. Climate change risks for
African agriculture. PIC 108: 4313-4315, 2010.
33. National Research Council. Nutrient Requirements of Swine, 11th
ed. Washington,
D.C.: National Academy Press, 2012.
34. Pearce SC, Gabler NK, Ross, JW, Escobar J, Patience JF, Rhoads RP,
Baumgard LH. The effects of heat stress and plane of nutrition on metabolism in
growing pigs. J Anim Sci 91: 1-11, 2013.
111
35. Piestun Y, Schinder D, Ruzal M, Halevy O, Brake J, Yahav S. Thermal
manipulations during broiler embryogenesis: Effect on the acquisition of
thermotolerance. Poult Sci 87: 1516-1525, 2008.
36. Reik W. Stability and flexibility of epigenetic gene regulation in mammalian
development. Nature 447: 425-432, 2007.
37. Rousset S, Alves-Guerra MC, Mozo J, Miroux B, Cassard-Doulcier AM,
Bouillaud F, et al. The biology of mitochondrial uncoupling proteins. Diabetes
53:S130-S135, 2004.
38. Schiaffonati L, Tacchini L, and Pappalardo C. Heat shock response in the liver:
expression and regulation of the hsp70 gene family and early response genes after in
vivo hyperthermia. Hepatology 20: 975-983, 1994.
39. Silva JE. Thermogenic mechanisms and their hormonal regulation. Physiol Rev
86:435-464, 2006.
40. Sorensen JG, Dahlgaard J, Loeschcke V. Genetic variation in thermal tolerance
among natural populations of Drosophila buzzatii: Down regulation of HSP-70
expression and variation in heat stress resistance traits. Funct Ecol 15: 289-296,
2001.
41. Tetievsky A, and Horowitz M. Posttranslational modifications in histones underlie
heat acclimation-mediated cytoprotective memory. J Appl Physiol 109: 1552-1561,
2010.
42. Tzschentke B. Attainment of thermoregulation as affected by environmental factors.
Poult Sci 86: 1025-1036, 2007.
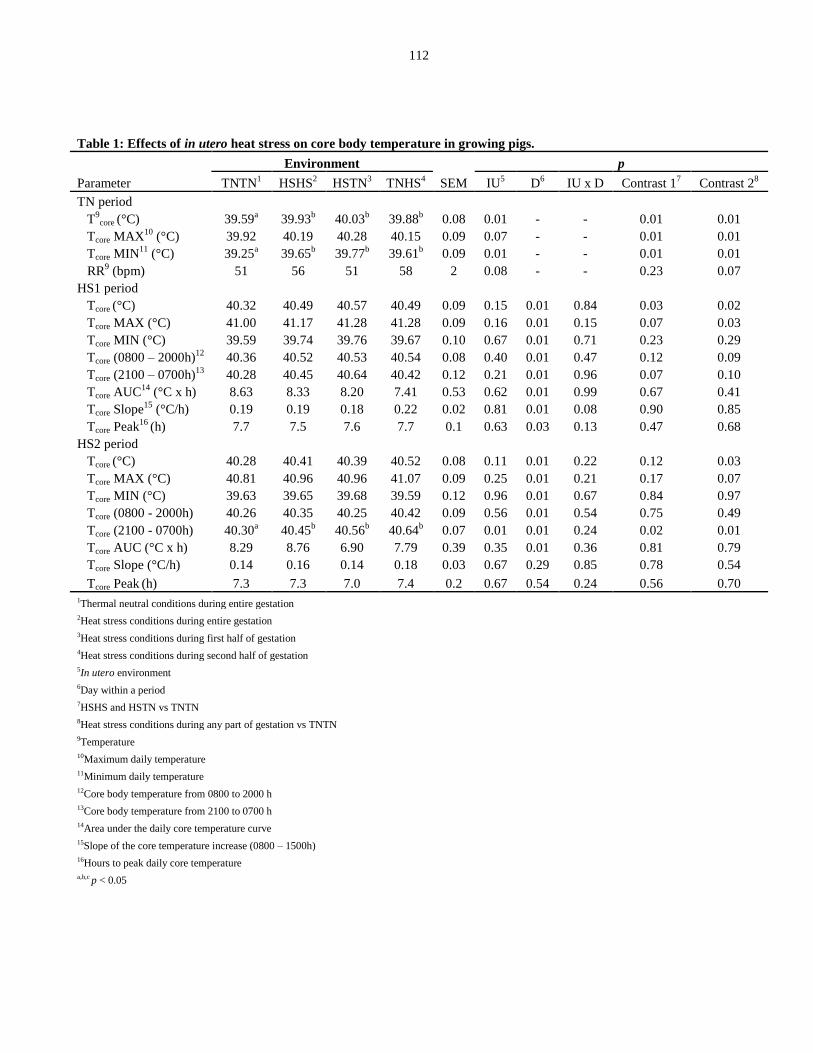
112
Table 1: Effects of in utero heat stress on core body temperature in growing pigs.
Environment p
Parameter TNTN1 HSHS
2 HSTN
3 TNHS
4 SEM IU
5 D
6 IU x D Contrast 1
7 Contrast 2
8
TN period
T9core (°C) 39.59
a 39.93
b 40.03
b 39.88
b 0.08 0.01 - - 0.01 0.01
Tcore MAX10
(°C) 39.92 40.19 40.28 40.15 0.09 0.07 - - 0.01 0.01
Tcore MIN11
(°C) 39.25a 39.65
b 39.77
b 39.61
b 0.09 0.01 - - 0.01 0.01
RR9 (bpm) 51 56 51 58 2 0.08 - - 0.23 0.07
HS1 period
Tcore (°C) 40.32 40.49 40.57 40.49 0.09 0.15 0.01 0.84 0.03 0.02
Tcore MAX (°C) 41.00 41.17 41.28 41.28 0.09 0.16 0.01 0.15 0.07 0.03
Tcore MIN (°C) 39.59 39.74 39.76 39.67 0.10 0.67 0.01 0.71 0.23 0.29
Tcore (0800 – 2000h)12
40.36 40.52 40.53 40.54 0.08 0.40 0.01 0.47 0.12 0.09
Tcore (2100 – 0700h)13
40.28 40.45 40.64 40.42 0.12 0.21 0.01 0.96 0.07 0.10
Tcore AUC14
(°C x h) 8.63 8.33 8.20 7.41 0.53 0.62 0.01 0.99 0.67 0.41
Tcore Slope15
(°C/h) 0.19 0.19 0.18 0.22 0.02 0.81 0.01 0.08 0.90 0.85
Tcore Peak16
(h) 7.7 7.5 7.6 7.7 0.1 0.63 0.03 0.13 0.47 0.68
HS2 period
Tcore (°C) 40.28 40.41 40.39 40.52 0.08 0.11 0.01 0.22 0.12 0.03
Tcore MAX (°C) 40.81 40.96 40.96 41.07 0.09 0.25 0.01 0.21 0.17 0.07
Tcore MIN (°C) 39.63 39.65 39.68 39.59 0.12 0.96 0.01 0.67 0.84 0.97
Tcore (0800 - 2000h) 40.26 40.35 40.25 40.42 0.09 0.56 0.01 0.54 0.75 0.49
Tcore (2100 - 0700h) 40.30a 40.45
b 40.56
b 40.64
b 0.07 0.01 0.01 0.24 0.02 0.01
Tcore AUC (°C x h) 8.29 8.76 6.90 7.79 0.39 0.35 0.01 0.36 0.81 0.79
Tcore Slope (°C/h) 0.14 0.16 0.14 0.18 0.03 0.67 0.29 0.85 0.78 0.54
Tcore Peak (h) 7.3 7.3 7.0 7.4 0.2 0.67 0.54 0.24 0.56 0.70
1Thermal neutral conditions during entire gestation
2Heat stress conditions during entire gestation
3Heat stress conditions during first half of gestation
4Heat stress conditions during second half of gestation
5In utero environment
6Day within a period
7HSHS and HSTN vs TNTN
8Heat stress conditions during any part of gestation vs TNTN
9Temperature
10Maximum daily temperature
11Minimum daily temperature
12Core body temperature from 0800 to 2000 h
13Core body temperature from 2100 to 0700 h
14Area under the daily core temperature curve
15Slope of the core temperature increase (0800 – 1500h)
16Hours to peak daily core temperature
a,b,c p < 0.05
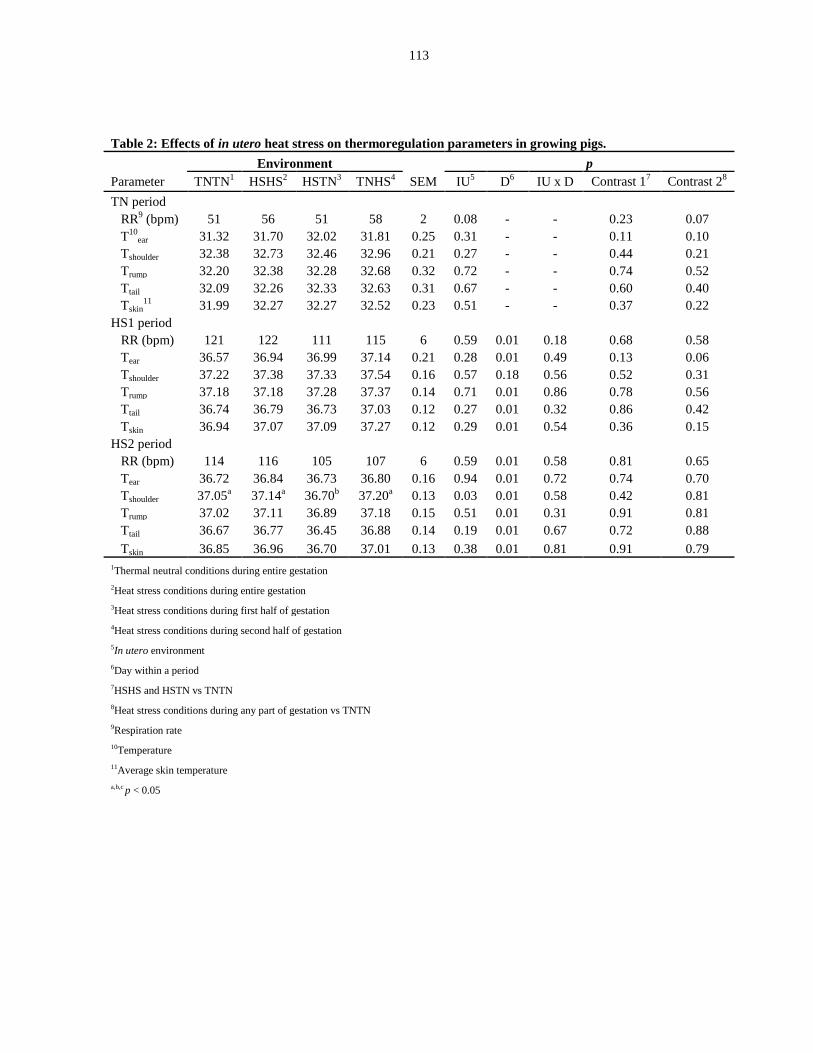
113
Table 2: Effects of in utero heat stress on thermoregulation parameters in growing pigs.
Environment p
Parameter TNTN1 HSHS
2 HSTN
3 TNHS
4 SEM IU
5 D
6 IU x D Contrast 1
7 Contrast 2
8
TN period
RR9 (bpm) 51 56 51 58 2 0.08 - - 0.23 0.07
T10
ear 31.32 31.70 32.02 31.81 0.25 0.31 - - 0.11 0.10
Tshoulder 32.38 32.73 32.46 32.96 0.21 0.27 - - 0.44 0.21
Trump 32.20 32.38 32.28 32.68 0.32 0.72 - - 0.74 0.52
Ttail 32.09 32.26 32.33 32.63 0.31 0.67 - - 0.60 0.40
Tskin11
31.99 32.27 32.27 32.52 0.23 0.51 - - 0.37 0.22
HS1 period
RR (bpm) 121 122 111 115 6 0.59 0.01 0.18 0.68 0.58
Tear 36.57 36.94 36.99 37.14 0.21 0.28 0.01 0.49 0.13 0.06
Tshoulder 37.22 37.38 37.33 37.54 0.16 0.57 0.18 0.56 0.52 0.31
Trump 37.18 37.18 37.28 37.37 0.14 0.71 0.01 0.86 0.78 0.56
Ttail 36.74 36.79 36.73 37.03 0.12 0.27 0.01 0.32 0.86 0.42
Tskin 36.94 37.07 37.09 37.27 0.12 0.29 0.01 0.54 0.36 0.15
HS2 period
RR (bpm) 114 116 105 107 6 0.59 0.01 0.58 0.81 0.65
Tear 36.72 36.84 36.73 36.80 0.16 0.94 0.01 0.72 0.74 0.70
Tshoulder 37.05a 37.14
a 36.70
b 37.20
a 0.13 0.03 0.01 0.58 0.42 0.81
Trump 37.02 37.11 36.89 37.18 0.15 0.51 0.01 0.31 0.91 0.81
Ttail 36.67 36.77 36.45 36.88 0.14 0.19 0.01 0.67 0.72 0.88
Tskin 36.85 36.96 36.70 37.01 0.13 0.38 0.01 0.81 0.91 0.79
1Thermal neutral conditions during entire gestation
2Heat stress conditions during entire gestation
3Heat stress conditions during first half of gestation
4Heat stress conditions during second half of gestation
5In utero environment
6Day within a period
7HSHS and HSTN vs TNTN
8Heat stress conditions during any part of gestation vs TNTN
9Respiration rate
10Temperature
11Average skin temperature
a,b,c p < 0.05
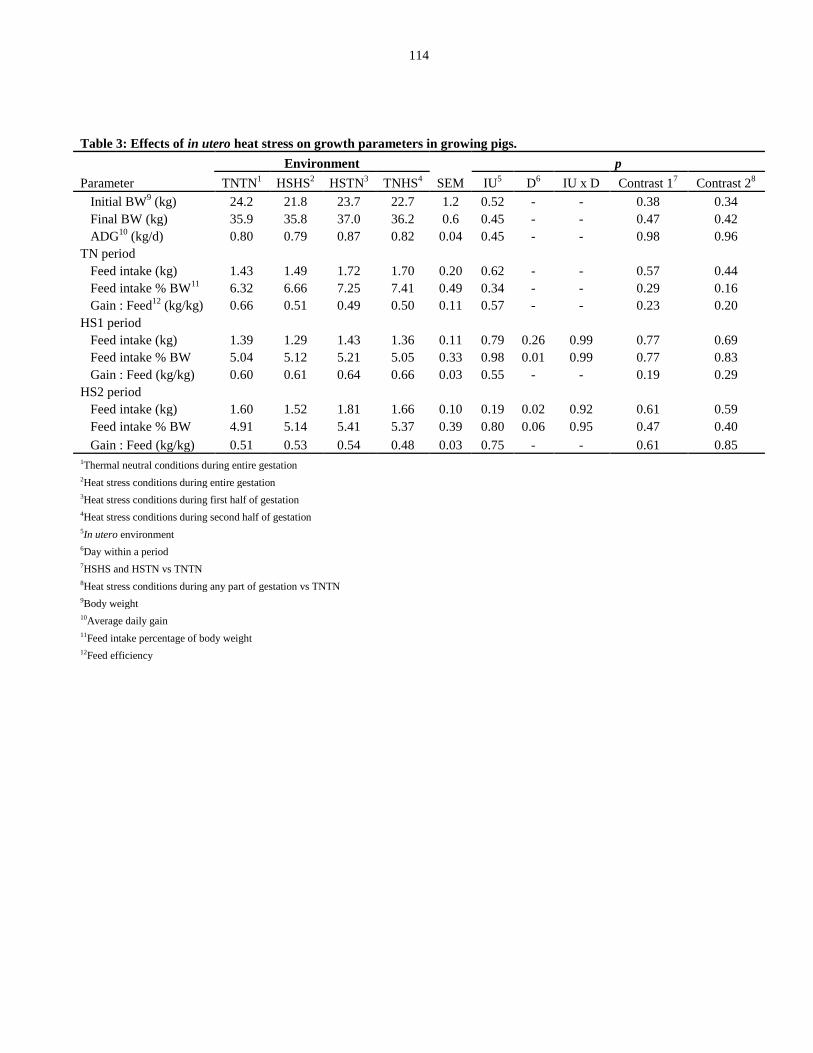
114
Table 3: Effects of in utero heat stress on growth parameters in growing pigs.
Environment p
Parameter TNTN1 HSHS
2 HSTN
3 TNHS
4 SEM IU
5 D
6 IU x D Contrast 1
7 Contrast 2
8
Initial BW9 (kg) 24.2 21.8 23.7 22.7 1.2 0.52 - - 0.38 0.34
Final BW (kg) 35.9 35.8 37.0 36.2 0.6 0.45 - - 0.47 0.42
ADG10
(kg/d) 0.80 0.79 0.87 0.82 0.04 0.45 - - 0.98 0.96
TN period
Feed intake (kg) 1.43 1.49 1.72 1.70 0.20 0.62 - - 0.57 0.44
Feed intake % BW11
6.32 6.66 7.25 7.41 0.49 0.34 - - 0.29 0.16
Gain : Feed12
(kg/kg) 0.66 0.51 0.49 0.50 0.11 0.57 - - 0.23 0.20
HS1 period
Feed intake (kg) 1.39 1.29 1.43 1.36 0.11 0.79 0.26 0.99 0.77 0.69
Feed intake % BW 5.04 5.12 5.21 5.05 0.33 0.98 0.01 0.99 0.77 0.83
Gain : Feed (kg/kg) 0.60 0.61 0.64 0.66 0.03 0.55 - - 0.19 0.29
HS2 period
Feed intake (kg) 1.60 1.52 1.81 1.66 0.10 0.19 0.02 0.92 0.61 0.59
Feed intake % BW 4.91 5.14 5.41 5.37 0.39 0.80 0.06 0.95 0.47 0.40
Gain : Feed (kg/kg) 0.51 0.53 0.54 0.48 0.03 0.75 - - 0.61 0.85 1Thermal neutral conditions during entire gestation
2Heat stress conditions during entire gestation
3Heat stress conditions during first half of gestation
4Heat stress conditions during second half of gestation
5In utero environment
6Day within a period
7HSHS and HSTN vs TNTN
8Heat stress conditions during any part of gestation vs TNTN
9Body weight
10Average daily gain
11Feed intake percentage of body weight
12Feed efficiency
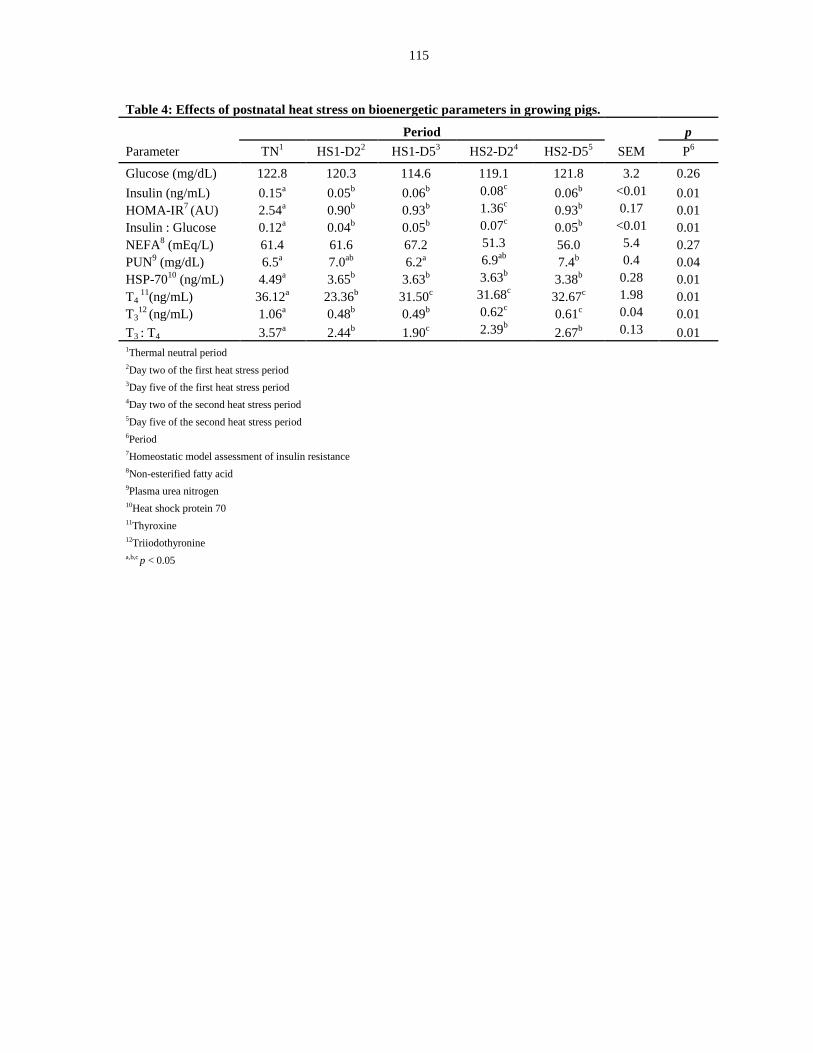
115
Table 4: Effects of postnatal heat stress on bioenergetic parameters in growing pigs.
Period p
Parameter TN1 HS1-D2
2 HS1-D5
3 HS2-D2
4 HS2-D5
5 SEM P
6
Glucose (mg/dL) 122.8 120.3 114.6 119.1 121.8 3.2 0.26
Insulin (ng/mL) 0.15a 0.05
b 0.06
b 0.08
c 0.06
b <0.01 0.01
HOMA-IR7 (AU) 2.54
a 0.90
b 0.93
b 1.36
c 0.93
b 0.17 0.01
Insulin : Glucose 0.12a 0.04
b 0.05
b 0.07
c 0.05
b <0.01 0.01
NEFA8 (mEq/L) 61.4 61.6 67.2 51.3 56.0 5.4 0.27
PUN9 (mg/dL) 6.5
a 7.0
ab 6.2
a 6.9
ab 7.4
b 0.4 0.04
HSP-7010
(ng/mL) 4.49a 3.65
b 3.63
b 3.63
b 3.38
b 0.28 0.01
T4 11
(ng/mL) 36.12a 23.36
b 31.50
c 31.68
c 32.67
c 1.98 0.01
T312
(ng/mL) 1.06a 0.48
b 0.49
b 0.62
c 0.61
c 0.04 0.01
T3 : T4 3.57
a 2.44
b 1.90
c 2.39
b 2.67
b 0.13 0.01
1Thermal neutral period 2Day two of the first heat stress period 3Day five of the first heat stress period 4Day two of the second heat stress period 5Day five of the second heat stress period 6Period 7Homeostatic model assessment of insulin resistance 8Non-esterified fatty acid 9Plasma urea nitrogen 10Heat shock protein 70 11Thyroxine 12Triiodothyronine a,b,c p < 0.05
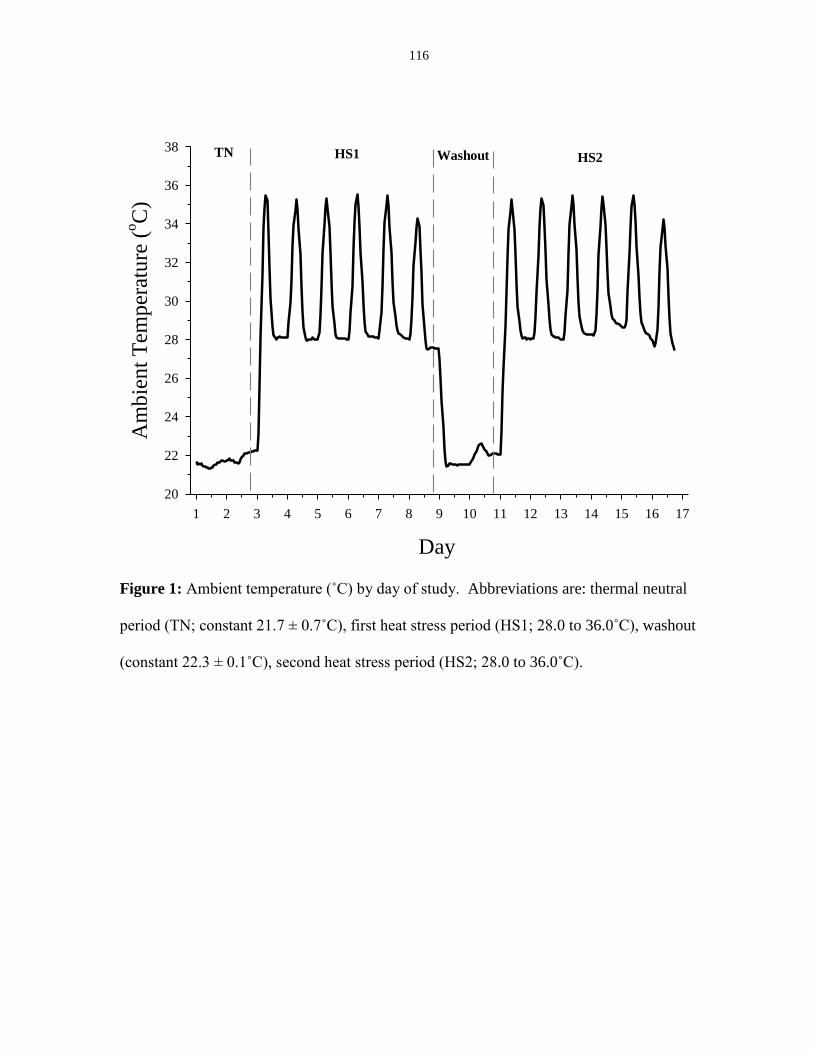
116
Day
1 2 3 4 5 6 7 8 9 10 11 12 13 14 15 16 17
Am
bie
nt
Tem
per
atu
re (
oC
)
20
22
24
26
28
30
32
34
36
38 TN HS1 Washout HS2
Figure 1: Ambient temperature (˚C) by day of study. Abbreviations are: thermal neutral
period (TN; constant 21.7 ± 0.7˚C), first heat stress period (HS1; 28.0 to 36.0˚C), washout
(constant 22.3 ± 0.1˚C), second heat stress period (HS2; 28.0 to 36.0˚C).
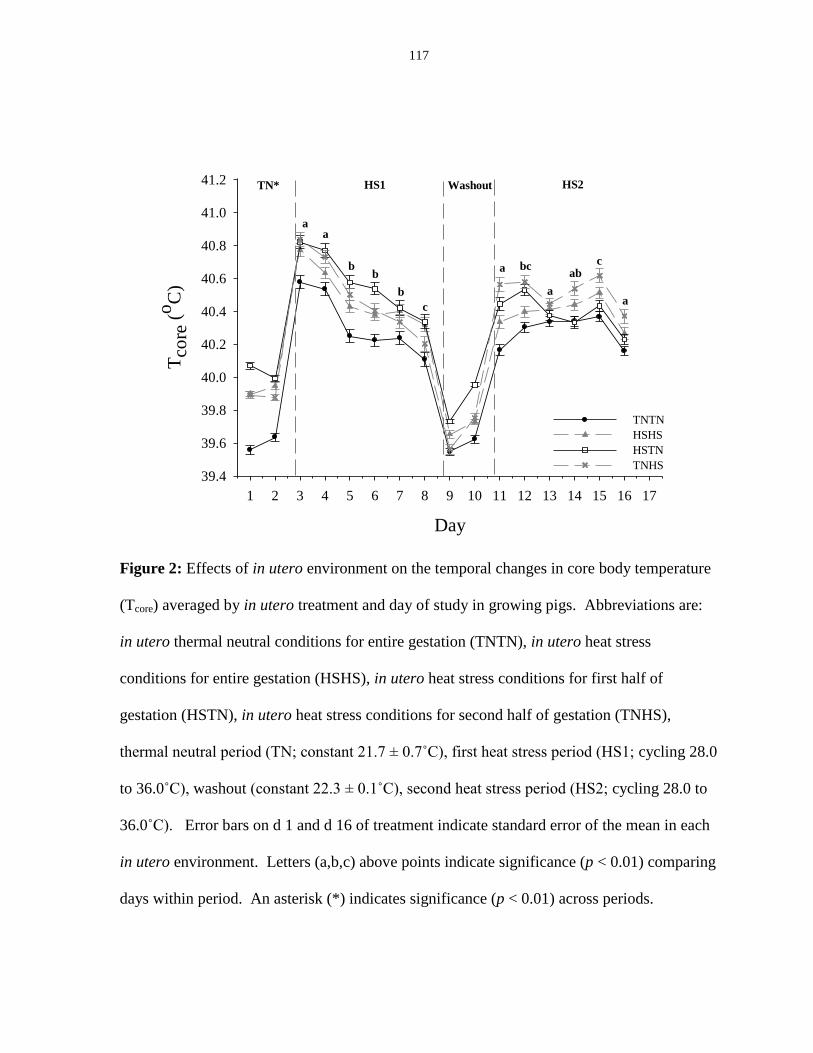
117
Day
1 2 3 4 5 6 7 8 9 10 11 12 13 14 15 16 17
Tco
re (
oC
)
39.4
39.6
39.8
40.0
40.2
40.4
40.6
40.8
41.0
41.2
TNTN
HSHS
HSTN
TNHS
TN* HS1 Washout HS2
aa
bb
b
c
a bc
a
abc
a
Figure 2: Effects of in utero environment on the temporal changes in core body temperature
(Tcore) averaged by in utero treatment and day of study in growing pigs. Abbreviations are:
in utero thermal neutral conditions for entire gestation (TNTN), in utero heat stress
conditions for entire gestation (HSHS), in utero heat stress conditions for first half of
gestation (HSTN), in utero heat stress conditions for second half of gestation (TNHS),
thermal neutral period (TN; constant 21.7 ± 0.7˚C), first heat stress period (HS1; cycling 28.0
to 36.0˚C), washout (constant 22.3 ± 0.1˚C), second heat stress period (HS2; cycling 28.0 to
36.0˚C). Error bars on d 1 and d 16 of treatment indicate standard error of the mean in each
in utero environment. Letters (a,b,c) above points indicate significance (p < 0.01) comparing
days within period. An asterisk (*) indicates significance (p < 0.01) across periods.
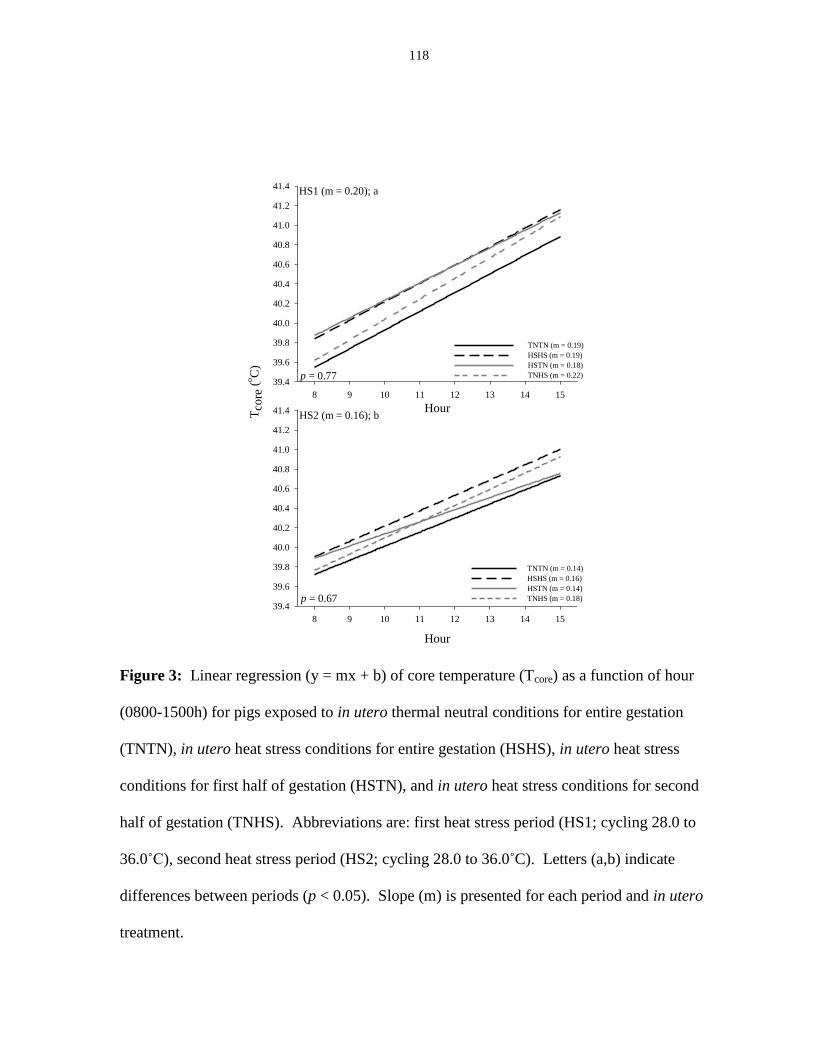
118
HS2 (m = 0.16); b
Hour
8 9 10 11 12 13 14 15
39.4
39.6
39.8
40.0
40.2
40.4
40.6
40.8
41.0
41.2
41.4
TNTN (m = 0.14)
HSHS (m = 0.16)
HSTN (m = 0.14)
TNHS (m = 0.18)p = 0.67
HS1 (m = 0.20); a
Hour
8 9 10 11 12 13 14 15
Tco
re (
oC
)
39.4
39.6
39.8
40.0
40.2
40.4
40.6
40.8
41.0
41.2
41.4
TNTN (m = 0.19)
HSHS (m = 0.19)
HSTN (m = 0.18)
TNHS (m = 0.22)p = 0.77
Figure 3: Linear regression (y = mx + b) of core temperature (Tcore) as a function of hour
(0800-1500h) for pigs exposed to in utero thermal neutral conditions for entire gestation
(TNTN), in utero heat stress conditions for entire gestation (HSHS), in utero heat stress
conditions for first half of gestation (HSTN), and in utero heat stress conditions for second
half of gestation (TNHS). Abbreviations are: first heat stress period (HS1; cycling 28.0 to
36.0˚C), second heat stress period (HS2; cycling 28.0 to 36.0˚C). Letters (a,b) indicate
differences between periods (p < 0.05). Slope (m) is presented for each period and in utero
treatment.
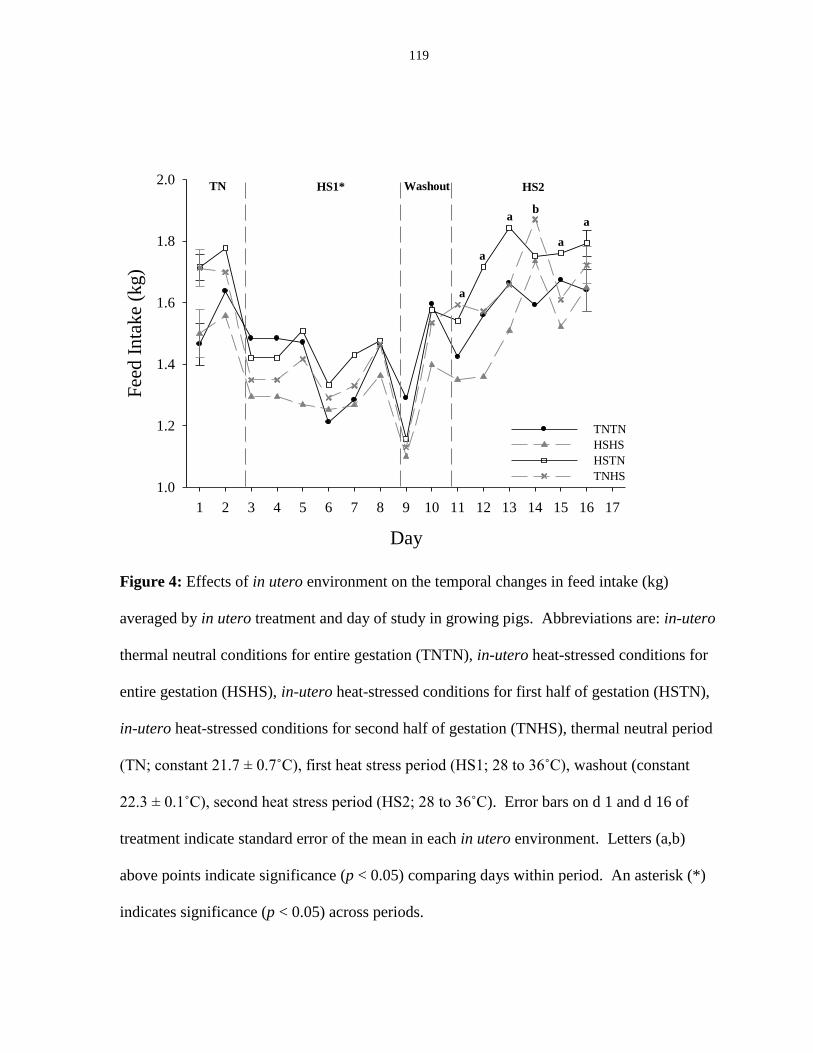
119
Day
1 2 3 4 5 6 7 8 9 10 11 12 13 14 15 16 17
Fee
d I
nta
ke
(kg)
1.0
1.2
1.4
1.6
1.8
2.0
TNTN
HSHS
HSTN
TNHS
TN HS1* Washout HS2
a
a
ab
a
a
Figure 4: Effects of in utero environment on the temporal changes in feed intake (kg)
averaged by in utero treatment and day of study in growing pigs. Abbreviations are: in-utero
thermal neutral conditions for entire gestation (TNTN), in-utero heat-stressed conditions for
entire gestation (HSHS), in-utero heat-stressed conditions for first half of gestation (HSTN),
in-utero heat-stressed conditions for second half of gestation (TNHS), thermal neutral period
(TN; constant 21.7 ± 0.7˚C), first heat stress period (HS1; 28 to 36˚C), washout (constant
22.3 ± 0.1˚C), second heat stress period (HS2; 28 to 36˚C). Error bars on d 1 and d 16 of
treatment indicate standard error of the mean in each in utero environment. Letters (a,b)
above points indicate significance (p < 0.05) comparing days within period. An asterisk (*)
indicates significance (p < 0.05) across periods.
120
CHAPTER IV: EFFECTS OF IN UTERO HEAT STRESS AND CORE BODY
TEMPERATURE ON TISSUE ACCRETION DURING THE
GROWING PHASE (30 TO 60 KG) IN PIGS
A paper submitted to The Jounal of Animal Science
J.S. Johnson1, M.V. Sanz-Fernandez
1, N.A. Gutierrez Cespedes
1, J.F. Patience
1,
J.W. Ross1, N.K. Gabler
1, M.C. Lucy
2, T.J. Safranski
2, R.P. Rhoads
3, L.H. Baumgard
1
1Department of Animal Science, Iowa State University, Ames, IA, 50011
2Division of Animal Sciences, University of Missouri, Columbia, MO, 65211
3Department of Animal and Poultry Sciences, Virginia Tech, Blacksburg, VA, 24061
Abstract
Environmentally induced heat stress (HS) negatively influences production variables
in agriculturally important species. However, the extent to which HS experienced in utero
affects nutrient partitioning during the rapid lean tissue accretion phase of postnatal growth is
unknown. Study objectives were to compare future whole-body tissue accretion rates in pigs
exposed to differing in utero and postnatal thermal environments when lean tissue deposition
is likely maximized. Pregnant sows were exposed to thermal neutral (TN; cyclical 15ºC
nighttime and 22ºC daytime; n = 9) or HS (cyclical 27ºC nighttime and 37ºC daytime; n =
12) conditions during their entire gestation. Twenty-four offspring from in utero TN (IUTN;
n = 6 gilts, 6 barrows; 30.8 ± 0.2 kg BW) and in utero HS (IUHS; n = 6 gilts, 6 barrows; 30.3
± 0.2 kg BW) were euthanized as an initial slaughter group (ISG). Following the ISG, 48
pigs from IUTN (n = 12 gilts, 12 barrows; 34.1 ± 0.5 kg BW) and IUHS (n = 12 gilts, 12
barrows; 33.3 ± 0.3 kg BW) were exposed to constant HS (34.1 ± 2.4°C) or TN (21.5 ±
121
2.0°C) conditions until they reached 61.5 ± 0.8 kg BW, at which point they were sacrificed
and their body composition was determined. Homogenized carcasses were analyzed for
nitrogen, crude fat, ash, water, and gross energy content. Data were analyzed using PROC
MIXED in SAS 9.3. Rectal temperature and respiration rate increased (P < 0.01) during
postnatal HS compared to TN (39.4 vs. 39.0°C and 94 vs. 49 bpm, respectively). Regardless
of in utero environment, postnatal HS reduced (P < 0.01) feed intake (2.06 vs. 2.37 kg/d) and
ADG (0.86 vs. 0.98 kg/d) compared to TN conditions. Postnatal HS did not alter water,
protein, and ash accretion rates, but reduced adipose tissue accretion rates (198 vs. 232 g/d; P
< 0.04) compared to TN-reared pigs. In utero environment had no effect on tissue deposition
rates; however, IUHS pigs from the ISG had reduced liver weight (P < 0.04; 17.9%)
compared to IUTN controls. In summary, postnatal HS reduced lipid accretion rates, but in
utero HS did not appear to impact either lean or adipose tissue accretion during this specific
growth phase.
Keywords: pigs, in utero heat stress, imprinting, and tissue accretion
Introduction
Heat stress (HS) reduces growth, alters carcass quality, and compromises efficiency,
thus diminishing efforts by animal agriculture to produce high quality protein for human
consumption (Baumgard et al., 2012). The negative effects of HS will likely become more
pronounced as climate models predict an increase in extreme summer temperatures for most
agricultural areas (Luber and McGeehin, 2008). Since basal heat production has markedly
increased with genetic selection for enhanced lean tissue accretion (Brown–Brandl et al.,
2004), some suggest faster growing animals are more sensitive to HS (Nienaber and Hahn,
122
2007). As a consequence, there is an urgent requirement to understand the mechanisms by
which HS reduces animal performance.
While the detrimental effects of postnatal HS on tissue accretion have been well
documented (Kouba et al., 2001; Collin et al., 2001a; Kerr et al., 2003), the extent to which
in utero hyperthermia affects future animal performance is relatively unknown. If climate
change lengthens summer duration and increases the frequency/intensity of heat waves, the
number of animals gestating during the stressful warm times of the year will increase.
Previous studies indicate prenatal stressors (non-thermal) can permanently alter growth
(Foxcroft et al., 2006, 2009), post-absorptive metabolism (Chen et al., 2010; Pinney and
Simmons, 2010), and body composition (Ravelli et al., 1976; Barker et al., 1993; Roseboom
et al., 2006); however, the effects of maternal HS on offspring postnatal growth variables are
unknown. Therefore, our study objectives were to determine the future rate and quantity of
whole-body tissue accretion in pigs exposed to differing in utero and postnatal thermal
environments. We hypothesized that in utero HS exposure would reduce future skeletal
muscle accretion during the growing phase (30 to 60 kg BW), the period when lean tissue
deposition dominates growth.
Materials and Methods
In utero environments
The University of Missouri Animal Care and Use Committee approved all procedures
involving pregnant sows. Twenty-one first parity-crossbred sows (Large White x Landrace;
GPK1 x GPK4; Choice Genetics USA; Des Moines, IA) were exposed to thermal neutral
(TN; cyclical 15°C nighttime and 22°C daytime; 55% RH; n = 9), or HS (cyclical 27°C
123
nighttime and 37°C daytime; 67.5% RH; n = 12) conditions in the Brody Environmental
Chambers at the University of Missouri (Lucy et al., 2012). Thermal treatments began six
days after insemination (Duroc; Swine Genetics International; Cambridge, IA) and continued
until farrowing (116.6 ± 0.5 d gestation; Lucy et al., 2012). Heat stress caused a sustained
increase in rectal temperature (Tre; P < 0.05; 0.3°C) in pregnant sows compared to TN
controls (Lucy et al., 2012). Feed intake (FI) did not differ between treatments (P > 0.15;
TN: 5.24 ± 0.07 kg/d and HS: 5.08 ± 0.08 kg/d) as both the HS and TN control pregnant
sows were limit-fed to prevent excessive maternal weight gain (standard industry practice;
Brendemuhl and Myer, 2009). Between parturition and weaning, all piglets were exposed to
the same environmental conditions (26 - 32˚C) as recommended by FASS (2010). After
weaning, all offspring (n = 253) were transported in an aluminum livestock trailer with wood
shavings (standard practice; 6 h) to Iowa State University.
Postnatal environments
The Iowa State University Institutional Animal Care and Use Committee approved all
procedures involving animals (protocol #7169-S). Between weaning and approximately 30
kg BW, all pigs were housed in TN conditions as recommended by FASS (2010), and
allowed to consume water and feed (based primarily on corn and soybean meal) ad libitum.
From the 253 pigs transported to Iowa State University, 24 pigs with no previous postnatal
HS exposure from in utero thermal neutral (IUTN; n = 6 gilts, 6 barrows; 30.8 ± 0.2 kg BW),
and in utero HS (IUHS; n = 6 gilts, 6 barrows; 30.3 ± 0.2 kg BW) were randomly selected
and euthanized as part of an initial slaughter group (ISG). Following the ISG, 48 pigs from
IUTN (n = 12 gilts, 12 barrows; 34.1 ± 0.5 kg initial BW) and IUHS (n = 12 gilts, 12
barrows; 33.3 ± 0.3 kg initial BW) were housed in individual pens (0.61 x 2.44 m) in one of
124
two environmentally controlled rooms. Pigs were evenly distributed within rooms based
upon treatment. Within each room, ambient temperature (Ta) and relative humidity (%RH)
were continuously recorded by two mounted data loggers (El – WIN – USB; accuracy: ±
1.0°C; Lascar Electronics Ltd.; Wiltshire, UK) every 30 min. Fans were utilized to prevent
uneven temperature dispersion, and data loggers were positioned at opposite ends of the
rooms to confirm uniform environmental conditions. Although Ta was controlled, %RH was
ungoverned throughout the experiment.
Twelve barrows (n = 6 IUTN, 6 IUHS) and 12 gilts (n = 6 IUTN, 6 IUHS) were
housed in constant TN conditions (21.5 ± 2.0°C; 68.1 ± 8.3 %RH), and 12 barrows (n = 6
IUTN, 6 IUHS) and 12 gilts (n = 6 IUTN, 6 IUHS) were maintained in constant HS
conditions (34.1 ± 2.4°C; 48.9 ± 6.7 %RH) until they reached approximately 60 kg. All pigs
were fed ad libitum, a standard commercial diet formulated to meet or exceed nutritional
requirements (Table 1; NRC, 2012). Feed intake was determined weekly and BW was
determined bi-weekly. Respiration rate (RR) and Tre were obtained twice daily (0800, 1600
h). Respiration rate (breaths per minute: BPM) was determined by counting flank movement
over a one-minute interval. Rectal temperature was determined with a calibrated and
lubricated thermistor thermometer (Welch Allyn SureTemp®Plus; accuracy: ± 0.1˚C;
Skaneateles Falls, NY) inserted approximately 10 cm into the rectum of unrestrained pigs.
Blood sampling and analysis
Blood (10 mL) was obtained from all pigs via jugular venipuncture (BD® vacutainers;
Franklin Lakes, NJ; K3EDTA; lithium heparin; serum) at 1500 h one day prior to sacrifice (in
a fed state while still experiencing their respective environmental treatment) and stored on
ice until processing; plasma and serum were then harvested by centrifugation at 2500 x g,
125
aliquoted and stored at -80°C. Glucose concentration was immediately determined from
whole blood collected in lithium heparin tubes using a Vet Scan iStat® C68+ cartridge
(Abaxis, Inc.; Union City, CA). Plasma insulin concentration was measured using an ELISA
kit (Mercodia Porcine Insulin ELISA; Mercodia AB; Uppsala, Sweden), following the
manufacturer’s instructions. Commercially available kits were used to determine plasma
non-esterified fatty acid (NEFA; Autokit NEFA; Wako Chemicals USA, Richmond, VA),
plasma urea nitrogen (PUN; Urea Nitrogen Reagent; TECO Diagnostics, Anaheim, CA), and
serum creatine kinase (CK) concentrations (Creatine Kinase-SL Assay; SEKISUI
Diagnostics, Charlottetown, PE Canada). The intra- and inter-assay coefficients of variation
were 3.8, 7.2, 6.4, 1.9%, and 8.0, 4.7, 8.3, 4.5% for insulin, NEFA, CK, and PUN,
respectively. Quantification of insulin resistance was determined by the homeostatic model
assessment of insulin resistance (HOMA-IR; (glucose (mmol/L) * insulin (mg/L))/450;
Haffner et al., 1996), and the insulin to FI ratio ([insulin]/average daily feed intake
throughout the entire experiment) was calculated for individual pigs using average daily FI
over the entire experiment.
Serial slaughter and sub-sample analysis
All pigs utilized in the postnatal experiment were harvested after an overnight fast in
TN conditions at 30.6 ± 0.2 kg BW (ISG), and 61.5 ± 0.8 kg BW (final slaughter group;
FSG). Initial and final BW were selected in an attempt to capture the period of rapid lean
accretion in commercially relevant growing pigs (Wagner et al., 1999; Van Milgen and
Noblet, 2003). The ISG was euthanized with an intravenous barbiturate overdose (100
mg/kg BW; Nembutol®; Ovation Pharmaceuticals Inc.; Deerfield, IL). Since a similar BW at
sacrifice was an objective, FSG pigs were harvested at different times (32.5 ± 4.5 d on trial).
126
At sacrifice, FSG pigs were electrically stunned and exsanguinated and blood was
collected. For initial and final slaughter groups, stomach, intestinal, gallbladder and bladder
contents were removed, and liver, spleen and total viscera weight (minus contents) was
recorded. Whole carcass, head, viscera (minus contents of stomach, intestine, gallbladder,
and bladder), and blood were weighed to determine empty body weight (EBW). Carcass,
head, viscera, and blood of individual pigs were frozen, sectioned, passed twice through a
mechanical grinder (Buffalo no. 66BX Enterprise; St. Louis, MO) and then passed four times
through a Hobart 52 grinder with a 5-mm die (model #4046; Troy, OH) for homogenization.
Ground pigs were sub-sampled, and sub-samples were immediately dried in a convection
oven (101˚C; 24 h) to a constant weight for determination of dry matter (DM) according to
method 950.46 (AOAC Int., 2002). Dried sub-samples were ground through a 1-mm screen
(Retsch ZM 100; Glen Mills Inc.; Clifton, NJ), and analyzed for ash, crude fat, nitrogen (N),
and gross energy (GE). Ash was determined by drying at 600°C (24 h) to a constant weight
according to method 923.03 (AOAC Int., 2002). Crude fat was determined by Soxhlet
extraction according to method 991.36 (AOAC Int., 2002) using n-hexane as the solvent
(Fischer Scientific; Fair Lawn, NJ). Nitrogen content was determined by combustion using a
LECO TruMac N Nitrogen Determinator (Leco Corporation; St. Joseph, MI; model #630-
300-300) according to method 992.15 (AOAC Int., 2002). Calibration of the LECO was
conducted with an EDTA standard (known N content 9.56 ± 0.03%; N content determined to
be 9.58 ± 0.06%), and crude protein was expressed as nitrogen * 6.25. Gross energy was
determined using isoperibol bomb calorimetry (Parr 620 calorimeter; Parr Instrument
Company; Moline, IL; model #6200), and benzoic acid was used as the calibration standard
(known GE 6,318 ± 18 kcal/kg; GE determined to be 6,319 ± 8 kcal/kg). All chemical
127
analyses were carried out in duplicate, and repeated when the intra-duplicate coefficient of
variation exceeded 3%.
Based on the sub-sample chemical content, total body composition was determined
for water, ash, adipose, and protein using the EBW (Noblet et al., 1987). The average
chemical composition of IUTN and IUHS pigs in the ISG was used to estimate the initial
body composition of IUTN and IUHS pigs in the FSG, respectively. Within each individual
pig, the accretion of water, adipose, protein, and ash were estimated by: (final content, g of
tissue – estimated initial content, g of tissue) / days between harvest dates.
To determine carcass gain efficiency (CE), the average carcass weight of IUTN and
IUHS pigs in the ISG was used to estimate the initial carcass weight of IUTN and IUHS pigs
in the FSG, respectively. Within each individual pig, the accretion of carcass tissue was
estimated by: (final carcass weight – estimated initial carcass weight)/days between harvest
dates. Carcass gain efficiency was calculated by dividing carcass gain by average daily FI in
individual pigs (carcass gain : FI).
Statistical analysis
All data were analyzed using the PROC MIXED procedure in SAS 9.3 (SAS Institute
Inc., Cary, NC). Statistical model components included in utero environment (IUTN;
IUHS), postnatal environment (TN; HS), gender (M; F), and all interactions. Since no
significant gender differences were detected, it was removed from the final analysis. All
interactions, regardless of significance level were included in the model and dam was used as
a random effect for all analyses. Average daily gain (ADG) of individual pigs calculated two
weeks prior to the start of the postnatal treatment was used as a covariate for analysis of all
body composition and growth variables. For repeated analysis of Tre and RR, each pig’s
128
respective parameter was analyzed using repeated measures with an auto-regressive
covariance structure with day as the repeated effect. Statistical significance was defined as P
≤ 0.05, and a tendency was defined as 0.05 < P ≤ 0.10.
Results
Thermal indices
An overall increase (P < 0.01) in RR and Tre was detected in postnatal HS pigs
compared to TN controls (94 ± 2 vs. 49 ± 2 bpm, Fig. 1A; 39.4 ± 0.1 vs 39.0 ± 0.1˚C, Fig.
1B, respectively). Neither in utero nor in utero by postnatal treatment differences were
detected for RR or Tre.
Growth performance
Although not affected by in utero environments (P > 0.50; 2.29 kg/d), postnatal HS
reduced (P < 0.01) FI by 13% compared to TN conditions (Table 2). Average daily gain was
reduced (P < 0.01; 0.12 kg/d) in pigs in postnatal HS compared to TN conditions (Table 2).
No postnatal feed efficiency (FE) differences were detected (0.42 kg gain/kg feed; Table 2),
and neither ADG nor FE were influenced by in utero thermal treatment (Table 2).
Regardless of in utero treatment, CE increased (P < 0.01; 12.5%) in postnatal HS compared
to TN-exposed pigs; however, no in utero or in utero by postnatal treatment differences in
CE (P > 0.15) were observed (Table 2). No in utero, postnatal, or in utero by postnatal
treatment differences (P > 0.10) were detected in BW gain per Mcal of metabolizable energy
(ME) consumed (0.12 kg/Mcal; Table 2).
129
Organ and carcass weights
In the ISG, absolute liver weight and liver weight as a percent of EBW were reduced
(P < 0.04; 17.9 and 13.6%, respectively), and total viscera weight tended (P < 0.10) to be
reduced (6.5%) in IUHS compared to IUTN pigs (Table 3). In the FSG, head weight was
reduced (P ≤ 0.05; 4.9%) in IUHS compared to IUTN pigs (Table 3). A decrease (P < 0.01)
in total viscera (450 g), liver (80 g), spleen (20 g), and blood (190 g) weight was observed in
pigs in postnatal HS compared to TN environments (Table 3). Total viscera, liver, and
spleen weight as a percent of EBW were decreased (P < 0.02) 5.9, 7.6, and 15.8 %,
respectively, in postnatal HS compared to TN control pigs (Table 3). No other in utero or
postnatal organ and carcass weight differences were detected (Table 3).
Tissue composition and accretion
In utero HS pigs in postnatal HS conditions had reduced (P < 0.03; 56 g/d) water
accretion compared to IUTN-HS pigs (Table 4). Regardless of in utero environment,
postnatal HS pigs had reduced adipose tissue accretion (P < 0.04; 14.7%) compared to TN
controls (Table 4; Fig. 2). No other in utero or postnatal tissue composition or accretion
differences were observed (Table 4).
Blood analyses
In utero HS pigs in postnatal HS conditions tended (P < 0.10) to have reduced
glucose concentrations (7.25 mg/dL) compared to IUTN-HS pigs (Table 5). Regardless of in
utero treatment, PUN was reduced (P < 0.04; 17%) and [insulin]/FI was increased (P ≤ 0.05;
30%) for pigs in postnatal HS compared to TN conditions (Table 5). No other in utero or
postnatal treatment differences in blood variables were detected (Table 5).
130
Discussion
Despite cooling system advances and improved management practices, HS continues
to compromise efficient high quality animal protein production. Although HS is primarily an
animal welfare and economic issue in developed countries, it is a food security and
humanitarian concern in regions that lack the resources to afford heat abatement technology
(Battisti and Naylor, 2009). While the negative effects of HS on postnatal performance have
been well documented (Renaudeau 2008, 2012; Baumgard and Rhoads, 2013), the impact of
in utero HS on future progeny performance is ill defined. The uncertainty of environmental
influence on future productivity will become more important if climate change intensifies the
severity and frequency of heat waves and extends summer length.
Non-thermal prenatal stressors can permanently reduce growth (Foxcroft et al., 2006,
2009), alter post-absorptive metabolism (Pinney and Simmons, 2010; Chen et al., 2010), and
influence body composition (Ravelli et al., 1976; Barker et al., 1993; Roseboom et al., 2006).
The offspring’s altered body composition and metabolism is generally characterized by
increased adiposity and a metabolite/endocrine profile that resembles Type II diabetes.
However, in the present study, in utero hyperthermia had no measureable impact on key body
composition variables during the growing phase of postnatal growth, when protein accretion is
ostensibly maximized (Wagner et al., 1999). Reasons for the lack of in utero treatment effects
on postnatal lean and adipose tissue accretion are not clear, but may be the result of similar
maternal FI (i.e. differences in dam nutrient intake may partly explain the aforementioned
non-thermal effects), insufficient maternal hyperthermia (i.e. the heat load applied to the
pregnant dams was inadequate to alter fetal programming), or the impact of in utero HS may
131
not be expressed until later in life when the rate of skeletal muscle accretion has slowed and
adipose accretion is increased.
As reviewed by Graham and colleagues (1998), in utero hyperthermia caused
microcephaly (reduced cranial size) in the present study, independent of postnatal treatment
(Table 3). Since head size is likely associated with brain size, this observation could be
indicative of micrencephaly (smaller brain size), which can negatively impact the central
nervous system and future skeletal muscle development in non-porcine models (as reviewed
by Graham et al., 1998). Additionally, liver weight and liver weight as a percent of EBW
were reduced in IUHS pigs compared to IUTN pigs in the ISG, which may impact
maintenance costs since reduced organ size (particularly liver and intestinal tissue) is
correlated with decreased fasting heat production (Koong et al., 1982). Regardless of in
utero environment, and similar to reports by others (Lefaucheur et al., 1989; Rinaldo and Le
Dividich, 1991), pigs maintained in postnatal HS conditions had reduced total viscera mass
and liver weight compared to those in postnatal TN conditions. Since the viscera (particularly
the liver) has a high metabolic activity (Burrin et al., 1988; Van Milgen and Noblet, 2003),
decreased splanchnic bed mass likely represents a strategy to minimize basal heat production
in response to hyperthermia, possibly due to reduced visceral blood flow as described by
others (Lambert et al., 2002; Leon and Helwig, 2010).
Although adipose tissue accretion was reduced (15%), protein deposition was similar
(173 g/d) in postnatal HS pigs compared to TN controls (Fig. 2). Reduced adiposity
corroborates results observed by Le Bellego and colleagues (2002), where both carcass fat
content and back fat thickness were decreased in HS pigs compared to ad libitum fed TN
controls. The observed reduction in adipose content was not unexpected since postnatal HS in
132
the present study negatively impacted FI and ADG (Table 2) as previously described in heat-
stressed livestock species (Renaudeau et al., 2008; Baumgard et al., 2012; Pearce et al., 2013;
Johnson et al., 2013a). Reduced FI limits energy available for growth, thus decreasing net
energy available for adipose deposition, but it is unclear why protein accretion was not
similarly affected. A likely explanation is that although FI was reduced, it was still adequate
to allow for maximum lean tissue deposition during this growth phase (Van Milgen and
Noblet, 2003).
No in utero thermal treatment differences were detected in circulating glucose,
insulin, NEFA, PUN, and CK (Table 5). The lack of differences in glucose and NEFA agrees
with our previous in utero HS reports (Boddicker et al., 2014), and were not unexpected, as
we did not detect gross differences in body composition. However, we previously reported
that in utero HS increases future circulating insulin concentration, regardless of postnatal
thermal environments (Boddicker et al., 2014). Reasons why the current experiment did not
corroborate our previous results are not clear, but may be due to infrequent blood sampling in
the current study.
Circulating insulin, glucose, NEFA, and CK concentrations were similar in pigs in
both postnatal environments. These data are somewhat surprising as insulin is frequently
reported to increase while glucose and NEFA concentrations are decreased during HS,
especially compared to pair-fed TN controls (Baumgard and Rhoads, 2013; Pearce et al.,
2013). Additionally, HS pigs consumed 13% less feed compared to TN controls, and
decreased FI normally reduces glucose and insulin levels, and increases circulating NEFA
concentrations, since insulin secretion (a potent lipogenic and antilipolytic signal) is sensitive
to changes in nutrient intake (Vernon, 1992). To better understand how HS influences the
133
insulin to FI relationship, we calculated the insulin to FI ratio and determined that HS-exposed
pigs had increased circulating insulin per unit of FI by 30% compared to TN controls. These
data agree with reports demonstrating that HS increases insulin secretion compared to TN
environments (Baumgard and Rhoads, 2013; Pearce et al., 2013). Contrary to previous
reports indicating that acute HS increases PUN in various species (as reviewed by Baumgard
and Rhoads, 2013), chronic postnatal HS in the present study reduced PUN by 17% (Table 5).
Discrepancies between data sets may be due to the length and severity of HS, since chronic
HS reduces protein turnover and PUN relative to control treatments (Temim et al., 2000), and
blood samples in the present study were obtained approximately five weeks after HS exposure
began.
In general, early reports (Kleiber, 1961; NRC, 1981; Curtis, 1983) indicate that an
animal’s maintenance costs increase when ambient temperature exceeds the upper critical
temperature. Increased HS-induced maintenance costs has specifically been reported in
multiple species including cattle (McDowell et al., 1969; Beede and Collier, 1986), lambs
(Ames and Brink, 1971), rodents (Collins et al., 1980), and pigs (Campos et al., 2014), and
this increase is primarily attributed to greater energy costs associated with employing heat
mitigating processes (i.e., panting, sweating) and enhanced chemical reaction rates as
predicted by the Van’t Hoff Arrhenius equation (Kleiber, 1961). However, some reports in
heat-stressed pigs (Collin et al., 2001b; Renaudeau et al., 2013) describe reduced total heat
and fasting heat production, and this is likely due to reductions in visceral mass caused by
both the hyperthermia (Rinaldo and Le Dividich, 1991), and reduced FI (Koong et al., 1982).
To gain a better appreciation for how HS alters bioenergetics, ME for maintenance
(MEmaintenance) was estimated with the following equation (Patience, 2012): MEmaintenance =
134
MEintake - (MEprotein + MEadipose). Where, MEintake = metabolizable energy in diet (Mcal/kg) *
feed intake (kg/d), MEprotein = g protein gain/d * 10.03 kcal/g of protein gain, and MEadipose = g
adipose gain/d * 11.65 kcal/g of adipose gain (as reviewed by Patience, 2012). Assuming that
the efficiency of protein and lipid gain and the efficiency of dietary energy use remained
unaltered during HS, it appears that pigs exposed to postnatal HS (regardless of in utero
environment) required approximately 588 kcal ME/d less energy for MEmaintenance.
The presumed increase in maintenance costs is the principal reason why HS likely
decreases FE as is frequently reported in pig research articles (Kerr et al., 2003; Renaudeau et
al., 2008), and reviews (NRC, 1981; Renaudeau et al., 2012). However, the effects of HS on
FE are inconsistent as some studies report either no FE differences (Collin et al., 2001a;
Johnson et al., 2013a), or actually improved FE (Lefaucheur et al., 1989) in HS compared to
TN-exposed pigs. In agreement with the aforementioned reports, gross FE was similar
amongst treatments (0.42 kg gain/ kg feed; Table 2). While reasons for this are unclear, it is
possible that the reduced maintenance costs observed in the current study increased energy
efficiency in HS-exposed pigs. Other indirect evidence also suggests that energy efficiency is
enhanced during HS. First, the efficiency of converting dietary energy into body mass was
increased during HS (i.e. the relationship between FI and BW gain is steeper in HS compared
to TN controls; Fig. 3). Second, despite reduced FI, HS pigs retained 4.0% more MEintake for
growth (MEprotein+ MEadipose) compared to TN controls. These data suggest that although HS
pigs consume less feed, a greater percentage of energy is partitioned toward growth, possibly
due to reduced maintenance costs and overall heat production compared to TN controls.
Although some inconsistencies exist within the literature regarding the effect of
environmental HS on FE (possibly due to experimental differences), one explanation may be
135
differences between gross measurements of FE (BW gain : feed intake) and the efficiency of
carcass tissue accretion (carcass gain : FI). For example, in the current experiment, although
carcass and head weights were similar, total viscera weight was reduced (7.7%) in HS-
exposed pigs compared to TN controls (Table 3), and this confirms reports by others
(Lefaucheur et al., 1989; Rinaldo and Le Dividich, 1991). Therefore, although gross FE was
similar, CE was actually increased (P < 0.01; 12.5%) in postnatal HS compared to TN-
exposed pigs (Table 2). These data suggest that reductions in gross FE due to HS (NRC,
1981; Kerr et al., 2003; Renaudeau et al., 2008, 2012) may be a result of decreased visceral
mass, and not due to a reduced rate of converting dietary nutrients into skeletal muscle and
adipose tissue.
We have previously demonstrated increased postnatal core body temperature in pigs
exposed to prenatal HS (Johnson et al., 2013a,b); though, no rectal temperature differences
were detected between in utero treatments in the present study (Fig. 1B). These results are
not surprising as identifying body temperature differences was not a primary objective, and
detecting small changes in body temperature (a cyclical parameter) requires multiple
measurements per day as demonstrated by our previous studies (Johnson et al., 2013a,b).
However, it is noteworthy that both the head and the liver weighed less in the IUHS pigs and
because these are both relatively large heat-producing systems it suggests our previous body
temperature results (Johnson et al., 2013a,b) are due to other heat generating organs/tissues
(assuming total heat production is related to mass).
136
Conclusion
While in utero programming can permanently modify future offspring development,
the present study indicates that in utero HS had little effect on growth during the period of life
primarily characterized by rapid lean tissue accretion. In contrast to in utero effects, postnatal
HS reduced adipose accretion but had no effect on protein accretion rates. When considering
that postnatal HS reduced visceral weight, HS pigs had increased efficiency of converting
dietary nutrients into carcass tissue, and this has obvious energetic implications for production
agriculture. Although it is possible that in utero HS may alter future nutrient partitioning later
in life (i.e. when skeletal muscle deposition plateaus and adipose accretion is increased), it
does not appear to influence tissue accretion during this particular growth phase.
Acknowledgements
The authors would like to acknowledge the assistance of Sarah Pearce, Sarah Stoakes,
Samantha Lei, Mateus Zucato, Levi Long, Emily Ullrich, Matt King and Wesley Schweer in
assisting in animal procedures, and Anna Gabler for organizing animal care and maintenance
of facilities.
Author Contributions
J.S. Johnson and L.H Baumgard were responsible for experimental design and
manuscript preparation. M.V. Sanz Fernandez, J.F. Patience, N.K. Gabler, J.W. Ross, and
R.P. Rhoads provided assistance with statistical analysis, lab work, and experimental design.
M.C. Lucy and T.J. Safranski performed maternal phase experiments. N.A. Gutierrez
Cespedes assisted with maintenance costs calculations.
137
References
Ames, D.R., and D.R. Brink. 1971. Effect of temperature on lamb performance and
protein efficiency ratio. J. Anim. Sci. 44: 136-140.
AOAC Int. 2002. Official Methods of Analysis. 17th
rev. ed. AOAC Int. Gaithersburg,
MD.
Barker, D.J.P., K.M. Godfrey, P.D. Gluckman, J.E. Harding, J.A. Owens, and J.S.
Robinson. 1993. Fetal nutrition and cardiovascular disease in adult life. The
Lancet. 341: 938-941.
Baumgard L.H., R.P. Rhoads, M.L. Rhoads, N.K. Gabler, J.W. Ross, A.F. Keating, R.L.
Boddicker, S. Lenka, and V. Sejian. 2012. Impact of climate change on livestock
production. In: Sejian V., S.M.K. Naqvi, T. Ezeji, J. Lakritz, R. Lal, eds.
Environmental Stress and Amelioration in Livestock Production. Berlin: Springer-
Verlag, pp. 413-468.
Baumgard, L.H., and R.P. Rhoads. 2013. Effects of heat stress on post-absorptive
metabolism and energetics. Annu. Rev. Anim. Bio. 1: 311-337.
Battisti, D.S., and R.L. Naylor. 2009. Historical warnings of future food insecurity with
unprecedented seasonal heat. Science. 323: 240-244.
Beede, D.K., and R.J. Collier. 1986. Potential nutritional strategies for intensively
managed cattle during thermal stress. J. Anim. Sci. 62: 543–554.
Boddicker, R.L., J.T. Seibert, J.S. Johnson, S.C. Pearce, J.T. Selsby, N.K. Gabler, M.C.
Lucy, T.J. Safranski, R.P. Rhoads, L.H. Baumgard, and J.W. Ross. 2014.
Gestational heat stress alters postnatal offspring body composition indices and
metabolic parameters in pigs. PLoS ONE. In Press.
138
Brendemuhl, J., and B. Myer. 2009. Types of swine diets. Gainesville, FL: University of
Florida, IFAS Extension. Available at: http://edis.ifas.ufl.edu/an036. Accessed
October 30, 2013.
Brown-Brandl, T.M., J.A. Nienaber, H. Xin, and R.S. Gate. 2004. A literature review of
swine production. Trans. ASAE. 47: 259-270.
Burrin, D.G., R.A. Britton, and C.L. Ferrell. 1988. Visceral organ size and hepatic
metabolic activity in fed and fasted rats. J. Nutr. 188: 1547-1552.
Campos, P.H., J. Noblet, Y. Jaguelin-Peyraud, H. Gilbert, P. Mormede, R.F.M. de
Oliveira Donzele, J.L. Donzele, and D. Renaudeau. 2014. Thermoregulatory
responses during thermal acclimation in pigs divergently selected for residual feed
intake. Int. J. Biometeorol. In Press.
Chen, X., A.L. Fahy, A.S. Green, M.J. Anderson, R.P. Rhoads, and S.W. Limesand.
2010. ß2-Adrenergic receptor desensitization in perirenal adipose tissue in fetuses
and lambs with placental insufficiency-induced intrauterine growth restriction. J.
Physiol. 588: 3539-3549.
.Collin, A., J. Van Milgan, S. Dubois, and J. Noblet. 2001a. Effect of high temperature and
feeding level on energy utilization in piglets. J. Anim. Sci. 79: 1849-1857.
Collin, A., J. van Milgen, S. Dubois, and J. Noblet. 2001b. Effect of high temperature on
feeding behavior and heat production in group-housed young pigs. Br. J. Nutr. 86:
63-70.
Collins F.G., F.A. Matros, and J.L. Skibba. 1980. Effect of palmitate on hepatic
biosynthetic functions at hyperthermic temperatures. Metabolism 29:524–531.
139
Curtis, S.E. 1983. Environmental management in animal agriculture. Iowa State University
Press. Ames, IA. p. 25.
Federation of Animal Science Societies. 2010. Guide for the care and use of agricultural
animals in research and teaching. 3rd
ed. Fed. Champaign, IL: Anim. Sci. Soc.,
2010, Chapter 11, pp. 143-156.
Foxcroft, G.R., W.T. Dixon, S. Novak, C.T. Putman, S.C. Town, and M.D. Vinsky. 2006.
The biological basis for prenatal programming of postnatal performance in
pigs. J. Anim. Sci. 84: E105-E112.
Foxcroft, G.R., W.T. Dixon, M.K. Dyck, S. Novak, J.C. Harding, and F.C. Almeida.
2009. Prenatal programming of postnatal development of the pig. Soc. Reprod.
Fertil. Suppl. 66: 213-231.
Graham, J.M., M.J. Edwards, and M.J. Edwards. 1998. Teratogen update: Gestational
effects of maternal hyperthermia due to febrile illnesses and resultant patterns of
defects in humans. Teratology. 58: 209-221.
Haffner, S.M., C. Gonzalez, H. Miettinen, E. Kennedy, and M.P. Stern. 1996. A
prospective analysis of the HOMA model: The Mexico City diabetes study.
Diabetes. 19: 1138-1141.
Johnson, J.S., R.L. Boddicker, M.V. Sanz-Fernandez, J.W. Ross, J.T. Selsby, M.C. Lucy,
T.J. Safranski, R.P. Rhoads, and L.H. Baumgard. 2013a. Effects of mammalian in
utero heat stress on adolescent thermoregulation. Int. J. Hyperthermia. 29: 696-
702.

140
Johnson, J.S., M.V. Sanz-Fernandez, S.K. Stoakes, M. Abuajamieh, J.W. Ross, M.C.
Lucy, T.J. Safranski, R.P. Rhoads, and L.H. Baumgard. 2013b. Gestational heat
stress alters postnatal thermoregulation. J. Anim. Sci. 91: 168. (Abstr.)
Kerr, B.J., J.T. Yen, J.A. Nienaber, and R.A. Easter. 2003. Influences of dietary protein
level, amino acid supplementation and environmental temperature on
performance, body composition, organ weights and total heat production of
growing pigs. J. Anim. Sci. 81: 1998-2007.
Kleiber, M. 1961. The fire of life: An introduction to animal energetics. New York &
London: John Wiley & Sons.
Koong, L.J., J.A. Nienaber, J.C. Pekas, and J.T. Yen. 1982. Effect of plane of nutrition on
organ size and fasting heat production in pigs. J. Nutr. 112: 1638-1642.
Kouba, M., D. Hermier, and J. Le Dividich. 2001. Influence of high ambient temperature on
lipid metabolism in the growing pig. J. Anim. Sci. 79: 81-87.
Lambert, G. P., C.V. Gisolfi, D.J. Berg, P.L. Moseley, L.W. Oberley, and K.C. Kregel.
2002. Selected contribution: Hyperthermia-induced intestinal permeability and the
role of oxidative and nitrosative stress. J. Appl. Physiol. 92: 1750-1761.
Le Bellego, L., J. van Milgen, and J. Noblet. 2002. Effect of high temperature and low
protein diets on the performance of growing-finishing pigs. J. Anim. Sci. 80:
691- 701.
Lefaucheur, L., J. Le Dividich, D. Krauss, P. Ecolan, J. Mourot, and G. Monin. 1989.
Influence de la température d’élevage sur la croissance, le métabolisme tissulaire et
la qualité de la viande. J. Rech. Porcine en France. 21: 231-238.
141
Leon, L.R., and B.C. Helwig. 2010. Heat stroke: Role of the systemic inflammatory
response. J. Appl. Physiol. 109: 1980-1988.
Luber, G., and M. McGeehin. 2008. Climate change and extreme heat events. Am. J.
Prevent. Med. 35: 459-467.
Lucy, M.C., T.J. Safranski, J.N. Rhoades, J.W. Ross, N.K. Gabler, R.P. Rhoads, and
L.H. Baumgard. 2012. Litter characteristics and thermoregulatory behavior of
first parity sows exposed to a controlled heat stress (HS) during gestation. J.
Anim. Sci. 90: 731. (Abstr.)
McDowell, R.E., E.G. Moody, P.J. Van Soest, R.P. Lehmann, and G.L. Ford. 1969.
Effect of heat stress on energy and water utilization of lactating cows. J. Dairy.
Sci. 52: 188-194.
Nienaber, J.A., and G.L. Hahn. 2008. Livestock production system management responses to
thermal challenges. Int. J. Biometeorol. 52: 149-157.
Noblet, J., Y. Henry, and S. Dubois. 1987. Effect of protein and lysine levels in the diet on
body gain composition and energy utilization in growing pigs. J. Anim. Sci. 65: 717-
726.
National Research Council Committee on Animal Nutrition and Subcommittee on
Environmental Stress. 1981. Effect of Environment on Nutrient Requirements of
Domestic Animals. Natl. Acad. Press, Washington D.C. pp. 22-26.
National Research Council. 2012. Nutrient Requirements of Swine. 11th
rev. ed. Natl.
Acad. Press, Washington, DC.
142
Patience, J.F. 2012. The influence of dietary energy on feed efficiency in grow-finish
swine. In: Patience, J.F., ed. Feed Efficiency in Swine. The Netherlands:
Wageningen Academic Publishers, pp. 101-129.
Pearce, S.C., N.K. Gabler, J.W. Ross, J. Escobar, J.F. Patience, R.P. Rhoads, and L.H.
Baumgard. 2013. The effects of heat stress and plane of nutrition on metabolism in
growing pigs. J. Anim. Sci. 91: 2108-2118.
Pinney, S.E., and R.A. Simmons. 2010. Epigenetic mechanisms in the development of
type 2 diabetes. Trends Endocrinol. Metab. 21: 223-229.
Ravelli, G.P., Z.A. Stein, and M.W. Susser. 1976. Obesity in young men after famine
exposure in utero and early infancy. N. Engl. J. Med. 295: 349-353.
Renaudeau, D., M. Kerdoncuff, C. Anais, and J.L. Gourdine. 2008. Effect of temperature on
thermal acclimation in Large White growing pigs. Anim. 2: 1619-1626.
Renaudeau, D., H. Gilbert, and J. Noblet. 2012. Effect of climatic environment on feed
efficiency in swine. In: Patience, J.F., ed. Feed Efficiency in Swine. The
Netherlands: Wageningen Academic Publishers, pp. 183-210.
Renaudeau, D., G. Frances, S. Dubois, H. Gilbert, and J. Noblet. 2013. Effect of thermal
heat stress on energy utilization in two lines of pigs divergently selected for
residual feed intake. J. Anim. Sci. 91: 1162-1175.
Rinaldo, D., and J. Le Dividich. 1991. Assessment of optimal temperature for
performance and chemical body composition of growing pigs. Livestock Prod.
Sci. 29: 61-75.
Roseboom, T., S. de Rooij, and R. Painter. 2006. The Dutch famine and its long-term
consequences for adult health. Early Human Development. 82: 485-491.
143
Temim, S., A.M. Chagneau, R. Peresson, and S. Tesseraud. 2000. Chronic heat exposure
alters protein turnover of three different skeletal muscles in finishing broiler
chickens fed 20 or 25% protein diets. J. Nutr. 130: 813-819.
Van Milgen, J., and J. Noblet. 2003. Partitioning of energy intake to heat, protein, and fat in
growing pigs. J. Anim. Sci. 81: E86-E93.
Vernon, R.G. 1992. Effects of diet on lipolysis and its regulation. Proceedings of the
Nutrition Society. 51:397-408.
Wagner, J.R., A.P. Schinckel, W. Chen, J.C. Forrest, and B.L. Coe. 1999. Analysis of
body composition changes of swine during growth and development. J. Anim.
Sci. 77: 1422-1466.
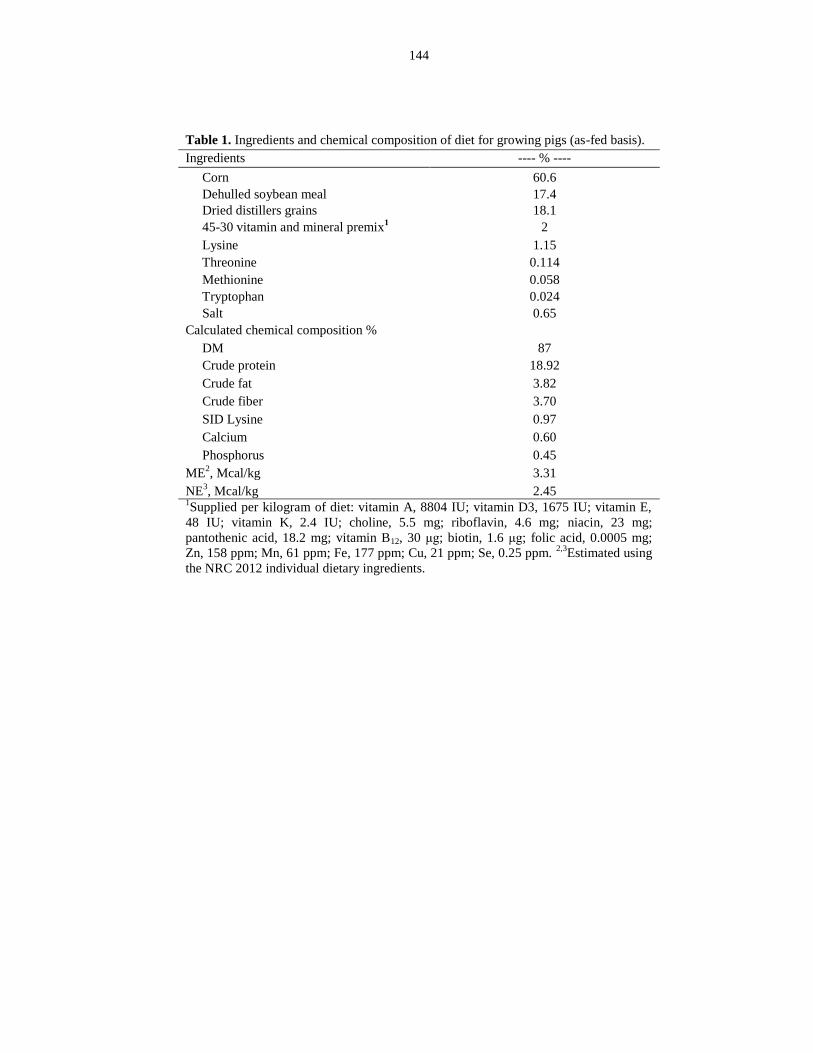
144
Table 1. Ingredients and chemical composition of diet for growing pigs (as-fed basis).
Ingredients ---- % ----
Corn 60.6
Dehulled soybean meal 17.4
Dried distillers grains 18.1
45-30 vitamin and mineral premix1 2
Lysine 1.15
Threonine 0.114
Methionine 0.058
Tryptophan 0.024
Salt 0.65
Calculated chemical composition %
DM 87
Crude protein 18.92
Crude fat 3.82
Crude fiber 3.70
SID Lysine 0.97
Calcium 0.60
Phosphorus 0.45
ME2, Mcal/kg
3.31
NE3, Mcal/kg
2.45
1Supplied per kilogram of diet: vitamin A, 8804 IU; vitamin D3, 1675 IU; vitamin E,
48 IU; vitamin K, 2.4 IU; choline, 5.5 mg; riboflavin, 4.6 mg; niacin, 23 mg;
pantothenic acid, 18.2 mg; vitamin B12, 30 μg; biotin, 1.6 μg; folic acid, 0.0005 mg;
Zn, 158 ppm; Mn, 61 ppm; Fe, 177 ppm; Cu, 21 ppm; Se, 0.25 ppm. 2,3
Estimated using
the NRC 2012 individual dietary ingredients.
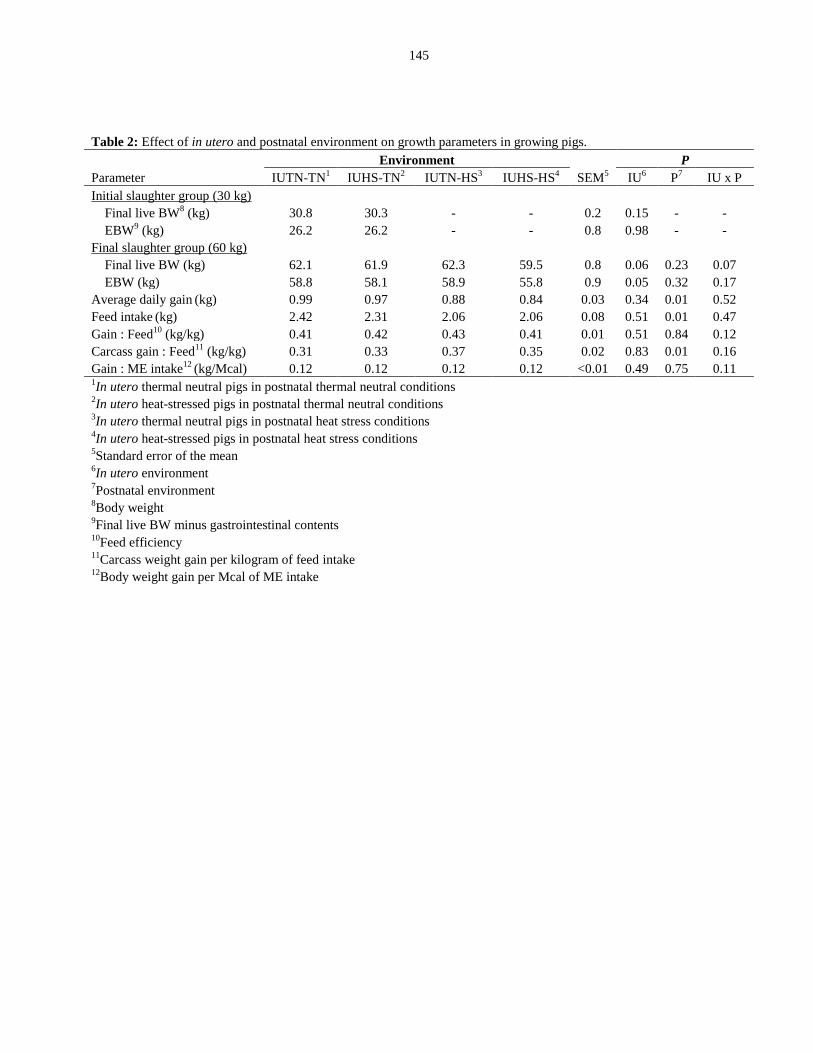
145
Table 2: Effect of in utero and postnatal environment on growth parameters in growing pigs.
Environment P
Parameter IUTN-TN1 IUHS-TN
2 IUTN-HS
3 IUHS-HS
4 SEM
5 IU
6 P
7 IU x P
Initial slaughter group (30 kg)
Final live BW8 (kg) 30.8 30.3 - - 0.2 0.15 - -
EBW9 (kg) 26.2 26.2 - - 0.8 0.98 - -
Final slaughter group (60 kg)
Final live BW (kg) 62.1 61.9 62.3 59.5 0.8 0.06 0.23 0.07
EBW (kg) 58.8 58.1 58.9 55.8 0.9 0.05 0.32 0.17
Average daily gain (kg) 0.99 0.97 0.88 0.84 0.03 0.34 0.01 0.52
Feed intake (kg) 2.42 2.31 2.06 2.06 0.08 0.51 0.01 0.47
Gain : Feed10
(kg/kg) 0.41 0.42 0.43 0.41 0.01 0.51 0.84 0.12
Carcass gain : Feed11
(kg/kg) 0.31 0.33 0.37 0.35 0.02 0.83 0.01 0.16
Gain : ME intake12
(kg/Mcal) 0.12 0.12 0.12 0.12 <0.01 0.49 0.75 0.11 1In utero thermal neutral pigs in postnatal thermal neutral conditions
2In utero heat-stressed pigs in postnatal thermal neutral conditions
3In utero thermal neutral pigs in postnatal heat stress conditions
4In utero heat-stressed pigs in postnatal heat stress conditions
5Standard error of the mean
6In utero environment
7Postnatal environment
8Body weight
9Final live BW minus gastrointestinal contents
10Feed efficiency
11Carcass weight gain per kilogram of feed intake
12Body weight gain per Mcal of ME intake
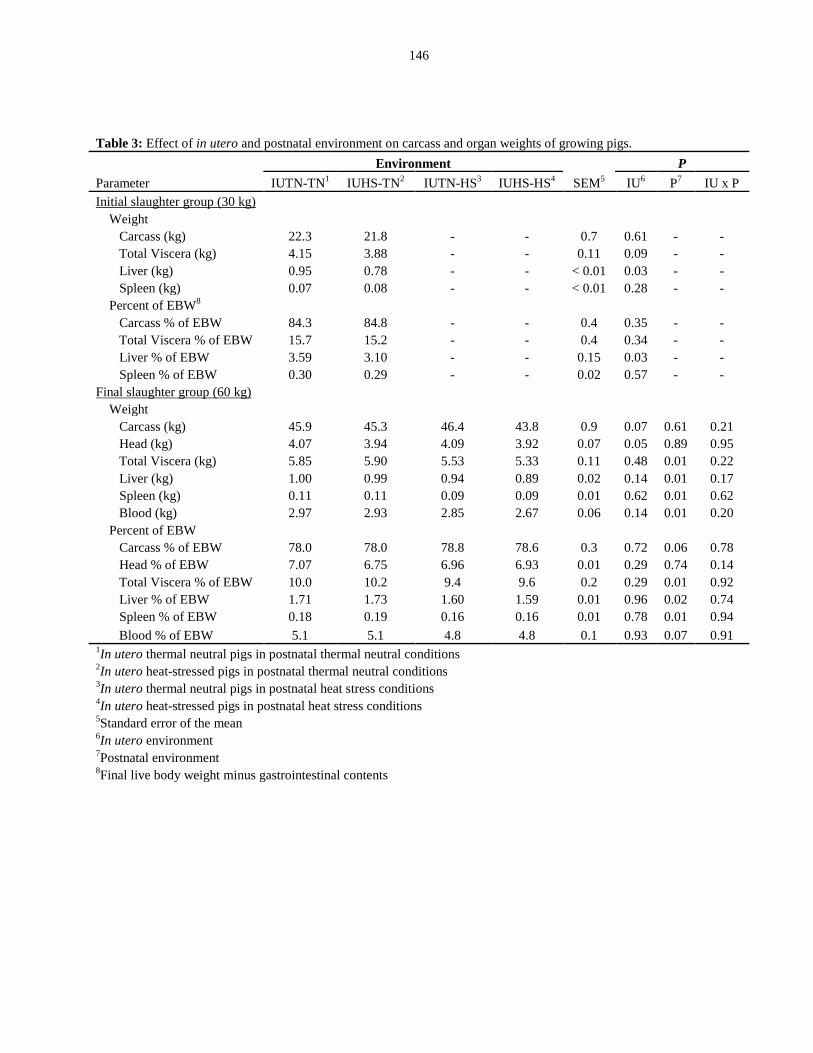
146
Table 3: Effect of in utero and postnatal environment on carcass and organ weights of growing pigs.
Environment P
Parameter IUTN-TN1 IUHS-TN
2 IUTN-HS
3 IUHS-HS
4 SEM
5 IU
6 P
7 IU x P
Initial slaughter group (30 kg)
Weight
Carcass (kg) 22.3 21.8 - - 0.7 0.61 - -
Total Viscera (kg) 4.15 3.88 - - 0.11 0.09 - -
Liver (kg) 0.95 0.78 - - < 0.01 0.03 - -
Spleen (kg) 0.07 0.08 - - < 0.01 0.28 - -
Percent of EBW8
Carcass % of EBW 84.3 84.8 - - 0.4 0.35 - -
Total Viscera % of EBW 15.7 15.2 - - 0.4 0.34 - -
Liver % of EBW 3.59 3.10 - - 0.15 0.03 - -
Spleen % of EBW 0.30 0.29 - - 0.02 0.57 - -
Final slaughter group (60 kg)
Weight
Carcass (kg) 45.9 45.3 46.4 43.8 0.9 0.07 0.61 0.21
Head (kg) 4.07 3.94 4.09 3.92 0.07 0.05 0.89 0.95
Total Viscera (kg) 5.85 5.90 5.53 5.33 0.11 0.48 0.01 0.22
Liver (kg) 1.00 0.99 0.94 0.89 0.02 0.14 0.01 0.17
Spleen (kg) 0.11 0.11 0.09 0.09 0.01 0.62 0.01 0.62
Blood (kg) 2.97 2.93 2.85 2.67 0.06 0.14 0.01 0.20
Percent of EBW
Carcass % of EBW 78.0 78.0 78.8 78.6 0.3 0.72 0.06 0.78
Head % of EBW 7.07 6.75 6.96 6.93 0.01 0.29 0.74 0.14
Total Viscera % of EBW 10.0 10.2 9.4 9.6 0.2 0.29 0.01 0.92
Liver % of EBW 1.71 1.73 1.60 1.59 0.01 0.96 0.02 0.74
Spleen % of EBW 0.18 0.19 0.16 0.16 0.01 0.78 0.01 0.94
Blood % of EBW 5.1 5.1 4.8 4.8 0.1 0.93 0.07 0.91 1In utero thermal neutral pigs in postnatal thermal neutral conditions
2In utero heat-stressed pigs in postnatal thermal neutral conditions
3In utero thermal neutral pigs in postnatal heat stress conditions
4In utero heat-stressed pigs in postnatal heat stress conditions
5Standard error of the mean
6In utero environment
7Postnatal environment
8Final live body weight minus gastrointestinal contents
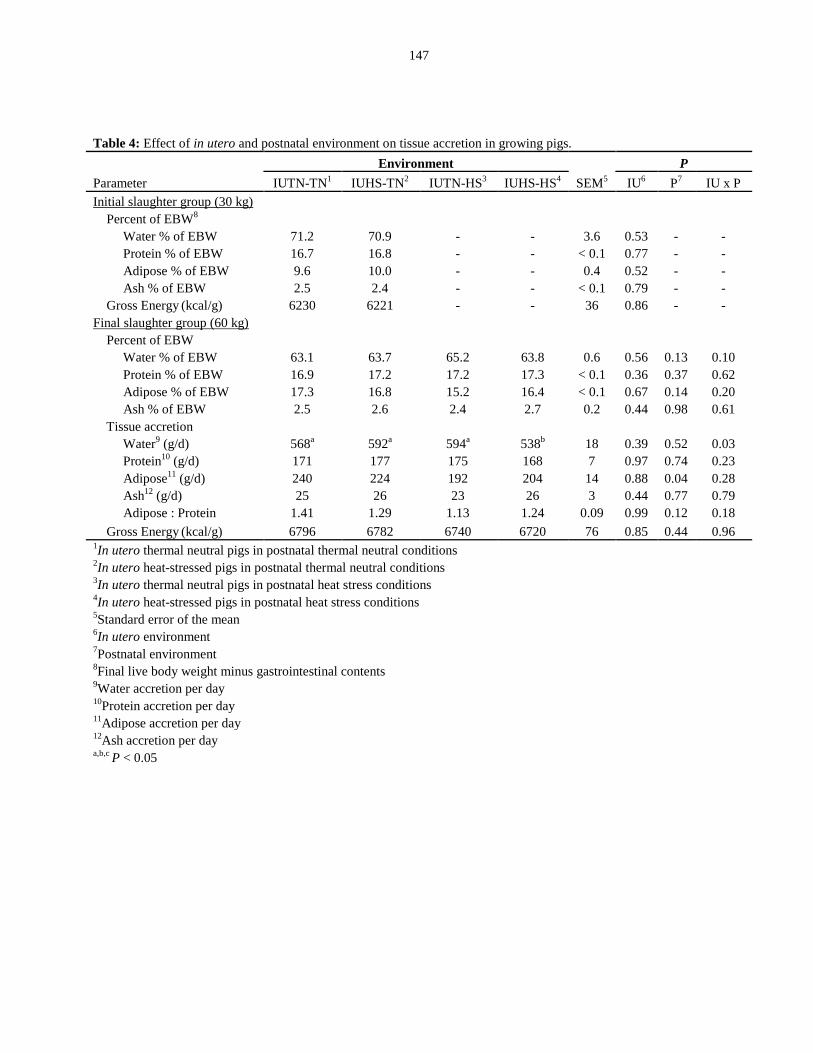
147
Table 4: Effect of in utero and postnatal environment on tissue accretion in growing pigs.
Environment P
Parameter IUTN-TN1 IUHS-TN
2 IUTN-HS
3 IUHS-HS
4 SEM
5 IU
6 P
7 IU x P
Initial slaughter group (30 kg)
Percent of EBW8
Water % of EBW 71.2 70.9 - - 3.6 0.53 - -
Protein % of EBW 16.7 16.8 - - < 0.1 0.77 - -
Adipose % of EBW 9.6 10.0 - - 0.4 0.52 - -
Ash % of EBW 2.5 2.4 - - < 0.1 0.79 - -
Gross Energy (kcal/g) 6230 6221 - - 36 0.86 - -
Final slaughter group (60 kg)
Percent of EBW
Water % of EBW 63.1 63.7 65.2 63.8 0.6 0.56 0.13 0.10
Protein % of EBW 16.9 17.2 17.2 17.3 < 0.1 0.36 0.37 0.62
Adipose % of EBW 17.3 16.8 15.2 16.4 < 0.1 0.67 0.14 0.20
Ash % of EBW 2.5 2.6 2.4 2.7 0.2 0.44 0.98 0.61
Tissue accretion
Water9 (g/d) 568
a 592
a 594
a 538
b 18 0.39 0.52 0.03
Protein10
(g/d) 171 177 175 168 7 0.97 0.74 0.23
Adipose11
(g/d) 240 224 192 204 14 0.88 0.04 0.28
Ash12
(g/d) 25 26 23 26 3 0.44 0.77 0.79
Adipose : Protein 1.41 1.29 1.13 1.24 0.09 0.99 0.12 0.18
Gross Energy (kcal/g) 6796 6782 6740 6720 76 0.85 0.44 0.96
1In utero thermal neutral pigs in postnatal thermal neutral conditions
2In utero heat-stressed pigs in postnatal thermal neutral conditions
3In utero thermal neutral pigs in postnatal heat stress conditions
4In utero heat-stressed pigs in postnatal heat stress conditions
5Standard error of the mean
6In utero environment
7Postnatal environment
8Final live body weight minus gastrointestinal contents
9Water accretion per day
10Protein accretion per day
11Adipose accretion per day
12Ash accretion per day
a,b,c P < 0.05
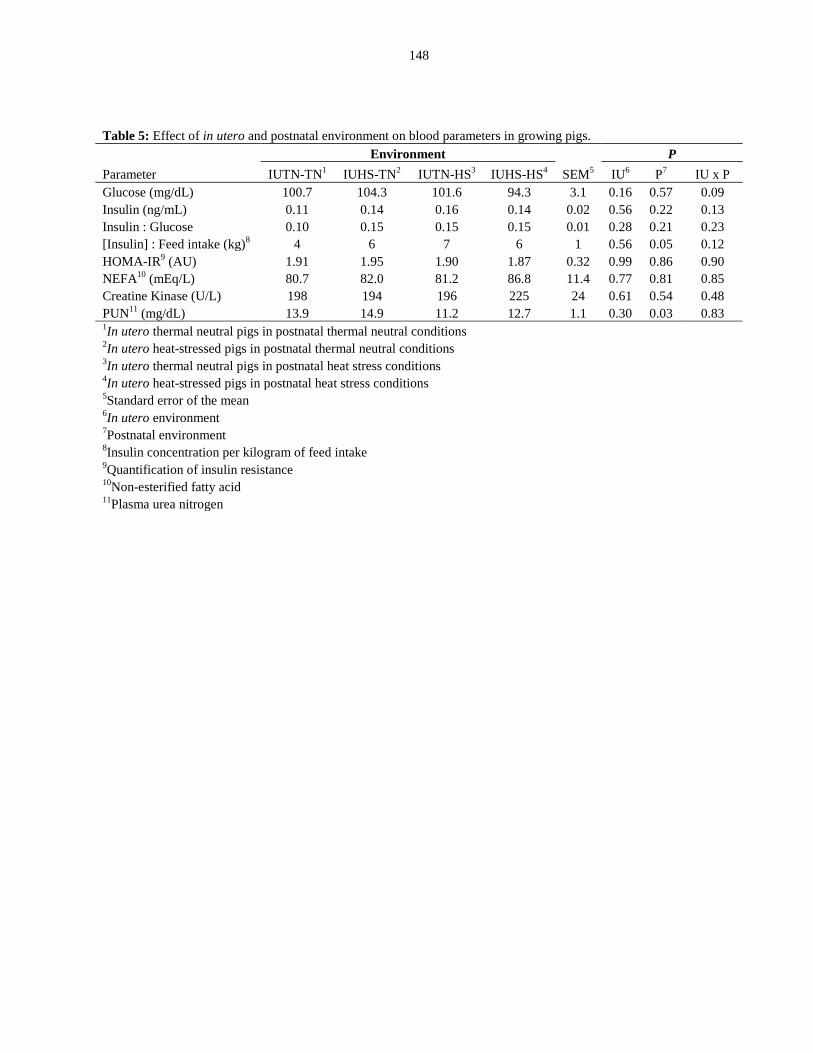
148
Table 5: Effect of in utero and postnatal environment on blood parameters in growing pigs.
Environment P
Parameter IUTN-TN1
IUHS-TN2
IUTN-HS3
IUHS-HS4
SEM5
IU6
P7
IU x P
Glucose (mg/dL) 100.7 104.3 101.6 94.3 3.1 0.16 0.57 0.09
Insulin (ng/mL) 0.11 0.14 0.16 0.14 0.02 0.56 0.22 0.13
Insulin : Glucose 0.10 0.15 0.15 0.15 0.01 0.28 0.21 0.23
[Insulin] : Feed intake (kg)8
4 6 7 6 1 0.56 0.05 0.12
HOMA-IR9 (AU) 1.91 1.95 1.90 1.87 0.32 0.99 0.86 0.90
NEFA10
(mEq/L) 80.7 82.0 81.2 86.8 11.4 0.77 0.81 0.85
Creatine Kinase (U/L) 198 194 196 225 24 0.61 0.54 0.48
PUN11
(mg/dL) 13.9 14.9 11.2 12.7 1.1 0.30 0.03 0.83 1In utero thermal neutral pigs in postnatal thermal neutral conditions
2In utero heat-stressed pigs in postnatal thermal neutral conditions
3In utero thermal neutral pigs in postnatal heat stress conditions
4In utero heat-stressed pigs in postnatal heat stress conditions
5Standard error of the mean
6In utero environment
7Postnatal environment
8Insulin concentration per kilogram of feed intake
9Quantification of insulin resistance
10Non-esterified fatty acid
11Plasma urea nitrogen
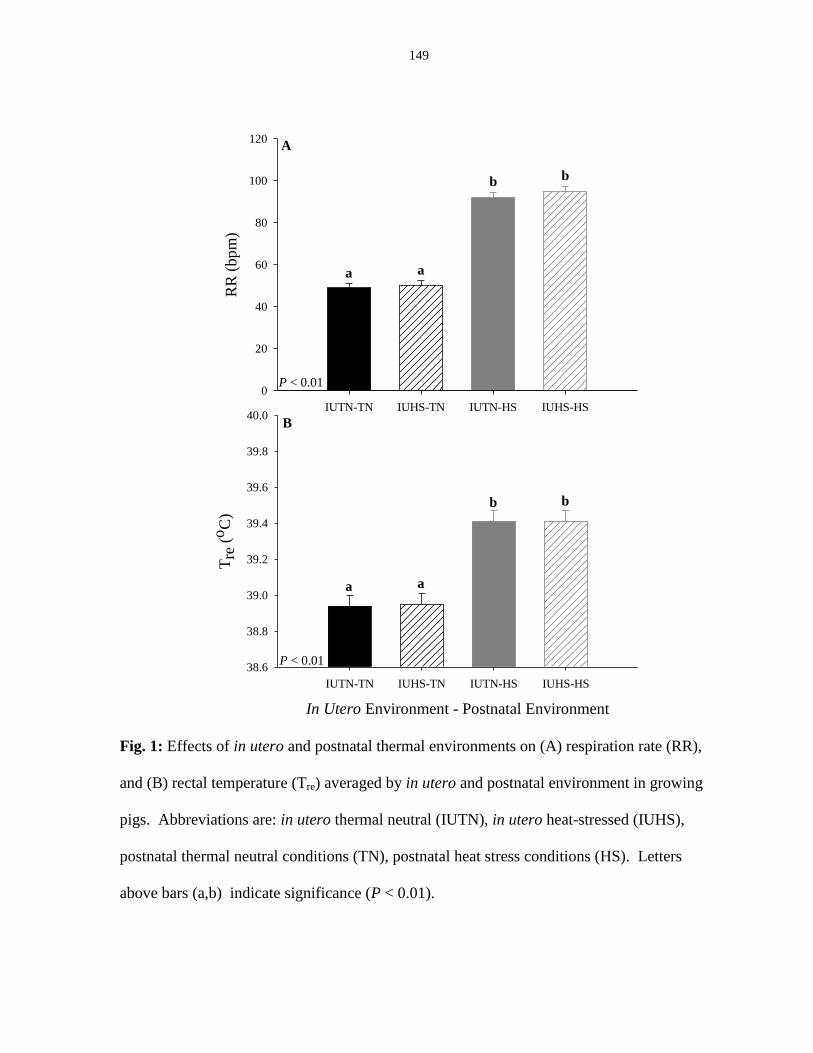
149
Fig. 1: Effects of in utero and postnatal thermal environments on (A) respiration rate (RR),
and (B) rectal temperature (Tre) averaged by in utero and postnatal environment in growing
pigs. Abbreviations are: in utero thermal neutral (IUTN), in utero heat-stressed (IUHS),
postnatal thermal neutral conditions (TN), postnatal heat stress conditions (HS). Letters
above bars (a,b) indicate significance (P < 0.01).
In Utero Environment - Postnatal Environment
IUTN-TN IUHS-TN IUTN-HS IUHS-HS
Tre
(o
C)
38.6
38.8
39.0
39.2
39.4
39.6
39.8
40.0
a a
b b
IUTN-TN IUHS-TN IUTN-HS IUHS-HS
RR
(b
pm
)
0
20
40
60
80
100
120
aa
b b
A
B
P < 0.01
P < 0.01
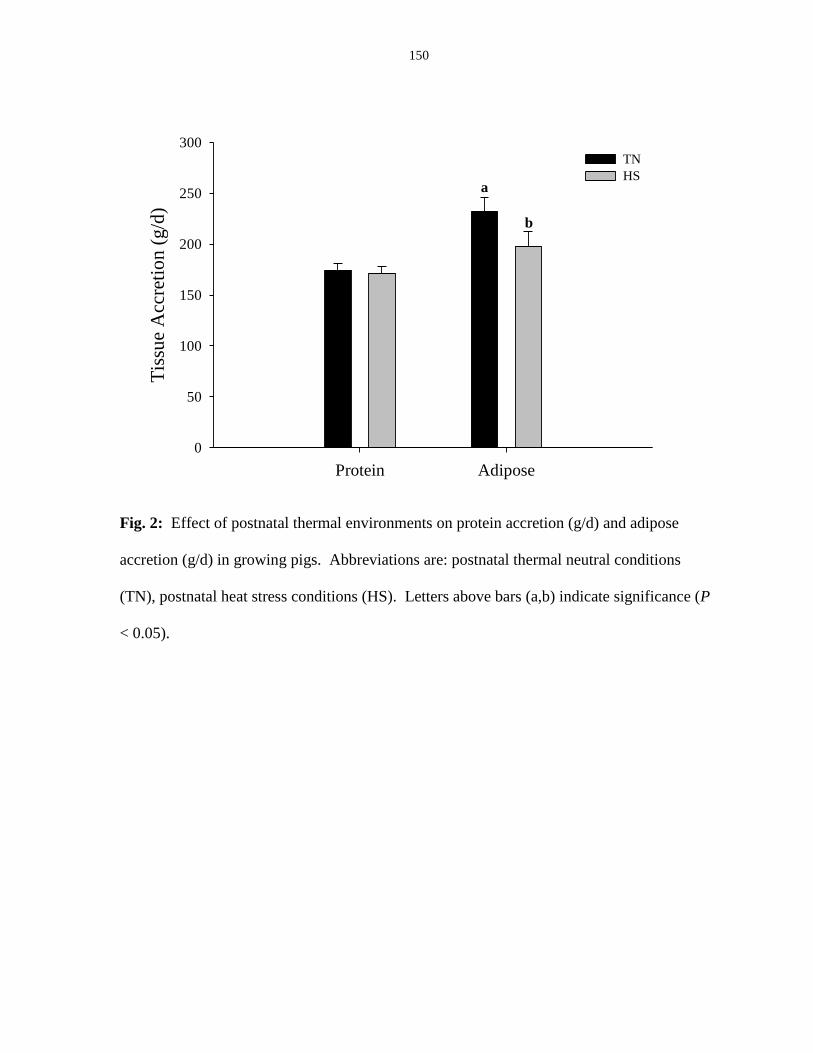
150
Fig. 2: Effect of postnatal thermal environments on protein accretion (g/d) and adipose
accretion (g/d) in growing pigs. Abbreviations are: postnatal thermal neutral conditions
(TN), postnatal heat stress conditions (HS). Letters above bars (a,b) indicate significance (P
< 0.05).
Protein Adipose
Tis
sue
Acc
reti
on
(g/d
)
0
50
100
150
200
250
300TN
HS a
b
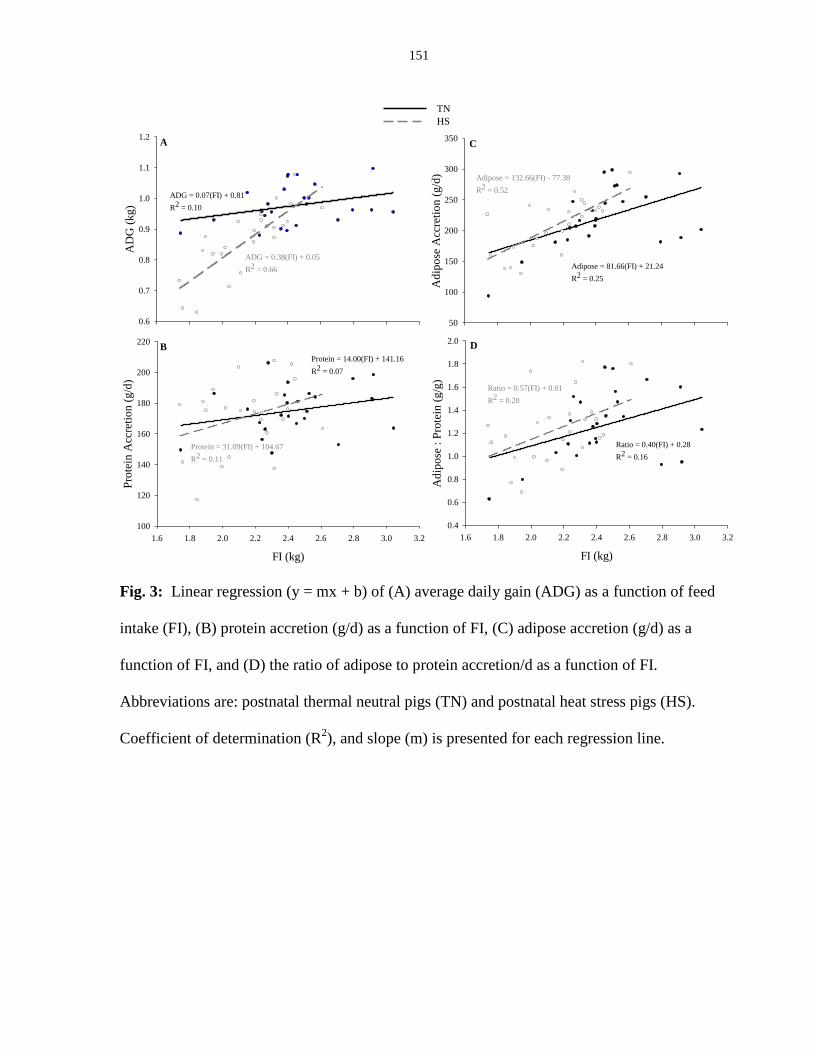
151
AD
G (
kg)
0.6
0.7
0.8
0.9
1.0
1.1
1.2
TN
HS
ADG = 0.38(FI) + 0.05
R2 = 0.66
ADG = 0.07(FI) + 0.81
R2 = 0.10
FI (kg)
1.6 1.8 2.0 2.2 2.4 2.6 2.8 3.0 3.2
Pro
tein
Acc
reti
on
(g/d
)
100
120
140
160
180
200
220
Protein = 14.00(FI) + 141.16
R2 = 0.07
Protein = 31.09(FI) + 104.67
R2 = 0.11
Ad
ipo
se A
ccre
tio
n (
g/d
)
50
100
150
200
250
300
350
Adipose = 81.66(FI) + 21.24
R2 = 0.25
Adipose = 132.66(FI) - 77.38
R2 = 0.52
FI (kg)
1.6 1.8 2.0 2.2 2.4 2.6 2.8 3.0 3.2
Ad
ipo
se :
Pro
tein
(g/g
)
0.4
0.6
0.8
1.0
1.2
1.4
1.6
1.8
2.0
Ratio = 0.40(FI) + 0.28
R2 = 0.16
Ratio = 0.57(FI) + 0.01
R2 = 0.20
B D
CA
Fig. 3: Linear regression (y = mx + b) of (A) average daily gain (ADG) as a function of feed
intake (FI), (B) protein accretion (g/d) as a function of FI, (C) adipose accretion (g/d) as a
function of FI, and (D) the ratio of adipose to protein accretion/d as a function of FI.
Abbreviations are: postnatal thermal neutral pigs (TN) and postnatal heat stress pigs (HS).
Coefficient of determination (R2), and slope (m) is presented for each regression line.
152
CHAPTER V: IN UTERO HEAT STRESS ALTERS BODY COMPOSITION
DURING THE EARLY FINISHING PHASE (60 TO 80 KG) IN PIGS
A paper submitted to The Jounal of Animal Science
J.S. Johnson1, M.V. Sanz-Fernandez
1, J.F. Patience
1, J.W. Ross
1, N.K. Gabler
1,
M.C. Lucy2, T.J. Safranski
2, R.P. Rhoads
3, L.H. Baumgard
1
1Department of Animal Science, Iowa State University, Ames, IA, 50011
2Division of Animal Sciences, University of Missouri, Columbia, MO, 65211
3Department of Animal and Poultry Sciences, Virginia Tech, Blacksburg, VA, 24061
Abstract
The detrimental effects of heat stress (HS) on animal productivity have been well-
documented. However, whether in utero HS interacts with a future thermal insult to alter
tissue deposition during the early finishing phase of pig growth is unknown. Study
objectives were to compare the subsequent rate and quantity of whole-body tissue accretion
in pigs exposed to differing in utero and postnatal thermal environments. Pregnant sows
were exposed to thermal neutral (TN; cyclical 15ºC nighttime and 22ºC daytime; n = 9) or
HS (cyclical 27ºC nighttime and 37ºC daytime; n = 11) conditions during gestation. Twenty-
four offspring from in utero TN (IUTN; n = 6 gilts, 6 barrows; 62.4 ± 0.7 kg BW), and in
utero HS (IUHS; n = 6 gilts, 6 barrows; 61.9 ± 0.8 kg BW) were euthanized as part of an
initial slaughter group (ISG). After the ISG, 48 pigs from IUTN (n = 12 gilts, 12 barrows;
66.1 ± 1.0 kg BW) and IUHS (n = 12 gilts, 12 barrows; 63.4 ± 0.7 kg BW) were exposed to
constant HS (34.4 ± 1.8°C) or TN (22.7 ± 2.5°C) conditions until they reached 80.5 ± 1.5 kg
BW, at which point they were sacrificed and their body composition was determined.
Homogenized carcasses were analyzed for nitrogen, crude fat, ash, water and gross energy
153
content. Data were analyzed using PROC MIXED in SAS 9.3. Rectal temperature and
respiration rate were increased during postnatal HS compared to TN (39.6 vs. 39.3˚C and 92
vs. 58 bpm, respectively; P < 0.01). Postnatal HS decreased (P < 0.01) feed intake (2.13 vs.
2.65 kg/d) and ADG (0.70 vs. 0.94 kg/d) compared to TN conditions, but neither variable
was influenced by in utero environment. Whole-body protein and adipose tissue accretion
rates were reduced in HS pigs compared to TN controls (126 vs. 164 g/d and 218 vs. 294 g/d,
respectively; P < 0.04). Independent of postnatal environments, in utero HS reduced future
protein accretion rates (16%; P < 0.01), and tended to increase adipose accretion rates (292
vs. 220 g/d; P < 0.07) compared to IUTN controls. The ratio of adipose to protein accretion
rates increased (95%; P < 0.01) in IUHS pigs compared to IUTN controls. In summary, the
future hierarchy of tissue accretion is altered by in utero HS, and this modified nutrient
partitioning favors adipose tissue deposition at the expense of skeletal muscle during this
specific phase of growth.
Keywords: pigs, in utero heat stress, adipose accretion, body composition
Introduction
Although advances in nutrition and production management (i.e. cooling systems and
barn design) have partially ameliorated the negative effects of heat stress (HS) on animal
agriculture, production losses continue during the warm summer months (St-Pierre et al.,
2003; Baumgard et al., 2012). Sources of reduced revenue in the swine industry include:
reduced growth, poor sow performance, increased morbidity and mortality, inconsistent
market weights, and altered carcass composition (Brown-Brandl et al., 2004; Baumgard et
al., 2012; Baumgard and Rhoads, 2013). Heat stress-related suboptimal production will
154
likely worsen as climate models predict an increase in extreme summer conditions for most
U.S. pig-producing areas (Luber and McGeehin, 2008). Further, continued genetic selection
for rapid lean growth increases basal heat production (Brown –Brandl et al., 2004), and this
may compromise HS-tolerance (Nienaber and Hahn, 2007). Consequently, there is an urgent
need to better understand the mechanisms by which HS hinders efficient pork production.
Normally, during insufficient nutrient intake, metabolic adaptations favor muscle
growth at the expense of adipose tissue accretion (Le Dividich et al., 1980; Oresanya et al.,
2008). However, when pigs and other animals are reared in HS conditions (a condition of
voluntarily reduced feed intake) carcasses typically accrete more adipose tissue than
energetically expected (Katsumata et al., 1990; Gerart et al., 1996; Kouba et al., 2001; Collin
et al., 2001a). This postnatal HS-induced altered nutrient partitioning is just beginning to be
characterized (as reviewed by Baumgard and Rhoads, 2013); however, the extent to which in
utero hyperthermia affects future bioenergetic metabolism and tissue growth patterns remains
largely unknown.
Previous studies evaluating non-thermal prenatal stressors reported permanent effects
on growth (Foxcroft et al., 2006, 2009), post-absorptive metabolism (Chen et al., 2010;
Pinney and Simmons, 2010), and nutrient partitioning (Ravelli et al., 1976; Barker et al.,
1993), changes that can be broadly characterized by insulin resistance. Consequently,
current study objectives were to compare the future rate and quantity of whole-body tissue
accretion in pigs exposed to differing in utero and postnatal thermal environments. We
hypothesized that in utero HS exposure would increase postnatal adipose tissue accretion
rates at the expense of protein gain.
155
Materials and Methods
In utero environments
The University of Missouri Animal Care and Use Committee approved all animal
procedures involving pregnant sows. Twenty, first parity-crossbred sows (Large White x
Landrace; GPK1 x GPK4; Choice Genetics USA; Des Moines, IA) were exposed to thermal
neutral (TN; cyclical 15°C nighttime and 22°C daytime; 55% RH; n = 9), or HS (cyclical
27°C nighttime and 37°C daytime; 67.5% RH; n = 11) conditions in the Brody
Environmental Chambers at the University of Missouri (Lucy et al., 2012). Thermal
treatments began six days after insemination (Duroc; Swine Genetics International;
Cambridge, IA) and continued until farrowing (116.6 ± 0.5 d gestation; Lucy et al., 2012).
Although heat-stressed pregnant sows had increased rectal temperature (P < 0.05; 0.3°C;
Lucy et al., 2012) compared to TN controls, feed intake (FI) did not differ between thermal
environments (P > 0.15; TN: 5.24 ± 0.07 kg/d and HS: 5.08 ± 0.08 kg/d) as all sows were
limit-fed to prevent excessive maternal weight gain (standard industry practice; Brendemuhl
and Myer, 2009). Between parturition and weaning, all piglets were exposed to the same
environmental conditions (26 - 32˚C) as recommended by FASS (2010). After weaning, all
offspring (n = 253) were transported in an aluminum livestock trailer with wood shavings
(standard practice; 6 h) to Iowa State University.
Postnatal environments
The Iowa State University Institutional Animal Care and Use Committee approved all
procedures involving animals (protocol #7169-S). Between weaning and approximately 60
kg BW, all pigs were housed in TN conditions as recommended by FASS (2010), and
allowed to consume water and feed (based primarily on corn and soybean meal) ad libitum.
156
From the 253 pigs transported to Iowa State University, 24 growing pigs with no previous
postnatal HS exposure from in utero TN (IUTN; n = 6 gilts, 6 barrows; 62.4 ± 0.7 kg BW),
or in utero HS (IUHS; n = 6 gilts, 6 barrows; 61.9 ± 0.8 kg BW) conditions were randomly
selected and euthanized as part of an initial slaughter group (ISG). Following the ISG, 48
pigs from IUTN (n = 12 gilts, 12 barrows; 66.1 ± 1 kg initial BW) and IUHS (n = 12 gilts, 12
barrows; 63.4 ± 0.7 kg initial BW) were housed in individual pens (0.61 x 2.44 m) in one of
two environmentally controlled rooms. Pigs were evenly distributed within rooms based
upon treatment. Within each room, ambient temperature (Ta) and relative humidity (%RH)
were continuously recorded by two data loggers (El – WIN – USB; accuracy: ± 1.0°C;
Lascar Electronics Ltd.; Wiltshire, UK) every 30 min. Circulating fans were utilized to
prevent uneven temperature dispersion. Relative humidity within the rooms was
ungoverned.
Twelve barrows (n = 6 IUTN, 6 IUHS) and 12 gilts (n = 6 IUTN, 6 IUHS) were
housed in constant TN conditions (22.7 ± 2.5°C; 72.5 ± 10.9 %RH), and 12 barrows (n = 6
IUTN, 6 IUHS) and 12 gilts (n = 6 IUTN, 6 IUHS) were maintained in constant HS
conditions (34.4 ± 1.8°C; 54.4 ± 9.2 %RH) until they reached approximately 80 kg. All pigs
were given ad libitum access to a standard commercial diet formulated to meet or exceed
nutritional requirements (Table 1; NRC, 2012). Feed intake was determined weekly and BW
was determined bi-weekly. Respiration rate (RR) and rectal temperature (Tre) were obtained
twice daily (0800, 1600 h). Respiration rate (breaths per minute: BPM) was determined by
counting flank movement for one minute. Rectal temperature was determined with a
calibrated and lubricated thermistor thermometer (Welch Allyn SureTemp®
Plus; accuracy: ±
157
0.1˚C; Skaneateles Falls, NY) inserted approximately 10 cm into the rectum of unrestrained
pigs.
Blood sampling and analysis
Blood (10 mL) was obtained on all pigs via jugular venipuncture (BD® vacutainers;
Franklin Lakes, NJ; K3EDTA; lithium heparin; serum) at 1500 h one day prior to sacrifice (in
a fed state and while still experiencing their respective postnatal environmental treatment)
and stored on ice until processing; plasma and serum were then harvested by centrifugation at
2500 x g, aliquoted and stored at -80°C. Glucose concentration was immediately determined
from whole blood collected in lithium heparin tubes using a Vet Scan iStat®
C68+ cartridge
(Abaxis, Inc.; Union City, CA). Plasma insulin concentration was measured using an ELISA
kit (Mercodia Porcine Insulin ELISA; Mercodia AB; Uppsala, Sweden), following the
manufacturer’s instructions. Commercially available kits were used to determine plasma
non-esterified fatty acid (NEFA; Autokit NEFA; Wako Chemicals USA, Richmond, VA),
plasma urea nitrogen (PUN; Urea Nitrogen Reagent; TECO Diagnostics, Anaheim, CA), and
serum creatine kinase (CK) concentrations (Creatine Kinase-SL Assay; SEKISUI
Diagnostics, Charlottetown, PE Canada). The intra- and inter-assay coefficients of variation
were 3.8, 7.2, 6.4, 1.9%, and 8.0, 4.7, 8.3, 4.5% for insulin, NEFA, CK, and PUN,
respectively. Systemic insulin sensitivity was estimated using the homeostatic model
assessment of insulin resistance (HOMA-IR; (glucose (mmol/L) * insulin (mg/L))/450;
Haffner et al., 1996), and the insulin to FI ratio ([insulin]/average daily feed intake
throughout the entire experiment) was calculated for individual pigs.
158
Serial slaughter and sub-sample analysis
All pigs utilized in the postnatal experiment were harvested after an overnight fast in
TN conditions at 62.2 ± 0.7 kg BW (ISG), and 80.5 ± 1.5 kg BW (final slaughter group;
FSG). Initial and final BW were selected to represent the early finishing phase in modern
pigs. Since a similar BW at sacrifice was an objective, FSG pigs were harvested at different
times (23.5 ± 3.5 d on trial).
At sacrifice, pigs were electrically stunned, exsanguinated, and blood was collected.
Stomach, intestinal, gallbladder and bladder contents were removed, and liver, spleen and
total viscera weight was recorded. Whole carcass, including head, viscera (minus contents of
stomach, intestine, gallbladder, and bladder) and blood were weighed to determine empty
body weight (EBW). Carcass, head, viscera and blood of individual pigs were frozen,
sectioned, passed twice through a mechanical grinder (Buffalo no. 66BX Enterprise; St.
Louis, MO), and then passed four times through a Hobart 52 grinder with a 5-mm die (model
#4046; Troy, OH) for homogenization. Ground carcasses were sub-sampled, and sub-
samples were immediately dried in a convection oven (101˚C; 24 h) to a constant weight for
determination of dry matter (DM) according to method 950.46 (AOAC Int., 2002). Dried
samples were ground through a 1-mm screen (Retsch ZM 100; Glen Mills Inc.; Clifton, NJ),
and analyzed for ash, crude fat, nitrogen (N), and gross energy (GE). Ash was determined
by drying at 600°C (24 h) to a constant weight according to method 923.03 (AOAC Int.,
2002). Crude fat was determined by Soxhlet extraction according to method 991.36 (AOAC
Int., 2002) using n-hexane as the solvent (Fischer Scientific; Fair Lawn, NJ). Nitrogen
content was determined by combustion using a LECO TruMac N Nitrogen Determinator
(Leco Corporation; St. Joseph, MI; model #630-300-300) according to method 992.15
159
(AOAC Int., 2002). Calibration of LECO was conducted with an EDTA standard (known N
content 9.56 ± 0.03%; N content determined to be 9.58 ± 0.06%), and crude protein was
expressed as nitrogen * 6.25. Gross energy was determined using isoperibol bomb
calorimetry (Parr 620 calorimeter; Parr Instrument Company; Moline, IL; model #6200), and
benzoic acid was used as the calibration standard (known GE 6,318 ± 18 kcal/kg; GE
determined to be 6,319 ± 8 kcal/kg). All chemical analyses were carried out in duplicate,
and repeated when the intra-duplicate coefficient of variation exceeded 3%.
Based on the sub-sample chemical content, total body composition was determined
for water, ash, adipose, and protein using the EBW as described (Noblet et al., 1987). The
average chemical composition of IUTN and IUHS pigs in the ISG was used to estimate the
initial body compositions of IUTN and IUHS pigs in the FSG, respectively. Within each
individual pig, the accretion of water, adipose, protein, and ash were estimated by: (final
content, g of tissue – estimated initial content, g of tissue) / days between harvest dates.
To determine carcass gain efficiency (CE), the average carcass weight of IUTN and
IUHS pigs in the ISG was used to estimate the initial carcass weight of IUTN and IUHS pigs
in the FSG, respectively. Within each individual pig, the accretion of carcass tissue was
estimated by: (final carcass weight – estimated initial carcass weight)/days between harvest
dates. Carcass gain efficiency was calculated by dividing carcass gain by average daily FI
for individual pigs (carcass gain : FI).
Statistical analysis
All data were analyzed using the PROC MIXED procedure in SAS 9.3 (SAS Institute
Inc., Cary, NC). Statistical model components included in utero environment (IUTN;
IUHS), postnatal environment (TN; HS), gender (M; F), and all interactions. Gender was
160
removed from the final model because it was insignificant on all measured parameters. All
interactions, regardless of significance level were included in the model and dam was used as
a random effect for all analyses. Average daily gain (ADG) of individual pigs calculated two
weeks prior to the start of treatment was used as a covariate for analysis of all body
composition and growth performance measurements. For repeated analysis of Tre and RR,
each pig’s respective parameter was analyzed using repeated measures with an auto-
regressive covariance structure with day as the repeated effect. Data are presented as
LSmeans and statistical significance was defined as P ≤ 0.05, and a tendency was defined as
0.05 < P ≤ 0.10.
Results
Thermal indices
Regardless of postnatal treatment, RR tended (P < 0.06) to be reduced (5 bpm) in
IUHS compared to IUTN pigs (Fig. 1A). Overall, a considerable increase (P < 0.01) in
postnatal RR was observed in HS-exposed (92 ± 2 bpm) compared to TN (58 ± 2 bpm; Fig.
1A) pigs. No in utero by postnatal environment interaction in RR was detected (P > 0.59).
While no overall in utero differences were detected, Tre increased (P < 0.01) in postnatal HS
pigs (39.6 ± 0.1˚C) compared to TN controls (39.3 ± 0.1˚C; Fig. 1B).
Growth performance
Overall, FI did not differ between in utero treatment groups (2.39 kg/d), but postnatal
HS reduced (P < 0.01) FI by 19.4% compared to TN controls (Table 2). No FI differences (P
> 0.33) were observed for the in utero by postnatal environment interaction (Table 2).
Overall, ADG was not affected by in utero treatment (0.81 kg/d); however, it was reduced (P
161
< 0.01; 0.23 kg/d) in postnatal HS compared to TN control pigs (Table 2). Pigs from in utero
HS had overall reduced overall feed efficiency (FE; P < 0.01; 11.1%) compared to IUTN
controls (Table 2). Although no in utero by postnatal interaction was detected, postnatal HS
exposure decreased FE (P < 0.02; 9%) compared to postnatal TN conditions (Table 2).
Regardless of postnatal treatment, CE was reduced (P < 0.03; 14.3%) in IUHS compared to
IUTN pigs; however, no postnatal or in utero by postnatal treatment differences in CE (P >
0.30) were observed (Table 2). Body weight gain per Mcal of metabolizable energy (ME)
consumed was reduced (P < 0.03; 9.5%) in IUHS compared to IUTN pigs, regardless of
postnatal environment (Table 2). Overall, BW gain per Mcal of ME consumed was reduced
(P < 0.05; 9.5%) in postnatal HS compared to TN-exposed pigs (Table 2). No in utero by
postnatal treatment interaction was observed for BW gain per Mcal of ME consumed (Table
2).
Organ and carcass weights
No treatment differences (P > 0.28) were detected for FSG carcass weight (63.7 kg),
spleen weight (0.13 kg), blood volume (3.36 kg), spleen weight as percent of EBW (0.16%),
and blood volume as percent of EBW (4.28%; Table 3). In utero HS reduced (P < 0.04;
5.5%) head weight compared to control pigs, regardless of postnatal environment (Table 3).
Total viscera and liver weights were reduced (P ≤ 0.05) in postnatal HS pigs by 340 and 80
g, respectively, compared to TN controls (Table 3). As a percent of EBW; head, total
viscera, and liver weights were decreased (P < 0.01; 3.9, 5.6, and 7.3%, respectively; Table
3) in postnatal HS pigs compared to TN controls. Overall, carcass weight as a percent of
EBW was not influenced by in utero environment, but was increased (P < 0.01; 0.9%) in HS
pigs compared to TN controls (Table 3).
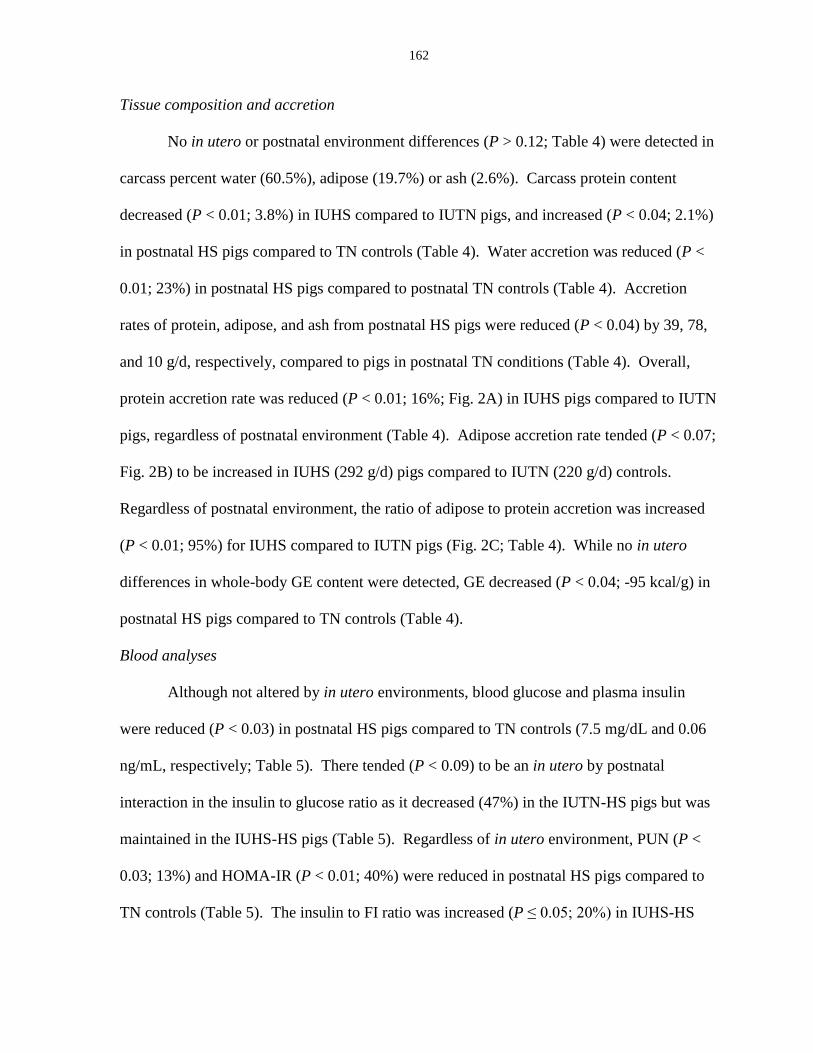
162
Tissue composition and accretion
No in utero or postnatal environment differences (P > 0.12; Table 4) were detected in
carcass percent water (60.5%), adipose (19.7%) or ash (2.6%). Carcass protein content
decreased (P < 0.01; 3.8%) in IUHS compared to IUTN pigs, and increased (P < 0.04; 2.1%)
in postnatal HS pigs compared to TN controls (Table 4). Water accretion was reduced (P <
0.01; 23%) in postnatal HS pigs compared to postnatal TN controls (Table 4). Accretion
rates of protein, adipose, and ash from postnatal HS pigs were reduced (P < 0.04) by 39, 78,
and 10 g/d, respectively, compared to pigs in postnatal TN conditions (Table 4). Overall,
protein accretion rate was reduced (P < 0.01; 16%; Fig. 2A) in IUHS pigs compared to IUTN
pigs, regardless of postnatal environment (Table 4). Adipose accretion rate tended (P < 0.07;
Fig. 2B) to be increased in IUHS (292 g/d) pigs compared to IUTN (220 g/d) controls.
Regardless of postnatal environment, the ratio of adipose to protein accretion was increased
(P < 0.01; 95%) for IUHS compared to IUTN pigs (Fig. 2C; Table 4). While no in utero
differences in whole-body GE content were detected, GE decreased (P < 0.04; -95 kcal/g) in
postnatal HS pigs compared to TN controls (Table 4).
Blood analyses
Although not altered by in utero environments, blood glucose and plasma insulin
were reduced (P < 0.03) in postnatal HS pigs compared to TN controls (7.5 mg/dL and 0.06
ng/mL, respectively; Table 5). There tended (P < 0.09) to be an in utero by postnatal
interaction in the insulin to glucose ratio as it decreased (47%) in the IUTN-HS pigs but was
maintained in the IUHS-HS pigs (Table 5). Regardless of in utero environment, PUN (P <
0.03; 13%) and HOMA-IR (P < 0.01; 40%) were reduced in postnatal HS pigs compared to
TN controls (Table 5). The insulin to FI ratio was increased (P ≤ 0.05; 20%) in IUHS-HS
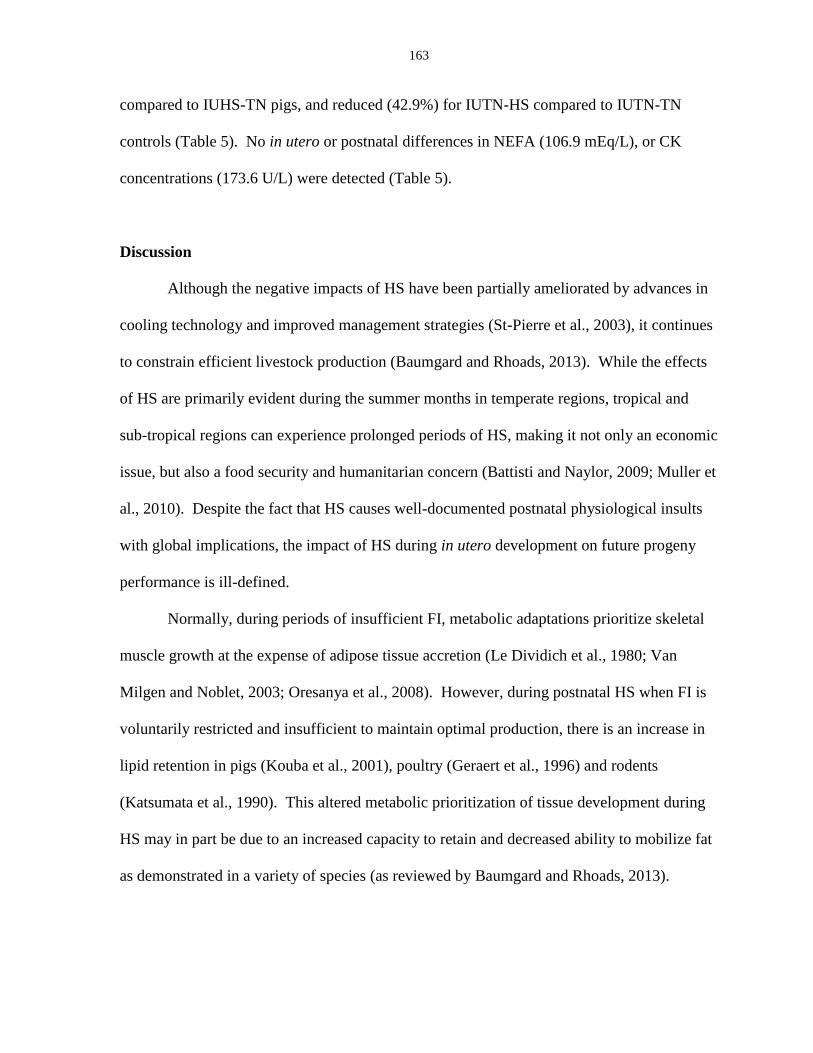
163
compared to IUHS-TN pigs, and reduced (42.9%) for IUTN-HS compared to IUTN-TN
controls (Table 5). No in utero or postnatal differences in NEFA (106.9 mEq/L), or CK
concentrations (173.6 U/L) were detected (Table 5).
Discussion
Although the negative impacts of HS have been partially ameliorated by advances in
cooling technology and improved management strategies (St-Pierre et al., 2003), it continues
to constrain efficient livestock production (Baumgard and Rhoads, 2013). While the effects
of HS are primarily evident during the summer months in temperate regions, tropical and
sub-tropical regions can experience prolonged periods of HS, making it not only an economic
issue, but also a food security and humanitarian concern (Battisti and Naylor, 2009; Muller et
al., 2010). Despite the fact that HS causes well-documented postnatal physiological insults
with global implications, the impact of HS during in utero development on future progeny
performance is ill-defined.
Normally, during periods of insufficient FI, metabolic adaptations prioritize skeletal
muscle growth at the expense of adipose tissue accretion (Le Dividich et al., 1980; Van
Milgen and Noblet, 2003; Oresanya et al., 2008). However, during postnatal HS when FI is
voluntarily restricted and insufficient to maintain optimal production, there is an increase in
lipid retention in pigs (Kouba et al., 2001), poultry (Geraert et al., 1996) and rodents
(Katsumata et al., 1990). This altered metabolic prioritization of tissue development during
HS may in part be due to an increased capacity to retain and decreased ability to mobilize fat
as demonstrated in a variety of species (as reviewed by Baumgard and Rhoads, 2013).
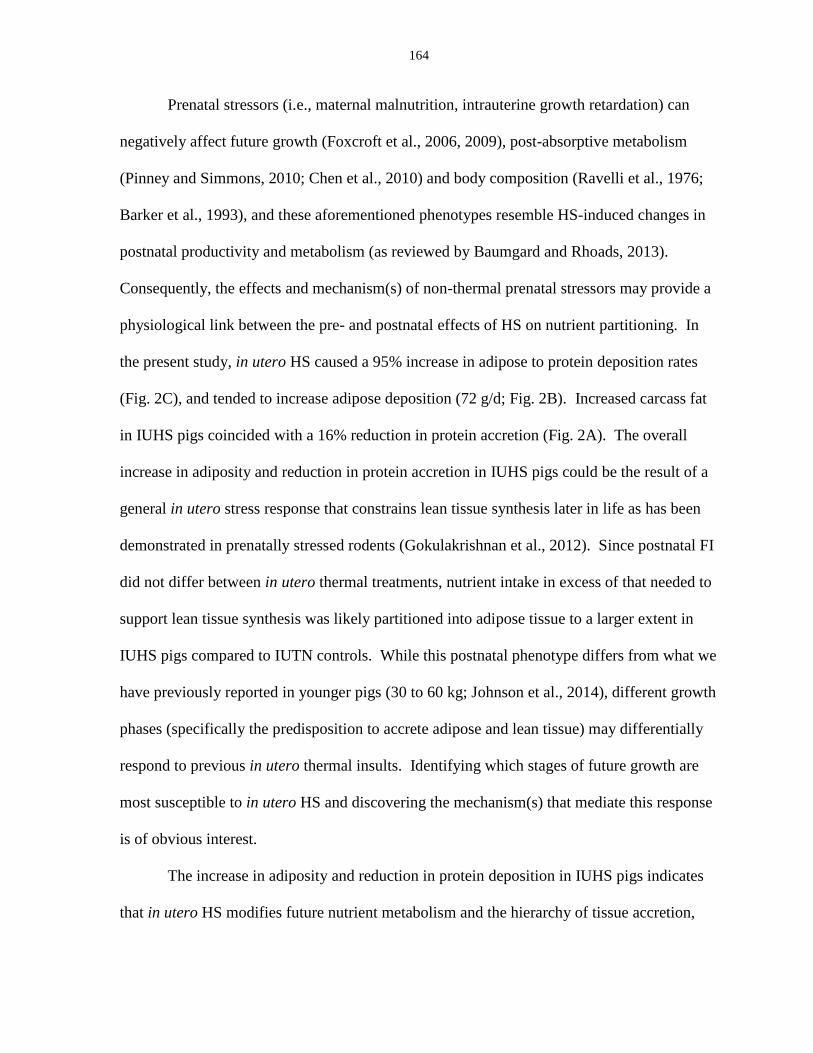
164
Prenatal stressors (i.e., maternal malnutrition, intrauterine growth retardation) can
negatively affect future growth (Foxcroft et al., 2006, 2009), post-absorptive metabolism
(Pinney and Simmons, 2010; Chen et al., 2010) and body composition (Ravelli et al., 1976;
Barker et al., 1993), and these aforementioned phenotypes resemble HS-induced changes in
postnatal productivity and metabolism (as reviewed by Baumgard and Rhoads, 2013).
Consequently, the effects and mechanism(s) of non-thermal prenatal stressors may provide a
physiological link between the pre- and postnatal effects of HS on nutrient partitioning. In
the present study, in utero HS caused a 95% increase in adipose to protein deposition rates
(Fig. 2C), and tended to increase adipose deposition (72 g/d; Fig. 2B). Increased carcass fat
in IUHS pigs coincided with a 16% reduction in protein accretion (Fig. 2A). The overall
increase in adiposity and reduction in protein accretion in IUHS pigs could be the result of a
general in utero stress response that constrains lean tissue synthesis later in life as has been
demonstrated in prenatally stressed rodents (Gokulakrishnan et al., 2012). Since postnatal FI
did not differ between in utero thermal treatments, nutrient intake in excess of that needed to
support lean tissue synthesis was likely partitioned into adipose tissue to a larger extent in
IUHS pigs compared to IUTN controls. While this postnatal phenotype differs from what we
have previously reported in younger pigs (30 to 60 kg; Johnson et al., 2014), different growth
phases (specifically the predisposition to accrete adipose and lean tissue) may differentially
respond to previous in utero thermal insults. Identifying which stages of future growth are
most susceptible to in utero HS and discovering the mechanism(s) that mediate this response
is of obvious interest.
The increase in adiposity and reduction in protein deposition in IUHS pigs indicates
that in utero HS modifies future nutrient metabolism and the hierarchy of tissue accretion,
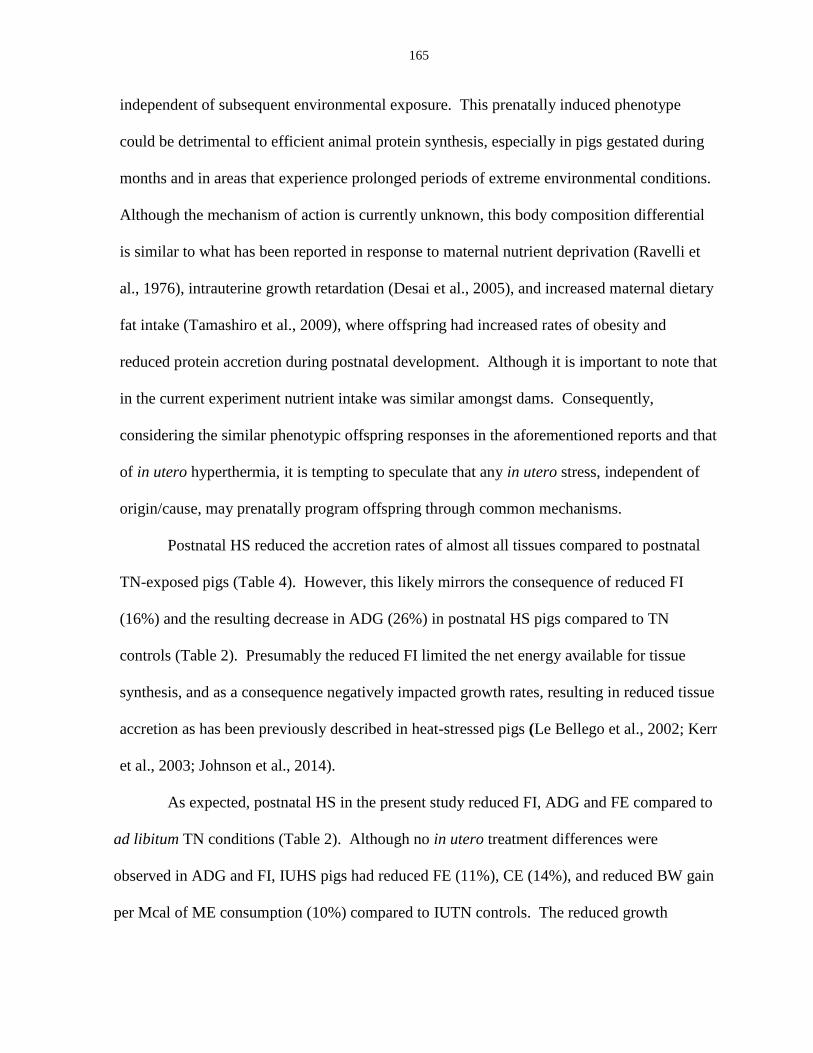
165
independent of subsequent environmental exposure. This prenatally induced phenotype
could be detrimental to efficient animal protein synthesis, especially in pigs gestated during
months and in areas that experience prolonged periods of extreme environmental conditions.
Although the mechanism of action is currently unknown, this body composition differential
is similar to what has been reported in response to maternal nutrient deprivation (Ravelli et
al., 1976), intrauterine growth retardation (Desai et al., 2005), and increased maternal dietary
fat intake (Tamashiro et al., 2009), where offspring had increased rates of obesity and
reduced protein accretion during postnatal development. Although it is important to note that
in the current experiment nutrient intake was similar amongst dams. Consequently,
considering the similar phenotypic offspring responses in the aforementioned reports and that
of in utero hyperthermia, it is tempting to speculate that any in utero stress, independent of
origin/cause, may prenatally program offspring through common mechanisms.
Postnatal HS reduced the accretion rates of almost all tissues compared to postnatal
TN-exposed pigs (Table 4). However, this likely mirrors the consequence of reduced FI
(16%) and the resulting decrease in ADG (26%) in postnatal HS pigs compared to TN
controls (Table 2). Presumably the reduced FI limited the net energy available for tissue
synthesis, and as a consequence negatively impacted growth rates, resulting in reduced tissue
accretion as has been previously described in heat-stressed pigs (Le Bellego et al., 2002; Kerr
et al., 2003; Johnson et al., 2014).
As expected, postnatal HS in the present study reduced FI, ADG and FE compared to
ad libitum TN conditions (Table 2). Although no in utero treatment differences were
observed in ADG and FI, IUHS pigs had reduced FE (11%), CE (14%), and reduced BW gain
per Mcal of ME consumption (10%) compared to IUTN controls. The reduced growth
166
efficiency parameters, despite similar ADG and FI, may be due to either increased
maintenance costs or the reorganization of nutrient partitioning priorities. To estimate
maintenance requirements in the present study, ME for maintenance (MEmaintenance) was
calculated using the following equation (Patience, 2012): MEmaintenance = MEintake – (MEprotein +
MEadipose). Where, MEintake = metabolizable energy of diet (Mcal/kg) * feed intake (kg/d),
MEprotein = g protein gain/d * 10.03 kcal/g of protein gain, and MEadipose = g adipose gain/d *
11.65 kcal/g of adipose gain (as reviewed by Patience, 2012).
Utilizing these variables and assuming that the efficiency of protein and lipid gain
and the efficiency of dietary energy use remained unaltered during HS, it appears that IUHS
pigs required approximately 212 kcal ME/d less energy for MEmaintenance compared to IUTN
pigs, and this was not due to reductions in visceral mass (Table 3). Instead, it is possible that
reduced MEmaintenance in IUHS pigs resulted from decreased muscle mass (as indicated by
reduced carcass protein content and deposition rate) and presumably reductions in protein
turnover rates (Van Milgen and Noblet, 2003). Reduced FE in IUHS pigs is likely reflected
by increased adipose and reduced lean accretion rates compared to IUTN controls (Fig. 2C),
since depositing adipose is less efficient than lean tissue (as reviewed by Patience, 2012).
Independent of in utero environment, pigs exposed to postnatal HS conditions
required about 433 kcal/d less energy for MEmaintenance compared to TN controls, and this
confirms our previous report (Johnson et al., 2014). The estimated decrease in maintenance
requirements in our experiment agrees with other reports indicating heat-stressed animals
typically have reduced circulating thyroid hormone concentrations (Sano et al., 1983; Prunier
et al, 1997; Sanz Fernandez et al., 2014a), oxygen consumption (Hales, 1973) and heat
production (Collin et al., 2001b: Kerr et al., 2003; Brown-Brandl et al., 2004; Renaudeau et
167
al., 2013), variables all associated with decreased maintenance costs. Although maintenance
costs appear to be decreased, postnatal gross FE was also reduced by 9% in HS compared to
TN controls. However, this reduction may be explained by differences between gross FE
measurements (BW gain : FI) and the efficiency of carcass tissue gain (carcass gain : FI).
Despite reduced gross FE, postnatal HS-exposed pigs had a numerical increase in CE (3.3%),
and a 4.3% reduction in visceral mass compared to TN controls (Table 3). These data suggest
that reductions in gross FE due to HS (NRC, 1981; Renaudeau et al., 2012) are a result of
decreased visceral mass, and not due to a reduced rate of converting dietary nutrients into
skeletal muscle and adipose tissue, further corroborating a recent report from our lab (Johnson
et al., 2014). Further, biological systems may also be altered during HS (e.g. nutrient
absorption, endocrine status), potentially compromising efficient growth independently of
increased maintenance costs (Baumgard and Rhoads, 2013).
Despite the fact that marked phenotypic changes in postnatal body composition were
detected in response to in utero HS, no significant bioenergetic differences (i.e. glucose,
insulin, NEFA) were detected between IUHS and IUTN pigs (Table 5). Reasons for this are
not clear but likely include the fact that only one blood sample per animal was obtained and
body composition changes are a continuous accumulation over time. Blood samples are
simply a snapshot in time and these bioenergetic parameters are influenced by numerous
environmental factors including time relative to feeding. Postnatal HS reduced circulating
glucose and insulin concentrations and plasma insulin concentration per kg FI, similar to
reports by Rinaldo and Le Dividich (1991), and increased insulin sensitivity as denoted by a
reduced HOMA-IR (Haffner et al., 1996; Table 5). The apparent HS-induced increase in
insulin sensitivity corresponds with previous reports in rodents (Kokura et al., 2007), pigs
168
(Sanz Fernandez et al., 2014b), lactating cows (Wheelock et al., 2010) and humans (McCarty
et al., 2009). The hyperthermia-induced increased insulin sensitivity might be one
mechanism for the increased adiposity in HS-exposed pigs (Kouba et al., 2001; Collin et al.,
2001a), as insulin is a potent lipogenic and antilipolytic hormone (Vernon, 1992).
We have previously demonstrated increased postnatal core body temperature in pigs
exposed to prenatal HS (Johnson et al., 2013a,b). However, in the present study, no postnatal
rectal temperature differences were detected between in utero treatments (Fig. 1B). These
results are not surprising as identifying body temperature differences was not a primary
objective, and detecting small differences in body temperature (a cyclical parameter) requires
multiple measurements per day. Regardless, the increased body temperature in pigs gestated
during in utero HS (Johnson et al., 2013 a,b) is presumably not the result of enhanced
skeletal muscle mass (a relatively large contributor to total heat production; Van Milgen and
Noblet, 2003) as our current data indicates reduced protein accretion rates in IUHS pigs. A
more likely explanation for the elevated body temperature in IUHS pigs could be increased
whole-body adipose tissue that may insulate against heat dissipation. Further, determining
the mechanism(s) by which pigs gestated during in utero HS maintain a higher body
temperature during postnatal life is of both bioenergetic and practical interest.
Similar to previous reports (Graham et al., 1998; Johnson et al., 2014), in utero HS
caused microcephaly (reduced head size), and may be indicative of micrencephaly (reduced
brain size), which negatively affects the central nervous system and is associated with
reduced muscle tone as reviewed by Graham and colleagues (1998). Pigs housed in the
postnatal HS environment also had reduced liver weight, liver weight as a percent of EBW,
and total viscera weight as a percent of EBW, regardless of in utero environment, and this
169
confirms previous reports by others (Rinaldo and Le Dividich, 1991; Table 3). As the
viscera (particularly the liver) has high metabolic activity (Burrin et al., 1988; Van Milgen
and Noblet, 2003), it is not surprising that size of the splanchnic bed, and likely heat
production would be decreased in response to HS, possibly due to reduced visceral blood
flow as described by others (Lambert et al., 2002; Leon and Helwig, 2010). Regardless of
why, the decrease in visceral mass agrees with our idea (Baumgard and Rhoads, 2013;
Johnson et al., 2014), and others (Collin et al., 2001b; Renaudeau et al., 2013) that HS
actually reduces maintenance costs and heat production in the growing pig.
In utero HS caused a multitude of postnatal phenotypic alterations, namely, an
increase in adiposity with a concomitant decrease in protein accretion during the early
finishing phase of pig growth. This shift in nutrient partitioning may have negative
implications with regards to the amount of lean tissue ultimately synthesized by pigs gestated
during the summer months. The negative consequences of in utero HS on postnatal body
composition would not be apparent until the animals reached market weight during mid- to
late spring. As a consequence, the impact of HS on the global pork industry may be much
more extensive than originally thought. Future research attempting to identify the stage of
gestation that is most susceptible to environmental hyperthermia may provide the foundation
for developing mitigation strategies that minimize the negative consequences of summer HS.
Conclusion
In utero programming can permanently modify offspring metabolism and
development, and we have now demonstrated that maternal hyperthermia alters the future
hierarchy of tissue synthesis. Specifically, pigs experiencing in utero HS deposited less
170
skeletal muscle and more adipose tissue during the postnatal development stage characterized
by rapid adipose accretion. These results have implications to the future performance and
carcass quality of animals gestated in HS conditions and could compromise the efficiency of
lean tissue production, especially in areas that experience prolonged periods of extremely
high ambient temperatures. Consequently, the negative consequences of in utero HS on
future livestock productivity needs to be considered when attempting to quantify the impact
of climate change on animal agriculture.
Acknowledgements
The authors would like to acknowledge the assistance of Sara Stoakes, Samantha Lei,
Sarah Pearce, Mateus Zucato, Levi Long, Emily Ullrich, Matt King, and Wesley Schweer in
assisting in animal procedures, Anna Gabler for organizing animal care and maintenance of
facilities, and Nestor Gutierrez Cespedes for assistance with bioenergetic calculations.
Author Contributions
J.S. Johnson and L.H Baumgard were responsible for experimental design and
manuscript preparation. M.V. Sanz Fernandez, J.F. Patience, N.K. Gabler, J.W. Ross, and
R.P. Rhoads provided assistance with statistical analysis, lab work, and experimental design.
M.C. Lucy and T.J. Safranski performed maternal phase experiments.
171
References
AOAC Int. 2002. Official Methods of Analysis. 17th
rev. ed. AOAC Int. Gaithersburg,
MD.
Barker, D.J.P., K.M. Godfrey, P.D. Gluckman, J.E. Harding, J.A. Owens, and J.S.
Robinson. 1993. Fetal nutrition and cardiovascular disease in adult life. The
Lancet. 341: 938-941.
Battisti, D.S., and R.L. Naylor. 2009. Historical warnings of future food insecurity with
unprecedented seasonal heat. Science. 323: 240-244.
Baumgard, L.H., R.P. Rhoads, M.L. Rhoads, N.K. Gabler, J.W. Ross, A.F. Keating, R.L.
Boddicker, S. Lenka, and V. Sejian. 2012. Impact of climate change on livestock
production. In: Sejian V., S.M.K. Naqvi, T. Ezeji, J. Lakritz, R. Lal, eds.
Environmental Stress and Amelioration in Livestock Production. Berlin: Springer-
Verlag, pp. 413-468.
Baumgard, L.H., and R.P. Rhoads. 2013. Effects of heat stress on post-absorptive
metabolism and energetics. Annu. Rev. Anim. Bio. 1: 311-337.
Brendemuhl, J., and B. Myer. 2009. Types of swine diets. Gainesville, FL: University of
Florida, IFAS Extension. Accessed October 30, 2013. Available at:
http://edis.ifas.ufl.edu/an036.
Brown-Brandl, T.M., J.A. Nienaber, H. Xin, and R.S. Gate. 2004. A literature review of
swine production. Trans. ASAE. 47: 259-270.
Burrin, D.G., R.A. Britton, and C.L. Ferrell. 1988. Visceral organ size and hepatic
metabolic activity in fed and fasted rats. J. Nutr. 188: 1547-1552.
172
Chen, X., A.L. Fahy, A.S. Green, M.J. Anderson, R.P. Rhoads, and S.W. Limesand.
2010. ß2-Adrenergic receptor desensitization in perirenal adipose tissue in fetuses
and lambs with placental insufficiency-induced intrauterine growth restriction. J.
Physiol. 588: 3539-3549.
Collin, A., J. van Milgen, S. Dubois, and J. Noblet. 2001a. Effect of high temperature and
feeding level on energy utilization in piglets. J. Anim. Sci. 79: 1849-1857.
Collin, A., J. van Milgen, S. Dubois, and J. Noblet. 2001b. Effect of high temperature on
feeding behavior and heat production in group-housed young pigs. Br. J. Nutr. 86:
63-70.
Desai, M., D. Gayle, J. Babu, and M.G. Ross. 2005. Programmed obesity in intrauterine
growth-restricted newborns: modulation by newborn nutrition. Am. J. Physiol.
Regu. Physiol. 288: R91-R96.
Federation of Animal Science Societies. 2010. Guide for the care and use of
agricultural animals in research and teaching. 3rd
ed. Fed. Champaign, IL: Anim.
Sci. Soc., Chapter 11, pp. 143-156.
Foxcroft, G.R., W.T. Dixon, S. Novak, C.T. Putman, S.C. Town, and M.D. Vinsky. 2006.
The biological basis for prenatal programming of postnatal performance in
pigs. J. Anim. Sci. 84: E105-E112.
Foxcroft, G.R., W.T. Dixon, M.K. Dyck, S. Novak, J.C. Harding, and F.C. Almeida.
2009. Prenatal programming of postnatal development of the pig. Soc. Reprod.
Fertil. Suppl. 66: 213-231.
173
Geraert, P.A., J.C.F. Padilha, and S. Guillaumin. 1996. Metabolic and endocrine changes
induced by chronic heat exposure in broiler chickens: growth performance, body
composition and energy retention. Br. J. Nutr. 75: 195-204.
Gokulakrishnan, G., I.J. Estrada, H.A. Sosa, and M.L. Fiorotto. 2012. In utero
glucocorticoid exposure reduces fetal skeletal muscle mass in rats independent of
effects on maternal nutrition. Am. J. Physiol. Regul. Integr. Comp. Physiol.
302: R1143-R1152
Graham, J.M., M.J. Edwards, and M.J. Edwards. 1998. Teratogen update: Gestational
effects of maternal hyperthermia due to febrile illnesses and resultant patterns of
defects in humans. Teratology. 58: 209-221.
Haffner, S.M., C. Gonzalez, H. Miettinen, E. Kennedy, and M.P. Stern. 1996. A
prospective analysis of the HOMA model: The Mexico City diabetes study.
Diabetes. 19: 1138-1141.
Hales, J.R.S. 1973. Effects of heat stress on blood flow in respiratory and non-respiratory
muscles in the sheep. Pflug. Arch. Eur. J. Physiol. 345: 123–130.
Johnson, J.S., R.L. Boddicker, M.V. Sanz-Fernandez, J.W. Ross, J.T. Selsby, M.C. Lucy,
T.J. Safranski, R.P. Rhoads, and L.H. Baumgard. 2013a. Effects of mammalian in
utero heat stress on adolescent thermoregulation. Int. J. Hyperthermia. 29: 696-
702.
Johnson, J.S., M.V. Sanz-Fernandez, S.K. Stoakes, M. Abuajamieh, J.W. Ross, M.C.
Lucy, T.J. Safranski, R.P. Rhoads, and L.H. Baumgard. 2013b. Gestational heat
stress alters postnatal thermoregulation. J. Anim. Sci. 91: 168. (Abstr.)

174
Johnson, J.S., J.F. Patience, J.W. Ross, N.K. Gabler, M.C. Lucy, T.J. Safranski, R.P.
Rhoads, and L.H. Baumgard. 2014. Effects of in utero heat stress on tissue
accretion during the growing phase (30 to 60 kg) in pigs. J. Anim. Sci. In Press.
Katsumata, M., H. Yano, N. Ishida, and A. Miyazaki. 1990. Influence of a high ambient
temperature and administration of clenbuterol on body composition in rats. J.
Nutr. Sci. Vitaminol. 36: 569-578.
Kerr, B.J., J.T. Yen, J.A. Nienaber, and R.A. Easter. 2003. Influences of dietary protein
level, amino acid supplementation and environmental temperature on
performance, body composition, organ weights and total heat production of
growing pigs. J. Anim. Sci. 81: 1998-2007.
Kouba, M., D. Hermier, and J. Le Dividich. 2001. Influence of high ambient temperature on
lipid metabolism in the growing pig. J. Anim. Sci. 79: 81-87.
Kokura, S., S. Adachi, E. Manabe, K. Mizushima, T. Hattori, T. Okuda, N. Nakabe, O.
Handa, T. Takagi, Y. Naito, N. Yoshida, and T. Yoshikawa. 2007. Whole-body
hyperthermia improves obesity induced insulin resistance in diabetic mice. Int. J.
Hyperthermia. 23: 259-265.
Lambert, G. P., C.V. Gisolfi, D.J. Berg, P.L. Moseley, L.W. Oberley, and K.C. Kregel.
2002. Selected contribution: Hyperthermia-induced intestinal permeability and the
role of oxidative and nitrosative stress. J. Appl. Physiol. 92: 1750-1761.
Le Bellego, L., J. van Milgen, and J. Noblet. 2002. Effect of high temperature and low-
protein diets on the performance of growing-finishing pigs. J. Anim. Sci. 80: 691-
701.
175
Le Dividich, J., M. Vermorel, J. Noblet, J.C. Bouvier, and A. Aumaitre. 1980. Effects of
environmental temperature on heat production, energy retention, protein and fat
gain in early-weaned piglets. Br. J. Nutr. 44: 313-323.
Leon, L.R., and B.C. Helwig. 2010. Heat stroke: Role of the systemic inflammatory
response. J. Appl. Physiol. 109: 1980-1988.
Luber, G., and M. McGeehin. 2008. Climate change and extreme heat events. Am. J.
Prevent. Med. 35: 459-467.
Lucy, M.C., T.J. Safranski, J.N. Rhoades, J.W. Ross, N.K. Gabler, R.P. Rhoads, and
L.H. Baumgard. 2012. Litter characteristics and thermoregulatory behavior of
first parity sows exposed to a controlled heat stress (HS) during gestation. J.
Anim. Sci. 90: 731. (Abstr.)
McCarty, M.F., J. Barroso-Aranda, and F. Contreras. 2009. Regular thermal therapy may
promote insulin sensitivity while boosting expression of endothelial nitric oxide
synthase-effects comparable to those of exercise training. Med. Hypotheses. 73:
103-105.
Muller, C., W. Cramer, W.L. Hare, and H. Lotze-Campen. 2010. Climate change risks for
African agriculture. Proc. Natl. Acad. Sci. USA 108: 4313-4315.
National Research Council: Committee on Animal Nutrition and Subcommittee on
Environmental Stress. 1981. Effect of Environment on Nutrient Requirements of
Domestic Animals. Natl. Acad. Press, Washington D.C. pp. 22-26.
National Research Council. 2012. Nutrient Requirements of Swine. 11th
rev. ed. Natl.
Acad. Press, Washington, DC.

176
Nienaber, J.A., and G.L. Hahn. 2007. Livestock production system management responses
to thermal challenges. Int. J. Biometeorol. 52: 149-157.
Noblet, J., Y. Henry, and S. Dubois. 1987. Effect of protein and lysine levels in the diet on
body gain composition and energy utilization in growing pigs. J. Anim. Sci. 65:
717-726.
Oresanya, T.F., A.D. Beaulieu, E. Beltranena, and J.F. Patience. 2008. Investigations of
energy metabolism in weanling barrows: The interaction of dietary energy
concentration and daily feed (energy) intake. J. Anim. Sci. 86: 45-55.
Patience, J.F. 2012. The influence of dietary energy on feed efficiency in grow-finish
Swine. In: Patience, J.F., ed. Feed Efficiency in Swine. The Netherlands:
Wageningen Academic Publishers, pp. 101-129.
Pinney, S.E., and R.A. Simmons. 2010. Epigenetic mechanisms in the development of
type 2 diabetes. Trends Endocrinol. Metab. 21: 223-229.
Prunier A., M. Messias de Bragança, and J.L. Dividich. 1997. Influence of high ambient
temperature on performance of reproductive sows. Livest. Prod. Sci. 52: 123–133.
Ravelli, G.P., Z.A. Stein, and M.W. Susser. 1976. Obesity in young men after famine
exposure in utero and early infancy. N. Engl. J. Med. 295: 349-353.
Renaudeau, D., H. Gilbert, and J. Noblet. 2012. Effect of climatic environment on feed
efficiency in swine. In: Patience, J.F., ed. Feed Efficiency in Swine. The
Netherlands: Wageningen Academic Publishers, pp. 183-210.
Renaudeau, D., G. Frances, S. Dubois, H. Gilbert, and J. Noblet. 2013. Effect of thermal
heat stress on energy utilization in two lines of pigs divergently selected for
residual feed intake. J. Anim. Sci. 91: 1162-1175.
177
Rinaldo, D., and J. Le Dividich. 1991. Effects of warm exposure on adipose tissue and
muscle metabolism in growing pigs. Comp. Biochem. Physiol. A Comp. Physiol.
100: 995-1002.
Sano, H., K. Takahashi, K. Ambo, and T. Tsuda. 1983. Turnover and oxidation rates of
blood glucose and heat production in sheep exposed to heat. J. Dairy Sci. 66: 856-
861.
Sanz Fernandez, M.V., J.S. Johnson, R.P. Rhoads, and L.H. Baumgard. 2014a. Effects of
heat stress on post-absorptive metabolism. J. Anim. Sci. 105. (Abstr.)
Sanz Fernandez, M.V., J.S. Johnson, M. Abuajamieh, S.K. Stoakes, J.T. Seibert, T.H.
Elsasser, J.W. Ross, R.P. Rhoads, and L.H. Baumgard. 2014b. Effects of heat
stress on basal and stimulated metabolism in pigs. J. Appl. Physiol. In
Submission.
St-Pierre, N., B. Cobanov, and G. Schnitkey. 2003. Economic losses from heat stress by US
livestock industries. Journal of Dairy Science 86: E52-E77.
Tamashiro, K.L.K., C.E. Terrillion, J. Hyun, J.I. Koenig, and T.H. Moran. 2009. Prenatal
stress or high-fat diet increases susceptibility to diet-induced obesity in rat offspring.
Diabetes. 58: 1116-1125.
Van Milgen, J., and J. Noblet. 2003. Partitioning of energy intake to heat, protein, and fat in
growing pigs. J. Anim. Sci. 81: E86-E93.
Vernon, R.G. 1992. Effects of diet on lipolysis and its regulation. Proceedings of the
Nutrition Society. 51: 397-408.

178
Wheelock, J.B., R.P. Rhoads, M.J. VanBaale, S.R. Sanders, and L.H. Baumgard. 2010.
Effects of heat stress on energetic metabolism in lactating Holstein cows. J. Dairy
Sci. 93: 644-655.
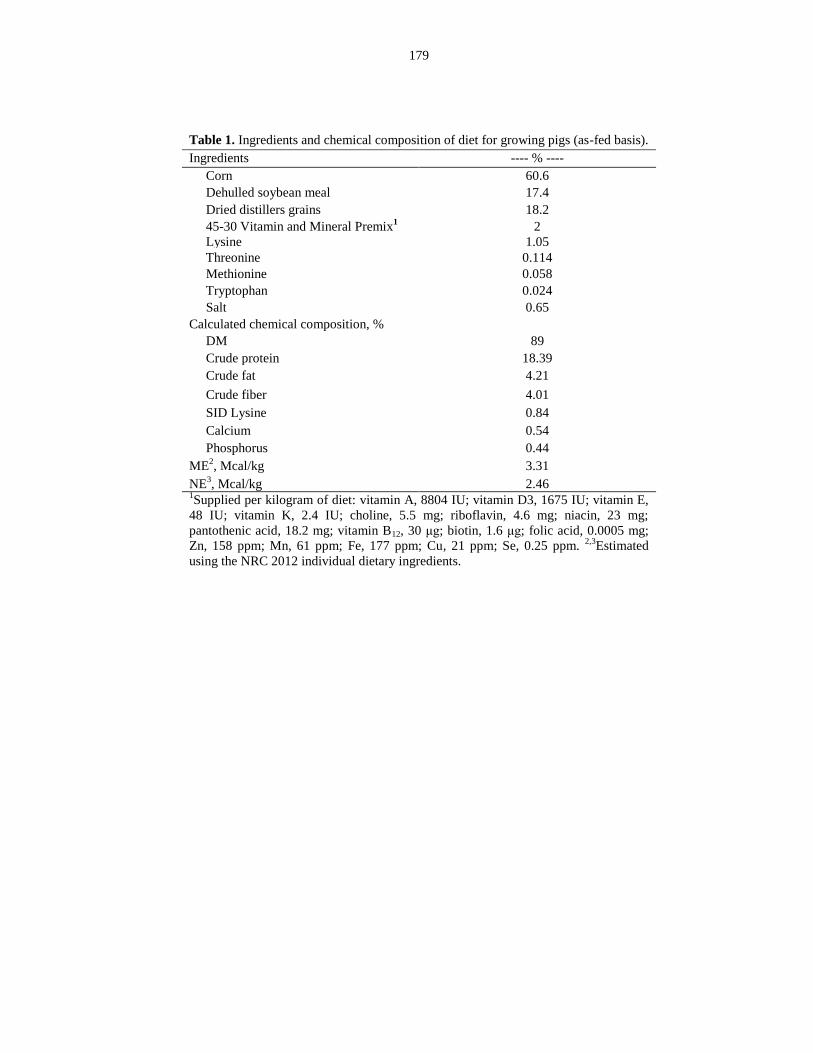
179
Table 1. Ingredients and chemical composition of diet for growing pigs (as-fed basis).
Ingredients ---- % ----
Corn 60.6
Dehulled soybean meal 17.4
Dried distillers grains 18.2
45-30 Vitamin and Mineral Premix1 2
Lysine 1.05
Threonine 0.114
Methionine 0.058
Tryptophan 0.024
Salt 0.65
Calculated chemical composition, %
DM 89
Crude protein 18.39
Crude fat 4.21
Crude fiber 4.01
SID Lysine 0.84
Calcium 0.54
Phosphorus 0.44
ME2, Mcal/kg
3.31
NE3, Mcal/kg
2.46
1Supplied per kilogram of diet: vitamin A, 8804 IU; vitamin D3, 1675 IU; vitamin E,
48 IU; vitamin K, 2.4 IU; choline, 5.5 mg; riboflavin, 4.6 mg; niacin, 23 mg;
pantothenic acid, 18.2 mg; vitamin B12, 30 μg; biotin, 1.6 μg; folic acid, 0.0005 mg;
Zn, 158 ppm; Mn, 61 ppm; Fe, 177 ppm; Cu, 21 ppm; Se, 0.25 ppm. 2,3
Estimated
using the NRC 2012 individual dietary ingredients.
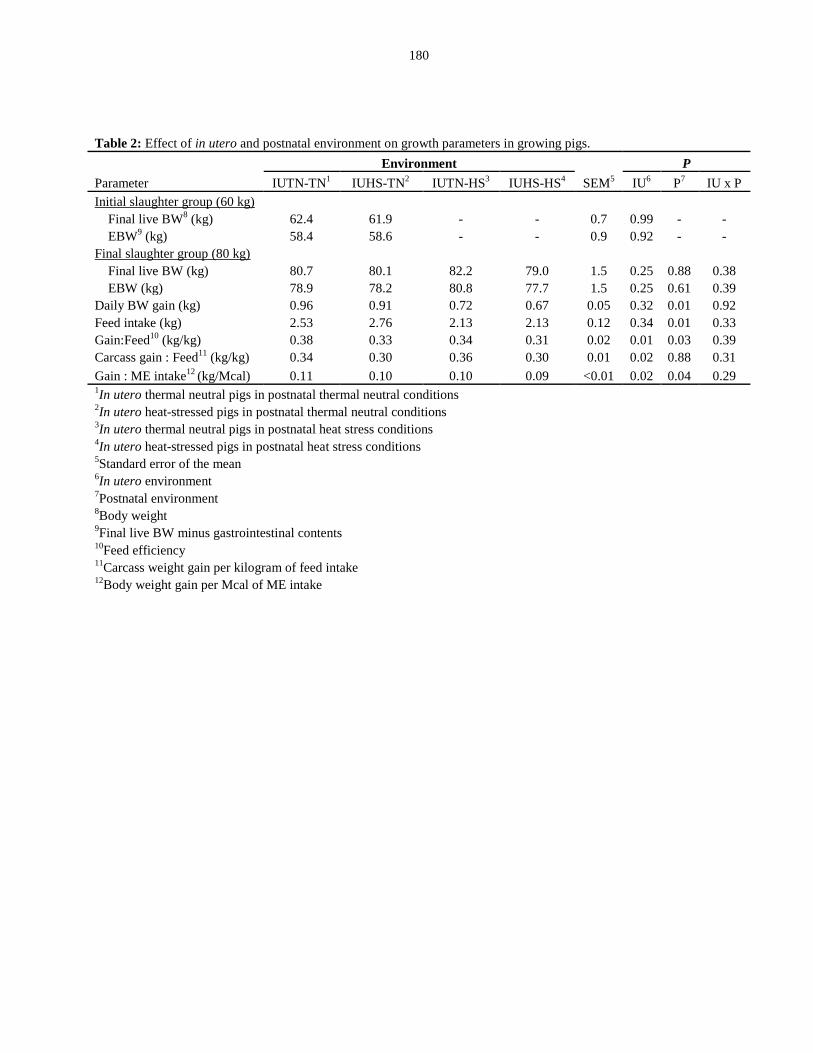
180
Table 2: Effect of in utero and postnatal environment on growth parameters in growing pigs.
Environment P
Parameter IUTN-TN1 IUHS-TN
2 IUTN-HS
3 IUHS-HS
4 SEM
5 IU
6 P
7 IU x P
Initial slaughter group (60 kg)
Final live BW8 (kg) 62.4 61.9 - - 0.7 0.99 - -
EBW9 (kg) 58.4 58.6 - - 0.9 0.92 - -
Final slaughter group (80 kg)
Final live BW (kg) 80.7 80.1 82.2 79.0 1.5 0.25 0.88 0.38
EBW (kg) 78.9 78.2 80.8 77.7 1.5 0.25 0.61 0.39
Daily BW gain (kg) 0.96 0.91 0.72 0.67 0.05 0.32 0.01 0.92
Feed intake (kg) 2.53 2.76 2.13 2.13 0.12 0.34 0.01 0.33
Gain:Feed10
(kg/kg) 0.38 0.33 0.34 0.31 0.02 0.01 0.03 0.39
Carcass gain : Feed11
(kg/kg) 0.34 0.30 0.36 0.30 0.01 0.02 0.88 0.31
Gain : ME intake12
(kg/Mcal) 0.11 0.10 0.10 0.09 <0.01 0.02 0.04 0.29 1In utero thermal neutral pigs in postnatal thermal neutral conditions
2In utero heat-stressed pigs in postnatal thermal neutral conditions
3In utero thermal neutral pigs in postnatal heat stress conditions
4In utero heat-stressed pigs in postnatal heat stress conditions
5Standard error of the mean
6In utero environment
7Postnatal environment
8Body weight
9Final live BW minus gastrointestinal contents
10Feed efficiency
11Carcass weight gain per kilogram of feed intake
12Body weight gain per Mcal of ME intake
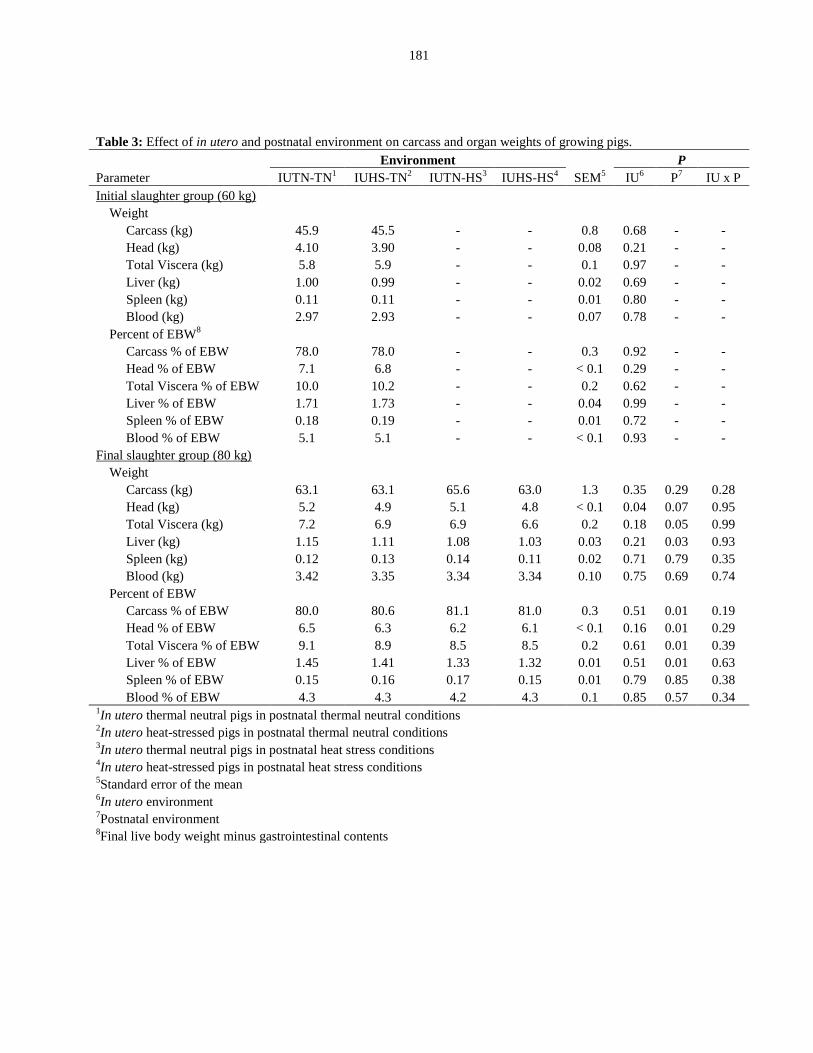
181
Table 3: Effect of in utero and postnatal environment on carcass and organ weights of growing pigs.
Environment P
Parameter IUTN-TN1 IUHS-TN
2 IUTN-HS
3 IUHS-HS
4 SEM
5 IU
6 P
7 IU x P
Initial slaughter group (60 kg)
Weight
Carcass (kg) 45.9 45.5 - - 0.8 0.68 - -
Head (kg) 4.10 3.90 - - 0.08 0.21 - -
Total Viscera (kg) 5.8 5.9 - - 0.1 0.97 - -
Liver (kg) 1.00 0.99 - - 0.02 0.69 - -
Spleen (kg) 0.11 0.11 - - 0.01 0.80 - -
Blood (kg) 2.97 2.93 - - 0.07 0.78 - -
Percent of EBW8
Carcass % of EBW
78.0 78.0 - - 0.3 0.92 - -
Head % of EBW
7.1 6.8 - - < 0.1 0.29 - -
Total Viscera % of EBW
10.0 10.2 - - 0.2 0.62 - -
Liver % of EBW
1.71 1.73 - - 0.04 0.99 - -
Spleen % of EBW
0.18 0.19 - - 0.01 0.72 - -
Blood % of EBW
5.1 5.1 - - < 0.1 0.93 - -
Final slaughter group (80 kg)
Weight
Carcass (kg) 63.1 63.1 65.6 63.0 1.3 0.35 0.29 0.28
Head (kg) 5.2 4.9 5.1 4.8 < 0.1 0.04 0.07 0.95
Total Viscera (kg) 7.2 6.9 6.9 6.6 0.2 0.18 0.05 0.99
Liver (kg) 1.15 1.11 1.08 1.03 0.03 0.21 0.03 0.93
Spleen (kg) 0.12 0.13 0.14 0.11 0.02 0.71 0.79 0.35
Blood (kg) 3.42 3.35 3.34 3.34 0.10 0.75 0.69 0.74
Percent of EBW
Carcass % of EBW
80.0 80.6 81.1 81.0 0.3 0.51 0.01 0.19
Head % of EBW
6.5 6.3 6.2 6.1 < 0.1 0.16 0.01 0.29
Total Viscera % of EBW
9.1 8.9 8.5 8.5 0.2 0.61 0.01 0.39
Liver % of EBW
1.45 1.41 1.33 1.32 0.01 0.51 0.01 0.63
Spleen % of EBW
0.15 0.16 0.17 0.15 0.01 0.79 0.85 0.38
Blood % of EBW
4.3 4.3 4.2 4.3 0.1 0.85 0.57 0.34 1In utero thermal neutral pigs in postnatal thermal neutral conditions
2In utero heat-stressed pigs in postnatal thermal neutral conditions
3In utero thermal neutral pigs in postnatal heat stress conditions
4In utero heat-stressed pigs in postnatal heat stress conditions
5Standard error of the mean
6In utero environment
7Postnatal environment
8Final live body weight minus gastrointestinal contents
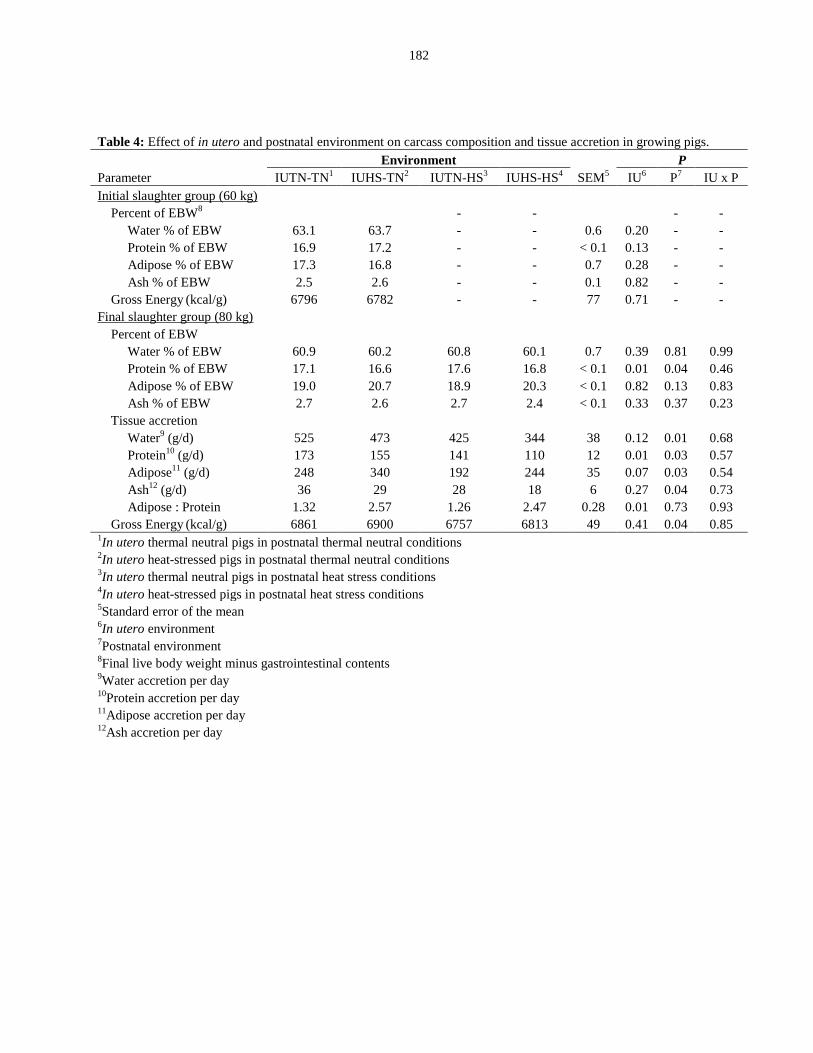
182
Table 4: Effect of in utero and postnatal environment on carcass composition and tissue accretion in growing pigs.
Environment P
Parameter IUTN-TN1
IUHS-TN2
IUTN-HS3
IUHS-HS4
SEM5
IU6
P7
IU x P
Initial slaughter group (60 kg)
Percent of EBW8 - - - -
Water % of EBW
63.1 63.7 - - 0.6 0.20 - -
Protein % of EBW 16.9 17.2 - - < 0.1 0.13 - -
Adipose % of EBW 17.3 16.8 - - 0.7 0.28 - -
Ash % of EBW 2.5 2.6 - - 0.1 0.82 - -
Gross Energy (kcal/g) 6796 6782 - - 77 0.71 - -
Final slaughter group (80 kg)
Percent of EBW
Water % of EBW
60.9 60.2 60.8 60.1 0.7 0.39 0.81 0.99
Protein % of EBW 17.1 16.6 17.6 16.8 < 0.1 0.01 0.04 0.46
Adipose % of EBW 19.0 20.7 18.9 20.3 < 0.1 0.82 0.13 0.83
Ash % of EBW 2.7 2.6 2.7 2.4 < 0.1 0.33 0.37 0.23
Tissue accretion
Water9 (g/d) 525 473 425 344 38 0.12 0.01 0.68
Protein10
(g/d) 173 155 141 110 12 0.01 0.03 0.57
Adipose11
(g/d)
248 340 192 244 35 0.07 0.03 0.54
Ash12
(g/d) 36 29 28 18 6 0.27 0.04 0.73
Adipose : Protein 1.32 2.57 1.26 2.47 0.28 0.01 0.73 0.93
Gross Energy (kcal/g) 6861 6900 6757 6813 49 0.41 0.04 0.85
1In utero thermal neutral pigs in postnatal thermal neutral conditions
2In utero heat-stressed pigs in postnatal thermal neutral conditions
3In utero thermal neutral pigs in postnatal heat stress conditions
4In utero heat-stressed pigs in postnatal heat stress conditions
5Standard error of the mean
6In utero environment
7Postnatal environment
8Final live body weight minus gastrointestinal contents
9Water accretion per day
10Protein accretion per day
11Adipose accretion per day
12Ash accretion per day
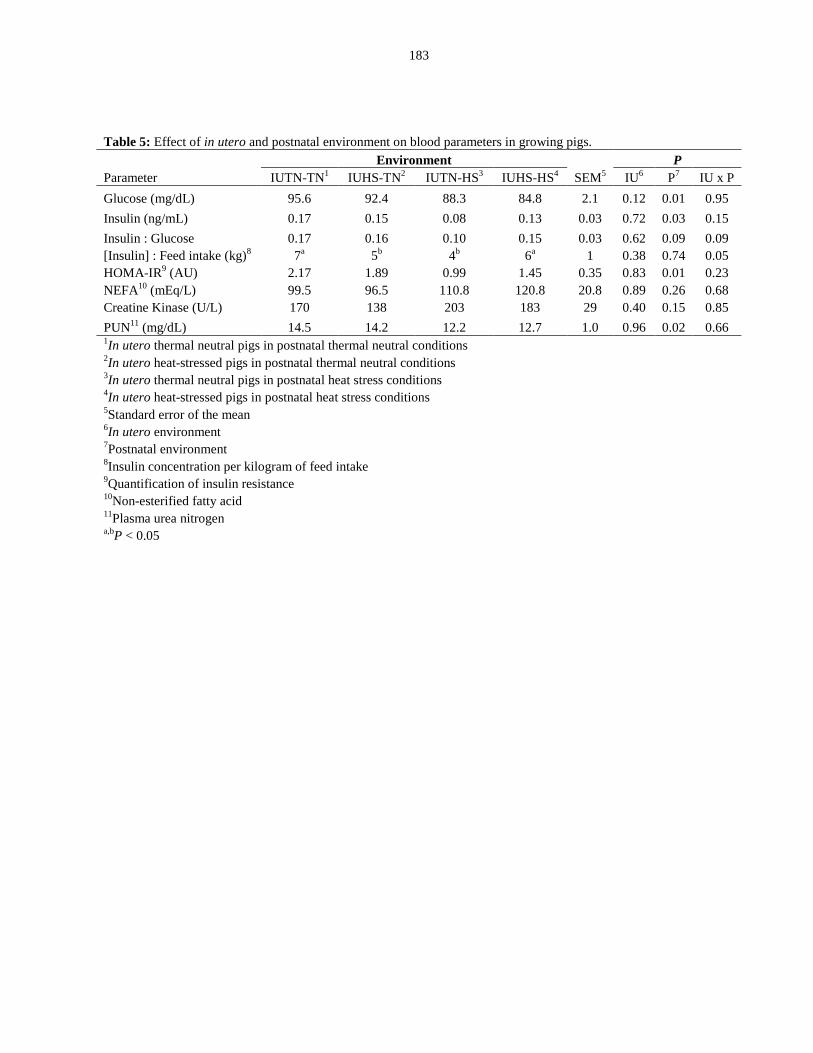
183
Table 5: Effect of in utero and postnatal environment on blood parameters in growing pigs.
Environment P
Parameter IUTN-TN1
IUHS-TN2
IUTN-HS3
IUHS-HS4
SEM5
IU6
P7
IU x P
Glucose (mg/dL) 95.6 92.4 88.3 84.8 2.1 0.12 0.01 0.95
Insulin (ng/mL) 0.17 0.15 0.08 0.13 0.03 0.72 0.03 0.15
Insulin : Glucose 0.17 0.16 0.10 0.15 0.03 0.62 0.09 0.09
[Insulin] : Feed intake (kg)8
7a
5b
4b
6a
1 0.38 0.74 0.05
HOMA-IR9 (AU) 2.17 1.89 0.99 1.45 0.35 0.83 0.01 0.23
NEFA10
(mEq/L) 99.5 96.5 110.8 120.8 20.8 0.89 0.26 0.68
Creatine Kinase (U/L) 170 138 203 183 29 0.40 0.15 0.85
PUN11
(mg/dL) 14.5 14.2 12.2 12.7 1.0 0.96 0.02 0.66 1In utero thermal neutral pigs in postnatal thermal neutral conditions
2In utero heat-stressed pigs in postnatal thermal neutral conditions
3In utero thermal neutral pigs in postnatal heat stress conditions
4In utero heat-stressed pigs in postnatal heat stress conditions
5Standard error of the mean
6In utero environment
7Postnatal environment
8Insulin concentration per kilogram of feed intake
9Quantification of insulin resistance
10Non-esterified fatty acid
11Plasma urea nitrogen
a,bP < 0.05
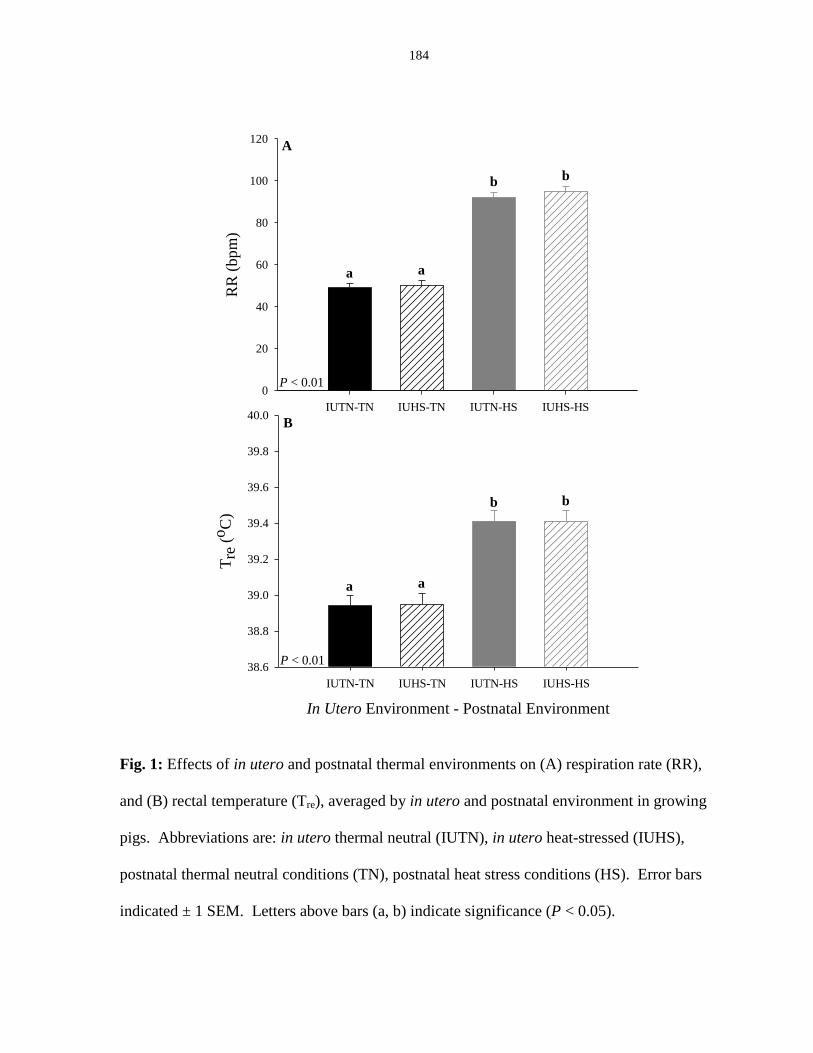
184
In Utero Environment - Postnatal Environment
IUTN-TN IUHS-TN IUTN-HS IUHS-HS
Tre
(o
C)
38.6
38.8
39.0
39.2
39.4
39.6
39.8
40.0
a a
b b
IUTN-TN IUHS-TN IUTN-HS IUHS-HS
RR
(b
pm
)
0
20
40
60
80
100
120
aa
b b
A
B
P < 0.01
P < 0.01
Fig. 1: Effects of in utero and postnatal thermal environments on (A) respiration rate (RR),
and (B) rectal temperature (Tre), averaged by in utero and postnatal environment in growing
pigs. Abbreviations are: in utero thermal neutral (IUTN), in utero heat-stressed (IUHS),
postnatal thermal neutral conditions (TN), postnatal heat stress conditions (HS). Error bars
indicated ± 1 SEM. Letters above bars (a, b) indicate significance (P < 0.05).

185
Fig. 2: Effect of in utero environments on (A) protein deposition (g/d), (B) adipose
deposition (g/d), and (C) the ratio of adipose to protein deposition (g/g) averaged by in utero
environment in growing pigs. Abbreviations are: in utero thermal neutral (IUTN), in utero
heat-stressed (IUHS). Error bars indicate ± 1 SEM.
IUTN IUHS
Pro
tein
Acc
reti
on
(g/d
)
60
80
100
120
140
160
180
200A
P < 0.01
IUTN IUHS
Ad
ipo
se :
Pro
tein
(g/g
)
0.5
1.0
1.5
2.0
2.5
3.0
3.5C
P < 0.01
IUTN IUHS
Ad
ipo
se A
ccre
tio
n (
g/d
)
120
160
200
240
280
320
360B
P < 0.07
186
CHAPTER VI: THE IMPACT OF IN UTERO HEAT STRESS AND NUTRIENT
RESTRICTION ON PROGENY BODY COMPOSITION
A paper to be published in The Journal of Applied Physiology
J.S. Johnson1, M. Abuajamieh
1, A.F. Keating
1, J.W. Ross
1,
J.T. Selsby1, R.P. Rhoads
2, L.H. Baumgard
1
1Department of Animal Science, Iowa State University, Ames, IA, 50011
2Department of Animal and Poultry Sciences, Virginia Tech, Blacksburg, VA, 24061
Abstract
We have recently demonstrated that in utero heat stress (IUHS) alters future tissue
accretion in pig progeny, but whether this transcends species, is indirectly due to reduced
maternal feed intake (FI), or is due to the direct effect of heat stress (HS) is not clear. Study
objectives were to compare the rate and quantity of tissue accretion in rats exposed to
differing in utero thermal environments while eliminating the confounding effect of
dissimilar maternal FI. On gestation d3, pregnant Sprague Dawley rats were exposed to
either thermal neutral (TN; constant 22ºC; n = 4), or HS conditions (cyclical 34ºC nighttime
and 30ºC daytime; n = 4) until d18 of gestation. A third group was pair-fed to HS-
counterparts in TN conditions (PFTN; constant 22ºC; n = 4) from d4 until d19 of gestation.
Overall, HS increased dam rectal temperature (p < 0.01; 1.3ºC) versus TN and PFTN
mothers, and reduced FI (p < 0.01; 33%) compared to TN controls. By experimental design,
the magnitude of FI reduction was similar between HS and PFTN dams. Litter size was
similar (p > 0.96; 10.9 pups/litter) between environmental treatments, but pup birth weight
was reduced (p < 0.04; 15.4%) in HS compared to PFTN and TN dams. At d26 of life, two
187
male pups per dam [n = 8 in utero TN (IUTN); n = 8 IUHS; n = 8 in utero PFTN (IUPFTN)]
were selected, and body composition was determined using dual-energy x-ray absorptiometry
(DXA). Following the initial scan, all offspring were individually housed in TN conditions
(21.8 ± 0.1ºC) and DXA analyses were repeated on d46 and d66 of life. In utero treatment
did not alter (p > 0.81) future offspring FI (18.6 g/d) or BW gain (5.8 g/d) from d26 to d66 of
life. Body fat content and total adipose tissue were increased (p < 0.01; 11.2 and 13.1%,
respectively) in IUPFTN compared to IUTN and IUHS offspring. In utero PFTN offspring
had reduced body lean tissue (p < 0.01; 2.6%) compared to IUTN and IUHS counterparts.
Body composition parameters did not differ between IUHS and IUTN offspring. In utero
environmental treatments did not alter body bone mineral content. From d26 to d66 of life,
the adipose to lean tissue accretion ratio was increased (p < 0.01; 19.2%) in IUPFTN
compared to IUHS offspring, but was similar to IUTN progeny. Epididymal fat pad weight
was increased (p < 0.04; 21.6%) in IUPFTN versus IUHS offspring, but no differences were
observed when comparing IUPFTN and IUHS progeny to IUTN controls. In summary and
in contrast to pigs, IUHS did not appear to impact future body composition; however, in
utero feed restriction altered the future hierarchy of tissue accretion.
Keywords: rat, in utero heat stress, nutrient restriction, tissue accretion
Introduction
Sub-optimal productivity due to heat stress (HS) jeopardizes efficient animal
production and threatens global food security (2). This is primarily explained by: decreased
and inconsistent growth, poor reproductive performance, altered carcass composition, and
increased morbidity and mortality (3, 5). The negative effects of HS will likely become more
188
evident as climate models predict an increase in extreme summer conditions for most
agricultural areas (21). While HS negatively impacts animals during postnatal life, exposure
to HS during fetal development may also have lifelong consequences that undermine
nutritional, management, and genetic advances made by the animal agriculture industries.
Defining the biology and mechanisms by which HS compromises animal performance both
pre- and postnatally is a prerequisite to developing future climate change mitigation
strategies.
Multiple intrauterine insults can have lasting effects on offspring performance (7, 19,
30). One extensively researched experimental model is maternal under-nutrition that can
increase offspring lipid accretion and reduce lean tissue (1, 7, 28, 30). In addition, we
recently reported (15) that in utero HS increases future adipose deposition at the expense of
skeletal muscle mass in pigs. Similarities between the in utero under-nutrition and HS
models, coupled with the fact that HS causes a well-documented reduction in feed intake in
almost all species (3, 10, 35), lends itself to the hypothesis that the two in utero insults may
be mechanistically linked. Study objectives were to investigate the direct and indirect effects
of in utero HS on the postnatal accretion of adipose and lean tissue in offspring derived from
dams exposed to HS, feed restricted to eliminate the confounding effect of dissimilar FI, or
fed ad libitum in TN throughout most of gestation. We hypothesized that postnatal adipose
and lean tissue accretion would be similarly altered by both maternal feed restriction and in
utero HS compared to in utero thermal neutral controls.
189
Materials and Methods
Maternal environment
Iowa State University Institutional Animal Care and Use Committee approved all
procedures involving pregnant rats (IACUC #7634-R). Twelve, first parity timed pregnant
OB Sprague Dawley rats (201.5 ± 3.1 g BW) were obtained from Charles River Laboratories
(Wilmington, MA) on d2 of gestation. Dams were fed a finely ground standard commercial
chow diet (Harlan 2018; Harlan; Woodland, CA; 18% CP) and housed in individual cages
(0.2 m x 0.4 m) in the Zumwalt Environmental Chambers at Iowa State University. Pregnant
rats were exposed to thermal neutral [TN; constant 22.2 ± <0.1°C; 34.6 ± 0.1% relative
humidity (%RH); n = 4], HS (cyclical 34.0°C nighttime and 30.0°C daytime; 20.1 ± 0.1%
RH; n = 4), or pair-fed as a percent of BW to HS mothers in TN conditions (PFTN; constant
22.2 ± <0.1°C; 34.6 ± 0.1%RH; n = 4) to eliminate the confounding effects of dissimilar feed
intake (FI). Within each room, ambient temperature (Ta) and %RH were continuously
recorded by one mounted data logger (El – WIN – USB, Accuracy: ± 1.0°C; Lascar
Electronics Ltd.; Wiltshire, UK) every five min. Although Ta was controlled, %RH was
ungoverned throughout the experiment.
Maternal environmental treatments began and ended on d3 and d18 of gestation,
respectively, for TN and HS mothers, and on d4 and d19 of gestation, respectively, for PFTN
mothers (Fig. 1). To minimize the risk of post-parturition maternal cannibalism of offspring,
and to ensure all progeny were exposed to similar lengths of in utero stress, all dams were
fed ad libitum and exposed to TN conditions (constant 22.2 ± <0.0°C; 34.6 ± 0.1%RH) from
d19 (TN, HS) or d20 (PFTN) of gestation until parturition (d22). Rectal temperatures (Tre)
were obtained on all dams at 1600 h every other day of the in utero treatment period using a
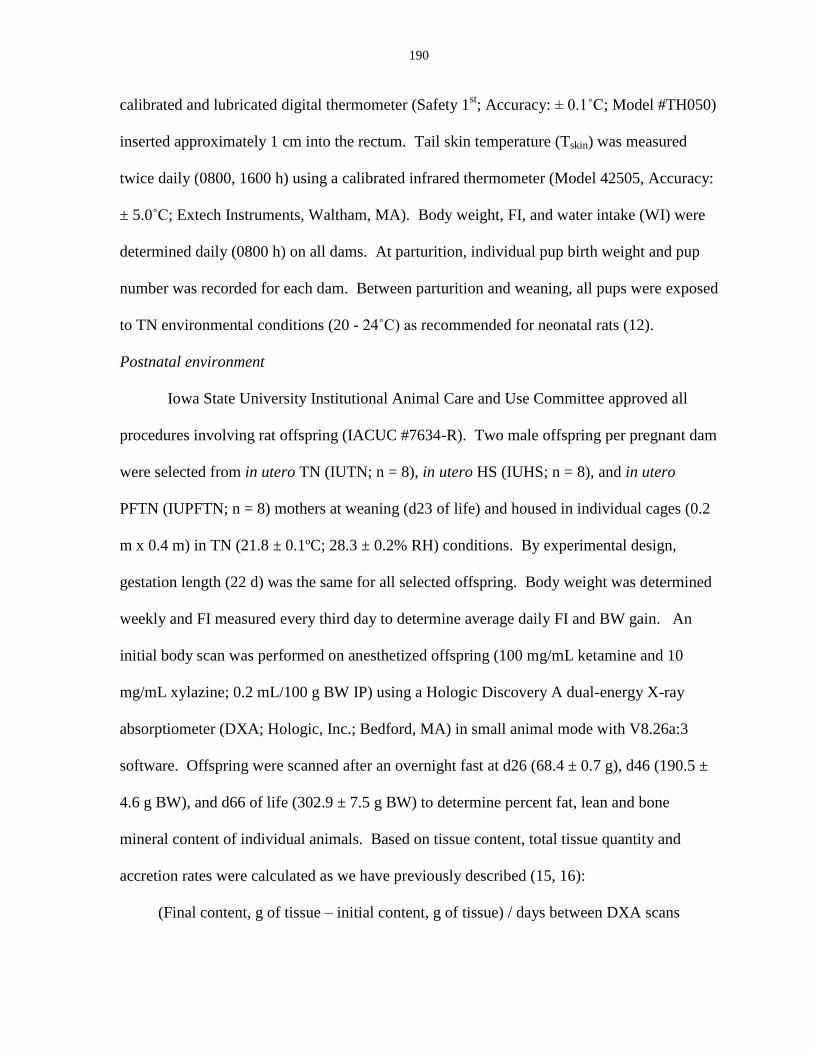
190
calibrated and lubricated digital thermometer (Safety 1st; Accuracy: ± 0.1˚C; Model #TH050)
inserted approximately 1 cm into the rectum. Tail skin temperature (Tskin) was measured
twice daily (0800, 1600 h) using a calibrated infrared thermometer (Model 42505, Accuracy:
± 5.0˚C; Extech Instruments, Waltham, MA). Body weight, FI, and water intake (WI) were
determined daily (0800 h) on all dams. At parturition, individual pup birth weight and pup
number was recorded for each dam. Between parturition and weaning, all pups were exposed
to TN environmental conditions (20 - 24˚C) as recommended for neonatal rats (12).
Postnatal environment
Iowa State University Institutional Animal Care and Use Committee approved all
procedures involving rat offspring (IACUC #7634-R). Two male offspring per pregnant dam
were selected from in utero TN (IUTN; n = 8), in utero HS (IUHS; n = 8), and in utero
PFTN (IUPFTN; n = 8) mothers at weaning (d23 of life) and housed in individual cages (0.2
m x 0.4 m) in TN (21.8 ± 0.1ºC; 28.3 ± 0.2% RH) conditions. By experimental design,
gestation length (22 d) was the same for all selected offspring. Body weight was determined
weekly and FI measured every third day to determine average daily FI and BW gain. An
initial body scan was performed on anesthetized offspring (100 mg/mL ketamine and 10
mg/mL xylazine; 0.2 mL/100 g BW IP) using a Hologic Discovery A dual-energy X-ray
absorptiometer (DXA; Hologic, Inc.; Bedford, MA) in small animal mode with V8.26a:3
software. Offspring were scanned after an overnight fast at d26 (68.4 ± 0.7 g), d46 (190.5 ±
4.6 g BW), and d66 of life (302.9 ± 7.5 g BW) to determine percent fat, lean and bone
mineral content of individual animals. Based on tissue content, total tissue quantity and
accretion rates were calculated as we have previously described (15, 16):
(Final content, g of tissue – initial content, g of tissue) / days between DXA scans
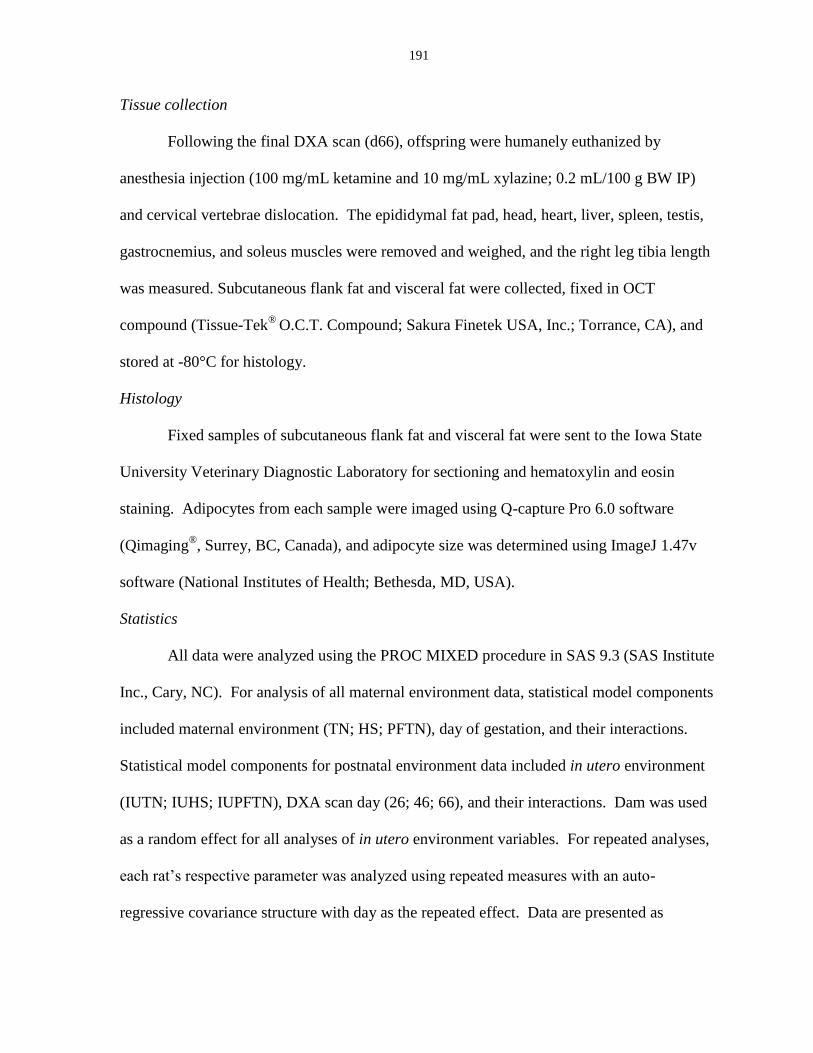
191
Tissue collection
Following the final DXA scan (d66), offspring were humanely euthanized by
anesthesia injection (100 mg/mL ketamine and 10 mg/mL xylazine; 0.2 mL/100 g BW IP)
and cervical vertebrae dislocation. The epididymal fat pad, head, heart, liver, spleen, testis,
gastrocnemius, and soleus muscles were removed and weighed, and the right leg tibia length
was measured. Subcutaneous flank fat and visceral fat were collected, fixed in OCT
compound (Tissue-Tek®
O.C.T. Compound; Sakura Finetek USA, Inc.; Torrance, CA), and
stored at -80°C for histology.
Histology
Fixed samples of subcutaneous flank fat and visceral fat were sent to the Iowa State
University Veterinary Diagnostic Laboratory for sectioning and hematoxylin and eosin
staining. Adipocytes from each sample were imaged using Q-capture Pro 6.0 software
(Qimaging®, Surrey, BC, Canada), and adipocyte size was determined using ImageJ 1.47v
software (National Institutes of Health; Bethesda, MD, USA).
Statistics
All data were analyzed using the PROC MIXED procedure in SAS 9.3 (SAS Institute
Inc., Cary, NC). For analysis of all maternal environment data, statistical model components
included maternal environment (TN; HS; PFTN), day of gestation, and their interactions.
Statistical model components for postnatal environment data included in utero environment
(IUTN; IUHS; IUPFTN), DXA scan day (26; 46; 66), and their interactions. Dam was used
as a random effect for all analyses of in utero environment variables. For repeated analyses,
each rat’s respective parameter was analyzed using repeated measures with an auto-
regressive covariance structure with day as the repeated effect. Data are presented as
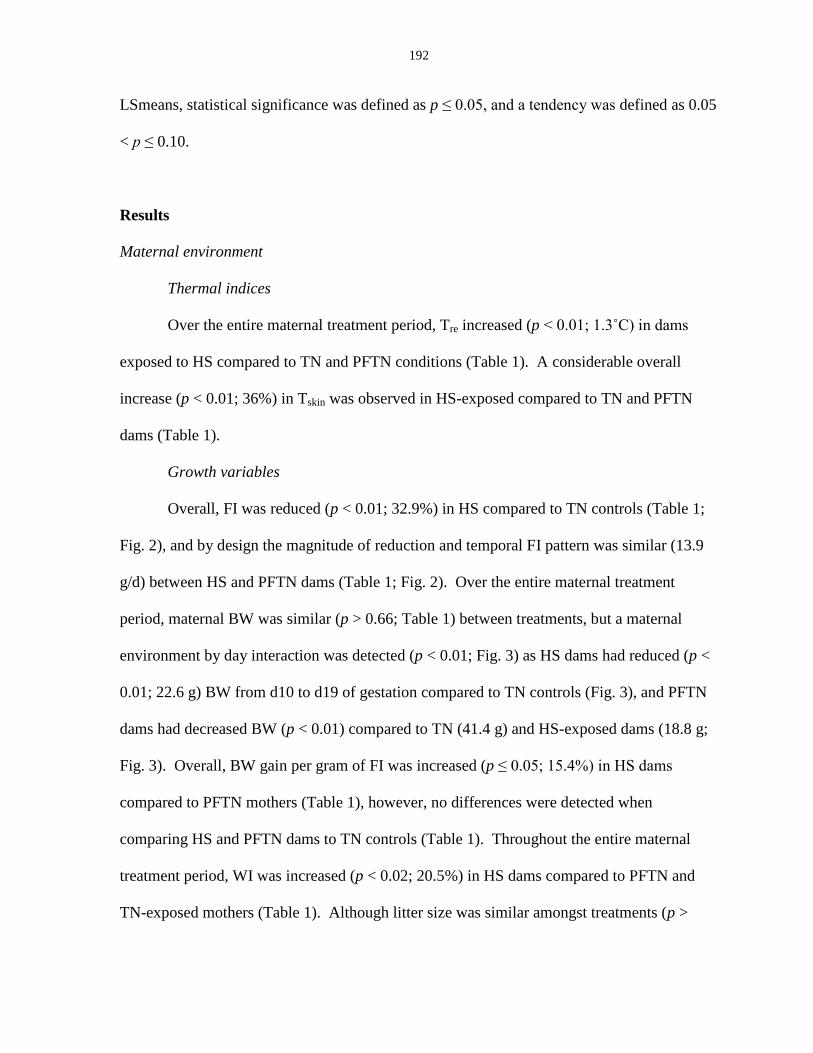
192
LSmeans, statistical significance was defined as p ≤ 0.05, and a tendency was defined as 0.05
< p ≤ 0.10.
Results
Maternal environment
Thermal indices
Over the entire maternal treatment period, Tre increased (p < 0.01; 1.3˚C) in dams
exposed to HS compared to TN and PFTN conditions (Table 1). A considerable overall
increase (p < 0.01; 36%) in Tskin was observed in HS-exposed compared to TN and PFTN
dams (Table 1).
Growth variables
Overall, FI was reduced (p < 0.01; 32.9%) in HS compared to TN controls (Table 1;
Fig. 2), and by design the magnitude of reduction and temporal FI pattern was similar (13.9
g/d) between HS and PFTN dams (Table 1; Fig. 2). Over the entire maternal treatment
period, maternal BW was similar (p > 0.66; Table 1) between treatments, but a maternal
environment by day interaction was detected (p < 0.01; Fig. 3) as HS dams had reduced (p <
0.01; 22.6 g) BW from d10 to d19 of gestation compared to TN controls (Fig. 3), and PFTN
dams had decreased BW (p < 0.01) compared to TN (41.4 g) and HS-exposed dams (18.8 g;
Fig. 3). Overall, BW gain per gram of FI was increased (p ≤ 0.05; 15.4%) in HS dams
compared to PFTN mothers (Table 1), however, no differences were detected when
comparing HS and PFTN dams to TN controls (Table 1). Throughout the entire maternal
treatment period, WI was increased (p < 0.02; 20.5%) in HS dams compared to PFTN and
TN-exposed mothers (Table 1). Although litter size was similar amongst treatments (p >
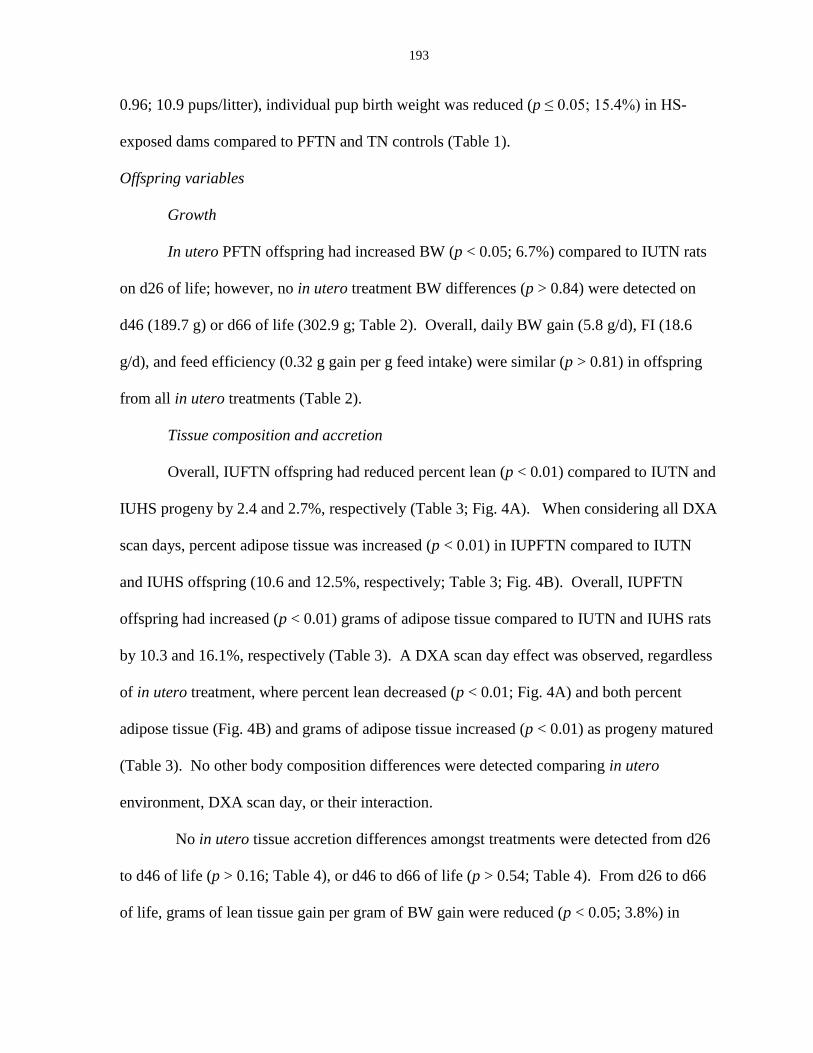
193
0.96; 10.9 pups/litter), individual pup birth weight was reduced (p ≤ 0.05; 15.4%) in HS-
exposed dams compared to PFTN and TN controls (Table 1).
Offspring variables
Growth
In utero PFTN offspring had increased BW (p < 0.05; 6.7%) compared to IUTN rats
on d26 of life; however, no in utero treatment BW differences (p > 0.84) were detected on
d46 (189.7 g) or d66 of life (302.9 g; Table 2). Overall, daily BW gain (5.8 g/d), FI (18.6
g/d), and feed efficiency (0.32 g gain per g feed intake) were similar (p > 0.81) in offspring
from all in utero treatments (Table 2).
Tissue composition and accretion
Overall, IUFTN offspring had reduced percent lean (p < 0.01) compared to IUTN and
IUHS progeny by 2.4 and 2.7%, respectively (Table 3; Fig. 4A). When considering all DXA
scan days, percent adipose tissue was increased (p < 0.01) in IUPFTN compared to IUTN
and IUHS offspring (10.6 and 12.5%, respectively; Table 3; Fig. 4B). Overall, IUPFTN
offspring had increased (p < 0.01) grams of adipose tissue compared to IUTN and IUHS rats
by 10.3 and 16.1%, respectively (Table 3). A DXA scan day effect was observed, regardless
of in utero treatment, where percent lean decreased (p < 0.01; Fig. 4A) and both percent
adipose tissue (Fig. 4B) and grams of adipose tissue increased (p < 0.01) as progeny matured
(Table 3). No other body composition differences were detected comparing in utero
environment, DXA scan day, or their interaction.
No in utero tissue accretion differences amongst treatments were detected from d26
to d46 of life (p > 0.16; Table 4), or d46 to d66 of life (p > 0.54; Table 4). From d26 to d66
of life, grams of lean tissue gain per gram of BW gain were reduced (p < 0.05; 3.8%) in
194
IUPFTN compared to IUHS rats; however, no differences were detected when compared to
IUTN controls (Table 4). Adipose tissue gain per gram of BW gain from d26 to d66 of life
increased (p < 0.04; 15.0%) in IUPFTN compared to IUHS offspring, but no differences
were observed when compared to IUTN controls (Table 4). From d26 to d66 of life, the ratio
of adipose to lean accretion increased (p < 0.04; 19.2%) in IUPFTN compared to IUHS
offspring; however, no differences were detected comparing IUHS and IUPFTN offspring to
IUTN controls (Table 4). No other in utero treatment differences in tissue accretion were
observed (Table 4).
Organ and tissue weights
Epididymal fat pad weight was increased (p ≤ 0.05; 0.77 g) in IUPFTN compared to
IUHS rats (Table 5), but no differences were detected when comparing IUHS and IUPFTN
offspring to IUTN controls (Table 5). In utero PFTN rats had increased (p < 0.04)
epididymal fat pad weight as a percent of BW compared to IUTN and IUHS rats (17.1 and
21.8%, respectively; Table 5). Testis weight and testis weight as a percent of BW were
increased (p < 0.05) in IUPFTN compared to IUTN and IUHS rats by 10.6 and 13.4%, and
7.4 and 11.5%, respectively (Table 5). Gastrocnemius muscle weight and gastrocnemius
muscle weight as a percent of BW were similar (p > 0.72; 1.77 g and 0.58%, respectively)
amongst in utero treatments (Table 5). Soleus muscle weight and soleus muscle weight as a
percent of BW were similar (p > 0.91; 0.13 g and 0.04%, respectively) between in utero
treatments (Table 5). No other organ and tissue weight differences were detected between in
utero treatments (Table 5).
195
Histology
Adipocyte size was increased (p < 0.01) in subcutaneous adipose tissue in IUPFTN
compared to IUTN and IUHS offspring by 83 and 92%, respectively (Table 5; Fig. 5). No
adipocyte size differences in visceral adipose tissue (p > 0.63; 3895 ± 505.6 microns2; Table
5) were detected amongst in utero treatments.
Discussion
Heat stress jeopardizes efforts by animal agriculture industries to efficiently produce
animal products for human consumption (3). The negative effects of HS will likely become
more apparent as climate models predict an increase in extreme summer conditions for most
U.S. animal producing areas (21). Although the effects of HS on animal production during
postnatal life are well-documented (10, 35), the direct and indirect effects of in utero HS on
postnatal animal performance and metabolism are not well-defined.
Intrauterine stress alters postnatal phenotypes and can negatively impact future
metabolism and nutrient partitioning (9, 15, 19). Specifically, prenatal under-nutrition,
results in reduced lean content and greater adiposity in offspring (1, 28, 30). Likewise, in
utero HS increases postnatal adipose accretion at the expense of skeletal muscle mass in pigs
(15). Considering the well-documented energy intake reduction of most species in response
to HS (10, 35), the negative intrauterine programming effects of prenatal HS may be an
indirect result of maternal feed restriction. In the current study, despite similar maternal feed
intake, IUPFTN offspring had increased adipose tissue mass compared to IUHS and IUTN
progeny (Table 3). Increased adiposity of IUPFTN compared to IUHS offspring was
accompanied by a slight reduction in total lean tissue content (Table 3), likely due to
196
modified postnatal nutrient partitioning resulting from either reduced protein synthesizing
capacity (15, 36), or decreased glucose uptake by skeletal muscle as described in intrauterine
growth restricted rodents by Ozanne and colleagues (25).
The stark differences in postnatal phenotypes described above may shed light on the
mechanism by which HS affects bioenergetics. A previous study by our lab (26) reported
enhanced BW gain in heat-stressed pigs compared to pair-fed counterparts in TN conditions.
Similarly, heat-stressed dams in the present study gained more BW (19 g), had increased BW
gain per day (19%) and BW gain per gram of FI (15%) compared to PFTN mothers, (Table
1), and this BW differential may have actually been greater (in terms of total maternal tissue
mass) when considering that total litter weight of IUHS mothers was 11.9 g less compared to
PFTN dams (Table 1). While specific mechanisms are unknown, increased BW gain and
efficiency of converting dietary nutrients into tissue may be the result of HS-induced
reductions in maintenance costs (15, 16) and heat production (17), thus sparing energy for
additional growth. This could imply that although HS and PFTN mothers consumed similar
amounts of gross energy, nutrient availability may have been greater in HS dams.
Subcutaneous adipocyte hypertrophy is closely linked with obesity (24, 32) and is a
postnatal phenotypic consequence of in utero under-nutrition (11, 23). In the present study,
subcutaneous adipocyte size was increased (87%) in IUPFTN compared to IUHS and IUTN
progeny (Table 5; Fig. 5). A report by O’Connell and colleagues (24) indicates that the
degree to which adipocytes can expand to accommodate excess lipid may be determined by
intrauterine influences (i.e. maternal under-nutrition, in utero stress). As a result,
hypertrophic adipocytes may indirectly influence metabolism by increasing incidence of
197
hyperinsulinemia because larger adipocytes are less sensitive to insulin action (13, 31), and
may be an independent predictor of type II diabetes (20, 39).
Increased epididymal fat pad weight is frequently reported in obese rodent models
(18), and may be a postnatal consequence of in utero under-nutrition (8). In accordance with
the aforementioned reports, epididymal fat pad weight and epididymal fat pad weight as a
percent of BW was increased (25 and 22%, respectively) in IUPFTN compared to IUHS
offspring (Table 4). The increased epididymal fat pad weight corroborates the DXA data and
because offspring FI and BW gain were similar, it is likely a consequence of preprogrammed
nutrient partitioning that favors adipose deposition in IUPFTN progeny. In addition, testis
weight and testis weight as a percent of BW was increased (12 and 9%, respectively) in
IUPFTN versus IUTN and IUHS progeny (Table 4). These results agree with those by Rae
and colleagues (27) where testis weight of sheep fetuses exposed to prenatal malnutrition was
numerically increased. Causes for how or why prenatal nutrient restriction increases testis
size is unknown, but may have practical implications to reproductive success in agriculturally
important animals. Although total body lean tissue content was reduced (2.6%) in IUPFTN
compared to IUHS and IUTN offspring, no in utero treatment differences in gastrocnemius
and soleus muscle weights were detected. Reasons for the inconsistency between whole
body lean tissue and specific muscle mass measurements are unknown, but a likely
explanation is that the decrease in lean content of IUPFTN offspring was not large enough to
be detected by gross measurements of individual muscles mass in a small sample size.
Reduced birth weight is a well-documented effect of in utero under-nutrition (1, 28,
30, 34) and hyperthermia (29, 33, 37), and is likely a consequence of intrauterine growth
retardation and shortened gestation length. In the present study, IUHS offspring had reduced
198
birth weight (16%) compared to IUTN controls, but IUPFTN treatment did not impact pup
weight (Table 1). Although birth weight was reduced for IUHS rats, litter size and gestation
length (by experimental design) were similar for all in utero treatments. Additionally, since
no pup birth weight differences were observed for IUPFTN offspring, this indicates that
reduced birth weight in IUHS rats was not a function of in utero restricted feed intake or
reduced gestation length. Instead, reduced birth weight may be a direct impact of prenatal
hyperthermia, possibly mediated by reduced placental blood flow as has been previously
suggested (22, 29). Since fetal development was retarded despite the overall apparent
increase in available nutrients in heat-stressed dams (as indicated by enhanced dam growth),
it may imply that the previously reported (15) negative postnatal consequences of in utero
HS in pigs are mediated by intrauterine growth retardation as opposed to maternal under-
nutrition. Further, as low birth weight is a significant risk factor for the development of
obesity in later life (34), IUHS offspring may have accumulated more adipose tissue if the
experiment had lasted longer into life.
Although IUHS treatments reduced offspring birth weight, pup BW at weaning was
similar to IUTN controls. This indicates that lactogenic capacity in heat-stressed mothers
was likely not compromised and was copious enough to allow for “catch-up” growth in
IUHS offspring. While IUPFTN conditions altered offspring body composition compared to
IUHS treatment, no BW or FI differences were detected during postnatal growth (Table 3).
These results likely represent pre-programmed differences in the hierarchy of tissue accretion
between IUPFTN and IUHS offspring, independent of energy intake and growth rate.
However, a lack of FI differences in IUPFTN offspring was surprising, since hyperphagia is
a commonly reported postnatal consequence of prenatal under- nutrition (4, 38), possibly
199
mediated by altered expression of the appetite controlling peptides pro-opiomelanocortin and
neuropeptide Y (6, 14). Reasons for the lack of postnatal hyperphagia in IUPFTN offspring
may be due to less severe maternal nutrient restriction in the current experiment compared to
previous reports (4, 38), since the primary objective was to mirror the reduced FI in heat-
stressed dams (33% reduction) and not to induce marked malnutrition.
A previous report by our lab (15) indicates that in utero HS alters postnatal nutrient
partitioning in growing pigs; however, no differences were observed when comparing IUHS
versus IUTN rats in the present study. Reasons for the difference between models are
unclear but may be due to differences in maternal environment (rat = cycling 30 to 34°C; pig
= cycling 27 to 37°C), timing of the gestational insult (rat = 73% of gestation; pig = 95% of
gestation), or because FI reductions were not expressed in heat-stressed compared to TN
sows due to the standard swine industry practice of limit-feeding during gestation (15).
Additionally, there may be species differences in how maternal HS affects fetal and postnatal
development.
Perspectives and Significance
Previous reports by our lab indicate that in utero HS alters postnatal nutrient
partitioning in pigs, and we hypothesized that this prenatal programming may be mediated by
maternal feed restriction. However, our hypothesis was challenged by the current rodent
model of in utero HS. Specifically, offspring from pair-fed dams in TN conditions had
altered body composition compared to progeny from heat-stressed dams, despite similar
levels of maternal nutrient restriction. These results may have implications for HS
bioenergetics and could represent reductions in maternal maintenance costs and heat
200
production (as indicated by enhanced dam growth). Although an apparent increase in
available nutrients occurred in heat-stressed dams, IUHS birth weight was reduced, which
may be indicative of intrauterine growth retardation and could predict enhanced adiposity
later in life. Although body composition differences were not observed comparing IUHS and
IUTN progeny during this particular stage of life, it may simply be a result of study design or
species differences. Furthermore, the mechanisms by which in utero HS alters postnatal
nutrient partitioning are still unknown, and this experiment likely needs to be repeated in
pigs.
Acknowledgements
The authors would like to acknowledge the assistance of Samantha Lei, M. Victoria
Sanz Fernandez, Jake Seibert, and Sara Stoakes in collecting animal tissues.
Declaration of Interest
Results described here within were supported by the Agriculture and Food Research
Initiative Competitive Grant no. 2011-67003-30007 from the USDA National Institute of
Food and Agriculture. Any opinion, findings, conclusions or recommendations expressed in
this publication are those of the authors and do not necessarily reflect the view of the U.S.
Department of Agriculture. No conflicts of interest, financial or otherwise are declared by the
author (s).

201
Author Contributions
J.S. Johnson and L.H. Baumgard were responsible for experimental design and
manuscript preparation. R.P. Rhoads, J.W. Ross, J.T Selsby and A.F. Keating provided
assistance with statistical analysis and experimental design. M. Abuajamieh assisted with
data collection.
202
References
1. Barker DJP, Godfrey KM, Gluckman PD, Harding JE, Owens JA, and
Robinson JS. Fetal nutrition and cardiovascular disease in adult life. The Lancet 341:
938-941, 1993.
2. Baumgard LH, Rhoads RP, Rhoads ML, Gabler NK, Ross JW, Keating AF,
Boddicker RL, Lenka S, and Sejian V. Impact of climate change on livestock
production. In: Environmental Stress and Amelioration in Livestock Production
edited by V Sejian SMKN, T Ezeji, J Lakritz, and R Lal, p. 413-468, 2012.
3. Baumgard LH, and Rhoads RP. Effects of heat stress on post-absorptive
metabolism and energetics. Annu Rev Anim Bio 1: 311-337, 2013.
4. Bellinger L, and Langley-Evans SC . Fetal programming of appetite by
exposure to a maternal low-protein diet in the rat. Clin Sci 109: 413-420, 2005.
5. Brown-Brandl TM, Nienaber JA, Xin H, Gates RS. A literature review of swine
production. Trans ASAE 47: 259-270, 2004.
6. Coupe B, Grit I, Darmaun D, and Parnet P. The timing of "catch-up growth"
affects metabolism and appetite regulation in male rats born with intrauterine growth
restriction. Am J Physiol Regul Integr Comp Physiol 297: R813-R824, 2009.
7. Desai M, Gayle D, Babu J, and Ross MG. Programmed obesity in intrauterine
growth-restricted newborns: modulation by newborn nutrition. Am J Physiol Regul
Integr Comp Physiol 288: R91-R96, 2005.
203
8. Ford SP, Hess BW, Schwope MM, Mijland MJ, Gilbert JS, Vonnahme KA,
Means WJ, Han H, and Nathanielsz PW. Maternal under nutrition during early to
mid-gestation in the ewe results in altered growth, adiposity, and glucose tolerance in
male offspring. J Anim Sci 85: 1285-1294, 2007.
9. Foxcroft GR, Dixon WT, Dyck MK, Novak S, Harding JC, and Almeida FC.
Prenatal programming of postnatal development of the pig. Soc Reprod Fertil Suppl
66: 213-231, 2009.
10. Fuquay JW. Heat stress as it affects animal production. J Anim Sci 52:164-174,
1981.
11. Garcia AP, Palou M, Sanchez J, Priego T, Palou A, and Pico C. Moderate caloric
restriction during gestation in rats alters adipose tissue sympathetic innervation and
later adiposity in offspring. PLoS One 6: e17313, 2011.
12. Hau J, and Schapiro SJ. Handbook of laboratory animal science, volume 1, 3rd
ed:
Essential principles and practices. United States: Taylor and Francis pp. 357-358,
2011.
13. Hirsch J, and Knittle JL. Cellularity of obese and non-obese human adipose tissue.
Fed Proc 29: 1516-1521, 1970.
14. Ikenasio-Thorpe BA, Breier BH, Vickers MH, and Fraser M. Prenatal influences
on susceptibility to diet-induced obesity are mediated by altered neuroendocrine gene
expression. J Endocrinol 193: 31-37, 2007.
15. Johnson JS, Patience JF, Ross JW, Gabler NK, Lucy MC, Safranski TJ, Rhoads
RP, and Baumgard LH. In utero heat stress alters body composition during the
early finishing phase (60 to 80 kg) in pigs. J Anim Sci In Press, 2014a.
204
16. Johnson JS, Patience JF, Ross JW, Gabler NK, Lucy MC, Safranski TJ, Rhoads
RP, and Baumgard LH. Effects of in utero heat stress and core body temperature on
tissue accretion during the growing phase (30 to 60 kg) in pigs. J Anim Sci In Press,
2014b.
17. Kerr BJ, Yen JT, Nienaber JA, and Easter RA. Influences of dietary protein level,
amino acid supplementation and environmental temperature on performance, body
composition, organ weights and total heat production of growing pigs. J Anim Sci 81:
1998-2007, 2003.
18. Knittle JL, and Hirsch J. Effect of early nutrition on the development of rat
epididymal fat pads: cellularity and metabolism. J Clin Invest 47: 2091-2098, 1968.
19. Limesand SW, Rozance PJ, Smith D, and Hay WW, Jr. Increased insulin
sensitivity and maintenance of glucose utilization rates in fetal sheep with placental
insufficiency and intrauterine growth restriction. Am J Physiol Endocrinol Metab 56:
E1716-E1725, 2007.
20. Lonn M, Mehlig K, Bengtsson C, and Lissner L. Adipocyte size predicts incidence
of type 2 diabetes in women. FASEB J 24: 326-331, 2010.
21. Luber G, and McGeehin M. Climate change and extreme heat events. Am J Prevent
Med 35: 459-467, 2008.
22. Nakamura H, Nagase H, Ogino K, Hatta K, and Matsuzaki I. Heat produces
uteroplacental circulatory disturbance in pregnant rats through action of corticotropin
releasing hormone (CRH). Placenta 21: 510-515, 2000.
205
23. Nguyen LT, Muhlhausler BS, Botting KJ, and Morrison JL. Maternal
undernutrition alters fat cell size distribution, but not lipogenic gene expression, in the
visceral fat of the late gestation guinea pig fetus. Placenta 31: 902-909, 2010.
24. O’Connell J, Lynch L, Cawood TJ, Kwasnik A, Nolan N, Geoghegan J,
McCormick A, O’Farrelly C, and O’Shea D. The relationship of omental and
subcutaneous adipocyte size to metabolic disease in severe obesity. PLoS ONE 5:
e9997, 2010.
25. Ozanne SE, Olsen GS, Hansen LL, Tingey KJ, Nave BT, Wang CL, Hartil K,
Petry CJ, Buckley AJ, and Mosthaf-Seedorf L. Early growth restriction leads to
down regulation of protein kinase C zeta and insulin resistance in skeletal muscle. J
Endocrinol 177: 235-241, 2003.
26. Pearce SC, Gabler NK, Ross JW, Escobar J, Patience JF, Rhoads RP, and
Baumgard LH. The effects of heat stress and plane of nutrition on metabolism in
growing pigs. J Anim Sci 91: 2108-2118, 2013.
27. Rae MT, Kyle CE, Miller DW, Hammond AJ, Brooks AN, and Rhind SM. The
effects of undernutrition, in utero, on reproductive function in adult male and female
sheep. Anim Reprod Sci 72: 63-71, 2002.
28. Ravelli GP, Stein ZA, and Susser MW. Obesity in young men after famine
exposure in utero and early infancy. N Engl J Med 295: 349-353, 1976.
29. Reynolds LP, Ferrell CL, Nienaber JA, and Ford SP. Effects of chronic
environmental heat stress on blood flow and nutrient uptake of the gravid bovine
uterus and foetus. J Agric Sci 104-289-297, 1985.
206
30. Roseboom T, de Rooij S, and Painter R. The Dutch famine and its long-term
consequences for adult health. Early Hum Dev 82: 485-491, 2006.
31. Salans LB, Knittle JL, and Hirsch J. Role of adipose cell size and adipose tissue
insulin sensitivity in the carbohydrate intolerance of human obesity. J Clin Invest 47:
153-165, 1968.
32. Shankar K, Harrell A, Liu X, Gilchrist JM, Ronis MJ, and Badger TM. Maternal
obesity at conception programs obesity in the offspring. Am J Physiol Regul Integr
Comp Physiol 294: R528-R538, 2008.
33. Shelton M, and Huston JE. Effects of high temperature stress during gestation on
certain aspects of reproduction in the ewe. J Anim Sci 27: 153-158, 1968.
34. Spencer SJ. Early life programming of obesity: the impact of the perinatal
environment on the development of obesity and metabolic dysfunction in the
offspring. Curr Diabetes Rev 8: 55-68, 2012.
35. St-Pierre NR, Cobanov B, and Schnitkey G. Economic losses from heat stress by
U.S livestock industries. J Dairy Sci 86: E52-E77, 2003.
36. Streffer C. Aspects of biochemical effects by hyperthermia. Natl Cancer Inst
Monogr 61:11–17, 1982.
37. Tao S, Monteiro AP, Thompson IM, Hayen MJ, and Dahl GE. Effect of late-
gestation maternal heat stress on growth and immune function of dairy calves. J
Dairy Sci 95: 128-136, 2012.
38. Vickers MH, Breier BH, Cutfield WS, Hofman PL, and Gluckman PD. Fetal
origins of hyperphagia, obesity, and hypertension and postnatal amplification by
hypercaloric nutrition. Am J Physiol Endocrinol Metab 279: E83-E87, 2000.

207
39. Weyer C, Foley JE, Bogardus C, Tataranni PA, and Pratley RE. Enlarged
subcutaneous abdominal adipocyte size, but not obesity itself, predicts Type II
diabetes independent of insulin resistance. Diabetologia 43: 1498-1506, 2000.
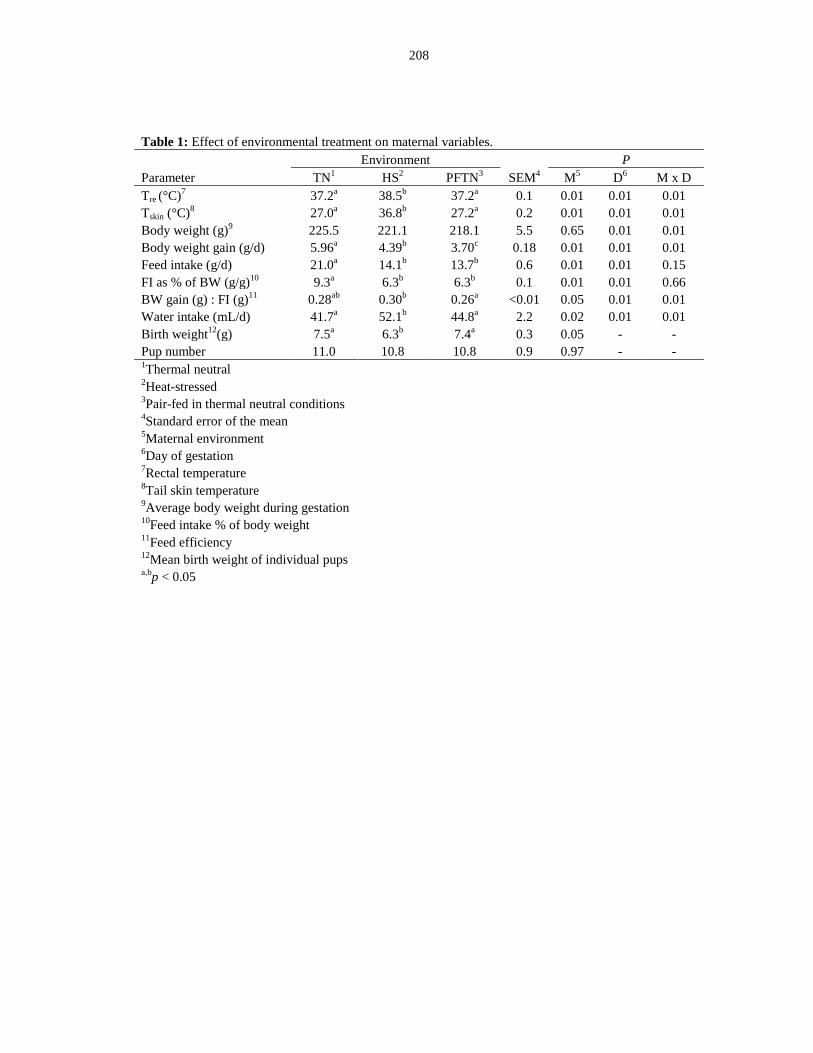
208
Table 1: Effect of environmental treatment on maternal variables.
Environment P
Parameter TN1 HS
2 PFTN
3 SEM
4 M
5 D
6 M x D
Tre (°C)7 37.2
a 38.5
b 37.2
a 0.1 0.01 0.01 0.01
Tskin (°C)8 27.0
a 36.8
b 27.2
a 0.2 0.01 0.01 0.01
Body weight (g)9 225.5 221.1 218.1 5.5 0.65 0.01 0.01
Body weight gain (g/d) 5.96a
4.39b
3.70c
0.18 0.01 0.01 0.01
Feed intake (g/d) 21.0a 14.1
b 13.7
b 0.6 0.01 0.01 0.15
FI as % of BW (g/g)10
9.3a 6.3
b 6.3
b 0.1 0.01 0.01 0.66
BW gain (g) : FI (g)11
0.28ab
0.30b
0.26a
<0.01 0.05 0.01 0.01
Water intake (mL/d) 41.7a 52.1
b 44.8
a 2.2 0.02 0.01 0.01
Birth weight12
(g) 7.5a 6.3
b 7.4
a 0.3 0.05 - -
Pup number 11.0 10.8 10.8 0.9 0.97 - - 1Thermal neutral
2Heat-stressed
3Pair-fed in thermal neutral conditions
4Standard error of the mean
5Maternal environment
6Day of gestation
7Rectal temperature
8Tail skin temperature
9Average body weight during gestation
10Feed intake % of body weight
11Feed efficiency
12Mean birth weight of individual pups
a,bp < 0.05
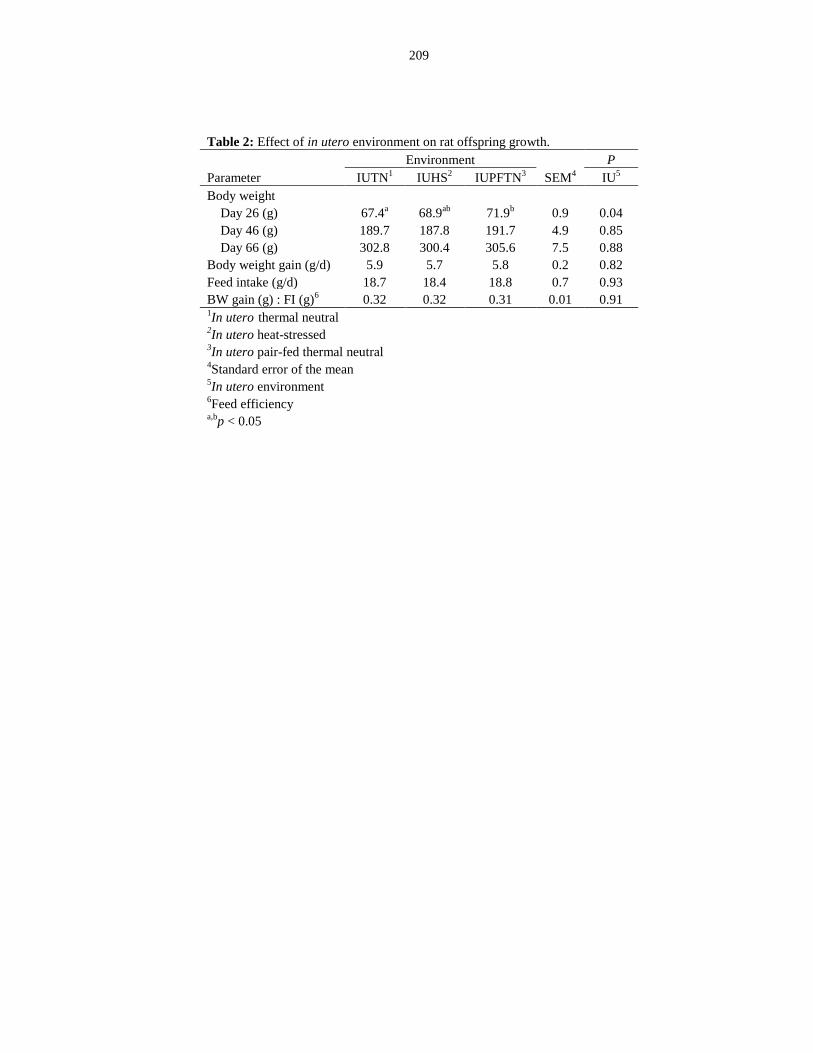
209
Table 2: Effect of in utero environment on rat offspring growth.
Environment P
Parameter IUTN1 IUHS
2 IUPFTN
3 SEM
4 IU
5
Body weight
Day 26 (g) 67.4a 68.9
ab 71.9
b 0.9 0.04
Day 46 (g) 189.7 187.8 191.7 4.9 0.85
Day 66 (g) 302.8 300.4 305.6 7.5 0.88
Body weight gain (g/d) 5.9 5.7 5.8 0.2 0.82
Feed intake (g/d) 18.7 18.4 18.8 0.7 0.93
BW gain (g) : FI (g)6 0.32 0.32 0.31 0.01 0.91
1In utero
thermal neutral
2In utero heat-stressed
3In utero pair-fed thermal neutral
4Standard error of the mean
5In utero environment
6Feed efficiency
a,bp < 0.05
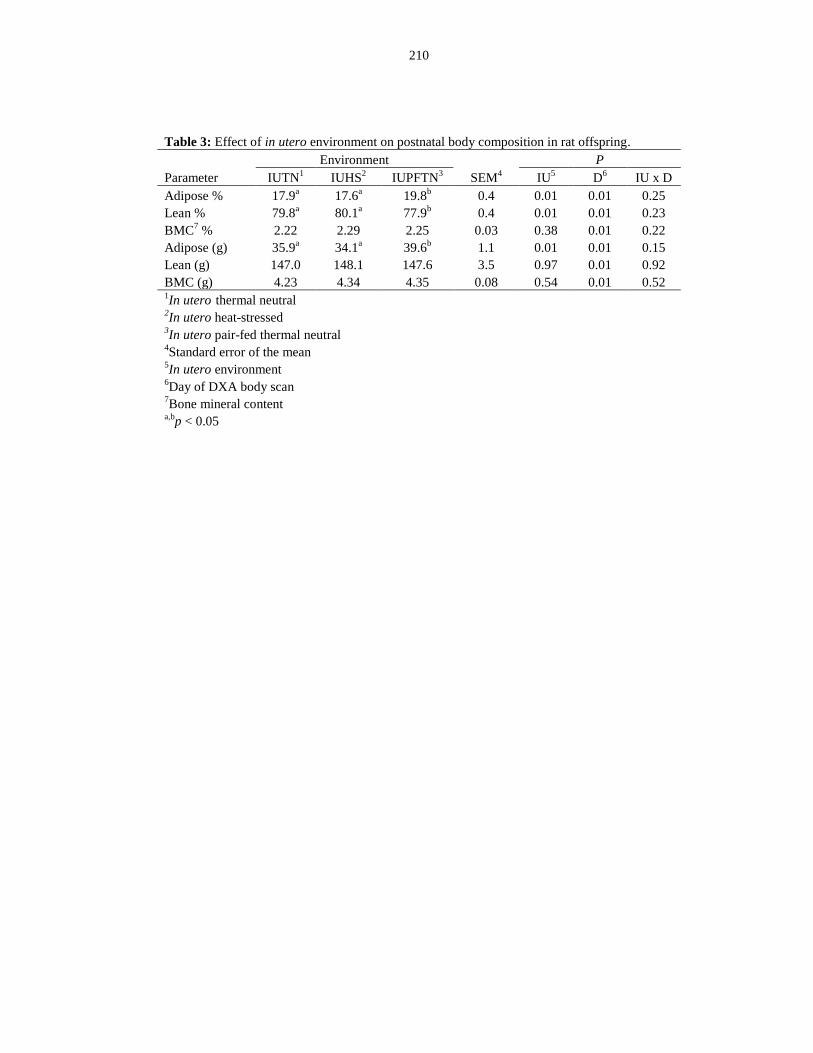
210
Table 3: Effect of in utero environment on postnatal body composition in rat offspring.
Environment P
Parameter IUTN1 IUHS
2 IUPFTN
3 SEM
4 IU
5 D
6 IU x D
Adipose % 17.9a 17.6
a 19.8
b 0.4 0.01 0.01 0.25
Lean % 79.8a 80.1
a 77.9
b 0.4 0.01 0.01 0.23
BMC7 % 2.22 2.29 2.25 0.03 0.38 0.01 0.22
Adipose (g) 35.9a 34.1
a 39.6
b 1.1 0.01 0.01 0.15
Lean (g) 147.0 148.1 147.6 3.5 0.97 0.01 0.92
BMC (g) 4.23 4.34 4.35 0.08 0.54 0.01 0.52 1In utero
thermal neutral
2In utero heat-stressed
3In utero pair-fed thermal neutral
4Standard error of the mean
5In utero environment
6Day of DXA body scan
7Bone mineral content
a,bp < 0.05
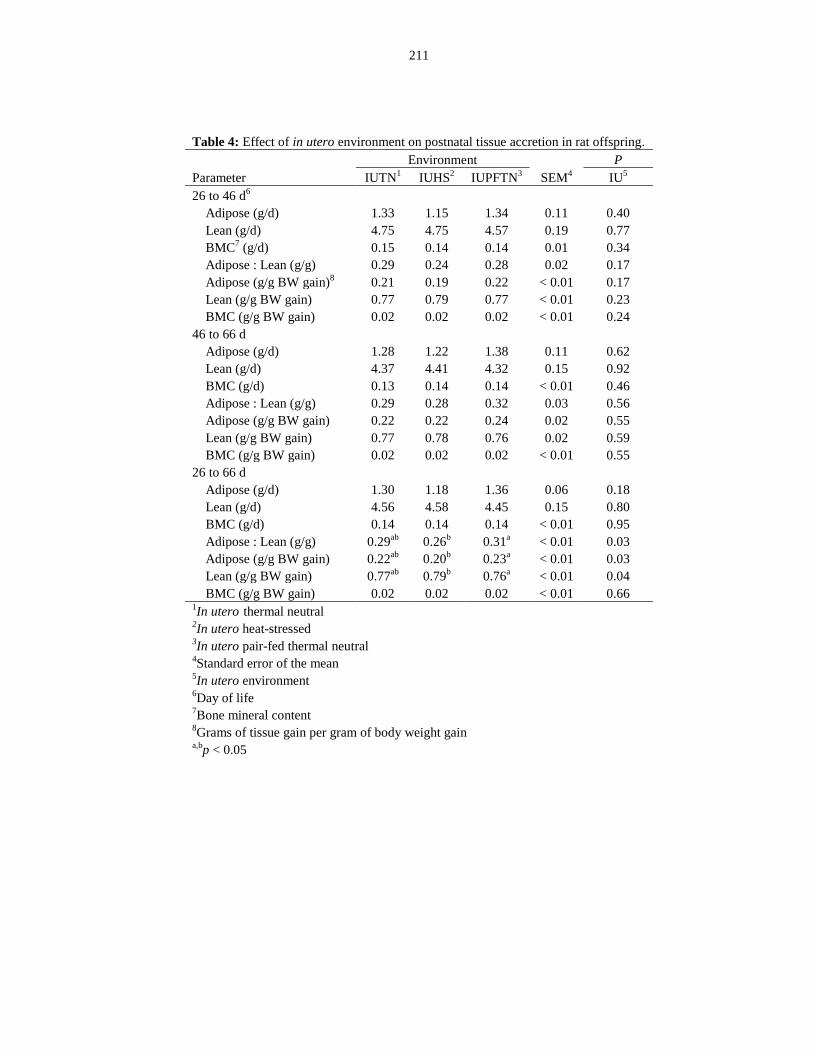
211
Table 4: Effect of in utero environment on postnatal tissue accretion in rat offspring.
Environment P
Parameter IUTN1 IUHS
2 IUPFTN
3 SEM
4 IU
5
26 to 46 d6
Adipose (g/d) 1.33 1.15 1.34 0.11 0.40
Lean (g/d) 4.75 4.75 4.57 0.19 0.77
BMC7 (g/d) 0.15 0.14 0.14 0.01 0.34
Adipose : Lean (g/g) 0.29 0.24 0.28 0.02 0.17
Adipose (g/g BW gain)8 0.21 0.19 0.22 < 0.01 0.17
Lean (g/g BW gain) 0.77 0.79 0.77 < 0.01 0.23
BMC (g/g BW gain) 0.02 0.02 0.02 < 0.01 0.24
46 to 66 d
Adipose (g/d) 1.28 1.22 1.38 0.11 0.62
Lean (g/d) 4.37 4.41 4.32 0.15 0.92
BMC (g/d) 0.13 0.14 0.14 < 0.01 0.46
Adipose : Lean (g/g) 0.29 0.28 0.32 0.03 0.56
Adipose (g/g BW gain) 0.22 0.22 0.24 0.02 0.55
Lean (g/g BW gain) 0.77 0.78 0.76 0.02 0.59
BMC (g/g BW gain) 0.02 0.02 0.02 < 0.01 0.55
26 to 66 d
Adipose (g/d) 1.30 1.18 1.36 0.06 0.18
Lean (g/d) 4.56 4.58 4.45 0.15 0.80
BMC (g/d) 0.14 0.14 0.14 < 0.01 0.95
Adipose : Lean (g/g) 0.29ab
0.26b 0.31
a < 0.01 0.03
Adipose (g/g BW gain) 0.22ab
0.20b 0.23
a < 0.01 0.03
Lean (g/g BW gain) 0.77ab
0.79b 0.76
a < 0.01 0.04
BMC (g/g BW gain) 0.02 0.02 0.02 < 0.01 0.66 1In utero
thermal neutral
2In utero heat-stressed
3In utero pair-fed thermal neutral
4Standard error of the mean
5In utero environment
6Day of life
7Bone mineral content
8Grams of tissue gain per gram of body weight gain
a,bp < 0.05
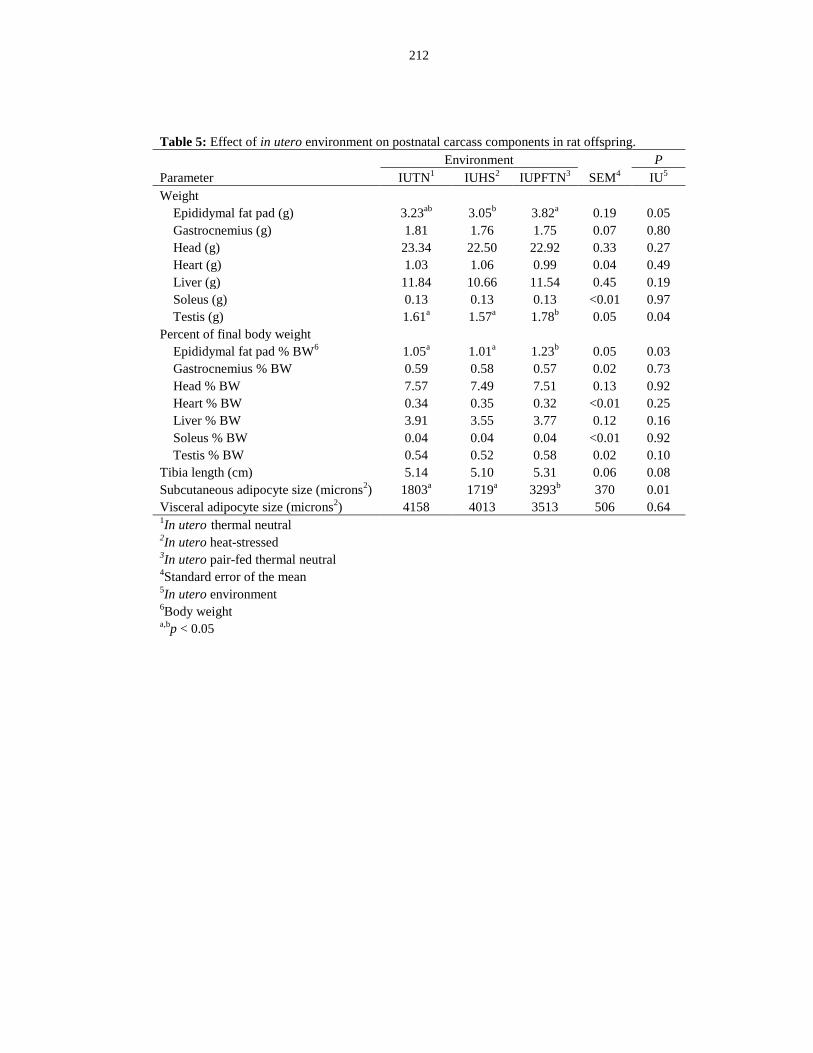
212
Table 5: Effect of in utero environment on postnatal carcass components in rat offspring.
Environment P
Parameter IUTN1 IUHS
2 IUPFTN
3 SEM
4 IU
5
Weight
Epididymal fat pad (g) 3.23ab
3.05b 3.82
a 0.19 0.05
Gastrocnemius (g) 1.81 1.76 1.75 0.07 0.80
Head (g) 23.34 22.50 22.92 0.33 0.27
Heart (g) 1.03 1.06 0.99 0.04 0.49
Liver (g) 11.84 10.66 11.54 0.45 0.19
Soleus (g) 0.13 0.13 0.13 <0.01 0.97
Testis (g) 1.61a 1.57
a 1.78
b 0.05 0.04
Percent of final body weight
Epididymal fat pad % BW6
1.05a 1.01
a 1.23
b 0.05 0.03
Gastrocnemius % BW 0.59 0.58 0.57 0.02 0.73
Head % BW 7.57 7.49 7.51 0.13 0.92
Heart % BW 0.34 0.35 0.32 <0.01 0.25
Liver % BW 3.91 3.55 3.77 0.12 0.16
Soleus % BW 0.04 0.04 0.04 <0.01 0.92
Testis % BW 0.54 0.52 0.58 0.02 0.10
Tibia length (cm) 5.14 5.10 5.31 0.06 0.08
Subcutaneous adipocyte size (microns2) 1803
a 1719
a 3293
b 370 0.01
Visceral adipocyte size (microns2) 4158 4013 3513 506 0.64
1In utero
thermal neutral
2In utero heat-stressed
3In utero pair-fed thermal neutral
4Standard error of the mean
5In utero environment
6Body weight
a,bp < 0.05
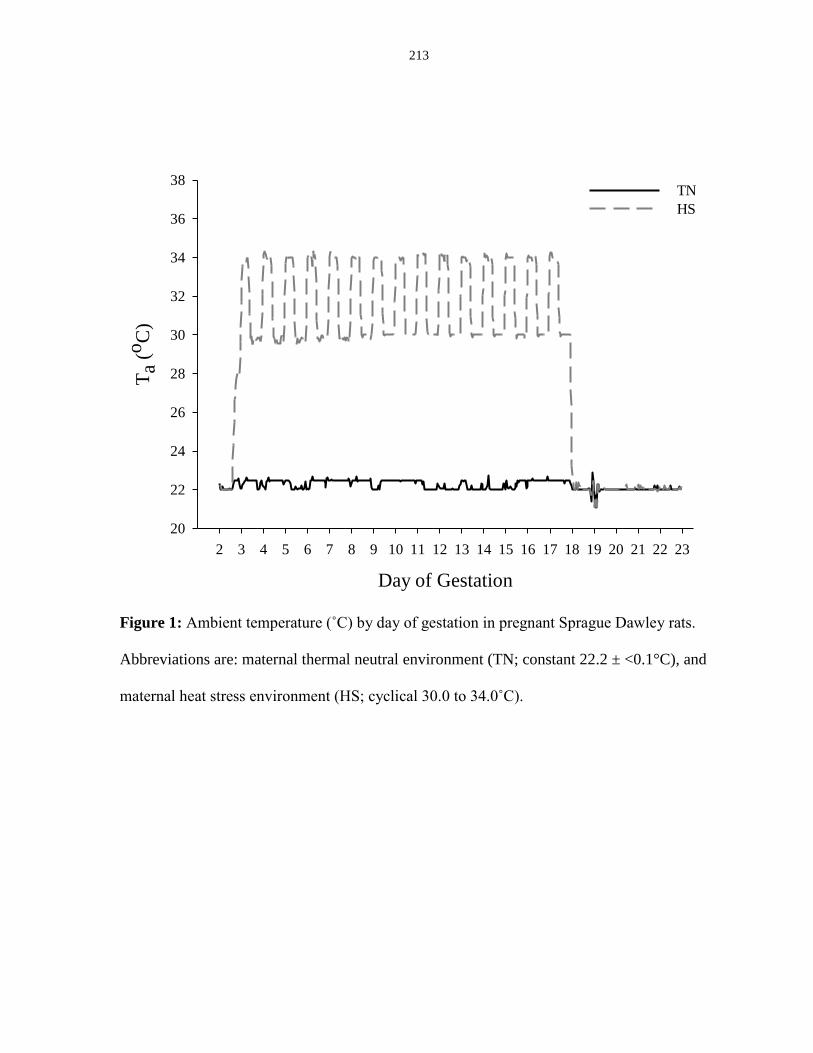
213
Figure 1: Ambient temperature (˚C) by day of gestation in pregnant Sprague Dawley rats.
Abbreviations are: maternal thermal neutral environment (TN; constant 22.2 ± <0.1°C), and
maternal heat stress environment (HS; cyclical 30.0 to 34.0˚C).
Day of Gestation
2 3 4 5 6 7 8 9 10 11 12 13 14 15 16 17 18 19 20 21 22 23
Ta
(oC
)
20
22
24
26
28
30
32
34
36
38TN
HS
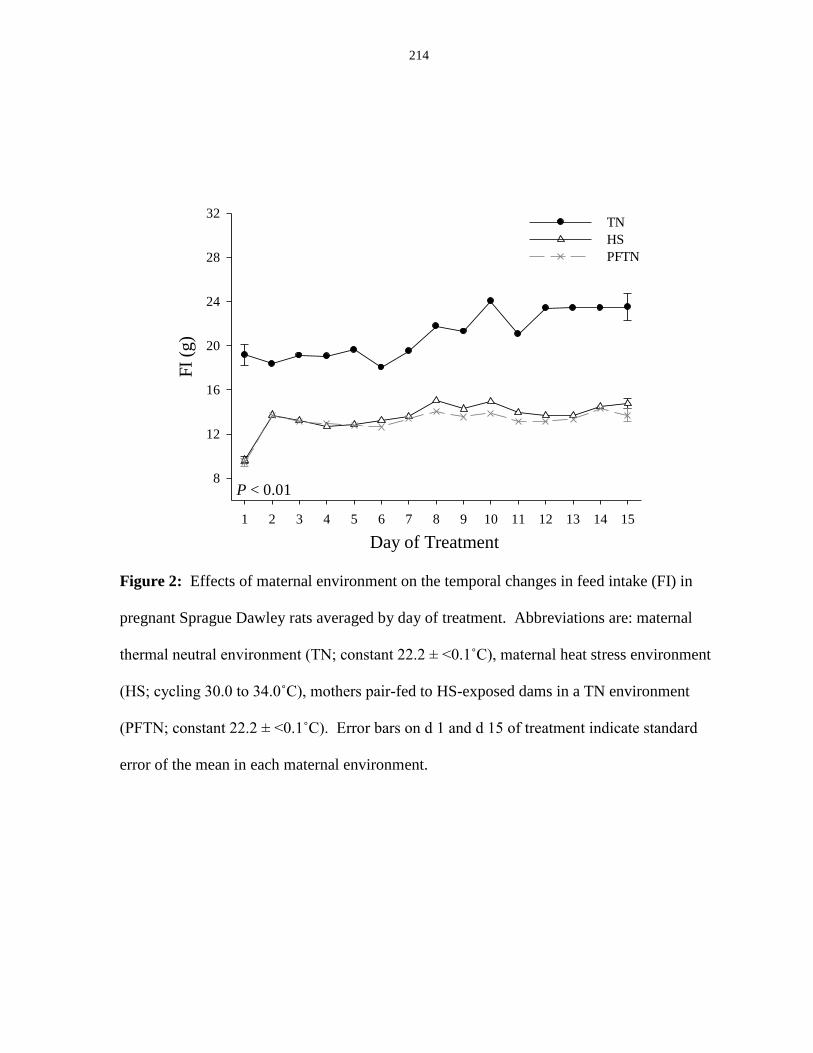
214
1 2 3 4 5 6 7 8 9 10 11 12 13 14 15
FI
(g)
8
12
16
20
24
28
32TN
HS
PFTN
P < 0.01
Day of Treatment
Figure 2: Effects of maternal environment on the temporal changes in feed intake (FI) in
pregnant Sprague Dawley rats averaged by day of treatment. Abbreviations are: maternal
thermal neutral environment (TN; constant 22.2 ± <0.1˚C), maternal heat stress environment
(HS; cycling 30.0 to 34.0˚C), mothers pair-fed to HS-exposed dams in a TN environment
(PFTN; constant 22.2 ± <0.1˚C). Error bars on d 1 and d 15 of treatment indicate standard
error of the mean in each maternal environment.
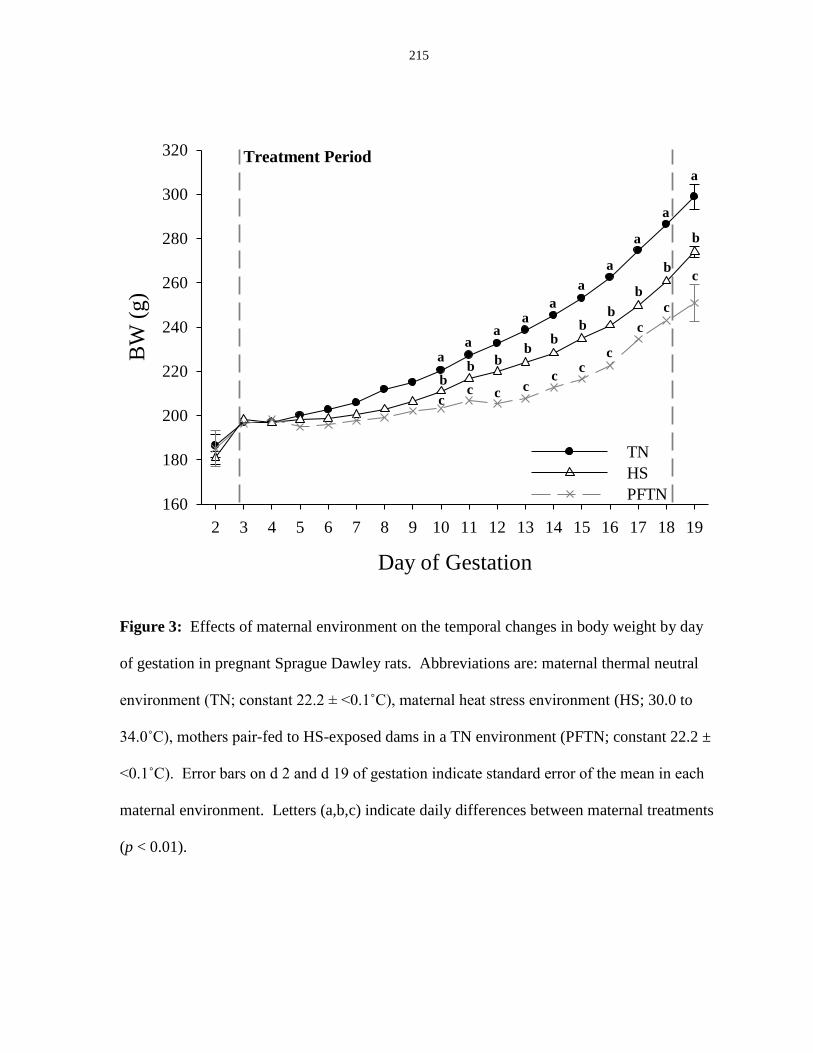
215
Figure 3: Effects of maternal environment on the temporal changes in body weight by day
of gestation in pregnant Sprague Dawley rats. Abbreviations are: maternal thermal neutral
environment (TN; constant 22.2 ± <0.1˚C), maternal heat stress environment (HS; 30.0 to
34.0˚C), mothers pair-fed to HS-exposed dams in a TN environment (PFTN; constant 22.2 ±
<0.1˚C). Error bars on d 2 and d 19 of gestation indicate standard error of the mean in each
maternal environment. Letters (a,b,c) indicate daily differences between maternal treatments
(p < 0.01).
Day of Gestation
2 3 4 5 6 7 8 9 10 11 12 13 14 15 16 17 18 19
BW
(g)
160
180
200
220
240
260
280
300
320
TN
HS
PFTN
aa
aa
a
a
a
a
a
a
bb b
bb
bb
b
b
b
cc c
cc
cc
c
c
c
Treatment Period
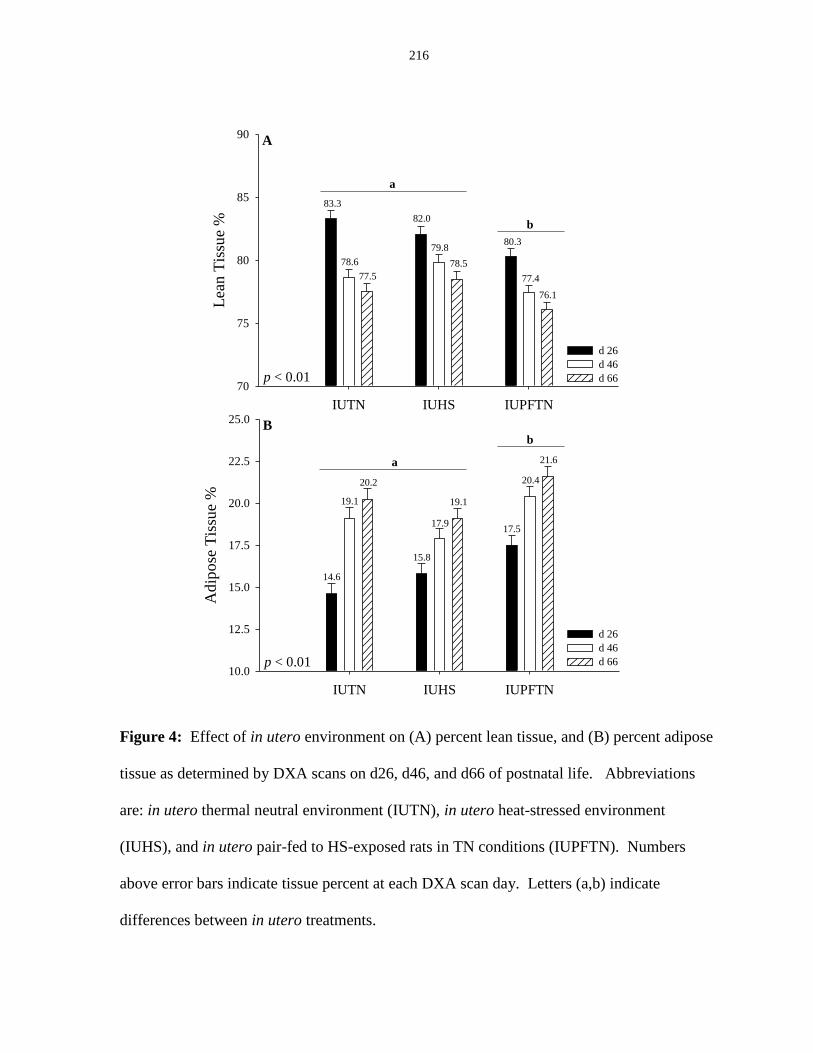
216
IUTN IUHS IUPFTN
Ad
ipo
se T
issu
e %
10.0
12.5
15.0
17.5
20.0
22.5
25.0
d 26
d 46
d 66
a
b
14.6
19.1
20.2
15.8
17.9
19.1
17.5
20.4
21.6
p < 0.01
IUTN IUHS IUPFTN
Lea
n T
issu
e %
70
75
80
85
90
d 26
d 46
d 66
a
b
83.3
78.6
77.5
82.0
79.8
78.5
80.3
77.4
76.1
p < 0.01
A
B
Figure 4: Effect of in utero environment on (A) percent lean tissue, and (B) percent adipose
tissue as determined by DXA scans on d26, d46, and d66 of postnatal life. Abbreviations
are: in utero thermal neutral environment (IUTN), in utero heat-stressed environment
(IUHS), and in utero pair-fed to HS-exposed rats in TN conditions (IUPFTN). Numbers
above error bars indicate tissue percent at each DXA scan day. Letters (a,b) indicate
differences between in utero treatments.
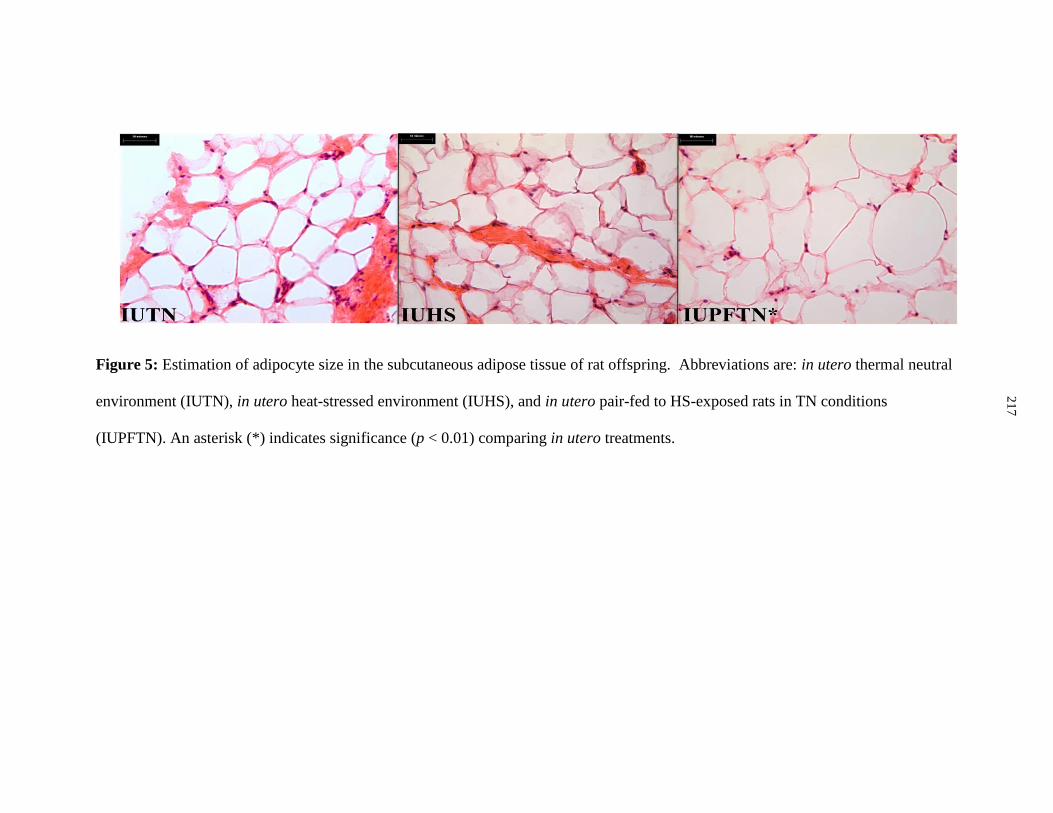
217
Figure 5: Estimation of adipocyte size in the subcutaneous adipose tissue of rat offspring. Abbreviations are: in utero thermal neutral
environment (IUTN), in utero heat-stressed environment (IUHS), and in utero pair-fed to HS-exposed rats in TN conditions
(IUPFTN). An asterisk (*) indicates significance (p < 0.01) comparing in utero treatments.
21
7
218
CHAPTER VII: SUMMARY
Environmentally induced hyperthermia results from an imbalance between thermal
energy flowing into and out of an animal, and negatively impacts health and development in
agriculturally important species. The economic impact of HS is substantial and will likely
increase as climate models predict more extreme summer conditions for most animal-
producing areas. Despite advances in heat abatement technology, HS continues to limit
animal production and is an economic problem in developed countries and a food security
and humanitarian concern in underdeveloped countries located in tropical and sub-tropical
regions. Consequently, there is an urgent need to understand mechanisms by which HS
compromises the efficient production of high quality animal protein during both pre- and
postnatal development.
Although HS can negatively impact animals during postnatal life, exposure to HS
during fetal development may have lifelong consequences that undermine considerable
advances made by animal agriculture industries. Intrauterine stressors (i.e. maternal under
nutrition, intrauterine growth retardation, heat stress) can have lasting effects on offspring
performance, postnatal metabolism, growth performance, and can be teratogenic. While
many studies of in utero HS have investigated its teratogenic impact, there is limited
knowledge of its effects on postnatal metabolism and bioenergetics in mammalian species.
In the present studies, in utero HS caused multiple postnatal phenotypic changes that
are detrimental to animal agriculture. Prenatal HS permanently increased core body
temperature, and altered postnatal nutrient partitioning by prioritizing the deposition of
adipose tissue over skeletal muscle during the lipid deposition phase of life. Both altered
219
phenotypes are likely to compromise efficient production as they come with considerable
bioenergetic cost.
Previous reports indicate that prenatal exposure to HS in unicellular organisms,
insects, and poultry species can infer increased postnatal thermal tolerance. However, we
demonstrated in three studies that mammalian species (pigs) have a different postnatal
thermoregulatory response to in utero HS. Specifically, pigs that experience in utero HS
maintain a greater core body temperature, regardless of the postnatal ambient temperature,
and this increase is likely not influenced by a reduced ability to dissipate body heat (i.e.
reduced skin temperature and respiration rate). Chronically increased core body temperature
has obvious bioenergetic implications in both human health and animal agriculture, as
maintaining this core body temperature differential requires a substantial amount of energy.
Further, these studies have added to our knowledge of how HS alters physiological responses
throughout all stages of the lifecycle that is likely due to epigenetic imprinting.
A permanent increase in future core temperature caused by in utero HS may
theoretically result from increased basal heat production, which implies increased metabolic
rate and greater maintenance costs. Although it is difficult to determine the exact amount r
source of the thermal energy being produced, calculations derived from Bruce and Clark
(1979) may help predict the bioenergetic implications. The calculation is described as: Watts
(Joules/sec) = (∆Tcore* SA) / (Ra + Rt). Where; ∆Tcore is the difference in Tcore comparing
IUHS and TNTN pigs in TN conditions, SA is the total surface area of the pig (m2), Ra is the
external thermal resistance at skin exposed to air (˚Cm2/W), and Rt is the tissue thermal
resistance (˚Cm2/W). Using this equation, and assuming that the average Tcore differential is
maintained throughout the pig’s entire life, we can determine the additional energy in
220
Mcal/day that IUHS pigs have to utilize to maintain their core temperature differential. For
our particular experiments, we determined that over the average lifespan of a market pig
(approximately 175 days), an average of 7 Mcal of extra thermal energy would be produced.
Although seemingly inconsequential, this elevated energy output may translate to an increase
in maintenance costs and a possible reduction in feed efficiency, which could ultimately
increase costs for producers and is detrimental to global food production. For example,
assuming that 1 kg of feed contained 3.5 Mcal of metabolizable energy, an IUHS pig would
have to consume 2 additional kg of feed to make up for extra thermal energy production. If
feed costs are $300 per 909 kg, this is an additional $0.66/pig, and when considering a barn
of 10,000 head, this could translate into thousands of lost dollars due to increased feed costs
and extra days on feed.
Altered body composition is a well-documented consequence of intrauterine stress
(i.e. under nutrition, intrauterine growth retardation), and can negatively impact lean content
of carcasses. In the current studies, we demonstrated that in utero HS alters porcine body
composition during the early finishing phase by reducing protein and increasing adipose
tissue deposition. While the specific mechanisms for this altered phenotype are unknown, it
is likely a result of a reduced capacity to synthesize protein that diverts excess consumed
energy toward adipose tissue. In addition to in utero effects, and in contrast to previous
literature, postnatal HS likely reduced the energy required for maintenance compared to
thermal neutral controls. These findings could have implications toward the mechanisms by
which HS reduces feed efficiency in livestock species and may indicate reduced visceral
mass rather that reduced lean tissue accretion.
221
Since HS causes a well-documented reduction in feed intake of animals, a link may
exist between the negative intrauterine programming effects of in utero feed restriction and
HS. However, despite similar gross energy consumption of pair-fed and heat-stressed
pregnant rats, only IUPFTN offspring appeared to display the negative phenotype generally
associated with in utero under-nutrition. These results were unexpected and may provide
greater insight into the bioenergetics of HS. Heat stress treatment increased maternal feed
efficiency and BW gain compared to PFTN dams, likely due to reduced maintenance costs
and heat production. Therefore, enhanced nutrient availability may have mitigated the
negative intrauterine programming impact of maternal nutrient restriction. However, because
birth weight of IUHS offspring was reduced compared to IUTN and IUPFTN progeny, it is
likely that fetal development was still compromised, possibly as a result of reduced placental
blood flow and intrauterine growth retardation. Further, while no postnatal alterations in
body composition were observed for IUHS offspring, their reduced birth weight (and
apparent intrauterine growth restriction) may predict increased rates of obesity in later stages
of life.
Mechanisms influencing in utero HS-induced phenotypic alterations require further
investigation. These include: determining the source of increased heat production and
verification heat production is increased (using indirect calorimetry); establish protein
synthesizing capacity of IUHS pigs; perform metabolic challenges in prenatally heat-stressed
animals; determine the specific programming mechanism by which in utero HS alters
postnatal body composition; determine the lifetime productivity of animals gestated during
summer compared to winter months; and repeat the rodent experiment utilizing a greater in
utero ambient temperature in the HS group. Data obtained in the current studies provides
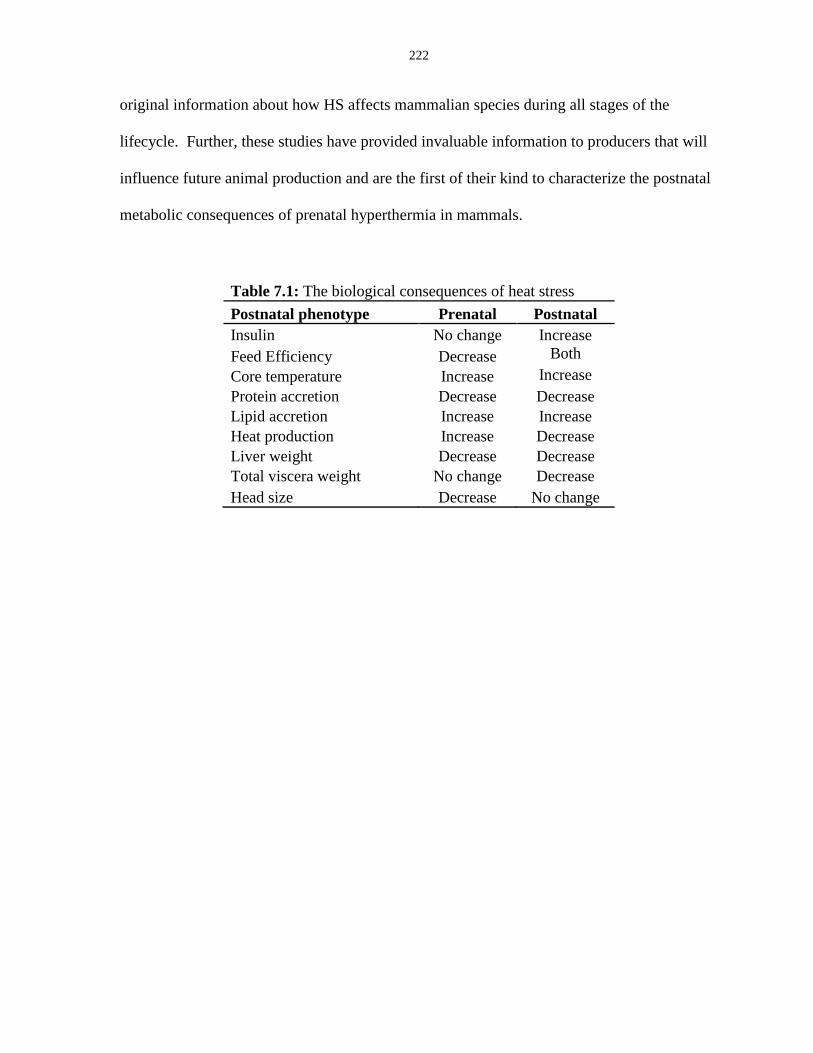
222
original information about how HS affects mammalian species during all stages of the
lifecycle. Further, these studies have provided invaluable information to producers that will
influence future animal production and are the first of their kind to characterize the postnatal
metabolic consequences of prenatal hyperthermia in mammals.
Table 7.1: The biological consequences of heat stress
Postnatal phenotype Prenatal Postnatal
Insulin No change Increase
Feed Efficiency Decrease Both
Core temperature Increase Increase
Protein accretion Decrease Decrease
Lipid accretion Increase Increase
Heat production Increase Decrease
Liver weight Decrease Decrease
Total viscera weight No change Decrease
Head size Decrease No change
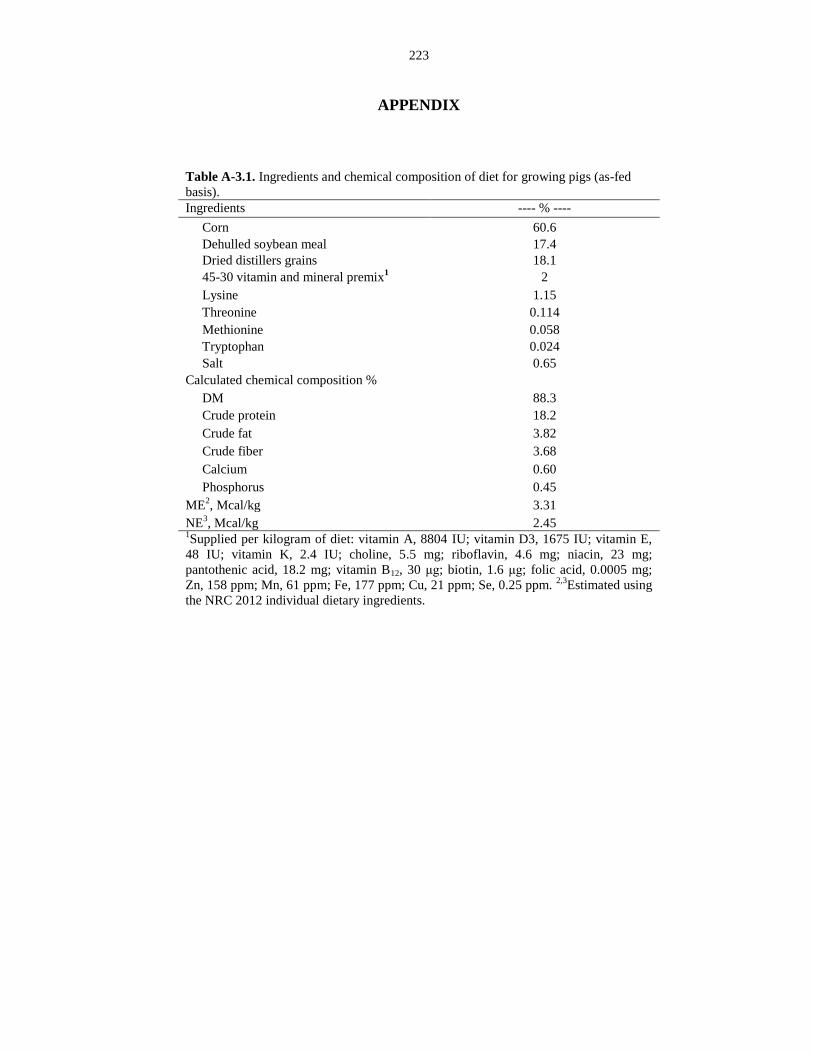
223
APPENDIX
Table A-3.1. Ingredients and chemical composition of diet for growing pigs (as-fed
basis).
Ingredients ---- % ----
Corn 60.6
Dehulled soybean meal 17.4
Dried distillers grains 18.1
45-30 vitamin and mineral premix1 2
Lysine 1.15
Threonine 0.114
Methionine 0.058
Tryptophan 0.024
Salt 0.65
Calculated chemical composition %
DM 88.3
Crude protein 18.2
Crude fat 3.82
Crude fiber 3.68
Calcium 0.60
Phosphorus 0.45
ME2, Mcal/kg
3.31
NE3, Mcal/kg
2.45
1Supplied per kilogram of diet: vitamin A, 8804 IU; vitamin D3, 1675 IU; vitamin E,
48 IU; vitamin K, 2.4 IU; choline, 5.5 mg; riboflavin, 4.6 mg; niacin, 23 mg;
pantothenic acid, 18.2 mg; vitamin B12, 30 μg; biotin, 1.6 μg; folic acid, 0.0005 mg;
Zn, 158 ppm; Mn, 61 ppm; Fe, 177 ppm; Cu, 21 ppm; Se, 0.25 ppm. 2,3
Estimated using
the NRC 2012 individual dietary ingredients.
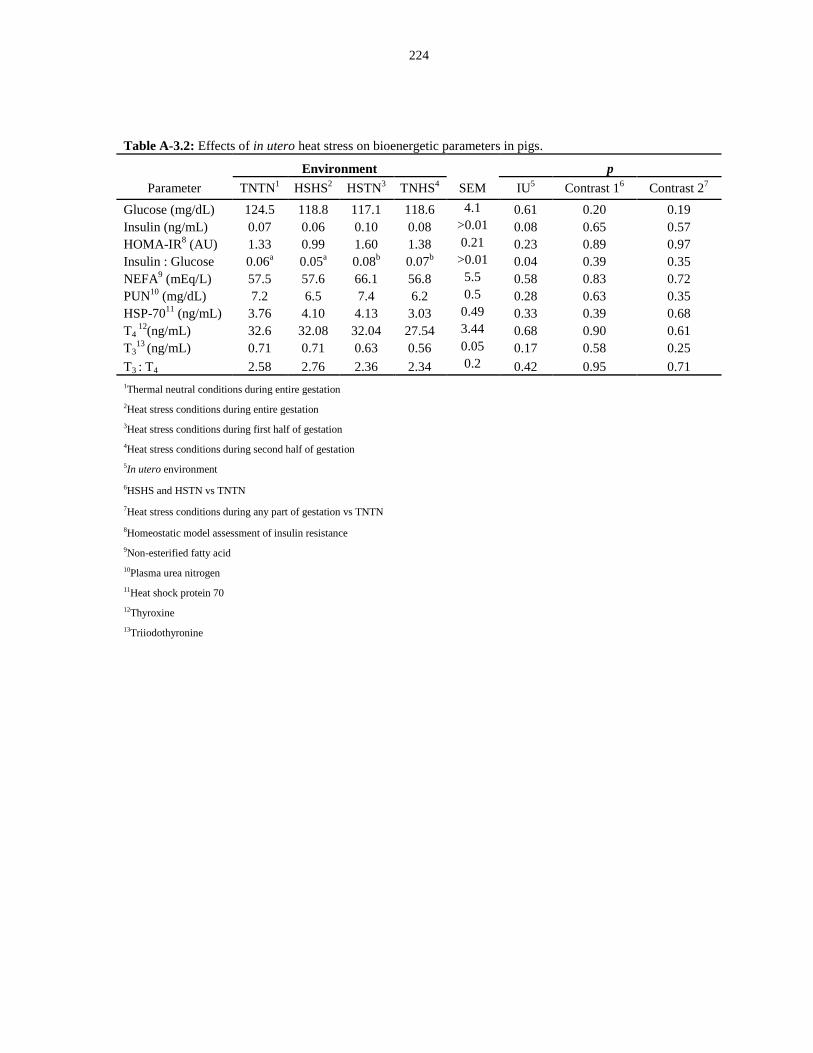
224
Table A-3.2: Effects of in utero heat stress on bioenergetic parameters in pigs.
Environment p
Parameter TNTN1 HSHS
2 HSTN
3 TNHS
4 SEM IU
5 Contrast 1
6 Contrast 2
7
Glucose (mg/dL) 124.5 118.8 117.1 118.6 4.1 0.61 0.20 0.19
Insulin (ng/mL) 0.07 0.06 0.10 0.08 >0.01 0.08 0.65 0.57
HOMA-IR8 (AU) 1.33 0.99 1.60 1.38 0.21 0.23 0.89 0.97
Insulin : Glucose 0.06a 0.05
a 0.08
b 0.07
b >0.01 0.04 0.39 0.35
NEFA9 (mEq/L) 57.5 57.6 66.1 56.8 5.5 0.58 0.83 0.72
PUN10
(mg/dL) 7.2 6.5 7.4 6.2 0.5 0.28 0.63 0.35
HSP-7011
(ng/mL) 3.76 4.10 4.13 3.03 0.49 0.33 0.39 0.68
T4 12
(ng/mL) 32.6 32.08 32.04 27.54 3.44 0.68 0.90 0.61
T313
(ng/mL) 0.71 0.71 0.63 0.56 0.05 0.17 0.58 0.25
T3 : T4 2.58 2.76 2.36 2.34 0.2 0.42 0.95 0.71
1Thermal neutral conditions during entire gestation
2Heat stress conditions during entire gestation
3Heat stress conditions during first half of gestation
4Heat stress conditions during second half of gestation
5In utero environment
6HSHS and HSTN vs TNTN
7Heat stress conditions during any part of gestation vs TNTN
8Homeostatic model assessment of insulin resistance
9Non-esterified fatty acid
10Plasma urea nitrogen
11Heat shock protein 70
12Thyroxine
13Triiodothyronine

225
Table A-6.1. Nutrient content of Harlan 2018 rodent diet (as-fed basis).
Nutrients ---- % ----
Starch 41.2
Sucrose 4.9
Fructose Trace
Crude Protein 18.6
Crude Fat 6.2
Vitamins1
1.0
Minerals2 4.8
Energy (ME) 3.1 1Supplied per gram of diet: vitamin A, 15.0 IU; vitamin D3, 1.5 IU; vitamin E, 110 IU;
vitamin K, 50 μg; choline, 17 μg; riboflavin, 15 μg; niacin, 70 μg; pantothenic acid, 33
μg; vitamin B12, 0.0008 μg; biotin, 0.004 μg; folic acid, 0.04 μg. 2Supplied per gram of
diet: Zn, 70 ppm; Mn, 100 ppm; Fe, 200 ppm; Cu, 15 ppm; Se, 0.23 ppm.
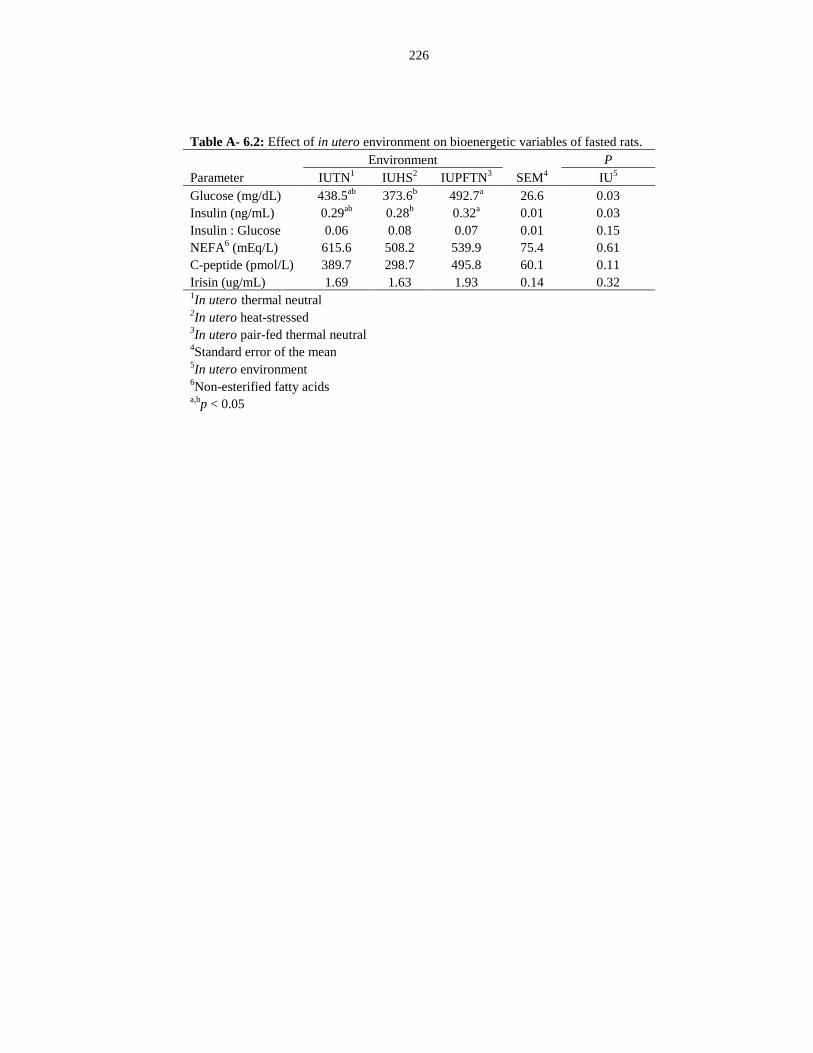
226
Table A- 6.2: Effect of in utero environment on bioenergetic variables of fasted rats.
Environment P
Parameter IUTN1 IUHS
2 IUPFTN
3 SEM
4 IU
5
Glucose (mg/dL) 438.5ab
373.6b 492.7
a 26.6 0.03
Insulin (ng/mL) 0.29ab
0.28b 0.32
a 0.01 0.03
Insulin : Glucose 0.06 0.08 0.07 0.01 0.15
NEFA6 (mEq/L) 615.6 508.2 539.9 75.4 0.61
C-peptide (pmol/L) 389.7 298.7 495.8 60.1 0.11
Irisin (ug/mL) 1.69 1.63 1.93 0.14 0.32 1In utero
thermal neutral
2In utero heat-stressed
3In utero pair-fed thermal neutral
4Standard error of the mean
5In utero environment
6Non-esterified fatty acids
a,bp < 0.05

227
Figure A-1.1: Effects of heat stress on the metabolite/endocrine profile of growing pigs.
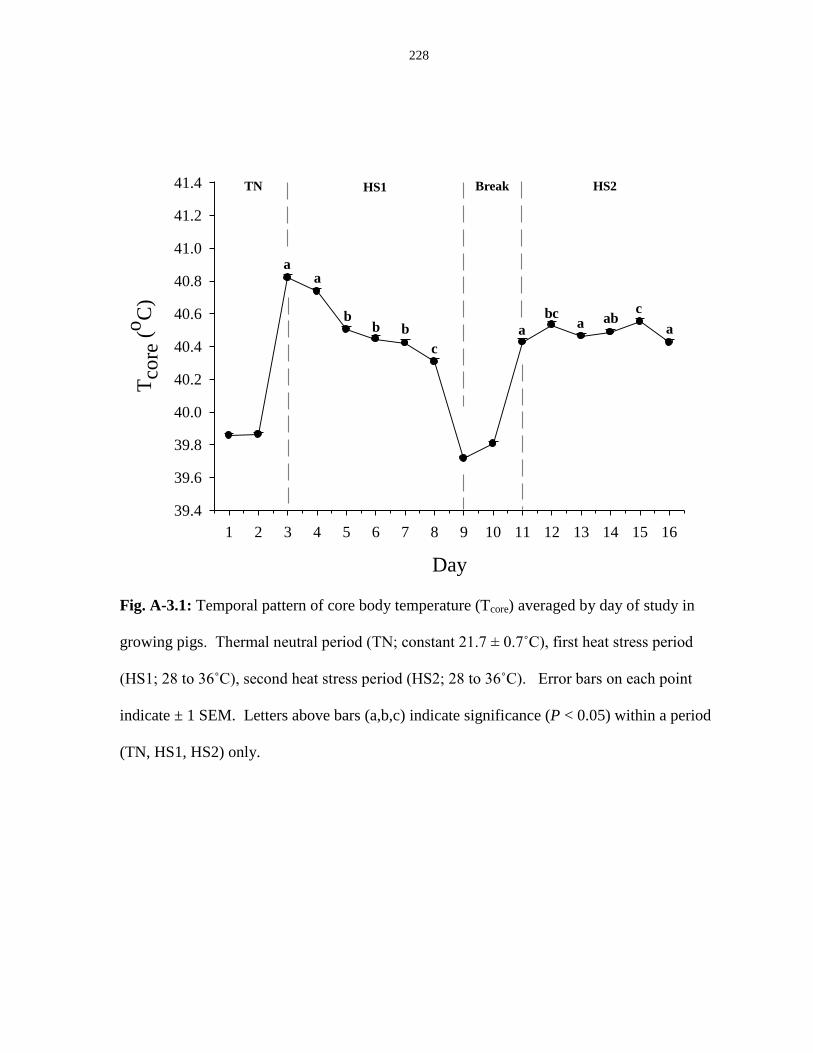
228
Day
1 2 3 4 5 6 7 8 9 10 11 12 13 14 15 16
Tco
re (
oC
)
39.4
39.6
39.8
40.0
40.2
40.4
40.6
40.8
41.0
41.2
41.4 TN HS1 Break HS2
a
b
c
a
b b aaa
cbc ab
Fig. A-3.1: Temporal pattern of core body temperature (Tcore) averaged by day of study in
growing pigs. Thermal neutral period (TN; constant 21.7 ± 0.7˚C), first heat stress period
(HS1; 28 to 36˚C), second heat stress period (HS2; 28 to 36˚C). Error bars on each point
indicate ± 1 SEM. Letters above bars (a,b,c) indicate significance (P < 0.05) within a period
(TN, HS1, HS2) only.
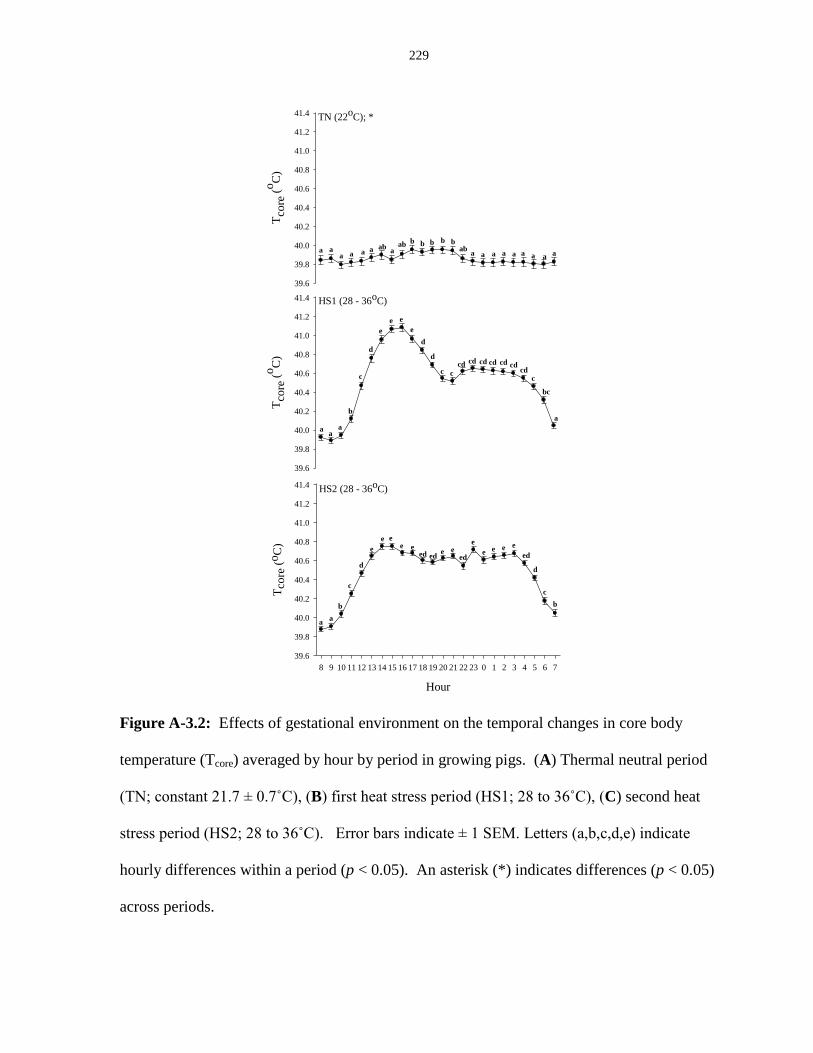
229
Figure A-3.2: Effects of gestational environment on the temporal changes in core body
temperature (Tcore) averaged by hour by period in growing pigs. (A) Thermal neutral period
(TN; constant 21.7 ± 0.7˚C), (B) first heat stress period (HS1; 28 to 36˚C), (C) second heat
stress period (HS2; 28 to 36˚C). Error bars indicate ± 1 SEM. Letters (a,b,c,d,e) indicate
hourly differences within a period (p < 0.05). An asterisk (*) indicates differences (p < 0.05)
across periods.
HS2 (28 - 36oC)
Hour
8 9 10 11 12 13 14 15 16 17 18 19 20 21 22 23 0 1 2 3 4 5 6 7
Tco
re (
oC
)
39.6
39.8
40.0
40.2
40.4
40.6
40.8
41.0
41.2
41.4
HS1 (28 - 36oC)
Tco
re (
oC
)
39.6
39.8
40.0
40.2
40.4
40.6
40.8
41.0
41.2
41.4
TN (22oC); *
Tco
re (
oC
)39.6
39.8
40.0
40.2
40.4
40.6
40.8
41.0
41.2
41.4
aa
a
b
c
d
e
e e
e
d
d
c c
cd cd cd cd cd cdcd
c
bc
a
aa
b
c
d
b
c
e
e ee e
ed ede e
ed
e
e e e e
ed
d
a aa a a a ab
b b b b baba ab
a aa a a a a a a
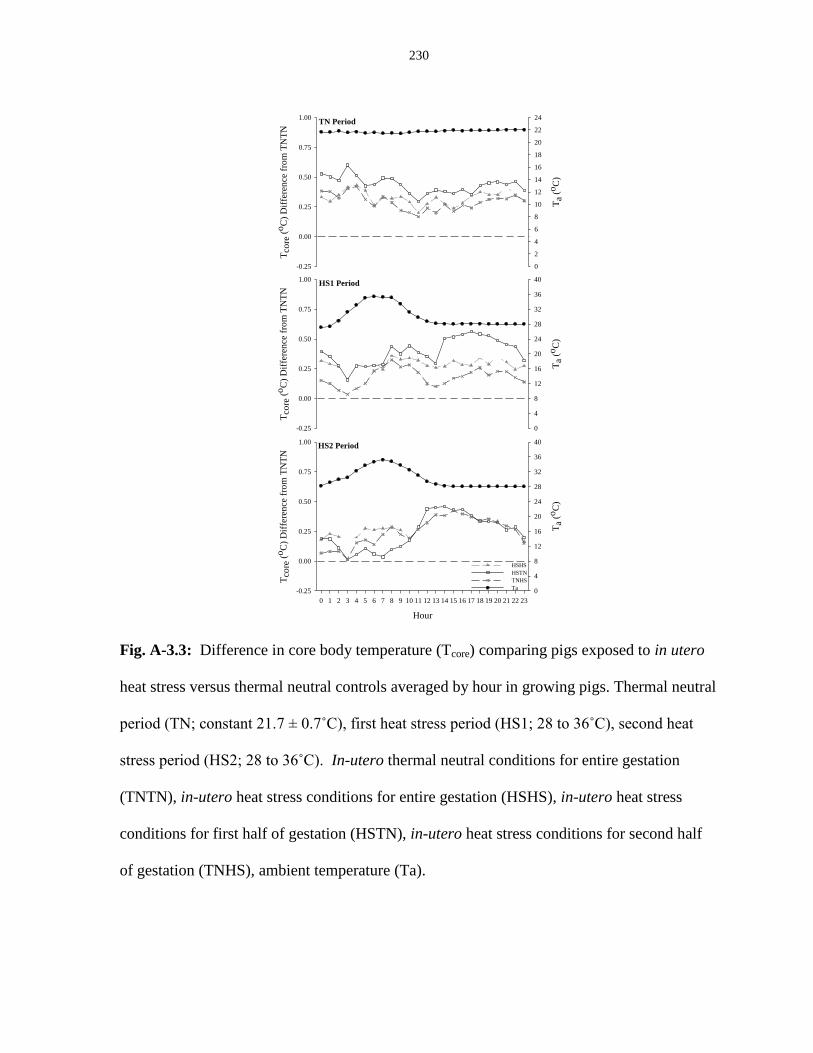
230
Tco
re (
oC
) D
iffe
ren
ce f
rom
TN
TN
-0.25
0.00
0.25
0.50
0.75
1.00
Ta
(oC
)
0
2
4
6
8
10
12
14
16
18
20
22
24TN Period
Tco
re (
oC
) D
iffe
ren
ce f
rom
TN
TN
-0.25
0.00
0.25
0.50
0.75
1.00
Ta
(oC
)
0
4
8
12
16
20
24
28
32
36
40HS1 Period
Hour
0 1 2 3 4 5 6 7 8 9 10 11 12 13 14 15 16 17 18 19 20 21 22 23
Tco
re (
oC
) D
iffe
ren
ce f
rom
TN
TN
-0.25
0.00
0.25
0.50
0.75
1.00
Ta
(oC
)
0
4
8
12
16
20
24
28
32
36
40
HSHS
HSTN
TNHS
Ta
HS2 Period
Fig. A-3.3: Difference in core body temperature (Tcore) comparing pigs exposed to in utero
heat stress versus thermal neutral controls averaged by hour in growing pigs. Thermal neutral
period (TN; constant 21.7 ± 0.7˚C), first heat stress period (HS1; 28 to 36˚C), second heat
stress period (HS2; 28 to 36˚C). In-utero thermal neutral conditions for entire gestation
(TNTN), in-utero heat stress conditions for entire gestation (HSHS), in-utero heat stress
conditions for first half of gestation (HSTN), in-utero heat stress conditions for second half
of gestation (TNHS), ambient temperature (Ta).
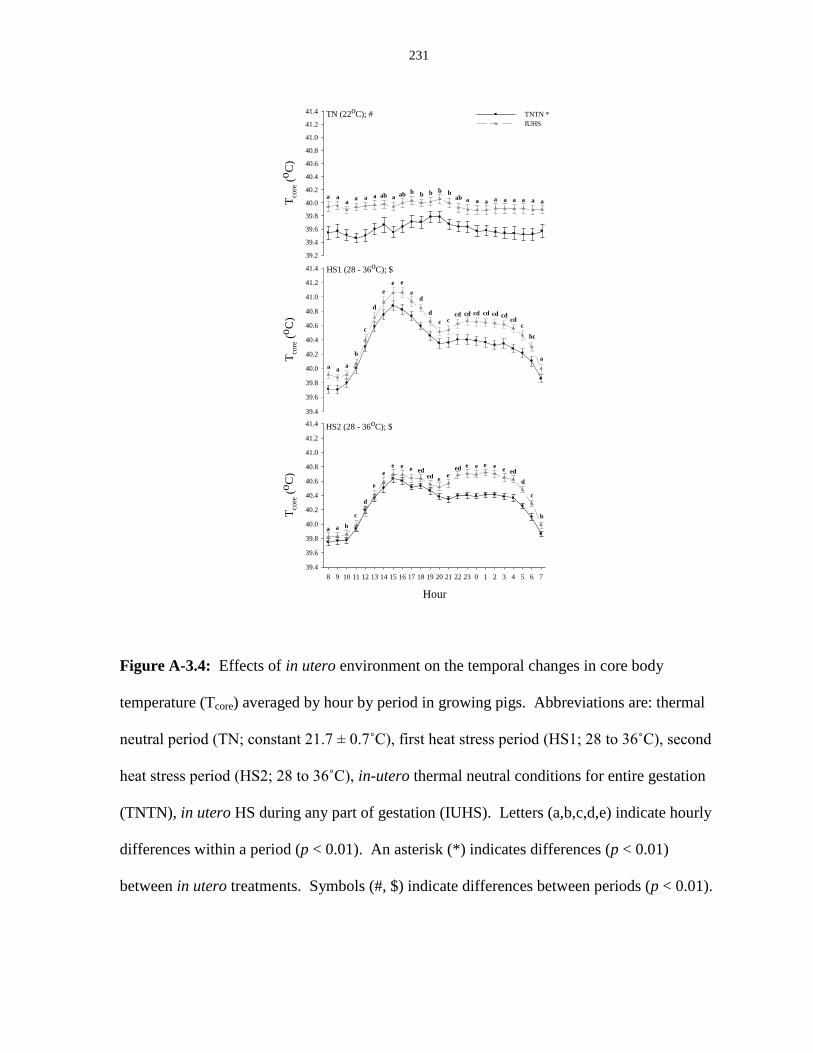
231
HS2 (28 - 36oC); $
Hour
8 9 10 11 12 13 14 15 16 17 18 19 20 21 22 23 0 1 2 3 4 5 6 7
Tco
re (
oC
)
39.4
39.6
39.8
40.0
40.2
40.4
40.6
40.8
41.0
41.2
41.4
HS1 (28 - 36oC); $
Tco
re (
oC
)
39.4
39.6
39.8
40.0
40.2
40.4
40.6
40.8
41.0
41.2
41.4
TN (22oC); #
Tco
re (
oC
)
39.2
39.4
39.6
39.8
40.0
40.2
40.4
40.6
40.8
41.0
41.2
41.4 TNTN *
IUHS
a aa
a a a abb b b b baba ab a aa a a a a a a
a aa
b
c
d
e
e e
ed
d
c ccd cd cd cd
cdc
bc
a
aa b
c
d
b
c
e
e
e e e eded e
eed e e e e
e ed
d
cd cd
Figure A-3.4: Effects of in utero environment on the temporal changes in core body
temperature (Tcore) averaged by hour by period in growing pigs. Abbreviations are: thermal
neutral period (TN; constant 21.7 ± 0.7˚C), first heat stress period (HS1; 28 to 36˚C), second
heat stress period (HS2; 28 to 36˚C), in-utero thermal neutral conditions for entire gestation
(TNTN), in utero HS during any part of gestation (IUHS). Letters (a,b,c,d,e) indicate hourly
differences within a period (p < 0.01). An asterisk (*) indicates differences (p < 0.01)
between in utero treatments. Symbols (#, $) indicate differences between periods (p < 0.01).
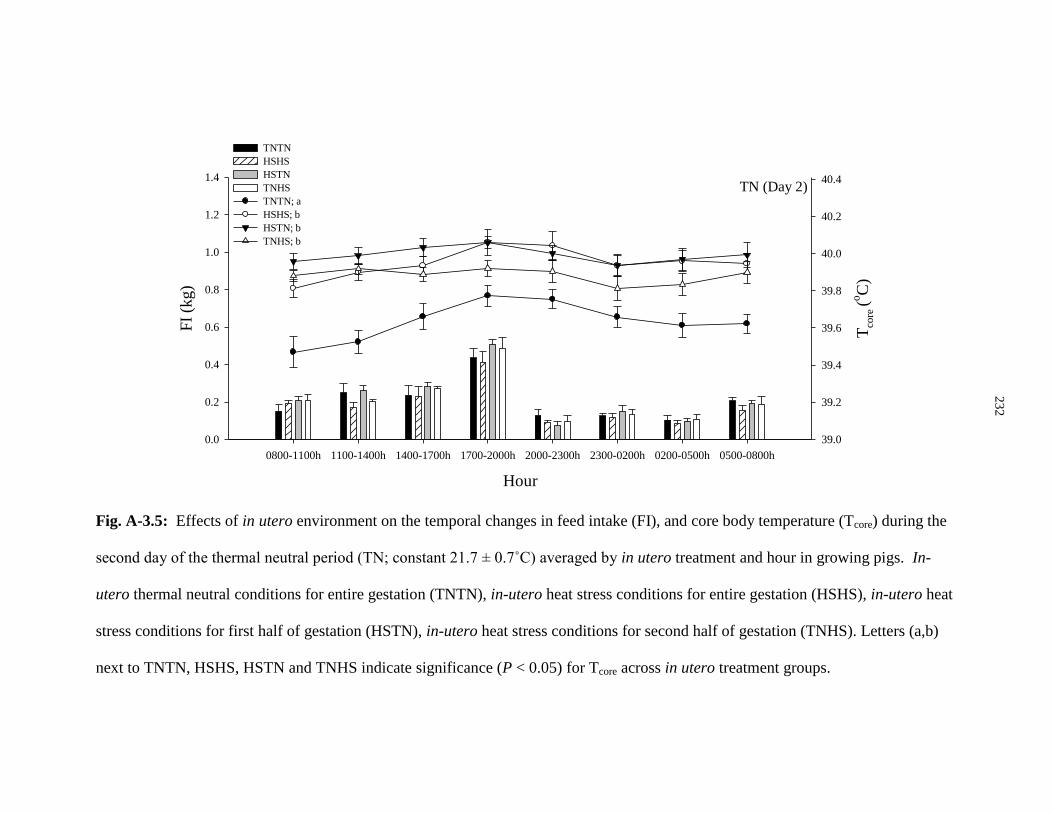
232
TN (Day 2)
Hour
0800-1100h 1100-1400h 1400-1700h 1700-2000h 2000-2300h 2300-0200h 0200-0500h 0500-0800h
FI
(kg)
0.0
0.2
0.4
0.6
0.8
1.0
1.2
1.4
Tco
re (
oC
)
39.0
39.2
39.4
39.6
39.8
40.0
40.2
40.4
TNTN
HSHS
HSTN
TNHS
TNTN; a
HSHS; b
HSTN; b
TNHS; b
Fig. A-3.5: Effects of in utero environment on the temporal changes in feed intake (FI), and core body temperature (Tcore) during the
second day of the thermal neutral period (TN; constant 21.7 ± 0.7˚C) averaged by in utero treatment and hour in growing pigs. In-
utero thermal neutral conditions for entire gestation (TNTN), in-utero heat stress conditions for entire gestation (HSHS), in-utero heat
stress conditions for first half of gestation (HSTN), in-utero heat stress conditions for second half of gestation (TNHS). Letters (a,b)
next to TNTN, HSHS, HSTN and TNHS indicate significance (P < 0.05) for Tcore across in utero treatment groups.
23
2
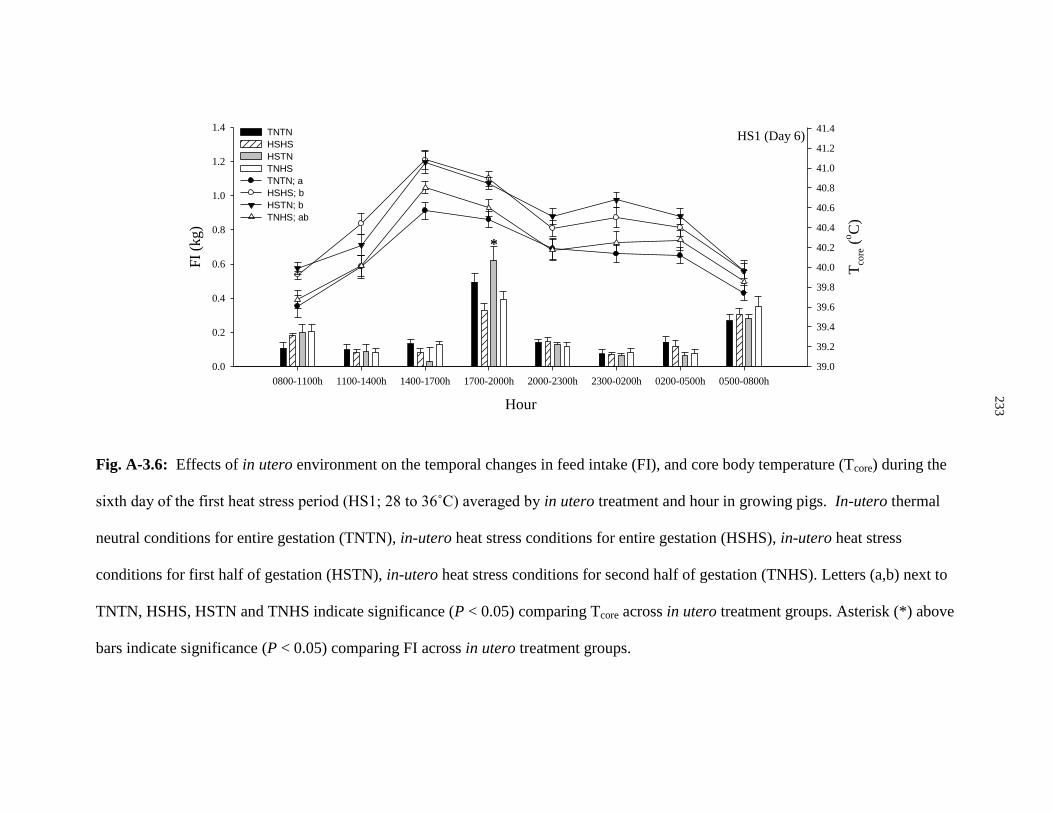
233
HS1 (Day 6)
Hour
0800-1100h 1100-1400h 1400-1700h 1700-2000h 2000-2300h 2300-0200h 0200-0500h 0500-0800h
FI
(kg)
0.0
0.2
0.4
0.6
0.8
1.0
1.2
1.4
Tco
re (
oC
)
39.0
39.2
39.4
39.6
39.8
40.0
40.2
40.4
40.6
40.8
41.0
41.2
41.4TNTN
HSHS
HSTN
TNHS
TNTN; a
HSHS; b
HSTN; b
TNHS; ab
*
Fig. A-3.6: Effects of in utero environment on the temporal changes in feed intake (FI), and core body temperature (Tcore) during the
sixth day of the first heat stress period (HS1; 28 to 36˚C) averaged by in utero treatment and hour in growing pigs. In-utero thermal
neutral conditions for entire gestation (TNTN), in-utero heat stress conditions for entire gestation (HSHS), in-utero heat stress
conditions for first half of gestation (HSTN), in-utero heat stress conditions for second half of gestation (TNHS). Letters (a,b) next to
TNTN, HSHS, HSTN and TNHS indicate significance (P < 0.05) comparing Tcore across in utero treatment groups. Asterisk (*) above
bars indicate significance (P < 0.05) comparing FI across in utero treatment groups.
23
3
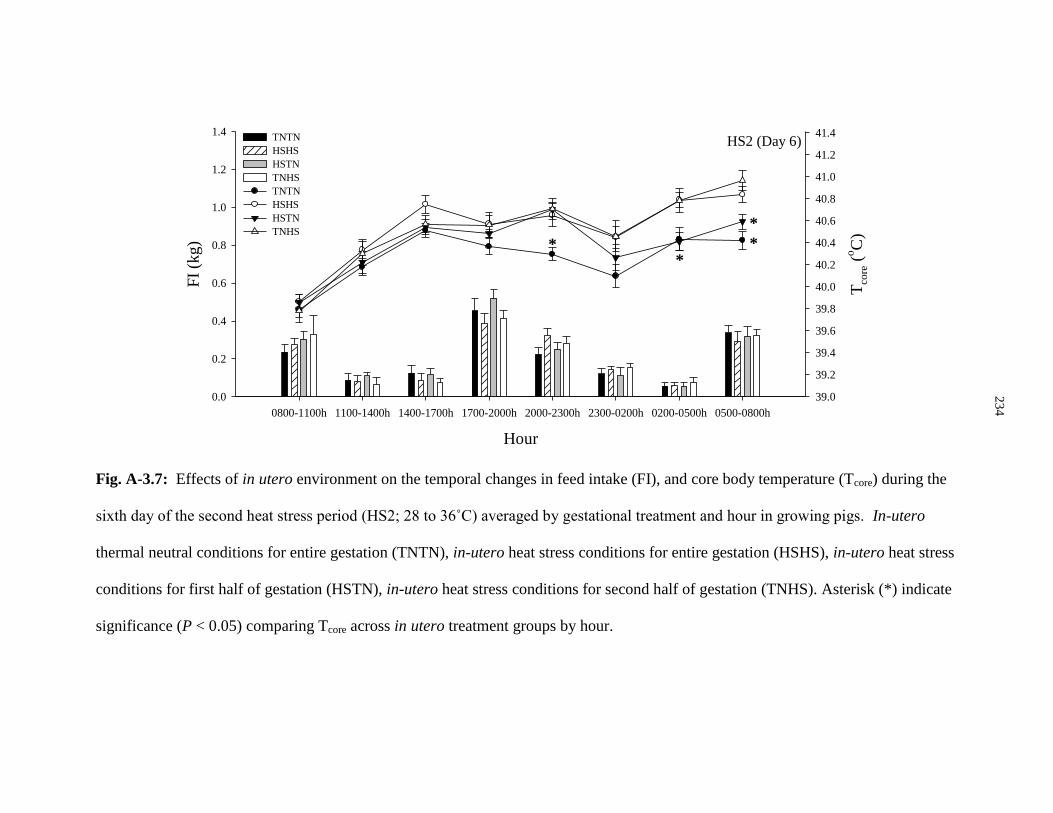
234
HS2 (Day 6)
Hour
0800-1100h 1100-1400h 1400-1700h 1700-2000h 2000-2300h 2300-0200h 0200-0500h 0500-0800h
FI
(kg)
0.0
0.2
0.4
0.6
0.8
1.0
1.2
1.4
Tco
re (
oC
)
39.0
39.2
39.4
39.6
39.8
40.0
40.2
40.4
40.6
40.8
41.0
41.2
41.4TNTN
HSHS
HSTN
TNHS
TNTN
HSHS
HSTN
TNHS
**
*
*
Fig. A-3.7: Effects of in utero environment on the temporal changes in feed intake (FI), and core body temperature (Tcore) during the
sixth day of the second heat stress period (HS2; 28 to 36˚C) averaged by gestational treatment and hour in growing pigs. In-utero
thermal neutral conditions for entire gestation (TNTN), in-utero heat stress conditions for entire gestation (HSHS), in-utero heat stress
conditions for first half of gestation (HSTN), in-utero heat stress conditions for second half of gestation (TNHS). Asterisk (*) indicate
significance (P < 0.05) comparing Tcore across in utero treatment groups by hour.
23
4
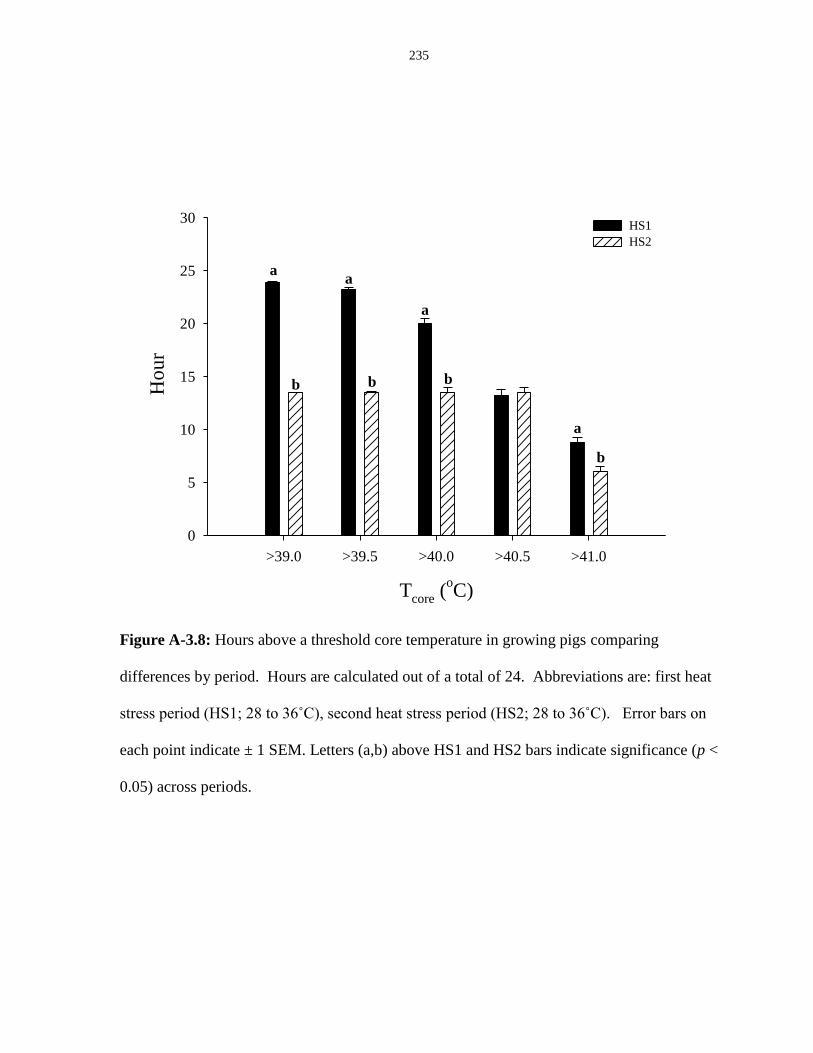
235
Figure A-3.8: Hours above a threshold core temperature in growing pigs comparing
differences by period. Hours are calculated out of a total of 24. Abbreviations are: first heat
stress period (HS1; 28 to 36˚C), second heat stress period (HS2; 28 to 36˚C). Error bars on
each point indicate ± 1 SEM. Letters (a,b) above HS1 and HS2 bars indicate significance (p <
0.05) across periods.
Tcore
(oC)
>39.0 >39.5 >40.0 >40.5 >41.0
Ho
ur
0
5
10
15
20
25
30HS1
HS2
aa
a
a
b b b
b
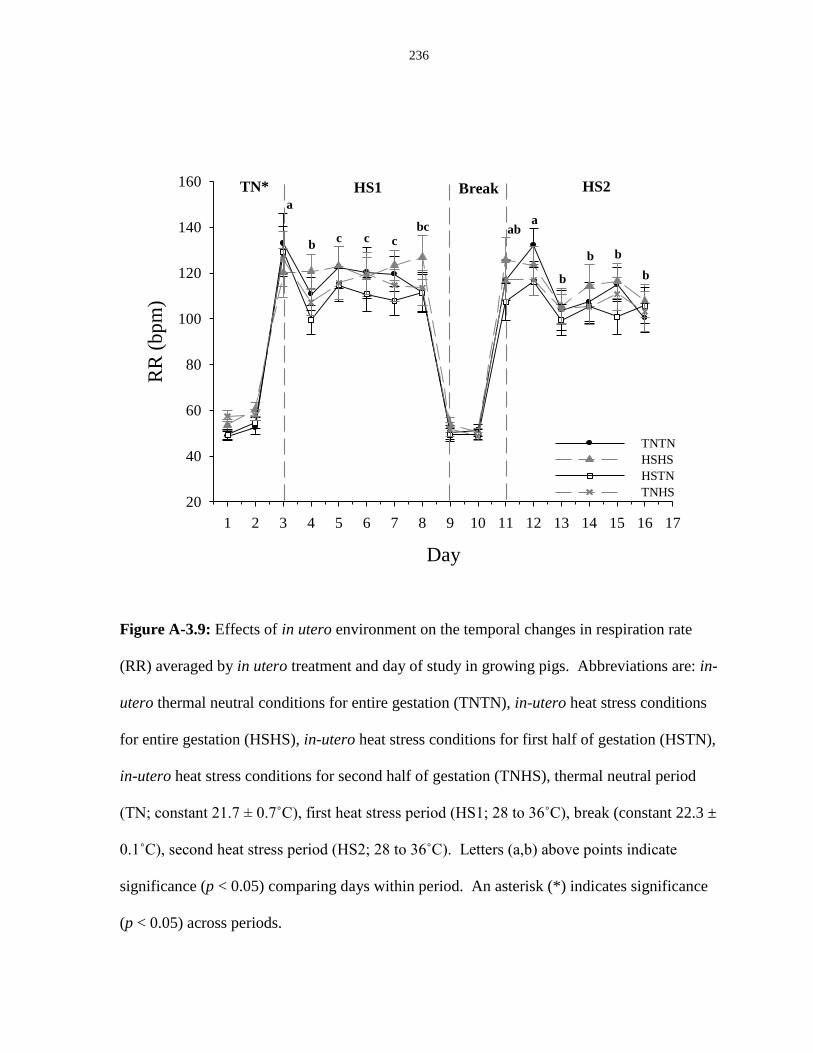
236
Day
1 2 3 4 5 6 7 8 9 10 11 12 13 14 15 16 17
RR
(b
pm
)
20
40
60
80
100
120
140
160
TNTN
HSHS
HSTN
TNHS
TN* HS1 Break HS2
a
bc c c
bc aba
b
b b
b
Figure A-3.9: Effects of in utero environment on the temporal changes in respiration rate
(RR) averaged by in utero treatment and day of study in growing pigs. Abbreviations are: in-
utero thermal neutral conditions for entire gestation (TNTN), in-utero heat stress conditions
for entire gestation (HSHS), in-utero heat stress conditions for first half of gestation (HSTN),
in-utero heat stress conditions for second half of gestation (TNHS), thermal neutral period
(TN; constant 21.7 ± 0.7˚C), first heat stress period (HS1; 28 to 36˚C), break (constant 22.3 ±
0.1˚C), second heat stress period (HS2; 28 to 36˚C). Letters (a,b) above points indicate
significance (p < 0.05) comparing days within period. An asterisk (*) indicates significance
(p < 0.05) across periods.
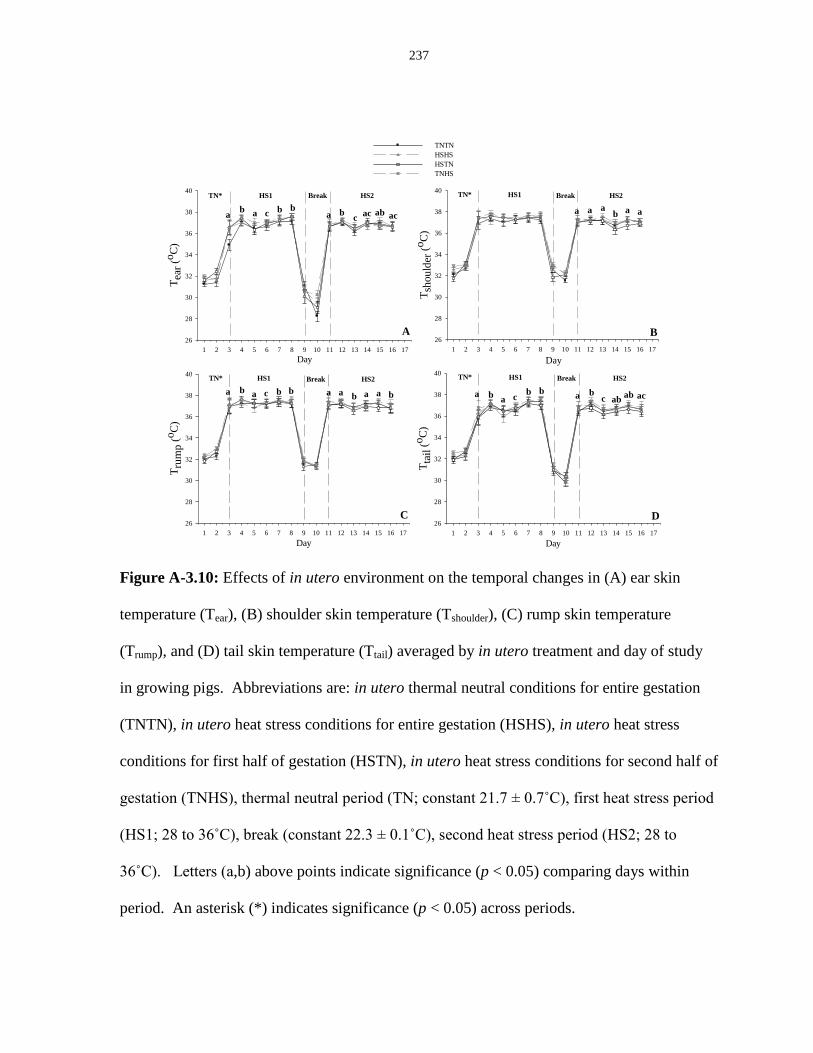
237
Day1 2 3 4 5 6 7 8 9 10 11 12 13 14 15 16 17
Tea
r (o
C)
26
28
30
32
34
36
38
40
TNTN
HSHS
HSTN
TNHS
TN* HS1 Break HS2
Day
1 2 3 4 5 6 7 8 9 10 11 12 13 14 15 16 17
Tru
mp
(oC
)
26
28
30
32
34
36
38
40TN* HS1 Break HS2
Day
1 2 3 4 5 6 7 8 9 10 11 12 13 14 15 16 17
Tta
il (
oC
)
26
28
30
32
34
36
38
40TN* HS1 Break HS2
Day
1 2 3 4 5 6 7 8 9 10 11 12 13 14 15 16 17
Tsh
ou
lder
(oC
)
26
28
30
32
34
36
38
40TN* HS1 Break HS2
BA
C D
ab a c b b
a b a c b b a ba c
b b
a bc
ac ab aca a a
b a a
a a b a a b a bc ab
ab ac
Figure A-3.10: Effects of in utero environment on the temporal changes in (A) ear skin
temperature (Tear), (B) shoulder skin temperature (Tshoulder), (C) rump skin temperature
(Trump), and (D) tail skin temperature (Ttail) averaged by in utero treatment and day of study
in growing pigs. Abbreviations are: in utero thermal neutral conditions for entire gestation
(TNTN), in utero heat stress conditions for entire gestation (HSHS), in utero heat stress
conditions for first half of gestation (HSTN), in utero heat stress conditions for second half of
gestation (TNHS), thermal neutral period (TN; constant 21.7 ± 0.7˚C), first heat stress period
(HS1; 28 to 36˚C), break (constant 22.3 ± 0.1˚C), second heat stress period (HS2; 28 to
36˚C). Letters (a,b) above points indicate significance (p < 0.05) comparing days within
period. An asterisk (*) indicates significance (p < 0.05) across periods.
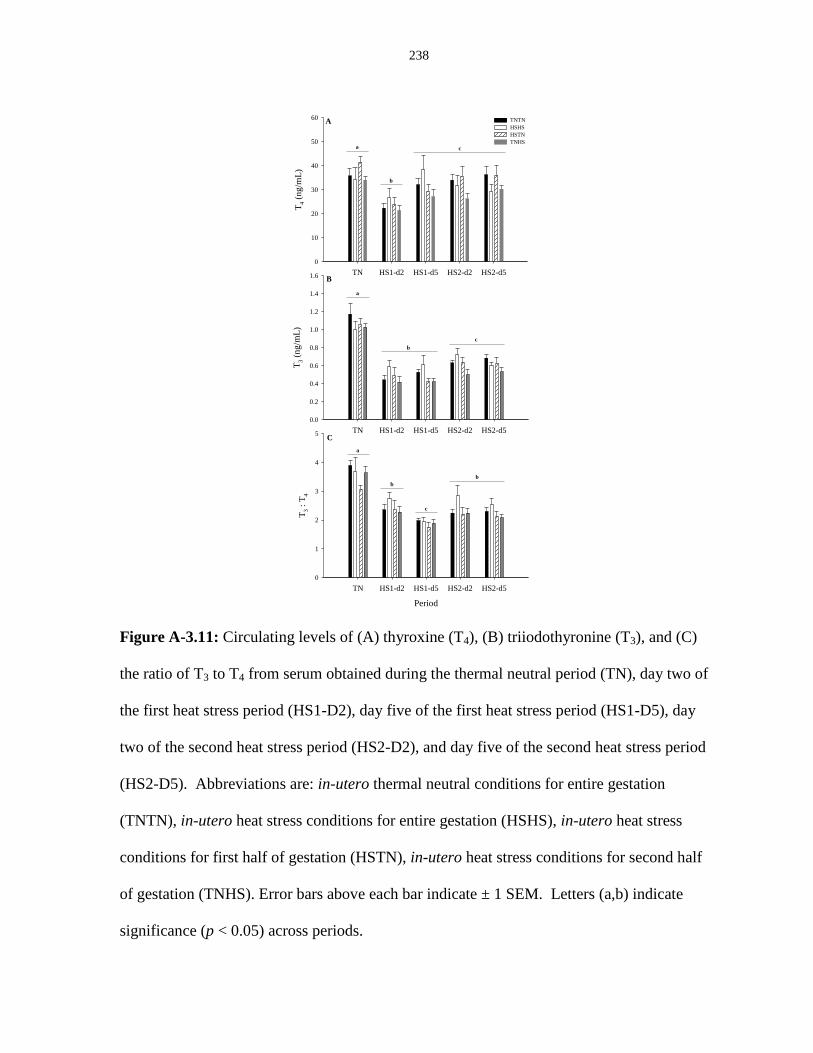
238
TN HS1-d2 HS1-d5 HS2-d2 HS2-d5
T4 (
ng/m
L)
0
10
20
30
40
50
60 TNTN
HSHS
HSTN
TNHS a
b
c
TN HS1-d2 HS1-d5 HS2-d2 HS2-d5
T3 (
ng/m
L)
0.0
0.2
0.4
0.6
0.8
1.0
1.2
1.4
1.6
a
b
c
Period
TN HS1-d2 HS1-d5 HS2-d2 HS2-d5
T3 :
T4
0
1
2
3
4
5
a
b
c
b
A
B
C
Figure A-3.11: Circulating levels of (A) thyroxine (T4), (B) triiodothyronine (T3), and (C)
the ratio of T3 to T4 from serum obtained during the thermal neutral period (TN), day two of
the first heat stress period (HS1-D2), day five of the first heat stress period (HS1-D5), day
two of the second heat stress period (HS2-D2), and day five of the second heat stress period
(HS2-D5). Abbreviations are: in-utero thermal neutral conditions for entire gestation
(TNTN), in-utero heat stress conditions for entire gestation (HSHS), in-utero heat stress
conditions for first half of gestation (HSTN), in-utero heat stress conditions for second half
of gestation (TNHS). Error bars above each bar indicate ± 1 SEM. Letters (a,b) indicate
significance (p < 0.05) across periods.
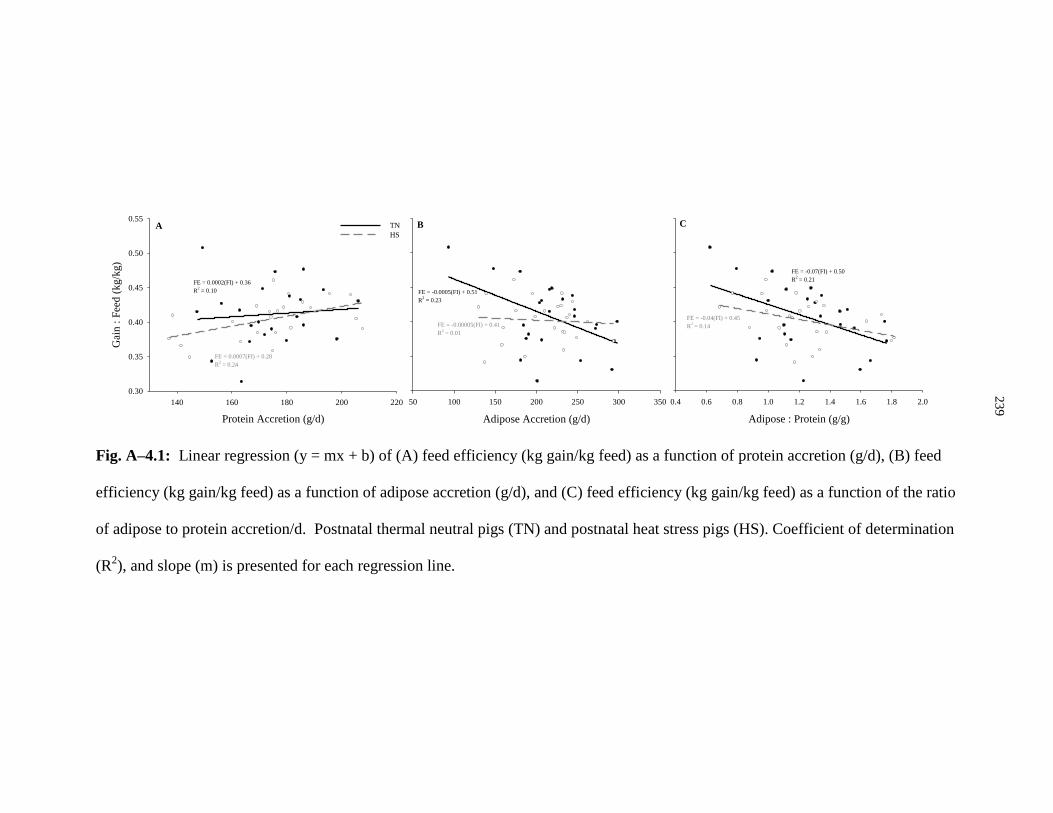
239
Protein Accretion (g/d)
140 160 180 200 220
Gai
n :
Fee
d (
kg/k
g)
0.30
0.35
0.40
0.45
0.50
0.55TN
HS
FE = 0.0002(FI) + 0.36
R2 = 0.10
FE = 0.0007(FI) + 0.28
R2 = 0.24
Adipose Accretion (g/d)
50 100 150 200 250 300 350
FE = -0.0005(FI) + 0.51
R2 = 0.23
FE = -0.00005(FI) + 0.41
R2 = 0.01
Adipose : Protein (g/g)
0.4 0.6 0.8 1.0 1.2 1.4 1.6 1.8 2.0
FE = -0.07(FI) + 0.50
R2 = 0.21
FE = -0.04(FI) + 0.45
R2 = 0.14
A B C
Fig. A–4.1: Linear regression (y = mx + b) of (A) feed efficiency (kg gain/kg feed) as a function of protein accretion (g/d), (B) feed
efficiency (kg gain/kg feed) as a function of adipose accretion (g/d), and (C) feed efficiency (kg gain/kg feed) as a function of the ratio
of adipose to protein accretion/d. Postnatal thermal neutral pigs (TN) and postnatal heat stress pigs (HS). Coefficient of determination
(R2), and slope (m) is presented for each regression line.
23
9
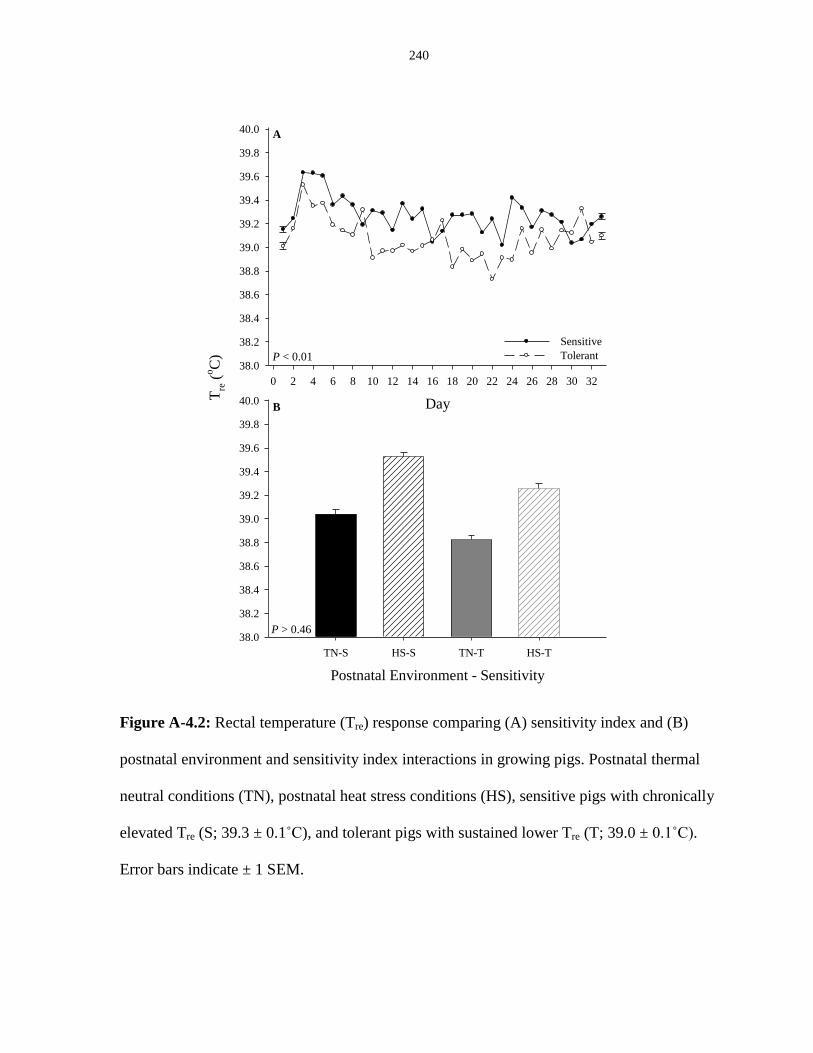
240
Postnatal Environment - Sensitivity
TN-S HS-S TN-T HS-T
Tre
(oC
)
38.0
38.2
38.4
38.6
38.8
39.0
39.2
39.4
39.6
39.8
40.0
P > 0.46
Day
0 2 4 6 8 10 12 14 16 18 20 22 24 26 28 30 32
38.0
38.2
38.4
38.6
38.8
39.0
39.2
39.4
39.6
39.8
40.0
Sensitive
TolerantP < 0.01
A
B
Figure A-4.2: Rectal temperature (Tre) response comparing (A) sensitivity index and (B)
postnatal environment and sensitivity index interactions in growing pigs. Postnatal thermal
neutral conditions (TN), postnatal heat stress conditions (HS), sensitive pigs with chronically
elevated Tre (S; 39.3 ± 0.1˚C), and tolerant pigs with sustained lower Tre (T; 39.0 ± 0.1˚C).
Error bars indicate ± 1 SEM.
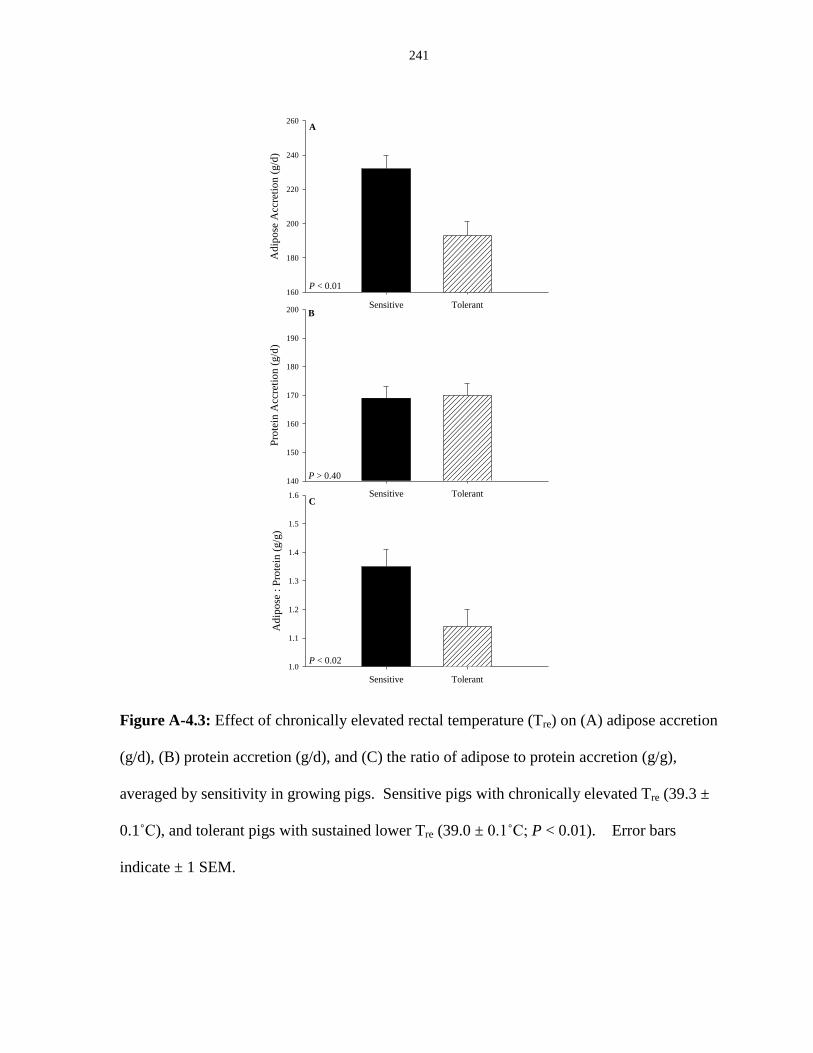
241
Sensitive Tolerant
Ad
ipo
se A
ccre
tio
n (
g/d
)
160
180
200
220
240
260
P < 0.01
A
Sensitive Tolerant
Ad
ipo
se :
Pro
tein
(g/g
)
1.0
1.1
1.2
1.3
1.4
1.5
1.6
P < 0.02
CSensitive Tolerant
Pro
tein
Acc
reti
on
(g/d
)
140
150
160
170
180
190
200 B
P > 0.40
Figure A-4.3: Effect of chronically elevated rectal temperature (Tre) on (A) adipose accretion
(g/d), (B) protein accretion (g/d), and (C) the ratio of adipose to protein accretion (g/g),
averaged by sensitivity in growing pigs. Sensitive pigs with chronically elevated Tre (39.3 ±
0.1˚C), and tolerant pigs with sustained lower Tre (39.0 ± 0.1˚C; P < 0.01). Error bars
indicate ± 1 SEM.
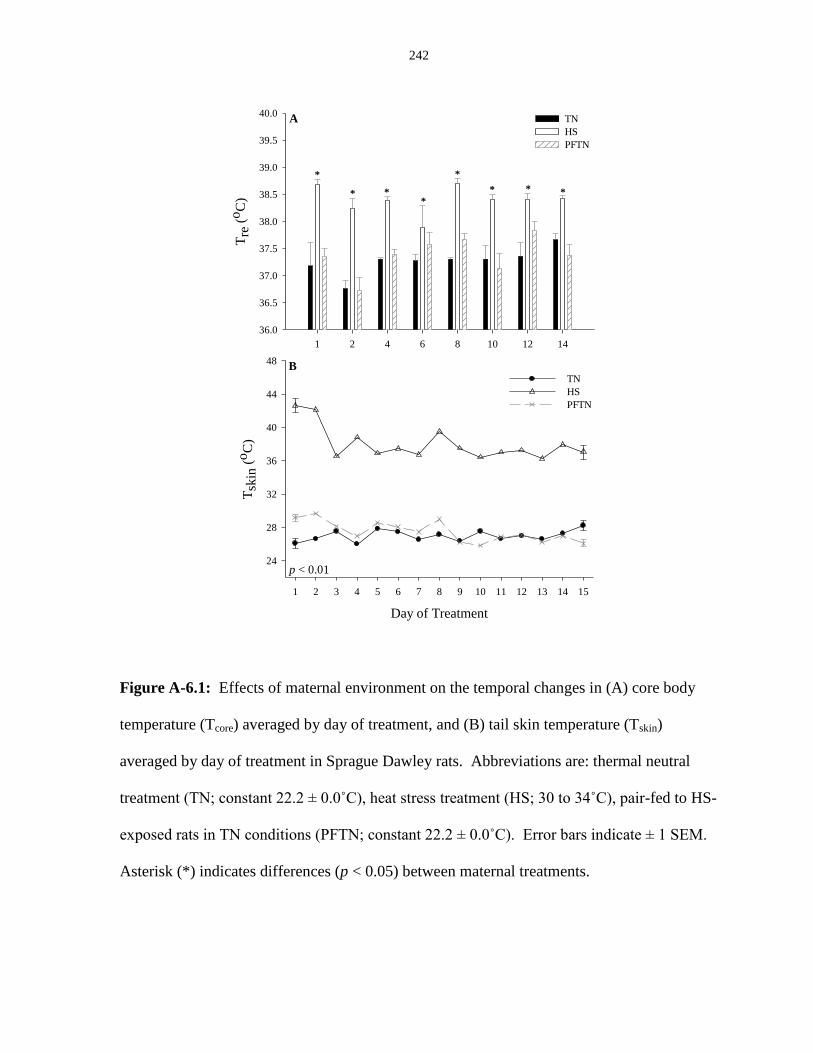
242
1 2 4 6 8 10 12 14
Tre
(o
C)
36.0
36.5
37.0
37.5
38.0
38.5
39.0
39.5
40.0TN
HS
PFTN
*
* **
*
* * *
A
Day of Treatment
1 2 3 4 5 6 7 8 9 10 11 12 13 14 15
Tsk
in (
oC
)
24
28
32
36
40
44
48
TN
HS
PFTN
p < 0.01
B
Figure A-6.1: Effects of maternal environment on the temporal changes in (A) core body
temperature (Tcore) averaged by day of treatment, and (B) tail skin temperature (Tskin)
averaged by day of treatment in Sprague Dawley rats. Abbreviations are: thermal neutral
treatment (TN; constant 22.2 ± 0.0˚C), heat stress treatment (HS; 30 to 34˚C), pair-fed to HS-
exposed rats in TN conditions (PFTN; constant 22.2 ± 0.0˚C). Error bars indicate ± 1 SEM.
Asterisk (*) indicates differences (p < 0.05) between maternal treatments.
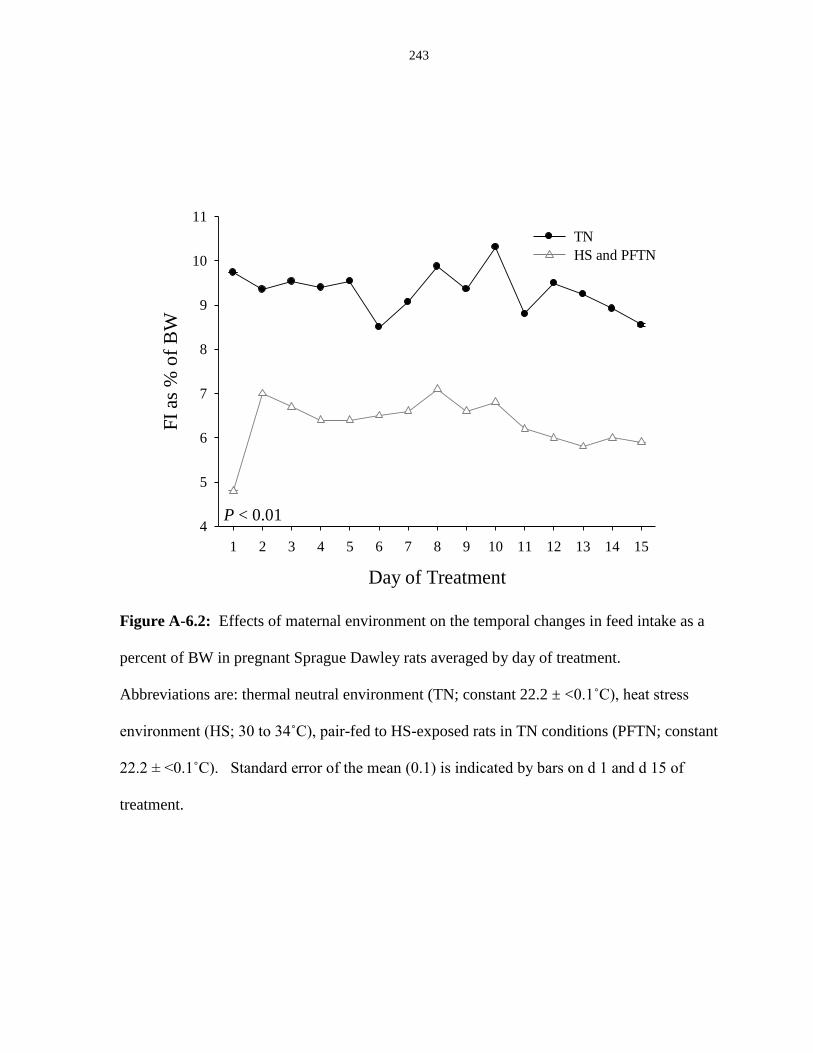
243
Day of Treatment
1 2 3 4 5 6 7 8 9 10 11 12 13 14 15
FI
as %
of
BW
4
5
6
7
8
9
10
11
TN
HS and PFTN
P < 0.01
Figure A-6.2: Effects of maternal environment on the temporal changes in feed intake as a
percent of BW in pregnant Sprague Dawley rats averaged by day of treatment.
Abbreviations are: thermal neutral environment (TN; constant 22.2 ± <0.1˚C), heat stress
environment (HS; 30 to 34˚C), pair-fed to HS-exposed rats in TN conditions (PFTN; constant
22.2 ± <0.1˚C). Standard error of the mean (0.1) is indicated by bars on d 1 and d 15 of
treatment.
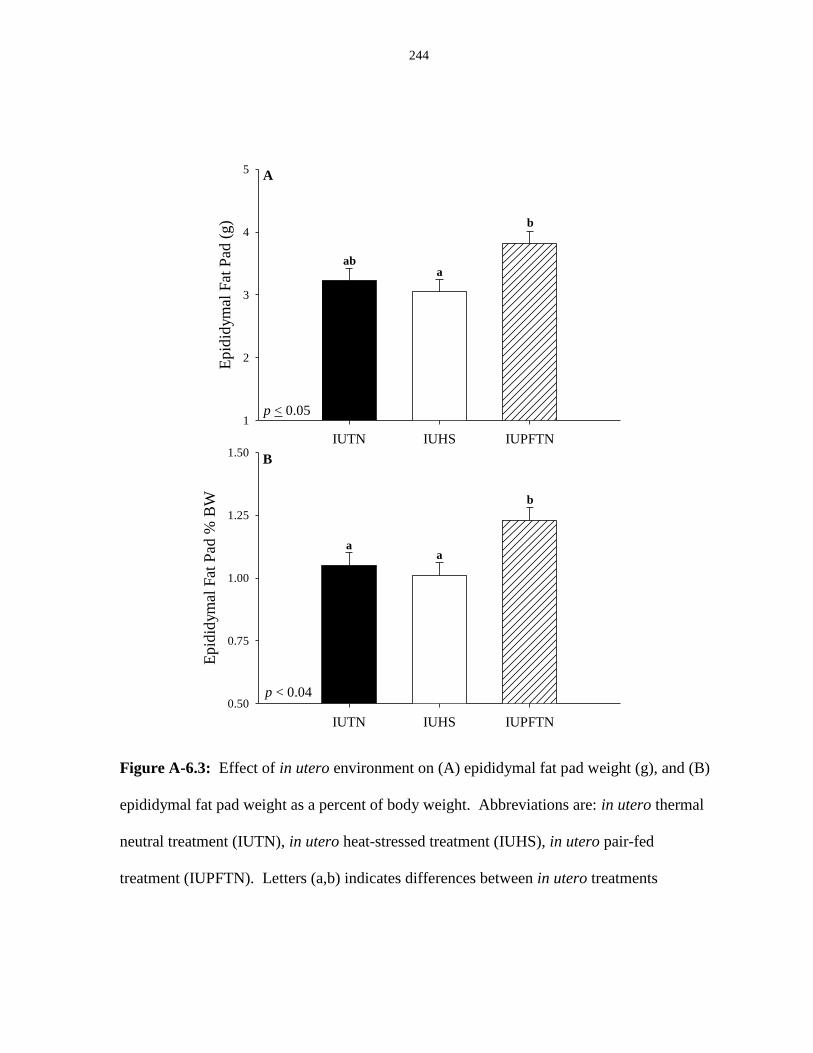
244
IUTN IUHS IUPFTN
Ep
idid
ym
al F
at P
ad (
g)
1
2
3
4
5
p < 0.05
aba
b
A
IUTN IUHS IUPFTN
Ep
idid
ym
al F
at P
ad %
BW
0.50
0.75
1.00
1.25
1.50B
aa
b
p < 0.04
Figure A-6.3: Effect of in utero environment on (A) epididymal fat pad weight (g), and (B)
epididymal fat pad weight as a percent of body weight. Abbreviations are: in utero thermal
neutral treatment (IUTN), in utero heat-stressed treatment (IUHS), in utero pair-fed
treatment (IUPFTN). Letters (a,b) indicates differences between in utero treatments
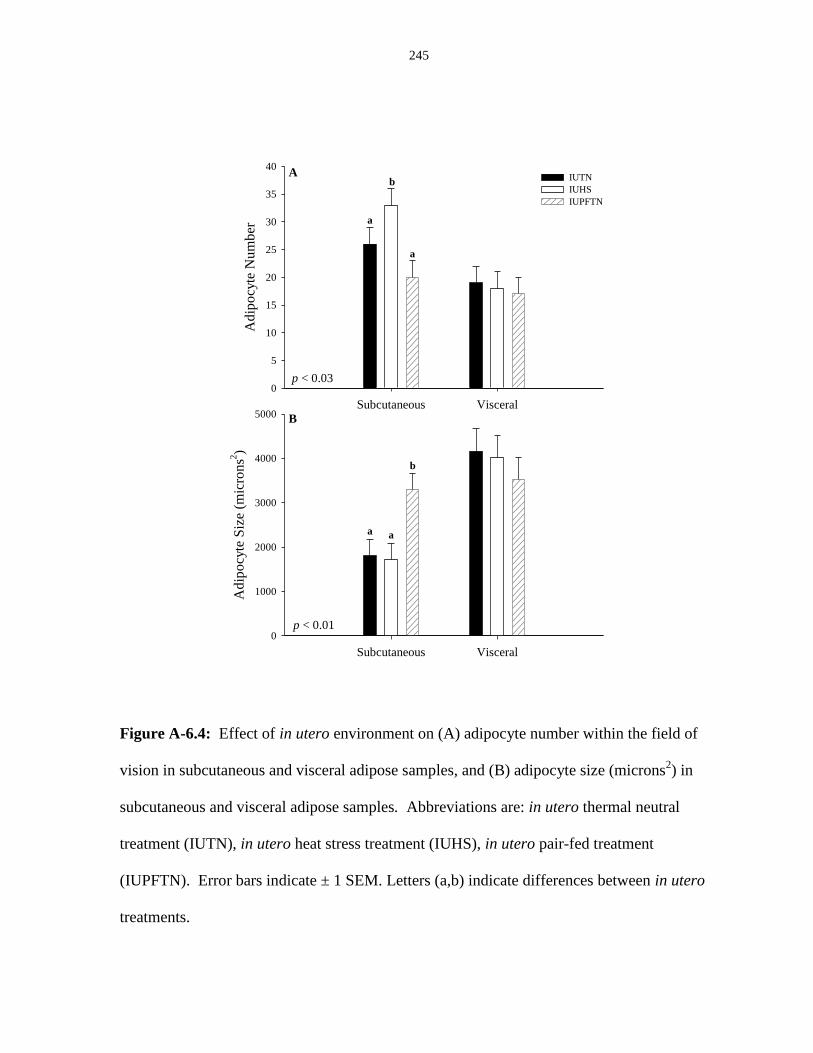
245
Subcutaneous Visceral
Ad
ipo
cyte
Nu
mb
er
0
5
10
15
20
25
30
35
40IUTN
IUHS
IUPFTN
a
b
a
A
Subcutaneous Visceral
Ad
ipo
cyte
Siz
e (m
icro
ns2
)
0
1000
2000
3000
4000
5000
a a
b
B
p < 0.03
p < 0.01
Figure A-6.4: Effect of in utero environment on (A) adipocyte number within the field of
vision in subcutaneous and visceral adipose samples, and (B) adipocyte size (microns2) in
subcutaneous and visceral adipose samples. Abbreviations are: in utero thermal neutral
treatment (IUTN), in utero heat stress treatment (IUHS), in utero pair-fed treatment
(IUPFTN). Error bars indicate ± 1 SEM. Letters (a,b) indicate differences between in utero
treatments.
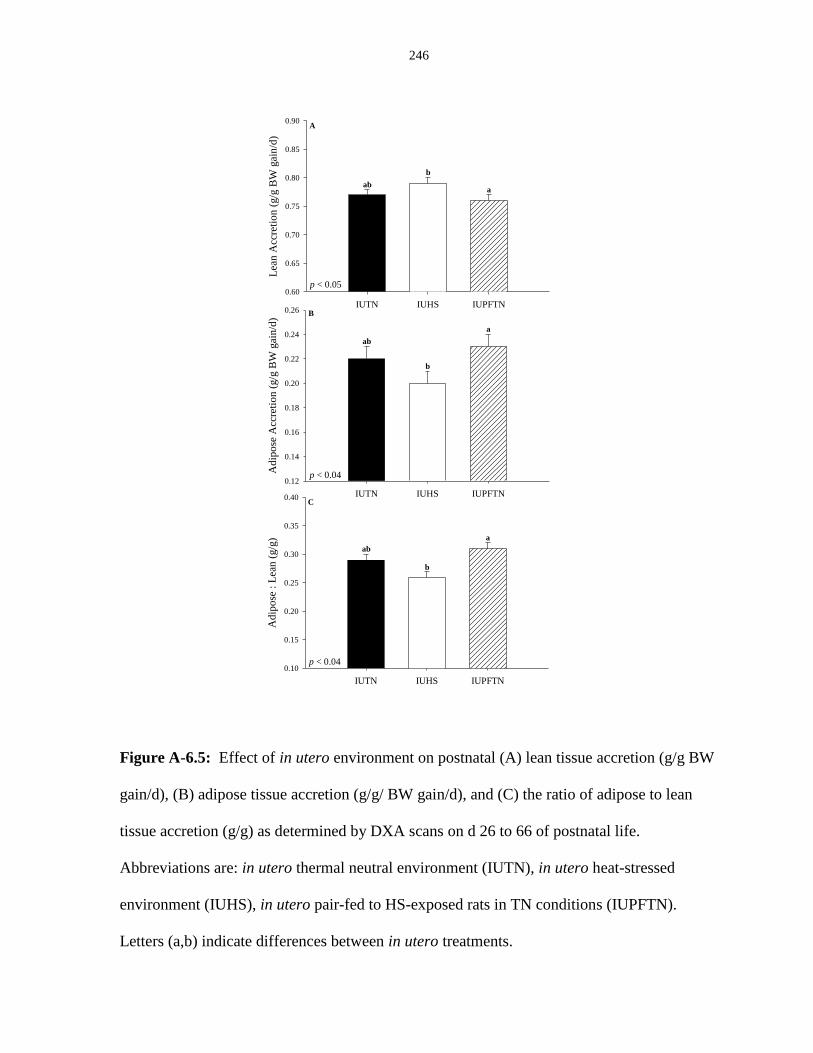
246
IUTN IUHS IUPFTN
Lea
n A
ccre
tio
n (
g/g
BW
gai
n/d
)
0.60
0.65
0.70
0.75
0.80
0.85
0.90A
ab
b
a
p < 0.05
IUTN IUHS IUPFTN
Ad
ipo
se A
ccre
tio
n (
g/g
BW
gai
n/d
)
0.12
0.14
0.16
0.18
0.20
0.22
0.24
0.26
p < 0.04
ab
b
a
B
IUTN IUHS IUPFTN
Ad
ipo
se :
Lea
n (
g/g
)
0.10
0.15
0.20
0.25
0.30
0.35
0.40
p < 0.04
ab
b
a
C
Figure A-6.5: Effect of in utero environment on postnatal (A) lean tissue accretion (g/g BW
gain/d), (B) adipose tissue accretion (g/g/ BW gain/d), and (C) the ratio of adipose to lean
tissue accretion (g/g) as determined by DXA scans on d 26 to 66 of postnatal life.
Abbreviations are: in utero thermal neutral environment (IUTN), in utero heat-stressed
environment (IUHS), in utero pair-fed to HS-exposed rats in TN conditions (IUPFTN).
Letters (a,b) indicate differences between in utero treatments.


