Embed Size (px)
Citation preview
Tectonophysics, 203 (1992) 11-97
Elsevier Science Publishers B.V., Amsterdam
Heat flow in the Valencia trough: geodynamic implications
J.P. Foucher a, A. Mauffret b, M. Steckler ‘, M.F. Brunet b, A. Maillard b, J.P. Rehault d, B. Alonso e, P. Desegaulx f, J. Murillas g and G. Ouillon a
a Institut Franqais de Recherche pour I’Ekploitation de la Mer, B P 70, 29280 Plouzane, France b Groupe d’Etude de la Marge Continentale et de I’Ocean, URA 718, Universite’ Pierre et Marie Curie, 4 Place Jussieu,
75252 Paris, France c Lament-Doherty Geological Observatory of Columbia Universify, Palisades, N.Y. 10964, USA
d Universite’ de Bretagne Occidentale, 6 avenue Le Gorgeu, 29283 Brest Cedex, France e Institute de Ciencas de1 Mar, Paseo National, s/n, 08003 Barcelona, Spain f Institut Franqais du P&role, BP 311, 92506 Rueil-Malmaison Cedex, France
s Institute of Earth Sciences “Jaume Almera”, Marti i Franques, s/n, 08028 Barcelona, Spain
Received December 181990, revised version accepted April 24, 1991
ABSTRACI
Foucher, J.P., Mauffret, A., Steckler, M., Brunet, M.F., Maillard, A., Rehault, J.P., Alonso, B., Desegaulx, P., Murillas, J. and Ouillon, G., 1992. Heat flow in the Valencia trough: geodynamic implications. In: E. Banda and P. Santanach (Editors), Geology and Geophysics of the Valencia Trough, Western Mediterranean. Tectonophysics, 203: 77-97.
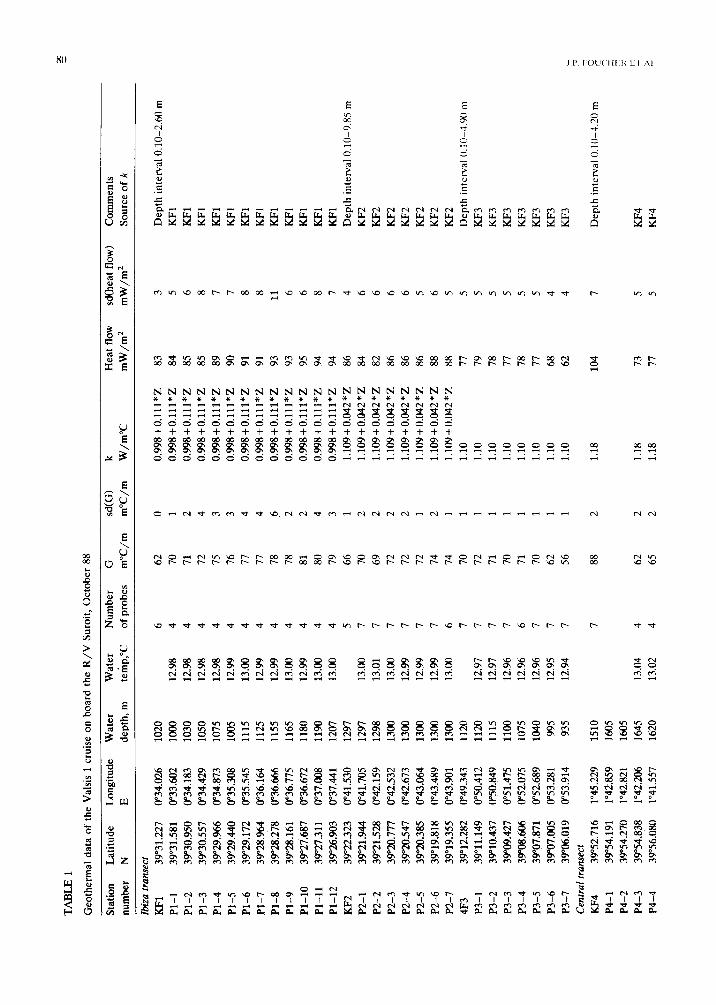
As part of the Valsis project, 110 heat-flow determinations were obtained in the axial, deep part of the Valencia trough during the Valsis 1 cruise of the R/V Le Suroit in 1988. The data gathered data provide a fairly comprehensive view of the regional heat-flow pattern. Regional heat flow increases from a value of 66 f 4 mW/m’ to the north of Menorca to 88 f 4 mW/m2 in the southern part of the rift between Valencia and Ibiza. A simple rifting model, assuming uniform stretching of the lithosphere during a single rifting event from 28 to 22 Ma ago, satisfactorily describes the observed heat flow and depth to sea floor in the northern part of the trough. In contrast, the southern Valencia trough has high heat flow and shallow sea floor that are difficult to reconcile with predictions of a uniform lithospheric stretching model even allowing for an initial elevation, a thin, hot lithosphere or a multi-episode history of rifting. Non-homogeneous lithospheric stretching models, assuming for example large-scale dike intrusion or a greater extension of the mantle than in the crust, provide potential explanations of the high heat flow and shallow sea floor in the southern Valencia trough. Yet, these models remain poorly constrained.
Introduction
The Valencia trough is an aborted rift formed during the opening of the western Mediterranean Sea (Biju-Duval et al., 1978; FontbotC et al., 1989; Maillard et al., 1992-this volume). The Valencia trough was created by the Late Oligocene-Early Miocene rifting of the Balearic promontory from the Spanish Meseta. As yet, the processes through which the trough was initiated and evolved to its present-day structure remain poorly understood.
Correspondence to: J.P. Foucher, Institut Franfais de Recherche pour IExploitation de la Mer, B.P. 70, 29280 Plouzand, France.
In this regard, the Valsis project has been a major step towards a better understanding of the deep structure of the trough and of the rifting processes that led to its formation. In addition to seismic studies (Maillard et al., 1992-this volume; Tome et al., 1992~this volume), the determination of the geothermal structure of the Valencia trough was a main objective of the Valsis project. This objective was chosen because the thermal struc- ture of basins formed by lithospheric extension is specific to the age of their formation and to the nature of the rifting processes (e.g., Royden and Keen, 1980; Buck et al., 1988; Louden et al., 1991).
In this paper, we present the results of 110 successful heat-flow measurements made in the
0040-1951/92/$05.00 0 1992 - Elsevier Science Publishers B.V. All rights reserved
78
0” 42(
41<
40’
390
38’
R/V LE S”ROlT YALSl-3 1
LOCATION MAP OF HEAT
OCT.1988
FLOW PROFILES
@ IBIZA
@ CENTRAL
@ MALLORCA
1” 00 10 2’ 30 40 5’
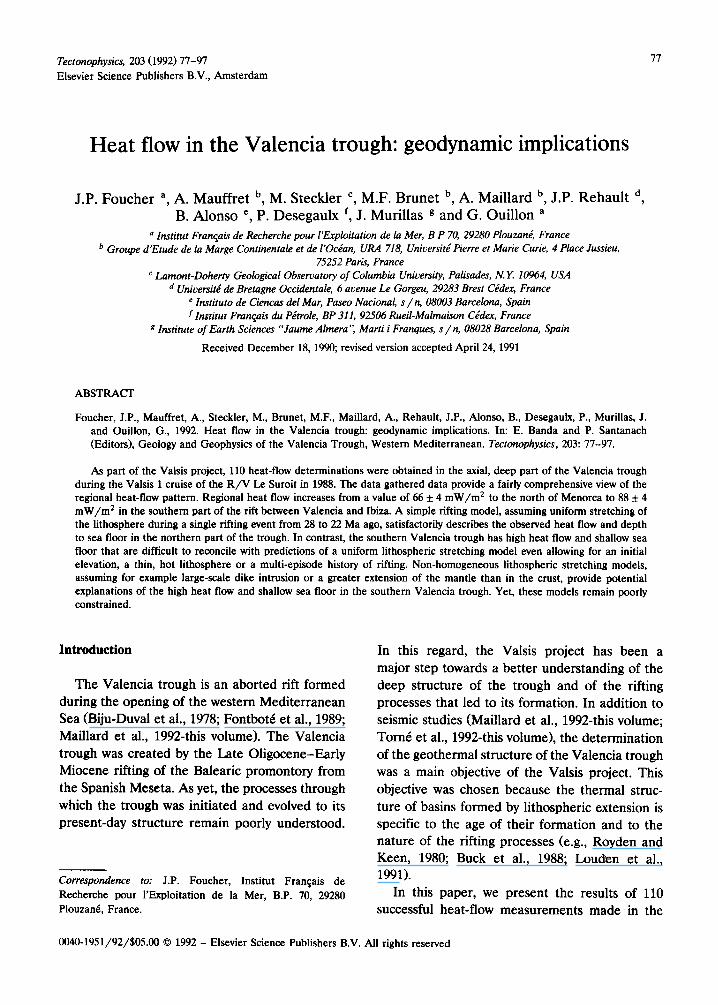
Fig. 1. Location map of the Valsis 1 heat-flow profiles. Along the heat- flow profiles, V2, V3, V4, V.5 and V7 refer to the Valsis 2 ESP profiles. The seismic refraction lines 196 and 197 were reported in Fahlquist (1963); B3 and B7 in Banda et al. (1980), and AI1
(Anna21 in Hinz (1972).
axial, deep part of the Valencia trough during the Valsis 1 cruise of the R/V Le Suroit in Septem- ber, 1988. The measurements were located along four main transects, namely the Ibiza, Central, Mallorca and Menorca transects (Fig. 1). The locations of these transects were selected in con- junction with those of the deep seismic soundings of the Valsis projects, so that the interpretation of the thermal data could benefit of the knowl- edge of the deep seismic structure. The Valsis 1 heat-flow measurements were the first ever made at the axis of this trough.
Sea-floor heat-flow observations
Temperature gradients were determined from temperatures measured at up to 8 distinct depths in the upper 4 to 10 meters of sediment. The measurements were taken using one of two
probes. The first probe was a trigger-release pis- ton corer with a 5-m or lo-m-long pipe on which up to 8 thermistor temperature sensors on outrig- gers were mounted in an helicoidal way at regular intervals of 0.60 or 1.20 m. The second probe consisted of a 800&g core head at the base of which a thin steel rod of 40 mm diameter and 3.6 or 5 m long, bearing up to 7 thermistor tempera- ture sensors at regular intervals of 0.60 m, was emplaced instead of the core pipe. With both probes, sediment temperatures were recorded digitally every 10 s during penetration times last- ing from 5 to 10 minutes. The effects of frictional heating upon penetration were removed by linear extrapolation of each sensor’s sediment tempera- ture record as a function of reciprocal time. Un- certainties in the relative equilibrium tempera- tures determined were usually less than 5 mK. Poor determinations with an uncertainty greater than 5 mK were discarded.
HEAT FLOW IN THE VALENCIA TROUGH: GEODYNAMIC IMPLICATIONS 79
The steel-rod instrument permitted multiple penetrations on one lowering to the sea floor, allowing for fine-scale variations in heat flow to
be detected on profiles of closely-spaced mea- surements. In contrast, the piston-corer instru- ment permitted only one single penetration on each lowering, but usually penetrated the sedi- ments to greater depths than those reached by the steel-rod probe which was useful to confirm the constancy of heat flow with depth. In addi- tion, sediment cores were recovered when the piston-corer probe was used, on which thermal conductivity, required to determine heat flow, could be measured in the ship’s laboratory. The two instruments were used in a complementary way during the Valsis 1 cruise.
Thermal conductivity was measured every 0.20 m on each recovered core using the continuous heating needle probe method (von Herzen and Maxwell, 1959). The needle temperature was dig- itally recorded every 5 s over a heating time of 120 s. Data from the time interval between 20 and 120 s were processed to determine thermal conductivity. All measurements were made after the cores had equilibrated to the laboratory tem- perature. All measured conductivities were cor- rected for in situ temperature and pressure (Ratcliffe, 1960). The uncertainty in conductivity was estimated to be uniformly 5%.
Heat flow was calculated as the simple product of the mean thermal gradient and the harmonic mean thermal conductivity at all the piston-coring stations that did not exhibit a significant increase in conductivity with depth. At those remaining stations for which an increase in conductivity with depth was noticeable, a best-fitting linear law of conductivity with depth was calculated and heat flow was taken as the slope of a temperature versus thermal resistance (reciprocal of thermal conductivity) plot. At stations where the steel-rod instrument was used, thermal conductivity was estimated from values measured at nearby piston-coring stations and heat flow was calcu- lated in the same way as described above for the piston-coring stations. Thermal gradients, con- ductivities and heat flows, with their associated
uncertainties, are reported in Table 1 for all stations.
Data presentation
The Ibiza transect
Twenty-nine measurements in three distinct groups (lines IBl, IB2, IB3, which are 10, 7 and 13 km long respectively, Figs. 1 and 2a) were obtained along the Ibiza transect. The measure- ments extend from the axial part of the Valencia trough (IBl, IB2) to its southern flank (IB3). The observed heat flow culminates at 95mW/m2 along line IBl, maintaining a markedly high value above 82 mW/m2 along lines IBl and IB2. It is slightly lower, with a constant value of 77-79 mW/m’, along the northern part of line IB3. The signifi- cantly lower values of 68 and 62 mW/m2 at the two southermost stations of line IB3 appear to indicate a rapid decrease in heat flow associated with the bottom of the Ibiza continental slope. Clearly, even though the heat-flow profile is not continuous along the Ibiza transect, the available data support the occurrence of a high regional heat flow, between 82 and 95 mW/m2, in the axial part of the Valencia trough, decreasing to significantly lower values, probably less than 62 mW/m2, at its southern edge. The mean heat flow along lines IBl and IB2 in the axial part of the trough is 88 f 4 mW/m2( + 1s.d.).
The Central transect
Seven successful measurements were obtained along a 22-km-long profile in the axial part of the trough near 40”N (Figs. 1 and 2b). The fairly uniform heat-flow values range from 68 to 78 mW/m2, averaging 73 + 4 mW/m2, with the ex- ception of an anomalously high value of 104 mW/m2 at station KF4. The latter high value probably reflects a local thermal structure associ- ated with a volcanic ridge nearby outcropping. Station KF4 is located 3 miles to the north of this ridge (Maillard et al., 1992-this volume).
The Mallorca transect
A nearly continuous suite of heat-flow mea-
surements was obtained from the toe of the Mal- lorca margin to that of the Catalan margin near
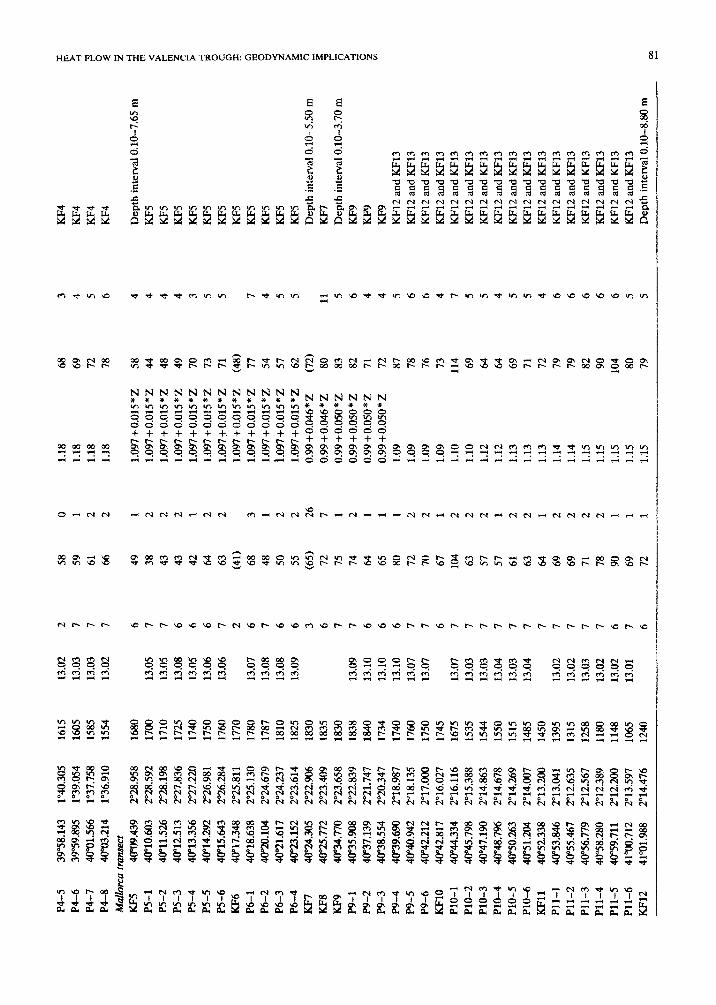
TA
BL
E
1
Geo
ther
mal
da
ta o
f th
e V
alsi
s 1
cru
ise
on b
oard
th
e R
/V
Su
roit
, O
ctob
er
88
Sta
tion
L
atit
ude
L
ongi
tude
W
ater
W
ater
N
um
ber
G
sd(G
) k
Hea
t fl
ow
sdfh
eat
flow
) C
omm
ents
nu
mbe
r N
E
de
pth
, m
te
mp,
“C
of p
robe
s m
”C/m
m
”C/m
W
/m”C
m
W/m
2 m
W/m
2 S
ourc
e of
k
Ibiz
a tr
anse
ct
KF
1 39
’31.
227
O”3
4.02
6 10
20
Pl-
1 39
O31
.581
O
”33.
602
1000
Pl-
2 3Y
30.9
50
o”34
.183
10
30
PI-
3 39
”30.
557
o”34
.429
10
50
Pl-
4 39
’29.
966
o”34
.873
10
75
Pl-
5 39
’29.
440
o”35
.308
10
05
Pl-
6 3m
.172
o”
35.5
45
1115
Pl-
7 39
=X
964
o”36
.164
11
25
Pl-
8 39
Q.2
78
o”36
.666
11
55
Pl-
9 39
’28.
161
O”3
6.77
5 11
65
Pl-
10
3Y27
.687
O
-36.
672
1180
Pl-
11
3Y27
.311
o”
37.0
08
1190
Pl-
12
3Y26
.903
0’
37.4
41
1207
KF
2 3Y
22.3
23
o”41
.530
12
97
P2-
1 39
O21
.944
O
”41.
705
1297
P2-
2 39
YX
.528
o”
42.1
59
1298
P2-
3 3Y
20.7
77
o”42
.532
13
00
P2-
4 3m
.547
o”
42.6
73
1300
P2-
5 3Y
20.3
85
o”43
.064
13
00
P2-
6 39
’19.
818
o”43
.489
13
00
P2-
7 39
O19
.355
o”
43.9
01
1300
4F3
39’1
2.28
2 o”
49.3
43
1120
P3-
1 39
Y1.
149
o”50
.412
11
20
P3-
2 39
O10
.437
w
50.8
49
1115
P3-
3 39
Yf9
.427
o”
51.4
75
1100
P3-
4 39
Yt8
.606
ff
52.0
75
1075
P3-
5 39
Yt7
.871
o”
52.6
89
1040
P3-
6 39
“07.
005
o”53
.281
99
5
P3-
7 39
v6.0
19
O”5
3.91
4 93
5
Cen
tral
tra
nse
ct
KF
4 3Y
52.7
16
l”45
.229
P4-
1 3q
54.1
91
l”42
.859
P4-
2 3v
54.2
70
l”42
.821
P4-
3 3Y
54.8
38
l”42
.206
P4-
4 39
O56
.080
l”
41.5
57
1510
1605
1605
1645
1620
12.9
8
12.9
8
12.9
8
12.9
8
12.9
9
13.0
0
12.9
9
12.9
9
13.0
0
12.9
9
13.0
0
13.0
0
13.0
0
13.0
1
13.0
0
12.9
9
12.9
9
12.9
9
13.0
0
12.9
7
12.9
7
12.9
6
12.9
6
12.9
6
12.9
5
12.9
4
13.0
4
13.0
2
6 62
0
0.99
8+0.
111*
2 83
3
4 70
1
0.99
8+0.
111*
Z
84
5
4 71
2
0.99
8+0.
111*
2 85
6
4 72
4
0.99
8+0.
111*
2 85
8
4 75
3
0.99
8+0.
111*
2 89
7
4 76
3
0.99
8+0.
111*
Z
90
7
4 77
4
0.99
8+0.
111*
2 91
8
4 77
4
0.99
8+0.
111*
2 91
8
4 78
6
0.99
8+O
.lll
*Z
93
11
4 78
2
0.99
8+0.
111*
2 93
6
4 81
2
0.99
8+0.
111*
2 95
6
4 80
4
0.99
8+0.
111*
2 94
8
4 79
3
0.99
8+0.
111*
2 94
7
5 66
1
1.10
9+0.
042*
z 86
4
7 70
2
1.10
9+0.
042*
Z
84
6
7 69
2
1.10
9+0.
042*
Z
82
6
7 72
2
1.10
9+0.
042*
z 86
6
7 72
2
1.10
9+0.
042*
z 86
6
7 72
1
1.10
9+0.
042*
z 86
5
7 74
2
1.10
9+0.
042*
z 88
6
6 74
1
1.10
9+0.
042*
z 88
5
7 70
1
1.10
77
5
7 72
1
1.10
79
5
7 71
1
1.10
78
5
7 70
1
1.10
77
5
6 71
1
1.10
78
5
7 70
1
1.10
77
5
7 62
1
1.10
68
4
7 56
1
1.10
62
4
88
62
65
2 1.
18
104
7
2 1.
18
73
5
2 1.
18
77
5
Dep
th
inte
rval
0.1
0-2.
60
m
KF
l
KF
l
RF
1
RF
1
KF
l
KF
l
KF
I
KF
l
KF
l
RF
1
KF
l
RF
1
Dep
th
inte
rval
0.1
0-9X
m
KF
2
KF
2
KF
2
KF
2
KF
2
KF
2
KF
2
Dep
th
inte
rval
0.1
0-3.
90
m
KF
3
KF
3
KF
3
KF
3
RF
3
KF
3
KF
3 L
a
Dep
th
inte
rval
0.1
0-4.
20
m
$ c 3 E
- K
F4
KF
4 Y
P4-
5 39
58.1
43
l”40
.305
P
4-6
3TS
9.89
5 l”
39.0
54
P4-
I 40
W.5
66
l”37
.758
P4-
8 4O
W3.
214
l”36
.910
Mal
lorc
a tra
nsec
t K
FS
P
5-1
P5-
2
P5-
3
P5-
4
P5-
5
P5-
6
KF
6
P6-
1
P6-
2
P6-
3
P6-
4
KJ?
7
KF
8
KF
9
P9-
1
P9-
2
P9-
3
P9-
4
P9-
5
P9-
6
KF
lO
PlO
-1
PlO
-2
PlO
-3
PM
-4
PlO
-5
PlO
-6
KF
ll
Pll
-1
Pll
-2
Pll
-3
Pll
-4
Pll
-5
Pll
-6
KF
12
4OV
9.43
9 2Y
28.9
58
w10
.603
2Y
B.5
92
4Vll
.526
2‘
28.1
98
4V12
.513
2’
27.8
36
W13
.356
2’
27.2
20
4001
4.29
2 2”
26.9
81
4ff1
5.64
3 2O
26.2
84
Wl7
.348
2T
.5.8
11
40Y
8.63
8 2Y
2S.1
30
4OT
O.1
04
2Y24
.679
W21
.617
2O
24.2
37
4V23
.152
2’
23.6
14
4oT
4.30
5 2O
22.9
06
40‘2
5.77
2 2’
23.4
09
4003
4.77
0 2T
3.65
8
W35
.908
2“
22.8
39
W37
.139
2’
21.7
47
4OY
38.5
54
2O20
.347
40’3
9.69
0 2’
18.9
87
40V
0.94
2 2O
18.1
35
W42
.212
2”
17.0
00
W42
.817
2O
16.0
27
40W
.334
2Y
6.11
6
W45
.798
2W
.388
4CP
47.1
90
2O14
.863
4OW
.796
2O
l4.6
78
40”5
0.26
3 2O
14.2
69
40‘5
1.20
4 2”
14.0
07
4OY
2.33
8 2”
13.2
00
4095
3.84
6 2”
13.0
41
4W55
.467
2Y
2.63
5
4W56
.779
2”
12.5
67
W58
.280
2”
12.3
89
4OY
9.71
1 r1
2.20
0
4loo
O.7
12
2O13
.597
41’0
1.98
8 2’
14.4
76
1615
13
.02
2 58
0
1605
13
.03
7 59
1
1585
13
.03
7 61
2
1554
13
.02
7 66
2
1680
1700
1710
1725
1740
1750
1760
1770
1780
1787
1810
1825
1830
1835
1830
1838
1840
1734
1740
1760
1750
1745
1675
1535
1544
1550
1515
1485
1450
1395
1315
1258
1180
1148
1065
1240
13.0
5
13.0
5
13.0
8
13.0
5
13.0
6
13.0
6
13.0
7
13.0
8
13.0
8
13.0
9
13.0
9
13.1
0
13.1
0
13.1
0
13.0
7
X3.
07
13.0
7
13.0
3
13.0
3
13.0
4
13.0
3
13.0
4
13.0
2
13.0
2
13.0
3
13.0
2
13.0
2
13.0
1
6 49
7 38
7 43
6 43
6 42
6 64
7 63
2 (4
1)
6 68
7 48
6 50
6 55
3 (6
5)
6 72
7 75
7 74
6 64
6 65
6 80
7 72
7 70
6 67
7 10
4
I 63
7 57
7 57
7 61
7 63
7 64
7 69
7 69
7 71
7 78
6 90
7 69
6 72
3 1 2 2 26
7 1 2 I 1 1 2 2 1 2 2 2 1 2 2 1 2 2 2 2 1 1 1
1.18
68
1.18
69
1.18
12
1.18
78
1.~
7+0.
015*
Z
58
1.09
7+0.
015*
z 44
1.09
7+0.
015*
Z
48
1.09
7+0.
015*
z 49
1.09
7+0.
015*
2 70
1.09
7 +
0.0
1s *
z
13
1.09
7,0.
015*
2 71
1.09
7+O
.OlS
*Z
(48)
1.09
7+0.
015*
z 77
1.09
7+0.
015*
z 54
1.09
7+0.
015*
z 51
1.09
7+O
.OlS
*Z
62
0.99
+0.
046*
z (7
2)
0.99
+0.
046*
Z
80
0.99
+O
.OS
O*Z
83
0.99
+O
.OS
O*Z
82
0.99
+0.
050*
2 71
0.99
+0.
05O
*Z
72
1.09
87
1.09
78
1.09
76
1.09
73
1.10
11
4
1.10
69
1.12
64
1.12
64
1.13
69
1.13
71
1.13
72
1.14
79
1.14
79
1.15
82
1.15
90
1.15
10
4
1.15
80
1.15
79
11 5 6 4 4 5 6 6 4 7 5 5 4 5 5 4 6 6 6 6 6 5 5
KF
4
KF
4 F
1
KF
4 ;I
KF
4 8 4
Dep
th i
nte
rvaf
0.1
0-7.
65
m
WS
2
KF
5 s E
K
F5
E
KF
5 j;
KF
5 ;;1
KF
5 z!
KF
5 E
KF
5 0
KF
5 z:
KF
5 s
KF
5 2
Dep
th i
nte
rval
0.1
0-5.
50
m
ij
KF
7 5
Dep
th
inte
rval
0.1
0-3.
70
m
:!
KF
9 T
KF
9 3
I@9
3
KF
12 a
nd
KF
13
KF
12 a
nd
KF
13
K.F
l2 a
nd
KF
13
KF
12 a
nd
KF
13
KF
12 a
nd
KF
13
KF
l2
and
KF
13
KF
12 a
nd
KF
13
I@12
an
d K
F13
KF
12 a
nd
KF
13
KF
12 a
nd
KF
13
KF
l2
and
KF
13
I@12
an
d K
F13
KF
12 a
nd
KF
13
KF
12 a
nd
KJ?
13
KF
12 a
nd
KF
13
KF
12 a
nd
KF
13
KF
l2
and
KF
13
Dep
th
inte
rval
0.1
0-8.
80
m
oc
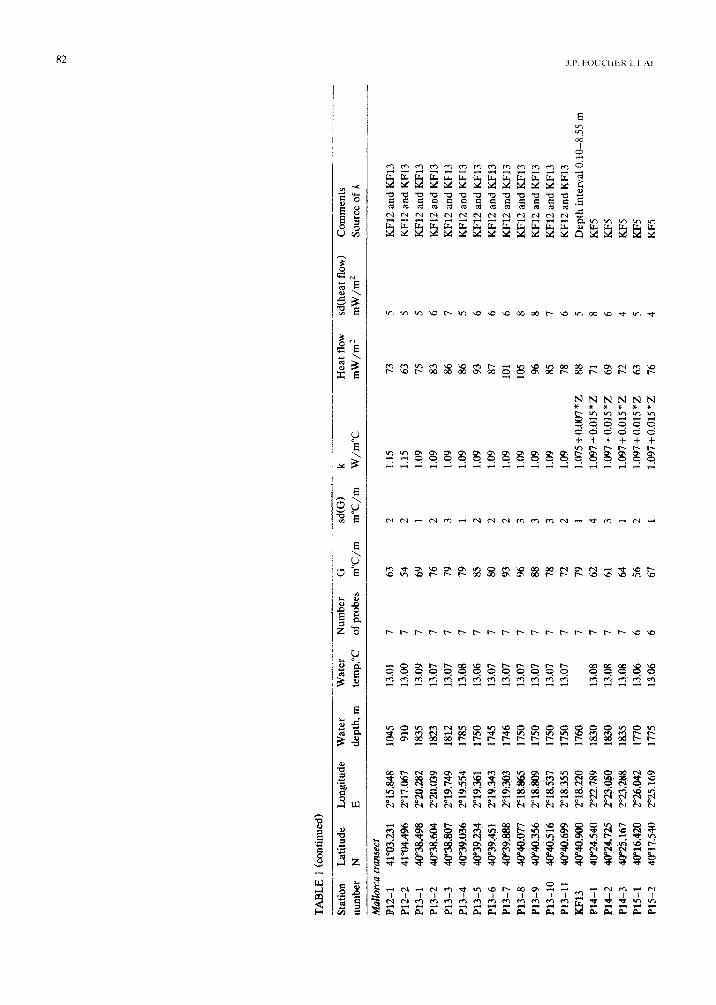
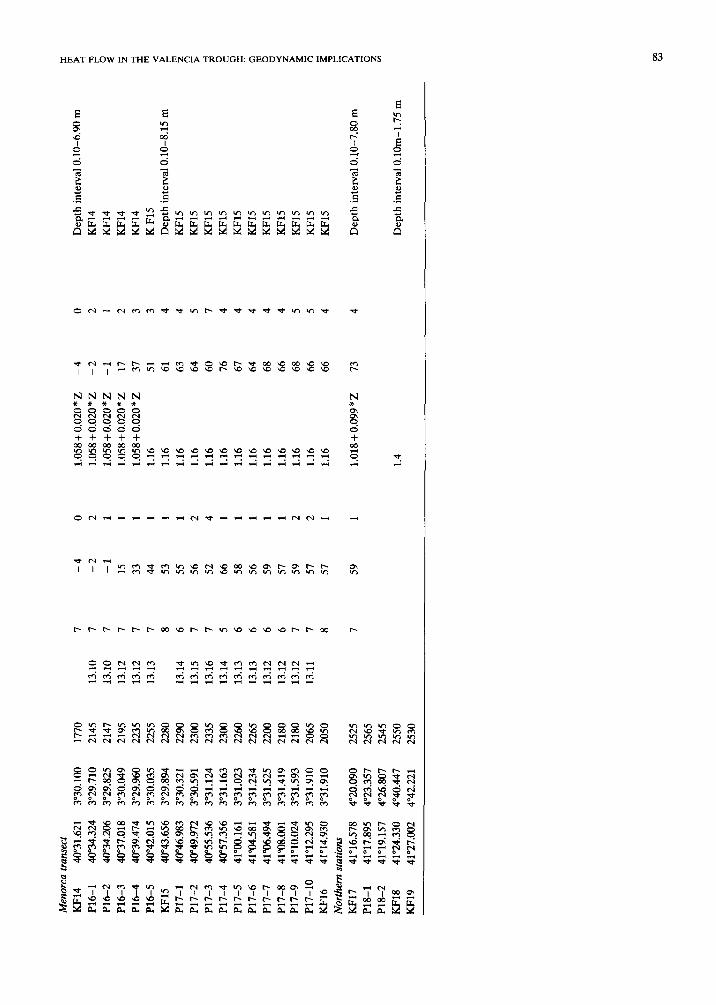
TA
3LE
1
(con
tinue
d)
Stat
ion
Lat
itude
L
ongi
tude
W
ater
W
ater
N
umbe
r G
sd
(G)
k H
eat
flow
sd
fhea
t fl
ow)
Com
men
ts
num
ber
N
E
dept
h,
m
tem
p,“C
of
pro
bes
m”C
/m
m”C
/m
W/m
”C
mW
/m*
mW
/m*
Sour
ce
of k
Mal
lorc
a tr
anse
ct
P12-
1 41
”03.
231
P12-
2 41
”04.
4%
P13-
1 4@
‘38.
498
P13-
2 4t
P38
.604
P1
3-3
4V38
.807
P1
3-4
4OY
9.03
6 P1
3-5
w39
.234
Pl
3-6
w39
.451
P1
3-7
w39
.888
P1
3-8
40w
.077
P1
3-9
4tP
40.3
56
P13
-10
40’4
fI.5
16
P13
-11
40V
J.69
9 K
F13
~~.~
P1
4-1
4v24
.540
P1
4-2
4fP
24.7
25
P14-
3 40
=25
.167
Pl
S-1
40”1
6.42
0 P1
5-2
w17
.540
2”15
.848
10
45
2”17
.061
91
0 2”
20.2
82
1835
2w
.039
18
23
2O19
.749
18
12
2Y9.
554
1785
Y
19.3
61
1750
2’
19.3
43
1745
2Y
9.30
3 17
46
FM
.865
17
50
2”18
.809
17
50
Z”l
g.53
7 17
50
T18
.355
17
50
2’18
.220
17
60
272.
789
1830
2Y
23.0
50
1830
2T
3.28
8 18
35
2Y26
.042
17
70
2’25
.169
17
75
13.0
1 13
.00
13.0
9 13
.07
13.0
7 13
.08
13.0
6 13
.07
13.0
7 13
.07
13.0
7 13
.07
13.0
7
13.0
8 13
.08
13.0
8 13
.06
13.0
6
7 63
2
1.15
73
5
7 54
2
1.15
63
5
7 69
1
1.09
75
5
7 76
2
1.09
83
6
7 79
3
1.09
86
7
7 79
1
1.09
86
5
7 85
2
1.09
93
6
7 80
2
I.09
87
6
7 93
2
1.09
10
1 6
7 96
3
1.09
10
5 8
7 88
3
1.09
96
8
7 78
3
1.09
85
7
7 72
2
1.09
78
6
7 79
1
1.07
5 -I
- 0.0
07 *
z
88
5 7
62
4 1.
097-
+0.
015*
z 71
8
7 61
3
1.09
7+0.
015*
z 69
6
7 64
1
1.09
7+0.
015*
z 72
4
6 56
2
1.09
7+0.
015*
z 63
5
6 67
1
1.09
7+0.
015*
z 76
4
KF1
2 an
d K
F13
KF1
2 an
d K
F13
KF1
2 an
d K
F13
KF1
2 an
d K
F13
KF1
2 an
d K
F13
KF1
2 an
d K
F13
KF1
2 an
d K
F13
KF1
2 an
d K
F13
KF1
2 an
d K
F13
KF1
2 an
d K
F13
KF1
2 an
d K
F13
KF1
2 an
d K
F13
KF1
2 an
d K
F13
i D
epth
in
terv
al
0.10
-8.5
5 m
e
KFS
c
KF5
y$
I
KF5
7 z:
K
F5
rr
KF5
>
Men
orca
tra
nse
ct
KF
14
40’3
1.62
1
P16
-1
W34
.324
P16
-2
40”3
4.20
6
P16
-3
W37
.018
P16
-4
w39
.474
P16
-5
W42
.015
KF
15
40=
‘43.
656
P17
-1
40%
.983
P17
-2
W49
.972
P17
-3
40“5
5.53
6
P17
-4
W57
.356
P17
-5
41”0
0.16
1
P17
-6
41W
.581
Pl7
-7
41w
6.49
4
P17
-8
41Y
l8.0
01
P17
-9
41”1
0.02
4
P17
-10
41O
12.2
95
KF
16
41T
4.93
0
Nor
ther
n s
tatio
ns
KF
17
41O
16.5
78
P18
-1
41Y
7.89
5
P18
-2
41Y
9.15
7
KF
I8
41T
4.33
0
KF
19
41”2
7.00
2
3”30
.100
17
70
7 -4
0
1.05
8 +
0.0
20 *
Z
-4
0 D
epth
in
terv
al 0
.10-
6.90
m
3O29
.710
21
45
13.1
0 7
-2
2 1.
058
+ 0
.020
* z
-2
2
KF
14
359.
825
2147
13
.10
7 -1
1
1.05
8+0.
02O
*Z
-1
1 K
F14
3”30
.049
21
95
13.1
2 7
15
1 1.
058
+ 0
.020
*z
17
2 K
F14
3”29
.%0
2235
13
.12
7 33
1
1.05
8 +
0.0
20 *
Z
37
3 K
F14
Y30
.035
22
55
13.1
3 7
44
1 1.
16
51
3 K
F15
Y29
.894
22
80
8 53
1
1.16
61
4
Dep
th
inte
rval
0.1
0-8.
15
m
350.
321
2290
13
.14
6 55
1
1.16
63
4
KF
15
3O30
.591
23
00
13.1
5 7
56
2 1.
16
64
5 K
F15
3O31
.124
23
35
13.1
6 7
52
4 1.
16
60
7 K
F15
3O31
.163
23
00
13.1
4 5
66
1 1.
16
76
4 K
F15
3O31
.023
22
60
13.1
3 6
58
1 1.
16
67
4 K
F15
3T31
.234
22
65
13.1
3 6
56
1 1.
16
64
4 K
F15
3O31
.525
22
00
13.1
2 6
59
1 1.
16
68
4 K
F15
3O31
.419
21
80
13.1
2 6
57
1 1.
16
66
4 K
F15
3O
31.5
93
2180
13
.12
7 59
2
1.16
68
5
KF
15
3O31
.910
20
65
13.1
1 7
57
2 1.
16
66
5 K
F15
39
1.91
0 20
50
8 57
1
1.16
66
4
KF
15
4”20
.090
25
25
4T3.
357
2565
4O26
.807
25
45
4O40
.447
25
50
4O42
.221
25
30
7 59
1
1.01
8+0.
099*
Z
73
4 D
epth
in
terv
al 0
.10-
7.80
m
1.4
Dep
th
inte
rval
O.l
Om
-1.7
5 m
8
I#
/,,
,,,
,,,
,, I,
8,
I/ ,,
,, ,,,
,,,
, ,,
,, /,,
,, ,,
,, ,,
,, ,,
,,,
84
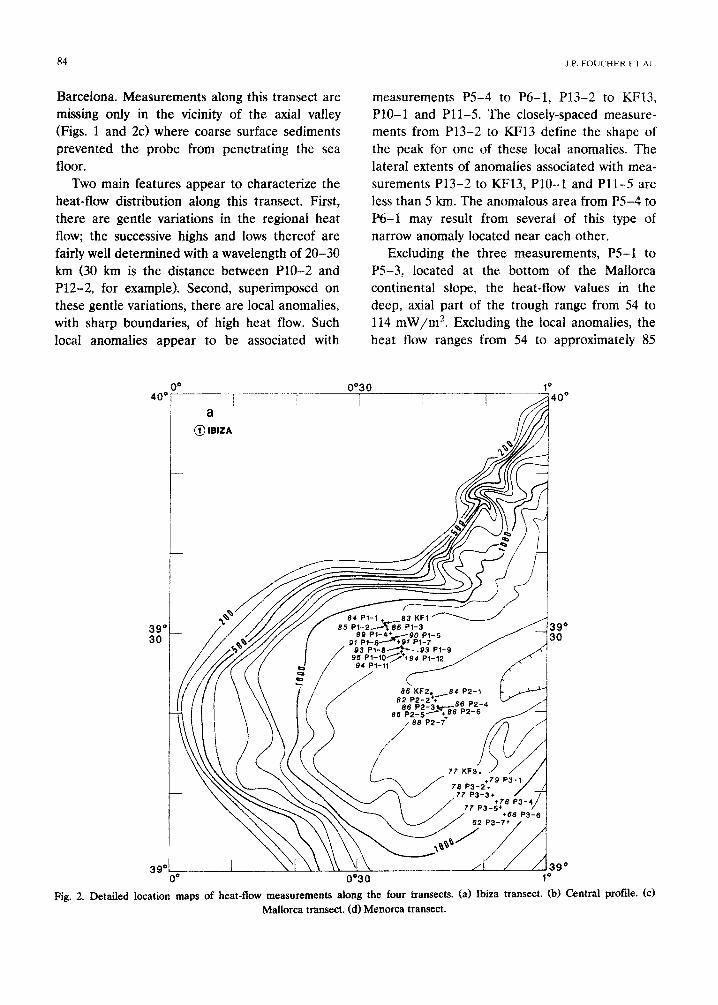
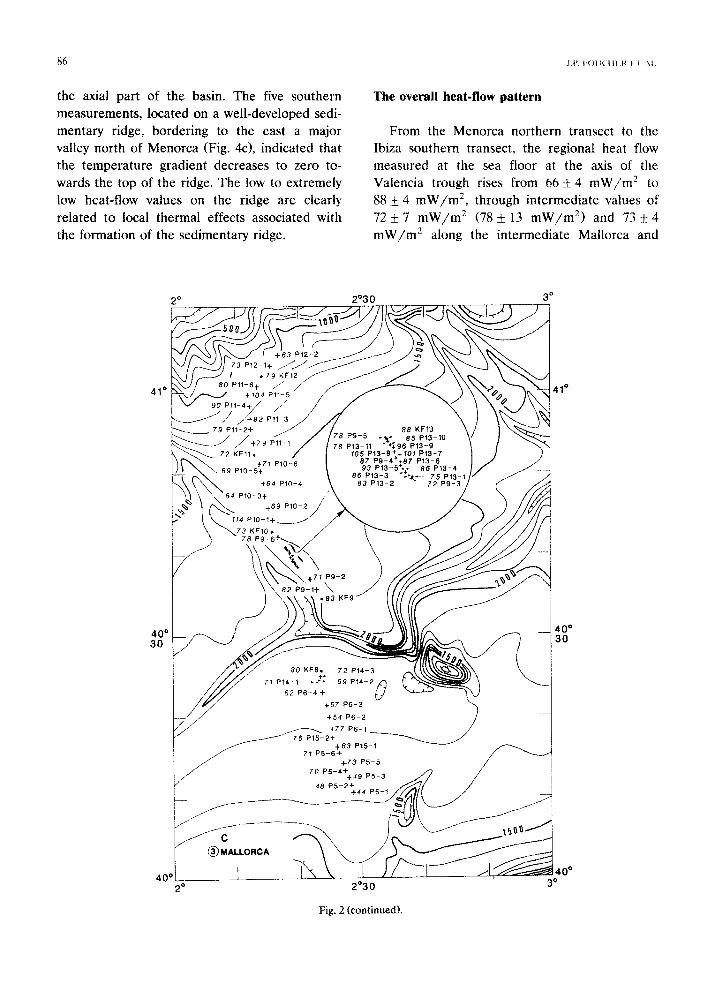
Barcelona. Measurements along this transect are missing only in the vicinity of the axial valley (Figs. 1 and 2 1 h c w ere coarse surface sediments prevented the probe from penetrating the sea floor.
Two main features appear to characterize the heat-flow distribution along this transect. First, there are gentle variations in the regional heat flow; the successive highs and lows thereof are fairly well determined with a wavelength of 20-30 km (30 km is the distance between PlO-2 and P12-2, for example). Second, superimposed on these gentle variations, there are local anomalies, with sharp boundaries, of high heat flow. Such Iocal anomalies appear to be associated with
J.P. FOUC‘HtK t. I Al.
measurements P5-4 to P6-1, P13-2 to KF13, PlO-1 and Pll-5. The closely-spaced measure- ments from P13-2 to KF13 define the shape of the peak for one of these local anomalies. The lateral extents of anomalies associated with mea- surements P13-2 to KF13, PlO-1 and Pll-5 are less than 5 km. The anomalous area from PS-4 to P6-1 may result from several of this type of narrow anomaly located near each other.
Excluding the three measurements, P5-1 to P5-3, located at the bottom of the Mallorca continental slope, the heat-flow values in the deep, axial part of the trough range from 54 to 114 mW/m2. Excluding the local anomalies, the heat flow ranges from 54 to approximately 85
40 rJ”
i
Fig. 2. Detailed location maps of heat-flow measurements along the four transects. (a) Ibiza transect. (b) Central profile. (c) Mallorca transect. Cd) Menorca transect.
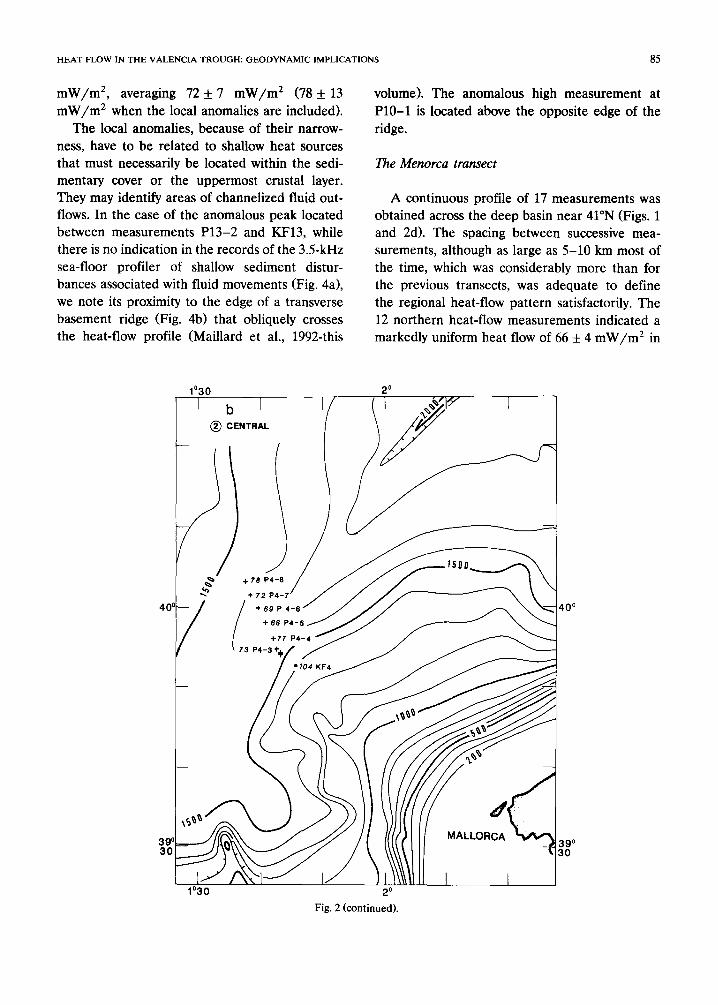
HEAT FLOW IN THE VALENCIA TROUGH: GEODYNAMIC IMPLICATIONS 85
mW/m’, averaging 72 it 7 mW/m’ (78 f 13
mW/m’ when the local anomalies are included). The local anomalies, because of their narrow-
ness, have to be related to shallow heat sources that must necessarily be located within the sedi- mentary cover or the uppermost crustal layer. They may identify areas of channelized fluid out- flows. In the case of the anomalous peak located between measurements P13-2 and KF13, while there is no indication in the records of the 3.5kHz sea-floor profiler of shallow sediment distur- bances associated with fluid movements (Fig. 4a), we note its proximity to the edge of a transverse basement ridge (Fig. 4b) that obliquely crosses the heat-flow profile (Maillard et al., 1992-this
volume). The anomalous high measurement at PlO-1 is located above the opposite edge of the
ridge.
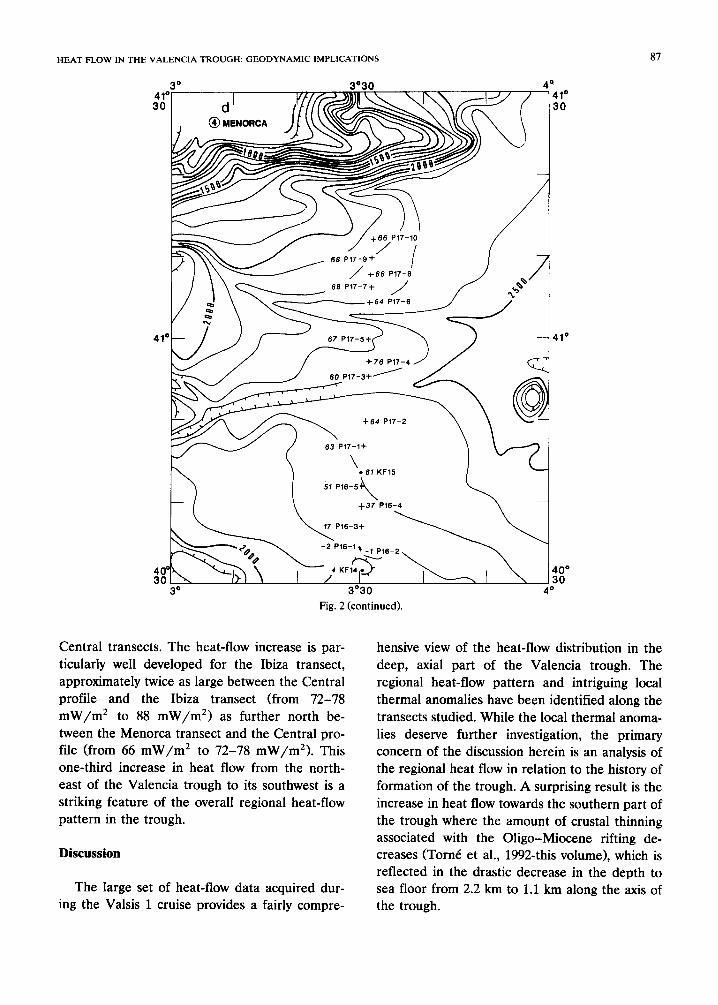
The Menorca transect
A continuous profile of 17 measurements was obtained across the deep basin near 41”N (Figs. 1 and 2d). The spacing between successive mea- surements, although as large as 5-10 km most of the time, which was considerably more than for the previous transects, was adequate to define the regional heat-flow pattern satisfactorily. The 12 northern heat-flow measurements indicated a markedly uniform heat flow of 66 k 4 mW/m’ in
O30
b @ CENTRAL
Fig. 2 (continued).
86 .l.l’. ~ot’(‘lil i: I I \I
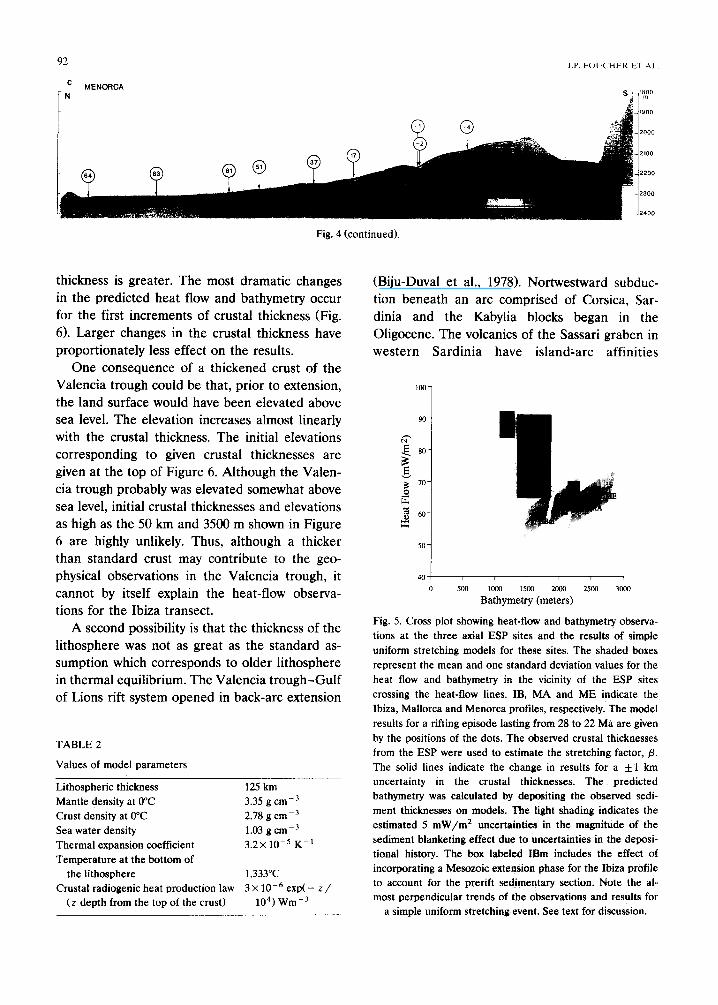
the axial part of the basin. The five southern measurements, located on a well-developed sedi- mentary ridge, bordering to the east a major valley north of Menorca (Fig. 4~1, indicated that the temperature gradient decreases to zero to- wards the top of the ridge. The low to extremely low heat-flow values on the ridge are clearly related to iocal thermal effects associated with the formation of the sedimentary ridge.
The overall heat-flow pattern
From the Menorca northern transect to the Ibiza southern transect, the regional heat flow measured at the sea floor at the axis of the Valencia trough rises from 66 F 4 mW/m~ to 88 i: 4 mW/m2, through intermediate values of 72 it 7 mW/m2 (78 L- 13 mW/m2) and 73 &4 mW/m2 along the intermediate Mallorca and
62 PC4 t fJ -----ii I
4o” 30
Fig. 2 (con~inued~.
HEAT FLOW IN THE VALENCIA TROUGH: GEODYNAMIC IMPLICATIONS 87
+ 64 P17-2
4o" 30
3O30 4O
Fig. 2 (continued).
Central transects. The heat-flow increase is par- ticularly well developed for the Ibiza transect, approximately twice as large between the Central profile and the Ibiza transect (from 72-78 mW/m* to 88 mW/m*) as further north be- tween the Menorca transect and the Central pro- file (from 66 mW/m* to 72-78 mW/m*). This one-third increase in heat flow from the north- east of the Valencia trough to its southwest is a striking feature of the overall regional heat-flow pattern in the trough.
Discussion
The large set of heat-flow data acquired dur- ing the Valsis 1 cruise provides a fairly compre-
hensive view of the heat-flow distribution in the deep, axial part of the Valencia trough. The regional heat-flow pattern and intriguing local thermal anomalies have been identified along the transects studied. While the local thermal anoma- lies deserve further investigation, the primary concern of the discussion herein is an analysis of the regional heat flow in relation to the history of formation of the trough. A surprising result is the increase in heat flow towards the southern part of the trough where the amount of crustal thinning associated with the Oligo-Miocene rifting de- creases (TornC et al., 1992-this volume), which is reflected in the drastic decrease in the depth to sea floor from 2.2 km to 1.1 km along the axis of the trough.
88
Rifting thermal models, using lithospheric ex- tension estimates derived from the crustal thick- ness results from the deep seismic data from the Valsis 2 two-ship seismic refraction experiments (Fig. 3; TornC et al., 1992-this volume) were com- puted in order to better assess the significance of the observed heat flow in the Valencia trough. Specifically, thermal models assuming that the Valencia trough formed by Oligo-Miocene ex- tension of the eastern edge of the continental lithosphere Iberian plate were tested against the observed heat flow. The results of these models are presented below.
Pure-shear rifting models with standard initial con- ditions
Our first approach was to calculate the pre- sent-day heat flow for a simple lithospheric pure-shear deformation model with a standard set of initial conditions (McKenzie, 1978). Initial conditions were thermal equilibrium within the lithosphere and an elevation at sea level. Values of the model parameters are given in Table 2. Thermal blanketing effects of the sediment cover were calculated by application of perturbation theory following the procedure used by Alvarez et al. (1984).
Uniform stretching of the lithosphere was as- sumed to be continuous and to take place at a constant rate for a single rifting episode lasting from 28 to 22 Ma ago (Bartrina et al., 1990). The p extension factors, with p as the ratio of the crustal thickness prior to rifting to that after rifting, were derived from the Valsis ESP deep seismic data (Torn6 et al., 1992-this volume), assuming a 30&m thickness of the crust prior to rifting. The choice of a 30-km original thickness is based on refraction results for eastern Spain and the Spanish meseta (Banda et al., 1981; Zeyen et al., 1985). It is consistent with the inference of near-shore crustal thicknesses of 20-22 km be- neath the Catalan coastal plain near Barcelona (Gallart et al., 1990) and 20-25 km beneath the Balearic promontory (Banda et al., 1980), that were marginally affected by the Oligo-Miocene rifting event. The j3 extension factors were thus taken equal to 3.5, 3.3 and 2.6 for the deep parts
of the Menorca, Mallorca and Ibiza transects, assuming present-day crustal thicknesses of 8.5, 9 and 9.2 km, respectively (Torn6 et al., 1992-this volume). The 2.6 value for the Ibiza transect assumes an earlier, Mesozoic extensional event, described by a p extension factor of 1.2-1.3 cor- responding to the deposition of 3-8 km of Juras- sic and Cretaceous sediments (Maillard et al., 1992-this volume). Instead of 30 km, the crustal thickness prior to the Oligo-Miocene rifting event was, therefore, taken equal to 24 km for the Ibiza transect.
Figure 5 illustrates the comparison of the pre- dicted present-day heat flow and sea floor depth with those observed for the three main transects studied. For the model calculations, the predicted bathymetry was calculated by loading the thinned crust by the sediment thicknesses observed on the Valsis 2 seismic lines. This enabled the model calculations rather than the heat-flow observa- tions to be corrected for the sediment blanketing effect. There is a fairly good agreement between the predicted and observed values for the Menorca transect. There are large departures for the Ibiza transect, along which the observed heat flow plots 25-29 mW/m* above the predicted value and the trough is 500-900 m shallower than calculated. Differences between predicted and observed values for the Mallorca transect follow the same trend as for the Ibiza transect, but are of lower magnitude. Thus, with respect to the computed uniform lithospheric stretching model, an anomalously high heat flow appears to corre- late with an anomalously shallow sea floor in the southern Valencia trough. This is well illustrated in Figure 5 by the contrasting trends of the Menorca, Mallorca and Ibiza data points and predictions. The model calculations follow the expected trend of a direct correlation of bathymetry and heat flow while the observations form an almost perpendicular trend, with increas- ing deviation from expectations towards the Menorca data point.
Model sensitivity to initial conditions
The model presented in the previous section assumed a standard set of initial conditions corre-
HEAT FLOW IN THE VALENCIA TROUGH: GEODYNAMIC IMPLICATIONS 89
MENORCA TRANSECT
f
1
b . 1 0 20 40km _I
MALLORCA TRANSECT
j 120 r M Fig.4b
Tm Fia.4a 1 --I
SSE
km
IBIZA TRANSECT
z too
L 6o 0 u. 60 t
A
10
30 km
w Neogene and Quaternary Sediments m Mesozoic Seismic Reflectors
I----_-I Messinian Unconformity I’y’v’v’ Volcanism
_ Pre-Neogene Sediments and Crust
SSE
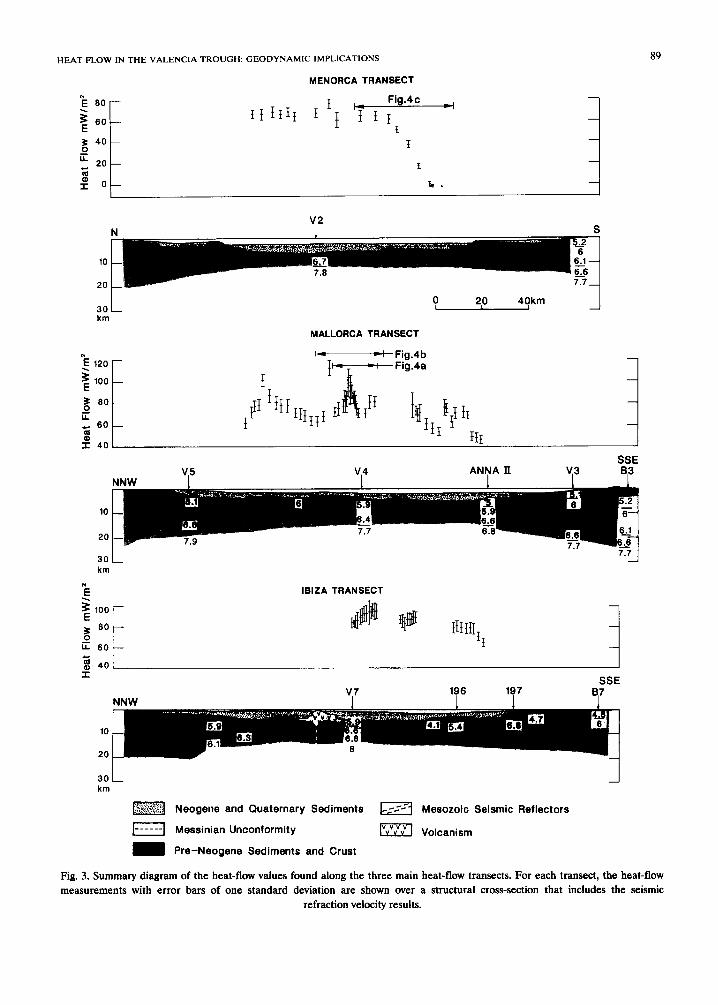
Fig. 3. Summary diagram of the heat-flow values found along the three main heat-flow transects. For each transect, the heat-flow measurements with error bars of one standard deviation are shown over a structural cross-section that includes the seismic
refraction velocity results.
sponding to a lithosphere at thermal equilibrium and an elevation at sea level. However, the Va- lencia trough region had a complex geologic his- tory, both prior to and subsequent to the Oligo- Miocene rifting event. Perhaps it is not surprising then that models based on the standard assump- tions usually applied to numerical models fail to predict the subsidence or heat flow aiong the axial of the Valencia trough accurately. This mis- fit is minor in the northeast, but becomes greater towards the southwest. Along the Ibiza profile, the error is substantial. We therefore investigated the sensitivity of the models to these assumptions, using the Ibiza profile where the problem is most severe.
In the Mesozoic, the region underlying the southern Valencia trough was extended and be- came a subsiding carbonate platform (Salas and Casas, 1990, Maillard et al., 1992~this volume). Subsequently, Lower Tertiary thrusting and com- pression during the Pyrenean orogeny affected the region. The Catalan coastal ranges were up- lifted (Anadon et al., 1985) and the portions of the Mesozoic basin on mainland Spain were in- verted to form the Iberian range. The Iberian range, the axis of the earlier basin, now has a thickened crust (Zeyen et al., 1985). During the Oligocene, what is at present the axis of the Valencia trough was elevated and acted as a source shedding sediment both northwards into the Ebro basin and southwards onto the Balearic Islands (Rota et al., 1990). The top of the Mesozic
a MALLOWA h
carbonates in the Valencia trough exhibits evi- dence of major erosion and truncation (Stoec- kinger, 1976). It is, therefore, probable that the Valencia trough had a thickened crust prior to Neogene extension. The crustal thickness was likely greatest in the southern part of the Valen- cia trough, the along-strike continuatibn of the Iberian range.
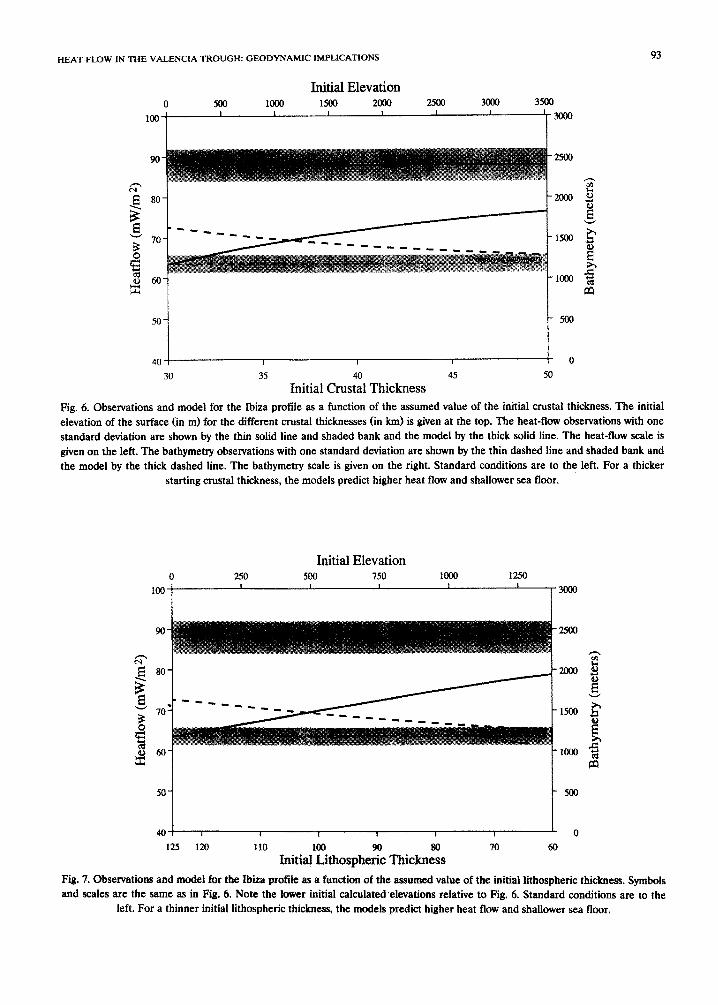
If the crust of the Valencia trough was initially thicker than 30 km, then the extension factor required to thin the crust to its present-day level would have been greater. The p factor would be increased by the ratio of the initial crustal thick- ness to the standard value of 30 km. We assume that the Tertiary crustal thickening event would negate the remnant thermal effects of the Meso- zoic sedimentation. However, an isostatic correc- tion (323 m) for the lower density of the carbon- ates relative to crystalline basement was applied. The carbonate density (2.59 g/cm31 was matched to that used in the model incorporating the Mesozoic extension (Fig. 5). Figure 6 examines the consequences for the calculated heat flow and bathymet~ of the modei beginning with an initially greater crustal thickness. Because of the larger extension factor required to thin the thick- est crust, the lithosphere at the end of rifting is thinner than in the standard case. As a result, the heat flow increases with the initial crustal thick- ness. In addition, because of the greater amount of heat advected upwards during extension, the basement is more elevated when the initial crustal
3.5 kHz
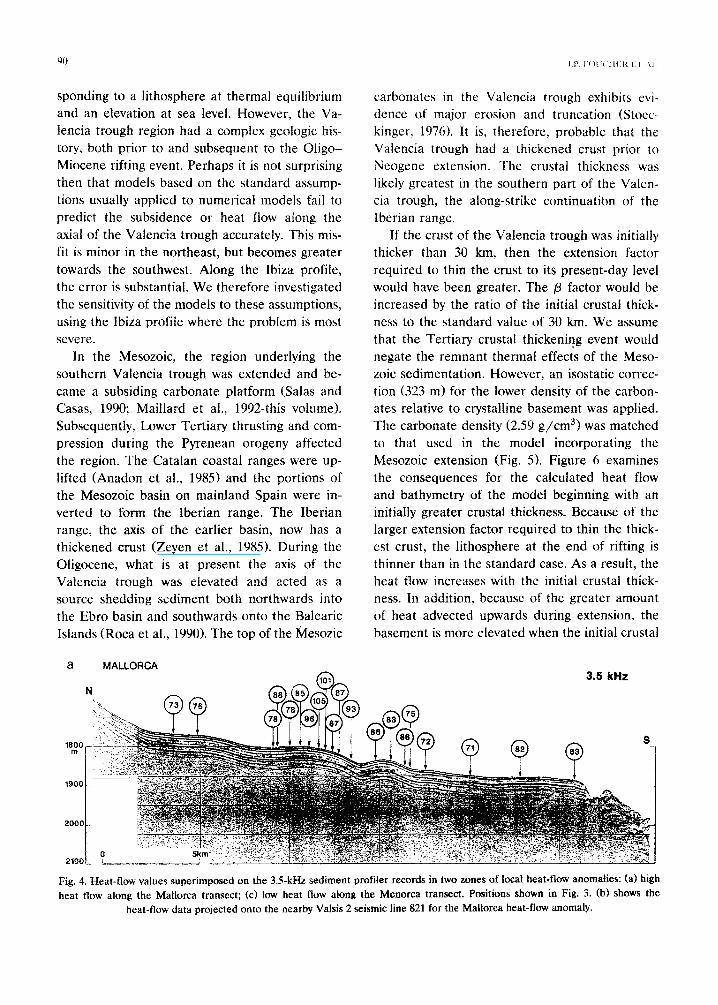
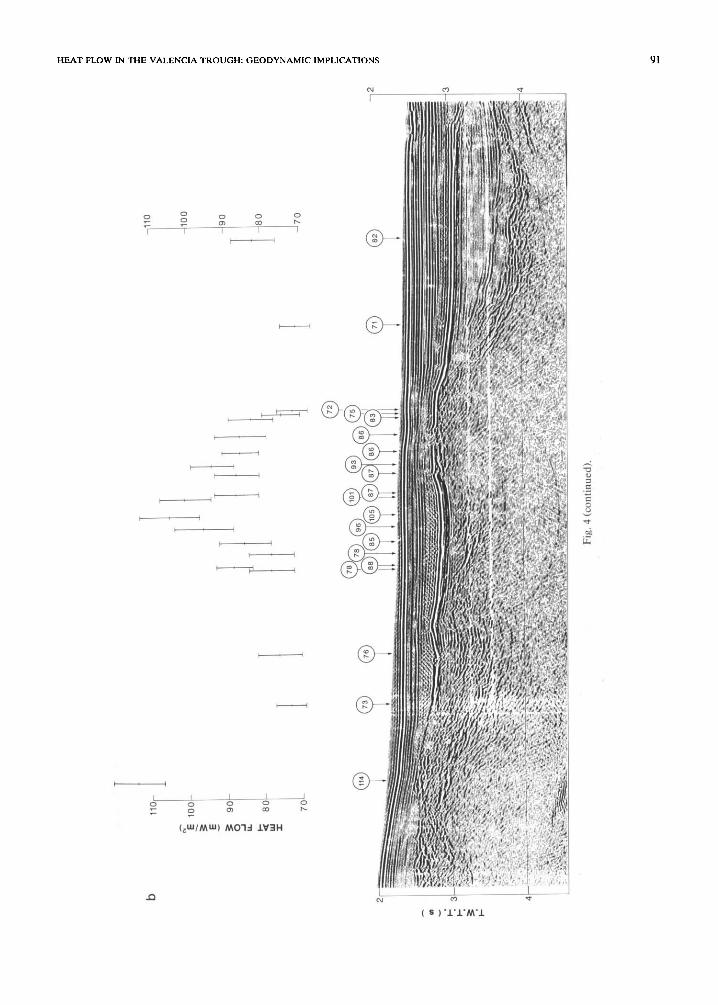
Fig. 4. Heat-flow values superimposed on the 3.5kHz sediment profiler records in two zones of local heat-flow anomaties: (a) high heat flow along the Mallorca transect; (c) low heat flow along the Menorca transect. Positions shown in Fig. 3. (b) shows the
heat-flow data projected onto the nearby Valsis 2 seismic line 821 for the Mallorca heat-flow anomaly.
HEAT FLOW IN THE VALENCIA TROUGH: GEODYNAMIC IMPLICATIONS
(u m t
91
-
, I
t i
I : I
92
C MENORCA
Fig. 4 (continued).
thickness is greater. The most dramatic changes (Biju-Duval et al., 1978). Nortwestward subduc- in the predicted heat flow and bathymetry occur tion beneath an arc comprised of Corsica, Sar- for the first increments of crustal thickness (Fig. dinia and the Kabylia blocks began in the 61. Larger changes in the crustal thickness have Oligocene. The volcanics of the Sassari graben in proportionately less effect on the results. western Sardinia have island-arc affinities
One consequence of a thickened crust of the Valencia trough could be that, prior to extension, the land surface would have been elevated above sea level. The elevation increases almost linearly with the crustal thickness. The initial elevations corresponding to given crustal thicknesses are given at the top of Figure 6. Although the Valen- cia trough probably was elevated somewhat above sea level, initial crustal thicknesses and elevations as high as the 50 km and 3500 m shown in Figure 6 are highly unlikely. Thus, although a thicker than standard crust may contribute to the geo- physical observations in the Valencia trough, it cannot by itself explain the heat-flow observa- tions for the Ibiza transect.
100-
90-
67 g so- 3 .!z 3 7o ,o !J. g 60- 5:
50-
40 I I / I 1 1
0 500 lcm 1503 2ml 2500 3cnxl
Bathymetry (meters)
A second possibility is that the thickness of the lithosphere was not as great as the standard as- sumption which corresponds to older lithosphere in thermal equilibrium. The Valencia trough-Gulf of Lions rift system opened in back-arc extension
TABLE 2
Values of model parameters
Lithospheric thickness Mantle density at 0°C Crust density at 0°C Sea water density Thermal expansion coefficient Temperature at the bottom of
125 km 3.35 g cmA3 2.78 g cme3 1.03 g cm-3 3.2x lo-’ K-’
the lithosphere 1,333”C Crustal radiogenic heat production law 3 X 10m6 exp(- z/
(z depth from the top of the crust) 104) Wm m3
Fig. 5. Cross plot showing heat-flow and bathymetry observa- tions at the three axial ESP sites and the results of simple
uniform stretching models for these sites. The shaded boxes represent the mean and one standard deviation values for the heat flow and bathymetty in the vicinity of the ESP sites crossing the heat-flow lines. IB, MA and ME indicate the Ibiza, Mallorca and Menorca profiles, respectiveIy. The model results for a rifting episode lasting from 28 to 22 Ma are given by the positions of the dots. The observed crustal thicknesses from the ESP were used to estimate the stretching factor, B. The solid lines indicate the change in results for a +1 km uncertainty in the crustal thicknesses. The predicted bathymetry was calculated by depositing the observed sedi- ment thicknesses on models. The light shading indicates the estimated 5 mW/m2 uncertainties in the magnitude of the sediment blanketing effect due to uncertainties in the deposi- tional history. The box labeled IBm includes the effect of incorporating a Mesozoic extension phase for the Ibiza profile to account for the prerift sedimentary section. Note the al- most perpendicular trends of the observations and results for
a simple uniform stretching event. See text for discussion.
HEAT FLOW IN THE VALENCIA TROUGH: GMDYNAMIC IMPLICATIONS 93
Initial Elevation
30 35
Initial Chs~~l Thickness 45 50
Fig. 6. Observations and model for the Ibiza profile as a function of the assumed value of the initial crustal thickness. The initial elevation of the surface (in m) for the different crustal thicknesses (in km) is given at the top. The heat-flow observations with one standard deviation are shown by the thin solid line and shaded bank and the model by the thick solid line. The heat-flow scale is given on the left. The bathymetry observations with one standard deviation are shown by the thin dashed line and shaded bank and the model by the thick dashed line. The bathymetry scale is given on the right. Standard conditions are to the left. For a thicker
starting crustal thickness, the models predict higher heat flow and shallower sea floor.
0
loo *
250 I
Initial Elevation 500 750 1GfN 1250
I a 8 t XMO
90 2500
c
125 120 110 70 60
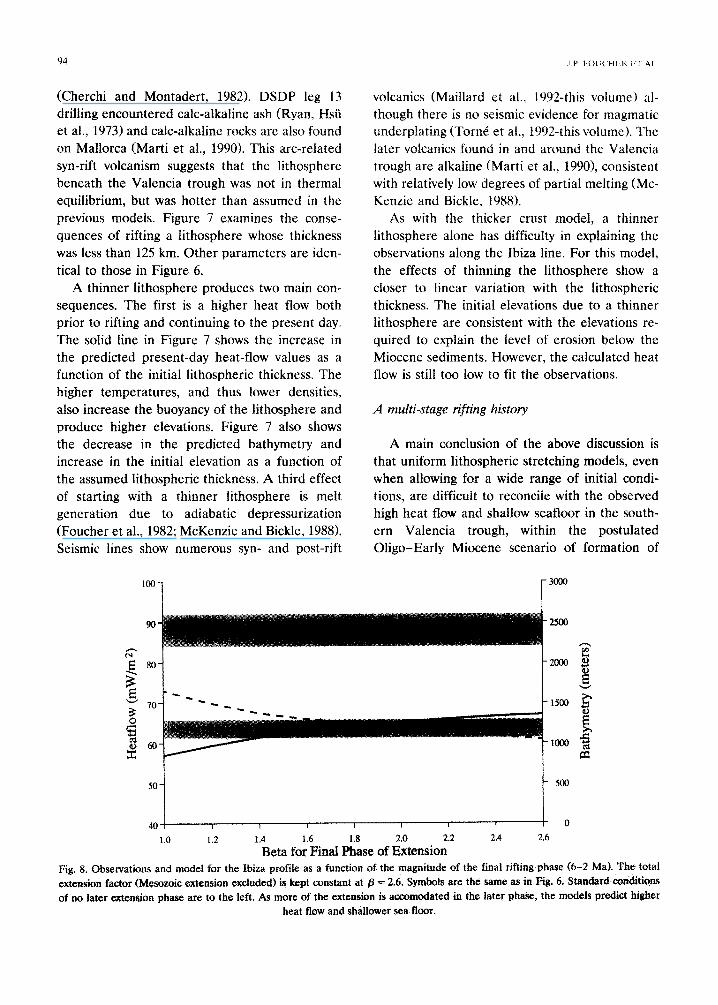
Fig. 7. Observations and model for the Ibiza profile as a function of the assumed value of the initial tithospheric thickness. Symbols and scales are the same as in Fig. 6. Note the lower initial calculated’elevations relative to Fig. 6. Standard conditions are to the
left. For a thinner initial lithospheric thickness, the models predict higher heat flow and shallower sea floor.
94
(Cherchi and Montadert, 1982). DSDP leg 13 drilling encountered talc-alkaline ash (Ryan, Hsii et al., 1973) and talc-alkaline rocks are also found on Mallorca (Marti et al., 1990). This arc-related syn-rift volcanism suggests that the lithosphere beneath the Valencia trough was not in thermal equilibrium, but was hotter than assumed in the previous models. Figure 7 examines the conse- quences of rifting a lithosphere whose thickness was less than 125 km. Other parameters are iden- tical to those in Figure 6.
A thinner lithosphere produces two main con- sequences. The first is a higher heat flow both prior to rifting and continuing to the present day. The solid line in Figure 7 shows the increase in the predicted present-day heat-flow values as a function of the initial lithospheric thickness. The higher temperatures, and thus lower densities, also increase the buoyancy of the lithosphere and produce higher elevations. Figure 7 also shows the decrease in the predicted bathymetry and increase in the initial elevation as a function of the assumed lithospheric thickness. A third effect of starting with a thinner lithosphere is melt generation due to adiabatic depressurization (Foucher et al., 1982; McKenzie and Bickle, 1988). Seismic lines show numerous syn- and post-rift
volcanics (Maillard et al., 1992-this volume) al- though there is no seismic evidence for magmatic underplating (Torn6 et al., 1992-this volume). The later volcanics found in and around the Valencia trough are alkaline (Marti et al., 19901, consistent with relatively low degrees of partial melting (Mc- Kenzie and Bickle, 1988).
As with the thicker crust model, a thinner lithosphere alone has difficulty in explaining the observations along the Ibiza line. For this model, the effects of thinning the lithosphere show a closer to linear variation with the lithospheric thickness. The initial elevations due to a thinner lithosphere are consistent with the elevations re- quired to explain the level of erosion below the Miocene sediments. However, the calculated heat flow is still too low to fit the observations.
A multi-stuck rifting history
A main conclusion of the above discussion is that uniform lithospheric stretching models, even when allowing for a wide range of initial condi- tions, are difficult to reconcile with the observed high heat flow and shallow seafloor in the south- ern Valencia trough, within the postulated Oligo-Early Miocene scenario of formation of
h
40
1.0 1.2 1.4 1.6 1.8 2.0 2.2
Beta for FinaI Phase of Extension
0
2.4 2.6
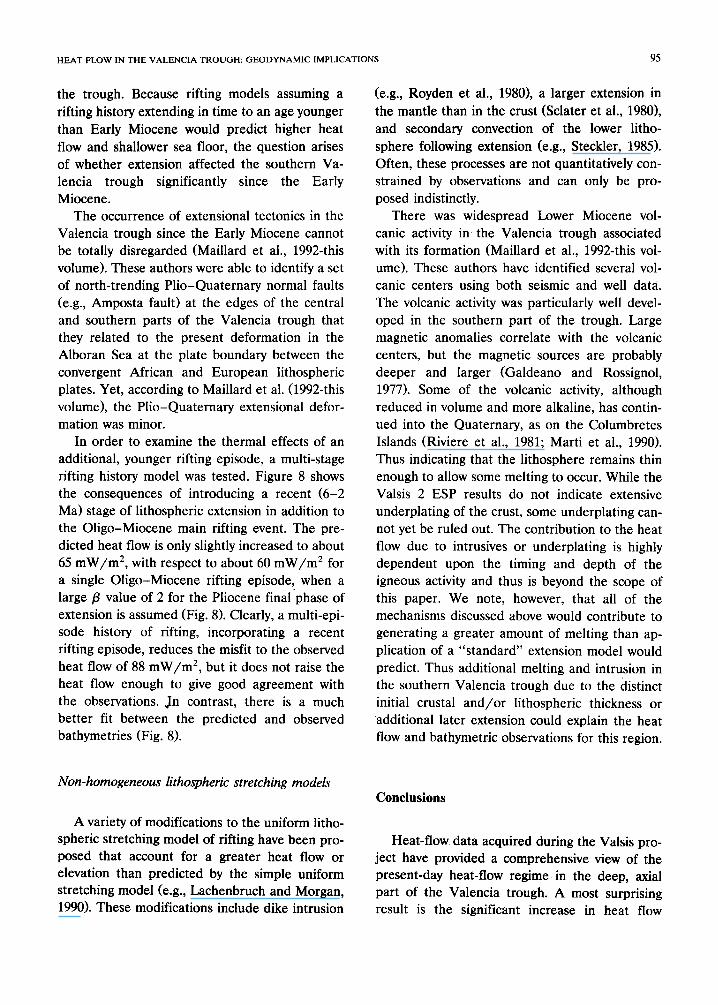
Fig. 8. Observations and model for the Ibiza profile as a function of the magnitude of the final rifting phase (6-2 Ma). The total extension factor (Mesozoic extension excluded) is kept constant at 8 = 2.6. Symbols are the same as in Fig. 6. Standard conditions of no later extension phase are to the left. As more of the extension is accomodated in the later phase, the models predict higher
heat flow and shallower sea floor.
HEAT FLOW IN THE VALENCIA TROUGH: GEODYNAMIC IMPLICATIONS 95
the trough. Because rifting models assuming a rifting history extending in time to an age younger than Early Miocene would predict higher heat
flow and shallower sea floor, the question arises of whether extension affected the southern Va- lencia trough significantly since the Early Miocene.
The occurrence of extensional tectonics in the Valencia trough since the Early Miocene cannot be totally disregarded (Maillard et al., 1992-this volume). These authors were able to identify a set of north-trending Plio-Quaternary normal faults (e.g., Amposta fault) at the edges of the central and southern parts of the Valencia trough that they related to the present deformation in the Alboran Sea at the plate boundary between the convergent African and European lithospheric plates. Yet, according to Maillard et al. (1992-this volume), the Plio-Quaternary extensional defor- mation was minor.
In order to examine the thermal effects of an additional, younger rifting episode, a multi-stage rifting history model was tested. Figure 8 shows the consequences of introducing a recent (6-2 Ma) stage of lithospheric extension in addition to the Oligo-Miocene main rifting event. The pre- dicted heat flow is only slightly increased to about 65 mW/m*, with respect to about 60 mW/m* for a single Oligo-Miocene rifting episode, when a large /3 value of 2 for the Pliocene final.phase of extension is assumed (Fig. 8). Clearly, a multi-epi- sode history of rifting, incorporating a recent rifting episode, reduces the misfit to the observed heat flow of 88 mW/m*, but it does not raise the heat flow enough to give good agreement with the observations. Jn contrast, there is a much better fit between the predicted and observed bathymetries (Fig. 8).
Non-homogeneous lithospheric stretching models
A variety of modifications to the uniform litho- spheric stretching model of rifting have been pro- posed that account for a greater heat flow or elevation than predicted by the simple uniform stretching model (e.g., Lachenbruch and Morgan, 1990). These modifications include dike intrusion
(e.g., Royden et al., 1980), a larger extension in
the mantle than in the crust &later et al., 19801, and secondary convection of the lower litho-
sphere following extension (e.g., Steckler, 1985). Often, these processes are not quantitatively con- strained by observations and can only be pro- posed indistinctly.
There was widespread Lower Miocene vol- canic activity in the Valencia trough associated with its formation (Maillard et al., 1992-this vol- ume). These authors have identified several vol- canic centers using both seismic and well data. The volcanic activity was particularly well devel- oped in the southern part of the trough. Large magnetic anomalies correlate with the volcanic centers, but the magnetic sources are probably deeper and larger (Galdeano and Rossignol, 1977). Some of the volcanic activity, although reduced in volume and more alkaline, has contin- ued into the Quaternary, as on the Columbretes Islands (Riviere et al., 1981; Marti et al., 1990). Thus indicating that the lithosphere remains thin enough to allow some melting to occur. While the Valsis 2 ESP results do not indicate extensive underplating of the crust, some underplating can- not yet be ruled out. The contribution to the heat flow due to intrusives or underplating is highly dependent upon the timing and depth of the igneous activity and thus is beyond the scope of this paper. We note, however, that all of the mechanisms discussed above would contribute to generating a greater amount of melting than ap- plication of a “standard” extension model would predict. Thus additional melting and intrusion in the southern Valencia trough due to the distinct initial crustal and/or lithospheric thickness or additional later extension could explain the heat flow and bathymetric observations for this region.
Conclusions
Heat-flow data acquired during the Valsis pro- ject have provided a comprehensive view of the present-day heat-flow regime in the deep, axial part of the Valencia trough. A most surprising result is the significant increase in heat flow
96 J P FOII( tft:H I..1 At
towards the southern part of the trough, whereas the Valsis seismic data suggest a decrease in the amount of the Oligo-Miocene crustal thinning, reflected in the decreasing depth to sea floor.
A simple uniform lithospheric stretching model of rifting accounts satisfactorily for the observed sea-floor heat flow and depth for the northern part of the trough, where the 66 + 4 heat-flow value along the Menorca transect is close to the near 60 mW/m2 values measured on the Gulf of Lions margin at comparable water depths (Foucher and Tisseau, 1984; Burrus and Foucher, 1986). The similarity of the heat-flow regimes of the deep part of the Gulf of Lions margin and of the northern Valencia trough along the Menorca transect is just as expected, if the two areas have experienced the same geological evolution and possibly belong to the same geological domain.
In contrast, the southern Valencia trough has a high heat flow and a shallow sea floor that are difficult to reconcile with predictions of uniform lithospheric stretching models, even though one allows for the occurrence of an initial elevation and/or a thin, hot lithosphere. More complex deformation of the lithosphere than was assumed within the uniform stretching model may be the reason of the misfit. The incorporation of melting into the lithospheric extension models could ac- count for the high heat flow and shallow sea floor of the southern Valencia trough.
Acknowledgments
This study was financed by IFREMER and INSU-CNRS and U.S. National Science Founda- tion grant OCE 86-14958. We are grateful to the captain, officers and crew of the R/V Le Suroit. We thank Fraqois Harmegnies, Claude Toulara- stel and Jean-Pierre QuCrC for technical assis- tance in operating the Ifremer heat-flow probe at sea. We thank Marie-Michelle PCdel and Jean- Pierre Ma& for help in the preparation of the manuscript. We also wish to thank Paul Morgan and an anonymous reviewer for useful comments. L-DGO Contribution number 0000.
References
Alvarez, F., Virieux, J. and Le Pichon, X., 1984. Thermal consequences of lithosphere extension: the initial stretch- ing phase. Geophys. J.R. Astron. Sot., 78: 389-411.
Anadon, P., Cabrera, L.I., GuimerC, J. and Santanach, P., 1985. Paleogene strike-slip deformation and sedimentation along the southeastern margin of the Ebro Basin. In: K.
Biddle and N. Christie-Blick (Editors), Strike-slip Defor- mation, Basin Formation, and Sedimentation. Sot. Econ. Paleontol. Mineral., Spec. Pub]., 37: 303-318.
Banda, E., Ansorge, J., Boloix, M. and Cordova, D., 1980. Structure of the crust and upper mantle beneath the Balearic islands (Western Mediterranean). Earth Planet. Sci. Lett., 49: 219-230.
Banda, E., Surinach, E., Aparicio, A., Sierra, J. and Ruiz de la Parte, E., 1981. Crust and upper mantle structure of the central Iberian Neseta (Spain). Geophys. J.R. Astron. Sot., 67: 779.
Bartrina, M.T., Cabrera, L. and Jurado, M.J., 1990. Structure and sedimentary record in onshore and offshore zones of the Catalan margin: Valles-Penedes and Barcelona half grabens, NE Spain. Terra Abstr.. 2: 2.
Biju-Duval, B., Letouzey, J. and Montadert, L., 1978. Struc- ture and evolution of the Mediterranean basin. In: K. Hsii,
et al. (Editors), Initial Reports of the Deep Sea Drilling Program, vol. 42. U.S. Government Printing Office, Wash- ington, DC, pp. 951-984.
Buck, W.R., Martinez, F., Steckler, M.S. and Cochran, J.R., 1988. Thermal consequences of lithospheric extension: pure and simple. Tectonics, 7: 213-234.
Burrus, J. and Foucher, J.P., 1986. Contribution to the ther- mal regime of the Provencal basin based on Flumed heat flow surveys and previous investigations. Tectonophysics, 128: 303-354.
Cherchi, A. and Montadert, L., 1982. Oligo-Miocene rift of Sardinia and the early history of the Western Mediter- ranean basin. Nature, 298: 736-739.
Fahlquist, E., 1963. Seismic refraction measurements in the Western Mediterranean Sea. Thesis, Mass. Inst. Technol., Boston, 173 pp.
FontbotC, J.M., Guimera, J., Rota, E., Sabat, F. and San- tanach, P., 1989. Para una interpretation cinematica de la gCnesis de la cuenca catalano-balear: datos estructurales de sus margenes emergidos. In: Libro homenaje a Rafael Soler. Assoc. Geol. Geofis. Esp. Pet., pp. 37-51.
Foucher, J.P., Le Pichon, X. and Sibuet, J.C., 1982. The ocean-continent transition in the uniform lithospheric stretching model: role of partial melting in the mantle. Philos. Trans. R. Sot. London, Ser. A, 305: 27-43.
Foucher, J.P. and Tisseau, C., 1984. Thermal regime of At- lantic type continental margins: Bay of Biscay and Gulf of Lion. In: B. Durand (Editor), Thermal Phenomena in Sedimentary Basins. Editions Technip, Paris, pp. 221-225.
Galdeano, A. and Rossignol, J.C., 1977. Contribution de I’aCromagnttisme B I’Ctude du Golfe de Valence (Mtditer- ran&e Occidentale). Earth Planet. Sci. Lett., 34: 85-99.
HEAT FLOW IN THE VALENCIA TROUGH: GEODYNAMIC IMPLICATIONS 97
Gallart, J., Rojas, H., Diaz, J. and D~obeitia, J.J., 1990. Features of deep crustal structure and the onshorc-off-
shore transition at the Iberian flank of the Valencia Trough (Western Mediterranean). J. Geodyn., 12: 233-252.
Hinz, K., 1972. Results of seismic refraction investigation (Project ANNA) in the western Mediterranean sea, south and north of the island of Mallorca. In: 0. Leenhart (Editor), Results of the Anna Cruise. Bull. Centre Rech. Pau (SNPA), Pau, 6: 405-426.
Lachenbruch, A.H. and Morgan, P., 1990. Continental exten- sion, magmatism and elevation; formal relations and rules of thumb. Tectonophysics, 174: 39-62.
Louden, K.E., Sibuet, J.C. and Foucher, J.P., 1991. Variations in heat flow across the Goban Spur and Galicia Bank continental margins. J. Geophys. Res., 96: 16,131-16,150.
Mailiard A., Mauffret, A., Watts, A.B., Tome, M., Pascal, G., Bulh, P. and Pinet, B., 1992. Seismic stratigraphy and
structure of the Valencia trough (western Medite~anean). In: E. Banda and P. Santanach (Editors), Geology and Geophysics of the Valencia Trough, Western Mediter- ranean. Tectonophysics, 203: 57-75.
Marti, J., Grachev, A., Mitjavila, J., Aparicio, A. and Rota, E., 1990. Cenozoic magmatism in the Valencia Trough. The Valencia Trough: Geology and Geophysics, Terra Abstr., 2: 114.
McKenzie, D.P., 1978. Some remarks on the development of sedimentary basins. Earth Planet. Sci. Lett., 40: 25-32.
McKenzie, D.P. and Bickle, M.J., 1988. The volume and composition of melt generated by extension of the litho- sphere, J. Petrol., 29: 625-679.
Ratcliffe, E-H., 1960. The thermal conductivities of ocean sediments. J. Geophys. Res., 65: 1535-1541.
Riviere, M., Bellon, H. and Bonnet-Courtois, C., 1981. As- pects g~~himiques et g~~hronolo~ques du volcanisme p~oclastique for& dans le Golfe de Valence: site 123 DSDP, Leg 13 (Espagne). Consequences geodynamiques. Mar. Geol., 41: 295-307.
Rota, E., Desegaulx, P., Fernandez Ortigosa, F., Roure, F.
and Pinet, B., 1990. Subsidence study and deep structure of the Valencia Trough area. in: B. Pinet and C. Bois
(Editors), The Potential of Deep Seismic Profiling for
Hydrocarbon Exploration. Editions Technip, Paris, pp.
439-449. Royden, L., Sclater, J.G. and von Herzen, R.P., 1980. Conti-
nental margin subsidence and heat flow: important param- eters in formation of petroleum hydrocarbons. Am. Assoc. Pet. Geol. Bull., 64(2): 173-187.
Royden, L. and Keen, C.E., 1980. Rifting process and thermal evolution of the ~ntinental margin of eastern Canada determined from subsidence curves. Earth Planet. Sci. Lett., 51: 343-361.
Ryan, W.B., Hsii, K.J., et al., 1973. Initial Reports of the
Deep Sea Drilling Project, 13. U.S. Government Printing Office, Washington D.C., 1448 pp.
Salas, R. and Casas, A., 1990. Subsidence history of the Mesozoic eastern Iberian Basins, NE Spain. In: The Va- lencia Trough: Geology and Geophysics. Terra Abstr., 2: 118.
Sclater, J.G., Royden, L., Horvath, F., Burchfiel, B.C., Semken, S. and Stegena, L., 1980. The formation of the intra-carpathian basins as determined from subsidence data. Earth Planet. Sci. Lett., 51: 139-162.
Steckler, M., 1985. Uplift and extension at the Gulf of Suez: indications of induced mantle convection. Nature, 317: 135-139.
Stoeckinger, W.T., 1976. Valencia Gulf offer deadline nears. Oil Gas J., March 29: 197-200, Aprii 5: 181-183.
Tort&, M., Pascal, G., Bulh, P,, Watts, A.B. and Mauffret, A., 1992. Crustal structure of the Valencia trough (western Mediterranean) derived from multichannel seismic data, In: E. Banda and P. Santanach (Editors), Geology and Geophysics of the Valencia Trough, Western Mediter- ranean. Tectonophysics, 203: 57-75.
van Herzen, R.P. and Maxwell, A.E., 1959. The measurement of thermal conductivity of deep-sea sediments by a needle-probe method. J. Geophys. Res., 64: 1557-1563.
Zeyen, H.J., Banda, E., Gallart, J. and Ansorge, J., 1985. A wide-angle seismic reconnaissance survey of the crust and
upper mantle in the Celtiberian Chain of eastern Spain. Earth Planet. Sci. L&t., 75: 393-402.


