Embed Size (px)
Citation preview
Have Poverty Reduction Strategy Papers actually reduced
poverty in poor countries?
Master Thesis in Global Studies (30 hec) Spring semester 2019
Author: Markus Bohlers Supervisor: Arne Wackenhut Word count: 18,709 words
University of Gothenburg School of Global Studies
GS2534
School of Global Studies University of Gothenburg Markus Bohlers
1
ABSTRACT
Throughout the past 15-20 years, poor countries have been implementing so-called Poverty Reduction
Strategy Papers (PRSPs) under the guidance of the International Monetary Fund and the World Bank.
Despite their enormous importance for national development efforts around the globe, the aggregate
performance of PRSPs remains understudied. One previous study, however, found that PRSPs were
successful in reducing poverty and should therefore act as the ‘mechanism to operationalise’ the
Sustainable Development Goals (SDGs) (Elkins et al 2018., 388).
Here, the robustness of these findings is tested in a panel data regression analysis which
estimates the effect of PRSP implementation on five primary SDG-indicators.1 Based on the
assumption that the ‘Washington Consensus’ development paradigm has been (partially) abandoned,
it is hypothesized that PRSPs successfully reduced multidimensional poverty, and that this success was
conditioned on increased economic growth.
While PRSP implementation did not yield a statistically significant effect on most outcome
variables, it was associated with small reductions in extreme, chronic undernourishment. It is
acknowledged that the results have a relatively weak empirical foundation and that they may suffer
from omitted variable bias. The author stresses the need for further research and calls for an increase
in resources allocated to the collection of well-developed data on multidimensional poverty.
Keywords: Poverty, PRSPs, poor countries, IFIs, development paradigm, Washington Consensus.
1 Contact the author at [email protected] to access the full Stata-data set.
School of Global Studies University of Gothenburg Markus Bohlers
2
ACKNOWLEDGEMENTS
Many thanks to my supervisor Arne Wackenhut for his helpful insights and constructive criticism. I
would also like to thank Valeriya Mechkova for clearing up some questions about the method, and
Meg Elkins for providing me with her dataset.
School of Global Studies University of Gothenburg Markus Bohlers
3
TABLE OF CONTENTS
ABSTRACT ACKNOWLEDGEMENTS TABLE OF CONTENTS ABBREVIATIONS 1. INTRODUCTION .............................................................................................................................. 6 1.1. Background............................................................................................................................................ 6 1.2. Aim and Research Question ............................................................................................................... 7 1.3. Hypotheses and Theoretical Assumption ......................................................................................... 7 1.4. Method and Operationalization ......................................................................................................... 8 1.5. Relevance ............................................................................................................................................... 8 1.6. Delimitations ......................................................................................................................................... 9 1.7. Ethical Considerations ......................................................................................................................... 9 1.8. Outline ................................................................................................................................................. 10 2. THEORY .............................................................................................................................................. 11 2.1. Epistemological Approach ............................................................................................................... 11 2.2. Theoretical Framework and Key Concepts .................................................................................... 11 Development paradigms Economics Development economics
Methodological nationalism Poverty
2.3. Washington Consensus ...................................................................................................................... 14 2.4. Post-Washington Consensus ............................................................................................................ 17 2.5. New York Consensus ........................................................................................................................ 18 3. BACKGROUND ................................................................................................................................. 18 3.1. The IFIs and the Debt Crisis ........................................................................................................... 19 3.2. Structural Adjustment ........................................................................................................................ 21 3.3. Poverty Reduction Strategy Papers .................................................................................................. 22 4. LITERATURE REVIEW ................................................................................................................ 23 4.1. Process and Content .......................................................................................................................... 24 4.2. Performance ........................................................................................................................................ 27 5. METHOD AND OPERATIONALIZATION ......................................................................... 32 5.1. Overview .............................................................................................................................................. 32 5.2. Fixed Effects ....................................................................................................................................... 32 5.3. Equations ............................................................................................................................................. 34 5.4. Sample and Populations .................................................................................................................... 34 Poor countries Fragile countries Internal validity of sample 5.5. Explanatory variable ........................................................................................................................... 36
School of Global Studies University of Gothenburg Markus Bohlers
4
5.6. Outcome Variables ............................................................................................................................. 37 Internal validity of outcome variables Poverty Undernourishment 5.7. Endogeneity Problems ....................................................................................................................... 40 Reversed causality and Ignorability of treatment Omitted variable bias and Post-treatment bias 5.8. Moderator Variable and Control Variables..................................................................................... 42 Moderator variable Control variables Internal validity of moderator and control variables 6. RESULTS AND ANALYSIS ........................................................................................................... 43 6.1. Additive Models .................................................................................................................................. 44 Table 1. Pooled OLS models and country fixed-effects models Table 2. Two-way fixed-effects models with control variables 6.2. Interaction Models ............................................................................................................................. 47 Table 3. Two-way fixed effects interaction models with control variables 6.3. Regression Diagnostics: Residual Analysis ..................................................................................... 49 Graph 1. Histogram of residuals (full additive models) Graph 2. Scatterplot between fitted values and residuals (full additive models) 6.4. Robust Additive Models .................................................................................................................... 53 Table 4. Robust full additive models 6.5. Robust Interaction Models................................................................................................................ 57 Table 5. Robust full interaction models 6.6. Summary .............................................................................................................................................. 59 7. CONCLUSION .................................................................................................................................. 60 LIST OF REFERENCES APPENDICES
Appendix A. Development Goals
Table 6. UN Millennium Development Goals
Table 7. Sustainable Development Goals
Appendix B. Sample
Table 8. Full treatment group and control group
Appendix C. Variables
Table 9. Definition and Source
Table 10. Descriptive statistics
Appendix D. Robust Models
Table 11. Robust additive models, without China and with fragile countries
School of Global Studies University of Gothenburg Markus Bohlers
5
ABBREVIATIONS:
APR Annual Progress Report
DAC Development Assistance Committee
FAO Food and Agricultural Organization
FDI Foreign Direct Investment
FE Fixed Effects
GDP Gross Domestic Product
GATT General Agreement on Tariffs and Trade
HIPC Heavily Indebted Poor Country
IBRD International Bank for Reconstruction and Development
IFI International Financial Institutions
IMF International Monetary Fund
IEO Independent Evaluations Office
IPL International Poverty Line
MDG Millennium Development Goal
NGO Non-Governmental Organizations
NIEO New International Economic Order
NPL National Poverty Line
OECD Organization for Economic Co-operation and Development
OED Operations Evaluation Department
ODA Official Development Assistance
OLS Ordinary Least Square
OPEC Organization of the Petroleum Exporting Countries
PPP Purchasing Power Parity
PRGF Poverty Reduction and Growth Facility
PRSP Poverty Reduction Strategy Paper
SAP Structural Adjustment Program
SDG Sustainable Development Goals
WDI World Development Indicator
WGI Worldwide Governance Indicator
WTO World Trade Organization
School of Global Studies University of Gothenburg Markus Bohlers
6
1. INTRODUCTION
1.1. Background
The turn of the new millennium marked the beginning of the Poverty Reduction Strategy initiative,
launched by the International Monetary Fund (IMF) and the World Bank. Under the guidance of these
international financial institutions (IFIs), poor countries subsequently began to implement Poverty
Reduction Strategy Papers (PRSPs), and in exchange, these countries received access to debt relief and
loans on concessional terms (Elkins et al. 2018, 378). The strategy papers contained macroeconomic,
structural and social policies aimed at reducing poverty and stimulating sustained economic growth
(Wachira & Ruger 2011, 1957). In the absence of an alternative roadmap, PRSPs also became a main
vehicle to achieve the Millennium Development Goals (MDGs) by 2015 (Elkins et al. 2018, 378-379).2
On paper, PRSPs were ‘owned’ by the implementing country. However, strategies were
expected to align with the development goals and principles of the IFIs’ Comprehensive Development
Framework, and for several years, every PRSP required ‘explicit endorsement’ by the executive boards
of the IFIs (Peet 2009, 145-147; Sumner 2006, 1401)3. It is fair to say, therefore, that the IFIs wielded
considerable influence over the strategies.
Despite their importance for national development efforts around the globe, the actual performance
of PRSPs remains understudied. To my knowledge, the only quantitative appraisal of PRSP
implementation that has been published in a peer-reviewed academic journal is by Meg Elkins, Simon
Feeny and David Prentice (2018). They estimate the effect of implementation on the main indicators
underpinning the Millennium Development Goals (MDGs). Their results show that PRSPs successfully
helped poor countries to reduce multidimensional poverty. Based on these findings, the authors
suggest that the PRSP approach should remain the “mechanism to operationalise” the Sustainable
Development Goals (SDGs), which is set to be achieved by 2030 (Elkins et al. 2018, 388).4
2 The 8 MDGs (see appendix A) were announced by the UN Secretariat in 2000. They crystallized the previously adopted Millennium Declaration and provided a plan of action to “meet the needs of the world’s poorest” by 2015 (UN 2019a). In the final MDG report, UN Secretary-General Ban Ki-Moon proclaimed that, although progress had been uneven and many countries had failed to accomplish all the goals, the MDGs still produced “the most successful anti-poverty movement in history” (UN 2015, 3). 3 In at least a few cases, the boards decided not to approve a strategy paper prepared by a government (in collaboration with other stakeholders) (Dijkstra & Komives 2009, 10). 4 The 17 SDGs (see Appendix A) originate from a 2015 UN resolution called “Transforming our World: the 2030 Agenda for Sustainable Development” (UN 2019c). These goals are even more ambitious than the MDGs, covering a total of 169 targets. The SDG commitment also amounts to a broader and more radical economic agenda for the whole world, covering areas such as environmental sustainability, economic growth, industry and production.
School of Global Studies University of Gothenburg Markus Bohlers
7
1.2. Aim and Research Question
The aim of this thesis is to test the robustness of the results in Elkins et al. (2018). In other words, I
aim to uncover if PRSPs actually succeeded to reduce poverty in poor countries. Following the
suggestion by Elkins et al., it seemed appropriate to evaluate the performance of PRSP implementation
using the relevant SDGs (or rather, the indicators underpinning them) as outcome variables. This will
also allow me to capture different dimensions of poverty. My research question reads as follows:
Has implementing Poverty Reduction Strategy Papers reduced poverty in its various dimensions, and if
so, to what extent?
1.3. Hypotheses and Theoretical Assumption
As per convention, my primary hypothesis is the null hypothesis (H0): Implementing PRSPs had no effect
on poverty in its various dimensions. However, as mentioned, Elkins et al. (2018) provide some empirical
evidence for an alternative hypothesis; that (H1) implementing PRSPs reduced poverty in its various dimensions.
This is corroborated by another, unpublished study by Marshall and Bernard Walters (2011), which
also found PRSP implementation to be associated with reduced poverty.
In order to establish a theoretical basis for why PRSPs were a success, I also draw on Elkins et
al. (2018), and specifically, their results suggesting that successful implementation was, for the most
part5, not conditioned on closer alignment with the ‘Washington Consensus’—the neoliberal
development paradigm pushed in the Structural Adjustment Programs (SAPs) of the 1980s and 90s.
Indeed, the SAPs are generally understood to have failed to reduce poverty and stimulate growth (see
for instance Cornia et al. 1987; Johnson & Schaefer 1999, Easterly 2005). The alignment scores utilized
in Elkins et al. (2018)—which are built on a scorecard system developed in two separate content
analyses by Elkins (2014) and Elkins and Feeny (2014)6—suggest that many PRSPs instead embraced
more diverse strategies influenced by development paradigms emphasizing ‘good governance’ and
‘pro-poor’ social spending (which will be discussed at length in chapter 2). In fact, Elkins et al. (2018)
found some evidence that successful PRSP implementation was conditioned on closer alignment to
the ‘New York Consensus’—the development paradigm associated with the MDG commitment.
5 The effect on maternal mortality represents an interesting exception, which I will return to in chapter 4. 6 Since these scores only stretches to 2008, they will not be utilized in this study.
School of Global Studies University of Gothenburg Markus Bohlers
8
In other words, while many have argued that PRSPs failed to sufficiently distance themselves from
the past (see for instance Hermele 2005, Stewart and Wang 2005; Fukuda-Parr 2010), it appears as if
the PRSP approach at least represented a step in the right direction—away from a one-size-fits-all
formula, unyielding IFI-conditionalities and the neoliberal orthodoxy of market solutions. Here, I
assume that this step was significant enough to render the aggregate performance of PRSP
implementation a success.
Echoing Marshall and Walters (2011), I also propose a complementary conditional hypothesis
(H2); that successful implementation was conditioned on increasing economic growth. Indeed, Marshall and Walters
found some evidence that this was the case. It is also in line with my theoretical argument, as
abandoning neoliberal orthodoxy does not mean abandoning economic growth as a mechanism to
reduce poverty. After all, PRSPs were aimed towards stimulating growth alongside poverty reduction.
1.4. Method and Operationalization
To test my hypotheses, I will estimate the effect of PRSP implementation on poverty-related SDG-
indicators in a linear panel data regression analysis using the difference-in-difference method. My regression
models will be run with both country-fixed effects and year-fixed effects, as well as with two control variables,
aid received and political stability. This will allow me to control for the effect of unobserved differences
across countries and changes over time. My full sample is comprised of an unbalanced panel dataset
of 103 non-fragile poor countries over 17 years—between 2000 and 2016.
In many ways, my study serves as a replication study of Elkins et al. (2018). The use of outcome
variables based on the SDGs will test the robustness of their findings, as will the inclusion of different
control variables and the interaction with Gross Domestic Product (GDP) per capita7. I will also
consider the main effect if PRSP-implementation is measured differently; if outlier countries are
removed; if robust standard errors are employed; and if the outcome variables are transformed using
the natural logarithm.
1.5. Relevance
The PRSP approach has been at the heart of international development efforts throughout the past
two decades. PRSPs have functioned as national development plans for well over 60 countries (see
7 The interaction models will allow me to consider the effect of economic growth without controlling away the effect of implementation. Such potential post-treatment bias is not addressed in Elkins et al. (2018).
School of Global Studies University of Gothenburg Markus Bohlers
9
IMF 2019). Despite this, we know very little about their aggregate performance. By beginning to fill
this gap in the literature, I argue that my study will make a valuable scholarly contribution of great
relevance to the field of Global Studies.
Evaluating PRSP performance also places the IFIs under scrutiny. Indeed, the findings of this
study may allow us to draw some conclusions about the judgement and expertise of these powerful
institutions; whether or not their continued influence over economic policy in poor countries can be
justified. To be sure, if we can conclude that PRSPs failed to reduce poverty then that is arguably a
serious indictment of the IFIs and their role in leading and shaping international development efforts.
If, on the contrary, we find a substantial reduction in poverty, the suggestion by Elkins et al. (2018)
that PRSPs should remain an instrument to achieve the SDGs will be validated.
1.6. Delimitations
Unfortunately, my analysis will not be able to factor in how closely PRSPs were aligned with different
development paradigms; whether each strategy was fully and correctly implemented; or to which
degree they can be said to have been ‘owned’ by the implementing country. Although it is difficult to
imagine a reliable method for quantitively determining national ownership of PRSPs, both paradigm
alignment and full/correct implementation could have been determined by systematically evaluating
every PRSP and every Annual Progress Report (APR) published for implementing countries. Such an
undertaking, however, is way beyond the scope of my thesis project.
Furthermore, it is important to emphasize that even if probabilistic causation can be established
using this method—theoretically, panel data regression can show that PRSP implementation probably
caused changes in poverty rates—my analysis will need to grapple with potential endogeneity problems
and limitations in the internal validity of the data (which I will discuss at length in chapter 5).
1.7. Ethical Considerations
Given that this is an observational study in which only publicly available and widely used secondary
data is being handled, no ethical considerations were raised when conducting it. There is, however, a
risk that the results of my analysis will be used to justify policies of ethically questionable nature. Once
again, therefore, I want to clarify that these results should not be interpreted as definitive proof of the
success or failure of the PRSP approach.
School of Global Studies University of Gothenburg Markus Bohlers
10
1.8. Outline
The rest of this study is divided into six chapters: Theory; Background; Literature Review; Method
and Operationalizations; Results and Analysis; and the final Conclusion.
Chapter 2 begins with a brief account of my epistemological point of departure (section 2.1).
This leads us to a discussion about the theoretical frameworks and concepts relevant to the study;
most notably, poverty and development paradigms (section 2.2). The remainder of the chapter outlines and
contextualizes the three dominant development paradigms which have been showed to drive policy
in PRSPs: The 'Washington Consensus’ (section 2.3), ‘post-Washington Consensus’ (2.4) and ‘New
York Consensus’ (2.4) (Elkins and Feeny 2005).
Chapter 3 should be read as an extension of the previous (sub)chapter. It covers the historical
background of the IFIs and the conditions and developments leading up to the ‘Third World debt
crisis’ (section 3.1), as well as the ensuing era of ‘structural adjustment’ that allowed the ‘Washington
Consensus’ to be applied in practice (3.2). The chapter ends with an overview of the PRSPs; how they
came to be and what they are (section 3.3).
In Chapter 4, the literature on PRSPs is reviewed at length. The first section (4.1) provides an
overview of the literature on the PRSP approach—on the process of implementation and on policy
content—while the second section (4.2) offers a more exhaustive account of previous quantitative
studies and reports on PRSP performance.
The first three sections (5.1; 5.2; 5.3) in Chapter 5 describes which method is used to conduct
my analysis and motivates why this method is chosen. The following four sections describe and discuss
the sample (section 5.4); the explanatory variable (5.5); the outcome variables (5.6); the control
variables and the moderator variable (5.8)8; as well as potential endogeneity problems (5.7) and
limitations to the internal validity of the data (which is discussed throughout).
Next, in Chapter 6, the results of the regression tests are reported and analyzed. First, we
analyze the results of the additive models (section 6.1) and the interaction models (6.2). To check the
robustness of the results, a residual analysis is carried out (section 6.3), followed by an analysis of the
robust additive models (6.4) and the robust interaction models (6.5). Lastly, the whole analysis is
summarized (section 6.6).
As a conclusion, Chapter 7 offers a brief overview of the study, a final discussion of my
findings and what they mean for the IFIs, followed by a few suggestions on further research.
8 Descriptive statistics and detailed definitions of all variables can be found in Table 9 and Table 10 in Appendix C.
School of Global Studies University of Gothenburg Markus Bohlers
11
2. THEORY
2.1. Epistemological Approach
Since the purpose of this study is to try to isolate and observe an empirical link between PRSP
implementation and poverty, my epistemological point of departure is heavily influenced by empiricism.
In other words, I take the position that ‘true’ knowledge, by and large, emanates from observations
in/of the ‘real’ world.
That being said, I also draw on the critical realist tradition in order to make a distinction between
the ‘real’ world, which exists regardless of our interpretations of it, and the ‘actual’ world, which is the
world we think we know through our interpretations. These interpretations are tainted not just by our
sensory filters but by discursive filters, which, in turn, are always situated in a particular social, cultural
and historical context (Haraway 1988). In the following section, therefore, I will not only define the
key concepts and frameworks used in this study, but try to contextualize them.
2.2. Theoretical Framework and Key Concepts
Development paradigms. In my study, the concept of paradigm is understood to be roughly
synonymous with discourse; that is, a particular way of interpreting and communicating (parts of) the
world (Jorgensen & Phillips 2002, 1). A ‘development paradigm’, then, encapsulates certain views
on/ideas about/approaches to (economic) development. It could be said that the three development
paradigms discussed in the next section are the ones competing for hegemony in the ‘discursive field’
of development economics (Hansen 2006, 7; Jorgensen & Phillips 2002, 66-73). I should add, however, that
while there is arguably enough discursive cohesion to justify why distinguishing these three paradigms
from each other serves more than merely an analytical purpose, such distinction is in and of itself a
discursive construction that may obscure important overlap and therefore cannot be said to perfectly
represent the ‘real’ world.
Economics. In a similar vein, the field economics is founded on a number of assumptions about the
world, which together, through intersection, create a particular discursive framework. Since my study
is primarily situated in development economics, I want to clarify that this framework places inevitable
restrictions on our ontological horizons, and some of them, arguably, are quite problematic. Below, I
shall discuss these restrictions at some length.
School of Global Studies University of Gothenburg Markus Bohlers
12
First of all, it has been convincingly argued that the invention of economics in the latter half of the
19th century effectively served to depoliticize knowledge about the economy, transforming into a less
contestable and more mathematically elegant ‘natural’ science (Peet & Hartwick 2014, 56-62). This
natural science, consequently, insulated ‘economists’ from other aspects of society and enforced the
notion that they acted as objective observers of, rather than participants in, economic life (ibid.). While
I have already established my rejection of dogmatic forms of empiricism, the sheer nature of statistical
methods and econometric data puts me in a position where I risk reproducing this so-called
‘economistic fallacy’.
Development economics. The advent of development economics in the latter half of the 20th century
added to economics another problematic dimension; the notion that ‘developing countries’ (or,
indeed, ‘emerging markets’) are an inferior, incomplete version of ‘developed countries’, most notably
Western Europe and North America (The ‘West’). Indeed, today’s ‘developing countries’ will not likely
be considered fully developed any time soon, despite the fact that many of them are richer, by
conventional measures, than many Western countries were only recently.
The reason for this, according to postcolonial and postmodern theorists, is that the hierarchical
binary of developed/underdeveloped represents a repackaging of colonialist thought (see for instance
Saïd 2003/1979; Escobar 1995): It is part of an intellectual tradition, rooted in Western modernism,
in which history is framed as a linear, universal process wherein the world progresses through different
stages (such as in Rostow’s stages of growth) and Western ‘civilization’ acts as the locomotive that pulls
the ‘backward’ Others out of a past in which they would otherwise be stuck.
Methodological nationalism. A closely related discursive framing is the conceptualization of social
geography as a mosaic of nation-states that each contain their own society and economy (Agnew
1994). This conceptualization has formed an equally important ontological basis for much of
modernist thinking about the world: In what is often labelled ‘methodological nationalism’, nation-
states serve as the primary unit of analysis and point of reference (ibid.).
Recently, however, the assumption that any state reign sovereign over its bounded territory,
and that its national borders simply function as a ‘line in the sand’, has increasingly been put into
question (Agnew 1994; Scholte 2005; Johnson et al. 2011; Parker & Vaughan-Williams 2012). Indeed,
in the past half century, revolutions in economics, logistics, transport and information technology
have facilitated a restructuring of states in favor of transborder markets and movements, eroding
School of Global Studies University of Gothenburg Markus Bohlers
13
national territorial integrity and bringing about a new configuration of space which calls for new
methodological and analytical tools (Scholte 2005). Then again, some parts of the world were probably
never a suitable fit for the ‘Westphalian state’ template, especially African countries (the typical PRSP
adopters) whose externally imposed national territories have always been a site of contestation,
competition and cooperation between both state and non-state actors (Abrahamsen 2017).
Arguably, the combination of methodological nationalism and development thinking has encouraged
researchers and policymakers to trace the source of poverty in a ‘developing’ country exclusively to its
state, its residents and their purported backwardness and economic illiteracy, rather than to the
colonial legacy, neo-colonial arrangements and inter- or transnational structures of power. In fact, the
PRSP approach has been criticized for placing the task of development solely in the national realm,
thereby undermining efforts to overcome development obstacles embedded in structures beyond the
nation-state, such as the rules of global trade, finance and intellectual property (Tan 2011).
While my emphasis on the role and influence of the IFIs clearly illuminates some of the more
supranational dimensions of economic policymaking, it will not be possible for me to completely
venture beyond the lens of methodological nationalism simply because of the nature of the PRSP
approach and the composition of the relevant data. I will, however, avoid using the term ‘developing
countries’ and instead opt for the more appropriate ‘poor countries’ or ‘poorer countries’.
Poverty. While being a ‘poor country’ refers to total national (monetary) income, my outcome
variables are concerned with poverty on the individual level. Here, such poverty is defined as the lack
of access to the basic material inputs necessary to sustain a decent life. Of course, poverty is by no
means a normatively and politically neutral and uncontested concept. It is important to note, therefore,
that my definition of poverty is rooted in a materialist understanding of the phenomenon which fails
to consider how the experience of poverty varies depending on different circumstances, such as the
presence of economic inequalities.
Moreover, even if we are to agree that poverty should be defined as I define it here, we also
need to be cognizant of the fact that there are many different ways to approximate, quantify and
measure it (see for instance Kwadzo 2015). No doubt, as I shall return to in chapter 5, the SDG-
indicators used in this study are not without their problems. The reason for why I nonetheless choose
to draw on the SDGs is that, apart from enhancing the commensurability and relevance of my study,
School of Global Studies University of Gothenburg Markus Bohlers
14
it allows me to investigate the effect of PRSP implementation on several different dimensions of
(material) poverty.
2.3. Washington Consensus
Although any claim on causation in this study remains probabilistic, critical realism contends that
careful, rigorous application of scientific methods can help us get closer to observing the ‘real’ world;
to produce ‘true’ knowledge. In order to really explain or understand a phenomenon, however, we
typically need to do more than just observe it; we also need to uncover the ‘generative mechanisms’
underneath it. This is where theory becomes useful.
As elaborated in the Introduction, I hypothesize that PRSPs were successful in reducing
poverty based on the theoretical assumption that the strategy papers were less aligned with the
‘Washington Consensus’ in favor of more diverse, country-specific strategies influenced by other
development paradigms. Below, I will be outlining and contextualizing the theoretical bedrock upon
which the ‘Washington Consensus’ emerged—that is, neoliberalism—and the economic policies
associated with it. Following this, I will offer a brief account of the criticism levelled against the
‘Washington Consensus’, and how this led to two new development paradigms, the ‘post-Washington
Consensus’ and the ‘New York Consensus’, which will also be discussed. Again, it bears repeating that
these paradigms are by no means dichotomous. Quite the opposite, there is significant overlap.
While neoliberalism has deep roots—indeed, it is rooted in classical liberalism—it emerged most
forcefully as an economic doctrine in the mid-1970s. Up until this point, ever since the global
depression, Keynesianism had reigned supreme (Peet & Hartwick 2015, 89-90). This had allowed for
considerable state ownership of national economies and, especially, its key industrial sectors; the use
of ‘deficit spending’ to pull countries out of economic downturns; a separation of social welfare
services from private markets; progressive taxation on income and wealth; and regulation of economic
flows through tariffs, quotas, price controls, capital controls, fixed exchange rates, and the lowering
of interest rates to stimulate consumption and investment (Peet & Hartwick 2015, 66-76). Throughout
its early decades, the IMF also echoed Keynesian ideas, promoting expansionary macroeconomic
policies and a regulated market. In fact, the whole Bretton Woods system (see next chapter)
School of Global Studies University of Gothenburg Markus Bohlers
15
represented a form of institutionalized international Keynesianism9 (Stiglitz 2002/2015, 109-110; Peet
2009, 48-59).
However, in the 1970s, the peculiar combination of low growth, high unemployment and high
inflation put Keynesian models into question and created an opening for new ideas; specifically,
neoliberalism (Peet and Hartwick 2015, 89). Rooted in a deeply individualistic ontological tradition,
the founders of this school of thought espoused a view of state interventionism and protectionism as
not only inefficient but inhibiting of human freedom (ibid. 90-94). Instead, they advocated for a system
in which the state would be relegated to little more than a ‘night-watchman’ role of maintaining the
rule of law, as well as performing limited macroeconomic tasks such as setting interest rates: Growth,
wealth and welfare were most efficiently achieved through unobstructed, voluntary competition
between self-interested, utility-maximizing private buyers and sellers (ibid.).
Contrasted with Keynesianism, these neoliberal ideas had radical policy implications. Some of
them had already been reflected in IMF-conditionalities in the 1970s, but it was the during the debt
crisis in the 80s that neoliberalism was fully embraced by the IFIs (Peet 2009, 84-85, 136-145). Whereas
the World Bank had focused on targeted poverty reduction and basic needs provision throughout the
1970s, the prevailing wisdom now was that if inflation could be kept under control and markets left
alone, or at least left unobstructed, then wealth would ‘trickle down’ to the poor (ibid. 134-137; Banks
& Hulme, 2012, 5).
In 1989, economist John Williamson formulated what was, in his view, the ten principal policy
recommendations of the neoliberal development paradigm—what he called the ‘Washington
Consensus’10 (Williamson 1990): (1) Commit to fiscal discipline, especially through (2) reduced public
spending, in order to avoid large budget deficits and macroeconomic instability; (3) enact tax reform
by broadening the tax base and lower marginal tax rates, thereby increasing incentives for investors;
(4) let interest rates be set by the market, but ensure that they are positive when adjusted for inflation
to attract and preserve capital; (5) allow for competitive exchange rates and (6) remove trade barriers
to channel resources into more productive use and encourage export-oriented growth; (7) liberalize
foreign direct investment (FDI) to allow foreign companies to compete on equal terms; (8) privatize
state enterprises to maximize economic efficiency; (9) remove unnecessary regulation of the market
to increase competition; and finally, (10) secure property rights to ensure an attractive investment
environment.
9 It was, in part, a brainchild of John Maynard Keynes himself. 10 A reference to the home of the IFIs and the US Treasury.
School of Global Studies University of Gothenburg Markus Bohlers
16
Criticism against the ‘Washington Consensus’ has been extensive (and this account is far from
exhaustive): For instance, it has been argued that neoliberalism builds on flawed and disingenuous
ontological assumptions about human nature, the nature of markets and the science of economics
(Peet & Hartwick 2015, 45-62, 112-117). Ha-Joon Chang, most notably, has made the case that the
‘Washington Consensus’ is devoid of historical analysis in that the development path it puts forward
runs counter to the one embarked upon by the West and the ‘emerging markets’ in East Asia—a path
which included considerable state intervention (Chang 2002, chapter 1 & 2). In fact, continuing
protectionism in rich countries have been a major impediment to the export-oriented growth that
neoliberalization is meant to facilitate in poor countries (Abrahamsson 2008, 16). To Marxists, such
hypocrisy reveals how neoliberal theories merely function as an ideological camouflage for what is
really an elitist political project aimed at solidifying the dominance of Western powers and the upper
classes, reducing the cost of labor, increasing surplus accumulation and redirecting it to the top (see
for instance Harvey 2005; Duménil & Lévy 2004; Varoufakis 2011; Prashad 2014).11
A less radical but more hard-hitting renunciation of the ‘Washington Consensus’ has come
from Joseph Stiglitz, who, in 1998, as chief economist at the World Bank, expressed the need to move
towards a ‘post-Washington Consensus’ (Stiglitz 1998). A few year later he elaborated on his criticism,
arguing that the uniform neoliberal policy packages imposed by the IFIs (which I will return to in the
next chapter) often had profoundly negative effects, not least during the 1997 East Asia crisis12 (Stiglitz
2002/2017, chapter 8). Stiglitz was especially critical of capital market liberalization and argued that it
is a fallacy to assume that capital flows are counter-cyclical13 (ibid. 161-162, 324-325). In Stiglitz view,
the IMF (in particular) put faith in overly simplistic, discredited economic models, leading to reforms
(like privatization and trade liberalization) being implemented with no sense of pacing and sequencing
and without the added inclusion of necessary regulation (like competition law) or safety nets (like
unemployment insurance and worker retraining programs) (ibid., chapter 7).14
11 This was achieved, it is argued, by transforming and relocating production systems; liberalizing financial capital flows, commodifying public services and privatizing state assets; and undermining unions and the prospects of a New International Economic Order (Prashad 2014, chapter 1). 12 The obsession with cutting deficits and increasing interest rates (despite high levels of indebtedness) had, in Stiglitz view, exacerbated the downturn and helped spread the crisis to other countries. 13 Money enters when an economy is growing and leaves when it is shrinking, not vice versa. 14 Stiglitz put the bulk of the blame on the IMF which, he argued, was ideologically blinded by a naïve ‘market fundamentalism’ and manifested a paternalistic mentality towards poorer countries reminiscent of colonialism (2002/2017, chapter 6 & 12). At the same time, Stiglitz found the approach to be intellectually incoherent as the IMF would sometimes push for certain government interventions (such as bailouts or exchange rates manipulations), seemingly to serve the interests of the ‘financial community’ (ibid.).
School of Global Studies University of Gothenburg Markus Bohlers
17
2.4. Post-Washington Consensus
Throughout the 1990s, the World Bank had started putting more emphasis on ‘market-friendly state
intervention’, ‘good governance’ and ‘inclusive’ and ‘pro-poor’ growth (Peet 2009, 145-149).
Following Stiglitz’ criticism, there was a deepening division within the Bank over the merits of the
‘Washington Consensus’ (Mosley 2001), and by 2004, its president James Wolfensohn proclaimed that
the consensus “has been dead for years” (as quoted in Sumner 2006, 1401). This message was brought
home forcefully in a major 2005 World Bank report which rejected the ‘one-size-fits-all’ formula of
previous programs and instead advocated for a more flexible, selective, moderate and experimental
approach to reform (World Bank 2005).
Meanwhile, at the IMF, its managing director Anne O. Krueger took a different position: The
problem with neoliberal programs was that they had been poorly implemented (Krueger 2004). She
doubled down on the importance of fiscal discipline but added that, if development is to be successful,
macroeconomic stability should coexist with “sound governance—at the national and corporate level;
effective and respected institutions; a well-established legal system; recognition of, and protection for,
property rights; a well-functioning financial sector” (ibid).
It is this emphasis on governance and institutions that is said to embody the ‘post-Washington
Consensus’ that Stiglitz called for (Rodrik 2006). While this development paradigm amounts to little
more than an augmented version of—or at least a complementary addition to—the original consensus,
it offers an ambitious policy agenda: According to the ‘post-Washington Consensus’, governments
need to step in to control corruption; make the judicial system more effective; increase transparency
and accountability within public institutions; give independence to the central bank; adhere to World
Trade Organization (WTO) principles; improve regulatory framework around firms—specifically
regarding capital requirements, bankruptcy and competition—while continuing to weaken labor
market regulations (Elkins & Feeny 2014, 233). In addition, under the ‘post-Washington Consensus’,
liberalization of capital accounts needs to be more ‘prudent’ (cautious and gradual), inflation rates
need to be targeted at 3-5%, while exchange rates fluctuate within a limited margin. Lastly, the state
needs to provide some social safety nets, alongside certain targeted poverty reduction efforts (ibid.).
School of Global Studies University of Gothenburg Markus Bohlers
18
2.5. New York Consensus
A no less ambitious but more social-welfarist and Keynesian approach to development has been
offered under what economist Andrew Sumner labeled the ‘New York Consensus’15 (Sumner 2006,
1405-1406). This development paradigm is closely related to the MDGs—which were formulated by
the UN secretariat but in collaboration with the IFIs (Kwon and Kim, 2014, p. 354)—and it draws
heavily on the work of Jeffrey Sachs (2005) and the UN Millennium Project. Its point of departure is that
the poorest countries are stuck in poverty ‘traps’ with low levels of innovation, FDI, domestic savings
and tax revenue—among other ills—and to escape these traps, a ‘big push’ fueled by increased foreign
aid is required (Sumner 2006, 1406; Rodrik 2006, 980-981).
Although the ‘New York Consensus’ aligns with the other consensuses in that good governance,
open trade and economic growth are viewed as necessary preconditions for development, it also allows
for greater state interventionism, including considerable increases in public spending on physical and
social infrastructure; a commitment to develop rural areas more efficiently; launch programs to combat
and prevent diseases; ensure representation and participation of women and girls; provide access to
free, universal primary enrollment and to more decent work programs (Elkins and Feeny 2014, 235).
In accordance with the ‘New York Consensus’, the IMF has emphasized the need to increase
social spending in the poorest countries, but, they add, such spending may also undermine “debt
sustainability and private sector activity” (IEO 2007, 37). Researchers have found an increased
presence of ‘social spending floors’ in IMF programs, but they also argue that the commitment to pro-
poor policies remains limited, and on a whole, changes to these programs are little more than cosmetic
(Kentikelenis et al. 2016). Others, however, have concluded that PRSPs have been increasingly aligned
to the ‘New York Consensus’ and a ‘social protection agenda’ (Elkins & Feeny 2014; Elkins 2015). I
will return to this in the Literature Review.
3. BACKGROUND
Before reviewing previous literature, I will chronicle the historical background of the IFIs; the
conditions and developments leading up to the ‘Third World debt crisis’; the ensuing era of neoliberal
‘structural adjustment’; and finally, the birth of the Poverty Reduction Strategy initiative. It goes without
saying that any exhaustive account on the subject is way beyond the scope of this study, and
15 A reference to the home of the UN headquarters.
School of Global Studies University of Gothenburg Markus Bohlers
19
necessarily, important nuances will be smoothened over. Moreover, when explaining how the debt
crisis came to be, emphasis is put on exogenous factors rather than those found within affected
countries16. Of course, there is no single culprit here, but as I will try to demonstrate, it is my conviction
that these factors were the most important ones.
3.1. The IFIs and the Debt Crisis
The World Bank and the IMF were formalized in 1944 at the UN Monetary and Financial Conference in
Bretton Woods, New Hampshire. Although both institutions are international in name, they have, by
and large, been kept under the sway of their North American and Western European members—
especially the United States17 (Peet 2009, 69, 177; Financial Times 2018; Weisbrot & Johnston, 2019).
The World Bank (originally the International Bank for Reconstruction and Development) was set up to help
finance the reconstruction of war-torn Europe, but it was quickly refashioned into a development
bank that would issue concessional loans for infrastructure projects in the South (Peet 2009, 129-131).
The IMF, meanwhile, was tasked with regulating the exchange rates among its members and to offer
short-term loans to those facing balance-of-payments problems (ibid., 66).
Following the 1971 decision to de-link the American dollar from the value of gold, the so-
called ‘Bretton Woods system’ collapsed and the fixed exchange rate regime that IMF had presided
over was replaced with a flexible one, sending shock waves through the world economy (Buckley
2008, 9-10). Shortly after that, in 1973, came a second shock: The oil-cartel OPEC (Organization of the
Petroleum Exporting Countries) imposed an embargo against the US and other Western countries, thereby
creating a spike in oil prices. The spike allowed the OPEC-members to reclaim some of the revenue
lost through the depreciation of the US dollar, yet much of the oil rents ended up in Western
commercial banks. Prompted by their sudden enrichment, these banks went on a lending spree in the
South, especially in larger, middle-income countries in Latin America (Peet 2009, 82-87; Sachs 1989,
10-11). Meanwhile, many governments in lower-income countries turned elsewhere for cheap credit,
most notably to the IFIs, which began to increase their lending after the (first) oil shock (Birdsall &
Williamson 2002, 15-17).
16 Of course, economies in the South suffered from a range of domestic ills, including militarization; corruption and (neo)patrimonialism; maldistribution of land and other productive resources; and overreliance on protectionism, dirigisme and planning—just to name a few (South Commission 1990, 37-55; Sachs 1989, 13-17)! 17 Despite some recent changes in favor of China, Russia, India and Brazil, the United States has ensured that it maintains a de facto veto power of key decisions (Financial Times 2018; Weisbrot & Johnston, 2019). In addition, the US still appoints the president of the World Bank and the deputy managing director of the IMF, while the European members appoints its managing director (Peet 2009, 69, 177). Both institutions are based in Washington.
School of Global Studies University of Gothenburg Markus Bohlers
20
Emerging out of colonial rule, few countries in the South had managed to escape their dependency
on specialized primary sector exports: It was easier to reinvest foreign exchange earnings in a sector
that was already developed, even as the market price for most primary commodities was low,
increasingly unstable and in decline (Prashad 2008, 181-182). Western countries had offered little
guidance or assistance out of this dependency. On the contrary, there had been a strong conviction in
the economics departments that ‘developing’ countries should continue to specialize in the primary
sector, at least before ‘taking off’ to the next development stage (Peet & Hartwick 2015, 141-146).
As the economic shocks and changes in the 1970s threw global commodity markets into
violent fluctuations—with the spikes in oil prices drastically increasing import bills for non-oil
producers—many countries in the South struggled with mounting deficits (Walton & Seddon, 13-15).
Calls for a New International Economic Order (NIEO) fell on deaf ears in the richer countries, and instead,
Western governments went to great length disrupting international efforts aimed at improving the
terms of trade of poorer countries, such as cartelization, while also raising protectionist walls around
sectors of special importance to the South, such as agriculture and textile18 (Stiglitz & Charlton 2007,
41-45; Prashad 2014, 24-34; South Commission 1990, 60-61). On top of that, Western governments
had begun pursuing contractionary macroeconomic policies to combat inflation, which had the dual
effect of decreasing demand for goods produced in poor countries and increasing interest rates on
their loans (South Commission 1990, 56).
There were of course many other reasons behind the mounting debt burdens in the South:
Even in times of relative stability, Southern governments had proven unwilling or unable to properly
balance their budgets and keep inflation down, and the massive borrowing that began in the 1970s
was in many cases always unstable as much of the funds did not go to productive use (South
Commission 1990, 37-56). When commercial banks realized that their loans were not being repaid—
except with new loans—they simply stopped lending more (Peet 2009, 83). In addition to this lack of
credit, some Latin American countries also experienced massive capital flight leading up to, and
exacerbating, the crisis (Sachs 1989, 9-13).
Nevertheless, in their 1979 annual report, the IMF acknowledged that the deficits in non-oil
exporting low-income countries were driven by falling primary commodity prices, on the one hand,
and rising interest payments, on the other (IMF 1979, 23). Then, later that same year, the US spiked
18 In fact, these sectors had been conveniently left out of General Agreement on Tariffs and Trade (GATT)—a multilateral free trade agreement which grew out of the Bretton Woods conference and would serve as the precursor to the WTO (Stiglitz & Charlton 2007, 41-45).
School of Global Studies University of Gothenburg Markus Bohlers
21
the interest rates on the American dollar, plunging several countries into near-bankruptcy (Prashad
2014, 52-56).
3.2 Structural Adjustment
This is when the World Bank and the IMF really steps into the picture: In coordination with the US
Treasury Department and major commercial banks, the IFIs began to offer concessional loans, debt
restructuring and, eventually, partial debt cancellation to the crisis-ridden countries (Peet 2009, 86-91,
136-146). In exchange, these countries had to undergo (short-term) ‘stabilization’ and (long-term)
‘structural adjustment’, that is to say, governments had to implement a program of structural and
macroeconomic reforms in accordance with the ‘Washington Consensus’ (ibid.). Implementation of
these reform programs—labeled Structural Adjustment Programs (SAPs)—would also become a
precondition to receive bilateral grants and loans (ibid., 115-116).
Throughout the 1980s and 90s, the roles played by each of the IFIs became increasingly
intertwined, largely because the IMF increasingly moved beyond its traditional concern with
macroeconomics and into areas which were more micro and structural in nature—where the World
Bank focused its attention (Mosley 2001, 310; Stiglitz 110-112, 2002/2017). Gradually, the number of
policy conditions that the IFIs imposed through their different programs also increased (Hermele
2005, 2). While these so called ‘conditionalities’ embodied the core principles of the ‘Washington
Consensus’ laid out in the previous chapter, it is worth noting that the IFIs often went further,
employing a ‘shock doctrine’ approach of rapid structural adjustment which included (but was not
limited to) de-unionization, layoffs, wage cuts, social spending cuts, and the elimination of subsidies
on basic goods (Peet and Hartwick 2015, 99-105; Sumner 2006, 16).
The consensus view is that SAPs did not deliver on their promises. It is of course difficult to determine
how countries would have fared in the absence of the programs, especially considering that the
external economic environment continued to deteriorate, at least throughout the 1980s (which is often
labeled the ‘lost decade’). We also have to consider the diversity of the places under ‘adjustment’. For
instance, it has been argued that SAPs made more sense in Latin America—for which the programs
were primarily designed—than they did elsewhere (Stiglitz 2002/2017, 149). Others have argued that
countries in Africa may have been worse off without the programs, or at least that they could have
been better off if the policy prescriptions had been fully and correctly implemented (Sahn et al. 1997;
Scott 2010).
School of Global Studies University of Gothenburg Markus Bohlers
22
That being said, there is ample evidence that SAPs failed to spur sustained growth and reduce poverty
(see for instance Johnson & Schaefer 1999, Easterly 2005; UNCTAD 2000; 2002). In fact, studies
show that the programs often did enormous damage to the already poor and vulnerable; to local
industry and agriculture; and to labor rights and human rights (Cornia et al. 1987; SAPRIN 2002;
Lloyd & Weissman 2010; Rodwan Abouharb et al. 2010). Even studies from within the IFIs concluded
that many of their policies and projects were unsuccessful (World Bank 1992; OED 1992; Khan 1990).
3.3. Poverty Reduction Strategy Papers
Structural adjustment—especially the removal of subsidies on basic goods—ignited massive protests
across the Global South and, beginning in the late 1980s, even in parts of the North (Peet 2009, 99-
104; Walton & Seddon 1994). There was a growing understanding that neoliberal prescriptions were
failing—perhaps by design—and that the debt burdens in poor countries were not just unfair, but
unpayable (ibid., 104-107). In response, the IFIs launched the Heavily Indebted Poor Countries (HIPC)
initiative in 1996. The purpose of the initiative was to start writing off some of the debt owed by the
poorest countries, but predictably, there were strings attached (ibid. 107-108):
After the HIPC initiative had been enhanced in 1999 to cover a larger number of countries,
those that could and wanted to access debt relief were expected to prepare and implement a so-called
Poverty Reduction Strategy Paper (PRSP) (Elkins et al. 2018, 378). A preliminary interim-PRSP was
to be followed by a full-PRSP, and throughout the implementation period—which typically lasted
three to four years—the recipient country had to follow up with Annual Progress Reports (APR) (Elkins
& Feeny 2014, 230).
Apart from an analysis of the poverty situation in the recipient country, PRSPs needed to
include the macroeconomic, structural and social policies required to reduce poverty and stimulate
sustained economic growth (Wachira & Ruger 2011, 1957). The strategies were supposed to focus on
results and outcomes that benefitted the poor, including in the long-term, and recognize that poverty
is a multidimensional phenomenon (Guimarães & Avendaño 2010, 320).
Since lack of local commitment was identified as a major obstacle to successful
implementation of IFI-supported programs, the PRSPs were to be formulated by the recipient country
(Booth 2005, 1). The national government should take the lead, but the PRSP was also expected to be
developed in collaboration with a range of domestic stakeholders—including opposition parties, trade
unions, businesses, NGOs and religious institutions—as well as international donors (Fraser 2005,
317; Dijkstra & Komives 2009, 3). As articulated in the IFIs’ Comprehensive Development Framework,
School of Global Studies University of Gothenburg Markus Bohlers
23
country ownership, broad-based participation and partnerships were touted as core principles of the
PRSP approach (Peet 2009, 145-147).
Shortly after the PRSP approach had been launched, even countries that were not eligible for
HIPC debt relief were urged to prepare PRSPs in order to access certain concessional lending
arrangement from the World Bank’s International Development Association and the IMF’s Enhanced
Structural Adjustment Facility (Peet 2009, 147)19. Following the 2002 International Conference on Financing for
Development, the PRSP approach also became an important framework through which other donors
organized their aid to poor countries (Elkins & Feeny 2014, 230).
Apart from access to debt relief and concessional loans, then, PRSP implementation brought
with it the prospect of increased bilateral aid, including as budget support (Elkins et al. 2018, 382). In
addition, PRSPs provided a “unique opportunity for poor countries to pursue an integrated, national
development strategy, something that had been missing since the late 1970s and early 1980s when
these countries embarked on market-oriented reforms” (Gottschalk 2005, 440). The strategies also
became an important vehicle to achieve the MDGs (Elkins et al. 2018, 378-379).
While the IFIs would continue to wield influence over the PRSPs, it was declared at the 2005
G8 summit that ‘explicit endorsement’ from their executive boards were no longer required to receive
loans for a strategy paper (Sumner 2006, 1401). In many ways, the Poverty Reduction Strategy initiative
allowed the IFIs to correct some of their past mistakes and to signal a shift in priorities, as epitomized
by the rediscovery of poverty. The World Bank even adopted the slogan “Working for a World Free of
Poverty”. Today, however, the fate of the PRSPs seems somewhat uncertain: The IFIs are still
committed to poverty reduction, and there has been no formal end to the initiative, yet no new PRSPs
appear to have been issued since 2014 (IMF 2019).
4. LITERATURE REVIEW
Did the promises of the initiative materialize? The literature on PRSPs has dealt with its different
aspects—policy content, performance and process of implementation—in different ways, most
frequently in the form of country case studies. For instance, in 2003, Development Policy Review ran a
special issue on PRSPs consisting of qualitative case studies from Benin, Kenya, Malawi, Mali,
Mozambique, Rwanda and Tanzania. Contributors found that the PRSP process were leading to some
19 The latter has been renamed into Poverty Reduction and Growth Facility (ibid. 110). Recipients of PRSP loans primarily included countries in the South, but also a few former Soviet states.
School of Global Studies University of Gothenburg Markus Bohlers
24
gains in areas such as budgetary efficiency, aid coordination, government accountability and civil
society participation (Booth 2003a). However, political turbulence, bad governance, poor state
capacity, and limited and partial national ownership of the strategies remained serious constraints to
successful implementation (ibid.).
Studies such as these offer an invaluable contribution: Not only do they allow for more
detailed examinations of PRSP policies, but they also contextualize the PRSP experience, revealing
the complexities and specificities that marked each implementation. To be sure, a successful
implementation of even the most well-crafted PRSP hinges on different factors that may be more or
less prevalent in each country and region. The problem, of course, is when the examination of a PRSP
or its implementation—and the theoretical arguments explored through and developed from that
examination—is generalized to all other cases.
As such, the following section will begin with a discussion on the PRSP approach based
primarily on country case studies and other qualitative studies, and then proceed to a review of the
few studies which have analyzed PRSP content using a larger quantity of cases. This will allow for a
smooth transition to the next section, in which previous quantitative studies on PRSP performance will
be outlined.
4.1. Process and Content
The questions of ownership and participation have attracted particular scholarly interest: Can PRSPs really
be said to have been homegrown and ‘owned’ by the implementing countries, and if so, did this
ownership go beyond the government’s ministries of finance or planning to also include key
stakeholders in civil society? While there is certainly no consensus among scholars, many agree that
the PRSP approach represented a step in the right the direction, but that it did not go far enough (see
for instance Booth 2003b; Driscoll & Evans 2005; Gottschalk 2005; Cheru 2006; Mouelhi & Rückert
2007): IFIs continued to exert ‘backstage’ influence over the PRSPs, with ‘participation’ often looking
more like consultation, and key stakeholders such as trade unions were sometimes excluded altogether
from the process (Oxfam 2004, 1; Stewart and Wang 2005, 456-457).
Moreover, while the formulation of the strategies was in some cases characterized by a high
‘degree of national ownership’, there could be quite a bit of distance between what was strategized on
paper and the actual implementation (Booth 2003b, 157; Dijkstra 2005; Dijkstra & Komives 2009,
18). In those cases where ownership was indeed strong, the fact that a range of different actors were
expected to participate in the formulation may have had the effect of weakening the legitimacy of
School of Global Studies University of Gothenburg Markus Bohlers
25
sitting governments (Stewart & Wang 2003, 27). This was especially problematic when the
government, unlike civil society actors, had a legitimate democratic mandate to act upon.
The IMF has acknowledged that the emphasis on ownership and participation in the PRSP
process would “make it easier to generate domestic political support for the program, since it is likely
to be seen, at least in part, as an indigenous product, rather than a foreign imposition” (IMF, 2001,
14). Several scholars, however, have taken issue with the participatory approach (see Craig and Porter
2003; Brown 2004; Fraser 2005; Rückert 2009; Dutta & Rastogi 2016): They argue that, in practice,
this approach merely serves as an instrument to disseminate market-based knowledge about poverty
reduction and development—presented as universal, ‘technical’ knowledge—thereby rationalizing the
imposition of policies and performance goals defined elsewhere (Rückert 2009; Dutta & Rastogi 2016).
Accordingly, IFI-led participation is understood as a technology of social and political control that
seeks to deepen the hegemony of neoliberalism: “Through participatory exercises, the World Bank
reaches deep into the cultural fabric of developing country societies, with the ultimate goal of
producing complicit neoliberal subjects” (Rückert 2009, 68).
No doubt, the questions of ownership and participation are closely linked to policy content. To
some, the PRSP approach has been little more than a public relations effort to allow the IFIs to escape
criticism and re-legitimize themselves and their controversial reform agenda in the court of public
opinion (Guimarães & Avendaño 2010; Saeed et al. 2015). But while the apparent survival of
‘Washington Consensus’ has been interpreted as evidence of the lack of national ownership (Stewart
and Wang 2003), others have argued that certain governments in the South have come to internalize
the worldview of donors, turning them into ‘post-conditionality regimes’ (Harrison 2001). In addition,
it is wrong to assume that people in the South cannot independently find an appeal in neoliberal
economics or associated policies20.
It has also been pointed out that, even if commitment to a radically different development
agenda existed, the PRSP approach was by its very nature unable to address (and may have even
undermined efforts against) extra-national obstacles to poverty reduction (Tan, 2011). For instance,
neoliberalization under SAPs made countries more vulnerable to the whims of global markets and the
power of transnational corporations. This have, in turn, almost certainly affected the content of the
PRSPs.
20 Indeed, for many governments, IFI-programs have served as a convenient excuse to implement uncomfortable but desired reforms.
School of Global Studies University of Gothenburg Markus Bohlers
26
A few studies have sought to analyze the content of a larger group of PRSPs. Early on, Frances Stewart
and Michael Wang (2003; 2005) examined the content of 30 first generation PRSPs and found that
not only were there a remarkable uniformity among the strategy papers, but no meaningful break with
the ‘Washington Consensus’ had occurred: Although many strategies emphasized good governance—
including measures to combat corruption and increase public transparency and accountability—most
PRSPs also endorsed continued privatization of state-owned enterprises and liberalization of trade,
capital accounts, the banking sector, exchange rates and interest rates; as well as contractionary
monetary and fiscal policies to keep inflation and deficits under control (ibid., 462-467).
Moreover, argued Stewart and Wang, the macroeconomic section in the PRSPs often seemed
detached from or even contradicting the poverty analysis section (2005, 467). This is in line with a
2005 report by the UN Millennium Project which criticize the PRSPs for letting pre-established
macroeconomic frameworks and budgetary ceilings dictate—and thereby limit—MDG progress,
rather than letting such policies be dictated by the requirements necessary to meet the MDGs (UN
Millennium Project 2005, 58-61).21
In another cross-country content analysis of 15 PRSPs focusing on the macroeconomic
section of the strategies, Ricardo Gottschalk (2005) noted a “strong agreement among the PRSPs that
broad-based growth should be at the centre of a development strategy” (emphasis added, 440). However,
he also found that the strategies in question did not “really support economic growth and poverty
reduction in a direct, clear way” (ibid., 440): The emphasis was still on achieving macroeconomic
stability, with fiscal and monetary policies lacking the flexibility required to deal with exogenous shocks
(such as a sudden drop in demand for a country’s exports’) and leaving little room for governments
to spend their way out of downturns.
The understanding that PRSPs generally championed strict fiscal and monetary policies was
confirmed in a content analysis of 50 PRSPs conducted by Andrew Sumner (2006). Privatization was
another policy pushed for in the vast majority of PRSPs under study, while liberalization of trade,
agriculture, capital accounts and FDI were somewhat less common features in the strategies, especially
in African HIPCs (Sumner 2006, 1406-1411). Sumner concluded that PRSPs had made some strides
away from the ‘Washington Consensus’, yet very few of the PRSP-policies could be labelled
‘unorthodox’ (ibid. 1408).
21 The World Bank and other donors, it was argued, should facilitate such re-prioritization by increasing development assistance.
School of Global Studies University of Gothenburg Markus Bohlers
27
In another study, Sakiko Fukuda-Parr (2010) examined 22 PRSPs based on alignment to the MDGs.
She found that commitment to meeting the goals was selective and that the majority of PRSPs lacked
strategies for broad-based growth and pro-poor investment in social infrastructure. Instead, the PRSPs
reflected “an assumption that ‘trickledown’ would achieve the poverty reduction objectives of the
MDG agenda” (Fukuda-Parr 2010, 33).
The conclusions above have been somewhat disputed by Meg Elkins and Simon Feeny (2014).
In their analysis—the most comprehensive to date—81 PRSPs were scored based on its overall
alignment to the ‘Washington Consensus’, the ‘post-Washington Consensus’ and the ‘New York
Consensus’. Their results suggest that PRSP policies were in fact marked by some diversity; that PRSPs
in poorer countries were generally less aligned with the ‘Washington Consensus’; that a shift away
from neoliberal orthodoxy had occurred, especially after 2004; and that, instead, the ‘New York
Consensus’ was driving content. Elkins and Feeny interpret their results as clear evidence that the
MDG commitment “has been successful at shifting policies in the PRSP process towards the
achievement of the MDGs” (2014, 243). In a separate but similar analysis of 87 PRSPs, Elkins also
found evidence that a ‘social protection agenda’ including policies and programmers aimed directly at
combatting poverty and vulnerability was outspoken in many strategy papers (Elkins 2014). This was
particularly true in richer and more ethnically homogenous countries (ibid.).
In conclusion, then, it appears as if PRSPs did indeed move beyond the neoliberal one-size-
fits-all formula of the SAPs, especially in the second and third generation strategies. However, we need
to keep in mind that many PRSPs may have been less aligned with the ‘Washington Consensus’ simply
because the neoliberal reforms that would otherwise indicate such alignment had already been carried
out in the country. In addition, it appears as if many strategies remained dedicated to strict
macroeconomic stability, which may of course have undermined commitments to increased social
spending.
4.2. Performance
When it comes cross-country studies of PRSP performance, the literature is surprisingly sparse. This
is particularly so if we consider the prominent role that the PRSP approach has had in shaping the
international development discourse and, more importantly, shaping national development within
poor countries. Perhaps it is the understanding that PRSPs were less uniform than previous programs
that have led scholars to refrain from conducting quantitative appraisals of their impact: If all PRSPs
School of Global Studies University of Gothenburg Markus Bohlers
28
differ from one another, how can we expect to find any meaningful divergence from the progress
made by non-implementing countries?
This is indeed what the World Bank has argued (Marshall and Walters 2011, 4). Given this
argument, it is all the more interesting that, in 2004, the external evaluations bodies of both the World
Bank and the IMF each released a report which included cross-country evaluations of progress made
through PRSP-implementation (IEO 2004, chapter 6; OED 2004, chapter 3). First, a report by the
Independent Evaluations Office (IEO) presented progress made by PRSP-countries as compared to non-
implementing countries on a number of macroeconomic indicators—such as economic growth and
terms of trade—for the period 2000-2002 (IEO 2004, 79-81). The authors of the report also compared
the data from that of 1997-1999—in other words, from before PRSPs were being implemented. The
results were mixed, and since the authors did not control for other potential factors explaining the
changes observed, any apparent association with PRSP implementation may very well be spurious.
Given the limited time-period, it is also questionable on a theoretical basis that any changes could have
been caused by PRSP-implementation. Lastly, it must be noted that none of the indicators used were
directly related to poverty.
The report by the Operations Evaluation Department (OED)22, however, did include a short
evaluation of the progress made by PRSP-countries on available MDG-indicators (OED 2004, 33-
34)23, but this evaluation was limited to the 12 countries which had at the time released APRs. More
importantly, their progress was not compared with non-implementing countries, and indeed, the
authors point out that “[t]here are clearly problems with attributing progress over the period to the
introduction of the PRSP Initiative because of the lack of a counterfactual; in addition, the PRSP was
introduced at different times in each of these countries” (ibid., 34). The considerable lack of data
combined with, again, the short time period makes for additional problems that further limits what
can be concluded from the results.
In an unpublished study, Dirk J. Bezemer and Andrea Eggen (2007; 200824) have also tried
investigating if implementing PRSPs increases progress on the MDGs. Unlike the above-mentioned
reports, they used panel data regressions to do so. Due to lack of data, however, the authors were only
able to estimate the effect on four indicators. Their results were mixed: PRSP implementation was
22 Which has since been renamed into Independent Evaluations Group. 23 The results of the evaluation are also published in the IEO-report, at page 82. 24 I have found two versions of the same study, and both are missing different parts.
School of Global Studies University of Gothenburg Markus Bohlers
29
found to be positively associated with higher immunization and school enrolment, but not with lower
mortality and illiteracy.
At the time of their study, PRSPs had been implemented for five or six years. The authors
acknowledged that the short implementation period is problematic but defended their study on the
basis that PRSPs were expected to achieve progress within a few years (Bezemer & Eggen 2008, 3).
What is more problematic, however, is the counterfactual used to estimate progress: Because the
authors limited their population to low-income countries, and because so many of them implemented
PRSPs, there were not enough countries left to make up a control group (the ‘nearest possible world’).
Instead, Bezemer and Eggen compared the average values of the available MDG-indicators between
1990-1999 and 2000-2005. A major issue with this approach is that many low-income countries were
implementing similar programs in the 1990s—namely SAPs. The authors made no effort controlling
for the influence of these programs (and in fact did not mention them at all).
In a separate analysis, that is also part of their paper (2007; 2008), Bezemer and Eggen
evaluated the implementation speed, duration and design of several PRSPs in order to estimate what
effect those aspects had on the MDG-indicators. They found that a PRSP which includes “better
quality of targets and indicators [were] significantly associated with more progress in improving school
completion rates, but also with less progress in enrolment rates” (Bezemer & Eggen 2007, 19).
Meanwhile, better formulated ‘concrete policy actions’ were associated with lower infant and under-
five mortality rates, and a speedier progression from interim-PRSPs to full PRSP was associated with
lower measles immunization rates and higher infant mortality rates (ibid.).
It should be noted, however, that the measurements used for ‘quality of targets and indicators’
were based on a World Bank assessment that only covers rural development. Moreover, it is
questionable if the number of months between an interim-PRSP and a full PRSP—their ‘speed’
variable—can really be considered a proxy for the extent of “domestic dialogue and ‘ownership’”, as
the authors suggested (ibid., 16).
In a similar, unpublished panel data regression analysis, Richard Marshall and Bernard Walters (2011)
investigated the relationship between PRSP implementation and poverty rates when controlling for
level of economic development and inequality. They also estimated if the main effect was conditioned
on increasing economic growth and decreasing inequality. To conduct their analysis, Marshall and
Walters ran regressions with both first difference and two-way fixed effects models (see next chapter). Their
control group was made up observations from those countries that were not implementing PRSPs in
School of Global Studies University of Gothenburg Markus Bohlers
30
the same period, 2000 to 2014. They employed propensity score matching25 to create a more homogenous
sample of countries.
Marshall and Walters found some evidence that implementing PRSPs was significantly
associated with poverty reduction, but only when poverty was operationalized as the percentage of a
population living on less than $1.25 a day. When the national poverty line (NPL) of each country was
used, the results were not statistically significant at any level. The estimated effect of PRSP
implementation on poverty according to the IPL appears to have been somewhat conditioned on
increasing economic growth, but not on decreasing inequality. From this, the authors concluded that
“it is possible to construe PRSPs as reshaped, but narrowly-based, growth strategies” (Marshall &
Walters 2011, 29).
To my knowledge, the only quantitative appraisal of PRSP performance that has been published in a
peer-reviewed academic journal is by Meg Elkins, Simon Feeny and David Prentice (2018). As already
alluded to, I myself have drawn significantly upon this paper. It is similar to that of Bezemer and
Eggen in that it also seeks to estimate the effect of implementing PRSPs on progress towards MDGs,
but unlike Bezemer and Eggen, and like Marshall and Waters, Elkins et al. uses a control group of
countries from the same years and employ propensity score matching to sample them. They also
conduct a panel data regression analysis, covering observations between 1999 and 2014, and their
models include two-way fixed effects.
Elkins et al. acknowledges that the “establishment of a PRSP is usually part of a broad process
of reform which may include debt relief from the international community as well as additional foreign
aid” (2018, 382), yet they do not control for these variables. Instead, they control for the effect of the
following three variables: GDP per capita, health expenditure, and governance. The latter is an indexed
version of the six dimensions of the Worldwide Governance Indicators (WGI). Given the range of
phenomena captured by these six dimensions, it is disputable that this ‘governance’ variable actually
conveys that much about good or bad governance, and indeed, its estimated effect is only statistically
significant for one indicator (maternal mortality, at the 90%-level).
Elkins et al. do not address the risk of post-treatment bias; that is to say, if they are controlling
for the effect of the implementation. Given that PRSPs were aimed at stimulating growth, it is certainly
possible that using GDP per capita as a control variable could create such bias.
25 A statistical matching technique used to approximate a random selection of cases into treatment group and control group.
School of Global Studies University of Gothenburg Markus Bohlers
31
Echoing Marshall and Walters (2011), Elkins et al. find that implementing PRSPs was positively
associated with reductions in poverty according to the IPL. In addition, they find positive associations
with reduced infant mortality, improved primary school enrolment and gender parity. The authors
interpret this as evidence suggesting that “PRSPs should continue as the mechanism to operationalise”
the SDGs (Elkins et al. 2018, 388).
By utilizing a scorecard system developed in two previous studies (see Elkins 2014; Elkins &
Feeny 2014), Elkins et al. also (2018) estimate if successful PRSP implementation was conditioned on
closer alignment to a specific development paradigm. (The scores only stretch to PRSPs issued in
2008, which is why I will not use it in my analysis.) Their results suggest that progress on primary
school enrollment, gender parity and infant mortality was conditioned on closer alignment to the ‘New
York Consensus’. Meanwhile, decreasing maternal mortality appear to have been conditioned on
closer alignment to the ‘Washington Consensus’.
Based on this result, the assumption that PRSPs were successful due to its distancing from the
‘Washington Consensus’ may not be applicable to maternal mortality—which is one of my five
outcome variables. However, it is worth mentioning that Elkins et al. (2018) use a different indicator
for maternal mortality than I will, and this indicator only includes data on 51 countries in the ‘paradigm
alignment’ interaction models.
To conclude, it seems as if at least some improvements can be attributed to the PRSPs—albeit we
should be carefully optimistic: We are a long way from any conclusive evidence, if we ever get there.
My aim is to get us a little bit closer. In many ways, my study serves as a replication study of Elkins et
al. (2018). The use of outcome variables based on the SDGs will test the robustness of their findings,
as will the inclusion of different control variables and the interaction with Gross Domestic Product
(GDP) per capita26. I will also consider the main effect if PRSP-implementation is measured
differently; if outlier countries are removed; if robust standard errors are employed; and if the outcome
variables are transformed using the natural logarithm. As such, I would argue that my analysis will
make an important contribution to the existing literature.
26 The interaction models will allow me to consider the effect of economic growth without controlling away the effect of implementation. Such potential post-treatment bias is not addressed in Elkins et al. (2018).
School of Global Studies University of Gothenburg Markus Bohlers
32
5. METHOD AND OPERATIONALIZATION
5.1. Overview
This is an observational statistical study of both cross-sectional and time-series design; that is to say,
it estimates the relationship between the main explanatory variable and the outcome variables across
cases and over time. The aim is to isolate a (probabilistic) causal link between PRSP implementation
and multidimensional poverty in (non-fragile) poor countries.
The full sample is comprised of an unbalanced panel dataset on 103 non-fragile poor countries
(see Appendix B) covering 17 years—between 2000 and 2016. Implementing countries are the
treatment group while non-implementing countries are the control group. However, since country by
year is the unit of observation, an implementing country is only part of the treatment group during the
implementation period. In the remaining years, it is designated as part of the control group.
Specifically, my study is conducted as a linear panel data regression analysis using the difference-in-
difference method. In other words, what we will analyze are the average differences in the outcome
variables between the treatment group and the control group. Of interest is how much of one unit
increase in PRSP across time—from no implementation to full implementation—is predicted to affect
the poverty-related indicators.
Once again, my primary hypothesis is the null hypothesis (H0); that implementing PRSPs had
no effect on poverty in its various dimensions. My alternative hypothesis (H1) is that implementation
did in fact lead to reductions in poverty. I will also test a complementary conditional hypothesis (H2);
that successful reductions in poverty was conditioned on increasing economic growth. Here, it is the
interaction effect of PRSP implementation and Gross Domestic Product (GDP) per capita that is of
interest. In other words, we analyze the effect on the outcome variables when GDP per capita
increases during treatment.
As per convention, the chosen level of statistical significance is 0.05. In order to reject the null,
therefore, we must be more than 95 percent certain that the estimated parameter effect is not zero in
the population; that is, in all poor countries (see Gerring & Christenson 2017, 306-309).
5.2. Fixed Effects
Rather than measuring data over a period of time, an alternative approach could have been to measure
the (percentage) difference in an indicator for every country from a year before and a year after the
implementation period, and then regressed the difference observed against the explanatory variable in
School of Global Studies University of Gothenburg Markus Bohlers
33
a series of linear Ordinary Least Squares (OLS) regression tests. However, panel data comes with a
number of advantages:
Apart from drastically increasing the number of observations in the dataset, panel data
regression testing also allows us to control for unobserved heterogeneity, specifically, by running fixed
effects (FE) models using a within country-estimator (see Woolridge 2013, 484-491; Park 2011, 29-33).
With country-fixed effects, we adjust for differences across countries that are constant throughout the
period of years under study. Such differences include more or less time-invariant factors such as
geography, climate and ethnic fractionalization, but also, and perhaps more importantly, it includes
base-year levels of time-variant factors, such as poverty, GDP per capita and governance. These
differences are held constant in the models, or to put it more bluntly, the models adjust so that every
country is assumed to have the same baseline level of development, governance, ethnic
fractionalization etc.
Moreover, by adding a temporal dimension to the spatial dimension, panel data regression
allows us to run time-fixed effects models, thereby adjusting for changes in time-variant factors that
have affected countries equally in the years under study. As such, we can control away some, but not
all, of the effect of important events that occurred between 2000 and 2016, most notably the global
commodity boom and the financial crisis.
While the two-way FE models will be the focus of our attention, I will begin by running a
series of bivariate pooled OLS models, which do not account for unobserved heterogeneity. I then
introduce the country-fixed effects, followed by the year-fixed effects, and finally the two control
variables, aid received and political stability (which are discussed further below). This is done in order to
illustrate the range of effect in the regression tests. I should note that, while the OLS models will be
instructive as a comparison to the FE models, they are particularly problematic when it comes to
poverty according to national thresholds as these thresholds differ from country to country and the
“perceived boundary between poor and non-poor typically rises with the average income of a country”
(World Bank 2019e).
Once again, to predict my FE models, I will be using a within country-estimator which reports
corrected, averaged intercepts that differs notably from the one in the pooled models (Park 2011, 33).
However, the F-score and R-squared coefficients reported for the FE models are estimated using a
standard least square dummy variable regression and are therefore corrected (ibid.).
School of Global Studies University of Gothenburg Markus Bohlers
34
5.3. Equations
Below is the equation for my full additive two-way FE model:
Additive: 𝑌𝑖𝑡 = �̂�0 + �̂�1𝑋𝑖𝑡 + �̂�3𝑍𝑖𝑡 + �̂�4𝑍𝑖𝑡 + �̂�𝑖 + �̂�𝑡 + 𝜀𝑖𝑡
𝑌 denotes the outcome variable; 𝑋 is the main regressor variable; 𝑍 are the control variables; �̂�𝑖 is the
country-fixed effects; and �̂�𝑡 the year-fixed effects; while 𝜀 is the error term—the unexplained
variance. �̂� represents the coefficient slope of each regressor variable, which is observed by country
(𝑖) and year (𝑡).
The interaction model is expressed slightly different, as the moderator variable (𝑀) and its
interaction with the main regressor variable (𝑋𝑀) is added to the equation:
Interaction: 𝑌𝑖𝑡 = �̂�0 + �̂�1𝑋𝑖𝑡 + �̂�3𝑍𝑖𝑡 + �̂�4𝑍𝑖𝑡 + �̂�5𝑀 + �̂�6𝑋𝑀 + �̂�𝑖 + �̂�𝑡 + 𝜀𝑖𝑡
5.4. Sample and Populations
Poor countries. Poor countries are defined as low-income or lower middle-income countries, according to
World Bank designations. However, since my panels begin in 2000, when the Poverty Reduction
Strategy initiative commenced, it is not appropriate to use those countries that are designated as low-
income or lower middle-income today. That would create a bias in my results as it would omit the
more ‘successful’ countries which have achieved a higher-income designation during the 17-year
period. Instead, my population are those countries that were listed as low-income or lower middle-
income in 2000 (as reported in a World Bank report on developing countries, see World Bank 2001,
192-193).27
There are a few exceptions: First of all, even though Timor-Leste is not on the World Bank
list as it only regained its independence in 2002, relevant data on the country exist from 2000 and
onward, and it began implementing a PRSP right away, in 2002. As such, I decided to include Timor-
27 Due to an error in the data gathering process, one upper middle-income country, South Korea, is included in the data set for models 3-5. However, since the outcome variables for South Korea changed almost nothing between 2000 and 2016, re-running the models without it made virtually no difference to the model estimates. In other words, the interpretation of the results remains the same.
School of Global Studies University of Gothenburg Markus Bohlers
35
Leste into my sample. Conversely, because of their recent break-ups, Serbia, Montenegro, Kosovo,
Sudan and South Sudan are all excluded from the sample.
Fragile Countries. Instability makes combatting poverty all the more difficult—it certainly
complicates the collection of poverty data—and it is therefore appropriate to exclude countries which
were consistently unstable between 2000 and 2016. In half of their models, Elkins et al. (2018) exclude
countries which were listed as ‘fragile’ by the Organization for Economic Co-operation and
Development (OECD) between 2007 and 2015 (382). For the most part, this made very little difference
to their model estimates. Indeed, others have argued that the definition of fragility needs to be stricter
and narrower if it is to be a meaningful category in studies such as this (Harttgen & Klasen 2013).
Accordingly, my operational definition of fragility is derived from the World Governance Indicator
(WGI) for Political stability and the absence of violence/terrorism, which is a widely used composite indicator
measuring “perceptions of the likelihood of political instability and/or politically-motivated violence,
including terrorism” (Kaufmann et al. 2010, 4). Here, countries defined as fragile are those that had a
negative score representing three quarters (75%) or higher of the approximate maximum score on this
indicator (-2.5) for three quarters or more of the 17 years measured.
A total of 15 countries met this criterion and were therefore excluded from my sample28. All
in all, this leaves 103 non-fragile poor countries and 1,751 yearly observations. 51 countries
implemented PRSPs and 52 did not (see Appendix B).
Internal validity of sample. Of inescapable concern is the lack of data on the outcome variables,
especially, as we shall see, when it comes to proportion of people living under the national or
international poverty line. In these models, 14 countries and between 1343-1256 yearly observations
are left out. In theory, this paucity is compensated for by the generalizability implied in a high level of
statistical significance. However, we need to be cognizant of the very real possibility that the true
success or failure of the PRSP approach is obscured by those missing observations. Indeed, it is
reasonable to assume that poorer countries, with less resources at their disposal, have a harder time
recording statistics on poverty. If so, this means that the available dataset is biased against the ‘failures’.
Likewise, we cannot properly control for political stability if countries and yearly observations are
missing because of political instability.
28 These are Afghanistan, Burundi, Central African Republic, Chad, Colombia, Côte d'Ivoire, Democratic Republic of Congo, Ethiopia, Iraq, Myanmar, Nigeria, Pakistan, Rwanda, Somalia, and Yemen.
School of Global Studies University of Gothenburg Markus Bohlers
36
5.5. Explanatory variable
Again, my main explanatory variable (alternately called a regressor) is PRSP implementation. It is
measured as a categorical ‘dummy’ variable, ranging between 0 to 1, wherein a country is scored 1 for
every year it is under ‘treatment’ and 0 the remaining years. Following the example of Elkins et al.
(2018), my base case models assume that the effects of PRSPs last the entire period (labeled PRSP+all
years in the tables); that is, treatment begins when a government issue its first PRSP and ends in 2016.
Indeed, the effects of PRSP policies are likely to last for several years, especially when it comes to
those reforms that is not easily reversed post-implementation, such as financial liberalization.
However, this assumption is problematic since, in at least a few countries, such as Bolivia,
implementation ended because subsequent governments were critical of the PRSP approach and wanted
to adopt another development plan (see Kay 2011, 261). Bolivia is also an example of a country where
the official implementation period concluded very early. In fact, there are considerable differences in
the dataset with regards to when implementation begins, and for how many years the PRSPs were
being implemented.
Given this, it is worth considering what changes limiting the treatment period will yield in the
main effect. As such, I will include a series of ‘robust models’ in which treatment covers only the
official implementation period (PRSP+no years). Treatment will also be measured as the
implementation period plus three years (PRSP+3 years), since it is reasonable to assume that there is
at least some time lag of the effects. Likewise, I will be measuring PRSP+all years and PRSP+3
years when the treatment period is lagged three years.
The information on which/when countries implemented PRSPs was retrieved from IMF’s
website (see IMF 2019). In those cases when a PRSP did not state a clear timeframe for
implementation, the average period of 4 years was assumed.
There are a few inescapable limitations to the PRSP-variable. First of all, it fails to capture how closely
the PRSPs were aligned with different development paradigms; how much each strategy can be said
to have been ‘owned’ by the implementing country; or to which extent PRSP-policies were fully and
correctly implemented. Although it is difficult to imagine a reliable method for quantitively
determining national ownership of PRSPs, both paradigm alignment and full/correct implementation
could have been determined by systematically evaluating every PRSP and every Annual Progress
Report (APR) published for implementing countries. Such an undertaking, however, is way beyond
the scope of my thesis project.
School of Global Studies University of Gothenburg Markus Bohlers
37
Another problem with the variable is the possibility that it violates the so-called stable unit treatment value
assumption, which would be the case if PRSP implementation in one country substantially influenced
changes in the outcome variables in another country (Gerring and Christenson 2017, 354). No doubt,
the narrow lens of methodological nationalism tend to obscure the fact that national economies do
not exist in isolation—far from it—and when we consider that PRSP implementation often entailed
changes to a country’s trade and investment policies, it is not difficult to imagine the strategies
affecting inter- and transnational economic flows in ways that at least marginally affected the poor in
other countries. Moreover, implementing PRSPs likely reprioritized the allocation of aid from richer
countries (Elkins et al. 2018, 382). This is part of the reason why I intend to control for the effect of
aid received.
5.6. Outcome Variables
Given the suggestion by Elkins et al. that PRSPs should remain the “mechanism to operationalise”
the Sustainable Development Goals (SDGs) (2018, 388), it seems appropriate to utilize them as my
outcome variables. This will also allow me to capture various dimensions of poverty.
Each SDG encompass a large set of targets—too many to include as outcome variables. For
several of the non-primary targets within each goal there are no indicators available measuring their
progress, while others are ambivalent with regards to poverty reduction29 (UN Statistics Division
2019). In addition, the SDGs also include targets which are at best indirectly related to poverty
reduction, and unlike the MDGs, some of these indirect targets, such as ending agricultural export
subsidies, are just as much meant for rich countries as poor countries (if not more so).
For these reasons, I will only be using the primary targets within the SDGs. I will also limit
myself to the first four goals that can be said are directly related to poverty30: ‘End poverty in all its
forms everywhere’ (SDG:1); ‘end hunger, achieve food security and improved nutrition and promote
sustainable agriculture’ (SDG:2); ‘ensure healthy lives and promote well-being for all at all ages’
(SDG:3); and ‘ensure availability and sustainable management of water and sanitation for all’ (SDG:6)
(UN Statistics Division 2019).
29The Proportion of population covered by social assistance programs found in the first SDG is perhaps the most notable: While social assistance programs help the poor, having a lower proportion of the population covered by these programs may also indicate that there is a lower demand for social assistance because fewer people are impoverished. It is therefore unclear if higher values reflect more or less poverty. 30 I assume, in other words, that the SDGs are ordered based on priority.
School of Global Studies University of Gothenburg Markus Bohlers
38
The indicators of interest are therefore the following: Poverty headcount ratio at $1.90 a day (Indicator
1.1.1); Poverty headcount ratio at national poverty lines (Indicator 1.2.1); Prevalence of undernourishment
(Indicator 2.1.1); Maternal mortality ratio (Indicator 3.1.1); and People using safely managed drinking water
services (Indicator 6.1.1). Arguably, these are all compatible with my definition of poverty as ‘the lack
of access to the basic material inputs necessary to sustain a decent life’.
In the case of Indicator 6.1.1, however, there were too many missing observations and I had
to replace it with People using at least basic drinking water services, which naturally increases the number of
people under consideration. This indicator has also been inverted in the regression models in order to
be consistent with the other outcome variables and measure the presence of poverty, not its absence.
In other words, the models estimate the effect on people not using basic drinking water services
(shortened to Lack of water in the tables).
As shown, I will include both the first and second primary indicator from SDG:1, that is,
Poverty headcount ratio at $1.90 a day (the international poverty line, or IPL) and Poverty headcount ratio at
national poverty lines (NPL). My reasons are threefold: (i) Poverty defined as living on less than a given
sum of money per day is the most conventional definition of poverty; (ii) PRSPs were often geared
towards reducing poverty according to national thresholds (Marshall & Walters 2011, 28-29); and, as
is discussed below, (iii) the IPL arguably underestimates the true number of people impoverished.
Poverty headcount ratio at $1.90 a day is the only outcome variable used by Elkins et al. (2018)
which reappear in this study31. All of the five indicators are measured continuously, on a ratio scale.
Their data was collected from the World Development Indicators database, which is published by the
Development Research Group at the World Bank. For a formal definition of each indicator, see Table 9 in
Appendix C. For descriptive statistics about them, see Table 10 in Appendix C.
Internal validity of outcome variables. Although my five outcome variables represent conventional
estimates of multidimensional poverty, it is worth investigating their empirical foundation: Can we
trust that they measure what they say they do?
Some of the issues with the indicators are true for much aggregate econometrical data. For
instance, most of them are based, in part, on household surveys. The World Bank acknowledges that
cross-country differences regarding survey design and quality of enumerators often compromises the
data, as does the timing and frequency of surveys (World Bank 2019c.). There are also obvious
31 A different indicator is used to measure maternal mortality in their study.
School of Global Studies University of Gothenburg Markus Bohlers
39
difficulties with randomizing the sampling frame for surveys conducted in countries with very big
informal sectors, where large parts of the population live unregistered. In addition, data from some
countries, such as North Korea, are certainly questionable simply by virtue of its origin.
The maternal mortality indicator is perhaps particularly problematic, given that its data comes
from a modeled estimate based on several different sources (including household surveys). In the
indicator description it is made very clear that “the ratios cannot be assumed to provide an exact
estimate of maternal mortality” (World Bank 2019d). Below, however, I will focus my attention on
the indicators underlying the first and second SDG, namely Poverty headcount ratio and Prevalence of
undernourishment. The reason for this extra scrutiny is simply due to the central position that these
indicators occupy in the SDGs, not to mention matters of development in general.
Poverty. The aggregate data on Poverty headcount ratio builds on household surveys compiled by national
statistical agencies and the World Bank’s national departments (World Bank 2019c.). Recently, the
World Bank stopped making adjustments depending on whether surveys were based on income or
consumption, arguing that it made little difference. Yet the Bank has also admitted that not making
the adjustments lowers the estimated headcount (Reddy & Lahoti 2016, 10).
The international poverty line (IPL), which determines what counts as being poor, was
originally derived from the typical national poverty line in the poorest 15 countries and is therefore
not very applicable elsewhere (Hickel 2016, 753-755, 762). In 2015, the line was changed from
$1.25/day to $1.90/day. Intuitively, one may think that this higher threshold also increased the
estimated number of impoverished people. Instead, the over-night change to the data seemingly lifted
some 100 million people out of poverty (ibid., 762). It has been argued that the reasoning behind the
updated IPL was built on faulty logic, making the choice of the new threshold quite arbitrary (Reddy
& Lahoti 2016, 2-6).
In order to equalize the purchasing power of different currencies, the dollar-based IPL is
converted using a theoretical exchange rate called Purchasing Power Parity, or PPP. However, the use of
PPP has been criticized on the basis that it factors in prices on goods that are not relevant to the poor
(Reddy & Lahoti 2016, 6). Moreover, the PPP conversion factor defined by the World Bank almost
never account for price differences within a country. The three exceptions are China, India and
Indonesia, for which differences in rural and urban price levels are adjusted (ibid. 8). The methods
behind the adjustments have been put into question, though, and without them the number of
impoverished would increase by approximately 290 million (in 2011) (Reddy & Lahoti 2016, 7-10).
School of Global Studies University of Gothenburg Markus Bohlers
40
In other words, the IPL is probably extremely conservative, and it is therefore more appropriate to
think of the indicator as measuring extreme lack of money. Again, this justifies exploring the effect of
PRSP implementation on poverty according to national poverty lines, which more accurately reflect
“local perceptions of the level and composition of consumption or income needed to be non-poor”
(World Bank 2019e).
Undernourishment. According to the IPL, hundreds of millions fewer are living in (monetary)
poverty than going hungry. While this raises serious questions about the internal validity of the IPL,
it appears as if the indicator for undernourishment suffers from quite a bit of underestimation, too:
Prevalence of undernourishment, which is compiled and calculated by the UN Food and Agricultural
Organization (FAO), captures the percentage of people whose caloric intake is “inadequate to cover
even minimum needs for a sedentary lifestyle” for “over a year” (as quoted in Hickel 2016, 759). The
caloric intake is calculated based on the average height of a population. However, as Jason Hickel
points out, this calculation becomes problematic when we consider that short stature is often a sign
of undernourishment (ibid.). We assume, in other words, that a population require less calories because
they are shorter, when, in fact, a population may be shorter because a considerable part of it have
consumed less calories than necessary for normal growth.
FAO has also acknowledged that people in poverty often live far from ‘sedentary lifestyles’,
meaning that their bodies require much more calories than the threshold for undernourishment
assume they do (Hickel 2016, 759). By exclusively focusing on caloric intake, moreover, FAO ignores
people’s need for vitamins and nutrients (Hickel 2016, 760). Lastly, and perhaps most significantly,
the FAO definition of undernourishment only counts people who are undernourished for an entire
year, thereby omitting all the people to whom hunger is a seasonal phenomenon (ibid., 760). In
conclusion, we should think of this indicator as prevalence of extreme, chronic lack of calories.
5.7. Endogeneity Problems
Reversed causality and Ignorability of treatment. Reversed causality, in this case, would mean
that it is in fact changes in poverty that cause countries to implement PRSPs (which may cause more
poverty, thus creating a causal loop). Because of the temporal dimension of the analysis, which allows
us to investigate the effect of treatment over time, we can write off the idea that the regression
estimates completely misrepresent the direction of the hypothetical relationship.
School of Global Studies University of Gothenburg Markus Bohlers
41
However, the issue of reversed causality still creeps in with regards to the ignorability-of-treatment
assumption: Unlike experimental studies where researchers have full control over who gets treated,
observational studies such as this cannot randomize treatment assignment. To put it differently, there
are reasons for why a country implemented PRSPs—why it was ‘treated’—and those reasons depend
on the specific characteristics of that country. Indeed, dealing with a lot of poverty, in different forms,
probably made adopting a PRSP more likely.
I have tried to compensate for the non-random nature of my sample composition partly by
limiting the sample to non-fragile low-income and lower middle-income countries and by applying
country-fixed effects, which ‘trick’ the models that there are no time-invariant or base-year level
differences across countries32. However, fixed effects cannot control for factors that varies across both
time and countries in the chosen period. For that, we need unique control variables:
Omitted variable bias and Post-treatment bias. The challenge with control variables is to
determine which factors are the most appropriate to control for. To be sure, the forces behind social
and economic change are complex and trying to identify them invites a whole host of potential
variables worthy of consideration. In fact, the omission of a variable that influences both the
explanatory variable and the outcome variables—that is, a confounding variable—will violate the
assumption that the error term in the models has a conditional mean of zero, thus creating a bias in
the results (Wooldridge 2013, 25-26).
Given that the main regressor is a dummy variable which does not reveal any other
information about the PRSP or its implementation, we should indeed be careful when attributing
estimated changes in the outcome variables solely to the presence of a strategy paper. Estimating the
main effect when treatment is measured over a more limited time period and comparing the result to
the base case model will hopefully allow us to write off some of this potential bias. However, even if
we assume that PRSPs dictated national economic policy during and after the years of official
implementation, many countries were surely also host to other important socioeconomic projects
whose effect we will not be able to control for.
As previously mentioned, moreover, year-fixed effects cannot control for how each country
was uniquely affected by external economic shocks or changes. Therefore, adding a control variable
for GDP per capita, the most conventional estimate of economic development, would be advisable.
32 I will also be excluding outlier countries in some models, which is elaborated upon in the next chapter.
School of Global Studies University of Gothenburg Markus Bohlers
42
However, since PRSPs were in part aimed at stimulating GDP growth, we run the risk of post-treatment
bias. To clarify, if I were to conduct a regression test in which the addition of GDP per capita as a
control variable weakened the estimated main effect, we may have actually just controlled away the
effect that PRSP implementation had on stimulating GDP growth.
5.8. Moderator Variable and Control Variables
Moderator variable. To escape above-mentioned predicament without leaving out GDP per capita
from the analysis, I decided to add it as a moderator variable and estimate its interaction with PRSP
implementation on the outcome variables instead. (In the tables, this interaction is referred to as the
interaction term). Specifically, we investigate if successful PRSP implementation was conditioned on
increased GDP per capita. The variable is measured on a ratio scale in thousands of international
dollars.
Control variables. I will also include two control variables which are not as likely to cause problems
with post-treatment bias, aid received and political stability33: First of all, since PRSP brought with it the
prospect of greater bilateral aid donations, it is possible that what looks like successful poverty
reduction as a result of PRSP implementation is actually caused by a largely unrelated increase in funds.
Controlling for aid might therefore mean that we are controlling for the effect of treatment, but a bi-
effect, not the implementation itself.
Of course, some countries have also participated in development arrangements such as Aid for
Trade, and aid flows have also been affected by other factors external to the development of poor
countries, such as the global recession. Therefore, I would argue that there are ample reasons for
holding constant the amount of aid received by each country per year. This control variable is
operationalized as Net official development assistance and official aid received (World Bank 2019f), which is
measured on an interval scale in hundreds of millions of US dollars.
Political stability, meanwhile, is measured with the same indicator that was used to exclude the
most fragile countries: The Worldwide Governance Indicator for Political stability and the absence of
violence/terrorism (which ranges between approximately -2.5 and 2.5). Remember, only those countries
that were very fragile for three quarters of the 17-year period were excluded. This means that the
remaining dataset still allows for sizable changes in stability, and those changes may very well influence
33 I also considered controlling for changes in a country’s external debt but decided not to because of the risk of post-treatment bias.
School of Global Studies University of Gothenburg Markus Bohlers
43
the main effect. Now, it should be noted that, while the risk of post-treatment bias is likely higher with
other WGI-indicators, such as Government Effectiveness and Regulatory Quality, we still need to be
cognizant of the possibility that changing levels of political violence and terrorism may be a
consequence of implementation. For instance, certain reforms come with real political risks, as
epitomized by the recent history of so-called ‘IMF-riots’.
Internal validity of moderator and control variables. Once again, we cannot expect these
indicators to perfectly capture the phenomena they claim to capture. Indeed, it has been recognized
that GDP estimates for poorer countries are sometimes considerably overestimated, and sometimes
considerably underestimated34 (Jerven 2013; 2014). The most extreme case in recent years was in 2010
when Ghana decided to update its measurement of GDP to the 1993 UN System of National Accounts
and found that it was approximately 60 percent higher than previously thought (ibid.).
The WGIs have also been subject to considerable criticism: For one, critics have highlighted
that the datasets underpinning each of the six dimensions of governance often differ between
countries and years (see Kwon & Kim 2014, 359-360). It has also been argued that the underlying data
is misleading, and that the different dimensions are poorly defined and rests on questionable
assumptions about the nature of governance (Thomas 2009). Moreover, since the WGIs only capture
‘perceptions’ of, in this case, ‘the likelihood of instability’, they might be internally valid without
actually measuring changes in instability (ibid., 36). On the other hand, aggregate perceptions are no
doubt influenced by the ‘real world’ experience of instability. In any case, very few indicators for
stability cover so many of the relevant countries and years as Political stability and the absence of
violence/terrorism.
6. RESULTS AND ANALYSIS
Below, the results of my regression tests are analyzed. The results are reported in five different tables
and every table includes several models, which are categorized based on the outcome variables used.
We begin with the additive models, which in Table 1 (page 45) are reported both without country-
fixed effects, as a pooled OLS regression, and with country-fixed effects. In Table 2 (page 46), the
year-fixed effects are added, followed by the two control variables. The full interaction models are
then reported in Table 3 (page 48).
34 In fact, this has been linked to the defunding of national statistical offices under structural adjustment (Jerven 2013).
School of Global Studies University of Gothenburg Markus Bohlers
44
The residual analysis is illustrated with histograms (Graph 1) and scatterplots (Graph 2) of the full
additive models (pages 49-53). Finally, the robust additive models are reported in Table 4 (page 56),
followed by the robust interaction models in Table 5 (page 58).
6.1. Additive Models
According the R-squared in Table 1, the estimates from the pooled OLS regression fit the data very
poorly, explaining only 4-11 percent of the variance in the indicators. When it comes to the fixed
effects (FE) models, however, the explanatory power increases drastically: Between 80 and 98 percent
of the variance can be explained when both fixed effects are added, according to the Adjusted R-
Squared (see Table 2). Considering that the FE models control for both time-invariant factors and
time-variant factors that are equal to all countries, it makes sense that the observations are well-fitted.
However, because of the extra outcome variables added with the fixed effects, and the decreasing
degrees of freedom it produces, the models are most likely suffering from over-fitting. In other words,
the explanatory power of the models reported by the R-squared measures are most likely inflated and
therefore misleading.
In any case, our main concern is not the power of the models as a whole, but rather the
estimated population effects of PRSP implementation on the five outcome variables in those models.
As such, the piece of information that we are primarily interested in are the coefficients for PRSP+all
years. In both the pooled OLS models and the fixed-effects models, the main effects are statistically
significant at the chosen 0.05 significance level, and even at the 0.01 level. This suggests that the null
hypothesis can be rejected: We can be at least 99 percent certain that implementing PRSPs is associated
with changes in the poverty-related indicators.
In the pooled OLS regression, the signs of the coefficient slopes are all positive. Substantively
though, this suggest a negative effect of PRSP implementation for poor countries; that it leads to
increased (monetary) poverty, undernourishment, maternal mortality and lack of access to basic
drinking water services. Moreover, the negative effect is quite large: Poverty is estimated to have
increased from implementation by approximately 8 or 13 percent, depending on if the national or
international poverty lines are used. Undernourishment increased with 5 percent, while usage of basic
drinking water services decreased with 11 percent. Maternal mortality increased with approximately
168 pregnancy-related deaths per 100,000 live births, which is very high if we consider that in the
absence of treatment maternal mortality is approximately 195 deaths.
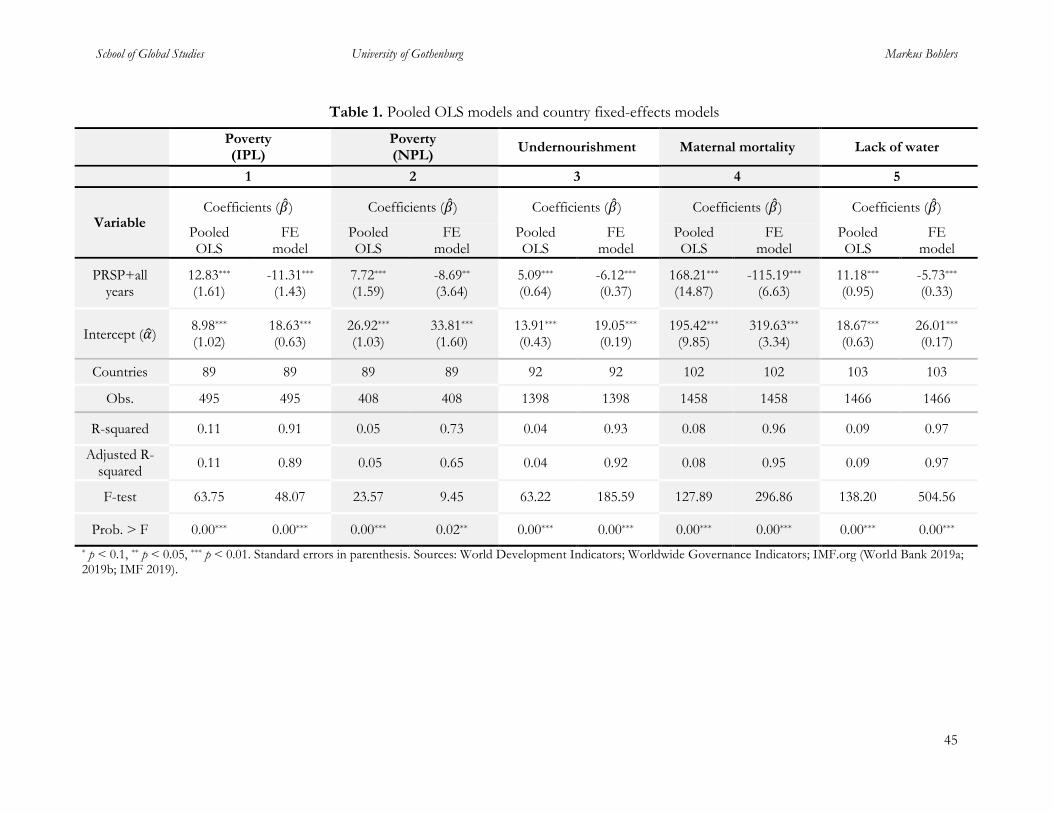
School of Global Studies University of Gothenburg Markus Bohlers
45
Table 1. Pooled OLS models and country fixed-effects models
Poverty (IPL)
Poverty (NPL)
Undernourishment Maternal mortality Lack of water
1 2 3 4 5
Variable Coefficients (�̂�) Coefficients (�̂�) Coefficients (�̂�) Coefficients (�̂�) Coefficients (�̂�)
Pooled OLS
FE model
Pooled OLS
FE model
Pooled OLS
FE model
Pooled OLS
FE model
Pooled OLS
FE model
PRSP+all years
12.83*** (1.61)
-11.31*** (1.43)
7.72*** (1.59)
-8.69** (3.64)
5.09*** (0.64)
-6.12*** (0.37)
168.21*** (14.87)
-115.19*** (6.63)
11.18*** (0.95)
-5.73*** (0.33)
Intercept (�̂�) 8.98*** (1.02)
18.63*** (0.63)
26.92*** (1.03)
33.81*** (1.60)
13.91*** (0.43)
19.05*** (0.19)
195.42*** (9.85)
319.63*** (3.34)
18.67*** (0.63)
26.01*** (0.17)
Countries 89 89 89 89 92 92 102 102 103 103
Obs. 495 495 408 408 1398 1398 1458 1458 1466 1466
R-squared 0.11 0.91 0.05 0.73 0.04 0.93 0.08 0.96 0.09 0.97
Adjusted R-squared
0.11 0.89 0.05 0.65 0.04 0.92 0.08 0.95 0.09 0.97
F-test 63.75 48.07 23.57 9.45 63.22 185.59 127.89 296.86 138.20 504.56
Prob. > F 0.00*** 0.00*** 0.00*** 0.02** 0.00*** 0.00*** 0.00*** 0.00*** 0.00*** 0.00***
* p < 0.1, ** p < 0.05, *** p < 0.01. Standard errors in parenthesis. Sources: World Development Indicators; Worldwide Governance Indicators; IMF.org (World Bank 2019a; 2019b; IMF 2019).
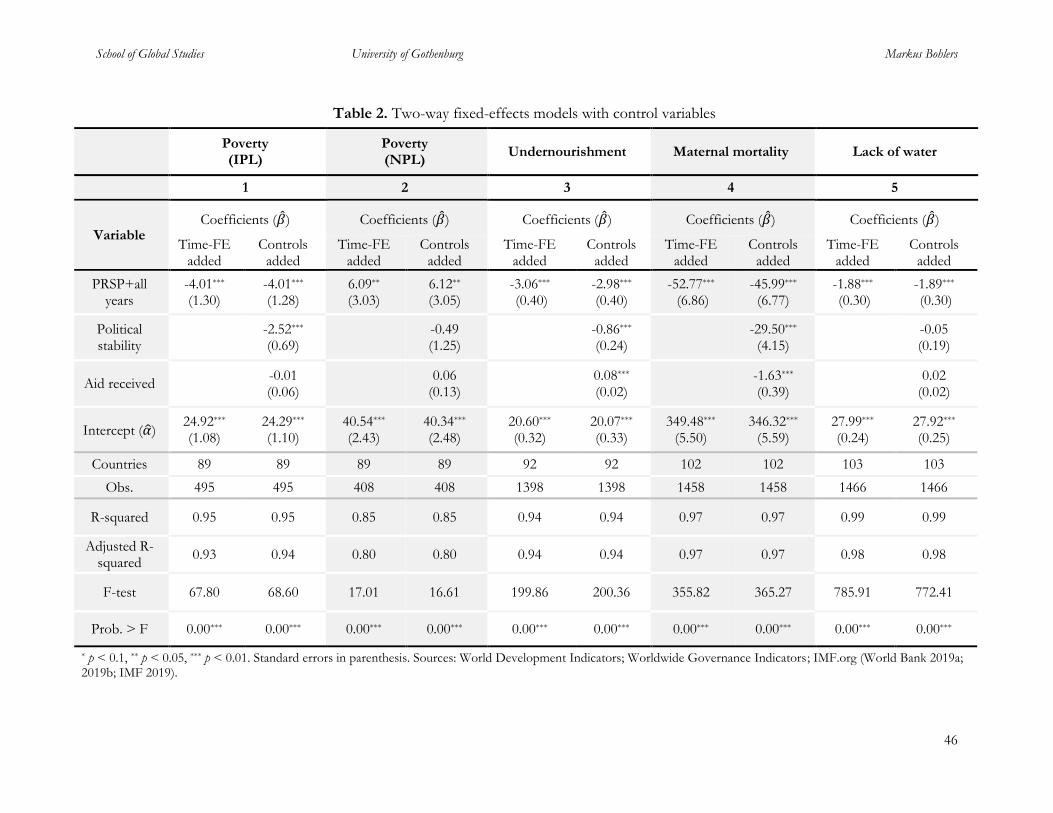
School of Global Studies University of Gothenburg Markus Bohlers
46
Table 2. Two-way fixed-effects models with control variables
Poverty (IPL)
Poverty (NPL)
Undernourishment Maternal mortality Lack of water
1 2 3 4 5
Variable Coefficients (�̂�) Coefficients (�̂�) Coefficients (�̂�) Coefficients (�̂�) Coefficients (�̂�)
Time-FE added
Controls added
Time-FE added
Controls added
Time-FE added
Controls added
Time-FE added
Controls added
Time-FE added
Controls added
PRSP+all years
-4.01*** (1.30)
-4.01*** (1.28)
6.09** (3.03)
6.12** (3.05)
-3.06*** (0.40)
-2.98*** (0.40)
-52.77*** (6.86)
-45.99*** (6.77)
-1.88*** (0.30)
-1.89*** (0.30)
Political stability
-2.52***
(0.69)
-0.49 (1.25)
-0.86*** (0.24)
-29.50***
(4.15)
-0.05 (0.19)
Aid received -0.01 (0.06)
0.06
(0.13)
0.08*** (0.02)
-1.63*** (0.39)
0.02
(0.02)
Intercept (�̂�) 24.92*** (1.08)
24.29*** (1.10)
40.54*** (2.43)
40.34*** (2.48)
20.60*** (0.32)
20.07*** (0.33)
349.48*** (5.50)
346.32*** (5.59)
27.99*** (0.24)
27.92*** (0.25)
Countries 89 89 89 89 92 92 102 102 103 103
Obs. 495 495 408 408 1398 1398 1458 1458 1466 1466
R-squared 0.95 0.95 0.85 0.85 0.94 0.94 0.97 0.97 0.99 0.99
Adjusted R-squared
0.93 0.94 0.80 0.80 0.94 0.94 0.97 0.97 0.98 0.98
F-test 67.80 68.60 17.01 16.61 199.86 200.36 355.82 365.27 785.91 772.41
Prob. > F 0.00*** 0.00*** 0.00*** 0.00*** 0.00*** 0.00*** 0.00*** 0.00*** 0.00*** 0.00***
* p < 0.1, ** p < 0.05, *** p < 0.01. Standard errors in parenthesis. Sources: World Development Indicators; Worldwide Governance Indicators; IMF.org (World Bank 2019a; 2019b; IMF 2019).
School of Global Studies University of Gothenburg Markus Bohlers
47
When country-fixed effects are added to the regression models, the estimated effect remains large
but—interestingly—the signs of the coefficient slopes change direction. In other words, when we
control for time-invariant differences between each country—such as geography, ethnic
fractionalization, and initial levels of development and governance—the models predict that
implementing PRSPs have led to reductions in multidimensional poverty. This lends support to the
alternative hypothesis.
As shown in Table 2, introducing year-fixed effects to the models considerable diminishes
the main effect. That is to say, when we control for changes over time that affected countries equally,
PRSP implementation emerges as less successful. The effect on the outcome variables is still negative,
however, with the surprising exception of NPL-based poverty, which is positive. Even more
surprising, the estimates remain virtually unaffected when changes in political stability and aid received
during the time period are controlled for.
According to the full additive models, then, maternal mortality is estimated to have decreased
from PRSP implementation with 46 pregnancy-related deaths (per 100,000 live births); lack of basic
drinking water, undernourishment and IPL-based poverty decreased with approximately 2, 3 and 4
percent respectively, while NPL-based poverty increased with more than 6 percent. Clearly, the latter
estimate is inconsistent with the rest of the model, but it is important to recall that most of the
observations for NPL-based poverty are missing in the data set, making its predicted relationship with
PRSP implementation particularly questionable. Putting this aside, it is worth noting that not only do
the models lend support to the alternative hypothesis, but the estimates are more or less on par with
the findings of Elkins et al. (2008).
6.2. Interaction Models
We now arrive at the interaction models, shown in Table 3 below. Here, the complimentary conditional
hypothesis is tested, and, as such, the most important piece of information is the coefficient of the
interaction term (GDP per capita x PRSP+all years). It estimates the effect on the outcome variables
when PRSP implementation and the moderator variable (GDP per capita) vary together.
This estimated interaction effect is only statistically significant on maternal mortality and lack of
basic drinking water. Since GDP per capita is measured in thousands of (international) dollars, the
interaction effect on these variables should be interpreted in the following way: For every thousand
dollars added in GDP per capita in countries implementing PRSPs, the proportion of people which
were not using at least basic drinking water services decreased by 0,16%. Meanwhile, the number of
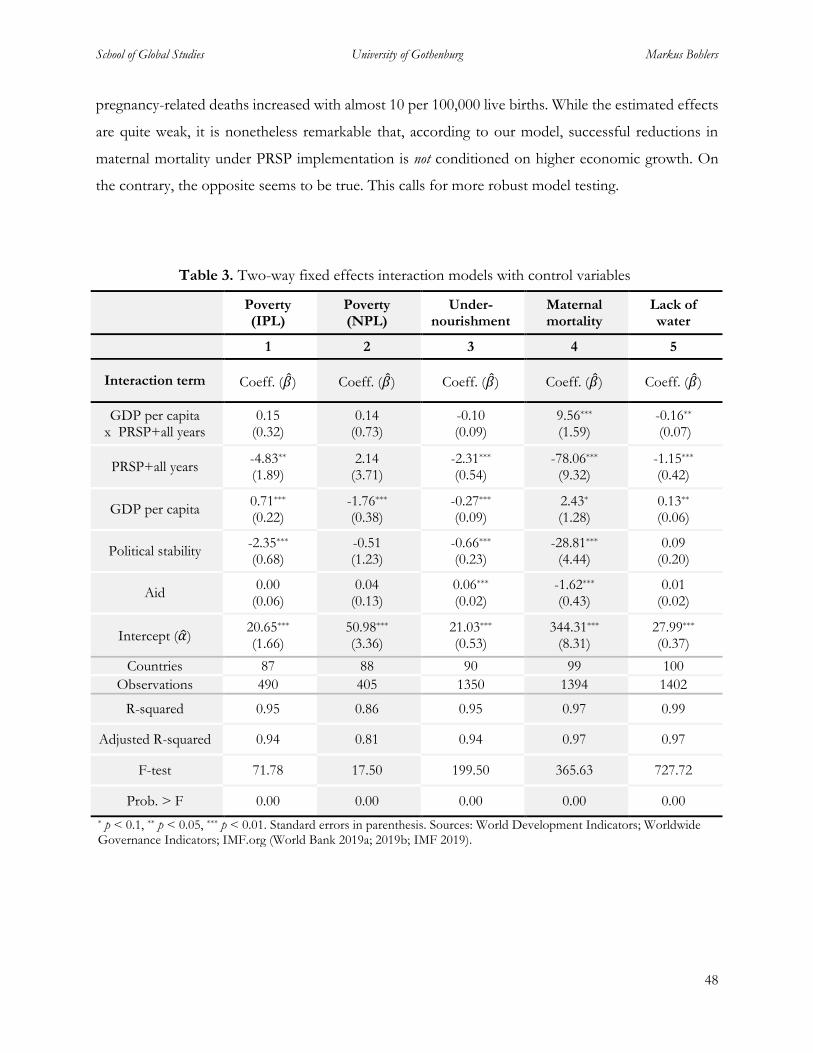
School of Global Studies University of Gothenburg Markus Bohlers
48
pregnancy-related deaths increased with almost 10 per 100,000 live births. While the estimated effects
are quite weak, it is nonetheless remarkable that, according to our model, successful reductions in
maternal mortality under PRSP implementation is not conditioned on higher economic growth. On
the contrary, the opposite seems to be true. This calls for more robust model testing.
Table 3. Two-way fixed effects interaction models with control variables
Poverty (IPL)
Poverty (NPL)
Under-nourishment
Maternal mortality
Lack of water
1 2 3 4 5
Interaction term Coeff. (�̂�) Coeff. (�̂�) Coeff. (�̂�) Coeff. (�̂�) Coeff. (�̂�)
GDP per capita x PRSP+all years
0.15 (0.32)
0.14 (0.73)
-0.10 (0.09)
9.56*** (1.59)
-0.16** (0.07)
PRSP+all years -4.83** (1.89)
2.14 (3.71)
-2.31*** (0.54)
-78.06*** (9.32)
-1.15*** (0.42)
GDP per capita 0.71*** (0.22)
-1.76*** (0.38)
-0.27*** (0.09)
2.43* (1.28)
0.13** (0.06)
Political stability -2.35*** (0.68)
-0.51 (1.23)
-0.66*** (0.23)
-28.81*** (4.44)
0.09 (0.20)
Aid 0.00
(0.06) 0.04
(0.13) 0.06*** (0.02)
-1.62*** (0.43)
0.01 (0.02)
Intercept (�̂�) 20.65*** (1.66)
50.98*** (3.36)
21.03*** (0.53)
344.31*** (8.31)
27.99*** (0.37)
Countries 87 88 90 99 100
Observations 490 405 1350 1394 1402
R-squared 0.95 0.86 0.95 0.97 0.99
Adjusted R-squared 0.94 0.81 0.94 0.97 0.97
F-test 71.78 17.50 199.50 365.63 727.72
Prob. > F 0.00 0.00 0.00 0.00 0.00
* p < 0.1, ** p < 0.05, *** p < 0.01. Standard errors in parenthesis. Sources: World Development Indicators; Worldwide Governance Indicators; IMF.org (World Bank 2019a; 2019b; IMF 2019).
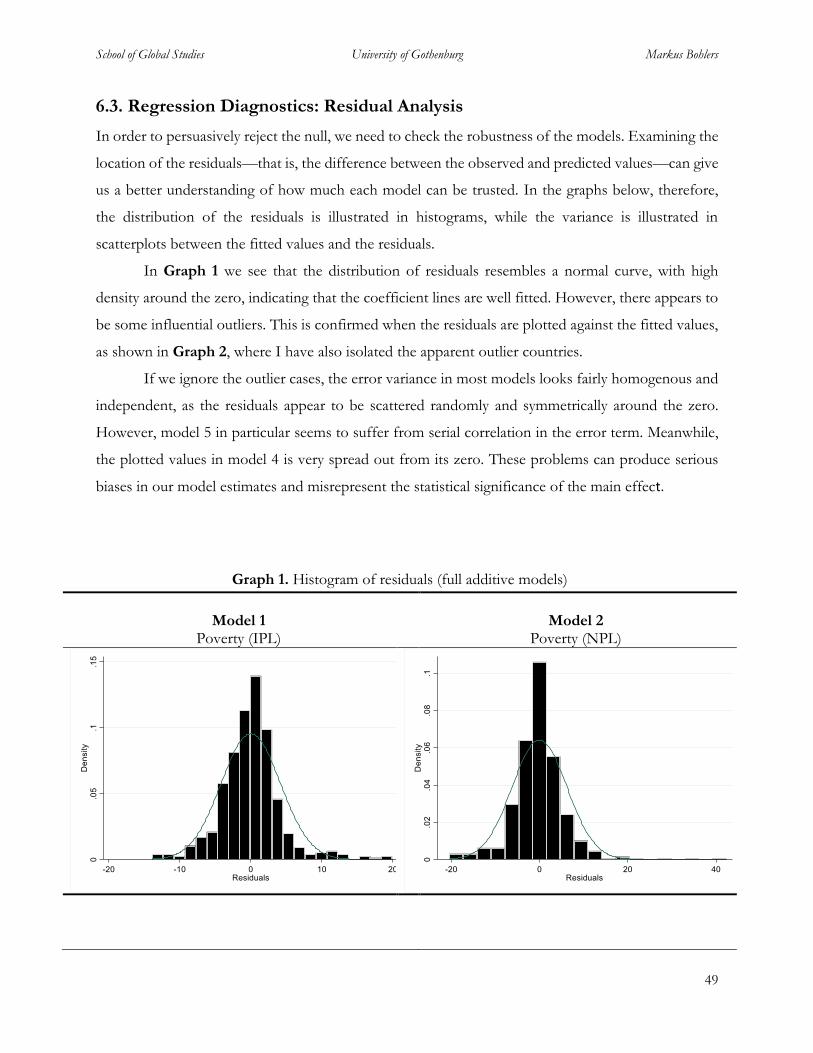
School of Global Studies University of Gothenburg Markus Bohlers
49
6.3. Regression Diagnostics: Residual Analysis
In order to persuasively reject the null, we need to check the robustness of the models. Examining the
location of the residuals—that is, the difference between the observed and predicted values—can give
us a better understanding of how much each model can be trusted. In the graphs below, therefore,
the distribution of the residuals is illustrated in histograms, while the variance is illustrated in
scatterplots between the fitted values and the residuals.
In Graph 1 we see that the distribution of residuals resembles a normal curve, with high
density around the zero, indicating that the coefficient lines are well fitted. However, there appears to
be some influential outliers. This is confirmed when the residuals are plotted against the fitted values,
as shown in Graph 2, where I have also isolated the apparent outlier countries.
If we ignore the outlier cases, the error variance in most models looks fairly homogenous and
independent, as the residuals appear to be scattered randomly and symmetrically around the zero.
However, model 5 in particular seems to suffer from serial correlation in the error term. Meanwhile,
the plotted values in model 4 is very spread out from its zero. These problems can produce serious
biases in our model estimates and misrepresent the statistical significance of the main effect.
Graph 1. Histogram of residuals (full additive models)
Model 1
Poverty (IPL)
Model 2
Poverty (NPL)
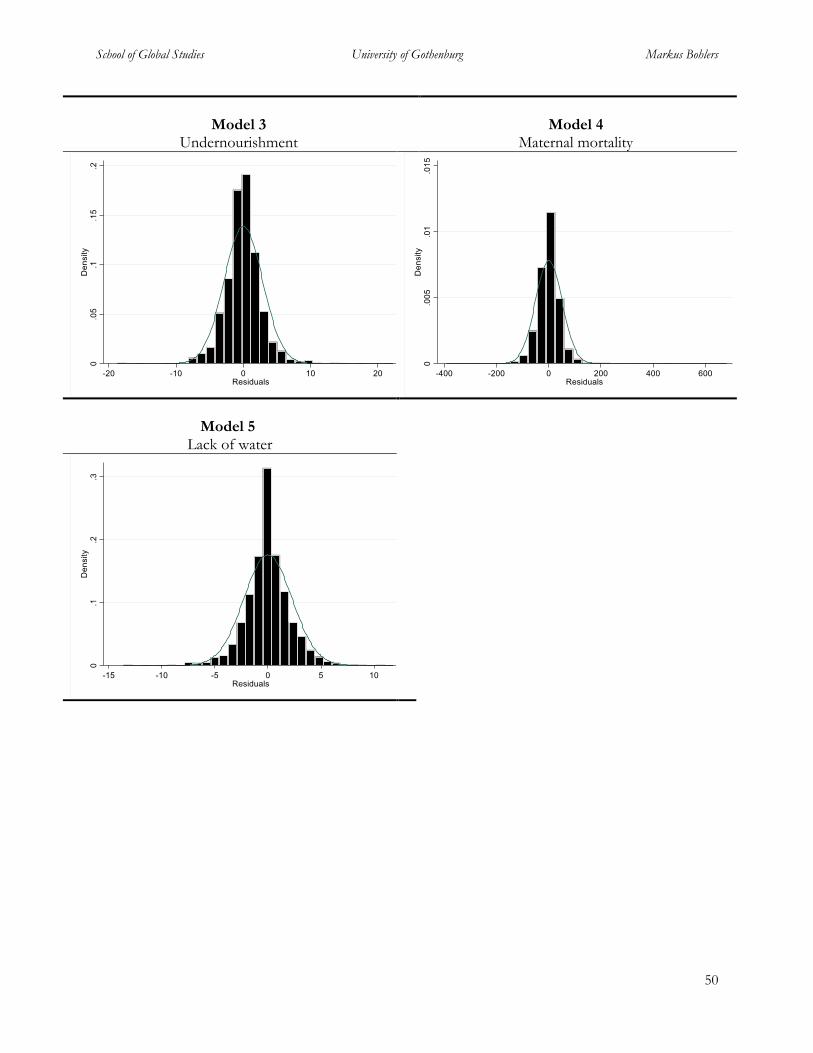
School of Global Studies University of Gothenburg Markus Bohlers
50
Model 3
Undernourishment
Model 4
Maternal mortality
Model 5 Lack of water
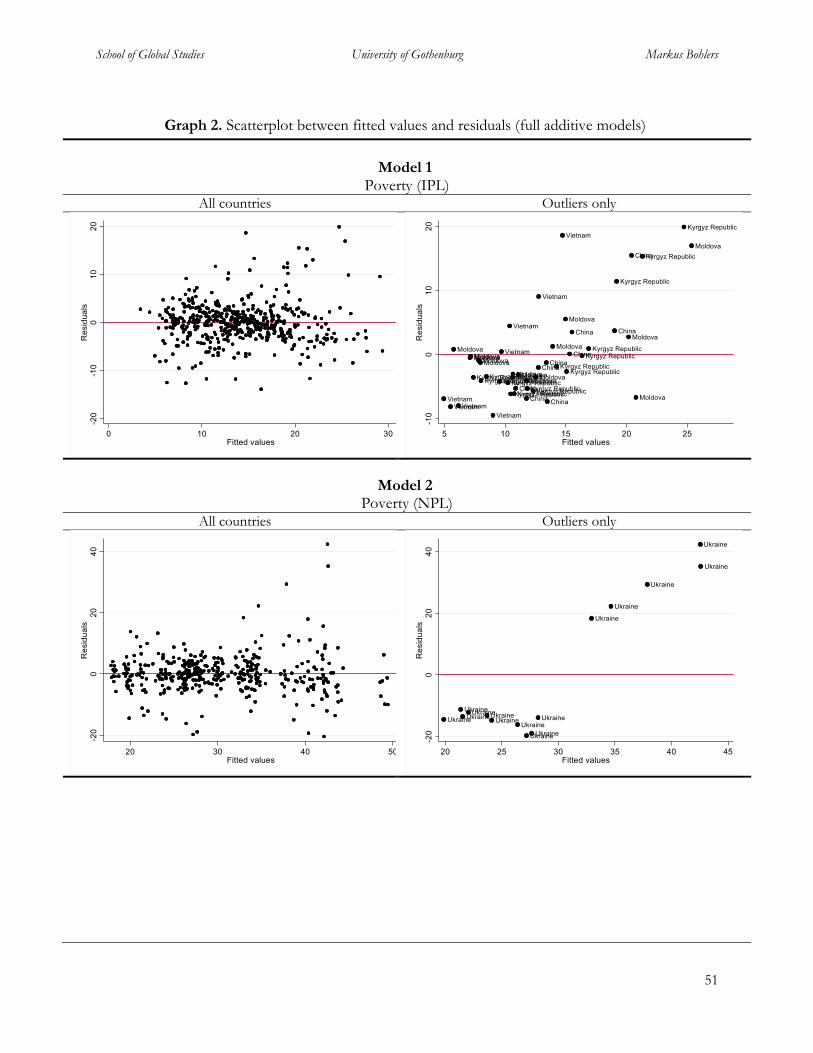
School of Global Studies University of Gothenburg Markus Bohlers
51
Graph 2. Scatterplot between fitted values and residuals (full additive models)
Model 1
Poverty (IPL) All countries Outliers only
Model 2 Poverty (NPL)
All countries Outliers only
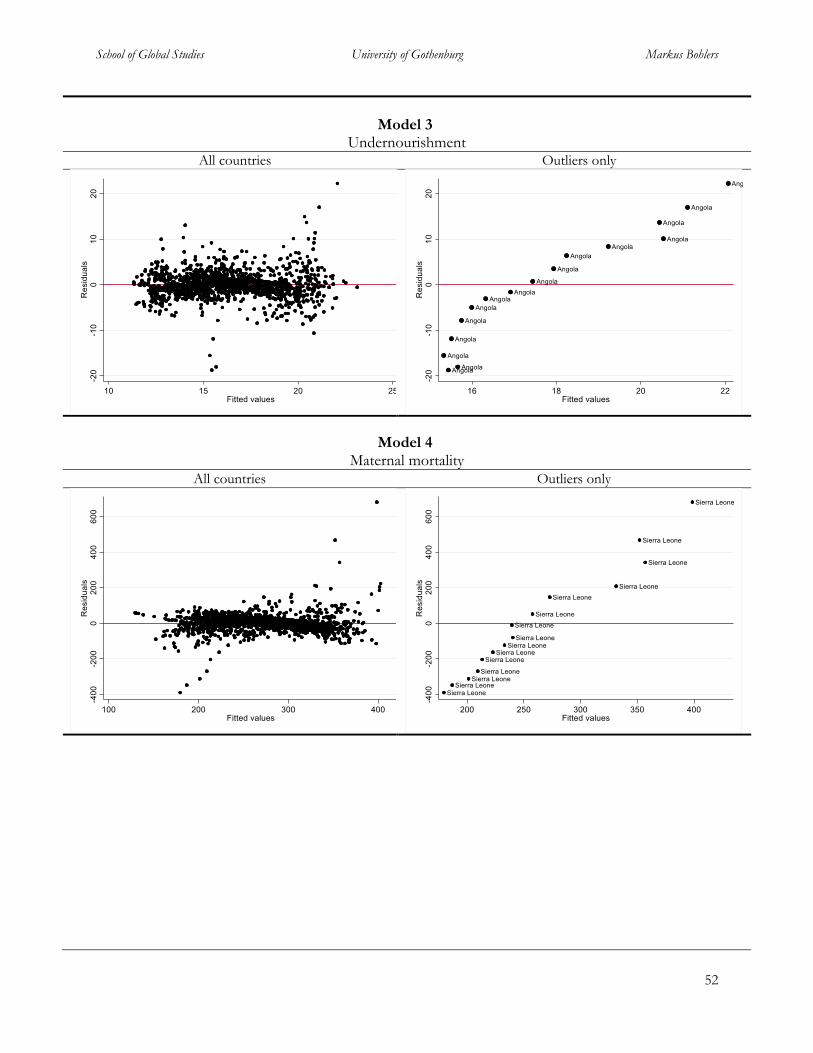
School of Global Studies University of Gothenburg Markus Bohlers
52
Model 3
Undernourishment All countries Outliers only
Model 4 Maternal mortality
All countries Outliers only
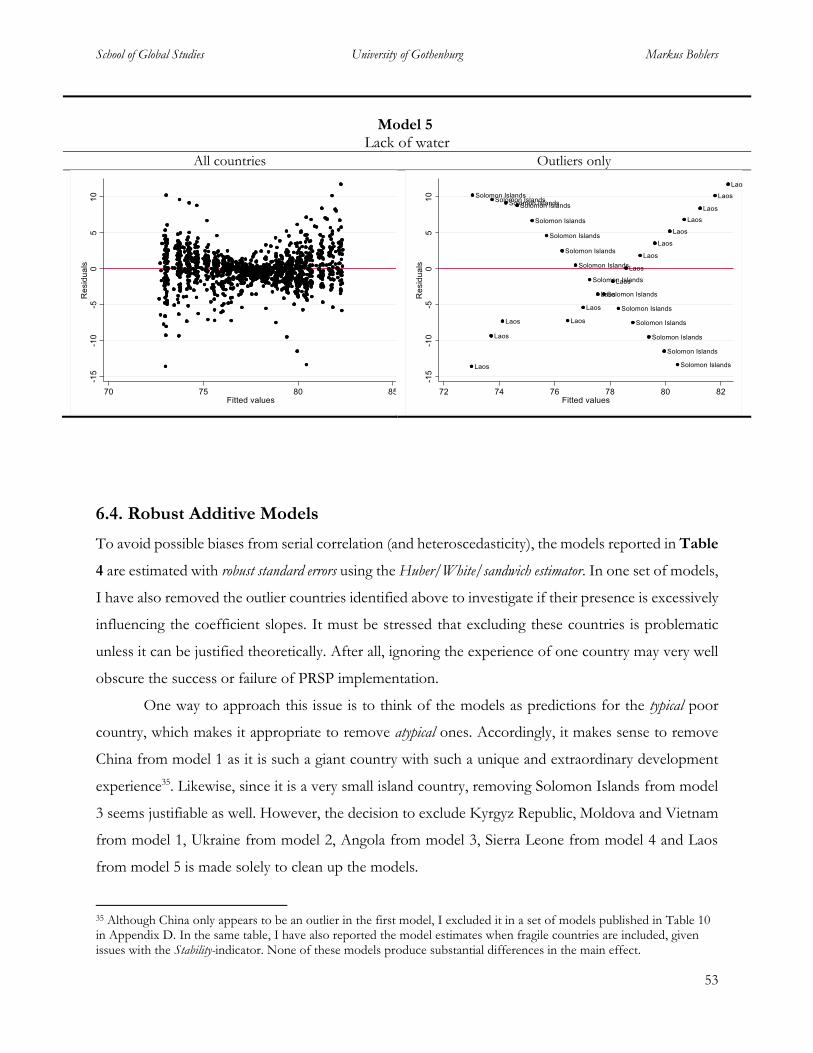
School of Global Studies University of Gothenburg Markus Bohlers
53
Model 5
Lack of water
All countries Outliers only
6.4. Robust Additive Models
To avoid possible biases from serial correlation (and heteroscedasticity), the models reported in Table
4 are estimated with robust standard errors using the Huber/White/sandwich estimator. In one set of models,
I have also removed the outlier countries identified above to investigate if their presence is excessively
influencing the coefficient slopes. It must be stressed that excluding these countries is problematic
unless it can be justified theoretically. After all, ignoring the experience of one country may very well
obscure the success or failure of PRSP implementation.
One way to approach this issue is to think of the models as predictions for the typical poor
country, which makes it appropriate to remove atypical ones. Accordingly, it makes sense to remove
China from model 1 as it is such a giant country with such a unique and extraordinary development
experience35. Likewise, since it is a very small island country, removing Solomon Islands from model
3 seems justifiable as well. However, the decision to exclude Kyrgyz Republic, Moldova and Vietnam
from model 1, Ukraine from model 2, Angola from model 3, Sierra Leone from model 4 and Laos
from model 5 is made solely to clean up the models.
35 Although China only appears to be an outlier in the first model, I excluded it in a set of models published in Table 10 in Appendix D. In the same table, I have also reported the model estimates when fragile countries are included, given issues with the Stability-indicator. None of these models produce substantial differences in the main effect.
School of Global Studies University of Gothenburg Markus Bohlers
54
As discussed in the previous chapter, the next table also includes models where treatment is measured
only during the official implementation period, as well as three years post-implementation. In addition,
we consider the effects of treatment when measured with a three-year time lag. Finally, in a last set of
models, the outcome variables have been transformed using the natural logarithm. This
transformation compresses the data and normalizes its distribution, thereby improving the model fit.
I should note, however, that taking the log from variables that are already measured in percentage is
suboptimal as it put serious strains on the interpretation. What we are primarily interested in, therefore,
is if the sign of the coefficients and their significance level survives the transformation.
When we estimate the full additive models using robust standard errors, the effect of PRSP
implementation on the two poverty variables loses their statistical significance: We are now less than
95 percent certain that there is a non-zero correlation between implementation and poverty in the
population, that is, in all non-fragile poor countries.
When treatment is limited to the official implementation period plus three years, the effect
diminishes considerably in all models, and only the effect on maternal mortality remains statistically
significant. Specifically, this model predicts that implementing PRSPs had the effect of decreasing
maternal mortality with 21 pregnancy-related deaths per 100,000 live births. When no years are added
to the official implementation period, the estimated effect in the models diminishes even more, and
even changes direction on NPL-based poverty and lack of basic drinking water. However, none of
these estimates are statistically significant.
Lagging PRSP+all years with three years yields very similar results to the base case model. A
notable difference is that the added time lag produces a stronger and statistically significant effect on
IPL-based poverty: The model now predicts that implementing PRSPs decreased the proportion of
people living under the IPL with almost 5 percent. Lagging PRSP+3 years with three years somewhat
enlarges the estimated effect of implementation as compared to PRSP+3 years without time lag, and
the coefficients are statistically significant on undernourishment, maternal mortality and lack of basic
drinking water. This suggests that the positive effects of PRSP implementation may be shown only
after a few years.
The estimated effect on undernourishment, maternal mortality and lack of basic drinking water
remains statically significant when outlier countries are excluded: The effect on undernourishment is
slightly larger than in the base case model, while the effect on lack of water and, especially, maternal
mortality diminishes. These changes, however, do not meaningfully impact the substantive
School of Global Studies University of Gothenburg Markus Bohlers
55
significance of the estimated effect. Excluding outliers when PRSP+3 years is replaced as the main
regressor does not yield any statistically significant results.
Lastly, we arrive at the set of models where the outcome variables have been log-transformed.
Notably, the effect on maternal mortality now changes direction, suggesting that PRSP
implementation lead to increases in pregnancy-related deaths. However, the estimate is not statistically
significant. The only significant results in these models are the estimated effects on NPL-based poverty
and undernourishment, and only when PRSP+all years is employed as the regressor. Despite
limitations to the interpretation, it appears that implementing PRSPs decreased undernourishment
while increasing poverty according to national thresholds. I will return to this apparent inconsistency
in the summary.
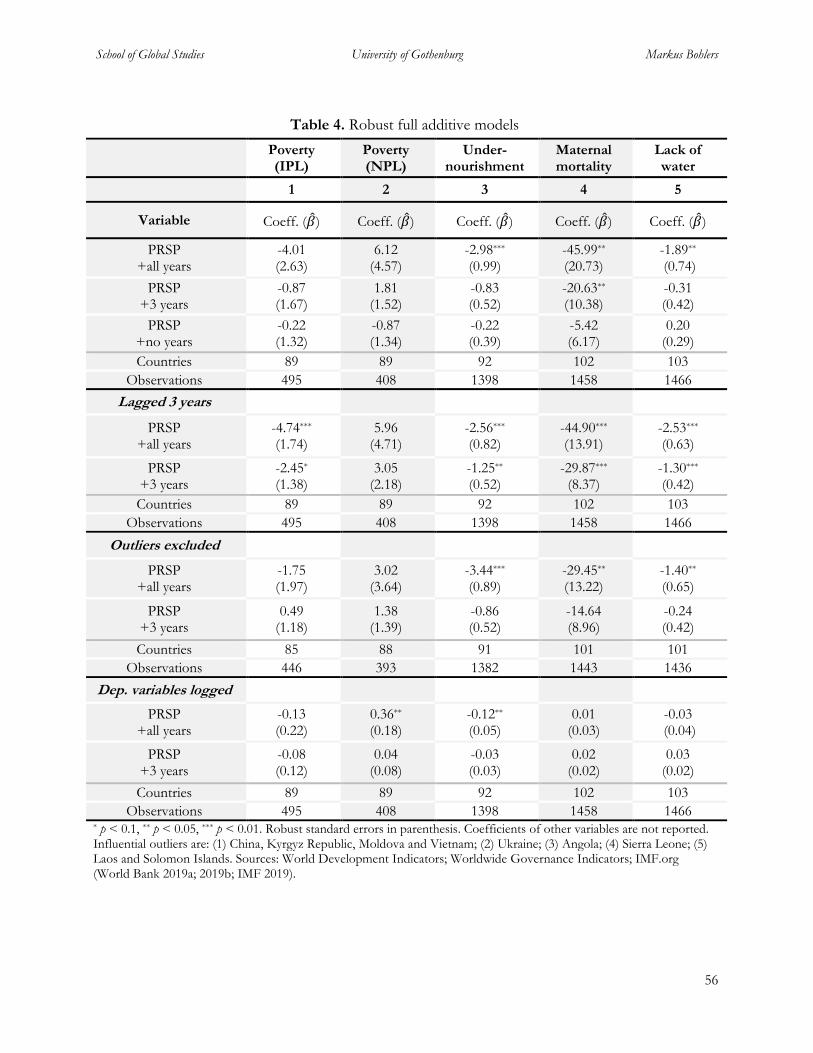
School of Global Studies University of Gothenburg Markus Bohlers
56
Table 4. Robust full additive models
Poverty (IPL)
Poverty (NPL)
Under-nourishment
Maternal mortality
Lack of water
1 2 3 4 5
Variable Coeff. (�̂�) Coeff. (�̂�) Coeff. (�̂�) Coeff. (�̂�) Coeff. (�̂�)
PRSP +all years
-4.01 (2.63)
6.12 (4.57)
-2.98*** (0.99)
-45.99** (20.73)
-1.89** (0.74)
PRSP +3 years
-0.87 (1.67)
1.81 (1.52)
-0.83 (0.52)
-20.63** (10.38)
-0.31 (0.42)
PRSP +no years
-0.22 (1.32)
-0.87 (1.34)
-0.22 (0.39)
-5.42 (6.17)
0.20 (0.29)
Countries 89 89 92 102 103
Observations 495 408 1398 1458 1466
Lagged 3 years
PRSP +all years
-4.74***
(1.74) 5.96
(4.71) -2.56*** (0.82)
-44.90*** (13.91)
-2.53*** (0.63)
PRSP +3 years
-2.45*
(1.38) 3.05
(2.18) -1.25** (0.52)
-29.87***
(8.37) -1.30***
(0.42)
Countries 89 89 92 102 103
Observations 495 408 1398 1458 1466
Outliers excluded
PRSP +all years
-1.75 (1.97)
3.02
(3.64) -3.44***
(0.89) -29.45** (13.22)
-1.40** (0.65)
PRSP +3 years
0.49 (1.18)
1.38
(1.39) -0.86
(0.52) -14.64 (8.96)
-0.24 (0.42)
Countries 85 88 91 101 101
Observations 446 393 1382 1443 1436
Dep. variables logged
PRSP +all years
-0.13 (0.22)
0.36** (0.18)
-0.12** (0.05)
0.01 (0.03)
-0.03 (0.04)
PRSP +3 years
-0.08 (0.12)
0.04 (0.08)
-0.03 (0.03)
0.02 (0.02)
0.03 (0.02)
Countries 89 89 92 102 103
Observations 495 408 1398 1458 1466 * p < 0.1, ** p < 0.05, *** p < 0.01. Robust standard errors in parenthesis. Coefficients of other variables are not reported. Influential outliers are: (1) China, Kyrgyz Republic, Moldova and Vietnam; (2) Ukraine; (3) Angola; (4) Sierra Leone; (5) Laos and Solomon Islands. Sources: World Development Indicators; Worldwide Governance Indicators; IMF.org (World Bank 2019a; 2019b; IMF 2019).
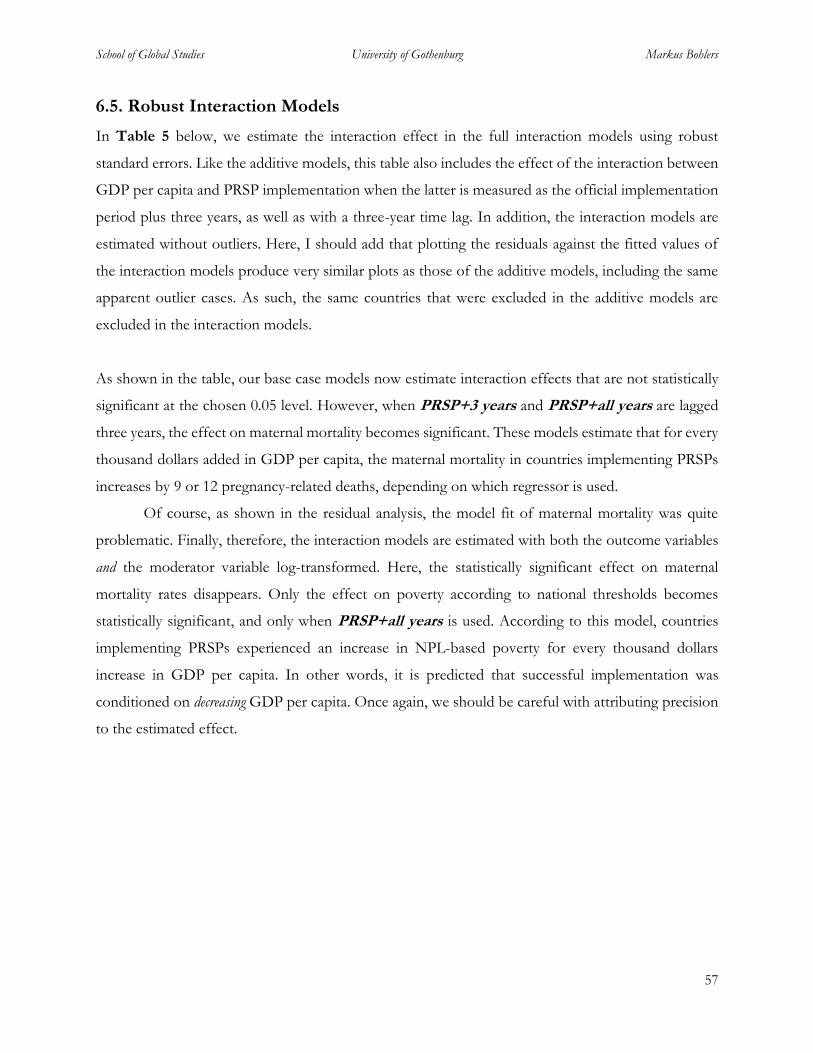
School of Global Studies University of Gothenburg Markus Bohlers
57
6.5. Robust Interaction Models
In Table 5 below, we estimate the interaction effect in the full interaction models using robust
standard errors. Like the additive models, this table also includes the effect of the interaction between
GDP per capita and PRSP implementation when the latter is measured as the official implementation
period plus three years, as well as with a three-year time lag. In addition, the interaction models are
estimated without outliers. Here, I should add that plotting the residuals against the fitted values of
the interaction models produce very similar plots as those of the additive models, including the same
apparent outlier cases. As such, the same countries that were excluded in the additive models are
excluded in the interaction models.
As shown in the table, our base case models now estimate interaction effects that are not statistically
significant at the chosen 0.05 level. However, when PRSP+3 years and PRSP+all years are lagged
three years, the effect on maternal mortality becomes significant. These models estimate that for every
thousand dollars added in GDP per capita, the maternal mortality in countries implementing PRSPs
increases by 9 or 12 pregnancy-related deaths, depending on which regressor is used.
Of course, as shown in the residual analysis, the model fit of maternal mortality was quite
problematic. Finally, therefore, the interaction models are estimated with both the outcome variables
and the moderator variable log-transformed. Here, the statistically significant effect on maternal
mortality rates disappears. Only the effect on poverty according to national thresholds becomes
statistically significant, and only when PRSP+all years is used. According to this model, countries
implementing PRSPs experienced an increase in NPL-based poverty for every thousand dollars
increase in GDP per capita. In other words, it is predicted that successful implementation was
conditioned on decreasing GDP per capita. Once again, we should be careful with attributing precision
to the estimated effect.
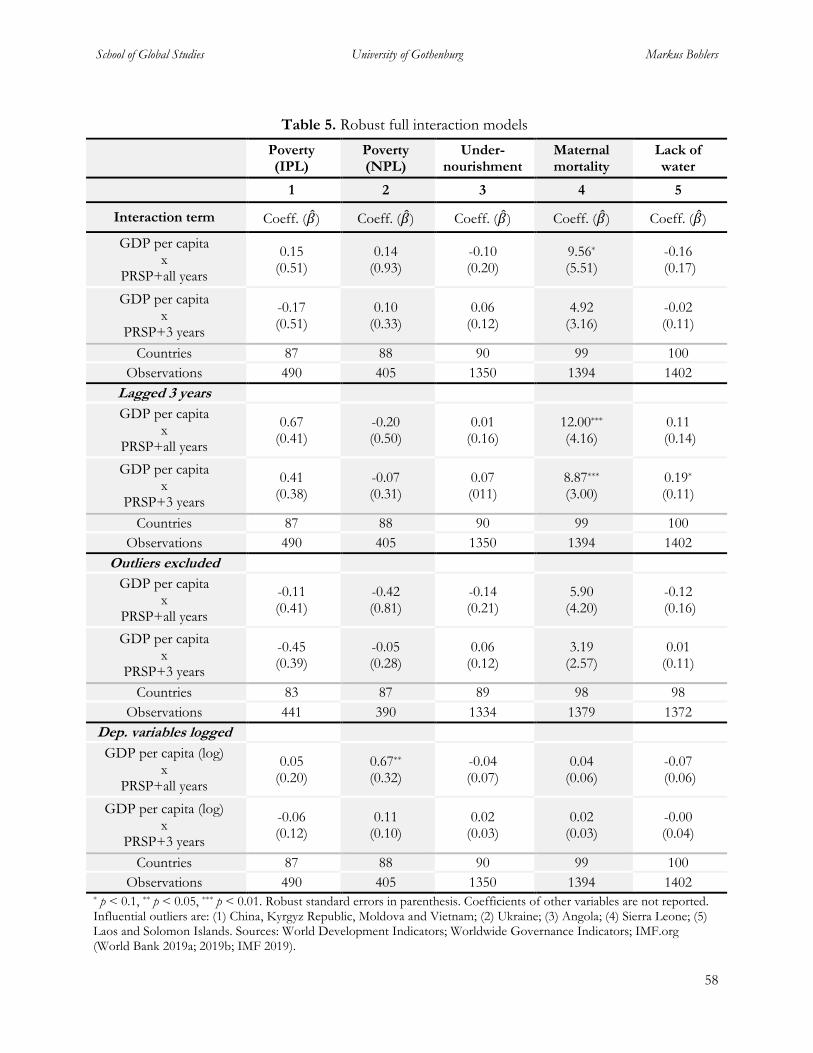
School of Global Studies University of Gothenburg Markus Bohlers
58
Table 5. Robust full interaction models
Poverty (IPL)
Poverty (NPL)
Under-nourishment
Maternal mortality
Lack of water
1 2 3 4 5
Interaction term Coeff. (�̂�) Coeff. (�̂�) Coeff. (�̂�) Coeff. (�̂�) Coeff. (�̂�)
GDP per capita x
PRSP+all years
0.15 (0.51)
0.14 (0.93)
-0.10 (0.20)
9.56* (5.51)
-0.16 (0.17)
GDP per capita x
PRSP+3 years
-0.17 (0.51)
0.10 (0.33)
0.06 (0.12)
4.92 (3.16)
-0.02 (0.11)
Countries 87 88 90 99 100
Observations 490 405 1350 1394 1402
Lagged 3 years
GDP per capita x
PRSP+all years
0.67 (0.41)
-0.20 (0.50)
0.01 (0.16)
12.00*** (4.16)
0.11 (0.14)
GDP per capita x
PRSP+3 years
0.41 (0.38)
-0.07 (0.31)
0.07 (011)
8.87***
(3.00) 0.19* (0.11)
Countries 87 88 90 99 100
Observations 490 405 1350 1394 1402
Outliers excluded
GDP per capita x
PRSP+all years
-0.11 (0.41)
-0.42 (0.81)
-0.14 (0.21)
5.90 (4.20)
-0.12 (0.16)
GDP per capita x
PRSP+3 years
-0.45 (0.39)
-0.05 (0.28)
0.06 (0.12)
3.19
(2.57) 0.01
(0.11)
Countries 83 87 89 98 98
Observations 441 390 1334 1379 1372
Dep. variables logged
GDP per capita (log) x
PRSP+all years
0.05 (0.20)
0.67** (0.32)
-0.04 (0.07)
0.04 (0.06)
-0.07 (0.06)
GDP per capita (log) x
PRSP+3 years
-0.06 (0.12)
0.11 (0.10)
0.02 (0.03)
0.02
(0.03) -0.00 (0.04)
Countries 87 88 90 99 100
Observations 490 405 1350 1394 1402 * p < 0.1, ** p < 0.05, *** p < 0.01. Robust standard errors in parenthesis. Coefficients of other variables are not reported. Influential outliers are: (1) China, Kyrgyz Republic, Moldova and Vietnam; (2) Ukraine; (3) Angola; (4) Sierra Leone; (5) Laos and Solomon Islands. Sources: World Development Indicators; Worldwide Governance Indicators; IMF.org (World Bank 2019a; 2019b; IMF 2019).
School of Global Studies University of Gothenburg Markus Bohlers
59
6.6. Summary
Has implementing PRSPs actually led to reductions in (multidimensional) poverty? Initially, before
any fixed effects were added, it appeared as if the answer was a resounding ‘no’: The additive models
indicated that poverty in its various dimensions increased when poor countries implemented PRSPs.
However, when we controlled for differences across countries, the sign of the coefficient
changed direction in all models, suggesting that PRSP implementation did indeed lead to poverty
reduction, thereby lending support to the alternative hypothesis (H1) at expense of the null (H0). The
relationship weakened when changes in time were controlled for, and in the case of poverty according
to the NPL, the sign was once again positive, suggesting that implementation resulted in a higher
percentage of impoverished people. Surprisingly, holding country-specific changes in political stability
and aid constant in the models made virtually no difference to the main effect.
Initially, the additive models predicted that the main effect was statistically significant, or, in
other words, we could say with more than 95 percent certainty that the relationship would not be zero
if all poor countries were included in the sample. However, plotting the fitted values with the residuals
suggested that at least some of our models suffered from serial correlation. In order to offset this,
robust standard errors were employed. This caused the effect on poverty according to both national
and international thresholds to lose its statistical significance, and it remained insignificant when
countries which appeared to excessively influence the coefficient slope were excluded. The exclusion
of outlier countries yielded no substantively significant changes in the effect on undernourishment,
basic drinking water usage, and maternal mortality.
Lastly, because of the problematic fit of some models, the outcome variables were transformed
using the natural log. Now, only the effect on undernourishment and NPL-based poverty remained
statistically significant, and only when treatment was measured from the beginning of implementation
to the end of the time period (PRSP+all years).
Moving on to the interaction models, successful PRSP implementation initially appeared to have been
somewhat conditioned on higher GDP per capita when it comes to increased usage of basic drinking
water services, thereby lending support to the complimentary hypothesis (H2). However, the sign of
the effect was reversed in the case of maternal mortality. If we were to trust these estimates, then,
fewer mothers died from pregnancy-related deaths when countries were implementing PRSPs and
GDP per capita decreased.
School of Global Studies University of Gothenburg Markus Bohlers
60
When robust standard errors were employed, the interaction effect lost its statistical significance on
all outcome variables (except for maternal mortality when treatment was lagged). Excluding outlier
countries made no difference. Only when log-transformations were performed did the (non-lagged)
models yield an interaction effect which we can be more than 95 percent certain was not zero. The
effect in question was on poverty according to the NPL and its direction was positive.
In conclusion, the statistically significant effect initially observed were not robust to log-
transformations, except for undernourishment and NPL-based poverty. According to these estimates,
PRSP implementation have reduced undernourishment but increased (monetary) poverty in poor
countries. Moreover, this impoverishment appears to have been somewhat conditioned on higher
economic growth.
Intuitively, this does not seem plausible. Here, it is important to recall the discussion in chapter
5 on the internal validity of the sample. Indeed, NPL-based poverty must be considered a particularly
problematic variable given its considerable paucity of data. The inconsistency in the results compared
to prevalence of undernourishment—whose model has a much more balanced panel—reinforces this
understanding. I will therefore refrain from drawing any further conclusions about the relationship
between PRSPs and poverty according to national thresholds.
The estimates on prevalence of undernourishment, however, is not as problematic: Not only
does this variable include observations on most years and countries, it also has a decent model fit. As
such, we should be able to substantively interpret the effect without considering the log-transformed
variable. Accordingly, poor countries implementing PRSPs could expect a reduction in
undernourishment with about 3 percent over time. This result is robust for measuring the
implementation with a three-year time lag, but not when limiting the treatment period (which
produced a weaker and statically insignificant effect).
7. CONCLUSION
Poverty Reduction Strategy Papers (PRSPs) have functioned as national development plans for well over
60 countries (see IMF 2019), and taken together, the strategies represent a major international
development initiative. Unfortunately, however, very little research has been dedicated to the actual
aggregate performance of PRSPs; did they accomplished their primary objective—reducing poverty—
School of Global Studies University of Gothenburg Markus Bohlers
61
or where they perhaps not sufficiently detached from the failed neoliberal policy formula of the
Structural Adjustment Programs (SAPs)?
Using the Millennium Development Goals (MDGs) as outcome variables, Meg Elkins, Simon
Feeny and David Prentice (2018) have recently concluded that PRSPs were indeed successful in
reducing poverty. Accordingly, I hypothesized that their findings would be confirmed if poverty was
instead operationalized using the relevant indicators underpinning the Sustainable Development Goals
(SDGs). I also proposed a complimentary hypothesis; that the success of PRSP implementation was
conditioned on higher economic growth.
Although my initial results seemed on par with those of Elkins et al. (2018), the hypothesized
success of PRSPs became increasingly questionable when appropriate robustness checks were
employed. In fact, only the effect on two variables remained statistically significant throughout, and
only one of those variables, prevalence of undernourishment, had enough observations for us to draw
reliable conclusions from.
Specifically, we can conclude that implementing PRSPs was associated with small reductions
in extreme, chronic undernourishment (or lack of calories), and this relationship was not conditioned
on higher growth. The relationship can only be observed when the explanatory variable is measured
from the first year of official implementation to the end of the time period. We have to be aware,
therefore, that the apparent effect of implementing PRSPs may in fact have been caused by other
policies and programs pursued after implementation officially ended. Because of such potential
omitted variable bias, I do not feel confident in making a claim on causation.
In any case, on most dimensions of poverty explored in this study, PRSP implementation did
not yield a statistically significant effect. This suggest that we should retain the null hypothesis. But
how should we interpret that? On one hand, the lack of a significant effect could indicate that PRSPs
did indeed fail to distance themselves enough from the ‘Washington Consensus’ to spur noteworthy
reductions in poverty. On the other hand, the inconclusive results may actually vindicate the argument
that PRSPs were too diverse in content to be evaluated as one collective project.
Nevertheless, the fact that we cannot find clear evidence of successful poverty reduction after
so many years of PRSPs guiding economic policy in poor countries undoubtedly reflects poorly on
the IFIs. Indeed, even if PRSPs were characterized by a greater degree of national ownership than had
been the case with the SAPs, there is no doubt that the IFIs continued to wield considerable influence
over the strategies and should therefore be held at least partly responsible for their outcome.
School of Global Studies University of Gothenburg Markus Bohlers
62
Here, we should also recall why poor countries primarily chose to implement PRSPs; in order to
alleviate their debt burdens and access new loans. As I demonstrated in the background chapter, it is
my understanding that the initial debt crisis leading up to the Heavily Indebted Poor Countries (HIPC)
initiative and the first PRSPs was largely an outcome of external factors originating in the West beyond
the control of governments in poor countries. It was certainly beyond the control of succeeding
governments, not to mention the people being governed. If we then consider the failures of the IFIs
in dealing with the debt crisis, and the damages caused by their structural adjustment, the inconclusive
results from PRSP implementation become all the more inexcusable.
Of course, it should be noted that my analysis suffers from several limitations. First of all, it
rests on a relatively weak empirical foundation where both the considerable lack of data on many
indicators and a variety of issues concerning their measurement constrain the internal validity of the
variables. In addition, as mentioned, there is also an inescapable risk that other relevant variables have
not been controlled for. Arguably, my study still makes an important contribution to the sizeable task
of evaluating the performance of PRSPs. At the very least, I can confidently say that my findings do
not lend support to the idea that PRSPs should become the mechanism to operationalize the SDGs.
That being said, my final conclusion is to highlight the lack of conclusive results.
This begs for further research on the subject. Ideally, there would be a major research commitment in
which every PRSP-implementing country was subject to in-depth case studies following a standard
formula. Such a commitment would allow for more detailed examinations of the PRSP experience in
the context of the specificities and complexities that marked each implementation and country,
including how non-state and extranational actors and structures influenced the process and outcome.
A less ambitious way forward, which have already been alluded to, would be to update Elkins’
and Feeny’s development paradigm alignment scores (2014; 2014) to cover every PRSP implemented
after 2008. This would allow us to investigate if successful implementation was really conditioned on
PRSPs being aligned to different development paradigms. One could also develop a score for the
Annual Progress Reports (APR) released for every PRSP-country, to control for the extent to which
the strategies were fully and correctly implemented. Another suggestion on further, quantitative
research would be to focus on one or a few policy aspects deemed particularly important in the PRSPs
and try to evaluate if successful implementation was conditioned on how they were dealt with, for
instance, if macroeconomic frameworks were contractionary or expansionary.
School of Global Studies University of Gothenburg Markus Bohlers
63
Lastly, it cannot be stressed enough how important it is that more resources are allocated to the
collection of multidimensional poverty data, especially in the poorest countries, and that conventional
indicators are reconsidered in favor of less conservative and more precise estimates (such as the ‘ethical
poverty line’; see Edward 2006). These estimates would ideally also try to escape the constraining lens
of methodological nationalism and capture poverty not only as a material condition but as a lived
experience.
School of Global Studies University of Gothenburg Markus Bohlers
64
List of References
Journal Articles:
Abrahamsen R. (2017). Africa and international relations: assembling Africa, studying the world, African Affairs, 116: 125-139.
Agnew, J. (1994). The territorial trap. The geographical assumptions of international relations theory, Review of International Political Economy 1(1): pp. 53-80.
Booth, D. (Ed.). (2003a). Are PRSPs making a difference? The African experience. [Special issue] Development Policy Review, 21(2), 131-287.
Booth, D. (2003b). Introduction and Overview. Development Policy Review, 21(2), 131-159.
Brown, D. (2004), 'Participation in Poverty Reduction Strategies: Democracy Strengthened or Democracy Undermined?' in S. Hickey and G. Mohan (eds.), Participation: From Tyranny to Transformation? London: Zed Books.
Clemens, M. A., Kenny, C. J., & Moss, T. J. (2007). The trouble with the MDGs: Confronting expectations of aid and development success. World Development, 35(5), 735–751.
Cheru, F. (2006). Building and supporting PRSPs in Africa: What has worked well so far? What needs changing?. Third World Quarterly, 27(2), 355-376.
Craig, D., & Porter, D. (2003), Poverty Reduction Strategy Papers: A New Convergence. World Development, 31(1), 53-69.
Dijkstra, G. (2005). The PRSP Approach and the Illusion of Improved Aid Effectiveness: Lessons from Bolivia, Honduras and Nicaragua, Development Policy Review, 23(4), 443-464.
Driscoll, R., & Evans, A. (2005). Second‐Generation Poverty Reduction Strategies: New Opportunities and Emerging Issues. Development Policy Review, 23(1), 5-25.
Dutta, M., & Rastogi, R. (2016). Deconstructing PRSP Measurement: Participation as Neoliberal Colonization. Journal of Creative Communications, 11(3), 211-226.
Easterly, W. (2005). What did structural adjustment adjust?: The association of policies and growth with repeated IMF and World Bank adjustment loans. Journal of Development Economics, 76(1), 1-22.
Edward, P. (2006) The Ethical Poverty Line: A Moral Quantification of Absolute Poverty. Third World Quarterly 37(2), 377–393.
Elkins, M., Feeny, S., & Prentice, D. (2018). Are Poverty Reduction Strategy Papers Associated with Reductions in Poverty and Improvements in Well-being? The Journal of Development Studies, 54(2), 377-393.
Elkins, M. & Feeny, S. (2014). Policies in Poverty Reduction Strategy Papers: dominance or diversity? Canadian Journal of Development Studies / Revue canadienne d'études du développement, 35(2), 1-21.
Elkins, M. (2014). Embedding the vulnerable into the Millennium Development Goals: Social Protection in Poverty Reduction Strategy Papers. Journal of International Development, 26(6), 853-874.
School of Global Studies University of Gothenburg Markus Bohlers
65
Fraser, A. (2005). Poverty reduction strategy papers: Now who calls the shots? Review of African Political Economy, 32(104-105), 317-340.
Gottschalk, R. (2005). The Macro Content of PRSPs: Assessing the Need for a More Flexible Macroeconomic Policy Framework. Development Policy Review, 23 (4), 419-442.
Gore, C. (2000). The Rise and Fall of the Washington Consensus as a Paradigm for Developing Countries. World Development, 28(5), 789-804.
Guimarães, J. P. C. & Avendaño, N. (2010). The Great Experiment: Testing the PRSP Approach in Nicaragua, 2000–2007. European Journal of Development Research, 23(2), 319-336
Hák, T., Janoušková, S., & Moldan, B. (2016). Sustainable Development Goals: A need for relevant indicators. Ecological Indicators, 60, 565-573.
Haraway, D. (1988). Situated Knowledges: The Science Question in Feminism and the Privilege of Partial Perspective. Feminist Studies. 14, 3: 575–599
Harttgen, K., & Klasen, S. (2013). Do Fragile Countries Experience Worse MDG Progress? The Journal of Development Studies, 49(1), 134-159.
Harrison, G. (2001) Post-conditionality politics and administrative reform: Reflections on the cases of Uganda and Tanzania, Development and Change, 32(4), 657-679.
Hickel, J. (2016). The true extent of global poverty and hunger: Questioning the good news narrative of the Millennium Development Goals. Third World Quarterly, 37(5), 1-19.
Hugé, J., & Hens, L. (2007). Sustainability assessment of Poverty Reduction Strategy Papers. Impact Assessment and Project Appraisal, 25(4), 247-258.
Ikhide, S., & Obadan, M. (2011). The Next Generation of Poverty Reduction Strategy Papers in Africa: What is the Role for Capacity Building? Poverty & Public Policy, 3(1), 1097.
Jenkins, R., & Tsoka, M. (2003). Malawi. Development Policy Review, 21(2), 197–215.
Jerven, M. (2013). Comparability of GDP estimates in Sub-Saharan Africa: The effect of Revisions in Sources and Methods Since Structural Adjustment. The Review of Income and Wealth, 59(S1), S16-S36.
Johnson, C., Jones, R., Paasi, A., Amoore, L., Mountz, A., Salter, M., & Rumford, C. (2011), Interventions on Rethinking ‘the Border’ in Border Studies, Political Geography, 30, 2: 61–69.
Kentikelenis, A. E., Stubbs, T. H., & King, L. P. (2016) IMF conditionality and development policy space, 1985–2014, Review of International Political Economy, 23(4), 543-582.
Kwadzo, M. (2015). Choosing Concepts and Measurements of Poverty: A Comparison of Three Major Poverty Approaches. Journal of Poverty, 19, 4: 409–423.
Kwon, H., & Kim, E. (2014). Poverty Reduction and Good Governance: Examining the Rationale of the Millennium Development Goals. Development and Change, 45(2), 353-375.
Lazarus, J. (2008). Participation in poverty reduction strategy papers: Reviewing the past, assessing
the present and predicting the future. Third World Quarterly, 29, 1205–1221.
Mouelhi, M., & Rückert, A. (2007). Ownership and Participation: The Limitations of the Poverty Reduction Strategy Paper Approach. Canadian Journal of Development Studies/Revue Canadienne D'études Du Développement, 28(2), 277-292.
School of Global Studies University of Gothenburg Markus Bohlers
66
Mosley, P. (2001). Attacking Poverty and the 'Post-Washington Consensus'. Journal of International Development, 13(3), 307-313.
Parker, N., & Vaughan-Williams, N (2012). Critical Border Studies: Broadening and Deepening the ‘Lines in the Sand’ Agenda, Geopolitics, 17, 4: 727-733.
Reddy, S., & Lahoti, R. (2016). $1.90 A DAY: WHAT DOES IT SAY? The New International Poverty Line. New Left Review, (97), 106-127.
Rodrik, D. (2006). Goodbye Washington Consensus, Hello Washington Confusion? A Review of the World Bank's Economic Growth in the 1990s: Learning from a Decade of Reform. Journal of Economic Literature, 44(4), 973-987.
Rückert, A. (2009). A decade of poverty reduction strategies in Latin America: Empowering or disciplining the poor? Labour, Capital and Society, 42(1-2), 56-81.
Saeed, A., Hassan, M., Atta, G., & Qazi, Q. (2015). The Politics of Poverty Reduction Strategy Papers. Journal of Political Studies, 22(2), 495-514.
Sumner, A. (2006). In search of the Post-Washington (dis)consensus: The ‘missing’ content of PRSPS. Third World Quarterly, 27(8), 1401-1412.
Tan, C. (2011). The New Biopower: Poverty Reduction Strategy Papers and the obfuscation of international collective responsibility. Third World Quarterly, 32(6), 1039-1056.
Thomas, M., A. (2009). What Do the Worldwide Governance Indicators Measure? European Journal of Development Research, 22(1), 31-54.
In Print:
Birdsall, N. & Williamson, J. (2002). Delivering on Debt Relief: From IMF Gold to a New Aid Architecture, Washington, DC: Center for Global Development.
Buckley, R. P. (2008). The International Financial System: Policy and Regulation. International Banking and Finance Law series. Kluwer Law International.
Chang, H.-J. (2002). Kicking away the Ladder: Development Strategy in Historical Perspective. London: Anthem Books.
Cornia, G. A., Jolly, R., & Stewart, F. (1987) Adjustment with a Human Face. New York: Oxford University Press.
Duménil, G., & Lévy, D. (2004). Capital resurgent. Cambridge: Harvard University Press.
Escobar, A. (1995). Encountering Development: The Making and Unmaking of the Third World. Princeton, NJ: Princeton University Press.
Gerring, J. and Christenson, D. (2017). Applied Social Science Methodology: An Introductory Guide. Cambridge: Cambridge University Press
Harvey, D. (2005). A Brief History of Neoliberalism. Oxford, UK: Oxford University Press.
Hansen, L. (2006) Security as Practice: Discourse Analysis and the Bosnian War. Abingdon: Routledge.
Johnson, B. T. & Schaefer, B. D. (1999) The International Monetary Fund: Outdated, Ineffective, and Unnecessary, Washington, DC: Heritage Foundation.
School of Global Studies University of Gothenburg Markus Bohlers
67
Jorgensen, M. and Phillips, L. (2002) Discourse Analysis as Theory and Method. London: Sage.
Karns, M. and Mingst, K. (2010). International Organizations. 2nd ed. Boulder, Colo.: Lynne Rienner Publishers.
Langan, M. (2018). Neo-colonialism and the poverty of 'development' in Africa. Cham, Switzerland: Palgrave Macmillan.
Lloyd, V., & Weissman, R. (2010) ‘How International Monetary Fund and World Bank Policies Undermine Labor Power and Rights’, in: G. Ritzer & Z. Atalay (ed.), Readings in Globalization; Key Concepts and Major Debates, Malden, MA: Wiley-Blackwell: 146-150.
Peet, R. (2010). Unholy trinity. 2nd ed. London: Zed Books.
Peet, R. and Hartwick, E. (2015). Theories of development. 3rd ed. New York: Guilford Press.
Prashad, V. (2008), The Darker Nations: A People’s History of the Third World. New York: New Press.
Prashad, V. (2014). The Poorer Nations: A Possible History of the Global South. London: Verso.
Rodwan Abouharb, M., & Cingranelli, D. L. (2010) ‘The Human Rights Effects of World Bank
Structural Adjustment, 1981-2000?’, in: G. Ritzer & Z. Atalay (ed.), Readings in Globalization; Key
Concepts and Major Debates, Malden, MA: Wiley-Blackwell: 138-146.
Sachs, J. (1989). “Introduction”, in: J. Sachs (ed.) Developing Country Debt and the World Economy. The National Bureau of Economic Research. Chicago: The University of Chicago Press: 1-33.
Sachs, J. (2005). The End of Poverty: How Can We Make It Happen in Our Lifetime. London: Penguin Books.
Sachs, J. (2015). The age of sustainable development. New York City: Columbia University Press.
Sahn, D., Dorosh, P. & Younger, S. (1997). Structural adjustment reconsidered. Cambridge, England: Cambridge University Press.
Scott, G. (2010) ‘Who Has Failed Africa?: IMF Measures or the African Leadership?’, in: G. Ritzer & Z. Atalay (ed.), Readings in Globalization; Key Concepts and Major Debates, Malden, MA: Wiley-Blackwell: 150-156.
Stewart, F., & Wang, M. (2005). ‘Poverty Reduction Strategy Papers within the Human Rights Perspective’. In Human Rights and Development (p. Human Rights and Development, Chapter 17). Oxford University Press: 447-474.
Saïd, E. (2003/1979). Orientalism. New York: Vintage Books.
Scholte, J. A. (2005). Globalization: A Critical Introduction. 2nd ed. New York, N.Y.: Palgrave Macmillan.
Stiglitz, J. E. (2002/2017). Globalization and its Discontents Revisited. London: Penguin Books.
Stiglitz, J., & Charlton, A. (2007). Fair trade for All. Oxford: Oxford University Press.
Varoufakis, Y. (2011). The global minotaur. London: Zed Books.
Walton, J., & Seddon, D. (1994), Free Markets and Food Riots: The Politics of Global Adjustment. Oxford: Blackwell.
School of Global Studies University of Gothenburg Markus Bohlers
68
Williamson, J. (1990). What Washington means by policy reform. In J. Williamson (Ed.), Latin American adjustment: How much has happened. Washington, DC: Institute for International Economics.
Wooldridge, J. (2013), Introductory Econometrics: A Modern Approach. 5th ed. Melbourne: South-Western Cengage Learning.
Working Papers:
Abrahamsson, H. (2008): Understanding world order and change: Development, Security and Justice in the global era Göteborg: Working paper. Gothenburg, Sweden: University of Gothenburg.
Banks, N. and Hulme, D. (2012). The role of NGOs and civil society in development and poverty reduction. Working Paper 171. Manchester: Brooks World Poverty Institute.
Dijkstra, G. & K. Komives. (2009). The Latin American Experience with the PRSP Approach, Paper presented at the Annual Convention of the International Studies (ISA), New York City.
Eggen, A. R. & Bezemer, D. J. (2007). Do Poverty Reduction Strategy Papers Help Achieve the Millennium Development Goals? MPRA Paper No. 7030.
Eggen, A. R. & Bezemer, D. J. (2008). The Role of Poverty Reduction Strategies in Achieving the Millennium Development Goals? Working Paper. Groningen, The Netherlands: University of Groningen
Jerven, M. (2014). African growth miracle or statistical tragedy? Interpreting trends in the data over the past two decades. WIDER Working Paper 2014/114. World Institute for Development Economics Research.
Kaufmann, D., Kraay, A., & Mastruzzi, M. (2010). The Worldwide Governance Indicators: Methodology and Analytical Issues. World Bank Policy Research Working Paper 5430.
Marshall, R. & Walters, B. (2011). Evaluating ten years of 'strategizing' for poverty reduction: A cross-sectional appraisal of the Poverty Reduction Strategy (PRSP) initiative. PWPI Working Paper 143. Brooks World Poverty Institute.
Park, H. M. (2011). Practical Guides to Panel Data Modeling: A Step-by-step Analysis Using Stata. Tutorial Working Paper. Graduate School of International Relations, International University of Japan.
Stewart, F., & Wang , M. (2003). Do PRSPs Empower Poor Countries and Disempower the World Bank, or Is it the Other Way Around? Queen Elizabeth House Working Paper Series Working paper 108. Oxford: University of Oxford Department of International Development.
Reports:
IEO (2004). Evaluation of the IMF’s Role in Poverty Reduction Strategy Papers and the Poverty Reduction and Growth Facility, Washington D.C: IMF
IEO (2007). The IMF and Aid to Sub‑Saharan Africa. Evaluation report. Washington, DC: IMF.
OED (1992). World Bank Structural and Sectoral Adjustment Operations: The Second OED Overview, OED Report 10870, Washington, DC: World Bank.
School of Global Studies University of Gothenburg Markus Bohlers
69
OED (2004). The Poverty Reduction Strategy Initiative: a review of the World Bank’s operations through 2003, Washington DC: World Bank
Oxfam International (2004). From ‘Donorship1’ to Ownership? Moving Towards PRSP Round Two. Oxfam Briefing Paper.
SAPRIN, (2002). ‘The Policy Roots of Economic Crisis and Poverty: A Multi-Country Participatory Assessment of Structural Adjustment’. Washington, DC: SAPRIN.
South Commission (1990): The Challenge of the South: Report of the South Commission. Geneva.
UN (2015). The Millennium Development Goals Report 2015. New York.
UNCTAD, (2002). Escaping the Poverty Trap. The Least Developed Countries Report 2002. Geneva.
UNCTAD, (2000). Aid, Private Capital Flows and External Debt: The Challenge of Financing Development in the LDCs. The Least Developed Countries Report 2002. Geneva.
UN Millennium Project (2005). Investing in Development: A Practical Plan to Achieve the Millennium Development Goals. New York.
Weisbrot, M., & Johnston, J. (2016). Voting Share Reform at the IMF: Will it Make a Difference? Center for Economic and Policy Research.
World Bank (1992) ‘Effective implementation: key to development impact’. Portfolio Management Task Force Report (Wapenhans Report), Washington, DC: World Bank.
World Bank (2001). Global Economic Prospects and the Developing Countries. Washington, DC: World Bank
World Bank. (2005). Economic growth in the 1990s: learning from a decade of reform. Washington, DC: World Bank
Other:
Hermele, K. (2005). The Poverty Reduction Strategies; A survey of the literature. Forum Syd.
Khan, M. (1990) “The Macroeconomic Effects of Fund-Supported Adjustment Programs,” IMF Staff Papers 37, 2.
Siglitz, J. (1998). “More Instruments and Broader Goals: Moving Toward the Post-Washington D.C Consensus”. The WIDER Annual Lecture. WIDER. Helsinki.
Krueger, A. O. (2004) “Meant Well, Tried Little, Failed Much: Policy Reforms in Emerging Market Economies”, remarks at the Roundtable Lecture at the Economic Honors Society, New York University. Retrieved from https://www.imf.org/en/News/Articles/2015/09/28/04/53/sp032304a [Accessed 30 March. 2019].
Websites:
Financial Times. (2018). China set for fewer World Bank loans in US fundraising deal. [online] Ft.com. Retrieved from https://www.ft.com/content/1eee6a9a-405f-11e8-803a-295c97e6fd0b
School of Global Studies University of Gothenburg Markus Bohlers
70
IMF (2019). Poverty Reduction Strategy Papers (PRSP). [online] Imf.org. Retrieved from https://www.imf.org/external/np/prsp/prsp.aspx [Accessed 25 March. 2019].
UN (2019a). United Nations Millennium Development Goals. un.org. [online] Available at: http://www.un.org/millenniumgoals/ [Accessed 7 May. 2019].
UN (2019b). United Nations Sustainable Development Goals. un.org. [online] Available at: https://www.un.org/sustainabledevelopment/ [Accessed 7 May. 2019].
UN (2019c). Transforming our world: the 2030 Agenda for Sustainable Development. sustainabledevelopment.un.org [online] Available at: https://sustainabledevelopment.un.org/post2015/transformingourworld [Accessed 7 May. 2019].
UN Statistics Division. (2019). SDG Indicators. unstats.un.org [online] Available at: https://unstats.un.org/sdgs/indicators/database/ [Accessed 1 Feb. 2019].
World Bank. (2019a). Data.worldbank.org. World Development Indicators | DataBank. [online] Available at: https://databank.worldbank.org/data/source/world-development-indicators [Accessed 7 Jan. 2019].
World Bank. (2019b). Data.worldbank.org. Worldwide Governance Indicators | DataBank. [online] Available at: https://databank.worldbank.org/data/source/worldwide-governance-indicators [Accessed 7 Jan. 2019].
World Bank. (2019c). Data.worldbank.org. Poverty headcount ratio at $1.90 a day (2011 PPP) (% of population) | Data. [online] Available at: https://data.worldbank.org/indicator/SI.POV.DDAY [Accessed 30 Jul. 2019].
World Bank. (2019d). Data.worldbank.org. Maternal mortality ratio (modeled estimate, per 100,000 live births)| Data. [online] Available at: https://data.worldbank.org/indicator/sh.sta.mmrt [Accessed 30 Jul. 2019].
World Bank. (2019e). Data.worldbank.org. Poverty headcount ratio at national poverty lines (% of population)| Data. [online] Available at: https://data.worldbank.org/indicator/SI.POV.NAHC [Accessed 30 Jul. 2019].
World Bank. (2019f). Data.worldbank.org. Net official development assistance received (current US$)| Data. [online] Available at: https://data.worldbank.org/indicator/DT.ODA.ODAT.CD [Accessed 30 Jul. 2019].
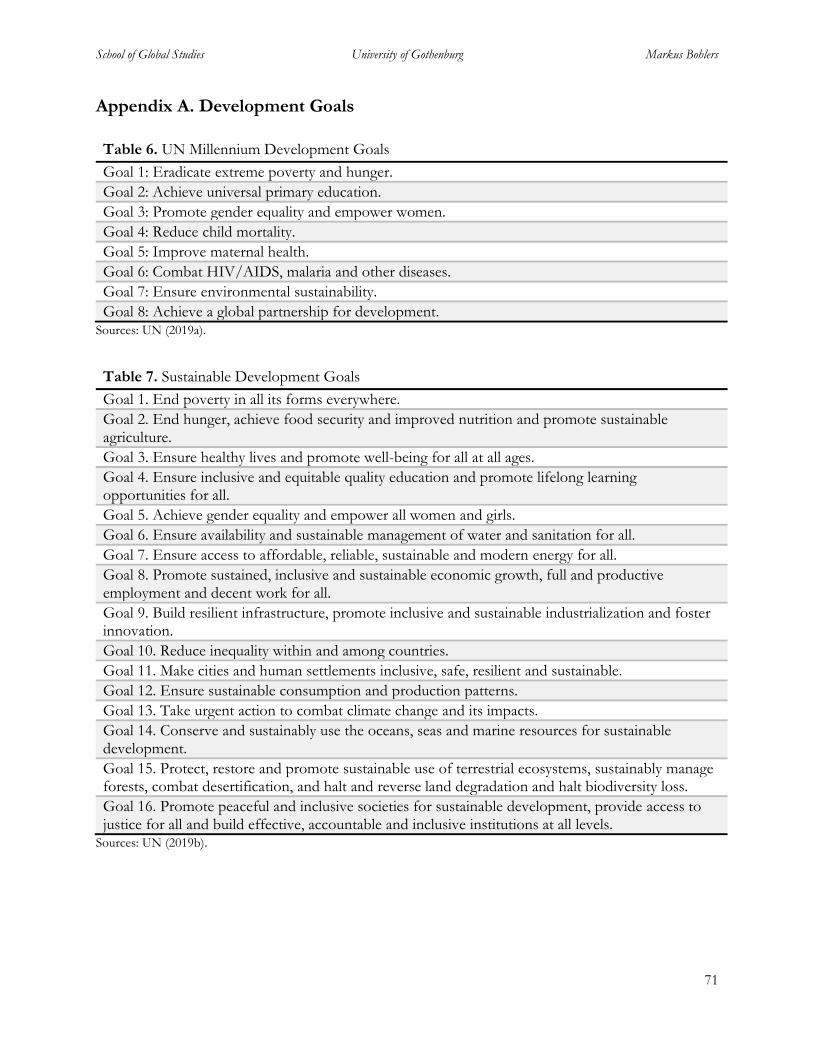
School of Global Studies University of Gothenburg Markus Bohlers
71
Appendix A. Development Goals
Table 6. UN Millennium Development Goals
Goal 1: Eradicate extreme poverty and hunger.
Goal 2: Achieve universal primary education.
Goal 3: Promote gender equality and empower women.
Goal 4: Reduce child mortality.
Goal 5: Improve maternal health.
Goal 6: Combat HIV/AIDS, malaria and other diseases.
Goal 7: Ensure environmental sustainability.
Goal 8: Achieve a global partnership for development. Sources: UN (2019a).
Table 7. Sustainable Development Goals
Goal 1. End poverty in all its forms everywhere.
Goal 2. End hunger, achieve food security and improved nutrition and promote sustainable agriculture.
Goal 3. Ensure healthy lives and promote well-being for all at all ages.
Goal 4. Ensure inclusive and equitable quality education and promote lifelong learning opportunities for all.
Goal 5. Achieve gender equality and empower all women and girls.
Goal 6. Ensure availability and sustainable management of water and sanitation for all.
Goal 7. Ensure access to affordable, reliable, sustainable and modern energy for all.
Goal 8. Promote sustained, inclusive and sustainable economic growth, full and productive employment and decent work for all.
Goal 9. Build resilient infrastructure, promote inclusive and sustainable industrialization and foster innovation.
Goal 10. Reduce inequality within and among countries.
Goal 11. Make cities and human settlements inclusive, safe, resilient and sustainable.
Goal 12. Ensure sustainable consumption and production patterns.
Goal 13. Take urgent action to combat climate change and its impacts.
Goal 14. Conserve and sustainably use the oceans, seas and marine resources for sustainable development.
Goal 15. Protect, restore and promote sustainable use of terrestrial ecosystems, sustainably manage forests, combat desertification, and halt and reverse land degradation and halt biodiversity loss.
Goal 16. Promote peaceful and inclusive societies for sustainable development, provide access to justice for all and build effective, accountable and inclusive institutions at all levels.
Sources: UN (2019b).
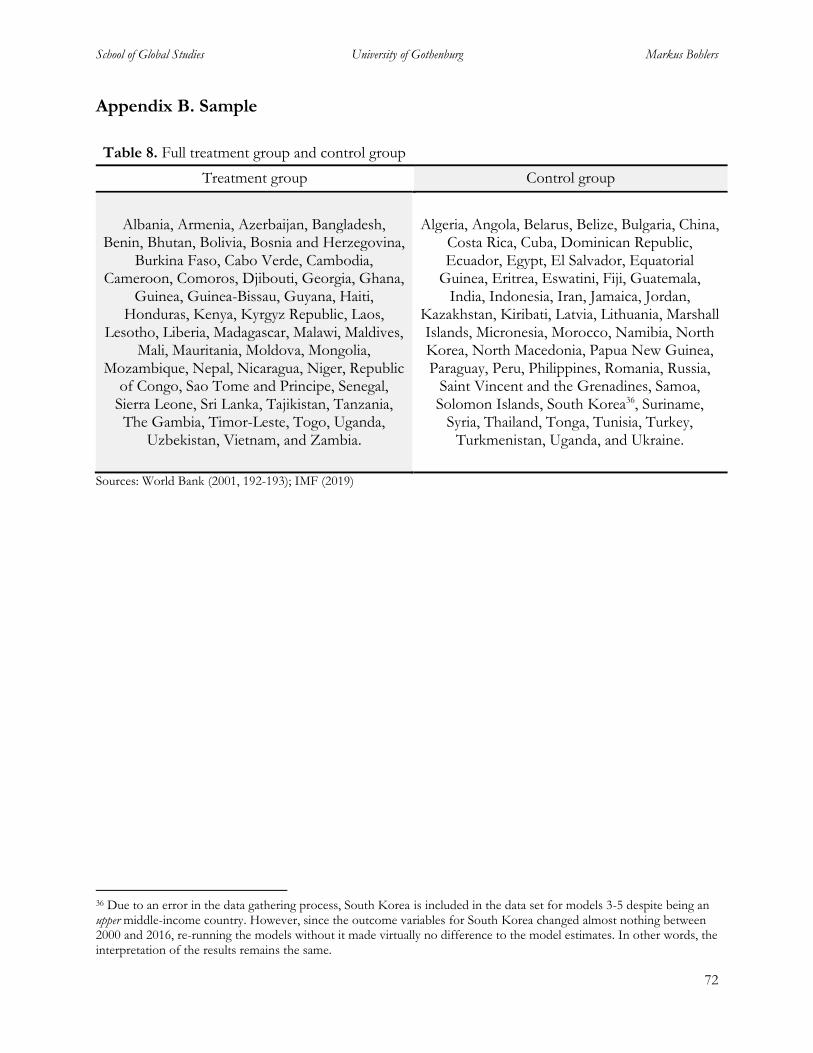
School of Global Studies University of Gothenburg Markus Bohlers
72
Appendix B. Sample
Table 8. Full treatment group and control group
Treatment group Control group
Albania, Armenia, Azerbaijan, Bangladesh, Benin, Bhutan, Bolivia, Bosnia and Herzegovina,
Burkina Faso, Cabo Verde, Cambodia, Cameroon, Comoros, Djibouti, Georgia, Ghana,
Guinea, Guinea-Bissau, Guyana, Haiti, Honduras, Kenya, Kyrgyz Republic, Laos,
Lesotho, Liberia, Madagascar, Malawi, Maldives, Mali, Mauritania, Moldova, Mongolia,
Mozambique, Nepal, Nicaragua, Niger, Republic of Congo, Sao Tome and Principe, Senegal,
Sierra Leone, Sri Lanka, Tajikistan, Tanzania, The Gambia, Timor-Leste, Togo, Uganda,
Uzbekistan, Vietnam, and Zambia.
Algeria, Angola, Belarus, Belize, Bulgaria, China, Costa Rica, Cuba, Dominican Republic, Ecuador, Egypt, El Salvador, Equatorial
Guinea, Eritrea, Eswatini, Fiji, Guatemala, India, Indonesia, Iran, Jamaica, Jordan,
Kazakhstan, Kiribati, Latvia, Lithuania, Marshall Islands, Micronesia, Morocco, Namibia, North Korea, North Macedonia, Papua New Guinea, Paraguay, Peru, Philippines, Romania, Russia,
Saint Vincent and the Grenadines, Samoa, Solomon Islands, South Korea36, Suriname,
Syria, Thailand, Tonga, Tunisia, Turkey, Turkmenistan, Uganda, and Ukraine.
Sources: World Bank (2001, 192-193); IMF (2019)
36 Due to an error in the data gathering process, South Korea is included in the data set for models 3-5 despite being an upper middle-income country. However, since the outcome variables for South Korea changed almost nothing between 2000 and 2016, re-running the models without it made virtually no difference to the model estimates. In other words, the interpretation of the results remains the same.
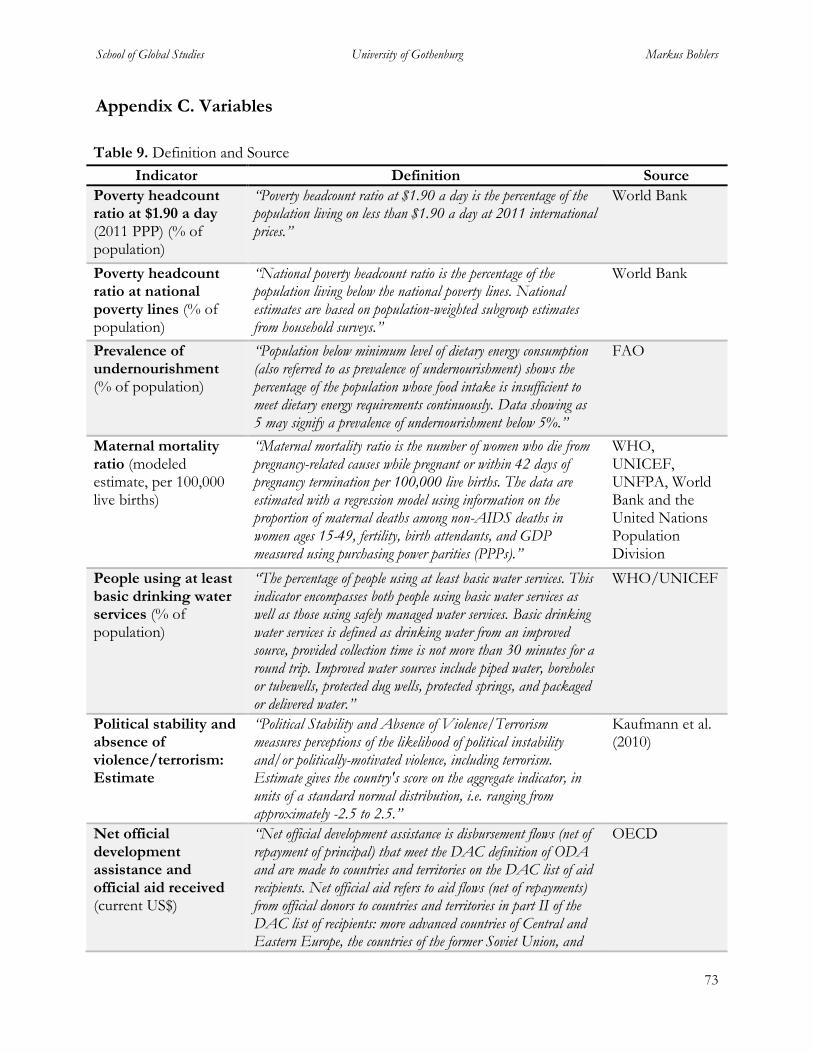
School of Global Studies University of Gothenburg Markus Bohlers
73
Appendix C. Variables
Table 9. Definition and Source
Indicator Definition Source
Poverty headcount ratio at $1.90 a day (2011 PPP) (% of population)
“Poverty headcount ratio at $1.90 a day is the percentage of the population living on less than $1.90 a day at 2011 international prices.”
World Bank
Poverty headcount ratio at national poverty lines (% of population)
“National poverty headcount ratio is the percentage of the population living below the national poverty lines. National estimates are based on population-weighted subgroup estimates from household surveys.”
World Bank
Prevalence of undernourishment (% of population)
“Population below minimum level of dietary energy consumption (also referred to as prevalence of undernourishment) shows the percentage of the population whose food intake is insufficient to meet dietary energy requirements continuously. Data showing as 5 may signify a prevalence of undernourishment below 5%.”
FAO
Maternal mortality ratio (modeled estimate, per 100,000 live births)
“Maternal mortality ratio is the number of women who die from pregnancy-related causes while pregnant or within 42 days of pregnancy termination per 100,000 live births. The data are estimated with a regression model using information on the proportion of maternal deaths among non-AIDS deaths in women ages 15-49, fertility, birth attendants, and GDP measured using purchasing power parities (PPPs).”
WHO, UNICEF, UNFPA, World Bank and the United Nations Population Division
People using at least basic drinking water services (% of population)
“The percentage of people using at least basic water services. This indicator encompasses both people using basic water services as well as those using safely managed water services. Basic drinking water services is defined as drinking water from an improved source, provided collection time is not more than 30 minutes for a round trip. Improved water sources include piped water, boreholes or tubewells, protected dug wells, protected springs, and packaged or delivered water.”
WHO/UNICEF
Political stability and absence of violence/terrorism: Estimate
“Political Stability and Absence of Violence/Terrorism measures perceptions of the likelihood of political instability and/or politically-motivated violence, including terrorism. Estimate gives the country's score on the aggregate indicator, in units of a standard normal distribution, i.e. ranging from approximately -2.5 to 2.5.”
Kaufmann et al. (2010)
Net official development assistance and official aid received (current US$)
“Net official development assistance is disbursement flows (net of repayment of principal) that meet the DAC definition of ODA and are made to countries and territories on the DAC list of aid recipients. Net official aid refers to aid flows (net of repayments) from official donors to countries and territories in part II of the DAC list of recipients: more advanced countries of Central and Eastern Europe, the countries of the former Soviet Union, and
OECD
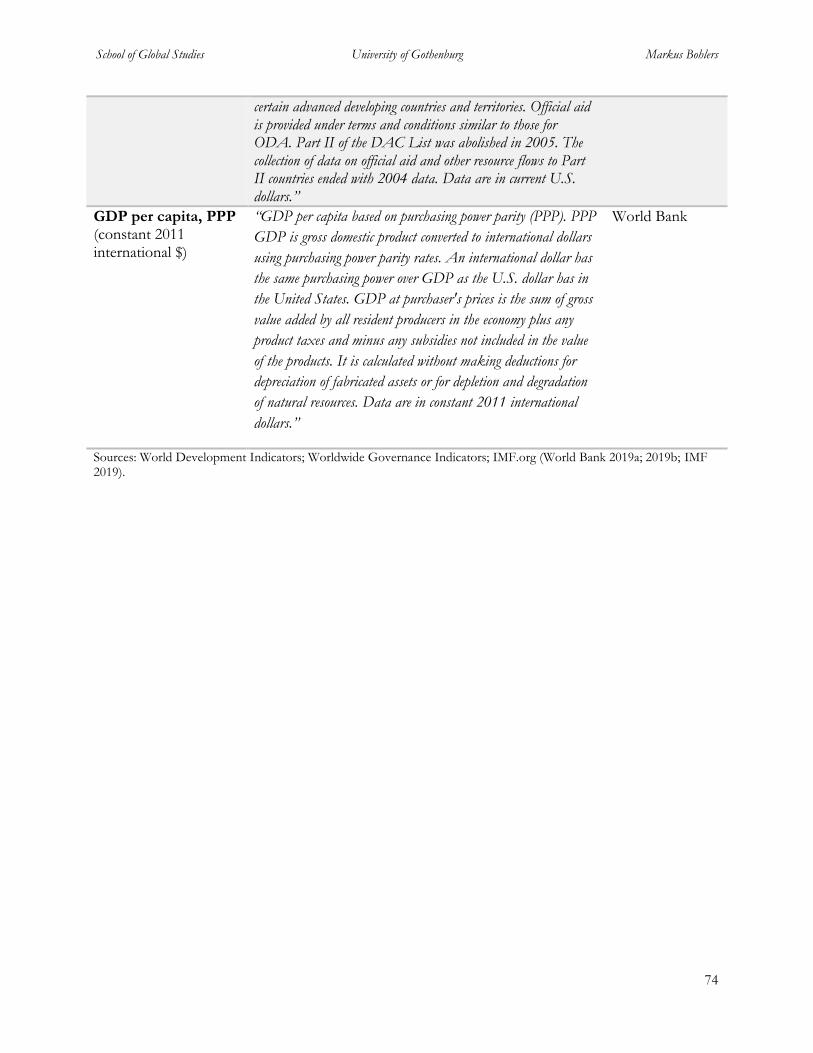
School of Global Studies University of Gothenburg Markus Bohlers
74
certain advanced developing countries and territories. Official aid is provided under terms and conditions similar to those for ODA. Part II of the DAC List was abolished in 2005. The collection of data on official aid and other resource flows to Part II countries ended with 2004 data. Data are in current U.S. dollars.”
GDP per capita, PPP (constant 2011 international $)
“GDP per capita based on purchasing power parity (PPP). PPP
GDP is gross domestic product converted to international dollars
using purchasing power parity rates. An international dollar has
the same purchasing power over GDP as the U.S. dollar has in
the United States. GDP at purchaser's prices is the sum of gross
value added by all resident producers in the economy plus any
product taxes and minus any subsidies not included in the value
of the products. It is calculated without making deductions for
depreciation of fabricated assets or for depletion and degradation
of natural resources. Data are in constant 2011 international
dollars.”
World Bank
Sources: World Development Indicators; Worldwide Governance Indicators; IMF.org (World Bank 2019a; 2019b; IMF 2019).
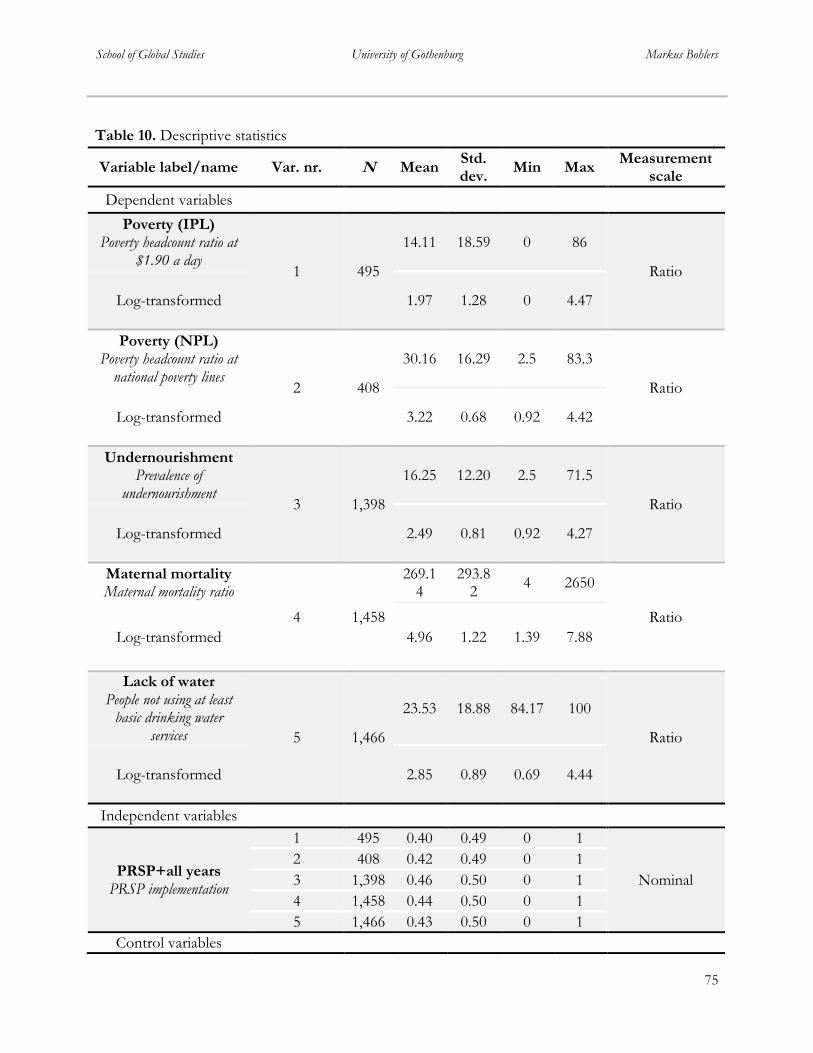
School of Global Studies University of Gothenburg Markus Bohlers
75
Table 10. Descriptive statistics
Variable label/name Var. nr. N Mean Std. dev.
Min Max Measurement
scale
Dependent variables
Poverty (IPL) Poverty headcount ratio at
$1.90 a day 1 495
14.11 18.59 0 86
Ratio
Log-transformed 1.97 1.28 0 4.47
Poverty (NPL) Poverty headcount ratio at
national poverty lines 2 408
30.16 16.29 2.5 83.3
Ratio
Log-transformed 3.22 0.68 0.92 4.42
Undernourishment Prevalence of
undernourishment 3 1,398
16.25 12.20 2.5 71.5
Ratio
Log-transformed 2.49 0.81 0.92 4.27
Maternal mortality Maternal mortality ratio
4 1,458
269.14
293.82
4 2650
Ratio
Log-transformed 4.96 1.22 1.39 7.88
Lack of water People not using at least
basic drinking water services 5 1,466
23.53 18.88 84.17 100
Ratio
Log-transformed 2.85 0.89 0.69 4.44
Independent variables
PRSP+all years PRSP implementation
1 495 0.40 0.49 0 1
Nominal
2 408 0.42 0.49 0 1
3 1,398 0.46 0.50 0 1
4 1,458 0.44 0.50 0 1
5 1,466 0.43 0.50 0 1
Control variables
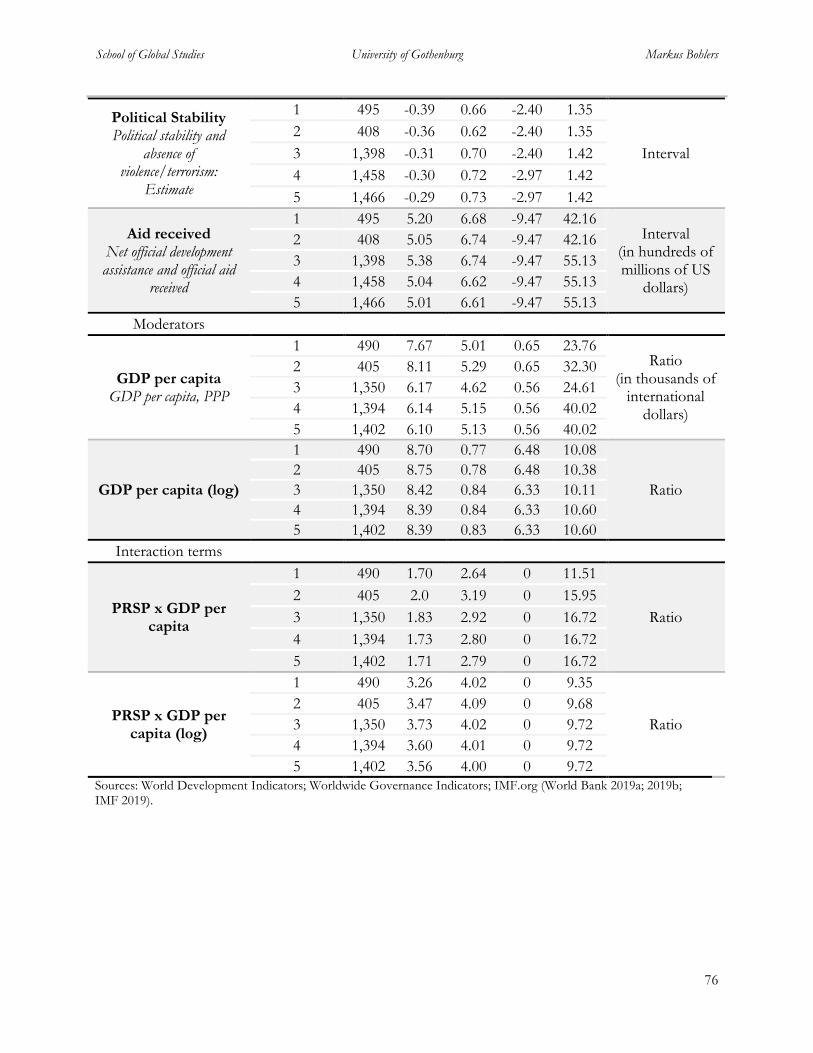
School of Global Studies University of Gothenburg Markus Bohlers
76
Political Stability Political stability and
absence of violence/terrorism:
Estimate
1 495 -0.39 0.66 -2.40 1.35
Interval
2 408 -0.36 0.62 -2.40 1.35
3 1,398 -0.31 0.70 -2.40 1.42
4 1,458 -0.30 0.72 -2.97 1.42
5 1,466 -0.29 0.73 -2.97 1.42
Aid received Net official development assistance and official aid
received
1 495 5.20 6.68 -9.47 42.16 Interval
(in hundreds of millions of US
dollars)
2 408 5.05 6.74 -9.47 42.16
3 1,398 5.38 6.74 -9.47 55.13
4 1,458 5.04 6.62 -9.47 55.13
5 1,466 5.01 6.61 -9.47 55.13
Moderators
GDP per capita GDP per capita, PPP
1 490 7.67 5.01 0.65 23.76 Ratio
(in thousands of international
dollars)
2 405 8.11 5.29 0.65 32.30
3 1,350 6.17 4.62 0.56 24.61
4 1,394 6.14 5.15 0.56 40.02
5 1,402 6.10 5.13 0.56 40.02
GDP per capita (log)
1 490 8.70 0.77 6.48 10.08
Ratio
2 405 8.75 0.78 6.48 10.38
3 1,350 8.42 0.84 6.33 10.11
4 1,394 8.39 0.84 6.33 10.60
5 1,402 8.39 0.83 6.33 10.60
Interaction terms
PRSP x GDP per capita
1 490 1.70 2.64 0 11.51
Ratio
2 405 2.0 3.19 0 15.95
3 1,350 1.83 2.92 0 16.72
4 1,394 1.73 2.80 0 16.72
5 1,402 1.71 2.79 0 16.72
PRSP x GDP per capita (log)
1 490 3.26 4.02 0 9.35
Ratio
2 405 3.47 4.09 0 9.68
3 1,350 3.73 4.02 0 9.72
4 1,394 3.60 4.01 0 9.72
5 1,402 3.56 4.00 0 9.72 Sources: World Development Indicators; Worldwide Governance Indicators; IMF.org (World Bank 2019a; 2019b; IMF 2019).
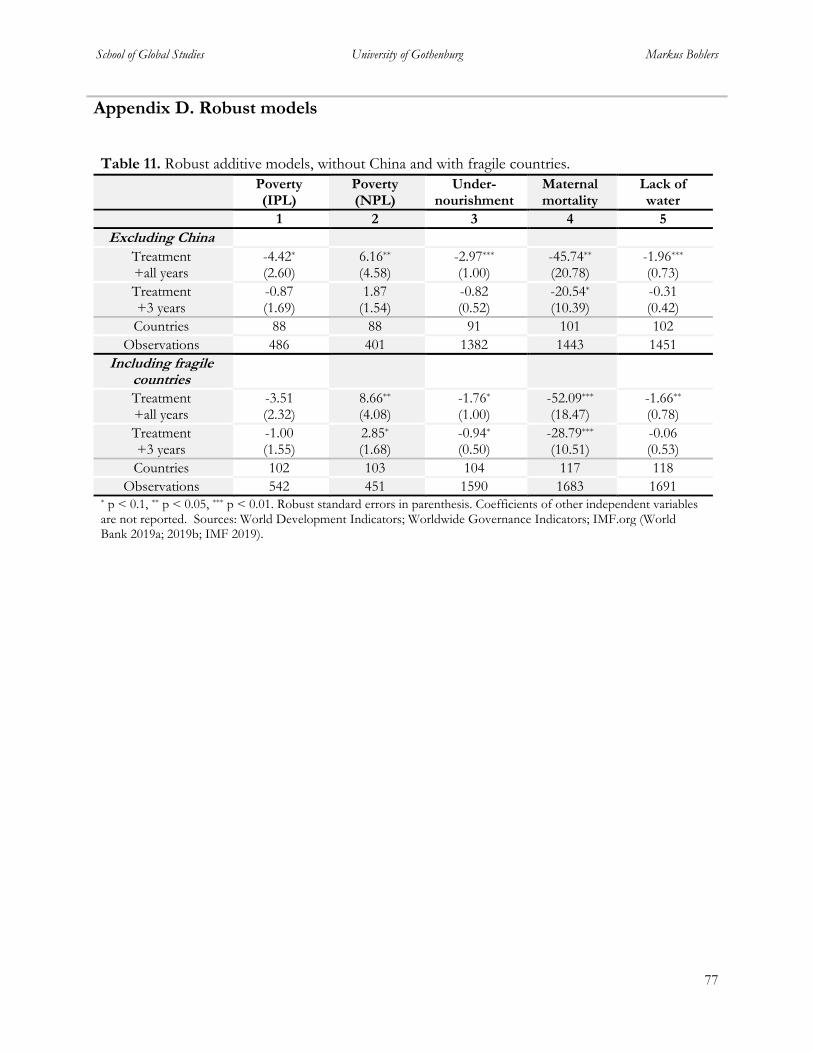
School of Global Studies University of Gothenburg Markus Bohlers
77
Appendix D. Robust models
Table 11. Robust additive models, without China and with fragile countries.
Poverty (IPL)
Poverty (NPL)
Under-nourishment
Maternal mortality
Lack of water
1 2 3 4 5
Excluding China
Treatment +all years
-4.42* (2.60)
6.16**
(4.58) -2.97***
(1.00) -45.74** (20.78)
-1.96*** (0.73)
Treatment +3 years
-0.87 (1.69)
1.87
(1.54) -0.82
(0.52) -20.54* (10.39)
-0.31 (0.42)
Countries 88 88 91 101 102
Observations 486 401 1382 1443 1451
Including fragile countries
Treatment +all years
-3.51 (2.32)
8.66**
(4.08) -1.76*
(1.00) -52.09*** (18.47)
-1.66** (0.78)
Treatment +3 years
-1.00 (1.55)
2.85*
(1.68) -0.94*
(0.50) -28.79*** (10.51)
-0.06 (0.53)
Countries 102 103 104 117 118
Observations 542 451 1590 1683 1691 * p < 0.1, ** p < 0.05, *** p < 0.01. Robust standard errors in parenthesis. Coefficients of other independent variables are not reported. Sources: World Development Indicators; Worldwide Governance Indicators; IMF.org (World Bank 2019a; 2019b; IMF 2019).

School of Global Studies University of Gothenburg Markus Bohlers
78


