Embed Size (px)
Citation preview

Hatches Harbor Salt Marsh Restoration:
2002 Annual Report
J. Portnoy
1, S. Smith
1, C. Roman
2, M-J James-Pirri
3, C. Boleyn
1 & E. Gwilliam
1
1 Cape Cod National Seashore, 99 Marconi Sire Road, Wellfleet MA 02667
2 Cooperative Ecosystems Studies Unit, National Park Service, University of Rhode Island, Narragansett RI
02882 3 Graduate School of Oceanography, University of Rhode Island, Narragansett, RI 02882
INTRODUCTION
In cooperation with the Town of Provincetown, Federal Aviation Administration and
Massachusetts Aeronautics Commission, the National Park Service (NPS) has been
incrementally restoring tidal exchange to the diked portions of Hatches Harbor since
March of 1999. The overall objective of this project is to restore native salt marsh
functions and values to the tide-restricted wetland to the extent possible without
compromising safety at the Provincetown Municipal Airport.
After an hydrodynamic assessment, large culverts were installed through the Hatches
Harbor Dike by the NPS in the winter of 1998-99 to accommodate increased tidal flow.
These gated culverts have been opened in small increments each year (Table 1) to ensure
Airport safety from flooding and to control and adaptively manage ecosystem response.
Cape Cod National Seashore (CCNS) staff and cooperators have monitored system
response intensively since 1999, with base line data collected in 1997 before new culvert
construction.
This reports on physical and ecological monitoring undertaken in 2002 and summarizes
progress towards habitat restoration. Monitoring has included tide heights,
sedimentation, sediment-water quality, wetland vegetation, nekton (fin-fish and decapod
crustaceans) and mosquitoes within both natural (unrestricted) and diked portions of the
Hatches Harbor flood plain (Fig. 1). The 2002 sampling included all but nekton; see the
2000-2001 Annual Report for 1997-1999 nekton data. We plan to sample nekton again
in 2003.
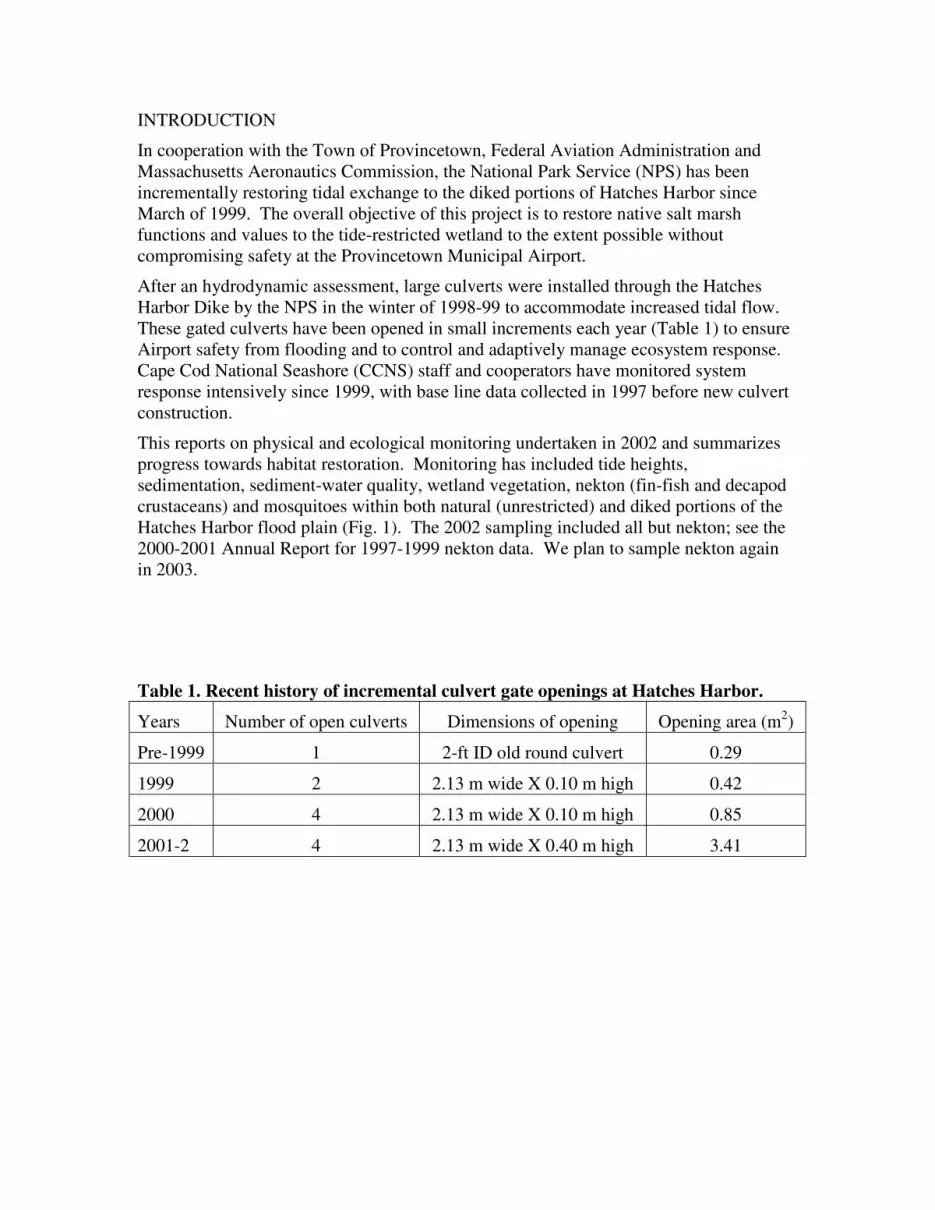
Table 1. Recent history of incremental culvert gate openings at Hatches Harbor.
Years Number of open culverts Dimensions of opening Opening area (m2)
Pre-1999 1 2-ft ID old round culvert 0.29
1999 2 2.13 m wide X 0.10 m high 0.42
2000 4 2.13 m wide X 0.10 m high 0.85
2001-2 4 2.13 m wide X 0.40 m high 3.41

Figure 1. Hatches Harbor salt marsh showing locations of tide gauges, transects for
vegetation and porewater sampling, and mosquito trapping stations.
Tide gauge
Mosquito trap
Vegetation plots along transects
TIDE HEIGHTS
Data loggers (YSI UPG6000) are installed on stable mounts on both sides (seaward and
landward) of the dike to record water depth and salinity in the principal tidal creek over
typically one-month deployments. The seaward station is about 10 m from the dike; the
landward station is about 300 m above the dike in the main creek draining the restricted
marsh. Depth transducers are referenced to m-MSL by differential leveling from local
benchmarks whose elevations are given in ft-MLW; ft-MLW units are converted to m-
MSL by subtracting half the tidal range for Provincetown (9.1 ft/2 = 4.55 ft) and dividing
by 3.28 (ft/m). Data are recorded at 15-min intervals.
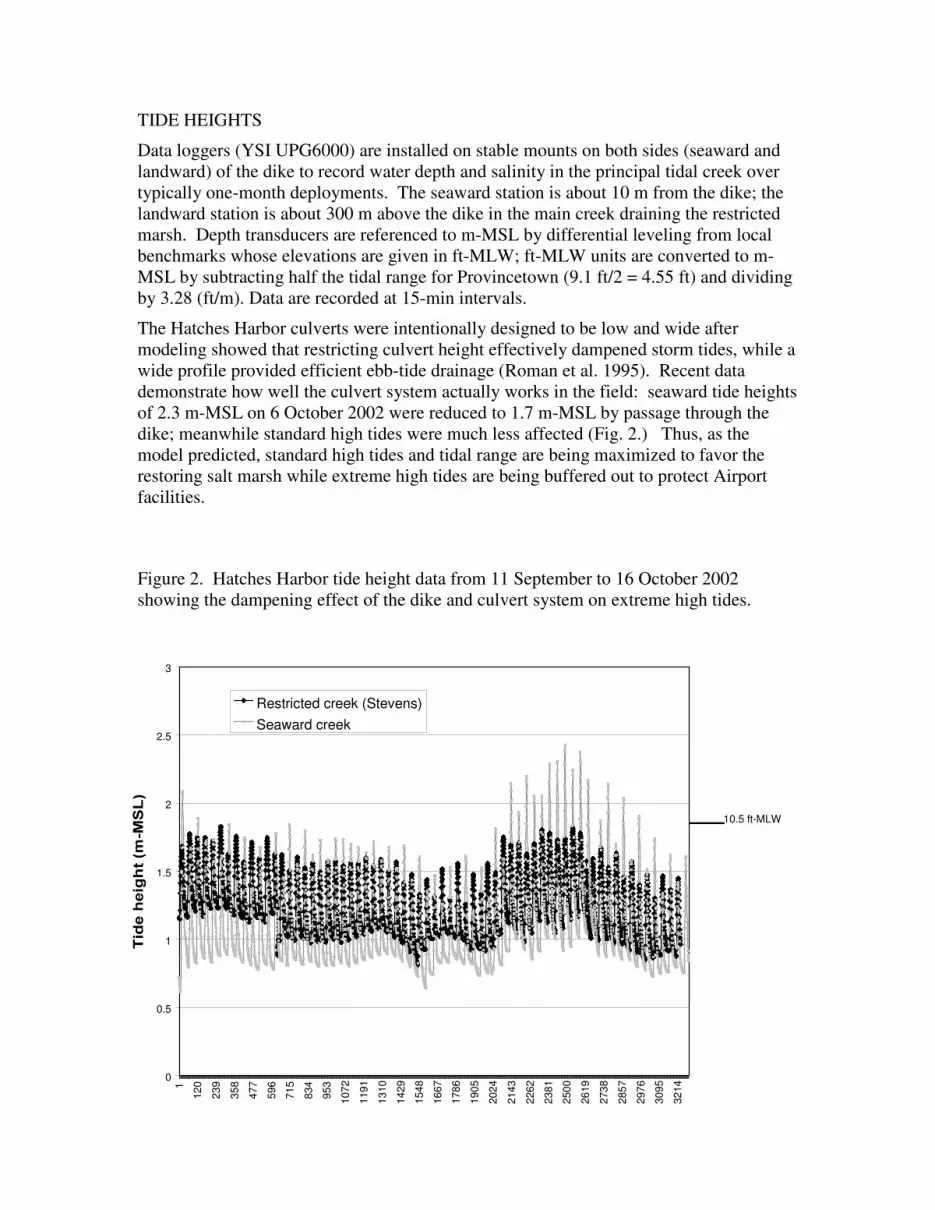
The Hatches Harbor culverts were intentionally designed to be low and wide after
modeling showed that restricting culvert height effectively dampened storm tides, while a
wide profile provided efficient ebb-tide drainage (Roman et al. 1995). Recent data
demonstrate how well the culvert system actually works in the field: seaward tide heights
of 2.3 m-MSL on 6 October 2002 were reduced to 1.7 m-MSL by passage through the
dike; meanwhile standard high tides were much less affected (Fig. 2.) Thus, as the
model predicted, standard high tides and tidal range are being maximized to favor the
restoring salt marsh while extreme high tides are being buffered out to protect Airport
facilities.
Figure 2. Hatches Harbor tide height data from 11 September to 16 October 2002
showing the dampening effect of the dike and culvert system on extreme high tides.
0
0.5
1
1.5
2
2.5
3
1
120
239
358
477
596
715
834
953
1072
1191
1310
1429
1548
1667
1786
1905
2024
2143
2262
2381
2500
2619
2738
2857
2976
3095
3214
Restricted creek (Stevens)
Seaward creek
10.5 ft-MLW

Table 2 summarizes all verified tide height data. Figure 3 presents mean high and low
tides from 1998 (pre-restoration) to the present relative to a typical restricted marsh
profile, i.e. Transect 2 running perpendicular to the main creek and about 300 m from the
dike. In general, high tide elevation has increased as expected with increased culvert
opening. Average high tides did not flood the marsh surface before the new culverts
were installed (1998). The initial 1999 opening of two of the new culverts 0.10 m raised
mean high tide about 6 cm. Notably, this replacement of the old circular 2-ft (0.61-m)
opening with the lower-profile and wider new culverts caused mean low to decrease 4
cm; thus, marsh drainage during low tide was enhanced. Opening all four culverts 0.10
m high in 2000 resulted in little change in either mean high or mean low tides.
The 2001 opening of all four culverts to 0.40 m has resulted in a substantial increase in
tide heights, with only a modest increase in mean low tide. This translates to a large
increase in the areal extent of wetland flooding during high tides, while still maintaining
good marsh drainage during low tides. The 18 cm increase in mean high between 2001
and 2002 (Fig. 3), when the culvert gates were unchanged, is unexplained: it may have
been due to 1) differential tidal forcing from Cape Cod Bay (undocumented) and/or 2) a
change in creek morphometry allowing more water to enter the upper creek system.
Tidal range in the restoring marsh is now about 60% that of unrestricted Hatches Harbor
(Table 2).
Figure 3. Typical wetland profile and recent history of mean high and low tide heights in
the restoring Hatches Harbor wetland.
0.8
0.9
1
1.1
1.2
1.3
1.4
1.5
1.6
1.7
1.8
-20 0 20 40 60 80 100 120 140 160 180 200 220 240 260 280 300
Distance from creek bank (m)
7.17
7.67
8.17
8.67
9.17
9.67
10.17
1998 mean high tide; pre-restoration
2001 mean high tide, 4 culverts open 40 cm
1998
1999 & 2000
2001 & 2002
Mean
Low
Tides
TRANSECT 2
1999 mean high, two culverts open 10 cm & 2000 mean high tide, 4 culverts open 10 cm
C
R
E
E
K
2002 mean high tide, 4 culverts open 40 cm

Table 2. Summary of tide height data from restricted (landward) and unrestricted (seaward)
portions of the Hatches Harbor main creek. Elevations are m-MSL.
Landward of dike Sampling interval
Mean high
Mean low Tide range (m)
2-ft culvert w/o flap 3/30-5/6/98 1.16 0.99 0.17
2 culverts open 10 cm May-Jun 1999
1.22 0.95 0.27
4 culverts open 10 cm 2/14-2/28/01
1.21 0.93 0.28
4 culverts open 40 cm 5/31-6/21/01
1.38 0.96 0.41
4/14-5/3/01 1.40 1.03 0.37
9/11-10/16/02
1.58 1.02 0.56
Seaward of dike 5/19-6/4/99 1.55 0.92 0.63
9/11-10/16/02
1.77 0.84 0.93
To represent hydroperiod within the vegetated wetland, tide heights are also monitored
over a spring-neap tide cycle during Aug-Sep within the wetland peat along Transect 2.
A critical variable affecting wetland plant vigor is the depth of dewatering and
consequent root-zone aeration during the growing season. Prior to tidal restoration, the
restricted wetland surface often remained flooded even through the low tide period; with
enlarged culverts, low-tide porewater levels have decreased substantially (Fig. 4). This,
together with increased salinity and low sulfide (see below) should encourage the re-
establishment and increase the vigor of salt marsh plants.
Figure 4. Low spring tide porewater levels along Transect 2 in the restoring Hatches
Harbor salt marsh, along with land surface elevation, 1997-2002
7.30
7.80
8.30
8.80
9.30
9.80
20 40 60 80 100 120 140 160 180 200 220 240
Distance from creek (m)
Ground
Porewater 1997
Porewater 1999
Porewater 2000
Porewater 2001
Porewater 2002
Spring Low Tide above Dike

SEDIMENT-WATER QUALITY
Along with water levels, salinity and sulfide have been monitored before restoration
(1997) and annually since 1999 in 10-cm-deep porewater in the vegetation plots of
Transect 2; see the 2000-2001 Annual Report for methods.
The objective of this monitoring is to document root-zone conditions for emergent
wetland plants. It is anticipated that increased salinity will stress Phragmites and
freshwater wetland vegetation and thereby favor the re-establishment and competitive
advantage of salt marsh grasses. Increased seawater supply should also increase sulfide
generation, but only if sediments remain waterlogged throughout the tide cycle.
Figure 5 presents mean salinity of typically 7-9 low-tide observations through the spring-
neap period in Aug-Sep of each year. Water of salinity > 20 ppt now penetrates the
wetland 240 m from the creek bank, with 30-33 ppt salinity up to 200 m.
Figure 5. Mean spring-neap salinity in 10-cm-deep porewater along Transect 2 in the
restoring Hatches Harbor salt marsh, 1997-2002.
0
5
10
15
20
25
30
35
40
0 20 40 60 80 100 120 140 160 180 200 220 240 260 280 300
Distance from creek (m)
1997
1999
2000
2001
2002
Transect 2B above dike
1 m-MSL
Land surface

Total sulfides in the root zone have been monitored along with salinity (Fig. 6). Sulfides
have remained consistently below 20µM throughout this wetland, or about 100 times
lower than many typical Cape Cod Bay salt marshes. This is expected with low low-tide
levels and an unusually highly permeable, low-organic-content peat that promotes the
drainage of water and entry of air into the root zone at low tide. Tidal restoration has not
increased waterlogging and, thus, sulfide concentrations, which remain about two orders
of magnitude below that likely to stress salt marsh plants. These observations, plus the
fact that sulfide analysis is time-consuming and generates hazardous waste, compel us to
suggest that routine sulfide monitoring at vegetation plots be terminated, except to
address specific research questions.
Figure 6. Mean spring-neap sulfide concentration in 10-cm-deep porewater along
Transect 2 in the restoring Hatches Harbor salt marsh, 1997-2002.
0.000
0.005
0.010
0.015
0.020
0.025
0.030
0.035
0.040
0.045
20 40 60 80 100 120 140 160 180 200 220 240
Distance from creek (m)
1997
1999
2000
2001
2002

VEGETATION PLOTS
With restoration of tidal flow to the Hatches Harbor salt marsh, it is expected that
vegetation of the tide-restored marsh will change dramatically from a Phragmites
australis and shrub-dominated brackish wetland to a Spartina-dominated marsh typical of
southern New England. Throughout the northeastern US, tides are being restored to tide-
restricted marshes and conversion of vegetation to Spartina marsh is being successfully
realized (e.g., Burdick et al. 1997, Roman et al. 2002, Warren et al. 2002).
At Hatches Harbor a long-term vegetation monitoring program has been established to
track the vegetation response to tidal restoration. The purpose of this report is to
summarize changes in the vegetation community that have occurred after 3 and 5 years of
tide restoration.
Methods
The fundamental study design follows a BACI (before, after, control, impact) approach,
with sampling of vegetation before tidal restoration and after restoration. The portion of
the marsh located downstream of the Hatches Harbor marsh, referred to as the tide-
unrestricted marsh, serves as a control. In the case of our BACI design, restoration of
tidal flow is the impact. With this approach it is possible to make several comparisons
aimed at determining, with statistical certainty, the response of vegetation to tidal
restoration. The following comparisons are presented in this summary report;
• 1997 Unrestricted Marsh vs. 1997 Tide-restricted Marsh
This represents conditions before any tidal restoration and will document the
effect that tidal restriction has had on marsh vegetation.
• 2000 Unrestricted Marsh vs. 2000 Tide-restored Marsh
2002 Unrestricted Marsh vs. 2002 Tide-restored Marsh
This sampling scheme represents 3 and 5 growing seasons of restored tidal flow
(2000 and 2002). With these comparisons, continuing for the long-term (e.g., 10
yrs of tide-restoration, 15 yrs of tide-restoration) it becomes possible to evaluate
the trajectory or direction of vegetation change. Over time, it is assumed that the
unrestricted and restoring marshes will become more similar.
• 1997 Tide-restricted Marsh vs. 2000 Tide-restored Marsh
1997 Tide-restricted Marsh vs. 2002 Tide-restored Marsh
This directly evaluates the response of the restoring marsh to re-introduced tidal
flow. Overtime, if restoration is successful there will be increases in typical salt
marsh species and decreases in brackish and woody species within the tide-
restored marsh.
• 1997 Unrestricted Marsh vs. 2000 Unrestricted Marsh
1997 Unrestricted Marsh vs. 2002 Unrestricted Marsh
2000 Unrestricted Marsh vs. 2002 Unrestricted Marsh
It is important to document vegetation changes of the control marsh overtime. If
after tidal restoration, vegetation changed within the tide-restored marsh, but the
control marsh vegetation did not change, then it can be suggested with some
certainty that the changes in the tide-restored marsh were due to increased tidal
flow and not some other factors. Over the long-term (decades), it is expected
that vegetation of the control marsh will change in response to sea-level rise,
altered hydrology, and other factors; however, vegetation changes in the tide-
restored marsh are expected to occur more rapidly.
A detailed presentation of field and data analysis methods are provided in the Seashores
salt marsh vegetation monitoring protocol (Roman et al. 2001) and will only be briefly
described here. Permanent 1 m2 vegetation plots were established in a stratified-random
manner throughout the unrestricted marsh and tide-restricted marsh and initially sampled
in summer 1997. Follow-up monitoring occurred in summer 2000 and summer 2002. In
each plot, vegetation species composition and abundance (cover) were estimated by the
point-intercept method. The vegetation plot data were analyzed by Analysis of
Similarity (ANOSIM), a non-parametric procedure aimed at comparing the similarity (or
dissimilarity) between groups of community data (e.g., tide-restricted vs. tide-restored).
A multivariate community ordination technique, detrended correspondence analysis, was
also used to document vegetation community changes. The analyses were performed on
37 permanent plots in the unrestricted marsh and 74 tide-restricted/tide-restored plots. It
is noted that when the vegetation plots were originally established in 1997, several plots
in the tide-restricted marsh included higher elevation remnant dune areas, dominated by
Deschampsia flexuosa. These plots are not likely to be influenced by increased tidal
flooding because of their elevation, and thus, have been eliminated from the analyses.
RESULTS AND DISCUSSION
General Species Composition: Just five marsh plants are encountered within the Spartina
alterniflora dominated unrestricted salt marsh (S. alterniflora, S. patens, Salicornia sp.,
Limonium nashii, Sueada maritima). Two species of brown macroalgae also contributed
substantially to cover within the unrestricted marsh (Ascophyllum nodosum and Fucus
vesiculosus). Over 80 species of vascular plants were found within the tide-
restricted/tide-restored marsh.
Community Analysis: Following the BACI study design, numerous comparisons were
made (Table 3). As expected, vegetation of the 1997 unrestricted and 1997 tide-restricted
marsh was significantly different. After 2 years of tidal restoration, there were no
significant changes detected, probably because of the small initial openings of the new
culverts. By 2002, however, after 5 years of tidal restoration, significant changes were
detected in the tide-restored marsh. [Note that despite these changes, even after 2 and 5
years of tidal restoration, vegetation above and below the dike structure remained
distinctly different.] Vegetation in the unrestricted control marsh remained similar
among sampling years, suggesting that the plant community changes in the tide-restored
marsh were related to tidal restoration activities and not some other factors (Table 3).

Table 3. Results of one-way ANOSIM tests for pair-wise comparisons of vegetation
data. Bonferroni adjusted alpha = 0.05/7 comparisons = 0.007.
Comparisons p Value
Unrestricted vs. tide-restricted or restored
Unrestricted 97 vs. Restricted 97
Unrestricted 00 vs. Restored 00
Unrestricted 02 vs. Restored 02
0.001
0.001
0.001
Tide-restricted vs. Tide-restored
Restricted 97 vs. Restored 00
Restricted 97 vs. Restored 02
0.04 (NS)
0.001
Unrestricted Control Marsh
1997 vs. 2000
1997 vs. 2002
0.36 (NS)
0.17 (NS)
Aside from knowing that the vegetation community of the tide-restored marsh changed
after 5 years of restored tidal flow, it is of interest to know which plant species
contributed most significantly to this difference. Table 4 shows that the dissimilarity in
vegetation from 1997 tide-restricted to 2002 tide-restored conditions was mostly
attributed to a decrease in brackish marsh species, such as purple loosestrife (Lythrum
salicaria) and soft rush (Juncus effusus), as well as some woody vegetation (e.g.,
blackberry, Rubus and bayberry, Myrica pensylvanica). It is not surprising that with
increases in soil salinity and flooding duration, these species are beginning to die-back. It
is also noted that the salt marsh species, black grass (Juncus gerardii), also deceased in
cover with tidal restoration. Black grass typically grows at the upland border of marshes
or at higher elevations and is intolerant of prolonged high soil salinities.

Table 4. Individual cover types contributing most to dissimilarities noted between the
1997 tide-restricted and 2002 tide-restored marsh. Cover class data are
presented as the mean of five ordinal ranked classes (1 = <1-5%, 2 = 6-25%, 3
= 26-50%, 4 = 51-75%, 4 = >75%). Cover types cumulatively contributing up
to 70% of the dissimilarity are presented.
Cover Type Mean % Cover Class %
Dissimilarity
97 Restricted 02 Restored
Spirea alba 0.94 0.16 9.9
Lythrum salicaria 0.90 0.14 9.4
Rubus sp. 1.70 0.96 8.9
Myrica pensylvanica 1.22 0.48 8.9
Euthamia tenuifolia 0.86 0.19 7.3
Juncus effusus 0.82 0.23 5.6
Carex sp. 0.73 0.16 5.3
Myrica (DEAD) 0.13 0.67 5.1
Holcus lanatus 0.79 0.27 4.4
Juncus gerardii 0.84 0.34 4.1
One of our restoration objectives is for the vegetation of the tide-restored marsh to
approach that of the unrestricted control marsh. As stated above, vegetation of the tide-
restored marsh after 2 and 5 years of tide restoration remained significantly different
from the unrestricted control marsh (Table 3); nevertheless, it is possible to demonstrate
the current trajectory of vegetation change. To do this, a measure of dissimilarity based
on the Euclidean distance metric (Dmax) was calculated (Table 5). As Dmax diminishes
toward zero the unrestricted and tide-restored marshes are becoming more similar. In
1997 with no tide restoration and in 2000 with just limited tide restoration, dissimilarity
between the marshes remained high as reflected in Dmax. However, after 5 years of tide
restoration Dmax diminished toward zero, confirming that the vegetation is changing in an
expected direction (i.e., reduction in brackish and woody species).
Table 5. Dmax, an overall measure of dissimilarity between the unrestricted and tide-
restricted or tide-restored marsh, demonstrates that the tide-restored marsh is
becoming more similar to the unrestricted control marsh. As Dmax diminishes
toward zero the marshes are becoming more similar.
Comparisons Dissimilarity (Dmax)
Unrestricted 97 vs. Tide-restricted 97 32
Unrestricted 00 vs. Tide-restored 00 35
Unrestricted 02 vs. Tide-restored 02 16

At this early stage of tidal restoration it is impossible to predict if the tide-restored marsh
vegetation will ever be statistically similar to the unrestricted control marsh. Because the
tide-restored marsh is located upstream of the unrestricted control marsh, similarity may
not be achieved; but it is expected that the vegetation of the restored marsh will change in
a trajectory toward the control marsh. Therefore, the trajectory of change becomes an
important indicator of restoration success.
In addition to ANOSIM, the Hatches Harbor marsh vegetation data were analyzed by the
ordination technique, Detrended Correspondence Analysis (DCA). Kent and Coker
(1992) and Roman et al. (2001) provide detailed descriptions of ordination techniques
including DCA. Ordination represents an objective means of ordering or arranging a
multidimensional vegetation data set into fewer dimensions (e.g., a 2-axis plot) such that
any pattern that the data possess becomes more apparent. Figure 7 is a DCA ordination
plot, with each point on the plot representing an individual 1-m2 quadrat collected from
the 1997 tide-restricted, 2000 tide-restored, or 2002 tide-restored marsh. Each quadrat
has a different species composition and abundance resulting in a very complex data set,
but as noted from the DCA diagram this complexity is arranged along a gradient.
Quadrats with similar vegetation (in terms of species composition and abundance) are
plotted close together, while dissimilar quadrats are far apart. On the far right side of the
ordination diagram are quadrats composed of low marsh cover types (e.g., S. alterniflora,
open water). On the very left side there is a large grouping of quadrats primarily
composed of woody and brackish wetland species. The quadrats at opposing ends of the
plot are very different, with a gradient of communities in between, including Phragmites
marsh and high marsh (e.g., S. patens).

0
100
200
300
400
500
600
700
0 100 200 300 400 500 600 700 800
Axis 1
Ax
is 2
1997 Tide-Restricted
2000 Tide-Restored
2002 Tide-Restored
Figure 7. Ordination diagram by Detrended Correspondence Analysis of vegetation
quadrats from Hatches Harbor tide-restricted/tide restored marsh. Individual 1-
m2 plots are shown. The plots fall along a gradient from woody and brackish
vegetation to the distinctly different Low Marsh characterized by S. alterniflora
and open water cover types. Also shown for some individual plots are time-
trajectory lines (arrows) indicating change in the vegetation of the identical plot
from 1997 to 2000 to 2002. Three plots are tracked over time (solid arrow, plot
4B160; coarse dash, plot 1B160; light dash, plot 1A40).
In terms of documenting temporal trends or trajectories in vegetation, ordination
techniques, like DCA, are especially valuable tools (Austin 1977). Time trajectories
(1997 pre-restoration to 2000 post-tidal restoration to 2002 post-tidal restoration) for
several individual vegetation quadrats are plotted and it is clearly demonstrated that the
vegetation is changing as expected. Plot 4B160, located 160m from the tidal creek of the
tide-restored marsh, was characterized by Rubus and Juncus effusus in 1997, changed
little after 2 years of tide restoration in 2000, but after 5 years of tide restoration (2002)
the plot was dominated by S. patens, clearly demonstrating a shift in vegetation as
expected. Plot 1A40, just 40 m from the creek and exposed to greater tidal influences,
changed from Juncus gerardii/S. patens in 1997 to S. alterniflora-dominated in 2002. It
is also noted that some plots, like 1B160 changed less dramatically, but this Phragmites-
dominated plot in 1997 was characterized by dead Phragmites in 2000 and 2002.
Application of multivariate vegetation analysis techniques, like ordination, will be
instrumental in documenting these changes and better understanding the processes
associated with vegetation recovery.

TRENDS IN PHRAGMITES AUSTRALIS POPULATIONS
Methods
Percent area-cover by plant species was determined using the point-intercept method
(Roman et al. 2001) in July-August of 1998, 2000, and 2002. In October 1998, the stems
of all Phragmites australis plants in transect 2 plots were counted and their heights
measured to the nearest cm. The same data were collected in October 2002, but in all
plots (i.e., transects 1-9). Live (growing season) P. australis biomass was then estimated
from these parameters based on regressions developed by Thursby et al. (2002).
Cover
From 1998 to 2002, % cover of P. australis decreased in 32 of 103 plots in the tidally
restricted portion of the marsh (i.e., transects 1-6). However, an increase in cover was
observed in 27 plots. Moreover, the mean values of both positive and negative change
were similar, suggesting zero net change in the cover of P. australis from a whole marsh
perspective.
Trend No. plots Mean value of change (% cover)
no change 0
negative 32 -32
positive 27 +27
Further analysis, however, revealed a strong spatial component underlying cover changes
along individual transects. Cover tended to decline in plots closer to the main tidal creek,
but increased or changed very little in plots distant from the creek (Figure 8). In general,
zones of high P. australis cover shifted up-gradient, away from the influence of tide
water. The most notable exceptions to this pattern occurred at 0 m (creek edge), where
the positive value is due solely to an increase in P. australis cover at plot 6A/B-0, which
is the furthest plot from the culverts in that distance category and receives much lower
inputs of seawater.

All - transects
2
44
4
4
5
5
51
6
1
5
2
6
2
6
3
848
78
-25
-15
-5
5
15
25
35
0
40
80
120
160
200
240
280
360
420
480
560
distance from creek (m)
change in
P. austr
alis
cover
(%)
Figure 8. Average percent change from 1998 to 2002 in P. australis cover with distance
away from the tidal creek (numbers above histograms represent no. of plots in each
distance category).
Biomass
The mean estimated biomass of P. australis along transect 2 (all plots pooled) was
significantly lower in 2002 than in 1998 (F= 73.8; p<0.001; T-test) (Figure 9). When all
data were plotted against distance from the creek, no clear relationship emerged. When
analyzed as separate transects, however, it became evident that distance was a significant
correlate. For example, plots ranging between 0 and 100 m from the creek frequently
exhibited large reductions in biomass while plots further away (>100 m) showed
relatively small increases, decreases, or remained unchanged (Figure 10). Two-way
ANOVA of stem height data along transect 2 (for which there were multiple values for
each plot) similarly demonstrated that both time (F=140.7, p<0.001) and distance
(F=25.5, p<0.001) exerted significant independent and interactive effects on P. australis
biomass. In this regard, major reductions in stem height occurred in plots between 0 and
100 m while more distant plots showed comparatively minor variation or static responses.

Transect 2
0
200
400
600
800
1000
Oct-98 Oct-02
est. b
iom
ass (
kg/m
2)
Figure 9. Mean biomass of P. australis in 1998 and 2002 (all plots, all transects)
Transect - 2
0
500
1000
1500
2000
2500
3000
3500
4000
2B
-0
2B
-20
2B
-40
2B
-60
2B
-80
2B
-100
2B
-120
2B
-140
2B
-160
2B
-180
2B
-200
2B
-220
2B
-240
2B
-260
2B
-280
2B
-320
2B
-360
2B
-400
2B
-440
2B
-480
2B
-520
2B
-560
plot
est. b
iom
ass (
g/m
2) Oct-98
Oct-02
Figure 10. Biomass of P. australis in 1998 and 2002 along transect 2.
Influence of physico-chemical factors
Porewater samples collected from a subset of plots along transect 2 were analyzed for
salinity, nutrients, pH, conductivity, iron, and sulfides. Plot elevations were determined
in a 1998 survey and depth to water during low tide over the spring neap period was
recorded in 2002. Multiple regression of biomass against these parameters revealed that
the average 4-year salinity value (1998-2002), average depth to water during spring neap
tide, and elevation comprised the best subset of predictor variables. In this relationship,
both mean salinity and elevation were negatively correlated with biomass while depth to
water was positively correlated (BIO = 4436 - 69*[mean salinity] + 344*[depth to water]
-2328*[elevation]; r2=0.77). However, a curvilinear regression of biomass vs. mean
salinity produced a higher r2 value (0.78), suggesting that long-term salinity conditions
can be used alone as a reliable indicator of P. australis vigor in this system (Figure 11a).
Mean stem height, the heights of the tallest 5 stems, and percentage of stems bearing an
inflorescence also showed good inverse relationships with salinity (Figure 11b,c)

Transect 2
R2 = 0.7857
0
200
400
600
800
1000
1200
1400
0 10 20 30
Mean salinity (97-02)
est. b
iom
ass (
g/m
2)
Transect 2
R2 = 0.803
0
50
100
150
200
250
0 10 20 30 40
Mean salinity (97-02)
mean s
tem
heig
ht (c
m)
A. B.
Transect 2
R2 = 0.7211
0
50
100
150
200
250
300
0 10 20 30 40
Mean salinity (97-02)
mean h
eig
ht of 5 talle
st
ste
ms (
cm
)
Transect 2
R2 = 0.6547
0%
20%
40%
60%
80%
100%
0 10 20 30
Mean salinity (97-02)
% flo
wering (
Oct-
02)
C. D.
Figure 11. Regressions of a) biomass, b) mean stem height, c) mean height of 5 tallest
stems, and d) % flowering stems of P. australis vs. mean salinity (98-02).
Discussion
An important finding of this work is that the overall vigor (as indicated by estimates of
standing live biomass) of P. australis is not well represented by point-intercept cover or
stem densities. Cover and stem densities also were poorly correlated with the salinity
gradient along transect 2, in contrast to stem height and biomass (Figure 11). While
measures of abundance in the horizontal plane provide very useful information on
community composition and changes therein, they do not characterize the vertical
structure of vegetation - a critical aspect of P. australis stands given their ability to attain
heights exceeding 3 m under optimal growing conditions. Accordingly, measurements of
stem height should be incorporated into all future monitoring of this species.
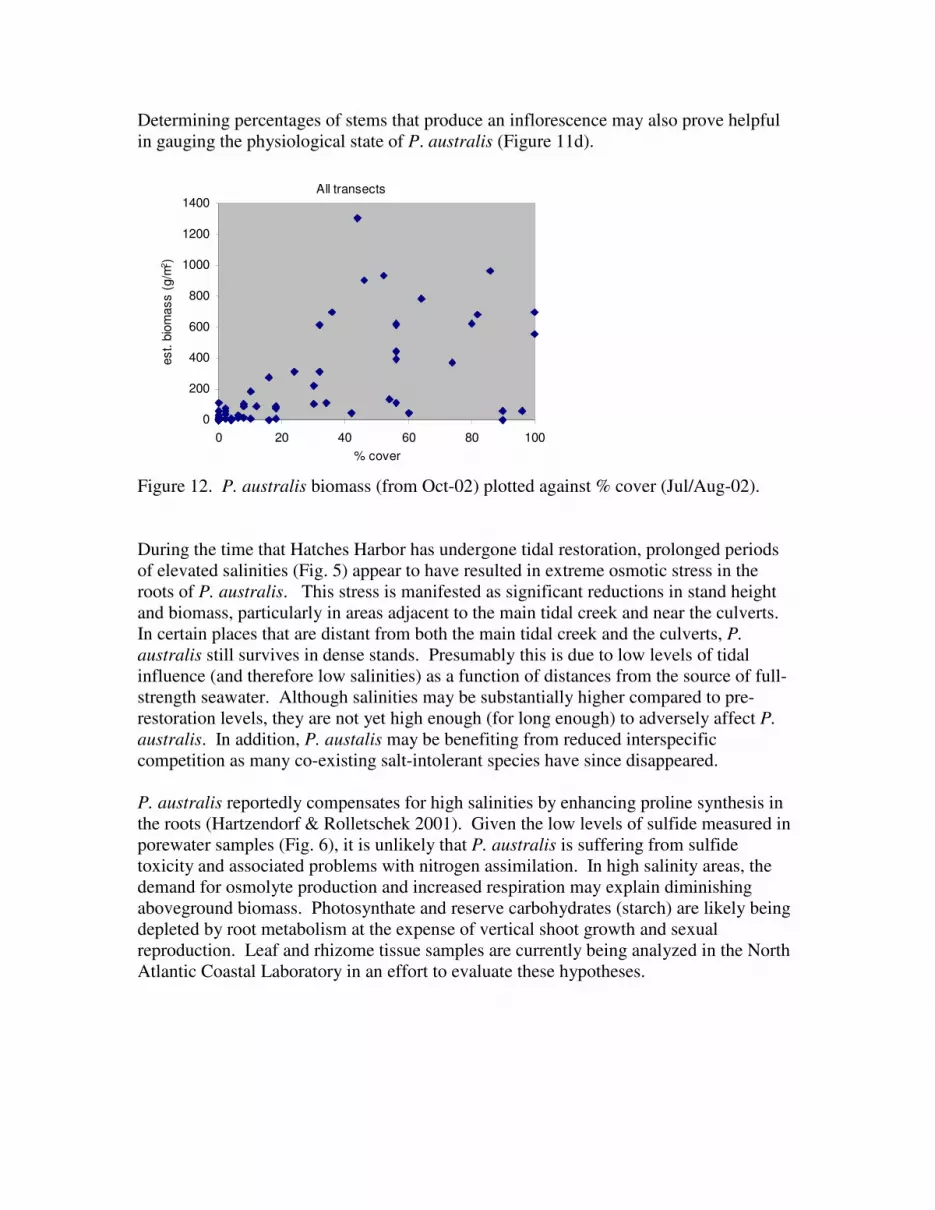
Determining percentages of stems that produce an inflorescence may also prove helpful
in gauging the physiological state of P. australis (Figure 11d).
All transects
0
200
400
600
800
1000
1200
1400
0 20 40 60 80 100
% cover
est. b
iom
ass (
g/m
2)
Figure 12. P. australis biomass (from Oct-02) plotted against % cover (Jul/Aug-02).
During the time that Hatches Harbor has undergone tidal restoration, prolonged periods
of elevated salinities (Fig. 5) appear to have resulted in extreme osmotic stress in the
roots of P. australis. This stress is manifested as significant reductions in stand height
and biomass, particularly in areas adjacent to the main tidal creek and near the culverts.
In certain places that are distant from both the main tidal creek and the culverts, P.
australis still survives in dense stands. Presumably this is due to low levels of tidal
influence (and therefore low salinities) as a function of distances from the source of full-
strength seawater. Although salinities may be substantially higher compared to pre-
restoration levels, they are not yet high enough (for long enough) to adversely affect P.
australis. In addition, P. austalis may be benefiting from reduced interspecific
competition as many co-existing salt-intolerant species have since disappeared.
P. australis reportedly compensates for high salinities by enhancing proline synthesis in
the roots (Hartzendorf & Rolletschek 2001). Given the low levels of sulfide measured in
porewater samples (Fig. 6), it is unlikely that P. australis is suffering from sulfide
toxicity and associated problems with nitrogen assimilation. In high salinity areas, the
demand for osmolyte production and increased respiration may explain diminishing
aboveground biomass. Photosynthate and reserve carbohydrates (starch) are likely being
depleted by root metabolism at the expense of vertical shoot growth and sexual
reproduction. Leaf and rhizome tissue samples are currently being analyzed in the North
Atlantic Coastal Laboratory in an effort to evaluate these hypotheses.

MOSQUITOES
The species composition and abundance of floodwater-breeding in coastal marshes is
affected by salinity, flooding duration and areal extent, and access to breeding sites by
(primarily fish) predators. The objective of mosquito monitoring at Hatches Harbor is to
assess whether changes in hydrography caused by the tidal restoration affect mosquito
species composition and abundance.
Adult mosquitoes have been monitored throughout July and August from 1997 through
2002 using light/CO2 traps set at least biweekly in three general habitats within the
Hatches Harbor flood plain (Fig. 1): at the dike, at the end of the taxiway, and at the
airport terminal. The dike station is surrounded by saline breeding habitat. The taxiway
was until 1999 surrounded by seasonally flooded freshwater wetlands; where since April
2001 salinity and flooding frequency have increased sharply. Trapping at the airport
terminal represents the upstream and freshest end of the estuarine gradient; it is the
location where most people and mosquitoes meet, i.e. the most likely location within the
system of a mosquito nuisance. Two traps are set in each location in the late afternoon
and retrieved in early morning. Trapped adult mosquitoes are identified and counted by
species.
Prior to 2001, adult mosquitoes were predominantly brackish- and freshwater-breeding
species whose annual abundance appeared to correlate with precipitation, especially Jun-
Aug rainfall (Fig. 13). This is consistent with tide height observations (Fig. 3) that
indicate little tidal flooding of the wetland surface; i.e. floodwater breeding before 2001
was dependent on precipitation, not tidal flooding. This mode of flooding would result in
low surface-water salinity, thus, the preponderance of brackish and freshwater, rather
than salt marsh, mosquitoes (Ochlerotatus sollicitans).
In April 2001 effective culvert opening was increased four fold causing increased tide
heights (Fig. 3); consequently, much more water of much higher salinity reached and, in
places, remained for weeks on the wetland surface. This appears to have caused a
qualitative change in mosquito breeding ecology: in that summer , very high numbers of
brackish-water breeders (Ochlerotatus cantator) were captured. In 2002, high captures
of both brackish and saltwater-breeding species (O. sollicitans) followed still more
extensive and higher-salinity flooding (Fig. 13).
Statistical comparisons (Analysis of Variance, P=0.05) of inter-annual trap collections by
habitat and species show significant increases in brackish-breeding species (O. cantator)
at the airport taxiway and terminal stations in 2001, and in saltwater-breeding species (O.
sollicitans) at the taxiway and dike stations in 2002. This sequence of brackish- and then
saltwater-breeding mosquitoes corresponded with the step-wise increase in the extent of
seawater flooding of the wetland surface. Species that breed in freshwater habitats
(Coquilletidia perturbans and O. canadensis) have significantly declined since 1998.
Specific breeding sites within the Hatches Harbor flood plain are being studied by the
Cape Cod Mosquito Control Project (CCMCP), who will report on findings at the
December 2002 Technical Review Committee meeting; however, adult trapping results
and casual observations of the occurrence of chronic standing water suggest that most
intensive breeding is in low areas just seaward (southwest) of the Airport taxiway. Trap

Figure 13. Hatches Harbor mosquito collections by breeding habitat (top panel) and
outer Cape Cod spring-summer precipitation, 1997-2002.
0
200
400
600
800
1000
1200
1997 1998 1999 2000 2001 2002
Saline floodwater
Brackish floodwater
Fresh floodwater
Freshwater ponds
All stations
New culverts
0
50
100
150
200
250
300
350
400
450
1997 1998 1999 2000 2001 2002
Mar-May
Jun-Aug

counts are nearly always highest at the end of the taxiway. The wetland in this area is
typically flooded for long periods between spring tides. Floodwater is often
topographically isolated (“land-locked”) hindering predatory fish access via tidal creeks.
Importantly, the topography of this area has very likely been artificially altered by
subsidence and dune migration during the nearly 70 years of blocked tidal flow (1930 to
1999); therefore, high mosquito production may be an artifact of human disturbance to
wetland hydrography and sedimentation. Historical aerial photographs (1938, 1947)
seem to show a shallow creek system connecting this area with the main tidal creek; with
the dike’s elimination of surface tidal flow, it appears that the old tributary creek has
since filled with wind-blown sand. With this perspective, it may be consistent with
restoration project goals to re-establish creeks ditch through these low swales to improve,
and probably restore, tidal exchange and fish access (Tyler & Zieman 1999, Williams et
al. 2002). The remoteness of this area from human habitation argues against creek
construction strictly for the purpose of nuisance mosquito control. Moreover, note that
brackish species were abundant at the Airport terminal in 2001, but less so in 2002; salt
marsh mosquitoes were scarce here in both years (Fig. 14).
Figure 14. Mosquito collections at the Provincetown Airport Terminal area, 1997-2002.
0.0
200.0
400.0
600.0
800.0
1000.0
1200.0
1997 1998 1999 2000 2001 2002
Saline floodwater
Brackish floodwater
Fresh floodwater
Freshwater ponds
Mosquitoes at Airport Terminal
New culverts

CONCLUSIONS
Tide heights
• Tide heights and tidal range have increased substantially in the restricted marsh
without exceeding the critical flooding threshold at the Airport.
• Tide heights in the restoring marsh are now about 60% those of unrestricted Hatches
Harbor.
• Low tide elevations remain low, facilitating peat drainage at low tide.
Sediment-water quality
• Nearly full-strength seawater (30 ppt) is penetrating typically 200 m into previously
Phragmites-dominated plant communities.
• Porewater sulfides remain extremely low, are not likely to affect plant growth, nor to
increase given continued efficient drainage, and can therefore probably be
discontinued from regular monitoring.
Vegetation
Based on an analysis of over 100 permanent 1-m2 vegetation plots, sampled before tidal
restoration in 1997, and then 2 and 5 growing seasons after tidal restoration (2000 and
2002, respectively), the Hatches Harbor marsh is responding to increased tidal flow as
expected.
• Woody (e.g., Myrica), thicket (e.g., Rubus) and brackish-water species (e.g.,
Lythrum, Juncus effuses) are decreasing in relative abundance throughout the
tide-restoring marsh, resulting in a statistically different vegetation community
from 1997 tide-restricted to 2002 tide-restored.
• Vegetation of the tide-restored marsh remains quite different from the
unrestricted control marsh; however, it is demonstrated that the tide-restored
vegetation is changing in a direction or trajectory that is similar to the Spartina-
dominated control marsh.
• Salinity stress to Phragmites is manifested as significant reductions in stand
height and biomass, particularly in areas adjacent to the main tidal creek and
near the culverts.
• In certain places that are distant from both the main tidal creek and the culverts,
P. australis still survives in dense stands.
The restoration process at Hatches Harbor is in the initial stages and it may take decades
for the complete benefits of tidal restoration to be realized, but it is encouraging to note
that vegetation is changing as expected. Monitoring vegetation by the permanent plot
method is tedious, but the method enables investigators to track very subtle changes in
vegetation and to quantify those changes with statistical certainty. Permanent plot
vegetation monitoring should continue at 5-yr intervals, thereby producing a data set that
will enhance our understanding of the marsh restoration process, increase our ability to
predict vegetation responses to tidal restoration, and provide useful information for
coastal managers engaged in marsh restoration at other sites.

Mosquitoes
• Brackish and salt marsh mosquito production has increased as higher high tides have
increased flooding extent and salinity on the wetland surface.
• Increased breeding appears to be focused on swales that flood with tidal water just
southwest of the Airport taxiway. Because these swales may be an artifact of diking,
creek construction to improve tidal exchange is an adaptive management option that
may improve tidal exchange, expedite habitat restoration, ease fish access and reduce
floodwater mosquito production.
PLANS FOR 2003
• Continue tide height, sediment-water salinity and mosquito monitoring.
• Repeat nekton monitoring conducted previously in 1997-8, before restoration, and in
1999. We anticipate a major change in nekton use of the marsh since tide heights and
the extent of wetland flooding were increased dramatically in 2001.
• Collect sediment cores and quantitatively describe physical and chemical peat
characteristics at vegetation plots.
• Continue to monitor Phragmites survival and vigor in the restricted, now restoring,
marsh.

LITERATURE CITED
Austin, M.P. 1977. Use of ordination and other multivariate descriptive methods to study
succession. Vegetatio 35: 165-175.
Burdick, D.M., M. Dionne, R.M. Boumans, and F.T. Short. 1997. Ecological responses to
tidal restorations of two northern New England salt marshes. Wetlands Ecology and
Management 4: 129-144.
Hartzendorf, T. and H. Rolletschek. 1999. Effects of NaCl-salinity on amino acid and
carbohydrate metabolism of Phragmites australis. Aquatic Botany 69:195-208.
Kent, M. and P. Coker. 1992. Vegetation Description and Analysis: A Practical
Approach. John Wiley & Sons.
Roman, C.T., R.W. Garvine & J.W. Portnoy. 1995. Hydrologic modeling as a predictive
basis for ecological restoration of salt marshes. Environ. Manage. 19:559-566.
Roman, C.T., M.J. James-Pirri, and J.F. Heltshe. 2001. Monitoring salt marsh vegetation.
Technical Report: Long-term Coastal Ecosystem Monitoring Program at Cape Cod
National Seashore, Wellfleet, MA. 47p. (available at:
http://www.nature.nps.gov/im/monitor/protocoldb.cfm)
Roman, C.T., K.B. Raposa, S.C. Adamowicz, M.J. James-Pirri, and J.G. Catena. 2002.
Quantifying vegetation and nekton response to tidal restoration of a New England salt
marsh. Restoration Ecology 10: 450-460.
Thursby, G.B., M.M. Chintala, D. Stetson, C. Wigand, and D.M. Champlin. 2002. A
rapid, non-destructive method for estimating aboveground biomass of salt marsh grasses.
Wetlands 22(3):626-630.
Tyler, A.C. & J.C. Zieman. 1999. Patterns of development in the creekbank region of a
barrier island Spartina alterniflora marsh. Mar. Ecol. Prog. Ser. 180:161-177.
Warren, R.S., P.E. Fell, R. Rozsa, A.H. Brawley, A.C. Orsted, E.T. Olson, V. Swamy,
and W.A. Niering. 2002. Salt marsh restoration in Connecticut: 20 years of science and
management. Restoration Ecology 10: 497-513.
Williams, P.B., M.K. Orr & N.J. Garrity. 2002. Hydraulic geometry: A geomorphic
design tool for tidal marsh channel evolution in wetland restoration projects. Restoration
Ecol. 10:577-590.


