Embed Size (px)
Citation preview
Working Paper
444
THE MOBILE COMMUNICATIONS SERVICES
INDUSTRY IN INDIA: HAS IT LED TO INDIA
BECOMING A MANUFACTURING HUB FOR
TELECOMMUNICATION EQUIPMENTS?
Sunil Mani
April 2011

Working Papers can be downloaded from the
Centre’s website (www.cds.edu)

THE MOBILE COMMUNICATIONS SERVICES INDUSTRY ININDIA: HAS IT LED TO INDIA BECOMING A
MANUFACTURING HUB FOR TELECOMMUNICATIONEQUIPMENTS?
Sunil Mani
April 2011
This is actually a continuation of the arguments set out and the evidencepresented in Mani (2008) wherein the implications of the growth inIndian telecommunications services for its domestic telecom equipmentindustry up to 2007 was explored. An earlier version of this paper waspresented at the international workshop, “Celling South Asia: TheMobile Phone’s Impact on a Region” at Institute of South Asian Studies,National University of Singapore, Singapore during February 17-182011. Thanks are due to the comments received at this workshop. FurtherI am extremely grateful to R Nagaraj for reading through successivedrafts very carefully and alerting me to some errors in the level of GrossValue Added in Communication Equipment as reported in CSO (2010).This alert has rescued the paper from drawing some erroneous conclusions.As usual, I thank,V S Sreekanth for his excellent research assistance.The usual disclaimer holds good.
4
ABSTRACT
The growth performance of the Indian mobile communications servicesindustry is now reasonably well recorded. It is one of the few industries in Indiawhich has travelled significantly from being a monopolistic and somnolent industryfrom the innovation point of view to an extremely competitive and technologicallyspeaking dynamic industry. This is despite the fact that it’s very recent history hasbeen punctuated by a few financial scams of sorts essentially due to the discretionarypowers still wielded by the government in allocating the much needed spectrumand so on. Also notwithstanding the very recent distinction that is made betweenactive users and the total number of subscribers (the former is only 70 per cent ofthe latter); the industry has witnessed a phenomenal increase in the length andindeed breadth of its coverage. There is also quantitative evidence to show that theextent of urban-rural divide too is on the decline. India now has one of the mostcompetitive telecom services in the world and this has positive implications for itsoutsourcing industry where significant decline in communications costs istremendously helpful for making this industry too remaining competitive whenother factor prices have been showing an increasing trend. While all these augurwell, questions had been raised about the ever rising trade balance in telecomequipments as the phenomenal growth of new subscribers that are added permonth (in 2010 it averaged 18 million new subscribers per month) was met withequal amount of equipment imports. The increasing share of equipment importswas due to the weak manufacturing base that India possessed; ironic though astelecom equipment production was one of the first manufacturing industries thatthe Indian state had sought to develop through explicit state participation right afterindependence. Subsequently the state even attempted to craft a sectoral system ofinnovation in the telecom equipment industry. However none of these effortsresulted in India being successful in establishing a manufacturing hub. In thecontext the paper argues that the growth of market for telecom equipmentsprecipitated by the growth of services has jump started an extremely dynamicmanufacturing industry, especially over the last five years or so. The dynamism ofthe industry can be gauged from the fact that for the first time, India has a positivetrade balance in mobile handsets facilitated by India emerging as a manufacturingand export base for cheaper handsets. Although the industry is dominated byMNCs, domestic firms have started making an entry into domestic manufacturingand indeed in innovations as well. However there is some evidence to show thatmost of the manufacturers are now more of assemblers of imported parts andcomponents than manufacturers per se. This unique story of growth in servicesleading to the emergence of a manufacturing industry is the focus of attention and
analysis in this paper.
JEL Classification: L96;O25;O38
Key words: telecommunications, fixed, mobile, telecom equipment, India
5
Introduction
India’s telecommunications industry is considered to be one of
the more successful stories of Indian liberalisation attempt. This is
indicated by the fact that the country has one of the cheapest and state-
of-the-art telecom services anywhere in the world. The density of
telephones in the country has increased from just 0.60 telephones per
100 people in 1991 to about 66 per 100 in 2010. Although the access to
telecom services have actually increased, it has not been across the board,
but concentrated largely in urban centres leading to a growing “urban-
rural divide” within the country with much of the rural areas being left
out of this revolution. There is of course evidence to show that the
urban-rural divide is now declining and the industry by its sheer size
and rate of growth has become an important contributor to India’s GDP
growth. The market for telecom services is actually giving rise to a large
domestic market for telecom equipments and the market for various
types of electronic components and semi conductor devices that go into
the production of these equipments. In fact, the Indian
telecommunications industry is a unique example of a services industry
leading to the growth and emergence of a manufacturing industry. Our
argument is that technological changes and reasonably well implemented
policies, relatively speaking, and especially regulatory policies have
actually contributed to the success of the industry. Both these have
reduced the height of entry barriers to the industry and made it extremely
competitive. The result has been fast diffusion of new technologies in
6
the provision of telecom services and through this process significant
reduction in prices has been achieved.
Although much has been written on the India telecommunications
industry and its evolution, much of it is journalistic in nature. Most of
the available studies (Desai, 2006), for instance, provides us with a
systematic account of the earlier reforms undertaken in the sector. Singh
(2008) however has attempted to model the diffusion of mobile phones
in the country. One of the most cited studies on mobile phones in India
is by Jensen (2007) which showed using microlevel survey data that the
adoption of mobile phones by ûshermen in the southern Indian and
wholesalers was associated with a dramatic reduction in price dispersion,
the complete elimination of waste, and near-perfect adherence to the
Law of One Price. Both consumer and producer welfare increased as a
result.
In the context, the purpose of this paper will be to trace the
performance of India’s telecom services industry and then analyse its
impact, potential as well actual on the equipment manufacturing
industry. In that process, the paper will also identify those areas where
policy measures still have a role to play to improve the state of affairs.
The paper is structured into five sections. Section I maps out the growing
importance of the telecommunications industry in India’s economy.
Section II will map out the emergence of a huge domestic market for
telecom equipments consequent to the phenomenal growth of services
segment of the industry. Section III analyses in detail the role of the
government in creating a large domestic market for telecom equipments.
Section IV examines in detail the hypothesis whether the country has
indeed become a manufacturing hub for telecom equipments. The
section pays particular attention to the channels through which the two
components of the industry, namely equipments and services are linked
to each other. Finally the last section sums up the main findings of the
paper.

7
I. Place of telecommunications in India’s economy
Telecommunications industry consists of two separate sectors:
manufacturing of telecom equipments and distribution of telecom
services. The industry currently (2007-08) accounted for about 3 per
cent of India’s GDP and contributed 0.75 per cent of the rate of growth of
the country’s GDP. It is one of the most important industries constituting
India’s ICT industry and has important linkage effects with rest of the
economy. For instance, cheap communication services have been very
helpful for especially the country’s IT services industry. It is also very
employment- intensive and according to CSO (2010), out of the total
employment of 3.15 million persons employed in India’s ICT industry
in 2006-07, almost 2.52 million or so are employed in the telecom
services sector or in other words about 80 per cent of those employed in
the ICT sector are to found in the distribution of telecom services industry.
Manufacturing of telecommunications equipments also has considerable
linkages as these equipments are based on assembly of components. A
still another way of measuring the growing importance of the industry is
by tracking the amount of license fees and spectrum charges which the
industry has brought to the exchequer. This has averaged about .26 per
cent of India’s GDP during the eight year period 2002-03 through 2009-
10 and at this level it is almost twice the amount that the government
spends on space research in India (government spends about 0.10 per
cent of its GDP on space research). See Figure 1. Further, in the most
recent budget (2011-12), the government has received Rs 106259.26
crores from the telecom sector mostly by way of proceeds from the
auction of 3G and Broadband Wireless Acess (BWA) spectrum charges1.
This amount has been very helpful to the finance minister towards
1. The total amount received is Rs 120806 crores. This implies that the balanceamount of Rs 14547 crores (Rs 1200806- Rs 106259.26 Crores) must havebeen the proceeds from spectrum charges and licence fees. See note 6.06,Receipt Budget 2011-12, Government of India, http://indiabudget.nic.in/ub2011-12/rec/ntr.pdf, (Accessed March 5, 2011).
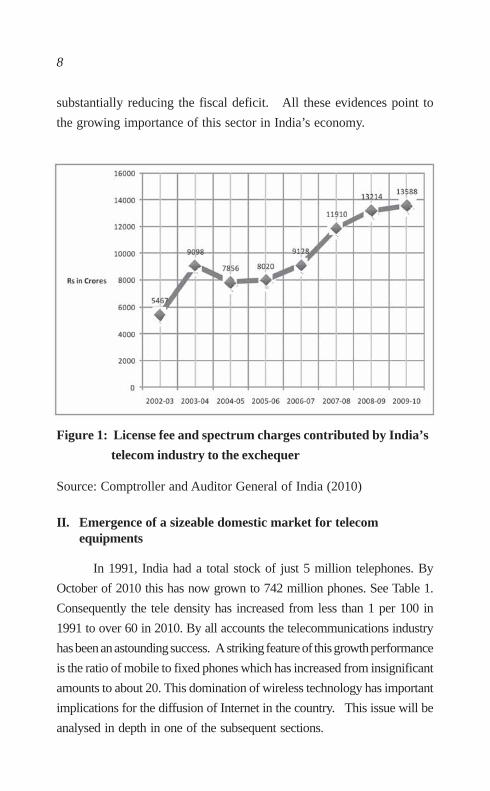
8
substantially reducing the fiscal deficit. All these evidences point to
the growing importance of this sector in India’s economy.
Figure 1: License fee and spectrum charges contributed by India’s
telecom industry to the exchequer
Source: Comptroller and Auditor General of India (2010)
II. Emergence of a sizeable domestic market for telecomequipments
In 1991, India had a total stock of just 5 million telephones. By
October of 2010 this has now grown to 742 million phones. See Table 1.
Consequently the tele density has increased from less than 1 per 100 in
1991 to over 60 in 2010. By all accounts the telecommunications industry
has been an astounding success. A striking feature of this growth performance
is the ratio of mobile to fixed phones which has increased from insignificant
amounts to about 20. This domination of wireless technology has important
implications for the diffusion of Internet in the country. This issue will be
analysed in depth in one of the subsequent sections.

9
Table 1: Growth of India’s telecom services, 1991-2010
(Millions of subscribers; Growth rates are in percentages;
Tele density is number telephones per 100 subscribers)
Fixed G. Rate Mobile G .Rate Total G. Tele Ratio ofRate density mobile
tofixed
1991 5.07 5.07 0.6
1992 5.81 14.60 5.81 14.60 0.67
1993 6.8 17.04 6.8 17.04 0.77
1994 8.03 18.09 8.03 18.09 0.89
1995 9.8 22.04 9.8 22.04 1.07
1996 11.98 22.24 11.98 22.24 1.26
1997 14.54 21.37 0.34 14.88 24.21 1.56 0.02
1998 17.8 22.42 0.88 158.82 18.68 25.54 1.94 0.05
1999 21.59 21.29 1.2 36.36 22.79 22.00 2.33 0.06
2000 26.51 22.79 1.88 56.67 28.39 24.57 2.86 0.07
2001 32.44 22.37 3.58 90.43 36.02 26.88 3.58 0.11
2002 41.48 27.87 13 263.13 54.48 51.25 4.3 0.31
2003 42.58 2.65 33.58 158.31 76.16 39.79 5.1 0.79
2004 45 5.68 50 48.90 95 24.74 7.04 1.11
2005 49 8.89 76 52.00 125 31.58 10.66 1.55
2006 40.43 -17.49 149.5 96.71 189.93 51.94 17.16 3.70
2007 39.25 -2.92 233.63 56.27 272.88 43.67 25 5.95
2008 37.9 -3.44 346.89 48.48 384.79 41.01 33.23 9.15
2009 37.06 -2.22 525.15 51.39 562.21 46.11 46.32 14.17
2010 35.09 -5.32 752.19 43.23 787.28 40.03 66.16 21.44
Source: Telecom Regulatory Authority of India (various issues)
As a corollary of the above, it is seen that there has been a steady
increase in the average number of mobile subscribers per month since
2002 (Figure 2). In 2002, on an average 0.46 million new subscribers
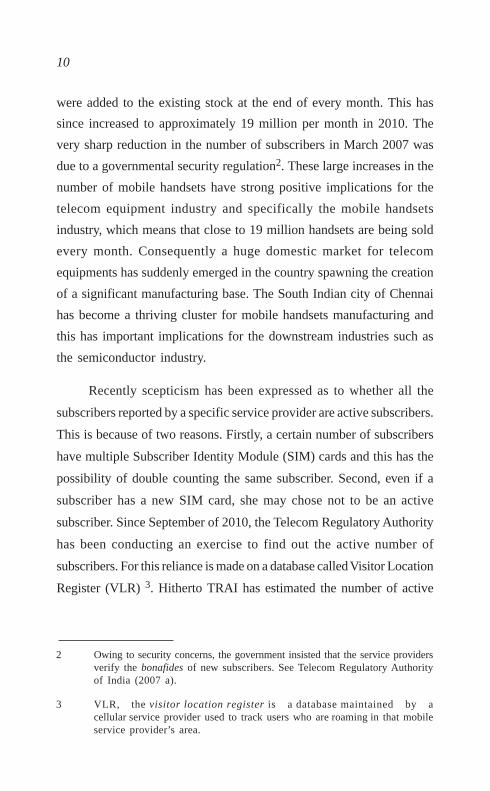
10
were added to the existing stock at the end of every month. This has
since increased to approximately 19 million per month in 2010. The
very sharp reduction in the number of subscribers in March 2007 was
due to a governmental security regulation2. These large increases in the
number of mobile handsets have strong positive implications for the
telecom equipment industry and specifically the mobile handsets
industry, which means that close to 19 million handsets are being sold
every month. Consequently a huge domestic market for telecom
equipments has suddenly emerged in the country spawning the creation
of a significant manufacturing base. The South Indian city of Chennai
has become a thriving cluster for mobile handsets manufacturing and
this has important implications for the downstream industries such as
the semiconductor industry.
Recently scepticism has been expressed as to whether all the
subscribers reported by a specific service provider are active subscribers.
This is because of two reasons. Firstly, a certain number of subscribers
have multiple Subscriber Identity Module (SIM) cards and this has the
possibility of double counting the same subscriber. Second, even if a
subscriber has a new SIM card, she may chose not to be an active
subscriber. Since September of 2010, the Telecom Regulatory Authority
has been conducting an exercise to find out the active number of
subscribers. For this reliance is made on a database called Visitor Location
Register (VLR) 3. Hitherto TRAI has estimated the number of active
2 Owing to security concerns, the government insisted that the service providersverify the bonafides of new subscribers. See Telecom Regulatory Authorityof India (2007 a).
3 VLR, the visitor location register is a database maintained by acellular service provider used to track users who are roaming in that mobileservice provider’s area.
11
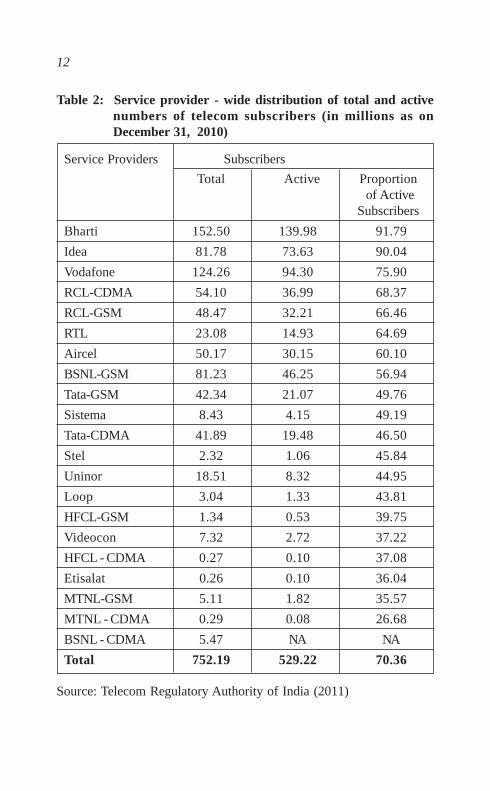
subscribers for two time points, namely as on September 30, 2010 and as
on December 30, 2010. Based on this the number of active subscribers
are only 529 million out of a total subscriber base of 752 million, thus
working out to about 70 per cent of the total. See Table 2. Surprisingly
the private service providers have a higher proportion of active
subscribers while the two state-owned service providers have a very low
proportion of active subscribers. But the important point is that even
though the number of active subscribers is less than the total number of
subscribers, the market for telecom services in India is larger than the
markets in the United States of America and the combined European
Union.
Figure 2: Average number of subscribers added per month: 2002-2010
Source: Telecom Regulatory Authority of India (various issues)
12
Table 2: Service provider - wide distribution of total and activenumbers of telecom subscribers (in millions as onDecember 31, 2010)
Service Providers Subscribers
Total Active Proportion of Active
Subscribers
Bharti 152.50 139.98 91.79
Idea 81.78 73.63 90.04
Vodafone 124.26 94.30 75.90
RCL-CDMA 54.10 36.99 68.37
RCL-GSM 48.47 32.21 66.46
RTL 23.08 14.93 64.69
Aircel 50.17 30.15 60.10
BSNL-GSM 81.23 46.25 56.94
Tata-GSM 42.34 21.07 49.76
Sistema 8.43 4.15 49.19
Tata-CDMA 41.89 19.48 46.50
Stel 2.32 1.06 45.84
Uninor 18.51 8.32 44.95
Loop 3.04 1.33 43.81
HFCL-GSM 1.34 0.53 39.75
Videocon 7.32 2.72 37.22
HFCL - CDMA 0.27 0.10 37.08
Etisalat 0.26 0.10 36.04
MTNL-GSM 5.11 1.82 35.57
MTNL - CDMA 0.29 0.08 26.68
BSNL - CDMA 5.47 NA NA
Total 752.19 529.22 70.36
Source: Telecom Regulatory Authority of India (2011)
13
III. Role of government in creating a large market for telecomequipments
Historically speaking right through independence in 1947, the
government has sought to create a domestic manufacturing base in
telecom equipments, although the size of this market was only a minute
fraction of what it is now. Over the period from 1947 and up until now,
one can identify three broad phases in the extent and nature of
government intervention in the telecom equipment industry. The first
phase covers the long period of 1947 through 1985, when state
intervention took an extreme form of manufacturing being under the
exclusive purview of state-owned undertakings but with imported
technology. The second phase covers the period 1985 through 1991,
when the manufacturing of some of the equipments were deregulated
and opened up to private sector participation and the state establishing
a public laboratory to generate state-of-the-art technologies domestically.
The third phase is the period since 1991, when the market was opened
up to private and indeed foreign participation. The main difference
between the first two and the third phase is in the size of the market.
During the first two phases the market for telecom equipments were
extremely small as there was only one technology, namely fixed line
and only one service provider which too was owned by the state. Mani
(2005) had shown that during this period the main instrument for market
creation was public technology procurement as the demand for these
equipments emanated from just one state-owned provider. During the
third phase there are two technologies, namely fixed and mobile and a
large number of private sector service providers. Our argument here is
that the state increased the size of the market by first promoting
competition between service providers and then by regulating their
market conducts through an independent regulatory agency. This
increased competition coupled with regulation reduced telecom tariffs
significantly to such an extent that India has now the cheapest telecom
services anywhere in the world. It is through this affordability angle that
14
the state has created a large market for telecom services leading in turn
to the creation of a large market for equipments. In the following we
discuss the nature and extent of competition in the provision of telecom
services. This is followed by a discussion of the role of the state with
respect to regulating the market conduct of service providers.
Competition in the telecom service market: Mani (2008) had
showed that the way the telecom service providers were licensed ensured
that there was intensive competition between them. The national market
was divided into several service areas and in each of the service areas a
number of providers were licensed. There are at present, at least, 10
service providers in most service areas although four of them are very
recent entrants and are too small in size to infuse any competitive pressure
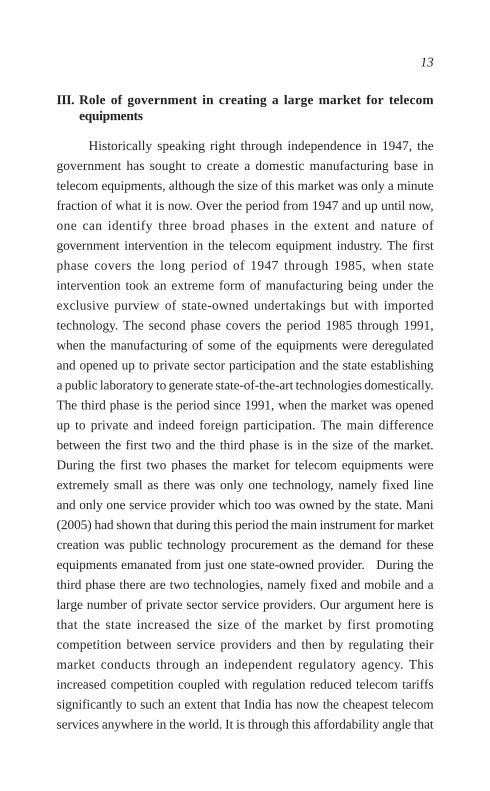
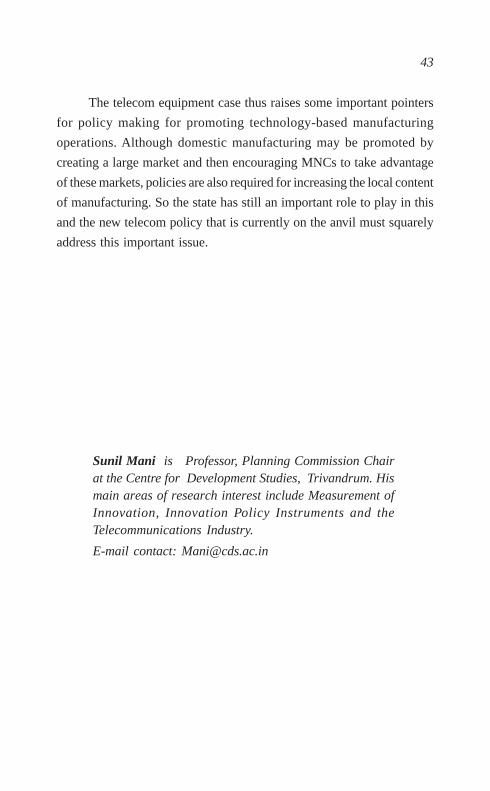
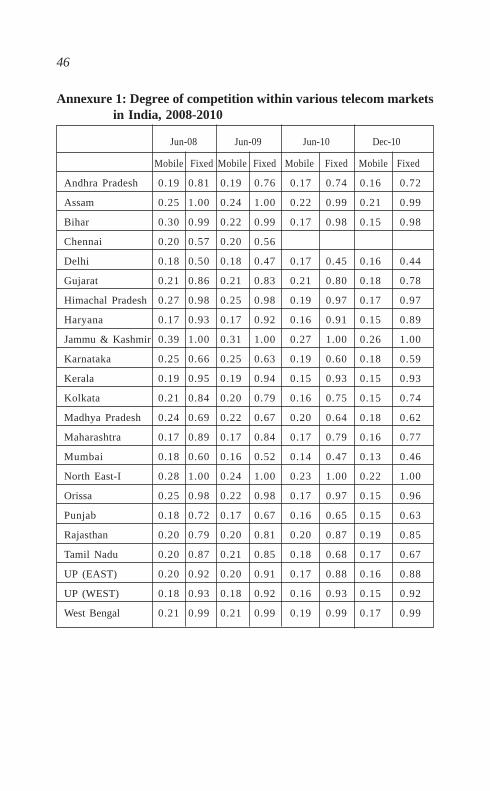
on the market. We measure competition interms of the Herfindahl Index
(HI). The detailed service area wide HI is presented in Annexure 1 and
the HI at the national level is mapped out in Figure 3. Most of the
service providers have focused on specific regional markets, with the
exception of Bharti (the largest mobile service provider). In fact there
are only four service providers who have a presence in all the service
areas. It is also interesting to see that the service areas where the state-
owned BSNL has a monopoly position are also those with very low
revenue potential. In other words, the private sector providers have
positioned themselves in the most revenue earning service areas. Also it
is seen that it is the circles with high revenue earning potential that one
sees an increase in the intensity of competition- the metros of Delhi,
Mumbai and Chennai for instance.
The state has intensified the degree of competition further by
licensing one more mobile standard, namely Code Division Multiple
Access (CDMA) in addition to the earlier standard, Global System for
Mobile Communications (GSM) and by introducing Mobile Number
Portability (MNP). The latter allows consumers to change their service
provider while retaining their original number. Although the scheme
15
has been introduced only very recently (on January 20 2011), within
the very first month of its introduction, the TRAI reported that about 3.8
million subscribers have taken advantage and changed their service
providers. MNP and the very existence of a regulatory agency have
actually increased the contestability of the market for telecom services.
The result has been considerable reductions in the price of telecom
services.
Figure 3: Trends in national level Herfindahl Index for mobileservices, 2003-2010
Source: Computed from Telecom Regulatory Authority of India, (various
issues)
Price of telecom services: One of the more direct effects of this
competition is lower prices. Before the deregulation of the telecom
services industry and indeed the entry of mobile service providers, the
telecom consumers were periodically subjected in increases in the tariff.
16
This has now been effectively checked. Although it is not easy talk
about the price of telecom services, basically it follows a two part tariff
both in the case of fixed and mobile services, first an activation charge
followed by a charge for each type of calls. For mobile communication
consumers then there is the additional cost of calls according to whether
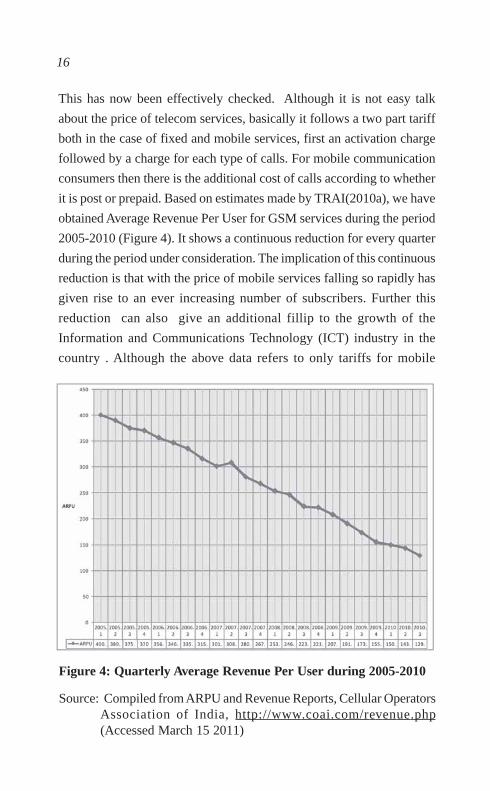
it is post or prepaid. Based on estimates made by TRAI(2010a), we have
obtained Average Revenue Per User for GSM services during the period
2005-2010 (Figure 4). It shows a continuous reduction for every quarter
during the period under consideration. The implication of this continuous
reduction is that with the price of mobile services falling so rapidly has
given rise to an ever increasing number of subscribers. Further this
reduction can also give an additional fillip to the growth of the
Information and Communications Technology (ICT) industry in the
country . Although the above data refers to only tariffs for mobile
Figure 4: Quarterly Average Revenue Per User during 2005-2010
Source: Compiled from ARPU and Revenue Reports, Cellular OperatorsAssociation of India, http://www.coai.com/revenue.php(Accessed March 15 2011)

17
telecommunications services, a similar trend may hold good even for
fixed services. If one were to plot the price of telecom services and the
number of subscribers, one can see an inverse relationship in the case of
mobile services although in the case of fixed services such an inverse
relationship is not visible. This is because of the relative advantages
which mobile technology can bestow on its user.
The two state-owned service providers, BSNL and MTNL have
launched “One India Plan” with effect from 01.03.2006. Under this a
three minute local call and a one minute national long distance call
(referred to as STD calls) will cost only Re. 1. The “One India” plan,
also, for the first time, takes away the distinction between the fixed line
tariff and the cellular tariff and thus, makes the tariff “technology
independent”. A similar plan has also been introduced for the customers
of post paid and pre-paid mobile services of BSNL and MTNL.
Reductions in Urban-Rural divide: Several commentators and
notably Desai (2006) had referred to the growing inequalities in the
availability of telephones especially between states and indeed between
the rural and urban areas within a state. This is so severe that the national
picture that I presented above is only representative of the urban areas
of some of the states. This growing urban-rural divide, as it is usually
referred to, is of course a reflection of the growing divides within the
country as far as income and wealth is considered. The ratio of urban to
rural tele density, which kept falling until 2002 has started rising again
since 2003 and in 2006 is much higher than what was in
1996, when the mobile revolution was just about to begin. There
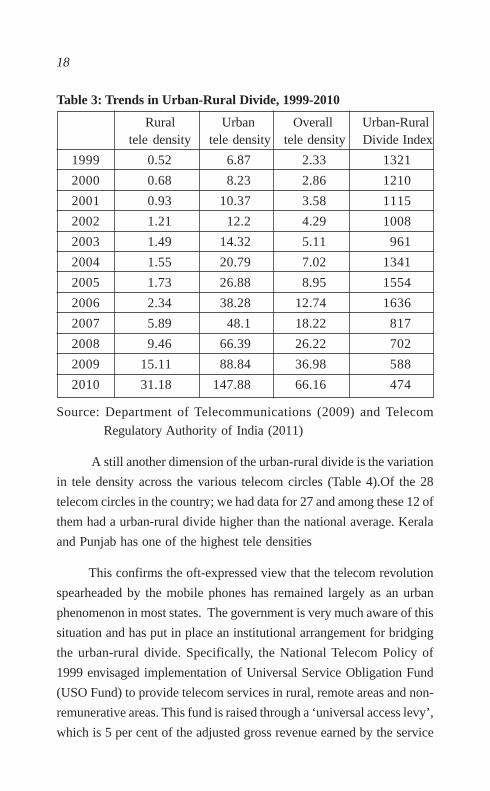
after it has started falling almost every year (Table 3). In order to show
this decline in the urban-rural availability of telephones, we compute
an index of it by taking the ratio of urban to rural teledensity multiplied
by 100. The index at its peak in 2006 stood at 1636 has since reduced
significantly to 588 in 2009 (up to March).
18
Table 3: Trends in Urban-Rural Divide, 1999-2010
Rural Urban Overall Urban-Ruraltele density tele density tele density Divide Index
1999 0.52 6.87 2.33 1321
2000 0.68 8.23 2.86 1210
2001 0.93 10.37 3.58 1115
2002 1.21 12.2 4.29 1008
2003 1.49 14.32 5.11 961
2004 1.55 20.79 7.02 1341
2005 1.73 26.88 8.95 1554
2006 2.34 38.28 12.74 1636
2007 5.89 48.1 18.22 817
2008 9.46 66.39 26.22 702
2009 15.11 88.84 36.98 588
2010 31.18 147.88 66.16 474
Source: Department of Telecommunications (2009) and Telecom
Regulatory Authority of India (2011)
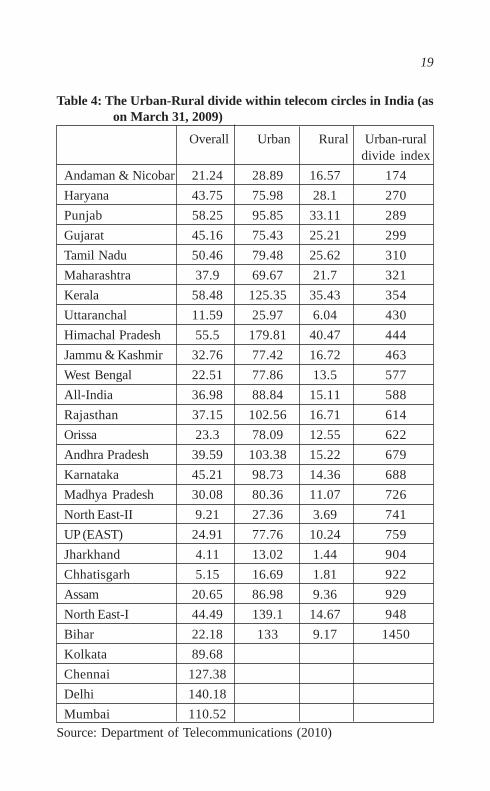
A still another dimension of the urban-rural divide is the variation
in tele density across the various telecom circles (Table 4).Of the 28
telecom circles in the country; we had data for 27 and among these 12 of
them had a urban-rural divide higher than the national average. Kerala
and Punjab has one of the highest tele densities
This confirms the oft-expressed view that the telecom revolution
spearheaded by the mobile phones has remained largely as an urban
phenomenon in most states. The government is very much aware of this
situation and has put in place an institutional arrangement for bridging
the urban-rural divide. Specifically, the National Telecom Policy of
1999 envisaged implementation of Universal Service Obligation Fund
(USO Fund) to provide telecom services in rural, remote areas and non-
remunerative areas. This fund is raised through a ‘universal access levy’,
which is 5 per cent of the adjusted gross revenue earned by the service
19
Table 4: The Urban-Rural divide within telecom circles in India (ason March 31, 2009)
Overall Urban Rural Urban-ruraldivide index
Andaman & Nicobar 21.24 28.89 16.57 174
Haryana 43.75 75.98 28.1 270
Punjab 58.25 95.85 33.11 289
Gujarat 45.16 75.43 25.21 299
Tamil Nadu 50.46 79.48 25.62 310
Maharashtra 37.9 69.67 21.7 321
Kerala 58.48 125.35 35.43 354
Uttaranchal 11.59 25.97 6.04 430
Himachal Pradesh 55.5 179.81 40.47 444
Jammu & Kashmir 32.76 77.42 16.72 463
West Bengal 22.51 77.86 13.5 577
All-India 36.98 88.84 15.11 588
Rajasthan 37.15 102.56 16.71 614
Orissa 23.3 78.09 12.55 622
Andhra Pradesh 39.59 103.38 15.22 679
Karnataka 45.21 98.73 14.36 688
Madhya Pradesh 30.08 80.36 11.07 726
North East-II 9.21 27.36 3.69 741
UP (EAST) 24.91 77.76 10.24 759
Jharkhand 4.11 13.02 1.44 904
Chhatisgarh 5.15 16.69 1.81 922
Assam 20.65 86.98 9.36 929
North East-I 44.49 139.1 14.67 948
Bihar 22.18 133 9.17 1450
Kolkata 89.68
Chennai 127.38
Delhi 140.18
Mumbai 110.52Source: Department of Telecommunications (2010)

20
providers under various licenses. The Universal Service Support Policy
for Implementation of USO has taken effect from April 1 2002. It is
administered by the DoT and it has three major components: (i) providing
public shared access; (ii) providing individual access; (iii) infrastructure
support for mobile service providers. The latter policy is on the anvil
and is yet to take shape. The overall performance of the USO Fund is far
from satisfactory, as cumulatively speaking only about 13 per cent of
the funds accumulated have actually been disbursed (Table 9).
Table 5: Functioning of the Universal Service Fund, 2002-03 through2009-10 (Rs in Millions)
Fiscal Opening Funds Total Funds Disburse-
year balance collected funds disbursed ment
ending as USL collected rate (%)
2003 0 16536 16536 3000 18.14
2004 13536 21432 34968 2000 5.72
2005 32968 34577 67545 13146 19.46
2006 54399 35333 89732 17669 19.69
2007 72064 42111 114175 15000 13.14
2008 99175 54055 153230 12900 8.42
2009 140330 57595 197925 16000 8.08
2010 181925 181925 24000 13.19
Source: Department of Telecommunications (2010)
The service providers, excepting for the state-owned BSNL, are
rather reluctant to provide shared access. However, the private providers
are keen to participate in the provision of individual access in rural
areas as it is more profitable than providing shared access.
Hitherto, the USO funds have been utilised only for provision of
fixed line connections. Given the fact that the future is in mobile
communications, it is prudent to involve mobile service providers too.

21
Some recent amendments made to the utilization of USO Funds have
expanded the scope of the funds to include three more items. In very
specific terms the following additional four items were included:
• Creation of infrastructure for provision of mobile services in rural
and remote areas;
• Provision of Broadband connectivity to villages in a phased
manner;
• Creation of general infrastructure in rural and remote areas for
development of telecommunication facilities; and
• Induction of new technological developments in the telecom
sector in rural and remote areas
Only the first of four are in the form of some implementation.
However it makes a lot of sense to extend the USO funds to provide
mobile services in rural areas as increasingly much of the growth in
mobile communications have emerged from ‘B’ and ‘C’ Circles. In fact
the four Metros have ceased to be the major force behind the growth of
the mobile connections in the country. Encouraging the growth of mobile
communications to the other circles and the rural areas within the circles
can increase the tele density in the country. Although such increases in
tele density through mobile phones have some negative consequences,
which is discussed below. There are also various other proposals for
bridging the urban-rural divide and this is an immediate task before the
policy makers.
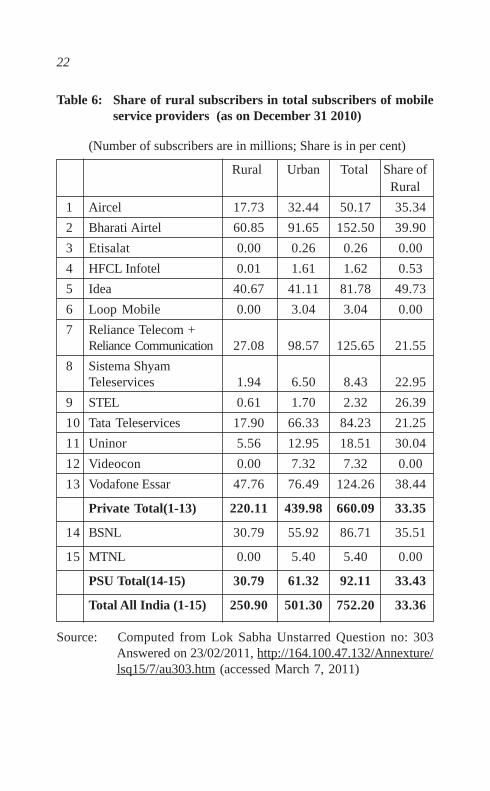
In fact the decreasing urban-rural divide, I argue, is due to the
activities of private sector telecom providers. As indicated in Table 6,
those service providers that offer only GSM services have a higher share
of rural subscribers than those offering only CDMA services.. In fact for
one of them, the share of rural subscribers is as much as close to 50 per
cent. Two factors have contributed to the spread of mobile phones to
22
Table 6: Share of rural subscribers in total subscribers of mobileservice providers (as on December 31 2010)
(Number of subscribers are in millions; Share is in per cent)
Rural Urban Total Share ofRural
1 Aircel 17.73 32.44 50.17 35.34
2 Bharati Airtel 60.85 91.65 152.50 39.90
3 Etisalat 0.00 0.26 0.26 0.00
4 HFCL Infotel 0.01 1.61 1.62 0.53
5 Idea 40.67 41.11 81.78 49.73
6 Loop Mobile 0.00 3.04 3.04 0.00
7 Reliance Telecom +Reliance Communication 27.08 98.57 125.65 21.55
8 Sistema ShyamTeleservices 1.94 6.50 8.43 22.95
9 STEL 0.61 1.70 2.32 26.39
10 Tata Teleservices 17.90 66.33 84.23 21.25
11 Uninor 5.56 12.95 18.51 30.04
12 Videocon 0.00 7.32 7.32 0.00
13 Vodafone Essar 47.76 76.49 124.26 38.44
Private Total(1-13) 220.11 439.98 660.09 33.35
14 BSNL 30.79 55.92 86.71 35.51
15 MTNL 0.00 5.40 5.40 0.00
PSU Total(14-15) 30.79 61.32 92.11 33.43
Total All India (1-15) 250.90 501.30 752.20 33.36
Source: Computed from Lok Sabha Unstarred Question no: 303Answered on 23/02/2011, http://164.100.47.132/Annexture/lsq15/7/au303.htm (accessed March 7, 2011)
23
rural areas. First is the saturation of markets in urban areas and the low
Average Revenue Per User (ARPU) has encouraged the service providers
to seek out markets in the hitherto underserved rural areas. In this way
given the low ARPU, with a larger and growing market they could
maximize their total sales revenue. Second, the increased competition
between services providers have, as argued earlier, led to significant
reductions in tariffs for telecom services, which made it affordable for
rural subscribers. Thus we see that the market itself has corrected the
imbalance in service provision between urban and rural areas although
it must be added that the government policy of stimulating competition
between service providers is at the heart of this policy.
Regulation of the conduct of service providers: An interesting
feature of the growth of telecommunications industry in the 1990s and
beyond compared to the earlier period is the strong public policy support
that the industry has received. It manifested in the form of the following
policies:
· National Telecom Policy of 1994
· Telecom Regulatory Authority Act of 1997
· New Telecom Policy of 1999
· Universal Access Service Licenses 2003
· Broadband Policy of 2004
· Introduction of dual technologies in 2007-08
Other policies having an indirect effect are: FDI policy, the
Electronic Hardware Policy of 2003, and the Semiconductor Policy of
2007. The most important piece of legislation that is determining the
growth performance of the industry is the establishment of a regulatory
agency in the name of Telecom Regulatory Authority of India (TRAI)4.
TRAI’s functions can be broadly categorised into two: recommendatory
4 In working out the ideas contained in this subsection, I have relied on myown writings on the topic in Mani (2002), and Desai (2006).

24
and mandatory. It is seen that in most of the important conduct variables
such as the promotion of competition, pricing, technology and quality
of service and in the efficient use of spectrum etc, the pronouncements
of TRAI are merely recommendatory and the final decision is to be
taken by the government. The mandatory powers of TRAI are restricted
to a number of technical issues such as fixing the terms and conditions
of inter-connectivity between the service providers, laying down the
standards of quality of service and to ensuring that these conditions are
actually met by the service providers and ensuring the effective
compliance of Universal Service Obligation. This shows that the
effective space that is available for the TRAI in terms of asserting its real
power is very limited.
IV. Emergence of India as a manufacturing hub fortelecommunications equipment
In the previous section, we have charted out the phenomenal
growth of the mobile services industry in India. Although mobile
communications stated in the late 1990s, the growth picked up and
accelerated over the last five years and to be very specific since 2006 or
so. This has led to the demand for a variety of telecommunications
equipment; most of which were and especially the handsets were not
being domestically manufactured. This is because as Mani (2005) has
shown that the domestic manufacturing industry and indeed the sectoral
system of innovation that the state had built up over time focused almost
entirely on fixed line technology and indeed products. So the initial
growth in the services segment was met through imports of equipment
leading to very high import dependence in the economy. However with
the domestic market becoming sizeable as an at average of 18 million
subscribers per month (say in 2011), the monthly demand for telecom
equipment in India is almost three or five times the annual demand for
such equipment in countries such as Finland, South Korea and the United
States of America (homes of some of the largest mobile handset
25
manufacturers in the world). Such being the case there has been steady
increase in the establishment of domestic manufacturing capacities in
India by all leading MNCs in the telecommunications equipment
industry. This was soon followed by a host of domestic manufacturers
as well. As a result the import dependence of the country has shown
some dramatic decreases as domestic production started increasing.
Simultaneously exports of telecom equipment too have started to
increase and it appears that India is now on the sure path to becoming a
manufacturing hub of sorts in this industry. In the following we subject
this hypothesis to some empirical scrutiny.
Government policy
India had always tried to create a domestic telecom manufacturing
industry. Its history can be traced back to 1948, when the very first
public sector enterprise created turned out to be the leading telecom
equipment manufacturer, ITI, was set up in Bangalore5. This was followed
by the establishment of a public laboratory in the name of C-DOT in
1985 to enhance the country’s domestic technological capability in the
area of equipment manufacturing. Mani (1992 and 2005) had shown
that the main public policy instrument used for domestic manufacturing
was public technology procurement. However with the deregulation
and consequent privatisation of the distribution of services, the ability
of the state to practice this has been compromised. So during the 1990s,
we find two discernible routes adopted by the state for encouraging
domestic manufacturing and indeed to translate into reality the new
desire of the government to make India a manufacturing hub. The first
one is through the provision of variety fiscal incentives including
through the creation of Special Economic Zones (SEZs). The second is
through opening up the sector to FDI in telecom equipment
manufacturing. We discuss each of these two briefly.
5 . For a history of ITI, see Subramanian (2010).

26
Provision of fiscal incentives for domestic manufacturing:
Beginning with the National Telecom Policy of 1994 and its
further elaboration in 1999, the government’s stated policy has been to
establish India as a hub for telecommunication equipment
manufacturing. In order to aid this, the Government has set the targets
for making India a hub of telecom manufacturing by facilitating a large
number of telecom specific SEZs to achieve exports of 10 billion during
11th Five year plan and doubling the telecom equipment R&D by 2010
The Government has also undertaken steps to encourage the
establishment of a supply chain facility through local manufacturers as
well as international investment, and has put together incentive schemes
like the SEZ and Electronic Hardware Technology Park (EHTP). These
special schemes have:
• Income tax exemption for 5 to 15 years;
• Duty free import of components and consumables;
• Duty free import of capital goods ;
• Duty free import of leases, rentals, free of cost transfers and second
hand capital goods ;
• Duty exemption on local procurement of components,
consumables; and
• Refund of local taxes paid on local procurement of components
and consumables.
Further in 2010, a committee headed by a former member
(technology) of the Telecom Commission, gave macro-level guidelines
to enhance indigenous manufacturing and research and development
(R&D) capabilities to the Department of Telecommunications (DoT).
The DoT formed yet another committee (in September 2010) to make
more specific recommendations based on earlier suggestions to enhance
India’s telecom manufacturing base and R&D, as well as for developing
interception and monitoring technologies. The main recommendations
of especially the second panel as reported in the press are:

27
• The panel has suggested a 5 per cent tax reimbursement to service
providers who buy equipment from Indian manufacturers.
• As for the Rs. 5,000 crore corpus, the panel has suggested creating
it by levying a 2% R&D and manufacturing cess on the adjusted
gross revenue (AGR) of telecom service providers. AGR is the
total revenue of a service provider less the revenue that does not
accrue to it directly, such as service tax and interconnection
charges. This corpus could be used to provide a line of credit to
equipment makers at a 5% rate of interest to be repaid in four
instalments starting from the third year.
• Another recommendation is for creating telecom manufacturing
zones, with the necessary infrastructure and facilities, owned by
the government and given on lease.
• The panel also recommends hiring a number of facilitators trained
in setting up manufacturing units, on a retainership paid by the
government and the entrepreneur involved.
• To ensure that telecom equipment makers treat their staff like
any other contract-based employee, the panel has suggested that
these firms not be subjected to existing labour laws, except those
concerning health and safety and provident fund rules.
• Other recommendations include introducing a mechanism of
skill certification and developing an Indian standard for telecom
equipment.
• It also proposes requesting the Reserve Bank of India to frame
guidelines for Indian banks to extend credit to foreign customers
based on their creditworthiness if they buy equipment from Indian
manufacturers.
As far as we know these recommendations are not articulated in
the form of a law. In fact the regulator, Telecommunications Regulatory
Authority of India (TRAI), has come out (on December 28 2010) with a
consultation paper on, “Encouraging telecom equipment manufacturing
28
in India” 6. The paper repeats these incentive schemes to make India
stronger in the R&D and manufacturing of telecom equipments.
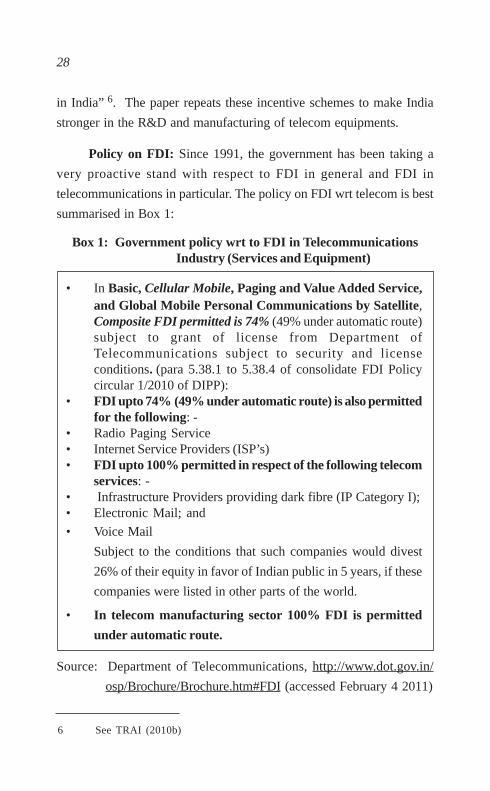
Policy on FDI: Since 1991, the government has been taking a
very proactive stand with respect to FDI in general and FDI in
telecommunications in particular. The policy on FDI wrt telecom is best
summarised in Box 1:
Box 1: Government policy wrt to FDI in TelecommunicationsIndustry (Services and Equipment)
• In Basic, Cellular Mobile, Paging and Value Added Service,and Global Mobile Personal Communications by Satellite,Composite FDI permitted is 74% (49% under automatic route)subject to grant of license from Department ofTelecommunications subject to security and licenseconditions. (para 5.38.1 to 5.38.4 of consolidate FDI Policycircular 1/2010 of DIPP):
• FDI upto 74% (49% under automatic route) is also permittedfor the following: -
• Radio Paging Service• Internet Service Providers (ISP’s)• FDI upto 100% permitted in respect of the following telecom
services: -• Infrastructure Providers providing dark fibre (IP Category I);• Electronic Mail; and
• Voice Mail
Subject to the conditions that such companies would divest
26% of their equity in favor of Indian public in 5 years, if these
companies were listed in other parts of the world.
• In telecom manufacturing sector 100% FDI is permitted
under automatic route.
Source: Department of Telecommunications, http://www.dot.gov.in/
osp/Brochure/Brochure.htm#FDI (accessed February 4 2011)
6 See TRAI (2010b)
29
Policy outcomes
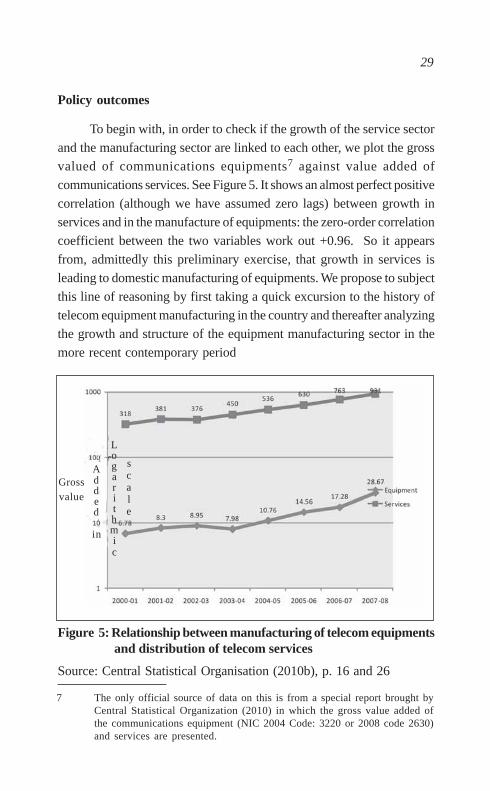
To begin with, in order to check if the growth of the service sector
and the manufacturing sector are linked to each other, we plot the gross
valued of communications equipments7 against value added of
communications services. See Figure 5. It shows an almost perfect positive
correlation (although we have assumed zero lags) between growth in
services and in the manufacture of equipments: the zero-order correlation
coefficient between the two variables work out +0.96. So it appears
from, admittedly this preliminary exercise, that growth in services is
leading to domestic manufacturing of equipments. We propose to subject
this line of reasoning by first taking a quick excursion to the history of
telecom equipment manufacturing in the country and thereafter analyzing
the growth and structure of the equipment manufacturing sector in the
more recent contemporary period
Figure 5: Relationship between manufacturing of telecom equipmentsand distribution of telecom services
Source: Central Statistical Organisation (2010b), p. 16 and 26
7 The only official source of data on this is from a special report brought byCentral Statistical Organization (2010) in which the gross value added ofthe communications equipment (NIC 2004 Code: 3220 or 2008 code 2630)and services are presented.
Grossvalue
Added
in
Logarithmic
scale
30
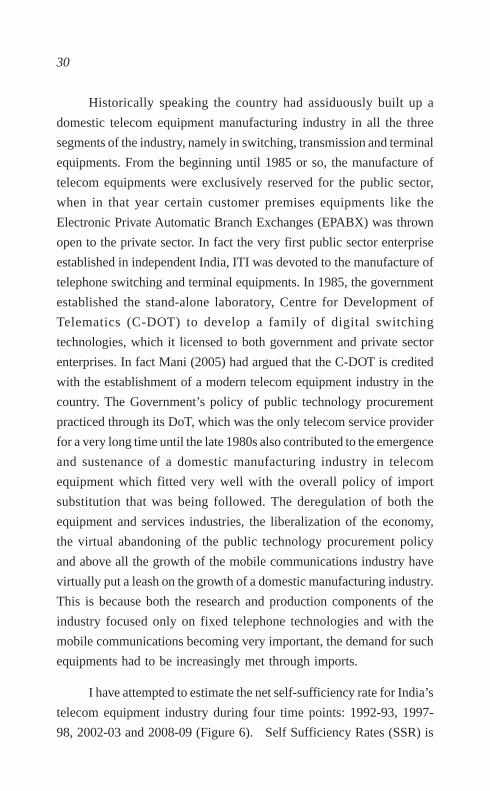
Historically speaking the country had assiduously built up a
domestic telecom equipment manufacturing industry in all the three
segments of the industry, namely in switching, transmission and terminal
equipments. From the beginning until 1985 or so, the manufacture of
telecom equipments were exclusively reserved for the public sector,
when in that year certain customer premises equipments like the
Electronic Private Automatic Branch Exchanges (EPABX) was thrown
open to the private sector. In fact the very first public sector enterprise
established in independent India, ITI was devoted to the manufacture of
telephone switching and terminal equipments. In 1985, the government
established the stand-alone laboratory, Centre for Development of
Telematics (C-DOT) to develop a family of digital switching
technologies, which it licensed to both government and private sector
enterprises. In fact Mani (2005) had argued that the C-DOT is credited
with the establishment of a modern telecom equipment industry in the
country. The Government’s policy of public technology procurement
practiced through its DoT, which was the only telecom service provider
for a very long time until the late 1980s also contributed to the emergence
and sustenance of a domestic manufacturing industry in telecom
equipment which fitted very well with the overall policy of import
substitution that was being followed. The deregulation of both the
equipment and services industries, the liberalization of the economy,
the virtual abandoning of the public technology procurement policy
and above all the growth of the mobile communications industry have
virtually put a leash on the growth of a domestic manufacturing industry.
This is because both the research and production components of the
industry focused only on fixed telephone technologies and with the
mobile communications becoming very important, the demand for such
equipments had to be increasingly met through imports.
I have attempted to estimate the net self-sufficiency rate for India’s
telecom equipment industry during four time points: 1992-93, 1997-
98, 2002-03 and 2008-09 (Figure 6). Self Sufficiency Rates (SSR) is
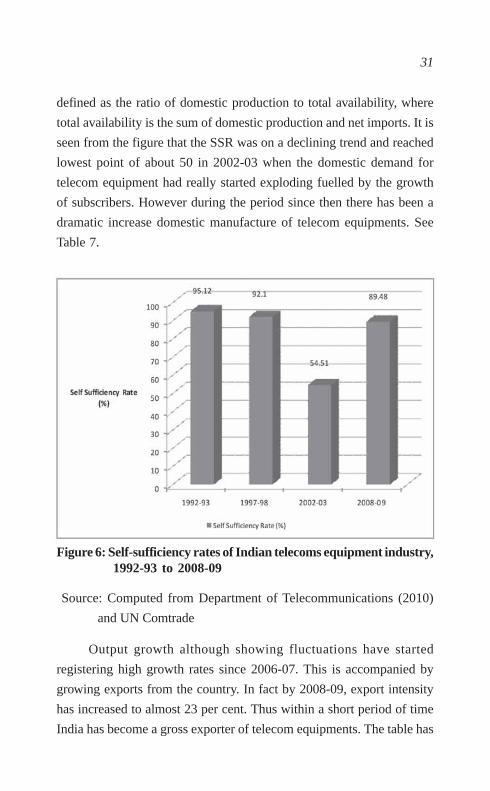
31
defined as the ratio of domestic production to total availability, where
total availability is the sum of domestic production and net imports. It is
seen from the figure that the SSR was on a declining trend and reached
lowest point of about 50 in 2002-03 when the domestic demand for
telecom equipment had really started exploding fuelled by the growth
of subscribers. However during the period since then there has been a
dramatic increase domestic manufacture of telecom equipments. See
Table 7.
Figure 6: Self-sufficiency rates of Indian telecoms equipment industry,1992-93 to 2008-09
Source: Computed from Department of Telecommunications (2010)
and UN Comtrade
Output growth although showing fluctuations have started
registering high growth rates since 2006-07. This is accompanied by
growing exports from the country. In fact by 2008-09, export intensity
has increased to almost 23 per cent. Thus within a short period of time
India has become a gross exporter of telecom equipments. The table has

32
given us one clue that the domestic manufacturing and exports of telecom
equipments have shown some significant increases over the last four
years or so. It is important at this stage to find out the composition of
exports. Data on disaggregated export categories are hard to come by.
And also most of the recent classifications of export data are not
Table 7: Trends in domestic production of telecommunicationsequipment in India (Rs in Millions)
Domestic Growth rate Exports Exportproduction (%) Intensity
(%)
1992-93 39850
1993-94 55000 38.02
1994-95 70000 27.27
1995-96 77500 10.71
1996-97 83000 7.10
1997-98 99600 20.00
1998-99 100000 0.40
1999-00 107600 7.60
2000-01 122710 14.04
2001-02 154370 25.80
2002-03 144000 -6.72 4020 2.79
2003-04 140000 -2.78 2500 1.79
2004-05 160900 14.93 4000 2.49
2005-06 178330 10.83 15000 8.41
2006-07 236560 32.65 18980 8.02
2007-08 412700 74.46 81310 19.70
2008-09 488000 18.25 110000 22.54
2009-10 575840 18.00 132500 23.44
Source: Compiled from Department of Telecommunications (2010),Telecom Equipment and Services Promotion Council, http://www.telecomepc.in/export_performance.php (accessed onFebruary 2, 2011)
33
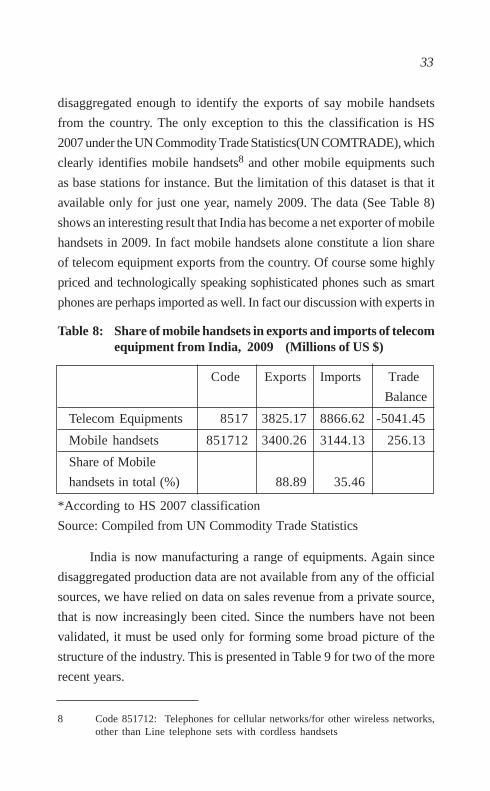
disaggregated enough to identify the exports of say mobile handsets
from the country. The only exception to this the classification is HS
2007 under the UN Commodity Trade Statistics(UN COMTRADE), which
clearly identifies mobile handsets8 and other mobile equipments such
as base stations for instance. But the limitation of this dataset is that it
available only for just one year, namely 2009. The data (See Table 8)
shows an interesting result that India has become a net exporter of mobile
handsets in 2009. In fact mobile handsets alone constitute a lion share
of telecom equipment exports from the country. Of course some highly
priced and technologically speaking sophisticated phones such as smart
phones are perhaps imported as well. In fact our discussion with experts in
Table 8: Share of mobile handsets in exports and imports of telecomequipment from India, 2009 (Millions of US $)
Code Exports Imports Trade
Balance
Telecom Equipments 8517 3825.17 8866.62 -5041.45
Mobile handsets 851712 3400.26 3144.13 256.13
Share of Mobile
handsets in total (%) 88.89 35.46
*According to HS 2007 classification
Source: Compiled from UN Commodity Trade Statistics
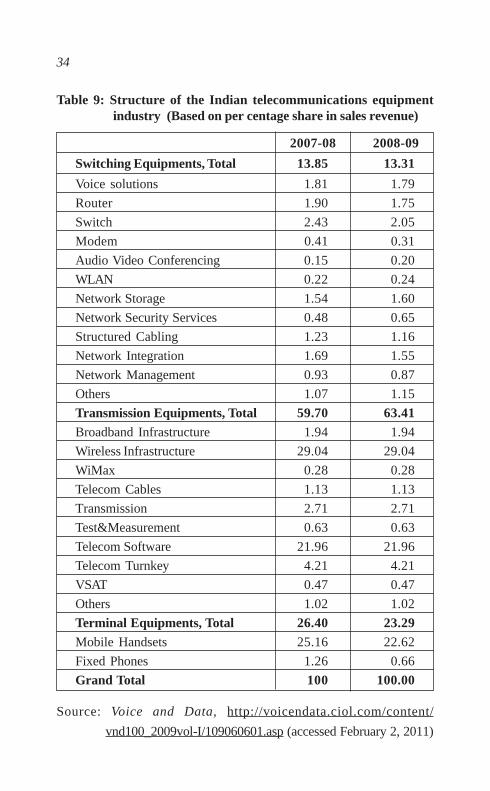
India is now manufacturing a range of equipments. Again since
disaggregated production data are not available from any of the official
sources, we have relied on data on sales revenue from a private source,
that is now increasingly been cited. Since the numbers have not been
validated, it must be used only for forming some broad picture of the
structure of the industry. This is presented in Table 9 for two of the more
recent years.
8 Code 851712: Telephones for cellular networks/for other wireless networks,other than Line telephone sets with cordless handsets
34
Table 9: Structure of the Indian telecommunications equipmentindustry (Based on per centage share in sales revenue)
2007-08 2008-09
Switching Equipments, Total 13.85 13.31
Voice solutions 1.81 1.79
Router 1.90 1.75
Switch 2.43 2.05
Modem 0.41 0.31
Audio Video Conferencing 0.15 0.20
WLAN 0.22 0.24
Network Storage 1.54 1.60
Network Security Services 0.48 0.65
Structured Cabling 1.23 1.16
Network Integration 1.69 1.55
Network Management 0.93 0.87
Others 1.07 1.15
Transmission Equipments, Total 59.70 63.41Broadband Infrastructure 1.94 1.94
Wireless Infrastructure 29.04 29.04
WiMax 0.28 0.28
Telecom Cables 1.13 1.13
Transmission 2.71 2.71
Test&Measurement 0.63 0.63
Telecom Software 21.96 21.96
Telecom Turnkey 4.21 4.21
VSAT 0.47 0.47
Others 1.02 1.02
Terminal Equipments, Total 26.40 23.29Mobile Handsets 25.16 22.62
Fixed Phones 1.26 0.66
Grand Total 100 100.00
Source: Voice and Data, http://voicendata.ciol.com/content/
vnd100_2009vol-I/109060601.asp (accessed February 2, 2011)

35
Our inquiries in the field show that most MNCs are considering
India has a hub for their manufacturing of cheaper handsets and within
India, the south Indian city of Chennai has become a telecom equipment
cluster with Nokia as the hanger firm in this cluster (See Box 2 for the
details). In fact the extent of FDI inflows to the sector is sizeable over the
years indicating the attractiveness of India as a growing market for
telecom equipments. See Figure 7. The MNCs which were hitherto
exporting equipmenmts to India has now replaced exports with
establishing domestic manufacturing plants at various locations in the
country but as noted before mostly at Chennai.
Figure 7: FDI inflows to India’s telecommunications industry: Annualand Cumulative since August 1991
Source: Department of Telecommunications (2010), p. 10
The entry of MNCs is best summed up by Department of
Telecommunications (2010, p. 26), “Rising demand for a wide range of
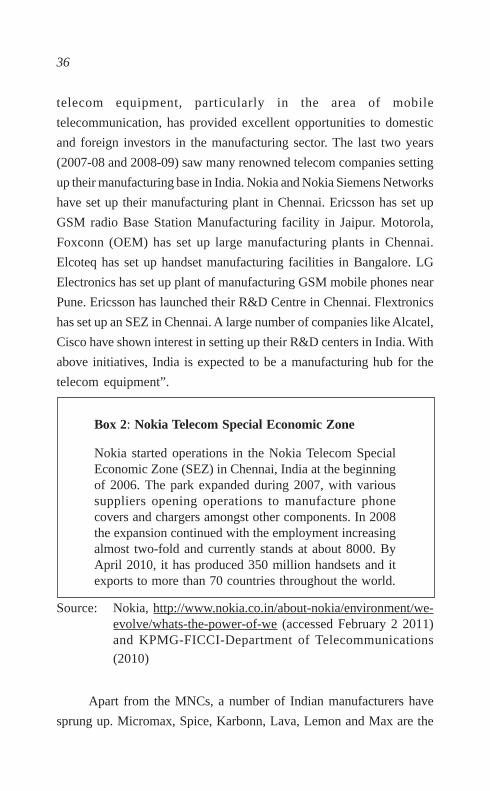
36
telecom equipment, particularly in the area of mobile
telecommunication, has provided excellent opportunities to domestic
and foreign investors in the manufacturing sector. The last two years
(2007-08 and 2008-09) saw many renowned telecom companies setting
up their manufacturing base in India. Nokia and Nokia Siemens Networks
have set up their manufacturing plant in Chennai. Ericsson has set up
GSM radio Base Station Manufacturing facility in Jaipur. Motorola,
Foxconn (OEM) has set up large manufacturing plants in Chennai.
Elcoteq has set up handset manufacturing facilities in Bangalore. LG
Electronics has set up plant of manufacturing GSM mobile phones near
Pune. Ericsson has launched their R&D Centre in Chennai. Flextronics
has set up an SEZ in Chennai. A large number of companies like Alcatel,
Cisco have shown interest in setting up their R&D centers in India. With
above initiatives, India is expected to be a manufacturing hub for the
telecom equipment”.
Box 2: Nokia Telecom Special Economic Zone
Nokia started operations in the Nokia Telecom SpecialEconomic Zone (SEZ) in Chennai, India at the beginningof 2006. The park expanded during 2007, with varioussuppliers opening operations to manufacture phonecovers and chargers amongst other components. In 2008the expansion continued with the employment increasingalmost two-fold and currently stands at about 8000. ByApril 2010, it has produced 350 million handsets and itexports to more than 70 countries throughout the world.
Source: Nokia, http://www.nokia.co.in/about-nokia/environment/we-evolve/whats-the-power-of-we (accessed February 2 2011)and KPMG-FICCI-Department of Telecommunications
(2010)
Apart from the MNCs, a number of Indian manufacturers have
sprung up. Micromax, Spice, Karbonn, Lava, Lemon and Max are the
37
Indian manufacturers of mobile handsets9. Of late one of the leading
service providers, Bharti, is also entering the manufacturing sector.
However most of these local manufacturers are mere assemblers, with
much of the components etc. are imported from especially from China.
But indications are that this is bound to change very soon in favour of
local manufacturing. One of oldest and leading telecom equipment
manufacturers in the country is the public sector enterprise ITI. The
firm’s product line was dominated by fixed line telecom equipments
and it has failed to reorient itself to manufacturing mobile
communication equipments. The reasons for this non diversification
into an expanding market can safely be attributed to its parent
department, the Department of Telecommunications, failing to
strategically reorienting ITI into the manufacture of mobile
communications equipments. Consequently the firm has been in the red
for a long time, although in the more recent years it has managed to
contain its losses by engaging in the manufacture of mobile equipments
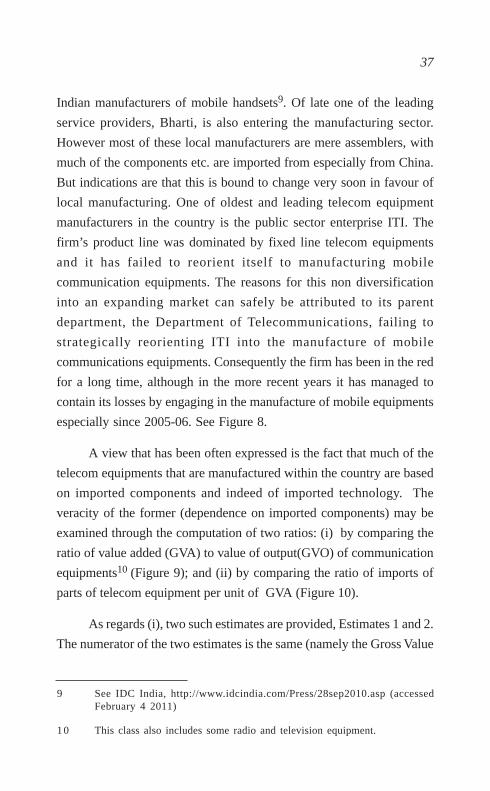
especially since 2005-06. See Figure 8.
A view that has been often expressed is the fact that much of the
telecom equipments that are manufactured within the country are based
on imported components and indeed of imported technology. The
veracity of the former (dependence on imported components) may be
examined through the computation of two ratios: (i) by comparing the
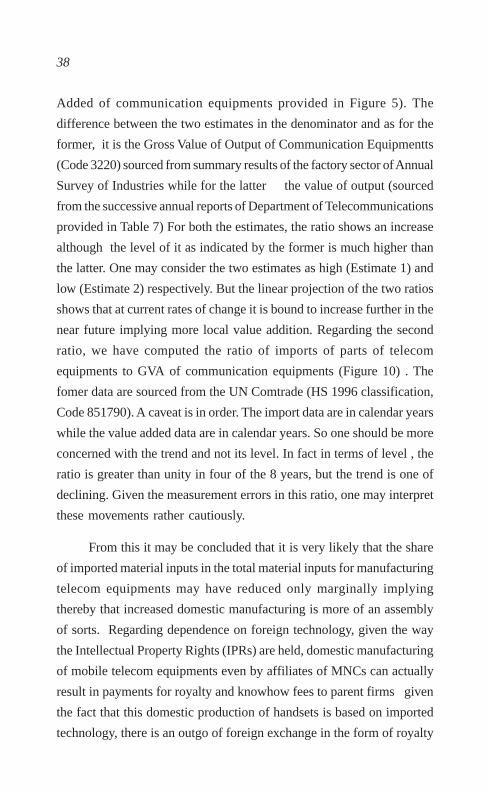
ratio of value added (GVA) to value of output(GVO) of communication
equipments10 (Figure 9); and (ii) by comparing the ratio of imports of
parts of telecom equipment per unit of GVA (Figure 10).
As regards (i), two such estimates are provided, Estimates 1 and 2.
The numerator of the two estimates is the same (namely the Gross Value
9 See IDC India, http://www.idcindia.com/Press/28sep2010.asp (accessedFebruary 4 2011)
10 This class also includes some radio and television equipment.
38
Added of communication equipments provided in Figure 5). The
difference between the two estimates in the denominator and as for the
former, it is the Gross Value of Output of Communication Equipmentts
(Code 3220) sourced from summary results of the factory sector of Annual
Survey of Industries while for the latter the value of output (sourced
from the successive annual reports of Department of Telecommunications
provided in Table 7) For both the estimates, the ratio shows an increase
although the level of it as indicated by the former is much higher than
the latter. One may consider the two estimates as high (Estimate 1) and
low (Estimate 2) respectively. But the linear projection of the two ratios
shows that at current rates of change it is bound to increase further in the
near future implying more local value addition. Regarding the second
ratio, we have computed the ratio of imports of parts of telecom
equipments to GVA of communication equipments (Figure 10) . The
fomer data are sourced from the UN Comtrade (HS 1996 classification,
Code 851790). A caveat is in order. The import data are in calendar years
while the value added data are in calendar years. So one should be more
concerned with the trend and not its level. In fact in terms of level , the
ratio is greater than unity in four of the 8 years, but the trend is one of
declining. Given the measurement errors in this ratio, one may interpret
these movements rather cautiously.
From this it may be concluded that it is very likely that the share
of imported material inputs in the total material inputs for manufacturing
telecom equipments may have reduced only marginally implying
thereby that increased domestic manufacturing is more of an assembly
of sorts. Regarding dependence on foreign technology, given the way
the Intellectual Property Rights (IPRs) are held, domestic manufacturing
of mobile telecom equipments even by affiliates of MNCs can actually
result in payments for royalty and knowhow fees to parent firms given
the fact that this domestic production of handsets is based on imported
technology, there is an outgo of foreign exchange in the form of royalty

39
payments11. In short although the country has become a hub for
manufacturing of telecom equipments there is actually a rather high
reliance on both imported components and indeed technology although,
it must be added that domestic value added has shown some impressive
increases in 2007-08 (as indicated by a 65 per cent increase in GVA in
2007-08 over 2006-07). The present exercise thus shows that local
value addition although low at this stage of development of the
equipment is bound to show increases in the future.
So the imperative before policy makers now is on improving the
domestic content of not only material production, but also of technology.
It is not immediately clear as to what is being done to address this issue
as India’s own R&D investments in the telecom sector have not shown
any increase. See Table 10.
Table 10: Trends in Telecom R&D in India (Values are in Rs Millions)
Private Sector Public Sector GRI Total
Fiscal R&D R&D R&D R&Dyear intensity intensity
ending (%) (%)
1999 30.00 1.07 62.05 0.63 1374 1466.05
2000 30.51 0.72 69.41 0.64 1456 1555.92
2001 69.13 1.27 80.72 0.67 1577 1726.85
2002 76.57 1.25 60.24 1.83 1423 1559.81
2003 55.04 1.41 47.92 2.19 1441 1543.95
2004 92.18 2.21 51.80 3.78 1773 1916.98
2005 81.81 1.51 37.82 2.68 1332 1451.63
2006 98.67 1.37 39.63 2.23 1425 1563.30
Source: Department of Science and Technology (various issues)
11 According to Department of Commerce (2011, p 39), each line of mobilephone capacity added results in an outflow of US$ 15 on account of royaltypayments. However the source does not tell us how these estimates werearrived at.
40
Figure 8: Trends in the losses of state-owned ITI, 2002-03-2009-10
Source: http://www.itiltd-india.com/upload/News%20Events/ITI%20Story%20another.pdf (accessed February 3, 2011)
Figure 9: Ratio of Gross Value Added to Gross Value of Output ofCommunications Equipment
Source: Computed from UN Comtrade and Central StatisticalOrganization (2010a )

41
Figure 10: Ratio of imports of telecom parts to GVASource: Source: Computed from UN Comtrade and Central Statistical
Organization (2010a)
Even the once prestigious, GRI, C-DOT, is maintaining a rather
low profile these days. But an area where much dynamism is seen is in
the area of R&D outsourcing by MNCs to various Indian entities although
precise estimates of this activity are hard to come by. An indirect evidence
of the growing R&D outsourcing in the field of telecommunications is
the increasing number of patents granted in the field of
telecommunications to Indian inventors in the USA. See Table 11.
Table 11: Patents granted in telecommunications technology to Indianinventors at the USPTO (number of patents)
Multi- Pulse or Tele- Telecommu-plexing digital phonic nications Total
2001 0 1 0 0 12002 2 1 0 1 42003 3 1 0 1 52004 6 2 1 0 92005 7 2 1 3 132006 14 2 3 8 272007 17 4 4 14 392008 37 11 1 10 592009 37 24 2 10 73
Source: USPTO
42
In fact the only Indian telecom firm that has secured some patents
is Sasken Communications, a Bangalore-based telecom software
manufacturer.
Thus we see that although the domestic manufacturing of telecom
equipments have increased, it is largely accounted for by foreign
companies. Currently the manufacturing is admittedly based on imported
components and parts although this likely to come down over time.
V. Conclusions
Telecommunications services industry is one of the most successful
cases of liberlisation in India although the industry is not without its
share of problems . Here the liberalization has been opening up of areas
hitherto reserved for public sector entities to private sector participation.
The market conduct of all players, both public and private was regulated
by a reasonably independent regulator. As result competition between
services providers intensified leading to significant reductions in prices.
This has really improved the access to telephones, first in urban areas but
increasingly in rural areas as well. This has increased the demand for
telecom equipments on a scale unprecedented in the history of this
industry. Although the state had sought to build considerable domestic
technological capability in the industry by establishing a number of public
sector entities, both in manufacturing and research as well, the failure to
strategically reorient the sectoral system of innovation, has now made the
equipment industry completely dominated by MNCs. On the positive
side the state’s desire to make India hub for telecom equipments appear to
have fructified in as much as a number of MNCs have established local
ventures. But these foreign ventures and the Indian firms which have
come up in the industry appear to be more of assemblers of imported parts
and components. Therefore an area where public policy has plenty of
room for application is in increasing the technological capability of local
firms and indeed increasing the local value added of the equipments that
are increasingly getting manufactured within the country.
43
The telecom equipment case thus raises some important pointers
for policy making for promoting technology-based manufacturing
operations. Although domestic manufacturing may be promoted by
creating a large market and then encouraging MNCs to take advantage
of these markets, policies are also required for increasing the local content
of manufacturing. So the state has still an important role to play in this
and the new telecom policy that is currently on the anvil must squarely
address this important issue.
Sunil Mani is Professor, Planning Commission Chairat the Centre for Development Studies, Trivandrum. Hismain areas of research interest include Measurement ofInnovation, Innovation Policy Instruments and theTelecommunications Industry.
E-mail contact: [email protected]
44
References
Comptroller and Auditor General (2010), Performance Audit Report on
the Issue of Licences and Allocation of 2G Spectrum by the
Department of Telecommunications, http://saiindia.gov.in/cag/
union-audit/report-no-19-performance-audit-issue-licences-and-
allocation-2g-spectrum-department-tele (Accessed March 5 2011)
Central Statistical Organisation (2010 a), Annual Survey of Industries,
Tabulated data on CD, Volumes 1 and , . New Delhi: National
Statistical Organization, Ministry of Statistics and Programme
Implementation, Government of India
Central Statistical Organisation (2010 b ), Value Addition and
Employment Generation in India, New Delhi: National Statistical
Organization, Ministry of Statistics and Programme
Implementation, Government of India
Department of Commerce (2011), Strategy for Doubling Exports in Next
Three Years (2011-12 to 2013-14), New Delhi: Ministry of
Commerce and Industry.
Department of Telecommunications (2009), Annual Report 2008-09,
New Delhi: Government of India.
Department of Telecommunications (2010), Annual Report 2009-10
New Delhi: Government of India.
Desai, Ashok (2006), India’s Telecommunications Industry, History,
Analysis, Diagnosis, New Delhi: Sage Publications.
Jensen, Robert (2007), ‘The Digital Provide: Information (Technology),
Market Performance, and Welfare in the South Indian Fisheries
Sector’, Quarterly Journal of Economics , Vol. 122, No. 3: 879–924.
KPMG-FICCI-Department of Telecommunications (2010), Broadband
for All, India Telecom 2010, New Delhi: KPMG.
Mani, Sunil (1992), Foreign Technology in Public Enterprises, New
Delhi: Oxford and IBH.
45
Mani, Sunil (2002), ‘Private Financing Initiatives in India’s Telecom
Sector’, in Sanford V.Berg, M.G Pollitt and Masatsugu Tsuji
(Eds.), Private Initiatives in Infrastructure, Cheltenham, UK and
Northampton, USA: Edward Elgar, pp. 118-139.
Mani, Sunil (2005), ‘Innovation Capability in India’s
Telecommunications Equipment Industry’ in A.Saith and M.
Vijayabaskar (eds), ICT’s and Indian Economic Development,
New Delhi: Sage Publications, pp. 265-322.
Mani, Sunil (2008), ‘Growth of India’s Telecom Services (1991-2007):
Can it Lead to Emergence of a Manufacturing Hub’, Economic
and Political Weekly, Vol. XLIII, No:3, pp. 37-46.
Singh, Sanjaya Kumar (2008), ‘The Diffusion of Mobile Phones in India’,
Telecommunications Policy, Volume 32, Issues 9-10, pp. 642-651.
Subramanian, Dilip (2010), Telecommunications Industry in India, State,
Business and Labour in a Global Economy, New Delhi: Social
Science Press.
Telecom Regulatory Authority of India (2009), Annual Report 2008-
09, New Delhi: Telecom Regulatory Authority of India.
Telecom Regulatory Authority of India (2010a), Annual Report 2009-
10, New Delhi: Telecom Regulatory Authority of India.
Telecom Regulatory Authority of India (2010b), Encouraging Telecom
Equipment Manufacturing in India, Consultation Paper, New
Delhi: Telecom Regulatory Authority of India, http://
www.trai.gov.in/WriteReadData/trai/upload/ConsultationPapers/235/
consultaionpapertdradiv28dec10.pdf (accessed February 4, 2011).
Telecom Authority of India (various issues), Press Releases Dealing
with Monthly Additions to Subscriber Base, New Delhi: Telecom
Regulatory Authority of India.
Telecom Regulatory Authority of India (2011), Press Release
No. 11 /2011, New Delhi: Telecom Regulatory Authority of India.
46
Annexure 1: Degree of competition within various telecom marketsin India, 2008-2010
Jun-08 Jun-09 Jun-10 Dec-10
Mobile Fixed Mobile Fixed Mobile Fixed Mobile Fixed
Andhra Pradesh 0.19 0.81 0.19 0.76 0.17 0.74 0.16 0.72
Assam 0.25 1.00 0.24 1.00 0.22 0.99 0.21 0.99
Bihar 0.30 0.99 0.22 0.99 0.17 0.98 0.15 0.98
Chennai 0.20 0.57 0.20 0.56
Delhi 0.18 0.50 0.18 0.47 0.17 0.45 0.16 0.44
Gujarat 0.21 0.86 0.21 0.83 0.21 0.80 0.18 0.78
Himachal Pradesh 0.27 0.98 0.25 0.98 0.19 0.97 0.17 0.97
Haryana 0.17 0.93 0.17 0.92 0.16 0.91 0.15 0.89
Jammu & Kashmir 0.39 1.00 0.31 1.00 0.27 1.00 0.26 1.00
Karnataka 0.25 0.66 0.25 0.63 0.19 0.60 0.18 0.59
Kerala 0.19 0.95 0.19 0.94 0.15 0.93 0.15 0.93
Kolkata 0.21 0.84 0.20 0.79 0.16 0.75 0.15 0.74
Madhya Pradesh 0.24 0.69 0.22 0.67 0.20 0.64 0.18 0.62
Maharashtra 0.17 0.89 0.17 0.84 0.17 0.79 0.16 0.77
Mumbai 0.18 0.60 0.16 0.52 0.14 0.47 0.13 0.46
North East-I 0.28 1.00 0.24 1.00 0.23 1.00 0.22 1.00
Orissa 0.25 0.98 0.22 0.98 0.17 0.97 0.15 0.96
Punjab 0.18 0.72 0.17 0.67 0.16 0.65 0.15 0.63
Rajasthan 0.20 0.79 0.20 0.81 0.20 0.87 0.19 0.85
Tamil Nadu 0.20 0.87 0.21 0.85 0.18 0.68 0.17 0.67
UP (EAST) 0.20 0.92 0.20 0.91 0.17 0.88 0.16 0.88
UP (WEST) 0.18 0.93 0.18 0.92 0.16 0.93 0.15 0.92
West Bengal 0.21 0.99 0.21 0.99 0.19 0.99 0.17 0.99
47
PUBLICATIONS
For information on all publications, please visit the CDS Website:www.cds.edu. The Working Paper Series was initiated in 1971. WorkingPapers from 279 can be downloaded from the site.
The Working Papers published after April 2007 are listed below:
W.P. 443 K. C. ZACHARIAH, S. IRUDAYA RAJAN, From Keralato Kerala Via The Gulf; Emigration Experiences of Return
Emigrants. March 2011.
W.P. 442 VIJAY KORRA, Short Duration Migration in India: AnAppraisal from Census 2001. March 2011.
W.P. 441 M.PARAMESWARAN, Financial Crisis and KeralaEconomy. January 2011.
W.P. 440 P.L. BEENA, Financing Pattern of Indian Corporate Sectorunder Liberalisation: With Focus on Acquiring Firms Abroad.January 2011.
W.P. 439 RAJEEV SHARMA Diversification in Rural LivelihoodStrategies: A Macro-Level Evidence from Jammu andKashmir, December 2010
W.P. 438 APARNA NAIR, The indifferent many and the hostile few:
An Assessment of Smallpox Vaccination in the ‘Model NativeState’ of Travancore 1804-1941. November 2010.
W.P. 437 VINOJ ABRAHAM, The Effect of Information Technologyon Wage Inequality: Evidence from Indian ManufacturingSector. September 2010.
W.P. 436 S. IRUDAYA RAJAN, D. NARAYANA, The Financial Crisisin the Gulf and its Impact on South Asian Migrant Workers.August 2010.
W.P. 435 ANUP KUMAR BHANDARI, Total Factor ProductivityGrowth and its Decomposition: An Assessment of the IndianBanking Sector in the True Liberalised Era. August 2010
W.P. 434 BEENA SARASWATHY, Cross-Border Mergers andAcquisitions in India: Extent, Nature and Structure. July 2010.
48
W.P. 433 VIJAY KORRA, Nature and Characteristics of SeasonalLabour Migration: A Case Study in Mahabubnagar Districtof Andhra Pradesh. July 2010
W.P. 432 K.C. ZACHARIAH S. IRUDAYA RAJAN, Impact of theGlobal Recession on Migration and Remittances in Kerala:New Evidences from the Return Migration Survey (RMS)2009. June 2010.
W.P. 431 GARGI SANATI, Integration of India’s FinancialMarkets on the Domestic and International Fronts: AnEmpirical Analysis of the Post-Liberalisation Period,June 2010.
W.P. 430 SUNIL MANI, Has China and India Become moreInnovative Since the onset of Reforms in theTwo Countries?May 2010.
W.P. 429 T. R. DILIP, School Educational Attainment in Kerala:
Trends And Differentials. April 2010.
W.P. 428 SUNIL MANI, The Flight from Defence to Civilian Space:Evolution of the Sectoral System of Innovation of India’sAerospace Industry. April 2010.
W.P. 427 J. DEVIKA, V. J. VARGHESE, To Survive or to Flourish?
Minority Rights and Syrian Christian Community Assertions
in 20th Century Travancore/Kerala. April 2010.
W.P. 426 ANUP KUMAR BHANDARI, Global Crisis, Environmental
Volatility and Expansion of the Indian Leather Industry.March 2010.
W.P. 425 P L. BEENA, HRUSHIKESH MALLICK, Exchange Rateand Export Behaviour of Indian Textiles & Clothing Sector:An Enquiry for Major Destination Countries. March 2010.
W.P. 424 K. C. ZACHARIAH, S. IRUDAYA RAJAN, MigrationMonitoring Study, 2008 Emigration and Remittancesin the Context of Surge in Oil Prices. March 2010.
W.P. 423 VIJAYAMOHANAN PILLAI N, Loss of Load Probabilityof a Power System: Kerala. February 2010.
49
W.P. 422 JAYASEKHAR S, C. NALIN KUMAR, Compliance,Competitiveness and Market Access: A Study on IndianSeafood Industry. February 2010.
W.P. 421 S. IRUDAYA RAJAN, V.J. VARGHESE, M.S. JAYAKUMAROverseas Recruitment in India: Structures, Practices andRemedies. December 2009.
W.P. 420 V.J. VARGHESE, Land, Labour and Migrations:Understanding Kerala’s Economic Modernity, December 2009.
W.P. 419 R.MOHAN, D. SHYJAN Tax Devolution and GrantDistribution to States in India Analysis and Roadmap forAlternatives, December 2009.
W.P. 418 WILLIAM JOE & U. S. MISHRA Household Out-of-Pocket
Healthcare Expenditure in India Levels, Patterns and Policy
Concerns, October 2009.
W.P. 417 NEETHI P Globalisation Lived Locally: New Forms of
Control, Conflict and Response Among Labour in Kerala,
Examined Through a Labour Geography Lens. October 2009.
W.P. 416 SUNIL MANI High skilled migration from India, An analysisof its economic implications, September 2009.
W.P. 415 SUNIL MANI Has India Become more Innovative Since1991? Analysis of the Evidence and Some DisquietingFeatures, September 2009.
W.P. 414 WILLIAM JOE, PRIYAJIT SAMAIYAR, U. S. MISHRAMigration and Urban Poverty in India Some PreliminaryObservations, September 2009.
W.P. 413 K. N. NAIR, T.P. SREEDHARAN, M. ANOOPKUMAR, AStudy of National Rural Employment Guarantee Programmein Three Grama Panchayats of Kasaragod District,August 2009
W.P. 412 B.S. SURAN, D. NARAYANA, The Deluge of Debt: Under-standing the Financial Needs of Poor Households. July 2009

50
W.P. 411 K. NAVANEETHAM , M. KABIR , C.S. KRISHNAKUMARMorbidity Patterns in Kerala: Levels and Determinants.April 2009.
W.P. 410 ARINDAM BANERJEE, Peasant Classes, Farm Incomesand Rural Indebtedness: An Analysis of HouseholdProduction Data from two States. March 2009.
W.P. 409 SUNIL MANI, The Growth of Knowledge-intensiveEntrepreneurship in India, 1991-2007 Analysis of itsEvidence and the Facilitating Factors. February, 2009
W.P. 408 M. S. HARILAL, Home to Market: Responses, Resurgenceand Transformation of Ayurveda from 1830s to 1920.November 2008
W.P. 407 HRUSHIKESH MALLICK, Do Remittances Impact theEconomy ? Some Empirical Evidences from a DevelopingEconomy. October 2008.
W.P. 406 K.C.ZACHARIAH, S.IRUDAYA RAJAN, Costs of BasicServices in Kerala, 2007, Education, Health, Childbirth andFinance (Loans) September 2008.
W.P. 405 SUNIL MANI Financing of industrial innovations in IndiaHow effective are tax incentives for R&D? August 2008.
W.P. 404 VINOJ ABRAHAM Employment Growth in Rural India:Distress Driven? August 2008.
W.P. 403 HRUSHIKESH MALLICK, Government Spending, TradeOpenness and Economic Growth in India: A Time SeriesAnalysis. July 2008.
W.P. 402 K. PUSHPANGADAN, G. MURUGAN, Dynamics of RuralWater Supply in Coastal Kerala: A Sustainable DevelopmentView, June 2008
W.P. 401 K. K. SUBRAHMANIAN, SYAM PRASAD, Rising InequalityWith High Growth Isn't this Trend Worrisome? Analysis ofKerala Experience, June 2008
W.P. 400 T.R. DILIP, Role Of Private Hospitals in Kerala: AnExploration, June 2008

51
W.P. 399 V. DHANYA, Liberalisation of Tropical Commodity Marketand Adding-up Problem: A Bound Test Approach, March 2008
W.P. 398 P. MOHANAN PILLAI, N. SHANTA, ICT and EmploymentPromotion Among Poor Women: How can we Make itHappen? Some Reflections on Kerala's Experience.February 2008.
W.P. 397 K.N.NAIR, VINEETHA MENON, Distress Debt and Suicidesamong Agrarian Households: Findings from three VillageStudies in Kerala. December 2007
W.P. 396 K.N.NAIR, C.P. VINOD, VINEETHA MENON,Agrarian Distress and Livelihood Strategies: A Studyin Pulpalli Panchayat, Wayanad District , KeralaDecember 2007
W.P. 395 K.C. ZACHARIAH, S.IRUDAYA RAJAN, Migration,Remittances And Employment Short-term Trends and Long-term Implications. December 2007
W.P. 394 K.N.NAIR, ANTONYTO PAUL, VINEETHA MENON,Livelihood Risks and Coping strategies: A Case Study in theAgrarian Village of Cherumad, Kerala. November 2007
W.P. 393 S. IRUDAYA RAJAN, U.S.MISHRA, Managing Migrationin the Philippines: Lessons for India. November 2007.
W.P. 392 K.N. NAIR, R. RAMAKUMAR Agrarian Distress and RuralLivelihoods, a Study in Upputhara Panchayat Idukki District,Kerala. November 2007.
W.P. 391 PULAPRE BALAKRISHNAN, Visible hand: Public policyand economic growth in the Nehru era. November 2007.
W.P. 390 SUNIL MANI, The Growth Performance of India’sTelecommunications Services Industry, 1991-2006 Can itLead to the Emergence of a Domestic Manufacturing Hub?September 2007.
W.P. 389 K. J. JOSEPH, VINOJ ABRAHAM, Information Technologyand Productivity: Evidence from India's ManufacturingSector. September 2007.

52
W.P. 388 HRUSHIKESH MALLICK, Does Energy Consumption FuelEconomic Growth In India? September 2007.
W.P. 387 D. SHYJAN,Public Investment and Agricultural Productivity:A State-wise Analysis of Foodgrains in India. July 2007.
W.P. 386 J. DEVIKA, 'A People United in Development':Developmentalism in Modern Malayalee Identity.June 2007.
W.P. 385 M. PARAMESWARAN, International Trade, R&D Spilloversand Productivity: Evidence from Indian ManufacturingIndustry. June 2007.
W.P. 384 K. C. ZACHARIAH, S. IRUDAYA RAJAN Economic andSocial Dynamics of Migration in Kerala, 1999-2004 Analysisof Panel Data. May 2007.
W.P. 383 SAIKAT SINHA ROY Demand and Supply Factors in theDetermination or India's Disaggregated Manufactured Exports :A Simultaneous Error-Correction Approach. May 2007.

This work is licensed under a Creative Commons Attribution – NonCommercial - NoDerivs 3.0 Licence. To view a copy of the licence please see: http://creativecommons.org/licenses/by-nc-nd/3.0/