Embed Size (px)
Citation preview

1
Happiness and International Migration
Linnea Polgreen University of Iowa
College of Pharmacy 115 S. Grand Ave.
Iowa City, IA 52242 [email protected]
Phone: 319-384-3024 Fax: 319-353-5646
Nicole B. Simpson∗ Colgate University
Department of Economics 13 Oak Dr.
Hamilton, NY 13346 [email protected] Phone: 315-288-7991 Fax: 315-228-7033
September 2010
Abstract In this paper, we consider the extent to which the aggregate happiness of a country affects the flow of people across its borders. We merge data from the World Values Survey, which produces happiness indices for 84 countries between 1981 and 2004, with three different migration datasets. We find that happiness has a U-shaped relationship with emigration rates: emigration rates fall in happiness for relatively unhappy countries, but rise for relatively happy countries. The U-shaped relationship also holds for migrant flows into the U.S. When analyzing net migration rates, we find that the reverse relationship exists. Net migration is associated with an increase in happiness for relatively unhappy countries, but after a threshold level of happiness, net migration is associated with a decrease in happiness. Our findings are robust to various empirical specifications and datasets.
JEL Codes: F22, I31, O15; International Migration, Happiness, Human Development/Migration
∗ Corresponding Author
2
Introduction
In the last half century, international migration has increased worldwide, despite increased efforts by
many governments to limit immigration.1 In 2005, approximately 191 million people lived outside their place of
birth, representing 3 percent of the world population,2 compared to 75 million in 1960 (2.5% of the world
population at that time). In this paper, we consider the extent to which the movement of people across borders is
related to aggregate measures of happiness.
Factors in both the source and destination country can affect the flow of people across countries,
including differentials in income and income inequality, costs of migration (distance, language and cultural
differences), immigration policy, stock of immigrants, political circumstances, macroeconomic conditions and
demographic structure (Borjas 1987, 1989; Massey et al. 1993; Chiswick 2000; Hatton and Williamson 2005; and
Clark, Hatton and Williamson 2007). The extent to which these and other factors affect the flow of people across
countries depends on the time period and migration sample under study.
Based on economic theory, migration decisions are made by comparing the utility of living in the home
country with the utility of living abroad (Sjaastad 1962). If the utility of living abroad exceeds the utility of
staying home net of migration costs (which could include distance, language, family left home, etc.), the
individual will move abroad, assuming immigration policy allows him to do so.
Happiness, or the lack thereof, also affects utility. Di Tella and MacCulloch (2006) show that happiness is
correlated with other variables that are known to be correlated with true utility (such as unemployment); thus,
happiness “captures something meaningful about utility” (p. 28). In addition, other research on the subject of
happiness has examined the relationship between aggregate measures of well-being and such things as income,
income inequality, unemployment, inflation, government policy, and political situations.3 For example, a country
with a developed democracy tends to have happier citizens than a country without a well-developed democracy
(Frey and Stutzer 2000a, 2000b; Graham 2005). Ruut Veenhoven, Professor of Human Happiness at Erasmus
University, finds that many, but not all, happy countries are wealthy, democratic, tolerant, and well-governed
(Stuart 2005). Helliwell and Huang (2008) find that governmental quality, as measured by government
effectiveness, regulatory quality, rule of law, and control of corruption, are closely linked to life satisfaction. 1 Hatton and Williamson (2005) have a nice discussion about how the pressures to limit migration have increased globally during this period, even though actual migrant flows have not decreased. 2 http://www.un.org/esa/population/publications/2006Migration_Chart/Migration2006.pdf 3 Frey and Stutzer (2002) and Di Tella and MacCulloch (2006) offer excellent reviews of this literature.

3
However, the relationship between income and happiness is more complicated. Stevenson and Wolfers
(2008) find a robust positive relationship between per capita GDP and average happiness across countries.
However, many social scientists believe that standard measures of income do not capture the well-being or quality
of life for individuals living in a given country (Layard 1980; Oswald 1997; Eckersley 2000; Frey and Stutzer
2002; Di Tella, MacCulloch and Oswald 2003; Blanchflower and Oswald 2004a; Graham 2005). They cite
Easterlin’s (1974) paradox: increases in real GDP are not accompanied by increases in happiness. In fact, income
only seems to have a large impact on happiness up until the point that basic needs are satisfied. Since the 1970s,
incomes in the U.S. have been rising, but happiness has not (Graham 2005), and happiness for women in
developed countries has actually been falling since the 1970s, even though women’s incomes have been rising
with respect to men’s (Stevenson and Wolfers 2009). These results may be driven by the fact that one’s place
within the income distribution, rather than gross income, is important (Layard 1980; Easterlin 2003; Blanchflower
and Oswald 2004a; Di Tella and MacCulloch 2006; Lee 2006). Furthermore, income inequality within a nation
has been shown to lower happiness levels (Alesina, Di Tella, and MacCulloch 2004).
Migration decisions are based on utility; happiness is related to utility; but to date, no investigators have
examined the relationship between migration and happiness. The link between migration and happiness could
work two ways. First, it is possible that happiness affects migration such that people in unhappy countries are
motivated to migrate to a happier country. Similarly, people in happy countries may have less incentive to move
abroad. However, the reverse could be true: migration could affect happiness, so that the presence of immigrants
may make people more or less happy in their country. Both effects are plausible, but impossible to discern given
available data. As such, we focus on the correlation between happiness and migration, instead of the direction of
causality.
By understanding the happiness-migration relationship, we may then be able to isolate some of the driving
forces behind migration, which has important policy implications. Even the vast literature on the determinants of
migration cannot fully explain migration trends. We posit that perhaps the relative happiness of countries may
explain why, for example, there are not larger migration flows between rich and poor countries, given the huge
wage differentials. In addition, our results may be informative for policymakers concerned about migration. In
developing countries that are relatively happy, policymakers could use happiness as a marketing tool to retain and
attract high-skill workers, thereby reversing brain drain. In addition, if potential migrants knew that citizens in

4
some of the popular migration destinations are relatively unhappy, that may discourage migration to those
countries, which may be better for both the sending and receiving countries.
In this paper, we assume happiness indices represent an accurate measure of aggregate well-being and
determine if cross-country differences in happiness are associated with migrant flows. We combine happiness data
from the World Values Survey (WVS) with three migration datasets: emigration rates from the Organization for
Economic Cooperation and Development (OECD), immigration rates from the U.S. Census, and net migration rates
from the United Nations (UN). We examine whether happiness is significantly associated with migration, while
controlling for other related variables such as income, income growth and time- and region-fixed effects.
Using these data, our results suggest a U-shaped relationship between happiness and emigration rates: in
very unhappy countries, emigration rates are quite high. However, emigration rates fall in happier countries. For
very happy countries, the relationship between emigration rates and average happiness becomes positive. This U-
shaped relationship between the happiness of the source country and the outflow of people is documented for two
datasets of emigration. We find the reverse relationship between happiness and net migration rates. For relatively
unhappy countries, higher levels of happiness correspond to higher net migration rates. However, beyond a
threshold level of happiness, net migration rates fall as happiness rises.
I. Data We obtain data on happiness from the World Values Survey.4,5 The WVS asks the following question about
happiness: “Taking all things together, would you say you are: 1) very happy, 2) quite happy, 3) not very happy, or
4) not at all happy.” Following much of the literature and for ease of interpretation, we convert this unhappiness
indicator to a happiness indicator, using the following formula: happiness = 5 - unhappiness. The WVS interviewed
between 1000 and 2000 people in each of the 84 countries between 1981 and 2004 in four waves (1981-1984, 1989-
1993, 1994-1999 and 1999-2004). Using weights provided by the survey, we calculate a weighted average of the
happiness indicator for each country-year available.6 Not all countries were sampled in each wave. Furthermore,
4 http://www.worldvaluessurvey.org/ 5 The WVS also reports a life-satisfaction measure, but there is no clear pattern in the economics literature about the use of happiness indices compared to measures of life-satisfaction. Life satisfaction is measured on a 10-point scale compared to the 4-point scale of the happiness index. Not surprisingly, the two indices are highly correlated. We report results using the happiness indices for ease of interpretation. However, results using the life satisfaction data are almost identical and can be obtained from the authors. 6 Specifically, we computed weighted averages of each country-year cell using the ‘s018’ weight. Weights are defined at: http://www.worldvaluessurvey.org/services/index.html.

5
many countries were not sampled the same number of times: the happiness indicator is available for one to five
years in each country.
The happiness data are individually self-reported, and, unlike most data used by economists (e.g.,
educational attainment, marital status), subjective. Any two people who seem outwardly similar, when ranking their
own happiness, may differ in the way they determine a response. Thus, interpersonal comparisons of happiness
indices are difficult to interpret (Di Tella and MacCulloch 2006). However, as the size of the group you are
comparing increases, comparability increases due to a reduction in “systematic differential reporting biases” (Di
Tella and MacCulloch 2006, p. 29). Di Tella and MacCulloch (2006) add, “the underlying assumption …(in the
economics literature) is that when people are measured in groups, the combination of their happiness scores reveals
useful information with which to make comparisons about social welfare” (p. 32).
Even though applying macro-level happiness indicators to explain social phenomena is not new, using
subjective measures of happiness as a proxy for utility is still approached with skepticism by some scientists.
Specifically, comparing subjective well-being measures across countries is complicated by differences in language
and culture. In addition, changes in well-being over time (within a country) may be associated with changes in
objective factors. However, several recent studies build credibility to the practice of comparing average well-being
measures across countries and time, including Frey and Stutzer (2002), Layard (2005), Kahneman and Krueger
(2006), Helliwell (2007) and Stevenson and Wolfers (2008, 2009).
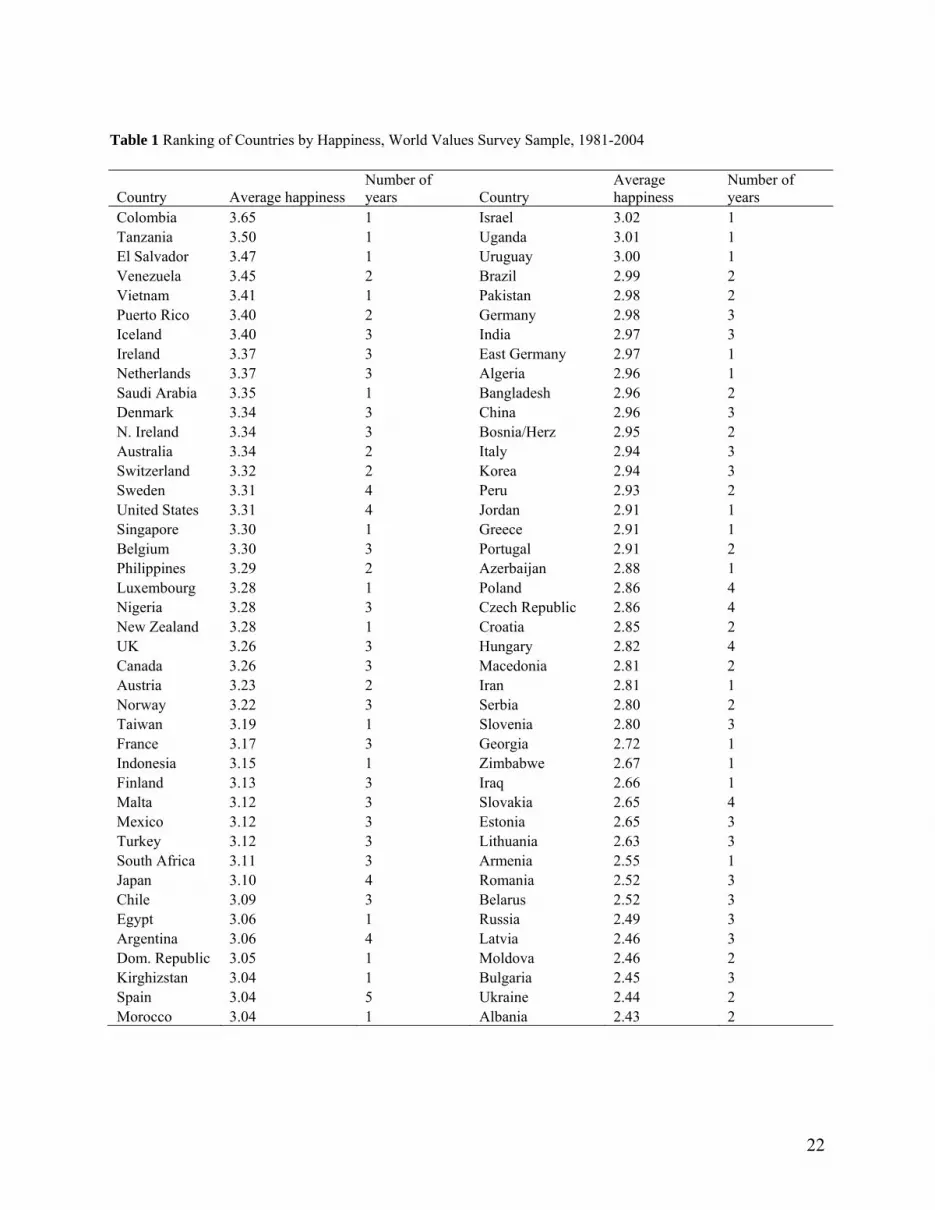
In Table 1, we list the average value of the happiness index for each country from the WVS and the number
of years in which it was reported. These values vary greatly among countries. Colombia, Tanzania, El Salvador,
Venezuela and Vietnam are some of the happiest countries in the world, even though none of them are among the
richest countries. Alternatively, high income countries, such as Italy, Greece and Portugal, are relatively unhappy.
In general, however, wealthier countries are happier and poorer countries are less happy. Many of the least happy
countries in this sample are transition economies of Eastern Europe, including Latvia, Moldova, Bulgaria, Ukraine
and Albania.
We apply the happiness data from the WVS to three different migration datasets to determine the
relationship between happiness and the flow of people across countries. All three datasets include legal and illegal
migrants. First, we obtain emigration rates from the OECD for 176 countries around the year 2000, using the series
6
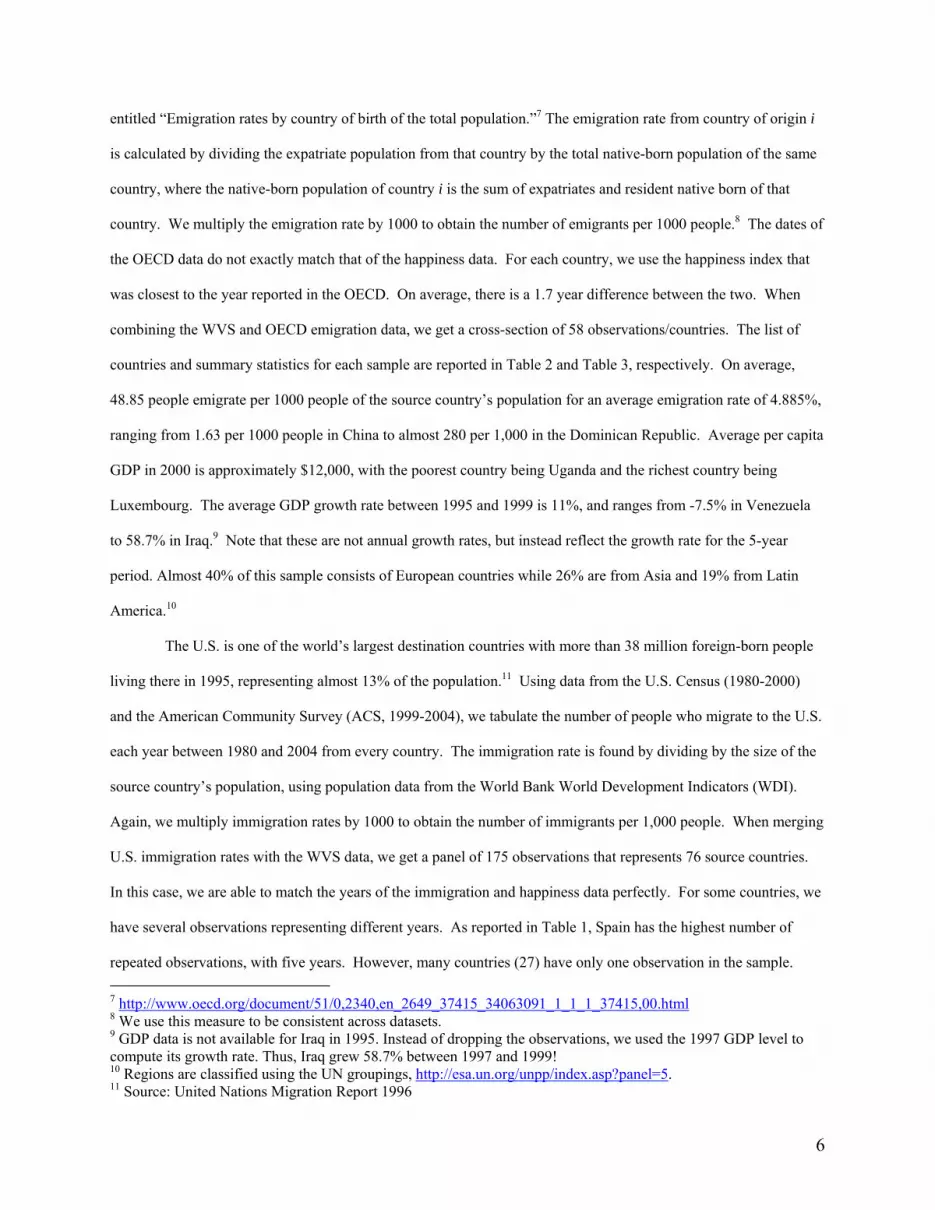
entitled “Emigration rates by country of birth of the total population.”7 The emigration rate from country of origin i
is calculated by dividing the expatriate population from that country by the total native-born population of the same
country, where the native-born population of country i is the sum of expatriates and resident native born of that
country. We multiply the emigration rate by 1000 to obtain the number of emigrants per 1000 people.8 The dates of
the OECD data do not exactly match that of the happiness data. For each country, we use the happiness index that
was closest to the year reported in the OECD. On average, there is a 1.7 year difference between the two. When
combining the WVS and OECD emigration data, we get a cross-section of 58 observations/countries. The list of
countries and summary statistics for each sample are reported in Table 2 and Table 3, respectively. On average,
48.85 people emigrate per 1000 people of the source country’s population for an average emigration rate of 4.885%,
ranging from 1.63 per 1000 people in China to almost 280 per 1,000 in the Dominican Republic. Average per capita
GDP in 2000 is approximately $12,000, with the poorest country being Uganda and the richest country being
Luxembourg. The average GDP growth rate between 1995 and 1999 is 11%, and ranges from -7.5% in Venezuela
to 58.7% in Iraq.9 Note that these are not annual growth rates, but instead reflect the growth rate for the 5-year
period. Almost 40% of this sample consists of European countries while 26% are from Asia and 19% from Latin
America.10
The U.S. is one of the world’s largest destination countries with more than 38 million foreign-born people
living there in 1995, representing almost 13% of the population.11 Using data from the U.S. Census (1980-2000)
and the American Community Survey (ACS, 1999-2004), we tabulate the number of people who migrate to the U.S.
each year between 1980 and 2004 from every country. The immigration rate is found by dividing by the size of the
source country’s population, using population data from the World Bank World Development Indicators (WDI).
Again, we multiply immigration rates by 1000 to obtain the number of immigrants per 1,000 people. When merging
U.S. immigration rates with the WVS data, we get a panel of 175 observations that represents 76 source countries.
In this case, we are able to match the years of the immigration and happiness data perfectly. For some countries, we
have several observations representing different years. As reported in Table 1, Spain has the highest number of
repeated observations, with five years. However, many countries (27) have only one observation in the sample. 7 http://www.oecd.org/document/51/0,2340,en_2649_37415_34063091_1_1_1_37415,00.html 8 We use this measure to be consistent across datasets. 9 GDP data is not available for Iraq in 1995. Instead of dropping the observations, we used the 1997 GDP level to compute its growth rate. Thus, Iraq grew 58.7% between 1997 and 1999! 10 Regions are classified using the UN groupings, http://esa.un.org/unpp/index.asp?panel=5. 11 Source: United Nations Migration Report 1996
7
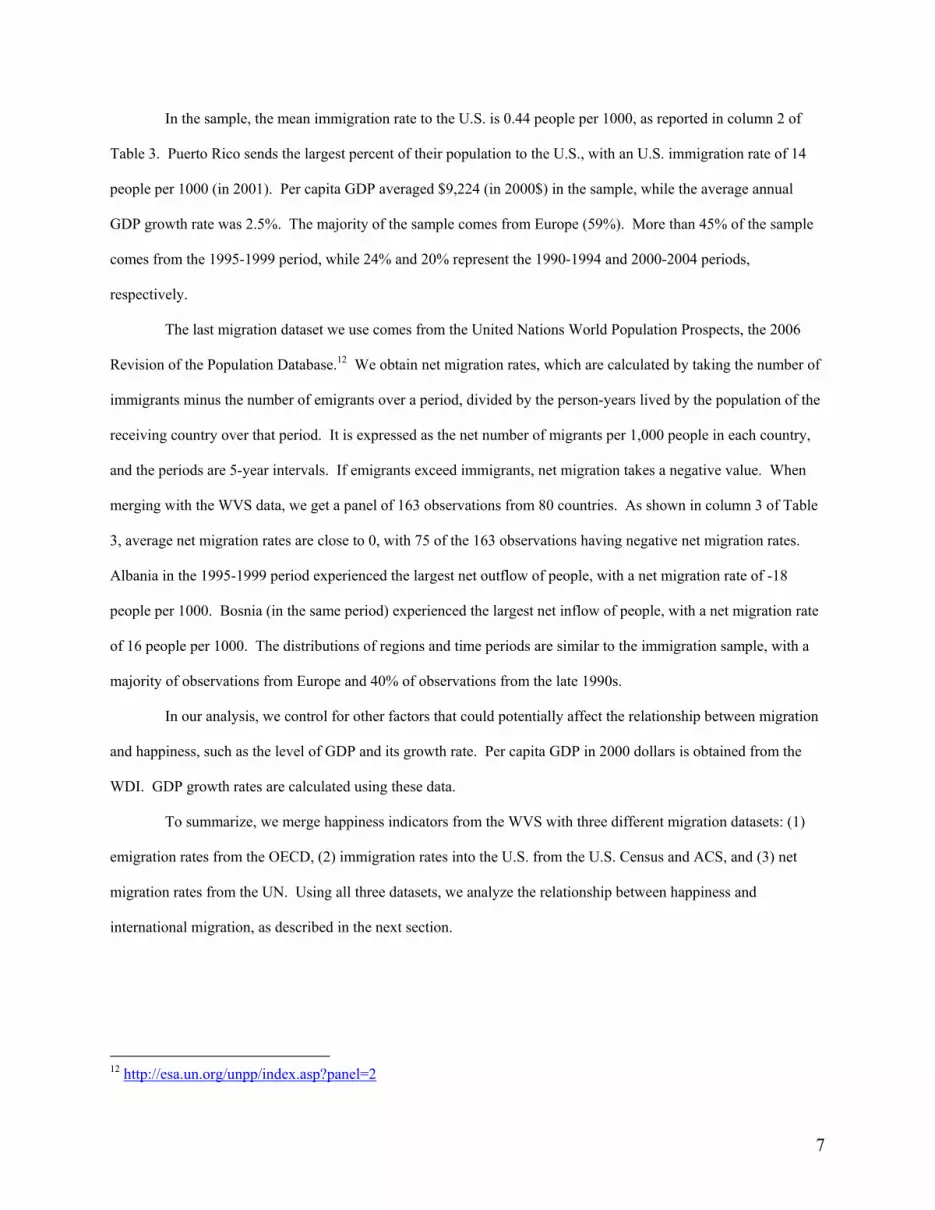
In the sample, the mean immigration rate to the U.S. is 0.44 people per 1000, as reported in column 2 of
Table 3. Puerto Rico sends the largest percent of their population to the U.S., with an U.S. immigration rate of 14
people per 1000 (in 2001). Per capita GDP averaged $9,224 (in 2000$) in the sample, while the average annual
GDP growth rate was 2.5%. The majority of the sample comes from Europe (59%). More than 45% of the sample
comes from the 1995-1999 period, while 24% and 20% represent the 1990-1994 and 2000-2004 periods,
respectively.
The last migration dataset we use comes from the United Nations World Population Prospects, the 2006
Revision of the Population Database.12 We obtain net migration rates, which are calculated by taking the number of
immigrants minus the number of emigrants over a period, divided by the person-years lived by the population of the
receiving country over that period. It is expressed as the net number of migrants per 1,000 people in each country,
and the periods are 5-year intervals. If emigrants exceed immigrants, net migration takes a negative value. When
merging with the WVS data, we get a panel of 163 observations from 80 countries. As shown in column 3 of Table
3, average net migration rates are close to 0, with 75 of the 163 observations having negative net migration rates.
Albania in the 1995-1999 period experienced the largest net outflow of people, with a net migration rate of -18
people per 1000. Bosnia (in the same period) experienced the largest net inflow of people, with a net migration rate
of 16 people per 1000. The distributions of regions and time periods are similar to the immigration sample, with a
majority of observations from Europe and 40% of observations from the late 1990s.
In our analysis, we control for other factors that could potentially affect the relationship between migration
and happiness, such as the level of GDP and its growth rate. Per capita GDP in 2000 dollars is obtained from the
WDI. GDP growth rates are calculated using these data.
To summarize, we merge happiness indicators from the WVS with three different migration datasets: (1)
emigration rates from the OECD, (2) immigration rates into the U.S. from the U.S. Census and ACS, and (3) net
migration rates from the UN. Using all three datasets, we analyze the relationship between happiness and
international migration, as described in the next section.
12 http://esa.un.org/unpp/index.asp?panel=2

8
II. The Models
To examine the relationship between happiness and international migration, we estimate a standard
empirical model of migration using Ordinary Least Squares for the three different datasets. The model is quite
similar in that the happiness indicator, GDP and GDP growth are used as independent variables, and time and
regional fixed effects are considered. However, the dependent variables are different in the three models.
For the dependent variable in the first model, we use the emigration rate from country i around the year
2000. For the second equation, we use the U.S. immigration rate from country i in year t. The dependent variable
for the last specification is the net migration rate of country i during period t. In the first two models, we examine
the source country. In the third model, we examine the destination country. All of these variables represent the
(legal and illegal) flow of people across borders.
In addition to examining the relationship between happiness and migration, we include other variables in
the models that are potentially correlated with migration. The most likely candidate is income because it is often the
primary motivation for many migration decisions (Hicks, 1932; Sjaastad 1962). Rotte and Vogler (2000) argue the
level of growth and development in source countries influences who has the largest incentive to migrate. Several
studies have documented a hump-shaped relationship between economic development and emigration (Massey
1988; Hatton and Williamson 1998; Stalker 2000), where emigration rates rise in income for very poor countries,
and fall in income for richer countries.
Other than income, various other factors have been associated with international migration, including
geography, cultural similarities, moving costs, demographics, social policies and immigration restrictions (Borjas
1987, Borjas and Bratsberg 1996, Greenwood et al. 1999, Karemera, Oguledo and Davis 2000, Clark, Hatton and
Williamson 2007). A recent paper by Mayda (2008) considers the role of source- and destination-country factors in
affecting world-wide bilateral migrant flows; she finds that along with income in the destination country,
immigration quotas, distance and demographics all pay important roles in determining international migrant flows.
With these studies in mind, we examine other variables that could be related to immigration: income
inequality, corruption, foreign domestic investment, trade volume, capital flows, political rights, rule of law, ethnic
fractionalization, labor force participation, educational attainment, and life expectancy.13 We found that all of these
variables are highly correlated with GDP and/or GDP growth and were ultimately dropped from the models. In each 13 These data were obtained from Weil (2005) and the WDI.
9
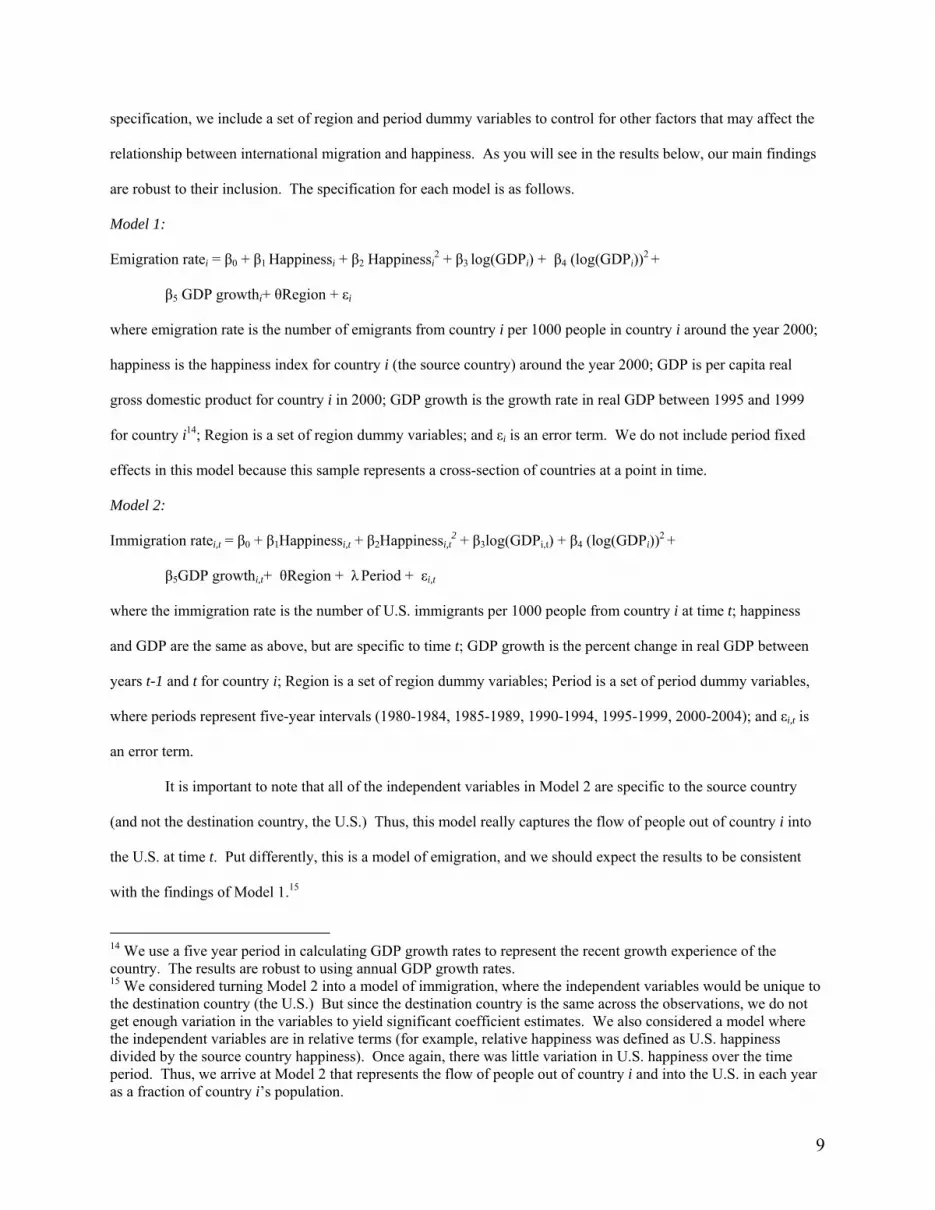
specification, we include a set of region and period dummy variables to control for other factors that may affect the
relationship between international migration and happiness. As you will see in the results below, our main findings
are robust to their inclusion. The specification for each model is as follows.
Model 1:
Emigration ratei = β0 + β1 Happinessi + β2 Happinessi2 + β3 log(GDPi) + β4 (log(GDPi))2 +
β5 GDP growthi+ θRegion + εi
where emigration rate is the number of emigrants from country i per 1000 people in country i around the year 2000;
happiness is the happiness index for country i (the source country) around the year 2000; GDP is per capita real
gross domestic product for country i in 2000; GDP growth is the growth rate in real GDP between 1995 and 1999
for country i14; Region is a set of region dummy variables; and εi is an error term. We do not include period fixed
effects in this model because this sample represents a cross-section of countries at a point in time.
Model 2:
Immigration ratei,t = β0 + β1Happinessi,t + β2Happinessi,t2 + β3log(GDPi,t) + β4 (log(GDPi))2 +
β5GDP growthi,t+ θRegion + λ Period + εi,t
where the immigration rate is the number of U.S. immigrants per 1000 people from country i at time t; happiness
and GDP are the same as above, but are specific to time t; GDP growth is the percent change in real GDP between
years t-1 and t for country i; Region is a set of region dummy variables; Period is a set of period dummy variables,
where periods represent five-year intervals (1980-1984, 1985-1989, 1990-1994, 1995-1999, 2000-2004); and εi,t is
an error term.
It is important to note that all of the independent variables in Model 2 are specific to the source country
(and not the destination country, the U.S.) Thus, this model really captures the flow of people out of country i into
the U.S. at time t. Put differently, this is a model of emigration, and we should expect the results to be consistent
with the findings of Model 1.15
14 We use a five year period in calculating GDP growth rates to represent the recent growth experience of the country. The results are robust to using annual GDP growth rates. 15 We considered turning Model 2 into a model of immigration, where the independent variables would be unique to the destination country (the U.S.) But since the destination country is the same across the observations, we do not get enough variation in the variables to yield significant coefficient estimates. We also considered a model where the independent variables are in relative terms (for example, relative happiness was defined as U.S. happiness divided by the source country happiness). Once again, there was little variation in U.S. happiness over the time period. Thus, we arrive at Model 2 that represents the flow of people out of country i and into the U.S. in each year as a fraction of country i’s population.

10
Model 3:
Net migration ratei,t = β0 + β1Happinessi,t + β2Happinessi,t2 + β3log(GDPi,t) + β4GDP growthi,t
+ θRegion + λ Period + εi,t
where the net migration rate for country i at time t is the difference between the number of immigrants and the
number of emigrants for country i over period t (which are five-year intervals), divided by the person-years lived by
the population of country i over that period; happiness and GDP are the same as above, but are specific to the
destination country; GDP growth for destination country i is the percent change in real GDP between the first and
last year of the relevant five-year period; Region and Period are the same as above; and εi,t is the error term. Note
that the happiness indices are matched to the 5-year intervals. For example, if happiness is reported in 1997 for
country i, it represents the happiness indicator for the 1995-1999 period for that country. For periods in which more
than one happiness indicator is available for a country, we average the relevant happiness indicators. This happened
for 18 of the 163 observations. Note that the square of log(GDP) in not included in Model 3 because we believe that
net migration is increasing in the destination country’s GDP: richer countries will attract more migrants, all else
equal.16
III. Results
Model 1:
The results for Model 1 are presented in Table 4. Recall that the independent variable is the number of
people who leave each country per 1000 people in the source country’s population. In column A, we include only
happiness of the source country and its square as the independent variables to isolate the relationship between
happiness and migration. Column B includes the natural log of per capita GDP (in 2000 $), its square and the
growth rate in real GDP as control variables. The last specification, in column C, controls for regional fixed effects
in addition to the level and growth of GDP.
Across all three specifications of Model 1, we find a significant, non-linear relationship between emigration
and happiness of the source country. In Figure 1, we plot the relationship using the estimated coefficients for the
three specifications. For relatively low levels of happiness, there is a negative relationship between happiness and
16 For all three models, various statistical models were considered, specifically, OLS models with log and square root transformations as well as generalized linear models with Gaussian and gamma families and multiple link functions. Using AIC as a model-selection criterion, none of these models were substantially better than the OLS model, and due to the ease of interpretation of the OLS model, it was chosen. In fact, the predictions from all models considered gave similar results.
11
emigration: happier countries have lower emigration rates than less happy countries. This makes sense: people in
happier countries have less incentive to migrate. However, beyond a threshold level of happiness, we find that the
relationship between happiness and emigration becomes positive. Thus, very happy countries have higher
emigration rates, and the order of magnitude is significant. In specification A, for example, a one standard deviation
increase in the average happiness indicator (from 3 to 3.28) increases emigration by 13.5 people per 1000 (or, an
1.35 percentage point increase in the emigration rate). In the next section (section V), we discuss the reasons why
people in very happy countries potentially think about migration differently than people in less happy countries.
The U-shaped relationship between happiness and emigration is maintained when controlling for GDP and
GDP growth (specification B) and other differences across regions (specification C). Figure 1 illustrates that the
threshold level of happiness in which the happiness-emigration relationship changes from negative to positive
depends on GDP and GDP growth (compare specifications A and C in Figure 1). When not controlling for income
and income growth (specification A), the happiness-emigration relationship becomes positive for lower levels of
happiness (at a happiness index of 2.93 versus 2.97 in specification C, just below the ‘quite happy’ level).17 In
addition, the inclusion of regional fixed effects changes the magnitude of the slope. For example, the slope is flatter
in specification C than specifications A and B for relatively happy countries. That is, an increase in happiness leads
to a smaller increase in emigration rates (for relatively happy countries) when unobserved differences in regions are
considered. It is important to note that while the happiness scale ranges from 1 to 4, no countries had an average
happiness index below 2.
In fact, as in previous studies (Massey 1988; Hatton and Williamson 1998; Stalker 2000), in specification B
we find a hump-shaped relationship between emigration and GDP: the coefficient on log(GDP) is positive and
significant, and the coefficient on the square of log(GDP) is negative and significant. People from very poor nations
are unlikely to migrate: they lack the financial means to move. As incomes increase, migration becomes possible as
they gain the resources needed, and they may also be more informed about opportunities outside of their own
country. These effects may dominate the rising level of income at home relative to abroad. Thus, the hump-shaped
relationship between emigration rates and income exists, even when controlling for the differences in happiness
across countries.
17 We calculate the inflection point by differentiating the estimated models. h* is based on the estimated coefficients for the happiness indicator (β1) and its square (β2), holding all other variables constant. That is, h*=-β1/2β2.
12
However, once we control for regional effects (in specification C), log(GDP) and its square are no longer
significant predictors of emigration. This is true because log(GDP) is correlated with most of the regional dummy
variables (e.g., Europe (r=0.505), Africa (r=-0.413), and Asia (r=-0.393). This demonstrates the disconnect between
happiness and GDP: although European countries are, in general, wealthy, and African countries are, in general,
poor, European countries are not universally happy, and African countries are not universally unhappy. More
important is the country’s recent growth experience: GDP growth is positively related to emigration rates, and this is
robust to the inclusion of regional fixed effects. In specification C, a one percentage point increase in GDP growth
increases the emigration rate by approximately 157 people per 1000 (15.7 percentage points). Thus, countries that
recently went through an expansionary period experience a significant increase in emigration rates, holding GDP
and happiness constant. Perhaps the macroeconomic expansion is a migration catalyst, providing potential migrants
the additional resources necessary to fund their migration.
Most importantly, the significant, U-shaped relationship between happiness and emigration remains, even
with the inclusion of GDP, GDP growth and regional fixed effects. Thus, the overall level of happiness in the
destination country is important to consider when analyzing the various determinants of international migration.
We also considered other control variables, including Gini coefficients, rule of law, corruption and capital
flows, and experimented with lags of happiness, GDP and GDP growth. Many of these variables were highly
correlated with GDP and/or GDP growth, and were thus excluded from the final analysis. However, even when
these variables were included in the regression (either in addition to GDP and GDP growth or as a substitute for
them), we found that the relationship between happiness and emigration is robust. While the magnitudes of the
coefficients changed a bit, their direction and significance did not. Thus, we feel confident that our model
accurately depicts this relationship.
Model 2:
Next, we apply U.S. Census and American Community Survey data to our model. The data consist of an
unbalanced panel of 76 countries between 1981 and 2003 for a total of 175 observations. The dependent variable of
Model 2 is the number of U.S. immigrants from country i that entered in year t relative to the population of country
i. Since the happiness index (on the right-hand side of the regression) is for the source country, this is a model of
emigration, just like Model 1, but with different data. That is, we now examine if U.S. immigrants come from
relatively happy or unhappy countries. Thus, this model represents immigration into the U.S. only (and not
13
worldwide migration, as in Model 1). In addition, the sample size is much larger since it is a time series. However,
the control variables and their functional form are the same as in Model 1. Also, as in Model 1, we report three
model specifications. All specifications are the same as Model 1, except that in this case, Specification C contains
time-period indicator variables.
The results are shown in Table 5 and are similar to those from Model 1. There is a U-shaped relationship
between happiness of the source country and the flow of people into the U.S. That is, up to a threshold level of
happiness, happier countries send fewer migrants to the U.S. After that threshold, immigration to the U.S. increases
with happiness. The findings are robust to the inclusion of GDP, GDP growth, and region- and period-dummy
variables. Figure 2 shows that the threshold level of happiness in which the happiness-migration relationship
changes is very similar across all three specifications: ranging from 2.80 in specification A to 2.91 in specification
C.
Notice that the coefficients on happiness and its square are smaller in magnitude than the results from
Model 1. This is because we are only considering emigration to the U.S., not total emigration. The results indicate
that for countries with happiness indices at 3, a one standard deviation increase in the happiness index will increase
the flow of migrants to the U.S. by 0.41 people per 1000 (or, 0.041 percentage points), based on the results from
specification C. Thus, it seems that differences in happiness indices in source countries of U.S. immigrants have a
small, yet significant, effect on the flow of people into the U.S.
In Model 2 we find the same hump-shaped relationship between log(GDP) and immigration to the U.S. as
we did with log(GDP) and worldwide emigration in Model 1, and these variables are significant at the 10% level in
specification B. However, the addition of regional variables in specification C causes these variables to become
insignificant. As in Model 1, we find some evidence that GDP growth in the source country is positively associated
with immigration to the U.S. A one percentage point increase in GDP growth (between the current and past year) is
associated with a 6.05 percentage point increase in immigration to the U.S. (specification B).18 Once we consider
region and period fixed effects (in specification C), GDP growth loses its significance (which did not happen in
Model 1). Of all of the region and period fixed effects, only the coefficient on Latin America is significant (at the
5% level).
18 Note that we also consider past GDP growth. The results are similar to those presented. Ideally, we would use GDP in the previous five years to be consistent with the other models, but in doing so we lose 8 observations. Again, the results are very similar.
14
These results confirm our findings from Model 1. We document a U-shaped relationship between
happiness and the flow of people out of countries. This is true even though the first model pertains to the worldwide
flow of people from 58 different countries around the year 2000 in response to changes in the source country’s
average level of happiness, while the second model pertains to the flow of people from 76 countries and into the
U.S. between 1981 and 2003. The U-shaped relationship between happiness and emigration rates is robust to the
inclusion of other macroeconomic variables, region and period fixed effects, and lags in happiness, GDP and GDP
growth.19
Model 3:
Lastly, we apply the model to net migration. Using data from the UN, we collect net migration rates for 80
countries between 1980 and 2004, and merge it with happiness data from the WVS. Net migration rates are defined
as the difference between immigrants and emigrants in country i divided by the person-years lived by the population
of country i. The UN reports net migration rates in five-year intervals. In this model, it is important to recognize
that all of the independent variables, including the happiness indicator, represent the destination country, which is
different from Models 1 and 2, where they represent source countries.
The results of Model 3 are presented in Table 6, and specifications A, B, and C are the same as in Model 2.
We find a hump-shaped relationship between net migration and happiness in the destination country, as illustrated in
Figure 3. For relatively unhappy countries, net migration rates increase with happiness. That is, immigrants exceed
emigrants in happier countries. Beyond a threshold level of happiness (approximately 3.15 in specifications B and
C), happier countries experience decreases in net migration rates. Specifically, a one standard deviation increase in
the happiness index (from 3.15) decreases net migration by approximately 1.11 people per 1000 in specification C
(or, 0.111 percentage points). Thus, more people are leaving happier countries than are entering during that period,
and this relationship is robust to the inclusion of regional dummy variables and period fixed effects.
Once again, the results are maintained across all three specifications. In this model, we find more support
of GDP and GDP growth as important determinants of net migration. Specifications B and C both deliver
significant, positive coefficients for the natural logarithm of GDP and the GDP growth rate. In this case, higher
income in the destination country is attracting migrants: net migration rates are higher in richer countries. In
addition, countries that experience more GDP growth have higher emigration rates. Since GDP growth in this 19 The set of control variables considered is smaller than in Model 1 because we do not have time series data on variables such as Gini coefficients, corruption, rule of law, etc.

15
model represents the amount of growth during the current period (compared to the past period, as in Model 1), this
result may indicate that destination countries grow faster as a result of the new migrants. Our results indicate that
this may be the case, and if so, the effect is economically significant: a one percentage point increase in GDP growth
in the period is associated with a 4.7 percentage point increase in emigration rates.
Specification C of Model 3 delivers a few significant region and time dummy variables: two of the five
region dummy variables are significant (Asia and Latin America), as is one of the period dummy variables (1980-
1984 period). Thus, unobserved differences between some regions and time periods cause at least some of the
differences in emigration rates.
The goodness of fit in Model 3 is much better than in Models 1 and 2, as indicated by the relatively high R2
in all three specifications. Thus, our set of control variables (namely, happiness indices and development indicators)
are better predictors of net migration rates than emigration rates (from Model 1 and Model 2).
The results from this model are consistent with our findings from Models 2 and 3; since net migration
reflects the difference between immigration and emigration, a positive emigration rate would lead to a negative net
migration rate, all else equal. Where these models differ is in terms of the marginal effect of happiness: emigration
rates respond the most to changes in average happiness, given by the large estimated coefficients in Table 4. The
smallest effects are found in migration rates to the U.S. In all cases, however, the happiness-migration relationship
is economically significant.
Our results show that the relationship between migration and happiness in nonlinear. Also, the threshold
level of happiness in which the relationship between happiness and migration changes is quite similar in all three
datasets: 2.91 (immigration), 2.97 (emigration), and 3.15 (net migration), all close to the ‘quite happy’ level.20
This indicates some consistency in the level of happiness at which the happiness-migration relationship changes
across all three datasets.
IV. Possible Explanations
All of our results point to a nonlinear relationship between happiness and migration. Generally speaking,
for countries that are at least ‘quite happy’ (happiness>3), happier countries have higher (lower) emigration (net
migration) rates. The reverse is true for countries that are ‘not very happy’ or ‘not at all happy’ on average
20 These thresholds are calculated for specification C in all three cases.
16
(happiness<3): happier countries have lower (higher) emigration (net migration) rates. Our results hold up to
various empirical specifications, datasets and control variables.
A priori, we expected the negative relationship between happiness and emigration rates: one would think
that people in happier countries are less willing to migrate (controlling for differences in income and income
growth). Those at the bottom of the happiness spectrum may be simply trying to improve their lives, so higher
levels of happiness at home push fewer people out of the country. Similarly, destination countries that are happier
would attract more people from abroad, pushing up net migration rates in those countries.
However, in both cases, the happiest of countries experience a different phenomenon: emigration rates
increase with the source country’s happiness and net migration rates increase in the happiness of the destination
country. So, why does the happiness-migration relationship change over the spectrum of happiness indices?
One explanation is that migrants from happy countries are more optimistic than people in less happy
countries. We think happiness reflects optimism, so that people in happier countries are more optimistic about life
in general and the possibilities that exist outside of their country and are more willing to move to take advantage of
better opportunities abroad. Thus, migrants tend to be optimistic. This is supported by Ek et al. (2008): people who
migrated (from rural to urban areas in Finland) were more optimistic in general than those who had not migrated.21
In addition, migrants were more likely to be very satisfied with their life than non-migrants. Of course, there is no
way to measure optimism in our dataset, but our findings suggest that there is something inherently different
between unhappy and happy countries when it comes to their attitudes on migration. This may be important in
managing world-wide migration flows. If the citizens of certain countries are more optimistic in general, that could
explain high rates of emigration. If emigration is a concern (as in the case of brain drain), policies could be designed
to keep them home, knowing that they are optimistic about outside opportunities. If countries want to promote
emigration (as a means of controlling population or influencing remittances from rich countries), policies could be
set to channel the inherent optimism of migrants.
Another possible explanation comes from prospect theory, originated by Kahneman and Tversky (1979.
Prospect theory suggests that choices are based on relative improvements in one’s position rather than the final
outcome. Recently, prospect theory has been used by Vendrik and Woltjer (2007) to analyze the relationship
between life satisfaction and income. In the context of happiness and migration, people in happier countries may 21 In their study, the life orientation test was used to measure optimistic versus pessimistic attitude towards the future.

17
view migration differently than people in less happy countries since a certain level of happiness is already attained.
For example, in relatively happy countries, an increase in happiness may be associated with higher emigration rates
since the possibility of achieving a higher level of happiness abroad may influence migration; people in this category
may be willing to tolerate more risk and hence migrate. However, in relatively unhappy countries, an increase in
happiness improves the situation in their home country and thereby lowers emigration rates; these people may be
more risk adverse with respect to migration. The difference in the reference points between the two groups distorts
the decision to migrate, consistent with prospect theory.
We find a link between happiness and migration, but we are not able to isolate exactly which factors are
making people happy (or unhappy) and influence them to migrate. However, the large literature on the determinants
of happiness helps in this regard. As mentioned before, macroeconomic variables such as unemployment, inflation,
government policy, and political situations affect the aggregate well-being of a society, which may in turn influence
migration. At the micro level, as documented by Blanchflower and Oswald (2004b), individual characteristics such
as gender, marital status, race, age, educational attainment, etc. influence the well-being of a person, and may be
associated with migration. In future work, we will use the micro-level happiness data from the WVS to determine
the factors associated with individual level happiness. We will then be able to determine if these factors are
associated with aggregate migration flows (recall that detailed migration histories are not available in these data).
V. Conclusions
In this paper, we study the relationship between the aggregate well-being of a country, as measured by the
average happiness of its citizens, and the flow of people across countries. A priori, one might expect the average
happiness of a society to motivate people to leave a country and/or attract people to a particular country. In fact, we
find evidence of two forces at work. Happiness has a U-shaped association with emigration: people from very
happy countries are likely to emigrate, as are people from very unhappy countries. However, people from countries
in the middle of the happiness distribution are less likely to emigrate. This relationship is robust to three different
migration datasets and controlling for differences in development indicators and regional and period fixed effects.
This study represents the first step in analyzing the complex relationship between happiness and worldwide
migrant flows, and we realize that there are limitations to our approach. First, movement between countries is not
completely free: many countries give preferential treatment to specific other countries. If freedom of movement is
not uniformly distributed among happy and unhappy countries, this may bias our results. For example, unhappy

18
countries may be unhappy partially due to their lack of freedom. In this case, if free movement were allowed, the
effects on emigration may be much more substantial on the lower end of the happiness scale.
Second, we use aggregate data; every society, happy or not, has unhappy citizens, and it might be the most
unhappy people from each country who choose to emigrate. Alternatively, if happiness reflects optimism, it might
be the happiest citizens who move abroad. How these immigrants compare to the non-foreign born citizens of a
destination country may also be an interesting feature to analyze, and may spur debate for the ongoing immigration
policy discussions in most of the advanced countries of the world. Unfortunately, very little micro-level data
currently exists that reports both happiness levels and cross-country migration history. While there is a small subset
of people in the WVS that live in a country different from their birth country (5.5% of the sample); however, only
their region of birth is reported (i.e., not their country) and their specific year of entry is not reported, making us
unable to generate migration histories for these individuals in the dataset.
Given these limitations, our next step is to attach country-specific migration rates to individual-level
happiness data. Alternatively, because those at the bottom of the income distribution in any particular country also
tend to be the least happy (Stevenson and Wolfers 2008), we will use individual-level migrant data to determine if
migrants from happy countries are more-, less- or equally likely to be from the bottom of the income distribution in
their home country than immigrants form unhappy countries. These, along with several other projects, will be
addressed in future work.

19
Acknowledgements
We wish to thank Michelle Wiggins for excellent research assistance. This paper benefited from helpful comments
made by Takao Kato, Giovanni Peri, Ann Own, seminar participants at Lafayette College, the Midwest Economic
Association 2007 meetings in Minneapolis, and the American Economic Association 2009 meetings in San
Francisco, CA. All errors are our own.
References
Alesina, A., Di Tella,R. & MacCulloch, R. (2004). Inequality and happiness: are Europeans and Americans different? Journal of Public Economics, 88(9-10): 2009--2042. Blanchflower, D.G. & Oswald, A.J. (2004a). Well-being over time in Britain and the USA. Journal of Public Economics, 88(7-8),1359--1386. Blanchflower, D.G. & Oswald, A.J. (2004b). Money, sex and happiness: an empirical study. Scandinavian Journal of Economics, 3, 393--415. Borjas, G. J. (1987). Self-selection and the earnings of immigrants. American Economic Review, 77, 531--553. Borjas, G. J. (1989). Economic theory and international migration. International Migration Review, 23(3), 457--485. Borjas, G. & Bratsberg. B. (1996). Who leaves? The outmigration of the foreign-born. Review of Economics and Statistics, 78(1),165--176. Chiswick, B. (2000). Are immigrants favorably self-selected? An economic analysis. In C.D. Brettell & J.F. Hollifield (Eds.), Migration theory: talking across disciplines (pp. 61--76). New York: Routledge. Clark, X., Hatton, T.J. & Williamson, J.G. (2007). Explaining U.S. immigration, 1971-1998. Review of Economics and Statistics, 89(2), 359--373. Di Tella, R., MacCulloch, R. & Oswald, A.J. (2003). The macroeconomics of happiness. Review of Economics and Statistics, 85(4), 809--827. Di Tella, R. & MacCulloch, R.. (2006). Some uses of happiness data in economics. Journal of Economic Perspectives, 20(1), 25-46. Easterlin, R. (1974). Does economic growth improve the human lot? Some empirical evidence. In P. David & M. Reder (Eds.), Nations and households in economic growth: essays in honour of Moses Abramovitz, (pp. 98–125). New York and London: Academic Press. Easterlin, R. (2003). Explaining happiness. Proceedings of the National Academy of Sciences, 100(19), 11176--11183. Eckersley, R. (2000). The mixed blessings of material progress: diminishing returns in the pursuit of happiness. Journal of Happiness Studies, 1(3), 267--292. Ek, E., Koiranena, M., Raatikkaa, V.P., Järvelinc, M.R. & Taanila, A., (2008). Psychosocial factors as mediators between migration and subjective well-being among young Finnish adults. Social Science & Medicine, 66(7), 1545--1556.

20
Frey, B. & Stutzer, A. (2000a). Happiness prospers in democracy. Journal of Happiness Studies, 1(1), 79--102. Frey, B. & Stutzer, A. (2000b). Happiness, economy and institutions. Economic Journal, 110(466), 918--938. Frey, B. & Stutzer, A. (2002). What can economists learn from happiness research? Journal of Economic Literature, 40(2), 402--435. Graham, C. (2005). Insights on development from the economics of happiness. World Bank Research Observer, 20(2), 201--231. Greenwood, M., McDowell, J., Waldman, D. & Zahniser, S. (1999). The influence of social programs in source countries on various classes of U.S. immigration. Journal of the American Statistical Association, 94, 64--74. Hatton, T.J. & Williamson, J.G. (1998). The age of mass migration: causes and economic impact. New York: Oxford University Press. Hatton, T.J. & Williamson, J.G. (2005). What fundamentals drive world migration? In G. Borjas & J. Crisp (Eds.), Poverty, international migration and asylum (pp.15-38). New York: Palgrave Macmillan in association with the United Nations University-World Institute for Development Economics Research. Helliwell, J.F. (2007). Well-being and social capital: does suicide pose a puzzle? Social Indicators Research, 81, 455--496; Helliwell, John F. & Huang, H. (2008). How's your government? International evidence linking good government and well-being. British Journal of Political Science, 38, 595--619. Hicks, J.R. (1932). The theory of wages. London: Macmillan. Kahneman, D. & Tversky, A. (1979). Prospect theory: an analysis of decision under risk. Econometrica, 47, 263–291. Kahneman, D. & Krueger, A.B. (2006). Developments in the measurement of subjective well-being. Journal of Economic Perspectives, 20(1), 3--24. Karemera, D., Oguledo, V.I. & Davis, B. (2000). A gravity model analysis of international migration to North America. Applied Economics, 32(13),1745--1755. Layard, R. (1980). Human satisfactions and public policy. The Economic Journal, 90(360),737--750. Layard, R. (2005). Happiness: lessons from a new science. London: Penguin. Lee, D. (2006). Who says money cannot buy happiness? Independent Review, 10(3), 385--400. Massey, D.S. (1988). Economic development and international migration in comparative perspective. Population and Development Review, 14(3), 383--413. Massey, D.S., Arango, J., Hugo, G., Kouaouci, A., Pellegrino, A. & and Taylor, J.E. (1993). Theories of international migration: a review and appraisal. Population and Development Review, 19(3), 431--466. Mayda, A.M. (2008). International migration: a panel data analysis of the determinants of bilateral flows, Journal of Population Economics, doi:10.1007/s00148-009-0251-x. Oswald, A.J. (1997). Happiness and economic performance. The Economic Journal, 107(445), 1815--1831. Rotte, R. & Vogler, M. (2000). The Effects of Development on Migration: Theoretical Issues and New Empirical Evidence. Journal of Population Economics, 13(3), 485—508.
21
Sjaastad, L.A. (1962). The Costs and Returns to Human Migration. Journal of Political Economy, 70, 80--93.
Stalker, P. (2000). Workers without frontiers: the impact of globalisation on international migration. London: Lynne Reinner.
Stevenson, B. & Wolfers, J. (2008). Economic growth and subjective well-being: reassessing the Easterlin Paradox. Brookings Papers on Economic Activity, Spring, 1--87.
Stevenson, B. & and Wolfers, J. (2009). The paradox of declining female happiness. American Economic Journal: Economic Policy, 1(2), 190--225.
Stuart, J. (2005). Dr. Feelgood. The Independent Review, 3 January, 2--3.
Vendrik, M. & Woltjer, G. (2007). Happiness and loss aversion: is utility concave or convex in relative income? Journal of Public Economics, 91, 1423--1448. Weil, D. (2005). Economic Growth. Upper Saddle River, NJ: Pearson Education.
22
Table 1 Ranking of Countries by Happiness, World Values Survey Sample, 1981-2004
Country Average happiness Number of years Country
Average happiness
Number of years
Colombia 3.65 1 Israel 3.02 1 Tanzania 3.50 1 Uganda 3.01 1 El Salvador 3.47 1 Uruguay 3.00 1 Venezuela 3.45 2 Brazil 2.99 2 Vietnam 3.41 1 Pakistan 2.98 2 Puerto Rico 3.40 2 Germany 2.98 3 Iceland 3.40 3 India 2.97 3 Ireland 3.37 3 East Germany 2.97 1 Netherlands 3.37 3 Algeria 2.96 1 Saudi Arabia 3.35 1 Bangladesh 2.96 2 Denmark 3.34 3 China 2.96 3 N. Ireland 3.34 3 Bosnia/Herz 2.95 2 Australia 3.34 2 Italy 2.94 3 Switzerland 3.32 2 Korea 2.94 3 Sweden 3.31 4 Peru 2.93 2 United States 3.31 4 Jordan 2.91 1 Singapore 3.30 1 Greece 2.91 1 Belgium 3.30 3 Portugal 2.91 2 Philippines 3.29 2 Azerbaijan 2.88 1 Luxembourg 3.28 1 Poland 2.86 4 Nigeria 3.28 3 Czech Republic 2.86 4 New Zealand 3.28 1 Croatia 2.85 2 UK 3.26 3 Hungary 2.82 4 Canada 3.26 3 Macedonia 2.81 2 Austria 3.23 2 Iran 2.81 1 Norway 3.22 3 Serbia 2.80 2 Taiwan 3.19 1 Slovenia 2.80 3 France 3.17 3 Georgia 2.72 1 Indonesia 3.15 1 Zimbabwe 2.67 1 Finland 3.13 3 Iraq 2.66 1 Malta 3.12 3 Slovakia 2.65 4 Mexico 3.12 3 Estonia 2.65 3 Turkey 3.12 3 Lithuania 2.63 3 South Africa 3.11 3 Armenia 2.55 1 Japan 3.10 4 Romania 2.52 3 Chile 3.09 3 Belarus 2.52 3 Egypt 3.06 1 Russia 2.49 3 Argentina 3.06 4 Latvia 2.46 3 Dom. Republic 3.05 1 Moldova 2.46 2 Kirghizstan 3.04 1 Bulgaria 2.45 3 Spain 3.04 5 Ukraine 2.44 2 Morocco 3.04 1 Albania 2.43 2

23
Table 2 List of Countries in Samples
Emigration Sample (58): Albania, Argentina, Australia, Bangladesh, Belgium, Brazil, Bulgaria, Canada, Chile, China, Colombia, Denmark, Dominican Republic, Egypt, El Salvador, Finland, France, Germany, Greece, Hungary, Iceland, India, Indonesia, Iran, Iraq, Ireland, Israel, Italy, Japan, Jordan, Luxembourg, Malta, Mexico, Morocco, Netherlands, New Zealand, Nigeria, Norway, Pakistan, Peru, Philippines, Poland, Portugal, Puerto Rico, Romania, Saudi Arabia, Singapore, Spain, Sweden, Switzerland, Turkey, Uganda, United Kingdom, United States, Uruguay, Venezuela, Vietnam, Zimbabwe
Immigration Sample (76): Albania, Algeria, Argentina, Armenia, Australia, Austria, Azerbaijan, Bangladesh, Belgium, Bosnia, Brazil, Bulgaria, Canada, Chile, China, Colombia, Croatia, Czech Republic, Denmark, Dominican Republic, Egypt, El Salvador, Estonia, Finland, France, Germany, Greece, Hungary, Iceland, India, Indonesia, Iran, Ireland, Israel, Italy, Japan, Jordan, Latvia, Lithuania, Luxembourg, Macedonia, Malta, Mexico, Moldavia, Morocco, Netherlands, New Zealand, Nigeria, Norway, Pakistan, Peru, Philippines, Poland, Portugal, Puerto Rico, Romania, Russia, Saudi Arabia, Serbia, Singapore, Slovakia, Slovenia, South Africa, South Korea, Spain, Sweden, Switzerland, Tanzania, Turkey, Uganda, Ukraine, United Kingdom, Uruguay, Venezuela, Vietnam, Zimbabwe
Net Migration Sample (80): Albania, Algeria, Argentina, Armenia, Australia, Austria, Azerbaijan, Bangladesh, Belarus, Belgium, Bosnia & Herzegovina, Brazil, Bulgaria, Canada, Chile, China, Colombia, Croatia, Czech Republic, Denmark, Dominican Republic, Egypt, El Salvador, Estonia, Finland, France, Georgia, Germany, Greece, Hungary, Iceland, India, Indonesia, Iran, Ireland, Israel, Italy, Japan, Jordan, Kyrgyzstan, Latvia, Lithuania, Luxembourg, Malta, Mexico, Moldova, Morocco, Netherlands, New Zealand, Nigeria, Norway, Pakistan, Peru, Philippines, Poland, Portugal, Puerto Rico, Korea, Romania, Russia, Saudi Arabia, Serbia, Singapore, Slovakia, Slovenia, South Africa, Spain, Sweden, Switzerland, Macedonia, Turkey, Uganda, Ukraine, United Kingdom, Tanzania, United States, Uruguay, Venezuela, Vietnam, Zimbabwe

24
Table 3 Summary Statistics for all Three Samples
Emigration Immigration Net Migration Variable Mean SD Mean SD Mean SD Migrants per 1000 48.85 62.21 0.44 1.76 -0.02 4.50 Happiness 3.11 0.28 3.01 0.29 3.03 0.28 Per capita GDP in 2000 $ $12,016 $12,262 $9,224 $9,445 $9,581a $9,699 GDP growth 11.0%b 11.2% 2.5% 4.7% 7.94%c 19.56% Africa 8.6% 28.3% 6.5% 24.8% 7.4% 26.2% Asia 25.9% 44.2% 17.9% 38.4% 20.2% 40.3% Europe 39.7% 49.3% 58.9% 49.3% 54.0% 50.0% Latin America 19.0% 39.5% 13.1% 33.8% 12.3% 32.9% North America 3.4% 18.4% 1.8% 13.3% 3.7% 18.9% Oceania 3.4% 18.4% 1.8% 13.3% 2.5% 15.5% 1980-1984 Period -- -- 8.9% 28.6% 11.0% 31.4% 1985-1989 Period -- -- 1.2% 10.9% 0.6% 7.8% 1990-1994 Period -- -- 23.8% 42.7% 25.8% 43.9% 1995-1999 Period -- -- 45.8% 50.0% 39.9% 49.1% 2000-2004 Period -- -- 20.2% 40.3% 22.7% 42.0% Number of Countries 58 76 80 Observations 58 175 163
aPer capita GDP at beginning of 5-year period (in 2000 $) bGDP growth between 1995-1999 cGDP growth in 5-year period Note: The emigration sample is for the year 2000; period dummy variables are not applicable.

25
Table 4 Regression Results for Model 1: Emigration
Specification CEmigrants per 1000 Coeff Std Error t-statistic Coeff Std Error t-statistic Coeff Std Error t-statisticConstant 1385.99 647.43 2.14 790.00 679.49 1.16 981.78 750.36 1.31Happiness -924.54** 434.92 -2.13 -976.34** 406.88 -2.40 -830.09* 441.71 -1.88Happiness^2 157.79** 72.67 2.17 165.50** 67.86 2.44 139.87* 72.97 1.92Log(GDP) -- -- -- 155.03** 70.11 2.21 61.84 85.52 0.72Log(GDP)^2 -- -- -- -8.77** 4.22 -2.08 -3.41 5.17 -0.66GDP Growth -- -- -- 154.27** 68.62 2.25 157.48 68.86 2.29Africa -- -- -- -- -- -- -23.75 53.46 -0.44Asia -- -- -- -- -- -- -27.90 46.08 -0.61Europe -- -- -- -- -- -- 3.95 42.60 0.09Latin America -- -- -- -- -- -- 25.83 45.29 0.57North America -- -- -- -- -- -- -46.50 57.22 -0.81Adjusted R^2 0.0515 0.1755 0.1825Countries 58 58 58Observations 58 58 58
Specification A Specification B
* (**) denotes significance at the 10% (5%) level

26
Table 5 Regression Results for Model 2: Immigration
Specification CImmigrants per 1000 Coeff Std Error t-statistic Coeff Std Error t-statistic Coeff Std Error t-statisticConstant 24.20 11.98 2.02 20.68 12.56 1.65 27.11 12.96 2.09Happiness -17.18** 8.14 -2.11 -21.51** 8.27 -2.60 -18.43** 8.66 -2.13Happiness^2 3.06** 1.37 2.22 3.80** 1.39 2.73 3.17** 1.45 2.19Log(GDP) -- -- -- 2.44* 1.27 1.92 -0.18 1.42 -0.13Log(GDP)^2 -- -- -- -0.15* 0.08 -1.92 0.01 0.09 0.13GDP Growth -- -- -- 6.05** 3.04 1.99 5.03 3.13 1.61Africa -- -- -- -- -- -- -0.05 1.17 -0.04Asia -- -- -- -- -- -- 0.13 1.08 0.12Europe -- -- -- -- -- -- 0.52 1.00 0.52Latin America -- -- -- -- -- -- 2.07** 1.05 1.97North America -- -- -- -- -- -- 0.22 1.38 0.161980-1984 Period -- -- -- -- -- -- -0.32 0.55 -0.591985-1989 Period -- -- -- -- -- -- -0.08 1.25 -0.071990-1994 Period -- -- -- -- -- -- -0.42 0.43 -0.991995-1999 Period -- -- -- -- -- -- -0.19 0.38 -0.49Adjusted R^2 0.0377 0.0602 0.4145Countries 76 76 76Observations 175 175 175
Specification A Specification B
* (**) denotes significance at the 10% (5%) level

27
Table 6 Regression Results for Model 3: Net Migration
Specification CNet Migrants Coeff Std Error t-statistic Coeff Std Error t-statistic Coeff Std Error t-statisticConstant -143.32 28.00 5.12 -122.14 26.79 4.56 -141.11 28.47 4.96Happiness 90.16** 19.01 4.74 72.34** 18.27 3.96 88.07** 19.54 4.51Happiness^2 -14.03** 3.21 -4.37 -11.48** 3.07 -3.74 -13.99** 3.24 -4.32Log(GDP) -- -- -- 1.05** 0.23 4.67 0.82** 0.31 2.66GDP Growth -- -- -- 4.52** 1.51 3.00 4.70** 1.58 2.96Africa -- -- -- -- -- -- -2.34 2.18 -1.07Asia -- -- -- -- -- -- -4.02** 1.93 -2.09Europe -- -- -- -- -- -- -2.40 1.79 -1.34Latin America -- -- -- -- -- -- -4.89** 1.92 -2.54North America -- -- -- -- -- -- -0.43 2.24 -0.191980-1984 Period -- -- -- -- -- -- -2.08* 1.11 -1.861985-1989 Period -- -- -- -- -- -- 2.64 3.55 0.741990-1994 Period -- -- -- -- -- -- 0.08 0.88 0.091995-1999 Period -- -- -- -- -- -- -0.84 0.80 -1.05Adjusted R^2 0.2784 0.3713 0.4145Countries 80 80 80Observations 163 163 163
Specification A Specification B
* (**) denotes significance at the 10% (5%) level

28
Fig. 1 Predicted Relationship between Happiness and Emigration

29
Fig. 2 Predicted Relationship between Happiness and Immigration

30
Fig. 3 Predicted Relationship between Happiness and Net Migration


