Embed Size (px)
Citation preview

ECONOMIC STUDIES
DEPARTMENT OF ECONOMICS SCHOOL OF BUSINESS, ECONOMICS AND LAW
UNIVERSITY OF GOTHENBURG 236
________________________
The Impact of Reproductive and Birth Technologies on Health, Fertility and Labor Outcomes
Hanna Mühlrad

ISBN 978-91-88199-31-7 (printed) ISBN 978-91-88199-32-4 (pdf) ISSN 1651-4289 (printed) ISSN 1651-4297 (online)
Printed in Sweden, Gothenburg University 2017

To my beloved husband Otto
and our families

Acknowledgments
During my years as a PhD-candidate, I have had the great pleasure of meeting many wonderful
people and this thesis would not have been possible without all of you.
I want to start by expressing my deepest gratitude to my supervisors Andreea Mitrut
and Randi Hjalmarsson for your guidance and support. I am extremely grateful for the advice,
feedback, and moral support I have received from you over the years. Thank you for always being
there and for pushing me and challenging me. You are both a huge source of inspiration and I
deeply appreciate all the time you have dedicated so that I could become a better researcher.
My gratitude also goes to my co-authors Mårten Palme, Sonia Bhalotra and Damian
Clarke—you are inspiring and excellent researchers and I am very grateful for the opportu-
nity to work with you. Thank you for everything you have taught me. Thank you Mårten
for the mentorship and support you have provided ever since I was an undergraduate student
at Stockholm University. Thank you Sonia—you are a fantastic researcher with a brilliant
mind and I am very happy for all the time we spent together working, chatting and laugh-
ing. Similarly, I want to express my gratitude to Damian for being the best of friends and a
wonderful co-author. Thank you for all inspiring and stimulating discussions and for all your
support! Thank you to Hans Grönqvist and Mircea Trandafir, for being opponents during my
final seminars and for providing me with insightful and helpful comments and feedback on my
papers.
I also want to thank all my colleagues at the Department of Economics at the University
of Gothenburg for great academic environment and warm atmosphere. Thank you to Måns
Söderbom and Ola Olsson for support and guidance though the whole course and thank you to
all my teachers and seminar audiences over the years. Big thanks to Aico Van Vuuren, Peter
Martinsson, Mikael Lindahl, Gustav Kjellson, Hans Bjurek, Anders Boman, Christina Gravert,
Amrish Patel, Oana Borcan, Åsa Löfgren, Inge van den Bijgaart, Kristian Bolin, Eva Ranehill.
An extra thank you to the whole development group including Arne Bigsten, Annika Lindskog,
Heather Congdon Fors, Pelle Ahlerup, Dick Durevall, Sven Tengvall, Ia Isaksson and Joe Vecci
for support and interesting and inspiring conversations we had in New Dehli. I also want to
i

thank Joe Vecci for all the help and good advice, friendship and for teaching me how to boulder.
A special thank you also goes to Anna Bindler and Nadine Ketel for excellent feedback and
advice. I also want to thank my dear friend and colleague Anja Tolonen for always believing in
me and for all the wonderful memories. Big thanks to all the administrative staff for all help
and support; Elisabeth Földi, Åsa Adin, Selma Olivera, Marie Andersson, Ann-Chrstin Nystöm-
Räätari, Mona Jönfors, Christina Varkki and Emma Lövgren. Extra thanks to Elisabeth for all
the great laughter we had through the years.
To my beloved fellow cohort PhD Students Carolin Sjöholm, Lisa Björk, Verena Kurz,
Josephine Gakii, Andrea Martinangeli, Laura Villalobos, Martin Chegere, Mikael Moutakis,
Simon Felgendreher, Tensay Meles, Yashodha, Yuanyan ‘Vivi’ Yi. Words cannot begin to
describe how much I will miss you and how much I hope our roads will cross soon again. Thank
you for all amazing moments we shared. Also, big thank you to all fellow PhD students in older
and younger cohorts.
I am also grateful to the Centre for the Study of African Economies at University of Oxford,
and to Simon Quinn for hosting me. I am particularly grateful to James Fenske for guidance
and feedback. My warmest thank you to Rachel Cassidy and Pavel Luengas Sierra for all the
wonderful time we spent together.
A special thank you to everyone at the Swedish Institute for Social Research (SOFI), Stock-
holm University. My heartfelt gratitude goes to SOFI for hosting me as a visiting PhD-student.
SOFI holds a special place in my heart and I will always think about SOFI as my second aca-
demic home. I especially want to thank Markus Jäntti, Anders Björklund, Matthew Lindsquist,
Dan-Olof Rooth, Susanne Niknami, Anne Bosccini, Jenny Säve-Söderbergh, Marianne Sund-
ström, Anders Stenberg, Eirini Tatsi, Simona Bejenariu, Emma von Essen, Ian Burn, Karin
Edmark, Kristian Koerselman, Torsten Santavirta, Niklas Kaunitz, Martin Berlin, Per Engzel,
Max Thaning, Anna Sandberg, Lena Lindahl, Karin Hederos and Julia Boguslaw for always be-
ing extremely welcoming and for providing me with a resourceful academic environment, tons
of inspiration and friendship. A special thank you to Anna, Karin, Susan, Julia and Lena who
always encouraged and supported me—you are all fantastic people and I’m so lucky to have
you as my friends!
I want to thank the Department of Economics and IIES at Stockholm University. Thank
you Rickard Foltyn, Jonna Olsson, Karl Harmenberg, Mattias Iwanowski, Wei Si, Anna Ae-
varsdottir, Miri Stryjan and Audinga Baltrunaite. I also want to thank Tamara Sobolevskaia
for support and friendship—all those hours spent with R and Stata in the computer hall in the
ii

A-building were not in vain. I also want to thank my undergraduate supervisors Anna Larsson
Seim and Maria Jakobsson for inspiration to pursue the academic course and Harry Flam for
valuable guidance.
Huge thank you to Sverker Ek and Anna Marsk for always answering my many questions
about obstetric care in Sweden and my many thanks to Nina Bohm Starke and Philip Haraldsson
for all your support and help. Nina and Philip, I really look forward to our future collaboration
on women’s and children’s health.
Finally, I want to thank my friends and family for outstanding support. Particularly, I want
to thank my baby brother and best friend Jacob. Thank you for wonderful conversations and
time spent together. I also want to thank both my parents who have done an extraordinary job
in always providing support and for believing in me. You both inspire me every day with your
strengths, grit, stubbornness and compassion. Thank you for providing an excellent environment
and tools for pursuing my dreams. I recognize how much you both have invested in me and for
that I am eternally grateful. Thank you for helping me with my homework, driving me to school
and to after school activities. Thank you, Mom, for your devotion and for giving me books like
the Iliad and the Odyssey as a 10-year-old dyslexic kid, and thank you for the gene of crazy
stubbornness/grit and for staying up late helping me with with homework and school reports. I
will never forget the face of my poor teacher who cried out, “you can barely read. . . This book
is too advanced. . . in fact it’s light years away”, but boy did I prove them wrong. Perhaps there
are mountains too high, but surely no book is too long or too complicated (except for Marcel
Proust’s stuff)! Thank you, Dad, for being a solid rock, always understanding. I also want to
thank my new and amazing family “the Swedrups” and all my awesome cousins and uncles and
aunts in Sweden, the US and Canada. I also want to thank all my amazing and wise friends.
Last but absolutely not least, I cannot begin to express my gratitude to my brilliant husband
Otto Swedrup for endless support, friendship and companionship. You are the love of my life
and I dedicate my thesis to you.
Hanna Mühlrad, Gothenburg 2017
x

Contents
Introduction xv
1 Cesarean Section for High-Risk Births: Short- and Long-Term Consequences
for Breech Births 1
1 Introduction . . . . . . . . . . . . . . . . . . . . . . . . . . . . . . . . . . . . . . . 2
2 Background . . . . . . . . . . . . . . . . . . . . . . . . . . . . . . . . . . . . . . . 7
2.1 Breech presentation and delivery mode . . . . . . . . . . . . . . . . . . . . 7
2.2 The Swedish context . . . . . . . . . . . . . . . . . . . . . . . . . . . . . . 8
2.3 Information shock to the medical society . . . . . . . . . . . . . . . . . . . 9
3 Data . . . . . . . . . . . . . . . . . . . . . . . . . . . . . . . . . . . . . . . . . . . 11
3.1 Data description . . . . . . . . . . . . . . . . . . . . . . . . . . . . . . . . 11
3.2 Main outcome variables and multiple hypothesis testing . . . . . . . . . . 13
3.3 Sample and descriptive statistics . . . . . . . . . . . . . . . . . . . . . . . 14
4 Empirical analysis . . . . . . . . . . . . . . . . . . . . . . . . . . . . . . . . . . . 17
5 Results . . . . . . . . . . . . . . . . . . . . . . . . . . . . . . . . . . . . . . . . . . 19
5.1 Effects on C-section and obstetric care . . . . . . . . . . . . . . . . . . . . 19
5.2 Effects on health, fertility and labor market outcomes . . . . . . . . . . . 24
5.3 Additional robustness and sensitivity . . . . . . . . . . . . . . . . . . . . . 29
6 Discussion and interpretation of the results . . . . . . . . . . . . . . . . . . . . . 30
7 Conclusion . . . . . . . . . . . . . . . . . . . . . . . . . . . . . . . . . . . . . . . 33
8 Figures and Tables . . . . . . . . . . . . . . . . . . . . . . . . . . . . . . . . . . . 35
Appendices 57
A1 Figures and tables . . . . . . . . . . . . . . . . . . . . . . . . . . . . . . . . . . . 59
2 Multiple Births, Birth Quality and Maternal Labor Supply: Analysis of IVF
Reform in Sweden 73
1 Introduction . . . . . . . . . . . . . . . . . . . . . . . . . . . . . . . . . . . . . . . 74
xi

2 Background . . . . . . . . . . . . . . . . . . . . . . . . . . . . . . . . . . . . . . . 77
2.1 IVF treatments in Sweden . . . . . . . . . . . . . . . . . . . . . . . . . . . 77
2.2 Number of embryo transfers and pregnancy success . . . . . . . . . . . . . 78
2.3 The SET reform . . . . . . . . . . . . . . . . . . . . . . . . . . . . . . . . 79
3 Data and descriptive statistics . . . . . . . . . . . . . . . . . . . . . . . . . . . . . 80
3.1 Data . . . . . . . . . . . . . . . . . . . . . . . . . . . . . . . . . . . . . . . 80
3.2 Main outcome variables, data limitation and multiple hypothesis testing . 81
3.3 Sample and summary statistics . . . . . . . . . . . . . . . . . . . . . . . . 83
3.4 Descriptive statistics of the SET reform . . . . . . . . . . . . . . . . . . . 85
4 Empirical strategy . . . . . . . . . . . . . . . . . . . . . . . . . . . . . . . . . . . 85
5 Results . . . . . . . . . . . . . . . . . . . . . . . . . . . . . . . . . . . . . . . . . . 87
5.1 Twin births . . . . . . . . . . . . . . . . . . . . . . . . . . . . . . . . . . . 87
5.2 Child and maternal outcomes . . . . . . . . . . . . . . . . . . . . . . . . . 88
5.3 Identifying assumptions . . . . . . . . . . . . . . . . . . . . . . . . . . . . 91
5.4 Mechanisms . . . . . . . . . . . . . . . . . . . . . . . . . . . . . . . . . . . 94
5.5 Additional robustness and sensitivity . . . . . . . . . . . . . . . . . . . . . 95
6 Conclusion . . . . . . . . . . . . . . . . . . . . . . . . . . . . . . . . . . . . . . . 96
7 Figures and tables . . . . . . . . . . . . . . . . . . . . . . . . . . . . . . . . . . . 99
Appendices 123
A1 Figures and tables . . . . . . . . . . . . . . . . . . . . . . . . . . . . . . . . . . . 125
A2 Measurement of IVF usage . . . . . . . . . . . . . . . . . . . . . . . . . . . . . . 134
3 The Impact of Abortion Legalization on Fertility and Female Empowerment:
New Evidence from Mexico 137
1 Introduction . . . . . . . . . . . . . . . . . . . . . . . . . . . . . . . . . . . . . . . 138
2 Unintended pregnancies, the Mexican context and the ILE reform . . . . . . . . 141
3 Data . . . . . . . . . . . . . . . . . . . . . . . . . . . . . . . . . . . . . . . . . . . 146
3.1 Birth records from INEGI . . . . . . . . . . . . . . . . . . . . . . . . . . . 146
3.2 Survey data from the Mexican family life survey (MxFLS) . . . . . . . . . 148
3.3 Additional data sources . . . . . . . . . . . . . . . . . . . . . . . . . . . . 149
4 Empirical strategy . . . . . . . . . . . . . . . . . . . . . . . . . . . . . . . . . . . 149
4.1 Estimating effects on fertility . . . . . . . . . . . . . . . . . . . . . . . . . 149
4.2 Estimating effects on individual and household behavior . . . . . . . . . . 151
xii

5 Results . . . . . . . . . . . . . . . . . . . . . . . . . . . . . . . . . . . . . . . . . . 153
5.1 Fertility . . . . . . . . . . . . . . . . . . . . . . . . . . . . . . . . . . . . . 153
5.2 Validity of difference-in-differences strategy . . . . . . . . . . . . . . . . . 154
5.3 Using entropy balancing to examine estimate validity . . . . . . . . . . . 155
5.4 Mechanisms: Availability, education, or behavior . . . . . . . . . . . . . . 156
5.5 Female empowerment . . . . . . . . . . . . . . . . . . . . . . . . . . . . . 157
6 Conclusion . . . . . . . . . . . . . . . . . . . . . . . . . . . . . . . . . . . . . . . 159
7 Figures and tables . . . . . . . . . . . . . . . . . . . . . . . . . . . . . . . . . . . 161
Appendices 173
A1 Tables and figures . . . . . . . . . . . . . . . . . . . . . . . . . . . . . . . . . . . 175
A2 Correction for FWER using Romano and Wolf’s stepdown procedure . . . . . . . 184
Bibliography 185
xiii


Introduction
Access to reproductive and birth technologies
Access to reproductive and birth technologies are essential for human welfare. While family
planning dates back to around 1550 BCE (O’Dowd and Philipp, 2000), recent technological in-
novation has spurred the opportunity to plan and optimize fertility. These innovations consist
of a broad range of technologies including modern contraception, induced abortion, assisted
conception (here referred to as “reproductive technologies”) as well as numerous medical pro-
cedures and treatments developed for use during pregnancy and child birth (here referred to as
“birth technologies”). Over the last century, the rapid advancement in these innovations, has
had an astonishing impact on demographic patterns, increased freedom of choice and economic
liberation of women (Bailey and Lindo, 2017). While several reproductive and birth technolo-
gies have been available for decades, many women and children lack access, especially in low
income countries. Even though great efforts are made in procuring access to reproductive and
birth health care by global health institutions, local governments and NGOs, large differences,
both across and within countries, still remain (The World Health Organization, 2015).
The aim of this thesis is to assess the impact of access to reproductive and birth technologies
on a range of socioeconomic outcomes for women and children. The outcomes of interest,
summarizing the topic of this thesis, are fertility, health and behavior in the household and
the labor market. The three chapters of the thesis build on the applied economic literature on
fertility, health and labor. Despite the rapid progress in the development of reproductive and
birth technologies, multiple questions remain unanswered regarding the consequences of these
technologies as well as how improved access can decrease the gaps in health between individuals.
My research contributes knowledge in this area and in particular on how medical interventions
and technologies can contribute to narrowing gaps with the emphasis on the causal- and long-run
impacts including both health indicators and labor market outcomes.
Reproductive technologies have contributed to a large worldwide reduction in total fertility
from 5 children per woman in the 1960s to 2.5 in 2015 (The World Bank, 2015). The use of
xv

modern contraceptives in industrialized countries has increased from only 9% during the 1960s
to nearly 60% in the 2000s (Grimes et al., 2006). Nevertheless, there is still a large unmet need of
contraception, which contributes to high rates of unintended pregnancies. Globally, unintended
pregnancies lead to an estimated 46 million induced abortions each year (Van Lerberghe et al.,
2005), many of which are done in clandestine and under unsafe circumstances (Grimes et al.,
2006). Legal restrictions are viewed as a barrier to safe abortion (Grimes et al., 2006). Starting
from the 1970s and onwards, local- and nation-wide policy changes have increased access to
elective abortions worldwide. These reforms have been documented to have substantial impacts
on women, children and families (Ananat et al., 2009; Bailey, M. J., 2013; Mitrut and Wolff,
2011; Pop-Eleches, 2005; Pop-Eleches, C., 2010), including impacts on total fertility and fertility
timing (Ananat et al., 2007; Clarke, 2017; Gruber et al., 1999; Guldi, 2008; Valente, 2014);
women’s labor market outcomes (Angrist and Evans, 1996; Mølland, 2016), the composition
of children and living conditions (Mitrut and Wolff, 2011; Pop-Eleches, C., 2010), as well as
female empowerment (Oreffice, 2007). However, the access to reproductive health rights has not
remained unchallenged over the course, which is reflected in multiple efforts in raising barriers
to accessing safe abortions (Bitler and Zavodny, 2001; Cunningham et al., 2017; Fischer et al.,
2017; Joyce and Kaestner, 1996; Lu and Slusky, 2016).
Reproductive technologies provide women with not only the ability to prevent childbearing,
they also assist individuals with involuntary infertility as well as providing women the oppor-
tunity to postpone childbearing. An estimated 10-15% of all couples worldwide suffer from
involuntary infertility. Assisted reproductive technology (ART) has greatly improved over the
last decade with the introduction of in vitro fertilization (IVF). The share of births facilitated
by assisted conception through IVF has increased rapidly, now exceeding 3% in several indus-
trialized countries (de Mouzon et al., 2010). Yet research shows adverse perinatal and neonatal
outcomes among children born after IVF compared with children born after unassisted concep-
tion (Kalra and Barnhart, 2011). Improvements in individual and aggregate health for children
born after IVF are therefore paramount and will be magnified as rates of IVF use continue to
increase worldwide.
The notion of reproductive health also includes access to care during pregnancy and child-
birth for assuring maternal and child health. Despite Cesarean section (C-section) being the
most common surgical procedure in industrialized countries, many questions remain regarding
the causal and long-term impact on child health and maternal health, future fertility and labor
market outcomes. The use of C-section is widely recognized by the medical society as a life sav-
xvi

ing measure for mother and child for many conditions during pregnancy and birth. However, for
low-risk births, C-section may lead to higher morbidity and mortality than vaginal birth (Clark
et al., 2008). The global use of C-section has dramatically increased from the 1970s until today,
with rates that cannot solely be attributed to demographical changes (Betran et al., 2015) or
parental preferences (Kozhimannil et al., 2013), suggesting that supply-side incentives are af-
fecting the usage of C-section (Halla et al., 2016; Kozhimannil et al., 2013), with sub-optimal
use in settings such as the US (Currie, J. and MacLeod, W. B., 2013). The implications of
C-section are not fully understood. To quote the World Health Organization: “The effects of
Cesarean section rates on other outcomes, such as maternal and perinatal morbidity, pediatric
outcomes, and psychological or social well-being are still unclear. More research is needed to
understand the health effects of Cesarean section on immediate and future outcomes.”
This thesis contributes to a large and growing literature within the bio-medical, sociological,
legal and economics fields. Fertility, health and family economics are widely recognized topics
within the discipline of economics and date back to the theoretical work on fertility, population
and economic development by Thomas Robert Malthus (Heckman, J.J, 2015). A landmark
contribution to this field (and to economics in general), is the pioneering work on the economics
of fertility and family by Gary Becker, who created a foundation to a significant body of research
on human capital, health, and labor (Heckman, J. J., 2015). Alongside, and as an extension
of this strand of literature, came a new era of empirical work, facilitated by better access to
micro-data and methods (Heckman, J.J, 2015).
Today, the body of literature on fertility, labor market responses, the importance of early
life conditions and health for later life outcomes continues to grow (Almond et al., 2017). Indeed,
during recent years, the importance of early life investment has been strongly emphasized within
economics. Many studies show that early childhood conditions have a strong and long term
impact on various socioeconomic outcomes such as cognitive and non-cognitive skills, health,
and income (Almond and Currie, 2010; Barker, 1995; Currie and Vogl, 2012; Cutler and Meara,
2000; Heckman, 2007). In particular, improved neonatal care (Almond et al., 2010; Bharadwaj
et al., 2013; Daysal, 2015; Daysal et al., 2013) has been shown to have a long-lasting impact on
health and educational performance later in life (Almond and Mazumder, 2011). Contributing to
this literature, I want to highlight how access to technologies and information regarding fertility
and reproductive health affect a large range of outcomes regarding the welfare of women and
children directly and by extension, the welfare of all.
xvii

Summary of the thesis
My dissertation consists of three independent empirical papers on fertility, child health, and
maternal health and labor market responses. The overall contribution of my thesis is to assess
the causal and long-run impacts of access to reproductive and birth technologies on a range of
socioeconomic outcomes for women, children and families. I use quasi-experimental methods and
detailed administrative data that allow for isolating the effects of policy reforms on outcomes, in
both high-income and emerging economies. In the first chapter, I examine the causal and long-
term impact of an increase in planned C-sections for high-risk births on multiple socioeconomic
outcomes including health, future fertility and labor responses. In the second chapter, the
impact of an IVF reform mandating single embryo transfer as default procedure providing a
negative fertility shock is analyzed. Finally, in the third chapter, we examine the effect from
abortion legalization in Mexico City on fertility and female empowerment.
In chapter one, “Cesarean Section for High-Risk Births: Short- and Long-Term Conse-
quences for Breech Births”, I study the causal impact of Cesarean section (C-section) on health,
subsequent fertility and labor market outcomes for “at risk” births. This particular high-risk
group consists of breech births, where the fetus is presented with its head upward instead of
downward. The causal impact of C-section is captured by exploring an information shock to
the medical society in Sweden, on the benefits of planned C-section for breech births, which led
to an increase in planned C-sections by 23% for this group. By employing a pre-post analysis,
I examine both the reduced form and 2SLS effects from the rise in C-sections using detailed
Swedish register data, combining birth records, in-patient records and labor market registers. I
find that an increase in C-sections for breech births led to strong improvements in child health
in both the short and long run, as indicated by higher Apgar scores at birth and fewer nights
hospitalized for children ages 1-7. In terms of maternal outcomes, no significant impact on
maternal health at birth or future births or labor market outcomes is found. However, the es-
timated impact on future fertility suggests a potential negative impact on subsequent fertility.
The contribution of the study is twofold: first, I address the issue of endogeneity estimating the
causal impact of an increase in C-sections. Second, compared to previous studies, I emphasize
the long-run impact focusing on a broader set of outcomes including maternal labor market
outcomes and subsequent birth and fertility outcomes.
Chapter two, “Multiple Births, Birth Quality and Maternal Labor Supply: Analysis of
IVF Reform in Sweden”, (with co-authors Sonia Bhalotra, Damian Clarke and Mårten Palme)
xviii
continues on the theme of fertility, health and maternal labor responses. Studying a policy
change in Sweden that mandated single embryo transfer (SET) instead of double embryo transfer
(DET), we assess the impact of SET as the default IVF procedure on rate of twin births, child
and maternal outcomes. By using detailed Swedish register data for the time period 1998-2007,
we examine the impact of switching from DET to SET on a broad set of outcomes using a
difference-in-differences approach. The new policy led to a precipitous drop in twin births by
63%. We find large positive effects of the SET reform on child health and maternal labor
outcomes, which narrow the differences in health between IVF and non-IVF births by 53%, and
differences in the labor market outcomes of mothers three years after birth by 85%. For first
time mothers it also narrowed the gap in maternal health between IVF and non-IVF births by
36%. Our study makes a number of important contributions. First, we employ a more robust
empirical design for eliciting the causal impacts and by estimating the effects using detailed
register data for a long time period. Second, the previous literature does not take into account
the impacts of SET on longer term health or maternal labor market outcomes. The findings of
this study have important implications for other countries considering policy reform similar to
that implemented in Sweden.
Focusing on fertility and women’s health rights in an emerging economy, in the third chap-
ter, “The Impact of Abortion Legalization on Fertility and Female Empowerment: New Evidence
from Mexico” (with co-author Damian Clarke), the impact of a large-scale, free, elective abor-
tion program in Mexico City in 2007 is assessed. This reform is unique by its kind, considering
the Latin American context, which exhibits some of the world’s most conservative laws on abor-
tion and other reproductive technologies. We document that abortion legalization in Mexico
City led to a legislative backlash in 18 other Mexican states which constitutionally altered penal
codes to raise barriers in accessing abortions. We explore this dual policy environment by using
a difference-in-differences approach and entropy weighting for estimating the causal impact of
progressive and regressive abortion reform on both fertility and female empowerment. Using
administrative birth data, our findings suggest that progressive abortion laws, and thus access to
free and safe elective abortion services, leads to lower fertility, especially among young women.
In addition, by using survey data, we study the impact on women’s participation in household
decision making and find it to increase with access to abortions. This result is in line with
economic theory and empirical results on female empowerment in a developed-country setting.
The results do not suggest any reverse relationship between amendments to more conservative
abortion laws and fertility or female empowerment. By analyzing mechanisms using evidence
xix

from a panel of women, we find no evidence indicating that the results are driven by changes
in sexual behavior, altered knowledge, or use of contraception, thus suggesting that improved
access to abortion is the main channel through which fertility and empowerment is affected.
The evidence in this paper suggests that abortion legalization in the context of an emerging
economy has strong and rapid impacts on political behavior, aggregate fertility patterns and
household decision-making.
xx

Chapter I


CHAPTER 1
Cesarean Section for High-Risk Births: Short- andLong-Term Consequences for Breech Births
Abstract
Cesarean sections (C-sections) are the most commonly performed surgical procedures in indus-trialized countries. While they can be potentially lifesaving in cases of high-risk pregnancies,as with any surgical procedure, they can pose complications, and little is known about theirlong-term consequences for the mothers and children involved. In this paper, I use a sample of“at-risk” births—namely, breech births, in which the fetus is presented with its head upwardinstead of downward—to study the causal impact of C-sections on the health of infants and onthe health, subsequent fertility, and labor market outcomes of mothers. Because selection intoC-section may be endogenous, I exploit an information shock to doctors in 2000, in which a newstudy about the benefits of planned C-sections for breech births led to a sharp 23% increase inplanned C-sections. This increase occurred across the board: I find no evidence of a shift inthe composition of women receiving C-sections following the shock. I then use this informationshock in a reduced form pre-post analysis and as an instrument for C-sections in a 2SLS anal-ysis of Swedish birth, in-patient, and labor market register data associated with births takingplace between 1997 and 2003. I find that an increase in C-sections among breech births ledto strong improvements in child health originating from both short- and long-term improve-ments, as indicated by higher Apgar scores at birth and fewer nights hospitalized during ages1-7. The estimates suggest that the medical intervention almost completely narrowed the gapin health between breech and cephalic (normal position) births. I find no significant impact onmaternal health at birth or subsequent births, nor on maternal labor market outcomes. Thoughmarginally insignificant, estimates suggest a potential negative impact on future fertility.
Keywords: fertility, maternal health, child health, birth technology, labor market responseJEL Codes: J13, I11, I12, I38, J24.
I am very grateful to Andreea Mitrut, Randi Hjalmarsson, Mircea Trandafir, Jon Skinner, Douglas Almond,Mårten Palme, Sonia Bhalotra, Dan-Olof Rooth, Matthew Lindquist, Joe Vecci, Sverker Ek, Anna Sandberg,Karin Hederos, Anna Bindler, Otto Swedrup, Damian Clarke, Julia Boguslaw, Nina Bohm Starke, Vellore Arthi,Erik Surtevall and seminar audiences at the Department of Economics at University of Gothenburg, SOFI atStockholm University, OB/GYN department at Karolinska Sjukhuset, ISER, University of Essex, and SustainableDevelopment Colloquium, Columbia University for useful comments and discussions.
1
1 Introduction
There are large disparities in early-life health both within and across countries. These disparities
stem from a multitude of factors, including health at birth, parental investments, and childhood
environment (Haenfler and Johnson, 2002). It is widely recognized that early life conditions
have long-lasting impacts on future socioeconomic outcomes (Almond et al., 2017). Given that
investments in early stages play a greater role in the production of human capital than do
investments later in life, medical intervention at birth could function as an efficient means for
narrowing gaps in later life outcomes (Almond and Currie, 2010; Cunha and Heckman, 2007).
While many medical interventions early in life, especially among high-risk births, are considered
to improve immediate health and long term health and educational performance (Almond et al.,
2010; Bharadwaj et al., 2013, 2017; Breining et al., 2015; Cutler and Meara, 2000; Daysal, 2015),
the returns to care of low risk births may be less clear (Almond and Doyle, 2011). In light of
the potential negative consequences of increases in medicalization of childbirth (Costello and
Osrin, 2005) and because of the rapid increase in medical spending on infants compared with
older individuals (Cutler and Meara, 2000), a better understanding of medical interventions at
birth is important.
A large proportion of children in OECD countries begin their lives through a medical
intervention, as around 28% of all births are delivered via Cesarean section (C-section). This
intervention is traditionally prescribed for high-risk pregnancies, especially in cases of breech
births (i.e., with the head facing upward instead of downward). In most populations, 3-4%
of all babies are presented in breech position at term (Herbst and Thorngren-Jerneck, 2001).
While the reasons for term breech presentation are unknown, it is associated with poorer birth
outcomes compared with the normal (cephalic) fetal position (Hofmeyr et al., 2001).1 Breech
presentation births are riskier, since a fetus positioned with its head upward experiences a more
difficult passage through the birth canal and is thus more likely to suffer from complications
including oxygen deficiency during a vaginal delivery (Kotaska et al., 2009).
The global incidence of C-section has dramatically increased from the 1970s until today,
with C-section rates now exceeding 30% in many countries, including Australia, China, Italy,
and the United States (Gibbons et al., 2010), and with rates up to 50% in countries such
1The risk of breech presentation is associated with higher maternal age, multiple births, preterm delivery,contracted pelvis, uterine anomalies, and placenta previa (a condition where the placenta covers the uterus).There are also a number of pregnancy complications that are associated with breech presentation: short umbilicalcord, fetal malformation, oligohydramnios (too much amniotic fluid in the uterus) and hydramnios (too littleamniotic fluid in the uterus), (Leyon and Hagberg, 2008).
2
as Brazil, Iran, and Mexico (Temmerman, 2016). Because the strong increase in C-section
rates worldwide cannot be attributed solely to demographic or maternal health changes, this
suggests that C-sections also are performed for nonmedical reasons, possibly driven by supply-
side incentives which lead to suboptimal use of the procedure (Betran et al., 2015; Currie and
MacLeod, 2008; Currie, J. and MacLeod, B., 2017; Halla et al., 2016; Johnson and Rehavi,
2016). The use of C-section is widely recognized by the medical society as a lifesaving measure
for mother and child when medically indicated. However, for low-risk births, C-section may lead
to higher morbidity and mortality than vaginal birth (Clark et al., 2008). C-section delivery is
also associated with adverse health outcomes for subsequent pregnancies (Daltveit et al., 2008)
and lower future fertility (Gurol-Urganci et al., 2013; O’Neill et al., 2013).2
Despite C-section being the most common surgical procedure in industrialized countries,
many questions remain regarding the causal and long-run impact on the health of children and
on the health, future fertility, and labor market outcomes of mothers. These questions can
be difficult to assess not only because of the lack of detailed data on long-term outcomes, but
also because the choice of delivery mode is endogenous to maternal and child outcomes, with
any preexisting conditions likely being correlated with the outcomes of the procedure. This
study overcomes both of these issues and aims to causally identify the impact of C-section on
maternal and child outcomes among high-risk births consisting of breech births. To obtain
reliable information on both long- and short-run outcomes, I use Swedish register data. To
overcome the intrinsic endogeneity issues, I explore an exogenous increase in C-section attributed
to an information shock to the medical establishment on the benefits of C-section among term
breech births.3 Specifically, I use a pre-post analysis wherein the timing of the birth, before
or after the information shock, creates a sharp discontinuity in the probability of planned C-
section amongst breech births, allowing me to capture the causal impact of the procedure on
subsequent maternal and child outcomes.
2The negative association between C-section and future fertility has still not been fully explained but has beenposited to be due to factors such as physiological channels (Hurry et al., 1984), psychological channels (Lobel andDeLuca, 2007; Rowlands and Redshaw, 2012), and maternal preferences (Bhattacharya et al., 2006; Norberg andPantano, 2016; Tollånes et al., 2007). C-section could affect future fertility outcomes for a number of reasons.First, complications from the surgery procedure may cause involuntary infertility (biological channels) (Hurryet al., 1984). Second, the time for recovery from C-section compared with vaginal birth is usually longer. Third, ifC-section is considered more traumatic than vaginal delivery, then the psychological cost of childbearing increaseswith C-sections, reducing the willingness of mothers to have subsequent births (psychological channels) (Lobeland DeLuca, 2007; Rowlands and Redshaw, 2012). Fourth, maternal preferences may also be a contributing factor(Bhattacharya et al., 2006; Norberg and Pantano, 2016; Tollånes et al., 2007). In contrast, Smith et al. (2006)find that the negative association between C-section and future fertility is strongly diminished when controllingfor maternal characteristics.
3This approach follows other studies using a medical information shock as a source of variation in treatment(Anderberg et al., 2011; Jensen and Wüst, 2015; Price and Simon, 2009).
3
The information shock I study in this paper occurred in August 2000, at the annual meeting
of the Swedish College of Obstetricians and Gynecologists. During this meeting, preliminary
results from a large-scale international randomized control trial by Hannah et al. (2000), called
the Term Breech Trial, were presented (Alexandersson et al., 2005).4 The new evidence sug-
gested that planned C-section delivery should be the preferred delivery mode for singleton term
breech births. This led to a substantial and immediate increase in planned C-sections for breech
births in Sweden (Herbst, 2005) as well as in multiple industrialized countries (Sharoni et al.,
2015).5 This information shock has had a strong and long-lasting impact on medical practice
worldwide. To quote Glezerman (2006), “Rarely in medical history have the results of a single
research project so profoundly and so ubiquitously changed medical practice as in the case of
this publication (TBT).” This was also the case for Sweden, which exhibited a stark rise in
planned C-sections for breech births, from 47% to over 60% between 2000 and 2001.
This paper makes important contributions to the previous literature regarding the impact
of C-sections on child and maternal outcomes in high-risk births.6 First, most previous studies,
particularly those in the biomedical literature, suffered from endogeneity issues, small sample
sizes, or both.7 The information shock to the medical society in 2000 allows me to credibly
identify the causal impact of C-section, since using Swedish register data provides a much
larger sample size and is unique in that it allows visibility into the universe of breech births,
alongside a rich set of maternal covariates. Second, previous studies with a causal interpretation
either focus on short- and mid-run health outcomes (Jensen and Wüst, 2015) or are limited to
maternal outcomes regarding future fertility and labor market outcomes without being able to
examine the intermediary effects on health outcomes for both mother and child (Halla et al.,
2016).8 By exploring exogenous variation in C-section and detailed Swedish register data, this
4Preliminary results from a retrospective cohort study by Herbst and Thorngren-Jerneck (2001) on the benefitsof planned C-section were also presented at the annual meeting in 2000. For a detailed discussion of evidencebased changes in delivery mode due to the Term Breech Trial, see Alexandersson et al. (2005).
5These countries include Denmark, Australia, UK, Netherlands, Malaysia, Finland, and Saudi Arabia (Sharoniet al., 2015).
6This study also relates to the literature on C-section and incentives and information (Currie, J. and MacLeod,B., 2017; Johnson and Rehavi, 2016), as well as Borra et al. (2014), which studies the effect of removing childbenefits on timing of births (scheduling of induced labor and C-section). The elimination of child benefits led toa rise in low birthweight children and neonatal mortality.
7A study with a more robust design is Norberg and Pantano (2016). Using multiple data sources and estimationtechniques, they find a negative association between C-section and future fertility (corresponding to a reductionby 17%), which is at least partly attributed to maternal preferences.
8Jensen and Wüst (2015) use the publication of the term breech trial as exogenous variation in C-section(see Section 2). Halla et al. (2016) use exogenous variation in emergency C-section, originating from supply-sideincentives to accelerate deliveries across weekdays, to assess the effect on fertility in Austria. Their findingssuggest that emergency C-section at first birth reduces fertility by approximately 17% and causes a temporaryrise in maternal employment such that income increases by 14%. Card et al "The Health Effects of CesareanSection: Evidence From the First Year of Life", examine the short-run impact of C-section on child health.
4

study considers a broader set of outcomes and a longer time horizon compared with previous
studies. To the best of my knowledge, this is the first study to analyze the causal impact
of C-section on outcomes such as child health up to age 7, maternal health outcomes during
any subsequent pregnancy, and labor market outcomes including income from both sickness
and parental benefits. Thus, relative to previous studies, this paper provides a more extensive
analysis by studying the impact of C-section on both short- and long-run impacts on child
health and maternal health, future fertility, and labor market responses. Third, the analysis in
this paper sheds light on possible heterogeneous effects across socioeconomic status and health
indicators, which is important given that breech births constitute a particular high-risk group,
implying a possible social gradient in the response to altered delivery mode.
The results from this study show that the information shock led to a substantive and
significant increased use of planned C-section deliveries by 11 percentage points among singleton
breech births at term, roughly corresponding to a 20% increase. This increase was not restricted
to any particular group of women with breech births, but was found among all women below age
35, all educational levels, and both normal-weight and overweight women. No change in delivery
mode was found for pregnancies with normal fetal position. Importantly, I find no evidence of
changes in the composition of mothers receiving a planned C-section or in the proportion of
breech births being reported. Likewise, I find no other discontinuities when examining placebo
dates.
The reduced form estimates from the pre-post analysis suggest that the information shock
improved child health among breech births, as measured by a summary index of various short-
and long-term health measures by 0.104 standard deviations,9 almost completely closing the
gap in child health between breech and normal-position births. This increase in child health
is driven by both improvements in health at birth and during childhood, indicated by higher
Apgar scores,10 and fewer nights hospitalized during ages 1-7. Thus, the increase in C-sections
improved child health in both the short and the long run. While the beneficial impacts of the
shock on children are clear, there appears to be little impact on mothers. I find no significant
impact of the information shock on maternal health at birth or at subsequent births. I also
find an insignificant negative impact on future fertility (in terms of both the total number of
future births and the probability of no future birth) in most specifications. However, because
9Child health is measured by a summary index according to Anderson (2008) consisting of Apgar score, infantmortality, and hospitalization during the first year of life and ages 1-7.
10Apgar stands for appearance, pulse, grimace response, activity, respiration. This score is an assessment madeby a physician 1, 5, and 10 minutes after birth. A score of 10 indicates perfect health and 1 extremely poorhealth.
5

these estimates are consistent across specifications and are occasionally marginally significant,
I cannot rule out a potential negative impact. Furthermore, I do not find any effects on labor
market outcomes for the mother when analyzing income from labor earnings, sickness and
parental benefits.
In addition to the reduced form analysis, I estimate a two-stage least squares model using
the information shock as an instrumental variable for planned C-section. While the reduced
form analysis provides the causal impact of the information shock on all breech births, the
two-stage least squares estimates provide the causal impact of C-sections that are generated
by the information shock. That is, this analysis gives us the local average treatment effect of
C-section on compliers. The two-stage least squares estimates suggest that the change from
vaginal delivery to planned C-section improved child health by 0.93 standard deviations, which
is driven by an increase in Apgar score of 0.58 units and by 5.9 fewer hospital nights.
The results are robust to a number of sensitivity checks, including alternative specifications
(using quadratic trends, cubic trends and triangular kernel and a smaller window of time), non-
weighted indices, and a difference-in-differences design using births with normal fetal position
(cephalic births) as controls.
In summary, this study suggests that the increase in planned C-sections for breech births
improves child health. However, it appears to have limited consequences for maternal health
and labor market outcomes, but a possible negative effect on future fertility. These findings
should be particularly relevant for countries with low rates of planned C-section for breech
births. Singleton breech births at term represent a reasonably large share (3-4%) of all births.
Thus, interventions that can improve health among this high-risk group are important. The
results from these exercises show that the gap in child health between this risk group and normal
births nearly vanishes in the face of this medical intervention. Moreover, this study contributes
to the general literature on the causal effects of C-section, and although it focuses primarily on
breech births, the results may be of interest for other high-risk groups as well.
The paper is structured as follows. Section 2 presents a description of breech birth in the
Swedish context and outlines the information shock to the medical society. In Sections 3 and 4,
the data and empirical strategy are described. Sections 5 and 6 present and discuss the results.
Section 7 concludes the study.
6
2 Background
2.1 Breech presentation and delivery mode
Multiple biomedical studies suggest that planned C-section deliveries reduce the risk of perinatal
and neonatal morbidity and mortality in breech births (Betran et al., 2015; Cheng and Hannah,
1993; Gifford et al., 1995; Herbst, 2005; Herbst and Thorngren-Jerneck, 2001). However, this
association does not necessarily provide a causal interpretation because of the correlation be-
tween the choice of delivery and birth outcomes (Hannah et al., 2000). This research position
is reflected in the lack of consensus within the medical society on the optimal delivery mode for
breech births (Glezerman, 2006; Goffinet et al., 2006; Sharoni et al., 2015; Turner, 2006).
A milestone within the medical literature regarding delivery mode for breech birth deliv-
eries at term was the publication of the Term Breech Trial by Hannah et al. (2000). This
large-scale international randomized controlled trial was conducted across 121 hospitals in 26
countries, covering 2,088 women randomly assigned to either a planned C-section or planned
vaginal delivery.11 The results showed that perinatal and neonatal mortality as well as severe
neonatal morbidity were significantly lower in breech births delivered with planned C-section
(1.6%) than with planned vaginal delivery (5.0%). Moreover, the reduction in mortality and
morbidity risks were higher in countries with already low neonatal death rates. No significant
differences in maternal mortality or severe maternal morbidity were found between planned C-
section and planned vaginal delivery. The study was terminated prematurely because of findings
of statistical differences in perinatal outcomes between the two groups, making it unethical to
continue the randomization (Hannah et al., 2000). While the Term Breech Trial had a strong
and long-lasting impact on medical care in multiple countries (Sharoni et al., 2015), the re-
sults of the study did not remain unchallenged. Strong criticism has been directed toward the
implementation of the trial by Glezerman (2006) and Turner (2006).12
Two follow-up studies were conducted two years after the Term Breech Trial, assessing
the impact of planned C-sections for breech births on child outcomes (Whyte et al., 2004) and
maternal outcomes (Hannah et al., 2004). These studies were conducted using survey data
collected from questionnaires directed to the mother and child from a subsample of women
from the Term Breech Trial sample.13 No significant impact was found on either child health11Women were eligible if the fetus was a singleton, was alive and had a weight below 4,000 grams at gestational
age 37 weeks or beyond. Births with known fetal anomalies were excluded from the trial.12Glezerman (2006) argues that most cases of the neonatal mortality and morbidity are unrelated to the delivery
mode.13The current study differs from these previous studies in that rich register data on long-term outcomes beyond
7

(Whyte et al., 2004) or maternal health or fertility (Hannah et al., 2004).14 These results were
surprising with regard to the Term Breech Trial, which showed a strong positive health effect
for babies delivered by planned C-section.
A more recent study supporting the findings of the Term Breech Trial is Jensen and Wüst
(2015), which examines the impacts of the Term Breech Trial on child and maternal health
in Denmark. By using the Term Breech Trial as exogenous variation in the likelihood of C-
section among high-risk pregnancies, Jensen and Wüst (2015) find that child health improves.
The results suggest that C-section among breech presentation pregnancies is associated with 4
percentage points higher Apgar score, 6 percentage points lower probability of an Apgar score
below 7 and approximately seven fewer visits to the doctor over the first three years of life. They
also find that C-section does not affect maternal health other than increasing hospitalization
by 2.3 days.15
2.2 The Swedish context
In Sweden, prenatal care is provided free of charge and includes ultrasounds, physical examina-
tions, and sampling of biomarkers, as well as birth classes.16 While midwives usually carry out
these tasks, pregnant women may also access care by an obstetrician or gynecologist (OB/GYN),
which is a necessity for prescription medications or medical procedures. Most women have their
first visit at a maternity unit during gestational weeks 6-12. From week 20, women are advised
to have monthly checkups until week 30, after which biweekly checkups are advised (Vårdguiden,
2017). Prenatal care attendance in Sweden is very high. Only 0.4% of all women visit less than
three times, and only 9.4% register later than gestational week 15 (Buekens et al., 1999).
Near the end of the pregnancy, around weeks 36-37, the fetal position is examined by a
midwife at the prenatal care unit. If the fetal position is suspected to be breech or deviates
from normal presentation in some other way, the woman is referred to a specialist maternity
two years are further explored for both mother and child. A longer time period is of interest because the averagebirth spacing in many countries including Sweden is over 3 years.
14Evidence on long-term impact of breech presentation is scarce. One exception is Mackay et al. (2015), whoshow that vaginal delivery among breech presentation pregnancies led to lower Apgar scores at birth and lowereducational attainment.
15The increased probability of C-section occurred only among second time mothers (or subsequent pregnancies)since C-section among first-time mothers with breech births was already the default delivery mode in Denmarkwhen the Term Breech Trial was published. For this reason, first-time mothers are omitted from their analysis,thereby excluding more than 50% of their sample. In Sweden, however, the main increase in C-section occurredamong first-time mothers.
16All residents in Sweden are guaranteed access to public health care, which is primarily provided by the countycouncils (Landsting) and funded by central and local taxation. Only 2.5% of all residents have taken out privatehealth insurance (Anell, 2008).
8

care unit, where the OB/GYN tries to manually turn the baby into a cephalic position using
a procedure called “external cephalic version”. If this is successful (and if the baby stays in
cephalic position until delivery) vaginal delivery is attempted following the normal procedures.
Approximately 50% of all external cephalic versions are unsuccessful. In such cases, a planned
C-section is usually scheduled 7-10 days before the expected day of delivery (based on the
date of last period and ultrasound examination). Vaginal delivery can be attempted if certain
criteria are fulfilled, including normal fetal growth, pelvis size, spontaneous start of delivery,
and abundant amniotic fluid. However, not all breech presentations are identified prior to birth.
If a breech position is discovered at the time of delivery, the decision-making process is similar
to that when discovered before (Karolinska Universitetssjukhuset, 2016).
2.3 Information shock to the medical society
In 2000, new scientific evidence became available, suggesting that planned C-section is the pre-
ferred delivery mode for singleton breech presentation births at term. In Sweden, the debate
within the medical society on the preferred delivery mode for breech births began before the
publication of the Term Breech Trial, at the annual meeting of the Swedish College of Obste-
tricians and Gynecologists (SFOG) in August 2000 (Alexandersson et al., 2005). The annual
meeting started with a symposium on “Term breech: C-section or vaginal delivery?”17 where
preliminary results from the Term Breech Trial by Hannah et al. (2000) were presented as
evidence in favor of planned C-section as preferred delivery mode.
The next piece of evidence was presented by Herbst and Thorngren-Jerneck (2001), con-
sisting of preliminary results from a cohort study in Sweden, suggesting that planned C-section
is the preferred delivery mode from breech births at term.18 Because of the new evidence pre-
sented at the annual meeting, the Swedish medical society of perinatal medicine organized an
extra meeting in Stockholm in December 2000 together with other medical societies of perinatal
medicine from Scandinavia.
Although no new guidelines were issued, multiple sources suggest that the dissemination of
new evidence on preferred delivery mode by Hannah et al. (2000) and Herbst and Thorngren-17The symposium, “Sätesändeläge i fullgången graviditet-kejsarsnitt eller vaginal förlossning”, was chaired by
Professor Ingemar Ingemarsson and consisted of several lecturers on the topic of preferred delivery mode accordingto evidence, based knowledge. The internal newsletter of SFOG “Medlemsbaldet nr 4, 2000” includes a detaileddescription of the SFOG annual meeting and the symposium.
18Herbst and Thorngren-Jerneck (2001) find that babies delivered by planned vaginal delivery had lower Apgarscores (3-5%) and exhibited higher neonatal neurological morbidity (3%). Another study by Herbst (2005) onperinatal and infant mortality among babies in breech presentation at term in Sweden, using the Medical BirthRegistry for the period 1991-2000, finds that breech babies delivered by C-section exhibit lower perinatal andinfant mortality.
9
Jerneck (2001) caused a strong increase in planned C-sections.19 First, an immediate poll
of SFOG members after the symposium on breech births at the annual meeting showed an
increased support for planned C-section compared with vaginal birth.20 Second, the data show
an evident pattern of altered Swedish obstetric practice regarding delivery mode among breech
presentation births attributed to new evidence-based recommendations (Alexandersson et al.,
2005), consistent with many other industrialized countries at this time (Sharoni et al., 2015).
In Figure 1, trends in C-section among breech births at term are presented. The trends show
a sharp increase in the rate of planned C-section, from approximately 47% in 2000 to over 60% in
2001 (Figure 1b). The trends at the monthly level (see Figure 2) display how C-section increased
after the annual meeting in August 2000. Based on residency, trends in probability of C-section
for breech births at term are presented by county in Figures A1, A2 and A3. The increase is
the sharpest in some of the most populated counties. From 2001 onward, approximately 70% of
breech-presentation pregnancies have been delivered by planned C-section in Sweden. During
this period, the prevalence of breech births is constant (see Figures 3 and 4) and no increase in
C-section for normal-position births can be found either by graphical examination (see Figure 5)
or in the regression analysis (see columns 3-4 in Table 1).
Since the information shock took place at an internal medical gathering rather than in the
public media, the increase in C-section can be thought of as mainly supply side driven. That
is, a woman giving birth to a baby in breech presentation at term after the annual meeting
in 2000 was more likely to be recommended a planned C-section than a vaginal birth. While
there are regional differences in planned C-section, residential sorting due to demand for a
planned C-section is less likely given that expectant mothers learn late in the pregnancy (weeks
36-37) about the fetal position of the child, thereby making it difficult to plan ahead. Given
that information on internal hospital routines can be hard to access as an outsider and that
expectant mothers in Sweden have a limited ability to choose the hospital at which to give birth,
it is thus reasonable to believe that the increase in C-sections can be attributed to supply-side
change due to the new evidence provided to the medical society. Finally, in the Swedish context,
there is no (known) financial incentive for the individual doctor to choose one specific delivery
19National guidelines for specific selection criteria on mode of delivery for breech presentation pregnancieshave been available in Sweden since 1974. During the 1980s and 1990s, studies from several countries (includingSweden) on preferred delivery mode for breech presentation pregnancies showed increasing support for plannedC-section. However, the evidence was not conclusive, which led to different medical practices across Swedishhospitals (Herbst, 2005).
20Nearly 50% of the OB/GYNs at the annual meeting voting in favor of routinely planned C-section. Whenthe same question was asked, but with the stipulation that the OB/GYNs should imagine that the patient was afamily member or oneself, two-thirds voted in favor of routine planned C-section (internal newsletter of SFOG,“Medlemsbaldet nr 4, 2000”).
10
mode over another.
3 Data
3.1 Data description
I use Swedish administrative population-level data to study the impacts of C-section on child
and maternal outcomes. I use data for all births in Sweden between 1973 and 2011 from
cohorts born between 1940 and 1985 (including their children and parents) which are identified
via the Swedish Multi-generational Registry (Flergenerationsregistret) and the Swedish Medical
Registry (Svenska födelseregistret). Based on this sample, covering more than 98% of all births
in Sweden during 1973-2011, multiple data registries on health and labor market outcomes are
combined, and data are complete for the period 1991-2011.
Information on pregnancy and birth outcomes is obtained from the Swedish Medical Birth
Registry. The Swedish Medical Registry is provided by the National Board of Health and Wel-
fare and contains information on all births in Sweden since 1973 (beyond 22 weeks of gestational
age and including both stillbirths or live births). This registry provides detailed information
on pregnancy, delivery and postpartum conditions, including maternal characteristics (mater-
nal age, height, and weight), previous health conditions (diabetes, asthma, and epilepsy) and
pregnancy behavior (tobacco usage and prenatal visits). In addition, it also provides extensive
data on perinatal and neonatal outcomes for the child, including fetal position, gestation, birth
weight, health at birth, malformation, surgeries, and medical diagnoses and treatments. There
is detailed information, for each birth, regarding medical interventions during delivery such as
C-section, induction of labor, and operative procedures such as the use of forceps and vacuum
extraction.
I particularly focus on delivery mode, whether vaginal delivery or C-section delivery. As
C-section can be either a planned or emergency surgical procedure, information about the
indication (whether a planned or emergency C-section) for the procedure is of interest. The
birth registry lacks detailed information about the indication for C-section before 2000. Instead,
it provides information on whether delivery started or ended with C-section. For this reason,
deliveries that started with C-sections are used as a proxy for planned C-section, and deliveries
that end with C-sections (after attempting vaginal delivery) are used as a proxy for emergency
C-section. Deliveries of term births that start with C-section are considered a good proxy for
planned C-section (Källén et al., 2005).
11

In order to define treatment status, I need to identify whether the birth occurred before
or after the information shock. Information on the exact date of birth is unfortunately not
available. As an approximation for date of birth, I use the discharge date from the maternity
unit minus the number of average hospital nights for corresponding delivery mode. In the year
2000, the number of nights spent at the hospital after delivery by C-section was, on average,
four nights, compared with two nights for vaginal delivery (The Swedish National Board of
Health and Welfare, 2003). There are other important variables for this analysis. These include
fetal position, in which breech birth is defined as complete, frank, or footling breech,21 Apgar
score at 5 minutes, indicating the general health condition of the newborn baby five minutes
after the delivery, and maternal complications postpartum, which are identified via the ICD-10
classification system. In particular, complications include diagnoses of postpartum hemorrhage
(severe blood loss) and maternal sepsis (infection).22
Data on hospitalization are obtained from the National Patient Registry, provided by the
National Board of Health and Welfare. Using this registry, I obtain information on inpatient
care at all Swedish hospitals since 1987, including length of each hospital stay. Because of data
availability, I use the mother’s discharge date from the maternity unit, via the Medical Birth
Registry, as a proxy for the date of delivery. Thus, for the mother, I can observe hospitalization
only after readmission to the hospital. Mortality data are identified using the Cause of Death
Registry, which is provided by the National Board of Health and Welfare and includes informa-
tion on all deaths of registered residents in Sweden since 1961. The diagnoses of causes of death
are coded according to the ICD system.
Data on labor market outcomes are obtained from the Longitudinal Integration Database
for Health Insurance and Labor Market Studies (LISA), which is provided by Statistics Swe-
den and contains annual information on education and earnings for all individuals above age
16 starting from 1991. To assess the impact of birth technology on labor market responses, I
focus on the following variables: income from gainful employment, defined as total annual gross
earnings (in cash) and net income from active business; income from parental leave, defined
as the total annual income from parental leave (this includes income from parental allowance,
temporary parental leave, and child care allowance); income from sick leave, defined as the total
annual income resulting from illness, injury, or rehabilitation (including a sick pay period of 14
21ICD-10: O80.1, O83, O64.1, P03.0, or codes defined by Swedish Medical Birth Registry: MAG00, MAG03,MAG10, MAG11, MAG20, or MAG96.
22ICD10 codes for sepsis: O85, O86, O860, and O861. ICD10 codes for postpartum hemorrhage: O678, O72,O720, O721, O721A, O721B, O721X, O722, O723, and DR029.
12

days); income from unemployment benefit, defined as the total annual income from unemploy-
ment benefits. All income variables are expressed by annual amount of 100 SEK. Education is
measured by the highest level of educational attainment (levels 1 to 7).23
3.2 Main outcome variables and multiple hypothesis testing
The outcomes are chosen based on data availability and to enable comparisons to previous
results (Hannah et al., 2000, 2004; Herbst, 2005; Herbst and Thorngren-Jerneck, 2001; Hofmeyr
et al., 2001; Jensen and Wüst, 2015). Since I test a large number of outcome variables, the
analysis is prone to type 1 errors. To account for this potential issue, I compute summary indices
as suggested by Anderson (2008), combing multiple outcomes into one measure for child health,
maternal health at birth, maternal health at subsequent birth, and labor market outcomes.
The indices are computed as follows: The direction of each outcome is oriented in the same
direction, such that a higher value indicates a better outcome. All outcomes are standardized,
subtracting the mean and dividing it by the standard deviation of the control group. For
each category of interest, an index is created using the standardized variables weighted by the
inverse of the covariance matrix. This means that variables with lower correlation with the
other variables within the category provide new information and will therefore obtain a higher
weight than variables with high correlation.24 The index is computed in such a way that mean
in the control group is zero with standard deviation one. The following indices are computed:
1. Child health index: Apgar score (scale 1-10, positively coded), Apgar score below 7 (nega-
tively coded), infant mortality (negatively coded), nights hospitalized (inpatient admission
overnight) within the first year of life (negatively coded), and between ages 1 and 7 (neg-
atively coded).
2. Maternal health index: Maternal sepsis (negatively coded) and postpartum hemorrhage
(negatively coded), number of nights hospitalized postbirth (inpatient admission overnight
within one year of birth, negatively coded).
3. Maternal health at subsequent birth index: Maternal sepsis (negatively coded) and post-
partum hemorrhage (negatively coded), number of nights hospitalized postbirth within
23Level 1 is primary education less than 9 years, level 2 is primary education of 9 years, level 3 is secondaryeducation at most 2 years, level 4 is secondary education of 3 years, level 5 is tertiary education less than 3 years,level 6 is tertiary education 3 years or more, and level 7 is graduate studies.
24See Anderson (2008).
13

one year from birth (negatively coded), and emergency C-section (negatively coded) at
subsequent birth.
4. Maternal labor market index : Annual labor income (in 100 SEK is positively coded),
parental benefits (negatively coded), and sickness benefits (negatively coded).
In addition, fertility outcomes using a fixed time period of 8 years after birth are analyzed
focusing on the total number of future births, a binary measure of any future birth, and birth
spacing. Finally, effects on income from gainful employment, sickness benefits, and parental
benefits are analyzed separately.25 The issue of multiple comparisons is further addressed by
controlling for false discovery rates (FDR), which is the proportion of type I errors. Corrected p-
values are estimated using the step-up procedure suggested by Benjamini and Hochberg (1995).
While FDR has the disadvantage of a higher number of false positives than with alternative
methods (for example, family wise error rate), the advantage is that it yields higher power.26
3.3 Sample and descriptive statistics
For this analysis, data from multiple registers are combined for the time period August 1997 to
August 2003 (i.e., 36 months before and after the information shock). The sample consists of
522,606 births. I further restrict the sample to mothers with a singleton birth, in which the fetus
is presented in breech position at term (gestational age equal to 37 weeks or above).27 Multiple
births and preterm births are omitted from the analysis since the information shock of preferred
delivery mode considers only singleton breech births at term. I cannot observe whether external
cephalic version was attempted. Thus, my sample consists of fetuses in breech presentation, in
which births with successful external cephalic version are implicitly omitted from the sample.
The final sample of breech babies covers 13,208 births (of which 34 are stillbirths and 1,107 are
babies with malformations).28
To illustrate how breech births are related to normal (cephalic) births at term, I present
summary statistics in Table 2 of unconditional means and standard deviations in child and25Since a significant proportion of the sample earns an income of zero, I use an inverse hyperbolic sine trans-
formation log(yi + (y2i + 1)1/2) analogue to Burbidge et al. (1988). This transformation has an analogous in-
terpretation to the standard logarithmic transformation (of the percentage change in income) but is defined atzero.
26Bonferroni corrected p-values, the most conservative alternative, will also be reported for comparison.27According to the Swedish National Board of Health, breech presentation is identified by maternal diagnosis
by ICD-10 codes O80.1, O83, O64.1, and P03.0. Breech implies breech or footling position.28During this period, there are 406,448 singleton term births with normal presentation. Subsamples of different
time periods around the information shock are also used for the analysis. I exclude births with no information onyear of birth or date of discharge (577 observations) as well as observations without information on gestationalage (48 observations), since these variables are pertinent for defining treatment status.
14

maternal characteristics among breech births (columns 1-3) and normal position births (columns
4-6).29 A t-test of differences in means between breech and normal births is presented (column
7) together with its p-values (column 8). This table shows a clear pattern in that singleton
babies presented in breech at term tend to have poorer health outcomes at birth than babies
in normal presentation. On average, birth weight is 250 grams lower for babies in breech
presentation and gestational age is one week shorter. Breech babies are less likely to be male
(0.46 compared with 0.51), suggesting negative selection of male fetuses in utero30 and more
likely to suffer from fetal malformation (8% compared with 3%). Apgar score is lower in absolute
terms as well as for the dichotomous measures of low health at birth (below score 7). The infant
mortality rate is higher for breech babies, at 3.2 deaths per 1,000 live births, compared with
normal position babies, at 1.3. Other health indicators show a similar pattern in which babies in
breech presentation exhibit inferior health compared with those in normal presentation. These
differences may not be due only to breech position but also to delivery mode and underlying
maternal characteristics. The differences in child health remain when comparing child health
between breech vaginal birth and normal vaginal birth.31
Maternal health outcomes show a similar pattern of adverse health and obstetric outcomes.
A striking difference between breech and normal position births is the delivery mode. Among
breech births, planned C-section delivery is the more common method (55.5%) compared with
emergency C-section (26.6%). In comparison, among normal position births, 3.9% of all deliver-
ies are planned C-sections, and 4.5% are emergency C-sections. Mothers with breech births have
higher educational attainment and higher annual labor income (114,792 SEK compared with
100,000 SEK) prior to birth, but no statistical differences are seen for the amount of sickness
benefits prior to birth. This suggests that women having breech births are not disadvantaged in
terms of education and income compared with mothers with normal position births. Finally, in
panel D, the indices confirm the summary statistics presented, showing that child and maternal
health are poorer among breech births (by 0.039, -0.02, -0.01) compared with normal position
births (0.106, 0.016, 0.157). This is, however, not the case for the labor market index, which
exhibits better outcomes (0.106) compared with normal births (-0.003).
Birth outcomes, delivery mode, and fertility outcomes for first-time mothers with term
breech singleton births are compared before and after the information shock in Table 3.32
29The samples of normal position births include singleton births at term (born in week 37 or later).30For example male fetuses are less likely to survive under distress (Almond and Mazumder, 2011).31These differences also remain when holding gestational age constant, regressing breech status on child health.
These results are available on request.32This simple pre-post comparison does not account for trends and covariates, which will follow in the empirical
15

Columns 1 and 2 display variable averages, 36 months before and after the annual meeting
in August 2000, respectively, and a t-test of the difference between means with p-values in
brackets below, is presented in column 3. In Panel A, the summary statistics document a
strong increase in all C-sections, which can be attributed mainly to the strong increase in
planned C-sections, from 47% to 65% compared with the smaller and less significant decrease
in emergency C-sections from 29% to 27%. The induction of labor decreased from 2% to
0.8%, which is consistent with a higher use of C-section deliveries. Child health outcomes are
presented in Panel B and suggest an overall improvement in health. Health at birth measured by
the absolute level of Apgar score as well as a dichotomous measure of low Apgar score (below 7)
is improved. While the infant mortality rate and number of hospital nights are lower in the post
period, these differences are not significantly different from zero. There is no clear pattern of
changes in maternal health at birth, maternal health at subsequent births or fertility outcomes
within a fixed time period of eight years,33 presented in Panels C, D, and E. Maternal labor
market outcomes appear to be improved, presented in Panel F, when comparing unconditional
means. The summary indices are presented in Panel G.
These outcomes for the full sample are further explored by graphical examination, which
confirms the summary statistics presented in Table 3. Trends in delivery mode and child and
maternal outcomes among breech births at term are presented in Figures 1, 2, 6, 7, and 8. These
graphs show monthly level (as well as yearly level for C-section) trends around the information
shock, where 0 is the month of information shock. The red vertical dashed line indicates the
month of the information shock, and each dot represents the average rate of C-section on a
monthly basis. Figures 1 and 2 show a sharp increase in C-section among breech births at
term, which is driven by an increase in planned C-section deliveries compared with emergency
C-sections.34 The proportion of breech presentation births during this period appears to be
constant across the cutoff, which is important for the identification strategy used in this project.
Moreover, no discontinuous increase in any type of C-section can be detected among normal
position births (see Figure 5).35 Thus, these graphs confirm the summary statistics.
analysis.33It should be noted that all subsequent pregnancies are likely to be endogenous to the first birth. See Section 6
for a longer discussion.34The proportion of emergency C-sections are presented in Figure A4.35The regression analysis confirms this finding and is further elaborated in Tables 1 and 5.
16

4 Empirical analysis
The aim of this paper is to study the causal impact of C-section on child and maternal out-
comes. The intrinsic endogeneity problem when studying this relationship is that delivery mode
tends to be correlated with prebirth characteristics of mother and child. Thus, a simple cor-
relation between outcomes and delivery mode will suffer from selection bias—it is likely that
important, but unobservable, prebirth maternal and child characteristics differ systematically
between C-section births and other births. For example, such maternal characteristics may
involve unobserved preferences, behavior, and health conditions that can affect both delivery
mode and outcomes. To overcome these issues, I use an identification strategy based on a pre-
post design. In short, I compare outcomes among breech births occurring before the information
shock with outcomes among breech births occurring after the information shock. Thus, births
delivered before the information shock function as a control group for births delivered after.
The key identifying assumption required for this empirical strategy to be valid is that the infor-
mation shock is exogenous to the timing of the birth. In other words, I can identify the causal
impact of an increased proportion of C-sections if prebirth maternal and child characteristics
are constant before and after the information shock.
I start by examining the impact of the information shock on delivery mode, obstetric care,
and outcomes for singleton breech births at term, which is estimated according to Equation 1
using ordinary least squares model.
Yit = α1 + α2InfoShockt + f(t) +Xitδ + εit (1)
The outcome variables are denoted by Y across individual i and time t. The variable
InfoShockt is a binary variable equal to one if birth occurs after the 25 of August 2000 and zero
if birth occurs before.36 Split time trends f(t) are included, consisting of a first-order polynomial
of normalized daily calendar time away from the information shock in August 2000, allowing for
different slopes across the cutoff. The calendar time is normalized such that the cutoff date, 25
of August 2000, is zero where treatment is positive to the right of this threshold. By including
f(t), I allow for different trends (slopes) before and after the information shock. In certain
specifications, a full set of child and maternal characteristics Xit, consisting of binary measures
of birth order, maternal age, county of residency, quarter of birth, nationality (born in Sweden
36Date of birth is not available. Instead, I use the discharge date as an approximation for date of birth. Moreinformation is available in Section 3.
17

or not), tobacco usage during the first trimester, sex of the baby, educational attainment, mean
income, and income from sickness benefits before giving birth, is included.37 The idiosyncratic
error term is denoted εit clustered on the discrete values of the assignment variable, day-month-
year, suggested by Lee and Card (2008).38 Robustness checks are conducted with respect to
the choice of polynomials, kernel, and time period.
The effect of planned C-section can be captured by a two-stage least squares model (2SLS)
using the information shock as an instrumental variable (IV) for planned C-section. The IV
strategy is analogue to a fuzzy regression discontinuity design (Lee and Lemieux, 2010) using
calendar time as the running variable. The estimated effect is thus the local average treatment
effect (LATE) (Angrist and Pischke, 2009), which can be interpreted as the average treatment
effect on “compliers”—that is, the breech presentation births delivered by C-section due to
altered routines following the information shock. The IV analysis is described by Equation 2,
where the relationship between various outcomes Yi and delivery mode, which can be attributed
to the information shock, is established.
Yit = β1 + β2 P (C-sectionit = 1) + g(t) +Xitθ + ξit (2)
The predicted likelihood of C-section due to the information shock is expressed byP (C-sectionit = 1) and estimated according to Equation 1. Trends, time-varying controls, and
the error term are handled analogously to Equation 1, such that each variable included in the
first stage is included in the second stage. The regression, expressed by Equation 2, is estimated
by a linear probability model using a 2SLS method where the estimated effect can be interpreted
as the local average treatment effect on compliers.
In addition to the date of birth being independent of the information shock, the IV strategy
is valid provided that the following assumptions are satisfied (Angrist and Pischke, 2009): First,
the exclusion restriction implies that the information shock affects outcomes only via a higher
likelihood of having had a C-section and not other medical practices and treatments. Second,
the instrument must be relevant such that the information shock is strongly correlated with the
adaptation of a new delivery practice—that is, C-section among breech pregnancies. Finally,
monotonicity implies that the information shock should have either a positive or zero treatment
effect (such that C-section is more likely after the information shock but never less likely).
37Information on birth hospital or birth county is unfortunately not available; instead the baby’s registeredcounty of residence is used as an approximation for birth county.
38There is an ongoing debate about clustering when using time as the running variable; see Hausman andRapson (2017). The results are robust to alternative clustering on the level of the mother.
18

While we can test the assumption of the existence of a strong and significant first stage
and monotonicity, we cannot test whether the exclusion restriction is satisfied. It is possible
that the information shock led to increased awareness of the risks associated with breech births,
resulting in improved care for all breech births in terms of not only more planned C-sections but
also other treatments.39 Maternal selection is an additional potential issue for identification.
These potential issues are further discussed in section 5.1.
5 Results
5.1 Effects on C-section and obstetric care
The sharp increase in planned C-sections among breech births is presented visually in Figures 1
and 2, and in regressions estimated according to Equation 1 presented in Table 1 (columns 1-2).
The results indicate that the information shock to the medical society had a strong significant
impact of approximately 11 percentage points on the probability of planned C-section among
breech births. The estimate and precision remain very robust to the inclusion of maternal and
child characteristics such as maternal weight, height, nationality, tobacco use during the first
trimester, and sex of the baby, as well as age, birth order, birth-quarter, and county fixed
effects.40 F statistics for each regression are presented in Table 1. The F statistics with and
without controls are 39.4 and 39.1 (see columns 1-2), respectively.41 Thus, the results imply
that there is a strong significant effect of the information shock to the medical society on the
proportion of C-sections among breech births corresponding to a 23% increase when compared
with the mean of the dependent variable in the pretreatment period.
While an increase in planned C-sections among breech presentation births is expected, there
should be no impact on the proportion of planned C-sections among births with normal fetal
position.42 This is tested analogously to breech births and presented in Table 1 (columns 3-4).
The estimates are both statistically insignificant and small in magnitude, with a F statistics
of 0.4 and 0.2. Hence, the results show no indication of altered delivery mode among normal
position births. These results suggest not only that there were no changes in delivery mode39For instance, I cannot observe whether breech births were attended by more midwives and senior OB/GYNs
or received improved care in general.40As birth timing is not exogenous (Quintana-Domeque et al., 2016), seasonality is controlled for using birth-
quarter fixed effects.41An indicator of having a weak instrument is an F statistics below 10, which is perceived as a “rule of thumb”
as suggested by Staiger and Stock (1994).42Analogous to the sample of singleton term breech births, the sample of normal position births excludes
preterm births (< gestational week 37), multiple births, and births in fetal positions other than prostrate neckor head presentations.
19

among normal position births but also that the rise in C-sections among breech births did
not crowd out C-sections for nonbreech births (due to constraints in the surgical team at the
hospital).43
Panel A of Table 4 demonstrates the robustness of the first-stage results to alternative
functional form and time period. These specifications include quadratic trends (column 1),
cubic trends (column 2),44 a triangular kernel that places more weight on observations close
to the cutoff and less on those farther away (column 3) and alternative sample of a shorter
time period of a 12-month window before and after the information shock (column 4) as well
as a shorter time period of a 300-day window (column 5).45 A full set of fixed effects and
maternal and child characteristics are included. These estimates of 0.11-0.13 are very similar
to the baseline estimate of 0.11 with an F statistic above 10.
To get a better understanding of the effect of the information shock, the impact on sup-
plementary or intermediate medical interventions during delivery for breech births is examined
and presented in Panel B, Table 4. The results are estimated analogously to the baseline spec-
ification, expressed by Equation 1, with a full set of covariates and fixed effects. The results
imply that the information shock had no statistically significant impact on emergency C-sections
(column 1), indicating that the rise in planned C-sections originated from women who would
otherwise have given birth by vaginal delivery. There is no significant impact on induced labor
(column 2) or the usage of forceps or vacuum extractor (column 4) but a strong significant
increase in the use of spinal anesthesia (column 3), which has a similar estimate (0.13) to the
increase in planned C-sections (0.11). The strong increase in the usage of spinal anesthesia is
an automatic response to the increase in C-sections, since spinal anesthesia is routinely used
during planned C-section. Finally, the likelihood of having an episiotomy,46 a surgical procedure
used at vaginal birth (column 5), drops by 5.7 percentage points, which is expected, since this
procedure is not necessary during a C-section.
In Sweden, a planned C-section due to a breech pregnancy is usually scheduled 7-10 days
before the expected date of delivery (determined by last date of menstruation and ultrasound).
This means that having a planned C-section may decrease the gestational length, which could
43Similarly, the information shock suggests that planned C-section was the preferred delivery mode for singletonbreech birth at term only, which is why we expect to see no impact on either breech twins or preterm breech.Consistent with this, no significant impact is found for either of these two groups. These results are presented inTable A1.
44There is an ongoing debate regarding the use of higher polynomials greater than two; see Gelman and Imbens(2014) for a detailed discussion.
45Three hundred days is the optimal bandwidth that minimizes the mean squared error suggested by Calonicoet al. (2014).
46Surgical incision made in the perineum to widen the opening of the vagina for a faster delivery.
20

affect the fetal growth in the late stage of the pregnancy (Borra et al., 2014).47 In Panel C, I
investigate how the information shock affected gestational age in weeks (column 1), birth weight
in kilograms (column 2), head circumference in centimeters (column 3), and length of the baby
in centimeters (column 4). I find that gestational age decreases by nearly 0.136 weeks, and the
baby’s length decreases by 0.124 centimeters on average. This result should be considered when
investigating the impact of planned C-section on child health.
Validity of the first stage
There are a number of potential threats to the identification. First, a potential issue is that the
information shock could have led to changes in the frequency of breech births being reported.
Similarly, if there were fewer attempts to turn the fetus to a normal position (external cephalic
version) due to the information shock, the proportion of breech births would increase and
possible selection issues could arise. By examining the proportion of breech births around the
time of the shock I may alleviate this concern. In Figures 3 and 4, the proportion of breech
births is presented. The trend in the proportion of breech births exhibits a highly constant
development over time including the time of the information shock in 2000. Additionally, this
is formally tested in Table 5, which confirms that the proportion of breech births remained
unchanged at the time of the information shock.48 Moreover, a McCrary test shows no evidence
of a discontinuity in the number of breech births at the time of the information shock. The
McCrary regression result for the information shock is -0.023 (se 0.13) and is visually presented
in Figure A5.
Second, the absence of maternal selection to C-sections is important for the validity of the
instrumental variable approach as well as for the interpretation of the reduced form treatment
effect. Maternal selection to C-section can be both demand and supply driven and it may be
difficult to distinguish between the two. However, demand-driven selection—that is mothers’
demand for C-section after having accessed new information on the preferred delivery mode
for breech births—can be considered less likely given that the information shock was targeting
OB/GYNs during an internal meeting and, to the best of my knowledge, not announced to
the public media. Also, the medical society reacted to preliminary findings of two studies, not
47Birth weight (as well as other growth indicators) is positivity correlated with later-life outcomes includingeducation and income (Bharadwaj et al., 2017).
48Manipulation of the running variable is less likely for several reasons: the fertility decision was made beforeany knowledge of the information shock was available: it is unlikely that women would be able to delay or movethe delivery to an earlier date: the preliminary results presented to the medical society were not announced inthe public media.
21

yet available to the public. Breech presentation is discovered late in the pregnancy, making it
difficult to plan ahead such that residential sorting can be considered less likely. Nevertheless,
maternal selection is further examined.
To investigate maternal selection, a balancing test of covariates across the discontinuity is
conducted, testing for compositional changes by running regressions with maternal characteris-
tics as the outcome variables and the information shock as the explanatory variable. The results
are presented in Panel A, Table 6 and suggest that for breech mothers, there was no significant
change in observable maternal characteristics such as age, height, weight, educational attain-
ment, labor income, or sickness benefits before birth at the time of the information shock.49
I also test for compositional changes among maternal characteristics on mothers receiving a
planned C-section, presented in Panel B, Table 6. Similarly, no significant impact on maternal
characteristics is observed across the information shock. In addition, I regress the likelihood of
having a planned C-section on a fully interacted model, in which the maternal characteristics
are interacted with the treatment status (post information shock). The results are presented in
Table A2 and show that none of these interactions are significantly different from zero except for
height. The conclusion from these exercises is that based on observable characteristics, I find no
persistent evidence in favor of changed maternal characteristics. This can alleviate concern to
some extent regarding both selection and demographic changes at the time of the information
shock.
Finally, I conduct placebo regressions for examining discontinuities at other points in the
distribution of the running variable. More specifically, by using a bandwidth of 12 months before
and after the placebo date, I examine whether there are any discontinuities in the proportion
of planned C-section on 25 of August in one to three years before or after 2000. By doing this,
I also check for seasonality in planned C-section to rule out that planned C-sections usually
increase during this time of year. The results are presented in Table 7 and show no signs of
significant changes in the probability of planned C-section at any of the placebo dates.
Heterogeneous effects of the first stage
In this section, I examine heterogeneous effects of the information shock on the probability of
planned C-section for different subgroups of birth order, age interval, educational level, and
49Since fertility choices are made nine months before delivery, it is unlikely that the information shock wouldhave caused demographic changes.
22

body mass index (BMI) classification.50 To understand the treatment effect, it is important
to analyze which women (with breech births) were more likely to have a C-section due to the
information shock—in other words, to identify whether the marginal woman can be confined to
a specific high- or low-risk type indicated by observable characteristics.
Heterogeneous effects of the information shock across birth order, age, BMI, and socioeco-
nomic status (SES) indicated by educational level are examined and presented in Table 8.51 The
heterogeneous analysis across birth order, presented in Panel A, Table 8 (columns 1-3), shows a
positive significant impact on both first- and second-time mothers. The treatment effects across
age groups are presented in Panel A, Table 8 showing a significant impact for all age groups
except for women age 35 and over (columns 4-8).
The treatment effects across educational levels is presented in Panel B, Table 8. The es-
timates indicate that the treatment effect is significant across all educational levels (columns
1-3), primary, secondary and tertiary education, with estimates of 0.090, 0.107, and 0.144, re-
spectively. While the magnitudes across educational levels differ slightly, with higher likelihood
of planned C-section for women with more education, these differences are statistically different
only for mothers with secondary and tertiary education. Finally, the treatment effects across
BMI classification levels are presented in Panel B, Table 8.52 These results suggest that the
treatment effect is largest among women in the normal weight range and overweight women
(columns 5-6). For obese women no significant impact is found, which is expected, since these
women are likely to “always-takers”. An increase in the probability of planned C-section is
identified for first- and second-time mothers, all educational levels, women under age 35, and
both normal and overweight women. This indicates that a broad category of women had a
planned C-section due to the information shock.
The results suggest that the information shock had less impact on C-section among women
at risk (older women and obese women). These women already exhibit a higher rate of planned
C-section of approximately 60% and are more likely to be always-takers. Finally, these results
suggest that the monotonicity assumption is satisfied, implying that the information shock had
either a positive or null effect but never a negative effect on the probability of planned C-section.
50BMI classification according to World Health Organization (2000): underweight <18.5, normal range 18.5 to24.9, overweight 25 to 29.9 and obese ≥ 30.
51These observables are chosen because of data availability and because birth order, age, BMI, and SES areconsidered important determinants for delivery mode (Ecker et al., 2001; Sebire et al., 2001; Sheiner et al., 2004).
52The number of underweight women was only 292, so they are not reported separately. The estimated impacton planned C-section among underweight women is 0.067, which is not statistically significant.
23

5.2 Effects on health, fertility and labor market outcomes
Baseline results
i) Reduced form analysis
The baseline results on child and maternal health, subsequent fertility outcomes, and labor
market outcomes are presented in Table 9. For each specification, I present estimates for the
full sample and first-time mothers. The reason for focusing on first-time mothers, in addition
to the full sample, is that future fertility outcomes could be endogenous to the first birth. The
effect of the information shock is estimated according to Equation 1 and includes a full set of
covariates and fixed effects.
Starting with the impact on child health presented in Table 9, the reduced form effect of
the information shock suggests a significant increase in child health for the full sample of 0.104
standard deviations (SD) (Panel A, column 1). For first-time mothers, the estimate is 0.087
SD (Panel B, column 1). The health outcomes are further scrutinized separately and presented
in Panel A, Table 10. When looking at the separate outcomes of the child index, there seems
to be a consistent pattern of improved infant and child health by higher Apgar score, lower
probability of low Apgar score, lower infant mortality, and fewer nights hospitalized within the
first year of life and during ages 1-7. Yet the only significant effects (below 5% significance level
using conventional p-values and below 10% using FDR), seem to originate from a higher level
in absolute Apgar score by 0.07 unit change (column 1) and lower number of nights hospitalized
during ages 1-7 by 0.67 nights (column 5). This result is interesting, since it suggests that the
information shock improved both short- and long-term health for children.
Turning to the effects on maternal health, presented in Table 9, the results for the full
sample and first-time mothers do not show any significant impact on maternal health (column
2, Panels A-B). The maternal health outcomes are presented separately in Panel B, Table 10.
While these separate estimates indicate a lower risk of sepsis and postbirth hospital nights (re-
admission), none of these effects are significantly different from zero, meaning that we cannot
infer any significant impact on maternal morbidity. For women having at least one more birth
within eight years after her breech birth, potential effects on maternal health outcomes are
analyzed in Table 9 (column 3). The estimated effect on maternal health at subsequent births
suggests no significant impact for either the full sample or first-time mothers. When examining
each outcome separately in Panel C, Table 10, no significant impact can be found for any of the
outcomes.
24

The impact on future fertility outcomes is investigated and presented in Table 9 (columns
4-6). These estimates suggest a negative but insignificant impact on future fertility measured
by total number of future births and a binary measure of the probability of not having another
birth. Compared with the mean of the outcome in the pretreatment period, the estimates
suggest a reduction in fertility by 4.5%, but insignificantly so. No significant impact is found
for birth spacing.
The effects on the labor market index are explored and presented in Table 9 (column 7).53,54
No significant impact is found for either the full sample (Panel A) or for first time mothers (Panel
B). In Table 10, the incomes from labor earnings, sickness benefits, and parental benefits within
five years after giving birth are examined separately.55,56 The results suggest that there was no
significant impact on any of the labor market outcomes. In addition to using the average impact
within five years from giving birth, event studies are carried out, examining the impact for each
year separately, one through five years after the information shock, presented in Figure A6.
Similarly to the previous results, no significant effect is found on any of the labor market
outcomes for either the full sample or first-time mothers.
The results are further analyzed using alternative functional form and period presented
in Table 11, such that all results are reestimated using quadratic and cubic trends (Panels A-
B), triangular kernel (Panel C), and for a smaller window of 12 months before and after the
information shock (Panel D). These results show that the estimates on child health (ranging
from 0.117 to 0.194 SD) are consistent across specifications (and to the baseline specification
of 0.104 SD). Similarly to the baseline results, the impacts on fertility, maternal health, birth
spacing, and labor market outcomes remain insignificantly different from zero regardless of the
specification.
ii) 2SLS results
The reduced form estimates capture the overall impact of the information shock on all breech
births. In addition, I want to capture the causal impact of C-section using the information53C-section alone does not qualify a woman for sickness benefits from the Swedish Social Insurance Agency.
Moreover, the level of sickness and parental benefits depend on labor income (individually set in proportion tothe labor earnings the year before giving birth). However, all Swedish residents receive a minimum amount ofbenefits when sick or becoming a parent.
54Three sources of income are analyzed: labor income, income from sickness benefits and income from maternityleave. Unfortunately, data on labor supply (e.g., working hours) are not available. Income data are availableonly on an annual basis. I am currently in the process of accessing new data with more suitable labor marketoutcomes to study the full implications from the increase in C-sections.
55Similar results are found for three, five and seven year averages after giving birth.56All income variables are transformed using inverse hyperbolic sine transformation, providing a similar inter-
pretation as log transformation of percentage change.
25

shock as an instrument. Provided that the exclusion restriction is satisfied, in other words, that
the information shock affects outcomes only through higher likelihood of C-section, the impact
of C-section attributed to the shock (the effect on complying women) can be estimated using
2SLS. The 2SLS model is estimated according to Equation 2 and is presented in Table 12.
The 2SLS results for the full sample (Panel A) suggest that child health significantly im-
proved by 0.93 SD for the full sample of those who obtained a C-section due to the information
shock and by 0.68 SD for first-time mothers. If we compare the estimated effects on child
health to the gap in health between breech and normal position births in the pretreatment
period, having a planned C-section would improve health beyond this gap.
The 2SLS estimates are presented in Table 13, for each outcome separately, showing that
the improvement in child health is mainly driven by higher Apgar score (Panel A, column
1) by 0.58 units and fewer nights spent at the hospital (Panel A, column 5) by 5.9 nights,
both significant below a 5% level when considering the conventional p-values. When correcting
for false discovery rate, however, none of the estimates remain significant. Nevertheless, the
estimates are all large in magnitude and show positive improvements in child health for each
separate outcome.
No significant effects are found for maternal health at birth or at any subsequent births,
future fertility, or maternal labor market outcomes for either the full sample or first-time mothers
(Panels A-B, Table 12, columns 2-7). Similarly, no significant impact on any separate outcome
is found, as presented in Table 13. Nonetheless, the fact that the magnitude is large—that is,
no precisely estimated zero effects—makes the interpretation difficult. A longer discussion is
provided in Section 6. These results are insensitive to choice of polynomial, kernel, and time
period, as presented in Table A3, with the exception of estimated impact on the child health
index, Panel D (column 1), which exhibits a larger magnitude than the baseline.
Alternative strategy
As an alternative approach for dealing with issues including other interventions occurring at
similar time for all births, demographic changes, correlation between season of birth, and mater-
nal and child characteristics, I report the Difference-in-Difference (DiD) estimates, comparing
outcomes for breech births with those for normal position births before and after the informa-
tion shock. While there are multiple plausible identification strategies, I conduct a DiD analysis
to examine the consistency of the estimates across models.
26

The DiD is estimated according to:
Yit = γ1 + γ2(Breech× InfoShock)it + γ3Breechi + πt +Xitµ+ εit (3)
in which Breech is a binary variable equal to one if breech and zero if singleton normal position
birth at term. γ2 is the parameter of interest (DiD estimate), capturing the relative change in
outcomes for breech births compared with normal position births due to the information shock.
The interaction term Breech× InfoShock is equal to one if a birth is a breech birth born post
the information shock and zero otherwise. π indicates day-month-year fixed effects, accounting
for time factors. The vector of maternal and child control variables Xit and the error term ε
are handled analogously to Equation 1.
Additionally, I combine the IV strategy with the DiD approach using the information shock
as an instrument for planned C-section and normal position births as a control group.57 When
conducting a pre-post analysis, a possible scenario that would invalidate the chosen identification
includes unobserved factors affecting the outcomes as well as treatment. Under the assumption
of parallel trends of breech and normal births, the causal impact of the information shock can be
captured using a DiD approach. In a pre-post analysis, other interventions are a possible threat
to the identification. For instance, if there was a general change in obstetric care, in addition
to the information shock, for all births, a DiD approach would account for this.58 Under the
assumption of common trends in the pretreatment period, the DiD approach should provide
results consistent with those of the pre-post analysis.
The trust we can invoke in DiD estimates depends on whether the identifying assumption
of parallel trends is satisfied. To explore the plausibility of the parallel trend assumption, I test
for differences in the pretreatment trends in the outcome variables by conducting multiple event
studies. For the event studies, I fully interact a binary indicator of breech presentation with the
years before and after the information shock such that each coefficient represents an interaction
term between year and breech birth. The year of treatment, 2000, is the omitted base category
following general convention. The results are presented in Figures A7 and suggest a highly
significant sharp increase in C-sections as well as significant improvements in child health after
the information shock but no impact on any other outcomes. Importantly, the event studies also
suggest that pretrends in the outcome variables are not significantly different between breech
57The DiD results can be compared with the reduced form baseline results (Table 14), and the DiD-IV approachwith the IV baseline results (Table 15), provided that the time period is the same across specifications.
58The protocol and internal newsletter from SFOG’s annual meeting in 2000 do not suggest that any otherdelivery practices were discussed or changed for either breech or normal births.
27

and normal positions. That is, out of eight outcomes, only one coefficient for one outcome
(maternal health) is significantly different from zero. Hence, these tests indicate that there are
common trends in the outcome variables in the pretreatment period.
The DiD estimates are presented in Table 14, suggesting a strong significant increase in
probability of C-section by 15.7 percentage points for the full sample (Panel A, column 1)
and by 17.4 percentage points for first-time mothers (Panel B, column 1). These estimates
are somewhat higher than those of the pre-post analysis (11 percentage points). The impact
on child health suggests a positive impact of 0.094 SD for the full sample (Panel A, column
2) and 0.1 SD for first-time mothers (Panel B, column 2). The overall results support the
findings in the baseline model. The magnitude of the child health estimates is similar to that
of the pre-post analysis but the DiD estimates exhibit a slightly higher effect size and precision
for first-time mothers. Unlike the pre-post analysis, a marginal significant negative impact on
fertility is found for the full sample as well as first-time mothers, by 0.019 and 0.026 births,
respectively, which corresponds to a reduction in future fertility by 2-3% when compared with
the mean of the dependent variable. Similarly to the pre-post analysis, no significant impact
is found for birth spacing, maternal health, or labor market outcomes. In addition, I include
breech-specific pretrends, Table A4, which shows similar results to the DiD estimates without
the trends but with slightly larger estimates for child health (0.139 and 0.117 SD) and fertility
outcomes (-0.042 and -0.044).
Turning to the combined 2SLS model and DiD estimates presented in Table 15, in which
the information shock is used as an instrument for planned C-section and normal position births
are used as a control group, these estimates suggest that planned C-section strongly improves
child health by 0.6 SD for the full sample and 0.58 SD for first-time mothers. As with the
baseline 2SLS results, the magnitude of the estimates is large and suggests that planned C-
section would more than compensate for the difference between breech and normal positions in
the pretreatment period. There is also a marginally significant negative impact on the number
of subsequent births (0.12 for the full sample and 0.15 for first-time mothers), suggesting a
reduction in future fertility (by 19% and 14%, respectively, when compared with the control
mean).
In summary, using an alternative estimator of DiD, with normal position births as a control
group, confirms the findings of the pre-post analysis while providing slightly more precision.
28

5.3 Additional robustness and sensitivity
A number of robustness and sensitivity checks are conducted for the baseline reduced form
results. I consider alternative dates for the information shock using alternative cutoffs, including
the date of publication of the Term Breech Trial and the date of the extraordinary Nordic
OB/GYN meeting held following the publication of the Term Breech Trial.59 To do this, I first
remove observations between the annual meeting of SFOG in August and each of the alternative
dates separately, since these births are at least partially treated in line with the documented
response from the medical society according to Alexandersson et al. (2005). First, I use the
date of the publication of the Term Breech Trial by Hannah et al. (2000), presented in Panel A,
Table A5, and show that the results are robust but with a slightly lower estimate for child health
of 0.08 SD (compared with the baseline of 0.10). Then I use the date of the extra OB/GYN
meeting held in December 2000, presented in Panel B, which suggests that the results are similar
to the baseline results but with a marginally significant negative estimate for the number of
future births by 0.042.
Because of data availability, I use the discharge date from the maternity unit minus the
number of average hospital nights for the corresponding delivery mode (four nights for C-section
and two nights for vaginal delivery) as an approximation of the date of birth. This procedure
may, however, result in a measurement error. To deal with this potential issue, I exclude a small
window across the information shock, dropping births one week before and after the shock. The
results are presented in Panel C, Table A5, and are similar to the baseline results, showing a
positive significant impact on child health by 0.097 SD (compared with the baseline 0.104 SD).
The trends in C-section by county in Figures A1, A2 and A3, suggest variation in the
response to the information shock across counties. This leads to the question of whether there
is in fact a stronger effect in counties that exhibit the greatest increase in C-sections. To
address this question first, I omit all but five of the largest counties,60 which exhibited the
greatest increase in C-sections. The results are presented in Panel D Table A5 and provide
similar estimates to the baseline results (child health 0.131). These results suggest that even
in counties with a greater increase in C-sections, the impact on maternal health and labor
market outcomes remains insignificant. Second, I control for county-specific split trends. The
results are presented in Panel E, Table A5 and show that the results are robust to the inclusion
59An extraordinary Nordic OB/GYN meeting was held in December 2000 in Stockholm as a result of thepublication of the Term Breech Trial by Hannah et al. (2000) (Alexandersson et al., 2005).
60Stockholm, Västragötaland, Skåne, Jönköping, and Halland.
29
of trends but with higher precision for the fertility outcome, showing a marginally significant
negative impact on the number of future total births by 0.046.
Finally, when constructing the summary index according to Anderson (2008), more weights
are attached to variables with less correlation to the other variables within that category (that
is, variables with “new information” are given more emphasis). The results are reestimated for
the indices but now summarized using uniform weights and presented in Panel A, Table A6.
Using equal weights provides results similar to the baseline results. For child health, the esti-
mated effect by 0.087 SD is slightly smaller compared with the baseline (0.104 SD). Turning to
the variables constructing the index, if binary measures of hospitalization (equal to one if hospi-
talized at least one night and zero otherwise) are used instead of continuous measures (number
of nights hospitalized), how would it affect the estimates? The results, presented in Panel B,
Table A6, are similar to the baseline results but with a slightly smaller estimated effect of 0.081
for the child health index. When further examining the binary measures of hospitalization,
presented in Panel C, Table A6, the results yield smaller estimates with less precision for child
health compared with the main results (see Table 10). That is, it is the number of total hospital
nights that is affected by the information shock rather than the likelihood of being hospitalized
at least one night.61
6 Discussion and interpretation of the results
Previous studies have suggested that health at birth for breech babies is improved when delivered
by planned C-section (Hannah et al., 2000; Herbst, 2005; Herbst and Thorngren-Jerneck, 2001;
Jensen and Wüst, 2015). In line with this literature, the findings in this study suggest that
child health among singleton breech births is improved by planned C-section as the delivery
mode. The improvements in child health stem from higher Apgar scores and also a decrease in
the number of nights hospitalized during ages 1-7, implying both short- and long-term positive
impacts on birth and childhood health. The long-term impact, up to age 7, is an important
aspect not previously studied. To interpret the impact of the reduced form estimates on a
general index of child health, planned C-section closes the gap in child health between children
in breech and normal positions by nearly 100%.62
61Further analysis on the impact of the information shock on nights hospitalized during childhood is providedin Panel A, Table A7, which shows a negative and significant impact of nights hospitalized in ages 0-3 and onwardamong breech babies. No impact (as expected) is found among normal position babies.
62The unconditional difference in means in the child health index between breech and normal position births,before the information shock, is approximately 0.1 SD.
30

The 2SLS estimates suggest that planned C-section among breech births leads to higher
Apgar scores by the magnitude of a 0.58 unit increase (a magnitude similar to that of Jensen
and Wüst (2015))63 and 5.9 fewer nights hospitalized during ages 1-7. In terms of economic
cost per child, 5.9 fewer hospital nights would, save, on average, 14,400 SEK per night and
84,960 SEK in total. Regarding the improvements in Apgar score, while it is hard to evaluate
the economic meaning of a 0.58 unit increase in Apgar score in the absolute level, the Apgar
score is a good predictor of health during infancy and childhood, including infant mortality and
neurological disorders during childhood (Casey et al., 2001; Li et al., 2011; Moster et al., 2001).
There is a positive association between Apgar score and cognitive development (Odd et al.,
2008). Figlio et al. (2014) find that a 1-unit increase in Apgar score maps to 0.8 SD higher
average test scores in reading and math.
In line with the findings of previous studies, Hannah et al. (2000) and Jensen and Wüst
(2015), I find no significant impact on maternal health at birth.64 Moreover, I find no evidence
of a significant impact on maternal health at future births, which is of particular interest, since
these outcomes have not previously been examined causally. However, one has to consider that
any future birth is endogenous to the previous, such that the impact on health outcomes at
future birth is relevant to a selected sample and may not reflect the effect of planned C-section
if all women had a future birth. While I find no evidence of a significant impact on maternal
health at birth or future births, the magnitudes of the estimates, and the 2SLS estimates in
particular, are not precisely estimated zeros. Although I cannot infer whether precision would
increase with a larger sample size, the estimates are sensitive across specifications and never
marginally significant, which suggests that the estimates may not be interpreted as different
from zero.
The results regarding future fertility (in terms of both the total number of subsequent
births and the probability of not having another birth within a fixed time period of eight years)
suggest a negative impact on future fertility, yet not significantly different from zero. These
estimates are, however, consistent across most specifications and marginally significant in some
specifications (i.e, when controlling for county-specific pretrends, using alternative dates of the
information shock and in the DiD model). That is, we cannot rule out that there may be a
negative impact on subsequent fertility. While a null result on future fertility is in line with
63The 2SLS estimate for Apgar score is 0.42 in Jensen and Wüst (2015).64Jensen and Wüst (2015) find that C-section leads to a longer hospital stay after giving birth by 2.4 nights
but has no impact on infections or other complications. Because of data availability, my outcome consistsof readmission to the hospital within the first year of birth, and thus my result on hospitalization cannot becompared with that of Jensen and Wüst (2015).
31

Hannah et al. (2004), these results are not completely comparable since my time period is four
times longer than that of Hannah et al. (2004), who examine fertility within two years from
giving birth. Likewise, the study by Halla et al. (2016) examines the impact of emergency
C-section for low-risk births, which not only applies to a different population but also considers
a different treatment (emergency C-section is associated with greater risks for mother and child
compared with planned C-section).
Finally, I find no impact on maternal labor market responses, which may be for multiple
reasons. Halla et al. (2016) hypothesize that lower future fertility is the main channel explaining
their findings of higher female labor market participation after having a C-section in the Austrian
setting. My results, however, do not suggest a highly significant impact on future fertility. Even
if there were a negative impact on future fertility, it does not necessarily translate into a positive
impact on labor outcomes because of differences in a potential “childbearing penalty” on the
Swedish labor market compared with the Austrian setting.
The results from this exercise should be interpreted with regard to the risk margin of
women delivering with planned C-sections due to the information shock. Among singleton
breech births, 47% were already being delivered with planned C-sections before August 2000.
Therefore, the marginal births were most likely not the highest risk births since the proportion
of planned C-sections among obese or older women was already high, and no significant effect
of the information shock was found on these groups. It is therefore noteworthy that the impact
on child health is substantial—especially since the increase in planned C-sections appears to be
attributed to fewer vaginal births rather than emergency C-section.
Regarding external validity, when interpreting the results, one should also consider the fact
that breech births constitute a particular high-risk group. The effects from marginal planned
C-sections are compared with those of high-risk vaginal births within this group, which may not
be generalizable to births with normal presentation. While we cannot extrapolate the results
regarding improved child health from more planned C-sections to normal births, it is plausible
that medical interventions improving health at birth could have long-term consequences for child
health (in terms of lower morbidity). Finally, breech births constitute a fairly large group across
most populations worldwide, which can be easily identified. Breech births are a continuous high-
risk group in need of extra medical interventions. Yet the preferred delivery mode continues to
be a controversial topic with substantial variation in planned C-sections across industrialized
countries. The findings in this paper are thus policy relevant, suggesting that countries with
lower proportions of planned C-sections among breech births could improve child health.
32

By doing a simple back-of-the-envelope calculation, the costs of having a planned C-section
can be explored. In Sweden, the average cost of a planned C-section ranges from 54,135 to 88,635
SEK, depending on how complicated the procedure is compared with 30,984 to47,572 SEK per
vaginal birth.65 The average cost of inpatient care per hospital night for children is 14,400 SEK.
While switching from vaginal birth to planned C-section would increase the cost at birth (by
12,000 SEK per night), taking into account the reduction in hospitalization during childhood
plus the average number of extra hospital nights for mothers who had a C-section, would save
as much as 19,897 to 54,397 SEK per birth.66
7 Conclusion
In this study, I have presented evidence that an increase in planned C-sections, among the
high-risk group of breech births, can lead to significant improvements in child health without
affecting maternal health at birth or any subsequent births or labor outcomes, but with a
potential negative impact on future fertility. To overcome the intrinsic endogeneity issue of
selection into C-section, I use exogenous variation from an information shock of new scientific
evidence to the medical society. This shock led to a precipitous rise in planned C-sections
for breech births by 23%. By using detailed Swedish register data for the time period 1997-
2003, I use this shock in a reduced form pre-post analysis and as an instrumental variable in a
2SLS model. The detailed Swedish register data enables me to examine the impact of planned
C-section on a broader set of outcomes not previously examined as well as for a longer time
period.
The increase in planned C-sections appears to originate from fewer vaginal births rather
than emergency C-sections. No impact on planned C-sections is found for normal position births.
Importantly for identification, I find no evidence of any changes in composition among mothers
receiving planned C-sections following the information shock. Moreover, I find no change in
the proportion of breech births reported (i.e., no manipulations) or any discontinuities at other
placebo dates.
The reduced form results show that the increase in planned C-section, following the infor-
mation shock, closed the gap in child health between breech and normal presentation births
65Information regarding average costs can be found in Table A8. The cost of each procedure depends onwhether the birth is complicated. There is no standard rate for a breech vaginal birth. However, a breech vaginalbirth is considered complicated and in need of extra resources such as a senior OB.
66Since I cannot measure whether planned C-sections leads to longer hospitalization for mothers, I use theaverage hospital stay for a C-section, which is two nights longer for a C-section than for a vaginal birth.
33

nearly completely. Using a general index on health outcomes, child health is improved by 0.10
SD. These improvements are found both immediately at birth (higher Apgar score by 0.07)
and during childhood (fewer nights hospitalized, during ages 1-7 by 0.67). Turning to the 2SLS
estimates, planned C-section (among complying mothers) leads to a strong improvement in
the child health index by 0.93 SD. This improvement includes a 0.58 unit increase in Apgar
score and a reduction in hospital stay by nearly 6 nights. No significant impact was found
for maternal labor market outcomes, maternal morbidity at birth, or maternal morbidity at
any future births. Although the estimates on future fertility are insignificant in most specifi-
cations, because the estimates are consistent across specifications and methods, and in some
specifications marginally significant, a potential reduction in future fertility cannot be ruled out.
These results are robust to a number of robustness and sensitivity checks, including alternative
specifications (using quadratic trends, cubic trends, triangular kernel, and a smaller window of
time), nonweighted indices, and the use of DiD design using births with normal fetal position
as controls.
This study shows how increased use of C-section among breech births can improve child
health in both the short and long run, implying that improved health at birth has a lasting
impact during childhood.
34
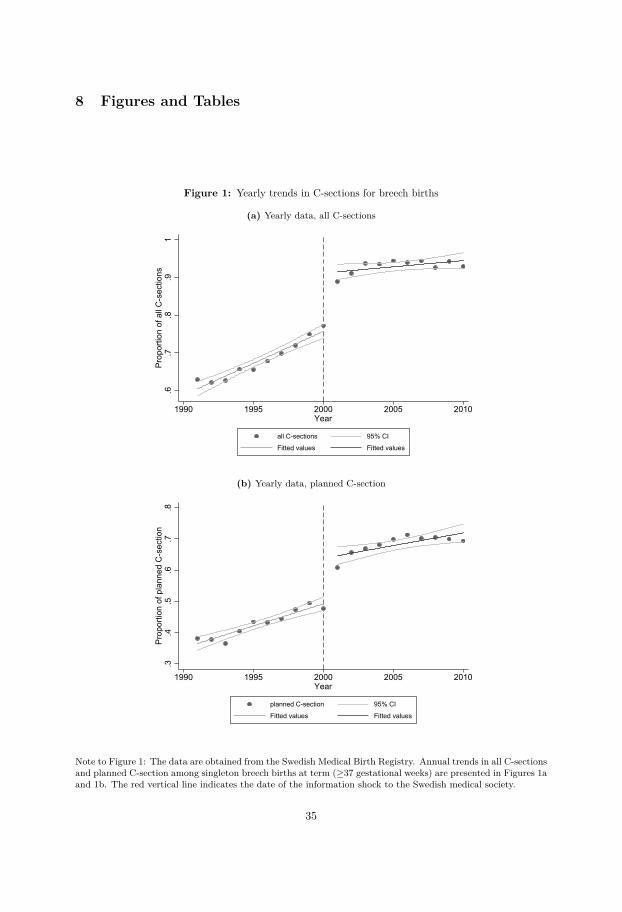
8 Figures and Tables
Figure 1: Yearly trends in C-sections for breech births
(a) Yearly data, all C-sections
.6.7
.8.9
1Pr
opor
tion
of a
ll C
-sec
tions
1990 1995 2000 2005 2010Year
all C-sections 95% CI
Fitted values Fitted values
(b) Yearly data, planned C-section
.3.4
.5.6
.7.8
Prop
ortio
n of
pla
nned
C-s
ectio
n
1990 1995 2000 2005 2010Year
planned C-section 95% CI
Fitted values Fitted values
Note to Figure 1: The data are obtained from the Swedish Medical Birth Registry. Annual trends in all C-sectionsand planned C-section among singleton breech births at term (≥37 gestational weeks) are presented in Figures 1aand 1b. The red vertical line indicates the date of the information shock to the Swedish medical society.
35
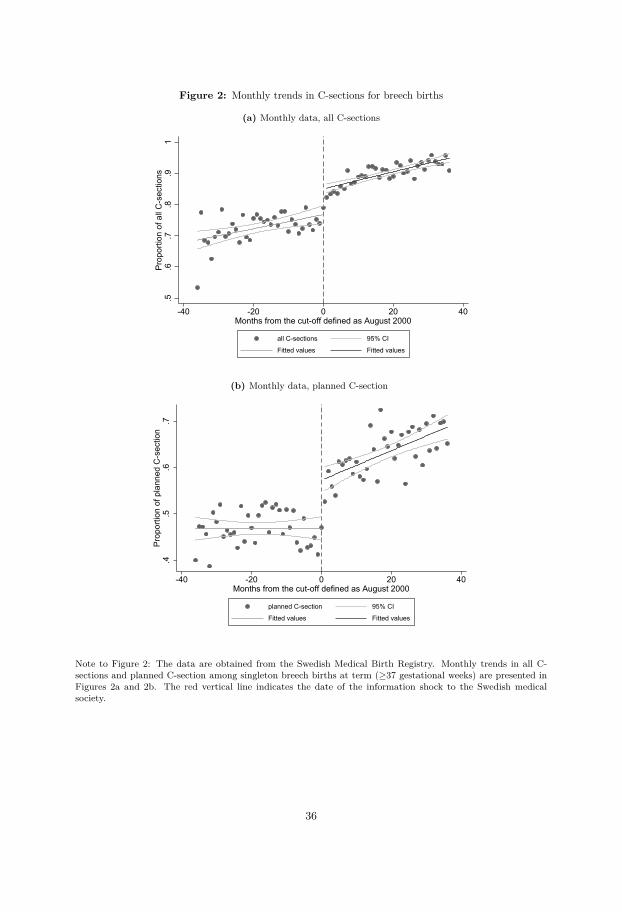
Figure 2: Monthly trends in C-sections for breech births
(a) Monthly data, all C-sections
.5.6
.7.8
.91
Prop
ortio
n of
all
C-s
ectio
ns
-40 -20 0 20 40Months from the cut-off defined as August 2000
all C-sections 95% CI
Fitted values Fitted values
(b) Monthly data, planned C-section
.4.5
.6.7
Prop
ortio
n of
pla
nned
C-s
ectio
n
-40 -20 0 20 40Months from the cut-off defined as August 2000
planned C-section 95% CI
Fitted values Fitted values
Note to Figure 2: The data are obtained from the Swedish Medical Birth Registry. Monthly trends in all C-sections and planned C-section among singleton breech births at term (≥37 gestational weeks) are presented inFigures 2a and 2b. The red vertical line indicates the date of the information shock to the Swedish medicalsociety.
36
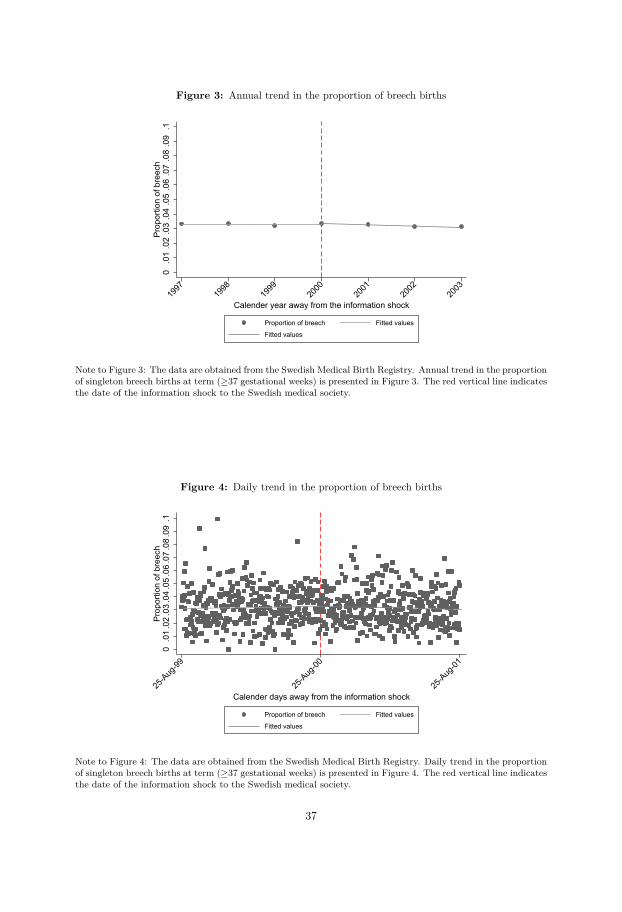
Figure 3: Annual trend in the proportion of breech births
0.0
1.0
2.0
3.0
4.0
5.0
6.0
7.0
8.0
9.1
Prop
ortio
n of
bre
ech
1997
1998
1999
2000
2001
2002
2003
Calender year away from the information shock
Proportion of breech Fitted values
Fitted values
Note to Figure 3: The data are obtained from the Swedish Medical Birth Registry. Annual trend in the proportionof singleton breech births at term (≥37 gestational weeks) is presented in Figure 3. The red vertical line indicatesthe date of the information shock to the Swedish medical society.
Figure 4: Daily trend in the proportion of breech births
0.0
1.0
2.0
3.0
4.0
5.0
6.0
7.0
8.0
9.1
Prop
ortio
n of
bre
ech
25-A
ug-99
25-A
ug-00
25-A
ug-01
Calender days away from the information shock
Proportion of breech Fitted values
Fitted values
Note to Figure 4: The data are obtained from the Swedish Medical Birth Registry. Daily trend in the proportionof singleton breech births at term (≥37 gestational weeks) is presented in Figure 4. The red vertical line indicatesthe date of the information shock to the Swedish medical society.
37
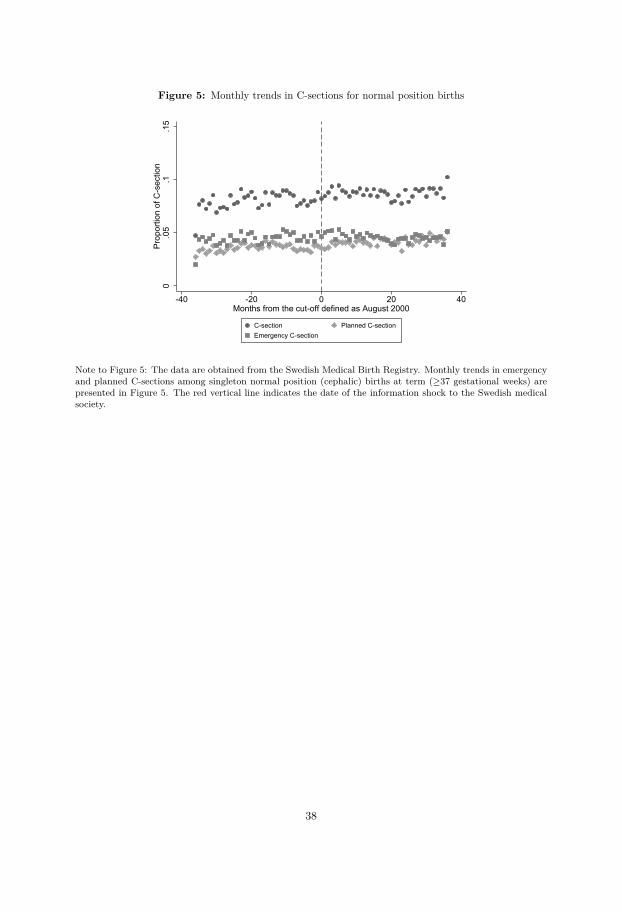
Figure 5: Monthly trends in C-sections for normal position births
0.0
5.1
.15
Prop
ortio
n of
C-s
ectio
n
-40 -20 0 20 40Months from the cut-off defined as August 2000
C-section Planned C-sectionEmergency C-section
Note to Figure 5: The data are obtained from the Swedish Medical Birth Registry. Monthly trends in emergencyand planned C-sections among singleton normal position (cephalic) births at term (≥37 gestational weeks) arepresented in Figure 5. The red vertical line indicates the date of the information shock to the Swedish medicalsociety.
38

Figure 6: Child health outcomes
(a) Apgar score
9.5
9.6
9.7
9.8
9.9
Apga
r sco
re
-40 -20 0 20 40Months from the cut-off defined as August 2000
Apgar score 95% CI
Fitted values Fitted values
(b) Apgar score below 7
0.0
1.0
2.0
3.0
4.0
5Ap
gar s
core
bel
ow 7
-40 -20 0 20 40Months from the cut-off defined as August 2000
Apgar score below 7 95% CI
Fitted values Fitted values
(c) Nights hospitalized ages 0-1
.51
1.5
22.
5N
ight
s ho
spita
lized
age
s 0-
1
-40 -20 0 20 40Months from the cut-off defined as August 2000
Nights hospitalized ages 0-1 95% CI
Fitted values Fitted values
(d) Nights hospitalized ages 1-7
.51
1.5
22.
53
Nig
hts
hosp
italiz
ed a
ges
1-7
-40 -20 0 20 40Months from the cut-off defined as August 2000
Nights hospitalized ages 1-7 95% CI
Fitted values Fitted values
(e) Infant mortality rate
05
1015
20In
fant
mor
talit
y ra
te
-40 -20 0 20 40Months from the cut-off defined as August 2000
Infant mortality rate 95% CI
Fitted values Fitted values
(f) Child health index
-.2-.1
0.1
.2C
hild
hea
lth in
dex
-40 -20 0 20 40Months from the cut-off defined as August 2000
Child health index 95% CI
Fitted values Fitted values
Note to Figure 6: The data are obtained from the Swedish Medical Birth Registry, Patient Registry, DeathRegistry, and the Longitudinal Integration Database for Health Insurance and Labor Market Studies. Monthlytrends in child health outcomes among singleton breech births at term (≥37 gestational weeks) are presented inFigure 6. The red vertical line indicates the date of the information shock to the Swedish medical society.
39
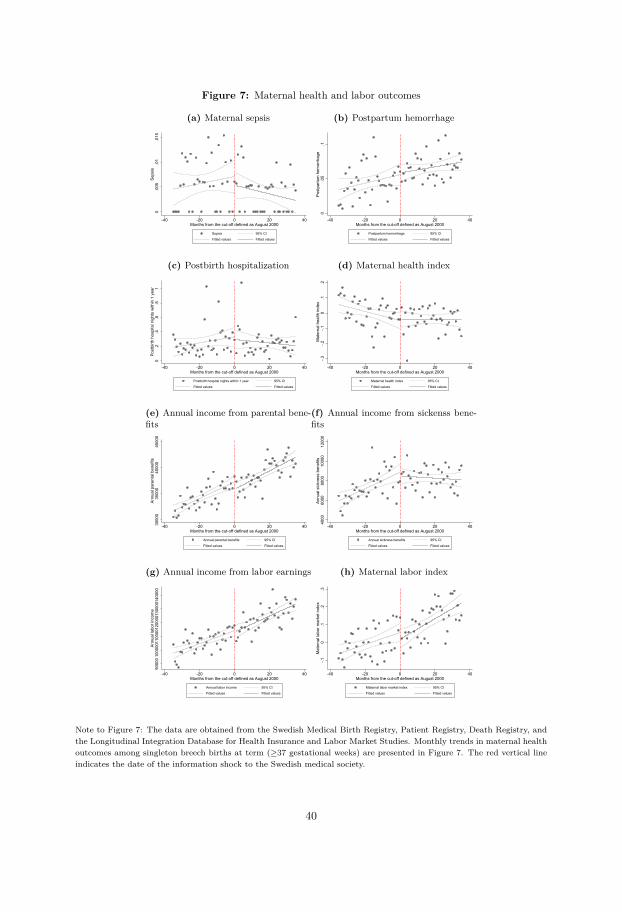
Figure 7: Maternal health and labor outcomes
(a) Maternal sepsis
0.0
05.0
1.0
15Se
psis
-40 -20 0 20 40Months from the cut-off defined as August 2000
Sepsis 95% CI
Fitted values Fitted values
(b) Postpartum hemorrhage
0.0
5.1
Post
partu
m h
emor
rhag
e
-40 -20 0 20 40Months from the cut-off defined as August 2000
Postpartum hemorrhage 95% CI
Fitted values Fitted values
(c) Postbirth hospitalization
0.2
.4.6
.81
Post
birth
hos
pita
l nig
hts
with
in 1
yea
r
-40 -20 0 20 40Months from the cut-off defined as August 2000
Postbirth hospital nights within 1 year 95% CI
Fitted values Fitted values
(d) Maternal health index
-.3-.2
-.10
.1.2
Mat
erna
l hea
lth in
dex
-40 -20 0 20 40Months from the cut-off defined as August 2000
Maternal health index 95% CI
Fitted values Fitted values
(e) Annual income from parental bene-fits
3000
035
000
4000
045
000
Annu
al p
aren
tal b
enef
its
-40 -20 0 20 40Months from the cut-off defined as August 2000
Annual parental benefits 95% CI
Fitted values Fitted values
(f) Annual income from sickenss bene-fits
4000
6000
8000
1000
012
000
Annu
al s
ickn
ess
bene
fits
-40 -20 0 20 40Months from the cut-off defined as August 2000
Annual sickness benefits 95% CI
Fitted values Fitted values
(g) Annual income from labor earnings
9000
010
0000
1100
0012
0000
1300
0014
0000
Annu
al la
bor i
ncom
e
-40 -20 0 20 40Months from the cut-off defined as August 2000
Annual labor income 95% CI
Fitted values Fitted values
(h) Maternal labor index
-.10
.1.2
.3M
ater
nal l
abor
mar
ket i
ndex
-40 -20 0 20 40Months from the cut-off defined as August 2000
Maternal labor market index 95% CI
Fitted values Fitted values
Note to Figure 7: The data are obtained from the Swedish Medical Birth Registry, Patient Registry, Death Registry, andthe Longitudinal Integration Database for Health Insurance and Labor Market Studies. Monthly trends in maternal healthoutcomes among singleton breech births at term (≥37 gestational weeks) are presented in Figure 7. The red vertical lineindicates the date of the information shock to the Swedish medical society.
40
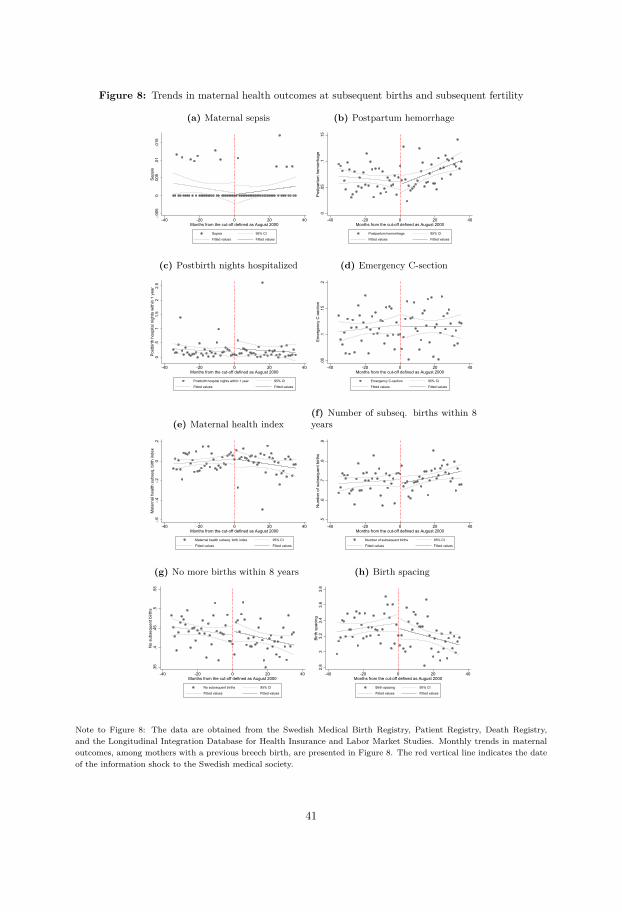
Figure 8: Trends in maternal health outcomes at subsequent births and subsequent fertility
(a) Maternal sepsis
-.005
0.0
05.0
1.0
15Se
psis
-40 -20 0 20 40Months from the cut-off defined as August 2000
Sepsis 95% CI
Fitted values Fitted values
(b) Postpartum hemorrhage
0.0
5.1
.15
Post
partu
m h
emor
rhag
e
-40 -20 0 20 40Months from the cut-off defined as August 2000
Postpartum hemorrhage 95% CI
Fitted values Fitted values
(c) Postbirth nights hospitalized
0.5
11.
52
2.5
Post
birth
hos
pita
l nig
hts
with
in 1
yea
r
-40 -20 0 20 40Months from the cut-off defined as August 2000
Postbirth hospital nights within 1 year 95% CI
Fitted values Fitted values
(d) Emergency C-section
.05
.1.1
5.2
Emer
genc
y C
-sec
tion
-40 -20 0 20 40Months from the cut-off defined as August 2000
Emergency C-section 95% CI
Fitted values Fitted values
(e) Maternal health index
-.6-.4
-.20
.2M
ater
nal h
ealth
sub
seq.
birt
h in
dex
-40 -20 0 20 40Months from the cut-off defined as August 2000
Maternal health subseq. birth index 95% CI
Fitted values Fitted values
(f) Number of subseq. births within 8years
.5.6
.7.8
.9N
umbe
r of s
ubse
quen
t birt
hs
-40 -20 0 20 40Months from the cut-off defined as August 2000
Number of subsequent births 95% CI
Fitted values Fitted values
(g) No more births within 8 years
.35
.4.4
5.5
.55
No
subs
eque
nt b
irths
-40 -20 0 20 40Months from the cut-off defined as August 2000
No subsequent births 95% CI
Fitted values Fitted values
(h) Birth spacing
2.8
33.
23.
43.
63.
8Bi
rth s
paci
ng
-40 -20 0 20 40Months from the cut-off defined as August 2000
Birth spacing 95% CI
Fitted values Fitted values
Note to Figure 8: The data are obtained from the Swedish Medical Birth Registry, Patient Registry, Death Registry,and the Longitudinal Integration Database for Health Insurance and Labor Market Studies. Monthly trends in maternaloutcomes, among mothers with a previous breech birth, are presented in Figure 8. The red vertical line indicates the dateof the information shock to the Swedish medical society.
41

Table 1: Impact of information shock on the probability of C-section
Breech Births Normal Position Births(1) (2) (3) (4)
PlannedC-section
PlannedC-section
PlannedC-section
PlannedC-section
Information shock 0.113*** 0.112*** 0.001 0.001(0.018) (0.018) (0.001) (0.001)
Mother weight 0.001*** 0.001***(0.000) (0.000)
Mother height -0.004*** -0.002***(0.001) (0.000)
Malformation -0.029* 0.013***(0.016) (0.002)
Smoking 1st trimester 0.015 0.004***(0.014) (0.001)
Male 0.011 0.002***(0.008) (0.001)
Native 0.059*** 0.003***(0.013) (0.001)
Income 0.000** 0.000*(0.000) (0.000)
Sickness benefits 0.000*** 0.000***(0.000) (0.000)
Fixed effects NO YES NO YESF-stat 39.42 39.12 0.45 0.20R2 0.029 0.063 0.000 0.024Obs 13,208 13,208 406,448 406,448Mean of dep. var. 0.555 0.555 0.039 0.039
Note to Table 1: The data are obtained from the Swedish Medical BirthRegistry, Patient Registry, Death Registry, and the Longitudinal IntegrationDatabase for Health Insurance and Labor Market Studies, for the time period25 August 1997 to 25 August 2003. Each column presents a separate regres-sion with OLS estimates of the impact of the information shock on the prob-ability of planned C-section for breech births (columns 1-2) and for normalposition (cephalic) births (columns 3-4). Only singleton births at term (≥37gestational weeks) are considered for analysis. Linear split time trends are in-cluded in each regression. Maternal age, birth order, birth-quarter and countyfixed effects, time-varying maternal and child characteristics, and binary vari-ables for missing values are included in columns 2 and 4. Standard errors areclustered at day-month-year level. * p<0.1, ** p<0.05, *** p<0.01.
42

Tab
le2:
Summarystatist
ics
Br e
ech
birt
hsN
orm
alpo
siti
on(c
epha
lic)
birt
hst-test
mean
sdN
mean
sdN
t-test
p-values
(1)
(2)
(3)
(4)
(5)
(6)
(7)
(8)
Pan
elA
:C
hild
char
acte
rist
ics
and
birt
hou
tcom
esBirt
hweigh
t(kg)
3,386.615
481.453
13,173
3,634.138
493.203
405,432
56.730
0.000
Gestatio
n(w
eek)
38.690
1.211
13,208
39.723
1.292
406,448
90.656
0.000
Male
0.458
0.498
13,208
0.515
0.500
406,446
12.894
0.000
Malform
ation
0.084
0.277
13,208
0.031
0.172
406,448
-34.145
0.000
Apg
arscore
9.718
0.851
13,108
9.766
0.695
403,893
7.719
0.000
Apg
arscorebe
low
70.013
0.114
13,108
0.008
0.088
403,893
-6.834
0.000
Infant
mortalityrate
3.180
56.303
13,208
1.351
36.727
406,448
-5.517
0.000
Nightsho
spita
lized
ages
0-1
1.180
6.529
13,158
0.818
5.600
405,271
-7.252
0.000
Nightsho
spita
lized
ages
1-7
1.102
6.773
13,158
0.918
6.971
405,271
-2.983
0.003
Pan
elB
:M
ater
nal
birt
han
dfe
rtili
tyou
tcom
esPlan
nedC-sectio
n0.555
0.497
13,208
0.039
0.193
406,448
-278.354
0.000
EmergencyC-sectio
n0.266
0.442
13,207
0.045
0.208
406,447
-113.897
0.000
Indu
ctionof
labo
r0.018
0.134
13,208
0.100
0.300
406,448
31.250
0.000
Sepsis
0.005
0.069
13,208
0.001
0.036
406,448
-10.805
0.000
Hem
orrhage
0.056
0.230
13,208
0.053
0.223
406,448
-1.793
0.073
Hospitaln
ights(readm
ission)
0.254
2.489
12,779
0.260
3.917
388,643
0.162
0.871
Sepsis,
future
0.073
0.260
7,585
0.052
0.221
205,664
-8.225
0.000
Hem
orrhage,
future
0.002
0.041
7,585
0.001
0.027
205,664
-3.146
0.002
Hospitaln
ights,
future
(readm
ission)
0.220
3.071
7,308
0.213
2.328
194,918
-0.239
0.811
EmergencyC-sectio
n,future
0.114
0.317
7,583
0.041
0.198
205,633
-30.700
0.000
Num
berof
child
ren
2.281
0.933
13,208
2.536
1.062
406,448
27.195
0.000
Num
berof
ofsubseq.births
0.708
0.724
13,208
0.647
0.760
406,448
-9.205
0.000
Nofuture
births
0.432
0.495
13,208
0.500
0.500
406,448
15.340
0.000
Birt
hspacing(years)
3.244
1.610
7,585
3.373
1.751
205,664
6.299
0.000
Pan
elC
:M
ater
nal
char
acte
rist
ics
Age
29.876
4.897
13,208
29.610
4.998
406,445
-6.029
0.000
Heigh
t166.442
6.262
12,318
166.432
6.245
376,157
-0.176
0.860
Weigh
t67.084
12.420
11,739
67.381
12.466
357,865
2.544
0.011
BMI
24.196
4.215
11,437
24.323
4.230
348,132
3.146
0.002
Hyp
ertensia
0.002
0.048
13,208
0.002
0.043
406,448
-1.019
0.308
Smoke1sttrim
ester
0.116
0.321
12,515
0.113
0.317
382,778
-1.052
0.293
Smoke3rdtrim
ester
0.073
0.260
8,906
0.081
0.273
281,611
2.708
0.007
Education
4.405
1.365
13,162
4.345
1.387
404,697
-4.895
0.000
Labo
rincome
1,147.921
826.686
13,080
1,000.657
782.827
402,500
-21.135
0.000
Sickness
benefits
27.491
94.403
13,080
28.246
83.931
402,500
1.008
0.313
Parental
benefits
72.926
131.792
13,080
117.363
152.925
402,500
32.839
0.000
Pan
elD
:In
dex
Child
health
index
0.039
0.931
13,208
0.106
0.724
406,448
10.386
0.000
Materna
lhealth
index
-0.020
0.995
13,208
0.016
1.083
406,448
3.844
0.000
Materna
lhealth
atsub.
birthindex
-0.010
1.033
7,585
0.157
0.780
205,664
18.009
0.000
Materna
llab
orindex
0.106
1.062
13,191
-0.003
1.043
405,999
-11.757
0.000
Noteto
Table2:
The
data
areob
tained
from
theSw
edish
Medical
Birt
hRegist
ry,P
atient
Regist
ry,D
eath
Regist
ryan
dLo
ngitu
dina
lIntegratio
nDatab
aseforHealth
Insurancean
dLa
borMarketStud
ies.
The
sampleinclud
essin
gleton
term
(≥37
gestationa
lweeks)births
presentedin
breech
posit
ion(colum
ns1-3)
andno
rmal
posi-
tion(cepha
lic)(colum
ns4-6)
forthetim
epe
riodAug
ust1997
toAug
ust2003.Meanvalues(colum
ns1an
d4),stand
arddeviations
(colum
ns2an
d5),t-test(colum
n7),a
ndp-values
(colum
n8)
aredisplayed.
43

Table 3: Summary statistics, before and after
Before After t-testA. Delivery mode
Planned C-section 0.472 0.649 -16.481(0.499) (0.477) [0.000]
Emergency C-section 0.290 0.273 1.761(0.454) (0.446) [0.078]
Induction of labor 0.021 0.008 5.216(0.144) (0.088) [0.000]
B. Child health outcomes
Birth weight (kg) 3348.861 3333.626 1.484(475.887) (455.227) [0.138]
Gestation (weeks) 38.859 38.553 11.602(1.284) (1.115) [0.000]
Apgar score 9.650 9.793 -7.644(0.988) (0.703) [0.000]
Apgar score below 7 0.021 0.008 4.666(0.142) (0.092) [0.000]
Infant mortality rate 3.106 2.725 0.321(55.656) (52.140) [ 0.748]
Nights hospitalized ages 0-1 1.136 1.055 0.599(5.624) (6.535) [0.549]
Nights hospitalized ages 1-7 1.146 0.927 1.545(7.788) (4.894) [0.122]
C. Maternal health outcomes
Sepsis 0.005 0.003 1.237(0.072) (0.058) [0.216]
Hemorrhage 0.039 0.055 -3.460(0.193) (0.227) [0.001]
Postbirth hospital nights (readmission) 0.262 0.251 0.181(3.082) (2.656) [0.857]
D. Maternal health outcomes at subseq. birth
Sepsis 0.064 0.082 -2.707(0.245) (0.274) [0.007]
Hemorrhage 0.002 0.002 0.221(0.045) (0.042) [0.825]
Post-birth hospital nights (readmission) 0.246 0.210 0.425(2.917) (3.587) [0.671]
Emergency C-section 0.121 0.117 0.521(0.326) (0.321) [0.603]
E. Fertility outcomes
Number of future births 0.957 0.954 0.176(0.697) (0.684) [0.860]
No future births 0.238 0.239 -0.082(0.426) (0.426) [0.935]
Birth spacing (years) 3.201 3.070 3.470(1.579) (1.443) [0.001]
F. Labor market outcomes
Labor income 1051.855 1258.342 -10.717(768.581) (955.763) [0.000]
Sickness benefits 63.842 73.234 -3.149(125.486) (143.190) [0.002]
Parental benefits 380.435 429.682 -11.491(191.588) (196.572) [0.000]
G. Index
Child health index -0.000 0.080 -3.951(1.000) (0.840) [0.000]
Maternal health index 0.000 -0.032 1.485(1.000) (0.977) [0.138]
Maternal health at sub. birth index -0.000 -0.018 0.708(1.000) (1.069) [0.479]
Maternal labor index -0.000 0.215 -9.048(1.000) (1.140) [0.000]
Observations 3,863 4,403
Note to Table 3: The data are obtained from the Swedish Medical Birth Registry, PatientRegistry, Death Registry, and the Longitudinal Integration Database for Health Insuranceand Labor Market Studies. The sample includes singleton term (≥37 gestational weeks)breech births for first-time mothers before (25 August 1997- 25 August 2000) and after (26August 2000- 25 August 2003) the information shock. Mean values are displayed, with stan-dard deviations below in parentheses in columns 1-2. T-statistics are reported in column 3,with p-values below in square brackets.
44
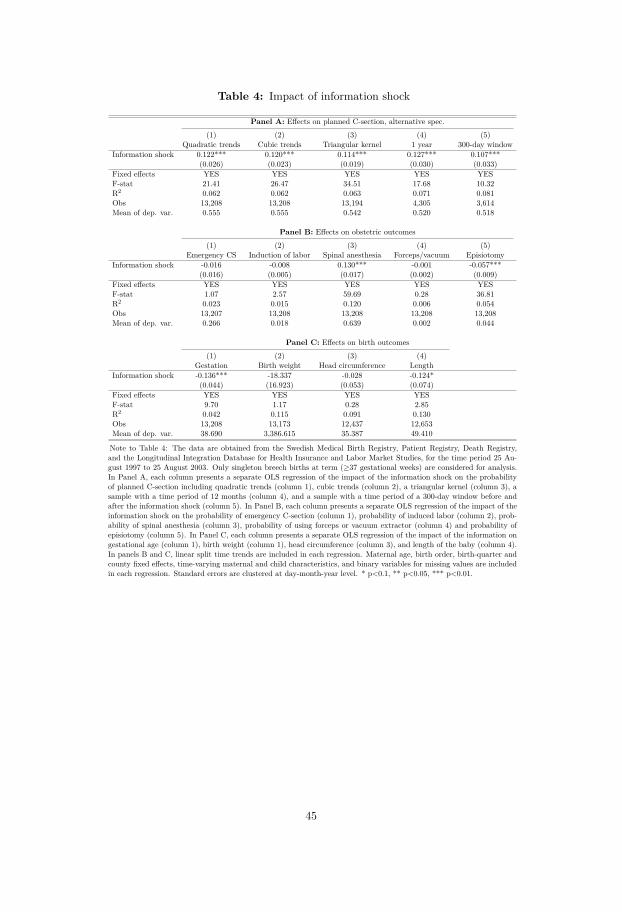
Table 4: Impact of information shock
Panel A: Effects on planned C-section, alternative spec.
(1) (2) (3) (4) (5)Quadratic trends Cubic trends Triangular kernel 1 year 300-day window
Information shock 0.122*** 0.120*** 0.114*** 0.127*** 0.107***(0.026) (0.023) (0.019) (0.030) (0.033)
Fixed effects YES YES YES YES YESF-stat 21.41 26.47 34.51 17.68 10.32R2 0.062 0.062 0.063 0.071 0.081Obs 13,208 13,208 13,194 4,305 3,614Mean of dep. var. 0.555 0.555 0.542 0.520 0.518
Panel B: Effects on obstetric outcomes
(1) (2) (3) (4) (5)Emergency CS Induction of labor Spinal anesthesia Forceps/vacuum Episiotomy
Information shock -0.016 -0.008 0.130*** -0.001 -0.057***(0.016) (0.005) (0.017) (0.002) (0.009)
Fixed effects YES YES YES YES YESF-stat 1.07 2.57 59.69 0.28 36.81R2 0.023 0.015 0.120 0.006 0.054Obs 13,207 13,208 13,208 13,208 13,208Mean of dep. var. 0.266 0.018 0.639 0.002 0.044
Panel C: Effects on birth outcomes
(1) (2) (3) (4)Gestation Birth weight Head circumference Length
Information shock -0.136*** -18.337 -0.028 -0.124*(0.044) (16.923) (0.053) (0.074)
Fixed effects YES YES YES YESF-stat 9.70 1.17 0.28 2.85R2 0.042 0.115 0.091 0.130Obs 13,208 13,173 12,437 12,653Mean of dep. var. 38.690 3,386.615 35.387 49.410
Note to Table 4: The data are obtained from the Swedish Medical Birth Registry, Patient Registry, Death Registry,and the Longitudinal Integration Database for Health Insurance and Labor Market Studies, for the time period 25 Au-gust 1997 to 25 August 2003. Only singleton breech births at term (≥37 gestational weeks) are considered for analysis.In Panel A, each column presents a separate OLS regression of the impact of the information shock on the probabilityof planned C-section including quadratic trends (column 1), cubic trends (column 2), a triangular kernel (column 3), asample with a time period of 12 months (column 4), and a sample with a time period of a 300-day window before andafter the information shock (column 5). In Panel B, each column presents a separate OLS regression of the impact of theinformation shock on the probability of emergency C-section (column 1), probability of induced labor (column 2), prob-ability of spinal anesthesia (column 3), probability of using forceps or vacuum extractor (column 4) and probability ofepisiotomy (column 5). In Panel C, each column presents a separate OLS regression of the impact of the information ongestational age (column 1), birth weight (column 1), head circumference (column 3), and length of the baby (column 4).In panels B and C, linear split time trends are included in each regression. Maternal age, birth order, birth-quarter andcounty fixed effects, time-varying maternal and child characteristics, and binary variables for missing values are includedin each regression. Standard errors are clustered at day-month-year level. * p<0.1, ** p<0.05, *** p<0.01.
45

Table 5: Proportion of term singleton breech births
Proportion of breech births(1) (2)
proportion breech proportion breechInformation shock 0.0008 0.0001
(0.0012) (0.0013)Fixed effects NO YESR2 0.003 0.058Obs 2,191 2,191Mean of dep. var. 0.032 0.032
Note to Table 5: The data are obtained from the SwedishMedical Birth Registry, Patient Registry, Death Registry, andthe Longitudinal Integration Database for Health Insuranceand Labor Market Studies, for the time period 25 August 1997to 25 August 2003. The proportion of breech births is col-lapsed to daily level. Each column presents a separate OLSregression of the impact of the information shock on the pro-portion of breech births. Fixed effects including age, weight,height, education, and sickness benefits are included in col-umn 2. Linear split time trends are included in each regres-sion. Standard errors are clustered at day-month-year level.* p<0.1, ** p<0.05, *** p<0.01.
46
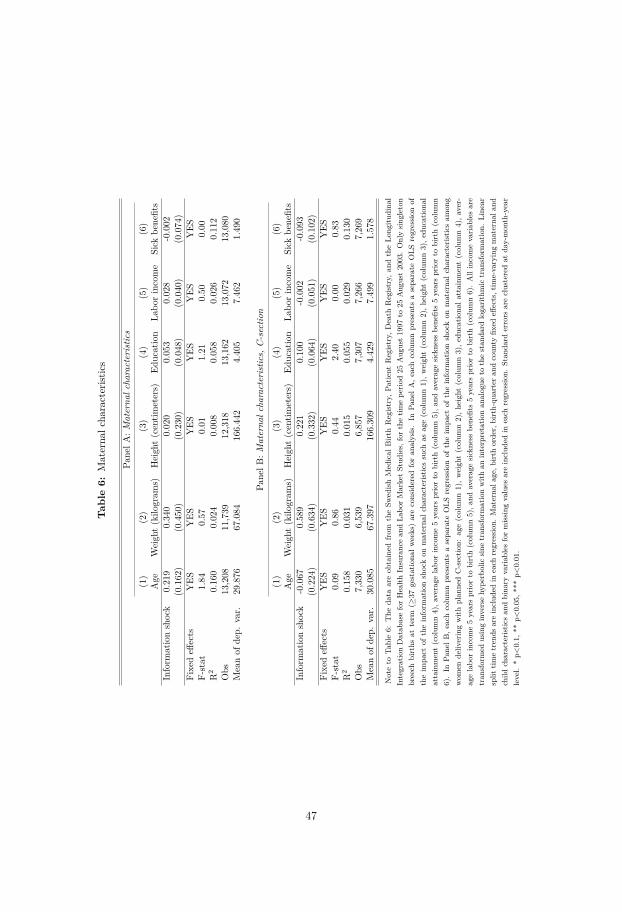
Tab
le6:
Materna
lcha
racterist
ics
PanelA
:Materna
lcharacteristic
s
(1)
(2)
(3)
(4)
(5)
(6)
Age
Weigh
t(kilo
gram
s)Heigh
t(centim
eters)
Education
Labo
rincome
Sick
benefits
Inform
ationshock
0.219
0.340
0.020
0.053
0.028
-0.002
(0.162)
(0.450)
(0.230)
(0.048)
(0.040)
(0.074)
Fixedeff
ects
YES
YES
YES
YES
YES
YES
F-stat
1.84
0.57
0.01
1.21
0.50
0.00
R2
0.160
0.024
0.008
0.058
0.026
0.112
Obs
13,208
11,739
12,318
13,162
13,072
13,080
Meanof
dep.
var.
29.876
67.084
166.442
4.405
7.462
1.490
PanelB
:Materna
lcharacteristic
s,C-sectio
n
(1)
(2)
(3)
(4)
(5)
(6)
Age
Weigh
t(kilo
gram
s)Heigh
t(centim
eters)
Education
Labo
rincome
Sick
benefits
Inform
ationshock
-0.067
0.589
0.221
0.100
-0.002
-0.093
(0.224)
(0.634)
(0.332)
(0.064)
(0.051)
(0.102)
Fixedeff
ects
YES
YES
YES
YES
YES
YES
F-stat
0.09
0.86
0.44
2.40
0.00
0.83
R2
0.158
0.031
0.015
0.055
0.029
0.130
Obs
7,330
6,539
6,857
7,307
7,266
7,269
Meanof
dep.
var.
30.085
67.397
166.309
4.429
7.499
1.578
Noteto
Table6:
The
data
areob
tained
from
theSw
edishMed
ical
Birt
hRegistry,
Patie
ntRegistry,
Death
Registry,
andtheLo
ngitu
dina
lIntegrationDatab
aseforHealth
Insuranc
ean
dLa
borMarketStud
ies,forthetim
epe
riod25
Aug
ust19
97to
25Aug
ust20
03.Onlysing
leton
breech
births
atterm
(≥37
gestationa
lweeks)areconsidered
foran
alysis.In
PanelA
,eachcolumnpresents
asepa
rate
OLS
regression
oftheim
pact
oftheinform
ationshockon
materna
lcha
racteristic
ssuch
asag
e(colum
n1),w
eigh
t(colum
n2),h
eigh
t(colum
n3),e
ducatio
nal
attainment(colum
n4),a
verage
labo
rincome5yearspriorto
birth(colum
n5),a
ndaverag
esickne
ssbe
nefits5yearspriorto
birth(colum
n6).In
Pane
lB,e
achcolumnpresents
asepa
rate
OLS
regression
oftheim
pact
oftheinform
ationshockon
materna
lcha
racteristic
sam
ong
wom
ende
liveringwith
plan
nedC-sectio
n:ag
e(colum
n1),w
eigh
t(colum
n2),h
eigh
t(colum
n3),e
ducatio
nala
ttainm
ent(colum
n4),a
ver-
agelabo
rincome5yearspriorto
birth(colum
n5),a
ndaverag
esickne
ssbe
nefits5yearspriorto
birth(colum
n6).Allincomevaria
bles
are
tran
sformed
usinginversehy
perbolic
sine
tran
sformationwith
aninterpretatio
nan
alog
ueto
thestan
dard
loga
rithm
ictran
sformation.
Line
arsplit
timetren
dsareinclud
edin
each
regression
.Materna
lage,b
irthorde
r,birth-qu
arteran
dcoun
tyfix
edeff
ects,tim
e-varyingmaterna
land
child
characteris
ticsan
dbina
ryvaria
bles
formissing
values
areinclud
edin
each
regression
.Stan
dard
errors
areclusteredat
day-mon
th-year
level.
*p<
0.1,
**p<
0.05
,***
p<0.01
.
47

Table
7:Placebo
discontinuities
(1)(2)
(3)(4)
(5)(6)
PlannedC-section
PlannedC-section
PlannedC-section
PlannedC-section
PlannedC-section
PlannedC-section
25-Aug-97
0.0504(0.0360)
25-Aug-98
0.0180(0.0384)
25-Aug-99
-0.0634(0.0399)
25-Aug-01
0.0502(0.0353)
25-Aug-02
0.0116(0.0366)
25-Aug-03
-0.0277(0.0351)
R2
0.0570.061
0.0590.057
0.0470.046
Obs
4,2674,204
4,2664,450
4,7264,952
Mean
ofdep.var.
0.4530.478
0.4730.615
0.6560.667
Note
toTable
7:The
dataare
obtainedfrom
theSw
edishMedicalB
irthRegistry,Patient
Registry,D
eathRegistry,and
theLongitudinalInte-
grationDatabase
forHealth
Insuranceand
LaborMarket
Studies,forthe
timeperiod
25August
1997to
25August
2003.Only
singletonbreech
birthsat
term(≥
37gestationalw
eeks)are
consideredfor
analysis.Using
abandw
idthof12
months
beforeand
after,eachcolum
nrepresents
aregression
examining
possiblediscontinuitiesin
plannedC-section
usingplacebo
datesof25August1997-1999
and2001-2003.
Maternalage,birth
order,birth-quarterand
countyfixed
effects,time-varying
maternaland
childcharacteristics
andbinary
variablesfor
missing
valuesare
includedin
eachregression.
Linearsplit
timetrends
areincluded
ineach
regression.Standard
errorsare
clusteredat
day-month-year
level.*p<0.1,**
p<0.05,***
p<0.01.
48
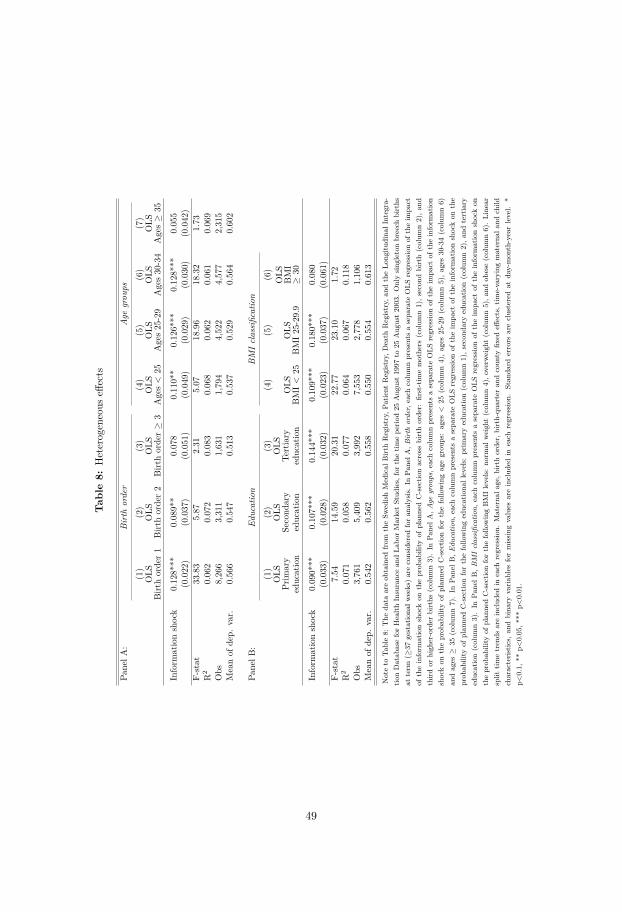
Tab
le8:
Heterogeneous
effects
PanelA
:Birth
order
Age
grou
ps
(1)
(2)
(3)
(4)
(5)
(6)
(7)
OLS
Birt
horder1
OLS
Birt
horder2
OLS
Birt
horder≥
3OLS
Ages<
25OLS
Ages25-29
OLS
Ages30-34
OLS
Ages≥
35
Inform
ationshock
0.128***
0.089**
0.078
0.110**
0.126***
0.128***
0.055
(0.022)
(0.037)
(0.051)
(0.049)
(0.029)
(0.030)
(0.042)
F-stat
33.83
5.87
2.31
5.07
18.96
18.32
1.73
R2
0.062
0.072
0.083
0.068
0.062
0.061
0.069
Obs
8,266
3,311
1,631
1,794
4,522
4,577
2,315
Meanof
dep.
var.
0.566
0.547
0.513
0.537
0.529
0.564
0.602
PanelB
:Ed
ucation
BMIclassification
(1)
(2)
(3)
(4)
(5)
(6)
OLS
Prim
ary
education
OLS
Second
ary
education
OLS
Tertiary
education
OLS
BMI<
25OLS
BMI25-29.9
OLS
BMI
≥30
Inform
ationshock
0.090***
0.107***
0.144***
0.109***
0.180***
0.080
(0.033)
(0.028)
(0.032)
(0.023)
(0.037)
(0.061)
F-stat
7.54
14.59
20.31
22.77
23.10
1.72
R2
0.071
0.058
0.077
0.064
0.067
0.118
Obs
3,761
5,409
3,992
7,553
2,778
1,106
Meanof
dep.
var.
0.542
0.562
0.558
0.550
0.554
0.613
Noteto
Table8:
The
data
areob
tained
from
theSw
edishMed
ical
Birt
hRegistry,
Patie
ntRegistry,
Death
Registry,
andtheLo
ngitu
dina
lIntegra-
tionDatab
aseforHealth
Insurancean
dLa
borMarketStud
ies,forthetim
epe
riod25
Aug
ust1997
to25
Aug
ust2003.Onlysing
letonbreech
births
atterm
(≥37
gestationa
lweeks)areconsidered
foran
alysis.In
PanelA
,Birth
order,
each
columnpresents
asepa
rate
OLS
regression
oftheim
pact
oftheinform
ationshockon
theprob
ability
ofplan
nedC-sectio
nacross
birthorde
r:first-tim
emothe
rs(colum
n1),s
econ
dbirth(colum
n2),a
ndthird
orhigh
er-order
births
(colum
n3).In
Pane
lA,A
gegrou
ps,e
achcolumnpresents
asepa
rate
OLS
regression
oftheim
pact
oftheinform
ation
shockon
theprob
ability
ofplan
nedC-sectio
nforthefollo
wingagegrou
ps:ages<
25(colum
n4),ages
25-29(colum
n5),ages
30-34(colum
n6)
andages
≥35
(colum
n7).In
Pane
lB,E
ducatio
n,each
columnpresents
asepa
rate
OLS
regression
oftheim
pact
oftheinform
ationshockon
the
prob
ability
ofplan
nedC-sectio
nforthefollo
winged
ucationa
llevels:
prim
aryed
ucation(colum
n1),s
econ
dary
education(colum
n2),a
ndtertiary
education(colum
n3).In
Pane
lB,B
MIclassification,
each
columnpresents
asepa
rate
OLS
regression
oftheim
pact
oftheinform
ationshockon
theprob
ability
ofplan
nedC-sectio
nforthefollo
wingBMIlevels:no
rmal
weigh
t(colum
n4),o
verw
eigh
t(colum
n5),a
ndob
ese(colum
n6).Line
arsplit
timetren
dsareinclud
edin
each
regression
.Materna
lage,b
irthorde
r,birth-qu
arteran
dcoun
tyfix
edeff
ects,tim
e-varyingmaterna
land
child
characteris
tics,
andbina
ryvaria
bles
formissing
values
areinclud
edin
each
regression
.Stan
dard
errors
areclusteredat
day-mon
th-yearlevel.
*p<
0.1,
**p<
0.05,*
**p<
0.01.
49

Table
9:Reduced
form:Im
pacton
childand
maternaloutcom
es
P anelA:Fullsam
ple
(1)(2)
(3)(4)
(5)(6)
(7)Child
healthindex
Maternalhealth
indexMaternalhealth
atsub.
birthindex
Num
beroffuture
birthsNomore
birthsBirth
spacingMaternallabor
indexInform
ationshock
0.104***0.018
0.030-0.033
0.019-0.014
-0.022(0.034)
(0.036)(0.042)
(0.022)(0.014)
(0.076)(0.034)
R2
0.0360.021
0.0180.263
0.3180.072
0.219Obs
13,20813,208
7,58513,208
13,2087,585
13,191Controlm
ean-0.00
0.000.00
0.700.44
3.320.00
Controlsd
1.001.00
1.000.73
0.501.66
1.00
PanelB:First-tim
emothers
(1)(2)
(3)(4)
(5)(6)
(7)Child
healthindex
Maternalhealth
indexMaternalhealth
atsub.
birthindex
Num
beroffuture
birthsNomore
birthsBirth
spacingMaternallabor
indexInform
ationshock
0.087**0.000
0.013-0.044
0.023-0.041
0.020(0.043)
(0.046)(0.044)
(0.031)(0.019)
(0.077)(0.043)
R2
0.0240.017
0.0180.099
0.1190.050
0.207Obs
8,2668,266
6,3658,266
8,2666,365
8,253Controlm
ean-0.00
0.00-0.00
0.960.24
3.20-0.00
Controlsd
1.001.00
1.000.70
0.431.58
1.00
Note
toTable
9:The
dataare
obtainedfrom
theSw
edishMedicalB
irthRegistry,Patient
Registry,D
eathRegistry,and
theLongitudinalIntegration
Database
forHealth
Insuranceand
LaborMarket
Studies,forthe
timeperiod
25August
1997to
25August
2003.Only
singletonbreech
birthsat
term(≥
37gestationalw
eeks)are
consideredfor
analysis.In
PanelA,for
thefullsam
ple,eachcolum
npresents
aseparate
OLS
regressionofthe
impact
frominform
ationshock,on
childhealth
index(colum
n1),m
aternalhealthindex
(column2),m
aternalhealthat
subsequentbirth
index(colum
n3),num
berofsubsequent
birthswithin
8years
frombreech
birth(colum
n4),probability
ofnomore
birthswithin
8years
(column5),birth
spacingwithin
8years
(column6),and
labormarket
index(colum
n7).
InPanelB
,theeffects
(similar
tothose
inPanelA
)on
first-timemothers
arepresented.
Linearsplit
timetrends
areincluded
ineach
regression.Maternalage,birth
order,birth-quarterand
countyfixed
effects,time-varying
maternaland
childcharacteristics,and
binaryvariables
formissing
valuesare
includedin
eachregression.
Standarderrors
areclustered
atday-m
onth-yearlevel.
*p<0.1,**
p<0.05,***
p<0.01.
50

Tab
le10:Reduced
form
-Impa
cton
child
andmaterna
lseparateou
tcom
es
Pan
elA
:C
hild
heal
th(1)
(2)
(3)
(4)
(5)
Apg
arscore
Apg
ar<
7Infant
mortalityrate
Hospitaln
ightsages
0-1
Hospitaln
ightsages
1-7
Inform
ationshock
0.067**
-0.003
-3.286
-0.309
-0.668***
[0.031]
[0.004]
[2.185]
[0.228]
[0.226]
FDR
p-value(treat)
0.246
0.832
0.528
0.528
0.048
Bon
ferron
ip-value
(treat)
0.492
1.000
1.000
1.000
0.048
R2
0.025
0.010
0.019
0.039
0.015
Observatio
ns13,108
13,108
13,208
13,158
13,158
Meanof
dep.
var.
9.718
0.013
3.180
1.180
1.102
Pan
elB
:M
ater
nal
heal
th(1)
(2)
(3)
Postbirthho
spita
lization
Sepsis
Hem
orrhage
Inform
ationshock
-0.065
-0.001
0.001
[0.104]
[0.003]
[0.008]
FDR
p-value(treat)
0.832
0.832
0.938
Bon
ferron
ip-value
(treat)
1.000
1.000
1.000
R2
0.006
0.011
0.025
Observatio
ns12,779
13,208
13,208
Meanof
dep.
var.
0.254
0.005
0.056
Pan
elC
:M
ater
nal
heal
that
subs
eque
ntbi
rth
(1)
(2)
(3)
(4)
EmergencyC-sectio
nPo
stbirthho
spita
lization
Hem
orrhage
Sepsis
Inform
ationshock
-0.013
0.056
-0.005
-0.001
[0.015]
[0.101]
[0.012]
[0.002]
FDR
p-value(treat)
0.832
0.832
0.832
0.832
Bon
ferron
ip-value
(treat)
1.000
1.000
1.000
1.000
R2
0.028
0.009
0.020
0.007
Observatio
ns7,583
7,308
7,585
7,585
Meanof
dep.
var.
0.114
0.220
0.073
0.002
Pan
elD
:M
ater
nal
labo
rou
tcom
es(1)
(2)
(3)
Labo
rincome
Parental
benefits
Sickness
benefits
Inform
ationshock
0.017
-0.009
-0.116
[0.060]
[0.028]
[0.080]
FDR
p-value(treat)
0.832
0.832
0.528
Bon
ferron
ip-value
(treat)
1.000
1.000
1.000
R2
0.251
0.181
0.086
Observatio
ns13,191
13,191
13,191
Meanof
dep.
var.
7.106
6.392
3.236
Noteto
Table10:The
data
areob
tained
from
theSw
edish
Medical
Birt
hRegist
ry,P
atient
Regist
ry,D
eath
Regist
ry,a
ndtheLo
ngitu
dina
lIntegratio
nDatab
aseforHealth
Insurance
andLa
borMarketStud
ies,
forthetim
epe
riod25
Aug
ust1997
to25
Aug
ust2003.Onlysin
gleton
breech
births
atterm
(≥37
gestationa
lweeks)areconsidered
foran
alysis.
Forthe
fullsample,
each
columnpresents
asepa
rate
OLS
regressio
nof
theim
pact
oftheinform
ationshockon
child
health
outcom
es(P
anel
A),
materna
lhealth
outcom
es(P
anel
B),
materna
lhealth
outcom
esat
subsequent
births
(Pan
elC),an
dmaterna
llab
ormarketou
tcom
es(P
anel
D).Allincomevaria
bles
aretran
sformed
usinginversehy
perbolic
sinetran
sformationwith
aninterpretatio
nan
alogue
tothestan
dard
logarit
hmic
tran
sformation.
Linear
split
timetrends
areinclud
edin
each
regressio
n.Materna
lage,b
irthorder,birth-qu
arteran
dcoun
tyfix
edeff
ects,t
ime-varyingmaterna
land
child
characteris
tics,
andbina
ryvaria
bles
formiss
ingvalues
areinclud
edin
each
regressio
n.Stan
dard
errors
areclusteredat
day-mon
th-yearlevel.
*p<
0.1,
**p<
0.05,*
**p<
0.01.FD
Rcorrectedp-values
andBon
ferron
i-corrected
p-values
arerepo
rted
foreach
estim
ate.
51

Table
11:Reduced
form:Polynom
ials,kernel,andperiod
Child
healthindex
Maternal
healthindex
Maternal
healthat
sub.birth
indexNum
berof
futurebirths
Nomore
birthsBirth
spacingMaternal
laborindex
Panel
A:Q
uadratictrends
(1)(2)
(3)(4)
(5)(6)
(7)Inform
ationshock
0.131**-0.080
0.052-0.046
0.028-0.007
-0.032(0.051)
(0.055)(0.063)
(0.034)(0.021)
(0.111)(0.051)
R2
0.0360.022
0.0180.263
0.3180.073
0.219Obs
13,20813,208
7,58513,208
13,2087,585
13,191
Panel
B:C
ubictrends
(1)(2)
(3)(4)
(5)(6)
(7)Inform
ationshock
0.126***-0.059
0.053-0.049
0.0280.007
-0.027(0.045)
(0.048)(0.054)
(0.030)(0.019)
(0.099)(0.045)
R2
0.0360.022
0.0180.263
0.3190.073
0.219Obs
13,20813,208
7,58513,208
13,2087,585
13,191
Panel
C:Triangular
kernel(1)
(2)(3)
(4)(5)
(6)(7)
Information
shock0.117***
-0.0180.046
-0.0340.020
-0.003-0.023
(0.038)(0.039)
(0.044)(0.024)
(0.015)(0.082)
(0.037)R
20.039
0.0210.021
0.2670.320
0.0770.214
Obs
13,19413,194
7,57613,194
13,1947,576
13,177
Panel
D:1
year(1)
(2)(3)
(4)(5)
(6)(7)
Information
shock0.194**
0.0080.041
-0.0250.029
-0.076-0.017
(0.081)(0.063)
(0.098)(0.049)
(0.031)(0.164)
(0.071)R
20.048
0.0310.043
0.2870.331
0.0980.201
Obs
4,3054,305
2,4354,305
4,3052,435
4,297
Note
toTable
11:The
dataare
obtainedfrom
theSw
edishMedicalB
irthRegistry,Patient
Registry,D
eathRegistry,and
theLongitudinalIntegration
Database
forHealth
Insuranceand
LaborMarket
Studies,forthe
timeperiod
25August
1997to
25August
2003.Only
singletonbreech
birthsat
term(≥
37gestationalw
eeks)are
consideredfor
analysis.For
thefullsam
ple,eachcolum
npresents
aseparate
OLS
regressionofthe
impact
oftheinform
ationshock
onthe
probabilityofplanned
C-section
oneach
outcomeanalogue
tothe
baselineresults
(inTable
1),includingquadratic
trends(PanelA
),cubictrends
(PanelB),a
triangularkernel(PanelC
),andasam
plewith
atim
eperiod
ofa1-year
window
beforeand
afterthe
information
shock(PanelD
).Maternalage,birth
order,birth-quarterand
countyfixed
effects,time-varying
maternaland
childcharacteristics,and
binaryvariables
formissing
valuesare
includedin
eachregression.
Standarderrors
areclustered
atday-m
onth-yearlevel.
*p<0.1,**
p<0.05,***
p<0.01.
52

Tab
le12:2S
LSestim
ates:Im
pact
onchild
andmaterna
loutcomes
P ane
lA:F
ulls
ample
(1)
(2)
(3)
(4)
(5)
(6)
(7)
Child
health
inde
xMaterna
lhealth
inde
xMaterna
lhealth
atsub.
birthinde
xNum
berof
future
births
Nomore
births
Birt
hspacing
Materna
llab
orinde
xPlan
nedC-sectio
n0.92
7***
0.16
40.26
6-0.291
0.17
3-0.127
-0.193
(0.320
)(0.317
)(0.374
)(0.204
)(0.131
)(0.660
)(0.299
)
Obs
13,208
13,208
7,58
513
,208
13,208
7,58
513
,191
Con
trol
mean
-0.00
0.00
0.00
0.70
0.44
3.32
0.00
Con
trol
sd1.00
1.00
1.00
0.73
0.50
1.66
1.00
Pane
lB:F
irst-tim
emothers
(1)
(2)
(3)
(4)
(5)
(6)
(7)
Child
health
inde
xMaterna
lhealth
inde
xMaterna
lhealth
atsub.
birthinde
xNum
berof
future
births
Nomore
births
Birt
hspacing
Materna
llab
orinde
xPlan
nedC-sectio
n0.67
8**
0.00
30.10
4-0.341
0.18
2-0.330
0.15
8(0.335
)(0.352
)(0.353
)(0.246
)(0.150
)(0.612
)(0.336
)
Obs
8,26
68,26
66,36
58,26
68,26
66,36
58,25
3Con
trol
mean
-0.00
0.00
-0.00
0.96
0.24
3.20
-0.00
Con
trol
sd1.00
1.00
1.00
0.70
0.43
1.58
1.00
Noteto
Table12
:The
data
areob
tained
from
theSw
edish
Med
ical
Birt
hRegist
ry,P
atient
Regist
ry,D
eath
Regist
ry,a
ndtheLo
ngitu
dina
lIntegratio
nDatab
aseforHealth
Insuranc
ean
dLa
borMarket
Stud
ies,
forthetim
epe
riod25
Aug
ust19
97to
25Aug
ust20
03.Onlysin
gleton
breech
births
atterm
(≥37
gestationa
lweeks)areconsidered
foran
alysis.
InPa
nelA
,eachcolumnpresents
asepa
rate
2SLS
regressio
nof
theim
pact
ofplan
nedC-sectio
nson
child
health
inde
x(colum
n1),m
aterna
lhealth
inde
x(colum
n2),m
aterna
lhealth
atsubseque
ntbirthinde
x(colum
n3),n
umbe
rof
subseque
ntbirths
with
in8yearsfrom
breech
birth(colum
n4),p
roba
bilityof
nomorebirths
with
in8years(colum
n5),b
irthspacingwith
in8years(colum
n6),a
ndlabo
rmarketinde
x(colum
n7).In
Pane
lB,the
effects
(sim
ilarto
thosein
Pane
lA)on
first-tim
emothe
rsarepresented.
Line
arsplit
timetren
dsareinclud
edin
each
regressio
n.Materna
lage,b
irthorde
r,birth-qu
arteran
dcoun
tyfix
edeff
ects,t
ime-
varyingmaterna
land
child
characteris
tics,an
dbina
ryvaria
bles
formiss
ingvalues
areinclud
edin
each
regressio
n.Stan
dard
errors
areclusteredat
day-mon
th-yearlevel.*p<
0.1,
**p<
0.05
,***
p<0.01
.
53

Table
13:2SLS
estimates:
Impact
onchild
andmaternalseparate
outcomes
Panel
A:
Child
health(1)
(2)(3)
(4)(5)
Apgar
scoreApgar
<7
Infantmortality
rateHospitalnights
ages0-1
Hospitalnights
ages1-7
PlannedC-section
0.580**-0.030
-29.251-2.715
-5.878***[0.269]
[0.036][19.740]
[2.009][2.190]
FDR
p-value(treat)
0.2360.831
0.5290.529
0.109Bonferronip-value
(treat)0.471
1.0001.000
1.0000.109
Observations
13,10813,108
13,20813,158
13,158Mean
ofdep.var.
9.7180.013
3.1801.180
1.102
Panel
B:
Maternal
health(1)
(2)(3)
Postbirthhospitalization
SepsisHem
orrhagePlanned
C-section
-0.556-0.010
0.005[0.887]
[0.022][0.070]
FDR
p-value(treat)
0.8310.831
0.938Bonferronip-value
(treat)1.000
1.0001.000
Observations
12,77913,208
13,208Mean
ofdep.var.
0.2540.005
0.056
Panel
C:
Maternal
healthat
subsequentbirth
(1)(2)
(3)(4)
Emergency
C-section
Postbirthhospitalization
Hem
orrhageSepsis
PlannedC-section
-0.1170.506
-0.044-0.007
[0.133][0.900]
[0.101][0.013]
FDR
p-value(treat)
0.8310.831
0.8310.831
Bonferronip-value
(treat)1.000
1.0001.000
1.000Observations
7,5837,308
7,5857,585
Mean
ofdep.var.
0.1140.220
0.0730.002
Panel
D:
Maternal
laboroutcom
es(1)
(2)(3)
Laborincom
eParentalbenefits
Sicknessbenefits
PlannedC-section
0.151-0.077
-1.030[0.531]
[0.252][0.736]
FDR
p-value(treat)
0.8310.831
0.529Bonferronip-value
(treat)1.000
1.0001.000
Observations
13,19113,191
13,191Mean
ofdep.var.
7.1066.392
3.236
Note
toTable
13:The
dataare
obtainedfrom
theSw
edishMedicalB
irthRegistry,Patient
Registry,D
eathRegistry,and
theLongitudinalIntegration
Database
forHealth
Insuranceand
LaborMarket
Studies,forthe
timeperiod
25August
1997to
25August
2003.Only
singletonbreech
birthsat
term(≥
37gestationalw
eeks)are
consideredfor
analysis.For
thefull
sample,each
columnpresents
aseparate
2SLSregression
oftheim
pactofplanned
C-section
onchild
healthoutcom
es(PanelA
),maternalhealth
outcomes
(PanelB),m
aternalhealthoutcom
esat
subsequentbirths
(PanelC)and
maternallabor
market
outcomes
(PanelD).A
llincomevariables
aretransform
edusing
inversehyperbolic
sinetransform
ationwith
aninter-
pretationanalogue
tothe
standardlogarithm
ictransform
ation.Linear
splittim
etrends
areincluded
ineach
regression.Maternalage,birth
order,birth-quarterand
countyfixed
effects,tim
e-varyingmaternaland
childcharacteristics,and
binaryvariables
formissing
valuesare
includedin
eachregression.
Standarderrors
areclustered
atday-m
onth-yearlevel.
*p<0.1,
**p<0.05,***
p<0.01.
FDR
correctedp-values
andBonferroni-corrected
p-valuesare
reportedfor
eachestim
ate.
54

Tab
le14:Difference-in
-differencesestim
ates
Pane
lA:D
ifferen
ce-in
-differen
ceestim
ates,fullsam
ple
(1)
(2)
(3)
(4)
(5)
(6)
(7)
(8)
Plan
ned
C-sectio
nChild
health
inde
xMaterna
lhealth
inde
xMaterna
lhealth
atsub.
birthinde
xNum
berof
future
births
Nomore
births
Birt
hspacing
Materna
llab
orinde
xInform
ationshock
0.15
7***
0.09
4***
-0.007
-0.021
-0.019
*0.01
0-0.009
-0.019
(0.009
)(0.023
)(0.023
)(0.032
)(0.011
)(0.007
)(0.037
)(0.016
)Breech
0.43
7***
-0.100
***
-0.043
**-0.217
***
-0.025
***
0.00
80.05
3*0.02
4**
(0.007
)(0.018
)(0.018
)(0.023
)(0.008
)(0.005
)(0.028
)(0.011
)
R2
0.17
50.01
60.00
40.00
70.26
00.30
70.07
70.19
5Obs
419,65
641
9,65
641
9,65
621
3,24
941
9,65
641
9,65
621
3,24
941
9,19
0Con
trol
mean
0.05
-0.00
0.00
0.00
0.65
0.50
3.37
-0.00
Con
trol
sd0.21
1.00
1.00
1.00
0.76
0.50
1.75
1.00
Pane
lB:D
ifferen
ce-in
-differen
ceestim
ates,fi
rst-tim
emothers
(1)
(2)
(3)
(4)
(5)
(6)
(7)
(8)
Plan
ned
C-sectio
nChild
health
inde
xMaterna
lhealth
inde
xMaterna
lhealth
atsub.
birthinde
xNum
berof
future
births
Nomore
births
Birt
hspacing
Materna
llab
orinde
xInform
ationshock
0.17
4***
0.10
0***
0.00
5-0.012
-0.026
*0.01
7*-0.010
-0.010
(0.011
)(0.027
)(0.023
)(0.037
)(0.016
)(0.009
)(0.038
)(0.020
)Breech
0.45
2***
-0.067
***
0.01
6-0.242
***
-0.032
***
0.00
80.05
1*0.05
0***
(0.008
)(0.021
)(0.018
)(0.027
)(0.012
)(0.007
)(0.029
)(0.014
)
R2
0.31
80.01
30.00
50.00
90.08
90.11
00.04
00.20
7Obs
178,72
317
8,72
317
8,72
314
2,78
017
8,72
317
8,72
314
2,78
017
8,51
2Con
trol
mean
0.03
-0.00
0.00
-0.00
1.03
0.21
3.13
-0.00
Con
trol
sd0.17
1.00
1.00
1.00
0.72
0.41
1.55
1.00
Noteto
Table14
:The
data
areob
tained
from
theSw
edish
Med
ical
Birt
hRegist
ry,P
atient
Regist
ry,D
eath
Regist
ry,a
ndtheLo
ngitu
dina
lIntegratio
nDatab
aseforHealth
Insuranc
ean
dLa
borMarketStud
ies,for
thetim
epe
riod25
Aug
ust1
997to
25Aug
ust2
003.
Onlysin
gleton
births
atterm
(≥37
gestationa
lweeks)a
reconsidered
fora
nalysis
.In
Pane
lA,e
achcolumnpresents
asepa
rate
diffe
renc
e-in-differen
cesregressio
nof
theim
pact
ofinform
ationon
plan
nedC-sectio
n(colum
n1),c
hild
health
inde
x(colum
n2),m
aterna
lhealth
inde
x(colum
n3),m
aterna
lhealth
atsubseque
ntbirthinde
x(colum
n4),n
umbe
rof
subseque
ntbirths
with
in8yearsfrom
breech
birth(colum
n5),p
roba
bilityof
nomorebirths
with
in8years(colum
n6),b
irthspacingwith
in8years(colum
n7),a
ndlabo
rmarketinde
x(colum
n8).In
Pane
lB,t
heeff
ects
(sim
ilar
tothosein
Pane
lA)on
first
timemothe
rsarepresented.
Day-m
onth-year,materna
lage,b
irthorde
r,birth-qu
arteran
dcoun
tyfix
edeff
ects,tim
e-varyingmaterna
land
child
characteris
ticsan
dbina
ryvaria
bles
for
miss
ingvalues
areinclud
edin
each
regressio
n.Stan
dard
errors
areclusteredat
day-mon
th-yearlevel.*p<
0.1,
**p<
0.05
,***
p<0.01
.
55

Table
15:Difference-in-differences
and2SLS
estimates
P anelA:D
ifference-in-differenceestim
ates,fullsample
(1)(2)
(3)(4)
(5)(6)
(7)Child
healthindex
Maternalhealth
indexMaternalhealth
atsub.
birthindex
Num
beroffuture
birthsNomore
birthsBirth
spacingMaternallabor
indexPlanned
CS
0.600***-0.047
-0.128-0.121*
0.065-0.054
-0.122(0.148)
(0.148)(0.191)
(0.073)(0.046)
(0.226)(0.101)
Breech
-0.362***-0.023
-0.1600.028
-0.0200.077
0.077(0.079)
(0.080)(0.102)
(0.038)(0.024)
(0.123)(0.052)
Obs
419,656419,656
213,249419,656
419,656213,249
419,190Controlm
ean-0.00
0.000.00
0.650.50
3.37-0.00
Controlsd
1.001.00
1.000.76
0.501.75
1.00
PanelB:D
ifference-in-differenceestim
ates,first-timemothers
(1)(2)
(3)(4)
(5)(6)
(7)Child
healthindex
Maternalhealth
indexMaternalhealth
atsub.
birthindex
Num
beroffuture
birthsNomore
birthsBirth
spacingMaternallabor
indexPlanned
CS
0.578***0.028
-0.067-0.149*
0.095*-0.056
-0.060(0.153)
(0.133)(0.211)
(0.090)(0.054)
(0.216)(0.113)
Breech
-0.328***0.003
-0.212*0.035
-0.0350.076
0.077(0.086)
(0.075)(0.115)
(0.050)(0.030)
(0.121)(0.061)
Obs
178,723178,723
142,780178,723
178,723142,780
178,512Controlm
ean-0.00
0.00-0.00
1.030.21
3.13-0.00
Controlsd
1.001.00
1.000.72
0.411.55
1.00
Note
toTable
15:The
dataare
obtainedfrom
theSw
edishMedicalB
irthRegistry,Patient
Registry,D
eathRegistry,and
theLongitudinalIntegration
Database
forHealth
Insuranceand
LaborMarket
Studies,forthe
timeperiod
25August
1997to
25August
2003.Only
singletonbirths
atterm
(≥37
gestationalweeks)
areconsidered
foranalysis.
InPanelA
,eachcolum
npresents
aseparate
difference-in-differences-2SLSregression
oftheim
pactofplanned
C-sections
onchild
healthindex
(column1),m
aternalhealthindex
(column2),m
aternalhealth
atsubsequent
birthindex
(column3),num
berofsubsequent
birthswithin
8years
frombreech
birth(colum
n4),probability
ofnomore
birthswithin
8years
(column5),birth
spacingwithin
8years
(column6),
andlabor
market
index(colum
n7).
InPanelB
,theeffects
(similar
tothose
inPanelA
)on
first-timemothers
arepresented.
Day-m
onth-year,maternalage,birth
order,birth-quarterand
countyfixed
effects,time-varying
maternaland
childcharacteristics,and
binaryvariables
formissing
valuesare
includedin
eachregression.
Standarderrors
areclustered
atday-m
onth-yearlevel.
*p<0.1,**
p<0.05,***
p<0.01.
56

Appendices
57


A1 Figures and tables
Figure A1: Trends in planned C-sections by county
(a) Stockholm, 21.3%
0.1
.2.3
.4.5
.6.7
.8.9
1st
ockh
olm
1995 1996 1997 1998 1999 2000 2001 2002 2003 2004 2005year
term_breech cephalic
Planned CS
(b) Skåne region, 10.5%
0.1
.2.3
.4.5
.6.7
.8.9
1sk
ane
1995 1996 1997 1998 1999 2000 2001 2002 2003 2004 2005year
term_breech cephalic
Planned CS
(c) Västra Götaland region, 9.2%
0.1
.2.3
.4.5
.6.7
.8.9
1vr
g
1995 1996 1997 1998 1999 2000 2001 2002 2003 2004 2005year
term_breech cephalic
Planned CS
(d) Uppsala, 3.9%
0.1
.2.3
.4.5
.6.7
.8.9
1up
psal
a
1995 1996 1997 1998 1999 2000 2001 2002 2003 2004 2005year
term_breech cephalic
Planned CS
(e) Östergötland, 3.8%
0.1
.2.3
.4.5
.6.7
.8.9
1os
terg
otla
nd
1995 1996 1997 1998 1999 2000 2001 2002 2003 2004 2005year
term_breech cephalic
Planned CS
(f) Jönköping, 3.2%
0.1
.2.3
.4.5
.6.7
.8.9
1jo
nkop
ing
1995 1996 1997 1998 1999 2000 2001 2002 2003 2004 2005year
term_breech cephalic
Planned CS
(g) Halland, 3.1%
0.1
.2.3
.4.5
.6.7
.8.9
1ha
lland
1995 1996 1997 1998 1999 2000 2001 2002 2003 2004 2005year
term_breech cephalic
Planned CS
(h) Västernorrland, 3.1%
0.1
.2.3
.4.5
.6.7
.8.9
1va
ster
norrl
and
1995 1996 1997 1998 1999 2000 2001 2002 2003 2004 2005year
term_breech cephalic
Planned CS
Note to Figure A1: The data are obtained from the Swedish Medical Birth Registry. Annual trends in plannedC-section among singleton breech births at term (≥37 gestational weeks) per county are presented in Figure A1.The red vertical line indicates the date of the information shock to the Swedish medical society.
59

Figure A2: Trends in planned C-sections by county
(a) Örebro, 2.8%
0.1
.2.3
.4.5
.6.7
.8.9
1or
ebro
1995 1996 1997 1998 1999 2000 2001 2002 2003 2004 2005year
term_breech cephalic
Planned CS
(b) Gävleborg, 2.8%
0.1
.2.3
.4.5
.6.7
.8.9
1ga
vleb
org
1995 1996 1997 1998 1999 2000 2001 2002 2003 2004 2005year
term_breech cephalic
Planned CS
(c) Norrbotten, 2.5%
0.1
.2.3
.4.5
.6.7
.8.9
1no
rrbot
ten
1995 1996 1997 1998 1999 2000 2001 2002 2003 2004 2005year
term_breech cephalic
Planned CS
(d) Västerbotten, 2.4%
0.1
.2.3
.4.5
.6.7
.8.9
1va
ster
botte
n
1995 1996 1997 1998 1999 2000 2001 2002 2003 2004 2005year
term_breech cephalic
Planned CS
(e) Värmland, 2.3%
0.1
.2.3
.4.5
.6.7
.8.9
1va
rmla
nd
1995 1996 1997 1998 1999 2000 2001 2002 2003 2004 2005year
term_breech cephalic
Planned CS
(f) Dalarna, 2.3%
0.1
.2.3
.4.5
.6.7
.8.9
1da
larn
a
1995 1996 1997 1998 1999 2000 2001 2002 2003 2004 2005year
term_breech cephalic
Planned CS
(g) Västmanland, 2.1%
0.1
.2.3
.4.5
.6.7
.8.9
1va
stm
anla
nd
1995 1996 1997 1998 1999 2000 2001 2002 2003 2004 2005year
term_breech cephalic
Planned CS
(h) Södermaland, 2.1%
0.1
.2.3
.4.5
.6.7
.8.9
1so
derm
alan
d
1995 1996 1997 1998 1999 2000 2001 2002 2003 2004 2005year
term_breech cephalic
Planned CS
Note to Figure A2: The data are obtained from the Swedish Medical Birth Registry. Annual trends in plannedC-section among singleton breech births at term (≥37 gestational weeks) per county are presented in Figure A2.The red vertical line indicates the date of the information shock to the Swedish medical society.
60
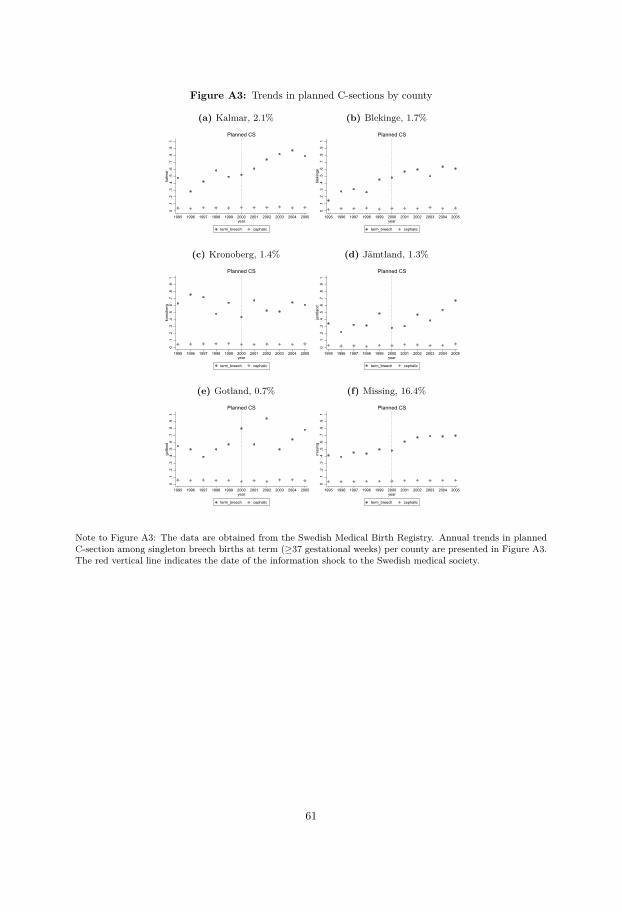
Figure A3: Trends in planned C-sections by county
(a) Kalmar, 2.1%
0.1
.2.3
.4.5
.6.7
.8.9
1ka
lmar
1995 1996 1997 1998 1999 2000 2001 2002 2003 2004 2005year
term_breech cephalic
Planned CS
(b) Blekinge, 1.7%
0.1
.2.3
.4.5
.6.7
.8.9
1bl
ekin
ge
1995 1996 1997 1998 1999 2000 2001 2002 2003 2004 2005year
term_breech cephalic
Planned CS
(c) Kronoberg, 1.4%
0.1
.2.3
.4.5
.6.7
.8.9
1kr
onob
erg
1995 1996 1997 1998 1999 2000 2001 2002 2003 2004 2005year
term_breech cephalic
Planned CS
(d) Jämtland, 1.3%
0.1
.2.3
.4.5
.6.7
.8.9
1ja
mtla
nd
1995 1996 1997 1998 1999 2000 2001 2002 2003 2004 2005year
term_breech cephalic
Planned CS
(e) Gotland, 0.7%
0.1
.2.3
.4.5
.6.7
.8.9
1go
tland
1995 1996 1997 1998 1999 2000 2001 2002 2003 2004 2005year
term_breech cephalic
Planned CS
(f) Missing, 16.4%
0.1
.2.3
.4.5
.6.7
.8.9
1m
issi
ng
1995 1996 1997 1998 1999 2000 2001 2002 2003 2004 2005year
term_breech cephalic
Planned CS
Note to Figure A3: The data are obtained from the Swedish Medical Birth Registry. Annual trends in plannedC-section among singleton breech births at term (≥37 gestational weeks) per county are presented in Figure A3.The red vertical line indicates the date of the information shock to the Swedish medical society.
61
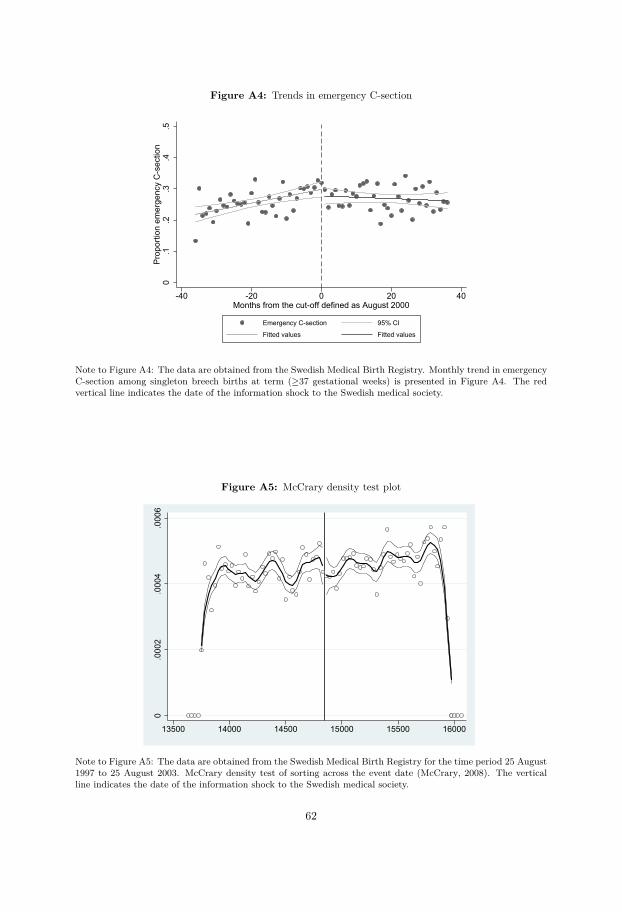
Figure A4: Trends in emergency C-section
0.1
.2.3
.4.5
Prop
ortio
n em
erge
ncy
C-s
ectio
n
-40 -20 0 20 40Months from the cut-off defined as August 2000
Emergency C-section 95% CI
Fitted values Fitted values
Note to Figure A4: The data are obtained from the Swedish Medical Birth Registry. Monthly trend in emergencyC-section among singleton breech births at term (≥37 gestational weeks) is presented in Figure A4. The redvertical line indicates the date of the information shock to the Swedish medical society.
Figure A5: McCrary density test plot
0.0
002
.000
4.0
006
13500 14000 14500 15000 15500 16000
Note to Figure A5: The data are obtained from the Swedish Medical Birth Registry for the time period 25 August1997 to 25 August 2003. McCrary density test of sorting across the event date (McCrary, 2008). The verticalline indicates the date of the information shock to the Swedish medical society.
62

Figure A6: Labor market outcomes, event study
(a) Parental benefits, full sample-.1
0.1
.2.3
Annu
al p
aren
tal b
enef
it
0 yea
rs
1 yea
rs
2 yea
rs
3 yea
rs
4 yea
rs
5 yea
rs
Year of birth = 0
(b) Parental benefits, first birth
-.2-.1
0.1
.2.3
Annu
al p
aren
tal b
enef
it
0 yea
rs
1 yea
rs
2 yea
rs
3 yea
rs
4 yea
rs
5 yea
rs
Year of birth = 0
(c) Sickness benefits, full sample
-.2-.1
0.1
.2An
nual
sic
k be
nefit
s
0 yea
rs
1 yea
rs
2 yea
rs
3 yea
rs
4 yea
rs
5 yea
rs
Year of birth = 0
(d) Sickness benefits, first birth
-.2-.1
0.1
.2.3
Annu
al s
ick
bene
fits
0 yea
rs
1 yea
rs
2 yea
rs
3 yea
rs
4 yea
rs
5 yea
rs
Year of birth = 0
(e) Labor income, full sample
-.3-.2
-.10
.1.2
Annu
al w
age
inco
me
0 yea
rs
1 yea
rs
2 yea
rs
3 yea
rs
4 yea
rs
5 yea
rs
Year of birth = 0
(f) Labor income, first birth
-.4-.2
0.2
.4An
nual
wag
e in
com
e
0 yea
rs
1 yea
rs
2 yea
rs
3 yea
rs
4 yea
rs
5 yea
rs
Year of birth = 0
Note to Figure A6: The data are obtained from the Swedish Medical Birth Registry, Patient Registry, Death Registry,and the Longitudinal Integration Database for Health Insurance and Labor Market Studies, for the time period 25 August1997 to 25 August 2003. Only singleton births at term (≥37 gestational weeks) are considered for analysis. The coefficientplots of the 2SLS estimates on labor market outcomes for each year separately, 1,2...5 years after giving birth (year 0).The effects on income from parental benefits are presented in figure A6a for the full sample and figure A6b for first-timemothers. The effects on income from sickness benefits are presented in figure A6c for the full sample and figure A6d forfirst-time mothers. The effects on labor income are presented in figure A6e for the full sample and figure A6f for first-timemothers. Maternal age, birth order, month, year and county fixed effects, time-varying maternal and child characteristics,and binary variables for missing values are included in each regression. Standard errors are clustered at day-month-yearlevel.
63
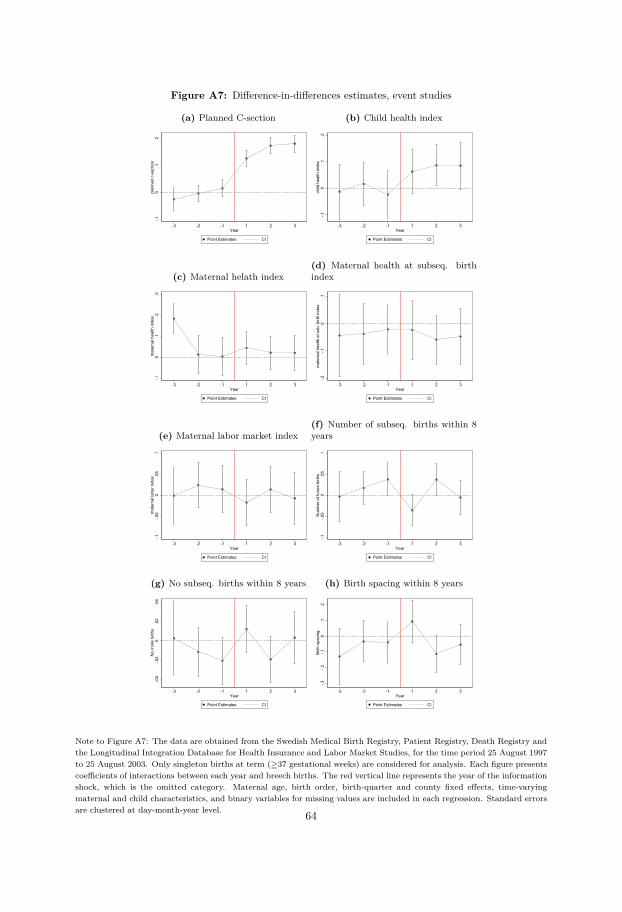
Figure A7: Difference-in-differences estimates, event studies
(a) Planned C-section
-.10
.1.2
plan
ned
c-se
ctio
n
-3 -2 -1 1 2 3Year
Point Estimates CI
(b) Child health index
-.10
.1.2
child
hea
lth in
dex
-3 -2 -1 1 2 3Year
Point Estimates CI
(c) Maternal helath index
-.10
.1.2
.3m
ater
nal h
ealth
inde
x
-3 -2 -1 1 2 3Year
Point Estimates CI
(d) Maternal health at subseq. birthindex
-.2-.1
0.1
mat
erna
l hea
lth a
t sub
. birt
h in
dex
-3 -2 -1 1 2 3Year
Point Estimates CI
(e) Maternal labor market index
-.1-.0
50
.05
.1m
ater
nal l
abor
inde
x
-3 -2 -1 1 2 3Year
Point Estimates CI
(f) Number of subseq. births within 8years
-.1-.0
50
.05
.1N
umbe
r of f
utur
e bi
rths
-3 -2 -1 1 2 3Year
Point Estimates CI
(g) No subseq. births within 8 years
-.04
-.02
0.0
2.0
4N
o m
ore
birth
s
-3 -2 -1 1 2 3Year
Point Estimates CI
(h) Birth spacing within 8 years
-.3-.2
-.10
.1.2
Birth
spa
cing
-3 -2 -1 1 2 3Year
Point Estimates CI
Note to Figure A7: The data are obtained from the Swedish Medical Birth Registry, Patient Registry, Death Registry andthe Longitudinal Integration Database for Health Insurance and Labor Market Studies, for the time period 25 August 1997to 25 August 2003. Only singleton births at term (≥37 gestational weeks) are considered for analysis. Each figure presentscoefficients of interactions between each year and breech births. The red vertical line represents the year of the informationshock, which is the omitted category. Maternal age, birth order, birth-quarter and county fixed effects, time-varyingmaternal and child characteristics, and binary variables for missing values are included in each regression. Standard errorsare clustered at day-month-year level. 64

Table A1: Preterm and twin breech births
Breech preterm Breech twin(1) (2) (3) (4)
PlannedC-section
PlannedC-section
PlannedC-section
PlannedC-section
Information shock -0.014 -0.018 0.050 0.044(0.031) (0.031) (0.037) (0.037)
Mother weight 0.003*** 0.002***(0.001) (0.001)
Mother height -0.003** -0.004***(0.001) (0.002)
Malformation 0.022 0.053(0.024) (0.035)
Smoking 1st trimester -0.044** 0.002(0.021) (0.028)
Male -0.024* -0.023(0.013) (0.015)
Native -0.001 -0.023(0.024) (0.026)
Income -0.000 0.000*(0.000) (0.000)
Sickness benefits 0.000* 0.000**(0.000) (0.000)
Fixed effects NO YES NO YESF-stat 0.19 0.33 1.85 1.41R2 0.001 0.042 0.008 0.067Obs 4,967 4,967 4,263 4,263Mean of dep. var. 0.333 0.333 0.376 0.376
Note to Table A1: The data are obtained from the Swedish MedicalBirth Registry, Patient Registry, Death Registry, and the LongitudinalIntegration Database for Health Insurance and Labor Market Studies, forthe time period 25 August 1997 to 25 August 2003. Only breech birthsare considered for analysis. Each column presents a separate regressionwith OLS estimates of the impact of the information shock on the prob-ability of planned C-section for preterm breech births (columns 1-2) andtwin breech births (columns 3-4). Linear split-breech specific trends areincluded in all regressions. Maternal age, birth order, birth-quarter andcounty fixed effects, time-varying maternal and child characteristics, andbinary variables for missing values are included in columns 2 and 4. Stan-dard errors are clustered at day-month-year level. * p<0.1, ** p<0.05,*** p<0.01.
65

Table A2: Compositional changes in maternal characteristics
Planned C-sectionInformation shock -1.0743***
(0.2629)Mother weight 0.0016***
(0.0006)Mother height -0.0084***
(0.0013)Mother age 0.0061***
(0.0017)Education -0.0038
(0.0054)Income 0.0000
(0.0000)Sickness benefits 0.0001
(0.0001)InfoShock × motherWeight -0.0001
(0.0008)InfoShock × motherHeight 0.0075***
(0.0016)InfoShock × motherAge -0.0013
(0.0023)InfoShock × educBefore 0.0047
(0.0072)InfoShock × incomeBefore -0.0000
(0.0000)InfoShock × sickBefore 0.0000
(0.0001)InfoShock × dTBT 0.0001***
(0.0000)dTBT -0.0000
(0.0000)R2 0.063Obs 11,087
Note to Table A2: The data are obtained from theSwedish Medical Birth Registry, Patient Registry,Death Registry, and the Longitudinal IntegrationDatabase for Health Insurance and Labor MarketStudies, for the time period 25 August 1997 to 25August 2003. Only singleton breech births at term(≥37 gestational weeks) are considered for analysis.This table presents a regression of the likelihoodof having a planned C-section on a fully interactedmodel, in which the maternal characteristics are in-teracted with the treatment status (post informa-tion shock). Linear split-breech specific trends areincluded in all regressions. Maternal age, birth or-der, birth-quarter and county fixed effects, time-varying maternal and child characteristics, and bi-nary variables for missing values are included ineach regression. Standard errors are clustered atday-month-year level. * p<0.1, ** p<0.05, ***p<0.01.
66
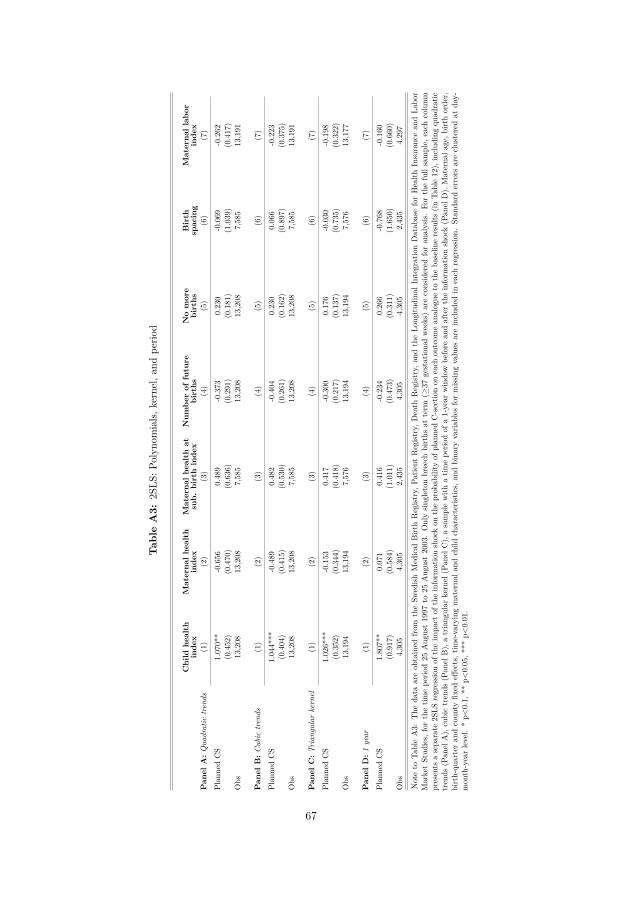
Tab
leA3:
2SLS
:Polyn
omials,
kernel,a
ndpe
riod
Child
health
inde
xMaterna
lhe
alth
inde
xMaterna
lhe
alth
atsub.
birthinde
xNum
berof
future
births
Nomore
births
Birth
spacing
Materna
llabo
rinde
xPan
elA:Q
uadratic
tren
ds(1)
(2)
(3)
(4)
(5)
(6)
(7)
Plan
nedCS
1.070**
-0.656
0.489
-0.373
0.230
-0.069
-0.262
(0.452)
(0.470)
(0.636)
(0.291)
(0.181)
(1.039)
(0.417)
Obs
13,208
13,208
7,585
13,208
13,208
7,585
13,191
Pan
elB:C
ubic
tren
ds(1)
(2)
(3)
(4)
(5)
(6)
(7)
Plan
nedCS
1.044***
-0.489
0.482
-0.404
0.230
0.066
-0.223
(0.404)
(0.415)
(0.530)
(0.261)
(0.162)
(0.897)
(0.375)
Obs
13,208
13,208
7,585
13,208
13,208
7,585
13,191
Pan
elC:T
rian
gularkernel
(1)
(2)
(3)
(4)
(5)
(6)
(7)
Plan
nedCS
1.026***
-0.153
0.417
-0.300
0.176
-0.030
-0.198
(0.352)
(0.344)
(0.418)
(0.217)
(0.137)
(0.735)
(0.322)
Obs
13,194
13,194
7,576
13,194
13,194
7,576
13,177
Pan
elD:1
year
(1)
(2)
(3)
(4)
(5)
(6)
(7)
Plan
nedCS
1.807**
0.071
0.416
-0.234
0.266
-0.768
-0.160
(0.917)
(0.584)
(1.011)
(0.473)
(0.311)
(1.650)
(0.660)
Obs
4,305
4,305
2,435
4,305
4,305
2,435
4,297
Noteto
TableA3:
The
data
areob
tained
from
theSw
edish
Medical
Birt
hRegist
ry,P
atient
Regist
ry,D
eath
Regist
ry,a
ndtheLo
ngitu
dina
lIntegratio
nDatab
aseforHealth
Insurancean
dLa
bor
MarketStud
ies,
forthetim
epe
riod25
Aug
ust1997
to25
Aug
ust2003.Onlysin
gleton
breech
births
atterm
(≥37
gestationa
lweeks)areconsidered
foran
alysis.
Forthefullsample,
each
column
presents
asepa
rate
2SLS
regressio
nof
theim
pact
oftheinform
ationshockon
theprob
ability
ofplan
nedC-sectio
non
each
outcom
ean
alogue
totheba
selin
eresults
(inTa
ble12),includ
ingqu
adratic
trends
(Pan
elA),cubictrends
(Pan
elB),atriang
ular
kernel
(Pan
elC),asamplewith
atim
epe
riodof
a1-year
windo
wbe
fore
andaftertheinform
ationshock(P
anel
D).Materna
lage,b
irthorder,
birth-qu
arteran
dcoun
tyfix
edeff
ects,t
ime-varyingmaterna
land
child
characteris
tics,
andbina
ryvaria
bles
formiss
ingvalues
areinclud
edin
each
regressio
n.Stan
dard
errors
areclusteredat
day-
mon
th-yearlevel.*p<
0.1,
**p<
0.05,*
**p<
0.01.
67

Table
A4:
Difference-in-differences
estimates,w
ithtrends
P anelA:D
ifference-in-differenceestim
ates,fullsample
(1)(2)
(3)(4)
(5)(6)
(7)(8)
PlannedC-section
Child
healthindex
Maternalhealth
indexMaternalhealth
atsub.
birthindex
Num
beroffuture
birthsNomore
birthsBirth
spacingMaternallabor
indexInform
ationshock
0.112***0.139***
0.0220.007
-0.042*0.022
0.005-0.027
(0.018)(0.050)
(0.048)(0.057)
(0.022)(0.014)
(0.077)(0.032)
Breech
0.429***-0.147***
-0.078**-0.195***
-0.028*0.005
0.109**0.024
(0.013)(0.041)
(0.034)(0.039)
(0.016)(0.010)
(0.055)(0.023)
R2
0.1750.016
0.0040.007
0.2590.306
0.0770.194
Obs
419,656419,656
419,656213,249
419,656419,656
213,249419,190
Controlm
ean0.05
-0.000.00
0.000.65
0.503.37
-0.00Controlsd
0.211.00
1.001.00
0.760.50
1.751.00
PanelB:D
ifference-in-differenceestim
ates,first-timemothers
(1)(2)
(3)(4)
(5)(6)
(7)(8)
PlannedC-section
Child
healthindex
Maternalhealth
indexMaternalhealth
atsub.
birthindex
Num
beroffuture
birthsNomore
birthsBirth
spacingMaternallabor
indexInform
ationshock
0.126***0.117**
-0.000-0.012
-0.0440.019
-0.0430.017
(0.022)(0.059)
(0.047)(0.065)
(0.031)(0.019)
(0.077)(0.040)
breech0.439***
-0.085*0.007
-0.200***-0.041*
0.0120.113**
0.037(0.016)
(0.048)(0.032)
(0.042)(0.022)
(0.014)(0.056)
(0.028)R
20.319
0.0120.004
0.0080.088
0.1090.040
0.207Obs
178,723178,723
178,723142,780
178,723178,723
142,780178,512
Controlm
ean0.03
-0.000.00
-0.001.03
0.213.13
-0.00Controlsd
0.171.00
1.001.00
0.720.41
1.551.00
Note
toTable
A4:
The
dataare
obtainedfrom
theSw
edishMedicalB
irthRegistry,Patient
Registry,D
eathRegistry,and
theLongitudinalIntegration
Database
forHealth
Insuranceand
LaborMarket
Studies,for
thetim
eperiod
25August
1997to
25August
2003.Only
singletonbirths
atterm
(≥37
gestationalweeks)
areconsidered
foranalysis.
InPanelA
,eachcolum
npresents
aseparate
difference-in-differencesregression
oftheim
pactofthe
information
shockon
plannedC-section
(column1),child
healthindex
(column2),m
aternalhealthindex
(column3),m
aternalhealthat
subsequentbirth
index(colum
n4),num
berofsubsequent
birthswithin
8years
frombreech
birth(colum
n5),probability
ofnomore
birthswithin
8years
(column6),birth
spacingwithin
8years
(column7),and
labormarket
index(colum
n8).
InPanel
B,the
effects(sim
ilarto
thosein
PanelA)on
first-timemothers
arepresented.
Linearsplit-breech
specifictrends
areincluded
inallregressions.
Maternalage,birth
order,birth-quarterand
countyfixed
effects,tim
e-varyingmaternaland
childcharacteristics,and
binaryvariables
formissing
valuesare
includedin
eachregression.
Standarderrors
areclustered
atday-m
onth-yearlevel.
*p<0.1,**
p<0.05,***
p<0.01.
68

Tab
leA5:
Rob
ustnessan
dsensitivity
Plann
edC-section
Child
health
inde
xMaterna
lhe
alth
inde
xMaterna
lhe
alth
atsub.
birthinde
xNum
berof
future
births
Nomore
births
Birth
spacing
Materna
llabo
rinde
xPan
elA:D
ateof
thepu
blicationof
TBT
ascutoff
(1)
(2)
(3)
(4)
(5)
(6)
(7)
(8)
Inform
ationshock
0.118***
0.081**
0.023
0.037
-0.037
0.021
0.009
-0.015
(0.019)
(0.037)
(0.039)
(0.042)
(0.023)
(0.015)
(0.080)
(0.035)
R2
0.063
0.036
0.021
0.017
0.262
0.319
0.073
0.221
Obs
12,888
12,888
12,888
7,400
12,888
12,888
7,400
12,871
Pan
elB:D
ateof
theSF
OG
meetin
gas
cutoff
(1)
(2)
(3)
(4)
(5)
(6)
(7)
(8)
Inform
ationshock
0.128***
0.090**
0.052
0.025
-0.042*
0.019
0.064
-0.026
(0.020)
(0.038)
(0.036)
(0.048)
(0.024)
(0.016)
(0.085)
(0.038)
R2
0.062
0.036
0.024
0.017
0.263
0.320
0.074
0.225
Obs
12,515
12,515
12,515
7,192
12,515
12,515
7,192
12,498
Pan
elC:R
emove1we
ekbefore
andaftertheshock
(1)
(2)
(3)
(4)
(5)
(6)
(7)
(8)
Inform
ationshock
0.118***
0.097***
0.021
0.025
-0.033
0.021
-0.013
-0.022
(0.018)
(0.034)
(0.036)
(0.043)
(0.022)
(0.015)
(0.076)
(0.034)
R2
0.062
0.036
0.022
0.018
0.262
0.318
0.072
0.219
Obs
13,120
13,120
13,120
7,534
13,120
13,120
7,534
13,103
Pan
elD:K
eeping
the5largestcoun
ties
(1)
(2)
(3)
(4)
(5)
(6)
(7)
(8)
Inform
ationshock
0.131***
0.131***
-0.032
0.033
-0.017
0.031
-0.050
-0.029
(0.026)
(0.045)
(0.057)
(0.059)
(0.033)
(0.022)
(0.112)
(0.052)
R2
0.078
0.027
0.033
0.033
0.260
0.319
0.075
0.237
Obs
6,224
6,224
6,224
3,621
6,224
6,224
3,621
6,216
Pan
elE:C
ounty-specificpretrend
seff
ects
(1)
(2)
(3)
(4)
(5)
(6)
(7)
(8)
Inform
ationshock
0.113***
0.107***
-0.021
0.019
-0.046*
0.025
0.043
-0.034
(0.020)
(0.036)
(0.039)
(0.046)
(0.024)
(0.016)
(0.082)
(0.036)
R2
0.074
0.041
0.033
0.023
0.270
0.324
0.082
0.286
Obs
11,005
11,005
11,005
6,328
11,005
11,005
6,328
10,995
Noteto
TableA5:
The
data
areob
tained
from
theSw
edish
Medical
Birt
hRegist
ry,P
atient
Regist
ry,D
eath
Regist
ry,a
ndtheLo
ngitu
dina
lIntegratio
nDatab
aseforHealth
Insurancean
dLa
borMarketStud
ies,forthetim
epe
riod25
Aug
ust1997
to25
Aug
ust2003.Onlysin
gleton
breech
births
atterm
(≥37
gestationa
lweeks)areconsidered
foran
alysis.
Forthefullsample,
each
columnpresents
asepa
rate
OLS
regressio
nof
theim
pact
oftheinform
ationshockon
theprob
ability
ofplan
ned
C-sectio
non
each
outcom
ean
alogue
totheba
selin
eresults
(inTa
ble1,
usingtheda
teof
thepu
blicationof
theTe
rmbreech
Triala
scutoff(P
anel
A),
usingtheda
teof
theextraSF
OG
meetin
gas
cutoff(P
anel
B),
removingob
servations
1week
before
andaftertheshock(P
anel
C),
usingon
lythefiv
elargestcoun
ties(P
anel
D),
andinclud
ingcoun
ty-spe
cific
pretrend
seff
ects
(Pan
elE)
.Linearsplit
timetrends
areinclud
edin
each
regressio
n.Materna
lage,b
irthorder,
birth-qu
arteran
dcoun
tyfix
edeff
ects,tim
e-varyingmaterna
land
child
characteris
tics,
andbina
ryvaria
bles
formiss
ingvalues
areinclud
edin
each
regressio
n.Stan
dard
errors
areclusteredat
day-mon
th-yearlevel.*p<
0.1,
**p<
0.05,*
**p<
0.01.
69
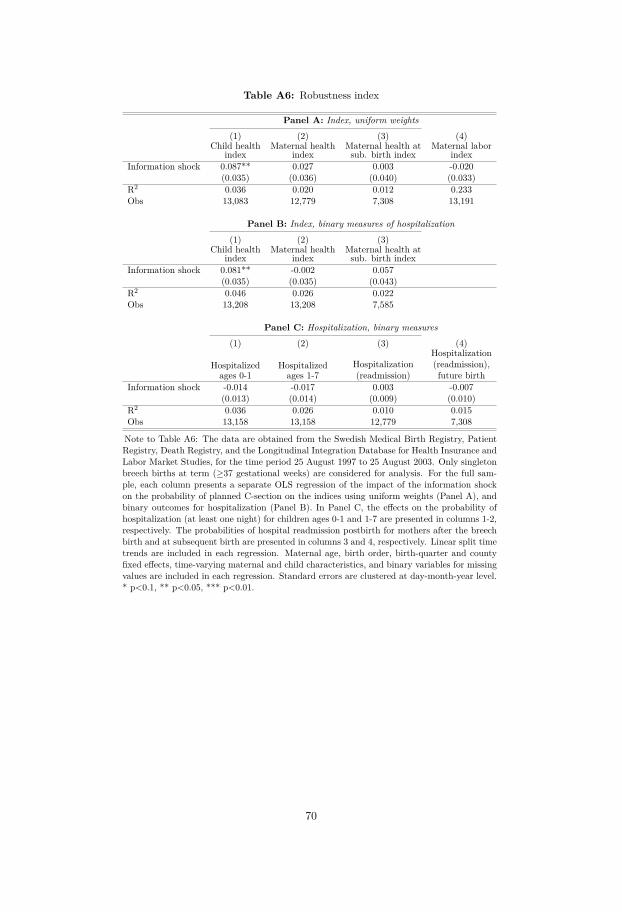
Table A6: Robustness index
Panel A: Index, uniform weights
(1) (2) (3) (4)Child health
indexMaternal health
indexMaternal health atsub. birth index
Maternal laborindex
Information shock 0.087** 0.027 0.003 -0.020(0.035) (0.036) (0.040) (0.033)
R2 0.036 0.020 0.012 0.233Obs 13,083 12,779 7,308 13,191
Panel B: Index, binary measures of hospitalization
(1) (2) (3)Child health
indexMaternal health
indexMaternal health atsub. birth index
Information shock 0.081** -0.002 0.057(0.035) (0.035) (0.043)
R2 0.046 0.026 0.022Obs 13,208 13,208 7,585
Panel C: Hospitalization, binary measures
(1) (2) (3) (4)
Hospitalizedages 0-1
Hospitalizedages 1-7
Hospitalization(readmission)
Hospitalization(readmission),future birth
Information shock -0.014 -0.017 0.003 -0.007(0.013) (0.014) (0.009) (0.010)
R2 0.036 0.026 0.010 0.015Obs 13,158 13,158 12,779 7,308
Note to Table A6: The data are obtained from the Swedish Medical Birth Registry, PatientRegistry, Death Registry, and the Longitudinal Integration Database for Health Insurance andLabor Market Studies, for the time period 25 August 1997 to 25 August 2003. Only singletonbreech births at term (≥37 gestational weeks) are considered for analysis. For the full sam-ple, each column presents a separate OLS regression of the impact of the information shockon the probability of planned C-section on the indices using uniform weights (Panel A), andbinary outcomes for hospitalization (Panel B). In Panel C, the effects on the probability ofhospitalization (at least one night) for children ages 0-1 and 1-7 are presented in columns 1-2,respectively. The probabilities of hospital readmission postbirth for mothers after the breechbirth and at subsequent birth are presented in columns 3 and 4, respectively. Linear split timetrends are included in each regression. Maternal age, birth order, birth-quarter and countyfixed effects, time-varying maternal and child characteristics, and binary variables for missingvalues are included in each regression. Standard errors are clustered at day-month-year level.* p<0.1, ** p<0.05, *** p<0.01.
70

Table A7: Robustness hospitalization
Panel A: Hospital nights, breech births
(1) (2) (3) (4) (5) (6) (7)ages 0-1 ages 0-2 ages 0-3 ages 0-4 ages 0-5 ages 0-6 ages 0-7
Information shock -0.309 -0.430 -0.479* -0.477 -0.707** -0.828** -0.893**(0.228) (0.264) (0.283) (0.294) (0.319) (0.337) (0.358)
F-stat 1.83 2.65 2.86 2.62 4.92 6.03 6.20R2 0.039 0.037 0.036 0.034 0.034 0.035 0.035Obs 13,158 13,158 13,158 13,158 13,158 13,158 13,158Mean of dep. var. 1.180 1.500 1.716 1.853 2.002 2.112 2.190
Panel B: Hospital nights, normal position (cephalic) births
(1) (2) (3) (4) (5) (6) (7)ages 0-1 ages 0-2 ages 0-3 ages 0-4 ages 0-5 ages 0-6 ages 0-7
Information shock 0.005 0.010 0.011 0.017 0.010 0.004 0.015(0.040) (0.048) (0.053) (0.057) (0.061) (0.064) (0.066)
F-stat 0.02 0.04 0.04 0.09 0.03 0.00 0.05R2 0.016 0.015 0.014 0.014 0.013 0.013 0.013Obs 405,271 405,271 405,271 405,271 405,271 405,271 405,271Mean of dep. var. 0.818 1.076 1.234 1.361 1.475 1.573 1.658
Note to Table A7: The data are obtained from the Swedish Medical Birth Registry, PatientRegistry, Death Registry, and the Longitudinal Integration Database for Health Insurance andLabor Market Studies, for the time period 25 August 1997 to 25 August 2003. Only singletonbirths at term (≥37 gestational weeks) are considered for analysis. For the sample of breechbirths (Panel A), each column presents a separate OLS regression of the impact of the informa-tion shock on the number of nights hospitalized during ages 0-1 (column 1), ages 0-2 (column2), ages 0-3 (column 3), ages 0-4 (column 4), ages 0-5 (column 5), ages 0-6 (column 6), and ages0-7 (column 7). In Panel B, the effects (similar to those in Panel A) for a sample of normalposition (cephalic) births are presented. Linear split time trends are included in each regres-sion. Maternal age, birth order, birth-quarter and county fixed effects, time-varying maternaland child characteristics, and binary variables for missing values are included in each regression.Standard errors are clustered at day-month-year level. * p<0.1, ** p<0.05, *** p<0.01.
Table A8: Costs and rates
Delivery modesCode Delivery mode Cost (SEK)P05C Vaginal complicated 47,572P05E Vaginal uncomplicated 30,984P01A C-section extremely complicated 88,635P01C C-section complicated 68,503P01E C-section uncomplicated 54,135
HospitalizationIn-patient case Average hourly rate (SEK) per night(SEK)Care at maternity unit 500/h 12,000Neonatal care, gestation >36 540/h 12,960Children’s hospital 600/h 14,400Note to Table A8: Data obtained from Karolinska Universitetssjukhuset Huddinge.
71


Chapter II

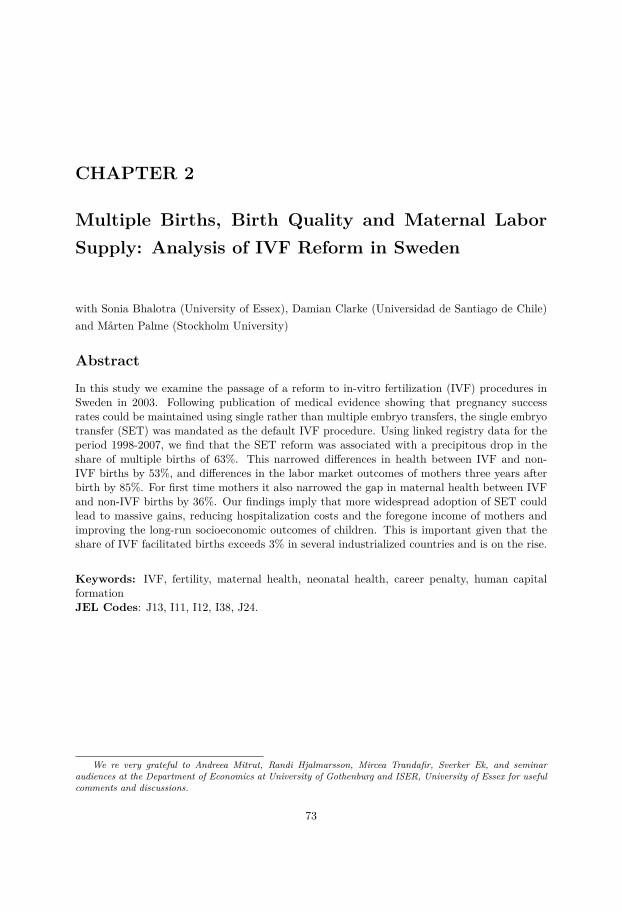
CHAPTER 2
Multiple Births, Birth Quality and Maternal LaborSupply: Analysis of IVF Reform in Sweden
with Sonia Bhalotra (University of Essex), Damian Clarke (Universidad de Santiago de Chile)and Mårten Palme (Stockholm University)
Abstract
In this study we examine the passage of a reform to in-vitro fertilization (IVF) procedures inSweden in 2003. Following publication of medical evidence showing that pregnancy successrates could be maintained using single rather than multiple embryo transfers, the single embryotransfer (SET) was mandated as the default IVF procedure. Using linked registry data for theperiod 1998-2007, we find that the SET reform was associated with a precipitous drop in theshare of multiple births of 63%. This narrowed differences in health between IVF and non-IVF births by 53%, and differences in the labor market outcomes of mothers three years afterbirth by 85%. For first time mothers it also narrowed the gap in maternal health between IVFand non-IVF births by 36%. Our findings imply that more widespread adoption of SET couldlead to massive gains, reducing hospitalization costs and the foregone income of mothers andimproving the long-run socioeconomic outcomes of children. This is important given that theshare of IVF facilitated births exceeds 3% in several industrialized countries and is on the rise.
Keywords: IVF, fertility, maternal health, neonatal health, career penalty, human capitalformationJEL Codes: J13, I11, I12, I38, J24.
We re very grateful to Andreea Mitrut, Randi Hjalmarsson, Mircea Trandafir, Sverker Ek, and seminaraudiences at the Department of Economics at University of Gothenburg and ISER, University of Essex for usefulcomments and discussions.
73
1 Introduction
In-vitro fertilization (IVF) is a landmark innovation within assisted reproductive technologies
(ART), assisting involuntary infertility as well as providing women with the opportunity to
postpone childbearing. Similar to the introduction of the pill, the legalization of abortion
and the availability of long-acting reversible contraceptives (Bailey and Lindo, 2017), IVF has
contributed to the economic liberation of women (Abramowitz, 2014; Abramowitz, J., 2017;
Kroeger and La Mattina, 2017; Rainer et al., 2011). Since its advent in the late 1970s, and
tracking significant advances in rates of female labor market participation and contraceptive
availability, uptake of this technology has increased steadily over time. As of 2012, more than
5 million children have been born as a result of IVF (Zegers-Hochschild et al., 2009), and the
share of all births owing to IVF now exceeds 3% in many industrialized countries (de Mouzon
et al., 2010).
However, there are substantial costs associated with IVF. In addition to costs of the pro-
cedure, estimated to range from 40,000 to over 200,000 USD per IVF birth in the US (Bitler,
2008), there are costs arising from adverse pregnancy outcomes (Sazonova et al., 2011) and ad-
verse birth outcomes (Kalra and Barnhart, 2011). Women conceiving through IVF treatment
are more likely to suffer from complications including hypertension, hemorrhage and emergency
C-section. Children born of IVF are more likely to be preterm, be presented in breech position,
have low birth weight and have lower Apgar scores at birth. This implies additional costs of
neonatal and maternal health care that are potentially large (Almond et al., 2010) and, over and
above, with expected long-run costs in terms of lower cognitive skills, educational attainment,
income and life expectancy among IVF births (Behrman and Rosenzweig, 2004; Bhalotra et al.,
2017; Bharadwaj et al., 2013; Black et al., 2007; Oreopoulos et al., 2008).
The main reason that IVF is associated with adverse pregnancy and birth outcomes is that
IVF births are 10 to 15 times more likely to be multiple births (Kalra and Barnhart, 2011;
Karlström and Bergh, 2007) and multiple births are associated with a higher risk of maternal
and neonatal health problems (Bergh et al., 1999; Hall, 2003). For instance, between 2004
and 2005, the rate of twin births among IVF pregnancies was 30% in the United States and
21% in Europe, compared to approximately 1.6% among non-IVF pregnancies (Maheshwari
et al., 2011). The reason that IVF births are so much more likely to be multiple births is
that IVF has typically involved multiple embryo transfers to increase the chances of success.
However, following advances in IVF technology, success rates with a single embryo transfer
74

(SET) have more or less converged to success rates obtained with the transfer of two embryos (see
section 2.3). In light of evidence of this in medical studies, in January 2003, the Swedish National
Board of Health and Welfare mandated a SET as the default IVF procedure. Exceptions were
allowed as detailed in section 2.3.
Sweden was the pioneer. In July 2003, Belgium followed suit. In 2010, Turkey and Quebec
implemented a similar reform. However, as we write in 2017, most IVF treatments in the United
States, the United Kingdom and other countries continue to involve a double embryo transfer
(DET). Using population registers for Sweden for 1998-2007, we compare outcomes for IVF vs
non-IVF births before and after the SET reform, tracing impacts of the reform on indices of
child and maternal health and maternal labor market outcomes in the years following birth.
We document a post-reform drop in the probability that an IVF birth is a twin of 63%. We
identify significant improvements in child health and maternal labor market outcomes overall
and, among first-time mothers, also significant improvements in maternal health. We estimate
that the reform narrowed the gap between IVF and non-IVF births by 53% in an index of child
health and 85% in an index of maternal labor market outcomes. Among first-time mothers,
the child health gap narrows by 58%, the maternal labor outcomes gap by 96% and the gap
in an index of maternal health by 36%. The increase in child health is evident in indicators
of child health, including fetal growth indicated by birth weight, length, head circumference,
longer gestational age and fewer complications such as breech presentation, emergency C-section
and hospitalization. The improvement in maternal labor markets outcomes is driven by higher
labor incomes within three years of birth, and lower sickness benefits.1 These are intent to treat
estimates since there was not perfect compliance with SET. We adjust for selection into IVF
and, conditional on IVF, for selection into SET. We allow that omitted trends are different for
IVF vs non-IVF births. Since we have many outcomes, we check robustness of the estimates to
adjusting for multiple hypothesis testing.
The documented improvements in maternal and child health flow directly from the reduc-
tion in the share of multiple births, consistent with the evidence cited above. The improvements
in maternal labor supply are likely to flow from both the direct effect of an increase in the share
of uniparous pregnancies, and the associated improvements in maternal and newborn health.
Evidence of the impacts of fertility on the labor market outcomes of mothers is mixed (see,
for example, Adda et al. (2017); Browning (1992); Lundborg et al. (2014)). Among reasons for
1This is a marker of lower sickness so although we do not find no average impacts on the maternal healthindex, we note that this is some evidence of improved health.
75

the evidence being ambiguous are that extensive margin fertility tends to have larger impacts
on wages (Lundborg et al., 2014), that many studies use the occurrence of a twin birth as an
instrument for fertility but twin births occur disproportionately to healthier women who may
have unobservable characteristics that predispose them towards stronger labor market perfor-
mance (Bhalotra and Clarke, 2016), or that the setting matters and the opportunity cost of
women’s time varies with the level of economic development (Aaronson et al., 2017).2 Studies
that instrument fertility with twins effectively model the impact of one unexpected child at any
parity, while Lundborg et al. (2014) leverage quasi-random variation in IVF success rates so
they effectively model the impact of an IVF birth at first parity and as this is often a twin,
often this involves the number of children jumping from 0 to 2. Like (Lundborg et al., 2014) we
study an IVF sample but our quasi-experiment (the SET reform) effectively delivers a discon-
tinuous change in the number of children in the opposite direction, from 2 to 1. Although this
is not discussed, previous studies are effectively modeling not only the impact of an increase
in the number of births but also the occurrence of twin births which we know are less healthy.
Similarly, the impact of a decrease in fertility in our study is combined with impacts of an
improvement in the health of the child. Using the procedure in Gelbach (2016), we estimate
that only a small portion of the improvement in the mother’s labor market outcomes can be
attributed to improvements in maternal and child health.
The Swedish SET reform has been analyzed in the biomedical literature but many of
these studies suffer from small samples and/or are unable to identify causal effects of SET
(Karlström and Bergh, 2007; Lundin and Bergh, 2007; Saldeen and Sundström, 2005; Sazonova
et al., 2011; Thurin et al., 2004). The closest relatives of our study in the economics literature
are Bitler (2008) and Lundborg et al. (2014). Bitler (2008) analyzes the negative impact of
infertility treatment mandates in the United States on birth outcomes, underlining the costs of
the rising share of twin births. Lundborg et al. (2014), discussed above, examine the impact of
fertility among IVF users on female labor supply in Denmark. Our paper is similar insofar as it
investigates variation in fertility brought about by IVF technologies, but we consider variation
in the number of births subject to successful IVF treatment, while they study variation in the
success of IVF treatment. We gain exogenous variation in the number of births in the IVF
sample from introduction of the SET reform, while they demonstrate that variation in IVF
success rates is orthogonal to the observed characteristics of women. Our purpose is to analyze
2This is a large literature and there are other variations including whether the outcome of interest is laborsupply or earnings, and the horizon over which it is measured.
76

thoroughly the impacts of the SET mandate on health and labor market outcomes, contributing
to the case for its more widespread adoption while theirs is to re-visit the classical question of
whether fertility influences women’s labor supply.
The findings of this study have important implications for other countries considering policy
reform similar to that initiated by Sweden in 2003. While there has been a shift from DET
to SET in multiple countries including Scandinavia and Belgium, and Turkey, DET or higher
order embryo transfers are still prevalent in most other countries including the US and the UK.
For example, only 10% of all embryo transfers were single transfers in 2008 in the US (Practice
Committee of the Society for Assisted Reproductive Technology and Practice Committee of the
American Society for Reproductive Medicine and others, 2012). There appears to be a lack
of information on the advantages of SET among couples seeking IVF treatments and this may
be a function of the financial incentives of insurance companies (Pinckney-Clark et al., 2016).
Countries with mostly private funding and/or insurance systems appear to have a harder time
implementing SET (Karlström and Bergh, 2007). Our findings shed light on the gains from SET
not only in terms of child health but also in terms of labor market outcomes for the mother.
This paper is structured in the following way. Section 2 presents a description of IVF in a
Swedish context and the implementation of the SET policy. In Sections 3 and 4, respectively,
the data and empirical strategy are described. Section 5 presents the results. In Section 6 the
findings are discussed, concluding the study.
2 Background
2.1 IVF treatments in Sweden
In Sweden, all residents (registered in the population registry) have access to heavily subsidized
health care provided by both private and public health care providers and IVF treatments are
covered under certain conditions discussed below.3 Health care in Sweden is mainly funded
by tax revenues and only 2% of all residents have private health insurance (Anell, 2008). IVF
procedures are primarily regulated under the law on genetic integrity.4 Access and funding
varies across counties, with local county council boards being responsible for the setting and
3For most medical services, there is a small fee until the patient reaches the maximum amount of 1100 SEK(approximately 110 USD) annually. Above this fee the health care services have usually no additional costs.
4In Swedish: “Lag (2006:351) om genetisk integritet m.m.”. Other aspects relating to IVF treatment suchas establishing parenthood and defining and protecting patient rights are regulated in other laws, includingthe Children and Parents’ Code (Föräldrabalk (1949:381)) and the Health and Medical Services Act (Hälso-ochsjukvårdslag (1982:763)).
77
implementation of rules and requirements of IVF in their jurisdiction (Vårdguiden, 2017). For
example, the maximum maternal age for government funded IVF differs across regions in the
country. To take two cases, in Örebro county the upper age limit is 43 while the limit is 37 in
Norrbotten county (Alm, 2010). The provision of IVF is allowed in private and public regimes,
subject to the approval of the Health and Social Care Inspectorate (Inspektionen för vård och
omsorg, IVO).5
The Swedish Association of Local Authorities and Regions provides guidelines for IVF
treatments, including eligibility guidance although the local health care provider is responsible
for making sure that these requirements are met and enforcement is not strict (SKL, 2016). The
criteria laid down are as follows. First, the couple undergoing treatment should be in a stable
union, either legally married or co-habitating for at least two years, although starting in 2016
single women are also allowed to access publicly funded IVF treatment. Second, the woman
should have no previous children, either biological or adopted. Third, a medical assessment
of the woman should be completed to confirm that her body mass index (BMI) is within the
normal range, that there is no evidence of risky behavior such as smoking and use of alcohol
and other drugs/narcotics, and that the county specific age restriction is met. Maternal age
for starting the first treatment should be below age 40 and any remaining embryos/egg cells
should be transferred before age 45. The age of the man should lie between 25 and 56 years.
Fourth, three rounds of treatment (follicle aspiration) should be offered to each couple, and any
remaining embryos and eggs of good quality should be frozen. Finally, additional conditions
including mental and physical illness or disability are to be considered before offering treatment.
2.2 Number of embryo transfers and pregnancy success
During the 1980s and early 1990s, IVF had relatively low delivery rates per treatment. There-
fore, multiple embryos were usually transferred in order to maximize the probability of a success-
ful pregnancy (Karlström and Bergh, 2007). While this improved success rates it also raised
the share of multiple births among IVF relative to non-IVF births. In response to multiple
births exhibiting worse neonatal outcomes (Bergh et al., 1999), in the early 1990s Swedish clin-
ics implemented a voluntary shift from triple embryo transfer (TET) to double embryo transfer
(DET). This reduced triple births drastically towards zero without lowering the delivery rate but
there remained a high prevalence of twins among IVF births throughout the 1990s (Karlström5IVF using donated gametes is only permitted in publicly funded university hospitals under the law
(2013:1147). For donated gametes an extraordinary assessment is required according to law (2016:18), withrequirements similar to an adoption process.
78

and Bergh, 2007). It was not until 2003 that the single embryo transfer (SET) was introduced
as a mandate.
The implementation of SET was a response to medical evidence that pregnancy success
rates of IVF could be maintained with SET. The pioneering study was by Vilska et al. (1999),
who looked at elective SET cases in Finland. Their evidence was broadly supported by one of
the largest randomized control trials in this domain, with over 660 participants, conducted at
multiple centers in Scandinavia (Thurin et al., 2004). This study showed that the success of IVF
was maintained with SET under certain circumstances, namely when the woman was below 36
years and had at least two embryos of good-quality. They found that the cumulative rate of live
births was not significantly different between elective SET (38.8%) and DET (42.9%), this being
the probability of at least one live birth following transfer of one fresh embryo (under SET),
and if needed, a subsequent transfer of a frozen embryo. Other randomized control trials with
smaller samples, and subsequent observational studies provided broadly similar results (Criniti
et al., 2005; Gerris et al., 2001; Karlström and Bergh, 2007; Lukassen et al., 2005; Lundin and
Bergh, 2007).
2.3 The SET reform
On January 1 2003, the Swedish National Board of Health and Welfare issued new provisions
and general guidelines for IVF, mandating that the routine procedure should be to transfer one
embryo at a time in IVF treatments, with exceptions allowed for women with a low perceived risk
of twinning. In particular, women with low embryo quality, those aged above 38 years and/or
those women with more than three previously failed IVF cycles were still allowed double embryo
transfer, provided that they were informed about the potential risks for the mother and child of
undergoing a DET (Saldeen and Sundström, 2005).6 The SET reform was motivated to improve
birth outcomes and lower costs of neonatal care. Previous studies of SET suggested it achieved
its goal of lowering costs per birth. One study estimates that costs six months following birth
fell from approximately 160,000 to 90,000 Euros (Thurin et al., 2004) and another estimated
that reduced maternal and neonatal hospital stays saved 10,000 Euros per birth (Lukassen et al.,
2005).
Although exceptions were permitted, the reform generated a sharp increase in the share of
IVF treatments that involved a single embryo transfer, from 30% to 70% within 24 months (see
6See also the 2003 provisions and general guidelines for IVF from the Swedish National Board of Health andWelfare: Socialstyrelsens föreskrifter och allmänna råd om assisterad befruktning, SOSFS 2002:13.
79
Figure 1a). The pregnancy success rate among IVF users was maintained at about one-quarter
(Karlström and Bergh, 2007); also see Figure 2a. The number of IVF treatments performed
is smooth around the cut-off (Figure 2b), although Figure 1b shows a slight decrease in the
proportion of IVF births following the reform.7 We shall formally test for discontinuities in the
proportion of IVF births and deliveries per transfer (success rates) (see Section 5.2). Over this
period there were no other changes in the IVF treatment procedure with respect to medication,
technique or equipment (Saldeen and Sundström, 2005).8
3 Data and descriptive statistics
3.1 Data
We use Swedish administrative data to examine the impact of the SET reform. In particular, we
use the Swedish Multi-Generational Registry (Flergenerationsregistret) provided by Statistics
Sweden, which contains all registered people in Sweden after 1961. Our baseline sample consists
of cohorts born between 1940 and 1985 including their children and parents. Based on these
individuals, we select all women giving birth during 1998-2007 and their children, which are
identified via the Swedish Medical Birth Registry. This sample constitutes approximately 98%
of all births in Sweden during this period.
The Swedish Medical Birth Registry (Medicinska Födelseregistret) is provided by the Na-
tional Board of Health and Welfare and contains detailed information on all pregnancies oc-
curring since 1973 that led to a childbirth (at greater than 22 weeks of gestation) in Sweden.
The information is provided by all Swedish prenatal care units, maternity clinics and neonatal
care units, and contains extensive information regarding pregnancy, delivery, and health of the
newborn child (including both stillborn and live births). These data include information on
birth outcomes and child characteristics such as delivery mode, parity, multiplicity of births,
7See Figure A1 which shows a gradually rising trend in the proportion of IVF births and the share of twinbirths in all (IVF and other) births. Trends in the proportions of each type of ART procedures are presented inFigure A1, which shows that IVF is the only ART procedure exhibiting a strong trend.
8There is one exception. In January 2003, coincident with the SET reform, there was a change in regulation(Socialstyrelsens föreskrifter och allmänna råd om assisterad befruktning SOSFS 2002:13) that allowed donatedeggs or sperm to be used in IVF treatments, although subject to an extensive assessment of the couple’s medical,psychological and socio-economic characteristics, similar to those in an adoption process (Socialstyrelsen, 2016).Also the amendment allowing donated gametes was restricted to publicly funded university hospitals. In 2002,only 19 IVF cycles using donated egg cells were attempted resulting in 6 live births (Socialstyrelsen, 2006).While the number of IVF cases with donated eggs cells has increased (from 19 cycles in 2003 to 401 cycles in2010, resulting in 86 live births), the share of IVF births using donated eggs cells is only 2% of all IVF births(Socialstyrelsen, 2013).
80

fetal position, gender, gestational age, birth weight, length, head circumference, Apgar score9
measured at 1, 5 and 10 minutes, malformations and severe maternal complications.10
The Medical Birth Registry also contains detailed information on maternal characteristics
such as age, number of previous births, weight, height, chronic diseases, and tobacco consump-
tion. It also contains information on prenatal conditions and treatments such as the use of
fetal diagnosis service and pregnancy complications (diagnosis and procedures). Since 1995,
the Medical Birth Registry collects information on fertility treatments including standard IVF,
Intra cytoplasmic sperm injection (ICSI), surgical procedures and ovarian stimulation, when
resulting in a successful pregnancy delivered after week 22. During the period of 1998-2007,
21,783 babies born after IVF are registered in the Medical Birth Registry. Out of those, 20%
are twin births.
We combine the Medical Birth Registry with the National Patient Registry in order to
obtain data on the number of nights spent in hospital by the mother and child (inpatient care),
as well as the Cause of Death Registry to obtain information on mortality. Both registries
are provided by the National Board of Health and Welfare. Finally, administrative data on
income and educational attainment of mothers is obtained from the Social Insurance Agency
(Försäkringskassan) and the Swedish Agency for Innovative Systems (LISA), provided by Statis-
tics Sweden. This information includes income from gainful employment, parental benefits and
sickness benefits11 as well as the highest level of education of each woman.12
3.2 Main outcome variables, data limitation and multiple hypothesis testing
In analyzing the effect of the reform we focus on mother and child health outcomes, and ma-
ternal labor market outcomes. As discussed above, child health outcomes include measures
frequently used in the economic literature on early-life human capital (for example Apgar, birth9Apgar score, measured 5 minutes after birth, stands for “appearance, pulse, grimace, activity, respiration”
and is a five-criterion evaluation method, indicating the general health condition of the newborn baby 1, 5 and10 minutes after the delivery.
10Severe maternal complications include postpartum hemorrhage (severe blood loss) and maternal sepsis (infec-tion). Sepsis is defined as “infection of the genital tract occurring at any time between the rupture of membranesor labor, and the 42nd day postpartum, of which two or more of the following are present: pelvic pain, fever 38.5C or more, abnormal vaginal discharge, abnormal smell of discharge, and delay in the rate of reduction of size ofuterus (less than 2 cm a day during the first 8 days)” by the WHO (Bamfo, 2013).
11These variables are measured (respectively) as: total annual gross earnings in cash and net income from activebusiness; total annual income from parental leave including income from parental allowance, temporary parentalleave and child care allowance; total annual income caused by illness, injury and/or rehabilitation including asick pay period of 14 days.
12This is a categorical measure from level 1-7. Level 1 is primary education less than 9 years, level 2 is primaryeducation of 9 years, level 3 is 2 or fewer years of secondary education, level 4 is 3 years of secondary education,level 5 is fewer than 3 years of tertiary education, level 6 is 3 or more years of tertiary education and level 7 isgraduate-level studies.
81

weight, length, head circumference and gender, infant mortality, and mortality under the age of
5) (Almond et al., 2017; Björkegren et al., 2016), as well as an additional set of rich measures
available in Swedish registry data (malformation, breech presentation at birth, nights hospi-
talized during the first year of life and during years 1-4). For mothers, we examine a series
of variables capturing health at the time of child birth, and potential results of child birth on
subsequent health. These are the use of emergency C-section (a C-section after attempting
vaginal delivery), maternal sepsis, postpartum hemorrhage, hypertension and nights hospital-
ized during the first year after delivery. Finally, we examine maternal labor market outcomes,
namely income from gainful employment, parental benefits and sickness benefits in expressed
in real terms using 1980 consumer price index and 100s SEK. We use an inverse hyperbolic sine
transformation log(yi + (y2i + 1)1/2), given that a non-negligible portion of women have zero
income in the years considered, and this measure can be interpreted in a similar way to a log
transformation, while also being defined at zero.
The Medical Birth Registry contains all births delivered after the 22nd week of gestation
(plus 0 days). As such, unsuccessful IVF treatments are not observed. For this analysis we
focus on births that are the product of IVF procedures including standard IVF and IVF with
ICSI. However, based on official usage figures, the Medical Birth Registry only contains ap-
proximately 70-90% of all IVF births occurring during this period, misclassifying 10-30% of all
IVF births as non-IVF births. This means that the control group consisting of non-IVF births
are “contaminated” by a small number of IVF births. We return to this point in section 5.3,
and document that even under conservative assumptions it is likely to cause only a very small
attenuation of estimated reform impacts.
When examining the impact of the SET reform on child and maternal outcomes we are
interested in multiple outcomes to capture child or maternal well-being. We are thus faced with
a problem of multiple-inference and risk over-rejecting null-hypotheses (i.e. an inflated rate of
type I errors). We address this issue using two different approaches. First, we create summary
indices for child health, maternal health and maternal labor outcomes separately. By doing
so we decrease the number of hypotheses tested to a single outcome for each class of outcome
variables. These indices are constructed as per Anderson (2008) by first ensuring that variables
are consistently measured so that more positive values imply a positive change,13 and then all
variables are standardized by subtracting the mean and dividing it by the standard deviation
13For example, when considering the variables birth weight and premature, prematurity is multiplied by -1 sothat both birth weight and “not premature” refer to positive health measures at birth.
82

of the variable in the control group. Finally, indices are created using a weighted average of the
standardized variables of interest. Each variable is weighted by the inverse of the covariance
matrix among the full set of variables so that those contributing the most linearly independent
information receive a higher weight in the index.
Secondly, we adjust p-values by controlling for the false discovery rate (the proportion of
type I errors in all significant findings) among all variables examined, using a step-up procedure
described by Benjamini and Hochberg (1995). This method has the advantage of greater power
compared to other approaches but at the cost of allowing for the false rejection of null-hypothesis
(Anderson, 2008). We also report considerably more demanding Bonferroni (1935) corrected
p-values, which controls for the Family Wise Error Rate, and thus sets the size of each test to
avoid falsely rejecting any hypothesis.
3.3 Sample and summary statistics
We consider all twin and singleton births conceived between 1998 and 2007. We remove the
small proportion of triplet and higher order births (516 births in all) given that these are a
particularly extreme and uncommon outcome. This period consists of 60 months before and
after the definition of the new SET guidelines relating to embryo transfer procedures. During
this period there are 21,783 births following IVF recorded in the Medical Birth Registry and
916,110 non-IVF births.
Table 1 displays summary statistics for maternal and child characteristics for IVF (columns
1-3) and non-IVF births (columns 4-6). We report t-tests for the equality of means of each
variable between IVF and non-IVF births in column 7 and p-values in column 8. As expected,
the rate of twin births is significantly higher among IVF births: approximately 20% of IVF births
result in twins compared to 2.5% among non-IVF births. Based on observable characteristics
and outcomes, women conceiving using IVF are different to women with unassisted conception
along multiple dimensions. First, women conceiving with IVF are much more likely to suffer
from pregnancy and birth complications such as hypertension, maternal diabetes, postpartum
hemorrhage, maternal sepsis and emergency C-sections compared to non-IVF mothers. For
example, mothers conceiving with IVF had double the risk of postpartum hemorrhage (12%)
and emergency C-section (16%) compared to non-IVF mothers. IVF mothers are also more
likely to be hospitalized the year after giving birth. Second, women conceiving with IVF are
somewhat taller and have a slightly higher weight. Moreover, IVF mothers are on average older
(age 33) than non-IVF mothers (age 30). The age distribution of IVF and non-IVF mothers is
83
presented in Figure 7. IVF mothers have higher education attainment based on the categorical
measure available (4.7 compared to 4.5) and higher labor income (average annual income before
birth is 65.4 TSEK compared to 42.5 TSEK).14 However, women conceiving with IVF receive
more sickness benefits before giving birth, of 1.9 TSEK compared to 1.4 TSEK and are more
likely to suffer from diseases like ulcerative colitis. Moreover, behavioral differences are found
between women conceiving with IVF and without IVF: IVF mothers are more than 50% less
likely to smoke cigarettes during the first (4.2% versus 9.6%) and third (2.4% versus 6.6%)
trimester. These differences in means suggest that high SES mothers (higher education and
non-smokers) select into IVF but also that women conceiving with IVF are more likely to suffer
from chronic diseases and receive sickness benefits.
Differences in means between children born following IVF and non-IVF are displayed in
Panel B, and show a similar pattern of poorer health outcomes. IVF children have lower Apgar
scores (9.63 versus 9.73) as well as a higher likelihood of having Apgar scores below 7. Mortality
rates (infant and under-5) is higher among children born after IVF with means of 4.5 and 5.6
compared to 2.7 and 3.4 for children with an unassisted conception. Other important health
indicators show a similar pattern, including shorter gestation by nearly a week, lower birth
weight by 300 grams, smaller head circumference and shorter length at birth. Malformations,
breech presentation, neonatal hospitalization and hospitalization during ages 1-4 are higher
among children born after IVF. No statistical difference is observed in the sex ratio.15
Previous studies suggest that twin births are a major contributor to the observed differences
in outcomes between children born following IVF and those following unassisted conceptions
(Kalra and Barnhart, 2011). However, singletons born after IVF have also been shown to
exhibit poorer health outcomes compared to non-IVF births (Pinborg et al., 2013). Similarly,
as documented in Table 2, we observe significant differences between singletons born after IVF
and those not following IVF (in the pre-reform period). These differences are however smaller.
Singletons born after IVF weigh 100 grams less than non-IVF births and exhibit alleviated risk
of mortality and hospitalization. This provides suggestive evidence that a significant part of
the differences in poorer health outcomes between IVF and non-IVF births is due to the higher
prevalence of multiple births.
14Expressed in real terms using 1980 consumer price index.15Male fetuses are less resilient to more demanding conditions in utero (Almond and Mazumder, 2011).
84
3.4 Descriptive statistics of the SET reform
Trends in the rates of twin births among IVF and non-IVF conceptions are displayed in Figure 3.
A clear drop in rates of twin birth from 30% to 13% is seen among IVF births in line with the
SET reform in 2003, while no similar change in rates of twinning are observed for non-IVF
births during this period. The improvements in child health for children born after IVF is seen
across multiple outcomes and displayed in Figures 4 and 5. These graphs show a clear pattern
of improved health for children born after IVF compared to non-IVF children when considering
birth weight, gestation, length, head circumference and Apgar score as well as reductions in
mortality and the probability of hospitalization within one year of birth. Trends in maternal
health and labor market outcomes are presented in Figure 6, and show a similar pattern of
improved outcomes for the likelihood of emergency C-section as well as somewhat decreased
sickness benefits and higher labor income.
A before and after comparison of differences in means in outcome variables for IVF births
during 1998-2007 is presented in Table A2 and confirms the observed trends. Means are re-
ported, with standard deviations below each mean, and an associated t-test in column 3. As in
the graphical evidence, significant differences in means around the reform are found for multiple
child outcomes including birth weight, gestational age, length and head circumference as well
as a lower probability of mortality. In terms of maternal outcomes, higher labor income and
lower sickness benefits are observed following the SET reform, and health improvements are
observed, for example a lower prevalence of emergency C-sections.
4 Empirical strategy
We estimate the impact of the SET reform using the following difference-in-differences (DiD)
specification:
Yit = α+ β1(PostSET × IV F )it + β2IV Fi +Xitδ + αc + πt + εit. (1)
This exploits both variation in IVF usage and reform timing, comparing outcomes for IVF and
non-IVF births prior to and posterior to the January 1, 2003 policy change. The dependent
variable Yit refers to a birth or maternal outcome for birth i in year t, and IV Fi refers to the
IVF status of each birth (1 if IVF was used, or 0 otherwise). The parameter of interest is β1,
capturing the change in outcomes for IVF births relative to non-IVF births after relative to
85

before the reform was implemented. While obstetric outcomes among IVF births are expected
to be better post-SET, IVF children will nevertheless tend to have poorer obstetric outcomes
than children born following an unassisted conception (Sazonova et al., 2011). Our estimates
will allow us to capture not only the SET-led improvements in IVF outcomes but also the extent
to which SET led to a convergence of outcomes from IVF with outcomes from non-IVF. Here
PostSET is a binary variable based on estimated date of conception: all births estimated to
have been conceived after January 1 2003 are assigned as PostSET = 1.16 Rather than include
the uninteracted PostSET term in the regression, we include a series of year fixed effects πt to
flexibly control for any time varying unobservables that may have evolved in a manner similar
to the reform. County-specific fixed effects αc capture time-invariant geographical variation in
the outcomes.
In some specifications, we additionally include maternal and birth characteristics, denoted
X. These include age and pregnancy order fixed effects, maternal height and weight before
pregnancy, nationality (a binary variable for having been born in Sweden or not), whether
the mother smoked during the first trimester of pregnancy, and the mother’s educational level,
sickness benefits and labor income averaged over the 3 years prior to birth. The idiosyncratic
error term is denoted by ε, and is clustered on the mother. We estimate equation 1 using OLS.
The identifying assumption is that in the absence of the SET reform, outcomes associated
with IVF and non-IVF births would have followed similar trends over time. In order to test
the plausibility of this assumption we estimate an event study, interacting the “treatment”
indicator (IVF) with a binary variable for each year prior and posterior to the reform date. The
specification we estimate is:
Yit = α+∑k∈`
γk(IV Fi × I{Y eart = SET + k}) + βIV Fi +Xitδ + αc + πt + νit, (2)
where ` = {−4,−3,−2, 0, . . . , 4} and the year before the SET reform, 2002, is omitted as a base
category. Equation 2 is similar to equation 1 except that instead of defining differences around
a single post-SET binary variable we allow the difference between IVF and non-IVF births to
vary year on year. If IVF and non-IVF outcomes exhibit differential pre-trends then this will
be evident in a test of the lagged coefficients.
We estimate the reduced form impact of the SET reform, that is, the average treatment
16Conception date is computed by subtracting the gestational days from the date of birth analogous to Currieand Schwandt (2013). Although date of birth is not available in our data set, we use the discharge date for thematernity unit.
86

effect among all IVF births (the intent to treat estimate). While the substantive change brought
about by SET is a reduction in twinning and this is the main mechanism for impacts on
outcomes, maternal selection into SET may also play a role. We expect positive selection
into SET since women perceived to have a low risk of twinning (older women and/or multiple
previous failed IVF cycles) were allowed to elect for DET following the SET reform. Positive
selection is a concern as it will tend to lead to overestimation of the improvements in child
and maternal outcomes. To account for selection into SET we estimate a specification that
conditions upon mother fixed effects. However, only approximately 50% of all IVF mothers
in the sample have more than one birth. We therefore show results on the restricted sample
of women with and without mother fixed effects. This way we can isolate changes in the
estimates arising from selection of a sample of women with at least two births from changes
in the estimates associated with selection into SET. As one check on the twinning channel, we
estimate a regression of the outcomes Yit on whether the birth is a twin birth, instrumenting
the indicator for a twin birth with an indicator for whether the birth occurred post-SET. This
provides a local average treatment effect (LATE) for SET compliers.
We will subject the estimates to a number of robustness checks. We will discuss the fact
that SET was mandated two years earlier in one county and re-estimate the model excluding
this county. We also re-estimate it excluding the two years during which we see a gradual
increase in the share of SET births among IVF mothers, so that identification comes from a
sharp discontinuity in this share. We will investigate changes in the composition of mothers
selecting into IVF treatment after SET, although this is accounted for by the main effect of
IVF in our specification.17 We will investigate heterogeneity in impacts of the reform by mother
characteristics. Of particular interest, we will show all results for all women and then again for
first-time mothers (44% of the sample).
5 Results
5.1 Twin births
Table 3 presents the impact of the SET reform on the likelihood of a twin as opposed to a
singleton birth. For the full sample (columns 1-2) we estimate a reduction in the share of twins
among IVF births of 16.8 to 17.3 percentage points (pp), depending on whether we do or do17As explained in the Data section, our data do not allow us to investigate differences in characteristics of
women who post-SET end up electing for SET vs DET, but we discussed above how we account for selectioninto SET among IVF users.
87
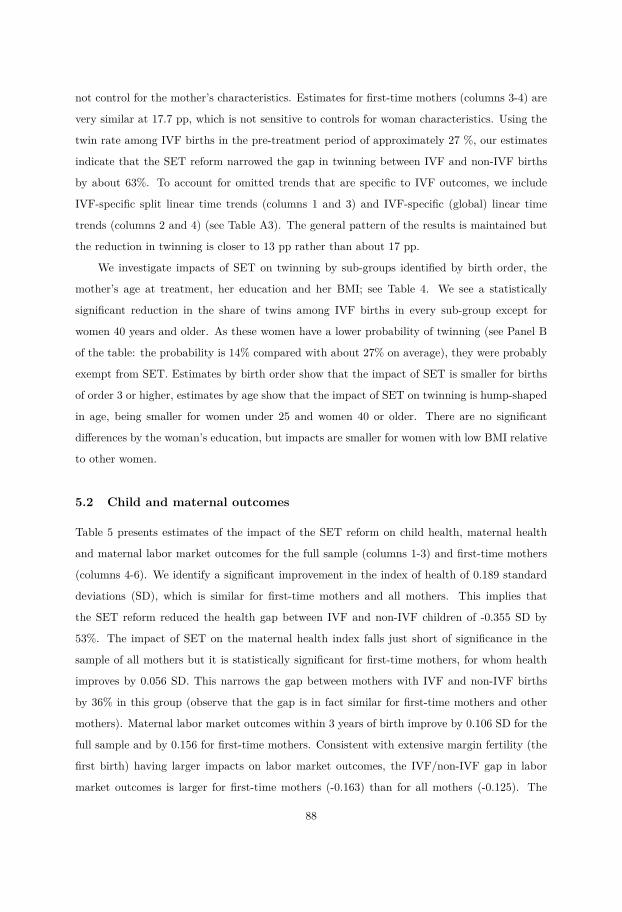
not control for the mother’s characteristics. Estimates for first-time mothers (columns 3-4) are
very similar at 17.7 pp, which is not sensitive to controls for woman characteristics. Using the
twin rate among IVF births in the pre-treatment period of approximately 27 %, our estimates
indicate that the SET reform narrowed the gap in twinning between IVF and non-IVF births
by about 63%. To account for omitted trends that are specific to IVF outcomes, we include
IVF-specific split linear time trends (columns 1 and 3) and IVF-specific (global) linear time
trends (columns 2 and 4) (see Table A3). The general pattern of the results is maintained but
the reduction in twinning is closer to 13 pp rather than about 17 pp.
We investigate impacts of SET on twinning by sub-groups identified by birth order, the
mother’s age at treatment, her education and her BMI; see Table 4. We see a statistically
significant reduction in the share of twins among IVF births in every sub-group except for
women 40 years and older. As these women have a lower probability of twinning (see Panel B
of the table: the probability is 14% compared with about 27% on average), they were probably
exempt from SET. Estimates by birth order show that the impact of SET is smaller for births
of order 3 or higher, estimates by age show that the impact of SET on twinning is hump-shaped
in age, being smaller for women under 25 and women 40 or older. There are no significant
differences by the woman’s education, but impacts are smaller for women with low BMI relative
to other women.
5.2 Child and maternal outcomes
Table 5 presents estimates of the impact of the SET reform on child health, maternal health
and maternal labor market outcomes for the full sample (columns 1-3) and first-time mothers
(columns 4-6). We identify a significant improvement in the index of health of 0.189 standard
deviations (SD), which is similar for first-time mothers and all mothers. This implies that
the SET reform reduced the health gap between IVF and non-IVF children of -0.355 SD by
53%. The impact of SET on the maternal health index falls just short of significance in the
sample of all mothers but it is statistically significant for first-time mothers, for whom health
improves by 0.056 SD. This narrows the gap between mothers with IVF and non-IVF births
by 36% in this group (observe that the gap is in fact similar for first-time mothers and other
mothers). Maternal labor market outcomes within 3 years of birth improve by 0.106 SD for the
full sample and by 0.156 for first-time mothers. Consistent with extensive margin fertility (the
first birth) having larger impacts on labor market outcomes, the IVF/non-IVF gap in labor
market outcomes is larger for first-time mothers (-0.163) than for all mothers (-0.125). The
88
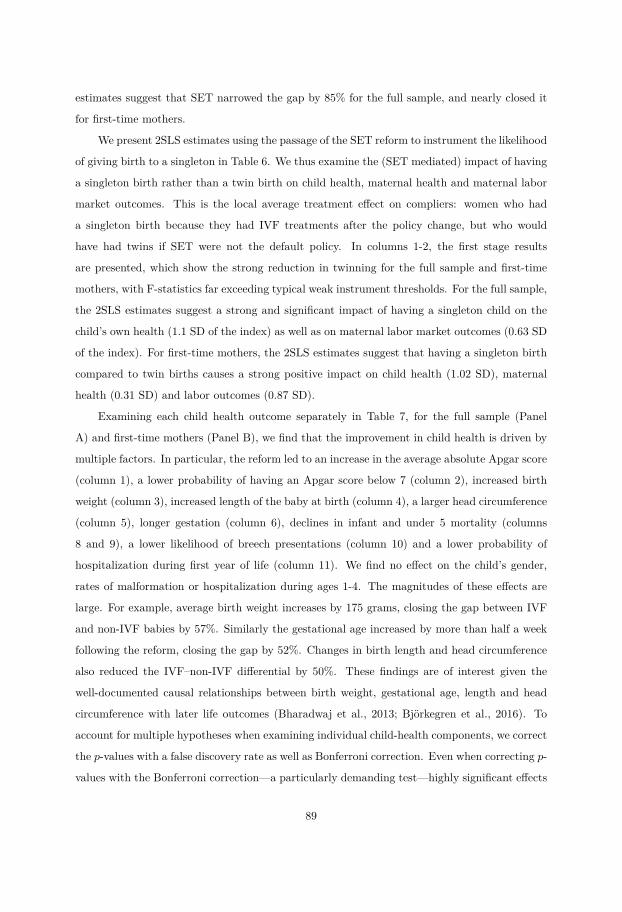
estimates suggest that SET narrowed the gap by 85% for the full sample, and nearly closed it
for first-time mothers.
We present 2SLS estimates using the passage of the SET reform to instrument the likelihood
of giving birth to a singleton in Table 6. We thus examine the (SET mediated) impact of having
a singleton birth rather than a twin birth on child health, maternal health and maternal labor
market outcomes. This is the local average treatment effect on compliers: women who had
a singleton birth because they had IVF treatments after the policy change, but who would
have had twins if SET were not the default policy. In columns 1-2, the first stage results
are presented, which show the strong reduction in twinning for the full sample and first-time
mothers, with F-statistics far exceeding typical weak instrument thresholds. For the full sample,
the 2SLS estimates suggest a strong and significant impact of having a singleton child on the
child’s own health (1.1 SD of the index) as well as on maternal labor market outcomes (0.63 SD
of the index). For first-time mothers, the 2SLS estimates suggest that having a singleton birth
compared to twin births causes a strong positive impact on child health (1.02 SD), maternal
health (0.31 SD) and labor outcomes (0.87 SD).
Examining each child health outcome separately in Table 7, for the full sample (Panel
A) and first-time mothers (Panel B), we find that the improvement in child health is driven by
multiple factors. In particular, the reform led to an increase in the average absolute Apgar score
(column 1), a lower probability of having an Apgar score below 7 (column 2), increased birth
weight (column 3), increased length of the baby at birth (column 4), a larger head circumference
(column 5), longer gestation (column 6), declines in infant and under 5 mortality (columns
8 and 9), a lower likelihood of breech presentations (column 10) and a lower probability of
hospitalization during first year of life (column 11). We find no effect on the child’s gender,
rates of malformation or hospitalization during ages 1-4. The magnitudes of these effects are
large. For example, average birth weight increases by 175 grams, closing the gap between IVF
and non-IVF babies by 57%. Similarly the gestational age increased by more than half a week
following the reform, closing the gap by 52%. Changes in birth length and head circumference
also reduced the IVF–non-IVF differential by 50%. These findings are of interest given the
well-documented causal relationships between birth weight, gestational age, length and head
circumference with later life outcomes (Bharadwaj et al., 2013; Björkegren et al., 2016). To
account for multiple hypotheses when examining individual child-health components, we correct
the p-values with a false discovery rate as well as Bonferroni correction. Even when correcting p-
values with the Bonferroni correction—a particularly demanding test—highly significant effects
89

on Apgar score, birth weight, length, gestation, head circumference, hospitalization and breech
presentation remain. Similar results are found for first-time mothers but with slightly larger
effects.
We estimate the impact of the SET reform at particular points in the distribution of birth
weight and gestational length that are commonly used in the literature, presented in Table 8.
Results are presented for the full sample in Panel A and first-time mothers in Panel B. We
focus on these weights/dates given their importance in the targeting of medical resources based
on (arbitrary but commonly used) treatment cut-offs (Almond et al., 2010; Bharadwaj et al.,
2013). For the full sample, the impact on the likelihood of being born with a weight below 1500
grams (very low birth weight), is large and negative, at 1.2 pp, and for a weight below 2500
grams (low birth weight) is a 6.8 pp reduction (column 2). This corresponds to a decrease of
60% when compared to the rate of low birth weight babies born via IVF before the reform.
Similarly, the probability of preterm delivery before week 28 (column 3), 32 (column 4) and
37 (column 5) decreases by 0.5, 1.3 and 8.3 pp, closing the gap by around 50% in each case.
Importantly, these results demonstrate that average impacts on birth weight and gestation are
not driven only by changes on the upper quintiles of outcome distributions. Very similar results
are found for first-time mothers (Panel B).
Turning to maternal outcomes, the results for each separate health outcome from the
maternal health index are presented in Table 9. The results are presented for the full sample
(Panel A) and first-time mothers (Panel B). These results demonstrate no significant impact
on complications such as postpartum hemorrhage (column 2), maternal sepsis (column 3), post
birth hospitalization (column 4), or hypertension (column 5) for either the full sample (Panel
A) or for first-time mothers (Panel B). Unsurprisingly, we do observe a significant negative
impact on the likelihood of engaging in an emergency C-section at birth (column 1), and this
impact closes the gap between IVF and non-IVF births by 42% for the full sample and 60% for
the first-time mothers. The negative impact on emergency C-section remains highly significant
when correcting for multiple hypothesis testing using a FDR and Bonferrroni correction.
We document the impact on each labor market outcome separately in Table 10, again
presented separately for the full sample (Panel A) and first-time mothers (Panel B). We have
transformed each income variable using hyperbolic sine transformation, so each coefficient can
be interpreted as a percentage change. Here we observe that income from parental benefits
decreases by 3.4%, sickness benefits decline by 43.6% and labor income increases by 8.5%.
These findings suggest that in the three years following the birth of a child, IVF mothers
90

have significantly higher labor earnings and lower usage of benefits and transfers. Correcting
for multiple hypotheses tests renders no longer a significant effect on parental benefits and
labor income when using the conservative Bonferroni correction (but not when referring to q-
sharpened p-values). For first-time mothers, a similarly strong decrease in sickness benefits is
found by 46.0%, but with no significant impact on labor income or parental income within 3
years after giving birth.
5.3 Identifying assumptions
Parallel trends and event studies
As is standard in difference-in-differences analyzes, correctly identifying the impact of the reform
requires a parallel trends assumption. In this case, we must assume that trends in outcomes
among IVF and non-IVF women would have evolved similarly over time in the absence of the
reform. While this assumption cannot be tested directly, we can partially test its plausibility
using event studies to examine the evolution of outcomes in the IVF and non-IVF groups in
the pre-reform period.
In Figure 4, we present trends in birth weight, gestational age, length, head circumference
and Apgar score, which show a clear improvement following the SET reform (the reform date
is indicated by the red vertical line). Trends in mortality and hospitalization exhibit larger
variation but also show an improvement following the 2003 reform. No apparent decrease is
seen in malformations and hospitalization during ages 1-4. While some outcomes exhibit larger
variation, overall, these graphs suggest approximately parallel trends in the outcome variables
prior to the reform by simple visual inspection. While trends in maternal labor market outcomes
i.e. income, parental, and sickness benefits appear to be parallel in the pretreatment period
depicted in Figure 6, trends in maternal health exhibit large variation making it hard to assess
the presence of common trends in the pre-treatment period presented in Figure 6.
To examine if the assumption of parallel trends is satisfied, we formally test this by IVF
and reform lags and leads, as per equation 2. By allowing for a more flexible model we can infer
trends in the pre-treatment period as well as whether the effect is persistent in the post-reform
period. The event studies are presented in Figure 8, and confirm previous findings of a sharp
and persistent decline in twin births (Figure 8a). Similarly, we find a strong increase in both
child health (Figure 8b) and maternal labor market outcomes (Figure 8d) but no impact on
maternal health (Figure 8c). Event studies for each component in the indices are presented
91
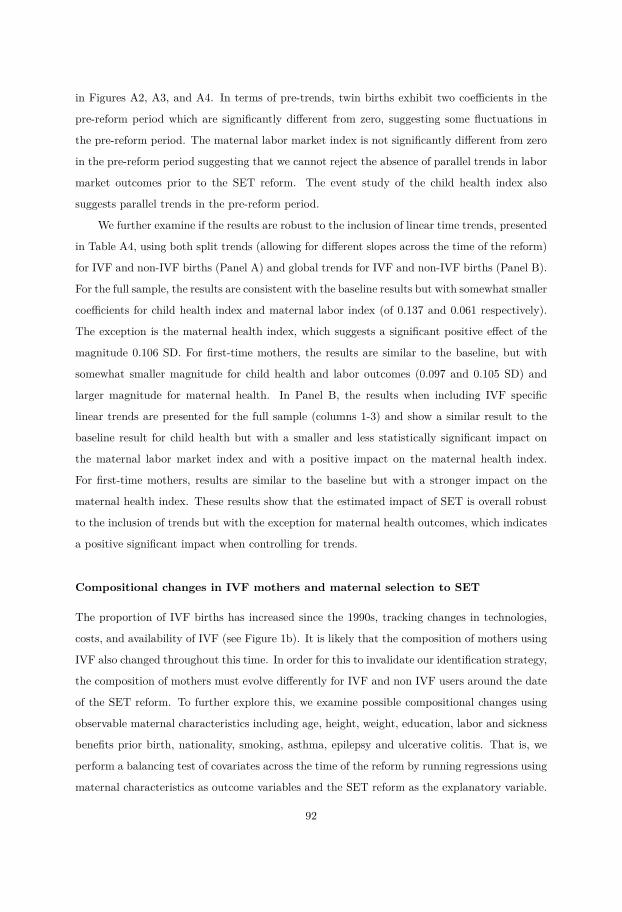
in Figures A2, A3, and A4. In terms of pre-trends, twin births exhibit two coefficients in the
pre-reform period which are significantly different from zero, suggesting some fluctuations in
the pre-reform period. The maternal labor market index is not significantly different from zero
in the pre-reform period suggesting that we cannot reject the absence of parallel trends in labor
market outcomes prior to the SET reform. The event study of the child health index also
suggests parallel trends in the pre-reform period.
We further examine if the results are robust to the inclusion of linear time trends, presented
in Table A4, using both split trends (allowing for different slopes across the time of the reform)
for IVF and non-IVF births (Panel A) and global trends for IVF and non-IVF births (Panel B).
For the full sample, the results are consistent with the baseline results but with somewhat smaller
coefficients for child health index and maternal labor index (of 0.137 and 0.061 respectively).
The exception is the maternal health index, which suggests a significant positive effect of the
magnitude 0.106 SD. For first-time mothers, the results are similar to the baseline, but with
somewhat smaller magnitude for child health and labor outcomes (0.097 and 0.105 SD) and
larger magnitude for maternal health. In Panel B, the results when including IVF specific
linear trends are presented for the full sample (columns 1-3) and show a similar result to the
baseline result for child health but with a smaller and less statistically significant impact on
the maternal labor market index and with a positive impact on the maternal health index.
For first-time mothers, results are similar to the baseline but with a stronger impact on the
maternal health index. These results show that the estimated impact of SET is overall robust
to the inclusion of trends but with the exception for maternal health outcomes, which indicates
a positive significant impact when controlling for trends.
Compositional changes in IVF mothers and maternal selection to SET
The proportion of IVF births has increased since the 1990s, tracking changes in technologies,
costs, and availability of IVF (see Figure 1b). It is likely that the composition of mothers using
IVF also changed throughout this time. In order for this to invalidate our identification strategy,
the composition of mothers must evolve differently for IVF and non IVF users around the date
of the SET reform. To further explore this, we examine possible compositional changes using
observable maternal characteristics including age, height, weight, education, labor and sickness
benefits prior birth, nationality, smoking, asthma, epilepsy and ulcerative colitis. That is, we
perform a balancing test of covariates across the time of the reform by running regressions using
maternal characteristics as outcome variables and the SET reform as the explanatory variable.
92

The results are presented in Table 11, and show a significant impact on three outcomes out of
eleven. These variables are: age (column 1), education (column 4), and smoking (column 8).
While the magnitude of the coefficient on age is rather small, the magnitude of the estimates for
education calls for closer consideration. It is hard to assess how a potential change in “quality”
in mothers have evolved over time. These estimates suggest that mothers are both slightly older
and somewhat more educated but also slightly more likely to be smokers.
We investigate the influence of this on our estimates of the impacts of SET using three
complementary approaches. First, we re-estimate the baseline results including linear trends in
maternal characteristics and IVF-status in each model. In Table 12, the estimates are presented
for the full sample (columns 1-3) and first-time mothers separately (columns 4-6). For the full
sample, the results show a positive and significant impact on child and labor market outcomes,
as in the baseline specification. The estimate for child health (0.149 SD, column 2) is similar
to the baseline estimate but for the maternal labor market index the estimated coefficient is
smaller (0.059 SD, column 3). In contrast to the baseline results, a positive and significant
effect is found for maternal health (column 2) of approximately 0.112 SD, which suggests that
maternal health may have improved by the reform. For first-time mothers, the result is similar
to the baseline but with a somewhat smaller magnitude in child health (0.122 SD, column 4)
and somewhat larger impact on maternal health (0.105 SD column 6).
Since we can only control for trends in observable characteristics, we also examine esti-
mates based on mother fixed effects. These will control for all unobservable time-invariant
characteristics of mothers. To implement this model we need to restrict the sample to women
with at least two pregnancies.18 Approximately 50% of all IVF mothers have more than one
pregnancy, and as such, the use of mother FEs excludes half of the sample. Since mothers
with two pregnancies may not be representative of all mothers, we examine characteristics of
IVF mothers with one pregnancy versus two pregnancies, and these are presented in Table A5.
These mothers differ across multiple dimensions, for example, IVF mothers with only one birth
have a higher risk of complications than those with two births. For this reason, we estimate
the model without mother fixed effects on the reduced sample before we introduce the fixed
18We have shown that the SET reform led to a highly significant decline in twin births among a broad categoryof women e.g. all education levels, BMI classifications, parity and ages except for women older than 39. Thissuggests that compliance with the SET reform is higher among younger women. Provided that child health isnegatively correlated with rising maternal age, this selection could bias our estimates upwards. In addition, thereis likely to be maternal selection based on unobservable characteristics, where mothers with multiple previouslyfailed IVF cycles are less likely to comply with SET, and are at a greater risk of adverse birth outcomes. Thatis, maternal selection into SET could potentially lead to biased estimates, and in particular, may cause upwardlybiased estimates of the improvements in child health and maternal labor market outcomes.
93

effects. We can then assess how the coefficients change with the sample independently of how
they change with controls for unobserved mother-level heterogeneity.
The results are presented in Table 13 and show the impact of the SET reform on twin rates
(column 1), child health (column 2), maternal health (column 3) and labor market outcomes
(column 4). In Panel A, the impact of SET on the selected sample of IVF mothers excluding
mother fixed effects are displayed, and show that the coefficients are similar to the baseline
results. In Panel B, results are presented including mother fixed effects. Again, similar results
to the baseline results are observed but with somewhat lower precision when including mother
fixed effects. We continue to observe large and significant effects of the SET reform even when
only examining within-mother variation in IVF laws. The impact of the SET reform is estimated
to increase child health and labor market attachment of women following birth.
To assess the magnitude of a potential selection bias, we postulate that selection based on
observable explanatory variables provide information on selection on unobservables as suggested
by Altonji et al. (2005). We consider the magnitude of omitted variable bias needed to eliminate
the impact of the SET reform, by computing the ratio of how large the covariance between
unobservables and the SET reform and the covariance between observables and the SET reform
must be to explain away the impact of SET.19 The more the inclusion of controls is affecting
the coefficient indicating the treatment effect, the larger the potential bias is and vice versa.
A large ratio indicates that it is less likely that omitted variables would explain away the
impact of the reform. Table 14 presents the results without including maternal controls. The
coefficients are very similar with and without controls, which is indicated by the ratio between
the two regression models presented in the bottom row. This simple exercise suggests that,
given the limited selection on observables (showed by the ratio) we may assume that selection
on unobservables is equally limited.
5.4 Mechanisms
We examine potential mechanisms through which maternal labor market outcomes are affected
by examining the importance of different components of the reform. We consider the negative
fertility shock as a direct effect of the reform and child and maternal health as indirect effects.
As a mechanism test we include child and maternal health outcomes, which themselves are
outcomes of the reform and therefore “bad controls” (Angrist and Pischke, 2009). However,
19This can be computed by using the estimates from OLS regressions both with and without controls:αcontrols
αnocontrols−αcontrols. For a more detailed discussion see Bellows and Miguel (2009).
94

they will provide us with information on how much the reform is affecting maternal labor
outcomes when improvements in child and maternal health are controlled for. To do this we
adopt the conditional decomposition proposed by Gelbach (2016). We are interested in how
much the estimated effect of the SET reform is affected by including maternal and child health
indicators, βuconditional − βconditional = δ, in which βuc indicates the unconditional specification
excluding child and maternal health and βc expresses the conditional specification including
child and maternal health. We can augment this expression by
βuconditionallabor − βconditional
labor
= Γchildhealthlabor βchildhealth
labor + Γmaternalhealthlabor βmaternalhealth
labor
= δchildhealthlabor + δmaternalhealth
labor = δlabor (3)
where Γ represents each estimate of the SET reform (postSET×IVF) for each potential mech-
anism as the outcome variable. The coefficient β indicates the estimate of the potential mech-
anisms as explanatory variables in the full specification with maternal labor outcomes as the
dependent variable. The conditional contribution of each component is given by δ, which is
computed by multiplying Γ with β.
In Table 15, the potential mechanisms of child and maternal health are included in the
baseline specification, Equation 1. Table 15 presents the impact of the SET reform on child
health (column 1), maternal health (column 2) and maternal labor index including the potential
mechanisms of child and maternal health (column 3). To see how each of the components are
affecting the maternal labor index, the Gelbach decomposition is presented in column 4. The
decomposition shows that the impact of changes in child health owing to the reform explains
only 0.005 of the improvements in the maternal labor market index, with an even smaller value
of 0.002 owing to changes in maternal health. The total explained difference is 0.007 of the total
0.099 SD of improvements in the maternal labor market index following from the SET reform.
This suggests that the drop in fertility is the main contributor to improvements in maternal
labor outcomes.
5.5 Additional robustness and sensitivity
Additional robustness checks are presented in Table 16. First (Panel A), we remove births from
the two years prior to the SET reform (2001-2002) in order to account for a potential gradual
increase in SET, which may bias our estimates downwards because of a partially contaminated
95

control group. The impact of SET on twin birth (column 1), child health index (column
2), maternal health index (column 3) and maternal labor index (column 4) shows a similar
coefficient and effect size to the baseline results. In Panel B, we remove the region of Skåne
because of a regional rule mandating SET as the default starting in 2001 in this region. The
results remain largely similar to the baseline results when removing this region.
In 2005, Sweden started to offer same-sex couples publicly funded access to fertility treat-
ments including IVF. Previous literature suggests that same-sex couples exhibit a higher socioe-
conomic status (Ahmed et al., 2011a,b). Their children, however, exhibit somewhat worse birth
outcomes in terms of lower birth weight, when compared with children born to heterosexual
couples (Aldén et al., 2017). While the number of children born to lesbian parents during 1995-
2010 is only 750, we further examine a potential impact of this legislative change. We restrict
our sample to conceptions occurring during 1998-2004, and re-estimate our baseline model. The
result is presented in Panel C in Table 16. The results are similar to the baseline results but
with somewhat smaller estimates of -15 pp for twin births, 0.154 SD for child health and 0.067
SD for maternal labor index.
As discussed previously, the Medical Birth Registry correctly identifies approximately 70%
of all IVF births based on reported usage in aggregate national IVF data. We may be concerned
that approximately 30% of IVF births are mis-reported, and are incorrectly reported as non-IVF
births, thus contaminating the control group. In practice, given that the size of the “treatment”
group is much smaller than the size of the “control” group, even if the reform’s impact was very-
large, the 30% of mis-classified IVF births will be unlikely to impact averages in the control
group in a substantive way. To see this, consider that the number of observed IVF births in
the Medical Birth Registry is 21,783, and the number of non-IVF births is 916,110. Inflating
the number of IVF births from 70 to 100% suggests that there are 9,356 IVF births incorrectly
classified as non-IVF births. This is only slightly over 1% of the entire group of births assumed
to be non-IVF births. We provide additional discussion, as well as a calculation of the (small)
magnitude of any expected attenuation, in Appendix A2.
6 Conclusion
The invention of IVF allowed radical changes in the fertility behavior of some women and
families, providing the opportunity to postpone childbearing, as well as assisting involuntary
childlessness. However, there are also well-documented immediate and long-run costs associated
96

with IVF-usage. As well as the direct financial costs of procedures, IVF births have been doc-
umented to be considerably more likely to suffer from adverse health outcomes when compared
to non-IVF births (Saldeen and Sundström, 2005). The adverse health outcomes following IVF
are mainly attributed to the increased likelihood of multiple births. Twin births are widely
documented as a major risk factor for mothers and children, for example, given the alleviated
risk of preterm birth, low birth weight, fetal malformation and complicated delivery (Gelbaya
et al., 2010). In particular, premature delivery is associated with higher mortality as well as
long term adverse effects on neurological development (Gelbaya et al., 2010).
In this study we document the causal impact of a reform mandating single embryo trans-
fer (SET) for IVF treatments on a broad set of child and maternal health and labor market
outcomes. Using rich Swedish registry data for the time period 1998-2007, we find that the
SET reform led to a sharp drop in rates of twin births: by over 60% for women under age 40.
Reduced rates of twinning are observed for a broad category of women across birth order, edu-
cation level and BMI classification. We find a highly significant and sizeable impact of the SET
reform on child health as measured by Apgar score, gestational age, birth weight, length and
head circumference. These findings are important given the well-known links between human
capital at birth, and outcomes across the entire life-course including cognitive and non-cognitive
ability, educational attainments, health and life expectancy. Moreover, our results suggest a
decrease in complications of labor such as breech presentation at birth, emergency C-sections
and reduced usage of neonatal hospitalization. Overall, our estimates suggest that the adoption
of SET as the official IVF procedure reduced the health differential between IVF and non-IVF
births by over 50%.
We also find that the adoption of SET resulted in a sizable and significant impact on
maternal labor outcomes. The positive impact on labor market outcomes originate from a
reduction in the usage of sickness benefits, and increased labor income in the period three years
subsequent to birth. A significant impact on maternal health is found for first-time mothers,
closing the gap in maternal health between IVF and non-IVF mothers by 36%.
The large magnitude of health benefits from SET is not limited to the children, mothers
and families, but will also have a positive effect on the health care system and social safety
net. Improvements in health at birth and during gestation will have follow-on effects, reducing
demand for prenatal, obstetric and neonatal care. The SET reform is likely to reduce the long-
term costs associated with IVF procedures, but at the immediate cost of less choice for women
and couples seeking IVF. However, given that the delivery rate was unchanged despite the shift
97

from DET to SET, this suggests there is no fertility-cost to the increased health of the child at
birth. One reason why multiple embryo transfer is still common in many industrialized countries
is likely due to financial incentives, jeopardizing the health of children and mothers (Karlström
and Bergh, 2007). IVF has increased rapidly since the 1980s and is now a key feature of the
reproductive landscape and is likely to increase further in the near future. Any improvements
in individual and aggregate health due to the adoption of SET as a default IVF option will be
magnified as rates of IVF use increase.
98
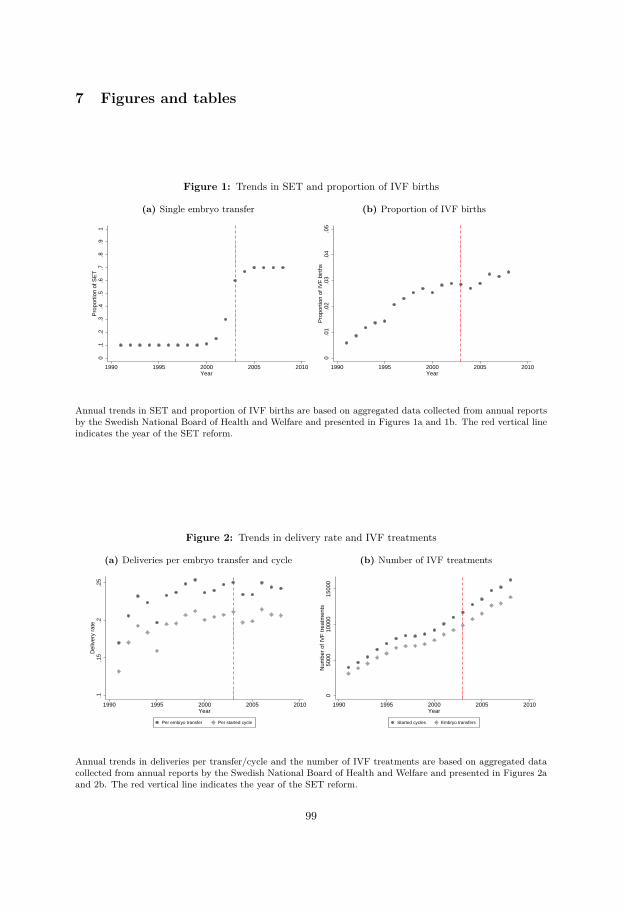
7 Figures and tables
Figure 1: Trends in SET and proportion of IVF births
(a) Single embryo transfer
0.1
.2.3
.4.5
.6.7
.8.9
1P
ropo
rtio
n of
SE
T
1990 1995 2000 2005 2010Year
(b) Proportion of IVF births
0.0
1.0
2.0
3.0
4.0
5P
ropo
rtio
n of
IVF
birt
hs
1990 1995 2000 2005 2010Year
Annual trends in SET and proportion of IVF births are based on aggregated data collected from annual reportsby the Swedish National Board of Health and Welfare and presented in Figures 1a and 1b. The red vertical lineindicates the year of the SET reform.
Figure 2: Trends in delivery rate and IVF treatments
(a) Deliveries per embryo transfer and cycle
.1.1
5.2
.25
Del
iver
y ra
te
1990 1995 2000 2005 2010Year
Per embryo transfer Per started cycle
(b) Number of IVF treatments
050
0010
000
1500
0N
umbe
r of
IVF
trea
tmen
ts
1990 1995 2000 2005 2010Year
Started cycles Embryo transfers
Annual trends in deliveries per transfer/cycle and the number of IVF treatments are based on aggregated datacollected from annual reports by the Swedish National Board of Health and Welfare and presented in Figures 2aand 2b. The red vertical line indicates the year of the SET reform.
99
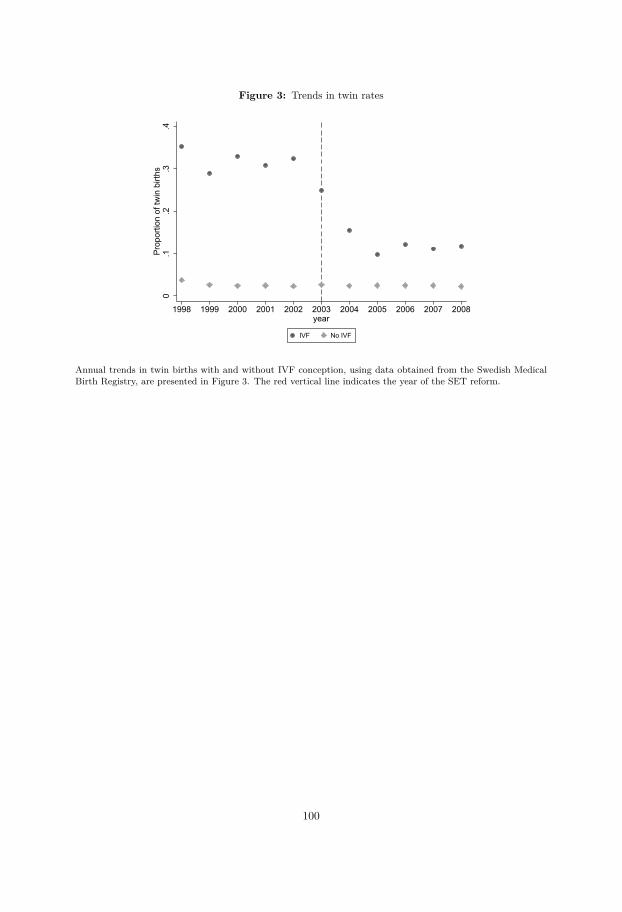
Figure 3: Trends in twin rates
0.1
.2.3
.4Pr
opor
tion
of tw
in b
irths
1998 1999 2000 2001 2002 2003 2004 2005 2006 2007 2008year
IVF No IVF
Annual trends in twin births with and without IVF conception, using data obtained from the Swedish MedicalBirth Registry, are presented in Figure 3. The red vertical line indicates the year of the SET reform.
100
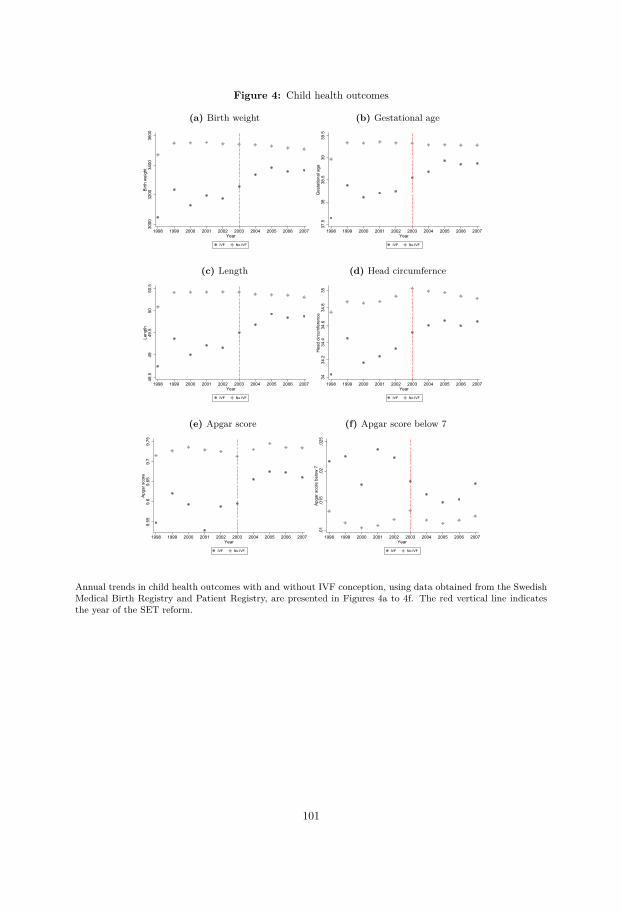
Figure 4: Child health outcomes
(a) Birth weight
3000
3200
3400
3600
Birth
wei
ght
1998 1999 2000 2001 2002 2003 2004 2005 2006 2007Year
IVF No IVF
(b) Gestational age
37.5
3838
.539
39.5
Ges
tatio
nal a
ge
1998 1999 2000 2001 2002 2003 2004 2005 2006 2007Year
IVF No IVF
(c) Length
48.5
4949
.550
50.5
Leng
th
1998 1999 2000 2001 2002 2003 2004 2005 2006 2007Year
IVF No IVF
(d) Head circumfernce
3434
.234
.434
.634
.835
Hea
d ci
rcum
fere
nce
1998 1999 2000 2001 2002 2003 2004 2005 2006 2007Year
IVF No IVF
(e) Apgar score
9.55
9.6
9.65
9.7
9.75
Apga
r sco
re
1998 1999 2000 2001 2002 2003 2004 2005 2006 2007Year
IVF No IVF
(f) Apgar score below 7
.01
.015
.02
.025
Apga
r sco
re b
elow
7
1998 1999 2000 2001 2002 2003 2004 2005 2006 2007Year
IVF No IVF
Annual trends in child health outcomes with and without IVF conception, using data obtained from the SwedishMedical Birth Registry and Patient Registry, are presented in Figures 4a to 4f. The red vertical line indicatesthe year of the SET reform.
101
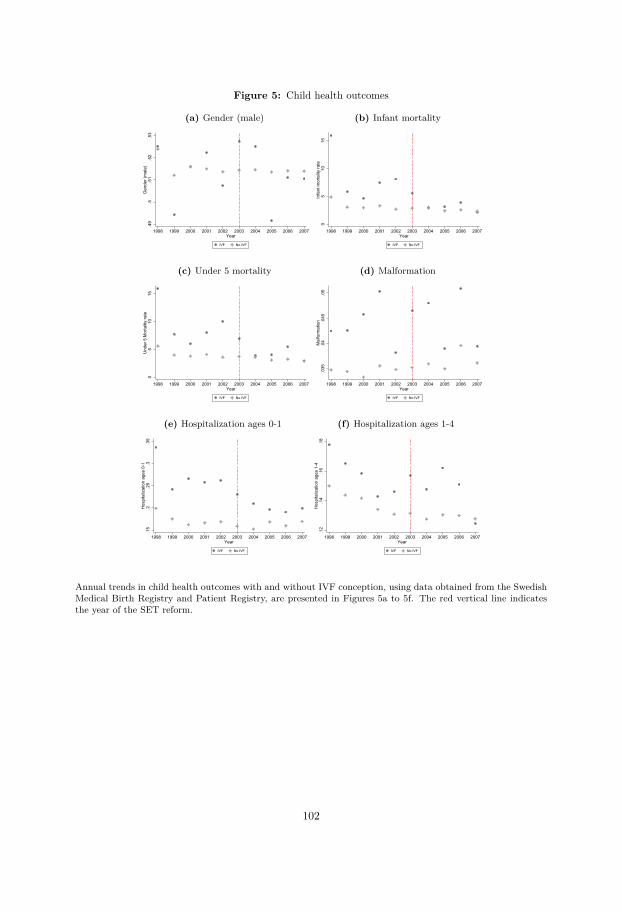
Figure 5: Child health outcomes
(a) Gender (male)
.49
.5.5
1.5
2.5
3G
ende
r (m
ale)
1998 1999 2000 2001 2002 2003 2004 2005 2006 2007Year
IVF No IVF
(b) Infant mortality
05
1015
Infa
nt m
orta
lity
rate
1998 1999 2000 2001 2002 2003 2004 2005 2006 2007Year
IVF No IVF
(c) Under 5 mortality
05
1015
Und
er 5
Mor
talit
y ra
te
1998 1999 2000 2001 2002 2003 2004 2005 2006 2007Year
IVF No IVF
(d) Malformation
.035
.04
.045
.05
Mal
form
atio
n
1998 1999 2000 2001 2002 2003 2004 2005 2006 2007Year
IVF No IVF
(e) Hospitalization ages 0-1
.15
.2.2
5.3
.35
Hos
pita
lizat
ion
ages
0-1
1998 1999 2000 2001 2002 2003 2004 2005 2006 2007Year
IVF No IVF
(f) Hospitalization ages 1-4
.12
.14
.16
.18
Hos
pita
lizat
ion
ages
1-4
1998 1999 2000 2001 2002 2003 2004 2005 2006 2007Year
IVF No IVF
Annual trends in child health outcomes with and without IVF conception, using data obtained from the SwedishMedical Birth Registry and Patient Registry, are presented in Figures 5a to 5f. The red vertical line indicatesthe year of the SET reform.
102
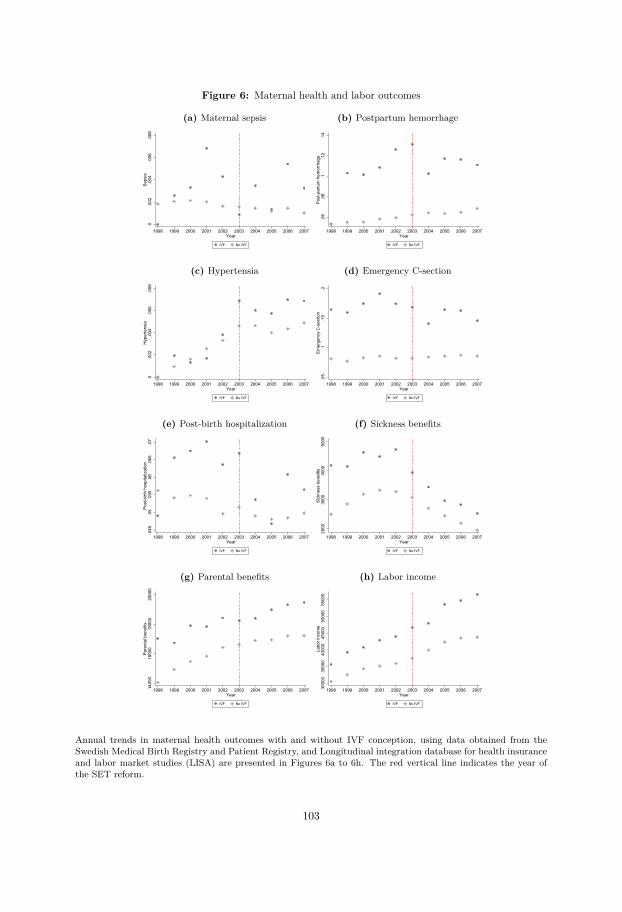
Figure 6: Maternal health and labor outcomes
(a) Maternal sepsis
0.0
02.0
04.0
06.0
08Se
psis
1998 1999 2000 2001 2002 2003 2004 2005 2006 2007Year
IVF No IVF
(b) Postpartum hemorrhage
.06
.08
.1.1
2.1
4Po
st-p
artu
m h
emor
rhag
e
1998 1999 2000 2001 2002 2003 2004 2005 2006 2007Year
IVF No IVF
(c) Hypertensia
0.0
02.0
04.0
06.0
08H
yper
tens
ia
1998 1999 2000 2001 2002 2003 2004 2005 2006 2007Year
IVF No IVF
(d) Emergency C-section
.05
.1.1
5.2
Emer
genc
y C
-sec
tion
1998 1999 2000 2001 2002 2003 2004 2005 2006 2007Year
IVF No IVF
(e) Post-birth hospitalization
.045
.05
.055
.06
.065
.07
Post
-birt
h ho
spita
lizat
ion
1998 1999 2000 2001 2002 2003 2004 2005 2006 2007Year
IVF No IVF
(f) Sickness benefits
2000
3000
4000
5000
Sick
ness
ben
efits
1998 1999 2000 2001 2002 2003 2004 2005 2006 2007Year
IVF No IVF
(g) Parental benefits
1400
016
000
1800
020
000
Pare
ntal
ben
efits
1998 1999 2000 2001 2002 2003 2004 2005 2006 2007Year
IVF No IVF
(h) Labor income
3000
035
000
4000
045
000
5000
055
000
Labo
r inc
ome
1998 1999 2000 2001 2002 2003 2004 2005 2006 2007Year
IVF No IVF
Annual trends in maternal health outcomes with and without IVF conception, using data obtained from theSwedish Medical Birth Registry and Patient Registry, and Longitudinal integration database for health insuranceand labor market studies (LISA) are presented in Figures 6a to 6h. The red vertical line indicates the year ofthe SET reform.
103

Figure 7: Age distribution among IVF and non IVF-mothers
0.0
2.0
4.0
6.0
8
10 20 30 40 50Mother's Age
IVF No IVF
Age
The data are obtained from the Swedish Medical Birth Registry for the time period 1998-2007. Figure 7 displaysthe age distribution among IVF and non-IVF mothers.
104
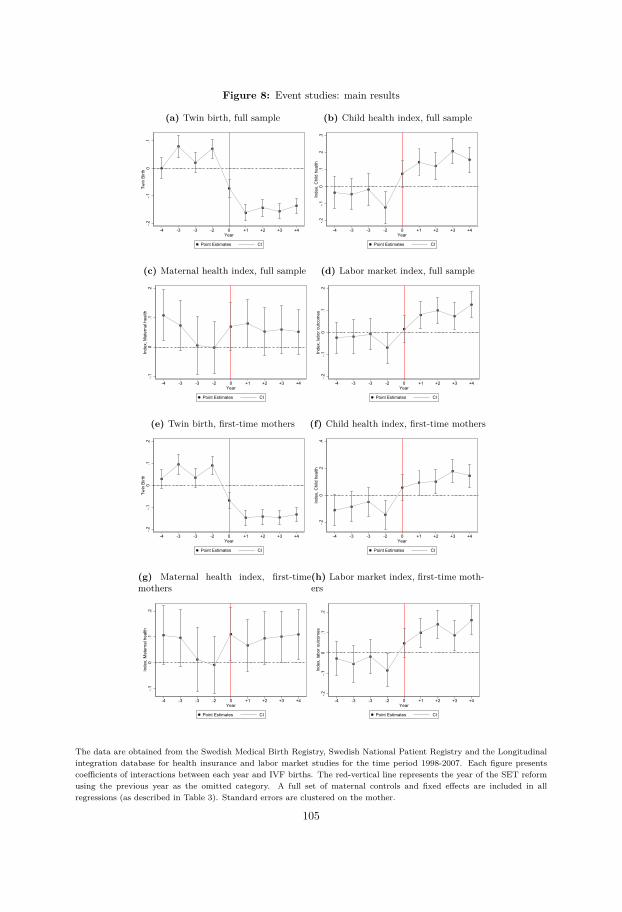
Figure 8: Event studies: main results
(a) Twin birth, full sample
-.2-.1
0.1
Twin
Birt
h
-4 -3 -3 -2 0 +1 +2 +3 +4Year
Point Estimates CI
(b) Child health index, full sample
-.2-.1
0.1
.2.3
Inde
x, C
hild
hea
lth
-4 -3 -3 -2 0 +1 +2 +3 +4Year
Point Estimates CI
(c) Maternal health index, full sample
-.10
.1.2
Inde
x, M
ater
nal h
ealth
-4 -3 -3 -2 0 +1 +2 +3 +4Year
Point Estimates CI
(d) Labor market index, full sample
-.2-.1
0.1
.2In
dex,
labo
r out
com
es
-4 -3 -3 -2 0 +1 +2 +3 +4Year
Point Estimates CI
(e) Twin birth, first-time mothers
-.2-.1
0.1
.2Tw
in B
irth
-4 -3 -3 -2 0 +1 +2 +3 +4Year
Point Estimates CI
(f) Child health index, first-time mothers
-.20
.2.4
Inde
x, C
hild
hea
lth
-4 -3 -3 -2 0 +1 +2 +3 +4Year
Point Estimates CI
(g) Maternal health index, first-timemothers
-.10
.1.2
Inde
x, M
ater
nal h
ealth
-4 -3 -3 -2 0 +1 +2 +3 +4Year
Point Estimates CI
(h) Labor market index, first-time moth-ers
-.2-.1
0.1
.2In
dex,
labo
r out
com
es
-4 -3 -3 -2 0 +1 +2 +3 +4Year
Point Estimates CI
The data are obtained from the Swedish Medical Birth Registry, Swedish National Patient Registry and the Longitudinalintegration database for health insurance and labor market studies for the time period 1998-2007. Each figure presentscoefficients of interactions between each year and IVF births. The red-vertical line represents the year of the SET reformusing the previous year as the omitted category. A full set of maternal controls and fixed effects are included in allregressions (as described in Table 3). Standard errors are clustered on the mother.
105
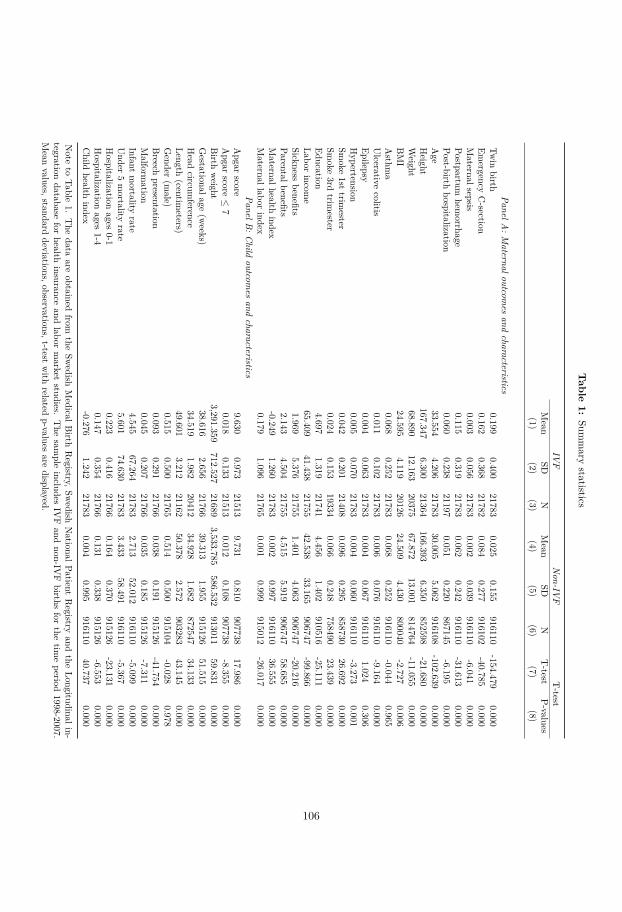
Table
1:Sum
mary
statistics
IVF
Non-IV
FT-test
Mean
SDN
Mean
SDN
T-test
P-values(1)
(2)(3)
(4)(5)
(6)(7)
(8)
PanelA:M
aternaloutcomes
andcharacteristics
Twin
birth0.199
0.40021783
0.0250.155
916110-154.479
0.000Em
ergencyC-section
0.1620.368
217820.084
0.277916102
-40.7850.000
Maternalsepsis
0.0030.056
217830.002
0.039916110
-6.0410.000
Postpartumhem
orrhage0.115
0.31921783
0.0620.242
916110-31.613
0.000Post-birth
hospitalization0.060
0.23821197
0.0510.220
867145-6.195
0.000Age
33.5544.206
2178330.005
5.062916108
-102.6390.000
Height
167.3476.300
21364166.393
6.350852598
-21.6800.000
Weight
68.89012.163
2037567.872
13.001814764
-11.0550.000
BMI
24.5954.119
2012624.509
4.430800040
-2.7270.006
Asthm
a0.068
0.25221783
0.0680.252
916110-0.044
0.965Ulcerative
colitis0.011
0.10221783
0.0060.076
916110-9.164
0.000Epilepsy
0.0040.063
217830.004
0.067916110
1.0240.306
Hypertension
0.0050.070
217830.004
0.060916110
-3.2730.001
Smoke
1sttrim
ester0.042
0.20121408
0.0960.295
85873026.692
0.000Sm
oke3rd
trimester
0.0240.153
193340.066
0.248758490
23.4390.000
Education4.697
1.31921741
4.4561.402
910516-25.111
0.000Labor
income
65.40941.438
2175542.538
33.165906747
-99.8660.000
Sicknessbenefits
1.9695.376
217551.401
4.063906747
-20.2160.000
Parentalbenefits2.143
4.50421755
4.5155.919
90674758.685
0.000Maternalhealth
index-0.249
1.26021783
0.0020.997
91611036.555
0.000Maternallabor
index0.179
1.09621765
0.0010.999
915012-26.017
0.000PanelB
:Child
outcomes
andcharacteristics
Apgar
score9.630
0.97321513
9.7310.810
90773817.986
0.000Apgar
score≤
70.018
0.13321513
0.0120.108
907738-8.355
0.000Birth
weight
3,291.359712.527
216893,533.785
586.532913011
59.8310.000
Gestationalage
(weeks)
38.6162.656
2176639.313
1.955915126
51.5150.000
Head
circumference
34.5191.982
2041234.928
1.682872547
34.1330.000
Length(centim
eters)49.601
3.21221162
50.3782.572
90328343.145
0.000Gender
(male)
0.5150.500
217650.514
0.500915104
-0.0280.978
Breech
presentation0.093
0.29121766
0.0380.191
915126-41.754
0.000Malform
ation0.045
0.20721766
0.0350.185
915126-7.311
0.000Infant
mortality
rate4.545
67.26421783
2.71352.012
916110-5.099
0.000Under
5mortality
rate5.601
74.63021783
3.43358.491
916110-5.367
0.000Hospitalization
ages0-1
0.2230.416
217660.164
0.370915126
-23.1310.000
Hospitalization
ages1-4
0.1470.354
217660.131
0.338915126
-6.5530.000
Child
healthindex
-0.2761.242
217830.004
0.995916110
40.7370.000
Note
toTable
1.The
dataare
obtainedfrom
theSw
edishMedicalB
irthRegistry,Sw
edishNationalPatient
Registry
andthe
Longitudinalin-tegration
databasefor
healthinsurance
andlabor
market
studies.The
sample
includesIV
Fand
non-IVF
birthsfor
thetim
eperiod
1998-2007.Mean
values,standarddeviations,observations,t-test
with
relatedp-values
aredisplayed.
106
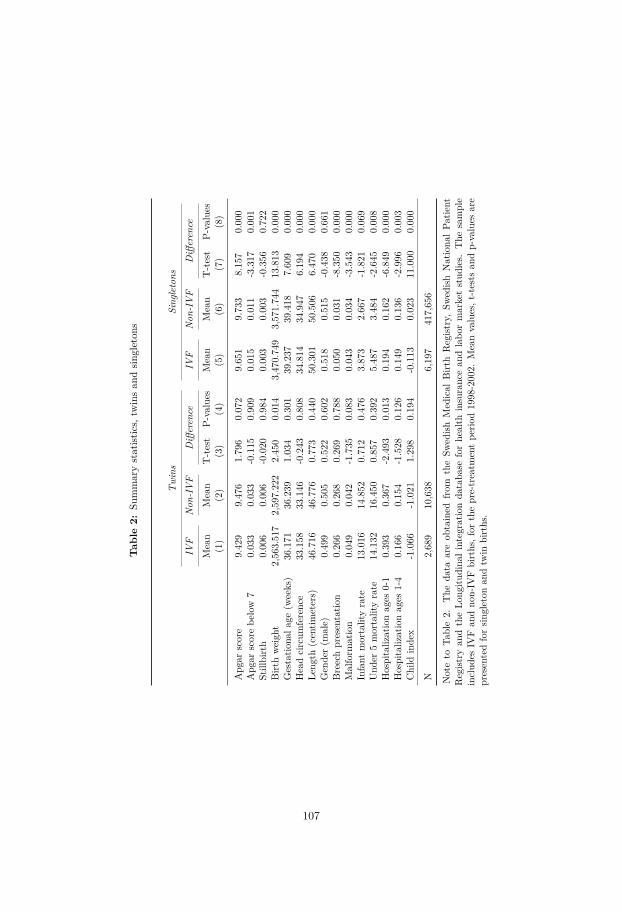
Tab
le2:
Summarystatist
ics,
twinsan
dsin
gleton
s
Twins
Sing
letons
IVF
Non
-IVF
Differen
ceIV
FNon
-IVF
Differen
ce
Mean
Mean
T-test
P-values
Mean
Mean
T-test
P-values
(1)
(2)
(3)
(4)
(5)
(6)
(7)
(8)
Apg
arscore
9.42
99.47
61.79
60.07
29.65
19.73
38.15
70.00
0Apg
arscorebe
low
70.03
30.03
3-0.115
0.90
90.01
50.01
1-3.317
0.00
1Stillbirth
0.00
60.00
6-0.020
0.98
40.00
30.00
3-0.356
0.72
2Birt
hweigh
t2,56
3.51
72,59
7.22
22.45
00.01
43,47
0.74
93,57
1.74
413
.813
0.00
0Gestatio
nala
ge(w
eeks)
36.171
36.239
1.03
40.30
139
.237
39.418
7.60
90.00
0Headcircum
ferenc
e33
.158
33.146
-0.243
0.80
834
.814
34.947
6.19
40.00
0Le
ngth
(centim
eters)
46.716
46.776
0.77
30.44
050
.301
50.506
6.47
00.00
0Gen
der(m
ale)
0.49
90.50
50.52
20.60
20.51
80.51
5-0.438
0.66
1Breechpresentatio
n0.26
60.26
80.26
90.78
80.05
00.03
1-8.350
0.00
0Malform
ation
0.04
90.04
2-1.735
0.08
30.04
30.03
4-3.543
0.00
0Infant
mortalityrate
13.016
14.852
0.71
20.47
63.87
32.66
7-1.821
0.06
9Und
er5mortalityrate
14.132
16.450
0.85
70.39
25.48
73.48
4-2.645
0.00
8Hospitaliz
ationag
es0-1
0.39
30.36
7-2.493
0.01
30.19
40.16
2-6.849
0.00
0Hospitaliz
ationag
es1-4
0.16
60.15
4-1.528
0.12
60.14
90.13
6-2.996
0.00
3Child
inde
x-1.066
-1.021
1.29
80.19
4-0.113
0.02
311
.000
0.00
0
N2,68
910
,638
6,19
741
7,65
6
Noteto
Table2.
The
data
areob
tained
from
theSw
edish
Med
ical
Birt
hRegist
ry,Sw
edish
Nationa
lPa
tient
Regist
ryan
dtheLo
ngitu
dina
lintegratio
nda
taba
seforhe
alth
insuranc
ean
dlabo
rmarketstud
ies.
The
sample
includ
esIV
Fan
dno
n-IV
Fbirths,for
thepre-treatm
entpe
riod19
98-200
2.Meanvalues,t
-tests
andp-values
are
presentedforsin
gleton
andtw
inbirths.
107

Table
3:Probability
oftwinning
Fullsample
First-timemothers
(1)(2)
(3)(4)
Twin
birthTwin
birthTwin
birthTwin
birth
postSET*IV
F-0.173***
-0.168***-0.177***
-0.177***(0.007)
(0.007)(0.009)
(0.009)IV
F0.276***
0.268***0.274***
0.268***(0.006)
(0.006)(0.007)
(0.007)Mother
weight
0.000***0.000***
(0.000)(0.000)
Mother
height0.000***
0.000***(0.000)
(0.000)Sm
oking1st
trimester
0.003***-0.001
(0.001)(0.001)
Native
-0.0000.004***
(0.001)(0.001)
Laborincom
e0.000
0.000*(0.000)
(0.000)Sickness
benefits0.000
0.000(0.000)
(0.000)Fixed
effectsNO
YES
No
YES
Controls
NO
YES
No
YES
R-Squared
0.0380.062
0.0640.067
Observations
937893937893
414182414182
Mean
ofdep.var.
0.0290.029
0.0290.029
Controlm
ean0.027
0.0270.027
0.027Controlsd
0.1630.163
0.1620.162
Note
toTable
3.The
dataare
obtainedfrom
theSw
edishMedicalB
irthRegistry,Sw
edishNationalPatientR
egistryand
theLon-
gitudinalintegrationdatabase
forhealth
insuranceand
labormarket
studiesfor
thetim
eperiod
1998-2007.Each
columnpresents
aseparate
OLS
regressionwith
DiD
estimates
oftheim
pactofthe
SETreform
onthe
probabilityoftw
inbirth
forthe
fullsam-
ple(colum
ns1-2)
andfirst-tim
emothers
(columns
3-4).In
columns
1and
3,controlsare
excluded.In
columns
2and
4,afullset
ofmaternaland
childcontrols
andfixed
effectsare
included(age,birth
order,countryfixed
effectsalong
with
maternalcharac-
teristicssuch
asweight,height,sm
oking,andbinary
variablesfor
missing
values).Estim
ateddate
ofconceptionfixed
effectsare
includedin
allregressions.Standard
errorsare
clusteredon
themother.
*p<0.1,**
p<0.05,***
p<0.01.
108

Tab
le4:
Prob
ability
oftw
inning
,heterogeneous
effects
Dependent
variable:twin
birth
Pan
elA
Sub-Sa
mple:
Birt
horder
Age
grou
ps
(1)
(2)
(3)
(4)
(5)
(6)
(7)
(8)
Birt
horder1
Birt
horder2
Birt
horder≥
3Ages<
25Ages25-29
Ages30-34
Ages35-39
Ages>
39
IVF×
postSE
T-0.178***
-0.160***
-0.0950***
-0.108**
-0.223***
-0.200***
-0.128***
-0.0235
(0.0087)
(0.0153)
(0.0329)
(0.0456)
(0.0182)
(0.0113)
(0.0125)
(0.0231)
IVF
0.268***
0.276***
0.212***
0.174***
0.308***
0.288***
0.235***
0.140***
(0.0074)
(0.0129)
(0.0264)
(0.0361)
(0.0152)
(0.0096)
(0.0105)
(0.0192)
Observatio
ns414182
341724
181347
132592
290706
331919
153399
29275
R2
0.066
0.045
0.047
0.085
0.067
0.079
0.104
0.254
Meanof
dep.
var.
0.0290
0.0278
0.0264
0.0162
0.0242
0.0316
0.0401
0.0373
Pan
elB
Sub-Sa
mple:
Education
BMIclassifi
catio
n
(1)
(2)
(3)
(4)
(5)
(6)
(7)
Prim
ary
education
Second
ary
education
Tertiary
education
Und
erweigh
tBMI<
18.5
Normal
weigh
tBMI18.5-24
Overw
eigh
tBMI25-29
Obe
sity
BMI≥
30
IVF×
postSE
T-0.146***
-0.162***
-0.183***
-0.0940**
-0.179***
-0.151***
-0.151***
(0.0154)
(0.0116)
(0.0123)
(0.0479)
(0.0098)
(0.0148)
(0.0224)
IVF
0.266***
0.257***
0.275***
0.207***
0.270***
0.270***
0.236***
(0.0118)
(0.0098)
(0.0108)
(0.0382)
(0.0084)
(0.0123)
(0.0195)
Observatio
ns236541
383284
312432
19433
498958
211379
90396
R2
0.089
0.067
0.078
0.344
0.069
0.088
0.123
Meanof
dep.
var.
0.0291
0.0280
0.0294
0.0226
0.0272
0.0301
0.0300
Noteto
Table4.
The
data
areob
tained
from
theSw
edish
Medical
Birt
hRegist
ry,S
wedish
Nationa
lPatient
Regist
ryan
dtheLo
ngitu
dina
lintegratio
nda
taba
seforhealth
insurancean
dlabo
rmarketstud
iesforthetim
epe
riod1998-2007.
Each
columnpresents
asepa
rate
OLS
regressio
nwith
DiD
estim
ates
oftheim
pact
oftheSE
Treform
ontheprob
ability
twin
birthfordiffe
rent
sub-samples
ofbirthorder,
agegrou
ps,e
ducatio
nattainments
andBMIclassifi
catio
ns.Allregressio
nsinclud
ingcoun
ty,e
stim
ated
date
ofconceptio
n,birthorderan
dagefix
edeff
ects
andbina
ryvaria
bles
formiss
ingvalues.Stan
dard
errors
areclusteredon
themother.
*p<
0.1,
**p<
0.05,*
**p<
0.01.
109

Table
5:Effects
ofSETon
childand
maternaloutcom
es
Fullsample
First-timemothers
(1)(2)
(3)(4)
(5)(6)
Child
healthindex
Maternalhealth
indexMaternallabor
indexChild
healthindex
Maternalhealth
indexMaternallabor
index
postSET*IV
F0.189***
0.0320.106***
0.184***0.056**
0.156***(0.019)
(0.020)(0.016)
(0.022)(0.023)
(0.019)IV
F-0.355***
-0.165***-0.125***
-0.319***-0.156***
-0.163***(0.016)
(0.015)(0.013)
(0.018)(0.018)
(0.016)
R-Squared
0.0190.023
0.1960.021
0.0270.198
Observations
937893937893
936777414180
414180413652
Mean
ofdep.var.
-0.003-0.003
0.005-0.003
-0.0040.006
Controlm
ean0.000
-0.000-0.000
0.0000.000
-0.000Controlsd
1.0001.000
1.0001.000
1.0001.000
Note
toTable
5.The
dataare
obtainedfrom
theSw
edishMedicalB
irthRegistry,Sw
edishNationalPatient
Registry
andthe
Longitudinalintegrationdatabase
forhealth
insur-ance
andlabor
market
studiesfor
thetim
eperiod
1998-2007.Each
columnpresents
aseparate
OLS
regressionwith
DiD
estimates
oftheim
pactofthe
SETreform
onchild
healthindex
(columns
1and
4),maternalhealth
index(colum
ns2and
5),maternallabor
market
index(colum
ns3and
6).PanelA
presentsestim
atesfor
thefullsam
pleand
PanelBasub-sam
pleoffirst-tim
emothers.
Afullset
ofmaternalcontrols
andfixed
effectsare
includedin
allregressions(as
describedin
Table3).
Standarderrors
areclustered
onthe
mother.
*p<0.1,**
p<0.05,***
p<0.01.
110
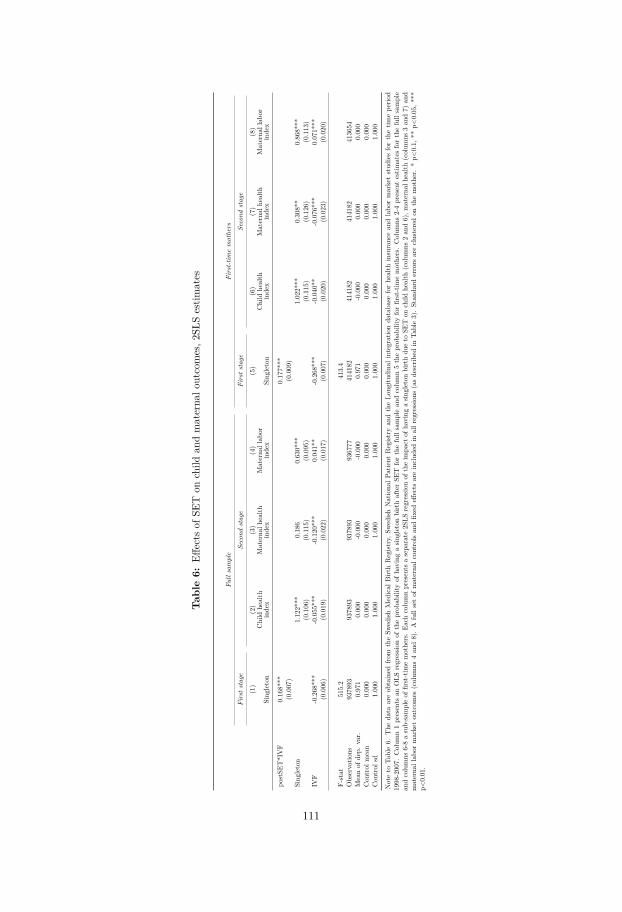
Tab
le6:
Effects
ofSE
Ton
child
andmaterna
loutcomes,2
SLSestim
ates
Fullsample
First-tim
emothers
Firststage
Second
stage
Firststage
Second
stage
(1)
(2)
(3)
(4)
(5)
(6)
(7)
(8)
Sing
leton
Child
health
inde
xMaterna
lhealth
inde
xMaterna
llab
orinde
xSing
leton
Child
health
inde
xMaterna
lhealth
inde
xMaterna
llab
orinde
x
postSE
T*IVF
0.16
8***
0.17
7***
(0.007
)(0.009
)Sing
leton
1.12
2***
0.18
60.63
0***
1.02
2***
0.30
8**
0.86
8***
(0.106
)(0.115
)(0.095
)(0.115
)(0.126
)(0.113
)IV
F-0.268
***
-0.055
***
-0.120
***
0.04
1**
-0.268
***
-0.040
**-0.076
***
0.07
1***
(0.006
)(0.019
)(0.022
)(0.017
)(0.007
)(0.020
)(0.023
)(0.020
)
F-stat
515.2
413.4
Observatio
ns93
7893
9378
9393
7893
9367
7741
4182
4141
8241
4182
4136
54Meanof
dep.
var.
0.97
10.00
0-0.000
-0.000
0.97
1-0.000
0.00
00.00
0Con
trol
mean
0.00
00.00
00.00
00.00
00.00
00.00
00.00
00.00
0Con
trol
sd1.00
01.00
01.00
01.00
01.00
01.00
01.00
01.00
0
Noteto
Table6.
The
data
areob
tained
from
theSw
edish
Med
ical
Birt
hRegist
ry,S
wed
ishNationa
lPatient
Regist
ryan
dtheLo
ngitu
dina
lintegratio
nda
taba
seforhe
alth
insuranc
ean
dlabo
rmarketstud
iesforthetim
epe
riod
1998
-200
7.Colum
n1presents
anOLS
regressio
nof
theprob
ability
ofha
ving
asin
gleton
birthafterSE
Tforthefullsamplean
dcolumn5theprob
ability
forfirst-tim
emothe
rs.Colum
ns2-4presentestim
ates
forthefullsample
andcolumns
6-8asub-sampleof
first-tim
emothe
rs.Ea
chcolumnpresents
asepa
rate
2SLS
regressio
nof
theim
pact
ofha
ving
asin
gleton
birthdu
eto
SET
onchild
health
(colum
ns2an
d6),m
aterna
lhealth
(colum
ns3an
d7)
and
materna
llab
ormarketou
tcom
es(colum
ns4an
d8).A
fullsetof
materna
lcon
trolsan
dfix
edeff
ects
areinclud
edin
allr
egressions
(asde
scrib
edin
Table3).Stan
dard
errors
areclusteredon
themothe
r.*p<
0.1,
**p<
0.05
,***
p<0.01
.
111

Table
7:Effects
ofSETon
childhealth
PanelA:Fullsam
ple
(1)(2)
(3)(4)
(5)(6)
(7)(8)
(9)(10)
(11)(12)
(13)
Apgarscore
Apgar
score<7
Birth
weight
Birth
lenghtHead
circumfernce
Gestation
Male
Infantmortalityrate
Underfive
mortality
Breech
position
Child
hospitalizationages
0-1
Child
hospitalizationages
1-4Fetal
malform
ation
postSET*IV
F0.061***
-0.005**175.119***
0.605***0.235***
0.539***0.005
-2.993***-3.492***
-0.036***-0.045***
-0.002-0.001
(0.014)(0.002)
(11.343)(0.052)
(0.032)(0.045)
(0.007)(1.062)
(1.163)(0.004)
(0.006)(0.005)
(0.003)IV
F-0.082***
0.006***-307.348***
-1.121***-0.547***
-1.037***-0.003
3.748***4.457***
0.063***0.088***
0.024***0.007***
(0.011)(0.002)
(9.283)(0.042)
(0.026)(0.037)
(0.005)(0.932)
(1.017)(0.004)
(0.005)(0.004)
(0.002)FD
Rp-value
(Treat)0.000
0.0670.000
0.0000.000
0.0000.304
0.0130.012
0.0000.000
0.7530.517
Bonferronip-value
(Treat)0.000
1.0000.000
0.0000.000
0.0001.000
0.2110.182
0.0000.000
1.0001.000
R-Squared
0.0210.008
0.0930.075
0.0570.024
0.0040.006
0.0050.012
0.0190.009
0.005Observations
930302930302
935714925477
894087937893
937870937893
937893937893
937893937893
937893Mean
ofdep.var.
9.7290.012
3528.06250.360
34.91839.297
0.5142.755
3.4830.039
0.1650.132
0.036Controlm
ean9.730
0.0123530.472
50.36734.922
39.3030.514
2.7503.478
0.0390.165
0.1310.036
Controlsd
0.8130.108
589.3222.584
1.6871.968
0.50052.371
58.8710.193
0.3710.338
0.185
PanelB:First-tim
emothers
(1)(2)
(3)(4)
(5)(6)
(7)(8)
(9)(10)
(11)(12)
(13)
Apgarscore
Apgar
score<7
Birth
weight
Birth
lenghtHead
circumfernce
Gestation
Male
Infantmortalityrate
Underfive
mortality
Breech
position
Child
hospitalizationages
0-1
Child
hospitalizationages
1-4Fetal
malform
ation
postSET*IV
F0.074***
-0.005**185.631***
0.646***0.242***
0.591***0.010
-3.127***-3.541***
-0.031***-0.049***
0.002-0.003
(0.017)(0.002)
(13.625)(0.063)
(0.039)(0.055)
(0.009)(1.181)
(1.313)(0.005)
(0.008)(0.006)
(0.004)IV
F-0.074***
0.004**-293.378***
-1.120***-0.525***
-1.074***-0.008
3.261***3.989***
0.057***0.087***
0.018***0.008***
(0.014)(0.002)
(11.176)(0.052)
(0.032)(0.046)
(0.007)(1.050)
(1.155)(0.004)
(0.006)(0.005)
(0.003)FD
Rp-value
(Treat)0.000
0.0670.000
0.0000.000
0.0000.304
0.0130.012
0.0000.000
0.7530.517
Bonferronip-value
(Treat)0.000
1.0000.000
0.0000.000
0.0001.000
0.2110.182
0.0000.000
1.0001.000
R-Squared
0.0230.012
0.0660.063
0.0450.027
0.0090.010
0.0100.014
0.0290.014
0.010Observations
411406411406
413106407269
393470414180
414167414180
414180414180
414180414180
414180Mean
ofdep.var.
9.6710.015
3431.77350.133
34.73939.299
0.5152.764
3.5300.052
0.1680.132
0.038Controlm
ean9.671
0.0153434.312
50.14334.744
39.3090.515
2.7673.529
0.0510.168
0.1320.038
Controlsd
0.8980.123
588.4402.687
1.7742.127
0.50052.527
59.3040.220
0.3730.339
0.192
Note
toTable
7.The
dataare
obtainedfrom
theSw
edishMedicalB
irthRegistry,Sw
edishNationalPatientR
egistryand
theLongitudinalintegration
databaseforhealth
insuranceand
labormarketstudiesforthe
timeperiod
1998-2007.Each
columnpresents
aseparate
OLS
regressionwith
DiD
estimates
oftheim
pactofthe
SETreform
onchild
healthoutcom
es.PanelA
presentsthe
resultsfor
thefullsam
pleand
PanelBfor
asub-sam
pleof
first-timemothers.
Afullset
ofmaternalcontrols
andfixed
effectsare
includedin
allregressions(as
describedin
Table3).
Both
FDR
andBonferronicorrected
p-valuesare
reportedin
additionto
theconventional.
Standarderrors
areclustered
onthe
mother.
*p<0.1,**
p<0.05,***
p<0.01.
112

Tab
le8:
Effects
ofSE
Ton
birthweigh
tan
dgestationa
lage
PanelA
:Fulls
ample
(1)
(2)
(3)
(4)
(5)
Birt
hweigh
t<1500
gram
s
Birt
hweigh
t<2500
gram
sGestatio
n<28
weeks
Gestatio
n<32
weeks
Gestatio
n<37
weeks
postSE
T*IVF
-0.012***
-0.068***
-0.005***
-0.013***
-0.083***
(0.003)
(0.006)
(0.002)
(0.003)
(0.007)
IVF
0.020***
0.112***
0.008***
0.025***
0.157***
(0.002)
(0.005)
(0.001)
(0.003)
(0.006)
FDR
p-value(T
reat)
0.000
0.000
0.009
0.000
0.000
Bon
ferron
ip-value
(Treat)
0.000
0.000
0.125
0.000
0.000
R-Squ
ared
0.010
0.021
0.012
0.012
0.018
Observatio
ns935714
935714
937893
937893
937893
Meanof
dep.
var.
0.008
0.042
0.003
0.009
0.113
Con
trol
mean
0.007
0.042
0.003
0.009
0.112
Con
trol
sd0.086
0.200
0.052
0.095
0.315
PanelB
:First-tim
emothers
(1)
(2)
(3)
(4)
(5)
Birt
hweigh
t<1500
gram
s
Birt
hweigh
t<2500
gram
sGestatio
n<28
weeks
Gestatio
n<32
weeks
Gestatio
n<37
weeks
postSE
T*IVF
-0.015***
-0.078***
-0.006***
-0.016***
-0.091***
(0.003)
(0.007)
(0.002)
(0.004)
(0.008)
IVF
0.023***
0.120***
0.010***
0.027***
0.156***
(0.003)
(0.006)
(0.002)
(0.003)
(0.007)
FDR
p-value(T
reat)
0.000
0.000
0.009
0.000
0.000
Bon
ferron
ip-value
(Treat)
0.000
0.000
0.125
0.000
0.000
R-Squ
ared
0.015
0.024
0.017
0.017
0.022
Observatio
ns413106
413106
414180
414180
414180
Meanof
dep.
var.
0.010
0.055
0.004
0.012
0.126
Con
trol
mean
0.010
0.054
0.003
0.011
0.124
Con
trol
sd0.097
0.226
0.059
0.106
0.330
Noteto
Table8.
The
data
areob
tained
from
theSw
edish
Medical
Birt
hRegist
ry,S
wedish
Nationa
lPatient
Regist
ryan
dtheLo
ngitu
dina
lintegratio
nda
taba
seforhealth
insurancean
dlabo
rmarketstud
iesforthetim
epe
riod1998-2007.
Each
columnpresents
asepa
rate
OLS
regressio
nwith
DiD
estim
ates
oftheim
pact
oftheSE
Treform
onchild
health
outcom
esregardinglow
birthw
eigh
tan
dprem
aturity
.Pa
nelA
presents
theresults
forthefullsamplean
dPa
nelB
forasub-
sampleof
first-tim
emothers.A
fullsetof
materna
lcon
trolsan
dfix
edeff
ects
areinclud
edin
allregressions
(asdescrib
edin
Table3).BothFD
Ran
dBon
ferron
icorrectedp-values
arerepo
rted
inad
ditio
nto
theconv
entio
nal.
Stan
dard
errors
areclusteredon
themother.
*p<
0.1,
**p<
0.05,*
**p<
0.01.
113

Table
9:Effects
ofSETon
maternalhealth
PanelA:Fullsam
ple
(1)(2)
(3)(4)
(5)Em
ergencyC-section
Hem
orrhageMaternalsepsis
Hospital
re-admission
Hypersention
postSET*IV
F-0.020***
-0.0010.000
-0.0040.001
(0.006)(0.005)
(0.001)(0.004)
(0.001)IV
F0.048***
0.039***0.001
0.014***-0.001
(0.005)(0.004)
(0.001)(0.003)
(0.001)FD
Rp-value
(Treat)0.000
0.2820.645
0.3620.532
Bonferronip-value
(Treat)0.003
1.0001.000
1.0001.000
R-Squared
0.0400.011
0.0060.009
0.007Observations
937884937893
937893888342
937893Mean
ofdep.var.
0.0850.063
0.0020.051
0.004Controlm
ean0.084
0.0630.002
0.0510.004
Controlsd
0.2780.242
0.0390.220
0.060
PanelB:First-tim
emothers
(1)(2)
(3)(4)
(5)Em
ergencyC-section
Hem
orrhageMaternalsepsis
Hospital
re-admission
Hypertension
postSET*IV
F-0.029***
-0.008-0.001
-0.0050.001
(0.007)(0.006)
(0.001)(0.005)
(0.001)IV
F0.048***
0.041***0.001
0.014***-0.001
(0.006)(0.005)
(0.001)(0.004)
(0.001)FD
Rp-value
(Treat)0.000
0.2820.645
0.3620.532
Bonferronip-value
(Treat)0.003
1.0001.000
1.0001.000
R-Squared
0.0410.017
0.0110.014
0.012Observations
414177414180
414180409619
414180Mean
ofdep.var.
0.1230.074
0.0020.053
0.003Controlm
ean0.122
0.0720.002
0.0530.003
Controlsd
0.3270.259
0.0470.225
0.054
Note
toTable
9.The
dataare
obtainedfrom
theSw
edishMedicalB
irthRegistry,Sw
edishNationalPatient
Registry
andthe
Longitudinalintegrationdatabase
forhealth
insuranceand
labormarket
studiesfor
thetim
eperiod
1998-2007.Each
columnpresents
aseparate
OLS
regressionwith
DiD
estimates
oftheim
pactofthe
SETreform
onmaternalhealth
outcomes.
PanelApresents
theresults
forthe
fullsample
andPanelB
forasub-sam
pleoffirst-tim
emothers.
Afullset
ofmaternalcontrols
andfixed
effectsare
includedin
allregressions(as
describedin
Table3).
Both
FDR
andBonferronicorrected
p-valuesare
reportedin
additionto
theconventional.
Standarderrors
areclustered
onthe
mother.
*p<0.1,**
p<0.05,***
p<0.01.
114
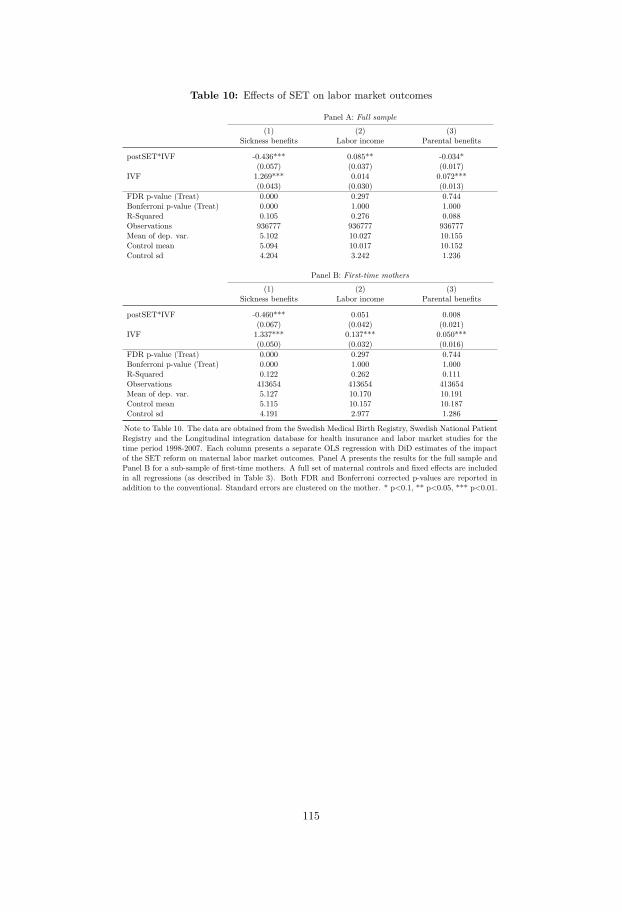
Table 10: Effects of SET on labor market outcomes
Panel A: Full sample
(1) (2) (3)Sickness benefits Labor income Parental benefits
postSET*IVF -0.436*** 0.085** -0.034*(0.057) (0.037) (0.017)
IVF 1.269*** 0.014 0.072***(0.043) (0.030) (0.013)
FDR p-value (Treat) 0.000 0.297 0.744Bonferroni p-value (Treat) 0.000 1.000 1.000R-Squared 0.105 0.276 0.088Observations 936777 936777 936777Mean of dep. var. 5.102 10.027 10.155Control mean 5.094 10.017 10.152Control sd 4.204 3.242 1.236
Panel B: First-time mothers
(1) (2) (3)Sickness benefits Labor income Parental benefits
postSET*IVF -0.460*** 0.051 0.008(0.067) (0.042) (0.021)
IVF 1.337*** 0.137*** 0.050***(0.050) (0.032) (0.016)
FDR p-value (Treat) 0.000 0.297 0.744Bonferroni p-value (Treat) 0.000 1.000 1.000R-Squared 0.122 0.262 0.111Observations 413654 413654 413654Mean of dep. var. 5.127 10.170 10.191Control mean 5.115 10.157 10.187Control sd 4.191 2.977 1.286
Note to Table 10. The data are obtained from the Swedish Medical Birth Registry, Swedish National PatientRegistry and the Longitudinal integration database for health insurance and labor market studies for thetime period 1998-2007. Each column presents a separate OLS regression with DiD estimates of the impactof the SET reform on maternal labor market outcomes. Panel A presents the results for the full sample andPanel B for a sub-sample of first-time mothers. A full set of maternal controls and fixed effects are includedin all regressions (as described in Table 3). Both FDR and Bonferroni corrected p-values are reported inaddition to the conventional. Standard errors are clustered on the mother. * p<0.1, ** p<0.05, *** p<0.01.
115

Table
11:Maternalcom
position
PanelA:Fullsam
ple
(1)(2)
(3)(4)
(5)(6)
(7)(8)
(9)(10)
(11)age
weight
(kg)height
(cm)
educationlabor
income
sickbenefits
nativesm
okeasthm
aepilepsy
u.colitis
IVF*postSET
0.190***-0.086
0.0030.107***
0.032-0.005
-0.0000.008**
0.0030.000
-0.000(0.063)
(0.195)(0.099)
(0.020)(0.033)
(0.059)(0.005)
(0.003)(0.004)
(0.001)(0.002)
IVF
4.446***1.798***
0.799***0.059***
0.845***0.814***
0.031***-0.050***
-0.006*-0.001
0.005***(0.050)
(0.156)(0.079)
(0.017)(0.026)
(0.045)(0.004)
(0.003)(0.003)
(0.001)(0.001)
R2
0.1930.025
0.0100.058
0.0600.122
0.0420.021
0.0090.004
0.005Obs
937,891835,139
873,962932,257
928,502906,708
937,393880,138
937,893937,893
937,893Mean
ofdep.var.
30.08767.897
166.4174.462
10.2272.870
0.8130.095
0.0680.004
0.006
PanelB:First-tim
emothers
(1)(2)
(3)(4)
(5)(6)
(7)(8)
(9)(10)
(11)age
weight
(kg)height
(cm)
educationlabor
income
sickbenefits
nativesm
okeasthm
aepilepsy
u.colitis
IVF*postSET
0.148*-0.132
-0.0760.115***
0.0450.042
-0.0090.007*
0.0050.001
0.000(0.076)
(0.231)(0.117)
(0.024)(0.038)
(0.066)(0.006)
(0.004)(0.005)
(0.001)(0.002)
IVF
4.789***2.114***
0.853***0.057***
0.868***0.853***
0.032***-0.054***
-0.008**-0.001
0.004***(0.059)
(0.180)(0.091)
(0.019)(0.029)
(0.050)(0.005)
(0.003)(0.004)
(0.001)(0.001)
R2
0.0830.020
0.0120.028
0.0230.017
0.0240.020
0.0140.009
0.010Obs
414,181368,213
384,525412,106
407,728392,747
413,965387,840
414,182414,182
414,182Mean
ofdep.var.
28.25366.777
166.6234.616
10.4691.401
0.8340.088
0.0750.004
0.006
Note
toTable
11.The
dataare
obtainedfrom
theSw
edishMedicalB
irthRegistry,Sw
edishNationalPatientR
egistryand
theLongitudinalintegration
databaseforhealth
insuranceand
labormarket
studiesfor
thetim
eperiod
1998-2007.PanelA
presentsthe
resultsfor
thefullsam
pleand
PanelBfor
asub-sam
pleoffirst-tim
emothers.
Eachcolum
npresents
aseparate
OLS
regressionwith
DiD
estimates
oftheim
pactofthe
SETreform
onmaternalage
(column1),w
eight(colum
n2),height
(column3),education
(column4),labor
income
priorbirth(colum
n5),sicknessbenefitspriorbirth
(column6),nationality
(Swedish)(colum
n7),sm
oking(colum
n8),asthm
a(colum
n9),epilepsy
(column10)and
ulcerativecolitis
(column11).
Birth
number,county
andconception
datefixed
effectsare
includedin
eachregression.
Standarderrors
areclustered
onthe
mother.
*p<0.1,**
p<0.05,***
p<0.01.
116

Tab
le12
:Eff
ects
ofSE
Ton
child
andmaterna
loutcomes,c
ontrollin
gfortrends
inIV
F-specificmaterna
lcha
racterist
ic
Fullsample
First-tim
emothers
(1)
(2)
(3)
(4)
(5)
(6)
Child
health
index
Materna
lhealth
index
Materna
llab
orindex
Child
health
index
Materna
lhealth
index
Materna
llab
orindex
postSE
T*IVF
0.149***
0.112***
0.059**
0.122***
0.120***
0.105***
(0.038)
(0.039)
(0.028)
(0.044)
(0.046)
(0.035)
IVF
-1.066***
0.139
-1.133***
-0.927***
0.536*
-0.627**
(0.270)
(0.282)
(0.228)
(0.309)
(0.320)
(0.270)
R-Squ
ared
0.021
0.027
0.263
0.024
0.033
0.266
Observatio
ns777363
777363
776837
337118
337118
336913
Meanof
dep.
var.
0.004
-0.001
0.031
0.001
-0.004
0.046
Con
trol
mean
0.000
-0.000
-0.000
0.000
-0.000
0.000
Con
trol
sd1.000
1.000
1.000
1.000
1.000
1.000
Noteto
Table12.The
data
areob
tained
from
theSw
edish
Medical
Birt
hRegist
ry,S
wedish
Nationa
lPatient
Regist
ryan
dtheLo
ngitu
dina
lintegratio
nda
taba
seforhealth
in-
surancean
dlabo
rmarketstud
iesforthetim
epe
riod1998-2007.
Colum
ns1-3presentestim
ates
forthefullsamplean
dcolumns
4-6asub-sampleof
first-tim
emothers.Ea
chcolumnpresents
asepa
rate
OLS
regressio
nwith
DiD
estim
ates
oftheim
pact
oftheSE
Treform
onchild
health
index(colum
ns1an
d4),m
aterna
lhealth
index(colum
ns2an
d5),m
aterna
llab
ormarketindex(colum
ns3an
d6).Allregressio
nsinclud
eIV
F-specificmaterna
lcha
racterist
ictim
etrends
(for
education,
labo
ran
dsic
knessbe
nefits,na
tiona
lity,
previous
health
cond
ition
san
dbe
havior
andage),a
fullsetof
fixed
effects
(con
ceptionda
te,b
irthorderan
dcoun
ty)an
dbina
ryvaria
bles
formiss
ingvalues.Stan
dard
errors
are
clusteredon
themother.
*p<
0.1,
**p<
0.05,*
**p<
0.01.
117
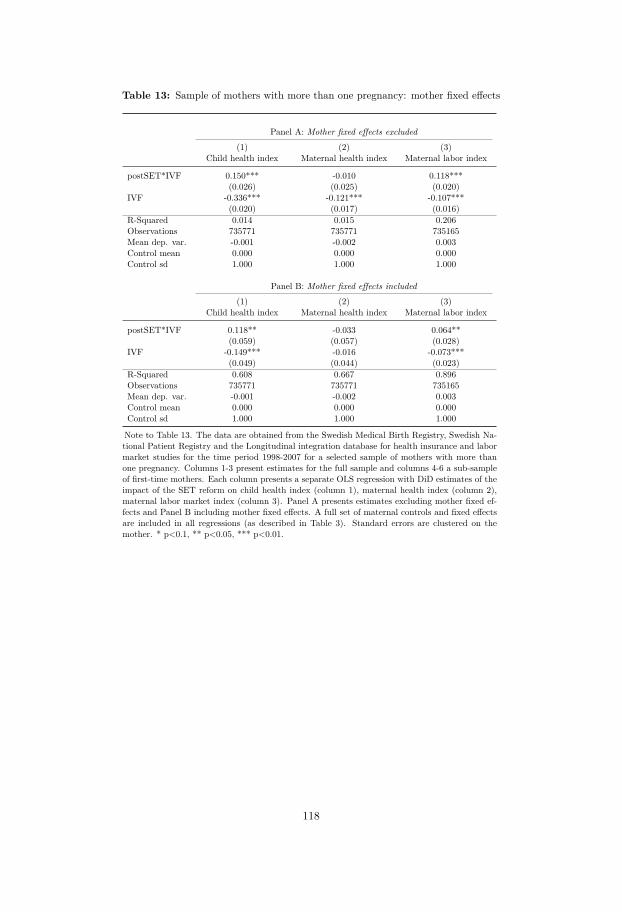
Table 13: Sample of mothers with more than one pregnancy: mother fixed effects
Panel A: Mother fixed effects excluded
(1) (2) (3)Child health index Maternal health index Maternal labor index
postSET*IVF 0.150*** -0.010 0.118***(0.026) (0.025) (0.020)
IVF -0.336*** -0.121*** -0.107***(0.020) (0.017) (0.016)
R-Squared 0.014 0.015 0.206Observations 735771 735771 735165Mean dep. var. -0.001 -0.002 0.003Control mean 0.000 0.000 0.000Control sd 1.000 1.000 1.000
Panel B: Mother fixed effects included
(1) (2) (3)Child health index Maternal health index Maternal labor index
postSET*IVF 0.118** -0.033 0.064**(0.059) (0.057) (0.028)
IVF -0.149*** -0.016 -0.073***(0.049) (0.044) (0.023)
R-Squared 0.608 0.667 0.896Observations 735771 735771 735165Mean dep. var. -0.001 -0.002 0.003Control mean 0.000 0.000 0.000Control sd 1.000 1.000 1.000
Note to Table 13. The data are obtained from the Swedish Medical Birth Registry, Swedish Na-tional Patient Registry and the Longitudinal integration database for health insurance and labormarket studies for the time period 1998-2007 for a selected sample of mothers with more thanone pregnancy. Columns 1-3 present estimates for the full sample and columns 4-6 a sub-sampleof first-time mothers. Each column presents a separate OLS regression with DiD estimates of theimpact of the SET reform on child health index (column 1), maternal health index (column 2),maternal labor market index (column 3). Panel A presents estimates excluding mother fixed ef-fects and Panel B including mother fixed effects. A full set of maternal controls and fixed effectsare included in all regressions (as described in Table 3). Standard errors are clustered on themother. * p<0.1, ** p<0.05, *** p<0.01.
118

Tab
le14
:Eff
ects
ofSE
Ton
child
andmaterna
loutcomes,e
xcluding
controls
Fullsample
First-tim
emothers
(1)
(2)
(3)
(4)
(5)
(6)
Child
health
index
Materna
lhealth
index
Materna
llab
orindex
Child
health
index
Materna
lhealth
index
Materna
llab
orindex
postSE
T*IVF
0.202***
0.033*
0.118***
0.189***
0.051**
0.157***
(0.019)
(0.020)
(0.017)
(0.022)
(0.023)
(0.020)
IVF
-0.398***
-0.268***
0.093***
-0.338***
-0.239***
0.021
(0.016)
(0.015)
(0.013)
(0.018)
(0.018)
(0.016)
R-Squ
ared
0.006
0.006
0.032
0.012
0.011
0.029
Observatio
ns937893
937893
936777
414180
414180
413652
Meanof
dep.
var.
-0.003
-0.003
0.005
-0.003
-0.004
0.006
Con
trol
mean
0.000
-0.000
-0.000
0.000
0.000
-0.000
Con
trol
sd1.000
1.000
1.000
1.000
1.000
1.000
Alto
njie
tal
2005
Ratio
14.5
32.0
8.8
36.8
-11.2
156.0
Noteto
Table14.The
data
areob
tained
from
theSw
edish
Medical
Birt
hRegist
ry,S
wedish
Nationa
lPatient
Regist
ryan
dtheLo
ngitu
dina
lintegratio
nda
taba
seforhealth
insurance
andlabo
rmarketstud
iesforthetim
epe
riod1998-2007.
Colum
ns1-3presentestim
ates
forthefullsamplean
dcolumns
4-6asub-sampleof
first-tim
emothers.Ea
chcolumnpresents
asepa
rate
OLS
regressio
nwith
DiD
estim
ates
oftheim
pact
oftheSE
Treform
onchild
health
index(colum
ns1an
d4),m
aterna
lhealth
index(colum
ns2an
d5),m
aterna
llab
ormarket
index(colum
ns3an
d6).Materna
land
child
controls
areexclud
ed.Stan
dard
errors
areclusteredon
themother.
*p<
0.1,
**p<
0.05,*
**p<
0.01.
119

Table
15:Gelbach
decomposition
(1)(2)
(3)(4)
Child
healthindex
Maternalhealth
indexMaternallabor
index
postSET*IV
FΓ
child
hea
lth=
0.189***Γ
ma
tern
alh
ealth
=0.032
0.099***(0.016)
βch
ildh
ealth
labo
r=childhealthindex
0.029***(0.001)
βm
ater
na
lhea
lthla
bor
=matern
alhealthindex
0.050***(0.001)
Γch
ildh
ealth
labo
r×β
child
hea
lthla
bor
δch
ildh
ealth
labo
r=
0.005***(0.001)
Γm
ater
na
lhea
lthla
bor
×β
ma
tern
alh
ealth
labo
rδ
ma
tern
alh
ealth
labo
r=
0.002(0.001)
Total
explaineddifference
0.007***(0.001)
Note
toTable
15.The
dataare
obtainedfrom
theSw
edishMedicalB
irthRegistry,Sw
edishNationalPatient
Registry
andthe
Longitudinalinte-gration
databasefor
healthinsurance
andlabor
market
studiesfor
thetim
eperiod
1998-2007.A
fullsetofm
aternalcontrolsand
fixedeffects
areincluded
inallregressions
(asdescribed
inTable
3).Standard
errorsare
clusteredon
themother.
*p<0.1,**
p<0.05,***
p<0.01.
Γrepresents
eachestim
ateofthe
SETreform
(postSET×IV
F)for
eachpotentialm
echanismas
theoutcom
evariable.
βindicates
theestim
ateofthe
potentialmechanism
sas
explanatoryvariables
inthe
fullspecificationwith
maternallabor
asthe
outcomevariable.
The
conditionalcontributionofeach
component
isgiven
byδ,w
hichis
computed
bymultiplying
Γwith
β.
120

Table 16: Robustness: additional sensitivity
Panel A: Removing 2001-2002
(1) (2) (3) (4)Twin birth Child health index Maternal health index Maternal labor index
postSET*IVF -0.168*** 0.177*** 0.002 0.100***(0.010) (0.024) (0.024) (0.020)
IVF 0.267*** -0.342*** -0.135*** -0.121***(0.009) (0.021) (0.021) (0.018)
R-Squared 0.055 0.019 0.024 0.197Observations 754464 754464 754464 753583Mean of dep. var. 0.028 -0.003 -0.004 0.005Control mean -0.000 -0.000 -0.000 -0.000Control sd 1.000 1.000 1.000 1.000
Panel B: Removing region of Skåne
(1) (2) (3) (4)Twin birth Child health index Maternal health index Maternal labor index
postSET*IVF -0.165*** 0.188*** 0.027 0.107***(0.008) (0.020) (0.020) (0.016)
IVF 0.265*** -0.348*** -0.158*** -0.122***(0.007) (0.016) (0.016) (0.013)
R-Squared 0.063 0.019 0.024 0.196Observations 854191 854191 854191 853191Mean of dep. var. 0.029 -0.003 -0.003 0.005Control mean -0.000 -0.000 -0.000 -0.000Control sd 1.000 1.000 1.000 1.000
Panel C: Removing 2005-2007
(1) (2) (3) (4)Twin birth Child health index Maternal health index Maternal labor index
postSET*IVF -0.150*** 0.154*** 0.044* 0.067***(0.009) (0.024) (0.025) (0.019)
IVF 0.267*** -0.357*** -0.170*** -0.114***(0.006) (0.016) (0.015) (0.013)
R-Squared 0.076 0.021 0.023 0.186Observations 631952 631952 631952 631184Mean of dep. var. 0.029 -0.002 -0.002 0.002Control mean 0.000 0.000 0.000 0.000Control sd 1.000 1.000 1.000 1.000
Note to Table 16. The data are obtained from the Swedish Medical Birth Registry, Swedish National Patient Registry andthe Longitudinal integration database for health insurance and labor market studies for the time period 1998-2007. Each col-umn presents a separate OLS regression with DiD estimates of the impact of the SET reform on the probability of twin birth(column 1), child health index (column 2), maternal health index (column 3), and maternal labor market index (column 4).In Panel A, the time period 2001-2002 is omitted. In Panel B, the region of Skåne is omitted and in Panel C, the time period2005-2007 is omitted. A full set of maternal controls and fixed effects are included in all regressions (as described in Table 3).Standard errors are clustered on the mother. * p<0.1, ** p<0.05, *** p<0.01.
121


Appendices
123

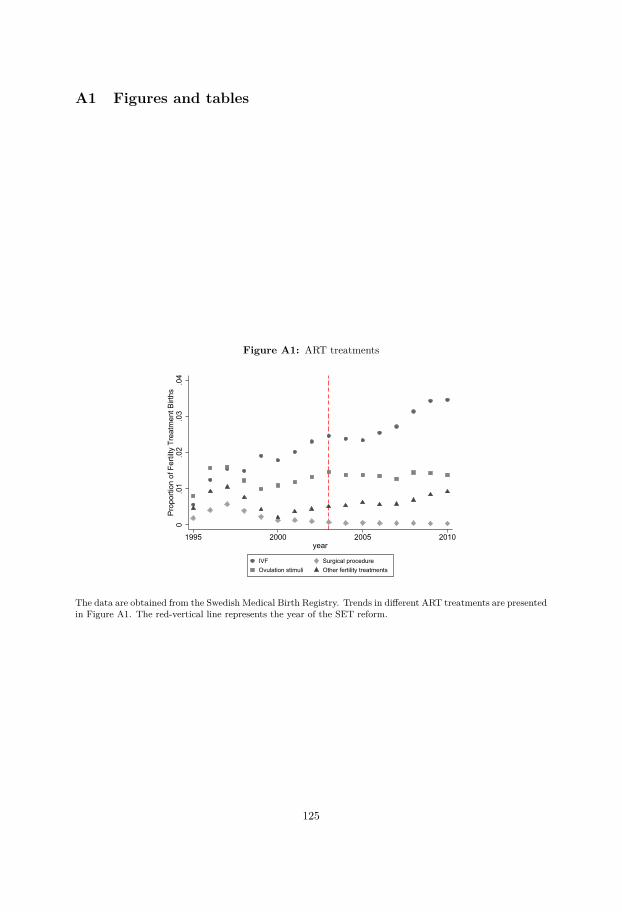
A1 Figures and tables
Figure A1: ART treatments
0.0
1.0
2.0
3.0
4Pr
opor
tion
of F
ertil
ty T
reat
men
t Birt
hs
1995 2000 2005 2010year
IVF Surgical procedureOvulation stimuli Other fertility treatments
The data are obtained from the Swedish Medical Birth Registry. Trends in different ART treatments are presentedin Figure A1. The red-vertical line represents the year of the SET reform.
125

Figure A2: Child health outcomes
(a) Gestational age
-.50
.5G
esta
tiona
l age
(wee
ks)
-4 -3 -3 -2 0 +1 +2 +3 +4Year
Point Estimates CI
(b) Birth weight
-200
-100
010
020
0Bi
rth w
eigh
t
-4 -3 -3 -2 0 +1 +2 +3 +4Year
Point Estimates CI
(c) Head circumference
-.4-.2
0.2
.4H
ead
circ
umfe
renc
e
-4 -3 -3 -2 0 +1 +2 +3 +4Year
Point Estimates CI
(d) Length
-1-.5
0.5
1Le
nght
(cen
timet
ers)
-4 -3 -3 -2 0 +1 +2 +3 +4Year
Point Estimates CI
(e) Apgar score
-.15
-.1-.0
50
.05
.1Ap
gar s
core
-4 -3 -3 -2 0 +1 +2 +3 +4Year
Point Estimates CI
(f) Apgar score below 7
-.01
-.005
0.0
05.0
1.0
15Ap
gar s
core
bel
ow 7
-4 -3 -3 -2 0 +1 +2 +3 +4Year
Point Estimates CI
The data are obtained from the Swedish Medical Birth Registry, Swedish National Patient Registry and theLongitudinal integration database for health insurance and labor market studies for the time period 1998-2007.Each figure presents coefficients of interactions between each year and IVF births. The red-vertical line representsthe year of the SET reform using the previous year as the omitted category. A full set of maternal controls andfixed effects are included in all regressions (as described in Table 3). Standard errors are clustered on the mother.
126
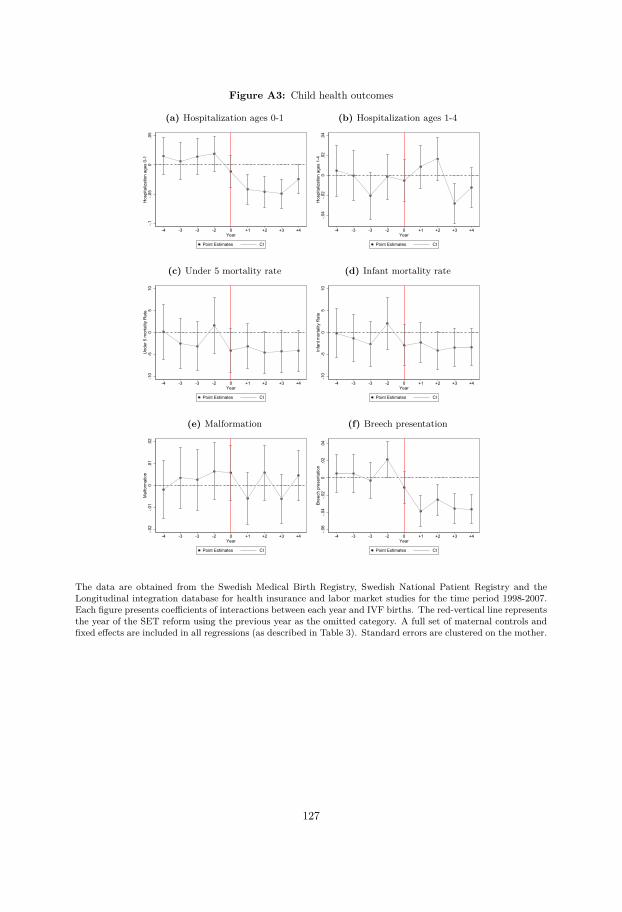
Figure A3: Child health outcomes
(a) Hospitalization ages 0-1
-.1-.0
50
.05
Hos
pita
lizat
ion
ages
0-1
-4 -3 -3 -2 0 +1 +2 +3 +4Year
Point Estimates CI
(b) Hospitalization ages 1-4
-.04
-.02
0.0
2.0
4H
ospi
taliz
atio
n ag
es 1
-4
-4 -3 -3 -2 0 +1 +2 +3 +4Year
Point Estimates CI
(c) Under 5 mortality rate
-10
-50
510
Und
er 5
mor
talit
y R
ate
-4 -3 -3 -2 0 +1 +2 +3 +4Year
Point Estimates CI
(d) Infant mortality rate
-10
-50
510
Infa
nt m
orta
lity
Rat
e
-4 -3 -3 -2 0 +1 +2 +3 +4Year
Point Estimates CI
(e) Malformation
-.02
-.01
0.0
1.0
2M
alfo
rmat
ion
-4 -3 -3 -2 0 +1 +2 +3 +4Year
Point Estimates CI
(f) Breech presentation
-.06
-.04
-.02
0.0
2.0
4Br
eech
pre
sent
atio
n
-4 -3 -3 -2 0 +1 +2 +3 +4Year
Point Estimates CI
The data are obtained from the Swedish Medical Birth Registry, Swedish National Patient Registry and theLongitudinal integration database for health insurance and labor market studies for the time period 1998-2007.Each figure presents coefficients of interactions between each year and IVF births. The red-vertical line representsthe year of the SET reform using the previous year as the omitted category. A full set of maternal controls andfixed effects are included in all regressions (as described in Table 3). Standard errors are clustered on the mother.
127
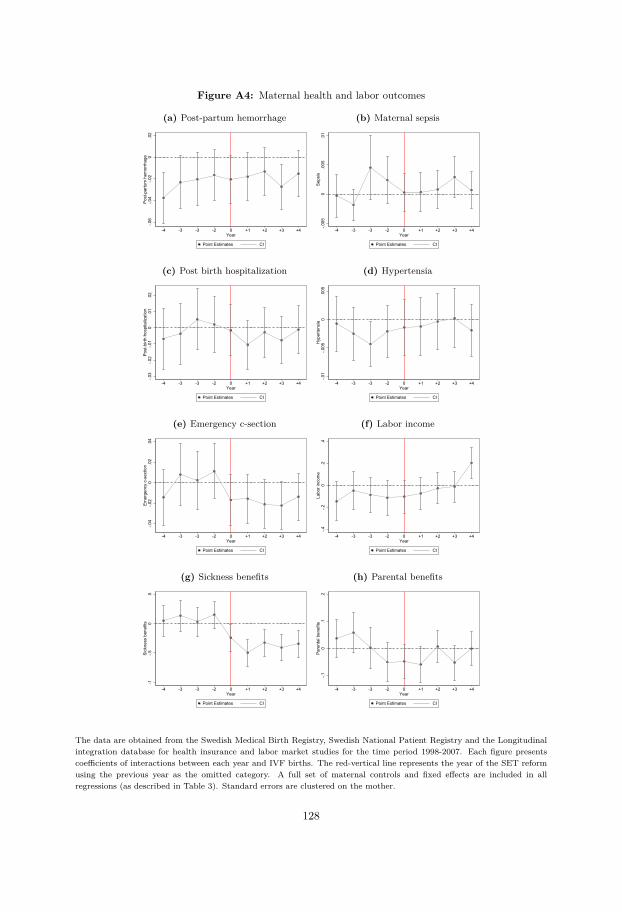
Figure A4: Maternal health and labor outcomes
(a) Post-partum hemorrhage
-.06
-.04
-.02
0.0
2Po
st-p
artu
m h
emor
rhag
e
-4 -3 -3 -2 0 +1 +2 +3 +4Year
Point Estimates CI
(b) Maternal sepsis
-.005
0.0
05.0
1Se
psis
-4 -3 -3 -2 0 +1 +2 +3 +4Year
Point Estimates CI
(c) Post birth hospitalization
-.03
-.02
-.01
0.0
1.0
2Po
st-b
irth
hosp
italiz
atio
n
-4 -3 -3 -2 0 +1 +2 +3 +4Year
Point Estimates CI
(d) Hypertensia
-.01
-.005
0.0
05H
yper
tens
ia
-4 -3 -3 -2 0 +1 +2 +3 +4Year
Point Estimates CI
(e) Emergency c-section
-.04
-.02
0.0
2.0
4Em
erge
ncy
c-se
ctio
n
-4 -3 -3 -2 0 +1 +2 +3 +4Year
Point Estimates CI
(f) Labor income
-.4-.2
0.2
.4La
bor i
ncom
e
-4 -3 -3 -2 0 +1 +2 +3 +4Year
Point Estimates CI
(g) Sickness benefits
-1-.5
0.5
Sick
ness
ben
efits
-4 -3 -3 -2 0 +1 +2 +3 +4Year
Point Estimates CI
(h) Parental benefits
-.10
.1.2
Pare
ntal
ben
efits
-4 -3 -3 -2 0 +1 +2 +3 +4Year
Point Estimates CI
The data are obtained from the Swedish Medical Birth Registry, Swedish National Patient Registry and the Longitudinalintegration database for health insurance and labor market studies for the time period 1998-2007. Each figure presentscoefficients of interactions between each year and IVF births. The red-vertical line represents the year of the SET reformusing the previous year as the omitted category. A full set of maternal controls and fixed effects are included in allregressions (as described in Table 3). Standard errors are clustered on the mother.
128
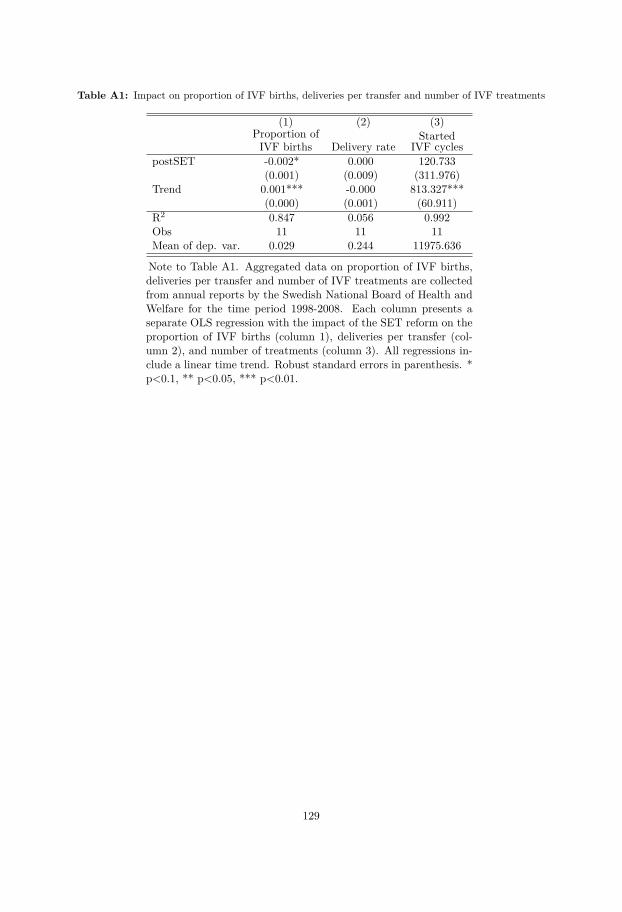
Table A1: Impact on proportion of IVF births, deliveries per transfer and number of IVF treatments
(1) (2) (3)Proportion ofIVF births Delivery rate
StartedIVF cycles
postSET -0.002* 0.000 120.733(0.001) (0.009) (311.976)
Trend 0.001*** -0.000 813.327***(0.000) (0.001) (60.911)
R2 0.847 0.056 0.992Obs 11 11 11Mean of dep. var. 0.029 0.244 11975.636
Note to Table A1. Aggregated data on proportion of IVF births,deliveries per transfer and number of IVF treatments are collectedfrom annual reports by the Swedish National Board of Health andWelfare for the time period 1998-2008. Each column presents aseparate OLS regression with the impact of the SET reform on theproportion of IVF births (column 1), deliveries per transfer (col-umn 2), and number of treatments (column 3). All regressions in-clude a linear time trend. Robust standard errors in parenthesis. *p<0.1, ** p<0.05, *** p<0.01.
129
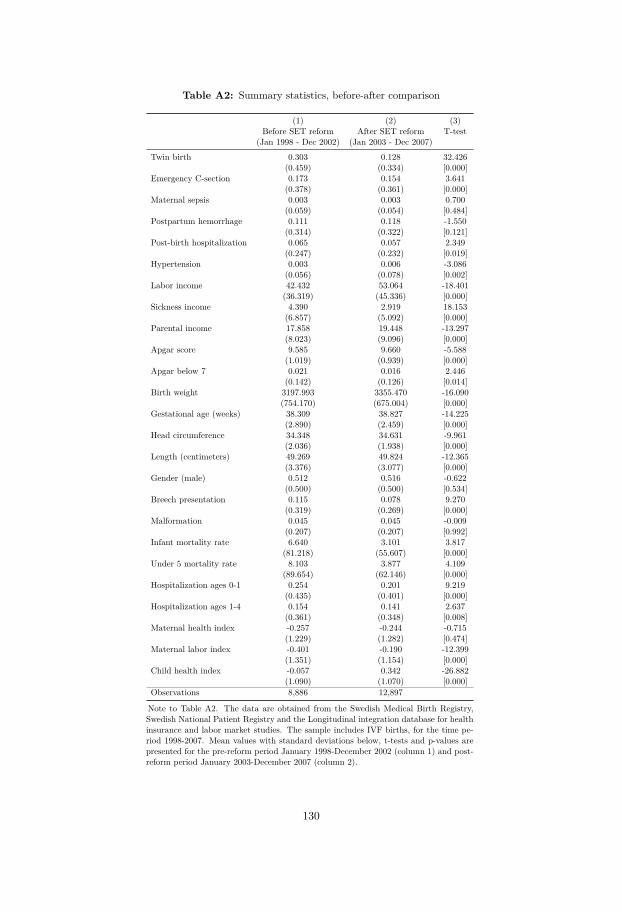
Table A2: Summary statistics, before-after comparison
(1) (2) (3)Before SET reform After SET reform T-test
(Jan 1998 - Dec 2002) (Jan 2003 - Dec 2007)
Twin birth 0.303 0.128 32.426(0.459) (0.334) [0.000]
Emergency C-section 0.173 0.154 3.641(0.378) (0.361) [0.000]
Maternal sepsis 0.003 0.003 0.700(0.059) (0.054) [0.484]
Postpartum hemorrhage 0.111 0.118 -1.550(0.314) (0.322) [0.121]
Post-birth hospitalization 0.065 0.057 2.349(0.247) (0.232) [0.019]
Hypertension 0.003 0.006 -3.086(0.056) (0.078) [0.002]
Labor income 42.432 53.064 -18.401(36.319) (45.336) [0.000]
Sickness income 4.390 2.919 18.153(6.857) (5.092) [0.000]
Parental income 17.858 19.448 -13.297(8.023) (9.096) [0.000]
Apgar score 9.585 9.660 -5.588(1.019) (0.939) [0.000]
Apgar below 7 0.021 0.016 2.446(0.142) (0.126) [0.014]
Birth weight 3197.993 3355.470 -16.090(754.170) (675.004) [0.000]
Gestational age (weeks) 38.309 38.827 -14.225(2.890) (2.459) [0.000]
Head circumference 34.348 34.631 -9.961(2.036) (1.938) [0.000]
Length (centimeters) 49.269 49.824 -12.365(3.376) (3.077) [0.000]
Gender (male) 0.512 0.516 -0.622(0.500) (0.500) [0.534]
Breech presentation 0.115 0.078 9.270(0.319) (0.269) [0.000]
Malformation 0.045 0.045 -0.009(0.207) (0.207) [0.992]
Infant mortality rate 6.640 3.101 3.817(81.218) (55.607) [0.000]
Under 5 mortality rate 8.103 3.877 4.109(89.654) (62.146) [0.000]
Hospitalization ages 0-1 0.254 0.201 9.219(0.435) (0.401) [0.000]
Hospitalization ages 1-4 0.154 0.141 2.637(0.361) (0.348) [0.008]
Maternal health index -0.257 -0.244 -0.715(1.229) (1.282) [0.474]
Maternal labor index -0.401 -0.190 -12.399(1.351) (1.154) [0.000]
Child health index -0.057 0.342 -26.882(1.090) (1.070) [0.000]
Observations 8,886 12,897
Note to Table A2. The data are obtained from the Swedish Medical Birth Registry,Swedish National Patient Registry and the Longitudinal integration database for healthinsurance and labor market studies. The sample includes IVF births, for the time pe-riod 1998-2007. Mean values with standard deviations below, t-tests and p-values arepresented for the pre-reform period January 1998-December 2002 (column 1) and post-reform period January 2003-December 2007 (column 2).
130

Table A3: Probability of twinning per birth, including trends
Full sample First-time mothers(1) (2) (3) (4)
Twin birth Twin birth Twin birth Twin birth
postSET*IVF -0.132*** -0.129*** -0.131*** -0.129***(0.015) (0.014) (0.017) (0.017)
IVF 0.263*** 0.249*** 0.252*** 0.246***(0.012) (0.008) (0.014) (0.010)
Mother weight 0.000*** 0.000*** 0.000*** 0.000***(0.000) (0.000) (0.000) (0.000)
Mother height 0.000*** 0.000*** 0.000*** 0.000***(0.000) (0.000) (0.000) (0.000)
Smoking 1st trimester 0.003*** 0.003*** -0.001 -0.001(0.001) (0.001) (0.001) (0.001)
Native -0.000 -0.000 0.004*** 0.004***(0.001) (0.001) (0.001) (0.001)
Labor income 0.000 0.000 0.000* 0.000*(0.000) (0.000) (0.000) (0.000)
Sickness benefits 0.000 0.000 0.000 0.000(0.000) (0.000) (0.000) (0.000)
IVF specific split time trends Yes NO YES NOIVF specific global time trends NO YES No YESR-Squared 0.062 0.062 0.068 0.068Observations 937893 937893 414182 414182Mean of dep. var. 0.029 0.029 0.029 0.029Control mean 0.027 0.027 0.027 0.027Control sd 0.163 0.163 0.162 0.162
Note to Table A3. The data are obtained from the Swedish Medical Birth Registry, SwedishNational Patient Registry and the Longitudinal integration database for health insuranceand labor market studies for the time period 1998-2007. Each column presents a separateOLS regression with DiD estimates of the impact of the SET reform on the probabilityof twin birth for the full sample (columns 1-2) and first-time mothers (columns 3-4). Incolumns 1 and 3, an IVF specific split linear time trend is included and in columns 2 and4, an IVF specific (global) linear time trend is included. A full set of maternal controls andfixed effects are included in all regressions (as described in Table 3). Standard errors areclustered on the mother. * p<0.1, ** p<0.05, *** p<0.01.
131

Table
A4:
EffectsofSET
onchild
andmaternaloutcom
es,includingtrends
PanelA:IV
Fspecific
splitlinear
timetrends
Fullsample
First-timemothers
(1)(2)
(3)(4)
(5)(6)
Child
healthindex
Maternalhealth
indexMaternallabor
indexChild
healthindex
Maternalhealth
indexMaternallabor
index
postSET*IV
F0.137***
0.106***0.061**
0.097**0.111**
0.105***(0.038)
(0.037)(0.029)
(0.043)(0.044)
(0.036)IV
F-0.357***
-0.224***-0.131***
-0.292***-0.217***
-0.159***(0.029)
(0.028)(0.022)
(0.033)(0.033)
(0.028)R-Squared
0.0190.023
0.1960.021
0.0270.198
Observations
937893937893
936777414180
414180413652
Mean
ofdep.var.
-0.003-0.003
0.005-0.003
-0.0040.006
Controlm
ean0.000
-0.000-0.000
0.0000.000
-0.000Controlsd
1.0001.000
1.0001.000
1.0001.000
PanelB:IV
Fspecific
lineartim
etrends
Fullsample
First-timemothers
(1)(2)
(3)(4)
(5)(6)
Child
healthindex
Maternalhealth
indexMaternallabor
indexChild
healthindex
Maternalhealth
indexMaternallabor
index
postSET*IV
F0.130***
0.099***0.054*
0.094**0.102**
0.099***(0.037)
(0.037)(0.028)
(0.042)(0.044)
(0.036)IV
F-0.327***
-0.197***-0.100***
-0.277***-0.178***
-0.136***(0.022)
(0.022)(0.017)
(0.024)(0.025)
(0.021)R-Squared
0.0190.023
0.1960.021
0.0270.198
Observations
937893937893
936777414180
414180413652
Mean
ofdep.var.
-0.003-0.003
0.005-0.003
-0.0040.006
Controlm
ean0.000
-0.000-0.000
0.0000.000
-0.000Controlsd
1.0001.000
1.0001.000
1.0001.000
Note
toTable
A4.
The
dataare
obtainedfrom
theSw
edishMedicalB
irthRegistry,Sw
edishNationalPatient
Registry
andthe
Longitudinalinte-gration
databasefor
healthinsurance
andlabor
market
studiesfor
thetim
eperiod
1998-2007.Colum
ns1-3
presentestim
atesfor
thefullsam
pleand
columns
4-6asub-sam
pleoffirst-tim
emothers.
Eachcolum
npresents
aseparate
OLS
regressionwith
DiD
estimates
oftheim
pactofthe
SETreform
onchild
healthindex
(columns
1and
4),maternalhealth
index(colum
ns2and
5),maternallabor
market
index(colum
ns3and
6).PanelA
includesIV
Fspecific
splitlinear
timetrends
andPanelB
includesIV
Fspecific
(global)linear
timetrends.
Afullset
ofmaternalcontrols
andfixed
effectsare
includedin
allregressions(as
describedin
Table3).
Standarderrors
areclustered
onthe
mother.
*p<0.1,**
p<0.05,***
p<0.01.
132

Table A5: Summary statistics, IVF mothers with 1 or more than 1 birth
IVF mothers with: ≥ 1 birth Only 1 birth Difference
(1) (2) (3) (4)Mean Mean T-test P-values
Twin birth 0.123 0.221 -22.558 0.000Planned C-section 0.145 0.168 -5.475 0.000Emergency C-section 0.108 0.204 -22.884 0.000Maternal sepsis 0.002 0.004 -3.358 0.001Postpartum hemorrhage 0.091 0.129 -10.318 0.000Post-birth hospitalization 0.057 0.061 -1.411 0.158Age 33.552 33.369 3.555 0.000Weight (kilograms) 167.335 167.358 -0.300 0.764Height (centimeters) 68.608 68.883 -1.809 0.070BMI 24.511 24.584 -1.411 0.158Asthma 0.060 0.074 -4.643 0.000Ulcerative colitis 0.010 0.011 -0.741 0.459Epilepsy 0.004 0.005 -1.479 0.139Hypertensia 0.005 0.005 0.167 0.868Smoking 1st trimester 0.044 0.041 1.383 0.167Smoking 3rd trimester 0.028 0.023 2.843 0.004Education 4.691 4.731 -2.539 0.011Labor income 58.220 70.097 -24.686 0.000Sickness benefits 2.041 1.566 7.289 0.000N births 18334 11154N mothers 9931 9831
Note to Table A5. The data are obtained from the Swedish Medical BirthRegistry, Swedish National Patient Registry and the Longitudinal integra-tion database for health insurance and labor market studies. The sampleincludes IVF mothers for the time period 1998-2007. Mean values, t-testand p-values for the t-tests are displayed.
133

A2 Measurement of IVF usage
A number of methodologies exist to consider mis-reporting of treatment variables (Horowitzand Manski, 1995), or selection into treatment (Alderman et al., 2011; Lee, 2009). The casewe are concerned with is relatively simple, as we are concerned only with a mis-classificationof treated units to be included as part of the control group. Given our application, in general,we are likely to under-estimate the effect size by a small amount. To see why, we provide somesimple algebra considering the difference between a DiD estimator where all treated units arecorrectly classified: β1, and an estimator where some portion of treated units are mis-classifiedas controls β1. These estimators can, respectively, be written as:
β1 = (YT 1 − YC1)− (YT 0 − YC0),
where YT 1 refers to average outcomes among treated following treatment, YC1 refers to averageoutcomes among controls following treatment, and YT 0 and YC0 are the same values prior totreatment. The biased estimator, on the other hand, is:
β1 = (YT 1 − ¯YC1)− (YT 0 − ¯YC0),
where now ¯YC1 includes a small portion of the incorrectly classified treated units, and similarlyfor ¯YC0. In particular,
¯YC1 = TC1TC1 + Tmc1
YC1 + Tmc1
TC1 + Tmc1YT 1.
Here TC1 refers to the total number of control units in period 1, and T 1mc refers to the total
number of mis-classified treated units included as controls following treatments. A similarvalue is defined for ¯YC0. It is worth noting here that ¯YC1 will equal the true value YC1 in twocircumstances: either if T 1
mc is zero (and there is no mis-classification), or if YC1 = YT 1 and somis-classification does not matter. Now, we can calculate the bias in the diff-in-diff estimate asthe difference between the true value β1 and the observed value with misclassification β1. Thisis calculated as:
Bias(β1) = β1 − β1 = ( ¯YC1 − YC1)− ( ¯YC0 − YC0)
=(
TC1TC1 + T 1
mc
YC1 + T 1mc
TC1 + T 1mc
YT 1 − YC1
)−(
TC0TC0 + T 0
mc
YC0 + T 0mc
TC0 + T 0mc
YT 0 − YC0
)
=(
T 1mc
TC1 + T 1mc
YT 1 −T 1
mc
TC1 + T 1mc
YC1
)−(
T 0mc
TC0 + T 0mc
YT 0 −T 0
mc
TC0 + T 0mc
YC0
)(4)
If we are further willing to assume that the misclassification of treatment units is constant overtime (in our setting, that IVF births are constantly under-reported by 30%), this can be furthersimplified to:
Bias(β1) = Tmc
TC + Tmc[(YT 1 − YC1)− (YT 0 − YC0)]. (5)
134

This simple bias formula thus suggests that misclassification will bias the estimate by the truediff-in-diff estimate, scaled by a parameter capturing the degree of mis-classification of thecontrol group. In our case, given that this proportion Tmc
TC+Tmcis small, biases in estimates will
also be small. And indeed, we can provide a back-of-the-envelope calculation of this bias usingthe observed values in the data. Assuming that the proportion of mis-classified IVF births isconstant over time, we have that Tmc
TC+Tmc= 9,336
916,110 = 0.0102. Now, for the case of birth weight,we can approximate the bias using values from the data as:
Bias(βBW1 ) = Tmc
TC + Tmc[(YT 1 − YC1)− (YT 0 − YC0)]
= 0.0102× [(3200− 3550)− (3400− 3530)] = −2.244 (6)
In this case, we estimate that the bias in the estimate of SET is likely to be around 2 or 3grams. When compared to the original estimate from table 8 of 176 grams, we see that thissuggests a (relatively) quite small attenuation of estimated effects.
135


Chapter III


CHAPTER 3
The Impact of Abortion Legalization on Fertility andFemale Empowerment: New Evidence from Mexico
with Damian Clarke (Universidad de Santiago de Chile)
Abstract
We examine the effect of a large-scale, free, elective abortion program implemented in MexicoCity in 2007. This reform resulted in a sharp increase in the request and use of early term electiveabortions. We document that this localized reform resulted in a legislative backlash in 18 otherMexican states which constitutionally altered penal codes to increase sanctions on abortions. Wetake advantage of this dual policy environment to estimate the effect of progressive and regressiveabortion reform on fertility and women’s empowerment. Using administrative birth data we findthat progressive abortion laws reduce rates of child-bearing, particularly among young women.Additionally, the reform is found to increase women’s role in household decision making—anempowerment result in line with economic theory and empirical results from a developed-countrysetting. We however find little evidence to suggest that the resulting regressive changes topenal codes have had an inverse result over the time period studied. In turning to mechanisms,evidence from a panel of women suggests that results are directly driven by increased access toabortion, rather than changes in sexual behavior, contraceptive use or contraceptive knowledge.
Keywords: fertility, female empowerment, abortion legalization, MexicoJEL Codes: J13, I15, I18, O15.
We are very grateful to Andreea Mitrut, Randi Hjalmarsson, Sonia Oreffice, Elin Larsson, Blair G. Darney,Hans Grönqvist and seminar audiences at the Department of Economics at University of Gothenburg, SOFIStockholm University, Karolinska Institute and the CSAE conference for useful comments and discussions. Wethank Alejandro del Valle and IPAS Mexico City for sharing data.
137

1 Introduction
Laws codifying access to abortion date from as far back as the early 20th century (Doan, 2007).
However the issue of abortion legalization remains a highly controversial social topic, with
considerable variation in the availability and legality of elective abortion world-wide. From the
1970s onwards a number of large-scale reforms have increased access to elective abortion, and
these have been documented to have considerable impacts on the life courses of women, children
and families (Ananat et al., 2009; Bailey, M. J., 2013; Mitrut and Wolff, 2011; Pop-Eleches,
2005; Pop-Eleches, C., 2010). However, legislation, both de jure and de facto has also lead to a
tightening of access to elective abortion in a number of contexts. At least in the USA, recent
work has shown that these restrictions lead to reductions in the use of abortions (Cunningham
et al., 2017; Grossman et al., 2017), and corresponding increases in fertility (Fischer et al.,
2017).
Despite, the political and legal complexities of abortion reform, the decisions taken by
national and local governments in setting these policies have important long and short-run
welfare implications. As well as impacts on total fertility and fertility timing (Ananat et al.
(2007); Gruber et al. (1999); Guldi (2008); Valente (2014); among many others),1 access to
abortion has been documented to impact women’s labor market outcomes (Angrist and Evans,
1996; Mølland, 2016), the composition of children as well as their living circumstances (Mitrut
and Wolff, 2011; Pop-Eleches, C., 2010), and women’s bargaining power (Oreffice, 2007).
In this study, we examine the effect of a sharply defined local abortion reform in Mexico
City and document the effect of free access to legal and safe abortion services on fertility, sexual
behavior and female empowerment. We combine the state-level variation over time resulting
from this natural experiment with high quality vital statistics data on 23 million births. This
reform—the so called legal interruption of pregnancy (or ILE for its name in Spanish)—was of
considerable importance. During the pre-reform period of 2001-2007 a total of 62 legal abortions
(available in restrictive conditions) were performed in Mexico City. Following the 2007 reform,
more than 90,000 women accessed safe legal abortion between 2008 and 2012.
Abortion laws are determined at the state level in Mexico, where Mexico City (also known
as the federal district of Mexico or Mexico D.F.) has its own legislative assembly. The ILE reform
provided all women who reside in Mexico City with access to legal and safe abortion procedures,
free of charge and for any reason, during the first trimester of pregnancy (Becker, 2013). The1An overview of the impacts of abortion policies on fertility in a range of contexts can be found in (Clarke,
2017).
138

law was a radical change from previous legislation in Mexico City, and also compared to the rest
of the states of Mexico, where abortion is still banned in all but the extreme circumstances of
rape, to save the mother’s life, or in cases of severe fetal malformation. Moreover, by legalizing
abortion, Mexico City distinguishes itself from nearly all other countries in Latin America
and the Caribbean which remain highly restrictive in their policies related to elective abortion
(Fraser, 2015).2 The passing of the ILE reform resulted in a swift backlash, with 18 states
following the announcement of the ILE reform by constitutionally modifying their penal codes
to increase the harshness of the treatment of suspected abortions. We construct a database
recording the precise date for each of these law changes by piecing together dates from published
constitutional decrees for each state, resulting in a time and state-varying measure of changes
in abortion laws.
This reform thus provides a unique opportunity to examine simultaneous expansions and
contractions of abortion policies. While much of the existing literature on the impact of
abortion—and contraceptive policies more generally—focuses on expansions in access, there
are a number of papers which focus on the contractions in policies. These include historical
restrictions in Romania (Pop-Eleches, C., 2010), the impact of parental consent or notification
laws targeted at adolescents in the USA (Bitler and Zavodny, 2001; Joyce and Kaestner, 1996),
and recent contractions in availability of providers due to state-specific legislation in the USA
(Cunningham et al., 2017; Fischer et al., 2017; Lu and Slusky, 2016). However, the ILE reform
in Mexico DF and resulting spate of constitutional changes increasing the harshness of sentenc-
ing of illegal abortion provides the opportunity to examine the impact of a contemporaneous
series of restrictive and permissive abortion policies in a single country and time.
This study adds to the existing literature by providing evidence on the effect of abor-
tion legalization absent simultaneous changes in other major contraceptive laws and reforms.3
And as described above, we take advantage of an idiosyncratic policy environment in which
regressive changes in abortion laws in multiple and geographically disperse areas followed a
large progressive change, allowing for the separate identification of the effects of both a loos-
ening and tightening of abortion legislation. By combining rich administrative data with panel
data following women on either side of abortion reforms we are able to test a number of exist-
2According to the most recent United Nations figures (United Nations, 2014), Mexico is one of only threecountries in the Latin America and Caribbean region (along with Uruguay and Guyana) to be classified as the“Least restrictive” in abortion policy, implying that abortions are permitted for economic or social reasons uponrequest.
3In Mexico, the country under study, contraception has been legal and freely provided by the governmentsince a constitutional declaration in 1974.
139
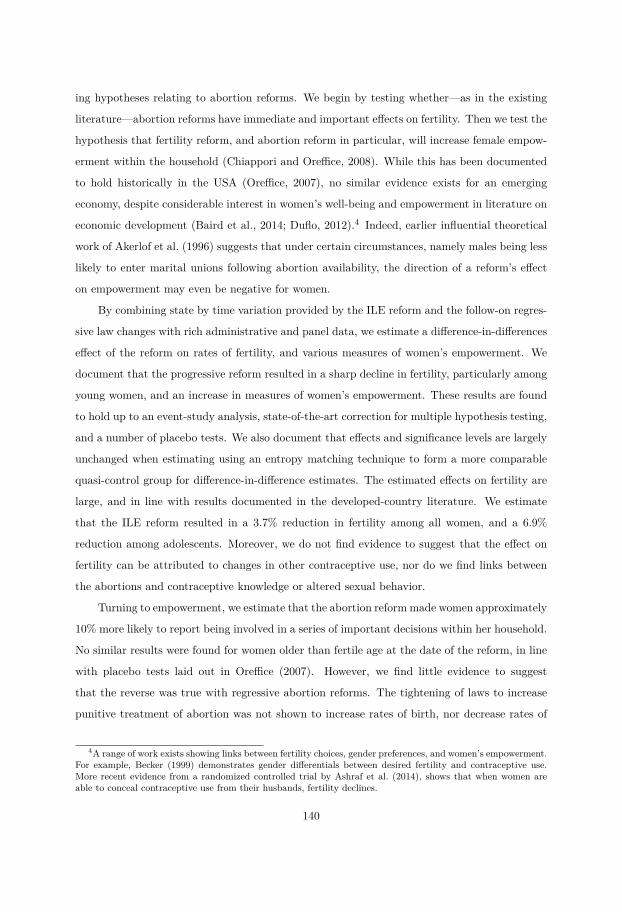
ing hypotheses relating to abortion reforms. We begin by testing whether—as in the existing
literature—abortion reforms have immediate and important effects on fertility. Then we test the
hypothesis that fertility reform, and abortion reform in particular, will increase female empow-
erment within the household (Chiappori and Oreffice, 2008). While this has been documented
to hold historically in the USA (Oreffice, 2007), no similar evidence exists for an emerging
economy, despite considerable interest in women’s well-being and empowerment in literature on
economic development (Baird et al., 2014; Duflo, 2012).4 Indeed, earlier influential theoretical
work of Akerlof et al. (1996) suggests that under certain circumstances, namely males being less
likely to enter marital unions following abortion availability, the direction of a reform’s effect
on empowerment may even be negative for women.
By combining state by time variation provided by the ILE reform and the follow-on regres-
sive law changes with rich administrative and panel data, we estimate a difference-in-differences
effect of the reform on rates of fertility, and various measures of women’s empowerment. We
document that the progressive reform resulted in a sharp decline in fertility, particularly among
young women, and an increase in measures of women’s empowerment. These results are found
to hold up to an event-study analysis, state-of-the-art correction for multiple hypothesis testing,
and a number of placebo tests. We also document that effects and significance levels are largely
unchanged when estimating using an entropy matching technique to form a more comparable
quasi-control group for difference-in-difference estimates. The estimated effects on fertility are
large, and in line with results documented in the developed-country literature. We estimate
that the ILE reform resulted in a 3.7% reduction in fertility among all women, and a 6.9%
reduction among adolescents. Moreover, we do not find evidence to suggest that the effect on
fertility can be attributed to changes in other contraceptive use, nor do we find links between
the abortions and contraceptive knowledge or altered sexual behavior.
Turning to empowerment, we estimate that the abortion reform made women approximately
10% more likely to report being involved in a series of important decisions within her household.
No similar results were found for women older than fertile age at the date of the reform, in line
with placebo tests laid out in Oreffice (2007). However, we find little evidence to suggest
that the reverse was true with regressive abortion reforms. The tightening of laws to increase
punitive treatment of abortion was not shown to increase rates of birth, nor decrease rates of
4A range of work exists showing links between fertility choices, gender preferences, and women’s empowerment.For example, Becker (1999) demonstrates gender differentials between desired fertility and contraceptive use.More recent evidence from a randomized controlled trial by Ashraf et al. (2014), shows that when women areable to conceal contraceptive use from their husbands, fertility declines.
140
women empowerment. We suggest that this may be because regressive constitutional changes
had little effect on rates of self-administered abortion, which often occur privately, without
any formal medical intervention (Lara et al., 2011). And unlike other restrictions in abortion
policy studied in the economic literature (Fischer et al., 2017; Joyce and Kaestner, 1996; Pop-
Eleches, C., 2010), the prevailing policies prior to the legislative changes in Mexico were already
restrictive.
This paper joins a number of studies on Mexico’s ILE reform, spread across a range of fields
including law (Johnson, 2013), public health (Becker, 2013; Contreras et al., 2011; Mondragón y
Kalb et al., 2011; Schiavon et al., 2010), medicine (Madrazo, 2009), and demography (Gutierrez-
Vazquez and Parrado, 2015).5 The present paper, however is the first to harness the full power
of vital statistics data, the first to collect and combine the ILE reform with the regressive law
changes following this reform, and the first to consider how women’s empowerment, as well as
fertility declines, may be affected by abortion reform in Mexico. All in all, the paper provides
strong evidence that abortion reform in an emerging economy leads to rapid and discernible
changes in political behavior, aggregate fertility rates, and individual empowerment within
households.
2 Unintended pregnancies, the Mexican context and the ILE
reform
Globally, unintended pregnancies lead to approximately 46 million induced abortions each year,
accounting for around 50% of the world-wide total of all (induced) abortions (Van Lerberghe
et al., 2005). Induced abortion is a procedure or medical treatment for terminating pregnancy,
and while induced abortion under appropriately supervised settings is considered one of the
safest medical procedures in modern medicine, unsafe abortion is associated with substantially
increased risks of severe morbidity and mortality.6 Breathtaking figures suggest that world-wide,5In examining the abortion reform and fertility outcomes, Gutierrez-Vazquez and Parrado (2015) use national
vital statistics to examine the effect on fertility across ages. Due to the use of a limited amount of data andlimitations inherent in the empirical design one cannot assign a causal interpretation to the results with confidence.More specifically, only a limited amount of data is used comparing outcomes between three different years (1990,2000 and 2010).
6Induced abortions in a safe setting are carried out by professional health care providers in safe environmentand in line with evidence based medicine. The procedure generally depends on gestational length of pregnancy. Asafe induced abortion usually entails either a surgical operation or medical procedure. During a surgical operation,the products of conception are removed from the womb. The medical procedure is a non-invasive procedure thatcauses contractions of the womb, terminating the pregnancy. Medical abortion procedures are safer and more cost-efficient compared to other methods for first trimester abortions. It is common that the patient self-administersthe medical abortion at home (Kulier et al., 2007). Induced abortion under safe conditions exhibits a mortalityrate below 1 per 100,000 procedures (Grimes, 2005).
141

unsafe abortions may result in as many as 8 maternal deaths per hour (The Lancet, 2009). By
the best available estimates, 13% of all maternal deaths are due to complications surrounding
clandestine and unsafe abortion, with these numbers being much higher in certain regions and
groups (WHO, 2011).
The highest estimated rate of unsafe abortion occurs in the Latin America and Caribbean
region. Each year, an estimated 4.2 million unsafe induced abortions are carried out, accounting
for 12% of all maternal deaths in the region (WHO, 2011). This region also exhibits some of the
world’s most conservative laws on abortion (United Nations, 2014). Prior to the legalization
of abortion in Mexico City in 2007, and in line with nearly all other countries in the region,
Mexico had very strict legal restriction on access to abortion.
Fertility and the Mexican context. Between the years 1975 and 2015, the fertility rate in
Mexico declined rapidly from roughly 6 children per woman to approximately 2.2 children per
woman. This major shift in fertility can be partially attributed to changes in access to modern
contraceptive methods in the country (Juarez et al., 2013). In 1975, the Mexican government
passed the General Population Law, which obliged the government to supply family planning
services and provide contraceptives via the public health care sector free of charge. In 1995,
family planning services were decentralized to the state level, where different states fund family
planning to various degrees, possibly making family planning services differentially available
across states. Although 67% of all women of childbearing age in Mexico report using modern
contraceptive methods (and 5% use traditional and less efficient methods), it is estimated that
more than half of all pregnancies are unintended.7 Estimates suggest that up to 54% of these
unintended pregnancies are terminated (Juarez et al., 2013).
Mexico consists of 32 federal entities, 31 of which are federal states plus the federal district
of Mexico (also known as Mexico D.F. or Mexico City). In addition to the national constitution,
each of the 32 federal entities has its own state or local constitution, defined by its own legislative
power. Abortion laws in all of Mexico are determined at the state level (Becker, 2013). Mexico
City contains approximately 8% of the entire population (8.9 million of Mexico’s 119.5 million
inhabitants according to 2015 estimates) and, since 2007, is the only state that allows for elective
abortion during the first trimester.
7Modern contraceptives are condoms, oral or/injectable/implants of hormones preventing ovulation, IUD,sterilization and emergency contraception. Traditional or less efficient methods are calendar method or rhythmmethod, coitus interrupts, herbs or teas. For a detailed account of modern and traditional methods, see forinstance Hubacher and Trussell (2015).
142

Legal restrictions and induced abortions. Prior to the reform in Mexico City, abortion
laws were quite uniform across the 32 federal entities of Mexico. Induced abortion continues to
be considered a criminal offense with the risk of up to 30 years imprisonment in many states, and
legal abortion was only permitted in the limited cases of rape, threat to the life of the mother,
or severe malformation of the fetus. In practice, even in these limited cases, legal abortion has
been described by human rights organizations as extremely difficult to access due to rigid legal
barriers (Juarez et al., 2013). In the densely populated Mexico City, only 62 abortions were
legally performed during 2001-2007 (Becker, 2013).
The estimated rate of induced abortions for Mexico in 2006 was 33 abortions per 1,000
women of fertile age (Juarez et al., 2008), which is considered high internationally (Becker,
2013). As a substitute to legal options, abortions were performed in clandestine and often unsafe
settings. In 2006 alone, medical records from public hospitals show that an estimated 150,000
women in Mexico were treated for abortion-related complications (Juarez et al., 2008). The
most common method of induced abortion is believed to be the abortifacient drug Misoprostol,
which despite the strict legal restrictions in Mexico, has been available in pharmacies since 1985
(Lara et al., 2011).8 Despite the fact Misoprostol and other abortifacients formally require a
doctor’s prescription in Mexico, studies show that abortifacients are frequently sold over the
counter without prescription (Lara et al., 2011). While a safe and well recognised method for
induced abortion when appropriately taken, instructions on dosage and usage of Misoprostol is
generally not available at pharmacies, leading to considerable risks when self administered (see
for example Grimes (2005)).
Due to the high number of unsafe abortions as well as a growing movement for women’s
reproductive health rights and a coalition of pro-choice NGOs, the legislative assembly of the
Federal District of Mexico City voted to legalize elective abortion (termed legal interruption
of pregnancy, or ILE for its name in Spanish) on April 24, 2007, reforming Articles 145-148 of
the penal code of Mexico City, and Article 14 of the Health Code. These reforms were signed
into law the following day, and published in the official Gazette of the Federal District on
April 26, 2007 (Ciudad de México, 2007). A broader discussion of the reform’s social and legal
setting is provided in Kulczycki (2011); Madrazo (2009), Blanco-Mancilla (2011) and Johnson
(2013). This immediately permitted women above the age of 18 to request legal interruption
8Misoprostol (sometimes referred to as Cytotec, Arthrotec, Oxaprost, Cyprostol, Mibetec, Prostokos or Mis-otrol) is one of the recommended substance for induced abortion by the WHO (Lara et al., 2011). Misoprostolis a prostaglandin with the original purpose of curing gastric ulcers. It is also utilized for OB/GYN reasons suchas induced abortion, post abortion procedures and induced labor for delivery (Kulier et al., 2007).
143

of pregnancy at up to 12 weeks of gestation without restriction. Access for minors requires
parental or guardian consent. Under this law, induced abortion was made legal in both the
public and private health care sectors.
Implementation of the ILE reform 2007. Immediate implementation was made possible
by collaboration between the Ministry of Health of Mexico City, members of the health depart-
ment and international NGOs, which had thoroughly designed a program for public provision of
abortion services called the “the ILE program” and its implementation even before the law was
passed (Singh et al., 2012). As such, abortion services were made available via the public health
care hospitals immediately after the law was passed in April 2007, although with lower capacity
and efficiency compared to current conditions. Abortion services were also quickly available
in the private health care sector (Blanco-Mancilla, 2011). Additionally, under this law sexual
education in schools was improved, and post-abortion contraceptives were made freely available
directly from the health clinics which provided abortions (Contreras et al., 2011). Records from
public hospitals show that the demand for post-abortion contraceptives is high (approximately
82% of all women accept contraceptives) and that prevalence of repeated abortion procedures
are low (Becker, 2013). On August 29, 2008 the decision to pass the ILE law was ratified by
the Supreme Court of Mexico, making Mexico City, together with Cuba and Uruguay, the most
liberal jurisdiction in terms of abortion legislation in the entire Latin American and Caribbean
region (Fraser, 2015).
Under the ILE program, women above the age of 18 with residency in Mexico City can
access abortion services free of charge at a selected number of public health clinics operated via
the Ministry of Health in Mexico City (MOH-DF).9 Women with residency outside Mexico City
can also access the public provision of abortion through MOH-DF but are charged with a sliding
fee scale determined with regard to the woman’s socioeconomic background. In 2010, 74% of
all women who received an abortion through the public health care sector were women living in
Mexico City, 24% were living in the state of Mexico (which shares a border with Mexico City)
and 2% were living in other states (Mondragón y Kalb et al., 2011).
Figures from the Secretary of Health’s administrative data suggest that abortions were
used by women of all ages, though were disproportionately sought by younger (21-25 year-olds)
and older women (36 year-olds and above), with lower rates of abortion among 26 to 35 year
9The public health care sector in Mexico is divided at both federal and state level, where the Ministry ofHealth (MOH) in Mexico City provides abortion procedures at a selected number of MOH-DF hospitals. OtherMOH facilities (federally or state funded) are not legally required to provide abortion procedures.
144

olds. The proportion of all births by age and all abortions in public health clinics by age is
presented in appendix figure A1. Approximately half of the abortions were sought by unmarried
women (45.5% to single women, and 4.1% to divorced women), with the remainder nearly evenly
split between married women, or those in a stable union. Information regarding the extent to
which women below the age of 18 have access to abortion services is relatively scarce. However,
according to a qualitative study by Tatum et al. (2012), the law on parental consent may be
differentially enforced depending on the caregiver. While Public Hospitals require parental
consent, only one out of three abortion providers in private health clinics require parental
consent (Schiavon et al., 2010).
Accessibility and utilization of legally induced abortions. Information regarding the
private provision of abortion services is limited due to a lack of supervision of the private market
for legal abortion services (Becker, 2013). Despite the fact that safe abortion, at no or low cost,
is provided by the public health system in Mexico City, women do seek abortion services within
the private sector. A descriptive study by Schiavon et al. (2012) suggests that private abortion
services are provided at high costs (157–505 US dollars) and that the quality of care is inferior
to that in the public sector, given that the less safe and efficient “dilation and curettage” is used
as the main method in the private sector (71%). A suggested explanation for the high rates of
usage of private care relates to beliefs that the overall quality is higher in the private health
sector (Schiavon et al., 2012).
Records from public hospitals show that during the year of 2007, when the reform was
implemented, more than 7,000 abortion procedures were performed at 14 selected MOH-DF
clinics. Over the years, the MOH-DF abortion program expanded its services and became more
efficient in meeting the high demand for elective abortion. The MOH-DF program offers both
surgical and medical abortion procedures and is the main provider of medical abortion (Winikoff
and Sheldon, 2012).10 The large shift from 25% of all abortion procedures being medical in 2007
to as much as 74% in 2011 have played a key part of meeting the demand (Becker, 2013). As of
2012, approximately 90,000 abortions were carried out at the MOH-DF clinics (Becker, 2013).
Post-April 2007 policy environment Almost immediately following Mexico D.F.’s ILE
reform, a number of states began a series of counter-legislations to change the respective sections
of their penal codes, defining the beginning of human life as occurring at conception. Often,10Medical abortion procedures constitutes 66 percent of all abortion procedures in the MOH-DF program where
Misoprostol was the main regimen until 2011 when Mifepristone was introduced.
145

these legal responses directly referenced Mexico D.F.’s ILE reform.11 Even in cases where
they did not directly refer to the ILE reform, it seems highly likely that the reform was a
defining factor. For example, in the 20 years prior to the ILE reform there had been only
two constitutionally defined changes to the articles relating to abortion in the penal codes of
all states of Mexico (Gamboa Montejano and Valdés Robledo, 2014), compared to 18 changes
between June 21, 2008 and November 17, 2009. Importantly, these reforms all changed the
status of abortion from an act which was penalized according to specific articles of the penal
code into a homicide, with considerably more severe sanctions of up to 30 years imprisonment.
In figure 1 we display the geographical distribution of law changes (progressive, regressive
or neutral) over the period under study. The only progressive reform refers to Mexico D.F.’s ILE
reform, while 18 states made regressive changes after the initial reform. We have compiled on
a state-by-state basis the exact dates the reforms were passed into law, and these are displayed
in table 1. To the best of our knowledge, there exists no centralized record of the dates and
laws which were altered in the post ILE era, and as such we compiled these from our reading of
legal source documents. In section 4 of this paper we return to how we use the state and time
variation of this law in our identification strategy.
3 Data
3.1 Birth records from INEGI
To examine the effects of abortion reforms on fertility, we use vital statistics on all births
registered in Mexico for the time period 2002-2011. The data is provided by the National
Institute of Statistics and Geography (INEGI for its name in Spanish) and covers 23,151,080
live births among women aged 15-44. Vital statistics for births in Mexico are compiled by
INEGI based on birth registries completed by each parent or guardian at the civil registry,
rather than being based on birth certificates issued at hospitals (as is the case, for example
with the National Vital Statistics System in the USA and in various developing and emerging
economies, like Chile and Argentina). Using data from the 2010 census and birth records up
until 2009, a recent (backward looking) analysis suggests that 93.4% of all births in Mexico
were registered within 1 year of birth of the child, and in total, 94.2% of births are eventually
registered at the national level (Instituto Nacional de Estadística y Geografía, 2012). The birth
11For example, the constitutional decree issued by the state of Nayarit when changing their penal code explicitlyrefers to the changes in the penal and civil code of Mexico D.F. (p. 14) (Gobierno de Nayarit, 2009).
146

register is released once per year, containing all births registered in that year, as well as the
year the birth occurred. In order to avoid problems of under-reporting, differential reporting
over time, and double-reporting, we collate all birth registers between 2002-2014, and then
keep all births registered within 3 years of the date of birth.12 This implies that we only have
complete birth registers based on birth years up to (and including) 2011. While these birth
registers are not universal, they are recognized as being considerably better than many other
registry systems in developing economies. On average, dated estimates suggest that across all
developing countries 41% of births are unregistered, and this figure for Latin America alone is
14% (UNICEF, 2005). As we discuss in later sections of this paper, unregistered births will
only be a problem if rates of birth registration change differentially between regions of Mexico
over the period under study. Empirical evidence on changes in birth records between 1999 and
2009 do not suggest a strong relationship between reform and non-reform areas, and changes in
rates of coverage (Instituto Nacional de Estadística y Geografía, 2012).
For our principal analysis, we focus on all births occurring to women aged between 15 and 44
years of age who reside in each of Mexico’s 32 states. Data from the birth registers is aggregated
by each age group, state, and year, resulting in a total of 9,600 cells (years×states×age). The
INEGI Birth Register contains information about the date of birth, actual birthplace and the
official residency of the mother. In addition, information on maternal characteristics such as
age, total fertility, educational attainment, marital status and employment status are recorded.
Summary statistics for birth data (as well as state-specific time-varying controls), are pro-
vided in table 2. Rates of birth are presented separately for Mexico D.F. (the principal reform
state), states which went on to pass regressive reforms, and states which left un-altered their
constitutions. We provide country averages in column 4, which agree with international calcula-
tions (The World Band, 2015). Summary statistics show that rates of birth in Mexico D.F. are
lower than rates of birth in the rest of the country, and broadly comparable among regressive
and non-regressive reform states. In principal analyses we capture difference in levels among
states by state fixed effects, and examine robustness of our results to entropy weighting which
matches on pre-reform birth rates.
12This allows us to record births even when they are registered months after birth (up to 36 months followingthe birth). Considering additional registration lags results in virtually unchanged estimates, as nearly all ever-registered births are registered within 3 years of birth. This is very similar to the methodology employed byMexico’s population authority in their calculation of official demographic trends (Consejo Nacional de Población,2012).
147
3.2 Survey data from the Mexican family life survey (MxFLS)
In order to examine female empowerment and potential mechanisms through which the reform
may have affected fertility, we use longitudinal data on household decision-making and con-
traceptive use and knowledge from the Mexican Family Life Survey (MxFLS). The MxFLS
is a nationally and regionally representative longitudinal data set that follows the Mexican
population over time, covering various topics regarding the well-being of individuals including
information on household decision-making and reproductive health. The MxFLS dataset is pub-
licly available, developed and operated by the Iberoamerican University (UIA) and the Center
for Economic Research and Teaching (CIDE) and also supported by multiple institutions in
both Mexico (INEGI and National Institute of Public Health) and the USA (Duke University
and Universities of California, Los Angeles). The survey was conducted in three waves during
2002-2003, 2005-2006 and 2009-2012.
The sample used for the analysis of household decision-making consists of a panel of 5,816
unique women living in a household together with their spouse or partner and who completed
the household module. The module on household decision-making includes questions on which
household members decide on children’s health and education, major household spending, labor
market participation and contraceptive use, among other things. In table 3, summary statistics
regarding women’s participation in household decision-making processes are presented, sepa-
rated by their region of residence. The averages in participation are presented again separately
for Mexico D.F (column 1), states which went on to pass regressive laws (column 2), states
which left their constitutions un-altered (column 3) and the averages for the full country (col-
umn 4). Panel A displays decision-making for women aged 15-44 (fertile age) and Panel B for
women above age 44. We employ this split into fertile and non-fertile age women in a placebo
test discussed in section 4. The summary statistics show that women with residency in Mexico
City are on average more likely to participate in household decisions compared to women in the
rest of the country. A similar pattern can be found across age groups, where women aged 15-44
appear to play more of a role in decisions within the household compared to women above age
44.
Finally, we use the reproductive health module from the MxFLS which collects information
on contraceptive knowledge and usage as well as information on sexual behavior such as the
number of sexual partners. This sample consists of a panel of women aged 15-44 who completed
the reproductive health questionnaire resulting in a total of 5,404 women. We return to use
148

these data in tests of behavior following abortion reforms. Summary statistics for reproductive
health across regions are provided as an online appendix (table A1) and show that average
knowledge of at least any kind of modern contraceptive methods are generally high across all
regions, while the average usage of any kind of contraceptives and modern contraceptives are
higher in Mexico City compared to other states.
3.3 Additional data sources
We collect a number of additional (time-varying) controls measured at the level of state and
year. This includes the population of women (variation by age, state and year) from the National
Population Council of Mexico (CONAPO), socioeconomic variables including illiteracy, school-
ing, and access to health insurance from the National Institute for Federalism and Municipal
Development (INAFED) and the National Education Statistical Information System (SNIE),
and data on the municipal-level roll-out of the national health insurance program Seguro Popu-
lar13 from the INEGI data bank. Socioeconomic data and measures of Seguro Popular coverage
vary by state and year. These are merged by year and state to the birth data discussed in
section 3.1, and are included as time-varying controls in certain regression specifications.
4 Empirical strategy
4.1 Estimating effects on fertility
The impact of the abortion reform is evaluated by using the sub-national variation in abor-
tion laws, and thus the access to legal and safe abortion procedures, resulting from the ILE
reform. Given the temporal- and geographical-variation in availability of free legal abortions,
and resulting regressive law changes, we estimate the following difference-in-differences (DiD)
specification:
ln(Birth)ast = β0 + β1ILEs,t−1 + β2Regressives,t−1 +Xstδ + αs + νt + πa + λs · t+ εast. (1)
Here the outcome variable of interest is the natural logarithm of the total number of births for
women of age a in state s and year t. We are interested in two quasi-treatment variables, each13Mexico’s General Health Law underwent a major reform in 2003, which intended to provide 50 million
Mexican citizens lacking social security with subsidized and publicly financed health insurance. The core of thisreform was the health insurance program Seguro Popular (SP). The “People’s Insurance” or Seguro Popular waslaunched in 2002, offering health service free of charge or subsidized to those without formal health insurance.By 2005, two years before the reform, all 32 states had enrolled in the SP program (Knaul et al., 2007).
149

of which are determined by the official residency of the woman. The first, indicated by ILEs,t−1
is a variable that takes the value of one in Mexico City nine months after the ILE reform was
adopted in order to compensate for the lag caused by the pregnancy length (assuming 40 weeks
of gestation), and zero otherwise.14 The second dependent variable of interest, Regressives,t−1 is
defined in a similar way, however taking the value of one in those states which passed regressive
laws in response to the ILE reform at least 9 months after each law was passed. As discussed
in section 2, a non-negligible proportion of all elective abortions were accessed by women with
residency in the neighboring state of Mexico. Thus, to ensure that any potential spillover effects
of the reform are not included as part of the quasi-control group, we always separately control
for this with a dummy for the post-reform period in Mexico State.
The difficulty in evaluating effects of these new laws lies in the fact that legislative changes
are often endogenously determined. That is, abortion legalization is likely to be correlated with
observed and unobserved characteristics of Mexico City and, similarly for the regressive reform
states. Even though the distribution of treatment is non-random, the inclusion of state (αs),
year (νt) and age (πa) fixed effects allows us to estimate the impact of the reform in a DiD
setting. Under the parallel-trends assumption that in the absence of the reform treated and
untreated states would have followed similar trends over time, DiD gives the causal impact of the
reform on outcome variables. We examine the veracity of this assumption in following sections
including estimating a full event study for the effect of the ILE reform. In certain specifications,
we include a set of state-level time-varying controls Xst, and also allow for differential linear
time trends in each state over time, captured by the λs ·t term. The idiosyncratic error term εast
is clustered at the state level in order to allow for autocorrelation of unobserved shocks within
states over time,15 and age by state by year cells are weighted by the number of births occurring
to women of that age in that state and year (see for example Dell (2015) for a discussion based
on a similar structure).
In our main specification, births are measured as the log number of total births occurring
in each cell. While births can be measured in a number of ways, including counts, gross fertility14We choose the most conservative definition of the post-treatment period starting in January 2008 and onwards
for our baseline specification.15This is the generally accepted method in a DiD model (Bertrand et al., 2004). However, there is a potential
inconsistency in the standard error caused by serial correlation when the time period is long and numbers ofgroups (i.e. states) are small (Bertrand et al., 2004). A likely outcome in these circumstances is underestimatedstandard errors leading to falsely significant DiD estimates. This raises concern, since the number of clusters inour case are 32, which is slightly below commonly accepted “rule of thumb” thresholds for consistent estimationof standard errors (Angrist, J. D. and Pischke, J., 2009; Cameron and Miller, 2015). One suggested way of dealingwith this problem is to use wild bootstrapped standard errors (Bertrand et al., 2004; Cameron and Miller, 2015),and as such, we also examine our main specifications using wild bootstrapped standard errors and show thatthese results are consistent with our baseline results.
150

rate and total fertility rate (which we report in the online appendix), we prefer the natural
logarithm of the number of births for a number of reasons. First, we lack micro-data registers
of population in each year and are constrained to demographic projections based on the census,
quinquennial surveys, migration, births and deaths (Consejo Nacional de Población, 2012). Sec-
ond, we estimate regressions with log births using OLS. Without the log normalization of births,
regression residuals are not normally distributed, and predicted values are at times negative.
Taking the log transformation allows us to resolve these issues in our case. Nevertheless, we
consistently report alternative specifications and measures in appendix tables.
In equation 1, all states which were not affected by either the ILE reform or resulting
regressive changes are considered as part of the quasi-control group. Given the considerable
heterogeneity across the country, both within and between urban and rural districts, this may
result in a quasi-control group which is considerably different from the quasi-treatment groups.
While our difference-in-difference study will pick up any difference in levels, nevertheless we may
be concerned that heterogeneity between groups drives the results, rather than the reform itself.
In order to temper these concerns, we provide additional estimates of equation 1, however this
time using entropy balancing to determine an optimal quasi-control group. Entropy-balancing,
from Hainmueller (2012), is a technique designed to optimize covariate balance between two
groups. This technique, increasingly used in economic applications (for example Stanton and
Thomas (2016)) matches the moments between samples of desired covariates.16 In order to
apply this to our DiD methodology we calculate entropy weights matching only on pre-reform
birth rates of births between states. As well as documenting graphical effects of the reform
under entropy matching, we can then replicate our findings from equation 1 with the optimal
weights, to examine whether our earlier effects are driven by a non-ideal control group.
4.2 Estimating effects on individual and household behavior
After documenting the effect of various reforms on fertility outcomes at a state level, we then go
on to estimate their effect on individual behaviors collected from the MxFLS data. Given that
the MxFLS follows women and families over time, this allows for the construction of a panel
overlapping the full sets of reforms on each side. When turning to behavioral outcomes, this
16The logic of this methodology is similar in style to synthetic control methods described in Abadie et al. (2010).However, we prefer entropy weighting rather than synthetic control methods as synthetic control estimates requirethat outcomes in the treated state are contained in a convex hull of outcomes in potential control states. Giventhat the number of births in Mexico D.F. is higher than the number of births in states in the rest of the country,this convex hull assumption often is not met, and as such, entropy weights are consistently preferred in thesealternative specifications.
151

leads to the following specification:
Behaviorist = α0 + α1ILEst−1 + α2Regressivest−1 + µi + φt +Xitδ + ηist (2)
As before, ILE and Regressive are dummy variables indicating whether the woman i in question
was exposed to either type of reform in the previous period. Once again these are measured at
the level of state of residence (which is where the woman is interviewed in her household). Our
outcome of interest in this case is Behavior, which measures a series of behaviors of interest,
both in terms of empowerment within the household, and reported sexual behavior. Given the
panel data setting and three rounds of data, we control for household-specific fixed effects (µi),
and survey wave fixed effects (φt). Our coefficients of interest are thus the effect of having
been exposed to the reform, conditional on all observable and unobservable household-specific
invariant factors which are absorbed in the fixed effect.
For our tests described in equation 2, there are various Behavior indicators which were
(ex-ante) defined as outcomes of interest. This implies running multiple regressions on our
treatment indicators, leading to a well known problem of testing multiple hypotheses with a
single reform. If we were to naively estimate multiple regressions and examine the test statistic
relating to α1 and α2 at a fixed significance level in each one, we would be at risk of incorrectly
over-rejecting null hypotheses after the first test. In order to account for this, we efficiently
(both statistically and computationally) fix the level of the family wise error rate (FWER) of
these tests. We follow a step-wise testing algorithm proposed by Romano and Wolf (2005);
Romano, J. P. and Wolf, M. (2005), which updates the proposed multiple hypothesis testing
algorithms of Bonferroni (1935) and Holm (1979). Fixing the FWER instead of a significance
level of each individual hypothesis means that we will no longer be propense to overcommit type
I errors. A full discussion of the Romano-Wolf step-down technique and the resulting p-values
is provided in appendix A2.
The hypotheses of interest tested in equation 2 relate to well-known (theoretical) results
suggesting that empowerment of women will respond to changes in birth control technologies
(Chiappori and Oreffice, 2008). In order to allay concerns that any results may represent a
general change of empowerment of all women, and identification concerns that empowerment
may be the cause, rather than the result, of the reform, we propose two placebo tests. The
first placebo test consists of re-estimating equation 2, however in place of using fertile aged
women, estimate the effects on women who are no longer of fertile age, and hence no longer
152

benefit from any additional bargaining power gained on the marriage market. This placebo
test is suggested by Oreffice (2007), who we follow here.17 The second test is an identification
test, and consists of estimating the same model using only pre-reform waves of the MxFLS.
Given that we have two waves of pre-reform data, we can re-estimate equation 2, where in place
of the actual reform dates, we use placebo dates between the first and second survey round
which were entirely before the actual reforms took place. In each case, the ILE and Regressive
variables are defined for the same states, however in the second pre-treatment period. If any
changes in empowerment do actually flow from the reform, we should see that these placebo
reforms have no effect on empowerment, suggesting that parallel trends between treated and
non-treated areas existed before implementation. As is the case with the main specifications,
in all cases where multiple hypotheses are tested, we efficiently correct for over-rejection fixing
the FWER using the Romano-Wolf procedure.
5 Results
5.1 Fertility
Table 4 presents results of the DiD model described in equation 1. The first three columns
display the pooled effect of the reforms on women of all ages, while columns 4-6 present the
same specifications for teenage women only (ages 15-19). These results suggest, first, that the
legalization of abortion in Mexico D.F. caused a large and statistically significant reduction in
rates of births, both for all women, and for teenage women. The estimated coefficient on ILE
Reform for all women fluctuates between a reduction of births by 2.2% (p < 0.05) to a reduction
by as much as (a marginally significant) 3.8% when including state-specific linear trends and
time-varying controls.18 When considering only the effect of passing the ILE reform on teenage
motherhood, we find larger effects, of a magnitude comparable to international evidence (Ananat
and Hungerman, 2012; Bailey, 2006; Guldi, 2008; Valente, 2014). The baseline (uncontrolled)
DiD effect is estimated as a 5.3% reduction in rates of teen pregnancy, with estimates as high
as a 7.0% reduction when accounting for time-varying controls and allowing for state-specific
17The results of Chiappori and Oreffice (2008) also suggest an alternative placebo test. Their proposition5 suggests that all women gain bargaining power following abortion legislation, with the exception of cases inwhich there is a shortage of marriageable men. They suggest that this situation occurs in certain groups, suchas low-skilled or minority women. As such, we replicate our tests using low-educated and minority groups, as apotential alternative placebo.
18Percentage change in births based in coefficients in the log model are interpreted as exp(β1) − 1. Thecoefficients can be approximately interpreted as the proportional reduction in rates of birth, but when we referto them in the text we will always perform the exponential transformation to refer to exact changes.
153

linear trends. The magnitude and direction of this effect is virtually identical to that found by
Pop-Eleches (2005) following the lifting of abortion restrictions in Romania.
The estimates corresponding to the effect of constitutionally tightening policies relating to
abortion appear to be largely of the reverse direction, however never at a statistically significant
level. When considering the effect of “Regressive Law Changes” in table 4 we see that these are
associated with small positive coefficients for all women (ranging from a 0.1% to a 1% increase
in rates of births), though always imprecisely estimated. For teenage women the evidence is
once again imprecise, suggesting that if anything, the effect of regressive laws are too small to
be statistically indistinguishable from zero.
Our principal specification uses population-weighted cells by age, state and year, so results
are interpreted as the effect on births per woman. In appendix table A2 we see that the negative
effect of the ILE reform on fertility is largely unchanged when considering unweighted results
which give equal weight to age by state cells.19 Similarly, we find that when replicating this
specification using cluster-robust wild bootstrapping (refer to appendix table A3), estimates
are largely unchanged: the effect of the ILE reform is found to be negative and statistically
distinguishable from zero, while we can never reject the null that the resulting regressive policy
changes have had any significant effect of birth rates for all women, or young women. When
examining results by age we see that results are largely driven by younger and older women
(refer to appendix table A4), and are substantively similar when instead of using log(births) as
the outcome variable of interest, we use the birth rate based on an estimated population in the
denominator (refer to appendix table A5).
5.2 Validity of difference-in-differences strategy
The validity of the previous results rely fundamentally on the validity of a parallel-trends as-
sumption for the DiD specification. We examine this assumption formally in figure 2 with the
plotting of an event study examining the effect of the ILE reform on rates of birth. In this plot
we fully interact a dummy of residing in Mexico D.F. with the years preceding and posterior
to the reform. The coefficients on these variables then allow us to compare changes in levels of
births in D.F. compared with changes in levels in the rest of the country, with respect to an
arbitrary base year.20 We follow the general convention of omitting the year that the reform19We note that in this specification, when not including any controls on regressive changes are actually negative
and at times significant, but when full controls are included, results are once again insignificant when examiningregressive changes in abortion laws.
20Crude trends of numbers of births in Mexico D.F. and the rest of the country are displayed in appendix figureA3. If we fit simple time trends on either side of the initial reform for each group we observe that each trend is
154

was implemented as the omitted base category, as the effect on fertility should begin in the first
post-reform year. The rest of the specification follows equation 1 precisely including the use of
time-varying controls, fixed effects, and clustered standard errors.
If the estimated reduction in fertility from table 4 is indeed due to the effect of the reform
rather than capturing prevailing differences in trends between quasi-treatment and quasi-control
areas, we should see that differences in trends emerge only after the implementation of the
reform. We see precisely this pattern in figure 2, where we display the event study for women
of all ages (a similar result holds when considering only adolescent fertility, and is displayed in
appendix figure A2). In the 5 pre-reform periods, there are no statistically significant differences
between quasi-treatment and quasi-control compared to the prevailing difference in the year
when the reform was implemented. However, a sharp reduction in fertility appears in Mexico
D.F. in the first post-reform year, leveling off at approximately -5% in the following 3 years.
This provides support of the parallel trend assumption, as any confounding factors which could
explain the reform’s effect on fertility must have emerged over exactly the same time-period
of the reform, rather than as pre-existing differential trends. The magnitude of the dynamic
effects also matches up quite well with actual usage figures of abortions in public health clinics,
which reached a plateau two years after the reform’s implementation.
5.3 Using entropy balancing to examine estimate validity
The results described in sections 5.1 and 5.2 provide convincing evidence that the ILE reform
produced a significant reduction in rates of birth, especially among younger women. However,
in the analysis up to this point, the reform area (Mexico D.F.) was compared to all untreated
areas of the country, regardless of differential state-level characteristics. Given the heterogeneity
between (and within) Mexican states, we examine the robustness of these findings to a poten-
tially more comparable quasi-control group. In order to do so, we use an entropy weighting
procedure described by Hainmueller (2012). This allows us to match states based on pre-reform
rates of fertility, and examine how these pre-matched states evolve once the reform has been
implemented.21
negative, and that the change to more negative in Mexico D.F. following the reform is larger than the change inthe rest of the country. Of course, these trends do not necessarily imply a causal relationship, which is why weestimate DiD models and event studies.
21The logic of entropy weighting shares certain characteristics with the synthetic control method for difference-in-differences of Abadie et al. (2010). However, entropy weighting does not rely on a convex hull assumptionwithin states over time, meaning that even if Mexico D.F. has higher rates of fertility over the period understudy, we can apply entropy matching using pre-reform birth rates. For this reason, we prefer entropy matchingover synthetic control methods.
155

In figure 3 we observe that entropy matching provides an appropriate pre-trend balance
between Mexico D.F. and the matched rest-of-Mexico sample. Graphically, we observe that
even when demanding that states are matched on pre-trends and levels of fertility, rates of birth
in Mexico D.F. decline faster and by a greater amount after the reform than in the matched
but untreated states. Similar results are presented by age-group in appendix figure A4, and we
observe that (up to the age of 35 at least), a similar dynamic is observed.
We examine these results in a regression framework in table 5. In these specifications we
use the weights estimated from the entropy matching process to replicate specification 1. We
find, reassuringly, that results are qualitatively similar. For all women the effect of the reform
is estimated to vary from -2.4% (baseline DiD) to -3.2% (including controls and state-specific
linear trends), though when including state-specific trends the result is no longer estimated with
sufficient precision to reject a null hypothesis of a zero effect. When turning to teenage births,
however, we are able to reject a null of no effect for both the baseline and the trend with control
model. In this case, our estimated effects are slightly smaller than when we use the full-Mexico
quasi control group, though the results still suggest a quantitatively considerable effect, varying
from a 4.4% to 5.2% reduction in teen births.
5.4 Mechanisms: Availability, education, or behavior
Along with the law change legalizing access to abortion, the ILE reform included additional
components relating to sexual education and disbursement of additional contraceptives in clinics
(refer to section 2 for a full discussion). In order to examine the channels through which the
reform affected fertility: whether it be only access, or a combination of access with behavioral
change, we turn to a dataset which allows us to observe (self-reported) behavior more directly.
We use the MxFLS data which follows women over time, and has survey rounds both before
and after the fertility reforms of interest. To examine the potential effect of the other aspects
of the reform (sexual education and alternative contraceptives), we estimate equation 2, which
allows for individual specific fixed-effects given the panel data nature of the MxFLS data used.
We examine the effect of abortion reform on all available measures of contraceptive use
(whether using any contraceptive or using modern contraceptives), the number of reported
sexual partners and whether the respondent reports having knowledge of modern contraceptive
methods. In this case, as we are regressing multiple outcome measures on an identical series
of reform variables, as discussed above it is well-known that classical tests will lead to over-
rejection of null hypotheses of a zero effect of the reform (Bonferroni, 1935; Holm, 1979). To
156
correct for a higher likelihood of committing type I errors, we estimate p-values using Romano
and Wolf (2005); Romano, J. P. and Wolf, M. (2005)’s step down method. This penalizes p-
values to account for multiple hypothesis testing, and does so in an efficient way which allows for
arbitrary correlations between outcome variables. In appendix A2 we provide a full discussion
of our implementation of this multiple hypothesis testing method.
We present results of these regressions in table 6. In general, we find very little evidence
to suggest that the results of the abortion reform flow from an increase in other contraceptive
knowledge in reform areas, or change in risky sexual behavior as a result of the reform. We find
quite close to zero effects for change in contraceptive use and knowledge, and an insignificant
reduction in the number of sexual partners reported. In all cases, these results are insignificant
at the 10% level when using both traditional and Romano-Wolf corrected p-values, though as
expected, p-values are lower when failing to account for multiple testing. When we replicate
these results using a repeated cross-section of women rather than household fixed-effects in a
panel setting, we reach similar conclusions that the ILE reform does not operate with alternative
contraception or information channels, suggesting that the ILE reform’s effect is largely due to
the sharp increase in utilization of abortion services (see appendix table A6 for the cross-sectional
replication). Similarly, we do not find that regressive changes in abortion laws cause women to
seek additional information or be more likely to use contraceptives, or change sexual behavior
as proxied by the number of sexual partners compared to areas which were not subject to a
regressive reform. Overall, like the case of the fertility results described in previous subsections,
these results suggest that regressive reforms themselves are not sufficient to result in easily
perceptible changes in fertility behavior.
5.5 Female empowerment
Table 7 presents results of the reform’s effect on women’s reported empowerment within the
household. Here we once again estimate specification 2 using MxFLS panel data. Table 7
suggests that, as in developed countries (Oreffice, 2007), so in an emerging economy setting
(progressive) abortion reform increases women’s bargaining power within the household. In
column 6 of this table we present a panel-data regression of an aggregate empowerment in-
dex on reform indicators. This aggregate indicator, a sum of all ex-ante defined measures of
women’s empowerment in the household variables, takes a more positive value when women
report having a greater role in decisions relating to their behaviors, or investments in their
children. Following the ILE reform in Mexico D.F. the average value of this index for women
157

was found to increase by substantially more than that for women in other parts of the country
(we discuss two placebo tests relating to these results in the following paragraphs). The effect
size is significant: on average, the sum of all empowerment variables increased by 10% of its
baseline value when comparing between reform and non-reform areas. However, we find very
little evidence to suggest that the regressive changes in abortion laws was sufficient to harm
women when considering intra-household outcomes only. The estimated effect on the aggregate
index was found to be positive, small, and statistically indistinguishable from zero following
regressive law changes.
In additional columns of table 7 we examine each item of the index separately, where in
each case a higher value for the variable indicates that the woman is more likely to take part in
the respective decision in her household. As before, given that multiple hypotheses are tested,
p-values are corrected using Romano and Wolf (2005); Romano, J. P. and Wolf, M. (2005)’s
stepdown procedure. With one exception, we see that for all outcomes considered, the reform’s
effect is to increase empowerment compared to non-reform areas. However, among the five
elements, the largest and most statistically significant effect is found on women reporting to be
more likely to participate in decisions regarding investments in their children. The coefficient
on taking part in a child’s educational decisions is found to be statistically significant, even
when correcting for multiple testing. Remaining variables, while signed in a way which suggests
increasing empowerment, are not statistically significant based on Romano-Wolf p-values.
These results, while suggestive, may capture many other underlying changes in empow-
erment across districts within Mexico which are unrelated to fertility reform. We provide an
additional test of whether these results may flow from the fertility reform using a placebo group
in which we estimate the same specification, however this time comparing women above fertile
age in reform and non-reform areas. This type of test follows discussion in Oreffice (2007), who
argue that empowerment effects should be observed among fertile aged couples, but not older
couples (for example, see p. 114 in Chiappori and Oreffice (2008) who also refer to the tests
of Oreffice (2007)). In table 8 we present results of the effect of the reform on women who
are no longer of fertile age. As in the empirical work of Oreffice (2007), we find no evidence
to suggest that the reform increases empowerment among women who are aged 45 or above.
Indeed, among the aggregate index and all elements of the index, both for the ILE reform and
regressive reform states, only one significant effect was found, and it was a significant negative
effect on participation in large expenditures. These placebo tests lead credence to the interpre-
tation that abortion reform increases empowerment among women of fertile age as, if anything,
158
empowerment was weakly decreasing in Mexico D.F. among women over the ages of 45.
Finally, we may be concerned that rather than being a result of the reform, women’s
empowerment may have been (part of) the cause of the reform. If this is the case, rather
than our results indicating that contraceptive reform increased empowerment in Mexico D.F.
we would be capturing causality that runs in the opposite direction. Fortunately, given our
panel-data setting with two pre-reform periods, we can test this formally to see if empowerment
changes emerge pre- or post-reform. The logic of this test is similar to typical tests of Granger
(1969) causality. In table 9 we estimate a placebo specification where we remove the third round
of survey data, and define the reform variables as if any reforms occurring between the second
and third survey wave had occurred between waves 1 and 2 of the survey. In this case, any
significant estimated effects of the reforms will indicate a pre-existing difference in trends among
reform and non-reform states, rather than a direct effect of the reform itself. Once again, we find
little—or no—evidence to suggest that this was the case. Among both the empowerment index
and the elements of the index, no statistically significant effects are found (when appropriately
adjusting for multiple hypothesis testing). While some individual elements have non-negligible
but insignificant point estimates, the impact on the aggregate index is a quite tightly estimated
zero (up to two decimal places).
6 Conclusion
The passing of the ILE reform in Mexico D.F. provided an unprecedented case among Latin
American countries, and joined very few large scale reforms of abortion in developing and
emerging countries world-wide. Given continual social and economic discussion of the tightening
and loosening of abortion policy in many contexts, the passing of this reform allows for an
important examination of the broad scope of potential effects. This paper allows us to test the
impact of state-specific expansions of abortion policies, and also joins recent work including Lu
and Slusky (2016) and Fischer et al. (2017) which examines the impact of regional contractions in
abortion policies. The legislative environment following the ILE reform in Mexico D.F. provides
an uncommon example of nearly simultaneous expansions and contractions of the availability
of, and risk of accessing, elective abortions in a single country.
In this paper we document that, first, the passing of the ILE reform lead to immediate
changes in policy which affected women even in states considerably separated from Mexico
D.F. We generate a database of regressive law changes relating to abortion which precisely
159

captures these policy changes, and allow for us to capture both the effects of the ILE reform,
and resulting legislative changes on a state-by-state basis. Second, we show that as documented
extensively in the USA and in a number of lower and middle income countries, the legalization of
abortion does lead to a reduction in fertility, and that this reduction is particularly noteworthy
for younger women. Had the abortion law not been passed in Mexico D.F., we estimate that
fertility would have been approximately 7% higher among adolescents, which is equivalent to
4 additional births per 1,000 15-19 year olds. For means of comparison, in the 14 years from
2000 to 2014, the adolescent fertility rate in the whole country has fallen from approximately
80 per 1,000 teens to 63.5 per 1,000, or a reduction of 15.5 births per 1,000 women (The World
Band, 2015). We document that this effect appears to be driven by access to legal abortion, and
find little evidence to suggest that it leads to large changes in sexual behavior, contraceptive
knowledge, or contraceptive use. Finally, we document that in the context of Mexico, large-
scale abortion reform brings with it increases in women’s empowerment within the household,
finding that empowerment changes accrue to fertile aged women rather than older women, as
proposed in formal economic models of fertility reform (Chiappori and Oreffice, 2008; Oreffice,
2007). Unlike recent evidence from the USA, we do not find statistically appreciable impacts
of the tightening of restrictions on accessing elective abortion. However, the context studied is
quite different to recent evidence from the USA (and other studies examining contractions of
abortion availability world-wide). In the case of Mexico, contractions focus on the demand for,
rather than supply of, elective abortions, and start from an already highly legislated setting
where abortions are penalized by law.
All in all, this paper provides additional evidence of the potential scope of legalized abortion,
even in a late-adopting setting. Although many countries, particularly in the developed world,
do allow access to legal abortion, the lessons from this case are relevant to many countries in
the developing world which currently do not allow abortion in any circumstance, or only under
a very limited set of conditions. At present, approximately 25% of the world’s population lives
in a place where abortion is not legal, suggesting that future reforms could be responsible for
(further) demographic transition, empowerment, and the additional benefits that accrue from
women playing a larger role in household decisions.
160
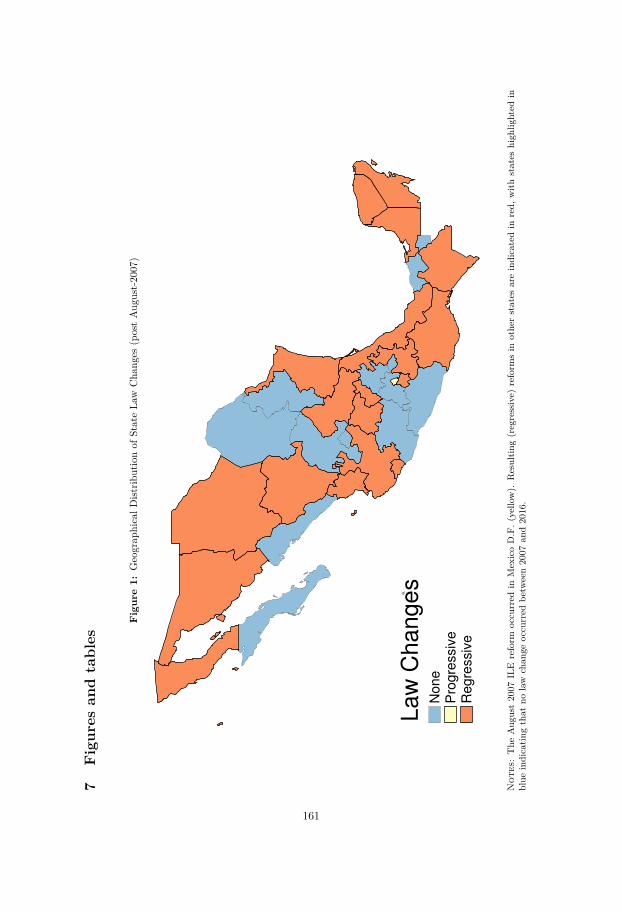
7Figures
andtables
Figure1:
Geograp
hicalD
istrib
utionof
StateLa
wCha
nges
(postAug
ust-2007)
No
ne
Pro
gre
ssiv
eR
eg
ressiv
e
La
w C
ha
ng
es
Not
es:The
Aug
ust2007
ILE
reform
occurred
inMexicoD.F.(
yello
w).
Resultin
g(regressive)
reform
sin
othe
rstates
areindicatedin
red,
with
states
high
lighted
inblue
indicatin
gthat
nolaw
chan
geoccurred
betw
een2007
and2016.
161
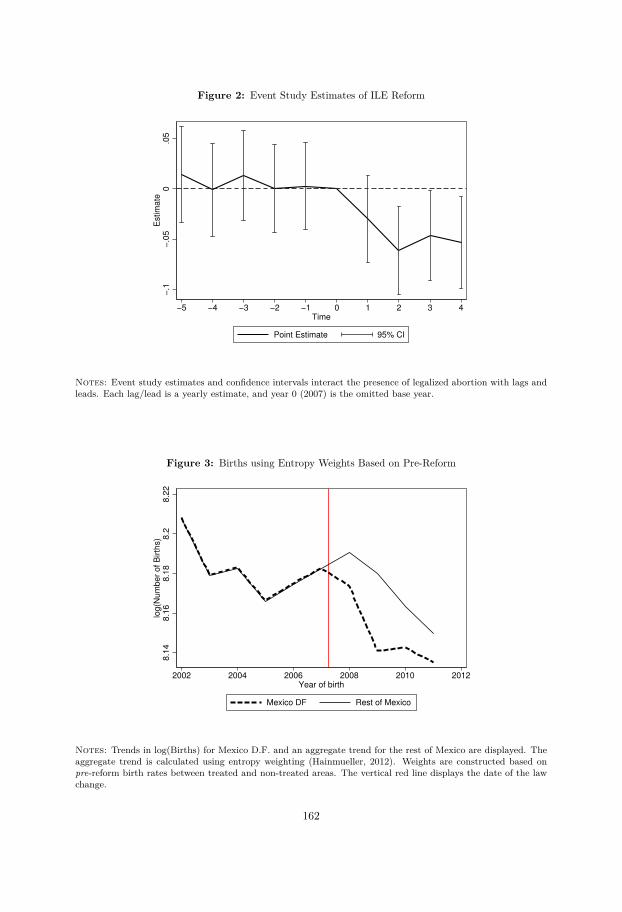
Figure 2: Event Study Estimates of ILE Reform
−.1
−.0
50
.05
Estim
ate
−5 −4 −3 −2 −1 0 1 2 3 4
Time
Point Estimate 95% CI
Notes: Event study estimates and confidence intervals interact the presence of legalized abortion with lags andleads. Each lag/lead is a yearly estimate, and year 0 (2007) is the omitted base year.
Figure 3: Births using Entropy Weights Based on Pre-Reform
8.1
48.1
68.1
88.2
8.2
2lo
g(N
um
ber
of B
irth
s)
2002 2004 2006 2008 2010 2012Year of birth
Mexico DF Rest of Mexico
Notes: Trends in log(Births) for Mexico D.F. and an aggregate trend for the rest of Mexico are displayed. Theaggregate trend is calculated using entropy weighting (Hainmueller, 2012). Weights are constructed based onpre-reform birth rates between treated and non-treated areas. The vertical red line displays the date of the lawchange.
162

Table 1: Constitutional Changes Following Mexico DF’s ILE Reform
State Reform Date Constitutional Article inDecree Question
Baja California Dec 26, 2008 Decree 175 7Chiapas Jan 20, 2009 Decree 139 178Chihuahua Jun 21, 2008 Decree 231-08 143Colima Nov 25, 2009 Decree 296 187Durango May 31, 2009 Decree 273 350Guanajuato May 26, 2009 Dictamen 836 158Jalisco Jul 02, 2009 Decree 22361 228Morelos Dec 11, 2008 Decree 1153 115Nayarit Jun 06, 2009 Decree 50 335Oaxaca Sep 11, 2009 Decree 1383 312Puebla Jun 03, 2009 SPI-ISS-27-09∗ 136Querétaro Sep 18, 2009 P. O. 68‡ 339Quintana Roo May 15, 2009 Decree 158 92San Luis Potosí Sep 02, 2009 Decree 833 128Sonora Apr 06, 2009 Law 174 265Tamaulipas Dec 23, 2009 Decree LX-1850 356Yucatán Aug 07, 2009 Decree 219 389Veracruz Nov 17, 2009 G. L. 155‡ 150Notes: All states which formally altered their constitutions following MexicoDF’s ILE reform are indicated above. Constitutional decree refers to the lawcomposed to alter the state constitution, and article in question refers to thearticle altered in the constitution or penal code which was altered by the de-cree. Dates, decrees and articles are collated by the authors from various stategovernment sources. The official document approving each decree and its asso-ciated date is available in a zipped folder on the authors’ websites.∗ Decrees or official newspapers for the State of Puebla could not be located bythe authors. The date and article in question is suggested by Gamboa Monte-jano and Valdés Robledo (2014).‡ P. O. refers to the official newspaper where laws are published in Querétaro,and G. L. refers to the same newspaper in Veracruz. The law was publishedwithout number (pp. 9857-9859) in P. O. 68 and in G. L. 155 (pp 2-5) in Queré-taro and Veracruz respectively.
163
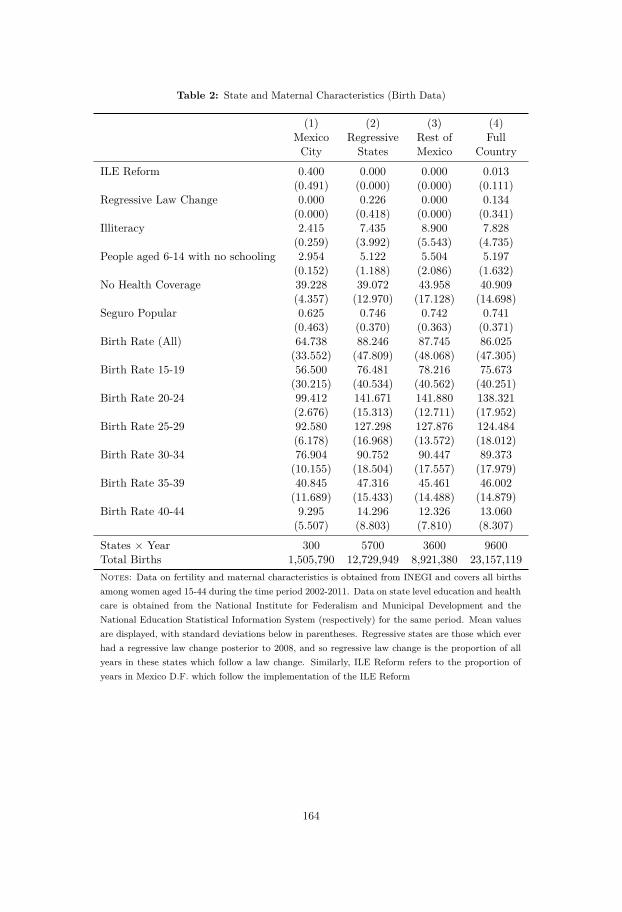
Table 2: State and Maternal Characteristics (Birth Data)
(1) (2) (3) (4)Mexico Regressive Rest of FullCity States Mexico Country
ILE Reform 0.400 0.000 0.000 0.013(0.491) (0.000) (0.000) (0.111)
Regressive Law Change 0.000 0.226 0.000 0.134(0.000) (0.418) (0.000) (0.341)
Illiteracy 2.415 7.435 8.900 7.828(0.259) (3.992) (5.543) (4.735)
People aged 6-14 with no schooling 2.954 5.122 5.504 5.197(0.152) (1.188) (2.086) (1.632)
No Health Coverage 39.228 39.072 43.958 40.909(4.357) (12.970) (17.128) (14.698)
Seguro Popular 0.625 0.746 0.742 0.741(0.463) (0.370) (0.363) (0.371)
Birth Rate (All) 64.738 88.246 87.745 86.025(33.552) (47.809) (48.068) (47.305)
Birth Rate 15-19 56.500 76.481 78.216 75.673(30.215) (40.534) (40.562) (40.251)
Birth Rate 20-24 99.412 141.671 141.880 138.321(2.676) (15.313) (12.711) (17.952)
Birth Rate 25-29 92.580 127.298 127.876 124.484(6.178) (16.968) (13.572) (18.012)
Birth Rate 30-34 76.904 90.752 90.447 89.373(10.155) (18.504) (17.557) (17.979)
Birth Rate 35-39 40.845 47.316 45.461 46.002(11.689) (15.433) (14.488) (14.879)
Birth Rate 40-44 9.295 14.296 12.326 13.060(5.507) (8.803) (7.810) (8.307)
States × Year 300 5700 3600 9600Total Births 1,505,790 12,729,949 8,921,380 23,157,119Notes: Data on fertility and maternal characteristics is obtained from INEGI and covers all birthsamong women aged 15-44 during the time period 2002-2011. Data on state level education and healthcare is obtained from the National Institute for Federalism and Municipal Development and theNational Education Statistical Information System (respectively) for the same period. Mean valuesare displayed, with standard deviations below in parentheses. Regressive states are those which everhad a regressive law change posterior to 2008, and so regressive law change is the proportion of allyears in these states which follow a law change. Similarly, ILE Reform refers to the proportion ofyears in Mexico D.F. which follow the implementation of the ILE Reform
164
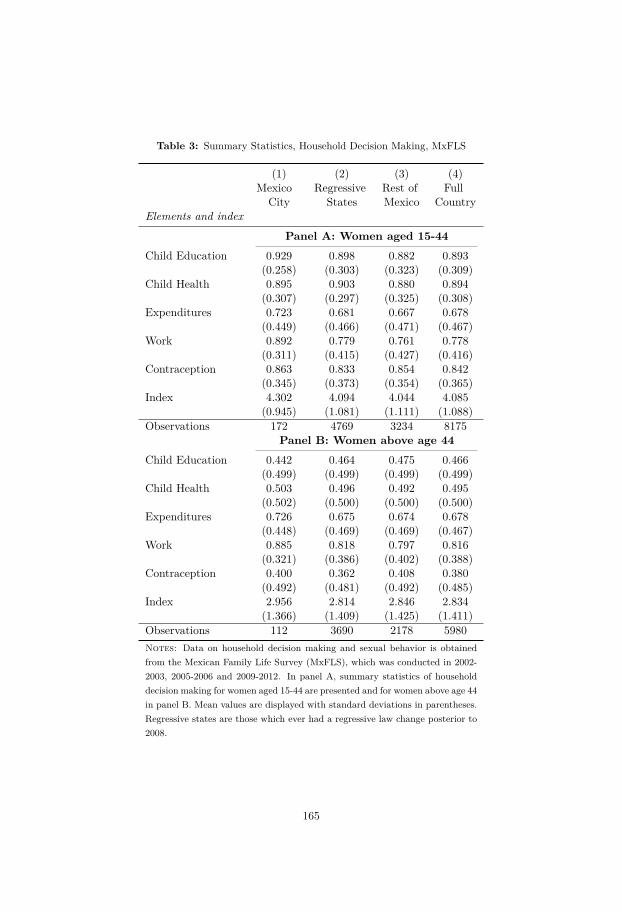
Table 3: Summary Statistics, Household Decision Making, MxFLS
(1) (2) (3) (4)Mexico Regressive Rest of Full
City States Mexico CountryElements and index
Panel A: Women aged 15-44Child Education 0.929 0.898 0.882 0.893
(0.258) (0.303) (0.323) (0.309)Child Health 0.895 0.903 0.880 0.894
(0.307) (0.297) (0.325) (0.308)Expenditures 0.723 0.681 0.667 0.678
(0.449) (0.466) (0.471) (0.467)Work 0.892 0.779 0.761 0.778
(0.311) (0.415) (0.427) (0.416)Contraception 0.863 0.833 0.854 0.842
(0.345) (0.373) (0.354) (0.365)Index 4.302 4.094 4.044 4.085
(0.945) (1.081) (1.111) (1.088)Observations 172 4769 3234 8175
Panel B: Women above age 44Child Education 0.442 0.464 0.475 0.466
(0.499) (0.499) (0.499) (0.499)Child Health 0.503 0.496 0.492 0.495
(0.502) (0.500) (0.500) (0.500)Expenditures 0.726 0.675 0.674 0.678
(0.448) (0.469) (0.469) (0.467)Work 0.885 0.818 0.797 0.816
(0.321) (0.386) (0.402) (0.388)Contraception 0.400 0.362 0.408 0.380
(0.492) (0.481) (0.492) (0.485)Index 2.956 2.814 2.846 2.834
(1.366) (1.409) (1.425) (1.411)Observations 112 3690 2178 5980Notes: Data on household decision making and sexual behavior is obtainedfrom the Mexican Family Life Survey (MxFLS), which was conducted in 2002-2003, 2005-2006 and 2009-2012. In panel A, summary statistics of householddecision making for women aged 15-44 are presented and for women above age 44in panel B. Mean values are displayed with standard deviations in parentheses.Regressive states are those which ever had a regressive law change posterior to2008.
165

Table
4:The
Effectofthe
ILEReform
andResulting
LawChanges
onlog(B
irths)
AllW
omen
Teen-agedWom
en
(1)(2)
(3)(4)
(5)(6)
ln(Birth)
ln(Birth)
ln(Birth)
ln(Birth)
ln(Birth)
ln(Birth)
ILEReform
-0.022**-0.028
-0.038*-0.053***
-0.058**-0.070**
[0.010][0.019]
[0.020][0.016]
[0.029][0.029]
Regressive
LawChange
0.0010.004
0.010-0.007
0.0010.013
[0.006][0.008]
[0.009][0.009]
[0.011][0.012]
Constant
5.537***0.080
-7.4585.443***
-12.660-31.098
[0.016][12.536]
[19.697][0.021]
[16.900][26.589]
Observations
96009600
96001600
16001600
Stateand
YearFEs
YY
YY
YY
StateLinear
TrendsY
YY
YTim
e-VaryingControls
YY
Notes:
Difference-in-differences
estimates
ofthe
reformon
ratesof
birthsare
displayed.Standard
errorsclustered
bystate
arepresented
inparentheses.
Allregressions
areweighted
bypopulation
ofwom
enof
therelevant
agegroup
ineach
stateand
year.***p-value<
0.01,**p-value<0.05,*p-value<
0.01.
166
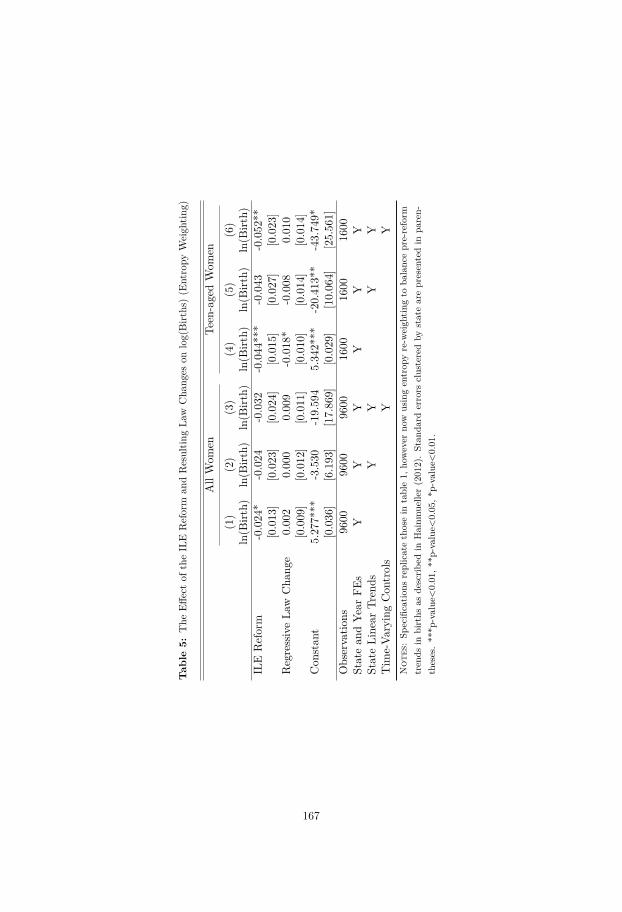
Tab
le5:
The
Effectof
theILE
Reform
andResultin
gLa
wCha
nges
onlog(Birt
hs)(E
ntropy
Weigh
ting)
AllWom
enTe
en-agedWom
en
(1)
(2)
(3)
(4)
(5)
(6)
ln(B
irth)
ln(B
irth)
ln(B
irth)
ln(B
irth)
ln(B
irth)
ln(B
irth)
ILE
Reform
-0.024
*-0.024
-0.032
-0.044
***
-0.043
-0.052
**[0.013
][0.023
][0.024
][0.015
][0.027
][0.023
]RegressiveLa
wCha
nge
0.00
20.00
00.00
9-0.018
*-0.008
0.01
0[0.009
][0.012
][0.011
][0.010
][0.014
][0.014
]Con
stan
t5.27
7***
-3.530
-19.59
45.34
2***
-20.41
3**
-43.74
9*[0.036
][6.193
][17.86
9][0.029
][10.06
4][25.56
1]Observatio
ns96
0096
0096
0016
0016
0016
00Statean
dYe
arFE
sY
YY
YY
YStateLine
arTr
ends
YY
YY
Tim
e-Va
ryingCon
trols
YY
Not
es:Sp
ecificatio
nsreplicatethosein
table1,
however
now
usingentrop
yre-w
eigh
tingto
balanc
epre-reform
tren
dsin
births
asde
scrib
edin
Hainm
uelle
r(201
2).Stan
dard
errors
clusteredby
statearepresentedin
paren-
theses.**
*p-value<0.01
,**p
-value<0.05
,*p-value<
0.01
.
167

Table 6: The Effect of the Abortion Reform on Reported Sexual Behaviour (Panel Specification)
(1) (2) (3) (4)Modern Contracep Any Modern Num of
Knowledge Contraception Contraception Sex Partners
ILE Reform 0.002 -0.012 -0.013 -0.111(0.276) (0.914) (0.901) (0.776)[0.693] [0.933] [0.993] [0.993]
Regressive Law Change -0.009 0.041 0.014 0.267(0.304) (0.492) (0.814) (0.064)[0.600] [0.760] [0.833] [0.220]
Observations 10007 10007 10007 10007R-Squared 0.889 0.568 0.558 0.531Mean of Dep Var 0.999 0.569 0.610 1.418Each column presents a seperate regression of a contraceptive or sexual behaviour variable on abortion reformmeasures, house-hold fixed effects, year fixed effects and time-varying controls. In order to correct for FamilyWise Error Rates from multiple hypothesis testing, we calculate Romano and Wolf (2005) p-values, using theirStepdown methods. Romano-Wolf p-values are presented in square brackets, and traditional (uncorrected)p-values are presented in round brackets. Significance stars refer to significance at 10% (*), 5% (**) or 1%(***) levels, and are based on Romano-Wolf p-values.
168

Tab
le7:
The
Effectof
theAbo
rtionReform
onWom
en’s
Empo
wermentin
theHou
seho
ld
Individu
alElem
ents
Inde
x
(1)
(2)
(3)
(4)
(5)
(6)
Child
Educ
Child
Health
Expe
nditu
reWork
Con
tracep
ILE
Reform
0.13
9**
0.07
60.19
4-0.001
0.06
60.47
4**
(0.012
)(0.346
)(0.059
)(0.994
)(0.369
)(0.028
)[0.047
][0.740
][0.213
][0.993
][0.587
]
RegressiveLa
wCha
nge
-0.071
-0.008
0.13
80.05
0-0.039
0.07
1(0.128
)(0.809
)(0.022
)(0.355
)(0.503
)(0.619
)[0.407
][0.787
][0.100
][0.720
][0.747
]
Observatio
ns81
7581
7581
7581
7581
7581
75R-Squ
ared
0.60
40.57
10.52
00.57
00.53
60.59
3Meanof
Dep
Var
0.87
40.87
30.67
80.77
00.85
04.04
4N
otes
:Eachcolumnpresents
asepe
rate
regression
ofan
empo
wermentvaria
bleor
theem
powermentinde
xinclud
ing
house-ho
ldfix
edeff
ects,y
earfix
edeff
ects
andtim
e-varyingcontrols.In
orde
rto
correctforFa
mily
WiseError
Rates
from
multip
lehy
pothesis
testing,
wecalculateRom
anoan
dWolf(200
5)p-values,usingtheirStep
down
metho
ds.
Rom
ano-Wolfp
-value
sarepresentedin
squa
rebrackets,a
ndtrad
ition
al(unc
orrected
)p-values
arepresentedin
roun
dbrackets.Sign
ificanc
estarsreferto
sign
ificanc
eat
10%
(*),5%
(**)
or1%
(***
)levels,a
ndareba
sedon
Rom
ano-Wolf
p-values.
169

Table
8:Placebo
Testofthe
Effectofthe
Reform
onWom
en’sEm
powerm
ent(W
omen
Aged
45+)
IndividualElements
Index
(1)(2)
(3)(4)
(5)(6)
Child
EducChild
Health
ExpenditureWork
Contracep
ILEReform
0.053-0.024
-0.334**-0.057
0.083-0.279
(0.611)(0.837)
(0.007)(0.616)
(0.562)(0.337)
[0.953][0.847]
[0.027][0.827]
[0.960]
Regressive
LawChange
-0.098-0.041
-0.1710.013
0.118-0.179
(0.194)(0.578)
(0.140)(0.885)
(0.268)(0.465)
[0.533][0.820]
[0.500][0.900]
[0.547]
Observations
59805980
59805980
59805980
R-Squared
0.6740.683
0.5400.529
0.6070.676
Mean
ofDep
Var0.463
0.4970.668
0.7910.380
2.799N
otes:For
fullnotesrefer
totable
7.Regression
resultspresented
hereare
estimated
asin
table7,how
evernow
thesam
pleconsists
ofmarried
wom
enabove
fertileage
(45years
andabove).
170

Tab
le9:
Identifi
catio
nTe
stof
theEff
ectof
theReform
onWom
en’s
Empo
werment(P
re-R
eform)
Individu
alElem
ents
Inde
x
(1)
(2)
(3)
(4)
(5)
(6)
Child
Educ
Child
Health
Expe
nditu
reWork
Con
tracep
ILE
Reform
-0.043
0.09
50.25
5-0.299
-0.006
0.00
2(0.815
)(0.547
)(0.028
)(0.050
)(0.972
)(0.996
)[0.973
][0.907
][0.153
][0.180
][0.960
]
RegressiveLa
wCha
nge
-0.008
0.01
60.07
7-0.076
-0.112
-0.103
(0.887
)(0.774
)(0.180
)(0.117
)(0.057
)(0.493
)[0.900
][0.940
][0.473
][0.387
][0.267
]
Observatio
ns35
3835
3835
3835
3835
3835
38R-Squ
ared
0.76
80.78
30.70
80.67
60.72
20.76
8Meanof
Dep
Var
0.50
70.54
60.66
80.78
20.38
12.88
3N
otes
:Fo
rfullno
tesreferto
table7.
Thisplaceb
otest
uses
only
thetw
opre-reform
roun
ds,a
ndde
fines
asaplaceb
otreatm
entgrou
preside
ntsof
MexicoD.F.inroun
dtw
o.A
simila
rdefin
tionis
used
tocreate
theplaceb
oRegressive
Law
Cha
ngegrou
pba
sedon
reside
ntsof
regressive
states,p
riorto
theim
plem
entatio
nof
thereform
.
171


Appendices
173

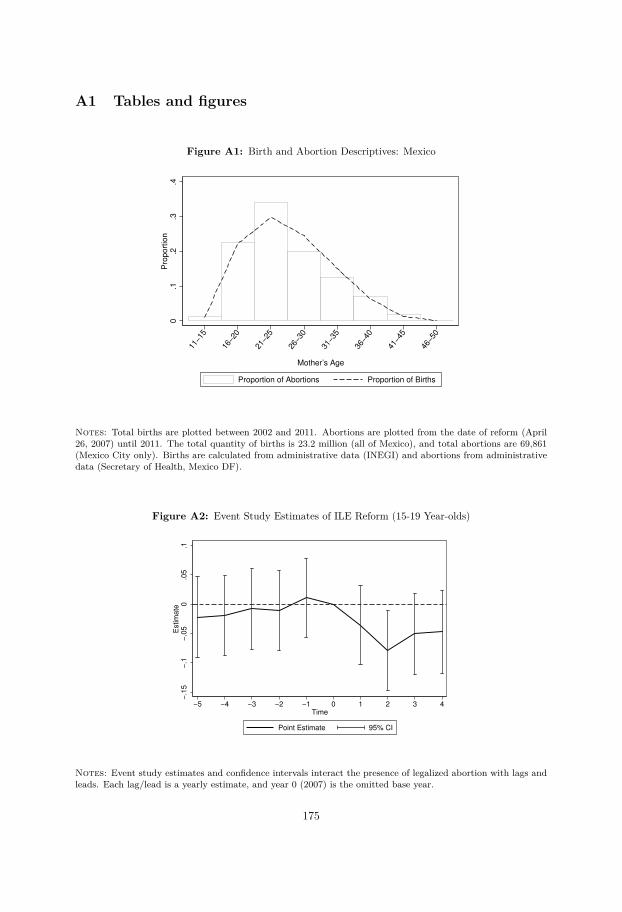
A1 Tables and figures
Figure A1: Birth and Abortion Descriptives: Mexico
0.1
.2.3
.4P
roport
ion
11−1
5
16−2
0
21−2
5
26−3
0
31−3
5
36−4
0
41−4
5
46−5
0
Mother’s Age
Proportion of Abortions Proportion of Births
Notes: Total births are plotted between 2002 and 2011. Abortions are plotted from the date of reform (April26, 2007) until 2011. The total quantity of births is 23.2 million (all of Mexico), and total abortions are 69,861(Mexico City only). Births are calculated from administrative data (INEGI) and abortions from administrativedata (Secretary of Health, Mexico DF).
Figure A2: Event Study Estimates of ILE Reform (15-19 Year-olds)
−.1
5−
.1−
.05
0.0
5.1
Estim
ate
−5 −4 −3 −2 −1 0 1 2 3 4
Time
Point Estimate 95% CI
Notes: Event study estimates and confidence intervals interact the presence of legalized abortion with lags andleads. Each lag/lead is a yearly estimate, and year 0 (2007) is the omitted base year.
175

Figure A3: Crude Birth Trends: Mexico D.F. and Rest of Mexico
1000000
1250000
1500000
1750000
2000000
#birt
hs in
the
rest
of M
exic
o
100000
125000
150000
175000
200000
#birt
hs in
Mex
ico
City
2002 2003 2004 2005 2006 2007 2008 2009 2010 2011Year
Mexico City
Rest of Mexico
Notes: Total births in each state are calculated from INEGI microdata registers based on state of residence ofthe mother.
176
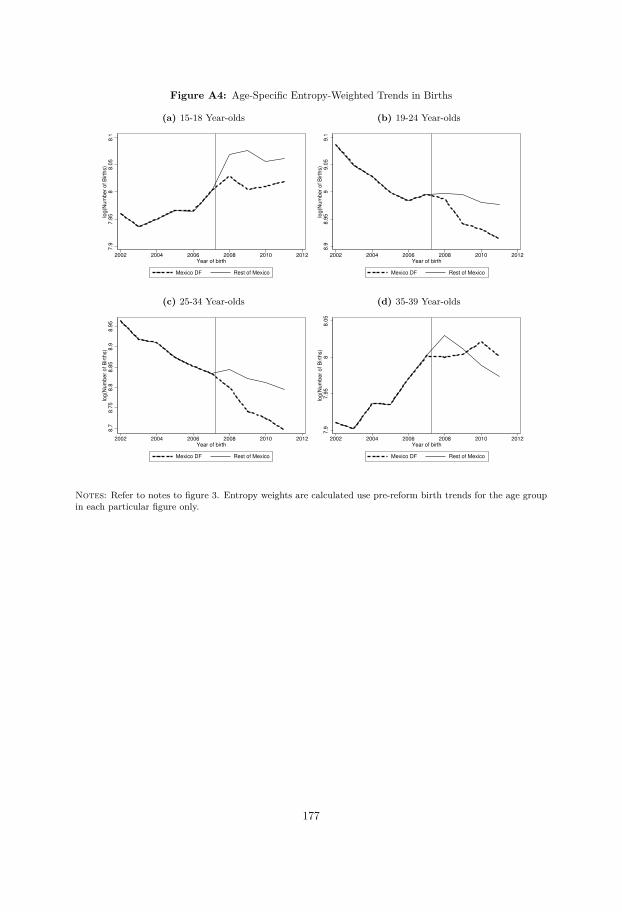
Figure A4: Age-Specific Entropy-Weighted Trends in Births
(a) 15-18 Year-olds7
.97
.95
88
.05
8.1
log
(Nu
mb
er
of
Birth
s)
2002 2004 2006 2008 2010 2012Year of birth
Mexico DF Rest of Mexico
(b) 19-24 Year-olds
8.9
8.9
59
9.0
59
.1lo
g(N
um
be
r o
f B
irth
s)
2002 2004 2006 2008 2010 2012Year of birth
Mexico DF Rest of Mexico
(c) 25-34 Year-olds
8.7
8.7
58
.88
.85
8.9
8.9
5lo
g(N
um
be
r o
f B
irth
s)
2002 2004 2006 2008 2010 2012Year of birth
Mexico DF Rest of Mexico
(d) 35-39 Year-olds
7.9
7.9
58
8.0
5lo
g(N
um
be
r o
f B
irth
s)
2002 2004 2006 2008 2010 2012Year of birth
Mexico DF Rest of Mexico
Notes: Refer to notes to figure 3. Entropy weights are calculated use pre-reform birth trends for the age groupin each particular figure only.
177

Table A1: Summary Statistics, Reproductive health, MxFLS
(1) (2) (3) (4)Mexico Regressive Rest of Full
City States Mexico Country
Women aged 15-44Knowledge of contraceptives 0.993 0.996 1.000 0.997
( 0.084) (0.061) (0.011) (0.051)Use modern method 0.653 0.565 0.565 0.570
(0.477) (0.496) (0.496) (0.495)Use any method 0.661 0.610 0.602 0.610
(0.474) (0.488) (0.489) (0.488)Number of sex partners 1.767 1.392 1.453 1.437
(1.474) (1.225) (1.335) (1.286)Observations 226 5758 4023 10007Notes: Data on household decision making and sexual behavior is obtained from theMexican Family Life Survey (MxFLS), which was conducted in 2002-2003, 2005-2006 and2009-2012. Mean values are displayed with standard deviations in parentheses. Regressivestates are those which ever had a regressive law change posterior to 2008.
178
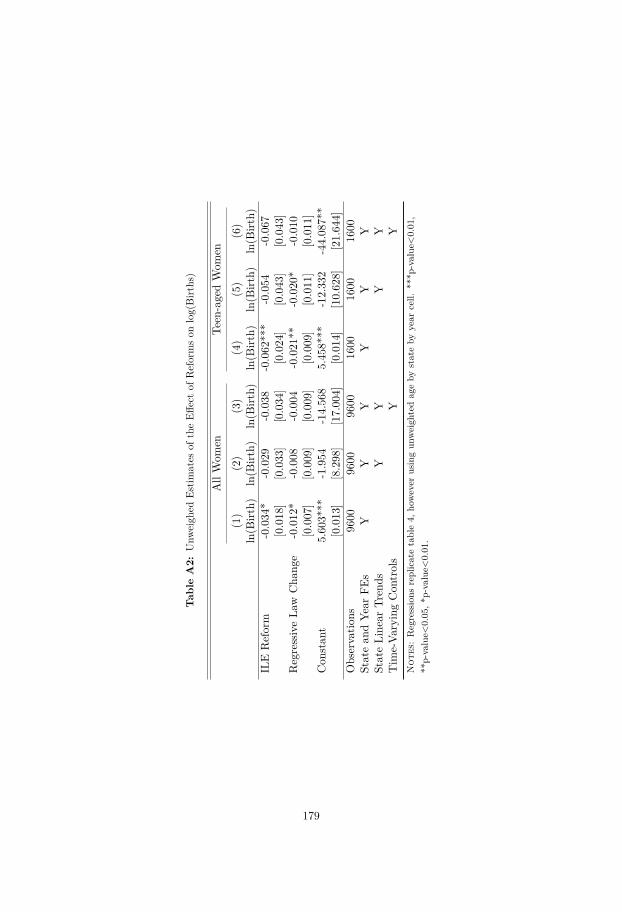
Tab
leA2:
Unw
eigh
edEs
timates
oftheEff
ectof
Reformson
log(Birt
hs)
AllWom
enTe
en-agedWom
en
(1)
(2)
(3)
(4)
(5)
(6)
ln(B
irth)
ln(B
irth)
ln(B
irth)
ln(B
irth)
ln(B
irth)
ln(B
irth)
ILE
Reform
-0.034
*-0.029
-0.038
-0.062
***
-0.054
-0.067
[0.018
][0.033
][0.034
][0.024
][0.043
][0.043
]RegressiveLa
wCha
nge
-0.012
*-0.008
-0.004
-0.021
**-0.020
*-0.010
[0.007
][0.009
][0.009
][0.009
][0.011
][0.011
]Con
stan
t5.60
3***
-1.954
-14.56
85.45
8***
-12.33
2-44.08
7**
[0.013
][8.298
][17.00
4][0.014
][10.62
8][21.64
4]Observatio
ns96
0096
0096
0016
0016
0016
00Statean
dYe
arFE
sY
YY
YY
YStateLine
arTr
ends
YY
YY
Tim
e-Va
ryingCon
trols
YY
Not
es:Regressions
replicatetable4,
however
usingun
weigh
tedag
eby
stateby
year
cell.
***p
-value<0.01
,**
p-value<
0.05
,*p-value<
0.01
.
179

Table
A3:
Replicating
FertilityResults
with
Wild
Cluster
Bootstrapping
AllW
omen
Teen-agedWom
en
(1)(2)
(3)(4)
(5)(6)
ln(Birth)
ln(Birth)
ln(Birth)
ln(Birth)
ln(Birth)
ln(Birth)
ILEReform
-0.034‡‡
-0.029‡‡
-0.038‡‡
-0.062‡‡
-0.054‡‡
-0.067‡‡
[-0.061,-0.012][-0.039,-0.021]
[-0.051,-0.028][-0.087,-0.037]
[-0.065,-0.042][-0.082,-0.054]
Regressive
LawChange
-0.012-0.008
-0.004-0.021
-0.020-0.010
[-0.047,0.018][-0.024,0.007]
[-0.016,0.009][-0.058,0.016]
[-0.049,0.007][-0.033,0.014]
Observations
96009600
96001600
16001600
Stateand
YearFEs
YY
YY
YY
StateLinear
TrendsY
YY
YTim
e-VaryingControls
YY
Notes:
Results
replicateunw
eighteddifference-in-difference
estimates
ofthe
effectof
reformson
ratesof
birth,how
evernow
usingwild
bootstrappedstandard
errorsin
placeofanalyticalstandard
errorsclustered
atthe
levelofthestate.
Pointestim
atesare
presented,alongwith
95%confidence
intervalsofthese
estimates
inparentheses.
‡‡Significant
atthe
95%level.
180

Tab
leA4:
The
Effectof
Abo
rtionReform
onlog(Birt
hs)by
Age
(1)
(2)
(3)
(4)
(5)
(6)
Ages15
-19
Ages20
-24
Ages25
-29
Ages30
-34
Ages35
-39
Ages40
-44
ILE
Reform
-0.070
**-0.013
0.01
1-0.062
***
-0.047
*-0.036
[0.029
][0.012
][0.013
][0.016
][0.024
][0.041
]RegressiveLa
wCha
nge
0.01
30.00
9*0.01
1*0.02
3***
-0.002
0.00
4[0.012
][0.005
][0.006
][0.007
][0.011
][0.019
]Con
stan
t-31.09
819
.381
*-6.635
10.290
-8.623
-37.29
7[26.58
9][11.71
2][13.17
2][16.74
4][25.51
2][43.92
3]Observatio
ns16
0016
0016
0016
0016
0016
00N
otes
:Allspecificatio
nsinclud
eag
e,statean
dyear
fixed
effects
state-specificlin
eartren
ds,an
dtim
evaryingcontrols
(ie,thespecificatio
nin
columns
(3)an
d(6)of
table4.)
Stan
dard
errors
clusteredby
statearepresentedin
parenthe
ses.
Allregression
sareweigh
tedby
popu
latio
nof
wom
enof
therelevant
agegrou
pin
each
statean
dyear.**
*p-value<0.01
,**
p-value<
0.05
,*p-value<
0.01
.
181

Table
A5:
Replication
Results
Using
Birth
Rates
insteadoflog(B
irhts)
(1)(2)
(3)(4)
(5)(6)
(7)Ages
15-19Ages
20-24Ages
25-29Ages
30-34Ages
35-39Ages
40-44AllA
gesILE
Reform
-3.942*-2.380
0.375-3.975***
-2.525**-0.220
-2.334*[2.132]
[1.723][1.558]
[1.371][0.988]
[0.624][1.252]
Regressive
LawChange
0.9121.479**
1.0041.666***
0.1760.077
0.936*[0.858]
[0.728][0.683]
[0.613][0.446]
[0.286][0.544]
Observations
16001600
16001600
16001600
9600N
otes:Regressions
resultsusing
ratesof
birthare
displayed.Allspecifications
includeage,
stateand
yearfixed
effects,state-specific
lineartrends,
andtim
evarying
controls(ie,the
specificationin
columns
(3)and
(6)of
table4.)
Standarderrors
clusteredby
stateare
presentedin
parentheses.Allregressions
areweighted
bypopulation
ofwom
enof
therelevant
agegroup
ineach
stateand
year.***p-value<
0.01,**p-value<0.05,*p-value<
0.01.
182

Table A6: The Effect of the Abortion Reform on Reported Sexual Behavior (Repeated Cross-SectionSpecification)
(1) (2) (3) (4)Modern Contracep Any Modern Num of
Knowledge Contraception Contraception Sex Partners
ILE Reform -0.011 -0.050 -0.057 -0.111(0.513) (0.579) (0.520) (0.675)[0.967] [0.773] [0.873] [0.693]
Regressive Law Change -0.002 0.093** 0.065 0.150(0.815) (0.008) (0.065) (0.106)[0.873] [0.020] [0.233] [0.213]
Observations 10007 10007 10007 10007R-Squared 0.037 0.027 0.029 0.033Mean of Dep Var 0.999 0.569 0.610 1.418Notes: Each column presents a seperate regression of a contraceptive or sexual behaviour variable on abortionreform measures, year fixed effects and time-varying controls. In order to correct for Family Wise ErrorRates from multiple hypothesis testing, we calculate Romano and Wolf (2005) p-values, using their Stepdownmethods. Romano-Wolf p-values are presented in square brackets, and traditional (uncorrected) p-values arepresented in round brackets. Significance stars refer to significance at 10% (*), 5% (**) or 1% (***) levels, andare based on Romano-Wolf p-values.
183

A2 Correction for FWER using Romano and Wolf’s stepdownprocedure
We are interested in testing K hypotheses regarding the effect of the reforms on particularindicators. As we are running multiple hypothesis tests, the probability of falsely rejecting anull given that it is true is high. If we set the accepted type I error rate for each individualhypothesis as α, the likelihood of rejecting at least one hypothesis incorrectly would be equalto 1 − (1 − α)K (assuming independent hypotheses). For a type I error rate of α = 0.05 perindividual hypothesis and K = 5 hypotheses, the likelihood of falsely rejecting at least 1 null isthus equal to αK = 0.226.
In order to proceed with testing we thus aim to fix the Family Wise Error Rate (FWER),rather than the probability of type I errors for each hypothesis individually. This FWER is theprobability of making at least one type I error in the family of K hypotheses, and we would liketo fix this value at αK = 0.05. The classical multiple hypothesis correction of Bonferroni (1935)suggests simply adjusting a constant correction to inflate all p-values associated with each ofthe K tests, however as is well-known, this testing procedure is overly conservative, resultingin low power (Romano, J. P. and Wolf, M., 2005). A more powerful series of tests which bothfix the FWER and have greater power are step-down methods, first proposed by Holm (1979).We follow a step-wise testing procedure which is more powerful in terms of type II errors thanclassical multiple hypothesis testing procedures given that it accounts for dependence betweenhypothesis tests. This stepdown procedure from Romano and Wolf (2005), is being increasinglyused in empirical economics, see for example Savelyev and Tan (2015).
We implement the “Studentized StepM Method” described in Romano, J. P. and Wolf, M.(2005) (p. 1252). Specifically, we proceed following the steps below, where the computationallyintensive steps 1 and 2 need only be estimated once. We have released along with this paper aprogram (rwolf) and documentation which performs these calculations in Stata.
1. Estimate the K models associated with each of the K hypotheses and calculate the t-statistics associated with each hypothesis as tk = (βk − β0
k)/se(βk). Rank the absolutevalue of the tk-statistics, and take the highest t-statistic to indicate the variable of interestfor testing
2. Estimate B = 150 bootstrap replications of each of the K models, storing the t-statisticassociated with each of the K tests for each of the B trials, resulting in tk,b t-statistics.Also calculate the (bootstrap) standard error for each variable using the distribution ofparameters across each of the B bootstrap samples for a particular k.
3. For the variable of interest for testing, form the null distribution of t-statistics by takingthe maximum t-statistic for each of the B bootstrap replications among all of the potentialdonor variables. The null distribution is defined as tnull
k = |(max(t)−max(t))/se(βk)|
4. Calculate the Romano Wolf p-value by comparing tk from step one with tnullk from step 3.
Store this p-value as the p-value corresponding to this variable.
5. Remove this variable from the list of variables to test, and remove the bootstrap replica-tions associated with this variable from the pool of t-values for the null distribution. Thevariable with the next highest t-statistic from 1 now becomes the variable of interest fortesting, and the donor variables consist of this and the remaining variables to be tested.If there remain variables to test, return to step 3. Otherwise, end.
184

Bibliography
Aaronson, D., R. H. Dehejia, A. Jordan, C. Pop-Eleches, C. Samii, and K. Schulze(2017): “The Effect of Fertility on Mothers’ Labor Supply over the Last Two Centuries,” .
Abadie, A., A. Diamond, and J. Hainmueller (2010): “Synthetic Control Methods forComparative Case Studies: Estimating the Effect of California’s Tobacco Control Program,”Journal of the American Statistical Association, 105, 493–505.
Abramowitz, J. (2014): “Turning back the ticking clock: the effect of increased affordabilityof assisted reproductive technology on women’s marriage timing,” Journal of PopulationEconomics, 27, 603–633.
Abramowitz, J. (2017): “Assisted Reproductive Technology and Women’s Timing of Marriageand Childbearing,” Journal of Family and Economic Issues, 38, 100–117.
Adda, J., C. Dustmann, and K. Stevens (2017): “The career costs of children,” Journalof Political Economy, 125, 293–337.
Ahmed, A. M., L. Andersson, and M. Hammarstedt (2011a): “Inter-and Intra-HouseholdEarnings Differentials among Homosexual and Heterosexual Couples,” British Journal ofIndustrial Relations, 49.
Ahmed, A. M., L. Andersson, M. Hammarstedt, et al. (2011b): “Sexual orientationand occupational rank,” Economics Bulletin, 31, 2422–2433.
Akerlof, G. A., J. L. Yellen, and M. L. Katz (1996): “An analysis of out-of-wedlockchildbearing in the United States,” The Quarterly Journal of Economics, 277–317.
Aldén, L., A. Bjorklund, and M. Hammarstedt (2017): “Early Health and School Out-comes for Children with Lesbian Parents: Evidence from Sweden,” .
Alderman, H., M. Lokshin, and S. Radyakin (2011): “Tall claims: Mortality selectionand the height of children in India,” Economics & Human Biology, 9, 393–406.
Alexandersson, O., M. Bixo, and U. Högberg (2005): “Evidence-based changes in termbreech delivery practice in Sweden,” Acta obstetricia et gynecologica Scandinavica, 84, 584–587.
Alm, A. (2010): “Olika regler i olika landsting,” Gefle Dagblad.
Almond, D. and J. Currie (2010): “Human Capital Development Before Age Five,” NBERWorking Papers 15827, National Bureau of Economic Research, Inc.
Almond, D., J. Currie, and V. Duque (2017): “Childhood Circumstances and AdultOutcomes: Act II,” Tech. rep., National Bureau of Economic Research.
185

Almond, D. and J. J. Doyle (2011): “After midnight: A regression discontinuity designin length of postpartum hospital stays,” American Economic Journal: Economic Policy, 3,1–34.
Almond, D., J. J. Doyle, A. E. Kowalski, and H. Williams (2010): “EstimatingMarginal Returns to Medical Care: Evidence from At-risk Newborns,” The Quarterly Journalof Economics, 125, 591–634.
Almond, D. and B. Mazumder (2011): “Health capital and the prenatal environment: theeffect of Ramadan observance during pregnancy,” American Economic Journal: Applied Eco-nomics, 56–85.
Altonji, J. G., T. E. Elder, and C. R. Taber (2005): “Selection on observed and unob-served variables: Assessing the effectiveness of Catholic schools,” Journal of political economy,113, 151–184.
Ananat, E. O., J. Gruber, and P. Levine (2007): “Abortion Legalization and Life-CycleFertility,” Journal of Human Resources, XLII, 375–397.
Ananat, E. O., J. Gruber, P. B. Levine, and D. Staiger (2009): “Abortion and Selec-tion,” Review of Economics and Statistics, 91, 124–136.
Ananat, E. O. and D. M. Hungerman (2012): “The Power of the Pill for the Next Gener-ation: Oral Contraception’s Effects on Fertility, Abortion, and Maternal and Child Charac-teristics,” The Review of Economics and Statistics, 94, 37–51.
Anderberg, D., A. Chevalier, and J. Wadsworth (2011): “Anatomy of a Health Scare:Education, Income and the MMR Controversy in the UK,” Journal of Health Economics, 30,515–530.
Anderson, M. L. (2008): “Multiple inference and gender differences in the effects of early in-tervention: A reevaluation of the Abecedarian, Perry Preschool, and Early Training Projects,”Journal of the American statistical Association, 103, 1481–1495.
Anell, A. (2008): “The Swedish health care system,” New York: The Common wealth.
Angrist, J. D. and W. N. Evans (1996): “Schooling and Labor Market Consequences of the1970 State Abortion Reforms,” NBER Working Papers 5406, National Bureau of EconomicResearch, Inc.
Angrist, J. D. and J.-S. Pischke (2009): Mostly harmless econometrics: an empiricist’scompanion, Princeton University Press.
Angrist, J. D. and Pischke, J. (2009): Mostly harmless econometrics: an empiricist’scompanion, Princeton University Press.
Ashraf, N., E. Field, and J. Lee (2014): “Household Bargaining and Excess Fertility: AnExperimental Study in Zambia,” American Economic Review, 104, 2210–37.
Bailey, M. J. (2006): “More Power to the Pill: The Impact of Contraceptive Freedom onWomen’s Life Cycle Labor Supply,” The Quarterly Journal of Economics, 121, 289–320.
Bailey, M. J. and J. M. Lindo (2017): “Access and Use of Contraception and Its Effects onWomen’s Outcomes in the US,” Tech. rep., National Bureau of Economic Research.
186

Bailey, M. J. (2013): “Fifty Years of Family Planning: New Evidence on the Long-Run Effectsof Increasing Access to Contraception,” Brookings Papers on Economic Activity, 46, 341–409.
Baird, S., E. Chirwa, J. de Hoop, and B. Özler (2014): “Girl Power: Cash Transfersand Adolescent Welfare: Evidence from a Cluster-Randomized Experiment in Malawi,” inAfrican Successes, Volume II: Human Capital, National Bureau of Economic Research, Inc,NBER Chapters, 139–164.
Bamfo, J. E. (2013): “Managing the risks of sepsis in pregnancy,” Best practice & researchClinical obstetrics & gynaecology, 27, 583–595.
Barker, D. J. (1995): “Fetal origins of coronary heart diseas,” British Medical Journal,311(6998), 171–4.
Becker, D. (2013): “Decriminalization of Abortion in Mexico City: The Effects on Women’sReproductive Rights,” American Journal of Public Health, 103, 590–593.
Becker, S. (1999): “Measuring unmet need: Wives, husbands or couples?” InternationalFamily Planning Perspectives, 25, 172–180.
Behrman, J. R. and M. R. Rosenzweig (2004): “Returns to birthweight,” Review of Eco-nomics and statistics, 86, 586–601.
Bellows, J. and E. Miguel (2009): “War and local collective action in Sierra Leone,” Journalof Public Economics, 93, 1144–1157.
Benjamini, Y. and Y. Hochberg (1995): “Controlling the false discovery rate: a practicaland powerful approach to multiple testing,” Journal of the royal statistical society. Series B(Methodological), 289–300.
Bergh, T., A. Ericson, T. Hillensjö, K. Nygren, and U.-B. Wennerholm (1999):“Deliveries and children born after in-vitro fertilisation in Sweden 1982–95: a retrospectivecohort study,” The Lancet, 354, 1579–1585.
Bertrand, M., E. Duflo, and S. Mullainathan (2004): “How Much Should We TrustDifferences-in-Differences Estimates?” Quarterly Journal of Economics, 119.
Betran, A., M. Torloni, J. Zhang, and A. Gülmezoglu (2015): “WHO Statement oncaesarean section rates,” BJOG: An International Journal of Obstetrics & Gynaecology.
Bhalotra, S., M. Karlsson, and T. Nilsson (2017): “Infant health and longevity: Evi-dence from a historical intervention in Sweden,” Journal of the European Economic Associa-tion, jvx028.
Bhalotra, S. R. and D. Clarke (2016): “The twin instrument,” .
Bharadwaj, P., K. V. Løken, and C. Neilson (2013): “Early Life Health Interventionsand Academic Achievement,” American Economic Review, 103, 1862–91.
Bharadwaj, P., P. Lundborg, and D.-O. Rooth (2017): “Birth weight in the long run,”Journal of Human Resources, 0715–7235R.
Bhattacharya, S., M. Porter, K. Harrild, A. Naji, J. Mollison, E. Van Teijlin-gen, D. Campbell, M. Hall, and A. Templeton (2006): “Absence of conception aftercaesarean section: voluntary or involuntary?” BJOG: An International Journal of Obstetrics& Gynaecology, 113, 268–275.
187

Bitler, M. and M. Zavodny (2001): “The effect of abortion restrictions on the timing ofabortions,” Journal of Health Economics, 20, 1011–1032.
Bitler, M. P. (2008): “Effects of increased access to infertility treatment on infant and childhealth: Evidence from health insurance mandates,” Unpublished manuscript.
Björkegren, E., A. Bütikofer, G. Conti, M. Palme, and K. Salvanes (2016): “Con-sequences of Health at Birth,” .
Black, S. E., P. J. Devereux, and K. G. Salvanes (2007): “From the cradle to the labormarket? The effect of birth weight on adult outcomes,” The Quarterly Journal of Economics,122, 409–439.
Blanco-Mancilla, G. (2011): “Implementation of health policies in Mexico City: whatfactors contribute to more effective service delivery?” Ph.D. thesis, The London School ofEconomics and Political Science (LSE).
Bonferroni, C. E. (1935): “Il calcolo delle assicurazioni su gruppi di teste,” in Studi in Onoredel Professore Salvatore Ortu Carboni, Rome, 13–60.
Borra, C., L. Gonzalez, and A. Sevilla (2014): “The Impact of Eliminating a ChildBenefit on Birth Timing and Infant Health,” IZA Discussion Papers 7967, Institute for theStudy of Labor (IZA).
Breining, S., N. M. Daysal, M. Simonsen, and M. Trandafir (2015): “Spillover effectsof early-life medical interventions,” .
Browning, M. (1992): “Children and household economic behavior,” Journal of EconomicLiterature, 30, 1434–1475.
Buekens, P. et al. (1999): “Disparity in prenatal care in Europe,” European Journal ofObstetrics and Gynecology and Reproductive Biology, 83, 185–190.
Burbidge, J. B., L. Magee, and A. L. Robb (1988): “Alternative transformations to handleextreme values of the dependent variable,” Journal of the American Statistical Association,83, 123–127.
Calonico, S., M. D. Cattaneo, R. Titiunik, et al. (2014): “Robust data-driven inferencein the regression-discontinuity design,” Stata Journal, 14, 909–946.
Cameron, A. C. and D. L. Miller (2015): “A Practitioner’s Guide to Cluster-RobustInference,” Journal of Human Resources, 50, 317–372.
Casey, B. M., D. D. McIntire, and K. J. Leveno (2001): “The continuing value of theApgar score for the assessment of newborn infants,” New England Journal of Medicine, 344,467–471.
Cheng, M. and M. Hannah (1993): “Breech delivery at term: A critical review of theliterature.” Obstetrics & Gynecology, 82, 605–618.
Chiappori, P.-A. and S. Oreffice (2008): “Birth Control and Female Empowerment: AnEquilibrium Analysis,” Journal of Political Economy, 116, 113–140.
Ciudad de México (2007): “Gaceta Oficial del Distrito Federal,” Gaceta Oficial, No 70,Órgano del Gobierno del Distrito Federal, 26 April, 2007.
188

Clark, S. L., M. A. Belfort, G. A. Dildy, M. A. Herbst, J. A. Meyers, and G. D.Hankins (2008): “Maternal death in the 21st century: causes, prevention, and relationshipto cesarean delivery,” American journal of obstetrics and gynecology, 199, 36–e1.
Clarke, D. (2017): “Children and Their Parents: A Review of Fertility and Causality,” Journalof Economic Surveys, n/a–n/a.
Consejo Nacional de Población (2012): “Proyecciones de la población de México 2010–2050,” Tech. Rep. Documento Metodológico, CONAPO.
Contreras, X., M. G. van Dijk, T. Sanchez, and P. S. Smith (2011): “Experiencesand Opinions of Health-Care Professionals Regarding Legal Abortion in Mexico City: AQualitative Study,” Studies in Family Planning, 42, 183–190.
Costello, A. and D. Osrin (2005): “Epidemiological transition, medicalisation of childbirth,and neonatal mortality: three Brazilian birth-cohorts,” The Lancet, 365, 825–826.
Criniti, A., A. Thyer, G. Chow, P. Lin, N. Klein, and M. Soules (2005): “Electivesingle blastocyst transfer reduces twin rates without compromising pregnancy rates,” Fertilityand sterility, 84, 1613–1619.
Cunha, F. and J. Heckman (2007): “The technology of skill formation,” Tech. rep., NationalBureau of Economic Research.
Cunningham, S., J. M. Lindo, C. Myers, and A. Schlosser (2017): “How Far Is TooFar? New Evidence on Abortion Clinic Closures, Access, and Abortions,” Working Paper23366, National Bureau of Economic Research.
Currie, J. and W. B. MacLeod (2008): “First do no harm? Tort reform and birth out-comes,” The Quarterly Journal of Economics, 123, 795–830.
Currie, J. and H. Schwandt (2013): “Within-mother analysis of seasonal patterns in healthat birth,” Proceedings of the National Academy of Sciences, 110, 12265–12270.
Currie, J. and T. Vogl (2012): “Early-Life Health and Adult Circumstance in DevelopingCountries,” NBER Working Papers 18371, National Bureau of Economic Research, Inc.
Currie, J. and MacLeod, B. (2017): “Diagnosing expertise: Human capital, decision mak-ing, and performance among physicians,” Journal of Labor Economics, 35, 1–43.
Currie, J. and MacLeod, W. B. (2013): “Diagnosis and unnecessary procedure use: Evi-dence from c-section,” Tech. rep., National Bureau of Economic Research.
Cutler, D. M. and E. Meara (2000): “The technology of birth: Is it worth it?” in Forumfor Health Economics & Policy, vol. 3.
Daltveit, A. K., M. C. Tollånes, H. Pihlstrøm, and L. M. Irgens (2008): “Cesareandelivery and subsequent pregnancies,” Obstetrics & Gynecology, 111, 1327–1334.
Daysal, N. M. (2015): “early-life medical care and human capital accumulation,” IZA Worldof Labor.
Daysal, N. M., M. Trandafir, and R. Van Ewijk (2013): “Returns to childbirth tech-nologies: Evidence from preterm births,” .
189

de Mouzon, J., V. Goossens, S. Bhattacharya, J. Castilla, A. Ferraretti, V. Ko-rsak, M. Kupka, K.-G. Nygren, and A. Nyboe Andersen (2010): “Assisted repro-ductive technology in Europe, 2006: results generated from European registers by ESHRE,”Human Reproduction, 25, 1851–1862.
Dell, M. (2015): “Trafficking Networks and the Mexican Drug War,” American EconomicReview, 105, 1738–79.
Doan, A. E. (2007): Opposition and Intimidation: The Abortion Wars and Strategies of Po-litical Harassment, University of Michigan Press.
Duflo, E. (2012): “Women Empowerment and Economic Development,” Journal of EconomicLiterature, 50, 1051–1079.
Ecker, J. L., K. T. Chen, A. P. Cohen, L. E. Riley, and E. S. Lieberman (2001):“Increased risk of cesarean delivery with advancing maternal age: indications and associatedfactors in nulliparous women,” American journal of obstetrics and gynecology, 185, 883–887.
Figlio, D., J. Guryan, K. Karbownik, and J. Roth (2014): “The Effects of Poor NeonatalHealth on Children’s Cognitive Development,” American Economic Review, 104, 3921–3955.
Fischer, S., H. Royer, and C. White (2017): “The Impacts of Reduced Access to Abortionand Family Planning Services: Evidence from Texas,” Working Paper 23634, National Bureauof Economic Research.
Fraser, B. (2015): “Tide begins to turn on abortion access in South America,” The Lancet,383, 2113 – 2114.
Gamboa Montejano, C. and S. Valdés Robledo (2014): “Regulación del Aborto enMéxico: Derecho Comparado de los 31 estados y del Distrito Federal, así como de diversospaíses en el mundo y estadísticas del INEGI en el tema,” SAPI-ISS 33-14, Subdirección deAnálisis de Política Interior.
Gelbach, J. B. (2016): “When Do Covariates Matter? And Which Ones, and How Much?”Journal of Labor Economics, 34, 509–543.
Gelbaya, T. A., I. Tsoumpou, and L. G. Nardo (2010): “The likelihood of live birth andmultiple birth after single versus double embryo transfer at the cleavage stage: a systematicreview and meta-analysis,” Fertility and sterility, 94, 936–945.
Gelman, A. and G. Imbens (2014): “Why high-order polynomials should not be used inregression discontinuity designs,” Tech. rep., National Bureau of Economic Research.
Gerris, J., E. Van Royen, D. De Neubourg, K. Mangelschots, M. Valkenburg, andG. Ryckaert (2001): “Impact of single embryo transfer on the overall and twin-pregnancyrates of an IVF/ICSI programme,” Reproductive BioMedicine Online, 2, 172–177.
Gibbons, L., J. M. Belizán, J. A. Lauer, A. P. Betrán, M. Merialdi, F. Althabe,et al. (2010): “The global numbers and costs of additionally needed and unnecessary cae-sarean sections performed per year: overuse as a barrier to universal coverage,” World healthreport, 30, 1–31.
Gifford, D. S., S. C. Morton, M. Fiske, and K. Kahn (1995): “A meta-analysis of infantoutcomes after breech delivery.” Obstetrics & Gynecology, 85, 1047–1054.
190

Glezerman, M. (2006): “Five years to the term breech trial: the rise and fall of a randomizedcontrolled trial,” American journal of obstetrics and gynecology, 194, 20–25.
Gobierno de Nayarit (2009): “Exposición de Motivos; Reformo y Adición al Artículo 7,Fracción XI, de la Constitución Política del Estado Libre y Soberano de Nayarit y cómputoy Declaratoria de Aprobación de la Reforma,” Periódico Oficial 079, Organo del Gobierno deNayarit.
Goffinet, F., M. Carayol, J.-M. Foidart, S. Alexander, S. Uzan, D. Subtil,G. Bréart, P. S. Group, et al. (2006): “Is planned vaginal delivery for breech pre-sentation at term still an option? Results of an observational prospective survey in Franceand Belgium,” American journal of obstetrics and gynecology, 194, 1002–1011.
Granger, C. W. J. (1969): “Investigating Causal Relations by Econometric Models andCross-spectral Methods,” Econometrica, 37, 424–438.
Grimes, D. A. (2005): “Risks of mifepristone abortion in context,” Contraception, 71, 161.
Grimes, D. A., J. Benson, S. Singh, M. Romero, B. Ganatra, F. E. Okonofua,and I. H. Shah (2006): “Unsafe abortion: the preventable pandemic,” The Lancet, 368,1908–1919.
Grossman, D., K. White, K. Hopkins, and J. Potter (2017): “Change in distanceto nearest facility and abortion in Texas, 2012 to 2014,” Journal of the American MedicalAssociation, 317, 437–439.
Gruber, J., P. Levine, and D. Staiger (1999): “Abortion Legalization and Child LivingCircumstances: Who is the “Marginal Child”?” The Quarterly Journal of Economics, 114,263–291.
Guldi, M. (2008): “Fertility Effects of Abortion and Birth Control Pill Access for Minors,”Demography, 45, 17–827.
Gurol-Urganci, I., S. Bou-Antoun, C. Lim, D. Cromwell, T. Mahmood, A. Tem-pleton, and J. van der Meulen (2013): “Impact of Caesarean section on subsequentfertility: a systematic review and meta-analysis,” Human Reproduction, det130.
Gutierrez-Vazquez, E. Y. and E. A. Parrado (2015): “Abortion Legalization and FertilityRates in Mexico,” Unpublished manuscript, University of Pennsylvania.
Haenfler, R. and B. Johnson (2002): “Economic status and health in childhood: Theorigins of the gradient,” The American Economic Review, 92, 1308–1334.
Hainmueller, J. (2012): “Entropy Balancing for Causal Effects: A Multivariate ReweightingMethod to Produce Balanced Samples in Observational Studies,” Political Analysis, 20, 25–46.
Hall, J. G. (2003): “Twinning,” The Lancet, 362, 735–743.
Halla, M., H. Mayr, G. J. Pruckner, and P. Garcia-Gomez (2016): “Cutting Fertility?The Effect of Cesarean Deliveries on Subsequent Fertility and Maternal Labor Supply,” .
Hannah, M. E., W. J. Hannah, S. A. Hewson, E. D. Hodnett, S. Saigal, A. R.Willan, and T. B. T. Collaborative (2000): “Planned caesarean section versus plannedvaginal birth for breech presentation at term: a randomised multicentre trial,” The Lancet,356, 1375–1383.
191

Hannah, M. E., H. Whyte, W. J. Hannah, S. Hewson, K. Amankwah, M. Cheng,A. Gafni, P. Guselle, M. Helewa, E. D. Hodnett, et al. (2004): “Maternal outcomesat 2 years after planned cesarean section versus planned vaginal birth for breech presentationat term: the international randomized Term Breech Trial,” American journal of obstetricsand gynecology, 191, 917–927.
Hausman, C. and D. S. Rapson (2017): “Regression Discontinuity in Time: Considerationsfor Empirical Applications,” Working Paper 23602, National Bureau of Economic Research.
Heckman, J. J. (2007): “The Economics, Technology and Neuroscience of Human CapabilityFormation,” IZA Discussion Papers 2875, Institute for the Study of Labor (IZA).
Heckman, J. J. (2015): “Gary Becker: Model Economic Scientist,” The American economicreview, 105, 74.
Heckman, J.J (2015): “Introduction to a Theory of the Allocation of Time by Gary Becker,”The Economic Journal, 125, 403–409.
Herbst, A. (2005): “Term breech delivery in Sweden: mortality relative to fetal presentationand planned mode of delivery,” Acta obstetricia et gynecologica Scandinavica, 84, 593–601.
Herbst, A. and K. Thorngren-Jerneck (2001): “Mode of delivery in breech presentationat term: increased neonatal morbidity with vaginal delivery,” Acta obstetricia et gynecologicaScandinavica, 80, 731–737.
Hofmeyr, G. J., M. Hannah, et al. (2001): “Planned caesarean section for term breechdelivery,” Cochrane Database Syst Rev, 1.
Holm, S. (1979): “A Simple Sequentially Rejective Multiple Test Procedure,” ScandinavianJournal of Statistics, 6, 65–70.
Horowitz, J. L. and C. F. Manski (1995): “Identification and robustness with contaminatedand corrupted data,” Econometrica: Journal of the Econometric Society, 281–302.
Hubacher, D. and J. Trussell (2015): “A definition of modern contraceptive methods,”Contraception, 92, 420–421.
Hurry, D. J., B. Larsen, and D. Charles (1984): “Effects of postcesarean section febrilemorbidity on subsequent fertility.” Obstetrics & Gynecology, 64, 256–260.
Instituto Nacional de Estadística y Geografía (2012): “Derecho a la identidad. Lacobertura del registro de nacimiento en México en 1999 y 2009,” Tech. rep., INEGI andUNICEF.
Jensen, V. M. and M. Wüst (2015): “Can Caesarean section improve child and maternalhealth? The case of breech babies,” Journal of health economics, 39, 289–302.
Johnson, E. M. and M. M. Rehavi (2016): “Physicians treating physicians: Informationand incentives in childbirth,” American Economic Journal: Economic Policy, 8, 115–141.
Johnson, T. (2013): “Guaranteed Access to Safe and Legal Abortions: The True Revolutionof Mexico City’s Legal Reforms Regarding Abortion,” Columbia Human Rights Law Review,44, 437–476.
Joyce, T. and R. Kaestner (1996): “State reproductive policies and adolescent pregnancyresolution: The case of parental involvement laws,” Journal of Health Economics, 15, 579–607.
192

Juarez, F., S. Singh, S. G. Garcia, and C. D. Olavarrieta (2008): “Estimates of inducedabortion in Mexico: what’s changed between 1990 and 2006?” International Family PlanningPerspectives, 158–168.
Juarez, F., S. Singh, I. Maddow-Zimet, and D. Wulf (2013): “Unintended Pregnancyand Induced Abortion in Mexico: Causes and Consequences,” Tech. rep., Guttmacher Insti-tute, New York.
Källén, K., H. Rydström, and P. Otterblad Olausson (2005): “Kejsarsnitt I Sverige1990-2001,” Redovisningar av forskningsresultat från EpC och IMS.
Kalra, S. K. and K. T. Barnhart (2011): “In vitro fertilization and adverse childhoodoutcomes: what we know, where we are going, and how we will get there. A glimpse intowhat lies behind and beckons ahead,” Fertility and sterility, 95, 1887–1889.
Karlström, P. O. and C. Bergh (2007): “Reducing the number of embryos transferred inSweden-impact on delivery and multiple birth rates,” Human Reproduction, 22, 2202–2207.
Karolinska Universitetssjukhuset (2016): “Vändningsförsök,” Karolinska Univer-sitetssjukhuset.
Knaul, F. M., H. Arreola-Ornelas, O. Méndez-Carniado, C. Bryson-Cahn,J. Barofsky, R. Maguire, M. Miranda, and S. Sesma (2007): “Evidence is good foryour health system: policy reform to remedy catastrophic and impoverishing health spendingin Mexico,” Salud Pública De México, 49, S70–87.
Kotaska, A., S. Menticoglou, R. Gagnon, D. Farine, M. Basso, H. Bos, M.-F.Delisle, K. Grabowska, L. Hudon, W. Mundle, et al. (2009): “Vaginal delivery ofbreech presentation: No. 226, June 2009,” International Journal of Gynecology & Obstetrics,107, 169–176.
Kozhimannil, K. B., M. R. Law, and B. A. Virnig (2013): “Cesarean delivery rates varytenfold among US hospitals; reducing variation may address quality and cost issues,” HealthAffairs, 32, 527–535.
Kroeger, S. and G. La Mattina (2017): “Assisted reproductive technology and women’schoice to pursue professional careers,” Journal of Population Economics, 30, 723–769.
Kulczycki, A. (2011): “Abortion in Latin America: Changes in Practice, Growing Conflict,and Recent Policy Developments,” Studies in Family Planning, 42, 199–220.
Kulier, R., A. Gülmezoglu, G. Hofmeyr, L. Cheng, and A. Campana (2007): “Med-ical methods for first trimester abortion (Review),” in he Cochrane Library, ed. by T. C.Collaboration, John Wiley & Sons, Ltd.
Lara, D., S. G. García, K. S. Wilson, and F. Paz (2011): “How often and under whichcircumstances do Mexican pharmacy vendors recommend misoprostol to induce an abortion?”International perspectives on sexual and reproductive health, 75–83.
Lee, D. S. (2009): “Training, wages, and sample selection: Estimating sharp bounds on treat-ment effects,” The Review of Economic Studies, 76, 1071–1102.
Lee, D. S. and D. Card (2008): “Regression discontinuity inference with specification error,”Journal of Econometrics, 142, 655–674.
193

Lee, D. S. and T. Lemieux (2010): “Regression Discontinuity Designs in Economics,” Journalof Economic Literature, 48, 281–355.
Leyon, J. and H. Hagberg (2008): Avvikande fosterlägen och huvudbjudningar, Studentlit-teratur, 529.
Li, J., J. Olsen, M. Vestergaard, and C. Obel (2011): “Low Apgar scores and risk ofchildhood attention deficit hyperactivity disorder,” The Journal of pediatrics, 158, 775–779.
Lobel, M. and R. S. DeLuca (2007): “Psychosocial sequelae of cesarean delivery: reviewand analysis of their causes and implications,” Social science & medicine, 64, 2272–2284.
Lu, Y. and D. J. Slusky (2016): “The Impact of Women’s Health Clinic Closures on Fertil-ity,” Working papers series in theoretical and applied economics 201607, University of Kansas,Department of Economics.
Lukassen, H. M., D. Braat, A. M. Wetzels, G. A. Zielhuis, E. M. Adang, E. Scheen-jes, and J. A. Kremer (2005): “Two cycles with single embryo transfer versus one cyclewith double embryo transfer: a randomized controlled trial,” Human Reproduction, 20, 702–708.
Lundborg, P., E. Plug, and A. W. Rasmussen (2014): “Fertility Effects on Female LaborSupply: IV Evidence from IVF Treatments,” .
Lundin, K. and C. Bergh (2007): “Cumulative impact of adding frozen–thawed cycles tosingle versus double fresh embryo transfers,” Reproductive biomedicine online, 15, 76–82.
Mackay, D. F., R. Wood, A. King, D. N. Clark, S.-A. Cooper, G. C. Smith, andJ. P. Pell (2015): “Educational outcomes following breech delivery: a record-linkage studyof 456 947 children,” International journal of epidemiology, dyu270.
Madrazo, A. (2009): “The evolution of Mexico City’s abortion laws: From public morality towomen’s autonomy,” International Journal of Gynecology & Obstetrics, 106, 266 – 269.
Maheshwari, A., S. Griffiths, and S. Bhattacharya (2011): “Global variations in theuptake of single embryo transfer,” Human Reproduction Update, 17, 107–120.
McCrary, J. (2008): “Manipulation of the running variable in the regression discontinuitydesign: A density test,” Journal of Econometrics, 142, 698–714.
Mitrut, A. and F.-C. Wolff (2011): “The Impact of Legalized Abortion on Child HealthOutcomes and Abandonment. Evidence from Romania,” Journal of Health Economics, 30,1219–1231.
Mølland, E. (2016): “Benefits from delay? The effect of abortion availability on young womenand their children,” Labour Economics, 43, 6–28.
Mondragón y Kalb, M., A. Ahued Ortega, J. Morales Velazquez, C. Diaz Olavar-rieta, J. Valencia Rodriguez, D. Becker, and S. Garcia (2011): “Patient character-istics and service trends following abortion legalization in Mexico City, 2007-10,” Americanjournal of public health, 3, 159–66.
Moster, D., R. T. Lie, L. M. Irgens, T. Bjerkedal, and T. Markestad (2001): “Theassociation of Apgar score with subsequent death and cerebral palsy: a population-basedstudy in term infants,” The Journal of pediatrics, 138, 798–803.
194

Norberg, K. and J. Pantano (2016): “Cesarean sections and subsequent fertility,” Journalof Population Economics, 29, 5–37.
Odd, D. E., F. Rasmussen, D. Gunnell, G. Lewis, and A. Whitelaw (2008): “A cohortstudy of low Apgar scores and cognitive outcomes,” Archives of Disease in Childhood-Fetaland Neonatal Edition, 93, F115–F120.
O’Dowd, M. J. and E. E. Philipp (2000): The history of obstetrics and gynaecology, Taylor& Francis.
O’Neill, S. M., P. M. Kearney, L. C. Kenny, T. B. Henriksen, J. E. Lutomski,R. A. Greene, and A. S. Khashan (2013): “Caesarean delivery and subsequent pregnancyinterval: a systematic review and meta-analysis,” BMC pregnancy and childbirth, 13, 1.
Oreffice, S. (2007): “Did the legalization of abortion increase women’s household bargainingpower? Evidence from labor supply,” Review of Economics of the Household, 5, 181–207.
Oreopoulos, P., M. Stabile, R. Walld, and L. L. Roos (2008): “Short-, medium-, andlong-term consequences of poor infant health an analysis using siblings and twins,” Journalof human Resources, 43, 88–138.
Pinborg, A., U.-B. Wennerholm, L. Romundstad, A. Loft, K. Aittomaki,V. Söderström-Anttila, K. Nygren, J. Hazekamp, and C. Bergh (2013): “Whydo singletons conceived after assisted reproduction technology have adverse perinatal out-come? Systematic review and meta-analysis,” Human reproduction update, 19, 87–104.
Pinckney-Clark, E., F. I. Sharara, J. M. Franasiak, P. W. Heiser, and T. Tobias(2016): “Promoting the use of elective single embryo transfer in clinical practice,” FertilityResearch and Practice, 2, 1.
Pop-Eleches, C. (2005): “The Impact of an Abortion Ban on Socio-Economic Outcomes ofChildren: Evidence from Romania,” Journal of Political Economy, 114, 744–773.
Pop-Eleches, C. (2010): “The Supply of Birth Control Methods, Education, and Fertility:Evidence from Romania,” Journal of Human Resources, 45, 971–997.
Practice Committee of the Society for Assisted Reproductive Technology andPractice Committee of the American Society for Reproductive Medicine andothers (2012): “Elective single-embryo transfer,” Fertility and Sterility, 97, 835–842.
Price, J. and K. Simon (2009): “Patient education and the impact of new medical research,”Journal of health economics, 28, 1166–1174.
Quintana-Domeque, C., D. Clarke, S. Oreffice, et al. (2016): “The Demand for Seasonof Birth,” Tech. rep.
Rainer, H., G. Selvaretnam, and D. Ulph (2011): “Assisted reproductive technologies(ART) in a model of fertility choice,” Journal of Population Economics, 24, 1101–1132.
Romano, J. P. and M. Wolf (2005): “Exact and Approximate Stepdown Methods forMultiple Hypothesis Testing,” Journal of the American Statistical Association, 100, 94–108.
Romano, J. P. and Wolf, M. (2005): “Stepwise Multiple Testing as Formalized Data Snoop-ing,” Econometrica, 73, 1237–1282.
195

Rowlands, I. J. and M. Redshaw (2012): “Mode of birth and women’s psychological andphysical wellbeing in the postnatal period,” BMC pregnancy and childbirth, 12, 138.
Saldeen, P. and P. Sundström (2005): “Would legislation imposing single embryo transferbe a feasible way to reduce the rate of multiple pregnancies after IVF treatment?” HumanReproduction, 20, 4–8.
Savelyev, P. A. and K. T. K. Tan (2015): “Socioemotional Skills, Education, and Health-Related Outcomes of High-Ability Individuals,” Mimeo 2450869, SSRN.
Sazonova, A., K. Källen, A. Thurin-Kjellberg, U.-B. Wennerholm, and C. Bergh(2011): “Obstetric outcome after in vitro fertilization with single or double embryo transfer,”Human reproduction, 26, 442–450.
Schiavon, R., M. E. Collado, E. Troncoso, J. E. S. Sánchez, G. O. Zorrilla,and T. Palermo (2010): “Characteristics of private abortion services in Mexico City afterlegalization,” Reproductive Health Matters, 18, 127–135.
Schiavon, R., E. Troncoso, and G. Polo (2012): “Analysis of maternal and abortion-related mortality in Mexico over the last two decades, 1990–2008,” International Journal ofGynecology & Obstetrics, 118, Supplement 2, S78 – S86.
Sebire, N. J., M. Jolly, J. Harris, J. Wadsworth, M. Joffe, R. Beard, L. Regan,and S. Robinson (2001): “Maternal obesity and pregnancy outcome: a study of 287 213pregnancies in London,” International journal of obesity, 25, 1175.
Sharoni, L., D. J. Lyell, and C. F. Weiniger (2015): “Too late to back out? Options forbreech presentation management,” Journal of epidemiology and community health, jech–2015.
Sheiner, E., A. Levy, T. S. Menes, D. Silverberg, M. Katz, and M. Mazor (2004):“Maternal obesity as an independent risk factor for caesarean delivery,” Paediatric and Peri-natal Epidemiology, 18, 196–201.
Singh, S., G. Sedgh, A. Bankole, R. Hussain, and S. London (2012): “Making abortionservices accessible in the wake of legal reforms: A framework and six case studies,” Tech.rep., Guttmacher Institute.
SKL (2016): “Rekommendation om enhetlighet i landstingens och regionernas erbjudande avoffentlig finansierad assisterad befruktning,” Sveriges Kommuner och Landsting.
Smith, G. C., A. M. Wood, J. P. Pell, and R. Dobbie (2006): “First cesarean birth andsubsequent fertility,” Fertility and sterility, 85, 90–95.
Socialstyrelsen (2006): “Assisterad befruktning 2003, Assisted reproduction, Results oftreatment 2003,” Socialstyrelsen.
Socialstyrelsen (2013): “Graviditeter, förlossningar och nyfödda barn. Medicinskafödelseregistret 1973–2011. Assisterad befruktning 1991–2010,” Socialstyrelsen.
Socialstyrelsen (2016): “Assisterad befruktning med donerade könsceller Nationellt kun-skapsstöd,” Socialstyrelsen.
Staiger, D. O. and J. H. Stock (1994): “Instrumental variables regression with weakinstruments,” .
196

Stanton, C. T. and C. Thomas (2016): “Landing the First Job: The Value of Intermediariesin Online Hiring,” The Review of Economic Studies, 83, 810–854.
Tatum, C., M. Rueda, J. Bain, J. Clyde, and G. Carino (2012): “Decisionmaking re-garding unwanted pregnancy among adolescents in Mexico City: a qualitative study,” Studiesin family planning, 43, 43–56.
Temmerman, M. (2016): “Caesarean section surgical techniques: all equally safe,” The Lancet,388, 8–9.
The Lancet (2009): “Unsafe abortions: eight maternal deaths every hour,” The Lancet, 374,1301 –.
The Swedish National Board of Health and Welfare (2003): “Medicinsk födelsereg-istrering 2001,” Tech. Rep. 2003-42-1, The National Board of Health and Welfare (Social-styrelsen).
The World Band (2015): http://data.worldbank.org, 2015. Consulted 31 May 2015.
The World Bank (2015): .
The World Health Organization (2015): “Family planning/Contraception,” Fact sheetNumber 351.
Thurin, A., J. Hausken, T. Hillensjö, B. Jablonowska, A. Pinborg, A. Strandell,and C. Bergh (2004): “Elective single-embryo transfer versus double-embryo transfer in invitro fertilization,” New England Journal of Medicine, 351, 2392–2402.
Tollånes, M. C., K. K. Melve, L. M. Irgens, and R. Skjaerven (2007): “Reducedfertility after cesarean delivery: a maternal choice,” Obstetrics & Gynecology, 110, 1256–1263.
Turner, M. (2006): “The term breech trial: Are the clinical guidelines justified by the evi-dence?” Journal of obstetrics and gynaecology, 26, 491–494.
UNICEF (2005): “The ‘Rights’ Start to Life: A statistical analysis of birth registration,” Unicefpublications, UNICEF.
United Nations (2014): “Abortion Policies and Reproductive Health around the World,”Tech. Rep. E.14.XIII.11, Department of Economic and Social Affairs: Population Division.
Valente, C. (2014): “Access to abortion, investments in neonatal health, and sex-selection:Evidence from Nepal,” Journal of Development Economics, 107, 225–243.
Van Lerberghe, W., A. Manuel, Z. Matthews, and W. Cathy (2005): The WorldHealth Report 2005-make every mother and child count, World Health Organization.
Vilska, S., A. Tiitinen, C. Hyden-Granskog, and O. Hovatta (1999): “Elective transferof one embryo results in an acceptable pregnancy rate and eliminates the risk of multiplebirth,” Human Reproduction, 14, 2392–2395.
Vårdguiden (2017): “Mödrahälsovård,” 1177 Vårdguiden.
WHO (2011): “Unsafe abortion: global and regional estimates of incidence of unsafe abortionand associated mortality in 2008,” Tech. Rep. 6th edition, World Health Organization Geneva.
197

Whyte, H., M. E. Hannah, S. Saigal, W. J. Hannah, S. Hewson, K. Amankwah,M. Cheng, A. Gafni, P. Guselle, M. Helewa, et al. (2004): “Outcomes of childrenat 2 years after planned cesarean birth versus planned vaginal birth for breech presentationat term: the International Randomized Term Breech Trial,” American journal of obstetricsand gynecology, 191, 864–871.
Winikoff, B. and W. R. Sheldon (2012): “Abortion: what is the problem?” The Lancet,379, 594 – 596.
World Health Organization (2000): Obesity: preventing and managing the global epidemic,894, World Health Organization.
Zegers-Hochschild, F., G. D. Adamson, J. de Mouzon, O. Ishihara, R. Mansour,K. Nygren, E. Sullivan, and S. Van der Poel (2009): “The international committee formonitoring assisted reproductive technology (ICMART) and the world health organization(WHO) revised glossary on ART terminology, 2009,” Human Reproduction, dep343.
198

Previous doctoral theses in the Department of Economics, Gothenburg Avhandlingar publicerade innan serien Ekonomiska Studier startades (Theses published before the series Ekonomiska Studier was started): Östman, Hugo (1911), Norrlands ekonomiska utveckling Moritz, Marcus (1911), Den svenska tobaksindustrien Sundbom, I. (1933), Prisbildning och ändamålsenlighet Gerhard, I. (1948), Problem rörande Sveriges utrikeshandel 1936/38 Hegeland, Hugo (1951), The Quantity Theory of Money Mattsson, Bengt (1970), Cost-Benefit analys Rosengren, Björn (1975), Valutareglering och nationell ekonomisk politik Hjalmarsson, Lennart (1975), Studies in a Dynamic Theory of Production and its Applications Örtendahl, Per-Anders (1975), Substitutionsaspekter på produktionsprocessen vid massaframställning Anderson, Arne M. (1976), Produktion, kapacitet och kostnader vid ett helautomatiskt emballageglasbruk Ohlsson, Olle (1976), Substitution och odelbarheter i produktionsprocessen vid massaframställning Gunnarsson, Jan (1976), Produktionssystem och tätortshierarki – om sambandet mellan rumslig och ekonomisk struktur Köstner, Evert (1976), Optimal allokering av tid mellan utbildning och arbete Wigren, Rune (1976), Analys av regionala effektivitetsskillnader inom industribranscher Wästlund, Jan (1976), Skattning och analys av regionala effektivitetsskillnader inom industribranscher Flöjstad, Gunnar (1976), Studies in Distortions, Trade and Allocation Problems Sandelin, Bo (1977), Prisutveckling och kapitalvinster på bostadsfastigheter Dahlberg, Lars (1977), Empirical Studies in Public Planning Lönnroth, Johan (1977), Marxism som matematisk ekonomi Johansson, Börje (1978), Contributions to Sequential Analysis of Oligopolistic Competition Ekonomiska Studier, utgivna av Nationalekonomiska institutionen vid Göteborgs Universitet. Nr 1 och 4 var inte doktorsavhandlingar. (The contributions to the department series ’Ekonomiska Studier’ where no. 1 and 4 were no doctoral theses): 2. Ambjörn, Erik (1959), Svenskt importberoende 1926-1956: en ekonomisk-
statistisk kartläggning med kommentarer 3. Landgren, K-G. (1960), Den ”Nya ekonomien” i Sverige: J.M. Keynes, E.
Wigfors och utecklingen 1927-39 5. Bigsten, Arne (1979), Regional Inequality and Development: A Case Study of
Kenya 6. Andersson, Lars (1979), Statens styrning av de kommunala budgetarnas struktur
(Central Government Influence on the Structure of the Municipal Budget) 7. Gustafsson, Björn (1979), Inkomst- och uppväxtförhållanden (Income and
Family Background) 8. Granholm, Arne (1981), Interregional Planning Models for the Allocation of

Private and Public Investments 9. Lundborg, Per (1982), Trade Policy and Development: Income Distributional
Effects in the Less Developed Countries of the US and EEC Policies for Agricultural Commodities
10. Juås, Birgitta (1982), Värdering av risken för personskador. En jämförande studie av implicita och explicita värden. (Valuation of Personal Injuries. A comparison of Explicit and Implicit Values)
11. Bergendahl, Per-Anders (1982), Energi och ekonomi - tillämpningar av input-output analys (Energy and the Economy - Applications of Input-Output Analysis)
12. Blomström, Magnus (1983), Foreign Investment, Technical Efficiency and Structural Change - Evidence from the Mexican Manufacturing Industry
13. Larsson, Lars-Göran (1983), Comparative Statics on the Basis of Optimization Methods
14. Persson, Håkan (1983), Theory and Applications of Multisectoral Growth Models
15. Sterner, Thomas (1986), Energy Use in Mexican Industry. 16. Flood, Lennart (1986), On the Application of Time Use and Expenditure
Allocation Models. 17. Schuller, Bernd-Joachim (1986), Ekonomi och kriminalitet - en empirisk
undersökning av brottsligheten i Sverige (Economics of crime - an empirical analysis of crime in Sweden)
18. Walfridson, Bo (1987), Dynamic Models of Factor Demand. An Application to Swedish Industry.
19. Stålhammar, Nils-Olov (1987), Strukturomvandling, företagsbeteende och förväntningsbildning inom den svenska tillverkningsindustrin (Structural Change, Firm Behaviour and Expectation Formation in Swedish Manufactury)
20. Anxo, Dominique (1988), Sysselsättningseffekter av en allmän arbetstidsför-kortning (Employment effects of a general shortage of the working time)
21. Mbelle, Ammon (1988), Foreign Exchange and Industrial Development: A Study of Tanzania.
22. Ongaro, Wilfred (1988), Adoption of New Farming Technology: A Case Study of Maize Production in Western Kenya.
23. Zejan, Mario (1988), Studies in the Behavior of Swedish Multinationals. 24. Görling, Anders (1988), Ekonomisk tillväxt och miljö. Förorenings-struktur och
ekonomiska effekter av olika miljövårdsprogram. (Economic Growth and Environment. Pollution Structure and Economic Effects of Some Environmental Programs).
25. Aguilar, Renato (1988), Efficiency in Production: Theory and an Application on Kenyan Smallholders.
26. Kayizzi-Mugerwa, Steve (1988), External Shocks and Adjustment in Zambia. 27. Bornmalm-Jardelöw, Gunilla (1988), Högre utbildning och arbetsmarknad
(Higher Education and the Labour Market) 28. Tansini, Ruben (1989), Technology Transfer: Dairy Industries in Sweden and
Uruguay. 29. Andersson, Irene (1989), Familjebeskattning, konsumtion och arbetsutbud - En
ekonometrisk analys av löne- och inkomstelasticiteter samt policysimuleringar för svenska hushåll (Family Taxation, Consumption and Labour Supply - An Econometric Analysis of Wage and Income Elasticities and Policy Simulations for

Swedish Households) 30. Henrekson, Magnus (1990), An Economic Analysis of Swedish Government
Expenditure 31. Sjöö, Boo (1990), Monetary Policy in a Continuous Time Dynamic Model for
Sweden 32. Rosén, Åsa (1991), Contributions to the Theory of Labour Contracts. 33. Loureiro, Joao M. de Matos (1992), Foreign Exchange Intervention, Sterilization
and Credibility in the EMS: An Empirical Study 34. Irandoust, Manuchehr (1993), Essays on the Behavior and Performance of
the Car Industry 35. Tasiran, Ali Cevat (1993), Wage and Income Effects on the Timing and
Spacing of Births in Sweden and the United States 36. Milopoulos, Christos (1993), Investment Behaviour under Uncertainty: An
Econometric Analysis of Swedish Panel Data 37. Andersson, Per-Åke (1993), Labour Market Structure in a Controlled Economy:
The Case of Zambia 38. Storrie, Donald W. (1993), The Anatomy of a Large Swedish Plant Closure 39. Semboja, Haji Hatibu Haji (1993), Energy and Development in Kenya 40. Makonnen, Negatu (1993), Labor Supply and the Distribution of Economic
Well-Being: A Case Study of Lesotho 41. Julin, Eva (1993), Structural Change in Rural Kenya 42. Durevall, Dick (1993), Essays on Chronic Inflation: The Brazilian Experience 43. Veiderpass, Ann (1993), Swedish Retail Electricity Distribution: A Non-
Parametric Approach to Efficiency and Productivity Change 44. Odeck, James (1993), Measuring Productivity Growth and Efficiency with
Data Envelopment Analysis: An Application on the Norwegian Road Sector 45. Mwenda, Abraham (1993), Credit Rationing and Investment Behaviour under
Market Imperfections: Evidence from Commercial Agriculture in Zambia 46. Mlambo, Kupukile (1993), Total Factor Productivity Growth: An Empirical
Analysis of Zimbabwe's Manufacturing Sector Based on Factor Demand Modelling 47. Ndung'u, Njuguna (1993), Dynamics of the Inflationary Process in Kenya 48. Modén, Karl-Markus (1993), Tax Incentives of Corporate Mergers and
Foreign Direct Investments 49. Franzén, Mikael (1994), Gasoline Demand - A Comparison of Models 50. Heshmati, Almas (1994), Estimating Technical Efficiency, Productivity Growth
And Selectivity Bias Using Rotating Panel Data: An Application to Swedish Agriculture
51. Salas, Osvaldo (1994), Efficiency and Productivity Change: A Micro Data Case Study of the Colombian Cement Industry
52. Bjurek, Hans (1994), Essays on Efficiency and Productivity Change with Applications to Public Service Production
53. Cabezas Vega, Luis (1994), Factor Substitution, Capacity Utilization and Total Factor Productivity Growth in the Peruvian Manufacturing Industry
54. Katz, Katarina (1994), Gender Differentiation and Discrimination. A Study of Soviet Wages
55. Asal, Maher (1995), Real Exchange Rate Determination and the Adjustment Process: An Empirical Study in the Cases of Sweden and Egypt

56. Kjulin, Urban (1995), Economic Perspectives on Child Care 57. Andersson, Göran (1995), Volatility Forecasting and Efficiency of the Swedish
Call Options Market 58. Forteza, Alvaro (1996), Credibility, Inflation and Incentive Distortions in the
Welfare State 59. Locking, Håkan (1996), Essays on Swedish Wage Formation 60. Välilä, Timo (1996), Essays on the Credibility of Central Bank Independence 61. Yilma, Mulugeta (1996), Measuring Smallholder Efficiency: Ugandan Coffee
and Food-Crop Production 62. Mabugu, Ramos E. (1996), Tax Policy Analysis in Zimbabwe Applying General
Equilibrium Models 63. Johansson, Olof (1996), Welfare, Externalities, and Taxation; Theory and Some
Road Transport Applications. 64. Chitiga, Margaret (1996), Computable General Equilibrium Analysis of Income
Distribution Policies in Zimbabwe 65. Leander, Per (1996), Foreign Exchange Market Behavior Expectations and
Chaos 66. Hansen, Jörgen (1997), Essays on Earnings and Labor Supply 67. Cotfas, Mihai (1997), Essays on Productivity and Efficiency in the Romanian
Cement Industry 68. Horgby, Per-Johan (1997), Essays on Sharing, Management and Evaluation of
Health Risks 69. Nafar, Nosratollah (1997), Efficiency and Productivity in Iranian Manufacturing
Industries 70. Zheng, Jinghai (1997), Essays on Industrial Structure, Technical Change,
Employment Adjustment, and Technical Efficiency 71. Isaksson, Anders (1997), Essays on Financial Liberalisation in Developing
Countries: Capital mobility, price stability, and savings 72. Gerdin, Anders (1997), On Productivity and Growth in Kenya, 1964-94 73. Sharifi, Alimorad (1998), The Electricity Supply Industry in Iran: Organization,
performance and future development 74. Zamanian, Max (1997), Methods for Mutual Fund Portfolio Evaluation: An
application to the Swedish market 75. Manda, Damiano Kulundu (1997), Labour Supply, Returns to Education, and
the Effect of Firm Size on Wages: The case of Kenya 76. Holmén, Martin (1998), Essays on Corporate Acquisitions and Stock Market
Introductions 77. Pan, Kelvin (1998), Essays on Enforcement in Money and Banking 78. Rogat, Jorge (1998), The Value of Improved Air Quality in Santiago de Chile 79. Peterson, Stefan (1998), Essays on Large Shareholders and Corporate Control 80. Belhaj, Mohammed (1998), Energy, Transportation and Urban Environment in
Africa: The Case of Rabat-Salé, Morocco 81. Mekonnen, Alemu (1998), Rural Energy and Afforestation: Case Studies from
Ethiopia 82. Johansson, Anders (1998), Empirical Essays on Financial and Real Investment
Behavior 83. Köhlin, Gunnar (1998), The Value of Social Forestry in Orissa, India 84. Levin, Jörgen (1998), Structural Adjustment and Poverty: The Case of Kenya

85. Ncube, Mkhululi (1998), Analysis of Employment Behaviour in Zimbabwe 86. Mwansa, Ladslous (1998), Determinants of Inflation in Zambia 87. Agnarsson, Sveinn (1998), Of Men and Machines: Essays in Applied Labour and
Production Economics 88. Kadenge, Phineas (1998), Essays on Macroeconomic Adjustment in Zimbabwe:
Inflation, Money Demand, and the Real Exchange Rate 89. Nyman, Håkan (1998), An Economic Analysis of Lone Motherhood in Sweden 90. Carlsson, Fredrik (1999), Essays on Externalities and Transport 91. Johansson, Mats (1999), Empirical Studies of Income Distribution 92. Alemu, Tekie (1999), Land Tenure and Soil Conservation: Evidence from
Ethiopia 93. Lundvall, Karl (1999), Essays on Manufacturing Production in a Developing
Economy: Kenya 1992-94 94. Zhang, Jianhua (1999), Essays on Emerging Market Finance 95. Mlima, Aziz Ponary (1999), Four Essays on Efficiency and Productivity in
Swedish Banking 96. Davidsen, Björn-Ivar (2000), Bidrag til den økonomisk-metodologiske
tenkningen (Contributions to the Economic Methodological Thinking) 97. Ericson, Peter (2000), Essays on Labor Supply 98. Söderbom, Måns (2000), Investment in African Manufacturing: A
Microeconomic Analysis 99. Höglund, Lena (2000), Essays on Environmental Regulation with Applications
to Sweden 100. Olsson, Ola (2000), Perspectives on Knowledge and Growth 101. Meuller, Lars (2000), Essays on Money and Credit 102. Österberg, Torun (2000), Economic Perspectives on Immigrants and
Intergenerational Transmissions 103. Kalinda Mkenda, Beatrice (2001), Essays on Purchasing Power Parity,
RealExchange Rate, and Optimum Currency Areas 104. Nerhagen, Lena (2001), Travel Demand and Value of Time - Towards an
Understanding of Individuals Choice Behavior 105. Mkenda, Adolf (2001), Fishery Resources and Welfare in Rural Zanzibar 106. Eggert, Håkan (2001), Essays on Fisheries Economics 107. Andrén, Daniela (2001), Work, Sickness, Earnings, and Early Exits from the
Labor Market. An Empirical Analysis Using Swedish Longitudinal Data 108. Nivorozhkin, Eugene (2001), Essays on Capital Structure 109. Hammar, Henrik (2001), Essays on Policy Instruments: Applications to Smoking
and the Environment 110. Nannyonjo, Justine (2002), Financial Sector Reforms in Uganda (1990-2000):
Interest Rate Spreads, Market Structure, Bank Performance and Monetary Policy 111. Wu, Hong (2002), Essays on Insurance Economics 112. Linde-Rahr, Martin (2002), Household Economics of Agriculture and Forestry
in Rural Vienam 113. Maneschiöld, Per-Ola (2002), Essays on Exchange Rates and Central Bank
Credibility 114. Andrén, Thomas (2002), Essays on Training, Welfare and Labor Supply 115. Granér, Mats (2002), Essays on Trade and Productivity: Case Studies of

Manufacturing in Chile and Kenya 116. Jaldell, Henrik (2002), Essays on the Performance of Fire and Rescue Services 117. Alpizar, Francisco, R. (2002), Essays on Environmental Policy-Making in
Developing Countries: Applications to Costa Rica 118. Wahlberg, Roger (2002), Essays on Discrimination, Welfare and Labor Supply 119. Piculescu, Violeta (2002), Studies on the Post-Communist Transition 120. Pylkkänen, Elina (2003), Studies on Household Labor Supply and Home
Production 121. Löfgren, Åsa (2003), Environmental Taxation – Empirical and Theoretical
Applications 122. Ivaschenko, Oleksiy (2003), Essays on Poverty, Income Inequality and Health in
Transition Economies 123. Lundström, Susanna (2003), On Institutions, Economic Growth and the
Environment 124. Wambugu, Anthony (2003), Essays on Earnings and Human Capital in Kenya 125. Adler, Johan (2003), Aspects of Macroeconomic Saving 126. Erlandsson, Mattias (2003), On Monetary Integration and Macroeconomic
Policy 127. Brink, Anna (2003), On the Political Economy of Municipality Break-Ups 128. Ljungwall, Christer (2003), Essays on China’s Economic Performance During
the Reform Period 129. Chifamba, Ronald (2003), Analysis of Mining Investments in Zimbabwe 130. Muchapondwa, Edwin (2003), The Economics of Community-Based Wildlife
Conservation in Zimbabwe 131. Hammes, Klaus (2003), Essays on Capital Structure and Trade Financing 132. Abou-Ali, Hala (2003), Water and Health in Egypt: An Empirical Analysis 133. Simatele, Munacinga (2004), Financial Sector Reforms and Monetary Policy in
Zambia 134. Tezic, Kerem (2004), Essays on Immigrants’ Economic Integration 135. INSTÄLLD 136. Gjirja, Matilda (2004), Efficiency and Productivity in Swedish Banking 137. Andersson, Jessica (2004), Welfare Environment and Tourism in Developing
Countries 138. Chen, Yinghong (2004), Essays on Voting Power, Corporate Governance and
Capital Structure 139. Yesuf, Mahmud (2004), Risk, Time and Land Management under Market
Imperfections: Applications to Ethiopia 140. Kateregga, Eseza (2005), Essays on the Infestation of Lake Victoria by the Water
Hyacinth 141. Edvardsen, Dag Fjeld (2004), Four Essays on the Measurement of Productive
Efficiency 142. Lidén, Erik (2005), Essays on Information and Conflicts of Interest in Stock
Recommendations 143. Dieden, Sten (2005), Income Generation in the African and Coloured Population
– Three Essays on the Origins of Household Incomes in South Africa 144. Eliasson, Marcus (2005), Individual and Family Consequences of Involuntary
Job Loss 145. Mahmud, Minhaj (2005), Measuring Trust and the Value of Statistical Lives:

Evidence from Bangladesh 146. Lokina, Razack Bakari (2005), Efficiency, Risk and Regulation Compliance:
Applications to Lake Victoria Fisheries in Tanzania 147. Jussila Hammes, Johanna (2005), Essays on the Political Economy of Land Use
Change 148. Nyangena, Wilfred (2006), Essays on Soil Conservation, Social Capital and
Technology Adoption 149. Nivorozhkin, Anton (2006), Essays on Unemployment Duration and Programme
Evaluation 150. Sandén, Klas (2006), Essays on the Skill Premium 151. Deng, Daniel (2006), Three Essays on Electricity Spot and Financial Derivative
Prices at the Nordic Power Exchange 152. Gebreeyesus, Mulu (2006), Essays on Firm Turnover, Growth, and Investment
Behavior in Ethiopian Manufacturing 153. Islam, Nizamul Md. (2006), Essays on Labor Supply and Poverty: A
Microeconometric Application 154. Kjaer, Mats (2006), Pricing of Some Path-Dependent Options on Equities and
Commodities 155. Shimeles, Abebe (2006), Essays on Poverty, Risk and Consumption Dynamics in
Ethiopia 156. Larsson, Jan (2006), Four Essays on Technology, Productivity and Environment 157. Congdon Fors, Heather (2006), Essays in Institutional and Development
Economics 158. Akpalu, Wisdom (2006), Essays on Economics of Natural Resource Management
and Experiments 159. Daruvala, Dinky (2006), Experimental Studies on Risk, Inequality and Relative
Standing 160. García, Jorge (2007), Essays on Asymmetric Information and Environmental
Regulation through Disclosure 161. Bezabih, Mintewab (2007), Essays on Land Lease Markets, Productivity,
Biodiversity, and Environmental Variability 162. Visser, Martine (2007), Fairness, Reciprocity and Inequality: Experimental
Evidence from South Africa 163. Holm, Louise (2007), A Non-Stationary Perspective on the European and
Swedish Business Cycle 164. Herbertsson, Alexander (2007), Pricing Portfolio Credit Derivatives 165. Johansson, Anders C. (2007), Essays in Empirical Finance: Volatility,
Interdependencies, and Risk in Emerging Markets 166. Ibáñez Díaz, Marcela (2007), Social Dilemmas: The Role of Incentives, Norms
and Institutions 167. Ekbom, Anders (2007), Economic Analysis of Soil Capital, Land Use and
Agricultural Production in Kenya 168. Sjöberg, Pål (2007), Essays on Performance and Growth in Swedish Banking 169. Palma Aguirre, Grisha Alexis (2008), Explaining Earnings and Income
Inequality in Chile 170. Akay, Alpaslan (2008), Essays on Microeconometrics and Immigrant
Assimilation 171. Carlsson, Evert (2008), After Work – Investing for Retirement

172. Munshi, Farzana (2008), Essays on Globalization and Occupational Wages 173. Tsakas, Elias (2008), Essays on Epistemology and Evolutionary Game Theory 174. Erlandzon, Karl (2008), Retirement Planning: Portfolio Choice for Long-Term
Investors 175. Lampi, Elina (2008), Individual Preferences, Choices, and Risk Perceptions –
Survey Based Evidence 176. Mitrut, Andreea (2008), Four Essays on Interhousehold Transfers and
Institutions in Post-Communist Romania 177. Hansson, Gustav (2008), Essays on Social Distance, Institutions, and Economic
Growth 178. Zikhali, Precious (2008), Land Reform, Trust and Natural Resource Management
in Africa 179. Tengstam, Sven (2008), Essays on Smallholder Diversification, Industry Location, Debt Relief, and Disability and Utility 180. Boman, Anders (2009), Geographic Labour Mobility – Causes and Consequences 181. Qin, Ping (2009), Risk, Relative Standing and Property Rights: Rural Household
Decision-Making in China 182. Wei, Jiegen (2009), Essays in Climate Change and Forest Management 183. Belu, Constantin (2009), Essays on Efficiency Measurement and Corporate
Social Responsibility 184. Ahlerup, Pelle (2009), Essays on Conflict, Institutions, and Ethnic Diversity 185. Quiroga, Miguel (2009), Microeconomic Policy for Development: Essays on
Trade and Environment, Poverty and Education 186. Zerfu, Daniel (2010), Essays on Institutions and Economic Outcomes 187. Wollbrant, Conny (2010), Self-Control and Altruism 188. Villegas Palacio, Clara (2010), Formal and Informal Regulations: Enforcement
and Compliance 189. Maican, Florin (2010), Essays in Industry Dynamics on Imperfectly Competitive
Markets 190. Jakobsson, Niklas (2010), Laws, Attitudes and Public Policy 191. Manescu, Cristiana (2010), Economic Implications of Corporate Social
Responsibility and Responsible Investments 192. He, Haoran (2010), Environmental and Behavioral Economics – Applications to
China 193. Andersson, Fredrik W. (2011), Essays on Social Comparison 194. Isaksson, Ann-Sofie (2011), Essays on Institutions, Inequality and Development 195. Pham, Khanh Nam (2011), Prosocial Behavior, Social Interaction and
Development: Experimental Evidence from Vietnam 196. Lindskog, Annika (2011), Essays on Economic Behaviour: HIV/AIDS,
Schooling, and Inequality 197. Kotsadam, Andreas (2011), Gender, Work, and Attitudes 198. Alem, Yonas (2011), Essays on Shocks, Welfare, and Poverty Dynamics:
Microeconometric Evidence from Ethiopia 199. Köksal-Ayhan, Miyase Yesim (2011), Parallel Trade, Reference Pricing and
Competition in the Pharmaceutical Market: Theory and Evidence 200. Vondolia, Godwin Kofi (2011), Essays on Natural Resource Economics 201. Widerberg, Anna (2011), Essays on Energy and Climate Policy – Green
Certificates, Emissions Trading and Electricity Prices

202. Siba, Eyerusalem (2011), Essays on Industrial Development and Political Economy of Africa
203. Orth, Matilda (2012), Entry, Competition and Productivity in Retail 204. Nerman, Måns (2012), Essays on Development: Household Income, Education,
and Female Participation and Representation 205. Wicks, Rick (2012), The Place of Conventional Economics in a World with
Communities and Social Goods 206. Sato, Yoshihiro (2012), Dynamic Investment Models, Employment Generation
and Productivity – Evidence from Swedish Data 207. Valsecchi, Michele (2012), Essays in Political Economy of Development 208. Teklewold Belayneh, Hailemariam (2012), Essays on the Economics of
Sustainable Agricultural Technologies in Ethiopia 209. Wagura Ndiritu, Simon (2013), Essays on Gender Issues, Food Security, and
Technology Adoption in East Africa 210. Ruist, Joakim (2013), Immigration, Work, and Welfare 211. Nordén, Anna (2013), Essays on Behavioral Economics and Policies for
Provision of Ecosystem Services 212. Yang, Xiaojun (2013), Household Decision Making, Time Preferences, and
Positional Concern: Experimental Evidence from Rural China 213. Bonilla Londoño, Jorge Alexander (2013), Essays on the Economics of Air
Quality Control 214. Mohlin, Kristina (2013), Essays on Environmental Taxation and Climate Policy 215. Medhin, Haileselassie (2013), The Poor and Their Neighbors: Essays on
Behavioral and Experimental Economics 216. Andersson, Lisa (2013), Essays on Development and Experimental Economics:
Migration, Discrimination and Positional Concerns 217. Weng, Qian (2014), Essays on Team Cooperation and Firm Performance 218. Zhang, Xiao-Bing (2015), Cooperation and Paradoxes in Climate Economics 219. Jaime Torres, Monica Marcela (2015) Essays on Behavioral Economics and
Policy Design 220. Bejenariu, Simona (2015) Determinants of Health Capital at Birth: Evidence
from Policy Interventions 221. Nguyen, Van Diem (2015) Essays on Takeovers and Executive Compensation 222. Tolonen, Anja (2015) Mining Booms in Africa and Local Welfare Effects: Labor
Markets, Women’s Empowerment and Criminality 223. Hassen, Sied (2015) On the Adoption and Dis-adoption of Household Energy and Farm Technologies 224. Moursli, Mohamed-Reda (2015) Corporate Governance and the Design of Board of Directors 225. Borcan, Oana (2015) Economic Determinants and Consequences of Political
Institutions 226. Ruhinduka, Remidius Denis (2015) Essays on Field Experiments and Impact
Evaluation 227. Persson, Emil (2016) Essays on Behavioral and Experimental Economics,
Cooperation, Emotions and Health. 228. Martinangeli, Andrea (2017) Bitter divisions: inequality, identity and
cooperation

229. Björk, Lisa (2017) Essays on Behavioral Economics and Fisheries: Coordination and Cooperation
230. Chegere, Martin Julius (2017) Post-Harvest Losses, Intimate Partner Violence and Food Security in Tanzania 231. Villalobos-Fiatt, Laura (2017) Essays on forest conservation policies, weather and school attendance 232. Yi, Yuanyuan (2017) Incentives and Forest Reform: Evidence from China 233. Kurz, Verena (2017) Essays on behavioral economics: Nudges, food
consumption and procedural fairness234. Yashodha, Yashodha (2017) Contract Choice and Trust in Informal Groundwater Markets
235. Meles, Tensay Hadus (2017) Power Outages, Increasing Block Tariffs and Billing Knowledge
236. Mühlrad, Hanna (2018) The Impact of Reproductive and Birth Technologies on Health, Fertility and Labor Outcomes


