Embed Size (px)
Citation preview
HALF-YEARLY MONETARY AND FINANCIAL STABILITY REPORT
March 2019
This Report reviews statistical information between the end of August 2018 and the end of February 2019.

Half-Yearly Monetary and Financial Stability Report March 2019
Table of Contents
1. Summary and overview 4
2. Global setting and outlook 10
2.1 External environment 10
2.2 Mainland China 19
3. Domestic economy 36
3.1 Real activities 36
3.2 Inflation and unemployment 37
4. Monetary and financial conditions 44
4.1 Exchange rate and capital flows 44
4.2 Monetary environment and interest rates 46
4.3 Equity market 51
4.4 Debt market 53
4.5 Property markets 55
5. Banking sector performance 58
5.1 Profitability and capitalisation 58
5.2 Liquidity and interest rate risks 61
5.3 Credit risk 63
5.4 Systemic risk 70
Box 1. Predictability in sovereign bond returns using technical trading rules with machine learning
16
Box 2. Drivers behind the recent recovery in Mainland overcapacity sectors
32
Box 3. The impact of the US-China trade dispute on Hong Kong’s external merchandise trade: Preliminary evidence and implications
39
Box 4. Assessing the credit risk of Mainland corporates: Evidence from Hong Kong banks’ syndicated loans
73
Glossary of terms
Abbreviation
Half-YearlY MonetarY and financial StabilitY report MarcH 2019 3
1. Summary and overview
Global economic expansion continued, but is losing momentum amid rising uncertainties due to lingering trade tensions, tighter financial conditions, and other idiosyncratic and cyclical headwinds. While investors have priced out another interest rate hike in the US as the Federal Reserve adjusted its stance on monetary policy to emphasise “data dependence” and the need for “patience”, financial markets could become more sensitive to incoming data, particularly those warranting a tighter monetary policy, such as higher readings of US inflation.
Despite the triggering of the weak-side Convertibility Undertaking (CU) in March, the Hong Kong dollar continued to trade in a smooth and orderly manner. Total loan growth contracted slightly in the second half of 2018, reflecting subdued credit demand amid headwinds including lingering US-China trade conflicts and weaker global economic growth. The housing market also cooled down in the second half, with a visible fall in transactions and a decline in housing prices, before stabilising somewhat in early 2019.
Looking ahead, the Hong Kong banking sector will face multiple headwinds amid rising uncertainties in the external environment. Should these uncertainties intensify and persist into the longer term, they could significantly dampen business confidence and credit demand, thereby posing downward pressure on banks’ profitability. With rising corporate leverage, banks should carefully assess how the possible deterioration in the external environment would affect the credit risk of their corporate exposure.
The external environment
The global economy continued to expand in the
second half of 2018. However, while the US
economy grew solidly, growth momentum
elsewhere shifted down a gear. Among advanced
economies, Japan and a number of major euro
area countries experienced slower growth, and
inflation was tepid. Slowing global trade flows
and a plunge in oil prices posed cyclical
headwinds to emerging market economies
(EMEs). In January, in recognition of the softer
global growth momentum, the International
Monetary Fund revised downward its global
growth projections for 2019 and 2020 by 0.2 and
0.1 percentage points, respectively, relative to
October 2018.
As the growth outlook became less optimistic
and with trade tensions taking hold, global
equity market volatility surged in late 2018. The
US Treasury yield curve flattened to levels not
seen since the global financial crisis, sparking
concerns among market participants of an
imminent US recession. However, with US
economic fundamentals still solid, a near-term
recession remains a low-probability scenario.
Nevertheless, the global economic outlook is
fraught with uncertainties. In the US, while
benign inflation has allowed the Federal Reserve
(Fed) leeway to put the rate hike cycle on pause,
a more data-dependent Fed also suggests that
financial markets will likely become more
sensitive to incoming economic data, especially
4 Half-YearlY MonetarY and financial StabilitY report MarcH 2019
5 Half-YearlY MonetarY and financial StabilitY report MarcH 2019
Summary and overview
those warranting a tighter monetary policy, such
as higher readings of inflation. At the same time,
the outcomes of trade negotiations between the
US and Mainland China, as well as those
between the US and the European Union, remain
uncertain. In the UK, it remains to be seen
whether solutions to prevent a “hard” Brexit can
be achieved.
In East Asia1, while financial markets have
stabilised on the back of a moderating US dollar
and expectations of a pause in Fed rate hikes, a
deteriorating external environment could weigh
on the region’s economic growth. Indeed, the
weakening global trade momentum has already
weighed on gross domestic product (GDP)
growth in many East Asian economies and
inflationary pressures have moderated. While
this may alleviate the growth-inflation policy
dilemma faced by the region’s central banks,
financial imbalances, such as high private sector
indebtedness in some countries in the region,
remain a challenge. Another challenge, as
detailed in Box 1 (page 16), is that shocks
emanating from Fed monetary policies — if they
materialise — tend to have large spillover effects
on EME sovereign bonds, including those issued
by East Asian economies.
In Mainland China, growth slowed further in the
second half of 2018, amid increased uncertainties
in the external environment and some
moderation in domestic demand. Looking
ahead, the economic outlook remains uncertain
as the outcome of the US-China trade talk
remains unknown. Rising financing difficulties
faced by private business owners especially small
firms in the past few quarters that resulted from
the notable contraction of shadow financing
activities, coupled with weaker economic
confidence, could also exert pressures on
business activities. In this challenging economic
environment, policymakers would have to
continue to strike a balance between stabilising
In this report, East Asia refers to a group of seven economies: Indonesia, Malaysia, the Philippines, Singapore, South Korea, Taiwan and Thailand.
the economy and containing potential systemic
risks, by adopting accommodative but targeted
measures such as targeted required reserve ratio
cuts. Meanwhile, the authorities also stepped up
supply-side measures to enhance productivity
growth, such as promoting competition among
firms with different ownership structure and
providing better social safety nets for individuals.
The official growth target for 2019 was also
tuned lower to the range of 6.0–6.5% from
around 6.5% in 2018.
Risk-off sentiment prevailed in the Mainland
financial market in 2018. Banks’ asset quality
also deteriorated somewhat over the review
period, while leverage of listed non-financial
corporate firms edged higher. Nevertheless,
banks’ loan loss provision increased further in
the second half and their exposure to off-balance
sheet wealth management products continued to
decline; both developments help protect the
banking system against potential deterioration in
credit quality. Another bright spot is that the
leverage of listed firms in overcapacity sectors,
one of the major sources of banks’ credit risks,
declined further in the first three quarters of
2018. Box 2 (page 32) provides a more in-depth
analysis of the factors leading to the recent
improvement in the business performance of the
overcapacity sectors.
The domestic economy
Compared with the first half of 2018, economic
activities in Hong Kong softened in the second
half. Sequential growth was muted and year-on-
year growth also slowed. This dragged the
full-year growth rate down to 3.0%, against 3.8%
a year earlier.
Weakening economic activities occurred as the
impact of the US-China trade conflict, either
directly or indirectly, weighed on consumption
and exports. Private consumption grew more
slowly, probably due to heightened economic
uncertainty and some negative wealth effects 1
Summary and overview
associated with local asset price corrections.
Externally, Hong Kong’s export performance also
worsened, particularly in the fourth quarter
following the actual imposition of additional
tariffs. Box 3 takes a closer look at the impact of
the US-China trade conflict on Hong Kong’s
merchandise trade performance and discusses its
near-term outlook and the associated risks.
Economic growth for 2019 is expected to slow
further, mainly reflecting a slowdown in global
growth. In the face of a number of cross-
currents, Hong Kong’s export performance is
expected to continue to struggle. Domestically,
private consumption will likely remain growth-
supportive amid the low unemployment rate and
rising household income, but the outlook for
overall investment spending may become more
uncertain. For 2019 as a whole, the Government
forecasts real GDP growth in the range of 2–3%,
while the latest growth forecasts by private-sector
analysts averaged 2.3%; these forecasts are
subject to a number of uncertainties and risks as
discussed above.
Local inflation increased slightly to a still
moderate level in the second half of 2018, due in
part to the effect of earlier rises in fresh-letting
private residential rentals. At the same time, the
unemployment rate stayed low at 2.8%, the
lowest level in more than 20 years, although
growth in total employment showed initial signs
of slowing. For 2019 as a whole, local
inflationary pressures will likely stay mild, along
with softer domestic growth momentum.
Monetary conditions and capital flows
After the triggering of the weak-side
Convertibility Undertaking (CU) in the latter
part of August, the Hong Kong dollar moved
away from 7.8500 to trade between 7.8062 and
7.8499 until the weak-side CU was triggered
again 4 times in March 2019 (up to
19 March 2019)2. The Hong Kong dollar
exchange rate strengthened in September and
November, partly reflecting the unwinding of
interest carry trade positions as liquidity
tightened. Stepping into 2019, the Hong Kong
dollar softened against the US dollar with some
rebuilding of interest carry positions. The
weak-side CU was triggered again in March.
Despite the triggering of the weak-side CU, the
Hong Kong dollar continued to trade in a
smooth and orderly manner. Due to the
triggering of the weak-side CU, the Aggregate
Balance edged down to HK$70.9 billion (as at
March 19).
The Hong Kong dollar interbank interest rates
broadly trended upwards during the second half,
primarily reflecting expectations of US rate hikes.
Compared to the first half of 2018, the three-
month and 12-month Hong Kong Interbank
Offered Rate (HIBOR) fixings moved up by about
30 basis points to 2.32% and 2.74% (monthly
average term) respectively in December. Moving
into 2019, the Hong Kong dollar interbank
interest rates generally eased as seasonal demand
faded. The composite interest rate, which
measures the average Hong Kong dollar funding
costs of retail banks, increased from 0.62% at the
end of June 2018 to 0.83% at the end of January
2019. In view of the higher funding costs, retail
banks raised their Best Lending Rates by 12.5–
25.0 basis points after the rise in the target range
for the US Federal Funds Rate in late September.
The average lending rate for new mortgages
moved along with the Best Lending Rates to
around 2.45% at the end of January 2019.
Amid the uncertainties arising from the US-
China trade tensions and Brexit negotiations,
fund flow volatility may increase. In addition,
substantial negative spreads between the Hong
Kong dollar and the US dollar interest rates may
encourage carry trade activities, leading to capital
outflows. In such circumstances, the outflow
and possible triggering of the weak-side CU is a
natural process to be expected under the Linked
Exchange Rate System.
2 Based on the closing rate.
6 Half-YearlY MonetarY and financial StabilitY report MarcH 2019
7 7 Half-YearlY MonetarY and financial StabilitY report MarcH 2019
Summary and overview
The offshore (CNH) and onshore (CNY) renminbi
have experienced weakening pressure since early
2018, due to the fear of an escalation in trade
tensions between Mainland China and the US.
However, both stabilised in November amid
optimism surrounding news that high-level trade
talks between Mainland China and the US had
resumed. The lingering trade tensions have so
far not exerted significant impact on funding
conditions in the offshore interbank market. The
overnight CNH HIBOR mostly traded below 4%
and the three-month CNH HIBOR hovered
around 4%. Hong Kong’s CNH liquidity pool
expanded steadily during the second half, with
renminbi customer deposits picking up by 5.2%
in the second half of 2018. The average daily
turnover of the renminbi real time gross
settlement system continued to stay high,
picking up further to RMB1,010.1 billion in
2018. Despite concerns over the US-China trade
tensions, it is expected Hong Kong’s offshore
renminbi business will grow along with the
progress of Mainland’s capital account
liberalisation, the development of the Stock and
Bond Connect schemes, and increasing regional
economic co-operation under the Belt and Road
and Greater Bay Area Initiatives.
Asset markets
Over the past six months, the local equity market
has been on a roller coaster ride. The market fell
sharply at the beginning of the review period
amid continued monetary tightening in the US,
the considerable divide between the two sides in
the US-China trade negotiations, and increased
signs of weakness in the Mainland economy.
Subsequently, the Fed switched to a “patient”
monetary stance amid a weaker and more
uncertain economic outlook, while Mainland
China stepped up its efforts to reduce its bilateral
trade surplus with the US and open its markets to
foreign investors during the trade truce. Despite
the highly politicised US indictment against a
Mainland telecoms company, both sides showed
friendly gestures and demonstrated
determination to reach a deal. This set the
backdrop for the sharp rebound in local equities
at the beginning of 2019. Nonetheless,
uncertainty still looms large in the period ahead
as the two sides get into the details of the deal, if
any. This is especially so in the difficult high-
tech sphere with the impending US federal
indictment case complicating the scene.
The Hong Kong dollar debt market grew slightly
last year. Yields declined and performance
improved towards year-end amid increased
expectations of a more moderate pace of
monetary normalisation in the US. As a result,
the flow of bond funds reversed its direction and
registered a mild increase in the second half of
2018. Hong Kong’s offshore renminbi market
saw a considerable rebound in issuance, ending a
three-consecutive-year decline. However, total
issuance was still outsized by maturing debt, as
corporate deleveraging continued on the
Mainland. The prospects for the local debt
market in the year ahead will be challenging,
depending on the global economic outlook,
especially for the Mainland.
The residential property market moderated in the
second half of 2018 amid the US-China trade
tensions, global stock market corrections and
higher local prime rates. Housing transactions
dropped visibly and flat prices declined by 9.0%
from the peak in July through December.
However, housing affordability remained
stretched, with both the price-to-income ratio
and the income gearing ratio staying at high
levels. During the same period, the non-
residential property market showed tentative
signs of softening, as suggested by lower
transactions and some price consolidation.
In early 2019, secondary-market housing prices
stabilised somewhat, and overall transactions
picked up in part because more property
developers pushed out new launches, with more
attractive pricing than previously to lure buyers.
Summary and overview
A host of external and domestic factors make the
outlook for the housing market uncertain. On
the external front, the uncertainty over the
US-China trade tensions will continue to cloud
Hong Kong’s property market outlook, possibly
through changes in market sentiment, economic
prospects and financial conditions. On the
domestic front, economic growth is softening,
but employment conditions and income growth
have remained largely stable which could
provide some support for property demand. The
trajectory for domestic interest rates partly
hinges on the future path of the US policy rate,
which in itself is uncertain. Over the longer
term, the supply-demand gap is expected to
narrow given increased flat completions during
the past few years and the Government’s effort to
increase land and housing supply.
Banking sector performance
Notwithstanding an uncertain external
environment, retail banks registered higher
profits in the second half of 2018, with pre-tax
operating profits rising by 14.3% compared with
the same period in 2017. The increase in profits
was mainly due to a significant growth in net
interest income, which more than offset the
increase in impairment charges and operating
expenses. As a result, the return on assets rose to
1.23% in the second half of 2018 compared with
1.14% in the same period last year.
Banks’ capital positions, as measured by Basel III
standards, were structurally robust and
strengthened further in the review period. The
consolidated capital ratio of locally incorporated
authorized institutions (AIs) rose to 20.3% at the
end of December 2018. The countercyclical
capital buffer rate for Hong Kong has been set to
2.5% to enhance banks’ resilience to systemic
risk. The liquidity positions of AIs were generally
sound, as the average Liquidity Coverage Ratio of
category 1 institutions and the average Liquidity
Maintenance Ratio of category 2 institutions
increased to 167.6% and 54.3% respectively in
the fourth quarter of 2018. In addition, the
average Net Stable Funding Ratio of category 1
institutions and the average Core Funding Ratio
of category 2A institutions both stayed at levels
well above the statutory minimum.
Reflecting subdued credit demand amid the
lingering US-China trade conflict and weaker
global economic growth, the full-year loan
growth slowed notably to 4.4% in 2018 from
16.1% in 2017. On a half-yearly basis, total loans
and advances contracted slightly by 0.9% in the
second half of 2018, driven by a 3% drop in
loans for use outside Hong Kong, while growth
in domestic loans (comprising loans for use in
Hong Kong and trade financing) decelerated
notably to 0.1%. However, there were signs of
stabilisation in loan growth since November
2018. The asset quality of banks’ loan portfolios
remained healthy by historical standards.
To broaden our understanding of the credit risk
of Mainland-related lending by banks in Hong
Kong, Box 4 (see page 73) provides a macro
assessment of the credit risk for Mainland
corporates based on locally-listed non-financial
Mainland corporates that have borrowed
syndicated loans from banks in Hong Kong. By
assessing a broader set of key financial
characteristics of Mainland corporates, the
findings suggest that the Hong Kong banking
sector, at least for the syndicated loan portfolio,
is less exposed to riskier Mainland corporates.
However, in view of concerns over Mainland’s
growth outlook and the uncertainty surrounding
the US-China trade negotiations, banks should
remain alert to the credit risk management of
their Mainland-related exposure.
In the near term, the Hong Kong banking sector
will face multiple headwinds, including the
unresolved US-China trade tensions, weaker
global economic growth, uncertainty over the
pace of the US tightening cycle, and geopolitical
8 Half-YearlY MonetarY and financial StabilitY report MarcH 2019

9 9 Half-YearlY MonetarY and financial StabilitY report MarcH 2019
Summary and overview
risks. Should these uncertainties intensify and
persist into the longer term, these could
significantly dampen business confidence and
credit demand, thereby posing downward
pressure on banks’ profitability. In view of the
rising corporate leverage, banks should also
carefully assess how the possible deterioration in
the external environment could affect the credit
risk of their corporate exposure.
The Half-yearly Report on Monetary and Financial
Stability is prepared by the staff of the Research
Department of the Hong Kong Monetary
Authority.
Half-YearlY MonetarY and financial StabilitY report MarcH 2019
2. Global setting and outlook
During the review period, the global economy remained in expansion but growth momentum, especially outside the US, moderated amid a confluence of idiosyncratic and cyclical headwinds. In view of the less optimistic growth outlook, the Federal Reserve adjusted its stance on monetary policy, emphasising “data dependence” and the need for “patience” instead of providing forward guidance on further rate hikes. As the Federal Reserve becomes more data dependent, financial markets could become more sensitive to incoming data, and monetary policy could be perceived as more uncertain. At the same time, heightened global trade policy uncertainty and geopolitical risks will likely continue to cloud the world economic outlook.
In East Asia3, amid signs of a slowing US rate hike cycle and a levelling-off in the US dollar, financial markets have generally stabilised since late 2018. However, the region could face a broad-based slowdown given the deteriorating external environment, namely the unresolved trade conflict between the US and Mainland China and weakening growth in the advanced economies.
In Mainland China, growth momentum eased further in the second half of 2018 and growth outlook has become more uncertain amid the US-China trade conflict and financing difficulties that confront small firms. In response, policymakers adopted more targeted measures to stabilise the economy and to help private and small firms. Facing these challenges, policymakers will need to strike a delicate balance between continuing with the containment of systemic risks and supporting firms and the real economy.
2.1 External environment
The global economy continued to enjoy broad-
based expansion in the second half of 2018.
However, while the US economic performance
remained solid overall, some signs of moderation
emerged. There are also clear signs that growth
momentum outside the US is slowing down. A
number of country-specific shocks — including
natural disasters in Japan, the introduction of
new automobile emission standards in Germany,
a spike in Italy’s sovereign yields amid the fiscal
standoff with the European Union (EU) and the
outbreak of civil unrest in France — weighed on
economic activities in advanced economies (AEs)
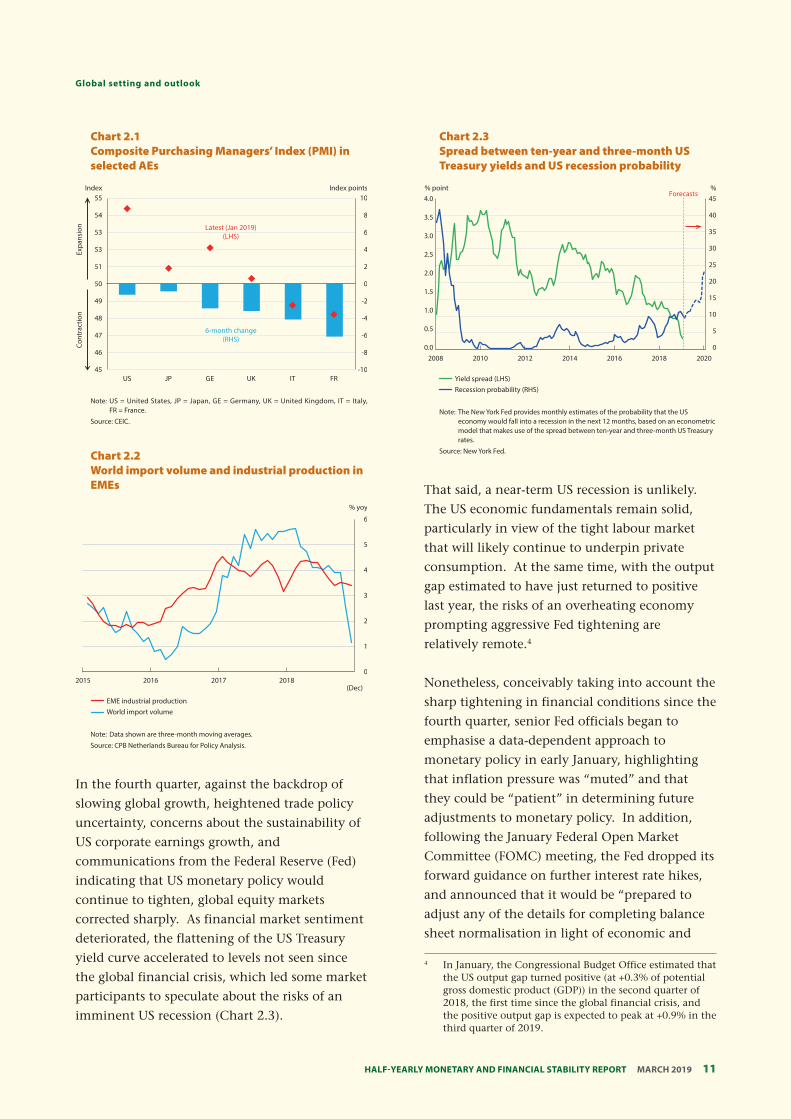
(Chart 2.1). In addition, a cyclical moderation in
world import growth has posed headwinds to
industrial production in emerging market
economies (EMEs) (Chart 2.2). The slump in oil
prices during the fourth quarter also presented
fresh challenges to commodity-exporting EMEs.
In view of the softer growth momentum in the
second half of 2018, the International Monetary
Fund revised downward its 2019 global growth
forecasts in January, by 0.2 percentage points to
3.5%.
In this chapter, East Asia refers to a group of seven economies; they are Indonesia, Malaysia, the Philippines, Singapore, South Korea, Taiwan and Thailand.
3
10
11 Half-YearlY MonetarY and financial StabilitY report MarcH 2019
Global setting and outlook
Chart 2.1 Composite Purchasing Managers’ Index (PMI) in selected AEs
10
8
6
4
2
0
-2
-4
-6
-8
-10
55
54
53
53
51
50
49
48
47
46
45
Index Index points
Expa
nsio
nCo
ntra
ctio
n
US JP GE UK IT FR
Latest (Jan 2019)(LHS)
6-month change(RHS)
Note: US = United States, JP = Japan, GE = Germany, UK = United Kingdom, IT = Italy, FR = France.
Source: CEIC.
Chart 2.3 Spread between ten-year and three-month US Treasury yields and US recession probability
2008 2010 2012 2014 2016 2018 20200.0
0.5
1.0
1.5
2.0
2.5
3.0
3.5
4.0
0
5
10
15
20
25
30
35
40
45% point %
Yield spread (LHS)Recession probability (RHS)
Forecasts
Note: The New York Fed provides monthly estimates of the probability that the US economy would fall into a recession in the next 12 months, based on an econometric model that makes use of the spread between ten-year and three-month US Treasury rates.
Source: New York Fed. Chart 2.2 World import volume and industrial production in EMEs
1
0
2
3
4
5
6
2015 2016 2017 2018(Dec)
% yoy
EME industrial productionWorld import volume
Note: Data shown are three-month moving averages.
Source: CPB Netherlands Bureau for Policy Analysis.
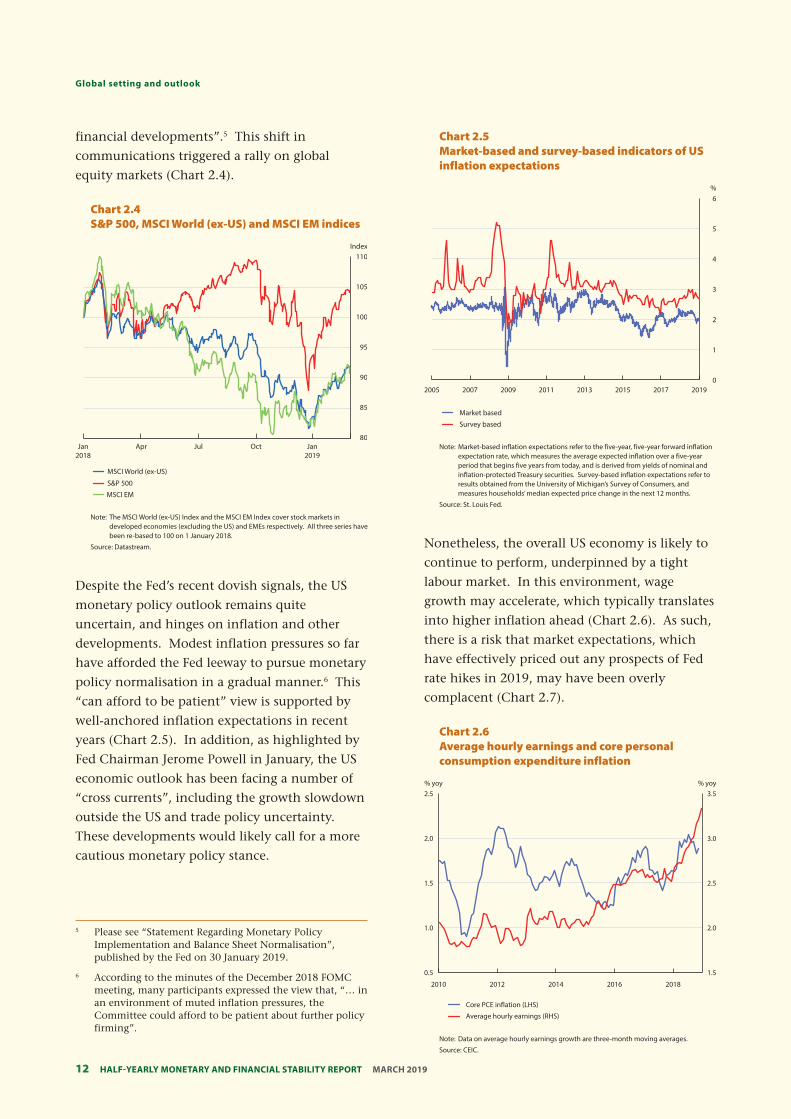
In the fourth quarter, against the backdrop of
slowing global growth, heightened trade policy
uncertainty, concerns about the sustainability of
US corporate earnings growth, and
communications from the Federal Reserve (Fed)
indicating that US monetary policy would
continue to tighten, global equity markets
corrected sharply. As financial market sentiment
deteriorated, the flattening of the US Treasury
yield curve accelerated to levels not seen since
the global financial crisis, which led some market
participants to speculate about the risks of an
imminent US recession (Chart 2.3).
That said, a near-term US recession is unlikely.
The US economic fundamentals remain solid,
particularly in view of the tight labour market
that will likely continue to underpin private
consumption. At the same time, with the output
gap estimated to have just returned to positive
last year, the risks of an overheating economy
prompting aggressive Fed tightening are
relatively remote.4
Nonetheless, conceivably taking into account the
sharp tightening in financial conditions since the
fourth quarter, senior Fed officials began to
emphasise a data-dependent approach to
monetary policy in early January, highlighting
that inflation pressure was “muted” and that
they could be “patient” in determining future
adjustments to monetary policy. In addition,
following the January Federal Open Market
Committee (FOMC) meeting, the Fed dropped its
forward guidance on further interest rate hikes,
and announced that it would be “prepared to
adjust any of the details for completing balance
sheet normalisation in light of economic and
4 In January, the Congressional Budget Office estimated that the US output gap turned positive (at +0.3% of potential gross domestic product (GDP)) in the second quarter of 2018, the first time since the global financial crisis, and the positive output gap is expected to peak at +0.9% in the third quarter of 2019.
Half-YearlY MonetarY and financial StabilitY report MarcH 201912
Global setting and outlook
financial developments”.5 This shift in
communications triggered a rally on global
equity markets (Chart 2.4).
Chart 2.4 S&P 500, MSCI World (ex-US) and MSCI EM indices
80
85
90
95
100
105
110
MSCI World (ex-US)
MSCI EM
S&P 500
Index
Jan2018
Apr Jul Oct Jan2019
Note: The MSCI World (ex-US) Index and the MSCI EM Index cover stock markets in developed economies (excluding the US) and EMEs respectively. All three series have been re-based to 100 on 1 January 2018.
Source: Datastream.
Despite the Fed’s recent dovish signals, the US
monetary policy outlook remains quite
uncertain, and hinges on inflation and other
developments. Modest inflation pressures so far
have afforded the Fed leeway to pursue monetary
policy normalisation in a gradual manner.6 This
“can afford to be patient” view is supported by
well-anchored inflation expectations in recent
years (Chart 2.5). In addition, as highlighted by
Fed Chairman Jerome Powell in January, the US
economic outlook has been facing a number of
“cross currents”, including the growth slowdown
outside the US and trade policy uncertainty.
These developments would likely call for a more
cautious monetary policy stance.
Chart 2.5 Market-based and survey-based indicators of US inflation expectations
5
6
0
1
2
3
4
2005 2007 2009 2011 2013 2015 2017 2019
%
Survey based
Market based
Note: Market-based inflation expectations refer to the five-year, five-year forward inflation expectation rate, which measures the average expected inflation over a five-year period that begins five years from today, and is derived from yields of nominal and inflation-protected Treasury securities. Survey-based inflation expectations refer to results obtained from the University of Michigan’s Survey of Consumers, and measures households’ median expected price change in the next 12 months.
Source: St. Louis Fed.
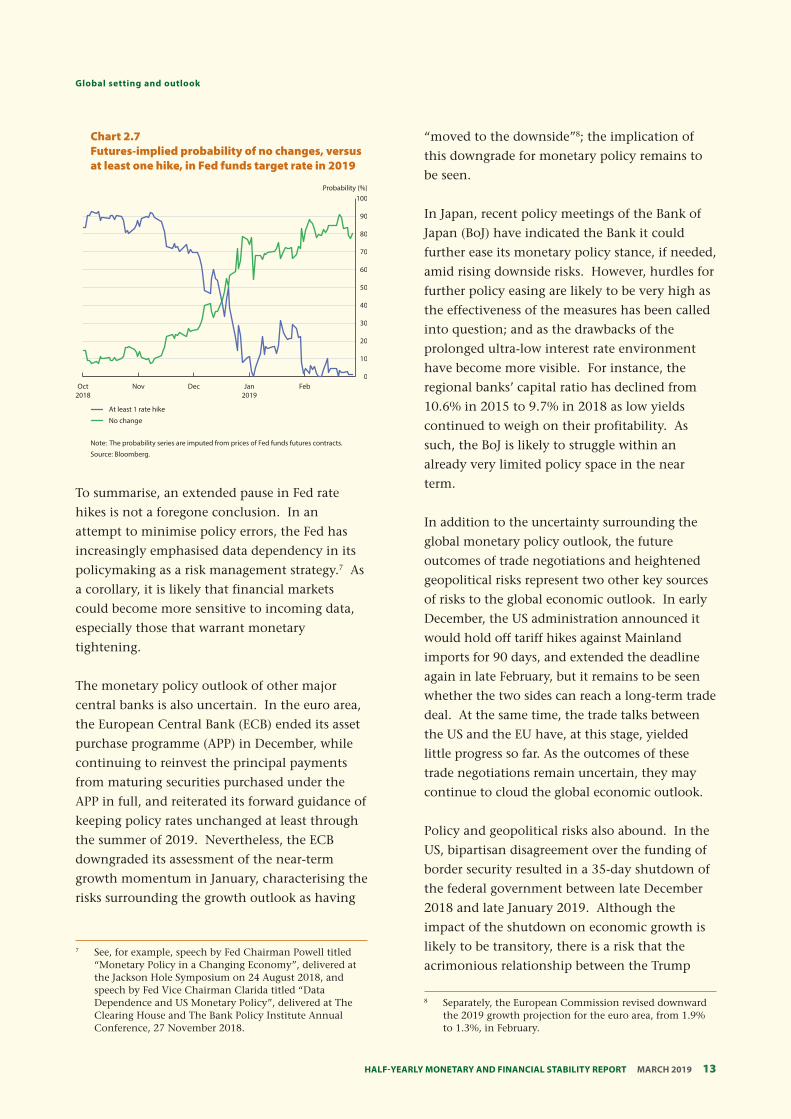
Nonetheless, the overall US economy is likely to
continue to perform, underpinned by a tight
labour market. In this environment, wage
growth may accelerate, which typically translates
into higher inflation ahead (Chart 2.6). As such,
there is a risk that market expectations, which
have effectively priced out any prospects of Fed
rate hikes in 2019, may have been overly
complacent (Chart 2.7).
Chart 2.6 Average hourly earnings and core personal consumption expenditure inflation
1.5
2010 2012 2014 2016 2018
2.0
2.5
3.0
3.5
0.5
1.0
1.5
2.0
2.5% yoy% yoy
Core PCE inflation (LHS)
Average hourly earnings (RHS)
Note: Data on average hourly earnings growth are three-month moving averages.
Source: CEIC.
5 Please see “Statement Regarding Monetary Policy Implementation and Balance Sheet Normalisation”, published by the Fed on 30 January 2019.
6 According to the minutes of the December 2018 FOMC meeting, many participants expressed the view that, “… in an environment of muted inflation pressures, the Committee could afford to be patient about further policy firming”.
13 Half-YearlY MonetarY and financial StabilitY report MarcH 2019
Global setting and outlook
Chart 2.7 Futures-implied probability of no changes, versus at least one hike, in Fed funds target rate in 2019
0
10
20
30
40
50
60
70
80
90
100
No change
At least 1 rate hike
Probability (%)
Oct2018
Nov Dec Jan2019
Feb
Note: The probability series are imputed from prices of Fed funds futures contracts.
Source: Bloomberg.
To summarise, an extended pause in Fed rate
hikes is not a foregone conclusion. In an
attempt to minimise policy errors, the Fed has
increasingly emphasised data dependency in its
policymaking as a risk management strategy.7 As
a corollary, it is likely that financial markets
could become more sensitive to incoming data,
especially those that warrant monetary
tightening.
The monetary policy outlook of other major
central banks is also uncertain. In the euro area,
the European Central Bank (ECB) ended its asset
purchase programme (APP) in December, while
continuing to reinvest the principal payments
from maturing securities purchased under the
APP in full, and reiterated its forward guidance of
keeping policy rates unchanged at least through
the summer of 2019. Nevertheless, the ECB
downgraded its assessment of the near-term
growth momentum in January, characterising the
risks surrounding the growth outlook as having
7 See, for example, speech by Fed Chairman Powell titled “Monetary Policy in a Changing Economy”, delivered at the Jackson Hole Symposium on 24 August 2018, and speech by Fed Vice Chairman Clarida titled “Data Dependence and US Monetary Policy”, delivered at The Clearing House and The Bank Policy Institute Annual Conference, 27 November 2018.
“moved to the downside”8; the implication of
this downgrade for monetary policy remains to
be seen.
In Japan, recent policy meetings of the Bank of
Japan (BoJ) have indicated the Bank it could
further ease its monetary policy stance, if needed,
amid rising downside risks. However, hurdles for
further policy easing are likely to be very high as
the effectiveness of the measures has been called
into question; and as the drawbacks of the
prolonged ultra-low interest rate environment
have become more visible. For instance, the
regional banks’ capital ratio has declined from
10.6% in 2015 to 9.7% in 2018 as low yields
continued to weigh on their profitability. As
such, the BoJ is likely to struggle within an
already very limited policy space in the near
term.
In addition to the uncertainty surrounding the
global monetary policy outlook, the future
outcomes of trade negotiations and heightened
geopolitical risks represent two other key sources
of risks to the global economic outlook. In early
December, the US administration announced it
would hold off tariff hikes against Mainland
imports for 90 days, and extended the deadline
again in late February, but it remains to be seen
whether the two sides can reach a long-term trade
deal. At the same time, the trade talks between
the US and the EU have, at this stage, yielded
little progress so far. As the outcomes of these
trade negotiations remain uncertain, they may
continue to cloud the global economic outlook.
Policy and geopolitical risks also abound. In the
US, bipartisan disagreement over the funding of
border security resulted in a 35-day shutdown of
the federal government between late December
2018 and late January 2019. Although the
impact of the shutdown on economic growth is
likely to be transitory, there is a risk that the
acrimonious relationship between the Trump
8 Separately, the European Commission revised downward the 2019 growth projection for the euro area, from 1.9% to 1.3%, in February.
Half-YearlY MonetarY and financial StabilitY report MarcH 201914
Global setting and outlook
administration and the House controlled by the
Democratic Party could lead to more policy
gridlock ahead. In the UK, the risks associated
with Brexit and its spillover effects increased after
the overwhelming defeat of the May
administration’s Brexit proposal in mid-January,
and it remains to be seen whether last-minute
solutions to prevent a disruptive “hard” Brexit
can be found. Elsewhere, geopolitical tensions in
the Middle East, such as the US’s renewed
sanctions on Iran, may also pose uncertainty to
oil prices that could affect the global growth
outlook.
In East Asia, financial markets generally stabilised
in the fourth quarter of 2018 after experiencing
bouts of market volatility in the first three
quarters. The levelling-off in the US dollar since
October and signs that the Fed may be patient
with further rate hikes have alleviated the
depreciation and capital outflow pressures faced
by East Asian economies. Many regional
currencies strengthened slightly against the
US dollar in the fourth quarter, while portfolio
inflows resumed (Chart 2.8).
Chart 2.8 East Asia: Currency index and capital flows
Currency index Portfolio flows(%) (USD bn)
10.1
1.6
-6.3
-8.3
Apr. 2018-Sep. 2018
Oct. 2018-Feb. 2019
Note: Currency index is Bloomberg JPM Asia dollar index (ADXY).
Sources: CEIC, EPFR and HKMA staff calculations.
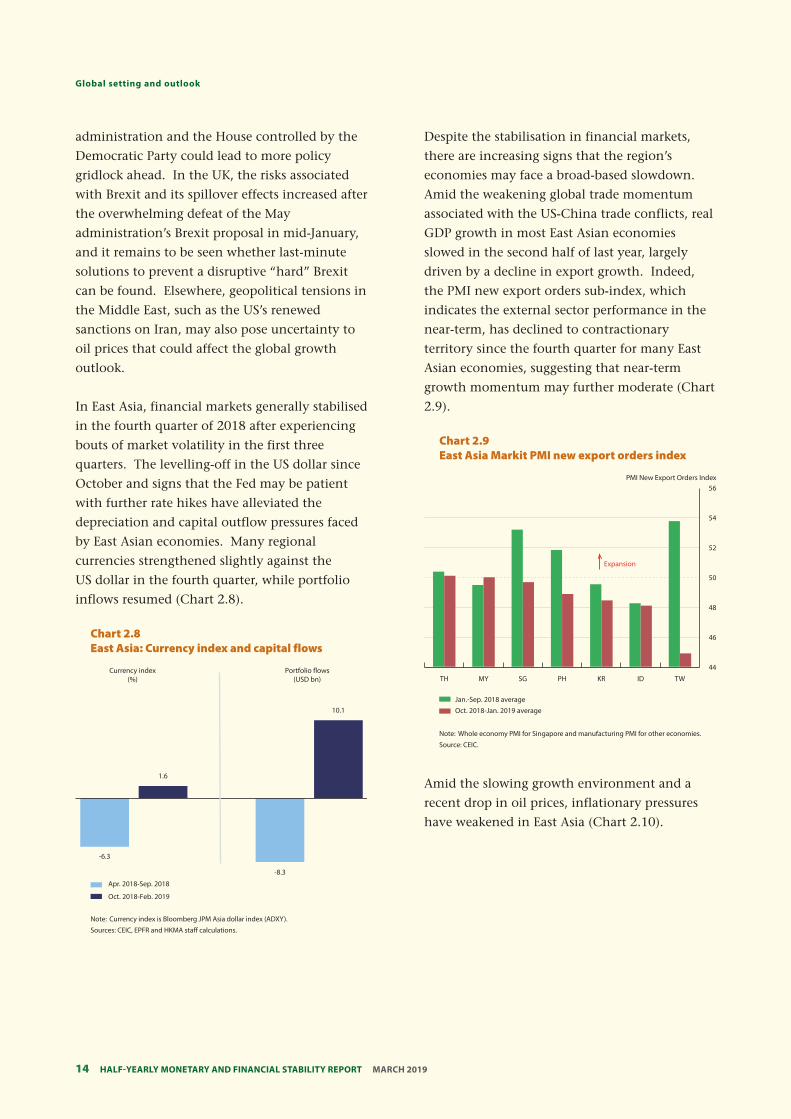
Despite the stabilisation in financial markets,
there are increasing signs that the region’s
economies may face a broad-based slowdown.
Amid the weakening global trade momentum
associated with the US-China trade conflicts, real
GDP growth in most East Asian economies
slowed in the second half of last year, largely
driven by a decline in export growth. Indeed,
the PMI new export orders sub-index, which
indicates the external sector performance in the
near-term, has declined to contractionary
territory since the fourth quarter for many East
Asian economies, suggesting that near-term
growth momentum may further moderate (Chart
2.9).
Chart 2.9 East Asia Markit PMI new export orders index
56
54
52
50
48
46
44
TH MY SG PH KR ID TW
PMI New Export Orders Index
Jan.-Sep. 2018 average Oct. 2018-Jan. 2019 average
Expansion
Note: Whole economy PMI for Singapore and manufacturing PMI for other economies.
Source: CEIC.
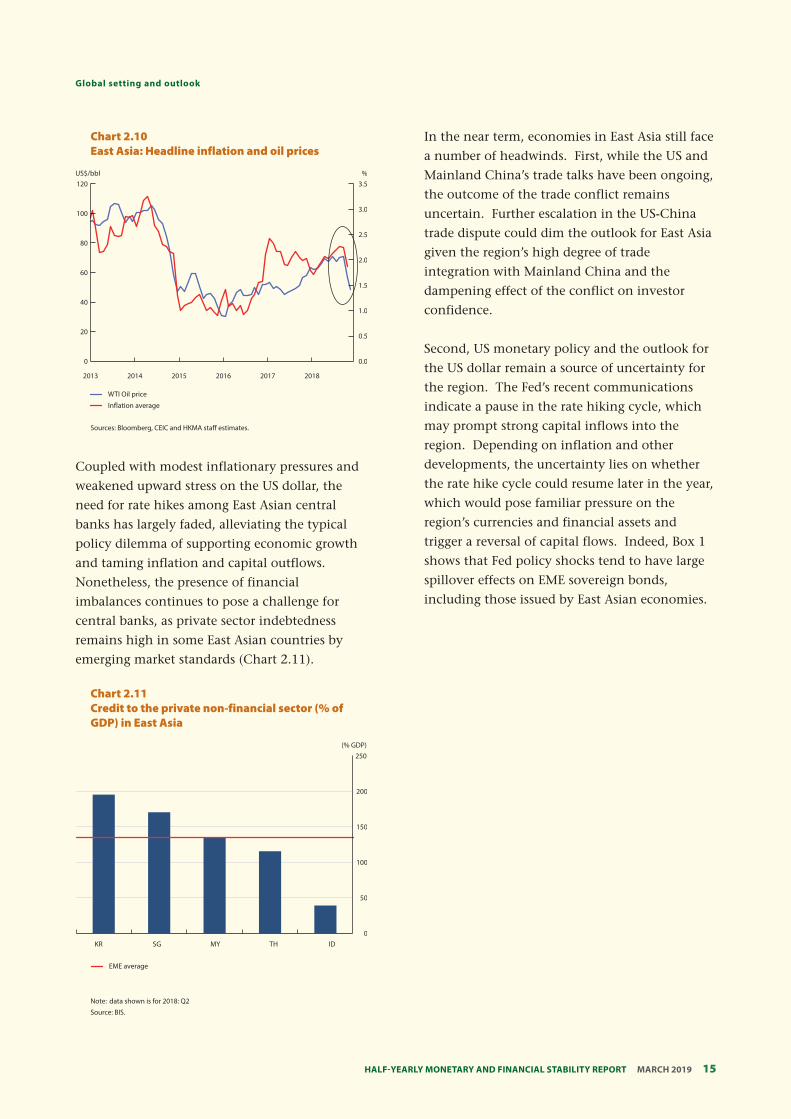
Amid the slowing growth environment and a
recent drop in oil prices, inflationary pressures
have weakened in East Asia (Chart 2.10).
15 Half-YearlY MonetarY and financial StabilitY report MarcH 2019
Global setting and outlook
Chart 2.10 East Asia: Headline inflation and oil prices
0.0
0.5
2013 2014 2015 2016 2017 2018
1.0
1.5
2.0
2.5
3.0
3.5
0
20
40
60
80
100
120%
Inflation average
WTI Oil price
US$/bbl
Sources: Bloomberg, CEIC and HKMA staff estimates.
Coupled with modest inflationary pressures and
weakened upward stress on the US dollar, the
need for rate hikes among East Asian central
banks has largely faded, alleviating the typical
policy dilemma of supporting economic growth
and taming inflation and capital outflows.
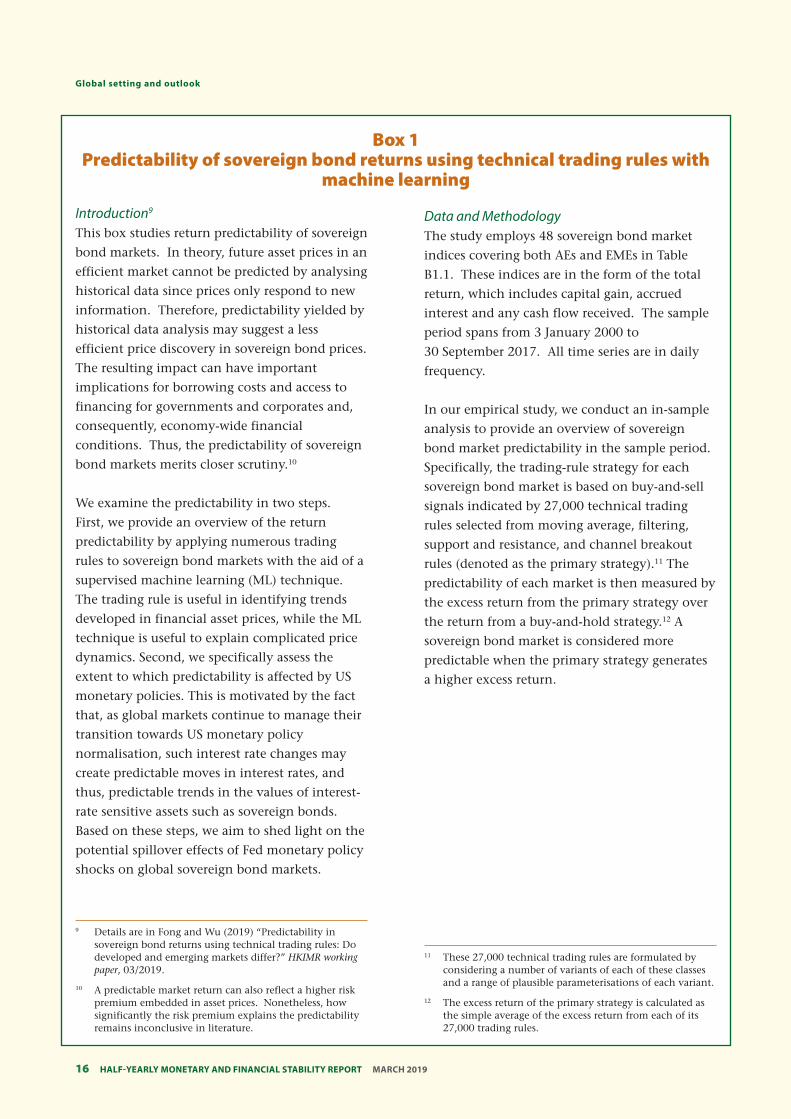
Nonetheless, the presence of financial
imbalances continues to pose a challenge for
central banks, as private sector indebtedness
remains high in some East Asian countries by
emerging market standards (Chart 2.11).
Chart 2.11 Credit to the private non-financial sector (% of GDP) in East Asia
0
50
100
150
200
250(% GDP)
EME average
KR SG MY TH ID
Note: data shown is for 2018: Q2
Source: BIS.
In the near term, economies in East Asia still face
a number of headwinds. First, while the US and
Mainland China’s trade talks have been ongoing,
the outcome of the trade conflict remains
uncertain. Further escalation in the US-China
trade dispute could dim the outlook for East Asia
given the region’s high degree of trade
integration with Mainland China and the
dampening effect of the conflict on investor
confidence.
Second, US monetary policy and the outlook for
the US dollar remain a source of uncertainty for
the region. The Fed’s recent communications
indicate a pause in the rate hiking cycle, which
may prompt strong capital inflows into the
region. Depending on inflation and other
developments, the uncertainty lies on whether
the rate hike cycle could resume later in the year,
which would pose familiar pressure on the
region’s currencies and financial assets and
trigger a reversal of capital flows. Indeed, Box 1
shows that Fed policy shocks tend to have large
spillover effects on EME sovereign bonds,
including those issued by East Asian economies.
Half-YearlY MonetarY and financial StabilitY report MarcH 201916
Global setting and outlook
Box 1 Predictability of sovereign bond returns using technical trading rules with
machine learning
Introduction9
This box studies return predictability of sovereign
bond markets. In theory, future asset prices in an
efficient market cannot be predicted by analysing
historical data since prices only respond to new
information. Therefore, predictability yielded by
historical data analysis may suggest a less
efficient price discovery in sovereign bond prices.
The resulting impact can have important
implications for borrowing costs and access to
financing for governments and corporates and,
consequently, economy-wide financial
conditions. Thus, the predictability of sovereign
bond markets merits closer scrutiny.10
We examine the predictability in two steps.
First, we provide an overview of the return
predictability by applying numerous trading
rules to sovereign bond markets with the aid of a
supervised machine learning (ML) technique.
The trading rule is useful in identifying trends
developed in financial asset prices, while the ML
technique is useful to explain complicated price
dynamics. Second, we specifically assess the
extent to which predictability is affected by US
monetary policies. This is motivated by the fact
that, as global markets continue to manage their
transition towards US monetary policy
normalisation, such interest rate changes may
create predictable moves in interest rates, and
thus, predictable trends in the values of interest-
rate sensitive assets such as sovereign bonds.
Based on these steps, we aim to shed light on the
potential spillover effects of Fed monetary policy
shocks on global sovereign bond markets.
Data and Methodology The study employs 48 sovereign bond market
indices covering both AEs and EMEs in Table
B1.1. These indices are in the form of the total
return, which includes capital gain, accrued
interest and any cash flow received. The sample
period spans from 3 January 2000 to
30 September 2017. All time series are in daily
frequency.
In our empirical study, we conduct an in-sample
analysis to provide an overview of sovereign
bond market predictability in the sample period.
Specifically, the trading-rule strategy for each
sovereign bond market is based on buy-and-sell
signals indicated by 27,000 technical trading
rules selected from moving average, filtering,
support and resistance, and channel breakout
rules (denoted as the primary strategy).11 The
predictability of each market is then measured by
the excess return from the primary strategy over
the return from a buy-and-hold strategy.12 A
sovereign bond market is considered more
predictable when the primary strategy generates
a higher excess return.
9 Details are in Fong and Wu (2019) “Predictability in sovereign bond returns using technical trading rules: Do developed and emerging markets differ?” HKIMR working paper, 03/2019.
10 A predictable market return can also reflect a higher risk premium embedded in asset prices. Nonetheless, how significantly the risk premium explains the predictability remains inconclusive in literature.
11 These 27,000 technical trading rules are formulated by considering a number of variants of each of these classes and a range of plausible parameterisations of each variant.
12 The excess return of the primary strategy is calculated as the simple average of the excess return from each of its 27,000 trading rules.
17 Half-YearlY MonetarY and financial StabilitY report MarcH 2019
Global setting and outlook
Table B1.1: Sovereign bond market by market groups
Chart B1.1: Overview of the machine learning algorithm
Training stage (1st stage)
Validation stage (2nd stage)
Testing stage (3rd stage)
2000 – 2015 data
Learn the historical pattern of the trading rules’ performance under tranquil, crisis, and post-crisis conditions
2016 data
Optimise the primary strategy by identifying the market condition that maximises the excess return
2017 data
Out-of-sample performance test of the optimised strategy
Market group Economies
Advanced economies (AEs) Australia, Austria, Belgium, Canada, Denmark, Finland, France, Germany, Hong Kong, Iceland, Ireland, Italy, Japan, Luxembourg, the Netherlands, New Zealand, Norway, Portugal, Singapore, Spain, Sweden, Switzerland, UK, US
Emerging Asia Mainland China, India, Indonesia, South Korea, Malaysia, the Philippines, Taiwan, Thailand
Other emerging market economies (other EMEs)
Brazil, Chile, Czech Republic, Egypt, Greece, Hungary, Mexico, Morocco, Nigeria, Peru, Poland, Russia, Slovakia, Slovenia, South Africa, Turkey
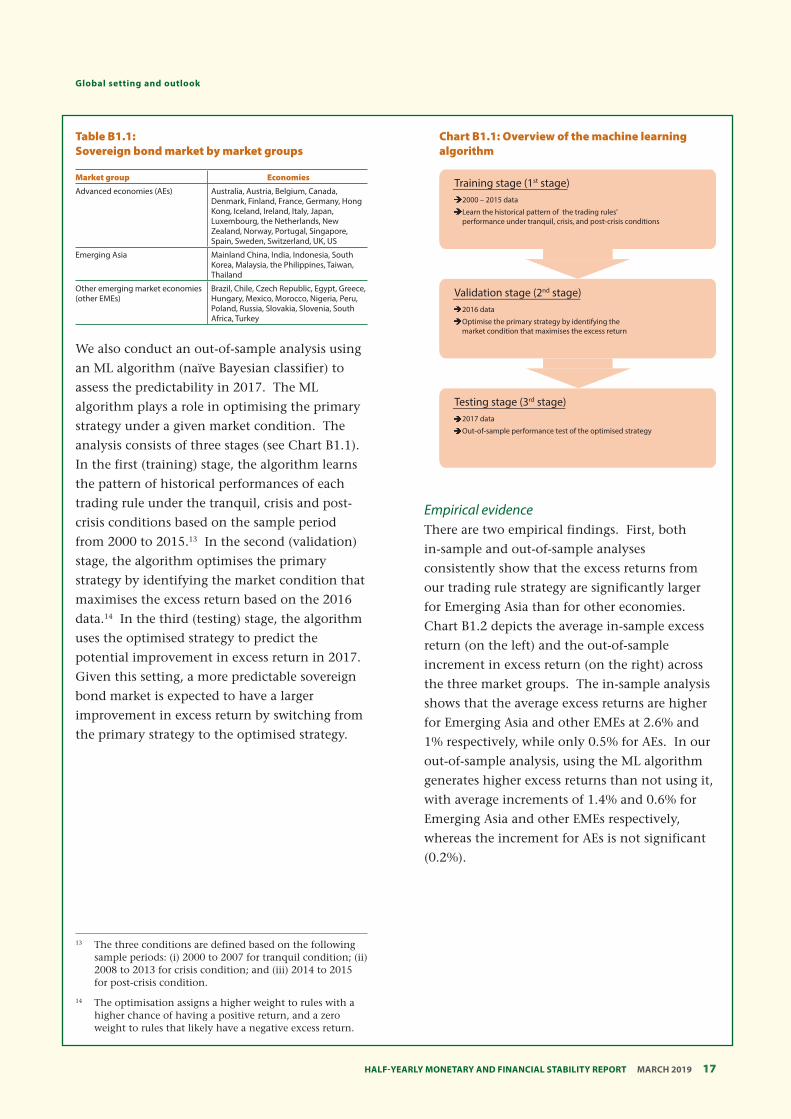
We also conduct an out-of-sample analysis using
an ML algorithm (naïve Bayesian classifier) to
assess the predictability in 2017. The ML
algorithm plays a role in optimising the primary
strategy under a given market condition. The
analysis consists of three stages (see Chart B1.1).
In the first (training) stage, the algorithm learns
the pattern of historical performances of each
trading rule under the tranquil, crisis and post-
crisis conditions based on the sample period
from 2000 to 2015.13 In the second (validation)
stage, the algorithm optimises the primary
strategy by identifying the market condition that
maximises the excess return based on the 2016
data.14 In the third (testing) stage, the algorithm
uses the optimised strategy to predict the
potential improvement in excess return in 2017.
Given this setting, a more predictable sovereign
bond market is expected to have a larger
improvement in excess return by switching from
the primary strategy to the optimised strategy.
13 The three conditions are defined based on the following sample periods: (i) 2000 to 2007 for tranquil condition; (ii) 2008 to 2013 for crisis condition; and (iii) 2014 to 2015 for post-crisis condition.
14 The optimisation assigns a higher weight to rules with a higher chance of having a positive return, and a zero weight to rules that likely have a negative excess return.
Empirical evidence There are two empirical findings. First, both
in-sample and out-of-sample analyses
consistently show that the excess returns from
our trading rule strategy are significantly larger
for Emerging Asia than for other economies.
Chart B1.2 depicts the average in-sample excess
return (on the left) and the out-of-sample
increment in excess return (on the right) across
the three market groups. The in-sample analysis
shows that the average excess returns are higher
for Emerging Asia and other EMEs at 2.6% and
1% respectively, while only 0.5% for AEs. In our
out-of-sample analysis, using the ML algorithm
generates higher excess returns than not using it,
with average increments of 1.4% and 0.6% for
Emerging Asia and other EMEs respectively,
whereas the increment for AEs is not significant
(0.2%).
Half-YearlY MonetarY and financial StabilitY report MarcH 201918
Global setting and outlook
Chart B1.2: Average excess returns of our trading-rule strategies by market group
2.6***
1.0***
0.5***
1.4**
0.6*
0.2
0
0.5
1
1.5
2
2.5
3
In-sample analysis Out-of-sample analysis
EmergingAsia
Other EMEs AEsEmergingAsia
Other EMEs AEs
Annualised %
Notes:
(1) In-sample excess returns by the primary strategy, based on full sample data from January 2000 to September 2017;
(2) Out-of-sample increment in excess returns by the optimised strategy, based on 2017 data;
(3) ***, ** and * denote statistical significance at 1, 5 and 10% respectively.
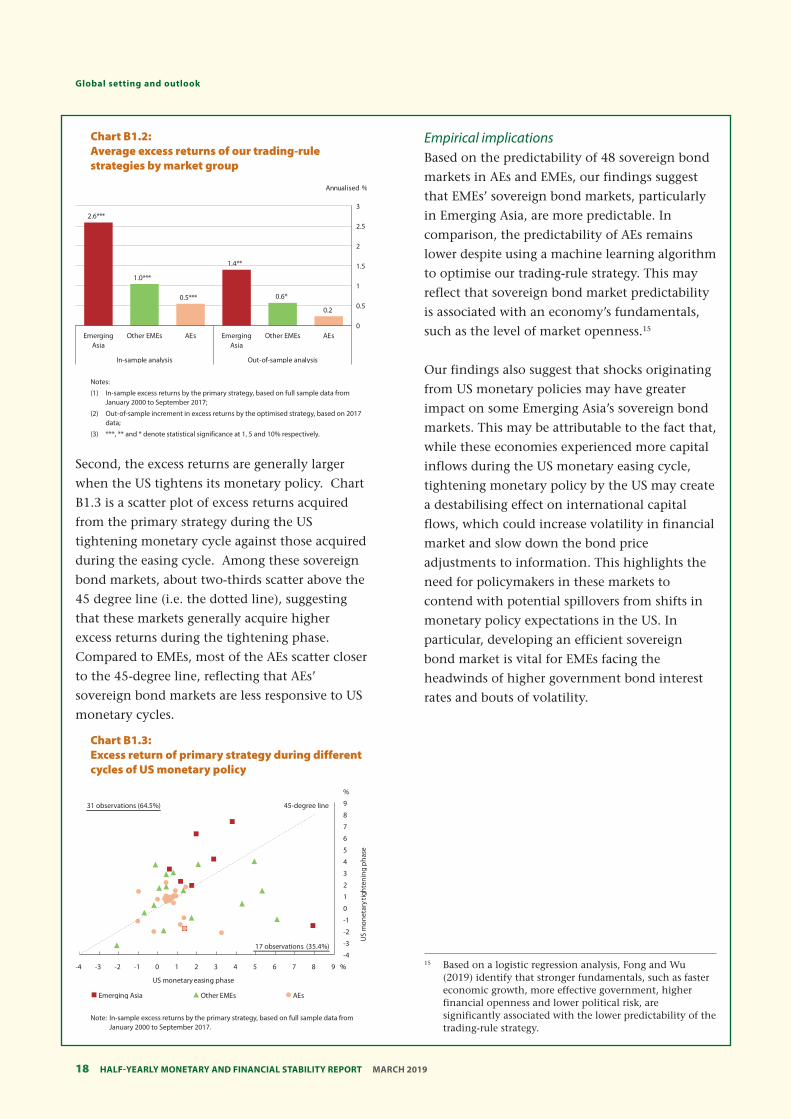
Second, the excess returns are generally larger
when the US tightens its monetary policy. Chart
B1.3 is a scatter plot of excess returns acquired
from the primary strategy during the US
tightening monetary cycle against those acquired
during the easing cycle. Among these sovereign
bond markets, about two-thirds scatter above the
45 degree line (i.e. the dotted line), suggesting
that these markets generally acquire higher
excess returns during the tightening phase.
Compared to EMEs, most of the AEs scatter closer
to the 45-degree line, reflecting that AEs’
sovereign bond markets are less responsive to US
monetary cycles.
Chart B1.3: Excess return of primary strategy during different cycles of US monetary policy
-4
-3
-2
-1
0
1
2
3
4
5
6
7
8
9
-4 -3 -2 -1 0 1 2 3 4 5 6 7 8 9 %
%
45-degree line31 observations (64.5%)
17 observations (35.4%)
US
mon
etar
y tig
hten
ing
phas
e
US monetary easing phase
Other EMEs AEsEmerging Asia
Note: In-sample excess returns by the primary strategy, based on full sample data from January 2000 to September 2017.
Empirical implications Based on the predictability of 48 sovereign bond
markets in AEs and EMEs, our findings suggest
that EMEs’ sovereign bond markets, particularly
in Emerging Asia, are more predictable. In
comparison, the predictability of AEs remains
lower despite using a machine learning algorithm
to optimise our trading-rule strategy. This may
reflect that sovereign bond market predictability
is associated with an economy’s fundamentals,
such as the level of market openness.15
Our findings also suggest that shocks originating
from US monetary policies may have greater
impact on some Emerging Asia’s sovereign bond
markets. This may be attributable to the fact that,
while these economies experienced more capital
inflows during the US monetary easing cycle,
tightening monetary policy by the US may create
a destabilising effect on international capital
flows, which could increase volatility in financial
market and slow down the bond price
adjustments to information. This highlights the
need for policymakers in these markets to
contend with potential spillovers from shifts in
monetary policy expectations in the US. In
particular, developing an efficient sovereign
bond market is vital for EMEs facing the
headwinds of higher government bond interest
rates and bouts of volatility.
15 Based on a logistic regression analysis, Fong and Wu (2019) identify that stronger fundamentals, such as faster economic growth, more effective government, higher financial openness and lower political risk, are significantly associated with the lower predictability of the trading-rule strategy.
19 Half-YearlY MonetarY and financial StabilitY report MarcH 2019
Global setting and outlook
2.2 Mainland China
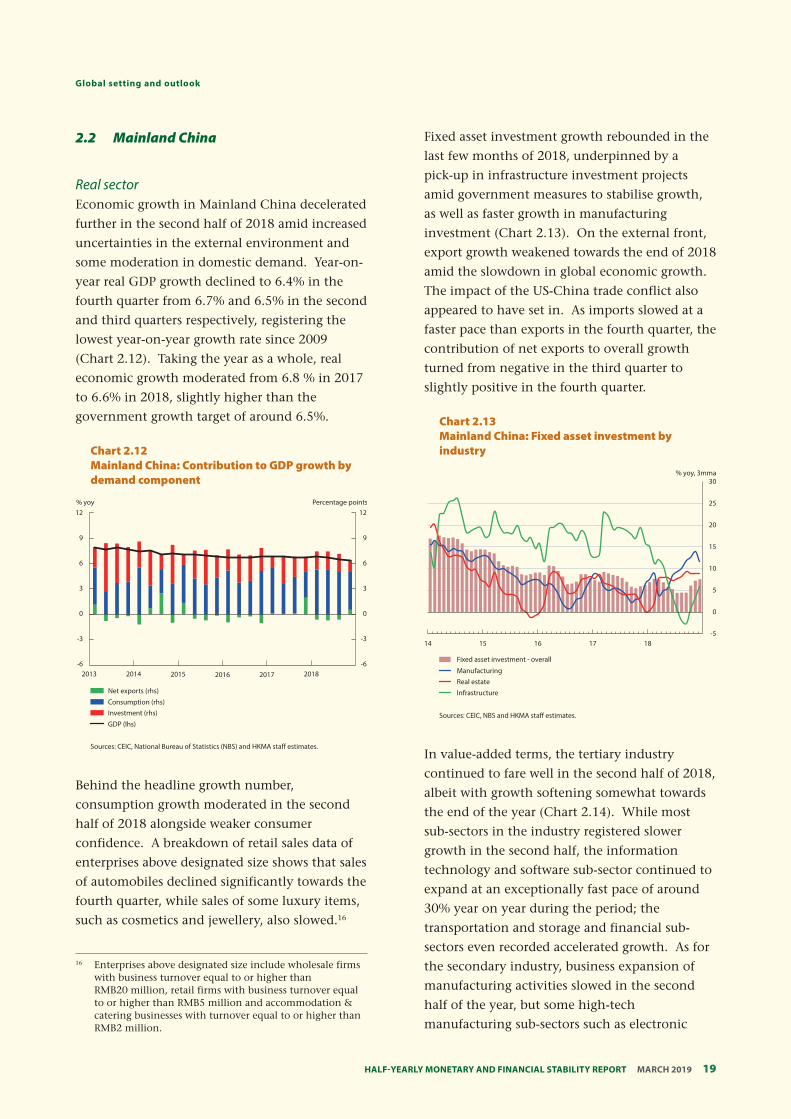
Real sector Economic growth in Mainland China decelerated
further in the second half of 2018 amid increased
uncertainties in the external environment and
some moderation in domestic demand. Year-on-
year real GDP growth declined to 6.4% in the
fourth quarter from 6.7% and 6.5% in the second
and third quarters respectively, registering the
lowest year-on-year growth rate since 2009
(Chart 2.12). Taking the year as a whole, real
economic growth moderated from 6.8 % in 2017
to 6.6% in 2018, slightly higher than the
government growth target of around 6.5%.
Chart 2.12 Mainland China: Contribution to GDP growth by demand component
-6
-3
0
3
6
9
12
-6
-3
0
3
6
9
12
2013 2014 2015 2016 2017 2018
Percentage points% yoy
Net exports (rhs)
Consumption (rhs)Investment (rhs)
GDP (lhs)
Sources: CEIC, National Bureau of Statistics (NBS) and HKMA staff estimates.
Behind the headline growth number,
consumption growth moderated in the second
half of 2018 alongside weaker consumer
confidence. A breakdown of retail sales data of
enterprises above designated size shows that sales
of automobiles declined significantly towards the
fourth quarter, while sales of some luxury items,
such as cosmetics and jewellery, also slowed.16
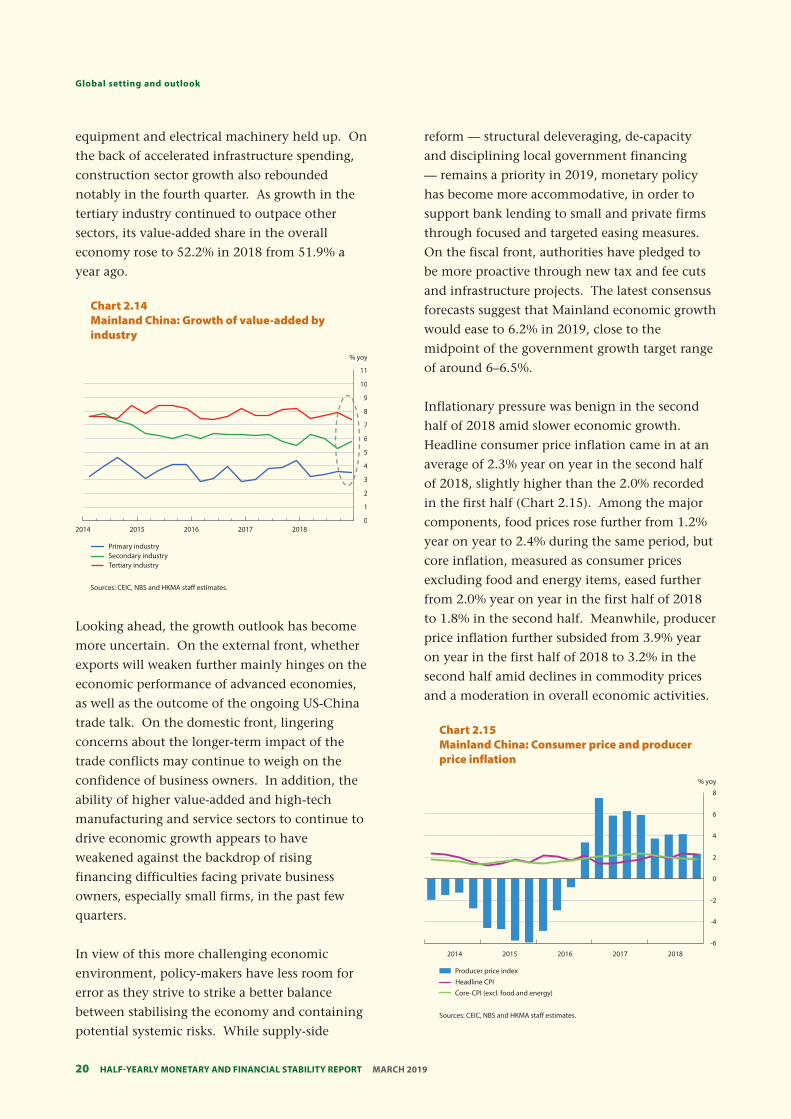
Fixed asset investment growth rebounded in the
last few months of 2018, underpinned by a
pick-up in infrastructure investment projects
amid government measures to stabilise growth,
as well as faster growth in manufacturing
investment (Chart 2.13). On the external front,
export growth weakened towards the end of 2018
amid the slowdown in global economic growth.
The impact of the US-China trade conflict also
appeared to have set in. As imports slowed at a
faster pace than exports in the fourth quarter, the
contribution of net exports to overall growth
turned from negative in the third quarter to
slightly positive in the fourth quarter.
Chart 2.13 Mainland China: Fixed asset investment by industry
-5
0
5
10
15
20
25
30
14 15 16 17 18
% yoy, 3mma
Fixed asset investment - overall
Manufacturing
Real estate
Infrastructure
Sources: CEIC, NBS and HKMA staff estimates.
In value-added terms, the tertiary industry
continued to fare well in the second half of 2018,
albeit with growth softening somewhat towards
the end of the year (Chart 2.14). While most
sub-sectors in the industry registered slower
growth in the second half, the information
technology and software sub-sector continued to
expand at an exceptionally fast pace of around
30% year on year during the period; the
transportation and storage and financial sub-
sectors even recorded accelerated growth. As for
the secondary industry, business expansion of
manufacturing activities slowed in the second
half of the year, but some high-tech
manufacturing sub-sectors such as electronic
16 Enterprises above designated size include wholesale firms with business turnover equal to or higher than RMB20 million, retail firms with business turnover equal to or higher than RMB5 million and accommodation & catering businesses with turnover equal to or higher than RMB2 million.
Half-YearlY MonetarY and financial StabilitY report MarcH 201920
Global setting and outlook
equipment and electrical machinery held up. On
the back of accelerated infrastructure spending,
construction sector growth also rebounded
notably in the fourth quarter. As growth in the
tertiary industry continued to outpace other
sectors, its value-added share in the overall
economy rose to 52.2% in 2018 from 51.9% a
year ago.
Chart 2.14 Mainland China: Growth of value-added by industry
0
1
2
3
4
5
6
7
8
9
10
11
2014 2015 2016 2017 2018
Primary industrySecondary industryTertiary industry
% yoy
Sources: CEIC, NBS and HKMA staff estimates.
Looking ahead, the growth outlook has become
more uncertain. On the external front, whether
exports will weaken further mainly hinges on the
economic performance of advanced economies,
as well as the outcome of the ongoing US-China
trade talk. On the domestic front, lingering
concerns about the longer-term impact of the
trade conflicts may continue to weigh on the
confidence of business owners. In addition, the
ability of higher value-added and high-tech
manufacturing and service sectors to continue to
drive economic growth appears to have
weakened against the backdrop of rising
financing difficulties facing private business
owners, especially small firms, in the past few
quarters.
In view of this more challenging economic
environment, policy-makers have less room for
error as they strive to strike a better balance
between stabilising the economy and containing
potential systemic risks. While supply-side
reform — structural deleveraging, de-capacity
and disciplining local government financing
— remains a priority in 2019, monetary policy
has become more accommodative, in order to
support bank lending to small and private firms
through focused and targeted easing measures.
On the fiscal front, authorities have pledged to
be more proactive through new tax and fee cuts
and infrastructure projects. The latest consensus
forecasts suggest that Mainland economic growth
would ease to 6.2% in 2019, close to the
midpoint of the government growth target range
of around 6–6.5%.
Inflationary pressure was benign in the second
half of 2018 amid slower economic growth.
Headline consumer price inflation came in at an
average of 2.3% year on year in the second half
of 2018, slightly higher than the 2.0% recorded
in the first half (Chart 2.15). Among the major
components, food prices rose further from 1.2%
year on year to 2.4% during the same period, but
core inflation, measured as consumer prices
excluding food and energy items, eased further
from 2.0% year on year in the first half of 2018
to 1.8% in the second half. Meanwhile, producer
price inflation further subsided from 3.9% year
on year in the first half of 2018 to 3.2% in the
second half amid declines in commodity prices
and a moderation in overall economic activities.
Chart 2.15 Mainland China: Consumer price and producer price inflation
-6
-4
-2
0
2
4
6
8
2014 2015 2016 2017 2018
% yoy
Producer price index
Headline CPI
Core-CPI (excl. food and energy)
Sources: CEIC, NBS and HKMA staff estimates.
21 Half-YearlY MonetarY and financial StabilitY report MarcH 2019
Global setting and outlook
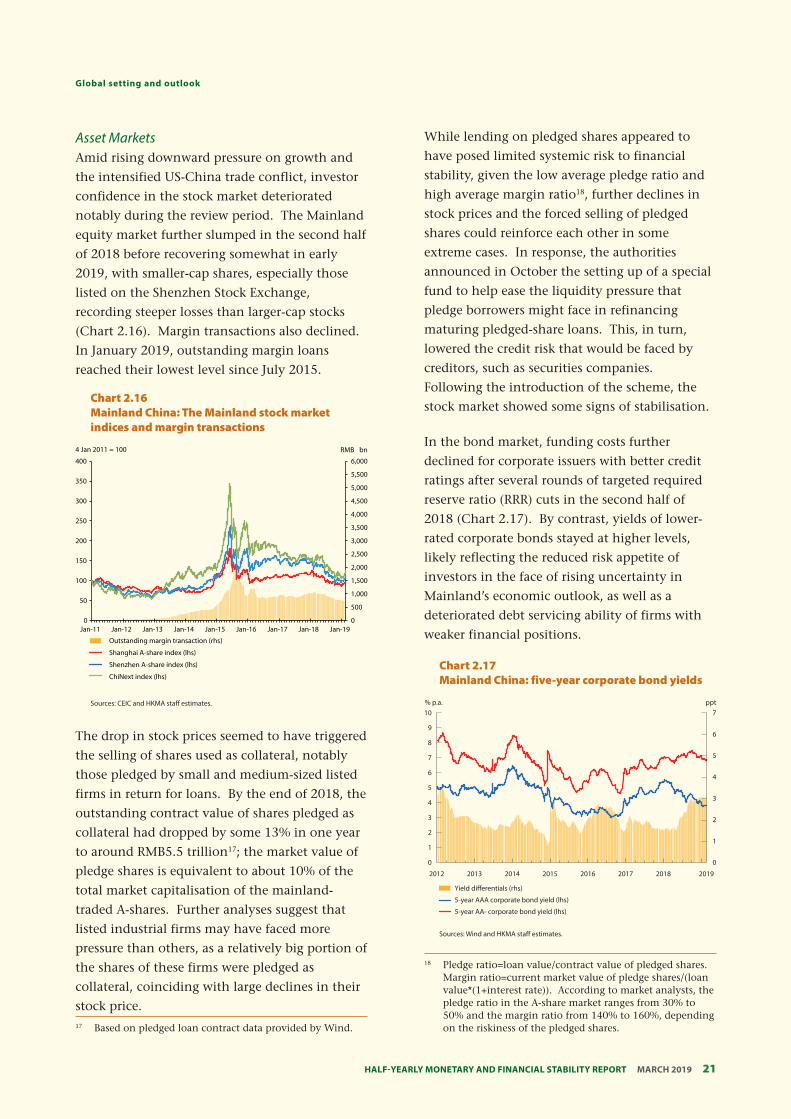
Amid rising downward pressure on growth and
the intensified US-China trade conflict, investor
confidence in the stock market deteriorated
notably during the review period. The Mainland
equity market further slumped in the second half
of 2018 before recovering somewhat in early
2019, with smaller-cap shares, especially those
listed on the Shenzhen Stock Exchange,
recording steeper losses than larger-cap stocks
(Chart 2.16). Margin transactions also declined.
In January 2019, outstanding margin loans
reached their lowest level since July 2015.
Asset Markets
Chart 2.16 Mainland China: The Mainland stock market indices and margin transactions
4 Jan 2011 = 100 RMB bn
400 6,000
5,500 350
5,000
300 4,500
4,000 250
3,500
200 3,000
2,500 150
2,000
100 1,500
1,000 50
500
0 0 Jan-11 Jan-12 Jan-13 Jan-14 Jan-15 Jan-16 Jan-17 Jan-18 Jan-19
Outstanding margin transaction (rhs)
Shanghai A-share index (lhs)
Shenzhen A-share index (lhs)
ChiNext index (lhs)
Sources: CEIC and HKMA staff estimates.
The drop in stock prices seemed to have triggered
the selling of shares used as collateral, notably
those pledged by small and medium-sized listed
firms in return for loans. By the end of 2018, the
outstanding contract value of shares pledged as
collateral had dropped by some 13% in one year
to around RMB5.5 trillion17; the market value of
pledge shares is equivalent to about 10% of the
total market capitalisation of the mainland-
traded A-shares. Further analyses suggest that
listed industrial firms may have faced more
pressure than others, as a relatively big portion of
the shares of these firms were pledged as
collateral, coinciding with large declines in their
stock price.
While lending on pledged shares appeared to
have posed limited systemic risk to financial
stability, given the low average pledge ratio and
high average margin ratio18, further declines in
stock prices and the forced selling of pledged
shares could reinforce each other in some
extreme cases. In response, the authorities
announced in October the setting up of a special
fund to help ease the liquidity pressure that
pledge borrowers might face in refinancing
maturing pledged-share loans. This, in turn,
lowered the credit risk that would be faced by
creditors, such as securities companies.
Following the introduction of the scheme, the
stock market showed some signs of stabilisation.
In the bond market, funding costs further
declined for corporate issuers with better credit
ratings after several rounds of targeted required
reserve ratio (RRR) cuts in the second half of
2018 (Chart 2.17). By contrast, yields of lower-
rated corporate bonds stayed at higher levels,
likely reflecting the reduced risk appetite of
investors in the face of rising uncertainty in
Mainland’s economic outlook, as well as a
deteriorated debt servicing ability of firms with
weaker financial positions.
Chart 2.17 Mainland China: five-year corporate bond yields
% p.a. ppt 10 7
9 6
8
7 5
6 4 5
3 4
3 2
2 1
1
0 0
2012 2013 2014 2015 2016 2017 2018 2019
Yield di�erentials (rhs)
5-year AAA corporate bond yield (lhs)
5-year AA- corporate bond yield (lhs)
Sources: Wind and HKMA staff estimates.
17 Based on pledged loan contract data provided by Wind.
18 Pledge ratio=loan value/contract value of pledged shares. Margin ratio=current market value of pledge shares/(loan value*(1+interest rate)). According to market analysts, the pledge ratio in the A-share market ranges from 30% to 50% and the margin ratio from 140% to 160%, depending on the riskiness of the pledged shares.
Half-YearlY MonetarY and financial StabilitY report MarcH 201922
Global setting and outlook
Chart 2.19 Mainland China: Residential prices by tier of cities and floor space sold
Property price Index, Jan 2015 = 100 Mn sq. m
180 500
160 400
140
300 120
100 200
80
100 60
40 0
12 13 14 15 16 17 18
Residential ˜oor space sold (rhs)
1st-tier cities (lhs) 2nd-tier cities (lhs) 3rd-tier cities (lhs)
Sources: CEIC and HKMA staff estimates.
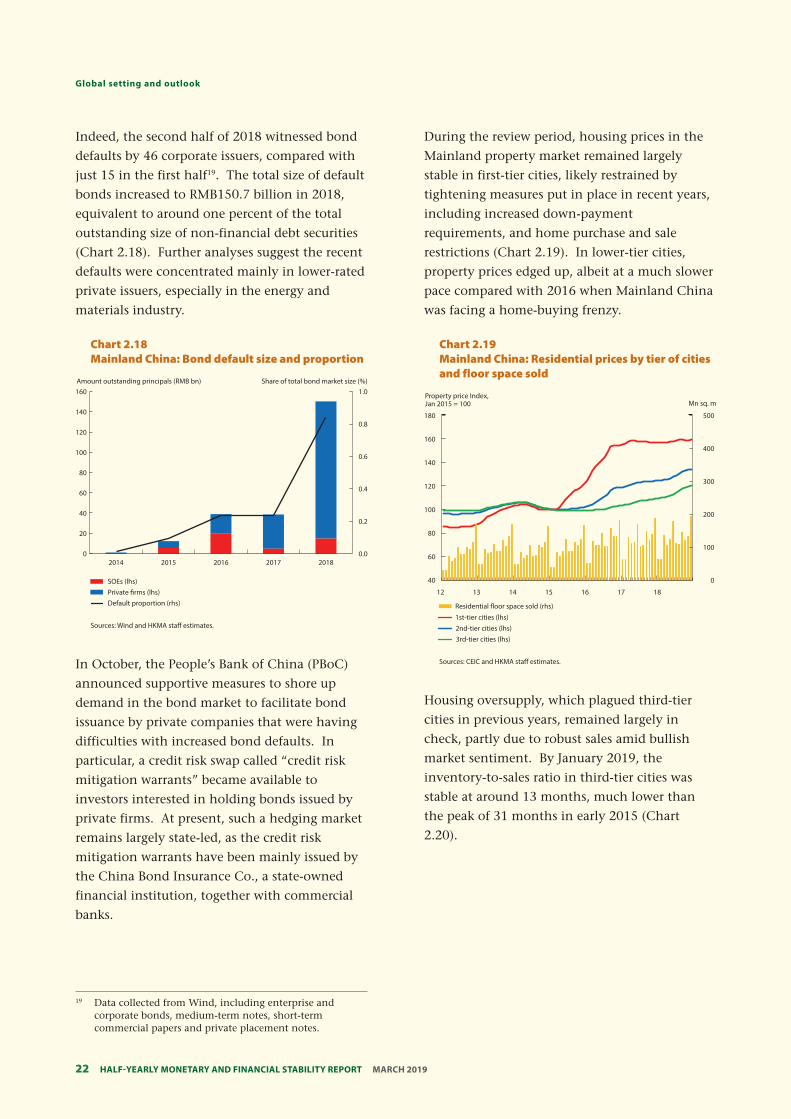
Indeed, the second half of 2018 witnessed bond
defaults by 46 corporate issuers, compared with
just 15 in the first half19. The total size of default
bonds increased to RMB150.7 billion in 2018,
equivalent to around one percent of the total
outstanding size of non-financial debt securities
(Chart 2.18). Further analyses suggest the recent
defaults were concentrated mainly in lower-rated
private issuers, especially in the energy and
materials industry.
Chart 2.18 Mainland China: Bond default size and proportion
Amount outstanding principals (RMB bn) Share of total bond market size (%) 160
140
120
100
80
60
40
20
0
1.0
0.8
0.6
0.4
0.2
0.0 2014 2015 2016 2017 2018
SOEs (lhs) Private ÿrms (lhs) Default proportion (rhs)
Sources: Wind and HKMA staff estimates.
In October, the People’s Bank of China (PBoC)
announced supportive measures to shore up
demand in the bond market to facilitate bond
issuance by private companies that were having
difficulties with increased bond defaults. In
particular, a credit risk swap called “credit risk
mitigation warrants” became available to
investors interested in holding bonds issued by
private firms. At present, such a hedging market
remains largely state-led, as the credit risk
mitigation warrants have been mainly issued by
the China Bond Insurance Co., a state-owned
financial institution, together with commercial
banks.
During the review period, housing prices in the
Mainland property market remained largely
stable in first-tier cities, likely restrained by
tightening measures put in place in recent years,
including increased down-payment
requirements, and home purchase and sale
restrictions (Chart 2.19). In lower-tier cities,
property prices edged up, albeit at a much slower
pace compared with 2016 when Mainland China
was facing a home-buying frenzy.
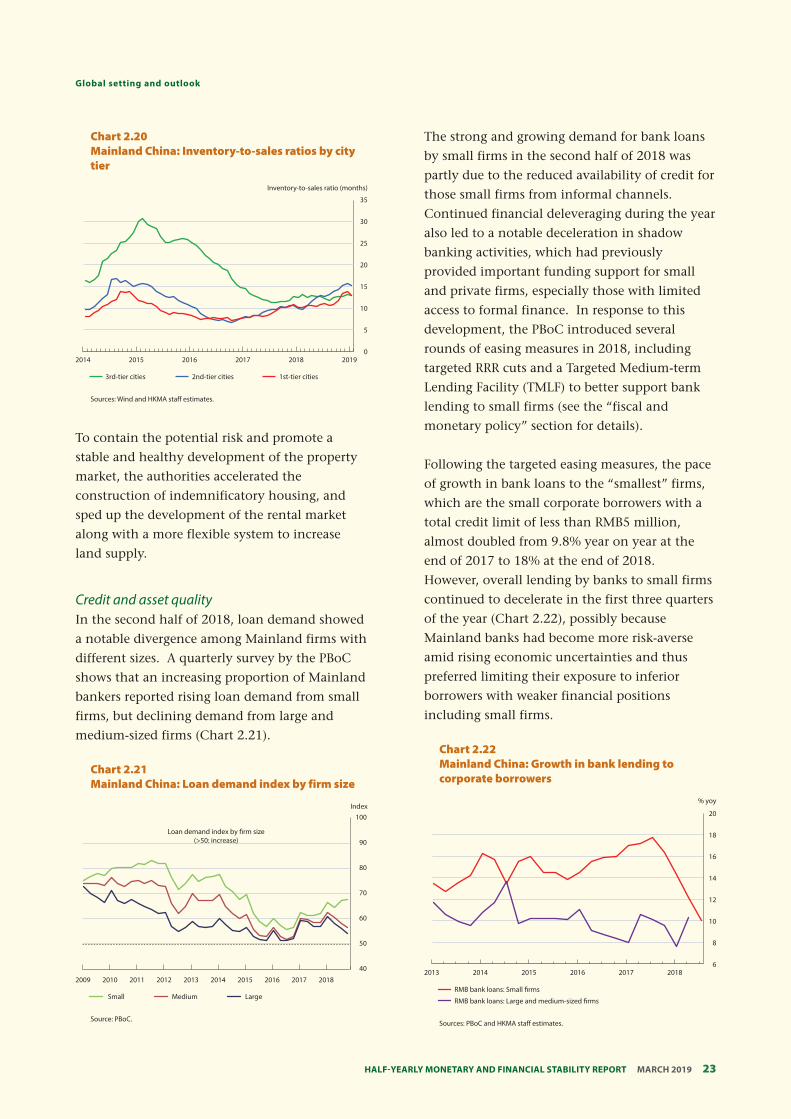
Housing oversupply, which plagued third-tier
cities in previous years, remained largely in
check, partly due to robust sales amid bullish
market sentiment. By January 2019, the
inventory-to-sales ratio in third-tier cities was
stable at around 13 months, much lower than
the peak of 31 months in early 2015 (Chart
2.20).
19 Data collected from Wind, including enterprise and corporate bonds, medium-term notes, short-term commercial papers and private placement notes.
23 Half-YearlY MonetarY and financial StabilitY report MarcH 2019
Global setting and outlook
Chart 2.22 Mainland China: Growth in bank lending to corporate borrowers
% yoy
20
18
16
14
12
10
8
6 2013 2014 2015 2016 2017 2018
RMB bank loans: Small ÿrms
RMB bank loans: Large and medium-sized ÿrms
Sources: PBoC and HKMA staff estimates.
Chart 2.21 Mainland China: Loan demand index by firm size
Index 100
Loan demand index by ÿrm size (>50: increase) 90
80
70
60
50
40
2009 2010 2011 2012 2013 2014 2015 2016 2017 2018
Small Medium Large
Source: PBoC.
Chart 2.20 Mainland China: Inventory-to-sales ratios by city tier
Inventory-to-sales ratio (months)
35
30
25
20
15
10
5
0 2014 2015 2016 2017 2018 2019
3rd-tier cities 2nd-tier cities 1st-tier cities
Sources: Wind and HKMA staff estimates.
To contain the potential risk and promote a
stable and healthy development of the property
market, the authorities accelerated the
construction of indemnificatory housing, and
sped up the development of the rental market
along with a more flexible system to increase
land supply.
Credit and asset quality In the second half of 2018, loan demand showed
a notable divergence among Mainland firms with
different sizes. A quarterly survey by the PBoC
shows that an increasing proportion of Mainland
bankers reported rising loan demand from small
firms, but declining demand from large and
medium-sized firms (Chart 2.21).
The strong and growing demand for bank loans
by small firms in the second half of 2018 was
partly due to the reduced availability of credit for
those small firms from informal channels.
Continued financial deleveraging during the year
also led to a notable deceleration in shadow
banking activities, which had previously
provided important funding support for small
and private firms, especially those with limited
access to formal finance. In response to this
development, the PBoC introduced several
rounds of easing measures in 2018, including
targeted RRR cuts and a Targeted Medium-term
Lending Facility (TMLF) to better support bank
lending to small firms (see the “fiscal and
monetary policy” section for details).
Following the targeted easing measures, the pace
of growth in bank loans to the “smallest” firms,
which are the small corporate borrowers with a
total credit limit of less than RMB5 million,
almost doubled from 9.8% year on year at the
end of 2017 to 18% at the end of 2018.
However, overall lending by banks to small firms
continued to decelerate in the first three quarters
of the year (Chart 2.22), possibly because
Mainland banks had become more risk-averse
amid rising economic uncertainties and thus
preferred limiting their exposure to inferior
borrowers with weaker financial positions
including small firms.
Half-YearlY MonetarY and financial StabilitY report MarcH 201924
Global setting and outlook
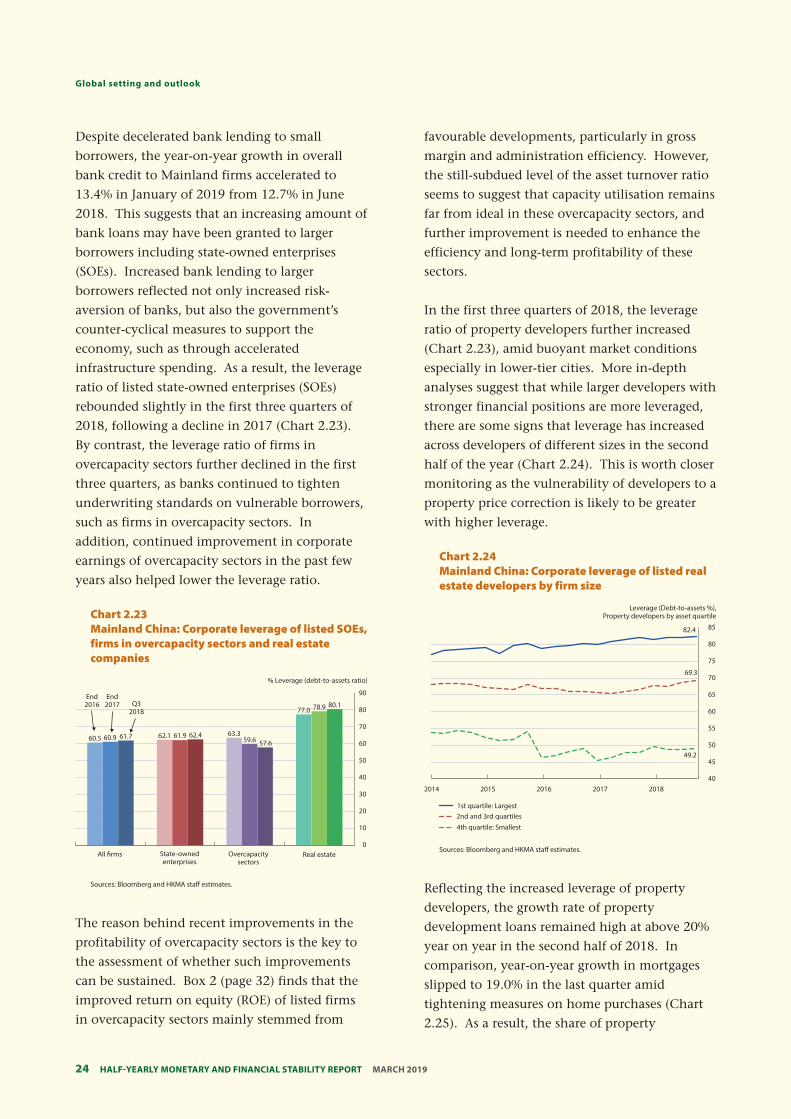
Chart 2.24 Mainland China: Corporate leverage of listed real estate developers by firm size
Leverage (Debt-to-assets %), Property developers by asset quartile
85 82.4
80
75
69.3 70
65
60
55
50 49.2
45
40 2014 2015 2016 2017 2018
1st quartile: Largest 2nd and 3rd quartiles 4th quartile: Smallest
Sources: Bloomberg and HKMA staff estimates.
Despite decelerated bank lending to small
borrowers, the year-on-year growth in overall
bank credit to Mainland firms accelerated to
13.4% in January of 2019 from 12.7% in June
2018. This suggests that an increasing amount of
bank loans may have been granted to larger
borrowers including state-owned enterprises
(SOEs). Increased bank lending to larger
borrowers reflected not only increased risk-
aversion of banks, but also the government’s
counter-cyclical measures to support the
economy, such as through accelerated
infrastructure spending. As a result, the leverage
ratio of listed state-owned enterprises (SOEs)
rebounded slightly in the first three quarters of
2018, following a decline in 2017 (Chart 2.23).
By contrast, the leverage ratio of firms in
overcapacity sectors further declined in the first
three quarters, as banks continued to tighten
underwriting standards on vulnerable borrowers,
such as firms in overcapacity sectors. In
addition, continued improvement in corporate
earnings of overcapacity sectors in the past few
years also helped lower the leverage ratio.
Chart 2.23 Mainland China: Corporate leverage of listed SOEs, firms in overcapacity sectors and real estate companies
% Leverage (debt-to-assets ratio)
60.5 62.1 63.3
77.0
60.9 61.9 59.6
78.9
61.7 62.4 57.6
80.1 End
2016 End
2017 Q3 2018
90
80
70
60
50
40
30
20
10
0 All ÿrms State-owned Overcapacity Real estate
enterprises sectors
Sources: Bloomberg and HKMA staff estimates.
The reason behind recent improvements in the
profitability of overcapacity sectors is the key to
the assessment of whether such improvements
can be sustained. Box 2 (page 32) finds that the
improved return on equity (ROE) of listed firms
in overcapacity sectors mainly stemmed from
favourable developments, particularly in gross
margin and administration efficiency. However,
the still-subdued level of the asset turnover ratio
seems to suggest that capacity utilisation remains
far from ideal in these overcapacity sectors, and
further improvement is needed to enhance the
efficiency and long-term profitability of these
sectors.
In the first three quarters of 2018, the leverage
ratio of property developers further increased
(Chart 2.23), amid buoyant market conditions
especially in lower-tier cities. More in-depth
analyses suggest that while larger developers with
stronger financial positions are more leveraged,
there are some signs that leverage has increased
across developers of different sizes in the second
half of the year (Chart 2.24). This is worth closer
monitoring as the vulnerability of developers to a
property price correction is likely to be greater
with higher leverage.
Reflecting the increased leverage of property
developers, the growth rate of property
development loans remained high at above 20%
year on year in the second half of 2018. In
comparison, year-on-year growth in mortgages
slipped to 19.0% in the last quarter amid
tightening measures on home purchases (Chart
2.25). As a result, the share of property
25 Half-YearlY MonetarY and financial StabilitY report MarcH 2019
Global setting and outlook
development loans and mortgages together in
total bank loans, which measures banks’ direct
exposure to the property market, increased
slightly to 27.3% at the end of 2018 from 26.5%
six months earlier.
Chart 2.25 Mainland China: Growth in mortgage and property development loans
% yoy
40
35
30
25
20
15
10
5
0
11 12 13 14 15 16 17 18
Property development loan Housing mortgage
Sources: CEIC and HKMA staff estimates.
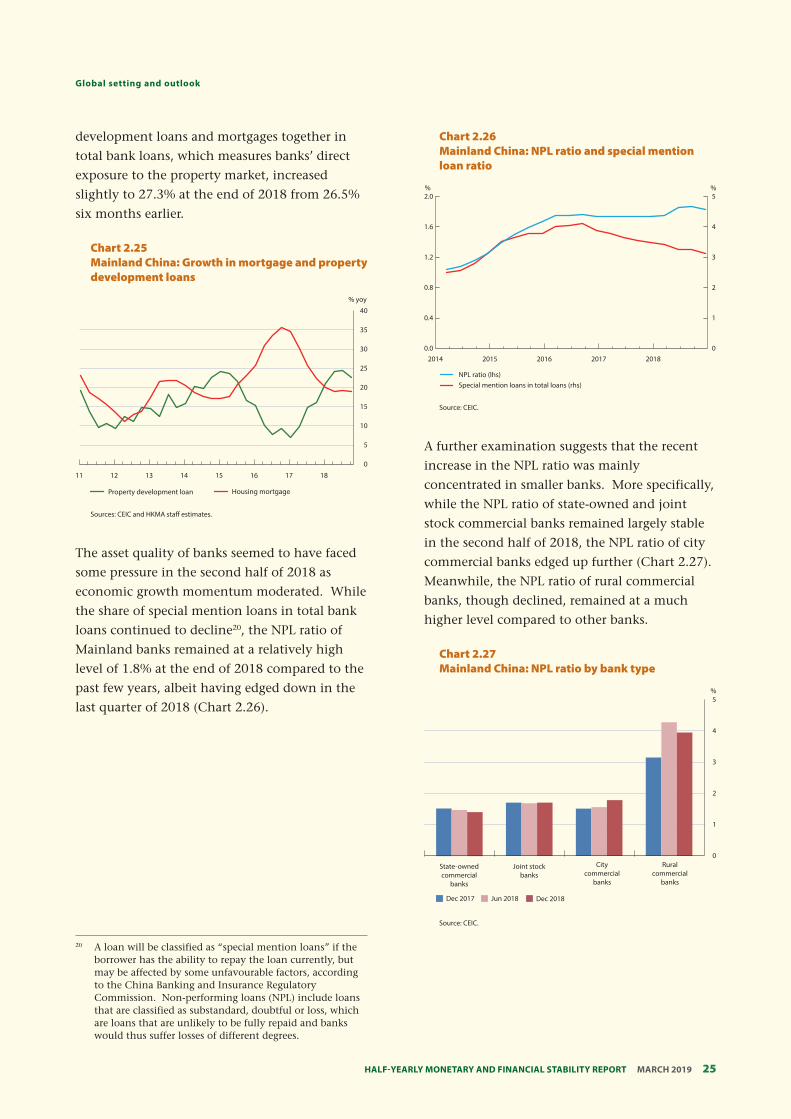
The asset quality of banks seemed to have faced
some pressure in the second half of 2018 as
economic growth momentum moderated. While
the share of special mention loans in total bank
loans continued to decline20, the NPL ratio of
Mainland banks remained at a relatively high
level of 1.8% at the end of 2018 compared to the
past few years, albeit having edged down in the
last quarter of 2018 (Chart 2.26).
Chart 2.26 Mainland China: NPL ratio and special mention loan ratio
% % 2.0 5
1.6 4
3 1.2
0.8 2
0.4 1
0.0 0 2014 2015 2016 2017 2018
NPL ratio (lhs) Special mention loans in total loans (rhs)
Source: CEIC.
A further examination suggests that the recent
increase in the NPL ratio was mainly
concentrated in smaller banks. More specifically,
while the NPL ratio of state-owned and joint
stock commercial banks remained largely stable
in the second half of 2018, the NPL ratio of city
commercial banks edged up further (Chart 2.27).
Meanwhile, the NPL ratio of rural commercial
banks, though declined, remained at a much
higher level compared to other banks.
Chart 2.27 Mainland China: NPL ratio by bank type
% 5
4
3
2
1
0 State-owned Joint stock City Rural commercial banks commercial commercial
banks banks banks
Dec 2017 Jun 2018 Dec 2018
Source: CEIC.
20 A loan will be classified as “special mention loans” if the borrower has the ability to repay the loan currently, but may be affected by some unfavourable factors, according to the China Banking and Insurance Regulatory Commission. Non-performing loans (NPL) include loans that are classified as substandard, doubtful or loss, which are loans that are unlikely to be fully repaid and banks would thus suffer losses of different degrees.
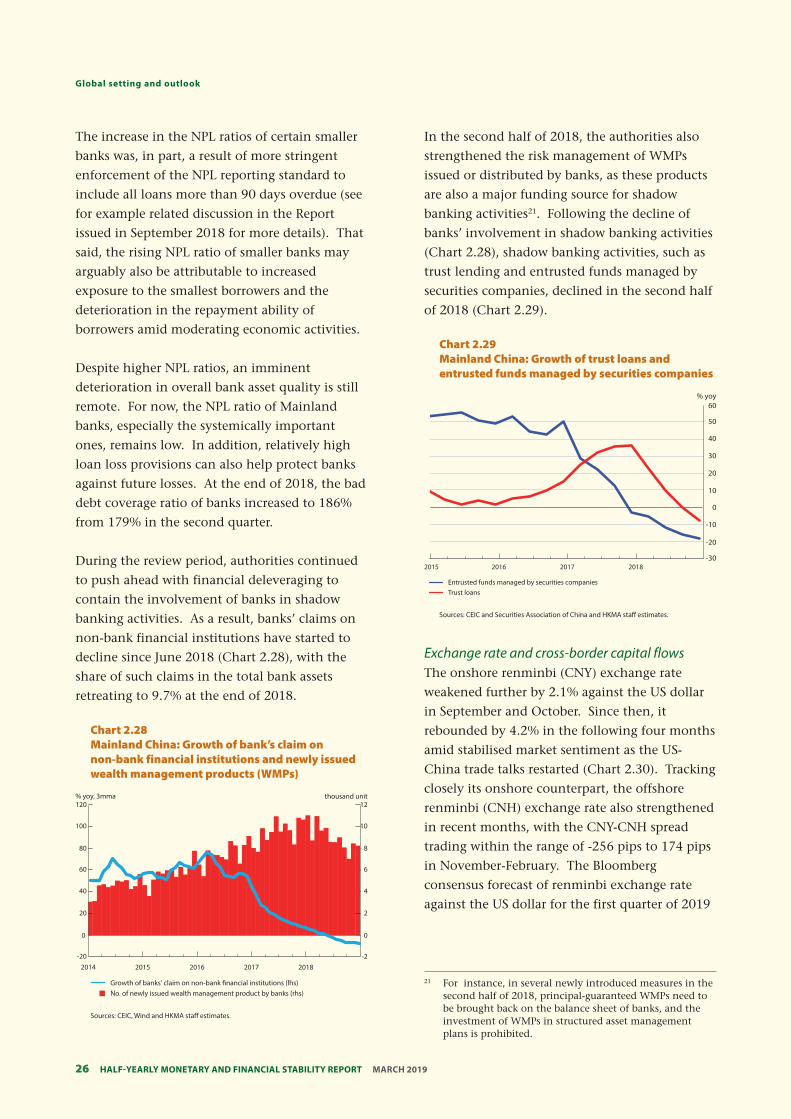
Half-YearlY MonetarY and financial StabilitY report MarcH 201926
Global setting and outlook
The increase in the NPL ratios of certain smaller
banks was, in part, a result of more stringent
enforcement of the NPL reporting standard to
include all loans more than 90 days overdue (see
for example related discussion in the Report
issued in September 2018 for more details). That
said, the rising NPL ratio of smaller banks may
arguably also be attributable to increased
exposure to the smallest borrowers and the
deterioration in the repayment ability of
borrowers amid moderating economic activities.
Despite higher NPL ratios, an imminent
deterioration in overall bank asset quality is still
remote. For now, the NPL ratio of Mainland
banks, especially the systemically important
ones, remains low. In addition, relatively high
loan loss provisions can also help protect banks
against future losses. At the end of 2018, the bad
debt coverage ratio of banks increased to 186%
from 179% in the second quarter.
During the review period, authorities continued
to push ahead with financial deleveraging to
contain the involvement of banks in shadow
banking activities. As a result, banks’ claims on
non-bank financial institutions have started to
decline since June 2018 (Chart 2.28), with the
share of such claims in the total bank assets
retreating to 9.7% at the end of 2018.
Chart 2.28 Mainland China: Growth of bank’s claim on non-bank financial institutions and newly issued wealth management products (WMPs)
% yoy, 3mma thousand unit 120 12
100 10
80 8
60 6
40 4
20 2
0 0
-20 -2 2014 2015 2016 2017 2018
Growth of banks' claim on non-bank ÿnancial institutions (lhs) No. of newly issued wealth management product by banks (rhs)
Sources: CEIC, Wind and HKMA staff estimates.
In the second half of 2018, the authorities also
strengthened the risk management of WMPs
issued or distributed by banks, as these products
are also a major funding source for shadow
banking activities21. Following the decline of
banks’ involvement in shadow banking activities
(Chart 2.28), shadow banking activities, such as
trust lending and entrusted funds managed by
securities companies, declined in the second half
of 2018 (Chart 2.29).
Chart 2.29 Mainland China: Growth of trust loans and entrusted funds managed by securities companies
% yoy 60
50
40
30
20
10
0
-10
-20
-30 2015 2016 2017 2018
Entrusted funds managed by securities companies Trust loans
Sources: CEIC and Securities Association of China and HKMA staff estimates.
Exchange rate and cross-border capital flows The onshore renminbi (CNY) exchange rate
weakened further by 2.1% against the US dollar
in September and October. Since then, it
rebounded by 4.2% in the following four months
amid stabilised market sentiment as the US-
China trade talks restarted (Chart 2.30). Tracking
closely its onshore counterpart, the offshore
renminbi (CNH) exchange rate also strengthened
in recent months, with the CNY-CNH spread
trading within the range of -256 pips to 174 pips
in November-February. The Bloomberg
consensus forecast of renminbi exchange rate
against the US dollar for the first quarter of 2019
21 For instance, in several newly introduced measures in the second half of 2018, principal-guaranteed WMPs need to be brought back on the balance sheet of banks, and the investment of WMPs in structured asset management plans is prohibited.
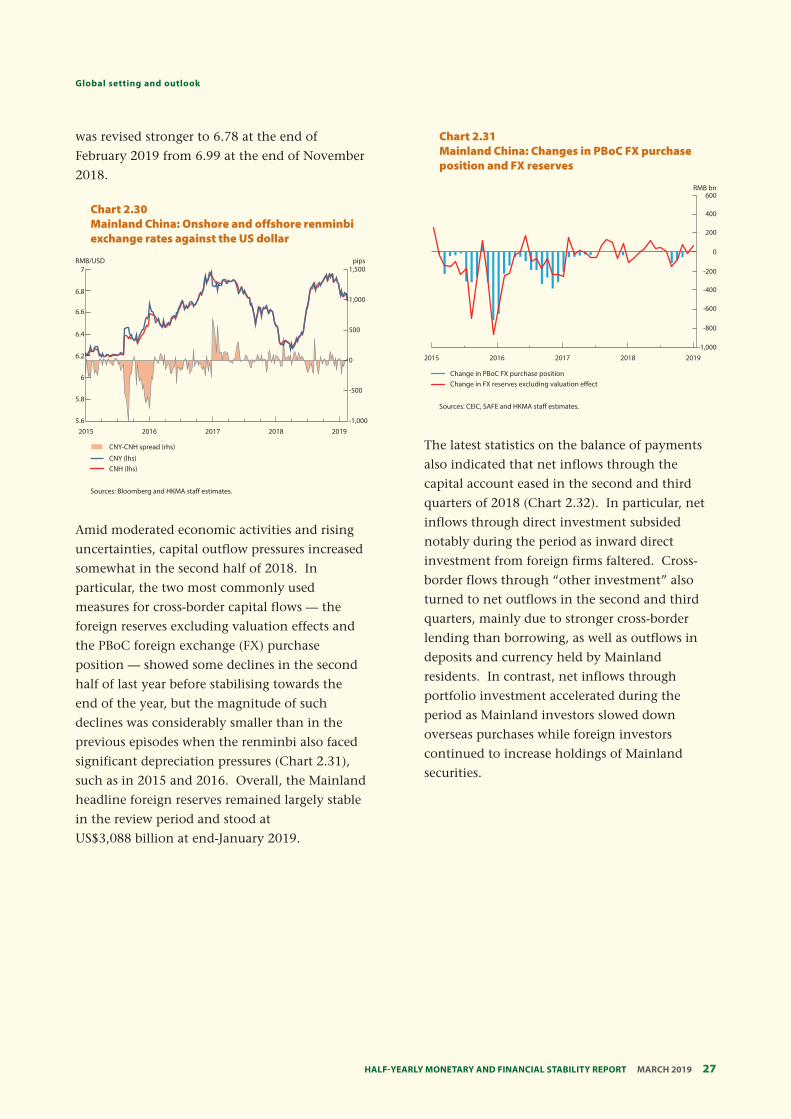
27 Half-YearlY MonetarY and financial StabilitY report MarcH 2019
Global setting and outlook
was revised stronger to 6.78 at the end of
February 2019 from 6.99 at the end of November
2018.
2015 2016 2017 2018 2019
Chart 2.30 Mainland China: Onshore and offshore renminbi exchange rates against the US dollar
RMB/USD pips 7 1,500
6.8 1,000
6.6
500 6.4
6.2 0
6
-500 5.8
5.6 -1,000
CNY-CNH spread (rhs)
CNY (lhs) CNH (lhs)
Sources: Bloomberg and HKMA staff estimates.
Amid moderated economic activities and rising
uncertainties, capital outflow pressures increased
somewhat in the second half of 2018. In
particular, the two most commonly used
measures for cross-border capital flows — the
foreign reserves excluding valuation effects and
the PBoC foreign exchange (FX) purchase
position — showed some declines in the second
half of last year before stabilising towards the
end of the year, but the magnitude of such
declines was considerably smaller than in the
previous episodes when the renminbi also faced
significant depreciation pressures (Chart 2.31),
such as in 2015 and 2016. Overall, the Mainland
headline foreign reserves remained largely stable
in the review period and stood at
US$3,088 billion at end-January 2019.
Chart 2.31 Mainland China: Changes in PBoC FX purchase position and FX reserves
RMB bn
2015 2016 2017 2018 2019
Change in PBoC FX purchase position Change in FX reserves excluding valuation e˜ect
600
400
200
0
-200
-400
-600
-800
-1,000
Sources: CEIC, SAFE and HKMA staff estimates.
The latest statistics on the balance of payments
also indicated that net inflows through the
capital account eased in the second and third
quarters of 2018 (Chart 2.32). In particular, net
inflows through direct investment subsided
notably during the period as inward direct
investment from foreign firms faltered. Cross-
border flows through “other investment” also
turned to net outflows in the second and third
quarters, mainly due to stronger cross-border
lending than borrowing, as well as outflows in
deposits and currency held by Mainland
residents. In contrast, net inflows through
portfolio investment accelerated during the
period as Mainland investors slowed down
overseas purchases while foreign investors
continued to increase holdings of Mainland
securities.
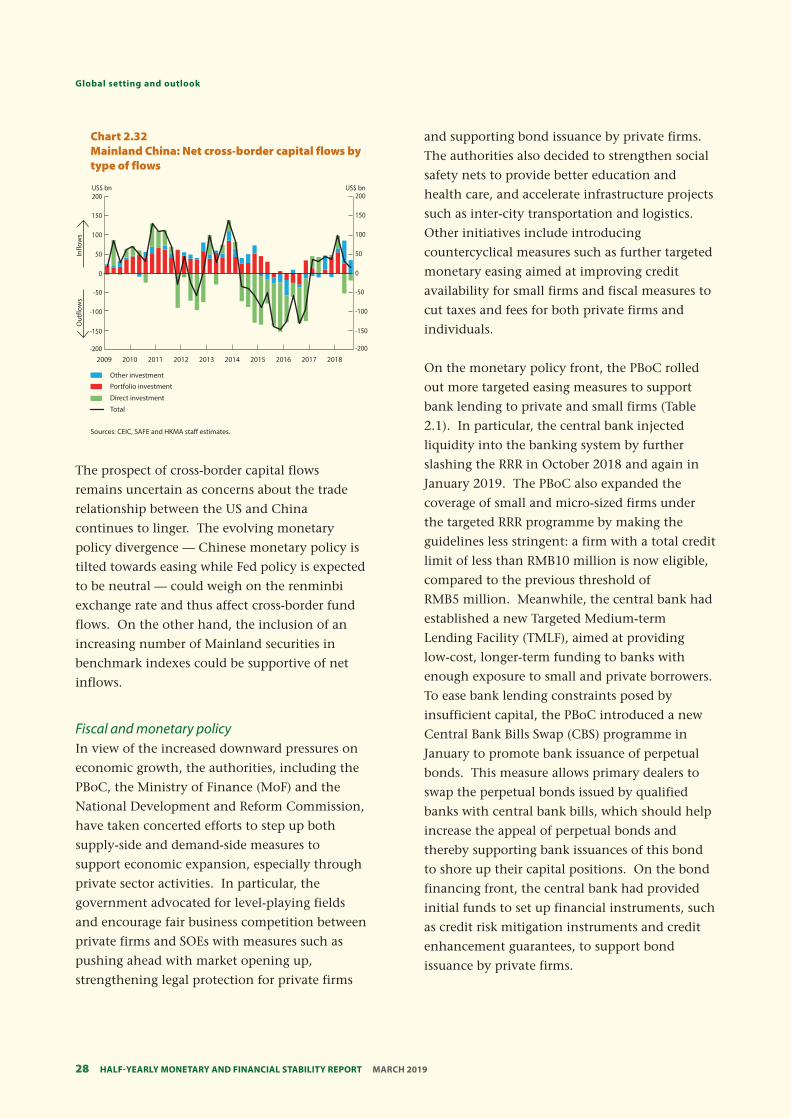
Half-YearlY MonetarY and financial StabilitY report MarcH 201928
Global setting and outlook
Chart 2.32 Mainland China: Net cross-border capital flows by type of flows
US$ bn US$ bn
2009 2010 2011 2012 2013 2014 2015 2016 2017 2018
Other investment
Portfolio investment
Direct investment
Out
flow
s In
flow
s
Total
Sources: CEIC, SAFE and HKMA staff estimates.
200
150
100
50
0
-50
-100
-150
-200
200
150
100
50
0
-50
-100
-150
-200
The prospect of cross-border capital flows
remains uncertain as concerns about the trade
relationship between the US and China
continues to linger. The evolving monetary
policy divergence — Chinese monetary policy is
tilted towards easing while Fed policy is expected
to be neutral — could weigh on the renminbi
exchange rate and thus affect cross-border fund
flows. On the other hand, the inclusion of an
increasing number of Mainland securities in
benchmark indexes could be supportive of net
inflows.
Fiscal and monetary policy In view of the increased downward pressures on
economic growth, the authorities, including the
PBoC, the Ministry of Finance (MoF) and the
National Development and Reform Commission,
have taken concerted efforts to step up both
supply-side and demand-side measures to
support economic expansion, especially through
private sector activities. In particular, the
government advocated for level-playing fields
and encourage fair business competition between
private firms and SOEs with measures such as
pushing ahead with market opening up,
strengthening legal protection for private firms
and supporting bond issuance by private firms.
The authorities also decided to strengthen social
safety nets to provide better education and
health care, and accelerate infrastructure projects
such as inter-city transportation and logistics.
Other initiatives include introducing
countercyclical measures such as further targeted
monetary easing aimed at improving credit
availability for small firms and fiscal measures to
cut taxes and fees for both private firms and
individuals.
On the monetary policy front, the PBoC rolled
out more targeted easing measures to support
bank lending to private and small firms (Table
2.1). In particular, the central bank injected
liquidity into the banking system by further
slashing the RRR in October 2018 and again in
January 2019. The PBoC also expanded the
coverage of small and micro-sized firms under
the targeted RRR programme by making the
guidelines less stringent: a firm with a total credit
limit of less than RMB10 million is now eligible,
compared to the previous threshold of
RMB5 million. Meanwhile, the central bank had
established a new Targeted Medium-term
Lending Facility (TMLF), aimed at providing
low-cost, longer-term funding to banks with
enough exposure to small and private borrowers.
To ease bank lending constraints posed by
insufficient capital, the PBoC introduced a new
Central Bank Bills Swap (CBS) programme in
January to promote bank issuance of perpetual
bonds. This measure allows primary dealers to
swap the perpetual bonds issued by qualified
banks with central bank bills, which should help
increase the appeal of perpetual bonds and
thereby supporting bank issuances of this bond
to shore up their capital positions. On the bond
financing front, the central bank had provided
initial funds to set up financial instruments, such
as credit risk mitigation instruments and credit
enhancement guarantees, to support bond
issuance by private firms.
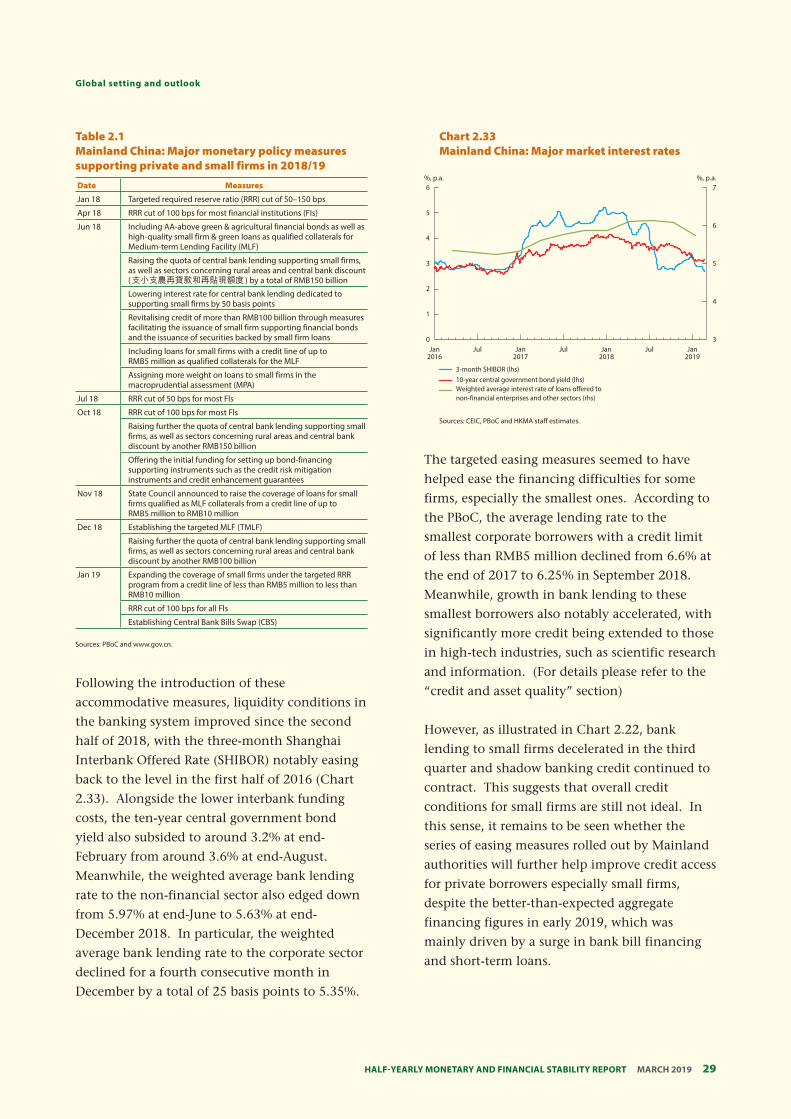
29 Half-YearlY MonetarY and financial StabilitY report MarcH 2019
Global setting and outlook
Table 2.1 Mainland China: Major monetary policy measures supporting private and small firms in 2018/19 Date Measures
Jan 18 Targeted required reserve ratio (RRR) cut of 50–150 bps
Apr 18 RRR cut of 100 bps for most financial institutions (FIs)
Jun 18 Including AA-above green & agricultural financial bonds as well as high-quality small firm & green loans as qualified collaterals for Medium-term Lending Facility (MLF)
Raising the quota of central bank lending supporting small firms, as well as sectors concerning rural areas and central bank discount (支小支農再貸款和再貼現額度 ) by a total of RMB150 billion
Lowering interest rate for central bank lending dedicated to supporting small firms by 50 basis points
Revitalising credit of more than RMB100 billion through measures facilitating the issuance of small firm supporting financial bonds and the issuance of securities backed by small firm loans
Including loans for small firms with a credit line of up to RMB5 million as qualified collaterals for the MLF
Assigning more weight on loans to small firms in the macroprudential assessment (MPA)
Jul 18 RRR cut of 50 bps for most Fls
Oct 18 RRR cut of 100 bps for most Fls
Raising further the quota of central bank lending supporting small firms, as well as sectors concerning rural areas and central bank discount by another RMB150 billion
Offering the initial funding for setting up bond-financing supporting instruments such as the credit risk mitigation instruments and credit enhancement guarantees
Nov 18 State Council announced to raise the coverage of loans for small firms qualified as MLF collaterals from a credit line of up to RMB5 million to RMB10 million
Dec 18 Establishing the targeted MLF (TMLF)
Raising further the quota of central bank lending supporting small firms, as well as sectors concerning rural areas and central bank discount by another RMB100 billion
Jan 19 Expanding the coverage of small firms under the targeted RRR program from a credit line of less than RMB5 million to less than RMB10 million
RRR cut of 100 bps for all Fls
Establishing Central Bank Bills Swap (CBS)
Sources: PBoC and www.gov.cn.
Following the introduction of these
accommodative measures, liquidity conditions in
the banking system improved since the second
half of 2018, with the three-month Shanghai
Interbank Offered Rate (SHIBOR) notably easing
back to the level in the first half of 2016 (Chart
2.33). Alongside the lower interbank funding
costs, the ten-year central government bond
yield also subsided to around 3.2% at end-
February from around 3.6% at end-August.
Meanwhile, the weighted average bank lending
rate to the non-financial sector also edged down
from 5.97% at end-June to 5.63% at end-
December 2018. In particular, the weighted
average bank lending rate to the corporate sector
declined for a fourth consecutive month in
December by a total of 25 basis points to 5.35%.
Chart 2.33 Mainland China: Major market interest rates
3
4
5
6
7
0
2
1
3
4
5
6
3-month SHIBOR (lhs)10-year central government bond yield (lhs) Weighted average interest rate of loans offered to non-financial enterprises and other sectors (rhs)
Jan2016
Jul Jan2017
Jul JulJan2018
Jan2019
%, p.a.%, p.a.
Sources: CEIC, PBoC and HKMA staff estimates.
The targeted easing measures seemed to have
helped ease the financing difficulties for some
firms, especially the smallest ones. According to
the PBoC, the average lending rate to the
smallest corporate borrowers with a credit limit
of less than RMB5 million declined from 6.6% at
the end of 2017 to 6.25% in September 2018.
Meanwhile, growth in bank lending to these
smallest borrowers also notably accelerated, with
significantly more credit being extended to those
in high-tech industries, such as scientific research
and information. (For details please refer to the
“credit and asset quality” section)
However, as illustrated in Chart 2.22, bank
lending to small firms decelerated in the third
quarter and shadow banking credit continued to
contract. This suggests that overall credit
conditions for small firms are still not ideal. In
this sense, it remains to be seen whether the
series of easing measures rolled out by Mainland
authorities will further help improve credit access
for private borrowers especially small firms,
despite the better-than-expected aggregate
financing figures in early 2019, which was
mainly driven by a surge in bank bill financing
and short-term loans.
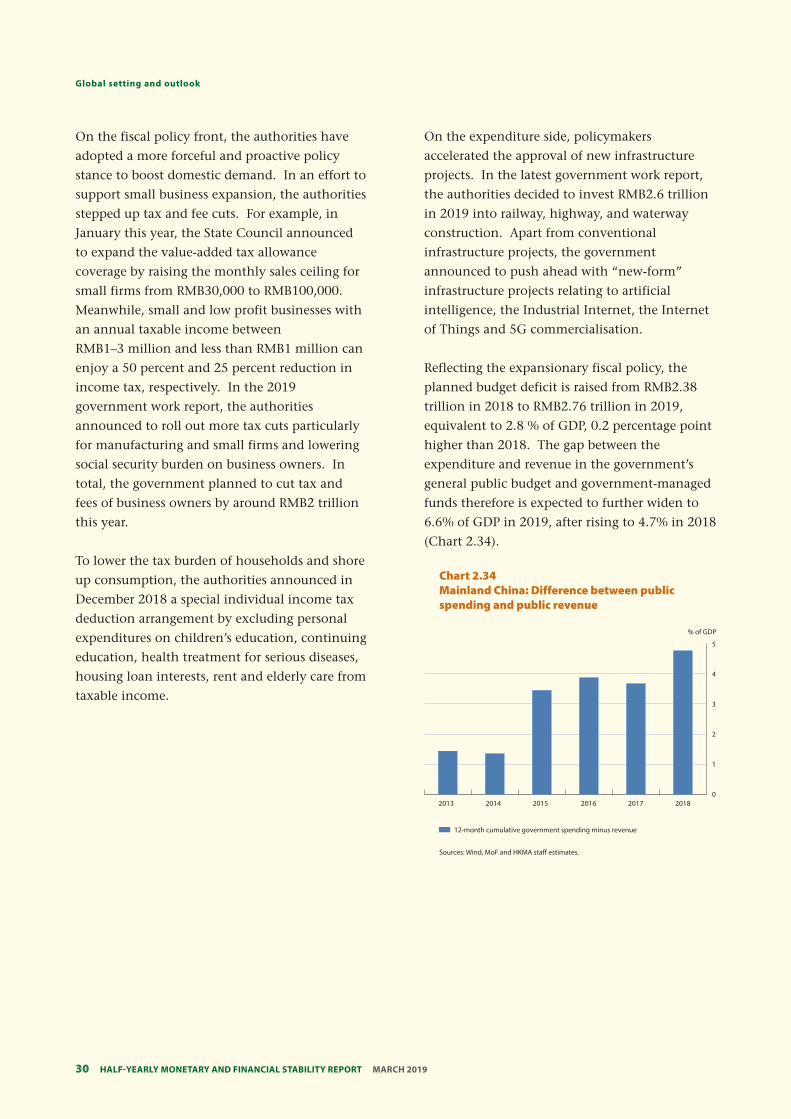
Half-YearlY MonetarY and financial StabilitY report MarcH 201930
Global setting and outlook
On the fiscal policy front, the authorities have
adopted a more forceful and proactive policy
stance to boost domestic demand. In an effort to
support small business expansion, the authorities
stepped up tax and fee cuts. For example, in
January this year, the State Council announced
to expand the value-added tax allowance
coverage by raising the monthly sales ceiling for
small firms from RMB30,000 to RMB100,000.
Meanwhile, small and low profit businesses with
an annual taxable income between
RMB1–3 million and less than RMB1 million can
enjoy a 50 percent and 25 percent reduction in
income tax, respectively. In the 2019
government work report, the authorities
announced to roll out more tax cuts particularly
for manufacturing and small firms and lowering
social security burden on business owners. In
total, the government planned to cut tax and
fees of business owners by around RMB2 trillion
this year.
To lower the tax burden of households and shore
up consumption, the authorities announced in
December 2018 a special individual income tax
deduction arrangement by excluding personal
expenditures on children’s education, continuing
education, health treatment for serious diseases,
housing loan interests, rent and elderly care from
taxable income.
On the expenditure side, policymakers
accelerated the approval of new infrastructure
projects. In the latest government work report,
the authorities decided to invest RMB2.6 trillion
in 2019 into railway, highway, and waterway
construction. Apart from conventional
infrastructure projects, the government
announced to push ahead with “new-form”
infrastructure projects relating to artificial
intelligence, the Industrial Internet, the Internet
of Things and 5G commercialisation.
Reflecting the expansionary fiscal policy, the
planned budget deficit is raised from RMB2.38
trillion in 2018 to RMB2.76 trillion in 2019,
equivalent to 2.8 % of GDP, 0.2 percentage point
higher than 2018. The gap between the
expenditure and revenue in the government’s
general public budget and government-managed
funds therefore is expected to further widen to
6.6% of GDP in 2019, after rising to 4.7% in 2018
(Chart 2.34).
Chart 2.34 Mainland China: Difference between public spending and public revenue
0
3
2
1
4
5
2013 2014 2015 2016 2017
% of GDP
12-month cumulative government spending minus revenue
2018
Sources: Wind, MoF and HKMA staff estimates.
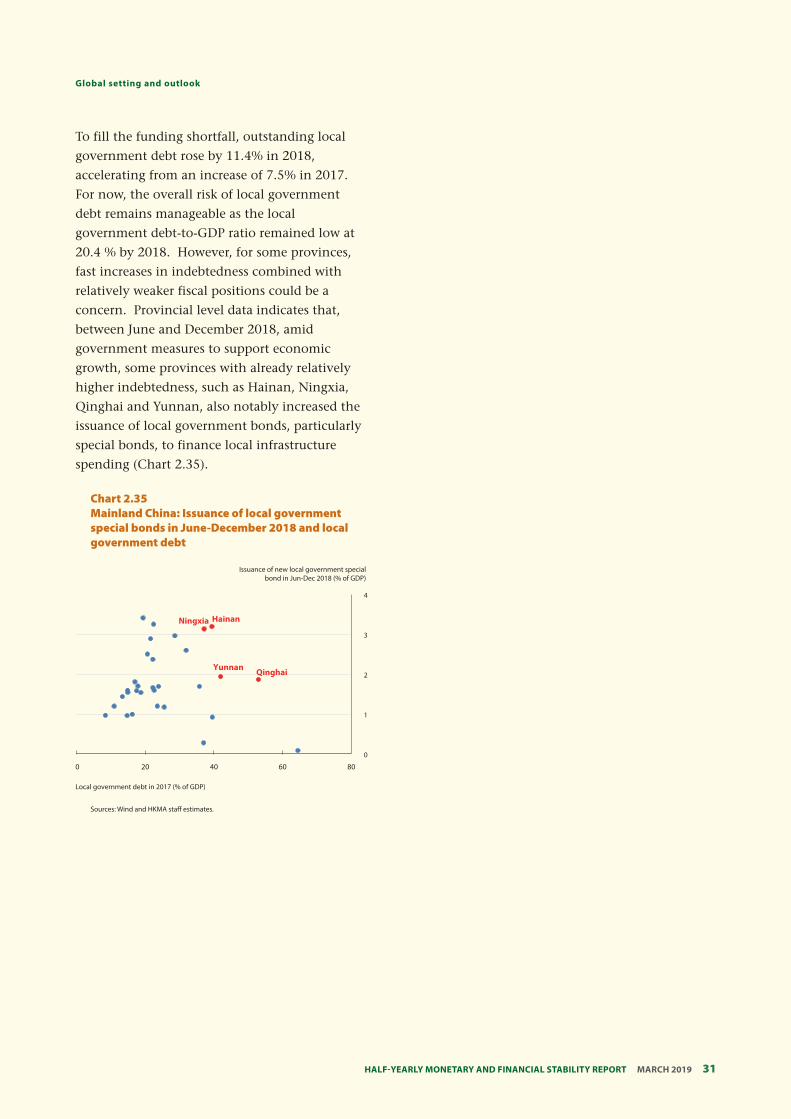
31 Half-YearlY MonetarY and financial StabilitY report MarcH 2019
Global setting and outlook
To fill the funding shortfall, outstanding local
government debt rose by 11.4% in 2018,
accelerating from an increase of 7.5% in 2017.
For now, the overall risk of local government
debt remains manageable as the local
government debt-to-GDP ratio remained low at
20.4 % by 2018. However, for some provinces,
fast increases in indebtedness combined with
relatively weaker fiscal positions could be a
concern. Provincial level data indicates that,
between June and December 2018, amid
government measures to support economic
growth, some provinces with already relatively
higher indebtedness, such as Hainan, Ningxia,
Qinghai and Yunnan, also notably increased the
issuance of local government bonds, particularly
special bonds, to finance local infrastructure
spending (Chart 2.35).
Chart 2.35 Mainland China: Issuance of local government special bonds in June-December 2018 and local government debt
0
1
2
3
4
0 20 40 60 80
Local government debt in 2017 (% of GDP)
Issuance of new local government special bond in Jun-Dec 2018 (% of GDP)
QinghaiYunnan
HainanNingxia
Sources: Wind and HKMA staff estimates.
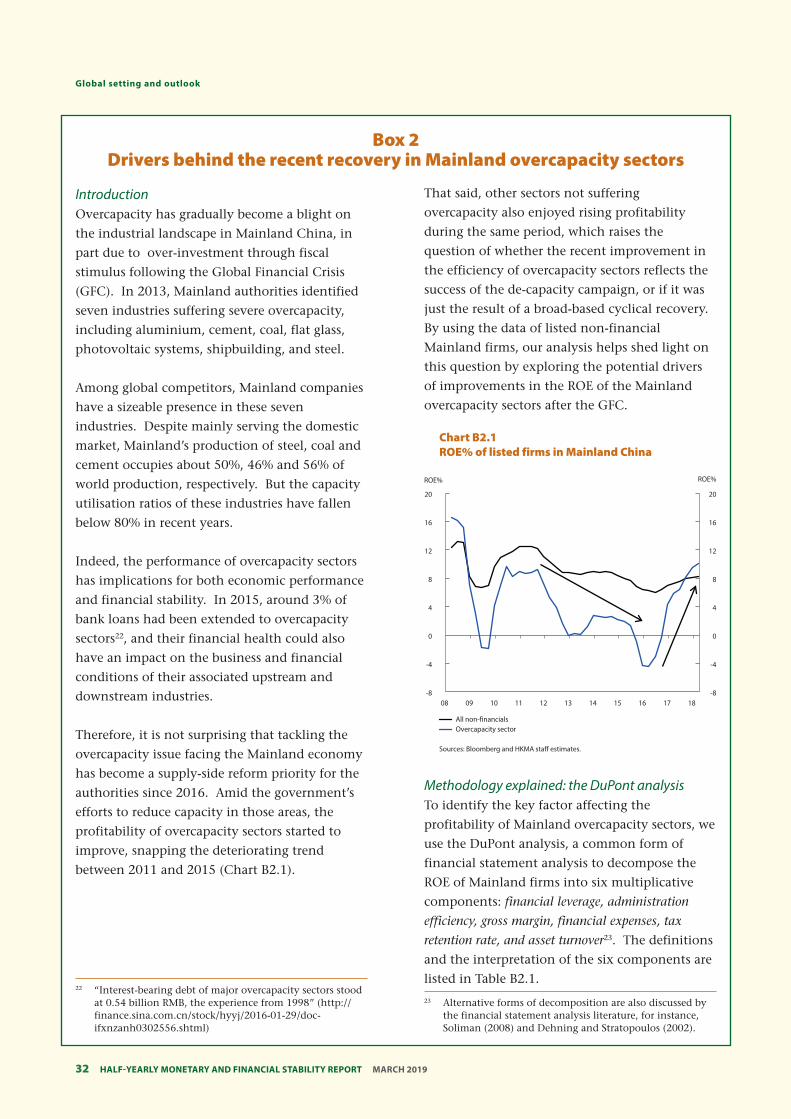
Half-YearlY MonetarY and financial StabilitY report MarcH 201932
Global setting and outlook
Box 2 Drivers behind the recent recovery in Mainland overcapacity sectors
Introduction Overcapacity has gradually become a blight on
the industrial landscape in Mainland China, in
part due to over-investment through fiscal
stimulus following the Global Financial Crisis
(GFC). In 2013, Mainland authorities identified
seven industries suffering severe overcapacity,
including aluminium, cement, coal, flat glass,
photovoltaic systems, shipbuilding, and steel.
Among global competitors, Mainland companies
have a sizeable presence in these seven
industries. Despite mainly serving the domestic
market, Mainland’s production of steel, coal and
cement occupies about 50%, 46% and 56% of
world production, respectively. But the capacity
utilisation ratios of these industries have fallen
below 80% in recent years.
Indeed, the performance of overcapacity sectors
has implications for both economic performance
and financial stability. In 2015, around 3% of
bank loans had been extended to overcapacity
sectors22, and their financial health could also
have an impact on the business and financial
conditions of their associated upstream and
downstream industries.
Therefore, it is not surprising that tackling the
overcapacity issue facing the Mainland economy
has become a supply-side reform priority for the
authorities since 2016. Amid the government’s
efforts to reduce capacity in those areas, the
profitability of overcapacity sectors started to
improve, snapping the deteriorating trend
between 2011 and 2015 (Chart B2.1).
That said, other sectors not suffering
overcapacity also enjoyed rising profitability
during the same period, which raises the
question of whether the recent improvement in
the efficiency of overcapacity sectors reflects the
success of the de-capacity campaign, or if it was
just the result of a broad-based cyclical recovery.
By using the data of listed non-financial
Mainland firms, our analysis helps shed light on
this question by exploring the potential drivers
of improvements in the ROE of the Mainland
overcapacity sectors after the GFC.
Chart B2.1 ROE% of listed firms in Mainland China
-8
-4
0
4
8
12
16
20
-8
-4
0
4
8
12
16
20
08 09 10 11 12 13 14 15 16 17 18
All non-financialsOvercapacity sector
ROE% ROE%
Sources: Bloomberg and HKMA staff estimates.
Methodology explained: the DuPont analysis To identify the key factor affecting the
profitability of Mainland overcapacity sectors, we
use the DuPont analysis, a common form of
financial statement analysis to decompose the
ROE of Mainland firms into six multiplicative
components: financial leverage, administration
efficiency, gross margin, financial expenses, tax
retention rate, and asset turnover23. The definitions
and the interpretation of the six components are
listed in Table B2.1. 22 “Interest-bearing debt of major overcapacity sectors stood
at 0.54 billion RMB, the experience from 1998” (http:// finance.sina.com.cn/stock/hyyj/2016-01-29/doc-ifxnzanh0302556.shtml)
23 Alternative forms of decomposition are also discussed by the financial statement analysis literature, for instance, Soliman (2008) and Dehning and Stratopoulos (2002).
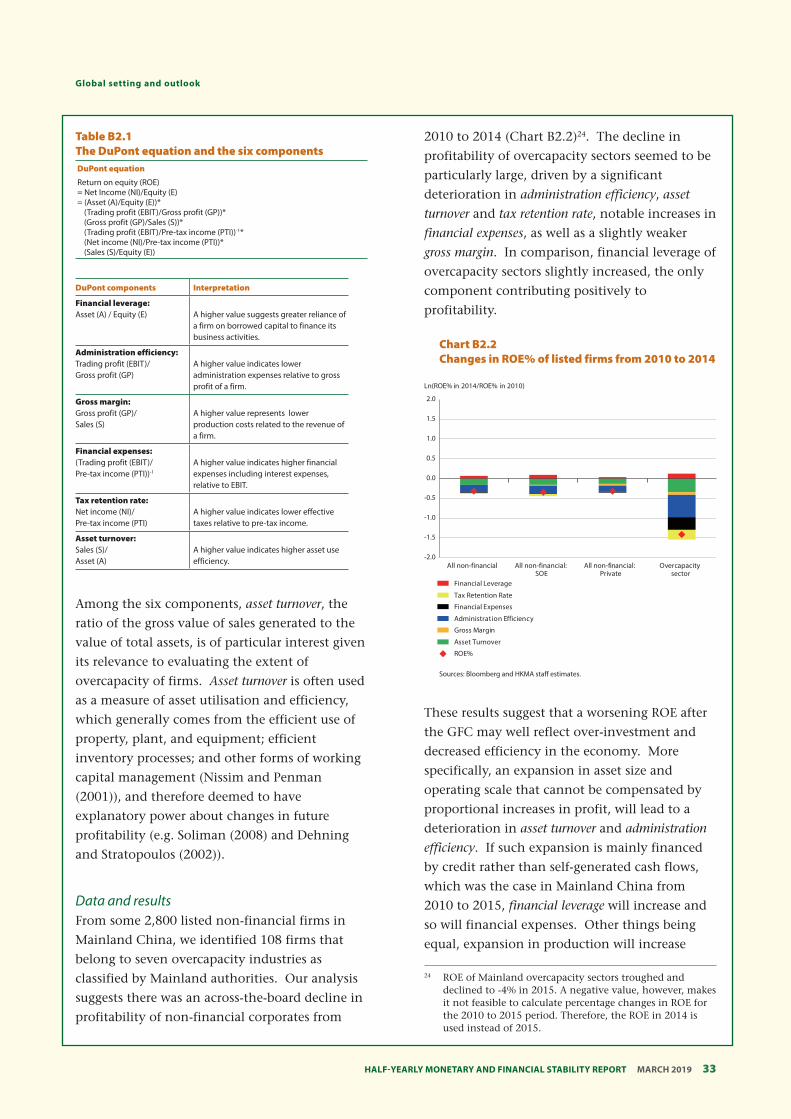
33 Half-YearlY MonetarY and financial StabilitY report MarcH 2019
Global setting and outlook
Table B2.1 The DuPont equation and the six components DuPont equation
Return on equity (ROE) = Net Income (NI)/Equity (E) = (Asset (A)/Equity (E))*
(Trading profit (EBIT)/Gross profit (GP))* (Gross profit (GP)/Sales (S))* (Trading profit (EBIT)/Pre-tax income (PTI))-1* (Net income (NI)/Pre-tax income (PTI))* (Sales (S)/Equity (E))
DuPont components Interpretation
Financial leverage: Asset (A) / Equity (E) A higher value suggests greater reliance of
a firm on borrowed capital to finance its business activities.
Administration efficiency: Trading profit (EBIT)/ A higher value indicates lower Gross profit (GP) administration expenses relative to gross
profit of a firm.
Gross margin: Gross profit (GP)/ A higher value represents lower Sales (S) production costs related to the revenue of
a firm.
Financial expenses: (Trading profit (EBIT)/ A higher value indicates higher financial Pre-tax income (PTI))-1 expenses including interest expenses,
relative to EBIT.
Tax retention rate: Net income (NI)/ A higher value indicates lower effective Pre-tax income (PTI) taxes relative to pre-tax income.
Asset turnover: Sales (S)/ A higher value indicates higher asset use Asset (A) efficiency.
Among the six components, asset turnover, the
ratio of the gross value of sales generated to the
value of total assets, is of particular interest given
its relevance to evaluating the extent of
overcapacity of firms. Asset turnover is often used
as a measure of asset utilisation and efficiency,
which generally comes from the efficient use of
property, plant, and equipment; efficient
inventory processes; and other forms of working
capital management (Nissim and Penman
(2001)), and therefore deemed to have
explanatory power about changes in future
profitability (e.g. Soliman (2008) and Dehning
and Stratopoulos (2002)).
Data and results From some 2,800 listed non-financial firms in
Mainland China, we identified 108 firms that
belong to seven overcapacity industries as
classified by Mainland authorities. Our analysis
suggests there was an across-the-board decline in
profitability of non-financial corporates from
2010 to 2014 (Chart B2.2)24. The decline in
profitability of overcapacity sectors seemed to be
particularly large, driven by a significant
deterioration in administration efficiency, asset
turnover and tax retention rate, notable increases in
financial expenses, as well as a slightly weaker
gross margin. In comparison, financial leverage of
overcapacity sectors slightly increased, the only
component contributing positively to
profitability.
Chart B2.2 Changes in ROE% of listed firms from 2010 to 2014
-2.0
-1.5
-1.0
-0.5
0.0
0.5
1.0
1.5
2.0
All non-financial All non-financial: SOE
All non-financial: Private
Overcapacity sector
Ln(ROE% in 2014/ROE% in 2010)
Financial Leverage
Tax Retention Rate
Financial Expenses
Administration Efficiency
Gross Margin
Asset Turnover
ROE%
Sources: Bloomberg and HKMA staff estimates.
These results suggest that a worsening ROE after
the GFC may well reflect over-investment and
decreased efficiency in the economy. More
specifically, an expansion in asset size and
operating scale that cannot be compensated by
proportional increases in profit, will lead to a
deterioration in asset turnover and administration
efficiency. If such expansion is mainly financed
by credit rather than self-generated cash flows,
which was the case in Mainland China from
2010 to 2015, financial leverage will increase and
so will financial expenses. Other things being
equal, expansion in production will increase
24 ROE of Mainland overcapacity sectors troughed and declined to -4% in 2015. A negative value, however, makes it not feasible to calculate percentage changes in ROE for the 2010 to 2015 period. Therefore, the ROE in 2014 is used instead of 2015.
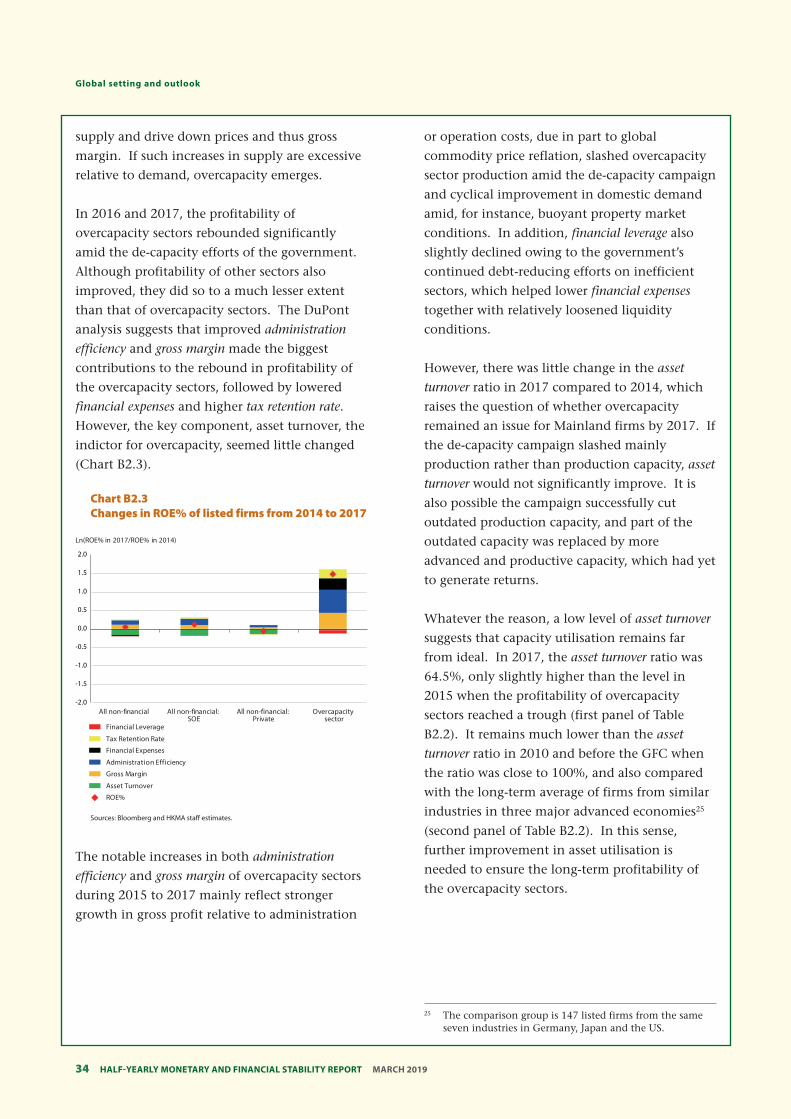
Half-YearlY MonetarY and financial StabilitY report MarcH 201934
Global setting and outlook
supply and drive down prices and thus gross
margin. If such increases in supply are excessive
relative to demand, overcapacity emerges.
In 2016 and 2017, the profitability of
overcapacity sectors rebounded significantly
amid the de-capacity efforts of the government.
Although profitability of other sectors also
improved, they did so to a much lesser extent
than that of overcapacity sectors. The DuPont
analysis suggests that improved administration
efficiency and gross margin made the biggest
contributions to the rebound in profitability of
the overcapacity sectors, followed by lowered
financial expenses and higher tax retention rate.
However, the key component, asset turnover, the
indictor for overcapacity, seemed little changed
(Chart B2.3).
Chart B2.3 Changes in ROE% of listed firms from 2014 to 2017
-2.0
-1.5
-1.0
-0.5
0.0
0.5
1.0
1.5
2.0
All non-financial All non-financial: SOE
All non-financial: Private
Overcapacity sector
Ln(ROE% in 2017/ROE% in 2014)
Financial Leverage
Tax Retention Rate
Financial Expenses
Administration Efficiency
Gross Margin
Asset Turnover
ROE%
Sources: Bloomberg and HKMA staff estimates.
The notable increases in both administration
efficiency and gross margin of overcapacity sectors
during 2015 to 2017 mainly reflect stronger
growth in gross profit relative to administration
or operation costs, due in part to global
commodity price reflation, slashed overcapacity
sector production amid the de-capacity campaign
and cyclical improvement in domestic demand
amid, for instance, buoyant property market
conditions. In addition, financial leverage also
slightly declined owing to the government’s
continued debt-reducing efforts on inefficient
sectors, which helped lower financial expenses
together with relatively loosened liquidity
conditions.
However, there was little change in the asset
turnover ratio in 2017 compared to 2014, which
raises the question of whether overcapacity
remained an issue for Mainland firms by 2017. If
the de-capacity campaign slashed mainly
production rather than production capacity, asset
turnover would not significantly improve. It is
also possible the campaign successfully cut
outdated production capacity, and part of the
outdated capacity was replaced by more
advanced and productive capacity, which had yet
to generate returns.
Whatever the reason, a low level of asset turnover
suggests that capacity utilisation remains far
from ideal. In 2017, the asset turnover ratio was
64.5%, only slightly higher than the level in
2015 when the profitability of overcapacity
sectors reached a trough (first panel of Table
B2.2). It remains much lower than the asset
turnover ratio in 2010 and before the GFC when
the ratio was close to 100%, and also compared
with the long-term average of firms from similar
industries in three major advanced economies25
(second panel of Table B2.2). In this sense,
further improvement in asset utilisation is
needed to ensure the long-term profitability of
the overcapacity sectors.
25 The comparison group is 147 listed firms from the same seven industries in Germany, Japan and the US.
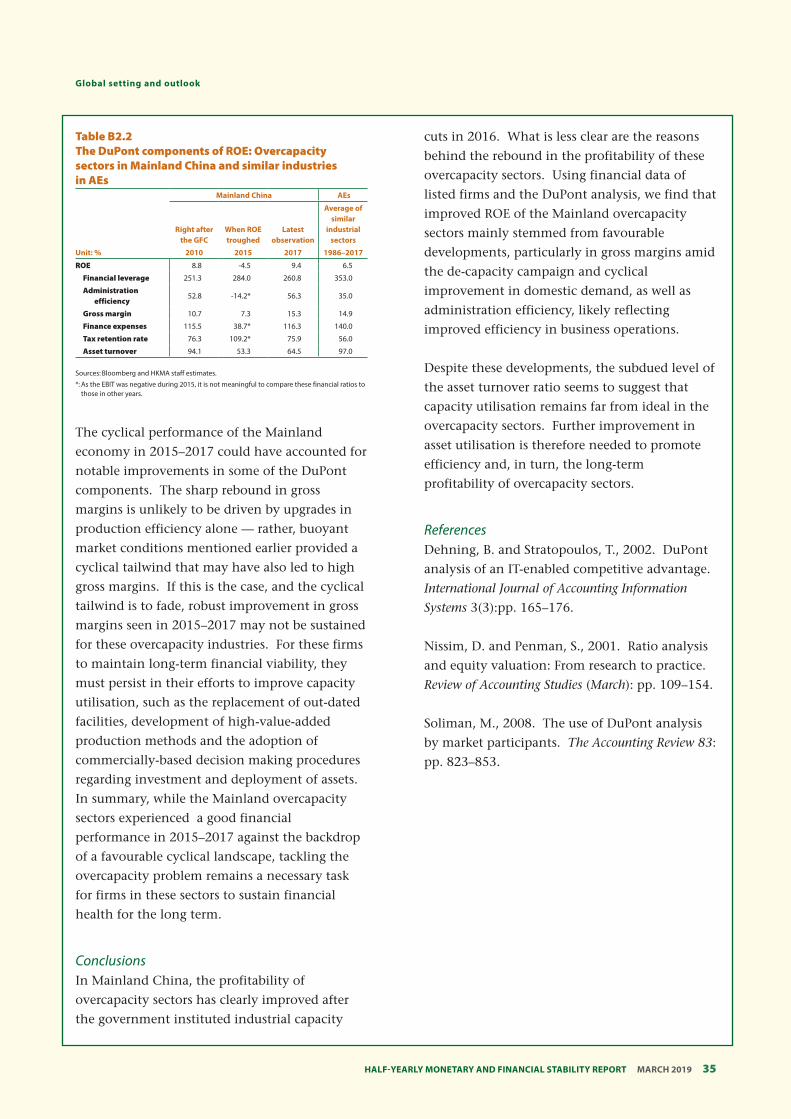
35 Half-YearlY MonetarY and financial StabilitY report MarcH 2019
Global setting and outlook
Table B2.2 The DuPont components of ROE: Overcapacity sectors in Mainland China and similar industries in AEs
Mainland China AEs
Average of similar
Right after When ROE Latest industrial the GFC troughed observation sectors
Unit: % 2010 2015 2017 1986–2017
ROE 8.8 -4.5 9.4 6.5
Financial leverage 251.3 284.0 260.8 353.0
Administration efficiency
52.8 -14.2* 56.3 35.0
Gross margin 10.7 7.3 15.3 14.9
Finance expenses 115.5 38.7* 116.3 140.0
Tax retention rate 76.3 109.2* 75.9 56.0
Asset turnover 94.1 53.3 64.5 97.0
Sources: Bloomberg and HKMA staff estimates.
*: As the EBIT was negative during 2015, it is not meaningful to compare these financial ratios to those in other years.
The cyclical performance of the Mainland
economy in 2015–2017 could have accounted for
notable improvements in some of the DuPont
components. The sharp rebound in gross
margins is unlikely to be driven by upgrades in
production efficiency alone — rather, buoyant
market conditions mentioned earlier provided a
cyclical tailwind that may have also led to high
gross margins. If this is the case, and the cyclical
tailwind is to fade, robust improvement in gross
margins seen in 2015–2017 may not be sustained
for these overcapacity industries. For these firms
to maintain long-term financial viability, they
must persist in their efforts to improve capacity
utilisation, such as the replacement of out-dated
facilities, development of high-value-added
production methods and the adoption of
commercially-based decision making procedures
regarding investment and deployment of assets.
In summary, while the Mainland overcapacity
sectors experienced a good financial
performance in 2015–2017 against the backdrop
of a favourable cyclical landscape, tackling the
overcapacity problem remains a necessary task
for firms in these sectors to sustain financial
health for the long term.
Conclusions In Mainland China, the profitability of
overcapacity sectors has clearly improved after
the government instituted industrial capacity
cuts in 2016. What is less clear are the reasons
behind the rebound in the profitability of these
overcapacity sectors. Using financial data of
listed firms and the DuPont analysis, we find that
improved ROE of the Mainland overcapacity
sectors mainly stemmed from favourable
developments, particularly in gross margins amid
the de-capacity campaign and cyclical
improvement in domestic demand, as well as
administration efficiency, likely reflecting
improved efficiency in business operations.
Despite these developments, the subdued level of
the asset turnover ratio seems to suggest that
capacity utilisation remains far from ideal in the
overcapacity sectors. Further improvement in
asset utilisation is therefore needed to promote
efficiency and, in turn, the long-term
profitability of overcapacity sectors.
References Dehning, B. and Stratopoulos, T., 2002. DuPont
analysis of an IT-enabled competitive advantage.
International Journal of Accounting Information
Systems 3(3):pp. 165–176.
Nissim, D. and Penman, S., 2001. Ratio analysis
and equity valuation: From research to practice.
Review of Accounting Studies (March): pp. 109–154.
Soliman, M., 2008. The use of DuPont analysis
by market participants. The Accounting Review 83:
pp. 823–853.
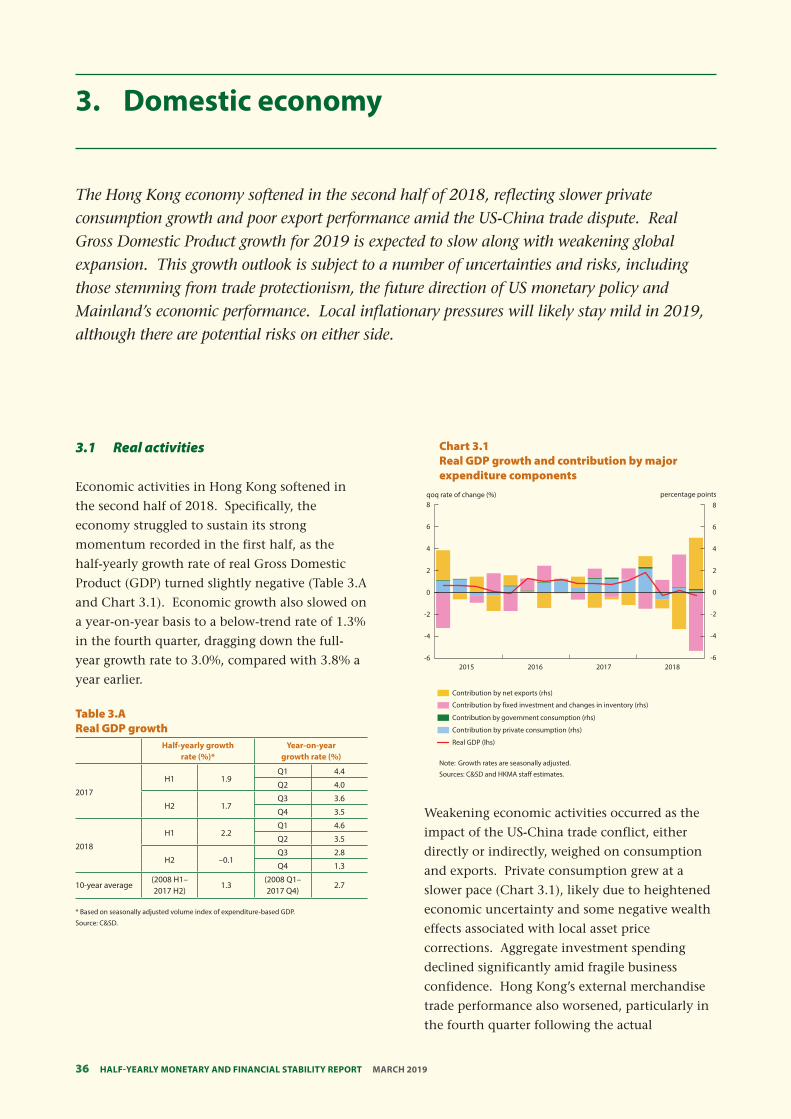
Half-YearlY MonetarY and financial StabilitY report MarcH 2019
3. Domestic economy
The Hong Kong economy softened in the second half of 2018, reflecting slower private consumption growth and poor export performance amid the US-China trade dispute. Real Gross Domestic Product growth for 2019 is expected to slow along with weakening global expansion. This growth outlook is subject to a number of uncertainties and risks, including those stemming from trade protectionism, the future direction of US monetary policy and Mainland’s economic performance. Local inflationary pressures will likely stay mild in 2019, although there are potential risks on either side.
3.1 Real activities
Economic activities in Hong Kong softened in
the second half of 2018. Specifically, the
economy struggled to sustain its strong
momentum recorded in the first half, as the
half-yearly growth rate of real Gross Domestic
Product (GDP) turned slightly negative (Table 3.A
and Chart 3.1). Economic growth also slowed on
a year-on-year basis to a below-trend rate of 1.3%
in the fourth quarter, dragging down the full-
year growth rate to 3.0%, compared with 3.8% a
year earlier.
Table 3.A Real GDP growth
Half-yearly growth Year-on-year rate (%)* growth rate (%)
2017
H1 1.9 Q1
Q2
4.4
4.0
H2 1.7 Q3
Q4
3.6
3.5
2018
H1 2.2 Q1
Q2
4.6
3.5
H2 –0.1 Q3
Q4
2.8
1.3
10-year average (2008 H1– 2017 H2)
1.3 (2008 Q1– 2017 Q4)
2.7
* Based on seasonally adjusted volume index of expenditure-based GDP.
Source: C&SD.
Chart 3.1 Real GDP growth and contribution by major expenditure components
-6
-4
-2
0
2
4
6
8
-6
-4
-2
0
2
4
6
8
2015 201820172016
Contribution by net exports (rhs)
Contribution by fixed investment and changes in inventory (rhs)
Contribution by government consumption (rhs)
Contribution by private consumption (rhs)
Real GDP (lhs)
percentage pointsqoq rate of change (%)
Note: Growth rates are seasonally adjusted.
Sources: C&SD and HKMA staff estimates.
Weakening economic activities occurred as the
impact of the US-China trade conflict, either
directly or indirectly, weighed on consumption
and exports. Private consumption grew at a
slower pace (Chart 3.1), likely due to heightened
economic uncertainty and some negative wealth
effects associated with local asset price
corrections. Aggregate investment spending
declined significantly amid fragile business
confidence. Hong Kong’s external merchandise
trade performance also worsened, particularly in
the fourth quarter following the actual
36
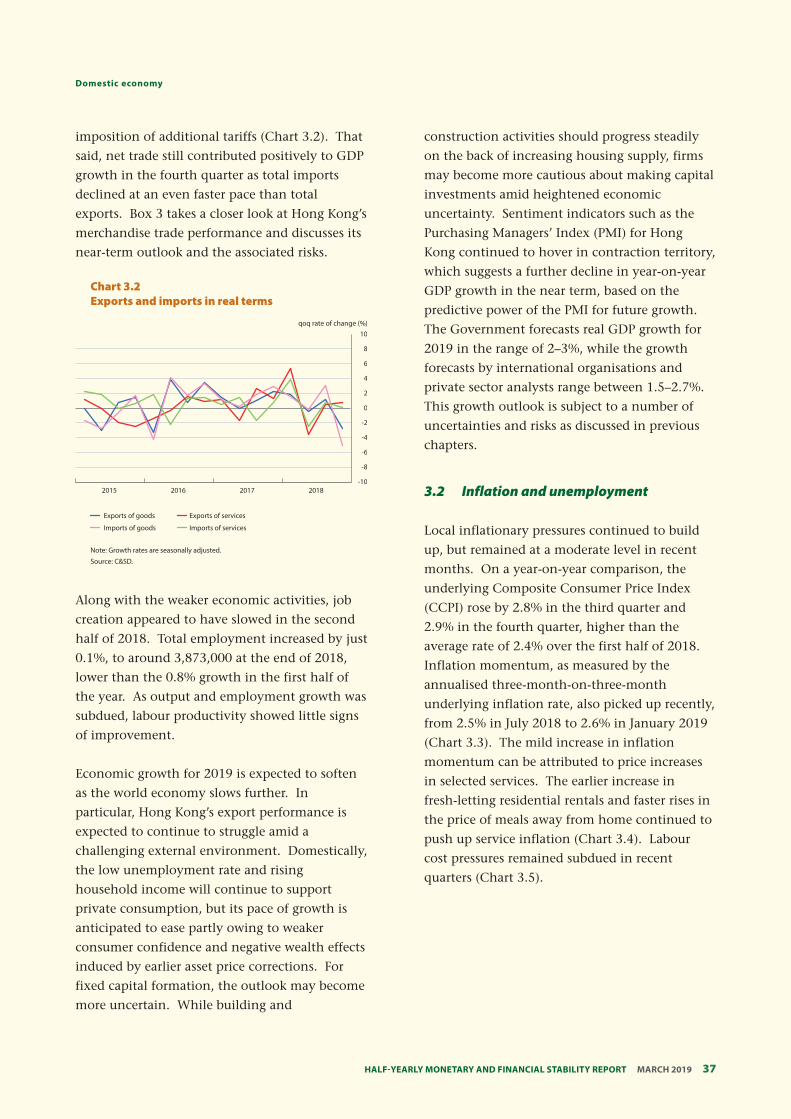
37 Half-YearlY MonetarY and financial StabilitY report MarcH 2019
domestic economy
imposition of additional tariffs (Chart 3.2). That
said, net trade still contributed positively to GDP
growth in the fourth quarter as total imports
declined at an even faster pace than total
exports. Box 3 takes a closer look at Hong Kong’s
merchandise trade performance and discusses its
near-term outlook and the associated risks.
Chart 3.2 Exports and imports in real terms
-10
-8
-6
-4
-2
0
2
4
6
8
10
2015 2016 2017 2018
Exports of goods Exports of services
Imports of goods Imports of services
qoq rate of change (%)
Note: Growth rates are seasonally adjusted.
Source: C&SD.
Along with the weaker economic activities, job
creation appeared to have slowed in the second
half of 2018. Total employment increased by just
0.1%, to around 3,873,000 at the end of 2018,
lower than the 0.8% growth in the first half of
the year. As output and employment growth was
subdued, labour productivity showed little signs
of improvement.
Economic growth for 2019 is expected to soften
as the world economy slows further. In
particular, Hong Kong’s export performance is
expected to continue to struggle amid a
challenging external environment. Domestically,
the low unemployment rate and rising
household income will continue to support
private consumption, but its pace of growth is
anticipated to ease partly owing to weaker
consumer confidence and negative wealth effects
induced by earlier asset price corrections. For
fixed capital formation, the outlook may become
more uncertain. While building and
construction activities should progress steadily
on the back of increasing housing supply, firms
may become more cautious about making capital
investments amid heightened economic
uncertainty. Sentiment indicators such as the
Purchasing Managers’ Index (PMI) for Hong
Kong continued to hover in contraction territory,
which suggests a further decline in year-on-year
GDP growth in the near term, based on the
predictive power of the PMI for future growth.
The Government forecasts real GDP growth for
2019 in the range of 2–3%, while the growth
forecasts by international organisations and
private sector analysts range between 1.5–2.7%.
This growth outlook is subject to a number of
uncertainties and risks as discussed in previous
chapters.
3.2 Inflation and unemployment
Local inflationary pressures continued to build
up, but remained at a moderate level in recent
months. On a year-on-year comparison, the
underlying Composite Consumer Price Index
(CCPI) rose by 2.8% in the third quarter and
2.9% in the fourth quarter, higher than the
average rate of 2.4% over the first half of 2018.
Inflation momentum, as measured by the
annualised three-month-on-three-month
underlying inflation rate, also picked up recently,
from 2.5% in July 2018 to 2.6% in January 2019
(Chart 3.3). The mild increase in inflation
momentum can be attributed to price increases
in selected services. The earlier increase in
fresh-letting residential rentals and faster rises in
the price of meals away from home continued to
push up service inflation (Chart 3.4). Labour
cost pressures remained subdued in recent
quarters (Chart 3.5).
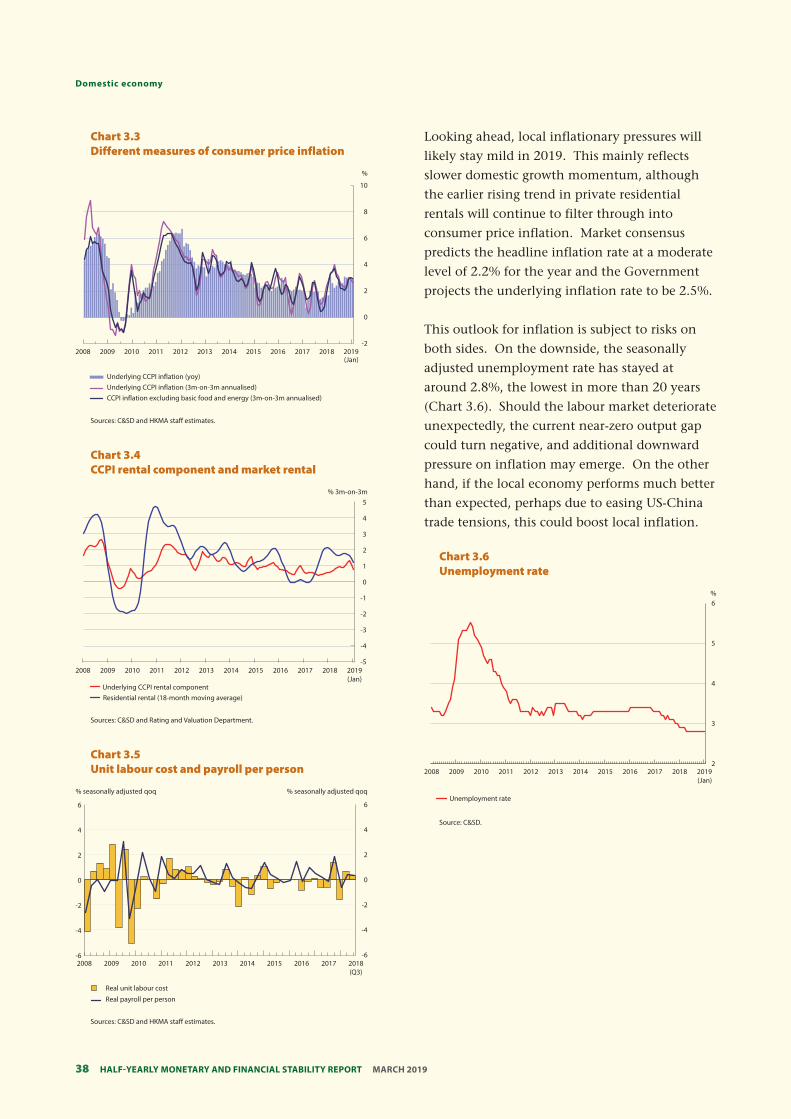
Half-YearlY MonetarY and financial StabilitY report MarcH 201938
Domestic economy
Chart 3.3 Different measures of consumer price inflation
-2
0
2
4
6
8
10
2008 2009 2010 2011 2012 2013 2014 2015 2016 2017 2018 2019(Jan)
%
Underlying CCPI inflation (yoy)Underlying CCPI inflation (3m-on-3m annualised)CCPI inflation excluding basic food and energy (3m-on-3m annualised)
Sources: C&SD and HKMA staff estimates.
Chart 3.4 CCPI rental component and market rental
% 3m-on-3m 5
4
3
2
1
0
-1
-2
-3
-4
-5 2008 2009 2010 2011 2012 2013 2014 2015 2016 2017 2018 2019
(Jan) Underlying CCPI rental component Residential rental (18-month moving average)
Sources: C&SD and Rating and Valuation Department.
% seasonally adjusted qoq % seasonally adjusted qoq
6 6
4 4
2 2
0 0
-2 -2
-4 -4
-6 -6 2008 2009 2010 2011 2012 2013 2014 2015 2016 2017 2018
(Q3)
Real unit labour cost
Real payroll per person
Sources: C&SD and HKMA staff estimates.
Chart 3.5 Unit labour cost and payroll per person
Looking ahead, local inflationary pressures will
likely stay mild in 2019. This mainly reflects
slower domestic growth momentum, although
the earlier rising trend in private residential
rentals will continue to filter through into
consumer price inflation. Market consensus
predicts the headline inflation rate at a moderate
level of 2.2% for the year and the Government
projects the underlying inflation rate to be 2.5%.
This outlook for inflation is subject to risks on
both sides. On the downside, the seasonally
adjusted unemployment rate has stayed at
around 2.8%, the lowest in more than 20 years
(Chart 3.6). Should the labour market deteriorate
unexpectedly, the current near-zero output gap
could turn negative, and additional downward
pressure on inflation may emerge. On the other
hand, if the local economy performs much better
than expected, perhaps due to easing US-China
trade tensions, this could boost local inflation.
Chart 3.6 Unemployment rate
% 6
5
4
3
2 2008 2009 2010 2011 2012 2013 2014 2015 2016 2017 2018 2019
(Jan)
Unemployment rate
Source: C&SD.
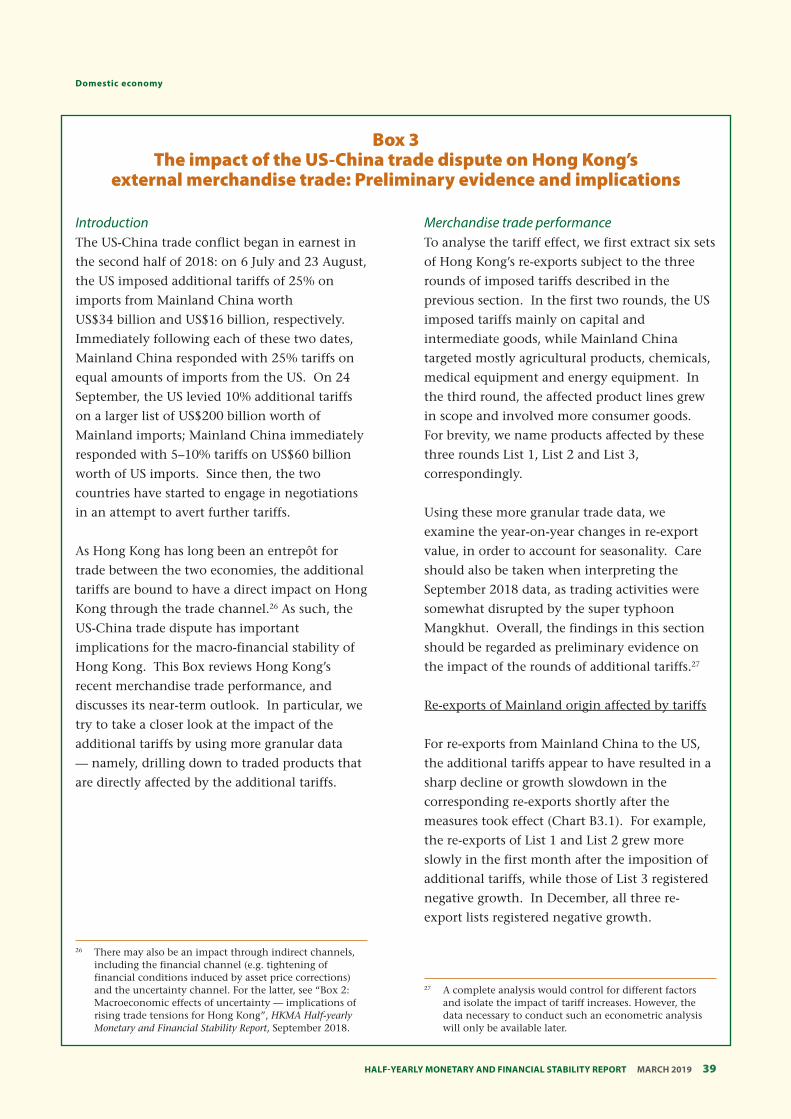
39 Half-YearlY MonetarY and financial StabilitY report MarcH 2019
domestic economy
Box 3 The impact of the US-China trade dispute on Hong Kong’s
external merchandise trade: Preliminary evidence and implications
Introduction The US-China trade conflict began in earnest in
the second half of 2018: on 6 July and 23 August,
the US imposed additional tariffs of 25% on
imports from Mainland China worth
US$34 billion and US$16 billion, respectively.
Immediately following each of these two dates,
Mainland China responded with 25% tariffs on
equal amounts of imports from the US. On 24
September, the US levied 10% additional tariffs
on a larger list of US$200 billion worth of
Mainland imports; Mainland China immediately
responded with 5–10% tariffs on US$60 billion
worth of US imports. Since then, the two
countries have started to engage in negotiations
in an attempt to avert further tariffs.
As Hong Kong has long been an entrepôt for
trade between the two economies, the additional
tariffs are bound to have a direct impact on Hong
Kong through the trade channel.26 As such, the
US-China trade dispute has important
implications for the macro-financial stability of
Hong Kong. This Box reviews Hong Kong’s
recent merchandise trade performance, and
discusses its near-term outlook. In particular, we
try to take a closer look at the impact of the
additional tariffs by using more granular data
— namely, drilling down to traded products that
are directly affected by the additional tariffs.
Merchandise trade performance To analyse the tariff effect, we first extract six sets
of Hong Kong’s re-exports subject to the three
rounds of imposed tariffs described in the
previous section. In the first two rounds, the US
imposed tariffs mainly on capital and
intermediate goods, while Mainland China
targeted mostly agricultural products, chemicals,
medical equipment and energy equipment. In
the third round, the affected product lines grew
in scope and involved more consumer goods.
For brevity, we name products affected by these
three rounds List 1, List 2 and List 3,
correspondingly.
Using these more granular trade data, we
examine the year-on-year changes in re-export
value, in order to account for seasonality. Care
should also be taken when interpreting the
September 2018 data, as trading activities were
somewhat disrupted by the super typhoon
Mangkhut. Overall, the findings in this section
should be regarded as preliminary evidence on
the impact of the rounds of additional tariffs.27
Re-exports of Mainland origin affected by tariffs
For re-exports from Mainland China to the US,
the additional tariffs appear to have resulted in a
sharp decline or growth slowdown in the
corresponding re-exports shortly after the
measures took effect (Chart B3.1). For example,
the re-exports of List 1 and List 2 grew more
slowly in the first month after the imposition of
additional tariffs, while those of List 3 registered
negative growth. In December, all three re-
export lists registered negative growth.
26 There may also be an impact through indirect channels, including the financial channel (e.g. tightening of financial conditions induced by asset price corrections) and the uncertainty channel. For the latter, see “Box 2: Macroeconomic effects of uncertainty — implications of rising trade tensions for Hong Kong”, HKMA Half-yearly Monetary and Financial Stability Report, September 2018.
27 A complete analysis would control for different factors and isolate the impact of tariff increases. However, the data necessary to conduct such an econometric analysis will only be available later.
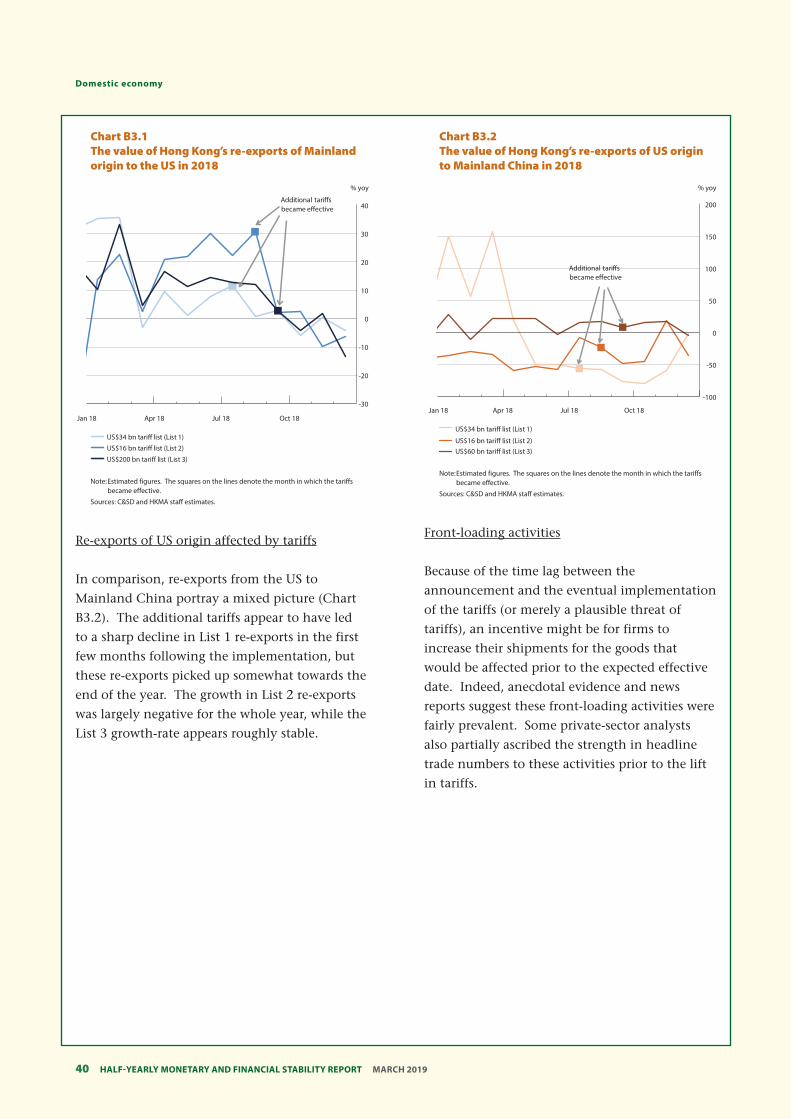
Half-YearlY MonetarY and financial StabilitY report MarcH 201940
Domestic economy
Chart B3.1 The value of Hong Kong’s re-exports of Mainland origin to the US in 2018
% yoy
Additional tari˜s became e˜ective 40
30
20
10
0
-10
-20
-30
Jan 18 Apr 18 Jul 18 Oct 18
US$34 bn tari˜ list (List 1)
US$16 bn tari˜ list (List 2)
US$200 bn tari˜ list (List 3)
Note:Estimated figures. The squares on the lines denote the month in which the tariffs became effective.
Sources: C&SD and HKMA staff estimates.
Re-exports of US origin affected by tariffs
In comparison, re-exports from the US to
Mainland China portray a mixed picture (Chart
B3.2). The additional tariffs appear to have led
to a sharp decline in List 1 re-exports in the first
few months following the implementation, but
these re-exports picked up somewhat towards the
end of the year. The growth in List 2 re-exports
was largely negative for the whole year, while the
List 3 growth-rate appears roughly stable.
Chart B3.2 The value of Hong Kong’s re-exports of US origin to Mainland China in 2018
% yoy
Additional tari˜s became e˜ective
Jan 18 Apr 18 Jul 18 Oct 18
200
150
100
50
0
-50
-100
US$34 bn tari˜ list (List 1)
US$16 bn tari˜ list (List 2) US$60 bn tari˜ list (List 3)
Note:Estimated figures. The squares on the lines denote the month in which the tariffs became effective.
Sources: C&SD and HKMA staff estimates.
Front-loading activities
Because of the time lag between the
announcement and the eventual implementation
of the tariffs (or merely a plausible threat of
tariffs), an incentive might be for firms to
increase their shipments for the goods that
would be affected prior to the expected effective
date. Indeed, anecdotal evidence and news
reports suggest these front-loading activities were
fairly prevalent. Some private-sector analysts
also partially ascribed the strength in headline
trade numbers to these activities prior to the lift
in tariffs.
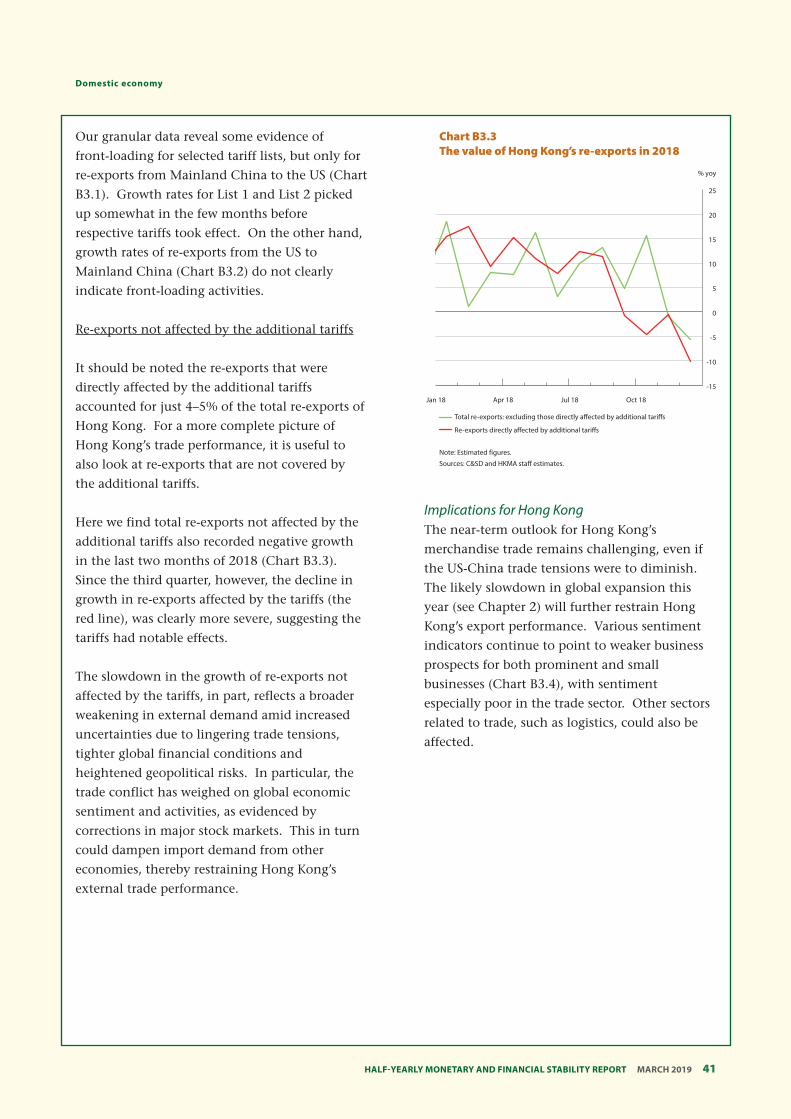
41 Half-YearlY MonetarY and financial StabilitY report MarcH 2019
domestic economy
Our granular data reveal some evidence of
front-loading for selected tariff lists, but only for
re-exports from Mainland China to the US (Chart
B3.1). Growth rates for List 1 and List 2 picked
up somewhat in the few months before
respective tariffs took effect. On the other hand,
growth rates of re-exports from the US to
Mainland China (Chart B3.2) do not clearly
indicate front-loading activities.
Re-exports not affected by the additional tariffs
It should be noted the re-exports that were
directly affected by the additional tariffs
accounted for just 4–5% of the total re-exports of
Hong Kong. For a more complete picture of
Hong Kong’s trade performance, it is useful to
also look at re-exports that are not covered by
the additional tariffs.
Here we find total re-exports not affected by the
additional tariffs also recorded negative growth
in the last two months of 2018 (Chart B3.3).
Since the third quarter, however, the decline in
growth in re-exports affected by the tariffs (the
red line), was clearly more severe, suggesting the
tariffs had notable effects.
The slowdown in the growth of re-exports not
affected by the tariffs, in part, reflects a broader
weakening in external demand amid increased
uncertainties due to lingering trade tensions,
tighter global financial conditions and
heightened geopolitical risks. In particular, the
trade conflict has weighed on global economic
sentiment and activities, as evidenced by
corrections in major stock markets. This in turn
could dampen import demand from other
economies, thereby restraining Hong Kong’s
external trade performance.
Chart B3.3 The value of Hong Kong’s re-exports in 2018
% yoy
25
20
15
10
5
0
-5
-10
-15
Jan 18 Apr 18 Jul 18 Oct 18
Total re-exports: excluding those directly a˜ected by additional tari˜s
Re-exports directly a˜ected by additional tari˜s
Note: Estimated figures.
Sources: C&SD and HKMA staff estimates.
Implications for Hong Kong The near-term outlook for Hong Kong’s
merchandise trade remains challenging, even if
the US-China trade tensions were to diminish.
The likely slowdown in global expansion this
year (see Chapter 2) will further restrain Hong
Kong’s export performance. Various sentiment
indicators continue to point to weaker business
prospects for both prominent and small
businesses (Chart B3.4), with sentiment
especially poor in the trade sector. Other sectors
related to trade, such as logistics, could also be
affected.
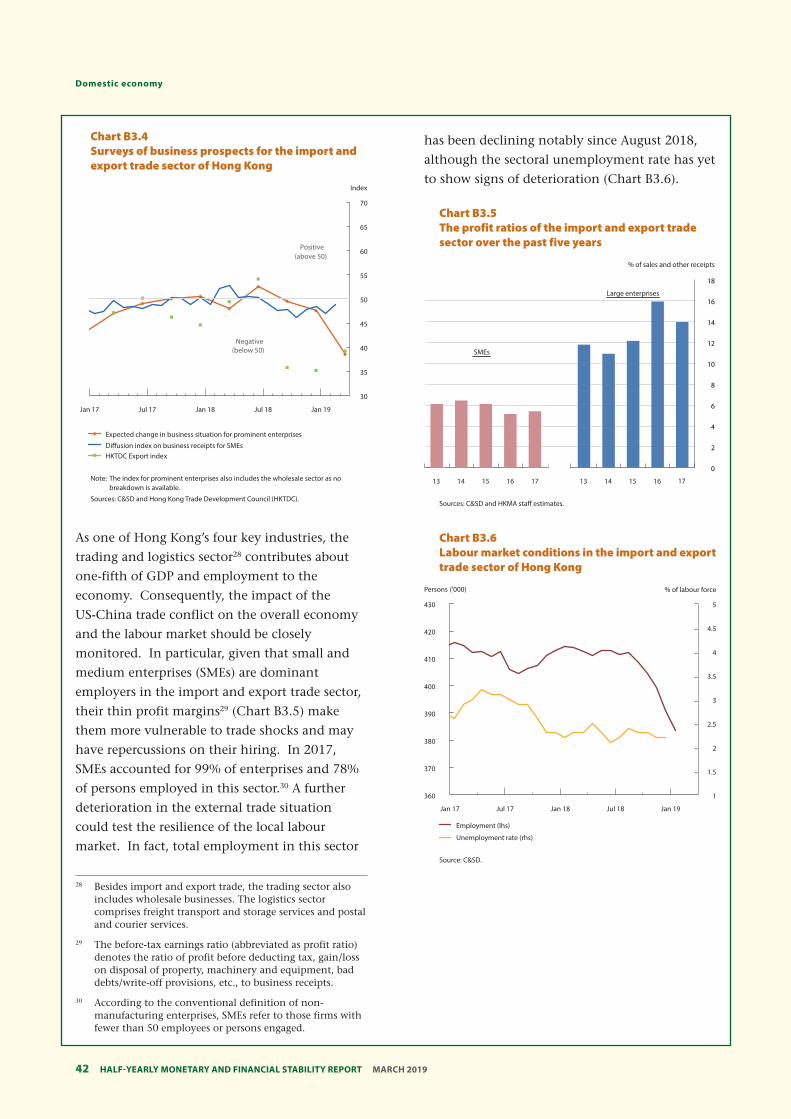
Half-YearlY MonetarY and financial StabilitY report MarcH 201942
Domestic economy
Chart B3.4 Surveys of business prospects for the import and export trade sector of Hong Kong
Index
Positive (above 50)
Negative (below 50)
70
65
60
55
50
45
40
35
30
Jan 17 Jul 17 Jan 18 Jul 18 Jan 19
Expected change in business situation for prominent enterprises
Di˜usion index on business receipts for SMEs HKTDC Export index
Note: The index for prominent enterprises also includes the wholesale sector as no breakdown is available.
Sources: C&SD and Hong Kong Trade Development Council (HKTDC).
As one of Hong Kong’s four key industries, the
trading and logistics sector28 contributes about
one-fifth of GDP and employment to the
economy. Consequently, the impact of the
US-China trade conflict on the overall economy
and the labour market should be closely
monitored. In particular, given that small and
medium enterprises (SMEs) are dominant
employers in the import and export trade sector,
their thin profit margins29 (Chart B3.5) make
them more vulnerable to trade shocks and may
have repercussions on their hiring. In 2017,
SMEs accounted for 99% of enterprises and 78%
of persons employed in this sector.30 A further
deterioration in the external trade situation
could test the resilience of the local labour
market. In fact, total employment in this sector
has been declining notably since August 2018,
although the sectoral unemployment rate has yet
to show signs of deterioration (Chart B3.6).
Chart B3.5 The profit ratios of the import and export trade sector over the past five years
% of sales and other receipts
18
16
14
12
10
8
6
4
2
0
13 14 15 16 17 13 14 15 16 17
Sources: C&SD and HKMA staff estimates.
SMEs
Large enterprises
Chart B3.6 Labour market conditions in the import and export trade sector of Hong Kong
Persons ('000) % of labour force
430 5
4.5 420
4 410
3.5 400
3
390 2.5
380 2
370 1.5
360 1
Jan 17 Jul 17 Jan 18 Jul 18 Jan 19
Employment (lhs)
Unemployment rate (rhs)
Source: C&SD.
28 Besides import and export trade, the trading sector also includes wholesale businesses. The logistics sector comprises freight transport and storage services and postal and courier services.
29 The before-tax earnings ratio (abbreviated as profit ratio) denotes the ratio of profit before deducting tax, gain/loss on disposal of property, machinery and equipment, bad debts/write-off provisions, etc., to business receipts.
30 According to the conventional definition of non-manufacturing enterprises, SMEs refer to those firms with fewer than 50 employees or persons engaged.
43 Half-YearlY MonetarY and financial StabilitY report MarcH 2019
domestic economy
Conclusions This Box shows that the US-China trade conflict
is taking its toll on Hong Kong’s external
merchandise trade. More granular data point to
an immediate adverse impact following the tariff
increases, especially for re-exports from Mainland
China to the US that are subject to the additional
tariffs. There was also some evidence of front-
loading activities. In addition, re-exports that
were not covered by the additional tariffs also
retreated towards the end of 2018, perhaps
reflecting a broader weakening in external
demand amid increased uncertainties due to the
lingering trade tensions, tighter global financial
conditions and heightened geopolitical risks.
The near-term outlook for Hong Kong’s
merchandise trade remains challenging even if
the US-China trade tensions were to abate, given
the deceleration in global growth. Sector-wise,
the import and export trade sector will bear the
brunt of the headwinds, possibly with negative
spillovers to the broader economy and the labour
market. SMEs in this sector may be particularly
vulnerable given their relatively thin profit
margins.
Half-YearlY MonetarY and financial StabilitY report MarcH 2019
4. Monetary and financial conditions
The Hong Kong dollar exchange rate strengthened in September and November, in part reflecting the unwinding of interest carry trade positions as liquidity conditions tightened amid anticipated seasonal funding demand. In early 2019, partly associated with the repatriation of proceeds raised in initial public offerings and some re-building of interest carry positions, the Hong Kong dollar weakened gradually and the weak-side Convertibility Undertaking (CU) was triggered in March. Despite this, the Hong Kong dollar remained traded in a smooth and orderly manner. Reflecting the expectation of US rate hikes and seasonal funding demand, Hong Kong Interbank Offered Rates broadly picked up during the second half of 2018 before easing in January 2019. Fund flows into and out of Hong Kong dollar in the near term may become more volatile amid uncertainties arising from the lingering US-China trade tensions, the Brexit negotiations and the less predictable pace of US monetary policy normalisation. If the large gaps between the Hong Kong dollar and US dollar interest rates remain, carry trade activities will likely keep the Hong Kong dollar weak in the near future and the weak-side CU may be triggered again, consistent with the design of the Linked Exchange Rate System.
4.1 Exchange rate and capital flows
After the triggering of the weak-side
Convertibility Undertaking (CU) in the latter
part of August, the Hong Kong dollar moved
away from 7.8500 to trade between 7.8062 and
7.8499 until the weak-side CU was triggered
again 4 times in March 2019 (up to
19 March 2019) (Chart 4.1).31 The Hong Kong
dollar exchange rate briefly strengthened in
September, partly reflecting unwinding of
interest carry trade positions amid tightening
interbank liquidity, before easing gradually in
October. Since November, the Hong Kong dollar
firmed again due to the unwinding of interest
carry positions as liquidity conditions tightened
amid year-end funding demand. Stepping into
2019, the spot rate weakened, partly associated
with repatriation of proceeds raised in initial
public offerings (IPOs) and some re-building of
interest carry positions.
Widened interest rate gaps between the Hong
Kong dollar and US dollar after the year-end
attracted carry trade activities that sell Hong
Kong dollar for US dollar, pushing the Hong
Kong dollar exchange rate towards the weak-side.
The weak-side CU was triggered again in March.
Despite the triggering of the weak-side CU, the
Hong Kong dollar continued to trade in a
smooth and orderly manner. The Aggregate
Balance remained unchanged at around
HK$76 billion since August (Chart 4.2); it
subsequently edged down to HK$70.9 billion
(as at March 19) due to the triggering of the
weak-side CU in March. The amount of outflows
since April 2018 constitutes only a small part of
the inflows since 2008, which amounted to
around HK$1 trillion.
31 Based on the closing rate.
44
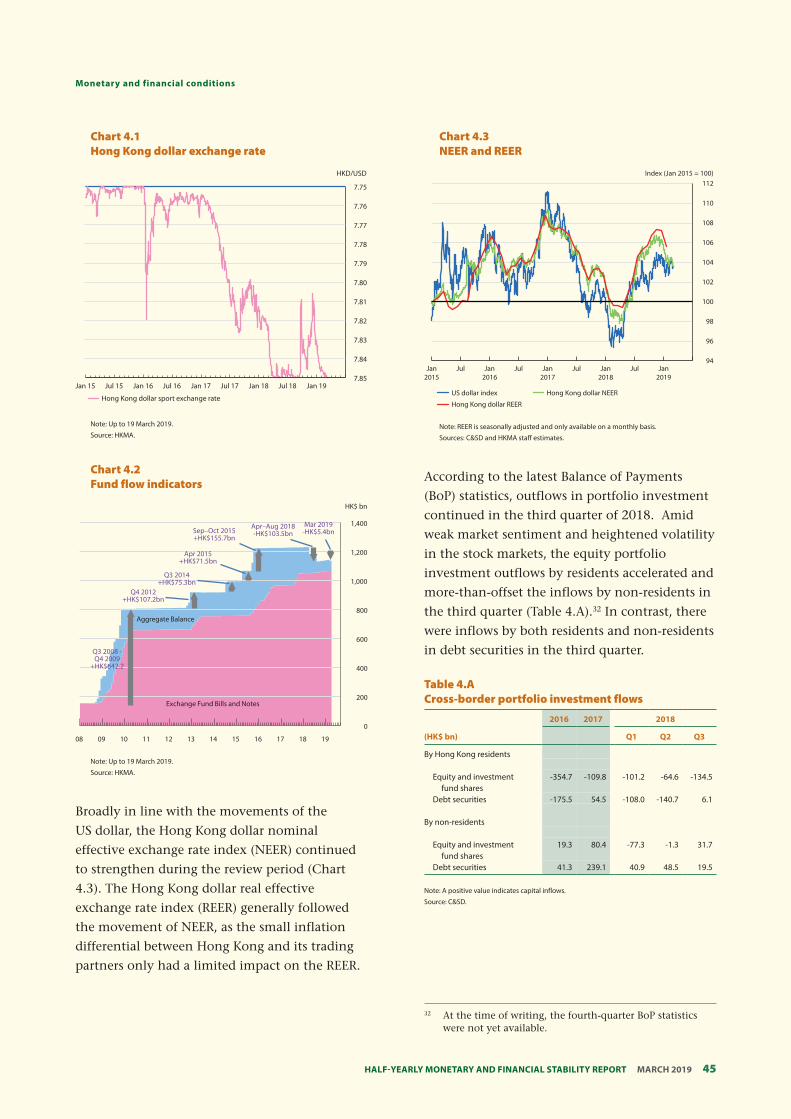
Half-YearlY MonetarY and financial StabilitY report MarcH 2019
Monetary and financial conditions
Chart 4.1 Hong Kong dollar exchange rate
HKD/USD
7.75
7.76
7.77
7.78
7.79
7.80
7.81
7.82
7.83
7.84
7.85 Jan 15 Jul 15 Jan 16 Jul 16 Jan 17 Jul 17 Jan 18 Jul 18 Jan 19
Hong Kong dollar sport exchange rate
Note: Up to 19 March 2019.
Source: HKMA.
Chart 4.2 Fund flow indicators
HK$ bn
1,400 Apr–Aug 2018 Mar 2019 Sep–Oct 2015 -HK$5.4bn -HK$103.5bn +HK$155.7bn
1,200 Apr 2015 +HK$71.5bn
Q3 2014 +HK$75.3bn 1,000
Q4 2012 +HK$107.2bn
800 Aggregate Balance
600
Q3 2008 -Q4 2009
+HK$642.2 400
200 Exchange Fund Bills and Notes
0
08 09 10 11 12 13 14 15 16 17 18 19
Note: Up to 19 March 2019.
Source: HKMA.
Chart 4.3 NEER and REER
Index (Jan 2015 = 100) 112
110
108
106
104
102
100
98
96
94 Jan Jul Jan Jul Jan Jul Jan Jul Jan
2015 2016 2017 2018 2019
US dollar index Hong Kong dollar NEER
Hong Kong dollar REER
Note: REER is seasonally adjusted and only available on a monthly basis.
Sources: C&SD and HKMA staff estimates.
Broadly in line with the movements of the
US dollar, the Hong Kong dollar nominal
effective exchange rate index (NEER) continued
to strengthen during the review period (Chart
4.3). The Hong Kong dollar real effective
exchange rate index (REER) generally followed
the movement of NEER, as the small inflation
differential between Hong Kong and its trading
partners only had a limited impact on the REER.
According to the latest Balance of Payments
(BoP) statistics, outflows in portfolio investment
continued in the third quarter of 2018. Amid
weak market sentiment and heightened volatility
in the stock markets, the equity portfolio
investment outflows by residents accelerated and
more-than-offset the inflows by non-residents in
the third quarter (Table 4.A).32 In contrast, there
were inflows by both residents and non-residents
in debt securities in the third quarter.
Table 4.A Cross-border portfolio investment flows
2016 2017 2018
(HK$ bn) Q1 Q2 Q3
By Hong Kong residents
Equity and investment -354.7 -109.8 -101.2 -64.6 -134.5 fund shares
Debt securities -175.5 54.5 -108.0 -140.7 6.1
By non-residents
Equity and investment 19.3 80.4 -77.3 -1.3 31.7 fund shares
Debt securities 41.3 239.1 40.9 48.5 19.5
Note: A positive value indicates capital inflows.
Source: C&SD.
32 At the time of writing, the fourth-quarter BoP statistics were not yet available.
45
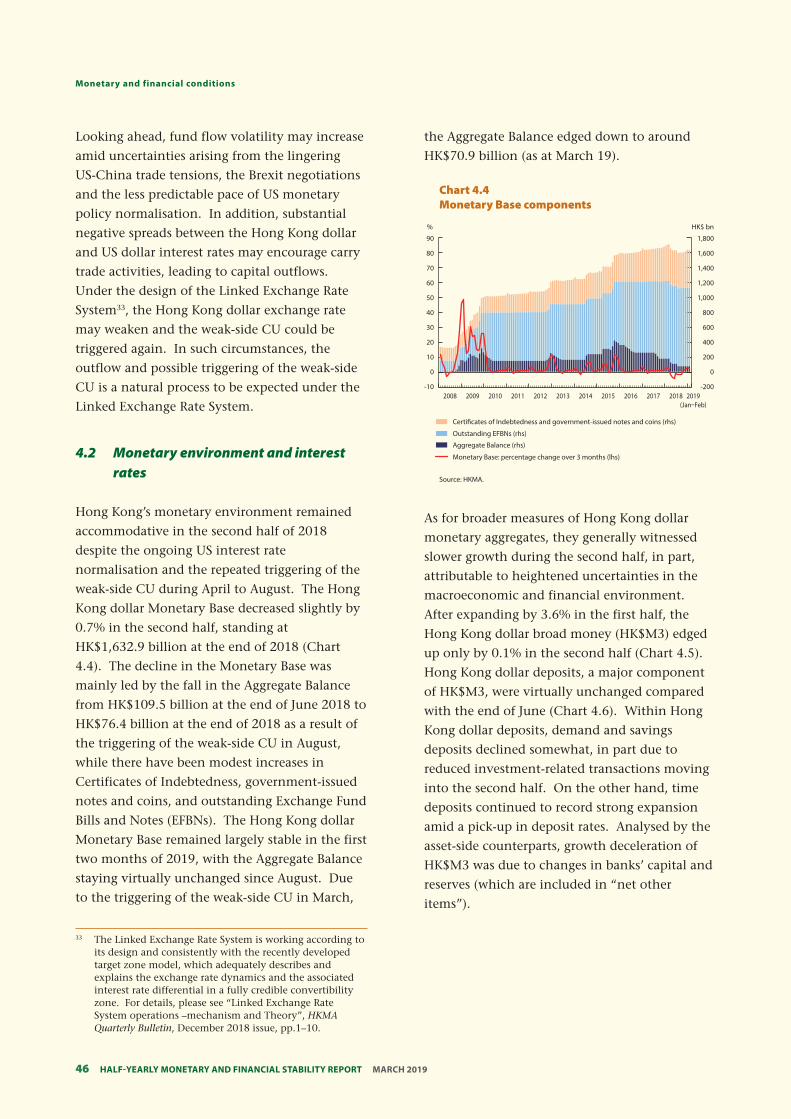
Half-YearlY MonetarY and financial StabilitY report MarcH 201946
Monetary and financial conditions
Chart 4.4 Monetary Base components
% HK$ bn
90 1,800
80 1,600
70 1,400
60 1,200
50 1,000
40 800
30 600
20 400
10 200
0 0
-10 -200 2008 2009 2010 2011 2012 2013 2014 2015 2016 2017 2018 2019
(Jan°Feb)
Certiÿcates of Indebtedness and government-issued notes and coins (rhs)
Outstanding EFBNs (rhs)
Aggregate Balance (rhs)
Monetary Base: percentage change over 3 months (lhs)
Source: HKMA.
Looking ahead, fund flow volatility may increase
amid uncertainties arising from the lingering
US-China trade tensions, the Brexit negotiations
and the less predictable pace of US monetary
policy normalisation. In addition, substantial
negative spreads between the Hong Kong dollar
and US dollar interest rates may encourage carry
trade activities, leading to capital outflows.
Under the design of the Linked Exchange Rate
System33, the Hong Kong dollar exchange rate
may weaken and the weak-side CU could be
triggered again. In such circumstances, the
outflow and possible triggering of the weak-side
CU is a natural process to be expected under the
Linked Exchange Rate System.
4.2 Monetary environment and interest rates
Hong Kong’s monetary environment remained
accommodative in the second half of 2018
despite the ongoing US interest rate
normalisation and the repeated triggering of the
weak-side CU during April to August. The Hong
Kong dollar Monetary Base decreased slightly by
0.7% in the second half, standing at
HK$1,632.9 billion at the end of 2018 (Chart
4.4). The decline in the Monetary Base was
mainly led by the fall in the Aggregate Balance
from HK$109.5 billion at the end of June 2018 to
HK$76.4 billion at the end of 2018 as a result of
the triggering of the weak-side CU in August,
while there have been modest increases in
Certificates of Indebtedness, government-issued
notes and coins, and outstanding Exchange Fund
Bills and Notes (EFBNs). The Hong Kong dollar
Monetary Base remained largely stable in the first
two months of 2019, with the Aggregate Balance
staying virtually unchanged since August. Due
to the triggering of the weak-side CU in March,
the Aggregate Balance edged down to around
HK$70.9 billion (as at March 19).
As for broader measures of Hong Kong dollar
monetary aggregates, they generally witnessed
slower growth during the second half, in part,
attributable to heightened uncertainties in the
macroeconomic and financial environment.
After expanding by 3.6% in the first half, the
Hong Kong dollar broad money (HK$M3) edged
up only by 0.1% in the second half (Chart 4.5).
Hong Kong dollar deposits, a major component
of HK$M3, were virtually unchanged compared
with the end of June (Chart 4.6). Within Hong
Kong dollar deposits, demand and savings
deposits declined somewhat, in part due to
reduced investment-related transactions moving
into the second half. On the other hand, time
deposits continued to record strong expansion
amid a pick-up in deposit rates. Analysed by the
asset-side counterparts, growth deceleration of
HK$M3 was due to changes in banks’ capital and
reserves (which are included in “net other
items”).
33 The Linked Exchange Rate System is working according to its design and consistently with the recently developed target zone model, which adequately describes and explains the exchange rate dynamics and the associated interest rate differential in a fully credible convertibility zone. For details, please see “Linked Exchange Rate System operations –mechanism and Theory”, HKMA Quarterly Bulletin, December 2018 issue, pp.1–10.
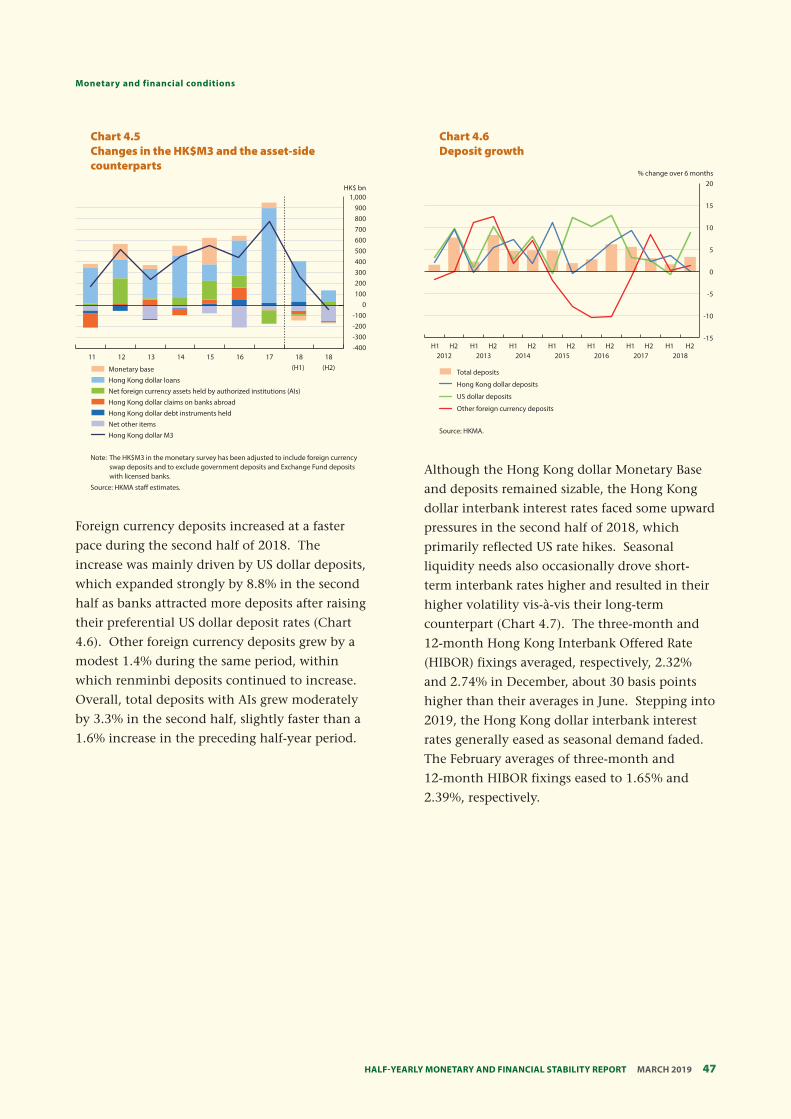
47 Half-YearlY MonetarY and financial StabilitY report MarcH 2019
Monetary and financial conditions
11 12 13 14 15 16 17 18 18
Chart 4.5 Changes in the HK$M3 and the asset-side counterparts
HK$ bn 1,000
900 800 700 600 500 400 300 200 100
0 -100 -200 -300 -400
Monetary base (H1) (H2)
Hong Kong dollar loans
Net foreign currency assets held by authorized institutions (AIs)
Hong Kong dollar claims on banks abroad
Hong Kong dollar debt instruments held
Net other items
Hong Kong dollar M3
Note: The HK$M3 in the monetary survey has been adjusted to include foreign currency swap deposits and to exclude government deposits and Exchange Fund deposits with licensed banks.
Source: HKMA staff estimates.
Foreign currency deposits increased at a faster
pace during the second half of 2018. The
increase was mainly driven by US dollar deposits,
which expanded strongly by 8.8% in the second
half as banks attracted more deposits after raising
their preferential US dollar deposit rates (Chart
4.6). Other foreign currency deposits grew by a
modest 1.4% during the same period, within
which renminbi deposits continued to increase.
Overall, total deposits with AIs grew moderately
by 3.3% in the second half, slightly faster than a
1.6% increase in the preceding half-year period.
Chart 4.6 Deposit growth
% change over 6 months 20
15
10
5
0
-5
-10
-15 H1 H2 H1 H2 H1 H2 H1 H2 H1 H2 H1 H2 H1 H2
2012 2013 2014 2015 2016 2017 2018
Total deposits
Hong Kong dollar deposits
US dollar deposits
Other foreign currency deposits
Source: HKMA.
Although the Hong Kong dollar Monetary Base
and deposits remained sizable, the Hong Kong
dollar interbank interest rates faced some upward
pressures in the second half of 2018, which
primarily reflected US rate hikes. Seasonal
liquidity needs also occasionally drove short-
term interbank rates higher and resulted in their
higher volatility vis-à-vis their long-term
counterpart (Chart 4.7). The three-month and
12-month Hong Kong Interbank Offered Rate
(HIBOR) fixings averaged, respectively, 2.32%
and 2.74% in December, about 30 basis points
higher than their averages in June. Stepping into
2019, the Hong Kong dollar interbank interest
rates generally eased as seasonal demand faded.
The February averages of three-month and
12-month HIBOR fixings eased to 1.65% and
2.39%, respectively.
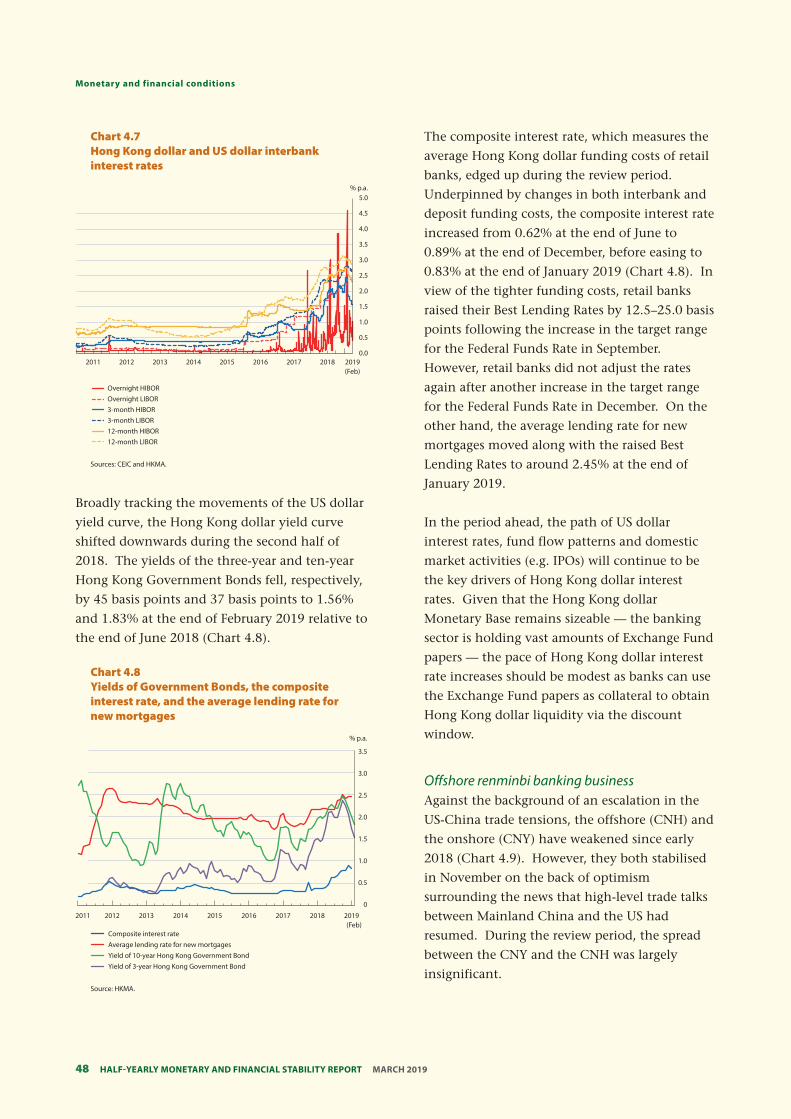
Half-YearlY MonetarY and financial StabilitY report MarcH 201948
Monetary and financial conditions
2015 2016 2017 2018
Chart 4.7 Hong Kong dollar and US dollar interbank interest rates
% p.a. 5.0
4.5
4.0
3.5
3.0
2.5
2.0
1.5
1.0
0.5
0.0 2011 2012 2013 2014 2019
(Feb)
Overnight HIBOR Overnight LIBOR 3-month HIBOR 3-month LIBOR 12-month HIBOR 12-month LIBOR
Sources: CEIC and HKMA.
Broadly tracking the movements of the US dollar
yield curve, the Hong Kong dollar yield curve
shifted downwards during the second half of
2018. The yields of the three-year and ten-year
Hong Kong Government Bonds fell, respectively,
by 45 basis points and 37 basis points to 1.56%
and 1.83% at the end of February 2019 relative to
the end of June 2018 (Chart 4.8).
Chart 4.8 Yields of Government Bonds, the composite interest rate, and the average lending rate for new mortgages
2011 2012 2013 2014 2015 2016 2017 2018
% p.a.
3.5
3.0
2.5
2.0
1.5
1.0
0.5
0
2019 (Feb)
Composite interest rate Average lending rate for new mortgages Yield of 10-year Hong Kong Government Bond Yield of 3-year Hong Kong Government Bond
Source: HKMA.
The composite interest rate, which measures the
average Hong Kong dollar funding costs of retail
banks, edged up during the review period.
Underpinned by changes in both interbank and
deposit funding costs, the composite interest rate
increased from 0.62% at the end of June to
0.89% at the end of December, before easing to
0.83% at the end of January 2019 (Chart 4.8). In
view of the tighter funding costs, retail banks
raised their Best Lending Rates by 12.5–25.0 basis
points following the increase in the target range
for the Federal Funds Rate in September.
However, retail banks did not adjust the rates
again after another increase in the target range
for the Federal Funds Rate in December. On the
other hand, the average lending rate for new
mortgages moved along with the raised Best
Lending Rates to around 2.45% at the end of
January 2019.
In the period ahead, the path of US dollar
interest rates, fund flow patterns and domestic
market activities (e.g. IPOs) will continue to be
the key drivers of Hong Kong dollar interest
rates. Given that the Hong Kong dollar
Monetary Base remains sizeable — the banking
sector is holding vast amounts of Exchange Fund
papers — the pace of Hong Kong dollar interest
rate increases should be modest as banks can use
the Exchange Fund papers as collateral to obtain
Hong Kong dollar liquidity via the discount
window.
Offshore renminbi banking business Against the background of an escalation in the
US-China trade tensions, the offshore (CNH) and
the onshore (CNY) have weakened since early
2018 (Chart 4.9). However, they both stabilised
in November on the back of optimism
surrounding the news that high-level trade talks
between Mainland China and the US had
resumed. During the review period, the spread
between the CNY and the CNH was largely
insignificant.
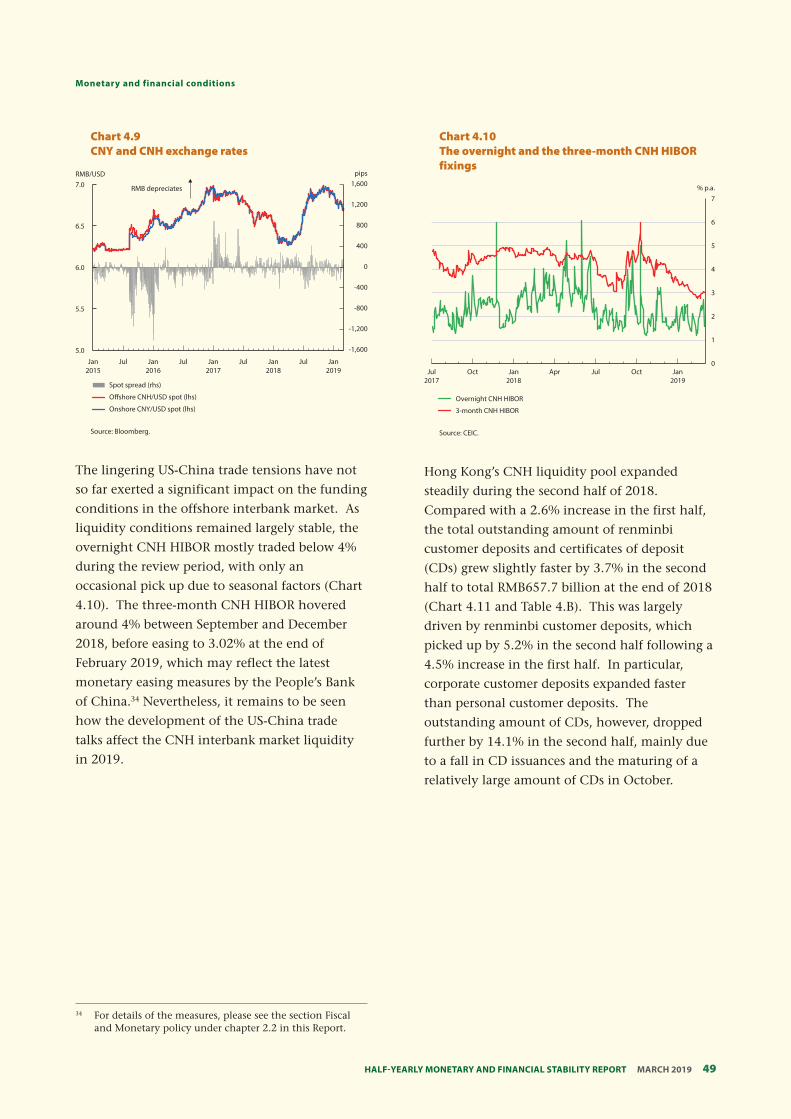
49 Half-YearlY MonetarY and financial StabilitY report MarcH 2019
Monetary and financial conditions
Chart 4.9 CNY and CNH exchange rates
RMB/USD pips
RMB depreciates 1,600 7.0
1,200
800 6.5
400
0 6.0
-400
-800 5.5
-1,200
-1,600
Jan Jul Jan Jul Jan Jul Jan Jul Jan 2015 2016 2017 2018 2019
5.0
Spot spread (rhs)
O˜shore CNH/USD spot (lhs)
Onshore CNY/USD spot (lhs)
Source: Bloomberg.
The lingering US-China trade tensions have not
so far exerted a significant impact on the funding
conditions in the offshore interbank market. As
liquidity conditions remained largely stable, the
overnight CNH HIBOR mostly traded below 4%
during the review period, with only an
occasional pick up due to seasonal factors (Chart
4.10). The three-month CNH HIBOR hovered
around 4% between September and December
2018, before easing to 3.02% at the end of
February 2019, which may reflect the latest
monetary easing measures by the People’s Bank
of China.34 Nevertheless, it remains to be seen
how the development of the US-China trade
talks affect the CNH interbank market liquidity
in 2019.
Chart 4.10 The overnight and the three-month CNH HIBOR fixings
% p.a. 7
6
5
4
3
2
1
0 Jul
2017 Oct Jan
2018 Apr Jul Oct Jan
2019
Overnight CNH HIBOR
3-month CNH HIBOR
Source: CEIC.
Hong Kong’s CNH liquidity pool expanded
steadily during the second half of 2018.
Compared with a 2.6% increase in the first half,
the total outstanding amount of renminbi
customer deposits and certificates of deposit
(CDs) grew slightly faster by 3.7% in the second
half to total RMB657.7 billion at the end of 2018
(Chart 4.11 and Table 4.B). This was largely
driven by renminbi customer deposits, which
picked up by 5.2% in the second half following a
4.5% increase in the first half. In particular,
corporate customer deposits expanded faster
than personal customer deposits. The
outstanding amount of CDs, however, dropped
further by 14.1% in the second half, mainly due
to a fall in CD issuances and the maturing of a
relatively large amount of CDs in October.
34 For details of the measures, please see the section Fiscal and Monetary policy under chapter 2.2 in this Report.
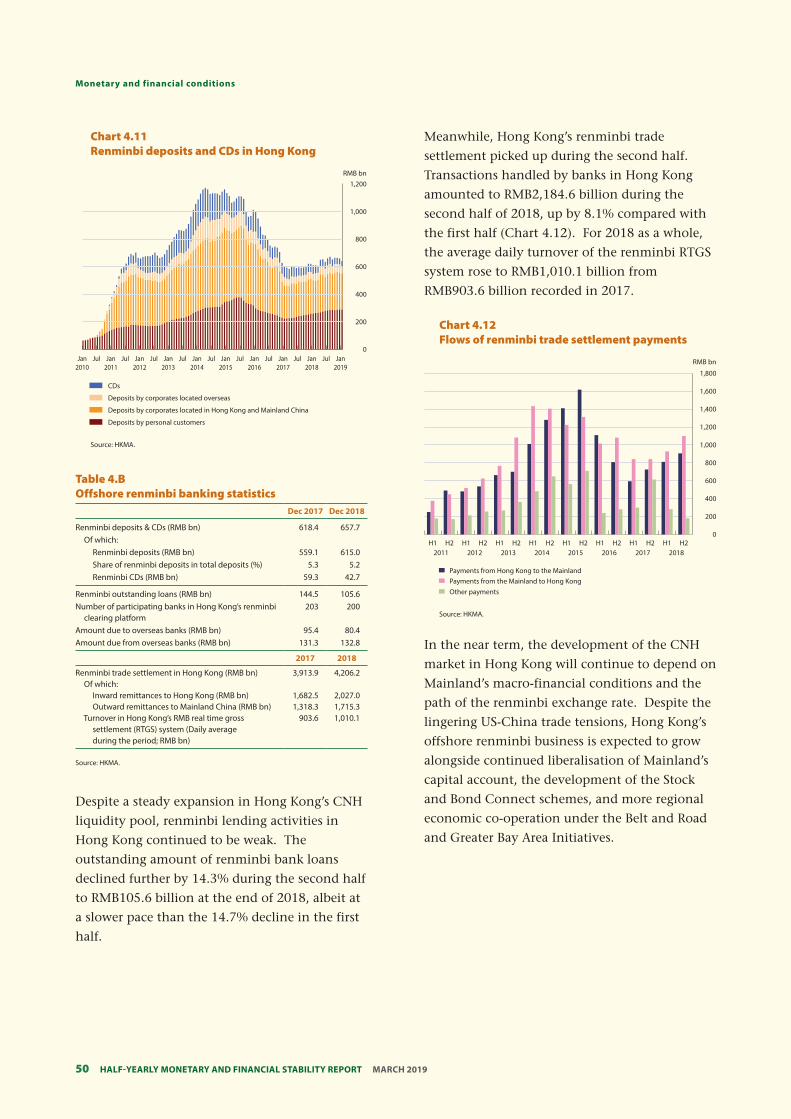
Half-YearlY MonetarY and financial StabilitY report MarcH 201950
Monetary and financial conditions
Chart 4.11 Renminbi deposits and CDs in Hong Kong
RMB bn 1,200
1,000
800
600
400
200
0 Jan Jul Jan Jul Jan Jul Jan Jul Jan Jul Jan Jul Jan Jul Jan Jul Jan Jul Jan
2010 2011 2012 2013 2014 2015 2016 2017 2018 2019
CDs
Deposits by corporates located overseas
Deposits by corporates located in Hong Kong and Mainland China
Deposits by personal customers
Source: HKMA.
Table 4.B Offshore renminbi banking statistics
Dec 2017 Dec 2018
Renminbi deposits & CDs (RMB bn) Of which:
Renminbi deposits (RMB bn) Share of renminbi deposits in total deposits (%) Renminbi CDs (RMB bn)
618.4
559.1 5.3
59.3
657.7
615.0 5.2
42.7
Renminbi outstanding loans (RMB bn) Number of participating banks in Hong Kong’s renminbi
clearing platform Amount due to overseas banks (RMB bn) Amount due from overseas banks (RMB bn)
144.5 203
95.4 131.3
105.6 200
80.4 132.8
2017 2018
Renminbi trade settlement in Hong Kong (RMB bn) 3,913.9 4,206.2 Of which:
Inward remittances to Hong Kong (RMB bn) 1,682.5 2,027.0 Outward remittances to Mainland China (RMB bn) 1,318.3 1,715.3
Turnover in Hong Kong’s RMB real time gross 903.6 1,010.1 settlement (RTGS) system (Daily average during the period; RMB bn)
Source: HKMA.
Despite a steady expansion in Hong Kong’s CNH
liquidity pool, renminbi lending activities in
Hong Kong continued to be weak. The
outstanding amount of renminbi bank loans
declined further by 14.3% during the second half
to RMB105.6 billion at the end of 2018, albeit at
a slower pace than the 14.7% decline in the first
half.
Meanwhile, Hong Kong’s renminbi trade
settlement picked up during the second half.
Transactions handled by banks in Hong Kong
amounted to RMB2,184.6 billion during the
second half of 2018, up by 8.1% compared with
the first half (Chart 4.12). For 2018 as a whole,
the average daily turnover of the renminbi RTGS
system rose to RMB1,010.1 billion from
RMB903.6 billion recorded in 2017.
Chart 4.12 Flows of renminbi trade settlement payments
RMB bn
1,800
1,600
1,400
1,200
1,000
800
600
400
200
0 H1 H2
2011 H1 H2
2012 H1 H2
2013 H1 H2
2014 H1 H2
2015 H1 H2
2016 H1 H2
2017 H1 H2
2018
Payments from Hong Kong to the Mainland Payments from the Mainland to Hong Kong Other payments
Source: HKMA.
In the near term, the development of the CNH
market in Hong Kong will continue to depend on
Mainland’s macro-financial conditions and the
path of the renminbi exchange rate. Despite the
lingering US-China trade tensions, Hong Kong’s
offshore renminbi business is expected to grow
alongside continued liberalisation of Mainland’s
capital account, the development of the Stock
and Bond Connect schemes, and more regional
economic co-operation under the Belt and Road
and Greater Bay Area Initiatives.
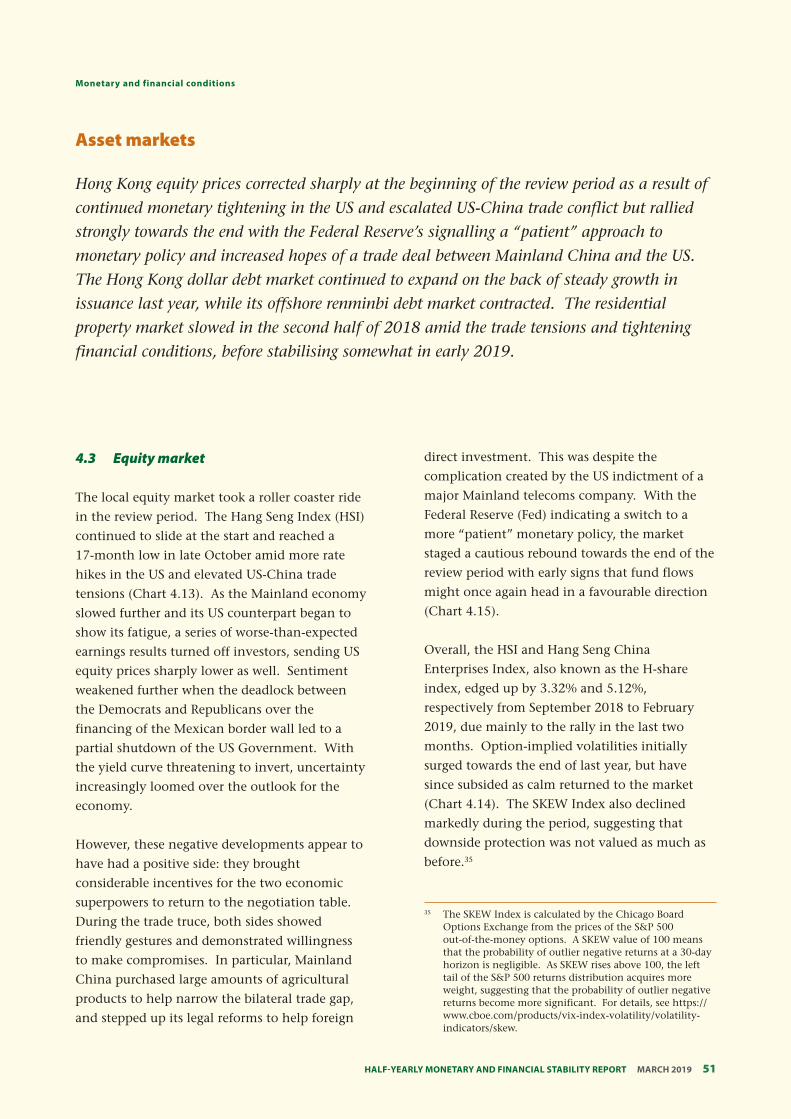
51 Half-YearlY MonetarY and financial StabilitY report MarcH 2019
Monetary and financial conditions
Asset markets
Hong Kong equity prices corrected sharply at the beginning of the review period as a result of
continued monetary tightening in the US and escalated US-China trade conflict but rallied
strongly towards the end with the Federal Reserve’s signalling a “patient” approach to
monetary policy and increased hopes of a trade deal between Mainland China and the US.
The Hong Kong dollar debt market continued to expand on the back of steady growth in
issuance last year, while its offshore renminbi debt market contracted. The residential
property market slowed in the second half of 2018 amid the trade tensions and tightening
financial conditions, before stabilising somewhat in early 2019.
4.3 Equity market
The local equity market took a roller coaster ride
in the review period. The Hang Seng Index (HSI)
continued to slide at the start and reached a
17-month low in late October amid more rate
hikes in the US and elevated US-China trade
tensions (Chart 4.13). As the Mainland economy
slowed further and its US counterpart began to
show its fatigue, a series of worse-than-expected
earnings results turned off investors, sending US
equity prices sharply lower as well. Sentiment
weakened further when the deadlock between
the Democrats and Republicans over the
financing of the Mexican border wall led to a
partial shutdown of the US Government. With
the yield curve threatening to invert, uncertainty
increasingly loomed over the outlook for the
economy.
However, these negative developments appear to
have had a positive side: they brought
considerable incentives for the two economic
superpowers to return to the negotiation table.
During the trade truce, both sides showed
friendly gestures and demonstrated willingness
to make compromises. In particular, Mainland
China purchased large amounts of agricultural
products to help narrow the bilateral trade gap,
and stepped up its legal reforms to help foreign
direct investment. This was despite the
complication created by the US indictment of a
major Mainland telecoms company. With the
Federal Reserve (Fed) indicating a switch to a
more “patient” monetary policy, the market
staged a cautious rebound towards the end of the
review period with early signs that fund flows
might once again head in a favourable direction
(Chart 4.15).
Overall, the HSI and Hang Seng China
Enterprises Index, also known as the H-share
index, edged up by 3.32% and 5.12%,
respectively from September 2018 to February
2019, due mainly to the rally in the last two
months. Option-implied volatilities initially
surged towards the end of last year, but have
since subsided as calm returned to the market
(Chart 4.14). The SKEW Index also declined
markedly during the period, suggesting that
downside protection was not valued as much as
before.35
35 The SKEW Index is calculated by the Chicago Board Options Exchange from the prices of the S&P 500 out-of-the-money options. A SKEW value of 100 means that the probability of outlier negative returns at a 30-day horizon is negligible. As SKEW rises above 100, the left tail of the S&P 500 returns distribution acquires more weight, suggesting that the probability of outlier negative returns become more significant. For details, see https:// www.cboe.com/products/vix-index-volatility/volatility-indicators/skew.
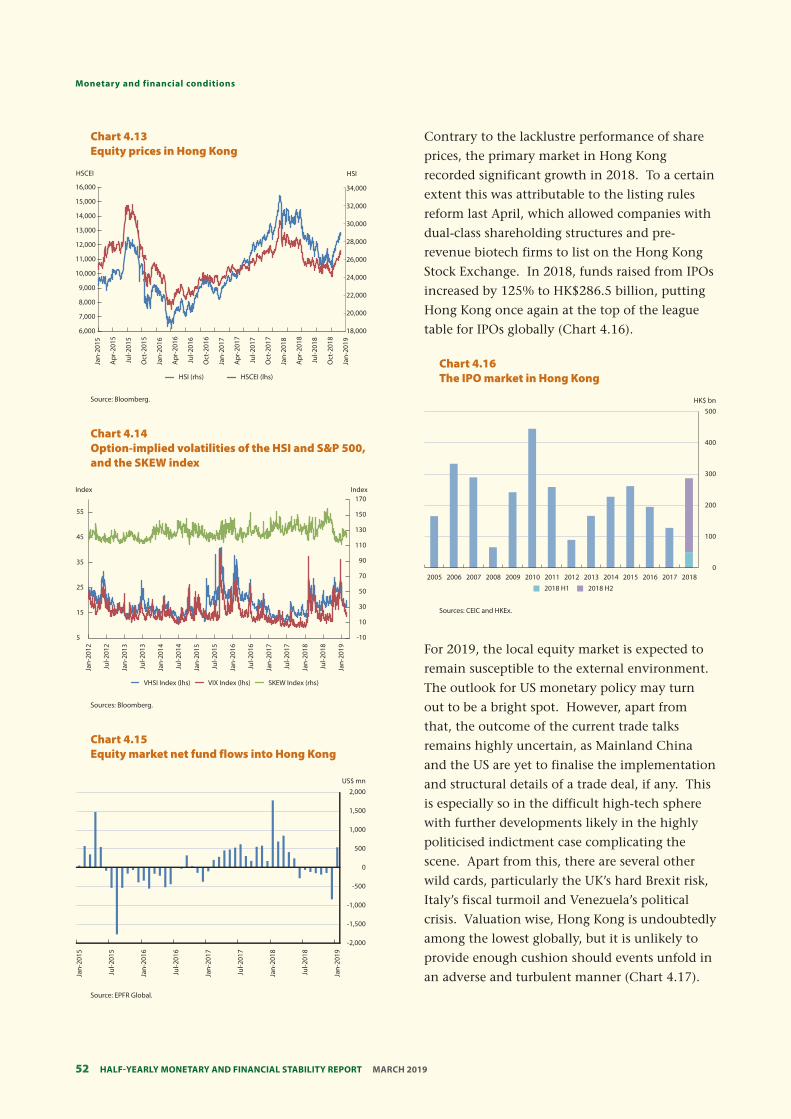
Half-YearlY MonetarY and financial StabilitY report MarcH 201952
Monetary and financial conditions
Chart 4.13 Equity prices in Hong Kong
6,000
7,000
8,000
9,000
10,000
11,000
12,000
13,000
14,000
15,000
16,000
18,000
20,000
22,000
24,000
26,000
28,000
30,000
32,000
34,000
Jan-
2015
Apr
-201
5
Jul-2
015
Oct
-201
5
Jan-
2016
Apr
-201
6
Jul-2
016
Oct
-201
6
Jan-
2017
Apr
-201
7
Jul-2
017
Oct
-201
7
Jan-
2018
Apr
-201
8
Jul-2
018
Oct
-201
8
Jan-
2019
HSI (rhs) HSCEI (lhs)
HSI HSCEI
Source: Bloomberg.
Chart 4.14 Option-implied volatilities of the HSI and S&P 500, and the SKEW index
-10
10
30
50
70
90
110
130
150
170
5
15
25
35
45
55
Jan-
2012
Jul-2
012
Jan-
2013
Jul-2
013
Jan-
2014
Jul-2
014
Jan-
2015
Jul-2
015
Jan-
2016
Jul-2
016
Jan-
2017
Jul-2
017
Jan-
2018
Jul-2
018
Jan-
2019
VHSI Index (lhs) VIX Index (lhs) SKEW Index (rhs)
Index Index
Sources: Bloomberg.
Chart 4.15 Equity market net fund flows into Hong Kong
-2,000
-1,500
-1,000
-500
0
500
1,000
1,500
2,000
Jan-
2015
Jul-2
015
Jan-
2016
Jul-2
016
Jan-
2017
Jul-2
017
Jan-
2018
Jul-2
018
Jan-
2019
US$ mn
Source: EPFR Global.
Contrary to the lacklustre performance of share
prices, the primary market in Hong Kong
recorded significant growth in 2018. To a certain
extent this was attributable to the listing rules
reform last April, which allowed companies with
dual-class shareholding structures and pre-
revenue biotech firms to list on the Hong Kong
Stock Exchange. In 2018, funds raised from IPOs
increased by 125% to HK$286.5 billion, putting
Hong Kong once again at the top of the league
table for IPOs globally (Chart 4.16).
Chart 4.16 The IPO market in Hong Kong
0
100
200
300
400
500
2005 2006 2007 2008 2009 2010 2011 2012 2013 2014 2015 2016 2017 2018
2018 H1 2018 H2
HK$ bn
Sources: CEIC and HKEx.
For 2019, the local equity market is expected to
remain susceptible to the external environment.
The outlook for US monetary policy may turn
out to be a bright spot. However, apart from
that, the outcome of the current trade talks
remains highly uncertain, as Mainland China
and the US are yet to finalise the implementation
and structural details of a trade deal, if any. This
is especially so in the difficult high-tech sphere
with further developments likely in the highly
politicised indictment case complicating the
scene. Apart from this, there are several other
wild cards, particularly the UK’s hard Brexit risk,
Italy’s fiscal turmoil and Venezuela’s political
crisis. Valuation wise, Hong Kong is undoubtedly
among the lowest globally, but it is unlikely to
provide enough cushion should events unfold in
an adverse and turbulent manner (Chart 4.17).
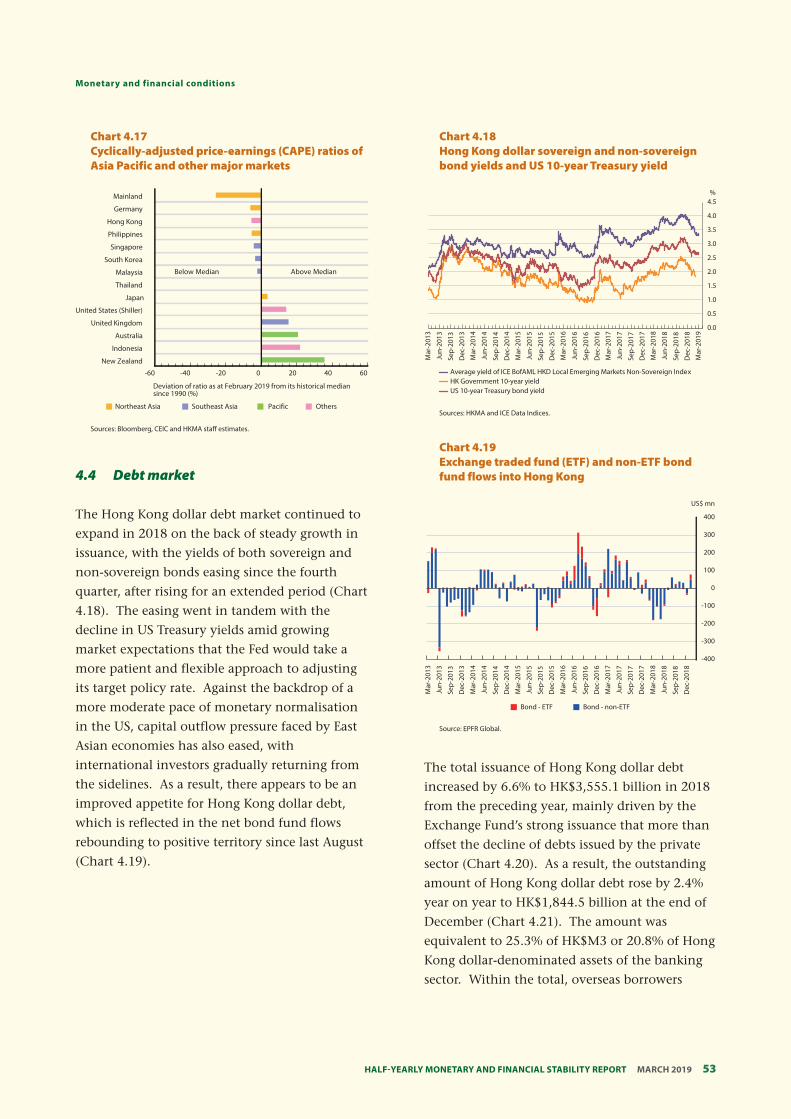
53 Half-YearlY MonetarY and financial StabilitY report MarcH 2019
Monetary and financial conditions
Chart 4.17 Cyclically-adjusted price-earnings (CAPE) ratios of Asia Pacific and other major markets
-60 -40 -20 0 20 40 60
New Zealand
Indonesia
Australia
United Kingdom
United States (Shiller)
Japan
Thailand
Malaysia
South Korea
Singapore
Philippines
Hong Kong
Germany
Mainland
Below Median Above Median
Deviation of ratio as at February 2019 from its historical median since 1990 (%)
Southeast Asia Pacific OthersNortheast Asia
Sources: Bloomberg, CEIC and HKMA staff estimates.
4.4 Debt market
The Hong Kong dollar debt market continued to
expand in 2018 on the back of steady growth in
issuance, with the yields of both sovereign and
non-sovereign bonds easing since the fourth
quarter, after rising for an extended period (Chart
4.18). The easing went in tandem with the
decline in US Treasury yields amid growing
market expectations that the Fed would take a
more patient and flexible approach to adjusting
its target policy rate. Against the backdrop of a
more moderate pace of monetary normalisation
in the US, capital outflow pressure faced by East
Asian economies has also eased, with
international investors gradually returning from
the sidelines. As a result, there appears to be an
improved appetite for Hong Kong dollar debt,
which is reflected in the net bond fund flows
rebounding to positive territory since last August
(Chart 4.19).
Chart 4.18 Hong Kong dollar sovereign and non-sovereign bond yields and US 10-year Treasury yield
0.0
0.5
1.0
1.5
2.0
2.5
3.0
3.5
4.0
4.5%
Mar
-201
3
Jun-
2013
Sep-
2013
Dec
-201
3
Mar
-201
4
Jun-
2014
Sep-
2014
Dec
-201
4
Mar
-201
5
Jun-
2015
Sep-
2015
Dec
-201
5
Mar
-201
6
Jun-
2016
Sep-
2016
Dec
-201
6
Mar
-201
7
Jun-
2017
Sep-
2017
Dec
-201
7
Mar
-201
8
Jun-
2018
Sep-
2018
Dec
-201
8
Mar
-201
9
Average yield of ICE BofAML HKD Local Emerging Markets Non-Sovereign IndexHK Government 10-year yieldUS 10-year Treasury bond yield
Sources: HKMA and ICE Data Indices.
Chart 4.19 Exchange traded fund (ETF) and non-ETF bond fund flows into Hong Kong
-400
-300
-200
-100
0
100
200
300
400
Mar
-201
3
Jun-
2013
Sep-
2013
Dec
-201
3
Mar
-201
4
Jun-
2014
Sep-
2014
Dec
-201
4
Mar
-201
5
Jun-
2015
Sep-
2015
Dec
-201
5
Mar
-201
6
Jun-
2016
Sep-
2016
Dec
-201
6
Mar
-201
7
Jun-
2017
Sep-
2017
Dec
-201
7
Mar
-201
8
Jun-
2018
Sep-
2018
Dec
-201
8
US$ mn
Bond - ETF Bond - non-ETF
Source: EPFR Global.
The total issuance of Hong Kong dollar debt
increased by 6.6% to HK$3,555.1 billion in 2018
from the preceding year, mainly driven by the
Exchange Fund’s strong issuance that more than
offset the decline of debts issued by the private
sector (Chart 4.20). As a result, the outstanding
amount of Hong Kong dollar debt rose by 2.4%
year on year to HK$1,844.5 billion at the end of
December (Chart 4.21). The amount was
equivalent to 25.3% of HK$M3 or 20.8% of Hong
Kong dollar-denominated assets of the banking
sector. Within the total, overseas borrowers
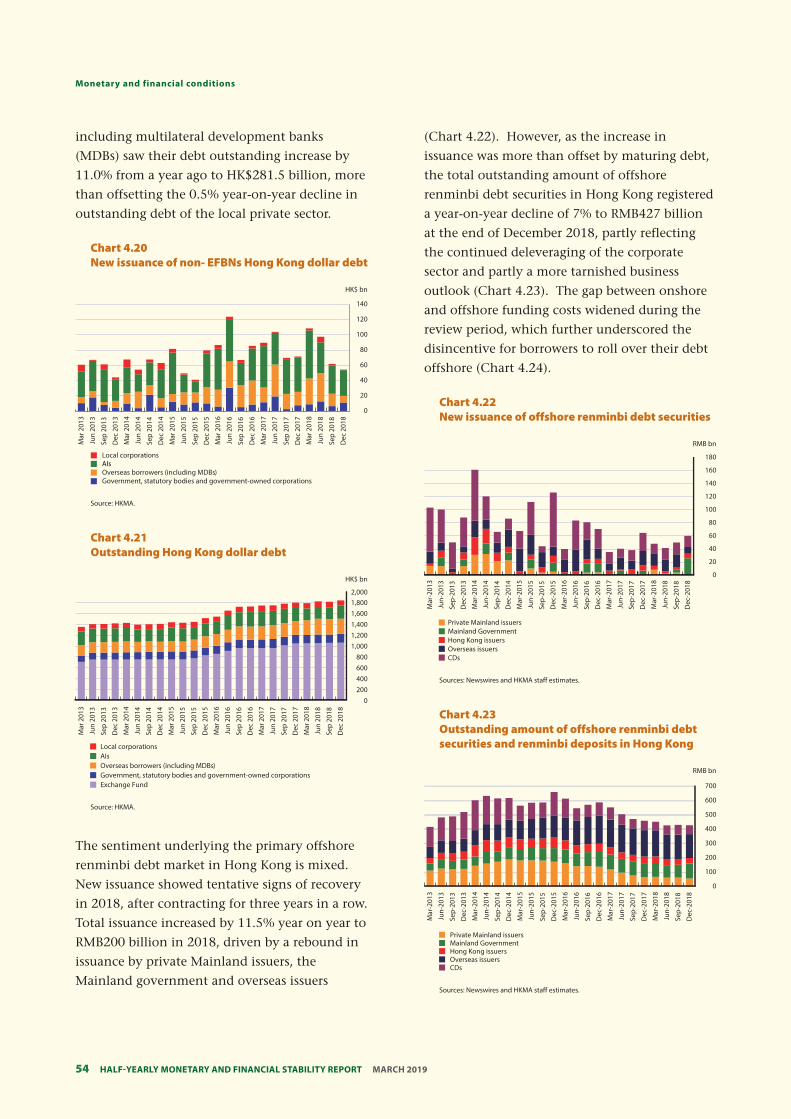
Half-YearlY MonetarY and financial StabilitY report MarcH 201954
Monetary and financial conditions
including multilateral development banks
(MDBs) saw their debt outstanding increase by
11.0% from a year ago to HK$281.5 billion, more
than offsetting the 0.5% year-on-year decline in
outstanding debt of the local private sector.
0
20
40
60
80
100
120
140
Mar
201
3
Jun
2013
Sep
2013
Dec
201
3
Mar
201
4
Jun
2014
Sep
2014
Dec
201
4
Mar
201
5
Jun
2015
Sep
2015
Dec
201
5
Mar
201
6
Jun
2016
Sep
2016
Dec
201
6
Mar
201
7
Jun
2017
Sep
2017
Dec
201
7
Mar
201
8
Jun
2018
Sep
2018
Dec
201
8
HK$ bn
Local corporationsAIsOverseas borrowers (including MDBs)Government, statutory bodies and government-owned corporations
Chart 4.20 New issuance of non- EFBNs Hong Kong dollar debt
Source: HKMA.
Source: HKMA.
0200400600800
1,0001,2001,4001,6001,8002,000
Mar
201
3
Jun
2013
Sep
2013
Dec
201
3
Mar
201
4
Jun
2014
Sep
2014
Dec
201
4
Mar
201
5
Jun
2015
Sep
2015
Dec
201
5
Mar
201
6
Jun
2016
Sep
2016
Dec
201
6
Mar
201
7
Jun
2017
Sep
2017
Dec
201
7
Mar
201
8
Jun
2018
Sep
2018
Dec
201
8
HK$ bn
Local corporationsAIsOverseas borrowers (including MDBs)Government, statutory bodies and government-owned corporationsExchange Fund
Chart 4.21 Outstanding Hong Kong dollar debt
The sentiment underlying the primary offshore
renminbi debt market in Hong Kong is mixed.
New issuance showed tentative signs of recovery
in 2018, after contracting for three years in a row.
Total issuance increased by 11.5% year on year to
RMB200 billion in 2018, driven by a rebound in
issuance by private Mainland issuers, the
Mainland government and overseas issuers
(Chart 4.22). However, as the increase in
issuance was more than offset by maturing debt,
the total outstanding amount of offshore
renminbi debt securities in Hong Kong registered
a year-on-year decline of 7% to RMB427 billion
at the end of December 2018, partly reflecting
the continued deleveraging of the corporate
sector and partly a more tarnished business
outlook (Chart 4.23). The gap between onshore
and offshore funding costs widened during the
review period, which further underscored the
disincentive for borrowers to roll over their debt
offshore (Chart 4.24).
Mar
-201
3
Private Mainland issuers Mainland Government Hong Kong issuers Overseas issuers CDs
Sources: Newswires and HKMA staff estimates.
Jun-
2013
Sep-
2013
Dec
-201
3
Mar
-201
4
Jun-
2014
Sep-
2014
Dec
-201
4
Mar
-201
5
Jun-
2015
Sep-
2015
Dec
-201
5
Mar
-201
6
Jun-
2016
Sep-
2016
Dec
-201
6
Mar
-201
7
Jun-
2017
Sep-
2017
Dec
-201
7
Mar
-201
8
Jun-
2018
Sep-
2018
Dec
-201
8
Chart 4.22 New issuance of offshore renminbi debt securities
RMB bn
180
160
140
120
100
80
60
40
20
0
Private Mainland issuers Mainland Government Hong Kong issuers Overseas issuers CDs
Sources: Newswires and HKMA staff estimates.
Sep-
2013
0
100
200
300
400
500
600
700
Mar
-201
3
Jun-
2013
Chart 4.23 Outstanding amount of offshore renminbi debt securities and renminbi deposits in Hong Kong
RMB bn
Dec
-201
3
Mar
-201
4
Jun-
2014
Sep-
2014
Dec
-201
4
Mar
-201
5
Jun-
2015
Sep-
2015
Dec
-201
5
Mar
-201
6
Jun-
2016
Sep-
2016
Dec
-201
6
Mar
-201
7
Jun-
2017
Sep-
2017
Dec
-201
7
Mar
-201
8
Jun-
2018
Sep-
2018
Dec
-201
8
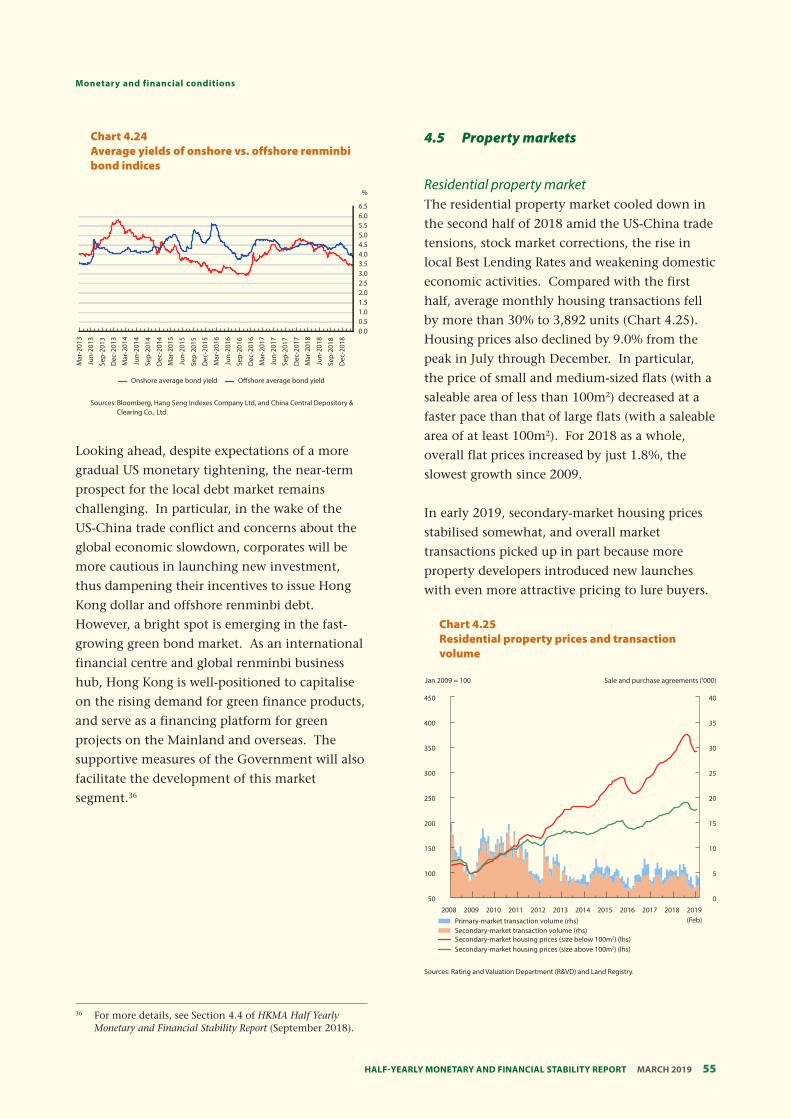
55 Half-YearlY MonetarY and financial StabilitY report MarcH 2019
Monetary and financial conditions
Chart 4.24 Average yields of onshore vs. offshore renminbi bond indices
%
6.5 6.0 5.5 5.0 4.5 4.0 3.5 3.0 2.5 2.0 1.5 1.0 0.5 0.0
Mar
-201
3
Jun-
2013
Sep-
2013
Dec
-201
3
Mar
-201
4
Jun-
2014
Sep-
2014
Dec
-201
4
Mar
-201
5
Jun-
2015
Sep-
2015
Dec
-201
5
Mar
-201
6
Jun-
2016
Sep-
2016
Dec
-201
6
Mar
-201
7
Jun-
2017
Sep-
2017
Dec
-201
7
Mar
-201
8
Jun-
2018
Sep-
2018
Dec
-201
8
Onshore average bond yield O˜shore average bond yield
Sources: Bloomberg, Hang Seng Indexes Company Ltd, and China Central Depository & Clearing Co., Ltd.
Looking ahead, despite expectations of a more
gradual US monetary tightening, the near-term
prospect for the local debt market remains
challenging. In particular, in the wake of the
US-China trade conflict and concerns about the
global economic slowdown, corporates will be
more cautious in launching new investment,
thus dampening their incentives to issue Hong
Kong dollar and offshore renminbi debt.
However, a bright spot is emerging in the fast-
growing green bond market. As an international
financial centre and global renminbi business
hub, Hong Kong is well-positioned to capitalise
on the rising demand for green finance products,
and serve as a financing platform for green
projects on the Mainland and overseas. The
supportive measures of the Government will also
facilitate the development of this market
segment.36
4.5 Property markets
Residential property market The residential property market cooled down in
the second half of 2018 amid the US-China trade
tensions, stock market corrections, the rise in
local Best Lending Rates and weakening domestic
economic activities. Compared with the first
half, average monthly housing transactions fell
by more than 30% to 3,892 units (Chart 4.25).
Housing prices also declined by 9.0% from the
peak in July through December. In particular,
the price of small and medium-sized flats (with a
saleable area of less than 100m2) decreased at a
faster pace than that of large flats (with a saleable
area of at least 100m2). For 2018 as a whole,
overall flat prices increased by just 1.8%, the
slowest growth since 2009.
In early 2019, secondary-market housing prices
stabilised somewhat, and overall market
transactions picked up in part because more
property developers introduced new launches
with even more attractive pricing to lure buyers.
Chart 4.25 Residential property prices and transaction volume
0
5
10
15
20
25
30
35
40
50
100
150
200
250
300
350
400
450
2008 2009 2010 2011 2012 2013 2014 2015 2016 2017 2018 2019Primary-market transaction volume (rhs)Secondary-market transaction volume (rhs)Secondary-market housing prices (size below 100m2) (lhs)Secondary-market housing prices (size above 100m2) (lhs)
(Feb)
Jan 2009 = 100 Sale and purchase agreements ('000)
Sources: Rating and Valuation Department (R&VD) and Land Registry.
36 For more details, see Section 4.4 of HKMA Half Yearly Monetary and Financial Stability Report (September 2018).
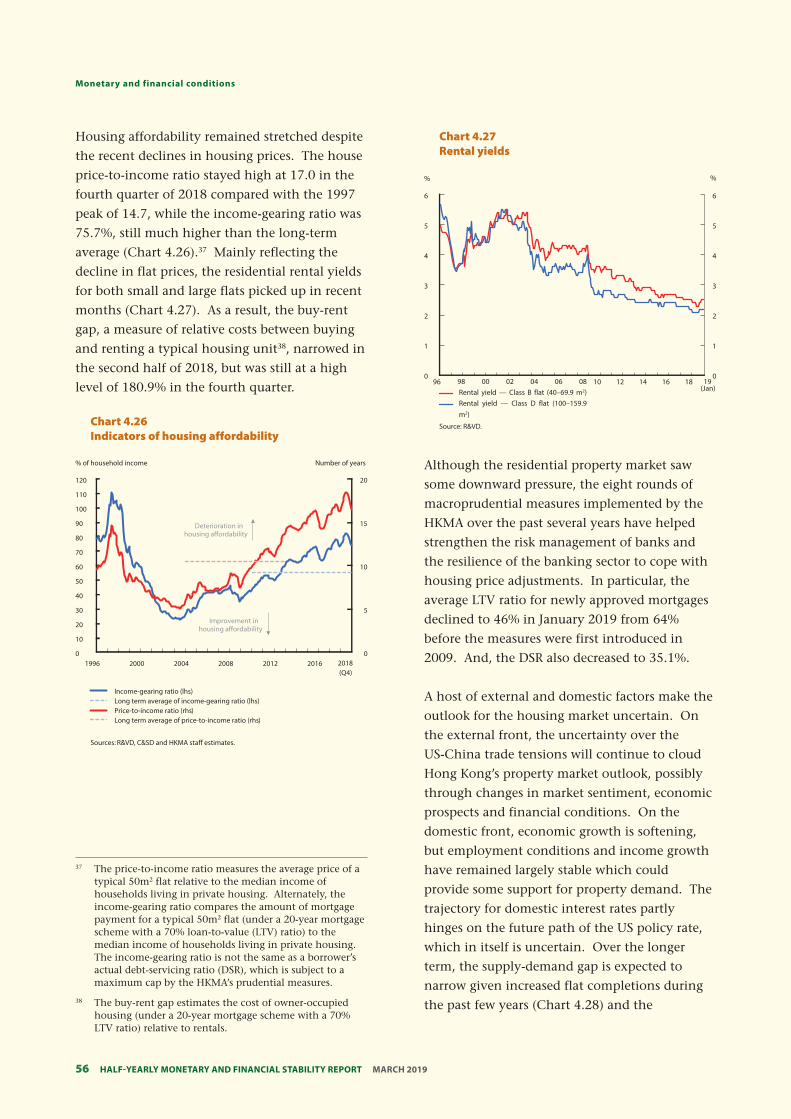
Half-YearlY MonetarY and financial StabilitY report MarcH 201956
Monetary and financial conditions
Housing affordability remained stretched despite
the recent declines in housing prices. The house
price-to-income ratio stayed high at 17.0 in the
fourth quarter of 2018 compared with the 1997
peak of 14.7, while the income-gearing ratio was
75.7%, still much higher than the long-term
average (Chart 4.26).37 Mainly reflecting the
decline in flat prices, the residential rental yields
for both small and large flats picked up in recent
months (Chart 4.27). As a result, the buy-rent
gap, a measure of relative costs between buying
and renting a typical housing unit38, narrowed in
the second half of 2018, but was still at a high
level of 180.9% in the fourth quarter.
Chart 4.26 Indicators of housing affordability
% of household income Number of years
120 20
110
100
90 15
80
70
60 10
50
40
30 5
20
10
0 0 1996
Deterioration inhousing a˜ordability
Improvement in housing a˜ordability
2000 2004 2008 2012 2016 2018 (Q4)
Income-gearing ratio (lhs) Long term average of income-gearing ratio (lhs) Price-to-income ratio (rhs) Long term average of price-to-income ratio (rhs)
Sources: R&VD, C&SD and HKMA staff estimates.
Chart 4.27 Rental yields
0
1
2
3
4
5
6
0
1
2
3
4
5
6
96 10 12 14 16 1898 00 02 04 06 08 Rental yield — Class B flat (40–69.9 m2) Rental yield — Class D flat (100–159.9 m2)
% %
19(Jan)
Source: R&VD.
Although the residential property market saw
some downward pressure, the eight rounds of
macroprudential measures implemented by the
HKMA over the past several years have helped
strengthen the risk management of banks and
the resilience of the banking sector to cope with
housing price adjustments. In particular, the
average LTV ratio for newly approved mortgages
declined to 46% in January 2019 from 64%
before the measures were first introduced in
2009. And, the DSR also decreased to 35.1%.
A host of external and domestic factors make the
outlook for the housing market uncertain. On
the external front, the uncertainty over the
US-China trade tensions will continue to cloud
Hong Kong’s property market outlook, possibly
through changes in market sentiment, economic
prospects and financial conditions. On the
domestic front, economic growth is softening,
but employment conditions and income growth
have remained largely stable which could
provide some support for property demand. The
trajectory for domestic interest rates partly
hinges on the future path of the US policy rate,
which in itself is uncertain. Over the longer
term, the supply-demand gap is expected to
narrow given increased flat completions during
the past few years (Chart 4.28) and the
37 The price-to-income ratio measures the average price of a typical 50m2 flat relative to the median income of households living in private housing. Alternately, the income-gearing ratio compares the amount of mortgage payment for a typical 50m2 flat (under a 20-year mortgage scheme with a 70% loan-to-value (LTV) ratio) to the median income of households living in private housing. The income-gearing ratio is not the same as a borrower’s actual debt-servicing ratio (DSR), which is subject to a maximum cap by the HKMA’s prudential measures.
38 The buy-rent gap estimates the cost of owner-occupied housing (under a 20-year mortgage scheme with a 70% LTV ratio) relative to rentals.
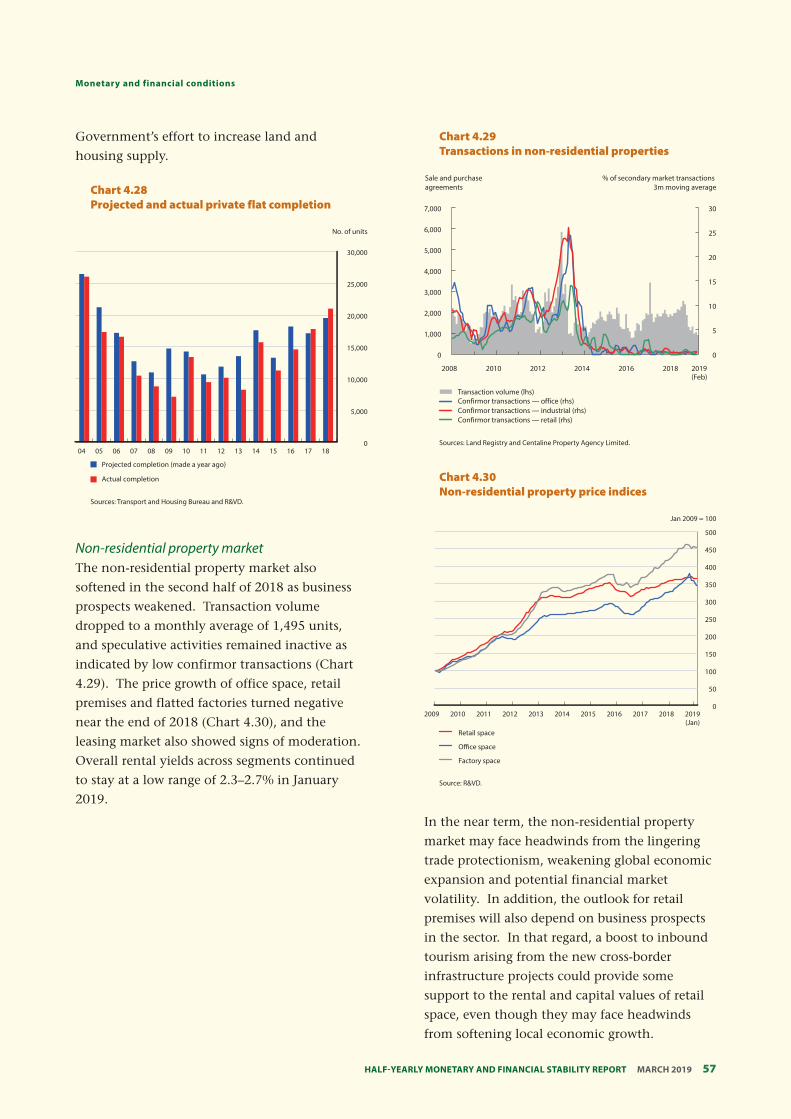
57 Half-YearlY MonetarY and financial StabilitY report MarcH 2019
Monetary and financial conditions
Government’s effort to increase land and
housing supply.
Chart 4.28 Projected and actual private flat completion
0
5,000
10,000
15,000
20,000
25,000
30,000
04 05 06 07 08 09 10 11 12 13 14 15 16 17 18
Projected completion (made a year ago)
Actual completion
No. of units
Sources: Transport and Housing Bureau and R&VD.
Non-residential property market The non-residential property market also
softened in the second half of 2018 as business
prospects weakened. Transaction volume
dropped to a monthly average of 1,495 units,
and speculative activities remained inactive as
indicated by low confirmor transactions (Chart
4.29). The price growth of office space, retail
premises and flatted factories turned negative
near the end of 2018 (Chart 4.30), and the
leasing market also showed signs of moderation.
Overall rental yields across segments continued
to stay at a low range of 2.3–2.7% in January
2019.
Chart 4.29 Transactions in non-residential properties
0
5
10
15
20
25
30
0
1,000
2,000
3,000
4,000
5,000
6,000
7,000
2008 2010 2012 2014 2016 2018
Transaction volume (lhs)Confirmor transactions — office (rhs) Confirmor transactions — industrial (rhs) Confirmor transactions — retail (rhs)
Sale and purchase agreements
% of secondary market transactions 3m moving average
2019(Feb)
Sources: Land Registry and Centaline Property Agency Limited.
Chart 4.30 Non-residential property price indices
Jan 2009 = 100
500
450
400
350
300
250
200
150
100
50
0 2009 2010 2011 2012 2013 2014 2015 2016 2017 2018 2019
(Jan) Retail space
O˜ce space
Factory space
Source: R&VD.
In the near term, the non-residential property
market may face headwinds from the lingering
trade protectionism, weakening global economic
expansion and potential financial market
volatility. In addition, the outlook for retail
premises will also depend on business prospects
in the sector. In that regard, a boost to inbound
tourism arising from the new cross-border
infrastructure projects could provide some
support to the rental and capital values of retail
space, even though they may face headwinds
from softening local economic growth.
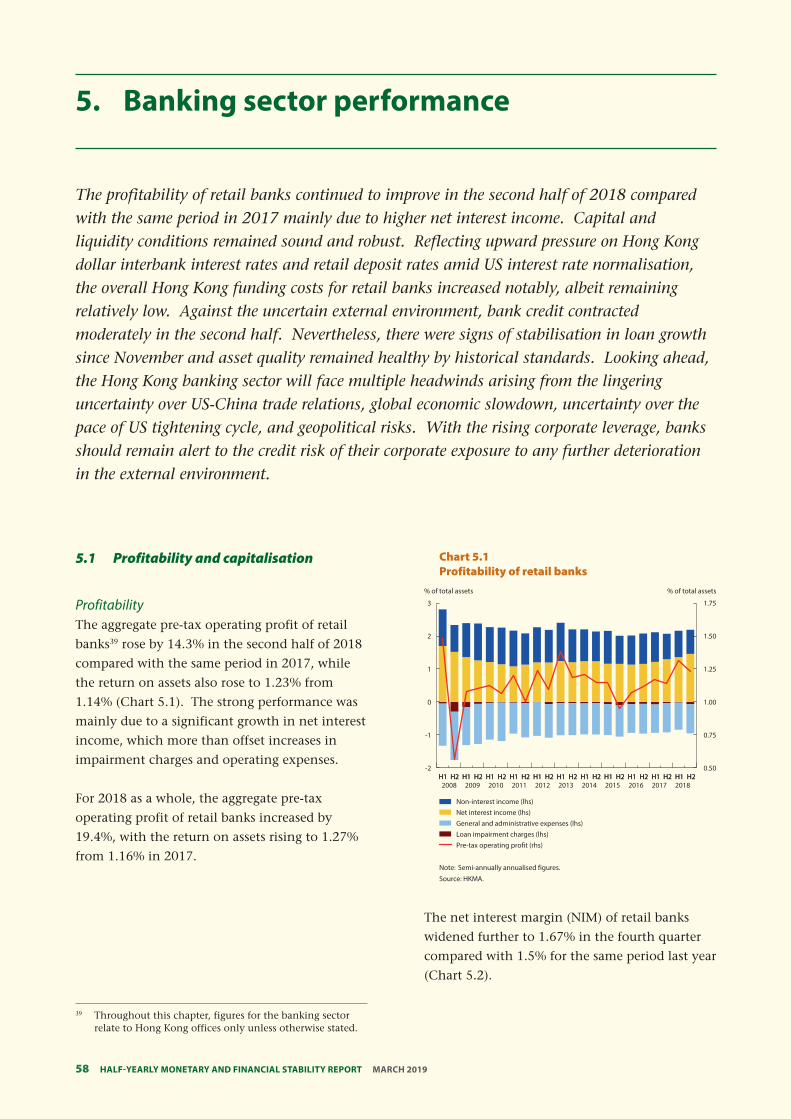
Half-YearlY MonetarY and financial StabilitY report MarcH 2019
5. Banking sector performance
The profitability of retail banks continued to improve in the second half of 2018 compared with the same period in 2017 mainly due to higher net interest income. Capital and liquidity conditions remained sound and robust. Reflecting upward pressure on Hong Kong dollar interbank interest rates and retail deposit rates amid US interest rate normalisation, the overall Hong Kong funding costs for retail banks increased notably, albeit remaining relatively low. Against the uncertain external environment, bank credit contracted moderately in the second half. Nevertheless, there were signs of stabilisation in loan growth since November and asset quality remained healthy by historical standards. Looking ahead, the Hong Kong banking sector will face multiple headwinds arising from the lingering uncertainty over US-China trade relations, global economic slowdown, uncertainty over the pace of US tightening cycle, and geopolitical risks. With the rising corporate leverage, banks should remain alert to the credit risk of their corporate exposure to any further deterioration in the external environment.
5.1 Profitability and capitalisation
Profitability The aggregate pre-tax operating profit of retail
banks39 rose by 14.3% in the second half of 2018
compared with the same period in 2017, while
the return on assets also rose to 1.23% from
1.14% (Chart 5.1). The strong performance was
mainly due to a significant growth in net interest
income, which more than offset increases in
impairment charges and operating expenses.
For 2018 as a whole, the aggregate pre-tax
operating profit of retail banks increased by
19.4%, with the return on assets rising to 1.27%
from 1.16% in 2017.
H1 H2 H1 H2 H1 H2 H1 H2 H1 H2 H1 H2 H1 H2 H1 H2 H1 H2 H1 H2 H1 H2
Chart 5.1 Profitability of retail banks
% of total assets % of total assets
3 1.75
2 1.50
1 1.25
0 1.00
-1 0.75
-2 0.50 H1 H2 H1 H2 H1 H2 H1 H2 H1 H2 H1 H2 H1 H2 H1 H2 H1 H2 H1 H2 H1 H2 2008 2009 2010 2011 2012 2013 2014 2015 2016 2017 2018
Non-interest income (lhs) Net interest income (lhs) General and administrative expenses (lhs) Loan impairment charges (lhs) Pre-tax operating proÿt (rhs)
Note: Semi-annually annualised figures.
Source: HKMA.
The net interest margin (NIM) of retail banks
widened further to 1.67% in the fourth quarter
compared with 1.5% for the same period last year
(Chart 5.2).
39 Throughout this chapter, figures for the banking sector relate to Hong Kong offices only unless otherwise stated.
58
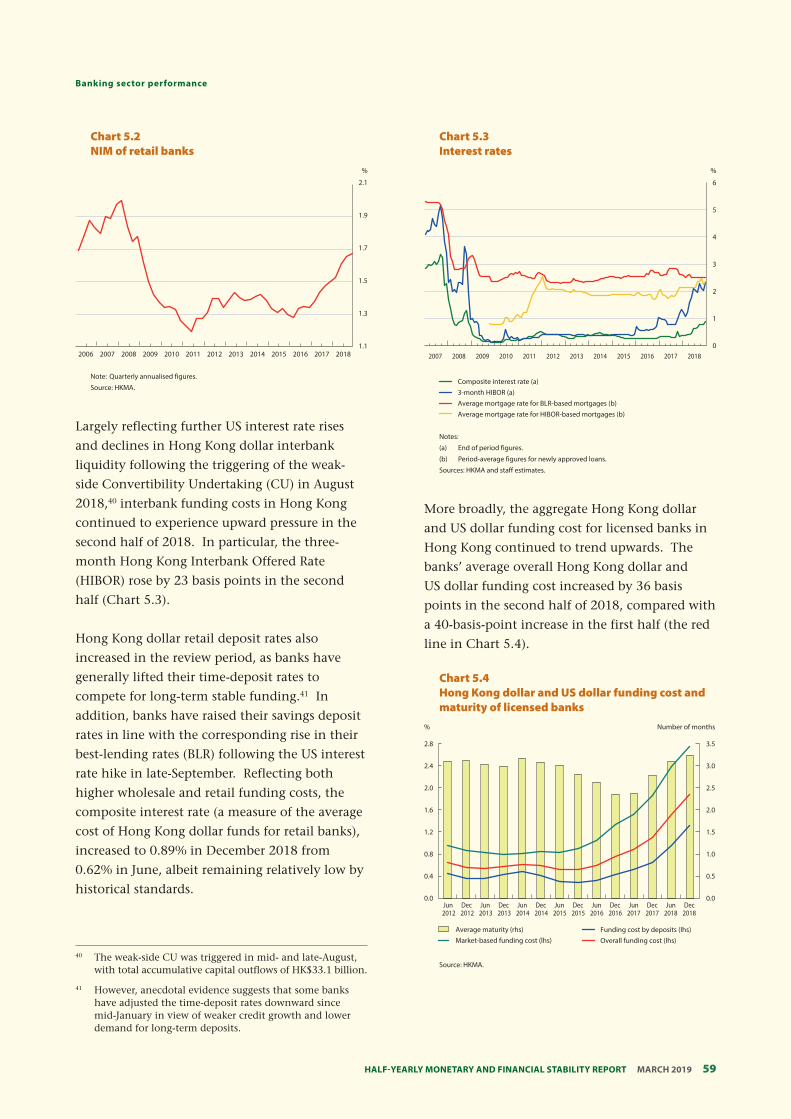
59 Half-YearlY MonetarY and financial StabilitY report MarcH 2019
banking sector performance
Chart 5.2 NIM of retail banks
%
2.1
1.9
1.7
1.5
1.3
1.1 2006 2007 2008 2009 2010 2011 2012 2013 2014 2015 2016 2017 2018
Note: Quarterly annualised figures.
Source: HKMA.
Largely reflecting further US interest rate rises
and declines in Hong Kong dollar interbank
liquidity following the triggering of the weak-
side Convertibility Undertaking (CU) in August
2018,40 interbank funding costs in Hong Kong
continued to experience upward pressure in the
second half of 2018. In particular, the three-
month Hong Kong Interbank Offered Rate
(HIBOR) rose by 23 basis points in the second
half (Chart 5.3).
Hong Kong dollar retail deposit rates also
increased in the review period, as banks have
generally lifted their time-deposit rates to
compete for long-term stable funding.41 In
addition, banks have raised their savings deposit
rates in line with the corresponding rise in their
best-lending rates (BLR) following the US interest
rate hike in late-September. Reflecting both
higher wholesale and retail funding costs, the
composite interest rate (a measure of the average
cost of Hong Kong dollar funds for retail banks),
increased to 0.89% in December 2018 from
0.62% in June, albeit remaining relatively low by
historical standards.
Chart 5.3 Interest rates
%
6
5
4
3
2
1
0 2007 2008 2009 2010 2011 2012 2013 2014 2015 2016 2017 2018
Composite interest rate (a) 3-month HIBOR (a) Average mortgage rate for BLR-based mortgages (b) Average mortgage rate for HIBOR-based mortgages (b)
Notes:
(a) End of period figures.
(b) Period-average figures for newly approved loans.
Sources: HKMA and staff estimates.
More broadly, the aggregate Hong Kong dollar
and US dollar funding cost for licensed banks in
Hong Kong continued to trend upwards. The
banks’ average overall Hong Kong dollar and
US dollar funding cost increased by 36 basis
points in the second half of 2018, compared with
a 40-basis-point increase in the first half (the red
line in Chart 5.4).
2.8
2.4
2.0
1.6
1.2
0.8
0.4
0.0
Chart 5.4 Hong Kong dollar and US dollar funding cost and maturity of licensed banks
% Number of months
Jun Dec Jun Dec Jun Dec Jun Dec Jun Dec Jun Dec Jun Dec 2012 2012 2013 2013 2014 2014 2015 2015 2016 2016 2017 2017 2018 2018
Average maturity (rhs) Funding cost by deposits (lhs) Market-based funding cost (lhs) Overall funding cost (lhs)
Source: HKMA.
3.5
3.0
2.5
2.0
1.5
1.0
0.5
0.0
40 The weak-side CU was triggered in mid- and late-August, with total accumulative capital outflows of HK$33.1 billion.
41 However, anecdotal evidence suggests that some banks have adjusted the time-deposit rates downward since mid-January in view of weaker credit growth and lower demand for long-term deposits.
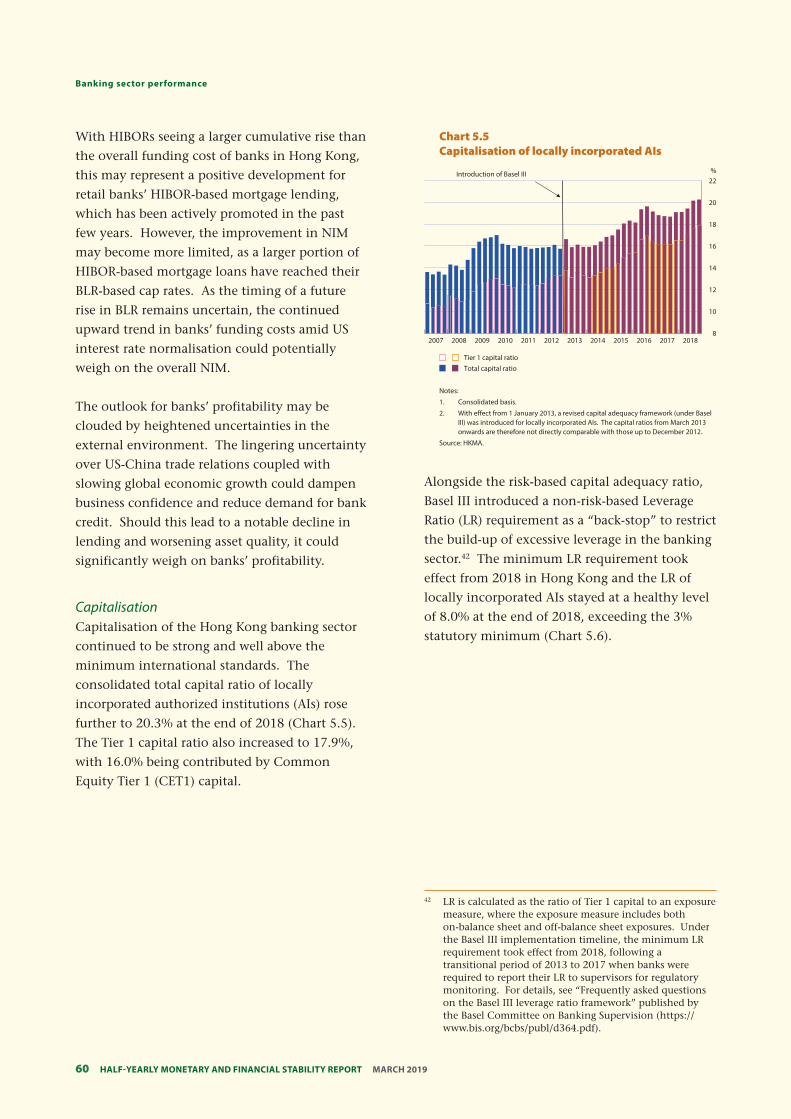
Half-YearlY MonetarY and financial StabilitY report MarcH 201960
Banking sector performance
With HIBORs seeing a larger cumulative rise than
the overall funding cost of banks in Hong Kong,
this may represent a positive development for
retail banks’ HIBOR-based mortgage lending,
which has been actively promoted in the past
few years. However, the improvement in NIM
may become more limited, as a larger portion of
HIBOR-based mortgage loans have reached their
BLR-based cap rates. As the timing of a future
rise in BLR remains uncertain, the continued
upward trend in banks’ funding costs amid US
interest rate normalisation could potentially
weigh on the overall NIM.
The outlook for banks’ profitability may be
clouded by heightened uncertainties in the
external environment. The lingering uncertainty
over US-China trade relations coupled with
slowing global economic growth could dampen
business confidence and reduce demand for bank
credit. Should this lead to a notable decline in
lending and worsening asset quality, it could
significantly weigh on banks’ profitability.
Capitalisation Capitalisation of the Hong Kong banking sector
continued to be strong and well above the
minimum international standards. The
consolidated total capital ratio of locally
incorporated authorized institutions (AIs) rose
further to 20.3% at the end of 2018 (Chart 5.5).
The Tier 1 capital ratio also increased to 17.9%,
with 16.0% being contributed by Common
Equity Tier 1 (CET1) capital.
2007 2008 2009 2010 2011 2012 2013 2014 2015 2016 2017 2018
Tier 1 capital ratio Total capital ratio
Chart 5.5 Capitalisation of locally incorporated AIs
% Introduction of Basel III 22
20
18
16
14
12
10
8
Notes:
1. Consolidated basis.
2. With effect from 1 January 2013, a revised capital adequacy framework (under Basel III) was introduced for locally incorporated AIs. The capital ratios from March 2013 onwards are therefore not directly comparable with those up to December 2012.
Source: HKMA.
Alongside the risk-based capital adequacy ratio,
Basel III introduced a non-risk-based Leverage
Ratio (LR) requirement as a “back-stop” to restrict
the build-up of excessive leverage in the banking
sector.42 The minimum LR requirement took
effect from 2018 in Hong Kong and the LR of
locally incorporated AIs stayed at a healthy level
of 8.0% at the end of 2018, exceeding the 3%
statutory minimum (Chart 5.6).
42 LR is calculated as the ratio of Tier 1 capital to an exposure measure, where the exposure measure includes both on-balance sheet and off-balance sheet exposures. Under the Basel III implementation timeline, the minimum LR requirement took effect from 2018, following a transitional period of 2013 to 2017 when banks were required to report their LR to supervisors for regulatory monitoring. For details, see “Frequently asked questions on the Basel III leverage ratio framework” published by the Basel Committee on Banking Supervision (https:// www.bis.org/bcbs/publ/d364.pdf).
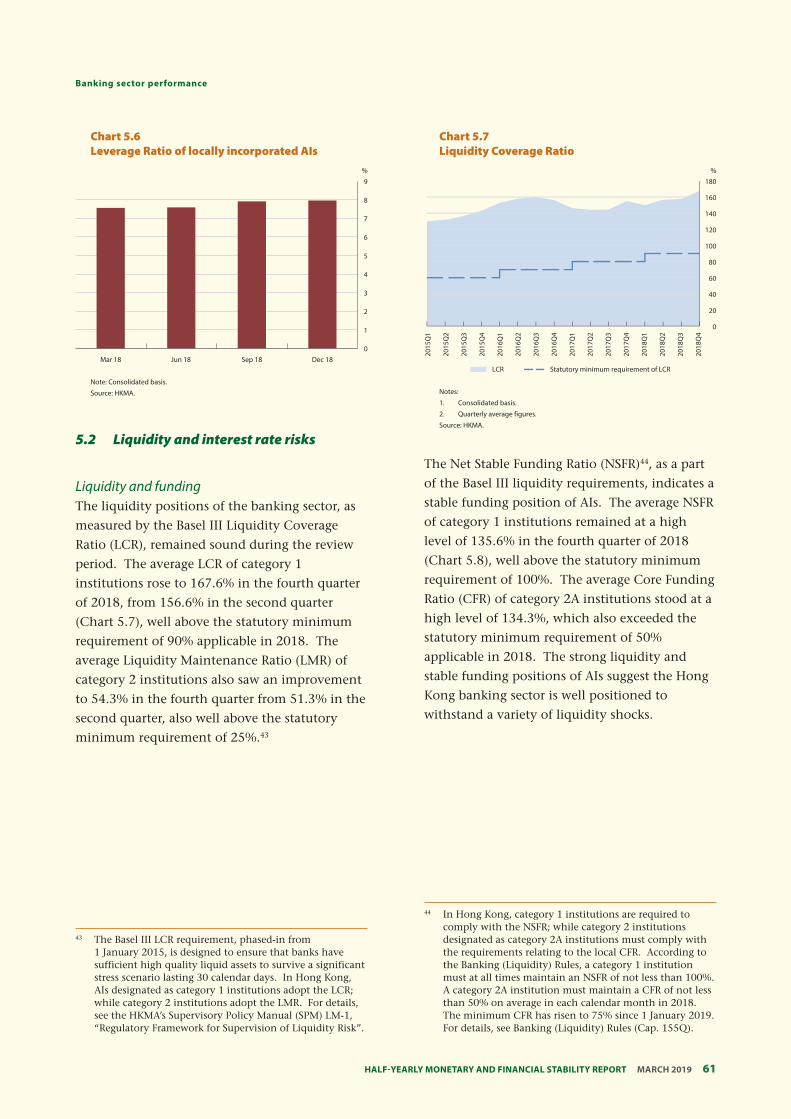
61 Half-YearlY MonetarY and financial StabilitY report MarcH 2019
banking sector performance
Chart 5.7 Liquidity Coverage Ratio
%
2015
Q1
2015
Q2
2015
Q3
2015
Q4
2016
Q1
2016
Q2
2016
Q3
2016
Q4
2017
Q1
2017
Q2
2017
Q3
2017
Q4
2018
Q1
2018
Q2
2018
Q3
2018
Q4
180
160
140
120
100
80
60
40
20
0
LCR Statutory minimum requirement of LCR
Notes:
1. Consolidated basis.
2. Quarterly average figures.
Source: HKMA.
Chart 5.6 Leverage Ratio of locally incorporated AIs
%
9
8
7
6
5
4
3
2
1
0 Mar 18 Jun 18 Sep 18 Dec 18
Note: Consolidated basis.
Source: HKMA.
5.2 Liquidity and interest rate risks
Liquidity and funding The liquidity positions of the banking sector, as
measured by the Basel III Liquidity Coverage
Ratio (LCR), remained sound during the review
period. The average LCR of category 1
institutions rose to 167.6% in the fourth quarter
of 2018, from 156.6% in the second quarter
(Chart 5.7), well above the statutory minimum
requirement of 90% applicable in 2018. The
average Liquidity Maintenance Ratio (LMR) of
category 2 institutions also saw an improvement
to 54.3% in the fourth quarter from 51.3% in the
second quarter, also well above the statutory
minimum requirement of 25%.43
The Net Stable Funding Ratio (NSFR)44, as a part
of the Basel III liquidity requirements, indicates a
stable funding position of AIs. The average NSFR
of category 1 institutions remained at a high
level of 135.6% in the fourth quarter of 2018
(Chart 5.8), well above the statutory minimum
requirement of 100%. The average Core Funding
Ratio (CFR) of category 2A institutions stood at a
high level of 134.3%, which also exceeded the
statutory minimum requirement of 50%
applicable in 2018. The strong liquidity and
stable funding positions of AIs suggest the Hong
Kong banking sector is well positioned to
withstand a variety of liquidity shocks.
43 The Basel III LCR requirement, phased-in from 1 January 2015, is designed to ensure that banks have sufficient high quality liquid assets to survive a significant stress scenario lasting 30 calendar days. In Hong Kong, AIs designated as category 1 institutions adopt the LCR; while category 2 institutions adopt the LMR. For details, see the HKMA’s Supervisory Policy Manual (SPM) LM-1, “Regulatory Framework for Supervision of Liquidity Risk”.
44 In Hong Kong, category 1 institutions are required to comply with the NSFR; while category 2 institutions designated as category 2A institutions must comply with the requirements relating to the local CFR. According to the Banking (Liquidity) Rules, a category 1 institution must at all times maintain an NSFR of not less than 100%. A category 2A institution must maintain a CFR of not less than 50% on average in each calendar month in 2018. The minimum CFR has risen to 75% since 1 January 2019. For details, see Banking (Liquidity) Rules (Cap. 155Q).
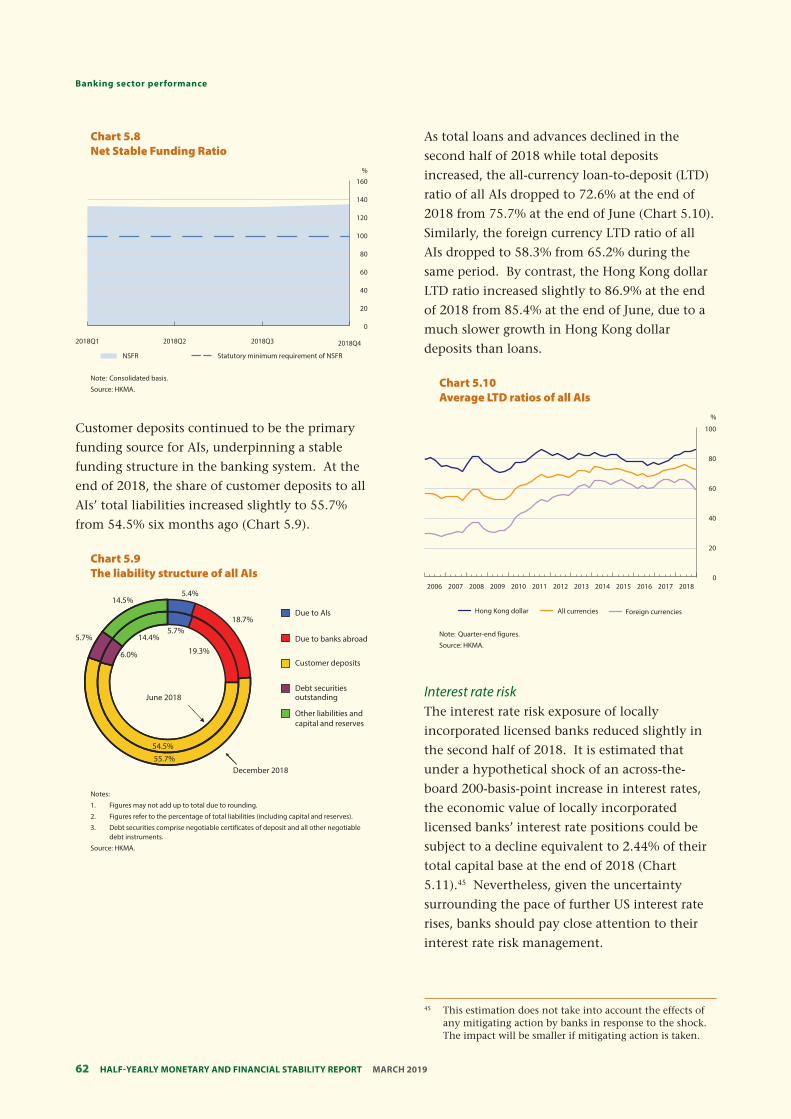
Half-YearlY MonetarY and financial StabilitY report MarcH 201962
Banking sector performance
Chart 5.8 Net Stable Funding Ratio
% 160
140
120
100
80
60
40
20
0
2018Q1 2018Q2 2018Q3 2018Q4
NSFR Statutory minimum requirement of NSFR
Note: Consolidated basis.
Source: HKMA.
Customer deposits continued to be the primary
funding source for AIs, underpinning a stable
funding structure in the banking system. At the
end of 2018, the share of customer deposits to all
AIs’ total liabilities increased slightly to 55.7%
from 54.5% six months ago (Chart 5.9).
Chart 5.9 The liability structure of all AIs
5.4% 14.5%
Due to AIs 18.7%
5.7%
June 2018
5.7%
19.3%
54.5%
6.0%
14.4%
55.7%
Due to banks abroad
Customer deposits
Debt securities outstanding
Other liabilities and capital and reserves
December 2018
Notes:
1. Figures may not add up to total due to rounding.
2. Figures refer to the percentage of total liabilities (including capital and reserves).
3. Debt securities comprise negotiable certificates of deposit and all other negotiable debt instruments.
Source: HKMA.
As total loans and advances declined in the
second half of 2018 while total deposits
increased, the all-currency loan-to-deposit (LTD)
ratio of all AIs dropped to 72.6% at the end of
2018 from 75.7% at the end of June (Chart 5.10).
Similarly, the foreign currency LTD ratio of all
AIs dropped to 58.3% from 65.2% during the
same period. By contrast, the Hong Kong dollar
LTD ratio increased slightly to 86.9% at the end
of 2018 from 85.4% at the end of June, due to a
much slower growth in Hong Kong dollar
deposits than loans.
Chart 5.10 Average LTD ratios of all AIs
%
100
80
60
40
20
0 2006 2007 2008 2009 2010 2011 2012 2013 2014 2015 2016 2017 2018
Hong Kong dollar All currencies Foreign currencies
Note: Quarter-end figures.
Source: HKMA.
Interest rate risk The interest rate risk exposure of locally
incorporated licensed banks reduced slightly in
the second half of 2018. It is estimated that
under a hypothetical shock of an across-the-
board 200-basis-point increase in interest rates,
the economic value of locally incorporated
licensed banks’ interest rate positions could be
subject to a decline equivalent to 2.44% of their
total capital base at the end of 2018 (Chart
5.11).45 Nevertheless, given the uncertainty
surrounding the pace of further US interest rate
rises, banks should pay close attention to their
interest rate risk management.
45 This estimation does not take into account the effects of any mitigating action by banks in response to the shock. The impact will be smaller if mitigating action is taken.
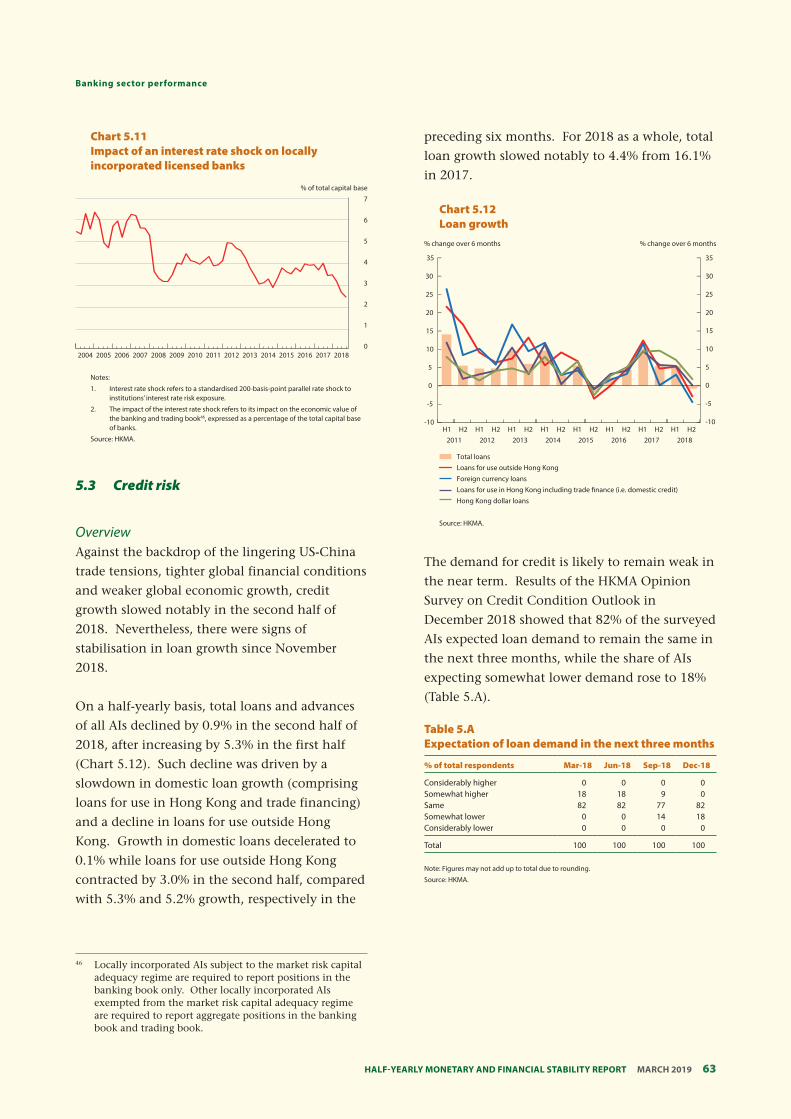
63 Half-YearlY MonetarY and financial StabilitY report MarcH 2019
banking sector performance
Chart 5.11 Impact of an interest rate shock on locally incorporated licensed banks
% of total capital base
7
6
5
4
3
2
1
0 2004 2005 2006 2007 2008 2009 2010 2011 2012 2013 2014 2015 2016 2017 2018
Notes:
1. Interest rate shock refers to a standardised 200-basis-point parallel rate shock to institutions’ interest rate risk exposure.
2. The impact of the interest rate shock refers to its impact on the economic value of the banking and trading book46, expressed as a percentage of the total capital base of banks.
Source: HKMA.
5.3 Credit risk
Overview Against the backdrop of the lingering US-China
trade tensions, tighter global financial conditions
and weaker global economic growth, credit
growth slowed notably in the second half of
2018. Nevertheless, there were signs of
stabilisation in loan growth since November
2018.
On a half-yearly basis, total loans and advances
of all AIs declined by 0.9% in the second half of
2018, after increasing by 5.3% in the first half
(Chart 5.12). Such decline was driven by a
slowdown in domestic loan growth (comprising
loans for use in Hong Kong and trade financing)
and a decline in loans for use outside Hong
Kong. Growth in domestic loans decelerated to
0.1% while loans for use outside Hong Kong
contracted by 3.0% in the second half, compared
with 5.3% and 5.2% growth, respectively in the
preceding six months. For 2018 as a whole, total
loan growth slowed notably to 4.4% from 16.1%
in 2017.
Chart 5.12 Loan growth
% change over 6 months % change over 6 months
35 35
30 30
25 25
20 20
15 15
10 10
5 5
0 0
-5 -5
-10 -10 H1 H2 H1 H2 H1 H2 H1 H2 H1 H2 H1 H2 H1 H2 H1 H2
2011 2012 2013 2014 2015 2016 2017 2018
Total loans Loans for use outside Hong Kong Foreign currency loans Loans for use in Hong Kong including trade ÿnance (i.e. domestic credit) Hong Kong dollar loans
Source: HKMA.
The demand for credit is likely to remain weak in
the near term. Results of the HKMA Opinion
Survey on Credit Condition Outlook in
December 2018 showed that 82% of the surveyed
AIs expected loan demand to remain the same in
the next three months, while the share of AIs
expecting somewhat lower demand rose to 18%
(Table 5.A).
Table 5.A Expectation of loan demand in the next three months
% of total respondents Mar-18 Jun-18 Sep-18 Dec-18
Considerably higher 0 0 0 0 Somewhat higher 18 18 9 0 Same 82 82 77 82 Somewhat lower 0 0 14 18 Considerably lower 0 0 0 0
Total 100 100 100 100
Note: Figures may not add up to total due to rounding.
Source: HKMA.
46 Locally incorporated AIs subject to the market risk capital adequacy regime are required to report positions in the banking book only. Other locally incorporated AIs exempted from the market risk capital adequacy regime are required to report aggregate positions in the banking book and trading book.
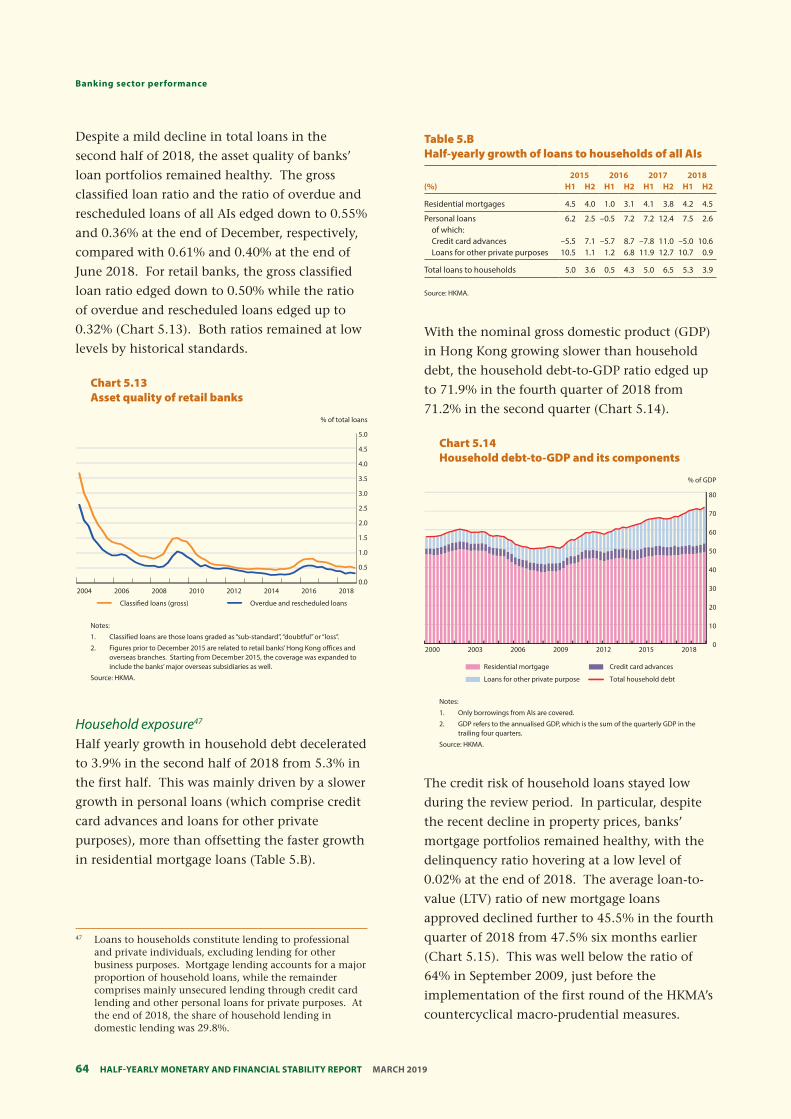
Half-YearlY MonetarY and financial StabilitY report MarcH 201964
Banking sector performance
Chart 5.13 Asset quality of retail banks
% of total loans
5.0
4.5
4.0
3.5
3.0
2.5
2.0
1.5
1.0
0.5
0.0
Classiÿed loans (gross) Overdue and rescheduled loans
Notes:
1. Classified loans are those loans graded as “sub-standard”, “doubtful” or “loss”.
2. Figures prior to December 2015 are related to retail banks’ Hong Kong offices and overseas branches. Starting from December 2015, the coverage was expanded to include the banks’ major overseas subsidiaries as well.
Source: HKMA.
2004 2006 2008 2010 2012 2014 2016 2018
Household exposure47
Half yearly growth in household debt decelerated
to 3.9% in the second half of 2018 from 5.3% in
the first half. This was mainly driven by a slower
growth in personal loans (which comprise credit
card advances and loans for other private
purposes), more than offsetting the faster growth
in residential mortgage loans (Table 5.B).
(%) 2015
H1 H22016
H1 H22017
H1 H22018
H1 H2
Residential mortgages 4.5 4.0 1.0 3.1 4.1 3.8 4.2 4.5
Personal loans of which: Credit card advances Loans for other private purposes
6.2
–5.5 10.5
2.5 –0.5
7.1 –5.7 1.1 1.2
7.2 7.2 12.4 7.5 2.6
8.7 –7.8 11.0 –5.0 10.6 6.8 11.9 12.7 10.7 0.9
Total loans to households 5.0 3.6 0.5 4.3 5.0 6.5 5.3 3.9
Despite a mild decline in total loans in the
second half of 2018, the asset quality of banks’
loan portfolios remained healthy. The gross
classified loan ratio and the ratio of overdue and
rescheduled loans of all AIs edged down to 0.55%
and 0.36% at the end of December, respectively,
compared with 0.61% and 0.40% at the end of
June 2018. For retail banks, the gross classified
loan ratio edged down to 0.50% while the ratio
of overdue and rescheduled loans edged up to
0.32% (Chart 5.13). Both ratios remained at low
levels by historical standards.
Table 5.B Half-yearly growth of loans to households of all AIs
Source: HKMA.
With the nominal gross domestic product (GDP)
in Hong Kong growing slower than household
debt, the household debt-to-GDP ratio edged up
to 71.9% in the fourth quarter of 2018 from
71.2% in the second quarter (Chart 5.14).
2000 2003 2006 2009 2012 2015 2018
Chart 5.14 Household debt-to-GDP and its components
% of GDP
80
70
60
50
40
30
20
10
0
Residential mortgage Credit card advances
Loans for other private purpose Total household debt
Notes:
1. Only borrowings from AIs are covered.
2. GDP refers to the annualised GDP, which is the sum of the quarterly GDP in the trailing four quarters.
Source: HKMA.
The credit risk of household loans stayed low
during the review period. In particular, despite
the recent decline in property prices, banks’
mortgage portfolios remained healthy, with the
delinquency ratio hovering at a low level of
0.02% at the end of 2018. The average loan-to-
value (LTV) ratio of new mortgage loans
approved declined further to 45.5% in the fourth
quarter of 2018 from 47.5% six months earlier
(Chart 5.15). This was well below the ratio of
64% in September 2009, just before the
implementation of the first round of the HKMA’s
countercyclical macro-prudential measures.
47 Loans to households constitute lending to professional and private individuals, excluding lending for other business purposes. Mortgage lending accounts for a major proportion of household loans, while the remainder comprises mainly unsecured lending through credit card lending and other personal loans for private purposes. At the end of 2018, the share of household lending in domestic lending was 29.8%.
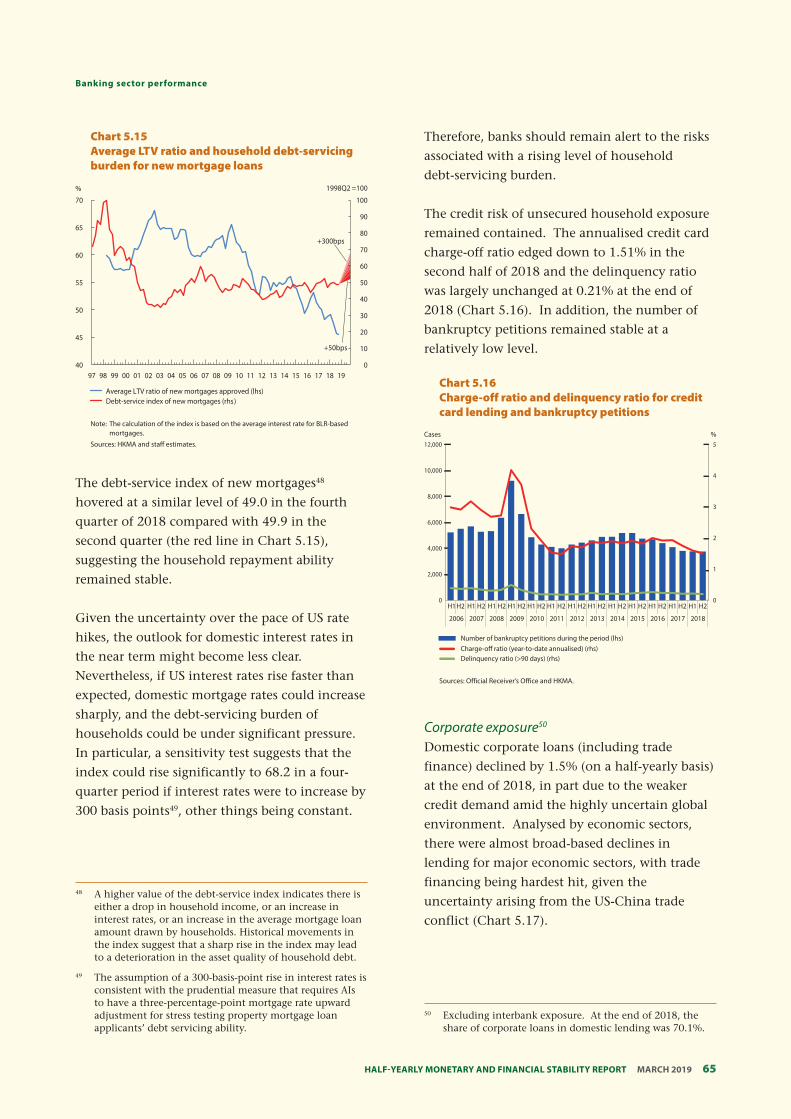
65 Half-YearlY MonetarY and financial StabilitY report MarcH 2019
banking sector performance
Chart 5.15 Average LTV ratio and household debt-servicing burden for new mortgage loans
% 1998Q2 =100
70
+50bps
+300bps
100
90 65
80
70 60
60
55 50
40 50
30
20 45
10
40 0 97 98 99 00 01 02 03 04 05 06 07 08 09 10 11 12 13 14 15 16 17 18 19
Average LTV ratio of new mortgages approved (lhs) Debt-service index of new mortgages (rhs)
Note: The calculation of the index is based on the average interest rate for BLR-based mortgages.
Sources: HKMA and staff estimates.
The debt-service index of new mortgages48
hovered at a similar level of 49.0 in the fourth
quarter of 2018 compared with 49.9 in the
second quarter (the red line in Chart 5.15),
suggesting the household repayment ability
remained stable.
Given the uncertainty over the pace of US rate
hikes, the outlook for domestic interest rates in
the near term might become less clear.
Nevertheless, if US interest rates rise faster than
expected, domestic mortgage rates could increase
sharply, and the debt-servicing burden of
households could be under significant pressure.
In particular, a sensitivity test suggests that the
index could rise significantly to 68.2 in a four-
quarter period if interest rates were to increase by
300 basis points49, other things being constant.
Therefore, banks should remain alert to the risks
associated with a rising level of household
debt-servicing burden.
The credit risk of unsecured household exposure
remained contained. The annualised credit card
charge-off ratio edged down to 1.51% in the
second half of 2018 and the delinquency ratio
was largely unchanged at 0.21% at the end of
2018 (Chart 5.16). In addition, the number of
bankruptcy petitions remained stable at a
relatively low level.
Chart 5.16 Charge-off ratio and delinquency ratio for credit card lending and bankruptcy petitions
Cases % 12,000 5
10,000 4
8,000
3
6,000
2
4,000
1 2,000
0 0 H1H2 H1 H2 H1 H2 H1 H2 H1 H2 H1 H2 H1 H2 H1 H2 H1 H2 H1 H2 H1 H2 H1 H2 H1 H2
2006 2007 2008 2009 2010 2011 2012 2013 2014 2015 2016 2017 2018
Number of bankruptcy petitions during the period (lhs) Charge-o˜ ratio (year-to-date annualised) (rhs) Delinquency ratio (>90 days) (rhs)
Sources: Official Receiver’s Office and HKMA.
Corporate exposure50
Domestic corporate loans (including trade
finance) declined by 1.5% (on a half-yearly basis)
at the end of 2018, in part due to the weaker
credit demand amid the highly uncertain global
environment. Analysed by economic sectors,
there were almost broad-based declines in
lending for major economic sectors, with trade
financing being hardest hit, given the
uncertainty arising from the US-China trade
conflict (Chart 5.17).
48 A higher value of the debt-service index indicates there is either a drop in household income, or an increase in interest rates, or an increase in the average mortgage loan amount drawn by households. Historical movements in the index suggest that a sharp rise in the index may lead to a deterioration in the asset quality of household debt.
49 The assumption of a 300-basis-point rise in interest rates is consistent with the prudential measure that requires AIs to have a three-percentage-point mortgage rate upward adjustment for stress testing property mortgage loan applicants’ debt servicing ability.
50 Excluding interbank exposure. At the end of 2018, the share of corporate loans in domestic lending was 70.1%.
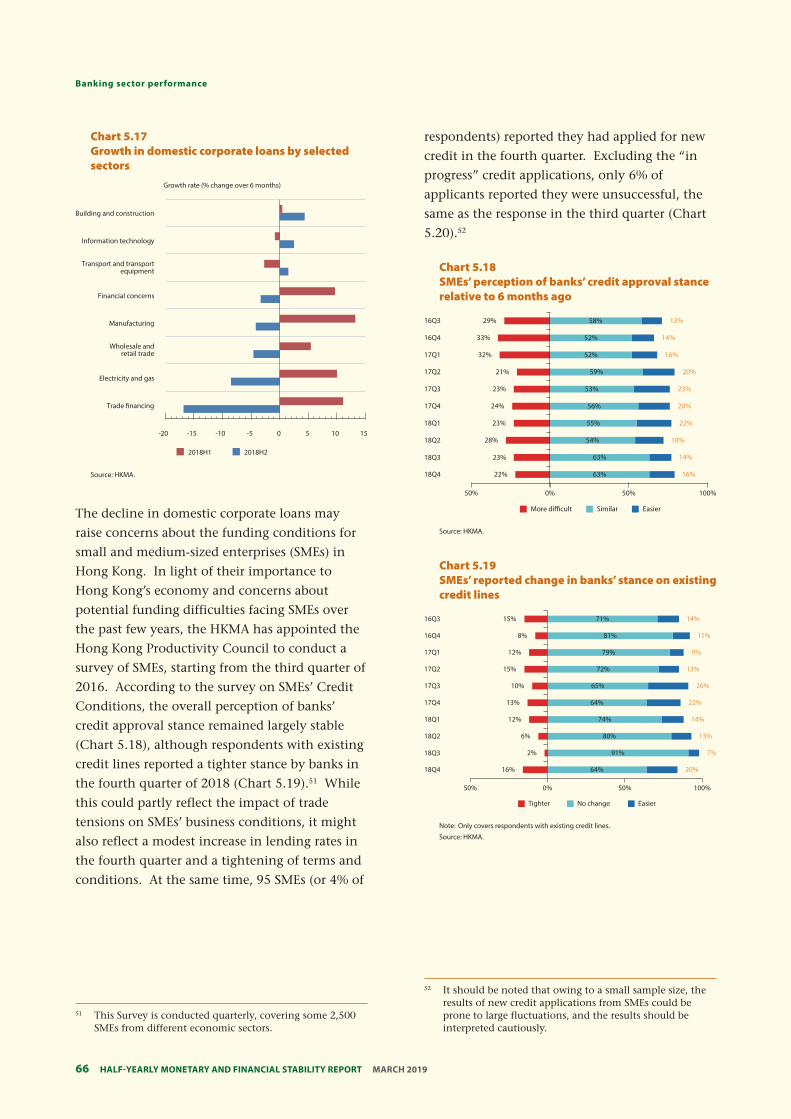
Half-YearlY MonetarY and financial StabilitY report MarcH 201966
Banking sector performance
Chart 5.17 Growth in domestic corporate loans by selected sectors
Growth rate (% change over 6 months)
Building and construction
Information technology
Transport and transport equipment
Financial concerns
Manufacturing
Wholesale and retail trade
Electricity and gas
Trade ÿnancing
-20 -15 -10 -5 0 5 10 15
2018H1 2018H2
Source: HKMA.
The decline in domestic corporate loans may
raise concerns about the funding conditions for
small and medium-sized enterprises (SMEs) in
Hong Kong. In light of their importance to
Hong Kong’s economy and concerns about
potential funding difficulties facing SMEs over
the past few years, the HKMA has appointed the
Hong Kong Productivity Council to conduct a
survey of SMEs, starting from the third quarter of
2016. According to the survey on SMEs’ Credit
Conditions, the overall perception of banks’
credit approval stance remained largely stable
(Chart 5.18), although respondents with existing
credit lines reported a tighter stance by banks in
the fourth quarter of 2018 (Chart 5.19).51 While
this could partly reflect the impact of trade
tensions on SMEs’ business conditions, it might
also reflect a modest increase in lending rates in
the fourth quarter and a tightening of terms and
conditions. At the same time, 95 SMEs (or 4% of
respondents) reported they had applied for new
credit in the fourth quarter. Excluding the “in
progress” credit applications, only 6% of
applicants reported they were unsuccessful, the
same as the response in the third quarter (Chart
5.20).52
Chart 5.18 SMEs’ perception of banks’ credit approval stance relative to 6 months ago
16Q3
16Q4
17Q1
17Q2
17Q3
17Q4
18Q1
18Q2
18Q3
18Q4
29%
33%
32%
21%
23%
24%
23%
28%
23%
22%
58% 13%
14%
16%
20% 59%
23%
20% 56%
22%
18%
14%
16%
52%
52%
54%
53%
55%
63%
63%
50% 0% 50% 100%
More di˜cult Similar Easier
Source: HKMA.
Chart 5.19 SMEs’ reported change in banks’ stance on existing credit lines
16Q3
16Q4
17Q1
17Q2
17Q3
17Q4
18Q1
18Q2
18Q3 7%
18Q4
15%
8%
12%
15%
10%
13%
12%
6%
2%
16%
71% 14%
11%
9%
13%
26% 65%
22%
14%
13%
20%
81%
79%
72%
74%
80%
91%
64%
64%
50% 0% 50% 100%
Tighter No change Easier
Note: Only covers respondents with existing credit lines.
Source: HKMA.
51 This Survey is conducted quarterly, covering some 2,500 SMEs from different economic sectors.
52 It should be noted that owing to a small sample size, the results of new credit applications from SMEs could be prone to large fluctuations, and the results should be interpreted cautiously.
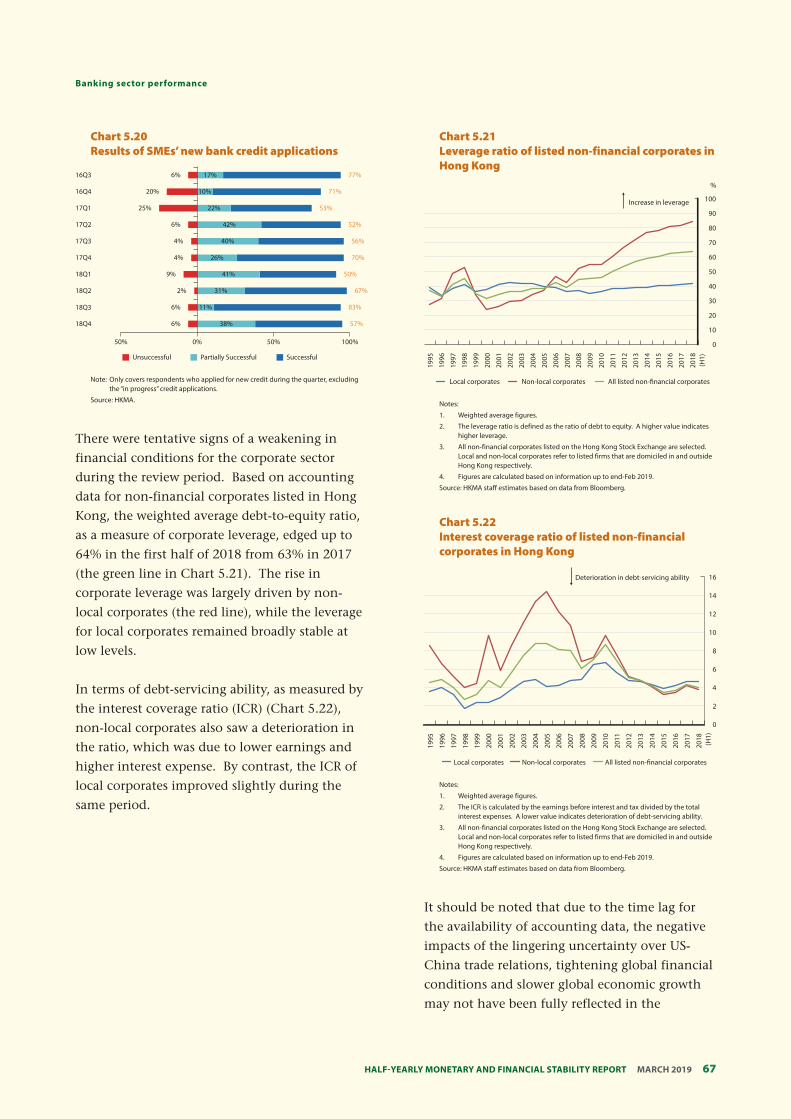
67 Half-YearlY MonetarY and financial StabilitY report MarcH 2019
banking sector performance
Chart 5.20 Results of SMEs’ new bank credit applications
16Q3
16Q4
17Q1
17Q2
17Q3
17Q4
18Q1
18Q2
18Q3
18Q4
50% 0% 50% 100%
57%
56%
70%
67%
6%
20%
25%
6%
4%
4%
9%
2%
6%
6%
17% 77%
71%
53%
52%
50%
83%
10%
22%
42%
40%
26%
41%
31%
11%
38%
the “in progress” credit applications.
Source: HKMA.
Unsuccessful Partially Successful Successful
Note: Only covers respondents who applied for new credit during the quarter, excluding
There were tentative signs of a weakening in
financial conditions for the corporate sector
during the review period. Based on accounting
data for non-financial corporates listed in Hong
Kong, the weighted average debt-to-equity ratio,
as a measure of corporate leverage, edged up to
64% in the first half of 2018 from 63% in 2017
(the green line in Chart 5.21). The rise in
corporate leverage was largely driven by non-
local corporates (the red line), while the leverage
for local corporates remained broadly stable at
low levels.
In terms of debt-servicing ability, as measured by
the interest coverage ratio (ICR) (Chart 5.22),
non-local corporates also saw a deterioration in
the ratio, which was due to lower earnings and
higher interest expense. By contrast, the ICR of
local corporates improved slightly during the
same period.
100
50
90
Chart 5.21 Leverage ratio of listed non-financial corporates in
Local and non-local corporates refer to listed firms that are domiciled in and outside Hong Kong respectively.
4. Figures are calculated based on information up to end-Feb 2019.
Source: HKMA staff estimates based on data from Bloomberg.
3.
Increase in leverage
70
60
Hong Kong
30
80
%
1995
Notes:
1. Weighted average figures.
2. The leverage ratio is defined as the ratio of debt to equity. A higher value indicates higher leverage.
All non-financial corporates listed on the Hong Kong Stock Exchange are selected. 19
96
Local corporates Non-local corporates All listed non-ÿnancial corporates
1997
1998
1999
2000
2001
2002
2003
2004
2005
2006
2007
2008
2009
2010
2011
2012
2013
2014
2015
2016
2017
2018
(H
1)
0
10
20
40
Chart 5.22 Interest coverage ratio of listed non-financial corporates in Hong Kong
Deterioration in debt-servicing ability 16
14
12
10
8
6
4
2
0
1995
1996
1997
1998
1999
2000
2001
2002
2003
2004
2005
2006
2007
2008
2009
2010
2011
2012
2013
2014
2015
2016
2017
2018
(H
1)
Local corporates Non-local corporates All listed non-ÿnancial corporates
Notes:
1. Weighted average figures.
2. The ICR is calculated by the earnings before interest and tax divided by the total interest expenses. A lower value indicates deterioration of debt-servicing ability.
3. All non-financial corporates listed on the Hong Kong Stock Exchange are selected. Local and non-local corporates refer to listed firms that are domiciled in and outside Hong Kong respectively.
4. Figures are calculated based on information up to end-Feb 2019.
Source: HKMA staff estimates based on data from Bloomberg.
It should be noted that due to the time lag for
the availability of accounting data, the negative
impacts of the lingering uncertainty over US-
China trade relations, tightening global financial
conditions and slower global economic growth
may not have been fully reflected in the
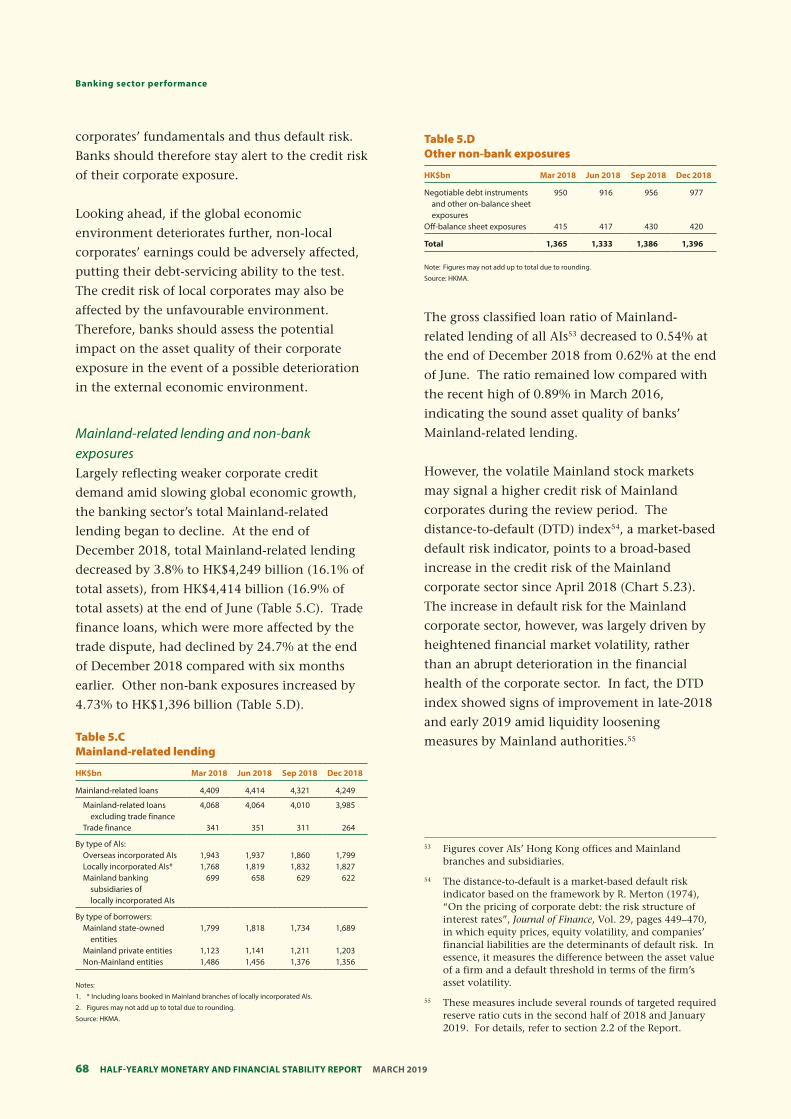
Half-YearlY MonetarY and financial StabilitY report MarcH 201968
Banking sector performance
HK$bn Mar 2018 Jun 2018 Sep 2018 Dec 2018
Mainland-related loans 4,409 4,414 4,321 4,249
Mainland-related loans 4,068 4,064 4,010 3,985 excluding trade finance
Trade finance 341 351 311 264
By type of Als: Overseas incorporated AIs 1,943 1,937 1,860 1,799 Locally incorporated AIs* 1,768 1,819 1,832 1,827 Mainland banking 699 658 629 622
subsidiaries of locally incorporated AIs
By type of borrowers: Mainland state-owned 1,799 1,818 1,734 1,689
entities Mainland private entities 1,123 1,141 1,211 1,203 Non-Mainland entities 1,486 1,456 1,376 1,356
HK$bn Mar 2018 Jun 2018 Sep 2018 Dec 2018
Negotiable debt instruments 950 916 956 977 and other on-balance sheet exposures
Off-balance sheet exposures 415 417 430 420
Total 1,365 1,333 1,386 1,396
corporates’ fundamentals and thus default risk.
Banks should therefore stay alert to the credit risk
of their corporate exposure.
Looking ahead, if the global economic
environment deteriorates further, non-local
corporates’ earnings could be adversely affected,
putting their debt-servicing ability to the test.
The credit risk of local corporates may also be
affected by the unfavourable environment.
Therefore, banks should assess the potential
impact on the asset quality of their corporate
exposure in the event of a possible deterioration
in the external economic environment.
Mainland-related lending and non-bank exposures Largely reflecting weaker corporate credit
demand amid slowing global economic growth,
the banking sector’s total Mainland-related
lending began to decline. At the end of
December 2018, total Mainland-related lending
decreased by 3.8% to HK$4,249 billion (16.1% of
total assets), from HK$4,414 billion (16.9% of
total assets) at the end of June (Table 5.C). Trade
finance loans, which were more affected by the
trade dispute, had declined by 24.7% at the end
of December 2018 compared with six months
earlier. Other non-bank exposures increased by
4.73% to HK$1,396 billion (Table 5.D).
Table 5.C Mainland-related lending
Notes:
1. * Including loans booked in Mainland branches of locally incorporated AIs.
2. Figures may not add up to total due to rounding.
Source: HKMA.
Table 5.D Other non-bank exposures
Note: Figures may not add up to total due to rounding.
Source: HKMA.
The gross classified loan ratio of Mainland-
related lending of all AIs53 decreased to 0.54% at
the end of December 2018 from 0.62% at the end
of June. The ratio remained low compared with
the recent high of 0.89% in March 2016,
indicating the sound asset quality of banks’
Mainland-related lending.
However, the volatile Mainland stock markets
may signal a higher credit risk of Mainland
corporates during the review period. The
distance-to-default (DTD) index54, a market-based
default risk indicator, points to a broad-based
increase in the credit risk of the Mainland
corporate sector since April 2018 (Chart 5.23).
The increase in default risk for the Mainland
corporate sector, however, was largely driven by
heightened financial market volatility, rather
than an abrupt deterioration in the financial
health of the corporate sector. In fact, the DTD
index showed signs of improvement in late-2018
and early 2019 amid liquidity loosening
measures by Mainland authorities.55
53 Figures cover AIs’ Hong Kong offices and Mainland branches and subsidiaries.
54 The distance-to-default is a market-based default risk indicator based on the framework by R. Merton (1974), “On the pricing of corporate debt: the risk structure of interest rates”, Journal of Finance, Vol. 29, pages 449–470, in which equity prices, equity volatility, and companies’ financial liabilities are the determinants of default risk. In essence, it measures the difference between the asset value of a firm and a default threshold in terms of the firm’s asset volatility.
55 These measures include several rounds of targeted required reserve ratio cuts in the second half of 2018 and January 2019. For details, refer to section 2.2 of the Report.
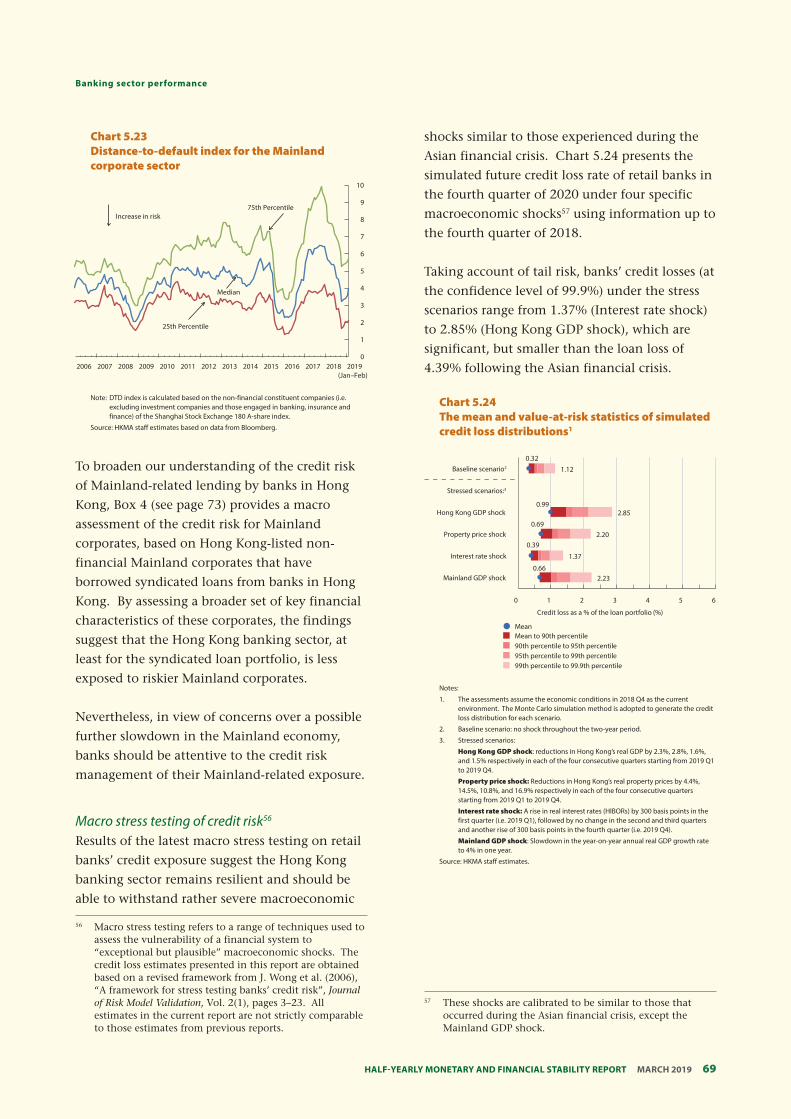
69 Half-YearlY MonetarY and financial StabilitY report MarcH 2019
banking sector performance
Chart 5.23 Distance-to-default index for the Mainland corporate sector
Increase in risk 75th Percentile
25th Percentile
Median
2006 2007 2008 2009 2010 2011 2012 2013 2014 2015 2016 2017 2018 2019
10
9
8
7
6
5
4
3
2
1
0
(Jan–Feb)
Note: DTD index is calculated based on the non-financial constituent companies (i.e. excluding investment companies and those engaged in banking, insurance and finance) of the Shanghai Stock Exchange 180 A-share index.
Source: HKMA staff estimates based on data from Bloomberg.
To broaden our understanding of the credit risk
of Mainland-related lending by banks in Hong
Kong, Box 4 (see page 73) provides a macro
assessment of the credit risk for Mainland
corporates, based on Hong Kong-listed non-
financial Mainland corporates that have
borrowed syndicated loans from banks in Hong
Kong. By assessing a broader set of key financial
characteristics of these corporates, the findings
suggest that the Hong Kong banking sector, at
least for the syndicated loan portfolio, is less
exposed to riskier Mainland corporates.
Nevertheless, in view of concerns over a possible
further slowdown in the Mainland economy,
banks should be attentive to the credit risk
management of their Mainland-related exposure.
Macro stress testing of credit risk56
Results of the latest macro stress testing on retail
banks’ credit exposure suggest the Hong Kong
banking sector remains resilient and should be
able to withstand rather severe macroeconomic
shocks similar to those experienced during the
Asian financial crisis. Chart 5.24 presents the
simulated future credit loss rate of retail banks in
the fourth quarter of 2020 under four specific
macroeconomic shocks57 using information up to
the fourth quarter of 2018.
Taking account of tail risk, banks’ credit losses (at
the confidence level of 99.9%) under the stress
scenarios range from 1.37% (Interest rate shock)
to 2.85% (Hong Kong GDP shock), which are
significant, but smaller than the loan loss of
4.39% following the Asian financial crisis.
Chart 5.24 The mean and value-at-risk statistics of simulated credit loss distributions1
2.23
1.37
2.20
2.85
1.12
0.66
0.39
0.69
0.99
0.32
0 1 2 3 4 5 6
Mainland GDP shock
Interest rate shock
Property price shock
Hong Kong GDP shock
Stressed scenarios:3
Baseline scenario2
Credit loss as a % of the loan portfolio (%)
Mean Mean to 90th percentile 90th percentile to 95th percentile 95th percentile to 99th percentile 99th percentile to 99.9th percentile
Notes:
1. The assessments assume the economic conditions in 2018 Q4 as the current environment. The Monte Carlo simulation method is adopted to generate the credit loss distribution for each scenario.
2. Baseline scenario: no shock throughout the two-year period.
3. Stressed scenarios:
Hong Kong GDP shock: reductions in Hong Kong’s real GDP by 2.3%, 2.8%, 1.6%, and 1.5% respectively in each of the four consecutive quarters starting from 2019 Q1 to 2019 Q4.
Property price shock: Reductions in Hong Kong’s real property prices by 4.4%, 14.5%, 10.8%, and 16.9% respectively in each of the four consecutive quarters starting from 2019 Q1 to 2019 Q4.
Interest rate shock: A rise in real interest rates (HIBORs) by 300 basis points in the first quarter (i.e. 2019 Q1), followed by no change in the second and third quarters and another rise of 300 basis points in the fourth quarter (i.e. 2019 Q4).
Mainland GDP shock: Slowdown in the year-on-year annual real GDP growth rate to 4% in one year.
Source: HKMA staff estimates.
56 Macro stress testing refers to a range of techniques used to assess the vulnerability of a financial system to “exceptional but plausible” macroeconomic shocks. The credit loss estimates presented in this report are obtained based on a revised framework from J. Wong et al. (2006), “A framework for stress testing banks’ credit risk”, Journal of Risk Model Validation, Vol. 2(1), pages 3–23. All estimates in the current report are not strictly comparable to those estimates from previous reports.
57 These shocks are calibrated to be similar to those that occurred during the Asian financial crisis, except the Mainland GDP shock.
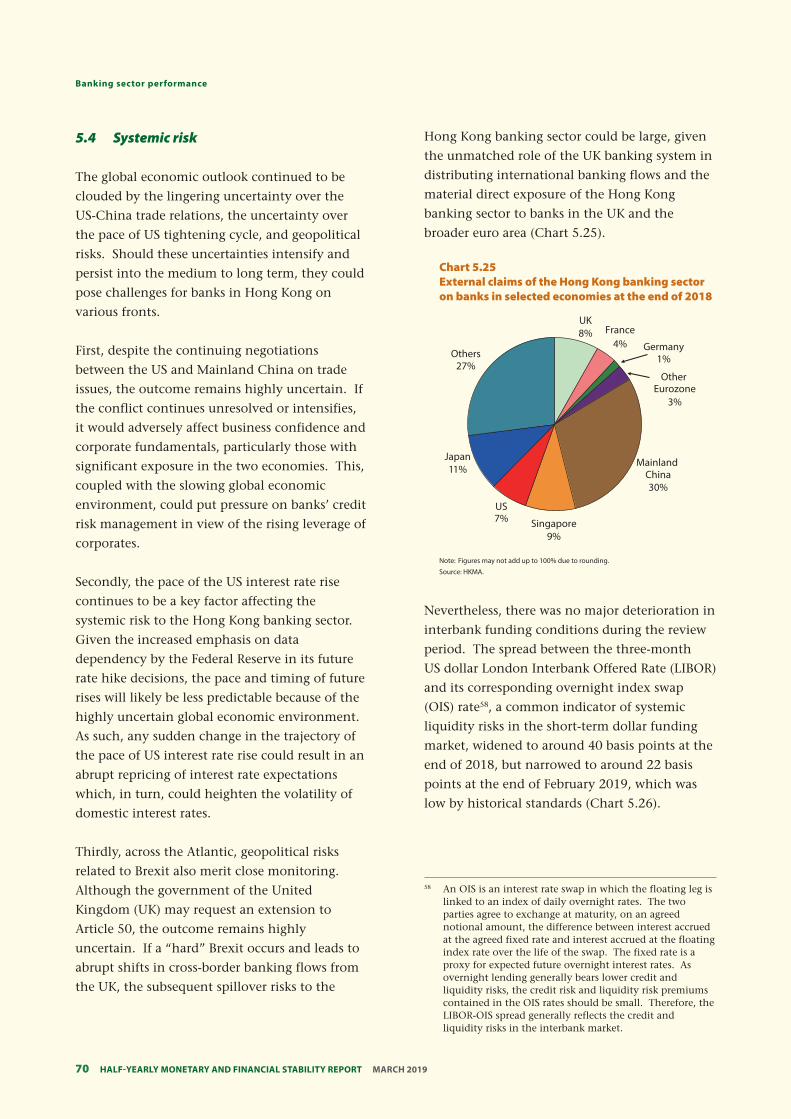
Half-YearlY MonetarY and financial StabilitY report MarcH 201970
Banking sector performance
5.4 Systemic risk
The global economic outlook continued to be
clouded by the lingering uncertainty over the
US-China trade relations, the uncertainty over
the pace of US tightening cycle, and geopolitical
risks. Should these uncertainties intensify and
persist into the medium to long term, they could
pose challenges for banks in Hong Kong on
various fronts.
First, despite the continuing negotiations
between the US and Mainland China on trade
issues, the outcome remains highly uncertain. If
the conflict continues unresolved or intensifies,
it would adversely affect business confidence and
corporate fundamentals, particularly those with
significant exposure in the two economies. This,
coupled with the slowing global economic
environment, could put pressure on banks’ credit
risk management in view of the rising leverage of
corporates.
Secondly, the pace of the US interest rate rise
continues to be a key factor affecting the
systemic risk to the Hong Kong banking sector.
Given the increased emphasis on data
dependency by the Federal Reserve in its future
rate hike decisions, the pace and timing of future
rises will likely be less predictable because of the
highly uncertain global economic environment.
As such, any sudden change in the trajectory of
the pace of US interest rate rise could result in an
abrupt repricing of interest rate expectations
which, in turn, could heighten the volatility of
domestic interest rates.
Thirdly, across the Atlantic, geopolitical risks
related to Brexit also merit close monitoring.
Although the government of the United
Kingdom (UK) may request an extension to
Article 50, the outcome remains highly
uncertain. If a “hard” Brexit occurs and leads to
abrupt shifts in cross-border banking flows from
the UK, the subsequent spillover risks to the
Hong Kong banking sector could be large, given
the unmatched role of the UK banking system in
distributing international banking flows and the
material direct exposure of the Hong Kong
banking sector to banks in the UK and the
broader euro area (Chart 5.25).
Chart 5.25 External claims of the Hong Kong banking sector on banks in selected economies at the end of 2018
UK 8% France
Others 27%
4% Germany 1%
Other Eurozone
3%
Japan Mainland 11% China
30%
US
Singapore 9%
Note: Figures may not add up to 100% due to rounding.
Source: HKMA.
7%
Nevertheless, there was no major deterioration in
interbank funding conditions during the review
period. The spread between the three-month
US dollar London Interbank Offered Rate (LIBOR)
and its corresponding overnight index swap
(OIS) rate58, a common indicator of systemic
liquidity risks in the short-term dollar funding
market, widened to around 40 basis points at the
end of 2018, but narrowed to around 22 basis
points at the end of February 2019, which was
low by historical standards (Chart 5.26).
58 An OIS is an interest rate swap in which the floating leg is linked to an index of daily overnight rates. The two parties agree to exchange at maturity, on an agreed notional amount, the difference between interest accrued at the agreed fixed rate and interest accrued at the floating index rate over the life of the swap. The fixed rate is a proxy for expected future overnight interest rates. As overnight lending generally bears lower credit and liquidity risks, the credit risk and liquidity risk premiums contained in the OIS rates should be small. Therefore, the LIBOR-OIS spread generally reflects the credit and liquidity risks in the interbank market.
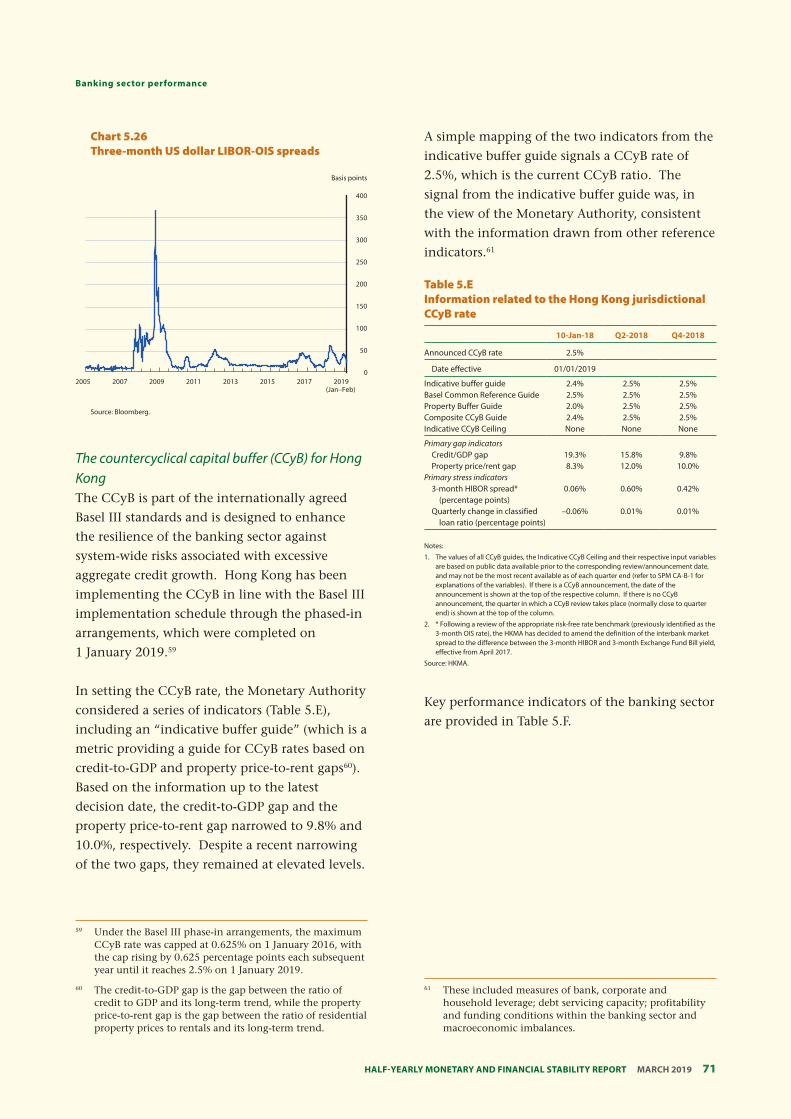
71 Half-YearlY MonetarY and financial StabilitY report MarcH 2019
banking sector performance
Basis points
400
350
300
250
200
150
100
50
0 2005 2007 2009 2011 2013 2015 2017 2019
(Jan–Feb)
Source: Bloomberg.
Chart 5.26 Three-month US dollar LIBOR-OIS spreads
The countercyclical capital buffer (CCyB) for Hong Kong The CCyB is part of the internationally agreed
Basel III standards and is designed to enhance
the resilience of the banking sector against
system-wide risks associated with excessive
aggregate credit growth. Hong Kong has been
implementing the CCyB in line with the Basel III
implementation schedule through the phased-in
arrangements, which were completed on
1 January 2019.59
In setting the CCyB rate, the Monetary Authority
considered a series of indicators (Table 5.E),
including an “indicative buffer guide” (which is a
metric providing a guide for CCyB rates based on
credit-to-GDP and property price-to-rent gaps60).
Based on the information up to the latest
decision date, the credit-to-GDP gap and the
property price-to-rent gap narrowed to 9.8% and
10.0%, respectively. Despite a recent narrowing
of the two gaps, they remained at elevated levels.
A simple mapping of the two indicators from the
indicative buffer guide signals a CCyB rate of
2.5%, which is the current CCyB ratio. The
signal from the indicative buffer guide was, in
the view of the Monetary Authority, consistent
with the information drawn from other reference
indicators.61
Table 5.E Information related to the Hong Kong jurisdictional CCyB rate
10-Jan-18 Q2-2018 Q4-2018
Announced CCyB rate 2.5%
Date effective 01/01/2019
Indicative buffer guide 2.4% 2.5% 2.5% Basel Common Reference Guide 2.5% 2.5% 2.5% Property Buffer Guide 2.0% 2.5% 2.5% Composite CCyB Guide 2.4% 2.5% 2.5% Indicative CCyB Ceiling None None None
Primary gap indicators Credit/GDP gap 19.3% 15.8% 9.8% Property price/rent gap 8.3% 12.0% 10.0%
Primary stress indicators 3-month HIBOR spread* 0.06% 0.60% 0.42%
(percentage points) Quarterly change in classified –0.06% 0.01% 0.01%
loan ratio (percentage points)
Notes:
1. The values of all CCyB guides, the Indicative CCyB Ceiling and their respective input variables are based on public data available prior to the corresponding review/announcement date, and may not be the most recent available as of each quarter end (refer to SPM CA-B-1 for explanations of the variables). If there is a CCyB announcement, the date of the announcement is shown at the top of the respective column. If there is no CCyB announcement, the quarter in which a CCyB review takes place (normally close to quarter end) is shown at the top of the column.
2. * Following a review of the appropriate risk-free rate benchmark (previously identified as the 3-month OIS rate), the HKMA has decided to amend the definition of the interbank market spread to the difference between the 3-month HIBOR and 3-month Exchange Fund Bill yield, effective from April 2017.
Source: HKMA.
Key performance indicators of the banking sector
are provided in Table 5.F.
59 Under the Basel III phase-in arrangements, the maximum CCyB rate was capped at 0.625% on 1 January 2016, with the cap rising by 0.625 percentage points each subsequent year until it reaches 2.5% on 1 January 2019.
60 The credit-to-GDP gap is the gap between the ratio of credit to GDP and its long-term trend, while the property price-to-rent gap is the gap between the ratio of residential property prices to rentals and its long-term trend.
61 These included measures of bank, corporate and household leverage; debt servicing capacity; profitability and funding conditions within the banking sector and macroeconomic imbalances.
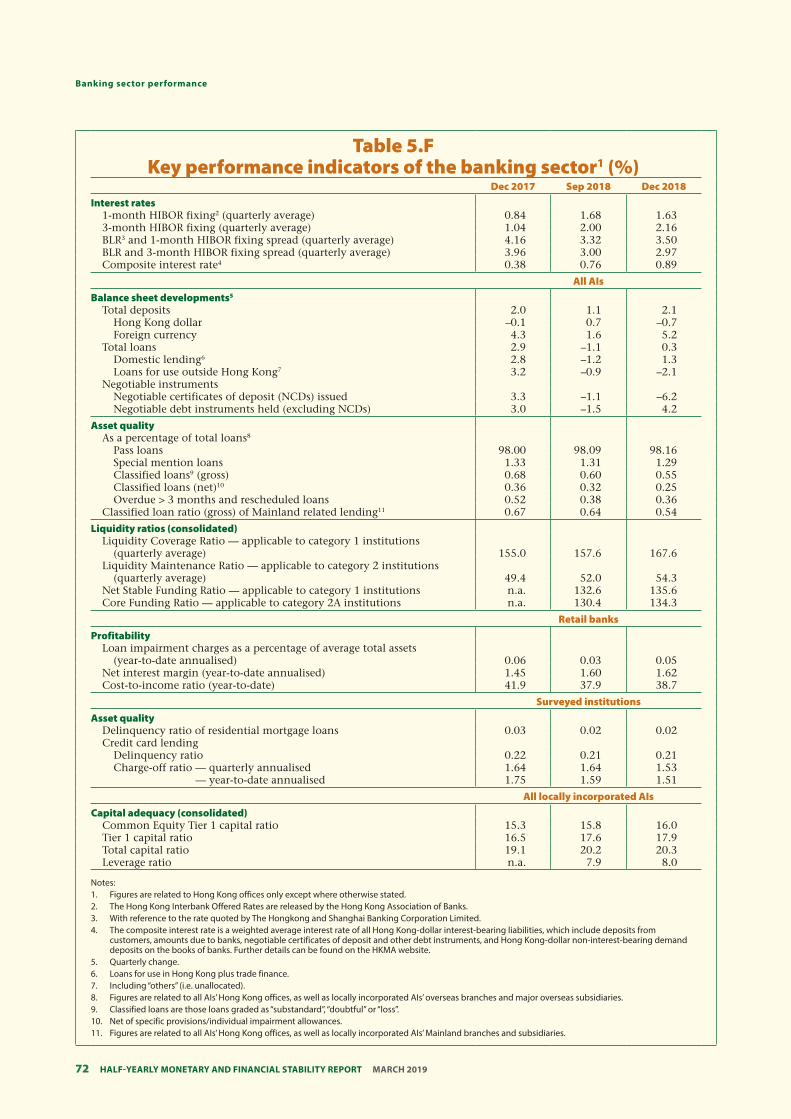
Half-YearlY MonetarY and financial StabilitY report MarcH 201972
Banking sector performance
Table 5.F Key performance indicators of the banking sector1 (%)
Dec 2017 Sep 2018 Dec 2018 Interest rates
1-month HIBOR fixing2 (quarterly average) 0.84 1.68 1.63 3-month HIBOR fixing (quarterly average) 1.04 2.00 2.16 BLR3 and 1-month HIBOR fixing spread (quarterly average) 4.16 3.32 3.50 BLR and 3-month HIBOR fixing spread (quarterly average) 3.96 3.00 2.97 Composite interest rate4 0.38 0.76 0.89
All AIs Balance sheet developments5
Total deposits 2.0 1.1 2.1 Hong Kong dollar –0.1 0.7 –0.7 Foreign currency 4.3 1.6 5.2
Total loans 2.9 –1.1 0.3 Domestic lending6 2.8 –1.2 1.3 Loans for use outside Hong Kong7 3.2 –0.9 –2.1
Negotiable instruments Negotiable certificates of deposit (NCDs) issued 3.3 –1.1 –6.2 Negotiable debt instruments held (excluding NCDs) 3.0 –1.5 4.2
Asset quality As a percentage of total loans8
Pass loans 98.00 98.09 98.16 Special mention loans 1.33 1.31 1.29 Classified loans9 (gross) 0.68 0.60 0.55 Classified loans (net)10 0.36 0.32 0.25 Overdue > 3 months and rescheduled loans 0.52 0.38 0.36
Classified loan ratio (gross) of Mainland related lending11 0.67 0.64 0.54
Liquidity ratios (consolidated) Liquidity Coverage Ratio — applicable to category 1 institutions
(quarterly average) Liquidity Maintenance Ratio — applicable to category 2 institutions
155.0 157.6 167.6
(quarterly average) 49.4 52.0 54.3 Net Stable Funding Ratio — applicable to category 1 institutions n.a. 132.6 135.6 Core Funding Ratio — applicable to category 2A institutions n.a. 130.4 134.3
Retail banks Profitability
Loan impairment charges as a percentage of average total assets (year-to-date annualised) 0.06 0.03 0.05
Net interest margin (year-to-date annualised) 1.45 1.60 1.62 Cost-to-income ratio (year-to-date) 41.9 37.9 38.7
Surveyed institutions Asset quality
Delinquency ratio of residential mortgage loans 0.03 0.02 0.02 Credit card lending
Delinquency ratio 0.22 0.21 0.21 Charge-off ratio — quarterly annualised 1.64 1.64 1.53
— year-to-date annualised 1.75 1.59 1.51
All locally incorporated AIs Capital adequacy (consolidated)
Common Equity Tier 1 capital ratio 15.3 15.8 16.0 Tier 1 capital ratio 16.5 17.6 17.9 Total capital ratio 19.1 20.2 20.3 Leverage ratio n.a. 7.9 8.0
Notes: 1. Figures are related to Hong Kong offices only except where otherwise stated. 2. The Hong Kong Interbank Offered Rates are released by the Hong Kong Association of Banks. 3. With reference to the rate quoted by The Hongkong and Shanghai Banking Corporation Limited. 4. The composite interest rate is a weighted average interest rate of all Hong Kong-dollar interest-bearing liabilities, which include deposits from
customers, amounts due to banks, negotiable certificates of deposit and other debt instruments, and Hong Kong-dollar non-interest-bearing demand deposits on the books of banks. Further details can be found on the HKMA website.
5. Quarterly change. 6. Loans for use in Hong Kong plus trade finance. 7. Including “others” (i.e. unallocated). 8. Figures are related to all AIs’ Hong Kong offices, as well as locally incorporated AIs’ overseas branches and major overseas subsidiaries. 9. Classified loans are those loans graded as “substandard”, “doubtful” or “loss”. 10. Net of specific provisions/individual impairment allowances. 11. Figures are related to all AIs’ Hong Kong offices, as well as locally incorporated AIs’ Mainland branches and subsidiaries.
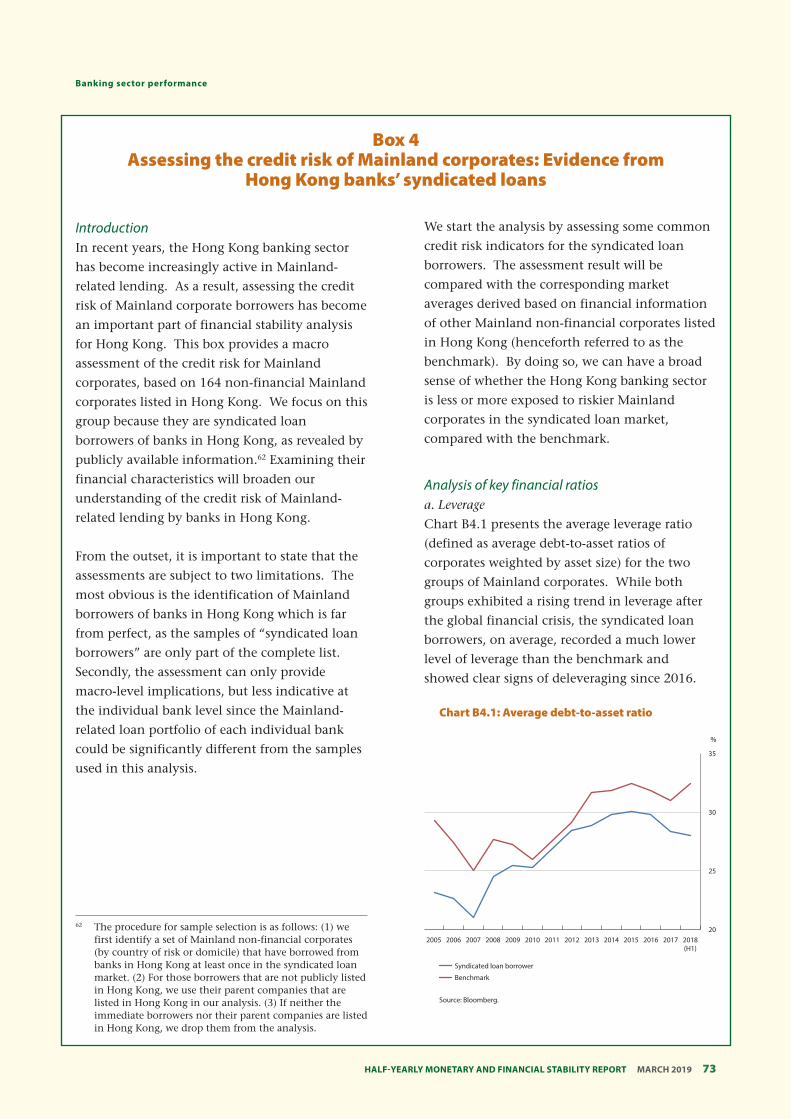
73 Half-YearlY MonetarY and financial StabilitY report MarcH 2019
banking sector performance
Box 4 Assessing the credit risk of Mainland corporates: Evidence from
Hong Kong banks’ syndicated loans
Introduction In recent years, the Hong Kong banking sector
has become increasingly active in Mainland-
related lending. As a result, assessing the credit
risk of Mainland corporate borrowers has become
an important part of financial stability analysis
for Hong Kong. This box provides a macro
assessment of the credit risk for Mainland
corporates, based on 164 non-financial Mainland
corporates listed in Hong Kong. We focus on this
group because they are syndicated loan
borrowers of banks in Hong Kong, as revealed by
publicly available information.62 Examining their
financial characteristics will broaden our
understanding of the credit risk of Mainland-
related lending by banks in Hong Kong.
From the outset, it is important to state that the
assessments are subject to two limitations. The
most obvious is the identification of Mainland
borrowers of banks in Hong Kong which is far
from perfect, as the samples of “syndicated loan
borrowers” are only part of the complete list.
Secondly, the assessment can only provide
macro-level implications, but less indicative at
the individual bank level since the Mainland-
related loan portfolio of each individual bank
could be significantly different from the samples
used in this analysis.
We start the analysis by assessing some common
credit risk indicators for the syndicated loan
borrowers. The assessment result will be
compared with the corresponding market
averages derived based on financial information
of other Mainland non-financial corporates listed
in Hong Kong (henceforth referred to as the
benchmark). By doing so, we can have a broad
sense of whether the Hong Kong banking sector
is less or more exposed to riskier Mainland
corporates in the syndicated loan market,
compared with the benchmark.
Analysis of key financial ratios a. Leverage
Chart B4.1 presents the average leverage ratio
(defined as average debt-to-asset ratios of
corporates weighted by asset size) for the two
groups of Mainland corporates. While both
groups exhibited a rising trend in leverage after
the global financial crisis, the syndicated loan
borrowers, on average, recorded a much lower
level of leverage than the benchmark and
showed clear signs of deleveraging since 2016.
Chart B4.1: Average debt-to-asset ratio
20
25
30
35
Syndicated loan borrower
Benchmark
%
(H1)201220082005 2006 2007 2009 2010 2011 2013 2014 2015 2016 2017 2018
Source: Bloomberg.
62 The procedure for sample selection is as follows: (1) we first identify a set of Mainland non-financial corporates (by country of risk or domicile) that have borrowed from banks in Hong Kong at least once in the syndicated loan market. (2) For those borrowers that are not publicly listed in Hong Kong, we use their parent companies that are listed in Hong Kong in our analysis. (3) If neither the immediate borrowers nor their parent companies are listed in Hong Kong, we drop them from the analysis.
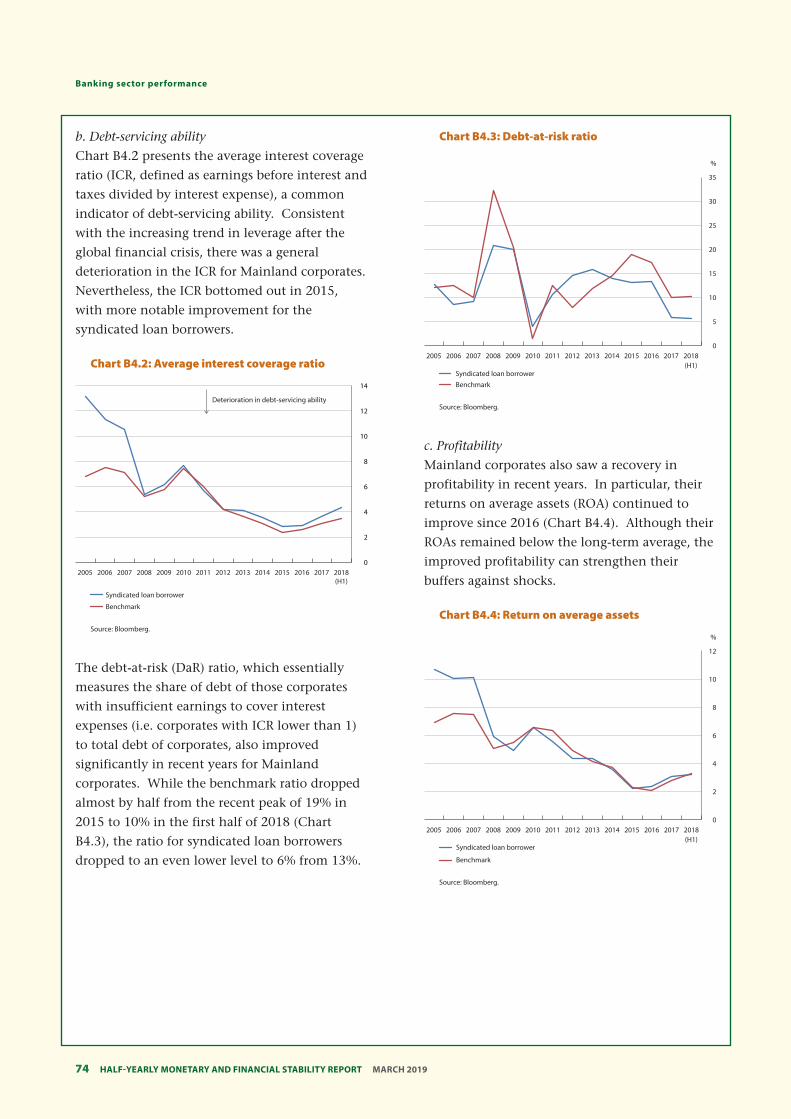
Half-YearlY MonetarY and financial StabilitY report MarcH 201974
Banking sector performance
Chart B4.3: Debt-at-risk ratio
0
5
10
15
20
25
30
35
%
Syndicated loan borrower
Benchmark
(H1)2005 2006 2007 2008 2009 2010 2011 2012 2013 2014 2015 2016 2017 2018
Source: Bloomberg.
b. Debt-servicing ability
Chart B4.2 presents the average interest coverage
ratio (ICR, defined as earnings before interest and
taxes divided by interest expense), a common
indicator of debt-servicing ability. Consistent
with the increasing trend in leverage after the
global financial crisis, there was a general
deterioration in the ICR for Mainland corporates.
Nevertheless, the ICR bottomed out in 2015,
with more notable improvement for the
syndicated loan borrowers.
Chart B4.2: Average interest coverage ratio
0
2
4
6
8
10
12
14
Syndicated loan borrower
Benchmark
(H1)
Deterioration in debt-servicing ability
20082005 2006 2007 2009 2010 2011 2012 2013 2014 2015 2016 2017 2018
Source: Bloomberg.
The debt-at-risk (DaR) ratio, which essentially
measures the share of debt of those corporates
with insufficient earnings to cover interest
expenses (i.e. corporates with ICR lower than 1)
to total debt of corporates, also improved
significantly in recent years for Mainland
corporates. While the benchmark ratio dropped
almost by half from the recent peak of 19% in
2015 to 10% in the first half of 2018 (Chart
B4.3), the ratio for syndicated loan borrowers
dropped to an even lower level to 6% from 13%.
c. Profitability
Mainland corporates also saw a recovery in
profitability in recent years. In particular, their
returns on average assets (ROA) continued to
improve since 2016 (Chart B4.4). Although their
ROAs remained below the long-term average, the
improved profitability can strengthen their
buffers against shocks.
Chart B4.4: Return on average assets
0
2
4
6
8
10
12
%
Syndicated loan borrower
Benchmark
(H1)2005 2006 2007 2008 2009 2010 2011 2012 2013 2014 2015 2016 2017 2018
Source: Bloomberg.
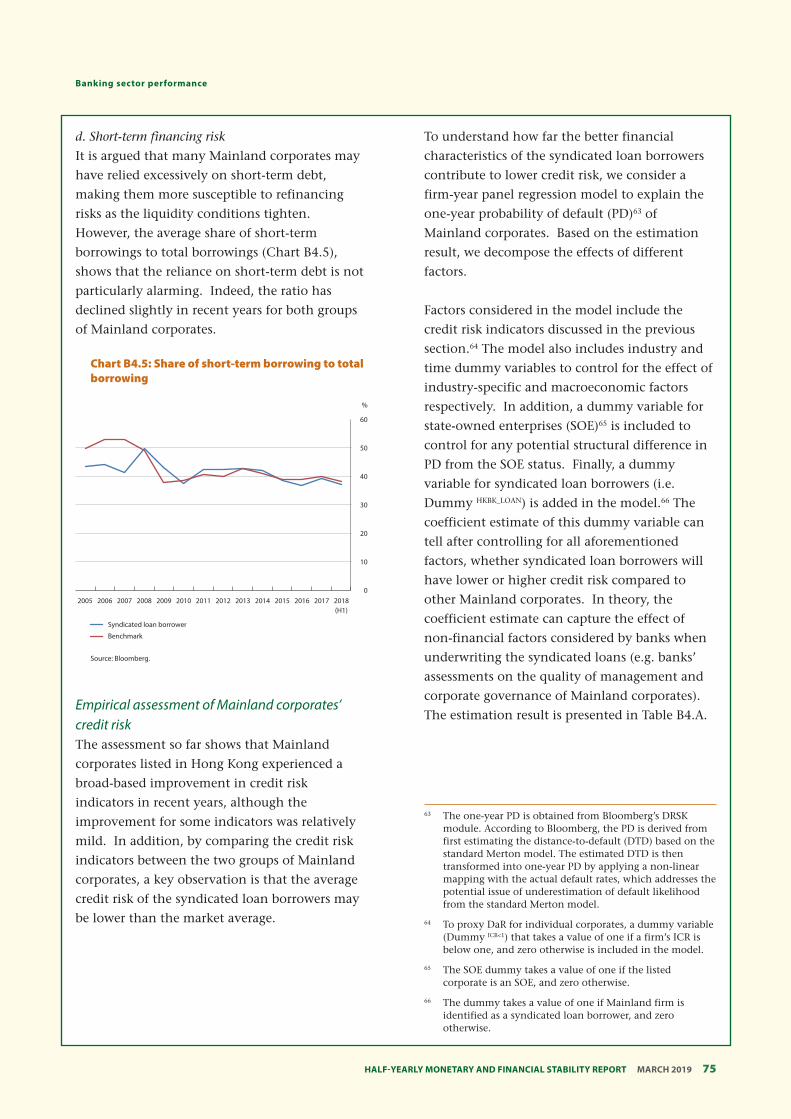
75 Half-YearlY MonetarY and financial StabilitY report MarcH 2019
banking sector performance
d. Short-term financing risk
It is argued that many Mainland corporates may
have relied excessively on short-term debt,
making them more susceptible to refinancing
risks as the liquidity conditions tighten.
However, the average share of short-term
borrowings to total borrowings (Chart B4.5),
shows that the reliance on short-term debt is not
particularly alarming. Indeed, the ratio has
declined slightly in recent years for both groups
of Mainland corporates.
Chart B4.5: Share of short-term borrowing to total borrowing
0
10
20
30
40
50
60
%
Syndicated loan borrower
Benchmark
(H1)2005 2006 2007 2008 2009 2010 2011 2012 2013 2014 2015 2016 2017 2018
Source: Bloomberg.
Empirical assessment of Mainland corporates’ credit risk The assessment so far shows that Mainland
corporates listed in Hong Kong experienced a
broad-based improvement in credit risk
indicators in recent years, although the
improvement for some indicators was relatively
mild. In addition, by comparing the credit risk
indicators between the two groups of Mainland
corporates, a key observation is that the average
credit risk of the syndicated loan borrowers may
be lower than the market average.
To understand how far the better financial
characteristics of the syndicated loan borrowers
contribute to lower credit risk, we consider a
firm-year panel regression model to explain the
one-year probability of default (PD)63 of
Mainland corporates. Based on the estimation
result, we decompose the effects of different
factors.
Factors considered in the model include the
credit risk indicators discussed in the previous
section.64 The model also includes industry and
time dummy variables to control for the effect of
industry-specific and macroeconomic factors
respectively. In addition, a dummy variable for
state-owned enterprises (SOE)65 is included to
control for any potential structural difference in
PD from the SOE status. Finally, a dummy
variable for syndicated loan borrowers (i.e.
Dummy HKBK_LOAN) is added in the model.66 The
coefficient estimate of this dummy variable can
tell after controlling for all aforementioned
factors, whether syndicated loan borrowers will
have lower or higher credit risk compared to
other Mainland corporates. In theory, the
coefficient estimate can capture the effect of
non-financial factors considered by banks when
underwriting the syndicated loans (e.g. banks’
assessments on the quality of management and
corporate governance of Mainland corporates).
The estimation result is presented in Table B4.A.
63 The one-year PD is obtained from Bloomberg’s DRSK module. According to Bloomberg, the PD is derived from first estimating the distance-to-default (DTD) based on the standard Merton model. The estimated DTD is then transformed into one-year PD by applying a non-linear mapping with the actual default rates, which addresses the potential issue of underestimation of default likelihood from the standard Merton model.
64 To proxy DaR for individual corporates, a dummy variable (Dummy ICR<1) that takes a value of one if a firm’s ICR is below one, and zero otherwise is included in the model.
65 The SOE dummy takes a value of one if the listed corporate is an SOE, and zero otherwise.
66 The dummy takes a value of one if Mainland firm is identified as a syndicated loan borrower, and zero otherwise.
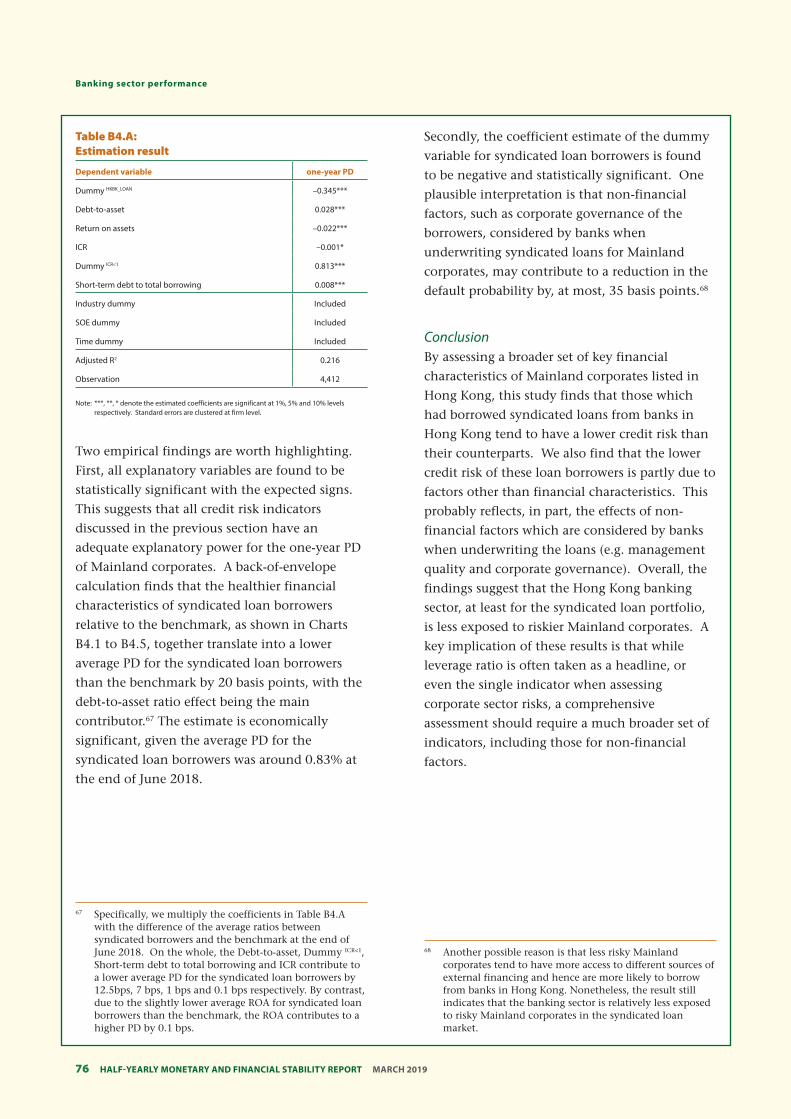
Half-YearlY MonetarY and financial StabilitY report MarcH 201976
Banking sector performance
Table B4.A: Estimation result
Dependent variable one-year PD
Dummy HKBK_LOAN –0.345***
Debt-to-asset 0.028***
Return on assets –0.022***
ICR –0.001*
Dummy ICR<1 0.813***
Short-term debt to total borrowing 0.008***
Industry dummy Included
SOE dummy Included
Time dummy Included
Adjusted R2 0.216
Observation 4,412
Note: ***, **, * denote the estimated coefficients are significant at 1%, 5% and 10% levels respectively. Standard errors are clustered at firm level.
Two empirical findings are worth highlighting.
First, all explanatory variables are found to be
statistically significant with the expected signs.
This suggests that all credit risk indicators
discussed in the previous section have an
adequate explanatory power for the one-year PD
of Mainland corporates. A back-of-envelope
calculation finds that the healthier financial
characteristics of syndicated loan borrowers
relative to the benchmark, as shown in Charts
B4.1 to B4.5, together translate into a lower
average PD for the syndicated loan borrowers
than the benchmark by 20 basis points, with the
debt-to-asset ratio effect being the main
contributor.67 The estimate is economically
significant, given the average PD for the
syndicated loan borrowers was around 0.83% at
the end of June 2018.
Secondly, the coefficient estimate of the dummy
variable for syndicated loan borrowers is found
to be negative and statistically significant. One
plausible interpretation is that non-financial
factors, such as corporate governance of the
borrowers, considered by banks when
underwriting syndicated loans for Mainland
corporates, may contribute to a reduction in the
default probability by, at most, 35 basis points.68
Conclusion By assessing a broader set of key financial
characteristics of Mainland corporates listed in
Hong Kong, this study finds that those which
had borrowed syndicated loans from banks in
Hong Kong tend to have a lower credit risk than
their counterparts. We also find that the lower
credit risk of these loan borrowers is partly due to
factors other than financial characteristics. This
probably reflects, in part, the effects of non-
financial factors which are considered by banks
when underwriting the loans (e.g. management
quality and corporate governance). Overall, the
findings suggest that the Hong Kong banking
sector, at least for the syndicated loan portfolio,
is less exposed to riskier Mainland corporates. A
key implication of these results is that while
leverage ratio is often taken as a headline, or
even the single indicator when assessing
corporate sector risks, a comprehensive
assessment should require a much broader set of
indicators, including those for non-financial
factors.
67 Specifically, we multiply the coefficients in Table B4.A with the difference of the average ratios between syndicated borrowers and the benchmark at the end of June 2018. On the whole, the Debt-to-asset, Dummy ICR<1, Short-term debt to total borrowing and ICR contribute to a lower average PD for the syndicated loan borrowers by 12.5bps, 7 bps, 1 bps and 0.1 bps respectively. By contrast, due to the slightly lower average ROA for syndicated loan borrowers than the benchmark, the ROA contributes to a higher PD by 0.1 bps.
68 Another possible reason is that less risky Mainland corporates tend to have more access to different sources of external financing and hence are more likely to borrow from banks in Hong Kong. Nonetheless, the result still indicates that the banking sector is relatively less exposed to risky Mainland corporates in the syndicated loan market.
77 Half-YearlY MonetarY and financial StabilitY report MarcH 2019
Glossary of terms
Aggregate Balance The sum of balances in the clearing accounts and reserve accounts maintained by commercial banks with
the central bank. In Hong Kong, this refers to the sum of the balances in the clearing accounts maintained
by the banks with the HKMA for settling interbank payments and payments between banks and the HKMA.
The Aggregate Balance represents the level of interbank liquidity, and is a part of the Monetary Base.
Authorized Institution (AI) An institution authorized under the Banking Ordinance to carry on the business of taking deposits.
Hong Kong maintains a Three-tier Banking System, which comprises licensed banks, restricted licence banks
and deposit-taking companies.
Best Lending Rate A benchmark interest rate that banks use to price loans. In Hong Kong, the Best Lending Rate is used as a
base for quoting interest rates on mortgage loans.
Certificates of Indebtedness (CIs) Certificates issued by the Financial Secretary under the Exchange Fund Ordinance, to be held by
note-issuing banks as cover for the banknotes they issue.
Composite Consumer Price Index (CCPI) The headline consumer price index (CPI) for Hong Kong. The Census and Statistics Department compiles
three separate CPI series relating to households in different expenditure ranges. The CPI(A) relates to about
50% of households in the relatively low expenditure range; the CPI(B) relates to the next 30% of households
in the medium expenditure range; and the CPI(C) relates to the next 10% of households in the relatively
high expenditure range. The Composite CPI is compiled based on the aggregate expenditure pattern of all
of the above households taken together.
Composite Interest Rate The composite interest rate is a weighted average interest rate of all Hong Kong dollar interest bearing
liabilities, which include deposits from customers, amounts due to banks, negotiable certificates of deposit
and other debt instruments, and Hong Kong dollar non-interest bearing demand deposits on the books of
banks. Data from retail banks, which account for about 90% of the total customers’ deposits in the banking
sector, are used in the calculation. It should be noted that the composite interest rate represents only
average interest expenses. There are various other costs involved in the making of a loan, such as operating
costs (e.g. staff and rental expenses), credit cost and hedging cost, which are not covered by the composite
interest rate.
Convertibility Undertaking (CU) An undertaking by a central bank or currency board to convert domestic currency into foreign currency and
vice versa at a fixed exchange rate. In Hong Kong, the HKMA operates Convertibility Undertakings on both
the strong side and the weak side. Under the strong-side Convertibility Undertaking, the HKMA undertakes
Half-YearlY MonetarY and financial StabilitY report MarcH 2019
to buy US dollars from licensed banks at 7.75. Under the weak-side Convertibility Undertaking, the HKMA
undertakes to sell US dollars at 7.85. Within the Convertibility Zone between 7.75 and 7.85, the HKMA may
choose to conduct market operations consistent with Currency Board principles with the aim of promoting
the smooth functioning of the money and foreign exchange markets.
Convertibility Zone The Hong Kong dollar-US dollar exchange rate band, defined by the levels of the strong- and weak-side
Convertibility Undertakings, within which the HKMA may choose to conduct market operations consistent
with Currency Board principles.
Exchange Fund Bills and Notes (EFBNs) Debt instruments issued by the HKMA for the account of the Exchange Fund. These instruments are fully
backed by the foreign reserves. The HKMA has undertaken that new Exchange Fund paper will only be
issued when there is an inflow of funds, thus enabling the additional paper to be fully backed by the foreign
reserves. Since 1 April 1999, interest payments on Exchange Fund paper have been allowed to expand the
Monetary Base. Additional Exchange Fund paper is issued to absorb such interest payments. This is
consistent with the Currency Board discipline since interest payments on Exchange Fund paper are backed
by interest income on the US dollar assets backing the Monetary Base.
Monetary Base A part of the monetary liabilities of a central bank. The monetary base is defined, at the minimum,
as the sum of the currency in circulation (banknotes and coins) and the balance of the banking system held
with the central bank (the reserve balance or the clearing balance). In Hong Kong, the Monetary Base
comprises Certificates of Indebtedness (for backing the banknotes issued by the note-issuing banks),
government-issued currency in circulation, the balance of the clearing accounts of banks kept with the
HKMA, and Exchange Fund Bills and Notes.
Nominal and Real Effective Exchange Rate (NEER and REER) An indicator of the overall exchange rate value of the Hong Kong dollar against a basket of currencies of
Hong Kong’s principal trading partners. The nominal effective exchange rate (NEER) is a weighted average
of the exchange rates between Hong Kong and its principal trading partners. The real effective exchange
rate (REER) is obtained by adjusting the NEER for relative movements in the seasonally adjusted consumer
price indices of those selected trading partners.
78
79 Half-YearlY MonetarY and financial StabilitY report MarcH 2019
Abbreviations
1m moving average One-month moving average
3m moving average Three-month moving average
3m-on-3m Three-month-on-three-month
AEs Advanced economies
AFC Asian Financial Crisis
APP Asset Purchase Programmes
ASEAN Association of Southeast Asian Nations
AIs Authorized institutions
BIS Bank for International Settlements
bn Billion
BLR Best lending rate
BoJ Bank of Japan
BoP Balance of Payments
BSD Buyer’s stamp duty
CAPE Cyclically-adjusted price-to-earnings
CAR Capital Adequacy Ratio
CBO Congressional Budget Office
CBIRC China Banking and Insurance Regulatory Commission
CBS Central Bank Bills Swap
CCPI Composite Consumer Price Index
CCyB Countercyclical capital buffer
CDs Certificates of deposits
CDS Credit default swap
CET1 Common equity tier-one
CFR Core Funding Ratio
ChiNext The start-ups board in the Shenzhen Stock Exchange
CIs Certificates of Indebtedness
CNH Offshore renminbi in Hong Kong
CNY Onshore renminbi
C&SD Census and Statistics Department
CPI Consumer Price Index
Half-YearlY MonetarY and financial StabilitY report MarcH 2019
CU Convertibility Undertaking
DaR Debt-at-risk
DF Deliverable forward
DI Direct investment
DSD Doubling of the ad valorem stamp duty rates
DSR Debt-servicing ratio
DTD Distance-to-default
EBIT Earnings before interest and tax
EBITDA Earnings before interest, taxes, depreciation and
amortization
ECB European Central Bank
EFBNs Exchange Fund Bills and Notes
EMEAP Executives’ Meeting of East Asia-Pacific Central Banks
EMEs Emerging Market Economies
EPIFs External primary income flows
EPU Economic policy uncertainty
ETFs Exchange traded funds
EU European Union
EUR Euro
FDI Foreign direct investment
Fed Federal Reserve
FI Financial Institutions
FOMC Federal Open Market Committee
FSB Financial Stability Board
FX Foreign exchange
GBP British Pound Sterling
GBs Government Bonds
GDP Gross Domestic Product
GFC Global financial crisis
G-SIBs Global systemically important banks
HIBOR Hong Kong Interbank Offered Rate
HK Hong Kong
HKD Hong Kong dollar
HKEx The Hong Kong Exchanges and Clearing Limited
HKMA Hong Kong Monetary Authority
HKPC Hong Kong Productivity Council
80
81 Half-YearlY MonetarY and financial StabilitY report MarcH 2019
HK$M3 Hong Kong dollar broad money supply
HSCEI Hang Seng China Enterprises Index
HSI Hang Seng Index
ICR Interest Coverage Ratio
IFC International Finance Corporation
IMF International Monetary Fund
IPO Initial Public Offering
IT Information technology
JPY Japanese Yen
LCR Liquidity Coverage Ratio
LIBOR London Interbank Offered Rate
LERS Linked Exchange Rate System
LMR Liquidity Maintenance Ratio
lhs Left-hand side
LR Leverage Ratio
IRB Internal Ratings-Based Approach
LTD Loan-to-deposit
LTV Loan-to-value
mn Million
MDBs Multilateral Development Banks
MLF Medium-term Lending Facility
MoF Ministry of Finance
MPA Macro Prudential Assessment
MRF Mutual Recognition of Funds
MSCI Morgan Stanley Capital International
MTN Medium-term Note
NAFTA North American Free Trade Agreement
NBER National Bureau of Economic Research
NBS National Bureau of Statistics
NCD Negotiable certificate of deposit
NEER Nominal effective exchange rate
NFIB National Federation of Independent Business
NIE Newly industrialised economies
NIM Net interest margin
NPL Non-performing loan
NSFR Net Stable Funding Ratio
Half-YearlY MonetarY and financial StabilitY report MarcH 2019
OECD Organisation for Economic Co-operation and
Development
OIS Overnight indexed swap
OMDSR Outstanding mortgage debt service ratio
OTC Over-the-counter
p.a. Per annum
P2P Peer-to-peer
PBoC People’s Bank of China
PCE Personal consumption expenditure
PD Probability of Default
PMI Purchasing Managers’ Index
PPI Producer Price Index
qoq Quarter-on-quarter
qoqa Quarter-on-quarter annualised
QE Quantitative Easing
QQE Quantitative and Qualitative Easing
R&VD Rating and Valuation Department
REER Real effective exchange rate
Repo Repurchase operation
rhs Right-hand side
RMB Renminbi
ROA Return on Asset
ROE Return on equity
RRR Required reserve ratio
RTGS Real Time Gross Settlement
SAFE State Administration of Foreign Exchange
SARS Severe Acute Respiratory Syndrome
SDR Special Drawing Rights
SHIBOR Shanghai Interbank Offered Rate
SKEW Chicago Board Options Exchange Skew Index
SLO Short-term Liquidity operation
SMEs Small and medium-sized enterprises
SOEs State-owned enterprises
SPM Supervisory Policy Manual
SSD Special stamp duty
SSE Shanghai Stock Exchange
82
83 Half-YearlY MonetarY and financial StabilitY report MarcH 2019
VIX Chicago Board Options Exchange Market Volatility Index
SWIFTs Society for Worldwide Interbank Financial
Telecommunication
S&P Sale and Purchase Agreements of Building Units
S&P 500 Standard & Poor’s 500 Index
TMLF Targeted Medium-term Lending Facility
TLTRO Targeted Longer-Term Refinancing Operation
TWI Trade Weighted Index
UK United Kingdom
US United States
USD US dollar
VAR Vector autoregressive
VHSI HSI Volatility Index
WMPs Wealth management products
WTO World Trade Organisation
yoy Year-on-year
©2019 Hong Kong Monetary Authority
Reproduction for non-commercial
purposes is permitted provided that the
source is properly stated.
Full text of this Report is available on the
HKMA website at www.hkma.gov.hk.
Hong Kong Monetary Authority 55th Floor, Two International Finance Centre,
8 Finance Street, Central, Hong Kong
Telephone: (852) 2878 8196
Fax: (852) 2878 8197
E-mail: [email protected]
www.hkma.gov.hk
Printed in Hong Kong
ISSN 2221-5727 (Print version)
ISSN 2222-1514 (Online version)
HK$60


