Embed Size (px)
Citation preview
You, S., Ok, Y. S., Chen, S. S., Tsang, D. C.W., Kwon, E. E., Lee, J. and Wang, C.-H.
(2017) A critical review on sustainable biochar system through gasification: Energy and
environmental applications. Bioresource Technology, 246, pp. 242-253.
There may be differences between this version and the published version. You are
advised to consult the publisher’s version if you wish to cite from it.
http://eprints.gla.ac.uk/153186/
Deposited on: 6 June 2018
Enlighten – Research publications by members of the University of Glasgow
http://eprints.gla.ac.uk
1
A Critical Review on Sustainable Biochar System through Gasification: Energy 1
and Environmental Applications 2
3
Siming You1#
, Yong Sik Ok2#
, Season S. Chen3, Daniel C.W. Tsang
3, Eilhann E. Kwon
4, Jechan 4
Lee4, Chi-Hwa Wang
5* 5
6
1NUS Environmental Research Institute, National University of Singapore, Singapore 138602, 7
Singapore; 8
2Korea Biochar Research Center, Kangwon National University, Chuncheon 24341, Korea; 9
3Department of Civil and Environmental Engineering, Hong Kong Polytechnic University, Hung 10
Hom, Kowloon, Hong Kong, China; 11
4Department of Energy and Environment, Sejong University, Seoul 05006, Korea; 12
5Department of Chemical and Biomolecular Engineering, National University of Singapore, 13
Singapore 117585, Singapore 14
15
16
# The authors contribute equally. 17
*Corresponding author: [email protected]; 18
19
Click here to view linked References
2
Abstract 20
This review lays great emphasis on production and characteristics of biochar through gasification. 21
Specifically, the physicochemical properties and yield of biochar through the diverse gasification 22
conditions associated with various types of biomass were extensively evaluated. In addition, 23
potential application scenarios of biochar through gasification were explored and their 24
environmental implications were discussed. To qualitatively evaluate biochar sustainability 25
through the gasification process, all gasification products (i.e., syngas and biochar) were 26
evaluated via life cycle assessment (LCA). A concept of balancing syngas and biochar 27
production for an economically and environmentally feasible gasification system was proposed 28
and relevant challenges and solutions were suggested in this review. 29
30
Keywords: Biochar; black carbon; pyrolysis; soil amendment; life cycle assessment. 31
32
3
1. Introduction 33
Gasification can be defined as a thermochemical process which transfer heating value from 34
carbonaceous materials into syngas (i.e., a mixture of H2 and CO), tars and biochar at high-35
temperature (>500 °C) and oxygen-deficient conditions. The gasification process generally 36
involves four consecutive steps, i.e., drying, pyrolysis (i.e., thermally-induced fragmentation via 37
bond dissociation and dehydrogenation), partial oxidation and reduction (Loha et al., 2014). In 38
terms of the gas-solid contacting mode, gasifiers could be categorized into three major types: 39
fixed bed, fluidized bed and entrained flow. In addition, their practical employments are highly 40
contingent on the types of biomass and the compositional matrix of the final products. 41
In general, biochar yield from the gasification process is less than other thermochemical 42
processes such as pyrolysis, which can be explicable by the conversion of carbon into carbon 43
monoxide (CO) due to its partial oxidation conditions (Brewer et al., 2009; Mohan et al., 2014). 44
Moreover, the operational conditions for gasification are varied to optimize a maximum energy 45
(i.e., syngas production) from the diverse carbonaceous feedstocks. The formation of biochar as 46
a co-product of the gasification process is intentionally restricted to maximize the energy 47
recovery (i.e., the high yield of syngas). Indeed, this inevitably limits the operational parameters 48
for the gasification process (Meyer et al., 2011). 49
Nevertheless, a great deal of researches conducted during the past decade envision fully 50
enlightened the effectiveness of biochar as a principal strategy for carbon sequestration due to its 51
recalcitrant properties. Therefore, the production of biochar from the gasification process 52
possibly offers the wide-ranged operational conditions for the gasification process. In this 53
context, most of the attention is focused on the soil amendment and carbon sequestration 54
application of biochar which prefer a high biochar yield (Lehmann et al., 2011). However, this 55
does not preclude the application potential of gasification biochar, and the economic and 56
4
environmental potential of gasification biochar systems could not be underestimated. Currently, 57
a huge amount of biomass and waste are available for gasification, meaning a substantial amount 58
of biochar will potentially be produced by gasification. In line with the constant development of 59
new biochar modification methods, it is possible to fine-tune gasification biochar for diverse 60
applications beyond soil amendment. 61
From a systemic perspective, producing biochar from the gasification process leads to 62
several technical and economic merits. Firstly, gasification generally produces more energy per 63
unit mass of carbonaceous material because of its high conversion efficiency of carbon compared 64
to fast and slow pyrolysis and hydrothermal treatment (Hammond et al., 2011; Shackley et al., 65
2012a). Gasification featured by its autothermal nature (i.e., exothermic reaction by the partial 66
oxidation) provides self-sustaining energy support for reactions in a gasifier, thereby resulting in 67
no use of inert gas like nitrogen and helium. Indeed, this significantly enhance the economic 68
viability of the gasification process. Secondly, the electricity and heat production can potentially 69
be used in feedstock-related upstream or biochar-related downstream treatment processes, which 70
enhances the economic feasibility of the gasification system. For instance, the pretreatment (e.g., 71
drying and hydrolysis) of moist feedstock requires significant energy supply which can be 72
obtained from the waste heat of the gasification system. Thirdly, the partial oxidizing 73
environment during the gasification process may serve to improve the textural and chemical 74
properties of gasification biochar which imparts the practical application of biochar (Manyà, 75
2012). Fourthly, gasification allows continuous feedstock feeding, which may cater to a higher 76
throughput design than pyrolysis (Peterson & Jackson, 2014). Lastly, gasification is suitable for 77
small- and medium-scale decentralized systems which have lower carbon conversion rates and 78
thus higher biochar yields than large-scale systems (Shackley et al., 2012a). 79
5
This review focuses on (i) examining the physicochemical characteristics of gasification 80
biochar; (ii) exploring feasible and non-soil applications of gasification biochar; (iii) discussing 81
the role of biochar in gasification systems using life cycle assessment (LCA); (iv) addressing the 82
identified economic, environmental, and technological challenges by a concept of balancing 83
syngas and biochar production. 84
85
2. Gasification Biochar 86
2.1 Characteristics of gasification biochar 87
2.1.1 Physical properties 88
The pore volume and size, specific surface area and particle size of biochar are key 89
parameters in defining the physical properties of biochar. The pore formation of biochar is 90
closely related to the release of volatiles from polymeric backbone of carbonaceous feedstock 91
(Chen et al., 2015). High volatile matter contents in the feedstock could promote the 92
development of porous structures and the reactivity of biochar (Pacioni et al., 2016). Total pore 93
volume is critical for the solid-gas interaction and exchange between gaseous reactants and the 94
active sites on the surface of biochar (Sun et al., 2012). According to the classification of 95
activated carbon pores by the International Union of Pure and Applied Chemistry (IUPAC), 96
pores with diameter less than 2 nm, between 2 - 50 nm, and larger than 50 nm are grouped as 97
micropores, mesopores, and macropores, respectively. The pore size determines the accessibility 98
of the active sites and mass transfer limitation, and the surfaces of macropores and mesopores 99
better represent the reactive surfaces compared to those of micropores (Wu et al., 2009). The 100
specific surface area of biochar is defined as the ratio of the total pore surface area to the total 101
6
biochar particle mass, and it is well correlated with its porosity. The physical properties may 102
affect the chemical properties of gasification biochar. For example, larger surface area and 103
micropore volume have been found to be correlated with higher total polycyclic aromatic 104
hydrocarbons (PAHs) on biochar surface (Rollinson, 2016). Alkali and alkaline earth metallic 105
(AAEM) species (e.g., K, Na, Ca, Fe, and Mg) are commonly observed in biomass. These 106
metallic species is known to have a crucial role in the gasification process for determining the 107
variation of gasification products and the efficiency for gasification, which is likely due to the 108
potential catalytic effects attributed by the common alkaline earth metallic species (Yip et al., 109
2009). Furthermore, the morphology of biochar can be affected by the dispersion of the AAEM 110
species. 111
The specific surface area and pore volume of biochar are mainly influenced by the 112
thermochemical conditions such as, temperature, residence time, and heating rate. The reported 113
specific surface areas and total carbon contents of gasification biochar is shown in Figure 1. The 114
specific surface area ranged from 14.3 to 748.5 m2 g
-1. The carbon content was in the range from 115
21.8 to 89.9 wt.%. The specific surface area is generally positively related to the total carbon 116
content, which could be well fitted by an exponential function, y = 9.97e0.047x
(R2=0.65). This 117
suggests that the carbon material plays a critical role in building up the porous structures of 118
gasification biochar. The switchgrass biochar generally had a low specific surface area (< 60 m2 119
g-1
), while wood-related feedstocks gave higher surface areas and carbon contents. Hansen et al. 120
(2015) attributed the higher specific surface area and pore volume for pine wood biochar than 121
wheat straw biochar due to the higher process temperature required for wood. However, this 122
difference in surface properties between the two biochar could also be resultant from the 123
difference of feedstocks. A high mineral content in raw feedstocks may lower the specific 124
7
surface of gasification biochar by blocking the pores in the biochar (Hansen et al., 2015). The 125
grape marc produced in a small-scale entrained flow gasifier had a low specific surface area 126
(<70 g m-2
) which was attributed to the coalescence of smaller pores and the presence of 127
fractures due to the thermal contractions and expansions as observed by SEM microscopy 128
(Hernández et al., 2016). The red dash line denotes the lower bound of the specific surface area 129
of activated carbon (500 m2 g
−1) (Yeo et al., 2012). The specific surface area of gasification 130
biochar is generally smaller than that of activated carbon, except for those with a total carbon 131
content of around 80 wt.% 132
In general, gasification biochar had smaller specific surface areas and total pore volumes 133
than those from slow and fast pyrolysis (Peterson & Jackson, 2014). This was mainly caused by 134
the effects of ash melting (pore clogging), pore expansion and collapse, and tar deposition 135
corresponding to the high temperatures during combustion and/or reduction stages of gasification. 136
However, the gasification process using O2 and steam as the gasifying reagents was similar to 137
some physical activation processes that are used to produce activated carbons with high specific 138
surface areas and total pore volume (Manyà, 2012; Xiu et al., 2017). Due to the activation effect 139
of the gasifying agents, the decrease in the specific surface area and total pore volume may be 140
partly offset. After the activation process, the surface area and total pore volume could increase 141
by up to one order-of-magnitude (Bhandari et al., 2014) and the surface areas (800 - 900 m2 g
−1) 142
of the resulting activated carbons are comparable to or even larger than those from of pyrolysis 143
biochar (Angın et al., 2013; Zhang et al., 2014). Brewer et al. (2011) showed that the specific 144
surface area of gasification biochar under the gasifying agent of O2 or steam could be double of 145
that of pyrolysis biochar for the same feedstocks. 146
8
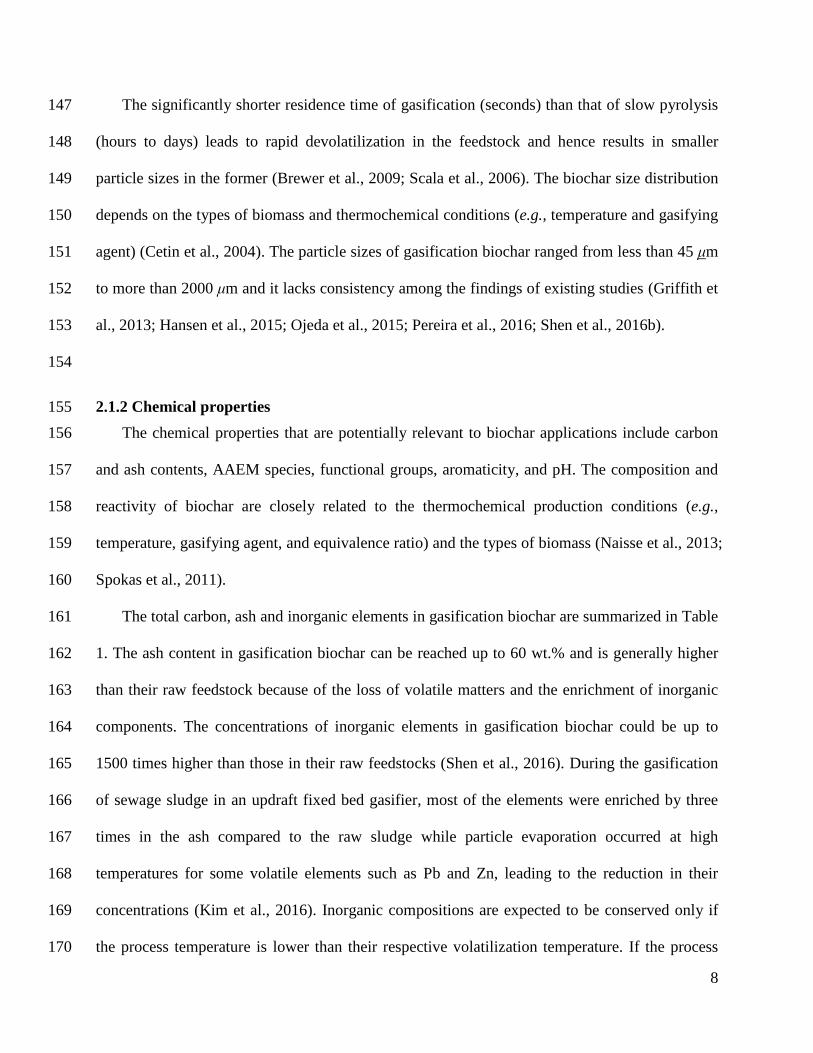
The significantly shorter residence time of gasification (seconds) than that of slow pyrolysis 147
(hours to days) leads to rapid devolatilization in the feedstock and hence results in smaller 148
particle sizes in the former (Brewer et al., 2009; Scala et al., 2006). The biochar size distribution 149
depends on the types of biomass and thermochemical conditions (e.g., temperature and gasifying 150
agent) (Cetin et al., 2004). The particle sizes of gasification biochar ranged from less than 45 μm 151
to more than 2000 μm and it lacks consistency among the findings of existing studies (Griffith et 152
al., 2013; Hansen et al., 2015; Ojeda et al., 2015; Pereira et al., 2016; Shen et al., 2016b). 153
154
2.1.2 Chemical properties 155
The chemical properties that are potentially relevant to biochar applications include carbon 156
and ash contents, AAEM species, functional groups, aromaticity, and pH. The composition and 157
reactivity of biochar are closely related to the thermochemical production conditions (e.g., 158
temperature, gasifying agent, and equivalence ratio) and the types of biomass (Naisse et al., 2013; 159
Spokas et al., 2011). 160
The total carbon, ash and inorganic elements in gasification biochar are summarized in Table 161
1. The ash content in gasification biochar can be reached up to 60 wt.% and is generally higher 162
than their raw feedstock because of the loss of volatile matters and the enrichment of inorganic 163
components. The concentrations of inorganic elements in gasification biochar could be up to 164
1500 times higher than those in their raw feedstocks (Shen et al., 2016). During the gasification 165
of sewage sludge in an updraft fixed bed gasifier, most of the elements were enriched by three 166
times in the ash compared to the raw sludge while particle evaporation occurred at high 167
temperatures for some volatile elements such as Pb and Zn, leading to the reduction in their 168
concentrations (Kim et al., 2016). Inorganic compositions are expected to be conserved only if 169
the process temperature is lower than their respective volatilization temperature. If the process 170

9
temperature in a gasifier exceeds the melting point of certain metals (e.g., Zn, Cd, As, Se, K, and 171
Na), these metals/metalloids could be volatilized and have low concentrations in the biochar 172
(Shackley et al., 2012b). An over-high alkali content in the initial feedstock and thus gasification 173
biochar may lower the melting temperature of ash, which cause ash agglomeration, slagging, and 174
fouling problems (Hernández et al., 2016). Ash agglomeration occurred when the peak 175
temperature at the ignition front was above the initial deformation temperature of ash with a low 176
combustion rate and an increased stoichiometry (Kim et al., 2016). 177
The carbon content of gasification biochar was previously suggested to be in the range of 20 178
- 60 wt.%, which was generally smaller than that of pyrolysis biochar (50 - 80 wt.%) (Yu et al., 179
2009). This was attributed to the fact that a relatively high temperature (>500 °C) and the 180
presence of limited amount of oxygen in a gasifier serve to oxidize carbon into CO2. However, 181
Table 1 showed that the total carbon content of gasification biochar could be well over 60 wt. %. 182
Although gasification biochar generally contains a lesser amount of carbon, it presents more 183
condensed aromatic rings (~ 17 rings per compound) (Brewer et al., 2009; Sohi et al., 2010). The 184
highly condensed structure of biochar is attributed to the high reaction temperature during the 185
gasification process (Brewer et al., 2009). As a result, gasification biochar shows more resistance 186
to chemical oxidation and microbial mineralization, which may increase the difficulty in the 187
modification of their surface functionality (Marks et al., 2016). The relatively high temperature 188
and the existence of a partial oxidation stage also cause gasification biochar to have a higher ash 189
content and pH value than pyrolysis biochar (Enders et al., 2012; Marks et al., 2016; Peterson & 190
Jackson, 2014). The ash content of gasification biochar should also depend on the types of 191
feedstocks. For example, the gasification biochar from corn stover have a significantly higher 192
ash and inorganic elements than those from oak (Cheah et al., 2014). Gasification of grape marc 193
10
in a small-scale entrained flow gasifier showed that approximately 70-80 wt.% of inorganic 194
elements were retained in the biochar, and the fraction decreased at higher temperatures 195
(Hernández et al., 2016). 196
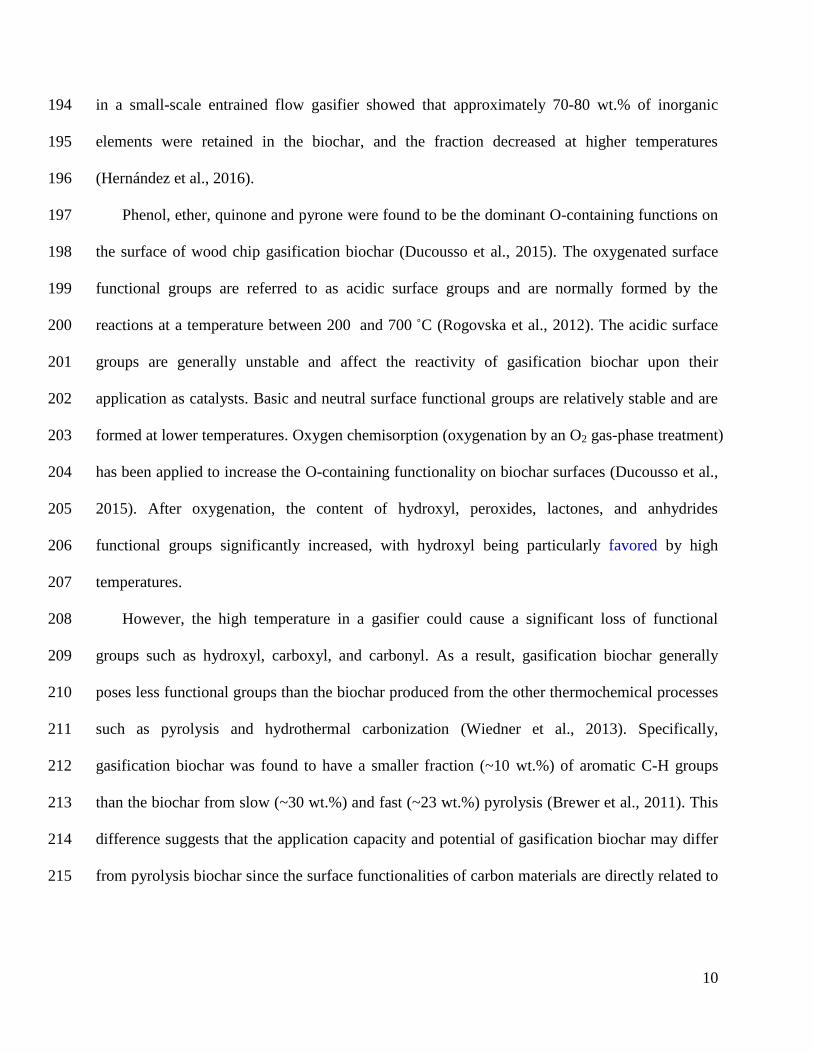
Phenol, ether, quinone and pyrone were found to be the dominant O-containing functions on 197
the surface of wood chip gasification biochar (Ducousso et al., 2015). The oxygenated surface 198
functional groups are referred to as acidic surface groups and are normally formed by the 199
reactions at a temperature between 200 and 700 ˚C (Rogovska et al., 2012). The acidic surface 200
groups are generally unstable and affect the reactivity of gasification biochar upon their 201
application as catalysts. Basic and neutral surface functional groups are relatively stable and are 202
formed at lower temperatures. Oxygen chemisorption (oxygenation by an O2 gas-phase treatment) 203
has been applied to increase the O-containing functionality on biochar surfaces (Ducousso et al., 204
2015). After oxygenation, the content of hydroxyl, peroxides, lactones, and anhydrides 205
functional groups significantly increased, with hydroxyl being particularly favored by high 206
temperatures. 207
However, the high temperature in a gasifier could cause a significant loss of functional 208
groups such as hydroxyl, carboxyl, and carbonyl. As a result, gasification biochar generally 209
poses less functional groups than the biochar produced from the other thermochemical processes 210
such as pyrolysis and hydrothermal carbonization (Wiedner et al., 2013). Specifically, 211
gasification biochar was found to have a smaller fraction (~10 wt.%) of aromatic C-H groups 212
than the biochar from slow (~30 wt.%) and fast (~23 wt.%) pyrolysis (Brewer et al., 2011). This 213
difference suggests that the application capacity and potential of gasification biochar may differ 214
from pyrolysis biochar since the surface functionalities of carbon materials are directly related to 215
11
their physicochemical and electrochemical properties such as wettability, electrical conductivity, 216
capacitance, pH, point of zero charge, and self-discharge characteristics (Rabou et al., 2009). 217
Corresponding to the lower density of functional groups, gasification biochar generally had a 218
higher degree of aromaticity (the fraction of carbons in biochar that form aromatic rings) than 219
pyrolysis biochar (Abdulrazzaq et al., 2014). A high degree of aromaticity suggests a low content 220
of readily degradable compounds and a highly condensed carbon structure with a strong 221
resistance to chemical oxidation (Hardy & Dufey, 2017). Hence, the aromaticity and degree of 222
aromatic condensation of biochar play an important role in determining the stability or 223
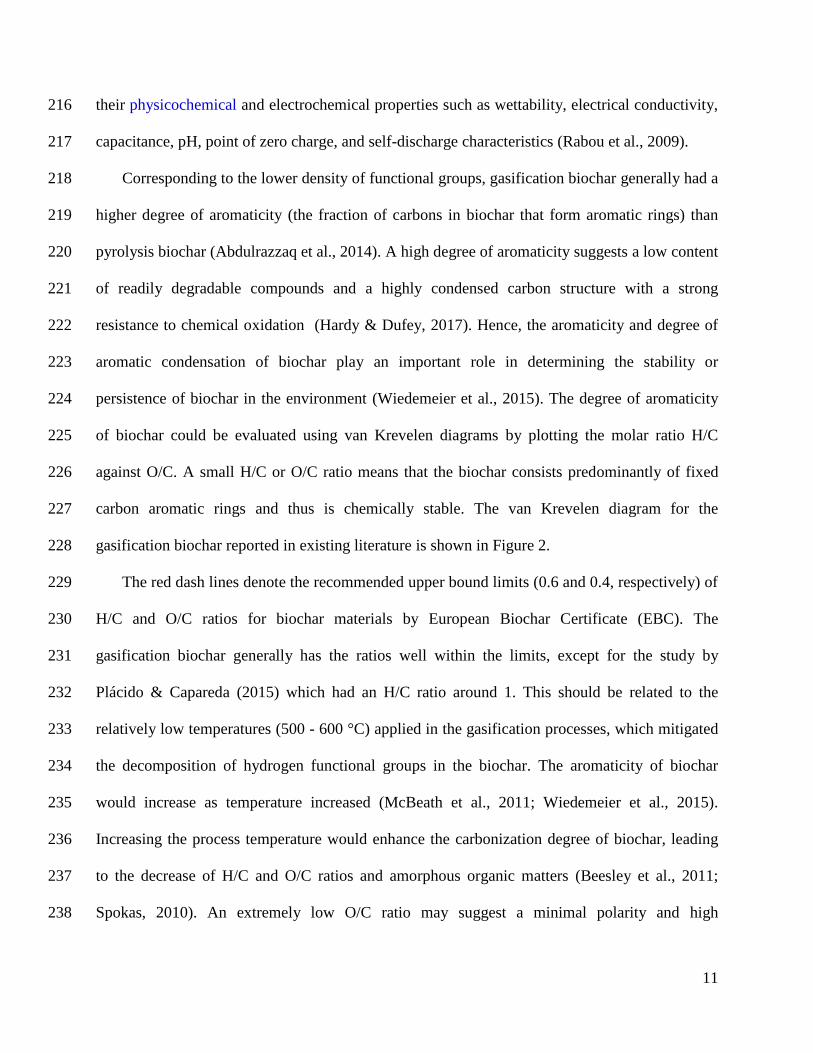
persistence of biochar in the environment (Wiedemeier et al., 2015). The degree of aromaticity 224
of biochar could be evaluated using van Krevelen diagrams by plotting the molar ratio H/C 225
against O/C. A small H/C or O/C ratio means that the biochar consists predominantly of fixed 226
carbon aromatic rings and thus is chemically stable. The van Krevelen diagram for the 227
gasification biochar reported in existing literature is shown in Figure 2. 228
The red dash lines denote the recommended upper bound limits (0.6 and 0.4, respectively) of 229
H/C and O/C ratios for biochar materials by European Biochar Certificate (EBC). The 230
gasification biochar generally has the ratios well within the limits, except for the study by 231
Plácido & Capareda (2015) which had an H/C ratio around 1. This should be related to the 232
relatively low temperatures (500 - 600 °C) applied in the gasification processes, which mitigated 233
the decomposition of hydrogen functional groups in the biochar. The aromaticity of biochar 234
would increase as temperature increased (McBeath et al., 2011; Wiedemeier et al., 2015). 235
Increasing the process temperature would enhance the carbonization degree of biochar, leading 236
to the decrease of H/C and O/C ratios and amorphous organic matters (Beesley et al., 2011; 237
Spokas, 2010). An extremely low O/C ratio may suggest a minimal polarity and high 238
12
hydrophobicity of biochar which was found in the sewage sludge, bluegrass seed screenings, and 239
white oak biochar, and this may enhance the biochar's performance in CO2 capture in the 240
presence of water (Shen et al., 2016). 241
The pH values of gasification biochar generally fall into the alkaline range (7<pH<12) 242
(Hansen et al., 2016b; Shackley et al., 2012b; Wiedner et al., 2013). This should be directly 243
related to their metal salt and/or ash content and high degree of carbonization (Griffith et al., 244
2013; Shen et al., 2016). For example, and the highest pH values of gasification biochar 245
corresponded to the highest elemental fractions of metals such as K and P (Yargicoglu et al., 246
2015). In contrast, the biochar from hydrothermal carbonization, fast pyrolysis, and slow 247
pyrolysis were acidic, near neutral pH values, and ranging from acidic to alkaline, respectively 248
(Yu et al., 2009). 249
250
2.1.3 Biochar yield 251
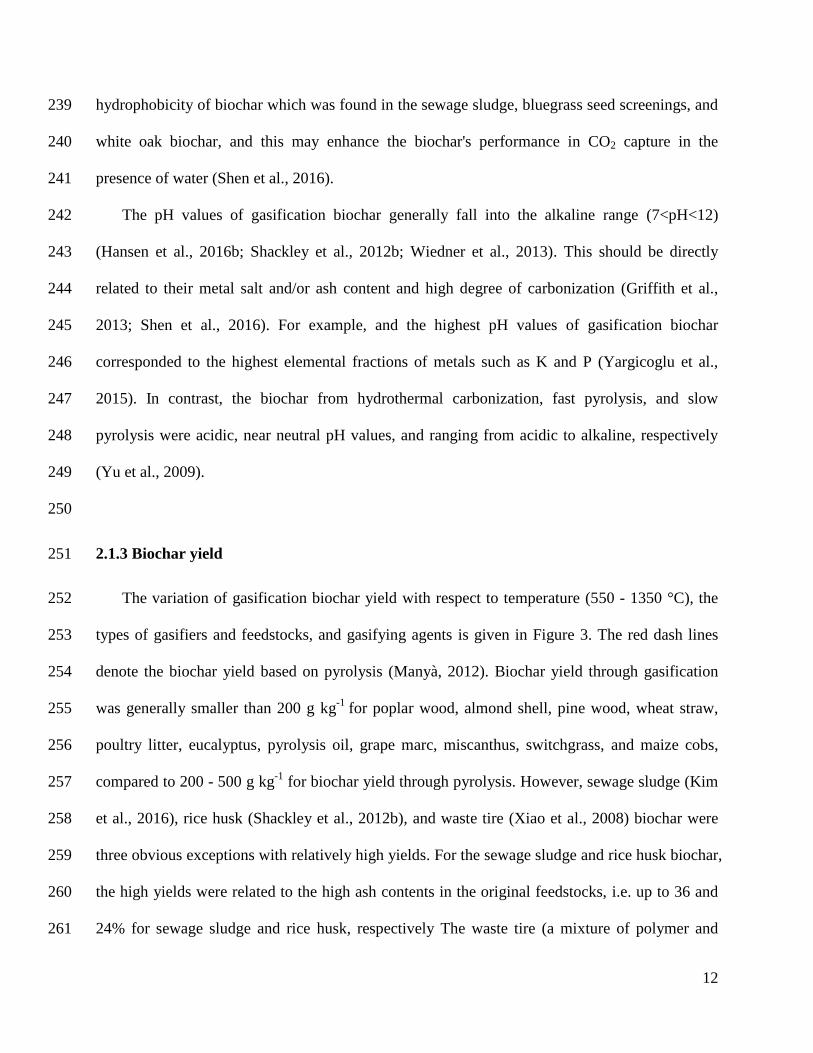
The variation of gasification biochar yield with respect to temperature (550 - 1350 °C), the 252
types of gasifiers and feedstocks, and gasifying agents is given in Figure 3. The red dash lines 253
denote the biochar yield based on pyrolysis (Manyà, 2012). Biochar yield through gasification 254
was generally smaller than 200 g kg-1
for poplar wood, almond shell, pine wood, wheat straw, 255
poultry litter, eucalyptus, pyrolysis oil, grape marc, miscanthus, switchgrass, and maize cobs, 256
compared to 200 - 500 g kg-1
for biochar yield through pyrolysis. However, sewage sludge (Kim 257
et al., 2016), rice husk (Shackley et al., 2012b), and waste tire (Xiao et al., 2008) biochar were 258
three obvious exceptions with relatively high yields. For the sewage sludge and rice husk biochar, 259
the high yields were related to the high ash contents in the original feedstocks, i.e. up to 36 and 260
24% for sewage sludge and rice husk, respectively The waste tire (a mixture of polymer and 261
13
carbon black) had a high carbon content over 80 wt.%. Under the relatively low temperature of 262
400 - 800 ˚C, most of the polymer was evaporated as volatile matter and the residual mass after 263
gasification was roughly equivalent to that from the pyrolysis process. For the same type of 264
feedstock, the gasification biochar yield generally decreases as the temperature increases. 265
Corresponding to their high temperatures, the biochar yields from industry-scale entrained flow 266
gasifiers were generally low. Leijenhorst et al. (2015) gasified pine wood- and wheat straw-267
derived pyrolysis oil at 1200 - 1500 °C in an entrained flow gasifier with a thermal throughput of 268
1 MW. The resultant biochar productions were 0.8 and 0.7 wt.%, for pine wood- and wheat 269
straw- derived pyrolysis oil, respectively. 270
271
2.2. Applications of gasification biochar beyond soil amendment 272
2.2.1 Gasification biochar for tar removal 273
The generation of tars during the biomass gasification is harmful to the system, which could 274
cause mechanical breakdown and deactivate the catalysts in the refining process (Shen, 2015). 275
The aromatic compounds such as benzene and PAHs in tars also pose environmental hazards 276
(Guan et al., 2012). Thermal and catalytic cracking techniques are available for tar removal (Han 277
& Kim, 2008). Biochar are recently employed as catalysts to decompose tar. The relatively high 278
surface area and porous structure of biochar could improve the dispersion of metal ions and 279
facilitate the transport of reactant molecules into the internal surfaces of catalysts, which make 280
them good catalyst supports (Shen & Yoshikawa, 2013). The major mechanisms of tar removal 281
by biochar-based catalysts are physical adsorption, thermochemical reforming, and a 282
combination of adsorption and catalytic conversion (Shen, 2015). 283
14
The removal capability of gasification biochar as a catalyst toward some model tars (phenol 284
and naphthalene) has been shown to be comparable with that of commonly used catalysts such as 285
calcined dolomite, olivine, and commercial nickel catalyst (El-Rub et al., 2008). However, the 286
commercial catalysts are much more expensive and are easily deactivated by carbon fouling (e.g., 287
coke deposition on nickel-based catalysts), and product gas contamination (Chan & Tanksale, 288
2014). 289
The gasification biochar achieved over 80 and 90% of phenol and naphthalene conversion 290
under a temperature from 700 to 900 ˚C, respectively, of which the conversion efficiency 291
increased with elevating temperature (El-Rub et al., 2008). Considering the continuous 292
production of biochar from the gasification process, El-Rub et al. (2008) argued that the 293
gasification biochar served as a good candidate catalyst for stable tar removal. Lower carbon 294
content in the biochar may lead to lower tar removal, as other constituents in the biochar such as 295
ash are ineffective for tar removal (Bhandari et al., 2014). The catalytic performance of biochar 296
may be further improved by attaching active metal such as nickel to the surface of biochar. In the 297
study by Qian & Kumar (2015), the red cedar char from a downdraft gasifier was activated by 298
KOH under a nitrogen flow and impregnated with nickel nitrate solution followed by drying and 299
reduction in a hydrogen flow for 3 h. The obtained catalyst was applied to remove lignin tar. The 300
reaction temperature had a positive effect on the removal efficiency of most of the tar 301
components except naphthalene. As pressure increased from 0.1 to 1.1 MPa, the removal 302
efficiencies of most of the aromatic hydrocarbons and phenols increased from 0 to 70% and from 303
30 to 70%, respectively. This biochar-derived catalyst also achieved nearly 100 % removal for 304
catechol, 2-methoxyvinylphenol, 4-methylcatechol, and o-xylene at 1.1 MPa. 305
15
The surface area and pore radius and volume of biochar-derived or activated carbon (from 306
biochar)-derived catalysts decreased significantly after tar removal experiments, suggesting that 307
it is critical to regenerate the catalysts for their commercialization. For example, the pore volume 308
of gasification biochar-derived catalysts decreased by 88 % after usage, which should be related 309
to the deposition of graphitic carbon on the catalysts leading to a coking effect, i.e., blockage of 310
pores (Bhandari et al., 2014). This means the deactivation of catalysts over time and a negative 311
relationship between tar removal efficiency and time on stream. Potential problems for biochar 312
with respect to their catalyst application include (1) degradation of surface properties of biochar 313
and (2) variability in catalytic performance due to coking effect (Bhandari et al., 2014). However, 314
some studies (Fortier et al., 2008; Xu et al., 2009) suggested that the neutral or weak base 315
properties of gasification biochar may enhance the catalyst’s resistance to deactivation due to 316
carbon and metal deposition. Meanwhile, the carbon deposition and thus coke formation can be 317
reduced by the effective use of catalyst supports such as dolomite and MgO and the addition of 318
AAEM species which are commonly found in raw gasification biochar. Basic supports are 319
generally more coke-resistant than acidic supports (Chan & Tanksale, 2014). For example, metal 320
elements such as Pt, Co and Cu could serve as promoters to improve the catalytic activity of 321
nickel-based catalysts by enhancing (1) nickel reducibility by forming strong interaction with 322
nickel, (2) dispersion of nickel on the support, and (3) resistance to coke formation (Chan & 323
Tanksale, 2014). 324
325
2.2.2 Gasification biochar as fuel 326
Biochar produced from gasification can be recycled back to the gasification process as fuel, 327
as such biochar contains high carbon content and calorific value. Due to their high heating values, 328
16
gasification biochar could be used as the feedstock of gasification to convert the residual carbon 329
"left" in a previous gasification process to extra gaseous fuel (Le & Kolaczkowski, 2015; Pacioni 330
et al., 2016). In that sense, they are often referred to as charcoal. For example, the palm kernel 331
shell biochar from a bubbling gasifier exhibited 75-91 % carbon content with a high heating 332
value of around 28 MJ kg-1
, which was comparable to the heating values of bituminous coal 333
(Bazargan et al., 2014). Note that the skeletal density of biochar was in the range of 1340 - 1960 334
kg m-3
(Brewer et al., 2014) which is slightly higher than bituminous coal (1250 - 1350 kg m-3
) 335
(Zhao et al., 2015). The reactivity of biochar is related to the carbon conversion levels upon its 336
production, which further depends on the types of feedstocks. Negative relationships were found 337
for the biochar of refuse derived fuel and coal (Le & Kolaczkowski, 2015; Liu et al., 2006), 338
while a positive relationship was found for wood biochar (Mermoud et al., 2006). The mineral 339
composition in feedstocks strongly affected the reactivity of gasification. Especially, the AAEM 340
species in gasification biochar may serve as catalysts to promote the gasification process (Wu et 341
al., 2009). For example, higher K and Ca contents in the biochar of spent coffee grounds and 342
apple pomace led to a significant higher gasification reaction rate compared to the biochar of 343
sawdust because of the catalytic effect of mineral elements (Pacioni et al., 2016). Compared to 344
the biochar with AAEM species being removed by acid treatment, the raw biochar showed a 345
higher reactivity (Yip et al., 2009). Ma et al. (2016) further showed that the AAEM species had a 346
significant effect on the water gas shift reaction (CO (g) + H2O (g) ↔ CO2 (g) + H2 (g)) during 347
the catalytic steam reforming of bio-oil model compounds. The presence of Na, K, and Ca 348
exhibited the strongest catalytic effect for biochar gasification (Dupont et al., 2011; Yip et al., 349
2009). Nevertheless, excessive ash content in gasification biochar possibly leads to the 350
encapsulation of AAEM species and a reduced porosity, hence, adversely affecting the reactivity 351
17
of biochar. The presence of tar in biochar could inhibit the gasification reactions when 352
gasification biochar are used as the feedstock (Nzihou et al., 2013). 353
354
2.2.3 Gasification biochar as adsorbent 355
Gasification biochar with high surface areas, pore volume, and oxygen-containing surface 356
functional groups could be directly used as adsorbents to remove heavy metals and/or organic 357
pollutants in the environment (Prasara-A & Gheewala, 2016; Thompson et al., 2016). The 358
adsorption capacity should be mainly related to the physical properties of biochar. Improvement 359
in pore structure such as enlarged pore sizes and a higher density of functional groups could 360
enhance the adsorption capacity of biochar for methylene and heavy metals, respectively 361
(Rafatullah et al., 2010; Wang et al., 2013). An increase in the specific surface area of biochar 362
was associated with a higher sorption capacity for organic chemicals, such as pesticides and 363
herbicides (Kasozi et al., 2010; Yu et al., 2015). The presence of oxygen-rich functional groups 364
such as C˗O and C=O, and aromatic groups on gasification biochar could serve as strong active 365
sites and enhance biochar’s adsorption capability (Xue et al., 2012). 366
Gasification biochar could also serve as the precursor of activated carbon featured by a 367
larger porosity and specific surface area, and thus greater adsorption capability (Qian et al., 368
2015). The physical activation method involves the use of the gases such as steam, CO2, or 369
ozone under a temperature higher than 700 ˚C, while chemical agents such as KOH, NaOH, NH3, 370
and ZnCl2 are used in the chemical activation methods. Activation significantly increases the 371
specific surface area and pore fraction of original biochar and benefit the downstream 372
applications of activated carbon as adsorbents (Angın et al., 2013). Bhandari et al. (2014) 373
converted switchgrass gasification biochar into activated carbon by ultrasonic impregnation of 374
18
potassium hydroxide (KOH) and found that introducing ultrasonication to the activation process 375
of the biochar from the downdraft gasifier could significantly increase the specific surface area 376
of the resulting activated carbon. The specific surface areas and total pore volume of the 377
resulting activated carbon were 150 and 50 times of original biochar. The authors also showed 378
that the original biochar contained un-burnt biomass particles and some biochar particles were 379
closed and non-porous. After activation, however, clear porous structures were created by the 380
volatilization and wash-out of solid residues by thermal treatment and wash cycles during 381
activation. 382
Activating agents could also affect the properties of activated carbon. Tay et al. (2009) 383
showed that K2CO3 was a more effective agent than KOH in activating soybean oil cake biochar, 384
and it could produce the activated carbon of a higher porosity, larger yield, and less ash and 385
sulfur contents. Zhang et al. (2014) found that CO2-activated biochar had a higher CO2 386
adsorption capacity than NH3- and CO2-NH3-activated biochar at a temperature of 20 °C. At a 387
temperature of 120 °C, the adsorption capacity depended on the N-content of biochar and the 388
CO2-NH3-activated biochar had the highest CO2 adsorption capacity due to the formation of 389
nitrogen functional groups from the reaction between biochar carbon and ammonia. The 390
activated carbon from switchgrass gasification biochar showed an effective toluene removal rate 391
of 69-92% (Bhandari et al., 2014). Maneerung et al. (2016) activated the wood gasification 392
biochar via steam, which showed a high adsorption capability (189.83 mg g-1
) towards 393
Rhodamine B. 394
395
19
2.2.4 Gasification biochar for electrochemical applications 396
Direct carbon fuel cells (DCFCs) have been received increasing attention due to their greater 397
electrical efficiency, size flexibility, and overall reliability, compared with conventional 398
technologies such as steam and gas turbines (Giddey et al., 2012). The high carbon content and 399
carbon-oxygen groups in biochar facilitate their application as the carbon material in DCFCs to 400
generate a high amount of valuable gases (CO, H2, and CH4) (Elleuch et al., 2015). A DCFC 401
system based on wood biochar achieved a power density level around 60 - 70 % of that based on 402
coal (Ahn et al., 2013b). The carbon content, specific surface area, and total pore volume of 403
biochar determine the performance of a biochar-based DCFC system by affecting the 404
electrochemical reactions, which are positively related to the maximum power density of a 405
DCFC system (Ahn et al., 2013a). High specific surface area and total pore volume facilitate the 406
reactivity of the anode electrochemical reaction and lead to a higher maximum power density in 407
a DCFC system (Ahn et al., 2013a; Ahn et al., 2013b). The reactivity and specific surface area of 408
biochar may play a complementary role to each other to affect the performance of a biochar-409
based DCFC. For example, although the specific surface area (244.6 m2 g
-1) of corn stover 410
biochar was smaller than that (750 m2 g
-1) of activated carbon, its high reactivity (the lost rate of 411
biochar mass) helped to achieve highly effective char utilization and support current loads 412
surpassing 500 mA cm-2
(Alexander et al., 2012). One of the potential technical demerits 413
associated with the fuel cell performance was reported as cell degradation (Munnings et al., 414
2014). This degradation is effected by two main factors: (1) less and less fuel is available for 415
reactions upon the consumption of carbon materials and (2) after carbon consumption, more and 416
more ash gets in contact with the anode, which further reduces the reaction surface area and 417
20
blocks the charge transfer through the cell. Hence, the ash content of gasification biochar needs 418
to be paid special attention when they were applied in a DCFC system. 419
The properties of high electrical conductivity, thermal and chemical stability, and large 420
specific surface area of gasification biochar suggest their great potential for other 421
electrochemistry-related applications such as electrocatalyst and supercapacitors. For example, 422
pine wood gasification biochar have been used as cathode electrocatalyst supports (Huggins et al., 423
2015). The original biochar were first sonicated for 30-min followed by 2-h heating in a 3 M 424
KOH aqueous solution. The treated biochar were then used as a manganese oxide electrocatalytic 425
support for microbial fuel cells (MFCs). The electrocatalyst support achieved satisfactory 426
maximum power densities which were comparable to the ones based on the conventional, more 427
(50 %) expensive cathode material, Vulcan Carbon (VC). Small-scale tests in single-chamber 428
MFCs inoculated with anaerobic sludge suggested that the gasification biochar could be used as 429
an effective, economical, and scalable electrocatalyst for MFC application. 430
The gasification biochar from a mixture of biomass and polymeric waste has been upgraded 431
into carbon nano-tubes which have high electronic conductivities and specific surface areas and 432
could potentially serve as an electrocatalyst support for fuel cells and electrode materials of 433
lithium-ion batteries (Esfahani et al., 2017). It is worth noting that pre-processing activities such 434
as sieving and milling may be needed to achieve the uniformity of biochar particle sizes for good 435
electrochemical performance. Biochar have also been used as the electrode materials of 436
supercapacitors because of their potentially high electrical conductivity and high electrochemical 437
activity (Chen et al., 2015; Li et al., 2017). Under a high reaction temperature of 1200 °C, the 438
electrical conductivities of gasification biochar of poplar wood, wheat straw, wood chips, 439
sorghum, and olive residues were found to be 997, 1327, 288, 502, and 238 µS cm-1
, respectively 440
21
(Wiedner et al., 2013). The capacitive performance of biochar-based supercapacitors is 441
influenced by the specific surface area, pore structure and distribution, electrical conductivity 442
and surface functionalities of biochar (Abioye & Ani, 2015). 443
In general, the electrochemical performance of biochar should be related to its texture and 444
surface chemistry, especially, the concentration of O-containing functional groups (Li et al., 445
2009). The conductive properties of biochar were found to be positively related to its degree of 446
aromaticity, i.e. its fused-ring aromatic structures and anomeric O-C-O carbons (Li et al., 2013). 447
The functional groups on biochar correspond to the presence of heteroatoms such as oxygen, 448
nitrogen, and sulfur which are closely associated with biochar's surface chemical heterogeneity. 449
These heteroatoms originate from raw feedstocks and are integrated into the carbon matrix due to 450
incomplete carbonization (Shafeeyan et al., 2010). In recent, the electrical conductivity of 451
biochar was found to be closely associated with its degree of carbonization (Gabhi et al., 2017), 452
where a six-order magnitude increase was observed as the carbon content of biochar increased 453
from 86.8 to 93.7 wt%. 454
455
2.2.5 Gasification biochar as additives for anaerobic digestion (AD) 456
Gasification-derived pine wood and white oak biochar have been used as additives for the 457
mesophilic and thermophilic AD of wastewater sludge to enhance methanogenic microbial-458
activities and reduce the CO2 content in biogas (Shen et al., 2016). The resulting methane content 459
in biogas was up to 92.3 and 79.0 vol.%, while 66.2 and 32.4 vol.% of CO2 was sequestered 460
during the mesophilic and thermophilic AD, respectively. The biogas from an ordinary AD 461
process of sludge generally consists of 50-70 and 30-50 vol.% of methane and CO2, respectively 462
(Appels et al., 2008). The biochar also enriched the macro- and micronutrients (i.e., K, Ca, Mg, 463
22
and Fe) in the digestate and made it suitable as a fertilizer (Shen et al., 2016). The AAEM 464
species contained in the gasification biochar could be released in the form of cations which may 465
react with CO2 from AD to generate /
buffer. As a result, the pH of the digester 466
increased with the addition of gasification biochar and maintained in an alkaline range (7.23-7.43 467
and 7.43-7.61 for mesophilic and thermophilic, respectively) throughout the mesophilic and 468
thermophilic AD processes. This alkaline pH range led to an increase in the stability of 469
mesophilic AD. Because of the high degree of aromaticity of gasification biochar, the biochar-470
amended AD showed a remarkably higher electrical conductivity than AD without biochar. It 471
was speculated that conductive biochar could promote the direct interspecies electron transfer 472
between syntrophic acetogen and methanogen communities by serving as an electron conductor 473
in an AD process, thus, accelerating methanogenesis (Shen et al., 2016). Furthermore, the large 474
specific surface area and porous structure of biochar favor the colonization of syntrophic 475
acetogenic bacteria and methanogenic archaea, which together with the increased reaction rate 476
facilitated the total organic carbon removal by AD (Cetin et al., 2004; Luo et al., 2015). 477
478
2.2.6 Gasification biochar as catalyst for biodiesel production 479
Biodiesel, a mixture of methyl esters, has the advantages of carbon neutrality, bio-480
degradability, and low CO and particulate matter emission for automobile application. Lee et al. 481
(2017) investigated the non-catalytic transesterification of olive oil by using the maize residue 482
biochar from pyrolysis and dimethyl carbonate (DMC) as an acyl acceptor. They achieved a 483
biodiesel yield to 95.4% under the optimal operational conditions (380 °C and molar ratio of 484
DMC to olive oil (36:1)). The maize residue biochar from pyrolysis was used as porous media 485
for the thermally-induced non-catalytic transesterification reaction to synthesize fatty acid ethyl 486
23
esters (FAEE) from coconut oil (Jung et al., 2017). The wide pore distribution in the biochar was 487
shown to enhance the yield of FAEEs, resulting in 87% yield of FAEE at 380 °C. In recent, the 488
performance of the gasification biochar from palm kernel shells as a CaO (quicklime/burnt lime) 489
catalyst for biodiesel production has been examined (Bazargan et al., 2015). The biochar had a 490
high calcium content, mainly in the form of CaCO3. The gasification biochar-based CaO catalyst 491
had the advantage of low synthesis temperature and showed a satisfactory catalytic effect on the 492
transesterification of sunflower oil with methanol (1:9). The reaction could be accelerated upon 493
the increase in the loading of catalyst. The results showed that CaCO3 contained in the palm 494
kernel shell biochar was a promising low-cost source for CaO catalyst production. The thermal 495
decomposition temperature (750 ˚C) of CaCO3 to CaO in the biochar was found to be lower than 496
that (> 900 °C) of raw limestone calcination, which was attributed to certain functional groups in 497
the biomass that led to distorted crystal morphology and consequently lowered apparent 498
activation energy for calcite decomposition (Thompson et al., 2014). Pyrolysis biochar-based 499
studies (Dehkhoda et al., 2010; Kastner et al., 2012) suggested that a larger specific surface area 500
and higher acid density of the catalyst were related to a higher biodiesel yield. Hence, the 501
alkaline nature of gasification biochar may adversely affect its application for biodiesel 502
production, which requires further investigation for improvement 503
504
3. Life cycle assessment (LCA) and Future Challenges 505
3.1 LCA 506
The potential economic and environmental (carbon abatement) benefits associated with the 507
deployment of a gasification system could be judged by LCA. Biochar proved to be able to 508
sequester carbon in the form of biochar with high persistence in soil environments. The findings 509
24
of the advantages of applying biochar for agricultural purpose stimulate wide consideration of 510
the carbon sequestration effect of biochar in LCA (Ibarrola et al., 2012; Nguyen et al., 2013). A 511
typical system boundary of LCA for a gasification-based waste disposal scheme without 512
considering the waste generation process is shown in Figure 4. 513
Since the main product from gasification is syngas, the energy offset by displacing 514
conventional fossil fuels (e.g., coal, oil, and natural gas) generally plays a dominant role in the 515
system's overall carbon abatement capacity followed by the carbon sequestration and soil effects 516
by biochar, respectively (Ibarrola et al., 2012). The energy production by walnut shell 517
gasification used to displace grid electricity could account for 91.8 %, and the carbon sink role of 518
biochar accounted for 8.2 % of the total carbon abatement (Pereira et al., 2016). In contrast, the 519
energy production from a pyrolysis system accounted for 10 – 25 % of the overall carbon 520
abatement while the biochar-related carbon abatement contributed to 40 - 66% of the overall 521
carbon abatement due to its high biochar yield (Elmouwahidi et al., 2012). 522
Consistently, Hammond et al. (2011) showed that gasification systems generally offer a 523
lower carbon abatement potential than pyrolysis systems where the carbon stored in biochar 524
would generally account for the greatest carbon abatement portion among all the carbon 525
abatement components. The authors showed that gasification systems tend to produce more 526
electricity than pyrolysis system, suggesting the economic advantage of gasification. Nguyen et 527
al. (2013) found that the electricity production from the gasification of straw was more 528
environmentally friendly than direct combustion because of: (1) a higher electricity generation 529
efficiency, (2) a lower exhaust emission, and (3) biochar generation. Most of the previous LCA 530
studies considered the application of biochar as a soil amendment. Relevant LCA considering the 531
25
applications of gasification biochar beyond soil amendment (Section 2.2) is still limited and 532
needs to be explored in the future. 533
534
3.2 Challenges and perspectives 535
Upon the design of a gasification system, engineers and researchers often face up to a 536
dilemma on balancing between the carbon abatement potential and overall energy delivery, 537
which is further tangled by considering the potential applications of gasification biochar. It is 538
more economically viable to produce more electricity because of its higher profitability 539
compared to biochar for the time being (Meyer et al., 2011). However, this situation may change 540
as the constant development of new biochar applications and the increasing demand of 541
gasification biochar. The most environmentally or economically sustainable gasification system 542
will achieve a balance between energy output and biochar generation, under which we need to 543
consider: (1) the source of gasification feedstock (waste or biomass), (2) the syngas yield, 544
composition, and applications (3) biochar yield and its physicochemical properties and 545
applications, and (4) the respective carbon abatement potential of applying syngas as a renewable 546
energy and applying biochar as a renewable source. A schematic of this concept is shown in 547
Figure 5. In the future, it is worth exploring novel and unconventional biochar application 548
scenarios and using LCA to optimize the combined economic and environmental performance of 549
gasification systems. 550
To achieve robust engineering design and development of sustainable gasification systems, 551
the capability of developing bespoke biochar is a must, that is, for a particular application, we 552
need to know how much specific surface area, pore volume, carbon content, specific functional 553
groups, etc, are desirable and what kind of gasification conditions are required to produce the 554
26
corresponding physicochemical properties. Hence, it is critical to understand the influences of 555
feedstock and thermochemical conditions towards the properties and performance of gasification 556
biochar. This is especially an urgent demand for gasification biochar because their relevant 557
studies are far less than other types of biochar mismatching their great application potential in 558
the industry. Specifically, a complete report of experimental conditions (gasifying agent, 559
temperature, feedstock, gasifier types) is needed to facilitate inter-study comparisons. Finally, a 560
thorough toxicology assessment is also needed prior to the practical application of gasification 561
biochar. The current assessment methods and the guideline values of contaminants (e.g., 12 µg g-
562
1 for 16 US EPA PAHs according to European Biochar Certificate guidelines) are mainly based 563
on the soil application of biochar which need to be extended to cater for the increasing 564
applications of biochar beyond soil amendment. 565
566
4. Conclusions 567
The production, physicochemical properties and yield of gasification biochar are extensively 568
reviewed. Biochar from gasification have found their applications in removing tars, serving as 569
gasification feedstock and a precursor as activated carbon, adsorbing contaminants, DCFC, 570
amending AD, catalyzing biodiesel production, and being upgraded to oxygenated catalyst, with 571
satisfactory performance. Complete experimental conditions (gasifying agent, temperature, 572
feedstock, gasifier types) should be reported to facilitate between-study comparisons. A concept 573
of balancing syngas and biochar production for an economically and environmentally feasible 574
gasification system was proposed. 575
576
27
Acknowledgement 577
Chi-Hwa Wang and Siming You acknowledge the funding support by the National Research 578
Foundation (NRF), Prime Minister’s Office, Singapore under its Campus for Research 579
Excellence and Technological Enterprise (CREATE) program. Grant Number R-706-001-101-580
281, National University of Singapore. 581
582
References 583
Abdulrazzaq, H., Jol, H., Husni, A., Abu-Bakr, R. 2014. Characterization and stabilisation of 584
biochar obtained from empty fruit bunch, wood, and rice husk. BioResources, 9(2), 2888-2898. 585
Abioye, A.M., Ani, F.N. 2015. Recent development in the production of activated carbon 586
electrodes from agricultural waste biomass for supercapacitors: A review. Renew. Sustainable 587
Energy Rev., 52, 1282-1293. 588
Ahn, S.Y., Eom, S.Y., Rhie, Y.H., Sung, Y.M., Moon, C.E., Choi, G.M., Kim, D.J. 2013a. 589
Application of refuse fuels in a direct carbon fuel cell system. Energy, 51, 447-456. 590
Ahn, S.Y., Eom, S.Y., Rhie, Y.H., Sung, Y.M., Moon, C.E., Choi, G.M., Kim, D.J. 2013b. 591
Utilization of wood biomass char in a direct carbon fuel cell (DCFC) system. Appl. energy, 105, 592
207-216. 593
Alexander, B., Mitchell, R., Gür, T. 2012. Experimental and modeling study of biomass 594
conversion in a solid carbon fuel cell. J. Electrochem. Soc., 159(3), B347-B354. 595
Angın, D., Altintig, E., Köse, T.E. 2013. Influence of process parameters on the surface and 596
chemical properties of activated carbon obtained from biochar by chemical activation. 597
Bioresour. Technol., 148, 542-549. 598
28
Appels, L., Baeyens, J., Degrève, J., Dewil, R. 2008. Principles and potential of the anaerobic 599
digestion of waste-activated sludge. Prog. Energy Combust. Sci., 34(6), 755-781. 600
Barisano, D., Freda, C., Nanna, F., Fanelli, E., Villone, A. 2012. Biomass gasification and in-bed 601
contaminants removal: Performance of iron enriched Olivine and bauxite in a process of 602
steam/O2 gasification. Bioresour. Technol., 118, 187-194. 603
Bazargan, A., Kostić, M.D., Stamenković, O.S., Veljković, V.B., McKay, G. 2015. A calcium 604
oxide-based catalyst derived from palm kernel shell gasification residues for biodiesel 605
production. Fuel, 150, 519-525. 606
Bazargan, A., Rough, S.L., McKay, G. 2014. Compaction of palm kernel shell biochar for 607
application as solid fuel. Biomass Bioenerg., 70, 489-497. 608
Beesley, L., Moreno-Jiménez, E., Gomez-Eyles, J.L., Harris, E., Robinson, B., Sizmur, T. 2011. 609
A review of biochar’ potential role in the remediation, revegetation and restoration of 610
contaminated soils. Environ. Pollut., 159(12), 3269-3282. 611
Bhandari, P.N., Kumar, A., Bellmer, D.D., Huhnke, R.L. 2014. Synthesis and evaluation of 612
biochar-derived catalysts for removal of toluene (model tar) from biomass-generated producer 613
gas. Renew. Energy, 66, 346-353. 614
Brewer, C.E., Schmidt-Rohr, K., Satrio, J.A., Brown, R.C. 2009. Characterization of biochar 615
from fast pyrolysis and gasification systems. Environ. Prog. Sustain. Energy, 28(3), 386-396. 616
Brewer, C.E., Unger, R., Schmidt-Rohr, K., Brown, R.C. 2011. Criteria to select biochar for field 617
studies based on biochar chemical properties. Bioenergy Res., 4(4), 312-323. 618
Brewer, C.E., Chuang, V.J., Masiello, C.A., Gonnermann, H., Gao, X., Dugan, B., Driver, L.E., 619
Panzacchi, P., Zygourakis, K., Davies, C.A. 2014. New approaches to measuring biochar 620
density and porosity. Biomass Bioenerg., 66, 176-185. 621
29
Carpenter, D.L., Bain, R.L., Davis, R.E., Dutta, A., Feik, C.J., Gaston, K.R., Jablonski, W., 622
Phillips, S.D., Nimlos, M.R. 2010. Pilot-scale gasification of corn stover, switchgrass, wheat 623
straw, and wood: 1. Parametric study and comparison with literature. Ind. Eng. Chem. Res., 624
49(4), 1859-1871. 625
Cetin, E., Moghtaderi, B., Gupta, R., Wall, T. 2004. Influence of pyrolysis conditions on the 626
structure and gasification reactivity of biomass chars. Fuel, 83(16), 2139-2150. 627
Chan, F.L., Tanksale, A. 2014. Review of recent developments in Ni-based catalysts for biomass 628
gasification. Renew. Sustainable Energy Rev., 38, 428-438. 629
Cheah, S., Malone, S.C., Feik, C.J. 2014. Speciation of sulfur in biochar produced from pyrolysis 630
and gasification of oak and corn stover. Environ. Sci. Technol., 48(15), 8474-8480. 631
Chen, H., Liu, D., Shen, Z., Bao, B., Zhao, S., Wu, L. 2015. Functional biomass carbons with 632
hierarchical porous structure for supercapacitor electrode materials. Electrochim. Acta, 180, 633
241-251. 634
Deal, C., Brewer, C.E., Brown, R.C., Okure, M.A., Amoding, A. 2012. Comparison of kiln-635
derived and gasifier-derived biochar as soil amendments in the humid tropics. Biomass 636
Bioenerg., 37, 161-168. 637
Dehkhoda, A.M., West, A.H., Ellis, N. 2010. Biochar based solid acid catalyst for biodiesel 638
production. Appl. Catal. A., 382(2), 197-204. 639
Ducousso, M., Weiss-Hortala, E., Nzihou, A., Castaldi, M.J. 2015. Reactivity enhancement of 640
gasification biochar for catalytic applications. Fuel, 159, 491-499. 641
Dupont, C., Nocquet, T., Da Costa, J.A., Verne-Tournon, C. 2011. Kinetic modelling of steam 642
gasification of various woody biomass chars: influence of inorganic elements. Bioresour. 643
Technol., 102(20), 9743-9748. 644
30
El-Rub, Z.A., Bramer, E., Brem, G. 2008. Experimental comparison of biomass chars with other 645
catalysts for tar reduction. Fuel, 87(10), 2243-2252. 646
Elleuch, A., Halouani, K., Li, Y. 2015. Investigation of chemical and electrochemical reactions 647
mechanisms in a direct carbon fuel cell using olive wood charcoal as sustainable fuel. J. Power 648
Sources, 281, 350-361. 649
Elmouwahidi, A., Zapata-Benabithe, Z., Carrasco-Marín, F., Moreno-Castilla, C. 2012. 650
Activated carbons from KOH-activation of argan (Argania spinosa) seed shells as 651
supercapacitor electrodes. Bioresour. Technol., 111, 185-190. 652
Enders, A., Hanley, K., Whitman, T., Joseph, S., Lehmann, J. 2012. Characterization of biochar 653
to evaluate recalcitrance and agronomic performance. Bioresour. Technol., 114, 644-653. 654
Esfahani, R.A.M., Osmieri, L., Specchia, S., Yusup, S., Tavasoli, A., Zamaniyan, A. 2017. H2-655
rich syngas production through mixed residual biomass and HDPE waste via integrated 656
catalytic gasification and tar cracking plus bio-char upgrading. Chem. Eng. J., 308, 578-587. 657
Fortier, H., Westreich, P., Selig, S., Zelenietz, C., Dahn, J. 2008. Ammonia, cyclohexane, 658
nitrogen and water adsorption capacities of an activated carbon impregnated with increasing 659
amounts of ZnCl2, and designed to chemisorb gaseous NH3 from an air stream. J. Colloid 660
Interface Sci., 320(2), 423-435. 661
Gabhi, R.S., Kirk, D.W., Jia, C.Q. 2017. Preliminary investigation of electrical conductivity of 662
monolithic biochar. Carbon, 116, 435-442. 663
Giddey, S., Badwal, S., Kulkarni, A., Munnings, C. 2012. A comprehensive review of direct 664
carbon fuel cell technology. Prog. Energy Combust. Sci., 38(3), 360-399. 665
31
Griffith, S.M., Banowetz, G.M., Gady, D. 2013. Chemical characterization of chars developed 666
from thermochemical treatment of Kentucky bluegrass seed screenings. Chemosphere, 92(10), 667
1275-1279. 668
Guan, G., Chen, G., Kasai, Y., Lim, E.W.C., Hao, X., Kaewpanha, M., Abuliti, A., Fushimi, C., 669
Tsutsumi, A. 2012. Catalytic steam reforming of biomass tar over iron-or nickel-based catalyst 670
supported on calcined scallop shell. Appl. Catal. B., 115, 159-168. 671
Hammond, J., Shackley, S., Sohi, S., Brownsort, P. 2011. Prospective life cycle carbon 672
abatement for pyrolysis biochar systems in the UK. Energy Policy, 39(5), 2646-2655. 673
Han, J., Kim, H. 2008. The reduction and control technology of tar during biomass 674
gasification/pyrolysis: An overview. Renew. Sustainable Energy Rev., 12(2), 397-416. 675
Hansen, V., Hauggaard-Nielsen, H., Petersen, C.T., Mikkelsen, T.N., Müller-Stöver, D. 2016a. 676
Effects of gasification biochar on plant-available water capacity and plant growth in two 677
contrasting soil types. Soil Tillage Res., 161, 1-9. 678
Hansen, V., Müller-Stöver, D., Ahrenfeldt, J., Holm, J.K., Henriksen, U.B., Hauggaard-Nielsen, 679
H. 2015. Gasification biochar as a valuable by-product for carbon sequestration and soil 680
amendment. Biomass Bioenerg., 72, 300-308. 681
Hansen, V., Müller-Stöver, D., Munkholm, L.J., Peltre, C., Hauggaard-Nielsen, H., Jensen, L.S. 682
2016b. The effect of straw and wood gasification biochar on carbon sequestration, selected soil 683
fertility indicators and functional groups in soil: An incubation study. Geoderma, 269, 99-107. 684
Hardy, B., Dufey, J. 2017. The resistance of centennial soil charcoal to the “Walkley-Black” 685
oxidation. Geoderma, 303, 37-43. 686
Hernández, J.J., Lapuerta, M., Monedero, E. 2016. Characterisation of residual char from 687
biomass gasification: effect of the gasifier operating conditions. J. Clean. Prod., 138, 83-93. 688
32
Huggins, T.M., Pietron, J.J., Wang, H., Ren, Z.J., Biffinger, J.C. 2015. Graphitic biochar as a 689
cathode electrocatalyst support for microbial fuel cells. Bioresour. Technol., 195, 147-153. 690
Ibarrola, R., Shackley, S., Hammond, J. 2012. Pyrolysis biochar systems for recovering 691
biodegradable materials: A life cycle carbon assessment. Waste Manage., 32(5), 859-868. 692
Jung, J.-M., Lee, J., Choi, D., Oh, J.-I., Lee, S.-R., Kim, J.-K., Kwon, E.E. 2017. Biochar as 693
porous media for thermally-induced non-catalytic transesterification to synthesize fatty acid 694
ethyl esters from coconut oil. Energy Convers. Manage., 145, 308-313. 695
Kasozi, G.N., Zimmerman, A.R., Nkedi-Kizza, P., Gao, B. 2010. Catechol and humic acid 696
sorption onto a range of laboratory-produced black carbons (biochar). Environ. Sci. Technol., 697
44(16), 6189-6195. 698
Kastner, J.R., Miller, J., Geller, D.P., Locklin, J., Keith, L.H., Johnson, T. 2012. Catalytic 699
esterification of fatty acids using solid acid catalysts generated from biochar and activated 700
carbon. Catal. Today, 190(1), 122-132. 701
Kim, M., Lee, Y., Park, J., Ryu, C., Ohm, T.-I. 2016. Partial oxidation of sewage sludge 702
briquettes in a updraft fixed bed. Waste Manage., 49, 204-211. 703
Klinghoffer, N.B., Castaldi, M.J., Nzihou, A. 2012. Catalyst properties and catalytic performance 704
of char from biomass gasification. Ind. Eng. Chem. Res., 51(40), 13113-13122. 705
Le, C., Kolaczkowski, S. 2015. Steam gasification of a refuse derived char: reactivity and 706
kinetics. Chem. Eng. Res. Des., 102, 389-398. 707
Lee, J., Jung, J.-M., Oh, J.-I., Ok, Y.S., Kwon, E.E. 2017. Establishing a Green Platform for 708
Biodiesel Synthesis via Strategic Utilization of Biochar and Dimethyl Carbonate. Bioresour. 709
Technol., In Press. 710
33
Lehmann, J., Rillig, M.C., Thies, J., Masiello, C.A., Hockaday, W.C., Crowley, D. 2011. Biochar 711
effects on soil biota-a review. Soil Biol. Biochem., 43(9), 1812-1836. 712
Leijenhorst, E., Assink, D., Van de Beld, L., Weiland, F., Wiinikka, H., Carlsson, P., Öhrman, O. 713
2015. Entrained flow gasification of straw-and wood-derived pyrolysis oil in a pressurized 714
oxygen blown gasifier. Biomass Bioenerg., 79, 166-176. 715
Li, X., Liu, L., Wang, X., Ok, Y.S., Elliott, J.A., Chang, S.X., Chung, H.-J. 2017. Flexible and 716
Self-Healing Aqueous Supercapacitors for Low Temperature Applications: Polyampholyte Gel 717
Electrolytes with Biochar Electrodes. Sci. Rep., 7. 718
Li, X., Shen, Q., Zhang, D., Mei, X., Ran, W., Xu, Y., Yu, G. 2013. Functional groups determine 719
biochar properties (pH and EC) as studied by two-dimensional 13
C NMR correlation 720
spectroscopy. PloS One, 8(6), e65949. 721
Li, X., Zhu, Z., Chen, J., De Marco, R., Dicks, A., Bradley, J., Lu, G. 2009. Surface modification 722
of carbon fuels for direct carbon fuel cells. J. Power Sources, 186(1), 1-9. 723
Liu, H., Luo, C., Kato, S., Uemiya, S., Kaneko, M., Kojima, T. 2006. Kinetics of CO2/Char 724
gasification at elevated temperatures: Part I: Experimental results. Fuel Process. Technol., 725
87(9), 775-781. 726
Loha, C., Gu, S., De Wilde, J., Mahanta, P., Chatterjee, P.K. 2014. Advances in mathematical 727
modeling of fluidized bed gasification. Renew. Sustainable Energy Rev., 40, 688-715. 728
Luo, C., Lü, F., Shao, L., He, P. 2015. Application of eco-compatible biochar in anaerobic 729
digestion to relieve acid stress and promote the selective colonization of functional microbes. 730
Water Res., 68, 710-718. 731
34
Ma, Z., Xiao, R., Zhang, H. 2016. Catalytic steam reforming of bio-oil model compounds for 732
hydrogen-rich gas production using bio-char as catalyst. Int. J. Hydrogen Energy, 42(6), 3579-733
3585 734
Maneerung, T., Liew, J., Dai, Y., Kawi, S., Chong, C., Wang, C.-H. 2016. Activated carbon 735
derived from carbon residue from biomass gasification and its application for dye adsorption: 736
kinetics, isotherms and thermodynamic studies. Bioresour. Technol., 200, 350-359. 737
Manyà, J.J. 2012. Pyrolysis for biochar purposes: a review to establish current knowledge gaps 738
and research needs. Environ. Sci. Technol., 46(15), 7939-7954. 739
Marks, E.A., Mattana, S., Alcañiz, J.M., Pérez-Herrero, E., Domene, X. 2016. Gasifier biochar 740
effects on nutrient availability, organic matter mineralization, and soil fauna activity in a multi-741
year Mediterranean trial. Agric. Ecosyst. Environ., 215, 30-39. 742
McBeath, A.V., Smernik, R.J., Schneider, M.P., Schmidt, M.W., Plant, E.L. 2011. Determination 743
of the aromaticity and the degree of aromatic condensation of a thermosequence of wood 744
charcoal using NMR. Org. Geochem., 42(10), 1194-1202. 745
Mermoud, F., Golfier, F., Salvador, S., Van de Steene, L., Dirion, J.-L. 2006. Experimental and 746
numerical study of steam gasification of a single charcoal particle. Combust. Flame, 145(1), 747
59-79. 748
Meyer, S., Glaser, B., Quicker, P. 2011. Technical, economical, and climate-related aspects of 749
biochar production technologies: A literature review. Environ. Sci. Technol., 45(22), 9473-750
9483. 751
Mohan, D., Sarswat, A., Ok, Y.S., Pittman, C.U. 2014. Organic and inorganic contaminants 752
removal from water with biochar, a renewable, low cost and sustainable adsorbent-A critical 753
review. Bioresour. Technol., 160, 191-202. 754
35
Munnings, C., Kulkarni, A., Giddey, S., Badwal, S. 2014. Biomass to power conversion in a 755
direct carbon fuel cell. Int. J. Hydrogen Energy, 39(23), 12377-12385. 756
Naisse, C., Alexis, M., Plante, A., Wiedner, K., Glaser, B., Pozzi, A., Carcaillet, C., Criscuoli, I., 757
Rumpel, C. 2013. Can biochar and hydrochar stability be assessed with chemical methods? Org. 758
Geochem., 60, 40-44. 759
Nguyen, T.L.T., Hermansen, J.E., Nielsen, R.G. 2013. Environmental assessment of gasification 760
technology for biomass conversion to energy in comparison with other alternatives: the case of 761
wheat straw. J. Clean. Prod., 53, 138-148. 762
Nzihou, A., Stanmore, B., Sharrock, P. 2013. A review of catalysts for the gasification of 763
biomass char, with some reference to coal. Energy, 58, 305-317. 764
Ojeda, G., Mattana, S., Àvila, A., Alcañiz, J.M., Volkmann, M., Bachmann, J. 2015. Are soil-765
water functions affected by biochar application? Geoderma, 249, 1-11. 766
Pacioni, T.R., Soares, D., Di Domenico, M., Rosa, M.F., Moreira, R.d.F.P.M., José, H.J. 2016. 767
Bio-syngas production from agro-industrial biomass residues by steam gasification. Waste 768
Manage., 58, 221-229. 769
Pereira, E.I.P., Suddick, E.C., Six, J. 2016. Carbon abatement and emissions associated with the 770
gasification of walnut shells for bioenergy and biochar production. PloS One, 11(3), e0150837. 771
Peterson, S.C., Jackson, M.A. 2014. Simplifying pyrolysis: Using gasification to produce corn 772
stover and wheat straw biochar for sorptive and horticultural media. Ind. Crops Prod., 53, 228-773
235. 774
Plácido, J., Capareda, S. 2015. Production of silicon compounds and fulvic acids from cotton 775
wastes biochar using chemical depolymerization. Ind. Crops Prod., 67, 270-280. 776
36
Prasara-A, J., Gheewala, S.H. 2016. Sustainable utilization of rice husk ash from power plants: A 777
review. J. Clean. Prod.. 778
Qian, K., Kumar, A. 2015. Reforming of lignin-derived tars over char-based catalyst using Py-779
GC/MS. Fuel, 162, 47-54. 780
Qian, K., Kumar, A., Zhang, H., Bellmer, D., Huhnke, R. 2015. Recent advances in utilization of 781
biochar. Renew. Sustainable Energy Rev., 42, 1055-1064. 782
Rabou, L.P., Zwart, R.W., Vreugdenhil, B.J., Bos, L. 2009. Tar in biomass producer gas, the 783
Energy research Centre of the Netherlands (ECN) experience: an enduring challenge. Energy 784
Fuels, 23(12), 6189-6198. 785
Rafatullah, M., Sulaiman, O., Hashim, R., Ahmad, A. 2010. Adsorption of methylene blue on 786
low-cost adsorbents: a review. J. Hazard. Mater., 177(1), 70-80. 787
Rogovska, N., Laird, D., Cruse, R., Trabue, S., Heaton, E. 2012. Germination tests for assessing 788
biochar quality. J. Environ. Qual., 41(4), 1014-1022. 789
Rollinson, A.N. 2016. Gasification reactor engineering approach to understanding the formation 790
of biochar properties. Proc. R. Soc. A., 472, 20150841. 791
Scala, F., Chirone, R., Salatino, P. 2006. Combustion and attrition of biomass chars in a fluidized 792
bed. Energy Fuels, 20(1), 91-102. 793
Shackley, S., Carter, S., Knowles, T., Middelink, E., Haefele, S., Haszeldine, S. 2012a. 794
Sustainable gasification-biochar systems? A case-study of rice-husk gasification in Cambodia, 795
Part II: Field trial results, carbon abatement, economic assessment and conclusions. Energy 796
Policy, 41, 618-623. 797
Shackley, S., Carter, S., Knowles, T., Middelink, E., Haefele, S., Sohi, S., Cross, A., Haszeldine, 798
S. 2012b. Sustainable gasification-biochar systems? A case-study of rice-husk gasification in 799
37
Cambodia, Part I: Context, chemical properties, environmental and health and safety issues. 800
Energy Policy, 42, 49-58. 801
Shafeeyan, M.S., Daud, W.M.A.W., Houshmand, A., Shamiri, A. 2010. A review on surface 802
modification of activated carbon for carbon dioxide adsorption. J. Anal. Appl. Pyrolysis, 89(2), 803
143-151. 804
Shen, Y. 2015. Chars as carbonaceous adsorbents/catalysts for tar elimination during biomass 805
pyrolysis or gasification. Renew. Sustainable Energy Rev., 43, 281-295. 806
Shen, Y., Linville, J.L., Ignacio-de Leon, P.A.A., Schoene, R.P., Urgun-Demirtas, M. 2016. 807
Towards a sustainable paradigm of waste-to-energy process: Enhanced anaerobic digestion of 808
sludge with woody biochar. J. Clean. Prod., 135, 1054-1064. 809
Shen, Y., Yoshikawa, K. 2013. Recent progresses in catalytic tar elimination during biomass 810
gasification or pyrolysis-A review. Renew. Sustainable Energy Rev., 21, 371-392. 811
Sohi, S., Krull, E., Lopez-Capel, E., Bol, R. 2010. A review of biochar and its use and function 812
in soil. Adv. Agron., 105, 47-82. 813
Spokas, K.A. 2010. Review of the stability of biochar in soils: predictability of O: C molar ratios. 814
Carbon Manag., 1(2), 289-303. 815
Spokas, K.A., Novak, J.M., Stewart, C.E., Cantrell, K.B., Uchimiya, M., DuSaire, M.G., Ro, K.S. 816
2011. Qualitative analysis of volatile organic compounds on biochar. Chemosphere, 85(5), 817
869-882. 818
Sun, H., Hockaday, W.C., Masiello, C.A., Zygourakis, K. 2012. Multiple controls on the 819
chemical and physical structure of biochar. Ind. Eng. Chem. Res., 51(9), 3587-3597. 820
Taupe, N., Lynch, D., Wnetrzak, R., Kwapinska, M., Kwapinski, W., Leahy, J. 2016. Updraft 821
gasification of poultry litter at farm-scale-A case study. Waste Manage., 50, 324-333. 822
38
Tay, T., Ucar, S., Karagöz, S. 2009. Preparation and characterization of activated carbon from 823
waste biomass. J. Hazard. Mater., 165(1), 481-485. 824
Thompson, K.A., Shimabuku, K.K., Kearns, J.P., Knappe, D.R., Summers, R.S., Cook, S.M. 825
2016. Environmental comparison of biochar and activated carbon for tertiary wastewater 826
treatment. Environ. Sci. Technol., 50(20), 11253-11262. 827
Thompson, S.P., Parker, J.E., Tang, C.C. 2014. Thermal breakdown of calcium carbonate and 828
constraints on its use as a biomarker. Icarus, 229, 1-10. 829
Wang, B., Li, C., Liang, H. 2013. Bioleaching of heavy metal from woody biochar using 830
Acidithiobacillus ferrooxidans and activation for adsorption. Bioresour. Technol., 146, 803-806. 831
Wiedemeier, D.B., Abiven, S., Hockaday, W.C., Keiluweit, M., Kleber, M., Masiello, C.A., 832
McBeath, A.V., Nico, P.S., Pyle, L.A., Schneider, M.P. 2015. Aromaticity and degree of 833
aromatic condensation of char. Org. Geochem., 78, 135-143. 834
Wiedner, K., Rumpel, C., Steiner, C., Pozzi, A., Maas, R., Glaser, B. 2013. Chemical evaluation 835
of chars produced by thermochemical conversion (gasification, pyrolysis and hydrothermal 836
carbonization) of agro-industrial biomass on a commercial scale. Biomass Bioenerg., 59, 264-837
278. 838
Wu, H., Yip, K., Tian, F., Xie, Z., Li, C.-Z. 2009. Evolution of char structure during the steam 839
gasification of biochar produced from the pyrolysis of various mallee biomass components. Ind. 840
Eng. Chem. Res., 48(23), 10431-10438. 841
Xiao, G., Ni, M.-J., Chi, Y., Cen, K.-F. 2008. Low-temperature gasification of waste tire in a 842
fluidized bed. Energy Convers. Manage., 49(8), 2078-2082. 843
Xiu, S., Shahbazi, A., Li, R. 2017. Characterization, Modification and Application of Biochar for 844
Energy Storage and Catalysis: A Review. Trends in Renewable Energy, 3(1), 86-101. 845
39
Xu, C.C., Hamilton, S., Ghosh, M. 2009. Hydro-treatment of Athabasca vacuum tower bottoms 846
in supercritical toluene with microporous activated carbons and metal-carbon composite. Fuel, 847
88(11), 2097-2105. 848
Xue, Y., Gao, B., Yao, Y., Inyang, M., Zhang, M., Zimmerman, A.R., Ro, K.S. 2012. Hydrogen 849
peroxide modification enhances the ability of biochar (hydrochar) produced from hydrothermal 850
carbonization of peanut hull to remove aqueous heavy metals: batch and column tests. Chem. 851
Eng. J., 200, 673-680. 852
Yargicoglu, E.N., Sadasivam, B.Y., Reddy, K.R., Spokas, K. 2015. Physical and chemical 853
characterization of waste wood derived biochar. Waste Manage., 36, 256-268. 854
Yeo, T., Tan, I., Abdullah, M. 2012. Development of adsorption air-conditioning technology 855
using modified activated carbon-A review. Renew. Sustainable Energy Rev., 16(5), 3355-3363. 856
Yip, K., Tian, F., Hayashi, J.-i., Wu, H. 2009. Effect of alkali and alkaline earth metallic species 857
on biochar reactivity and syngas compositions during steam gasification. Energy Fuels, 24(1), 858
173-181. 859
Yu, M.M., Masnadi, M.S., Grace, J.R., Bi, X.T., Lim, C.J., Li, Y. 2015. Co-gasification of 860
biosolids with biomass: Thermogravimetric analysis and pilot scale study in a bubbling 861
fluidized bed reactor. Bioresour. Technol., 175, 51-58. 862
Yu, X.-Y., Ying, G.-G., Kookana, R.S. 2009. Reduced plant uptake of pesticides with biochar 863
additions to soil. Chemosphere, 76(5), 665-671. 864
Zhang, X., Zhang, S., Yang, H., Feng, Y., Chen, Y., Wang, X., Chen, H. 2014. Nitrogen 865
enriched biochar modified by high temperature CO2-ammonia treatment: Characterization and 866
adsorption of CO2. Chem. Eng. J., 257, 20-27. 867
40
Zhao, P., Mao, Z., Jin, D., Zhao, P., Sun, B., Sun, W., Pang, X. 2015. Investigation on log 868
responses of bulk density and thermal neutrons in coalbed with different ranks. J. Geophys. 869
Eng., 12(3), 477. 870
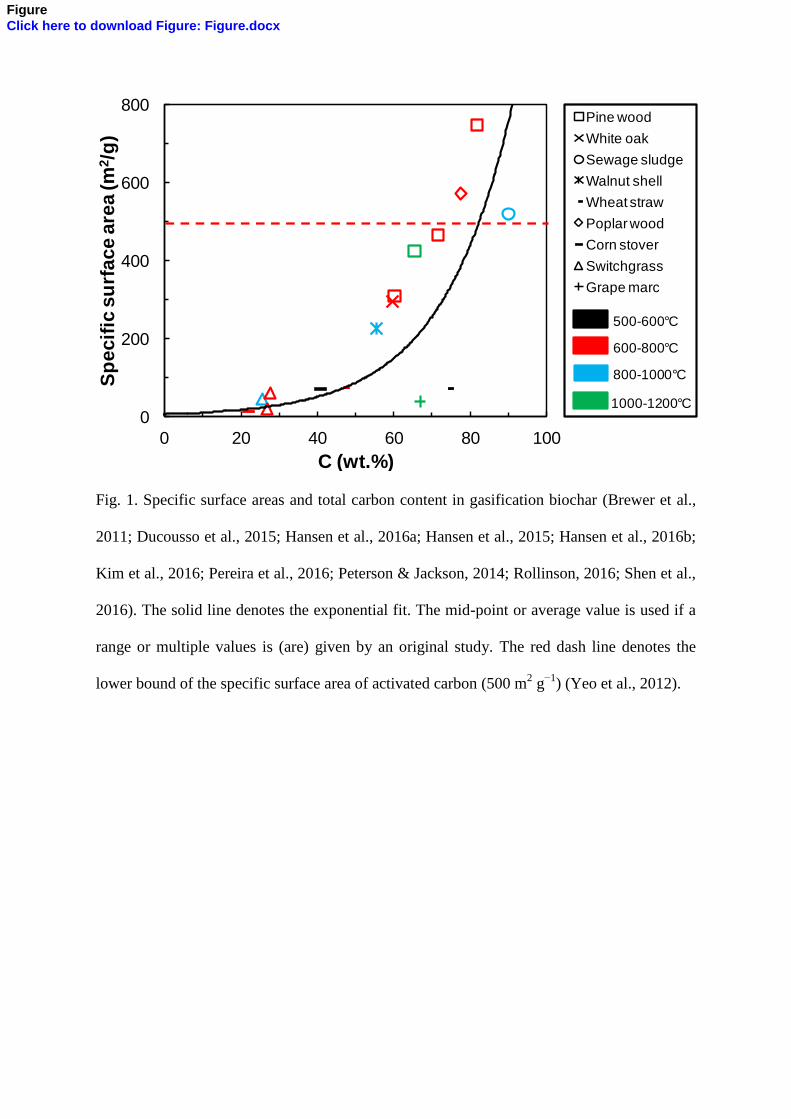
Fig. 1. Specific surface areas and total carbon content in gasification biochar (Brewer et al.,
2011; Ducousso et al., 2015; Hansen et al., 2016a; Hansen et al., 2015; Hansen et al., 2016b;
Kim et al., 2016; Pereira et al., 2016; Peterson & Jackson, 2014; Rollinson, 2016; Shen et al.,
2016). The solid line denotes the exponential fit. The mid-point or average value is used if a
range or multiple values is (are) given by an original study. The red dash line denotes the
lower bound of the specific surface area of activated carbon (500 m2 g
−1) (Yeo et al., 2012).
0
200
400
600
800
0 20 40 60 80 100
Sp
ecif
ic s
urf
ace a
rea (m
2/g
)
C (wt.%)
Pine wood
White oak
Sewage sludge
Walnut shell
Wheat straw
Poplar wood
Corn stover
Switchgrass
Grape marc
500-600°C
600-800°C
800-1000°C
1000-1200°C0
200
400
600
800
0 20 40 60 80 100
Sp
ecif
ic s
urf
ace a
rea (m
2/g
)
C (wt.%)
Pine wood
White oak
Sewage sludge
Walnut shell
Wheat straw
Poplar wood
Corn stover
Switchgrass
Grape marc
A
S
AA
S
SN
SN
A
ASOASOSO
SOA
A
500-600°C
600-800°C
800-1000°C
1000-1200°C
A
0
200
400
600
800
0 20 40 60 80 100
Pine wood
White oak
Sewage sludge
Walnut shell
Wheat straw
Poplar wood
Corn stover
Switchgrass
Grape marc
A
S
A
AS
SN
SN
A
ASO
ASO
SO
SOA
A
FigureClick here to download Figure: Figure.docx
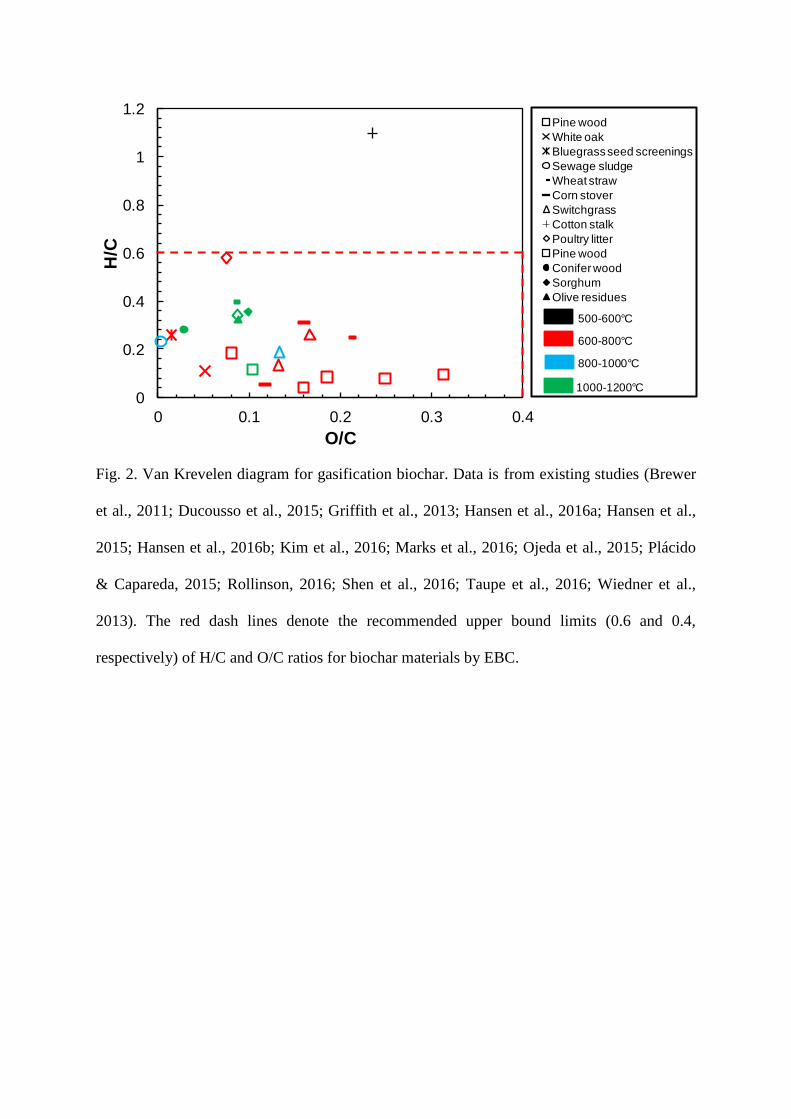
Fig. 2. Van Krevelen diagram for gasification biochar. Data is from existing studies (Brewer
et al., 2011; Ducousso et al., 2015; Griffith et al., 2013; Hansen et al., 2016a; Hansen et al.,
2015; Hansen et al., 2016b; Kim et al., 2016; Marks et al., 2016; Ojeda et al., 2015; Plácido
& Capareda, 2015; Rollinson, 2016; Shen et al., 2016; Taupe et al., 2016; Wiedner et al.,
2013). The red dash lines denote the recommended upper bound limits (0.6 and 0.4,
respectively) of H/C and O/C ratios for biochar materials by EBC.
0
0.2
0.4
0.6
0.8
1
1.2
0 0.1 0.2 0.3 0.4
H/C
O/C
Pine wood
White oak
Bluegrass seed screenings
Sewage sludge
Wheat straw
Corn stover
Switchgrass
Cotton stalk
Poultry litter
Pine wood
Poplar wood
Wheat straw
Conifer wood
Sorghum
Olive residues
500-600°C
600-800°C
800-1000°C
1000-1200°C
0
200
400
600
800
0 20 40 60 80 100
Sp
ecif
ic s
urf
ace a
rea (m
2/g
)
C (wt.%)
Pine wood
White oak
Sewage sludge
Walnut shell
Wheat straw
Poplar wood
Corn stover
Switchgrass
Grape marc
A
S
AA
S
SN
SN
A
ASOASOSO
SOA
A
500-600°C
600-800°C
800-1000°C
1000-1200°C
A
0
0.2
0.4
0.6
0.8
1
1.2
0 0.1 0.2 0.3 0.4
H/C
O/C
Pine wood
White oak
Bluegrass seed screenings
Sewage sludge
Wheat straw
Corn stover
Switchgrass
Cotton stalk
Poultry litter
Pine wood
Conifer wood
Sorghum
Olive residues
500-600°C
600-800°C
800-1000°C
1000-1200°C
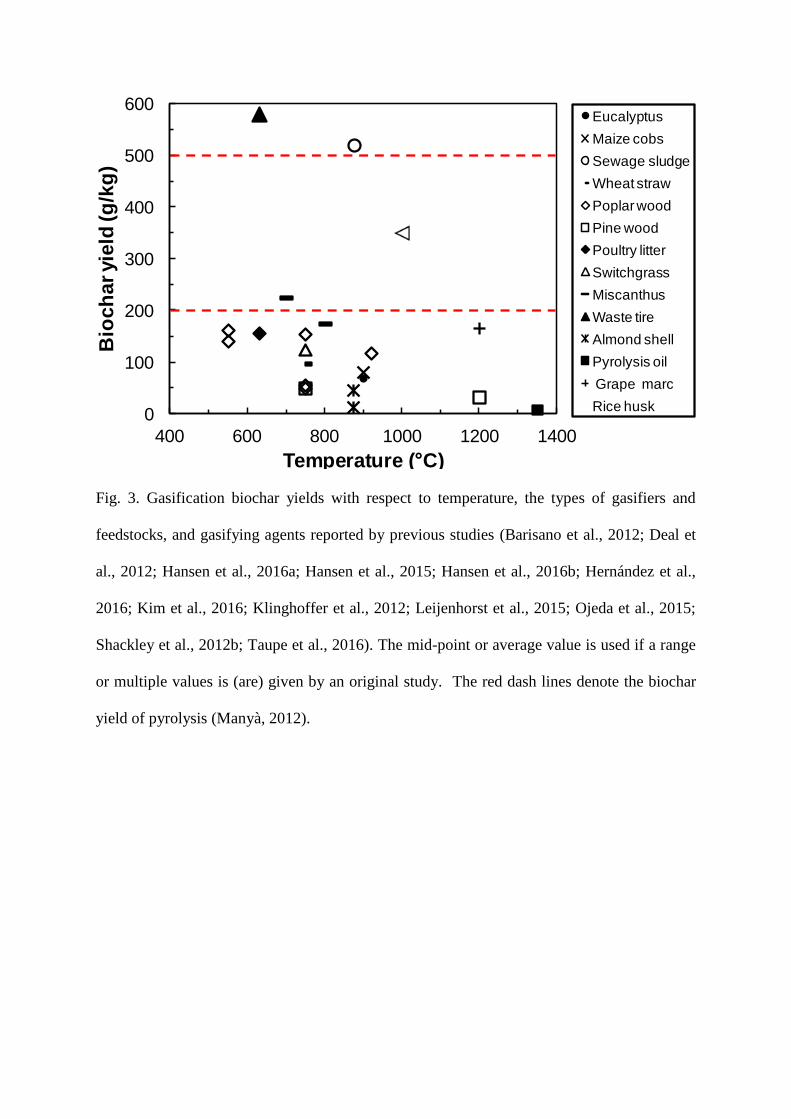
Fig. 3. Gasification biochar yields with respect to temperature, the types of gasifiers and
feedstocks, and gasifying agents reported by previous studies (Barisano et al., 2012; Deal et
al., 2012; Hansen et al., 2016a; Hansen et al., 2015; Hansen et al., 2016b; Hernández et al.,
2016; Kim et al., 2016; Klinghoffer et al., 2012; Leijenhorst et al., 2015; Ojeda et al., 2015;
Shackley et al., 2012b; Taupe et al., 2016). The mid-point or average value is used if a range
or multiple values is (are) given by an original study. The red dash lines denote the biochar
yield of pyrolysis (Manyà, 2012).
0
100
200
300
400
500
600
400 600 800 1000 1200 1400
Bio
ch
ar yie
ld (g
/kg
)
Temperature ( C)
Eucalyptus
Maize cobs
Sewage sludge
Wheat straw
Poplar wood
Pine wood
Poultry litter
Switchgrass
Miscanthus
Waste tire
Almond shell
Pyrolysis oil
Grape marc
Rice husk
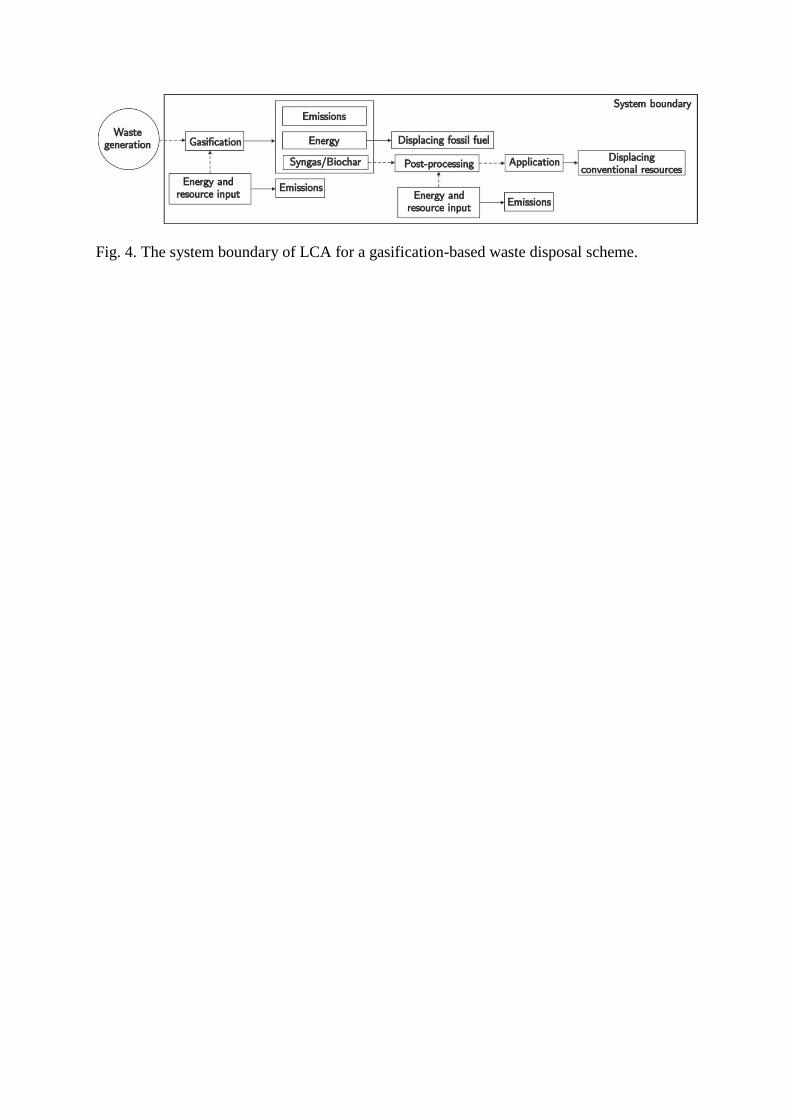
Fig. 4. The system boundary of LCA for a gasification-based waste disposal scheme.
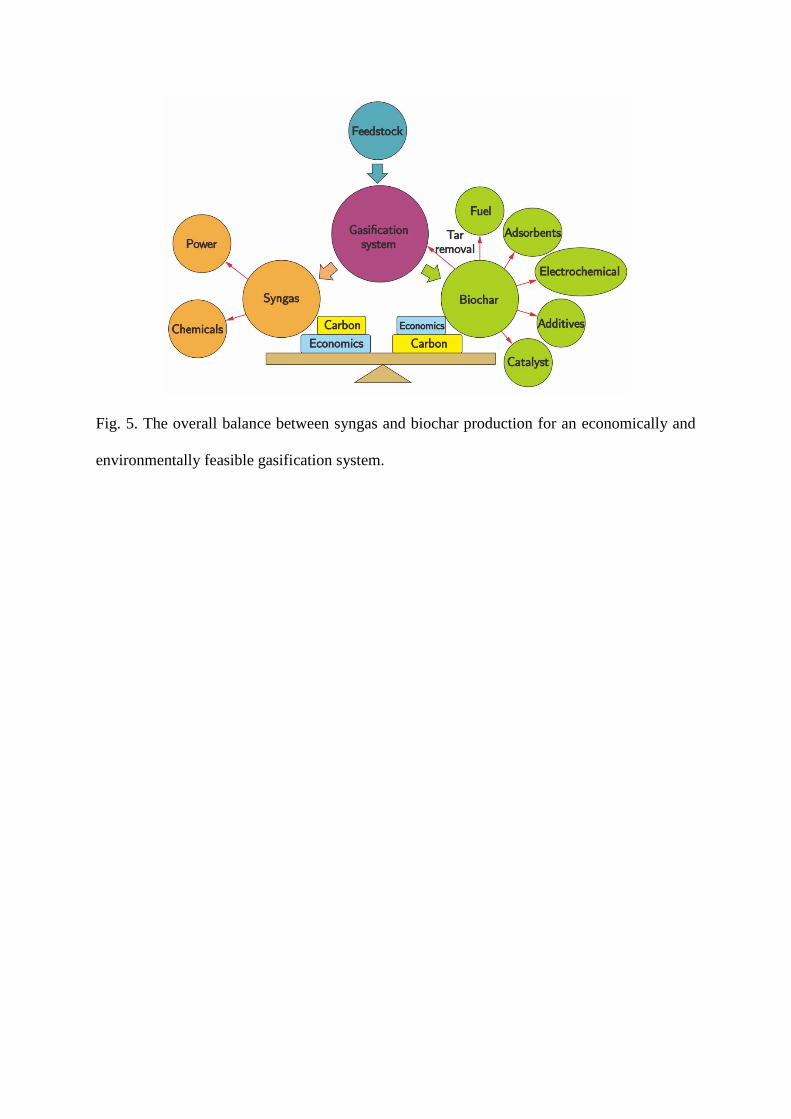
Fig. 5. The overall balance between syngas and biochar production for an economically and
environmentally feasible gasification system.
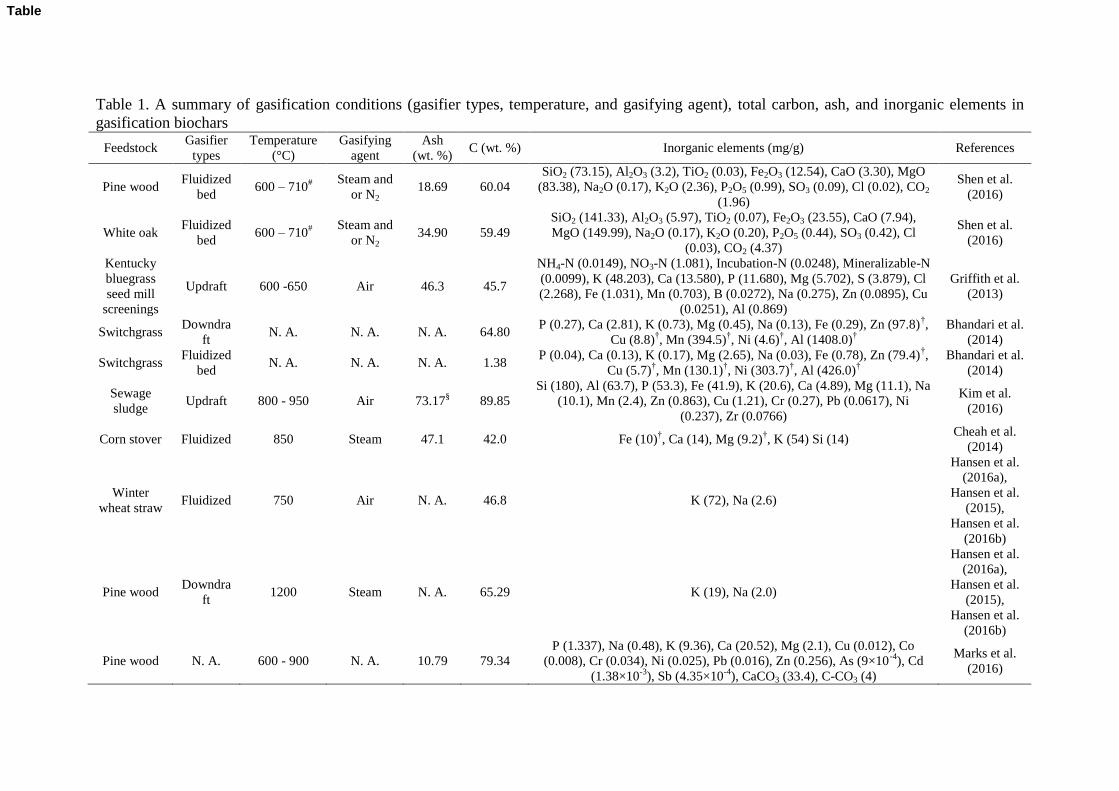
Table 1. A summary of gasification conditions (gasifier types, temperature, and gasifying agent), total carbon, ash, and inorganic elements in
gasification biochars
Feedstock Gasifier
types
Temperature
(°C)
Gasifying
agent
Ash
(wt. %) C (wt. %) Inorganic elements (mg/g) References
Pine wood Fluidized
bed 600 – 710
#
Steam and
or N2 18.69 60.04
SiO2 (73.15), Al2O3 (3.2), TiO2 (0.03), Fe2O3 (12.54), CaO (3.30), MgO
(83.38), Na2O (0.17), K2O (2.36), P2O5 (0.99), SO3 (0.09), Cl (0.02), CO2
(1.96)
Shen et al.
(2016)
White oak Fluidized
bed 600 – 710
#
Steam and
or N2 34.90 59.49
SiO2 (141.33), Al2O3 (5.97), TiO2 (0.07), Fe2O3 (23.55), CaO (7.94),
MgO (149.99), Na2O (0.17), K2O (0.20), P2O5 (0.44), SO3 (0.42), Cl
(0.03), CO2 (4.37)
Shen et al.
(2016)
Kentucky
bluegrass
seed mill
screenings
Updraft 600 -650 Air 46.3 45.7
NH4-N (0.0149), NO3-N (1.081), Incubation-N (0.0248), Mineralizable-N
(0.0099), K (48.203), Ca (13.580), P (11.680), Mg (5.702), S (3.879), Cl
(2.268), Fe (1.031), Mn (0.703), B (0.0272), Na (0.275), Zn (0.0895), Cu
(0.0251), Al (0.869)
Griffith et al.
(2013)
Switchgrass Downdra
ft N. A. N. A. N. A. 64.80
P (0.27), Ca (2.81), K (0.73), Mg (0.45), Na (0.13), Fe (0.29), Zn (97.8)†,
Cu (8.8)†, Mn (394.5)
†, Ni (4.6)
†, Al (1408.0)
†
Bhandari et al.
(2014)
Switchgrass Fluidized
bed N. A. N. A. N. A. 1.38
P (0.04), Ca (0.13), K (0.17), Mg (2.65), Na (0.03), Fe (0.78), Zn (79.4)†,
Cu (5.7)†, Mn (130.1)
†, Ni (303.7)
†, Al (426.0)
†
Bhandari et al.
(2014)
Sewage
sludge Updraft 800 - 950 Air 73.17
§ 89.85
Si (180), Al (63.7), P (53.3), Fe (41.9), K (20.6), Ca (4.89), Mg (11.1), Na
(10.1), Mn (2.4), Zn (0.863), Cu (1.21), Cr (0.27), Pb (0.0617), Ni
(0.237), Zr (0.0766)
Kim et al.
(2016)
Corn stover Fluidized 850 Steam 47.1 42.0 Fe (10)†, Ca (14), Mg (9.2)
†, K (54) Si (14)
Cheah et al.
(2014)
Winter
wheat straw Fluidized 750 Air N. A. 46.8 K (72), Na (2.6)
Hansen et al.
(2016a),
Hansen et al.
(2015),
Hansen et al.
(2016b)
Pine wood Downdra
ft 1200 Steam N. A. 65.29 K (19), Na (2.0)
Hansen et al.
(2016a),
Hansen et al.
(2015),
Hansen et al.
(2016b)
Pine wood N. A. 600 - 900 N. A. 10.79 79.34
P (1.337), Na (0.48), K (9.36), Ca (20.52), Mg (2.1), Cu (0.012), Co
(0.008), Cr (0.034), Ni (0.025), Pb (0.016), Zn (0.256), As (9×10⁻⁴
), Cd
(1.38×10⁻³
), Sb (4.35×10⁻⁴
), CaCO3 (33.4), C-CO3 (4)
Marks et al.
(2016)
Table
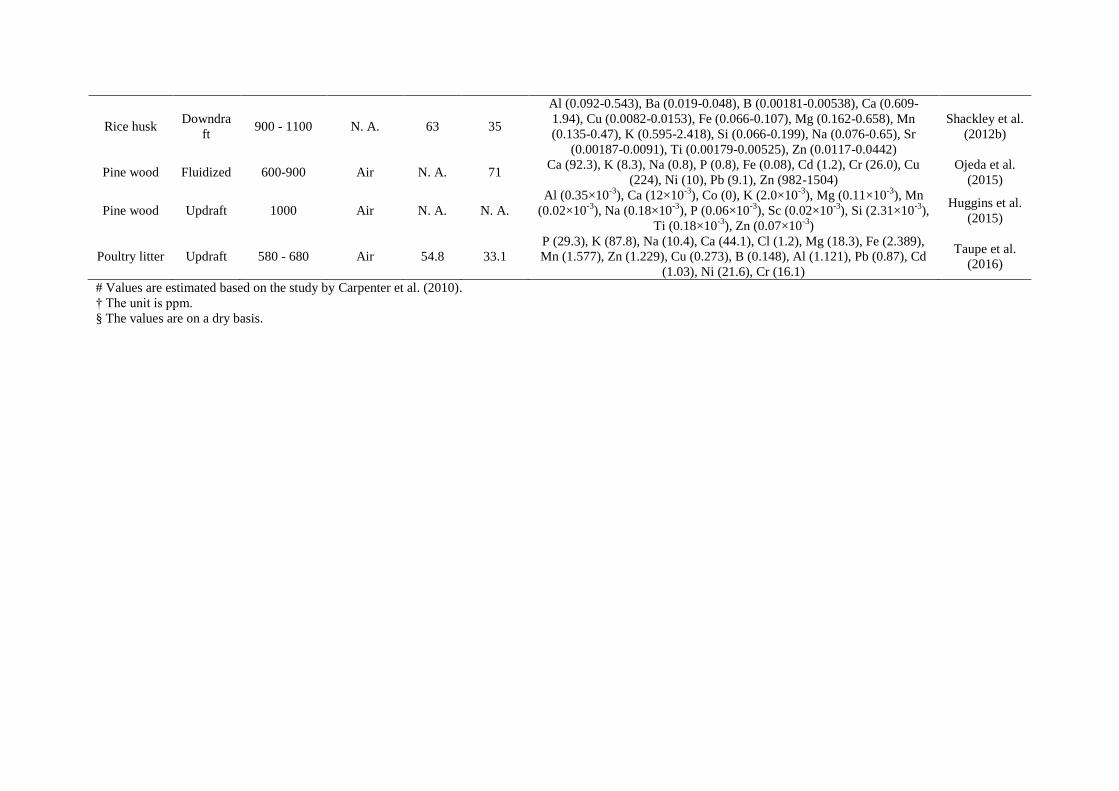
Rice husk Downdra
ft 900 - 1100 N. A. 63 35
Al (0.092-0.543), Ba (0.019-0.048), B (0.00181-0.00538), Ca (0.609-
1.94), Cu (0.0082-0.0153), Fe (0.066-0.107), Mg (0.162-0.658), Mn
(0.135-0.47), K (0.595-2.418), Si (0.066-0.199), Na (0.076-0.65), Sr
(0.00187-0.0091), Ti (0.00179-0.00525), Zn (0.0117-0.0442)
Shackley et al.
(2012b)
Pine wood Fluidized 600-900 Air N. A. 71 Ca (92.3), K (8.3), Na (0.8), P (0.8), Fe (0.08), Cd (1.2), Cr (26.0), Cu
(224), Ni (10), Pb (9.1), Zn (982-1504)
Ojeda et al.
(2015)
Pine wood Updraft 1000 Air N. A. N. A.
Al (0.35×10⁻³
), Ca (12×10-3
), Co (0), K (2.0×10⁻³
), Mg (0.11×10⁻³
), Mn
(0.02×10⁻³
), Na (0.18×10⁻³
), P (0.06×10⁻³
), Sc (0.02×10⁻³
), Si (2.31×10⁻³
),
Ti (0.18×10⁻³
), Zn (0.07×10⁻³
)
Huggins et al.
(2015)
Poultry litter Updraft 580 - 680 Air 54.8 33.1
P (29.3), K (87.8), Na (10.4), Ca (44.1), Cl (1.2), Mg (18.3), Fe (2.389),
Mn (1.577), Zn (1.229), Cu (0.273), B (0.148), Al (1.121), Pb (0.87), Cd
(1.03), Ni (21.6), Cr (16.1)
Taupe et al.
(2016)
# Values are estimated based on the study by Carpenter et al. (2010).
† The unit is ppm.
§ The values are on a dry basis.


