Embed Size (px)
Citation preview
Gross Economic Contribution of the
Financial Sector in The Bahamas (2021)
Published in the Quarterly Economic Review, March, 2022 (Vol. 31, No. 1) Pages 38-48
GROSS ECONOMIC CONTRIBUTION OF THE FINANCIAL SECTOR
IN THE BAHAMAS (2021)
INTRODUCTION
The financial services sector, accounts for approximately 10%-15% of the country’s Gross Domestic Product (GDP), the second largest contributor to the economy. The sector employs a substantial number of highly skilled workers and has direct effect on both employment and spending, while indirectly impacting other sectors, such as construction, real estate and wholesale & retail trade. However, there is a contrast in product offerings, as the domestic sector is more retail and labour intensive, while the international sector products focus on more high net worth clients and targets more specialist higher priced labour.
Data from The Bahamas’ financial services sector 2021 survey suggests that the sector continued to face headwinds, with global regulatory standards and efficiency pressures impacting balance sheet and operations consolidation. Specifically, the international sector continues to adjust to heightened standards for tax cooperation, anti-money laundering (AML), counter financing of terrorism (CFT) and anti-proliferation. Further, amid reducing levels of employment, the international sector has settled towards re-domiciling clients and operations to emerging lucrative opportunities outside of North America and Europe.
During 2021, the estimated balance sheet size of financial sector operations decreased, shown by a falloff in assets holdings within the banking sector. In particular, on balance sheet assets contracted by approximately $23.0 billion (13.3%) to $149.8 billion, as the reduction in international banks assets, outweighed the gains in domestic banks assets. Further, fiduciary assets fell by $69.4 billion (31.1%) to $153.8 billion. Assets under management also reduced, but marginally for the securities industry. Among credit unions, contributions were constrained, evidenced by declines in balance sheet assets. Meanwhile, onshore insurance operations featured stable balance sheet trends vis-à-vis 2020, following a significant expansion in 2019, which was due to undisbursed claims settlements related to the major hurricane.
During the year, the Central Bank continued to monitor supervised financial institutions’ (SFIs) approach to adapting their operations under the restrained conditions of the COVID-19 pandemic, and the identified risk management challenges of the environment. Further, the pandemic continued to pose heightened cybersecurity and fraud risk, for which awareness and education campaigns persisted, particularly to mitigate these risks for clients of domestic SFIs. In addition, supervision of credit unions remained focused on multiple risk-based outcomes around AML/Know Your Customer (KYC), corporate governance and credit risk management frameworks.
GOVERNMENT REVENUES
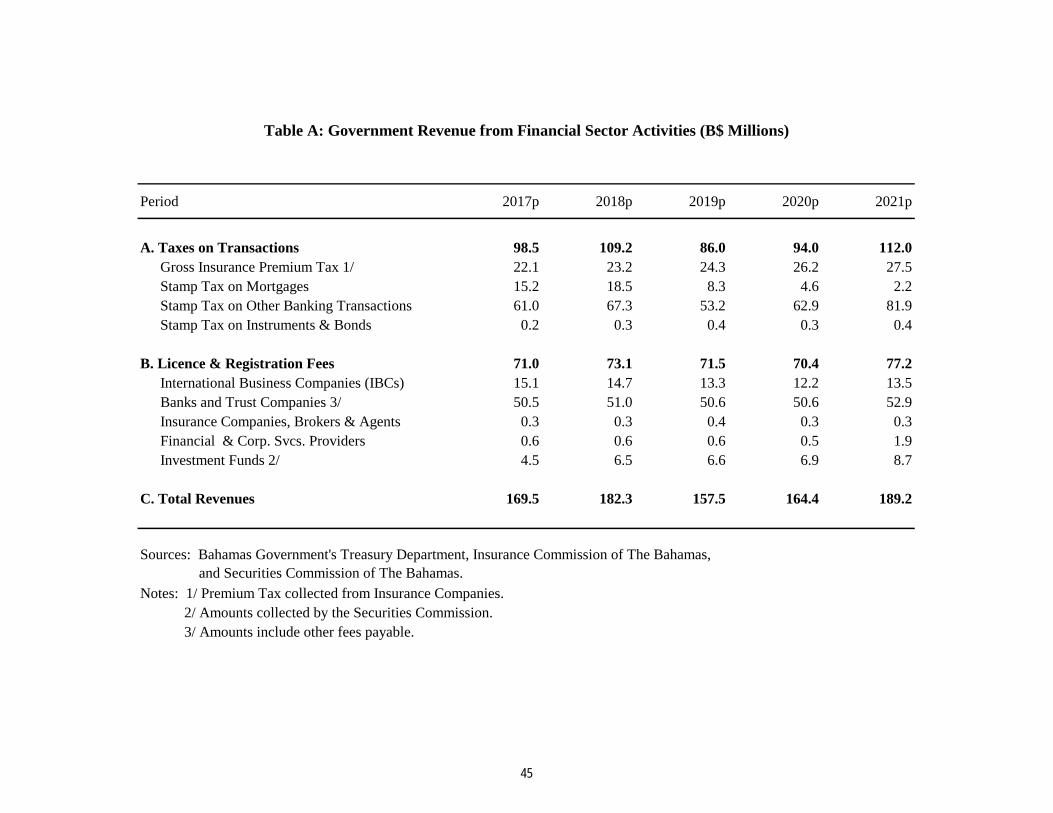
An analysis of the financial sector performance showed that total taxes and fees collected by the Government increased by 15.1% to $189.2 million in 2021. Underlying this development, transactional taxes on domestic intermediation activities rose by 19.2% to $112.0 million, largely attributed to the growth in taxes on banking transactions (30.2%) and insurance premium taxes (5.0%). Further, license and registration fees rose by 9.6% to $77.2 million, underpinned by a 25.7% rise in collections from investment funds (11.2% of the total) and 10.6% from international business companies (17.4% of the total). In addition, receivables from banks and trust companies (68.5% of the total) grew by 4.6%, while collections from financial and corporate service providers surged to $1.9 million from $0.5 million in 2021.
38
THE BANKING SECTOR
The banking sector continued to dominate the financial landscape, notwithstanding operating within a COVID-19 pandemic environment. On the domestic side, local banks maintained high liquidity levels, due primarily to subdued private sector credit demand and banks’ conservative lending posture. Meanwhile, for these SFIs, credit quality indicators weakened, owing to the conclusion of loan deferral schemes implemented to support persons and businesses impacted by the COVID-19 pandemic.
The total number of banks and trust companies licensed in The Bahamas decreased by 3 to 214 in 2021, following a reduction of 4 in 2020. Public banks and trust companies reduced by 4 to 80, while restricted, non-active & nominees increased by 1 to 134. Public institutions providing an arrangement of domestic and international services included 48 Bahamian incorporated entities and 12 euro-currency branches of foreign banks operating inside The Bahamas. Further, there were 20 authorized dealers & agents, which comprised of 11 authorised agents (resident trust companies) and 9 authorised dealers (commercial banks)—inclusive of 7 clearing banks.
In 2021, total domestic assets within the banking sector grew by 1.1% to $11.0 billion, trailing a gain of 2.0% in the preceding year, and average annual increase of 2.2% over the past five years. Growth was underpinned by a rise in Government bond holdings and surplus liquid balances with the Central Bank. Conversely, total assets of the international banking sector reduced by 15.8% to $129.0 billion. This extended the 8.7% falloff from the prior year and the average annual decline of 7.2% over the last five years.
EMPLOYMENT
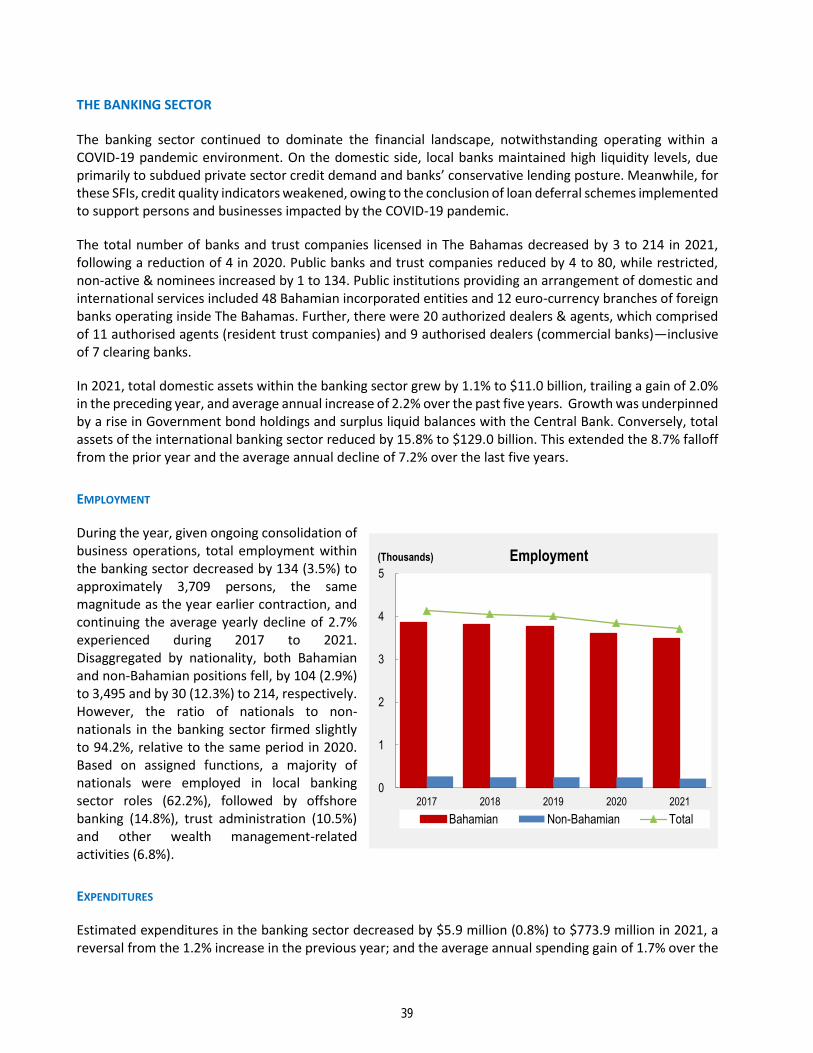
During the year, given ongoing consolidation of business operations, total employment within the banking sector decreased by 134 (3.5%) to approximately 3,709 persons, the same magnitude as the year earlier contraction, and continuing the average yearly decline of 2.7% experienced during 2017 to 2021. Disaggregated by nationality, both Bahamian and non-Bahamian positions fell, by 104 (2.9%) to 3,495 and by 30 (12.3%) to 214, respectively. However, the ratio of nationals to non-nationals in the banking sector firmed slightly to 94.2%, relative to the same period in 2020. Based on assigned functions, a majority of nationals were employed in local banking sector roles (62.2%), followed by offshore banking (14.8%), trust administration (10.5%) and other wealth management-related activities (6.8%).
EXPENDITURES
Estimated expenditures in the banking sector decreased by $5.9 million (0.8%) to $773.9 million in 2021, a reversal from the 1.2% increase in the previous year; and the average annual spending gain of 1.7% over the
0
1
2
3
4
5
2017 2018 2019 2020 2021
(Thousands) Employment
Bahamian Non-Bahamian Total
39
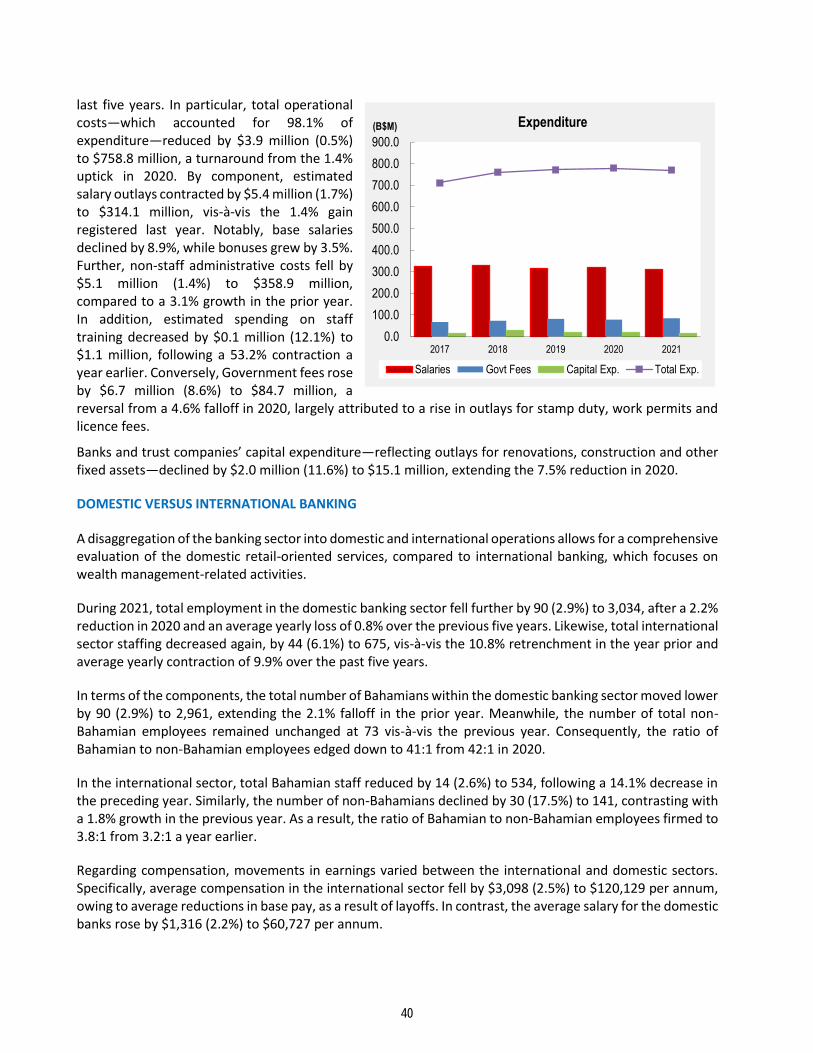
last five years. In particular, total operational costs—which accounted for 98.1% of expenditure—reduced by $3.9 million (0.5%) to $758.8 million, a turnaround from the 1.4% uptick in 2020. By component, estimated salary outlays contracted by $5.4 million (1.7%) to $314.1 million, vis-à-vis the 1.4% gain registered last year. Notably, base salaries declined by 8.9%, while bonuses grew by 3.5%. Further, non-staff administrative costs fell by $5.1 million (1.4%) to $358.9 million, compared to a 3.1% growth in the prior year. In addition, estimated spending on staff training decreased by $0.1 million (12.1%) to $1.1 million, following a 53.2% contraction a year earlier. Conversely, Government fees rose by $6.7 million (8.6%) to $84.7 million, a reversal from a 4.6% falloff in 2020, largely attributed to a rise in outlays for stamp duty, work permits and licence fees.
Banks and trust companies’ capital expenditure—reflecting outlays for renovations, construction and other fixed assets—declined by $2.0 million (11.6%) to $15.1 million, extending the 7.5% reduction in 2020.
DOMESTIC VERSUS INTERNATIONAL BANKING
A disaggregation of the banking sector into domestic and international operations allows for a comprehensive evaluation of the domestic retail-oriented services, compared to international banking, which focuses on wealth management-related activities.
During 2021, total employment in the domestic banking sector fell further by 90 (2.9%) to 3,034, after a 2.2% reduction in 2020 and an average yearly loss of 0.8% over the previous five years. Likewise, total international sector staffing decreased again, by 44 (6.1%) to 675, vis-à-vis the 10.8% retrenchment in the year prior and average yearly contraction of 9.9% over the past five years.
In terms of the components, the total number of Bahamians within the domestic banking sector moved lower by 90 (2.9%) to 2,961, extending the 2.1% falloff in the prior year. Meanwhile, the number of total non-Bahamian employees remained unchanged at 73 vis-à-vis the previous year. Consequently, the ratio of Bahamian to non-Bahamian employees edged down to 41:1 from 42:1 in 2020.
In the international sector, total Bahamian staff reduced by 14 (2.6%) to 534, following a 14.1% decrease in the preceding year. Similarly, the number of non-Bahamians declined by 30 (17.5%) to 141, contrasting with a 1.8% growth in the previous year. As a result, the ratio of Bahamian to non-Bahamian employees firmed to 3.8:1 from 3.2:1 a year earlier.
Regarding compensation, movements in earnings varied between the international and domestic sectors. Specifically, average compensation in the international sector fell by $3,098 (2.5%) to $120,129 per annum, owing to average reductions in base pay, as a result of layoffs. In contrast, the average salary for the domestic banks rose by $1,316 (2.2%) to $60,727 per annum.
0.0
100.0
200.0
300.0
400.0
500.0
600.0
700.0
800.0
900.0
2017 2018 2019 2020 2021
(B$M) Expenditure
Salaries Govt Fees Capital Exp. Total Exp.
40
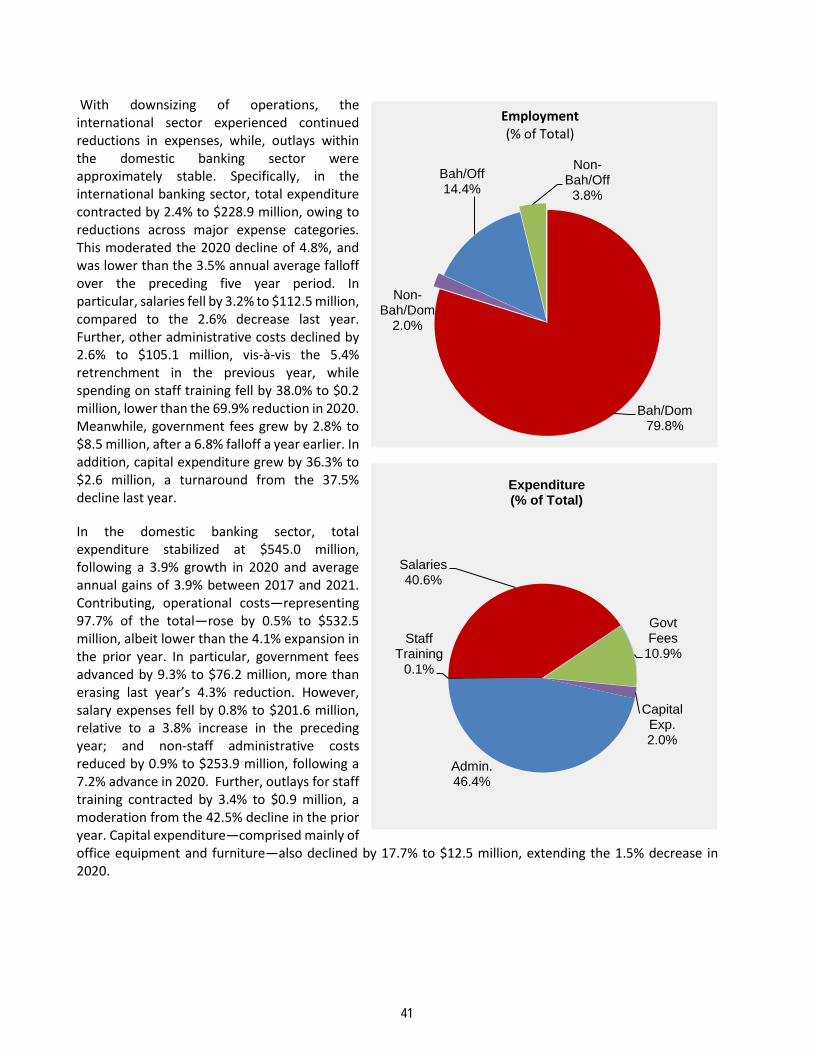
With downsizing of operations, the international sector experienced continued reductions in expenses, while, outlays within the domestic banking sector were approximately stable. Specifically, in the international banking sector, total expenditure contracted by 2.4% to $228.9 million, owing to reductions across major expense categories. This moderated the 2020 decline of 4.8%, and was lower than the 3.5% annual average falloff over the preceding five year period. In particular, salaries fell by 3.2% to $112.5 million, compared to the 2.6% decrease last year. Further, other administrative costs declined by 2.6% to $105.1 million, vis-à-vis the 5.4% retrenchment in the previous year, while spending on staff training fell by 38.0% to $0.2 million, lower than the 69.9% reduction in 2020. Meanwhile, government fees grew by 2.8% to $8.5 million, after a 6.8% falloff a year earlier. In addition, capital expenditure grew by 36.3% to $2.6 million, a turnaround from the 37.5% decline last year.
In the domestic banking sector, total expenditure stabilized at $545.0 million, following a 3.9% growth in 2020 and average annual gains of 3.9% between 2017 and 2021. Contributing, operational costs―representing 97.7% of the total―rose by 0.5% to $532.5 million, albeit lower than the 4.1% expansion in the prior year. In particular, government fees advanced by 9.3% to $76.2 million, more than erasing last year’s 4.3% reduction. However, salary expenses fell by 0.8% to $201.6 million, relative to a 3.8% increase in the preceding year; and non-staff administrative costs reduced by 0.9% to $253.9 million, following a 7.2% advance in 2020. Further, outlays for staff training contracted by 3.4% to $0.9 million, a moderation from the 42.5% decline in the prior year. Capital expenditure—comprised mainly of office equipment and furniture—also declined by 17.7% to $12.5 million, extending the 1.5% decrease in 2020.
Bah/Dom79.8%
Non-Bah/Dom
2.0%
Bah/Off14.4%
Non-Bah/Off
3.8%
Employment (% of Total)
Salaries40.6%
Govt Fees
10.9%
Capital Exp.2.0%
Admin.46.4%
Staff Training
0.1%
Expenditure (% of Total)
41
OTHER FINANCIAL SECTOR ACTIVITIES
CREDIT UNIONS
Indications are that the credit union sector’s economic value-added was subdued in 2021, on a stable base of 10 regulated entities—inclusive of the Bahamas Co-operative League Limited. Specifically, the sector’s total assets fell by 1.6% to $474.6 million in 2021, attributed to a 33.2% falloff in liquid investments—primarily fixed deposits—and a 10.8% decline in cash balances. In addition, funding resources primarily from members’ deposits, decreased by 1.9% to $409.1 million. However, net loans to members rose by 4.3% to $225.7 million, mainly on account of mortgage flows.
Credit unions’ total expenditure reduced by 5.9% to $27.3 million in 2021. In particular, capital outlays (investment property expenses) contracted by 9.2% to $1.4 million, while the remaining non-capital costs fell by 3.5% to $5.7 million. In contrast, operational costs grew by 2.0% to $17.9 million, owing to increases in general business (5.6%) and personnel (7.5%) expenses—inclusive of base salaries, bonuses and training. As to employment, credit unions’ total staffing was approximately stable at 189.
SECURITIES INDUSTRY
Although comprehensive data on expenditure and employment was not available for the securities sector, contractions in the volume of supervised entities and vehicles indicated reduced activity. In particular, evidence from the Securities Commission of The Bahamas (SCB), revealed that the number of licensed investment fund administrators decreased by 3 to 45, while the number of licensed investment funds under administration declined by 30 to 682. However, total assets under management increased marginally by 0.6% to an estimated $50.0 billion.
The SCB also supervises the financial and corporate services providers (FCSPs), which are professional firms that offer services to the financial sector. In 2021, the number of FCSPs fell by 94 to 246, owing to a falloff in demand for these services. It should be noted that, these registrants provide other business services, hence, relinquishing of FCSPs permits do not amount materially to private sector exit or closure of such operations.
INSURANCE SECTOR
During 2021, the local insurance sector remained relatively stable, despite the ongoing challenges presented by the COVID-19 pandemic. Official data provided by the Insurance Commission of The Bahamas (ICB), disclosed that the number of licensed insurers, brokers and agents edged down by 1 to 158 during the review year. Specifically, the number of external insurers and intermediaries lessened by 1 to 31, while domestic intermediaries and insurers steadied at 127 in 2021. Further, total assets of domestic companies grew by 2.1% to $2,152.9 million in 2021, as the asset base of the long-term insurance segment moved higher by 2.2% to $1,562.7 million. However, assets of the general insurers reduced by 13.5% to $590.2 million.
As it relates to employment, the number of persons employed in the industry increased by 17 to 931 in 2021, as the estimated average annual salary moved closer to $40,000. Although a comprehensive estimate was not attained, indications are that aggregate expenditures in the economy grew. In particular, outlays among domestic long-term insurers were estimated at $135.1 million, higher than the $104.3 million registered in the previous year—representing 97.7% of operating cost recorded in 2021.
42
OTHER FINANCIAL SECTOR DEVELOPMENTS
During the year, financial sector initiatives remained targeted on improving The Bahamas’ supervisory regime, with sustained focus on satisfying international regulatory standards, jurisdictional cooperation and transparency, financial crimes risk reduction and prudential regulation. As the fallout from the COVID-19 pandemic extended into 2021, the Central Bank continued to monitor SFIs’ approach to adapting their operations under the restrained conditions of the pandemic, and the identified risk management challenges of the environment. In this context, the Bank’s policies were directed towards mitigating financial sector disruptions and solidifying resilience.
The Bank also noted the growing interest of businesses in the digital assets space. With the passage of the Digital Assets and Registered Exchanges Act 2020, it is anticipated that SFIs will seek to expand their reach in this market. As such, the Central Bank is developing supervisory guidance for the industry, in line with the evolving global benchmarks for digital assets, and with a view to promote robust standards for the financial integrity of transactions and prudential outcomes for the safety and soundness of SFIs operations.
CENTRAL BANK INITIATIVES
The Central Bank continued to supervise AML risk management practices among its licensed entities, and to support coordinated efforts to elevate the jurisdictions’ compliance and effectiveness profile in international
assessments. These efforts resulted in a peer Caribbean Financial Action Task Force (CFAF) re-rating in 2021, which judged The Bahamas compliant or largely compliant with 38 out of the 40 Financial Action Task Force (FATF) recommendations for strengthening the country’s AML/CFT technical compliance. This followed the December 2020 delisting of The Bahamas from the FATF’s list of Jurisdictions under Increased Monitoring.
Regulatory attention also sharpened around SFIs preparedness to address operations risks posed by severe hurricanes. Specifically, following the 2020 Hurricane Preparedness Survey, the Central Bank engaged with the Association of International Banks & Trusts (“AIBT”) and the Clearing Banks Association (“CBA”) to release, in July 2021, two industry-developed codes of practice around practical guidance for dealing with such disruptions. One addressed Maintenance of Effective Communication with Clients and the other Managing Catastrophe-Related Staff Issues before, after and during a catastrophic storm. In particular, the codes of practice offer practical industry guidance on how to effectively manage staff and communications with customers before, during and after a catastrophic event.
Developments include an action plan to operationalize the recovery and resolution framework that became effective under the new Banks and Trust Companies Regulation Act 2020. The Central Bank received significant support through an IMF technical assistance mission, in October, 2021 and from which a follow-up engagement is scheduled for mid-2022. Two substantive deliverables in 2021, were the release of a draft Recovery Planning Guidelines for public licensees and the commencement of a pilot for six supervised financial institutions—three commercial banks and three international banks to produce their recovery plans by 31st May, 2022.
In the payments system, the Central Bank continued to develop the digital currency infrastructure around the Sand Dollar. In 2021, the Bahamian Dollar Digital Currency Regulations, 2021 were issued. These define the operations and governance framework for the digital currency. For participating financial institutions, they include minimum technical requirements around cyber security, AML/CFT risk management, financial inclusion and interoperability. During the year, three additional authorized financial institutions (AFIs) were approved to disseminate Sand Dollars. Moreover, the wallets of all nine AFIs became fully interoperable with the digital currency platform. A number of Government agencies were also integrated into the Sand Dollar
43
ecosystem via the Government’s DigiPay platform; while efforts progressed to integrate the platform to the commercial bank operated, Bahamas Automated Clearing House (the ACH).
Also noteworthy, the credit bureau transitioned into operations, going live on 30th April 2021, with CRIF Bahamas, the credit bureau operator, working closely with 38 credit information providers, to build the credit reporting system. Other than licenses of the Central Bank, Insurance Commission and Securities Commission that were already mandated to report information to the bureau, during the year, the Central Bank also
formally designated the operating utility companies as credit information providers.1
CONCLUSION AND OUTLOOK
The 2021 survey of financial sector activities continues to underscore adjustment to challenges for the industry which predate the COVID-19 pandemic, and are most concentrated in banking and trust activities. Aside from the response to evolving global regulatory compliance standards, the sector also continues to consolidate along efficiency lines. These have been further summarised, in downward adjustments in staffing levels in both international and domestic banking. The international securities business also experienced recent retrenchment, though mostly in terms of registrants rather than the volume of assets under management. That said, the business model of international firms is showing growth potential in markets outside of Europe and North America and in the expanded regulated focus of the jurisdiction on digital assets. Adjustment pressures appear less acute for domestic insurance, with expansionary to stable trends. Meanwhile, credit unions’ prospects reflected ongoing adjustment to more concentrated credit exposures to COVID-19 tourism, than the rest of domestic banking sector and smaller capital and liquidity surpluses in such regards.
The jurisdiction’s prospects for expanded economic returns in international services remains favourably linked to ongoing strengthening of the regulatory landscape, including increasing effectiveness in delivering upon obligations for financial integrity and tax transparency. Going forward, the Central Bank will sustain its efforts to strengthen the regulatory framework for its SFIs. Equally, the collaborative stance across all regulators will continue to be strengthened, so as to support the growth and resilience of the financial sector. The Bank will also remained focused on initiatives to strengthen financial inclusion and deepen financial literacy.
1 These are the licensees of the Utilities Competitions and Regulations Authority (URCA).
44
Period 2017p 2018p 2019p 2020p 2021p
A. Taxes on Transactions 98.5 109.2 86.0 94.0 112.0
Gross Insurance Premium Tax 1/ 22.1 23.2 24.3 26.2 27.5
Stamp Tax on Mortgages 15.2 18.5 8.3 4.6 2.2
Stamp Tax on Other Banking Transactions 61.0 67.3 53.2 62.9 81.9
Stamp Tax on Instruments & Bonds 0.2 0.3 0.4 0.3 0.4
B. Licence & Registration Fees 71.0 73.1 71.5 70.4 77.2
International Business Companies (IBCs) 15.1 14.7 13.3 12.2 13.5
Banks and Trust Companies 3/ 50.5 51.0 50.6 50.6 52.9
Insurance Companies, Brokers & Agents 0.3 0.3 0.4 0.3 0.3
Financial & Corp. Svcs. Providers 0.6 0.6 0.6 0.5 1.9
Investment Funds 2/ 4.5 6.5 6.6 6.9 8.7
C. Total Revenues 169.5 182.3 157.5 164.4 189.2
Notes: 1/ Premium Tax collected from Insurance Companies.
2/ Amounts collected by the Securities Commission.
3/ Amounts include other fees payable.
Sources: Bahamas Government's Treasury Department, Insurance Commission of The Bahamas,
and Securities Commission of The Bahamas.
Table A: Government Revenue from Financial Sector Activities (B$ Millions)
45
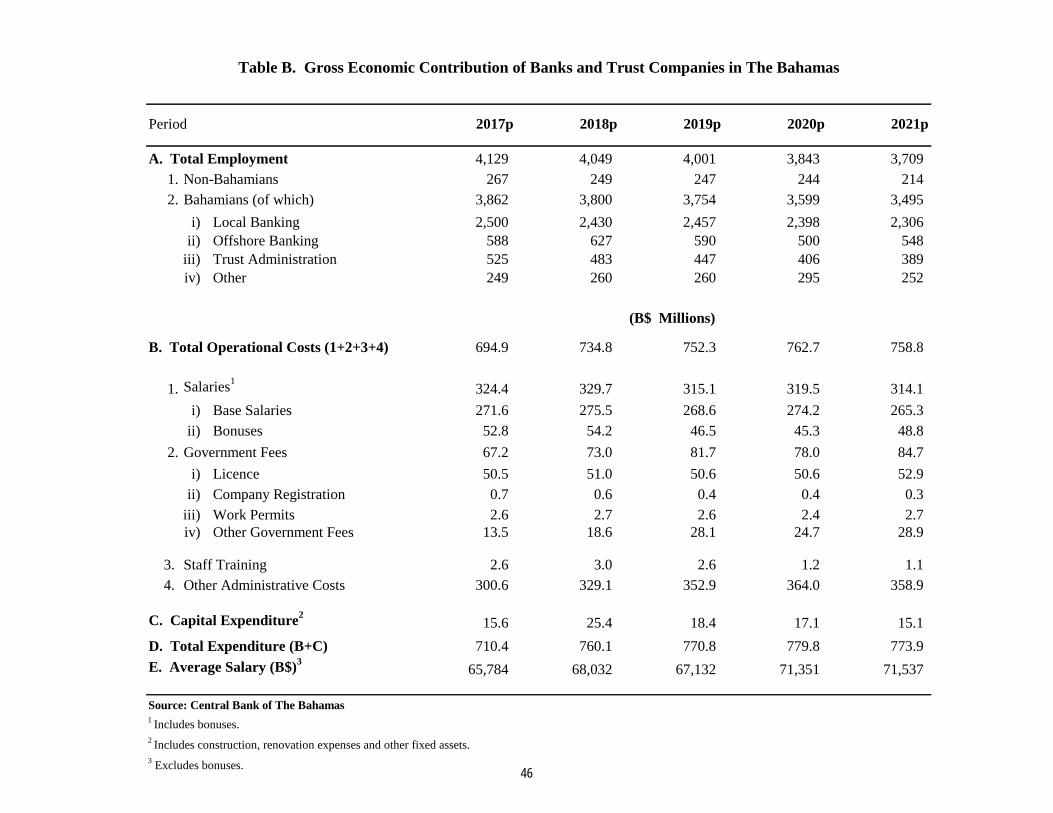
Period 2017p 2018p 2019p 2020p 2021p
A. Total Employment 4,129 4,049 4,001 3,843 3,709
1. Non-Bahamians 267 249 247 244 214
2. Bahamians (of which) 3,862 3,800 3,754 3,599 3,495
i) Local Banking 2,500 2,430 2,457 2,398 2,306
ii) Offshore Banking 588 627 590 500 548
iii) Trust Administration 525 483 447 406 389
iv) Other 249 260 260 295 252
B. Total Operational Costs (1+2+3+4) 694.9 734.8 752.3 762.7 758.8
1. Salaries1
324.4 329.7 315.1 319.5 314.1
i) Base Salaries 271.6 275.5 268.6 274.2 265.3
ii) Bonuses 52.8 54.2 46.5 45.3 48.8
2. Government Fees 67.2 73.0 81.7 78.0 84.7
i) Licence 50.5 51.0 50.6 50.6 52.9
ii) Company Registration 0.7 0.6 0.4 0.4 0.3
iii) Work Permits 2.6 2.7 2.6 2.4 2.7
iv) Other Government Fees 13.5 18.6 28.1 24.7 28.9
3. Staff Training 2.6 3.0 2.6 1.2 1.1
4. Other Administrative Costs 300.6 329.1 352.9 364.0 358.9
C. Capital Expenditure2
15.6 25.4 18.4 17.1 15.1
D. Total Expenditure (B+C) 710.4 760.1 770.8 779.8 773.9
E. Average Salary (B$)3
65,784 68,032 67,132 71,351 71,537
Source: Central Bank of The Bahamas1
Includes bonuses.
2 Includes construction, renovation expenses and other fixed assets.
3 Excludes bonuses.
(B$ Millions)
Table B. Gross Economic Contribution of Banks and Trust Companies in The Bahamas
46
Period 2017p 2018p 2019p 2020p 2021p 2017p 2018p 2019p 2020p 2021p
A. Total Employment 3,133 3,182 3,195 3,124 3,034 996 867 806 719 675
1. Non-Bahamians 54 66 79 73 73 213 183 168 171 141
2. Bahamians (of which) 3,079 3,116 3,116 3,051 2,961 783 684 638 548 534
i) Local Banking 2,500 2,430 2,457 2,398 2,306 -- -- -- -- --
ii) Offshore Banking 97 182 200 193 222 491 445 390 307 326
iii) Trust Administration 310 317 292 266 239 215 166 155 140 150
iv) Other 172 187 167 194 194 77 73 93 101 58
B. Total Operational Costs (1+2+3+4) 452.0 495.8 509.1 530.0 532.5 242.8 239.0 243.2 232.7 226.3
1. Salaries1
182.9 196.0 195.8 203.3 201.6 141.5 133.7 119.3 116.2 112.5
i) Base Salaries 166.1 179.1 178.0 185.6 184.2 105.5 96.3 90.6 88.6 81.1
ii) Bonuses 16.8 16.9 17.8 17.7 17.3 36.0 37.3 28.7 27.6 31.4
2. Government Fees 57.5 63.7 72.8 69.7 76.2 9.8 9.4 8.9 8.3 8.5
i) Licence 44.3 44.9 44.5 44.4 46.9 6.2 6.2 6.1 6.1 5.9
ii) Company Registration 0.0 0.4 0.1 0.2 0.2 0.7 0.2 0.2 0.2 0.1
iii) Work Permits 0.6 0.9 0.7 0.9 0.6 2.0 1.8 1.9 1.5 2.1
iv) Other Government Fees 12.5 17.5 27.5 24.2 28.6 0.9 1.1 0.6 0.5 0.4
3. Staff Training 1.7 2.1 1.6 0.9 0.9 0.9 0.9 1.0 0.3 0.2
4. Other Administrative Costs 210.0 234.1 238.9 256.1 253.9 90.6 95.0 114.0 107.9 105.1
C. Capital Expenditure2
12.6 15.2 15.4 15.1 12.5 3.0 10.2 3.1 1.9 2.6
D. Total Expenditure (B+C) 464.6 511.0 524.5 545.1 545.0 245.8 249.2 246.3 234.6 228.9
E. Average Salary (B$)3
53,028 56,289 55,708 59,411 60,727 105,911 111,129 112,419 123,227 120,129
Source: Central Bank of The Bahamas1 Includes bonuses.
2 Includes construction, renovation expenses and other fixed assets.
3 Excludes bonuses.
Table C. Gross Economic Contribution of Banks and Trust Companies by Group
(B$ Millions)
Domestic International
47
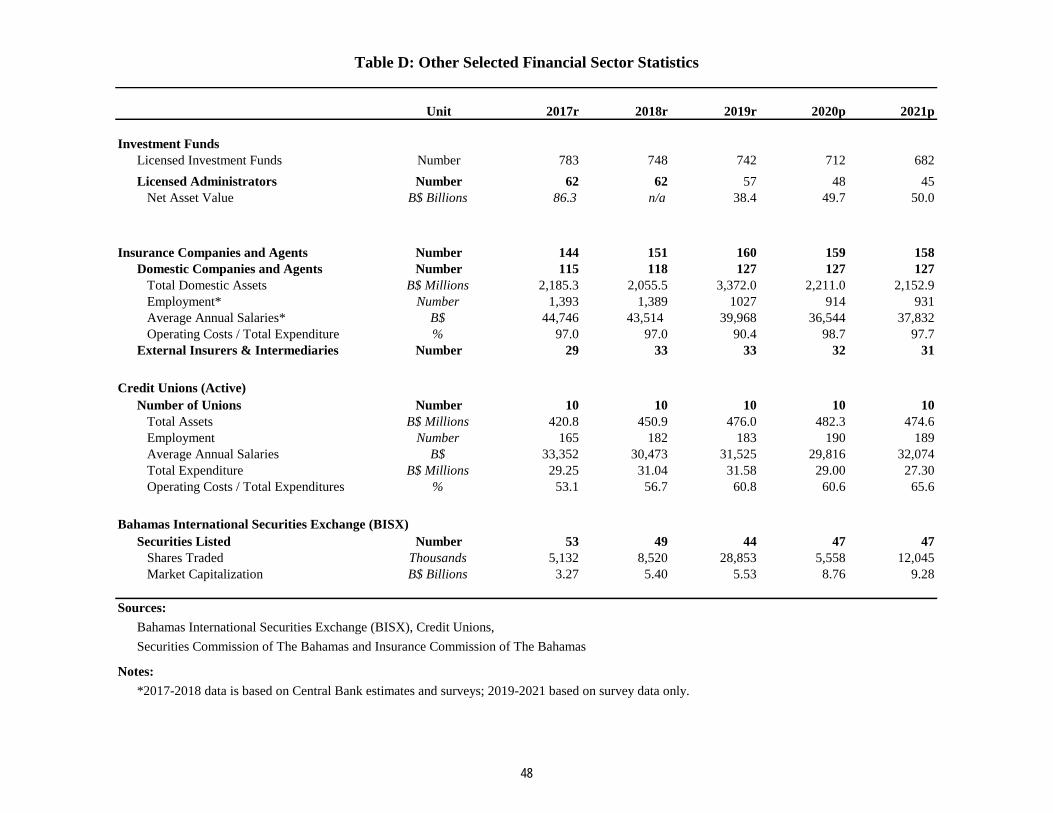
Unit 2017r 2018r 2019r 2020p 2021p
Investment Funds
Licensed Investment Funds Number 783 748 742 712 682
Licensed Administrators Number 62 62 57 48 45
Net Asset Value B$ Billions 86.3 n/a 38.4 49.7 50.0
Insurance Companies and Agents Number 144 151 160 159 158
Domestic Companies and Agents Number 115 118 127 127 127
Total Domestic Assets B$ Millions 2,185.3 2,055.5 3,372.0 2,211.0 2,152.9
Employment* Number 1,393 1,389 1027 914 931
Average Annual Salaries* B$ 44,746 43,514 39,968 36,544 37,832
Operating Costs / Total Expenditure % 97.0 97.0 90.4 98.7 97.7
External Insurers & Intermediaries Number 29 33 33 32 31
Credit Unions (Active)
Number of Unions Number 10 10 10 10 10
Total Assets B$ Millions 420.8 450.9 476.0 482.3 474.6
Employment Number 165 182 183 190 189
Average Annual Salaries B$ 33,352 30,473 31,525 29,816 32,074
Total Expenditure B$ Millions 29.25 31.04 31.58 29.00 27.30
Operating Costs / Total Expenditures % 53.1 56.7 60.8 60.6 65.6
Bahamas International Securities Exchange (BISX)
Securities Listed Number 53 49 44 47 47
Shares Traded Thousands 5,132 8,520 28,853 5,558 12,045
Market Capitalization B$ Billions 3.27 5.40 5.53 8.76 9.28
Sources:
Bahamas International Securities Exchange (BISX), Credit Unions,
Securities Commission of The Bahamas and Insurance Commission of The Bahamas
Notes:
*2017-2018 data is based on Central Bank estimates and surveys; 2019-2021 based on survey data only.
Table D: Other Selected Financial Sector Statistics
48


