Embed Size (px)
Citation preview

Universidad de las Islas Baleares
Facultad de Ciencias
Departamento de Biología Fundamental y Ciencias de la Salud
Laboratorio de Biología Molecular, Nutrición y Biotecnología – Nutrigenómica
TESIS DOCTORAL
Nuevas interacciones nutrientes-genes en conexión con el problema de la obesidad
y la función adipocitaria
Memoria para optar al grado de
Doctora por la Universidad de las Islas Baleares
Programa Oficial de Doctorado de Nutrigenómica y Nutrición Personalizada
Departamento de Biología Fundamental y Ciencias de la Salud de la UIB
Presentada por:
Núria Granados Borbolla
Palma de Mallorca, septiembre de 2011


Con el consentimiento de la directora
Dra. M. Luisa Bonet
Profesora Titular de Bioquímica y Biologia Molecular
La interesada
Núria Granados Borbolla


A mis padres,
a mis hijos,
y
a Loren

AGRADECIMIENTOS
En un primer borrador de los agradecimientos que quería expresar empecé a
temer que éstos llegaran a ser más extensos que el contenido de la tesis en sí
mismo y si bien en un principio me originó una cierta preocupación ésta se ha ido
transformando gradualmente en alegría ya que este trabajo no sólo representa el
fin de una etapa académica, sino que casi me atrevería a llamarlo de milagro en
mi vida personal y no hubiera sido posible sin la ayuda, las enseñanzas, el
apoyo, la confianza y el amor de muchas personas, motivo por el cual me siento
muy afortunada.
Mi especial agradecimiento a mi Directora María Luisa Bonet por su dedicación,
por su contribución en mi formación como persona, por su apoyo y porque fueron
sus magníficas clases durante la carrera las que encendieron de nuevo en mi la
ilusión por estudiar, por aprender y en consecuencia por empezar este proyecto
Al Profesor Andreu Palou por la confianza que ha depositado en mí y la
oportunidad que me ha brindado de poder formar parte del grupo de investigación
que dirige.
A los demás profesores del grupo: Profesora Francisca Serra, Dra. Catalina Picó,
Dra. Paula Oliver, Dr Joan Ribot y Dra Ana María Rodríguez porque siempre me
he sentido respaldada, ayudada y animada por todos ellos.
A nuestras post-docs, Tere y Joana, siempre dispuestas a ayudar en todo,
amigas y compañeras, sois fantásticas.
A Pep, Felip y Pep Lluis que me ayudaron en mis comienzos.
A todos mis compañeros de laboratorio, Pilar- por todos esos viajes compartidos y
porque siempre has sido un ejemplo para mí,- Toni-te añoro por el labo-, Mariona-
catalizadora de la vida social-, Enzo- por todo ese tiempo que compartimos
despacho-, Xisco- por estar siempre dispuesto a echarnos a todos una mano-Aixa,
María, Rubén, Ana Paula, Bea, Raúl, Juana Mari, Yuri etc., a los colaboradores,
Gokulan, Marc, Maite etc., y a todos los que han empezado ahora la tesis ¡mucha
suerte y ánimos!
A Jaume Amengual, a quien he echado tanto de menos en esta última etapa, sus
valiosas ideas y su capacidad de convertir el trabajo en algo tremendamente
divertido y estimulante, harán que recuerde con gran cariño estos años.
A Petar con quien tengo la suerte de colaborar actualmente, su tesón e
inteligencia alimentan mi ilusión por emprender nuevos proyectos.
A la organización NuGO, a la cual nuestro laboratorio pertenece, que me ha
permitido asistir a cursos y congresos en Europa y cuya filosofía siempre ha
renovado mis energías.
Al CIBERobn que me permite dedicarme a lo que más me gusta.
A Laura por todas esas salidas en bici que han constituida mi válvula de escape,
mi fuente de endorfinas y la práctica totalidad de mi vida social.
A mis amigas Charo, Marga, Victoria, Rosa y Antonia con las que empecé la
carrera en una primera etapa y que nunca dejaron de animarme a continuar.
A todos los profesionales y amigos que han cuidado a la perfección de: mi salud
emocional,Dr Ticoulat y Gemma artífices del milagro que supuso para mí empezar
una nueva etapa; de mi salud física, Luis Escriche; y de mis asuntos “terrenales”
Federico y Mª Antonia liberándome de preocupaciones y permitiéndome centrarme
en mi trabajo y estudios.
A Carmen y Marga de secretaria que me han ayudado siempre con todo el
papeleo y a Lali que mantiene mi despacho en condiciones.
A la familia de Loren por su interés en este trabajo y su comprensión todas las
veces que llegué tarde o no llegué…
A mi familia -
A mis hermanos, Puchi y Diego y mis guapísimos sobrinos Oscar, Quique y Diego.
A mis padres, para los que no tengo aquí espacio ni palabras para expresarles
todo mi amor y agradecimiento, los mejores padres que nunca podría haber
imaginado, sólo espero no defraudaros nunca. Muy especialmente en este
contexto quiero agradeceros todos los valores que me inculcasteis gracias a los
cuales esto ha llegado a su fin. ESTO ES POR Y PARA VOSOTROS!
A mis hijas, por todo el tiempo que les he robado y por el inmenso cariño que
siempre he recibido de ellas, por esos masajes de Núria que me dejan nueva y
por todas esas deliciosas comidas que nos prepara Mayu cuándo llego a las
tantas…Estoy muy orgullosa de vosotras.
Loren, esto no hubiera sido posible sin ti. Por tu apoyo permanente desde el día
que retomé los estudios hasta esta misma madrugada imprimiendo la última
versión. Por todas las veces que me acompañaste y esperaste mientras “daba de
comer a las células”. Por todos esos viajes de ensueño, por tus ánimos en todos
los momentos de bajón, por ese “pepino” de bici que me ha abierto un mundo de
caminos para disfrutar con los que más quiero, por enseñarme a bucear, por
tantas y tantas cosas.
Os quiero.
I
INDICE
Lista de abreviaturas más utilizadas III
Resumen V
Lista de artículos originales VII
1. INTRODUCCIÓN 1
1.1. La obesidad y complicaciones médicas asociadas 3
1.1.1. Obesidad e inflamación 4
1.1.2. Resistencia a la insulina y diabetes tipo II 7
1.1.3. Enfermedad cardiovascular 10
1.1.4. Osteoartritis 13
1.2. El tejido adiposo en el contexto de la obesidad y sus complicaciones 15
1.2.1. El tejido adiposo marrón 17
1.2.2. El tejido adiposo blanco 18
1.2.3. Adipogénesis 19
1.2.4. El tejido adiposo como órgano secretor 20
1.2.5. Alteraciones en el tejido adiposo en la obesidad 25
1.3. El músculo esquelético en el contexto de la obesidad y sus complicaciones 28
1.3.1. Metabolismo en el músculo esquelético 28
1.3.2. El músculo esquelético como órgano secretor 29
1.4. Interacciones nutrientes-genes en el control del balance energético y las
complicaciones metabólicas de la obesidad
32
1.4.1. Papel de la grasa dietética y de los ácidos grasos trans 32
1.4.2. Papel de la vitamina A 35
1.4.3. Papel de la nutrición perinatal 39
2. OBJETIVOS 43
3. PLANTEAMIENTO EXPERIMENTAL 47
4. RESULTADOS Y DISCUSIÓN 55
4.1. Retinol-binding Protein 4 and Nicotinamide Phosphoribosyltransferase/
Visfatin in Rat Obesity Models.
57
II
4.2. All-Trans Retinoic Acid Decreases Murine Adipose Retinol Binding
Protein 4 Production. 65
4.3. Distinct effects of oleic acid and its trans-isomer elaidic acid on the
expression of myokines and adipokines in cell models.
77
4.4. Effects of selected compounds related to joint health on the
differentiation of mouse embryo fibroblast cells: Cross-talk with the
adipogenic and the chondrogenic programs.
89
4.5. Molecular players at the intersection of obesity and osteoarthritis. 115
4.6. Moderate vitamin A supplementation in early life affects later adiposity in
rats
169
5. RECAPITULACIÓN 201
6. CONCLUSIONES 211
7. BIBLIOGRAFIA 217
ANEXO I: MATERIALES Y MÉTODOS 247
III
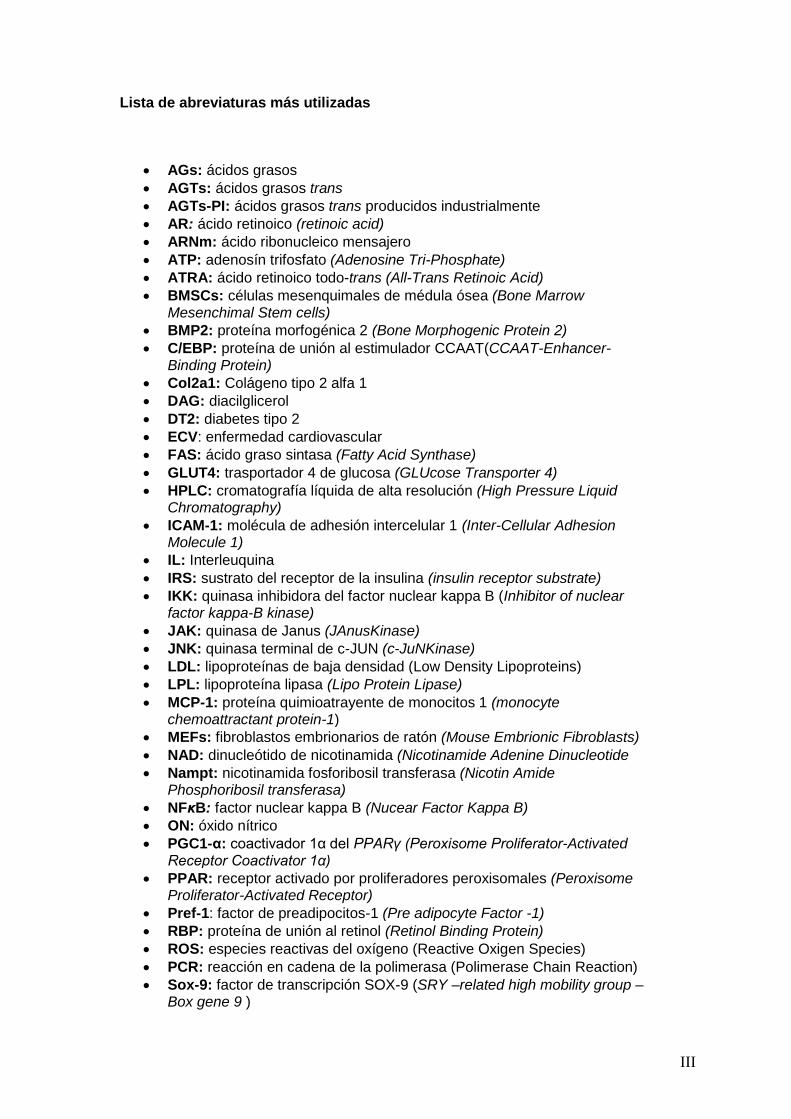
Lista de abreviaturas más utilizadas
AGs: ácidos grasos AGTs: ácidos grasos trans AGTs-PI: ácidos grasos trans producidos industrialmente AR: ácido retinoico (retinoic acid) ARNm: ácido ribonucleico mensajero ATP: adenosín trifosfato (Adenosine Tri-Phosphate) ATRA: ácido retinoico todo-trans (All-Trans Retinoic Acid) BMSCs: células mesenquimales de médula ósea (Bone Marrow
Mesenchimal Stem cells) BMP2: proteína morfogénica 2 (Bone Morphogenic Protein 2) C/EBP: proteína de unión al estimulador CCAAT(CCAAT-Enhancer-
Binding Protein) Col2a1: Colágeno tipo 2 alfa 1 DAG: diacilglicerol DT2: diabetes tipo 2 ECV: enfermedad cardiovascular FAS: ácido graso sintasa (Fatty Acid Synthase) GLUT4: trasportador 4 de glucosa (GLUcose Transporter 4) HPLC: cromatografía líquida de alta resolución (High Pressure Liquid
Chromatography) ICAM-1: molécula de adhesión intercelular 1 (Inter-Cellular Adhesion
Molecule 1) IL: Interleuquina IRS: sustrato del receptor de la insulina (insulin receptor substrate) IKK: quinasa inhibidora del factor nuclear kappa B (Inhibitor of nuclear
factor kappa-B kinase) JAK: quinasa de Janus (JAnusKinase) JNK: quinasa terminal de c-JUN (c-JuNKinase) LDL: lipoproteínas de baja densidad (Low Density Lipoproteins) LPL: lipoproteína lipasa (Lipo Protein Lipase) MCP-1: proteína quimioatrayente de monocitos 1 (monocyte
chemoattractant protein-1) MEFs: fibroblastos embrionarios de ratón (Mouse Embrionic Fibroblasts) NAD: dinucleótido de nicotinamida (Nicotinamide Adenine Dinucleotide Nampt: nicotinamida fosforibosil transferasa (Nicotin Amide
Phosphoribosil transferasa) NFκB: factor nuclear kappa B (Nucear Factor Kappa B) ON: óxido nítrico PGC1-α: coactivador 1α del PPARγ (Peroxisome Proliferator-Activated
Receptor Coactivator 1α) PPAR: receptor activado por proliferadores peroxisomales (Peroxisome
Proliferator-Activated Receptor) Pref-1: factor de preadipocitos-1 (Pre adipocyte Factor -1) RBP: proteína de unión al retinol (Retinol Binding Protein) ROS: especies reactivas del oxígeno (Reactive Oxigen Species) PCR: reacción en cadena de la polimerasa (Polimerase Chain Reaction) Sox-9: factor de transcripción SOX-9 (SRY –related high mobility group –
Box gene 9 )

IV
TAB: tejido adiposo blanco TAM: tejido adiposo marrón TNFα: factor de necrosis tumoral alfa (Tumor Necrosis Factor alpha) TGs: triacilgliceroles UCP: proteína desacopladora (UnCoupling Protein) VCAM-1: molécula de adhesión vascular (Vascular Cell Adhesion
Molecule-1)
V
Nuevas interacciones nutriente-genes en conexión con el problema de la obesidad y la función adipocitaria Departamento de Biología Fundamental y Ciencias de la Salud Facultad de Ciencias – Universidad de las Islas Baleares Núria Granados Borbolla
Resumen Inflamación sub-crónica y resistencia a la insulina constituyen el eje de toda una serie de complicaciones médicas asociadas a la obesidad a las que se les atribuye la tercera parte de todas las muertes y discapacidades a nivel mundial. Más allá del exceso, los nutrientes impactan específicamente sobre marcadores de pérdida de la homeostasia metabólica. Los objetivos de esta tesis se centran en el estudio de interacciones entre nutrientes y genes de potencial relevancia en el contexto de la obesidad y sus co-morbilidades. En particular se ha estudiado: a) la regulación de proteínas bioactivas de secreción de adipocitos y miocitos por obesidad, vitamina A y ácidos grasos trans; b) la regulación de la adipogénesis por nutrientes con efectos saludables sobre la función articular; y c) los efectos a largo plazo de una suplementación con vitamina A durante la lactancia sobre la susceptibilidad a la obesidad. Las alteraciones de la proteína de unión a retinol (RBP) y la Nampt/visfatina de origen adipocitario en el estado obeso y su posible papel en las complicaciones metabólicas asociadas al mismo son aspectos controvertidos. Nuestros resultados sobre los niveles circulantes y de expresión en tejido adiposo blanco de RBP y Nampt/visfatina en dos modelos de obesidad en rata, uno dietético (ratas Wistar alimentadas con dieta de cafetería) y uno genético (ratas obesas Zucker fa/fa), indican que, en estos modelos, el desarrollo de resistencia a la insulina es independiente de incrementos en estas dos proteínas. Además de por la obesidad, la función secretora del tejido adiposo puede verse afectada por nutrientes específicos, como la vitamina A y ciertos ácidos grasos. Nuestros resultados muestran que el ácido retinoico (forma carboxílica de la vitamina A) reprime la expresión de RBP en modelos de adipocitos en cultivo y selectivamente en el tejido adiposo blanco, pero no en el hígado, in vivo. La RBP de origen adipocitario se ha postulado como un factor de resistencia a la insulina y, de acuerdo con este rol, su reducción en respuesta al tratamiento agudo in vivo con ácido retinoico se acompañó de un aumento de la sensibilidad a la insulina en los animales. Todo ello refuerza el concepto de que vitámeros de la vitamina A pueden afectar la sensibilidad a la insulina vía efectos sobre adipoquinas. La ingesta de ácidos grasos trans de origen industrial se asocia con efectos deletéreos sobre la salud cardiovascular y metabólica. Nuestros resultados muestran efectos directos diferenciales del ácido oleico y de su isómero trans, el ácido elaídico, el más abundante de los ácidos grasos trans de origen industrial, sobre la función secretora de adipocitos y células musculares en cultivo. En conjunto los resultados muestran que la exposición a ácido oleico, pero no elaídico, induce la expresión de proteínas que mejoran la sensibilidad a la insulina, como la interleuquina-6 en células musculares y la adiponectina en células adiposas, al tiempo que reduce la expresión adipocitaria de resistina, proteína relacionada con la resistencia a la insulina y de potencial pro-inflamatorio. Por el contrario, la exposición a ácido elaídico, pero no oleico, induce en células musculares la expresión de un factor de resistencia a la insulina, el factor de
VI
necrosis tumoral , al tiempo que disminuye la expresión de interleuquina-15, un factor anabólico muscular de efectos anti-obesogénicos. Estos resultados contribuyen a establecer un vínculo molecular entre los efectos adversos del ácido elaídico y beneficiosos del ácido oleico sobre la sensibilidad a la insulina y el riesgo cardiovascular y la función secretora de adipocitos y miocitos. La relación entre obesidad y osteoartritis tiene bases biomecánicas, metabólicas, y posiblemente también celulares. La diferenciación de células multipotentes en adipocitos o condrocitos está competitivamente equilibrada. Nuestros resultados muestran que nutrientes con conocidos efectos sobre la condrogénesis y la salud articular inhiben la adipogénesis en fibroblastos embrionarios de ratón, al tiempo que disminuyen en estas células la expresión de proteínas consideradas pro-inflamatorias y/o de efectos negativos sobre la sensibilidad a la insulina, como la resistina y la RBP, e incrementan la expresión de proteínas de efecto anti-adipogénico, como la leptina. Se sugiere que los nutrientes ensayados poseen una cierta capacidad de regular el balance de diferenciación de estas células multipotentes hacia unos u otros tipos celulares, lo que podría ser de interés en estrategias para el control simultáneo de la adiposidad corporal y la salud articular. Las interacciones nutrientes-genes pueden tener consecuencias diferentes dependiendo de la etapa del desarrollo. Así, mientras resultados previos indican un efecto anti-obesogénico de la vitamina A en animales adultos, los resultados de esta tesis muestran que ratas que recibieron una suplementación moderada de vitamina A (como retinil palmitato) durante la lactancia presentan un mayor potencial de proliferación celular en el tejido adiposo blanco en el momento del destete, y acumulan subsiguientemente más grasa corporal que las controles en respuesta a una dieta hiperlipídica. Los resultados sugieren que la vitamina A en etapas tempranas de la vida puede condicionar efectos a largo plazo sobre la adiposidad corporal vía efectos sobre el desarrollo y la celularidad del tejido adiposo. En definitiva, el conjunto de resultados presentados nos aportan nueva información acerca de los efectos de varios nutrientes sobre la secreción de proteínas bioactivas del tejido adiposo y muscular, la adipogénesis y también, administrados en etapas tempranas del desarrollo, la futura susceptibilidad a la obesidad. El conocimiento de las interacciones nutrientes-genes en procesos que regulan la adiposidad corporal y la sensibilidad a la insulina en etapas tempranas y en la edad adulta puede ayudar al diseño de nuevas estrategias para prevenir/tratar la obesidad y complicaciones médicas asociadas.
VII
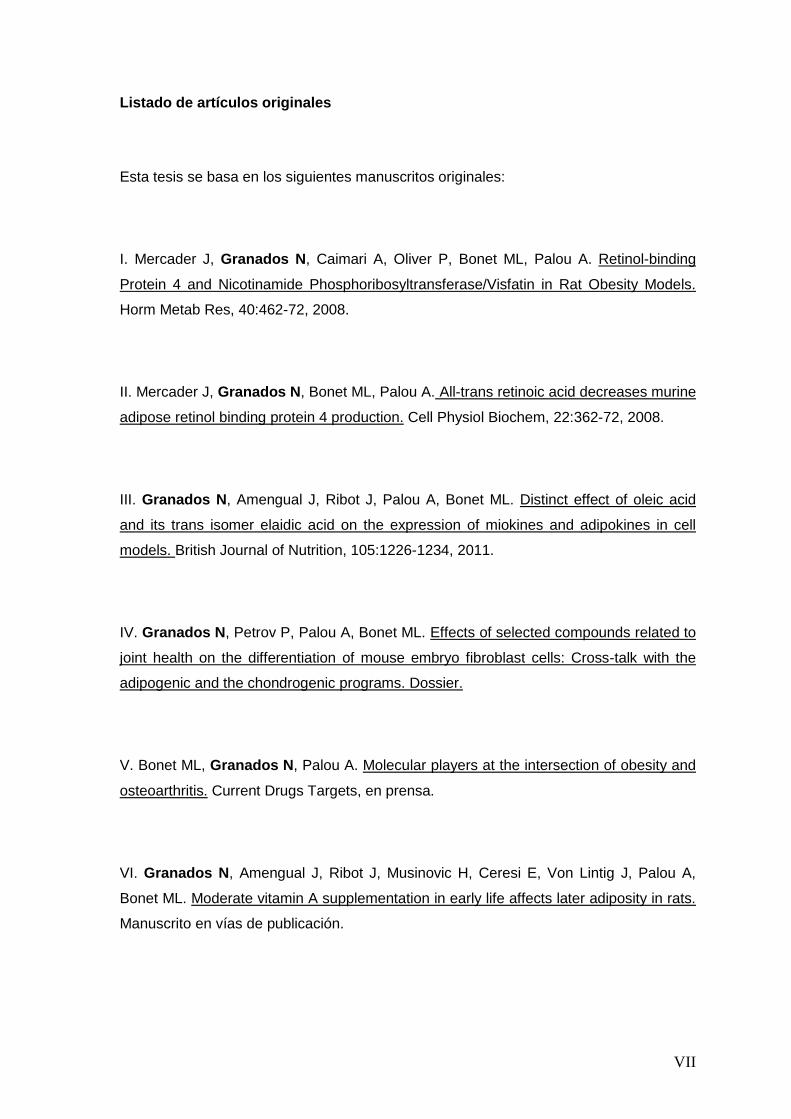
Listado de artículos originales
Esta tesis se basa en los siguientes manuscritos originales:
I. Mercader J, Granados N, Caimari A, Oliver P, Bonet ML, Palou A. Retinol-binding
Protein 4 and Nicotinamide Phosphoribosyltransferase/Visfatin in Rat Obesity Models.
Horm Metab Res, 40:462-72, 2008.
II. Mercader J, Granados N, Bonet ML, Palou A. All-trans retinoic acid decreases murine
adipose retinol binding protein 4 production. Cell Physiol Biochem, 22:362-72, 2008.
III. Granados N, Amengual J, Ribot J, Palou A, Bonet ML. Distinct effect of oleic acid
and its trans isomer elaidic acid on the expression of miokines and adipokines in cell
models. British Journal of Nutrition, 105:1226-1234, 2011.
IV. Granados N, Petrov P, Palou A, Bonet ML. Effects of selected compounds related to
joint health on the differentiation of mouse embryo fibroblast cells: Cross-talk with the
adipogenic and the chondrogenic programs. Dossier.
V. Bonet ML, Granados N, Palou A. Molecular players at the intersection of obesity and
osteoarthritis. Current Drugs Targets, en prensa.
VI. Granados N, Amengual J, Ribot J, Musinovic H, Ceresi E, Von Lintig J, Palou A,
Bonet ML. Moderate vitamin A supplementation in early life affects later adiposity in rats.
Manuscrito en vías de publicación.


1. INTRODUCCIÓN

Introducción
3
La obesidad es un estado en el que la salud se ve comprometida por el exceso de grasa
acumulada. De una forma simplificada, su aparición se explica como el resultado de un
desequilibrio sostenido del balance energético en el que la ingesta calórica supera el
gasto. Sin embargo, los mecanismos fisiológicos y procesos moleculares encargados de
mantener la homeostasia energética constituyen una red muy compleja dónde
interactúan toda una serie de señales producidas por el sistema nervioso central y los
tejidos periféricos.
El conocimiento de la biología de los tejidos periféricos y de los procesos bioquímicos
que determinan el balance energético y la deposición de grasas puede ser decisivo para
combatir la obesidad y sus complicaciones médicas asociadas de una forma racional y
eficaz. Algunos nutrientes intervienen en la regulación de los procesos bioquímicos
implicados y la presente Tesis se enmarca dentro de esta línea de investigación, que es
una de las principales líneas en las que trabaja nuestro grupo de investigación, el
Laboratorio de Biología Molecular, Nutrición y Biotecnología-Nutrigenómica de la UIB.
1.1. LA OBESIDAD Y COMPLICACIONES MÉDICAS ASOCIADAS
Según datos de la Organización Mundial de la Salud (OMS), 1,5 billones de adultos en
el año 2008 y 43 millones de niños menores de 5 años en el 2010 padecían sobrepeso u
obesidad (índice de masa corporal (IMC) ≥ 25 ) (WHO, 2011). La gran disponibilidad de
alimentos energéticamente muy densos y la reducción de la actividad física, lo que se
ha dado en llamar “ambiente obesogénico”, en el contexto de una evolución génica que
ha favorecido la predisposición a almacenar energía, explicaría esta epidemia global de
obesidad. La prevalencia de la obesidad es mucho mayor de lo que se había estimado
previamente, en gran parte debido a su actual incremento en regiones donde
tradicionalmente la malnutrición había sido el problema dominante, como Latinoamérica,
el Caribe, China, Australasia, Vietnam e Islas del Pacífico. La OMS prevé que en el
2015 se alcance la cifra de 2,3 billones de adultos con sobrepeso (IMC ≥ 25) y más de
700 millones de obesos (IMC ≥30). En España, el porcentaje de obesidad en la
población adulta se ha duplicado desde el año 1987, y se estima que hoy en día el 62%
de los adultos tiene sobrepeso u obesidad (Rodriguez-Artalejo et al., 2011).
La obesidad infantil preocupa especialmente. A nivel mundial, se ha duplicado en tan
sólo cinco años, afectando actualmente a un 10% de la población pediátrica de todo el
mundo. Los niños con sobrepeso tienen muchas probabilidades de convertirse en
adultos obesos y, en comparación con los niños sin sobrepeso, tienen más
probabilidades de sufrir a edades más tempranas diabetes y enfermedades
Tesis Doctoral Núria Granados Borbolla
4
cardiovasculares, que a su vez se asocian a un aumento de la probabilidad de muerte
prematura y discapacidad. En España, uno de cada tres niños padece sobrepeso u
obesidad y según datos recientes de la Sociedad Gallega de Endocrinología, Nutrición y
Metabolismo, uno de cada cuatro casos nuevos de diabetes que se dan en Galicia es un
menor de diez años (Sociedad Gallega de Endocrinología, 2011).
Hasta principio de los años 80 no empezó a considerarse la obesidad como un
problema médico que inducía o amplificaba toda una serie enfermedades tales como la
enfermedad cardiovascular, hipertensión o diabetes (Black, 1983). Varios grupos de
trabajo en Escandinavia, Inglaterra, Francia y Estados Unidos estaban ya investigando
intensamente sobre el control del apetito y las consecuencias metabólicas del aumento
de peso. Asimismo, se comenzaba a estudiar la influencia de la nutrición en etapas
tempranas del desarrollo sobre la susceptibilidad a padecer obesidad y desórdenes
metabólicos en la edad adulta (McCance and Widdowson, 1974). Sin embargo, no fue
hasta finales de los 90 cuando se documentó con gran precisión que toda una gama de
condiciones médicas y factores de riesgo cardiovascular son mucho más frecuentes a
medida que el IMC incrementa a partir de 20 (Shaper et al., 1997; Willett et al., 1999).
Según datos de la OMS, la obesidad se considera actualmente el tercer factor de riesgo
en sociedades desarrolladas, tras el consumo de alcohol y tabaco, para todas las
discapacidades y muertes prematuras (WHO, 2009).
Por todo ello es necesaria una mayor comprensión de los procesos asociados a la
obesidad, así como la búsqueda de nuevas estrategias dirigidas a prevenirla ya desde
etapas tempranas del desarrollo y a favorecer y mantener la pérdida de peso en sujetos
obesos.
1.1.1. Obesidad e inflamación
El sistema metabólico (vías de detección de nutrientes) y el sistema inmune (vías de
detección de patógenos) están estrechamente relacionados (Hotamisligil, 2006). El
equilibrio entre las respuestas inmune y metabólica puede verse amenazado tanto por
un déficit crónico de nutrientes como por una ingesta calórica excesiva continuada. Bajo
condiciones de exceso de energía, el potencial inflamatorio de tejidos y órganos puede
verse reactivado, y de hecho la obesidad está asociada a un estado de inflamación
crónica de bajo grado, si bien hay que señalar que no se trata de la clásica respuesta
inflamatoria, sino más bien debería considerarse como una forma aberrante de
inmunidad desencadenada por nutrientes, u otras señales intrínsecas, a la que se ha
denominado meta-inflamación o para-inflamación (Medzhitov, 2008). La cronificación de
este estado de inflamación incrementa el riesgo de dañar múltiples sistemas, incluidos,
Introducción
5
entre otros, aquellos involucrados en la homeostasis de la glucosa (Gregor and
Hotamisligil, 2011; Wellen and Hotamisligil, 2005).
Durante la última década, han sido intensamente estudiadas las principales vías de
señalización involucradas en la respuesta inflamatoria (ver descripción a continuación) y
los principales mediadores inflamatorios que activan dichas vías y que resultan estar
incrementados en el estado obeso, entre los que se incluyen proteínas, lípidos y
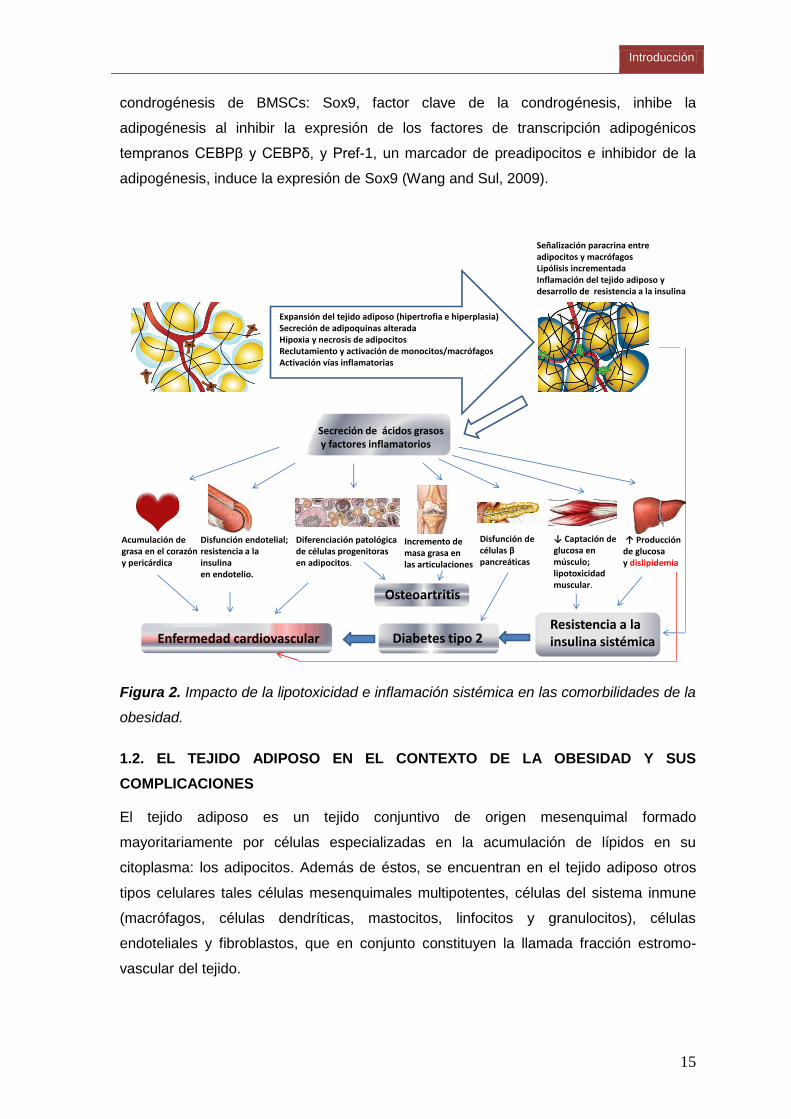
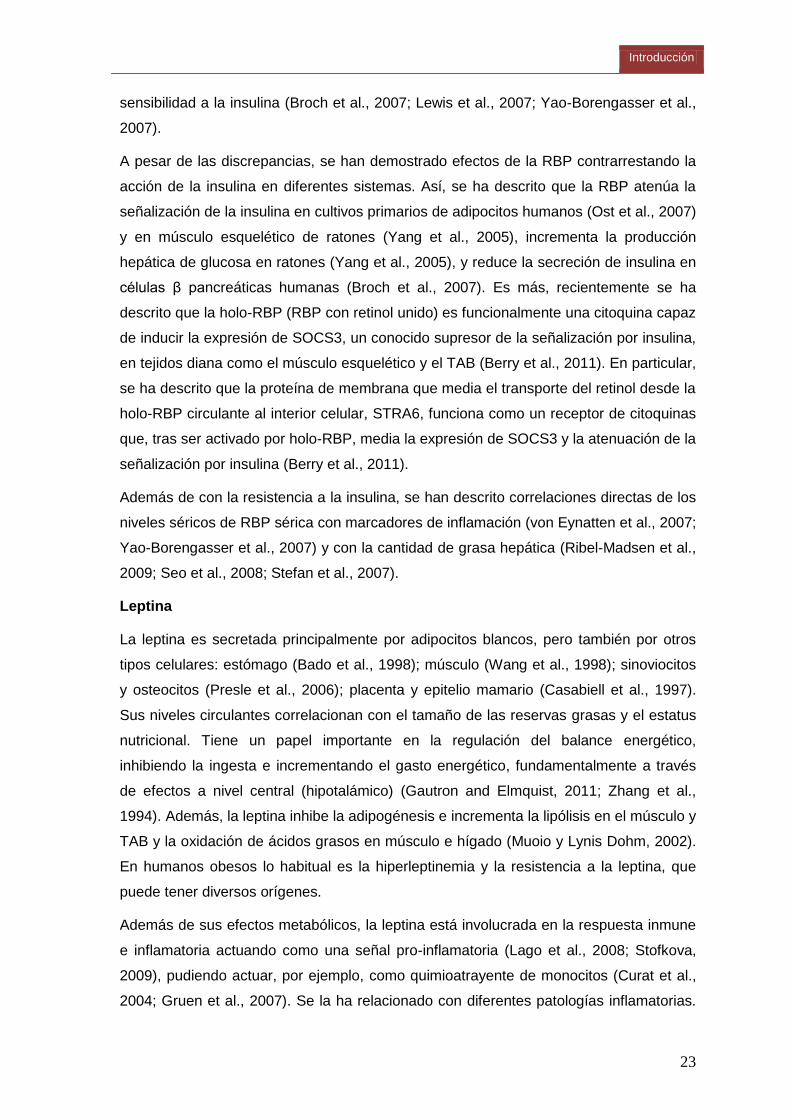
especies reactivas del oxígeno (véase el apartado 1.2.5) (Figura 1).
Las principales vías de señalización pro-inflamatorias asociadas a la obesidad son la vía
del factor nuclear kappa B (NFκB), la vía de la C-JUN N-terminal quinasa (JNK) y la vía
Janus quinasa/transductor de la señal y activador de la transcripción (vía JAK/STAT).
Estas vías se introducen brevemente a continuación.
a) Vía IKKβ/NFκB
Es la vía de señalización dominante en la inflamación. Se relacionó por primera vez con
la obesidad en el año 2001, cuando se observó que ratones transgénicos IKKβ +/- no
desarrollaban resistencia a la insulina en el estado obeso (Yuan et al., 2001). Desde
entonces, la activación de esta vía se ha observado en adipocitos, hepatocitos y
neuronas en condiciones de obesidad.
IKKβ (quinasa inhibidora del inhibidor kappa B) es una proteína quinasa que cataliza la
fosforilación del inhibidor kappa B (IκBα), marcándolo de ese modo para su posterior
ubiquitinización y degradación en el proteosoma (Baeuerle and Henkel, 1994); la
degradación de IκBα permite la liberación del factor de transcripción NFκB, que puede
entonces viajar al núcleo y ejercer su actividad transcripcional (Karin and Ben-Neriah,
2000).
La actividad de NFκB inhibe la expresión y actividad del PPARγ (peroxisome
proliferator-activated receptor gamma, principal factor de transcripción adipogénico) (Ye,
2008), e incrementa la síntesis de citoquinas pro-inflamatorias factor de necrosis
tumoral α (TNFα), interleuquina-1 (IL-1), interleuquina-6 (IL-6), factor quimiotáctico de
macrófagos (MCP-1) moléculas de adhesión intercelular (ICAM-1) y moléculas de
adhesión vascular (VCAM-1). Además, IKKβ tiene la capacidad de fosforilar
directamente al sustrato 1 del receptor de insulina (IRS-1) en residuos de serina,
inhibiendo así la señalización de la insulina (Gao et al., 2002).
En el estado obeso la vía IKKβ/NFκB puede ser activada por señales extracelulares
e.g. TNFα (Hotamisligil, 1999; Peraldi and Spiegelman, 1998), IL-1, ácidos grasos (Itani
et al., 2002; Kim et al., 2001; Yuan et al., 2001) y por señales intracelulares e. g.
Tesis Doctoral Núria Granados Borbolla
6
especies reactivas del oxígeno (Mercurio et al., 1997; Piette et al., 1997), señales de
estrés del retículo endoplásmico, diacilglicerol y ceramidas (de Luca and Olefsky, 2008).
Entre las quinasas corriente arriba activadoras de IKKβ está la proteína quinasa C
(PKC), activada por diacilglicerol (Tojima et al., 2000).
b) Vía de la JNK
JNK es una proteína serina quinasa ubicua. Se la empezó a relacionar con la
obesidad/metabolismo cuando se descubrió que, en respuesta a TNFα, JNK inhibía la
respuesta a la insulina mediante fosforilación de un residuo de serina de IRS-1 (Aguirre
et al., 2000; Rui et al., 2001). Además, JNK activa el factor de transcripción activador de
la proteína 1 (AP1), que a su vez regula la transcripción génica de factores inflamatorios.
De las tres isoformas conocidas, JNK1 ha sido la más estudiada en el campo de la
obesidad. JNK1 es activada en el estado obeso por TNFα, ácidos grasos, insulina,
activadores de la PKC (diacilglicerol), ceramidas y señales de estrés del retículo
endoplásmico (Aguirre et al., 2002; Gao et al., 2004; Gao et al., 2003; Jiang et al., 2003;
Lee et al., 2003b; Ozcan et al., 2004; Rui et al., 2001). JNK1 promueve la resistencia a
la insulina sistémica a través de la inflamación del hígado (Nakatani et al., 2004) y el
tejido adiposo (Sabio et al., 2008). En páncreas, la activación de JNK por citoquinas
media la inflamación y la apoptosis (Abdelli et al., 2004; Ammendrup et al., 2000) y
disfunción de las células β (Kaneto et al., 2004; Kaneto et al., 2002). La inhibición de
JNK mejora la sensibilidad a la insulina en animales obesos con resistencia a la insulina
(Bennett et al., 2003).
c) Vía JAK/STAT
Muchas citoquinas y factores de crecimiento ponen en marcha esta vía en sus células
diana. En respuesta a la unión de la citoquina a su correspondiente receptor de
membrana se activan tirosina proteína quinasas intracelulares (de la familia de las Janus
quinasas, JAKs) que fosforilan e inducen la dimerización y el transporte al núcleo de
factores de transcripción de la familia STAT. La actividad de las STATs se asocia a
respuestas metabólicas e inflamatorias. La vía JAK/STAT es regulada negativamente
por los “supresores de la señalización por citoquinas” (SOCS), que son importantes
reguladores fisiológicos de la inflamación y la inmunidad (Tamiya et al., 2011). Las
SOCS (e.g. SOCS3) también están implicadas en la atenuación de la señalización por
insulina y leptina.
STAT3 ha sido estrechamente relacionado con la obesidad ya que es activado por
leptina, IL-6 e IL-10. Esta vía de regulación metabólica actúa tanto a nivel central como
periférico. En el sistema nervioso central inhibe la ingesta y promueve el gasto
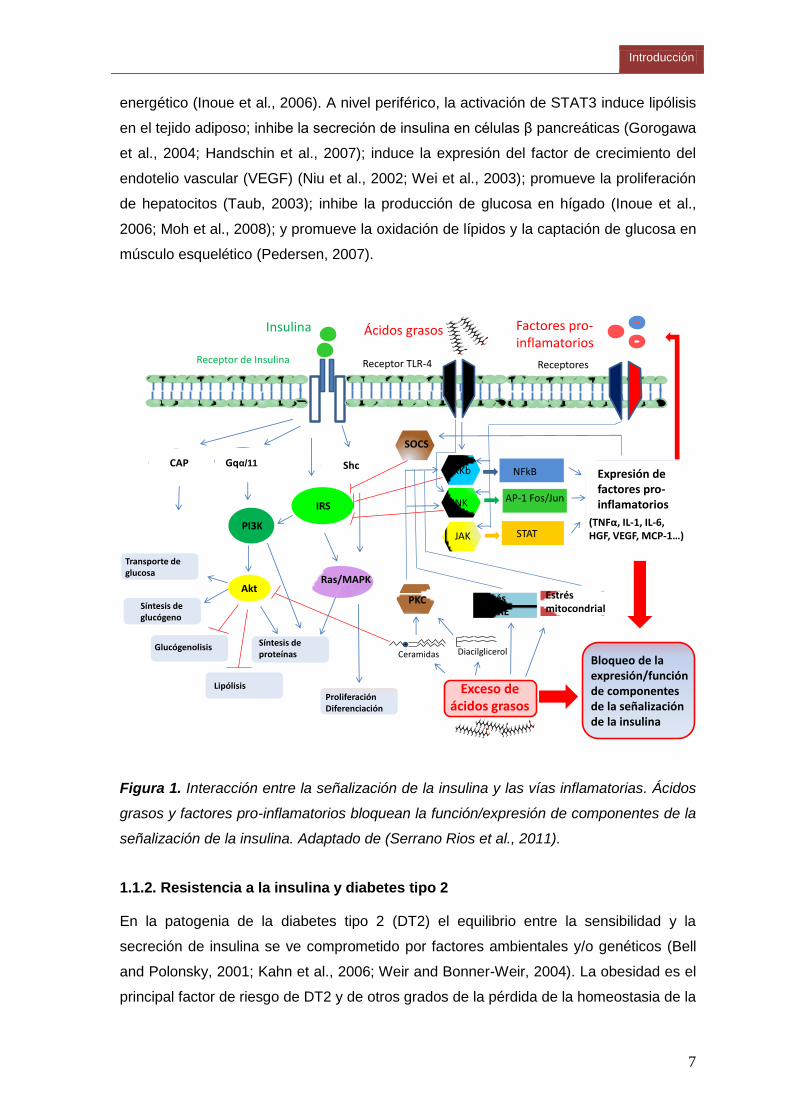
Introducción
7
energético (Inoue et al., 2006). A nivel periférico, la activación de STAT3 induce lipólisis
en el tejido adiposo; inhibe la secreción de insulina en células β pancreáticas (Gorogawa
et al., 2004; Handschin et al., 2007); induce la expresión del factor de crecimiento del
endotelio vascular (VEGF) (Niu et al., 2002; Wei et al., 2003); promueve la proliferación
de hepatocitos (Taub, 2003); inhibe la producción de glucosa en hígado (Inoue et al.,
2006; Moh et al., 2008); y promueve la oxidación de lípidos y la captación de glucosa en
músculo esquelético (Pedersen, 2007).
Estrés mitocondrial
Insulina
Receptor de Insulina Receptor TLR-4
IRS
Gqα/11
PI3K
Akt
Transporte de glucosa
Síntesis de glucógeno
Glucógenolisis
Lipólisis
Síntesis deproteínas
Ras/MAPK
Proliferación Diferenciación
IKKb
JNK
NFkB
AP-1 Fos/Jun
Estrés del RE
Shc
SOCS
Expresión de factores pro-inflamatorios
Bloqueo de la expresión/función de componentes de la señalización de la insulina
PKC
JAK STAT
Exceso de ácidos grasos
Diacilglicerol Ceramidas
Ácidos grasos
Receptores
(TNFα, IL-1, IL-6, HGF, VEGF, MCP-1…)
CAP
Factores pro-inflamatorios
Figura 1. Interacción entre la señalización de la insulina y las vías inflamatorias. Ácidos
grasos y factores pro-inflamatorios bloquean la función/expresión de componentes de la
señalización de la insulina. Adaptado de (Serrano Rios et al., 2011).
1.1.2. Resistencia a la insulina y diabetes tipo 2
En la patogenia de la diabetes tipo 2 (DT2) el equilibrio entre la sensibilidad y la
secreción de insulina se ve comprometido por factores ambientales y/o genéticos (Bell
and Polonsky, 2001; Kahn et al., 2006; Weir and Bonner-Weir, 2004). La obesidad es el
principal factor de riesgo de DT2 y de otros grados de la pérdida de la homeostasia de la
Tesis Doctoral Núria Granados Borbolla
8
glucosa, hasta el punto que se ha acuñado el término diabesity para referirse a esta
pandemia de enfermedades gemelas (Astrup and Finer, 2000).
Los parámetros de diagnóstico de la DT2 incluyen resistencia a la insulina,
hiperinsulinemia e hiperglucemia. En general, se acepta que la hiperinsulinemia es una
respuesta compensatoria a la resistencia a la insulina, resultado de una hipertrofia de
las células β pancreáticas y un deficiente mecanismo de captación de insulina por parte
del hígado. La hiperglucemia, que define esta enfermedad, tiene lugar cuando los
mecanismos de compensación fallan.
La insulina es la principal hormona anabólica en mamíferos y es esencial para la
homeostasis metabólica. Sintetizada y secretada por las células β de los islotes
pancreáticos de Langerhans, juega un papel crucial en la homeostasia de la glucosa
mediante efectos coordinados sobre la captación de glucosa, el metabolismo y el
almacenamiento de energía en tejidos clave como músculo esquelético, células β, tejido
adiposo e hígado. En particular, la insulina es fundamental en la regulación de todos los
aspectos de la biología de los adipocitos: promueve la adipogénesis, la síntesis de
triacilgliceroles, induce la lipogénesis, e inhibe la lipólisis.
La acción de la insulina empieza con su unión a receptores de membrana en tejidos
diana, desencadenando una cascada de señalizaciones intracelulares que se inicia con
la activación de la actividad tirosina quinasa del propio receptor de insulina, seguida del
reclutamiento y la fosforilación en residuos de tirosina de los “sustratos intracelulares del
receptor de insulina” (IRSs, particularmente IRS-1 e RS-2), que a su vez activarán a la
fosfatidil inositol 3 quinasa (PI3Ks) y a la proteína quinasa B (PKB/Akt), críticas en la
mediación de los efectos metabólicos de la insulina, a través de una compleja red de
señales corriente abajo (Figura 1). De igual relevancia es la activación de la vía Ras-
proteína quinasa activada por mitógenos (MAPK), crucial en los efectos mitogénicos de
la insulina.
La resistencia a la insulina es una constante en la fisiopatología de la obesidad y la DT2,
constituyendo el mayor enlace entre ambas condiciones. La inflamación crónica de bajo
grado asociada a la obesidad es un mecanismo etiológico importante en la disminución
de la señalización de la insulina.
Distintos mecanismos, no mutuamente excluyentes, han sido propuestos para explicar
el desarrollo de la resistencia a la insulina en la obesidad. En síntesis, todos los
individuos tenemos una capacidad máxima de expansión del tejido adiposo,
determinada por factores genéticos y ambientales. Cuando se alcanza este máximo,
numerosos mecanismos (hipertrofia del adipocito, necrosis, hipoxia y señales de estrés
Introducción
9
oxidativo y del retículo endoplásmico) activan vías inflamatorias que interfieren con la
señalización de la insulina, a la vez que contribuyen a la infiltración y activación de
macrófagos que a su vez se convertirán en una fuente importante de señales
inflamatorias (véase el apartado 1.2.5). Así pues los propios adipocitos, “sordos” a la
señalización de la insulina, inician un metabolismo lipolítico con la consecuente
liberación de ácidos grasos, además de adipoquinas y mediadores inflamatorios que
junto a los producidos por los macrófagos tendrán un efecto sistémico sobre la
sensibilidad a la insulina. Mucha evidencia científica respalda el concepto de que las
células adiposa obesas liberan ácidos grasos a la circulación, que podrán ser captados
por tejidos periféricos que, en condiciones fisiológicas, también poseen cierta capacidad
de almacenar grasa, como son el músculo esquelético, el hígado, las células β
pancreáticas, y probablemente otros (Smith and Ravussin, 2002).
Los ácidos grasos inducen inflamación y resistencia a la insulina por varios
mecanismos. Por una parte, son capaces de activar la vía IKK/NFκB en adipocitos y
macrófagos mediante su unión al receptor de membrana TLR4 (Toll Like Receptor 4)
(Gao et al., 2004; Lee et al., 2003a; Shi et al., 2006) (Figura 1). Un segundo mecanismo
ocurre a nivel intracelular. Cuando el flujo de ácidos grasos procedentes del adipocito
obeso es excesivo, la capacidad de síntesis de triacilgliceroles en las células que los
captan puede llegar a saturarse, y se acumulan productos intermedios como ácido
lisofosfatídico, ácido fosfatídico y diaciglicerol, que a su vez estimulan la síntesis de
ceramidas. Todos estos compuestos interfieren con las vías de señalización de la
insulina, produciendo lipotoxicidad (de Luca and Olefsky, 2008; Schenk et al., 2008). Por
ejemplo, el diacilglicerol y las ceramidas son activadores alostéricos de ciertas isoformas
de PKC inactivadoras de IRS-1 e inducen las vías inflamatorias IKKB/ NFκB y JNK
(Ballou et al., 1996; Brose and Rosenmund, 2002) (Figura 1). Las ceramidas poseen
también la capacidad de inactivar la PKB/Akt en hígado, en células β y en músculo
(Corcoran et al., 2007; de Luca and Olefsky, 2008; Donnelly et al., 2005; Haber et al.,
2003; Schenk et al., 2008; Zierath, 2007). Por último, el exceso de ácidos grasos en
adipocitos y tejidos con capacidad de almacenar lípidos provoca estrés en la
mitocondria y el retículo endoplásmico que se traduce en la producción de señales
activadoras de las vías inflamatorias (de Luca and Olefsky, 2008; Gambert and Ricquier,
2007; Hotamisligil, 2010; Schenk et al., 2008).
En resumen, en el estado obeso, el incremento de los niveles de ácidos grasos
circulantes procedentes de la lipólisis en el tejido adiposo y señales inflamatorias
procedentes del tejido adiposo y de otros tejidos serán los principales desencadenantes
de la resistencia a la insulina sistémica y en tejidos clave (véase la Figura 2). En
Tesis Doctoral Núria Granados Borbolla
10
humanos, por ejemplo, se ha demostrado que un exceso de ácidos grasos circulantes
puede disminuir en un 50% la captación y metabolismo de la glucosa en músculo
esquelético (Lois and Kumar, 2009; Roden, 2004; Shulman, 2000).
A pesar de la extensa evidencia epidemiológica de la asociación entre obesidad y DT2,
existe aproximadamente un 23-24% de obesos que no desarrollan la enfermedad. Esto
ha sugerido que la disfunción de las células β del páncreas podría ser decisiva en el
desarrollo de la hiperglucemia que define la DT2 (Ahren and Pacini, 2005; Kahn et al.,
2006; Muoio and Newgard, 2008; Weir and Bonner-Weir, 2004). De hecho, recientes
estudios de asociación del genoma completo con la DT2 muestran que la mayoría de los
loci génicos identificados están relacionados con la alteración de la función de células β.
Estos hallazgos, aunque no descartan la importancia de la resistencia a la insulina,
ponen de relieve la contribución genética de la disfunción de las células β en la
patogénesis de la DT2 (Florez, 2008).
1.1.3. Enfermedad cardiovascular
La obesidad es uno de los principales factores de riesgo de enfermedad cardiovascular
(ECV). La relación entre obesidad y riesgo cardiovascular es compleja y está mediada
por varios mecanismos biológicos. Aunque el término ECV incluya todas las
enfermedades que afectan al sistema cardiovascular (hipertensión, disfunción endotelial,
enfermedad coronaria, etc.), usualmente se utiliza para referirse a aquellas que afectan
a las arterias, y en concreto a la aterosclerosis (del griego athero (pasta) y skleros (duro,
piedra)).
La aterosclerosis es un proceso inflamatorio crónico en la pared arterial por el depósito e
infiltración de sustancias lipídicas en las paredes de mediano y grueso calibre (Ross,
1999). Provoca una reacción inflamatoria y la multiplicación y migración de las células
musculares lisas de la pared que van produciendo estrechamientos de la luz arterial.
Los engrosamientos concretos se denominan placas de ateroma. En casos avanzados
se observa un proceso de calcificación de las placas de ateroma que aumenta el riesgo
de ruptura, ulceración o erosión de las mismas, además de su exposición a agentes
trombogénicos. Si los trombos se desprenden y viajan por el torrente sanguíneo pueden
ocluir el flujo en arterias coronarias, cerebrales o pulmonares causando ataques al
corazón, accidentes cerebrovasculares o embolias pulmonares que junto con
aneurismas (debilitamiento de la pared arterial causado principalmente por las placas de
ateroma) constituye la principal causa de muerte en los países occidentales.
Inflamación y resistencia a la insulina en el endotelio, dislipidemia, y acumulación
patológica de lípidos en el corazón y la médula ósea son condiciones asociadas al
Introducción
11
estado obeso que impactan negativamente en todos los elementos de la patogénesis de
la enfermedad cardiovascular (véase la Figura 2):
a) Obesidad y disfunción endotelial
En la obesidad, los elevados niveles circulantes de ácidos grasos, citoquinas pro-
inflamatorias y especies reactivas del oxígeno interfieren con importantes vías de
señalización intracelular en células endoteliales; las consecuencias más destacables
son el desarrollo de resistencia a la insulina y la producción de mediadores inflamatorios
(TNFα, MCP-1, IL-8, ICAM-1 y VCAM-1) que promueven la infiltración de monocitos
circulantes y su activación a macrófagos en el espacio sub-endotelial (Boden, 2008;
Curat et al., 2004; Gruen et al., 2007; Pilz and Marz, 2008; Steinberg et al., 2000).
Una de las manifestaciones de la resistencia a la insulina en el endotelio es la inhibición
de la óxido nítrico sintasa endotelial (eNOS), y con ello una menor producción de óxido
nítrico (ON) (Cersosimo and DeFronzo, 2006). El ON secretado por las células
endoteliales es un vasodilatador y un potente inhibidor de la agregación plaquetaria y la
adhesión a la pared vascular (Caballero, 2003). Además, este gas reduce la
permeabilidad vascular y la tasa de oxidación de las LDL, e inhibe la proliferación de
células musculares lisas (Kim et al., 2006). La insulina normalmente estimula la
producción de ON endotelial, en lo que parece ser un mecanismo destinado a
incrementar la disponibilidad de glucosa para los tejidos; de hecho, se ha estimado que
entre el 25-40% del incremento de captación de glucosa inducida por insulina en el
músculo se debe al incremento del flujo sanguíneo mediado por ON (Kim et al., 2006).
En respuesta a la insulina, la eNOS es normalmente activada por fosforilación catalizada
por la PKB/Akt. La hiperglucemia inhibe per se la producción de ON por favorecer la
glicosilación de la eNOS en el residuo de serina diana de la PKB/Akt (Du et al., 2001).
Esto es parte de la relación subyacente entre diabetes y aterosclerosis (Caballero,
2003).
b) Obesidad y retención sub-endotelial de las LDL
La retención de las LDL en el sub-endotelio es un evento temprano en la aterosclerosis
que queda potenciado en condiciones de obesidad. En primer lugar, porque sobrepeso y
obesidad se asocian a niveles circulantes aumentados de LDL. Y en segundo lugar,
porque en la obesidad se favorecen determinadas modificaciones de las LDL que
suponen un aumento del potencial aterogénico de estas lipoproteínas. La interacción
entre las LDL y los proteoglicanos de la pared arterial depende de enlaces
electrostáticos entre grupos amino (+) de la apolipoproteína B100 (apoB100) y grupos
Tesis Doctoral Núria Granados Borbolla
12
cargados negativamente de los proteoglicanos. Modificaciones post- traduccionales de
la apoB100 pueden modificar la afinidad de esta proteína por los proteoglicanos y en
consecuencia modificar el potencial aterogénico de las LDL. Es bien conocido el
incremento del potencial aterogénico de las LDL tras ser oxidadas (Steinberg et al.,
1989). Más recientemente, se ha descrito que la glicosilación de la apoB100 cuadruplica
su potencial aterogénico (Rabbani et al., 2011). Este hallazgo contribuye a comprender
a nivel molecular la relación entre DT2 y enfermedad cardiovascular.
c) Obesidad y respuesta inflamatoria originada por el material retenido
Los macrófagos infiltrados en el espacio sub-endotelial ingieren lípidos y colesterol de
las LDL y se convierten en las llamadas células espumosas, que contribuyen al
crecimiento de la placa de ateroma. Los ácidos grasos, cuyos niveles circulantes están
aumentados en la obesidad, son ligandos activadores de los receptores TLR4 de la
superficie de macrófagos, y la activación de estos receptores desemboca en el
reclutamiento y activación de más monocitos circulantes, y la retención de más lípidos y
proteínas aterogénicas. En definitiva, se inicia un proceso que se retroalimenta
positivamente y finaliza con la formación de la placa de ateroma.
d) Obesidad y lipotoxicidad cardiaca
En el estado obeso, el exceso de lípidos puede acumularse tanto dentro del corazón, en
adipocitos inter-miocitos, como en la capa superficial de tejido adiposo que envuelve al
corazón. Esta capa de tejido adiposo tiene una gran capacidad de secretar ácidos
grasos que sirven de sustrato metabólico para el miocardio, pero también puede
convertirse en una fuente de proteínas pro-aterogénicas y pro- inflamatorias como
ocurre en pacientes con enfermedad coronaria (Baker et al., 2009). Además, en el
estado obeso incrementa el número de adipocitos intercalados entre los miocitos, que
pueden provenir de células madre mesenquimales (destinadas normalmente a
reemplazar miocitos) (Gesta et al., 2007; Hill et al., 2009) o de la transdiferenciacion de
miocitos maduros (Aguiari et al., 2008). Este incremento de masa adiposa (interna y
externa) no contráctil contribuye al fallo cardiaco y a la ateroesclerosis de las coronarias.
e) Obesidad y recambio/reparación del endotelio
Dentro de la población de células multipotentes de la médula ósea, las células
progenitoras endoteliales (EPCs, endothelial progenitor cells) son aquellas que han
adquirido el compromiso para diferenciarse en células endoteliales y tienen la capacidad
de migrar desde la medula ósea para reparar el endotelio dañado o para crear nuevos
Introducción
13
vasos sanguíneos en respuesta a ON y varias citoquinas, incluyendo VEGF (vascular
endothelial growth factor) y SCF (stem cell factor) (Aicher et al., 2003). Las EPCs juegan
un papel crucial en la biología cardiovascular, hasta tal punto que el número de EPCs
circulantes se considera un reflejo de la salud cardiovascular (Fadini et al., 2006). Todos
los factores de riesgo aterogénico (diabetes, hipercolesterolemia, hipertensión y
tabaquismo) se han asociado con una menor cantidad o disfunción de las EPCs (Fadini
et al., 2005; Kondo et al., 2004; Levy, 2005; Urbich and Dimmeler, 2005).
La obesidad abdominal y el síndrome metabólico se asocian a una menor cantidad de
EPCs circulantes (Westerweel et al., 2008), hecho que se ha relacionado con un
incremento de la adipogénesis en la médula ósea en detrimento de la hematopoyesis
(Calvo et al., 1976; Naveiras et al., 2009). Recíprocamente, la pérdida de peso se asocia
con un incremento de las EPCs circulantes (Muller-Ehmsen et al., 2008). La
adiponectina, una adipoquina con actividad anti-diabética y anti-aterosclerótica cuyos
niveles circulantes están reducidos en la obesidad (ver apartado 1.2.4), es un
quimioatrayente y estimulador de la diferenciación de las EPCs (Kondo et al., 2009;
Shibata et al., 2008).
1.1.4. Osteoartritis
La osteoartritis o enfermedad degenerativa articular es una patología multifactorial
caracterizada por la pérdida de cartílago articular. La visión actual es que se trata de un
desorden sistémico músculo-esquelético que afecta a la articulación en su conjunto,
incluido el hueso subcondral y la cápsula sinovial (membrana y tejido periarticular)
(Goldring and Goldring, 2007; Samuels et al., 2008). También se ha reconsiderado el
papel de la inflamación en el desarrollo de la osteoartritis. Así, aunque la osteoartritis no
haya sido tradicionalmente considerada una enfermedad inflamatoria (ya que no se da
un incremento importante del número de leucocitos en el líquido sinovial), creciente
evidencia científica demuestra la existencia de inflamación del sinovio en etapas
tempranas de la enfermedad. Los sinoviocitos inflamados secretan citoquinas pro-
inflamatorias que favorecen la infiltración de células del sistema inmune, y finalmente
tanto el hueso subcondral como el propio cartílago activan la destrucción del cartílago
mediante la producción de enzimas que degradan la matriz extracelular (Aspden, 2008;
Iannone and Lapadula, 2010).
La obesidad es un factor de riesgo de desarrollo de osteoartritis. Tradicionalmente, la
relación entre obesidad y osteoartritis se explicaba únicamente por razones
biomecánicas. Sin embargo, actualmente se considera que esta relación tiene una base
metabólica, como lo indican el hecho de que la obesidad es un factor de riesgo de
Tesis Doctoral Núria Granados Borbolla
14
osteoartritis no sólo en las articulaciones que deben soportar un exceso de peso
(rodillas, caderas) sino también en las que no soportan peso, como las de las manos, y
que la pérdida de masa grasa mejora los síntomas de la osteoartritis más que la pérdida
de peso corporal per se (Aspden et al., 2001; Griffin and Guilak, 2008; Iannone and
Lapadula, 2010; Pottie et al., 2006).
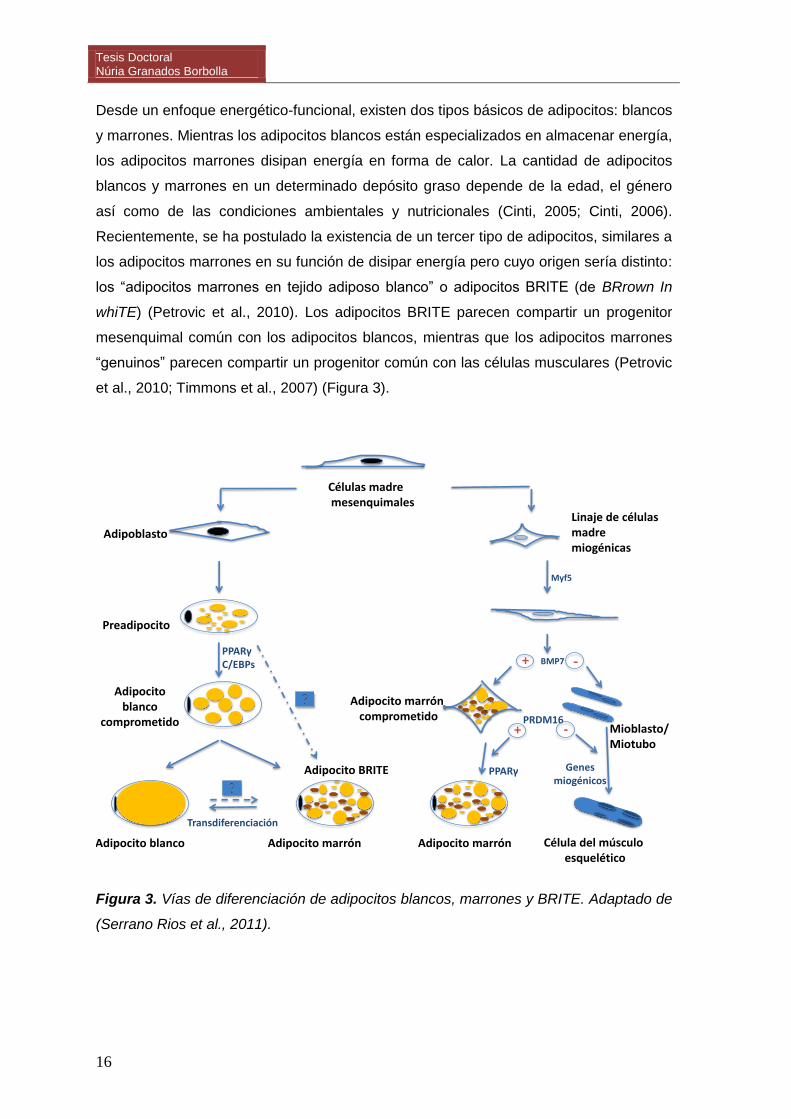
Existen varios niveles de conexión entre obesidad y osteoartritis (véase la Figura 2). Por
una parte, a nivel sistémico, la producción y secreción alterada de adipoquinas y
mediadores inflamatorios en el tejido adiposo, la hiperlipidemia y el estrés oxidativo son
condiciones frecuentemente asociadas a la obesidad que favorecen la degeneración de
las articulaciones. Por otra parte, existen depósitos de grasa en las articulaciones
(adipocitos en grasa infrapatelar de la rodilla y en la médula ósea) cuya secreción de
adipoquinas y factores inflamatorios también puede afectar a la funcionalidad de los
tejidos de la articulación. Además, en la obesidad podría verse comprometida la
capacidad del organismo de mantener y regenerar las articulaciones (véase a
continuación).
Complejas vías de señalización y factores de crecimiento regulan la formación de las
articulaciones durante el desarrollo embrionario, y estas mismas vías, aunque menos
activas, son responsables de mantener la homeostasia articular en la vida adulta (De
Bari et al., 2010). La pérdida de esa homeostasia, como ocurre con la edad y
probablemente en el estado obeso, conduce a la aparición de osteoartritis en múltiples
articulaciones (De Bari et al., 2010). Los mecanismos subyacentes a esta pérdida de
homeostasia podrían en parte tener su origen, tal y como hemos visto en el apartado
anterior, en la degeneración grasa de la médula ósea. Aquí hay células madre
mesenquimales (BMSCs, bone marrow stem cells) capaces de diferenciarse en
diferentes tipos celulares incluidos adipocitos, condro-/osteo-blastos y miocitos. La
diferenciación de las BMSCs en los diferentes linajes está competitivamente equilibrada:
factores de transcripción que promueven la diferenciación en un determinado linaje
inhiben activamente la diferenciación en los otros linajes. Por ejemplo, el PPARγ, factor
clave para la adipogénesis, inhibe la diferenciación terminal de osteoblastos al inhibir la
expresión de Runx2 (Takada et al., 2009b); en relación con ello, es bien conocido el
efecto de las tiazolidinedionas ligandos sintéticos del PPARγ utilizados en clínica
como anti-diabéticos sobre la reducción de masa ósea (Lecka-Czernik, 2010).
Recíprocamente, vías de señalización que estimulan la osteoblastogénesis de BMSCs,
como las iniciadas por Wnt-5a, TNF e IL-1, promueven la represión del PPARγ
(Takada et al., 2009a). También hay un control recíproco de la adipogénesis y la
Introducción
15
condrogénesis de BMSCs: Sox9, factor clave de la condrogénesis, inhibe la
adipogénesis al inhibir la expresión de los factores de transcripción adipogénicos
tempranos CEBPβ y CEBPδ, y Pref-1, un marcador de preadipocitos e inhibidor de la
adipogénesis, induce la expresión de Sox9 (Wang and Sul, 2009).
Expansión del tejido adiposo (hipertrofia e hiperplasia)Secreción de adipoquinas alteradaHipoxia y necrosis de adipocitosReclutamiento y activación de monocitos/macrófagosActivación vías inflamatorias
Señalización paracrina entre adipocitos y macrófagosLipólisis incrementadaInflamación del tejido adiposo y desarrollo de resistencia a la insulina
Secreción de ácidos grasosy factores inflamatorios
Disfunción endotelial;resistencia a la insulina en endotelio.
Incremento de masa grasa enlas articulaciones
Diferenciación patológica de células progenitoras en adipocitos.
Enfermedad cardiovascular
↓ Captación de glucosa en músculo;lipotoxicidad muscular.
Disfunción de células βpancreáticas
Resistencia a la insulina sistémicaDiabetes tipo 2
Acumulación de grasa en el corazón y pericárdica
Osteoartritis
↑ Producción de glucosa y dislipidemia
Figura 2. Impacto de la lipotoxicidad e inflamación sistémica en las comorbilidades de la
obesidad.
1.2. EL TEJIDO ADIPOSO EN EL CONTEXTO DE LA OBESIDAD Y SUS
COMPLICACIONES
El tejido adiposo es un tejido conjuntivo de origen mesenquimal formado
mayoritariamente por células especializadas en la acumulación de lípidos en su
citoplasma: los adipocitos. Además de éstos, se encuentran en el tejido adiposo otros
tipos celulares tales células mesenquimales multipotentes, células del sistema inmune
(macrófagos, células dendríticas, mastocitos, linfocitos y granulocitos), células
endoteliales y fibroblastos, que en conjunto constituyen la llamada fracción estromo-
vascular del tejido.
Tesis Doctoral Núria Granados Borbolla
16
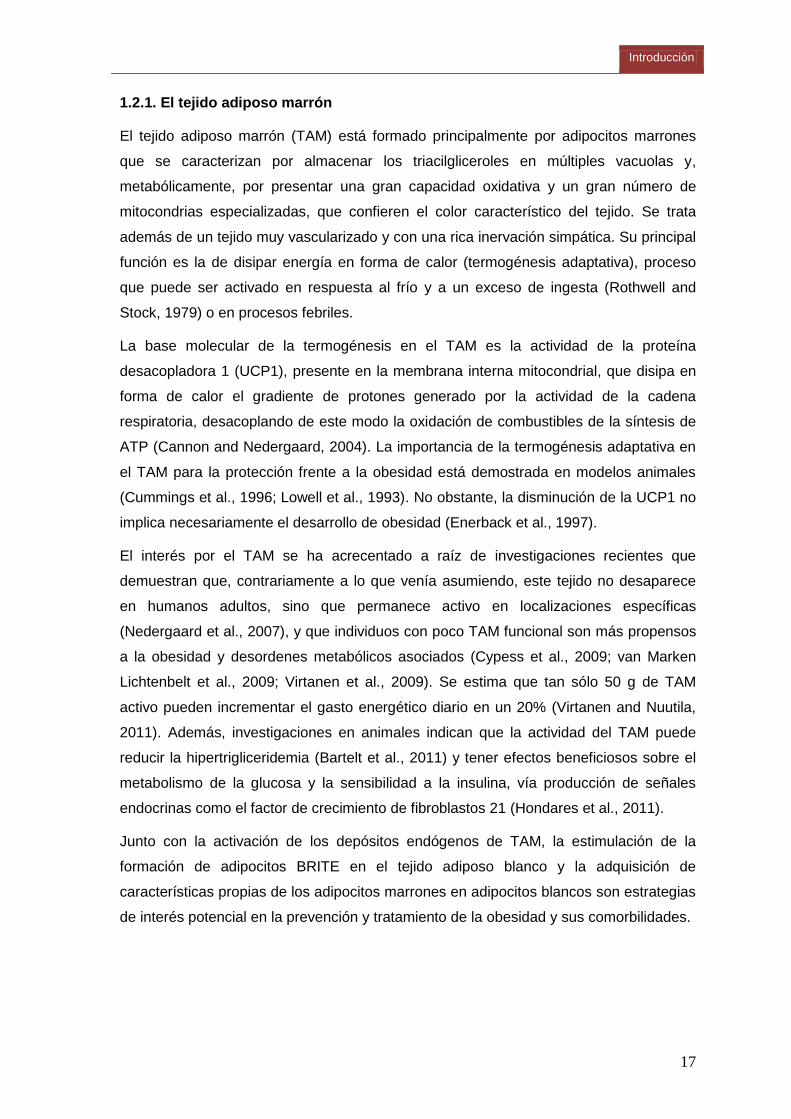
Desde un enfoque energético-funcional, existen dos tipos básicos de adipocitos: blancos
y marrones. Mientras los adipocitos blancos están especializados en almacenar energía,
los adipocitos marrones disipan energía en forma de calor. La cantidad de adipocitos
blancos y marrones en un determinado depósito graso depende de la edad, el género
así como de las condiciones ambientales y nutricionales (Cinti, 2005; Cinti, 2006).
Recientemente, se ha postulado la existencia de un tercer tipo de adipocitos, similares a
los adipocitos marrones en su función de disipar energía pero cuyo origen sería distinto:
los “adipocitos marrones en tejido adiposo blanco” o adipocitos BRITE (de BRrown In
whiTE) (Petrovic et al., 2010). Los adipocitos BRITE parecen compartir un progenitor
mesenquimal común con los adipocitos blancos, mientras que los adipocitos marrones
“genuinos” parecen compartir un progenitor común con las células musculares (Petrovic
et al., 2010; Timmons et al., 2007) (Figura 3).
Adipocito marrón comprometido
PPARγC/EBPs
Transdiferenciación
BMP7
Linaje de células madre miogénicas
PRDM16+
PPARγ Genes miogénicos
Células madremesenquimales
Adipoblasto
Preadipocito
Adipocito blanco
comprometido
Adipocito blanco Adipocito marrón Adipocito marrón Célula del músculo esquelético
Mioblasto/Miotubo
Myf5
Adipocito BRITE
-
+ -
Figura 3. Vías de diferenciación de adipocitos blancos, marrones y BRITE. Adaptado de
(Serrano Rios et al., 2011).
Introducción
17
1.2.1. El tejido adiposo marrón
El tejido adiposo marrón (TAM) está formado principalmente por adipocitos marrones
que se caracterizan por almacenar los triacilgliceroles en múltiples vacuolas y,
metabólicamente, por presentar una gran capacidad oxidativa y un gran número de
mitocondrias especializadas, que confieren el color característico del tejido. Se trata
además de un tejido muy vascularizado y con una rica inervación simpática. Su principal
función es la de disipar energía en forma de calor (termogénesis adaptativa), proceso
que puede ser activado en respuesta al frío y a un exceso de ingesta (Rothwell and
Stock, 1979) o en procesos febriles.
La base molecular de la termogénesis en el TAM es la actividad de la proteína
desacopladora 1 (UCP1), presente en la membrana interna mitocondrial, que disipa en
forma de calor el gradiente de protones generado por la actividad de la cadena
respiratoria, desacoplando de este modo la oxidación de combustibles de la síntesis de
ATP (Cannon and Nedergaard, 2004). La importancia de la termogénesis adaptativa en
el TAM para la protección frente a la obesidad está demostrada en modelos animales
(Cummings et al., 1996; Lowell et al., 1993). No obstante, la disminución de la UCP1 no
implica necesariamente el desarrollo de obesidad (Enerback et al., 1997).
El interés por el TAM se ha acrecentado a raíz de investigaciones recientes que
demuestran que, contrariamente a lo que venía asumiendo, este tejido no desaparece
en humanos adultos, sino que permanece activo en localizaciones específicas
(Nedergaard et al., 2007), y que individuos con poco TAM funcional son más propensos
a la obesidad y desordenes metabólicos asociados (Cypess et al., 2009; van Marken
Lichtenbelt et al., 2009; Virtanen et al., 2009). Se estima que tan sólo 50 g de TAM
activo pueden incrementar el gasto energético diario en un 20% (Virtanen and Nuutila,
2011). Además, investigaciones en animales indican que la actividad del TAM puede
reducir la hipertrigliceridemia (Bartelt et al., 2011) y tener efectos beneficiosos sobre el
metabolismo de la glucosa y la sensibilidad a la insulina, vía producción de señales
endocrinas como el factor de crecimiento de fibroblastos 21 (Hondares et al., 2011).
Junto con la activación de los depósitos endógenos de TAM, la estimulación de la
formación de adipocitos BRITE en el tejido adiposo blanco y la adquisición de
características propias de los adipocitos marrones en adipocitos blancos son estrategias
de interés potencial en la prevención y tratamiento de la obesidad y sus comorbilidades.
Tesis Doctoral Núria Granados Borbolla
18
1.2.2. El tejido adiposo blanco
El tejido adiposo blanco (TAB) se encarga de almacenar el exceso de energía en forma
de triacilgliceroles y de proporcionarla cuando el organismo lo requiere. En una situación
de demanda energética, los triacilgliceroles almacenados en el TAB son hidrolizados por
lipasas, en un proceso conocido como lipólisis, de forma que se liberan ácidos grasos
no esterificados y glicerol a la circulación, los cuales serán utilizados como sustratos
oxidables para satisfacer los requerimientos energéticos de otros tejidos, principalmente
músculo, hígado y riñón.
Dos enzimas juegan un papel clave en el proceso lipolítico: la triacilglicerol lipasa
adiposa (ATGL, adipose triglyceride lipase) y la lipasa sensible a las hormonas (HSL,
hormone sensitive lipase). Se acepta hoy día que la ATGL inicia la movilización de los
triacilgliceroles produciendo diacilgliceroles que son subsecuentemente hidrolizados por
la HSL. El proceso lipolítico en el TAB mediado por estas enzimas se encuentra
finamente controlado por ciertas hormonas tales como la insulina, las catecolaminas y
los glucocorticoides, cuya secreción, a su vez, está regulada por el estatus nutricional
del organismo (Jaworski et al., 2007).
En situaciones de abundancia energética, la insulina inhibe normalmente la lipólisis
(inhibición de HSL y ATGL) a la vez que estimula la lipogénesis en el TAB, al estimular
la captación por los adipocitos de ácidos grasos de los triacilgliceroles contenidos en
lipoproteínas circulantes (vía activación de la lipoproteína lipasa, LPL) y de glucosa
circulante (vía inducción de la síntesis y translocación a la membrana plasmática del
transportador de glucosa 4, GLUT4). Dentro del adipocito, ácidos grasos y glucosa
sirven como precursores para la síntesis de triacilgliceroles.
El TAB no es un tejido uniforme, sino que se encuentra distribuido en forma de
depósitos en distintos lugares anatómicos. De forma convencional, se pueden dividir en
subcutáneos y viscerales y tienen función biológica y actividad metabólica distintas
(Einstein et al., 2005; Giorgino et al., 2005; Klaus and Keijer, 2004). Los desórdenes
metabólicos asociados al exceso de grasa se relacionan específicamente con la
acumulación de grasa visceral en la región abdominal, probablemente por poseer esta
grasa mayor actividad metabólica que la grasa subcutánea. El TAB visceral capta más
glucosa en respuesta a la insulina (Virtanen et al., 2002) y también posee mayor
actividad lipolítica (Giorgino et al., 2005). Los ácidos grasos liberados por el TAB
visceral alcanzan rápidamente el hígado vía circulación portal, disminuyendo en ese
tejido la acción de la insulina e incrementando la salida de glucosa y VLDL (Boden,
1998; Giorgino et al., 2005).
Introducción
19
1.2.3. La adipogénesis
La adipogénesis es el proceso que implica la determinación y la diferenciación de una
célula precursora en un adipocito. Durante este proceso un gran número de genes son
regulados de forma selectiva, secuencial y coordinada, lo que se refleja en cambios
sustanciales de la morfología celular, la sensibilidad a hormonas y las capacidades
metabólicas celulares, particularmente para la lipogénesis y la lipólisis, y en el caso de
los adipocitos marrones también para la termogénesis.
Durante el desarrollo la formación de células adiposas ocurre a partir del mesodermo.
Los depósitos de TAM, necesarios para el control térmico en el nacimiento, aparecen
durante la fase final de la gestación, mientras que el TAB crece fundamentalmente en la
etapa post-natal temprana, como resultado del incremento del tamaño de adipocitos
existentes y la proliferación de células precursoras (Feve, 2005).
La regulación de la adipogénesis es muy compleja. Depende de estímulos hormonales y
nutricionales que controlan la expresión y acción de una serie de factores de
transcripción pro- y anti- adipogénicos (Feve, 2005). Entre los pro- adipogénicos
destacan el PPARγ y los de la familia de las C/EBPs (CCAAT/enhancer-binding
proteins) que incluye C/EBPα, C/EBPβ y C/EBPδ. En respuesta a estímulos pro-
adipogénicos se produce una inducción transitoria de C/EBPβ y C/EBPδ, que a su vez
inducen la expresión de PPARγ. PPARγ induce la expresión de C/EBPα y éste, de
forma recíproca, induce la de PPARγ. PPARγ y C/EBPα presentan un comportamiento
sinérgico en la diferenciación de adipocitos, ya que en el promotor de muchos genes
marcadores adipocitarios co-existen elementos de respuesta para ambos factores de
transcripción (Rosen et al., 2000). Se considera al PPARγ el regulador clave de la
adipogénesis, siendo su actividad necesaria y suficiente para la adipogénesis, y al
C/EBPα necesario para mantener elevados los niveles de PPARγ y para la adquisición
de la sensibilidad a la insulina (Rosen, 2005). Modificaciones post-traduccionales,
interacción con coactivadores/correpresores y unión de ligandos, constituyen toda una
gama de mecanismos que integran todas las señales presentes y modulan finamente la
actividad de estos factores de transcripción.
Mientras que el proceso de diferenciación de preadipocitos en adipocitos ha sido muy
estudiado, especialmente en líneas celulares inmortalizadas comprometidas a
diferenciarse en adipocitos blancos (como las células 3T3-L1), se sabe relativamente
poco del origen de los preadipocitos. Las células madre mesenquimales residen
principalmente en la médula ósea (BMSCs) pero también se las encuentra en la fracción
estromo-vascular del tejido adiposo, así como en músculo, sangre periférica, hígado y
Tesis Doctoral Núria Granados Borbolla
20
tejidos embrionarios. Algunos estudios han sugerido que el precursor del adipocito es
una célula circulante derivada de la médula ósea, pero esto es controvertido (Kahn,
2008). Otros estudios indican que las células progenitoras de los adipocitos blancos son
pericitos residentes en la pared de los vasos sanguíneos del tejido adiposo (Tang et al.,
2008) [los pericitos son células parecidas a células musculares lisas, que recubren el
endotelio capilar].
En todo caso, la capacidad de diferenciación de adipocitos a partir de células
precursoras se mantiene toda la vida. De hecho, estudios recientes indican que la
población de adipocitos es más dinámica de lo que se creía. Así, en humanos, aunque
el número de adipocitos blancos queda establecido en la adolescencia, un porcentaje
considerable (10%) es renovado anualmente durante toda la vida adulta, mediante la
coordinación de adipogénesis de novo y muerte de adipocitos preexistentes (Spalding et
al., 2008). Muchos adultos obesos presentan un exceso de celularidad (hiperplasia) en
el TAB, y estos individuos pueden ser especialmente refractarios a la pérdida de peso a
largo plazo y propensos al conocido efecto yo-yo. El control de la adipogénesis emerge
en este contexto como una nueva diana terapéutica en el control de la obesidad, que,
complementando a la clásica intervención de dieta y ejercicio, favorecería el
mantenimiento de la reducción de las reservas de grasa.
Mención aparte merece la adipogénesis en células mesenquimales de la médula ósea
(BMSCs). Éstas constituyen una población heterogénea de células madre con
capacidad de diferenciarse en linajes celulares tanto mesodérmicos como no
mesodérmicos, incluyendo adipocitos, osteocitos, condrocitos, miocitos, cardiomiocitos,
fibroblastos, células epiteliales y neuronas. El control de la adipogénesis de las células
mesenquimales de la médula ósea favorecería la homeostasia de múltiples órganos y
tejidos cuya funcionalidad, como hemos ido viendo en apartados anteriores, está
comprometida en el estado obeso (e.g. corazón, vasos sanguíneos, articulaciones).
1.2.4. El tejido adiposo como órgano secretor
El tejido adiposo, particularmente el blanco, lejos de ser una reserva inerte de grasa es
un importante órgano endocrino y secretor (Trayhurn and Beattie, 2001). Produce y
secreta una gran variedad de compuestos, incluidos ácidos grasos y una variedad de
proteínas con función reguladora denominadas colectivamente adipoquinas.
Funcionando como señales autocrinas, paracrinas y endocrinas, las adipoquinas
modulan el crecimiento y metabolismo del propio tejido adiposo y de otros órganos, y
juegan un papel clave en la regulación del equilibrio energético y otros procesos
Introducción
21
fisiológicos y patológicos, como el mantenimiento de la homeostasia de la glucosa y las
respuestas inflamatoria y aterogénica.
A continuación se introducen las principales adipoquinas que han sido objeto de estudio
en esta tesis:
Nicotinamida fosforibosil transferasa (Nampt)/visfatina
Nampt/visfatina fue originalmente identificada como una citoquina que estimula la
maduración de precursores de linfocitos B (Samal et al., 1994) y después como una
enzima citosólica que cataliza el primer paso en la síntesis de nicotinamin adenin
dinucleótido (NAD), la condensación de nicotinamida (vitamina B3) con 5-fosfo ribosil-1-
pirofosfato para rendir el mononucleótido de nicotinamida (NMN) (Rongvaux et al.,
2002). Más recientemente, esta proteína fue descrita como una adipoquina (visfatina)
secretada principalmente por la grasa visceral en el estado obeso y con efectos
análogos a la insulina (Fukuhara et al., 2005). Sin embargo, ante la irreproducibildad de
estos últimos resultados, los autores se vieron obligados a retirar la publicación
(Fukuhara et al., 2007).
La importancia de la Nampt/visfatina en la respuesta inmune, metabólica y frente a
situaciones de estrés radica en sus funciones extra-celulares (de citoquina/enzima) e
intra-celulares (de enzima). Como citoquina sus funciones son básicamente pro-
inflamatorias, ya que induce la producción de citoquinas pro-inflamatorias como el
TNFα, IL-1β o IL-6 en monocitos CD14+ (Luk et al., 2008; Moschen et al., 2007; Revollo
et al., 2007a; Tilg and Moschen, 2008). Sin embargo, existen resultados contradictorios
respecto del efecto de citoquinas pro-inflamatorias sobre la producción adipocitaria de
visfatina: mientras algunos estudios en adipocitos 3T3-L1 muestran un efecto inhibitorio
de TNFα e IL-6 (Kralisch et al., 2005a; Kralisch et al., 2005b), otros estudios realizados
en adipocitos humanos muestran una activación de la producción de visfatina en estas
células por TNFα (Hector et al., 2007).
La actividad enzimática de la Nampt/visfatina en plasma parece jugar un papel
importante en la provisión de NMN a tejidos/órganos donde la actividad de
Nampt/visfatina es insuficiente para cubrir las necesidades celulares de NAD. En este
contexto, la actividad sistémica de la Nampt/visfatina es importante para la secreción de
insulina por las células pancreáticas β, que depende del suministro de NMN a estas
células (Imai, 2009b; Revollo et al., 2007b).
La actividad intracelular de la Nampt/visfatina interviene en el control de enzimas
dependientes de NAD, como por ejemplo las sirtuínas, afectando de ese modo a
Tesis Doctoral Núria Granados Borbolla
22
múltiples procesos relacionados con la restricción calórica (lipólisis en tejido adiposo,
oxidación de ácidos grasos en músculo, gluconeogénesis en hígado, etc.) y la
supervivencia celular (Imai, 2009a).
A diferencia de adipoquinas prototipo como leptina y adiponectina expresadas
preferencialmente por adipocitos blancos, la Nampt/visfatina se expresa en una variedad
de tipos celulares y abundantemente en adipocitos marrones (Revollo et al., 2007b) y
monocitos/granulocitos (Friebe et al., 2011).
Proteína 4 de unión al retinol (RBP4, retinol binding protein 4)
La RBP4 (o simplemente RBP) es una proteína de 21 KD de la familia de las lipocalinas
que se expresa principalmente en hígado (Blaner, 1989; Soprano et al., 1986), seguido
del TAB (Tsutsumi et al., 1992). La función más conocida de la RBP es la de proteína
transportadora de retinol, desde los tejidos que almacenan vitamina A (principalmente el
hígado, y en menor medida TAB) hasta los tejidos que la requieren. En el TAB la
expresión de RBP es prácticamente exclusiva de adipocitos, y la expresión de RBP
aumenta durante la diferenciación de los adipocitos (Tsutsumi et al., 1992).
La RBP derivada específicamente del TAB fue propuesta como un factor circulante que
inducía resistencia a la insulina a partir de estudios en ratones deficientes en GLUT4 en
el TAB (Yang et al., 2005). Los mismos autores mostraron altos niveles circulantes de
RBP en otros modelos animales de resistencia a la insulina y en humanos insulino-
resistentes, y que, en roedores, manipulaciones genéticas y farmacológicas que
suponen un incremento de los niveles séricos de RBP provocaban resistencia a la
insulina, mientras que la reducción de la RBP sérica mejoraba la sensibilidad a la
insulina (Yang et al., 2005).
Con posterioridad, diversos estudios en humanos han encontrado una correlación
directa entre los niveles séricos de RBP y el grado de resistencia a la insulina en
individuos obesos con baja tolerancia a la glucosa o DT2 (Cho et al., 2006; Graham et
al., 2006; Lee et al., 2007; Ribel-Madsen et al., 2009; Yang et al., 2005). En
concordancia, niveles séricos bajos de RBP se correlacionan con una mayor
sensibilidad a la insulina en individuos sanos (Aeberli et al., 2007; Cho et al., 2006;
Stefan et al., 2007). Asimismo, se han descrito polimorfismos del gen de la rbp que se
han asociado con una mayor susceptibilidad a padecer DT2 en humanos (Craig et al.,
2007; Kovacs et al., 2007; Munkhtulga et al., 2007). No obstante, también existen
estudios que no encuentran ninguna correlación entre niveles séricos de RBP y
Introducción
23
sensibilidad a la insulina (Broch et al., 2007; Lewis et al., 2007; Yao-Borengasser et al.,
2007).
A pesar de las discrepancias, se han demostrado efectos de la RBP contrarrestando la
acción de la insulina en diferentes sistemas. Así, se ha descrito que la RBP atenúa la
señalización de la insulina en cultivos primarios de adipocitos humanos (Ost et al., 2007)
y en músculo esquelético de ratones (Yang et al., 2005), incrementa la producción
hepática de glucosa en ratones (Yang et al., 2005), y reduce la secreción de insulina en
células β pancreáticas humanas (Broch et al., 2007). Es más, recientemente se ha
descrito que la holo-RBP (RBP con retinol unido) es funcionalmente una citoquina capaz
de inducir la expresión de SOCS3, un conocido supresor de la señalización por insulina,
en tejidos diana como el músculo esquelético y el TAB (Berry et al., 2011). En particular,
se ha descrito que la proteína de membrana que media el transporte del retinol desde la
holo-RBP circulante al interior celular, STRA6, funciona como un receptor de citoquinas
que, tras ser activado por holo-RBP, media la expresión de SOCS3 y la atenuación de la
señalización por insulina (Berry et al., 2011).
Además de con la resistencia a la insulina, se han descrito correlaciones directas de los
niveles séricos de RBP sérica con marcadores de inflamación (von Eynatten et al., 2007;
Yao-Borengasser et al., 2007) y con la cantidad de grasa hepática (Ribel-Madsen et al.,
2009; Seo et al., 2008; Stefan et al., 2007).
Leptina
La leptina es secretada principalmente por adipocitos blancos, pero también por otros
tipos celulares: estómago (Bado et al., 1998); músculo (Wang et al., 1998); sinoviocitos
y osteocitos (Presle et al., 2006); placenta y epitelio mamario (Casabiell et al., 1997).
Sus niveles circulantes correlacionan con el tamaño de las reservas grasas y el estatus
nutricional. Tiene un papel importante en la regulación del balance energético,
inhibiendo la ingesta e incrementando el gasto energético, fundamentalmente a través
de efectos a nivel central (hipotalámico) (Gautron and Elmquist, 2011; Zhang et al.,
1994). Además, la leptina inhibe la adipogénesis e incrementa la lipólisis en el músculo y
TAB y la oxidación de ácidos grasos en músculo e hígado (Muoio y Lynis Dohm, 2002).
En humanos obesos lo habitual es la hiperleptinemia y la resistencia a la leptina, que
puede tener diversos orígenes.
Además de sus efectos metabólicos, la leptina está involucrada en la respuesta inmune
e inflamatoria actuando como una señal pro-inflamatoria (Lago et al., 2008; Stofkova,
2009), pudiendo actuar, por ejemplo, como quimioatrayente de monocitos (Curat et al.,
2004; Gruen et al., 2007). Se la ha relacionado con diferentes patologías inflamatorias.
Tesis Doctoral Núria Granados Borbolla
24
Específicamente, en relación a la patofisiología de la osteoartritis, se han descrito tanto
acciones anabólicas (Dumond et al., 2003; Figenschau et al., 2001) como catabólicas
(Bao et al.; Griffin et al., 2009; Simopoulou et al., 2007; Vuolteenaho et al., 2009) de la
leptina. En células mesenquimales de la médula ósea la leptina inhibe la adipogénesis y
estimula la osteo-condrogénesis (Hamrick and Ferrari, 2008).
La leptina se encuentra en la leche materna, y estudios de nuestro grupo han mostrado
que la suplementación oral con leptina a dosis fisiológicas durante el periodo de
lactancia previene la obesidad, mejora la resistencia a la insulina y disminuye la
preferencia por dietas ricas en grasa en la edad adulta (Pico et al., 2007; Priego et al.,
2010; Sanchez et al., 2008).
Resistina
La resistina fue descubierta como una proteína secretada por adipocitos murinos cuya
producción disminuía en respuesta a drogas anti-diabéticas y que causaba resistencia a
la insulina cuando se inyectaba a ratones (Steppan et al., 2001). Sin embargo,
actualmente existe una gran controversia en torno a este rol, principalmente en
humanos.
Estudios recientes han demostrado la expresión de resistina en muchos otros tipos
celulares además del adipocito, notablemente en humanos en células del sistema
inmunitario (monocitos y macrófagos) (Patel et al., 2003; Savage et al., 2001), y han
relacionado a la resistina con la respuesta inflamatoria (Pang and Le, 2006). Se ha
descrito que la activación de vías inflamatorias induce la expresión de resistina en
monocitos humanos y que, a su vez, la resistina induce la expresión de citoquinas pro-
inflamatorias en monocitos y macrófagos humanos (Anderson et al., 2007; Bokarewa et
al., 2005; Kaser et al., 2003; Lehrke et al., 2004). Además, los niveles plasmáticos de
resistina correlacionan directamente con marcadores de inflamación en varias
condiciones patofisiológicas en humanos (Pang and Le, 2006). Se ha sugerido que la
resistina podría constituir un enlace entre inflamación y resistencia a la insulina
(McTernan et al., 2006).
Adiponectina
La adiponectina es una hormona proteica secretada en gran cantidad por el TAB y
específicamente por los adipocitos que circula en plasma en diferentes isoformas
producidas por modificaciones post-traduccionales. Desempeña un papel en la
prevención de la resistencia a la insulina y de la aterosclerosis, teniendo propiedades
anti-diabéticas y propiedades anti-inflamatorias en el endotelio vascular (Akiyama et al.,
Introducción
25
2005; Kadowaki et al., 2006; Wellen and Hotamisligil, 2005). En humanos y roedores,
los niveles circulantes de adiponectina están reducidos en la obesidad, estados de
resistencia a la insulina y DT2, así como en la enfermedad cardiovascular y la
hipertensión (Kadowaki et al., 2006).
La adiponectina inhibe la gluconeogénesis hepática, aumenta la captación y utilización
de la glucosa por el músculo esquelético, y favorece la reducción del contenido en
triacilgliceroles en hígado y músculo, ya que estimula la oxidación de ácidos grasos y
suprime la lipogénesis (Kadowaki et al., 2006). Estos efectos están mediados por la
activación de la proteína quinasa activada por AMP (AMPK) y de la isoforma alfa del
PPAR (PPAR). La AMPK es una enzima reguladora que se activa en condiciones de
depleción de energía intracelular (aumento de la ratio AMP/ATP) y por fosforilación,
cuya actividad inhibe rutas metabólicas consumidoras de energía y activa rutas
metabólicas productoras de energía. El PPAR es una isoforma de PPAR que controla
al alza la transcripción de genes relacionados con la oxidación de ácidos grasos y el
metabolismo oxidativo en general.
En células endoteliales, la adiponectina inhibe la vía inflamatoria IKK/NFκB (Ouchi et al.,
2000) a la vez que es un quimioatrayente y estimulador de la diferenciación de las
células progenitoras endoteliales (EPCs), procesos necesarios para mantener y reparar
el tejido vascular (Kondo et al., 2009; Shibata et al., 2008) .
1.2.5. Alteraciones en el tejido adiposo en la obesidad
El tejido adiposo en el estado obeso se caracteriza por una lipólisis basal incrementada,
y por una expresión alterada de adipoquinas y factores pro-inflamatorios a la que
contribuyen los adipocitos hipertrofiados (Halberg et al., 2008; Kershaw and Flier, 2004;
Skurk et al., 2007) y en especial los macrófagos, cuya presencia en el tejido adiposo
obeso se encuentra aumentada (Weisberg et al., 2003; Xu et al., 2003) (Tabla 1).
En condiciones de balance energético positivo, el exceso de energía se almacena
primero en los adipocitos maduros, causando un incremento de su tamaño (hipertrofia),
a lo que sigue un incremento de la adipogénesis de células mesenquimales del tejido
adiposo, con aumento del número de adipocitos (hiperplasia) (Bjorntorp et al., 1982; de
Ferranti and Mozaffarian, 2008). Ambos procesos permitirían mantener la funcionalidad
del tejido adiposo. Cuando se alcanza el límite de expansión del tejido adiposo
(determinado por factores genéticos y ambientales), se inicia una cascada inflamatoria
con efectos locales y sistémicos que conducen al desarrollo de resistencia a la insulina y
sus consecuencias metabólicas, muchas de las cuales han sido descritas en apartados
anteriores (Medina-Gomez et al., 2007; Virtue and Vidal-Puig, 2010).
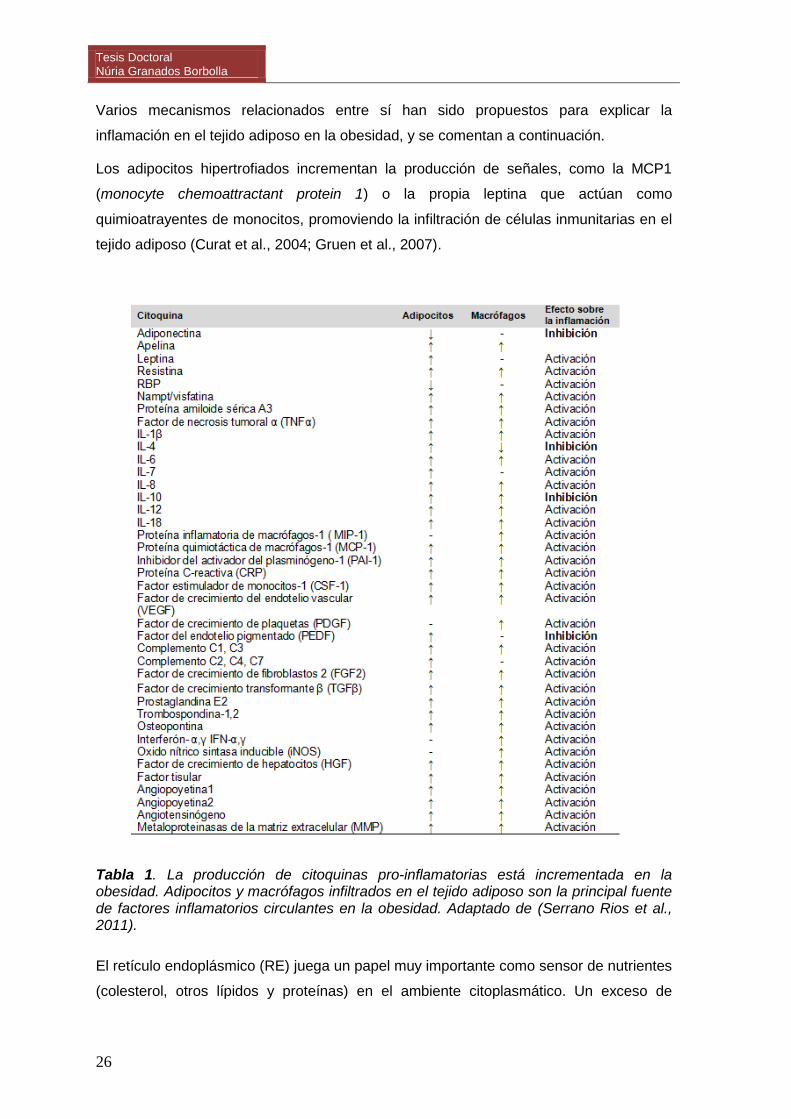
Tesis Doctoral Núria Granados Borbolla
26
Varios mecanismos relacionados entre sí han sido propuestos para explicar la
inflamación en el tejido adiposo en la obesidad, y se comentan a continuación.
Los adipocitos hipertrofiados incrementan la producción de señales, como la MCP1
(monocyte chemoattractant protein 1) o la propia leptina que actúan como
quimioatrayentes de monocitos, promoviendo la infiltración de células inmunitarias en el
tejido adiposo (Curat et al., 2004; Gruen et al., 2007).
Tabla 1. La producción de citoquinas pro-inflamatorias está incrementada en la obesidad. Adipocitos y macrófagos infiltrados en el tejido adiposo son la principal fuente de factores inflamatorios circulantes en la obesidad. Adaptado de (Serrano Rios et al., 2011).
El retículo endoplásmico (RE) juega un papel muy importante como sensor de nutrientes
(colesterol, otros lípidos y proteínas) en el ambiente citoplasmático. Un exceso de
Introducción
27
nutrientes como en el estado obeso causa estrés en el RE, y la célula en respuesta
pone en marcha una serie de funciones adaptativas (defensivas) colectivamente
llamadas unfolded protein response (UPR), que incluyen la activación de la vía
inflamatoria de JNK y la inducción de la expresión del factor pro-inflamatorio TNFα (de
Ferranti and Mozaffarian, 2008; Hotamisligil, 2010).
Además, por mecanismos que no son del todo comprendidos, el exceso de ácidos
grasos, puede favorecer la generación de especies reactivas del oxígeno (ROS) en las
mitocondrias y con ello el estrés oxidativo mitocondrial (de Ferranti and Mozaffarian,
2008). ROS y TNFα secretados por los adipocitos activan la respuesta inflamatoria en
macrófagos, que a su vez secretan más factores inflamatorios que atraen a más
monocitos circulantes (Surmi and Hasty, 2008).
Una menor vascularización debida a la rápida expansión del tejido puede conducir a una
situación de hipoxia y, en consecuencia, producirse un incremento de la expresión de
múltiples genes inflamatorios y el desencadenamiento de procesos de muerte celular
(necrosis de adipocitos) que a su vez, atraen la llegada de células fagocitarias
(macrófagos y neutrófilos) (Surmi and Hasty, 2008). También se ha propuesto que los
adipocitos que alcanzan un tamaño máximo entran en necrosis espontáneamente, lo
que favorece la infiltración de macrófagos en torno a ellos (Cinti et al., 2005).
La comunicación paracrina que se establece entre adipocitos y macrófagos estaría
promoviendo el inicio y la perpetuación del estado de inflamación que caracteriza a la
obesidad (Permana et al., 2006; Suganami et al., 2005; Suganami et al., 2007). Los
factores inflamatorios producidos por macrófagos se unen a sus respectivos receptores
en la membrana de los adipocitos, desencadenando la activación de diferentes MAPKs,
así como del NFκβ, a través de los cuales se produce una mayor activación de la
lipólisis y de la expresión de genes inflamatorios por parte de los adipocitos (Capel et al.,
2009). A su vez, los ácidos grasos saturados liberados por los adipocitos se unen al
receptor TLR4 de macrófagos, cuya activación conduce a la producción de TNFα vía
NFκB (de Ferranti and Mozaffarian, 2008). Este circuito se considera que juega un
importante papel en el desarrollo de la inflamación en el tejido adiposo obeso (Suganami
et al., 2007).
1.3. EL MÚSCULO ESQUELÉTICO EN EL CONTEXTO DE LA OBESIDAD Y SUS
COMPLICACIONES
El músculo, al igual que el TAB, es un tejido de origen mesenquimal, en este caso
formado por células contráctiles llamadas miocitos. Existen varios tipos de tejido
Tesis Doctoral Núria Granados Borbolla
28
muscular en el organismo, clasificados según su organización estructural en músculo
liso, músculo cardíaco y músculo esquelético. El músculo esquelético está implicado en
el movimiento, el mantenimiento de la postura, la estabilidad, la producción de calor, la
tolerancia al frío y la comunicación inter-órganos.
1.3.1. Metabolismo en el músculo esquelético
El músculo esquelético representa aproximadamente el 40% del peso corporal y su
actividad aproximadamente el 50% del gasto energético diario, y juega un papel clave la
homeostasia de la glucosa y el metabolismo glucídico y lipídico. Es responsable del 80%
de la captación de glucosa estimulada por insulina y un importante órgano catabolizador
de ácidos grasos (AGs). Alteraciones del metabolismo en el músculo esquelético están
implicadas en la resistencia a la insulina, la DT2 y el síndrome metabólico (Parish and
Petersen, 2005; Perseghin, 2005; Sell et al., 2006).
Clásicamente, se ha considerado al músculo esquelético como un tejido oxidativo en el
que los AGs suponen su mayor fuente de energía. Los AGs son transportados al interior
de la célula muscular a través de la ácido graso translocasa (FAT/CD36) y otras
proteínas transportadoras de AGs (FATPs, principalmente FATP1) (Sebastian et al.,
2009). En la célula muscular, los AGs pueden ser oxidados en la mitocondria mediante
la β-oxidación o almacenados como triacilgliceroles intramiocelulares. Las mismas
proteínas que facilitan el transporte de AGs a través de la membrana plasmática, como
la FAT/CD36 y la FATP1, colaboran con la carnitina palmitoil transferasa 1 (CPT1) en el
transporte de ácidos grasos activados a la matriz mitocondrial
La tasa de captación de AGs en el músculo está determinada por la concentración de
lípidos plasmáticos, especialmente en condiciones de hipersinsulinemia (Brechtel et al.,
2001). En pacientes obesos y con DT2, la concentración de AGs libres circulantes está
incrementada, situándose típicamente en rangos de 600-800 μmol/L comparado con
300-400 μmol/L en individuos sanos normopeso. Esto, unido a la reducida capacidad de
oxidación lipídica que caracteriza al músculo obeso, conduce a una acumulación de
lípidos intramiocelulares, especialmente metabolitos intermedios como diacilgicerol y
ceramida, que interfieren con la acción de la insulina (Corcoran et al., 2007; Sabin et al.,
2007) (véase también el apartado 1.1.2 y la Figura 1). Ello se traduce en un bloqueo de
la translocación de GLUT4 a la membrana, una menor captación de glucosa circulante y
una menor síntesis de glucógeno en las células musculares que puede alterar la
homeostasis de la glucosa a nivel sistémico (Turcotte and Fisher, 2008).
Introducción
29
La acumulación de triacilgliceroles intramiocelulares no es per se un indicador de
resistencia a la insulina, como lo demuestra el hecho de que los atletas bien entrenados
son muy sensibles a la insulina y poseen un elevado contenido de triacilgliceroles
intramiocelulares, rasgo que constituye una de las adaptaciones al entrenamiento. En
respuesta a una mayor demanda de energía, el músculo esquelético incrementa la
captación, transporte, utilización y oxidación de AGs, y en este sentido otro efecto bien
conocido del entrenamiento es el incremento de la biogénesis de mitocondrias y de la
tasa de oxidación mitocondrial de AGs (Corcoran et al., 2007; Menshikova et al., 2006).
El problema en la obesidad y la DT2 es que, al estar reducida la capacidad de oxidación
de AGs (Morino et al., 2005; Parish and Petersen, 2005), la tasa de recambio de los
lípidos intramiocelulares es baja, lo que favorece la peroxidación lipídica y la
acumulación de metabolitos intermedios inhibidores de la señalización por insulina, del
tipo del diacilglicerol y la ceramida (Corcoran et al., 2007). De hecho, los efectos
beneficiosos del ejercicio físico en relación a la sensibilidad a la insulina se relacionan
con una mayor tasa de recambio de los lípidos musculares, que a su vez implica la
eliminación de estos metabolitos intermedios (Moro et al., 2008).
1.3.2. El músculo esquelético cómo órgano secretor
El músculo esquelético ha sido recientemente descrito como un órgano endocrino que,
especialmente en respuesta al ejercicio, produce y secreta, citoquinas y otros péptidos
que se han denominado colectivamente mioquinas (Pedersen and Febbraio, 2008). Las
mioquinas ejercen sus efectos a nivel local y/o sistémico: sus efectos auto y paracrinos
modulan el metabolismo del músculo, y sus efectos endocrinos, el metabolismo de otros
órganos como el tejido adiposo. El impacto de las mioquinas sobre el metabolismo es
actualmente un importante tema de investigación. Al igual que en el caso de las
adipoquinas, a las mioquinas se les atribuye un papel importante en la regulación de la
sensibilidad a la insulina y en la protección o mejora inducida por el ejercicio físico sobre
muchas enfermedades crónicas. (Pedersen, 2010; Pedersen, 2011; Pedersen et al.,
2007)
A continuación se introducen las mioquinas descritas hasta el momento, con especial
énfasis en las que han sido objeto de estudio en esta tesis:
Interleuquina-6 (IL-6)
Fue la primera mioquina descrita y ha sido la más estudiada. Una gran cantidad de
estudios demuestran que los niveles plasmáticos de IL-6 aumentan exponencialmente
en respuesta al ejercicio y que este aumento, contrariamente a lo que se pensaba hasta
hace pocos años, no está relacionado con el daño muscular. El incremento, que puede
Tesis Doctoral Núria Granados Borbolla
30
alcanzar hasta 100 veces los niveles previos a la actividad física, refleja la duración e
intensidad del ejercicio, la masa muscular involucrada y la capacidad de resistencia.
Tras el ejercicio, la concentración sérica de IL-6 desciende hasta niveles iniciales. Se ha
demostrado que son las fibras musculares activas las que producen y secretan IL-6 en
respuesta al ejercicio, mientras que en reposo la principal fuente de IL-6 circulante es el
tejido adiposo (Pedersen, 2007; Pedersen and Febbraio, 2008).
En el músculo esquelético, la IL-6 estimula la captación de glucosa basal y estimulada
por insulina y la oxidación de lípidos intramiocelulares, probablemente mediante la
activación de la AMPK (Carey et al., 2006). A su vez, la AMPK regularía positivamente
la secreción de IL-6 por el músculo (Pedersen and Febbraio, 2008). La producción y
secreción de IL-6 en el músculo activo tiene lugar en condiciones en que la
disponibilidad de carbohidratos está reducida, y la IL-6 tiene efectos extra-musculares
estimulando la lipólisis en adipocitos. Esto sugiere que la IL-6 actuaría como un sensor
energético que activaría la lipólisis en tejido adiposo con el fin de proveer sustratos
energéticos al músculo (Pedersen and Febbraio, 2008).
La IL-6 se detecta y expresa, junto con sus receptores (muy similares a los de la
leptina), en conjuntos de neuronas hipotalámicas implicadas en el control de la
homeostasis energética, y tiene efectos anti-obesogénicos que dependerían, al menos
en parte, de acciones al nivel del sistema nervioso central. Posiblemente la prueba más
convincente de los efectos anti-obesogénicos de la IL-6 es la observación de que los
ratones deficientes (knockout) en IL-6 desarrollan obesidad e intolerancia a la glucosa
(Wallenius et al., 2002), y que ratones transgénicos que sobreexpresan IL-6 humana
predominantemente en cerebro y pulmón son resistentes a la obesidad dietética, y más
sensibles a la insulina y a las acciones centrales de la leptina (Sadagurski et al., 2010;
Wallenius et al., 2002).
Aunque la IL-6 se considera clásicamente una citoquina pro-inflamatoria, también
existen evidencias de una acción anti-inflamatoria, basados en la capacidad de la IL-6
de estimular la producción de citoquinas anti-inflamatorias como la IL-1ra y la IL-10
(Steensberg et al., 2003).
El concepto de la IL-6 como una mioquina de efectos anti-obesogénicos y que aumenta
la sensibilidad a la insulina en el músculo choca con la visión tradicional de la IL-6 como
una citoquina pro-inflamatoria, aumentada en la obesidad y promotora de resistencia a
la insulina. Ciertamente, estudios en hepatocitos aislados e in vivo en ratones han
mostrado que la IL-6 reduce la sensibilidad hepática al efecto supresor de la insulina
sobre la gluconeogénesis, al incrementar la expresión de SOCS3 en hepatocitos (Bonet
Introducción
31
et al., 2009). Además, la elevación crónica de IL-6 se ha asociado con reducción de
peso, hiperinsulinemia, deficiente captación de glucosa estimulada por insulina en
músculo e inflamación hepática (Franckhauser et al., 2008).
La controversia suscitada por las diferentes observaciones podría ser explicada, entre
otras cosas, por diferencias entre un efecto agudo (producción asociada a la contracción
muscular, que se traduce en un incremento de hasta 100 veces los niveles circulantes
previos al ejercicio) vs crónico (producción en el tejido adiposo obeso/inflamado, que se
traduce en unos niveles circulantes de 3 a 5 veces superiores a los observados en
sujetos normopeso). Se ha sugerido que, en este último contexto, podría existir un
fenómeno de “resistencia a la IL-6” similar a lo que ocurre con la insulina y leptina
cuando sus niveles permanecen elevados de forma crónica (Pedersen and Febbraio,
2008).
Interleuquina-15
La IL-15 se expresa a alto nivel en el músculo esquelético, donde su expresión es
inducida por el ejercicio intenso (Nielsen et al., 2007). La IL-15 tiene importantes efectos
en el músculo: estimula la diferenciación de las células musculares y la acumulación de
miosina en miocitos diferenciados, antagoniza la proteólisis muscular, y promueve la
oxidación de ácidos grasos y la captación y utilización de glucosa. (Busquets et al.,
2005; Furmanczyk and Quinn, 2003; Quinn et al., 1997). Además de estos efectos anti-
diabetogénicos y anabólicos en músculo, la IL-15 parece tener un efecto anti-
adiposidad, reduciendo el tejido adiposo visceral. (Nielsen et al., 2008). Los adipocitos
no expresan IL-15, pero sí su receptor, lo que reforzaría la hipótesis de que una acción
endocrina de la IL-15, desde el músculo al tejido adiposo (Quinn et al., 2005).
Otras mioquinas
Otras mioquinas recientemente descubiertas de efectos locales y cuyos niveles
incrementan con el ejercicio son la IL-8, que estimula la angiogénesis; leukaemia
inhibitory factor (LIF), que estimula la proliferación de células musculares satélites
(Alvarez et al., 2002; Pedersen et al., 2007; Quinn et al., 2009; Quinn et al., 2005); y
brain derived neurotrofic factor (BDNF), cuyo efecto auto-paracrino estimula la oxidación
de ácidos grasos en las células musculares, vía activación de la AMPK (Broholm and
Pedersen, 2010).
Tesis Doctoral Núria Granados Borbolla
32
1.4. INTERACCIONES NUTRIENTES–GENES EN EL CONTROL DEL BALANCE
ENERGÉTICO Y LAS COMPLICACIONES METABÓLICAS DE LA OBESIDAD
El desequilibrio energético crónico que conduce al estado obeso es fruto de alteraciones
o deficiencias genéticas o adquiridas en procesos bioquímicos que afectan al control de
la ingesta, la eficiencia energética, la adipogénesis y/o la distribución de los nutrientes
entre tejidos y vías metabólicas (Palou et al., 2004). Del mismo modo que la
susceptibilidad genética individual (e.g., polimorfismos en genes específicos) puede
influir sobre estos procesos, se ha demostrado que los nutrientes pueden afectar todos
estos procesos a distintos niveles:
Como sustratos de las vías metabólicas. La disponibilidad de ciertos nutrientes
regula la velocidad de las reacciones enzimáticas de las cuales son sustrato, y
por tanto el flujo de las vías metabólicas en las que participan.
Como reguladores de la secreción hormonal y de diferentes eslabones en las
vías de señalización hormonal que impactan sobre el metabolismo.
Como reguladores de la actividad de enzimas y otras proteínas reguladoras, bien
por unión directa o promoviendo modificaciones post-tradicionales (fosforilación
/desfosforilación, glucosilación, proteólisis parcial, etc.).
Como reguladores de la concentración de enzimas y otras proteínas reguladoras,
actuando como modificadores específicos de la expresión génica.
Como factores que condicionan la impronta metabólica causada por efectos
epigenéticos a nivel de ADN, histonas y otras biomoléculas.
A continuación se introducen los nutrientes o condiciones nutricionales que han sido
objeto de estudio en esta tesis.
1.4.1. Papel de la grasa dietética y de los ácidos grasos trans
La calidad de la grasa de la dieta impacta sobre procesos implicados en el control de la
adiposidad corporal (e.g. adipogénesis, lipogénesis, oxidación de ácidos grasos,
expresión de proteínas desacoplantes) y en parámetros relacionados como la lipidemia
y la sensibilidad a la insulina. En general, los efectos de la composición grasa de la dieta
se relacionan con: a) cambios en la composición lipídica de las membranas celulares,
que afectan a su fluidez y a funciones de señalización, incluyendo la sensibilidad a
señales extracelulares que interaccionan con receptores de membrana; b) cambios en la
cantidad y el tipo de segundos mensajeros lipídicos que se puedan generar (e.g.,
Introducción
33
eicosanoides, diacilglicerol, ceramidas); y c) los efectos de ácidos grasos particulares y
derivados estimulando determinadas vías y factores de transcripción (e.g., PPARs).
Numerosos estudios correlacionan la ingesta de grasa saturada, en especial ácidos
grasos saturados de cadena larga (16-20 C), con la síntesis de diacilglicerol y ceramidas
y el desarrollo de resistencia a la insulina en el músculo (Corcoran et al., 2007).
Además, los ácidos grasos saturados favorecen el aumento de la colesterolemia,
principal factor de riesgo de ECV, y tienen efectos pro-inflamatorios en el endotelio y
otros tejidos vía activación del TLR4 (Boden, 2008; Pilz and Marz, 2008). Por el
contrario, abundante evidencia científica avala los efectos beneficiosos de la grasa
insaturada, especialmente de los ácidos grasos poliinsaturados n-3 (PUFA n-3) de
cadena larga, como el ácido eicosapentaenoico (20:5 cis-∆5,8,11,14,17) y el
docosahexaenoico (22:6 cis-∆4,7,10,13,16,19). En comparación con la grasa saturada y los
PUFA n-6, los PUFA n-3 tienen efectos anti-inflamatorios, y pueden favorecer la
reducción de la colesterolemia, la trigliceredemia y la grasa visceral, y preservar la
sensibilidad a la insulina (Corcoran et al., 2007; Oliver et al., 2010).
La ingesta de ácidos grasos trans (AGTs) también se ha relacionado con muchos de los
efectos deletéreos de la grasa saturada. Los AGTs son ácidos grasos insaturados con al
menos un doble enlace en configuración trans, en lugar de la configuración cis habitual
en la naturaleza. Son por lo tanto isómeros geométricos cuya estructura molecular
resulta más rígida y les confiere propiedades físicas distintivas, fundamentalmente un
punto de fusión más elevado y una mayor estabilidad termodinámica.
Los AGTs aparecen de forma natural en productos lácteos y otras grasas animales, pero
la gran mayoría de AGTs que se consumen se producen industrialmente (AGTs de
producción industrial, AGTs-PI) durante la hidrogenación catalítica de aceites vegetales
(hardening). Esta técnica, desarrollada ya en los años 30, consiste en la introducción de
gas hidrógeno en aceite vegetal a temperaturas de más de 400ºC a elevadas presiones
y en presencia de diferentes catalizadores, con el objetivo de conseguir ácidos grasos
saturados. Sin embargo, dependiendo de las condiciones, la hidrogenación no llega a
ser completa y permanecen algunos dobles enlaces ahora en configuración trans. Esta
grasa parcialmente hidrogenada, sólida a temperatura ambiente, se utiliza en una
amplia variedad de productos: margarinas, bollería industrial, frituras, aperitivos y fast
food De los productos del mercado español con más porcentaje de AGTs en relación
con el total de ácidos grasos destacan las palomitas de maíz para preparar en
microondas (36%), las patatas fritas (20,9%), sopas deshidratadas (15,4%), bollería
industrial (hasta un 10%), hamburguesas (4%) y pizzas (3-15%; aquí también pueden
provenir del queso) (Fernández-San Juan, 2009). Las margarinas comercializadas en
Tesis Doctoral Núria Granados Borbolla
34
España han reducido su porcentaje de trans en los últimos años mediante el proceso de
interesterificación documentándose actualmente una media del 3% de trans respecto al
total de ácidos grasos (Fernández-San Juan, 2009). El ácido elaídico (trans-9-18:1), el
isómero trans del ácido oleico, es el AGT de producción industrial predominante
(Mensink, 2005; Stender et al., 2008).
Mientras la evidencia científica avala los efectos favorables de las dietas enriquecidas
en ácido oleico, y del ácido oleico en sí mismo, sobre el riesgo de padecer enfermedad
cardiovascular, el mantenimiento del peso corporal y la sensibilidad a la insulina
(Bondia-Pons et al., 2007; Fito et al., 2008; Fito et al., 2007; Lopez-Miranda et al., 2010;
Riserus et al., 2009; Schroeder et al., 2008), las dietas ricas en AGTs-PI se asocian
generalmente con efectos perjudiciales sobre la salud (Stender et al., 2008). Los efectos
adversos de los AGTs-PI sobre múltiples factores de riesgo cardiovascular están bien
establecidos, entre ellos la promoción de un perfil lipídico/lipoproteínico en suero pro-
aterogénico, la disfunción endotelial y la producción de citoquinas pro-inflamatorias
(Dorfman et al., 2009; Lemaitre et al., 2006; Micha and Mozaffarian, 2008; Micha and
Mozaffarian, 2009; Mozaffarian et al., 2007; Salmeron et al., 2001). Los efectos de los
AGTs-PI sobre la resistencia a la insulina y el riesgo de DT2 son más controvertidos, ya
que se han descrito efectos perjudiciales en este sentido en algunos, pero no todos, los
estudios observacionales y experimentos cortos de intervención dietética realizados en
humanos (Lovejoy et al., 2002; Odegaard and Pereira, 2006; Riserus et al., 2009; Tardy
et al., 2008). Análogamente, en ratas alimentadas con dietas ricas en AGTs-PI, se ha
descrito el desarrollo de resistencia a la insulina en algunos estudios (Dorfman et al.,
2009; Ibrahim et al., 2005; Natarajan and Ibrahim, 2005), pero no en otros (Tardy et al.,
2008). En un estudio a largo plazo (5 años) en monos en el que se compararon los
efectos de una dieta rica en AGTs-PI y otra rica en ácido oleico se encontró que los
animales sometidos a la dieta rica en AGTs-PI desarrollaron resistencia a la insulina,
alteraciones en el metabolismo de la glucosa y más obesidad abdominal (Kavanagh et
al., 2007).
Los mecanismos que subyacen a los efectos adversos de los AGTs-PI sobre la salud
metabólica son múltiples y se conocen sólo parcialmente (Riserus et al., 2009), y
podrían incluir efectos sobre la producción de adipoquinas y mioquinas relacionadas con
la inflamación y la resistencia a la insulina, siendo este último un aspecto poco
estudiado que se ha abordado específicamente en la presente tesis.
Introducción
35
1.4.2. Papel de la vitamina A
La vitamina A es un nutriente esencial liposoluble que se encuentra en el organismo en
varias formas que difieren en su estado de oxidación: retinal, retinol, y ácido retinoico
(AR). Estos tres vitámeros, junto con sus metabolitos derivados y ciertos análogos
sintéticos, reciben colectivamente el nombre de retinoides. Los retinoides juegan un
papel crítico en muchos procesos esenciales para la vida como la visión, reproducción,
función inmunitaria, desarrollo embrionario y modulación de la proliferación,
diferenciación y muerte celular de un gran número de tipos celulares, incluidos los
adipocitos (Blomhoff and Blomhoff, 2006).
La vitamina A está presente en la dieta de los animales en dos formas: como vitamina A
preformada, principalmente ésteres de retinol con ácido graso (retinil ésteres)
contenidos en grasa e hígado de otros animales, y como carotenoides precursores
contenidos en alimentos de origen vegetal. De los más de 700 carotenoides
identificados en la naturaleza, unos 50 pueden dar lugar a la formación de vitamina A.
El más importante desde el punto de vista nutricional es el β-caroteno (40 C), cuya
escisión por la enzima β,β-caroteno-15,15´-oxigenasa (Bcmo1) rinde dos moléculas de
retinal (20 C) (von Lintig and Vogt, 2004). El metabolismo del β-caroteno difiere en
función del organismo: en roedores, prácticamente todo el β-caroteno absorbido es
transformado en vitamina A en los enterocitos, mientras que en humanos tan sólo un 60-
70% lo es, y el resto pasa intacto empaquetado en los quilomicrones. Recientemente, se
ha descrito un factor de transcripción, ISX (Intestin specific homeobox), cuya expresión
en el epitelio intestinal resulta inducida por AR y cuya actividad limita la captación del β-
caroteno de la dieta y su conversión en vitamina A mediante efectos sobre la expresión
génica del receptor de β-caroteno y la Bcmo1 (Seino et al., 2008).
Los retinil ésteres y los carotenoides de la dieta son transformados en el lumen del
intestino y en la mucosa intestinal principalmente en retinol, el cual se esterifica a ácido
graso (e.g., palmítico) formando nuevamente retinil ésteres que pasan a la circulación
asociados a los quilomicrones (Harrison and Hussain, 2001). Una parte minoritaria del
retinol dietético se convierte dentro de los enterocitos en AR, que entra por el sistema
portal unido a albúmina sérica (Harrison and Hussain, 2001). El hígado capta la mayor
parte del retinol dietético, que le llega a través de los quilomicrones remanentes, y
constituye el principal órgano de reserva de vitamina A. No obstante, otros tejidos
incluyendo el tejido adiposo pueden derivar retinol y carotenoides a partir de los
quilomicrones (Blaner et al., 1994; Harrison and Hussain, 2001; Paik et al., 2004). El
retinol almacenado en el hígado y tejido adiposo puede volver a la circulación unido a su
proteína de transporte específica, la RBP (ver apartado 1.2.4). El retinol unido a RBP es
Tesis Doctoral Núria Granados Borbolla
36
captado por diferentes tejidos que expresan un receptor de membrana específico,
STRA6 (Kawaguchi et al., 2007). Una vez en el interior celular, el retinol puede ser
almacenado como retinil éster o metabolizado a retinal y, por oxidación de éste, a la
forma más activa de AR. Este último tiene una vida media breve, ya que es
metabolizado por diversas enzimas de la familia de la citocromo P450 (CYP26A1,
CYP26B1, CYP26C1) que rinden una gran variedad de productos más hidrosolubles,
con aún cierta actividad biológica (Idres et al., 2001), que serán excretados por la orina
y/o la bilis. Todo el metabolismo intracelular de los retinoides ocurre con éstos unidos a
proteínas intracelulares de unión específicas.
A nivel celular, los distintos tipos de retinoides pueden actuar provocando cambios en la
función de las biomembranas y modificaciones post-traduccionales de ciertas proteínas,
como retinilización (unión covalente de retinilo) o fosforilación (hay proteína quinasas
cuya actividad resulta modulada por retinoides). No obstante, la mayoría de los efectos
de los retinoides se dan a nivel de la regulación transcripcional de la expresión génica
principalmente (aunque no sólo) a través de su interacción con los receptores de
retinoides, que son factores de transcripción dependientes de ligando de la superfamilia
de receptores nucleares (Bonet et al., 2011; Ziouzenkova and Plutzky, 2008). El AR se
considera la forma más activa de la vitamina A en la regulación de la expresión génica
(Bastien and Rochette-Egly, 2004). Existen dos familias de receptores de retinoides: los
RAR (retinoic acid receptors), que responden a AR todo trans y AR 9-cis, y los RXR
(retinoid X receptors), que responden específicamente al isómero 9-cis AR y también a
otros compuestos como los ácidos grasos insaturados (Wolf, 2006). Se han descrito tres
subtipos diferentes para cada familia, α, β y γ, codificados por genes individuales y cuyo
patrón de expresión es específico de cada tejido y etapa del desarrollo (Mangelsdorf and
Evans, 1995).
Los RAR se unen en forma de heterodímeros con el RXR a elementos de respuesta al
AR (RARE, retinoic acid response element) situados en la región reguladora (promotor
génico) de genes sensibles a retinoides y, en general, incrementan la tasa de inicio de la
transcripción de estos genes en función de la unión del ligando (AR todo trans o 9 cis) a
la mitad RAR, aunque también hay genes reprimidos activamente por RAR de manera
dependiente de ligando (Aranda and Pascual, 2001; Bastien and Rochette-Egly, 2004).
Los RXR también pueden formar homodímeros, que se unen a otro tipo de RAREs, y
heterodímeros con otros miembros de la superfamilia de receptores nucleares como el
receptor de hormona tiroidea (TR), el receptor de vitamina D (VDR) o los PPARs, entre
otros. Algunos heterodímeros de RXR con receptores nucleares, incluyendo el
PPAR:RXR, se pueden activar por ligandos de los dos componentes, resultando la
Introducción
37
activación máxima por unión simultánea de ambos ligandos (Aranda and Pascual,
2001). Numerosos factores adicionales pueden modular los efectos sobre la
transcripción génica mediados por receptores de retinoides, entre ellos la interacción
con proteínas reguladoras (co-activadores y co-represores) cuya actividad, así como la
de los propios receptores de retinoides, puede ser controlada por modificaciones post-
traduccionales (fosforilación, ubiquitinización, etc.) (Bour et al., 2007).
El espectro de mecanismos a través de los cuales los retinoides pueden impactar la
expresión génica es todavía más amplio. Los receptores de retinoides activados por
ligando pueden interferir con la actividad de otros factores de transcripción como AP1,
NF-κB o C/EBPs (Blomhoff and Blomhoff, 2006). Además, los retinoides pueden afectar
la expresión génica por mecanismos independientes de su interacción con RAR o RXR.
Se ha descrito, por ejemplo, que el AR todo-trans, además de a los RAR, puede activar
al PPAR/ (una isoforma de PPAR abundante en el músculo, que controla genes
implicados en la oxidación de ácidos grasos) (Shaw et al., 2003). Asimismo, se han
descrito efectos de la RBP con retinol unido (holo-RBP) modulando la expresión génica
desde el exterior celular, vía activación del receptor de membrana STRA6 (Berry et al.,
2011).
La actividad del AR como modulador de la adipogénesis se conoce desde hace tiempo.
En estudios in vitro se han demostrado efectos que son dependientes de la dosis y el
estado de la diferenciación. A dosis relativamente altas (0.1-10μM) y en una etapa
temprana de la diferenciación, el AR todo-trans es un potente inhibidor de la
adipogénesis (Kuri-Harcuch, 1982; Murray and Russell, 1980), porque los RAR
activados interfieren con la actividad del C/EBP, que es un factor de transcripción
adipogénico temprano (Schwarz et al., 1997). Otros metabolitos en la vía del -
caroteno/vitamina A, en particular el retinal y el -apo-14'-carotenal (un derivado de la
rotura asimétrica del β-caroteno), también reprimen la adipogénesis in vitro por un
mecanismo distinto, que implicaría su unión física a PPAR y RXR, y con ello la
supresión de la actividad del heterodímeros PPAR:RXR (Ziouzenkova and Plutzky,
2008). Por el contrario, a dosis relativamente bajas (1pM-10nM) y en un estado terminal
de la diferenciación, el AR todo-trans actúa como una hormona pro-adipogénica
(Safonova et al., 1994a), e incluso se han descrito efectos sinérgicos sobre la
adipogénesis del AR todo-trans junto a los ácidos grasos (Safonova et al., 1994b).
Además, el compromiso de células madre embrionarias hacia la línea adipocitaria es
dependiente de la presencia de AR todo-trans en el medio (Bost et al., 2002; Dani et al.,
1997) y se ha descrito que el AR favorece la proliferación de preadipocitos in
vitro.(Gupta et al., 2007).
Tesis Doctoral Núria Granados Borbolla
38
Más allá de los efectos sobre la adipogénesis, en los últimos años se ha evidenciado un
papel regulador de la vitamina A y sus derivados en la biología del adipocito y la
adiposidad corporal (Bonet et al., 2003; Bonet et al., 2011; Villarroya et al., 2004). La
manipulación genética (deleción o sobreexpresión) de varias enzimas y proteínas de
transporte implicadas en el metabolismo de los retinoides se ha demostrado que resulta
en alteraciones de la adiposidad en roedores (Amengual et al., 2011; Hessel et al.,
2007; Schupp et al., 2009; Zhang et al., 2007; Ziouzenkova et al., 2007; Zizola et al.,
2010; Zizola et al., 2008). Asimismo, se ha demostrado que, tanto en ratones
normopeso como obesos, el tratamiento con AR reduce el peso corporal y la masa de
los tejidos adiposos independientemente de cambios en la ingesta (Berry and Noy,
2009; Bonet et al., 2000; Felipe et al., 2005; Mercader et al., 2006; Puigserver et al.,
1996), y mejora la tolerancia a la glucosa y la sensibilidad a la insulina (Berry and Noy,
2009; Felipe et al., 2004; Mercader et al., 2008). El tratamiento con retinal, otro vitámero
de la vitamina A, también reduce la masa grasa e incrementa la sensibilidad a la insulina
en ratones genéticamente obesos (Ziouzenkova et al., 2007).
La pérdida de masa grasa inducida por el AR se correlaciona con una activación del
tejido adiposo marrón (Bonet et al., 2000; Puigserver et al., 1996), una reducción de la
capacidad adipogénica/lipogénica en tejido adiposo blanco (Ribot et al., 2001) e hígado
(Amengual et al., 2010), y una capacidad incrementada para el metabolismo energético
y la termogénesis en tejido adiposo blanco (Berry and Noy, 2009; Mercader et al., 2007;
Mercader et al., 2006), músculo esquelético (Berry and Noy, 2009; Felipe et al., 2003) e
hígado (Amengual et al., 2010). Al incremento de la sensibilidad a la insulina tras el
tratamiento agudo con AR en ratones podrían contribuir asimismo efectos sobre la
expresión de determinadas adipoquinas (Felipe et al., 2004), siendo éste un aspecto
que se ha abordado específicamente como parte de esta tesis (Mercader et al., 2008).
En concordancia con lo anterior, hay evidencia que el estatus en vitamina A puede tener
un impacto sobre la adiposidad corporal. Estudios en animales adultos indican que un
estatus pobre en vitamina A favorece la formación de tejido adiposo (Kawada et al.,
1996; Ribot et al., 2001). Además, existen resultados en humanos que relacionan los
niveles de carotenoides/retinoides circulantes con la adiposidad corporal, siendo éstos
inferiores en niños y adolescentes con sobrepeso que en normopesos (de Souza
Valente da Silva et al., 2007). Unos niveles de carotenoides/retinoides inadecuadamente
bajos se asocian también con ciertos desórdenes como la resistencia a la insulina y el
desarrollo de hígado graso en humanos obesos (Chaves et al., 2007; Pereira et al.,
2009; Villaca Chaves et al., 2008). Recíprocamente, se ha reportado que, en ratas y
ratones adultos, la suplementación con vitamina A (como retinil palmitato) reduce el
Introducción
39
contenido en masa grasa e impide parcialmente el desarrollo de obesidad (Jeyakumar et
al., 2005; Kumar et al., 1999) e incrementa el potencial termogénico del tejido adiposo
marrón y el músculo esquelético (Felipe et al., 2005; Jeyakumar et al., 2005; Kumar et
al., 1999). No obstante, en un estudio realizado en ratas jóvenes (50-70 g, 21 días de
edad) la vitamina A dietética sinergizó los efectos de una dieta de cafetería en la
promoción de la expansión del tejido adiposo (Redonnet et al., 2008).
En resumen, el posible papel de la vitamina A en el control de la adiposidad corporal
está suscitando un interés científico creciente. Principalmente en forma de AR, la
vitamina A afecta diferentes procesos implicados en el control de la adiposidad corporal
incluyendo: la proliferación de preadipocitos; la diferenciación de preadipocitos en
adipocitos maduros o adipogénesis; la expresión de proteínas termogénicas
desacoplantes; el metabolismo lipídico en tejidos adiposos blanco y marrón, hígado y
músculo esquelético; y la producción de adipoquinas que participan en el control del
balance energético y la sensibilidad a la insulina. No obstante, la mayor parte de los
estudios que relacionan la vitamina A con el control de la adiposidad corporal se han
realizado en modelos de células en cultivo (estudios in vitro) y/o en animales adultos, y
no han cubierto las etapas tempranas de la vida postnatal.
1.4.3. Papel de la nutrición perinatal
Estudios epidemiológicos y en modelos animales revelan que los orígenes de la
obesidad y desórdenes metabólicos asociados que aparecen en la edad adulta se
encuentran no sólo en la dotación genética individual y en los clásicos factores de riesgo
como el sedentarismo y la incorrecta alimentación, sino que también se adquieren, o
están ligados, a factores del entorno que actúan mucho antes, durante el periodo
perinatal (Taylor and Poston, 2007). Alteraciones hormonales, metabólicas o
nutricionales en etapas críticas del desarrollo pueden determinar la propensión a
padecer obesidad y complicaciones metabólicas asociadas en la edad adulta (Breier et
al., 2001; Gluckman and Hanson, 2004a; Godfrey and Barker, 2001). Frecuentemente la
obesidad es resistente a la terapia (Gunnell et al., 1998) por lo que su prevención es de
crucial importancia, y cada vez hay mayor conciencia de que dicha prevención, para ser
eficaz, pasa por la implementación de estrategias integradas ya desde la infancia, y aún
antes.
En mamíferos la nutrición de la madre es un factor clave que determina la alimentación
de su descendencia, primero vía placentaria y después mediante la leche materna.
Numerosos estudios relacionan una alimentación inadecuada durante etapas críticas del
desarrollo con la aparición de la obesidad y enfermedades asociadas, en la edad adulta
Tesis Doctoral Núria Granados Borbolla
40
(ECV, DT2, etc.). Parece ser que el desarrollo del sistema cardiovascular, del sistema
de control del balance energético y de las vías metabólicas relacionadas con la
homeostasia de la glucosa y de los lípidos es particularmente propenso a las
perturbaciones a nivel nutricional (Taylor and Poston, 2007). Cambios en la alimentación
de la madre durante la gestación y la lactancia producen cambios en el ambiente
nutricional de la descendencia que podrían traducirse en alteraciones en la
programación de los mecanismos de regulación del balance energético de los
individuos. En este contexto, se ha planteado que la nutrición en etapas tempranas del
desarrollo puede condicionar adaptaciones perdurables del organismo con el fin de
optimizar su supervivencia que, en otros contextos futuros, pueden propiciar la obesidad
y el síndrome metabólico (Cripps et al., 2005; Fowden et al., 2005; Gluckman and
Hanson, 2004b; Martorell et al., 2001).
Los mecanismos de la programación metabólica incluirían efectos de nutrientes/dietas
sobre el control epigenético de la expresión génica (e.g. cambios en el estado de
metilación del DNA o de modificaciones covalentes de histonas) (Godfrey et al., 2011;
Palou et al., 2011) y sobre el desarrollo estructural de órganos importantes en el control
del balance energético y la adiposidad corporal como los circuitos neuronales
hipotalámicos involucrados en este control o el propio tejido adiposo (Delahaye et al.,
2008; Garcia et al., 2010; Garcia et al., 2011). En particular, la programación del número
de adipocitos presentes en los depósitos grasos puede ser muy importante, ya que hay
evidencia de que un número incrementado de adipocitos puede favorecer el desarrollo
de obesidad, y de que dicho número queda fijado en etapas tempranas de la vida,
permaneciendo constante durante la edad adulta, aun cuando aproximadamente un
10% de los adipocitos se renueven anualmente en la especie humana (Arner and
Spalding, 2010; Spalding et al., 2008).
La sobrealimentación, la infralimentación y la composición en macronutrientes de la
dieta son factores nutricionales relevantes en la programación metabólica conocidos
desde hace tiempo. También han sido implicados algunos nutrientes específicos. Se ha
propuesto, por ejemplo, la implicación de la leptina (Palou and Pico, 2009), que se sabe
está presente en la leche materna y es absorbida intacta por los neonatos, y de ciertas
vitaminas y otros factores dietéticos que intervienen en reacciones bioquímicas de
metilación relacionadas con cambios epigenéticos, como el folato y la vitamina B12
(Rosenberg, 2008). Asimismo, diversos estudios han mostrado una correlación directa
entre los niveles de ácidos grasos trans de la leche materna y de la dieta de la madre
(Mojska et al., 2003; Ross et al., 1985), así como el impacto negativo que la grasa trans
puede tener sobre el metabolismo a largo plazo (Albuquerque et al., 2006; Pisani et al.,
Introducción
41
2008). No obstante, la identificación de factores nutricionales concretos implicados en
los fenómenos de programación metabólica de la obesidad y el conocimiento de sus
mecanismos de acción es un campo todavía en sus inicios, importante por cuanto puede
permitir recomendaciones concretas y menos generalistas.
En particular, se sabe relativamente poco del impacto de la ingesta de vitamina A en
etapas tempranas de la vida sobre el desarrollo del tejido adiposo y la susceptibilidad
futura a la obesidad. Y ello a pesar de que es sabido que la vitamina A juega un papel
crucial en el desarrollo; que la actividad de los retinoides modula diferentes procesos
relacionados con el control de la adiposidad corporal, incluyendo la adipogénesis y la
proliferación de preadipocitos (véase el apartado 1.4.2.); y que el contenido en vitamina
A de la leche materna depende del contenido en vitamina A y β-caroteno de la dieta,
tanto en humanos (Rice et al., 1999; Villard and Bates, 1987) como en roedores
(Akohoue et al., 2006; Davila et al., 1985; Green et al., 2001).


2. OBJETIVOS

Objetivos
45
Los objetivos de esta tesis se enmarcan dentro del principal campo de investigación de
nuestro grupo: la identificación y caracterización de interacciones nutrientes-genes de
potencial relevancia en el contexto de la obesidad y sus complicaciones clínicas
asociadas. Los objetivos de la tesis reflejan la evolución de este campo en los últimos
años, así como la implicación creciente del grupo en proyectos de investigación aplicada
en colaboración con la industria. En particular, se ha investigado en las siguientes
líneas:
a) Modulación de la función secretora del tejido adiposo por estatus nutricional y
nutrientes específicos
El inicio de esta tesis coincidió con el redescubrimiento de RBP y Nampt/visfatina, como
posibles adipoquinas potencialmente relacionadas con la sensibilidad/acción de la
insulina, cuyos cambios en el estado obeso eran poco conocidos. La controversia en
torno a ello, junto con la escasez de estudios en modelos animales, nos motivó a
estudiar los cambios de expresión de RBP y Nampt/visfatina en dos modelos de
obesidad en ratas, uno genético (Zucker fa/fa) y uno inducido por la dieta (ratas Wistar
alimentadas con dieta de cafetería). Los resultados de este estudio condujeron a la
publicación del manuscrito I.
Trabajos previos de nuestro grupo indicaban que, en animales adultos, el tratamiento
con ácido retinoico mejora la sensibilidad a la insulina y afecta la producción de
adipoquinas relacionadas con la sensibilidad a la insulina, como la resistina. Esto nos
condujo a plantearnos la hipótesis que el ácido retinoico podría afectar la producción
adipocitaria de RBP, otra adipoquina que, como la resistina, puede contribuir a la
resistencia a la insulina. Además, la RBP es clave en el transporte de la vitamina A
(retinol), y su regulación por vitamina A había sido muy estudiada en el hígado, principal
lugar de almacenamiento de retinol y síntesis de RBP, pero no en el tejido adiposo. Así
pues, un objetivo particular fue estudiar la modulación de la expresión de RBP por ácido
retinoico en modelos celulares de adipocitos, e in vivo comparativamente en hígado y
tejido adiposo. Los resultados de este estudio condujeron a la publicación del
manuscrito II.
La ingesta de ácidos grasos trans, especialmente de origen industrial, ha sido
relacionada con complicaciones clínicas frecuentes en la obesidad como la ECV y la
resistencia a la insulina. Los mecanismos subyacentes a la relación de los ácidos grasos
trans con la salud metabólica son variados y podrían incluir efectos sobre la producción
de adipoquinas y también mioquinas, a la luz de la evidencia científica que ha ido
consolidando al músculo como un importante órgano de secreción de proteínas
reguladoras del metabolismo. Al inicio de esta tesis, no había apenas estudios
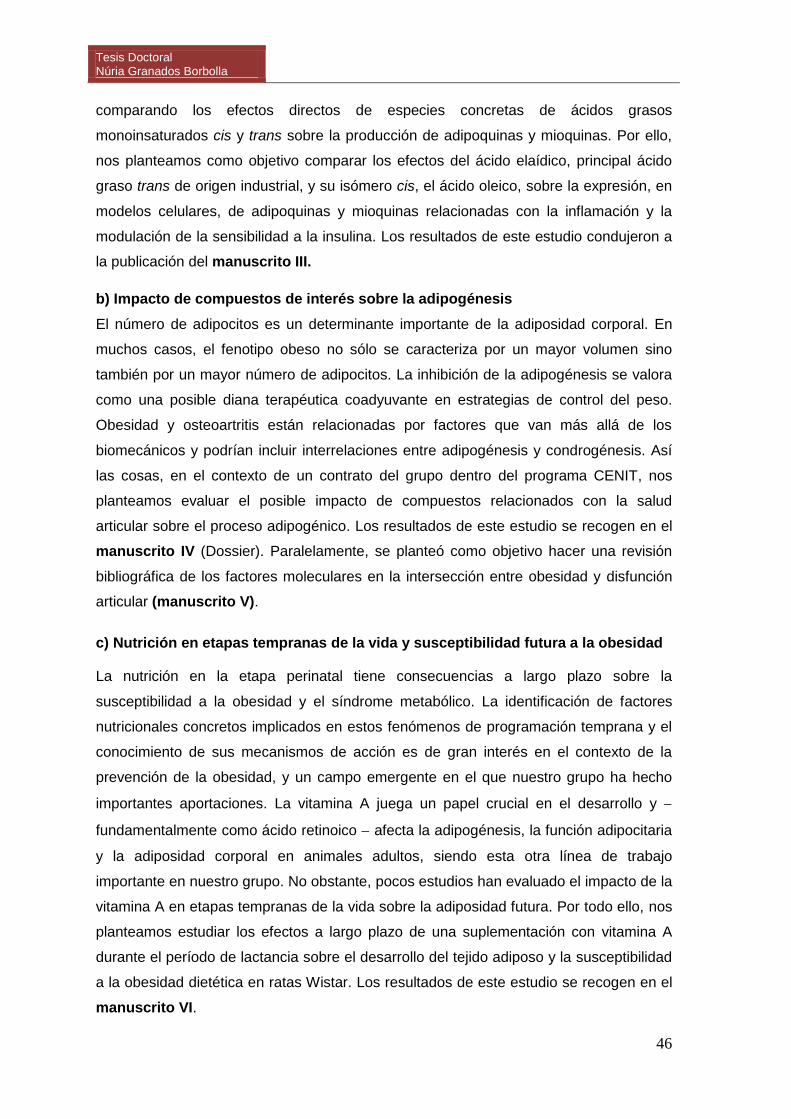
Tesis Doctoral Núria Granados Borbolla
46
comparando los efectos directos de especies concretas de ácidos grasos
monoinsaturados cis y trans sobre la producción de adipoquinas y mioquinas. Por ello,
nos planteamos como objetivo comparar los efectos del ácido elaídico, principal ácido
graso trans de origen industrial, y su isómero cis, el ácido oleico, sobre la expresión, en
modelos celulares, de adipoquinas y mioquinas relacionadas con la inflamación y la
modulación de la sensibilidad a la insulina. Los resultados de este estudio condujeron a
la publicación del manuscrito III.
b) Impacto de compuestos de interés sobre la adipogénesis
El número de adipocitos es un determinante importante de la adiposidad corporal. En
muchos casos, el fenotipo obeso no sólo se caracteriza por un mayor volumen sino
también por un mayor número de adipocitos. La inhibición de la adipogénesis se valora
como una posible diana terapéutica coadyuvante en estrategias de control del peso.
Obesidad y osteoartritis están relacionadas por factores que van más allá de los
biomecánicos y podrían incluir interrelaciones entre adipogénesis y condrogénesis. Así
las cosas, en el contexto de un contrato del grupo dentro del programa CENIT, nos
planteamos evaluar el posible impacto de compuestos relacionados con la salud
articular sobre el proceso adipogénico. Los resultados de este estudio se recogen en el
manuscrito IV (Dossier). Paralelamente, se planteó como objetivo hacer una revisión
bibliográfica de los factores moleculares en la intersección entre obesidad y disfunción
articular (manuscrito V).
c) Nutrición en etapas tempranas de la vida y susceptibilidad futura a la obesidad
La nutrición en la etapa perinatal tiene consecuencias a largo plazo sobre la
susceptibilidad a la obesidad y el síndrome metabólico. La identificación de factores
nutricionales concretos implicados en estos fenómenos de programación temprana y el
conocimiento de sus mecanismos de acción es de gran interés en el contexto de la
prevención de la obesidad, y un campo emergente en el que nuestro grupo ha hecho
importantes aportaciones. La vitamina A juega un papel crucial en el desarrollo y
fundamentalmente como ácido retinoico afecta la adipogénesis, la función adipocitaria
y la adiposidad corporal en animales adultos, siendo esta otra línea de trabajo
importante en nuestro grupo. No obstante, pocos estudios han evaluado el impacto de la
vitamina A en etapas tempranas de la vida sobre la adiposidad futura. Por todo ello, nos
planteamos estudiar los efectos a largo plazo de una suplementación con vitamina A
durante el período de lactancia sobre el desarrollo del tejido adiposo y la susceptibilidad
a la obesidad dietética en ratas Wistar. Los resultados de este estudio se recogen en el
manuscrito VI.

3. PLANTEAMIENTO EXPERIMENTAL

Planteamiento experimental
49
Para la consecución de los objetivos de la presente tesis se han utilizado distintos
modelos experimentales que se describen brevemente en este apartado. Los detalles de
las técnicas individuales utilizadas se encuentran expuestos en los correspondientes
manuscritos y en el apéndice I. Toda la experimentación con animales llevada a cabo se
ha realizado de acuerdo con estándares de cuidado aceptados y ha sido aprobada por
el comité de bioética de la Universidad de las Islas Baleares.
Modelos in vivo
1) Modelos de obesidad genética y dietética
Estos modelos fueron empleados para estudiar la regulación de la RBP y la
Nampt/visfatina en la obesidad (manuscrito I).
Como modelo de obesidad genética se utilizaron ratas obesas macho de tres meses de
edad de la cepa Zucker que presentaban una mutación del receptor de la leptina en
homocigosis (ratas Zucker fa/fa); como grupo control se emplearon ratas de las mismas
características pero normopeso y con al menos un alelo salvaje del gen para el receptor
de la leptina (ratas Zucker -/?). Como modelo de obesidad inducida por la dieta se
emplearon ratas macho de la cepa Wistar alimentadas desde los dos hasta los seis
meses de edad con una dieta de cafetería consistente en: galletas con paté de hígado y
sobrasada, caramelos, galletas dulces, chocolate, queso, cacahuetes salados,
ensaimada, tocino y leche con un 20% de azúcar; como grupo control se emplearon
ratas Wistar alimentadas con una dieta estándar.
En ambos modelos se determinaron: los niveles circulantes de glucosa e insulina tras un
periodo de ayuno y, a partir de ellos, el índice HOMA-IR como medida de la resistencia
a la insulina; el peso y la adiposidad corporal; el peso de los depósitos adiposos de TAB
epididimal, retroperitoneal, mesentérico e inguinal; los niveles circulantes de leptina,
insulina, glucosa, Nampt/visfatina y RBP; y la expresión de Nampt/visfatina y RBP a
nivel de ARNm en los distintos depósitos adiposos de TAB.
2) Modelo de tratamiento agudo con ácido retinoico
Este modelo ha sido utilizado repetidamente en nuestro laboratorio y aquí se empleó
para estudiar específicamente los efectos de la vitamina A como AR sobre la expresión
de RBP en tejidos adiposos e hígado (manuscrito II).
Se emplearon ratones macho NMRI de 12 semanas de edad, alimentados con una dieta
estándar. Se trataron con una dosis diaria de AR todo trans (10, 50 o 100 mg/kg de
animal) durante los 4 días previos al sacrificio. El AR todo trans se administró por
Tesis Doctoral Núria Granados Borbolla
50
inyección subcutánea disuelto en aceite de oliva, y como control del tratamiento se
inyectó aceite de oliva a animales de las mismas características.
Se determinó el efecto del tratamiento sobre la producción de RBP en depósitos de TAB
y en hígado a nivel de ARNm y proteína, y sobre los niveles circulantes de RBP,
medidos por immunoblotting tras electroforesis desnaturalizante del suero. Los
complejos de RBP en suero también fueron analizados por immunoblotting tras una
electroforesis no desnaturalizante, que puede permitir distinguir los complejos con
retinol-RBP, AR-RBP y apo-RBP (RBP sin retinoides unido); en este análisis, suero
delipidado de animales control sirvió como marcador de los complejos conteniendo apo-
RBP. Asimismo, se determinó el índice HOMA-IR en una cohorte independiente de
animales control y tratados con AR a una dosis de 50 mg/kg de animal durante los 4
días previos a la medida. (Los efectos del tratamiento con AR sobre la ingesta
energética y parámetros biométricos y sanguíneos habían sido previamente publicados
en otros trabajos del grupo).
3) Modelo de intervención nutricional temprana
Este modelo se empleó para el estudio del efecto de la suplementación con vitamina A
durante el periodo de lactancia sobre la ulterior susceptibilidad a la obesidad
(manuscrito VI).
Se utilizaron crías de ratas de la cepa Wistar recién nacidas a las que se suministró
diariamente durante todo el periodo de lactancia (desde el día 0 al 20 de vida) una dosis
suplementaria de vitamina A en forma de retinil palmitato, disuelta en aceite de oliva,
equivalente aproximadamente a tres veces la ingerida a través de la leche materna. Los
animales del grupo control recibieron la misma cantidad del vehículo (aceite de oliva).
Una parte de las crías se sacrificaron al final de la lactancia y el resto de ratas macho de
cada grupo (control y tratado con vitamina A) se subdividieron en dos grupos en función
de la dieta suministrada desde el destete (en el día 21 de vida) hasta el sacrificio (en el
día 135 de vida): animales alimentados con una dieta rica en grasa (60% de las calorías
en forma de grasa) y animales alimentados con una dieta estándar (10% de calorías en
forma de grasa), generándose un total de cuatro grupos experimentales.
En todos los animales se determinaron: parámetros biométricos (peso, adiposidad
corporal y peso de depósitos adiposos e hígado); niveles circulantes de glucosa, leptina,
resistina, y retinoides; niveles de retinoides en TAB inguinal e hígado; análisis
morfométrico del TAB inguinal; expresión de ISX a nivel de ARNm en intestino;
expresión de UCP1 en TAM; niveles de ARNm en TAB inguinal de genes que codifican
Planteamiento experimental
51
para proteínas relacionadas con la adipogénesis y la lipogénesis (PPARγ, CEBPα, LPL,
FAS, GLUT4).
En las crías sacrificadas en el momento del destete, adicionalmente se determinó: en
TAB inguinal, la expresión de PCNA a nivel de ARNm y proteína y niveles de ARNm de
p21, PPARγ y CEBPα; y en el hígado, los niveles de ARNm de Cyp26a1.
En las ratas adultas, adicionalmente se determinó: ingesta; índice HOMA-IR; tolerancia
a la glucosa; niveles circulantes de insulina, triacilgliceroles, ácidos grasos libres y
resistina; análisis morfológico y composición tisular de los distintos depósitos adiposos
(contenido total de ADN, proteína y lípidos); análisis morfológico del hígado; contenido
total de lípidos y triacilgliceroles hepáticos; temperatura rectal; niveles de ARNm de
genes para proteínas relacionadas con la lipogénesis (SREBP1-c, FAS, SCD1) y con la
oxidación de ácidos grasos (PPARα) en hígado; y niveles de ARNm de genes para
proteínas relacionadas con la oxidación de ácidos grasos y proteínas desacoplantes de
la cadena respiratoria en TAM (PGC-1, UCP1) y músculo esquelético (PPAR/,
UCP3).
Modelos celulares
1) Modelo de miocitos C2C12
Este modelo se utilizó para comparar los efectos del ácido oleico y su isómero trans, el
ácido elaídico, sobre la expresión de mioquinas y la captación de glucosa basal y
estimulada por insulina (manuscrito III).
Cultivos de mioblastos C2C12 fueron diferenciados a miocitos utilizando suero de
caballo y se incubaron durante 24 horas con los ácidos grasos de interés (oleico y
elaídico), disueltos en DMSO, a tres concentraciones finales diferentes: 20, 100 y 500
μM. Como control se emplearon miocitos C2C12 tratados con vehículo (DMSO).
En este modelo se determinó la expresión a nivel de ARNm y la secreción de proteína al
medio de cultivo de IL-6 y TNFα, así como los niveles de ARNm de IL-15. También se
determinó la captación de glucosa basal y estimulada por insulina, previa incubación con
los ácidos grasos mencionados, o con DMSO como control, durante 24 horas.
2) Modelo de adipocitos blancos 3T3-L1
Este modelo se empleó para estudiar el efecto del AR todo trans sobre la producción
adipocitaria de RBP (manuscrito II) y para comparar los efectos del ácido oleico y su
isómero trans, el ácido elaídico, sobre la expresión de adipoquinas y la captación de
glucosa basal y estimulada por insulina en adipocitos (manuscrito III).
Tesis Doctoral Núria Granados Borbolla
52
En el primer caso, cultivos de fibroblastos 3T3-L1 fueron diferenciados a adipocitos
blancos utilizando un coctel hormonal estándar (consistente en dexametasona, 3-isobutil
-1- metilxantina (IBMX) e insulina) administrado (en el que se considera el día 0 de
cultivo) dos días después de alcanzada la confluencia. A día 8-10 de cultivo, las células,
ya diferenciadas en adipocitos, fueron tratadas con distintas dosis de AR todo trans (0,1,
1 y 10 μM) durante 48 horas, y se determinó la expresión de RBP a nivel de ARNm.
Como control se emplearon adipocitos 3T3-L1 tratados con vehículo (DMSO).
En el segundo caso, los adipocitos 3T3-L1, una vez diferenciados como en el caso
anterior, fueron incubados durante 24 horas con los ácidos grasos de interés (oleico y
elaídico), disueltos en DMSO, a una concentración final de 100 μM. Como control se
emplearon adipocitos 3T3-L1 tratados con el vehículo (DMSO). En este sistema se
determinó la expresión a nivel de ARNm de resistina y adiponectina. También se
determinó la captación de glucosa basal y estimulada por insulina tras 24 horas de
incubación con los ácidos grasos citados o DMSO como control.
3) Modelo de adipocitos blancos derivados de MEFs (Mouse Embryonic Fibroblasts)
Este modelo, se empleó para dos propósitos. En primer lugar, para comparar los efectos
de AR todo trans, retinal y agonistas de RAR y RXR sobre la producción de RBP en
adipocitos (manuscrito II). En segundo lugar, para estudiar los efectos de compuestos
empleados en salud articular sobre la adipogénesis (manuscrito IV).
En el primer caso, cultivos post-confluentes de fibroblastos de embrión de ratón
C57BL/6J de 13 días de edad embrionaria fueron diferenciados a adipocitos utilizando
un coctel hormonal estándar (conteniendo dexametasona, IBMX, insulina y
rosiglitazona) (día 0). A día 8, se trataron durante 48 horas con distintas
concentraciones de AR todo trans, retinal o agonistas de los receptores de retinoides
RAR y RXR. Se analizó la expresión de RBP a nivel de ARNm y la acumulación de RBP
proteína en el medio de cultivo condicionado por las células.
En el segundo caso, cultivos post-confluentes de fibroblastos de embrión de ratón
C57BL/6J de 13 días de edad embrionaria fueron estimulados a diferenciarse en
adipocitos como en el caso anterior, pero al tiempo que se añadían los compuestos de
interés desde el día 0 hasta el día 8. Como control se emplearon fibroblastos
estimulados a adipocitos de la manera estándar. Se analizó el contenido intracelular de
triacilgliceroles y los niveles de ARNm de: marcadores adipocitarios (PPARγ, CEBPα,
FAS); proteínas de secreción (leptina, RBP, adiponectina, resistina); proteínas
inhibidoras de la adipogénesis y/o relacionadas con la condrogénesis (Sox-9, PGC1α,
Planteamiento experimental
53
leptina, TNFα); y componentes de la matriz extracelular (proteína del agrecan, colágeno
tipo 2a1).
4) Modelo de MEFs no estimulados con coctel adipogénico
Este modelo se empleó para estudiar el impacto de compuestos empleados en salud
articular sobre el devenir “espontáneo” de los MEFs y compararlo con el de una proteína
con conocida actividad pro-condrogénica en estas células, la proteína 2 morfogénica del
hueso (BMP2) (manuscrito IV). Se analizaron los efectos en dos tipos de cultivo, cultivo
en monocapa y cultivo de alta densidad celular o también llamado cultivo en tres
dimensiones.
Desde el día 0 (equivalente a 48 horas tras la confluencia en cultivos en monocapa y al
día de la siembra en cultivos en tres dimensiones) hasta el día 13 se añadieron los
compuestos de interés a una dosis de 100 μM, o BMP2 a una dosis de 100 nM. Como
control se emplearon cultivos a los que no se les añadió ningún tratamiento. Las células
fueron cosechadas a diferentes días de cultivo (día 0, día 3, día 8 y día 13). Se midieron
los niveles de ARNm de genes que codifican para proteínas involucradas en la
diferenciación de condrocitos (Pref-1, Sox-9) y para componentes estructurales
(proteína del agrecan, colágeno tipo 2a1) y enzimas remodeladoras (agrecanasa) de la
matriz extracelular de condrocitos. La diferenciación espontánea en adipocitos se evaluó
por la presencia de acumulación lipídica intracelular al microscopio de contraste de fase
y a partir de los niveles de ARNm de marcadores adipocitarios (PPARγ, FAS), a día 8 de
cultivo.


4. RESULTADOS Y DISCUSIÓN

Resultados y Discusión
57
MANUSCRITO I
Retinol-binding Protein 4 and Nicotinamide Phosphoribosyltransferase/Visfatin in
Rat Obesity Models.
Mercader J., Granados N., Caimari A., Oliver P., Bonet M. L., Palou A.
Horm Metab Res, 40:462-72, 2008.

Animals, Clinical 1
Mercader J et al. RBP4 and Nampt / Visfatin in Rat Obesity Models … Horm Metab Res 2008 ; 40: 1 – 6
HMR/498/11.3.2008/Macmillan
received 18.07.2007 accepted 17.12.2007
Bibliography DOI 10.1055/s-2008-1065324 Horm Metab Res 2008 ; 40: 1 – 6 © Georg Thieme Verlag KG Stuttgart · New York ISSN 0018-5043
Correspondence Dr. M. L. Bonet Laboratori de Biologia Molecular Nutrici ó i Biotecnologia Departament de Biologia Fonamental i Ci è ncies de la Salut Universitat de les Illes Balears Crta. Valldemossa Km 7.5 07122 Palma de Mallorca Spain Tel.: + 34 / 971 / 17 27 34 Fax: + 34 / 971 / 17 34 26 [email protected]
Key words � � adipokines � � insulin sensitivity � � insulin resistance � � diabetes � � fa / fa Zucker rats � � diet-induced obesity
Retinol-binding Protein 4 and Nicotinamide Phosphoribosyltransferase / Visfatin in Rat Obesity Models
modulation of insulin biology and glucose homeo-stasis. Following the re-identifi cation of RBP4 and Nampt / visfatin as adipokines, attention focused mainly on possible correlations between the lev-els and genetic variation of these proteins with parameters of obesity, insulin resistance, and other components of the metabolic syndrome in humans, giving rise to controversial results. How-ever, the number of reports dealing with the expression of these novel adipokines in animal models of obesity / insulin resistance is surpris-ingly small [2, 3, 5] . This prompted us to examine RBP4 and Nampt / visfatin serum levels and rela-tive adipose tissue gene expression in two well-established rat models of obesity, namely, Zucker fa / fa rats, which display genetic obesity due to defi ciencies in the leptin receptors, and cafeteria diet – fed Wistar rats, which develop diet-induced hyperphagia and obesity [6] . Expression of RBP4 and Nampt / visfatin in these models had not been previously addressed.
Introduction & Adipokines are proteins secreted by adipose tis-sue that affect whole-body energy metabolism. Their dysregulated production in obesity has implicated them as potential mediators in the pathogenesis of obesity-related risk factors (reviewed in [1] ). Retinol-binding protein 4 (RBP4) and visfatin — the latter previously known as pre-B cell colony-enhancing factor and nicoti-namide phosphoribosyltransferase (Nampt) and referred to throughout the rest of this paper as Nampt / visfatin — are two proteins that have been recently rediscovered as adipokines. Evidence was presented of effects of adipose tissue-derived RBP4 promoting systemic insulin resistance [2] and of insulin-mimetic effects of Nampt / visfatin [3] . Though the insulin-mimetic function of Nampt / visfatin has not consistently been repro-duced and therefore remains unproved, it is accepted that differentiated adipocytes are likely to be a major source of circulating Nampt / visfatin and that Nampt / visfatin, acting as a systemic NAD biosynthetic enzyme, affects insulin secre-tion in pancreatic � -cells [4] . Therefore, both RBP4 and Nampt / visfatin might have a role in the
Authors J. Mercader , N. Granados , A. Caimari , P. Oliver , M. L. Bonet , A. Palou
Affi liation Laboratory of Molecular Biology, Nutrition and Biotechnology, Universitat de les Illes Balears, Palma de Mallorca, Spain and CIBER Fisiopatolog í a de la Obesidad y Nutrici ó n (CB06 / 03), Instituto de Salud Carlos III, Spain
Abstract & Retinol-binding protein 4 (RBP4) and nicotina-mide phosphoribosyltransferase / visfatin (Nampt / visfatin) are adipocyte-secreted proteins (adi-pokines) whose relevance to the metabolic syndrome and regulation in obesity remain con-troversial. Here, we tested the hypothesis that adipose tissue expression and circulating levels of these two adipokines are elevated in obesity by analyzing their changes in both a genetic and a diet-induced model of obesity in the rat (obese fa / fa Zucker rats and Wistar rats fed a cafeteria diet, respectively). Compared with lean controls,
obese fa / fa rats were hyperleptinemic, hyperin-sulinemic, and insulin resistant and had reduced RBP4 serum levels and mRNA levels in adipose depots, unchanged Nampt / visfatin serum levels, and reduced Nampt / visfatin mRNA levels selec-tively in the inguinal adipose depot. Cafeteria diet-induced obesity resulted in increased fed blood glucose levels, a variable degree of insulin resistance, unchanged serum Nampt / visfatin and RBP4 levels, and reduced mRNA levels of both adipokines in several adipose depots. Hence, increases in RBP4 or Nampt / visfatin do not accompany obesity and insulin resistance in the models examined.
Animals, Clinical2
Mercader J et al. RBP4 and Nampt / Visfatin in Rat Obesity Models … Horm Metab Res 2008 ; 40: 1 – 6
HMR/498/11.3.2008/Macmillan
Materials and Methods & Animals Three-month-old male lean ( – / ?) and obese ( fa / fa ) Zucker rats fed regular chow (n = 10 animals per group, distributed in two independent experiments) and six-month-old male Wistar rats fed from the age of two months either regular chow or a cafete-ria diet (n = 5 animals per group) were used (from Charles River Laboratories Espa ñ a SA, Barcelona, Spain). The cafeteria diet included cookies with liver p â t é and sobrassada (a typical Major-can sausage), candies, fresh bacon, biscuits, chocolate, salted peanuts, cheese, ensa ï mada (a typical Majorcan pastry), and milk containing 20 % (w / v) sucrose. Animals were housed at 22 ° C with a period of light / dark of 12 hours and sacrifi ced by decapitation at the start of the light period. White adipose tissue (WAT) depots (epididymal, retro-peritoneal, mesenteric, and inguinal; eWAT, rWAT, mWAT, and iWAT, respectively) were excised in their entirety, weighed, fro-zen in liquid nitrogen, and stored at − 80 ° C until analysis. Tron-cular blood was collected from the neck, stored at room temperature for 1 hour, and centrifuged at 1000 × g for 10 min-utes to collect serum.
Adiposity index The adiposity index was computed as the sum of the mass of all WAT depots taken expressed as percentage of total body weight.
HOMA-IR analysis Insulin resistance was assessed by the homeostatic model assessment for insulin resistance (HOMA-IR) in parallel groups of lean and obese Zucker rats and control and cafeteria diet – fed Wistar rats that had been submitted to overnight (14 h) fasting (n = 5 for all groups). The HOMA-IR score was calculated from fasting insulin and glucose concentrations using the formula of Matthews et al. [7] : HOMA-IR = fasting glucose (mmol / l) × fasting insulin (mU / l) / 22.5.
Western blotting analysis A total of 3 � l of serum was mixed with 10 � l phosphate-buffered saline and solubilized and boiled for three minutes in Laemmli sample buffer containing 20 % 2-mercaptoethanol. Total protein was fractionated by SDS-polyacrylamide gel electrophoresis (13 % polyacrylamide) and electrotransferred onto a PVDF mem-brane (Bio-Rad, Madrid, Spain). Black amide B10 staining pro-vided visual evidence for correct loading and blotting of proteins. After blocking, membranes were incubated with primary mouse monoclonal antibodies (anti-RBP4 from Abcam, Cambridge, UK or anti-visfatin from Axxora LLC, San Diego, CA) and then with secondary horseradish peroxidase-linked anti-mouse IgG anti-body (Amersham Biosciences, Barcelona, Spain). Immunocom-plexes were revealed using an enhanced chemiluminescence detection system (ECL, Biosciences, Barcelona, Spain). Mem-branes were exposed to Hyperfi lm ECL (Amersham Biosciences, Barcelona, Spain). Bands in fi lms were analyzed by scanner pho-todensitometry and quantifi ed using the BioImage program (Millipore, Bedford, MA).
Tissue RNA extraction and real-time PCR analysis Total RNA was extracted using Trizol (Invitrogen, Carlsbad CA, USA) according to the supplier ’ s instructions. cDNA synthesis was performed from 1 � g total RNA using leukemia virus reverse
transcriptase (Perkin-Elmer, Madrid, Spain) in the presence of 50 pmol of random primers, in a Perkin-Elmer 2400 Thermal Cycler. After diluting the cDNA samples 1:10, real-time PCR analyses were conducted in the LightCycler System with SYBR Green I sequence nonspecifi c detection (Roche Diagnostic GmbH, Mannheim, Germany). LDL receptor-related protein 10 (LRP10) was used as a reference gene, after verifying that its mRNA expression levels varied very little between the different adi-pose depots and between lean and obese animals (data not shown), in agreement with a previous report [8] . Sense and anti-sense primers used in the PCR reactions were designed with specifi c primer analysis software Primer3 (Whitehead Institute for Biomedical Research, Cambridge, MA) to hybridize to differ-ent exons and to avoid amplifi cation of any residual genomic DNA, and their specifi city was analyzed by the ENTREZ and BLAST databases utilities (National Center for Biotechnology Information, Bethesda, MD). The following primers were used. For RBP4 (Genbank accession number NM_013162), 5 � -ACT-GGGGTGTAGCCTCCTTT-3 � and 5 � -GGTGTCGTAGTCCGTGTCG-3 � ; for Nampt / visfatin (Genbank accession number NM_177298), 5 � -CATAGGGGCATCTGCTCATT-3 � and 5 � -GCTATCGCTGACCACA-GACA-3 � ; and for LRP10 (Genbank accession number NM_001037777), 5 � -TCCCCTTTCTTCTCCTCCTC-3 � and 5 � -TTACCGTC-TGTTCCTTGCTG-3 � . Each PCR was performed in a total volume of 8 � l, made from 2 � l diluted cDNA template, 0.375 � l forward and reverse primers, 0.6 � l MgCl 2 , 3.9 � l PCR-grade water, and 0.75 � l SYBR Green I master mix. After an initial Taq activation at 95 ° C for 10 minutes, LightCycler PCR was performed using 40 cycles with the following cycling conditions: denaturation at 95 ° C for two seconds, annealing at 61 ° C (for RBP4) or 60 ° C (for Nampt / visfatin and LRP10) for six seconds, and extension at 72 ° C for four seconds (for RBP4) or nine seconds (for Nampt / visfatin and LRP10). To verify the purity of the PCR products, a melting curve was produced after each run and these products were separated in a 2 % agarose gel (Agarose D-1 Low EEO; Pronadisa, Madrid, Spain) in 0.5 × Tris-borate-EDTA buffer and stained with ethid-ium bromide. Threshold cycle values were determined using the LightCycler software. Relative gene expression numbers were calculated using the 2 − � � Ct method [9] .
Quantifi cation of circulating insulin, leptin and glucose Serum insulin and leptin were measured using ELISA kits (from DRG Instruments, Marburg, Germany, and R & D Systems, Min-neapolis, MN, respectively), and blood glucose was measured using an Accu-Chek Glucometer (Roche Diagnostics, Barcelona, Spain).
Statistical analysis Data are presented as mean ± SEM. Statistical signifi cance of dif-ferences between lean and obese rats was assessed by two-tailed Student ’ s t -test. Statistical signifi cance of differences in relative gene expression among fat depots was assessed by one-way ANOVA followed by least-signifi cant difference (LSD) post hoc comparison. Results were considered statistically signifi cant when p < 0.05.
Results & Compared to lean ( – / ?) controls, Zucker fa / fa rats displayed a 24 % increase in body weight, a 3.2-fold increase in adiposity index, and a marked increase in circulating leptin levels and
Animals, Clinical 3
Mercader J et al. RBP4 and Nampt / Visfatin in Rat Obesity Models … Horm Metab Res 2008 ; 40: 1 – 6
HMR/498/11.3.2008/Macmillan
were euglycemic but hyperinsulinemic in the fed state ( Table 1 ). HOMA-IR determined in parallel groups of fasted animals con-fi rmed systemic insulin resistance in the fa / fa rats, as expected (HOMA-IR: lean Zucker rats, 1.80 ± 0.20; obese fa / fa Zucker rats, 21.18 ± 3.26; p = 0.000). RBP4 mRNA levels (determined per microgram of tissue RNA relative to LRP10 as a reference gene) were lower in WAT depots of obese Zucker fa / fa rats than in their lean controls: the reduction reached statistical signifi cance in the epididymal (p = 0.013) and retroperitoneal (p = 0.002) depots and showed a clear trend in the mesenteric depot (p = 0.056) ( � � Fig. 1A ). In line with the mRNA profi le, serum RBP4 levels were signifi cantly lower in obese Zucker fa / fa rats than in their lean controls (p = 0.01) ( � � Fig. 1B ). Obesity in Zucker fa / fa rats did not bring about noticeable changes in serum Nampt / visfatin or relative Nampt / visfatin gene expression in visceral WAT depots, but it was accompanied by a signifi cant reduction in Nampt / visfatin gene expression in the inguinal depot (p = 0.023) ( � � Fig. 1C,D ). Compared with age-matched controls fed a standard chow diet, Wistar rats fed a cafeteria diet for 16 weeks from the age of two months exhibited a 37 % increase in body weight, a 2.2-fold increase in body adiposity, and a 3.5-fold increase in leptinemia ( Table 2 ). Cafeteria diet-induced obesity did not signifi cantly
alter circulating insulin levels but resulted in increased blood glucose levels in the fed state ( Table 2 ). HOMA-IR analysis per-formed in parallel groups of fasted cafeteria and control Wistar rats indicated reduced insulin sensitivity in the former, although the difference did not reach statistical signifi cance owing to interindividual variability in the cafeteria group (HOMA-IR score: control Wistar rats, 5.25 ± 1.52; cafeteria-fed Wistar rats, 10.96 ± 4.91). Cafeteria diet-induced obesity did not affect serum RBP4 or Nampt / visfatin levels ( � � Fig. 2B,D ) and was accompa-nied by a signifi cant decrease in RBP4 gene expression in the inguinal adipose depot (p = 0.036) ( � � Fig. 2A ) and in Nampt / visfatin gene expression in the mesenteric (p = 0.019) and inguinal (p = 0.000) adipose depots ( � � Fig. 2C ). We compared RBP4 and Nampt / visfatin gene expression levels in subcutaneous (inguinal) and visceral depots of Zucker and Wistar lean rats ( Table 3 ). In lean Zucker rats, RBP4 mRNA levels were similar in all fat depots analyzed, and no increased Nampt / visfatin expression in visceral depots over that found in the inguinal depot was detected. In lean Wistar rats, RBP4 mRNA levels were lower in the inguinal depot than in visceral depots (epididymal and mesenteric), and Nampt / visfatin mRNA levels were maximal in the mesenteric depot, followed by the inguinal depot.
Table 1 Biometric parameters, glycemia, insulinemia, and leptinemia in lean and obese Zucker rats
Parameter ( – / ?) rats fa / fa rats t -test *
body weight (g) 321 ± 6 397 ± 8 p = 0.000 eWAT mass (g) 1.87 ± 0.13 5.50 ± 0.52 p = 0.000 rWAT mass (g) 1.71 ± 0.16 5.04 ± 0.38 p = 0.000 mWAT mass (g) 1.40 ± 0.11 4.04 ± 0.43 p = 0.000 iWAT mass (g) 4.09 ± 0.27 21.6 ± 0.5 p = 0.000 adiposity index ( % ) 2.82 ± 0.17 9.13 ± 0.21 p = 0.000
circulating glucose (mM) 6.29 ± 0.30 6.49 ± 0.49 circulating insulin ( � g / l) 0.72 ± 0.13 15.4 ± 3.7 p = 0.003 circulating leptin ( � g / l) 3.47 ± 0.24 41.1 ± 2.9 p = 0.000
Three-month-old male lean ( – / ?) and obese ( fa / fa ) Zucker rats fed regular chow were
used. Biometric data are the mean ± SEM of 10 animals per group, distributed in two
independent experiments. Blood parameters are the mean ± SEM of 5 animals per
group in a single experiment
* Student’s t -test signifi cance is given
Table 2 Biometric parameters, glycemia, insulinemia, and leptinemia in Wistar rats made obese by cafeteria diet feeding and their controls
Parameter Control
group
Cafeteria
group
t -test *
body weight (g) 475 ± 22 652 ± 4 p = 0.000 eWAT mass (g) 11.7 ± 1.5 34.5 ± 2.5 p = 0.000 rWAT mass (g) 12.1 ± 2.2 33.9 ± 2.6 p = 0.000 mWAT mass (g) 6.40 ± 1.62 18.6 ± 0.6 p = 0.001 iWAT mass (g) 8.06 ± 1.02 27.0 ± 2.7 p = 0.001 adiposity index ( % ) 7.95 ± 0.86 17.5 ± 0.9 p = 0.000 circulating glucose (mM) 6.43 ± 0.31 8.11 ± 0.35 p = 0.012 circulating insulin ( � g / l) 3.25 ± 0.47 3.41 ± 0.98 circulating leptin ( � g / l) 10.7 ± 1.8 38.0 ± 4.9 p = 0.001
Six-month-old male Wistar rats fed from the age of 2 months with either regular
chow (control group) or a cafeteria diet (cafeteria group) were used. Data are the
mean ± SEM of 5 animals per group
* Student’s t -test signifi cance is given
Serum RBP4Relative RBP4 mRNA expression
100
125
150
80
100
120
*
RB
P4
mR
NA
/LR
P1
0
mR
NA
(%
)
25
50
75 *
se
rum
RB
P4
(%
)
20
40
60
0
100
125
150
25
50
75
0
eWAT0
80100120140
204060
0
Relative visfatin mRNA expression Serum visfatin
vis
fatin
mR
NA
/LR
P1
0
mR
NA
(%
)
*
se
rum
vis
fatin
(%
)
iWATmWATrWAT
eWAT iWATmWATrWAT
A B
C D
**
Fig. 1 Adipose tissue expression and serum levels of RBP4 ( A , B ) and visfatin ( C , D ) in lean and obese Zucker rats. Three-month-old male lean ( – / ?) and obese ( fa / fa ) Zucker rats fed regular chow were used (white bars and gray bars, respectively). Gene expression data in mWAT and circulating RBP4 and visfatin data are the mean ± SEM of 5 animals per group in a single experiment. Gene expression data in eWAT, rWAT, and iWAT are the mean ± SEM of 10 animals per group, distributed in two independent experiments. Data are expressed relative to the mean value of the lean group, which was set as 100 % . Representative immunoblots of RBP4 and visfatin in 3 � l of serum are shown at the bottom of panels B and D , respectively. Student ’ s t -test signifi cance: * p < 0.05; * * p < 0.01.
Animals, Clinical4
Mercader J et al. RBP4 and Nampt / Visfatin in Rat Obesity Models … Horm Metab Res 2008 ; 40: 1 – 6
HMR/498/11.3.2008/Macmillan
Discussion and Conclusions & Serum RBP4 levels have been reported to be increased in insu-lin-resistant mouse models, some involving obesity (such as mice on a high-fat diet and ob / ob mice) and others not (such as adipose-specifi c GLUT4-defi cient mice) [2] . Biochemical, genetic, and pharmacological studies have suggested that in mice, adi-pose tissue – derived RBP4 can cause insulin resistance by mech-anisms that might include impairment of insulin signaling in muscle and enhancement of hepatic glucose output [2] . How-ever, the relationship between RBP4 and obesity and insulin resistance remains unclear. Some authors reported a positive association between serum RBP4 levels and general measures of obesity such as BMI or percentage body fat in humans (e.g. [2, 10, 11] ,); other authors did not detect such correlations (e.g. [12 – 15] ,) but found a correlation with liver fat [14] or percentage trunk fat [15] . An association between high serum RBP4 levels and impaired insulin sensitivity, even independent of obesity, was found in some human studies (e.g. [10, 11, 14 – 16] ,) but not in others (e.g. [12, 13, 17] ,). Our results do not sustain a role for RBP4 in the development of systemic insulin resistance in the rat models examined, as serum RBP4 levels — measured by “ gold standard ” Western blotting [18] — were clearly reduced in insu-lin-resistant Zucker fa / fa rats and unchanged in cafeteria diet – fed rats relative to lean controls. A reduced RBP4 level in the serum of fa / fa rats was an unex-pected fi nding. It could have been expected that defi ciencies in leptin and leptin receptors lead to a similar RBP4 phenotype. In fact, in both leptin-defi cient ob / ob mice [2] and obese Zucker fa / fa rats (this work), specifi c RBP4 gene expression in adipose
tissues is reduced by 40 – 50 % compared with lean controls, sug-gesting that leptin signaling normally upregulates RBP4 gene transcription in adipocytes. This transcriptional response could contribute to local effects of leptin antagonizing insulin signal-ing in adipose tissues, as effects of RBP4 attenuating insulin sig-naling in adipocytes have been described [19] . However, serum RBP4 levels are reduced in hyperleptinemic fa / fa Zucker rats (this work) and elevated by a factor of 13 (remarkably much more than in the other mouse models of insulin resistance ana-lyzed) in ob / ob mice lacking leptin [2] . This difference may sug-gest that high leptin normally has side effects independent of leptin receptors that favor reduction of RBP4 levels in serum (e.g., increased clearance and / or reduced secretion). This sce-nario, with hyperleptinemia having opposite effects on adipose RBP4 gene expression and RBP4 serum levels, may partly explain inconsistencies in the literature regarding RBP4 in obesity, espe-cially when it is considered that hyperleptinemia and leptin resistance coexist at various degrees in many forms of obesity. It is also possible that species differences exist between rats and mice concerning RBP4 regulation. The biology of Nampt / visfatin and its connections with patho-physiological conditions such as obesity and type 2 diabetes remain poorly understood. Acting as a systemic NAD biosyn-thetic enzyme, Nampt / visfatin has been shown to positively modulate insulin secretion in pancreatic -cells, suggesting a role for this protein in the regulation of glucose homeostasis [4] . Nampt / visfatin may also represent a survival signal for adi-pocytes and other cell types as a consequence of its intracellular role in the provision of NAD for cell survival reactions linked to the sirtuin family of protein deacetylases [20] . In fact, Nampt /
Relative RBP4 mRNA expression Serum RBP4140150
125 120
100100
7580
5060
*40
25 20
se
rum
RB
P4
(%
)
0 0eWAT
RB
P4
mR
NA
/LR
P1
0
mR
NA
(%
)
Relative visfatin mRNA expression Serum visfatin140150120
125100
100
7580
****
6050 *** 40
25
se
rum
vis
fatin
(%
)
20
0 0
vis
fatin
mR
NA
/LR
P1
0
mR
NA
(%
)
iWATmWATrWAT
eWAT iWATmWATrWAT
A B
C D
Fig. 2 Adipose tissue expression and serum levels of RBP4 ( A , B ) and visfatin ( C , D ) in Wistar rats made obese by cafeteria diet feeding and their controls. Six-month-old male Wistar rats fed from the age of 2 months either with regular chow (control group) or a cafeteria diet were used (dashed bars and black bars, respectively). Data are the mean ± SEM of 5 animals per group and are expressed relative to the mean value of the control group, which was set as 100 % . Representative immunoblots of RBP4 and visfatin in 3 � l of serum are shown at the bottom of panels B and D , respectively. Student ’ s t -test signifi cance: * p < 0.05; * * * p < 0.001.
Table 3 Expression of RBP4 and Nampt / visfatin mRNA in different adipose tissue depots of three-month-old male lean ( – / ?) Zucker rats and six-month-old male Wistar rats fed regular chow
iWAT eWAT rWAT mWAT ANOVA
RBP4 mRNA Zucker lean 0.96 ± 0.50 1.48 ± 0.21 1.87 ± 0.33 1.11 ± 0.10 Wistar lean 1.29 ± 0.12 a 3.44 ± 0.83 b 1.14 ± 0.16 a 4.44 ± 0.33 b D Nampt / visfatin mRNA Zucker lean 1.18 ± 0.33 a 1.17 ± 0.14 a 0.56 ± 0.10 b 0.99 ± 0.15 a,b D Wistar lean 1.23 ± 0.15 a 0.88 ± 0.13 b 0.79 ± 0.07 b 2.01 ± 0.08 c D
Ratios of gene expression to LRP10 as a reference gene are given as mean ± SEM of n = 5 animals per group
D = one-way ANOVA signifi cance, p < 0.05, effect of depot
In each row, values not sharing a common letter are statistically different by LSD post hoc comparison (p < 0.05)
Animals, Clinical 5
Mercader J et al. RBP4 and Nampt / Visfatin in Rat Obesity Models … Horm Metab Res 2008 ; 40: 1 – 6
HMR/498/11.3.2008/Macmillan
visfatin is upregulated by hypoxia in cell types including adi-pocytes [21, 22] and reportedly stimulates angiogenesis [23] , inhibits apoptosis [24] , and extends the cell ’ s lifespan [20] . Hence, Nampt / visfatin may act as an intracellular and / or para-crine signal for sustained WAT development / maintenance and as a systemic positive modulator of insulin secretion. Changes in Nampt / visfatin levels in obesity are controversial. Nampt / visfatin serum levels and expression in visceral fat were reported to increase in KKAy mice (a polygenic model of diabes-ity) at the onset of obesity and to be increased in mice on a high-fat diet [3] . In humans, plasma levels of Nampt / visfatin have been reported to correlate with measures of obesity (BMI, per-centage body fat) [3, 25 – 27] , to be increased in proportion to visceral fat accumulation [3, 27] , and to be reduced after weight loss [28] . However, others found reduced plasma Nampt / visfatin levels in obese compared with normal-weight subjects [29, 30] or lack of association between plasma Nampt / visfatin and BMI [31] or whole-body adiposity [32] . Changes in Nampt / visfatin levels in insulin resistance and type 2 diabetes are also contro-versial. Increased serum concentrations of Nampt / visfatin in type 2 diabetic humans independent of their BMI have been reported [33] , as has increased expression of Nampt / visfatin mRNA in peripheral blood mononuclear cells of type 2 diabetic women independent of their BMI [34] . However, other authors found no association between serum visfatin and parameters of insulin sensitivity in humans [25, 29] . Our results do not sustain the concept that Nampt / visfatin is characteristically upregulated in obesity or insulin resistance states and are in line with previ-ous fi ndings in obese Wistar Ottawa Karlsburg rats with the MHC RT1u haplotype (WOKW rats), an animal model for poly-genically inherited metabolic syndrome [5] . We found a preferential expression of both Nampt / visfatin and RBP4 in the mesenteric vs. the subcutaneous inguinal depot in lean Wistar rats, but not in lean Zucker rats. Our results are com-patible, however, with a preferential expression of Nampt / visfatin in the visceral depots in the obese state because, in both models, obesity was accompanied by a downregulation of Nampt / visfatin gene expression in the inguinal depot that was absent or less marked in the visceral depots analyzed. In conclusion, our results in both a genetic and a diet-induced rat model of obesity do not support a major role for increased RBP4 or Nampt / visfatin in the development of insulin resistance in these models, or an effect of increased adiposity per se induc-ing the expression of these two adipokines in WAT depots.
Acknowledgments & This work was supported by the Spanish government (Ministe-rio e Educaci ó n y Ciencia, AGL2006-04887 / ALI and AGL2004-07496 / ALI). J. M. and A. C. are the recipients of fellowships from the governments of Spain and the Balearic Islands, respectively. Our laboratory is a member of The European Nutrigenomics Organisation (NuGO, EU Contract FOOD-CT-2004-506360).
References 1 Fischer-Posovszky P , Wabitsch M , Hochberg Z . Endocrinology of adipose
tissue – an update . Horm Metab Res 2007 ; 39 : 314 – 321 2 Yang Q , Graham TE , Mody N , Preitner F , Peroni OD , Zabolotny JM ,
Kotani K , Quadro L , Kahn BB . Serum retinol binding protein 4 contri-butes to insulin resistance in obesity and type 2 diabetes . Nature 2005 ; 436 : 356 – 362
3 Fukuhara A , Matsuda M , Nishizawa M , Segawa K , Tanaka M , Kishimoto K , Matsuki Y , Murakami M , Ichisaka T , Murakami H , Watanabe E , Takagi T , Akiyoshi M , Ohtsubo T , Kihara S , Yamashita S , Makishima M , Funahashi T , Yamanaka S , Hiramatsu R , Matsuzawa Y , Shimomura I . Visfatin: a protein secreted by visceral fat that mimics the effects of insulin . Science 2005 ; 307 : 426 – 430 . (Retraction in: Science 2007; 318: 565)
4 Revollo JR , Korner A , Mills KF , Satoh A , Wang T , Garten A , Dasgupta B , Sasaki Y , Wolberger C , Townsend RR , Milbrandt J , Kiess W , Imai S . Nampt/PBEF/Visfatin regulates insulin secretion in beta cells as a sys-temic NAD biosynthetic enzyme . Cell Metab 2007 ; 6 : 363 – 375
5 Kloting N , Kloting I . Visfatin: gene expression in isolated adipocytes and sequence analysis in obese WOKW rats compared with lean con-trol rats . Biochem Biophys Res Commun 2005 ; 332 : 1070 – 1072
6 Rodriguez AM , Quevedo-Coli S , Roca P , Palou A . Sex-dependent dietary obesity, induction of UCPs, and leptin expression in rat adipose tis-sues . Obesity Res 2001 ; 9 : 579 – 588
7 Matthews DR , Hosker JP , Rudenski AS , Naylor BA , Treacher DF , Turner RC . Homeostasis model assessment: insulin resistance and beta-cell function from fasting plasma glucose and insulin concentra-tions in man . Diabetologia 1985 ; 28 : 412 – 419
8 Gabrielsson BG , Olofsson LE , Sjogren A , Jernas M , Elander A , Lonn M , Rudemo M , Carlsson LM . Evaluation of reference genes for studies of gene expression in human adipose tissue . Obesity Res 2005 ; 13 : 649 – 652
9 Livak KJ , Schmittgen TD . Analysis of relative gene expression data using real-time quantitative PCR and the 2(-Delta Delta C(T)) Method . Meth-ods 2001 ; 25 : 402 – 408
10 Graham TE , Yang Q , Bluher M , Hammarstedt A , Ciaraldi TP , Henry RR , Wason CJ , Oberbach A , Jansson PA , Smith U , Kahn BB . Retinol-binding protein 4 and insulin resistance in lean, obese, and diabetic subjects . N Engl J Med 2006 ; 354 : 2552 – 2563
11 Lee DC , Lee JW , Im JA . Association of serum retinol binding protein 4 and insulin resistance in apparently healthy adolescents . Metabolism 2007 ; 56 : 327 – 331
12 Broch M , Vendrell J , Ricart W , Richart C , Fernandez-Real JM . Circulating retinol-binding protein-4, insulin sensitivity, insulin secretion, and insulin disposition index in obese and nonobese subjects . Diabetes Care 2007 ; 30 : 1802 – 1806
13 Janke J , Engeli S , Boschmann M , Adams F , Bohnke J , Luft FC , Sharma AM , Jordan J . Retinol-binding protein 4 in human obesity . Diabetes 2006 ; 55 : 2805 – 2810
14 Stefan N , Hennige AM , Staiger H , Machann J , Schick F , Schleicher E , Fritsche A , Haring HU . High circulating retinol-binding protein 4 is associated with elevated liver fat but not with total, subcutaneous, visceral, or intramyocellular fat in humans . Diabetes Care 2007 ; 30 : 1173 – 1178
15 Gavi S , Stuart LM , Kelly P , Melendez MM , Mynarcik DC , Gelato MC , MacNurlan MA . Retinol-binding protein 4 is associated with insulin resistance and body fat distribution in nonobese subjects without type 2 diabetes . J Clin Endocrinol Metab 2007 ; 92 : 1886 – 1890
16 Cho YM , Youn BS , Lee H , Lee N , Min SS , Kwak SH , Lee HK , Park KS . Plasma retinol-binding protein-4 concentrations are elevated in human sub-jects with impaired glucose tolerance and type 2 diabetes . Diabetes Care 2006 ; 29 : 2457 – 2461
17 Silha JV , Nyomba BL , Leslie WD , Murphy LJ . Ethnicity, insulin resistance, and infl ammatory adipokines in women at high and low risk for vas-cular disease . Diabetes Care 2007 ; 30 : 286 – 291
18 Graham TE , Wason CJ , Bluher M , Kahn BB . Shortcomings in methodol-ogy complicate measurements of serum retinol binding protein (RBP4) in insulin-resistant human subjects . Diabetologia 2007 ; 50 : 814 – 823
19 Ost A , Danielsson A , Liden M , Eriksson U , Nystrom FH , Stralfors P . Reti-nol-binding protein-4 attenuates insulin-induced phosphorylation of IRS1 and ERK1/2 in primary human adipocytes . FASEB J 2007 ; 21 : 3696 – 3704
20 Veer E van der , Ho C , O ’ Neil C , Barbosa N , Scott R , Cregan SP , Pickering JG . Extension of human cell lifespan by nicotinamide phosphoribosyl-transferase . J Biol Chem 2007 ; 282 : 10841 – 10845
21 Segawa K , Fukuhara A , Hosogai N , Morita K , Okuno Y , Tanaka M , Nakagawa Y , Kihara S , Funahashi T , Komuro R , Matsuda M , Shimomura I . Visfatin in adipocytes is upregulated by hypoxia through HIF1alpha-dependent mechanism . Biochem Biophys Res Commun 2006 ; 349 : 875 – 882
22 Bae SK , Kim SR , Kim JG , Kim JY , Koo TH , Jang HO , Yun I , Yoo MA , Bae MK . Hypoxic induction of human visfatin gene is directly medi-ated by hypoxia-inducible factor-1 . FEBS Lett 2006 ; 580 : 4105 – 4113
Animals, Clinical6
Mercader J et al. RBP4 and Nampt / Visfatin in Rat Obesity Models … Horm Metab Res 2008 ; 40: 1 – 6
HMR/498/11.3.2008/Macmillan
23 Kim SR , Bae SK , Choi KS , Park SY , Jun HO , Lee JY , Jang HO , Yun I , Yoon KH , Kim YJ , Yoo MA , Kim KW , Bae MK . Visfatin promotes angio-genesis by activation of extracellular signal-regulated kinase 1/2 . Biochem Biophys Res Commun 2007 ; 357 : 150 – 156
24 Jia SH , Li Y , Parodo J , Kapus A , Fan L , Rotstein OD , Marshall JC . Pre-B cell colony-enhancing factor inhibits neutrophil apoptosis in experi-mental infl ammation and clinical sepsis . J Clin Invest 2004 ; 113 : 1318 – 1327
25 Berndt J , Kloting N , Kralisch S , Kovacs P , Fasshauer M , Schon MR , Stumvoll M , Bluher M . Plasma visfatin concentrations and fat depot-specifi c mRNA expression in humans . Diabetes 2005 ; 54 : 2911 – 2916
26 Haider DG , Holzer G , Schaller G , Weghuber D , Widhalm K , Wagner O , Kapiotis S , Wolzt M . The adipokine visfatin is markedly elevated in obese children . J Pediatr Gastroenterol Nutr 2006 ; 43 : 548 – 549
27 Sandeep S , Velmurugan K , Deepa R , Mohan V . Serum visfatin in relation to visceral fat, obesity, and type 2 diabetes mellitus in Asian Indians . Metabolism 2007 ; 56 : 565 – 570
28 Haider DG , Schindler K , Schaller G , Prager G , Wolzt M , Ludvik B . Increased plasma visfatin concentrations in morbidly obese subjects are reduced after gastric banding . J Clin Endocrinol Metab 2006 ; 91 : 1578 – 1581
29 Pagano C , Pilon C , Olivieri M , Mason P , Fabris R , Serra R , Milan G , Rossato M , Federspil G , Vettor R . Reduced plasma visfatin/pre-B cell colony-enhancing factor in obesity is not related to insulin resistance in humans . J Clin Endocrinol Metab 2006 ; 91 : 3165 – 3170
30 Jian WX , Luo TH , Gu YY , Zhang HL , Zheng S , Dai M , Han JF , Zhao Y , Li G , Luo M . The visfatin gene is associated with glucose and lipid metabolism in a Chinese population . Diabet Med 2006 ; 23 : 967 – 973
31 Dogru T , Sonmez A , Tasci I , Bozoglu E , Yilmaz MI , Genc H , Erdem G , Gok M , Bingol N , Kilic S , Ozgurtas T , Bingol S . Plasma visfatin levels in patients with newly diagnosed and untreated type 2 diabetes mellitus and impaired glucose tolerance . Diabetes Res Clin Pract 2007 ; 76 : 24 – 29
32 Wang P , Greevenbroek MM van , Bouwman FG , Brouwers MC , Kallen CJ van der , Smit E , Keijer J , Mariman EC . The circulating PBEF/NAMPT/visfatin level is associated with a benefi cial blood lipid profi le . Pfl ugers Arch 2007 ; 454 : 971 – 976
33 Chen MP , Chung FM , Chang DM , Tsai JC , Huang HF , Shin SJ , Lee YJ . Elevated plasma level of visfatin/pre-B cell colony-enhancing factor in patients with type 2 diabetes mellitus . J Clin Endocrinol Metab 2006 ; 91 : 295 – 299
34 Tsiotra PC , Tsigos C , Yfanti E , Anastasiou E , Vikentiou M , Psarra K , Papasteriades C , Raptis SA . Visfatin, TNF-alpha and IL-6 mRNA expres-sion is increased in mononuclear cells from type 2 diabetic women . Horm Metab Res 2007 ; 39 : 758 – 763
Resultados y Discusión
65
MANUSCRITO II
Mercader J., Granados N., Bonet M.L., Palou A.
All-trans retinoic acid decreases murine adipose retinol binding protein 4
production.
Cell Physiol Biochem, 22:362-72, 2008

363
Original Paper
Cell Physiol Biochem 2008;22:363-372 Accepted: April 21, 2008Cellular PhysiologyCellular PhysiologyCellular PhysiologyCellular PhysiologyCellular Physiologyand Biochemistrand Biochemistrand Biochemistrand Biochemistrand Biochemistryyyyy
Copyright © 2008 S. Karger AG, Basel
Fax +41 61 306 12 34E-Mail [email protected]
© 2008 S. Karger AG, Basel1015-8987/08/0224-0363$24.50/0
Accessible online at:www.karger.com/cpb
All-Trans Retinoic Acid Decreases Murine AdiposeRetinol Binding Protein 4 Production
Josep Mercader, Nuria Granados, M. Luisa Bonet and Andreu Palou
Laboratory of Molecular Biology, Nutrition and Biotechnology, Universitat de les Illes Balears, Palma deMallorca, Spain, CIBER Fisiopatología de la Obesidad y Nutrición (CB06/03), Instituto de SaludCarlos III, Spain
Dr. M. Luisa BonetDepartament de Biologia Fonamental i Ciències de la SalutUniversitat de les Illes BalearsCrta. Valldemossa Km 7.5, 07122 Palma de Mallorca (Spain)Tel. +34 971 172734, Fax +34 971 173184, E-Mail [email protected]
Key WordsVitamin A • Retinoic acid • Retinaldehyde • Adipokines• Insulin resistance • Adipocyte
AbstractBackground/Aims: Adipose-derived retinol bindingprotein 4 (RBP4) might contribute to the developmentof insulin resistance, and therefore further knowledgeof factors regulating it is of interest. Retinoic acid,the acid form of vitamin A, affects the expression ofseveral adipokines related to insulin sensitivity inmice. Here, we sought to investigate its impact onadipose RBP4 production. Methods: Changes inRBP4 expression were analyzed in adipose tissuesand liver of mice treated in vivo with all-trans retinoicacid (ATRA), and in 3T3-L1 adipocytes andadipocytes derived from mouse embryonic fibroblastsexposed to ATRA. Results: ATRA treatment in miceincreased insulin sensitivity as assessed by thehomeostatic model assessment for insulin resistance,and led to a reduction of RBP4 mRNA and proteinlevels in adipose tissues, a reduction of RBP4 proteinbut not RBP4 mRNA levels in the liver, and a markedincrease in circulating RBP4 protein levels. Inadipocyte cell models, ATRA down-regulated RBP4
mRNA levels in a dose-dependent manner: this effectwas reproduced by retinaldehyde and retinoidreceptors agonists, and correlated with a reducedaccumulation of RBP4 protein in the culture medium.Conclusion: These results reveal a selective effectof ATRA inhibiting RBP4 expression specifically inadipocytes, and reinforce the concept that vitamin Avitamers may affect insulin sensitivity through effectson adipokine production.
Introduction
Retinol binding protein 4 (RBP4) is a 21-kDa singlepolypeptide chain protein best known for being theprincipal physiological carrier of retinol, the parent vitaminA molecule, in blood. RBP4 helps vertebrates adapt tofluctuations in dietary vitamin A intake by allowing thedelivery of retinol from tissue storage sites to target tissues,which express a specific membrane receptor for RBP4(STRA6) that mediates retinol uptake from vitamin A-loaded RBP4 (holo-RBP4) complexes [1]. Both apo- andholo-RBP4 circulate in blood complexed to plasmatransthyretin in a 1:1 molar ratio. Liver and, to a lesserextent, white adipose tissue (WAT) are two main sites of
364
vitamin A storage and RBP4 synthesis. RBP4 isabundantly expressed in WAT depots [2-4], almostexclusively in the adipocytes and only weakly in thestromal-vascular cells [3], and adipocytes express RBP4in a differentiation-dependent manner [5].
RBP4 was recently identified by microarray profilingas a gene overexpressed in WAT (but not liver) of adipose-specific GLUT4 knockout mice, which are insulin resistant,and underexpressed in WAT of transgenic miceoverexpressing GLUT4 in adipose tissues, which haveenhanced insulin sensitivity, suggesting adipocyte-derivedRBP4 may act as an insulin resistance factor [6]. Inkeeping with this role, serum RBP4 levels are elevated ininsulin-resistant mouse models; the anti-diabetic drugrosiglitazone reduces serum RBP4 levels and RBP4mRNA expression in WAT (but not liver) of adipose-specific GLUT4 knockout mice; and genetic andpharmacological interventions that elevate serum RBP4impair, while those reducing serum RBP4 enhance, insulinsensitivity in mice [6]. In humans, several studies havefound a correlation between serum RBP4 levels and themagnitude of insulin resistance in subjects with obesity,impaired glucose tolerance or type 2 diabetes [6-10]. Someauthors even reported a negative correlation betweenserum RBP4 and insulin sensitivity in healthy humansubjects [9, 11, 12]. The association between serum RBP4levels and insulin resistance remains, however,controversial, as several studies failed to find it [13-19],although in some of these reports an association of RBP4with inflammatory markers and other components of themetabolic syndrome was noticed [17, 18]. Despite thesediscrepancies, there is evidence of effects of RBP4counteracting insulin action, as RBP4 has been reportedto attenuate insulin signaling in primary human adipocytes[20] and in skeletal muscle of mice [6], to increase hepaticglucose output in mice [6], and to negatively affect insulinsecretion by pancreatic beta-cells in humans [16]. Inaddition, single nucleotide polymorphisms in the RBP4gene have been found to be associated with susceptibilityto type 2 diabetes and insulin resistance in humans [21-23].
RBP4 regulation by vitamin A has been most studiedin the liver, but not in the adipose tissue, and this becomesof special interest in view of the potential role of adipose-derived RBP4 in the modulation of insulin action. It isunclear whether the link between RBP4 and insulinresistance occurs through vitamin A-dependent and/orvitamin A-independent mechanisms [6]. Retinoic acid, thecarboxylic acid form of vitamin A, is a well knownregulator of gene expression in mammals, mainly though
not solely through binding to and activation of specificretinoid receptors that behave as ligand-modulatedtranscription factors. Retinoic acid has many remarkableeffects on adipocyte biology (reviewed in [24]), includingeffects on the production of several adipocyte-secretedbioactive proteins (adipokines), such as resistin and leptin[25-27]. The aim of this study was to evaluate RBP4regulation by retinoic acid in murine adipose tissues andcultured white adipocytes.
Materials and Methods
Animal studiesTwelve-week-old NMRI male mice (CRIFFA, Barcelona,
Spain) fed ad libitum regular chow (Panlab, Barcelona, Spain)and kept at 22°C with a 12-h light/dark cycle (lights on at 08:00)received one daily subcutaneous injection of all-trans retinoicacid (ATRA, Sigma, St. Louis, MO) at a dose of 10, 50, or 100mg/kg body weight during the 4 days before they were killed(5-6 animals/group). Controls were injected the vehicle (oliveoil). The animals were killed with CO2 and decapitated at thestart of the light cycle. Blood was collected from the neck andserum prepared and frozen at –20ºC. Interscapular brownadipose tissue (BAT), inguinal WAT, epididymal WAT,retroperitoneal WAT and liver were excised in their entirety,weighed, frozen in liquid nitrogen and stored at –70ºC untilanalysis. Biometric and blood parameters of animals used inthe present study have already been published [28]. Insulinresistance was assessed by the homeostatic model assessmentfor insulin resistance (HOMA-IR) in additional twelve-week-old NMRI male mice treated as described above with vehicle(n=6) or 50 mg ATRA/kg body weight (n=6) and submitted to a6-h fast (from 24:00 to 06:00) after the last vehicle/ATRAinjection. The HOMA-IR score was calculated from fastinginsulin and glucose concentrations using the formula ofMatthews et al. [29]: HOMA-IR = fasting glucose (mmol/L) xfasting insulin (mU/L)/22.5. All animal experimentation wasconducted according to accepted standards of humane careand use of laboratory animals and the studies were approvedby our institutional bioethical committee.
Cell culture and differentiation3T3-L1 cells (American Type Culture Collection, LGC
Deselaers SL, Barcelona, Spain) were grown to confluence inbasal medium − Dulbecco’s modified Eagle’s medium (DMEM;Sigma) with 50 IU/ml penicillin (Sigma), 50 µg/ml streptomycin(Sigma) and 2 mM L-glutamine (Sigma) − supplemented with10% new born calf serum (Linus, Madrid, Spain). Two daysafter the cells reached confluence (referred as day 0) they wereinduced to differentiate in basal medium containing 10% fetalbovine serum (FBS; Invitrogen, Carlsbad, CA), 1 µMdexamethasone (DEX; Sigma), 0.5 mM methylisobutylxanthine(MIX; Sigma) and 1 µg/ml insulin (Sigma) for 2 days, followedby 2 days in basal medium containing 10% FBS and 1 µg/mlinsulin. The cells were subsequently refed every other day fresh
Mercader/Granados/Bonet/PalouCell Physiol Biochem 2008;22:363-372
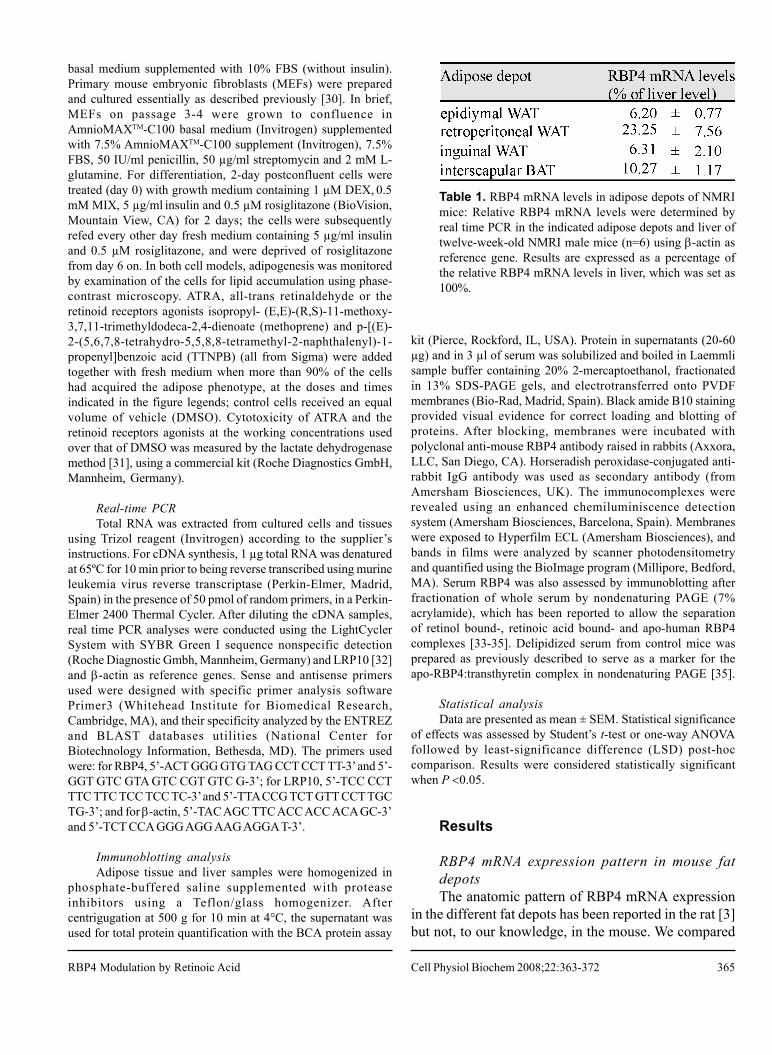
365
basal medium supplemented with 10% FBS (without insulin).Primary mouse embryonic fibroblasts (MEFs) were preparedand cultured essentially as described previously [30]. In brief,MEFs on passage 3-4 were grown to confluence inAmnioMAXTM-C100 basal medium (Invitrogen) supplementedwith 7.5% AmnioMAXTM-C100 supplement (Invitrogen), 7.5%FBS, 50 IU/ml penicillin, 50 µg/ml streptomycin and 2 mM L-glutamine. For differentiation, 2-day postconfluent cells weretreated (day 0) with growth medium containing 1 µM DEX, 0.5mM MIX, 5 µg/ml insulin and 0.5 µM rosiglitazone (BioVision,Mountain View, CA) for 2 days; the cells were subsequentlyrefed every other day fresh medium containing 5 µg/ml insulinand 0.5 µM rosiglitazone, and were deprived of rosiglitazonefrom day 6 on. In both cell models, adipogenesis was monitoredby examination of the cells for lipid accumulation using phase-contrast microscopy. ATRA, all-trans retinaldehyde or theretinoid receptors agonists isopropyl- (E,E)-(R,S)-11-methoxy-3,7,11-trimethyldodeca-2,4-dienoate (methoprene) and p-[(E)-2-(5,6,7,8-tetrahydro-5,5,8,8-tetramethyl-2-naphthalenyl)-1-propenyl]benzoic acid (TTNPB) (all from Sigma) were addedtogether with fresh medium when more than 90% of the cellshad acquired the adipose phenotype, at the doses and timesindicated in the figure legends; control cells received an equalvolume of vehicle (DMSO). Cytotoxicity of ATRA and theretinoid receptors agonists at the working concentrations usedover that of DMSO was measured by the lactate dehydrogenasemethod [31], using a commercial kit (Roche Diagnostics GmbH,Mannheim, Germany).
Real-time PCRTotal RNA was extracted from cultured cells and tissues
using Trizol reagent (Invitrogen) according to the supplier’sinstructions. For cDNA synthesis, 1 µg total RNA was denaturedat 65ºC for 10 min prior to being reverse transcribed using murineleukemia virus reverse transcriptase (Perkin-Elmer, Madrid,Spain) in the presence of 50 pmol of random primers, in a Perkin-Elmer 2400 Thermal Cycler. After diluting the cDNA samples,real time PCR analyses were conducted using the LightCyclerSystem with SYBR Green I sequence nonspecific detection(Roche Diagnostic Gmbh, Mannheim, Germany) and LRP10 [32]and β-actin as reference genes. Sense and antisense primersused were designed with specific primer analysis softwarePrimer3 (Whitehead Institute for Biomedical Research,Cambridge, MA), and their specificity analyzed by the ENTREZand BLAST databases utilities (National Center forBiotechnology Information, Bethesda, MD). The primers usedwere: for RBP4, 5’-ACT GGG GTG TAG CCT CCT TT-3’ and 5’-GGT GTC GTA GTC CGT GTC G-3’; for LRP10, 5’-TCC CCTTTC TTC TCC TCC TC-3’ and 5’-TTA CCG TCT GTT CCT TGCTG-3’; and for β-actin, 5’-TAC AGC TTC ACC ACC ACA GC-3’and 5’-TCT CCA GGG AGG AAG AGGA T-3’.
Immunoblotting analysisAdipose tissue and liver samples were homogenized in
phosphate-buffered saline supplemented with proteaseinhibitors using a Teflon/glass homogenizer. Aftercentrigugation at 500 g for 10 min at 4°C, the supernatant wasused for total protein quantification with the BCA protein assay
kit (Pierce, Rockford, IL, USA). Protein in supernatants (20-60µg) and in 3 µl of serum was solubilized and boiled in Laemmlisample buffer containing 20% 2-mercaptoethanol, fractionatedin 13% SDS-PAGE gels, and electrotransferred onto PVDFmembranes (Bio-Rad, Madrid, Spain). Black amide B10 stainingprovided visual evidence for correct loading and blotting ofproteins. After blocking, membranes were incubated withpolyclonal anti-mouse RBP4 antibody raised in rabbits (Axxora,LLC, San Diego, CA). Horseradish peroxidase-conjugated anti-rabbit IgG antibody was used as secondary antibody (fromAmersham Biosciences, UK). The immunocomplexes wererevealed using an enhanced chemiluminiscence detectionsystem (Amersham Biosciences, Barcelona, Spain). Membraneswere exposed to Hyperfilm ECL (Amersham Biosciences), andbands in films were analyzed by scanner photodensitometryand quantified using the BioImage program (Millipore, Bedford,MA). Serum RBP4 was also assessed by immunoblotting afterfractionation of whole serum by nondenaturing PAGE (7%acrylamide), which has been reported to allow the separationof retinol bound-, retinoic acid bound- and apo-human RBP4complexes [33-35]. Delipidized serum from control mice wasprepared as previously described to serve as a marker for theapo-RBP4:transthyretin complex in nondenaturing PAGE [35].
Statistical analysisData are presented as mean ± SEM. Statistical significance
of effects was assessed by Student’s t-test or one-way ANOVAfollowed by least-significance difference (LSD) post-hoccomparison. Results were considered statistically significantwhen P <0.05.
Results
RBP4 mRNA expression pattern in mouse fatdepotsThe anatomic pattern of RBP4 mRNA expression
in the different fat depots has been reported in the rat [3]but not, to our knowledge, in the mouse. We compared
Table 1. RBP4 mRNA levels in adipose depots of NMRImice: Relative RBP4 mRNA levels were determined byreal time PCR in the indicated adipose depots and liver oftwelve-week-old NMRI male mice (n=6) using β-actin asreference gene. Results are expressed as a percentage ofthe relative RBP4 mRNA levels in liver, which was set as100%.
RBP4 Modulation by Retinoic Acid Cell Physiol Biochem 2008;22:363-372
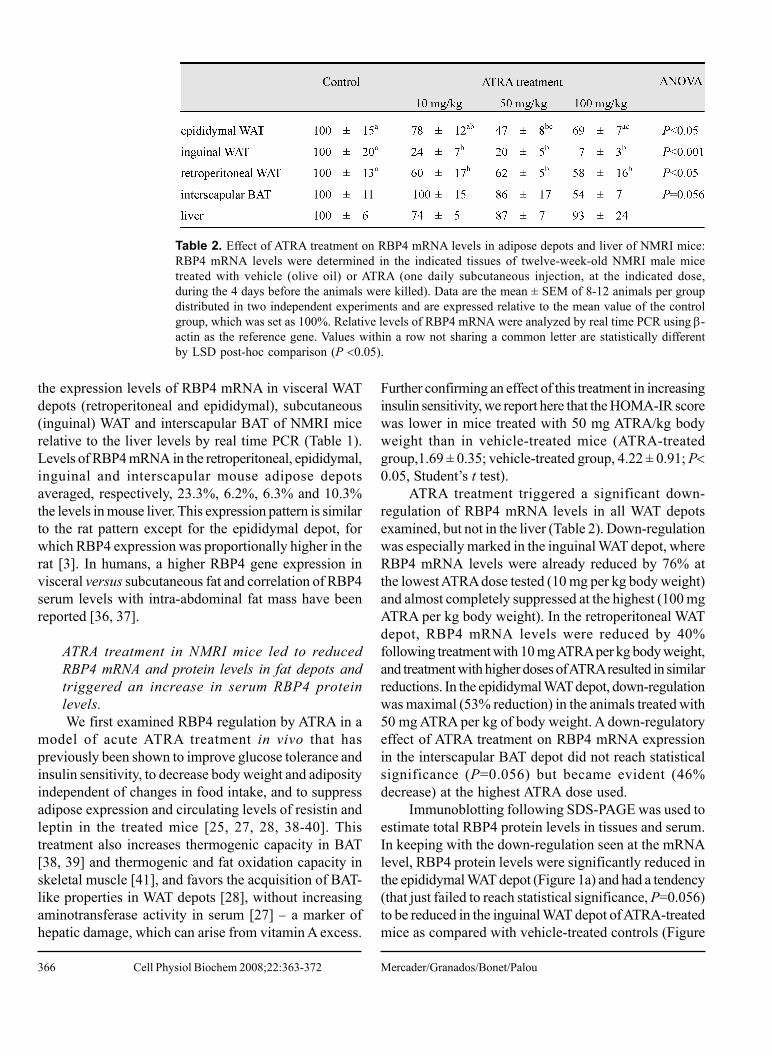
366
the expression levels of RBP4 mRNA in visceral WATdepots (retroperitoneal and epididymal), subcutaneous(inguinal) WAT and interscapular BAT of NMRI micerelative to the liver levels by real time PCR (Table 1).Levels of RBP4 mRNA in the retroperitoneal, epididymal,inguinal and interscapular mouse adipose depotsaveraged, respectively, 23.3%, 6.2%, 6.3% and 10.3%the levels in mouse liver. This expression pattern is similarto the rat pattern except for the epididymal depot, forwhich RBP4 expression was proportionally higher in therat [3]. In humans, a higher RBP4 gene expression invisceral versus subcutaneous fat and correlation of RBP4serum levels with intra-abdominal fat mass have beenreported [36, 37].
ATRA treatment in NMRI mice led to reducedRBP4 mRNA and protein levels in fat depots andtriggered an increase in serum RBP4 proteinlevels.We first examined RBP4 regulation by ATRA in a
model of acute ATRA treatment in vivo that haspreviously been shown to improve glucose tolerance andinsulin sensitivity, to decrease body weight and adiposityindependent of changes in food intake, and to suppressadipose expression and circulating levels of resistin andleptin in the treated mice [25, 27, 28, 38-40]. Thistreatment also increases thermogenic capacity in BAT[38, 39] and thermogenic and fat oxidation capacity inskeletal muscle [41], and favors the acquisition of BAT-like properties in WAT depots [28], without increasingaminotransferase activity in serum [27] − a marker ofhepatic damage, which can arise from vitamin A excess.
Further confirming an effect of this treatment in increasinginsulin sensitivity, we report here that the HOMA-IR scorewas lower in mice treated with 50 mg ATRA/kg bodyweight than in vehicle-treated mice (ATRA-treatedgroup,1.69 ± 0.35; vehicle-treated group, 4.22 ± 0.91; P<0.05, Student’s t test).
ATRA treatment triggered a significant down-regulation of RBP4 mRNA levels in all WAT depotsexamined, but not in the liver (Table 2). Down-regulationwas especially marked in the inguinal WAT depot, whereRBP4 mRNA levels were already reduced by 76% atthe lowest ATRA dose tested (10 mg per kg body weight)and almost completely suppressed at the highest (100 mgATRA per kg body weight). In the retroperitoneal WATdepot, RBP4 mRNA levels were reduced by 40%following treatment with 10 mg ATRA per kg body weight,and treatment with higher doses of ATRA resulted in similarreductions. In the epididymal WAT depot, down-regulationwas maximal (53% reduction) in the animals treated with50 mg ATRA per kg of body weight. A down-regulatoryeffect of ATRA treatment on RBP4 mRNA expressionin the interscapular BAT depot did not reach statisticalsignificance (P=0.056) but became evident (46%decrease) at the highest ATRA dose used.
Immunoblotting following SDS-PAGE was used toestimate total RBP4 protein levels in tissues and serum.In keeping with the down-regulation seen at the mRNAlevel, RBP4 protein levels were significantly reduced inthe epididymal WAT depot (Figure 1a) and had a tendency(that just failed to reach statistical significance, P=0.056)to be reduced in the inguinal WAT depot of ATRA-treatedmice as compared with vehicle-treated controls (Figure
Table 2. Effect of ATRA treatment on RBP4 mRNA levels in adipose depots and liver of NMRI mice:RBP4 mRNA levels were determined in the indicated tissues of twelve-week-old NMRI male micetreated with vehicle (olive oil) or ATRA (one daily subcutaneous injection, at the indicated dose,during the 4 days before the animals were killed). Data are the mean ± SEM of 8-12 animals per groupdistributed in two independent experiments and are expressed relative to the mean value of the controlgroup, which was set as 100%. Relative levels of RBP4 mRNA were analyzed by real time PCR using β-actin as the reference gene. Values within a row not sharing a common letter are statistically differentby LSD post-hoc comparison (P <0.05).
Mercader/Granados/Bonet/PalouCell Physiol Biochem 2008;22:363-372
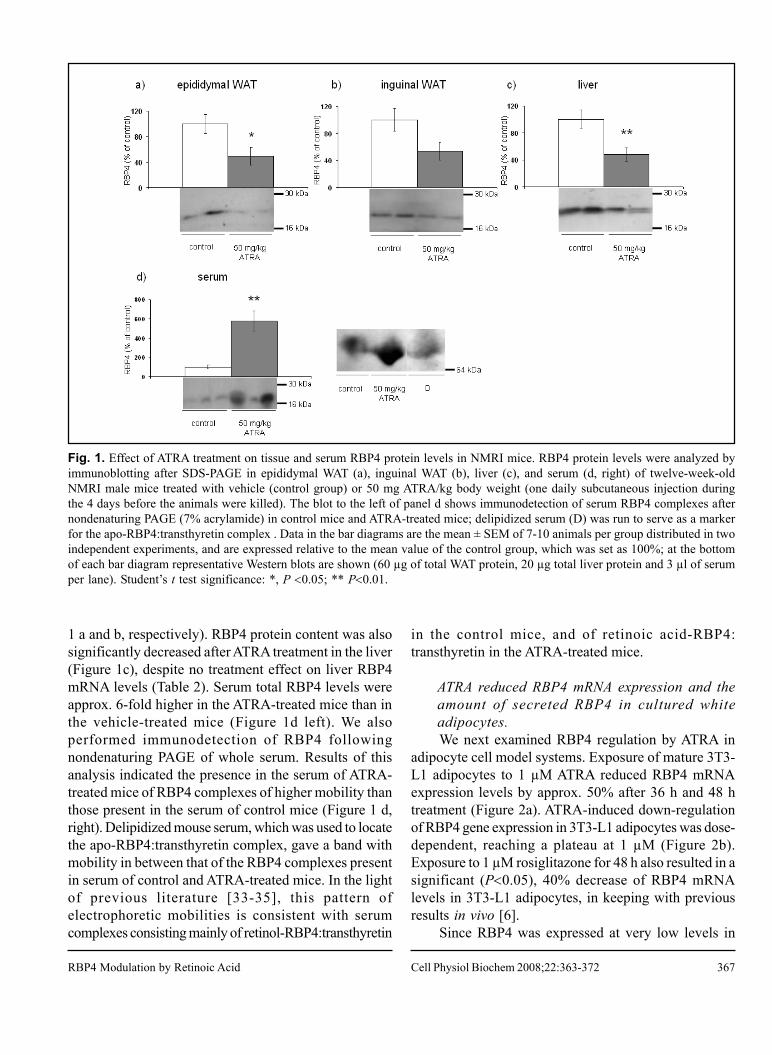
367
1 a and b, respectively). RBP4 protein content was alsosignificantly decreased after ATRA treatment in the liver(Figure 1c), despite no treatment effect on liver RBP4mRNA levels (Table 2). Serum total RBP4 levels wereapprox. 6-fold higher in the ATRA-treated mice than inthe vehicle-treated mice (Figure 1d left). We alsoperformed immunodetection of RBP4 followingnondenaturing PAGE of whole serum. Results of thisanalysis indicated the presence in the serum of ATRA-treated mice of RBP4 complexes of higher mobility thanthose present in the serum of control mice (Figure 1 d,right). Delipidized mouse serum, which was used to locatethe apo-RBP4:transthyretin complex, gave a band withmobility in between that of the RBP4 complexes presentin serum of control and ATRA-treated mice. In the lightof previous literature [33-35], this pattern ofelectrophoretic mobilities is consistent with serumcomplexes consisting mainly of retinol-RBP4:transthyretin
in the control mice, and of retinoic acid-RBP4:transthyretin in the ATRA-treated mice.
ATRA reduced RBP4 mRNA expression and theamount of secreted RBP4 in cultured whiteadipocytes.We next examined RBP4 regulation by ATRA in
adipocyte cell model systems. Exposure of mature 3T3-L1 adipocytes to 1 µM ATRA reduced RBP4 mRNAexpression levels by approx. 50% after 36 h and 48 htreatment (Figure 2a). ATRA-induced down-regulationof RBP4 gene expression in 3T3-L1 adipocytes was dose-dependent, reaching a plateau at 1 µM (Figure 2b).Exposure to 1 µM rosiglitazone for 48 h also resulted in asignificant (P<0.05), 40% decrease of RBP4 mRNAlevels in 3T3-L1 adipocytes, in keeping with previousresults in vivo [6].
Since RBP4 was expressed at very low levels in
Fig. 1. Effect of ATRA treatment on tissue and serum RBP4 protein levels in NMRI mice. RBP4 protein levels were analyzed byimmunoblotting after SDS-PAGE in epididymal WAT (a), inguinal WAT (b), liver (c), and serum (d, right) of twelve-week-oldNMRI male mice treated with vehicle (control group) or 50 mg ATRA/kg body weight (one daily subcutaneous injection duringthe 4 days before the animals were killed). The blot to the left of panel d shows immunodetection of serum RBP4 complexes afternondenaturing PAGE (7% acrylamide) in control mice and ATRA-treated mice; delipidized serum (D) was run to serve as a markerfor the apo-RBP4:transthyretin complex . Data in the bar diagrams are the mean ± SEM of 7-10 animals per group distributed in twoindependent experiments, and are expressed relative to the mean value of the control group, which was set as 100%; at the bottomof each bar diagram representative Western blots are shown (60 µg of total WAT protein, 20 µg total liver protein and 3 µl of serumper lane). Student’s t test significance: *, P <0.05; ** P<0.01.
RBP4 Modulation by Retinoic Acid Cell Physiol Biochem 2008;22:363-372
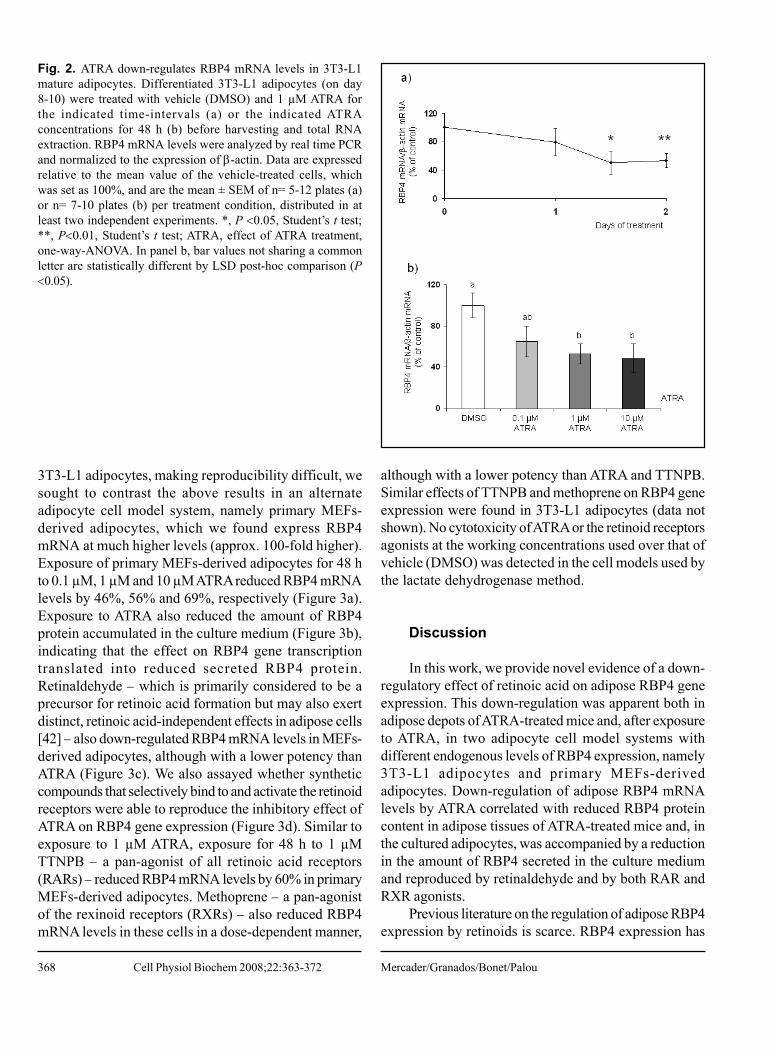
368
3T3-L1 adipocytes, making reproducibility difficult, wesought to contrast the above results in an alternateadipocyte cell model system, namely primary MEFs-derived adipocytes, which we found express RBP4mRNA at much higher levels (approx. 100-fold higher).Exposure of primary MEFs-derived adipocytes for 48 hto 0.1 µM, 1 µM and 10 µM ATRA reduced RBP4 mRNAlevels by 46%, 56% and 69%, respectively (Figure 3a).Exposure to ATRA also reduced the amount of RBP4protein accumulated in the culture medium (Figure 3b),indicating that the effect on RBP4 gene transcriptiontranslated into reduced secreted RBP4 protein.Retinaldehyde − which is primarily considered to be aprecursor for retinoic acid formation but may also exertdistinct, retinoic acid-independent effects in adipose cells[42] − also down-regulated RBP4 mRNA levels in MEFs-derived adipocytes, although with a lower potency thanATRA (Figure 3c). We also assayed whether syntheticcompounds that selectively bind to and activate the retinoidreceptors were able to reproduce the inhibitory effect ofATRA on RBP4 gene expression (Figure 3d). Similar toexposure to 1 µM ATRA, exposure for 48 h to 1 µMTTNPB − a pan-agonist of all retinoic acid receptors(RARs) − reduced RBP4 mRNA levels by 60% in primaryMEFs-derived adipocytes. Methoprene − a pan-agonistof the rexinoid receptors (RXRs) − also reduced RBP4mRNA levels in these cells in a dose-dependent manner,
although with a lower potency than ATRA and TTNPB.Similar effects of TTNPB and methoprene on RBP4 geneexpression were found in 3T3-L1 adipocytes (data notshown). No cytotoxicity of ATRA or the retinoid receptorsagonists at the working concentrations used over that ofvehicle (DMSO) was detected in the cell models used bythe lactate dehydrogenase method.
Discussion
In this work, we provide novel evidence of a down-regulatory effect of retinoic acid on adipose RBP4 geneexpression. This down-regulation was apparent both inadipose depots of ATRA-treated mice and, after exposureto ATRA, in two adipocyte cell model systems withdifferent endogenous levels of RBP4 expression, namely3T3-L1 adipocytes and primary MEFs-derivedadipocytes. Down-regulation of adipose RBP4 mRNAlevels by ATRA correlated with reduced RBP4 proteincontent in adipose tissues of ATRA-treated mice and, inthe cultured adipocytes, was accompanied by a reductionin the amount of RBP4 secreted in the culture mediumand reproduced by retinaldehyde and by both RAR andRXR agonists.
Previous literature on the regulation of adipose RBP4expression by retinoids is scarce. RBP4 expression has
Fig. 2. ATRA down-regulates RBP4 mRNA levels in 3T3-L1mature adipocytes. Differentiated 3T3-L1 adipocytes (on day8-10) were treated with vehicle (DMSO) and 1 µM ATRA forthe indicated time-intervals (a) or the indicated ATRAconcentrations for 48 h (b) before harvesting and total RNAextraction. RBP4 mRNA levels were analyzed by real time PCRand normalized to the expression of β-actin. Data are expressedrelative to the mean value of the vehicle-treated cells, whichwas set as 100%, and are the mean ± SEM of n= 5-12 plates (a)or n= 7-10 plates (b) per treatment condition, distributed in atleast two independent experiments. *, P <0.05, Student’s t test;**, P<0.01, Student’s t test; ATRA, effect of ATRA treatment,one-way-ANOVA. In panel b, bar values not sharing a commonletter are statistically different by LSD post-hoc comparison (P<0.05).
Mercader/Granados/Bonet/PalouCell Physiol Biochem 2008;22:363-372
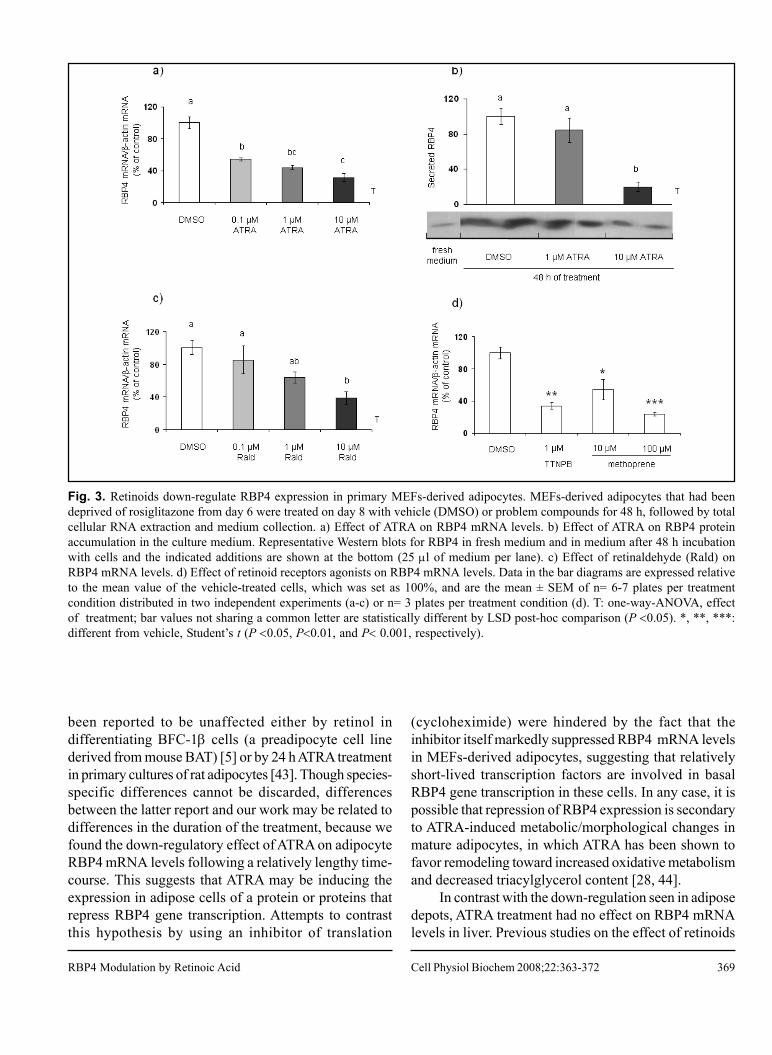
369
been reported to be unaffected either by retinol indifferentiating BFC-1β cells (a preadipocyte cell linederived from mouse BAT) [5] or by 24 h ATRA treatmentin primary cultures of rat adipocytes [43]. Though species-specific differences cannot be discarded, differencesbetween the latter report and our work may be related todifferences in the duration of the treatment, because wefound the down-regulatory effect of ATRA on adipocyteRBP4 mRNA levels following a relatively lengthy time-course. This suggests that ATRA may be inducing theexpression in adipose cells of a protein or proteins thatrepress RBP4 gene transcription. Attempts to contrastthis hypothesis by using an inhibitor of translation
(cycloheximide) were hindered by the fact that theinhibitor itself markedly suppressed RBP4 mRNA levelsin MEFs-derived adipocytes, suggesting that relativelyshort-lived transcription factors are involved in basalRBP4 gene transcription in these cells. In any case, it ispossible that repression of RBP4 expression is secondaryto ATRA-induced metabolic/morphological changes inmature adipocytes, in which ATRA has been shown tofavor remodeling toward increased oxidative metabolismand decreased triacylglycerol content [28, 44].
In contrast with the down-regulation seen in adiposedepots, ATRA treatment had no effect on RBP4 mRNAlevels in liver. Previous studies on the effect of retinoids
Fig. 3. Retinoids down-regulate RBP4 expression in primary MEFs-derived adipocytes. MEFs-derived adipocytes that had beendeprived of rosiglitazone from day 6 were treated on day 8 with vehicle (DMSO) or problem compounds for 48 h, followed by totalcellular RNA extraction and medium collection. a) Effect of ATRA on RBP4 mRNA levels. b) Effect of ATRA on RBP4 proteinaccumulation in the culture medium. Representative Western blots for RBP4 in fresh medium and in medium after 48 h incubationwith cells and the indicated additions are shown at the bottom (25 μl of medium per lane). c) Effect of retinaldehyde (Rald) onRBP4 mRNA levels. d) Effect of retinoid receptors agonists on RBP4 mRNA levels. Data in the bar diagrams are expressed relativeto the mean value of the vehicle-treated cells, which was set as 100%, and are the mean ± SEM of n= 6-7 plates per treatmentcondition distributed in two independent experiments (a-c) or n= 3 plates per treatment condition (d). T: one-way-ANOVA, effectof treatment; bar values not sharing a common letter are statistically different by LSD post-hoc comparison (P <0.05). *, **, ***:different from vehicle, Student’s t (P <0.05, P<0.01, and P< 0.001, respectively).
RBP4 Modulation by Retinoic Acid Cell Physiol Biochem 2008;22:363-372
370
on liver RBP4 expression reveal a complex picture. Onthe one hand, animal studies have shown that liver RBP4mRNA levels do not change in response to changes inthe vitamin A status (reviewed in [45]). On the other hand,it has been reported that retinol and retinoic acid induceRBP4 mRNA expression in human and mouse hepatomacell lines [4, 46] and that, in mice, a single oral dose ofretinoic acid (either ATRA or the 9-cis isomer) up-regulates liver RBP4 mRNA levels [4]. Moreover, aretinoic acid response element in the promoter region ofthe RBP4 gene has been described that allowstransactivation of transcription by liganded RARhomodimers, RXR homodimers and, especially,RAR:RXR heterodimers in cells of hepatic origin [47].We were unable to detect an increase in liver RBP4mRNA levels following subcutaneous ATRA injection for4 consecutive days in mice. It is possible that both theregimen of ATRA treatment (single versus repeateddoses) and the way of administration (oral versussubcutaneous) are factors that influence effects on liverRBP4 gene transcription. In any case, our results reveala differential regulation of liver and adipose RBP4 geneexpression by ATRA that deserves further investigationand may be related to differences in the battery of retinoidreceptors and transcriptional cofactors expressed in eachtissue.
Treatment of adult, vitamin A-sufficient mice withATRA led to a marked increase of RBP4 levels in serum.Adipose tissue is unlikely to be a source for this increase,because ATRA reduced RBP4 gene expression both inWAT depots in vivo and in cultured adipocytes and, inthe cell model, this was accompanied by a reduction inRBP4 protein accumulation in the culture medium. Theliver is a likely source, not only because it is the main siteof RBP4 production but also because in this tissue ATRAtreatment depleted RBP4 protein levels without affectingRBP4 mRNA levels, suggesting that reduction in liverRBP4 protein content reflects enhanced release into thecirculation. Importantly, in support of this interpretation,previous reports have shown that retinoic acid can bindto RBP4 [48, 49] and stimulate secretion of RBP4 bycultured liver cells [50, 51], similar to retinol, whose positiveeffect on hepatic RBP4 secretion (in the form of holo-protein) is well established [45]. Thus, a plausibleexplanation for the increased serum RBP4 levels inATRA-treated mice is that excess ATRA in liver cells isfavoring the export of the retinoid bound to RBP4,potentially minimizing toxicity. This is in line with ournondenaturing PAGE results, which are consistent witha preponderance of the retinoic acid-RBP4:transthyretin
complex in serum of the ATRA-treated mice.Since glucose tolerance and insulin sensitivity were
improved after ATRA treatment ([25] and this work), ourresults would indicate that increased serum levels of holo-RBP4 of non-adipose origin do not cause per se insulinresistance in mice. Although the idea that insulin resistanceis related to adipose-derived rather than liver-derivedRBP4 was implicit in the seminal work by Yang et al. [6],the molecular basis for this difference remains unclear(whether or not there may be differences in theglycoprotein moiety, for instance). It is also unclearwhether apo-RBP4, holo-RBP4 or both are the activespecies for the effect [6]. In fact, an involvement of apo-RBP4 seems more plausible, as some of the manipulationsthat were reported [6] to result in increased insulinresistance (such as overexpression of RBP4 in transgenicmice and injection of RBP4 in normal mice) are not to beexpected to translate into differences in serum holo-RBP4levels in the absence of changes in the vitamin A statusof the animals. Moreover, a recent report showed that, inchildren, the serum RBP4 to serum retinol ratio morestrongly correlates with components of the metabolicsyndrome than serum RBP4, suggesting a specificinvolvement of apo-RBP4 [10].
Results in this work are compatible with adipose-derived RBP4 being a contributor factor to systemicinsulin resistance in mice, as ATRA treatment down-regulated RBP4 expression specifically in adipocytes (butnot in the liver) while it enhanced systemic glucosetolerance and insulin sensitivity of the animals ([25] andthis work). Remarkably, ATRA treatment also suppressesthe adipose expression of another insulin resistance factorof adipose origin in mice, namely resistin [25], as well asthe adipose expression of leptin [25-27]. RBP4 [20],resistin [52-54] and leptin [55] are known to exertparacrine effects in WAT antagonizing insulin signaling,which in WAT is pro-adipogenic and pro-lipogenic, andATRA is an agent that promotes body fat loss in mice invivo and a metabolic remodeling of adipocytes (both invivo and in cell models) toward increased oxidativemetabolism [24, 28, 44]. Given the essential role of adiposecells in fat storage, from a teleological point of view theATRA-induced down-regulation of adipose RBP4, resistinand leptin expression may be viewed as part of a securitymechanism to avoid fat depletion (by increasing localinsulin sensitivity in the adipocytes, and also through theCNS-mediated consequences of reduced leptinemia) inthe context of an overall fat-mobilizing effect of ATRA.Agents displaying fat-mobilizing effects coupled to down-regulatory effects on the expression of insulin resistance
Mercader/Granados/Bonet/PalouCell Physiol Biochem 2008;22:363-372
371
factors of adipose origin might be ideally suited to serveas insulin sensitizers, provided that safety issues can beguaranteed.
In summary, this work demonstrates a selectiveeffect of ATRA inhibiting RBP4 expression specificallyin adipocytes, which correlated with increased systemicinsulin sensitivity in the ATRA-treated mice. These resultsare compatible with an involvement of adipose-derivedRBP4 in the development of insulin resistance, andreinforce the concept that vitamin A vitamers may affectinsulin sensitivity through effects on adipokine production.
Acknowledgements
The authors are grateful to Dr. Ana Maria Rodriguezfor her work in preparing the MEFs. This workwas supported by the Spanish Government (AGL2006-04887/ALI and AGL2004-07496/ALI). Our Laboratoryis a member of The European NutrigenomicsOrganisation (NuGO, EU Contract FOOD-CT-2004-506360). J.M. is the recipient of a pre-doctoralfellowship from the Spanish Government.
References
1 Kawaguchi R, Yu J, Honda J, Hu J,Whitelegge J, Ping P, Wiita P, Bok D,Sun H: A membrane receptor for retinolbinding protein mediates cellular uptakeof vitamin A. Science 2007;315:820-825.
2 Makover A, Soprano DR, Wyatt ML,Goodman DS: Localization of retinol-binding protein messenger RNA in therat kidney and in perinephric fat tissue. JLipid Res 1989;30:171-180.
3 Tsutsumi C, Okuno M, Tannous L,Piantedosi R, Allan M, Goodman DS,Blaner WS: Retinoids and retinoid-bindingprotein expression in rat adipocytes. JBiol Chem 1992;267:1805-1810.
4 Jessen KA, Satre MA: Mouse retinolbinding protein gene: cloning, expressionand regulation by retinoic acid. Mol CellBiochem 2000;211:85-94.
5 Zovich DC, Orologa A, Okuno M, KongLW, Talmage DA, Piantedosi R,Goodman DS, Blaner WS:Differentiation-dependent expression ofretinoid-binding proteins in BFC-1 betaadipocytes. J Biol Chem1992;267:13884-13889.
6 Yang Q, Graham TE, Mody N, PreitnerF, Peroni OD, Zabolotny JM, Kotani K,Quadro L, Kahn BB: Serum retinolbinding protein 4 contributes to insulinresistance in obesity and type 2 diabetes.Nature 2005;436:356-362.
7 Graham TE, Yang Q, Bluher M,Hammarstedt A, Ciaraldi TP, Henry RR,Wason CJ, Oberbach A, Jansson PA,Smith U, Kahn BB: Retinol-bindingprotein 4 and insulin resistance in lean,obese, and diabetic subjects. N Engl J Med2006;354:2552-2563.
8 Cho YM, Youn BS, Lee H, Lee N, MinSS, Kwak SH, Lee HK, Park KS: Plasmaretinol-binding protein-4 concentrationsare elevated in human subjects withimpaired glucose tolerance and type 2diabetes. Diabetes Care 2006;29:2457-2461.
9 Lee DC, Lee JW, Im JA: Association ofserum retinol binding protein 4 andinsulin resistance in apparently healthyadolescents. Metabolism 2007;56:327-331.
10 Aeberli I, Biebinger R, Lehmann R,L’Allemand D, Spinas GA, ZimmermannMB: Serum retinol-binding protein 4concentration and its ratio to serumretinol are associated with obesity andmetabolic syndrome components inchildren. J Clin Endocrinol Metab2007;92:4359-4365.
11 Stefan N, Hennige AM, Staiger H,Machann J, Schick F, Schleicher E,Fritsche A, Haring HU: High circulatingretinol-binding protein 4 is associatedwith elevated liver fat but not with total,subcutaneous, visceral, orintramyocellular fat in humans. DiabetesCare 2007;30:1173-1178.
1 2 Gavi S, Stuart LM, Kelly P, MelendezMM, Mynarcik DC, Gelato MC,McNurlan MA: Retinol-binding protein4 is associated with insulin resistance andbody fat distribution in nonobese subjectswithout type 2 diabetes. J Clin EndocrinolMetab 2007;92:1886-1890.
13 Janke J, Engeli S, Boschmann M, AdamsF, Bohnke J, Luft FC, Sharma AM, JordanJ: Retinol-binding protein 4 in humanobesity. Diabetes 2006;55:2805-2810.
14 Silha JV, Nyomba BL, Leslie WD,Murphy LJ: Ethnicity, insulin resistance,and inflammatory adipokines in womenat high and low risk for vascular disease.Diabetes Care 2007;30:286-291.
15 Lewis JG, Shand BI, Frampton CM, ElderPA: An ELISA for plasma retinol-bindingprotein using monoclonal and polyclonalantibodies: plasma variation in normaland insulin resistant subjects. ClinBiochem 2007;40:828-834.
1 6 Broch M, Vendrell J, Ricart W, RichartC, Fernandez-Real JM: Circulatingretinol-binding protein-4, insulinsensitivity, insulin secretion, and insulindisposition index in obese and nonobesesubjects. Diabetes Care 2007;30:1802-1806.
1 7 Yao-Borengasser A, Varma V, Bodles AM,Rasouli N, Phanavanh B, Lee MJ, StarksT, Kern LM, Spencer HJ, 3rd, RashidiAA, McGehee RE, Jr., Fried SK, KernPA: Retinol binding protein 4 expressionin humans: relationship to insulinresistance, inflammation, and responseto pioglitazone. J Clin Endocrinol Metab2007;92:2590-2597.
1 8 von Eynatten M, Lepper PM, Liu D,Lang K, Baumann M, Nawroth PP,Bierhaus A, Dugi KA, Heemann U, AllolioB, Humpert PM: Retinol-binding protein4 is associated with components of themetabolic syndrome, but not with insulinresistance, in men with type 2 diabetesor coronary artery disease. Diabetologia2007;50:1930-1937.
1 9 Promintzer M, Krebs M, Todoric J, LugerA, Bischof MG, Nowotny P, Wagner O,Esterbauer H, Anderwald C: Insulinresistance is unrelated to circulatingretinol binding protein and protein Cinhibitor. J Clin Endocrinol Metab2007;92:4306-4312.
20 Ost A, Danielsson A, Liden M, ErikssonU, Nystrom FH, Stralfors P: Retinol-binding protein-4 attenuates insulin-induced phosphorylation of IRS1 andERK1/2 in primary human adipocytes.Faseb J 2007;21:3696-3704.
2 1 Munkhtulga L, Nakayama K, Utsumi N,Yanagisawa Y, Gotoh T, Omi T, KumadaM, Erdenebulgan B, Zolzaya K,Lkhagvasuren T, Iwamoto S:Identification of a regulatory SNP in theretinol binding protein 4 gene associatedwith type 2 diabetes in Mongolia. HumGenet 2007;120:879-888.
RBP4 Modulation by Retinoic Acid Cell Physiol Biochem 2008;22:363-372
372
2 2 Craig RL, Chu WS, Elbein SC: Retinolbinding protein 4 as a candidate gene fortype 2 diabetes and prediabeticintermediate traits. Mol Genet Metab2007;90:338-344.
23 Kovacs P, Geyer M, Berndt J, Kloting N,Graham TE, Bottcher Y, Enigk B, TonjesA, Schleinitz D, Schon MR, Kahn BB,Bluher M, Stumvoll M: Effects of geneticvariation in the human retinol bindingprotein-4 gene (RBP4) on insulinresistance and fat depot-specific mRNAexpression. Diabetes 2007;56:3095-3100.
24 Bonet ML, Ribot J, Felipe E, Palou A:Vitamin A and the regulation of fatreserves. Cell Mol Life Sci2003;60:1311-1321.
25 Felipe F, Bonet ML, Ribot J, Palou A:Modulation of resistin expression byretinoic acid and vitamin A status.Diabetes 2004;53:882-889.
2 6 Hollung K, Rise CP, Drevon CA, ReselandJE: Tissue-specific regulation of leptinexpression and secretion by all-transretinoic acid. J Cell Biochem2004;92:307-315.
2 7 Felipe F, Mercader J, Ribot J, Palou A,Bonet ML: Effects of retinoic acidadministration and dietary vitamin Asupplementation on leptin expression inmice: lack of correlation with changesof adipose tissue mass and food intake.Biochim Biophys Acta 2005;1740:258-265.
28 Mercader J, Ribot J, Murano I, Felipe F,Cinti S, Bonet ML, Palou A: Remodelingof white adipose tissue after retinoic Acidadministration in mice. Endocrinology2006;147:5325-5332.
2 9 Matthews DR, Hosker JP, Rudenski AS,Naylor BA, Treacher DF, Turner RC:Homeostasis model assessment: insulinresistance and beta-cell function fromfasting plasma glucose and insulinconcentrations in man. Diabetologia1985;28:412-419.
3 0 Hansen JB, Jorgensen C, Petersen RK,Hallenborg P, De Matteis R, Boye HA,Petrovic N, Enerback S, Nedergaard J,Cinti S, te Riele H, Kristiansen K:Retinoblastoma protein functions as amolecular switch determining whiteversus brown adipocyte differentiation.Proc Natl Acad Sci U S A 2004;101:4112-4117.
3 1 Decker T, Lohmann-Matthes ML: Aquick and simple method for thequantitation of lactate dehydrogenaserelease in measurements of cellularcytotoxicity and tumor necrosis factor(TNF) activity. J Immunol Methods1988;115:61-69.
32 Gabrielsson BG, Olofsson LE, Sjogren A,Jernas M, Elander A, Lonn M, RudemoM, Carlsson LM: Evaluation of referencegenes for studies of gene expression inhuman adipose tissue. Obes Res2005;13:649-652.
3 3 Siegenthaler G, Saurat JH: Retinol-bindingprotein in human serum: conformationalchanges induced by retinoic acid binding.Biochem Biophys Res Commun1987;143:418-423.
3 4 Siegenthaler G, Saurat JH: A slab gelelectrophoresis technique formeasurement of plasma retinol-bindingprotein, cellular retinol-binding andretinoic-acid-binding proteins in humanskin. Eur J Biochem 1987;166:209-214.
3 5 Sapin V, Alexandre MC, Chaib S,Bournazeau JA, Sauvant P, Borel P,Jacquetin B, Grolier P, Lemery D,Dastugue B, Azais-Braesco V: Effect ofvitamin A status at the end of termpregnancy on the saturation of retinolbinding protein with retinol. Am J ClinNutr 2000;71:537-543.
36 Kloting N, Graham TE, Berndt J, KralischS, Kovacs P, Wason CJ, Fasshauer M,Schon MR, Stumvoll M, Bluher M, KahnBB: Serum retinol-binding protein ismore highly expressed in visceral thanin subcutaneous adipose tissue and is amarker of intra-abdominal fat mass. CellMetab 2007;6:79-87.
37 Jia W, Wu H, Bao Y, Wang C, Lu J, ZhuJ, Xiang K: Association of serum retinol-binding protein 4 and visceral adiposityin Chinese subjects with and without type2 diabetes. J Clin Endocrinol Metab2007;92:3224-3229.
38 Puigserver P, Vázquez F, Bonet ML, PicóC, Palou A: In vitro and in vivo inductionof brown adipocyte uncoupling protein(thermogenin) by retinoic acid. BiochemJ 1996;317:827-833.
3 9 Bonet ML, Oliver J, Picó C, Felipe F,Ribot J, Cinti S, Palou A: Opposite effectsof vitamin A deficient diet-feeding andretinoic acid treatment on brown adiposetissue UCP1, UCP2 and leptin expression.J Endocrinol 2000;166:511-517.
40 Ribot J, Felipe F, Bonet ML, Palou A:Changes of adiposity in response tovitamin A status correlate with changesof PPAR gamma 2 expression. Obes Res2001;9:500-509.
4 1 Amengual J, Ribot J, Bonet ML, PalouA: Retinoic acid treatment increases lipidoxidation capacity in skeletal muscle ofmice. Obesity 2008;16:585-591.
4 2 Ziouzenkova O, Orasanu G, Sharlach M,Akiyama TE, Berger JP, Viereck J,Hamilton JA, Tang G, Dolnikowski GG,Vogel S, Duester G, Plutzky J:Retinaldehyde represses adipogenesis anddiet-induced obesity. Nat Med2007;13:695-702.
43 Okuno M, Caraveo VE, Goodman DS,Blaner WS: Regulation of adipocyte geneexpression by retinoic acid and hormones:effects on the gene encoding cellularretinol-binding protein. J Lipid Res1995;36:137-147.
44 Mercader J, Madsen L, Felipe F, Palou A,Kristiansen K, Bonet L: All-trans retinoicAcid increases oxidative metabolism inmature adipocytes. Cell Physiol Biochem2007;20:1061-1072.
4 5 Soprano DR, Blaner WS: Plasma retinol-binding protein. in Sporn MB, RobertsAB, Goodman DS (eds): The retinoids.Biology, chemistry and medicine. NewYork, NY/USA: Raven Press 1994;257-281.
4 6 Mourey MS, Quadro L, Panariello L,Colantuoni V: Retinoids regulateexpression of the retinol-binding proteingene in hepatoma cells in culture. J CellPhysiol 1994;160:596-602.
47 Panariello L, Quadro L, Trematerra S,Colantuoni V: Identification of a novelretinoic acid response element in thepromoter region of the retinol-bindingprotein gene. J Biol Chem1996;271:25524-25532.
48 Cogan U, Kopelman M, Mokady S,Shinitzky M: Binding affinities of retinoland related compounds to retinol bindingproteins. Eur J Biochem 1976;65:71-78.
4 9 Breustedt DA, Schonfeld DL, Skerra A:Comparative ligand-binding analysis often human lipocalins. Biochim BiophysActa 2006;1764:161-173.
50 Smith JE, Borek C, Gawinowicz MA,Goodman DS: Structure-functionrelationships of retinoids in their effectson retinol-binding protein metabolism incultured H4II EC3 liver cells. ArchBiochem Biophys 1985;238:1-9.
51 Dixon JL, Goodman DS: Studies on themetabolism of retinol-binding protein byprimary hepatocytes from retinol-deficient rats. J Cell Physiol1987;130:14-20.
52 Kim KH, Lee K, Moon YS, Sul HS: Acysteine-rich adipose tissue-specificsecretory factor inhibits adipocytedifferentiation. J Biol Chem2001;276:11252-11256.
53 Steppan CM, Bailey ST, Bhat S, BrownEJ, Banerjee RR, Wright CM, Patel HR,Ahima RS, Lazar MA: The hormoneresistin links obesity to diabetes. Nature2001;409:307-312.
54 Steppan CM, Wang J, Whiteman EL,Birnbaum MJ, Lazar MA: Activation ofSOCS-3 by resistin. Mol Cell Biol2005;25:1569-1575.
55 Bjorbaek C, Kahn BB: Leptin signalingin the central nervous system and theperiphery. Recent Prog Horm Res2004;59:305-331.
Mercader/Granados/Bonet/PalouCell Physiol Biochem 2008;22:363-372
Resultados y Discusión
77
MANUSCRITO III
Distinct effect of oleic acid and its trans isomer elaidic acid on the expression of
miokines and adipokines in cell models.
Granados. N, Amengual J., Ribot J., Palou A., Bonet M.L.
British Journal of Nutrition, 105:1226-1234, 2011

Distinct effects of oleic acid and its trans-isomer elaidic acid on theexpression of myokines and adipokines in cell models
Nuria Granados, Jaume Amengual†, Joan Ribot, Andreu Palou* and M. Luisa Bonet
Laboratory of Molecular Biology, Nutrition and Biotechnology, Universitat de les Illes Balears, CIBER de Fisiopatologıa de la
Obesidad y Nutricion (CIBERobn), Cra. Valldemossa, Km 7.5, 07122 Palma de Mallorca, Spain
(Received 3 June 2010 – Revised 25 October 2010 – Accepted 27 October 2010 – First published online 5 January 2011)
Abstract
Trans-fatty acids (TFA) and cis-monounsaturated fat appear to exert detrimental and beneficial effects, respectively, on glucose metabolism
and insulin sensitivity. Adipose tissue and skeletal muscle are a source of signalling proteins (adipokines and myokines), some of which
have been related to the control of insulin sensitivity. Here, we investigated the possible differential effects of elaidic acid (EA; trans-
9-18 : 1) – the major component in industrially produced TFA – and oleic acid (OA; cis-9-18 : 1) – its cis-isomer naturally present in
food – on cellular glucose uptake and the expression of selected myokines and adipokines using cell models. Differentiated C2C12
myotubes and 3T3-L1 adipocytes were pretreated with the vehicle (control cells) or fatty acids for 24 h, after which basal and insulin-
stimulated 2-deoxyglucose uptake and the expression of selected signalling proteins were measured. In C2C12 myotubes, pretreatment
with OA, but not with EA, led to increased insulin-stimulated 2-deoxyglucose uptake and IL-6 expression levels, while pretreatment
with EA, but not with OA, led to reduced IL-15 mRNA levels and increased TNF-a expression levels. In 3T3-L1 adipocytes, exposure
to OA, but not to EA, resulted in reduced resistin gene expression and increased adiponectin gene expression. The results show evidence
of distinct, direct effects of OA and EA on muscle glucose uptake and the expression of target myokines and adipokines, thus suggesting
novel mechanisms by which cis- and trans-monounsaturated fat may differentially affect systemic functions.
Key words: Adipokines and myokines: Glucose uptake: Trans-fatty acids: Oleic acid: Cell models
Trans-fatty acids (TFA) are unsaturated fatty acids with at
least one double bond in the trans, rather than the typical
cis, configuration. A major source of TFA in food is indus-
trially produced trans-fatty acids (IP-TFA) generated during
partial hydrogenation (‘hardening’) of vegetable fat.
Industrial hydrogenation involves heating the raw oils to
about 4008C under high pressure and with the addition
of different catalysts, and in this process, trans-double
bonds are undesirably formed along with fatty acid
molecules from position six and higher, at the same time
as SFA are formed. Partially hydrogenated fat is used in a
variety of food products, especially spreads, baked goods
and fast food. Elaidic acid (EA; trans-9-18 : 1), the trans-
isomer of oleic acid (OA), is the predominant IP-TFA(1,2).
While there is evidence pointing to favourable effects
of OA-enriched diets and of OA itself on CVD risk,
weight maintenance and insulin sensitivity(3–5), dietary
TFA is generally associated with detrimental effects on
health(2,6,7). Importantly, deleterious effects are well
documented for IP-TFA, but not for TFA of ruminant
origin, in the low amounts usually consumed(2,6). In fact,
health benefits have been suggested for conjugated linoleic
acid and vaccenic acid (trans-11-18 : 1), the major TFA
naturally present in beef and dairy products(8,9).
Adverse effects of IP-TFA consumption on multiple
cardiovascular risk factors are well established, including
promotion of a pro-atherogenic serum lipid/lipoprotein
profile, endothelial dysfunction and an increased
production of pro-inflammatory cytokines(6,7,10). The
impact of IP-TFA consumption on insulin resistance and
the risk of type 2 diabetes is more controversial, since detri-
mental effects have been reported in some, but not all,
human observational studies and short-term intervention
trials on the topic(11–14). Likewise, in rats, the effects of
TFA-enriched diets (fed for 8–12 weeks) increasing
insulin resistance and impairing systemic and tissue-
specific glucose disposal have been reported in some
studies(15–17), but not in others(18). Nevertheless, in
† Present address: Department of Pharmacology, School of Medicine, Case Western Reserve University, Cleveland, OH, USA.*Corresponding author: Professor A. Palou, fax þ34 971 173426, email [email protected]
Abbreviations: 2-DOG, 2-deoxy-D-glucose; EA, elaidic acid; FBS, fetal bovine serum; IP-TFA, industrially produced trans-fatty acid; OA, oleic acid; TFA,
trans-fatty acids.
British Journal of Nutrition (2011), 105, 1226–1234 doi:10.1017/S0007114510004885q The Authors 2011
British
Journal
ofNutrition
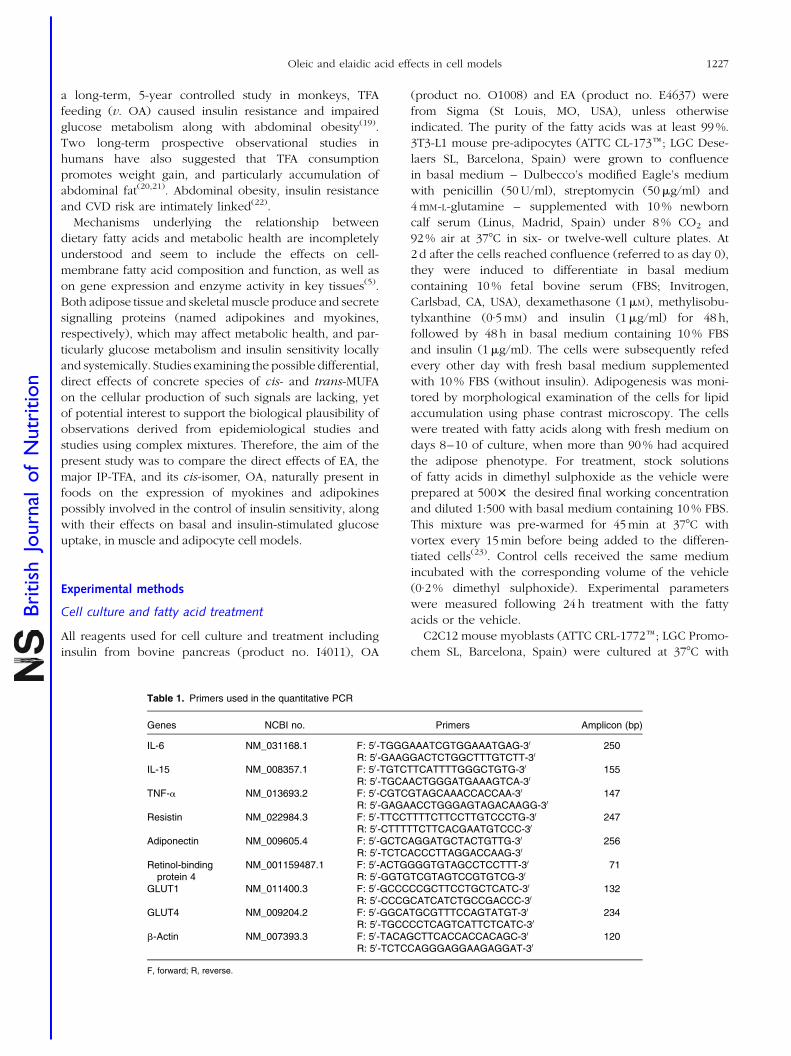
a long-term, 5-year controlled study in monkeys, TFA
feeding (v. OA) caused insulin resistance and impaired
glucose metabolism along with abdominal obesity(19).
Two long-term prospective observational studies in
humans have also suggested that TFA consumption
promotes weight gain, and particularly accumulation of
abdominal fat(20,21). Abdominal obesity, insulin resistance
and CVD risk are intimately linked(22).
Mechanisms underlying the relationship between
dietary fatty acids and metabolic health are incompletely
understood and seem to include the effects on cell-
membrane fatty acid composition and function, as well as
on gene expression and enzyme activity in key tissues(5).
Both adipose tissue and skeletal muscle produce and secrete
signalling proteins (named adipokines and myokines,
respectively), which may affect metabolic health, and par-
ticularly glucose metabolism and insulin sensitivity locally
and systemically. Studies examining the possible differential,
direct effects of concrete species of cis- and trans-MUFA
on the cellular production of such signals are lacking, yet
of potential interest to support the biological plausibility of
observations derived from epidemiological studies and
studies using complex mixtures. Therefore, the aim of the
present study was to compare the direct effects of EA, the
major IP-TFA, and its cis-isomer, OA, naturally present in
foods on the expression of myokines and adipokines
possibly involved in the control of insulin sensitivity, along
with their effects on basal and insulin-stimulated glucose
uptake, in muscle and adipocyte cell models.
Experimental methods
Cell culture and fatty acid treatment
All reagents used for cell culture and treatment including
insulin from bovine pancreas (product no. I4011), OA
(product no. O1008) and EA (product no. E4637) were
from Sigma (St Louis, MO, USA), unless otherwise
indicated. The purity of the fatty acids was at least 99 %.
3T3-L1 mouse pre-adipocytes (ATTC CL-173e; LGC Dese-
laers SL, Barcelona, Spain) were grown to confluence
in basal medium – Dulbecco’s modified Eagle’s medium
with penicillin (50 U/ml), streptomycin (50mg/ml) and
4 mM-L-glutamine – supplemented with 10 % newborn
calf serum (Linus, Madrid, Spain) under 8 % CO2 and
92 % air at 378C in six- or twelve-well culture plates. At
2 d after the cells reached confluence (referred to as day 0),
they were induced to differentiate in basal medium
containing 10 % fetal bovine serum (FBS; Invitrogen,
Carlsbad, CA, USA), dexamethasone (1mM), methylisobu-
tylxanthine (0·5 mM) and insulin (1mg/ml) for 48 h,
followed by 48 h in basal medium containing 10 % FBS
and insulin (1mg/ml). The cells were subsequently refed
every other day with fresh basal medium supplemented
with 10 % FBS (without insulin). Adipogenesis was moni-
tored by morphological examination of the cells for lipid
accumulation using phase contrast microscopy. The cells
were treated with fatty acids along with fresh medium on
days 8–10 of culture, when more than 90 % had acquired
the adipose phenotype. For treatment, stock solutions
of fatty acids in dimethyl sulphoxide as the vehicle were
prepared at 500£ the desired final working concentration
and diluted 1:500 with basal medium containing 10 % FBS.
This mixture was pre-warmed for 45 min at 378C with
vortex every 15 min before being added to the differen-
tiated cells(23). Control cells received the same medium
incubated with the corresponding volume of the vehicle
(0·2 % dimethyl sulphoxide). Experimental parameters
were measured following 24 h treatment with the fatty
acids or the vehicle.
C2C12 mouse myoblasts (ATTC CRL-1772e; LGC Promo-
chem SL, Barcelona, Spain) were cultured at 378C with
Table 1. Primers used in the quantitative PCR
Genes NCBI no. Primers Amplicon (bp)
IL-6 NM_031168.1 F: 50-TGGGAAATCGTGGAAATGAG-30
R: 50-GAAGGACTCTGGCTTTGTCTT-30
250
IL-15 NM_008357.1 F: 50-TGTCTTCATTTTGGGCTGTG-30
R: 50-TGCAACTGGGATGAAAGTCA-30
155
TNF-a NM_013693.2 F: 50-CGTCGTAGCAAACCACCAA-30
R: 50-GAGAACCTGGGAGTAGACAAGG-30
147
Resistin NM_022984.3 F: 50-TTCCTTTTCTTCCTTGTCCCTG-30
R: 50-CTTTTTCTTCACGAATGTCCC-30
247
Adiponectin NM_009605.4 F: 50-GCTCAGGATGCTACTGTTG-30
R: 50-TCTCACCCTTAGGACCAAG-30
256
Retinol-bindingprotein 4
NM_001159487.1 F: 50-ACTGGGGTGTAGCCTCCTTT-30
R: 50-GGTGTCGTAGTCCGTGTCG-30
71
GLUT1 NM_011400.3 F: 50-GCCCCCGCTTCCTGCTCATC-30
R: 50-CCCGCATCATCTGCCGACCC-30
132
GLUT4 NM_009204.2 F: 50-GGCATGCGTTTCCAGTATGT-30
R: 50-TGCCCCTCAGTCATTCTCATC-30
234
b-Actin NM_007393.3 F: 50-TACAGCTTCACCACCACAGC-30
R: 50-TCTCCAGGGAGGAAGAGGAT-30
120
F, forward; R, reverse.
Oleic and elaidic acid effects in cell models 1227
British
Journal
ofNutrition
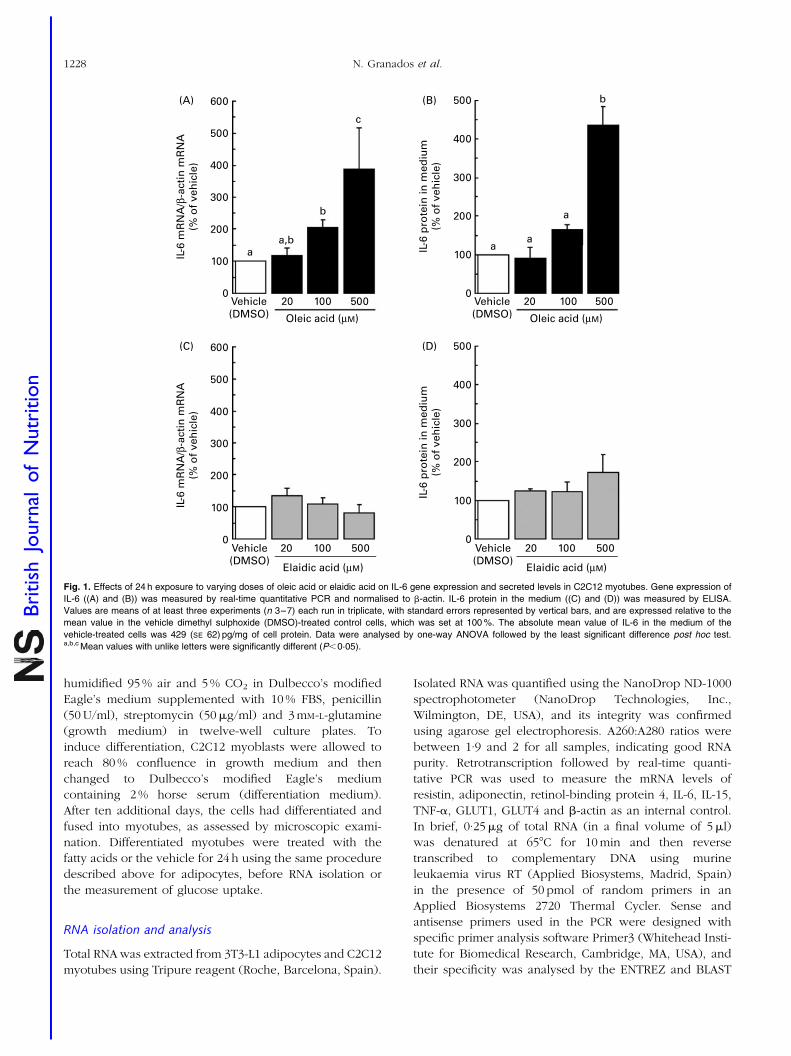
humidified 95 % air and 5 % CO2 in Dulbecco’s modified
Eagle’s medium supplemented with 10 % FBS, penicillin
(50 U/ml), streptomycin (50mg/ml) and 3 mM-L-glutamine
(growth medium) in twelve-well culture plates. To
induce differentiation, C2C12 myoblasts were allowed to
reach 80 % confluence in growth medium and then
changed to Dulbecco’s modified Eagle’s medium
containing 2 % horse serum (differentiation medium).
After ten additional days, the cells had differentiated and
fused into myotubes, as assessed by microscopic exami-
nation. Differentiated myotubes were treated with the
fatty acids or the vehicle for 24 h using the same procedure
described above for adipocytes, before RNA isolation or
the measurement of glucose uptake.
RNA isolation and analysis
Total RNA was extracted from 3T3-L1 adipocytes and C2C12
myotubes using Tripure reagent (Roche, Barcelona, Spain).
Isolated RNA was quantified using the NanoDrop ND-1000
spectrophotometer (NanoDrop Technologies, Inc.,
Wilmington, DE, USA), and its integrity was confirmed
using agarose gel electrophoresis. A260:A280 ratios were
between 1·9 and 2 for all samples, indicating good RNA
purity. Retrotranscription followed by real-time quanti-
tative PCR was used to measure the mRNA levels of
resistin, adiponectin, retinol-binding protein 4, IL-6, IL-15,
TNF-a, GLUT1, GLUT4 and b-actin as an internal control.
In brief, 0·25mg of total RNA (in a final volume of 5ml)
was denatured at 658C for 10 min and then reverse
transcribed to complementary DNA using murine
leukaemia virus RT (Applied Biosystems, Madrid, Spain)
in the presence of 50 pmol of random primers in an
Applied Biosystems 2720 Thermal Cycler. Sense and
antisense primers used in the PCR were designed with
specific primer analysis software Primer3 (Whitehead Insti-
tute for Biomedical Research, Cambridge, MA, USA), and
their specificity was analysed by the ENTREZ and BLAST
600
IL-6
mR
NA
/β-a
ctin
mR
NA
(% o
f ve
hic
le)
IL-6
mR
NA
/β-a
ctin
mR
NA
(% o
f ve
hic
le)
IL-6
pro
tein
in m
ediu
m(%
of
veh
icle
)IL
-6 p
rote
in in
med
ium
(% o
f ve
hic
le)
500
400
aa,b
b
c
300
200
100a
a
a
b
0
500(D)
(B)
(C)
(A)
400
300
200
100
Vehicle(DMSO)
Elaidic acid (µM)
20 100 500 Vehicle(DMSO)
Elaidic acid (µM)
20 100 5000
500
400
300
200
100
0
600
500
400
300
200
100
0
Vehicle(DMSO) Oleic acid (µM)
20 100 500Vehicle(DMSO) Oleic acid (µM)
20 100 500
Fig. 1. Effects of 24 h exposure to varying doses of oleic acid or elaidic acid on IL-6 gene expression and secreted levels in C2C12 myotubes. Gene expression of
IL-6 ((A) and (B)) was measured by real-time quantitative PCR and normalised to b-actin. IL-6 protein in the medium ((C) and (D)) was measured by ELISA.
Values are means of at least three experiments (n 3–7) each run in triplicate, with standard errors represented by vertical bars, and are expressed relative to the
mean value in the vehicle dimethyl sulphoxide (DMSO)-treated control cells, which was set at 100 %. The absolute mean value of IL-6 in the medium of the
vehicle-treated cells was 429 (SE 62) pg/mg of cell protein. Data were analysed by one-way ANOVA followed by the least significant difference post hoc test.a,b,c Mean values with unlike letters were significantly different (P,0·05).
N. Granados et al.1228
British
Journal
ofNutrition
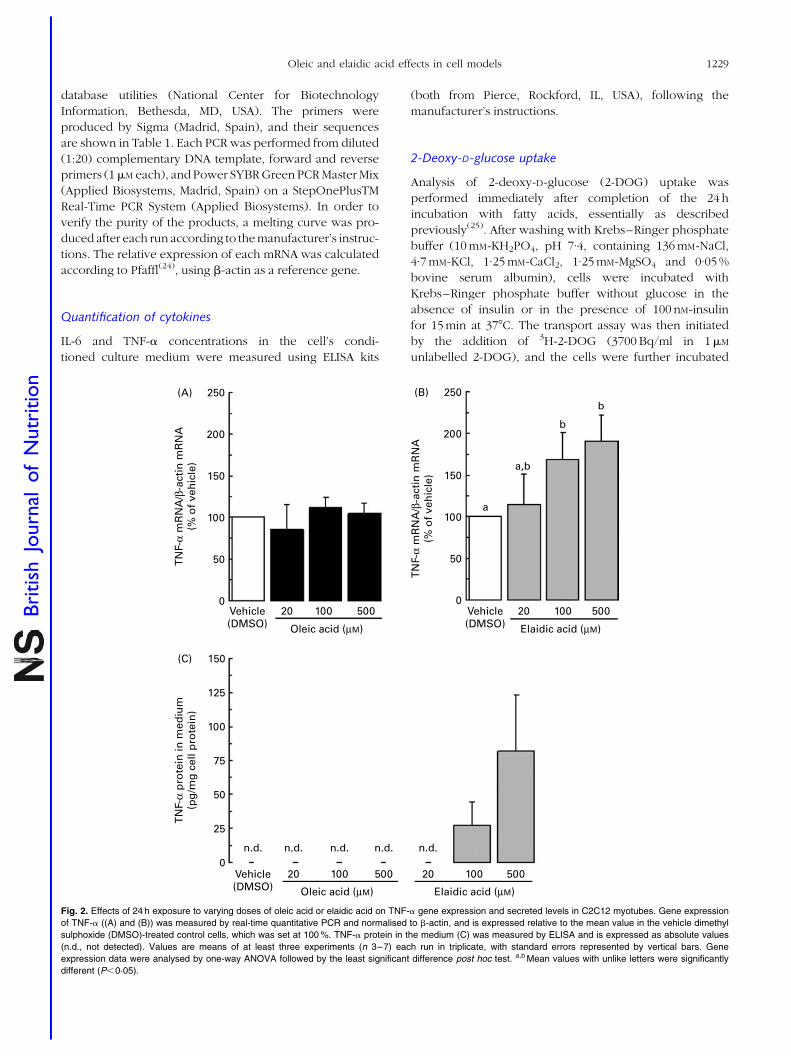
database utilities (National Center for Biotechnology
Information, Bethesda, MD, USA). The primers were
produced by Sigma (Madrid, Spain), and their sequences
are shown in Table 1. Each PCR was performed from diluted
(1:20) complementary DNA template, forward and reverse
primers (1mM each), and Power SYBR Green PCR Master Mix
(Applied Biosystems, Madrid, Spain) on a StepOnePlusTM
Real-Time PCR System (Applied Biosystems). In order to
verify the purity of the products, a melting curve was pro-
duced after each run according to the manufacturer’s instruc-
tions. The relative expression of each mRNA was calculated
according to Pfaffl(24), using b-actin as a reference gene.
Quantification of cytokines
IL-6 and TNF-a concentrations in the cell’s condi-
tioned culture medium were measured using ELISA kits
(both from Pierce, Rockford, IL, USA), following the
manufacturer’s instructions.
2-Deoxy-D-glucose uptake
Analysis of 2-deoxy-D-glucose (2-DOG) uptake was
performed immediately after completion of the 24 h
incubation with fatty acids, essentially as described
previously(25). After washing with Krebs–Ringer phosphate
buffer (10 mM-KH2PO4, pH 7·4, containing 136 mM-NaCl,
4·7 mM-KCl, 1·25 mM-CaCl2, 1·25 mM-MgSO4 and 0·05 %
bovine serum albumin), cells were incubated with
Krebs–Ringer phosphate buffer without glucose in the
absence of insulin or in the presence of 100 nM-insulin
for 15 min at 378C. The transport assay was then initiated
by the addition of 3H-2-DOG (3700 Bq/ml in 1mM
unlabelled 2-DOG), and the cells were further incubated
250
TN
F-α
mR
NA
/β-a
ctin
mR
NA
(% o
f ve
hic
le)
TN
F-α
pro
tein
in m
ediu
m(p
g/m
g c
ell p
rote
in)
TN
F-α
mR
NA
/β-a
ctin
mR
NA
(% o
f ve
hic
le)
200
150
100
50
a
a,b
b
b
0
125
75
25
150
100
50
0
250
200
150
100
50
0
(B)
(C)
(A)
Vehicle(DMSO) Elaidic acid (µM)
20
n.d. n.d.n.d. n.d. n.d.
100 500 20 100 500
Vehicle(DMSO) Elaidic acid (µM)
20 100 500Vehicle(DMSO) Oleic acid (µM)
Oleic acid (µM)
20 100 500
Fig. 2. Effects of 24 h exposure to varying doses of oleic acid or elaidic acid on TNF-a gene expression and secreted levels in C2C12 myotubes. Gene expression
of TNF-a ((A) and (B)) was measured by real-time quantitative PCR and normalised to b-actin, and is expressed relative to the mean value in the vehicle dimethyl
sulphoxide (DMSO)-treated control cells, which was set at 100 %. TNF-a protein in the medium (C) was measured by ELISA and is expressed as absolute values
(n.d., not detected). Values are means of at least three experiments (n 3–7) each run in triplicate, with standard errors represented by vertical bars. Gene
expression data were analysed by one-way ANOVA followed by the least significant difference post hoc test. a,b Mean values with unlike letters were significantly
different (P,0·05).
Oleic and elaidic acid effects in cell models 1229
British
Journal
ofNutrition
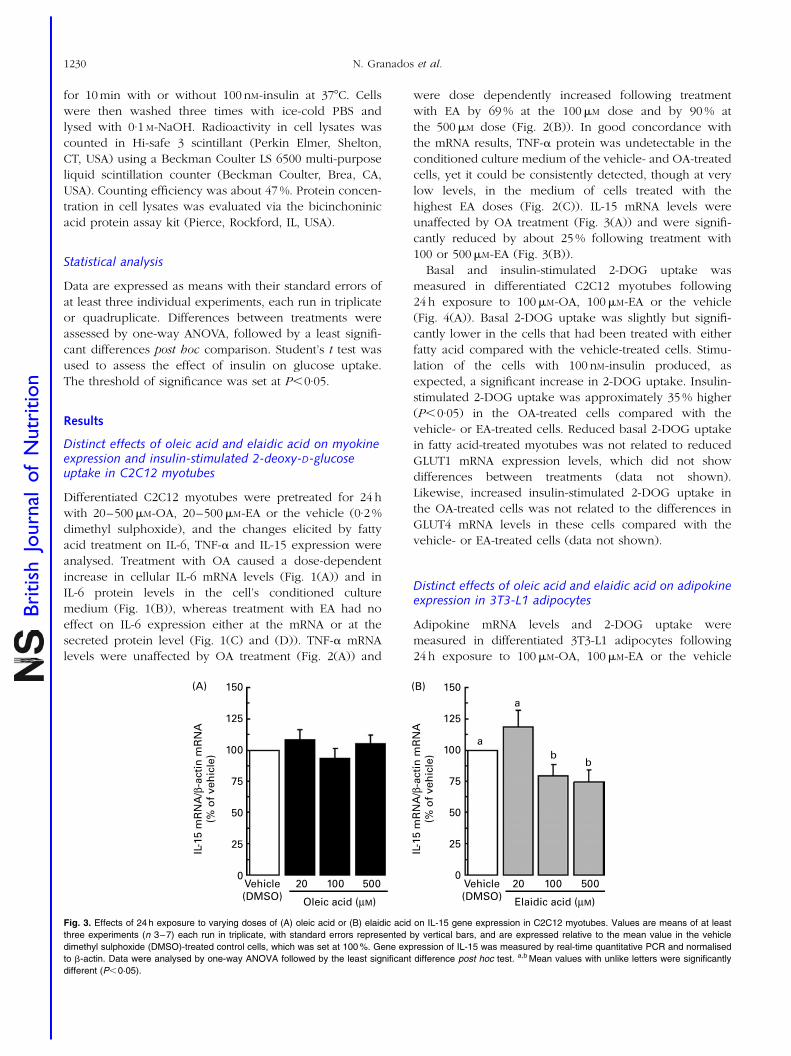
for 10 min with or without 100 nM-insulin at 378C. Cells
were then washed three times with ice-cold PBS and
lysed with 0·1 M-NaOH. Radioactivity in cell lysates was
counted in Hi-safe 3 scintillant (Perkin Elmer, Shelton,
CT, USA) using a Beckman Coulter LS 6500 multi-purpose
liquid scintillation counter (Beckman Coulter, Brea, CA,
USA). Counting efficiency was about 47 %. Protein concen-
tration in cell lysates was evaluated via the bicinchoninic
acid protein assay kit (Pierce, Rockford, IL, USA).
Statistical analysis
Data are expressed as means with their standard errors of
at least three individual experiments, each run in triplicate
or quadruplicate. Differences between treatments were
assessed by one-way ANOVA, followed by a least signifi-
cant differences post hoc comparison. Student’s t test was
used to assess the effect of insulin on glucose uptake.
The threshold of significance was set at P,0·05.
Results
Distinct effects of oleic acid and elaidic acid on myokineexpression and insulin-stimulated 2-deoxy-D-glucoseuptake in C2C12 myotubes
Differentiated C2C12 myotubes were pretreated for 24 h
with 20–500mM-OA, 20–500mM-EA or the vehicle (0·2 %
dimethyl sulphoxide), and the changes elicited by fatty
acid treatment on IL-6, TNF-a and IL-15 expression were
analysed. Treatment with OA caused a dose-dependent
increase in cellular IL-6 mRNA levels (Fig. 1(A)) and in
IL-6 protein levels in the cell’s conditioned culture
medium (Fig. 1(B)), whereas treatment with EA had no
effect on IL-6 expression either at the mRNA or at the
secreted protein level (Fig. 1(C) and (D)). TNF-a mRNA
levels were unaffected by OA treatment (Fig. 2(A)) and
were dose dependently increased following treatment
with EA by 69 % at the 100mM dose and by 90 % at
the 500mM dose (Fig. 2(B)). In good concordance with
the mRNA results, TNF-a protein was undetectable in the
conditioned culture medium of the vehicle- and OA-treated
cells, yet it could be consistently detected, though at very
low levels, in the medium of cells treated with the
highest EA doses (Fig. 2(C)). IL-15 mRNA levels were
unaffected by OA treatment (Fig. 3(A)) and were signifi-
cantly reduced by about 25 % following treatment with
100 or 500mM-EA (Fig. 3(B)).
Basal and insulin-stimulated 2-DOG uptake was
measured in differentiated C2C12 myotubes following
24 h exposure to 100mM-OA, 100mM-EA or the vehicle
(Fig. 4(A)). Basal 2-DOG uptake was slightly but signifi-
cantly lower in the cells that had been treated with either
fatty acid compared with the vehicle-treated cells. Stimu-
lation of the cells with 100 nM-insulin produced, as
expected, a significant increase in 2-DOG uptake. Insulin-
stimulated 2-DOG uptake was approximately 35 % higher
(P,0·05) in the OA-treated cells compared with the
vehicle- or EA-treated cells. Reduced basal 2-DOG uptake
in fatty acid-treated myotubes was not related to reduced
GLUT1 mRNA expression levels, which did not show
differences between treatments (data not shown).
Likewise, increased insulin-stimulated 2-DOG uptake in
the OA-treated cells was not related to the differences in
GLUT4 mRNA levels in these cells compared with the
vehicle- or EA-treated cells (data not shown).
Distinct effects of oleic acid and elaidic acid on adipokineexpression in 3T3-L1 adipocytes
Adipokine mRNA levels and 2-DOG uptake were
measured in differentiated 3T3-L1 adipocytes following
24 h exposure to 100mM-OA, 100mM-EA or the vehicle
IL-1
5 m
RN
A/β
-act
in m
RN
A(%
of
veh
icle
)
50
25
0
150
125
100
75
(A)
IL-1
5 m
RN
A/β
-act
in m
RN
A(%
of
veh
icle
)
50
25
0
150
a
a
bb
125
100
75
(B)
Vehicle(DMSO)
20 100 500
Oleic acid (µM)
Vehicle(DMSO)
20 100 500
Elaidic acid (µM)
Fig. 3. Effects of 24 h exposure to varying doses of (A) oleic acid or (B) elaidic acid on IL-15 gene expression in C2C12 myotubes. Values are means of at least
three experiments (n 3–7) each run in triplicate, with standard errors represented by vertical bars, and are expressed relative to the mean value in the vehicle
dimethyl sulphoxide (DMSO)-treated control cells, which was set at 100 %. Gene expression of IL-15 was measured by real-time quantitative PCR and normalised
to b-actin. Data were analysed by one-way ANOVA followed by the least significant difference post hoc test. a,b Mean values with unlike letters were significantly
different (P,0·05).
N. Granados et al.1230
British
Journal
ofNutrition
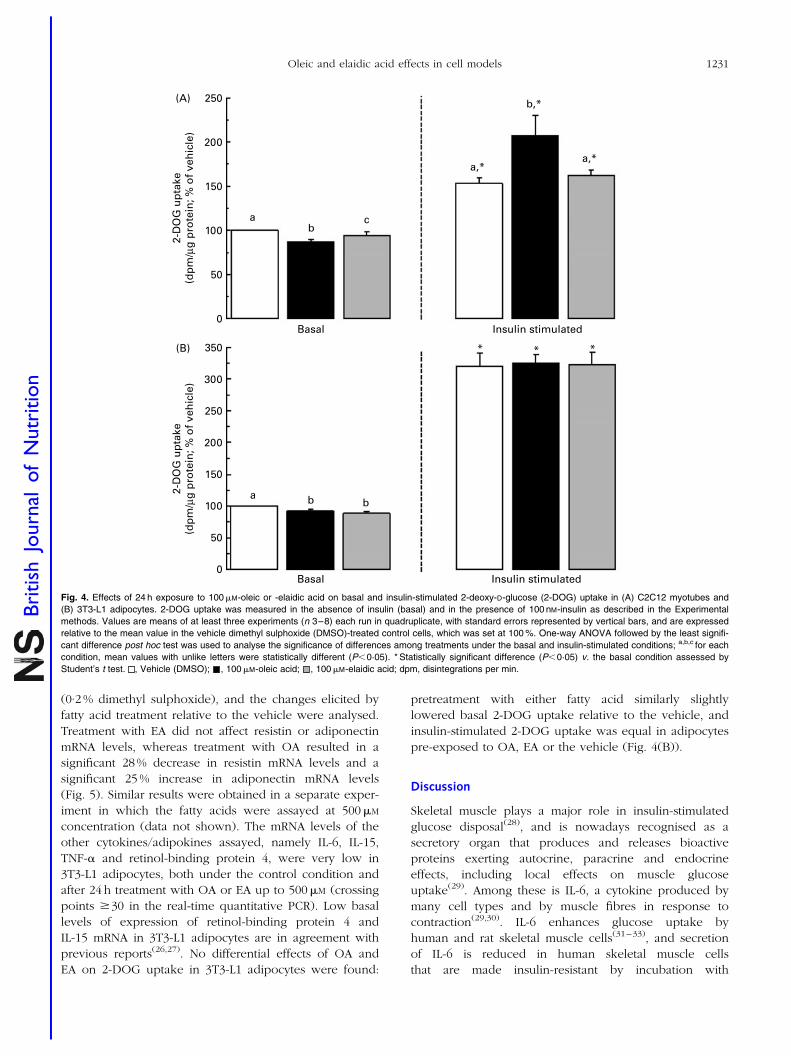
(0·2 % dimethyl sulphoxide), and the changes elicited by
fatty acid treatment relative to the vehicle were analysed.
Treatment with EA did not affect resistin or adiponectin
mRNA levels, whereas treatment with OA resulted in a
significant 28 % decrease in resistin mRNA levels and a
significant 25 % increase in adiponectin mRNA levels
(Fig. 5). Similar results were obtained in a separate exper-
iment in which the fatty acids were assayed at 500mM
concentration (data not shown). The mRNA levels of the
other cytokines/adipokines assayed, namely IL-6, IL-15,
TNF-a and retinol-binding protein 4, were very low in
3T3-L1 adipocytes, both under the control condition and
after 24 h treatment with OA or EA up to 500mM (crossing
points $30 in the real-time quantitative PCR). Low basal
levels of expression of retinol-binding protein 4 and
IL-15 mRNA in 3T3-L1 adipocytes are in agreement with
previous reports(26,27). No differential effects of OA and
EA on 2-DOG uptake in 3T3-L1 adipocytes were found:
pretreatment with either fatty acid similarly slightly
lowered basal 2-DOG uptake relative to the vehicle, and
insulin-stimulated 2-DOG uptake was equal in adipocytes
pre-exposed to OA, EA or the vehicle (Fig. 4(B)).
Discussion
Skeletal muscle plays a major role in insulin-stimulated
glucose disposal(28), and is nowadays recognised as a
secretory organ that produces and releases bioactive
proteins exerting autocrine, paracrine and endocrine
effects, including local effects on muscle glucose
uptake(29). Among these is IL-6, a cytokine produced by
many cell types and by muscle fibres in response to
contraction(29,30). IL-6 enhances glucose uptake by
human and rat skeletal muscle cells(31–33), and secretion
of IL-6 is reduced in human skeletal muscle cells
that are made insulin-resistant by incubation with
150
a
abb
a,*
b,*
a,*
bc
200
250
100
0
50
Basal Insulin stimulated
Basal Insulin stimulated
* * *
(A)
2-D
OG
up
take
(dp
m/µ
g p
rote
in; %
of
veh
icle
)2-
DO
G u
pta
ke(d
pm
/µg
pro
tein
; % o
f ve
hic
le)
250
200
300
350
150
100
0
50
(B)
Fig. 4. Effects of 24 h exposure to 100mM-oleic or -elaidic acid on basal and insulin-stimulated 2-deoxy-D-glucose (2-DOG) uptake in (A) C2C12 myotubes and
(B) 3T3-L1 adipocytes. 2-DOG uptake was measured in the absence of insulin (basal) and in the presence of 100 nM-insulin as described in the Experimental
methods. Values are means of at least three experiments (n 3–8) each run in quadruplicate, with standard errors represented by vertical bars, and are expressed
relative to the mean value in the vehicle dimethyl sulphoxide (DMSO)-treated control cells, which was set at 100 %. One-way ANOVA followed by the least signifi-
cant difference post hoc test was used to analyse the significance of differences among treatments under the basal and insulin-stimulated conditions; a,b,c for each
condition, mean values with unlike letters were statistically different (P,0·05). * Statistically significant difference (P,0·05) v. the basal condition assessed by
Student’s t test. , Vehicle (DMSO); , 100mM-oleic acid; , 100mM-elaidic acid; dpm, disintegrations per min.
Oleic and elaidic acid effects in cell models 1231
British
Journal
ofNutrition
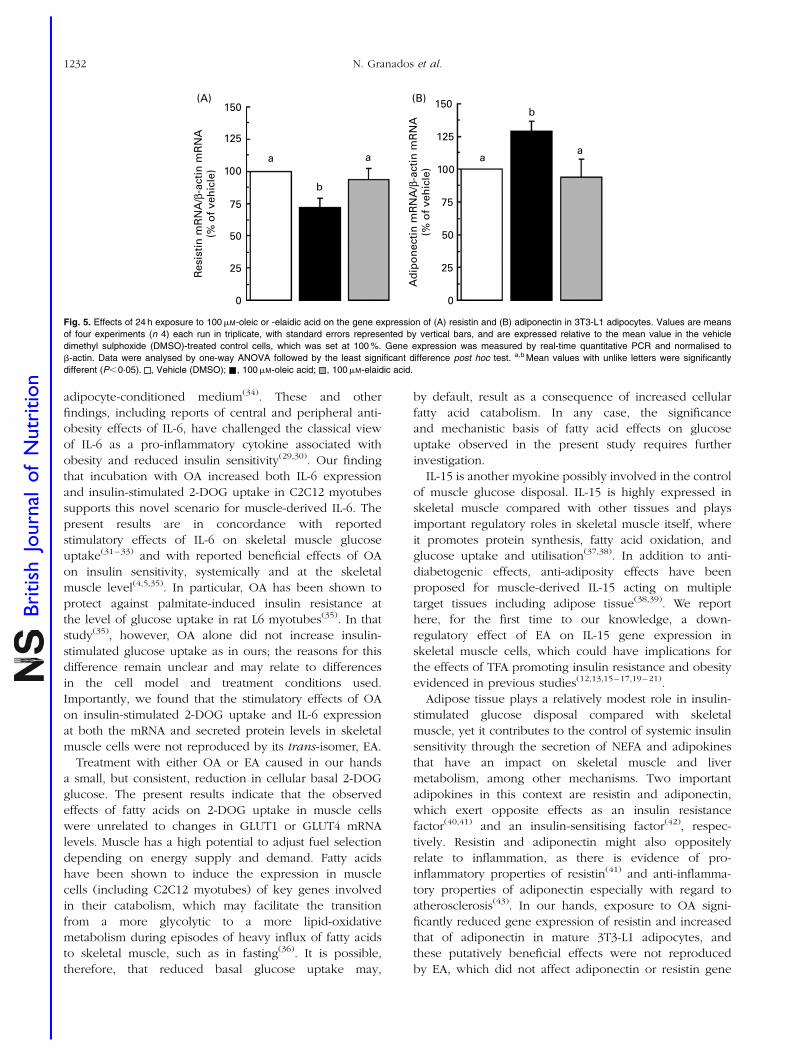
adipocyte-conditioned medium(34). These and other
findings, including reports of central and peripheral anti-
obesity effects of IL-6, have challenged the classical view
of IL-6 as a pro-inflammatory cytokine associated with
obesity and reduced insulin sensitivity(29,30). Our finding
that incubation with OA increased both IL-6 expression
and insulin-stimulated 2-DOG uptake in C2C12 myotubes
supports this novel scenario for muscle-derived IL-6. The
present results are in concordance with reported
stimulatory effects of IL-6 on skeletal muscle glucose
uptake(31–33) and with reported beneficial effects of OA
on insulin sensitivity, systemically and at the skeletal
muscle level(4,5,35). In particular, OA has been shown to
protect against palmitate-induced insulin resistance at
the level of glucose uptake in rat L6 myotubes(35). In that
study(35), however, OA alone did not increase insulin-
stimulated glucose uptake as in ours; the reasons for this
difference remain unclear and may relate to differences
in the cell model and treatment conditions used.
Importantly, we found that the stimulatory effects of OA
on insulin-stimulated 2-DOG uptake and IL-6 expression
at both the mRNA and secreted protein levels in skeletal
muscle cells were not reproduced by its trans-isomer, EA.
Treatment with either OA or EA caused in our hands
a small, but consistent, reduction in cellular basal 2-DOG
glucose. The present results indicate that the observed
effects of fatty acids on 2-DOG uptake in muscle cells
were unrelated to changes in GLUT1 or GLUT4 mRNA
levels. Muscle has a high potential to adjust fuel selection
depending on energy supply and demand. Fatty acids
have been shown to induce the expression in muscle
cells (including C2C12 myotubes) of key genes involved
in their catabolism, which may facilitate the transition
from a more glycolytic to a more lipid-oxidative
metabolism during episodes of heavy influx of fatty acids
to skeletal muscle, such as in fasting(36). It is possible,
therefore, that reduced basal glucose uptake may,
by default, result as a consequence of increased cellular
fatty acid catabolism. In any case, the significance
and mechanistic basis of fatty acid effects on glucose
uptake observed in the present study requires further
investigation.
IL-15 is another myokine possibly involved in the control
of muscle glucose disposal. IL-15 is highly expressed in
skeletal muscle compared with other tissues and plays
important regulatory roles in skeletal muscle itself, where
it promotes protein synthesis, fatty acid oxidation, and
glucose uptake and utilisation(37,38). In addition to anti-
diabetogenic effects, anti-adiposity effects have been
proposed for muscle-derived IL-15 acting on multiple
target tissues including adipose tissue(38,39). We report
here, for the first time to our knowledge, a down-
regulatory effect of EA on IL-15 gene expression in
skeletal muscle cells, which could have implications for
the effects of TFA promoting insulin resistance and obesity
evidenced in previous studies(12,13,15–17,19–21).
Adipose tissue plays a relatively modest role in insulin-
stimulated glucose disposal compared with skeletal
muscle, yet it contributes to the control of systemic insulin
sensitivity through the secretion of NEFA and adipokines
that have an impact on skeletal muscle and liver
metabolism, among other mechanisms. Two important
adipokines in this context are resistin and adiponectin,
which exert opposite effects as an insulin resistance
factor(40,41) and an insulin-sensitising factor(42), respec-
tively. Resistin and adiponectin might also oppositely
relate to inflammation, as there is evidence of pro-
inflammatory properties of resistin(41) and anti-inflamma-
tory properties of adiponectin especially with regard to
atherosclerosis(43). In our hands, exposure to OA signi-
ficantly reduced gene expression of resistin and increased
that of adiponectin in mature 3T3-L1 adipocytes, and
these putatively beneficial effects were not reproduced
by EA, which did not affect adiponectin or resistin gene
Res
isti
n m
RN
A/β
-act
in m
RN
A(%
of
veh
icle
)
Ad
ipo
nec
tin
mR
NA
/β-a
ctin
mR
NA
(% o
f ve
hic
le)
50
25
0
150
125
100
75
(A)
50
25
0
150
a aa
a
b
b
125
100
75
(B)
Fig. 5. Effects of 24 h exposure to 100mM-oleic or -elaidic acid on the gene expression of (A) resistin and (B) adiponectin in 3T3-L1 adipocytes. Values are means
of four experiments (n 4) each run in triplicate, with standard errors represented by vertical bars, and are expressed relative to the mean value in the vehicle
dimethyl sulphoxide (DMSO)-treated control cells, which was set at 100 %. Gene expression was measured by real-time quantitative PCR and normalised to
b-actin. Data were analysed by one-way ANOVA followed by the least significant difference post hoc test. a,b Mean values with unlike letters were significantly
different (P,0·05). , Vehicle (DMSO); , 100mM-oleic acid; , 100mM-elaidic acid.
N. Granados et al.1232
British
Journal
ofNutrition
expression. We also investigated the effects on
retinol-binding protein 4 – which, similar to resistin,
might function as an insulin resistance factor secreted by
adipocytes(44) – and found no effect of OA or EA treatment
on its (very low) gene expression in 3T3-L1 adipocytes.
Repression of adipocyte resistin expression by OA has
been previously reported(45), and a stimulatory effect of
OA on adiponectin expression might be in line with a
recent report showing a positive association between
serum adiponectin levels and OA content in white adipose
tissue in rats(46). In a previous study in 3T3-L1 adipocytes,
however, 48 h incubation with 250mM-OA had no effect on
adiponectin gene expression(47). Studies examining the
effects of TFA on adipokine expression in adipocyte cell
models are lacking, to our knowledge. There are, however,
reports indicating that, in rats, consumption of TFA-
enriched diets is associated with increased resistin
expression(48,49) and reduced adiponectin expression in
white adipose tissue(49,50). Additionally, also in rats, a
negative correlation between adipose adiponectin gene
expression and TFA levels in the serum has been
described(46). Taken together, these in vivo studies and
our cell studies suggest that the effects of TFA-enriched
diets on adipokine expression observed in vivo are likely
to be indirect.
TNF-a is a cytokine linked to inflammation and
obesity-associated insulin resistance(51). TFA intake has
been reported to be associated with increased TNF
system activity in observational studies in humans(10) and
with increased TNF-a expression in white adipose tissue
in experimental studies in rats(49,50). In our hands, gene
expression of TNF-a was negligible in 3T3-L1 adipocytes
yet readily detectable in C2C12 myotubes, in which both
TNF-a mRNA levels and secreted TNF-a protein increased
following exposure to EA. TNF-a activity favours insulin
resistance and protein wasting in skeletal muscle(52), effects
that are the opposite to those exerted in muscle by
IL-15(38), and, remarkably, we found here that EA
oppositely affected gene expression of these two cytokines
in muscle cells.
In summary, the present study revealed the distinct,
direct effects of OA and EA on the expression of target
myokines and adipokines. OA, but not EA, dose
dependently induced IL-6 expression in skeletal muscle
cells, and repressed resistin and induced adiponectin
gene expression in cultured adipocytes. EA, but not OA,
repressed IL-15 gene expression and induced TNF-a
expression in cultured skeletal muscle cells. Overall,
these findings suggest novel mechanisms by which cis-
and trans-monounsaturated fat may differentially affect
systemic functions.
Acknowledgements
The present study was supported by grants from the
Spanish Government (AGL2009-11277/ALI to A. P.) and
the European Union (BIOCLAIMS project, FP7-244995,
Coordinator A. P.). Our laboratory consists of a member
of the European Nutrigenomics Organization (NuGO,
European Union Contract FOOD-CT-2004-506360). CIBER
de Fisiopatologıa de la Obesidad y Nutricion is an initiative
of the ISCIII (Spanish Government). All authors contribu-
ted to the design and discussion of the study. N. G. and
J. A. undertook all the experiments. N. G. drafted the
manuscript. J. R., A. P. and M. L. B. supervised the experi-
ments. M. L. B. was in charge of the final writing of the
manuscript. The authors declare that there is no conflict
of interest.
References
1. Mensink RP (2005) Metabolic and health effects of isomericfatty acids. Curr Opin Lipidol 16, 27–30.
2. Stender S, Astrup A & Dyerberg J (2008) Ruminant andindustrially produced trans-fatty acids: health aspects. FoodNutr Res 52 (epublication 12 March 2008).
3. Covas MI (2007) Olive oil and the cardiovascular system.Pharmacol Res 55, 175–186.
4. Schroder H (2007) Protective mechanisms of the Mediterra-nean diet in obesity and type 2 diabetes. J Nutr Biochem18, 149–160.
5. Riserus U, Willett WC & Hu FB (2009) Dietary fats andprevention of type 2 diabetes. Prog Lipid Res 48, 44–51.
6. Mozaffarian D, Aro A & Willett WC (2009) Health effects oftrans-fatty acids: experimental and observational evidence.Eur J Clin Nutr 63, Suppl. 2, S5–S21.
7. Teegala SM, Willett WC & Mozaffarian D (2009) Consump-tion and health effects of trans fatty acids: a review.J AOAC Int 92, 1250–1257.
8. Bhattacharya A, Banu J, Rahman M, et al. (2006) Biologicaleffects of conjugated linoleic acids in health and disease.J Nutr Biochem 17, 789–810.
9. Field CJ, Blewett HH, Proctor S, et al. (2009) Human healthbenefits of vaccenic acid. Appl Physiol Nutr Metab 34,979–991.
10. Mozaffarian D (2006) Trans fatty acids – effects on systemicinflammation and endothelial function. Atheroscler Suppl 7,29–32.
11. Lovejoy JC, Smith SR, Champagne CM, et al. (2002) Effects ofdiets enriched in saturated (palmitic), monounsaturated(oleic), or trans (elaidic) fatty acids on insulin sensitivityand substrate oxidation in healthy adults. Diabetes Care25, 1283–1288.
12. Odegaard AO & Pereira MA (2006) Trans fatty acids, insulinresistance, and type 2 diabetes. Nutr Rev 64, 364–372.
13. Riserus U (2006) Trans fatty acids and insulin resistance.Atheroscler Suppl 7, 37–39.
14. Tardy AL, Lambert-Porcheron S, Malpuech-Brugere C, et al.(2009) Dairy and industrial sources of trans fat do notimpair peripheral insulin sensitivity in overweight women.Am J Clin Nutr 90, 88–94.
15. Natarajan S & Ibrahim A (2005) Dietary trans fatty acids alterdiaphragm phospholipid fatty acid composition, triacylgly-cerol content and glucose transport in rats. Br J Nutr 93,829–833.
16. Ibrahim A, Natrajan S & Ghafoorunissa R (2005) Dietarytrans-fatty acids alter adipocyte plasma membrane fattyacid composition and insulin sensitivity in rats. Metabolism54, 240–246.
Oleic and elaidic acid effects in cell models 1233
British
Journal
ofNutrition
17. Dorfman SE, Laurent D, Gounarides JS, et al. (2009) Meta-bolic implications of dietary trans-fatty acids. Obesity(Silver Spring) 17, 1200–1207.
18. Tardy AL, Giraudet C, Rousset P, et al. (2008) Effects of transMUFA from dairy and industrial sources on muscle mito-chondrial function and insulin sensitivity. J Lipid Res 49,1445–1455.
19. Kavanagh K, Jones KL, Sawyer J, et al. (2007) Trans fat dietinduces abdominal obesity and changes in insulin sensitivityin monkeys. Obesity (Silver Spring) 15, 1675–1684.
20. Koh-Banerjee P, Chu NF, Spiegelman D, et al. (2003) Pro-spective study of the association of changes in dietaryintake, physical activity, alcohol consumption, and smokingwith 9-y gain in waist circumference among 16 587 US men.Am J Clin Nutr 78, 719–727.
21. Field AE, Willett WC, Lissner L, et al. (2007) Dietary fat andweight gain among women in the Nurses’ Health Study.Obesity (Silver Spring) 15, 967–976.
22. Ritchie SA & Connell JM (2007) The link between abdominalobesity, metabolic syndrome and cardiovascular disease.Nutr Metab Cardiovasc Dis 17, 319–326.
23. Amri EZ, Teboul L, Vannier C, et al. (1996) Fatty acids regu-late the expression of lipoprotein lipase gene and activity inpreadipose and adipose cells. Biochem J 314 (Pt 2),541–546.
24. Pfaffl MW (2001) A new mathematical model for relativequantification in real-time RT-PCR. Nucleic Acids Res 29, e45.
25. Kumar N & Dey CS (2003) Development of insulin resistanceand reversal by thiazolidinediones in C2C12 skeletal musclecells. Biochem Pharmacol 65, 249–257.
26. Mercader J, Granados N, Bonet ML, et al. (2008) All-transretinoic acid decreases murine adipose retinol binding pro-tein 4 production. Cell Physiol Biochem 22, 363–372.
27. Quinn LS, Strait-Bodey L, Anderson BG, et al. (2005)Interleukin-15 stimulates adiponectin secretion by 3T3-L1adipocytes: evidence for a skeletal muscle-to-fat signalingpathway. Cell Biol Int 29, 449–457.
28. Parish R & Petersen KF (2005) Mitochondrial dysfunctionand type 2 diabetes. Curr Diab Rep 5, 177–183.
29. Pedersen BK & Febbraio MA (2008) Muscle as an endocrineorgan: focus on muscle-derived interleukin-6. Physiol Rev88, 1379–1406.
30. Hoene M & Weigert C (2008) The role of interleukin-6 ininsulin resistance, body fat distribution and energy balance.Obes Rev 9, 20–29.
31. Carey AL, Steinberg GR, Macaulay SL, et al. (2006) Interleu-kin-6 increases insulin-stimulated glucose disposal inhumans and glucose uptake and fatty acid oxidationin vitro via AMP-activated protein kinase. Diabetes 55,2688–2697.
32. Al-Khalili L, Bouzakri K, Glund S, et al. (2006) Signaling speci-ficity of interleukin-6 action on glucose and lipid metabolismin skeletal muscle. Mol Endocrinol 20, 3364–3375.
33. Glund S, Deshmukh A, Long YC, et al. (2007) Interleukin-6directly increases glucose metabolism in resting humanskeletal muscle. Diabetes 56, 1630–1637.
34. Sell H, Eckardt K, Taube A, et al. (2008) Skeletal muscleinsulin resistance induced by adipocyte-conditionedmedium: underlying mechanisms and reversibility. AmJ Physiol Endocrinol Metab 294, E1070–E1077.
35. Gao D, Griffiths HR & Bailey CJ (2009) Oleate protectsagainst palmitate-induced insulin resistance in L6 myotubes.Br J Nutr 102, 1557–1563.
36. Rodriguez AM, Sanchez J, Tobaruela A, et al. (2010) Time-course effects of increased fatty acid supply on theexpression of genes involved in lipid/glucose metabolismin muscle cells. Cell Physiol Biochem 25, 337–346.
37. Busquets S, Figueras M, Almendro V, et al. (2006)Interleukin-15 increases glucose uptake in skeletal muscle.An antidiabetogenic effect of the cytokine. Biochim BiophysActa 1760, 1613–1617.
38. Argiles JM, Lopez-Soriano FJ & Busquets S (2009) Thera-peutic potential of interleukin-15: a myokine involved inmuscle wasting and adiposity. Drug Discov Today 14,208–213.
39. Quinn LS, Anderson BG, Strait-Bodey L, et al. (2009)Oversecretion of interleukin-15 from skeletal muscle reducesadiposity. Am J Physiol Endocrinol Metab 296, E191–E202.
40. Lazar MA (2007) Resistin- and obesity-associated metabolicdiseases. Horm Metab Res 39, 710–716.
41. Barnes KM & Miner JL (2009) Role of resistin in insulin sen-sitivity in rodents and humans. Curr Protein Pept Sci 10,96–107.
42. Kadowaki T, Yamauchi T, Kubota N, et al. (2006) Adiponec-tin and adiponectin receptors in insulin resistance, diabetes,and the metabolic syndrome. J Clin Invest 116, 1784–1792.
43. Stofkova A (2009) Leptin and adiponectin: from energy andmetabolic dysbalance to inflammation and autoimmunity.Endocr Regul 43, 157–168.
44. Yang Q, Graham TE, Mody N, et al. (2005) Serum retinolbinding protein 4 contributes to insulin resistance in obesityand type 2 diabetes. Nature 436, 356–362.
45. Rea R & Donnelly R (2006) Effects of metformin and oleicacid on adipocyte expression of resistin. Diabetes ObesMetab 8, 105–109.
46. Perez de Heredia F, Sanchez J, Priego T, et al. (2009) Adipo-nectin is associated with serum and adipose tissue fatty acidcomposition in rats. J Endocrinol Invest 32, 659–665.
47. Bueno AA, Oyama LM, de Oliveira C, et al. (2008) Effects ofdifferent fatty acids and dietary lipids on adiponectin geneexpression in 3T3-L1 cells and C57BL/6J mice adiposetissue. Pflugers Arch 455, 701–709.
48. Saravanan N, Haseeb A, Ehtesham NZ, et al. (2005) Differen-tial effects of dietary saturated and trans-fatty acids onexpression of genes associated with insulin sensitivity inrat adipose tissue. Eur J Endocrinol 153, 159–165.
49. Duque-Guimaraes DE, de Castro J, Martinez-Botas J, et al.(2009) Early and prolonged intake of partially hydrogenatedfat alters the expression of genes in rat adipose tissue.Nutrition 25, 782–789.
50. Pisani LP, Oyama LM, Bueno AA, et al. (2008) Hydrogenatedfat intake during pregnancy and lactation modifies serumlipid profile and adipokine mRNA in 21-day-old rats.Nutrition 24, 255–261.
51. Ryden M & Arner P (2007) Tumour necrosis factor-alpha inhuman adipose tissue – from signalling mechanisms to clini-cal implications. J Intern Med 262, 431–438.
52. Argiles JM, Alvarez B, Carbo N, et al. (2000) The divergenteffects of tumour necrosis factor-alpha on skeletal muscle:implications in wasting. Eur Cytokine Netw 11, 552–559.
N. Granados et al.1234
British
Journal
ofNutrition

Resultados y Discusión
89
MANUSCRITO IV
Effects of selected compounds related to joint health on the differentiation of
mouse embryo fibroblast cells: Cross-talk with the adipogenic and the
chondrogenic programs.
Granados N., Petrov P., Palou A., Bonet M.L.
Dossier

91
DOSSIER
Effects of selected compounds related to joint health on the
differentiation of mouse embryo fibroblast cells: Cross-talk with
the adipogenic and the chondrogenic programs
Nuria Granados1,2, Petar D. Petrov1,2, Andreu Palou1,2 M. Luisa Bonet1,2
1Laboratory of Molecular Biology, Nutrition and Biotechnology, Universitat de les Illes
Balears, and 2CIBER de Fisiopatología de la Obesidad y Nutrición (CIBERobn), Palma
de Mallorca, Spain
Acknowledgements:
This work has been developed mainly as part of a contract between Bioibérica S.A.
(Spain) and the University of the Balearic Islands within the framework of the CENIT
PRONAOS project, funded by the CDTI and sponsored by the Ministerio de Ciencia e
Innovación of the Spanish Government. It has also been sponsored in part by grant from
the Spanish Government AGL2009-11277/ALI (to A.P.).
92
SUMMARY
Obesity and degenerative joint disease (osteoarthritis) are two multifactorial pathologies
that are becoming major medical issues with the aging of the world population and which
often appear together. The relationship of osteoarthritis with obesity is complex,
underlying both biomechanical and metabolic/developmental links. Various transcription-
related factors and regulatory signals have been implicated in the differentiation and/or
function of both adipocytes and joint cells. Mouse embryo fibroblast (MEFs) are
multipotent cells which among other lineages give rise to adipocytes and chondrocytes
through mechanisms competitively balanced, and are considered a powerful tool for
cartilage regeneration studies. Here, we investigated in these cells the effects of specific
compounds best known for their possible usefulness in promoting joint health on some
regulatory factors implicated in the development, maintenance and function of
adipocytes and chondrocytes. We show that these compounds can block the adipogenic
differentiation of MEFs while promoting osteo-/chondrogenic gene expression and
regulating the production of adipokines in the cells. Overall, these constitute promising
data suggesting that some of the compounds tested could be useful in the simultaneous
management of obesity and osteoarthritis.
93
INTRODUCTION
Obesity is a condition where excess body fat accumulates to such an extent that health
may be affected. The expanded body fat mass characteristic of the obese phenotype is
associated with increased morbidity and mortality and causes an enormous disease
burden to the society. Degenerative joint disease (osteoarthritis) is another pathology
that, like obesity, is becoming a major public issue. The hallmarks of osteoarthritis are
the irreversible destruction of cartilage, subchondral bone alterations (thickening,
osteophyte formation) and synovitis (inflammation of the synovial membrane). Obesity
and osteoarthritis are interrelated, and often appear together. This relationship includes
biomechanical and metabolic and developmental links. Dysregulated production of
adipokines and inflammatory mediators, hyperlipidemia, and increased systemic
oxidative stress are, for instance, conditions frequently associated with obesity that may
favor joint degeneration (1-4).
Obesity is ultimately caused by a chronic energy imbalance whereby energy intake
exceeds energy expenditure. However, alterations in metabolic pathways and in
processes affecting adipocyte number may also contribute to the development of obesity
as well as to its treatment. Traditional weight loss regimes, such as diet and exercise,
are successful in decreasing adipocyte size, but fail to reduce adipocyte number. Since
many obese and almost all severely obese individuals have more than the average
number of adipocytes, control of adipogenesis (the process of adipocyte differentiation
from precursor cells) might contribute, along with diet and exercise, to reduce and
maintain the fat mass to lean levels. In this context, a dynamic and highly regulated
turnover of adipocytes has been demonstrated in adults humans− so that the total
number of adipocytes remains remarkably constant but about 10% of them are renewed
every year −, which establishes a new therapeutic target whereby pharmacological or
nutritional intervention may potentially tip the adipocyte birth-death balance in favor of
reducing the number of fat cells (5).
Mesenchymal stem cells (MSCs), or multipotent mesenchymal stromal cells as
they are also known, have been identified in bone marrow as well as in other tissues of
the joint, including adipose, synovium, periosteum, perichondrium, and cartilage. These
cells are characterized by their ability to differentiate into chondrocytes, osteoblasts and
adipocytes. The potential of stem cells to repair compromised cartilage is a promising
tool for cell therapy, either through direct contribution to the repair of bone, tendon and
cartilage or as an adjunct therapy through protein production and immune mediation (6).
94
The differentiation of MSCs into chondrocytes, osteoblasts or adipocytes occurs
through the crosstalk between complex signaling pathways - including those derived
from bone morphogenic proteins, wingless- type MMTV integration site proteins, hedge-
hogs, delta/jagged proteins, fibroblast growth factors, insulin, insulin-like growth factors
and cytokines - which in concert with cell-matrix and cell-cell interactions control the
expression and activity of key lineage-specific transcription factors. The differentiation of
MSCs into these three lineages is competitively balanced, in that mechanisms that
promote one cell fate often actively suppress mechanisms that induce alternative
lineages. In this context, many common regulatory factors have been implicated not only
in the development but also in the maintenance of the cell terminal differentiated state
and healthy function of adipose tissue, cartilage and other articular joint tissues.
The aim of this work was to elucidate the effects of selected compounds mainly used
for joint health on the expression of key molecular players at the intersection of adipose
tissue and joint cell’s biology. As a model system, we used primary mouse embryo
fibroblasts (MEFs), which have the ability to differentiate to adipocytes and chondrocytes
among other lineages. We show in these cells dual effects of tested compounds
preventing adipose conversion and promoting the expression of some markers of
chondrocyte differentiation, while modulating the expression of secreted regulatory
protein factors of pathophysiological significance. The work has been developed mainly
as part of a contract between Bioibérica S.A. (Spain) and the University of the Balearic
Islands within the CENIT PRONAOS project, and it is an example of translational
academy-industry research.
MATERIALS AND METHODS
MEFs isolation and culture
MEFs were isolated from mouse embryos derived from mothers at day 13.5 of gestation.
Briefly head, liver and other organs were removed and the remaining carcass was
minced and incubated at 37 ºC for one hour with collagenase After that, fragment
embryos were passed over a syringe (20G) in order to obtain single cells. Collagenase
was inactivated by addition of Dulbecco’s modified Eagle’s medium (DMEM)
supplemented with 10% fetal calf serum (FCS) and antibiotics. The outgrowing primary
cell population was passaged by trypsinization at a ratio of 1:3 to 1:4 upon confluency
and continuously cultured in AmnioMAX-C100 basal medium supplemented with 7.5%
AmnioMAX-C100 supplement, 7.5% FCS, 50 IU/mL penicillin, 50 µg/ml streptomycin,
95
and 2 mmol/L l-glutamine (growth medium). Differentiation experiments were carried out
using cells between passage 3 and 5.
Adipogenic induction
For adipocyte differentiation, 2-day post confluent MEFs were treated (day 0) with growth
medium containing 1µmol/L dexamethasone, 0.5 mmol/L methylisobutylxanthine, 5
µg/mL insulin and 0.5 µmol/l rosiglitazone (adipogenic cocktail) for 48 h. The cells were
subsequently refed every other day with fresh medium containing 5 µg/mL insulin and
0.5 µmol/L rosiglitazone (adipogenic medium). From day 6 onwards, cells were deprived
of insulin and rosiglitazone. Adipogenesis was routinely monitored by morphological
examination of the cells for lipid accumulation using phase-contrast microscopy.
Compounds tested − C1 and C2, and their derivates obtained by enzymatic modification,
named C1’ and C2’, respectively − were added to the cells from day 0 to day 8, at the
doses indicated in the figure legends; control cells received an equal volume of vehicle
(TRIS 50 mM pH 8). Cells were harvested at day 8. (The actual names of the
compounds under investigation are subjected to confidentiality issues).
Chondrogenic induction
MEFs were plated onto 12-well-plates in monolayer culture as in the prior section (1.2 x
105 cells/well) or in high-density micromass culture (see below), and were treated with
vehicle, compound C1, compound C2, or human recombinant bone morphogenic protein
2 (BMP2, Sigma Catalog number B3555, used at 100 ng/mL) in the absence of
adipogenic stimuli. For micromass culture, 1.2 x 10⁵ cells in a 10 µL droplet were plated
in the center of each well of a 24-well plate and left to adhere for four hours at 37 ºC in a
humidified atmosphere. Once the cells had adhered, medium was added and cells were
cultured as usual. BMP2 has previously been shown to have the potential to induce
chondrogenic differentiation of MEFs in ex vivo cultures (7), and it plays an important
role in the induction of chondrogenesis of condensed mesenchyme in vivo (8). The
treatments started (day 0) after attachment of the cells, in the case of the micromass
cultures, and 2 days after the cells had reached confluence, in the case of the monolayer
cultures. In both systems, the cells received fresh medium and treatment every two to
three days, and were harvested at days 0, 3, 8 and 13 of culture.
RNA isolation and analysis
Total RNA was extracted from monolayer cultures using Trizol reagent (Invitrogen) and
from micromass cultures using E.Z.N.A columns, according to the supplier's instructions.
Isolated RNA was quantified using the NanoDrop ND-1000 spectrophotometer
(NadroDrop Technologies Inc Wilmington, DE, USA) and its integrity confirmed using
96
agarose gel electrophoresis. A260/A280 ratios were between 1.9 and 2 for all samples,
indicating good purity. Retrotranscription followed by real-time polymerase chain reaction
(RT-qPCR) was used to measure the mRNA expression levels of: peroxisome
proliferator-activated receptor gamma (PPARg); CCAAT/enhancer binding protein alpha
(C/EBPa); fatty acid synthase (FAS); Sry-related high-mobility-group box 9 (Sox9);
collagen type II, alpha 1 (Col2a1); PPARg coactivator 1 alpha (PGC1a); cytochrome-
oxidase subunit II (COX II); leptin; adiponectin; resistin; retinol binding protein 4 (RBP4);
preadipocyte factor 1 (Pref-1); disintegrin-like and metallopeptidase (reprolysin type) with
thrombospondin type 1 motif 5 (ADAMTS5, also known as aggrecanase 2); and b-actin,
the latter as internal control. In brief, 0.25 µg of total RNA (in a final volume of 5 µL) was
denatured at 65 °C for 10 min and then reverse transcribed to cDNA using MuLV reverse
transcriptase (Applied Biosystem, Madrid, Spain) at 20ºC for 15 min, 42 °C for 30 min,
with a final step of 5 min at 95 °C in an Applied Biosystem 2720 Thermal Cycler. Sense
and antisense primers used in the PCR reactions were designed with specific primer
analysis software Primer3 (Whitehead Institute for Biomedical Research, Cambridge,
MA, USA), and their specificity analyzed by the ENTREZ and BLAST databases utilities
(National Center for Biotechnology Information, Bethesda, MD, USA). The primers were
produced by Sigma (Madrid, Spain), and their sequences are shown in Table 1. Each
PCR was performed from diluted (1/20) cDNA template, forward and reverse primers
(1mM each), and Power SYBER Green PCR Master Mix (Applied Biosystems). Real time
PCR was performed using the Applied Biosystems StepOnePlusTM Real-Time PCR
Systems (Applied Biosystems) with the following profile: 10 min at 95 ºC, followed by a
total of 40 two- temperature cycles (15 s at 95 ºC and 1 min at 60 ºC). In order to verify
the purity of the products, a melting curve was produced after each run according to the
manufacturer's instructions. The threshold cycle (Ct) was calculated by the instrument's
software (StepOne Software v2.0) and the relative expression of each mRNA was
calculated according to Pfaffl (9), using b-actin as a reference gene.
Oil Red O Staining
Cells were fixed in 4% paraformaldehyde for 30 min at room temperature, washed with
PBS, rinsed with isopropanol and stained with 0.2% Oil red O (Sigma, St. Louis, Mo.,
USA) in 60% isopropanol for 1 hour. The intracytoplasmatic dye extracted with
isopropanol was quantified as described previously (10).
97
Statistical analysis
Data are expressed as means ± s.e.m. The statistical differences in mean values were
assessed by Student’s t test. All experiments were repeated at least four times (in
triplicates or quadruplicates per each tested condition) except time-course experiments
for chondrogenic induction that were performed once (in triplicates). Threshold of
significance was set at P<0.05.
RESULTS
Effects of the tested compounds on terminal adipocyte differentiation
MEFs were induced to differentiate into adipocytes using a standard adipogenic
mixture in the presence of vehicle or individual problem compounds at two different
doses (20 and 200 mg/mL). After 8 days of differentiation, the cells were stained for
neutral lipids with Oil Red O. As expected, most cells exposed to the vehicle had by then
differentiated into adipocytes and were filled with lipids. In contrast, there were few lipid-
laden cells present in the cultures treated with compounds C1’ and C2’ (Figure 1A).
Semi-quantification of the accumulated lipids by spectrophotometric analysis of the
amount of extracted dye (10) revealed a dose–response effect more pronounced for the
modified compounds C1’ and C2’ (data not shown).
To characterize the pattern of gene expression in these cells, total RNA was isolated
at day 8 of culture and subjected to RT-qPCR. We first examined the expression of key
players of the transcriptional cascade that controls adipocyte differentiation. It has been
well established that transcription factors of the C/EBP family, in particular C/EBPb and
C/EBPd are induced very early in adipogenesis and play a crucial role in initiating the
differentiation of adipocytes by promoting cell cycle arrest and clonal expansion (case of
C/EBPb) and activating the expression of PPARg (case of C/EBPd). PPARg, upon
agonist ligand binding, activates the expression of C/EBPa (11). PPARg and C/EBPa
control each other expression and function together to activate the entire program of
morphological and biochemical adipocyte terminal differentiation (12). We measured
PPARg and C/EBPa mRNA levels in our cells at day 8 of culture (Figure 1B). We did not
find significant changes in PPARg mRNA expression levels, except for a decrease in the
cells treated with C1’ at the low dose. However, gene expression of C/EBPa was
strongly decreased by compounds C1’, C2 and C2’, in a manner that was dose-
dependent for C1’ and C2’. We also measured the gene expression of fatty acid
synthase (FAS), an end product of adipogenesis. Changes in FAS mRNA levels largely
paralleled those of CEBPa, being strongly decreased by C1’, C2 and C2’ (Figure 1B).
98
A key aspect of this experimental design is the use of a mixture of stimulus to induce
adipogenesis. The adipogenic stimuli include isobutylmethylxanthine, dexamethasone,
insulin, and rosiglitazone. The individual components of this mixture facilitate different
aspects of adipogenesis. Isobutylmethylxanthine, a phosphodiesterase inhibitor, elevates
cellular cAMP levels leading to activation of protein kinase A (PKA). One of the PKA
substrates in adipocytes is the transcription factor cAMP-response element-binding
protein (CREB). Activated CREB positively regulates the expression of C/EBPb.
Dexamethasone activates the glucocorticoid receptor, whose targets include C/EBPd, a
transcription factor that induces the expression of the PPARg gene (13). Rosiglitazone
serves as an activating ligand of PPARg, which as previously stated regulates target
gene mRNA expression in a ligand-dependent manner. Importantly, modifications in the
PPARg molecule or associations with intracellular signal transducers or transcriptional
factors play a pivotal role in the modulation of PPARg physiological action (14). This
opens the possibility that, even if PPARg expression levels are unaffected, C1’, C2 and
C2’ act by inhibiting the ligand-dependent transactivation function of PPARg on target
genes, such as C/EBPa. The observed repression of FAS expression would, in turn, be
consistent with previous studies demonstrating an important role for C/EBPa in
lipogenesis per se and specifically in FAS expression (11).
Overall, these results indicate that enzimatically modified compound 1 (C1’) and
compound 2, either intact (C2) or enzymatically modified (C2’), inhibit adipocyte terminal
differentiation by suppressing C/EBPa expression and, possibly, the transactivation
function of PPARg, through as yet unknown mechanisms.
Effects of the tested compounds on adipokine expression
Dysregulated production of adipokines is frequently associated with obesity and
several adipokines, such as leptin, adiponectin and resistin, have been implicated
specifically in the pathophysiology of joint disease. Adipokines are supposed to be
released specifically by adipocytes, however most of them are in fact produced in a
variety of cell types. In particular, joint tissues including synovium, osteophytes, cartilage
and bone have been demonstrated to produce adipokines such as leptin and adiponectin
(15). The joint cavity is a special space where each adipokine undergoes specific
regulatory pathways, reinforcing the idea that adipokines may have local effects in the
joint (15). In view of the connections between adipokines and joint health and of effects
on adipogenesis presented in the prior section, we decided to analyze adipokine
99
expression levels in MEFs following 8 days of culture under adipogenic conditions in the
presence or absence of the problem compounds.
It has been described that leptin inhibits adipogenic differentiation and stimulates
osteo-/chondrogenic differentiation in bone marrow mesenchymal stem cells (16).
Moreover, previous studies showed that chondrocytes treated with leptin exhibited
increased proliferation, proteoglycan and collagen synthesis and expression of leptin
itself (17, 18), although other studies found evidence of catabolic effects of leptin in
cartilage (19, 20). Our results show a trend of leptin expression to be increased in MEFs
following treatment with all the problem compounds, particularly at the low dose (Figure
2a). This trend reached statistical significance for compound C2 at the low dose,
whereas variability among samples precluded the attainment of statistical significance for
the other treatments assayed.
There is some controversy whether increased adiponectin in the diseased joint
serves to counteract local inflammation or, on the opposite, contributes to cartilage
destruction. The mRNA levels of adiponectin were not significantly changed by any of
the treatments (Figure 2b).
Resistin and RBP4 adipose expression and circulating levels positively correlate with
adiposity (21, 22), and these two protein signals have been implicated in the
development of insulin resistance in some studies in both rodents and humans (23, 24).
Resistin has also been implicated as a pro-inflammatory and pro-catabolic factor in the
diseased joint (25, 26). The mRNA expression levels of resistin (Figure 2c) and RBP4
(Figure 2d) were reduced by all treatments. Down-regulation of resistin expression
reached statistical significance for C1’ and C2’, and down-regulation of RBP4 expression
for C1’, C2 and C2’.
Effects of the tested compounds on osteo-/chondrogenic markers
a) Studies in MEFS subjected to adipogenic stimulation
MEFs have the potential to differentiate into different lineages, including adipocytes,
chondrocytes and osteoblasts. To investigate a possible effect of treatments promoting
chondrogenic induction, we first measured Sox9 mRNA levels in MEFs following 8 days
of culture under adipogenic conditions, in the presence or absence of the problem
compounds (Figure 3a). Sox9 is a transcription factor considered the canonical “master
regulator” of chondrogenesis, since it is required for mesenchymal condensation and for
initiation of early chondrogenesis to generate immature chondrocytes that express
cartilaginous matrix proteins, such as type II and IX collagens and aggrecan (27). Thus,
100
Sox9 is expressed in all chondro-osteoprogenitor cells and in mesenchymal
condensations, and it promotes chondrogenic commitment. Lineage-specific
transcription factors can actively inhibit differentiation of other lineages and, interestingly,
Sox9 has been shown to directly bind to the promoter region of the C/EBPb and C/EBPd
encoding genes to suppress their activity, thus preventing adipocyte differentiation (28).
There was a trend of Sox9 mRNA levels to be increased in cells treated with C2 and,
especially, the modified compounds C1’ and C2’ (Figure 3a). Remarkably, the gene
expression of a Sox9 target gene, collagen type II alpha 1 (Col2a1), although highly
variable, also exhibited a clear trend to be increased in the cells exposed to the
treatments, particularly to compound 2 intact or modified (Figure 3b).
Sox9 requires molecular partners to control chondrogenesis and chondrogenic
gene expression. PGC-1a in particular was identified as a coactivator for Sox9 during
chondrogenesis (29), and it is also an important transcriptional coactivator for
mitochondrial biogenesis and brown versus white adipogenesis (30). Interestingly,
expression levels of PGC-1a were consistently increased in MEFs exposed to C2 and
C2’, an effect that reached statistical significance for compound C2’ (Fig 3c). Considering
the well known role of PGC-1a on mitochondrial biogenesis, we next measured the
expression of cytochrome C oxidase subunit II (COX II), a component of the
mitochondrial respiratory chain. Exposure to C2, and to C2’ at the low dose, significantly
resulted in increased COXII mRNA levels in cells (Figure 3d).
Cytokines such as TNFa and IL-1 appear to alter the fate of pluripotent
mesenchymal stem cells directing cellular differentiation towards osteoblasts rather than
adipocytes through activation of NF-kB (31). In its active form, NF-kB blocks the ligand-
induced transactivation function of PPARg by forming a complex with PPARg (31). In two
of the four independent experiments performed, TNFα expression was barely detected in
control cells and significantly induced by C1’, C2 and C2’ treatments in a dose-
dependent manner, whereas in the other two experiments TNFα expression was very
low irrespective of treatment (data not shown).
b) Studies in MEFS not subjected to adipogenic stimulation
In an attempt to get further insight into the capacity of the compounds tested to influence
chondrogenic differentiation, we assayed their effects in MEFs not submitted to
adipogenic induction (i.e., cultured in growth medium not supplemented with the
adipogenic stimuli). In particular, the time-course of the effects of compounds C1 and C2
101
(both at 100 mg/mL) on the expression of selected chondrogenesis/chondrocyte-related
genes were analyzed and compared to the effects of BMP2 (100 ng/mL), which has
been shown to induce chondrogenic differentiation, both in cultured precursor cells and
in vivo (7, 8). We measured the expression levels over time of Sox9, Col2a1,Pref-1,
aggrecan protein and aggrecanase 2, first in monolayer cultures (Figure 4). Pref-1 is a
well-known pre-adipocyte marker that has recently been shown to inhibit adipocyte
differentiation by up-regulating Sox9 (28). Aggrecan protein is the core protein of the
cartilage-specific proteoglycan aggrecan, which together with type II collagen are the
main components of the extracellular matrix surrounding chondrocytes in cartilage.
Aggrecanase 2 (also known as ADAMTS-5) is a proteinase that appears to be the
primary enzyme responsible for aggrecan degradation in mice, and it plays a role in
terminal differentiation of chondrocytes (32). Pref-1 was transiently induced at day 3 and
then significantly decreased in cells treated with C2 and BMP2 (Figure 4a), but only in
BMP2-treated cells were Sox9 mRNA levels increased relative to vehicle-treated cells
(Figure 4b). Aggrecan protein expression was powerfully increased from day 3 on in cells
exposed to C2 or BMP2, reaching an 8-fold and a 5-fold increase by day 13 of culture,
respectively (Figure 4c). Aggrecanase 2 levels increased along the culture history
irrespective of treatments (Figure 4d). Col2a1 expression was not increased upon BMP2,
or C1 or C2 treatment (Figure 4e); this was not unexpected, since a previous study found
that BMP2 treatment induced Sox9 expression but failed to induce Col2a1 expression in
MEFs in monolayer culture (7).
In contrast to conventional monolayer cell cultures in which cells grow in only two
dimensions on the flat surface of a plastic dish, high-density micromass culture provides
cell-cell contacts in 3 dimensions (3D) similar to what occurs in vivo in condensing
mesenchyme prior to induction of chondrogenesis, and is preferred for chondrogenesis
induction. For instance, whereas (as stated above) BMP2 treatment failed to induce
Col2a1expresion in MEFs in monolayer culture, it has been reported that BMP2
synergizes with 3D cell contacts resulting in a robust Col2a1 (and Sox9) induction in
MEFs in micromass culture (7). This background prompted us to repeat the experiment
described in the previous paragraph using MEFs in micromass culture (Figure 5). As in
monolayer culture, in micromass culture aggrecan protein mRNA levels were robustly
induced by C2 and BMP2, but not C1 (Figure 5c), and aggrecanase 2 mRNA levels
showed a sustained increase along the culture history with all treatments (Figure 5d).
Additionally, C2 and BMP2 induced similar time-dependent changes in Pref-1 mRNA
levels and Col2a1 mRNA levels as compared to vehicle or C1 (Figures 5a and 5e).
Nevertheless, neither C2 nor BMP2 induced Sox9 or Col2a1 mRNA levels in MEFs in
102
micromass culture over the levels in vehicle-treated time control cells; on the contrary,
down-regulation of Col2a1 levels was apparent (Figures 5b and 5e).
Both in monolayer (Figure 6A) and micromass (not shown) cultures, morphological
examination of the cells by phase-contrast microscopy revealed little islands of fully
differentiated adipocytes in vehicle- and C1-treated cultures, but not in C2- or BMP2-
treated cultures. Some studies have reported that serum may induce spontaneous
adipogenesis while inhibiting chondrogenesis in bovine synovial explants (33) and
human bone-marrow derived stem cells (34). To confirm that C2 and BMP2 were
inhibiting the spontaneous adipogenic conversion of MEFs, we measured the gene
expression of PPARg and FAS in cells at day 8 in monolayer culture (Figure 6B). As
expected from the microscopic examination of the cells, the mRNA levels of PPARg and
FAS were powerfully decreased after C2 and BMP2 treatment, while C1 treatment had
no effect.
DISCUSSION
The results of this study indicate that compound 2 − either intact (C2) or enzymatically
modified (C2’) − and modified compound 1 (C1’) have the potential to inhibit terminal
adipocyte differentiation of MEFs even in the presence of adipogenic stimuli. Thus, lipid
content and expression of lipogenic genes such as CEBPa and FAS was decreased in
MEFs undergoing adipogenic differentiation in the presence of these chemical species.
Nevertheless, the expression levels of the master regulator of adipogenesis, PPARg,
which are induced by the presence of glucocorticoid (dexamethasone) in the adipogenic
cocktail, remained unchanged, pointing to direct or indirect effects of the compounds on
PPARg transcriptional activity. When C1 and C2 were tested in MEFs not exposed to the
adipogenic stimuli, compound C2 but not compound C1 powerfully inhibited spontaneous
adipogenesis and the cellular expression of PPARg and FAS.
Mounting evidence indicates that crosstalk exists among potential differentiation
programs of pluripotent cells, such as bone marrow mesenchymal stem cells or adipose-
derived stem cells. MEFs have the ability to differentiate, among other lineages, to
adipocytes and chondrocytes. Our results show that, when these cells were cultured in
adipogenic medium, tested compounds that inhibited adipogenesis (C1’, C2 and C2’)
also tended to increase chondrogenic markers (Sox9, Col2a1). Furthermore, the
expression of PCG-1a (a transcriptional coactivator of Sox9) and TNFa (an inhibitor of
103
adipogenesis and inductor of osteoblastogenesis) was also increased, reinforcing the
idea that these compounds may act to favor the chondrogenic, over the adipogenic,
program. Interestingly, in cells cultured without adipogenic stimuli (both in monolayer and
in 3D cultures) compound C2 had effects that were similar to those exerted by the well-
known chondrogenic inducer, BMP2. Thus, C2 and BMP2, but not C1, inhibited
spontaneous adipogenesis in MEFs, and the expression patterns over time of genes
related to the chondrogenic program were similarly affected by C2 and BMP2, but not
C1, treatment. In particular, both C2 and BMP2 led to a robust induction of aggrecan
protein over time, which is consistent with the profile of immature chondrocytes and the
subsequent formation of cartilage tissue (28, 35). Nevertheless, the decrease of Col2a1
mRNA levels that we found under both C2 and BMP2 treatments is not consistent with a
chondrogenic effect and conflicts with previous results regarding BMP2 effects on MEFs
(7). Further analysis − such as Col2a1 and aggrecan protein levels (by immunoblotting or
immunostaining) and production of other chondrocyte markers − are required to further
test the hypothesis that compounds tested, particularly C2, may positively affect
chondrogenesis of pluripotent MEF cells.
Taken together, we conclude that compound 2 either intact or in modified form and
compound 1 only in modified form (C1’) have the potential to inhibit adipocyte
differentiation and promote to some extent the expression of chondrogenesis-related
genes in pluripotent MEFs cells. These compounds also had effects on the adipokine
profile of potential interest in the context of the management of obesity and osteoarthritis,
as they induced leptin and repressed resistin and RBP4.
Joint morphogenesis involves signaling pathways and growth factors that recur in the
adult life with less redundancy to safeguard joint homeostasis (36). Loss of such
homeostasis due to abnormal signaling networks, as might occur in obesity, can lead to
osteoarthritis. It is foreseen that compounds with effects both on the underlying
mechanisms involved in obesity and osteoarthritis and on the stem cell niches and
related remodeling signals, may emerge as useful interventions to support effective joint
tissue regeneration, to restore joint homeostasis, and to prevent osteoarthritis, while
possibly serving simultaneously as coadjuvants in strategies to control and manage
obesity.
104
REFERENCES
1. Aspden RM, Scheven BA, Hutchison JD 2001 Osteoarthritis as a systemic
disorder including stromal cell differentiation and lipid metabolism. Lancet
357:1118-1120
2. Griffin TM, Guilak F 2008 Why is obesity associated with osteoarthritis?
Insights from mouse models of obesity. Biorheology 45:387-398
3. Iannone F, Lapadula G 2010 Obesity and inflammation--targets for OA therapy.
Curr Drug Targets 11:586-598
4. Pottie P, Presle N, Terlain B, Netter P, Mainard D, Berenbaum F 2006
Obesity and osteoarthritis: more complex than predicted! Ann Rheum Dis
65:1403-1405
5. Arner E, Westermark PO, Spalding KL, Britton T, Ryden M, Frisen J,
Bernard S, Arner P 2010 Adipocyte turnover: relevance to human adipose tissue
morphology. Diabetes 59:105-109
6. Meyerrose T, Olson S, Pontow S, Kalomoiris S, Jung Y, Annett G, Bauer G,
Nolta JA 2010 Mesenchymal stem cells for the sustained in vivo delivery of
bioactive factors. Adv Drug Deliv Rev 62:1167-1174
7. Lengner CJ, Lepper C, van Wijnen AJ, Stein JL, Stein GS, Lian JB 2004
Primary mouse embryonic fibroblasts: a model of mesenchymal cartilage
formation. J Cell Physiol 200:327-333
8. Zeng L, Kempf H, Murtaugh LC, Sato ME, Lassar AB 2002 Shh establishes
an Nkx3.2/Sox9 autoregulatory loop that is maintained by BMP signals to induce
somitic chondrogenesis. Genes Dev 16:1990-2005
9. Pfaffl MW 2001 A new mathematical model for relative quantification in real-
time RT-PCR. Nucleic Acids Res 29:e45
10. Ramirez-Zacarias JL, Castro-Munozledo F, Kuri-Harcuch W 1992
Quantitation of adipose conversion and triglycerides by staining intracytoplasmic
lipids with Oil red O. Histochemistry 97:493-497
11. Wu Z, Rosen ED, Brun R, Hauser S, Adelmant G, Troy AE, McKeon C,
Darlington GJ, Spiegelman BM 1999 Cross-regulation of C/EBP alpha and
PPAR gamma controls the transcriptional pathway of adipogenesis and insulin
sensitivity. Mol Cell 3:151-158
12. Siersbaek R, Nielsen R, Mandrup S 2010 PPARgamma in adipocyte
differentiation and metabolism--novel insights from genome-wide studies. FEBS
Lett 584:3242-3249
13. Berry DC, Soltanian H, Noy N 2010 Repression of cellular retinoic acid-binding
protein II during adipocyte differentiation. J Biol Chem 285:15324-15332
14. Takada I, Kouzmenko AP, Kato S 2010 PPAR-gamma Signaling Crosstalk in
Mesenchymal Stem Cells. PPAR Res 2010
15. Presle N, Pottie P, Dumond H, Guillaume C, Lapicque F, Pallu S, Mainard D,
Netter P, Terlain B 2006 Differential distribution of adipokines between serum
105
and synovial fluid in patients with osteoarthritis. Contribution of joint tissues to
their articular production. Osteoarthritis Cartilage 14:690-695
16. Hamrick MW, Ferrari SL 2008 Leptin and the sympathetic connection of fat to
bone. Osteoporos Int 19:905-912
17. Dumond H, Presle N, Terlain B, Mainard D, Loeuille D, Netter P, Pottie P
2003 Evidence for a key role of leptin in osteoarthritis. Arthritis Rheum 48:3118-
3129
18. Figenschau Y, Knutsen G, Shahazeydi S, Johansen O, Sveinbjornsson B 2001
Human articular chondrocytes express functional leptin receptors. Biochem
Biophys Res Commun 287:190-197
19. Simopoulou T, Malizos KN, Iliopoulos D, Stefanou N, Papatheodorou L,
Ioannou M, Tsezou A 2007 Differential expression of leptin and leptin's receptor
isoform (Ob-Rb) mRNA between advanced and minimally affected osteoarthritic
cartilage; effect on cartilage metabolism. Osteoarthritis Cartilage 15:872-883
20. Vuolteenaho K, Koskinen A, Kukkonen M, Nieminen R, Paivarinta U,
Moilanen T, Moilanen E 2009 Leptin enhances synthesis of proinflammatory
mediators in human osteoarthritic cartilage--mediator role of NO in leptin-induced
PGE2, IL-6, and IL-8 production. Mediators Inflamm 2009:345838
21. Aeberli I, Biebinger R, Lehmann R, L'Allemand D, Spinas GA,
Zimmermann MB 2007 Serum retinol-binding protein 4 concentration and its
ratio to serum retinol are associated with obesity and metabolic syndrome
components in children. J Clin Endocrinol Metab 92:4359-4365
22. Steppan CM, Bailey ST, Bhat S, Brown EJ, Banerjee RR, Wright CM, Patel
HR, Ahima RS, Lazar MA 2001 The hormone resistin links obesity to diabetes.
Nature 409:307-312
23. McTernan PG, Kusminski CM, Kumar S 2006 Resistin. Curr Opin Lipidol
17:170-175
24. Wolf G 2007 Serum retinol-binding protein: a link between obesity, insulin
resistance, and type 2 diabetes. Nutr Rev 65:251-256
25. Lee JH, Ort T, Ma K, Picha K, Carton J, Marsters PA, Lohmander LS,
Baribaud F, Song XY, Blake S 2009 Resistin is elevated following traumatic
joint injury and causes matrix degradation and release of inflammatory cytokines
from articular cartilage in vitro. Osteoarthritis Cartilage 17:613-620
26. Senolt L, Housa D, Vernerova Z, Jirasek T, Svobodova R, Veigl D,
Anderlova K, Muller-Ladner U, Pavelka K, Haluzik M 2007 Resistin in
rheumatoid arthritis synovial tissue, synovial fluid and serum. Ann Rheum Dis
66:458-463
27. Akiyama H, Lyons JP, Mori-Akiyama Y, Yang X, Zhang R, Zhang Z, Deng
JM, Taketo MM, Nakamura T, Behringer RR, McCrea PD, de Crombrugghe
B 2004 Interactions between Sox9 and beta-catenin control chondrocyte
differentiation. Genes Dev 18:1072-1087
28. Wang Y, Sul HS 2009 Pref-1 regulates mesenchymal cell commitment and
differentiation through Sox9. Cell Metab 9:287-302
106
29. Kawakami Y, Tsuda M, Takahashi S, Taniguchi N, Esteban CR, Zemmyo M,
Furumatsu T, Lotz M, Belmonte JC, Asahara H 2005 Transcriptional
coactivator PGC-1alpha regulates chondrogenesis via association with Sox9. Proc
Natl Acad Sci U S A 102:2414-2419
30. Puigserver P, Wu Z, Park CW, Graves R, Wright M, Spiegelman BM 1998 A
cold-inducible coactivator of nuclear receptors linked to adaptive thermogenesis.
Cell 92:829-839
31. Suzawa M, Takada I, Yanagisawa J, Ohtake F, Ogawa S, Yamauchi T,
Kadowaki T, Takeuchi Y, Shibuya H, Gotoh Y, Matsumoto K, Kato S 2003
Cytokines suppress adipogenesis and PPAR-gamma function through the
TAK1/TAB1/NIK cascade. Nat Cell Biol 5:224-230
32. Glasson SS, Askew R, Sheppard B, Carito B, Blanchet T, Ma HL, Flannery
CR, Peluso D, Kanki K, Yang Z, Majumdar MK, Morris EA 2005 Deletion of
active ADAMTS5 prevents cartilage degradation in a murine model of
osteoarthritis. Nature 434:644-648
33. Shintani N, Hunziker EB 2007 Chondrogenic differentiation of bovine
synovium: bone morphogenetic proteins 2 and 7 and transforming growth factor
beta1 induce the formation of different types of cartilaginous tissue. Arthritis
Rheum 56:1869-1879
34. Neumann K, Endres M, Ringe J, Flath B, Manz R, Haupl T, Sittinger M,
Kaps C 2007 BMP7 promotes adipogenic but not osteo-/chondrogenic
differentiation of adult human bone marrow-derived stem cells in high-density
micro-mass culture. J Cell Biochem 102:626-637
35. Bi W, Huang W, Whitworth DJ, Deng JM, Zhang Z, Behringer RR, de
Crombrugghe B 2001 Haploinsufficiency of Sox9 results in defective cartilage
primordia and premature skeletal mineralization. Proc Natl Acad Sci U S A
98:6698-6703
36. De Bari C, Kurth TB, Augello A 2010 Mesenchymal stem cells from
development to postnatal joint homeostasis, aging, and disease. Birth Defects Res
C Embryo Today 90:257-271
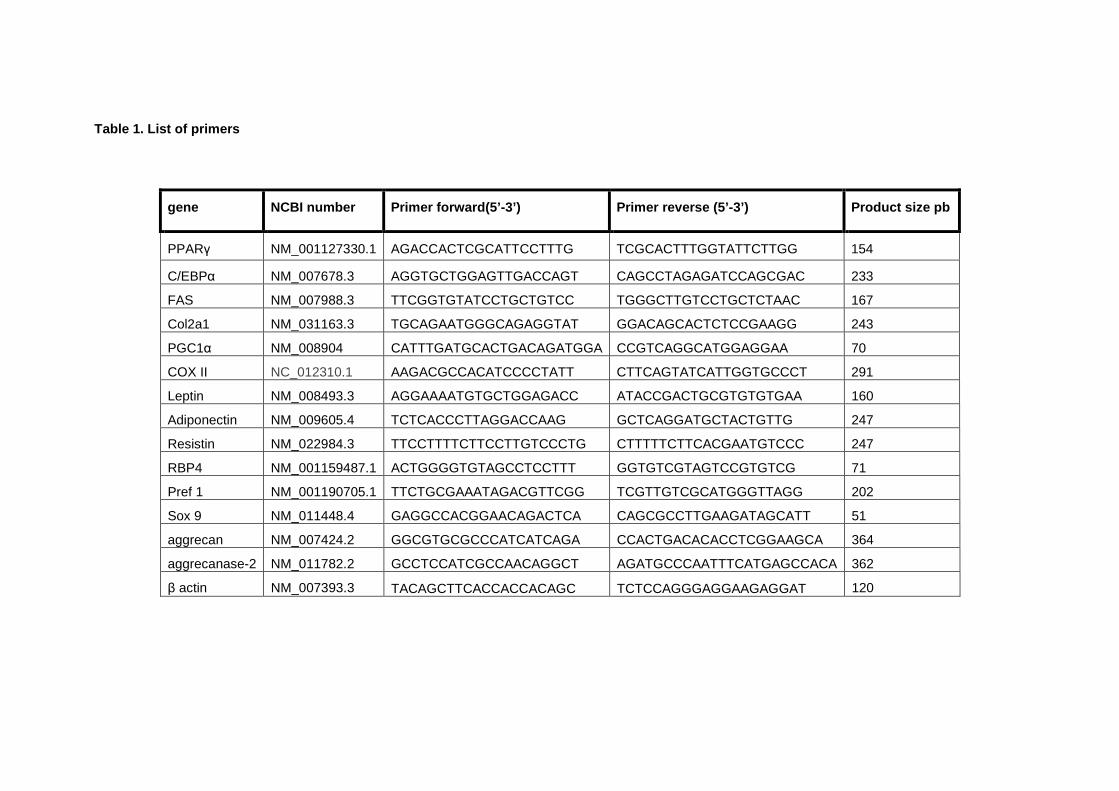
Table 1. List of primers
gene NCBI number Primer forward(5’-3’) Primer reverse (5 ’-3’) Product size pb
PPARγ NM_001127330.1 AGACCACTCGCATTCCTTTG TCGCACTTTGGTATTCTTGG 154
C/EBPα NM_007678.3 AGGTGCTGGAGTTGACCAGT CAGCCTAGAGATCCAGCGAC 233
FAS NM_007988.3 TTCGGTGTATCCTGCTGTCC TGGGCTTGTCCTGCTCTAAC 167
Col2a1 NM_031163.3 TGCAGAATGGGCAGAGGTAT GGACAGCACTCTCCGAAGG 243
PGC1α NM_008904 CATTTGATGCACTGACAGATGGA CCGTCAGGCATGGAGGAA 70
COX II NC_012310.1 AAGACGCCACATCCCCTATT CTTCAGTATCATTGGTGCCCT 291
Leptin NM_008493.3 AGGAAAATGTGCTGGAGACC ATACCGACTGCGTGTGTGAA 160
Adiponectin NM_009605.4 TCTCACCCTTAGGACCAAG GCTCAGGATGCTACTGTTG 247
Resistin NM_022984.3 TTCCTTTTCTTCCTTGTCCCTG CTTTTTCTTCACGAATGTCCC 247
RBP4 NM_001159487.1 ACTGGGGTGTAGCCTCCTTT GGTGTCGTAGTCCGTGTCG 71
Pref 1 NM_001190705.1 TTCTGCGAAATAGACGTTCGG TCGTTGTCGCATGGGTTAGG 202
Sox 9 NM_011448.4 GAGGCCACGGAACAGACTCA CAGCGCCTTGAAGATAGCATT 51
aggrecan NM_007424.2 GGCGTGCGCCCATCATCAGA CCACTGACACACCTCGGAAGCA 364
aggrecanase-2 NM_011782.2 GCCTCCATCGCCAACAGGCT AGATGCCCAATTTCATGAGCCACA 362
β actin NM_007393.3 TACAGCTTCACCACCACAGC TCTCCAGGGAGGAAGAGGAT 120
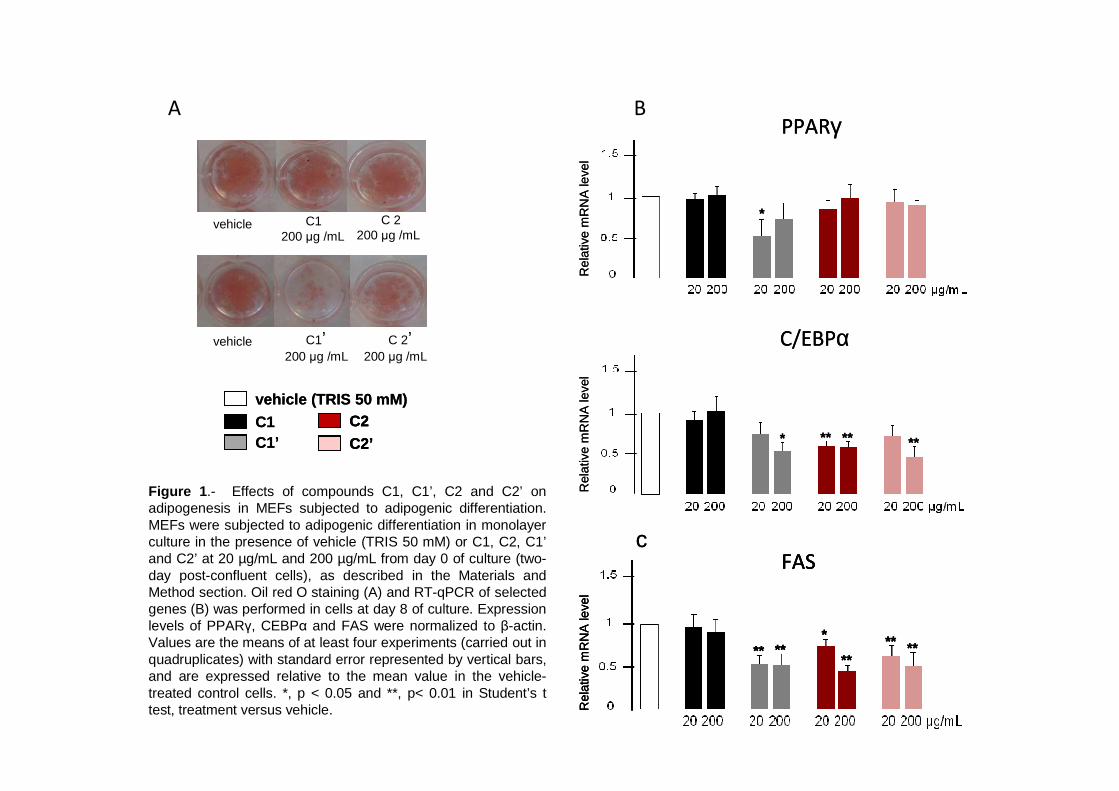
B
Figure 1 .- Effects of compounds C1, C1’, C2 and C2’ on adipogenesis in MEFs subjected to adipogenic differentiation. MEFs were subjected to adipogenic differentiation in monolayer culture in the presence of vehicle (TRIS 50 mM) or C1, C2, C1’and C2’ at 20 µg/mL and 200 µg/mL from day 0 of culture (two-day post-confluent cells), as described in the Materials and Method section. Oil red O staining (A) and RT-qPCR of selected genes (B) was performed in cells at day 8 of culture. Expressionlevels of PPARγ, CEBPα and FAS were normalized to β-actin. Values are the means of at least four experiments (carried out in quadruplicates) with standard error represented by vertical bars, and are expressed relative to the mean value in the vehicle-treated control cells. *, p < 0.05 and **, p< 0.01 in Student’s ttest, treatment versus vehicle.
APPARγ
Rel
ativ
em
RN
Ale
vel
*
FASR
elat
ive
mR
NA
leve
l
******
*
****
Rel
ativ
em
RN
Ale
vel
C/EBPα
* **** **
c
PPARγ
Rel
ativ
em
RN
Ale
vel
*
FASR
elat
ive
mR
NA
leve
l
******
*
****
FASR
elat
ive
mR
NA
leve
l
******
*
****
Rel
ativ
em
RN
Ale
vel
C/EBPα
* **** **
c
vehicle C1200 µg /mL
C 2 200 µg /mL
C 2’200 µg /mL
C1’200 µg /mL
vehicle
vehicle (TRIS 50 mM)
C1C1’
C2 C2’
vehicle (TRIS 50 mM)
C1C1’
C2 C2’C2 C2’
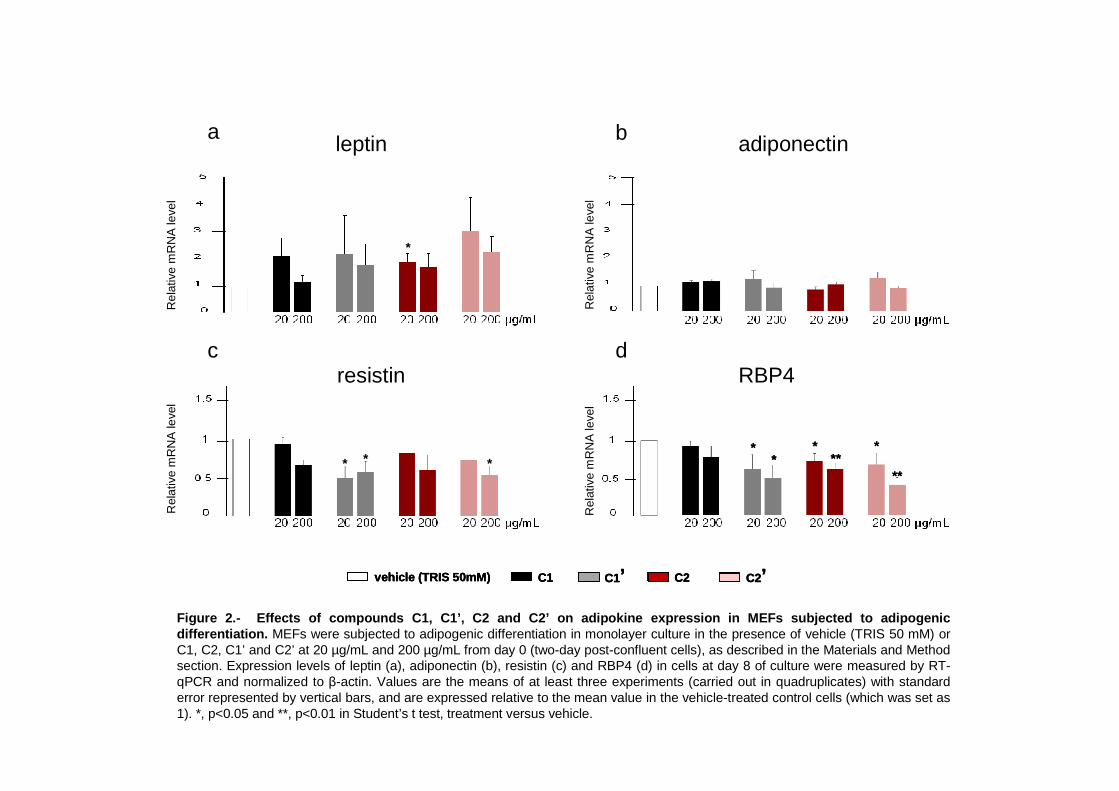
Figure 2.- Effects of compounds C1, C1’, C2 and C2’ o n adipokine expression in MEFs subjected to adipoge nic differentiation. MEFs were subjected to adipogenic differentiation in monolayer culture in the presence of vehicle (TRIS 50 mM) or C1, C2, C1’ and C2’ at 20 µg/mL and 200 µg/mL from day 0 (two-day post-confluent cells), as described in the Materials and Method section. Expression levels of leptin (a), adiponectin (b), resistin (c) and RBP4 (d) in cells at day 8 of culture were measured by RT-qPCR and normalized to β-actin. Values are the means of at least three experiments (carried out in quadruplicates) with standard error represented by vertical bars, and are expressed relative to the mean value in the vehicle-treated control cells (which was set as 1). *, p<0.05 and **, p<0.01 in Student’s t test, treatment versus vehicle.
Rel
ativ
e m
RN
A le
vel
Rel
ativ
e m
RN
A le
vel
leptin adiponectin
resistin RBP4
Rel
ativ
e m
RN
A le
vel
Rel
ativ
e m
RN
A le
vel
vehicle (TRIS 50mM) C1 C2 C2’C1’vehicle (TRIS 50mM)vehicle (TRIS 50mM) C1C1 C2C2 C2’C2’C1’C1’
a
d
b
c
*
* * ***
****
**
****
**
**
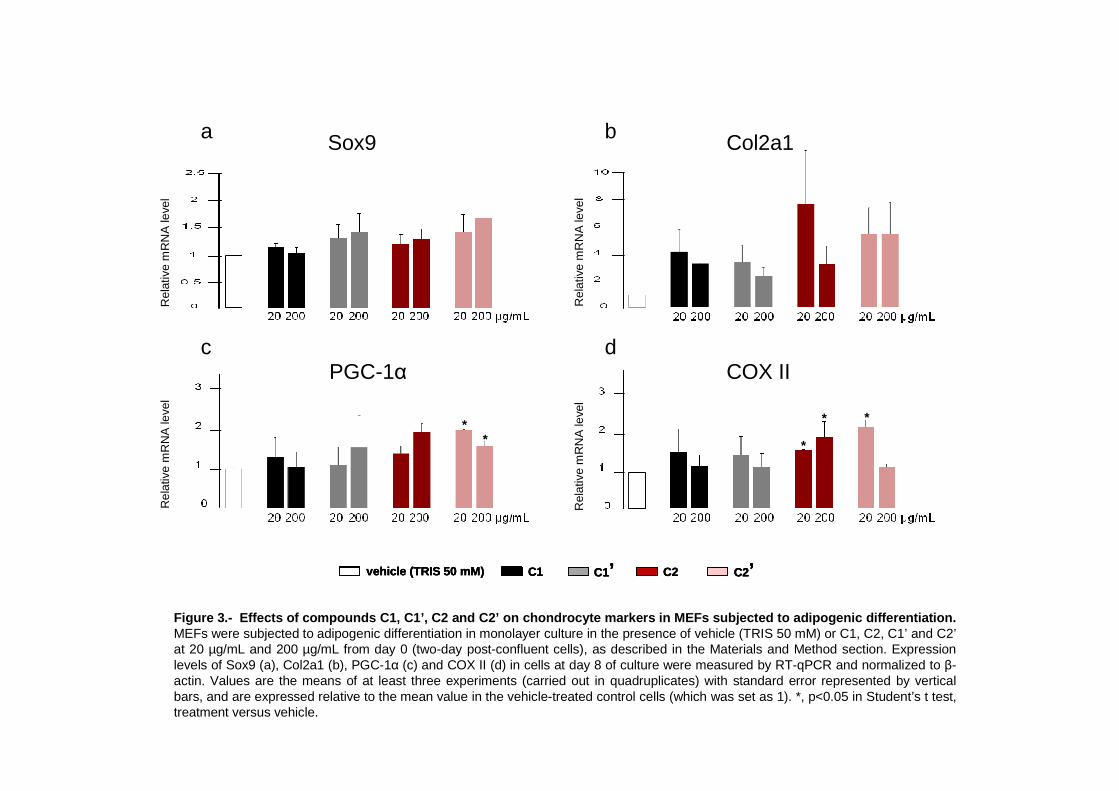
Figure 3.- Effects of compounds C1, C1’, C2 and C2’ o n chondrocyte markers in MEFs subjected to adipogenic differentiation. MEFs were subjected to adipogenic differentiation in monolayer culture in the presence of vehicle (TRIS 50 mM) or C1, C2, C1’ and C2’at 20 µg/mL and 200 µg/mL from day 0 (two-day post-confluent cells), as described in the Materials and Method section. Expression levels of Sox9 (a), Col2a1 (b), PGC-1α (c) and COX II (d) in cells at day 8 of culture were measured by RT-qPCR and normalized to β-actin. Values are the means of at least three experiments (carried out in quadruplicates) with standard error represented by verticalbars, and are expressed relative to the mean value in the vehicle-treated control cells (which was set as 1). *, p<0.05 in Student’s t test, treatment versus vehicle.
Rel
ativ
em
RN
Ale
vel
Rel
ativ
em
RN
Ale
vel
Sox9 Col2a1
PGC-1α COX II
Rel
ativ
em
RN
Ale
vel
Rel
ativ
em
RN
Ale
vel
vehicle (TRIS 50 mM) C1 C2 C2’C1’vehicle (TRIS 50 mM)vehicle (TRIS 50 mM) C1C1 C2C2 C2’C2’C1’C1’
a
d
b
c
** *
* *
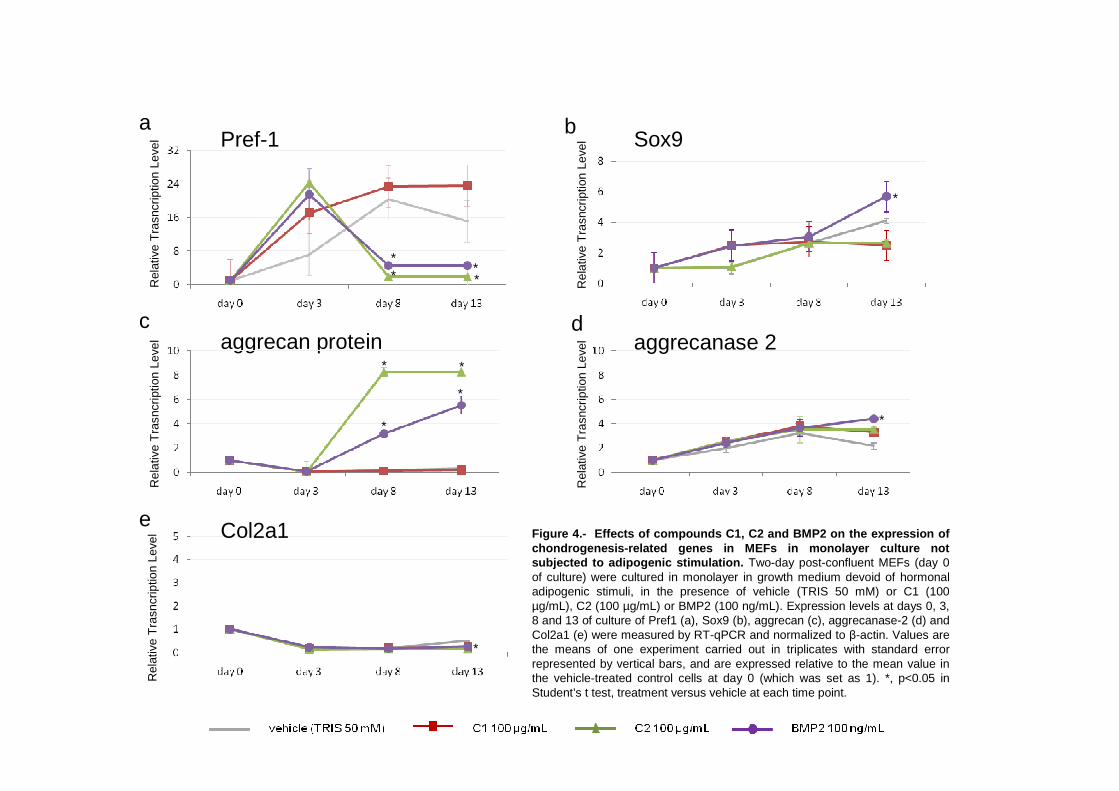
Figure 4.- Effects of compounds C1, C2 and BMP2 on t he expression of chondrogenesis-related genes in MEFs in monolayer cu lture not subjected to adipogenic stimulation. Two-day post-confluent MEFs (day 0 of culture) were cultured in monolayer in growth medium devoid of hormonal adipogenic stimuli, in the presence of vehicle (TRIS 50 mM) or C1 (100 µg/mL), C2 (100 µg/mL) or BMP2 (100 ng/mL). Expression levels at days 0, 3, 8 and 13 of culture of Pref1 (a), Sox9 (b), aggrecan (c), aggrecanase-2 (d) and Col2a1 (e) were measured by RT-qPCR and normalized to β-actin. Values are the means of one experiment carried out in triplicates with standard error represented by vertical bars, and are expressed relative to the mean value in the vehicle-treated control cells at day 0 (which was set as 1). *, p<0.05 in Student’s t test, treatment versus vehicle at each time point.
Rel
ativ
eT
rasn
crip
tion
Leve
lR
elat
ive
Tra
sncr
iptio
nLe
vel aggrecan protein
Rel
ativ
eT
rasn
crip
tion
Leve
l Col2a1
a b
c d
e
Pref-1
*
*
***
*
*
*
*
Rel
ativ
eT
rasn
crip
tion
Leve
lR
elat
ive
Tra
sncr
iptio
nLe
vel Sox9
aggrecanase 2
*
*
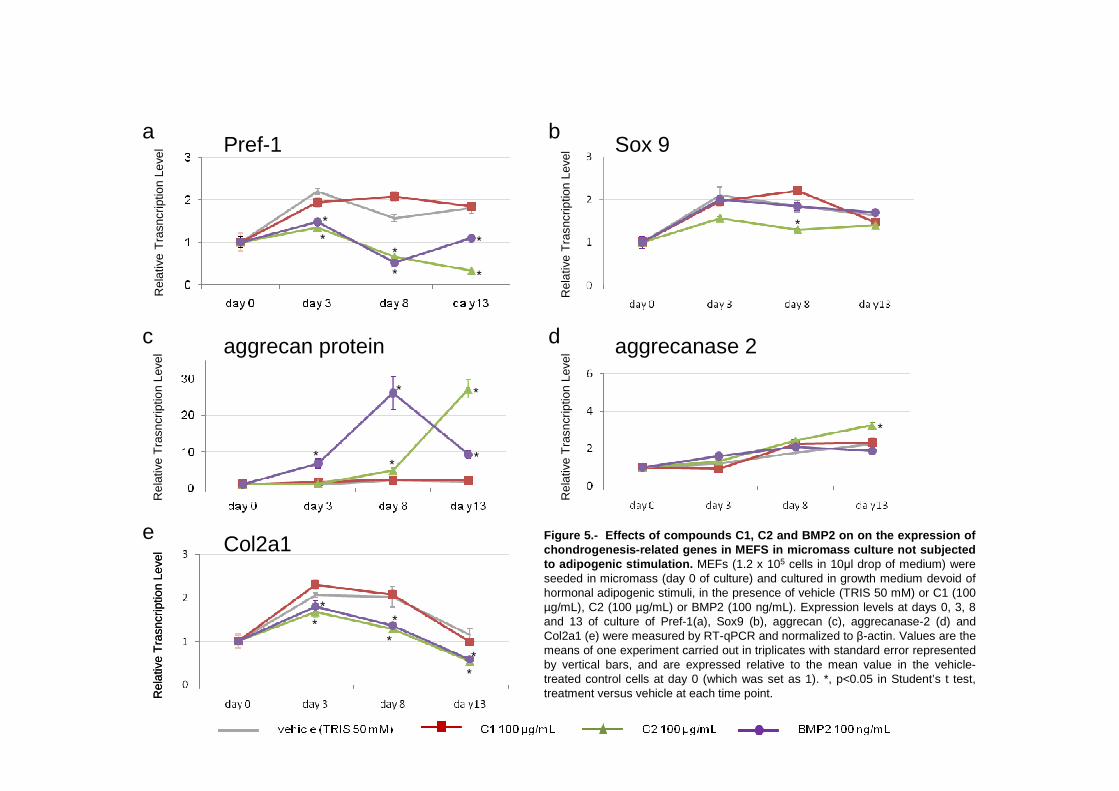
Rel
ativ
eT
rasn
crip
tion
Leve
lR
elat
ive
Tra
sncr
iptio
nLe
vel
Rel
ativ
eT
rasn
crip
tion
Leve
lR
elat
ive
Tra
sncr
iptio
nLe
velPref-1
aggrecan protein
Rel
ativ
eT
rasn
crip
tion
Leve
lR
elat
ive
Tra
sncr
iptio
nLe
vel
Sox 9
aggrecanase 2
a b
c d
e Col2a1 Figure 5.- Effects of compounds C1, C2 and BMP2 on o n the expression of chondrogenesis-related genes in MEFS in micromass cu lture not subjected to adipogenic stimulation. MEFs (1.2 x 10⁵ cells in 10µl drop of medium) were seeded in micromass (day 0 of culture) and cultured in growth medium devoid of hormonal adipogenic stimuli, in the presence of vehicle (TRIS 50 mM) or C1 (100 µg/mL), C2 (100 µg/mL) or BMP2 (100 ng/mL). Expression levels at days 0, 3, 8 and 13 of culture of Pref-1(a), Sox9 (b), aggrecan (c), aggrecanase-2 (d) and Col2a1 (e) were measured by RT-qPCR and normalized to β-actin. Values are the means of one experiment carried out in triplicates with standard error represented by vertical bars, and are expressed relative to the mean value in the vehicle-treated control cells at day 0 (which was set as 1). *, p<0.05 in Student’s t test, treatment versus vehicle at each time point.
*
*
* *
*
*
*
**
*
*
*
*
*
**
*
*
*
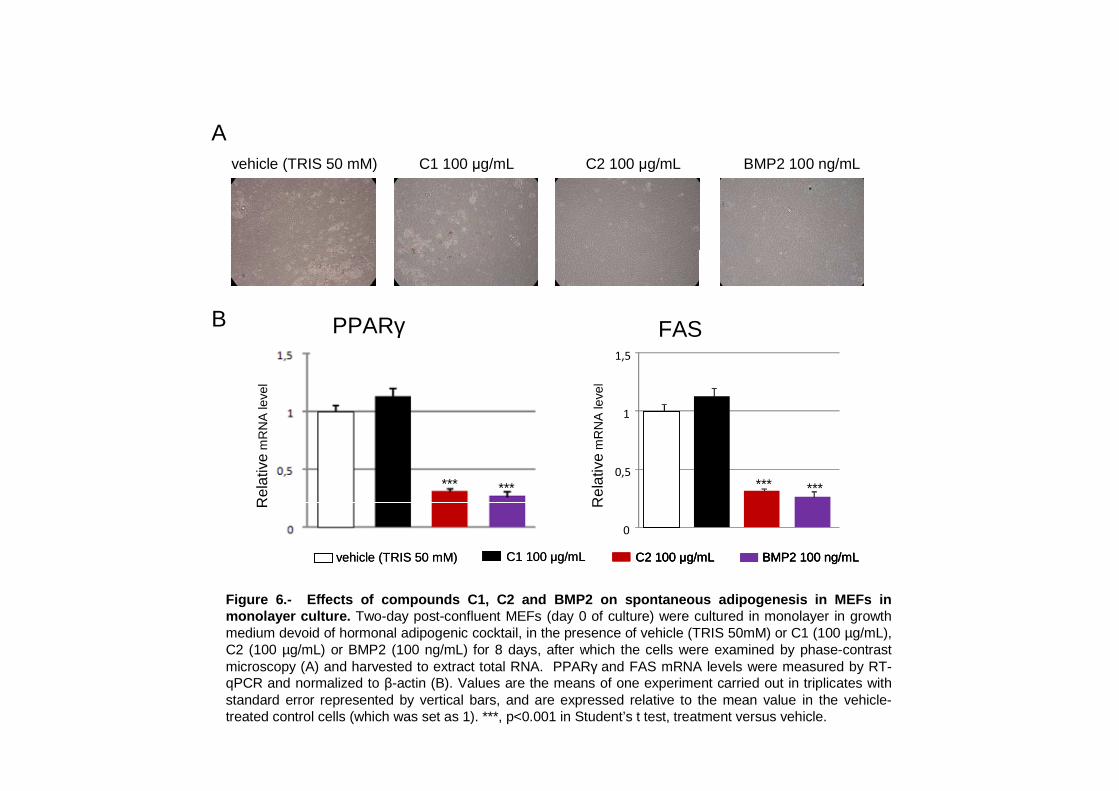
0
0,5
1
1,5
0
0,5
1
1,5
PPARγ FAS
********* ***
Rel
ativ
em
RN
Ale
vel
Rel
ativ
em
RN
Ale
vel
vehicle (TRIS 50 mM) C2 100 µg/mL BMP2 100 ng/mLC1 100 µg/mL
vehicle (TRIS 50 mM) C1 100 µg/mL C2 100 µg/mL BMP2 100 ng/mLvehicle (TRIS 50 mM) C1 100 µg/mL C2 100 µg/mLC2 100 µg/mL BMP2 100 ng/mLBMP2 100 ng/mL
Figure 6.- Effects of compounds C1, C2 and BMP2 on s pontaneous adipogenesis in MEFs in monolayer culture. Two-day post-confluent MEFs (day 0 of culture) were cultured in monolayer in growth medium devoid of hormonal adipogenic cocktail, in the presence of vehicle (TRIS 50mM) or C1 (100 µg/mL), C2 (100 µg/mL) or BMP2 (100 ng/mL) for 8 days, after which the cells were examined by phase-contrast microscopy (A) and harvested to extract total RNA. PPARγ and FAS mRNA levels were measured by RT-qPCR and normalized to β-actin (B). Values are the means of one experiment carried out in triplicates with standard error represented by vertical bars, and are expressed relative to the mean value in the vehicle-treated control cells (which was set as 1). ***, p<0.001 in Student’s t test, treatment versus vehicle.
A
B


Resultados y Discusión
115
MANUSCRITO V
Molecular players at the intersection of obesity and osteoarthritis.
Bonet M.L., Granados N., Palou A.
Current Drugs Targets, en prensa.

117
Title: Molecular Players at the Intersection of Obesity and Osteoarthritis
Authors: M. Luisa Bonet1,2
, Nuria Granados1,2
, Andreu Palou1,2
Affiliations: 1
Laboratory of Molecular Biology, Nutrition and Biotechnology, Universitat de les Illes
Balears, and 2CIBER de Fisiopatología de la Obesidad y Nutrición (CIBERobn), Palma de Mallorca, Spain
Running title: obesity and osteoarthritis
Corresponding author: Dr. M. Luisa Bonet, Laboratori de Biologia Molecular, Nutrició i Biotecnologia.
Departament de Biologia Fonamental i Ciències de la Salut, Universitat de les Illes Balears, Crta.
Valldemossa Km 7.5, 07122 Palma de Mallorca, Spain. Fax: +34 971 173184. Phone: +34 971 172734. E-
mail: [email protected]
118
ABSTRACT
Obesity and degenerative joint disease (osteoarthritis, OA) are two multifactorial pathologies that are
becoming major medical issues with the aging of the world population. The relationship of OA with obesity
is complex, involving both biomechanical and metabolic links. Dysregulated production of adipose tissue-
derived inflammatory mediators, hyperlipidemia, and increased systemic oxidative stress are conditions
frequently associated with obesity that may favor joint degeneration. In addition, it is remarkable that many
regulatory factors have been implicated in the development, maintenance and function of both adipose
tissues and cartilage and other articular joint tissues. Disturbances in these factors may underlie additional
links between obesity and OA. In this review, molecular players at the intersection of adipose tissue and
joint cell biology − including differentiation signals and transcription factors, extracellular matrix
components and remodelers, joint cell- and adipose tissue cell-derived mediators (cytokines, adipokines),
hypoxia inducible transcription factors, lipids, advanced glycation end products and miRNAs − are
reviewed, with emphasis on their dysregulation in obesity and OA. Knowledge of these factors may
illuminate a novel, adipocentric avenue for the pathogenesis and therapy of OA and other joint diseases.
Keywords: adipose tissue, adipokines, advanced glycation end products, differentiation signals,
extracellular matrix, joint tissues, lipids, miRNAs, transcription factors
119
INTRODUCTION
Obesity and degenerative joint disease (osteoarthritis, OA) are two multifactorial pathologies that are
becoming major public health issues with the aging of the world population. Both of them represent an
increasing burden from a medical, social and economic point of view. Obesity and OA are interrelated. This
relationship is nowadays well recognized to extend beyond a biomechanical basis to a metabolic basis
following the realization that obesity is a risk factor for OA, not only for weight-bearing joints (e.g., knees),
but also for non-weight-bearing joints (e.g. hands); that reduction of body fat ameliorates OA more than
reduction of body weight per se; and that systemic factors frequently associated with obesity might be
critically involved in the development of OA, particularly generalized OA affecting multiple joints [1-6].
Obesity can be most simply defined as the presence of excess body fat as adipose tissue and is
strongly associated with the metabolic syndrome (clustering of dyslipidemia, insulin resistance,
hypertension and often also fatty liver in an individual). Obesity is ultimately caused by chronic energy
imbalance whereby energy intake exceeds energy expenditure. Biochemical processes and systems
influencing body fat content and distribution include those controlling satiety/hunger and/or thermogenesis,
nutrient partitioning between tissues and catabolic versus anabolic pathways, and adipocyte number (e.g.,
preadipocyte proliferation, adipocyte differentiation or adipogenesis, adipocyte apoptosis) [7-9]. Obesity
can arise basically from genetic and/or acquired alterations affecting any of these aspects. The central
nervous system (CNS) plays a key role in the control of energy balance and peripheral metabolism [10].
Adipose tissue also plays an important role in this context, by producing signaling molecules (e.g.,
adipokines) that impinge on relevant CNS regulatory circuitries and peripheral tissue metabolism, and
owing to the unique capabilities of brown adipose tissue (BAT) to dissipate energy as heat and of white
adipose tissue (WAT) to store fat in a relatively “safe” manner (see Appendix for differences between WAT
and BAT). When WAT, particularly subcutaneous WAT, is in shortage (e.g. in lipodystrophies),
pathological accumulation of fat in other tissues may occur, thus leading to metabolic disturbances
(lipotoxicity) [11]. Hence, both excess and deficiency of WAT may have severe metabolic consequences.
Osteoarthritis, in turn, has traditionally been regarded as a disease of articular cartilage, although
nowadays it is viewed as a process that affects the whole joint, including the subchondral bone, synovial
capsule and membrane and the periarticular (connective and muscular) tissues [12, 13]. Moreover, it has
been proposed that OA, at least in its generalized form, is a systemic musculoskeletal disorder with a
metabolic component [14]. The hallmarks of OA are articular cartilage breakdown, subchondral bone
alterations (thickening, osteophyte formation) and synovitis (inflammation of the synovial membrane). OA
is thought to arise as a response to abnormal mechanical loading, instability or injury, in conjunction with
predisposing factors such as genetics, aging, and several systemic aspects. Thus, it is generally accepted
that OA can result from abnormal loads on normal cartilage or normal loads on abnormal cartilage [12].
Dysregulated production of adipose tissue-secreted inflammatory mediators, hyperlipidemia, and
increased systemic oxidative stress are conditions frequently associated with obesity that may also favor
joint degeneration. In addition, it is remarkable that many regulatory factors have been implicated in the
development, maintenance and function of both adipose tissues and cartilage and other articular joint
tissues. Disturbances in these factors may underlie additional links between obesity and OA. In this review,
120
molecular players at the intersection of adipose tissue and joint cell biology are reviewed, with emphasis on
their possible dysregulation in obesity and OA. Knowledge of these factors may illuminate novel avenues
for the simultaneous prevention/treatment of these two conditions, which often coexist in afflicted
individuals.
DIFFERENTIATION SIGNALS AND TRANSCRIPTION FACTORS
Adipocytes, chondrocytes and osteoblasts originate from a common multipotent mesenchymal stem cell
precursor. Adipogenesis occurs late in embryonic development and in postnatal periods. Chondrogenesis
and osteogenesis during skeletal development occur in early embryonic stages. The initial step in
chondrogenesis is the recruitment of mesenchymal cells to future sites of skeletal development, which is
followed by cellular aggregation (condensation) and the differentiation of mesenchymal cells to the
chondrogenic lineage. Differentiated chondrocytes may remain as such, to form articular cartilage and
function in joint development, or may undergo maturation into hyperthrophic chondrocytes to function as a
template for long bone formation through endochondral ossification. Osteogenesis of other bones occurs
directly from mesenchymal condensation by intramembranous ossification [15].
Distinctive, yet interacting, transcription factors play an essential role in the specification of the
adipocyte, chondrocyte and osteoblast lineage. These include CCAAT/enhancer binding proteins (C/EBPs)
and peroxisome proliferator activated receptor (PPAR) for adipocytes, runt-related transcription factor 2
(Runx2) and osterix for osteoblasts, and Sry-related high-mobility-group box 9 (Sox9) for chondrocytes
[16]. Interestingly, lineage-specific transcription factors can inhibit differentiation of other lineages by
suppressing gene expression. For instance, PPAR inhibits Runx2 expression and thus terminal osteoblast
differentiation of mesenchymal cells [17]. Sox9, the master regulator of chondrogenic commitment and
early chondrogenesis, prevents chondrocyte maturation and osteogenesis [18] and, of particular interest in
the context of this review, has recently been shown to repress adipogenesis as well [19]. Modulation of
lineage-specific transcription factors during development is controlled by several conserved signaling
pathways which in turn are modified by cell-matrix and cell-cell interactions.
Signaling pathways involved in lineage determination from mesenchymal stem cells during
development might be of relevance for both joint and adipose function and pathophysiology. First, similar
pathways are likely to be implicated in cell turnover in adult tissues involving differentiation of resident
adult mesenchymal stem cells, which are found in bone marrow, adipose tissues and joint-related tissues
(synovium, synovial fluid) among other tissues. Second, these pathways are likely to play a role in the
maintenance of cell terminal differentiated state and healthy function. In cartilage, for example, reduced
Sox9 expression and related dedifferentiation of chondrocytes appears to contribute to OA pathology [15,
18]. Moreover, the hypothesis has been proposed that OA ultimately results from excessive, poorly
regulated growth of musculoskeletal tissues possibly resulting from cells reverting to an earlier
developmental phenotype [14, 20]. Finally, an understanding of these pathways is crucial for stem-cell
based regenerative and reconstructive strategies in the areas of cartilage repair, orthopedics and aesthetics,
which involve the ex-vivo or in vivo controlled differentiation of stem cells into specific cell types.
121
The contribution of transcription-related factors and developmental signals implicated in the
differentiation and/or function of adipocytes and joint cells is compiled in Tables 1 and 2, and further
addressed in this section. Importantly, most of these factors and signaling pathways have been found to be
dysregulated both in obesity and OA, consistent with a role of endogenous stem cell niches in adipose tissue
and joint homeostasis, remodeling and disease.
Pref-1 signaling and Sox9
Preadipocyte factor 1(Pref-1) is a protein highly expressed in preadipocytes which, in its secreted form,
functions in a paracrine/autocrine manner to prevent preadipocyte differentiation through activation of
mitogen activated protein kinase (MAPK) pathways [21]. Expression levels of Pref-1 markedly decrease
upon differentiation of preadipocytes into adipocytes, and the repressive effect of Pref-1 on adipogenesis
has been firmly established, both in adipocyte cell models and in vivo [22-24].
Recently, a functional link between Pref-1 and Sox9 was unveiled following the demonstration that
Pref-1 inhibits adipogenesis through up-regulating Sox9 [19]. It was shown that Sox9 expression parallels
Pref-1 expression during adipogenic differentiation of multipotent mesenchymal cells (mouse embryo
fibroblasts) and already committed preadipose cells (3T3-L1); that constitutive overexpression of Sox9
inhibits, while knockdown of Sox9 enhances adipocyte differentiation in cell models and in vivo; that Pref-1
was unable to inhibit adipogenesis in cells in which Sox9 had been silenced; and that, mechanistically, Sox9
directly binds to the promoter regions of the early adipogenic transcription factors C/EBP and C/EBP to
suppress their promoter activity, thus preventing adipocyte differentiation. Interestingly, by inducing Sox9,
Pref-1 was also shown to promote chondrogenic induction of mesenchymal cells [19].
Sox-9 is required for mesenchymal cell condensation during development and for the expression of
cartilaginous matrix proteins such as type II and IX collagens and aggrecan [18]. Sox9 expression in
cartilage is reduced in individuals with OA compared with age-matched controls and down-regulated in
response to pro-inflammatory cytokines favoring cartilage degradation [18]. These and other findings
suggest that Sox9 has potential clinical value in the treatment of OA. The results of a number of cell and
animal studies support the concept of Sox9 gene augmentation therapy in the treatment of OA, and
pharmacological activation of Sox9 in chondrocytes, although not as yet reported, is also of interest in this
context [18].
A putative dysregulation of Sox9 in obesity remains largely unexplored. However, it is suggested
by the findings that Sox9 mRNA is expressed in the stromal vascular fraction of mouse WAT, and that its
expression is reduced in WAT of high fat diet-induced and genetically obese (ob/ob) mice, which also
display reduced WAT expression of Pref-1 and increased WAT levels of adipocyte markers compared with
lean animals [19]. In view of the reported inhibitory effect of Sox9 on adipogenesis, increasing Sox9
activity in WAT could be a way of tipping the adipocyte birth-death balance in favor of reducing the
number of fat cells. Overall, activation of Sox9 is emerging as a potential molecular target in the treatment
of both OA and obesity.
122
PPAR
Peroxisome proliferator-activated receptors (PPARs) are lipid-activated transcription factors of the nuclear
receptor superfamily that play important roles during embryonic development [25] and in the transcriptional
control of lipid and glucose metabolism and inflammation in adulthood [26]. PPARs form heterodimers
with retinoic X receptors, and, upon ligand binding, modulate the expression of downstream target genes
depending on the presence of co-activators or co-repressors. There are three known PPAR family members:
PPAR, PPAR and PPAR each encoded by a separate gene and with different ligand specificities, tissue
distribution and target genes. PPAR is the most studied member of the PPAR family. It exists in two
isoforms, PPAR1 and PPAR2, which derive from a single gene through alternate promoter usage and
splicing. The PPAR2 protein is expressed mainly in adipose tissues. PPAR1 is expressed in many tissues
and is the predominant form expressed in human cartilage [27].
PPAR plays critical roles in adipose tissue biology: it is the master regulator of fat cell
differentiation (adipogenesis), it promotes lipid storage in mature adipocytes by enhancing the expression of
key genes in fatty acid uptake and trapping, and it is required for the survival of mature adipocytes [28, 29].
PPAR is also involved in the control of whole-body glucose homeostasis and insulin sensitivity and is the
presumed target for binding by thiazolidinediones (TZDs), a class of synthetic insulin sensitizers that are
used to treat human type 2 diabetes, though at the expense of subcutaneous fat gain and other undesirable
side effects. Genetic studies have confirmed an important role of PPAR in adipogenesis, fat cell function
and insulin sensitivity in humans [30].
Dysregulation of PPAR in cartilage has been implicated in the pathogenesis of joint diseases [27,
31]. PPAR1 expression is diminished in human OA cartilage compared with normal cartilage, and in
human articular chondrocytes following exposure to inflammatory cytokines and inflammatory lipid
mediators known to play a role in the development of OA, such as interleukin-1 (IL-1), tumor necrosis
factor (TNF), and prostaglandin E2 (PGE2). Several studies have shown that PPAR agonists down-
regulate inflammatory and catabolic responses in chondrocytes and synovial fibroblasts, and protective
effects of PPAR agonists have been demonstrated in arthritis experimental models in vivo. PPARs can
suppress the expression of inflammation-related genes by interacting with and blocking the activity of key
transcription factors in the inflammatory response, such as nuclear factor-B (NF-B) and SP-1, and by
other means [27]. Thus, accumulated evidence suggests that PPAR agonists might be useful as anti-
arthritic drugs, and there are ongoing clinical trials testing this concept [27, 31]. Reduced PPAR activity in
the OA joint may also contribute to abnormal growth and remodeling of subchondral bone, since recent
research has unveiled an inhibitory role of PPAR on osteoblastogenesis [32].
PPAR coactivator 1 alpha (PGC-1)
PGC-1 is a transcriptional coactivator for several nuclear receptors and other transcription factors
involved in multiple aspects of cellular energy metabolism [33]. PGC-1 coactivates the transcription of the
uncoupling protein 1 (UCP1) gene encoding the molecular marker and thermogenic effector of brown
adipocytes and of genes related to mitochondrial biogenesis and function [34, 35]. Dysregulation of PGC-
123
1 in obesity and diabetes has been described. The expression of PGC-1 isoforms is reduced in skeletal
muscle and WAT of obese and diabetic humans and rodents [36-40], and several human genetic studies
have found polymorphisms in PGC-1 isoforms to associate with obesity and diabetes [41-44].
Interestingly, expression of PGC-1 is induced at chondrogenesis sites during mouse embryonic
limb development and during chondrogenesis in human mesenchymal stem cells cultures [45]. Moreover, it
has been shown that PGC-1 directly interacts with Sox9 and promotes Sox9-dependent transcriptional
activity on the type II collagen gene, strongly suggesting that PGC-1 behaves as a transcriptional
coactivator for Sox9 in chondrogenesis [45]. However, dysregulation of PGC-1 expression in articular
chondrocytes as a factor in OA remains, to our knowledge, an unexplored issue.
Wnt signaling
Wnts (wingless-type MMTV integration site) are a family of secreted glycoproteins acting in autocrine and
paracrine manners to control cell proliferation, survival, fate and behavior during embryonic development
and adult tissue homeostasis and remodeling [46, 47]. Wnt proteins bind to frizzled (Fzd) receptors and
LRP5/6 (low-density lipoprotein-receptor-related protein-5 or -6) co-receptors at the cell membrane
initiating a signaling cascade that leads to the activation and nuclear translocation of the transcriptional
regulator beta-catenin and subsequent changes in gene expression. Wnt proteins can also activate a number
of additional, non-canonical, pathways independently of beta-catenin. Wnt signaling is modulated by
several intracellular inhibitory proteins and extracellular antagonists. The latter include secreted frizzled-
related proteins (sFRPs) and dickkopf (Dkk) family members [48]. Activation of the canonical Wnt
pathway generally results in inhibition of chondrogenesis and adipogenesis and induction of
osteoblastogenesis [15, 32].
There is increasing recognition that activation of Wnt signaling in musculoskeletal tissues of the
joint (cartilage, subchondral bone) may represent a pathologic mechanism for OA development [14, 15, 49,
50]. An increased level of beta-catenin, certain Wnt signals (Wnt16) and the downstream Wnt signaling
effector WISP-1 (Wnt-induced signaling protein 1) have been observed in degenerative cartilage, both in
humans and rodents [15, 49-51]. In adult mice, conditional chondrocyte-specific activation of the beta-
catenin gene [52] or adenoviral overexpression of WISP-1 in knee joints [51] leads to an OA-like
phenotype. A genetic polymorphism in the Wnt inhibitor sFRP-3 that results in a protein product with a
reduced ability to limit beta-catenin signaling has been found to associate with an increased susceptibility to
develop OA in humans [49]. Conversely, high circulating levels of another Wnt inhibitor, Dkk-1, associated
with a slow progression of hip OA in humans [49].
Endogenous Wnts (possibly Wnt10b) normally function to restrain adipogenesis by blocking the
induction of PPAR and C/EBP in preadipose cells [53]. Adipose-specific overexpression of Wnt10b
results in leanness and protects against diet-induced obesity [54] and genetic obesity [55] in transgenic
mice. Polymorphisms in Wnt related genes have been associated with obesity and/or obesity-related traits in
human population studies [56, 57]. Results from animal studies suggest that epigenetic reprogramming of
Wnt signaling in WAT might alter susceptibility to obesity [58]. Very recently, the Wnt inhibitor sFRP5 has
emerged as a potential anti-inflammatory adipokine capable of attenuating systemic metabolic dysfunction
124
in obesity, probably by neutralizing Wnt5a-dependent c-Jun N-terminal kinase (JNK) activation in WAT
[59]. In the same report, human obese individuals with a bad metabolic profile (i.e., exhibiting increased
WAT inflammation and insulin resistance) were shown to have reduced sFRP5 transcript expression in
WAT biopsies compared with healthier obese individuals [59]. Overall, these and other results implicate
alterations of Wnt signaling in obesity.
Wnt signaling has been suggested as a potential target in OA therapy [60] and in the therapy of
obesity and associated disorders [53]. However, the complexity and widespread biological effects of Wnt
signaling, which include proven roles in carcinogenesis, makes Wnt-based approaches challenging. Specific
strategies are required to pinpoint targets for safe and efficient OA therapy, based on identifying the
misexpression of specific Wnt proteins, Wnt inhibitors, or downstream Wnt signaling effector molecules in
tissues that are important in OA and obesity.
Hedgehog signaling
The Hedgehog (Hh) signaling pathway is one of the key regulators of animal development conserved from
flies to humans [61]. Secreted Hh proteins convey changes in gene expression following their interaction
with specific cell membrane receptors, and they regulate the commitment of precursors to a wide array of
cell fates.
Hh signaling regulates early and terminal chondrocyte differentiation as well as osteoblastogenesis
and bone formation through endochondral ossification (see [62, 63]). During chondrocyte terminal
differentiation, Sox9 expression decays, Runx2 expression increases, and chondrocytes become
hypertrophic, remove the collagen and aggrecan matrix through the production of specific extracellular
proteases, and finally die by apoptosis and are replaced by bone. In OA, articular cartilage chondrocytes
undergo phenotypic and gene expression changes that are reminiscent of their end-stage differentiation in
the growth plate during skeletal development, and abnormal activation of Hh signaling appears to be
involved in this process [63]. Pharmacological or genetic inhibition of Hh signaling has been seen to reduce
the severity of OA in mice and human cartilage explants [63]. Activation of Hh signaling may also underlie
subchondral bone remodeling in OA [64]. Together, the findings point to a blockade of Hh signaling as a
potential therapeutic target in OA.
Hh signaling also plays an important role in regulating adipogenesis, having been shown to inhibit
white fat formation in species as diverse as flies and mice [65, 66]. Hh signals elicit this function early in
adipogenesis, upstream of PPAR, potentially diverting preadipocytes and multipotent mesenchymal
precursors away from adipogenesis and toward osteogenesis [65]. Signs of reduced Hh signaling in WAT in
mouse models of obesity have been reported [65] and, interestingly, mice with constitutive activation of Hh
signaling in adipose tissues display WAT-specific lipoatrophy with normal BAT development, normal
glucose tolerance and insulin sensitivity and no evidence of pathologic ectopic lipid accumulation [66]. The
favorable metabolic profile despite WAT lipoatrophy of these transgenics has been attributed [66] to their
intact capacity to burn energy in BAT and to their higher production of adiponectin, an anti-diabetic and
anti-atherosclerotic adipokine. The Hh pathway could be a potential therapeutic target for adipose tissue-
related disorders including obesity, in which activation of adipose Hh signaling would be pursued.
125
Transforming growth factor beta (TGF)
TGFβ is the prototypic member of a large family of structurally related pleiotropic, secreted cytokines that
control differentiation, proliferation, and state of activation of many different cell types, including
differentiation of mesenchymal stem cells into different lineages. TGFβ and members of the TGFβ
superfamily signal through binding to specific cell membrane receptors, initiating specific intracellular
transduction pathways, such as those involving the Smad transcription factors.
TGFβ is a multifunctional regulator of chondrocyte biology with dual roles in OA development
[67]. In general, TGFβ is protective for articular cartilage, behaving as an anabolic and repair factor capable
of stimulating extracellular matrix (ECM) synthesis by chondrocytes. However, this protective effect is lost
in older animals, and there is evidence that TGFβ signaling can be deleterious for articular cartilage [67],
besides being involved in osteophyte formation [68]. Dual effects of TGFβ on chondrocytes have been
attributed to its ability to signal via different receptors and related Smad signaling routes [67]. In the
nucleus, different activated (phosphorylated) Smads modify the expression of distinct subsets of genes.
Whereas activation of the Smad2/3 route appears to potentiate anabolic responses, activation of the
Smad1/5/8 route would selectively stimulate chondrocyte expression of extracellular proteases, terminal
differentiation and hyperthrophy, all of which are hallmarks of OA. Remarkably, the ALK1/ALK5 ratio in
cartilage is significantly increased in aging mice and in experimental models of OA, a feature that may
favor TGFβ signaling via the “deleterious” Smad1/5/8 route. Stimulation of the Smad2/3 route and/or
inhibition of the Smad1/5/8 route downstream of TGFβ are potential targets in OA therapy, although the
possible side effects are unclear [67].
Cumulative evidence indicates an inhibitory role for TGF on white adipogenesis, by enhancing
ECM synthesis and preventing normal changes of the ECM during adipogenesis [69, 70] and by Smad3
interacting with C/EBPs and repressing C/EBP transactivation function [71]. In vivo, transgenic
overexpression of TGFβ results in a lipodystrophy-like syndrome, with a severe reduction of body fat in the
mutant mice [72]. Quite paradoxically, TGFβ expression is increased in WAT depots of obese mice [73]
and humans [74], where it closely correlates with the expression levels of plasminogen activator inhibitor-1
(PAI-1) [74]. The latter is one of the best characterized downstream targets of TGFβ in many cell systems
and the most important physiological inhibitor of the fibrinolytic process that degrades fibrin clots in the
blood.
Bone morphogenetic proteins (BMPs)
BMPs are cytokines of the TGFβ superfamily with wide-ranging biological activities, including the
regulation of proliferation, apoptosis, differentiation and migration of mesenchymal cells. Over 20 BMPs
are known and these proteins are involved in numerous cellular functions of which bone formation is just a
small part. BMPs play important roles during embryonic development and are also important for the
maintenance of tissue homeostasis during adult life.
BMP activity boosts all phases of chondrocyte differentiation, from mesenchymal condensation to
terminal differentiation [75]. The paradigm is that BMPs are protective for articular cartilage because of
their ability to promote ECM synthesis and deposition through up-regulation of Sox-9, and BMP-based
126
therapies hold considerable promise for effective cartilage repair and/or regeneration [75]. However, there
is evidence that with aging and/or with the development of OA, articular chondrocytes may become
unresponsive to growth factor stimulation. Moreover, similar to TGF, there is evidence that BMPs may
play a role in cartilage destruction and OA progression by favoring the expression of extracellular proteases
associated to chondrocyte terminal differentiation and hypertrophy [75].
There is increasing recognition that different BMPs may have differential effects on cartilage, and
that not all BMPs are equally well suited for OA therapy [75]. One BMP of particular interest in this
context is BMP-7, also known as osteogenic protein-1. BMP-7 has been reported to induce similar anabolic
responses in normal and OA chondrocytes from young and old donors without causing chondrocyte
hypertrophy [76]. Moreover, unlike other members of the BMP family, BMP-7 has anti-catabolic properties
in addition to its strong pro-anabolic activity. Thus, reported effects of BMP-7 in chondrocytes include:
counteraction of the inhibition of proteoglycan and hyaluronan synthesis induced by various catabolic
mediators; inhibition of the endogenous expression of pro-inflammatory cytokines; blockade of basal and
cytokine-induced expression of key matrix degrading enzymes; and reduction of chondrocyte apoptosis
after acute cartilage trauma in a sheep model. Inhibition of transcription factors NF-B and AP-1 are
thought to be part of the underlying mechanisms responsible for the anti-catabolic activity of BMP-7 in
chondrocytes [76].
BMPs have been implicated in adipogenesis [77]. Remarkably, whereas the activity of other BMP
family members (such as BMP-2 and BMP-4) promotes white adipogenesis, BMP-7 behaves specifically as
a brown fat inducer capable of activating by itself the full program of brown adipogenesis, including
induction of UCP1 and of mitochondria biogenesis, both in cell models (primary brown preadipocytes or
pluripotent C3H10T1/2 mesenchymal cells) and in vivo [78]. Moreover, BMP-7 knockout embryos showed
a marked paucity of brown fat and an almost complete absence of UCP1, indicating an essential role of
BMP-7 in the development of BAT in vivo [78]. Interestingly, adenoviral-mediated expression of BMP7 in
adult mice resulted in a significant increase in brown, but not white, fat mass and led to increased energy
expenditure and reduced weight gain [78]. Overall, up-regulation of BMP-7 is emerging as an attractive
potential therapeutic target in the treatment of both obesity and OA.
Insulin-like growth factor 1 (IGF-1)
IGF-1 is the main anabolic mediator in articular cartilage, i.e. the main stimulator of matrix synthesis by
chondrocytes. It is believed that in the OA cartilage IGF-1 has poor anabolic efficacy partly because of its
sequestration by abnormally high levels of extracellular IGF binding proteins (IGBPs) [79]. The latter are a
superfamily of homologous proteins, totaling 15 members, which modulate the availability of IGF-1 to the
cells. IGBPs generally bind IGFs preventing them from binding their cognate receptors, although there are
examples of positive modulation of IGF signaling by IGBPs, as well as of IGF-independent effects of
IGBPs [80, 81]. IGFBP-3 is the main IGFBP secreted by OA cartilage explants [82]. Reducing IGFBP-3
activity is a potential therapeutic target in OA, and small molecules have been developed that inhibit the
binding of IGF-1 to IGFBP-3 and effectively restore proteoglycan synthesis by human OA chondrocytes in
culture [82]. Interestingly, in human articular cartilage IGFBP-3 is located not only extracellularly, but also
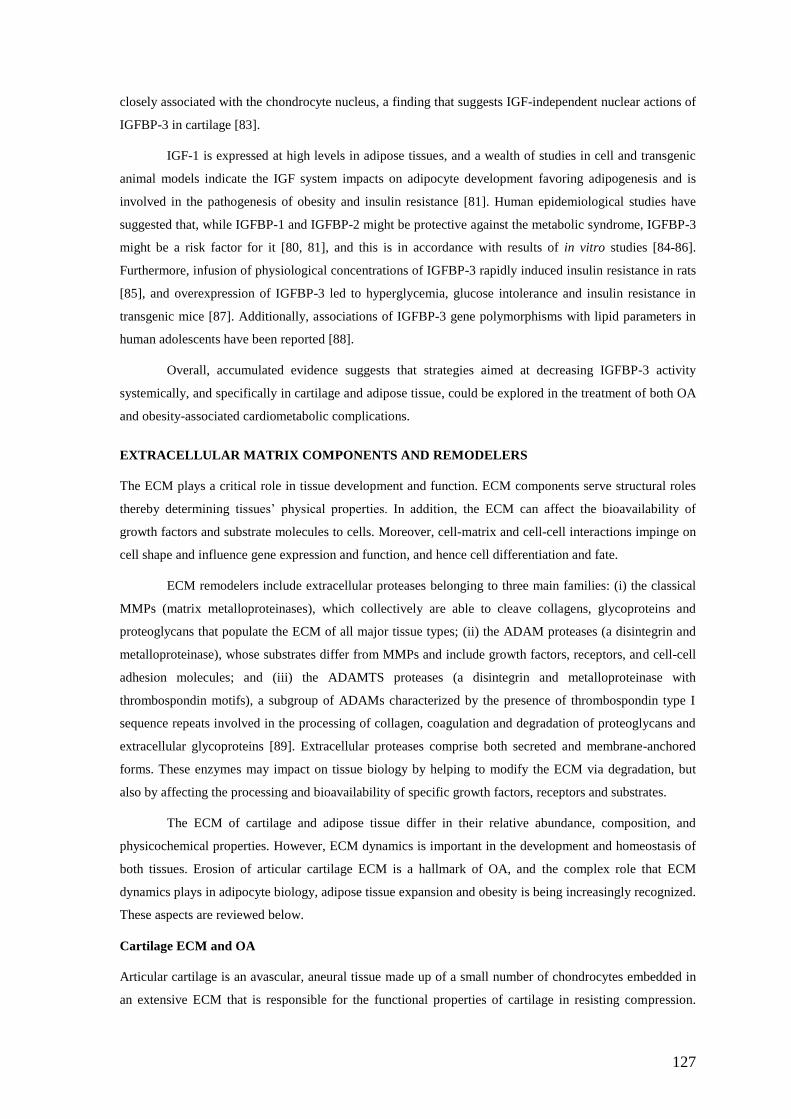
127
closely associated with the chondrocyte nucleus, a finding that suggests IGF-independent nuclear actions of
IGFBP-3 in cartilage [83].
IGF-1 is expressed at high levels in adipose tissues, and a wealth of studies in cell and transgenic
animal models indicate the IGF system impacts on adipocyte development favoring adipogenesis and is
involved in the pathogenesis of obesity and insulin resistance [81]. Human epidemiological studies have
suggested that, while IGFBP-1 and IGFBP-2 might be protective against the metabolic syndrome, IGFBP-3
might be a risk factor for it [80, 81], and this is in accordance with results of in vitro studies [84-86].
Furthermore, infusion of physiological concentrations of IGFBP-3 rapidly induced insulin resistance in rats
[85], and overexpression of IGFBP-3 led to hyperglycemia, glucose intolerance and insulin resistance in
transgenic mice [87]. Additionally, associations of IGFBP-3 gene polymorphisms with lipid parameters in
human adolescents have been reported [88].
Overall, accumulated evidence suggests that strategies aimed at decreasing IGFBP-3 activity
systemically, and specifically in cartilage and adipose tissue, could be explored in the treatment of both OA
and obesity-associated cardiometabolic complications.
EXTRACELLULAR MATRIX COMPONENTS AND REMODELERS
The ECM plays a critical role in tissue development and function. ECM components serve structural roles
thereby determining tissues’ physical properties. In addition, the ECM can affect the bioavailability of
growth factors and substrate molecules to cells. Moreover, cell-matrix and cell-cell interactions impinge on
cell shape and influence gene expression and function, and hence cell differentiation and fate.
ECM remodelers include extracellular proteases belonging to three main families: (i) the classical
MMPs (matrix metalloproteinases), which collectively are able to cleave collagens, glycoproteins and
proteoglycans that populate the ECM of all major tissue types; (ii) the ADAM proteases (a disintegrin and
metalloproteinase), whose substrates differ from MMPs and include growth factors, receptors, and cell-cell
adhesion molecules; and (iii) the ADAMTS proteases (a disintegrin and metalloproteinase with
thrombospondin motifs), a subgroup of ADAMs characterized by the presence of thrombospondin type I
sequence repeats involved in the processing of collagen, coagulation and degradation of proteoglycans and
extracellular glycoproteins [89]. Extracellular proteases comprise both secreted and membrane-anchored
forms. These enzymes may impact on tissue biology by helping to modify the ECM via degradation, but
also by affecting the processing and bioavailability of specific growth factors, receptors and substrates.
The ECM of cartilage and adipose tissue differ in their relative abundance, composition, and
physicochemical properties. However, ECM dynamics is important in the development and homeostasis of
both tissues. Erosion of articular cartilage ECM is a hallmark of OA, and the complex role that ECM
dynamics plays in adipocyte biology, adipose tissue expansion and obesity is being increasingly recognized.
These aspects are reviewed below.
Cartilage ECM and OA
Articular cartilage is an avascular, aneural tissue made up of a small number of chondrocytes embedded in
an extensive ECM that is responsible for the functional properties of cartilage in resisting compression.
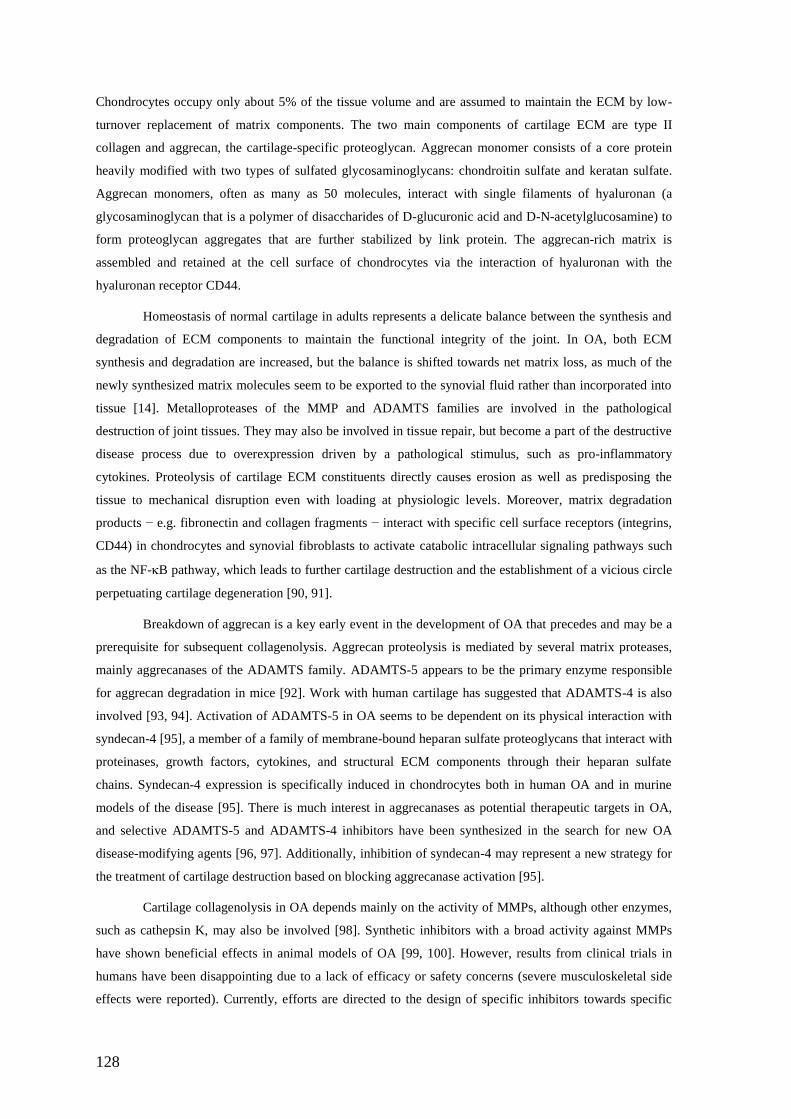
128
Chondrocytes occupy only about 5% of the tissue volume and are assumed to maintain the ECM by low-
turnover replacement of matrix components. The two main components of cartilage ECM are type II
collagen and aggrecan, the cartilage-specific proteoglycan. Aggrecan monomer consists of a core protein
heavily modified with two types of sulfated glycosaminoglycans: chondroitin sulfate and keratan sulfate.
Aggrecan monomers, often as many as 50 molecules, interact with single filaments of hyaluronan (a
glycosaminoglycan that is a polymer of disaccharides of D-glucuronic acid and D-N-acetylglucosamine) to
form proteoglycan aggregates that are further stabilized by link protein. The aggrecan-rich matrix is
assembled and retained at the cell surface of chondrocytes via the interaction of hyaluronan with the
hyaluronan receptor CD44.
Homeostasis of normal cartilage in adults represents a delicate balance between the synthesis and
degradation of ECM components to maintain the functional integrity of the joint. In OA, both ECM
synthesis and degradation are increased, but the balance is shifted towards net matrix loss, as much of the
newly synthesized matrix molecules seem to be exported to the synovial fluid rather than incorporated into
tissue [14]. Metalloproteases of the MMP and ADAMTS families are involved in the pathological
destruction of joint tissues. They may also be involved in tissue repair, but become a part of the destructive
disease process due to overexpression driven by a pathological stimulus, such as pro-inflammatory
cytokines. Proteolysis of cartilage ECM constituents directly causes erosion as well as predisposing the
tissue to mechanical disruption even with loading at physiologic levels. Moreover, matrix degradation
products − e.g. fibronectin and collagen fragments − interact with specific cell surface receptors (integrins,
CD44) in chondrocytes and synovial fibroblasts to activate catabolic intracellular signaling pathways such
as the NF-B pathway, which leads to further cartilage destruction and the establishment of a vicious circle
perpetuating cartilage degeneration [90, 91].
Breakdown of aggrecan is a key early event in the development of OA that precedes and may be a
prerequisite for subsequent collagenolysis. Aggrecan proteolysis is mediated by several matrix proteases,
mainly aggrecanases of the ADAMTS family. ADAMTS-5 appears to be the primary enzyme responsible
for aggrecan degradation in mice [92]. Work with human cartilage has suggested that ADAMTS-4 is also
involved [93, 94]. Activation of ADAMTS-5 in OA seems to be dependent on its physical interaction with
syndecan-4 [95], a member of a family of membrane-bound heparan sulfate proteoglycans that interact with
proteinases, growth factors, cytokines, and structural ECM components through their heparan sulfate
chains. Syndecan-4 expression is specifically induced in chondrocytes both in human OA and in murine
models of the disease [95]. There is much interest in aggrecanases as potential therapeutic targets in OA,
and selective ADAMTS-5 and ADAMTS-4 inhibitors have been synthesized in the search for new OA
disease-modifying agents [96, 97]. Additionally, inhibition of syndecan-4 may represent a new strategy for
the treatment of cartilage destruction based on blocking aggrecanase activation [95].
Cartilage collagenolysis in OA depends mainly on the activity of MMPs, although other enzymes,
such as cathepsin K, may also be involved [98]. Synthetic inhibitors with a broad activity against MMPs
have shown beneficial effects in animal models of OA [99, 100]. However, results from clinical trials in
humans have been disappointing due to a lack of efficacy or safety concerns (severe musculoskeletal side
effects were reported). Currently, efforts are directed to the design of specific inhibitors towards specific
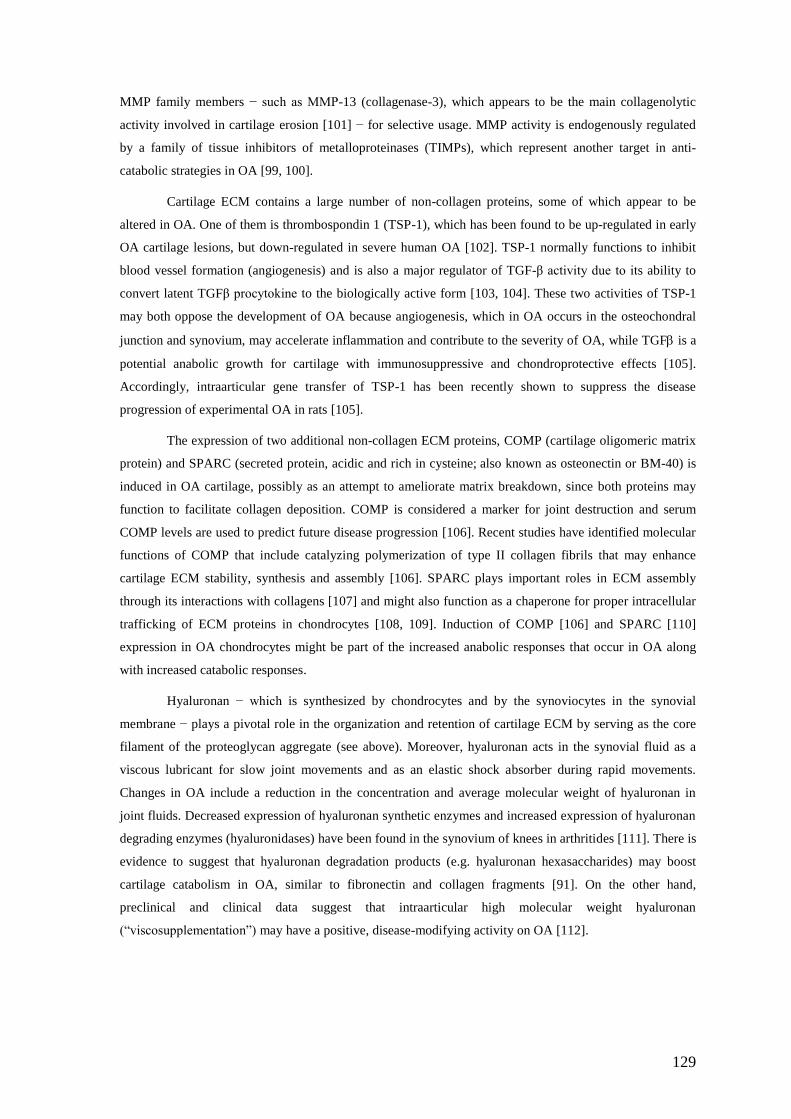
129
MMP family members − such as MMP-13 (collagenase-3), which appears to be the main collagenolytic
activity involved in cartilage erosion [101] − for selective usage. MMP activity is endogenously regulated
by a family of tissue inhibitors of metalloproteinases (TIMPs), which represent another target in anti-
catabolic strategies in OA [99, 100].
Cartilage ECM contains a large number of non-collagen proteins, some of which appear to be
altered in OA. One of them is thrombospondin 1 (TSP-1), which has been found to be up-regulated in early
OA cartilage lesions, but down-regulated in severe human OA [102]. TSP-1 normally functions to inhibit
blood vessel formation (angiogenesis) and is also a major regulator of TGF-β activity due to its ability to
convert latent TGFβ procytokine to the biologically active form [103, 104]. These two activities of TSP-1
may both oppose the development of OA because angiogenesis, which in OA occurs in the osteochondral
junction and synovium, may accelerate inflammation and contribute to the severity of OA, while TGF is a
potential anabolic growth for cartilage with immunosuppressive and chondroprotective effects [105].
Accordingly, intraarticular gene transfer of TSP-1 has been recently shown to suppress the disease
progression of experimental OA in rats [105].
The expression of two additional non-collagen ECM proteins, COMP (cartilage oligomeric matrix
protein) and SPARC (secreted protein, acidic and rich in cysteine; also known as osteonectin or BM-40) is
induced in OA cartilage, possibly as an attempt to ameliorate matrix breakdown, since both proteins may
function to facilitate collagen deposition. COMP is considered a marker for joint destruction and serum
COMP levels are used to predict future disease progression [106]. Recent studies have identified molecular
functions of COMP that include catalyzing polymerization of type II collagen fibrils that may enhance
cartilage ECM stability, synthesis and assembly [106]. SPARC plays important roles in ECM assembly
through its interactions with collagens [107] and might also function as a chaperone for proper intracellular
trafficking of ECM proteins in chondrocytes [108, 109]. Induction of COMP [106] and SPARC [110]
expression in OA chondrocytes might be part of the increased anabolic responses that occur in OA along
with increased catabolic responses.
Hyaluronan − which is synthesized by chondrocytes and by the synoviocytes in the synovial
membrane − plays a pivotal role in the organization and retention of cartilage ECM by serving as the core
filament of the proteoglycan aggregate (see above). Moreover, hyaluronan acts in the synovial fluid as a
viscous lubricant for slow joint movements and as an elastic shock absorber during rapid movements.
Changes in OA include a reduction in the concentration and average molecular weight of hyaluronan in
joint fluids. Decreased expression of hyaluronan synthetic enzymes and increased expression of hyaluronan
degrading enzymes (hyaluronidases) have been found in the synovium of knees in arthritides [111]. There is
evidence to suggest that hyaluronan degradation products (e.g. hyaluronan hexasaccharides) may boost
cartilage catabolism in OA, similar to fibronectin and collagen fragments [91]. On the other hand,
preclinical and clinical data suggest that intraarticular high molecular weight hyaluronan
(“viscosupplementation”) may have a positive, disease-modifying activity on OA [112].
130
Adipose tissue ECM and obesity
Mature adipocytes are surrounded by a unique ECM that takes the form of a basement membrane composed
mainly of collagens VI and IV, laminin and heparan sulfate. Collagen VI, in particular, is highly enriched in
the ECM of WAT as compared to other tissues. WAT ECM provides mechanical support to maintain the
structural integrity of adipocytes, in addition to participating in a variety of signaling events. Extensive
ECM remodeling accompanies adipogenesis, and changes in the ECM are also required to accommodate
adipocyte hyperthrophy and to sustain neovascularization during adipose tissue expansion [113, 114].
Specific extracellular proteases have been implicated as factors necessary for proper preadipocyte
proliferation, adipogenesis and WAT expansion. For example, the activity of MMP-14 (a membrane-
anchored collagenase) appears to be required for normal adipogenesis. In MMP-14- null mice, WAT (but
not BAT) development is aborted, leaving fat depots populated by mini-adipocytes which render the null
mice lipodystrophic [115]. MMP-14 activity is also required for adult WAT expansion: on a high fat diet,
MMP-14 haploinsufficient mice are unable to remodel fat pad collagen architecture and display blunted
weight gain [116]. This is in keeping with reports showing that treatment with broad-spectrum MMP
inhibitors reduces fat mass gain induced by a high fat diet in mice, coupled with increased adipose collagen
content [117, 118]. It is unclear whether the aforementioned concepts imply that MMP inhibitors could be
useful in the treatment of human obesity. In fact, it is now recognized that, both in rodents and humans,
increased deposition of collagens in the ECM, so-called adipose tissue fibrosis, characterizes WAT in
obesity and diabetes [119, 120]. Adipose tissue fibrosis might directly contribute to a failure to further
expand the tissue mass during states of positive energy balance, and has been related to the development of
adipose tissue inflammation and obesity-linked metabolic derangements [119].
As a mediator of collagen deposition, the matricellular protein SPARC might contribute to limit
WAT expansion but also to adipose tissue fibrosis and subsequent metabolic dysregulation in obesity.
Recombinant SPARC was shown to inhibit the adipose conversion of primary murine preadipocytes by
retarding morphological changes of the ECM and through activation of the Wnt/beta-catenin signaling
pathway [121]. In humans, SPARC is abundantly expressed in WAT, especially subcutaneous WAT, and
SPARC plasma concentration directly correlates with body mass index (BMI) and is associated with insulin
resistance and diabetes complications [122]. Expression of SPARC in WAT is also enhanced in several
murine models of obesity [123].
Although a dense ECM seems to exert a gross inhibitory effect on adipogenesis, specific ECM
components may actually stimulate this process. For instance, there is evidence of a functional role of
aggrecan in promoting early stages of adipogenesis of preadipose cells in vitro [124]. One potential
mechanism to explain this is that cell surface heparan sulfate proteoglycans such as aggrecan can bind
different lipoprotein particles and facilitate their uptake by differentiating fat cells [125]. Interestingly,
aggrecan and aggrecanase (ADAMTS-4 and ADAMTS-5) mRNAs are expressed in mouse WAT, mainly in
cells of the stromal-vascular fraction, and signs of increased aggrecan catabolism in WAT are present in
diet-induced and genetic murine obesity [124]. It is suggested that intact aggrecan promotes adipose tissue
formation in its very early stages, and is gradually down-regulated and degraded during further
development, especially with obesity [124].
131
Adipose tissue expansion requires the parallel growth of its capillary network. Adipose tissue
angiogenesis is increasingly been considered as a therapeutic target for obesity and metabolic diseases [126,
127]. Although inhibition is the usual paradigm in anti-obesity strategies, activation of adipose tissue
angiogenesis might also be desirable (e.g., in BAT to promote BAT growth and thermogenic function, or in
WAT when ectopic fat deposition in non-WAT tissues is the problem). Specific extracellular proteases
switch on neovascularization by activation, liberation, and modification of angiogenic growth factors and
degradation of the endothelial and interstitial matrix [128]. Accordingly, administration of synthetic MMP
inhibitors reduces adipose tissue angiogenesis and results in reduced high fat diet-induced obesity in mice
[126]. On the other hand, other ECM-related factors such as certain ADAMTS family members (e.g.
ADAMTS-1 and -8) and thrombospondins (TSP-1 and TSP-2) are generally considered to be endogenous
anti-angiogenic factors. In humans, TSP-1 is highly expressed in adipocytes of obese, insulin-resistant
subjects, and adipose TSP-1 expression is highly correlated with markers of WAT inflammation and with
the adipose expression of pro-thrombotic factor PAI-1, and is decreased following treatment with anti-
diabetic drugs (TZDs) [129]. TSP-1 is expressed to higher levels in visceral than in subcutaneous fat, and it
has been suggested that the physiological processes related with this gene (and with carboxypeptidase E)
may contribute to adipose depot- and gender-specific differences regarding the metabolic complications of
obesity [130].
Beyond direct effects on adipose tissue ECM remodeling, ECM-related factors may impact on
adipose tissue expansion by acting in other tissues, e.g. in the hypothalamus to affect central circuitries
regulating food intake and/or energy expenditure. For example, TIMP-1 mRNA is induced by leptin in
mouse hypothalamus, and hyperphagia and obesity have been reported in mice lacking TIMP-1 [131]. As
another example, syndecan-3 has been implicated in the control of food intake by interacting with the
central melanocortin system [132], and syndecan-3 null mice are hypophagic and resistant to diet-induced
obesity [133, 134]. Another member of the syndecan family, syndecan-1, mediates the hepatic clearance of
triglyceride-rich lipoprotein remnants, and its dysregulation appears to contribute to postprandial
hyperlipidemia associated with diabetes and abdominal obesity [135].
ADIPOKINES AND PRO-INFLAMMATORY PROTEIN MEDIATORS
Adipokines are adipose tissue-derived, secreted signaling proteins. White adipose tissue cells, including
adipocytes, stromovascular cells and the associated immune cells, cross-talk via adipokines with the
hypothalamus and other organs, which is essential to the control of energy homeostasis and metabolism. In
addition, adipokines have important local (paracrine and autocrine) effects, because adipocytes express
receptors for most of the signals they produce. Adipokines also play important roles in modulating
inflammation and the immune response [136], and several of them have been implicated specifically in the
pathophysiology of joint diseases such as rheumatoid arthritis (RA) and OA.
Some adipokines are cytokines or cytokine-like molecules and the distinction between these two
categories is vague. As opposed to cytokines, which are produced by multiple cell types, and in WAT often
mainly by immune cells infiltrating the tissue, adipokines are supposed to be released specifically by
adipocytes. However, most (if not all) adipokines are produced also in cell types other than adipocytes. In
132
particular, joint tissues including synovium, osteophytes, cartilage and bone have been demonstrated to
produce typical adipokines such as leptin and adiponectin [137]. Noteworthy, some joints contain articular
adipose tissue, e.g. the infrapatellar fat pad of the knee joint, which is situated intracapsularly and
extrasynovially and in close contact with synovial layers and articular cartilage [138]. Thus, adipokines and
cytokines found in the joint may originate in adipose tissue or other non-joint tissues (and reach thereafter
the joint by diffusion from the circulation) and/or be produced locally. The origin of articular adipokines
and cytokines in joint diseases may have important implications for therapy (see Concluding remarks).
Main cytokines and adipokines known to be dysregulated in obesity and implicated in OA are
summarized in Table 3 and briefly addressed next (see [5, 6] for recent reviews).
Pro-inflammatory cytokines
Inflammation plays an important role in the pathogenesis of both obesity and OA. A low-grade, chronic,
systemic and WAT inflammation accompanies obesity, and it is thought that inflammation might be a
primary cause of obesity-linked metabolic disturbances [139, 140]. Hypertrophied adipocytes and/or
macrophages that selectively infiltrate WAT in obesity produce pro-inflammatory cytokines whose elevated
levels, through local and distant effects, contribute to insulin resistance, hepatosteatosis (fatty liver) and
increased risk markers for cardiovascular disease. The link between obesity and a pro-inflammatory state is
further corroborated by the reduction of inflammatory markers in overweight subjects following weight
loss. As for OA, even if it is traditionally classified as a non-inflammatory arthritis (due to low synovial
fluid leukocyte count), there is increasing evidence that synovial inflammation is already common at early
stages of the disease. It is now well established that, in OA, pro-inflammatory cytokines secreted by the
synovial membrane, infiltrated immune cells, subchondral bone and the cartilage itself actively trigger
cartilage destruction by inducing the expression of ECM degrading enzymes [5, 141]. Pro-inflammatory
cytokines also boost the production of additional inflammatory mediators (such as nitric oxide and PGE2)
and of reactive oxygen species (ROS) that can induce oxidative damage, including mitochondrial damage
eventually leading to chondrocyte apoptosis [142]. These effects are mediated by cytokine-dependent
activation of intracellular signaling pathways such as the p38 MAPK, JNK, and NF-B pathways.
Several mechanisms have been proposed to explain WAT inflammation associated with adipocyte
enlargement, including adipocyte death, cellular (endoplasmic reticulum and mitochondrial) stress
including oxidative stress, increased production of inflammatory lipid mediators and adipose tissue
hypoxia. These mechanisms are not mutually exclusive and are likely to be cross-related. It has been
proposed that adipocytes that reach a maximal size upon lipid loading spontaneously undergo necrosis,
which is associated with increased infiltration of macrophages around the dying adipocyte [143]. Shear
forces at the cell membrane-ECM interface may play a role in the death of enlarging adipocytes [119]. The
infiltration of macrophages into obese WAT may also result from the release of monocyte chemoattractant
protein 1 (MCP1) and other chemotactic signals (possibly including leptin) by the hypertrophied adipocytes
[140]. An emerging view is that hypertrophy of adipocytes prevents proper oxygen supply to the cells
creating a state of hypoxia that may promote adipocyte death and subsequent tissue inflammation [144,
145]. Additionally, hypoxia can induce oxidative stress and endoplasmic reticulum stress, which may also
contribute to WAT inflammation [144, 145]. The mechanisms by which production of inflammatory
133
mediators in the joint is initiated are unclear, but abnormal mechanical and oxidative stresses have been
implicated [12], as well as synovial tissue hypoxia [146].
Inflammatory cytokines known to be produced by adipose tissue, increased in obesity, and
involved in obesity-associated metabolic disturbances such as insulin resistance and fatty liver have also
been implicated in synovitis and other aspects of OA [5, 141, 147-153] (Table 3). This has led to the
concept that − in addition to locally produced (joint born) cytokines − adipose tissue-derived cytokines in
obesity may contribute to the cytokine storm in the joint that is a hallmark of the early stages of OA [5,
154]. The pathophysiological relevance of adipose tissue-derived signals is highlighted by the fact that
WAT as a whole may be one of the largest endocrine organs in obese individuals [155].
Pro-inflammatory cytokines dysregulated in both obesity and OA include TNF- and various
interleukins such as IL-1, IL-6, IL-18 and IL-8. In particular, IL-1 and TNF- are considered major players
in cartilage breakdown [5, 141]. Strikingly, many of these cytokines − e.g. IL-1, IL-6, IL-18, as well as
leptin (see below) − appear to play a physiological role in the endogenous control of energy homeostasis
exerting an overall anti-obesogenic effect, in such a way that their deficiency results in obesity in mouse
models [156-160]. This has led to the suggestion that up-regulation of these cytokines in WAT in obesity,
i.e. adipose tissue inflammation, may serve as a feedback break to inhibit further increases in adiposity, yet
at the expense of systemic derangements [139].
Pro-inflammatory cytokine activity is counteracted by several regulating factors such as IL-10,
which in animal models can prevent diet-induced insulin resistance [161] and cartilage destruction induced
by IL-1 and TNF- [5]. Expression of IL-10 is increased in OA cartilage according to the degree of
anatomical damage, and this up-regulation is generally viewed as an attempt to restore normal chondrocyte
functions [5]. Importantly, human WAT is a regulated source of IL-10 [162] and increases in circulating
levels of IL-10 after weight loss in humans have been reported [163]. These findings further reinforce the
link between obesity and joint disease and contribute to explain the potential benefit of weight loss in OA
patients [5].
Polymorphisms in cytokine-related genes have been found to associate with OA and obesity traits
in human genetic epidemiology studies, further reinforcing the involvement of inflammatory cytokines in
both conditions. For example, polymorphisms in genes of the IL-1 system (which include the IL-1 isoforms
themselves, their receptors and an endogenous antagonist, the IL1 receptor antagonist or IL1Ra) have been
linked to fat mass content and specifically to central obesity in humans ([164] and references therein), as
well as to radiographic signs of OA [165-167].
Leptin
The most studied adipokine, leptin, is prevalently (though not solely) secreted by white adipocytes,
circulates in blood at levels that correlate with the size of fat stores, and has central and peripheral effects
that oppose weight gain, downstream of its interaction with specific cell surface receptors belonging to class
I cytokine receptors [168]. In both rodents and humans, defective leptin signaling due to leptin deficiency
(e.g. in ob/ob mice) or dysfunctional leptin receptors (e.g. in db/db mice) causes early-onset, severe,
spontaneous obesity. However, the vast majority of obese subjects have very high levels of circulating
134
leptin in their blood and appear to be resistant to the action of leptin. The metabolic effects of leptin include
reduction of food intake, stimulation of energy expenditure including BAT thermogenesis, enhancement of
lipolysis in adipocytes and of fatty acid oxidation in several tissues (adipose tissues, skeletal muscle, liver),
and inhibition of gluconeogenesis and lipogenesis in the liver. Most of these effects originate from the
central actions of leptin on hypothalamic neurons, although direct peripheral action of leptin contributes as
well [169]. Leptin also has an impact on the development of the neuronal circuitries regulating energy
homeostasis [170], and animal studies indicate that oral leptin intake in early life can prevent
overweight/obesity in adulthood, with an improvement of related functions such as leptin and insulin
sensitivity and food preferences [171-173].
In addition to its principle role as a regulator of energy homeostasis, leptin is also involved in the
immune and inflammatory response, acting mainly as a pro-inflammatory signal [174, 175], and has been
specifically implicated in the pathophysiology of OA. Synovial fluid obtained from OA patients contains
leptin at levels that correlate with BMI [176] but exceed those in paired serum samples [137, 177], and it
has been shown that OA cartilage (and other joint tissues) produces leptin to a level that correlates with the
degree of cartilage damage [176, 177].
There is evidence to suggest that increased articular leptin production in OA may represent an
endogenous homeostatic, chondroprotective mechanism. Articular chondrocytes express functional leptin
receptors, and cultured human chondrocytes stimulated with leptin exhibit increased proliferation and
proteoglycan and collagen synthesis [178]. Intra-articular injection of leptin into the rat knee joint
stimulates proteoglycan synthesis and the expression of the anabolic factors IGF-1 and TGF, as well as of
leptin itself, in cartilage [176]. Moreover, in human OA cartilage, the pattern and level of leptin expression
parallel those of IGF-1 and TGF, while normal cartilage does not express either leptin or growth factors,
further suggesting a functional and reciprocal link [176]. However, leptin has also been reported to
stimulate the expression of pro-inflammatory mediators (IL-1, IL-6, IL-18, nitric oxide, PGE2) and
extracellular proteases (MMP-9, MMP-13) in cultured chondrocytes and human cartilage explants [177,
179]. Furthermore, recombinant leptin injection into rat knee induced proteolytic enzymes in articular
cartilage including ADAMTS-4 and ADAMTS-5 [180], the main aggrecanases in the pathogenesis of OA.
Leptin is also likely to be involved in changes in subchondral bone in OA [5]. Importantly, a recent study
showed that extreme obesity per se does not cause knee osteoarthritis in mutant mice with impaired leptin
signaling (ob/ob and db/db), suggesting that, in mice, leptin is essential to induce OA, and other fat-derived
messengers cannot surrogate leptin action [181].
On the whole, leptin seems to exert both anabolic and catabolic actions in articular cartilage, which
is significant because both anabolic and catabolic activities of chondrocytes are up-regulated with the
development of OA [181].
Adiponectin
Adiponectin is an adipokine with well established insulin-sensitizing and anti-atherogenic effects [182].
Adiponectin increases insulin sensitivity by stimulating glucose utilization and fatty acid oxidation in
skeletal muscle and liver, and by suppressing gluconeogenesis and de novo lipogenesis in liver [182].
135
Adiponectin also exerts effects at adipose tissue level, as it is pro-adipogenic [183]. More recently, central
effects of adiponectin on hypothalamic centers regulating feeding have been reported, although there have
been controversial results as to whether central adiponectin stimulates [184] or suppresses [185] food
intake, and the physiological importance of adiponectin in the hypothalamic regulation of energy
homeostasis remains to be defined. Adipose expression and circulating levels of adiponectin, as well as the
expression of adiponectin receptors (AdipoR1 and AdipoR2) in tissues, are decreased in obesity, conditions
associated with insulin resistance, and cardiovascular disease [182].
An inverse correlation between adiponectin and classic markers of inflammation in plasma, such as
C-reactive protein and IL-6, is found in obese and insulin-resistant subjects, and several reports have shown
that adiponectin brings about a variety of anti-inflammatory activities, ranging from inhibition of
inflammatory cytokine production by adipocytes and macrophages, to induction of anti-inflammatory
factors, reduction of adhesion molecules expression in the vasculature, and others [175, 186]. However, in
some chronic inflammatory/autoimmune diseases adiponectin may have pro-inflammatory effects and its
production correlates with inflammatory markers and disease activity [175, 186]. In this context, the effects
of adiponectin on joint inflammation and both RA and OA are interesting but controversial.
Adiponectin levels in serum are elevated in RA patients compared with healthy controls with a
similar BMI [187, 188] and in patients with erosive compared with non-erosive OA [189]. In the synovial
fluid, adiponectin levels have been reported to be higher in RA patients, in whom joint inflammation is
more prominent, than in OA patients [188]. Interestingly, adiponectin levels in the synovial fluid of RA and
OA patients are lower than in paired serum samples, with significant correlation noted between levels in the
two sources, suggesting that the main source of articular adiponectin is peripheral adipose tissue rather than
local tissues [188, 190].
A protective effect of adiponectin against cartilage degeneration has been suggested by the finding
that in synovial fluid of RA patients, adiponectin levels inversely correlate with leukocyte count [188].
Moreover, joint tissues including chondrocytes express functional adiponectin receptors [190, 191], and
incubation with adiponectin up-regulates the expression of the MMP inhibitor TIMP-2 and down-regulates
IL-1-induced MMP-13 expression in OA chondrocytes [190]. However, there is also evidence pointing to a
destructive role of adiponectin in cartilage homeostasis, since adiponectin-dependent induction of pro-
inflammatory cytokines and other inflammatory mediators (e.g. IL-6, IL-8, MCP1, nitric oxide, PGE2),
MMPs (MMP-1, MMP-3, MMP-9), and vascular endothelial growth factor has been reported in human
cultured chondrocytes and synovial fibroblasts [191-195]. Thus, there is controversy as to whether
increased adiponectin in the diseased joint may serve to counteract local inflammation or, on the contrary,
contribute to cartilage destruction.
Renin-angiotensin system
The renin-angiotensin system (RAS) converts angiotensinogen into angiotensin II, which is an important
vasoconstrictor and a regulator of blood pressure and of salt and water balance. In the classical RAS,
circulating renal-derived renin cleaves angiotensinogen, a protein principally synthesized in the liver, to
form the inactive decapeptide angiotensin I, which in turn is converted into active angiotensin II by the
action of the dipeptidyl carboxypeptidase angiotensin-converting enzyme (ACE) in the lungs [196]. Effects
136
of angiotensin II are mediated by specific cell surface receptors, notably angiotensin type 1 and 2 receptors
(AT1 and AT2).
In addition to the systemic RAS that regulates blood pressure and fluid-electrolyte balance, local
functional RAS have been demonstrated in many organ and tissue systems. In particular, the components of
the RAS are fully represented in WAT [197, 198]. There is evidence that, with obesity, the adipose tissue
RAS becomes activated and is a primary contributor to systemic concentrations of angiotensin peptides
[197]. In addition, angiotensin II might exert paracrine/autocrine effects in WAT, as both AT1 and AT2
receptors have been localized to adipocytes, and effects of angiotensin II on adipocyte growth and
differentiation, lipid metabolism, and expression and release of adipokines and RAS components have been
reported [197]. Angiotensin II, mainly through the AT1 receptor, has also been demonstrated to promote
inflammation by elaboration of cytokines and chemokines (e.g., upregulation of TNF, IL-6 and MCP1)
and increased oxidative stress [199]. In particular, angiotensin II activates NF-B and it is itself a
chemotactic factor for the recruitment of inflammatory cells. Therefore, activation of the adipose tissue
RAS system in the obese state may contribute to WAT inflammation and related metabolic disorders, as
well as to hypertension and other potential systemic effects − including effects on the joints − by elevating
the circulating concentrations of RAS components. Furthermore, there is evidence of a pathophysiological
crosstalk between the activation of RAS and the generation of advanced glycation end products in diabetic
vascular complications [200].
Studies have suggested that local RAS activity can contribute to synovial inflammation and joint
destruction in RA [201]. For instance, synovial fluid ACE levels and renin concentrations are higher in
patients with RA than in patients with OA [201], and AT1 receptors are up-regulated in the rheumatoid
synovium [202]. Whether RAS activation plays a role in OA is less clear. Interestingly, polymorphisms in
the ACE gene have been associated with the risk of OA in some human population studies [203].
Angiotensin-receptor blockers are used clinically for the treatment of hypertension and
cardiovascular disease. More recently, studies in experimental models of obesity have shown that AT1
receptor blockade reduces plasma glucose levels and improves insulin sensitivity [204]. There is also
evidence, principally from studies in animal models, that AT1 receptor antagonists can reduce
inflammatory synovitis [202]. Further studies are warranted to establish the extent to which AT1 receptor
blockers may provide anti-inflammatory benefits in the context of obesity and/or OA in humans.
Resistin and visfatin
Resistin was originally identified as an adipocyte-secreted protein down-regulated by anti-diabetic drugs
that causes insulin resistance in mice, although there have been subsequent conflicting findings, particularly
in humans [205]. Visfatin, in turn, was claimed to be a beneficial adipokine with insulin-
mimicking/sensitizing effects, although regulation of visfatin production and its physiological importance in
the conditions of obesity and type 2 diabetes remains unclear [206]. Despite putative opposing effects of
resistin and visfatin on insulin sensitivity, both adipokines have pro-inflammatory properties [207], and
both have emerged as pro-inflammatory and pro-catabolic factors in arthritides [5, 6]. Resistin is detected in
the inflamed joints of patients with OA and, especially, RA, and resistin serum levels positively correlate
137
with disease activity in RA [208]. In line with a catabolic role, resistin is elevated in the joint following
traumatic joint injury and resistin promotes ECM degradation and release of inflammatory cytokines from
articular cartilage in vitro [209]. Likewise, serum levels of visfatin are elevated in RA patients, in which
they correlate with the severity of the disease [210], and there is evidence that visfatin is produced by
human OA chondrocytes and stimulates the production of matrix degrading enzymes and PGE2 by cultured
chondrocytes [211].
More recently, newly discovered adipokines such as vaspin, omentin and apelin have been
detected in the synovial fluid of RA and OA patients [212, 213]. Apelin, in particular, appears to play a
catabolic role in cartilage in both in vitro and in vivo studies [214]. Nerve growth factor is another signal
produced by adipose tissue that might play a role in the pathogenesis of obesity-associated OA and
cardiometabolic diseases, with a pro-inflammatory effect [5, 6, 100].
HYPOXIA INDUCIBLE TRANSCRIPTION FACTORS (HIFs)
HIFs control changes in gene expression typically in response to changes in oxygen availability in the
cellular environment, although their activity might respond to other forms of cellular stress besides hypoxia
[215]. The HIF protein family consists of - and -subunit members which function by forming
heterodimers. Under normoxic conditions, the -subunit members (HIF-1, HIF-2 and HIF-3) undergo
oxygen-dependent hydroxylation, resulting in ubiquitination and degradation by the proteosome. In
contrast, under hypoxic conditions they are neither hydroxylated nor degraded and are active in the control
of hypoxia-inducible genes, which include genes encoding proteins that promote angiogenesis, anaerobic
metabolism and pH homeostasis.
Articular cartilage is a physiologically hypoxic tissue, and HIF-1 is required for the maintenance
of anaerobic glycolysis and ECM synthesis in mature chondrocytes and as a survival factor inhibiting
chondrocyte apoptosis [216, 217]. In striking contrast, the closely related HIF-2 has recently emerged as a
central player promoting the development of OA [217-219]. It has been shown that HIF-2 directly induces
the expression in chondrocytes of catabolic factors including MMPs and aggrecanases as well as of proteins
linked to pathological endochondral ossification; that HIF-2 expression in cartilage is markedly increased
in early stages of human and mouse OA; that ectopic expression of HIF-2 results in articular cartilage
destruction in mice and rabbits, whereas its experimental knockdown blocks cartilage destruction; and that
HIF-2 expression is induced in chondrocytes by multiple pro-inflammatory cytokines, possibly through
the activation of the NF-B pathway [218, 219]. These findings suggest that in OA cartilage there is a
stress-induced increase in the activity of HIF-2 which overshadows the beneficial effects of HIF-1, and
that down-regulation of HIF-2 in the joint may represent a novel therapeutic target in OA [217].
HIFs, in particular HIF-1, have also been implicated in adipose tissue biology and obesity. HIF-
1 transactivates the human leptin gene, which is induced in response to hypoxia in human adipocytes and
preadipocytes [144, 220]. In addition, a role of HIF-1 for normal BAT function, and thereof for obesity
resistance, has been recently proposed, following the demonstration of an obesity-prone phenotype in mice
with adipose tissue-selective inhibition of HIF-1 which is associated with reduced angiogenesis in BAT
138
(but not WAT) and reduced mitochondrial content in brown adipocytes [221]. Other authors have
investigated the consequences of transgenic HIF-1 overexpression in adipose tissues and found that HIF-
1 activation initiates a local fibrotic response with an associated increase in local inflammation [222].
Induction of adipose tissue fibrosis by activated HIF-1 is explained, at least in part, because one HIF-1
target gene encodes a lysil oxidase that catalyses cross-linking of collagen I and III to form the fibrilar
collagen fibers [222]. Fibrosis in adipose tissue has previously been linked to increased stress on expanding
adipocytes, and to adipocyte necrosis [119]. The results led the authors to hypothesize that, in obesity,
localized WAT hypoxia and subsequent HIF-1 activation and HIF-1-induced fibrosis could be early
upstream initiator factors for subsequent adipocyte death, monocyte infiltration, local inflammation and
systemic consequences thereof, such as reduced insulin sensitivity [222]. Overall, the emerging picture is
that activation of HIF-1 in BAT might serve to increase thermogenesis in tissue and energy expenditure,
whereas activation of HIF-1 in WAT may favor WAT dysfunction and insulin resistance.
LIPIDS
Obesity, particularly abdominal obesity, is frequently accompanied by dyslipidemia, with high circulating
levels of free fatty acids, triacylglycerol and cholesterol, all of which are well-known risk factors for type II
diabetes and vascular disease. Different factors underlie dyslipidemia in obesity, including aberrant
lipolysis and/or fatty acid metabolism in dysfunctional adipocytes. Because lipids are likely contributors to
the pathogenesis of cartilage degradation, altered lipid metabolism is a potential link between obesity and
OA [1, 4, 223].
Multiple lines of evidence implicate lipids in the development of OA. Even if articular cartilage is
an avascular tissue, there is evidence that circulating lipids can access chondrocytes. For instance, dietary
lipid interventions in animals impact on the fatty acid composition of articular cartilage [224, 225], and in
ex vivo experiments using cartilage explants fatty acids were shown to enter the cartilage matrix at a faster
rate than albumin [226]. Excessive fat in the synovial fluid can induce arthritic changes in articular cartilage
and synovial membrane, and raised concentrations of fatty acids and neutral lipids are found in cartilage
from patients with OA [227, 228]. Epidemiological studies have shown serum cholesterol to be a risk factor
for OA development [1, 223]. Proteomic analyses indicate that many of the proteins that are differentially
expressed in OA cartilage compared with normal cartilage are related to lipid metabolism [223]. In
particular, human OA chondrocytes display a reduced expression of genes regulating cholesterol efflux
[228], and an increased expression of the oxidized low density lipoprotein receptor, LOX-1 [229].
Apart from effects related to hypercholesterolemia, oversupply of free fatty acids to tissues as
occurs in obesity might boost the local production of inflammatory lipid mediators which may play a part in
pathologies typically associated with obesity as well as in arthritides [230, 231]. The main bioactive lipids
in this context are addressed below.
Eicosanoids
The n-6 polyunsaturated fatty acid (PUFA) arachidonic acid (ARA, 20:4 cis-5,8,11,14
) is the precursor of
pro-inflammatory eicosanoids [232]. ARA is formed from the essential n-6 fatty acid linoleic acid (18:2 cis-
139
9,12
) and is abundant in cell membrane phospholipids. The first step in the production of ARA-derived
eicosanoids is the release of ARA from cell membrane phospholipids by the action of phospholipase A2,
especially when inflammatory signals such as interleukins or interferons stimulate the cell. Released ARA
is then converted to leukotrienes through the action of the enzyme lipooxygenase or to prostaglandin G2
(PGG2) through the action of cyclooxygenases. From PGG2 other prostaglandins and thromboxanes are
formed through different terminal synthases. Cycloxygenase-derived metabolites are collectively termed
prostanoids. Prostanoids can function from the cell exterior in a paracrine-autocrine manner through
activation of specific cell-surface G protein-coupled receptors, or they can function in an intracrine manner
by serving as activating ligands of nuclear receptors such as PPARs.
Evidence from animal studies indicates that cyclooxygenase activation is crucially involved in the
development of the inflammatory response in WAT of high fat diet-induced obese rats and in obesity-linked
insulin resistance and fatty liver [233, 234]. In addition, prostaglandins modulate adipocyte differentiation
and lipid metabolism in a rather complex manner. For instance PGE2 inhibits white adipocyte
differentiation [235], yet it can contribute to the hypertrophic enlargement of adipocytes through its anti-
lipolytic activity [236]. Moreover, recent studies in animals indicate that local cyclooxygenase activity and
PGE2 in WAT may oppose obesity by favoring the recruitment of brown adipocyte precursors present in
white fat depots, and thereof energy expenditure [237, 238]. Interestingly, reduced production of PGE2 in
WAT in obesity has been reported [239], a feature that could contribute to dysregulated lipolysis, enhanced
white adipogenesis and reduced energy expenditure. Other ARA-derived eicosanoids, in particular PGI2
(prostacyclin) and 15-deoxy PGJ2, have been implicated as pro-adipogenic factors capable of inducing
white adipogenesis and fat accumulation in mature adipocytes [240, 241]. In keeping with an overall pro-
adipogenic effect of ARA-derived eicosanoids, several human and animal studies have shown a direct
correlation between increased levels of ARA in fat depots or plasma and increased obesity or body weight
[231, 242].
ARA-derived eicosanoids have been implicated in the pathogenesis of OA. The articular cartilage
content of ARA correlates with OA severity [227]. The expression of microsomal PGE2 synthase-1
(mPGES-1) a terminal PGE2-synthesizing enzyme is induced in human cartilage in response to
inflammatory cytokines [243] and mechanical compression [244]. Among the prostaglandins, a lot of work
has focused on PGE2, which is usually implicated as a major lipid inflammatory mediator, yet its role in
chondrogenesis and OA development remains controversial. Whereas some studies have found PGE2 to be
pro-catabolic and anti-anabolic in cartilage (e.g. [245, 246]) others have found this prostaglandin to induce
chondrogenesis in vitro and cartilage regeneration in vivo [247, 248]. Chondrocytes express different
isoforms of the PGE2 cell surface receptor (named EP1 to EP4), and PGE2 appears to exert different effects
through each isoform. Data suggest that PGE2 signals catabolic effects through the EP4 receptor [245] and
anabolic effects through the EP2 receptor [247, 248]. Whether the expression pattern of PGE2 receptors in
cartilage varies with OA development is unknown, but is conceivable since, for instance, up-regulation of
EP1 and EP4 in articular chondrocytes following pro-inflammatory cytokine (IL-1) stimulation has been
reported [249]. Other prostaglandins besides PGE2 have been implicated in the pathogenesis of OA. In
140
particular, a potential role of 15-deoxy PGJ2 favoring articular chondrocyte apoptosis has been proposed
[250].
Interestingly, normal young cartilage in human and other species appears to have a unique fatty
acid composition, with high levels of unusual n-9 PUFA (20:3 cis-5,8,11
) and low levels of n-6 PUFA
(linoleic acid and ARA) [251]. Importantly, the high levels of n-9 fatty acid in young cartilage are
progressively depleted during aging, accompanied by an increase in n-6 PUFA, a trend that is particularly
pronounced in OA cartilage [251]. The significance of these findings is not fully understood, but it was
suggested that, since the 20:3 n-9 fatty acid cannot be a substrate for cyclooxygenase, its accumulation in
young cartilage may be important to prevent prostaglandin-induced inflammatory responses [251].
Whereas n-6 PUFA-derived eicosanoids have pro-inflammatory and pro-atherogenic effects,
eicosanoids derived from the n-3 PUFAs eicosapentaenoic acid (EPA, 20:5 cis-∆5,8,11,14,17
) and
docosahexaenoic acid (DHA, 22:6 cis-∆4,7,10,13,16,19
) have either the opposite effects or possess much lower
levels of biological activity than the n-6 eicosanoids [232]. Moreover, additional classes of anti-
inflammatory lipid mediators, namely resolvins and protectins, are formed from n-3 PUFAs [252]. In
chondrocyte cell systems, incubation with n-3 PUFAs (particularly EPA) specifically reduced the
expression of cartilage-degrading proteinases (aggrecanases, MMP-13), inflammatory cytokines (IL-1 and
TNF) and cyclooxygenase-2 [253]. Besides anti-inflammatory, n-3 PUFAs may be viewed as anti-
obesogenic because they can inhibit the production of pro-adipogenic lipid mediators from n-6 PUFA in
preadipocytes (by competing for the same eicosanoid producing enzymes), and because they have well-
established effects reducing lipogenesis in liver and stimulating fatty acid oxidation in WAT [254]. In fact,
it has been suggested that a relatively high intake of n-6 PUFA and low of n-3 PUFA, especially during
early life and infancy, could be a contributory factor to current obesity pandemics; what is more, it has been
noted that the n-6 PUFA/n-3 PUFA ratio has continuously and markedly increased in human breast milk
and infant formulas in the last decades [255]. EPA ad DHA are abundant in fatty fish and fish oil, and can
be formed in mammalian cells from the essential n-3 fatty acid -linolenic acid (18:3 cis-∆9,12,15
), although
only in low amounts.
Cardioprotective effects of fish oil consumption are well established, and n-3 PUFA
supplementation is also viewed as a useful anti-inflammatory strategy to decrease obesity-induced insulin
resistance [256]. As for effects on obesity itself, studies in rodents have consistently reported that intake of
n-3 PUFA reduces adipose mass, preferentially visceral fat, and limits diet-induced obesity (see [257]). In
humans, there have been studies showing that dietary fish oil consumption can increase whole-body lipid
oxidation, reduce total body fat content and specifically abdominal fat content, and improve insulin
sensitivity [258, 259]. In one study, dietary n-3 PUFA supplementation combined with a very low calorie
intake enhanced weight loss in obese women [260]. Regarding arthritis, clinical trials have generally shown
that dietary supplementation with n-3 PUFA provides modest symptomatic benefit in arthritic patients, but
most of these studies have focused on RA, rather than on OA [253, 261].
141
Ceramide and sphingolipids
Sphingolipids are derivatives of sphingosine, an 18-carbon amino alcohol itself derived from linkage of
serine and palmitic acid (from palmitoyl-CoA) through the action of the enzyme serine palmitoyltransferase
[230]. Sphingolipids are structural components of cell membranes and many of them also exert signaling
functions. Ceramide, a sphingolipid made up of sphingosine and a fatty acid, is an important signaling
molecule on its own and a precursor for other signaling molecules including sphingosine, sphingosine-1-
phosphate (S1P), and ceramide-1-phosphate. Ceramide also functions as a structural building block for
complex sphingolipids such as sphingomyelin and glycosphingolipids. Sphingolipids have been implicated
in diverse regulatory functions including: promotion of apoptosis (ceramide), inhibition of apoptosis and
promotion of cell proliferation (S1P), and promotion of inflammation (S1P, ceramide-1-phosphate) [230].
S1P and ceramide-1-phosphate favor the production of inflammatory lipid mediators by activating
cyclooxygenase-2 and phospholipase A2 in cells, respectively [230]. Moreover, S1P is produced in
response to inflammatory cytokines (such as TNF and IL-1) and promotes further cytokine production
by activating NF-B signaling, potentially providing a positive feedback loop in the inflammatory response
[230].
Tissue production of sphingolipids is increased in human and rodent obesity, probably boosted by
fatty acid oversupply, and it is now recognized that aberrant production of sphingolipids plays a part in the
pathophysiological changes associated with obesity [230, 262]. Sphingolipids have also been implicated in
the pathophysiology of arthritides [4]. Cell-permeant ceramide increases proteoglycan degradation in
cartilage explants and induces the production of MMPs and apoptosis in cultured chondrocytes [263]. There
are results indicating increased local production and concentration of S1P in the inflamed joint [264, 265],
and suggesting a catabolic, pro-inflammatory activity of S1P in human cartilage and synovium [264, 266].
Other authors, however, have reached the opposite conclusion that S1P might provide a pro-proliferative,
anti-catabolic signal in articular chondrocytes [267, 268]. All in all, although the effects of S1P in
chondrocytes require further investigation, the accumulated evidence sustains a role for sphingolipid
balance in joint diseases.
Inhibition of sphingolipid synthesis (by treatment with the serine palmitoyltransferase inhibitor
myriocin) increased insulin sensitivity, resolved hepatic steatosis and prevented the onset of diabetes in
obese rodents [269]. Chemical inhibition of sphingosine kinase (which catalyses the synthesis of S1P from
sphingosine) inhibited disease severity and reduced articular inflammation and joint destruction in a murine
model of inflammatory arthritis [270]. These and other results suggest that modulation of sphingolipid
levels and sphingolipid signaling pathways may represent a novel therapeutic target in pathologies
associated with obesity as well as in arthritides.
Lipid peroxidation
Oxidative stress (i.e., the accumulation of ROS and other free radicals) and inflammation go hand-in-hand
because oxidative stress induces the production of pro-inflammatory cytokines, and the cytokines in turn
induce free radical production. Oxidative stress has been implicated both in cartilage degeneration [271]
and in obesity and the metabolic syndrome [272]. One specific facet of oxidative stress is membrane lipid
peroxidation, an autocatalytic process initiated by free radical attack on the double bonds of membrane
142
unsaturated fatty acids. A specific aldehydic product of lipid peroxidation, 4-hydroxynonenal (HNE), is
increasingly recognized as a particularly important mediator and marker of cellular dysfunction and
degeneration in a range of disorders including arthritis [4, 273] and the metabolic syndrome [274].
HNE acts mainly by covalently modifying (i.e. forming adducts with) different proteins. Levels of
HNE are increased in tissues (blood, muscle) of obese subjects [274] and in OA joints [4, 273]. HNE can
damage pancreatic beta cells, impair the ability of muscle and liver cells to respond to insulin, promote
atherosclerosis by modifying lipoproteins and cause cardiac cell damage by impairing metabolic enzymes
[274]. Additionally, it has been suggested that increased levels of HNE in the brain may underlie
associations of obesity (or factors promoting it) with increased risk of neurodegenerative diseases such as
Alzheimer’s and Parkinson’s [274]. In cartilage, HNE activates MMP-13 and facilitates collagen
degradation by MMP-13 by forming adducts with type II collagen [273]. Moreover, a recent report
indicates that interactions of articular chondrocytes with HNE-modified ECM protein can induce a plethora
of changes in cell phenotype and function which may contribute to OA development, including induction of
inflammatory and catabolic responses and cell death, and that these outcomes can be prevented by an HNE-
trapping drug (carnosine) [275].
Exercise and dietary energy restriction reduce HNE production and may also increase cellular
systems for HNE detoxification including glutathione and oxidoreductases [274]. Additionally, it has been
suggested that specific dietary interventions and pharmacological strategies aimed at preventing HNE
production or blocking its adverse action (e.g., treatment with low molecular weight molecules that
scavenge HNE, such as carnosine analogs) may be useful in the treatment of obesity and the metabolic
syndrome [274], and possibly also OA [275].
ADVANCED GLYCATION END PRODUCTS (AGEs)
AGEs are a heterogeneous group of macromolecules that are formed by the non-enzymatic glycation of
proteins, lipids and nucleic acids [276, 277]. AGEs resulting from the reaction between reducing sugars and
free amino groups in lysine or arginine residues of proteins have been studied most. Once they are formed,
AGEs cannot be removed from the protein and only leave a tissue when the protein involved is degraded;
therefore, AGE accumulation is largely determined by the rate of protein turnover, affecting mainly long-
lived proteins. Humans are exposed to two main sources of AGEs: AGEs formed endogenously and AGEs
originating from exogenous sources such as tobacco smoke and diet. Food processing, especially prolonged
heating, has an accelerating effect on AGE formation, and a significant proportion of ingested AGEs are
absorbed with food, although the relative importance of these exogenous sources of AGEs in the
pathogenesis of disease remains to be determined.
AGEs interfere with normal physiology by directly modifying and covalently cross-linking
proteins and other macromolecules, and by initiating cellular responses after interacting with specific
proteins that bind to these chemical moieties [276]. Among the latter, the most extensively studied is the
receptor for AGE (RAGE), a member of the Ig superfamily of receptors found at the cell surface. AGE
modification of ECM proteins is prominent because of the low turnover rate of these proteins, and leads to
structural alterations including increased stiffness and resistance to proteolytic digestion. Additionally,
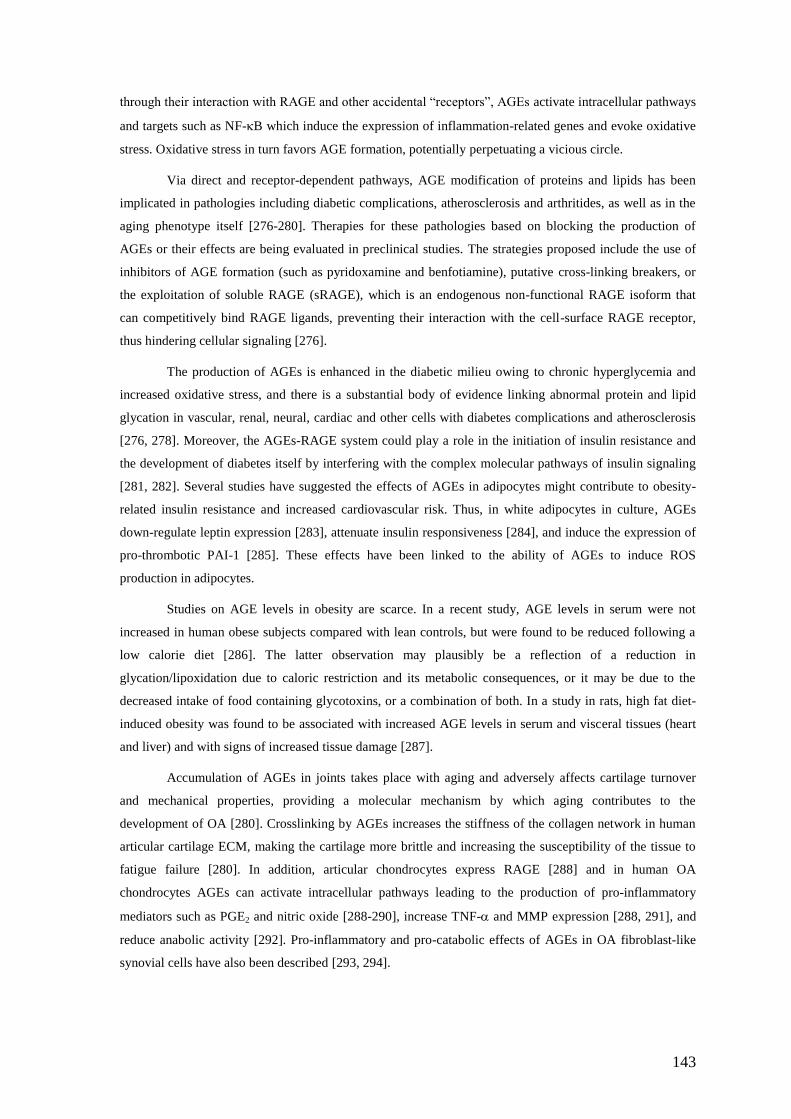
143
through their interaction with RAGE and other accidental “receptors”, AGEs activate intracellular pathways
and targets such as NF-B which induce the expression of inflammation-related genes and evoke oxidative
stress. Oxidative stress in turn favors AGE formation, potentially perpetuating a vicious circle.
Via direct and receptor-dependent pathways, AGE modification of proteins and lipids has been
implicated in pathologies including diabetic complications, atherosclerosis and arthritides, as well as in the
aging phenotype itself [276-280]. Therapies for these pathologies based on blocking the production of
AGEs or their effects are being evaluated in preclinical studies. The strategies proposed include the use of
inhibitors of AGE formation (such as pyridoxamine and benfotiamine), putative cross-linking breakers, or
the exploitation of soluble RAGE (sRAGE), which is an endogenous non-functional RAGE isoform that
can competitively bind RAGE ligands, preventing their interaction with the cell-surface RAGE receptor,
thus hindering cellular signaling [276].
The production of AGEs is enhanced in the diabetic milieu owing to chronic hyperglycemia and
increased oxidative stress, and there is a substantial body of evidence linking abnormal protein and lipid
glycation in vascular, renal, neural, cardiac and other cells with diabetes complications and atherosclerosis
[276, 278]. Moreover, the AGEs-RAGE system could play a role in the initiation of insulin resistance and
the development of diabetes itself by interfering with the complex molecular pathways of insulin signaling
[281, 282]. Several studies have suggested the effects of AGEs in adipocytes might contribute to obesity-
related insulin resistance and increased cardiovascular risk. Thus, in white adipocytes in culture, AGEs
down-regulate leptin expression [283], attenuate insulin responsiveness [284], and induce the expression of
pro-thrombotic PAI-1 [285]. These effects have been linked to the ability of AGEs to induce ROS
production in adipocytes.
Studies on AGE levels in obesity are scarce. In a recent study, AGE levels in serum were not
increased in human obese subjects compared with lean controls, but were found to be reduced following a
low calorie diet [286]. The latter observation may plausibly be a reflection of a reduction in
glycation/lipoxidation due to caloric restriction and its metabolic consequences, or it may be due to the
decreased intake of food containing glycotoxins, or a combination of both. In a study in rats, high fat diet-
induced obesity was found to be associated with increased AGE levels in serum and visceral tissues (heart
and liver) and with signs of increased tissue damage [287].
Accumulation of AGEs in joints takes place with aging and adversely affects cartilage turnover
and mechanical properties, providing a molecular mechanism by which aging contributes to the
development of OA [280]. Crosslinking by AGEs increases the stiffness of the collagen network in human
articular cartilage ECM, making the cartilage more brittle and increasing the susceptibility of the tissue to
fatigue failure [280]. In addition, articular chondrocytes express RAGE [288] and in human OA
chondrocytes AGEs can activate intracellular pathways leading to the production of pro-inflammatory
mediators such as PGE2 and nitric oxide [288-290], increase TNF- and MMP expression [288, 291], and
reduce anabolic activity [292]. Pro-inflammatory and pro-catabolic effects of AGEs in OA fibroblast-like
synovial cells have also been described [293, 294].
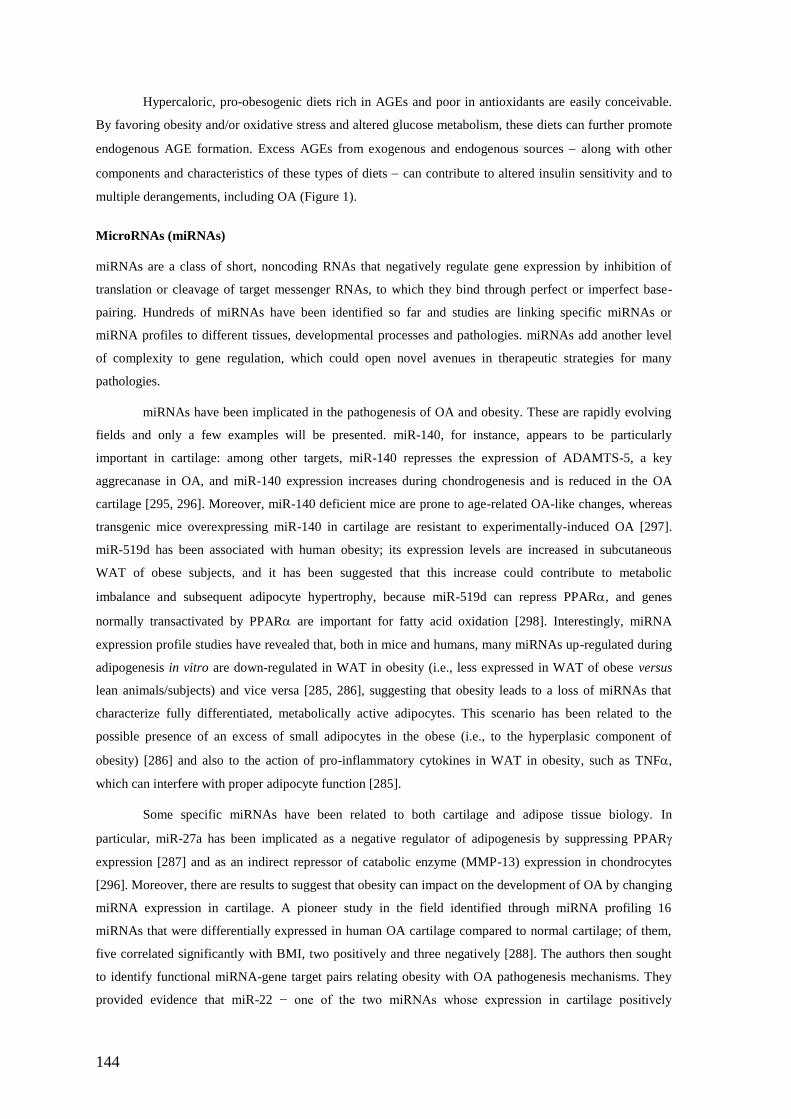
144
Hypercaloric, pro-obesogenic diets rich in AGEs and poor in antioxidants are easily conceivable.
By favoring obesity and/or oxidative stress and altered glucose metabolism, these diets can further promote
endogenous AGE formation. Excess AGEs from exogenous and endogenous sources along with other
components and characteristics of these types of diets can contribute to altered insulin sensitivity and to
multiple derangements, including OA (Figure 1).
MicroRNAs (miRNAs)
miRNAs are a class of short, noncoding RNAs that negatively regulate gene expression by inhibition of
translation or cleavage of target messenger RNAs, to which they bind through perfect or imperfect base-
pairing. Hundreds of miRNAs have been identified so far and studies are linking specific miRNAs or
miRNA profiles to different tissues, developmental processes and pathologies. miRNAs add another level
of complexity to gene regulation, which could open novel avenues in therapeutic strategies for many
pathologies.
miRNAs have been implicated in the pathogenesis of OA and obesity. These are rapidly evolving
fields and only a few examples will be presented. miR-140, for instance, appears to be particularly
important in cartilage: among other targets, miR-140 represses the expression of ADAMTS-5, a key
aggrecanase in OA, and miR-140 expression increases during chondrogenesis and is reduced in the OA
cartilage [295, 296]. Moreover, miR-140 deficient mice are prone to age-related OA-like changes, whereas
transgenic mice overexpressing miR-140 in cartilage are resistant to experimentally-induced OA [297].
miR-519d has been associated with human obesity; its expression levels are increased in subcutaneous
WAT of obese subjects, and it has been suggested that this increase could contribute to metabolic
imbalance and subsequent adipocyte hypertrophy, because miR-519d can repress PPAR, and genes
normally transactivated by PPAR are important for fatty acid oxidation [298]. Interestingly, miRNA
expression profile studies have revealed that, both in mice and humans, many miRNAs up-regulated during
adipogenesis in vitro are down-regulated in WAT in obesity (i.e., less expressed in WAT of obese versus
lean animals/subjects) and vice versa [285, 286], suggesting that obesity leads to a loss of miRNAs that
characterize fully differentiated, metabolically active adipocytes. This scenario has been related to the
possible presence of an excess of small adipocytes in the obese (i.e., to the hyperplasic component of
obesity) [286] and also to the action of pro-inflammatory cytokines in WAT in obesity, such as TNF,
which can interfere with proper adipocyte function [285].
Some specific miRNAs have been related to both cartilage and adipose tissue biology. In
particular, miR-27a has been implicated as a negative regulator of adipogenesis by suppressing PPAR
expression [287] and as an indirect repressor of catabolic enzyme (MMP-13) expression in chondrocytes
[296]. Moreover, there are results to suggest that obesity can impact on the development of OA by changing
miRNA expression in cartilage. A pioneer study in the field identified through miRNA profiling 16
miRNAs that were differentially expressed in human OA cartilage compared to normal cartilage; of them,
five correlated significantly with BMI, two positively and three negatively [288]. The authors then sought
to identify functional miRNA-gene target pairs relating obesity with OA pathogenesis mechanisms. They
provided evidence that miR-22 − one of the two miRNAs whose expression in cartilage positively
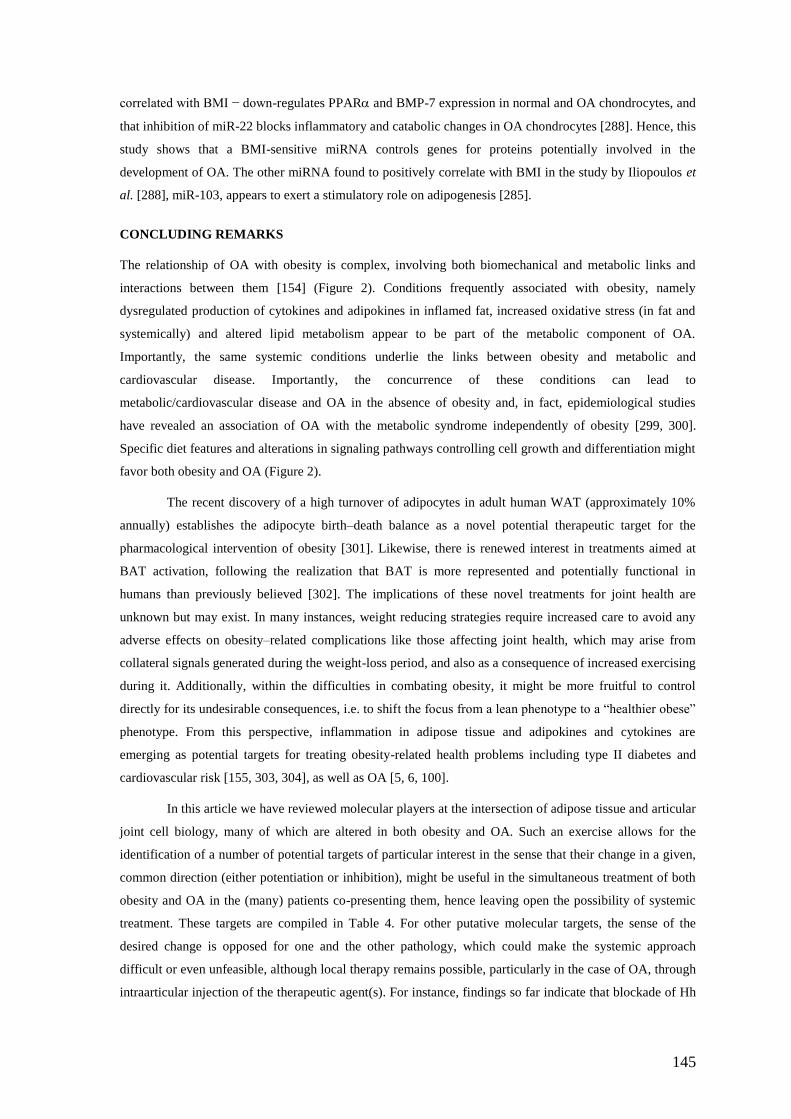
145
correlated with BMI − down-regulates PPAR and BMP-7 expression in normal and OA chondrocytes, and
that inhibition of miR-22 blocks inflammatory and catabolic changes in OA chondrocytes [288]. Hence, this
study shows that a BMI-sensitive miRNA controls genes for proteins potentially involved in the
development of OA. The other miRNA found to positively correlate with BMI in the study by Iliopoulos et
al. [288], miR-103, appears to exert a stimulatory role on adipogenesis [285].
CONCLUDING REMARKS
The relationship of OA with obesity is complex, involving both biomechanical and metabolic links and
interactions between them [154] (Figure 2). Conditions frequently associated with obesity, namely
dysregulated production of cytokines and adipokines in inflamed fat, increased oxidative stress (in fat and
systemically) and altered lipid metabolism appear to be part of the metabolic component of OA.
Importantly, the same systemic conditions underlie the links between obesity and metabolic and
cardiovascular disease. Importantly, the concurrence of these conditions can lead to
metabolic/cardiovascular disease and OA in the absence of obesity and, in fact, epidemiological studies
have revealed an association of OA with the metabolic syndrome independently of obesity [299, 300].
Specific diet features and alterations in signaling pathways controlling cell growth and differentiation might
favor both obesity and OA (Figure 2).
The recent discovery of a high turnover of adipocytes in adult human WAT (approximately 10%
annually) establishes the adipocyte birth–death balance as a novel potential therapeutic target for the
pharmacological intervention of obesity [301]. Likewise, there is renewed interest in treatments aimed at
BAT activation, following the realization that BAT is more represented and potentially functional in
humans than previously believed [302]. The implications of these novel treatments for joint health are
unknown but may exist. In many instances, weight reducing strategies require increased care to avoid any
adverse effects on obesity–related complications like those affecting joint health, which may arise from
collateral signals generated during the weight-loss period, and also as a consequence of increased exercising
during it. Additionally, within the difficulties in combating obesity, it might be more fruitful to control
directly for its undesirable consequences, i.e. to shift the focus from a lean phenotype to a “healthier obese”
phenotype. From this perspective, inflammation in adipose tissue and adipokines and cytokines are
emerging as potential targets for treating obesity-related health problems including type II diabetes and
cardiovascular risk [155, 303, 304], as well as OA [5, 6, 100].
In this article we have reviewed molecular players at the intersection of adipose tissue and articular
joint cell biology, many of which are altered in both obesity and OA. Such an exercise allows for the
identification of a number of potential targets of particular interest in the sense that their change in a given,
common direction (either potentiation or inhibition), might be useful in the simultaneous treatment of both
obesity and OA in the (many) patients co-presenting them, hence leaving open the possibility of systemic
treatment. These targets are compiled in Table 4. For other putative molecular targets, the sense of the
desired change is opposed for one and the other pathology, which could make the systemic approach
difficult or even unfeasible, although local therapy remains possible, particularly in the case of OA, through
intraarticular injection of the therapeutic agent(s). For instance, findings so far indicate that blockade of Hh
146
signaling in cartilage could be therapeutic in OA, whereas activation of Hh signaling in adipose tissue could
be desirable in obesity. Another example is offered by adiponectin, for which there is evidence of a
destructive role in cartilage homeostasis, but of anti-inflammatory effects on the vasculature and positive
effects on metabolic pathways. Finally, other signaling pathways/molecules reviewed herein (e.g. Wnt
signaling, TGF) are involved in OA and/or obesity in rather complex ways or have an intrinsic complexity
which makes it difficult to make predictions as to possible therapeutic implications, which in any case
would only be feasible provided specificity can be achieved. On the whole, understanding the connections
between joint degeneration and excess body fat could serve to better and more efficiently combat both
conditions.
Acknowledgements: This work has been developed mainly as part of a contract between Bioibérica S.A.
(Spain) and the University of the Balearic Islands within the framework of the CENIT PRONAOS project,
funded by the CDTI and sponsored by the Ministerio de Ciencia e Innovación of the Spanish Government.
Research on obesity in the laboratory of A.P. is funded by grants from the Spanish Government (AGL2009-
11277/ALI to A.P.) and the European Union (BIOCLAIMS project, FP7-244995, coordinated by A.P., and
IDEFICS project, FP6-2004-FOOD-3-A016181-2). Our Laboratory is a member of The European
Nutrigenomics Organization (NuGO, EU Contract FOOD-CT-2004-506360). CIBER de Fisiopatología de
la Obesidad y Nutrición is an initiative of the ISCIII (Spanish Government).
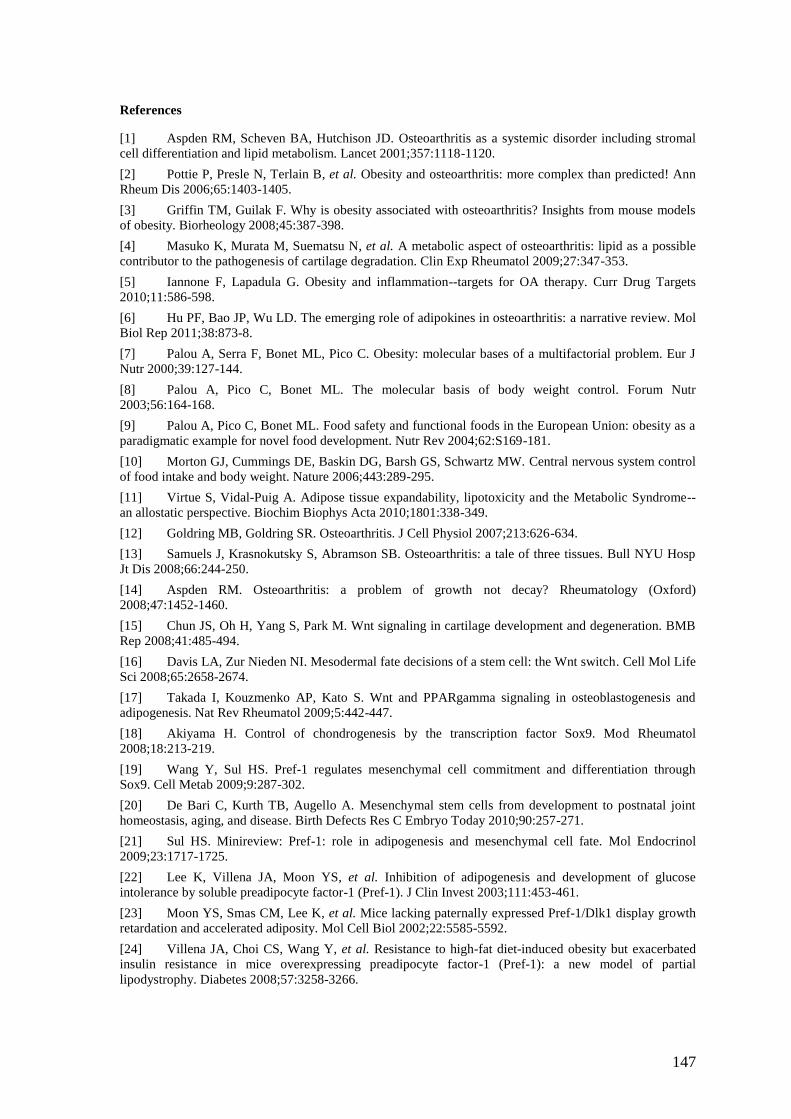
147
References
[1] Aspden RM, Scheven BA, Hutchison JD. Osteoarthritis as a systemic disorder including stromal
cell differentiation and lipid metabolism. Lancet 2001;357:1118-1120.
[2] Pottie P, Presle N, Terlain B, et al. Obesity and osteoarthritis: more complex than predicted! Ann
Rheum Dis 2006;65:1403-1405.
[3] Griffin TM, Guilak F. Why is obesity associated with osteoarthritis? Insights from mouse models
of obesity. Biorheology 2008;45:387-398.
[4] Masuko K, Murata M, Suematsu N, et al. A metabolic aspect of osteoarthritis: lipid as a possible
contributor to the pathogenesis of cartilage degradation. Clin Exp Rheumatol 2009;27:347-353.
[5] Iannone F, Lapadula G. Obesity and inflammation--targets for OA therapy. Curr Drug Targets
2010;11:586-598.
[6] Hu PF, Bao JP, Wu LD. The emerging role of adipokines in osteoarthritis: a narrative review. Mol
Biol Rep 2011;38:873-8.
[7] Palou A, Serra F, Bonet ML, Pico C. Obesity: molecular bases of a multifactorial problem. Eur J
Nutr 2000;39:127-144.
[8] Palou A, Pico C, Bonet ML. The molecular basis of body weight control. Forum Nutr
2003;56:164-168.
[9] Palou A, Pico C, Bonet ML. Food safety and functional foods in the European Union: obesity as a
paradigmatic example for novel food development. Nutr Rev 2004;62:S169-181.
[10] Morton GJ, Cummings DE, Baskin DG, Barsh GS, Schwartz MW. Central nervous system control
of food intake and body weight. Nature 2006;443:289-295.
[11] Virtue S, Vidal-Puig A. Adipose tissue expandability, lipotoxicity and the Metabolic Syndrome--
an allostatic perspective. Biochim Biophys Acta 2010;1801:338-349.
[12] Goldring MB, Goldring SR. Osteoarthritis. J Cell Physiol 2007;213:626-634.
[13] Samuels J, Krasnokutsky S, Abramson SB. Osteoarthritis: a tale of three tissues. Bull NYU Hosp
Jt Dis 2008;66:244-250.
[14] Aspden RM. Osteoarthritis: a problem of growth not decay? Rheumatology (Oxford)
2008;47:1452-1460.
[15] Chun JS, Oh H, Yang S, Park M. Wnt signaling in cartilage development and degeneration. BMB
Rep 2008;41:485-494.
[16] Davis LA, Zur Nieden NI. Mesodermal fate decisions of a stem cell: the Wnt switch. Cell Mol Life
Sci 2008;65:2658-2674.
[17] Takada I, Kouzmenko AP, Kato S. Wnt and PPARgamma signaling in osteoblastogenesis and
adipogenesis. Nat Rev Rheumatol 2009;5:442-447.
[18] Akiyama H. Control of chondrogenesis by the transcription factor Sox9. Mod Rheumatol
2008;18:213-219.
[19] Wang Y, Sul HS. Pref-1 regulates mesenchymal cell commitment and differentiation through
Sox9. Cell Metab 2009;9:287-302.
[20] De Bari C, Kurth TB, Augello A. Mesenchymal stem cells from development to postnatal joint
homeostasis, aging, and disease. Birth Defects Res C Embryo Today 2010;90:257-271.
[21] Sul HS. Minireview: Pref-1: role in adipogenesis and mesenchymal cell fate. Mol Endocrinol
2009;23:1717-1725.
[22] Lee K, Villena JA, Moon YS, et al. Inhibition of adipogenesis and development of glucose
intolerance by soluble preadipocyte factor-1 (Pref-1). J Clin Invest 2003;111:453-461.
[23] Moon YS, Smas CM, Lee K, et al. Mice lacking paternally expressed Pref-1/Dlk1 display growth
retardation and accelerated adiposity. Mol Cell Biol 2002;22:5585-5592.
[24] Villena JA, Choi CS, Wang Y, et al. Resistance to high-fat diet-induced obesity but exacerbated
insulin resistance in mice overexpressing preadipocyte factor-1 (Pref-1): a new model of partial
lipodystrophy. Diabetes 2008;57:3258-3266.
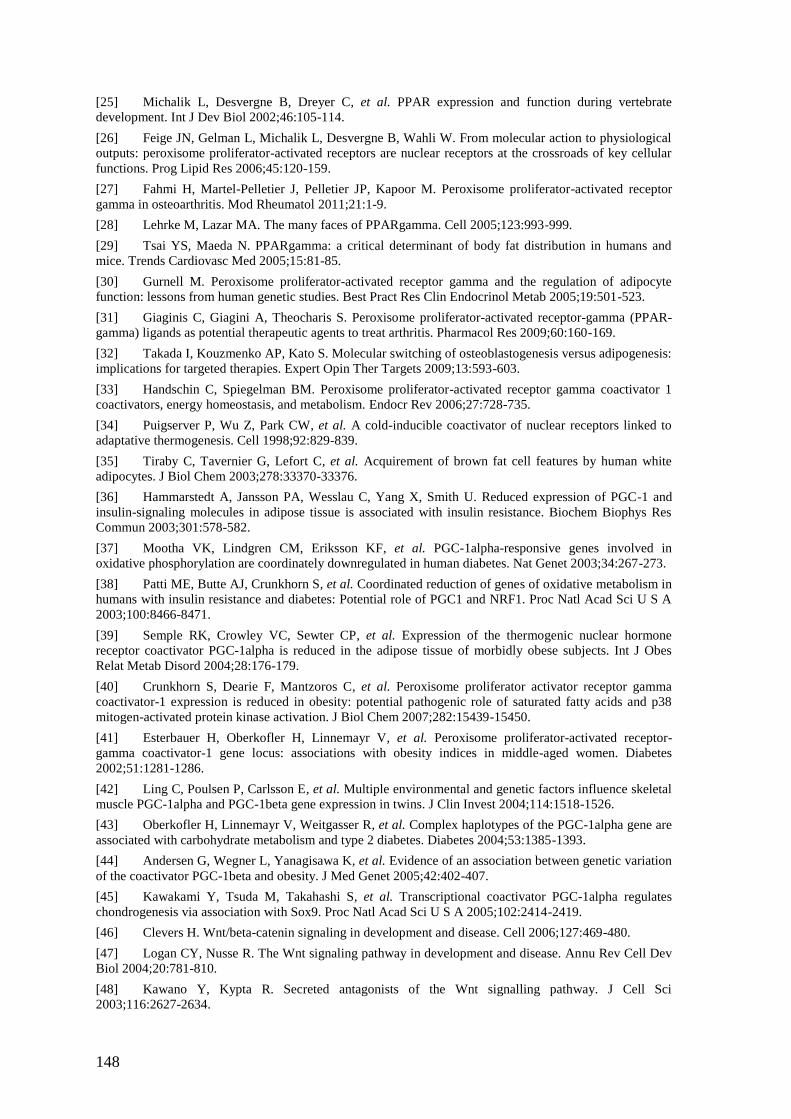
148
[25] Michalik L, Desvergne B, Dreyer C, et al. PPAR expression and function during vertebrate
development. Int J Dev Biol 2002;46:105-114.
[26] Feige JN, Gelman L, Michalik L, Desvergne B, Wahli W. From molecular action to physiological
outputs: peroxisome proliferator-activated receptors are nuclear receptors at the crossroads of key cellular
functions. Prog Lipid Res 2006;45:120-159.
[27] Fahmi H, Martel-Pelletier J, Pelletier JP, Kapoor M. Peroxisome proliferator-activated receptor
gamma in osteoarthritis. Mod Rheumatol 2011;21:1-9.
[28] Lehrke M, Lazar MA. The many faces of PPARgamma. Cell 2005;123:993-999.
[29] Tsai YS, Maeda N. PPARgamma: a critical determinant of body fat distribution in humans and
mice. Trends Cardiovasc Med 2005;15:81-85.
[30] Gurnell M. Peroxisome proliferator-activated receptor gamma and the regulation of adipocyte
function: lessons from human genetic studies. Best Pract Res Clin Endocrinol Metab 2005;19:501-523.
[31] Giaginis C, Giagini A, Theocharis S. Peroxisome proliferator-activated receptor-gamma (PPAR-
gamma) ligands as potential therapeutic agents to treat arthritis. Pharmacol Res 2009;60:160-169.
[32] Takada I, Kouzmenko AP, Kato S. Molecular switching of osteoblastogenesis versus adipogenesis:
implications for targeted therapies. Expert Opin Ther Targets 2009;13:593-603.
[33] Handschin C, Spiegelman BM. Peroxisome proliferator-activated receptor gamma coactivator 1
coactivators, energy homeostasis, and metabolism. Endocr Rev 2006;27:728-735.
[34] Puigserver P, Wu Z, Park CW, et al. A cold-inducible coactivator of nuclear receptors linked to
adaptative thermogenesis. Cell 1998;92:829-839.
[35] Tiraby C, Tavernier G, Lefort C, et al. Acquirement of brown fat cell features by human white
adipocytes. J Biol Chem 2003;278:33370-33376.
[36] Hammarstedt A, Jansson PA, Wesslau C, Yang X, Smith U. Reduced expression of PGC-1 and
insulin-signaling molecules in adipose tissue is associated with insulin resistance. Biochem Biophys Res
Commun 2003;301:578-582.
[37] Mootha VK, Lindgren CM, Eriksson KF, et al. PGC-1alpha-responsive genes involved in
oxidative phosphorylation are coordinately downregulated in human diabetes. Nat Genet 2003;34:267-273.
[38] Patti ME, Butte AJ, Crunkhorn S, et al. Coordinated reduction of genes of oxidative metabolism in
humans with insulin resistance and diabetes: Potential role of PGC1 and NRF1. Proc Natl Acad Sci U S A
2003;100:8466-8471.
[39] Semple RK, Crowley VC, Sewter CP, et al. Expression of the thermogenic nuclear hormone
receptor coactivator PGC-1alpha is reduced in the adipose tissue of morbidly obese subjects. Int J Obes
Relat Metab Disord 2004;28:176-179.
[40] Crunkhorn S, Dearie F, Mantzoros C, et al. Peroxisome proliferator activator receptor gamma
coactivator-1 expression is reduced in obesity: potential pathogenic role of saturated fatty acids and p38
mitogen-activated protein kinase activation. J Biol Chem 2007;282:15439-15450.
[41] Esterbauer H, Oberkofler H, Linnemayr V, et al. Peroxisome proliferator-activated receptor-
gamma coactivator-1 gene locus: associations with obesity indices in middle-aged women. Diabetes
2002;51:1281-1286.
[42] Ling C, Poulsen P, Carlsson E, et al. Multiple environmental and genetic factors influence skeletal
muscle PGC-1alpha and PGC-1beta gene expression in twins. J Clin Invest 2004;114:1518-1526.
[43] Oberkofler H, Linnemayr V, Weitgasser R, et al. Complex haplotypes of the PGC-1alpha gene are
associated with carbohydrate metabolism and type 2 diabetes. Diabetes 2004;53:1385-1393.
[44] Andersen G, Wegner L, Yanagisawa K, et al. Evidence of an association between genetic variation
of the coactivator PGC-1beta and obesity. J Med Genet 2005;42:402-407.
[45] Kawakami Y, Tsuda M, Takahashi S, et al. Transcriptional coactivator PGC-1alpha regulates
chondrogenesis via association with Sox9. Proc Natl Acad Sci U S A 2005;102:2414-2419.
[46] Clevers H. Wnt/beta-catenin signaling in development and disease. Cell 2006;127:469-480.
[47] Logan CY, Nusse R. The Wnt signaling pathway in development and disease. Annu Rev Cell Dev
Biol 2004;20:781-810.
[48] Kawano Y, Kypta R. Secreted antagonists of the Wnt signalling pathway. J Cell Sci
2003;116:2627-2634.
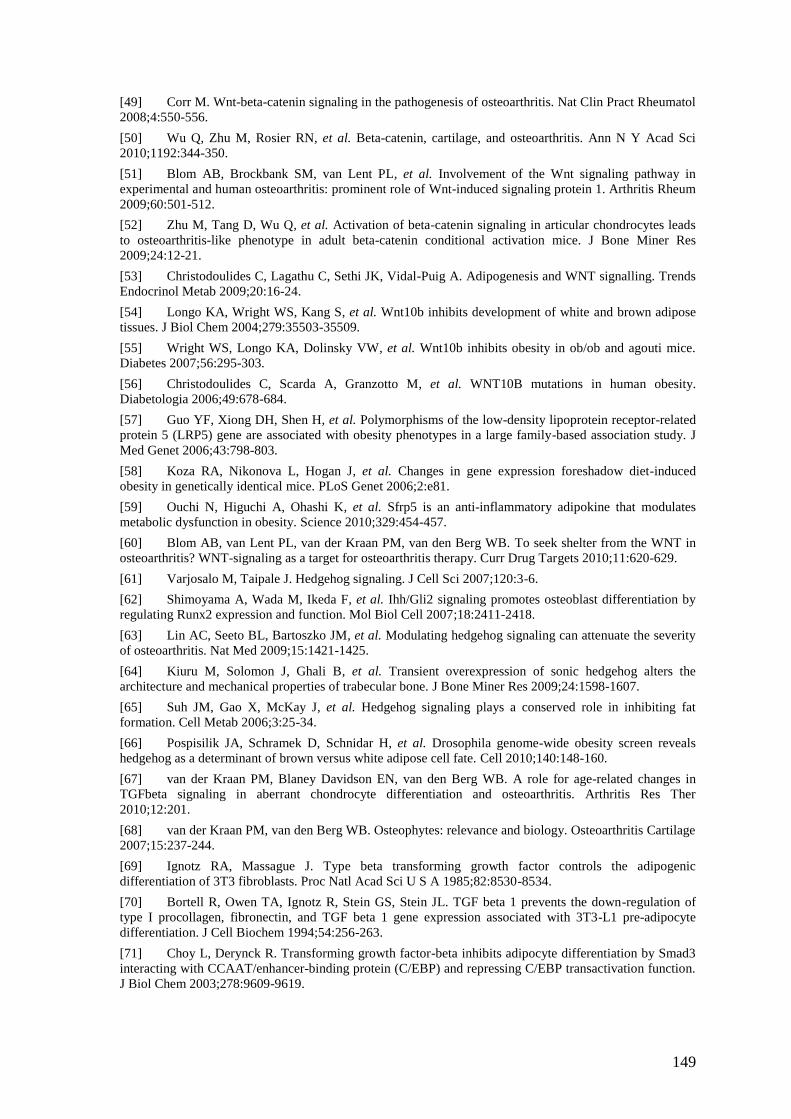
149
[49] Corr M. Wnt-beta-catenin signaling in the pathogenesis of osteoarthritis. Nat Clin Pract Rheumatol
2008;4:550-556.
[50] Wu Q, Zhu M, Rosier RN, et al. Beta-catenin, cartilage, and osteoarthritis. Ann N Y Acad Sci
2010;1192:344-350.
[51] Blom AB, Brockbank SM, van Lent PL, et al. Involvement of the Wnt signaling pathway in
experimental and human osteoarthritis: prominent role of Wnt-induced signaling protein 1. Arthritis Rheum
2009;60:501-512.
[52] Zhu M, Tang D, Wu Q, et al. Activation of beta-catenin signaling in articular chondrocytes leads
to osteoarthritis-like phenotype in adult beta-catenin conditional activation mice. J Bone Miner Res
2009;24:12-21.
[53] Christodoulides C, Lagathu C, Sethi JK, Vidal-Puig A. Adipogenesis and WNT signalling. Trends
Endocrinol Metab 2009;20:16-24.
[54] Longo KA, Wright WS, Kang S, et al. Wnt10b inhibits development of white and brown adipose
tissues. J Biol Chem 2004;279:35503-35509.
[55] Wright WS, Longo KA, Dolinsky VW, et al. Wnt10b inhibits obesity in ob/ob and agouti mice.
Diabetes 2007;56:295-303.
[56] Christodoulides C, Scarda A, Granzotto M, et al. WNT10B mutations in human obesity.
Diabetologia 2006;49:678-684.
[57] Guo YF, Xiong DH, Shen H, et al. Polymorphisms of the low-density lipoprotein receptor-related
protein 5 (LRP5) gene are associated with obesity phenotypes in a large family-based association study. J
Med Genet 2006;43:798-803.
[58] Koza RA, Nikonova L, Hogan J, et al. Changes in gene expression foreshadow diet-induced
obesity in genetically identical mice. PLoS Genet 2006;2:e81.
[59] Ouchi N, Higuchi A, Ohashi K, et al. Sfrp5 is an anti-inflammatory adipokine that modulates
metabolic dysfunction in obesity. Science 2010;329:454-457.
[60] Blom AB, van Lent PL, van der Kraan PM, van den Berg WB. To seek shelter from the WNT in
osteoarthritis? WNT-signaling as a target for osteoarthritis therapy. Curr Drug Targets 2010;11:620-629.
[61] Varjosalo M, Taipale J. Hedgehog signaling. J Cell Sci 2007;120:3-6.
[62] Shimoyama A, Wada M, Ikeda F, et al. Ihh/Gli2 signaling promotes osteoblast differentiation by
regulating Runx2 expression and function. Mol Biol Cell 2007;18:2411-2418.
[63] Lin AC, Seeto BL, Bartoszko JM, et al. Modulating hedgehog signaling can attenuate the severity
of osteoarthritis. Nat Med 2009;15:1421-1425.
[64] Kiuru M, Solomon J, Ghali B, et al. Transient overexpression of sonic hedgehog alters the
architecture and mechanical properties of trabecular bone. J Bone Miner Res 2009;24:1598-1607.
[65] Suh JM, Gao X, McKay J, et al. Hedgehog signaling plays a conserved role in inhibiting fat
formation. Cell Metab 2006;3:25-34.
[66] Pospisilik JA, Schramek D, Schnidar H, et al. Drosophila genome-wide obesity screen reveals
hedgehog as a determinant of brown versus white adipose cell fate. Cell 2010;140:148-160.
[67] van der Kraan PM, Blaney Davidson EN, van den Berg WB. A role for age-related changes in
TGFbeta signaling in aberrant chondrocyte differentiation and osteoarthritis. Arthritis Res Ther
2010;12:201.
[68] van der Kraan PM, van den Berg WB. Osteophytes: relevance and biology. Osteoarthritis Cartilage
2007;15:237-244.
[69] Ignotz RA, Massague J. Type beta transforming growth factor controls the adipogenic
differentiation of 3T3 fibroblasts. Proc Natl Acad Sci U S A 1985;82:8530-8534.
[70] Bortell R, Owen TA, Ignotz R, Stein GS, Stein JL. TGF beta 1 prevents the down-regulation of
type I procollagen, fibronectin, and TGF beta 1 gene expression associated with 3T3-L1 pre-adipocyte
differentiation. J Cell Biochem 1994;54:256-263.
[71] Choy L, Derynck R. Transforming growth factor-beta inhibits adipocyte differentiation by Smad3
interacting with CCAAT/enhancer-binding protein (C/EBP) and repressing C/EBP transactivation function.
J Biol Chem 2003;278:9609-9619.
150
[72] Clouthier DE, Comerford SA, Hammer RE. Hepatic fibrosis, glomerulosclerosis, and a
lipodystrophy-like syndrome in PEPCK-TGF-beta1 transgenic mice. J Clin Invest 1997;100:2697-2713.
[73] Samad F, Yamamoto K, Pandey M, Loskutoff DJ. Elevated expression of transforming growth
factor-beta in adipose tissue from obese mice. Mol Med 1997;3:37-48.
[74] Alessi MC, Bastelica D, Morange P, et al. Plasminogen activator inhibitor 1, transforming growth
factor-beta1, and BMI are closely associated in human adipose tissue during morbid obesity. Diabetes
2000;49:1374-1380.
[75] van der Kraan PM, Davidson EN, van den Berg WB. Bone morphogenetic proteins and articular
cartilage: To serve and protect or a wolf in sheep clothing's? Osteoarthritis Cartilage 2010;18:735-741.
[76] Chubinskaya S, Hurtig M, Rueger DC. OP-1/BMP-7 in cartilage repair. Int Orthop 2007;31:773-
781.
[77] Schulz TJ, Tseng YH. Emerging role of bone morphogenetic proteins in adipogenesis and energy
metabolism. Cytokine Growth Factor Rev 2009;20:523-531.
[78] Tseng YH, Kokkotou E, Schulz TJ, et al. New role of bone morphogenetic protein 7 in brown
adipogenesis and energy expenditure. Nature 2008;454:1000-1004.
[79] Martel-Pelletier J, Di Battista JA, Lajeunesse D, Pelletier JP. IGF/IGFBP axis in cartilage and bone
in osteoarthritis pathogenesis. Inflamm Res 1998;47:90-100.
[80] Wheatcroft SB, Kearney MT. IGF-dependent and IGF-independent actions of IGF-binding protein-
1 and -2: implications for metabolic homeostasis. Trends Endocrinol Metab 2009;20:153-162.
[81] Ruan W, Lai M. Insulin-like growth factor binding protein: a possible marker for the metabolic
syndrome? Acta Diabetol 2010;47:5-14.
[82] De Ceuninck F, Caliez A, Dassencourt L, Anract P, Renard P. Pharmacological disruption of
insulin-like growth factor 1 binding to IGF-binding proteins restores anabolic responses in human
osteoarthritic chondrocytes. Arthritis Res Ther 2004;6:R393-403.
[83] Hunziker EB, Kapfinger E, Martin J, Buckwalter J, Morales TI. Insulin-like growth factor (IGF)-
binding protein-3 (IGFBP-3) is closely associated with the chondrocyte nucleus in human articular
cartilage. Osteoarthritis Cartilage 2008;16:185-194.
[84] Chan SS, Twigg SM, Firth SM, Baxter RC. Insulin-like growth factor binding protein-3 leads to
insulin resistance in adipocytes. J Clin Endocrinol Metab 2005;90:6588-6595.
[85] Kim HS, Ali O, Shim M, et al. Insulin-like growth factor binding protein-3 induces insulin
resistance in adipocytes in vitro and in rats in vivo. Pediatr Res 2007;61:159-164.
[86] Zappala G, Rechler MM. IGFBP-3, hypoxia and TNF-alpha inhibit adiponectin transcription.
Biochem Biophys Res Commun 2009;382:785-789.
[87] Silha JV, Gui Y, Murphy LJ. Impaired glucose homeostasis in insulin-like growth factor-binding
protein-3-transgenic mice. Am J Physiol Endocrinol Metab 2002;283:E937-945.
[88] Mong JL, Ng MC, Guldan GS, et al. Associations of insulin-like growth factor binding protein-3
gene polymorphisms with IGF-I activity and lipid parameters in adolescents. Int J Obes (Lond)
2009;33:1446-1453.
[89] Iruela-Arispe ML. Regulation of thrombospondin1 by extracellular proteases. Curr Drug Targets
2008;9:863-868.
[90] Yasuda T. Cartilage destruction by matrix degradation products. Mod Rheumatol 2006;16:197-
205.
[91] Sofat N. Analysing the role of endogenous matrix molecules in the development of osteoarthritis.
Int J Exp Pathol 2009;90:463-479.
[92] Glasson SS, Askew R, Sheppard B, et al. Deletion of active ADAMTS5 prevents cartilage
degradation in a murine model of osteoarthritis. Nature 2005;434:644-648.
[93] Song RH, Tortorella MD, Malfait AM, et al. Aggrecan degradation in human articular cartilage
explants is mediated by both ADAMTS-4 and ADAMTS-5. Arthritis Rheum 2007;56:575-585.
[94] Fosang AJ, Rogerson FM. Identifying the human aggrecanase. Osteoarthritis Cartilage
2010;18:1109-1116.
[95] Echtermeyer F, Bertrand J, Dreier R, et al. Syndecan-4 regulates ADAMTS-5 activation and
cartilage breakdown in osteoarthritis. Nat Med 2009;15:1072-1076.
151
[96] Fosang AJ, Little CB. Drug insight: aggrecanases as therapeutic targets for osteoarthritis. Nat Clin
Pract Rheumatol 2008;4:420-427.
[97] Bondeson J, Wainwright S, Hughes C, Caterson B. The regulation of the ADAMTS4 and
ADAMTS5 aggrecanases in osteoarthritis: a review. Clin Exp Rheumatol 2008;26:139-145.
[98] Vinardell T, Dejica V, Poole AR, et al. Evidence to suggest that cathepsin K degrades articular
cartilage in naturally occurring equine osteoarthritis. Osteoarthritis Cartilage 2009;17:375-383.
[99] Burrage PS, Brinckerhoff CE. Molecular targets in osteoarthritis: metalloproteinases and their
inhibitors. Curr Drug Targets 2007;8:293-303.
[100] Alcaraz MJ, Megias J, Garcia-Arnandis I, Clerigues V, Guillen MI. New molecular targets for the
treatment of osteoarthritis. Biochem Pharmacol 2010;80:13-21.
[101] Little CB, Barai A, Burkhardt D, et al. Matrix metalloproteinase 13-deficient mice are resistant to
osteoarthritic cartilage erosion but not chondrocyte hypertrophy or osteophyte development. Arthritis
Rheum 2009;60:3723-3733.
[102] Pfander D, Cramer T, Deuerling D, Weseloh G, Swoboda B. Expression of thrombospondin-1 and
its receptor CD36 in human osteoarthritic cartilage. Ann Rheum Dis 2000;59:448-454.
[103] Murphy-Ullrich JE, Poczatek M. Activation of latent TGF-beta by thrombospondin-1: mechanisms
and physiology. Cytokine Growth Factor Rev 2000;11:59-69.
[104] Bornstein P. Thrombospondins as matricellular modulators of cell function. J Clin Invest
2001;107:929-934.
[105] Hsieh JL, Shen PC, Shiau AL, et al. Intraarticular gene transfer of thrombospondin-1 suppresses
the disease progression of experimental osteoarthritis. J Orthop Res 2010;28:1300-1306.
[106] Posey KL, Hecht JT. The role of cartilage oligomeric matrix protein (COMP) in skeletal disease.
Curr Drug Targets 2008;9:869-877.
[107] Bradshaw AD. The role of SPARC in extracellular matrix assembly. J Cell Commun Signal
2009;3:239-246.
[108] Hecht JT, Sage EH. Retention of the matricellular protein SPARC in the endoplasmic reticulum of
chondrocytes from patients with pseudoachondroplasia. J Histochem Cytochem 2006;54:269-274.
[109] Martinek N, Shahab J, Sodek J, Ringuette M. Is SPARC an evolutionarily conserved collagen
chaperone? J Dent Res 2007;86:296-305.
[110] Nakamura S, Kamihagi K, Satakeda H, et al. Enhancement of SPARC (osteonectin) synthesis in
arthritic cartilage. Increased levels in synovial fluids from patients with rheumatoid arthritis and regulation
by growth factors and cytokines in chondrocyte cultures. Arthritis Rheum 1996;39:539-551.
[111] Yoshida M, Sai S, Marumo K, et al. Expression analysis of three isoforms of hyaluronan synthase
and hyaluronidase in the synovium of knees in osteoarthritis and rheumatoid arthritis by quantitative real-
time reverse transcriptase polymerase chain reaction. Arthritis Res Ther 2004;6:R514-520.
[112] Bellamy N, Campbell J, Robinson V, et al. Viscosupplementation for the treatment of
osteoarthritis of the knee. Cochrane Database Syst Rev 2006:CD005321.
[113] Lilla J, Stickens D, Werb Z. Metalloproteases and adipogenesis: a weighty subject. Am J Pathol
2002;160:1551-1554.
[114] Mariman EC, Wang P. Adipocyte extracellular matrix composition, dynamics and role in obesity.
Cell Mol Life Sci 2010;67:1277-1292.
[115] Chun TH, Hotary KB, Sabeh F, et al. A pericellular collagenase directs the 3-dimensional
development of white adipose tissue. Cell 2006;125:577-591.
[116] Chun TH, Inoue M, Morisaki H, et al. Genetic link between obesity and MMP14-dependent
adipogenic collagen turnover. Diabetes 2010;59:2484-2494.
[117] Lijnen HR, Maquoi E, Hansen LB, et al. Matrix metalloproteinase inhibition impairs adipose
tissue development in mice. Arterioscler Thromb Vasc Biol 2002;22:374-379.
[118] Demeulemeester D, Collen D, Lijnen HR. Effect of matrix metalloproteinase inhibition on adipose
tissue development. Biochem Biophys Res Commun 2005;329:105-110.
[119] Khan T, Muise ES, Iyengar P, et al. Metabolic dysregulation and adipose tissue fibrosis: role of
collagen VI. Mol Cell Biol 2009;29:1575-1591.
152
[120] Divoux A, Tordjman J, Lacasa D, et al. Fibrosis in human adipose tissue: composition,
distribution, and link with lipid metabolism and fat mass loss. Diabetes 2010;59:2817-2825.
[121] Nie J, Sage EH. SPARC inhibits adipogenesis by its enhancement of beta-catenin signaling. J Biol
Chem 2009;284:1279-1290.
[122] Kos K, Wilding JP. SPARC: a key player in the pathologies associated with obesity and diabetes.
Nat Rev Endocrinol 2010;6:225-235.
[123] Tartare-Deckert S, Chavey C, Monthouel MN, Gautier N, Van Obberghen E. The matricellular
protein SPARC/osteonectin as a newly identified factor up-regulated in obesity. J Biol Chem
2001;276:22231-22237.
[124] Voros G, Sandy JD, Collen D, Lijnen HR. Expression of aggrecan(ases) during murine
preadipocyte differentiation and adipose tissue development. Biochim Biophys Acta 2006;1760:1837-1844.
[125] Wilsie LC, Chanchani S, Navaratna D, Orlando RA. Cell surface heparan sulfate proteoglycans
contribute to intracellular lipid accumulation in adipocytes. Lipids Health Dis 2005;4:2.
[126] Cao Y. Adipose tissue angiogenesis as a therapeutic target for obesity and metabolic diseases. Nat
Rev Drug Discov 2010;9:107-115.
[127] Christiaens V, Lijnen HR. Angiogenesis and development of adipose tissue. Mol Cell Endocrinol
2010;318:2-9.
[128] van Hinsbergh VW, Engelse MA, Quax PH. Pericellular proteases in angiogenesis and
vasculogenesis. Arterioscler Thromb Vasc Biol 2006;26:716-728.
[129] Varma V, Yao-Borengasser A, Bodles AM, et al. Thrombospondin-1 is an adipokine associated
with obesity, adipose inflammation, and insulin resistance. Diabetes 2008;57:432-439.
[130] Ramis JM, Franssen-van Hal NL, Kramer E, et al. Carboxypeptidase E and thrombospondin-1 are
differently expressed in subcutaneous and visceral fat of obese subjects. Cell Mol Life Sci 2002;59:1960-
1971.
[131] Gerin I, Louis GW, Zhang X, et al. Hyperphagia and obesity in female mice lacking tissue
inhibitor of metalloproteinase-1. Endocrinology 2009;150:1697-1704.
[132] Reizes O, Benoit SC, Strader AD, et al. Syndecan-3 modulates food intake by interacting with the
melanocortin/AgRP pathway. Ann N Y Acad Sci 2003;994:66-73.
[133] Reizes O, Lincecum J, Wang Z, et al. Transgenic expression of syndecan-1 uncovers a
physiological control of feeding behavior by syndecan-3. Cell 2001;106:105-116.
[134] Strader AD, Reizes O, Woods SC, Benoit SC, Seeley RJ. Mice lacking the syndecan-3 gene are
resistant to diet-induced obesity. J Clin Invest 2004;114:1354-1360.
[135] Williams KJ, Chen K. Recent insights into factors affecting remnant lipoprotein uptake. Curr Opin
Lipidol 2010;21:218-228.
[136] Lago F, Dieguez C, Gomez-Reino J, Gualillo O. The emerging role of adipokines as mediators of
inflammation and immune responses. Cytokine Growth Factor Rev 2007;18:313-325.
[137] Presle N, Pottie P, Dumond H, et al. Differential distribution of adipokines between serum and
synovial fluid in patients with osteoarthritis. Contribution of joint tissues to their articular production.
Osteoarthritis Cartilage 2006;14:690-695.
[138] Clockaerts S, Bastiaansen-Jenniskens YM, Runhaar J, et al. The infrapatellar fat pad should be
considered as an active osteoarthritic joint tissue: a narrative review. Osteoarthritis Cartilage 2010;18:876-
882.
[139] Wellen KE, Hotamisligil GS. Inflammation, stress, and diabetes. J Clin Invest 2005;115:1111-
1119.
[140] Gustafson B. Adipose tissue, inflammation and atherosclerosis. J Atheroscler Thromb
2010;17:332-341.
[141] Fernandes JC, Martel-Pelletier J, Pelletier JP. The role of cytokines in osteoarthritis
pathophysiology. Biorheology 2002;39:237-246.
[142] Kim J, Xu M, Xo R, et al. Mitochondrial DNA damage is involved in apoptosis caused by pro-
inflammatory cytokines in human OA chondrocytes. Osteoarthritis Cartilage 2010;18:424-432.
[143] Cinti S, Mitchell G, Barbatelli G, et al. Adipocyte death defines macrophage localization and
function in adipose tissue of obese mice and humans. J Lipid Res 2005;46:2347-2355.
153
[144] Wood IS, de Heredia FP, Wang B, Trayhurn P. Cellular hypoxia and adipose tissue dysfunction in
obesity. Proc Nutr Soc 2009;68:370-377.
[145] Ye J. Emerging role of adipose tissue hypoxia in obesity and insulin resistance. Int J Obes (Lond)
2009;33:54-66.
[146] Ng CT, Biniecka M, Kennedy A, et al. Synovial tissue hypoxia and inflammation in vivo. Ann
Rheum Dis 2010;69:1389-1395.
[147] Ryden M, Arner P. Tumour necrosis factor-alpha in human adipose tissue -- from signalling
mechanisms to clinical implications. J Intern Med 2007;262:431-438.
[148] Dinarello CA, Donath MY, Mandrup-Poulsen T. Role of IL-1beta in type 2 diabetes. Curr Opin
Endocrinol Diabetes Obes 2010;17:314-321.
[149] Chandrasekar B, Patel DN, Mummidi S, et al. Interleukin-18 suppresses adiponectin expression in
3T3-L1 adipocytes via a novel signal transduction pathway involving ERK1/2-dependent NFATc4
phosphorylation. J Biol Chem 2008;283:4200-4209.
[150] Chu CJ, Lu RH, Wang SS, et al. Plasma levels of interleukin-6 and interleukin-8 in Chinese
patients with non-alcoholic fatty liver disease. Hepatogastroenterology 2007;54:2045-2048.
[151] Jarrar MH, Baranova A, Collantes R, et al. Adipokines and cytokines in non-alcoholic fatty liver
disease. Aliment Pharmacol Ther 2008;27:412-421.
[152] Kim JH, Bachmann RA, Chen J. Interleukin-6 and insulin resistance. Vitam Horm 2009;80:613-
633.
[153] Troseid M, Seljeflot I, Arnesen H. The role of interleukin-18 in the metabolic syndrome.
Cardiovasc Diabetol 2010;9:11.
[154] Aspden RM. Obesity punches above its weight in osteoarthritis. Nat Rev Rheumatol 2011;7:65-8.
[155] Catalan V, Gomez-Ambrosi J, Rodriguez A, Salvador J, Fruhbeck G. Adipokines in the treatment
of diabetes mellitus and obesity. Expert Opin Pharmacother 2009;10:239-254.
[156] Luheshi GN, Gardner JD, Rushforth DA, Loudon AS, Rothwell NJ. Leptin actions on food intake
and body temperature are mediated by IL-1. Proc Natl Acad Sci U S A 1999;96:7047-7052.
[157] Garcia MC, Wernstedt I, Berndtsson A, et al. Mature-onset obesity in interleukin-1 receptor I
knockout mice. Diabetes 2006;55:1205-1213.
[158] Jansson JO, Wallenius K, Wernstedt I, et al. On the site and mechanism of action of the anti-
obesity effects of interleukin-6. Growth Horm IGF Res 2003;13 Suppl A:S28-32.
[159] Netea MG, Joosten LA, Lewis E, et al. Deficiency of interleukin-18 in mice leads to hyperphagia,
obesity and insulin resistance. Nat Med 2006;12:650-656.
[160] Zorrilla EP, Sanchez-Alavez M, Sugama S, et al. Interleukin-18 controls energy homeostasis by
suppressing appetite and feed efficiency. Proc Natl Acad Sci U S A 2007;104:11097-11102.
[161] Hong EG, Ko HJ, Cho YR, et al. Interleukin-10 prevents diet-induced insulin resistance by
attenuating macrophage and cytokine response in skeletal muscle. Diabetes 2009;58:2525-2535.
[162] Juge-Aubry CE, Somm E, Pernin A, et al. Adipose tissue is a regulated source of interleukin-10.
Cytokine 2005;29:270-274.
[163] Jung SH, Park HS, Kim KS, et al. Effect of weight loss on some serum cytokines in human
obesity: increase in IL-10 after weight loss. J Nutr Biochem 2008;19:371-375.
[164] Carter KW, Hung J, Powell BL, et al. Association of Interleukin-1 gene polymorphisms with
central obesity and metabolic syndrome in a coronary heart disease population. Hum Genet 2008;124:199-
206.
[165] Nakki A, Kouhia ST, Saarela J, et al. Allelic variants of IL1R1 gene associate with severe hand
osteoarthritis. BMC Med Genet 2010;11:50.
[166] Attur M, Wang HY, Kraus VB, et al. Radiographic severity of knee osteoarthritis is conditional on
interleukin 1 receptor antagonist gene variations. Ann Rheum Dis 2010;69:856-861.
[167] Kanoh T, Hasegawa Y, Masui T, et al. Interleukin-1beta gene polymorphism associated with
radiographic signs of osteoarthritis of the knee. J Orthop Sci 2008;13:97-100.
[168] Oswal A, Yeo G. Leptin and the control of body weight: a review of its diverse central targets,
signaling mechanisms, and role in the pathogenesis of obesity. Obesity (Silver Spring) 2010;18:221-229.
154
[169] Muoio DM, Lynis Dohm G. Peripheral metabolic actions of leptin. Best Pract Res Clin Endocrinol
Metab 2002;16:653-666.
[170] Bouret SG, Draper SJ, Simerly RB. Trophic action of leptin on hypothalamic neurons that regulate
feeding. Science 2004;304:108-110.
[171] Pico C, Oliver P, Sanchez J, et al. The intake of physiological doses of leptin during lactation in
rats prevents obesity in later life. Int J Obes (Lond) 2007;31:1199-1209.
[172] Priego T, Sanchez J, Palou A, Pico C. Leptin intake during the suckling period improves the
metabolic response of adipose tissue to a high-fat diet. Int J Obes (Lond) 2010;34:809-819.
[173] Sanchez J, Priego T, Palou M, et al. Oral supplementation with physiological doses of leptin
during lactation in rats improves insulin sensitivity and affects food preferences later in life. Endocrinology
2008;149:733-740.
[174] Lago R, Gomez R, Lago F, Gomez-Reino J, Gualillo O. Leptin beyond body weight regulation--
current concepts concerning its role in immune function and inflammation. Cell Immunol 2008;252:139-
145.
[175] Stofkova A. Leptin and adiponectin: from energy and metabolic dysbalance to inflammation and
autoimmunity. Endocr Regul 2009;43:157-168.
[176] Dumond H, Presle N, Terlain B, et al. Evidence for a key role of leptin in osteoarthritis. Arthritis
Rheum 2003;48:3118-3129.
[177] Simopoulou T, Malizos KN, Iliopoulos D, et al. Differential expression of leptin and leptin's
receptor isoform (Ob-Rb) mRNA between advanced and minimally affected osteoarthritic cartilage; effect
on cartilage metabolism. Osteoarthritis Cartilage 2007;15:872-883.
[178] Figenschau Y, Knutsen G, Shahazeydi S, Johansen O, Sveinbjornsson B. Human articular
chondrocytes express functional leptin receptors. Biochem Biophys Res Commun 2001;287:190-197.
[179] Vuolteenaho K, Koskinen A, Kukkonen M, et al. Leptin enhances synthesis of proinflammatory
mediators in human osteoarthritic cartilage--mediator role of NO in leptin-induced PGE2, IL-6, and IL-8
production. Mediators Inflamm 2009;2009:345838.
[180] Bao JP, Chen WP, Feng J, et al. Leptin plays a catabolic role on articular cartilage. Mol Biol Rep
2010;37:3265-3272.
[181] Griffin TM, Huebner JL, Kraus VB, Guilak F. Extreme obesity due to impaired leptin signaling in
mice does not cause knee osteoarthritis. Arthritis Rheum 2009;60:2935-2944.
[182] Kadowaki T, Yamauchi T, Kubota N, et al. Adiponectin and adiponectin receptors in insulin
resistance, diabetes, and the metabolic syndrome. J Clin Invest 2006;116:1784-1792.
[183] Fu Y, Luo N, Klein RL, Garvey WT. Adiponectin promotes adipocyte differentiation, insulin
sensitivity, and lipid accumulation. J Lipid Res 2005;46:1369-1379.
[184] Kubota N, Yano W, Kubota T, et al. Adiponectin stimulates AMP-activated protein kinase in the
hypothalamus and increases food intake. Cell Metab 2007;6:55-68.
[185] Coope A, Milanski M, Araujo EP, et al. AdipoR1 mediates the anorexigenic and insulin/leptin-like
actions of adiponectin in the hypothalamus. FEBS Lett 2008;582:1471-1476.
[186] Fantuzzi G. Adiponectin and inflammation: consensus and controversy. J Allergy Clin Immunol
2008;121:326-330.
[187] Otero M, Lago R, Gomez R, et al. Changes in plasma levels of fat-derived hormones adiponectin,
leptin, resistin and visfatin in patients with rheumatoid arthritis. Ann Rheum Dis 2006;65:1198-1201.
[188] Senolt L, Pavelka K, Housa D, Haluzik M. Increased adiponectin is negatively linked to the local
inflammatory process in patients with rheumatoid arthritis. Cytokine 2006;35:247-252.
[189] Filkova M, Liskova M, Hulejova H, et al. Increased serum adiponectin levels in female patients
with erosive compared with non-erosive osteoarthritis. Ann Rheum Dis 2009;68:295-296.
[190] Chen TH, Chen L, Hsieh MS, et al. Evidence for a protective role for adiponectin in osteoarthritis.
Biochim Biophys Acta 2006;1762:711-718.
[191] Lago R, Gomez R, Otero M, et al. A new player in cartilage homeostasis: adiponectin induces
nitric oxide synthase type II and pro-inflammatory cytokines in chondrocytes. Osteoarthritis Cartilage
2008;16:1101-1109.
155
[192] Ehling A, Schaffler A, Herfarth H, et al. The potential of adiponectin in driving arthritis. J
Immunol 2006;176:4468-4478.
[193] Choi HM, Lee YA, Lee SH, et al. Adiponectin may contribute to synovitis and joint destruction in
rheumatoid arthritis by stimulating vascular endothelial growth factor, matrix metalloproteinase-1, and
matrix metalloproteinase-13 expression in fibroblast-like synoviocytes more than proinflammatory
mediators. Arthritis Res Ther 2009;11:R161.
[194] Kitahara K, Kusunoki N, Kakiuchi T, Suguro T, Kawai S. Adiponectin stimulates IL-8 production
by rheumatoid synovial fibroblasts. Biochem Biophys Res Commun 2009;378:218-223.
[195] Kusunoki N, Kitahara K, Kojima F, et al. Adiponectin stimulates prostaglandin E(2) production in
rheumatoid arthritis synovial fibroblasts. Arthritis Rheum 2010;62:1641-1649.
[196] Goossens GH, Blaak EE, van Baak MA. Possible involvement of the adipose tissue renin-
angiotensin system in the pathophysiology of obesity and obesity-related disorders. Obes Rev 2003;4:43-
55.
[197] Cassis LA, Police SB, Yiannikouris F, Thatcher SE. Local adipose tissue renin-angiotensin system.
Curr Hypertens Rep 2008;10:93-98.
[198] Yvan-Charvet L, Quignard-Boulange A. Role of adipose tissue renin-angiotensin system in
metabolic and inflammatory diseases associated with obesity. Kidney Int 2011;79:162-168.
[199] Skultetyova D, Filipova S, Riecansky I, Skultety J. The role of angiotensin type 1 receptor in
inflammation and endothelial dysfunction. Recent Pat Cardiovasc Drug Discov 2007;2:23-27.
[200] Yamagishi SI, Maeda S, Matsui T, et al. Role of advanced glycation end products (ages) and
oxidative stress in vascular complications in diabetes. Biochim Biophys Acta 2011,
doi:10.1016/j.bbagen.2011.03.014.
[201] Cobankara V, Ozturk MA, Kiraz S, et al. Renin and angiotensin-converting enzyme (ACE) as
active components of the local synovial renin-angiotensin system in rheumatoid arthritis. Rheumatol Int
2005;25:285-291.
[202] Price A, Lockhart JC, Ferrell WR, et al. Angiotensin II type 1 receptor as a novel therapeutic target
in rheumatoid arthritis: in vivo analyses in rodent models of arthritis and ex vivo analyses in human
inflammatory synovitis. Arthritis Rheum 2007;56:441-447.
[203] Bayram B, Sayin E, Gunes HV, et al. DD genotype of ace gene I/D polymorphism is associated in
a Turkish study population with osteoarthritis. Mol Biol Rep 2011;38:1713-1716.
[204] Iwai M, Horiuchi M. Role of renin-angiotensin system in adipose tissue dysfunction. Hypertens
Res 2009;32:425-427.
[205] McTernan PG, Kusminski CM, Kumar S. Resistin. Curr Opin Lipidol 2006;17:170-175.
[206] Moschen AR, Gerner RR, Tilg H. Pre-B cell colony enhancing factor/NAMPT/visfatin in
inflammation and obesity-related disorders. Curr Pharm Des 2010;16:1913-1920.
[207] Stofkova A. Resistin and visfatin: regulators of insulin sensitivity, inflammation and immunity.
Endocr Regul 2010;44:25-36.
[208] Senolt L, Housa D, Vernerova Z, et al. Resistin in rheumatoid arthritis synovial tissue, synovial
fluid and serum. Ann Rheum Dis 2007;66:458-463.
[209] Lee JH, Ort T, Ma K, et al. Resistin is elevated following traumatic joint injury and causes matrix
degradation and release of inflammatory cytokines from articular cartilage in vitro. Osteoarthritis Cartilage
2009;17:613-620.
[210] Rho YH, Solus J, Sokka T, et al. Adipocytokines are associated with radiographic joint damage in
rheumatoid arthritis. Arthritis Rheum 2009;60:1906-1914.
[211] Gosset M, Berenbaum F, Salvat C, et al. Crucial role of visfatin/pre-B cell colony-enhancing factor
in matrix degradation and prostaglandin E2 synthesis in chondrocytes: possible influence on osteoarthritis.
Arthritis Rheum 2008;58:1399-1409.
[212] Senolt L, Polanska M, Filkova M, et al. Vaspin and omentin: new adipokines differentially
regulated at the site of inflammation in rheumatoid arthritis. Ann Rheum Dis 2010;69:1410-1411.
[213] Hu PF, Tang JL, Chen WP, Bao JP, Wu LD. Increased apelin serum levels and expression in
human chondrocytes in osteoarthritic patients. Int Orthop 2010, doi 10.1007/s00264-010-1100-y.
[214] Hu PF, Chen WP, Tang JL, Bao JP, Wu LD. Apelin plays a catabolic role on articular cartilage: in
vivo and in vitro studies. Int J Mol Med 2010;26:357-363.
156
[215] Webb JD, Coleman ML, Pugh CW. Hypoxia, hypoxia-inducible factors (HIF), HIF hydroxylases
and oxygen sensing. Cell Mol Life Sci 2009;66:3539-3554.
[216] Pfander D, Gelse K. Hypoxia and osteoarthritis: how chondrocytes survive hypoxic environments.
Curr Opin Rheumatol 2007;19:457-462.
[217] Husa M, Liu-Bryan R, Terkeltaub R. Shifting HIFs in osteoarthritis. Nat Med 2010;16:641-644.
[218] Saito T, Fukai A, Mabuchi A, et al. Transcriptional regulation of endochondral ossification by
HIF-2alpha during skeletal growth and osteoarthritis development. Nat Med 2010;16:678-686.
[219] Yang S, Kim J, Ryu JH, et al. Hypoxia-inducible factor-2alpha is a catabolic regulator of
osteoarthritic cartilage destruction. Nat Med 2010;16:687-693.
[220] Wang B, Wood IS, Trayhurn P. Hypoxia induces leptin gene expression and secretion in human
preadipocytes: differential effects of hypoxia on adipokine expression by preadipocytes. J Endocrinol
2008;198:127-134.
[221] Zhang X, Lam KS, Ye H, et al. Adipose tissue-specific inhibition of hypoxia-inducible factor
1{alpha} induces obesity and glucose intolerance by impeding energy expenditure in mice. J Biol Chem
2010;285:32869-32877.
[222] Halberg N, Khan T, Trujillo ME, et al. Hypoxia-inducible factor 1alpha induces fibrosis and
insulin resistance in white adipose tissue. Mol Cell Biol 2009;29:4467-4483.
[223] Gkretsi V, Simopoulou T, Tsezou A. Lipid metabolism and osteoarthritis: lessons from
atherosclerosis. Prog Lipid Res 2011;50:133-140.
[224] Lippiello L, Fienhold M, Grandjean C. Metabolic and ultrastructural changes in articular cartilage
of rats fed dietary supplements of omega-3 fatty acids. Arthritis Rheum 1990;33:1029-1036.
[225] Xu H, Watkins BA, Adkisson HD. Dietary lipids modify the fatty acid composition of cartilage,
isolated chondrocytes and matrix vesicles. Lipids 1994;29:619-625.
[226] Arkill KP, Winlove CP. Fatty acid transport in articular cartilage. Arch Biochem Biophys
2006;456:71-78.
[227] Lippiello L, Walsh T, Fienhold M. The association of lipid abnormalities with tissue pathology in
human osteoarthritic articular cartilage. Metabolism 1991;40:571-576.
[228] Tsezou A, Iliopoulos D, Malizos KN, Simopoulou T. Impaired expression of genes regulating
cholesterol efflux in human osteoarthritic chondrocytes. J Orthop Res 2010;28:1033-1039.
[229] Simopoulou T, Malizos KN, Tsezou A. Lectin-like oxidized low density lipoprotein receptor 1
(LOX-1) expression in human articular chondrocytes. Clin Exp Rheumatol 2007;25:605-612.
[230] Cowart LA. Sphingolipids: players in the pathology of metabolic disease. Trends Endocrinol
Metab 2009;20:34-42.
[231] Iyer A, Fairlie DP, Prins JB, Hammock BD, Brown L. Inflammatory lipid mediators in adipocyte
function and obesity. Nat Rev Endocrinol 2010;6:71-82.
[232] Allayee H, Roth N, Hodis HN. Polyunsaturated fatty acids and cardiovascular disease:
implications for nutrigenetics. J Nutrigenet Nutrigenomics 2009;2:140-148.
[233] Hsieh PS, Jin JS, Chiang CF, et al. COX-2-mediated inflammation in fat is crucial for obesity-
linked insulin resistance and fatty liver. Obesity (Silver Spring) 2009;17:1150-1157.
[234] Hsieh PS, Lu KC, Chiang CF, Chen CH. Suppressive effect of COX2 inhibitor on the progression
of adipose inflammation in high-fat-induced obese rats. Eur J Clin Invest 2010;40:164-171.
[235] Tsuboi H, Sugimoto Y, Kainoh T, Ichikawa A. Prostanoid EP4 receptor is involved in suppression
of 3T3-L1 adipocyte differentiation. Biochem Biophys Res Commun 2004;322:1066-1072.
[236] Jaworski K, Ahmadian M, Duncan RE, et al. AdPLA ablation increases lipolysis and prevents
obesity induced by high-fat feeding or leptin deficiency. Nat Med 2009;15:159-168.
[237] Vegiopoulos A, Muller-Decker K, Strzoda D, et al. Cyclooxygenase-2 controls energy
homeostasis in mice by de novo recruitment of brown adipocytes. Science 2010;328:1158-1161.
[238] Madsen L, Pedersen LM, Lillefosse HH, et al. UCP1 induction during recruitment of brown
adipocytes in white adipose tissue is dependent on cyclooxygenase activity. PLoS One 2010;5:e11391.
[239] Hetu PO, Riendeau D. Down-regulation of microsomal prostaglandin E2 synthase-1 in adipose
tissue by high-fat feeding. Obesity (Silver Spring) 2007;15:60-68.
157
[240] Massiera F, Saint-Marc P, Seydoux J, et al. Arachidonic acid and prostacyclin signaling promote
adipose tissue development: a human health concern? J Lipid Res 2003;44:271-279.
[241] Mazid MA, Chowdhury AA, Nagao K, et al. Endogenous 15-deoxy-Delta(12,14)-prostaglandin
J(2) synthesized by adipocytes during maturation phase contributes to upregulation of fat storage. FEBS
Lett 2006;580:6885-6890.
[242] Ailhaud G, Guesnet P, Cunnane SC. An emerging risk factor for obesity: does disequilibrium of
polyunsaturated fatty acid metabolism contribute to excessive adipose tissue development? Br J Nutr
2008;100:461-470.
[243] Masuko-Hongo K, Berenbaum F, Humbert L, et al. Up-regulation of microsomal prostaglandin E
synthase 1 in osteoarthritic human cartilage: critical roles of the ERK-1/2 and p38 signaling pathways.
Arthritis Rheum 2004;50:2829-2838.
[244] Gosset M, Berenbaum F, Levy A, et al. Prostaglandin E2 synthesis in cartilage explants under
compression: mPGES-1 is a mechanosensitive gene. Arthritis Res Ther 2006;8:R135.
[245] Attur M, Al-Mussawir HE, Patel J, et al. Prostaglandin E2 exerts catabolic effects in osteoarthritis
cartilage: evidence for signaling via the EP4 receptor. J Immunol 2008;181:5082-5088.
[246] Li X, Ellman M, Muddasani P, et al. Prostaglandin E2 and its cognate EP receptors control human
adult articular cartilage homeostasis and are linked to the pathophysiology of osteoarthritis. Arthritis Rheum
2009;60:513-523.
[247] Otsuka S, Aoyama T, Furu M, et al. PGE2 signal via EP2 receptors evoked by a selective agonist
enhances regeneration of injured articular cartilage. Osteoarthritis Cartilage 2009;17:529-538.
[248] Sato T, Konomi K, Fujii R, et al. Prostaglandin EP2 receptor signalling inhibits the expression of
matrix metalloproteinase 13 in human osteoarthritic chondrocytes. Ann Rheum Dis 2011;70:221-6.
[249] Alvarez-Soria MA, Largo R, Sanchez-Pernaute O, et al. Prostaglandin E2 receptors EP1 and EP4
are up-regulated in rabbit chondrocytes by IL-1beta, but not by TNFalpha. Rheumatol Int 2007;27:911-917.
[250] Shan ZZ, Masuko-Hongo K, Dai SM, et al. A potential role of 15-deoxy-delta(12,14)-
prostaglandin J2 for induction of human articular chondrocyte apoptosis in arthritis. J Biol Chem
2004;279:37939-37950.
[251] Adkisson HDt, Risener FS, Jr., Zarrinkar PP, et al. Unique fatty acid composition of normal
cartilage: discovery of high levels of n-9 eicosatrienoic acid and low levels of n-6 polyunsaturated fatty
acids. FASEB J 1991;5:344-353.
[252] Levy BD. Resolvins and protectins: natural pharmacophores for resolution biology. Prostaglandins
Leukot Essent Fatty Acids 2010;82:327-332.
[253] Hurst S, Zainal Z, Caterson B, Hughes CE, Harwood JL. Dietary fatty acids and arthritis.
Prostaglandins Leukot Essent Fatty Acids 2010;82:315-318.
[254] Palou A, Bonet ML. Controlling thermogenesis and lipogenesis and the use of ergogenic aids for
weight control in Henry CJK (ed) Novel food ingredients for weight control Abington, UK,
Woodhead Publishing, 2007, pp 58-103.
[255] Ailhaud G, Guesnet P. Fatty acid composition of fats is an early determinant of childhood obesity:
a short review and an opinion. Obes Rev 2004;5:21-26.
[256] Oliver E, McGillicuddy F, Phillips C, Toomey S, Roche HM. The role of inflammation and
macrophage accumulation in the development of obesity-induced type 2 diabetes mellitus and the possible
therapeutic effects of long-chain n-3 PUFA. Proc Nutr Soc 2010;69:232-243.
[257] Ruzickova J, Rossmeisl M, Prazak T, et al. Omega-3 PUFA of marine origin limit diet-induced
obesity in mice by reducing cellularity of adipose tissue. Lipids 2004;39:1177-1185.
[258] Couet C, Delarue J, Ritz P, Antoine JM, Lamisse F. Effect of dietary fish oil on body fat mass and
basal fat oxidation in healthy adults. Int J Obes Relat Metab Disord 1997;21:637-643.
[259] Summers LK, Fielding BA, Bradshaw HA, et al. Substituting dietary saturated fat with
polyunsaturated fat changes abdominal fat distribution and improves insulin sensitivity. Diabetologia
2002;45:369-377.
[260] Kunesova M, Braunerova R, Hlavaty P, et al. The influence of n-3 polyunsaturated fatty acids and
very low calorie diet during a short-term weight reducing regimen on weight loss and serum fatty acid
composition in severely obese women. Physiol Res 2006;55:63-72.
158
[261] Stamp LK, James MJ, Cleland LG. Diet and rheumatoid arthritis: a review of the literature. Semin
Arthritis Rheum 2005;35:77-94.
[262] Haus JM, Kashyap SR, Kasumov T, et al. Plasma ceramides are elevated in obese subjects with
type 2 diabetes and correlate with the severity of insulin resistance. Diabetes 2009;58:337-343.
[263] Sabatini M, Rolland G, Leonce S, et al. Effects of ceramide on apoptosis, proteoglycan
degradation, and matrix metalloproteinase expression in rabbit articular cartilage. Biochem Biophys Res
Commun 2000;267:438-444.
[264] Kitano M, Hla T, Sekiguchi M, et al. Sphingosine 1-phosphate/sphingosine 1-phosphate receptor 1
signaling in rheumatoid synovium: regulation of synovial proliferation and inflammatory gene expression.
Arthritis Rheum 2006;54:742-753.
[265] Pi X, Tan SY, Hayes M, et al. Sphingosine kinase 1-mediated inhibition of Fas death signaling in
rheumatoid arthritis B lymphoblastoid cells. Arthritis Rheum 2006;54:754-764.
[266] Masuko K, Murata M, Nakamura H, et al. Sphingosine-1-phosphate attenuates proteoglycan
aggrecan expression via production of prostaglandin E2 from human articular chondrocytes. BMC
Musculoskelet Disord 2007;8:29.
[267] Kim MK, Lee HY, Kwak JY, et al. Sphingosine-1-phosphate stimulates rat primary chondrocyte
proliferation. Biochem Biophys Res Commun 2006;345:67-73.
[268] Stradner MH, Hermann J, Angerer H, et al. Spingosine-1-phosphate stimulates proliferation and
counteracts interleukin-1 induced nitric oxide formation in articular chondrocytes. Osteoarthritis Cartilage
2008;16:305-311.
[269] Holland WL, Brozinick JT, Wang LP, et al. Inhibition of ceramide synthesis ameliorates
glucocorticoid-, saturated-fat-, and obesity-induced insulin resistance. Cell Metab 2007;5:167-179.
[270] Lai WQ, Irwan AW, Goh HH, et al. Anti-inflammatory effects of sphingosine kinase modulation
in inflammatory arthritis. J Immunol 2008;181:8010-8017.
[271] Henrotin Y, Kurz B, Aigner T. Oxygen and reactive oxygen species in cartilage degradation:
friends or foes? Osteoarthritis Cartilage 2005;13:643-654.
[272] Grattagliano I, Palmieri VO, Portincasa P, Moschetta A, Palasciano G. Oxidative stress-induced
risk factors associated with the metabolic syndrome: a unifying hypothesis. J Nutr Biochem 2008;19:491-
504.
[273] Morquette B, Shi Q, Lavigne P, et al. Production of lipid peroxidation products in osteoarthritic
tissues: new evidence linking 4-hydroxynonenal to cartilage degradation. Arthritis Rheum 2006;54:271-
281.
[274] Mattson MP. Roles of the lipid peroxidation product 4-hydroxynonenal in obesity, the metabolic
syndrome, and associated vascular and neurodegenerative disorders. Exp Gerontol 2009;44:625-633.
[275] El-Bikai R, Welman M, Margaron Y, et al. Perturbation of adhesion molecule-mediated
chondrocyte-matrix interactions by 4-hydroxynonenal binding: implication in osteoarthritis pathogenesis.
Arthritis Res Ther 2010;12:R201.
[276] Goh SY, Cooper ME. Clinical review: The role of advanced glycation end products in progression
and complications of diabetes. J Clin Endocrinol Metab 2008;93:1143-1152.
[277] Semba RD, Nicklett EJ, Ferrucci L. Does accumulation of advanced glycation end products
contribute to the aging phenotype? J Gerontol A Biol Sci Med Sci 2010;65:963-975.
[278] Miyazawa T, Nakagawa K, Shimasaki S, Nagai R. Lipid glycation and protein glycation in
diabetes and atherosclerosis. Amino Acids 2010, doi 10.1007/s00726-010-0772-3.
[279] DeGroot J. The AGE of the matrix: chemistry, consequence and cure. Curr Opin Pharmacol
2004;4:301-305.
[280] Shane Anderson A, Loeser RF. Why is osteoarthritis an age-related disease? Best Pract Res Clin
Rheumatol 2010;24:15-26.
[281] Schalkwijk CG, Brouwers O, Stehouwer CD. Modulation of insulin action by advanced glycation
endproducts: a new player in the field. Horm Metab Res 2008;40:614-619.
[282] Unoki H, Yamagishi S. Advanced glycation end products and insulin resistance. Curr Pharm Des
2008;14:987-989.
159
[283] Unno Y, Sakai M, Sakamoto Y, et al. Advanced glycation end products-modified proteins and
oxidized LDL mediate down-regulation of leptin in mouse adipocytes via CD36. Biochem Biophys Res
Commun 2004;325:151-156.
[284] Unoki H, Bujo H, Yamagishi S, et al. Advanced glycation end products attenuate cellular insulin
sensitivity by increasing the generation of intracellular reactive oxygen species in adipocytes. Diabetes Res
Clin Pract 2007;76:236-244.
[285] Uchida Y, Ohba K, Yoshioka T, et al. Cellular carbonyl stress enhances the expression of
plasminogen activator inhibitor-1 in rat white adipocytes via reactive oxygen species-dependent pathway. J
Biol Chem 2004;279:4075-4083.
[286] Gugliucci A, Kotani K, Taing J, et al. Short-term low calorie diet intervention reduces serum
advanced glycation end products in healthy overweight or obese adults. Ann Nutr Metab 2009;54:197-201.
[287] Li SY, Liu Y, Sigmon VK, McCort A, Ren J. High-fat diet enhances visceral advanced glycation
end products, nuclear O-Glc-Nac modification, p38 mitogen-activated protein kinase activation and
apoptosis. Diabetes Obes Metab 2005;7:448-454.
[288] Loeser RF, Yammani RR, Carlson CS, et al. Articular chondrocytes express the receptor for
advanced glycation end products: Potential role in osteoarthritis. Arthritis Rheum 2005;52:2376-2385.
[289] Nah SS, Choi IY, Lee CK, et al. Effects of advanced glycation end products on the expression of
COX-2, PGE2 and NO in human osteoarthritic chondrocytes. Rheumatology (Oxford) 2008;47:425-431.
[290] Huang CY, Hung LF, Liang CC, Ho LJ. COX-2 and iNOS are critical in advanced glycation end
product-activated chondrocytes in vitro. Eur J Clin Invest 2009;39:417-428.
[291] Nah SS, Choi IY, Yoo B, et al. Advanced glycation end products increases matrix
metalloproteinase-1, -3, and -13, and TNF-alpha in human osteoarthritic chondrocytes. FEBS Lett
2007;581:1928-1932.
[292] DeGroot J, Verzijl N, Bank RA, et al. Age-related decrease in proteoglycan synthesis of human
articular chondrocytes: the role of nonenzymatic glycation. Arthritis Rheum 1999;42:1003-1009.
[293] Franke S, Sommer M, Ruster C, et al. Advanced glycation end products induce cell cycle arrest
and proinflammatory changes in osteoarthritic fibroblast-like synovial cells. Arthritis Res Ther
2009;11:R136.
[294] Steenvoorden MM, Huizinga TW, Verzijl N, et al. Activation of receptor for advanced glycation
end products in osteoarthritis leads to increased stimulation of chondrocytes and synoviocytes. Arthritis
Rheum 2006;54:253-263.
[295] Miyaki S, Nakasa T, Otsuki S, et al. MicroRNA-140 is expressed in differentiated human articular
chondrocytes and modulates interleukin-1 responses. Arthritis Rheum 2009;60:2723-2730.
[296] Tardif G, Hum D, Pelletier JP, Duval N, Martel-Pelletier J. Regulation of the IGFBP-5 and MMP-
13 genes by the microRNAs miR-140 and miR-27a in human osteoarthritic chondrocytes. BMC
Musculoskelet Disord 2009;10:148.
[297] Miyaki S, Sato T, Inoue A, et al. MicroRNA-140 plays dual roles in both cartilage development
and homeostasis. Genes Dev 2010;24:1173-1185.
[298] Martinelli R, Nardelli C, Pilone V, et al. miR-519d overexpression is associated with human
obesity. Obesity (Silver Spring) 2010;18:2170-2176.
[299] Katz JD, Agrawal S, Velasquez M. Getting to the heart of the matter: osteoarthritis takes its place
as part of the metabolic syndrome. Curr Opin Rheumatol 2010;22:512-519.
[300] Puenpatom RA, Victor TW. Increased prevalence of metabolic syndrome in individuals with
osteoarthritis: an analysis of NHANES III data. Postgrad Med 2009;121:9-20.
[301] Arner P, Spalding KL. Fat cell turnover in humans. Biochem Biophys Res Commun
2010;396:101-104.
[302] Fruhbeck G, Becerril S, Sainz N, Garrastachu P, Garcia-Velloso MJ. BAT: a new target for human
obesity? Trends Pharmacol Sci 2009;30:387-396.
[303] Athyros VG, Tziomalos K, Karagiannis A, Anagnostis P, Mikhailidis DP. Should adipokines be
considered in the choice of the treatment of obesity-related health problems? Curr Drug Targets
2010;11:122-135.
[304] Kralisch S, Bluher M, Paschke R, Stumvoll M, Fasshauer M. Adipokines and adipocyte targets in
the future management of obesity and the metabolic syndrome. Mini Rev Med Chem 2007;7:39-45.

160
[305] Cinti S. Adipocyte differentiation and transdifferentiation: plasticity of the adipose organ. J
Endocrinol Invest 2002;25:823-835.
[306] Timmons JA, Wennmalm K, Larsson O, et al. Myogenic gene expression signature establishes that
brown and white adipocytes originate from distinct cell lineages. Proc Natl Acad Sci U S A 2007;104:4401-
4406.
[307] Seale P, Bjork B, Yang W, et al. PRDM16 controls a brown fat/skeletal muscle switch. Nature
2008;454:961-967.
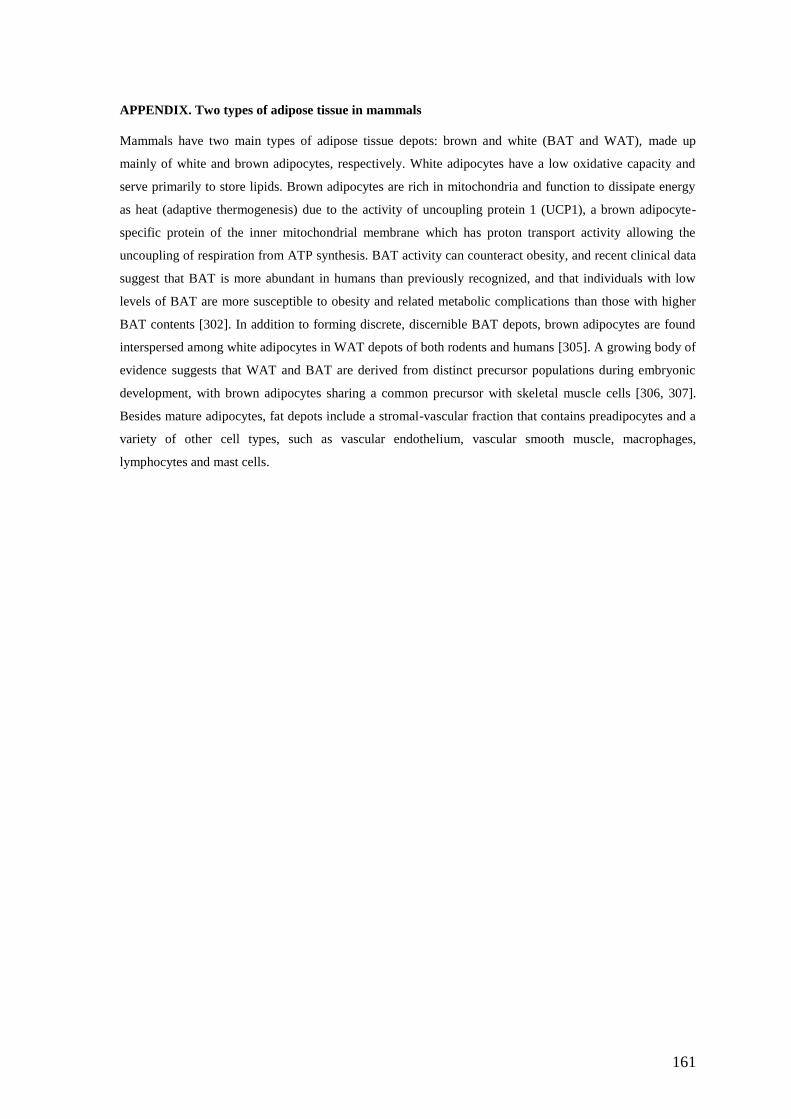
161
APPENDIX. Two types of adipose tissue in mammals
Mammals have two main types of adipose tissue depots: brown and white (BAT and WAT), made up
mainly of white and brown adipocytes, respectively. White adipocytes have a low oxidative capacity and
serve primarily to store lipids. Brown adipocytes are rich in mitochondria and function to dissipate energy
as heat (adaptive thermogenesis) due to the activity of uncoupling protein 1 (UCP1), a brown adipocyte-
specific protein of the inner mitochondrial membrane which has proton transport activity allowing the
uncoupling of respiration from ATP synthesis. BAT activity can counteract obesity, and recent clinical data
suggest that BAT is more abundant in humans than previously recognized, and that individuals with low
levels of BAT are more susceptible to obesity and related metabolic complications than those with higher
BAT contents [302]. In addition to forming discrete, discernible BAT depots, brown adipocytes are found
interspersed among white adipocytes in WAT depots of both rodents and humans [305]. A growing body of
evidence suggests that WAT and BAT are derived from distinct precursor populations during embryonic
development, with brown adipocytes sharing a common precursor with skeletal muscle cells [306, 307].
Besides mature adipocytes, fat depots include a stromal-vascular fraction that contains preadipocytes and a
variety of other cell types, such as vascular endothelium, vascular smooth muscle, macrophages,
lymphocytes and mast cells.

Table 1. Transcription –related factors at the intersection of adipose tissue and joint cell biology
Protein Function Effects on adipogenesis/
adipocytes
Changes/involvement
in obesity
Effects on joint cell
biology
Changes in OA References
Sox9 DNA-binding
transcription
factor
Inhibits adipogenesis
Down-regulated in
WAT in murine obesity
Stimulates
chondrogenesis;
Might be important to
maintain anabolic
functions in mature
chondrocytes
Down-regulated in
OA cartilage
[18]
[19]
PPAR DNA-binding
transcription
factor
Stimulates adipogenesis
and lipogenesis;
Modulates adipokine
expression in a favorable
manner
Its activity can
contribute to obesity
and to increased
systemic insulin
sensitivity
Suppresses the
expression of
inflammation-related
and catabolic genes in
chondrocytes;
Inhibits
osteoblastogenesis
Down-regulated in
OA cartilage
[27]
[28]
[31]
[32]
PGC-1 Transcriptional
coactivator
Stimulates brown
adipogenesis (expression
of UCP1 and of genes
related to
mitochondriogenesis)
Down-regulated in
skeletal muscle and
WAT of obese and
diabetic subjects
Stimulates
chondrogenesis by
serving as a coactivator
of Sox9
Unknown [34-40]
[45]
Table 2. Signaling pathways, growth factors and related proteins at the intersection of adipose tissue and joint cell biology
Signaling
pathway/protein
Effects on
adipogenesis/adipocytes
Involvement in obesity Effects on joint cell biology Involvement in OA References
Pref-1 Inhibition of white
adipogenesis
Its deficiency in null mice
accelerates fat deposition;
Overexpression in AT* leads to
leanness but with exacerbated
insulin resistance
Promotes chondrogenic
induction of mesenchymal cells
Unknown [19]
[21]
[22]
[23]
[24]
Wnt signaling Inhibition of white and
brown adipogenesis
Overexpression in AT protects
against obesity without signs of
lipotoxicity;
Polymorphisms in related genes
have been linked to human
obesity
Inhibition of chondrogenesis;
Induction of osteoblastogenesis
Activated in OA cartilage
(canonical pathway);
Polymorphisms in Wnt-related
genes have been linked to
human OA
[15]
[32]
[53]
Hh signaling Inhibition of white
adipogenesis
Constitutive activation in AT
results in leanness without signs
of lipotoxicity
Activates chondrogenesis,
chondrocyte terminal
differentiation, endochondral
ossification, and
osteoblastogenesis
Activated in OA cartilage [62]
[63]
[65]
[66]
TGF Inhibition of white
adipogenesis
Increased in WAT in obesity;
Expression in WAT correlates
with that of pro-thrombotic
PAI-1
Activates chondrogenesis and
chondrocyte terminal
differentiation;
Favors osteophyte formation
Dual effects in cartilage: it
induces anabolic responses but
may also induce matrix
degradation during terminal
differentiation, and osteophyte
formation
[67]
[71]
[73]
[74]
BMP-7 Induction of brown
adipogenesis
Overexpression in adult mice
reduces weight gain
Induces chondrogenesis but not
chondrocyte terminal
differentiation
Pro-anabolic and anti-catabolic
effects in cartilage
[76]
[78]
IGFBP-3 Causes insulin resistance
and suppresses adiponectin
expression
Possible risk factor for the
metabolic syndrome
Anti-anabolic activity through
sequestering of IGF-1
Increased in OA cartilage [81]
[82]
*AT, adipose tissues
Table 3. Main cytokines and adipokines at the intersection of adipose tissue and articular joint cell biology
Factor Effects related to OA Metabolic effects Levels in obesity References
IL-1 Synovitis
Cartilage breakdown
Impaired beta-cell function
and insulin secretion
Increased [5]
[141]
[148]
TNF Synovitis
Cartilage breakdown
Insulin resistance Increased [5]
[141]
[147]
IL-6 Synovitis
Osteophyte formation
Insulin resistance in liver and
adipose tissue
Increased [5]
[141]
[152]
IL-18 Synovitis
Chondrocyte apoptosis
Insulin resistance and pro-
atherogenic effects, through
down-regulation of
adiponectin and by other
means
Increased [5]
[149]
[153]
IL-8 Synovitis Pathogenesis of non-alcoholic
fatty liver disease
Increased [5]
[141]
[150]
[151]
IL-10 Anti-inflammatory effects
Chondroprotective effects
Anti-inflammatory effects;
Prevention of diet-induced
insulin resistance
Decreased [5 ]
[141]
[161]
Leptin Induction of cartilage
IGF-1 and TGF-
expression and
proteoglycan synthesis;
Pro-inflammatory effects;
Stimulation of cartilage
MMPs;
Bone matrix regulation
Reduces food intake;
Increases energy expenditure;
Enhances lipolysis and fatty
acid oxidation in peripheral
tissues;
Inhibits gluconeogenesis and
lipogenesis
Increased, but
resistance to its
effects
[5]
[6]
Adiponectin Inhibition/stimulation of
inflammation;
Inhibition/stimulation of
cartilage MMPs
Insulin-sensitizing effects;
Anti-atherogenic effects
Decreased [5]
[6]
Resistin Stimulation of
inflammation;
Stimulation of cartilage
MMPs
May promote insulin
resistance
Increased [5]
[6]
Visfatin Stimulation of
inflammation;
Stimulation of cartilage
MMPs
May have insulin-sensitizing
effects
Increased [5]
[6]
Angiotensin II Pro-inflammatory action
(proven in rheumatoid
arthritis)
Favors hypertension;
May favor adipose tissue
inflammation, dyslipidemia
and insulin resistance
Increased [201]
[202]
[197]
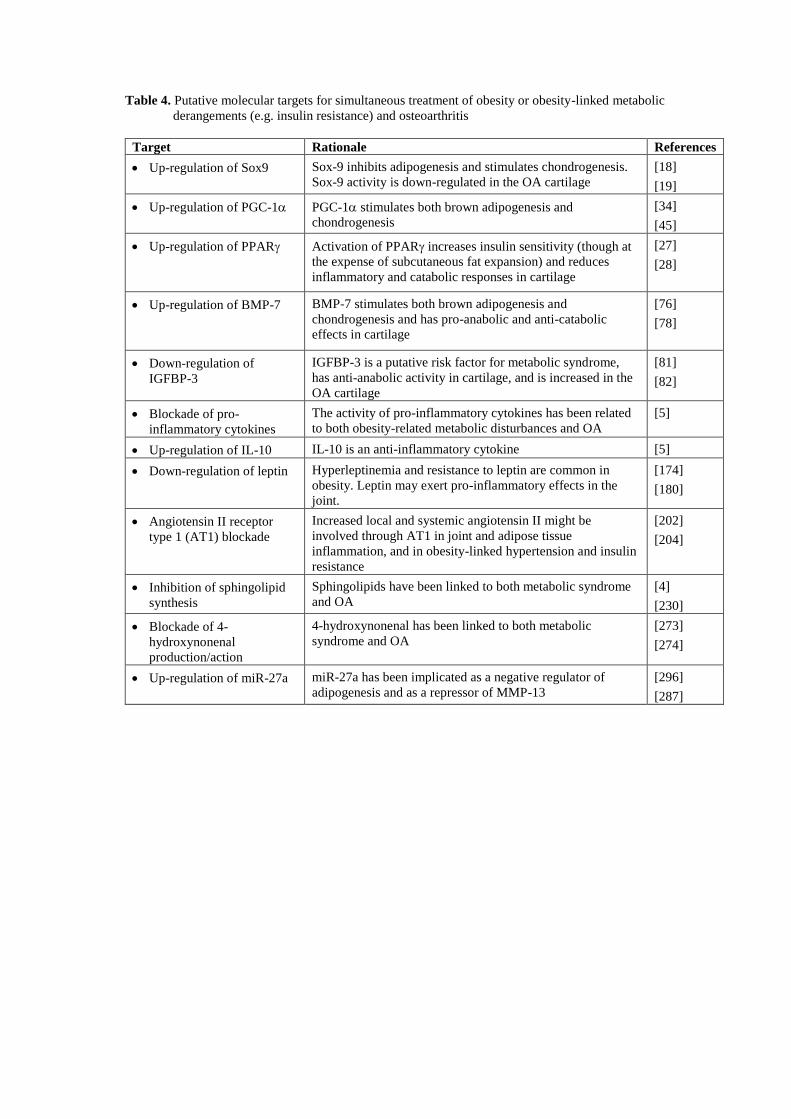
Table 4. Putative molecular targets for simultaneous treatment of obesity or obesity-linked metabolic
derangements (e.g. insulin resistance) and osteoarthritis
Target Rationale References
Up-regulation of Sox9 Sox-9 inhibits adipogenesis and stimulates chondrogenesis.
Sox-9 activity is down-regulated in the OA cartilage
[18]
[19]
Up-regulation of PGC-1 PGC-1 stimulates both brown adipogenesis and
chondrogenesis
[34]
[45]
Up-regulation of PPAR Activation of PPAR increases insulin sensitivity (though at
the expense of subcutaneous fat expansion) and reduces
inflammatory and catabolic responses in cartilage
[27]
[28]
Up-regulation of BMP-7 BMP-7 stimulates both brown adipogenesis and
chondrogenesis and has pro-anabolic and anti-catabolic
effects in cartilage
[76]
[78]
Down-regulation of
IGFBP-3
IGFBP-3 is a putative risk factor for metabolic syndrome,
has anti-anabolic activity in cartilage, and is increased in the
OA cartilage
[81]
[82]
Blockade of pro-
inflammatory cytokines
The activity of pro-inflammatory cytokines has been related
to both obesity-related metabolic disturbances and OA
[5]
Up-regulation of IL-10 IL-10 is an anti-inflammatory cytokine [5]
Down-regulation of leptin Hyperleptinemia and resistance to leptin are common in
obesity. Leptin may exert pro-inflammatory effects in the
joint.
[174]
[180]
Angiotensin II receptor
type 1 (AT1) blockade
Increased local and systemic angiotensin II might be
involved through AT1 in joint and adipose tissue
inflammation, and in obesity-linked hypertension and insulin
resistance
[202]
[204]
Inhibition of sphingolipid
synthesis
Sphingolipids have been linked to both metabolic syndrome
and OA
[4]
[230]
Blockade of 4-
hydroxynonenal
production/action
4-hydroxynonenal has been linked to both metabolic
syndrome and OA
[273]
[274]
Up-regulation of miR-27a miR-27a has been implicated as a negative regulator of
adipogenesis and as a repressor of MMP-13
[296]
[287]
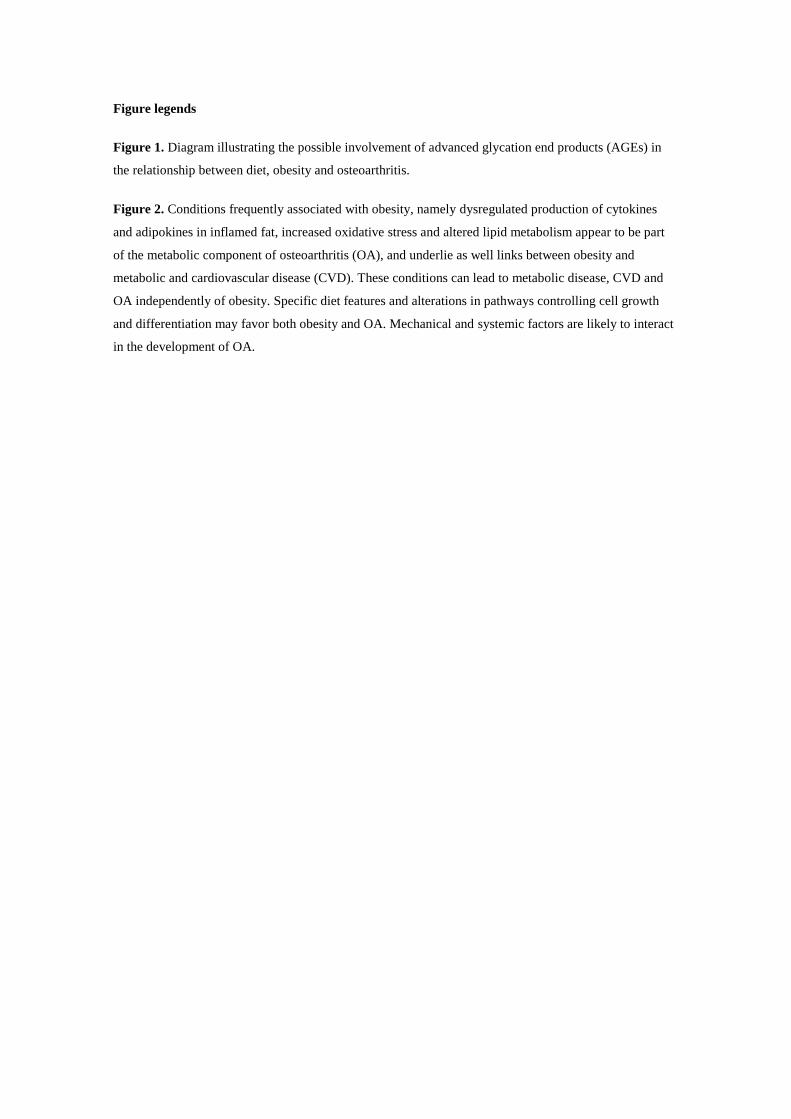
Figure legends
Figure 1. Diagram illustrating the possible involvement of advanced glycation end products (AGEs) in
the relationship between diet, obesity and osteoarthritis.
Figure 2. Conditions frequently associated with obesity, namely dysregulated production of cytokines
and adipokines in inflamed fat, increased oxidative stress and altered lipid metabolism appear to be part
of the metabolic component of osteoarthritis (OA), and underlie as well links between obesity and
metabolic and cardiovascular disease (CVD). These conditions can lead to metabolic disease, CVD and
OA independently of obesity. Specific diet features and alterations in pathways controlling cell growth
and differentiation may favor both obesity and OA. Mechanical and systemic factors are likely to interact
in the development of OA.
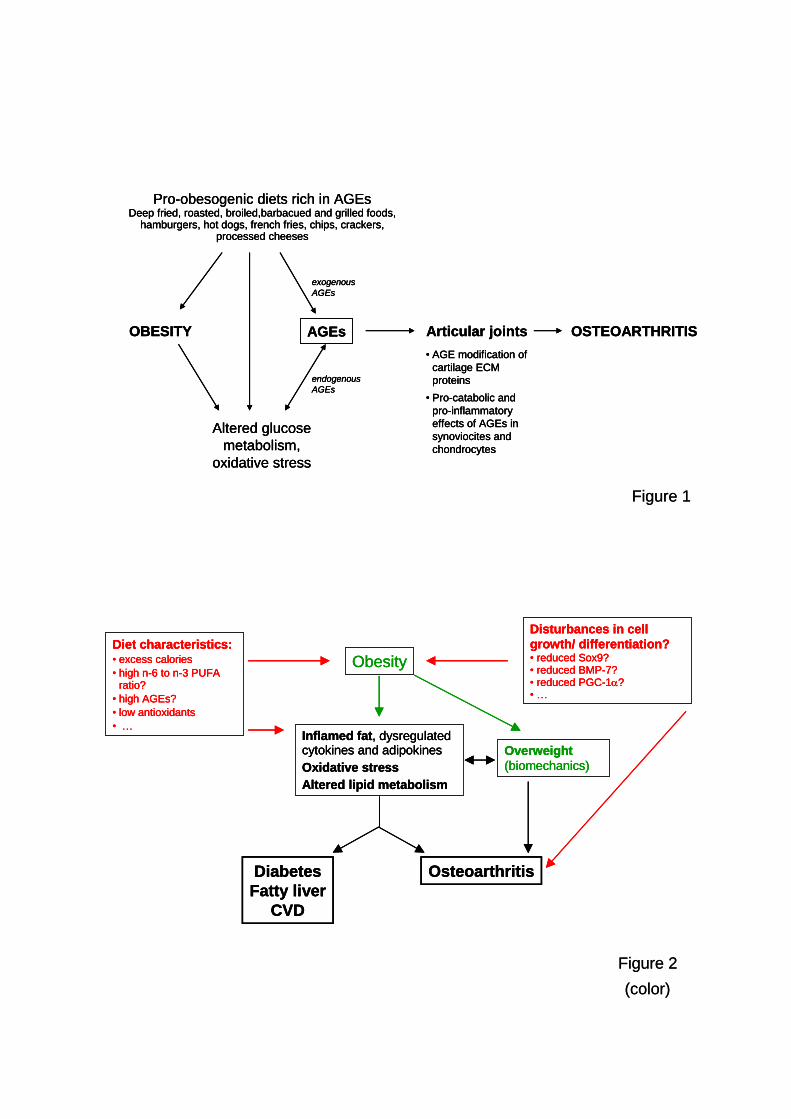
Pro-obesogenic diets rich in AGEsDeep fried, roasted, broiled,barbacued and grilled foods,
hamburgers, hot dogs, french fries, chips, crackers, processed cheeses
OBESITY
Altered glucose
metabolism,
oxidative stress
AGEs Articular joints OSTEOARTHRITIS
exogenous
AGEs
endogenous
AGEs
• AGE modification of
cartilage ECM
proteins
• Pro-catabolic and
pro-inflammatory
effects of AGEs in
synoviocites and
chondrocytes
Figure 1
Pro-obesogenic diets rich in AGEsDeep fried, roasted, broiled,barbacued and grilled foods,
hamburgers, hot dogs, french fries, chips, crackers, processed cheeses
OBESITY
Altered glucose
metabolism,
oxidative stress
AGEs Articular joints OSTEOARTHRITIS
exogenous
AGEs
endogenous
AGEs
• AGE modification of
cartilage ECM
proteins
• Pro-catabolic and
pro-inflammatory
effects of AGEs in
synoviocites and
chondrocytes
Figure 1
Figure 2
(color)
Disturbances in cell
growth/ differentiation?• reduced Sox9?• reduced BMP-7?• reduced PGC-1?• …
Diet characteristics:• excess calories
• high n-6 to n-3 PUFA ratio?
• high AGEs?
• low antioxidants
• …
Obesity
Inflamed fat, dysregulatedcytokines and adipokines
Oxidative stress
Altered lipid metabolism
Diabetes
Fatty liver
CVD
Osteoarthritis
Overweight
(biomechanics)

Resultados y Discusión
169
MANUSCRITO VI
Moderate vitamin A supplementation in early life affects later adiposity in rats.
Granados N., Amengual J., Ribot J., Musinovic H., Ceresi E., Von Lintig J., Palou A, Bonet M.L.
Manuscrito en vías de publicación

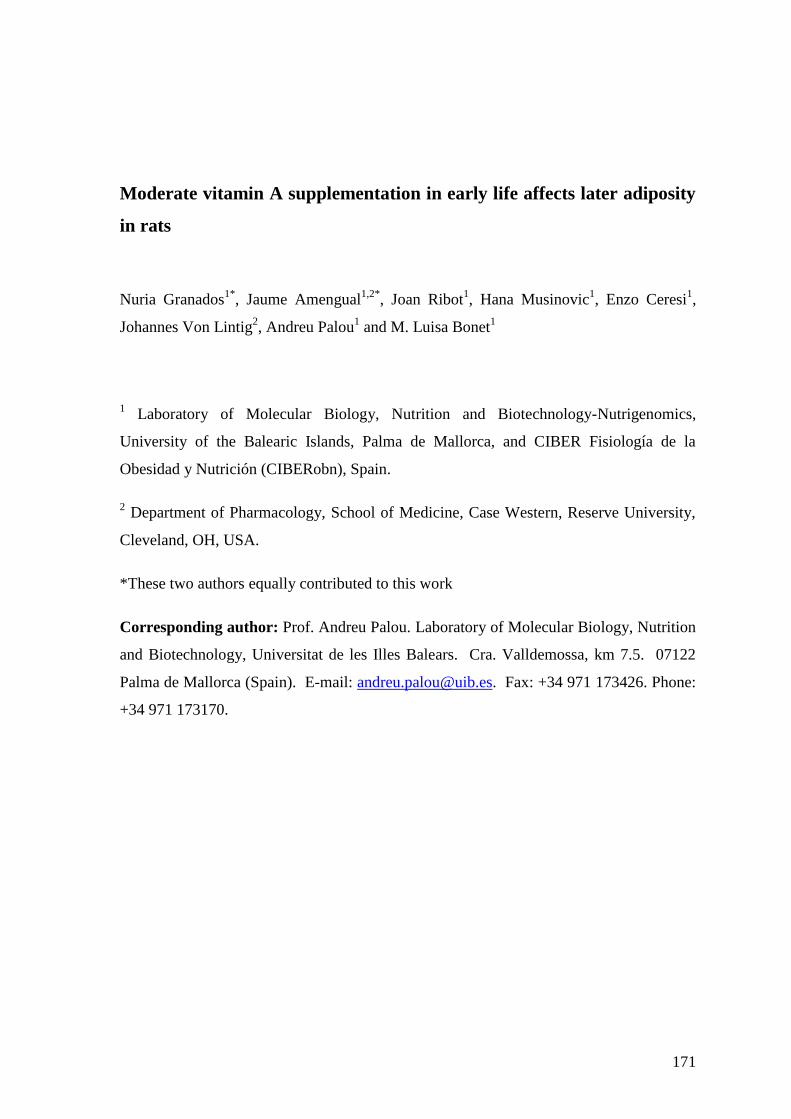
171
Moderate vitamin A supplementation in early life affects later adiposity
in rats
Nuria Granados1*
, Jaume Amengual1,2*
, Joan Ribot1, Hana Musinovic
1, Enzo Ceresi
1,
Johannes Von Lintig2, Andreu Palou
1 and M. Luisa Bonet
1
1 Laboratory of Molecular Biology, Nutrition and Biotechnology-Nutrigenomics,
University of the Balearic Islands, Palma de Mallorca, and CIBER Fisiología de la
Obesidad y Nutrición (CIBERobn), Spain.
2 Department of Pharmacology, School of Medicine, Case Western, Reserve University,
Cleveland, OH, USA.
*These two authors equally contributed to this work
Corresponding author: Prof. Andreu Palou. Laboratory of Molecular Biology, Nutrition
and Biotechnology, Universitat de les Illes Balears. Cra. Valldemossa, km 7.5. 07122
Palma de Mallorca (Spain). E-mail: [email protected]. Fax: +34 971 173426. Phone:
+34 971 173170.
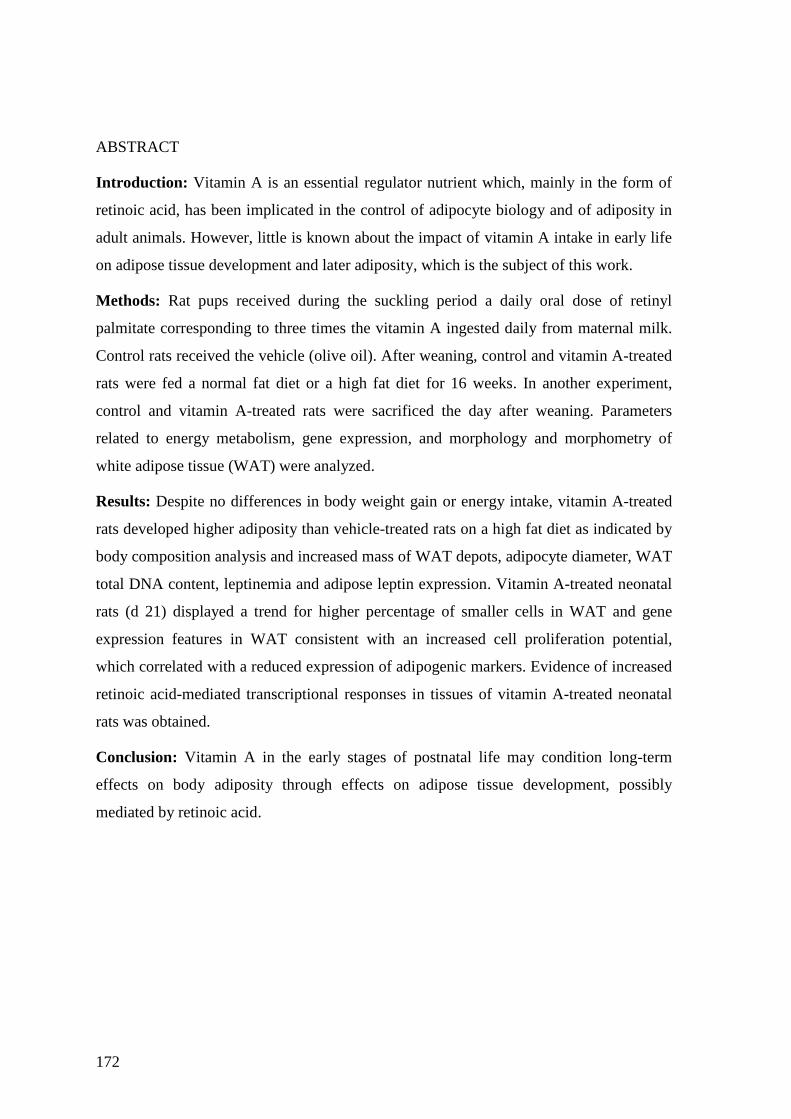
172
ABSTRACT
Introduction: Vitamin A is an essential regulator nutrient which, mainly in the form of
retinoic acid, has been implicated in the control of adipocyte biology and of adiposity in
adult animals. However, little is known about the impact of vitamin A intake in early life
on adipose tissue development and later adiposity, which is the subject of this work.
Methods: Rat pups received during the suckling period a daily oral dose of retinyl
palmitate corresponding to three times the vitamin A ingested daily from maternal milk.
Control rats received the vehicle (olive oil). After weaning, control and vitamin A-treated
rats were fed a normal fat diet or a high fat diet for 16 weeks. In another experiment,
control and vitamin A-treated rats were sacrificed the day after weaning. Parameters
related to energy metabolism, gene expression, and morphology and morphometry of
white adipose tissue (WAT) were analyzed.
Results: Despite no differences in body weight gain or energy intake, vitamin A-treated
rats developed higher adiposity than vehicle-treated rats on a high fat diet as indicated by
body composition analysis and increased mass of WAT depots, adipocyte diameter, WAT
total DNA content, leptinemia and adipose leptin expression. Vitamin A-treated neonatal
rats (d 21) displayed a trend for higher percentage of smaller cells in WAT and gene
expression features in WAT consistent with an increased cell proliferation potential,
which correlated with a reduced expression of adipogenic markers. Evidence of increased
retinoic acid-mediated transcriptional responses in tissues of vitamin A-treated neonatal
rats was obtained.
Conclusion: Vitamin A in the early stages of postnatal life may condition long-term
effects on body adiposity through effects on adipose tissue development, possibly
mediated by retinoic acid.
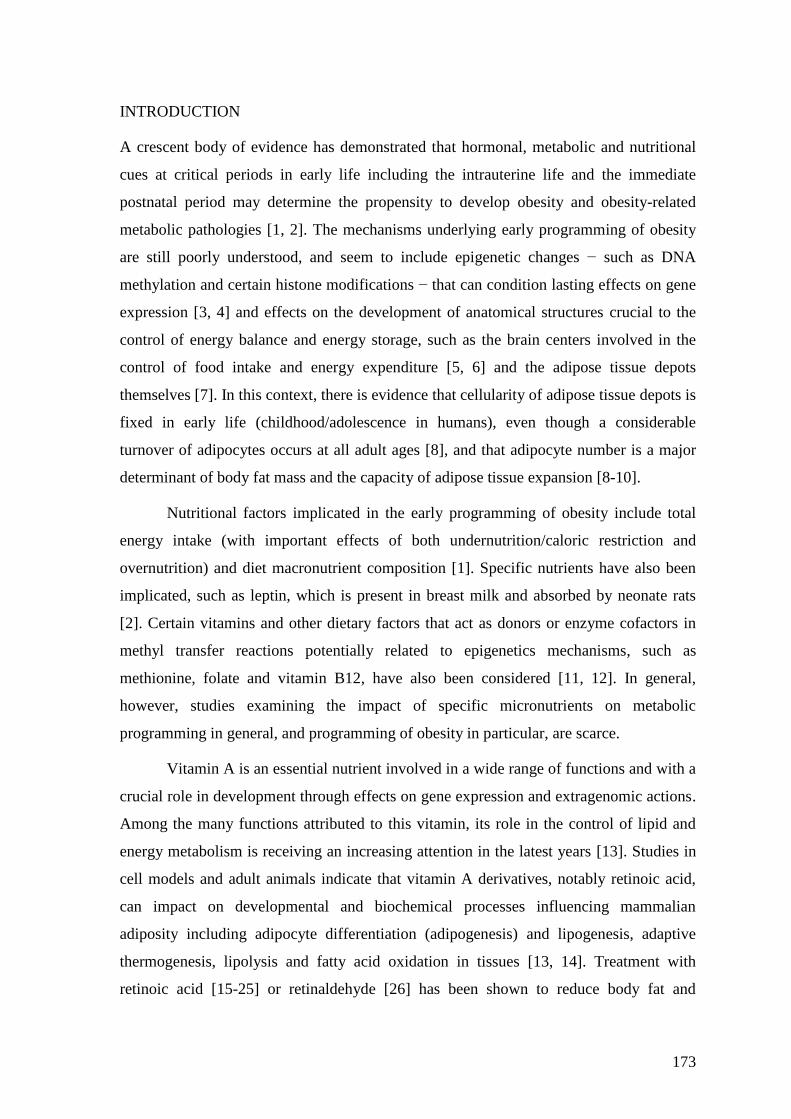
173
INTRODUCTION
A crescent body of evidence has demonstrated that hormonal, metabolic and nutritional
cues at critical periods in early life including the intrauterine life and the immediate
postnatal period may determine the propensity to develop obesity and obesity-related
metabolic pathologies [1, 2]. The mechanisms underlying early programming of obesity
are still poorly understood, and seem to include epigenetic changes − such as DNA
methylation and certain histone modifications − that can condition lasting effects on gene
expression [3, 4] and effects on the development of anatomical structures crucial to the
control of energy balance and energy storage, such as the brain centers involved in the
control of food intake and energy expenditure [5, 6] and the adipose tissue depots
themselves [7]. In this context, there is evidence that cellularity of adipose tissue depots is
fixed in early life (childhood/adolescence in humans), even though a considerable
turnover of adipocytes occurs at all adult ages [8], and that adipocyte number is a major
determinant of body fat mass and the capacity of adipose tissue expansion [8-10].
Nutritional factors implicated in the early programming of obesity include total
energy intake (with important effects of both undernutrition/caloric restriction and
overnutrition) and diet macronutrient composition [1]. Specific nutrients have also been
implicated, such as leptin, which is present in breast milk and absorbed by neonate rats
[2]. Certain vitamins and other dietary factors that act as donors or enzyme cofactors in
methyl transfer reactions potentially related to epigenetics mechanisms, such as
methionine, folate and vitamin B12, have also been considered [11, 12]. In general,
however, studies examining the impact of specific micronutrients on metabolic
programming in general, and programming of obesity in particular, are scarce.
Vitamin A is an essential nutrient involved in a wide range of functions and with a
crucial role in development through effects on gene expression and extragenomic actions.
Among the many functions attributed to this vitamin, its role in the control of lipid and
energy metabolism is receiving an increasing attention in the latest years [13]. Studies in
cell models and adult animals indicate that vitamin A derivatives, notably retinoic acid,
can impact on developmental and biochemical processes influencing mammalian
adiposity including adipocyte differentiation (adipogenesis) and lipogenesis, adaptive
thermogenesis, lipolysis and fatty acid oxidation in tissues [13, 14]. Treatment with
retinoic acid [15-25] or retinaldehyde [26] has been shown to reduce body fat and
174
improve insulin sensitivity in lean and obese rodents, and genetic manipulation of various
carotenoid/retinoid-metabolising enzymes and transport proteins has been shown to result
in alterations in adiposity in mouse models [26-31]. Additionally, there is evidence that
adiposity might be physiologically related to vitamin A status: animal studies indicate that
diets low in vitamin A favor adipose tissue formation [16, 32] and, in humans, studies
have reported an inadequate vitamin A status in overweight and obese individuals [33]
and an inverse association between vitamin A intake and adiposity [34]. On the other
hand, vitamin A supplementation as retinol or retinyl palmitate (at 40- to 50-fold the
regular dose) was shown to associate with reduced WAT mass in some studies in adult
rats [35, 36] and modestly counterbalanced the development of diet-induced obesity in
mice [37]. The anti-adiposity action of retinoic acid has been traced to increased oxidative
metabolism and energy expenditure in tissues including brown and white adipose tissues,
skeletal muscle and the liver [15, 19, 21-23, 38], and to reduced peroxisome proliferator-
activated receptor (PPAR) levels and activity in white adipose tissue [16, 31, 39].
PPAR is a PPAR isoform of particular relevance for adipocyte biology, since it is the
master regulator of adipogenesis and is also required for lipogenesis and survival in
mature adipocytes [40].
Despite the accumulated evidence linking vitamin A to the control of adiposity in
adult animals, little is known about the impact of vitamin A intake in early life on adipose
tissue development and later adiposity. In this work, we sought to contribute to fulfill this
gap by studying the impact of a moderate vitamin A supplementation during the suckling
period on the later response to a high fat diet in rats.
MATERIALS AND METHODS
Animals, diets and experimental designs
Animal protocols followed in this study were reviewed and approved by the Bioethical
Committee of the University of the Balearic Islands, and guidelines for the use and care
of laboratory animals of our institution were followed.
Analysis of vitamin A concentration in milk of nursing rats during lactation
Our study design involved supplementing rat pups with a moderate amount of vitamin A
during the entire suckling period. It has been reported that vitamin A concentration in rat
milk doesn’t significantly change throughout lactation and it is highly dependent on the
175
mother’s vitamin A consumption [41, 42]. In order to fix the exact vitamin A amount to
be used in our experiments, we first quantified by HPLC the total vitamin A (retinol)
concentration in the milk of lactating rats mated at our animal house. For this, after an
acclimation period of one month, three-month-old, virgin female Wistar rats rat (from
Charles River Laboratories, Barcelona, Spain) were caged with a male rat. After mating,
each female was placed in an individual cage. Rats were kept in a room with controlled
temperature (22 ºC) and a 12-h light/dark cycle, with free access to water and a standard
chow (Panlab, Barcelona, Spain; 15000 UI vitamin A/kg). After delivery, three dams
were used for milk studies. Birth was defined as d 0 of lactation. Milk samples from each
dam were collected on d 7, 12 and 18 of lactation. For milk collection, nursing rats were
separated from their pups for 6 h to guarantee that mammary glands were full of milk.
Before milking, dams were exposed to ether, and then milk was obtained from the
mammary glands by manual milking and stored frozen at -20 ºC until analysis. HPLC
analysis revealed that vitamin A sources in milk were free retinol (in all-trans and 13-cis
form) and retinyl ester. The total vitamin A concentration (free retinol plus retinyl ester)
in rat milk at d 7, 12 and 18 of lactation was, respectively, 1.15 mol/L, 0.93 mol/L and
1.32 mol/L. The average concentration of the three days (1.13 mol/L) was used in
further study designs (see below).
Analysis of the effects of vitamin A supplementation during the suckling period on high fat
diet-induced obesity later in life
Female Wistar rats were mated with male rats and housed as described above. At d 1 after
delivery, excess pups in each litter were removed to keep 10 pups per dam, and the pups
were randomly assigned into two groups: control group and vitamin A-treated group (5
pups in each group). From day 1 to 20 of lactation, between 10 and 15 µl of the vehicle
(olive oil) or a solution of vitamin A as retinyl palmitate (Sigma, Madrid, Spain) was
supplied orally every day to the pups in the control and the vitamin A-treated groups,
respectively, using a pipette. The amount of vitamin A given was progressively adjusted
throughout the suckling period to be approx. 3 times the daily vitamin A intake from
maternal milk. The latter was calculated from the experimentally determined vitamin A
content in rat milk (1.13 mol/L, see above) and the estimated daily milk intake
throughout the suckling period according to Kojima et al. (1998) [43]. Blood samples
were taken from the pups on d 10 and d 20 between one and two hours our after treatment
to verify retinyl ester absorption. On the day after weaning (d 21), control and vitamin A-
176
treated male rats (10 animals per group) were housed 2 or 3 animals per cage and split
into two groups (5 animals per group), which were fed ad libitum with a normal fat (NF)
diet (3.8 kcal.g-1
, 10% calories from fat) or a high fat (HF) diet (5.2 kcal.g-1
, 60% calories
from fat), making a total of 4 experimental groups. Both diets are commercially available
and were obtained from Research Diets, Inc., New Brunswick, NJ, USA. Male rats were
used because in preliminary experiments they were found to develop more obesity upon
HF diet feeding than female rats. Possible differences between litters were solved by
ensuring the presence of pups from the same litter in each of the four experimental
groups. Body weight and food intake were recorded between 2 and 3 times a week from d
21 on. Rectal temperature and body composition was determined at defined time points
during the experiment using a digital thermometer and an Echo MRI-TM wall body
composition analyzer, respectively. The animals were killed after 16 weeks on the NF or
the HF diet, at d 135 of age, by decapitation, under fed conditions and within the first
three hours of the light period. Tissues including brown adipose tissue (BAT), different
white adipose tissue (WAT) depots – gonadal, inguinal and retroperitoneal –,
gastrocnemius muscle, and liver were rapidly removed, weighted, frozen in liquid
nitrogen, and stored at -70 ºC until analysis. Blood was collected, incubated at room
temperature for 1 h and centrifuged at 1000g for 1 min to obtain the serum, which was
stored at -20 ºC until analysis. This experiment was conducted twice, using two
independent cohorts of 20 animals each.
Analysis of the effects of vitamin A supplementation during the suckling period in young
rats
Male and female rats that had been treated during the suckling period with vehicle or
vitamin A as described above were killed on the day after weaning (d 21) (13-16 rats per
group). Blood was collected to prepare the serum and tissues including intestine, liver and
WAT depots (gonadal, retroperitoneal and inguinal) were sampled as described above and
stored at -70 ºC until analysis. A lengthways fragment of inguinal WAT (iWAT) was
fixed by immersion in 4% paraformaldehyde in 0.1 M PBS (pH 7.4) overnight at 4 ºC, for
histology and immunohistochemistry analysis (see below).
Oral glucose tolerance test
An oral glucose tolerance test was performed to the four groups of rats in the feeding
experiment at the age of 70 and 128-130 d, to check glucose tolerance and insulin
177
sensitivity in an early and an advanced stage of the HF diet challenge. A load of 1- to 1.5-
ml glucose (1.5 g/kg body weight) was orally given to the rats using a cannula, after
overnight fasting. Blood samples were taken from the tail of the animals before glucose
load at time zero and at 30, 60, 120, and 180 min thereafter. Plasma glucose levels were
measured as described below. The homeostatic model assessment for insulin resistance
(HOMA-IR) score was calculated from fasting insulin and glucose concentrations at time
zero as previously [44].
Histology and immunohistochemistry
Fixed iWAT lobules were dehydrated, cleared and then paraffin-embedded so that the
plane of section corresponded with the one of the wider surface. 3 µm-thick sections at
the same level were obtained and stained with hematoxylin/eosin for morphometric
analysis, performed by digital acquisition of adipose tissue areas (Digital Still Camera
DXM 1200 and NIKON 6000 Eclipse Microscope). Two histological sections were
counted per mouse. Immunohistochemistry of proliferating cell nuclear antigen (PCNA)
was performed using a commercial anti-PCNA antibody (Santa Cruz Biotechnology,
Santa Cruz, CA, USA).
Extraction and analysis of retinoids
Retinoids were extracted from milk and plasma under dim red safety light (600 nm).
Briefly, 200 l of plasma or milk was added to 200 l of methanol. Then, 400 l of
acetone was added to the sample. The extraction of retinoids was repeated three times
using petrolether, and the collected organic phases were dried under stream of nitrogen
and redissolved in HPLC solvent. Extraction of retinoids from adipose tissue and liver
tissue was performed as previously described [27, 31]. HPLC separation of retinoids and
quantification of the peak integrals was perfomed as previously described [45]. Solvents
for HPLC and extraction were purchased in HLPC grade from Merck (Darmstadt,
Germany).
Blood parameters
Serum insulin, leptin and resistin concentrations were measured using commercial ELISA
kits (from DRG Instruments GnbH, Marburg, Germany, for insulin; R&D Systems,
Minneapolis, MS, USA, for leptin; and Phoenix Pharmaceutical Inc, Belmont, CA, USA,
for resistin). Glucose, triacylglycerol and nonesterified fatty acids (NEFA) in serum were
measured enzymatically using commercial kits and following standard procedures (kits
178
from Roche and R-Biopharm, Darmstadt, Germany, for glucose; Sigma, St. Louis, MO,
USA, for triacylglycerol; and Wako Chemicals GmbH, Neuss, Germany, for NEFA).
Other determinations
Tissue DNA content was determined by a fluorometric method that uses 3,5-
diaminobenzoic acid and total lipid content was extracted using organic solvents and
quantified by weight, as previously described [19].
RNA isolation
Total RNA was extracted from tissues using Tripure Reagent (Roche, Barcelona, Spain).
Isolated RNA was quantified using the NanoDrop ND-1000 spectrophotometer
(NadroDrop Technologies Inc., Wilmington, DE, USA) and its integrity confirmed using
agarose gel electrophoresis.
Real-time quantitative PCR (RT-qPCR) analyses
Real-time polymerase chain reaction was used to measure the mRNA expression levels
of: PPAR, PPAR coactivator 1 (PGC-1), PPAR/, PPAR, CCAAT-enhancer
binding protein (C/EBP), lipoprotein lipase (LPL), glucose transporter 4 (GLUT4),
PCNA, preadipocyte factor 1 (Pref1), Cyp26a1, ISX, uncoupling protein (UCP)1 (UCP1),
UCP3, sterol regulatory element binding protein 1c (SREBP1c), fatty acid synthase
(FAS), stearoyl-CoA desaturase 1 (SCD1), vascular endothelial growth factor (VEGF),
18S rRNA, β-actin and LRP10 (the latter three used as internal controls). 0.25 µg of total
RNA (in a final volume of 5 µl) was denatured at 65 C for 10 min and then reverse
transcribed to cDNA using MuLV reverse transcriptase (Applied Biosystem, Madrid,
Spain) at 20ºC for 15 min, 42 C for 30 min, with a final step of 5 min at 95 C in a
Applied Biosystems 2720 Thermal Cycler (Applied Biosystem, Madrid, Spain). Each
PCR was performed from diluted (1/20) cDNA template, forward and reverse primers (1
M each), and Power SYBER Green PCR Master Mix (Applied Biosystems, CA, USA).
Primers for the different genes were obtained from Sigma (Madrid, Spain) (sequences are
available upon request). Real time PCR was performed using the Applied Biosystems
StepOnePlusTM Real-Time PCR Systems (Applied Biosystems) with the following
profile: 10 min at 95 ºC, followed by a total of 40 two- temperature cycles (15 s at 95 ºC
and 1 min at 60 ºC). In order to verify the purity of the products, a melting curve was
produced after each run according to the manufacturer's instructions. The threshold cycle
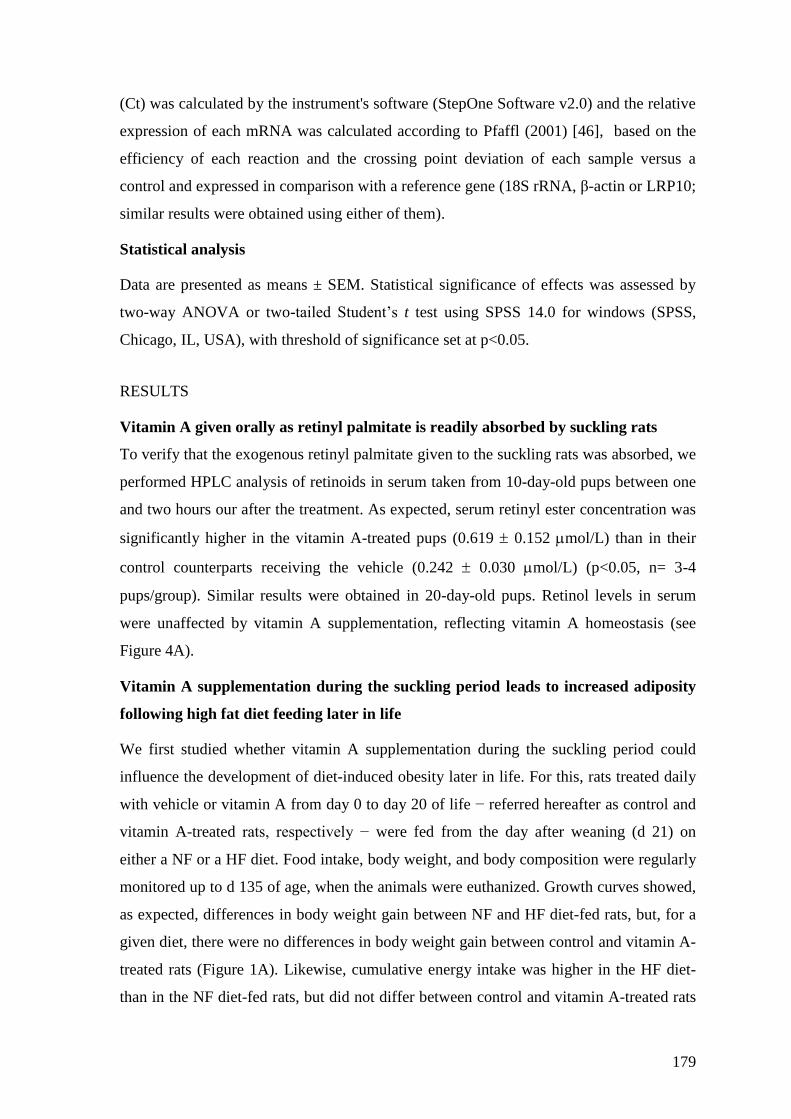
179
(Ct) was calculated by the instrument's software (StepOne Software v2.0) and the relative
expression of each mRNA was calculated according to Pfaffl (2001) [46], based on the
efficiency of each reaction and the crossing point deviation of each sample versus a
control and expressed in comparison with a reference gene (18S rRNA, β-actin or LRP10;
similar results were obtained using either of them).
Statistical analysis
Data are presented as means ± SEM. Statistical significance of effects was assessed by
two-way ANOVA or two-tailed Student’s t test using SPSS 14.0 for windows (SPSS,
Chicago, IL, USA), with threshold of significance set at p<0.05.
RESULTS
Vitamin A given orally as retinyl palmitate is readily absorbed by suckling rats
To verify that the exogenous retinyl palmitate given to the suckling rats was absorbed, we
performed HPLC analysis of retinoids in serum taken from 10-day-old pups between one
and two hours our after the treatment. As expected, serum retinyl ester concentration was
significantly higher in the vitamin A-treated pups (0.619 0.152 mol/L) than in their
control counterparts receiving the vehicle (0.242 0.030 mol/L) (p<0.05, n= 3-4
pups/group). Similar results were obtained in 20-day-old pups. Retinol levels in serum
were unaffected by vitamin A supplementation, reflecting vitamin A homeostasis (see
Figure 4A).
Vitamin A supplementation during the suckling period leads to increased adiposity
following high fat diet feeding later in life
We first studied whether vitamin A supplementation during the suckling period could
influence the development of diet-induced obesity later in life. For this, rats treated daily
with vehicle or vitamin A from day 0 to day 20 of life − referred hereafter as control and
vitamin A-treated rats, respectively − were fed from the day after weaning (d 21) on
either a NF or a HF diet. Food intake, body weight, and body composition were regularly
monitored up to d 135 of age, when the animals were euthanized. Growth curves showed,
as expected, differences in body weight gain between NF and HF diet-fed rats, but, for a
given diet, there were no differences in body weight gain between control and vitamin A-
treated rats (Figure 1A). Likewise, cumulative energy intake was higher in the HF diet-
than in the NF diet-fed rats, but did not differ between control and vitamin A-treated rats
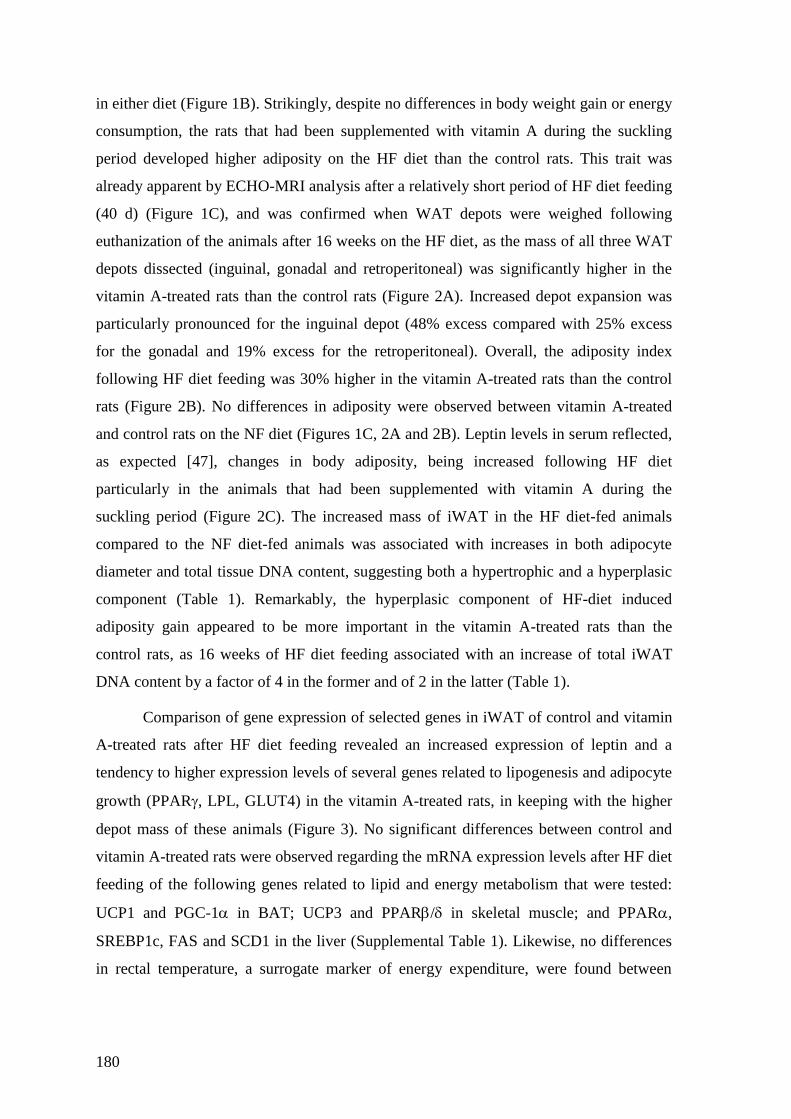
180
in either diet (Figure 1B). Strikingly, despite no differences in body weight gain or energy
consumption, the rats that had been supplemented with vitamin A during the suckling
period developed higher adiposity on the HF diet than the control rats. This trait was
already apparent by ECHO-MRI analysis after a relatively short period of HF diet feeding
(40 d) (Figure 1C), and was confirmed when WAT depots were weighed following
euthanization of the animals after 16 weeks on the HF diet, as the mass of all three WAT
depots dissected (inguinal, gonadal and retroperitoneal) was significantly higher in the
vitamin A-treated rats than the control rats (Figure 2A). Increased depot expansion was
particularly pronounced for the inguinal depot (48% excess compared with 25% excess
for the gonadal and 19% excess for the retroperitoneal). Overall, the adiposity index
following HF diet feeding was 30% higher in the vitamin A-treated rats than the control
rats (Figure 2B). No differences in adiposity were observed between vitamin A-treated
and control rats on the NF diet (Figures 1C, 2A and 2B). Leptin levels in serum reflected,
as expected [47], changes in body adiposity, being increased following HF diet
particularly in the animals that had been supplemented with vitamin A during the
suckling period (Figure 2C). The increased mass of iWAT in the HF diet-fed animals
compared to the NF diet-fed animals was associated with increases in both adipocyte
diameter and total tissue DNA content, suggesting both a hypertrophic and a hyperplasic
component (Table 1). Remarkably, the hyperplasic component of HF-diet induced
adiposity gain appeared to be more important in the vitamin A-treated rats than the
control rats, as 16 weeks of HF diet feeding associated with an increase of total iWAT
DNA content by a factor of 4 in the former and of 2 in the latter (Table 1).
Comparison of gene expression of selected genes in iWAT of control and vitamin
A-treated rats after HF diet feeding revealed an increased expression of leptin and a
tendency to higher expression levels of several genes related to lipogenesis and adipocyte
growth (PPAR, LPL, GLUT4) in the vitamin A-treated rats, in keeping with the higher
depot mass of these animals (Figure 3). No significant differences between control and
vitamin A-treated rats were observed regarding the mRNA expression levels after HF diet
feeding of the following genes related to lipid and energy metabolism that were tested:
UCP1 and PGC-1 in BAT; UCP3 and PPAR/ in skeletal muscle; and PPAR,
SREBP1c, FAS and SCD1 in the liver (Supplemental Table 1). Likewise, no differences
in rectal temperature, a surrogate marker of energy expenditure, were found between
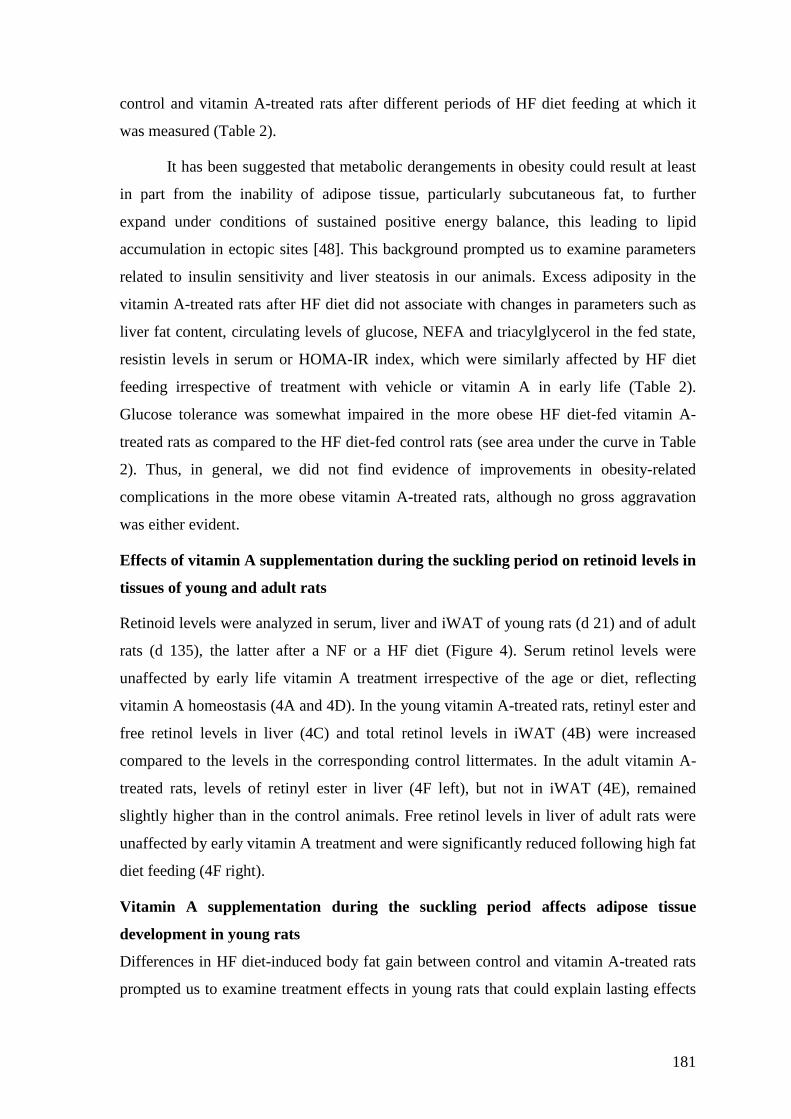
181
control and vitamin A-treated rats after different periods of HF diet feeding at which it
was measured (Table 2).
It has been suggested that metabolic derangements in obesity could result at least
in part from the inability of adipose tissue, particularly subcutaneous fat, to further
expand under conditions of sustained positive energy balance, this leading to lipid
accumulation in ectopic sites [48]. This background prompted us to examine parameters
related to insulin sensitivity and liver steatosis in our animals. Excess adiposity in the
vitamin A-treated rats after HF diet did not associate with changes in parameters such as
liver fat content, circulating levels of glucose, NEFA and triacylglycerol in the fed state,
resistin levels in serum or HOMA-IR index, which were similarly affected by HF diet
feeding irrespective of treatment with vehicle or vitamin A in early life (Table 2).
Glucose tolerance was somewhat impaired in the more obese HF diet-fed vitamin A-
treated rats as compared to the HF diet-fed control rats (see area under the curve in Table
2). Thus, in general, we did not find evidence of improvements in obesity-related
complications in the more obese vitamin A-treated rats, although no gross aggravation
was either evident.
Effects of vitamin A supplementation during the suckling period on retinoid levels in
tissues of young and adult rats
Retinoid levels were analyzed in serum, liver and iWAT of young rats (d 21) and of adult
rats (d 135), the latter after a NF or a HF diet (Figure 4). Serum retinol levels were
unaffected by early life vitamin A treatment irrespective of the age or diet, reflecting
vitamin A homeostasis (4A and 4D). In the young vitamin A-treated rats, retinyl ester and
free retinol levels in liver (4C) and total retinol levels in iWAT (4B) were increased
compared to the levels in the corresponding control littermates. In the adult vitamin A-
treated rats, levels of retinyl ester in liver (4F left), but not in iWAT (4E), remained
slightly higher than in the control animals. Free retinol levels in liver of adult rats were
unaffected by early vitamin A treatment and were significantly reduced following high fat
diet feeding (4F right).
Vitamin A supplementation during the suckling period affects adipose tissue
development in young rats
Differences in HF diet-induced body fat gain between control and vitamin A-treated rats
prompted us to examine treatment effects in young rats that could explain lasting effects
182
as observed. At the end of the treatment, at the age of 21 d, there were no differences
between control and vitamin A-treated rats in body weight (control rats, 41.3 ± 0.9 g;
vitamin A-treated rats, 41.3 ± 0.6 g; n= 13-16 per group), fat depot mass (combined mass
of WAT depots: control rats, 0.56 0.03 g; vitamin A-treated rats, 0.56 ± 0.03 g) or
leptin levels in serum (control rats, 1233 ± 118 pg/mL; vitamin A-treated rats, 1167 ± 142
pg/mL). There were no differences either in liver mass (control rats, 1.55 ± 0.04 g;
vitamin A-treated rats, 1.60 ± 0.04 g), indicating no major hepatotoxic effect of the
moderate vitamin A dose administered. Morphometric analysis of iWAT of the young
rats revealed, however, a tendency to an increased proportion of smaller adipocytes in the
vitamin A-treated animals (Figure 5A and B). Gene expression analysis indicated
significantly reduced levels of PPAR mRNA (by 30%) and increased levels of PCNA
mRNA (by 90%) in iWAT of vitamin A-treated rats compared with control rats (Figure
5C). Vitamin A-treated rats also displayed a tendency to reduced mRNA levels of
C/EBPα, LPL and p21 in iWAT, although differences in the expression of these genes
between the two groups did not reach statistical significance (p=0.14, p=0.11, and p=0.31,
respectively; Student’s t test) (Figure 5C). Pref-1 and VEGF mRNA levels were
expressed to similar levels in iWAT of control and vitamin A-treated rats. Increased
expression of PCNA in iWAT of vitamin A-treated young rats was confirmed by
immunohistochemical analysis, which revealed more PCNA positive cells scattered
among the white adipocytes in iWAT sections from these rats compared to control rats
(Figure 5D, I and II). Interestingly, PCNA positive staining was observed not only in
typical precursor cells (Figure 5D, III), but in the vitamin A-treated animals eventually
also in cells presenting with small cytoplasmic lipid droplets, i.e. presumably already
engaged in terminal adipogenic differentiation (Figure 5D, IV).
Vitamin A supplementation during the suckling period results in increased retinoic
acid-mediated responses in tissues of neonatal rats
To examine whether oral vitamin A supplementation in the form of retinyl palmitate
could elicit increased retinoic acid-mediated responses in tissues of neonatal rats, we
compared control and vitamin A-treated rats for the expression of CYP26a1 mRNA in
adipose and liver tissue and ISX in the intestine. CYP26a1 is a retinoic acid hydroxylase
that is transcriptionally induced by retinoic acid in a RAR-dependent manner [49]. ISX is
a gut specific transcription factor that is induced in intestinal cells by retinoic acid via
RAR and functions to limit intestinal beta-carotene absorption and conversion to vitamin
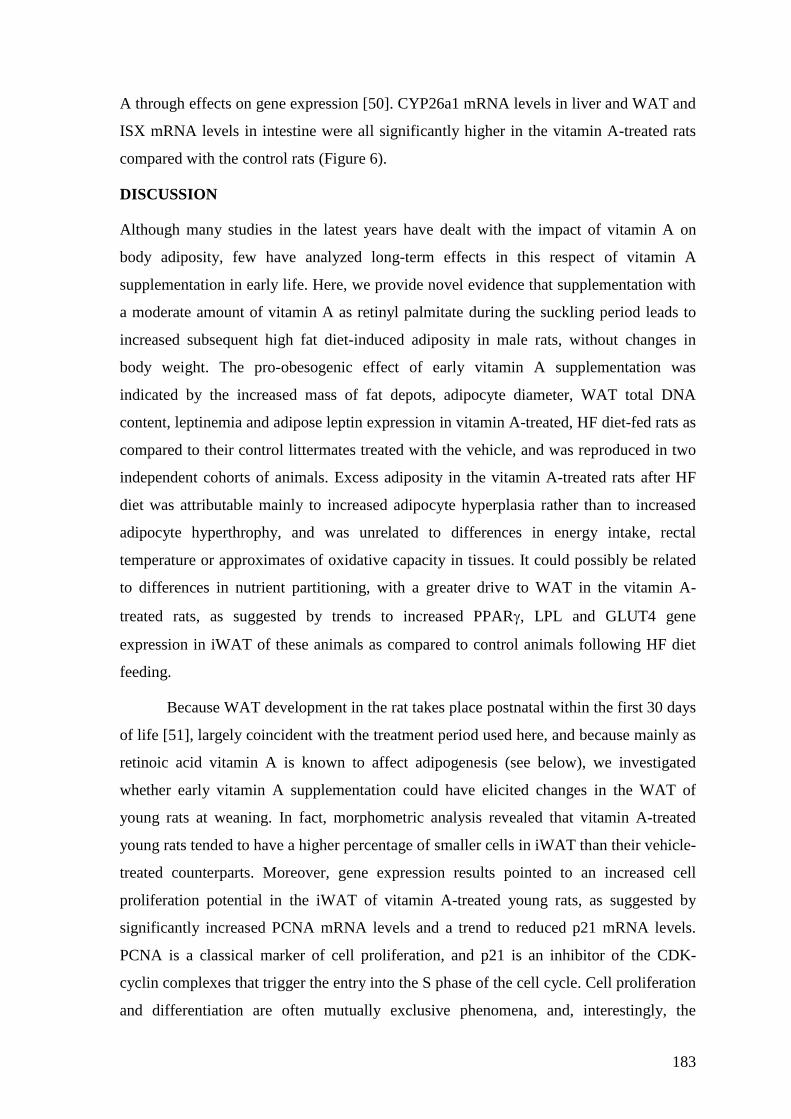
183
A through effects on gene expression [50]. CYP26a1 mRNA levels in liver and WAT and
ISX mRNA levels in intestine were all significantly higher in the vitamin A-treated rats
compared with the control rats (Figure 6).
DISCUSSION
Although many studies in the latest years have dealt with the impact of vitamin A on
body adiposity, few have analyzed long-term effects in this respect of vitamin A
supplementation in early life. Here, we provide novel evidence that supplementation with
a moderate amount of vitamin A as retinyl palmitate during the suckling period leads to
increased subsequent high fat diet-induced adiposity in male rats, without changes in
body weight. The pro-obesogenic effect of early vitamin A supplementation was
indicated by the increased mass of fat depots, adipocyte diameter, WAT total DNA
content, leptinemia and adipose leptin expression in vitamin A-treated, HF diet-fed rats as
compared to their control littermates treated with the vehicle, and was reproduced in two
independent cohorts of animals. Excess adiposity in the vitamin A-treated rats after HF
diet was attributable mainly to increased adipocyte hyperplasia rather than to increased
adipocyte hyperthrophy, and was unrelated to differences in energy intake, rectal
temperature or approximates of oxidative capacity in tissues. It could possibly be related
to differences in nutrient partitioning, with a greater drive to WAT in the vitamin A-
treated rats, as suggested by trends to increased PPAR, LPL and GLUT4 gene
expression in iWAT of these animals as compared to control animals following HF diet
feeding.
Because WAT development in the rat takes place postnatal within the first 30 days
of life [51], largely coincident with the treatment period used here, and because mainly as
retinoic acid vitamin A is known to affect adipogenesis (see below), we investigated
whether early vitamin A supplementation could have elicited changes in the WAT of
young rats at weaning. In fact, morphometric analysis revealed that vitamin A-treated
young rats tended to have a higher percentage of smaller cells in iWAT than their vehicle-
treated counterparts. Moreover, gene expression results pointed to an increased cell
proliferation potential in the iWAT of vitamin A-treated young rats, as suggested by
significantly increased PCNA mRNA levels and a trend to reduced p21 mRNA levels.
PCNA is a classical marker of cell proliferation, and p21 is an inhibitor of the CDK-
cyclin complexes that trigger the entry into the S phase of the cell cycle. Cell proliferation
and differentiation are often mutually exclusive phenomena, and, interestingly, the
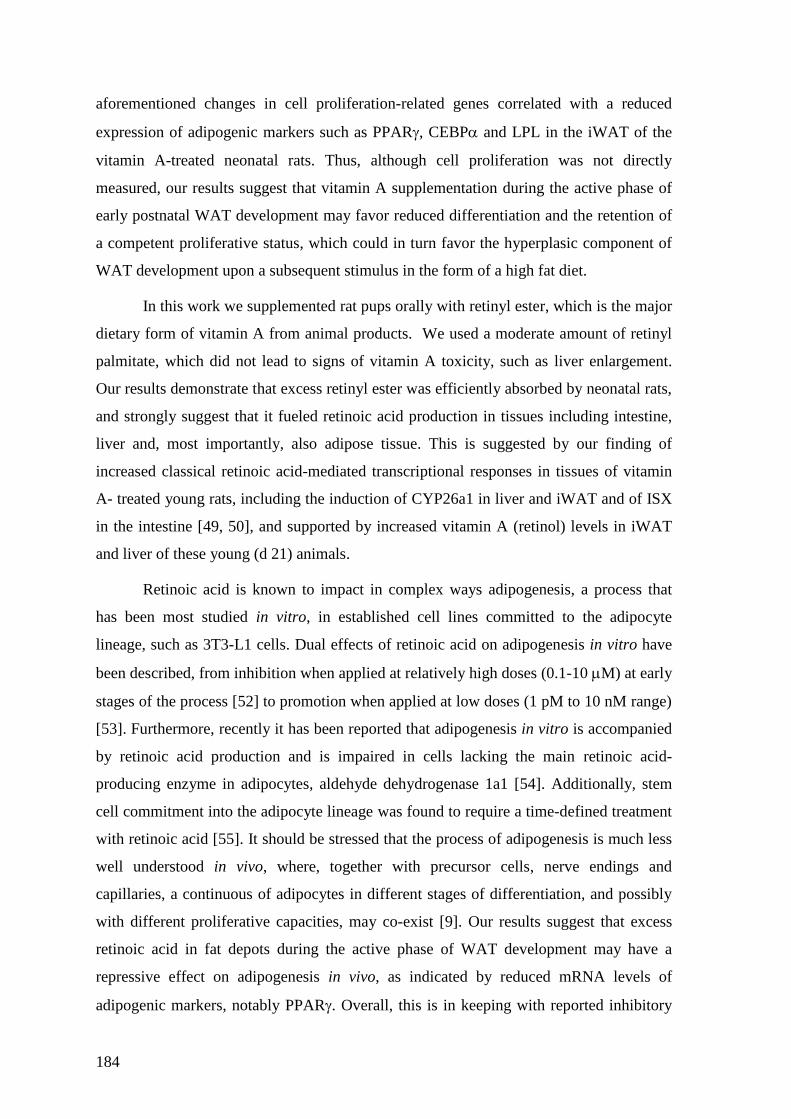
184
aforementioned changes in cell proliferation-related genes correlated with a reduced
expression of adipogenic markers such as PPAR, CEBP and LPL in the iWAT of the
vitamin A-treated neonatal rats. Thus, although cell proliferation was not directly
measured, our results suggest that vitamin A supplementation during the active phase of
early postnatal WAT development may favor reduced differentiation and the retention of
a competent proliferative status, which could in turn favor the hyperplasic component of
WAT development upon a subsequent stimulus in the form of a high fat diet.
In this work we supplemented rat pups orally with retinyl ester, which is the major
dietary form of vitamin A from animal products. We used a moderate amount of retinyl
palmitate, which did not lead to signs of vitamin A toxicity, such as liver enlargement.
Our results demonstrate that excess retinyl ester was efficiently absorbed by neonatal rats,
and strongly suggest that it fueled retinoic acid production in tissues including intestine,
liver and, most importantly, also adipose tissue. This is suggested by our finding of
increased classical retinoic acid-mediated transcriptional responses in tissues of vitamin
A- treated young rats, including the induction of CYP26a1 in liver and iWAT and of ISX
in the intestine [49, 50], and supported by increased vitamin A (retinol) levels in iWAT
and liver of these young (d 21) animals.
Retinoic acid is known to impact in complex ways adipogenesis, a process that
has been most studied in vitro, in established cell lines committed to the adipocyte
lineage, such as 3T3-L1 cells. Dual effects of retinoic acid on adipogenesis in vitro have
been described, from inhibition when applied at relatively high doses (0.1-10 M) at early
stages of the process [52] to promotion when applied at low doses (1 pM to 10 nM range)
[53]. Furthermore, recently it has been reported that adipogenesis in vitro is accompanied
by retinoic acid production and is impaired in cells lacking the main retinoic acid-
producing enzyme in adipocytes, aldehyde dehydrogenase 1a1 [54]. Additionally, stem
cell commitment into the adipocyte lineage was found to require a time-defined treatment
with retinoic acid [55]. It should be stressed that the process of adipogenesis is much less
well understood in vivo, where, together with precursor cells, nerve endings and
capillaries, a continuous of adipocytes in different stages of differentiation, and possibly
with different proliferative capacities, may co-exist [9]. Our results suggest that excess
retinoic acid in fat depots during the active phase of WAT development may have a
repressive effect on adipogenesis in vivo, as indicated by reduced mRNA levels of
adipogenic markers, notably PPAR. Overall, this is in keeping with reported inhibitory
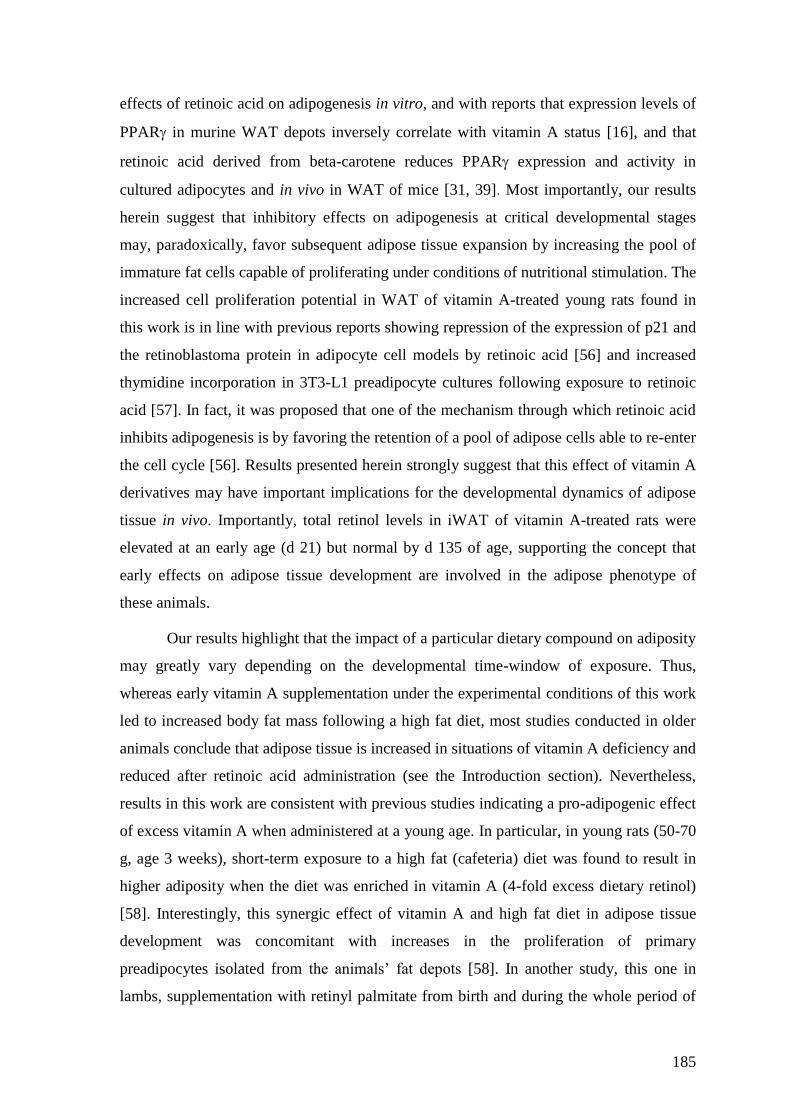
185
effects of retinoic acid on adipogenesis in vitro, and with reports that expression levels of
PPAR in murine WAT depots inversely correlate with vitamin A status [16], and that
retinoic acid derived from beta-carotene reduces PPAR expression and activity in
cultured adipocytes and in vivo in WAT of mice [31, 39]. Most importantly, our results
herein suggest that inhibitory effects on adipogenesis at critical developmental stages
may, paradoxically, favor subsequent adipose tissue expansion by increasing the pool of
immature fat cells capable of proliferating under conditions of nutritional stimulation. The
increased cell proliferation potential in WAT of vitamin A-treated young rats found in
this work is in line with previous reports showing repression of the expression of p21 and
the retinoblastoma protein in adipocyte cell models by retinoic acid [56] and increased
thymidine incorporation in 3T3-L1 preadipocyte cultures following exposure to retinoic
acid [57]. In fact, it was proposed that one of the mechanism through which retinoic acid
inhibits adipogenesis is by favoring the retention of a pool of adipose cells able to re-enter
the cell cycle [56]. Results presented herein strongly suggest that this effect of vitamin A
derivatives may have important implications for the developmental dynamics of adipose
tissue in vivo. Importantly, total retinol levels in iWAT of vitamin A-treated rats were
elevated at an early age (d 21) but normal by d 135 of age, supporting the concept that
early effects on adipose tissue development are involved in the adipose phenotype of
these animals.
Our results highlight that the impact of a particular dietary compound on adiposity
may greatly vary depending on the developmental time-window of exposure. Thus,
whereas early vitamin A supplementation under the experimental conditions of this work
led to increased body fat mass following a high fat diet, most studies conducted in older
animals conclude that adipose tissue is increased in situations of vitamin A deficiency and
reduced after retinoic acid administration (see the Introduction section). Nevertheless,
results in this work are consistent with previous studies indicating a pro-adipogenic effect
of excess vitamin A when administered at a young age. In particular, in young rats (50-70
g, age 3 weeks), short-term exposure to a high fat (cafeteria) diet was found to result in
higher adiposity when the diet was enriched in vitamin A (4-fold excess dietary retinol)
[58]. Interestingly, this synergic effect of vitamin A and high fat diet in adipose tissue
development was concomitant with increases in the proliferation of primary
preadipocytes isolated from the animals’ fat depots [58]. In another study, this one in
lambs, supplementation with retinyl palmitate from birth and during the whole period of
186
growth (until d 101 of age) under normal feed did not influence growth or adiposity, but
resulted in a 30% increase in the number of adipocytes in the perirenal depot, and in
smaller adipocytes in this and other fat depots [59]. Signs of increased proliferative
potential in WAT of young rats treated with vitamin A during the suckling period
detected in our work might be in keeping with these previous reports.
Increased adipose tissue mass is the primary phenotypic characteristic of obesity.
Under conditions of a positive energy balance, it is known that the deposition of lipid
initially results in increased fat cell size, but soon triggers increases in fat cell number [9].
Studies have highlighted adipose tissue cellularity as an important determinant of fat mass
[8], and evidence from animal models suggest that increased adipocyte number might per
se lead to obesity, by altering or overcoming the normal mechanisms of body weight
control [10]. Thus research into factors and molecular mechanisms influencing adipose
cell proliferation and differentiation in vivo at critical life stages represents a crucial area
of research. Results in this work indicate that, in rats, a moderate excess of dietary
vitamin A in the early stages of postnatal life potentiates adiposity gain in response to a
high fat diet later in life possibly through effects on adipose tissue development, thus
suggesting that vitamin A intake during the suckling period might be one of such factors.
The results might have implications for the obesity pandemics and particularly for
childhood obesity, as the vitamin A content of human milk is related to maternal vitamin
A status and maternal dietary vitamin A intake during lactation [60].
Acknowledgments
The research leading to these results has received funding from the European Union’s
Seventh Framework Programme FP7 2007-2013 under grant agreement nº 244995
(BIOCLAIMS Project). It has also been supported by a grant from the Spanish
Government (AGL2009-11277/ALI to A.P.). The UIB laboratory is a member of The
European Nutrigenomics Organization (NuGO). CIBER de Fisiopatología de la Obesidad
y Nutrición is an initiative of the ISCIII (Spanish Government).
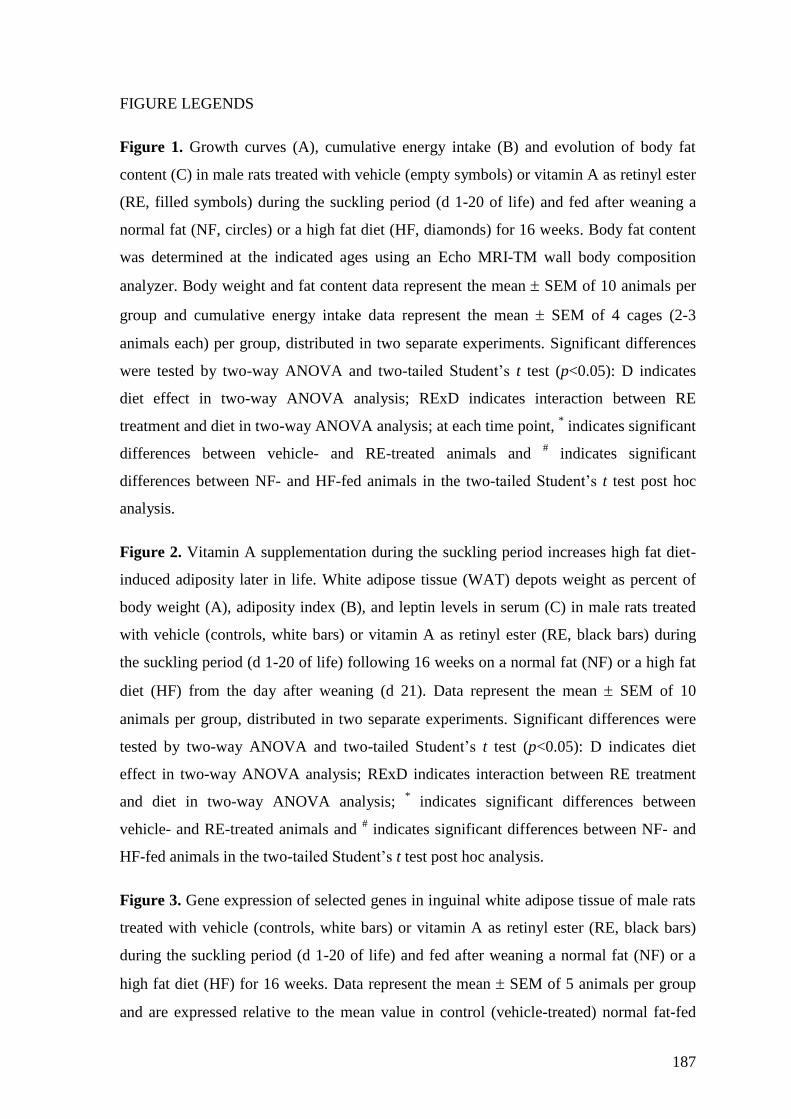
187
FIGURE LEGENDS
Figure 1. Growth curves (A), cumulative energy intake (B) and evolution of body fat
content (C) in male rats treated with vehicle (empty symbols) or vitamin A as retinyl ester
(RE, filled symbols) during the suckling period (d 1-20 of life) and fed after weaning a
normal fat (NF, circles) or a high fat diet (HF, diamonds) for 16 weeks. Body fat content
was determined at the indicated ages using an Echo MRI-TM wall body composition
analyzer. Body weight and fat content data represent the mean SEM of 10 animals per
group and cumulative energy intake data represent the mean SEM of 4 cages (2-3
animals each) per group, distributed in two separate experiments. Significant differences
were tested by two-way ANOVA and two-tailed Student’s t test (p<0.05): D indicates
diet effect in two-way ANOVA analysis; RExD indicates interaction between RE
treatment and diet in two-way ANOVA analysis; at each time point, * indicates significant
differences between vehicle- and RE-treated animals and # indicates significant
differences between NF- and HF-fed animals in the two-tailed Student’s t test post hoc
analysis.
Figure 2. Vitamin A supplementation during the suckling period increases high fat diet-
induced adiposity later in life. White adipose tissue (WAT) depots weight as percent of
body weight (A), adiposity index (B), and leptin levels in serum (C) in male rats treated
with vehicle (controls, white bars) or vitamin A as retinyl ester (RE, black bars) during
the suckling period (d 1-20 of life) following 16 weeks on a normal fat (NF) or a high fat
diet (HF) from the day after weaning (d 21). Data represent the mean SEM of 10
animals per group, distributed in two separate experiments. Significant differences were
tested by two-way ANOVA and two-tailed Student’s t test (p<0.05): D indicates diet
effect in two-way ANOVA analysis; RExD indicates interaction between RE treatment
and diet in two-way ANOVA analysis; * indicates significant differences between
vehicle- and RE-treated animals and # indicates significant differences between NF- and
HF-fed animals in the two-tailed Student’s t test post hoc analysis.
Figure 3. Gene expression of selected genes in inguinal white adipose tissue of male rats
treated with vehicle (controls, white bars) or vitamin A as retinyl ester (RE, black bars)
during the suckling period (d 1-20 of life) and fed after weaning a normal fat (NF) or a
high fat diet (HF) for 16 weeks. Data represent the mean SEM of 5 animals per group
and are expressed relative to the mean value in control (vehicle-treated) normal fat-fed
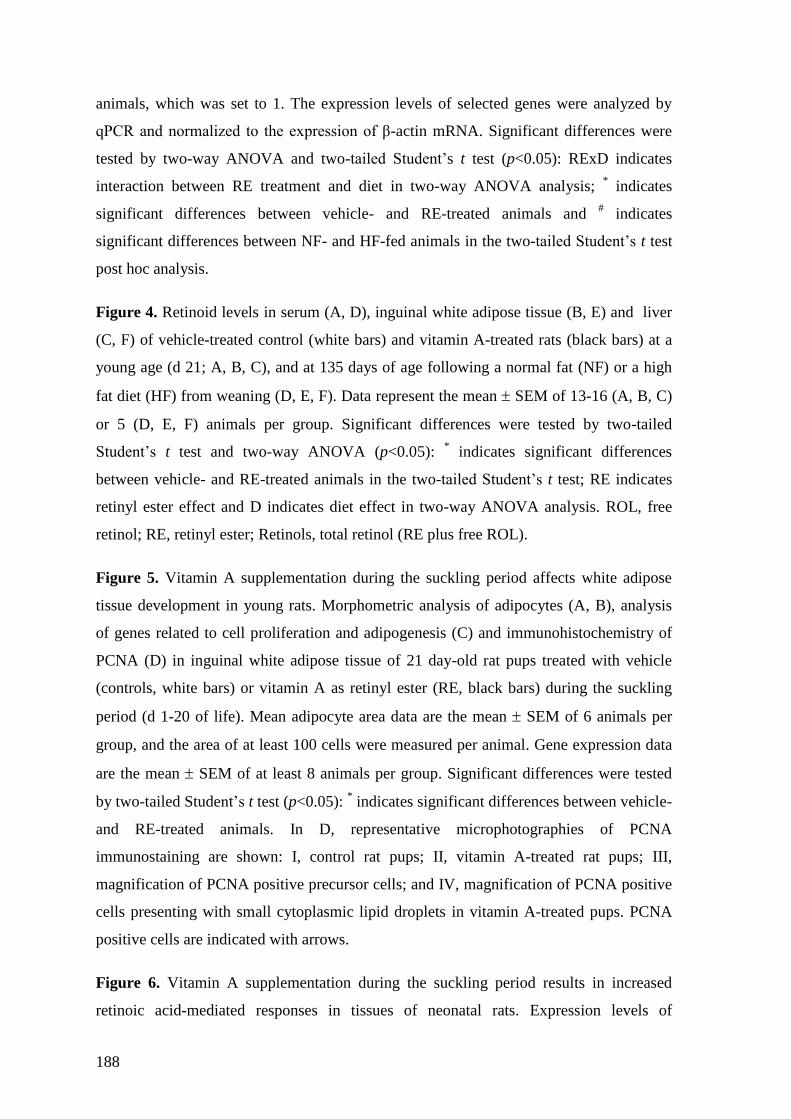
188
animals, which was set to 1. The expression levels of selected genes were analyzed by
qPCR and normalized to the expression of β-actin mRNA. Significant differences were
tested by two-way ANOVA and two-tailed Student’s t test (p<0.05): RExD indicates
interaction between RE treatment and diet in two-way ANOVA analysis; * indicates
significant differences between vehicle- and RE-treated animals and # indicates
significant differences between NF- and HF-fed animals in the two-tailed Student’s t test
post hoc analysis.
Figure 4. Retinoid levels in serum (A, D), inguinal white adipose tissue (B, E) and liver
(C, F) of vehicle-treated control (white bars) and vitamin A-treated rats (black bars) at a
young age (d 21; A, B, C), and at 135 days of age following a normal fat (NF) or a high
fat diet (HF) from weaning (D, E, F). Data represent the mean SEM of 13-16 (A, B, C)
or 5 (D, E, F) animals per group. Significant differences were tested by two-tailed
Student’s t test and two-way ANOVA (p<0.05): * indicates significant differences
between vehicle- and RE-treated animals in the two-tailed Student’s t test; RE indicates
retinyl ester effect and D indicates diet effect in two-way ANOVA analysis. ROL, free
retinol; RE, retinyl ester; Retinols, total retinol (RE plus free ROL).
Figure 5. Vitamin A supplementation during the suckling period affects white adipose
tissue development in young rats. Morphometric analysis of adipocytes (A, B), analysis
of genes related to cell proliferation and adipogenesis (C) and immunohistochemistry of
PCNA (D) in inguinal white adipose tissue of 21 day-old rat pups treated with vehicle
(controls, white bars) or vitamin A as retinyl ester (RE, black bars) during the suckling
period (d 1-20 of life). Mean adipocyte area data are the mean SEM of 6 animals per
group, and the area of at least 100 cells were measured per animal. Gene expression data
are the mean SEM of at least 8 animals per group. Significant differences were tested
by two-tailed Student’s t test (p<0.05): * indicates significant differences between vehicle-
and RE-treated animals. In D, representative microphotographies of PCNA
immunostaining are shown: I, control rat pups; II, vitamin A-treated rat pups; III,
magnification of PCNA positive precursor cells; and IV, magnification of PCNA positive
cells presenting with small cytoplasmic lipid droplets in vitamin A-treated pups. PCNA
positive cells are indicated with arrows.
Figure 6. Vitamin A supplementation during the suckling period results in increased
retinoic acid-mediated responses in tissues of neonatal rats. Expression levels of

189
CYP26a1 mRNA in inguinal white adipose tissue (A), CYP26a1 in the liver (B) and ISX
mRNA in the intestine (C) of 21 day-old rat pups treated with vehicle (controls, white
bars) or vitamin A as retinyl ester (RE, black bars) during the suckling period (d 1-20 of
life). Data represent the mean SEM of at least 8 animals per group. Significant
differences were tested by two-tailed Student’s t test (p<0.05): * indicates significant
differences between vehicle- and RE-treated animals.

190
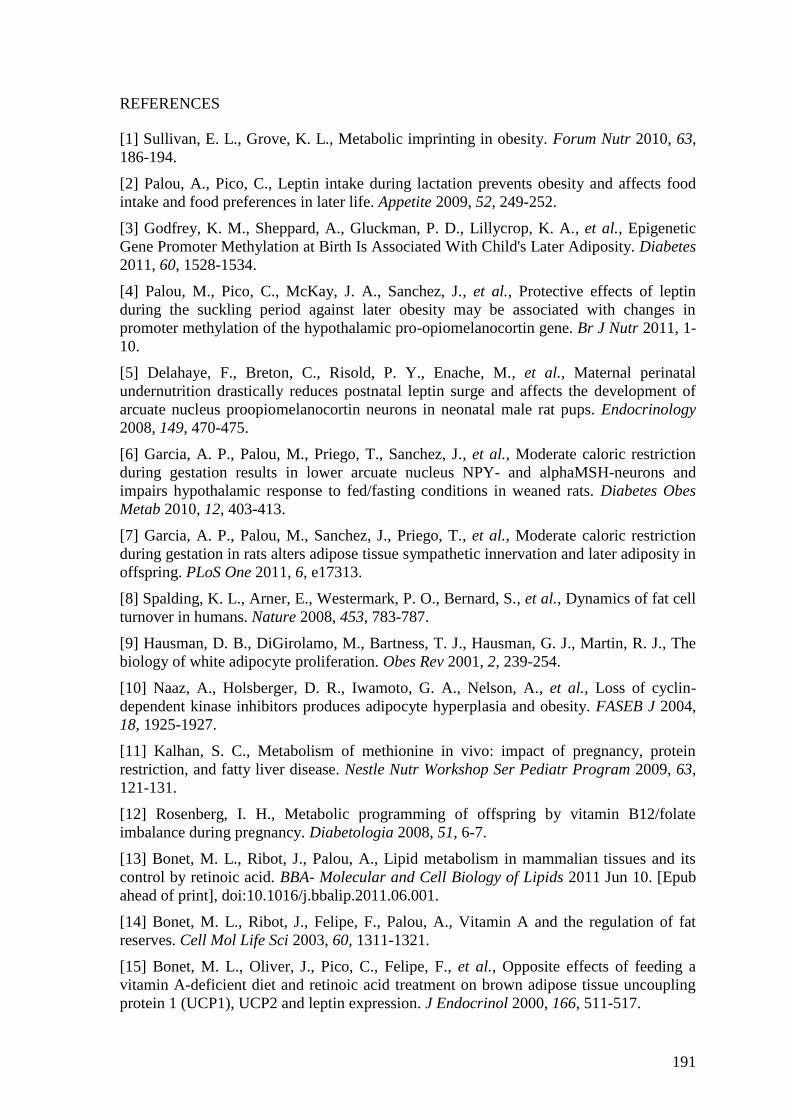
191
REFERENCES
[1] Sullivan, E. L., Grove, K. L., Metabolic imprinting in obesity. Forum Nutr 2010, 63,
186-194.
[2] Palou, A., Pico, C., Leptin intake during lactation prevents obesity and affects food
intake and food preferences in later life. Appetite 2009, 52, 249-252.
[3] Godfrey, K. M., Sheppard, A., Gluckman, P. D., Lillycrop, K. A., et al., Epigenetic
Gene Promoter Methylation at Birth Is Associated With Child's Later Adiposity. Diabetes
2011, 60, 1528-1534.
[4] Palou, M., Pico, C., McKay, J. A., Sanchez, J., et al., Protective effects of leptin
during the suckling period against later obesity may be associated with changes in
promoter methylation of the hypothalamic pro-opiomelanocortin gene. Br J Nutr 2011, 1-
10.
[5] Delahaye, F., Breton, C., Risold, P. Y., Enache, M., et al., Maternal perinatal
undernutrition drastically reduces postnatal leptin surge and affects the development of
arcuate nucleus proopiomelanocortin neurons in neonatal male rat pups. Endocrinology
2008, 149, 470-475.
[6] Garcia, A. P., Palou, M., Priego, T., Sanchez, J., et al., Moderate caloric restriction
during gestation results in lower arcuate nucleus NPY- and alphaMSH-neurons and
impairs hypothalamic response to fed/fasting conditions in weaned rats. Diabetes Obes
Metab 2010, 12, 403-413.
[7] Garcia, A. P., Palou, M., Sanchez, J., Priego, T., et al., Moderate caloric restriction
during gestation in rats alters adipose tissue sympathetic innervation and later adiposity in
offspring. PLoS One 2011, 6, e17313.
[8] Spalding, K. L., Arner, E., Westermark, P. O., Bernard, S., et al., Dynamics of fat cell
turnover in humans. Nature 2008, 453, 783-787.
[9] Hausman, D. B., DiGirolamo, M., Bartness, T. J., Hausman, G. J., Martin, R. J., The
biology of white adipocyte proliferation. Obes Rev 2001, 2, 239-254.
[10] Naaz, A., Holsberger, D. R., Iwamoto, G. A., Nelson, A., et al., Loss of cyclin-
dependent kinase inhibitors produces adipocyte hyperplasia and obesity. FASEB J 2004,
18, 1925-1927.
[11] Kalhan, S. C., Metabolism of methionine in vivo: impact of pregnancy, protein
restriction, and fatty liver disease. Nestle Nutr Workshop Ser Pediatr Program 2009, 63,
121-131.
[12] Rosenberg, I. H., Metabolic programming of offspring by vitamin B12/folate
imbalance during pregnancy. Diabetologia 2008, 51, 6-7.
[13] Bonet, M. L., Ribot, J., Palou, A., Lipid metabolism in mammalian tissues and its
control by retinoic acid. BBA- Molecular and Cell Biology of Lipids 2011 Jun 10. [Epub
ahead of print], doi:10.1016/j.bbalip.2011.06.001.
[14] Bonet, M. L., Ribot, J., Felipe, F., Palou, A., Vitamin A and the regulation of fat
reserves. Cell Mol Life Sci 2003, 60, 1311-1321.
[15] Bonet, M. L., Oliver, J., Pico, C., Felipe, F., et al., Opposite effects of feeding a
vitamin A-deficient diet and retinoic acid treatment on brown adipose tissue uncoupling
protein 1 (UCP1), UCP2 and leptin expression. J Endocrinol 2000, 166, 511-517.
192
[16] Ribot, J., Felipe, F., Bonet, M. L., Palou, A., Changes of adiposity in response to
vitamin A status correlate with changes of PPAR gamma 2 expression. Obes Res 2001, 9,
500-509.
[17] Felipe, F., Bonet, M. L., Ribot, J., Palou, A., Modulation of resistin expression by
retinoic acid and vitamin A status. Diabetes 2004, 53, 882-889.
[18] Felipe, F., Mercader, J., Ribot, J., Palou, A., Bonet, M. L., Effects of retinoic acid
administration and dietary vitamin A supplementation on leptin expression in mice: lack
of correlation with changes of adipose tissue mass and food intake. Biochim Biophys Acta
2005, 1740, 258-265.
[19] Mercader, J., Ribot, J., Murano, I., Felipe, F., et al., Remodeling of white adipose
tissue after retinoic acid administration in mice. Endocrinology 2006, 147, 5325-5332.
[20] Mercader, J., Granados, N., Bonet, M. L., Palou, A., All-trans retinoic acid decreases
murine adipose retinol binding protein 4 production. Cell Physiol Biochem 2008, 22, 363-
372.
[21] Amengual, J., Ribot, J., Bonet, M. L., Palou, A., Retinoic acid treatment increases
lipid oxidation capacity in skeletal muscle of mice. Obesity (Silver Spring) 2008, 16, 585-
591.
[22] Amengual, J., Ribot, J., Bonet, M. L., Palou, A., Retinoic acid treatment enhances
lipid oxidation and inhibits lipid biosynthesis capacities in the liver of mice. Cell Physiol
Biochem 2010, 25, 657-666.
[23] Berry, D. C., Noy, N., All-trans-retinoic acid represses obesity and insulin resistance
by activating both peroxisome proliferation-activated receptor beta/delta and retinoic acid
receptor. Mol Cell Biol 2009, 29, 3286-3296.
[24] Manolescu, D. C., Sima, A., Bhat, P. V., All-trans retinoic acid lowers serum retinol-
binding protein 4 concentrations and increases insulin sensitivity in diabetic mice. J Nutr
2010, 140, 311-316.
[25] Strom, K., Gundersen, T. E., Hansson, O., Lucas, S., et al., Hormone-sensitive lipase
(HSL) is also a retinyl ester hydrolase: evidence from mice lacking HSL. FASEB J 2009,
23, 2307-2316.
[26] Ziouzenkova, O., Orasanu, G., Sharlach, M., Akiyama, T. E., et al., Retinaldehyde
represses adipogenesis and diet-induced obesity. Nat Med 2007, 13, 695-702.
[27] Hessel, S., Eichinger, A., Isken, A., Amengual, J., et al., CMO1 deficiency abolishes
vitamin A production from beta-carotene and alters lipid metabolism in mice. J Biol
Chem 2007, 282, 33553-33561.
[28] Zhang, M., Hu, P., Krois, C. R., Kane, M. A., Napoli, J. L., Altered vitamin A
homeostasis and increased size and adiposity in the rdh1-null mouse. FASEB J 2007, 21,
2886-2896.
[29] Zizola, C. F., Schwartz, G. J., Vogel, S., Cellular retinol-binding protein type III is a
PPARgamma target gene and plays a role in lipid metabolism. Am J Physiol Endocrinol
Metab 2008, 295, E1358-1368.
[30] Zizola, C. F., Frey, S. K., Jitngarmkusol, S., Kadereit, B., et al., Cellular retinol-
binding protein type I (CRBP-I) regulates adipogenesis. Mol Cell Biol 2010, 30, 3412-
3420.
193
[31] Amengual, J., Gouranton, E., van Helden, Y. G. J., Hessel, S., et al., Beta-Carotene
Reduces Body Adiposity of Mice via BCMO1. PLoS ONE 2011, 6(6): e20644.
doi:10.1371/journal.pone.0020644.
[32] Kawada, T., Kamei, Y., Sugimoto, E., The possibility of active form of vitamins A
and D as suppressors on adipocyte development via ligand-dependent transcriptional
regulators. Int J Obes Relat Metab Disord 1996, 20 Suppl 3, S52-57.
[33] Garcia, O. P., Long, K. Z., Rosado, J. L., Impact of micronutrient deficiencies on
obesity. Nutr Rev 2009, 67, 559-572.
[34] Zulet, M. A., Puchau, B., Hermsdorff, H. H., Navarro, C., Martinez, J. A., Vitamin A
intake is inversely related with adiposity in healthy young adults. J Nutr Sci Vitaminol
(Tokyo) 2008, 54, 347-352.
[35] Kumar, M. V., Sunvold, G. D., Scarpace, P. J., Dietary vitamin A supplementation in
rats: suppression of leptin and induction of UCP1 mRNA. J Lipid Res 1999, 40, 824-829.
[36] Jeyakumar, S. M., Vajreswari, A., Giridharan, N. V., Chronic dietary vitamin A
supplementation regulates obesity in an obese mutant WNIN/Ob rat model. Obesity
(Silver Spring) 2006, 14, 52-59.
[37] Felipe, F., Bonet, M. L., Ribot, J., Palou, A., Up-regulation of muscle uncoupling
protein 3 gene expression in mice following high fat diet, dietary vitamin A
supplementation and acute retinoic acid-treatment. Int J Obes Relat Metab Disord 2003,
27, 60-69.
[38] Mercader, J., Madsen, L., Felipe, F., Palou, A., et al., All-trans retinoic acid
increases oxidative metabolism in mature adipocytes. Cell Physiol Biochem 2007, 20,
1061-1072.
[39] Lobo, G. P., Amengual, J., Li, H. N., Golczak, M., et al., Beta,beta-carotene
decreases peroxisome proliferator receptor gamma activity and reduces lipid storage
capacity of adipocytes in a beta,beta-carotene oxygenase 1-dependent manner. J Biol
Chem 2010, 285, 27891-27899.
[40] Lefterova, M. I., Lazar, M. A., New developments in adipogenesis. Trends
Endocrinol Metab 2009, 20, 107-114.
[41] Akohoue, S. A., Green, J. B., Green, M. H., Dietary vitamin A has both chronic and
acute effects on vitamin A indices in lactating rats and their offspring. J Nutr 2006, 136,
128-132.
[42] Green, M. H., Snyder, R. W., Akohoue, S. A., Green, J. B., Increased rat mammary
tissue vitamin A associated with increased vitamin A intake during lactation is maintained
after lactation. J Nutr 2001, 131, 1544-1547.
[43] Kojima, T., Nishimura, M., Yajima, T., Kuwata, T., et al., Effect of intermittent
feeding on the development of disaccharidase activities in artificially reared rat pups.
Comp Biochem Physiol A Mol Integr Physiol 1998, 121, 289-297.
[44] Ribot, J., Rodriguez, A. M., Rodriguez, E., Palou, A., Adiponectin and resistin
response in the onset of obesity in male and female rats. Obesity (Silver Spring) 2008, 16,
723-730.
[45] von Lintig, J., Vogt, K., Filling the gap in vitamin A research. Molecular
identification of an enzyme cleaving beta-carotene to retinal. J Biol Chem 2000, 275,
11915-11920.
194
[46] Pfaffl, M. W., A new mathematical model for relative quantification in real-time RT-
PCR. Nucleic Acids Res 2001, 29, e45.
[47] Ahima, R. S., Flier, J. S., Leptin. Annu Rev Physiol 2000, 62, 413-437.
[48] Virtue, S., Vidal-Puig, A., Adipose tissue expandability, lipotoxicity and the
Metabolic Syndrome--an allostatic perspective. Biochim Biophys Acta 2010, 1801, 338-
349.
[49] Ozpolat, B., Mehta, K., Lopez-Berestein, G., Regulation of a highly specific retinoic
acid-4-hydroxylase (CYP26A1) enzyme and all-trans-retinoic acid metabolism in human
intestinal, liver, endothelial, and acute promyelocytic leukemia cells. Leuk Lymphoma
2005, 46, 1497-1506.
[50] Lobo, G. P., Hessel, S., Eichinger, A., Noy, N., et al., ISX is a retinoic acid-sensitive
gatekeeper that controls intestinal beta,beta-carotene absorption and vitamin A
production. FASEB J 2010, 24, 1656-1666.
[51] Cryer, A., Jones, H. M., The early development of white adipose tissue. Effects of
litter size on the lipoprotein lipase activity of four adipose-tissue depots, serum
immunoreactive insulin and tissue cellularity during the first four weeks of life in the rat.
Biochem J 1979, 178, 711-724.
[52] Schwarz, E. J., Reginato, M. J., Shao, D., Krakow, S. L., Lazar, M. A., Retinoic acid
blocks adipogenesis by inhibiting C/EBPbeta-mediated transcription. Mol Cell Biol 1997,
17, 1552-1561.
[53] Safonova, I., Darimont, C., Amri, E. Z., Grimaldi, P., et al., Retinoids are positive
effectors of adipose cell differentiation. Mol Cell Endocrinol 1994, 104, 201-211.
[54] Reichert, B., Yasmeen, R., Jeyakumar, S. M., Yang, F., et al., Concerted action of
aldehyde dehydrogenases influences depot-specific fat formation. Mol Endocrinol 2011,
25, 799-809.
[55] Bost, F., Caron, L., Marchetti, I., Dani, C., et al., Retinoic acid activation of the ERK
pathway is required for embryonic stem cell commitment into the adipocyte lineage.
Biochem J 2002, 361, 621-627.
[56] Ribot, J., Oliver, P., Serra, F., Palou, A., Retinoic acid modulates the retinoblastoma
protein during adipocyte terminal differentiation. Biochim Biophys Acta 2005, 1740, 249-
257.
[57] Gupta, P., Park, S. W., Farooqui, M., Wei, L. N., Orphan nuclear receptor TR2, a
mediator of preadipocyte proliferation, is differentially regulated by RA through
exchange of coactivator PCAF with corepressor RIP140 on a platform molecule GRIP1.
Nucleic Acids Res 2007, 35, 2269-2282.
[58] Redonnet, A., Ferrand, C., Bairras, C., Higueret, P., et al., Synergic effect of vitamin
A and high-fat diet in adipose tissue development and nuclear receptor expression in
young rats. Br J Nutr 2008, 100, 722-730.
[59] Arana, A., Mendizabal, J. A., Alzon, M., Soret, B., Purroy, A., The effect of vitamin
A supplementation on postnatal adipose tissue development of lambs. J Anim Sci 2008,
86, 3393-3400.
[60] Haskell, M. J., Brown, K. H., Maternal vitamin A nutriture and the vitamin A
content of human milk. J Mammary Gland Biol Neoplasia 1999, 4, 243-257.

Table 1. Depot weight, mean adipocyte diameter and DNA content in inguinal WAT of male rats treated with vehicle
(control) or vitamin A as retinyl ester (RE) during the suckling period (d 1-20 of life) and thereafter fed for 16 weeks a
normal fat or a high fat diet.
Normal fat High fat
Control RE Control RE ANOVA
depot weigth (g) 10.2 ± 0.6 10.1 ± 0.8 22.9 ± 3.1 # 31.5 ± 1.9 *,# RExD
adipocyte diameter (µm) 54 ± 2 64 ± 8 76 ± 2 97 ± 7 D, RE
DNA content
(µg DNA/g wet tissue) 343 ± 94 268 ± 38 334 ± 27 384 ± 61
(mg DNA) 3.56 ± 0.81 2.61 ± 0.25 7.66 ± 1.24 # 12.3 ± 1.84 *,# RExD
Mean adipocyte diameter data are the mean SEM of 3 animals per group, and for each animal at least 100 adipocytes were
measured. Other data are the mean SEM of 5 animals per group. Significant differences were tested by two-way ANOVA and
two-tailed Student’s t test (p<0.05): D indicates diet effect in two-way ANOVA analysis; RExD indicates interaction between
RE treatment and diet in two-way ANOVA analysis; * indicates significant differences between vehicle- and RE-treated animals
and # indicates significant differences between normal fat- and high fat-fed animals in the two-tailed Student’s t test post hoc
analysis.
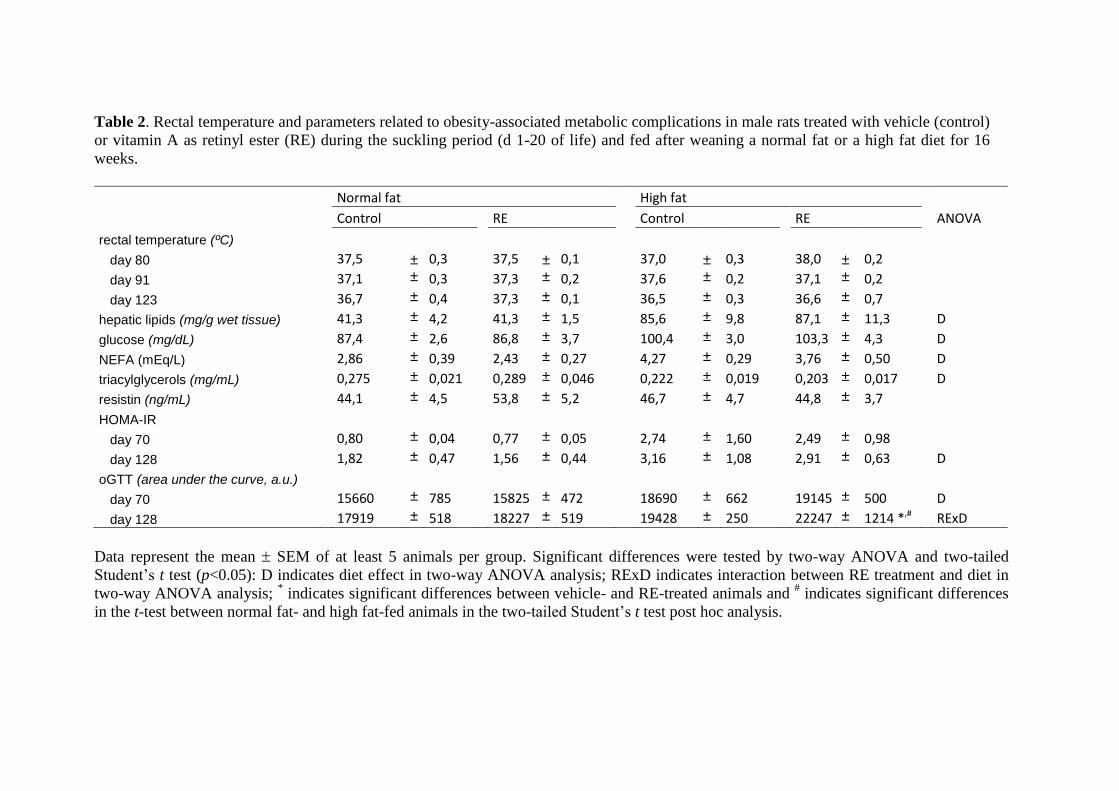
Table 2. Rectal temperature and parameters related to obesity-associated metabolic complications in male rats treated with vehicle (control)
or vitamin A as retinyl ester (RE) during the suckling period (d 1-20 of life) and fed after weaning a normal fat or a high fat diet for 16
weeks.
Normal fat High fat
Control RE Control RE ANOVA
rectal temperature (ºC)
day 80 37,5 ± 0,3 37,5 ± 0,1 37,0 ± 0,3 38,0 ± 0,2
day 91 37,1 ± 0,3 37,3 ± 0,2 37,6 ± 0,2 37,1 ± 0,2
day 123 36,7 ± 0,4 37,3 ± 0,1 36,5 ± 0,3 36,6 ± 0,7
hepatic lipids (mg/g wet tissue) 41,3 ± 4,2 41,3 ± 1,5 85,6 ± 9,8 87,1 ± 11,3 D
glucose (mg/dL) 87,4 ± 2,6 86,8 ± 3,7 100,4 ± 3,0 103,3 ± 4,3 D
NEFA (mEq/L) 2,86 ± 0,39 2,43 ± 0,27 4,27 ± 0,29 3,76 ± 0,50 D
triacylglycerols (mg/mL) 0,275 ± 0,021 0,289 ± 0,046 0,222 ± 0,019 0,203 ± 0,017 D
resistin (ng/mL) 44,1 ± 4,5 53,8 ± 5,2 46,7 ± 4,7 44,8 ± 3,7
HOMA-IR
day 70 0,80 ± 0,04 0,77 ± 0,05 2,74 ± 1,60 2,49 ± 0,98
day 128 1,82 ± 0,47 1,56 ± 0,44 3,16 ± 1,08 2,91 ± 0,63 D
oGTT (area under the curve, a.u.)
day 70 15660 ± 785 15825 ± 472 18690 ± 662 19145 ± 500 D
day 128 17919 ± 518 18227 ± 519 19428 ± 250 22247 ± 1214 *,# RExD
Data represent the mean SEM of at least 5 animals per group. Significant differences were tested by two-way ANOVA and two-tailed
Student’s t test (p<0.05): D indicates diet effect in two-way ANOVA analysis; RExD indicates interaction between RE treatment and diet in
two-way ANOVA analysis; * indicates significant differences between vehicle- and RE-treated animals and
# indicates significant differences
in the t-test between normal fat- and high fat-fed animals in the two-tailed Student’s t test post hoc analysis.
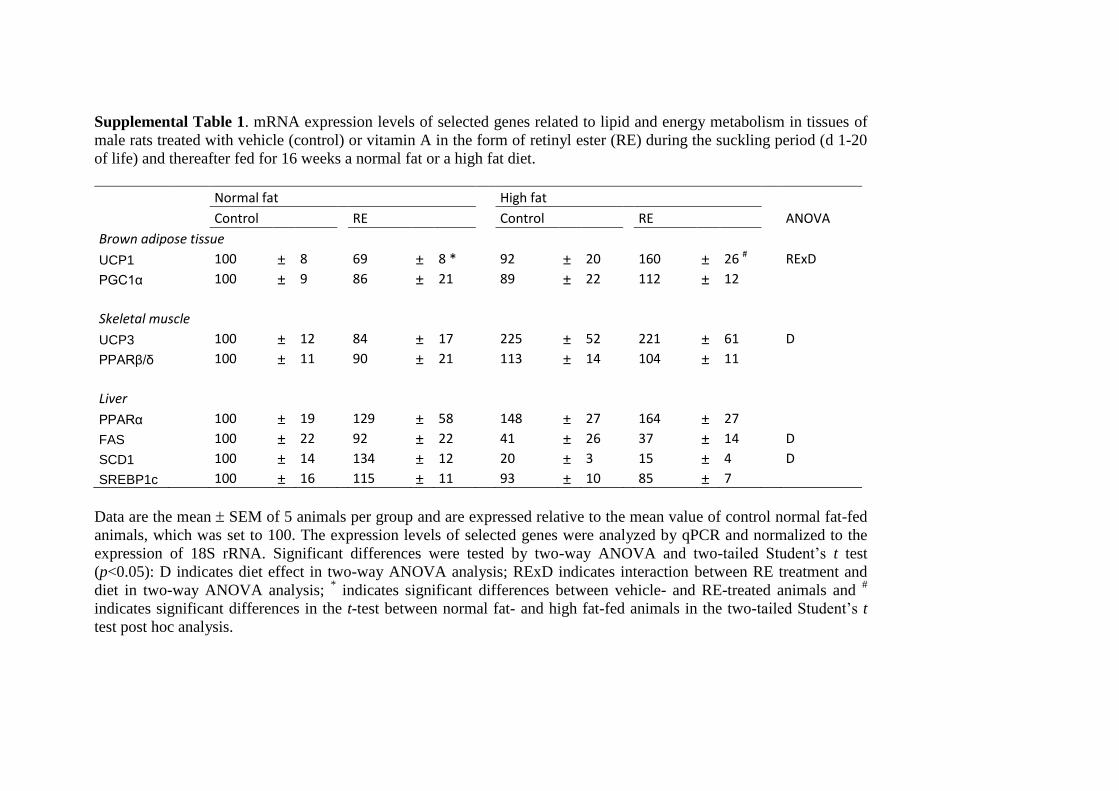
Supplemental Table 1. mRNA expression levels of selected genes related to lipid and energy metabolism in tissues of
male rats treated with vehicle (control) or vitamin A in the form of retinyl ester (RE) during the suckling period (d 1-20
of life) and thereafter fed for 16 weeks a normal fat or a high fat diet.
Normal fat High fat
Control RE Control RE ANOVA
Brown adipose tissue
UCP1 100 ± 8 69 ± 8 * 92 ± 20 160 ± 26 # RExD
PGC1α 100 ± 9 86 ± 21 89 ± 22 112 ± 12
Skeletal muscle
UCP3 100 ± 12 84 ± 17 225 ± 52 221 ± 61 D
PPARβ/δ 100 ± 11 90 ± 21 113 ± 14 104 ± 11
Liver
PPARα 100 ± 19 129 ± 58 148 ± 27 164 ± 27
FAS 100 ± 22 92 ± 22 41 ± 26 37 ± 14 D
SCD1 100 ± 14 134 ± 12 20 ± 3 15 ± 4 D
SREBP1c 100 ± 16 115 ± 11 93 ± 10 85 ± 7
Data are the mean SEM of 5 animals per group and are expressed relative to the mean value of control normal fat-fed
animals, which was set to 100. The expression levels of selected genes were analyzed by qPCR and normalized to the
expression of 18S rRNA. Significant differences were tested by two-way ANOVA and two-tailed Student’s t test
(p<0.05): D indicates diet effect in two-way ANOVA analysis; RExD indicates interaction between RE treatment and
diet in two-way ANOVA analysis; * indicates significant differences between vehicle- and RE-treated animals and
#
indicates significant differences in the t-test between normal fat- and high fat-fed animals in the two-tailed Student’s t
test post hoc analysis.
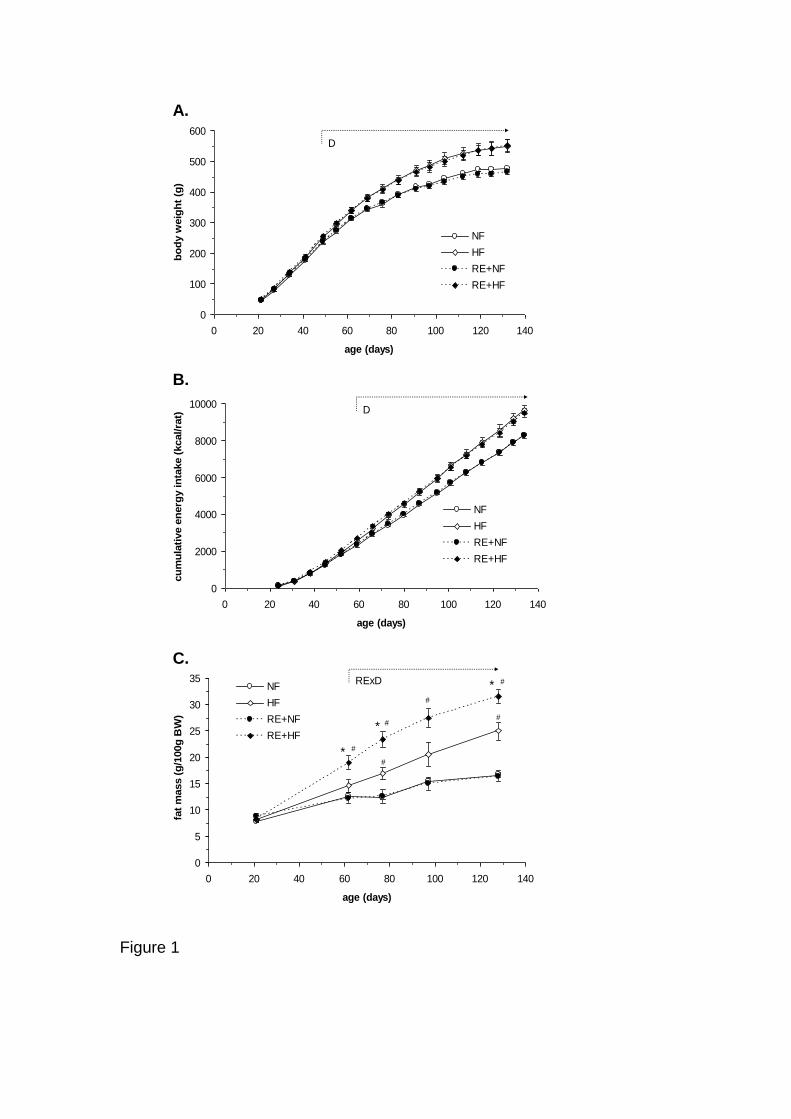
A.
B.
C.
Figure 1
0
100
200
300
400
500
600
0 20 40 60 80 100 120 140
age (days)
bo
dy w
eig
ht
(g)
NF
HF
RE+NF
RE+HF
D
0
2000
4000
6000
8000
10000
0 20 40 60 80 100 120 140
age (days)
cu
mu
lati
ve e
nerg
y in
take (
kcal/ra
t)
NF
HF
RE+NF
RE+HF
D
0
5
10
15
20
25
30
35
0 20 40 60 80 100 120 140
age (days)
fat
mass (
g/1
00g
BW
)
NF
HF
RE+NF
RE+HF
RExD
*
*
*
#
#
#
#
#
#
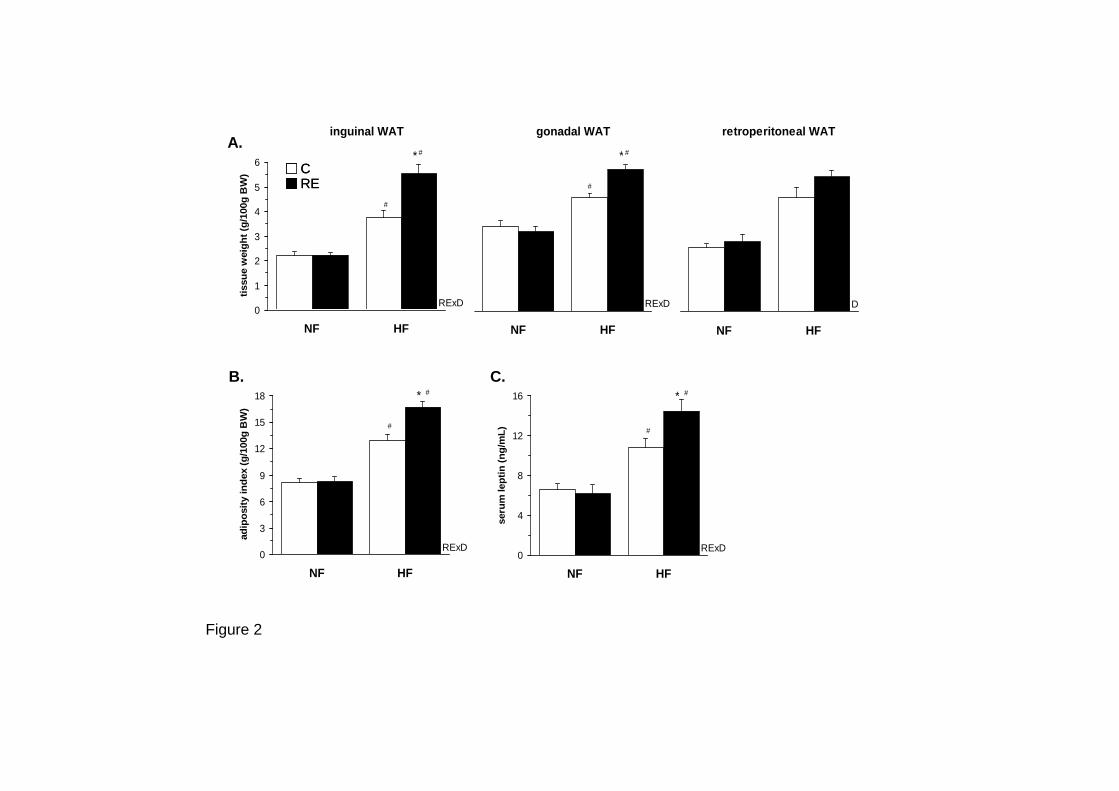
retroperitoneal WAT
0
1
2
3
4
5
6
NF HF
tissu
e w
eig
ht
(g/1
00g
bo
dy w
eig
ht)
D
0
3
6
9
12
15
18
NF HF
ad
ipo
sit
y in
dex (
g/1
00g
BW
)
RExD
* #
#
0
4
8
12
16
NF HF
seru
m lep
tin
(n
g/m
L)
RExD
* #
#
gonadal WAT
0
1
2
3
4
5
6
NF HF
tissu
e w
eig
ht
(g/1
00g
bo
dy w
eig
ht)
RExD
* #
#
inguinal WAT
0
1
2
3
4
5
6
NF HF
tissu
e w
eig
ht
(g/1
00g
BW
)
RExD
* #
#
B.
Figure 2
A.
C.
CRECRE
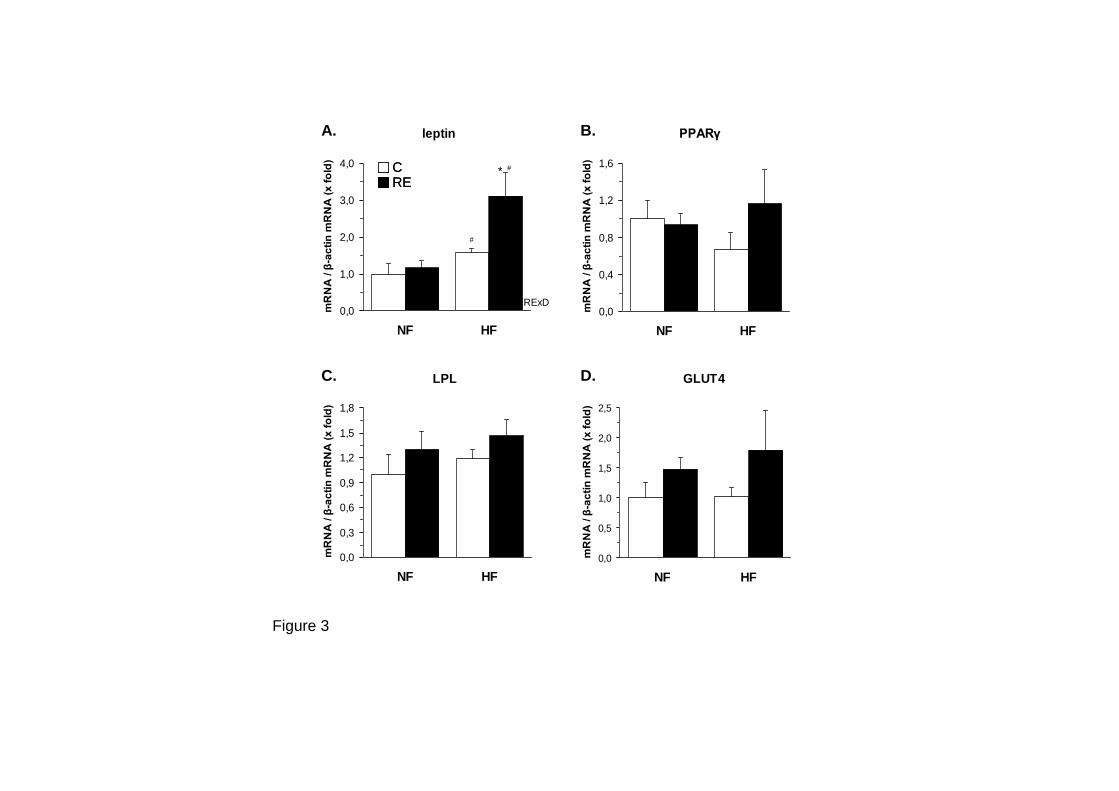
Figure 3
leptin
0,0
1,0
2,0
3,0
4,0
NF HFm
RN
A / β
-ac
tin
mR
NA
(x
fo
ld)
RExD
* #
#
PPARγ
0,0
0,4
0,8
1,2
1,6
NF HF
mR
NA
/ β
-ac
tin
mR
NA
(x
fo
ld)
LPL
0,0
0,3
0,6
0,9
1,2
1,5
1,8
NF HF
mR
NA
/ β
-ac
tin
mR
NA
(x
fo
ld)
GLUT4
0,0
0,5
1,0
1,5
2,0
2,5
NF HFm
RN
A / β
-ac
tin
mR
NA
(x
fo
ld)
B.A.
C. D.
CRECRE
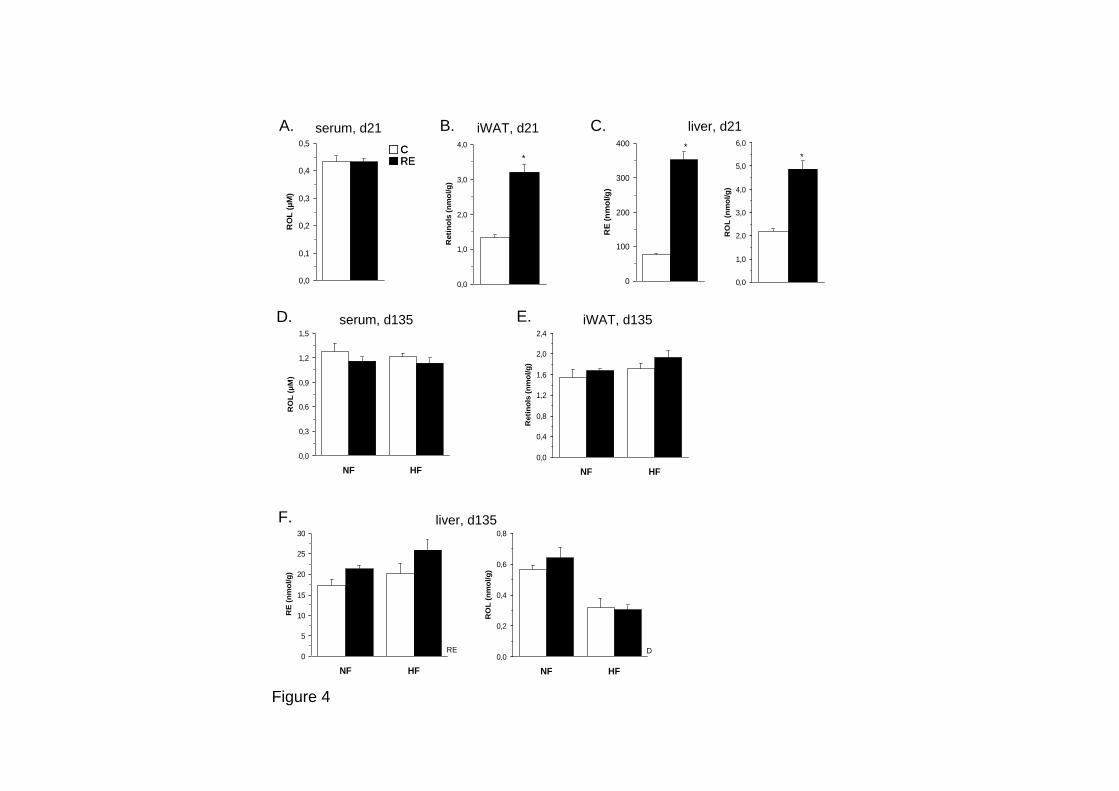
serum, d135D.
liver, d135
E. iWAT, d135
F.
Figure 4
0,0
0,1
0,2
0,3
0,4
0,5
RO
L (
µM
)
0,0
0,3
0,6
0,9
1,2
1,5
NF HF
RO
L (
µM
)
0
5
10
15
20
25
30
NF HF
RE
(n
mo
l/g
)
RE0,0
0,2
0,4
0,6
0,8
NF HF
RO
L (
nm
ol/g
)
D
0,0
1,0
2,0
3,0
4,0
Reti
no
ls (
nm
ol/g
)
*
0
100
200
300
400
RE
(n
mo
l/g
)
*
0,0
1,0
2,0
3,0
4,0
5,0
6,0
RO
L (
nm
ol/g
)
*
0,0
0,4
0,8
1,2
1,6
2,0
2,4
NF HF
Reti
no
ls (
nm
ol/g
)
A. B. C.iWAT, d21serum, d21 liver, d21
CRECRE
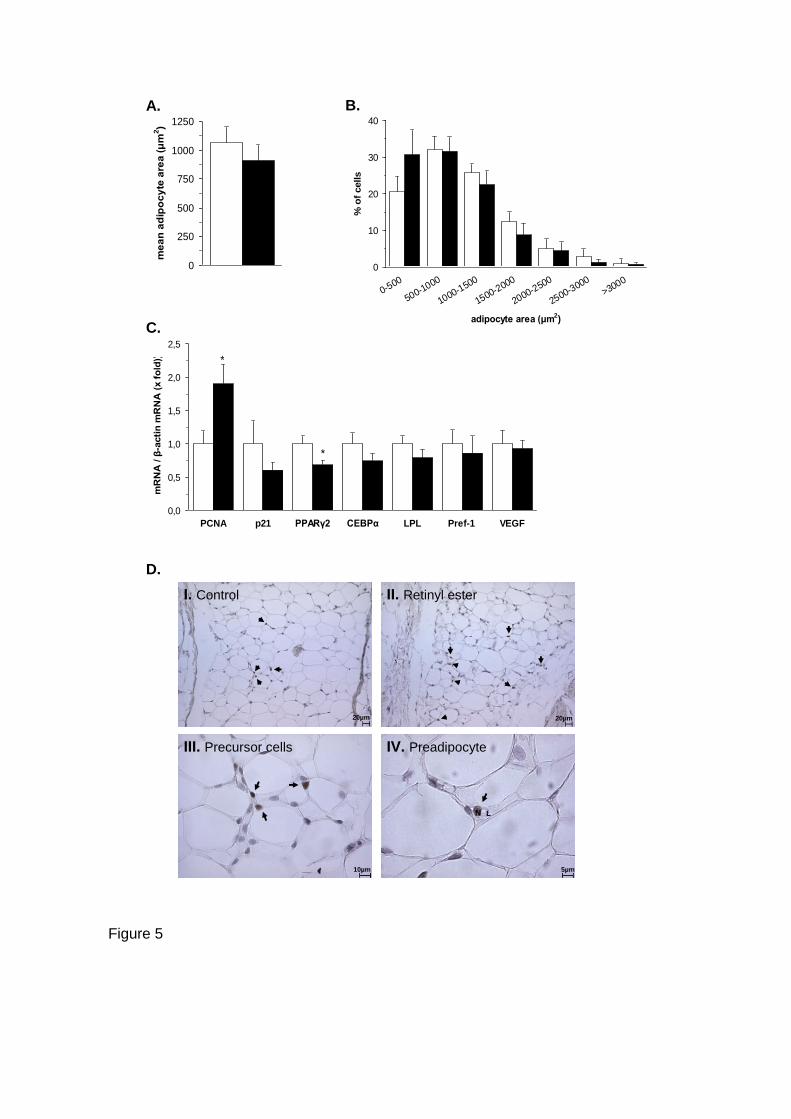
0
10
20
30
40
0-500
500-1000
1000-1500
1500-2000
2000-2500
2500-3000
>3000
adipocyte area (μm2)
% o
f cells
0
250
500
750
1000
1250
me
an
ad
ipo
cy
te a
rea
(μ
m2)
0,0
0,5
1,0
1,5
2,0
2,5
PCNA p21 PPARγ2 CEBPα LPL Pref-1 VEGF
mR
NA
/ β
-acti
n m
RN
A (
x f
old
)) *
*
20µm 20µm
10µm
N LN L
5µm
I. Control II. Retinyl ester
III. Precursor cells IV. Preadipocyte
C.
A. B.
D.
Figure 5
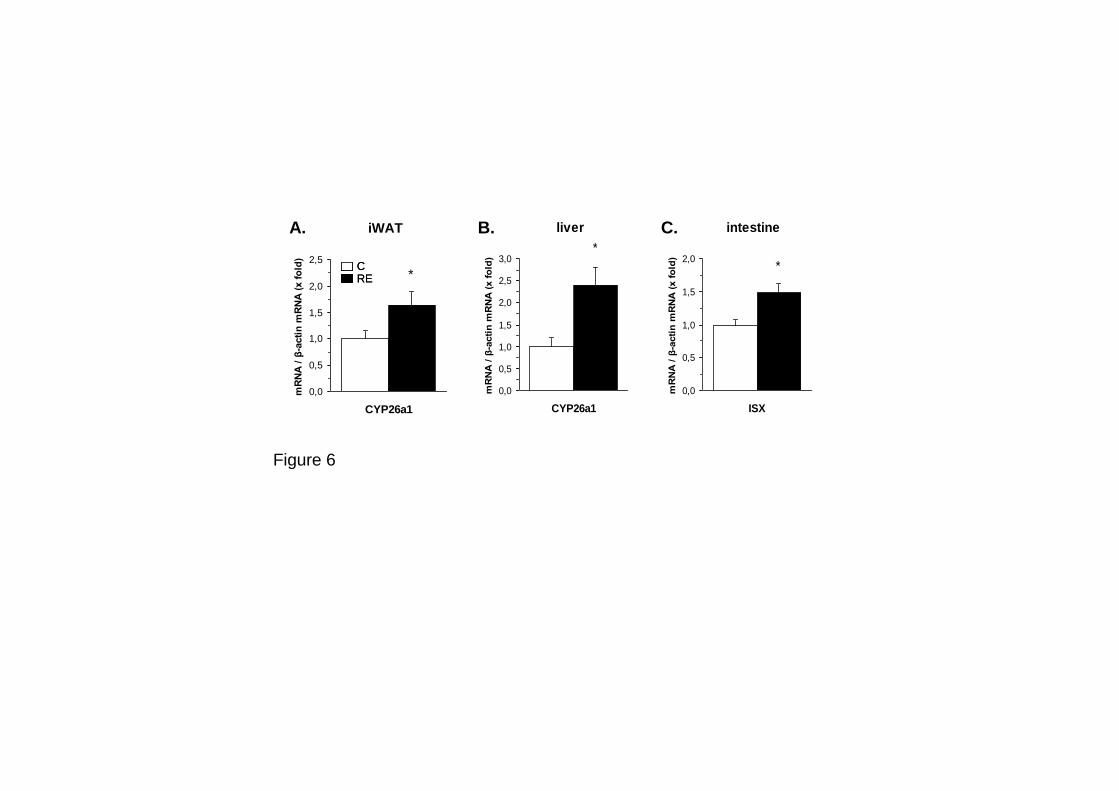
A. B. C.
Figure 6
CRECRE
iWAT
0,0
0,5
1,0
1,5
2,0
2,5
CYP26a1
mR
NA
/ β
-acti
n m
RN
A (
x f
old
)
*
liver
0,0
0,5
1,0
1,5
2,0
2,5
3,0
CYP26a1
mR
NA
/ β
-acti
n m
RN
A (
x f
old
)
*
intestine
0,0
0,5
1,0
1,5
2,0
ISX
mR
NA
/ β
-acti
n m
RN
A (
x f
old
)
*


5. RECAPITULACIÓN

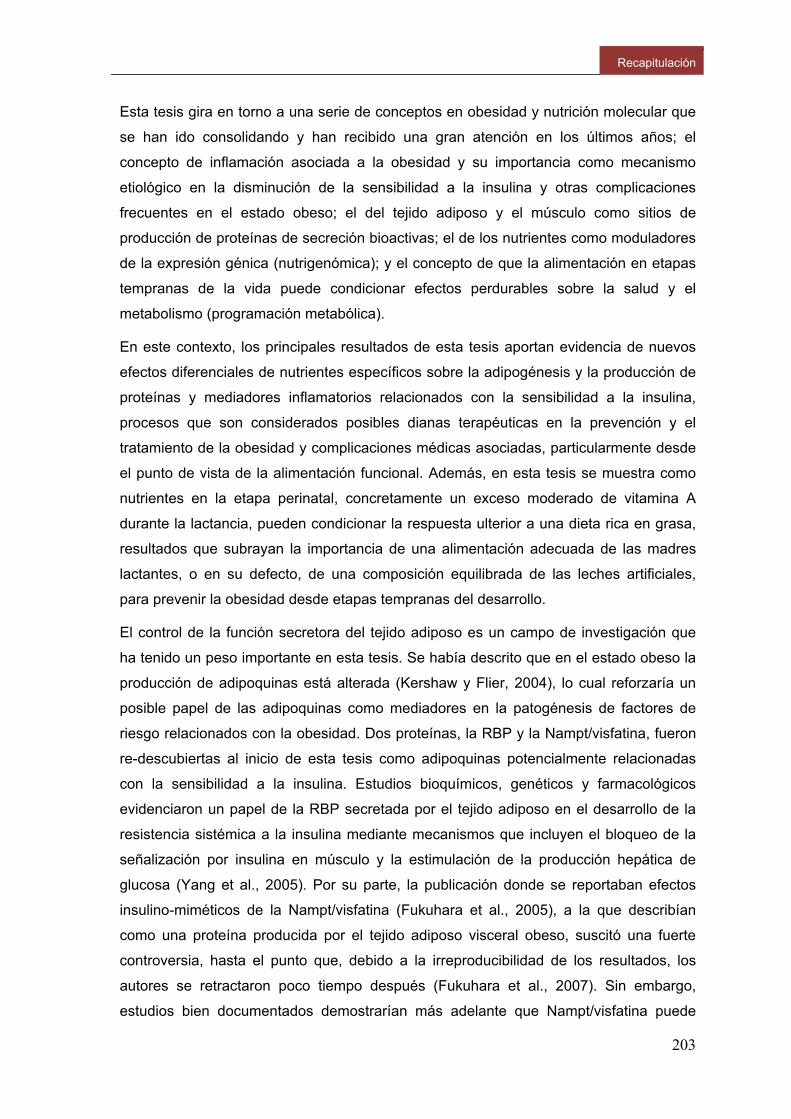
Recapitulación
203
Esta tesis gira en torno a una serie de conceptos en obesidad y nutrición molecular que
se han ido consolidando y han recibido una gran atención en los últimos años; el
concepto de inflamación asociada a la obesidad y su importancia como mecanismo
etiológico en la disminución de la sensibilidad a la insulina y otras complicaciones
frecuentes en el estado obeso; el del tejido adiposo y el músculo como sitios de
producción de proteínas de secreción bioactivas; el de los nutrientes como moduladores
de la expresión génica (nutrigenómica); y el concepto de que la alimentación en etapas
tempranas de la vida puede condicionar efectos perdurables sobre la salud y el
metabolismo (programación metabólica).
En este contexto, los principales resultados de esta tesis aportan evidencia de nuevos
efectos diferenciales de nutrientes específicos sobre la adipogénesis y la producción de
proteínas y mediadores inflamatorios relacionados con la sensibilidad a la insulina,
procesos que son considerados posibles dianas terapéuticas en la prevención y el
tratamiento de la obesidad y complicaciones médicas asociadas, particularmente desde
el punto de vista de la alimentación funcional. Además, en esta tesis se muestra como
nutrientes en la etapa perinatal, concretamente un exceso moderado de vitamina A
durante la lactancia, pueden condicionar la respuesta ulterior a una dieta rica en grasa,
resultados que subrayan la importancia de una alimentación adecuada de las madres
lactantes, o en su defecto, de una composición equilibrada de las leches artificiales,
para prevenir la obesidad desde etapas tempranas del desarrollo.
El control de la función secretora del tejido adiposo es un campo de investigación que
ha tenido un peso importante en esta tesis. Se había descrito que en el estado obeso la
producción de adipoquinas está alterada (Kershaw y Flier, 2004), lo cual reforzaría un
posible papel de las adipoquinas como mediadores en la patogénesis de factores de
riesgo relacionados con la obesidad. Dos proteínas, la RBP y la Nampt/visfatina, fueron
re-descubiertas al inicio de esta tesis como adipoquinas potencialmente relacionadas
con la sensibilidad a la insulina. Estudios bioquímicos, genéticos y farmacológicos
evidenciaron un papel de la RBP secretada por el tejido adiposo en el desarrollo de la
resistencia sistémica a la insulina mediante mecanismos que incluyen el bloqueo de la
señalización por insulina en músculo y la estimulación de la producción hepática de
glucosa (Yang et al., 2005). Por su parte, la publicación donde se reportaban efectos
insulino-miméticos de la Nampt/visfatina (Fukuhara et al., 2005), a la que describían
como una proteína producida por el tejido adiposo visceral obeso, suscitó una fuerte
controversia, hasta el punto que, debido a la irreproducibilidad de los resultados, los
autores se retractaron poco tiempo después (Fukuhara et al., 2007). Sin embargo,
estudios bien documentados demostrarían más adelante que Nampt/visfatina puede
Tesis Doctoral Núria Granados Borbolla
204
actuar como una citoquina pro-inflamatoria y también modular numerosos procesos
dependientes de NAD, incluyendo la secreción de insulina por las células β pancreáticas
(Revollo et al., 2007b).
A partir del re-descubrimiento de RBP y Nampt/visfatina como adipoquinas, numerosos
trabajos, sobre todo en humanos, estudiaron posibles asociaciones entre niveles
circulantes y de expresión en el tejido adiposo de estas proteínas con la
obesidad/resistencia a la insulina, con resultados contradictorios (Broch et al., 2007;
Dogru et al., 2007; Friebe et al., 2011; Fukuhara et al., 2005; Janke et al., 2006; Jian et
al., 2006; Lemaitre et al., 2006; Lewis et al., 2007; Pagano et al., 2006; Promintzer et al.,
2007; Revollo et al., 2007b; Sandeep et al., 2007; Silha et al., 2007; von Eynatten et al.,
2007; Yao-Borengasser et al., 2007). Esta controversia, junto con la relativa escasez de
trabajos que evaluaran posibles cambios en la expresión de RBP y Nampt/visfatina en
modelos animales de obesidad y resistencia a la insulina (Kloting y Kloting, 2005; Yang
et al., 2005), nos llevó a estudiar dichos cambios en dos modelos de obesidad en ratas
bien establecidos, un modelo de obesidad genética (ratas Zucker fa/fa deficientes en el
receptor de leptina) y un modelo de obesidad dietética (ratas Wistar alimentadas con
dieta de cafetería (manuscrito I).
Las ratas Zucker fa/fa desarrollaron, como era de esperar, hiperleptinemia,
hiperinsulinemia y resistencia a la insulina, mientras que las ratas con obesidad dietética
desarrollaron signos de resistencia a la insulina en grado variable. Ambos modelos de
obesidad presentaron, en comparación con sus correspondientes controles delgados,
niveles séricos y de expresión génica en tejidos adiposos de RBP y Nampt/visfatina no
alterados o reducidos. Por tanto, en conjunto, nuestros resultados indican que, en los
modelos animales de obesidad estudiados, el desarrollo de resistencia a la insulina es
independiente de incrementos en la concentración circulante o la expresión adiposa de
RBP o Nampt/visfatina.
Llama la atención que los niveles séricos de RBP estén reducidos en las ratas obesas
Zucker fa/fa comparadas con sus correspondientes controles delgados, ya que se había
descrito que los niveles séricos de RBP están incrementados por un factor de 13 en
ratones ob/ob deficientes en leptina (Yang et al., 2005), y hubiera sido de esperar que la
deficiencia en leptina (como en los ratones ob/ob) y en su receptor (como en las ratas
Zucker fa/fa) diera lugar a un mismo fenotipo RBP. De hecho, tanto en ratones ob/ob
(Yang et al., 2005) como en nuestras ratas Zucker fa/fa se detecta una reducción de la
expresión génica específica de RBP en tejidos adiposos, lo que sugiere que la leptina
normalmente regula al alza la expresión de la RBP adiposa. Esta regulación por leptina
estaría de acuerdo con el papel de la leptina como lipostato y el papel de la RBP
Recapitulación
205
antagonizando la señalización pro-lipogénica por insulina en el tejido adiposo. El
diferente fenotipo RBP en ratas Zucker fa/fa hiperleptinémicas y en ratones ob/ob
deficientes en leptina sugiere que la leptina puede tener efectos independientes de su
receptor favoreciendo la reducción de la RBP circulante (por ejemplo, su eliminación del
torrente sanguíneo). Efectos opuestos de la leptina sobre la expresión adiposa y la
concentración circulante de RBP, aumentando la primera y reduciendo la segunda,
podrían explicar parcialmente las inconsistencias en la literatura sobre RBP en
obesidad, especialmente si se tiene en cuenta que hiperleptinemia y resistencia a la
leptina son condiciones que coexisten en diferentes grados en muchas formas de
obesidad. Por otro lado, no puede descartarse que la regulación de la RBP sea
dependiente de la especie y distinta en ratas, ratones y humanos.
Actividad investigadora previa de nuestro grupo y otros grupos ha evidenciado un papel
regulador de la vitamina A, particularmente en forma de AR, sobre la biología del
adipocito y la adiposidad corporal (Bonet et al., 2003; Bonet et al., 2011; Villarroya et al.,
2004). En ratones, los efectos del tratamiento in vivo con AR incluyen un incremento de
la tolerancia a la glucosa y la sensibilidad a la insulina que obedecería tanto a efectos
indirectos, consecuencia de la reducción de la adiposidad corporal que propicia, como a
efectos directos del AR modulando la expresión de adipoquinas. En concreto, se había
demostrado al inicio de esta tesis que el AR inhibe la producción adiposa de resistina y
leptina (Felipe et al., 2004; Felipe et al., 2005; Hollung et al., 2004), dos proteínas
consideradas pro-inflamatorias y relacionadas con la disminución de la sensibilidad a la
insulina. La RBP tiene un papel clave y bien conocido en el transporte de la vitamina A
(retinol), y su regulación por vitamina A había sido muy estudiada en el hígado, su
principal lugar de síntesis, pero no en el tejido adiposo, lugar de producción de la RBP
relacionada con la resistencia a la insulina. Por todo ello, nos interesó explorar la
regulación de la RBP por retinoides en tejidos adiposos (manuscrito II).
Nuestros resultados muestran que el AR inhibe la producción de RBP a nivel
transcripcional en TAB, pero no en el hígado, in vivo y en dos modelos celulares de
adipocitos blancos, adipocitos 3T3-L1 y adipocitos derivados de MEFs, en los que dicha
inhibición fue reproducida por retinal y por agonistas de los receptores de retinoides
RAR y RXR. In vivo, el tratamiento agudo con AR se acompañó de un incremento de la
sensibilidad a la insulina (con reducción del HOMA-IR), una reducción de los niveles de
proteína RBP en depósitos de TAB e hígado, y un aumento drástico de la RBP
circulante. Ésta última es poco probable que proceda de los tejidos adiposos, ya que el
tratamiento con AR inhibió la expresión de RBP en TAB a nivel transcripcional y redujo
la cantidad de RBP secretada al medio en adipocitos en cultivo; nuestros resultados,
Tesis Doctoral Núria Granados Borbolla
206
incluyendo el inmunoanálisis de complejos de RBP en suero tras electroforesis no
desnaturalizante llevado a cabo, sugieren que se trataría de RBP unida a AR de origen
hepático.
En conjunto, nuestros resultados (manuscrito II) revelan una regulación diferencial de
la RBP por vitamina A en función del tejido, disminuyendo el AR selectivamente la
producción adiposa pero no la hepática, son compatibles con una papel de la RBP
específicamente de origen adiposo en el desarrollo de resistencia a la insulina, y
vendrían a reforzar el concepto de que vitámeros de la vitamina A pueden afectar la
sensibilidad a la insulina vía efectos sobre adipoquinas. Teleológicamente, que un
agente que promueve la movilización de la grasa almacenada en el TAB como es el AR
suprima la expresión adipocitaria de leptina (Felipe et al., 2005; Hollung et al., 2004),
resistina (Felipe et al., 2004) y RBP (manuscrito II) puede verse como un mecanismo de
seguridad tendente a evitar una depleción masiva de grasa, teniendo en cuenta que
estas tres adipoquinas tienen efectos paracrinos suprimiendo la actividad pro-lipogénica
de la insulina en TAB (Bjorbaek y Kahn, 2004; Kim et al., 2001b; Ost et al., 2007;
Steppan et al., 2001; Steppan et al., 2005).
Numerosos estudios han mostrado efectos beneficiosos del ácido oleico sobre la salud
cardiovascular y la sensibilidad a la insulina y efectos adversos derivados del consumo
de ácidos gras trans de origen industrial (AGT-PI) sobre múltiples factores de riesgo
cardiovascular, incluyendo la inducción de un perfil lipídico pro-aterogénico, disfunción
endotelial e inflamación (Mozaffarian, 2006; Mozaffarian et al., 2009; Teegala et al.,
2009). Sin embargo, hay más controversia en relación al impacto del consumo de AGTs-
PI sobre la resistencia a la insulina y el riesgo de DT2, y, además, los posibles
mecanismos moleculares subyacentes han sido relativamente poco estudiados (Lovejoy
et al., 2002; Mozaffarian et al., 2009; Odegaard y Pereira, 2006; Riserus et al., 2009;
Tardy et al., 2008). En este contexto, nos interesó comparar los efectos directos del
ácido oleico y su isómero trans, el ácido elaídico − el más abundante en la grasa trans
de origen industrial − sobre la producción de mioquinas y adipoquinas potencialmente
relacionadas con la inflamación, la sensibilidad a la insulina y el metabolismo
(manuscrito III).
Concretamente, en células musculares en cultivo comparamos la interacción de oleico y
elaídico con los niveles de IL-6 e lL-15, dos proteínas secretadas por el músculo en
contracción con efectos positivos sobre la sensibilidad a la insulina y efectos anti-
obesogénicos (Pedersen y Febbraio, 2008), y de TNFα, un factor potencialmente
patogénico en el desarrollo de la resistencia a la insulina cuyos niveles están
Recapitulación
207
aumentados en músculo y tejido adiposo en el estado obeso. En adipocitos blancos
3T3-L1, analizamos los efectos de ambos ácidos grasos sobre la producción de
adiponectina, una adipoquina anti-inflamatoria de efectos positivos sobre la sensibilidad
a la insulina y la salud cardiovascular cuyos niveles están disminuidos en la obesidad y
la resistencia a la insulina (Kondo et al., 2009; Ohashi et al., 2009; Ouchi et al., 2000;
Ribel-Madsen et al., 2009; Shibata et al., 2008; Yun et al., 2009), y resistina, una
proteína pro-inflamatoria e inductora de resistencia a la insulina (Lee et al., 2009;
McTernan et al., 2006; Steppan et al., 2001; Won et al., 2009).
Nuestros resultados muestran efectos diferenciales del ácido oleico y el ácido elaídico
sobre la producción de todas estas proteínas (manuscrito III). La exposición a ácido
oleico, pero no elaídico, indujo la expresión de IL-6 en las células musculares e indujo la
expresión de adiponectina a la vez que reprimió la de resistina en los adipocitos en
cultivo. La exposición a ácido elaídico, pero no oleico, indujo la expresión de TNFα y
reprimió la expresión de IL-15 en las células musculares. En conjunto, estos resultados
son compatibles con efectos beneficiosos del ácido oleico y adversos del ácido elaídico
sobre la sensibilidad a la insulina previamente descritos, y describen por primera vez
mecanismos moleculares que sustentan dicha relación vinculados a efectos directos
diferenciales sobre la producción de adipoquinas y mioquinas.
También demostramos que la captación de glucosa estimulada por insulina en células
musculares es menor si las células habían sido previamente incubadas con ácido
elaídico respecto a células pre-incubadas con ácido oleico (manuscrito III). Teniendo
en cuenta que el músculo esquelético es responsable del 80% de la captación de
glucosa estimulada por insulina (Parish y Petersen, 2005), estos resultados vendrían a
confirmar un efecto adverso directo de la grasa trans, comparada con la cis, sobre la
homeostasia de la glucosa vía reducción de su captación por células musculares.
Numerosos estudios muestran una relación inversa entre masa adiposa y masa ósea
(osteoporosis) (Duque, 2008) y una relación entre desórdenes músculo- esqueléticos
como la disfunción articular (osteoartritis) y la obesidad que va más allá del mero nexo
biomecánico para incluir asimismo múltiples nexos metabólicos y celulares (Aspden et
al., 2001; Griffin y Guilak, 2008; Hu et al., 2010; Iannone y Lapadula, 2010; Pottie et al.,
2006). En este contexto, y dentro de un contrato de nuestro grupo con la empresa
Bioibérica S.A. enmarcado en el programa CENIT-Pronaos, nos interesó realizar una
revisión de los factores moleculares simultáneamente involucrados en el desarrollo y
función de adipocitos y condrocitos, con especial énfasis en su posible alteración en la
obesidad y la osteoartritis y su idoneidad como dianas terapéuticas para ambas
condiciones en los (muchos) casos en que coexisten en un mismo individuo. Hemos
Tesis Doctoral Núria Granados Borbolla
208
identificado las siguientes categorías de factores en la intersección entre obesidad y
osteoartritis: señales y factores de transcripción involucrados en la diferenciación celular
a partir de células multipotentes; componentes y factores de remodelación de la matriz
extracelular; adipoquinas y mediadores proteicos pro-inflamatorios; factores de
transcripción inducidos por hipoxia; lípidos; productos finales de la glicosilación
avanzada y microRNAs (manuscrito V).
Adipocitos, condrocitos y osteoblastos se cree que derivan de células mesenquimales
precursoras comunes durante el desarrollo, y hay evidencia de que la diferenciación de
células multipotentes en estos diferentes tipos celulares está competitivamente
equilibrada. Se había descrito el papel que algunos nutrientes tenían sobre la función
articular, pero no se había evaluado si estos mismos nutrientes podían tener algún
efecto sobre el proceso adipogénico (la identidad de estos compuestos está sujeta a
medidas de confidencialidad de cara a una posible patente). Nuestros resultados,
obtenidos de la observación microscópica de la morfología celular y la tinción de
triacilgliceroles intracelulares, muestran un efecto inhibidor de algunos de los nutrientes
de este tipo ensayados sobre la adipogénesis en MEFs, tanto espontánea como
inducida hormonalmente (manuscrito IV). Al nivel molecular, algunos de los nutrientes
ensayados indujeron en MEFs la expresión de factores que inhiben la adipogénesis y
estimulan la condro-/osteo-génesis (Sox-9, Pref-1, PGC1α, TNFα, leptina), y reprimieron
la expresión de PPARγ, un factor clave en la diferenciación de adipocitos. Además, la
expresión de genes clave en la diferenciación terminal de adipocitos (CEBPα) y la
lipogénesis (FAS) y adipoquinas pro-inflamatorias como la resistina y la RBP resultó
inhibida por los nutrientes ensayados, al tiempo que la expresión de un componente de
la matriz extracelular del cartílago como es la proteína del agregan resultó
incrementada. Estos resultados sugieren que los nutrientes ensayados tienen capacidad
de regular el balance de diferenciación de células multipotentes hacia unos u otros tipos
celulares, inhibiendo la adipogénesis y potenciando la condrogénesis, lo que puede
resultar de interés en la alimentación funcional para, simultáneamente, prevenir/tratar la
obesidad y mejorar la salud articular. La regeneración del cartílago y la inhibición de la
adipogénesis en la médula ósea podrían ser objetivos en la terapia de la osteoartritis
(De Bari et al., 2010; Liu et al., 2009). Por su parte, la inhibición de la adipogénesis en
los depósitos de TAB puede ser una diana terapéutica en el tratamiento de la obesidad
complementaria a las estrategias convencionales basadas en la consecución de un
balance energético negativo, especialmente en los casos de obesidad hiperplásica, más
refractaria a la pérdida estable de peso/adiposidad (Spalding et al., 2008).
Recapitulación
209
Finalmente, en esta tesis nos ha interesado estudiar los efectos a largo plazo de la
suplementación con vitamina A durante la lactancia sobre la susceptibilidad a la
obesidad dietética. Esta investigación la planteamos a la luz de diferentes
considerandos. La nutrición en etapas tempranas de la vida puede tener consecuencias
a largo plazo sobre la susceptibilidad a padecer obesidad y desórdenes metabólicos
asociados en la edad adulta, y la vitamina A modula múltiples procesos determinantes
del balance energético y la adiposidad corporal en animales adultos, incluyendo el
metabolismo lipídico y energético en diferentes tejidos, y es un conocido regulador de la
adipogénesis y un nutriente esencial clave en el desarrollo embrionario. Y, a pesar de
todo ello, los estudios sobre los efectos de la vitamina A en etapas tempranas de la vida
sobre el desarrollo de los tejidos adiposos eran escasos.
Nuestros resultados (manuscrito VI) muestran que ratas que recibieron una
suplementación moderada de vitamina A en forma de retinil palmitato durante la
lactancia (días 0 a 20 de vida) acumulan subsiguientemente más grasa corporal que sus
controles en respuesta a una dieta hiperlipídica, presentando mayor leptinemia,
diámetro de los adipocitos y, especialmente, mayor contenido en ADN en el TAB. La
ganancia de peso y la ingesta fueron, no obstante, comparables en animales controles y
tratados. Los mecanismos subyacentes a esta ganancia incrementada de adiposidad en
las ratas tratadas con vitamina A estarían posiblemente relacionados con cambios en el
desarrollo del TAB, que en la rata ocurre sobre todo post-natalmente durante el primer
mes de vida. En concreto, en el momento del destete, en el tejido adiposo subcutáneo
de las crías los niveles de ARNm de PCNA, un marcador de proliferación celular, se
presentaron incrementados, mientras que los niveles de expresión de marcadores de
diferenciación adipocitaria (como PPARγ y CEBPα) se presentaron disminuidos. Esto
sugiere una mayor competencia proliferativa en los tejidos adiposos juveniles en las
ratas tratadas con vitamina A que podría derivar, en respuesta a una rica dieta en grasa,
en un mayor número de adipocitos y en consecuencia en una mayor adiposidad
corporal. En conjunto, los resultados sugieren que la vitamina A en etapas tempranas de
la vida puede condicionar efectos a largo plazo sobre la adiposidad corporal vía efectos
sobre el desarrollo y la celularidad del tejido adiposo. Teniendo en cuenta que los
niveles de vitamina A en la leche materna reflejan el estatus de vitamina A de la madre
así como la ingesta materna de vitamina A, estos hallazgos pueden resultar de interés
en la prevención de la obesidad y especialmente la obesidad infantil, actualmente un
grave problema de salud a nivel mundial.
En definitiva, el conjunto de resultados presentados nos aportan nueva información
acerca de los efectos de determinados nutrientes sobre la secreción de proteínas

Tesis Doctoral Núria Granados Borbolla
210
bioactivas por tejido adiposo y muscular, la adipogénesis y también, administrados en
etapas tempranas del desarrollo, la futura susceptibilidad a la obesidad. El conocimiento
de las interacciones nutrientes-genes en procesos que regulan la adiposidad corporal y
la sensibilidad a la insulina en etapas tempranas y en la edad adulta puede ayudar al
diseño de nuevas estrategias para prevenir/tratar la obesidad y complicaciones médicas
asociadas.

6. CONCLUSIONES

Conclusiones
213
1) En ratas obesas Zucker fa/fa y ratas Wistar obesas por dieta de cafetería el
desarrollo de resistencia a la insulina es independiente de incrementos en la
concentración circulante o expresión adiposa de RBP y Nampt/visfatina, lo que
sugiere que la desregulación de estas dos proteínas no es un factor relevante en
el deterioro de la homeostasia metabólica en dichos modelos de obesidad en
rata.
2) El ácido retinoico (AR), forma carboxílica de la vitamina A, inhibe la expresión de
RBP a nivel transcripcional en modelos celulares de adipocitos. En adipocitos
derivados de fibroblastos embrionarios de ratón (MEFs), dicha inhibición es
reproducida por agonistas de receptores de retinoides (RAR y RXR) y por retinal,
y se acompaña de una reducción de la RBP secretada al medio de cultivo. En
ratones, el tratamiento agudo in vivo con AR reprime selectivamente la expresión
génica de RBP en el tejido adiposo blanco, pero no en el hígado, y conlleva un
incremento de la sensibilidad a la insulina. En conjunto, los resultados revelan
una regulación tejido-específica de la RBP por AR, son compatibles con una
papel de la RBP específicamente de origen adiposo en el desarrollo de
resistencia a la insulina en ratones, y vienen a reforzar el concepto de que
vitámeros de la vitamina A pueden afectar la sensibilidad a la insulina vía efectos
sobre adipoquinas.
3) El ácido oleico y su isómero trans, el ácido elaídico, tienen efectos directos
diferenciales sobre la producción de proteínas bioactivas secretadas por
adipocitos y células musculares en cultivo. La exposición a ácido oleico
incrementa la expresión de interleuquina-6 muscular y adiponectina adiposa, al
tiempo que reduce la expresión de resistina en adipocitos. La exposición a ácido
elaídico incrementa la producción de TNFα y disminuye la expresión de
interleuquina-15 en células musculares. Estos resultados contribuyen a
establecer un vínculo molecular entre los efectos adversos del ácido elaídico y
beneficiosos del ácido oleico sobre la sensibilidad a la insulina y el riesgo
cardiovascular y la función secretora de adipocitos y miocitos.
4) La exposición a ácido elaídico disminuye la captación de glucosa estimulada por
insulina en células musculares en comparación con el ácido oleico, lo que estaría
de acuerdo con un efecto adverso directo de la grasa trans sobre la homeostasia
de la glucosa. A los efectos sobre la captación de glucosa estimulada por
insulina podrían contribuir los cambios observados en la regulación de la
expresión de mioquinas.
Tesis Doctoral Núria Granados Borbolla ]
214
5) El tratamiento con determinados compuestos comúnmente vinculados a la salud
de las articulaciones inhibe la adipogénesis e induce la expresión de marcadores
condrogénicos en células multipotentes. En particular, en MEFs en vías de
diferenciación en presencia de estímulos adipogénicos, los compuestos
ensayados determinan una disminución de la acumulación de lípidos y una
inhibición de la expresión de genes para proteínas involucradas en la
diferenciación terminal de adipocitos y la lipogénesis (CEBPα, FAS) y proteínas
potencialmente inflamatorias (RBP y resistina), así como un incremento de la
expresión de señales anti-adipogénicas (leptina) y de proteínas relacionadas con
la función mitocondrial y/o la condrogénesis (PGC1α, Sox-9, Col2a1). En MEFs
no estimulados a diferenciarse en adipocitos, algunos de los compuestos
ensayados reprimieron la adipogénesis espontánea y tuvieron efectos sobre la
expresión génica similares a los de un conocido factor inductor de la
condrogénesis (BMP2).
6) Existen numerosos factores moleculares alterados en la obesidad y la
osteoartritis que reflejan como la pérdida de homeostasia en el estado obeso
afecta negativamente al desarrollo, función y mantenimiento de las
articulaciones. El conocimiento de estos factores puede ayudar a prevenir y/o
tratar de forma simultánea ambas condiciones patológicas.
7) Ratas que recibieron una suplementación moderada de vitamina A como retinil
palmitato durante la lactancia presentan un mayor potencial de proliferación
celular en el tejido adiposo blanco en el momento del destete, con un incremento
de la expresión del marcador de proliferación celular PCNA, una disminución de
la expresión de marcadores adipogénicos (PPARγ, CEBPα, LPL), y una
tendencia a presentar una mayor proporción de células de pequeño tamaño.
8) Ratas que recibieron una suplementación moderada de vitamina A como retinil
palmitato durante la lactancia acumulan subsiguientemente más grasa corporal
que sus controles en respuesta a una dieta hiperlipídica, y presentan mayor
leptinemia, diámetro de los adipocitos y contenido en ADN en el tejido adiposo
blanco. A esta mayor ganancia de adiposidad podría contribuir la retención de
una mayor competencia proliferativa celular en el tejido adiposo, que podría
derivar en una mayor hiperplasia de este tejido bajo el estímulo de una dieta rica
en grasa.

7. BIBLIOGRAFÍA

Bibliografía
217
Abdelli, S., Ansite, J., Roduit, R., Borsello, T., Matsumoto, I., Sawada, T., Allaman-Pillet,
N., Henry, H., Beckmann, J. S., Hering, B. J., and Bonny, C. (2004): Intracellular
stress signaling pathways activated during human islet preparation and following
acute cytokine exposure. Diabetes 53, 2815-23.
Aeberli, I., Biebinger, R., Lehmann, R., L'Allemand, D., Spinas, G. A., and Zimmermann,
M. B. (2007): Serum retinol-binding protein 4 concentration and its ratio to serum
retinol are associated with obesity and metabolic syndrome components in
children. J Clin Endocrinol Metab 92, 4359-65.
Aguiari, P., Leo, S., Zavan, B., Vindigni, V., Rimessi, A., Bianchi, K., Franzin, C., Cortivo,
R., Rossato, M., Vettor, R., Abatangelo, G., Pozzan, T., Pinton, P., and Rizzuto,
R. (2008): High glucose induces adipogenic differentiation of muscle-derived
stem cells. Proc Natl Acad Sci U S A 105, 1226-31.
Aguirre, V., Uchida, T., Yenush, L., Davis, R., and White, M. F. (2000): The c-Jun NH(2)-
terminal kinase promotes insulin resistance during association with insulin
receptor substrate-1 and phosphorylation of Ser(307). J Biol Chem 275, 9047-54.
Aguirre, V., Werner, E. D., Giraud, J., Lee, Y. H., Shoelson, S. E., and White, M. F.
(2002): Phosphorylation of Ser307 in insulin receptor substrate-1 blocks
interactions with the insulin receptor and inhibits insulin action. J Biol Chem 277,
1531-7.
Ahren, B., and Pacini, G. (2005): Islet adaptation to insulin resistance: mechanisms and
implications for intervention. Diabetes Obes Metab 7, 2-8.
Aicher, A., Heeschen, C., Mildner-Rihm, C., Urbich, C., Ihling, C., Technau-Ihling, K.,
Zeiher, A. M., and Dimmeler, S. (2003): Essential role of endothelial nitric oxide
synthase for mobilization of stem and progenitor cells. Nat Med 9, 1370-6.
Akiyama, H., Kamitani, T., Yang, X., Kandyil, R., Bridgewater, L. C., Fellous, M., Mori-
Akiyama, Y., and de Crombrugghe, B. (2005): The transcription factor Sox9 is
degraded by the ubiquitin-proteasome system and stabilized by a mutation in a
ubiquitin-target site. Matrix Biol 23, 499-505.
Akohoue, S. A., Green, J. B., and Green, M. H. (2006): Dietary vitamin A has both
chronic and acute effects on vitamin A indices in lactating rats and their offspring.
J Nutr 136, 128-32.
Albuquerque, K. T., Sardinha, F. L., Telles, M. M., Watanabe, R. L., Nascimento, C. M.,
Tavares do Carmo, M. G., and Ribeiro, E. B. (2006): Intake of trans fatty acid-rich
hydrogenated fat during pregnancy and lactation inhibits the hypophagic effect of
central insulin in the adult offspring. Nutrition 22, 820-9.
Alvarez, B., Carbo, N., Lopez-Soriano, J., Drivdahl, R. H., Busquets, S., Lopez-Soriano,
F. J., Argiles, J. M., and Quinn, L. S. (2002): Effects of interleukin-15 (IL-15) on
adipose tissue mass in rodent obesity models: evidence for direct IL-15 action on
adipose tissue. Biochim Biophys Acta 1570, 33-7.
Amengual, J., Gouranton, E., van Helden, Y. G., Hessel, S., Ribot, J., Kramer, E., Kiec-
Wilk, B., Razny, U., Lietz, G., Wyss, A., Dembinska-Kiec, A., Palou, A., Keijer, J.,
Tesis Doctoral Núria Granados Borbolla
218
Landrier, J. F., Bonet, M. L., and von Lintig, J. (2011): Beta-carotene reduces
body adiposity of mice via BCMO1. PLoS One 6, e20644.
Amengual, J., Ribot, J., Bonet, M. L., and Palou, A. (2010): Retinoic acid treatment
enhances lipid oxidation and inhibits lipid biosynthesis capacities in the liver of
mice. Cell Physiol Biochem 25, 657-66.
Ammendrup, A., Maillard, A., Nielsen, K., Aabenhus Andersen, N., Serup, P., Dragsbaek
Madsen, O., Mandrup-Poulsen, T., and Bonny, C. (2000): The c-Jun amino-
terminal kinase pathway is preferentially activated by interleukin-1 and controls
apoptosis in differentiating pancreatic beta-cells. Diabetes 49, 1468-76.
Anderson, P. D., Mehta, N. N., Wolfe, M. L., Hinkle, C. C., Pruscino, L., Comiskey, L. L.,
Tabita-Martinez, J., Sellers, K. F., Rickels, M. R., Ahima, R. S., and Reilly, M. P.
(2007): Innate immunity modulates adipokines in humans. J Clin Endocrinol
Metab 92, 2272-9.
Aranda, A., and Pascual, A. (2001): Nuclear hormone receptors and gene expression.
Physiol Rev 81, 1269-304.
Arner, E., Westermark, P. O., Spalding, K. L., Britton, T., Ryden, M., Frisen, J., Bernard,
S., and Arner, P. (2010): Adipocyte turnover: relevance to human adipose tissue
morphology. Diabetes 59, 105-9.
Arner, P., and Spalding, K. L. (2010): Fat cell turnover in humans. Biochem Biophys Res
Commun 396, 101-4.
Aspden, R. M. (2008): Osteoarthritis: a problem of growth not decay? Rheumatology
(Oxford) 47, 1452-60.
Aspden, R. M., Scheven, B. A., and Hutchison, J. D. (2001): Osteoarthritis as a systemic
disorder including stromal cell differentiation and lipid metabolism. Lancet 357,
1118-20.
Astrup, A., and Finer, N. (2000): Redefining type 2 diabetes: 'diabesity' or 'obesity
dependent diabetes mellitus'? Obes Rev 1, 57-9.
Bado, A., Levasseur, S., Attoub, S., Kermorgant, S., Laigneau, J. P., Bortoluzzi, M. N.,
Moizo, L., Lehy, T., Guerre-Millo, M., Le Marchand-Brustel, Y., and Lewin, M. J.
(1998): The stomach is a source of leptin. Nature 394, 790-3.
Baeuerle, P. A., and Henkel, T. (1994): Function and activation of NF-kappa B in the
immune system. Annu Rev Immunol 12, 141-79.
Baker, A. R., Harte, A. L., Howell, N., Pritlove, D. C., Ranasinghe, A. M., da Silva, N. F.,
Youssef, E. M., Khunti, K., Davies, M. J., Bonser, R. S., Kumar, S., Pagano, D.,
and McTernan, P. G. (2009): Epicardial adipose tissue as a source of nuclear
factor-kappaB and c-Jun N-terminal kinase mediated inflammation in patients
with coronary artery disease. J Clin Endocrinol Metab 94, 261-7.
Ballou, L. R., Laulederkind, S. J., Rosloniec, E. F., and Raghow, R. (1996): Ceramide
signalling and the immune response. Biochim Biophys Acta 1301, 273-87.
Bao, J. P., Chen, W. P., Feng, J., Hu, P. F., Shi, Z. L., and Wu, L. D. Leptin plays a
catabolic role on articular cartilage. Mol Biol Rep 37, 3265-72.
Bibliografía
219
Bartelt, A., Bruns, O. T., Reimer, R., Hohenberg, H., Ittrich, H., Peldschus, K., Kaul, M.
G., Tromsdorf, U. I., Weller, H., Waurisch, C., Eychmuller, A., Gordts, P. L.,
Rinninger, F., Bruegelmann, K., Freund, B., Nielsen, P., Merkel, M., and Heeren,
J. (2011): Brown adipose tissue activity controls triglyceride clearance. Nat Med
17, 200-5.
Bastien, J., and Rochette-Egly, C. (2004): Nuclear retinoid receptors and the
transcription of retinoid-target genes. Gene 328, 1-16.
Bell, G. I., and Polonsky, K. S. (2001): Diabetes mellitus and genetically programmed
defects in beta-cell function. Nature 414, 788-91.
Bennett, B. L., Satoh, Y., and Lewis, A. J. (2003): JNK: a new therapeutic target for
diabetes. Curr Opin Pharmacol 3, 420-5.
Berry, D. C., Jin, H., Majumdar, A., and Noy, N. (2011): Signaling by vitamin A and
retinol-binding protein regulates gene expression to inhibit insulin responses.
Proc Natl Acad Sci U S A 108, 4340-5.
Berry, D. C., and Noy, N. (2009): All-trans-retinoic acid represses obesity and insulin
resistance by activating both PPAR{beta}/{delta} and RAR. Mol Cell Biol.
Bjorbaek, C., and Kahn, B. B. (2004): Leptin signaling in the central nervous system and
the periphery. Recent Prog Horm Res 59, 305-31.
Bjorntorp, P., Karlsson, M., and Pettersson, P. (1982): Expansion of adipose tissue
storage capacity at different ages in rats. Metabolism 31, 366-73.
Black, D. (1983): Obesity. Report of the Royal College of Physicians 17.
Blaner, W. S. (1989): Retinol-binding protein: the serum transport protein for vitamin A.
Endocr Rev 10, 308-16.
Blaner, W. S., Obunike, J. C., Kurlandsky, S. B., al-Haideri, M., Piantedosi, R.,
Deckelbaum, R. J., and Goldberg, I. J. (1994): Lipoprotein lipase hydrolysis of
retinyl ester. Possible implications for retinoid uptake by cells. J Biol Chem 269,
16559-65.
Blomhoff, R., and Blomhoff, H. K. (2006): Overview of retinoid metabolism and function.
J Neurobiol 66, 606-30.
Boden, G. (1998): Free fatty acids (FFA), a link between obesity and insulin resistance.
Front Biosci 3, d169-75.
Boden, G. (2008): Obesity and free fatty acids. Endocrinol Metab Clin North Am 37, 635-
46, viii-ix.
Bokarewa, M., Nagaev, I., Dahlberg, L., Smith, U., and Tarkowski, A. (2005): Resistin, an
adipokine with potent proinflammatory properties. J Immunol 174, 5789-95.
Bondia-Pons, I., Schroder, H., Covas, M. I., Castellote, A. I., Kaikkonen, J., Poulsen, H.
E., Gaddi, A. V., Machowetz, A., Kiesewetter, H., and Lopez-Sabater, M. C.
(2007): Moderate consumption of olive oil by healthy European men reduces
systolic blood pressure in non-Mediterranean participants. J Nutr 137, 84-7.
Tesis Doctoral Núria Granados Borbolla
220
Bonet, M., Ribot, J., and Palou, A. (2009): Citocinas y control metabólico. Revista
Española de Obesidad 7, 22-47.
Bonet, M. L., Oliver, J., Pico, C., Felipe, F., Ribot, J., Cinti, S., and Palou, A. (2000):
Opposite effects of feeding a vitamin A-deficient diet and retinoic acid treatment
on brown adipose tissue uncoupling protein 1 (UCP1), UCP2 and leptin
expression. J Endocrinol 166, 511-7.
Bonet, M. L., Ribot, J., Felipe, F., and Palou, A. (2003): Vitamin A and the regulation of
fat reserves. Cell Mol Life Sci 60, 1311-21.
Bonet, M. L., Ribot, J., and Palou, A. (2011): Lipid metabolism in mammalian tissues and
its control by retinoic acid. Biochim Biophys Acta.
Bost, F., Caron, L., Marchetti, I., Dani, C., Le Marchand-Brustel, Y., and Binetruy, B.
(2002): Retinoic acid activation of the ERK pathway is required for embryonic
stem cell commitment into the adipocyte lineage. Biochem J 361, 621-7.
Bour, G., Lalevee, S., and Rochette-Egly, C. (2007): Protein kinases and the proteasome
join in the combinatorial control of transcription by nuclear retinoic acid receptors.
Trends Cell Biol 17, 302-9.
Brechtel, K., Dahl, D. B., Machann, J., Bachmann, O. P., Wenzel, I., Maier, T., Claussen,
C. D., Haring, H. U., Jacob, S., and Schick, F. (2001): Fast elevation of the
intramyocellular lipid content in the presence of circulating free fatty acids and
hyperinsulinemia: a dynamic 1H-MRS study. Magn Reson Med 45, 179-83.
Breier, B. H., Vickers, M. H., Ikenasio, B. A., Chan, K. Y., and Wong, W. P. (2001): Fetal
programming of appetite and obesity. Mol Cell Endocrinol 185, 73-9.
Broch, M., Vendrell, J., Ricart, W., Richart, C., and Fernandez-Real, J. M. (2007):
Circulating retinol-binding protein-4, insulin sensitivity, insulin secretion, and
insulin disposition index in obese and nonobese subjects. Diabetes Care 30,
1802-6.
Broholm, C., and Pedersen, B. K. (2010): Leukaemia inhibitory factor--an exercise-
induced myokine. Exerc Immunol Rev 16, 77-85.
Brose, N., and Rosenmund, C. (2002): Move over protein kinase C, you've got company:
alternative cellular effectors of diacylglycerol and phorbol esters. J Cell Sci 115,
4399-411.
Busquets, S., Figueras, M. T., Meijsing, S., Carbo, N., Quinn, L. S., Almendro, V.,
Argiles, J. M., and Lopez-Soriano, F. J. (2005): Interleukin-15 decreases
proteolysis in skeletal muscle: a direct effect. Int J Mol Med 16, 471-6.
Caballero, A. E. (2003): Endothelial dysfunction in obesity and insulin resistance: a road
to diabetes and heart disease. Obes Res 11, 1278-89.
Calvo, W., Fliedner, T. M., Herbst, E., Hugl, E., and Bruch, C. (1976): Regeneration of
blood-forming organs after autologous leukocyte transfusion in lethally irradiated
dogs. II. Distribution and cellularity of the marrow in irradiated and transfused
animals. Blood 47, 593-601.
Bibliografía
221
Cannon, B., and Nedergaard, J. (2004): Brown adipose tissue: function and physiological
significance. Physiol Rev 84, 277-359.
Capel, F., Klimcakova, E., Viguerie, N., Roussel, B., Vitkova, M., Kovacikova, M., Polak,
J., Kovacova, Z., Galitzky, J., Maoret, J. J., Hanacek, J., Pers, T. H., Bouloumie,
A., Stich, V., and Langin, D. (2009): Macrophages and adipocytes in human
obesity: adipose tissue gene expression and insulin sensitivity during calorie
restriction and weight stabilization. Diabetes 58, 1558-67.
Carey, A. L., Steinberg, G. R., Macaulay, S. L., Thomas, W. G., Holmes, A. G., Ramm,
G., Prelovsek, O., Hohnen-Behrens, C., Watt, M. J., James, D. E., Kemp, B. E.,
Pedersen, B. K., and Febbraio, M. A. (2006): Interleukin-6 increases insulin-
stimulated glucose disposal in humans and glucose uptake and fatty acid
oxidation in vitro via AMP-activated protein kinase. Diabetes 55, 2688-97.
Casabiell, X., Pineiro, V., Tome, M. A., Peino, R., Dieguez, C., and Casanueva, F. F.
(1997): Presence of leptin in colostrum and/or breast milk from lactating mothers:
a potential role in the regulation of neonatal food intake. J Clin Endocrinol Metab
82, 4270-3.
Cersosimo, E., and DeFronzo, R. A. (2006): Insulin resistance and endothelial
dysfunction: the road map to cardiovascular diseases. Diabetes Metab Res Rev
22, 423-36.
Cinti, S. (2005): The adipose organ. Prostaglandins Leukot Essent Fatty Acids 73, 9-15.
Cinti, S. (2006): The role of brown adipose tissue in human obesity. Nutr Metab
Cardiovasc Dis 16, 569-74.
Cinti, S., Mitchell, G., Barbatelli, G., Murano, I., Ceresi, E., Faloia, E., Wang, S., Fortier,
M., Greenberg, A. S., and Obin, M. S. (2005): Adipocyte death defines
macrophage localization and function in adipose tissue of obese mice and
humans. J Lipid Res 46, 2347-55.
Corcoran, M. P., Lamon-Fava, S., and Fielding, R. A. (2007): Skeletal muscle lipid
deposition and insulin resistance: effect of dietary fatty acids and exercise. Am J
Clin Nutr 85, 662-77.
Craig, R. L., Chu, W. S., and Elbein, S. C. (2007): Retinol binding protein 4 as a
candidate gene for type 2 diabetes and prediabetic intermediate traits. Mol Genet
Metab 90, 338-44.
Cripps, R. L., Martin-Gronert, M. S., and Ozanne, S. E. (2005): Fetal and perinatal
programming of appetite. Clin Sci (Lond) 109, 1-11.
Cummings, D. E., Brandon, E. P., Planas, J. V., Motamed, K., Idzerda, R. L., and
McKnight, G. S. (1996): Genetically lean mice result from targeted disruption of
the RII beta subunit of protein kinase A. Nature 382, 622-6.
Curat, C. A., Miranville, A., Sengenes, C., Diehl, M., Tonus, C., Busse, R., and
Bouloumie, A. (2004): From blood monocytes to adipose tissue-resident
macrophages: induction of diapedesis by human mature adipocytes. Diabetes 53,
1285-92.

Tesis Doctoral Núria Granados Borbolla
222
Cypess, A. M., Lehman, S., Williams, G., Tal, I., Rodman, D., Goldfine, A. B., Kuo, F. C.,
Palmer, E. L., Tseng, Y. H., Doria, A., Kolodny, G. M., and Kahn, C. R. (2009):
Identification and importance of brown adipose tissue in adult humans. N Engl J
Med 360, 1509-17.
Chaves, G. V., Pereira, S. E., Saboya, C. J., and Ramalho, A. (2007): Nutritional status
of vitamin A in morbid obesity before and after Roux-en-Y gastric bypass. Obes
Surg 17, 970-6.
Cho, Y. M., Youn, B. S., Lee, H., Lee, N., Min, S. S., Kwak, S. H., Lee, H. K., and Park,
K. S. (2006): Plasma retinol-binding protein-4 concentrations are elevated in
human subjects with impaired glucose tolerance and type 2 diabetes. Diabetes
Care 29, 2457-61.
Dani, C., Smith, A. G., Dessolin, S., Leroy, P., Staccini, L., Villageois, P., Darimont, C.,
and Ailhaud, G. (1997): Differentiation of embryonic stem cells into adipocytes in
vitro. J Cell Sci 110 ( Pt 11), 1279-85.
Davila, M. E., Norris, L., Cleary, M. P., and Ross, A. C. (1985): Vitamin A during
lactation: relationship of maternal diet to milk vitamin A content and to the vitamin
A status of lactating rats and their pups. J Nutr 115, 1033-41.
De Bari, C., Kurth, T. B., and Augello, A. (2010): Mesenchymal stem cells from
development to postnatal joint homeostasis, aging, and disease. Birth Defects
Res C Embryo Today 90, 257-71.
de Ferranti, S., and Mozaffarian, D. (2008): The perfect storm: obesity, adipocyte
dysfunction, and metabolic consequences. Clin Chem 54, 945-55.
de Luca, C., and Olefsky, J. M. (2008): Inflammation and insulin resistance. FEBS Lett
582, 97-105.
de Souza Valente da Silva, L., Valeria da Veiga, G., and Ramalho, R. A. (2007):
Association of serum concentrations of retinol and carotenoids with overweight in
children and adolescents. Nutrition 23, 392-7.
Delahaye, F., Breton, C., Risold, P. Y., Enache, M., Dutriez-Casteloot, I., Laborie, C.,
Lesage, J., and Vieau, D. (2008): Maternal perinatal undernutrition drastically
reduces postnatal leptin surge and affects the development of arcuate nucleus
proopiomelanocortin neurons in neonatal male rat pups. Endocrinology 149, 470-
5.
Dogru, T., Sonmez, A., Tasci, I., Bozoglu, E., Yilmaz, M. I., Genc, H., Erdem, G., Gok,
M., Bingol, N., Kilic, S., Ozgurtas, T., and Bingol, S. (2007): Plasma visfatin levels
in patients with newly diagnosed and untreated type 2 diabetes mellitus and
impaired glucose tolerance. Diabetes Res Clin Pract 76, 24-9.
Donnelly, K. L., Smith, C. I., Schwarzenberg, S. J., Jessurun, J., Boldt, M. D., and Parks,
E. J. (2005): Sources of fatty acids stored in liver and secreted via lipoproteins in
patients with nonalcoholic fatty liver disease. J Clin Invest 115, 1343-51.
Dorfman, S. E., Laurent, D., Gounarides, J. S., Li, X., Mullarkey, T. L., Rocheford, E. C.,
Sari-Sarraf, F., Hirsch, E. A., Hughes, T. E., and Commerford, S. R. (2009):
Bibliografía
223
Metabolic implications of dietary trans-fatty acids. Obesity (Silver Spring) 17,
1200-7.
Du, X. L., Edelstein, D., Dimmeler, S., Ju, Q., Sui, C., and Brownlee, M. (2001):
Hyperglycemia inhibits endothelial nitric oxide synthase activity by
posttranslational modification at the Akt site. J Clin Invest 108, 1341-8.
Dumond, H., Presle, N., Terlain, B., Mainard, D., Loeuille, D., Netter, P., and Pottie, P.
(2003): Evidence for a key role of leptin in osteoarthritis. Arthritis Rheum 48,
3118-29.
Duque, G. (2008): Bone and fat connection in aging bone. Curr Opin Rheumatol 20, 429-
34.
Einstein, F. H., Atzmon, G., Yang, X. M., Ma, X. H., Rincon, M., Rudin, E., Muzumdar,
R., and Barzilai, N. (2005): Differential responses of visceral and subcutaneous
fat depots to nutrients. Diabetes 54, 672-8.
Enerback, S., Jacobsson, A., Simpson, E. M., Guerra, C., Yamashita, H., Harper, M. E.,
and Kozak, L. P. (1997): Mice lacking mitochondrial uncoupling protein are cold-
sensitive but not obese. Nature 387, 90-4.
Fadini, G. P., Miorin, M., Facco, M., Bonamico, S., Baesso, I., Grego, F., Menegolo, M.,
de Kreutzenberg, S. V., Tiengo, A., Agostini, C., and Avogaro, A. (2005):
Circulating endothelial progenitor cells are reduced in peripheral vascular
complications of type 2 diabetes mellitus. J Am Coll Cardiol 45, 1449-57
Fadini, G. P., Sartore, S., Schiavon, M., Albiero, M., Baesso, I., Cabrelle, A., Agostini, C.,
and Avogaro, A. (2006): Diabetes impairs progenitor cell mobilisation after
hindlimb ischaemia-reperfusion injury in rats. Diabetologia 49, 3075-84.
Felipe, F., Bonet, M. L., Ribot, J., and Palou, A. (2003): Up-regulation of muscle
uncoupling protein 3 gene expression in mice following high fat diet, dietary
vitamin A supplementation and acute retinoic acid-treatment. Int J Obes Relat
Metab Disord 27, 60-9.
Felipe, F., Bonet, M. L., Ribot, J., and Palou, A. (2004): Modulation of resistin expression
by retinoic acid and vitamin A status. Diabetes 53, 882-9.
Felipe, F., Mercader, J., Ribot, J., Palou, A., and Bonet, M. L. (2005): Effects of retinoic
acid administration and dietary vitamin A supplementation on leptin expression in
mice: lack of correlation with changes of adipose tissue mass and food intake.
Biochim Biophys Acta 1740, 258-65.
Fernández-San Juan, P.-M. (2009): Trans fatty acids (tFA): sources and intake levels,
biological effects and content in commercial Spanish food. Nutrición Hospitalaria
24, 515-520.
Feve, B. (2005): Adipogenesis: cellular and molecular aspects. Best Pract Res Clin
Endocrinol Metab 19, 483-99.
Figenschau, Y., Knutsen, G., Shahazeydi, S., Johansen, O., and Sveinbjornsson, B.
(2001): Human articular chondrocytes express functional leptin receptors.
Biochem Biophys Res Commun 287, 190-7.
Tesis Doctoral Núria Granados Borbolla
224
Fito, M., Cladellas, M., de la Torre, R., Marti, J., Munoz, D., Schroder, H., Alcantara, M.,
Pujadas-Bastardes, M., Marrugat, J., Lopez-Sabater, M. C., Bruguera, J., and
Covas, M. I. (2008): Anti-inflammatory effect of virgin olive oil in stable coronary
disease patients: a randomized, crossover, controlled trial. Eur J Clin Nutr 62,
570-4.
Fito, M., de la Torre, R., and Covas, M. I. (2007): Olive oil and oxidative stress. Mol Nutr
Food Res 51, 1215-24.
Florez, J. C. (2008): Newly identified loci highlight beta cell dysfunction as a key cause of
type 2 diabetes: where are the insulin resistance genes? Diabetologia 51, 1100-
10.
Folch, J., Lees, M., and Sloane Stanley, G. H. (1957): A simple method for the isolation
and purification of total lipides from animal tissues. J Biol Chem 226, 497-509.
Fowden, A. L., Giussani, D. A., and Forhead, A. J. (2005): Endocrine and metabolic
programming during intrauterine development. Early Hum Dev 81, 723-34.
Franckhauser, S., Elias, I., Rotter Sopasakis, V., Ferre, T., Nagaev, I., Andersson, C. X.,
Agudo, J., Ruberte, J., Bosch, F., and Smith, U. (2008): Overexpression of Il6
leads to hyperinsulinaemia, liver inflammation and reduced body weight in mice.
Diabetologia 51, 1306-16.
Friebe, D., Neef, M., Kratzsch, J., Erbs, S., Dittrich, K., Garten, A., Petzold-Quinque, S.,
Bluher, S., Reinehr, T., Stumvoll, M., Bluher, M., Kiess, W., and Korner, A.
(2011): Leucocytes are a major source of circulating nicotinamide
phosphoribosyltransferase (NAMPT)/pre-B cell colony (PBEF)/visfatin linking
obesity and inflammation in humans. Diabetologia 54, 1200-11.
Fukuhara, A., Matsuda, M., Nishizawa, M., Segawa, K., Tanaka, M., Kishimoto, K.,
Matsuki, Y., Murakami, M., Ichisaka, T., Murakami, H., Watanabe, E., Takagi, T.,
Akiyoshi, M., Ohtsubo, T., Kihara, S., Yamashita, S., Makishima, M., Funahashi,
T., Yamanaka, S., Hiramatsu, R., Matsuzawa, Y., and Shimomura, I. (2005):
Visfatin: a protein secreted by visceral fat that mimics the effects of insulin.
Science 307, 426-30.
Fukuhara, A., Matsuda, M., Nishizawa, M., Segawa, K., Tanaka, M., Kishimoto, K.,
Matsuki, Y., Murakami, M., Ichisaka, T., Murakami, H., Watanabe, E., Takagi, T.,
Akiyoshi, M., Ohtsubo, T., Kihara, S., Yamashita, S., Makishima, M., Funahashi,
T., Yamanaka, S., Hiramatsu, R., Matsuzawa, Y., and Shimomura, I. (2007):
Retraction. Science 318, 565.
Furmanczyk, P. S., and Quinn, L. S. (2003): Interleukin-15 increases myosin accretion in
human skeletal myogenic cultures. Cell Biol Int 27, 845-51.
Gambert, S., and Ricquier, D. (2007): Mitochondrial thermogenesis and obesity. Curr
Opin Clin Nutr Metab Care 10, 664-70.
Gao, Z., Hwang, D., Bataille, F., Lefevre, M., York, D., Quon, M. J., and Ye, J. (2002):
Serine phosphorylation of insulin receptor substrate 1 by inhibitor kappa B kinase
complex. J Biol Chem 277, 48115-21.
Bibliografía
225
Gao, Z., Zhang, X., Zuberi, A., Hwang, D., Quon, M. J., Lefevre, M., and Ye, J. (2004):
Inhibition of insulin sensitivity by free fatty acids requires activation of multiple
serine kinases in 3T3-L1 adipocytes. Mol Endocrinol 18, 2024-34.
Gao, Z., Zuberi, A., Quon, M. J., Dong, Z., and Ye, J. (2003): Aspirin inhibits serine
phosphorylation of insulin receptor substrate 1 in tumor necrosis factor-treated
cells through targeting multiple serine kinases. J Biol Chem 278, 24944-50
Gautron, L., and Elmquist, J. K. (2011): Sixteen years and counting: an update on leptin
in energy balance. J Clin Invest 121, 2087-93.
Garcia, A. P., Palou, M., Priego, T., Sanchez, J., Palou, A., and Pico, C. (2010):
Moderate caloric restriction during gestation results in lower arcuate nucleus
NPY- and alphaMSH-neurons and impairs hypothalamic response to fed/fasting
conditions in weaned rats. Diabetes Obes Metab 12, 403-13.
Garcia, A. P., Palou, M., Sanchez, J., Priego, T., Palou, A., and Pico, C. (2011):
Moderate caloric restriction during gestation in rats alters adipose tissue
sympathetic innervation and later adiposity in offspring. PLoS One 6, e17313.
Gesta, S., Tseng, Y. H., and Kahn, C. R. (2007): Developmental origin of fat: tracking
obesity to its source. Cell 131, 242-56.
Giorgino, F., Laviola, L., and Eriksson, J. W. (2005): Regional differences of insulin
action in adipose tissue: insights from in vivo and in vitro studies. Acta Physiol
Scand 183, 13-30.
Gluckman, P. D., and Hanson, M. A. (2004a): The developmental origins of the
metabolic syndrome. Trends Endocrinol Metab 15, 183-7.
Gluckman, P. D., and Hanson, M. A. (2004b): Living with the past: evolution,
development, and patterns of disease. Science 305, 1733-6.
Godfrey, K. M., and Barker, D. J. (2001): Fetal programming and adult health. Public
Health Nutr 4, 611-24.
Godfrey, K. M., Sheppard, A., Gluckman, P. D., Lillycrop, K. A., Burdge, G. C., McLean,
C., Rodford, J., Slater-Jefferies, J. L., Garratt, E., Crozier, S. R., Emerald, B. S.,
Gale, C. R., Inskip, H. M., Cooper, C., and Hanson, M. A. (2011): Epigenetic
gene promoter methylation at birth is associated with child's later adiposity.
Diabetes 60, 1528-34.
Goldring, M. B., and Goldring, S. R. (2007): Osteoarthritis. J Cell Physiol 213, 626-34.
Gorogawa, S., Fujitani, Y., Kaneto, H., Hazama, Y., Watada, H., Miyamoto, Y., Takeda,
K., Akira, S., Magnuson, M. A., Yamasaki, Y., Kajimoto, Y., and Hori, M. (2004):
Insulin secretory defects and impaired islet architecture in pancreatic beta-cell-
specific STAT3 knockout mice. Biochem Biophys Res Commun 319, 1159-70.
Graham, T. E., Yang, Q., Bluher, M., Hammarstedt, A., Ciaraldi, T. P., Henry, R. R.,
Wason, C. J., Oberbach, A., Jansson, P. A., Smith, U., and Kahn, B. B. (2006):
Retinol-binding protein 4 and insulin resistance in lean, obese, and diabetic
subjects. N Engl J Med 354, 2552-63.
Tesis Doctoral Núria Granados Borbolla
226
Green, M. H., Snyder, R. W., Akohoue, S. A., and Green, J. B. (2001): Increased rat
mammary tissue vitamin A associated with increased vitamin A intake during
lactation is maintained after lactation. J Nutr 131, 1544-7.
Gregor, M. F., and Hotamisligil, G. S. (2007): Thematic review series: Adipocyte Biology.
Adipocyte stress: the endoplasmic reticulum and metabolic disease. J Lipid Res
48, 1905-14.
Gregor, M. F., and Hotamisligil, G. S. (2011): Inflammatory mechanisms in obesity. Annu
Rev Immunol 29, 415-45.
Griffin, T. M., and Guilak, F. (2008): Why is obesity associated with osteoarthritis?
Insights from mouse models of obesity. Biorheology 45, 387-98.
Griffin, T. M., Huebner, J. L., Kraus, V. B., and Guilak, F. (2009): Extreme obesity due to
impaired leptin signaling in mice does not cause knee osteoarthritis. Arthritis
Rheum 60, 2935-44.
Gruen, M. L., Hao, M., Piston, D. W., and Hasty, A. H. (2007): Leptin requires canonical
migratory signaling pathways for induction of monocyte and macrophage
chemotaxis. Am J Physiol Cell Physiol 293, C1481-8.
Gunnell, D. J., Frankel, S. J., Nanchahal, K., Peters, T. J., and Davey Smith, G. (1998):
Childhood obesity and adult cardiovascular mortality: a 57-y follow-up study
based on the Boyd Orr cohort. Am J Clin Nutr 67, 1111-8.
Gupta, P., Park, S. W., Farooqui, M., and Wei, L. N. (2007): Orphan nuclear receptor
TR2, a mediator of preadipocyte proliferation, is differentially regulated by RA
through exchange of coactivator PCAF with corepressor RIP140 on a platform
molecule GRIP1. Nucleic Acids Res 35, 2269-82.
Haber, E. P., Ximenes, H. M., Procopio, J., Carvalho, C. R., Curi, R., and Carpinelli, A.
R. (2003): Pleiotropic effects of fatty acids on pancreatic beta-cells. J Cell Physiol
194, 1-12.
Hamrick, M. W., and Ferrari, S. L. (2008): Leptin and the sympathetic connection of fat to
bone. Osteoporos Int 19, 905-12.
Handschin, C., Choi, C. S., Chin, S., Kim, S., Kawamori, D., Kurpad, A. J., Neubauer, N.,
Hu, J., Mootha, V. K., Kim, Y. B., Kulkarni, R. N., Shulman, G. I., and
Spiegelman, B. M. (2007): Abnormal glucose homeostasis in skeletal muscle-
specific PGC-1alpha knockout mice reveals skeletal muscle-pancreatic beta cell
crosstalk. J Clin Invest 117, 3463-74.
Harrison, E. H., and Hussain, M. M. (2001): Mechanisms involved in the intestinal
digestion and absorption of dietary vitamin A. J Nutr 131, 1405-8.
Hector, J., Schwarzloh, B., Goehring, J., Strate, T. G., Hess, U. F., Deuretzbacher, G.,
Hansen-Algenstaedt, N., Beil, F. U., and Algenstaedt, P. (2007): TNF-alpha alters
visfatin and adiponectin levels in human fat. Horm Metab Res 39, 250-5.
Hessel, S., Eichinger, A., Isken, A., Amengual, J., Hunzelmann, S., Hoeller, U., Elste, V.,
Hunziker, W., Goralczyk, R., Oberhauser, V., von Lintig, J., and Wyss, A. (2007):
Bibliografía
227
CMO1 deficiency abolishes vitamin A production from beta-carotene and alters
lipid metabolism in mice. J Biol Chem 282, 33553-61.
Hill, M. J., Metcalfe, D., and McTernan, P. G. (2009): Obesity and diabetes: lipids,
'nowhere to run to'. Clin Sci (Lond) 116, 113-23.
Hollung, K., Rise, C. P., Drevon, C. A., and Reseland, J. E. (2004): Tissue-specific
regulation of leptin expression and secretion by all-trans retinoic acid. J Cell
Biochem 92, 307-15.
Hondares, E., Iglesias, R., Giralt, A., Gonzalez, F. J., Giralt, M., Mampel, T., and
Villarroya, F. (2011): Thermogenic activation induces FGF21 expression and
release in brown adipose tissue. J Biol Chem 286, 12983-90.
Hotamisligil, G. S. (1999): Mechanisms of TNF-alpha-induced insulin resistance. Exp
Clin Endocrinol Diabetes 107, 119-25.
Hotamisligil, G. S. (2006): Inflammation and metabolic disorders. Nature 444, 860-7.
Hotamisligil, G. S. (2010): Endoplasmic reticulum stress and the inflammatory basis of
metabolic disease. Cell 140, 900-17.
Hu, P. F., Bao, J. P., and Wu, L. D. (2010): The emerging role of adipokines in
osteoarthritis: a narrative review. Mol Biol Rep 38, 873-8.
Iannone, F., and Lapadula, G. (2010): Obesity and inflammation--targets for OA therapy.
Curr Drug Targets 11, 586-98.
Ibrahim, A., Natrajan, S., and Ghafoorunissa, R. (2005): Dietary trans-fatty acids alter
adipocyte plasma membrane fatty acid composition and insulin sensitivity in rats.
Metabolism 54, 240-6.
Idres, N., Benoit, G., Flexor, M. A., Lanotte, M., and Chabot, G. G. (2001): Granulocytic
differentiation of human NB4 promyelocytic leukemia cells induced by all-trans
retinoic acid metabolites. Cancer Res 61, 700-5.
Imai, S. (2009a): The NAD World: a new systemic regulatory network for metabolism and
aging--Sirt1, systemic NAD biosynthesis, and their importance. Cell Biochem
Biophys 53, 65-74.
Imai, S. (2009b): Nicotinamide phosphoribosyltransferase (Nampt): a link between NAD
biology, metabolism, and diseases. Curr Pharm Des 15, 20-8.
Inoue, H., Ogawa, W., Asakawa, A., Okamoto, Y., Nishizawa, A., Matsumoto, M.,
Teshigawara, K., Matsuki, Y., Watanabe, E., Hiramatsu, R., Notohara, K.,
Katayose, K., Okamura, H., Kahn, C. R., Noda, T., Takeda, K., Akira, S., Inui, A.,
and Kasuga, M. (2006): Role of hepatic STAT3 in brain-insulin action on hepatic
glucose production. Cell Metab 3, 267-75.
Itani, S. I., Ruderman, N. B., Schmieder, F., and Boden, G. (2002): Lipid-induced insulin
resistance in human muscle is associated with changes in diacylglycerol, protein
kinase C, and IkappaB-alpha. Diabetes 51, 2005-11.
Tesis Doctoral Núria Granados Borbolla
228
Janke, J., Engeli, S., Boschmann, M., Adams, F., Bohnke, J., Luft, F. C., Sharma, A. M.,
and Jordan, J. (2006): Retinol-binding protein 4 in human obesity. Diabetes 55,
2805-10.
Jaworski, K., Sarkadi-Nagy, E., Duncan, R. E., Ahmadian, M., and Sul, H. S. (2007):
Regulation of triglyceride metabolism. IV. Hormonal regulation of lipolysis in
adipose tissue. Am J Physiol Gastrointest Liver Physiol 293, G1-4.
Jeyakumar, S. M., Vajreswari, A., Sesikeran, B., and Giridharan, N. V. (2005): Vitamin A
supplementation induces adipose tissue loss through apoptosis in lean but not in
obese rats of the WNIN/Ob strain. J Mol Endocrinol 35, 391-8.
Jian, W. X., Luo, T. H., Gu, Y. Y., Zhang, H. L., Zheng, S., Dai, M., Han, J. F., Zhao, Y.,
Li, G., and Luo, M. (2006): The visfatin gene is associated with glucose and lipid
metabolism in a Chinese population. Diabet Med 23, 967-73.
Jiang, G., Dallas-Yang, Q., Liu, F., Moller, D. E., and Zhang, B. B. (2003): Salicylic acid
reverses phorbol 12-myristate-13-acetate (PMA)- and tumor necrosis factor alpha
(TNFalpha)-induced insulin receptor substrate 1 (IRS1) serine 307
phosphorylation and insulin resistance in human embryonic kidney 293 (HEK293)
cells. J Biol Chem 278, 180-6.
Kadowaki, T., Yamauchi, T., Kubota, N., Hara, K., Ueki, K., and Tobe, K. (2006):
Adiponectin and adiponectin receptors in insulin resistance, diabetes, and the
metabolic syndrome. J Clin Invest 116, 1784-92.
Kahn, C. R. (2008): Medicine. Can we nip obesity in its vascular bud? Science 322, 542-
3.
Kahn, S. E., Hull, R. L., and Utzschneider, K. M. (2006): Mechanisms linking obesity to
insulin resistance and type 2 diabetes. Nature 444, 840-6.
Kaneto, H., Xu, G., Fujii, N., Kim, S., Bonner-Weir, S., and Weir, G. C. (2002):
Involvement of c-Jun N-terminal kinase in oxidative stress-mediated suppression
of insulin gene expression. J Biol Chem 277, 30010-8.
Karin, M., and Ben-Neriah, Y. (2000): Phosphorylation meets ubiquitination: the control
of NF-[kappa]B activity. Annu Rev Immunol 18, 621-63.
Kaser, S., Kaser, A., Sandhofer, A., Ebenbichler, C. F., Tilg, H., and Patsch, J. R. (2003):
Resistin messenger-RNA expression is increased by proinflammatory cytokines
in vitro. Biochem Biophys Res Commun 309, 286-90.
Kavanagh, K., Jones, K. L., Sawyer, J., Kelley, K., Carr, J. J., Wagner, J. D., and Rudel,
L. L. (2007): Trans fat diet induces abdominal obesity and changes in insulin
sensitivity in monkeys. Obesity (Silver Spring) 15, 1675-84.
Kawada, T., Kamei, Y., and Sugimoto, E. (1996): The possibility of active form of
vitamins A and D as suppressors on adipocyte development via ligand-
dependent transcriptional regulators. Int J Obes Relat Metab Disord 20 Suppl 3,
S52-7.
Bibliografía
229
Kawaguchi, R., Yu, J., Honda, J., Hu, J., Whitelegge, J., Ping, P., Wiita, P., Bok, D., and
Sun, H. (2007): A membrane receptor for retinol binding protein mediates cellular
uptake of vitamin A. Science 315, 820-5.
Kershaw, E. E., and Flier, J. S. (2004): Adipose tissue as an endocrine organ. J Clin
Endocrinol Metab 89, 2548-56.
Khan, T., Muise, E. S., Iyengar, P., Wang, Z. V., Chandalia, M., Abate, N., Zhang, B. B.,
Bonaldo, P., Chua, S., and Scherer, P. E. (2009): Metabolic dysregulation and
adipose tissue fibrosis: role of collagen VI. Mol Cell Biol 29, 1575-91.
Kim, J. A., Montagnani, M., Koh, K. K., and Quon, M. J. (2006): Reciprocal relationships
between insulin resistance and endothelial dysfunction: molecular and
pathophysiological mechanisms. Circulation 113, 1888-904.
Kim, J. K., Kim, Y. J., Fillmore, J. J., Chen, Y., Moore, I., Lee, J., Yuan, M., Li, Z. W.,
Karin, M., Perret, P., Shoelson, S. E., and Shulman, G. I. (2001a): Prevention of
fat-induced insulin resistance by salicylate. J Clin Invest 108, 437-46.
Kim, K. H., Lee, K., Moon, Y. S., and Sul, H. S. (2001b): A cysteine-rich adipose tissue-
specific secretory factor inhibits adipocyte differentiation. J Biol Chem 276,
11252-6.
Kissane, J. M., and Robins, E. (1958): The fluorometric measurement of
deoxyribonucleic acid in animal tissues with special reference to the central
nervous system. J Biol Chem 233, 184-8.
Klaus, S., and Keijer, J. (2004): Gene expression profiling of adipose tissue: individual,
depot-dependent, and sex-dependent variabilities. Nutrition 20, 115-20.
Kloting, N., and Kloting, I. (2005): Visfatin: gene expression in isolated adipocytes and
sequence analysis in obese WOKW rats compared with lean control rats.
Biochem Biophys Res Commun 332, 1070-2.
Kondo, M., Shibata, R., Miura, R., Shimano, M., Kondo, K., Li, P., Ohashi, T., Kihara, S.,
Maeda, N., Walsh, K., Ouchi, N., and Murohara, T. (2009): Caloric restriction
stimulates revascularization in response to ischemia via adiponectin-mediated
activation of endothelial nitric-oxide synthase. J Biol Chem 284, 1718-24.
Kondo, T., Hayashi, M., Takeshita, K., Numaguchi, Y., Kobayashi, K., Iino, S., Inden, Y.,
and Murohara, T. (2004): Smoking cessation rapidly increases circulating
progenitor cells in peripheral blood in chronic smokers. Arterioscler Thromb Vasc
Biol 24, 1442-7.
Kovacs, P., Geyer, M., Berndt, J., Kloting, N., Graham, T. E., Bottcher, Y., Enigk, B.,
Tonjes, A., Schleinitz, D., Schon, M. R., Kahn, B. B., Bluher, M., and Stumvoll, M.
(2007): Effects of genetic variation in the human retinol binding protein-4 gene
(RBP4) on insulin resistance and fat depot-specific mRNA expression. Diabetes
56, 3095-100.
Kralisch, S., Klein, J., Lossner, U., Bluher, M., Paschke, R., Stumvoll, M., and
Fasshauer, M. (2005a): Hormonal regulation of the novel adipocytokine visfatin in
3T3-L1 adipocytes. J Endocrinol 185, R1-8.
Tesis Doctoral Núria Granados Borbolla
230
Kralisch, S., Klein, J., Lossner, U., Bluher, M., Paschke, R., Stumvoll, M., and
Fasshauer, M. (2005b): Interleukin-6 is a negative regulator of visfatin gene
expression in 3T3-L1 adipocytes. Am J Physiol Endocrinol Metab 289, E586-90.
Kumar, M. V., Sunvold, G. D., and Scarpace, P. J. (1999): Dietary vitamin A
supplementation in rats: suppression of leptin and induction of UCP1 mRNA. J
Lipid Res 40, 824-9.
Kuri-Harcuch, W. (1982): Differentiation of 3T3-F442A cells into adipocytes is inhibited
by retinoic acid. Differentiation 23, 164-9.
Lago, R., Gomez, R., Lago, F., Gomez-Reino, J., and Gualillo, O. (2008): Leptin beyond
body weight regulation--current concepts concerning its role in immune function
and inflammation. Cell Immunol 252, 139-45.
Landskroner-Eiger, S., Qian, B., Muise, E. S., Nawrocki, A. R., Berger, J. P., Fine, E. J.,
Koba, W., Deng, Y., Pollard, J. W., and Scherer, P. E. (2009): Proangiogenic
contribution of adiponectin toward mammary tumor growth in vivo. Clin Cancer
Res 15, 3265-76.
Lecka-Czernik, B. (2010): Bone loss in diabetes: use of antidiabetic thiazolidinediones
and secondary osteoporosis. Curr Osteoporos Rep 8, 178-84.
Lee, D. C., Lee, J. W., and Im, J. A. (2007): Association of serum retinol binding protein
4 and insulin resistance in apparently healthy adolescents. Metabolism 56, 327-
31.
Lee, J. Y., Ye, J., Gao, Z., Youn, H. S., Lee, W. H., Zhao, L., Sizemore, N., and Hwang,
D. H. (2003a): Reciprocal modulation of Toll-like receptor-4 signaling pathways
involving MyD88 and phosphatidylinositol 3-kinase/AKT by saturated and
polyunsaturated fatty acids. J Biol Chem 278, 37041-51.
Lee, T. S., Lin, C. Y., Tsai, J. Y., Wu, Y. L., Su, K. H., Lu, K. Y., Hsiao, S. H., Pan, C. C.,
Kou, Y. R., Hsu, Y. P., and Ho, L. T. (2009): Resistin increases lipid accumulation
by affecting class A scavenger receptor, CD36 and ATP-binding cassette
transporter-A1 in macrophages. Life Sci 84, 97-104.
Lee, Y. H., Giraud, J., Davis, R. J., and White, M. F. (2003b): c-Jun N-terminal kinase
(JNK) mediates feedback inhibition of the insulin signaling cascade. J Biol Chem
278, 2896-902.
Lehrke, M., Reilly, M. P., Millington, S. C., Iqbal, N., Rader, D. J., and Lazar, M. A.
(2004): An inflammatory cascade leading to hyperresistinemia in humans. PLoS
Med 1, e45.
Lemaitre, R. N., King, I. B., Mozaffarian, D., Sotoodehnia, N., Rea, T. D., Kuller, L. H.,
Tracy, R. P., and Siscovick, D. S. (2006): Plasma phospholipid trans fatty acids,
fatal ischemic heart disease, and sudden cardiac death in older adults: the
cardiovascular health study. Circulation 114, 209-15.
Levy, B. I. (2005): Beneficial effects of circulating progenitor endothelial cells activated
by angiotensin receptor antagonists. Hypertension 45, 491-2.
Bibliografía
231
Lewis, J. G., Shand, B. I., Frampton, C. M., and Elder, P. A. (2007): An ELISA for plasma
retinol-binding protein using monoclonal and polyclonal antibodies: plasma
variation in normal and insulin resistant subjects. Clin Biochem 40, 828-34.
Liu, Z. J., Zhuge, Y., and Velazquez, O. C. (2009): Trafficking and differentiation of
mesenchymal stem cells. J Cell Biochem 106, 984-91.
Lois, K., and Kumar, S. (2009): Obesity and diabetes. Endocrinol Nutr 56 Suppl 4, 38-
42.
Lopez-Miranda, J., Perez-Jimenez, F., Ros, E., De Caterina, R., Badimon, L., Covas, M.
I., Escrich, E., Ordovas, J. M., Soriguer, F., Abia, R., de la Lastra, C. A., Battino,
M., Corella, D., Chamorro-Quiros, J., Delgado-Lista, J., Giugliano, D., Esposito,
K., Estruch, R., Fernandez-Real, J. M., Gaforio, J. J., La Vecchia, C., Lairon, D.,
Lopez-Segura, F., Mata, P., Menendez, J. A., Muriana, F. J., Osada, J.,
Panagiotakos, D. B., Paniagua, J. A., Perez-Martinez, P., Perona, J., Peinado, M.
A., Pineda-Priego, M., Poulsen, H. E., Quiles, J. L., Ramirez-Tortosa, M. C.,
Ruano, J., Serra-Majem, L., Sola, R., Solanas, M., Solfrizzi, V., de la Torre-
Fornell, R., Trichopoulou, A., Uceda, M., Villalba-Montoro, J. M., Villar-Ortiz, J.
R., Visioli, F., and Yiannakouris, N. (2010): Olive oil and health: summary of the II
international conference on olive oil and health consensus report, Jaen and
Cordoba (Spain) 2008. Nutr Metab Cardiovasc Dis 20, 284-94.
Lovejoy, J. C., Smith, S. R., Champagne, C. M., Most, M. M., Lefevre, M., DeLany, J. P.,
Denkins, Y. M., Rood, J. C., Veldhuis, J., and Bray, G. A. (2002): Effects of diets
enriched in saturated (palmitic), monounsaturated (oleic), or trans (elaidic) fatty
acids on insulin sensitivity and substrate oxidation in healthy adults. Diabetes
Care 25, 1283-8.
Lowell, B. B., V, S. S., Hamann, A., Lawitts, J. A., Himms-Hagen, J., Boyer, B. B., Kozak,
L. P., and Flier, J. S. (1993): Development of obesity in transgenic mice after
genetic ablation of brown adipose tissue. Nature 366, 740-2.
Luk, T., Malam, Z., and Marshall, J. C. (2008): Pre-B cell colony-enhancing factor
(PBEF)/visfatin: a novel mediator of innate immunity. J Leukoc Biol 83, 804-16.
Mangelsdorf, D. J., and Evans, R. M. (1995): The RXR heterodimers and orphan
receptors. Cell 83, 841-50.
Martorell, R., Stein, A. D., and Schroeder, D. G. (2001): Early nutrition and later
adiposity. J Nutr 131, 874S-880S.
McCance, R. A., and Widdowson, E. M. (1974): The determinants of growth and form.
Proc R Soc Lond B Biol Sci 185, 1-17.
McTernan, P. G., Kusminski, C. M., and Kumar, S. (2006): Resistin. Curr Opin Lipidol 17,
170-5.
Medina-Gomez, G., Gray, S. L., Yetukuri, L., Shimomura, K., Virtue, S., Campbell, M.,
Curtis, R. K., Jimenez-Linan, M., Blount, M., Yeo, G. S., Lopez, M., Seppanen-
Laakso, T., Ashcroft, F. M., Oresic, M., and Vidal-Puig, A. (2007): PPAR gamma
2 prevents lipotoxicity by controlling adipose tissue expandability and peripheral
lipid metabolism. PLoS Genet 3, e64.
Tesis Doctoral Núria Granados Borbolla
232
Medzhitov, R. (2008): Origin and physiological roles of inflammation. Nature 454, 428-
35.
Menshikova, E. V., Ritov, V. B., Fairfull, L., Ferrell, R. E., Kelley, D. E., and Goodpaster,
B. H. (2006): Effects of exercise on mitochondrial content and function in aging
human skeletal muscle. J Gerontol A Biol Sci Med Sci 61, 534-40.
Mensink, R. P. (2005): Metabolic and health effects of isomeric fatty acids. Curr Opin
Lipidol 16, 27-30.
Mercader, J., Granados, N., Bonet, M. L., and Palou, A. (2008): All-trans retinoic acid
decreases murine adipose retinol binding protein 4 production. Cell Physiol
Biochem 22, 363-72.
Mercader, J., Madsen, L., Felipe, F., Palou, A., Kristiansen, K., and Bonet, M. L. (2007):
All-trans retinoic acid increases oxidative metabolism in mature adipocytes. Cell
Physiol Biochem 20, 1061-72.
Mercader, J., Ribot, J., Murano, I., Felipe, F., Cinti, S., Bonet, M. L., and Palou, A.
(2006): Remodeling of white adipose tissue after retinoic acid administration in
mice. Endocrinology 147, 5325-32.
Mercurio, F., Zhu, H., Murray, B. W., Shevchenko, A., Bennett, B. L., Li, J., Young, D. B.,
Barbosa, M., Mann, M., Manning, A., and Rao, A. (1997): IKK-1 and IKK-2:
cytokine-activated IkappaB kinases essential for NF-kappaB activation. Science
278, 860-6.
Micha, R., and Mozaffarian, D. (2008): Trans fatty acids: effects on cardiometabolic
health and implications for policy. Prostaglandins Leukot Essent Fatty Acids 79,
147-52.
Micha, R., and Mozaffarian, D. (2009): Trans fatty acids: effects on metabolic syndrome,
heart disease and diabetes. Nat Rev Endocrinol 5, 335-44.
Moh, A., Zhang, W., Yu, S., Wang, J., Xu, X., Li, J., and Fu, X. Y. (2008): STAT3
sensitizes insulin signaling by negatively regulating glycogen synthase kinase-3
beta. Diabetes 57, 1227-35.
Mojska, H., Socha, P., Socha, J., Soplinska, E., Jaroszewska-Balicka, W., and Szponar,
L. (2003): Trans fatty acids in human milk in Poland and their association with
breastfeeding mothers' diets. Acta Paediatr 92, 1381-7.
Moro, C., Bajpeyi, S., and Smith, S. R. (2008): Determinants of intramyocellular
triglyceride turnover: implications for insulin sensitivity. Am J Physiol Endocrinol
Metab 294, E203-13.
Morino, K., Petersen, K. F., Dufour, S., Befroy, D., Frattini, J., Shatzkes, N., Neschen, S.,
White, M. F., Bilz, S., Sono, S., Pypaert, M., and Shulman, G. I. (2005): Reduced
mitochondrial density and increased IRS-1 serine phosphorylation in muscle of
insulin-resistant offspring of type 2 diabetic parents. J Clin Invest 115, 3587-93.
Moschen, A. R., Kaser, A., Enrich, B., Mosheimer, B., Theurl, M., Niederegger, H., and
Tilg, H. (2007): Visfatin, an adipocytokine with proinflammatory and
immunomodulating properties. J Immunol 178, 1748-58.
Bibliografía
233
Mozaffarian, D. (2006): Trans fatty acids - effects on systemic inflammation and
endothelial function. Atheroscler Suppl 7, 29-32.
Mozaffarian, D., Abdollahi, M., Campos, H., Houshiarrad, A., and Willett, W. C. (2007):
Consumption of trans fats and estimated effects on coronary heart disease in
Iran. Eur J Clin Nutr 61, 1004-10.
Mozaffarian, D., Aro, A., and Willett, W. C. (2009): Health effects of trans-fatty acids:
experimental and observational evidence. Eur J Clin Nutr 63 Suppl 2, S5-21.
Muller-Ehmsen, J., Braun, D., Schneider, T., Pfister, R., Worm, N., Wielckens, K.,
Scheid, C., Frommolt, P., and Flesch, M. (2008): Decreased number of
circulating progenitor cells in obesity: beneficial effects of weight reduction. Eur
Heart J 29, 1560-8.
Munkhtulga, L., Nakayama, K., Utsumi, N., Yanagisawa, Y., Gotoh, T., Omi, T., Kumada,
M., Erdenebulgan, B., Zolzaya, K., Lkhagvasuren, T., and Iwamoto, S. (2007):
Identification of a regulatory SNP in the retinol binding protein 4 gene associated
with type 2 diabetes in Mongolia. Hum Genet 120, 879-88.
Muoio, D. M., and Newgard, C. B. (2008): Mechanisms of disease: molecular and
metabolic mechanisms of insulin resistance and beta-cell failure in type 2
diabetes. Nat Rev Mol Cell Biol 9, 193-205.
Murray, T., and Russell, T. R. (1980): Inhibition of adipose conversion in 3T3-L2 cells by
retinoic acid. J Supramol Struct 14, 255-66.
Nakatani, Y., Kaneto, H., Kawamori, D., Hatazaki, M., Miyatsuka, T., Matsuoka, T. A.,
Kajimoto, Y., Matsuhisa, M., Yamasaki, Y., and Hori, M. (2004): Modulation of the
JNK pathway in liver affects insulin resistance status. J Biol Chem 279, 45803-9.
Natarajan, S., and Ibrahim, A. (2005): Dietary trans fatty acids alter diaphragm
phospholipid fatty acid composition, triacylglycerol content and glucose transport
in rats. Br J Nutr 93, 829-33.
Naveiras, O., Nardi, V., Wenzel, P. L., Hauschka, P. V., Fahey, F., and Daley, G. Q.
(2009): Bone-marrow adipocytes as negative regulators of the haematopoietic
microenvironment. Nature 460, 259-63.
Nedergaard, J., Bengtsson, T., and Cannon, B. (2007): Unexpected evidence for active
brown adipose tissue in adult humans. Am J Physiol Endocrinol Metab 293,
E444-52.
Nielsen, A. R., Hojman, P., Erikstrup, C., Fischer, C. P., Plomgaard, P., Mounier, R.,
Mortensen, O. H., Broholm, C., Taudorf, S., Krogh-Madsen, R., Lindegaard, B.,
Petersen, A. M., Gehl, J., and Pedersen, B. K. (2008): Association between
interleukin-15 and obesity: interleukin-15 as a potential regulator of fat mass. J
Clin Endocrinol Metab 93, 4486-93.
Nielsen, A. R., and Pedersen, B. K. (2007): The biological roles of exercise-induced
cytokines: IL-6, IL-8, and IL-15. Appl Physiol Nutr Metab 32, 833-9.
Niu, G., Wright, K. L., Huang, M., Song, L., Haura, E., Turkson, J., Zhang, S., Wang, T.,
Sinibaldi, D., Coppola, D., Heller, R., Ellis, L. M., Karras, J., Bromberg, J.,
Tesis Doctoral Núria Granados Borbolla
234
Pardoll, D., Jove, R., and Yu, H. (2002): Constitutive Stat3 activity up-regulates
VEGF expression and tumor angiogenesis. Oncogene 21, 2000-8.
Odegaard, A. O., and Pereira, M. A. (2006): Trans fatty acids, insulin resistance, and
type 2 diabetes. Nutr Rev 64, 364-72.
Ohashi, K., Parker, J. L., Ouchi, N., Higuchi, A., Vita, J. A., Gokce, N., Pedersen, A. A.,
Kalthoff, C., Tullin, S., Sams, A., Summer, R., and Walsh, K. (2009): Adiponectin
promotes macrophage polarization toward an anti-inflammatory phenotype. J Biol
Chem 285, 6153-60.
Oliver, E., McGillicuddy, F., Phillips, C., Toomey, S., and Roche, H. M. (2010): The role
of inflammation and macrophage accumulation in the development of obesity-
induced type 2 diabetes mellitus and the possible therapeutic effects of long-
chain n-3 PUFA. Proc Nutr Soc 69, 232-43.
Ost, A., Danielsson, A., Liden, M., Eriksson, U., Nystrom, F. H., and Stralfors, P. (2007):
Retinol-binding protein-4 attenuates insulin-induced phosphorylation of IRS1 and
ERK1/2 in primary human adipocytes. FASEB J 21, 3696-704.
Ouchi, N., Kihara, S., Arita, Y., Okamoto, Y., Maeda, K., Kuriyama, H., Hotta, K.,
Nishida, M., Takahashi, M., Muraguchi, M., Ohmoto, Y., Nakamura, T.,
Yamashita, S., Funahashi, T., and Matsuzawa, Y. (2000): Adiponectin, an
adipocyte-derived plasma protein, inhibits endothelial NF-kappaB signaling
through a cAMP-dependent pathway. Circulation 102, 1296-301.
Ozcan, U., Cao, Q., Yilmaz, E., Lee, A. H., Iwakoshi, N. N., Ozdelen, E., Tuncman, G.,
Gorgun, C., Glimcher, L. H., and Hotamisligil, G. S. (2004): Endoplasmic
reticulum stress links obesity, insulin action, and type 2 diabetes. Science 306,
457-61.
Pagano, C., Pilon, C., Olivieri, M., Mason, P., Fabris, R., Serra, R., Milan, G., Rossato,
M., Federspil, G., and Vettor, R. (2006): Reduced plasma visfatin/pre-B cell
colony-enhancing factor in obesity is not related to insulin resistance in humans.
J Clin Endocrinol Metab 91, 3165-70.
Paik, J., Vogel, S., Quadro, L., Piantedosi, R., Gottesman, M., Lai, K., Hamberger, L.,
Vieira Mde, M., and Blaner, W. S. (2004): Vitamin A: overlapping delivery
pathways to tissues from the circulation. J Nutr 134, 276S-280S.
Palou, A., Bonet, M. L., Pico, C., and Rodriguez, A. M. (2004): [Nutrigenomics and
obesity]. Rev Med Univ Navarra 48, 36-48.
Palou, A., and Pico, C. (2009): Leptin intake during lactation prevents obesity and affects
food intake and food preferences in later life. Appetite 52, 249-52.
Palou, M., Pico, C., McKay, J. A., Sanchez, J., Priego, T., Mathers, J. C., and Palou, A.
(2011): Protective effects of leptin during the suckling period against later obesity
may be associated with changes in promoter methylation of the hypothalamic
pro-opiomelanocortin gene. Br J Nutr 106, 769-78.
Pang, S. S., and Le, Y. Y. (2006): Role of resistin in inflammation and inflammation-
related diseases. Cell Mol Immunol 3, 29-34.
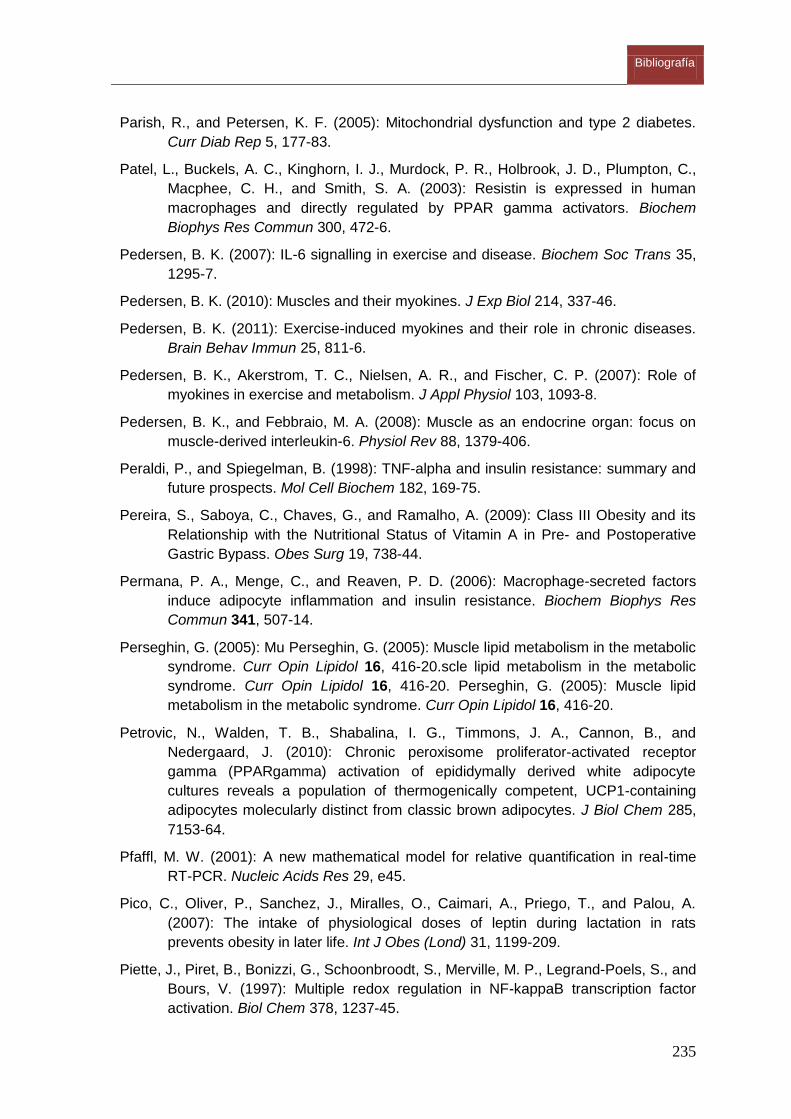
Bibliografía
235
Parish, R., and Petersen, K. F. (2005): Mitochondrial dysfunction and type 2 diabetes.
Curr Diab Rep 5, 177-83.
Patel, L., Buckels, A. C., Kinghorn, I. J., Murdock, P. R., Holbrook, J. D., Plumpton, C.,
Macphee, C. H., and Smith, S. A. (2003): Resistin is expressed in human
macrophages and directly regulated by PPAR gamma activators. Biochem
Biophys Res Commun 300, 472-6.
Pedersen, B. K. (2007): IL-6 signalling in exercise and disease. Biochem Soc Trans 35,
1295-7.
Pedersen, B. K. (2010): Muscles and their myokines. J Exp Biol 214, 337-46.
Pedersen, B. K. (2011): Exercise-induced myokines and their role in chronic diseases.
Brain Behav Immun 25, 811-6.
Pedersen, B. K., Akerstrom, T. C., Nielsen, A. R., and Fischer, C. P. (2007): Role of
myokines in exercise and metabolism. J Appl Physiol 103, 1093-8.
Pedersen, B. K., and Febbraio, M. A. (2008): Muscle as an endocrine organ: focus on
muscle-derived interleukin-6. Physiol Rev 88, 1379-406.
Peraldi, P., and Spiegelman, B. (1998): TNF-alpha and insulin resistance: summary and
future prospects. Mol Cell Biochem 182, 169-75.
Pereira, S., Saboya, C., Chaves, G., and Ramalho, A. (2009): Class III Obesity and its
Relationship with the Nutritional Status of Vitamin A in Pre- and Postoperative
Gastric Bypass. Obes Surg 19, 738-44.
Permana, P. A., Menge, C., and Reaven, P. D. (2006): Macrophage-secreted factors
induce adipocyte inflammation and insulin resistance. Biochem Biophys Res
Commun 341, 507-14.
Perseghin, G. (2005): Mu Perseghin, G. (2005): Muscle lipid metabolism in the metabolic
syndrome. Curr Opin Lipidol 16, 416-20.scle lipid metabolism in the metabolic
syndrome. Curr Opin Lipidol 16, 416-20. Perseghin, G. (2005): Muscle lipid
metabolism in the metabolic syndrome. Curr Opin Lipidol 16, 416-20.
Petrovic, N., Walden, T. B., Shabalina, I. G., Timmons, J. A., Cannon, B., and
Nedergaard, J. (2010): Chronic peroxisome proliferator-activated receptor
gamma (PPARgamma) activation of epididymally derived white adipocyte
cultures reveals a population of thermogenically competent, UCP1-containing
adipocytes molecularly distinct from classic brown adipocytes. J Biol Chem 285,
7153-64.
Pfaffl, M. W. (2001): A new mathematical model for relative quantification in real-time
RT-PCR. Nucleic Acids Res 29, e45.
Pico, C., Oliver, P., Sanchez, J., Miralles, O., Caimari, A., Priego, T., and Palou, A.
(2007): The intake of physiological doses of leptin during lactation in rats
prevents obesity in later life. Int J Obes (Lond) 31, 1199-209.
Piette, J., Piret, B., Bonizzi, G., Schoonbroodt, S., Merville, M. P., Legrand-Poels, S., and
Bours, V. (1997): Multiple redox regulation in NF-kappaB transcription factor
activation. Biol Chem 378, 1237-45.
Tesis Doctoral Núria Granados Borbolla
236
Pilz, S., and Marz, W. (2008): Free fatty acids as a cardiovascular risk factor. Clin Chem
Lab Med 46, 429-34.
Pisani, L. P., Oller do Nascimento, C. M., Bueno, A. A., Biz, C., Albuquerque, K. T.,
Ribeiro, E. B., and Oyama, L. M. (2008): Hydrogenated fat diet intake during
pregnancy and lactation modifies the PAI-1 gene expression in white adipose
tissue of offspring in adult life. Lipids Health Dis 7, 13.
Pottie, P., Presle, N., Terlain, B., Netter, P., Mainard, D., and Berenbaum, F. (2006):
Obesity and osteoarthritis: more complex than predicted! Ann Rheum Dis 65,
1403-5.
Presle, N., Pottie, P., Dumond, H., Guillaume, C., Lapicque, F., Pallu, S., Mainard, D.,
Netter, P., and Terlain, B. (2006): Differential distribution of adipokines between
serum and synovial fluid in patients with osteoarthritis. Contribution of joint
tissues to their articular production. Osteoarthritis Cartilage 14, 690-5.
Priego, T., Sanchez, J., Palou, A., and Pico, C. (2010): Leptin intake during the suckling
period improves the metabolic response of adipose tissue to a high-fat diet. Int J
Obes (Lond) 34, 809-19.
Promintzer, M., Krebs, M., Todoric, J., Luger, A., Bischof, M. G., Nowotny, P., Wagner,
O., Esterbauer, H., and Anderwald, C. (2007): Insulin resistance is unrelated to
circulating retinol binding protein and protein C inhibitor. J Clin Endocrinol Metab
92, 4306-12.
Puigserver, P., Vazquez, F., Bonet, M. L., Pico, C., and Palou, A. (1996): In vitro and in
vivo induction of brown adipocyte uncoupling protein (thermogenin) by retinoic
acid. Biochem J 317 ( Pt 3), 827-33.
Quinn, L. S., Anderson, B. G., Strait-Bodey, L., Stroud, A. M., and Argiles, J. M. (2009):
Oversecretion of interleukin-15 from skeletal muscle reduces adiposity. Am J
Physiol Endocrinol Metab 296, E191-202.
Quinn, L. S., Haugk, K. L., and Damon, S. E. (1997): Interleukin-15 stimulates C2
skeletal myoblast differentiation. Biochem Biophys Res Commun 239, 6-10.
Quinn, L. S., Strait-Bodey, L., Anderson, B. G., Argiles, J. M., and Havel, P. J. (2005):
Interleukin-15 stimulates adiponectin secretion by 3T3-L1 adipocytes: evidence
for a skeletal muscle-to-fat signaling pathway. Cell Biol Int 29, 449-57.
Rabbani, N., Godfrey, L., Xue, M., Shaheen, F., Geoffrion, M., Milne, R., and Thornalley,
P. J. (2011): Glycation of LDL by Methylglyoxal Increases Arterial Atherogenicity:
A Possible Contributor to Increased Risk of Cardiovascular Disease in Diabetes.
Diabetes.
Rajala, M. W., and Scherer, P. E. (2003): Minireview: The adipocyte--at the crossroads
of energy homeostasis, inflammation, and atherosclerosis. Endocrinology 144,
3765-73.
Ramirez-Zacarias, J. L., Castro-Munozledo, F., and Kuri-Harcuch, W. (1992):
Quantitation of adipose conversion and triglycerides by staining intracytoplasmic
lipids with Oil red O. Histochemistry 97, 493-7.
Bibliografía
237
Redonnet, A., Ferrand, C., Bairras, C., Higueret, P., Noel-Suberville, C., Cassand, P.,
and Atgie, C. (2008): Synergic effect of vitamin A and high-fat diet in adipose
tissue development and nuclear receptor expression in young rats. Br J Nutr 100,
722-30.
Revollo, J. R., Grimm, A. A., and Imai, S. (2007a): The regulation of nicotinamide
adenine dinucleotide biosynthesis by Nampt/PBEF/visfatin in mammals. Curr
Opin Gastroenterol 23, 164-70.
Revollo, J. R., Korner, A., Mills, K. F., Satoh, A., Wang, T., Garten, A., Dasgupta, B.,
Sasaki, Y., Wolberger, C., Townsend, R. R., Milbrandt, J., Kiess, W., and Imai, S.
(2007b): Nampt/PBEF/Visfatin regulates insulin secretion in beta cells as a
systemic NAD biosynthetic enzyme. Cell Metab 6, 363-75.
Ribel-Madsen, R., Friedrichsen, M., Vaag, A., and Poulsen, P. (2009): Retinol-binding
protein 4 in twins: regulatory mechanisms and impact of circulating and tissue
expression levels on insulin secretion and action. Diabetes 58, 54-60.
Ribot, J., Felipe, F., Bonet, M. L., and Palou, A. (2001): Changes of adiposity in
response to vitamin A status correlate with changes of PPAR gamma 2
expression. Obes Res 9, 500-9.
Rice, A. L., Stoltzfus, R. J., de Francisco, A., Chakraborty, J., Kjolhede, C. L., and
Wahed, M. A. (1999): Maternal vitamin A or beta-carotene supplementation in
lactating bangladeshi women benefits mothers and infants but does not prevent
subclinical deficiency. J Nutr 129, 356-65.
Riserus, U., Willett, W. C., and Hu, F. B. (2009): Dietary fats and prevention of type 2
diabetes. Prog Lipid Res 48, 44-51.
Roden, M. (2004): How free fatty acids inhibit glucose utilization in human skeletal
muscle. News Physiol Sci 19, 92-6.
Rodriguez-Artalejo, F., Graciani, A., Guallar-Castillon, P., Leon-Munoz, L. M., Zuluaga,
M. C., Lopez-Garcia, E., Gutierrez-Fisac, J. L., Taboada, J. M., Aguilera, M. T.,
Regidor, E., Villar-Alvarez, F., and Banegas, J. R. (2011): Rationale and Methods
of the Study on Nutrition and Cardiovascular Risk in Spain (ENRICA). Rev Esp
Cardiol.
Rongvaux, A., Shea, R. J., Mulks, M. H., Gigot, D., Urbain, J., Leo, O., and Andris, F.
(2002): Pre-B-cell colony-enhancing factor, whose expression is up-regulated in
activated lymphocytes, is a nicotinamide phosphoribosyltransferase, a cytosolic
enzyme involved in NAD biosynthesis. Eur J Immunol 32, 3225-34.
Rosen, E. D. (2005): The transcriptional basis of adipocyte development. Prostaglandins
Leukot Essent Fatty Acids 73, 31-4.
Rosen, E. D., Walkey, C. J., Puigserver, P., and Spiegelman, B. M. (2000):
Transcriptional regulation of adipogenesis. Genes Dev 14, 1293-307.
Rosenberg, I. H. (2008): Metabolic programming of offspring by vitamin B12/folate
imbalance during pregnancy. Diabetologia 51, 6-7.
Tesis Doctoral Núria Granados Borbolla
238
Ross, A. C., Davila, M. E., and Cleary, M. P. (1985): Fatty acids and retinyl esters of rat
milk: effects of diet and duration of lactation. J Nutr 115, 1488-97.
Ross, R. (1999): Atherosclerosis--an inflammatory disease. N Engl J Med 340, 115-26.
Rothwell, N. J., and Stock, M. J. (1979): A role for brown adipose tissue in diet-induced
thermogenesis. Nature 281, 31-5.
Rui, L., Aguirre, V., Kim, J. K., Shulman, G. I., Lee, A., Corbould, A., Dunaif, A., and
White, M. F. (2001): Insulin/IGF-1 and TNF-alpha stimulate phosphorylation of
IRS-1 at inhibitory Ser307 via distinct pathways. J Clin Invest 107, 181-9.
Sabio, G., Das, M., Mora, A., Zhang, Z., Jun, J. Y., Ko, H. J., Barrett, T., Kim, J. K., and
Davis, R. J. (2008): A stress signaling pathway in adipose tissue regulates
hepatic insulin resistance. Science 322, 1539-43.
Sadagurski, M., Norquay, L., Farhang, J., D'Aquino, K., Copps, K., and White, M. F.
(2010): Human IL6 enhances leptin action in mice. Diabetologia 53, 525-35.
Safonova, I., Darimont, C., Amri, E. Z., Grimaldi, P., Ailhaud, G., Reichert, U., and
Shroot, B. (1994a): Retinoids are positive effectors of adipose cell differentiation.
Mol Cell Endocrinol 104, 201-11.
Safonova, I., Reichert, U., Shroot, B., Ailhaud, G., and Grimaldi, P. (1994b): Fatty acids
and retinoids act synergistically on adipose cell differentiation. Biochem Biophys
Res Commun 204, 498-504.
Salmeron, J., Hu, F. B., Manson, J. E., Stampfer, M. J., Colditz, G. A., Rimm, E. B., and
Willett, W. C. (2001): Dietary fat intake and risk of type 2 diabetes in women. Am
J Clin Nutr 73, 1019-26.
Samal, B., Sun, Y., Stearns, G., Xie, C., Suggs, S., and McNiece, I. (1994): Cloning and
characterization of the cDNA encoding a novel human pre-B-cell colony-
enhancing factor. Mol Cell Biol 14, 1431-7.
Samuels, J., Krasnokutsky, S., and Abramson, S. B. (2008): Osteoarthritis: a tale of
three tissues. Bull NYU Hosp Jt Dis 66, 244-50.
Sanchez, J., Priego, T., Palou, M., Tobaruela, A., Palou, A., and Pico, C. (2008): Oral
supplementation with physiological doses of leptin during lactation in rats
improves insulin sensitivity and affects food preferences later in life.
Endocrinology 149, 733-40.
Sandeep, S., Velmurugan, K., Deepa, R., and Mohan, V. (2007): Serum visfatin in
relation to visceral fat, obesity, and type 2 diabetes mellitus in Asian Indians.
Metabolism 56, 565-70.
Savage, D. B., Sewter, C. P., Klenk, E. S., Segal, D. G., Vidal-Puig, A., Considine, R. V.,
and O'Rahilly, S. (2001): Resistin / Fizz3 expression in relation to obesity and
peroxisome proliferator-activated receptor-gamma action in humans. Diabetes
50, 2199-202.
Schaeffler, A., Gross, P., Buettner, R., Bollheimer, C., Buechler, C., Neumeier, M., Kopp,
A., Schoelmerich, J., and Falk, W. (2009): Fatty acid-induced induction of Toll-like
Bibliografía
239
receptor-4/nuclear factor-kappaB pathway in adipocytes links nutritional signalling
with innate immunity. Immunology 126, 233-45.
Schenk, S., Saberi, M., and Olefsky, J. M. (2008): Insulin sensitivity: modulation by
nutrients and inflammation. J Clin Invest 118, 2992-3002.
Schroeder, F., Petrescu, A. D., Huang, H., Atshaves, B. P., McIntosh, A. L., Martin, G.
G., Hostetler, H. A., Vespa, A., Landrock, D., Landrock, K. K., Payne, H. R., and
Kier, A. B. (2008): Role of fatty acid binding proteins and long chain fatty acids in
modulating nuclear receptors and gene transcription. Lipids 43, 1-17.
Schupp, M., Lefterova, M. I., Janke, J., Leitner, K., Cristancho, A. G., Mullican, S. E.,
Qatanani, M., Szwergold, N., Steger, D. J., Curtin, J. C., Kim, R. J., Suh, M. J.,
Albert, M. R., Engeli, S., Gudas, L. J., and Lazar, M. A. (2009): Retinol saturase
promotes adipogenesis and is downregulated in obesity. Proc Natl Acad Sci U S
A 106, 1105-10.
Schwarz, E. J., Reginato, M. J., Shao, D., Krakow, S. L., and Lazar, M. A. (1997):
Retinoic acid blocks adipogenesis by inhibiting C/EBPbeta-mediated
transcription. Mol Cell Biol 17, 1552-61.
Sebastian, D., Guitart, M., Garcia-Martinez, C., Mauvezin, C., Orellana-Gavalda, J. M.,
Serra, D., Gomez-Foix, A. M., Hegardt, F. G., and Asins, G. (2009): Novel role of
FATP1 in mitochondrial fatty acid oxidation in skeletal muscle cells. J Lipid Res.
Sell, H., Eckel, J., and Dietze-Schroeder, D. (2006): Pathways leading to muscle insulin
resistance--the muscle--fat connection. Arch Physiol Biochem 112, 105-13.
Seino, Y., Miki, T., Kiyonari, H., Abe, T., Fujimoto, W., Kimura, K., Takeuchi, A.,
Takahashi, Y., Oiso, Y., Iwanaga, T., and Seino, S. (2008): Isx participates in the
maintenance of vitamin A metabolism by regulation of beta-carotene 15,15'-
monooxygenase (Bcmo1) expression. J Biol Chem 283, 4905-11.
Seo, J. A., Kim, N. H., Park, S. Y., Kim, H. Y., Ryu, O. H., Lee, K. W., Lee, J., Kim, D. L.,
Choi, K. M., Baik, S. H., Choi, D. S., and Kim, S. G. (2008): Serum retinol-binding
protein 4 levels are elevated in non-alcoholic fatty liver disease. Clin Endocrinol
(Oxf) 68, 555-60.
Serrano Rios, M., Ordovás, J. M., and Gútierrez Fuentes, J. A. (2011): Obesity Elsevier
España,S.L., Barcelona.
Shaper, A. G., Wannamethee, S. G., and Walker, M. (1997): Body weight: implications
for the prevention of coronary heart disease, stroke, and diabetes mellitus in a
cohort study of middle aged men. BMJ 314, 1311-7.
Shaw, N., Elholm, M., and Noy, N. (2003): Retinoic acid is a high affinity selective ligand
for the peroxisome proliferator-activated receptor beta/delta. J Biol Chem 278,
41589-92.
Shi, H., Kokoeva, M. V., Inouye, K., Tzameli, I., Yin, H., and Flier, J. S. (2006): TLR4
links innate immunity and fatty acid-induced insulin resistance. J Clin Invest 116,
3015-25.
Tesis Doctoral Núria Granados Borbolla
240
Shibata, R., Skurk, C., Ouchi, N., Galasso, G., Kondo, K., Ohashi, T., Shimano, M.,
Kihara, S., Murohara, T., and Walsh, K. (2008): Adiponectin promotes endothelial
progenitor cell number and function. FEBS Lett 582, 1607-12.
Shulman, G. I. (2000): Cellular mechanisms of insulin resistance. J Clin Invest 106, 171-
6.
Silha, J. V., Nyomba, B. L., Leslie, W. D., and Murphy, L. J. (2007): Ethnicity, insulin
resistance, and inflammatory adipokines in women at high and low risk for
vascular disease. Diabetes Care 30, 286-91.
Simopoulou, T., Malizos, K. N., Iliopoulos, D., Stefanou, N., Papatheodorou, L., Ioannou,
M., and Tsezou, A. (2007): Differential expression of leptin and leptin's receptor
isoform (Ob-Rb) mRNA between advanced and minimally affected osteoarthritic
cartilage; effect on cartilage metabolism. Osteoarthritis Cartilage 15, 872-83.
Skurk, T., Alberti-Huber, C., Herder, C., and Hauner, H. (2007): Relationship between
adipocyte size and adipokine expression and secretion. J Clin Endocrinol Metab
92, 1023-33.
Smith, S. R., and Ravussin, E. (2002): Emerging paradigms for understanding fatness
and diabetes risk. Curr Diab Rep 2, 223-30.
Sociedad Gallega de Endocrinología, N. y. M. (2011): Uno de cada cuatro pacientes con
diabetes detectados en Galicia ya es un menor: El Faro de Vigo, Vigo.
Song, M. J., Kim, K. H., Yoon, J. M., and Kim, J. B. (2006): Activation of Toll-like receptor
4 is associated with insulin resistance in adipocytes. Biochem Biophys Res
Commun 346, 739-45.
Soprano, D. R., Soprano, K. J., and Goodman, D. S. (1986): Retinol-binding protein
messenger RNA levels in the liver and in extrahepatic tissues of the rat. J Lipid
Res 27, 166-71.
Spalding, K. L., Arner, E., Westermark, P. O., Bernard, S., Buchholz, B. A., Bergmann,
O., Blomqvist, L., Hoffstedt, J., Naslund, E., Britton, T., Concha, H., Hassan, M.,
Ryden, M., Frisen, J., and Arner, P. (2008): Dynamics of fat cell turnover in
humans. Nature 453, 783-7.
Steensberg, A., Fischer, C. P., Keller, C., Moller, K., and Pedersen, B. K. (2003): IL-6
enhances plasma IL-1ra, IL-10, and cortisol in humans. Am J Physiol Endocrinol
Metab 285, E433-7.
Stefan, N., Hennige, A. M., Staiger, H., Machann, J., Schick, F., Schleicher, E., Fritsche,
A., and Haring, H. U. (2007): High circulating retinol-binding protein 4 is
associated with elevated liver fat but not with total, subcutaneous, visceral, or
intramyocellular fat in humans. Diabetes Care 30, 1173-8.
Steinberg, D., Parthasarathy, S., Carew, T. E., Khoo, J. C., and Witztum, J. L. (1989):
Beyond cholesterol. Modifications of low-density lipoprotein that increase its
atherogenicity. N Engl J Med 320, 915-24.
Stender, S., Astrup, A., and Dyerberg, J. (2008): Ruminant and industrially produced
trans fatty acids: health aspects. Food Nutr Res 52.
Bibliografía
241
Steppan, C. M., Bailey, S. T., Bhat, S., Brown, E. J., Banerjee, R. R., Wright, C. M.,
Patel, H. R., Ahima, R. S., and Lazar, M. A. (2001): The hormone resistin links
obesity to diabetes. Nature 409, 307-12.
Steppan, C. M., Wang, J., Whiteman, E. L., Birnbaum, M. J., and Lazar, M. A. (2005):
Activation of SOCS-3 by resistin. Mol Cell Biol 25, 1569-75.
Stofkova, A. (2009): Leptin and adiponectin: from energy and metabolic dysbalance to
inflammation and autoimmunity. Endocr Regul 43, 157-68.
Suganami, T., Tanimoto-Koyama, K., Nishida, J., Itoh, M., Yuan, X., Mizuarai, S., Kotani,
H., Yamaoka, S., Miyake, K., Aoe, S., Kamei, Y., and Ogawa, Y. (2007): Role of
the Toll-like receptor 4/NF-kappaB pathway in saturated fatty acid-induced
inflammatory changes in the interaction between adipocytes and macrophages.
Arterioscler Thromb Vasc Biol 27, 84-91.
Surmi, B. K., and Hasty, A. H. (2008): Macrophage infiltration into adipose tissue:
initiation, propagation and remodeling. Future Lipidol 3, 545-556.
Takada, I., Kouzmenko, A. P., and Kato, S. (2009a): Molecular switching of
osteoblastogenesis versus adipogenesis: implications for targeted therapies.
Expert Opin Ther Targets 13, 593-603.
Takada, I., Kouzmenko, A. P., and Kato, S. (2009b): Wnt and PPARgamma signaling in
osteoblastogenesis and adipogenesis. Nat Rev Rheumatol 5, 442-7.
Tamiya, T., Kashiwagi, I., Takahashi, R., Yasukawa, H., and Yoshimura, A. (2011):
Suppressors of cytokine signaling (SOCS) proteins and JAK/STAT pathways:
regulation of T-cell inflammation by SOCS1 and SOCS3. Arterioscler Thromb
Vasc Biol 31, 980-5.
Tang, W., Zeve, D., Suh, J. M., Bosnakovski, D., Kyba, M., Hammer, R. E., Tallquist, M.
D., and Graff, J. M. (2008): White fat progenitor cells reside in the adipose
vasculature. Science 322, 583-6.
Tardy, A. L., Giraudet, C., Rousset, P., Rigaudiere, J. P., Laillet, B., Chalancon, S.,
Salles, J., Loreau, O., Chardigny, J. M., and Morio, B. (2008): Effects of trans
MUFA from dairy and industrial sources on muscle mitochondrial function and
insulin sensitivity. J Lipid Res 49, 1445-55.
Taub, R. (2003): Hepatoprotection via the IL-6/Stat3 pathway. J Clin Invest 112, 978-80.
Taylor, P. D., and Poston, L. (2007): Developmental programming of obesity in
mammals. Exp Physiol 92, 287-98.
Teegala, S. M., Willett, W. C., and Mozaffarian, D. (2009): Consumption and health
effects of trans fatty acids: a review. J AOAC Int 92, 1250-7.
Tilg, H., and Moschen, A. R. (2008): Role of adiponectin and PBEF/visfatin as regulators
of inflammation: involvement in obesity-associated diseases. Clin Sci (Lond) 114,
275-88.
Timmons, J. A., Wennmalm, K., Larsson, O., Walden, T. B., Lassmann, T., Petrovic, N.,
Hamilton, D. L., Gimeno, R. E., Wahlestedt, C., Baar, K., Nedergaard, J., and
Cannon, B. (2007): Myogenic gene expression signature establishes that brown
Tesis Doctoral Núria Granados Borbolla
242
and white adipocytes originate from distinct cell lineages. Proc Natl Acad Sci U S
A 104, 4401-6
Tojima, Y., Fujimoto, A., Delhase, M., Chen, Y., Hatakeyama, S., Nakayama, K.,
Kaneko, Y., Nimura, Y., Motoyama, N., Ikeda, K., Karin, M., and Nakanishi, M.
(2000): NAK is an IkappaB kinase-activating kinase. Nature 404, 778-82.
Trayhurn, P., and Beattie, J. H. (2001): Physiological role of adipose tissue: white
adipose tissue as an endocrine and secretory organ. Proc Nutr Soc 60, 329-39.
Tsutsumi, C., Okuno, M., Tannous, L., Piantedosi, R., Allan, M., Goodman, D. S., and
Blaner, W. S. (1992): Retinoids and retinoid-binding protein expression in rat
adipocytes. J Biol Chem 267, 1805-10.
Turcotte, L. P., and Fisher, J. S. (2008): Skeletal muscle insulin resistance: roles of fatty
acid metabolism and exercise. Phys Ther 88, 1279-96.
Urbich, C., and Dimmeler, S. (2005): Risk factors for coronary artery disease, circulating
endothelial progenitor cells, and the role of HMG-CoA reductase inhibitors.
Kidney Int 67, 1672-6.
van Marken Lichtenbelt, W. D., Vanhommerig, J. W., Smulders, N. M., Drossaerts, J. M.,
Kemerink, G. J., Bouvy, N. D., Schrauwen, P., and Teule, G. J. (2009): Cold-
activated brown adipose tissue in healthy men. N Engl J Med 360, 1500-8.
Villaca Chaves, G., Pereira, S. E., Saboya, C. J., and Ramalho, A. (2008): Non-alcoholic
fatty liver disease and its relationship with the nutritional status of vitamin A in
individuals with class III obesity. Obes Surg 18, 378-85.
Villard, L., and Bates, C. J. (1987): Effect of vitamin A supplementation on plasma and
breast milk vitamin A levels in poorly nourished Gambian women. Hum Nutr Clin
Nutr 41, 47-58.
Villarroya, F., Iglesias, R., and Giralt, M. (2004): Retinoids and retinoid receptors in the
control of energy balance: novel pharmacological strategies in obesity and
diabetes. Curr Med Chem 11, 795-805.
Virtanen, K. A., Lidell, M. E., Orava, J., Heglind, M., Westergren, R., Niemi, T., Taittonen,
M., Laine, J., Savisto, N. J., Enerback, S., and Nuutila, P. (2009): Functional
brown adipose tissue in healthy adults. N Engl J Med 360, 1518-25.
Virtanen, K. A., Lonnroth, P., Parkkola, R., Peltoniemi, P., Asola, M., Viljanen, T.,
Tolvanen, T., Knuuti, J., Ronnemaa, T., Huupponen, R., and Nuutila, P. (2002):
Glucose uptake and perfusion in subcutaneous and visceral adipose tissue
during insulin stimulation in nonobese and obese humans. J Clin Endocrinol
Metab 87, 3902-10.
Virtanen, K. A., and Nuutila, P. (2011): Brown adipose tissue in humans. Curr Opin
Lipidol 22, 49-54.
von Eynatten, M., Lepper, P. M., Liu, D., Lang, K., Baumann, M., Nawroth, P. P.,
Bierhaus, A., Dugi, K. A., Heemann, U., Allolio, B., and Humpert, P. M. (2007):
Retinol-binding protein 4 is associated with components of the metabolic
Bibliografía
243
syndrome, but not with insulin resistance, in men with type 2 diabetes or coronary
artery disease. Diabetologia 50, 1930-7.
von Lintig, J., and Vogt, K. (2004): Vitamin A formation in animals: molecular
identification and functional characterization of carotene cleaving enzymes. J
Nutr 134, 251S-6S.
Vuolteenaho, K., Koskinen, A., Kukkonen, M., Nieminen, R., Paivarinta, U., Moilanen, T.,
and Moilanen, E. (2009): Leptin enhances synthesis of proinflammatory
mediators in human osteoarthritic cartilage--mediator role of NO in leptin-induced
PGE2, IL-6, and IL-8 production. Mediators Inflamm 2009, 345838.
Wallenius, V., Wallenius, K., Ahren, B., Rudling, M., Carlsten, H., Dickson, S. L.,
Ohlsson, C., and Jansson, J. O. (2002): Interleukin-6-deficient mice develop
mature-onset obesity. Nat Med 8, 75-9.
Wang, J., Liu, R., Hawkins, M., Barzilai, N., and Rossetti, L. (1998): A nutrient-sensing
pathway regulates leptin gene expression in muscle and fat. Nature 393, 684-8.
Wang, Y., and Sul, H. S. (2009): Pref-1 regulates mesenchymal cell commitment and
differentiation through Sox9. Cell Metab 9, 287-302.
Wei, D., Le, X., Zheng, L., Wang, L., Frey, J. A., Gao, A. C., Peng, Z., Huang, S., Xiong,
H. Q., Abbruzzese, J. L., and Xie, K. (2003): Stat3 activation regulates the
expression of vascular endothelial growth factor and human pancreatic cancer
angiogenesis and metastasis. Oncogene 22, 319-29.
Weir, G. C., and Bonner-Weir, S. (2004): Five stages of evolving beta-cell dysfunction
during progression to diabetes. Diabetes 53 Suppl 3, S16-21.
Weisberg, S. P., McCann, D., Desai, M., Rosenbaum, M., Leibel, R. L., and Ferrante, A.
W., Jr. (2003): Obesity is associated with macrophage accumulation in adipose
tissue. J Clin Invest 112, 1796-808.
Wellen, K. E., and Hotamisligil, G. S. (2005): Inflammation, stress, and diabetes. J Clin
Invest 115, 1111-9.
Westerweel, P. E., Visseren, F. L., Hajer, G. R., Olijhoek, J. K., Hoefer, I. E., de Bree, P.,
Rafii, S., Doevendans, P. A., and Verhaar, M. C. (2008): Endothelial progenitor
cell levels in obese men with the metabolic syndrome and the effect of
simvastatin monotherapy vs. simvastatin/ezetimibe combination therapy. Eur
Heart J 29, 2808-17.
WHO (2009): Global health risks: mortality and burden of disease attributable to selected
major risks
WHO (2011): Fact sheet N°311.
Willett, W. C., Dietz, W. H., and Colditz, G. A. (1999): Guidelines for healthy weight. N
Engl J Med 341, 427-34.
Wolf, G. (2006): Is 9-cis-retinoic acid the endogenous ligand for the retinoic acid-X
receptor? Nutr Rev 64, 532-8.
Tesis Doctoral Núria Granados Borbolla
244
Won, J. C., Park, C. Y., Lee, W. Y., Lee, E. S., Oh, S. W., and Park, S. W. (2009):
Association of plasma levels of resistin with subcutaneous fat mass and markers
of inflammation but not with metabolic determinants or insulin resistance. J
Korean Med Sci 24, 695-700.
Xu, H., Barnes, G. T., Yang, Q., Tan, G., Yang, D., Chou, C. J., Sole, J., Nichols, A.,
Ross, J. S., Tartaglia, L. A., and Chen, H. (2003): Chronic inflammation in fat
plays a crucial role in the development of obesity-related insulin resistance. J Clin
Invest 112, 1821-30.
Yang, Q., Graham, T. E., Mody, N., Preitner, F., Peroni, O. D., Zabolotny, J. M., Kotani,
K., Quadro, L., and Kahn, B. B. (2005): Serum retinol binding protein 4
contributes to insulin resistance in obesity and type 2 diabetes. Nature 436, 356-
62.
Yao-Borengasser, A., Varma, V., Bodles, A. M., Rasouli, N., Phanavanh, B., Lee, M. J.,
Starks, T., Kern, L. M., Spencer, H. J., 3rd, Rashidi, A. A., McGehee, R. E., Jr.,
Fried, S. K., and Kern, P. A. (2007): Retinol binding protein 4 expression in
humans: relationship to insulin resistance, inflammation, and response to
pioglitazone. J Clin Endocrinol Metab 92, 2590-7.
Ye, J. (2008): Regulation of PPARgamma function by TNF-alpha. Biochem Biophys Res
Commun 374, 405-8.
Ye, J., Gao, Z., Yin, J., and He, Q. (2007): Hypoxia is a potential risk factor for chronic
inflammation and adiponectin reduction in adipose tissue of ob/ob and dietary
obese mice. Am J Physiol Endocrinol Metab 293, E1118-28.
Yuan, M., Konstantopoulos, N., Lee, J., Hansen, L., Li, Z. W., Karin, M., and Shoelson,
S. E. (2001): Reversal of obesity- and diet-induced insulin resistance with
salicylates or targeted disruption of Ikkbeta. Science 293, 1673-7.
Yun, J. E., Sull, J. W., Lee, H. Y., Park, E., Kim, S., Jo, J., Lee, S. J., Kim, S. Y., Choi, Y.
J., Jee, S. H., and Huh, K. B. (2009): Serum adiponectin as a useful marker for
metabolic syndrome in type 2 diabetic patients. Diabetes Metab Res Rev 25,
259-65.
Zhang, M., Hu, P., Krois, C. R., Kane, M. A., and Napoli, J. L. (2007): Altered vitamin A
homeostasis and increased size and adiposity in the rdh1-null mouse. FASEB J
21, 2886-96.
Zhang, Y., Proenca, R., Maffei, M., Barone, M., Leopold, L., and Friedman, J. M. (1994):
Positional clonin Zhang, Y., Proenca, R., Maffei, M., Barone, M., Leopold, L., and
Friedman, J. M. (1994): Positional cloning of the mouse obese gene and its
human homologue. Nature 372, 425-32.g of the mouse obese gene and its
human homologue. Nature 372, 425-32.
Zierath, J. R. (2007): The path to insulin resistance: paved with ceramides? Cell Metab
5, 161-3.
Ziouzenkova, O., Orasanu, G., Sharlach, M., Akiyama, T. E., Berger, J. P., Viereck, J.,
Hamilton, J. A., Tang, G., Dolnikowski, G. G., Vogel, S., Duester, G., and Plutzky,
Bibliografía
245
J. (2007): Retinaldehyde represses adipogenesis and diet-induced obesity. Nat
Med 13, 695-702.
Ziouzenkova, O., and Plutzky, J. (2008): Retinoid metabolism and nuclear receptor
responses: New insights into coordinated regulation of the PPAR-RXR complex.
FEBS Lett 582, 32-8.
Zizola, C. F., Frey, S. K., Jitngarmkusol, S., Kadereit, B., Yan, N., and Vogel, S. (2010):
Cellular retinol-binding protein type I (CRBP-I) regulates adipogenesis. Mol Cell
Biol 30, 3412-20.
Zizola, C. F., Schwartz, G. J., and Vogel, S. (2008): Cellular retinol-binding protein type
III is a PPARgamma target gene and plays a role in lipid metabolism. Am J
Physiol Endocrinol Metab 295, E1358-68.


ANEXO I

Anexo I
Materiales y Métodos
249
ANEXO I: Índice de materiales y métodos.
1. Animales de estudio
2. Cultivo de células 3T3-L1. Siembra, subcultivo, proliferación y diferenciación a
adipocitos. Tratamientos.
3. Cultivo de fibroblastos embrionarios de ratón (MEFs, Mouse Embryonic
Fibroblasts). Obtención, siembra, proliferación y diferenciación a adipocitos y
condrocitos. Tratamientos.
4. Cultivo de células C2C12 (Mouse myoblast cell line). Siembra, proliferación,
diferenciación a miocitos. Tratamientos.
5. Tinción Oil Red y valoración del contenido de triacilgliceroles.
6. Determinación del transporte de glucosa en modelos celulares.
7. Determinación de metabolitos plasmáticos.
8. Determinación de proteínas secretadas al medio de cultivo.
9. Determinación de los lípidos totales en hígado.
10. Determinación del contenido en ADN.
11. Aislamiento y cuantificación de proteínas.
12. Western-Blot.
13. Aislamiento y cuantificación de ARN.
14. RT-qPCR.
15. Medida de concentración de retinoides por HPLC.
16. Análisis morfométrico de tejidos.
17. Análisis imunohistoquímico de tejidos.
18. Análisis estadístico.
19. Bibliografía.

Anexo I
Materiales y Métodos
251
1. Animales de estudio
Las ratas empleadas eran de las cepas Wistar y Zucker (normopeso (fa/?) y
obesas(fa/fa)) y los ratones eran de la cepa NMRI. Todos los animales fueron
suministrados por los laboratorios Charles River (Barcelona). Durante el periodo de
experimentación los animales se mantenían en el estabulario de la UIB aclimatados a
22ºC con un ciclo de doce horas de luz y doce horas de oscuridad., con acceso libre
al agua y al pienso estándar (Panlab). Los ratones fueron sacrificados por asfixia
mediante CO2 .Las ratas fueron sacrificadas por decapitación mediante guillotina.
Después de la disección los tejidos de interés o bien se lavaban con salino que
contenía 0,1% de dietilpirocarbonato (DEPC, Sigma) para evitar la degradación del
ARN y se almacenaban a -70ºC, o bien se guardaban en paraformalheído al 4% para
futuros análisis morfométricos e immunohistiquímicos.
2. Cultivo de células 3T3-L1. Siembra, subcultivo, proliferación y
diferenciación a adipocitos. Tratamientos.
Siembra: Partíamos de un criovial de pre- adipocitos de ratón 3T3-L1 (ATT CL-
173TM; LGC Deselaers SL. Barcelona, Spain), conservado en nitrógeno líquido, con
aproximadamente 5 x 10⁵ células en 1 ml de medio de conservación. El criovial se
descongelaba rápidamente en un baño termostatizado a 37Cº y con agitación, y la
suspensión de células se pipeteaba en un frasco de cultivo de 25 cm2 al que se le
añadían 4 ml de medio de crecimiento para obtener un volumen total de 5ml. Las
células se dejaban proliferar en un incubador a 37Cº y 5% de CO2.
Subcultivo (Tripsinizacion). Se aspiraba el medio de crecimiento del frasco y las
células se lavaban dos veces con tampón fosfato salino (PBS) celular. Se añadía 1
ml de tripsina (Sigma) por frasco, se introducían los frascos cerrados en el incubador
a 37ºC y se esperaba a que las células se despegasen (aproximadamente 2-3
minutos). Una vez despegadas las células, se inactivaba la tripsina añadiendo 4 ml
de medio de crecimiento por frasco.
Recuento celular y siembra para experimento: Para el recuento celular se utilizaba
una cámara de Neubauer y se mezclaban a partes iguales (10 μl) suspensión celular
y azul tripan (Sigma). Las células se sembraban a una densidad de 5.000
células/cm2.
Diferenciación: Dos días de después de que las células hubieran llegado a la
confluencia (día 0), se sustituía el medio de crecimiento por un primer medio inductor
Tesis Doctoral
Núria Granados Borbolla
252
de la diferenciación que contenía un estímulo hormonal. Transcurridos dos días se
sustituía por un medio de diferenciación suplementado con insulina durante 48 horas
más. A partir de entonces se dejaban las células con medio básico que se cambiaba
cada dos días, muy cuidadosamente para evitar que se despegaran las células que
se iban cargando de lípidos, hasta que se observaban gotículas lipídicas en más del
95% de las células (generalmente a día 8-10), en este momento se añadían los
tratamientos: retinoides o ácidos grasos disueltos en DMSO. Como controles se
empleaban células tratadas con el vehículo DMSO.
Medios:
*todos los reactivos eran de Sigma a menos que se indique lo contrario
- Medio de crecimiento: preparado con Dulbecco's Modified Eagle Medium (DMEM) al
que se le añadía un 10% (vol/vol) de suero de feto bovino (Linus), glutamina (4 mM) y
antibióticos (50 IU penicilina/ml y 50 mg estreptomicina/ml).
- Medio de diferenciación I: se preparaba añadiendo al medio de crecimiento las
siguientes hormonas: insulina (0.175μM), isobutilmetilxantina (IBMX) (0.5mM) y
dexametasona (1μM).
- Medio de diferenciación II: se preparaba añadiendo al medio de crecimiento insulina
(175mM).
3. Cultivo de fibroblastos embrionarios de ratón (MEFs, Mouse Embryonic
Fibroblasts). Obtención, siembra, proliferación y diferenciación a adipocitos
y condrocitos. Tratamientos.
Obtención y siembra: Los fibroblastos de ratón se obtenían de la carcasa de
embriones de 13 días (tras descartar cabeza, hígado y otros órganos).La carcasa de
cada embrión se cortaba en piezas pequeñas que se resuspendían en 50 ml de
tampón fosfato salino (PBS) y después se centrifugaban (300g / 5 min), este paso se
repetía las veces necesarias hasta la obtención de un sobrenadante claro. Tras
descartar el sobrenadante, el precipitado se resuspendían en una solución de
colagenasa a 37ºC en agitación durante una hora, tras lo cual se disgregaban las
células pasándolas varias veces por una jeringa. Las células ya disgregadas se
resuspendían en medio de crecimiento y se sembraban a una densidad de
aproximadamente 50.000 células /cm2 y se dejaban proliferar a 37ºC 5% CO2.
Anexo I
Materiales y Métodos
253
Subcultivo (Tripsinizacion). Se aspiraba el medio de crecimiento del frasco y las
células se lavaban dos veces con tampón fosfato salino (PBS) celular. Se añadía 1
ml de tripsina (Sigma) por frasco, se introducían los frascos cerrados en el incubador
a 37ºC y se esperaba a que las células se despegasen (aproximadamente 2-3
minutos). Una vez despegadas las células, se inactivaba la tripsina añadiendo 4 ml
de medio de crecimiento por frasco.
Recuento celular y siembra para experimento: Para el recuento celular se utilizaba
una cámara de Neubauer y se mezclaban a partes iguales (10 μl) suspensión celular
y azul tripan (Sigma). Las células se sembraban a una densidad de 5.000 células/
cm2 aproximadamente.
Diferenciación en adipocitos: Dos días de después de que las células hubieran
llegado a la confluencia (día 0) se sustituía el medio de crecimiento por un primer
medio inductor de la diferenciación que contenía un estímulo hormonal. Transcurridos
dos días se sustituía el medio inductor de la diferenciación por un medio de
crecimiento suplementado con insulina y rosiglitazona durante 48 horas más. A partir
de entonces se dejaban las células con medio de crecimiento que se cambiaba cada
dos días hasta que se observaban gotículas lipídicas en un 95% de las células
(generalmente a día 6-8).
En los estudios de los efectos de la vitamina A sobre la producción adipocitaria de
RBP4 los tratamientos (retinoides y agonistas de RAR, RXR) se añadían al medio a
día 8 cuando las células estaban completamente diferenciadas en adipocitos.
En los estudios sobre los efectos de los compuestos de interés habitualmente usados
para mejorar la función articular sobre la adipogénesis, los tratamientos se añadieron
desde el día 0 hasta el final del experimento.
Medios:
- Medio de crecimiento: preparado con medio básico AmnioMAX-C1008 (Invitrogen)
al que se le añadía un 7,5% (vol/vol) de medio suplementado AmnioMax (Invitrogen),
glutamina (2 mM) (Sigma) y antibióticos (50 IU penicilina/ml y 50 μg
estreptomicina/ml) (Sigma).
- Medio de diferenciación I: se preparaba añadiendo al medio de crecimiento las
siguientes hormonas: insulina (0,87μM) (Sigma), isobutilmetilxantina (IBMX) (Sigma),
(0.5 mM), dexametasona (1μM) (Sigma), y rosiglitazona (0.5μM) (BioVision).
Tesis Doctoral
Núria Granados Borbolla
254
- Medio de diferenciación II: se preparaba añadiendo al medio de crecimiento insulina
(0,87μM) y rosiglitazona (0.5μM).
Diferenciación en condrocitos:
Para la diferenciación de MEFs en condrocitos se emplearon dos variantes en la
metodología del cultivo: a) cultivo en monocapa y b) cultivo en tres dimensiones.
a) cultivo en monocapa. Para el cultivo en monocapa se procedía de la misma
manera que la descrita anteriormente para diferenciar MEFs en adipocitos con la
única salvedad que no se añadía ninguno de los inductores de la adipogénesis
(insulina, rosiglitazona, IBMX, dexametasona). Dos días después de la confluencia
(día 0) y hasta el final del experimento, se añadían o bien los tratamientos o bien
proteína morfogénica 2 (BMP2) (Sigma), como control positivo de la chondrogenesis,
a una concentración de 100 ng/ml.
b) cultivo en tres dimensiones. Para el cultivo en tres dimensiones se dejaban
proliferar las células en frascos de 75 cm2 hasta obtener el número de células total
suficiente para el experimento. Después de tripsinizar, contar y centrifugar se
resuspendían las células una concentración 12.000 células/μl y en placas de 24
pocillos se ponían dos gotas de 10 μl de suspensión celular (1,2 x 10⁵ células por
gota) lo suficientemente separadas entre ellas y del borde del pocillo. Se introducía la
placa en el incubador y se dejaba 4 horas a 37ºC, para que se adhirieran las células
entre ellas y a la superficie celular. De esta manera las células crecían estableciendo
contactos entre ellas en tres dimensiones de forma análoga a lo que ocurre in vivo
en la condensación mesenquimática previa a la condrogénesis. Tras sacar las placas
de la estufa (día 0) se añadirán 500 μl de medio de crecimiento por pocillo,
conteniendo este medio o bien los tratamientos o bien BMP2 100 ng/ml (como control
positivo de la condrogénesis), estos medios se mantenían hasta el final del
experimento.
4. Cultivo de células C2C12 (Mouse myoblast cell line). Siembra, proliferación,
diferenciación a miocitos. Tratamientos.
Siembra: Partíamos de un criovial, conservado en nitrógeno líquido, con
aproximadamente 2 x 10⁵ células en 1,5 ml de medio de conservación. El criovial
descongelaba rápidamente en un baño termostatizado a 37Cº, y la suspensión de
células se pipeteaba en un frasco de cultivo de 25 cm2 al que se le añadían 3,5 ml de
Anexo I
Materiales y Métodos
255
medio de crecimiento para obtener un volumen total de 5ml. Las células se dejaban
proliferar en un incubador a 37Cº y 5% de CO2.
Subcultivo (Tripsinizacion). Se aspiraba el medio de crecimiento del frasco y las
células se lavaban dos veces con tampón fosfato salino (PBS) celular. Se añadía 1
ml de tripsina (Sigma) por frasco, se introducían los frascos cerrados en el incubador
a 37ºC y se esperaba a que las células se despegasen (aproximadamente 2-3
minutos). Una vez despegadas las células, se inactivaba la tripsina añadiendo 4 ml
de medio de crecimiento por frasco y se centrifugaban a 1.000 g durante 5 min. El
sobrenadante se descartaba y las células se resuspendÍan en medio de crecimiento
fresco.
Recuento celular y siembra para experimento: Para el recuento celular se utilizaba
una cámara de Neubauer y se mezclaba a partes iguales suspensión celular y azul
tripan (Sigma) (10 μl). Las células se sembraban a una densidad de 5.000
células/cm2.
Diferenciación: Cuando las células alcanzaban un 85% de confluencia
(aproximadamente transcurridas 24 horas desde su siembra) el medio de crecimiento
se sustituía por medio de diferenciación (día 0) que se sustituía por medio fresco
cada dos días. Transcurridos 9-10 días las células se habían diferenciado en
miotubos, en este momento se añadían los tratamientos (ácidos oleico y elaídico).
Medios:
- Medio de crecimiento: preparado con Dulbecco's Modified Eagle Medium
(DMEM, Sigma) al que se le añadía un 10% (vol/vol) de suero de feto procedente de
ternera, glutamina (3 mM) y antibióticos (50 IU penicilina/ml y 50 μg
estreptomicina/ml).
- Medio de diferenciación: preparado con DMEM al que se le añadía un 2% (vol/vol)
de suero de caballo, glutamina (3 mM) y antibióticos (50 IU penicilina/ml y 50 μg
estreptomicina/ml).
5. Tinción Oil Red y valoración del contenido de triacilgliceroles.
El Oil Red es un colorante que tiñe específicamente triacilgliceroles y ésteres de
colesterol. Se preparaba una solución stock disolviendo 0.5 g de Oil Red (Sigma) en
Tesis Doctoral
Núria Granados Borbolla
256
100 ml de isopropanol. Esta solución se diluía con agua en el momento de ser
utilizada (3 vol de solución stock /2 vol agua).
Se descartaba el medio de cultivo de las células y se lavaban tres veces con PBS,
tras lo cual se fijaban con paraformalheído al 4% durante una hora a temperatura
ambiente. Se lavaban de nuevo con PBS y se incubaban a durante 2-3 minutos con
isopropanol antes de ser teñidas con 0.5 ml (placas de 12 pocillos) de la solución Oil
Red recién preparada durante una hora a temperatura ambiente. Finalmente se
lavaban tres veces con agua estéril para realizar fotografías.
La determinación del contenido de triacilgliceroles intracelulares se realizaba a partir
de células teñidas con Oil Red siguiendo el protocolo descrito en el artículo de
Ramirez-ZacaríasJ.L; et al.Histochemistry 97(1992) pp.493-497.El agua estéril se
evaporaba a 32ºC y se añadía isopropanol para disolver el colorante y se recogía
pipeteando varias veces. Se determinaba la absorbancia a 510 nm tras haber
calculado previamente la linealidad de las muestras.
6. Determinación del transporte de glucosa en modelos celulares.
La determinación del transporte de glucosa se midió mediante la utilización de 2-
deoxi-glucosa (2DOG) marcada radioactivamente con tritio (3H) en cultivos celulares
de células C2C12 y adipocitos 3T3-L1.
Las células se diferenciaron en placas de 12 pocillos y se trataron durante 24 horas
con los ácidos grasos de interés (ácido oleico y ácido elaídico).Después se lavaron
con tampón KRP (Kreb's Ringer phosphate) y con 0,05% albúmina bovina sérica
(BSA). Luego se les añadía el mismo tampón previamente atemperado, con o sin
insulina (100 nM), dependiendo de si queríamos medir captación de glucosa
estimulada con insulina o basal respectivamente, durante 15 minutos a 37ºC.
Transcurrido este tiempo, las células se incubaban durante 10 minutos más a 37ºC
con el buffer KRP (con o sin insulina 100 nM) al que se le añadía 3H-2-DOG-H
(3700Bq/ml en una solución de 2-DOG1 μM no marcada) y cuya actividad específica
final era de 0.2 μCi/ml.
Pasado este tiempo, rápidamente, las células se lavaban 3 veces con PBS celular
frío y se resuspendían con 500 µl de NaOH (0,1N) que se transfería a un expender
para posterior sonicación. Dos alícuotas de 100 µl de células lisadas se pasaban a 2
nuevos ependorfs, se les añadía 1 ml de líquido de centelleo para contar
radioactividad (Perkin Elmer, Shelton, CT, USA) usando el contador de líquido de
Anexo I
Materiales y Métodos
257
centelleo Beckman Coulter LS 6500. El resto de lisado celular (300μl) se utilizaba
para la cuantificación de las proteínas totales mediante el Kit BCA protein assay
(Pierce, USA).
-Tampón PRK: el tampón estaba compuesto por : 10 mM de KH2PO4 a pH=7.4, 136
mM de NaCl, 4.7 mM de KCl, 1.25 mM de CaCl2, 1.25 mM de MgSO4 .
7. Determinación de metabolitos plasmáticos
La glucosa en sangre se determinó mediante el uso del medidor de glucemia Accu-
Check Sensor (Roche Diagnostics).
Los niveles en suero de leptina, resistina e insulina, se determinaron mediante el uso
de kits basados en el ensayo por inmuno-absorcion ligado a enzimas (ELISA),
siguiendo siempre las instrucciones de las casas comerciales:
Kits:
- Leptina: Leptin Quantikine ELISA kit (R&D Systems, USA).
- Resistina: Mouse Resistin Quantikine ELISA kit (R&D Systems, USA).
- Insulina: Insulin Mouse Ultrasensitive ELISA kit (DRGInstruments GmbH,
Alemania).
La concentracion de ácidos grasos libres y triacilgliceroles se determinó utilizando kits
basados en reacciones enzimático-colorimétricas:
Kits
- ácidos grasos libres: test colorimétrico enzimático NEFA-C (Wako) Este método se
basa en la acilación de la coenzima A (CoA) por los ácidos grasos de la muestra en
presencia acil-CoA sintetasa (ACS). CoA. El acil-CoA que se produce es oxidado en
una segunda reacción por acil-CoA oxidasa (ACOD) con la generación de peróxido
de hidrógeno (H2O2), éste último induce la condensación oxidativa del 3-metil-N-etil-
N (β-hidroxietil)-anilina (MEFA) con 4 aminoantipirina para rendir un pigmento rojo-
púrpura. La determinación se realizaba siguiendo las indicaciones del fabricante y la
absorbancia se medía a 550nm en un espectrofotómetro de placas de ELISA Sunrise
de TECAN.
Tesis Doctoral
Núria Granados Borbolla
258
- triacilgliceroles: test colorimétrico enzimático Sigma Diagnostics (España). Este
método cuantifica la cantidad de glicerol existente en la muestra. El glicerol es
secuencialmente fosforilado (glicerol quinasa) y oxidado (glicerol fosfato oxidasa)
reacción que se acompaña de la producción de peróxido de hidrógeno
(H2O2).Finalmente una peroxidasa cataliza la unión de H2O2 4 aminoantipirina y N-
textil-N-(3-sulfopropyl)m-anisidine(ESPA) para producir un colorante (quinoneimina)
que absorbe a 540. La determinación se realizaba siguiendo las indicaciones del
fabricante y la absorbancia se medía a 540nm en un espectrofotómetro de placas de
ELISA Sunrise de TECAN.
*Los triacilgliceroles en hígado también se determinaron siguiendo este método.
8. Determinación de proteínas secretadas al medio de cultivo.
La concentración IL-6 y TNFα en medio de cultivo celular se determinó mediante el
uso de kits basados en el ensayo por inmuno-absorción ligado a enzimas (ELISA),
siguiendo siempre las instrucciones de las casas comerciales:
Kits:
-IL-6: Mouse IL-6 Colorimetric ELISA Kit (Pierce, Rockford, IL., USA)
-TNFα: Mouse TNF alpha Colorimetric ELISA Kit (Pierce, Rockford, IL., USA)
La concentración de RBP4 se determinó por Western-blot.
9. Determinación de los lípidos totales en hígado.
Para la determinación del contenido total de lípidos en el hígado se utilizó el método
de Folch (Ramirez-Zacarias et al., 1992). Aproximadamente 0,5 g de tejido se
pesaron en una balanza de precisión, se homogenizaron en una mezcla 2:1 de
cloroformo (Panreac): metanol (Panreac) y posteriormente se enrasaron hasta 10 ml
en un tubo de vidrio. Los restos de tejido sin homogenizar fueron descartados
mediante el uso de un filtro de papel. A continuación se añadieron 2 ml de NaCl
(Panreac) 0,45% (para eliminar posibles impurezas polares que se encontraran en la
mezcla) y se agitó vigorosamente durante 5 min, después se eliminó la fase superior
acuosa y la fase inferior se enrasó con metanol hasta 10 ml. Se añadieron 2 ml de
NaCl 0.9% y, transcurridos 5 min, se eliminó de nuevo la fase acuosa y se enrasó
con metanol hasta 10 ml. Este paso se repitió 2 veces. Una vez finalizado, se enrasó
hasta 10 ml con cloroformo/metanol y de cada muestra se recogieron 8 ml que se
Anexo I
Materiales y Métodos
259
repartieron en dos tubos Folch previamente pesados (4 ml en cada uno). Se dejaron
los tubos destapados a 60ºC toda la noche con el fin de evaporar todo el
cloroformo/metanol y luego se volvieron a pesar los tubos con el extracto de lípidos.
La medida del peso final del tubo Folch menos la medida de peso inicial indica la
cantidad de lípidos totales en 4 ml y conociendo el peso exacto del tejido utilizado se
puede calcular la cantidad de lípidos totales por gramo de tejido.
10. Determinación del contenido en ADN.
Para la determinación del contenido de ADN de los tejidos utilizados se siguió el
protocolo basado en el artículo de Kissane J.M. y Robins, E. J.Biol Chem., (1958)
233:184-188. (Folch et al., 1957). Las muestras de tejido se homogenizaban con un
homogeneizador de aspas con PBS (dilución 1:3 p:v) en frío y se centrifugaban a
500g durante 10 minutos a 4ºC, después se recogía el sobrenadante que contenía el
ADN. Primero se realizaba una estimación el contenido de ADN con un
espectrofotómetro Nanodrop (ND-100) a 260 nm teniendo en cuenta que una unidad
de densidad óptica equivale a 35-40 μg de ADN/ml. Después se preparaban
alícuotas de las muestras de tal forma que el contenido estimado de ADN entrase en
el patrón. Todas las muestras se enrasaban a 100μl con PBS y se añadían 50μl de
ácido diaminobenzoico 1,2 M en cada tubo; se agitaban y se incubaban durante 50
min en un baño a 60ºC.Tras dejar que las muestras se enfriaran se añadía 1 ml de
HCl 1M y se leía la absorbancia en un fluorímetro a una longitud de onda de
excitación de 405nm y de emisión de 505 nm.
11. Aislamiento y cuantificación de proteínas
Para la homogenización de muestras procedentes de tejido adiposo se utilizaba
tampón PBS (NaCl 137 mM, KCl 2.7 mM y fosfato sódico mono/di-básico 10 mM,
todos los reactivos de Panreac) con una mezcla de inhibidores de proteasas (0.6 mM
de fluoruro de fenilmetilsulfonilo, 1 mg/ml de aprotinina y 1 mg/ml de leupectina, todos
procedentes de Sigma). La homogenización de la muestra se realizaba con Potter-
Envelhein en frio, después se centrifugaba el homogenado a 500g durante 10
minutos a 4ºC y se descartaba el precipitado. En este punto se podía cuantificar la
proteína.
En el caso de las células se empleó PBS (manuscrito 3) o TBS (manuscrito 2) (Tris
HCl pH6.8, 10% de glicerol, 2.5% dodecil sulfato sódico (SDS), 10mM DTE, 10mM B
–glicerofosfato, 10mM NaF, 0.1mM Na ortovanadato e inhibidores de proteasas). Con
Tesis Doctoral
Núria Granados Borbolla
260
la ayuda de un raspador se despegaron todas las células de la superficie del frasco
de cultivo y o bien se sonicaron (manuscrito 3) o se vortearon e hirvieron durante 3
minutos antes de ser tratadas con benzonasa (1μl/pocillo) durante 15 minutos.
Por último se centrifugaban los lisados obtenidos (por cualquiera de los dos métodos)
a 13.000 rpm durante 3 minutos y se descartaba el precipitado. En este punto se
podía cuantificar la proteína.
La cuantificación de las proteínas totales se realizaba mediante el Kit BCA protein
assay (Pierce), que se basa en la reducción del Cu2+ a Cu1+ por parte de los enlaces
proteicos en un medio alcalino (reacción de Biuret) y en la detección colorimétrica del
catión utilizando ácido bicinconinico (BCA). Se utilizaba como patrón albúmina bovina
sérica (BSA) disuelta en el mismo tampón de homogenización (PBS). En una placa
de 96 pocillos se añadían 25 µl de muestra, blanco y recta patrón así como 200 µl de
una mezcla de 50 partes de reactivo A (que contiene BCA) y una parte de reactivo B
(que contiene sulfato cúprico al 4%). La placa se protegía de la luz y se mezclaba
durante 30 segundos. La reacción se producía incubando a 37ºC durante 30 min.
Finalmente se leía la absorbancia a 562 nm en un lector de placas modelo Sunrise
(Tecam).
12. Western-Blot
La determinación de los niveles de RBP4 y Nampt/visfatina en suero, tejidos y células
en cultivos se realizó por Western Blot.
Preparación de las muestras
Por cada 7 μg de proteína resuspendida en tampón (PBS) o (TBS) se añadía 1 μl de
tampón de carga: Tris-HCl 0.5 M pH 6.8 (Panreac); 5% SDS (Sigma); 10% de glicerol
(Sigma); 5% de 2-mercaptoetanol (Sigma) y 1% de azul de bromofenol (Panreac) per
cada 7 μg de proteína, de manera que la proporción proteína : SDS fuera 1:4. Las
muestras se calentaban en un baño hirviendo durante 2-3 minutos. Para las
determinaciones de RBP4 se cargaron 20-50 μg de proteína en tejido adiposo e
hígado, 3 μl de suero disueltos en PBS y 10 μl de medio de cultivo celular.
Electroforesis. Primero se preparaba el gel de acrilamida en el que se llevaba a cabo
la separación de las proteínas en función de su peso molecular (resolving gel)
mezclando: 2.5ml de Tris-HCl 1,5M pH 8,8, 0,1ml de SDS al 10% y unos volúmenes
determinados de una solución al 40% de acrilamida/bis-acrilamida 37,5:1(BioRad) y
Anexo I
Materiales y Métodos
261
agua bidestilada hasta un total de 10 ml. El porcentaje de acrilamida variaba en
función del tamaño de la proteína que debíamos separar, en el caso de
Nampt/visfatina empleábamos un gel de acrilamida al 10% y en el caso de la RBP4 al
13%. Después se añadían los polimerizadores: 10 μl de TEMED (Sigma) y 100 μl de
persulfato amónico al 4% (Panreac) se mezclaba y se añadía rápidamente dentro de
los moldes de polimerización (Mini-protean 3, BioRad) previamente ensamblados. En
la parte superior se añadía una capa de agua bidestilada para evitar la inhibición por
oxígeno de la polimerización. Mientras el resolving gel polimerizaba se preparaba el
stacking gel al 4% de acrilamida, cuya función era concentrar las muestras. El
stacking gel al 4% se preparaba mezclando: 2,5 ml de Tris-HCl 0.5 M pH 6.8, 0,1 ml
de SDS al 10%, 1,3 ml de acrilamida y 6,1 de agua bidestilada. Se añadían los
polimerizadores ; 20 μl de TEMED y 100 μl de persulfato amónico al 4%, se
mezclaba y rápidamente se introducía la mezcla en los moldes de polimerización por
encima del resolving gel, para ello previamente se eliminaba la capa de agua
bidestilada. Se introducía un peine que funciona como molde para la formación de
pocillos en el stacking gel. El número y grosor de los pocillos variaba en función de la
cantidad de muestra que necesitáramos emplear para detectar la proteína.
Se cargaban las muestras en los geles de acrilamida incluyendo el marcador de
pesos moleculares (Invitrogen) y se corrían en el tampón Tris-glicina 0.5x pH 8.3 (Tris
base 0.025 M, glicina 0.195 M, 0.2 % SDS) aproximadamente durante 1 h.
Transferencia: Las proteínas se trasferían a una membrana de PolyVinyliDene
Fluoride, PVDF (BioRad) de 0.2 µm utilizando un electroblotter semi-seco (Trans-blot
Semi-dry Electophoretic Transfer Cell, BioRad). La membrana de PVDF se activaba
previamente sumergiéndola 5 segundos en metanol (Panreac), después se lavaba en
agua bidestilada durante 2 min y finalmente se mantenía en el tampón de
transferencia (48 mM Tris, 39 mM Glicina y un 20% de metanol pH 9.2) durante al
menos 5 min. Sobre el cátodo de titanio se colocaban 6 trozos de papel Whatman nº
3 del mismo tamaño que la membrana, empapados en tampón de transferencia. Se
eliminaban las burbujas formadas entre las capas de papel y sobre ellos se colocaba
la membrana de PVDF. Después se colocaba el gel de acrilamida previamente
equilibrado en tampón de transferencia y finalmente, sobre el gel, se colocaban 6
trozos más de papel Whatman nº 3 empapados en tampón de transferencia. Se
colocaba el cátodo de acero y se aplicaba un amperaje constante de 0,25 A durante
30 min. Una vez transferidas las proteínas a la membrana de PVDF se procedía a la
tinción de la membrana con negro amido B10 con el objetivo de verificar que se había
Tesis Doctoral
Núria Granados Borbolla
262
cargado y transferido correctamente. El exceso de tinción de negro amido B10 se
eliminaba con varios lavados de agua bidestilada.
Incubación de la membrana: La membrana conteniendo la totalidad de proteínas se
bloqueaba durante 1 hora con PBS-Tween (Sigma) con 5% de leche en polvo. Tras
sucesivos lavados se incubaba con anticuerpo de RBP4 para ratón producido en
conejos (Axxora) durante 1 hora (PBS-Tween, 0,1% de BSA, 0,1% y anticuerpo
diluido 1:1000). Como anticuerpo secundario se utilizó anti IgG de conejo conjugado
a un complejo estreptavidina biotinilada-peroxidasa de rábano (Sigma) diluido 1:5000
en PBS-Tween y con 0,1 µg de BSA y 2% de leche en polvo. Tras 1 h se volvía a
lavar la membrana 3 veces (15, 5, y 5 min) con PBS y se procedía a la detección por
quimioluminiscencia del marcaje poniendo sobre la membrana reactivo de detección
(ECL)(Amersham).
Revelado y cuantificación. Se ponía sobre la membrana reactivo de detección (ECL)
Amershan, después se colocaban entre transparencias y se introducían en un casete
donde se exponían a películas fotográficas Hyperfilm ECL (Amersham) durante el
tiempo necesario para obtener una buena señal. La imagen era captada con el
transiluminador Chemigenius (Syngene) utilizando el programa GeneSnap
(Syngene). Las densidades de las bandas se cuantificaban con el programa
GeneTools (Syngene).
13. Aislamiento y cuantificación de ARN
Se utilizaban dos métodos distintos a la hora de extraer el ARN en función de la
cantidad de muestra. La extracción de ARN a partir de tejidos o células en cultivo
(frascos de 25 cm2, placas de 6 y 12 pocillos) se realizaba utilizando un reactivo
comercial basado en fenol e isotiocianato de guanidina que permite la lisis de las
estructuras celulares manteniendo la integridad del ARN (Tripure, Roche)
(procedimiento I). A la hora de extraer ARN de células cultivadas en placas de 24
pocillos (monocapa o 3-D), se utilizaba un kit comercial, E.Z.N.ATM. EaZy Nucleic Acid
Isolation (procedimiento II) que permite extraer ARN de una forma rápida y sencilla a
partir de pequeñas cantidades de muestra.
En ambos casos se siguieron las instrucciones de las casas comerciales.
Anexo I
Materiales y Métodos
263
Procedimiento I:
Las muestras de tejido se homogenizaban con Tripure (1 ml de Tripure por cada 100
mg de TAM, hígado o músculo y por cada 300 mg de TAB). En el caso de las células
en cultivo, las células se lavaban previamente con PBS frio y se añadía a
continuación el Tripure (40 μl Tripure/cm2). Cuando se trataba de muestras adiposas
se realizaba una centrifugación a 12000 g durante 10 min para eliminar la grasa. Para
la separación del ARN se añadían 200/50 μl (tejido/cultivo celular) de cloroformo
(Sigma) a las muestras y se agitaba vigorosamente durante 15 s. Las muestras se
dejaban reposar unos 5-15 min y posteriormente se centrifugaban 15 min a 12000g y
4ºC, recogiendo a continuación la fase acuosa superior, transparente, que contenía el
ARN mientras que la fase inferior, en la que se encontraban las proteínas y el ADN,
se guardaba a -20ªC. Para la precipitación del ARN se añadían 500/125 μl
(tejido/cultivo celular) de isopropanol (Sigma) y se agitaba ligeramente por inversión.
Las muestras se dejaban reposar al menos 10 min a temperatura ambiente o a -20ºC
toda la noche. Después, las muestras se centrifugaban a 12000g durante 15 min y se
obtenía así un precipitado de ARN. Se retiraba el isopropanol, se añadía 1 ml de
etanol al 75% (Panreac) y se agitaba vigorosamente durante 15 s. A continuación se
realizaba una centrifugación, esta vez a 7600g durante 5 min, obteniéndose así el
precipitado final de ARN. Una vez eliminado el etanol, el ARN se resuspendía en un
volumen apropiado (entre 20 y 200 μl) de agua libre de ARNasas (Sigma).
Para facilitar la resuspensión del ARN, las muestras se podían calentar en un baño
termostatizado a 60ºC. El ARN extraído se guardaba a -70ºC para su correcta
conservación.
Procedimiento II:
El kit de extracción de ARN, combina la lisis con isotiocianato de guanidina con la
rapidez y la purificación de las columnas con membrana de silica. Las células se
lisaban con 350 μl de tampón de lisis (isotiocinato de guanidina), se añadían 350 μl
de etanol al 70% para favorecer las condiciones de unión del ARN a la membrana de
las columnas y se mezclaba con la pipeta. El lisado obtenido se transfería a una
columna HiBind y se centrifugaba a 10.000g durante 1 min a temperatura ambiente.
Se descartaba el eluyente y se añadía a la columna los tampones incluidos en el kit
para la eliminación de posibles contaminantes y se centrifugaba en las mismas
condiciones anteriores. Finalmente se añadían entre 30-50 μl de agua libre de
ARNasas y se centrifugaba a 10.000g 2 min para eluir el ARN purificado.
Tesis Doctoral
Núria Granados Borbolla
264
Cuantificación y valoración del estado del ARN
Cuantificación: El ARN se cuantificaba por espectrofotometría (NanoDrop ND-1000),
valorando la absorbancia de las muestras a 260 nm. Una unidad de absorbancia a
260 nm corresponde a 40 μg de ARN por ml. Se realizaba también una medida a 280
y 230 nm y se calculaban los siguientes ratios: 260/280 y 260/230 indicativos del
grado de contaminación por proteínas y por disolventes orgánicos respectivamente.
Un ARN puro tiene valores de entre 1,8-2,0 para el ratio 260/280 y de 1,8-2,2 para el
ratio 260/230.
Valoración de la integridad del ARN. La integridad del ARN se comprobaba mediante
la carga de 0,25 μg de ARN, previamente mezclados con un tampón de carga, en un
gel de agarosa al 1% (Pronadisa) con bromuro de etidio. La visualización de dos
bandas correspondientes a los ARNs ribosomales 28S y 18S son indicativos de un
ARN en buen estado mientras que un difuminado de bandas indica que el ARN esta
degradado.
Tampones:
- Tampón de electroforesis: TBE 0,5 ´.
- Tampón de carga: glicerol, azul de bromofenol.
14. RT-qPCR
Retro-transcripción (RT): Para la síntesis de ADN-copia del ARN previamente
purificado se usaban 0,25 μg de ARN total diluidos en 5 μl de agua libre de
ARNasas (Sigma) previamente desnaturalizados a 65ºC durante 10 min. Para llevar a
cabo la RT se añadían 7,5 μl de una mezcla de RT que contenía: a) Tampón
(Promega); b) 2,5 mM de MgCl2 (Promega); c) 0,4 mM de nucleótidos (Invitrogen);
d) 5 μM de una mezcla de hexámeros sintetizados al azar (Applied Biosystems);
e) 5 μM de inhibidor de ARNasas (Applied Biosystems) y f) 2,5 U/l de transcriptasa
inversa (MuLV RT, murine leukemia virus reverse transcriptase, Applied Biosystems).
Las condiciones de retrotranscripción eran las siguientes: 15 min a 20ºC, 30 min a
42ºC y un paso final de 5 min a 95ºC. Todas las reacciones se llevaron a cabo en un
termociclador Perkin Elmer 9700.
Reacción en cadena de la polimerasa a tiempo real (qPCR): En éste caso se
utilizaban 2 μl de una dilución del ADN copia (desde 1/5 a 1/50, dependiendo de la
abundancia del gen problema en la muestra).
Anexo I
Materiales y Métodos
265
A la muestra se le añadían 4,25 µl de una mezcla de PCR que contenía: a) 0.5 μl de
agua libre de ARNasa; b) 0,313 μl de cebadores en dirección 5’-3’ y 3´-5’ (sigma)
diseñados para cada gen con el programa Primer3 (Whitehead Institute for
Biomedical Research, Cambridge, MA, USA) a una concentración que dependía de la
abundancia de cada ARNm, generalmente a 20μM) y c) 3,124 μl de una mezcla
comercial Power SYBR Green PCR Master Mix (Applied Biosystems). La PCR fue
llevada a cabo utilizando el sistema StepOnePlusTM (Applied Biosystems) con el
siguiente perfil: 10 min a 95ºC, seguido por un total de 40 ciclos que incluían una
desnaturalización durante 15 segundos a 95ºC seguida de una elongación de 1 min a
60ºC. Con el objetivo de verificar la pureza de los productos obtenidos, se realizó una
curva de desnaturalización después de cada PCR siguiendo las instrucciones de la
casa comercial. Adicionalmente, una vez finalizada la reacción se verificaba el
fragmento amplificado mediante la visualización con luz ultravioleta de un gel de
agarosa al 2% teñido con bromuro de etidio. Las imágenes se captaban con el
programa GeneSnap y las bandas se cuantificaban con el programa GeneTools. La
expresión relativa de cada ARNm se calculó de acuerdo a Pfaff, M. W., Nucleic Acids
Res. 2001 1;29(9):e45.(Kissane and Robins, 1958) utilizando distintos genes de
referencia en función del modelo celular, tejido y tratamiento (β actina, 18S, LRP10).
15. Medida de concentración de retinoides por HPLC
La cuantificación de los retinoides extraídos por HPLC (Agilent, Santa Clara, CA,
EE.UU.) en fase normal se llevó a cabo siguiendo el protocolo descrito por (von Lintig
and Vogt, 2000) (von Lintig and Vogt, 2000) con algunas modificaciones.
Brevemente, 1mg de hígado o tejido adiposo se homogeneizó en 100 μl PBS celular,
y se volvió a diluir en PBS 1:3 (vol: vol). Para la extracción se partió 70 a 100 μl de
suero, leche, u homogenado de tejido a los que se le añadieron 200 μl de metanol.
Después se añadieron 400 μl de acetona y la extracción se repitió dos veces usando
500 μl de hexano. Las fases orgánicas fueron secadas bajo una corriente de
nitrógeno y disueltas en solvente de HPLC .Para el análisis de HPLC se empleó una
columna Zorbax SB-C18 de 4,6 x 150 mm y tamaño de partícula 5 μm (Agilent). La
separación cromatográfica se logró por el flujo isocrático de una solución al 10% de
etilacetato: 90% de hexano con una velocidad de flujo de 1,4 ml/min. Al final del
proceso los retinoides fueron detectados por UV (λ absorción 325nm). El análisis de
los cromatogramas se realizó con el programa (Star Chromatography Workstation,
Varian Deutschland GmbH, Darmstadt, Germany).Para la cuantificación de
Tesis Doctoral
Núria Granados Borbolla
266
cantidades molares de retinoides, las integrales de los picos fueron comparadas con
cantidades conocidas de las sustancias de referencia.
16. Análisis morfométrico de tejidos
Fragmentos de tejido adiposo blanco inguinal e hígado frescos se fijaron por
inmersión con paraformalheído al 4% en tampón fosfato 0,1M toda la noche a 4ºC.
Las muestras se lavaron con tampón fosfato 0,1M. A continuación, se deshidrataban
las muestras sumergiéndolas secuencialmente en soluciones con concentraciones
crecientes de etanol (50, 75, 96 y 100%) hasta que finalmente se incuban en xileno.
Después las muestras se incluían en parafina y se dejaban solidificar en bloques a
temperatura ambiente. Posteriormente, los tejidos se cortaban con un micrótomo en
secciones de 5 μm de grosor y se tenían con hematoxilina y eosina. Las imágenes
del tejido se obtuvieron empleando un microscopio óptico (Zeiss Axioskop 2) y se
analizaron con el programa Axio Vision (Carl Zeiss Imaging Solutions).
Se calculó el diámetro de 200 adipocitos por cada muestra de tejido.
Reactivos:
- Paraformalheído (Sigma)
- Tampón fosfato 0,1 M (Tampón fosfato 0.2 M diluido 1:1 en H2O destilada)
- Tampón fosfato 0.2 M pH 7.2 (3.25 g NaH2PO4 H2O, 11.24 g Na2HPO4 en 1 L)
- Etanol absoluto (Panreac).
- Chile (Panreac)
- Paraplast (Sigma)
- Hematoxilina (Panreac)
- Eosina (Panreac)
17. Análisis Immunohistoquímico de tejidos
Se contaron las células inmunoreactivas al antígeno nuclear de células en proliferación
(PCNA) en tejidos adiposos inguinales de crías de ratas Wistar a día 21. Mediante el
método de avidina-biotina peroxidasa (ABCLas secciones de tejido se montaron en los
portaobjetos Super-Frost/Plus y se incubaron secuencialmente en: a) solución de tampón
citrato pH 6 durante 10 min en el microondas; b) peróxido de hidrógeno al 3% en metanol
durante 10 min, para bloquear la peroxidasa endógena; c) suero normal de cabra al 2%
en PBS, para reducir las tinciones inespecíficas que puedan aparecer antes de la
incubación con el anticuerpo primario y que incrementarían la señal de fondo. Después
se incubaron con el anticuerpo primario: anticuerpo policlonal anti-PCNA de conejo
Anexo I
Materiales y Métodos
267
(Santa Cruz Biotechnology cat. FL-261) diluido 1:50 en PBS, toda la noche a 4ºC.
Posteriormente, las muestras se incubaron a temperatura ambiente durante 30 minutos
con un anticuerpo secundario biotinilado anti-conejo (Vector cat. BA 1000) diluido 1:200
en PBS. A continuación se incubaron con el reactivo ABC (Vectastain ABC , Vector) que
porta la enzima peroxidasa ligada, disuelto en PBS, durante 30 min a temperatura
ambiente, y después se añadió 3,3’ Diaminobenzidine (DABA) incubando durante 3
minutos en oscuridad, permitiendo la actividad de la enzima peroxidasa. Finalmente, las
muestras se lavaron con agua destilada, se tiñeron con hematoxilina y fueron
deshidratadas con concentraciones crecientes de etanol y finalmente con xileno y se
montaron con Eukitt. Paralelamente a las muestras se procesaron controles negativos
por omisión del anticuerpo primario durante el proceso.
Reactivos:
- Peróxido de hidrógeno al 3% en metanol (*Sigma)
- H20 bidestilada
- PBS, pH 7.4: NaCl (Panreac) 137 mm, KCl (Panreac) 2.7 mm y fosfato
- sódico mono-/dibasic (Panreac) 10 mm.
- Etanol absoluto (Panreac)
- DAB (Sigma)
- Reactivo ABC, Vectastain ABC kit (Vector)
- Suero normal de cabra (Vector)- Citrato de Sodio (Panreac)
18. Análisis estadístico
Para el análisis estadístico se utilizaba el programa SPSS para Windows. En función
del tipo de variable y los grupos de estudio las diferencias se determinaban utilizando
el análisis de la media por t-student o por análisis de la varianza (ANOVA) de
medidas repetidas o univariante seguido del test de la diferencia menos significativa
(Least Significant Difference, LSD) También se utilizaron las correlaciones bivariadas
de Pearson. En todos los casos el nivel de confianza considerado era 95% (P<0,05)
o superior.
Tesis Doctoral
Núria Granados Borbolla
268
19. Bibliografía del Anexo I
Ramirez-Zacarias, J. L., Castro-Munozledo, F., and Kuri-Harcuch, W. (1992):
Quantitation of adipose conversion and triglycerides by staining
intracytoplasmic lipids with Oil red O. Histochemistry 97, 493-7.
Folch, J., Lees, M., and Sloane Stanley, G. H. (1957): A simple method for the
isolation and purification of total lipides from animal tissues. J Biol Chem 226,
497-509.
Kissane, J. M., and Robins, E. (1958): The fluorometric measurement of
deoxyribonucleic acid in animal tissues with special reference to the central
nervous system. J Biol Chem 233, 184-8.
Pfaffl, M. W. (2001): A new mathematical model for relative quantification in real-time
RT-PCR. Nucleic Acids Res 29, e45.
Hsu, S. M., Raine, L., and Fanger, H. (1981): Use of avidin-biotin-peroxidase complex
(ABC) in immunoperoxidase techniques: a comparison between ABC and
unlabeled antibody (PAP) procedures. J Histochem Cytochem 29, 577-80.


