Embed Size (px)
Citation preview

Graduate Theses, Dissertations, and Problem Reports
2016
Grainyhead-like 2 Reverses the Metabolic Changes Induced by the Grainyhead-like 2 Reverses the Metabolic Changes Induced by the
Oncogenic Epithelialmesenchymal Transition: Effects on Anoikis Oncogenic Epithelialmesenchymal Transition: Effects on Anoikis
Joshua C. Farris
Follow this and additional works at: https://researchrepository.wvu.edu/etd
Recommended Citation Recommended Citation Farris, Joshua C., "Grainyhead-like 2 Reverses the Metabolic Changes Induced by the Oncogenic Epithelialmesenchymal Transition: Effects on Anoikis" (2016). Graduate Theses, Dissertations, and Problem Reports. 5579. https://researchrepository.wvu.edu/etd/5579
This Dissertation is protected by copyright and/or related rights. It has been brought to you by the The Research Repository @ WVU with permission from the rights-holder(s). You are free to use this Dissertation in any way that is permitted by the copyright and related rights legislation that applies to your use. For other uses you must obtain permission from the rights-holder(s) directly, unless additional rights are indicated by a Creative Commons license in the record and/ or on the work itself. This Dissertation has been accepted for inclusion in WVU Graduate Theses, Dissertations, and Problem Reports collection by an authorized administrator of The Research Repository @ WVU. For more information, please contact [email protected].
Grainyhead-like 2 Reverses the Metabolic Changes Induced by the Oncogenic Epithelial-
mesenchymal Transition: Effects on Anoikis
Joshua C. Farris
Dissertation submitted to the School of Medicine at West Virginia University in partial
fulfillment of the requirements for the degree of
Doctor of Philosophy in Cancer Cell Biology
Scott Weed, PhD, Committee Chairperson
Linda Vona Davis, PhD
John Hollander, PhD
Elena Pugacheva, PhD
Christopher Cifarelli, MD/PhD
Steven M. Frisch, PhD, mentor
Cancer Cell Biology Program
Morgantown, West Virginia
2016
Keywords: EMT, grainy head like 2, GLUD1, metabolism, cancer stem cell, reactive oxygen species, anoikis
Copyright Joshua C. Farris 2016
Abstract
Grainyhead-like 2 Reverses the Metabolic Changes Induced by the Oncogenic
Epithelial-mesenchymal Transition: Effects on Anoikis
Joshua C. Farris
When deprived of connections to their extracellular matrix, normal epithelial cells
trigger a process of programmed cell death referred to as anoikis. The transcriptional reprogramming event known as Epithelial-Mesenchymal transition (EMT) confers anoikis resistance and ultimately, increased metastatic potential. Distant metastatic disease contributes to the majority of deaths occurring in many cancer types, especially those originating in breast tissue. The ability to metastasize depends critically upon a cancer cell’s ability to evade anoikis. Heterogeneity of tumors containing anoikis, therapy resistant populations likely explains the tendency of disease to reappear in distant locations after a period of apparent remission. The wound healing transcription factor, Grainyhead-like 2 (GRHL2), has been previously demonstrated to play an indispensable role in the maintenance of the epithelial phenotype through both suppression of EMT and promotion of the reciprocal event, Mesenchymal-Epithelial transition (MET), accompanied by suppression of the cancer stem cell (CSC) phenotype and re-sensitization to anoikis. Loss of GRHL2 expression is associated with aggressive, metastatic breast tumor types such as claudin low and basal B subclasses of tumor cell lines. Specifically, GRHL2 expression is lost in the cancer stem cell-like compartment of tumors characterized by their enrichment in the CD44hi/CD24low cell population and an EMT phenotype. Constitutive expression of the epithelial enforcer GRHL2 results in increased anoikis sensitivity as well as reduction in tumor initiating frequency. Here, the effects of GRHL2 upon intracellular metabolism in the context of reversion of the EMT/CSC phenotype, with a view toward understanding how these effects promote anoikis sensitivity were investigated. EMT resulted in enhanced mitochondrial oxidative metabolism. While this was accompanied by higher accumulation of superoxide, the overall level of Reactive Oxygen Species (ROS) declined, due to decreased hydrogen peroxide. Glutamate Dehydrogenase 1 (GLUD1) expression increased in EMT, and this increase, via the product α-ketoglutarate (α-KG), was important for suppressing

hydrogen peroxide and protecting against anoikis. GRHL2 suppressed GLUD1 gene expression, decreased α-KG, increased ROS and sensitized cells to anoikis. These results demonstrate a mechanistic role for GRHL2 in promoting anoikis through metabolic alterations.

iv
Dedication
This dissertation is dedicated to my loving wife Breanne Farris, who has consistently supported me through my undergraduate education, medical school, and graduate school. I would also like to dedicate this work to my parents Gena' and Mickey Farris, as well as my brother and sister-in-law Michael and Sun Hee Park. I would like to thank my mother and father-in-law, Richard and Susan Yingling, my sister-in-law Jerica Yingling, Collette, Eric, Aida, and Savannah Sites, as well as the rest of my family and friends. They have supported me through my frustrations, and celebrated my successes. Without their support through my doctoral training, I would have surely failed along with the many failed experiments. Lastly, I would like to dedicate this dissertation to my grandmother, Virgie Pauline Sprouse, whose struggle with cancer inspired me to embark on this path.

v
Acknowledgments
Steven Frisch for his excellent mentorship. He has demonstrated what being a true scientist actually entails. Dr. Frisch has a long standing track record of innovative work, and he consistently pushes his students to work on the cutting edge of scientific research.
Fred Minnear and the MD/PhD admissions committee for my acceptance into the program.
My thesis committee including Scott Weed, Christopher Cifarelli, John Hollander, Linda Vona Davis, and Elena Pugacheva who consistently provided valuable scientific insight throughout my time in graduate school.
Special thanks to Richard Getty for instilling a love of Biology in me early in my education, and for inspiring me to pursue a career as a scientist.
Thanks to Stephen Scott, who was an exemplary undergraduate research mentor who encouraged me to pursue a career in both medicine and research.
I would like to thank my labmate Phillip Pifer, with whom I’ve spent far too much time over the last four years. I would also like to thank previous lab members including Benjamin Cieply and Sun Hee Park for their excellent advice early in my training.
Finally, I would like to thank the MD/PhD program for both financial support to attain these degrees as well as consistent mentorship from both faculty and students to guide me through the difficult stages of my training.
vi
Table of Contents Title Page………………………………………………………………………………………………………………………i Abstract………………………………………………………………………………………………………………………...ii Dedication……..……………………………………………………………………………………………………………...iv Acknowledgements………………………………………………………………………………………………………..v Table of Contents…………………………………………………………………………………………………………...vi Chapter 1 - Part 1: Introduction and Literature Review………………………………………………...….1 Chapter 1 – Part 2: GRHL2 Transcription Factor Role in Cancer…..………………………………….48 Chapter 2 - Grainyhead-like 2 Reverses the Metabolic Changes Induced by the Oncogenic Epithelial-mesenchymal Transition: Effects on Anoikis……………………..……………………………70 Chapter 3 – The Effect of GRHL2 on Tumor Recurrence following Chemotherapy or Oncogene Withdrawal…………………………………………………………………………………………………124 Chapter 4 – EMT and ROS Mechanisms: A brief description of the NOX complex and FAT cadherins………………………………………………………………………………………………………………….. 142 Chapter 5 – The Role of Tubulins in Regulation of Anoikis through Mitochondria………….151 Chapter 6 – Overall Discussion and Future Directions…………………………………………………..177 Curriculum Vitae………………………………………………………………………………………………………...186 Appendix AI: Cieply B., Farris J., et al.: Epithelial-Mesenchymal Transition and Tumor Suppression Are Controlled by a Reciprocal Feedback Loop between ZEB1 and Grainyhead-like-2. Cancer Research 73(20); 1-11 Appendix AII: Pifer P, Farris J., et al., Grainyhead-like-2 inhibits the co-activator p300, suppressing tubulogenesis and the epithelial-mesenchymal transition. Under review Molecular Biology of the Cell 2016.

1
Chapter 1 Introduction and Literature Review
2
Epithelial-to-Mesenchymal Transition
Epithelial vs. Mesenchymal Cell Adhesion/Polarity
The major role of epithelial tissues is to function as barriers to physiologically
separate compartments. Epithelial cells display a unique gene expression profile relative to
mesenchymal cells which endows them with the ability to achieve the two major
characteristics of epithelial tissues: cell-cell adhesion and cell polarity. Phenotypically,
epithelial cells have a tendency to exist as a monolayer in a classically described cobblestone
pattern appearance often seen in two-dimensional tissue culture. These epithelial
monolayers are maintained due to the expression of specific epithelial proteins including E-
cadherin, occludins, desmogleins, claudins, and desmocollins located at cellular junctions (1-
3). In vivo, however, epithelial cells generally polarize resulting in one side of cells attaching
to extracellular matrix (ECM) with its basal side attached to the basement membrane, while
the apical surface is oriented toward the lumen of a vessel or duct. Epithelial cells rely on
basolateral membrane interactions in order to survive (see section on anoikis below). Cells
maintain polarity through organization of tight junctions via claudins and occludins, which
restriction the diffusion of integral membrane proteins from apical to basolateral
membranes (4). Rab25 and Ankyrin G are epithelial-specific proteins found in the cytosolic
compartment of cells which act to ensure proper localization of junctional proteins (5, 6). A
major example of how the epithelial architecture maintained by cell-cell adhesion molecules
contributes to the gene expression profile of epithelial cells is that of Epithelial-cadherin, or
E-cadherin. The extracellular domain of E-cadherin functions to interact homophilically with
the extracellular region of adjacent cell E-cadherin proteins. The intracellular domain acts
3
to orchestrate cortical actin assembly, cell polarity, and influences gene expression through
sequestration of β-catenin, all contributing to the epithelial phenotype (7, 8).
Conversely, mesenchymal cells either do not express, or express very low levels of
many of the previously mentioned junctional proteins. In fact, a microarray comparison of
epithelial vs mesenchymal gene expression profiles reveals that these two phenotypic cell
variants differ dramatically (9). The inability to produce tight junctions, adhere with
neighboring cells, and thus establish apical-basolateral polarity results in failure to maintain
barriers like their epithelial counterparts. Mesenchymal cells tend to migrate as individual
cells, and they are generally significantly more invasive (10). Due to these features,
mesenchymal cells lack the same dependence on their extracellular matrix for survival as do
epithelial cells, resulting in their resistance to cell death when detached from their matrix
(see anoikis section below) (11-15). In addition to the loss of cell adhesion and polarity
associated proteins, mesenchymal cells gain expression of other mesenchymal markers such
as N-cadherin, vimentin, fibronectin, and upregulation of transcription factors associated
with repression of the epithelial phenotype (more on this in a later section).
Whereas epithelial cells tend to form linings of organs or ducts due to their ability to
establish strong barrier compartments, normal mesenchymal cells in adults tend to be
involved in establishment of the extracellular matrix, as is the case with normal adult
fibroblasts, or they give rise to other tissue types altogether, as is the case with Mesenchymal
stem cells (MSCs). For example, MSCs can give rise to adipocytes, osteoblasts, and
chondrocytes.
Epithelial-to-Mesenchymal Transition: Role in Normal Physiology
4
The epithelial-mesenchymal transition (EMT), a process implicated in cancer
progression as well as other pathogenic processes such as fibrosis, describes a major shift
which endows epithelial cells with characteristics of mesenchymal cells including disruption
of cell-cell adhesion, acquisition of increased motility and invasiveness, chemotherapeutic
resistance, and resistance to anoikis. While cellular plasticity between these two states can
drive the progression of disease, in the context of normal physiological function, EMT and its
converse process termed mesenchymal-to-epithelial transition (MET), are indispensable to
events such as embryological development and wound healing (16). Three separate
categories of EMT have been described which vary based on the tissue involved as well as
the resulting changes (17). Type 1 EMT refers to implantation, embryo formation, and organ
development. For example, both Snail1 and 2, well established EMT associated transcription
factors, are required in early embryogenesis, as it has been demonstrated that embryos
depleted of these factors fail to gastrulate as a result of unyielding epithelial junctions of
mesodermal cells, preventing formation of the primitive streak (18, 19). The importance of
EMT plasticity is also displayed soon after primitive streak formation, where strong
epithelial junctions are required for neural tube closure, which is followed immediately by
an EMT event which is required during neural crest delamination (20-22). These EMT’d
cells then migrate away from the neural tube only to MET in order to develop into structures
such as the somites and the notochord (23).
In adults, wound healing is a dynamic process that requires plasticity between
epithelial and mesenchymal states. Type 2 EMT refers to the cellular transitions that occur
during wound healing, tissue regeneration, and organ fibrosis. Epidermal wound healing
5
requires the activity of myofibroblasts both for wound contractility as well as restructuring
of the extracellular matrix. Keratinocytes at the wound border recapitulate the process of
EMT by exhibiting a partial EMT or “metastable” phenotype in which they are able to move,
advancing an attached epithelial sheet rather than invading as individual cells (23, 24). TGF-
β induced EMT of epithelial cells also occurs within an organ in some pathogenic states, and
this can contribute to the tissue fibrosis wherein fibroblasts generate excessive levels of
collagen (25).
EMT and Oncogenesis
Aberrant regulation of normal cellular processes such as cellular proliferation and
growth are common features to many malignancies. EMT is another example of a normal
process that is often employed inappropriately in the context of cancer progression. Type 3
EMT refers to plasticity between epithelial and mesenchymal states that results in metastatic
progression of malignant disease. A multitude of (epi)genetic changes can alter oncogene
and tumor suppressor expression resulting in neoplastic growth. This growth is typically
characterized by increased proliferation and angiogenesis. Many cues in the
microenvironmental milieu can influence cell fate and result in induction of EMT such as
nutrient or oxygen starvation (26, 27). It is well established that oncogenes are known to
induce senescence in some contexts. There is evidence to suggest that cancer cell EMT
events may play a role in the escape of oncogene-induced senescence, thereby leading to the
acquisition of many deleterious traits by cancer cells (28-30). These traits will be detailed
below.
6
Migration, Invasion, and Chemotherapeutic Resistance
While aberrant epithelial cell proliferation and angiogenesis are indeed early
hallmarks in the initiation of epithelial cancers, the major event which signals the onset of
metastatic dissemination of these carcinomas is invasion, often conferred by EMT, leading to
cancer cells passing through the basement membrane (17, 31). A widely studied feature that
EMT induces in carcinomas is the gain of migratory and invasive properties, as this is
considered the final stages in the cascade of oncogenesis leading to metastatic dissemination
of disease. The association of EMT with invasion has been observed in many in vivo and in
vitro experimental models in which carcinoma cells acquire mesenchymal traits and
upregulate mesenchymal markers such as α-SMA, FSP1, vimentin, and desmin at the invasive
front of primary tumors – the ultimate result being the activation of the metastatic cascade
including intravasation, circulatory transport to a secondary site, extravasation and
formation of micrometastases (17). Generally speaking, one of the major alterations that
occurs as a result of EMT that influences this invasion is the loss of the cell-cell adhesion
intermembrane protein E-cadherin. Experimentally, enforced expression of E-cadherin
abrogates invasive properties in cancer cells, and clinically, expression of E-cadherin is
associated with lower risk of tumor invasion (32-35). E-cadherin may block these invasive
traits either physically, a result of homophilic interactions with the extracellular domain of
other E-cadherin molecules favored more highly than interactions with extracellular matrix.
This invasive phenotype is also influenced through other pathways that E-cadherin interacts
with such as polarity complex interactions, sequestration of pro-survival factors such as
NRAGE, β-catenin, YAP/TAZ (signaling molecules involved in HIPPO signaling), and Smad3
(critical for TGF-β signaling). These pathways will be discussed further in discussions of
7
anoikis below. In addition to the association with metastatic phenotype, EMT also confers
upon cancer cells the pro-survival effects of chemotherapeutic resistance to cytotoxic
chemical agents and radiation which have been extensively documented (36-39).
EMT confers Cancer Stem Cell Properties
It was long ago hypothesized in pioneering work, originally in the context of
hematological malignancies, that only a small subpopulation of the leukemic cancer cell lines
has the intrinsic ability to recapitulate the original disease (40-43). This notion has held true
in solid tumors as well, specifically in the context of breast and brain cancers (44, 45). This
subpopulation is known as cancer stem cells (CSC) or tumor initiating cells (TICs). There are
several explanations for the origins of these populations in tumors. For example, it was
demonstrated by Eric Landers group that phenotypic equilibrium between non-CSC and CSC
populations are the result of “stochastic state transitions” which is predictable given a
particular mathematic algorithm (46). It has also been reported that EMT results in the
acquisition of stem cell markers, an increased ability to form mammospheres as well as
increase in the ability to seed tumors in animal hosts, both well-established characteristics
of stem cells (47). Subsequent work has demonstrated that it is possible to physically
segregate two populations from a single tumor sample which differ in their cell-surface
antigen marker profiles (eg. CD24 and CD44 cell surface markers in the case of breast
cancer). Of critical importance is the observation that when re-implanted in vivo, these CSC
populations then produce tumors which are pre-dominantly not CSCs, demonstrating their
stem cell-like self-renewal properties. These observations present a unique challenge to
therapeutic intervention in that if any CSCs are not eradicated in the treatment of the
8
primary malignancy, they contain the ability to regenerate the entire disease in the form of
local recurrence or even drive the emergence of distant disease at metastatic nodes.
The field of CSCs/TICs is quite controversial, both in terms of their origin as well as
what percentage of the total malignancy they truly comprise (44). A common CSC surface
profile used in the case of breast cancer is the CD44HIGH/CD24LOW phenotype which has been
used to isolate the tumorigenic from the non-tumorigenic population (45). It was shown by
Mani et al. that normal immortalized human mammary epithelial (HMLE) cells display a
phenotypic conversion toward the CD44HIGH/CD24LOW phenotype following induction of the
EMT program (47). It has also been demonstrated that a distinct group of EMT’d cells exists
within the epithelial HMLE cell line termed MSP or mesenchymal-subpopulation which is
dependent on paracrine and autocrine signaling pathways including TGF-β, canonical as well
as noncanonical Wnt activation, as well as BMP pathway inhibition (10). A recent
publication by Scheel et al. however, demonstrated that transient Twist1 activation
permanently alters cell state and primes epithelial cells for stem cell-like properties which
did not require permanent acquisition of the EMT phenotype (48). This finding informs the
intimidating reality that any tumor cell subjected to the proper conditions in the tumor
microenvironment may undergo EMT and thus potentially become a cancer stem cell
highlighting the need for targeted therapy to eradicate this subpopulation.
The extent of involvement of EMT/MET in the area of metastasis is an area of
controversy in the field currently. Reversion of mesenchymal to epithelial cells in some
contexts has been shown to enhance metastatic colonization (17). This has led to the
establishment of a theory opposing the prevailing dogma that instead of EMT as a culprit for
metastasis, MET is the critical event which ultimately leads to the establishment of
9
secondary tumors and eventual death of cancer patients. For example, it has been
demonstrated by Nieto and colleagues that downregulation of the EMT inducing homeobox
transcription factor Prrx1 is required for cancer cells to seed metastatic locations in vivo;
however, it was noted in this study that Prrx1 overexpression does not induce cancer stem
cell-like traits as does ZEB1, Twist, or Snail mediated EMT events as previously described
(47, 49-51). In fact, breast cancer metastases are typically epithelial and express E-cadherin
(52). However, it is undeniable that EMT invokes many traits in cancer cells associated with
aggressiveness, invasion, anoikis resistance, therapeutic resistance, and tumor recurrence.
A potential reconciliation of these views are that EMT/MET plasticity is in fact the major
force to endow cancer cells with their malignant properties. An extension of this
interpretation would imply that either EMT or MET could be viewed as tumor suppressive
or oncogenic events depending on the stage of disease progression. This observation that
metastatic tumors often do not resemble the mesenchymal cells which gave rise to them is
likely a consequence of differing local microenvironmental stimuli encountered following
extravasation into distant organs, where the stress signals initially invoking EMT in the
primary tumor are no longer present (31, 53, 54). It is clear that a better understanding of
the major regulators of EMT and MET is critical in order to prevent the emergence of
treatment resistance metastases and recurrence.
Regulation of EMT
EMT Induction – Transcription Factors
Many factors are known to induce EMT. These factors far outweigh the number of
EMT inhibitory elements. A multitude of extracellular signals originating from the stromal
tissue associated with the primary tumor are known to stimulate the EMT program including
10
HGF, EGF, PDGF, and TGF-β. These growth factors activate a horde of receptors to ultimately
result in the induction of many proteins including major EMT inducing transcription factors
such as Snail, Slug, Twist, Goosecoid, FOXC2, and ZEB1. Many of these factors when
overexpressed alone, can lead to the orchestration of the EMT program, while the
mechanism varies. Snail and ZEB1, well established E-box binding transcription factors,
function as direct repressors of epithelial genes such as E-cadherin (55-58). Twist,
Goosecoid, and FOXC2 are inducers of EMT which coordinate through more indirect means,
typically through Snail or ZEB1 upregulation (9, 23). Supporting the view of the role of
oncogenic EMT, overexpression of these transcription factors leads to progression of
malignancy in multiple models.
Very well characterized signaling networks including PI3K, Akt, ERK, MAPK, Ras,
RhoB, β-catenin, LEF, c-FOS, and Smad are critical components of the implementation of the
EMT program (17). Cell surface integrins also play a role in the activation of EMT, enabled
by the disruption of cell-cell and cell-matrix adhesions (30, 47, 59). As previously mentioned,
YAP and TAZ, critical components of the Hippo signaling pathway, are examples of pro-
survival transcription factors that are also sequestered by cell-cell and epithelial cell polarity
complexes (9, 60). Homeoproteins such as HOXA5, LBX1 and SIX1 are further examples of
well-established TFs involved in developmental EMT which also play a role in the oncogenic
EMT, through direct transactivation of the ZEB1 promoter (61-63).
TGF-β superfamily ligands bind to TGF-βR1/R2 heterodimeric receptors resulting in
the serine phosphorylation of Smad2/3 (often referred to as R-Smads or receptor regulated
Smads), which then can bind Smad4, resulting in nuclear translocation and upregulation of
many genes ranging from growth inhibitory to EMT activating genes such as ZEB1 (64, 65).
11
It is in large part this enormous range of regulated genes that gives the TGF-β-Smad2/3 axis
its context dependent, and seemingly paradoxical effects of either oncogenesis or tumor
suppression (66, 67). Recently published work by our lab shines some light on what
determines which response a cell line will have to TGF-β signals (ie. Growth arrest vs EMT).
This will be discussed further below in the section on Grainyhead-like 2.
Inhibition of EMT
As is evident above, many factors contribute to the induction of the EMT process;
however, there are relatively fewer inhibitors of oncogenic EMT. Included in this list are
BMPs, the mir200 family, ESRP1/2, and the human homologue of drosophila Grainyhead,
Grainyhead-like 2 (GRHL2). BMPs or Bone Morphogenetic Proteins, named for their ability
to induce formation of bone and cartilage, belong to the TGF-β superfamily (68). BMPs
represent a major class of EMT inhibitors which induce MET through inhibition of TGF-β
signaling. Overexpression of BMP family members has been shown to enforce the epithelial
phenotype, and pharmacologic studies have verified that TGF-β receptor inhibition results
in effects mimicking that of BMPs (10, 68-70). Further, the BMP functional inhibitors chordin
and gremlin are known to enhance TGF-β induced EMT (71). This signaling is accomplished
via BMP ligand binding to BMPR1A/R1B heterodimeric complexes resulting in R-Smad1/5
phosphorylation, which complete with R-Smad2/3 for binding to Smad4 (70).
EMT is further controlled by microRNAs, specifically those of the miR-200 family.
These small noncoding endogenous regulators of gene expression have been shown to be
downregulated during EMT, and their enforced expression inhibits TGF-β induced EMT and
is sufficient to initiate MET in mesenchymal populations (72). It has been well established
that the primary mechanism by which the miR-200 family acts to enforce the epithelial
12
phenotype is through post-transcriptional repression of ZEB1/2, and in fact, a negative
feedback loop has been demonstrated such that ZEB transcription factors transcriptionally
repress miR-200 expression (64, 72-76).
Yet an additional example of post-transcriptional regulation of the EMT phenotype is that
of the mRNA splicing factors ESRP1 and ESRP2. These splicing regulatory proteins are
downregulated during EMT. Their depletion by shRNA results in EMT associated with loss
of cell polarity and characteristic upregulation of fibronectin, a mesenchymal associated
extracellular matrix glycoprotein, and the intermediate filament vimentin. Interestingly, it
has been reported that loss of ESRP1 and 2 contributes to the acquisition of EMT traits by
independent mechanisms. Stable knockdown of ESRP1 has been shown to result in change
in cell motility via induction of Rac1b, whereas loss of ESRP2 results in abrogated cell-cell
adhesion through induction of EMT associated transcription factors (77).
Finally, another major negative regulator of EMT is one of the three mammalian
homologues of drosophila Grainyhead, known as Grainyhead-like 2 (GRHL2 - also known as
TFCP2L3 or BOM). GRHL2 represses the oncogenic EMT through multiple mechanisms
including direct repression of the ZEB1 promoter, upregulation of miR-200b/c, upregulation
of BMP2, and inhibition of TGF-β-Smad2/3 mediated transcription (78, 79). These and other
findings have established GRHL2 as a master regulator of the epithelial phenotype and
repressor of EMT plasticity. A more detailed review of the functions of Grainyhead-like 2
transcription factor in the context of cancer will be presented in a later section.
Anoikis
Physiological Role of Anoikis
13
Normal epithelial cells undergo a program of apoptosis when detached from their
ECM or when attached to an inappropriate matrix termed “anoikis”(11). Anoikis, the Greek
word meaning “homelessness,” is a normal apoptotic process which ensures epithelial cells,
which are often shed at a high frequency, are eradicated, such as in the case of skin or colonic
epithelium (15). The process of anoikis ensures that cells are unable to take up residence in
inappropriate locations. What factor(s) establish sensitivity vs resistance to anoikis has
been the major question in the field since its discovery.
This is of significant importance in the case of oncogenic transformation of cells.
Anoikis prevents the translocation of cells which have (epi)genetic changes from attaching
elsewhere and exploiting their growth/survival advantages at these secondary locations.
Metastasis of cancer cells requires the suppression of anoikis (80-83). The apoptotic
mechanism induced by detachment is not specific to this context, and is regulated by normal
death-effector machinery common to other forms of cell death signaling pathways (84).
Therefore, regardless of the exact mechanism of activation, these signals typically culminate
with mitochondrial outer membrane permeabilization (MOMP), resulting in the release of
cytochrome c generating a caspase-9 containing apoptosome, ultimately activating effector
caspases. Bcl-2 family proteins play anti/pro-apoptotic roles upstream of mitochondrial
membrane permeabilization, cytochrome c release, and apoptosome formation as in other
apoptotic settings. In this vein, BH3-only family genes (including Bim, Bad, Bmf, Noxa, and
Puma) are exquisitely sensitive to integrin-assisted signal transduction, and these pathways
have been widely characterized in the setting of anoikis (85). For example, Bim, a BH3-only
family protein, has been shown to act as a mediator of anoikis dependent on β1-integrin
engagement, EGFR downregulation, and inhibition of the Erk pathway in detached basal
14
mammary epithelial cell line MCF10a cells (86). While the results do not appear
generalizable to all cell lines or contexts, death receptor signaling has been reported to be
involved in anoikis signaling such that the FAS-associated death domain protein (FADD) has
been shown to contribute to anoikis sensitivity, though the precise mechanisms are unclear
(87).
The influence of other inputs upstream of the apoptotic machinery which influence
anoikis such as reactive oxygen species and metabolism have been topics of significant
recent research. The contribution of these variables to differences in anoikis sensitivity
endowed by the epithelial-mesenchymal transition is poorly understood however, and will
be discussed further below.
The Oncogenic Epithelial-to-Mesenchymal Transition Confers Resistance to Anoikis
Among their many deleterious traits, metastatic tumor cells have a compromised
anoikis response (14, 88). As discussed previously, EMT is generally viewed as a major
contributory program driving metastasis. In addition to increasing migratory and invasive
properties, it has become well established that EMT also induces anoikis resistance in cancer
cells (14, 89, 90). As was alluded to earlier, many of the core cellular signaling pathways
involved in the implementation of the EMT program such as PI3K/Akt and MAPK activation
also contribute to cell survival in general, anoikis being no exception (91).
E-Cadherin: Ankryin-G, Wnt/β-catenin and TGF-β, and HIPPO Contribute to Anoikis
In the seminal work in which anoikis was first identified, epithelial cells, specifically
Madin-Darby canine kidney epithelial (MDCK) cells, were noted to be exquisitely sensitive
15
to this mode of apoptosis, especially when grown to confluence, an observation also reported
elsewhere (11, 92). While the mechanism contributing to this phenomenon is not fully
explained, several points of evidence point to a major role of the cell-cell adhesion protein E-
cadherin to explain these findings. In a p53-dominant negative tumor model, depletion of E-
cadherin in a conditional knockout significantly increased tumor metastasis in vivo;
moreover, the resulting cell lines produced from this study were anoikis resistant compared
to their E-cadherin positive counterparts (93). These findings have also been further
generalized to include the Human Mammary Epithelial Cell line (HMLE) cells (94).
Interestingly, the major characterized pathways upstream of anoikis resistance observed in
mesenchymal cells have a common node emanating from the cell-cell junctional protein E-
cadherin. These pathways include the Ankryin-G/NRAGE/p14ARF, Wnt/β-catenin, and the
HIPPO/YAP/TAZ pathways. While these pathways contribute in individual ways to both
EMT, and its conferred anoikis resistance, they are highly interrelated, resulting in significant
cross talk between each pathway (95). Each of these pathways and their contribution to
anoikis resistance in the context of EMT will be outlined below.
Our lab previously reported the role in anoikis of the E-cadherin associated gene,
Ankyrin G (Ank-3), an epithelial cytoskeletal linker protein responsible for sequestration of
the transcription factor NRAGE. NRAGE was found to be sequestered by Ankyrin-G,
preventing its nuclear translocation where it typically represses the pro-apoptotic gene
p14ARF; however, in the context of EMT, E-cadherin and Ankyrin-G downregulation result
in unhindered NRAGE to undergo nuclear translocation, repress p14ARF and contribute to
anoikis resistance (12). E-cadherin further influences anoikis sensitivity by way of the
Wnt/β-catenin signaling axis. In the context of E-cadherin depletion, which by its

16
intercellular domain acts to sequester β-catenin, HMLE cells exhibited an increase in β-
catenin phosphorylation, stability, and nuclear translocation, resulting in transactivation of
target genes and anoikis resistance (94).
Apical/baso-lateral polarity was described above as a major trait of epithelial cells -
one that is lost during EMT, either by downregulation of these components or failure of
proper localization (96-98). Crumbs, Par and Scribble are polarity complexes in normal
epithelial cells which contribute to apical, apical/basolateral border, and basolateral side
polarity, respectively (99). The HIPPO kinase pathway has previously been well established
as a critical regulator of organ size during development (100). Cell-cell contacts promote the
formation of the polarity complexes Crumbs, Par, and Scribble; interactions of the HIPPO
signaling pathway with these complexes results in phosphorylation and cytoplasmic
sequestration of the pro-survival factors YAP/TAZ (95, 101, 102). When in their
unphosphorylated forms, YAP/TAZ are localized to the nuclear compartment, where they
interact with Smad proteins (TGF-β signal transducers discussed previously) to activate a
large variety of target genes. Loss of cellular polarity is thought to result in resistance to
anoikis, at least in part, through deficient HIPPO kinase cascade activation where
cytoplasmic retention of YAP/TAZ transcriptional co-activators is lost, resulting in nuclear
translocation and repression of pro-apoptotic protein Bim. Further evidence that cell
polarity established through HIPPO kinase cascade is linked to anoikis was shown where
luminal clearance, a process in which anoikis is required, was shown to be reliant on the cell
polarity complex Scribble assessed by MCF10a mammary morphogenesis assays (103).
Of note, the apoptosis stimulating protein of p53 effector protein, ASPP1, acts as an
activator of YAP/TAZ transcriptional activity through inhibition of kinases LATS1 or LATS2,
17
which normally modify these survival co-activators such that they are tagged for nuclear
export and degradation. It has been reported that ASPP1 mediated downregulation of Bim
mediates cell survival, enhanced cellular migration, and anoikis resistance, indicating an
oncogenic role of this HIPPO associated protein, although the exact mechanism of Bim
downregulation is unclear at present (104). Further, EMT induced mislocalization of
scribble resulting in TAZ activation and increased anoikis resistant mammospheres (102).
Hippo signaling may explain the initial observations of increased sensitivity to anoikis of
confluent MDCK cells, as it has been reported that the Crumbs complex acts as a mode of
sensing cellular density, and these signals are relayed through YAP/TAZ interaction with the
TGF-β pathway (105).
Alternative to inhibition of direct transactivation of pro-survival target genes of YAP
and TAZ, the HIPPO pathway also functions to inhibit the Wnt and TGF-β pathways, both of
which contribute to EMT and anoikis resistance (described above). This is accomplished
through direct protein-protein interactions of phosphorylated forms of YAP/TAZ with the
Crumbs polarity complex and Smads, resulting in inhibition of both pathways. Therefore,
cellular polarity is able to regulate TGF-β signaling beyond E-cadherin direct sequestration
of β-catenin. This is accomplished through YAP/TAZ binding to Smad3, which relies on
receptor mediated phosphorylation through TGF-βR1/R2. LATS1/2 phosphorylation of
YAP/TAZ results in sequestration of these factors to the cytoplasm, effectively binding
Smad3 to this compartment as well (95, 106) . Therefore, upon loss of cell polarity, Smad
sequestration by YAP/TAZ is inhibited, allowing for further reinforcement of EMT through
TGF-β signaling. It has also been demonstrated that phosphorylation of YAP is regulated
through a integrin-matrix interaction involving actin-tubulin rearrangement where cell
18
detachment activates LATS1 and LATS2 resulting in YAP sequestration (107). Cross talk of
the HIPPO pathway with Wnt activation is also present, as it has been demonstrated that
through Casein Kinase I (CKI), YAP and TAZ interact with the disheveled homologue Dvl,
inhibiting its activation, resulting in canonical Wnt inactivation (108). Thus, these findings
demonstrate the multiple levels of regulation on the HIPPO pathway and cross-talk between
other critical pathways for control of anoikis and demonstrates how these are influenced by
the EMT phenotype.
Interestingly, there are cellular polarity complexes whose role in contributing to
anoikis pathways seems limited or context dependent. Loss of scribble in keratinocyte
models have revealed alterations in cell invasion with very little effect on anoikis; however,
depletion of Dlg1 (disc large homologue 1) results in maintenance of cell polarity but
significantly suppresses anoikis (109).
Direct Influence of EMT regulatory Transcription Factors on Anoikis
Above, an indepth review of major transcription factor regulation of the process of
EMT itself was given. Here, the modification by these EMT associated transcription factors
to the core apoptotic machinery will be described. As was mentioned earlier, the major E-
box binding transcription factors Snail, Slug, Twist, and ZEB1/2 act predominantly as
transcriptional repressors of the major adhesion genes such as E-cadherin, and those
components contributing to the formation of tight junctions and desmosomes. Given the
known critical function of maintenance of cell polarity on preserving anoikis sensitivity, it
follows that these EMT factors which disrupt cell polarity will indirectly result in
suppression of anoikis due to dysregulation of the pathways described above.
19
These transcription factors also contribute to the acquisition of anoikis resistance
through regulation of cell-survival factors as well. ZEB1 represses the pro-apoptotic gene
Tp73 through direct E-box binding to intron 1 (110). Snail has been described to contribute
to cell survival pathways through upregulation of MAPK and PI3K signaling pathways (111).
Both, Snail and Slug have been reported to promote resistance to cell death through direct
transcriptional repression of pro-apoptotic genes such as BID and caspase-6 (112). Snail also
has been shown to suppress genes associated with p53-mediated apoptosis, promoting cell
survival (113). The pro-apoptotic gene p14ARF was described above as the major target of
the Ankyrin-G sequestered transcription factor NRAGE, which is released following EMT
(12). Myc induced apoptosis has been shown to rely on formation of the pro-apoptotic Myc-
ARF complex (114). Twist mediates direct repression of p14ARF, preventing apoptosis by
interfering with the ability of Myc to form this complex, thereby collaborating with Myc to
result in a transformed phenotype rather than inducing cell death (115). The transcriptional
co-repressor CTBP is generally required for EMT induction and attenuation of anoikis (55).
Mechanistically, this may occur through ZEB1 co-repression of E-cadherin (15), but it has
also been demonstrated that CTBP can repress Bik (Bcl-2-interacting killer) resulting in
further repression of the anoikis response (116).
In some contexts, NF-κB is a critical component of EMT initiation in response to
inflammatory pathway activation (117, 118). This signaling pathway has also shown to be
critical for anoikis regulation in both the context of intestinal epithelial cells, as well as in
basal breast mammary epithelial cells where DBC1 was reported to stimulate NF-κB
pathway activation through direct interaction with IKK-β, stimulating its kinase activity,
which increased NF-κB transcriptional upregulation of c-FLIP and bcl-xl survival factors
20
(119, 120). Other pro-survival target genes of this pathway include several members of the
IAP (inhibitor of apoptosis) family, bcl-2, CFLAR, survivin, and XIAP (15). Survivin
specifically has been shown to mediate anoikis resistance via complex with XIAP which
activates transcriptional activity of NF-κB to result in fibronectin increase which maintains
clustering and β1-integrin signaling to rescue from anoikis (121).
FAK and ILK signaling pathways– Anoikis and EMT
Activation of FAK and ILK pathways results in suppression of anoikis (92, 122). This
is generally by promoting the epithelial-mesenchymal transition resulting in the repression
of epithelial adhesion genes such as E-cadherin through multiple pathways; however FAK
has been reported to influence expression of multiple E-box binding transcription factors
such as Snail, Twist, and ZEB1/2 (123). Co-localization of these proteins with integrins links
activation of these pathways with integrin-ligand cell-ECM interactions (124-126). FAK and
ILK are activated by attachment to matrix components such as collagen and influence EMT
inducing machinery as well as are activated by growth factor induced EMT (mediated by
TGF-β, EGF, HGF, etc.) (127-130).
While EMT linked anoikis resistance appeared to be an insurmountable obstacle to
cancer researchers for many years, the emergence of master regulators of the epithelial
phenotype (e.g. GRHL2) give hope to the possibility that EMT suppression and enhancement
of anoikis sensitivity in cancer cells might be a therapeutic possibility through determination
of pathways which suppress these important transcription factors (of significant interest are
the Wnt, TGF-b, and BMP pathways). This would inform treatment protocols and may
greatly reduce metastasis and disease recurrence usually associated with the EMT
21
phenotype. The mechanisms of GRHL2 induced MET and anoikis sensitivity will be
discussed in great detail in later sections. First, alternative contributors to the induction of
anoikis will be highlighted.
Reactive Oxygen Species
Reactive Oxygen Species and Intratumoral Cellular Metabolic Needs
It is not fully clear why cancer cells initially engage a program of phenotypic and
(epi)genetic alterations, such as EMT, that ultimately culminate with leaving their primary
site. This has pointed to the idea that a problem exists in their primary microenvironment.
Oncogenic mutations in tumors generally lead to properties that are advantageous to the
tumor in the short term such as increased proliferation; however, the primary site in which
they are located typically lacks the vasculature to support this activity, leading to challenges
such as lack of carbon source nutrients, hypoxia, and resulting reactive oxygen species
accumulation.
In some cases, oncogenic alterations may in fact be harmful and threaten cell survival.
As was mentioned earlier, c-Myc forms a complex with p14ARF, which, if not accompanied
by defects in the basic apoptotic machinery, will lead to devastating consequences. In the
case of oncogenic EMT, E-cadherin and the associated cytoskeletal linker protein, Ankyrin-
G, are downregulated, resulting in NRAGE nuclear translocation and suppression of p14ARF,
which is also directly suppressed by Twist activation (12). Prior to an increase in
angiogenesis, the rapidly proliferating tumor cells can be exposed to hypoxic conditions.
This results in the need for tumor cells to increase their anabolic processes in the face of
anaerobic conditions.
22
There is evidence that these challenges to the tumor microenvironment may be the
very driving force to invoke adaptive changes such as the EMT transcriptional program. This
is demonstrated by observations that in hypoxic conditions, HIF1α stabilization occurs,
resulting in the induction of a myriad of genes to combat the hostile environment. Hypoxia,
paradoxically, results in the generation and accumulate of reactive oxygen species (80).
Stabilization of HIF1α, usually targeted for ubiquitination by Von-Hippel-Lindau protein
(VHL) (131), results in the induction of multiple antioxidant genes (80) as well as EMT
inducing transcription factors including Twist, Snail, and ZEB1 (27, 132).
While high ROS levels are known to induce various types of cell damage, tumor cells
have been reported to have higher ROS relative to “normal” tissues, and are thought to
upregulate antioxidant enzymes in order to keep ROS within a “non-lethal” threshold limit.
Of importance, the observation that tumors generally have elevated ROS levels (133), comes
with the caveat that these comparisons normally compare bulk, predominantly epithelial
tumor samples to “normal” tissue which in the case of many cancer types, especially breast
cancer, is often stromal tissue containing an entirely different gene expression profile.
Therefore, comparisons of these tissue types which claim ROS as a survival factor in some
contexts, should be considered with caution. The true role of ROS is likely as not as simple
as either cell survival protagonist or antagonist. The maintenance of ROS within a crucial
range my aid in some cellular processes acting as a signaling molecule of sorts (134), while
rising beyond that range can be catastrophic, requiring safeguards such as antioxidant gene
expression. In fact, when totally quenched by pharmacologic intervention, ROS levels
plummet resulting in cell cycle arrest or even apoptosis (135). In light of these observations,
the evolving model posits that tumor cells react to changes in their microenvironmental
23
signals by adopting particular metabolic adaptations which may include, but are not limited
to, changes in EMT status, migration, invasion, and importantly for survival distal to the
primary site, anoikis resistance (136).
Cellular Sources of Reactive Oxygen Species
There are a multitude of cellular sources of ROS which vary in their triggers, species
of ROS they produce, and their implications to biological processes. Classically, ROS
generation has been considered to come from two chief sources including oxidative
phosphorylation in the mitochondria, and the NADPH oxidase (NOX) complex at the cell
membrane, both of which predominantly generate the superoxide species (137). While
these processes are important to consider as ROS sources, other major contributors and/or
regulators are emerging as critical players in the control of ROS-related anoikis induction.
Studies to show what fraction of ROS these pathways contribute to the overall pool are yet
to be carried out in most cases.
During normal oxidative phosphorylation, single electrons passed between
components of the mitochondrial electron transport chain (ETC) are shunted instead
directly to molecular oxygen at a fairly substantial frequency (0.1-2%). This superoxide
(O2.-) leak is generally quickly converted to hydrogen peroxide (H2O2) by the mitochondrial
isoform of superoxide dismutase (SOD2), which can be further detoxified by catalase or
glutathione peroxidase (Gpx) to produce harmless water. Individual components of the
electron transport chain have differing contributions to ROS generated by this mechanisms
however. The majority of ROS contributed by the ETC comes from complexes I and III (137).
Experimental depletion of core components of the mitochondrial respiratory complex I
24
(NDUFS-3 and GRIM-19) by siRNA transduction resulted in ROS reduction generated
through the NADH ubiquinone oxidoreductase complex (138). Alternatively, metformin has
been demonstrated to abrogate mitochondrial activity through complex I inhibition,
resulting in increased ROS level, sensitizing to radiotherapeutic approaches (139). These
findings demonstrate the complexity of ROS generation from the mitochondrial electron
transport chain as a source, signifying both positive and negative implications toward ROS
production.
Mitochondrial uncoupling proteins family members (UCP1-3) generally act to protect
cells from processes favoring ROS generation through uncoupling respiratory chain input of
substrates for oxidation from ADP phosphorylation output, with implications toward
longevity (140). The consequence of these uncouplers on ROS production toward regulation
of apoptosis is unclear as ANT (adenine nucleotide translocase) proteins, another major
uncoupling source resulting in proton leak in the mitochondrial membrane, have been
associated with transient opening of the MPTP (mitochondrial permeability transition pore),
but it is unclear at present whether this is a normal part of mitochondrial metabolism or
associated exclusively with apoptosis (134). The ROS generating activities of the NOX
complex, its regulation, and roles in cellular processes will be discussed in greater detail in a
later chapter.
Reactive Oxygen Species and their Reactivity
Oxyradicals are harmful when produced at high levels due to their propensity to
interact non-selectively with biomolecules disrupting their function, and this reactivity has
been implicated in a number of damaging processes including DNA strand breaks, direct
25
oxidative damage to DNA bases, and can lead to peroxidation of lipid bilayer components,
altering membrane permeability (134, 137). This disruption has a place in normal
physiological processes, such as in lysosomal or phagocytic ROS bursts intended to remove
unwanted cellular components or microbicidal killing. Overproduction of ROS however, can
result in the oxidation of critical cysteine residues, often in the active site of enzymes,
modulating or eliminating their activity seen in protein tyrosine phosphatases, lipid
phosphatases (e.g. PTEN), MAPK phosphatases, and can also result in disruption of ubiquitin
regulatory proteins altering proper protein degradation pathways (141-143). As was
alluded to earlier, maintenance of the proper cellular range of ROS is critical for many cellular
process, given that complete quenching of ROS results in global hyperactivation PTPs,
resulting in broad inhibition of signaling pathways requiring tyrosine phosphorylation
(135).
Mitochondria exists as the major source of ROS due to their reliance on aerobic
processes utilizing O2 as the ultimate electron acceptor. Since O2 is only capable of accepting
one electron at a given time, the reduction of O2 to H2O can be somewhat muddled,
producing reactive intermediates including hydrogen peroxide (H2O2), superoxide (O2.-),
and hydroxyl radicals (OH.-), which vary from least to most reactive, respectively. ROS is a
very broad term intending to encompass each of these species, including singlets, doublets,
and nonradicals such as hydrogen peroxide (144). While these species are all encompassed
by the ROS umbrella, they differ in properties such permeability to cellular compartments as
well as the targets with which they have a propensity to interact. For example, superoxide
is membrane impermeant; the results of which is restriction to the compartment in which it
is produced until it is converted to another, permeable form. Superoxide can be converted
26
to H2O2, or can react with H2O2 via iron sulfur centers to generate hydroxyl radicals via the
Fenton reaction. Hydrogen peroxide, relative to superoxide, is less reactive, more membrane
permeant, and tends to oxidize proteins with low-pKa cysteine residues, peroxidases, and
unsaturated lipids (145). Hydroxyl radicals on the other hand are highly reactive, and tend
to produce secondary radical species. Taken together, it is clear that a variety of reactive
oxygen species contribute to the damage of critical cellular components. How these effects
are believed to contribute to anoikis will be discussed below.
Reactive Oxygen Species Induce Anoikis
Detachment from ECM has been demonstrated to result in diversion of glucose
transporters from the plasma membrane, resulting in increased ROS which inhibits fatty acid
oxidation (FAO), resulting in loss of ATP (146). It is unclear at present, however, whether
low ATP induces anoikis, or whether production of a ROS burst somewhere in this process
is the crucial factor. Antioxidant enzymes such as superoxide dismutase and catalase have
been shown to prevent ATP loss following detachment (147). Compounds which act to
scavenge reactive oxygen such as α-lipoic acid and reduced glutathione have been shown to
inhibit caspase activation in suspension (148). Consistent with these findings,
overexpression of antioxidant enzymes (e.g. SOD, catalase) protects from detachment
induced cell death while depletion of these enzymes both increases cellular ROS as well as
death (147).
Furthermore, ROS has also been shown to contribute to apoptosis directly through
mechanisms such as direct mitochondrial peroxidation of cardiolipin, a lipid which
sequesters cytochrome c, as well as direct inactivation of the anti-apoptotic Bcl-2 (149).
27
Recently, ROS and metabolism have been under investigation highlighting their importance
in anoikis (80, 146, 147). From a particular isoform derived from an alternative promoter
of the SHC1 gene, p66Shc protein is produced in the mitochondria. Here it acts to form a
complex with cytochrome c and generates superoxide radicals resulting in mitochondrial
dysfunction (150). While cytoplasmically located p66Shc appears to have antioxidant
functions, mitochondrial p66Shc has a clear positive link with ROS induction. It has been
demonstrated that depletion of p66Shc results in protection from anoikis, although this
effect appears to be independent of the cytochrome c interaction domain, but instead relies
on activation of RhoA (151). Interestingly, RhoA activation is implicated in ROS production
via activation of the NOX complex (152) (which will be described further in a later chapter).
Further, the anti-apoptotic protein Bcl-2, in addition to its roles in MOMP
suppression, acts to influence cellular redox balance via mitochondrial membrane proteins
where it interacts with complex IV and the small GTPase-Rac1 (153). The critical role of
maintaining a low ROS environment in cancer stem-like cells for evading cell death induced
by radiation and chemotherapy has been well documented (154-156). The role of ROS
suppression in cancer stem-like cells in inhibiting anoikis is hypothetically also a critical
feature of this subclass of cells – a feature that appears to be intrinsically related to their
metabolic phenotype.
ROS can be produced in response to a number of extracellular stimuli including
growth factors, cytokines, and activation of G-coupled protein receptors (157). Further, it
has been reported that ROS perturbs a number of cell signaling pathways which (as
discussed above) are critical for maintaining anoikis resistance, especially in the context of
EMT including ERK, JNK, NF-κB, FAK, Ras, Rac, and Akt transduction pathways (158).
28
There are multiple factors which further alter the production of ROS in tumor cells.
The importance of glucose and glutamine have been shown (through separate mechanisms
which will be discussed in more detail later) to dramatically affect not only cellular metabolic
pathways, but also influence the intracellular redox potential, principally through alteration
of ROS scavenging pathways. Enzymes which are involved in the processing of these carbon
sources thus greatly impact their utilization and shunting to different pathways. It has been
shown that in a non-small cell lung carcinoma model, EMT causes upregulation of the neural
isoform glucose transporter, GLUT3, via ZEB1 (159). The exact roles of these processes in
ROS generation will be detailed below.
Previous work indicates that glucose uptake in suspension declines due to relocation
of glucose transporters from the plasma membrane, and that glucose metabolism is integral
to maintaining an antioxidant environment through shunting to the pentose phosphate
pathway to produce NADPH (146). The result is a sharp increase in cellular ROS level.
Reduced glutathione (GSH) and thioredoxin pools (maintained by other processes) play a
significant role in neutralizing ROS and are critical for the maintenance of a reduced state
requiring the cofactor NADPH (160, 161). Along with the production of antioxidant enzymes
such as superoxide dismutase and catalase (discussed above), these are additional pathways
in which cells maintain a low ROS environment.
The ROS induced cell death described previously was reported to be caspase-
independent, thus non-apoptotic in nature, and was due to inhibition of FAO and ATP decline
(146). Here, the authors proposed that this cell death was a consequence of ATP loss
resulting in low energy charge; however, it is unclear at present whether their findings are
causative or the result of cell death as they evaluate late stage time points in suspended

29
culture after which caspase activation may have led to ROS pathway activation (e.g. caspase
cleavage of PKC resulting in activation of the NOX complex).
In light of these, as well as other studies showing ROS scavenging methods protect
from anoikis (148), it is clear that detachment induced ROS burst have clear role in induction
of cell death in suspended conditions. ROS can have even more upstream implications in cell
survival properties. It has been shown that AMPK activation occurs after cells detach from
their matrix (via activation through LBK1 kinase), which results in anoikis resistance
through MTORC1 suppression as well as inhibition of acetyl CoA carboxylase, resulting in
maintenance of NADPH (162). Also of note, pyruvate kinase isoform M2 (PKM2) tends to be
overexpressed in tumor cells. Interestingly, PKM2 is inhibited by high ROS level resulting in
a buildup of metabolites prior to the branch step converting pyruvate to acetyl CoA, resulting
in abundance of glycolytic intermediates supplying the PPP, increasing NADPH production
(163).
Various proliferation inducing oncogenes such as K-Ras, B-Raf, and Myc, described in
previous sections to lend survival traits to tumors including anoikis resistance, also result in
increased in Nrf2 gene expression. Nrf2 is a master regulator of the ROS cellular milieu when
released from its cytoplasmic negative regulatory sequestration partner Keap1. When redox
sensitive cysteine resides in Keap1 are oxidized due to oxidative stress, conformational
changes result in release of Nrf2, which undergoes nuclear translocation and dimerizing with
Maf to transactivate the antioxidant response element (ARE) (164). Through this
mechanism, Nrf2 induces numerous antioxidant enzymes, including major targets such as
HO-1 and NQO1, the latter reported to have specific roles in ROS detoxification in NSCLC
models such that its depletion sensitizes cells to anoikis (165). In addition to antioxidant
30
enzymes, Nrf2 also transactivates expression of genes related to the pentose phosphate
pathway, thereby aiding in maintenance of NADPH. In summary, evidence of the role of ROS
suppression in tumorigenesis and anoikis resistance is abundant.
Reactive Oxygen Species and the Epithelial-Mesenchymal Transition
While it appears that ROS and EMT share a paradoxical relationship in that ROS is
purported to result in the activation of the EMT program (e.g. hypoxia induced HIF1α
stabilization or NFκB activation) (166, 167), few studies have been done to examine the
eventual ROS environment in cells once they have undergone this transition. Rac1b, an
alternatively spliced Rac isoform, is reportedly activated by MMP-associated ectodomain
cleavage of E-cadherin, resulting in activation of NOX complexes (168). However,
considering this as a source of ROS only takes superoxide species into account. Also, it is
unclear from the current reports if ROS induces the EMT phenotype, or rather, selects for
EMT subpopulations which are resistant to the harmful effects of ROS. A more global
description of ROS in mesenchymal vs epithelial cells is required. How EMT contributes to
anoikis through suppression of ROS and altered metabolic function will be discussed in detail
in Chapter 2.
Metabolism: Glycolysis, Oxidative Phosphorylation, and Glutaminolysis – Impact on Anoikis
Metabolism has been an area of intensive focus in the study of malignancy since Otto
Heinrich Warburg first described the concept of aerobic glycolysis, in which he defined
cancer cells as relying extensively on glycolytic metabolism regardless of the presence of
abundant oxygen which could be utilized to drive oxidative phosphorylation, a much more
31
energy efficient means of carbon utilization (169). Through this process, cancer cells not
only act to fulfill their energy requirements, they also produce vital biosynthetic precursors
for anabolic processes such as fatty acid synthesis, ribose production, amino acid production,
and protein glycosylation (170). While these observations were groundbreaking in their
time, and brought attention to an extraordinarily important area of research in cancer
biology, his original idea has been dramatically oversimplified however, and are insufficient
to explain the complex metabolomics that occurs in cancer cells. Warburg’s original
observations have been widely misinterpreted to mean that cancer cells in fact suppress
their mitochondrial oxidative pathways in favor of glycolysis or that their mitochondria are
somehow defective. It is now understood that cancer cells even within a single tumors vary
dramatically from one portion to another in their reliance on these two primary means of
energy utilization (171, 172). Given this observed variety, it is no surprise that there is also
significant metabolic diversity when comparing primary tumor, circulating tumor, and
metastatic cells (173). The metabolic profile of tumors is likely far more dependent on the
regional oxygen/nutrient constraints, soluble factors from the tumor microenvironment
heavily influenced by nearby tumor associated stromal fibroblast cells, as well as the
infiltration of the tumor with immune cells. Given the great increase in efficiency of EMT
plasticity on the ability to migrate away from the primary site, survive in suspension, and
colonize a secondary site, it is most likely that the cellular metabolic needs of successful
tumor cells are also plastic, resulting in adaptation to their surroundings (136). In
connection with this idea, the concept of “metabolic coupling” has emerged, and has been
reviewed eloquently by the Lisanti group (174), which has shown that in fact, the majority
of glycolysis occurs in the tumor stromal compartment. This is due to influence from
32
secreted factors from tumor cells, resulting in the production of significant amounts of
pyruvate and lactate. It has even been postulated that tumor cells produce oxidative stress
to extract nutrients from surrounding stromal cells, resulting in induction of mitophagic
processes producing energy rich nutrients that “feed” the cancer cells (174). Tumor cells
have abundant monocarboxylate transporters (MCT) family proteins often overexpressed
on the cell surfaces of aggressive tumors. These glycolytic end products can then be
imported into the tumor cells where they are converted into carbon fuel sources for
oxidative metabolism.
In breast cancer cell line models, cancer stem-like cells have been reported to display
a shift in metabolism favoring oxidative phosphorylation as a means of ATP production, and
interestingly, more metastatic basal and claudin low cell lines show a more significant
increase in this population when compared to luminal subtypes (156). Given the metabolic
differences seen in these CSC subpopulation, it follows that EMT, which endows cancer cells
with properties of CSCs, would influence the oxidative phenotype. It has been reported EMT
in breast cancer cells supports increased oxidative phosphorylation, and a greater reliance
on alternative fuel sources to carbohydrate catabolism such as fatty acid oxidation is needed
to overcome the inefficient process of metastasis (170, 175).
Multiple changes in suspended culture can possibly result in alterations in fatty acid
oxidation. Pyruvate dehydrogenase kinase (PDK4), an enzyme which inhibits pyruvate
dehydrogenase, has been reported to increase in expression in suspension resulting in a
reliance on FAO and alternative fuels for oxidative phosphorylation; however ROS can inhibit
these alternate processes (146, 176, 177). The importance of EMT in regulation of these
critical metabolic pathways is evident as E-cadherin depletion in vivo, either by ZEB1
33
overexpression or shRNA targeting E-cadherin, altered the metabolic profile of cancer cells
which favored oxidative phosphorylation over glycolysis (178).
Cancer cells have been reported to favor glutaminolysis as a carbon source in some
contexts, and even display a “glutamine addiction” in many cancer types (179, 180). In fact,
even though glutamine is a non-essential amino acid, most mammalian cells cannot
proliferate without exogenously supplied glutamine. Increased glutamine consumption is
essential for many cancer types during periods of excessive proliferation (181), and has even
been linked to aberrant regulation of oncogenes and tumor suppressors (182, 183).
Glutaminolysis is the processes by which cells metabolize the amino acid glutamine via its
conversion to α-ketoglutarate (α-KG), which proceeds through the tricarboxylic acid (TCA)
cycle to produce reducing equivalents for ATP production by means of the ETC. In highly
proliferative cancer cells, citrate (an earlier intermediate in the Krebs cycle) is shunted to
the cytoplasm where it is involved in the production of NADPH and fatty acids; however,
glutaminolysis replenishes this loss with α-KG, a process referred to as anaplerosis (184,
185). Glutaminolysis has been ascribed roles in various cellular processes aside from
anaplerosis, the implications of which in anoikis were previously unclear. In addition to
replenishing the TCA cycle, glutaminolysis has implications in autophagy and regulation of
ROS, the implications of which will be discussed below.
Through the process of glutaminolysis, glutamine undergoes deamidation through an
irreversible reaction catalyzed by glutaminase (GLS). Mitochondrial Glutamate
Dehydrogenase I (GLUD1 or GDH1) is then responsible for the deamination of glutamate to
α-KG (186, 187). GLUD1 will be discussed in more detail as it relates to the induction of
anoikis resistance in the following chapter. Regulation of this process is complex and
34
involves a series of positive and negative feedback regulation of these enzymes. The enzyme
glutaminase is inhibited by its product, glutamate by a direct negative feedback regulation.
Leucine on the other hand, is a potent allosteric activator of GLUD1. Activation of GLUD1
increases the glutamate to α-KG conversion, decreasing glutamate and removing GLS
inhibition. The glutamine bidirection antiporter SLC7A5-SLC3A2 extrudes glutamine and
imports leucine into the cell (188). Glutamine modulation of cellular leucine levels therefore
directly activates GLUD1 and increases the conversion of glutamate to αKG, further
removing GLS inhibition to signal the process forward.
Glutamine is a known regulator of autophagy, a process used by cells to degrade
proteins and organelles, replenishing energy charge (189). Activation of autophagy would
protect from anoikis by replenishing energy charge, a process inhibited by activation of
MTORC1, mammalian target of rapamycin complex I, which is a central regulator of cell
growth, translation of mRNA, and metabolic pathways (190-192). The exact mechanisms
regarding glutamine inhibition of MTORC, influences over autophagy, and exactly how this
impacts anoikis are unclear (193, 194). Pharmacologic inhibition of the major regulators
and antiporters involved in this process and their effects on cellular processes such as
autophagy, anapleurosis, and anoikis merits further study.
It has been reported that mouse embryonic stem cells, when grown in conditions
which maintain their naïve pluripotency, proliferate in the absence of exogenous glutamine;
however, when replaced, they utilize higher levels of glutamine and use this to maintain high
level of level of intracellular αKG (195). In this study, the authors proposed that embryonic
stem cells sustain an elevated αKG: succinate ratio, which maintains their pluripotency,
promoting histone/DNA demethylation (195). Conditions that favor elevated αKG:
35
succinate ratio (e.g. elevated rates of glutaminolysis), thus favor epigenetic changes
supporting the stem cell phenotype. As was discussed in detail in previous sections, EMT
induces the acquisition of stem cell features and flexible epigenetic state. Given the other
major characteristics innate to mesenchymal cells, such as anoikis resistance, the
involvement of the process of glutaminolysis and the role of αKG in its regulation in the
context of EMT is of critical importance.
The implications of these metabolic alterations on anoikis and EMT are described
here. Tumor cell coupling with associated stromal fibroblasts become reliant on these
carbon sources for energy production, meaning less flow through glycolytic pathways, and
thus less input into the PPP, hampering the production of NADPH. This could initially
increase ROS in these tumor cells causing EMT through mechanisms described above (HIF1α
stabilization, NFκB induction, etc). During the EMT process, in addition to other deleterious
features, cells upregulate defenses against this oxidative environment, through Nrf2 and
HIF1α transactivation of ARE, antioxidant defense systems are engaged, resulting in low
ROS. Tumor cells that are now reliant on oxidative phosphorylation as an energy production
source are now poorly suited to remain in the hypoxic primary tumor environment.
Considering these stimuli, cells are encouraged to undergo transient EMT processes,
increase invasiveness and anoikis resistance, and leave their primary site. In fact, breast
cancer cells recovered from metastatic sites have been observed to contain elevated
mitochondrial number and increased mitochondrial membrane potential (136, 196). These
findings all support the role of EMT in modulating ROS, metabolism and anoikis.
References

36
1. Baum B, Georgiou M. Dynamics of adherens junctions in epithelial establishment, maintenance, and remodeling. The Journal of cell biology. 2011;192:907-17. 2. Dusek RL, Attardi LD. Desmosomes: new perpetrators in tumour suppression. Nature reviews Cancer. 2011;11:317-23. 3. Turksen K, Troy T-C. Junctions gone bad: Claudins and loss of the barrier in cancer. Biochimica et Biophysica Acta (BBA) - Reviews on Cancer. 2011;1816:73-9. 4. Yeaman C, Grindstaff KK, Hansen MDH, Nelson WJ. Cell polarity: Versatile scaffolds keep things in place. Current Biology. 1999;9:R515-R7. 5. Kizhatil K, Davis JQ, Davis L, Hoffman J, Hogan BL, Bennett V. Ankyrin-G is a molecular partner of E-cadherin in epithelial cells and early embryos. J Biol Chem. 2007;282:26552-61. 6. Kizhatil K, Yoon W, Mohler PJ, Davis LH, Hoffman JA, Bennett V. Ankyrin-G and beta2-spectrin collaborate in biogenesis of lateral membrane of human bronchial epithelial cells. J Biol Chem. 2007;282:2029-37. 7. Qin Y, Capaldo C, Gumbiner BM, Macara IG. The mammalian Scribble polarity protein regulates epithelial cell adhesion and migration through E-cadherin. J Cell Biol. 2005;171:1061-71. 8. Tian X, Liu Z, Niu B, Zhang J, Tan TK, Lee SR, et al. E-Cadherin/β-Catenin Complex and the Epithelial Barrier. Journal of Biomedicine and Biotechnology. 2011;2011:567305. 9. Taube JH, Herschkowitz JI, Komurov K, Zhou AY, Gupta S, Yang J, et al. Core epithelial-to-mesenchymal transition interactome gene-expression signature is associated with claudin-low and metaplastic breast cancer subtypes. Proc Natl Acad Sci U S A. 2010;107:15449-54. 10. Scheel C, Eaton EN, Li SH, Chaffer CL, Reinhardt F, Kah KJ, et al. Paracrine and autocrine signals induce and maintain mesenchymal and stem cell states in the breast. Cell. 2011;145:926-40. 11. Frisch SM, Francis H. Disruption of epithelial cell-matrix interactions induces apoptosis. J Cell Biol. 1994;124:619-26. 12. Kumar S, Park SH, Cieply B, Schupp J, Killiam E, Zhang F, et al. A pathway for the control of anoikis sensitivity by E-cadherin and epithelial-to-mesenchymal transition. Mol Cell Biol.31:4036-51. 13. Smit MA, Geiger TR, Song JY, Gitelman I, Peeper DS. A Twist-Snail axis critical for TrkB-induced epithelial-mesenchymal transition-like transformation, anoikis resistance, and metastasis. Mol Cell Biol. 2009;29:3722-37. 14. Tiwari N, Gheldof A, Tatari M, Christofori G. EMT as the ultimate survival mechanism of cancer cells. Semin Cancer Biol. 2012. 15. Frisch SM, Schaller M, Cieply B. Mechanisms that link the oncogenic epithelial-mesenchymal transition to suppression of anoikis. J Cell Sci. 2013;126:21-9. 16. Lee JM, Dedhar S, Kalluri R, Thompson EW. The epithelial-mesenchymal transition: new insights in signaling, development, and disease. J Cell Biol. 2006;172:973-81. 17. Kalluri R, Weinberg RA. The basics of epithelial-mesenchymal transition. The Journal of Clinical Investigation. 2009;119:1420-8. 18. Hudson LG, Newkirk KM, Chandler HL, Choi C, Fossey SL, Parent AE, et al. Cutaneous wound reepithelialization is compromised in mice lacking functional Slug (Snai2). Journal of dermatological science. 2009;56:19-26.
37
19. Kusewitt DF, Choi C, Newkirk KM, Leroy P, Li Y, Chavez M, et al. Slug/Snai2 is a downstream mediator of epidermal growth factor receptor-stimulated reepithelialization. The Journal of investigative dermatology. 2009;129:491-5. 20. Werth M, Walentin K, Aue A, Schönheit J, Wuebken A, Pode-Shakked N, et al. The transcription factor grainyhead-like 2 regulates the molecular composition of the epithelial apical junctional complex. Development. 2010;137:3835-45. 21. Pyrgaki C, Liu A, Niswander L. Grainyhead-like 2 regulates neural tube closure and adhesion molecule expression during neural fold fusion. Dev Biol. 2011;353:38-49. 22. Rifat Y, Parekh V, Wilanowski T, Hislop NR, Auden A, Ting SB, et al. Regional neural tube closure defined by the Grainy head-like transcription factors. Developmental biology. 2010;345:237-45. 23. Thiery JP, Acloque H, Huang RYJ, Nieto MA. Epithelial-Mesenchymal Transitions in Development and Disease. Cell. 2009;139:871-90. 24. Savagner P, Kusewitt DF, Carver EA, Magnino F, Choi C, Gridley T, et al. Developmental transcription factor slug is required for effective re-epithelialization by adult keratinocytes. J Cell Physiol. 2005;202:858-66. 25. Radisky DC, Kenny PA, Bissell MJ. Fibrosis and Cancer: Do Myofibroblasts Come Also From Epithelial Cells Via EMT? Journal of cellular biochemistry. 2007;101:830-9. 26. Higgins DF, Kimura K, Bernhardt WM, Shrimanker N, Akai Y, Hohenstein B, et al. Hypoxia promotes fibrogenesis in vivo via HIF-1 stimulation of epithelial-to-mesenchymal transition. J Clin Invest. 2007;117:3810-20. 27. Haase VH. Oxygen regulates epithelial-to-mesenchymal transition: insights into molecular mechanisms and relevance to disease. Kidney Int. 2009;76:492-9. 28. Smit MA, Peeper DS. Deregulating EMT and Senescence: Double Impact by a Single Twist. Cancer Cell.14:5-7. 29. Ansieau S, Bastid J, Doreau A, Morel A-P, Bouchet BP, Thomas C, et al. Induction of EMT by Twist Proteins as a Collateral Effect of Tumor-Promoting Inactivation of Premature Senescence. Cancer Cell.14:79-89. 30. Weinberg RA. Twisted epithelial-mesenchymal transition blocks senescence. Nat Cell Biol. 2008;10:1021-3. 31. Hanahan D, Weinberg RA. The hallmarks of cancer. Cell. 2000;100:57-70. 32. Behrens J, Weidner KM, Frixen UH, Schipper JH, Sachs M, Arakaki N, et al. The role of E-cadherin and scatter factor in tumor invasion and cell motility. In: Goldberg ID, editor. Cell Motility Factors. Basel: Birkhäuser Basel; 1991. p. 109-26. 33. Schipper JH, Frixen UH, Behrens J, Unger A, Jahnke K, Birchmeier W. E-Cadherin Expression in Squamous Cell Carcinomas of Head and Neck: Inverse Correlation with Tumor Dedifferentiation and Lymph Node Metastasis. Cancer Research. 1991;51:6328-37. 34. E-cadherin-mediated cell-cell adhesion prevents invasiveness of human carcinoma cells. The Journal of cell biology. 1991;113:173-85. 35. Vleminckx K, Vakaet L, Mareel M, Fiers W, Van Roy F. Genetic manipulation of E-cadherin expression by epithelial tumor cells reveals an invasion suppressor role. Cell. 1991;66:107-19. 36. Woodward WA, Chen MS, Behbod F, Alfaro MP, Buchholz TA, Rosen JM. WNT/beta-catenin mediates radiation resistance of mouse mammary progenitor cells. Proc Natl Acad Sci U S A. 2007;104:618-23.
38
37. Barr S, Thomson S, Buck E, Russo S, Petti F, Sujka-Kwok I, et al. Bypassing cellular EGF receptor dependence through epithelial-to-mesenchymal-like transitions. Clin Exp Metastasis. 2008;25:685-93. 38. Buck E, Eyzaguirre A, Rosenfeld-Franklin M, Thomson S, Mulvihill M, Barr S, et al. Feedback Mechanisms Promote Cooperativity for Small Molecule Inhibitors of Epidermal and Insulin-Like Growth Factor Receptors. Cancer Research. 2008;68:8322-32. 39. Li X, Lewis MT, Huang J, Gutierrez C, Osborne CK, Wu M-F, et al. Intrinsic Resistance of Tumorigenic Breast Cancer Cells to Chemotherapy. Journal of the National Cancer Institute. 2008;100:672-9. 40. Bergsagel DE. The Chronic Leukemias: A Review of Disease Manifestations and the Aims of Therapy. Canadian Medical Association Journal. 1967;96:1615-20. 41. Terpstra W, Prins A, Ploemacher RE, Wognum BW, Wagemaker G, Lowenberg B, et al. Long-term leukemia-initiating capacity of a CD34-subpopulation of acute myeloid leukemia. Blood. 1996;87:2187-94. 42. Bonnet D, Dick JE. Human acute myeloid leukemia is organized as a hierarchy that originates from a primitive hematopoietic cell. Nat Med. 1997;3:730-7. 43. Lapidot T, Sirard C, Vormoor J, Murdoch B, Hoang T, Caceres-Cortes J, et al. A cell initiating human acute myeloid leukaemia after transplantation into SCID mice. Nature. 1994;367:645-8. 44. Gupta PB, Chaffer CL, Weinberg RA. Cancer stem cells: mirage or reality? Nat Med. 2009;15:1010-2. 45. Al-Hajj M, Wicha M, Benito-Hernandez A, Morrison S, Clarke M. Prospective identification of tumorigenic breast cancer cells. Proc Natl Acad Sci U S A. 2003;early edition:1-6. 46. Gupta PB, Fillmore CM, Jiang G, Shapira SD, Tao K, Kuperwasser C, et al. Stochastic state transitions give rise to phenotypic equilibrium in populations of cancer cells. Cell.146:633-44. 47. Mani SA, Guo W, Liao MJ, Eaton EN, Ayyanan A, Zhou AY, et al. The epithelial-mesenchymal transition generates cells with properties of stem cells. Cell. 2008;133:704-15. 48. Schmidt JM, Panzilius E, Bartsch HS, Irmler M, Beckers J, Kari V, et al. Stem-cell-like properties and epithelial plasticity arise as stable traits after transient Twist1 activation. Cell reports. 2015;10:131-9. 49. Ocaña Oscar H, Córcoles R, Fabra Á, Moreno-Bueno G, Acloque H, Vega S, et al. Metastatic Colonization Requires the Repression of the Epithelial-Mesenchymal Transition Inducer Prrx1. Cancer Cell. 2012;22:709-24. 50. Morel A-P, Lièvre M, Thomas C, Hinkal G, Ansieau S, Puisieux A. Generation of Breast Cancer Stem Cells through Epithelial-Mesenchymal Transition. PLoS ONE. 2008;3:e2888. 51. Wellner U, Schubert J, Burk UC, Schmalhofer O, Zhu F, Sonntag A, et al. The EMT-activator ZEB1 promotes tumorigenicity by repressing stemness-inhibiting microRNAs. Nat Cell Biol. 2009;11:1487-95. 52. Kowalski PJ, Rubin MA, Kleer CG. E-cadherin expression in primary carcinomas of the breast and its distant metastases. Breast Cancer Research. 2003;5:R217-R22. 53. Bissell MJ, Radisky DC, Rizki A, Weaver VM, Petersen OW. The organizing principle: microenvironmental influences in the normal and malignant breast. Differentiation; research in biological diversity. 2002;70:537-46.
39
54. Jechlinger M, Grünert S, Beug H. Mechanisms in Epithelial Plasticity and Metastasis: Insights from 3D Cultures and Expression Profiling. Journal of Mammary Gland Biology and Neoplasia.7:415-32. 55. Grooteclaes M, Deveraux Q, Hildebrand J, Zhang Q, Goodman RH, Frisch SM. C-terminal-binding protein corepresses epithelial and proapoptotic gene expression programs. Proc Natl Acad Sci U S A. 2003;100:4568-73. 56. Cano A, Perez-Moreno MA, Rodrigo I, Locascio A, Blanco MJ, del Barrio MG, et al. The transcription factor snail controls epithelial-mesenchymal transitions by repressing E-cadherin expression. Nat Cell Biol. 2000;2:76-83. 57. Herranz N, Pasini D, Diaz VM, Franci C, Gutierrez A, Dave N, et al. Polycomb complex 2 is required for E-cadherin repression by the Snail1 transcription factor. Mol Cell Biol. 2008;28:4772-81. 58. Sanchez-Tillo E, Lazaro A, Torrent R, Cuatrecasas M, Vaquero EC, Castells A, et al. ZEB1 represses E-cadherin and induces an EMT by recruiting the SWI/SNF chromatin-remodeling protein BRG1. Oncogene. 2010;29:3490-500. 59. Yang J, Weinberg RA. Epithelial-Mesenchymal Transition: At the Crossroads of Development and Tumor Metastasis. Developmental Cell.14:818-29. 60. Mani SA, Yang J, Brooks M, Schwaninger G, Zhou A, Miura N, et al. Mesenchyme Forkhead 1 (FOXC2) plays a key role in metastasis and is associated with aggressive basal-like breast cancers. Proceedings of the National Academy of Sciences of the United States of America. 2007;104:10069-74. 61. Cieply B, Farris J, Denvir J, Ford HL, Frisch SM. Epithelial-Mesenchymal Transition and Tumor Suppression Are Controlled by a Reciprocal Feedback Loop between ZEB1 and Grainyhead-like-2. Cancer Res. 2013;73:6299-309. 62. Gouti M, Briscoe J, Gavalas A. Anterior Hox Genes Interact with Components of the Neural Crest Specification Network to Induce Neural Crest Fates. Stem Cells (Dayton, Ohio). 2011;29:858-70. 63. Yu M, Smolen GA, Zhang J, Wittner B, Schott BJ, Brachtel E, et al. A developmentally regulated inducer of EMT, LBX1, contributes to breast cancer progression. Genes Dev. 2009;23:1737-42. 64. Gregory PA, Bracken CP, Smith E, Bert AG, Wright JA, Roslan S, et al. An autocrine TGF-beta/ZEB/miR-200 signaling network regulates establishment and maintenance of epithelial-mesenchymal transition. Mol Biol Cell. 2011;22:1686-98. 65. Thillainadesan G, Chitilian Jennifer M, Isovic M, Ablack Jailal Nicholas G, Mymryk Joe S, Tini M, et al. TGF-β-Dependent Active Demethylation and Expression of the p15<sup>ink4b</sup> Tumor Suppressor Are Impaired by the ZNF217/CoREST Complex. Molecular Cell.46:636-49. 66. Massagué J. TGFβ in Cancer. Cell.134:215-30. 67. Massague J. TGF[beta] signalling in context. Nat Rev Mol Cell Biol. 2012;13:616-30. 68. Chen D, Zhao M, Mundy GR. Bone Morphogenetic Proteins. Growth Factors. 2004;22:233-41. 69. Samavarchi-Tehrani P, Golipour A, David L, Sung HK, Beyer TA, Datti A, et al. Functional genomics reveals a BMP-driven mesenchymal-to-epithelial transition in the initiation of somatic cell reprogramming. Cell Stem Cell.7:64-77.
40
70. Candia AF, Watabe T, Hawley SH, Onichtchouk D, Zhang Y, Derynck R, et al. Cellular interpretation of multiple TGF-beta signals: intracellular antagonism between activin/BVg1 and BMP-2/4 signaling mediated by Smads. Development. 1997;124:4467-80. 71. Ali IHA, Brazil DP. Bone morphogenetic proteins and their antagonists: current and emerging clinical uses. British journal of pharmacology. 2014;171:3620-32. 72. Gregory PA, Bert AG, Paterson EL, Barry SC, Tsykin A, Farshid G, et al. The miR-200 family and miR-205 regulate epithelial to mesenchymal transition by targeting ZEB1 and SIP1. Nat Cell Biol. 2008;10:593-601. 73. Wellner U, Schubert J, Burk UC, Schmalhofer O, Zhu F, Sonntag A, et al. The EMT-activator ZEB1 promotes tumorigenicity by repressing stemness-inhibiting microRNAs. Nat Cell Biol. 2009;11:1487-95. 74. Howe EN, Cochrane DR, Richer JK. Targets of miR-200c mediate suppression of cell motility and anoikis resistance. Breast Cancer Res.13:R45. 75. Park S-M, Gaur AB, Lengyel E, Peter ME. The miR-200 family determines the epithelial phenotype of cancer cells by targeting the E-cadherin repressors ZEB1 and ZEB2. Genes & Development. 2008;22:894-907. 76. Brabletz S, Brabletz T. The ZEB/miR-200 feedback loop—a motor of cellular plasticity in development and cancer? EMBO Reports. 2010;11:670-7. 77. Ishii H, Saitoh M, Sakamoto K, Kondo T, Katoh R, Tanaka S, et al. Epithelial Splicing Regulatory Proteins 1 (ESRP1) and 2 (ESRP2) Suppress Cancer Cell Motility via Different Mechanisms. The Journal of Biological Chemistry. 2014;289:27386-99. 78. Cieply B, Riley Pt, Pifer PM, Widmeyer J, Addison JB, Ivanov AV, et al. Suppression of the epithelial-mesenchymal transition by Grainyhead-like-2. Cancer Res. 2012;72:2440-53. 79. Cieply B, Farris J, Denvir J, Ford HL, Frisch SM. Epithelial-mesenchymal transition and tumor suppression are controlled by a reciprocal feedback loop between ZEB1 and Grainyhead-like-2. Cancer Res. 2013;73:6299-309. 80. Buchheit CL, Weigel KJ, Schafer ZT. Cancer cell survival during detachment from the ECM: multiple barriers to tumour progression. Nat Rev Cancer. 2014;14:632-41. 81. Charpentier MS, Whipple RA, Vitolo MI, Boggs AE, Slovic J, Thompson KN, et al. Curcumin targets breast cancer stem-like cells with microtentacles that persist in mammospheres and promote reattachment. Cancer Res. 2014;74:1250-60. 82. Paoli P, Giannoni E, Chiarugi P. Anoikis molecular pathways and its role in cancer progression. Biochim Biophys Acta. 2013;1833:3481-98. 83. Simpson CD, Anyiwe K, Schimmer AD. Anoikis resistance and tumor metastasis. Cancer Lett. 2008;272:177-85. 84. Frisch SM, Screaton RA. Anoikis mechanisms. Current Opinion in Cell Biology. 2001;13:555-62. 85. Schmelzle T, Mailleux AA, Overholtzer M, Carroll JS, Solimini NL, Lightcap ES, et al. Functional role and oncogene-regulated expression of the BH3-only factor Bmf in mammary epithelial anoikis and morphogenesis. Proceedings of the National Academy of Sciences. 2007;104:3787-92. 86. Reginato MJ, Mills KR, Paulus JK, Lynch DK, Sgroi DC, Debnath J, et al. Integrins and EGFR coordinately regulate the pro-apoptotic protein Bim to prevent anoikis. Nat Cell Biol. 2003;5:733-40. 87. Frisch SM. Evidence for a function of death-receptor-related, death-domain-containing proteins in anoikis. Current Biology. 1999;9:1047-9.
41
88. Guadamillas MC, Cerezo A, Del Pozo MA. Overcoming anoikis--pathways to anchorage-independent growth in cancer. J Cell Sci.124:3189-97. 89. Drasin DJ, Robin TP, Ford HL. Breast cancer epithelial-to-mesenchymal transition: examining the functional consequences of plasticity. Breast Cancer Res. 2011;13:226. 90. Klymkowsky MW, Savagner P. Epithelial-Mesenchymal Transition : A Cancer Researcher’s Conceptual Friend and Foe. The American journal of pathology. 2009;174:1588-93. 91. Martin MJ, Melnyk N, Pollard M, Bowden M, Leong H, Podor TJ, et al. The insulin-like growth factor I receptor is required for Akt activation and suppression of anoikis in cells transformed by the ETV6-NTRK3 chimeric tyrosine kinase. Mol Cell Biol. 2006;26:1754-69. 92. Frisch SM, Vuori K, Kelaita D, Sicks S. A role for Jun-N-terminal kinase in anoikis; suppression by bcl-2 and crmA. J Cell Biol. 1996;135:1377-82. 93. Derksen PW, Liu X, Saridin F, van der Gulden H, Zevenhoven J, Evers B, et al. Somatic inactivation of E-cadherin and p53 in mice leads to metastatic lobular mammary carcinoma through induction of anoikis resistance and angiogenesis. Cancer Cell. 2006;10:437-49. 94. Onder TT, Gupta PB, Mani SA, Yang J, Lander ES, Weinberg RA. Loss of E-cadherin promotes metastasis via multiple downstream transcriptional pathways. Cancer Res. 2008;68:3645-54. 95. Varelas X, Wrana JL. Coordinating developmental signaling: novel roles for the Hippo pathway. Trends in Cell Biology. 2012;22:88-96. 96. Godde NJ, Galea RC, Elsum IA, Humbert PO. Cell polarity in motion: redefining mammary tissue organization through EMT and cell polarity transitions. J Mammary Gland Biol Neoplasia.15:149-68. 97. Xu J, Lamouille S, Derynck R. TGF-beta-induced epithelial to mesenchymal transition. Cell Res. 2009;19:156-72. 98. Moreno-Bueno G, Portillo F, Cano A. Transcriptional regulation of cell polarity in EMT and cancer. Oncogene. 2008;27:6958-69. 99. Ellenbroek SI, Iden S, Collard JG. Cell polarity proteins and cancer. Semin Cancer Biol.22:208-15. 100. Pan D. Hippo signaling in organ size control. Genes Dev. 2007;21:886-97. 101. Willecke M, Hamaratoglu F, Kango-Singh M, Udan R, Chen CL, Tao C, et al. The fat cadherin acts through the hippo tumor-suppressor pathway to regulate tissue size. Curr Biol. 2006;16:2090-100. 102. Cordenonsi M, Zanconato F, Azzolin L, Forcato M, Rosato A, Frasson C, et al. The Hippo transducer TAZ confers cancer stem cell-related traits on breast cancer cells. Cell.147:759-72. 103. Zhan L, Rosenberg A, Bergami KC, Yu M, Xuan Z, Jaffe AB, et al. Deregulation of scribble promotes mammary tumorigenesis and reveals a role for cell polarity in carcinoma. Cell. 2008;135:865-78. 104. Vigneron AM, Ludwig RL, Vousden KH. Cytoplasmic ASPP1 inhibits apoptosis through the control of YAP. Genes Dev.24:2430-9. 105. Varelas X, Samavarchi-Tehrani P, Narimatsu M, Weiss A, Cockburn K, Larsen BG, et al. The Crumbs Complex Couples Cell Density Sensing to Hippo-Dependent Control of the TGF-β-SMAD Pathway. Developmental Cell. 2010;19:831-44. 106. Varelas X, Miller BW, Sopko R, Song S, Gregorieff A, Fellouse FA, et al. The Hippo Pathway Regulates Wnt/β-Catenin Signaling. Developmental Cell. 2010;18:579-91.
42
107. Zhao B, Li L, Wang L, Wang CY, Yu J, Guan KL. Cell detachment activates the Hippo pathway via cytoskeleton reorganization to induce anoikis. Genes Dev. 2012;26:54-68. 108. Knippschild U, Krüger M, Richter J, Xu P, García-Reyes B, Peifer C, et al. The CK1 Family: Contribution to Cellular Stress Response and Its Role in Carcinogenesis. Frontiers in Oncology. 2014;4:96. 109. Massimi P, Zori P, Roberts S, Banks L. Differential Regulation of Cell-Cell Contact, Invasion and Anoikis by hScrib and hDlg in Keratinocytes. PLoS ONE. 2012;7:e40279. 110. Fontemaggi G, Gurtner A, Strano S, Higashi Y, Sacchi A, Piaggio G, et al. The transcriptional repressor ZEB regulates p73 expression at the crossroad between proliferation and differentiation. Mol Cell Biol. 2001;21:8461-70. 111. Wu Y, Zhou BP. Snail: More than EMT. Cell adhesion & migration. 2010;4:199-203. 112. Kajita M, McClinic KN, Wade PA. Aberrant expression of the transcription factors snail and slug alters the response to genotoxic stress. Mol Cell Biol. 2004;24:7559-66. 113. Kurrey NK, Jalgaonkar SP, Joglekar AV, Ghanate AD, Chaskar PD, Doiphode RY, et al. Snail and slug mediate radioresistance and chemoresistance by antagonizing p53-mediated apoptosis and acquiring a stem-like phenotype in ovarian cancer cells. Stem Cells. 2009;27:2059-68. 114. Qi Y, Gregory MA, Li Z, Brousal JP, West K, Hann SR. p19ARF directly and differentially controls the functions of c-Myc independently of p53. Nature. 2004;431:712-7. 115. Valsesia-Wittmann S, Magdeleine M, Dupasquier S, Garin E, Jallas AC, Combaret V, et al. Oncogenic cooperation between H-Twist and N-Myc overrides failsafe programs in cancer cells. Cancer Cell. 2004;6:625-30. 116. Kovi RC, Paliwal S, Pande S, Grossman SR. An ARF/CtBP2 complex regulates BH3-only gene expression and p53-independent apoptosis. Cell Death Differ.17:513-21. 117. Min C, Eddy SF, Sherr DH, Sonenshein GE. NF-kappaB and epithelial to mesenchymal transition of cancer. J Cell Biochem. 2008;104:733-44. 118. Li C-W, Xia W, Huo L, Lim S-O, Wu Y, Hsu JL, et al. Epithelial-mesenchyme transition induced by TNF-α requires NF-κB-mediated transcriptional upregulation of Twist1. Cancer Research. 2012;72:1290-300. 119. Toruner M, Fernandez-Zapico M, Sha JJ, Pham L, Urrutia R, Egan LJ. Antianoikis effect of nuclear factor-kappaB through up-regulated expression of osteoprotegerin, BCL-2, and IAP-1. J Biol Chem. 2006;281:8686-96. 120. Park SH, Riley P, Frisch SM. Regulation of anoikis by Deleted in Breast Cancer-1 (DBC1) through NF-κB. Apoptosis : an international journal on programmed cell death. 2013;18:949-62. 121. Mehrotra S, Languino LR, Raskett CM, Mercurio AM, Dohi T, Altieri DC. IAP regulation of metastasis. Cancer Cell.17:53-64. 122. Atwell S, Roskelley C, Dedhar S. The integrin-linked kinase (ILK) suppresses anoikis. Oncogene. 2000;19:3811-5. 123. Li XY, Zhou X, Rowe RG, Hu Y, Schlaepfer DD, Ilic D, et al. Snail1 controls epithelial-mesenchymal lineage commitment in focal adhesion kinase-null embryonic cells. J Cell Biol.195:729-38. 124. Schaller MD, Borgman CA, Cobb BS, Vines RR, Reynolds AB, Parsons JT. pp125FAK a structurally distinctive protein-tyrosine kinase associated with focal adhesions.
43
Proceedings of the National Academy of Sciences of the United States of America. 1992;89:5192-6. 125. Integrin-dependent phosphorylation and activation of the protein tyrosine kinase pp125FAK in platelets. The Journal of cell biology. 1992;119:905-12. 126. Hannigan GE, Leung-Hagesteijn C, Fitz-Gibbon L, Coppolino MG, Radeva G, Filmus J, et al. Regulation of cell adhesion and anchorage-dependent growth by a new [beta]1-integrin-linked protein kinase. Nature. 1996;379:91-6. 127. Medici D, Nawshad A. Type I collagen promotes epithelial-mesenchymal transition through ILK-dependent activation of NF-kappaB and LEF-1. Matrix Biol.29:161-5. 128. Shintani Y, Fukumoto Y, Chaika N, Svoboda R, Wheelock MJ, Johnson KR. Collagen I-mediated up-regulation of N-cadherin requires cooperative signals from integrins and discoidin domain receptor 1. J Cell Biol. 2008;180:1277-89. 129. Cicchini C, Laudadio I, Citarella F, Corazzari M, Steindler C, Conigliaro A, et al. TGFbeta-induced EMT requires focal adhesion kinase (FAK) signaling. Exp Cell Res. 2008;314:143-52. 130. Serrano I, McDonald PC, Lock FE, Dedhar S. Role of the integrin-linked kinase (ILK)/Rictor complex in TGFbeta-1-induced epithelial-mesenchymal transition (EMT). Oncogene. 131. Pugh CW, Ratcliffe PJ. The von Hippel–Lindau tumor suppressor, hypoxia-inducible factor-1 (HIF-1) degradation, and cancer pathogenesis. Seminars in Cancer Biology. 2003;13:83-9. 132. Gammon L, Biddle A, Heywood HK, Johannessen AC, Mackenzie IC. Sub-sets of cancer stem cells differ intrinsically in their patterns of oxygen metabolism. PLoS One. 2013;8:e62493. 133. Liou G-Y, Storz P. Reactive oxygen species in cancer. Free radical research. 2010;44:10.3109/10715761003667554. 134. Mailloux RJ, Harper ME. Mitochondrial proticity and ROS signaling: lessons from the uncoupling proteins. Trends Endocrinol Metab. 2012;23:451-8. 135. Giannoni E, Buricchi F, Grimaldi G, Parri M, Cialdai F, Taddei ML, et al. Redox regulation of anoikis: reactive oxygen species as essential mediators of cell survival. Cell Death Differ. 2008;15:867-78. 136. Taddei ML, Giannoni E, Comito G, Chiarugi P. Microenvironment and tumor cell plasticity: an easy way out. Cancer Lett. 2013;341:80-96. 137. Lambeth JD, Neish AS. Nox enzymes and new thinking on reactive oxygen: a double-edged sword revisited. Annu Rev Pathol. 2014;9:119-45. 138. Huang G, Chen Y, Lu H, Cao X. Coupling mitochondrial respiratory chain to cell death: an essential role of mitochondrial complex I in the interferon-beta and retinoic acid-induced cancer cell death. Cell Death Differ. 2007;14:327-37. 139. Skinner HD, Sandulache VC, Ow TJ, Meyn RE, Yordy JS, Beadle BM, et al. TP53 disruptive mutations lead to head and neck cancer treatment failure through inhibition of radiation-induced senescence. Clin Cancer Res. 2012;18:290-300. 140. Mookerjee SA, Divakaruni AS, Jastroch M, Brand MD. Mitochondrial uncoupling and lifespan. Mech Ageing Dev. 2010;131:463-72. 141. Kamata H, Honda S, Maeda S, Chang L, Hirata H, Karin M. Reactive oxygen species promote TNFalpha-induced death and sustained JNK activation by inhibiting MAP kinase phosphatases. Cell. 2005;120:649-61.
44
142. Tonks NK. Redox Redux: Revisiting PTPs and the Control of Cell Signaling. Cell. 2005;121:667-70. 143. Barford D. The role of cysteine residues as redox-sensitive regulatory switches. Current Opinion in Structural Biology. 2004;14:679-86. 144. Mailloux RJ, Harper ME. Uncoupling proteins and the control of mitochondrial reactive oxygen species production. Free Radic Biol Med. 2011;51:1106-15. 145. Chiarugi P, Fiaschi T, Taddei ML, Talini D, Giannoni E, Raugei G, et al. Two vicinal cysteines confer a peculiar redox regulation to low molecular weight protein tyrosine phosphatase in response to platelet-derived growth factor receptor stimulation. J Biol Chem. 2001;276:33478-87. 146. Schafer ZT, Grassian AR, Song L, Jiang Z, Gerhart-Hines Z, Irie HY, et al. Antioxidant and oncogene rescue of metabolic defects caused by loss of matrix attachment. Nature. 2009;461:109-13. 147. Davison CA, Durbin SM, Thau MR, Zellmer VR, Chapman SE, Diener J, et al. Antioxidant enzymes mediate survival of breast cancer cells deprived of extracellular matrix. Cancer Res. 2013;73:3704-15. 148. Kamarajugadda S, Stemboroski L, Cai Q, Simpson NE, Nayak S, Tan M, et al. Glucose oxidation modulates anoikis and tumor metastasis. Mol Cell Biol. 2012;32:1893-907. 149. Huttemann M, Pecina P, Rainbolt M, Sanderson TH, Kagan VE, Samavati L, et al. The multiple functions of cytochrome c and their regulation in life and death decisions of the mammalian cell: From respiration to apoptosis. Mitochondrion. 2011;11:369-81. 150. Giorgio M, Migliaccio E, Orsini F, Paolucci D, Moroni M, Contursi C, et al. Electron transfer between cytochrome c and p66Shc generates reactive oxygen species that trigger mitochondrial apoptosis. Cell. 2005;122:221-33. 151. Ma Z, Myers DP, Wu RF, Nwariaku FE, Terada LS. p66Shc mediates anoikis through RhoA. J Cell Biol. 2007;179:23-31. 152. Manickam N, Patel M, Griendling KK, Gorin Y, Barnes JL. RhoA/Rho kinase mediates TGF-beta1-induced kidney myofibroblast activation through Poldip2/Nox4-derived reactive oxygen species. Am J Physiol Renal Physiol. 2014;307:F159-71. 153. Chong SJF, Low ICC, Pervaiz S. Mitochondrial ROS and involvement of Bcl-2 as a mitochondrial ROS regulator. Mitochondrion. 2014;19, Part A:39-48. 154. Mizuno T, Suzuki N, Makino H, Furui T, Morii E, Aoki H, et al. Cancer stem-like cells of ovarian clear cell carcinoma are enriched in the ALDH-high population associated with an accelerated scavenging system in reactive oxygen species. Gynecol Oncol. 2015;137:299-305. 155. Diehn M, Cho RW, Lobo NA, Kalisky T, Dorie MJ, Kulp AN, et al. Association of reactive oxygen species levels and radioresistance in cancer stem cells. Nature. 2009;458:780-3. 156. Vlashi E, Lagadec C, Vergnes L, Reue K, Frohnen P, Chan M, et al. Metabolic differences in breast cancer stem cells and differentiated progeny. Breast Cancer Res Treat. 2014;146:525-34. 157. Finkel T. Oxygen radicals and signaling. Current Opinion in Cell Biology. 1998;10:248-53. 158. Simon AR, Rai U, Fanburg BL, Cochran BH. Activation of the JAK-STAT pathway by reactive oxygen species. American Journal of Physiology - Cell Physiology. 1998;275:C1640-C52.
45
159. Masin M, Vazquez J, Rossi S, Groeneveld S, Samson N, Schwalie PC, et al. GLUT3 is induced during epithelial-mesenchymal transition and promotes tumor cell proliferation in non-small cell lung cancer. Cancer Metab. 2014;2:11. 160. Singh S, Khan AR, Gupta AK. Role of glutathione in cancer pathophysiology and therapeutic interventions. J Exp Ther Oncol. 2012;9:303-16. 161. Lu J, Holmgren A. The thioredoxin antioxidant system. Free Radical Biology and Medicine. 2014;66:75-87. 162. Ng TL, Leprivier G, Robertson MD, Chow C, Martin MJ, Laderoute KR, et al. The AMPK stress response pathway mediates anoikis resistance through inhibition of mTOR and suppression of protein synthesis. Cell Death Differ. 2012;19:501-10. 163. Vander Heiden MG, Lunt SY, Dayton TL, Fiske BP, Israelsen WJ, Mattaini KR, et al. Metabolic pathway alterations that support cell proliferation. Cold Spring Harb Symp Quant Biol. 2011;76:325-34. 164. McMahon M, Itoh K, Yamamoto M, Hayes JD. Keap1-dependent Proteasomal Degradation of Transcription Factor Nrf2 Contributes to the Negative Regulation of Antioxidant Response Element-driven Gene Expression. Journal of Biological Chemistry. 2003;278:21592-600. 165. Madajewski B, Boatman MA, Chakrabarti G, Boothman DA, Bey EA. Depleting Tumor-NQO1 Potentiates Anoikis and Inhibits Growth of NSCLC. Molecular Cancer Research. 2016;14:14-25. 166. Cannito S, Novo E, Compagnone A, Valfre di Bonzo L, Busletta C, Zamara E, et al. Redox mechanisms switch on hypoxia-dependent epithelial-mesenchymal transition in cancer cells. Carcinogenesis. 2008;29:2267-78. 167. Cichon MA, Radisky DC. ROS-induced epithelial-mesenchymal transition in mammary epithelial cells is mediated by NF-kB-dependent activation of Snail. Oncotarget. 2014;5:2827-38. 168. Radisky DC, Levy DD, Littlepage LE, Liu H, Nelson CM, Fata JE, et al. Rac1b and reactive oxygen species mediate MMP-3-induced EMT and genomic instability. Nature. 2005;436:123-7. 169. Warburg O, Wind F, Negelein E. THE METABOLISM OF TUMORS IN THE BODY. The Journal of General Physiology. 1927;8:519-30. 170. Cha YH, Yook JI, Kim HS, Kim NH. Catabolic metabolism during cancer EMT. Arch Pharm Res. 2015;38:313-20. 171. Dang CV. p32 (C1QBP) and Cancer Cell Metabolism: Is the Warburg Effect a Lot of Hot Air? Molecular and Cellular Biology. 2010;30:1300-2. 172. Koppenol WH, Bounds PL, Dang CV. Otto Warburg's contributions to current concepts of cancer metabolism (vol 11, pg 325, 2011). Nature Reviews Cancer. 2011;11:618-. 173. Sonveaux P, Vegran F, Schroeder T, Wergin MC, Verrax J, Rabbani ZN, et al. Targeting lactate-fueled respiration selectively kills hypoxic tumor cells in mice. J Clin Invest. 2008;118:3930-42. 174. Martinez-Outschoorn UE, Pavlides S, Howell A, Pestell RG, Tanowitz HB, Sotgia F, et al. Stromal-epithelial metabolic coupling in cancer: integrating autophagy and metabolism in the tumor microenvironment. Int J Biochem Cell Biol. 2011;43:1045-51.
46
175. LeBleu VS, O'Connell JT, Gonzalez Herrera KN, Wikman H, Pantel K, Haigis MC, et al. PGC-1alpha mediates mitochondrial biogenesis and oxidative phosphorylation in cancer cells to promote metastasis. Nat Cell Biol. 2014;16:992-1003, 1-15. 176. Grassian AR, Metallo CM, Coloff JL, Stephanopoulos G, Brugge JS. Erk regulation of pyruvate dehydrogenase flux through PDK4 modulates cell proliferation. Genes & Development. 2011;25:1716-33. 177. Roche TE, Hiromasa Y. Pyruvate dehydrogenase kinase regulatory mechanisms and inhibition in treating diabetes, heart ischemia, and cancer. Cellular and Molecular Life Sciences. 2007;64:830-49. 178. Chu K, Boley KM, Moraes R, Barsky SH, Robertson FM. The Paradox of E-Cadherin: Role in response to hypoxia in the tumor microenvironment and regulation of energy metabolism. Oncotarget. 2013;4:446-62. 179. Matés JM, Segura JA, Campos-Sandoval JA, Lobo C, Alonso L, Alonso FJ, et al. Glutamine homeostasis and mitochondrial dynamics. The International Journal of Biochemistry & Cell Biology. 2009;41:2051-61. 180. Wise DR, Thompson CB. Glutamine Addiction: A New Therapeutic Target in Cancer. Trends in biochemical sciences. 2010;35:427-33. 181. Medina MÁ. Glutamine and Cancer. The Journal of nutrition. 2001;131:2539S-42S. 182. Wise DR, DeBerardinis RJ, Mancuso A, Sayed N, Zhang X-Y, Pfeiffer HK, et al. Myc regulates a transcriptional program that stimulates mitochondrial glutaminolysis and leads to glutamine addiction. Proceedings of the National Academy of Sciences of the United States of America. 2008;105:18782-7. 183. Hu W, Zhang C, Wu R, Sun Y, Levine A, Feng Z. Glutaminase 2, a novel p53 target gene regulating energy metabolism and antioxidant function. Proceedings of the National Academy of Sciences of the United States of America. 2010;107:7455-60. 184. Hensley CT, Wasti AT, DeBerardinis RJ. Glutamine and cancer: cell biology, physiology, and clinical opportunities. The Journal of Clinical Investigation.123:3678-84. 185. Vander Heiden MG, Cantley LC, Thompson CB. Understanding the Warburg Effect: The Metabolic Requirements of Cell Proliferation. Science (New York, NY). 2009;324:1029-33. 186. Zhao Y, Butler EB, Tan M. Targeting cellular metabolism to improve cancer therapeutics. Cell death & disease. 2013;4:e532. 187. Villar VH, Merhi F, Djavaheri-Mergny M, Duran RV. Glutaminolysis and autophagy in cancer. Autophagy. 2015;11:1198-208. 188. Nicklin P, Bergman P, Zhang B, Triantafellow E, Wang H, Nyfeler B, et al. Bidirectional Transport of Amino Acids Regulates mTOR and Autophagy. Cell. 2009;136:521-34. 189. Seglen PO, Gordon PB, Poli A. Amino acid inhibition of the autophagic/lysosomal pathway of protein degradation in isolated rat hepatocytes. Biochimica et Biophysica Acta (BBA) - General Subjects. 1980;630:103-18. 190. Kim J, Kundu M, Viollet B, Guan K-L. AMPK and mTOR regulate autophagy through direct phosphorylation of Ulk1. Nature cell biology. 2011;13:132-41. 191. Rabinowitz JD, White E. Autophagy and Metabolism. Science (New York, NY). 2010;330:1344-8. 192. Laplante M, Sabatini DM. mTOR signaling in growth control and disease. Cell. 2012;149:274-93.

47
193. Jewell JL, Russell RC, Guan K-L. Amino acid signalling upstream of mTOR. Nature reviews Molecular cell biology. 2013;14:133-9. 194. Bar-Peled L, Sabatini DM. Regulation of mTORC1 by amino acids. Trends in cell biology. 2014;24:400-6. 195. Carey BW, Finley LW, Cross JR, Allis CD, Thompson CB. Intracellular alpha-ketoglutarate maintains the pluripotency of embryonic stem cells. Nature. 2015;518:413-6. 196. Amoedo ND, Rodrigues MF, Rumjanek FD. Mitochondria: are mitochondria accessory to metastasis? Int J Biochem Cell Biol. 2014;51:53-7.
48
Grainyhead-like transcription factor family: Roles in Cancer
The three mammalian homologues of Drosophila Grainyhead, termed GRHL1, 2, and
3 have each been demonstrated to play significant roles in carcinogenesis. These
homologues share some common targets; however, like their distinct chronological
induction during embryogenesis and varied expression patterns in adult tissues, they have
unique target genes and effects on cellular processes. In the context of cancer, GRHL1 has
been demonstrated to act as a tumor suppressor in both squamous cell carcinoma (SCC) and
neuroblastoma (1). In the context of SCC, the tumor suppressive role of GRHL1 was
demonstrated in Grhl1-/- mice, which developed a higher number of malignant lesions
following treatment with topical carcinogen, DMBA as compared to wild type. In this study,
Mlacki et al., demonstrated that mechanistically, loss of GRHL1 resulted in a chronic
elevation of inflammatory factors as well as a faulty keratinocyte terminal differentiation
program (2). Interestingly, the closely related family member, GRHL3, has also been
demonstrated to have tumor suppressive functions in SCC via maintenance of its target gene
PTEN, where the expression of GRHL3 was demonstrated to be repressed by the proto-
oncogenic network mediated through miR-21 (3). The role of GRHL2 in oncogenesis remains
contested, and appears to play a role which at the very least might be context and/or tissue
specific in its tumor promoting or suppressing behavior. Highlighting the most critical
findings in regards to GRHL2 will be the focus of this review.
Suppression of the Oncogenic Epithelial-to-Mesenchymal Transition by Grainyhead-like 2
49
The epithelial-mesenchymal transition (EMT), has been strongly implicated in the
malignant progression of cancer, endowing subpopulations of tumors with enriched
metastatic potential as well as stem cell-like properties (4). This cellular event represents a
major shift within these epithelial subpopulations, resulting in characteristics reminiscent
of mesenchymal cells including disruption of cell-cell adhesion (5), increased motility and
invasiveness(6), chemo/radiotherapeutic resistance (7-10), and resistance to matrix-
detachment induced cell death, a process referred to as anoikis (11-14). These features
represent the manifestations of cellular phenotypic plasticity conferred by passage between
these two distinct states. In the context of normal physiological function, EMT and its
converse process termed mesenchymal-epithelial transition (MET), are indispensable to
events such as embryological development and wound healing (5, 15). However, these
normal processes, when dysregulated, can have catastrophic consequences. Perturbations
of normal cellular functions such as proliferation and growth are extensively characterized
in the context of cancer progression, and an extensive body of evidence has now established
EMT/MET plasticity as a normal process employed inappropriately in the context of
malignancy.
In breast cancer specifically, loss of GRHL2 expression is seen specifically in the
aggressive claudin-low and basal B subtypes, which are known to exhibit a frank EMT
phenotype, and are often associated with resistance to therapeutic intervention and poor
prognosis (16-18). While a multitude of factors have been shown to induce EMT, these
factors far outweigh those which inhibit this event. GRHL2 has emerged as a master
regulator of the epithelial phenotype, the mechanisms of which are largely established (18-
20). Overexpression of GRHL2 is associated with MET resulting in downregulation of the
50
mesenchymal markers vimentin, fibronectin, N-cadherin, and CD44S as well as E-cadherin
upregulation (18). Snail and ZEB1, well established E-box binding transcription factors,
function to directly repress epithelial genes such as E-cadherin (21-24), directly contributing
to loss of cell-cell junctional networks of epithelial cells, and further enhancing
transactivation of survival genes associated with Wnt signaling through loss of β-catenin
sequestration (25). A critical reciprocal feedback loop has been discovered between GRHL2
and ZEB1 such that in ovarian cancer, colorectal carcinoma, and breast cancer cell lines,
GRHL2 and ZEB1 expression levels have been found to inversely correlate (20, 26, 27). This
relationship is mediated at least partially through direct GRHL2 repression of the ZEB1
promoter as demonstrated through ChIP assay (18), and furthermore, it has also been
demonstrated that ZEB1 represses the GRHL2 promoter through direct binding as well (19).
Of note, in an superb study by Chung et al., the reciprocal feedback loop between GRHL2 and
ZEB1 was confirmed in epithelial ovarian cancer (27); however, they were unable support
previous findings (18) that demonstrated direct GRHL2 binding to the ZEB1 promoter. This
discrepancy is most likely the result of relative gain difference comparing ChIP-seq
technique to direct ChIP assay in which the sensitivity of interaction detected can be
significantly modified through DNA fragment input alteration. Further, support for direct
GRHL2 binding to the ZEB1 promoter was confirmed by repression of a luciferase tagged
ZEB1 promoter construct co-transfected with GRHL2 in a dose-dependent manner as well as
enhanced ZEB1 promoter activity in cells expressing stable GRHL2 knockdown (18).
Additionally, GRHL2 has been demonstrated to interfere with ZEB1 expression through
other mechanisms. The homeoprotein SIX1 is a well-established transcription factor
involved in developmental EMT which also plays a role in the oncogenic EMT, through direct
51
transactivation of the ZEB1 promoter (28, 29). Interestingly, GRHL2 further disrupts ZEB1
expression by altering the Six1-DNA complex resulting in further abrogated transcription at
this site (19).
In addition to suppressing ZEB1 transcriptional activity, GRHL2 further supports the
epithelial phenotype through suppression of TGF-β/Smad mediated transcription. TGF-β
has been extensively described to confer either tumor suppressive (through induction of
CDK inhibitor proteins) or tumor promoting (through transcriptional support of EMT)
properties dependent on tumor stage. In fact, TGF-β signaling, along with
canonical/noncanonical Wnt signaling is upregulated and through autocrine signaling
pathways maintain the mesenchymal subpopulation present in Human mammary epithelial
lines (HMLE) (30). GRHL2 inhibits Smad mediated transcription, and depletion of GRHL2 is
permissive of EMT induction in HMLE cells (18), which are otherwise resistant to this
stimulus (due to high endogenous GRHL2 levels) (30). Further, it was confirmed that
depletion of GRHL2 in HMLE cells expressing low level K-Ras (HMLER) results in EMT, a
phenomenon shown to be dependent on autocrine TGF-β signaling (18). Additionally,
GRHL2 was shown to prevent TGF-β induced EMT in MCF10a cells constitutively expressing
GRHL2 (20). Notably, GRHL2 was reported to upregulate BMP-2, a member of the bone
morphogenetic protein family, belonging to the TGF-β superfamily, which are known to
inhibit TGF-β receptor signaling through competition with Smad2/3 for Smad4 binding and
nuclear translocation (18, 31).
It has been well established that the primary mechanism by which the miR-200 family
acts to enforce the epithelial phenotype is through post-transcriptional repression of
ZEB1/2, and in fact a negative feedback loop has been demonstrated such that ZEB
52
transcription factors also transcriptionally repress miR-200 expression (11, 32-36). It is
now well established that GRHL2 positively regulates the transcription of this family of
microRNAs. Stable knockdown of GRHL2 resulted in a significant reduction in both miR-
200b/c transcript levels (18). Further, GRHL2 was shown to bind directly to the promoter
region regulating the polycistronic primary transcript of mi-R200b, miR-200a, and miR-429
(27), inducing their expression. Interestingly, it was shown here that stable overexpression
of either miR-200b or miR-200a was able to restore E-cadherin expression in OVCA429
ovarian cancer cells expressing stable knockdown of GRHL2, indicating a so-called “double
negative” regulatory feedback loop with the miR-200 family, GRHL2, and ZEB1. The positive
regulatory effect of GRHL2 on the miR-200 family has also been confirmed in other models
including oral squamous cell carcinoma (37, 38). The transcription factor p63 is a multi-
isoform relative of p53 critical for proper epidermal development (39). A recent report
showed a critical role in the maintenance of the epithelial phenotype for p63 and
demonstrates a positive regulatory loop between p63 and GRHL2. It was demonstrated here
that depletion of p63 results in loss of GRHL2 and miR-200 family gene expression as well as
other epithelial specific markers and resulted in an EMT phenotype (38).
Several of the aforementioned pathways have regulatory control of endogenous
GRHL2 expression as well. As previously stated, TGF-β is only able to induce EMT in
particular contexts or stages of tumor progression. For example, in the setting of HMLE cells,
EMT is only induced by TGF-β in conjunction with either stable GRHL2 knockdown (18) or
activation of Wnt signaling (30). It is now clear that activation of the Wnt and TGF-β
pathways work in concert to downregulate endogenous GRHL2 expression. Neither
activation of the Wnt pathway via BIO compound (GSK3 inhibitor) or stably expressed S33Y

53
β-catenin nor long term TGF-β treatment resulted in significant downregulation of GRHL2
alone; however, in combination, these pathways downregulated GRHL2 considerably (19).
BMP2, which was significantly upregulated in GRHL2 expressing cells (18), acts as an
inhibitor of TGF-β signaling. Treatment of cells with BMP2 prevented downregulation of
GRHL2 and ZEB1 upregulation in response to Twist mediated EMT (19). As will be
demonstrated below, it is clear that a better understanding of how to inhibit these pathways
successfully in vivo could be a crucial step in inhibition of EMT plasticity and preventing
mortality from chemotherapeutic resistance, recurrence, and metastasis.
Anoikis, Cancer Stem Cell Phenotype, Recurrence and Metastasis: Reversal by GRHL2
Among the various deleterious traits of metastatic tumor cells, one especially
important for their ability to survive beyond their primary site is a compromised anoikis
response (14, 40). Along with increasing migratory and invasive characteristics, it is well
established that EMT induces anoikis resistance in cancer cells (14, 41, 42). Many of the core
cellular signaling pathways involved in the implementation of the EMT program such as
PI3K/Akt and MAPK activation also contribute to cell survival in general, anoikis being no
exception (43). Ectopic GRHL2 expression was shown to restore sensitivity to anoikis in
MDA-MB-231 breast cancer cells as well as the mesenchymal subpopulation of HMLE cells
(18). Accordingly, depletion of GRHL2 by shRNA in HMLE+Twist-ER and MCF10a neoT cells
also decreased sensitivity to anoikis (44). While many signaling pathways are aberrantly
activated during EMT (e.g. FAK, ILK, TrkB; refer to (13) for an indepth review), and
contribute to anoikis resistance, our lab recently showed GRHL2 at least partially enforces
54
anoikis sensitivity through downregulation of the mitochondrial enzyme glutamate
dehydrogenase I (GLUD1) (44). GLUD1, an enzyme shown to have pro-tumorigenic roles in
orthotopic models, has been demonstrated to influence the cellular oxidative milieu via
production of α-ketoglutarate (α-KG), increasing fumarate production in the citric acid cycle,
stabilizing the antioxidant enzyme glutathione peroxidase 1. Further, in this study, Jin et al.
demonstrated by IHC that GLUD1 expression correlates with progressive stages of both
breast and lung carcinomas (45). Our lab found that overexpression of GRHL2 resulted in a
decline in α-ketoglutarate levels, elevating reactive oxygen species (ROS), and impacting
mitochondrial metabolism; further, stable knockdown of GLUD1 increased ROS and anoikis
sensitivity, while replacement of α-KG in these cells resulted in decreased ROS and enhanced
resistance to anoikis (44). Luciferase assays showed that the GLUD1 promoter was
significantly repressed by GRHL2 in cotransfection experiments. Here, it was demonstrated
that GRHL2 acts to repress the GLUD1 promoter as well as the EMT program in HMLE cells
and further suppresses tubulogenesis in MDCK cells via inhibition of the histone
acetyltransferase co-activator, p300 (Pifer et al., 2016; in review).
Resistance to anoikis is a pre-requisite for tumor metastasis. In order for cancer cells
to escape their primary microenvironment, they must be able to shed their connections to
the surrounding extracellular matrix in their primary environment and survive
intravasation into the vasculature or lymphatic system. Experimentally, enforced
expression of E-cadherin abrogates invasive properties in cancer cells, and clinically,
expression of E-cadherin is associated with lower risk of tumor invasion (46-49),
highlighting the importance of the EMT program in these early stages of metastasis. EMT
thus endows subpopulations of tumor cells with anoikis resistance allowing them to survive
55
dissemination after invading out of their primary niche. In a p53-dominant negative tumor
model, depletion of E-cadherin in a conditional knockout mouse transgenic line significantly
increased tumor metastasis in vivo; moreover, the resulting cell lines produced from this
study were anoikis resistant compared to their E-cadherin positive counterparts (50).
However, despite these findings, the role of EMT/MET in metastasis is an area of
controversy.
Reversion of mesenchymal to epithelial cells in some contexts has been shown to
enhance metastatic colonization (5). In fact, breast cancer metastases are often, but not
always, epithelial and express E-cadherin (51). As such, it was demonstrated by Nieto and
colleagues that depletion of the EMT inducing homeobox transcription factor Prrx1 is
required for cancer cells to seed metastatic locations in vivo; however, it was noted in this
study that Prrx1 overexpression does not induce cancer stem cell-like traits as does ZEB1,
Twist, or Snail mediated EMT events as previously described(52-55). This contradicts
findings showing that tumor metastases, at least in some cases, are mesenchymal or contain
a mixture of mesenchymal and epithelial cells, indicating that the EMT phenotype likely still
exists in metastases, at least in early stages of metastatic colonization. This observation that
metastatic tumors often do not resemble the mesenchymal cells which gave rise to them is
likely a consequence of differing local microenvironmental stimuli encountered following
extravasation into distant organs, where the stress signals initially invoking EMT in the
primary tumor are no longer present (6, 56, 57). Some studies have posited that following
Twist activation and EMT induction, in order for circulating tumor cells to colonize distant
sites, it must be silenced (58). While it may be true that MET confers proliferative
advantages in metastatic settings, a major flaw with this reasoning is evidenced by the
56
inhibition of proliferation which occurs due to activation of exogenous Twist in these
settings, which may result in misinterpretation of these results.
A potential reconciliation of these views is that EMT/MET plasticity is in fact the
major force to endow cancer cells with their malignant properties. An extension of this
interpretation would imply that either EMT or MET could be viewed as tumor suppressive
or oncogenic events depending on the stage of disease progression. A recent publication by
Scheel et al. however, demonstrated that transient Twist1 activation permanently alters cell
state and primes epithelial cells for stem cell-like properties which did not require
permanent acquisition of the EMT phenotype (58). This finding informs the intimidating
reality that any tumor cell subjected to the proper conditions in the tumor
microenvironment may undergo EMT even transiently, and thus potentially attaining cancer
stem cell-like properties highlighting the need for targeted therapy to eradicate this
subpopulation, or rather, prevent its emergence. It is clear that a better understanding of
the major regulators of EMT and MET is critical in order to prevent the emergence of
treatment resistant metastases and recurrence. Regardless of the seemingly contradictory
evidences, it is undeniable that EMT invokes many traits in cancer cells associated with
aggressive malignancies, invasion, and anoikis resistance, and that these features are
ameliorated by expression of the epithelial enforcer GRHL2. Of critical importance, it was
demonstrated through a comprehensive IHC analysis of primary breast tumors that a
striking loss of GRHL2 expression occurs at the invasive front of primary tumors, and a
significant inverse correlation exists between GRHL2 expression and the presence of lymph
node metastases (20). Also, it was noted by the authors in this study that while correlative
evidence, basal cell carcinomas, which nearly never metastasize, as well as non-invasive
57
urinary bladder cancer both showed incredibly strong expression of GRHL2. Conversely,
other reports have associated GRHL2 expression with increased risk of metastasis and poor
relapse free survival (59, 60). However, these studies do account for that fact that tumors of
epithelial phenotype enrich for genes such as GRHL2 or E-cadherin relative to “normal”
tissue (which is often predominantly fibroblastic stromal tissue). This provides the
implication that the more rapidly an epithelial tumor grows, the more “epithelial” it will
appear to techniques such as RNA-seq due to expansion of this compartment. In addition to
this, as mentioned previously, the most relevant sub-compartment of the tumor to driving
therapy resistance, recurrence and metastasis is a very small proportion of the overall tumor
which downregulates GRHL2, therefore this population is masked by techniques that
consider the entire tumor.
Disease recurrence several years following initially successful treatment of primary
disease is a frequent reality, and is the most common cause of death from cancer. It has been
extensively demonstrated that in these settings, plasticity conferred by EMT benefits small
populations of cells, bestowing CSC-like and chemoresistant properties to these primary
tumor cells, which persist, only to resume growth after a period of dormancy (41, 61-66). In
breast cancer, these populations are often identified by a shift in surface expression toward
a CD44HIGH/CD24LOW phenotype. In culture, treatment of HMLE cells with taxol derivatives
selects for this CSC-like population; conversely, stable expression of GRHL2 significantly
sensitizes these, as well as MDA-MB-231 cells, to this therapy. Most importantly, ectopically
expressed GRHL2 prevents the chemotherapy-induced emergence of this population capable
of tumor initiation (19). In a study by Singh et al, it was demonstrated that epithelial SUM149
cells subjected to metabolic stress such as glutamine deprivation resulted in the emergence
58
of a “metabolically adaptable,” glutamine independent population, termed SUM149-MA or
MA2. It was demonstrated here that in addition to having undergone EMT, these cells now
displayed chemotherapeutic resistance to taxol, Erlotinib, doxorubicin, and a number of
other both targeted and cytotoxic agents. Upon global gene expression analysis, it was
discovered that MA2 cells had significantly downregulated GRHL2 and upregulated ZEB1.
The authors noted a significant decrease in histone activation marks H3K4 trimethylation
and H3K14 acetylation in the MA population previously reported to be associated with the
drug resistant state (67), which when reversed using HDAC inhibitor pretreatment,
significantly sensitized cells to chemotherapy (68). Interestingly, it has also been reported
that while H3K4me3 marks remain largely unchanged following GRHL2 depletion with
shRNA, repressive mark H3K27me3 significantly increased in the promoter regions of genes
positively regulated by GRHL2 including CDH1, MIR-200B/200A and 429(27). These findings
strongly point to a potential role for GRHL2 in epigenetic modification as a mechanism of
transcriptional regulation. Observations such as these support a role in both sensitization
to chemotherapy by GRHL2, as well as a critical role in abrogating CSC emergence crucial for
the initiation of recurrent disease.
Mouse models recapitulating recurrence following regression of primary tumors
driven by doxycycline inducible neuNT, Wnt1, or c-myc have shown that in comparison to
the primary tumors, recurrent disease that emerges following withdrawal of the oncogenic
driver have undergone EMT (64, 69, 70). Analysis of tetO-neuNT and tetO-Wnt1 primary vs
recurrent RNA expression revealed a striking decrease in GRHL2 expression in recurrent
tumors (19). These findings strongly support the hypothesis that GRHL2 is a tumor
suppressor, is specifically silenced in the tumor initiating subpopulation of the primary
59
tumor, and is a major suppressor of disease recurrence. Further evaluation is needed in
order to more clearly define the precise role of GRHL2 in preventing recurrence in vivo.
GRHL2: Tumor Suppressor or Oncogene?
Despite the extensive evidence reporting GRHL2 as a tumor suppressor and inhibitor
of the EMT phenotype, there are contradictory reports in both breast and other malignancies
supporting a role of GRHL2 in oncogenesis (1). It is clear that the expression pattern of
GRHL2 in adult tissues is immensely complex. GRHL2 is found almost exclusively in tissues
of the body that are predominantly epithelial (71), correlating with expression of junctional
proteins such as E-cadherin and CLDN4 (72); however, its expression is diversely regulated,
showing up and downregulation often within the same tissue type, highlighting its potential
for tumor suppressive or oncogenic roles, depending on the context .
It was reported that in oral squamous cell carcinoma, GRHL2 interacted directly with
the promoter of hTERT (human telomerase reverse transcriptase) as assessed by promoter
magnetic IP (PMP assay). In this model, telomerase, which is required to maintain the
malignant phenotype, had higher activity in tumor lines expressing high GRHL2 expression,
and depletion of GRHL2 reduced telomerase activity and cell viability, as well as resulted in
hypermethylation of the hTERT promoter (73, 74). The precise rationale for this GRHL2-
mediated regulation of cellular immortalization in this context is unclear at present. In
agreement with these findings, Chen et al demonstrated that depletion of GRHL2 abrogated
tumorigenesis and was necessary for maintenance of stemness in a model of oral squamous
cell carcinoma (37). Another study reported that the 8q22 gene cluster was involved in
death receptor-mediated apoptosis. Here, GRHL2 was identified in a whole-genome RNAi
60
screen which indicated that it suppressed death receptor signaling (75); however, unlike
other target genes identified in this screen, the authors were unable to rescue the RNAi
associated phenotype resulting from GRHL2 depletion, therefore an off-target effect could
not be eliminated. Also noteworthy, the shRNA pool used in the study was conducted in
HT1080 fibrosarcoma lines which have minimal expression of endogenous GRHL2.
Many of these findings can be rationally explained, such as studies which knocked
down GRHL2 expression in already mesenchymal HT1080 fibrosarcoma cells (75), or
overexpressing GRHL2 in NIH3T3 fibroblast lines (20), whose cancer relevance, as noted by
the authors, is questionable. Still other studies contain discrepancies not fully understood
at present. For example, while it was reported by Xiang et al that highly invasive 4T1 cells
orthotopically injected into the mammary fat pad would metastasize in a period of about 4
weeks, and that the resulting metastases recovered from the lungs displayed an EMT
phenotype, they observed a counterintuitive increase in metastasis when injecting 4T1 cells
overexpressing GRHL2 (59). Further, GRHL2 was confirmed in this study to enforce the
epithelial phenotype. These results are in direct opposition to those showing a direct role of
EMT in promoting metastases, rather than inhibiting it (12, 76-83). In our hands, we have
found that GRHL2 does not retain several critical functions in some murine cell lines such as
4T1 cells (unpublished observations); therefore, it is possible that in some restricted murine
settings, GRHL2 fails to inhibit metastasis.
As detailed above, GRHL2 expression is lost in recurrences which often display EMT
phenotype (19); however, other studies have shown that gain of GRHL2 (via amplification of
GRHL2 gene at chromosome 8q22.3) was demonstrated to be a marker of early recurrence
in hepatocellular carcinomas (84). However, unlike in the context of basal-B breast cancer
61
cell lines, where GRHL2 was reported to have no effect on proliferation (18, 20), in the HCC
lines studied by Tanaka and colleagues, GRHL2 knockdown resulted in decreased cell
proliferation, indicating that in this context, either GRHL2 significantly impacts tumor cell
growth and proliferation which may contribute to earlier detection of apparent recurrent
disease in some tissue types (84). Likewise, colorectal carcinomas, which have been
reported express high levels of GRHL2, have been described to show enhanced proliferation,
larger tumor size, and more advanced clinical stage in this setting (85). These findings were
verified by depletion of GRLH2 in colorectal cell lines HCT116 and HT29 cells (26);
conversely, in our hands, HCT116 cell lines were found to express very low levels of
endogenous GRHL2 (unpublished observations). A potential explanation of the role of
GRHL2 in regulating cellular proliferation may be found in examination of the reported
target gene Erbb3 by GRHL2. Erbb3, with known roles in carcinogenesis and proliferation,
was identified as a GRHL2 target gene by Werner et al, and furthermore, was found to contain
a single conserved GRHL2 DNA binding site (AACCGGTT) upstream of the transcriptional
start site. Binding to this site was demonstrated by EMSA and activation was shown through
luciferase cotransfection experiments (20). Importantly, this upregulation was originally
noted in NIH3T3 cells overexpressing GRHL2, and the authors noted that in the triple
negative breast cancer line MDA-MB-231 cells, where GRHL2 has no reported effect on
proliferation, there was no upregulation of Erbb3 (20). It is possible that differential gene
regulation in different cell lines may therefore contribute to findings demonstrating
alterations in proliferation by GRHL2. Of note, it has been demonstrated that GRHL2 copy
number gain, reported in several cancer types including gastric (86) and hepatocellular
carcinoma (84) does not necessarily translate to an increased expression of GRHL2 (71).
62
However, in a directly conflicting report, it was demonstrated by Xiang et al, that gastric
cancer cell lines contained significantly downregulated GRHL2 mRNA and protein levels;
moreover, expression of exogenous GRHL2 in this setting significantly inhibited
proliferation and promoted apoptosis (87). Further, the authors of this study demonstrated
that GRHL2 negatively regulated the pro-survival factors c-myc and Bcl2.
In a finding that has since been discredited in multiple models, Yang et al, reported
that in wound healing scratch assays, MDCK and MCF7 cells overexpressing GRHL2
displayed increased invasion relative to vector only expressing cells (60). As these results
were not confirmed using assays more specific to migration and invasion such as Boyden
chamber assays, the most likely interpretation of these data is that in this cell lines,
overexpressing of GRHL2 increased proliferation as it has been reported to do in other
models rather than enhanced migration as discussed previously (26, 85). Opposed to this
view, it was reported that overexpression of GRHL2 in both MDA-MB-231 and BT549 cells
result in MET and significantly suppressed migration in Boyden chamber assays (20).
Further, it was demonstrated that depletion of GRHL2 in ovarian cancer cells enhanced
migration, invasion, and motility using a matrigel embedded gap invasion assay, a more
specific approach for analysis of invasion (27). In fact, this report demonstrated that
shGRHL2 cells migrated as individual cells rather than a collective front, and further verified
that differences were not due to proliferation differences.
The discrepancies in the reported roles of GRHL2 in tumor progression could
resemble that of the TGF-β pathway which has reported roles in both processes. This theory
is certainly is conceivable given the well-established interaction of GRHL2 in the inhibition
of the TGF-β pathway. Given the critical role of EMT in metastasis and establishment of CSC-

63
like populations, a better understanding of pathways regulating expression of master
regulatory transcription factors such as GRHL2 is crucial for improving patient survival, both
in terms of sensitizing to initial chemotherapy as well as preventing the emergence of
treatment resistant secondary disease.
64
References
1. Mlacki M, Kikulska A, Krzywinska E, Pawlak M, Wilanowski T. Recent discoveries concerning the involvement of transcription factors from the Grainyhead-like family in cancer. Experimental Biology and Medicine. 2015;240:1396-401. 2. Mlacki M, Darido C, Jane SM, Wilanowski T. Loss of Grainy Head-Like 1 Is Associated with Disruption of the Epidermal Barrier and Squamous Cell Carcinoma of the Skin. PLoS ONE. 2014;9:e89247. 3. Darido C, Georgy SR, Wilanowski T, Dworkin S, Auden A, Zhao Q, et al. Targeting of the Tumor Suppressor GRHL3 by a miR-21-Dependent Proto-Oncogenic Network Results in PTEN Loss and Tumorigenesis. Cancer Cell. 2012;20:635-48. 4. Mani SA, Guo W, Liao MJ, Eaton EN, Ayyanan A, Zhou AY, et al. The epithelial-mesenchymal transition generates cells with properties of stem cells. Cell. 2008;133. 5. Kalluri R, Weinberg RA. The basics of epithelial-mesenchymal transition. The Journal of Clinical Investigation. 2009;119:1420-8. 6. Hanahan D, Weinberg RA. The hallmarks of cancer. Cell. 2000;100:57-70. 7. Woodward WA, Chen MS, Behbod F, Alfaro MP, Buchholz TA, Rosen JM. WNT/beta-catenin mediates radiation resistance of mouse mammary progenitor cells. Proc Natl Acad Sci U S A. 2007;104:618-23. 8. Barr S, Thomson S, Buck E, Russo S, Petti F, Sujka-Kwok I, et al. Bypassing cellular EGF receptor dependence through epithelial-to-mesenchymal-like transitions. Clin Exp Metastasis. 2008;25:685-93. 9. Buck E, Eyzaguirre A, Rosenfeld-Franklin M, Thomson S, Mulvihill M, Barr S, et al. Feedback Mechanisms Promote Cooperativity for Small Molecule Inhibitors of Epidermal and Insulin-Like Growth Factor Receptors. Cancer Research. 2008;68:8322-32. 10. Li X, Lewis MT, Huang J, Gutierrez C, Osborne CK, Wu M-F, et al. Intrinsic Resistance of Tumorigenic Breast Cancer Cells to Chemotherapy. Journal of the National Cancer Institute. 2008;100:672-9. 11. Howe EN, Cochrane DR, Richer JK. Targets of miR-200c mediate suppression of cell motility and anoikis resistance. Breast Cancer Res.13:R45. 12. Kumar S, Park SH, Cieply B, Schupp J, Killiam E, Zhang F, et al. A pathway for the control of anoikis sensitivity by E-cadherin and epithelial-to-mesenchymal transition. Mol Cell Biol. 2011;31:4036-51. 13. Frisch SM, Schaller M, Cieply B. Mechanisms that link the oncogenic epithelial-mesenchymal transition to suppression of anoikis. J Cell Sci. 2013;126:21-9. 14. Tiwari N, Gheldof A, Tatari M, Christofori G. EMT as the ultimate survival mechanism of cancer cells. Semin Cancer Biol. 2012. 15. Hudson LG, Newkirk KM, Chandler HL, Choi C, Fossey SL, Parent AE, et al. Cutaneous wound reepithelialization is compromised in mice lacking functional Slug (Snai2). Journal of dermatological science. 2009;56:19-26. 16. Hennessy BT, Gonzalez-Angulo AM, Stemke-Hale K, Gilcrease MZ, Krishnamurthy S, Lee JS, et al. Characterization of a naturally occurring breast cancer subset enriched in epithelial-to-mesenchymal transition and stem cell characteristics. Cancer Res. 2009;69:4116-24.
65
17. Prat A, Parker JS, Karginova O, Fan C, Livasy C, Herschkowitz JI, et al. Phenotypic and molecular characterization of the claudin-low intrinsic subtype of breast cancer. Breast Cancer Research. 2010;12:1-18. 18. Cieply B, Riley Pt, Pifer PM, Widmeyer J, Addison JB, Ivanov AV, et al. Suppression of the epithelial-mesenchymal transition by Grainyhead-like-2. Cancer Res. 2012;72:2440-53. 19. Cieply B, Farris J, Denvir J, Ford HL, Frisch SM. Epithelial-mesenchymal transition and tumor suppression are controlled by a reciprocal feedback loop between ZEB1 and Grainyhead-like-2. Cancer Res. 2013;73:6299-309. 20. Werner S, Frey S, Riethdorf S, Schulze C, Alawi M, Kling L, et al. Dual roles of the transcription factor grainyhead-like 2 (GRHL2) in breast cancer. J Biol Chem. 2013;288:22993-3008. 21. Grooteclaes M, Deveraux Q, Hildebrand J, Zhang Q, Goodman RH, Frisch SM. C-terminal-binding protein corepresses epithelial and proapoptotic gene expression programs. Proc Natl Acad Sci U S A. 2003;100:4568-73. 22. Cano A, Perez-Moreno MA, Rodrigo I, Locascio A, Blanco MJ, del Barrio MG, et al. The transcription factor snail controls epithelial-mesenchymal transitions by repressing E-cadherin expression. Nat Cell Biol. 2000;2:76-83. 23. Herranz N, Pasini D, Diaz VM, Franci C, Gutierrez A, Dave N, et al. Polycomb complex 2 is required for E-cadherin repression by the Snail1 transcription factor. Mol Cell Biol. 2008;28:4772-81. 24. Sanchez-Tillo E, Lazaro A, Torrent R, Cuatrecasas M, Vaquero EC, Castells A, et al. ZEB1 represses E-cadherin and induces an EMT by recruiting the SWI/SNF chromatin-remodeling protein BRG1. Oncogene. 2010;29:3490-500. 25. Tian X, Liu Z, Niu B, Zhang J, Tan TK, Lee SR, et al. E-Cadherin/β-Catenin Complex and the Epithelial Barrier. Journal of Biomedicine and Biotechnology. 2011;2011:567305. 26. Quan Y, Jin R, Huang A, Zhao H, Feng B, Zang L, et al. Downregulation of GRHL2 inhibits the proliferation of colorectal cancer cells by targeting ZEB1. Cancer biology & therapy. 2014;15:878-87. 27. Chung VY, Tan TZ, Tan M, Wong MK, Kuay KT, Yang Z, et al. GRHL2-miR-200-ZEB1 maintains the epithelial status of ovarian cancer through transcriptional regulation and histone modification. Scientific reports. 2016;6:19943. 28. Gouti M, Briscoe J, Gavalas A. Anterior Hox Genes Interact with Components of the Neural Crest Specification Network to Induce Neural Crest Fates. Stem Cells (Dayton, Ohio). 2011;29:858-70. 29. Yu M, Smolen GA, Zhang J, Wittner B, Schott BJ, Brachtel E, et al. A developmentally regulated inducer of EMT, LBX1, contributes to breast cancer progression. Genes Dev. 2009;23:1737-42. 30. Scheel C, Eaton EN, Li SH, Chaffer CL, Reinhardt F, Kah KJ, et al. Paracrine and autocrine signals induce and maintain mesenchymal and stem cell states in the breast. Cell. 2011;145:926-40. 31. Candia AF, Watabe T, Hawley SH, Onichtchouk D, Zhang Y, Derynck R, et al. Cellular interpretation of multiple TGF-beta signals: intracellular antagonism between activin/BVg1 and BMP-2/4 signaling mediated by Smads. Development. 1997;124:4467-80. 32. Gregory PA, Bracken CP, Smith E, Bert AG, Wright JA, Roslan S, et al. An autocrine TGF-beta/ZEB/miR-200 signaling network regulates establishment and maintenance of epithelial-mesenchymal transition. Mol Biol Cell. 2011;22:1686-98.
66
33. Wellner U, Schubert J, Burk UC, Schmalhofer O, Zhu F, Sonntag A, et al. The EMT-activator ZEB1 promotes tumorigenicity by repressing stemness-inhibiting microRNAs. Nat Cell Biol. 2009;11:1487-95. 34. Gregory PA, Bert AG, Paterson EL, Barry SC, Tsykin A, Farshid G, et al. The miR-200 family and miR-205 regulate epithelial to mesenchymal transition by targeting ZEB1 and SIP1. Nat Cell Biol. 2008;10:593-601. 35. Park S-M, Gaur AB, Lengyel E, Peter ME. The miR-200 family determines the epithelial phenotype of cancer cells by targeting the E-cadherin repressors ZEB1 and ZEB2. Genes & Development. 2008;22:894-907. 36. Brabletz S, Brabletz T. The ZEB/miR-200 feedback loop—a motor of cellular plasticity in development and cancer? EMBO Reports. 2010;11:670-7. 37. Chen W, Yi JK, Shimane T, Mehrazarin S, Lin YL, Shin KH, et al. Grainyhead-like 2 regulates epithelial plasticity and stemness in oral cancer cells. Carcinogenesis. 2016. 38. Mehrazarin S, Chen W, Oh JE, Liu ZX, Kang KL, Yi JK, et al. The p63 Gene Is Regulated by Grainyhead-like 2 (GRHL2) through Reciprocal Feedback and Determines the Epithelial Phenotype in Human Keratinocytes. J Biol Chem. 2015;290:19999-20008. 39. Truong AB, Kretz M, Ridky TW, Kimmel R, Khavari PA. p63 regulates proliferation and differentiation of developmentally mature keratinocytes. Genes & Development. 2006;20:3185-97. 40. Guadamillas MC, Cerezo A, Del Pozo MA. Overcoming anoikis--pathways to anchorage-independent growth in cancer. J Cell Sci.124:3189-97. 41. Drasin DJ, Robin TP, Ford HL. Breast cancer epithelial-to-mesenchymal transition: examining the functional consequences of plasticity. Breast Cancer Res. 2011;13:226. 42. Klymkowsky MW, Savagner P. Epithelial-Mesenchymal Transition : A Cancer Researcher’s Conceptual Friend and Foe. The American journal of pathology. 2009;174:1588-93. 43. Martin MJ, Melnyk N, Pollard M, Bowden M, Leong H, Podor TJ, et al. The insulin-like growth factor I receptor is required for Akt activation and suppression of anoikis in cells transformed by the ETV6-NTRK3 chimeric tyrosine kinase. Mol Cell Biol. 2006;26:1754-69. 44. Farris JC, Pifer PM, Zheng L, Gottlieb E, Denvir J, Frisch SM. Grainyhead-like 2 Reverses the Metabolic Changes Induced by the Oncogenic Epithelial-mesenchymal Transition: Effects on Anoikis. Molecular Cancer Research. 2016. 45. Jin L, Li D, Alesi GN, Fan J, Kang HB, Lu Z, et al. Glutamate dehydrogenase 1 signals through antioxidant glutathione peroxidase 1 to regulate redox homeostasis and tumor growth. Cancer Cell. 2015;27:257-70. 46. Behrens J, Weidner KM, Frixen UH, Schipper JH, Sachs M, Arakaki N, et al. The role of E-cadherin and scatter factor in tumor invasion and cell motility. In: Goldberg ID, editor. Cell Motility Factors. Basel: Birkhäuser Basel; 1991. p. 109-26. 47. Schipper JH, Frixen UH, Behrens J, Unger A, Jahnke K, Birchmeier W. E-Cadherin Expression in Squamous Cell Carcinomas of Head and Neck: Inverse Correlation with Tumor Dedifferentiation and Lymph Node Metastasis. Cancer Research. 1991;51:6328-37. 48. E-cadherin-mediated cell-cell adhesion prevents invasiveness of human carcinoma cells. The Journal of cell biology. 1991;113:173-85. 49. Vleminckx K, Vakaet L, Mareel M, Fiers W, Van Roy F. Genetic manipulation of E-cadherin expression by epithelial tumor cells reveals an invasion suppressor role. Cell. 1991;66:107-19.
67
50. Derksen PW, Liu X, Saridin F, van der Gulden H, Zevenhoven J, Evers B, et al. Somatic inactivation of E-cadherin and p53 in mice leads to metastatic lobular mammary carcinoma through induction of anoikis resistance and angiogenesis. Cancer Cell. 2006;10:437-49. 51. Kowalski PJ, Rubin MA, Kleer CG. E-cadherin expression in primary carcinomas of the breast and its distant metastases. Breast Cancer Research. 2003;5:R217-R22. 52. Ocaña Oscar H, Córcoles R, Fabra Á, Moreno-Bueno G, Acloque H, Vega S, et al. Metastatic Colonization Requires the Repression of the Epithelial-Mesenchymal Transition Inducer Prrx1. Cancer Cell. 2012;22:709-24. 53. Mani SA, Guo W, Liao MJ, Eaton EN, Ayyanan A, Zhou AY, et al. The epithelial-mesenchymal transition generates cells with properties of stem cells. Cell. 2008;133:704-15. 54. Morel A-P, Lièvre M, Thomas C, Hinkal G, Ansieau S, Puisieux A. Generation of Breast Cancer Stem Cells through Epithelial-Mesenchymal Transition. PLoS ONE. 2008;3:e2888. 55. Wellner U, Schubert J, Burk UC, Schmalhofer O, Zhu F, Sonntag A, et al. The EMT-activator ZEB1 promotes tumorigenicity by repressing stemness-inhibiting microRNAs. Nat Cell Biol. 2009;11:1487-95. 56. Bissell MJ, Radisky DC, Rizki A, Weaver VM, Petersen OW. The organizing principle: microenvironmental influences in the normal and malignant breast. Differentiation; research in biological diversity. 2002;70:537-46. 57. Jechlinger M, Grünert S, Beug H. Mechanisms in Epithelial Plasticity and Metastasis: Insights from 3D Cultures and Expression Profiling. Journal of Mammary Gland Biology and Neoplasia.7:415-32. 58. Schmidt JM, Panzilius E, Bartsch HS, Irmler M, Beckers J, Kari V, et al. Stem-cell-like properties and epithelial plasticity arise as stable traits after transient Twist1 activation. Cell reports. 2015;10:131-9. 59. Xiang X, Deng Z, Zhuang X, Ju S, Mu J, Jiang H, et al. Grhl2 determines the epithelial phenotype of breast cancers and promotes tumor progression. PLoS One. 2012;7:e50781. 60. Yang X, Vasudevan P, Parekh V, Penev A, Cunningham JM. Bridging cancer biology with the clinic: relative expression of a GRHL2-mediated gene-set pair predicts breast cancer metastasis. PLoS One. 2013;8:e56195. 61. Ahmad A. Pathways to breast cancer recurrence. ISRN oncology. 2013;2013:290568. 62. Cheng Q, Chang JT, Gwin WR, Zhu J, Ambs S, Geradts J, et al. A signature of epithelial-mesenchymal plasticity and stromal activation in primary tumor modulates late recurrence in breast cancer independent of disease subtype. Breast Cancer Res. 2014;16:407. 63. Creighton CJ, Li X, Landis M, Dixon JM, Neumeister VM, Sjolund A, et al. Residual breast cancers after conventional therapy display mesenchymal as well as tumor-initiating features. Proc Natl Acad Sci U S A. 2009;106:13820-5. 64. Moody SE, Perez D, Pan TC, Sarkisian CJ, Portocarrero CP, Sterner CJ, et al. The transcriptional repressor Snail promotes mammary tumor recurrence. Cancer Cell. 2005;8:197-209. 65. Oliveras-Ferraros C, Corominas-Faja B, Cufi S, Vazquez-Martin A, Martin-Castillo B, Iglesias JM, et al. Epithelial-to-mesenchymal transition (EMT) confers primary resistance to trastuzumab (Herceptin). Cell Cycle. 2012;11:4020-32. 66. Giordano A, Gao H, Anfossi S, Cohen E, Mego M, Lee BN, et al. Epithelial-mesenchymal transition and stem cell markers in patients with HER2-positive metastatic breast cancer. Mol Cancer Ther. 2012;11:2526-34.
68
67. Sharma SV, Lee DY, Li B, Quinlan MP, Takahashi F, Maheswaran S, et al. A chromatin-mediated reversible drug-tolerant state in cancer cell subpopulations. Cell. 2010;141:69-80. 68. Singh B, Shamsnia A, Raythatha MR, Milligan RD, Cady AM, Madan S, et al. Highly adaptable triple-negative breast cancer cells as a functional model for testing anticancer agents. PLoS One. 2014;9:e109487. 69. Debies MT, Gestl SA, Mathers JL, Mikse OR, Leonard TL, Moody SE, et al. Tumor escape in a Wnt1-dependent mouse breast cancer model is enabled by p19Arf/p53 pathway lesions but not p16 Ink4a loss. J Clin Invest. 2008;118:51-63. 70. Cowling VH, D'Cruz CM, Chodosh LA, Cole MD. c-Myc transforms human mammary epithelial cells through repression of the Wnt inhibitors DKK1 and SFRP1. Mol Cell Biol. 2007;27:5135-46. 71. Riethdorf S, Frey S, Santjer S, Stoupiec M, Otto B, Riethdorf L, et al. Diverse expression patterns of the EMT suppressor grainyhead-like 2 (GRHL2) in normal and tumour tissues. International Journal of Cancer. 2016;138:949-63. 72. Kohn KW, Zeeberg BM, Reinhold WC, Pommier Y. Gene Expression Correlations in Human Cancer Cell Lines Define Molecular Interaction Networks for Epithelial Phenotype. PLoS ONE. 2014;9:e99269. 73. Kang X, Chen W, Kim RH, Kang MK, Park N-H. Regulation of the hTERT promoter activity by MSH2, the hnRNPs K and D, and GRHL2 in human oral squamous cell carcinoma cells. Oncogene. 2009;28:565-74. 74. Chen W, Dong Q, Shin KH, Kim RH, Oh JE, Park NH, et al. Grainyhead-like 2 enhances the human telomerase reverse transcriptase gene expression by inhibiting DNA methylation at the 5'-CpG island in normal human keratinocytes. J Biol Chem.285:40852-63. 75. Dompe N, Rivers CS, Li L, Cordes S, Schwickart M, Punnoose EA, et al. A whole-genome RNAi screen identifies an 8q22 gene cluster that inhibits death receptor-mediated apoptosis. Proc Natl Acad Sci U S A.108:E943-51. 76. Zhang P, Sun Y, Ma L. ZEB1: at the crossroads of epithelial-mesenchymal transition, metastasis and therapy resistance. Cell Cycle. 2015;14:481-7. 77. Smit MA, Peeper DS. Zeb1 is required for TrkB-induced epithelial-mesenchymal transition, anoikis resistance and metastasis. Oncogene.30:3735-44. 78. Smit MA, Geiger TR, Song JY, Gitelman I, Peeper DS. A Twist-Snail axis critical for TrkB-induced epithelial-mesenchymal transition-like transformation, anoikis resistance, and metastasis. Mol Cell Biol. 2009;29:3722-37. 79. Spaderna S, Schmalhofer O, Wahlbuhl M, Dimmler A, Bauer K, Sultan A, et al. The transcriptional repressor ZEB1 promotes metastasis and loss of cell polarity in cancer. Cancer Res. 2008;68:537-44. 80. Xu J, Lamouille S, Derynck R. TGF-beta-induced epithelial to mesenchymal transition. Cell Res. 2009;19:156-72. 81. Vega S, Morales AV, Ocana OH, Valdes F, Fabregat I, Nieto MA. Snail blocks the cell cycle and confers resistance to cell death. Genes Dev. 2004;18:1131-43. 82. Micalizzi DS, Christensen KL, Jedlicka P, Coletta RD, Baron AE, Harrell JC, et al. The Six1 homeoprotein induces human mammary carcinoma cells to undergo epithelial-mesenchymal transition and metastasis in mice through increasing TGF-beta signaling. J Clin Invest. 2009;119:2678-90.
69
83. Zhang P, Hu P, Shen H, Yu J, Liu Q, Du J. Prognostic role of Twist or Snail in various carcinomas:a systematic review and meta-analysis. European journal of clinical investigation. 2014. 84. Tanaka Y, Kanai F, Tada M, Tateishi R, Sanada M, Nannya Y, et al. Gain of <em>GRHL2</em> is associated with early recurrence of hepatocellular carcinoma. Journal of hepatology.49:746-57. 85. Quan Y, Xu M, Cui P, Ye M, Zhuang B, Min Z. Grainyhead-like 2 Promotes Tumor Growth and is Associated with Poor Prognosis in Colorectal Cancer. Journal of Cancer. 2015;6:342-50. 86. Cheng L, Wang P, Yang S, Yang Y, Zhang Q, Zhang W, et al. Identification of genes with a correlation between copy number and expression in gastric cancer. BMC Medical Genomics. 2012;5:14-. 87. Xiang J, Fu X, Ran W, Chen X, Hang Z, Mao H, et al. Expression and role of grainyhead-like 2 in gastric cancer. Medical Oncology. 2013;30:1-7.

70
Chapter 2 Grainyhead-like 2 Reverses the Metabolic Changes Induced by the Oncogenic
Epithelial-mesenchymal Transition: Effects on Anoikis
Published in: Molecular Cancer Research
Mol Cancer Res. 2016 Apr 15. pii: molcanres.0050.2016.
71
Grainyhead-like 2 Reverses the Metabolic Changes Induced by the Oncogenic Epithelial-
mesenchymal Transition: Effects on Anoikis
Joshua C. Farris1, Phillip M. Pifer1, Liang Zheng3, Eyal Gottlieb3, James Denvir4, and Steven
M. Frisch1,2*
1-Mary Babb Randolph Cancer Center
1 Medical Center Drive, Campus Box 9300
West Virginia University
Morgantown, WV 26506
2-Department of Biochemistry
1 Medical Center Drive
West Virginia University
Morgantown, WV 26506
3-Beatson Institute for Cancer Research
Switchback Road
Glasgow, UK
4-Department of Biochemistry and Microbiology
Marshall University
Huntington, West Virginia
*Address for correspondence: Steven M. Frisch, Mary Babb Randolph Cancer Center, 1
Medical Center Drive, Room 2833, West Virginia University, Morgantown, WV 26506.
Email: [email protected]
72
Abstract
Resistance to anoikis is a pre-requisite for tumor metastasis. The epithelial to
mesenchymal transition (EMT) allows tumor cells to evade anoikis. The wound healing
regulatory transcription factor Grainyhead-like 2 (GRHL2) suppresses/reverses EMT,
accompanied by suppression of the cancer stem cell (CSC) phenotype and by re-sensitization
to anoikis. Here, we have investigated the effects of GRHL2 upon intracellular metabolism in
the context of reversion of the EMT/CSC phenotype, with a view toward understanding how
these effects promote anoikis sensitivity. EMT enhanced mitochondrial oxidative
metabolism. While this was accompanied by higher accumulation of superoxide, the overall
level of Reactive Oxygen Species (ROS) declined, due to decreased hydrogen peroxide.
Glutamate Dehydrogenase 1 (GLUD1) expression increased in EMT, and this increase, via the
product α-ketoglutarate, was important for suppressing hydrogen peroxide and protecting
against anoikis. GRHL2 suppressed GLUD1 gene expression, decreasing α-ketoglutarate,
increasing ROS and sensitizing cells to anoikis. These results demonstrate a novel role of
GRHL2 in promoting anoikis through metabolic alterations.

73
Introduction
When deprived of connections to their extracellular matrix, normal epithelial cells
trigger a process of programmed cell death referred to as anoikis (1). The ability to
metastasize depends critically upon a cancer cell’s ability to evade anoikis (2-4). The
transcriptional reprogramming event known as the Epithelial to Mesenchymal transition
(EMT) confers anoikis resistance and ultimately, increased metastatic potential (5). The
increased phenotypic plasticity underlying transitions between epithelial and mesenchymal
states is thought to be epigenetically driven (6-10). One additional manifestation of this
increased plasticity, aside from EMT, is that cancer stem cell subpopulations emerge, that,
like cells resulting from EMT, are resistant to anoikis; these contribute crucially to both
metastasis and disease recurrence.
The wound healing regulatory transcription factor, Grainyhead-like 2 (GRHL2), plays
an indispensable role in the maintenance of the epithelial phenotype and branching
morphogenesis (11-14). Previously, we reported that GRHL2 suppresses the oncogenic EMT,
i.e., promotes MET (15-17). The loss of GRHL2 expression is associated with aggressive,
metastatic breast tumor types that contain an unusually large fraction of EMT-like
subpopulations, and in the cancer stem cell-like subpopulation of tumors resulting from EMT
and/or drug resistance. Interestingly, the constitutive expression of GRHL2 invariably led
also to anoikis-sensitivity (15, 16). The mechanism underlying this effect was unclear,
however.
Reactive oxygen species (ROS) are ubiquitously important in apoptosis through
mechanisms such as direct mitochondrial peroxidation of cardiolipin, a lipid which
sequesters cytochrome c, as well as direct inactivation of the anti-apoptotic Bcl-2 (18).
74
Accordingly, ROS contributes to anoikis as well as the non-apoptotic cell death of detached
cells accompanying ATP loss (19, 20). It is unclear at present, however, whether changes in
ROS levels occur in EMT or cancer stem cell transitions, and, if so, what drives these changes.
The HMLE cell line is an immortalized mammary epithelial cell line that contains a
CD44hi/CD24low subpopulation referred to as the Mesenchymal Sub-Population (MSP) that
co-expresses EMT and cancer stem cell phenotypes (21, 22). Previously, we reported that
MSP cells have low GRHL2 expression, and are resistant to anoikis (15, 16). Forced
expression of GRHL2 in MSP suppressed their cancer stem cell-like as well as EMT
phenotypes and sensitized them to anoikis. The possibility that GRHL2 achieves the latter
effect by altering intracellular metabolism has not been explored.
Glutaminolysis is a critical metabolic pathway on which tumors rely as a major
alternate carbon source to glucose, with significant ramifications for cell proliferation,
metabolic adaptability and cell survival (23-25). Following deamination of glutamine to
produce glutamate, glutamate dehydrogenase-1 (GLUD1 or GDH1) generates the Krebs cycle
intermediate α-ketoglutarate (α-KG), which is converted by the Krebs cycle to fumarate, an
important cofactor for glutathione peroxidase enzymes. Accordingly, α-KG is an important
protective factor against oxidative stress, and GLUD1 is over-expressed in breast and lung
carcinomas (26, 27).
In this paper, we report that, in reversing EMT, GRHL2 suppresses GLUD1 expression,
elevating H2O2 ROS levels and promoting anoikis-sensitivity. GRHL2 also reversed the
cancer stem cell-like shift to oxidative phosphorylation-based ATP production and cell
survival. These results inform a novel connection between EMT, metabolic pathways, ROS
and anoikis-sensitivity, regulated by GRHL2.
75
Materials and Methods
Cell lines
HMLE, and HMLE+Twist-ER cells and generously provided by R. Weinberg (The
Whitehead Institute, Cambridge, MA); MCF10A neoT cells were provided by F. Miller
(Karmanos Cancer Center). HMLE and HMLE+Twist-ER cells were maintained in Advanced
Dulbecco’s Modified Eagle’s Medium (DMEM): Ham’s F-12 (Gibco) + 5% horse serum + 1X
penicillin-streptomycin-glutamine (PSG) + 10 μg/mL insulin, 10 ng/mL EGF, 0.5 μg/mL
hydrocortisone. MCF10A neoT cells were maintained in the same media as HMLE cells with
the addition of 0.1 μg/mL cholera toxin. If indicated, HMLE+Twist-ER cells were growth in
the presence of 4-hydroxytamoxifen (10 ng/mL) in order to activate the ER inducible Twist
construct. MSP cells were obtained from HMLE cells by sorting for CD44-APC high
population/CD24-Cy5.5 LOW. HMLE cells were sorted according to CD24-Cy5.5 high and
CD44-APC low.
Generation of stable cell lines by retroviral transduction
The template for Human GRHL2 was purchased from Open Biosystems (MHS4426-
99625903). GRHL2 was subcloned by standard molecular biology protocols into the pMXS-
IRES-puro retroviral vector in frame with the C-terminal 3X-FLAG tag (vector contribution
of Russ Carstens, University of Pennsylvania). Retroviral packaging and amplification was
done in GP2+293T cells by transfection of 4.5 μg of retroviral plasmid and 2.5 μg of pCMV-
VSV-G on collagen coated 60 mm2 dishes that were pre-coated for >1 hr with 50 μg/mL
76
collagen using Lipofectamine 2000 (Invitrogen). Plates were refed 4-6 hours following
transfection and viral supernatants were harvested approximately 36 hours following
refeed. Viral stocks were filtered through 0.45 μm filters (Whatman) and 1 mL of
supernatant was used to infect 1 well of target cells. This was followed by 1,400 RPM
centrifugation for 1 hour at room temperature followed by 6 hour or overnight incubation.
Infected cells were passaged to 100 mm dishes, and incubated for 48 hours following
infection. Cells were then selected for puromycin (2 μg/mL for HMLE or MCF10A neoT cells).
Generation of stable cell knockdown cell lines by lentiviral transduction
Lentiviral GLUD1 short hairpin RNA (shRNA) was purchased from Open Biosystems
in the pLKO vector. ShRNA #1 was Open Biosystems catalogue number RHS3979-
201758959 and shRNA#2 was RHS3979-201758962. pLKO scramble control vector was
generously contributed by the laboratory of Dr. Scott Weed (WVU). Lentiviral constructs
were packaged and amplified in 293T cells by transfection of 3.5 μg shRNA vector, 2.3 μg
sPAX2, and 1.2 μg CMV-VSV-G on 60 mm2 dishes that were pre-coated for >1 hr with 50
μg/mL collagen using Lipofectamine 2000. GRHL2 shRNA was described previously and
was shown to duplicate the biologic effects of transfected siRNAs (15).
Western Blotting
SDS-PAGE was conducted using 4-20% gradient Tris-Glycine gels (Invitrogen).
Proteins were electrophoretically transferred to polyvinylidine difluoride filters
(Immobilon) in 5% methanol Tris-Glycine transfer buffer. PBS + 0.1% Tween-20 + 5% nonfat
milk were used for blocking filters, primary antibodies were incubated in PBS+0.1% Tween-
77
20 + 5% nonfat milk. Primary antibodies were typically incubated between 2 hours at room
temperature or overnight at 4 degrees C. Primaries used were: E-cadherin, ms (BD
Biosciences), CD44 (HCAM) ms [Santa Cruz Biotech (SCBT)]; GRHL2, rb (Sigma), Akt or pAkt,
rb (Cell Signaling); GLUD1, rb (Abcam 168352), α-tubulin, Rb (Cell Signaling), Fibronectin,
ms (BD Biosciences), GAPDH, ms (Origene), β-actin, ms (Thermo-pierce), SOD2, Rb (Cell
Signaling), HIF1α, ms (BD Biosciences), p110, ms (BD Biosciences), TOMM20, ms (BD
Biosciences), VDAC1, Rb (Cell Signaling). Secondary antibodies for chemiluminescence were
either anti-mouse or anti-rabbit, conjugated to horseradish peroxidase (HRP) enzyme (Bio-
Rad). Secondary antibodies (Biorad) were used at 1:3000 dilution and filters were incubated
for approximately 1 hour at room temperature. Western blots were developed via ECL Super
Signal West Pico (Thermo-Pierce).
Anoikis Assays
For anoikis assays, caspase activation was measured using the Caspase-Glo 3/7
assay kit (Promega). Cells were dissociated using TrypLE Express (Invitrogen) and a fixed
number of cells (1.5 x 10⁵ cells) were placed per 6 well poly-(2-hydroxyethyl methacrylate)
(poly-HEMA) coated low attachment plates in 2.0 ml of normal growth medium + 0.5%
methylcellulose for the indicated time. Aliquots of cells were mixed 1:1 with caspase glo
reagent at indicated time points and assayed for luminescence utilizing a Wallac Envison
Perkin Elmer plate reader according to manufacturer’s instructions. Where indicated,
time-zero cell death values were subtracted from the data presented to normalize for small
loading variation.
78
ROS Assays
For ROS assay, cells were seeded as above and attached for 48 hours. Cells were
detached by trypsinization, and equal numbers of cells were placed in a 15 mL centrifuge
tube. Cells were assayed immediately by flow cytometry after staining for 15 min at 37
degrees with 1 uM CM-H2DCFDA (Invitrogen) protected from light. If indicated, 24 hr ROS
was examined after plating cells in low attachment polyHEMA (2 mg/mL) coated 100 mm
dishes in 5 mL of 0.5% methylcellulose to prevent excess cell clumping. Cells were harvested
by diluting well with 10 mL DME/F12 + 10% Horse Serum containing media. Cells were
centrifuged at 2000 RPM for 2 minutes. Pellets were washed 2X with HBSS and stained in 1
uM CM-H2DCFDA as indicated previously. In some cases, Amplex Red (Invitrogen) assays
were used to measure ROS in order to compare attached and suspended conditions and were
used according to manufacturer’s instructions. For measurement of general cellular
superoxide, cells were processed as above and stained with 5 uM dihydroethidium (DHE)
(Invitrogen) for 15 minutes at 37 degrees C protected from light followed by flow cytometric
analysis at 605 nm fluorescence. Mitochondrial specific superoxide was measured using
mitoSOX (Invitrogen) dye by staining cells with 5 uM mitoSOX solution for 10 minutes at 37
degrees C protected from light. Samples were analyzed by flow cytometry at 580 nm
fluorescence using a BD LSRFortessa Cell analyzer.
ATP Assays
For the measurement of ATP in attached cells, Cell Titer Glo (Promega) reagent was
added to 96 well plates. Luminescence was read after 10 minute incubation at room
temperature. Values were normalized based on BCA protein assay (Pierce). To measure ATP
in detached conditions, cells were detached and placed in 6 well poly-HEMA dishes. Aliquots
79
were mixed 1:1 with Cell Titer Glo reagent. Values were normalized based on BCA protein
assay (Pierce).
JC1 Assay
Cells were seeded on poly-d-lysine coated MatTek dishes. Cells were incubated in 2
ug/mL JC1 (5’,6,6’-tetrachloro-1,1’,3,3’-tetraethylbenzimidazolylcarbocyanine iodide)
(Invitrogen) at 37 degrees for 30 minutes protected from light. After incubation, dye was
washed off of cells and replaced with normal growth medium. Cells were analyzed using an
Axiovert 100M LSM510 Zeiss Confocal microscope. Cells were excited with an argon-ion
laser source at 488 nm. JC1 monomer emission was observed at 529 nm and J-aggregate
emission was observed at 590 nm. Images were acquired using 20X/0.75 Plan-Neofluar
objective. Software used was Zeiss AIM software, version 3.2.
Oxygen Consumption and Extracellular Acidification Rate
The oxygen consumption rates (OCR) and extracellular acidification rate (ECAR) of
adherent cells were measured utilizing the Seahorse XF Extracellular Flux Analyzer
(Seahorse Biosciences Inc., North Billerica, MA). This method of analysis allows for real time
monitoring of extracellular acidification rates and oxygen consumption based on two
fluorimetric probes inserted into the small volume well. Equal numbers of cells (7500 cells
per well) were seeded in a defined small volume in Seahorse XF-96 well plates. The following
day, wells were refed with fresh HEPES buffered media approximately 1 hour prior to assay.
In short, the sensor cartridge was loaded with metabolic inhibitors to target specific
components of the electron transport chain at specific times, while monitoring pH change as
80
well as oxygen consumption. The metabolic inhibitors used are oligomycin (ATP synthase
inhibitor), followed by the protonophore FCCP (an uncoupler of oxidative phosphorylation),
and finally a combination of rotenone (complex I inhibitor) and antimycin A (complex III
inhibitor). Basal OCR and ECAR measurement during time course treatment with the
inhibitors listed above allow for calculations of basal OCR, maximum mitochondrial
respiratory capacity, OCR due to proton leak, ATP production, spare respiratory capacity,
and non-mitochondrial derived OCR. Fatty acid oxidation study was done by treating cells
overnight prior to assay with substrate limited media (DME/F12 media + 1% horse serum,
0.5 mM carnitine hydrochloride [pH adjusted], 1X PSG, 0.5 mM D-(+)-Glucose, 5 mM HEPES
buffer). On day of assay, substrate limited media was replaced with FAO medium 45 minutes
prior to the start of the assay (Homemade Krebs Henseleit Buffer modified with CaCl2: To
500 mL sterile water the following was added: 111 mM NaCl, 5.7 mM KCl, 1.25 mM CaCl2, 2.0
mM MgSO4, 1.2 mM Na2HPO4; This buffer was supplemented with 2.5 mM glucose, 0.5 mM
carnitine, 5 mM HEPES, pH adjusted to 7.4 with NaOH). 15 minutes prior to start of assay, 40
μM Etomoxir was added to the appropriate wells. At the beginning of the assay, either
palmitate:BSA or BSA control was added to appropriate wells. Mitostress test was the
conducted according to manufacturer’s instructions. For glycolytic stress test, cells are
deprived of glucose for approximately 1 hour prior to the beginning of the assay. ECAR is
measured and glucose is re-introduced to the media. The increase in ECAR is attributed to
glucose conversion to pyruvate through glycolysis. Oligomycin is then added to shunt all
metabolic function to glycolysis, which results in a large increase in ECAR indicating the
glycolytic reserve. Following addition of 2-deoxy-glucose (competitive inhibitor of
hexokinase), the non-glucose derived OCR can be calculated.
81
Flow Cytometry Sorting
Trypsinized cells (1 x 10⁶) were stained with APC tagged mouse anti-human CD44
(BD Biosciences 560890), and PerCP-Cy5.5 tagged mouse anti-human CD24 (BD Biosciences
561647) in 100 uL of flow sorting buffer (1X PBS, 2.5 mmol/L EDTA, 10 mmol/L HEPES, and
2% horse serum) on ice protected from light for 30 minutes. Following staining, cells were
washed with 1X HBSS and resuspended in flow sorting buffer. Cells were analyzed and sorted
using a FACS-Aria.
Cell Culture Antioxidant Treatments
For suppression of reactive oxygen species, the following antioxidants were used.
Where indicated, HMLE cells were treated with N-acetyl cysteine (NAC) at the concentration
indicated for 1 hr prior to assay. Reduced glutathione (GSH) was added to HMLE cells after
pH correction to 7.4 and incubated for approximately 1-2 hours depending on experiment at
the indicated concentration. 6-hydroxy-2,5,7,8-tetramethylchroman-2-carboxylic acid
(Trolox) was added to cells at the indicated concentration for overnight pretreatment of
HMLE or HMLE+shGLUD1 cells. HMLE or HMLE+shGLUD1 cells were treated with cell
permeable di-methyl-α-ketoglutarate (Sigma) which was pH corrected to 7.4. Cells were
treated at the indicated concentration between overnight and 2 hour pre-treatment.
RNA Sequencing
RNA was isolated in triplicate from both MSP cells expressing vector alone or stably
expressing GRHL2. For RNA isolation, the RNeasy Plus Kit (Qiagen) was used and was
82
quantified using Nanodrop (Fisher Scientific). The RNA quality check was performed on
Bioanalyzer (Agilent). RNA quality check and libraries builds were done by the WVU
genomics core. RNA samples were then sent to the University of Illinois Core Facility for
100BP single end data RNA sequencing. FastQC was used to visualize quality of sequencing.
After it was determined that no filtering was needed, the reads were mapped to hg38 using
STAR. The data was then quantified with featureCounts with the following flag set: —ignore
dup—primary. This count data was used as input into DEseq2 to produce a list of
differentially expressed genes with some visualizations also included. The list of genes with
FPKM was also acquired and was produced from the count data with a simple custom script.
Kinetic α-KG assay
HMLE, MSP, or MSP+GRHL2 cells were seeded in 6 well dishes in duplicate wells and
allowed to attach for 24 hours. Wells were washed 2X with PBS, followed by lysis in 300 uL
RIPA buffer (50 mM Tris pH 7.4, 150 mM NaCl, 1% Triton-X100, 1% Sodium Deoxycholate,
0.1% sodium dodecyl sulfate, + pierce miniprotease inhibitor table per 10 mL lysis buffer).
Lysates were scraped into microfuge tubes and cleared in cold centrifuge at 4ºC at full speed
for 10 minutes. Supernatants were saved and assayed in 100 uL reaction buffer (100 mM
KPO4 pH 7.2, 10 mM NH4Cl, 5 mM MgCl2, and 0.15 mM NADH added immediately prior to
assay). 10 uL of sample were added to 100 uL reaction buffer. Immediately prior to the
beginning of the assay, 0.7 uL (0.5 units) of L-Glutamate Dehydrogenase enzyme (bovine
liver, sigma G2626) was added to each of the wells using a multi-channel pipettor. Positive
control samples were done to ensure linear range of α-KG concentration in samples. OD was
read kinetically at 37 ºC at 340 nm reading the sample every 10-20 seconds depending on
83
the number of samples in the assay. Depending on the level of α-KG in the sample, the
reaction would proceed more quickly or more slowly. The slope of the line created by
monitoring the decline in NADH absorbance as it was used up in the reaction was calculated
and indicated the relative concentration of α-KG. Calculated slopes were normalized to
protein in the samples as determined quantitatively by BCA assay (Pierce).
Extraction of Cells for LC-MS Analysis
All solvents used were high quality HPLC gradient grade and sterile milliQ grade
water was used. Cells were plated in triplicate per condition in 6 well dishes. Cells were
seeded for at least 24 hours prior to extraction. Wells were washed 3X with PBS. Extract
solution was made up of 50% methanol, 30% acetonitrile, and 20% milliQ water. Extraction
buffer was pre-chilled in a dry ice ethanol bath. Eppendorf tubes were pre-chilled in a dry
ice/ethanol bath placed in a metal heating block for maximum cooling. Intracellular extracts
were made by adding 500 uL of pre-chilled extraction buffer to wells and placing plate on a
shaker in the cold room for 10 minutes. The solution was then transferred into pre-chilled
Eppendorf tubes. Samples were centrifuged at 0 ºC at full speed for 10 minutes. Supernatants
were transferred to HPLC vials and stored at -80 ºC. For LC-MS method, Column was the
sequant Zic-pHilic (150 mm × 2.1 mm i.d. 5 μm) with the guard column (20 mm × 2.1 mm i.d.
5 μm) from HiChrom, Reading, UK. Mobile phase A: 20 mM ammonium carbonate plus
0.1% ammonia hydroxide in water. Mobile phase B: acetonitrile. The flow rate was kept at
100 μl min−1 and gradient as follow: 0 min 80% of B, 30 min 20% of B, 31 min 80% of B, 45 min
80% of B. The mass spectrometer (Thermo Exactive Orbitrap) was operated in a polarity switching
mode.
84
Immunofluorescence
Cells were plated on chamber slides (LabTek154526) using ~0.5 ml medium per
chamber. Wells were pre-coated with sterile 0.5 mg/ml poly-lysine or 20 ug/ml collagen for
~1 hour, and washed off prior to plating. Cells were washed in HBSS or D-PBS, and fixed
in EM grade 4% formaldehyde in 1X PBS for 20 minutes at room temperature. Cells were
washed 2X with PBS. Samples were then permeabilized in 0.5% TX100 in PBS at 4 degrees
for 10minutes. Permeabilization solution was washed 2X with PBS. Cells were incubated in
100mM glycine in PBS for 10 minutes to quench the formaldehyde. Cells were blocked for
one hour in PBS+10% goat serum+0.1% Tween-20+0.1%BSA for 1 hour. Primary antibody
was diluted in blocking solution, and incubated 1 hr/RT or overnight/4 degrees (TOMM20,
ms; BD Biosciences). Primary antibody was typically diluted 1:250. After probing, cells were
washed with PBS+0.1% Tween-20, 3X. Secondary antibody (Anti-mouse Alex Fluor 555;
Invitrogen) was diluted in blocking solution, and incubated 1-2 hr/RT (typically 1:1000
dilution). Cells were washed again with PBS+0.1% Tween-20, 3X. Samples mounted in
ProLong Gold+DAPI.
Statistical Analysis
Error bars in graphs represent SDs. P-values were calculated using a Student’s two-
tailed t-test.
Results
85
EMT shifts metabolism from glycolysis to oxidative phosphorylation, which is reversed by
GRHL2.
MSP and TGF-β-induced MCF10aneoT cells result from EMT that requires GRHL2
down-regulation (15, 16, 28), accompanied by a CD44highCD24low marker profile (figure 1A).
Re-expression of GRHL2 sensitized these cell lines to anoikis significantly, as assessed by a
caspase activation assay (figure 1B, 1C, figure S1A). Conversely, the stable knockdown of
GRHL2 using shRNA conferred anoikis-resistance in HMLE+Twist-ER cells as well as
MCF10A neoT cells (figure 1D, S1B). We first endeavored to characterize the effect of EMT
and, conversely, the effect of GRHL2-induced MET on metabolism in our system. We found
that the ATP level in attached MSP cells was elevated significantly compared to HMLE cells.
When cells were suspended, ATP level declined significantly in HMLE cells, but was
maintained in MSP cells, even at twenty-four hours of suspension (Figure 2A). GRHL2
reduced the level of ATP in both suspended and attached MSP cells (figure 2B). In light of the
higher efficiency of mitochondrial oxidative phosphorylation compared to glycolysis in the
production of ATP, these results suggested that EMT perhaps caused a shift to the former.
MSP cells had a higher mitochondrial membrane potential (ΔΨ), reflecting increased
oxidative phosphorylation. Conversely, GRHL2 overexpression resulted in decreased ΔΨ in
MSP cells (Figure 2C). These results, and the marked ATP differences, indicated that EMT
shifted cells toward an increased utilization of mitochondrial oxidative phosphorylation to
increase basal ATP levels and sustain ATP even in suspended cells.
In order to test the effect of EMT or GRHL2-induced MET on regulation of oxidative
metabolism specifically, we compared oxygen consumption rate in HMLE, MSP, and
86
MSP+GRHL2 cells using the Seahorse mitochondrial stress test. The Seahorse XF assay
system measures extracellular acidification rate (ECAR) as well as oxygen consumption rate
(OCR) in order to determine fluxes in metabolic parameters that occur upon addition of
various inhibitors and stimulators of the electron transport chain. Our results indicated that
MSP cells had greater ATP, maximum respiration, as well as spare oxidative capacity relative
to HMLE cells, and re-expression of GRHL2 reversed these effects (figures 3A,B). The
increased mitochondrial activity of MSP and reversal by GRHL2 were not limited to cells
utilizing glucose and glutamine as carbon sources, as similar effects were seen with the fatty
acid carnitine as the sole carbon source (figures S4A,S4B). Moreover, HMLE cells had higher
glycolytic activity than MSP cells (figure S2A). Stably depleting GRHL2 in both HMLE+Twist-
ER and MCF10A neoT cells partially reversed the mesenchymal metabolic phenotype,
increasing ATP and maximum respiration (figure S2B, S2C, S2D).
To determine whether the increased OCR observed was due to elevated
mitochondrial number, cell lines were stained for a mitochondrial structural protein,
TOMM20. Surprisingly, we found that MSP cells had lower mitochondrial staining than HMLE
cells (figure S2E, S2F). This may indicate that HMLE cells partially compensate for low
mitochondrial activity by up-regulating mitochondrial biogenesis. Taken together, these
results confirmed that mesenchymal cells enhanced oxidative phosphorylation, and partially
suppressed glycolysis, both of which are counteracted by GRHL2. Confirming this
observation, we found that treatment with 2-deoxyglucose (2-DG) resulted in greater
decrease in ATP level in HMLE cells (58% of no treatment control) and MSP+GRHL2 cells
(59.1% of no treatment control) than in MSP cells (72.1% of no treatment control) (figure
87
S3A). GLUD1 depletion did not directly affect ATP levels, as reported (29). The loss of GLUD1
did, however, result in a decrease in mitochondrial membrane potential (figure S3B).
EMT suppresses the accumulation of ROS; reversal by GRHL2
To identify genes regulated by GRHL2 underlying its metabolic effects, we conducted
RNA-seq analysis. Surprisingly, we did not find that major ETC components or Krebs cycle
metabolic enzymes were significantly affected by GRHL2 expression, with the possible
exception of pyruvate dehydrogenase kinase 4 (PDK4), but its levels were highly sensitive to
the initial conditions of each individual experiment, precluding definitive conclusions as to
its regulation (data not shown). GRHL2 did, however, regulate several genes that participate
in reactive oxygen species (ROS) regulation (Table 1). Interestingly, GRHL2 expression did
not significantly affect expression of the major ROS regulatory enzymes superoxide
dismutase or catalase (Table 1).
We compared endogenous ROS levels in HMLE, MSP, and MSP+GRHL2 cells. We found
that the MSP cells display a significant reduction in ROS by fluorigenic reporter assay (CM-
H2DCFDA) in both 0 hour and 24 hour suspended conditions, and that GRHL2 increased
ROS to the approximate level detected in HMLE cells (figure 4A). Inducing EMT in the basal
mammary epithelial cell line, MCF10A neoT, with TGF-β treatment resulted in decreased
ROS; further, overexpression of GRHL2 elevated ROS level (figure S5A). Conversely, shRNA
depletion of GRHL2 suppressed ROS levels both in HMLE+Twist-ER cells and MCF10A
neoT cells (figures 4C, S5D).
88
To identify the species of ROS present, we analyzed cells with a variety of fluorometric
dyes with varying species selectivities. CM-H2DCFDA staining is a general ROS indicator that
responds well to hydrogen peroxide (H2O2). In order to verify that this was the predominant
species, we stained cells with MitoSOX red, dihydroethidium (DHE), and Amplex red-
hydrogen peroxide reporter. Amplex Red, which reports hydrogen peroxide specifically,
indicated ROS trends similar to those obtained by CM-H2DCFDA staining in both attached
and suspended conditions (figure 4B). MitoSOX red and DHE staining report mitochondrial
and generalized superoxide, respectively. These probes showed that HMLE cells had lower
mitochondrial and general superoxide (O2.-) levels than MSP cells and that overexpression
of GRHL2 resulted in a decreased O2.- level (figure S5B, S5C). Mitochondrial electron
transport is the major source of cellular superoxide (30). In this light, our superoxide data
correlated well with our data on mitochondrial oxidative phosphorylation. These data
indicated clearly that mitochondria are not the major source of higher ROS in normal
epithelial cells or GRHL2-reverted epithelial cells, as this ROS was hydrogen peroxide, not
superoxide, and mitochondria were more active in mesenchymal cells, which had lower
overall ROS.
We further sought to examine the role played by ROS in contributing to anoikis
sensitivity. HMLE cells were treated with two common antioxidant compounds including
reduced glutathione and the vitamin E derivative, Trolox. We found that these compounds
reduced ROS level in cells and significantly reduced both ROS and sensitivity to anoikis
(Figure 4D). In figure S5A, we show that MCF10a neoT cells experience a large ROS burst
between 0 and 24 hours. Speculatively, this burst may occur much earlier in HMLE cells,
resulting in little difference between 0 and 24 hours. It is also plausible that in HMLE cells
89
at 24 hours, enough cell death has occurred to obscure the ROS burst. These findings
support the crucial role of ROS in triggering anoikis.
We have previously reported that CD44S, which is upregulated in MSP cells, contributes
to anoikis resistance (31). CD44 was shown elsewhere to decrease ROS by shifting
metabolism from oxidative phosphorylation toward glycolysis and pentose phosphate
pathways, thereby increasing reduced glutathione levels (32). Consistent with this, the
stable knockdown of CD44 resulted in increased ROS, and increased sensitivity to anoikis
(figure S7A, S7B). Our metabolic findings were inconsistent with the mechanism proposed
in (32) because we observed a shift toward oxidative phosphorylation in MSP cells (figure
3) and because reduced glutathione levels in HMLE and MSP cells were similar (figure S8).
Interestingly, neutralizing cellular ROS in HMLE cells with the scavenger N-acetyl
cysteine (NAC) resulted in a significant increase in ΔΨ (Figure 4E). Neutralizing ROS in
MSP+GRHL2 cells replicated this effect (figure S6A), indicating that the low-ROS cellular
environment could play a role in sustaining the elevated mitochondrial function that we
observed in mesenchymal cells (figure 2).
EMT up-regulates glutamate dehydrogenase-1; reversal by GRHL2
Our RNA-seq data indicated that GRHL2 down-regulated several genes that have well
established effects on ROS in other systems (Table 1). Manipulation of the levels of
NCF2/p67PHOX, ALOX15, FAT4 and NQO1, however, produced no significant change in ROS
in our cells (data not shown). GRHL2 also down-regulated Glutamate Dehydrogenase 1
(GDH1 or GLUD1), an enzyme implicated in the suppression of ROS (27). By western
90
blotting, we found that GLUD1 protein was upregulated in MSP cells relative to HMLE cells,
and downregulated in MSP by GRHL2 expression, in agreement with our RNA-seq data
(figure 5A). Similarly, EMT that was generated by transient activation of Twist-ER protein
also up-regulated GLUD1, which was prevented by GRHL2 (figure 5B); similar effects were
found in TGF-β-induced MCF10a neoT cells (Figure S8). Conversely, GLUD1 expression
increased following depletion of GRHL2 in both HMLE+Twist-ER and MCF10A neoT cells
(figure 5C), indicating that GRHL2 is an important repressor of GLUD1.
Depletion of GLUD1 was previously shown to reduce α-ketoglutarate (α-KG) levels,
indicating that GLUD1, through glutaminolysis, is a major source of α-KG (27). Interestingly,
we found that MSP cells have an elevated α-KG:succinate ratio relative to HMLE cells and that
GRHL2 decreased α-KG, using both enzymatic and liquid chromatography/mass
spectrometric assays, consistent with the expression levels of GLUD1 (Figure 5D, 5E, 5F).
GLUD1 suppresses ROS and anoikis
Next, we tested the effects of altered GLUD1 and α-KG levels on ROS and anoikis. The
stable knockdown of GLUD1 enzyme using shRNA transduction resulted in both an increase
in ROS level as well as increased sensitivity to anoikis (figure 6A). A similar effect of GLUD1
knockdown was observed in HMLE+Twist-ER cells (figure S8C).
To confirm that the GLUD1 effect on ROS was mediated by α-KG, we tested the effect
of α-KG supplementation using the cell-permeable di-methyl-α-ketoglutarate derivative in
GLUD1-depleted cells. This resulted in a dose dependent protection from anoikis as well as
a reduction in ROS in HMLE cells (figure 6B). Moreover, the excess anoikis observed in HMLE
91
cells as well as MSP+GRHL2 cells was suppressed by α-KG replacement, demonstrating that
the loss of GLUD1 promoted anoikis through ROS (figure 6C, 6D, S10). Neutralizing ROS with
antioxidants or α-KG partially protected HMLE+shGLUD1 cells against anoikis as well (figure
6E, 6F).
These data indicate the critical role of GLUD1 up-regulation during EMT, resulting in
protection from anoikis by suppressing ROS, and the converse role of GRHL2 in promoting
anoikis through GLUD1 down-regulation (summarized in figure 7).
Discussion
The role and mechanism of the Warburg-like shift to aerobic glycolysis in tumor cells
has received extensive investigation, but this effect is now known to be highly context
dependent. In fact, recent studies indicate that cancer stem cells (related, in some instances,
to EMT) develop an enhanced capacity for and dependence on oxidative phosphorylation
((33),see (34) for an excellent review). Moreover, oxidative phosphorylation can contribute
to tumor metastasis (35, 36). This is thought, counter-intuitively, to have advantages for
slow-cycling cancer stem cells, such as better maintenance of ATP in nutrient-poor tumor
environments due to the higher efficiency of the TCA/ETC pathway (using fatty acids or
glutamine as carbon sources); moreover, the tumor microenvironment is rarely, if ever,
hypoxic enough to inhibit oxidative phosphorylation (34). Our metabolic results comparing
MSP vs. HMLE cells are highly consistent with this new understanding, and they show that
GRHL2 reverts MSP cells back to an epithelial type metabolism (higher glycolysis, lower
oxidative phosphorylation), accompanying re-sensitization to anoikis.
92
Metabolic changes due to oncogenic transformation, EMT or transition to cancer
stem cells have been reported extensively, with unique effects in each system (35, 37-40).
In this paper, we provide a mechanism by which EMT/cancer stem cell transition lowers
ROS so at protect cells against anoikis. Under this model, GRHL2 reverses EMT,
suppressing mitochondrial oxidative function by repression of the critical enzyme
regulating glutaminolysis, GLUD1, resulting in loss of glutamine utilization, increased ROS
level, ultimately shifting metabolism resulting in anoikis sensitivity (Figure 6).
There may be multiple mechanisms of ROS neutralization downstream of α-
ketoglutarate. First, it can act synergistically with other compounds (e.g., ascorbic acid) as
a co-antioxidant (41). Secondly, the reverse GLUD1 reaction yields glutamate, contributing
to glutathione synthesis. Thirdly, α-ketoglutarate is a co-factor for both histone
demethylase and DNA demethylase enzymes. Changes in the level of this co-factor could
affect gene expression epigenetically, as observed in other settings (42), with effects on
metabolism and ROS. Finally, a recent report shows that up-regulated GLUD1 in tumor
cells led to increases in α-ketoglutarate, increasing fumarate, in turn, through Krebs cycle
enzymes. This contributed to the neutralization of cellular ROS, because fumarate
activated glutathione peroxidase activity. GLUD1 up-regulation was, accordingly, shown to
be pro-tumorigenic, and this effect was mediated by decreased ROS levels (27). In renal cell
carcinoma, fumarate hydratase (FH) deficiency was increased fumarate to millimolar
levels, contributing to oxidative stress rather than alleviating it (43). However, the major
ROS in that study was superoxide rather than hydrogen peroxide, and GRHL2 did not affect
FH level in our cells (data not shown). We speculate that the contradictory effects of
93
fumarate in FH-deficient vs. GLUD1-over-expressing tumor cells may be reconciled by
these considerations.
Interestingly, autophagy, which may play positive or negative roles in anoikis and
non-apoptotic cell death after detachment, is regulated by glutaminolysis as well, through
mTORC complexes (25). Speculatively, GLUD1/ α-ketoglutarate alterations due to EMT or
GRHL2 may affect cell survival through these additional pathways.
The upregulation of GLUD1 would have multiple advantages for EMT/CSC cells,
including increased use of glutamine or glutamate as alternative carbon sources in glucose-
poor environments, protection against ROS, and the increased ETC/oxidative
phosphorylation capability afforded by less ROS-induced mitochondrial damage.
Interestingly, the aspartate/glutamate transporter SLC1A6 was down-regulated
dramatically by EMT, and, conversely, up-regulated by GRHL2 (table 1). Recently, SLC1A6
was found to act primarily as a glutamate exporter (44). EMT/CSC cells are predicted,
therefore, to have increased accumulation of intracellular glutamate, contributing to the
pathway that we have emphasized here.
Acknowledgments
The authors thank Dr. Stephanie Rellick and the laboratory of Dr. James Simpkins
for assistance with Seahorse techniques, Dr. Kathy Brundage for flow cytometry, Drs. John
Hollander and John LeMasters for technical advice concerning mitochondrial metabolism,
Tyler Calkins for early contributions to the project, Aniello Infante and Ryan Percifield for
assistance in RNA library construction and analysis of RNA seq data, Dr. Zachary Schafer

94
for providing constructs and technical advice, Dr. Michael Ochs for significant guidance
with bioinformatics analysis, and Dr. Amanda Ammer for expertise in Confocal image
acquisition. The work was supported by a grant from the Mary Kay Foundation and a grant
from the National Institute Of General Medical Sciences, U54GM104942. The following NIH
grants supported the flow cytometry facility: GM103488/RR032138;
RR020866;OD016165;GM103434.
95
References
1. Frisch SM, Francis H. Disruption of epithelial cell-matrix interactions induces apoptosis. J Cell Biol. 1994;124:619-26. 2. Chiarugi P, Giannoni E. Anoikis: a necessary death program for anchorage-dependent cells. Biochem Pharmacol. 2008;76:1352-64. 3. Paoli P, Giannoni E, Chiarugi P. Anoikis molecular pathways and its role in cancer progression. Biochim Biophys Acta. 2013;1833:3481-98. 4. Buchheit CL, Weigel KJ, Schafer ZT. Cancer cell survival during detachment from the ECM: multiple barriers to tumour progression. Nat Rev Cancer. 2014. 5. Frisch SM, Schaller M, Cieply B. Mechanisms that link the oncogenic epithelial-mesenchymal transition to suppression of anoikis. J Cell Sci. 2013;126:21-9. 6. Malouf GG, Taube JH, Lu Y, Roysarkar T, Panjarian S, Estecio MR, et al. Architecture of epigenetic reprogramming following Twist1-mediated epithelial-mesenchymal transition. Genome Biol. 2013;14:R144. 7. Sharma SV, Lee DY, Li B, Quinlan MP, Takahashi F, Maheswaran S, et al. A chromatin-mediated reversible drug-tolerant state in cancer cell subpopulations. Cell. 2010;141:69-80. 8. Singh B, Shamsnia A, Raythatha MR, Milligan RD, Cady AM, Madan S, et al. Highly adaptable triple-negative breast cancer cells as a functional model for testing anticancer agents. PloS one. 2014;9:e109487. 9. Javaid S, Zhang J, Anderssen E, Black JC, Wittner BS, Tajima K, et al. Dynamic chromatin modification sustains epithelial-mesenchymal transition following inducible expression of Snail-1. Cell reports. 2013;5:1679-89. 10. McDonald OG, Wu H, Timp W, Doi A, Feinberg AP. Genome-scale epigenetic reprogramming during epithelial-to-mesenchymal transition. Nature structural & molecular biology. 2011;18:867-74. 11. Walentin K, Hinze C, Werth M, Haase N, Varma S, Morell R, et al. A Grhl2-dependent gene network controls trophoblast branching morphogenesis. Development. 2015;142:1125-36. 12. Senga K, Mostov KE, Mitaka T, Miyajima A, Tanimizu N. Grainyhead-like 2 regulates epithelial morphogenesis by establishing functional tight junctions through the organization of a molecular network among claudin3, claudin4, and Rab25. Mol Biol Cell.23:2845-55. 13. Werth M, Walentin K, Aue A, Schonheit J, Wuebken A, Pode-Shakked N, et al. The transcription factor grainyhead-like 2 regulates the molecular composition of the epithelial apical junctional complex. Development.137:3835-45. 14. Gao X, Vockley CM, Pauli F, Newberry KM, Xue Y, Randell SH, et al. Evidence for multiple roles for grainyhead-like 2 in the establishment and maintenance of human mucociliary airway epithelium.[corrected]. Proc Natl Acad Sci U S A. 2013;110:9356-61. 15. Cieply B, Riley Pt, Pifer PM, Widmeyer J, Addison JB, Ivanov AV, et al. Suppression of the Epithelial-Mesenchymal Transition by Grainyhead-like-2. Cancer research. 2012;72:2440-53.

96
16. Cieply B, Farris J, Denvir J, Ford HL, Frisch SM. Epithelial-Mesenchymal Transition and Tumor Suppression Are Controlled by a Reciprocal Feedback Loop between ZEB1 and Grainyhead-like-2. Cancer research. 2013;73:6299-309. 17. Mlacki M, Kikulska A, Krzywinska E, Pawlak M, Wilanowski T. Recent discoveries concerning the involvement of transcription factors from the Grainyhead-like family in cancer. Exp Biol Med (Maywood). 2015;240:1396-401. 18. Huttemann M, Pecina P, Rainbolt M, Sanderson TH, Kagan VE, Samavati L, et al. The multiple functions of cytochrome c and their regulation in life and death decisions of the mammalian cell: From respiration to apoptosis. Mitochondrion. 2011;11:369-81. 19. Schafer ZT, Grassian AR, Song L, Jiang Z, Gerhart-Hines Z, Irie HY, et al. Antioxidant and oncogene rescue of metabolic defects caused by loss of matrix attachment. Nature. 2009;461:109-13. 20. Kamarajugadda S, Stemboroski L, Cai Q, Simpson NE, Nayak S, Tan M, et al. Glucose oxidation modulates anoikis and tumor metastasis. Molecular and cellular biology. 2012;32:1893-907. 21. Scheel C, Eaton EN, Li SH, Chaffer CL, Reinhardt F, Kah KJ, et al. Paracrine and autocrine signals induce and maintain mesenchymal and stem cell States in the breast. Cell. 2011;145:926-40. 22. Mani SA, Guo W, Liao MJ, Eaton EN, Ayyanan A, Zhou AY, et al. The epithelial-mesenchymal transition generates cells with properties of stem cells. Cell. 2008;133:704-15. 23. DeBerardinis RJ, Mancuso A, Daikhin E, Nissim I, Yudkoff M, Wehrli S, et al. Beyond aerobic glycolysis: transformed cells can engage in glutamine metabolism that exceeds the requirement for protein and nucleotide synthesis. Proceedings of the National Academy of Sciences of the United States of America. 2007;104:19345-50. 24. Lu W, Pelicano H, Huang P. Cancer metabolism: is glutamine sweeter than glucose? Cancer cell. 2010;18:199-200. 25. Villar VH, Merhi F, Djavaheri-Mergny M, Duran RV. Glutaminolysis and autophagy in cancer. Autophagy. 2015;11:1198-208. 26. Friday E, Oliver R, 3rd, Welbourne T, Turturro F. Glutaminolysis and glycolysis regulation by troglitazone in breast cancer cells: Relationship to mitochondrial membrane potential. J Cell Physiol. 2011;226:511-9. 27. Jin L, Li D, Alesi GN, Fan J, Kang HB, Lu Z, et al. Glutamate dehydrogenase 1 signals through antioxidant glutathione peroxidase 1 to regulate redox homeostasis and tumor growth. Cancer Cell. 2015;27:257-70. 28. Werner S, Frey S, Riethdorf S, Schulze C, Alawi M, Kling L, et al. Dual roles of the transcription factor grainyhead-like 2 (GRHL2) in breast cancer. J Biol Chem. 2013;288:22993-3008. 29. Kang SW, Lee S, Lee EK. ROS and energy metabolism in cancer cells: alliance for fast growth. Arch Pharm Res. 2015;38:338-45. 30. Mailloux RJ, Harper ME. Mitochondrial proticity and ROS signaling: lessons from the uncoupling proteins. Trends Endocrinol Metab. 2012;23:451-8. 31. Cieply B, Koontz C, Frisch SM. CD44S-hyaluronan interactions protect cells resulting from EMT against anoikis. Matrix biology : journal of the International Society for Matrix Biology. 2015;48:55-65.
97
32. Tamada M, Nagano O, Tateyama S, Ohmura M, Yae T, Ishimoto T, et al. Modulation of glucose metabolism by CD44 contributes to antioxidant status and drug resistance in cancer cells. Cancer Res. 2012;72:1438-48. 33. Gordon N, Skinner AM, Pommier RF, Schillace RV, O'Neill S, Peckham JL, et al. Gene expression signatures of breast cancer stem and progenitor cells do not exhibit features of Warburg metabolism. Stem cell research & therapy. 2015;6:157. 34. Viale A, Corti D, Draetta GF. Tumors and Mitochondrial Respiration: A Neglected Connection. Cancer research. 2015. 35. LeBleu VS, O'Connell JT, Gonzalez Herrera KN, Wikman H, Pantel K, Haigis MC, et al. PGC-1alpha mediates mitochondrial biogenesis and oxidative phosphorylation in cancer cells to promote metastasis. Nat Cell Biol. 2014;16:992-1003, 1-15. 36. Amoedo ND, Rodrigues MF, Rumjanek FD. Mitochondria: are mitochondria accessory to metastasis? Int J Biochem Cell Biol. 2014;51:53-7. 37. Cuyas E, Corominas-Faja B, Menendez JA. The nutritional phenome of EMT-induced cancer stem-like cells. Oncotarget. 2014;5:3970-82. 38. Dong C, Yuan T, Wu Y, Wang Y, Fan TW, Miriyala S, et al. Loss of FBP1 by Snail-mediated repression provides metabolic advantages in basal-like breast cancer. Cancer Cell. 2013;23:316-31. 39. Vlashi E, Lagadec C, Vergnes L, Reue K, Frohnen P, Chan M, et al. Metabolic differences in breast cancer stem cells and differentiated progeny. Breast Cancer Res Treat. 2014;146:525-34. 40. Birsoy K, Possemato R, Lorbeer FK, Bayraktar EC, Thiru P, Yucel B, et al. Metabolic determinants of cancer cell sensitivity to glucose limitation and biguanides. Nature. 2014;508:108-12. 41. Kang YH, Park SH, Lee YJ, Kang JS, Kang IJ, Shin HK, et al. Antioxidant alpha-keto-carboxylate pyruvate protects low-density lipoprotein and atherogenic macrophages. Free radical research. 2002;36:905-14. 42. Carey BW, Finley LW, Cross JR, Allis CD, Thompson CB. Intracellular alpha-ketoglutarate maintains the pluripotency of embryonic stem cells. Nature. 2015;518:413-6. 43. Zheng L, Cardaci S, Jerby L, MacKenzie ED, Sciacovelli M, Johnson TI, et al. Fumarate induces redox-dependent senescence by modifying glutathione metabolism. Nature communications. 2015;6:6001. 44. Beaudin S, Welsh J. 1,25-Dihydroxyvitamin D induces the glutamate transporter SLC1A1 and alters glutamate handling in non-transformed mammary cells. Molecular and cellular endocrinology. 2016.
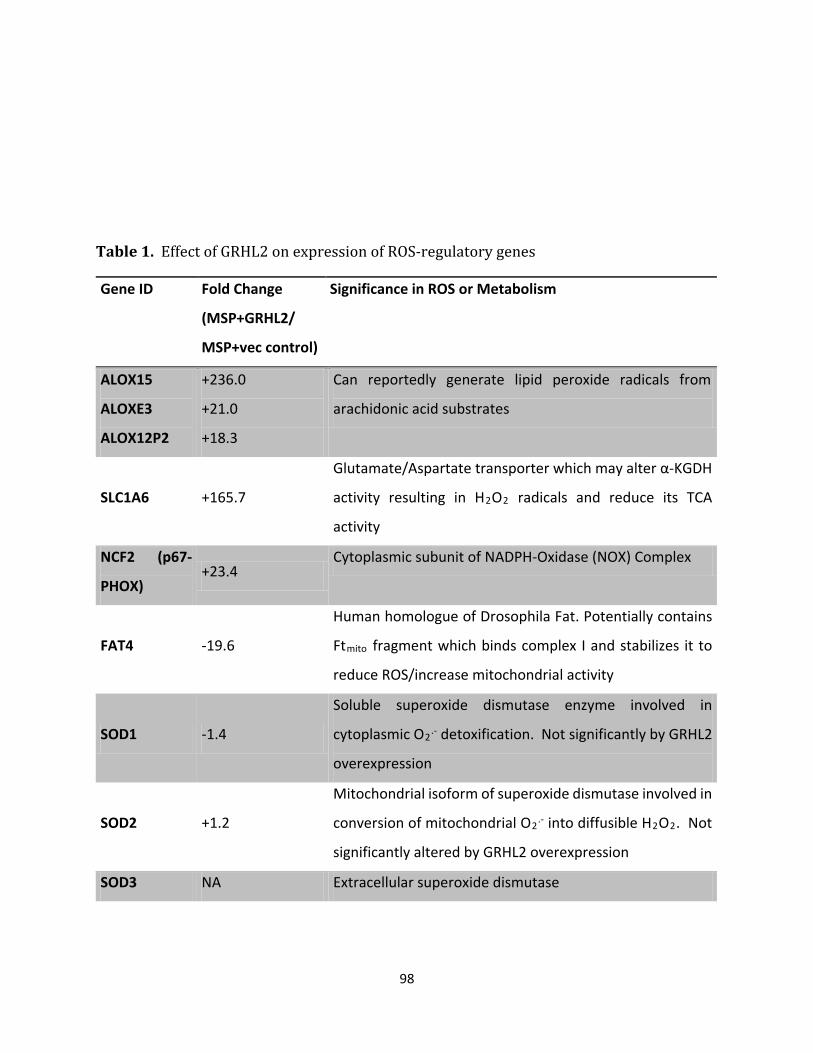
98
Table 1. Effect of GRHL2 on expression of ROS-regulatory genes
Gene ID Fold Change
(MSP+GRHL2/
MSP+vec control)
Significance in ROS or Metabolism
ALOX15
ALOXE3
ALOX12P2
+236.0
+21.0
+18.3
Can reportedly generate lipid peroxide radicals from
arachidonic acid substrates
SLC1A6 +165.7
Glutamate/Aspartate transporter which may alter α-KGDH
activity resulting in H2O2 radicals and reduce its TCA
activity
NCF2 (p67-
PHOX) +23.4
Cytoplasmic subunit of NADPH-Oxidase (NOX) Complex
FAT4 -19.6
Human homologue of Drosophila Fat. Potentially contains
Ftmito fragment which binds complex I and stabilizes it to
reduce ROS/increase mitochondrial activity
SOD1 -1.4
Soluble superoxide dismutase enzyme involved in
cytoplasmic O2.- detoxification. Not significantly by GRHL2
overexpression
SOD2 +1.2
Mitochondrial isoform of superoxide dismutase involved in
conversion of mitochondrial O2.- into diffusible H2O2. Not
significantly altered by GRHL2 overexpression
SOD3 NA Extracellular superoxide dismutase
99
Cat -1.3
Catalase enzyme involved in detoxification of H2O2 ROS
species. Appears to be slightly regulated by EMT, but not
significantly altered by GRHL2 overexpression
NQO1 -1.9 ROS detoxifying enzyme which reduces quinines to
hydroquinones – major Nrf2 target gene
GLUD1 -2.5
Reported be the primary source of cellular regulation of α-
KG which feeds to TCA cycle to increase Fumarate and
stabilize GPx1
Figure Legends
Figure 1. MSP cells are an anoikis resistant subpopulation of HMLE cells which have
undergone EMT and lost GRHL2 expression. A. (upper panel): HMLE cells were sorted for
CD44 and CD24 by FACS (insert shows up-regulated CD44S in MSP cells); B: Resulting sub-
populations were assayed for anoikis sensitivity by caspase 3/7 activation assay; C. MSP cells
in which GRHL2 was re-expressed were assayed for anoikis compared to vector control (24
hour time point with zero time subtracted). (lower panel): confirmation of GRHL2
expression by western blotting. D. HMLE+Twist-ER cells depleted of GRHL2 by shRNA
transduction were assayed for anoikis; the confirmation of GRHL2 knockdown is shown as
part of figure 5C.
Figure 2. ATP levels are elevated in mesenchymal relative to epithelial cells due to
increased mitochondrial membrane potential (ΔΨ) A. HMLE and MSP cells were
analyzed for ATP level under attached or suspended (16 h, 24 h) conditions. (The line
indicates that the attached level cannot be directly compared to the suspended levels due to
proliferation in attached condition). B. GRHL2 suppresses ATP level in MSP cells in both
attached and suspended conditions. C. ΔΨ is elevated in MSP cells, which is reduced by
GRHL2 overexpression (JC1 fluorescent probe; green=monomers to indicate free JC1,
orange=aggregates of JC1 proportional to ΔΨ); (right panel): Image J quantification and ratio
calculation of raw intensity pixel density for single phase red and green images.
100
Figure 3. Shift from glycolysis to oxidative phosphorylation accompanies EMT;
reversal by GRHL2 A. MSP cells have higher ATP production, maximum respiration, and
higher spare capacity for oxidative phosphorylation than HMLE; B. Reversal by GRHL2
Figure 4. Epithelial cells have higher ROS than mesenchymal cells, and the excess ROS
promotes anoikis. A. HMLE cells have higher ROS compared to MSP cells, which is elevated
by GRHL2 expression in MSP cells: CM-H2DCFDA fluorescence at the indicated times of
suspension. B. Hydrogen peroxide is the major regulated ROS type (Amplex Red assay); C.
shRNA depletion of GRHL2 decreases ROS in HMLE+Twist-ER cells. D. Antioxidant
compounds protect against anoikis. MSP+GRHL2 cells were pre-treated overnight with
reduced glutathione (GSH, 5 mM) and Trolox (100 uM) followed by ROS and anoikis assay;
E. Suppression of ROS resulted in increased JC1 aggregate formation and elevated ΔΨ. HMLE
cells were treated with N-acetyl cysteine (NAC) at 0.25 and 0.5 mM for 1 hr before staining
with JC-1 fluorimetric dye. (right panel): Image J quantification and ratio calculation of raw
intensity pixel density of single phase red and green images.
FIGURE 5. GRHL2 regulates Glutamate dehydrogenase-1 and α-ketoglutarate levels.
A, GLUD1 is downregulated by GRHL2 in MSP cells (upper panel: RNA-seq data lower
panel: western blot); B. GLUD1 expression is upregulated during EMT and is
downregulated by GRHL2 in HMLE-Twist cells; C. shRNA depletion of GRHL2 results in
increased GLUD1 protein. D. α-KG is higher in MSP cells relative to HMLE cells, and GRHL2
overexpression decreases it (enzymatic assay measuring loss of NADH absorbance); E. α-
KG:succinate ratio is higher in MSP than in HMLE or MSP+GRHL2 cells (mass spectrometric
assay). F. α-KG:succinate ratio is decreased by GRHL2 in HMLE cells induced to undergo
EMT by Twist-ER activation (mass spectrometric assay).
FIGURE 6. GLUD1 and α-KG regulate anoikis through ROS. A. (upper panel): Western
blot analysis of HMLE+shGLUD1 cells. (lower panel): GLUD1 knockdown elevates ROS
level; (B) GLUD1 knockdown promotes anoikis as assessed by CM-H2DCFDA assay and
caspase 3/7 activation assay (respectively); C. Dimethyl-α-KG lowers ROS; (D) Dimethyl-

101
α-KG protects HMLE cells against anoikis; E. DM-αKG and Trolox lower ROS level; (F) DM-
αKG and Trolox protect GLUD1 knockdown cells against anoikis.
FIGURE 7. GRHL2 suppresses EMT and results in the loss of GLUD1. This decreases α-KG,
suppressing oxidative metabolism, increasing ROS, and sensitizing cells to anoikis.
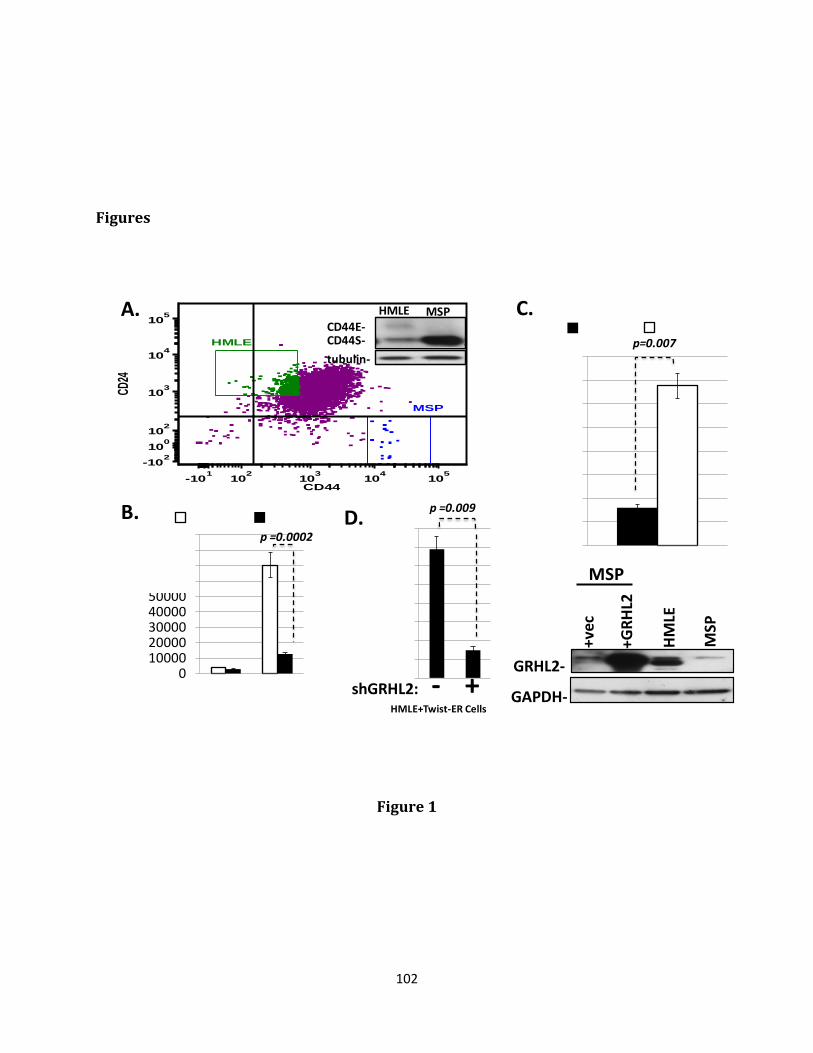
102
Figures
CD44
CD24
-101 102 103 104 105-102100102
103
104
105
MSP
HMLE CD44S-CD44E-
HMLE MSP
tubulin-
A.
01000020000300004000050000
p =0.0002
B.
GAPDH-
GRHL2-
+GRH
L2
+vec
MSP
HMLE
MSP
C.
shGRHL2: - +
D. p =0.009
p=0.007
HMLE+Twist-ER Cells
Figure 1
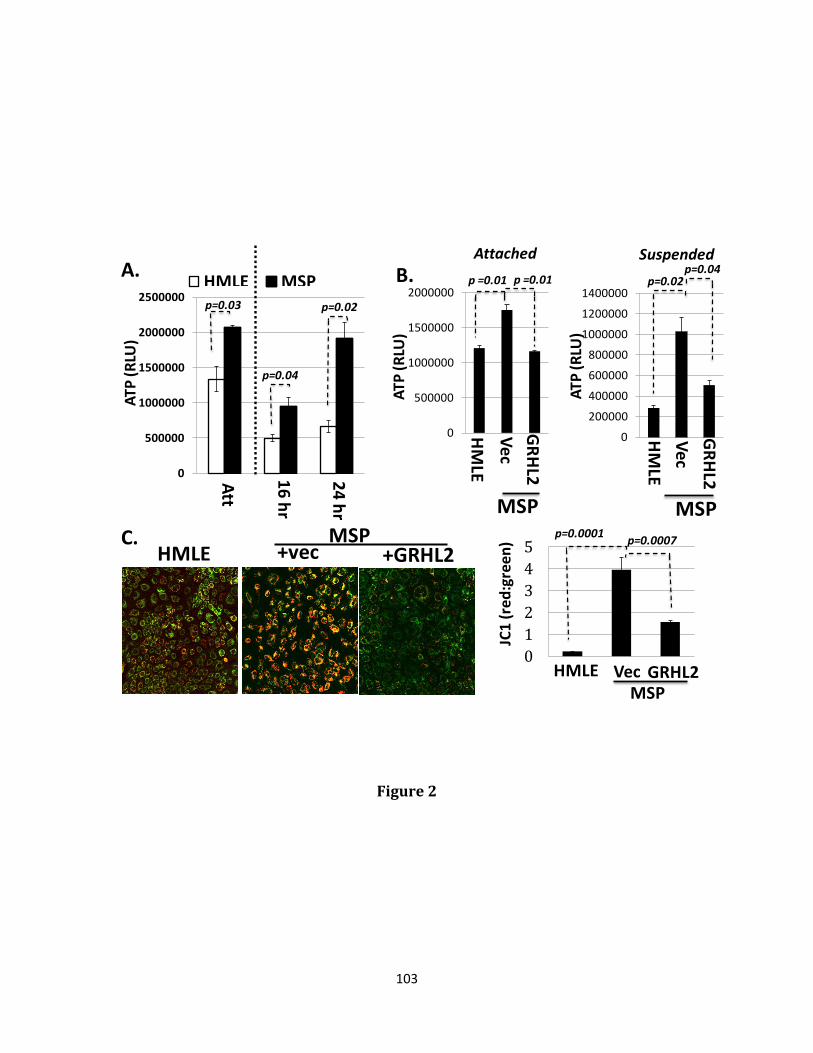
103
A.
0
500000
1000000
1500000
2000000
ATP
(RLU
)
MSP
p =0.01 p =0.01
HM
LEVecG
RHL20
500000
1000000
1500000
2000000
2500000
ATP
(RLU
)
HMLE MSP
p=0.04
p=0.03 p=0.02
Att
16 hr
24 hr
B.
MSP
HM
LEVecG
RHL2
0
200000
400000
600000
800000
1000000
1200000
1400000
ATP
(RLU
)
p=0.02p=0.04
+vecHMLE +GRHL2 MSPC.
012345
JC1
(red
:gre
en) p=0.0001 p=0.0007
MSPHMLE Vec GRHL2
Attached Suspended
Figure 2

104
0.00
20.00
40.00
60.00
80.00
100.00
120.00
140.00
HMLE MSP
OCR
(pm
ol/m
in)
ATP Production
0.00
50.00
100.00
150.00
200.00
250.00
300.00
HMLE MSP
OCR
(pm
ol/m
in)
Maximum Respiration
0.00
20.00
40.00
60.00
80.00
100.00
120.00
140.00
160.00
HMLE MSP
OCR
(pm
ol/m
in)
Spare Capacity p=0.002 p=6.9x10⁻⁶ p=2.3x10⁻⁵
A.
0
20
40
60
80
100
120
+ vec +GRHL2
OCR
(pm
ol/m
in)
ATP production
0
50
100
150
200
250
300
+ vec +GRHL2
OCR
(pm
ol/m
in)
Maximum Respiration
0
20
40
60
80
100
120
140
+ vec +GRHL2
OCR
(pm
ol/m
in)
Spare Capacityp=5.9x10⁻¹⁴ p= 4.7x10⁻¹³
p=1.1x10⁻⁹
B.
Figure 3
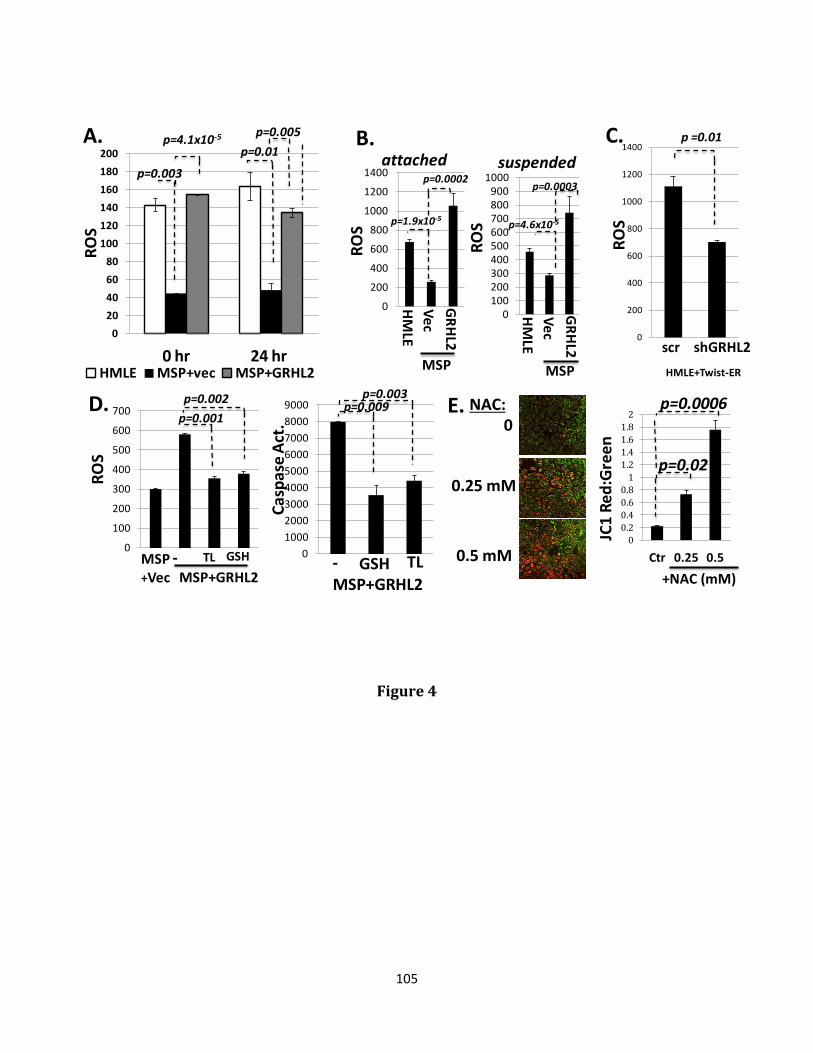
105
020406080
100120140160180200
0 hr 24 hr
ROS
HMLE MSP+vec MSP+GRHL2
p=0.003
p=4.1x10⁻⁵
p=0.01p=0.005
0
200
400
600
800
1000
1200
1400
ROS
HM
LEVecG
RHL2
attached
p=1.9x10⁻⁵
p=0.0002
MSP
suspended
0100200300400500600700800900
1000
ROS
p=0.0003
p=4.6x10⁻⁵
HM
LEVecG
RHL2
MSP
B.
0
100
200
300
400
500
600
700
ROS
TL GSH-MSP+GRHL2
MSP+Vec
p=0.001p=0.002
0100020003000400050006000700080009000
Casp
ase
Act.
GSH TL-MSP+GRHL2
p=0.009p=0.003D. E.
0.25 mM mM
0.5 mM
NAC:0
00.20.40.60.8
11.21.41.61.8
2
Ctr 0.25 0.5
JC1
Red:
Gree
n
p=0.02
p=0.0006
+NAC (mM)
HMLE+Twist-ER
0
200
400
600
800
1000
1200
1400
ROS
C.
scr shGRHL2
p =0.01A.
Figure 4
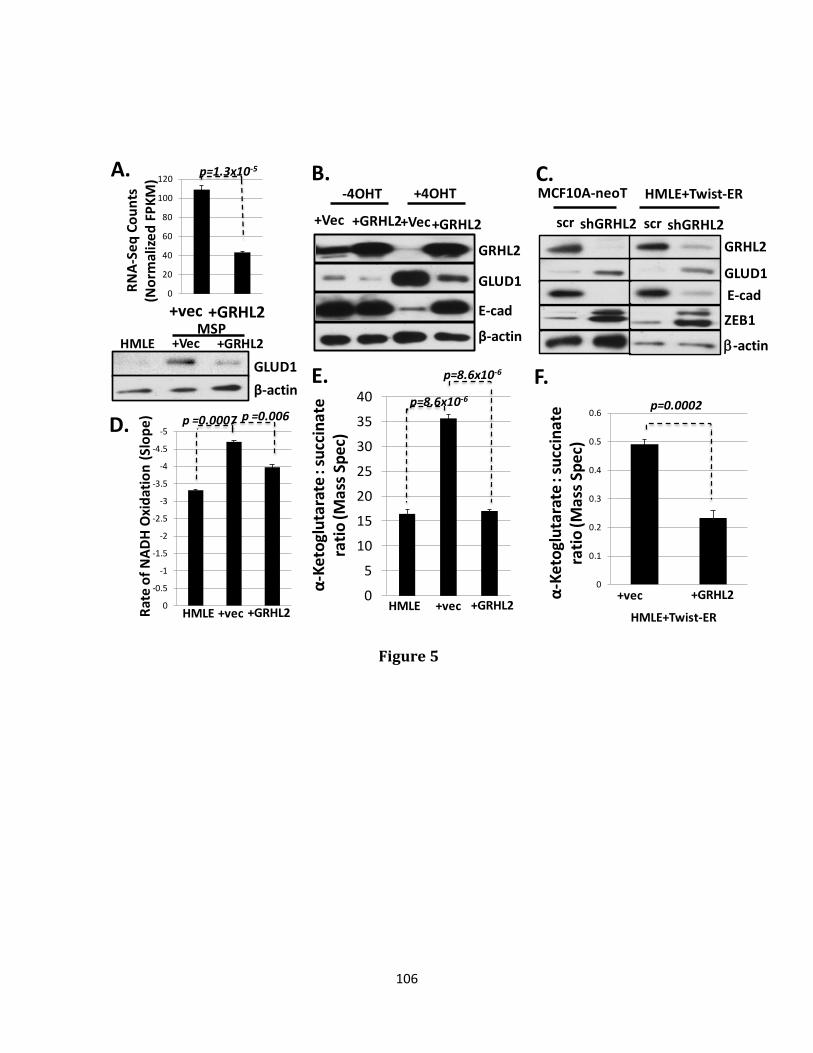
106
GLUD1
β-actin
-4OHT +4OHT
+Vec +GRHL2+Vec+GRHL2
GRHL2
E-cad
GLUD1E-cad
ZEB1
β-actin
scr shGRHL2GRHL2
MCF10A-neoT HMLE+Twist-ER
scr shGRHL2
-5
-4.5
-4
-3.5
-3
-2.5
-2
-1.5
-1
-0.5
0+vec +GRHL2Ra
te o
f NAD
H O
xida
tion
(Slo
pe)
GLUD1β-actin
HMLE +Vec +GRHL2MSP
0
20
40
60
80
100
120p=1.3x10⁻⁵
+vec +GRHL2
RNA-
Seq
Coun
ts
(Nor
mal
ized
FPKM
)
HMLE
p =0.0007 p =0.006
A.
0
5
10
15
20
25
30
35
40
α-Ke
togl
utar
ate :
succ
inat
e ra
tio (M
ass S
pec)
+vec +GRHL2HMLE
0
0.1
0.2
0.3
0.4
0.5
0.6p=0.0002
α-Ke
togl
utar
ate :
succ
inat
e ra
tio (M
ass S
pec)
+vec +GRHL2
p=8.6x10⁻⁶
p=8.6x10⁻⁶
HMLE+Twist-ER
B. C.
D.
E. F.
Figure 5
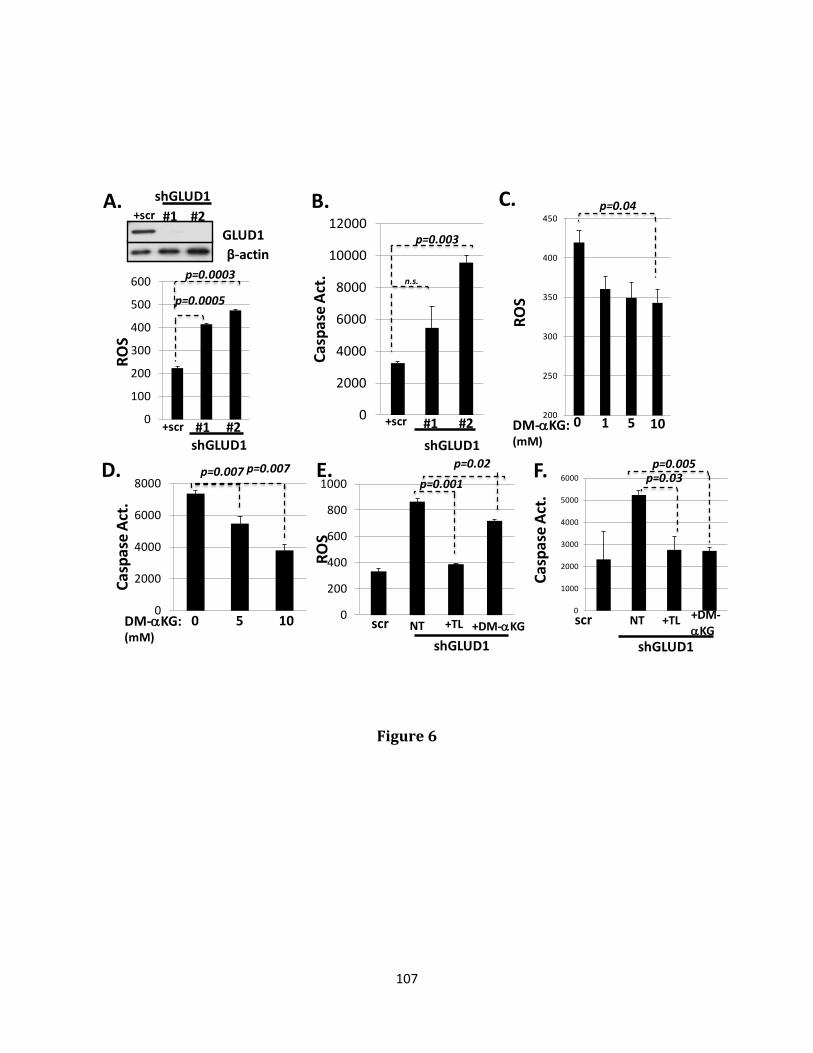
107
+scr #1 #2shGLUD1
GLUD1β-actin
0
100
200
300
400
500
600
ROS
p=0.0003
p=0.0005
+scr #1 #2shGLUD1
0
2000
4000
6000
8000
10000
12000
Casp
ase
Act. n.s.
p=0.003
+scr #1 #2shGLUD1
200
250
300
350
400
450
ROS
p=0.04
0 1 5 10
DM-αKG: (mM)
0
2000
4000
6000
8000
Casp
ase
Act.
p=0.007p=0.007
0 5 100
1000
2000
3000
4000
5000
6000
Casp
ase
Act.
p=0.005p=0.03
A. B. C.
D. E. F.
0
200
400
600
800
1000
ROS
p=0.02p=0.001
scrshGLUD1
NT +TL +DM-αKG scr
shGLUD1
NT +TL +DM-αKG
DM-αKG: (mM)
Figure 6
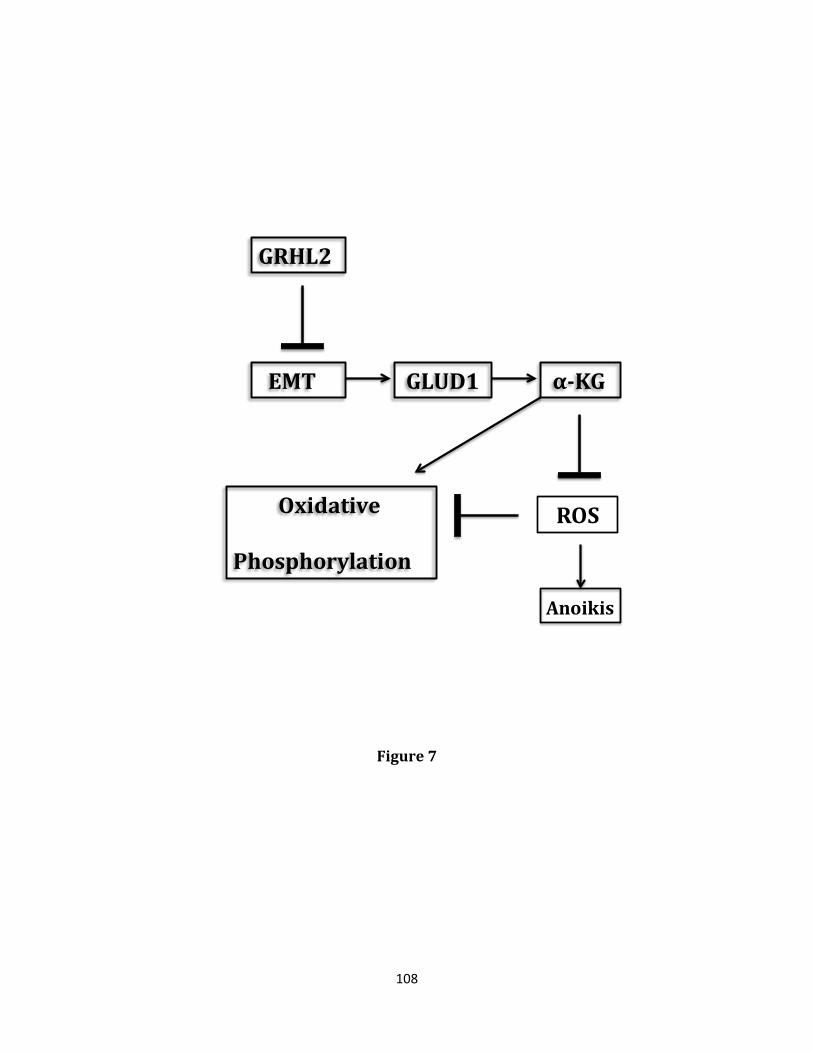
108
GRHL2
GLUD1EMT α-KG
Oxidative
Phosphorylation
ROS
Anoikis
Figure 7
109
Supplemental Figure Legends
Figure S1. GRHL2 sensitizes MCF10A neoT cells to anoikis. A. Caspase 3/7 activation
assay on 24 hour anoikis assay (zero hour subtracted). B. shRNA depletion of GRHL2
decreases anoikis sensitivity in MCF10A neoT cells.
Figure S2. EMT causes a metabolic shift from glycolysis to oxidative phosphorylation, that
is partially reversed by GRHL2. A. Elevated glycolysis in HMLE cells relative to MSP cells
(Seahorse XF-96 glycolysis stress test); (B) shRNA depletion of GRHL2 increases ATP and
maximum respiration (Seahorse XF-96 mitostress test) in HMLE+Twist-ER cells; (C) shRNA
depletion of GRHL2 increases ATP and maximum respiration in MCF10A neoT cells. D.
Graphical representations of Seahorse assays showing OCR measurements prior to and
following addition of stimulators and inhibitors of oxidative phosphorylation. E. MSP cells
(derived from HMLE+Twist-ER cells, not treated with 4-OHT) have decreased mitochondrial
structural protein TOMM20 when compared to HMLE+Twist-ER (not treated with 4-OHT)
epithelial subpopulation. F. MSP cells have lower expression of the mitochondrial structural
proteins TOMM20 and VDAC1 by western blotting.
Figure S3. MSP cells are able to maintain ATP in spite of inhibition of glucose
utilization with 2-deoxyglucose; reversal by GRHL2. A. Cells were treated with 5 and 10
mM 2-DG for 24 hours and evaluated for ATP level (Cell Titer Glo). Error bars are SD of mean.
B. Knockdown of GLUD1 in HMLE cells decreases mitochondrial membrane potential (JC1
aggregate formation) (lower panel): Image J quantification and ratio calculation of raw
intensity pixel density of red and green images.
Figure S4. Multiple carbon sources, including fatty acids, contribute to the elevated
mitochondrial function in MSP cells. A. Elevated FAO in MSP cells relative to HMLE cells
(Seahorse XF-96 FAO assay test; Eto = Etomoxir fatty acid oxidation inhibitor); B. GRHL2 re-
expression decreases ATP production and maximum respiration in response to a fatty acid
substrate (carnitine).
110
Figure S5. EMT decreases overall ROS and results in anoikis resistance, but elevates
superoxide levels. A. (left and middle panels): Treatment of MCF10A neoT cells with TGF-
β (5 ng/mL) induced irreversible EMT resulting in decrease in ROS and anoikis; (right panel):
Overexpression of GRHL2 increased ROS in MCF10A neoT cells; B. Mitochondrial superoxide
was increased by EMT and diminished by GRHL2 overexpression (MitoSOX); C. GRHL2
overexpression also decreased general superoxide level (DHE). D. Depletion of GRHL2 in
MCF10A neoT cells decreases ROS by CM-H2DCFDA staining.
Figure S6. Treatment of MSP+GRHL2 cells with antioxidant compounds results in
elevated ΔΨ. (left panel): Representative images of treated cells. (right panel): Image J
quantification and ratio calculation of raw intensity pixel density of single phase red and
green images.
Figure S7. Depletion of CD44 with stable shRNA transduction increases anoikis and
ROS. A,B. shCD44 cells are more sensitive to anoikis (caspase 3/7 activation assay) and have
increased ROS level (CM-H2DCFDA fluorescence).
Figure S8. HMLE and MSP cells have similar levels of reduced glutathione.
Figure S9. GRHL2 downregulates GLUD1 in MCF10A neoT cells and depletion of
GLUD1 from HMLE+Twist-ER cells increases ROS and anoikis. A. 4OHT was added to
HMLE+Twist-ER cells for 9 days, causing EMT; 4-OHT was then removed (+/-), causing
cells expressing exogenous GRHL2 to revert to an epithelial state, while the control cells
remained mesenchymal (15). Lysates were made 9 days after 4OHT removal and analyzed
for the indicated proteins by western blotting. B. GRHL2 down-regulates GLUD1 in
MCF10aneoT cells induced with TGF-β. C. Stable knockdown of GLUD1 by shRNA
transduction increases ROS (left panel) and anoikis (right panel) in HMLE+Twist-ER cells
to a similar level as in HMLE cells.
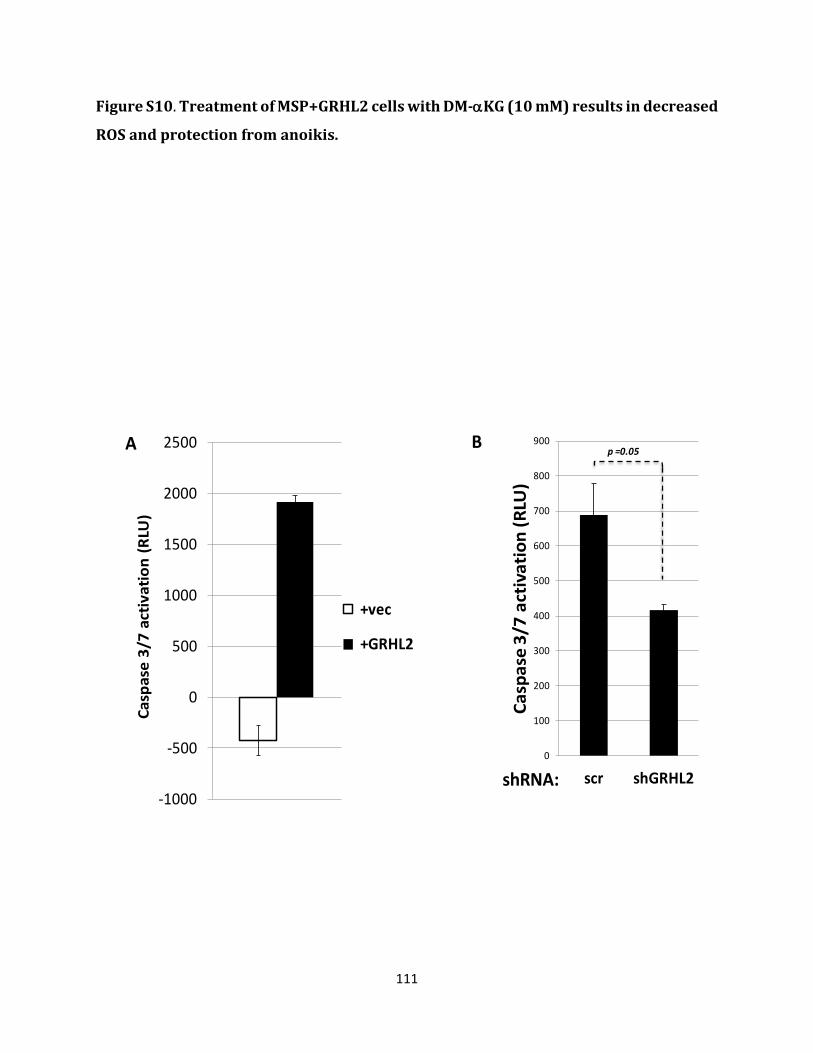
111
Figure S10. Treatment of MSP+GRHL2 cells with DM-αKG (10 mM) results in decreased
ROS and protection from anoikis.
-1000
-500
0
500
1000
1500
2000
2500
Casp
ase
3/7
activ
atio
n (R
LU)
+vec
+GRHL2
A B
0
100
200
300
400
500
600
700
800
900
scr shGRHL2
Casp
ase
3/7
activ
atio
n (R
LU)
p =0.05
shRNA:
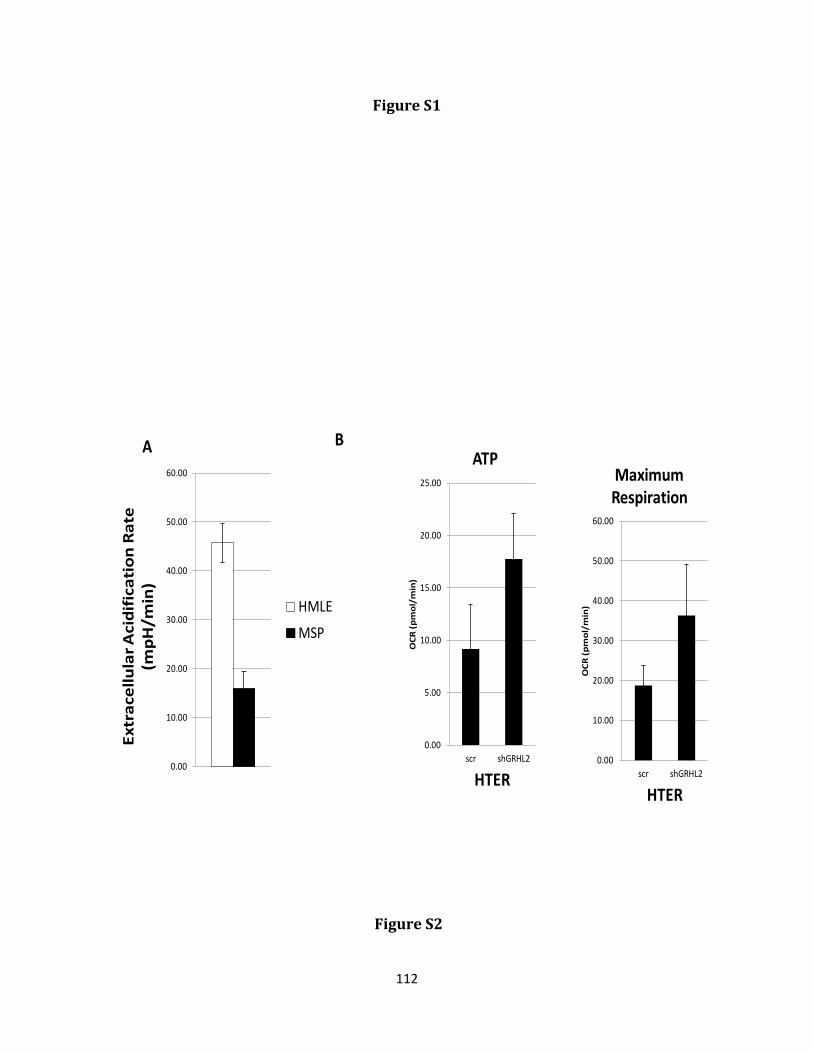
112
Figure S1
A B
0.00
10.00
20.00
30.00
40.00
50.00
60.00
Extr
acel
lula
r Aci
difi
cati
on R
ate
(mpH
/min
)
HMLE
MSP
0.00
5.00
10.00
15.00
20.00
25.00
scr shGRHL2
OCR
(pm
ol/m
in)
HTER
ATP
0.00
10.00
20.00
30.00
40.00
50.00
60.00
scr shGRHL2
OCR
(pm
ol/m
in)
HTER
Maximum Respiration
Figure S2
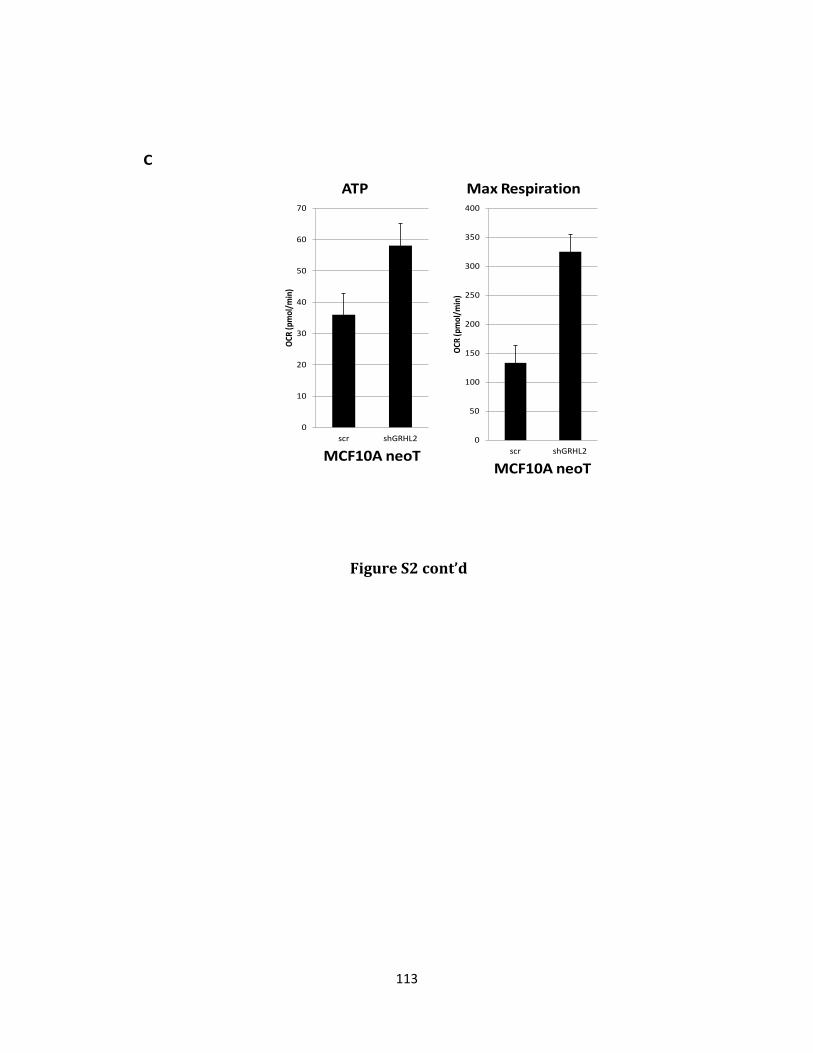
113
C
0
10
20
30
40
50
60
70
scr shGRHL2
OCR
(pm
ol/m
in)
MCF10A neoT
ATP
0
50
100
150
200
250
300
350
400
scr shGRHL2OC
R (p
mol
/min
)MCF10A neoT
Max Respiration
Figure S2 cont’d
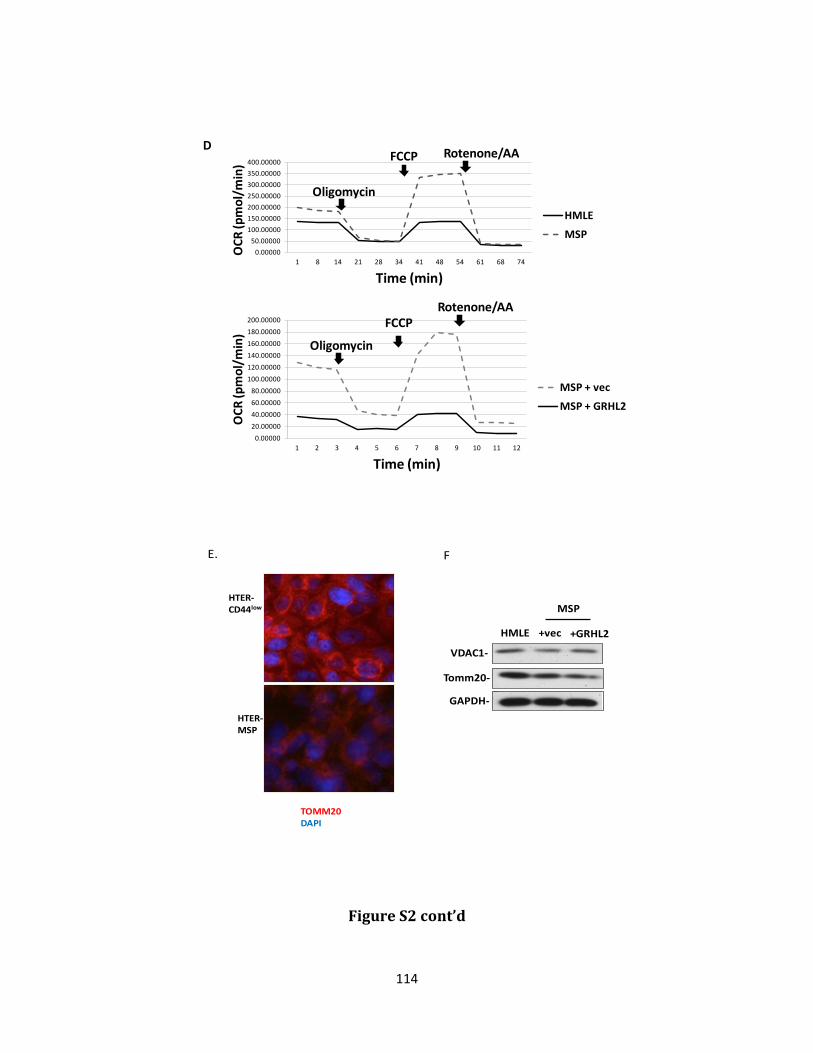
114
0.0000050.00000
100.00000150.00000200.00000250.00000300.00000350.00000400.00000
1 8 14 21 28 34 41 48 54 61 68 74
OCR
(pm
ol/m
in)
Time (min)
HMLE
MSP
Oligomycin
FCCP Rotenone/AA
0.0000020.0000040.0000060.0000080.00000
100.00000120.00000140.00000160.00000180.00000200.00000
1 2 3 4 5 6 7 8 9 10 11 12
OCR
(pm
ol/m
in)
Time (min)
MSP + vec
MSP + GRHL2
Oligomycin
FCCPRotenone/AA
D
HTER-MSP
HTER-CD44low
TOMM20DAPI
Tomm20-
VDAC1-
GAPDH-
+vecHMLE +GRHL2
MSP
FE.
Figure S2 cont’d
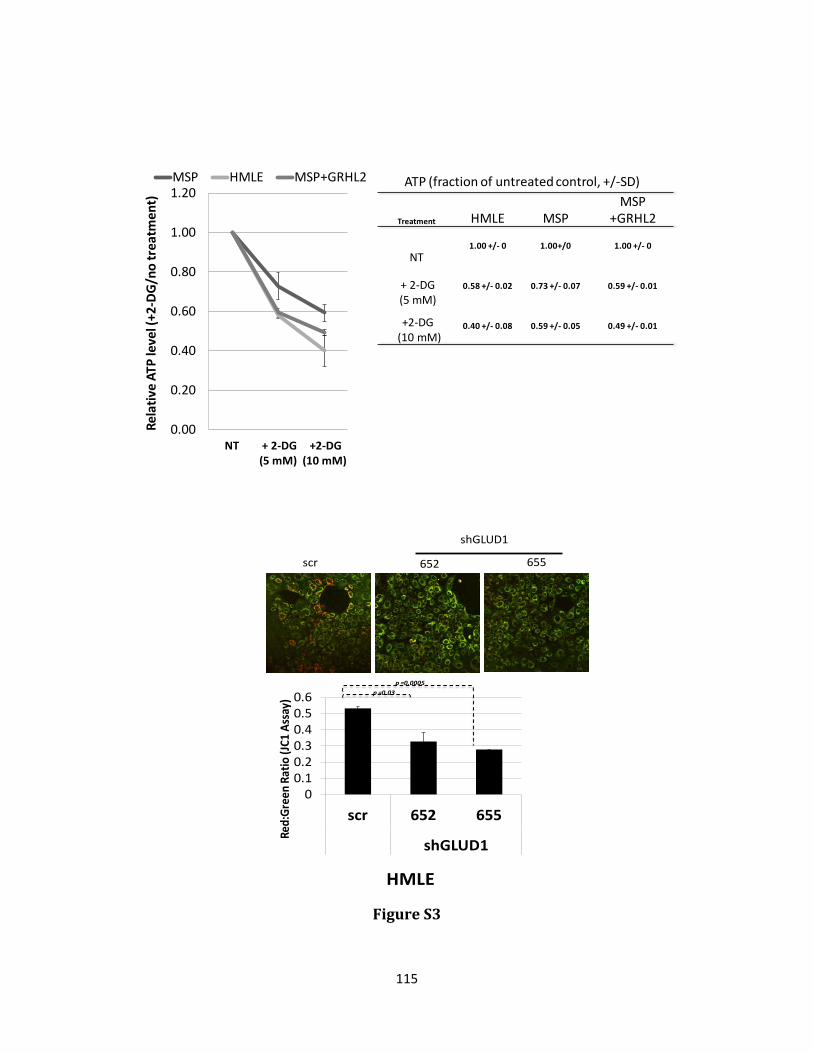
115
0.00
0.20
0.40
0.60
0.80
1.00
1.20
NT + 2-DG (5 mM)
+2-DG (10 mM)
Rela
tive
ATP
leve
l (+2
-DG/
no tr
eatm
ent)
MSP HMLE MSP+GRHL2
Treatment HMLE MSPMSP
+GRHL2
NT1.00 +/- 0 1.00+/0 1.00 +/- 0
+ 2-DG (5 mM)
0.58 +/- 0.02 0.73 +/- 0.07 0.59 +/- 0.01
+2-DG (10 mM)
0.40 +/- 0.08 0.59 +/- 0.05 0.49 +/- 0.01
ATP (fraction of untreated control, +/-SD)
scr 652 655
shGLUD1
00.10.20.30.40.50.6
scr 652 655
shGLUD1
Red:
Gree
nRa
tio (J
C1 A
ssay
)
HMLE
p =0.0005 p =0.03
Figure S3
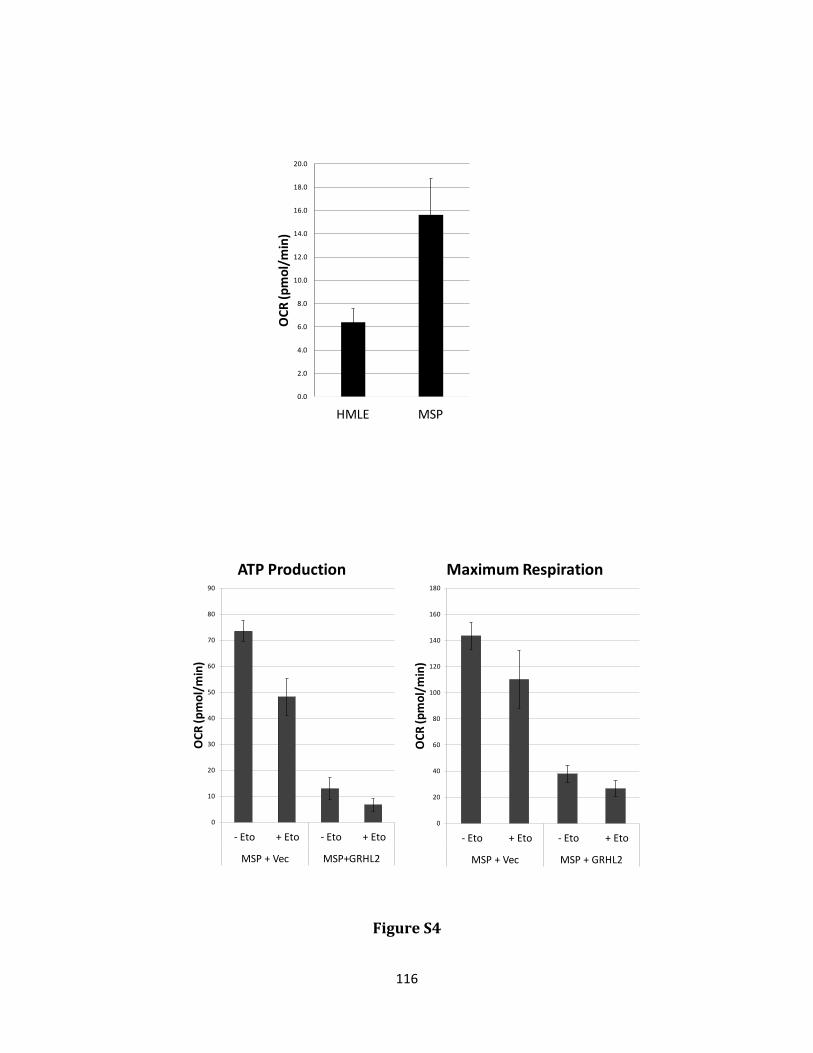
116
0.0
2.0
4.0
6.0
8.0
10.0
12.0
14.0
16.0
18.0
20.0
HMLE MSP
OCR
(pm
ol/m
in)
0
10
20
30
40
50
60
70
80
90
- Eto + Eto - Eto + Eto
MSP + Vec MSP+GRHL2
OCR
(pm
ol/m
in)
ATP Production
0
20
40
60
80
100
120
140
160
180
- Eto + Eto - Eto + Eto
MSP + Vec MSP + GRHL2
OCR
(pm
ol/m
in)
Maximum Respiration
Figure S4
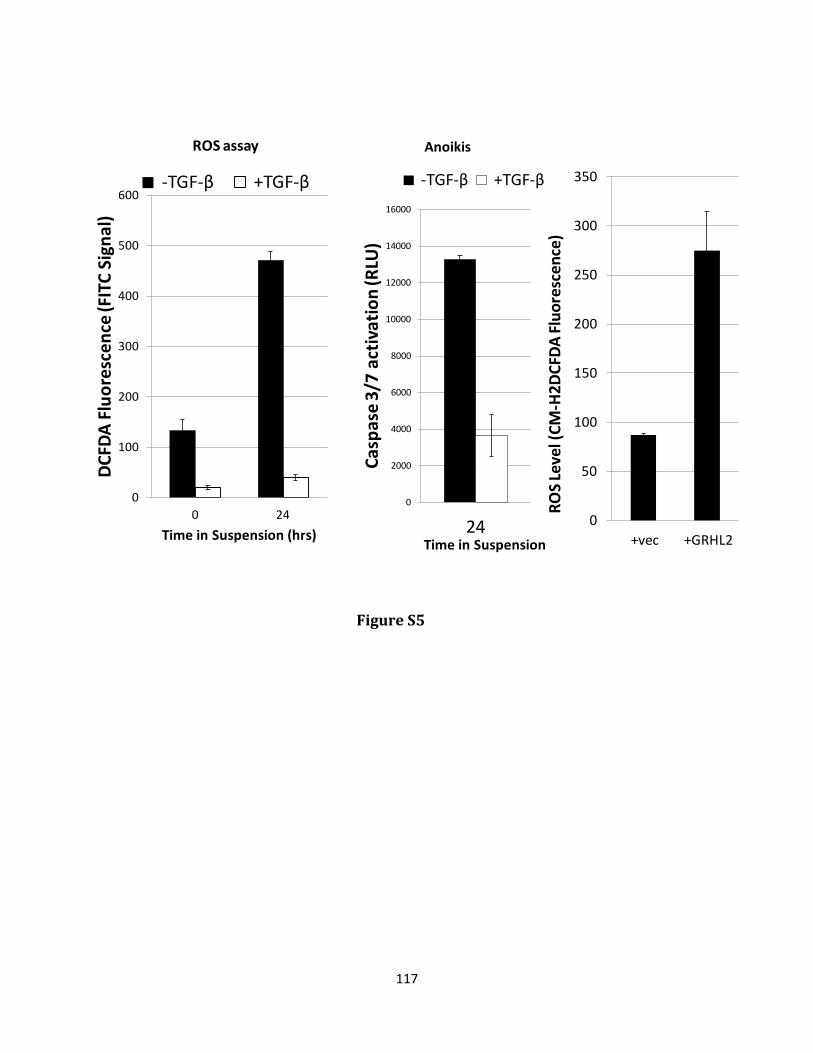
117
0
2000
4000
6000
8000
10000
12000
14000
16000
24
Casp
ase
3/7
activ
atio
n (R
LU)
Time in Suspension
Anoikis
-TGF-β +TGF-β
0
100
200
300
400
500
600
0 24
DCFD
A Fl
uore
scen
ce (F
ITC
Sign
al)
Time in Suspension (hrs)
ROS assay
-TGF-β +TGF-β
0
50
100
150
200
250
300
350
+vec +GRHL2RO
S Lev
el (C
M-H
2DCF
DA Fl
uore
scen
ce)
Figure S5
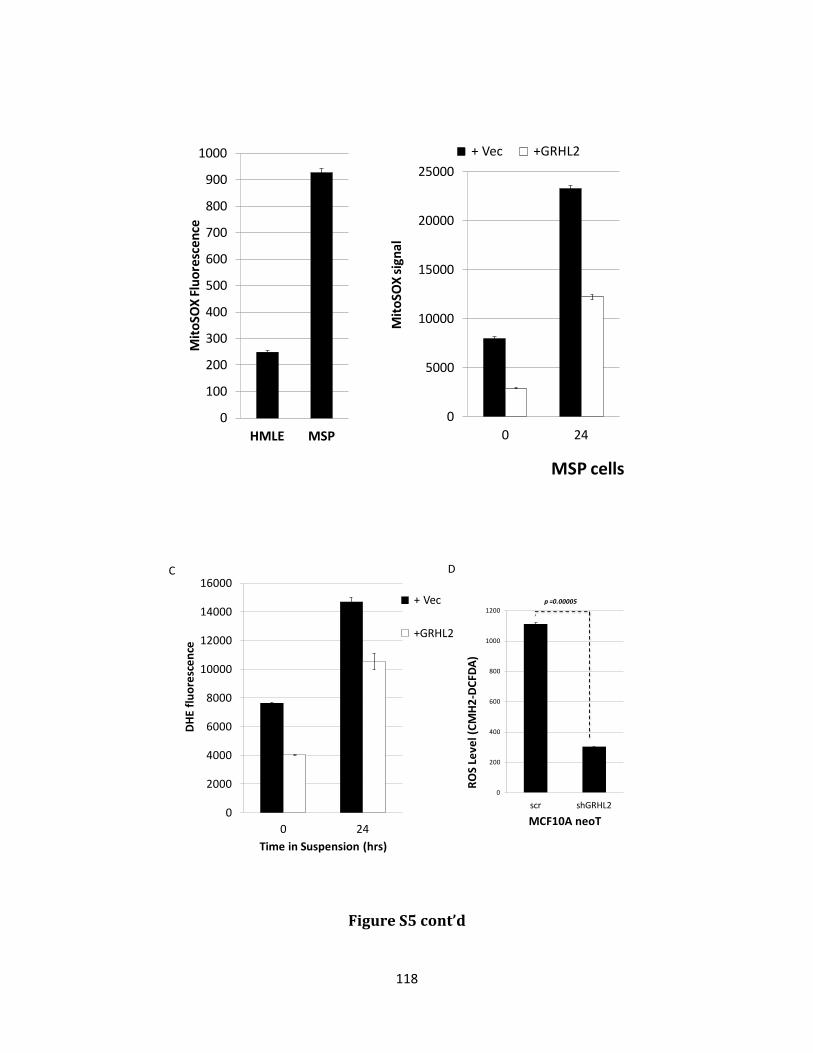
118
0
5000
10000
15000
20000
25000
0 24
Mito
SOX
signa
l
+ Vec +GRHL2
0
100
200
300
400
500
600
700
800
900
1000
HMLE MSP
Mito
SOX
Fluo
resc
ence
MSP cells
0
2000
4000
6000
8000
10000
12000
14000
16000
0 24
DHE
fluor
esce
nce
Time in Suspension (hrs)
+ Vec
+GRHL2
0
200
400
600
800
1000
1200
scr shGRHL2
ROS
Leve
l (CM
H2-D
CFDA
)
MCF10A neoT
p =0.00005
C D
Figure S5 cont’d
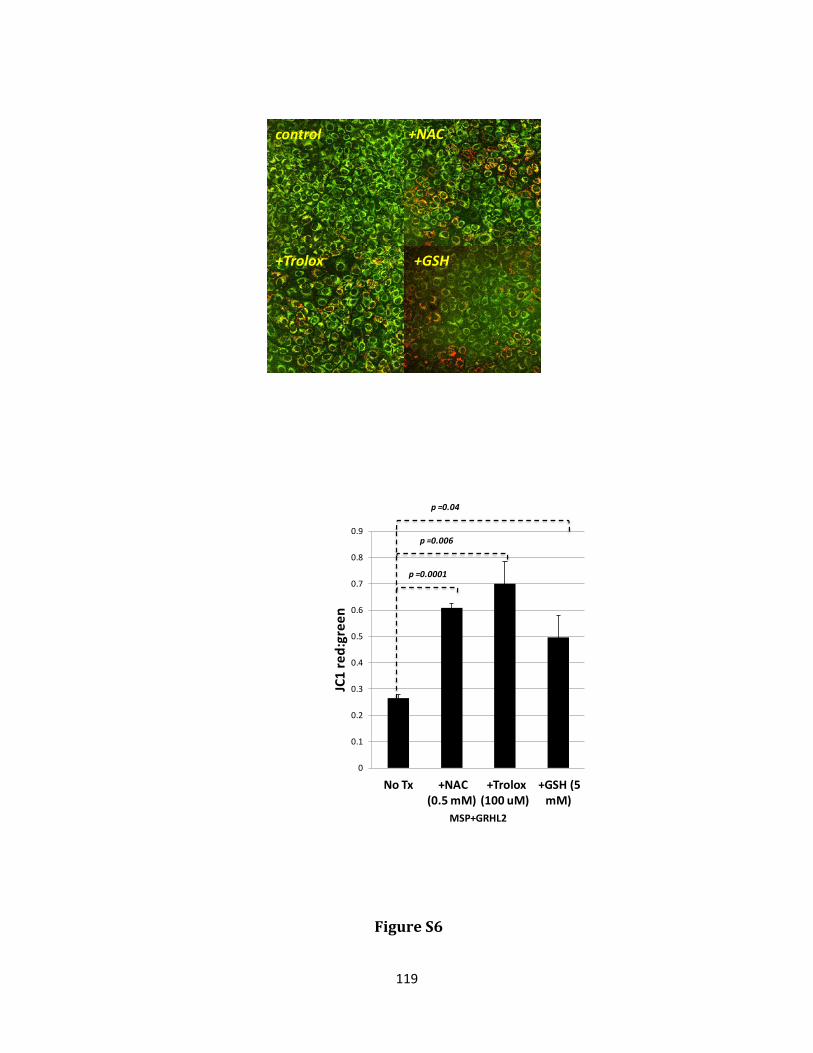
119
control +NAC
+Trolox +GSH
0
0.1
0.2
0.3
0.4
0.5
0.6
0.7
0.8
0.9
No Tx +NAC (0.5 mM)
+Trolox (100 uM)
+GSH (5 mM)
JC1
red:
gree
n
MSP+GRHL2
p =0.0001
p =0.006
p =0.04
Figure S6
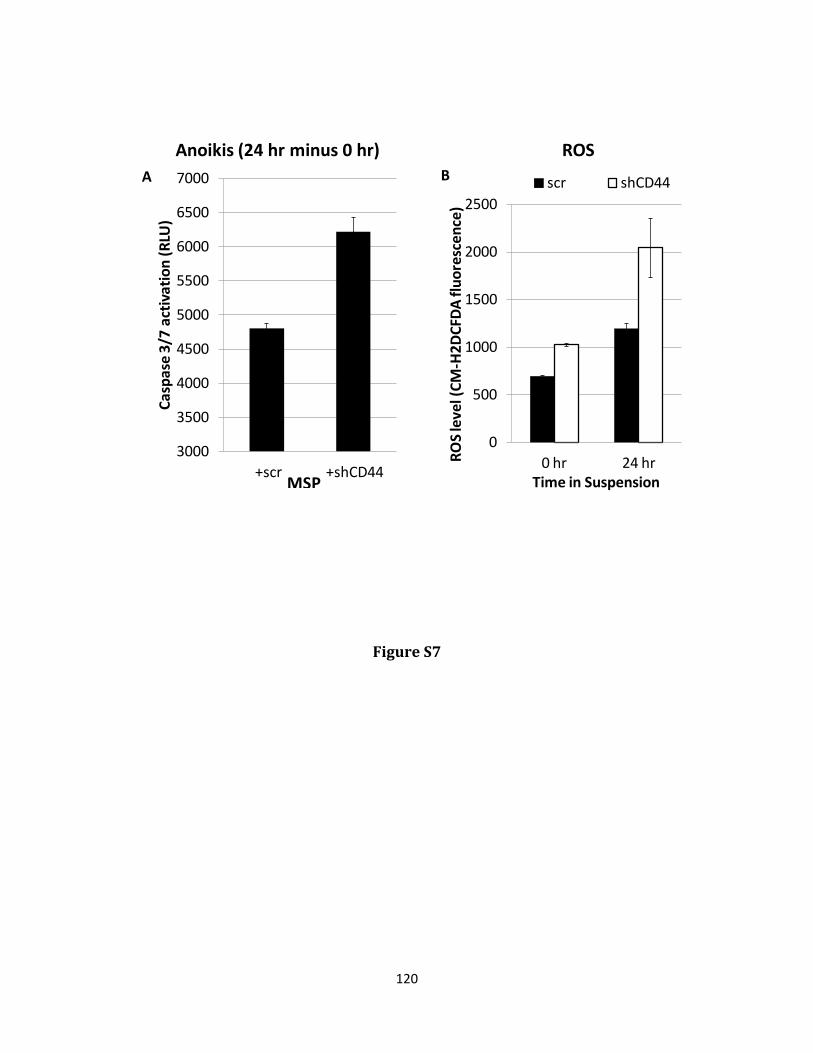
120
3000
3500
4000
4500
5000
5500
6000
6500
7000
+scr +shCD44
Casp
ase
3/7
activ
atio
n (R
LU)
Anoikis (24 hr minus 0 hr)
MSP
0
500
1000
1500
2000
2500
0 hr 24 hrROS
leve
l (CM
-H2D
CFDA
fluo
resc
ence
)
Time in Suspension
ROS
scr shCD44A B
Figure S7
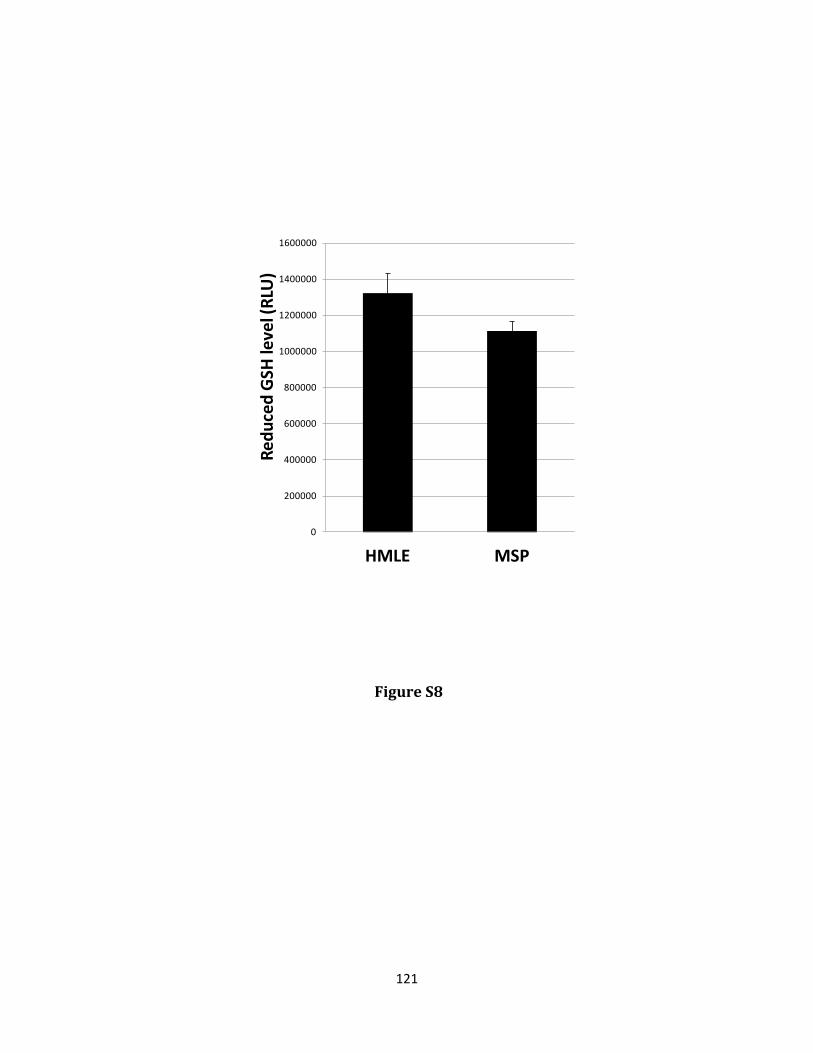
121
0
200000
400000
600000
800000
1000000
1200000
1400000
1600000
HMLE MSP
Redu
ced
GSH
leve
l (RL
U)
Figure S8
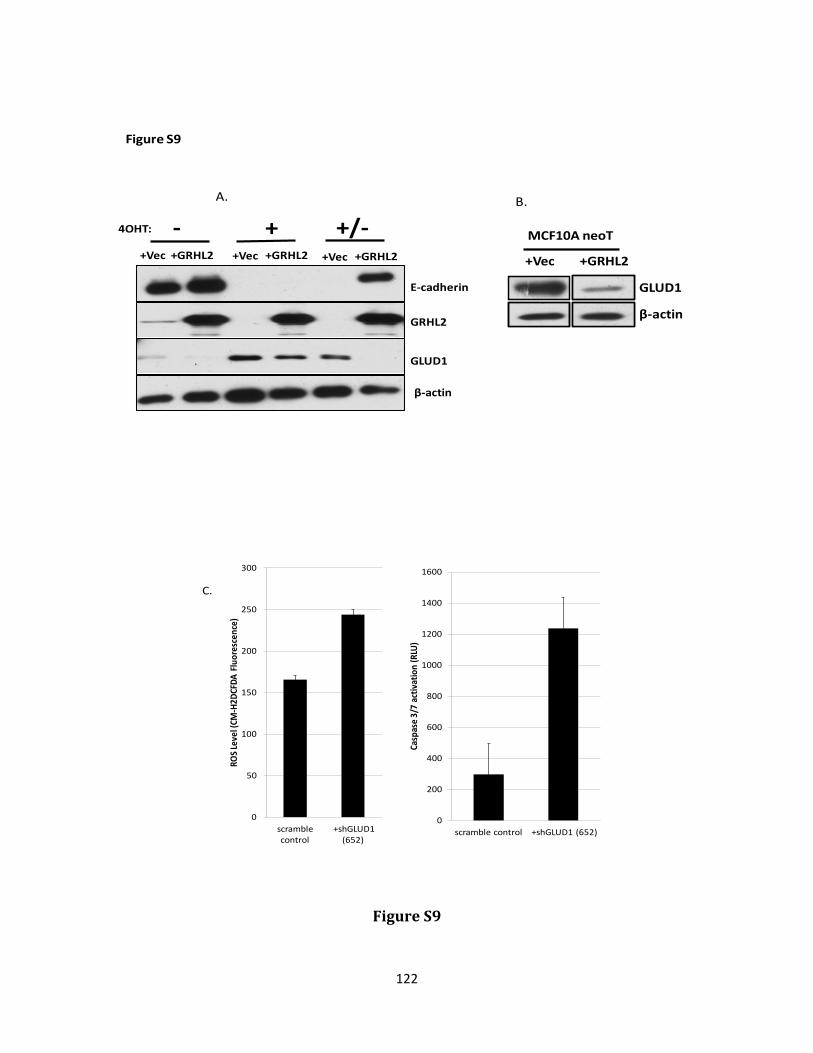
122
4OHT: -+Vec +GRHL2 +Vec +GRHL2
GLUD1
β-actin
GRHL2
E-cadherin
+Vec +GRHL2
+ +/-
Figure S9
GLUD1
β-actin
+Vec +GRHL2
MCF10A neoT
A. B.
0
200
400
600
800
1000
1200
1400
1600
scramble control +shGLUD1 (652)
Casp
ase 3
/7 a
ctiv
atio
n (R
LU)
0
50
100
150
200
250
300
scramble control
+shGLUD1 (652)
ROS L
evel
(CM
-H2D
CFDA
Flu
ores
cenc
e)
C.
Figure S9
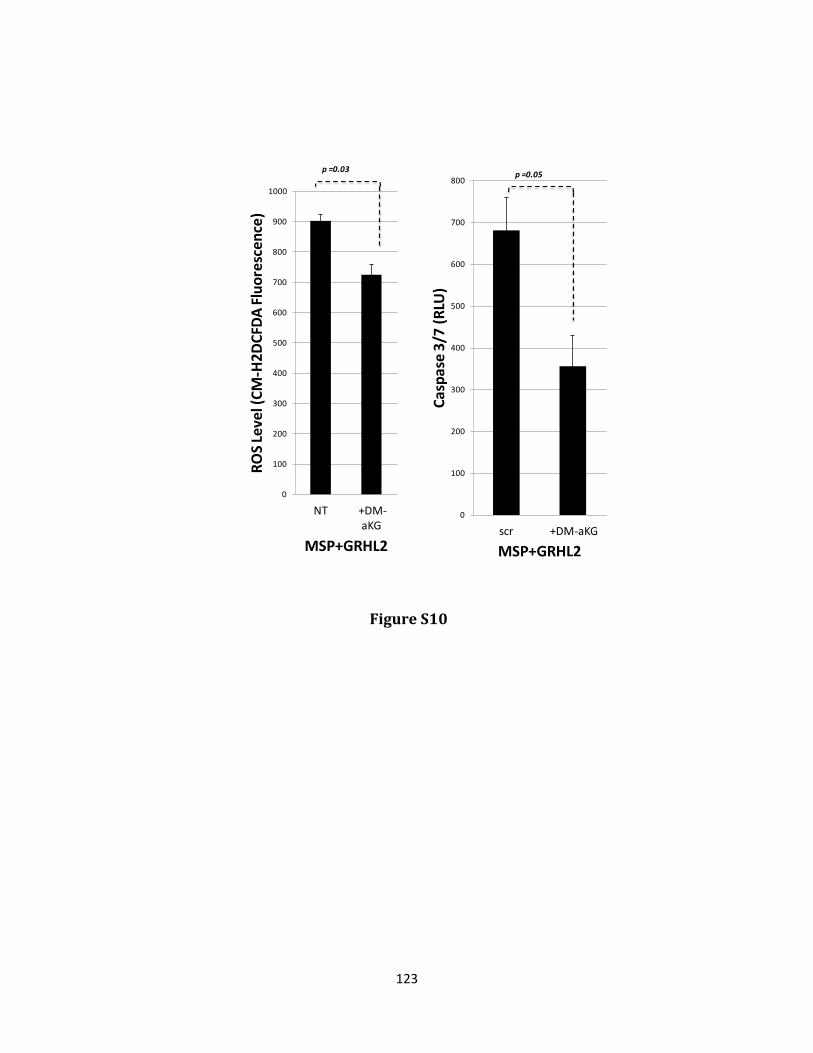
123
0
100
200
300
400
500
600
700
800
scr +DM-aKG
Casp
ase
3/7
(RLU
)
MSP+GRHL2
p =0.05
0
100
200
300
400
500
600
700
800
900
1000
NT +DM-aKG
ROS L
evel
(CM
-H2D
CFDA
Fluo
resc
ence
)
MSP+GRHL2
p =0.03
Figure S10
123
Chapter 3
The Effect of GRHL2 on Tumor Recurrence following Chemotherapy or Oncogene
Withdrawal
The following represents unpublished data. Select portions of this work are ongoing projects
in the Frisch Lab.
124
Project Overview
Grainyhead genes play an important role in embryogenesis in the context of neural
tube closure, wound healing, and carcinogenesis. For a more thorough discuss on the role
of Grainyhead-like 2 in cancer, chemotherapy resistance, and tumor recurrence, refer to
Chapter 1, part 2 of this dissertation. The major aims of this project were to investigate the
effect of GRHL2 overexpression on prevention of either chemotherapy induced recurrence
in an orthotopic injection model or oncogene independent recurrence in a transgenic
mouse model. These will be detailed below.
Introduction/Project Design
Disease recurrence several years following successful treatment of primary tumors
is a frequent reality, and is the most common cause of mortality from cancer. It has been
extensively demonstrated that in these settings, plasticity conferred by EMT benefits small
populations of cells, bestowing CSC-like and chemoresistant properties to these primary
tumor cells, which persist, only to resume growth after a period of dormancy (1-7). In
breast cancer, these populations are often identified by a shift in surface expression toward
a CD44HIGH/CD24LOW phenotype. In culture, treatment of HMLE cells with taxol derivatives
selects for this CSC-like population; conversely, stable expression of GRHL2 significantly
sensitizes these, as well as MDA-MB-231 cells, to this therapy. Most importantly,
ectopically expressed GRHL2 prevents the chemotherapy-induced emergence of this
population capable of tumor initiation (8). It is well accepted that EMT is generally
associated with a heightened propensity for metastasis as well as a decreased sensitivity to
conventional cytotoxic chemotherapeutics. Further, it has been demonstrated by
125
Chakrabarty et al. that treatment of cancer cells with the anti-cancer chemotherapeutic
agent paclitaxel enriches for CD44 and ALDH expression as well as CD24 downregulation,
all features associated with cancer stem cells (9).
In order to elucidate the role of GRHL2 in prevention of chemoresistant CSC-like
subpopulations in vivo, we designed a doxycycline inducible ectopic GRHL2 construct. This
GRHL2 inducible vector has prevented EMT in HMLE-Twist-ER cells when subjected to 4-
hydroxytamoxifen induction, further supporting the importance of GRHL2 in suppression of
EMT. Work shown here proposed injection of tumor lines containing GRHL2 inducible
constructs into syngeneic mice followed by treatment with chemotherapy and subsequent
analysis of recurrent populations. In order to determine the role of GRHL2 in protection
from EMT/chemotherapy induced CSC enrichment, we planned to develop stable mouse
tumor cell line expressing a doxycycline inducible GRHL2 construct, inject these tumor cells
orthotopically into the mammary fat pad of syngeneic mice allowing tumors to form to sizes
of greater than 5 mm. We would then treat with chemotherapy (approved therapies include
Cisplatin, Cyclophosphamide, Doxorubucin, and Paclitaxel), dividing therapy groups further
into +/- DOX groups in order to induce GRHL2. We would observe the effect on GRHL2 tumor
sensitivity, tumor recurrence, and metastasis. To examine the role of EMT in the generation
of the CSC fraction in vivo, a murine breast cancer cell line referred to as Py2T was evaluated
for potential use in murine syngeneic orthotopic injection experiments. This cell line,
derived from a polyoma middle-T antigen mouse transgenic model, has been previously
described to undergo EMT either by addition of TGF-β in vitro or spontaneously by
orthotropic injection in vivo (10). Considered together with previous studies, our data
indicate a significant role for GRHL2 in the context of prevention of recurrence post-
126
therapeutic intervention. This section will highlight the technical difficulties experienced in
this project and future aims.
An additional focus of this project is to determine the effect of constitutive Grhl2
expression in a murine model of recurrence. Mouse models recapitulating recurrence
following regression of primary tumors driven by doxycycline inducible neuNT, Wnt1, or c-
myc have shown that in comparison to the primary tumors, recurrent disease that emerges
following withdrawal of the oncogenic driver have undergone EMT (4, 11, 12). Analysis of
tetO-neuNT and tetO-Wnt1 primary vs recurrent RNA expression revealed a striking
decrease in GRHL2 expression in recurrent tumors (8). These findings strongly support the
hypothesis that GRHL2 is a tumor suppressor, is specifically silenced in the tumor initiating
subpopulation of the primary tumor, and that it is major suppressor of disease recurrence.
Further evaluation is needed in order to more clearly define the precise role of GRHL2 in
preventing recurrence in vivo. We hypothesized here that constitutive GRHL2 expression
abrogates the emergence of the CSC population enriched for by chemotherapy or EMT,
thereby preventing therapy resistant recurrence in vivo. The search for a tumor suppressive
type transcription factor that might alter this transition from chemosensitive “normal”
tumor cell to the chemoresistant CSC could prove critical in producing improved outcomes
for patients with breast cancer.
Methods and Materials
Cell Lines
Py2T cell lines were generously donated from the lab of G. Christofori (Department of
Biomedicine, University of Basel – Switzerland). Py2T cells were grown in Dulbecco’s
127
Modified Eagle’s Medium (DMEM) + 10% Fetal Bovine Serum (FBS) + 1X Penicillin-
Streptomycin-Glutamine (PSG). Clonal isolation of the mixed population (epithelial +
mesenchymal cells) was done in order to generate a purely epithelial colony of cells. These
cells were titled “Py2T C7” (clone 7). HMLE+Twist-ER cells were a generous contribution
from R. Weinberg (The Whitehead Institute, Cambridge, MA). HMLE+Twist-ER cells were
grown in Dulbecco’s Modified Eagle’s F12 Media (DME/F12) + 5% horse serum + 1X
penicillin-streptomycin-glutamine (PSG) + 10 ug/mL insulin + 10 ng/mL EGF + 0.5 ug/mL
hydrocortisone. 4T1 mouse mammary carcinoma cells were ordered from ATCC and
maintained in RPMI 1640 Complete media supplemented with 10% FBS + 1X PSG. Where
indicated, 4-hydroxytamoxifen (10 ng/mL) was added to the HMLE+Twist-ER cells to
activate the Twist-ER protein. Where indicated, Transforming Growth Factor-β (TGF-β)
was added to the HMLE+Twist-ER cells (5 ng/mL).
Generation of Stable Cell Lines by Retroviral Transduction
Mouse GRHL2 was amplified from a template purchased from Open Biosystems (MHS4426-
99625903) and subcloned via standard molecular biological methodology into pcDNA3.1+-
3XF expression vector in order to generate a flag tagged mGRHL2 plasmid (cloned into SalI
site using Xho1 compatible enzyme). It was further subcloned into the doxycyline inducible
expression vector pLUT (cloned into Not1 and NheI sites). Separately, GRHL2 was
subcloned previously into MSCV-IRES-puro retroviral vector (Cieply et al., 2012). Also
cloned human GRHL2 into pLUT vector for verification of findings in human cell lines as
well as mouse lines. Lentiviruses of mGRHL2-pLUT plasmids were packaged and amplified
into 293T cells by transfection of 3.3 ug mGRHL2-pLUT, 2.2 ug psPAX, and 1.2 ug of pCMV-
128
VSV-G (plasmids obtained from Addgene) with Mirus TransitLT transfection reagent onto
60 mm2 dishes. GRHL2-MSCV-IRES-puro retroviral was packaged and amplified into GP2 +
293T cells by transfection of 4.5 ug of retroviral vector, 2.5 ug of pCMV-VSV-G per 60 mm2
dish of cells, with Mirus TransitLT transfection reagent. Cells were refed with Dulbecco’s
Modified Eagle’s Medium (DMEM) + 10% Fetal Bovine Serum (FBS) + 1X Penicillin-
Streptomycin-Glutamine (PSG) media after incubating with DNA/transfection medium
overnight. Viral supernatants were harvested 48 hrs later, filtered through 0.45 micron
filters (Whatman), and stored at -80°C. In subsequent infections, 0.6 mL of viral stock was
used to transduce cells with plasmid per 1 well of a 6 well dish, and dish was subjected to
centrifugation at ~1,400 rpm for 1 hr followed by 6 hours to overnight incubation with
viral supernatant. Infected cells were subsequently refed and passaged to larger dishes for
selection by puromycin. Following puromycin selection, cells were examined for protein
content by Western Blot analysis probing for GRHL2 protein in order to verify protein
overexpression in lentivirally transduced lines.
Animal Models
Animal work involving tumor injection and subsequent chemotherapy has all been
approved by the West Virginia University Animal Care and Use Committee (ACUC # 11-
0706.4, approved 10-31-12). We generated MMTV-GRHL2 transgenic mice by embryo
transfer of a GRHL2-flag-MMTV fragment with the help of the WVU animal transgenics core
facility. Founders were found to express GRHL2 constitutively in the mammary gland and
developed normally (data not shown), as described previously. We crossed these
transgenic mice with a double transgenic tetO-neuNT/MMTV-rtTA mouse line in a FVB
129
background provided by the laboratory of L. Chodosh. At six weeks of age, oncogene
expressing transgenic mice either containing the GRHL2 transgene, or GRHL2 negative
littermates were induced using 2 mg/mL doxycycline 5% sucrose water. Within 6-7 weeks,
primary tumors emerged in both groups and were allowed to grow to approximately
15x15 mm2. Tumors were monitored using caliper measurements weekly.
Immunofluorescence
For further evaluation as to the percentage positivity of GRHL2 within Py2T C7 cell
populations expressing lentivirally transduced mGRHL2-pLUT, immunofluorescence was
carried out in order to confirm ~100% cellular expression. Collagen coated chamber well
microscope slides (20 ug/mL) were used to plate cells for IF experiments. 40,000 cells
were plated at least 24 hrs prior to fixation. Cells were fixed with 4% paraformaldehyde
(PFA) in sterile PBS. PFA was quenched with 100 mmol/L glycine in PBS. Cells were
permeabilized with 0.5% Triton X-100 in PBS at 4 degrees for 10 minutes, followed by PBS
washing twice. Were blocked for 1 hr in PBS + 10% goat serum + 0.1% Tween-20 + 0.1%
BSA. The primary antibodies were used as follows: GRHL2, rb (Sigma) 1:250; Flag, ms
(Sigma) 1:250. The secondary antibody was rb or ms Alexaflour 555 (red), 1:1000.
Mounting media: Prolong Gold w/ DAPI (Invitrogen). Coverslips were mounted in Prolong
Gold. Images were produced with the Axiovert 200M microscope, AxioCam MRM camera,
and Axio Vision 4.3.1 software (Zeiss).
Western Blotting
130
SDS-PAGE was performed with pre-cast 4-20% gradient Tris-Glycine gels (Invitrogen).
Proteins were immobilized by electrophorectic transfer to polyvinylidene difluoride filters
(Immobilon) in 5% MeOH containing Tris-Glycine transfer buffer. Transfer was done
running at either 80V for 3 hours or 50V for 14 hour overnight transfer. Filters were
blocked in TBS + 0.1% Tween-20 + 5% nonfat milk. Primary antibodies were incubated in
blocking solution either overnight at 4°C or for two hours at room temperature. Secondary
antibodies were incubated in blocking solution for 1 hour at room temperature. Primary
antibodies were used as follows: E-cadherin, ms (BD Biosciences) 1:1000; Fibronectin, rb
(BD Biosciences) 1:1000; GRHL2, rb (Sigma) 1:1000; β-actin, ms (Millipore) 1:1000;
Secondary antibodies for ECL chemiluminescence were either anti-mouse or anti-rabbit,
conjugated to horse-raddish peroxidase (Bio-Rad) and were used at a 1:3000 dilution.
Western blot membranes were developed using (ECL-West Pico, Pierce).
Statistics
GRHL2 expression data was obtained via NCBI Gene Expression Omnibus (accession
number GSE10885; ref 3) to compare log expression of GRHL2 among tumor types
including normal, luminal, Her2, claudin, and basal in order to develop an appropriate
model system to evaluate. Previous work by our lab showed by Tukey HSD tests which
compared these tumor lines for statistical differences in GRHL2 expression (Cieply et al.,
2012). Any statistical analyses were conducted by R version 2.13.1 (www.r-project.org).
Data for gene expression not shown.
131
Results and Discussion
The Py2T cell line was originally generated by the Christofori laboratory as a model
cell line for examining the effects of EMT due to its ability to undergo EMT in vitro upon
addition of TGF-β, and spontaneously in vivo upon orthotopic injection into the mammary
fat pad (10). This murine breast cancer line thus seemed a model platform for examining
the effects of GRHL2 on EMT in the context of CSC marker enrichment in vitro as well as
sensitivity to chemotherapy, recurrence, and metastasis in vivo. TGF-β induction
resulted in EMT in Py2T cells (figure 1). This EMT was accompanied by a striking
reduction in GRHL2. Analysis of common markers of EMT (E-cadherin and fibronectin)
revealed expected regulation showing downregulation of the epithelial cell-cell junctional
marker E-cadherin as well as upregulation of the mesenchymal marker Fibronectin.
Next, we attempted to overexpress human-GRHL2 in multiple murine cell lines
(figure 2a, b). These results showed that human-GRHL2 protein was not overexpressed by
lenti- or retroviral transduction in mouse cell lines. mRNA analysis by qPCR showed that
human GRHL2 was significantly elevated in 4T1 cells expressing h-GRHL2-MSCV-IRES-
puro, indicating a defect in protein translation (figure 2c). Based on these findings, it was
determined that mouse-Grhl2 would be needed to overexpress Grhl2 protein in murine
models.
Murine Grhl2 was successfully overexpressed in the Py2T C7 mouse breast cancer
cell line (figure 3) in a doxycycline inducible lentiviral vector (pLUT). Overexpression was
confirmed by western blot analysis (figure 3a). However, as was evident by IF analysis, the
resulting population had significant heterogeneity in Grhl2 expression showing strong
nuclear expression in a majority of cells, while others either lacked nuclear localization of
132
Grhl2 or lacked even cytoplasmic expression (data not shown). It has been previously
observed in our laboratory that injection of heterogenous clones results in failure of GRHL2
to prevent tumorigenesis due to tumor initiation from the GRHL2-neg subpopulation.
Analysis of tumors that result shows that cells are devoid of GRHL2 expression indicating
selection for GRHL2 negative cells (data not shown). Based on this, we attempted to
isolate more homogenous expressers of Grhl2 by cloning out individual cell populations.
We isolated a cell population that contained a higher number of Grhl2 positive cells than
the parent population (figure 3b). However, upon treatment with TGF-β, these cells failed
to undergo EMT, regardless of the presence of Grhl2 (figure 4). It was concluded that the
lack of effect of TGF-β was due to overpassaging of the cells or selection against the TGF-β
responsive population during passaging. The cells did form protrusions at the leading edge
of colonies, but this occurred in both + and – GRHL2 cells. In 4T1 murine breast cancer
cells, Grhl2 was insufficient to prevent TGF-β induced EMT (data now shown). In order to
verify that the DOX inducible GRHL2 construct resulted in sufficient GRHL2 induction to
prevent EMT in our previously characterized models, human-GRHL2 pLUT was transduced
into HMLE+Twist-ER cells. The resulting line was confirmed by immunofluorescence to
contain a homogenous, nuclear localized GRHL2 positive population. Simultaneous GRHL2
induction and treatment with 4-hydroxytamoxifen confirmed that GRHL2 overexpression
protects against EMT in the context of activation of the Twist-ER fusion gene (figure 5b).
These results indicate that there may be restricted murine cell line settings in which
perhaps Grhl2 lacks appropriate co-factors required for enforcing the epithelial phenotype.
It was determined that experiments utilizing Grhl2 overexpression in murine models in
order to achieve syngeneic implantation of primary tumors would not be practical.
133
Elucidating the effect of chemotherapy on emergence of recurrent disease in orthotopic
injection of human tumors in immunocompromised NSG mice will be an area of future
research.
Primary mammary tumors induced by doxycycline driven by a tetO-neuNT gene
regress upon doxycycline withdrawal, but recur at a high rate, forming tumors that have an
EMT signature which are no longer reliant on the initiating oncogene (4, 11, 13). While the
primary tumors are epithelial and express high levels of GRHL2, recurrent tumors have
significantly lower expression of this transcription factor and are morphologically
mesenchymal. This is a highly clinical relevant model of disease recurrence in HER2-
positive breast cancer populations whose tumors contain EMT-like subpopulations
conferring resistance to targeted therapies such as trastuzumab (5), resulting in emergence
of treatment resistance recurrent disease. We tested the supposition that enforced Grhl2
expression in this murine model would prevent recurrence of oncogene-independent EMT-
like tumors. GRHL2 positivity in GRHL2-transgenic mice was confirmed by genotyping
using Taqman expression array designed to amplify exogenous GRHL2-flag (figure 6a).
GRHL2-MMTV expression was confirmed in mammary tissue of founder pups by qPCR
using trans-exonic primers to identify exogenous GRHL2 only (figure 6b). We induced 6
week old transgenic mice (tetO-neuNT/tetO-rtTA with GRHL2 transgene or littermate
negative controls) to drive the development of the primary tumor. Following withdrawal
of doxycycline, tumors regressed rapidly within around 17 days. The tumors recurred at
varying times such that 5 out of 17 control mice (29.4%) developed recurrences while 0
out of 13 Grhl2-positive mice developed recurrent tumors (0%) (figure 7). These tumors
were verified to be EMT-like and have lost GRHL2 expression in the control tumor (figure
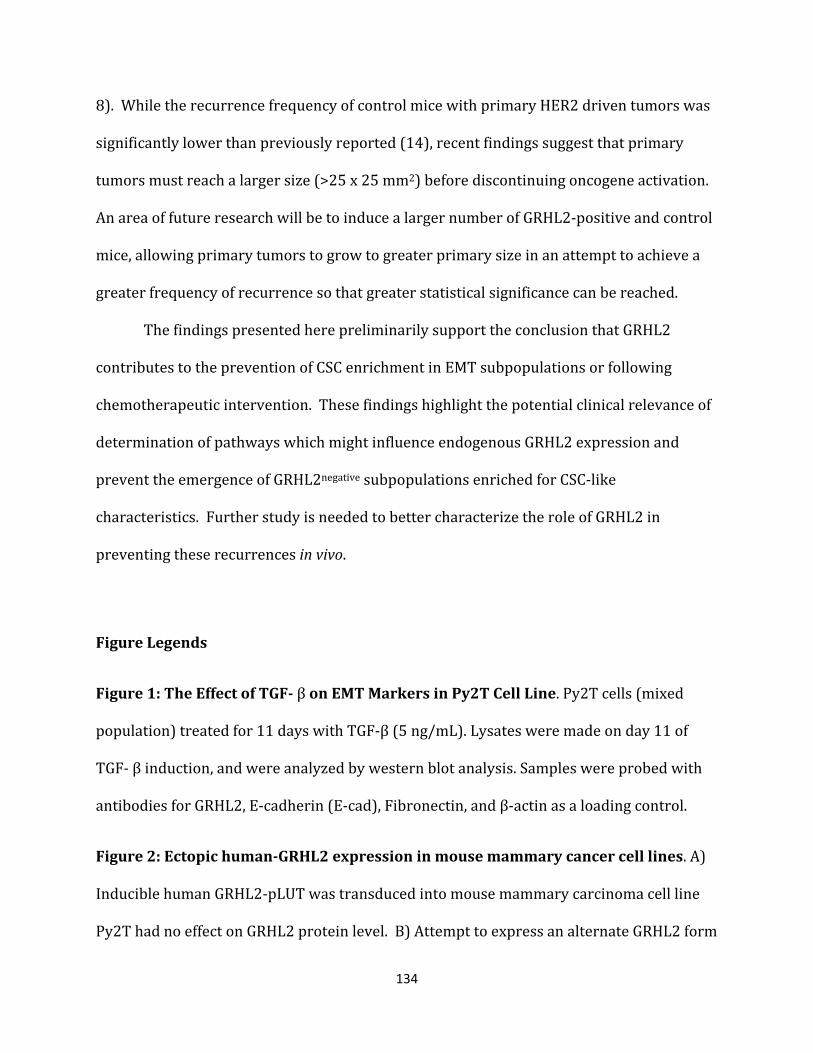
134
8). While the recurrence frequency of control mice with primary HER2 driven tumors was
significantly lower than previously reported (14), recent findings suggest that primary
tumors must reach a larger size (>25 x 25 mm2) before discontinuing oncogene activation.
An area of future research will be to induce a larger number of GRHL2-positive and control
mice, allowing primary tumors to grow to greater primary size in an attempt to achieve a
greater frequency of recurrence so that greater statistical significance can be reached.
The findings presented here preliminarily support the conclusion that GRHL2
contributes to the prevention of CSC enrichment in EMT subpopulations or following
chemotherapeutic intervention. These findings highlight the potential clinical relevance of
determination of pathways which might influence endogenous GRHL2 expression and
prevent the emergence of GRHL2negative subpopulations enriched for CSC-like
characteristics. Further study is needed to better characterize the role of GRHL2 in
preventing these recurrences in vivo.
Figure Legends
Figure 1: The Effect of TGF- β on EMT Markers in Py2T Cell Line. Py2T cells (mixed
population) treated for 11 days with TGF-β (5 ng/mL). Lysates were made on day 11 of
TGF- β induction, and were analyzed by western blot analysis. Samples were probed with
antibodies for GRHL2, E-cadherin (E-cad), Fibronectin, and β-actin as a loading control.
Figure 2: Ectopic human-GRHL2 expression in mouse mammary cancer cell lines. A)
Inducible human GRHL2-pLUT was transduced into mouse mammary carcinoma cell line
Py2T had no effect on GRHL2 protein level. B) Attempt to express an alternate GRHL2 form
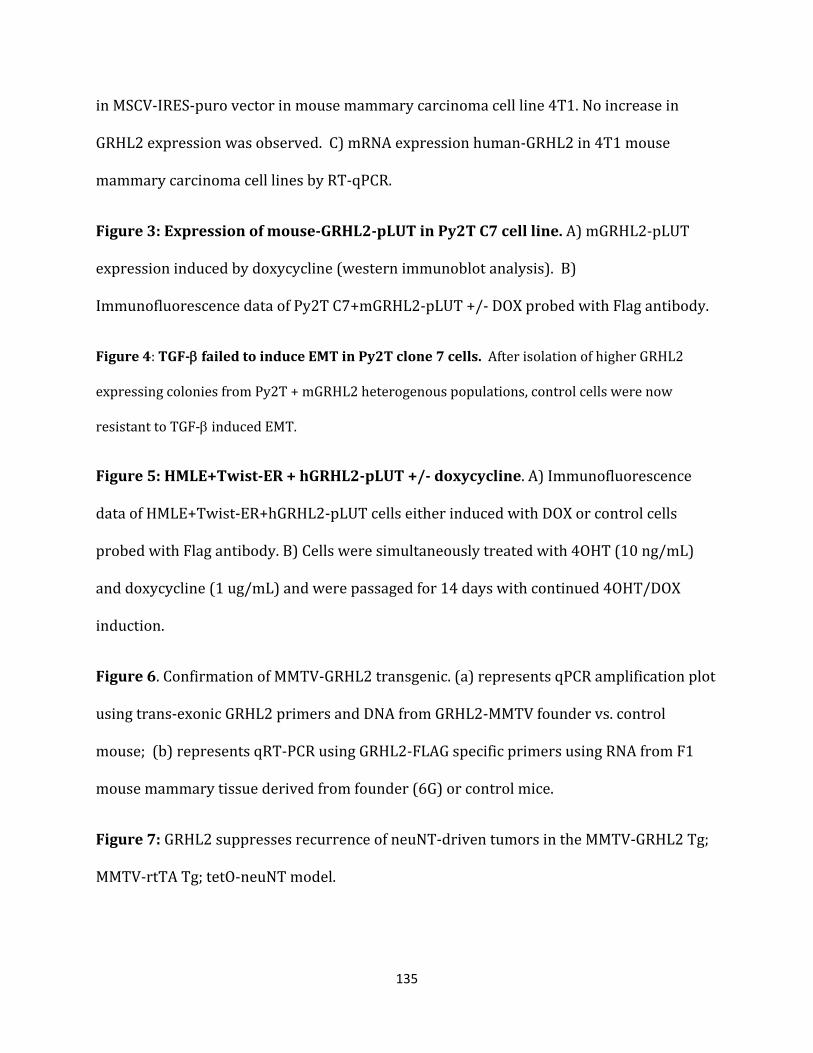
135
in MSCV-IRES-puro vector in mouse mammary carcinoma cell line 4T1. No increase in
GRHL2 expression was observed. C) mRNA expression human-GRHL2 in 4T1 mouse
mammary carcinoma cell lines by RT-qPCR.
Figure 3: Expression of mouse-GRHL2-pLUT in Py2T C7 cell line. A) mGRHL2-pLUT
expression induced by doxycycline (western immunoblot analysis). B)
Immunofluorescence data of Py2T C7+mGRHL2-pLUT +/- DOX probed with Flag antibody.
Figure 4: TGF-β failed to induce EMT in Py2T clone 7 cells. After isolation of higher GRHL2
expressing colonies from Py2T + mGRHL2 heterogenous populations, control cells were now
resistant to TGF-β induced EMT.
Figure 5: HMLE+Twist-ER + hGRHL2-pLUT +/- doxycycline. A) Immunofluorescence
data of HMLE+Twist-ER+hGRHL2-pLUT cells either induced with DOX or control cells
probed with Flag antibody. B) Cells were simultaneously treated with 4OHT (10 ng/mL)
and doxycycline (1 ug/mL) and were passaged for 14 days with continued 4OHT/DOX
induction.
Figure 6. Confirmation of MMTV-GRHL2 transgenic. (a) represents qPCR amplification plot
using trans-exonic GRHL2 primers and DNA from GRHL2-MMTV founder vs. control
mouse; (b) represents qRT-PCR using GRHL2-FLAG specific primers using RNA from F1
mouse mammary tissue derived from founder (6G) or control mice.
Figure 7: GRHL2 suppresses recurrence of neuNT-driven tumors in the MMTV-GRHL2 Tg;
MMTV-rtTA Tg; tetO-neuNT model.
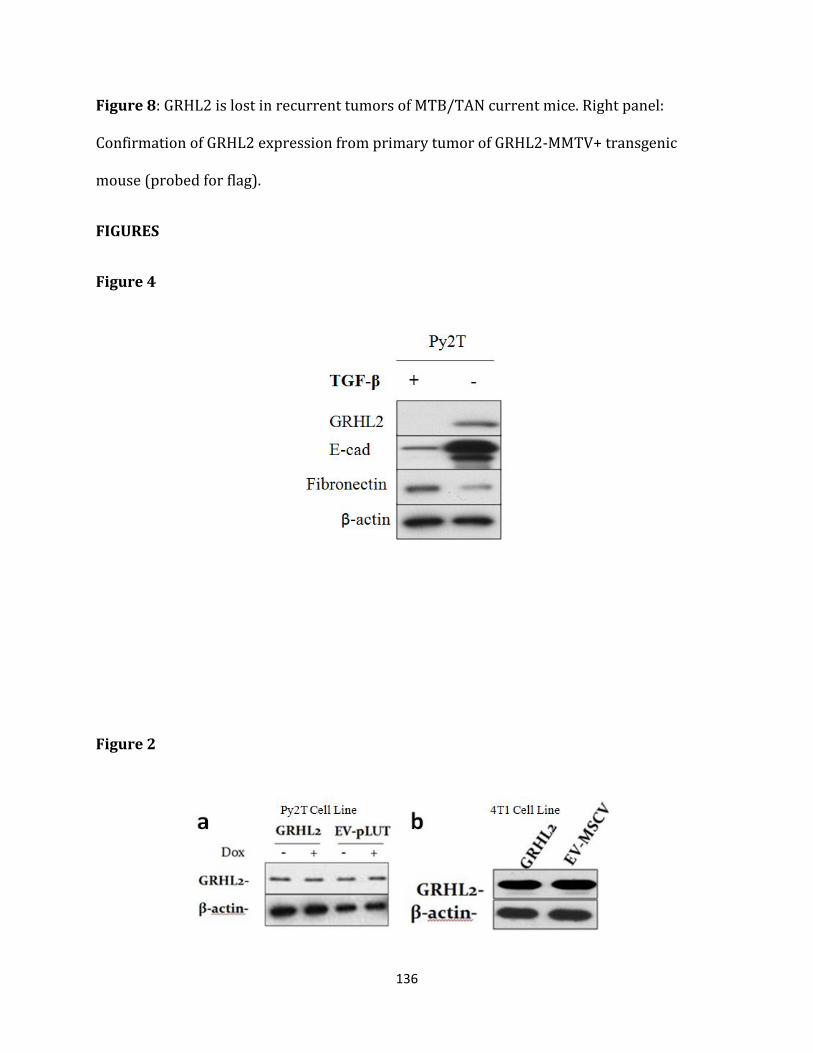
136
Figure 8: GRHL2 is lost in recurrent tumors of MTB/TAN current mice. Right panel:
Confirmation of GRHL2 expression from primary tumor of GRHL2-MMTV+ transgenic
mouse (probed for flag).
FIGURES
Figure 4
Figure 2
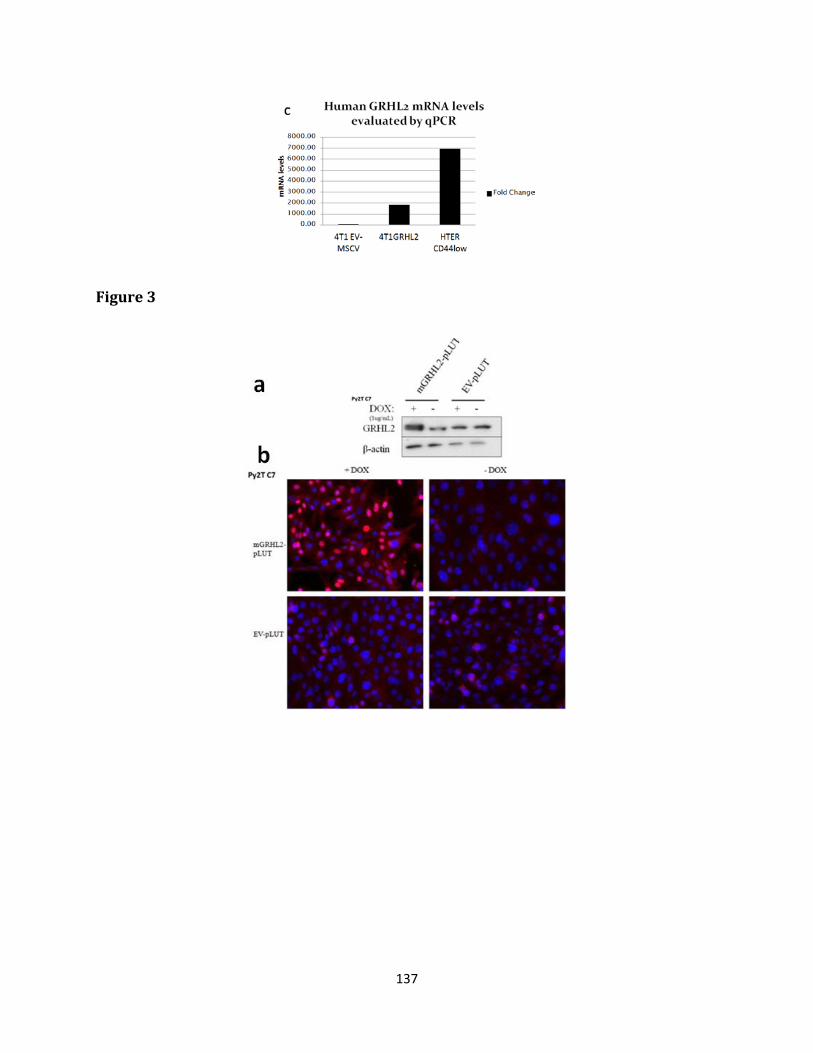
137
Figure 3
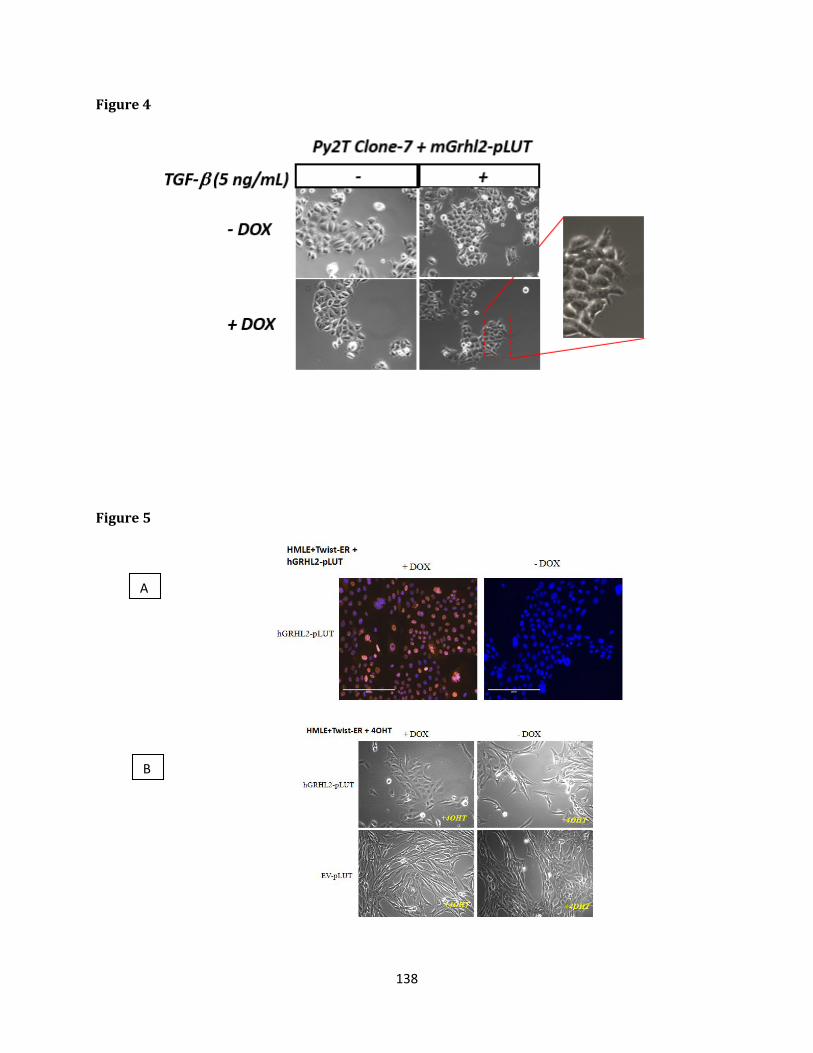
138
Figure 4
Figure 5
A
B
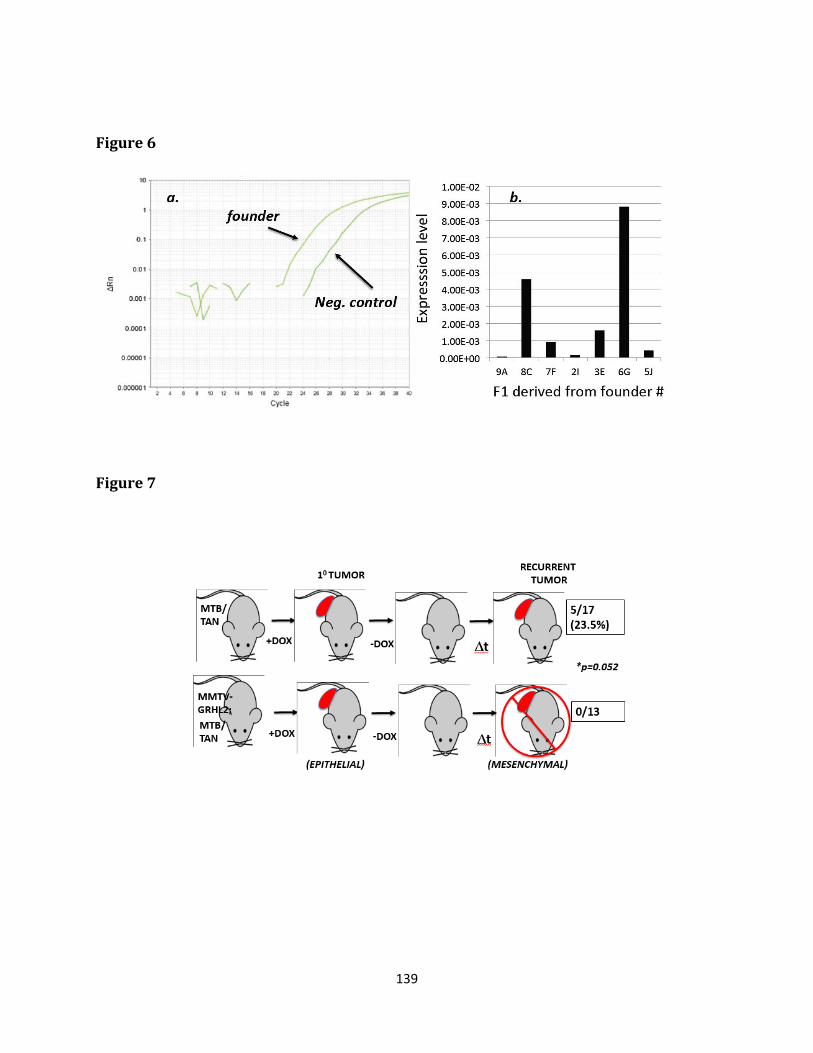
139
Figure 6
Figure 7
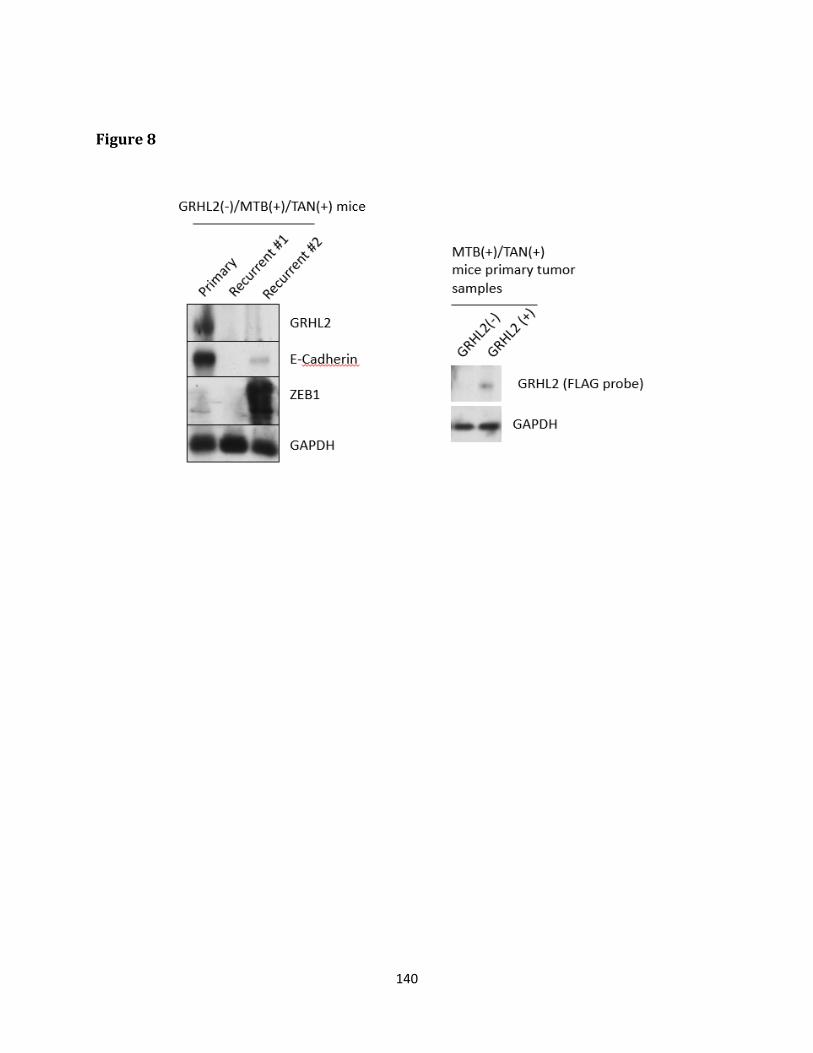
140
Figure 8
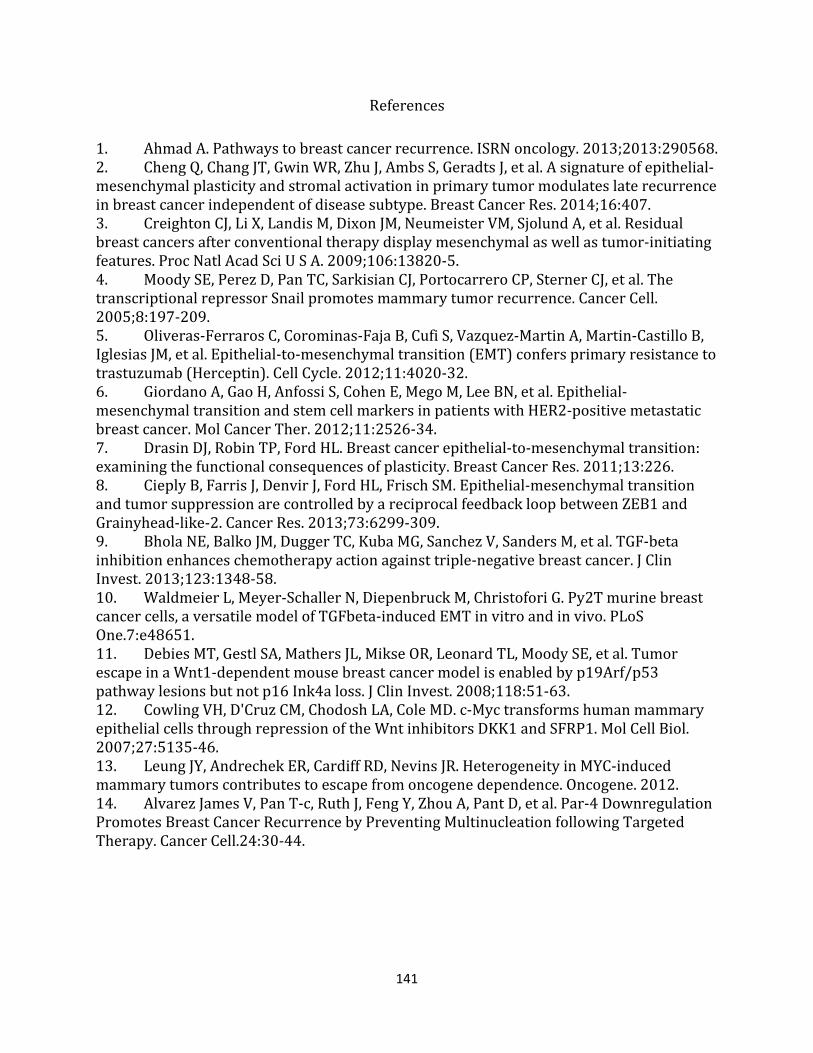
141
References
1. Ahmad A. Pathways to breast cancer recurrence. ISRN oncology. 2013;2013:290568. 2. Cheng Q, Chang JT, Gwin WR, Zhu J, Ambs S, Geradts J, et al. A signature of epithelial-mesenchymal plasticity and stromal activation in primary tumor modulates late recurrence in breast cancer independent of disease subtype. Breast Cancer Res. 2014;16:407. 3. Creighton CJ, Li X, Landis M, Dixon JM, Neumeister VM, Sjolund A, et al. Residual breast cancers after conventional therapy display mesenchymal as well as tumor-initiating features. Proc Natl Acad Sci U S A. 2009;106:13820-5. 4. Moody SE, Perez D, Pan TC, Sarkisian CJ, Portocarrero CP, Sterner CJ, et al. The transcriptional repressor Snail promotes mammary tumor recurrence. Cancer Cell. 2005;8:197-209. 5. Oliveras-Ferraros C, Corominas-Faja B, Cufi S, Vazquez-Martin A, Martin-Castillo B, Iglesias JM, et al. Epithelial-to-mesenchymal transition (EMT) confers primary resistance to trastuzumab (Herceptin). Cell Cycle. 2012;11:4020-32. 6. Giordano A, Gao H, Anfossi S, Cohen E, Mego M, Lee BN, et al. Epithelial-mesenchymal transition and stem cell markers in patients with HER2-positive metastatic breast cancer. Mol Cancer Ther. 2012;11:2526-34. 7. Drasin DJ, Robin TP, Ford HL. Breast cancer epithelial-to-mesenchymal transition: examining the functional consequences of plasticity. Breast Cancer Res. 2011;13:226. 8. Cieply B, Farris J, Denvir J, Ford HL, Frisch SM. Epithelial-mesenchymal transition and tumor suppression are controlled by a reciprocal feedback loop between ZEB1 and Grainyhead-like-2. Cancer Res. 2013;73:6299-309. 9. Bhola NE, Balko JM, Dugger TC, Kuba MG, Sanchez V, Sanders M, et al. TGF-beta inhibition enhances chemotherapy action against triple-negative breast cancer. J Clin Invest. 2013;123:1348-58. 10. Waldmeier L, Meyer-Schaller N, Diepenbruck M, Christofori G. Py2T murine breast cancer cells, a versatile model of TGFbeta-induced EMT in vitro and in vivo. PLoS One.7:e48651. 11. Debies MT, Gestl SA, Mathers JL, Mikse OR, Leonard TL, Moody SE, et al. Tumor escape in a Wnt1-dependent mouse breast cancer model is enabled by p19Arf/p53 pathway lesions but not p16 Ink4a loss. J Clin Invest. 2008;118:51-63. 12. Cowling VH, D'Cruz CM, Chodosh LA, Cole MD. c-Myc transforms human mammary epithelial cells through repression of the Wnt inhibitors DKK1 and SFRP1. Mol Cell Biol. 2007;27:5135-46. 13. Leung JY, Andrechek ER, Cardiff RD, Nevins JR. Heterogeneity in MYC-induced mammary tumors contributes to escape from oncogene dependence. Oncogene. 2012. 14. Alvarez James V, Pan T-c, Ruth J, Feng Y, Zhou A, Pant D, et al. Par-4 Downregulation Promotes Breast Cancer Recurrence by Preventing Multinucleation following Targeted Therapy. Cancer Cell.24:30-44.
142
Chapter 4
EMT ROS Mechanisms: A brief description of the NOX complex and FAT cadherins
The following represents unpublished data.
143
Overview and Preliminary Findings
As discussed extensively in Chapter 2, GRHL2 overexpression alters the ROS, ATP,
and mitochondrial membrane potential in MSP cells. In order to characterize the specific
mechanism by which GRHL2 promotes anoikis and generates ROS in our model system, we
analyzed the expression of specific genes involved in ROS scavenging, mitochondrial
metabolism, NADPH oxidase (NOX) complex genes, as well as FAT atypical cadherin proteins.
ROS generation is known to paradoxically accompany hypoxia, a factor commonly resulting
from and influencing the poorly vascularized portions of tumors, which stabilizes HIF1α (1).
HIF1α is thought to contribute to the induction of EMT through upregulation of several EMT
associated transcription factors (e.g., ZEB1, Twist, and Snail) (2, 3). HIF1α transcriptional
activity can serve to ameliorate ROS through upregulation of antioxidant response genes (1).
The NADPH oxidase complex is made up of multiple isoforms which are differentially
expressed in a variety of tissues. The catalytic subunit, NOX, found in the plasma membrane,
binds to its dimeric partner p22phox, resulting in the assembly of several cytoplasmic
regulatory factors such as p67phox and p47phox, which are responsible for generation of a ROS
burst, commonly occurring in the setting of immune function (4, 5). The potential
contribution of the NADPH oxidase complex to tumorigenesis has even been linked to a
specific role in EMT regulation of the NOX complex through Rac1b (5).
Another emerging mechanism of ROS production and metabolic control relates to the
FAT atypical cadherin protein family. FAT cadherins are enormous cell adhesion molecules
(>500 kDa) which have been demonstrated to play a critical role in regulation of planar cell
polarity (PCP) as well as Hippo pathways for tissue organization and organ size regulation
respectively (6, 7). It was recently shown by Sing et al that in Drosophila, the mitochondrial
144
electron transport chain relies critically on an imported intracellular cleaved peptide
originating from FAT protein (termed FtMito) which localizes to the mitochondria to stabilize
the holoenyzme NADPH dehydrogenase ubiquinone flavoprotein (Ndufv2), a core
component of complex I, which results in increased mitochondrial function, and
interestingly, decreases production of reactive oxygen species (8). FAT4 is the most closely
related human homologue of drosophila FAT protein (9). Recent evidence has indicated that
FAT4 protein expression is significantly upregulated in human triple-negative breast cancer
(9), specifically in the claudin low subclass in which GRHL2 expression is lost (10). The role
of antioxidant gene expression, NOX complex activation, and FAT protein on ROS as well as
the involvement of GRHL2 in regulating these pathways was explored here.
Preliminary evidence indicates that differential antioxidant gene expression, the NOX
complex, and/or FAT atypical cadherins may play specific roles in the resistance to anoikis
seen in MSP cells. Suppression of reactive oxygen species using pharmacological ROS
scavengers protects cells from anoikis (refer to Chapter 2 published manuscript). Before
discovering the regulation GLUD1 by GRHL2, we first reasoned that if EMT or GRHL2
expression leads to altered antioxidant gene expression, as is known to accompany EMT, this
may explain why ROS is significantly different between HMLE and MSP cells. While we
confirmed that overexpression of SOD2 (mitochondrial isoform of superoxide dismutase)
did somewhat decrease sensitivity to anoikis in HMLE cells, we found that this effect was
very minor (figure 1). Also, we were also able to confirm that several antioxidant genes are
upregulated during EMT including catalase, SOD2, and NQO1, which were upregulated in
MSP cells relative to HMLE cells (Figure 2). We further confirmed protein upregulation in
MSP cells of both catalase, SOD2, and HIF1α by western blot analysis (figure 2). However,
145
these proteins were not downregulated following GRHL2 re-expression (data note shown).
This indicated that while EMT may upregulate antioxidant response elements to ameliorate
ROS accumulation which may occur in their microenvironments, this was likely not the
mechanism by which GRHL2 increases ROS.
Through analysis of publicly available microarray data (11), we have discovered that
multiple important components of both the NADPH oxidase as well as the atypical cadherin
FAT protein family are differentially expressed in MSP relative to HMLE cells.
Overexpression of GRHL2 significantly upregulates a major cytoplasmic binding partner of
NOX involved in producing ROS bursts known as p67phox (figure 3), but does not appear to
significantly regulate p22phox, or any of the catalytic NOX isoforms analyzed (data not
shown). Further, stable knockdown of GRHL2 resulted in decreased expression of the
cytoplasmic regulator of the NOX complex. We reasoned that if alternate regulation of one
of the major components of the NOX complex in cells which have undergone EMT or GRHL2
induced MET contributes to ROS bursts in suspended culture, this might elucidate the
mechanism of GRHL2 induced ROS accumulation. However, we found that transient
depletion of neither p22phox nor p67phox by siRNA transfection had any significant protective
effect on anoikis (figure 4) and did not alter the ROS observed in our system (data not
shown). The primary assay used in ROS determination was CM-H2DCFDA which is a
fluorescent probe for general ROS, being most sensitive to cellular hydrogen peroxide. We
later conducted assays to determine the precise ROS species being overproduced in our
model which we determined to be predominantly hydrogen peroxide (H2O2) (see Chapter
2). Since ROS produced via the NADPH oxidase system is predominantly that of superoxide
(O2.-), which was in fact elevated in MSP cells relative to HMLE cells (reflective of their
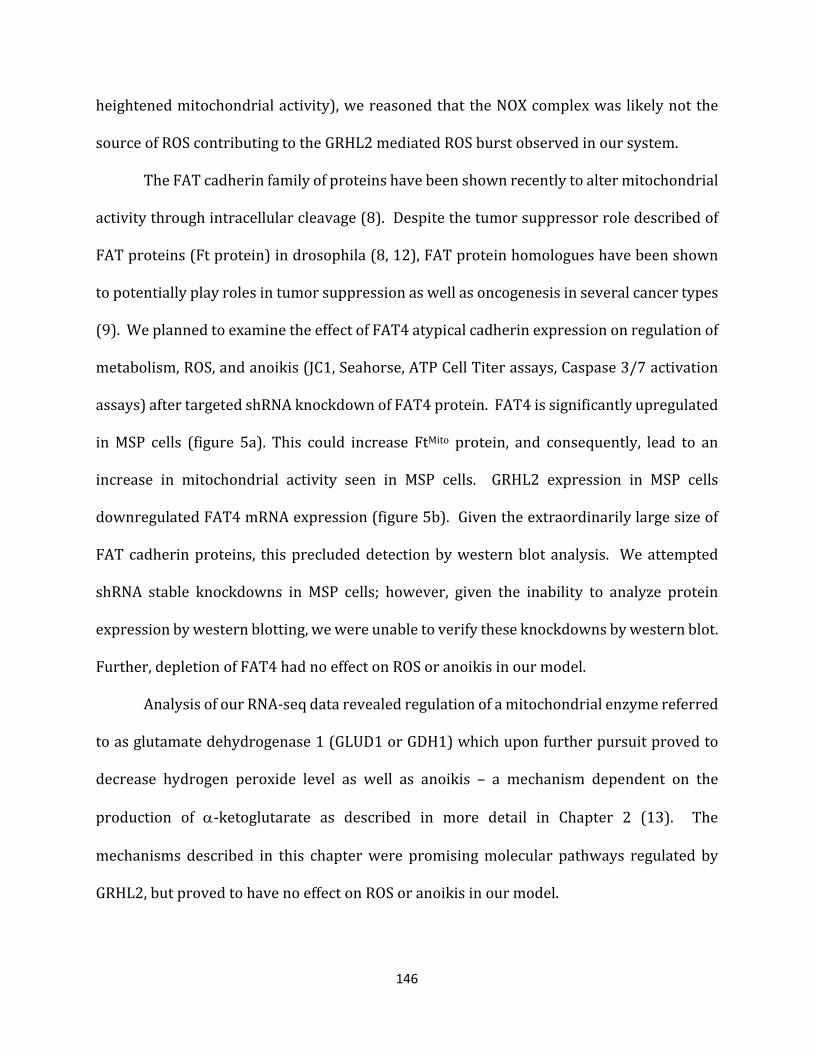
146
heightened mitochondrial activity), we reasoned that the NOX complex was likely not the
source of ROS contributing to the GRHL2 mediated ROS burst observed in our system.
The FAT cadherin family of proteins have been shown recently to alter mitochondrial
activity through intracellular cleavage (8). Despite the tumor suppressor role described of
FAT proteins (Ft protein) in drosophila (8, 12), FAT protein homologues have been shown
to potentially play roles in tumor suppression as well as oncogenesis in several cancer types
(9). We planned to examine the effect of FAT4 atypical cadherin expression on regulation of
metabolism, ROS, and anoikis (JC1, Seahorse, ATP Cell Titer assays, Caspase 3/7 activation
assays) after targeted shRNA knockdown of FAT4 protein. FAT4 is significantly upregulated
in MSP cells (figure 5a). This could increase FtMito protein, and consequently, lead to an
increase in mitochondrial activity seen in MSP cells. GRHL2 expression in MSP cells
downregulated FAT4 mRNA expression (figure 5b). Given the extraordinarily large size of
FAT cadherin proteins, this precluded detection by western blot analysis. We attempted
shRNA stable knockdowns in MSP cells; however, given the inability to analyze protein
expression by western blotting, we were unable to verify these knockdowns by western blot.
Further, depletion of FAT4 had no effect on ROS or anoikis in our model.
Analysis of our RNA-seq data revealed regulation of a mitochondrial enzyme referred
to as glutamate dehydrogenase 1 (GLUD1 or GDH1) which upon further pursuit proved to
decrease hydrogen peroxide level as well as anoikis – a mechanism dependent on the
production of α-ketoglutarate as described in more detail in Chapter 2 (13). The
mechanisms described in this chapter were promising molecular pathways regulated by
GRHL2, but proved to have no effect on ROS or anoikis in our model.
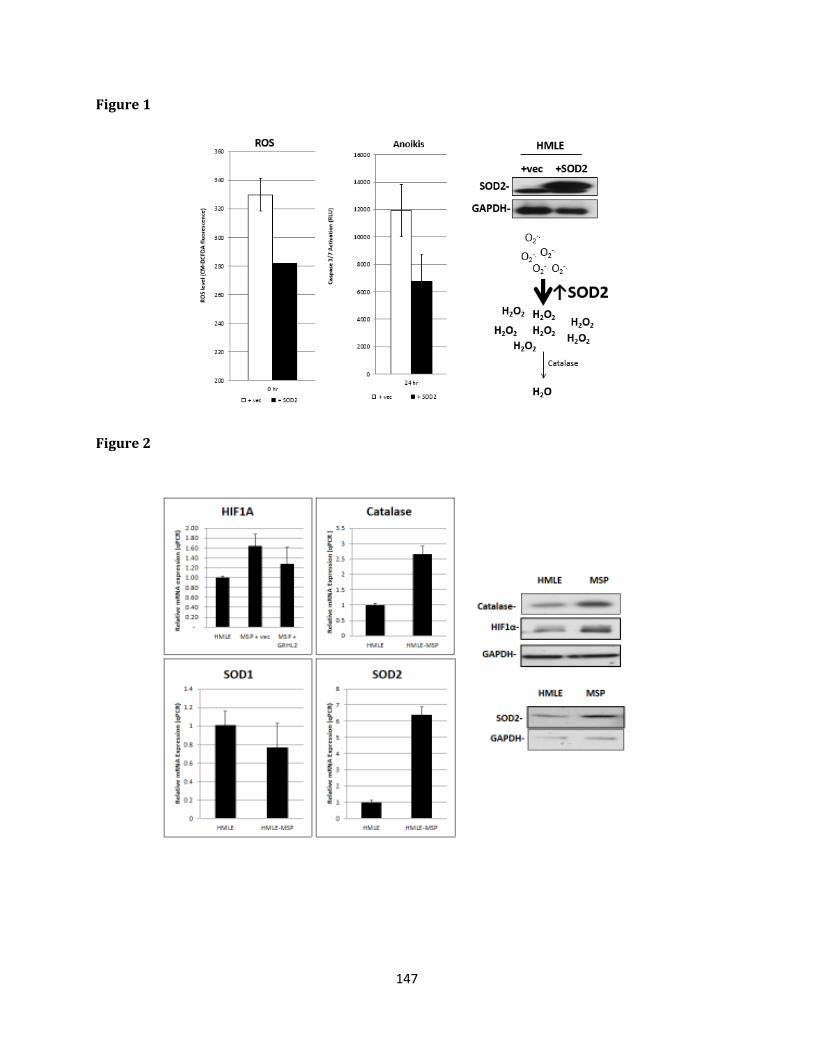
147
Figure 1
Figure 2
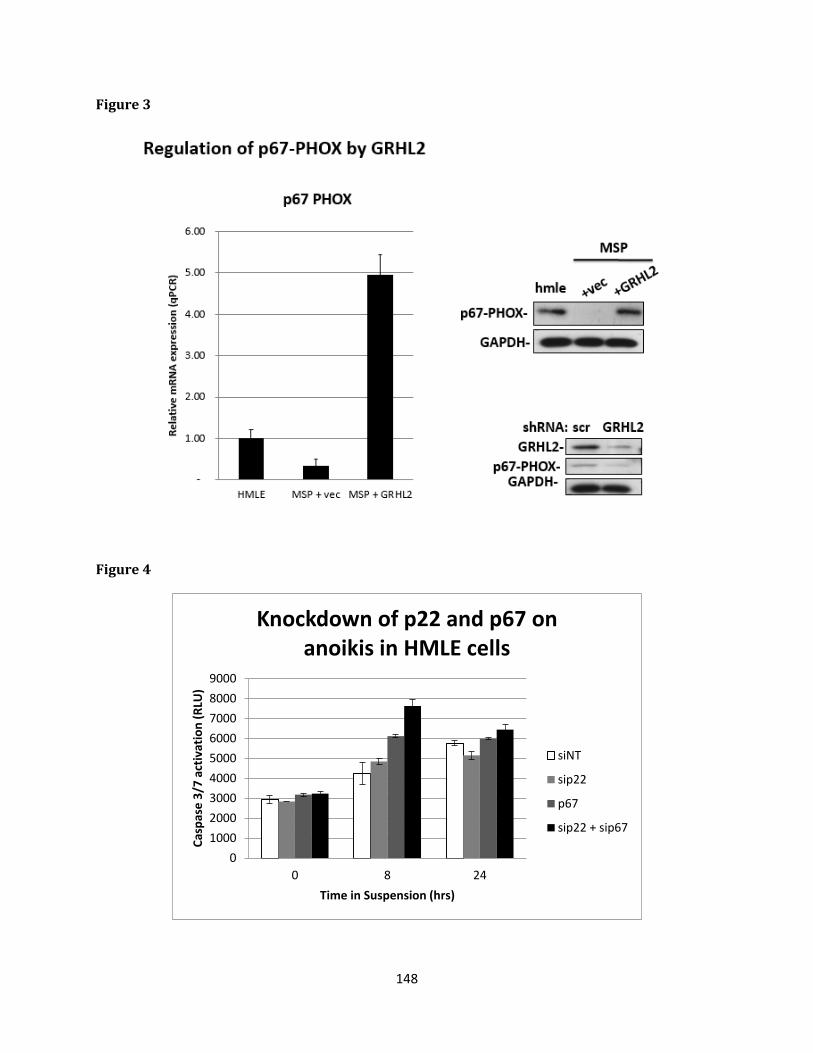
148
Figure 3
Figure 4
0100020003000400050006000700080009000
0 8 24
Casp
ase
3/7
activ
atio
n (R
LU)
Time in Suspension (hrs)
Knockdown of p22 and p67 on anoikis in HMLE cells
siNT
sip22
p67
sip22 + sip67
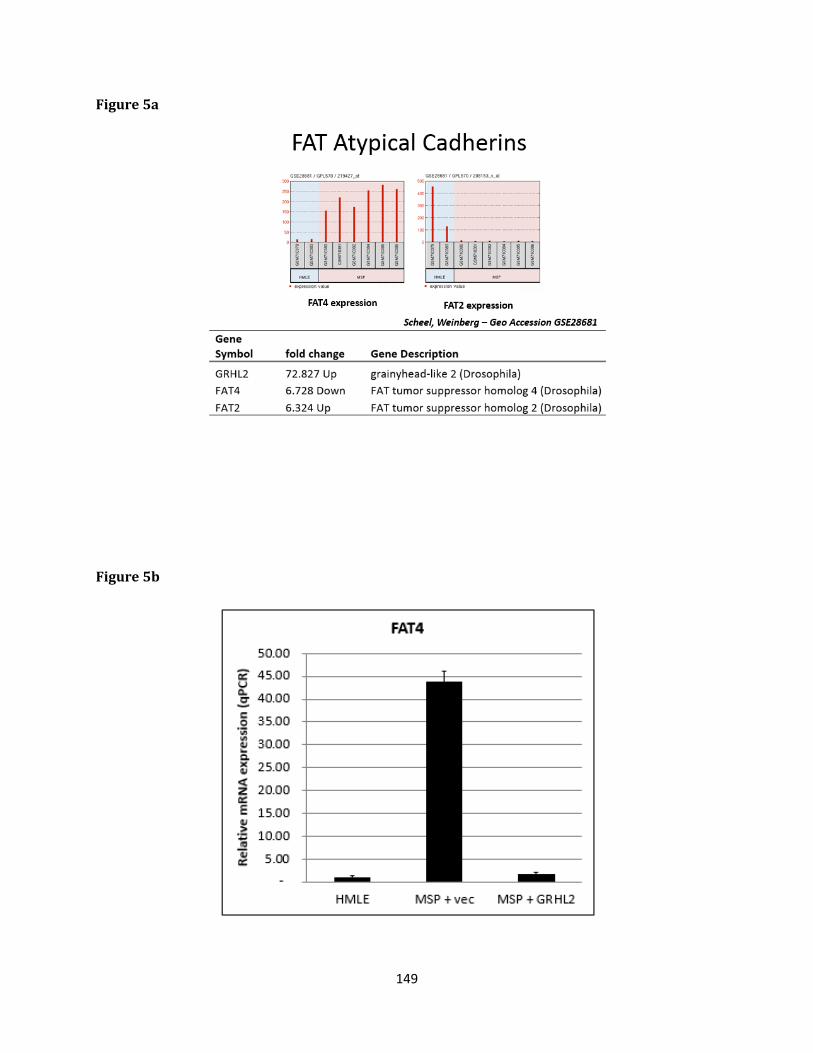
149
Figure 5a
Figure 5b
150
References
1. Buchheit CL, Weigel KJ, Schafer ZT. Cancer cell survival during detachment from the ECM: multiple barriers to tumour progression. Nat Rev Cancer. 2014;14:632-41. 2. Du J, Sun B, Zhao X, Gu Q, Dong X, Mo J, et al. Hypoxia promotes vasculogenic mimicry formation by inducing epithelial-mesenchymal transition in ovarian carcinoma. Gynecol Oncol. 2014;133:575-83. 3. Haase VH. Oxygen regulates epithelial-to-mesenchymal transition: insights into molecular mechanisms and relevance to disease. Kidney Int. 2009;76:492-9. 4. Lambeth JD, Neish AS. Nox enzymes and new thinking on reactive oxygen: a double-edged sword revisited. Annu Rev Pathol. 2014;9:119-45. 5. Lee K, Chen QK, Lui C, Cichon MA, Radisky DC, Nelson CM. Matrix compliance regulates Rac1b localization, NADPH oxidase assembly, and epithelial-mesenchymal transition. Mol Biol Cell. 2012;23:4097-108. 6. Sharma P, McNeill H. Regulation of long-range planar cell polarity by Fat-Dachsous signaling. Development. 2013;140:3869-81. 7. Matis M, Axelrod JD. Regulation of PCP by the Fat signaling pathway. Genes & Development. 2013;27:2207-20. 8. Sing A, Tsatskis Y, Fabian L, Hester I, Rosenfeld R, Serricchio M, et al. The atypical cadherin fat directly regulates mitochondrial function and metabolic state. Cell. 2014;158:1293-308. 9. Sadeqzadeh E, de Bock CE, Thorne RF. Sleeping giants: emerging roles for the fat cadherins in health and disease. Med Res Rev. 2014;34:190-221. 10. Cieply B, Riley Pt, Pifer PM, Widmeyer J, Addison JB, Ivanov AV, et al. Suppression of the Epithelial-Mesenchymal Transition by Grainyhead-like-2. Cancer Res. 2012;72:2440-53. 11. Scheel C, Eaton EN, Li SH, Chaffer CL, Reinhardt F, Kah KJ, et al. Paracrine and autocrine signals induce and maintain mesenchymal and stem cell states in the breast. Cell. 2011;145:926-40. 12. Katoh M. Function and cancer genomics of FAT family genes (review). Int J Oncol. 2012;41:1913-8. 13. Farris JC, Pifer PM, Zheng L, Gottlieb E, Denvir J, Frisch SM. Grainyhead-like 2 Reverses the Metabolic Changes Induced by the Oncogenic Epithelial-mesenchymal Transition: Effects on Anoikis. Molecular Cancer Research. 2016.

151
Chapter 5
The Role of Tubulins in Regulation
of Anoikis through Mitochondria
The following represents unpublished data which reflected our views of ROS mechanisms and contributions to anoikis at the time. Since these observations were made, our views on the links between ROS, metabolism, and anoikis have been updated by more recent findings (see Chapter 2).
152
Introduction
Detachment from extracellular matrix induces an apoptotic program or non-
apoptotic cell death process collectively called “anoikis” (1). For a more complete
review of this topic, refer to Chapter 1. The anoikis response is compromised in cells
that undergo the oncogenic Epithelial-Mesenchymal Transition (EMT), facilitating
tumor metastasis. Tumor metastasis is critically dependent upon mechanisms that
allow tumor cells to evade anoikis, such as EMT (2-5). The basic mechanisms of
anoikis regulation are critical to our understanding and therapeutic development,
and while the core machinery influencing anoikis is identical to that of apoptosis,
much is unknown regarding the aberrant activation of pathways allowing
mesenchymal cells to escape this process.
Many signaling mechanisms are engaged in the activation of the anoikis
response of normal epithelial cells, a subset of which are clearly defective in tumors,
a result of epigenetic, genetic or other modifications. These findings have been
demonstrated in tissue culture as well as animal models of metastatic tumor
progression (3-5). Other matrix-dependent cell death events likely closely related
to anoikis, but non-apoptotic (caspase-independent) in nature, have been
demonstrated as well (“metabolic cell death”) (6, 7).
Both caspase-dependent and caspase-independent forms of anoikis are
critically regulated through cellular metabolic pathways (6, 7). These effects may be
the result of ATP depletion and/or excessive generation of reactive oxygen species
(ROS). For example, the three-dimensional acinar morphogenesis of MCF10a cells in
153
matrigel, imitating terminal end bud clearance in vivo, relies on both caspase-
dependent and caspase–independent processes. The latter is likely the result of
inhibition of glucose transport due to sequestration of transporters, and partly
because fatty acid oxidation (FAO), which generally acts as a backup for ATP
maintenance when carbohydrate sources are lacking—is inhibited by ROS. In this
context, ROS accumulates to high levels due to lack of pentose phosphate pathway
input, which then fails to produce NADPH reducing equivalents. ErbB2 specifically,
has been reported to rescue these phenotypes, protecting from anoikis (8). The early
events connecting cytoskeletal changes to these downstream effects are not yet
understood, however.
For an indepth discussion of ROS, its cellular sources, reactivity, and
consequences, refer to the Reactive Oxygen Species section of Chapter 1. Under
normal conditions, ROS is generated in the process of normal mitochondrial function
as electrons are shunted directly to oxygen from components of the electron
transport chain during oxidative phosphorylation. ROS levels have been shown to
increase dramatically in detached cells (8). This suggests that suppression of ROS in
detached cells could be a means of anoikis evasion for tumor cells. For example, in
detached cells, pyruvate dehydrogenase kinase 4 (PDK4) is upregulated, inactivating
pyruvate dehydrogenase (PDH) and attenuating mitochondrial oxidative
phosphorylation; further, experimental depletion of PDK4 stimulates ox-phos, ROS
production, and promotes anoikis (9). Many tumor cells have been observed to over-
express antioxidant enzymes, resulting in ROS neutralization in detached cells,
154
rescuing these cells from anoikis (10). These observations powerfully demonstrate
the pro-anoikis effect of ROS.
Integrin engagement results in basal stimulation of ROS at least in attached
cells, permitting anoikis resistance, through the ubiquitous increase of tyrosine
phoshorylation (including Src) due to tyrosine phosphatase’s exquisite sensitivity to
inactivation by ROS (11). In summary, mitochondrial oxidative phosphorylation
affects anoikis, both of caspase-dependent and –independent types, through both ATP
(protective) and ROS (protective or promoting, depending upon context). The precise
mechanisms by which cells generate ROS and maintain energy charge is unclear and
requires further examination.
Voltage Dependent Anion Channels (VDAC1-3) transport ADP, ATP, NAD(H)
and various metabolic intermediates across the outer mitochondrial membrane
(MOM), thereby regulating metabolic flux of the mitochondria, earning them the title
of “governators” of metabolism (12). VDACs are the most abundant channel of the
mitochondrial outer membrane. At low transmembrane voltage, VDACs are fully
open to anion transport. They are closed to anions/selective for cations at higher
voltages. VDAC greatly affects ∆ψ (mitochondrial outer membrane potential) (13)
which affects ATP, ROS generation, and may even be part of the MPT (mitochondrial
permeability transition) pore, although this idea is somewhat controversial and
evidence for this idea is not uniformly expressed in the literature (14).
Importantly, VDACs are regulated by several signaling inputs, including
protein kinase A (PKA) or GSK-3β (which phosphorylate VDACs), or via direct
interactions with Bcl-2 protein, hexokinases, or free tubulin dimers (12, 15, 16).
155
Phosphorylation of the VDAC channel itself occurs on the “cis” (cytosolic) side of the
channel by kinases such as GSK3β and PKA, activities of which have been reported to
be altered during suspension (17, 18). This phosphorylation greatly (by orders of
magnitude) affects the sensitivity of VDAC to tubulin dimers, which affects their
propensity to close. Given their dramatic effects on mitochondrial metabolism, which
may affect ATP and ROS level, VDACs affect cell survival vs. apoptosis cell fate
decisions (19).
In fact, VDACs control cell survival in a number of settings. Persistent closure
of VDAC has been shown to compromise the integrity of the outer mitochondrial
membrane, leading to cytochrome c release and apoptosome-mediated apoptosis (20,
21). There are multiple methods of VDAC modulation to simulate physiological
opening or closing of VDAC channels. A VDAC-specific compound, erastin, induces
non-apoptotic cell death specifically in Ras-transformed cell lines via VDAC-2 and
VDAC-3 inhibition (22). Conversely, a bacterial pillus protein, FimA, enters host cells,
where it binds and stabilizes the fully open, hexokinase-interacting conformation of
VDACs, resulting in protection of host cells against apoptosis (23). Opening and
closure of VDAC clearly is more complicated in its regulation of cell survival as in
other contexts, opening of VDACs can trigger apoptosis (24).
Microtubules make up the internal structure of both cilia and flagella, form the
framework for secretory vesicles, and organelles. They play a major role in mitosis
during cytokinesis. Microtubules shift back and forth between soluble and insoluble
pools rapidly, free dimer and microtubule polymers respectively. α and β tubulin
dimers, but not microtubules, interact with the VDACs, stabilizing the closed
156
conformation of the membrane channel. This interaction occurs through the C-
terminal tail of tubulin, which is extensively modified (15). Heterodimers combine to
form rows of protofilaments, which then make up microtubules. These microtubules
are the basis of cell shape and movement. Under stable conditions, heterodimers
attach to both ends of microtubules, thereby increasing microtubule length.
Destabilization of microtubules causes a greater loss of tubulin dimers from the
microtubules, leading to a higher concentration of free dimers.
In vivo, pharmacologic agents which act by stabilizing microtubules (e.g.,
paclitaxel) decrease free tubulin levels, which increases mitochondrial membrane
potential. Conversely, drugs which destabilize microtubules (e.g., nocodazole),
increase free tubulin dimers, decreasing mitochondrial membrane potential (25).
The free to polymerized tubulin ratio may act as a metabolic programmer of
mitochondrial function through regulation of VDAC channels (12). The role of tubulin
may be rationalized because non-polymerized free tubulin, which tends to be
elevated in cancer cells (e.g., potentially due to the overexpression of stathmin/Op18
in some contexts, a microtubule-destabilizing factor), may aid in the maintenance of
the glycolytic phenotype, maintaining the Warburg effect. Mechanistically, Op18
binds two molecules of αβ dimers into a T2S complex which it sequesters away from
the polymerized pool of tubulin, thus decreasing microtubules and increasing free
tubulin (26). Physiologically, Op18 protein aids in rapid dissociation of microtubules
to allow better control of microtubule-tubulin dynamics during processes like
chromosome segregation in mitosis. Patient data suggests that Op18 (which is
157
expressed in various subtypes of breast cancer and several other malignancies)
negatively impacts response to microtubule targeting drugs.
Most studies have focused on cell death in the context of matrix detachment
related to alteration of signaling pathways regulated through cell-cell adhesion
molecules and integrins that are transduced by the actin cytoskeleton. An area of
increasing research involves metabolic alterations which occur after cells are placed
in suspension, and how those changes contribute to cell death. The connection
between cytoskeleton networks and metabolism is presently unknown.
In this project, we hypothesized that cell-matrix detachment and/or EMT
alters the microtubule cytoskeleton. This alters the pool of free tubulin dimers
available for interaction with and regulation of the conductivity of the Voltage
Dependent Anion Channels (VDACs) on mitochondria. VDACs regulate cellular
metabolism, in numerous ways, including ATP levels and reactive oxygen levels,
which together determine cell survival vs. cell death. A better understanding of this
pathway may reveal the importance of microtubule cytoskeleton in anoikis for the
first time, integrating cytoskeletal and metabolic mechanisms of cell death, and will
indicate the novel ramifications of the use of microtubule drugs in the treatment of
cancer.
Methods
Microtubule Stability Assays
To prepare the lysates, aliquots of D-PBS and MST buffer were equilibrated to
37°C in a water bath. MST buffer consisted by 85 mM PIPES, pH corrected to 6.9, 1
mM EGTA, 1 mM MgCl2, 2M Glycerol, 0.5% TX-100. Microcentrifuge tubes were
158
labeled and pre-warmed to 37°C. Cells were plated in 6 well dishes and allowed to
attach for 36hours. Cells were trypsinized, spun at 1200 RPM at room temperature,
followed by placement 1.5mL of 1% methylcellulose containing MCF10a medium in
low attachment polyHEMA dishes (2 mg/mL). At the indicated time of suspension,
cells were transferred to a pre-warmed microfuge tube and spun down for 15 seconds
at 7,000rpm. The supernatant was discarded, washing of the pellet in 1mL of 37° D-
PBS. After spinning, the supernatant was discarded and cells were resuspended in
300uL of 37° MST (microtubule stabilization buffer) buffer containing 4uM taxol and
Roche protease inhibitor. Samples were centrifuged at full speed for 10 minutes.
Supernatant was saved in pre-warmed microfuge tube and mixed with an equal
volume of 2X SDS sample buffer. After careful removal of the remaining supernatant,
the pellet was resuspended in 500uL of 1X SDS sample buffer. Samples were boiled
at 95° C for 3 minutes. To prepare attached samples, cells were washed twice with
approximately 1mL of 37° D-PBS. The cells were then scraped into 300uL of 37° MST
buffer containing 4uM taxol and Roche protease inhibitor. Lysates were centrifuged,
and supernatant and pellet were retained as described previously.
Western Blotting
SDS-PAGE was conducted using 4-20% gradient Tris-Glycine gels (Invitrogen).
Proteins were electrophoretically transferred to polyvinylidine difluoride filters
(Immobilon) in 5% methanol Tris-Glycine transfer buffer containing 5% methanol.
PBS + 0.1% Tween-20 + 5% nonfat milk were used for blocking filters, primary
antibodies were incubated in PBS+0.1% Tween-20 + 5% nonfat milk. Primary

159
antibodies were typically incubated between 2 hours at room temperature or
overnight at 4 degrees C. Primaries used were: β-tubulin, Rb (Cell Signaling), VDAC1,
Rb (Cell Signaling); . Secondary antibodies for chemiluminescence were either anti-
mouse or anti-rabbit, conjugated to horseradish peroxidase (HRP) enzyme (Bio-Rad).
Secondary antibodies (Biorad) were used at 1:3000 dilution and filters were
incubated for approximately 1 hour at room temperature. Western blots were
developed via ECL Super Signal West Pico (Thermo-Pierce).
Anoikis Assays
For anoikis assays, caspase activation was measured using the Caspase-Glo
3/7 assay kit (Promega). Cells were dissociated using TrypLE Express (Invitrogen)
and a fixed number of cells (1.5 x 10⁵ cells) were placed per 6 well poly-(2-
hydroxyethyl methacrylate) (poly-HEMA) coated low attachment plates in 2.0 ml of
normal growth medium + 0.5% methylcellulose for the indicated time. Aliquots of
cells were mixed 1:1 with caspase glo reagent at indicated time points and assayed
for luminescence utilizing a Wallac Envison Perkin Elmer plate reader according to
manufacturer’s instructions. Where indicated, time-zero cell death values were
subtracted from the data presented to normalize for small loading variation.
ROS Assays
For ROS assay, cells were seeded as above and attached for 48 hours. Cells
were detached by trypsinization, and equal numbers of cells were placed in a 15 mL
centrifuge tube. Cells were assayed immediately by flow cytometry after staining for
160
15 min at 37 degrees with 1 uM CM-H2DCFDA (Invitrogen) protected from light. If
indicated, 24 hr ROS was examined after plating cells in low attachment polyHEMA
(2 mg/mL) coated 100 mm dishes in 5 mL of 0.5% methylcellulose to prevent excess
cell clumping. Cells were harvested by diluting well with 10 mL DME/F12 + 10%
Horse Serum containing media. Cells were centrifuged at 2000 RPM for 2 minutes.
Pellets were washed 2X with HBSS and stained in 1 uM CM-H2DCFDA as indicated
previously. In some cases, Amplex Red (Invitrogen) assays were used to measure ROS
in order to compare attached and suspended conditions and were used according to
manufacturer’s instructions. For measurement of general cellular superoxide, cells
were processed as above and stained with 5 uM dihydroethidium (DHE) (Invitrogen)
for 15 minutes at 37 degrees C protected from light followed by flow cytometric
analysis at 605 nm fluorescence. Mitochondrial specific superoxide was measured
using mitoSOX (Invitrogen) dye by staining cells with 5 uM mitoSOX solution for 10
minutes at 37 degrees C protected from light. Samples were analyzed by flow
cytometry at 580 nm fluorescence using a BD LSRFortessa Cell analyzer.
JC1 Assay
Cells were seeded on poly-d-lysine coated MatTek dishes. Cells were incubated
in 2 ug/mL JC1 (5’,6,6’-tetrachloro-1,1’,3,3’-tetraethylbenzimidazolylcarbocyanine
iodide) (Invitrogen) at 37 degrees for 30 minutes protected from light. After
incubation, dye was washed off of cells and replaced with normal growth medium.
JC1 monomer emission was observed at 529 nm and J-aggregate emission was
161
observed at 590 nm. Samples were analyzed by flow cytometry using a BD
LSRFortessa Cell analyzer.
siRNA transfections
MCF10a PG2 cells were grown to ~70% confluence and transfected with
siRNA (5 nM) targeting either non-target control siNT (Ambion, Austin TX), VDAC1,
VDAC2, or VDAC3. siNT was Silencer Select Negative control #1 siRNA (Cat
#4390844). siRNAs targeting VDACs were Silencer select siRNAs: VDAC1 (Cat #
4390824; ID:s14769), VDAC2 (Cat # 4392420; ID:s14771), VDAC3 (Cat # 4392420;
ID: 230730). siRNAs were transfected using Lipofectamine RNAiMAX (Invitrogen,
Carlsbad, CA) according to manufacturer’s instructions.
Quantitative reverse transcription PCR analysis
MCF10a PG2 cells were plated on collagen coated 60mm2 dishes and treated
as indicated. Cells were harvested using RNAeasy Plus mini kit (Qiagen), analyzed
using Nanodrop, and converted to cDNA using SuperScript III First-Strand Synthesis
SuperMix (Invitrogen) with oligo dT primers and 1ug of RNA. cDNA was analyzed
using SYBR Green PCR Master Mix on an Applied Biosystems 7500 Real Time PCR
System. Primers were as follows: VDAC1 (F: GGGTGCTCTGGTGCTAGGT; R:
GACAGCGGTCTCCAACTTCT), VDAC2 (F: CCAAATCAAAGCTGACAAGGA, R:
TTTAGCTGCAATGCCAAAAC) VDAC3 (F: TTGACACAGCCAAATCCAAA, R:
TGTTACTCCCAGCTGTCCAA). CBX1-F (AAGTATTGCAAGGCCACCCA), CBX-
162
R(TTTTCCCAATCAGGCCCCAA). Values reported were determined using the ∆∆CT
VDAC primer sequences were amplified as follows using CBX1 as an internal control
Results
The findings presented in this chapter were preliminary data of my previous
work. This project proposed to determine the effect of cell-matrix adhesion on the
tubulin/VDAC/mitochondrial axis in normal epithelial cells or in cells resulting from
epithelial-mesenchymal transition (EMT). To this end, we evaluated the effects of
EMT on free vs polymerized tubulins, VDACs, and mitochondrial function. We also
planned to test the function of components of the tubulin/VDAC/mitochondrial axis
on anoikis in normal epithelial cells or in cells resulting from EMT, including the
effects of altered VDACs, and the effects of altered tubulins/microtubules. Here, our
preliminary findings that led us to these hypotheses will be discussed, and how the
findings contributed to our current views of metabolism, ROS, and anoikis (which was
previously discussed in Chapter 2). Ultimately our findings were that manipulation of
VDACs had minimal impact on metabolic function, ROS, and anoikis.
Polymerized tubulin and free tubulin levels were determined through lysis in
microtubule stabilizing buffer (containing paclitaxel) followed by western blotting of
soluble vs. insoluble fractions, as described previously (25). We found that free
tubulin shifts to polymerized microtubules rapidly following cell-matrix detachment
of the normal epithelial cell line MCF10a (figure 1a); however, the microtubule
stability assays were highly inconsistent and given the start conditions, in some
experiments we were unable to see this effect (figure 1b). We next assayed MCF10a
163
neoT +/- TGF-β, which induces a stable EMT event in this context, in order to
determine the effect of EMT on the response of tubulin polymerization in detached
culture. While it was expected that EMT would result in stabilization of the free
tubulin dimer pool (closing VDAC, decreasing ROS, and protecting from anoikis), we
were unable to show this expected phenomenon in our cells. We decided to shift our
focus to that of the microtubule associated proteins Op18 and Tau.
Free tubulin dimers have been reported to interact with VDACs, causing
closure of the anion channel activity (12, 15). Overexpression of the microtubule
destabilizing protein Oncoprotein 18 (Op18; otherwise known as Stathmin)
increased free tubulin dimers levels (Figure 2a). We expected that an increase in free
tubulin dimers would close VDAC channels, decreasing mitochondrial activity,
decreasing ROS and protection from anoikis. However, we found that overexpression
of Op18 in MCF10a PG2 cells resulted in increased cell death in suspended culture
(figure 2b). Our original assumption was that this increase in the free pool of tubulin
would result in increased VDAC binding, resulting in their closure, but this may not
be the case. It is quite possibly that binding of tubulin dimers in the T2S quaternary
complex with Op18 prevents their binding to VDAC channels, effectively
competitively inhibiting free tubulin binding, resulting in a paradoxical opening of
VDAC channels. Alternatively, if free tubulin dimer binding and closing VDAC
channels results in decreased ATP, this may negatively influence cell survival in
suspension, resulting in increased anoikis as shown here.
Further manipulation of tubulin dynamics was accomplished via
overexpression of the Alzheimer associated neural protein, Tau (also known as MAP4
164
or Microtubule associated protein 4). Tau primarily tends to bind to microtubules
and stabilize them, leading to a decrease in the total tubulin dimer pool,
hypothetically resulting in increased mitochondrial activity through lack of tubulin
induced VDAC closure. We found that increasing the polymerized pool results in
significantly lower colony formation by the same assay (figure 2c). We hypothesized
that decreased tubulin would result in removal of VDAC suppression opening the
channel to increase ROS and lead to oxidative stress potentially causing cell death.
We extended these findings to the MDCK cell line (Madin-Darby canine kidney).
When Tau was overexpressed in this model, we found that MDCK cells were more
sensitive to anoikis at 4, 8, and 24 hours, assessed by caspase 3/7 activation assay
(figure 2d). However, this effect was not reinforced when cell death was assessed
more generally by colony formation assay (figure 2e).
Given that modification to proteins involved in microtubule polymerization
could have multiple, even paradoxical effects, we next reasoned that if tubulin binding
to VDAC results in VDAC closure, removal of VDAC by siRNA transfection would be
equivalent to closing the channel. VDAC knockdown was confirmed by western blot
analysis and RT-qPCR (figure 3a, b; VDAC3 antibody was not specific for this isoform
but rather detected Pan-VDAC – data not shown). Utilizing isoform specific siRNA
transfection targeting VDAC1, 2, and 3 individually, we found that cells depleted of
VDAC1 protected somewhat against anoikis; however, this effect was very small
(figure 3c). Conversely, depletion of VDAC2 appeared to further sensitize cells to
anoikis (figure 3c). VDAC3 depletion did not have a consistent effect on anoikis as
average fold change (relative to siNT control) showed that depletion of this isoform
165
had no significant effect on caspase activation when averaged between two
independent experiments (figure 3d).
In order to determine the role of VDAC channels in ROS regulation in our
system, ROS bursts were measured by CM-H2DFCDA fluorescence by flow cytometry.
Independent depletion of VDAC1, 2, and 3 all ameliorated ROS generated by
incubation in suspension relative to non-target control cells (figure 3e). While this
result is consistent with the view that VDAC closure decreases mitochondrial activity,
hampering ROS generated by oxidative phosphorylation, VDAC knockdown did not
correlate with loss of mitochondrial activity in excess of that seen in the control
samples however as assessed by JC1 fluorimetric assay (figure 4). If ROS were in fact
coming from loss of mitochondrial oxidative phosphorylation activity, we would have
expected to see a greater decrease in JC1 signal in suspended VDAC knockdown
samples. Further, we found no significant effect of either microtubule stabilization
alteration (through Op18 or Tau) on ATP level or basal JC1 signal (data not shown).
Given the results presented here, we concluded that the Tubulin/VDAC/ROS axis was
not playing a significant role in the induction of anoikis in our model.
Discussion
The results of this study were largely inconclusive or counter to our original
hypothesis. We attempted to show whether the open or closed state of VDACs is more
favorable for anoikis, and, whether the primary outcome is a reprogramming effect
that occurs prior to detachment vs. a more significant effect during the
detachment/suspension phase. Given the difficulty of showing consistent effects of

166
microtubule alterations on anoikis (see Op18 and Tau anoikis results), we concluded
that any effect on anoikis was likely due to alterations of tubulin dynamic
homeostasis. We were unable to find a link between regulation of tubulin dynamics
and the Epithelial-Mesenchymal transition.
A determination regarding the effect of higher or lower ratio of free:
polymerized tubulin and which condition was more favorable to anoikis was unable
to be determined due to difficulty isolating free vs polymerized tubulin forms given
its incredible instability at room temperature. It was anticipated that the direction of
the tubulin effect would be consistent with the direction of the VDAC effect (more free
tubulin=closed VDAC=metabolic effects arising from closed VDAC= cell death). Given
the range of phenotypes that are correlated here, any consistency in these models
proved very difficult to achieve.
While we were able to show a very robust effect of VDAC knockdown on ROS,
this phenotype likely was due to an unconsidered alternative source, as the ROS
decrease was not associated with an accompanying decrease in JC1 or ATP decline in
detached conditions beyond that which occurred the control cells.
In an attempt to evaluate experimentally manipulated tubulin levels effects on
anoikis, we overexpressed both microtubule associated proteins Op18 and Tau. As
discussed previously, our original assumption was that alterations in the free pool of
tubulin via Op18 induced destabilization of microtubules would close VDACs, due to
direct tubulin binding, however, this may not be the case. It is possible that binding
of tubulin dimers in the T2S quaternary complex with Op18 prevents their binding to
VDAC channels, effectively competitively inhibiting free tubulin binding, resulting in
167
a paradoxical opening of VDAC channels. Additionally, Op18 overexpression could
potentially result in cell death even if it does cause tubulin-VDAC binding, because
any dysregulation of this tightly controlled program in tubulin dynamics could be
problematic for cells. Op18 may also bind to the tips of protofilaments and directly
destabilize growing microtubules. A final alternative is that Op18 induces
accumulation of free tubulin which is able to close VDACs, and that the effect on
anoikis seen is due to a loss of mitochondrial activity, causing metabolic catastrophe
(see Chapter 2).
VDAC1 is typically the most abundant isoform expressed in cells (27). VDAC1/2
are most sensitive to tubulin induced blockade, while VDAC-3 is expressed in
significantly lower abundance, and is far less affected by tubulin dynamics (28).
Isoform 3 is thought to contribute most to typical mitochondrial membrane potential
in steady state while VDAC1/2 are generally kept closed by endogenous free tubulin.
In suspension, VDAC1/2 may open due to a decrease in free tubulin which would
result in oxidative injury. Effects of VDAC knockdown (~VDAC closure) on anoikis
were largely insignificant and/or inconsistent. We found that knockdown of VDAC1
resulted in small protection from anoikis, whereas VDAC3 depletion had no effect on
anoikis. Interestingly, depletion of VDAC2 sensitized cells significantly. It was
previously observed that the pro-apoptotic protein, Bak, is sequestered through an
interaction with VDAC2; furthermore, it was demonstrated here that overexpression
of VDAC2 inhibited apoptosis through Bak sequestration (29). Disruption of this
interaction releases Bak through VDAC knockdown likely releases Bak from the
mitochondria inducing apoptosis in detachment, potentially representing an
168
interesting area of future research. Given the results presented here, we concluded
that the Tubulin/VDAC/ROS axis was not playing a significant role in the induction
control of mitochondrial function contributing to anoikis in our model.
Figure Legends
Figure 1. a) Western blot showing effect of cell-matrix detachment on tubulin: microtubule
ratios. MCF10aneoT cells were lysed in mitochondrial stabilization buffer in the attached
state or following suspension for the indicated periods of time, fractionated into
free/supernant (F) or microtubule/pellet (M) fractions and analyzed by western blotting for
β-tubulin. b) Effect of EMT on tubulin:microtubule ratios in attached vs detachment
conditions. MCF10aneoT cells shown here either before or after treatment with TGF-β
(resulting in irreversible EMT). p = pellet (insoluble microtubule fraction); s = supernatant
(soluble tubulin dimer fraction)
Figure 2. a) Western blot showing effect of Op18 overexpression in MCF10a PG2 cells
on tubulin: microtubule ratios. Op18 elevated free tubulin: microtubule ratio by
destabilization of polymerized microtubules. b) Op18 constitutive expression was
associated with increased anoikis, assessed by colony formation assay conducted
after suspension in 0.5% methylcellulose containing media in polyHEMA low
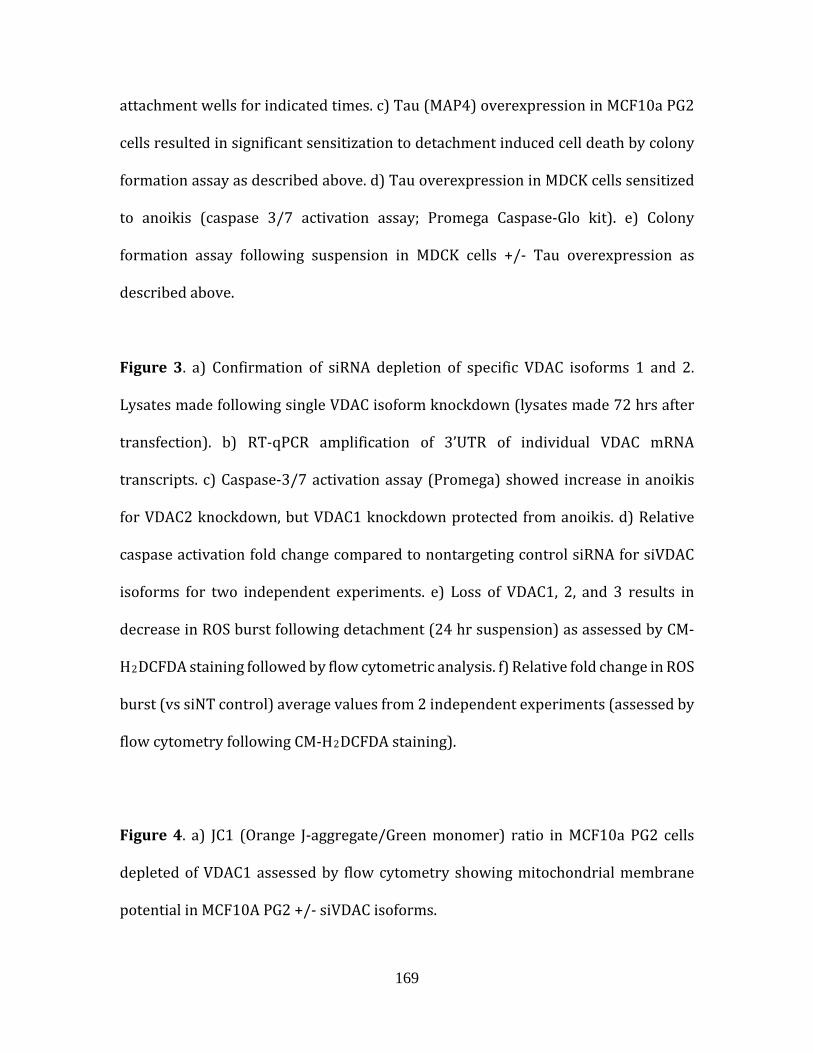
169
attachment wells for indicated times. c) Tau (MAP4) overexpression in MCF10a PG2
cells resulted in significant sensitization to detachment induced cell death by colony
formation assay as described above. d) Tau overexpression in MDCK cells sensitized
to anoikis (caspase 3/7 activation assay; Promega Caspase-Glo kit). e) Colony
formation assay following suspension in MDCK cells +/- Tau overexpression as
described above.
Figure 3. a) Confirmation of siRNA depletion of specific VDAC isoforms 1 and 2.
Lysates made following single VDAC isoform knockdown (lysates made 72 hrs after
transfection). b) RT-qPCR amplification of 3’UTR of individual VDAC mRNA
transcripts. c) Caspase-3/7 activation assay (Promega) showed increase in anoikis
for VDAC2 knockdown, but VDAC1 knockdown protected from anoikis. d) Relative
caspase activation fold change compared to nontargeting control siRNA for siVDAC
isoforms for two independent experiments. e) Loss of VDAC1, 2, and 3 results in
decrease in ROS burst following detachment (24 hr suspension) as assessed by CM-
H2DCFDA staining followed by flow cytometric analysis. f) Relative fold change in ROS
burst (vs siNT control) average values from 2 independent experiments (assessed by
flow cytometry following CM-H2DCFDA staining).
Figure 4. a) JC1 (Orange J-aggregate/Green monomer) ratio in MCF10a PG2 cells
depleted of VDAC1 assessed by flow cytometry showing mitochondrial membrane
potential in MCF10A PG2 +/- siVDAC isoforms.
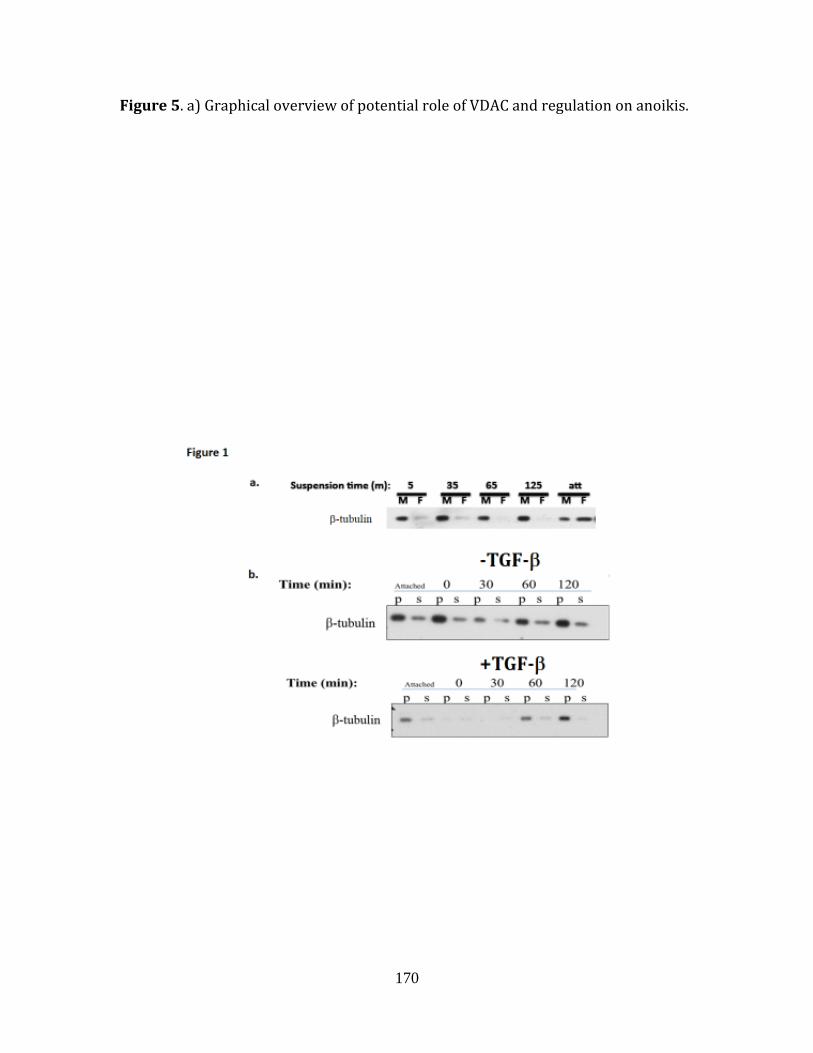
170
Figure 5. a) Graphical overview of potential role of VDAC and regulation on anoikis.
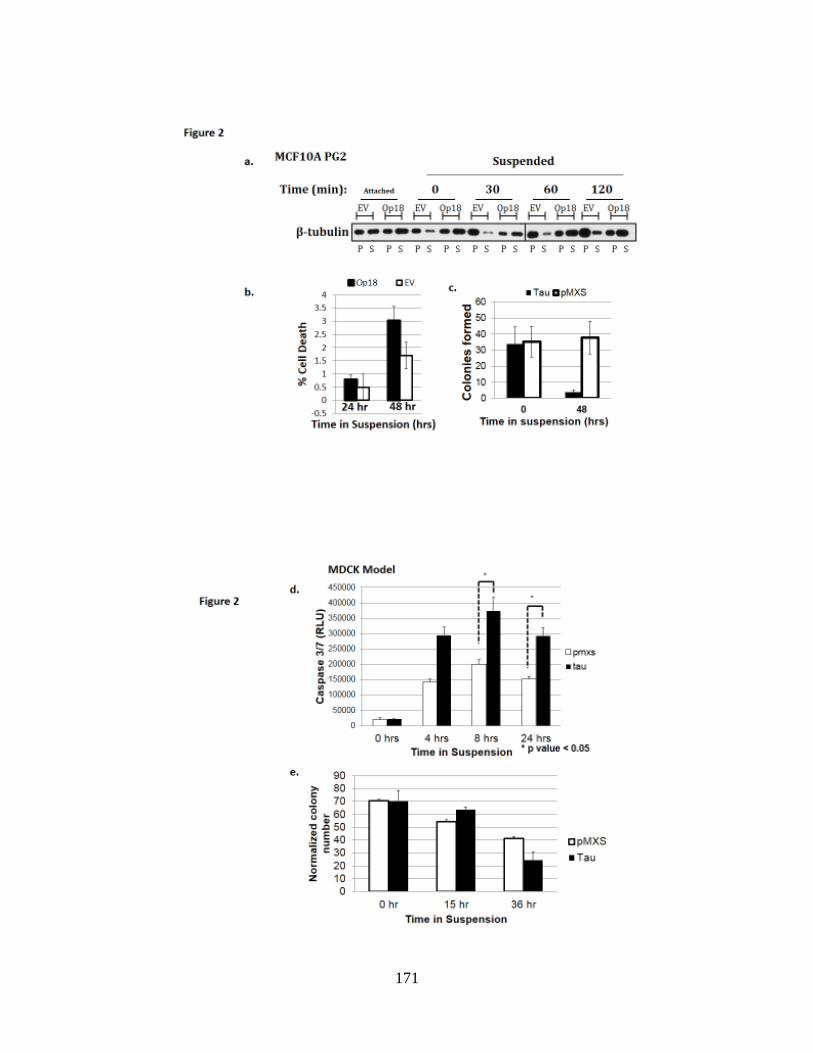
171
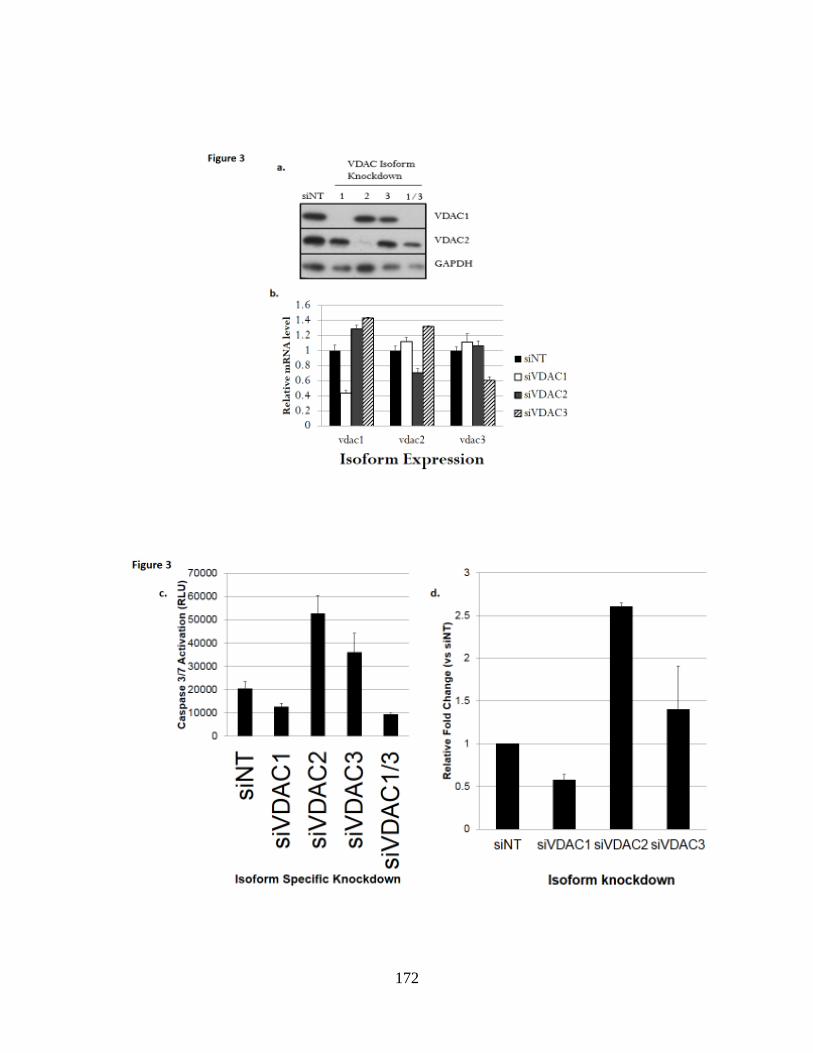
172
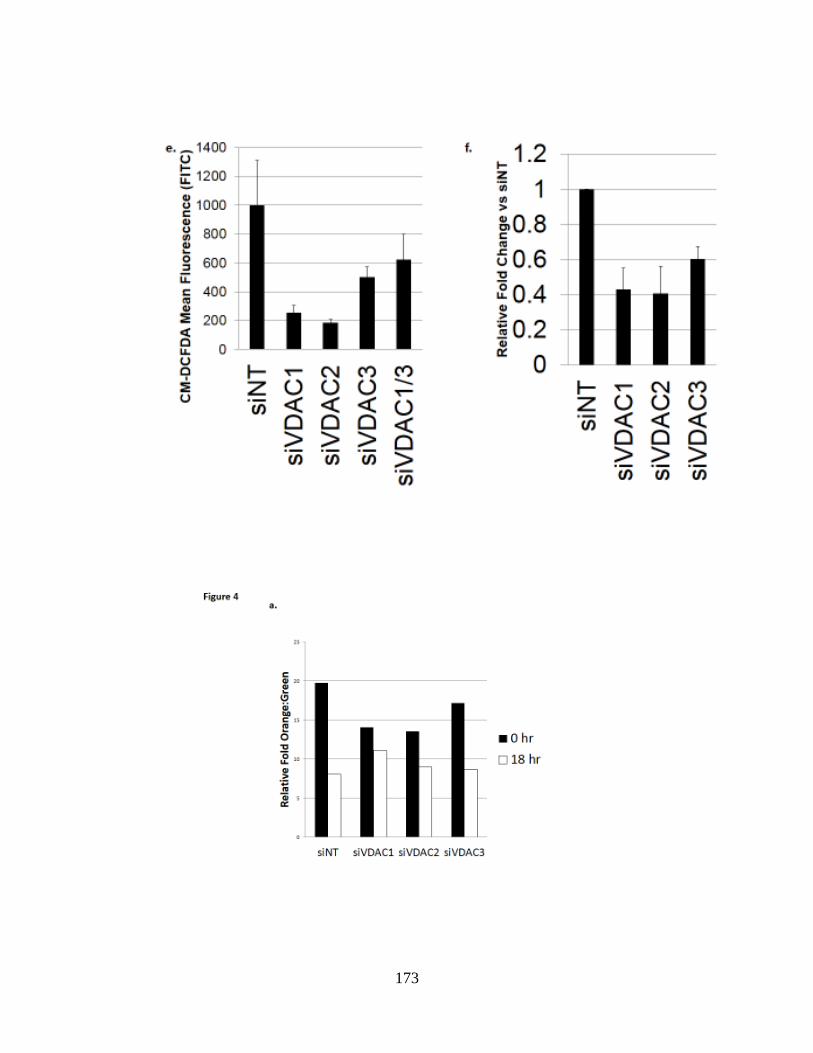
173
174
Figure 5
175
References
1. Frisch SM, Francis H. Disruption of epithelial cell-matrix interactions induces apoptosis. J Cell Biol. 1994;124:619-26. 2. Simpson CD, Anyiwe K, Schimmer AD. Anoikis resistance and tumor metastasis. Cancer Lett. 2008;272:177-85. 3. Frisch SM, Schaller M, Cieply B. Mechanisms that link the oncogenic epithelial-mesenchymal transition to suppression of anoikis. J Cell Sci. 2013;126:21-9. 4. Tiwari N, Gheldof A, Tatari M, Christofori G. EMT as the ultimate survival mechanism of cancer cells. Semin Cancer Biol. 2012. 5. Paoli P, Giannoni E, Chiarugi P. Anoikis molecular pathways and its role in cancer progression. Biochim Biophys Acta. 6. Grassian AR, Coloff JL, Brugge JS. Extracellular matrix regulation of metabolism and implications for tumorigenesis. Cold Spring Harb Symp Quant Biol.76:313-24. 7. Buchheit CL, Rayavarapu RR, Schafer ZT. The regulation of cancer cell death and metabolism by extracellular matrix attachment. Semin Cell Dev Biol.23:402-11. 8. Schafer ZT, Grassian AR, Song L, Jiang Z, Gerhart-Hines Z, Irie HY, et al. Antioxidant and oncogene rescue of metabolic defects caused by loss of matrix attachment. Nature. 2009;461:109-13. 9. Kamarajugadda S, Stemboroski L, Cai Q, Simpson NE, Nayak S, Tan M, et al. Glucose oxidation modulates anoikis and tumor metastasis. Mol Cell Biol.32:1893-907. 10. Davison CA, Durbin SM, Thau MR, Zellmer VR, Chapman SE, Diener J, et al. Antioxidant enzymes mediate survival of breast cancer cells deprived of extracellular matrix. Cancer Res.73:3704-15. 11. Zhu P, Tan MJ, Huang RL, Tan CK, Chong HC, Pal M, et al. Angiopoietin-like 4 protein elevates the prosurvival intracellular O2(-):H2O2 ratio and confers anoikis resistance to tumors. Cancer Cell.19:401-15. 12. Maldonado EN, Lemasters JJ. Warburg revisited: regulation of mitochondrial metabolism by voltage-dependent anion channels in cancer cells. J Pharmacol Exp Ther.342:637-41. 13. Maldonado EN, Patnaik J, Mullins MR, Lemasters JJ. Free tubulin modulates mitochondrial membrane potential in cancer cells. Cancer Res. 2010;70:10192-201. 14. Baines CP, Kaiser RA, Sheiko T, Craigen WJ, Molkentin JD. Voltage-dependent anion channels are dispensable for mitochondrial-dependent cell death. Nat Cell Biol. 2007;9:550-5. 15. Rostovtseva TK, Bezrukov SM. VDAC inhibition by tubulin and its physiological implications. Biochim Biophys Acta.1818:1526-35. 16. Rostovtseva TK, Sheldon KL, Hassanzadeh E, Monge C, Saks V, Bezrukov SM, et al. Tubulin binding blocks mitochondrial voltage-dependent anion channel and regulates respiration. Proc Natl Acad Sci U S A. 2008;105:18746-51. 17. Sheldon KL, Maldonado EN, Lemasters JJ, Rostovtseva TK, Bezrukov SM. Phosphorylation of voltage-dependent anion channel by serine/threonine kinases governs its interaction with tubulin. PLoS One.6:e25539.
176
18. Delcommenne M, Tan C, Gray V, Rue L, Woodgett J, Dedhar S. Phosphoinositide-3-OH kinase-dependent regulation of glycogen synthase kinase 3 and protein kinase B/AKT by the integrin-linked kinase. Proc Natl Acad Sci U S A. 1998;95:11211-6. 19. Vander Heiden MG, Chandel NS, Li XX, Schumacker PT, Colombini M, Thompson CB. Outer mitochondrial membrane permeability can regulate coupled respiration and cell survival. Proc Natl Acad Sci U S A. 2000;97:4666-71. 20. Lai JC, Benimetskaya L, Khvorova A, Wu S, Hua E, Miller P, et al. Phosphorothioate oligodeoxynucleotides and G3139 induce apoptosis in 518A2 melanoma cells. Mol Cancer Ther. 2005;4:305-15. 21. Rostovtseva TK, Tan W, Colombini M. On the role of VDAC in apoptosis: fact and fiction. J Bioenerg Biomembr. 2005;37:129-42. 22. Yagoda N, von Rechenberg M, Zaganjor E, Bauer AJ, Yang WS, Fridman DJ, et al. RAS-RAF-MEK-dependent oxidative cell death involving voltage-dependent anion channels. Nature. 2007;447:864-8. 23. Sukumaran SK, Fu NY, Tin CB, Wan KF, Lee SS, Yu VC. A soluble form of the pilus protein FimA targets the VDAC-hexokinase complex at mitochondria to suppress host cell apoptosis. Mol Cell.37:768-83. 24. Elinder F, Akanda N, Tofighi R, Shimizu S, Tsujimoto Y, Orrenius S, et al. Opening of plasma membrane voltage-dependent anion channels (VDAC) precedes caspase activation in neuronal apoptosis induced by toxic stimuli. Cell Death Differ. 2005;12:1134-40. 25. Maldonado EN, Sheldon KL, DeHart DN, Patnaik J, Manevich Y, Townsend DM, et al. Voltage-dependent anion channels modulate mitochondrial metabolism in cancer cells: regulation by free tubulin and erastin. J Biol Chem.288:11920-9. 26. Honnappa S, Cutting B, Jahnke W, Seelig J, Steinmetz MO. Thermodynamics of the Op18/Stathmin-Tubulin Interaction. Journal of Biological Chemistry. 2003;278:38926-34. 27. Maldonado EN, Lemasters JJ. Warburg revisited: regulation of mitochondrial metabolism by voltage-dependent anion channels in cancer cells. J Pharmacol Exp Ther. 2012;342:637-41. 28. Maldonado EN, Sheldon KL, DeHart DN, Patnaik J, Manevich Y, Townsend DM, et al. Voltage-dependent anion channels modulate mitochondrial metabolism in cancer cells: regulation by free tubulin and erastin. J Biol Chem. 2013;288:11920-9. 29. Plötz M, Gillissen B, Hossini AM, Daniel PT, Eberle J. Disruption of the VDAC2–Bak interaction by Bcl-x(S) mediates efficient induction of apoptosis in melanoma cells. Cell Death and Differentiation. 2012;19:1928-38.

177
Chapter 6 Overall Discussion and Future Directions

178
The EMT has been demonstrated extensively to confer resistance to anoikis. Here, it
was demonstrated that EMT resulted in increased mitochondrial oxidative metabolism
resulting in maintenance of ATP during suspension. Increased oxidative phosphorylation in
mesenchymal cells was accompanied by increased production of mitochondrial superoxide;
however, general ROS was suppressed due to decreased production of hydrogen peroxide
(H2O2). We established here that glutamate dehydrogenase 1 (GLUD1) was upregulated
during EMT, resulting in increased production of α-ketoglutarate which was critical for
suppression of H2O2 and protection from anoikis. The work presented here demonstrated
that the wound healing transcription factor GRHL2, through suppression of EMT, sensitizes
cells to anoikis, at least in part through downregulation of GLUD1 resulting in depletion of
α-ketoglutarate and increased production of ROS. Therefore, this thesis has established a
novel pathway for control of anoikis through metabolic alteration and ROS suppression
occurring during the oncogenic EMT, and demonstrated an additional mechanism by which
GRHL2 sensitizes to anoikis.
Warburg metabolism has been extensively studied in the context of tumor cells;
however, these findings are largely context dependent (1, 2). Recent work has demonstrated
that the CSC phenotype is in fact dependent on oxidative phosphorylation (3, 4). Moreover,
oxidative metabolism has been shown to be enhanced in distant metastases, highlighting the
critical importance of a better understanding of how tumor metabolism influences these
metastatic, chemoresistant subpopulations in vivo (5, 6). As discussed previously, the
precise cues inducing cellular migration from the primary tumor are incompletely
understood. What is clear at present is that EMT is a major mechanism by which cells acquire
the (epi)genetic alterations to aid invasion from their primary site, and further, evade anoikis
179
during tumor dissemination. It has been postulated that oncogenic mutations in
subpopulations of tumors may lead to the acquisition of properties that are advantageous to
the growth of tumors in the short term such as those that increase proliferation; however,
these changes are ultimately detrimental in the primary site which may lack the proper
vasculature to support this activity. This can lead to challenges including lack of carbon
source nutrients, hypoxia, and results in reactive oxygen species accumulation. Metabolic
alterations due to oncogenic transformation, EMT or transition to cancer stem cells have
been reported extensively, with unique effects in each system (5, 7-10).
Paradoxically, oxygen deprivation results in the generation and accumulation of
reactive oxygen species (11). HIF1α stabilization due to hypoxic conditions reduces
mitochondrial biogenesis (12), results in the induction of multiple antioxidant genes (11),
and signals EMT via induction of transcription factors including Twist, Snail, and ZEB1 (13,
14). In fact, in our own hands, MSP cells were found to have stabilized HIF1α compared to
parental HMLE cells (unpublished data; refer to Chapter 4). This could potentially, at least
in part, explain the decreased mitochondrial load present in MSP cells (Chapter 2), which are
paradoxically more efficient than those in their epithelial counterparts. Alternatively, HMLE
cells may upregulate production of mitochondria due to their lack of functional activity
compared to mesenchymal cells. The reactive oxygen generated from hypoxic conditions in
some cases leading to the induction of the EMT program is thus the likely culprit of gene
expression changes that ameliorate these toxicities, resulting in a relatively low ROS
environment compared to epithelial cells.
As noted earlier, tumor tissues are known to have high ROS levels relative to “normal”
tissues, and are thought to upregulate antioxidant enzymes in order to keep these harmful

180
oxidants within a “non-lethal” threshold limit. The maintenance of ROS within a crucial
range may aid in some cellular processes, acting as a signaling molecule of sorts (15), while
rising beyond that range can be catastrophic. This requires the presence of safeguards such
as robust expression of antioxidant genes. However, it has also been shown that if driven to
critically low levels the result is cell cycle arrest or even apoptosis (16). In fact, ANGPLT4
was reported to protect from anoikis by stimulating ROS of the superoxide variety from the
NOX complex stimulating Src leading to increased activity of PI3K and ERK pro-survival
signaling (17). Note that in our hands (as has been reported elsewhere), ROS suppression,
assessed by CM-H2DCFDA detecting H2O2 primarily, protects from anoikis. This discrepancy
may be due to a species or source specific effect or may lie in the fact that short term caspase
activation assays may only show effects of increased caspase activity due to alleviation of
ROS suppressing cysteine active sites of caspases, which is overcome at later time points. In
fact, our findings support that anoikis resistant MSP cells have higher superoxide level
relative to HMLE or MSP+GRHL2 cells (Chapter 2). We interpret this result as a readout of
mitochondrial oxidative phosphorylation generating ROS from complex’s I and III – but
perhaps these cells have some yet unexplored mechanism by which they induced c-SRC
activation through increased superoxide (17). Based on RNA-seq, we found that GRHL2
upregulates ANGPTL4 significantly (3.8 fold) which would support a role in ROS generation,
however in our model, GRHL2 overexpression decreased superoxide level, both from general
sources as well as specifically from mitochondria and increased H2O2, indicating lack of
generalizability of these previously reported findings to our system.
Another yet unexplored pathway through which GRHL2 may exert regulatory control
over anoikis is through that of the atypical FAT cadherin family of proteins. GRHL2 greatly
181
downregulates expression of FAT4 specifically, which is highly upregulated in mesenchymal
cells (Chapter 4). FAT4, the mammalian homologue most closely related to Drosophila fat
(18), has been described to play a role in both regulation of planar cell polarity (PCP) as well
as HIPPO signaling. As extensively described in Chapter 1, YAP and TAZ are pro-survival
factors that mediate Hippo pathway signaling which are critical pro-survival factors with
described roles in anoikis (19, 20). Regulation of the FAT cadherin family members may be
yet another means by which GRHL2 enforces epithelial cell sensitivity to anoikis through
regulation of Hippo signaling, a pathway which merits further study.
Our lab has previously demonstrated that reversal of EMT by GRHL2 suppresses the
oncogenic EMT, enforces the default epithelial cell state, and resulted in reversal of the
cancer stem cell-like state (21, 22). It has been extensively demonstrated that in these
settings, plasticity conferred by EMT benefits small populations of cells, bestowing CSC-like
and chemoresistant properties to these subpopulations that resume growth after a period of
dormancy (23-29). In culture, treatment of HMLE cells with taxol derivatives enriches for
this CSC-like population; conversely, stable expression of GRHL2 significantly sensitizes
these, as well as MDA-MB-231 cells, to this therapy. Critically, ectopically expressed GRHL2
prevents the chemotherapy-induced emergence of this CSC-like population (22). Further,
SUM149 cells subjected to metabolic stress such as glutamine deprivation largely die, but the
rare resistant populations which result are described as a “metabolically adaptable,”
glutamine independent population (30). In addition to having undergone EMT, these cells
now display chemotherapeutic resistance to a multitude of chemotherapeutic agents
including taxol, Erlotinib, doxorubicin, and other targeted and cytotoxic agents. These cells
are reported to have significantly downregulated GRHL2 and upregulated ZEB1 (a finding
182
confirmed by our laboratory). Preliminary evidence suggests that re-expression of GRHL2
in this model significantly sensitizes MA cells to chemotherapeutic intervention.
Additionally, significant changes in histone activation marks H3K4 trimethylation and
H3K14 acetylation have been reported to be associated with the drug resistant state (31),
which when reversed using HDAC inhibitor pretreatment, significantly sensitized cells to
chemotherapy (30). This highlights the critical need for a better understanding of how
GRHL2 regulates epigenetic modification of genes to sensitize to chemotherapies.
Prevention of the emergence of CSC-like populations will be a critical step to abrogate
chemo/radiotherapy resistant recurrence or metastases developing after initially successful
treatment of primary disease. As established previously by our lab (22), Wnt and TGF-β
signaling collaborate to coordinately downregulate GRHL2, while inhibition of these
pathways maintains endogenous GRHL2. It was established here that BMP2 was able to
inhibit TGF-β signaling to maintain GRHL2 protein levels. Combining BMP pathway
activation and Wnt inhibitors with conventional cytotoxic or targeted chemotherapy may
establish a means by which chemotherapy resistant subpopulations are sensitized,
preventing recurrence of disease. A better understanding of the pathways which regulate
endogenous GRHL2 levels is critical to establish a practical means by which to translate this
knowledge to patient care.
The findings presented here establish a role of GRHL2 in anoikis beyond that of
previously described pathways by which EMT influences anoikis. Here, we provided a
mechanism by which EMT decreases ROS as to protect cells against anoikis. Under this
model, GRHL2 reverses EMT, suppressing mitochondrial oxidative function and α-
ketoglutarate level through the repression of the critical enzyme regulating glutaminolysis,

183
GLUD1, resulting in loss of glutamine utilization, increased ROS level, ultimately shifting
metabolism resulting in anoikis sensitivity.
References
184
1. Martinez-Outschoorn UE, Pavlides S, Howell A, Pestell RG, Tanowitz HB, Sotgia F, et al. Stromal-epithelial metabolic coupling in cancer: integrating autophagy and metabolism in the tumor microenvironment. Int J Biochem Cell Biol. 2011;43:1045-51. 2. Curry JM, Tuluc M, Whitaker-Menezes D, Ames JA, Anantharaman A, Butera A, et al. Cancer metabolism, stemness and tumor recurrence: MCT1 and MCT4 are functional biomarkers of metabolic symbiosis in head and neck cancer. Cell Cycle. 2013;12:1371-84. 3. Gordon N, Skinner AM, Pommier RF, Schillace RV, O'Neill S, Peckham JL, et al. Gene expression signatures of breast cancer stem and progenitor cells do not exhibit features of Warburg metabolism. Stem cell research & therapy. 2015;6:157. 4. Viale A, Corti D, Draetta GF. Tumors and Mitochondrial Respiration: A Neglected Connection. Cancer Res. 2015. 5. LeBleu VS, O'Connell JT, Gonzalez Herrera KN, Wikman H, Pantel K, Haigis MC, et al. PGC-1alpha mediates mitochondrial biogenesis and oxidative phosphorylation in cancer cells to promote metastasis. Nat Cell Biol. 2014;16:992-1003, 1-15. 6. Amoedo ND, Rodrigues MF, Rumjanek FD. Mitochondria: are mitochondria accessory to metastasis? Int J Biochem Cell Biol. 2014;51:53-7. 7. Cuyas E, Corominas-Faja B, Menendez JA. The nutritional phenome of EMT-induced cancer stem-like cells. Oncotarget. 2014;5:3970-82. 8. Dong C, Yuan T, Wu Y, Wang Y, Fan TW, Miriyala S, et al. Loss of FBP1 by Snail-mediated repression provides metabolic advantages in basal-like breast cancer. Cancer Cell. 2013;23:316-31. 9. Vlashi E, Lagadec C, Vergnes L, Reue K, Frohnen P, Chan M, et al. Metabolic differences in breast cancer stem cells and differentiated progeny. Breast Cancer Res Treat. 2014;146:525-34. 10. Birsoy K, Possemato R, Lorbeer FK, Bayraktar EC, Thiru P, Yucel B, et al. Metabolic determinants of cancer cell sensitivity to glucose limitation and biguanides. Nature. 2014;508:108-12. 11. Buchheit CL, Weigel KJ, Schafer ZT. Cancer cell survival during detachment from the ECM: multiple barriers to tumour progression. Nat Rev Cancer. 2014;14:632-41. 12. Zhang H, Gao P, Fukuda R, Kumar G, Krishnamachary B, Zeller KI, et al. HIF-1 inhibits mitochondrial biogenesis and cellular respiration in VHL-deficient renal cell carcinoma by repression of C-MYC activity. Cancer Cell. 2007;11:407-20. 13. Gammon L, Biddle A, Heywood HK, Johannessen AC, Mackenzie IC. Sub-sets of cancer stem cells differ intrinsically in their patterns of oxygen metabolism. PLoS One. 2013;8:e62493. 14. Haase VH. Oxygen regulates epithelial-to-mesenchymal transition: insights into molecular mechanisms and relevance to disease. Kidney Int. 2009;76:492-9. 15. Mailloux RJ, Harper ME. Mitochondrial proticity and ROS signaling: lessons from the uncoupling proteins. Trends Endocrinol Metab. 2012;23:451-8. 16. Giannoni E, Buricchi F, Grimaldi G, Parri M, Cialdai F, Taddei ML, et al. Redox regulation of anoikis: reactive oxygen species as essential mediators of cell survival. Cell Death Differ. 2008;15:867-78. 17. Zhu P, Tan MJ, Huang RL, Tan CK, Chong HC, Pal M, et al. Angiopoietin-like 4 protein elevates the prosurvival intracellular O2(-):H2O2 ratio and confers anoikis resistance to tumors. Cancer Cell.19:401-15.
185
18. Sadeqzadeh E, de Bock CE, Thorne RF. Sleeping giants: emerging roles for the fat cadherins in health and disease. Med Res Rev. 2014;34:190-221. 19. Vigneron AM, Ludwig RL, Vousden KH. Cytoplasmic ASPP1 inhibits apoptosis through the control of YAP. Genes Dev.24:2430-9. 20. Zhao B, Li L, Wang L, Wang CY, Yu J, Guan KL. Cell detachment activates the Hippo pathway via cytoskeleton reorganization to induce anoikis. Genes Dev. 2012;26:54-68. 21. Cieply B, Riley Pt, Pifer PM, Widmeyer J, Addison JB, Ivanov AV, et al. Suppression of the epithelial-mesenchymal transition by Grainyhead-like-2. Cancer Res.72:2440-53. 22. Cieply B, Farris J, Denvir J, Ford HL, Frisch SM. Epithelial-mesenchymal transition and tumor suppression are controlled by a reciprocal feedback loop between ZEB1 and Grainyhead-like-2. Cancer Res. 2013;73:6299-309. 23. Ahmad A. Pathways to breast cancer recurrence. ISRN oncology. 2013;2013:290568. 24. Cheng Q, Chang JT, Gwin WR, Zhu J, Ambs S, Geradts J, et al. A signature of epithelial-mesenchymal plasticity and stromal activation in primary tumor modulates late recurrence in breast cancer independent of disease subtype. Breast Cancer Res. 2014;16:407. 25. Creighton CJ, Li X, Landis M, Dixon JM, Neumeister VM, Sjolund A, et al. Residual breast cancers after conventional therapy display mesenchymal as well as tumor-initiating features. Proc Natl Acad Sci U S A. 2009;106:13820-5. 26. Moody SE, Perez D, Pan TC, Sarkisian CJ, Portocarrero CP, Sterner CJ, et al. The transcriptional repressor Snail promotes mammary tumor recurrence. Cancer Cell. 2005;8:197-209. 27. Oliveras-Ferraros C, Corominas-Faja B, Cufi S, Vazquez-Martin A, Martin-Castillo B, Iglesias JM, et al. Epithelial-to-mesenchymal transition (EMT) confers primary resistance to trastuzumab (Herceptin). Cell Cycle. 2012;11:4020-32. 28. Giordano A, Gao H, Anfossi S, Cohen E, Mego M, Lee BN, et al. Epithelial-mesenchymal transition and stem cell markers in patients with HER2-positive metastatic breast cancer. Mol Cancer Ther. 2012;11:2526-34. 29. Drasin DJ, Robin TP, Ford HL. Breast cancer epithelial-to-mesenchymal transition: examining the functional consequences of plasticity. Breast Cancer Res. 2011;13:226. 30. Singh B, Shamsnia A, Raythatha MR, Milligan RD, Cady AM, Madan S, et al. Highly adaptable triple-negative breast cancer cells as a functional model for testing anticancer agents. PLoS One. 2014;9:e109487. 31. Sharma SV, Lee DY, Li B, Quinlan MP, Takahashi F, Maheswaran S, et al. A chromatin-mediated reversible drug-tolerant state in cancer cell subpopulations. Cell. 2010;141:69-80.
JC. FARRIS 1
Joshua C. Farris 10 East End Ave, Morgantown WV 26505
PHONE: (828) 430-0325 EMAIL: [email protected]
EDUCATION
Ph.D. M.D.-Ph.D. Dual degree scholar: 07/2010-05/2018 Anticipated degree date: Ph.D.: 05/2018 Time in Ph.D.: 07/2012-06/2016
West Virginia University, Morgantown, WV Department of Biochemistry, Program in Cancer Cell Biology, School of Medicine Dissertation Title: Grainyhead-like 2 Reverses the Metabolic Changes Induced by the Oncogenic Epithelial-Mesenchymal Transition: Effects on Anoikis Dissertation Advisor: Steven M. Frisch Ph.D. Dissertation Defense Date: 06/03/2016
M.D. M.D.-Ph.D. Dual degree scholar: 07/2010-05/2018 Anticipated degree date: M.D.: 05/2018
West Virginia University, Morgantown, WV School of Medicine
B.S. (Summa
Cum Laude)
B.S. (Summa
Cum Laude)
Chemistry: 08/2007-05/2010 Thesis: 08/2009-05/2010 Biology: 08/2007-05/2010 Honors Thesis: 08/2008-05/2010
Lenoir-Rhyne University, Hickory, NC Department of Chemistry Thesis Title: Antioxidant Effects of Phenolic Compounds on Oxidative Stress to Low Density Lipoproteins Thesis Advisor: Joshua Ring Ph.D. Lenoir-Rhyne University, Hickory, NC Department of Biology Honors Thesis: The Effect of Meditative Breathing on Pulse Transit Time: An Analysis in the Frequency Domain Honors Thesis Advisor: Stephen Scott M.D.
A.A.
Associates of Art 08/2005-05/2007
McDowell Technical Community College, Marion, NC
Research Experience MD/PhD Trainee, Dept. of Biochemistry, WVU Advisor: Steven M. Frisch, PhD. Dissertation Title: “Grainyhead-like 2 Reverses the Metabolic Changes Induced by the Oncogenic Epithelial-Mesenchymal Transition: Effects on Anoikis” 2012-2016 Research Rotation – Laboratory of J. Michael Ruppert, PhD Summer 2011
JC. FARRIS 2
Research Rotation – Laboratory of Peter Stoilov, PhD Summer 2010 Honors Biology Research, Lenoir-Rhyne University. Advisor: Stephen Scott MD. “The Effect of Meditative Breathing on Pulse Transit Time: An Analysis in the Frequency Domain” 2008-2010 Publications
Farris JC, Pifer PM, Zheng L, Gottlieb E, Denvir J, Frisch SM. Grainyhead-like 2 Reverses the Metabolic Changes Induced by the Oncogenic Epithelial-mesenchymal Transition: Effects on Anoikis. Molecular Cancer Research. 2016. Apr 15. pii: molcanres.0050.2016
Pifer PM, Farris JC, Thomas AL, Stoilov P, Denvir J, Smith DM, et al. Grainyhead-like-2 inhibits the coactivator p300, suppressing tubulogenesis and the epithelial-mesenchymal transition. Molecular Biology of the Cell. 2016
Cieply B, Farris JC, Denvir J, Ford HL, Frisch SM. Epithelial-mesenchymal transition and tumor suppression are controlled by a reciprocal feedback loop between ZEB1 and grainyhead-like-2. Cancer Res. 2013 10/15; 73(20): 6299-6309.
Manuscript(s) Under Review
Cifarelli C, Cifarelli D, Farris JC, Pifer PM, Frisch SM. Modulation of Radiation Sensitivity in High Grade Glioma via Cadherin-Mediated Cell-Cell Interaction. Under Review Techniques Cell and Molecular Biology: Tissue Cell Culture with sterile technique, PCR Primer Design, Molecular Cloning Techniques (Including sub-cloning, site directed mutagenesis, and plasmid preparation), RNA isolation (from primary tissues and cells), DNA purification, qRT-PCR, RNA seq sample preparation, immunofluorescent staining, ingenuity pathway examination, 3D culture mammosphere assays, cell transfection, mammalian cell retroviral and lentiviral transduction, luciferase reporter assays, immunoblotting (western blot), immunoprecipitation, chromatin immunoprecipitation, flow cytometry based assays including cell surface antigen staining, assays for reactive oxygen species (CM-H2DCFDA, mitoSOX, mitotracker green FM, and DHE staining), Anoikis assays (caspase 3/7 activation assays, cell death elisa, cell viability clonogenic assays), soft agar assays, generation of transgenic murine lines, working with murine models of mammary cancer, mouse genotyping, mouse colony maintenance, confocal microscopy based JC1 mitochondrial assays. HONORS & AWARDS Class Honors (Top 15%), West Virginia University School of Medicine 2010 - 2012
• Awarded in Human Function, Physical Diagnosis & Clinical Integration (Spring 2011), Neurobiology, Behavioral Science/Psychopathology, Health Care Ethics, Pathology, Microbiology, Pharmacology, and Physical Diagnosis & Clinical Integration 2 (Fall 2011 and Spring 2012)
Special Commendation for Academic Excellence – WVU School of Medicine 2011 and 2012 First Honor Graduate Spring 2010
JC. FARRIS 3
Steeleman Science Scholarship Spring 2010 North Carolina Academy of Science – 2nd Place Award Spring 2010 Lenoir-Rhyne Sponsor-a-Bear Scholarship 2009-2010 Biology Honors Program 2008-2010 Lenoir-Rhyne University President’s List – Six Semesters 2007-2010 CRC – Chemistry Achievement Award Spring 2008 Phi Theta Kappa Honors Society 2006-2007 Honors Deans List – McDowell Technical Community College 2005-2007 Presentations Farris JC, Frisch SM. Regulation of Anoikis through Metabolic Reprogramming during EMT or GRHL2-mediated MET. Department of Biochemistry – Cancer Cell Biology Dissertation Defense. June 3rd, 2016 Farris JC, Pifer PM. The MD/PhD Career Track. West Virginia Cancer Institute Summer Undergraduate Research Program. May 2016 Farris JC, Frisch SM. Regulation of Anoikis through Metabolic Reprogramming during EMT or GRHL2-mediated MET. Department of Biochemistry – Cancer Cell Biology Seminar. November 4th, 2015. Farris JC, Frisch SM. Regulation of Anoikis through Metabolic Reprogramming during EMT or GRHL2-mediated MET. Biochemistry Departmental Seminar. October 29th, 2015. Farris JC, Frisch SM. Regulation of Anoikis through Metabolic Reprogramming during EMT or GRHL2-mediated MET. Department of Biochemistry – Cancer Cell Biology Proposal Defense. March 11th, 2015. Farris JC, Frisch SM. Exploring the Role of Tubulins in Regulating Anoikis through Mitochondria. Department of Biochemistry – Cancer Cell Biology Seminar. March 19, 2014. Farris JC, Frisch SM. The Role of Grainyhead-like factors in Tumor Recurrence and Metastasis after Chemotherapy. Department of Biochemistry – Cancer Cell Biology Seminar. February 27, 2013. COMMITTEES and LEADERSHIP EXPERIENCE MD/PhD Student Admission Committee 2015
• Interviewed perspective incoming MD/PhD candidates President of Chi Beta Phi Academic Honors Society 2009 – 2010

JC. FARRIS 4
TEACHING EXPERIENCE Physics Teaching Assistant 2008 - 2009
• Assisted in both Physics 101 and 102 lab teaching exercises and graded exams/lab work
Geology Teaching Assistant 2008 – 2009
• Assisted in Geology lab teaching exercises and graded exams/lab work Farris JC. Common Anoikis Assay Techniques and Methodology. BMS 706 Cellular Methods Course. October 2015 Mentorship of undergraduate researchers 2012-2016 Collegiate Activities Alumnus of Lenoir-Rhyne University (2007-2010) Circle K Volunteer Society Member 2008 – 2010 Health Career Internship 2009-2010 WORK EXPERIENCE Frisch Laboratory Graduate Researcher 2012-2016
• West Virginia University – Department of Biochemistry Physics and Geology Laboratory Teaching Assistant 2008-2009
• Lenoir-Rhyne University – Physics Department Saw Mill Worker 2003-2007
• Peeled and processed poplar logs into home siding VOLUNTEER ACTIVITES Community Service* Homeless Care Packages January 2016
• Raised funds and helped make care packages which contained cold weather items, and distributed to homeless individuals in Morgantown
Graduate Student Organization Mad Scientist Children’s Library Learning Event May 2016 WV State Science Bowl Competition – Science Judge February 2016 Graduate Student Organization Relay for Life Mad Scientist Event Volunteer June 2015

JC. FARRIS 5
WV State Science Bowl Competition – Science Judge February 2015 Assisted in Graduate Student Orientation Activities at Wes Vaco-WVU forest August 2014 Health Science & Technology Academy Judge May 2014 AAPS Science Experiment Demonstrations at Boys and Girls Club of America May 2014 Children’s Home Society of WV Valentine Bowling Activity for Foster Children February 2012 Burke United Christian Ministries Soup Kitchen and Food Pantry Volunteer 2008-2010 Medical Mission trip to Guatemala (Surgical Mission Trip) June 2009 *Over 100 hours logged in undergraduate; Over 60 hours in medical school PERSONAL INTERESTS & HOBBIES Traveling, hiking, camping, reading, playing guitar

Appendix AI
Cieply B., Farris JC., et al.: Epithelial-Mesenchymal Transition and Tumor
Suppression Are Controlled by a Reciprocal Feedback Loop Between ZEB and Grainyhead-like 2. Cancer Research 2013 73(20); 1-11

Published OnlineFirst August 13, 2013.Cancer Res Benjamin Cieply, Joshua Farris, James Denvir, et al. ZEB1 and Grainyhead-like-2Are Controlled by a Reciprocal Feedback Loop between
Mesenchymal Transition and Tumor Suppression−Epithelial
Updated version
10.1158/0008-5472.CAN-12-4082doi:
Access the most recent version of this article at:
Material
Supplementary
ml
http://cancerres.aacrjournals.org/content/suppl/2013/08/13/0008-5472.CAN-12-4082.DC1.htAccess the most recent supplemental material at:
E-mail alerts related to this article or journal.Sign up to receive free email-alerts
Subscriptions
Reprints and
To order reprints of this article or to subscribe to the journal, contact the AACR Publications
Permissions
To request permission to re-use all or part of this article, contact the AACR Publications
Research. on October 9, 2013. © 2013 American Association for Cancercancerres.aacrjournals.org Downloaded from
Published OnlineFirst August 13, 2013; DOI: 10.1158/0008-5472.CAN-12-4082
Research. on October 9, 2013. © 2013 American Association for Cancercancerres.aacrjournals.org Downloaded from
Published OnlineFirst August 13, 2013; DOI: 10.1158/0008-5472.CAN-12-4082
Research. on October 9, 2013. © 2013 American Association for Cancercancerres.aacrjournals.org Downloaded from
Published OnlineFirst August 13, 2013; DOI: 10.1158/0008-5472.CAN-12-4082
Research. on October 9, 2013. © 2013 American Association for Cancercancerres.aacrjournals.org Downloaded from
Published OnlineFirst August 13, 2013; DOI: 10.1158/0008-5472.CAN-12-4082
Research. on October 9, 2013. © 2013 American Association for Cancercancerres.aacrjournals.org Downloaded from
Published OnlineFirst August 13, 2013; DOI: 10.1158/0008-5472.CAN-12-4082
Research. on October 9, 2013. © 2013 American Association for Cancercancerres.aacrjournals.org Downloaded from
Published OnlineFirst August 13, 2013; DOI: 10.1158/0008-5472.CAN-12-4082
Research. on October 9, 2013. © 2013 American Association for Cancercancerres.aacrjournals.org Downloaded from
Published OnlineFirst August 13, 2013; DOI: 10.1158/0008-5472.CAN-12-4082
Research. on October 9, 2013. © 2013 American Association for Cancercancerres.aacrjournals.org Downloaded from
Published OnlineFirst August 13, 2013; DOI: 10.1158/0008-5472.CAN-12-4082
Research. on October 9, 2013. © 2013 American Association for Cancercancerres.aacrjournals.org Downloaded from
Published OnlineFirst August 13, 2013; DOI: 10.1158/0008-5472.CAN-12-4082
Research. on October 9, 2013. © 2013 American Association for Cancercancerres.aacrjournals.org Downloaded from
Published OnlineFirst August 13, 2013; DOI: 10.1158/0008-5472.CAN-12-4082
Research. on October 9, 2013. © 2013 American Association for Cancercancerres.aacrjournals.org Downloaded from
Published OnlineFirst August 13, 2013; DOI: 10.1158/0008-5472.CAN-12-4082
Research. on October 9, 2013. © 2013 American Association for Cancercancerres.aacrjournals.org Downloaded from
Published OnlineFirst August 13, 2013; DOI: 10.1158/0008-5472.CAN-12-4082
Tumor and Stem Cell Biology
Epithelial–Mesenchymal Transition and Tumor SuppressionAre Controlled by a Reciprocal Feedback Loop betweenZEB1 and Grainyhead-like-2
Benjamin Cieply1, Joshua Farris1, James Denvir3, Heide L. Ford4, and Steven M. Frisch1,2
AbstractEpithelial–mesenchymal transition (EMT) in carcinoma cells enhances malignant progression by promoting
invasion and survival. EMT is induced by microenvironmental factors, including TGF-b and Wnt agonists, andby the E–box-binding transcription factors Twist, Snail, and ZEB. Grainyhead-like-2 (GRHL2), a member of themammalian Grainyhead family of wound-healing regulatory transcription factors, suppresses EMT andrestores sensitivity to anoikis by repressing ZEB1 expression and inhibiting TGF-b signaling. In this study,we elucidate the functional relationship between GRHL2 and ZEB1 in EMT/MET and tumor biology. At leastthree homeodomain proteins, Six1, LBX1, and HoxA5, transactivated the ZEB1 promoter, in the case of Six1,through direct protein–promoter interaction. GRHL2 altered the Six1–DNA complex, inhibiting this trans-activation. Correspondingly, GRHL2 expression prevented tumor initiation in xenograft assays, sensitizedbreast cancer cells to paclitaxel, and suppressed the emergence of CD44highCD24low cells (defining the cancerstem cell phenotype in the cell type studied). GRHL2 was downregulated in recurrent mouse tumors that hadevolved to an oncogene-independent, EMT-like state, supporting a role for GRHL2 downregulation in thisphenotypic transition, modeling disease recurrence. The combination of TGF-b and Wnt activation repressedGRHL2 expression by direct interaction of ZEB1 with the GRHL2 promoter, inducing EMT. Together, ourobservations indicate that a reciprocal feedback loop between GRHL2 and ZEB1 controls epithelial versusmesenchymal phenotypes and EMT-driven tumor progression. Cancer Res; 73(20); 1–11. �2013 AACR.
IntroductionThe oncogenic epithelial–mesenchymal transition (EMT)
contributes to tumor progression by enhancing tumor cellinvasiveness and anoikis-resistance, which may enhance theearly steps of metastasis (1–5). Chemo- and radioresistancealso accompany EMT, confounding stable patient responses totreatment, especially in the claudin-low subclass of breastcancer, where a frank EMT-like pattern of genes is expressed(6–9). In certain contexts, EMT also promotes the transition oftumor cells to cancer stem cell (CSC)/tumor-initiating cells,although CSCs can arise independently of EMT (10–14).The transcription factors ZEB1 and ZEB2 (SIP1) are pivotal
activators of EMT. ZEB1 and, subsequently, ZEB2 were iden-
tified as the first repressors of the mammalian E-cadherinpromoter (15, 16). They are now known to regulate cytoskel-etal, cell polarity, cell adhesion, and apoptosis-regulatory genesthat collectively suffice for EMT induction (17, 18). ZEB1 isinduced by transcription factors that include NF-kB, Twist/Snail (acting in concert), TCF4, and LBX1 (19–22). Conversely,ZEB1 expression is translationally attenuated by mir-200b/c,whose expression is, in turn, repressed by TGF-b signaling,explaining (in part) the engagement of stable autocrine TGF-bsignaling in the maintenance of EMT (23).
Grainyhead-like-2 (GRHL2) is a transcription factor thatregulates the EMT/MET-related processes of wound healing,epidermal junction assembly, and neural tube closure (24–27). Previously, we reported that GRHL2 is a generalizedsuppressor of oncogenic EMT, through at least two mechan-isms – direct repression of ZEB1 expression and inhibition ofthe TGF-b pathway (28). Here, we show that GRHL2 inhibitedtransactivation of the ZEB1 promoter mediated by the home-odomain proteins Six1, LBX1, and HoxA5. GRHL2 acted as atumor suppressor gene, by the criterion of suppressed tumor-initiation frequency. In addition, GRHL2 sensitized tumorcells to paclitaxel and prevented the emergence of CD44high
CD24low mammary epithelial cells. The combination of Wntand TGF-b pathway activation upregulated ZEB1 expression.ZEB1 reciprocally repressed GRHL2 expression through adirect interaction with the GRHL2 promoter. These observa-tions reveal a novel GRHL2–ZEB1 reciprocal feedback loop
Authors' Affiliations: 1Mary Babb Randolph Cancer Center and 2Depart-ment of Biochemistry, West Virginia University, Morgantown; 3Departmentof Biochemistry and Microbiology, Marshall University, Huntington, WestVirginia; and 4Departments of Biochemistry/Molecular Genetics andObstetrics/Gynecology, University of Colorado, Denver, Colorado
Note: Supplementary data for this article are available at Cancer ResearchOnline (http://cancerres.aacrjournals.org/).
Corresponding Author: Steven M. Frisch, Mary Babb Randolph CancerCenter, 1 Medical Center Drive, Room 2833, West Virginia University,Morgantown, WV 26506. Phone: 304-293-2980; Fax: 304-293-4667;E-mail: [email protected]
doi: 10.1158/0008-5472.CAN-12-4082
�2013 American Association for Cancer Research.
CancerResearch
www.aacrjournals.org OF1
that drives EMT versus MET in response to extracellularsignals.
Materials and MethodsCell lines
HMLE and HMLEþtwist-ER were kindly provided by R.Weinberg (Whitehead Institute, Cambridge, MA) and theMDA-MB-231LN by E. Pugacheva (West Virginia University,Morgantown, WV). Cells were cultured and stable cell lineswere generated via retroviral transduction as describedpreviously (28) GRHL2 was expressed using either MSCV-IRES-puro or MSCV-IRES-GFP (pMIG, Addgene) and mixedpopulations or multiple clonal lines were used as indicated.The b-catenin S33Y mutant (provided by S.P.S. Monga,University of Pittsburgh, Pittsburgh, PA) was subcloned intothe pMXS-IRES-PURO retroviral vector [contributed by RussCarstens, University of Pennsylvania (Philadelphia, PA) in-frame with a C-terminal FLAG tag]. The human Six1sequence was also subcloned into the pMXS-IRES-PUROvector. ZEB1 shRNA (V3LHS_356186, Open Biosystems) andZEB1 cDNA were expressed via the pTRIPZ and pLUTlentiviral vectors, respectively, as described previously (28).Human H-rasV12 in MSCV-IRES-Blast (Addgene) was used toexpress activated Ras in CD44low (flow-sorted) HMLE cellsfor tumor assays. HMLEþRas cells were subjected to stableGRHL2 knockdown (Open Biosystems RHS4430-99291384)using pGIPZ, followed by selection for puromycin resistanceand sorting for GFP.
Xenograft assaysMDA-MB-231LN stably expressing either empty-MSCV-
IRES-Puro or GRHL2-IRES-Puro were trypsinized and resus-pended in growth media, and the indicated cell numbers in 0.1mL were injected into the fourth inguinal mammary fat pad offemale BALB/c nude mice (Charles River) at approximatelyfour weeks of age. HMLEþRas cells with GRHL2 or controlshort-hairpin RNA (shRNA; see earlier) were trypsinized andsuspended in growthmedium; the indicated cell numbers wereinjected in 0.1 mL into the fourth inguinal mammary fat pad offemale nonobese diabetic/severe combined immunodeficient(NOD/SCID; Charles River). Assays were carried out for 10weeks (HMLER) or for indicated times. Tumor volume wasdetermined using the formula p(L1 � L22)/6, where L1 is thelong axis and L2 is the short axis. Tumor burdenwasmonitoredaccording to the WVU ACUC Tumor Burden Policy. Animalstudies were approved by the West Virginia University AnimalCare and Use Committee.
Western blottingElectrophoresis, transfer, immunoblotting, and antibodies
used were described (28). Other antibodies used here were:rabbit anti-vimentin (Cell Signaling Technology), mouse anti-FLAG (M2; Sigma), andmouse anti-GAPDH (Thermo Scientific).
Chemosensitivity assaysMDA-MB-231 cells with stable GRHL2-MSCV-IRES-puro or
empty MSCV-IRES-puro were plated in 96-well dishes at a
density of 5,000 cells per well and assayed in biological trip-licate for cell viability after three days of incubation, with theindicated concentration of paclitaxel, using Presto-Blue (Invi-trogen) according to the manufacturer's protocol. For thechemo-induced marker analysis, the protocol was modeledafter the study by Gupta and colleagues (38). HMLE cellsexpressing empty-MSCV-IRES-GFP or GRHL2–MSCV-IRES-GFP were treated with paclitaxel (10 nmol/L) for four days,followed by seven days of recovery and flow analysis for CD44using a CD44-PE antibody (BD Biosciences). HMLE induced toundergo EMT by ectopic twist were used as a positive controlfor the CD44high phenotype.
Quantitative reverse transcription PCR analysis ofprimary vs. recurrent mouse tumors
RNAs from primary and recurrent tetO-neuNT (n ¼ 5 foreach group; ref. 29) or tetO-Wnt1 (n ¼ 4 for each group;ref. 30) were provided by L. Chodosh (University of Penn-sylvania) or E. Gunther (Penn State University, Hershey, PA)and analyzed for GRHL2 expression using a b2-microglobu-lin internal control as described previously (28), using theprimers: mGRHL2-f: caaggacgaccagcgcagca; mGRHL2-r:ggccctccccctgcttctga; mB2M-f: tggtctttctggtgcttgtc; mB2M-r:gggtggaactgtgttacgtag.
BIO, TGF-b, and BMP2 treatmentsHMLE cells were treated with 5 mM 6-bromo-3-[(3E)-1,3-
dihydro-3-(hydroxyimino)-2H-indol-2-ylidene]-1,3-dihydro-(3Z)-2H-indol-2-one (BIO; ref. 31) and/or TGF-b1 (5 ng/mL) forfour days. BIO was removed and the TGF-b was continued foranother six days; samples were then analyzed by Western blot.HMLEþtwist-ERwere treatedwith either 50nmol/L 4-hydroxy-tamoxifen (4OHT), 0.5 mg/mL BMP-2 (R&D Biosystems), orboth for 7 to 10 days and then analyzed by Western blot.
Reporter assaysCotransfections, luciferase, and b-galactosidase assays as
well as the GRHL2 expression vector and ZEB1-WT- promoterreporterwere described previously (28); all values represent theaverage relative luciferase activity/b-galactosidase activity ofbiological duplicates; error bars represent SD from the mean.The transcription factors used in the cotransfection/reporterassays were obtained and cloned as follows: hLBX1 wasobtained from D. Haber (Dana–Farber Cancer Center) inpBABE and cloned into pCDNA3.1. The hHOXA5 was pur-chased from Addgene and subcloned from pET28B intopCDNA-3.1. mTwist (pBABE-mTWIST-ER) was purchasedfrom Addgene and the twist cDNA was subcloned intopCDNA-3.1 (GC rich Phusion buffer). HA-Snail-pCDNA-3.1 waspurchased from Addgene. The GRHL2 genomic sequence from�625 to þ335 (relative to the transcription start site of thestandard GRHL2 transcript) was subcloned into pGL4.14using the following primers: Gra-prom-f3: CTCACCTGTTT-GAAAATCTG and Gra-prom-r12: TGTTTGATCCAATGAA-CTTGC, using the Bacterial Artificial Chromosome clone2058A8 (Invitrogen) as a template; these coordinates werebased on the GRHL2 transcript NM_024915. The band result-ing from this PCR was reamplified with similar primers
Cieply et al.
Cancer Res; 73(20) October 15, 2013 Cancer ResearchOF2
containing NheI (forward) and BglII (reverse) restriction sites,and subcloned into pGL4.14 (Promega).The ZEB1 promoters containing a mutant downstream
homeobox site or deleted upstream homeobox site or bothwere generated as follows. The downstream site was mutatedby using the mutagenic primers Mut-f3: cgtgcctccctctccccac-cagtccgtaggaaaacttttccc Mut-r3: gggaaaagttttcctacggactggt-ggggagagggaggcacg in the Quickchange-IIXL kit (Agilent) withthe ZEB1 promoter/pGL3basic clone (provided by AntonioGarcia de Herreros, University of Barcelona) as a template. Thedeletion of the upstream site was generated by amplifyingthe same template in two separate PCR reactions, usingAnt-f: TAATTTACGCGTCCTTAAGGTCCTGCACGGCG, Ant-r: TTTAAAAAGCTTCCGCCATGATCCTCTCGC (reaction 1)andAnt-f2: tatataGCGGCCGCAAGGGAAGGGAAGGGAGTCC,Ant-r2: TTTAAAGCGGCCGCTTCAATGAGATTGAACTTCA.Following restriction digestion and isolation from an agarosegel, fragments were three-way ligated into pGL3basic.
Chromatin immunoprecipitation assaysThe protocol for cross-linking, immunoprecipitation, de–
cross-linking, and quantitative PCR (qPCR) analysis was asdescribed previously (28). For Six1 protein interaction withthe ZEB1 promoter, five dishes of HMLEþ empty vector(pMXS-IRES-puro) or FLAG-Six1 were immunoprecipitatedwith mouse anti-FLAG-M2-agarose or mouse IgG (Santa CruzBioTechnology)-agarose in conjunction with DNA/protein-blocked protein A/G agarose (Pierce/Thermo). Primers toamplify the ZEB1 promoter were: f: gccgccgagcctccaacttt;r: tgctagggaccgggcggttt. For interaction of ZEB1 protein withthe GRHL2 promoter, five dishes of HMLE expressing ZEB1 (inpLUT vector) were processed. To pull down ZEB1, 1 mg of thefollowing antibodies (3 mg in total) were used: ZEB1, rb,Sigma HPA004820; ZEB1, rb, Cell Signaling Technology3396S; and ZEB1, rb, Santa Cruz Biotechnology SC-25388. Thecontrol antibody was rabbit immunoglobulin G (IgG, 3 mg;Santa Cruz Biotechnology). Primers to analyze the ZEB1chromatin immunoprecipitation (chIP) were: positive control:Ecad-ZEB1-f: ggccggcaggtgaaccctca; Ecad-ZEB1-r: gggctggag-tctgaactga; GRHL2 promoter set 1: f: cgccgctccactcgggtaaa;r: tgcgcgatgattggctgggg; GRHL2 promoter set2: f: tcagctctca-caggctgccg; r: gaggcgcgctcaggtaaggc. The negative controlprimer set for all CHIP assays was from an intergenic regionupstream of the GAPDH locus: GAPDH-f: atgggtgccactggg-gatct; GAPDH-r: tgccaaagcctaggggaaga.
Electrophoretic mobility shift assayPurified recombinant Six1 protein was generated as
described previously (32). Purified recombinant GRHL2 pro-teinwas obtained by expressing the GRHL2 coding sequence inEscherichia coli (E. coli) BL21 using the pGEX-6P3 vector andpurifying the fusion protein as described previously (15). Afterbinding to the glutathione Sepharose resin (GE Healthcare),the protein was cleaved free of GST sequence using Pre-Scission Protease, which was then dialyzed against electro-phoretic mobility shift assay (EMSA) buffer (see further) usingSlide-A-LyzerMini-dialysis Unit (Thermo Scientific). 2� EMSAbuffer was: 30 mmol/L HEPES pH 7.6, 20% glycerol, 1 mmol/L
EDTA, 200 mmol/L KCL, 0.5% NP40, 5 mg/mL BSA (addedfresh), 10 mmol/L DTT (added fresh). For 20 mL bindingreactions: 10 mL 2� EMSA bufferþ1 mL poly dIdC (0.5mg/mL)þ2 mL annealed 100 nmol/L oligonucleotide, andrecombinant protein (as indicated). Oligonucleotides forEMSA were synthesized with Cy5 groups on both 50 ends(Operon) and annealed at 10 mmol/L Tris/1 mmol/L EDTA/100 mmol/L NaCl. Binding reactions were incubated at 4�C for20 minutes, 15 minutes at room temperature, and analyzed on6% polyacrylamide/TBE gels in 0.25� TBE buffer (pre-run for1 hour) at 170V. The fluorescent signals were imaged usingthe LiCor Odyssey imaging system.
Oligo sequences (Forward strands) ZEB1-WT-Promoter:(Cy5)-GGAAGGTGATGTCGTAAAGCCGGGAGTGTCGTAAA-CCAGGTGCGGTGGG
ZEB1-MT-Promoter: (Cy5)-GGAAGGTGATGTCGTCCCGC-CGGGAGTGTCGTCCCCCAGGTGCGGTGGG
GRHL2-Pos-Con: (Cy5)-AACTATAAAACCGGTTTATCTA-GTTGG
Six1-Pos-Con: (Cy5)-GGGGGCTCAGGTTTCTGTGGCNegative control (from E-cadherin promoter): (Cy5)-TGG-
CCGGCAGGTGAACCCTCAGCCAATCAGCGCTACGGGGGG-CGGTGCTCCGGGGCTCACCTGGCTGCAG
Flow cytometryTrypsinized cells (1 � 105) were stained with APC mouse
anti-human CD44 (BD 560890) and PerCP-Cy5.5 mouse anti-human CD24 (BD 561647) in 100 uL of PBS containing 2.5mmol/L EDTA, 10 mmol/L HEPES, and 2% horse serum,followed by washing and analysis using a FACS-Aria.
Statistical methodsError bars in graphs represent SDs, using a two-tailed t test. P
values for tumor assays were calculated using the two-tailedFisher exact test. Tumors were considered present when thetumor volume was reported to be greater than 100 mm3. ORsand P values for tumor incidence were calculated using theFisher exact Test as implemented in R v2.15.1 (www.r-project.org).
ResultsGRHL2 inhibits the activation of ZEB1 expression byhomeodomain proteins
Previously, we reported that GRHL2 binds and represses theZEB1 promoter so as to suppress EMT (28). To characterizethis transcriptional regulation further, we analyzed the ZEB1promoter using a transcription factor-binding prediction pro-gram (Genomatix) and identified two tandem homeodomainconsensus binding sites, overlapping with and just upstream ofthe putative GRHL2 site. Alignment of this sequence betweenseveral species revealed that both the putative GRHL2 bindingsite as well as these homeobox sites were highly conserved(Fig. 1A). In this light, we tested the effect of two homeodomainfactors that were previously shown to be involved in EMTinduction in breast cancer cells – LBX1 and Six1 – on theactivity of the ZEB1 promoter (22, 33). These factors activatedtranscription of the ZEB1 promoter significantly; mutation
GRHL2 vs. ZEB1 Feedback Controls EMT
www.aacrjournals.org Cancer Res; 73(20) October 15, 2013 OF3
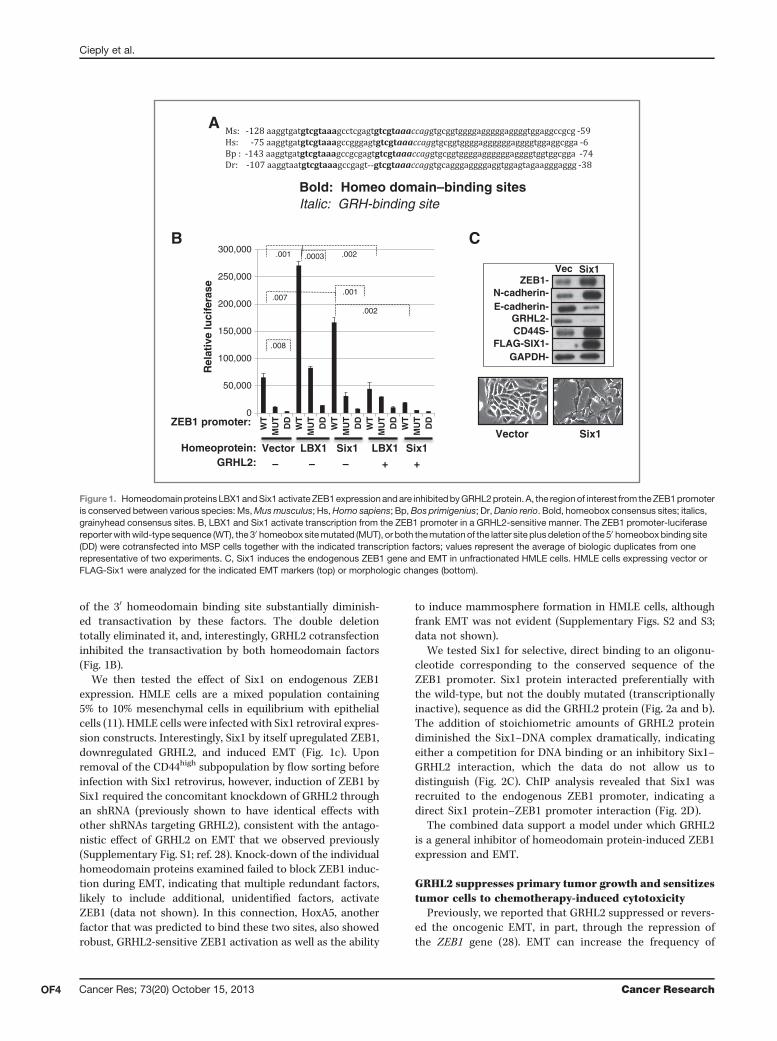
of the 30 homeodomain binding site substantially diminish-ed transactivation by these factors. The double deletiontotally eliminated it, and, interestingly, GRHL2 cotransfectioninhibited the transactivation by both homeodomain factors(Fig. 1B).
We then tested the effect of Six1 on endogenous ZEB1expression. HMLE cells are a mixed population containing5% to 10% mesenchymal cells in equilibrium with epithelialcells (11). HMLE cells were infected with Six1 retroviral expres-sion constructs. Interestingly, Six1 by itself upregulated ZEB1,downregulated GRHL2, and induced EMT (Fig. 1c). Uponremoval of the CD44high subpopulation by flow sorting beforeinfection with Six1 retrovirus, however, induction of ZEB1 bySix1 required the concomitant knockdown of GRHL2 throughan shRNA (previously shown to have identical effects withother shRNAs targeting GRHL2), consistent with the antago-nistic effect of GRHL2 on EMT that we observed previously(Supplementary Fig. S1; ref. 28). Knock-down of the individualhomeodomain proteins examined failed to block ZEB1 induc-tion during EMT, indicating that multiple redundant factors,likely to include additional, unidentified factors, activateZEB1 (data not shown). In this connection, HoxA5, anotherfactor that was predicted to bind these two sites, also showedrobust, GRHL2-sensitive ZEB1 activation as well as the ability
to induce mammosphere formation in HMLE cells, althoughfrank EMT was not evident (Supplementary Figs. S2 and S3;data not shown).
We tested Six1 for selective, direct binding to an oligonu-cleotide corresponding to the conserved sequence of theZEB1 promoter. Six1 protein interacted preferentially withthe wild-type, but not the doubly mutated (transcriptionallyinactive), sequence as did the GRHL2 protein (Fig. 2a and b).The addition of stoichiometric amounts of GRHL2 proteindiminished the Six1–DNA complex dramatically, indicatingeither a competition for DNA binding or an inhibitory Six1–GRHL2 interaction, which the data do not allow us todistinguish (Fig. 2C). ChIP analysis revealed that Six1 wasrecruited to the endogenous ZEB1 promoter, indicating adirect Six1 protein–ZEB1 promoter interaction (Fig. 2D).
The combined data support a model under which GRHL2is a general inhibitor of homeodomain protein-induced ZEB1expression and EMT.
GRHL2 suppresses primary tumor growth and sensitizestumor cells to chemotherapy-induced cytotoxicity
Previously, we reported that GRHL2 suppressed or revers-ed the oncogenic EMT, in part, through the repression ofthe ZEB1 gene (28). EMT can increase the frequency of
0
50,000
100,000
150,000
200,000
250,000
300,000W
TM
UT
DD
WT
MU
TD
DW
TM
UT
DD
WT
MU
TD
DW
TM
UT
DD
Rel
ativ
e lu
cife
rase
ZEB1 promoter:
Homeoprotein: Vector LBX1 Six1 LBX1 Six1GRHL2: – – – + +
B
.008
.001
.007
.0003 .002
.002
.001ZEB1-
N-cadherin-E-cadherin-
GRHL2-CD44S-
FLAG-SIX1-GAPDH-
Vec Six1
Vector Six1
C
A
Bold: Homeo domain–binding sitesItalic: GRH-binding site
Figure1. Homeodomainproteins LBX1andSix1 activateZEB1expressionandare inhibitedbyGRHL2protein. A, the regionof interest from theZEB1promoteris conserved between various species: Ms,Musmusculus; Hs,Homo sapiens; Bp,Bos primigenius; Dr,Danio rerio. Bold, homeobox consensus sites; italics,grainyhead consensus sites. B, LBX1 and Six1 activate transcription from the ZEB1 promoter in a GRHL2-sensitive manner. The ZEB1 promoter-luciferasereporterwithwild-type sequence (WT), the 30 homeobox sitemutated (MUT), or both themutation of the latter site plus deletion of the 50 homeoboxbinding site(DD) were cotransfected into MSP cells together with the indicated transcription factors; values represent the average of biologic duplicates from onerepresentative of two experiments. C, Six1 induces the endogenous ZEB1 gene and EMT in unfractionated HMLE cells. HMLE cells expressing vector orFLAG-Six1 were analyzed for the indicated EMT markers (top) or morphologic changes (bottom).
Cieply et al.
Cancer Res; 73(20) October 15, 2013 Cancer ResearchOF4
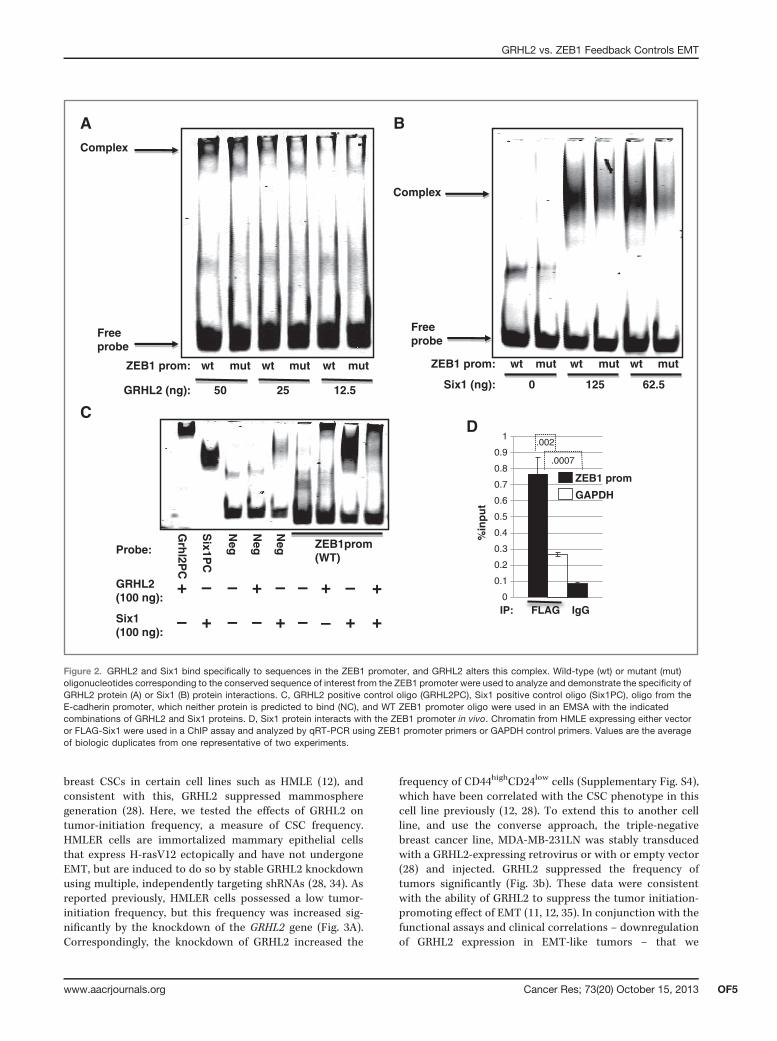
breast CSCs in certain cell lines such as HMLE (12), andconsistent with this, GRHL2 suppressed mammospheregeneration (28). Here, we tested the effects of GRHL2 ontumor-initiation frequency, a measure of CSC frequency.HMLER cells are immortalized mammary epithelial cellsthat express H-rasV12 ectopically and have not undergoneEMT, but are induced to do so by stable GRHL2 knockdownusing multiple, independently targeting shRNAs (28, 34). Asreported previously, HMLER cells possessed a low tumor-initiation frequency, but this frequency was increased sig-nificantly by the knockdown of the GRHL2 gene (Fig. 3A).Correspondingly, the knockdown of GRHL2 increased the
frequency of CD44highCD24low cells (Supplementary Fig. S4),which have been correlated with the CSC phenotype in thiscell line previously (12, 28). To extend this to another cellline, and use the converse approach, the triple-negativebreast cancer line, MDA-MB-231LN was stably transducedwith a GRHL2-expressing retrovirus or with or empty vector(28) and injected. GRHL2 suppressed the frequency oftumors significantly (Fig. 3b). These data were consistentwith the ability of GRHL2 to suppress the tumor initiation-promoting effect of EMT (11, 12, 35). In conjunction with thefunctional assays and clinical correlations – downregulationof GRHL2 expression in EMT-like tumors – that we
wt wt wtmut mut mutZEB1 prom:
GRHL2 (ng): 50 25 12.5
wt wt wtmut mut mutZEB1 prom:
Six1 (ng): 0 125 62.5
Complex
Freeprobe
Complex
Freeprobe
A
Probe:
Grh
l2PC
Six1P
C
Neg
Neg ZEB1prom
(WT)N
eg
GRHL2(100 ng):
+ –– + – – + – +
Six1(100 ng):
– – –+ + +–– +
C
B
0
0.1
0.2
0.3
0.4
0.5
0.6
0.7
0.8
0.9
1
IP: FLAG IgG
.0007
.002
ZEB1 prom
GAPDH%
inp
ut
D
Figure 2. GRHL2 and Six1 bind specifically to sequences in the ZEB1 promoter, and GRHL2 alters this complex. Wild-type (wt) or mutant (mut)oligonucleotides corresponding to the conserved sequence of interest from the ZEB1 promoter were used to analyze and demonstrate the specificity ofGRHL2 protein (A) or Six1 (B) protein interactions. C, GRHL2 positive control oligo (GRHL2PC), Six1 positive control oligo (Six1PC), oligo from theE-cadherin promoter, which neither protein is predicted to bind (NC), and WT ZEB1 promoter oligo were used in an EMSA with the indicatedcombinations of GRHL2 and Six1 proteins. D, Six1 protein interacts with the ZEB1 promoter in vivo. Chromatin from HMLE expressing either vectoror FLAG-Six1 were used in a ChIP assay and analyzed by qRT-PCR using ZEB1 promoter primers or GAPDH control primers. Values are the averageof biologic duplicates from one representative of two experiments.
GRHL2 vs. ZEB1 Feedback Controls EMT
www.aacrjournals.org Cancer Res; 73(20) October 15, 2013 OF5
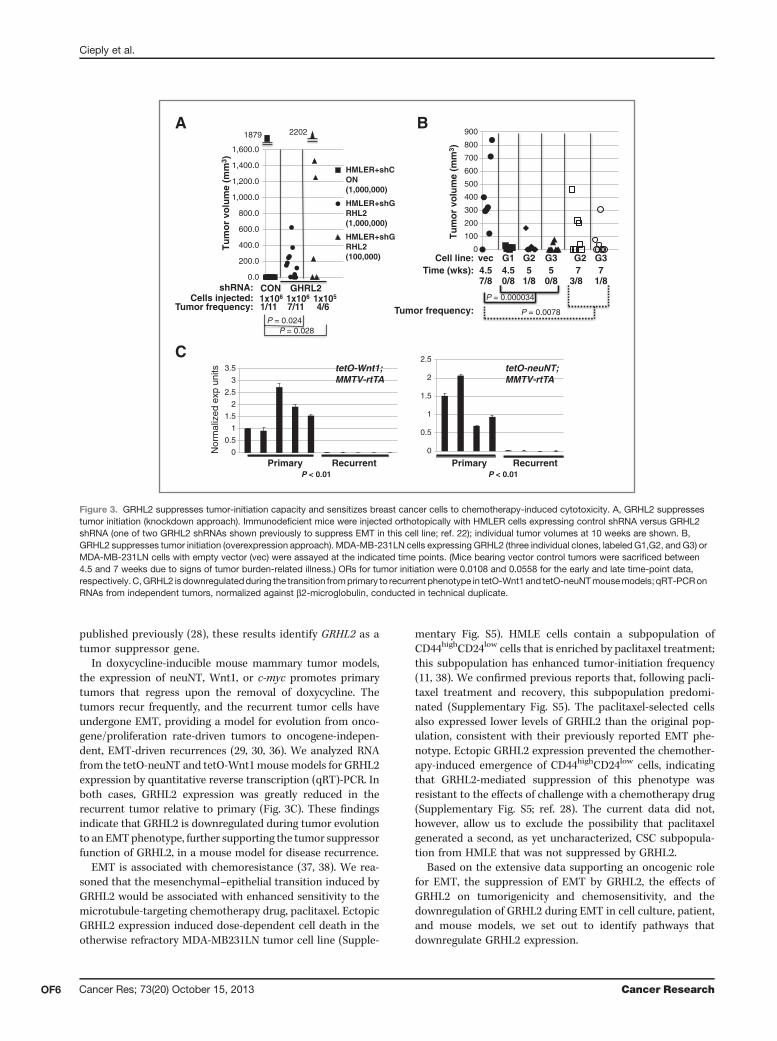
published previously (28), these results identify GRHL2 as atumor suppressor gene.
In doxycycline-inducible mouse mammary tumor models,the expression of neuNT, Wnt1, or c-myc promotes primarytumors that regress upon the removal of doxycycline. Thetumors recur frequently, and the recurrent tumor cells haveundergone EMT, providing a model for evolution from onco-gene/proliferation rate-driven tumors to oncogene-indepen-dent, EMT-driven recurrences (29, 30, 36). We analyzed RNAfrom the tetO-neuNT and tetO-Wnt1mousemodels for GRHL2expression by quantitative reverse transcription (qRT)-PCR. Inboth cases, GRHL2 expression was greatly reduced in therecurrent tumor relative to primary (Fig. 3C). These findingsindicate that GRHL2 is downregulated during tumor evolutionto an EMTphenotype, further supporting the tumor suppressorfunction of GRHL2, in a mouse model for disease recurrence.
EMT is associated with chemoresistance (37, 38). We rea-soned that the mesenchymal–epithelial transition induced byGRHL2 would be associated with enhanced sensitivity to themicrotubule-targeting chemotherapy drug, paclitaxel. EctopicGRHL2 expression induced dose-dependent cell death in theotherwise refractory MDA-MB231LN tumor cell line (Supple-
mentary Fig. S5). HMLE cells contain a subpopulation ofCD44highCD24low cells that is enriched by paclitaxel treatment;this subpopulation has enhanced tumor-initiation frequency(11, 38). We confirmed previous reports that, following pacli-taxel treatment and recovery, this subpopulation predomi-nated (Supplementary Fig. S5). The paclitaxel-selected cellsalso expressed lower levels of GRHL2 than the original pop-ulation, consistent with their previously reported EMT phe-notype. Ectopic GRHL2 expression prevented the chemother-apy-induced emergence of CD44highCD24low cells, indicatingthat GRHL2-mediated suppression of this phenotype wasresistant to the effects of challenge with a chemotherapy drug(Supplementary Fig. S5; ref. 28). The current data did not,however, allow us to exclude the possibility that paclitaxelgenerated a second, as yet uncharacterized, CSC subpopula-tion from HMLE that was not suppressed by GRHL2.
Based on the extensive data supporting an oncogenic rolefor EMT, the suppression of EMT by GRHL2, the effects ofGRHL2 on tumorigenicity and chemosensitivity, and thedownregulation of GRHL2 during EMT in cell culture, patient,and mouse models, we set out to identify pathways thatdownregulate GRHL2 expression.
0
100
200
300
400
500
600
700
800
900
Cell line: vec G1 G2 G3 G2 G3Time (wks): 4.5 5 5 7 7
Tumor frequency:
7/8 0/8 1/8 0/8 3/8 1/8
P = 0.0078
4.5
P = 0.000034shRNA: CON GHRL2
Cells injected: 1x10⁶ 1x10⁶ 1x10⁵
Tumor frequency:
0.0
200.0
400.0
600.0
800.0
1,000.0
1,200.0
1,400.0
1,600.0
1879 2202
1/11 7/11 4/6P = 0.024
P = 0.028
A B
Primary Recurrent0
0.5
1
1.5
2
2.5
Primary RecurrentP < 0.01 P < 0.01
C
Nor
mal
ized
exp
uni
tsT
um
or
volu
me
(mm
3 )
Tu
mo
r vo
lum
e (m
m3 )
HMLER+shCON(1,000,000)
HMLER+shGRHL2(1,000,000)
HMLER+shGRHL2(100,000)
0
0.5
1
1.5
2
2.5
3
3.5 tetO-Wnt1;MMTV-rtTA
tetO-neuNT;MMTV-rtTA
Figure 3. GRHL2 suppresses tumor-initiation capacity and sensitizes breast cancer cells to chemotherapy-induced cytotoxicity. A, GRHL2 suppressestumor initiation (knockdown approach). Immunodeficient mice were injected orthotopically with HMLER cells expressing control shRNA versus GRHL2shRNA (one of two GRHL2 shRNAs shown previously to suppress EMT in this cell line; ref. 22); individual tumor volumes at 10 weeks are shown. B,GRHL2 suppresses tumor initiation (overexpression approach). MDA-MB-231LN cells expressing GRHL2 (three individual clones, labeled G1,G2, and G3) orMDA-MB-231LN cells with empty vector (vec) were assayed at the indicated time points. (Mice bearing vector control tumors were sacrificed between4.5 and 7 weeks due to signs of tumor burden-related illness.) ORs for tumor initiation were 0.0108 and 0.0558 for the early and late time-point data,respectively.C,GRHL2 isdownregulatedduring the transition fromprimary to recurrent phenotype in tetO-Wnt1and tetO-neuNTmousemodels; qRT-PCRonRNAs from independent tumors, normalized against b2-microglobulin, conducted in technical duplicate.
Cieply et al.
Cancer Res; 73(20) October 15, 2013 Cancer ResearchOF6
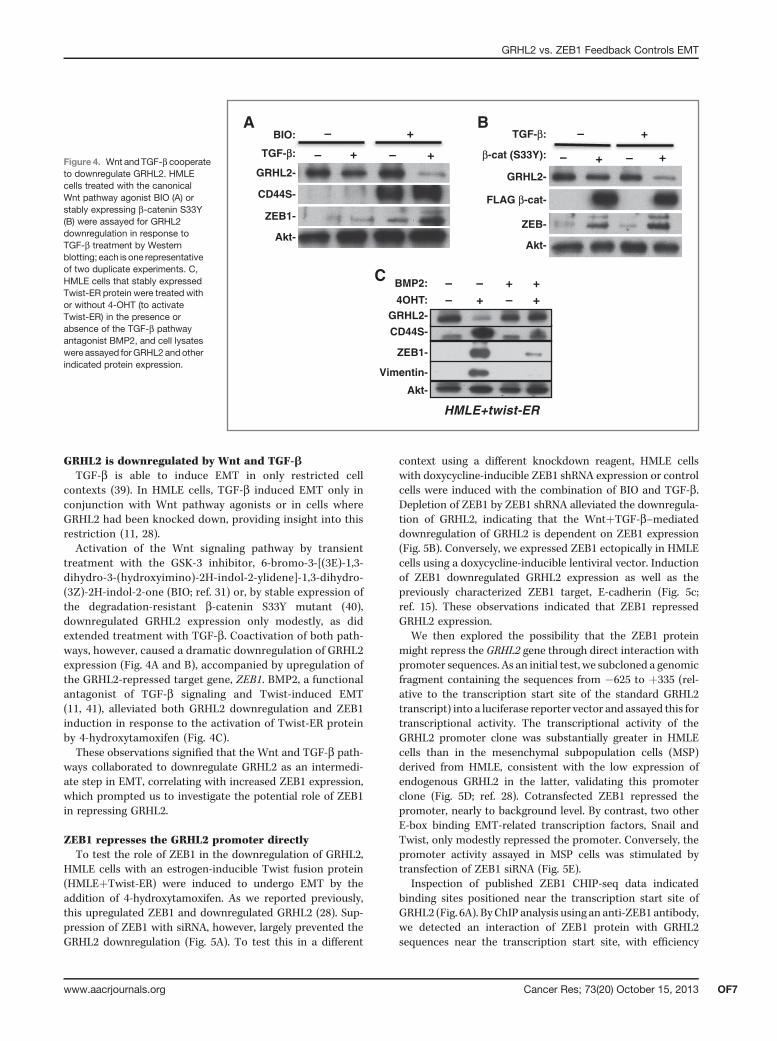
GRHL2 is downregulated by Wnt and TGF-bTGF-b is able to induce EMT in only restricted cell
contexts (39). In HMLE cells, TGF-b induced EMT only inconjunction with Wnt pathway agonists or in cells whereGRHL2 had been knocked down, providing insight into thisrestriction (11, 28).Activation of the Wnt signaling pathway by transient
treatment with the GSK-3 inhibitor, 6-bromo-3-[(3E)-1,3-dihydro-3-(hydroxyimino)-2H-indol-2-ylidene]-1,3-dihydro-(3Z)-2H-indol-2-one (BIO; ref. 31) or, by stable expression ofthe degradation-resistant b-catenin S33Y mutant (40),downregulated GRHL2 expression only modestly, as didextended treatment with TGF-b. Coactivation of both path-ways, however, caused a dramatic downregulation of GRHL2expression (Fig. 4A and B), accompanied by upregulation ofthe GRHL2-repressed target gene, ZEB1. BMP2, a functionalantagonist of TGF-b signaling and Twist-induced EMT(11, 41), alleviated both GRHL2 downregulation and ZEB1induction in response to the activation of Twist-ER proteinby 4-hydroxytamoxifen (Fig. 4C).These observations signified that the Wnt and TGF-b path-
ways collaborated to downregulate GRHL2 as an intermedi-ate step in EMT, correlating with increased ZEB1 expression,which prompted us to investigate the potential role of ZEB1in repressing GRHL2.
ZEB1 represses the GRHL2 promoter directlyTo test the role of ZEB1 in the downregulation of GRHL2,
HMLE cells with an estrogen-inducible Twist fusion protein(HMLEþTwist-ER) were induced to undergo EMT by theaddition of 4-hydroxytamoxifen. As we reported previously,this upregulated ZEB1 and downregulated GRHL2 (28). Sup-pression of ZEB1 with siRNA, however, largely prevented theGRHL2 downregulation (Fig. 5A). To test this in a different
context using a different knockdown reagent, HMLE cellswith doxycycline-inducible ZEB1 shRNA expression or controlcells were induced with the combination of BIO and TGF-b.Depletion of ZEB1 by ZEB1 shRNA alleviated the downregula-tion of GRHL2, indicating that the WntþTGF-b–mediateddownregulation of GRHL2 is dependent on ZEB1 expression(Fig. 5B). Conversely, we expressed ZEB1 ectopically in HMLEcells using a doxycycline-inducible lentiviral vector. Inductionof ZEB1 downregulated GRHL2 expression as well as thepreviously characterized ZEB1 target, E-cadherin (Fig. 5c;ref. 15). These observations indicated that ZEB1 repressedGRHL2 expression.
We then explored the possibility that the ZEB1 proteinmight repress the GRHL2 gene through direct interaction withpromoter sequences. As an initial test, we subcloned a genomicfragment containing the sequences from �625 to þ335 (rel-ative to the transcription start site of the standard GRHL2transcript) into a luciferase reporter vector and assayed this fortranscriptional activity. The transcriptional activity of theGRHL2 promoter clone was substantially greater in HMLEcells than in the mesenchymal subpopulation cells (MSP)derived from HMLE, consistent with the low expression ofendogenous GRHL2 in the latter, validating this promoterclone (Fig. 5D; ref. 28). Cotransfected ZEB1 repressed thepromoter, nearly to background level. By contrast, two otherE-box binding EMT-related transcription factors, Snail andTwist, only modestly repressed the promoter. Conversely, thepromoter activity assayed in MSP cells was stimulated bytransfection of ZEB1 siRNA (Fig. 5E).
Inspection of published ZEB1 CHIP-seq data indicatedbinding sites positioned near the transcription start site ofGRHL2 (Fig. 6A). By ChIP analysis using an anti-ZEB1 antibody,we detected an interaction of ZEB1 protein with GRHL2sequences near the transcription start site, with efficiency
BIO:
Akt-
GRHL2-
CD44S-
ZEB1-
TGF-ββ:
TGF-β:
– + – +
– +A
ZEB-
GRHL2-
Akt-
FLAG β-cat-
β-cat (S33Y): – –+ +
– +B
HMLE+twist-ER
Akt-
GRHL2-
CD44S-
4OHT: – + – +++– –BMP2:
ZEB1-
Vimentin-
C
Figure 4. Wnt and TGF-b cooperateto downregulate GRHL2. HMLEcells treated with the canonicalWnt pathway agonist BIO (A) orstably expressing b-catenin S33Y(B) were assayed for GRHL2downregulation in response toTGF-b treatment by Westernblotting; each is one representativeof two duplicate experiments. C,HMLE cells that stably expressedTwist-ER protein were treated withor without 4-OHT (to activateTwist-ER) in the presence orabsence of the TGF-b pathwayantagonist BMP2, and cell lysateswere assayed forGRHL2 and otherindicated protein expression.
GRHL2 vs. ZEB1 Feedback Controls EMT
www.aacrjournals.org Cancer Res; 73(20) October 15, 2013 OF7
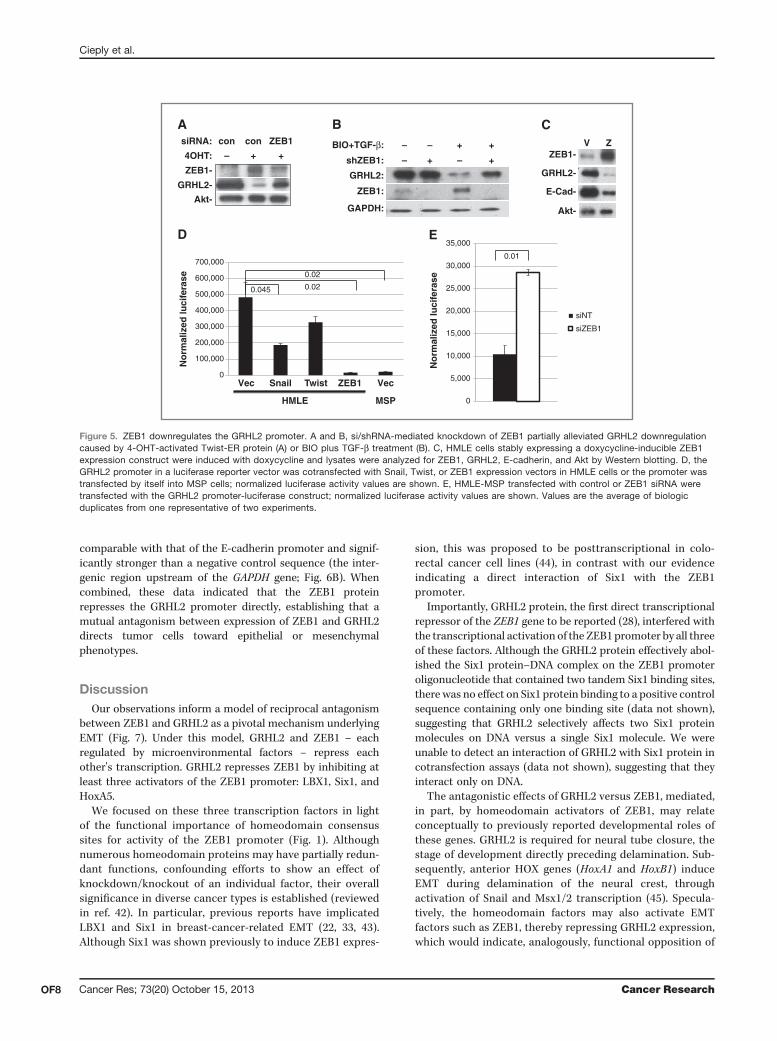
comparable with that of the E-cadherin promoter and signif-icantly stronger than a negative control sequence (the inter-genic region upstream of the GAPDH gene; Fig. 6B). Whencombined, these data indicated that the ZEB1 proteinrepresses the GRHL2 promoter directly, establishing that amutual antagonism between expression of ZEB1 and GRHL2directs tumor cells toward epithelial or mesenchymalphenotypes.
DiscussionOur observations inform a model of reciprocal antagonism
between ZEB1 and GRHL2 as a pivotal mechanism underlyingEMT (Fig. 7). Under this model, GRHL2 and ZEB1 – eachregulated by microenvironmental factors – repress eachother's transcription. GRHL2 represses ZEB1 by inhibiting atleast three activators of the ZEB1 promoter: LBX1, Six1, andHoxA5.
We focused on these three transcription factors in lightof the functional importance of homeodomain consensussites for activity of the ZEB1 promoter (Fig. 1). Althoughnumerous homeodomain proteins may have partially redun-dant functions, confounding efforts to show an effect ofknockdown/knockout of an individual factor, their overallsignificance in diverse cancer types is established (reviewedin ref. 42). In particular, previous reports have implicatedLBX1 and Six1 in breast-cancer-related EMT (22, 33, 43).Although Six1 was shown previously to induce ZEB1 expres-
sion, this was proposed to be posttranscriptional in colo-rectal cancer cell lines (44), in contrast with our evidenceindicating a direct interaction of Six1 with the ZEB1promoter.
Importantly, GRHL2 protein, the first direct transcriptionalrepressor of the ZEB1 gene to be reported (28), interfered withthe transcriptional activation of the ZEB1 promoter by all threeof these factors. Although the GRHL2 protein effectively abol-ished the Six1 protein–DNA complex on the ZEB1 promoteroligonucleotide that contained two tandem Six1 binding sites,there was no effect on Six1 protein binding to a positive controlsequence containing only one binding site (data not shown),suggesting that GRHL2 selectively affects two Six1 proteinmolecules on DNA versus a single Six1 molecule. We wereunable to detect an interaction of GRHL2 with Six1 protein incotransfection assays (data not shown), suggesting that theyinteract only on DNA.
The antagonistic effects of GRHL2 versus ZEB1, mediated,in part, by homeodomain activators of ZEB1, may relateconceptually to previously reported developmental roles ofthese genes. GRHL2 is required for neural tube closure, thestage of development directly preceding delamination. Sub-sequently, anterior HOX genes (HoxA1 and HoxB1) induceEMT during delamination of the neural crest, throughactivation of Snail and Msx1/2 transcription (45). Specula-tively, the homeodomain factors may also activate EMTfactors such as ZEB1, thereby repressing GRHL2 expression,which would indicate, analogously, functional opposition of
GRHL2-
ZEB1-
Akt-
4OHT:
siRNA:
– + +
con con ZEB1
A
ZEB1-
GRHL2-
E-Cad-
Akt-
V Z
C
shZEB1:
BIO+TGF-β:
GRHL2:
ZEB1:
GAPDH:
+–
– – + +
+–
B
No
rmal
ized
luci
fera
se
No
rmal
ized
luci
fera
se
Vec Snail Twist ZEB1 Vec
HMLE MSP
D
0.045
0.02
siNT
siZEB1
E
0.01
0.02
0
100,000
200,000
300,000
400,000
500,000
600,000
700,000
0
5,000
10,000
15,000
20,000
25,000
30,000
35,000
Figure 5. ZEB1 downregulates the GRHL2 promoter. A and B, si/shRNA-mediated knockdown of ZEB1 partially alleviated GRHL2 downregulationcaused by 4-OHT-activated Twist-ER protein (A) or BIO plus TGF-b treatment (B). C, HMLE cells stably expressing a doxycycline-inducible ZEB1expression construct were induced with doxycycline and lysates were analyzed for ZEB1, GRHL2, E-cadherin, and Akt by Western blotting. D, theGRHL2 promoter in a luciferase reporter vector was cotransfected with Snail, Twist, or ZEB1 expression vectors in HMLE cells or the promoter wastransfected by itself into MSP cells; normalized luciferase activity values are shown. E, HMLE-MSP transfected with control or ZEB1 siRNA weretransfected with the GRHL2 promoter-luciferase construct; normalized luciferase activity values are shown. Values are the average of biologicduplicates from one representative of two experiments.
Cieply et al.
Cancer Res; 73(20) October 15, 2013 Cancer ResearchOF8
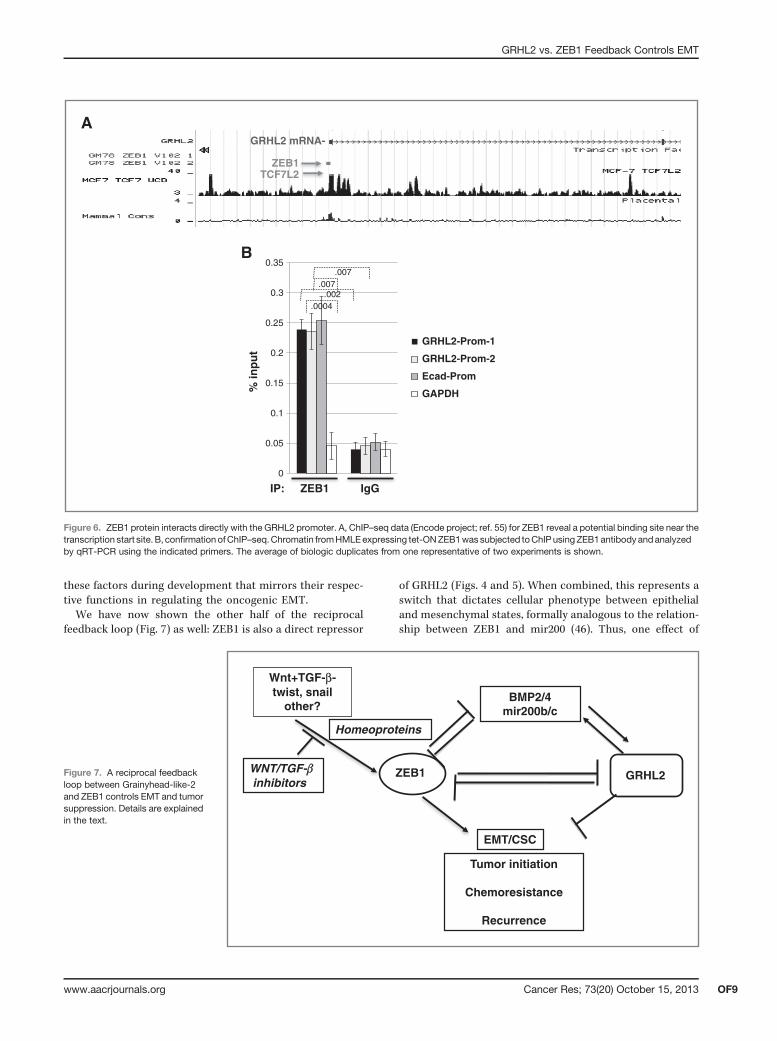
these factors during development that mirrors their respec-tive functions in regulating the oncogenic EMT.We have now shown the other half of the reciprocal
feedback loop (Fig. 7) as well: ZEB1 is also a direct repressor
of GRHL2 (Figs. 4 and 5). When combined, this represents aswitch that dictates cellular phenotype between epithelialand mesenchymal states, formally analogous to the relation-ship between ZEB1 and mir200 (46). Thus, one effect of
ZEB1TCF7L2
A
B
GRHL2 mRNA-
GRHL2-Prom-1
GRHL2-Prom-2
Ecad-Prom
GAPDH
IP: ZEB1 IgG
% in
pu
t
.002
.007
.0004
.007
0
0.05
0.1
0.15
0.2
0.25
0.3
0.35
Figure 6. ZEB1 protein interacts directly with the GRHL2 promoter. A, ChIP–seq data (Encode project; ref. 55) for ZEB1 reveal a potential binding site near thetranscription start site. B, confirmation ofChIP–seq.Chromatin fromHMLEexpressing tet-ONZEB1was subjected toChIPusingZEB1antibodyandanalyzedby qRT-PCR using the indicated primers. The average of biologic duplicates from one representative of two experiments is shown.
ZEB1
Wnt+TGF-β-twist, snail
other?
Tumor initiation
Chemoresistance
Recurrence
BMP2/4 mir200b/c
GRHL2
Homeoproteins
WNT/TGF inhibitors
EMT/CSC
Figure 7. A reciprocal feedbackloop between Grainyhead-like-2and ZEB1 controls EMT and tumorsuppression. Details are explainedin the text.
GRHL2 vs. ZEB1 Feedback Controls EMT
www.aacrjournals.org Cancer Res; 73(20) October 15, 2013 OF9

inducing ZEB1 expression by microenvironmental factors isto repress GRHL2 expression, stabilizing ZEB1 expression. Inthis connection, we found that neither TGF-b nor thecanonical Wnt pathway stimulation was sufficient to induceZEB1/downregulate GRHL2; however, the two in conjunc-tion tipped the balance in favor of ZEB1. This finding isprecisely consistent with those showing that multiple micro-environmental signals are needed to regulate EMT or MET(10, 47) and may prove to be the underlying mechanism.Other combinations of factors induce ZEB1 and EMT, atleast in specific cell contexts, including TGF-bþ FGF2, TGF-bþ TNF-a, TGF-bþEGF(R), TGF-bþmechanotransductionfrom extracellular matrix, or factors in the "senescentcell secretory phenotype" (SASP; refs. 19, 48–51). It is alsonotable that Six1 expression activates autocrine TGF-b andWnt signaling loops, suggesting that it activates ZEB1 bothdirectly and indirectly (33).
Our results indicate that these combinations of factorsmay downregulate GRHL2 as an intermediate step leading toEMT. Moreover, stable GRHL2 expression suppressed EMT,decreased tumor frequency, and sensitized tumor cells to theeffects of chemotherapeutic drugs. Thus, factors that down-regulate GRHL2 are potential drug targets for novel therapiesacting to enhance chemotherapeuic responses and preventdisease recurrence. In this connection, it is interesting to notethat the related gene, GRHL3, is a tumor suppressor in squa-mous cell carcinoma that upregulates PTEN (52, 53). Duringdevelopment, GRHL2 and GRHL3 regulate some unique andother common genes (54), suggesting that the biologic func-tions of GRHL2 should be investigated in the context of otherGrainyhead family members for optimal translational benefit.
Cellular commitment to undergo an oncogenic EMT isformally analogous to cell-cycle control in that both involvea transition from dependence on extracellular signals to anautonomous, stable state. For example, the cell cycle becomesautonomous beyond the mitogen-driven restriction point,activation of cyclinD-CDK4/6 complexes, and maintains that
state by a number of mechanisms, including stable activationof cyclin E expression by free E2F. Similarly, oncogenic EMT isinitiated by microenvironmental factors, for example, TGF-band Wnt agonists. We propose that the transition to anautonomous state is defined, in part, by downregulation ofGRHL2, stabilizing autocrine signaling through ZEB1, TGF-b,Wnt, and other factors. Thus, GRHL2 downregulation is an"oncogenic EMT restriction point."
Disclosure of Potential Conflicts of InterestNo potential conflicts of interest were disclosed.
Authors' ContributionsConception and design: B. Cieply, S.M. FrischDevelopment of methodology: B. Cieply, S.M. FrischAcquisition of data (provided animals, acquired and managed patients,provided facilities, etc.): B. Cieply, J. Farris, S.M. FrischAnalysis and interpretation of data (e.g., statistical analysis, biostatistics,computational analysis): B. Cieply, J. Farris, J. Denvir, H.L. Ford, S.M. FrischWriting, review, and/or revision of themanuscript: B. Cieply, J. Denvir, H.L.Ford, S.M. FrischAdministrative, technical, or material support (i.e., reporting or orga-nizing data, constructing databases): B. Cieply, H.L. Ford, S.M. FrischStudy supervision: B. Cieply, S.M. Frisch
AcknowledgmentsThe authors thank Sarah McLaughlin for technical assistance with mouse
tumor assays, Kathy Brundage for flow cytometry, Philip Riley IV for assistancewith molecular biology, James Coad and Ryan Livengood for analysis of tumorpathology, Daniel Haber, Stephen Jane, Paul Monga, Brad Hillgartner, and PeterStoilov for constructs and advice, and Lewis Chodosh and Ed Gunther for tumorRNA samples.
Grant SupportS.M. Frisch was supported by the NIH grant R01CA123359. The flow cyto-
metry core facility (Mary Babb Randolph Cancer Center) was supported by NIHgrants RR020866 and P20 RR16440. J. Denvir was supported in part by NIH grants2P20RR016477 and 8P20GM103434.
The costs of publication of this article were defrayed in part by the payment ofpage charges. This article must therefore be hereby marked advertisement inaccordance with 18 U.S.C. Section 1734 solely to indicate this fact.
Received October 31, 2012; revised July 9, 2013; accepted July 22, 2013;published OnlineFirst August 13, 2013.
References1. Tiwari N, Gheldof A, Tatari M, Christofori G. EMT as the ultimate
survival mechanism of cancer cells. Semin Cancer Biol 2012;22:194–207.
2. Yilmaz M, Christofori G. EMT, the cytoskeleton, and cancer cellinvasion. Cancer Metastasis Rev 2009;28:15–33.
3. Thiery JP, Acloque H, Huang RY, Nieto MA. Epithelial–mesenchy-mal transitions in development and disease. Cell 2009;139:871–90.
4. Guadamillas MC, Cerezo A, Del Pozo MA. Overcoming anoikis–path-ways to anchorage-independent growth in cancer. J Cell Sci 2011;124:3189–97.
5. Frisch SM, Schaller M, Cieply B. Mechanisms that link the oncogenicepithelial–mesenchymal transition to suppression of anoikis. J Cell Sci2013;126:21–9.
6. Ito Y, Iwase T, Hatake K. Eradication of breast cancer cells in patientswith distant metastasis: the finishing touches? Breast Cancer 2012;19:206–11.
7. Woodward WA, Chen MS, Behbod F, Alfaro MP, Buchholz TA,Rosen JM. WNT/beta-catenin mediates radiation resistance ofmouse mammary progenitor cells. Proc Natl Acad Sci U S A 2007;104:618–23.
8. Usary JE, ZhaoW,DarrD, RobertsPJ, LiuM,Balletta L, et al. Predictingdrug responsiveness in human cancers using genetically engineeredmice. Clin Cancer Res 2013 Jul 19. [Epub ahead of print].
9. Ellis MJ, Perou CM. The genomic landscape of breast cancer as atherapeutic roadmap. Cancer Discov 2013;3:27–34.
10. Scheel C, Weinberg RA. Phenotypic plasticity and epithelial–mesen-chymal transitions in cancer and normal stem cells? Int J Cancer2011;129:2310–4.
11. Scheel C, Eaton EN, Li SH, Chaffer CL, Reinhardt F, Kah KJ, et al.Paracrine and autocrine signals induce and maintain mesenchymaland stem cell states in the breast. Cell 2011;145:926–40.
12. Mani SA, Guo W, Liao MJ, Eaton EN, Ayyanan A, Zhou AY, et al. Theepithelial–mesenchymal transition generates cells with properties ofstem cells. Cell 2008;133:704–15.
13. Brabletz T. EMT and MET in metastasis: where are the cancer stemcells? Cancer Cell 2013;22:699–701.
14. Liu S, Clouthier SG, Wicha MS. Role of microRNAs in the regulation ofbreast cancer stem cells. J Mammary Gland Biol Neoplasia 2012;17:15–21.
15. Grooteclaes ML, Frisch SM. Evidence for a function of CtBP inepithelial gene regulation and anoikis. Oncogene 2000;19:3823–8.
Cieply et al.
Cancer Res; 73(20) October 15, 2013 Cancer ResearchOF10

16. Comijn J, Berx G, Vermassen P, Verschueren K, van Grunsven L,Bruyneel E, et al. The two-handed E box binding zinc finger proteinSIP1 downregulates E-cadherin and induces invasion. Mol Cell 2001;7:1267–78.
17. Browne G, Sayan AE, Tulchinsky E. ZEB proteins link cell motility withcell cycle control and cell survival in cancer. Cell Cycle 2010;9:886–91.
18. Brabletz S, Brabletz T. The ZEB/miR-200 feedback loop–a motor ofcellular plasticity in development and cancer? EMBO Rep 2011;11:670–7.
19. Chua HL, Bhat-Nakshatri P, Clare SE, Morimiya A, Badve S, NakshatriH. NF-kappaB represses E-cadherin expression and enhances epi-thelial tomesenchymal transition ofmammary epithelial cells: potentialinvolvement of ZEB-1 and ZEB-2. Oncogene 2007;26:711–24.
20. Dave N, Guaita-Esteruelas S, Gutarra S, Frias �A, Beltran M, Peir�o S,et al. Functional cooperation betweenSnail1 and twist in the regulationof ZEB1 expression during epithelial to mesenchymal transition. J BiolChem 2011;286:12024–32.
21. Sanchez-Tillo E, de Barrios O, Siles L, Cuatrecasas M, Castells A,Postigo A. Beta-catenin/TCF4 complex induces the epithelial-to-mes-enchymal transition (EMT)-activator ZEB1 to regulate tumor invasive-ness. Proc Natl Acad Sci U S A 2012;108:19204–9.
22. Yu M, Smolen GA, Zhang J, Wittner B, Schott BJ, Brachtel E, et al. Adevelopmentally regulated inducer of EMT, LBX1, contributes tobreast cancer progression. Genes Dev 2009;23:1737–42.
23. Gregory PA, Bert AG, Paterson EL, Barry SC, Tsykin A, Farshid G, et al.The miR-200 family and miR-205 regulate epithelial to mesenchymaltransition by targeting ZEB1 and SIP1. Nat Cell Biol 2008;10:593–601.
24. Wang S, Samakovlis C. Grainy head and its target genes in epithelialmorphogenesis andwound healing. Curr TopDevBiol 2012;98:35–63.
25. Schafer M, Werner S. Cancer as an overhealing wound: an oldhypothesis revisited. Nat Rev Mol Cell Biol 2008;9:628–38.
26. Pyrgaki C, Liu A, Niswander L. Grainyhead-like 2 regulates neural tubeclosure and adhesion molecule expression during neural fold fusion.Dev Biol 2011;353:38–49.
27. Kerosuo L, Bronner-Fraser M. What is bad in cancer is good in theembryo: importance of EMT in neural crest development. Semin CellDev Biol 2012;23:320–32.
28. CieplyB, Riley IVP, Pifer PM,Widmeyer J, Addison JB, IvanovAV, et al.Suppression of the epithelial–mesenchymal transition by grainyhead-like-2. Cancer Res 2012;72:2440–53.
29. Moody SE, Perez D, Pan TC, Sarkisian CJ, Portocarrero CP, SternerCJ, et al. The transcriptional repressorSnail promotesmammary tumorrecurrence. Cancer Cell 2005;8:197–209.
30. Debies MT, Gestl SA, Mathers JL, Mikse OR, Leonard TL, Moody SE,et al. Tumor escape in aWnt1-dependent mouse breast cancer modelis enabledbyp19Arf/p53pathway lesions but not p16 Ink4a loss. JClinInvest 2008;118:51–63.
31. Sato N, Meijer L, Skaltsounis L, Greengard P, Brivanlou AH. Mainte-nance of pluripotency in human and mouse embryonic stem cellsthrough activation of Wnt signaling by a pharmacological GSK-3-specific inhibitor. Nat Med 2004;10:55–63.
32. Patrick AN, Schiemann BJ, Yang K, Zhao R, Ford HL. Biochemical andfunctional characterization of six SIX1 Branchio-oto-renal syndromemutations. J Biol Chem 2009;284:20781–90.
33. Micalizzi DS, Christensen KL, Jedlicka P, Coletta RD, Bar�onAE,HarrellJC, et al. The Six1 homeoprotein induces humanmammary carcinomacells to undergo epithelial–mesenchymal transition and metastasis inmice through increasing TGF-beta signaling. J Clin Invest 2009;119:2678–90.
34. ElenbaasB,Spirio L, Koerner F, FlemingMD,Zimonjic DB,Donaher JL,et al. Human breast cancer cells generated by oncogenic transforma-tion of primary mammary epithelial cells. Genes Dev 2001;15:50–65.
35. Wellner U, Schubert J, Burk UC, Schmalhofer O, Zhu F, Sonntag A,et al. The EMT-activator ZEB1 promotes tumorigenicity by repressingstemness-inhibiting microRNAs. Nat Cell Biol 2009;11:1487–95.
36. Leung JY, Andrechek ER, Cardiff RD, Nevins JR. Heterogeneity inMYC-inducedmammary tumors contributes to escape fromoncogenedependence. Oncogene 2012;31:2545–54.
37. Creighton CJ, Li X, Landis M, Dixon JM, Neumeister VM, Sjolund A,et al. Residual breast cancers after conventional therapy displaymesenchymal as well as tumor-initiating features. Proc Natl Acad SciU S A 2009;106:13820–5.
38. Gupta PB, Onder TT, Jiang G, Tao K, Kuperwasser C, Weinberg RA,et al. Identification of selective inhibitors of cancer stem cells by high-throughput screening. Cell 2009;138:645–59.
39. Brown KA, Aakre ME, Gorska AE, Price JO, Eltom SE, Pietenpol JA,et al. Induction by transforming growth factor-beta1 of epithelial tomesenchymal transition is a rare event in vitro. Breast Cancer Res2004;6:R215–31.
40. Yook JI, Li XY, Ota I, Hu C, Kim HS, Kim NH, et al. A Wnt-Axin2-GSK3beta cascade regulates Snail1 activity in breast cancer cells. NatCell Biol 2006;8:1398–406.
41. Candia AF, Watabe T, Hawley SH, Onichtchouk D, Zhang Y, DerynckR, et al. Cellular interpretation of multiple TGF-beta signals: intracel-lular antagonism between activin/BVg1 and BMP-2/4 signaling medi-ated by Smads. Development 1997;124:4467–80.
42. ShahN, Sukumar S. TheHox genes and their roles in oncogenesis. NatRev Cancer 2010;10:361–71.
43. McCoy EL, Iwanaga R, Jedlicka P, Abbey NS, Chodosh LA,Heichman KA, et al. Six1 expands the mouse mammary epithelialstem/progenitor cell pool and induces mammary tumors thatundergo epithelial–mesenchymal transition. J Clin Invest 2009;119:2663–77.
44. Ono H, Imoto I, Kozaki K, Tsuda H, Matsui T, Kurasawa Y, et al. SIX1promotes epithelial–mesenchymal transition in colorectal cancerthrough ZEB1 activation. Oncogene 2012;31:4923–34.
45. Gouti M, Briscoe J, Gavalas A. Anterior Hox genes interact withcomponents of the neural crest specification network to induce neuralcrest fates. Stem Cells 2011;29:858–70.
46. Gregory PA, Bracken CP, Smith E, Bert AG, Wright JA, Roslan S, et al.An autocrine TGF-beta/ZEB/miR-200 signaling network regulatesestablishment andmaintenance of epithelial–mesenchymal transition.Mol Biol Cell 2011;22:1686–98.
47. Gao D, Vahdat LT, Wong S, Chang JC, Mittal V. Microenvironmentalregulation of epithelial–mesenchymal transitions in cancer. CancerRes 2013;72:4883–9.
48. Shirakihara T, Horiguchi K, Miyazawa K, Ehata S, Shibata T, Morita I,et al. TGF-beta regulates isoform switching of FGF receptors andepithelial–mesenchymal transition. EMBO J 2011;30:783–95.
49. Ohashi S, Natsuizaka M, Wong GS, Michaylira CZ, Grugan KD, StairsDB, et al. Epidermal growth factor receptor andmutant p53 expand anesophageal cellular subpopulation capable of epithelial-to-mesenchy-mal transition through ZEB transcription factors. Cancer Res 2010;70:4174–84.
50. LabergeRM,AwadP,Campisi J,DesprezPY.Epithelial–mesenchymaltransition induced by senescent fibroblasts. Cancer Microenviron2011;5:39–44.
51. Gjorevski N, Boghaert E, Nelson CM. Regulation of epithelial–mesen-chymal transition by transmission of mechanical stress through epi-thelial tissues. Cancer Microenviron 2011;5:29–38.
52. Bhandari A, Gordon W, Dizon D, Hopkin AS, Gordon E, Yu Z, et al.The Grainyhead transcription factor Grhl3/Get1 suppresses miR-21expression and tumorigenesis in skin: modulation of the miR-21target MSH2 by RNA-binding protein DND1. Oncogene 2013;32:1497–507
53. DaridoC,GeorgySR,Wilanowski T, Dworkin S, Auden A, ZhaoQ, et al.Targeting of the tumor suppressor GRHL3 by a miR-21-dependentproto-oncogenic network results in PTEN loss and tumorigenesis.Cancer Cell 2012;20:635–48.
54. Boglev Y, Wilanowski T, Caddy J, Parekh V, Auden A, Darido C, et al.The unique and cooperative roles of the Grainy head-like transcriptionfactors in epidermal development reflect unexpected target genespecificity. Dev Biol 2011;349:512–22.
55. Bernstein BE, Birney E, Dunham I, Green ED, Gunter C, Snyder M. Anintegrated encyclopedia of DNA elements in the human genome.Nature 489:57–74.
GRHL2 vs. ZEB1 Feedback Controls EMT
www.aacrjournals.org Cancer Res; 73(20) October 15, 2013 OF11

Appendix AII
Pifer P., Farris JC., et al.: Grainyhead-like 2 inhibits the co-activator p300,
suppressing tubulogenesis and the epithelial-mesenchymal transition. Accepted for publication – Molecular Biology of the Cell 2016
Mol. Biol. Cell. 2016 Jun 1. doi: 10.1091/mbc.E16-04-0249

51
Grainyhead-like-2 inhibits the co-activator p300, suppressing
tubulogenesis and the epithelial-mesenchymal transition
Phillip M. Pifer1, Joshua C. Farris1, Alyssa L.Thomas1, Peter Stoilov2 James Denvir3, David M. Smith2 and Steven M. Frisch1,2*
1-Mary Babb Randolph Cancer Center
1 Medical Center Drive, Campus Box 9300
West Virginia University
Morgantown, WV 26506
2 -Department of Biochemistry
1 Medical Center Drive
West Virginia University
Morgantown, WV 26506
3-Department of Biochemistry and Microbiology
Marshall University
One John Marshall Drive
Huntington, West Virginia 25755
*Address for correspondence: Steven M. Frisch, Mary Babb Randolph Cancer Center, 1
Medical Center Drive, Room 2833, West Virginia University, Morgantown, WV 26506.
Email: [email protected]
52
Abstract
Developmental morphogenesis and tumor progression require a transient or stable
breakdown of epithelial junctional complexes to permit programmed migration, invasion and
anoikis-resistance, characteristics endowed by the Epithelial-Mesenchymal Transition. The
epithelial master-regulatory transcription factor Grainyhead-like 2 (GRHL2) suppresses and
reverses EMT, causing a mesenchymal-epithelial transition to the default epithelial phenotype.
Here, we investigated the role of GRHL2 in tubulogenesis of Madin-Darby Canine Kidney
(MDCK) cells, a process requiring transient, partial EMT. GRHL2 was required for
cystogenesis, but it suppressed tubulogenesis in response to Hepatocyte Growth Factor (HGF).
Surprisingly, GRHL2 suppressed this process by inhibiting the histone acetyltransferase co-
activator, p300, preventing the induction of matrix metalloproteases and other p300-dependent
genes required for tubulogenesis. A thirteen amino acid region of GRHL2 was necessary and
sufficient for the inhibition of p300, the suppression of tubulogenesis and the interference with
EMT. The results demonstrate that p300 is required for the partial or complete EMT occurring
in tubulogenesis or tumor progression, and that GRHL2 suppresses EMT in both contexts,
through inhibition of p300.
53
INTRODUCTION
p300 is a co-activator of transcription that interacts with at least four hundred DNA-
factors to activate transcription from thousands of enhancers/promoters, mostly contingent upon
its intrinsic histone acetyltransferase (HAT) activity. In this context, it is viewed as an
“integrator” factor that serves as a nexus among multiple signaling pathways and programs of
gene expression (Yao et al.; Kamei et al., 1996; Vo and Goodman, 2001; Bedford et al., 2010).
Accordingly, p300/CBP null mice die at E9.5-11.5 with massive deficits of mesenchymal cells
and erythroid cells, as well as defects in neurulation and heart development (Yao et al.; Oike et
al., 1999). p300 is essential for the differentiation of muscle, erythroid lineages, osteoblast,
oligodendrocytes, and stem cells (Puri et al., 1997; Oike et al., 1999; Blobel, 2000; Polesskaya et
al., 2001; Narayanan et al., 2004; Teo and Kahn, 2010; Zhang et al., 2016). A recent study has
demonstrated p300 is a marker for super-enhancers, positioning it to control cell state transitions
(Witte et al., 2015).
Grainyhead-like 2 (GRHL2) is one of the three genes comprising a family of mammalian
transcription factors related to Drosophila Grainyhead, the first zygotically encoded transcription
factor expressed during the maternal to zygotic transition (the MZT) (Harrison et al.). GRHL2 is
important for epithelial barrier assembly in, for example, the morphogenesis of kidney collecting
ducts, placenta, lung alveoli and the mammary gland ductal system (through OVOL2, a GRHL2
target gene) (Gao et al., 2013; Watanabe et al., 2014; Aue et al., 2015; Walentin et al., 2015).
Grainyhead factors are also critical for diverse developmental events that involve the formation
of epithelial barriers, including epidermal assembly, neural crest formation, and, in the adult,
wound-healing (Wilanowski et al., 2002; Gustavsson et al., 2008; Wang and Samakovlis, 2012;
Mlacki et al., 2015). GRHL2 activates the expression of multiple genes encoding epithelial cell
54
adhesion molecules (e.g., E-cadherin, desmosomal proteins, tight junction proteins), and due to
its widespread expression, may be generally important for enforcing an epithelial phenotype
(Rifat et al.; Senga et al.; Wilanowski et al., 2002; Ting et al., 2003; Ting et al., 2005; Auden et
al., 2006; Werth et al., 2010; Boglev et al., 2011; Cieply et al., 2012; Tanimizu and Mitaka,
2013; Aue et al., 2015). Correspondingly, the GRHL2 expression plays an important role in
suppressing the oncogenic EMT, thereby functioning as a tumor suppressor that enhances
anoikis-sensitivity (Cieply et al., 2012; Cieply et al., 2013; Mlacki et al., 2015); in fact, the gene
most tightly correlated with E-cadherin expression in human tumors was GRHL2 (Kohn et al.,
2014).
The opposing roles of GRHL2 in establishing the epithelial state vs. p300 in differentiation -
- including EMT -- motivated us to investigate a potential role for GRHL2 in inhibiting p300
function. Kidney tubulogenesis is contingent upon temporal and spatial regulation of epithelial
cells, in which GRHL2, which is expressed in the ureteric buds of the developing kidney plays a
critical organizing role (Schmidt-Ott et al., 2005; Aue et al., 2015; Walentin et al., 2015).
Madin-Darby Canine Kidney (MDCK) tubulogenesis in response to Hepatocyte Growth Factor
(HGF) models some aspects of kidney collecting duct tubulogenesis in vivo and requires a
transient, partial EMT (pEMT) (Pollack et al., 1998; O'Brien et al., 2002; Pollack et al., 2004;
Leroy and Mostov, 2007; Hellman et al., 2008; Jung et al., 2012; Zhang et al., 2014). HGF
causes MDCK cells to undergo cell scattering in two-dimensional culture, and induces
tubulogenesis of MDCK cysts that form in a three-dimensional collagen gel (Wang et al.,
1990,1991 #4686; Pollack et al., 2004). Induction of MMP1 and MMP13 by HGF through
AP1/p300 complexes is a required for tubulogenesis in the MDCK model (Benbow and
Brinckerhoff, 1997; Clark et al., 2008; Hellman et al., 2008; Chacon-Heszele et al., 2014).

55
Targeted knockout studies indicate a role for HGF/Met in kidney development, and, relatedly,
HGF/Met signaling is a potent stimulator of Wnt signaling, a crucial signaling pathway in this
process, validating the in vivo relevance of this approach (Monga et al., 2002; Bridgewater et al.,
2008; Ishibe et al., 2009).
Herein, we report that GRHL2 promoted cystogenesis but suppressed tubulogenesis. GRHL2
protein interacted functionally with p300, inhibiting its HAT activity and transcriptional
activation of target genes, including matrix metalloproteases. A small (thirteen amino acid)
sequence of GRHL2 was important for inhibition of p300, suppression of tubulogenesis and the
reversal of EMT. These results mechanistically position GRHL2, an enforcer of the epithelial
default phenotype, as an antagonist of p300, a co-activator of differentiation-specific genes, with
important ramifications for developmental and tumor biology.
RESULTS
GRHL2 suppresses cell scattering and tubulogenesis
In light of the epithelial programming role of GRHL2, we tested the effect of HGF on
GRHL2 levels in MDCK cells. Interestingly, we found that HGF down-regulated the expression
of endogenous GRHL2 protein levels at early time points (figure 1A). When constitutively
expressed in MDCK cells, GRHL2 significantly inhibited HGF-induced cell scattering compared
to vector control cells (figure 1B). Conversely, MDCK cells with GRHL2 shRNA knockdown
demonstrated enhanced HGF-induced cell scattering; retention of E-cadherin expression showed
that EMT did not occur in response to the knockdown of GRHL2 alone (figure 1C and see video
56
in supplemental figure S1). GRHL2 had only modest effects on the phosphorylation status of
two established HGF/Met signaling mediators, Erk and Akt (figure S2).
We then examined the effects of GRHL2 on HGF-induced tubulogenesis in the three-
dimensional collagen model. GRHL2 expression caused the formation of larger cysts compared
to vector control cells, consistent with previous reports in hepatic bile duct cells (figure 1D)
(Tanimizu and Mitaka, 2013). GRHL2 significantly suppressed tubulogenesis/branching
morphogenesis following HGF treatment (figure 1D); a similar effect of murine Grhl2 was
observed in mouse inner medullary collecting duct cell line (figure S3A), indicating the
important role of GRHL2 down-regulation in tubulogenesis. Conversely, the stable knockdown
of GRHL2 prevented cystogenesis (figure S3B), presumably by down-regulating epithelial
adhesion molecules (Senga et al.; Werth et al., 2010). Transient knockdown of GRHL2
following cyst formation using a doxycycline-induced shRNA vector, however, clearly indicated
that the loss of GRHL2 promoted tubulogenesis (figure S4A). There was no effect of the
GRHL2 shRNA on cell proliferation (figure S4B). These results indicated that GRHL2
suppressed HGF-activated cell scattering and tubulogenesis.
GRHL2 suppresses the expression of matrix metalloproteases
To identify GRHL2 target genes responsible for the attenuation of cellular responses to
HGF/Met signaling, RNA-Seq was used to compare MDCK cells with constitutive GRHL2
expression vs. GRHL2 depletion, either with no treatment or with HGF induction (24 hours).
This experimental scheme allowed for two distinct comparisons: genes regulated by HGF in the
absence vs. presence of GRHL2, and genes regulated by GRHL2 with vs. without HGF
induction. GRHL2 down-regulated several known matrix metalloproteases (MMP) family
members (Table 1, confirmed by qPCR in figure 2A). In light of the established importance of
57
specific MMPs for tubulogenesis in the MDCK and mIMCD-3 cell culture models (Hotary et al.,
2000; Jorda et al., 2005; Hellman et al., 2008; Chacon-Heszele et al., 2014), we verified their
importance for branching tubulogenesis in embryonic kidneys cultured ex-vivo using the
generalized MMP inhibitor, batimastat (figure S5). The down-regulation of MMPs by GRHL2
could contribute significantly to the tubulogenesis-suppressing effect of constitutive GRHL2
expression, although additional contributions from EMT/MET-related GRHL2 genes are likely.
To investigate the transcriptional mechanisms of MMP gene regulation by GRHL2,
MMP1 and MMP14 promoters were assayed as luciferase reporter constructs by cotransfection
in HT1080 fibrosarcoma cells, in which the endogenous MMPs are expressed constitutively
(Tang and Hemler, 2004; Nonaka et al., 2005). GRHL2 was found to suppress MMP1 and
MMP14 promoters using adenovirus E1a protein, a known repressor of MMP genes, as a positive
control (figure 2B). These results demonstrated that GRHL2 repressed MMP1 and MMP14
promoters; however, examination of the promoter sequences utilized in our reporters constructs
did not indicate the presence of GRHL2 DNA binding consensus sites (Wilanowski et al., 2002;
Gao et al., 2013; Aue et al., 2015; Walentin et al., 2015), suggesting a more subtle mechanism
for repression not involving direct DNA binding.
GRHL2 inhibits p300 function
The AP-1 transcription factor family is important in the regulation of most MMP genes
(Clark et al., 2008). GRHL2 significantly suppressed AP-1 activity on minimal reporter
constructs in HT1080 and 293 cells (figure 3A). GRHL2 did not appear to affect the expression
of FOS or JUN family members following HGF induction (figure S6).
58
In light of the functional similarities between adenovirus E1a and GRHL2 (see
Discussion), we compared a published list of genes that E1a down-regulated through p300
interaction (Ferrari et al., 2014) against our list of GRHL2-downregulated genes; this latter list
was derived from the RNA-seq analysis that we performed on GRHL2-expressing human
mesenchymal subpopulation cells (MSP), reported in (Farris et al., 2016) (as comparison of
canine vs. human gene lists proved uninformative for technical reasons). About 43.5% of the
genes that E1a repressed through p300 were also repressed by GRHL2 (figure 3B). Downstream
Effector Analysis/Ingenuity Pathway analysis revealed that the expression of GRHL2 suppressed
the regulation of numerous p300-associated genes that were up-regulated or down-regulated by
HGF in the absence of GRHL2 expression (figure 3C and figure S7). These results suggested
that GRHL2 could potentially inhibit p300 function.
To investigate this, the effect of GRHL2 upon the activity of a GAL4-DNA binding
domain-p300 fusion protein was assayed by transient transfection using a GAL4-responsive
luciferase promoter, an established method for testing p300 coactivator function without
confounding effects from primary DNA binding activator proteins (Snowden et al., 2000).
Adenovirus E1a protein repressed the AP-1 and GAL4/GAL4-p300 reporter activities, but a
p300-non-binding mutant of E1a (Ferrari et al., 2014) failed to do so (figure S8), validating the
p300-dependence of transcription in these assays. GRHL2 inhibited the co-activator function of
p300 in this assay (figure 3D). As additional negative controls, GRHL2 did not affect the ability
of a p300-independent GAL4-activator fusion protein (VP16-GAL4; (Kutluay et al., 2009)) to
activate the same reporter; another transcription factor unrelated to GRHL2, c-Myc, failed to
inhibit GAL4-p300 function in this assay (figure S9). These results indicated that GRHL2 was a
59
potent suppressor of p300 function. The highly related GRHL1 and GRHL3 proteins were found
to have similar effects in the reporter assay (figure S10).
GRHL2 inhibits the histone acetyltransferase (HAT) activity of p300
The HAT domain of p300 acetylates numerous substrates, including lysines 18 and 27 in
the N-terminal tail of histone 3 (H3) (Ogryzko et al., 1996; Kasper et al., 2010; Jin et al., 2011).
Using recombinant proteins, GRHL2 inhibited acetylation of H3K27 by p300 in a dose
dependent manner in vitro (figure 4A). Similar results were obtained using the p300 HAT
domain alone (amino acids1283-1673) rather than full-length p300 (figure S11). Recombinant
GRHL1 and GRHL3 proteins also inhibited the HAT activity of p300 (figure S12).
To confirm these in vitro effects in cells, we analyzed histone acetylation by CHIP-qPCR
using the human cell line, HT1080 (as Encode reference data reporting histone acetylation are
available for the human genome.) Consistent with the in vitro results, the acetylation of H3K27
was inhibited in HT1080 cells expressing GRHL2 constitutively, specifically on promoters that
GRHL2 repressed, including MMP1, MMP14, MMP2, and ZEB1; acetylation of GRHL2-
upregulated gene promoter-associated H3K27 was either not affected (CDH1, ESRP1) or up-
regulated (RAB25) (figure 4B). Unlike the effect of E1a on p300, there was neither an effect of
GRHL2 on global H3 acetylation nor global chromatin condensation, assayed by Western
blotting (figure 4B) or by immunofluorescent localization of a LacI-mCherry-GRHL2 protein
(Ferrari et al., 2014), respectively (figure S13).
GRHL2 interacted with p300 by the criteria of co-immunoprecipitation of transiently co-
transfected genes, or of endogenous proteins (figure 4C). The recombinant proteins interacted
60
only weakly, however (figure S14) suggesting that the interaction is transient or requires post-
translational modifications absent from our recombinant proteins.
GRHL2 inhibits the C-terminal transactivation domain of P300
Multiple domains of p300 can co-activate transcription independently. One of these is
the C-terminal domain (1665aa-2414aa) which interacts with the p160 family of co-activators
(Stiehl et al., 2007). Previous reports suggested that the activity of the C-terminal domain is
stimulated by auto-acetylation, catalyzed by the p300 HAT domain (Stiehl et al., 2007). In light
of the HAT-inhibitory effect of GRHL2 described above, we hypothesized that GRHL2 inhibited
the C-terminal domain through this mechanism. We confirmed that transcriptional activation by
the C-terminal domain, assayed as a GAL4-C-term fusion protein, was stimulated by a co-
transfected p300 HAT domain, and that the latter domain had no detectable ability to activate
transcription independently (figure 5A). GRHL2 inhibited the enhanced transactivation by the
p300 C-terminal domain in the presence of co-transfected p300 HAT (figure 5B). Embedded
within the C-terminal domain is a small sub-domain called the IRF-3 Binding Domain (IBID;
amino acids 2050-2096) that mediates the interaction with the p160 co-activator family,
including the family member Steroid Receptor Coactivator-1 (SRC-1) (Sheppard et al., 2001).
While neither the IBID domain of p300 nor SRC-1 alone activated transcription efficiently, the
combination of both activated transcription, as reported previously (figure 5C) (Sheppard et al.,
2001). GRHL2 potently inhibited transcription that was driven by the complex of p300-IBID
and SRC-1 (figure 5D). Interestingly, mutation of the two lysines (K2086 and K2091) of the
IBID domain that are acetylated in vivo abrogated the ability of the p300-IBID/SRC1 complex to
activate transcription (figure 5E). These results indicate that the transcriptional activation by the
p300 C-terminus -- which is supported by SRC-1 and abrogated by GRHL2 – depends upon
61
acetylation of at least these (and probably other) lysines by p300 HAT, or perhaps other GRHL2-
sensitive HATs that remain to be determined.
A small region of GRHL2 inhibits p300 and is critical for suppressing tubulogenesis and EMT
To identify the region of GRHL2 responsible for p300 inhibition, whole domains of
GRHL2 were deleted initially (figure 6A) and assayed for inhibition of HAT activity and
transcriptional activation by GAL4-p300. In light of the lack of GRHL2 binding sites in most
GRHL2-repressed promoters (data not shown), the surprising result was that the DNA binding
domain (amino acids 245-494) was critical for inhibition (figure S15, S16). GST-GRHL2
protein sub-fragments derived from the DNA binding domain were assayed for HAT inhibition
(figure 6B). The region 325-475aa, and within that, the thirteen amino acid sequence 425-437aa,
inhibited HAT activity potently (figure 6C), and a synthetic peptide (aa420-442) was also able to
inhibit p300 HAT activity (figure S15C). The 425-437 fragment (IRDEERKQNRKKG) is an α-
helix conserved amongst GRHL1, GRHL2, and GRHL3 (Kokoszynska et al., 2008). A GRHL2
∆425-437 construct (with a synthetic nuclear localization signal) was unable to repress an AP-1-
promoter, GAL4-P300 transactivation (assayed on a GAL4-Luc reporter), the MMP1 promoter
or the MMP14 promoter (figure 6D). We recently reported that GRHL2 repressed the expression
of the glutamate dehydrogenase-1 gene (GLUD1), with important consequences for metabolism
and anoikis (Farris et al., 2016). Interestingly, GRHL2 also repressed this promoter in a manner
that required amino acids 425 to 437 (figure S17). GRHL2 ∆425-437 was still able to interact
with p300 in a co-transfection assay, however (figure S18).
We hypothesized that the inhibition of p300 function could provide a mechanism for
some aspects of transcriptional reprogramming by GRHL2. Consistent with the inability of the
62
GRHL2 ∆425-437 to repress the AP1-dependent promoters MMP1 and MMP14 (figure 6C), this
mutant was unable to suppress HGF-induced tubulogenesis in MDCK cells (figure 7A).
Moreover, wild-type GRHL2 reverses EMT in Mesenchymal Subpopulation (MSP) cells, a
cancer stem cell-like subpopulation derived from the mammary epithelial cell line HMLE
(Cieply et al., 2012; Cieply et al., 2013). The GRHL2 ∆425-437 mutant failed to reverse EMT,
by the criteria of cell morphology as well as EMT marker protein and mRNA expression (figure
7B). These results indicated that the inhibition of p300 by GRHL2 contributes significantly to
transcriptional reprogramming involved in both tubulogenesis and EMT (figure 8).
DISCUSSION
Previously, we proposed that the epithelial cell is the default phenotype from both
developmental and cancer biologic points of view. Under this hypothesis, the epithelial
phenotype is adopted automatically by a cell in the absence of genomic/epigenetic alterations or
inductive differentiation signaling (Frisch, 1997). Consistent with this idea, E-cadherin-
expressing cells are the first to emerge at the late two cell stage; these eventually give rise to all
differentiated cell types of the adult organism (Hyafil et al., 1980; Vestweber and Kemler, 1985;
Fleming et al.,1989; Larue et al., 1994). The adenovirus-5 E1a protein, which interacts with and
negatively modulates p300, enforces an epithelial phenotype, suppresses EMT, enhances anoikis,
suppresses MMP expression, and exerts a ubiquitously acting tumor suppression effect in human
tumor cells (Frisch and Mymryk, 2002).
The default idea has been invoked in recent studies from other laboratories, to explain,
for example, the mesenchymal-epithelial transition (MET) occurring at metastatic sites (Thiery
and Sleeman, 2006; Polyak and Weinberg, 2009; Tam and Weinberg, 2013). The default
hypothesis could be explained molecularly if critical co-activators such as p300 were required
63
for differentiation-specific but not epithelial-specific gene expression (Frisch, 1997).
Accordingly, we reported previously that GRHL2, shown here to antagonize the co-activator
p300, inhibits and reverses the oncogenic EMT, suppressing tumor initiation, drug-resistance and
anoikis-resistance (Cieply et al., 2012; Cieply et al., 2013).
The novel observation that GRHL2 antagonizes p300-dependent pathways in the context
of tubulogenesis provides a potentially unifying mechanism for both the developmental and
oncologic effects of GRHL2. GRHL2 probably regulates tubulogenesis by additional, p300-
independent mechanisms. For example, cells which fail to down-regulate GRHL2 appropriately
may fail to down-regulate cell adhesion molecules in response to morphogenic factors (Werth et
al., 2010; Senga et al., 2012). For example, E-cadherin relocalizes from cell junctions to diffuse
membrane pattern in protrusive cell extensions during tubulogenesis; this relocalization might be
envisioned to require GRHL2 down-regulation and subsequent loss of junctional complex
components in these specific cells (Pollack et al., 1998).
p300 contributes to tubulogenesis and cancer-related EMT in multiple important ways
providing a mechanism for GRHL2, via inhibition of p300, to suppress these processes. With
regard to cancer, transcription factors that utilize p300/CBP and additional coactivators that
interact with p300/CBP have been implicated in the oncogenic EMT, tumor drug-resistance and
tumor recurrence (Matthews et al., 2007; Qin et al., 2009; Santer et al., 2011; Zhou et al., 2012;
Delvecchio et al., 2013; Ringel and Wolberger, 2013; Yang et al., 2013; Xu et al., 2014; Cho et
al., 2015). The upregulation of matrix metalloproteases (MMPs) associated with the oncogenic
EMT requires AP-1, Ets and other p300-dependent factors (Westermarck and KÄHÄRi, 1999;
Sun et al., 2004; Chou et al., 2006; Clark et al., 2008; Lee and Partridge, 2010; Santer et al.,
2011).
64
With regard to tubulogenesis, the p300-dependent Ets family transcription factors Etv4
and Etv5, are key transcriptional regulators of this developmental process (Yang et al., 1998;
Jayaraman et al., 1999; Goel and Janknecht, 2003; Foulds et al., 2004; Lu et al., 2009; Oh et al.,
2012; Wollenick et al., 2012). In addition, the family of p300-dependent TCF/β-catenin
transcription complexes is a central hub for Wnt signaling, crucial for nephron induction (Li et
al., 2007; Bridgewater et al., 2008; Miller and McCrea, 2010; Ma et al., 2012).
p300 activates transcription through an array of mechanisms; acetylation of histones,
acetylation of transcription factors, the binding of the p300 bromodomain to acetylated histones to
promote transcriptional activity, and recruitment of histone methyltransferases (e.g., Set1b
complex) (Mizzen and Allis; Ogryzko et al., 1996; Gu and Roeder, 1997; Ito et al., 2001; Wolf et
al., 2002; Stiehl et al., 2007; Chen et al., 2010; Tang et al., 2013). By inhibiting the p300 HAT
activity, GRHL2 could enforce an inactive state on p300 in at least two ways. First, p300 HAT
activity is substantially increased by auto-acetylation of an autoinhibitory loop on the HAT
domain, which GRHL2 would suppress, stably inhibiting the enzyme (Thompson et al., 2004).
Secondly, the p300 HAT domain potentiates p300 C-terminal domain (1665aa-2414aa)
transactivation (Stiehl et al., 2007), which GRHL2 blocked. The minimal domain for p300 C-
terminal transactivation is amino acids 2000-2180 which include the IRF-3 binding domain (IBID)
(Lin et al., 2001; Matsuda et al., 2004). The p300 IBID domain cooperates with SRC1, a
p160/steroid receptor coactivator family member, to activate transcription (Sheppard et al., 2001).
By inhibiting the HAT activity of p300, GRHL2 suppressed co-activation by the p300-IBID
complex, which was highly dependent upon the two known acetylation sites, K2086 and K2091
for activity. Interestingly, SRC1-p300 has been shown previously to induce TWIST expression
and EMT in breast cancer (Qin et al., 2009), and GRHL2 is a potent EMT suppressor.
65
Although more than four hundred DNA binding proteins interact with p300 and utilize it
as a co-activator, the inhibitory effect of GRHL2 on p300 is nearly unique, shared by only one
other family of proteins called the E1a-like inhibitor of differentiation (EID) proteins. EID1
inhibits p300 HAT activity (MacLellan et al., 2000) and EID3 blocks the SRC-1/CBP interaction,
while the mechanism of EID2 is controversial (Ji et al., 2003; Miyake et al., 2003; Båvner et al.,
2005). The effects of EID proteins upon EMT or tubulogenesis have not yet been investigated to
our knowledge.
GRHL2 regulates intracellular metabolism and this could indirectly affect p300 by altering
the levels of the co-factors for p300 HAT, acetyl-CoA or crotonyl-CoA (Li and Li, 2015; Farris et
al., 2016). This may provide an additional, more indirect mechanism for GRHL2 to affect p300
function.
In summary, p300 and related co-activators are crucial for cells to differentiate. Under the
default-phenotype hypothesis, this can be extended to critical roles in EMT, in contexts such as
tubulogenesis and oncogenesis. The inhibition of p300 by GRHL2 provides a mechanism for
GRHL2 to enforce the default epithelial phenotype.
MATERIALS AND METHODS
Cell lines
293 HEK cells without T antigen (Doug Black, UCLA, Los Angeles), MDCK cells (Clone M8
described previously in Frisch et al. (Frisch and Francis, 1994), and HT1080 cells (ATCC) were
cultured in advanced Dulbecco’s Modified Eagle’s Medium (DMEM) (Gibco) with 10% fetal
bovine serum (Hyclone) and 1x penicillin-streptomycin-glutamine (PSG) (Invitrogen). miMCD-
66
3 cells (ATCC) cultured in advanced DMEM:Ham’s F12 (Gibco) with 10% fetal bovine serum
and 1x PSG. HMLE and HMLE MSP cells were described previously (Cieply et al., 2013).
Generation of stable cell lines by retroviral transduction and lentiviral transduction
Full-length GRHL2/pMXS-IRES-Puro and retroviral packaging protocol were described
previously (Farris et al., 2016). GRHL2 ∆425-437 was subcloned into pMXS-IRES-Puro from
GRHL2 ∆425-437-NLS-3xFLAG/pCDNA3.1+. GRHL2 shRNA/pGipZ and scramble control
shRNA/pGipz were obtained from Open Biosystems and packaged as previously described
(Cieply et al., 2012). The shRNA construct in pTRIPZ was made by subcloning a MluI-XbaI
fragment from pGIPZ.
Cell Scattering Assays
MDCK cells were plated on collagen coated 6 well dishes to give 25% cell confluency on HGF
induction. Cells were treated with 60ng/ml recombinant human HGF (RD Systems) in DMEM
media or fresh DMEM media for the time periods indicated. The cells were imaged and then
harvested for protein or RNA analysis. Images were obtained using a Zeiss Axiovert 200M,
Axiocam MRM camera, Phase 20x/0.55, RT, Axiovision Rel. 4.8 software. Cell scattering time
lapse movies were taken every 15 minutes over a 24 hour period. Time lapse images were
obtained using a Nikon Eclipse TE2000-E with Photometrics CoolSNAP HQ2 Monochrome
CCD with Phase 40x/0.75 objective using Bioptechs Delta T4 Culture Dish Heater, Prior
ProScan II Encoded Motorized Stage, and OKO LABS Digital Stage Top Incubator (37 degrees
and 5% CO2). For each data point, four 40x images were stitched together using 10% overlap
with background correction in NIS-Elements AR Nikon.
Western Blotting
67
Protein lysates were incubated at 95 degrees for 5 minutes in 1X SDS lysis buffer (125mM Tris-
HCl, pH 6.8, 0.04% SDS, 0.024% bromophenol blue, 5% β-mercapatoethanol, and 20%
glycerol). SDS-Page was run in 4%-20% gradient Novex Tris-Glycine gel (Invitrogen).
Proteins were electrophoretically transferred to a polyvinylidene difluoride membrane
(Immobilon) in Tris-Glycine buffer with 5% methanol. Membranes were blocked for 1 hour in
1xTBS+ 5% nonfat milk. Primary and secondary antibodies were incubated in 1xTBS+5%
nonfat milk+ 0.1% Tween-20. Primary antibodies were incubated for 2hour/RT or overnight/4
degrees at 1:1000 dilution. Primary antibodies used were: GRHL2, rb (Sigma); β-actin, ms
(Thermo-pierce); Fibronectin, ms (BD Biosciences); Vimentin, ms ((Santa Cruz Bio-tech
[SCBT]); β-actin, ms (Sigma); E-cadherin, ms (BD Biosciences); β-catenin, ms (BD
Biosciences); GAPDH, ms (Origene); acetyl-lysine, rb (Millipore); H3K18AC, rb (Cell
Signaling [CS]); H3K27AC, rb (CS); total H3, rb (CS); GST, ms (Thermo-pierce); p300,rb
(SCBT sc-584); p300, rb (SCBT sc-585); FLAG, ms (Sigma); GAL4, rb (SCBT). Goat anti-
rabbit or anti-mouse horseradish peroxidase conjugated secondary antibodies (Bio-rad) were
used at 1:3000 dilution and incubated for 1hour/RT. Western blot membranes were developed
using ECL-West Pico (Pierce) and analyzed using standard chemiluminescence techniques.
MDCK Tubulogenesis assay
MDCK Tubulogenesis assay was performed as previously described (Elia and Lippincott-
Schwartz, 2001). Briefly, collagen matrix was made by mixing 10x MEM (Invitrogen), 100x PSG,
23.5g/L NaHCO3 (Invitrogen), sterile water, and HEPES (Invitrogen) to working concentrations.
Vitrogen Bovine Collagen (Advanced Biomatrix 5005-b) was added to a final concentration of
2mg/mL. NaHCO3 was used to bring the solution to pH 7.3 via pH strip indicator (Elia and
Lippincott-Schwartz, 2001). In a 24-well plate, 100µl of working collagen solution was placed in
68
a 1.0 micron pore cell culture insert (Falcon) and allowed to solidify for 3 hours in tissue culture
incubator. Sub-confluent MDCK cells were trypsinized and counted using Countess Cell counting
machine (Invitrogen). Cells were pipetted into the working collagen solution to give a final
concentration of 5,000 cells/ml. Then, 250µl of cell/collagen solution was pipetted onto the pre-
solidified collagen matrix in the cell culture insert. The cell-collagen matrix was allowed to
solidify for 2 hours at 37 degrees and 5% CO2 and then 250 µl and 500µl of media were place on
cell-collagen matrix cell culture insert and in 24 well the, respectively. Media were changed every
3 days. After 6 days, 60 ng/ml recombinant human HGF was added to indicated wells, and
branching morphogenesis was monitored by microscopy. MDCK cyst staining was performed as
previously described (Elia and Lippincott-Schwartz, 2001), with the only modification being the
substitution of 7mg/mL fish skin gelatin for Triton X-100 in permeabilization buffer. Cysts were
stained with Alexa Fluor 488 Phalloidin (Molecular Probes) and Hoescht 33258 (Molecular
Probes). Representative 2 day post-HGF images were obtained using a Zeiss 710 Confocal with
Airyscan, Apochromat 40x/1.2 W Autocorr M27, RT, AxioObserver.Z1 software, and Diode 405
and Argon 488 lasers. Images were processed in Adobe Photoshop. Tubulogenesis was observed
by day 2 post-HGF addition and quantified on day 5 post-HGF addition.
RNA-Seq Assay
MDCK+GRHL2/pMXS and MDCK+shGRHL2/Gipz cells were plated in collagen coated
60mm2 dishes to obtained 25% confluency upon HGF treatment. Cells were treated with either
60ng/ml HGF in DMEM complete or DMEM complete media alone for 24 hours; RNA was
isolated from all four treatment conditions in triplicate using the RNeasy Plus Kit (Qiagen) and
quantified using Nandrop (Fischer). Raw data were aligned to the CanFam3 reference genome
using TopHat2 (Kim et al., 2013). For each sample and each gene, the number of reads
69
generated from that sample and mapping to that gene were counted using RSamtools. Genes
were as defined in the ensembl database v82 (Cunningham et al., 2015). The resulting count
table was analyzed using DESeq (Anders and Huber, 2010), performing two independent
comparisons: samples with HGF compared to those without, with GRHL2 overexpressed, and,
samples with HGF compared to those without, both expressing GRHL2 shRNA. Genes were
considered differentially expressed if they showed a false discovery rate of 0.05 or less and a
fold change of 1.5 or higher in either direction. Genes found to be regulated by HGF with
shRNA against GRHL2, but not found to be regulated by HGF with GRHL2 overexpressed were
uploaded to Ingenuity Pathway Analysis (Qiagen), where a Core Analysis was performed using
default settings.
Quantitative reverse transcription PCR analysis
MDCK parent, GRHL2/pMXS, and shGRHL2/pGipZ cells were plated on collagen coated
60mm2 dishes and treated as indicated. Cells were harvested using RNAeasy Plus mini kit
(Qiagen), analyzed using Nanodrop, and converted to cDNA using SuperScript III First-Strand
Synthesis SuperMix (Invitrogen) with oligo dT primers and 1ug of RNA. cDNA was analyzed
using SYBR Green PCR Master Mix on an Applied Biosystems 7500 Real Time PCR System.
Values reported were determined using the delta delta CT method using canine CBX1 as internal
control. Primers were as follows: CBX1-F (AAGTATTGCAAGGCCACCCA), CBX-R
(TTTTCCCAATCAGGCCCCAA), GRHL2-F (TTCCTCCCCAGGAGAGATGG), GRHL2-R
(GGCCCAACACACGGATAAGA), MMP1-F (TGACTGGAAAGGTCGACACG), MMP1-R
(GACCTTGGTGAAGGTCAGGG), MMP3-F (CTGACCCTAGCGCTCTGATG), MMP3-R
(GTCCTGAGGGATTTTCGCCA ), MMP13-F (GGACTTCCCAGGGATTGGTG), MMP13-R
(ATGACACGGACAATCCGCTT), MMP14-F (CCCAGAGGAGGGCATGTTTT), MMP14-R
70
(GACTCCCCACCCTTCCAATG), FOS-F (GGGAGGACCTTATCTGTGCG), FOS-R
(ACACACTCCATGCGTTTTGC), FOSL1-F (ACACCCTCCCTGACTCCTTT), FOSL1-R
(CTGAAGAGGGCATGGGATTA), FOSB-F (GGAGAAGAGAAGGGTTCGCC), FOSB-R
(CACAAACTCCAGACGCTCCT), JUN-F (GACCTTCTACGACGATGCCC), JUN-R
(TTCTTGGGGCACAGGAACTG), JUNB-F (GTGAAGACACTCAAGGCCGA), and JUNB-R
(AGACTGGGGGAATGTCCGTA).
Luciferase Reporter Assays
HT1080 or 293 NOT cells were transiently transfected using Lipofectamine 2000 (Invitrogen) at
a 1µg DNA: 3µl Lipofectamine ratio. After 20 minute incubation in 300µl of Opti-MEM
(Invitrogen), a total of 1.0µg of DNA was transfected into a 12 well with DMEM media and
refeed 4 hours later with DMEM media. After 28-36 hours post-transfection, the cells were
washed twice with cold PBS, lysed in 200µl of 1x Cell Culture Lysis Buffer (Promega), frozen
for at least 1 hour at -80 degrees, thawed on ice, and centrifuged at 13,200rpm. The supernatants
were assayed for luciferase activity (Promega) and β-galactosidase activity as internal control
(2x β-galactosidase assay reagent, 200mmol/l sodium phosphate, pH 7.3, 2mmol/L MgCl2,
100mmol/L 2-mercaptoethanol, and 1.33mg/mL o-nitrophenylgalactoside). MMP1 promoter (-
1200 to +60) and MMP14 promoter (-1114 to -242) luciferase reporter plasmids were generated
by subcloning the promoter from genomic DNA using PCR into the pGL3-basic luciferase
reporter plasmid. Primer sequences were: MMP1prom-F
(TTATTACTCGAGCCCTCCCTCTGATGCCTCTGA), MMP1prom-R
(TATATAAAGCTTCTCCAATATCCCAGCTAGGAA), MMP14prom-f
(TTATTACTCGAGCCCTTTCTCACGGTCAGCTT), MMP14prom-R
(TATATAAAGCTTTCTCGCTCTCTCCTCTGGTC). GRHL2/pcDNA3.1, TK-LacZ and
71
E1a/pCDNA3.1 plasmids were described previously (Grooteclaes and Frisch, 2000; Cieply et al.,
2012). E1A p300 binding mutant was a generous gift from Arnold Berk (UCLA, Los Angeles,
California) subcloned into pCDNA3.1+. GRHL2 ∆425-437 was generated by cloning GRHL2
1-424aa and GRHL2 438-625aa fragments and ligating together with Bglll and then ligating into
pCDNA3.1+ using BamHI and Sal1. Primers used were GRHL2-1-424-F
(TATATAGGATCCATGTCACAAGAGTCGGACAA), GRHL2-1-424-R
(ATATAAAGATCTTTTTCTTTCTGCTCCTTTGT), GRHL2-438-625-F
(TAAATTAGATCTAAAGGCCAGGCCTCCCAAAC), GRHL2-438-625-R
(TTATATGTCGACCTAGATTTCCATGAGCGTGA). pGL4.44[luc2P/AP1 RE/Hygro]
(Promega) was used to assay for AP-1 responsive promoter activity and control plasmid was
pGL4.27 (Promega). Phorhol 12-myristate 13-acetate (PMA) induction (10ng/mL)
(ThermoFisher) was used for assaying AP-1 activity in tranfected 293 cells. Full length p300-
GAL4/VR1012 and EV-GAL4/VR1012 were generous gifts from Neil Perkins (Newcastle
University, UK); they were assayed on the GAL4 responsive reporter pG5-Luc (Promega).
GAL4- p300 HAT (1283-1674aa), GAL4- p300C-terminus (1665-2414aa), and GAL4- p300
IBID (2050-2096) were generated by subcloning PCR fragments (MluI-NotI) into pBIND
(Promega). Primer sequences were: p300 c-terminal-F
(TATATAACGCGTATCGCTTTGTCTACACCTGCAAT), p300 c-terminal-R
(TTTAAAGCGGCCGCCTAGTGTATGTCTAGTGTAC), p300 HAT-F
(TATATAACGCGTATAGGAAAGAAAATAAGTTTTCT), p300 HAT-R
(TTTAAAGCGGCCGCCTAGTCCTGGCTCTGCGTGTGCAG), p300 IBID-F
(TATATAACGCGTATGCCTTACAAAACCTTTTGCG), and p300 IBID-R
(TTTAAAGCGGCCGCCTAATTAGAGTTGGCATACTTGG). To generate the p300-IBID
72
Mutant (K2086A and K2091A), the p300 IBID lysine nucleotide sequences were mutated to
alanine and flanking Mlu1 and Not1 restriction enzyme were added to the 5’ and 3’ ends,
respectively. The sequence was then generated as a gBlock gene fragment (IDT). The p300
mutant sequence was 5’ CACAACCAGG ATTGGGCCAG GTAGGTATCA GCCCACTCGC
ACCAGGCACT GTGTCTCAAC AAGCCTTACA AAACCTTTTG CGGACTCTCA
GGTCTCCCAG CTCTCCCCTG CAGCAGCAAC AGGTGCTTAG TATCCTTCAC
GCCAACCCCC AGCTGTTGGC TGCATTCATC GCGCAGCGGG CTGCCGCGTA
TGCCAACTCT AATCCACAAC 3”. The IBID mutant fragment was digested and ligated into
pBIND vector. HA-SRC1/pACTAG was a generous gift from Timothy Beischlag (Simon Fraser
University, Canada).
Immunoprecipitation
GRHL2-STAP contained full-length human GRHL2 fused to a C-terminal myc-Streptavidin
Binding Peptide-S-Tag sequence derived by ligating a synthetic oligonucleotide containing the
S-tag to a PCR product containing the myc-SBP tags from the pCeMM-CTAP vector described
(Burckstummer et al., 2006). 293 NOT cells were plated on collagen coated 6 well dishes and
transfected using 1µg of empty vector/pCDNA3.1+ or GRHL2-S-TAP/pCDNA3.1+ and 1ug of
empty vector/VR1012 or p300/VR1012) with 6ul of lipofectamine (Invitrogen) in 300ul of Opti-
MEM (Invitrogen). Cells were incubated for 4-6 hours with DMEM media, and then refed with
DMEM media. After 28 hours post-transfection, cells were lysed in 600µl of cold p300 Lysis
Buffer (25mM Tris-HCl pH8, 75mM NaCl, 0.5mM EDTA, 10% glycerol, 0.1% NP40, and
protease inhibitor tablet (Roche)). Sample lysates were passed through 1ml syringe with 27g
needle 3 times and precleared in 4 degree microcentrifuge at 13,200rpm for 10 minutes. Total
lysate samples were obtained, mixed 1:1 with 2X SDS Lysis buffer (250mM Tris-HCl, pH 6.8,
73
0.08% SDS, 0.048% bromophenol blue, 10% β-mercapatoethanol, 40% glycerol) and heated for
5 minutes at 95 degrees. Lysates were precipitated for 2 hours with 40ul of a 50% of S protein-
agarose (EMD Millipore) which had been pre-equilibrated with p300 lysis buffer containing
10mg/ml BSA. Immunoprecipitation lysates were washed three times with p300 lysis buffer,
diluted with 2X SDS lysis buffer, and heated for 5 minutes at 95 degrees. Lysates were
processed using previously described western blotting methods. For Endogenous p300 and
Ectopic GRHL2 co-immunoprecipitation, MSP cells with empty vector/pMXS or GRHL2/pMXS
were used in the experiment. For endogenous p300 and endogenous GRHL2 co-
immunoprecipitation, parental HMLE cells were used in the experiment. The co-
immunoprecipitation method was identical between the different cell lines. For each cell line, 2
100mm dishes were grown to 80% confluency, washed twice with cold PBS, lysed in 1mL of
p300 lysis Buffer with protease inhibitors, and passed through 27g needle three times. After
lysates were precleared at 13,200rp, 10µg of p300 antibody (SCBT, SC-584) or rabbit IgG
(Jackson) was added to lysates and incubated overnight on 4 degree wheel. Pre-equilbrated
Protein A-Sepharose (45µl) (GE Healthcare) was added and incubated for 90 minutes. Samples
were washed 3 times in p300 lysis buffer, added 45ul of 2X SDS lysis buffer, and heated at 95
degrees for 5 minutes. Lysates were processed using previously described western blotting
methods.
Histone Acetylation Assays
Histone acetylation reactions contained indicated amounts of recombinant baculovirus flag-
tagged p300 (37.5ng) (Active Motif) or baculovirus p300 HAT (1283-1673) (Sigma), 250ng of
H3 (Cayman), 100 µM acetyl-CoA (MP Biomedical), and indicated amounts of prescission
cleaved GRHL2, GST-GRHL2 or GST alone in 30µl of p300 acetylation buffer (50mM Tris-
74
HCl pH 8.0, 1mM DTT, 0.1mM EDTA, 10% glycerol and protease inhibitor). Acetylation
reactions were incubated for 15 minutes at 30 degrees on heat block. Reactions were diluted
with 2x SDS Lysis buffer and incubated for 5 minutes at 95 degrees. Lysates were processed
using previously described western blotting methods.
Recombinant protein purification
Full length GRHL2 was subcloned into pGEX-6P-3 vector (GE Healthcare) and transformed in
to BL21 bacteria (Invitrogen). GRHL2 fragments were subcloned into pGEX-6p-3 using
BamH1 and Sal1. A colony was selected and grown in 20mL of LB+amp overnight at 37
degrees. The following day, 10 mL of culture was inoculated into 500 mL of LB+amp and
incubated for approximately 2 hours at 37 degrees with shaking until OD~ 0.6 was obtained.
IPTG was added to final concentration of 0.1mM and incubated overnight on shaker at room
temperature. The bacteria were spun in chilled centrifuge for 10 minutes at 5000rpm. Bacterial
pellet was resuspended in 10 mL of BL21 lysis buffer (1xPBS, 1% Triton-100, 1mM DTT, 0.4%
lysozyme and protease inhibitor tablet), incubated for 10 minutes, and sonicated twice for 30
seconds. The suspension was cleared at 13,000 rpm for 10 minutes. To the supernatant, 150µL
of 50% glutathione-sepharose beads (GE Healthcare) was added and incubated for 2 hours with
rotation at 4 degrees. Glutathione-sepharose beads were washed three times with glutathione
washing buffer (1xPBS, 1mM DTT and 0.1% Triton-X) and eluted for 30 minutes with
glutathione elution buffer (100mM Tris pH 8, 150mM NaCl, 20mM Glutathione, and protease
inhibitors). Alternatively, glutathione-sepharose beads with GRHL2 protein attached were
washed 3 times in PreScission cleavage buffer (50mM Tris-HCl, 150mM NaCl, 1mM EDTA,
1mM DTT, pH 7.0). The GST-GRHL2 on glutathione-sepharose beads was cleaved by adding
80ul of Prescission Protease (GE Healthcare) per mL of PreScission cleavage buffer at 5 degrees
75
overnight. The sample was spun at 2,000rpm and the supernatant with the GST cleaved GRHL2
was obtained. Proteins were dialyzed against p300 acetylation buffer overnight at 4 degrees
using 20,000 MWCO Slide-A-Lyzer MINI Dialysis Unit (Thermo-Scientific). Protein was
analyzed on SDS-PAGE by Coomassie Blue staining and quantified by comparison of
Coomassie staining to a BSA standard and/or a BCA assay. Synthetic peptides were purchased
from ThermoFischer Scientific with n-terminus acetyl group and c-terminus amidation: GRHL2
420-442aa (GAERKIRDEERKQNRKKGKGQAS) and scramble (IDEKNKGRERQRK)
Chromatin Immunoprecipitation (ChIP)
For ChIP assay, HT1080 cell lines expressing empty vector/pMXS or GRHL2/pMXS cells were
used, and chromatin generated as described previously with the following modifications (Kumar
et al.): (i) Immunopreciptation was performed with 3ug of H3K27-Ac antibody (Cell Signaling)
or rabbit IgG (Jackson) to 3.3x10⁶ cell-equivalents in ChIP RIPA buffer. (ii) Protein A-sepharose
was used instead of FLAG-agarose beads. (iii) qPCRs were performed using 2X SYBR green
master mix (Applied Biosystems; 10 uL), 0.08 uL of 100 micromolar primer, 1 uL ChIP DNA in
a 20 uL reaction. Primer sequences were as follows: MMP1-1-F
(AACCTCAGAGAACCCCGAAG), MMP1-1-R (TACTAACACTGCGCACCTGA) MMP1-2-
F (CAGAGTGGGGCATGAGTAGG), MMP1-2-R (TGTCTTCGGTACTGGTGACC),
MMP14-F (AAGTAAGTGAGCTTCCCGGC), MMP14-R (GGAGTTCGCCCCAGTTGTAA),
MMP2-F (TCGCCCATCATCAAGTTCCC), MMP2-R (CCCCCAAGCTGTTTACCGAA),
ZEB1-1-F (GCGAGGCGTGGGACTGATGG), ZEB1-1-R (AAAGTTGGAGGCTCGGCGGC),
ZEB1-2-F (CTGCACGGCGATGACCGCT), ZEB1-2-R (TTCCGCTTGCCAGCAGCCTC),
CDH1-F (ACTCCAGGCTAGAGGGTCACC), CHD1-R
(CCGCAAGCTCACAGCTTTGCAGTTCC), ESRP1-F (GGGAGCTTGGTCAAGTCAAC),
76
ESRP1-R (TCTTAAATCGGGCCACGCAG), RAB25-F (AGGTCCTGTCCCTTTTTCGC),
RAB25-R (TTGGGGGTAAGGGGACTTCT), GAPDH-F (ATGGTTGCCACTGGGGATCT),
and GAPDH-R (TGCCAAAGCCTAGGGGAAGA). Results were normalized to GAPDH
values.
Ex Vivo Kidney Culture
All experiments involving mice were approved by WVU IACUC. Hoxb7creEGFP transgenic
mice and ex vivo kidney culture method were described previously (Zhao et al., 2004). We
removed embryonic kidney at E13.5 and the kidneys were cultured in 1uM batimastat (Tocris) or
vector in culture media for 48 hours. Images were taken of GFP ureteric buds on Olympus
MVX10 Macro Zoom, ORCA-Flash 4.0 Monochrome camera, Objective 2x, Zoom 4x, FITC,
and using CellSen Imaging Software. Ureteric buds were counted for quantification.
Confocal microscopy of transfected RRE.1 cells
RRE.1 cells, wt e1a-NLS-LacI-mCherry, and empty vector NLS-LacI-mCherry were
generous gift from Arnold Berk (UCLA, Los Angeles) and experiment was performed as
previously described (Verschure et al., 2005; Ferrari et al., 2014). GRHL2 was subcloned into
empty vector NLS-LacI-mCherry using Sal1. Images were taken on Zeiss Axiolmager Z1
microscope LSM 510 Confocal, 63x/0.75 LDPlan-neofluar, DAPI and Rhodamine, and Zeiss
Zen Software. Images were quantified using mean area on Image J.
Statistical Analysis
Error bars in graphs represent standard deviation. P-values were calculated using a
Student’s two-tailed t-test.
77
ACKNOWLEDGMENTS
The authors would like to thank Dr. Neil Perkins (University of Newcastle, UK) Dr.
Arnold Berk (UCLA) and Dr. Stephen Jane (Monash University, Australia) for constructs and
technical advice, Dr. Kathy Brundage for flow cytometry, Dr. Karen Martin and Dr. Amanda
Ammer for imaging expertise, Dr. Ryan Percifield for assistance in RNA library construction,
Dr. Neil Infante for bioinformatics support, Dr. Peter Mathers, Sarah McLaughlin and Emily
Ellis for animal management, Dr. Paolo Fagone for protein preparation, Dr. Carlton Bates and
Dr. Kenneth Walker for kidney development techniques, and Dr. Mary Davis for Ingenuity
Pathway Analysis. The work was supported by a grant from the Mary Kay Foundation and a
grant from the National Institute Of General Medical Sciences, U54GM104942. Dr. James
Denvir was supported in part by the West Virgina IDeA Network for Biomedical Research
Excellence (NIH/NIGMS P20GM103434). The following NIH grants supported the flow
cytometry facility: GM103488/RR032138; RR020866;OD016165;GM103434. AMIF: “Small
animal imaging and image analysis were performed in the West Virginia University Animal
Models & Imaging Facility, which has been supported by the Mary Babb Randolph Cancer
Center and NIH grants P20 RR016440, P30 GM103488 and S10 RR026378.” MIF: “Imaging
experiments and image analysis were performed in the West Virginia University Microscope
Imaging Facility, which has been supported by the Mary Babb Randolph Cancer Center and NIH
grants P20 RR016440, P30 GM103488 and P20 GM103434.”
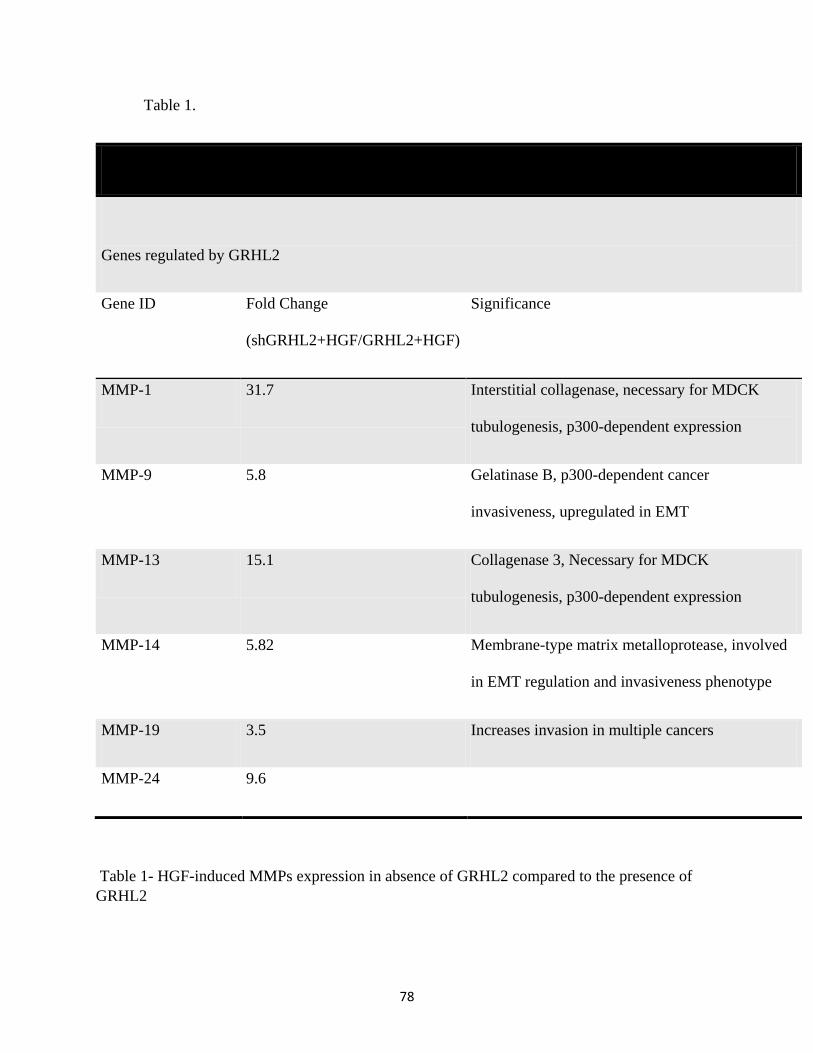
78
Table 1.
Genes regulated by GRHL2
Gene ID Fold Change
(shGRHL2+HGF/GRHL2+HGF)
Significance
MMP-1 31.7 Interstitial collagenase, necessary for MDCK
tubulogenesis, p300-dependent expression
MMP-9 5.8 Gelatinase B, p300-dependent cancer
invasiveness, upregulated in EMT
MMP-13 15.1 Collagenase 3, Necessary for MDCK
tubulogenesis, p300-dependent expression
MMP-14 5.82 Membrane-type matrix metalloprotease, involved
in EMT regulation and invasiveness phenotype
MMP-19 3.5 Increases invasion in multiple cancers
MMP-24 9.6
Table 1- HGF-induced MMPs expression in absence of GRHL2 compared to the presence of GRHL2
79
References
Fleming, T. , McConnell, J., Johnson, MH., and Stevenson BR. (1989). Development of tight
junctions de novo in the mouse early embryo: control of assembly of the tight junction-specific
protein, ZO-1. J Cell Biol 108, 1407-1418.
Anders, S., and Huber, W. (2010). Differential expression analysis for sequence count data.
Genome Biol 11, R106.
Auden, A., Caddy, J., Wilanowski, T., Ting, S.B., Cunningham, J.M., and Jane, S.M. (2006).
Spatial and temporal expression of the Grainyhead-like transcription factor family during murine
development. Gene Expr Patterns 6, 964-970.
Aue, A., Hinze, C., Walentin, K., Ruffert, J., Yurtdas, Y., Werth, M., Chen, W., Rabien, A.,
Kilic, E., Schulzke, J.-D., Schumann, M., and Schmidt-Ott, K.M. (2015). A Grainyhead-Like
2/Ovo-Like 2 Pathway Regulates Renal Epithelial Barrier Function and Lumen Expansion. J Am
Soc Nephrol 26, 2704-2715.
Båvner, A., Matthews, J., Sanyal, S., Gustafsson, J.-Å., and Treuter, E. (2005). EID3 is a novel
EID family member and an inhibitor of CBP-dependent co-activation. Nucleic Acids Res 33,
3561-3569.
Bedford, D.C., Kasper, L.H., Fukuyama, T., and Brindle, P.K. (2010). Target gene context
influences the transcriptional requirement for the KAT3 family of CBP and p300 histone
acetyltransferases. Epigenetics 5, 9-15.
Benbow, U., and Brinckerhoff, C.E. (1997). The AP-1 site and MMP gene regulation: What is all
the fuss about? Matrix Biol 15, 519-526.
Blobel, G.A. (2000). CREB-binding protein and p300: molecular integrators of hematopoietic
transcription. Blood 95, 745-755.
Boglev, Y., Wilanowski, T., Caddy, J., Parekh, V., Auden, A., Darido, C., Hislop, N.R.,
Cangkrama, M., Ting, S.B., and Jane, S.M. (2011). The unique and cooperative roles of the
Grainy head-like transcription factors in epidermal development reflect unexpected target gene
specificity. Dev Biol 349, 512-522.
Bridgewater, D., Cox, B., Cain, J., Lau, A., Athaide, V., Gill, P.S., Kuure, S., Sainio, K., and
Rosenblum, N.D. (2008). Canonical WNT/β-catenin signaling is required for ureteric branching.
Dev Biol 317, 83-94.
80
Burckstummer, T., Bennett, K.L., Preradovic, A., Schutze, G., Hantschel, O., Superti-Furga, G.,
and Bauch, A. (2006). An efficient tandem affinity purification procedure for interaction
proteomics in mammalian cells. Nat Methods 3, 1013-1019.
Chacon-Heszele, M.F., Zuo, X., Hellman, N.E., McKenna, S., Choi, S.Y., Huang, L., Tobias,
J.W., Park, K.M., and Lipschutz, J.H. (2014). Novel MAPK-dependent and -independent
tubulogenes identified via microarray analysis of 3D-cultured Madin-Darby canine kidney cells.
Am J Physiol Renal Physiol 306, F1047-F1058.
Chen, J., Ghazawi, F.M., and Li, Q. (2010). Interplay of bromodomain and histone acetylation in
the regulation of p300-dependent genes. Epigenetics 5, 509-515.
Cho, M.H., Park, J.H., Choi, H.J., Park, M.K., Won, H.Y., Park, Y.J., Lee, C.H., Oh, S.H., Song,
Y.S., Kim, H.S., Oh, Y.H., Lee, J.Y., and Kong, G. (2015). DOT1L cooperates with the c-Myc-
p300 complex to epigenetically derepress CDH1 transcription factors in breast cancer
progression. Nat Commun 6, 7821.
Chou, Y.T., Wang, H., Chen, Y., Danielpour, D., and Yang, Y.C. (2006). Cited2 modulates
TGF-[beta]-mediated upregulation of MMP9. Oncogene 25, 5547-5560.
Cieply, B., Farris, J., Denvir, J., Ford, H.L., and Frisch, S.M. (2013). Epithelial-Mesenchymal
Transition and Tumor Suppression Are Controlled by a Reciprocal Feedback Loop between
ZEB1 and Grainyhead-like-2. Cancer Res 73, 6299-6309.
Cieply, B., Riley, P.t., Pifer, P.M., Widmeyer, J., Addison, J.B., Ivanov, A.V., Denvir, J., and
Frisch, S.M. (2012). Suppression of the Epithelial-Mesenchymal Transition by Grainyhead-like-
2. Cancer Res 72, 2440-2453.
Clark, I.M., Swingler, T.E., Sampieri, C.L., and Edwards, D.R. (2008). The regulation of matrix
metalloproteinases and their inhibitors. Int J Biochem Cell Biol.40, 1362-1378.
Cunningham, F., Amode, M.R., Barrell, D., Beal, K., Billis, K., Brent, S., Carvalho-Silva, D.,
Clapham, P., Coates, G., Fitzgerald, S., Gil, L., Girón, C.G., Gordon, L., Hourlier, T., Hunt, S.E.,
Janacek, S.H., Johnson, N., Juettemann, T., Kähäri, A.K., Keenan, S., Martin, F.J., Maurel, T.,
McLaren, W., Murphy, D.N., Nag, R., Overduin, B., Parker, A., Patricio, M., Perry, E.,
Pignatelli, M., Riat, H.S., Sheppard, D., Taylor, K., Thormann, A., Vullo, A., Wilder, S.P.,
Zadissa, A., Aken, B.L., Birney, E., Harrow, J., Kinsella, R., Muffato, M., Ruffier, M., Searle,
S.M.J., Spudich, G., Trevanion, S.J., Yates, A., Zerbino, D.R., and Flicek, P. (2015). Ensembl
2015. Nucleic Acids Res 43, D662-D669.
81
Delvecchio, M., Gaucher, J., Aguilar-Gurrieri, C., Ortega, E., and Panne, D. (2013). Structure of
the p300 catalytic core and implications for chromatin targeting and HAT regulation. Nat Struct
Mol Biol 20, 1040-1046.
Elia, N., and Lippincott-Schwartz, J. (2009). Culturing MDCK Cells in Three Dimensions for
Analyzing Intracellular Dynamics. In: Curr Protoc Cell Biol: John Wiley & Sons, Inc.
Farris, J.C., Pifer, P.M., Zheng, L., Gottlieb, E., Denvir, J., and Frisch, S.M. (2016). Grainyhead-
like 2 Reverses the Metabolic Changes Induced by the Oncogenic Epithelial-mesenchymal
Transition: Effects on Anoikis. Mol Cancer Res
Ferrari, R., Gou, D., Jawdekar, G., Johnson, S.A., Nava, M., Su, T., Yousef, A.F., Zemke, N.R.,
Pellegrini, M., Kurdistani, S.K., and Berk, A.J. (2014). Adenovirus Small E1A Employs the
Lysine Acetylases p300/CBP and Tumor Suppressor Rb to Repress Select Host Genes and
Promote Productive Virus Infection. Cell host & microbe 16, 663-676.
Foulds, C.E., Nelson, M.L., Blaszczak, A.G., and Graves, B.J. (2004). Ras/Mitogen-Activated
Protein Kinase Signaling Activates Ets-1 and Ets-2 by CBP/p300 Recruitment. Mol Cell Biol 24,
10954-10964.
Frisch, S.M. (1997). The epithelial cell default-phenotype hypothesis and its implications for
cancer. Bioessays 19, 705-709.
Frisch, S.M., and Francis, H. (1994). Disruption of epithelial cell-matrix interactions induces
apoptosis. J Cell Biol 124, 619-626.
Frisch, S.M., and Mymryk, J.S. (2002). Adenovirus-5 E1A: paradox and paradigm. Nat Rev Mol
Cell Biol 3, 441-452.
Gao, X., Vockley, C.M., Pauli, F., Newberry, K.M., Xue, Y., Randell, S.H., Reddy, T.E., and
Hogan, B.L. (2013). Evidence for multiple roles for grainyhead-like 2 in the establishment and
maintenance of human mucociliary airway epithelium.[corrected]. Proc Natl Acad Sci U S A
110, 9356-9361.
Goel, A., and Janknecht, R. (2003). Acetylation-Mediated Transcriptional Activation of the ETS
Protein ER81 by p300, P/CAF, and HER2/Neu. Molecular and Cellular Biology 23, 6243-6254.
Grooteclaes, M.L., and Frisch, S.M. (2000). Evidence for a function of CtBP in epithelial gene
regulation and anoikis. Oncogene 19, 3823-3828.
Gu, W., and Roeder, R.G. (1997). Activation of p53 Sequence-Specific DNA Binding by
Acetylation of the p53 C-Terminal Domain. Cell 90, 595-606.
82
Gustavsson, P., Copp, A.J., and Greene, N.D. (2008). Grainyhead genes and mammalian neural
tube closure. Birth Defects Res A Clin Mol Teratol 82, 728-735.
Harrison, M.M., Botchan, M.R., and Cline, T.W. (2010). Grainyhead and Zelda compete for
binding to the promoters of the earliest-expressed Drosophila genes. Dev Biol 345, 248-255.
Hellman, N.E., Spector, J., Robinson, J., Zuo, X., Saunier, S., Antignac, C., Tobias, J.W., and
Lipschutz, J.H. (2008). Matrix Metalloproteinase 13 (MMP13) and Tissue Inhibitor of Matrix
Metalloproteinase 1 (TIMP1), Regulated by the MAPK Pathway, Are Both Necessary for
Madin-Darby Canine Kidney Tubulogenesis. J Biol Chem 283, 4272-4282.
Hotary, K., Allen, E., Punturieri, A., Yana, I., and Weiss, S.J. (2000). Regulation of Cell
Invasion and Morphogenesis in a Three-Dimensional Type I Collagen Matrix by Membrane-
Type Matrix Metalloproteinases 1, 2, and 3. J Cell Biol 149, 1309-1323.
Hyafil, F., Morello, D., Babinet, C., and Jacob, F. (1980). A cell surface glycoprotein involved in
the compaction of embryonal carcinoma cells and cleavage stage embryos. Cell 21, 927-934.
Ishibe, S., Karihaloo, A., Ma, H., Zhang, J., Marlier, A., Mitobe, M., Togawa, A., Schmitt, R.,
Czyczk, J., Kashgarian, M., Geller, D.S., Thorgeirsson, S.S., and Cantley, L.G. (2009). Met and
the epidermal growth factor receptor act cooperatively to regulate final nephron number and
maintain collecting duct morphology. Development (Cambridge, England) 136, 337-345.
Ito, A., Lai, C.-H., Zhao, X., Saito, S.i., Hamilton, M.H., Appella, E., and Yao, T.-P. (2001).
p300/CBP-mediated p53 acetylation is commonly induced by p53-activating agents and inhibited
by MDM2. EMBO J. 20, 1331-1340.
Jayaraman, G., Srinivas, R., Duggan, C., Ferreira, E., Swaminathan, S., Somasundaram, K.,
Williams, J., Hauser, C., Kurkinen, M., Dhar, R., Weitzman, S., Buttice, G., and Thimmapaya,
B. (1999). p300/cAMP-responsive Element-binding Protein Interactions with Ets-1 and Ets-2 in
the Transcriptional Activation of the Human Stromelysin Promoter. J Biol Chem 274, 17342-
17352.
Ji, A., Dao, D., Chen, J., and MacLellan, W.R. (2003). EID-2, a novel member of the EID family
of p300-binding proteins inhibits transactivation by MyoD. Gene 318, 35-43.
Jin, Q., Yu, L.-R., Wang, L., Zhang, Z., Kasper, L.H., Lee, J.-E., Wang, C., Brindle, P.K., Dent,
S.Y.R., and Ge, K. (2011). Distinct roles of GCN5/PCAF-mediated H3K9ac and CBP/p300-
mediated H3K18/27ac in nuclear receptor transactivation. EMBO J. 30, 249-262.
83
Jorda, M., Olmeda, D., Vinyals, A., Valero, E., Cubillo, E., Llorens, A., Cano, A., and Fabra, A.
(2005). Upregulation of MMP-9 in MDCK epithelial cell line in response to expression of the
Snail transcription factor. J Cell Sci 118, 3371-3385.
Jung, Y.S., Liu, X.-W., Chirco, R., Warner, R.B., Fridman, R., and Kim, H.-R.C. (2012). TIMP-
1 Induces an EMT-Like Phenotypic Conversion in MDCK Cells Independent of Its MMP-
Inhibitory Domain. PLoS ONE 7, e38773.
Kamei, Y., Xu, L., Heinzel, T., Torchia, J., Kurokawa, R., Gloss, B., Lin, S.-C., Heyman, R.A.,
Rose, D.W., Glass, C.K., and Rosenfeld, M.G. (1996). A CBP Integrator Complex Mediates
Transcriptional Activation and AP-1 Inhibition by Nuclear Receptors. Cell 85, 403-414.
Kasper, L.H., Lerach, S., Wang, J., Wu, S., Jeevan, T., and Brindle, P.K. (2010). CBP/p300
double null cells reveal effect of coactivator level and diversity on CREB transactivation. EMBO
J. 29, 3660-3672.
Kim, D., Pertea, G., Trapnell, C., Pimentel, H., Kelley, R., and Salzberg, S.L. (2013). TopHat2:
accurate alignment of transcriptomes in the presence of insertions, deletions and gene fusions.
Genome Biol 14.
Kohn, K.W., Zeeberg, B.M., Reinhold, W.C., and Pommier, Y. (2014). Gene expression
correlations in human cancer cell lines define molecular interaction networks for epithelial
phenotype. PLoS One 9, e99269.
Kokoszynska, K., Ostrowski, J., Rychlewski, L., and Wyrwicz, L.S. (2008). The fold recognition
of CP2 transcription factors gives new insights into the function and evolution of tumor
suppressor protein p53. Cell Cycle (Georgetown, Tex.) 7, 2907-2915.
Kumar, S., Park, S.H., Cieply, B., Schupp, J., Killiam, E., Zhang, F., Rimm, D.L., and Frisch,
S.M. A pathway for the control of anoikis sensitivity by E-cadherin and epithelial-to-
mesenchymal transition. Mol Cell Biol 31, 4036-4051.
Kutluay, S.B., DeVos, S.L., Klomp, J.E., and Triezenberg, S.J. (2009). Transcriptional
Coactivators Are Not Required for Herpes Simplex Virus Type 1 Immediate-Early Gene
Expression In Vitro. J Virol. 83, 3436-3449.
Larue, L., Ohsugi, M., Hirchenhain, J., and Kemler, R. (1994). E-cadherin null mutant embryos
fail to form a trophectoderm epithelium. Proc Natl Acad Sci USA. 91, 8263-8267.
84
Lee, M., and Partridge, N.C. (2010). Parathyroid Hormone Activation of Matrix
Metalloproteinase-13 Transcription Requires the Histone Acetyltransferase Activity of p300 and
PCAF and p300-dependent Acetylation of PCAF. J Biol Chem 285, 38014-38022.
Leroy, P., and Mostov, K.E. (2007). Slug Is Required for Cell Survival during Partial Epithelial-
Mesenchymal Transition of HGF-induced Tubulogenesis. Mol Biol Cell 18, 1943-1952.
Li, J., Sutter, C., Parker, D.S., Blauwkamp, T., Fang, M., and Cadigan, K.M. (2007). CBP/p300
are bimodal regulators of Wnt signaling. EMBO J. 26, 2284-2294.
Li, L., and Li, W. (2015). Epithelial–mesenchymal transition in human cancer: Comprehensive
reprogramming of metabolism, epigenetics, and differentiation. PharmacolTher. 150, 33-46.
Lin, C.H., Hare, B.J., Wagner, G., Harrison, S.C., Maniatis, T., and Fraenkel, E. (2001). A Small
Domain of CBP/p300 Binds Diverse Proteins: Solution Structure and Functional Studies. Mol
Cell 8, 581-590.
Lu, B.C., Cebrian, C., Chi, X., Kuure, S., Kuo, R., Bates, C.M., Arber, S., Hassell, J., MacNeil,
L., Hoshi, M., Jain, S., Asai, N., Takahashi, M., Schmidt-Ott, K.M., Barasch, J., D'Agati, V., and
Costantini, F. (2009). Etv4 and Etv5 are required downstream of GDNF and Ret for kidney
branching morphogenesis. Nat Genet 41, 1295-1302.
Ma, H., Guo, M., Shan, B., and Xia, Z. (2012). Targeted functional analysis of p300 coactivator
in Wnt/β-catenin signaling pathway using phosphoproteomic and biochemical approaches. J
Proteomics 75, 2601-2610.
MacLellan, W.R., Xiao, G., Abdellatif, M., and Schneider, M.D. (2000). A Novel Rb- and p300-
Binding Protein Inhibits Transactivation by MyoD. Mol Cell Biol. 20, 8903-8915.
Matsuda, S., Harries, J.C., Viskaduraki, M., Troke, P.J.F., Kindle, K.B., Ryan, C., and Heery,
D.M. (2004). A Conserved α-Helical Motif Mediates the Binding of Diverse Nuclear Proteins to
the SRC1 Interaction Domain of CBP. J. Biol Chem 279, 14055-14064.
Matthews, C.P., Colburn, N.H., and Young, M.R. (2007). AP-1 a target for cancer prevention.
Curr Cancer Drug Targets 7, 317-324.
Miller, R.K., and McCrea, P.D. (2010). Wnt to Build a Tube: Contributions of Wnt signaling to
epithelial tubulogenesis. Dev Dyn. 239, 77-93.
Miyake, S., Yanagisawa, Y., and Yuasa, Y. (2003). A Novel EID-1 Family Member, EID-2,
Associates with Histone Deacetylases and Inhibits Muscle Differentiation. J. Biol Chem. 278,
17060-17065.
85
Mizzen, A.C., and Allis, D.C. Linking histone acetylation to transcriptional regulation. Cell Mol
Life Sci. 54, 6-20.
Mlacki, M., Kikulska, A., Krzywinska, E., Pawlak, M., and Wilanowski, T. (2015). Recent
discoveries concerning the involvement of transcription factors from the Grainyhead-like family
in cancer. Exp Biol Med (Maywood) 240, 1396-1401.
Monga, S.P.S., Mars, W.M., Pediaditakis, P., Bell, A., Mulé, K., Bowen, W.C., Wang, X.,
Zarnegar, R., and Michalopoulos, G.K. (2002). Hepatocyte Growth Factor Induces Wnt-
independent Nuclear Translocation of β-Catenin after Met-β-Catenin Dissociation in
Hepatocytes. Cancer Res 62, 2064-2071.
Narayanan, K., Srinivas, R., Peterson, M.C., Ramachandran, A., Hao, J., Thimmapaya, B.,
Scherer, P.E., and George, A. (2004). Transcriptional Regulation of Dentin Matrix Protein 1 by
JunB and p300 during Osteoblast Differentiation. J Biol Chem. 279, 44294-44302.
Nonaka, T., Nishibashi, K., Itoh, Y., Yana, I., and Seiki, M. (2005). Competitive disruption of
the tumor-promoting function of membrane type 1 matrix metalloproteinase/matrix
metalloproteinase-14 in vivo. Mol Cancer Ther 4, 1157-1166.
O'Brien, L.E., Zegers, M.M.P., and Mostov, K.E. (2002). Building epithelial architecture:
insights from three-dimensional culture models. Nat Rev Mol Cell Biol 3, 531-537.
Ogryzko, V.V., Schiltz, R.L., Russanova, V., Howard, B.H., and Nakatani, Y. (1996). The
Transcriptional Coactivators p300 and CBP Are Histone Acetyltransferases. Cell 87, 953-959.
Oh, S., Shin, S., and Janknecht, R. (2012). ETV1, 4 and 5: An Oncogenic Subfamily of ETS
Transcription Factors. Biochim Biophys Acta. 1826, 1-12.
Oike, Y., Takakura, N., Hata, A., Kaname, T., Akizuki, M., Yamaguchi, Y., Yasue, H., Araki,
K., Yamamura, K.-i., and Suda, T. (1999). Mice Homozygous for a Truncated Form of CREB-
Binding Protein Exhibit Defects in Hematopoiesis and Vasculo-angiogenesis. Blood 93, 2771-
2779.
Polesskaya, A., Naguibneva, I., Fritsch, L., Duquet, A., Ait-Si-Ali, S., Robin, P., Vervisch, A.,
Pritchard, L.L., Cole, P., and Harel-Bellan, A. (2001). CBP/p300 and muscle differentiation: no
HAT, no muscle. EMBO J. 20, 6816-6825.
Pollack, A.L., Apodaca, G., and Mostov, K.E. (2004). Hepatocyte growth factor induces MDCK
cell morphogenesis without causing loss of tight junction functional integrity. Am J Physiol Cell
Physiol 286, C482-C494.
86
Pollack, A.L., Runyan, R.B., and Mostov, K.E. (1998). Morphogenetic Mechanisms of Epithelial
Tubulogenesis: MDCK Cell Polarity Is Transiently Rearranged without Loss of Cell–Cell
Contact during Scatter Factor/Hepatocyte Growth Factor-Induced Tubulogenesis. Dev Biol/ 204,
64-79.
Polyak, K., and Weinberg, R.A. (2009). Transitions between epithelial and mesenchymal states:
acquisition of malignant and stem cell traits. Nat Rev Cancer 9, 265-273.
Puri, P.L., Sartorelli, V., Yang, X.-J., Hamamori, Y., Ogryzko, V.V., Howard, B.H., Kedes, L.,
Wang, J.Y.J., Graessmann, A., Nakatani, Y., and Levrero, M. (1997). Differential Roles of p300
and PCAF Acetyltransferases in Muscle Differentiation. Mol Cell 1, 35-45.
Qin, L., Liu, Z., Chen, H., and Xu, J. (2009). The steroid receptor coactivator-1 regulates twist
expression and promotes breast cancer metastasis. Cancer Res 69, 3819-3827.
Rifat, Y., Parekh, V., Wilanowski, T., Hislop, N.R., Auden, A., Ting, S.B., Cunningham, J.M.,
and Jane, S.M. Regional neural tube closure defined by the Grainy head-like transcription
factors. Dev Biol 345, 237-245.
Ringel, A.E., and Wolberger, C. (2013). A new RING tossed into an old HAT. Structure 21,
1479-1481.
Santer, F.R., Hoschele, P.P., Oh, S.J., Erb, H.H., Bouchal, J., Cavarretta, I.T., Parson, W.,
Meyers, D.J., Cole, P.A., and Culig, Z. (2011). Inhibition of the acetyltransferases p300 and CBP
reveals a targetable function for p300 in the survival and invasion pathways of prostate cancer
cell lines. Mol Cancer Ther 10, 1644-1655.
Schmidt-Ott, K.M., Yang, J., Chen, X., Wang, H., Paragas, N., Mori, K., Li, J.-Y., Lu, B.,
Costantini, F., Schiffer, M., Bottinger, E., and Barasch, J. (2005). Novel Regulators of Kidney
Development from the Tips of the Ureteric Bud. J Am Soc Nephrol 16, 1993-2002.
Senga, K., Mostov, K.E., Mitaka, T., Miyajima, A., and Tanimizu, N. Grainyhead-like 2
regulates epithelial morphogenesis by establishing functional tight junctions through the
organization of a molecular network among claudin3, claudin4, and Rab25. Mol Biol Cell 23,
2845-2855.
Sheppard, H.M., Harries, J.C., Hussain, S., Bevan, C., and Heery, D.M. (2001). Analysis of the
Steroid Receptor Coactivator 1 (SRC1)-CREB Binding Protein Interaction Interface and Its
Importance for the Function of SRC1. Mol Cell Biol 21, 39-50.
87
Snowden, A.W., Anderson, L.A., Webster, G.A., and Perkins, N.D. (2000). A Novel
Transcriptional Repression Domain Mediates p21WAF1/CIP1 Induction of p300
Transactivation. Mol Cell Biol 20, 2676-2686.
Stiehl, D.P., Fath, D.M., Liang, D., Jiang, Y., and Sang, N. (2007). Histone Deacetylase
Inhibitors Synergize p300 Autoacetylation that Regulates Its Transactivation Activity and
Complex Formation. Cancer Res.67, 2256-2264.
Sun, Y., Zeng, X.-R., Wenger, L., Firestein, G.S., and Cheung, H.S. (2004). p53 down-regulates
matrix metalloproteinase-1 by targeting the communications between AP-1 and the basal
transcription complex. J Cell Biochem 92, 258-269.
Tam, W.L., and Weinberg, R.A. (2013). The epigenetics of epithelial-mesenchymal plasticity in
cancer. Nat Med 19, 1438-1449.
Tang, W., and Hemler, M.E. (2004). Caveolin-1 Regulates Matrix Metalloproteinases-1
Induction and CD147/EMMPRIN Cell Surface Clustering. J. Biol Chem. 279, 11112-11118.
Tang, Z., Chen, W.-Y., Shimada, M., Nguyen, Uyen T.T., Kim, J., Sun, X.-J., Sengoku, T.,
McGinty, Robert K., Fernandez, Joseph P., Muir, Tom W., and Roeder, Robert G. (2013). SET1
and p300 Act Synergistically, through Coupled Histone Modifications, in Transcriptional
Activation by p53. Cell 154, 297-310.
Tanimizu, N., and Mitaka, T. (2013). Role of grainyhead-like 2 in the formation of functional
tight junctions. Tissue Barriers 1, e23495.
Teo, J.-L., and Kahn, M. (2010). The Wnt signaling pathway in cellular proliferation and
differentiation: A tale of two coactivators. Advanced Drug Delivery Reviews 62, 1149-1155.
Thiery, J.P., and Sleeman, J.P. (2006). Complex networks orchestrate epithelial-mesenchymal
transitions. Nat Rev Mol Cell Biol 7, 131-142.
Thompson, P.R., Wang, D., Wang, L., Fulco, M., Pediconi, N., Zhang, D., An, W., Ge, Q.,
Roeder, R.G., Wong, J., Levrero, M., Sartorelli, V., Cotter, R.J., and Cole, P.A. (2004).
Regulation of the p300 HAT domain via a novel activation loop. Nat Struct Mol Biol 11, 308-
315.
Ting, S.B., Caddy, J., Hislop, N., Wilanowski, T., Auden, A., Zhao, L.L., Ellis, S., Kaur, P.,
Uchida, Y., Holleran, W.M., Elias, P.M., Cunningham, J.M., and Jane, S.M. (2005). A homolog
of Drosophila grainy head is essential for epidermal integrity in mice. Science 308, 411-413.
88
Ting, S.B., Wilanowski, T., Cerruti, L., Zhao, L.L., Cunningham, J.M., and Jane, S.M. (2003).
The identification and characterization of human Sister-of-Mammalian Grainyhead (SOM)
expands the grainyhead-like family of developmental transcription factors. Biochem J 370, 953-
962.
Verschure, P.J., van der Kraan, I., de Leeuw, W., van der Vlag, J., Carpenter, A.E., Belmont,
A.S., and van Driel, R. (2005). In Vivo HP1 Targeting Causes Large-Scale Chromatin
Condensation and Enhanced Histone Lysine Methylation. Mol Cell Biol 25, 4552-4564.
Vestweber, D., and Kemler, R. (1985). Identification of a putative cell adhesion domain of
uvomorulin. EMBO J. 4, 3393-3398.
Vo, N., and Goodman, R.H. (2001). CREB-binding Protein and p300 in Transcriptional
Regulation. J Biol Chem 276, 13505-13508.
Walentin, K., Hinze, C., Werth, M., Haase, N., Varma, S., Morell, R., Aue, A., Pötschke, E.,
Warburton, D., Qiu, A., Barasch, J., Purfürst, B., Dieterich, C., Popova, E., Bader, M., Dechend,
R., Staff, A.C., Yurtdas, Z.Y., Kilic, E., and Schmidt-Ott, K.M. (2015). A Grhl2-dependent gene
network controls trophoblast branching morphogenesis. Development 142, 1125-1136.
Wang, A.Z., Ojakian, G.K., and Nelson, W.J. (1990). Steps in the morphogenesis of a polarized
epithelium. I. Uncoupling the roles of cell-cell and cell-substratum contact in establishing plasma
membrane polarity in multicellular epithelial (MDCK) cysts. J Cell Sci 95, 137-151.
Wang, S., and Samakovlis, C. (2012). Grainy head and its target genes in epithelial
morphogenesis and wound healing. Curr Top Dev Biol 98, 35-63.
Watanabe, K., Villarreal-Ponce, A., Sun, P., Salmans, Michael L., Fallahi, M., Andersen, B., and
Dai, X. (2014). Mammary Morphogenesis and Regeneration Require the Inhibition of EMT at
Terminal End Buds by Ovol2 Transcriptional Repressor. Dev Cell 29, 59-74.
Werth, M., Walentin, K., Aue, A., Schönheit, J., Wuebken, A., Pode-Shakked, N., Vilianovitch,
L., Erdmann, B., Dekel, B., Bader, M., Barasch, J., Rosenbauer, F., Luft, F.C., and Schmidt-Ott,
K.M. (2010). The transcription factor grainyhead-like 2 regulates the molecular composition of
the epithelial apical junctional complex. Development 137, 3835-3845.
Westermarck, J., and KÄHÄRi, V.-M. (1999). Regulation of matrix metalloproteinase
expression in tumor invasion. The FASEB Journal 13, 781-792.
89
Wilanowski, T., Tuckfield, A., Cerruti, L., O'Connell, S., Saint, R., Parekh, V., Tao, J.,
Cunningham, J.M., and Jane, S.M. (2002). A highly conserved novel family of mammalian
developmental transcription factors related to Drosophila grainyhead. Mech Dev 114, 37-50.
Witte, S., Bradley, A., Enright, A.J., and Muljo, S.A. (2015). High-density P300 enhancers
control cell state transitions. BMC Genomics 16, 1-13.
Wolf, D., Rodova, M., Miska, E.A., Calvet, J.P., and Kouzarides, T. (2002). Acetylation of β-
Catenin by CREB-binding Protein (CBP). J Bioll Chem 277, 25562-25567.
Wollenick, K., Hu, J., Kristiansen, G., Schraml, P., Rehrauer, H., Berchner-Pfannschmidt, U.,
Fandrey, J., Wenger, R.H., and Stiehl, D.P. (2012). Synthetic transactivation screening reveals
ETV4 as broad coactivator of hypoxia-inducible factor signaling. Nucleic Acids Res 40, 1928-
1943.
Xu, Y., Hu, B., Qin, L., Zhao, L., Wang, Q., Wang, Q., Xu, Y., and Jiang, J. (2014). SRC-1 and
Twist1 expression positively correlates with a poor prognosis in human breast cancer. Int J Biol
Sci 10, 396-403.
Yang, C., Shapiro, L.H., Rivera, M., Kumar, A., and Brindle, P.K. (1998). A Role for CREB
Binding Protein and p300 Transcriptional Coactivators in Ets-1 Transactivation Functions. Mol
Cell Biol 18, 2218-2229.
Yang, H., Pinello, C.E., Luo, J., Li, D., Wang, Y., Zhao, L.Y., Jahn, S.C., Saldanha, S.A., Chase,
P., Planck, J., Geary, K.R., Ma, H., Law, B.K., Roush, W.R., Hodder, P., and Liao, D. (2013).
Small-molecule inhibitors of acetyltransferase p300 identified by high-throughput screening are
potent anticancer agents. Mol Cancer Ther 12, 610-620.
Yao, T.-P., Oh, S.P., Fuchs, M., Zhou, N.-D., Ch'ng, L.-E., Newsome, D., Bronson, R.T., Li, E.,
Livingston, D.M., and Eckner, R. Gene Dosage (2013);Dependent Embryonic Development and
Proliferation Defects in Mice Lacking the Transcriptional Integrator p300. Cell 93, 361-372.
Zhang, L., He, X., Liu, L., Jiang, M., Zhao, C., Wang, H., He, D., Zheng, T., Zhou, X., Hassan,
A., Ma, Z., Xin, M., Sun, Z., Lazar, Mitchell A., Goldman, Steven A., Olson, Eric N., and Lu,
Q.R. (2016). Hdac3 Interaction with p300 Histone Acetyltransferase Regulates the
Oligodendrocyte and Astrocyte Lineage Fate Switch. Dev Cell 36, 316-330.
Zhang, Y., Yan, W., and Chen, X. (2014). P63 regulates tubular formation via epithelial-to-
mesenchymal transition. Oncogene 33, 1548-1557.

90
Zhao, H., Kegg, H., Grady, S., Truong, H.-T., Robinson, M.L., Baum, M., and Bates, C.M.
(2004). Role of fibroblast growth factor receptors 1 and 2 in the ureteric bud. Dev Biol 276, 403-
415.
Zhou, B., Liu, Y., Kahn, M., Ann, D.K., Han, A., Wang, H., Nguyen, C., Flodby, P., Zhong, Q.,
Krishnaveni, M.S., Liebler, J.M., Minoo, P., Crandall, E.D., and Borok, Z. (2012). Interactions
between beta-catenin and transforming growth factor-beta signaling pathways mediate epithelial-
mesenchymal transition and are dependent on the transcriptional co-activator cAMP-response
element-binding protein (CREB)-binding protein (CBP). J Biol Chem 287, 7026-7038.
91
Figure Legends
Figure 1. GRHL2 suppresses HGF-induced cell scattering and tubulogenesis, and is down-
regulated by HGF. A. HGF induction downregulates endogenous GRHL2 protein. Western blot
and densitometric quantitation of HGF treatment time course in MDCK cells are shown. HGF
induction downregulates endogenous GRHL2 mRNA in MDCK cells; qPCR results expressed as
ratios compared to vector control. B. Constitutive GRHL2 expression in MDCK cells suppresses
HGF-induced cell scattering; images represent representative morphologies of cells treated for
42 hours. C. GRHL2 knockdown in enhanced HGF-induced cell scattering (16 hours), but
MDCK shGRHL2 cells did not undergo an EMT phenotypic change when EMT markers were
examined via western blotting. D. Constitutive GRHL2 expression in MDCK cells prevents
tubulogenesis (blue-nuclei and green-actin). Scale bar equals 20 microns. Graph represents
quantification of percentage of cysts that demonstrated tubulogenesis.
Figure 2. GRHL2 suppresses the induction of MMP genes and MMP promoters by HGF.
A. GRHL2 suppresses the induction of MMP genes (qPCR analysis; EN: endogenous GRHL2,
CE: constitutively expressed GRHL2, KD: GRHL2 shRNA knockdown). B. GRHL2 suppresses
the induction of MMP promoters by HGF. HT1080 cells were cotransfected with either MMP1
or MMP14 promoter-luciferase reporter constructs and GRHL2, E1A, or empty expression
vectors. Values represent relative luciferase activity normalized to TK-β-galactosidase control.
Figure 3. GRHL2 suppresses AP-1 and p300 function. A. GRHL2 suppresses AP1 function.
HT1080 and 293T cells were cotransfected with AP-1 response element- luciferase reporter
construct and GRHL2 expression vector or empty vector. Phorhol 12-myristate 13-acetate
(PMA) was used to induce AP-1 signaling in 293T cells. Values represent relative luciferase
activity normalized to TK-β-galactosidase control. B. Venn diagram comparing GRHL2-
92
repressed genes (Farris et al., 2016) vs. p300 target genes identified via E1a (Ferrari et al., 2014).
C. GRHL2 suppresses the p300 pathway. p300 effector and target genes induced by HGF in
MDCK cells with GRHL2 shRNA vs. cells with constitutive GRHL2 determined by IPA
analysis quantitation of the number of unregulated, HGF up-regulated or HGF down-regulated
genes for both cell lines is shown in the graph. The p300 interactome diagram on which this is
based is shown in figure S7. D. GRHL2 suppresses p300 function. GAL4-minimal promoter-
luciferase activation by a co-transfected GAL4-p300 was assayed in HT1080 cells in the
presence or absence of cotransfected GRHL2 expression vector; values represent relative
luciferase activity normalized to TK-β-galactosidase control.
Figure 4. GRHL2 suppresses the HAT activity of p300. A. In vitro HAT assays with
recombinant H3, p300 and GRHL2 proteins. Coomassie stains to assess the quality of
recombinant proteins used throughout this study are shown in figure S19. B. GRHL2 inhibits the
acetylation of H3 on GRHL2-repressed but not GRHL2-induced promoters in vivo (ChIP assay).
Crosslinked chromatin from HT1080+vector HT-1080+GRHL2 cells immunoprecipitated with
H3K27-Ac or rabbit IgG; the indicated promoters were assayed for H3K27Ac by qPCR using the
primers in Materials and Methods. * indicates p values of < 0.05. GRHL2 does not affect global
histone H3K18-Ac or H3K27-Ac (western blotting of total histones). C. GRHL2 interacts with
p300. (left panel): co-transfection of indicated expression constructs, followed by co-
immunoprecipation/western blotting; (middle panel): co-immunoprecipitation of retrovirally
expressed S-tagged GRHL2 with endogenous p300; (right panel): co-immunoprecipitation of
endogenous GRHL2 and endogenous P300.
93
Figure 5. GRHL2 inhibits the C-terminal transactivation domain of p300. A. The p300 HAT
domain stimulates transactivation by the p300 C-terminus (co-transfection in HT1080 cells). B.
GRHL2 inhibits transactivation by the p300 C-terminus. HT1080 cells were cotransfected with
GAL4 response element luciferase reporter in the presence of the indicated expression
constructs. C. The IBID domain of p300 and the co-activator SRC-1 synergize to activate
transcription. HT1080 cells were cotransfected with GAL4 response element luciferase reporter I
in the presence of the indicated expression constructs. D. GRHL2 inhibits transactivation by the
IBID-SRC-1 complex. HT1080 cells were cotransfected with GAL4 response element luciferase
reporter in the presence of the indicated expression constructs. E. Transactivation by the IBID-
SRC-1 complex is contingent upon lysines 2086 and 2091. HT1080 cells were cotransfected
with GAL4 response element luciferase reporter in the presence of the indicated expression
constructs. (a-e):Values represent relative luciferase activity normalized to TK-β-galactosidase
control. F. Schematic of p300 domains. KIX- CREB-binding domain, Bd- bromodomain, HAT-
histone acetyltransferase domain, and IBID- IRF-3 binding domain.
Figure 6. A small region within the DNA binding domain of GRHL2, amino acids 425-437,
inhibits p300. A. Schematic of GRHL2 domains. TAD- transactivation domain , DBD- DNA
binding domain, and DD- dimerization domain. B. HAT assays using the indicated GRHL2
fragments, assayed as GST-fusion proteins C. GRHL2 aa425-437 inhibits p300 HAT activity.
The indicated fragments derived from GRHL2 were assayed as GST-fusions (left panels) or as
recombinant peptides (right panel) for inhibition of HAT activity. D. GRHL2 amino acids 425-
437 are required for inhibition of an AP-1 reporter, GAL4 reporter in conjunction with GAL4-
94
p300, MMP1 reporter or MMP14 reporter. Values represent relative luciferase activity
normalized to TK-β-galactosidase control.
Figure 7. The p300-inhibitory domain of GRHL2 is important for the suppression of
tubulogenesis and reversion of EMT. A MDCK cells expressing GRHL2 wild-type or GRHL2
∆425-437 were assayed for tubulogenesis (blue-nuclei and green-actin). Scale bar equals 20
microns.; quantitation is shown in the middle panel and Western blot confirmation of protein
levels in the right panel. B. MSP cells expressing GRHL2 wild-type or GRHL2 ∆425-437 were
assayed for reversion of EMT, by western blotting for EMT markers (left panel), cell
morphology (middle panel), or qPCR (right panel).
Figure 8. GRHL2 suppresses tubulogenesis and EMT by inhibition of p300.
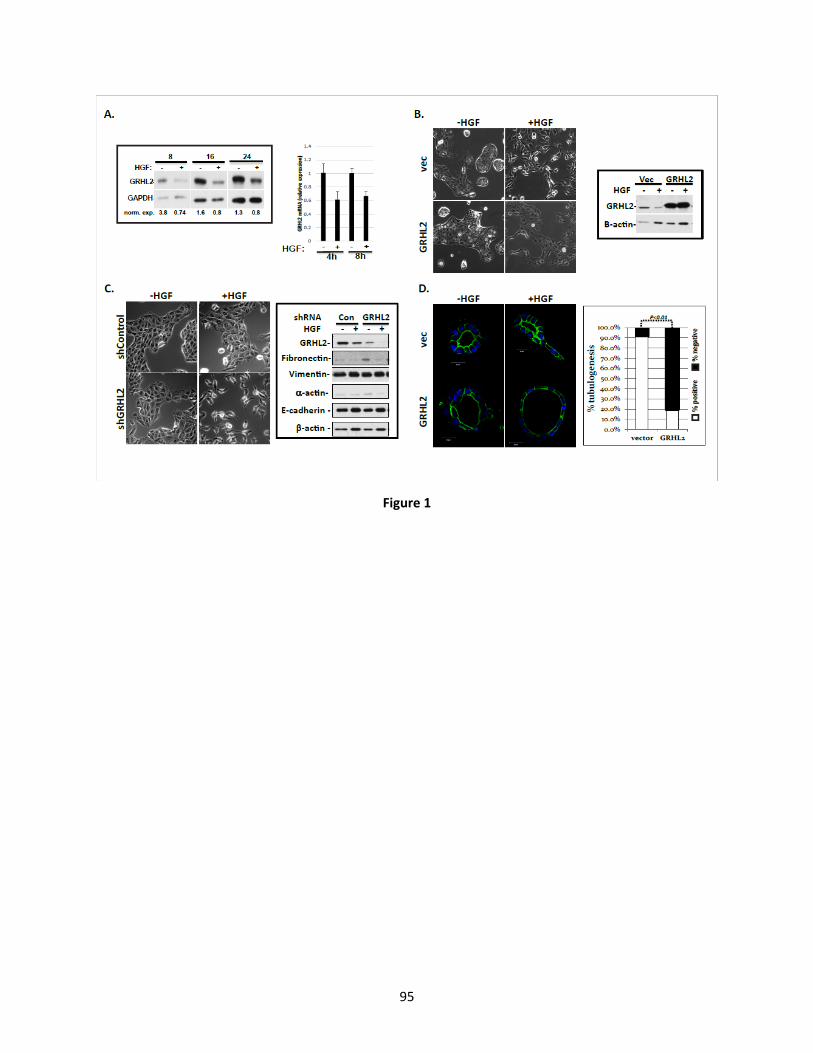
95
Figure 1
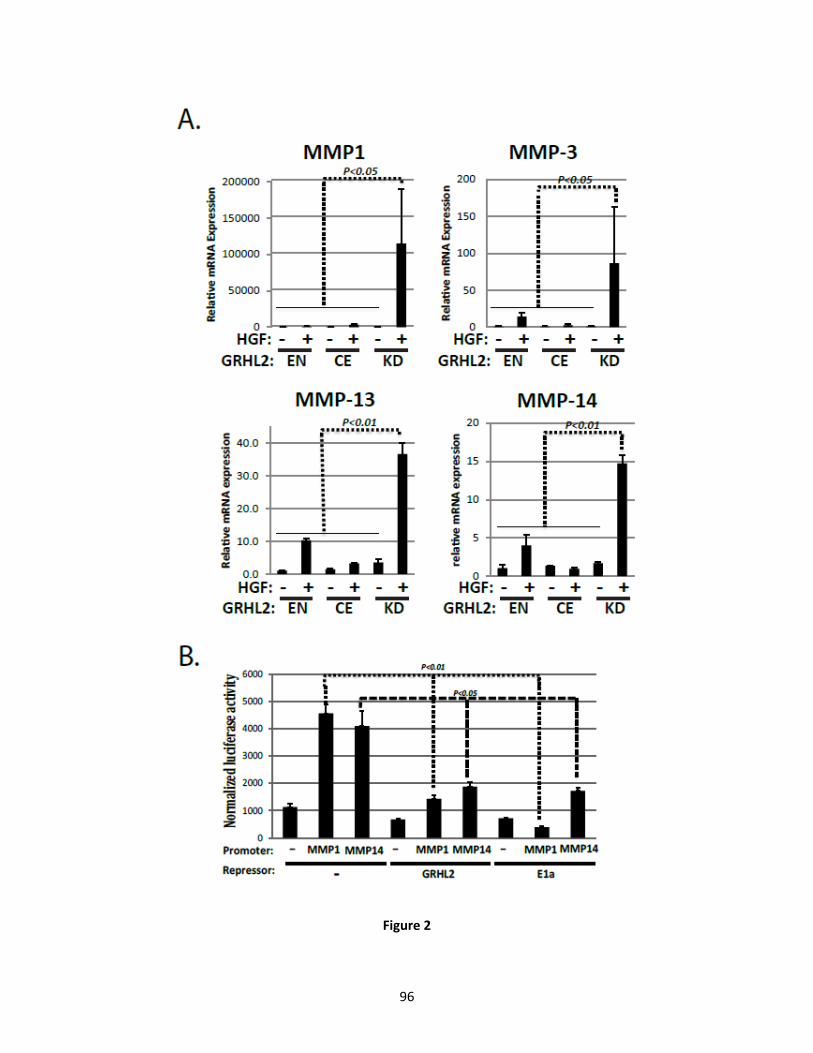
96
Figure 2
97
Figure 3
98
Figure 4
99
Figure 5
100
Figure 6
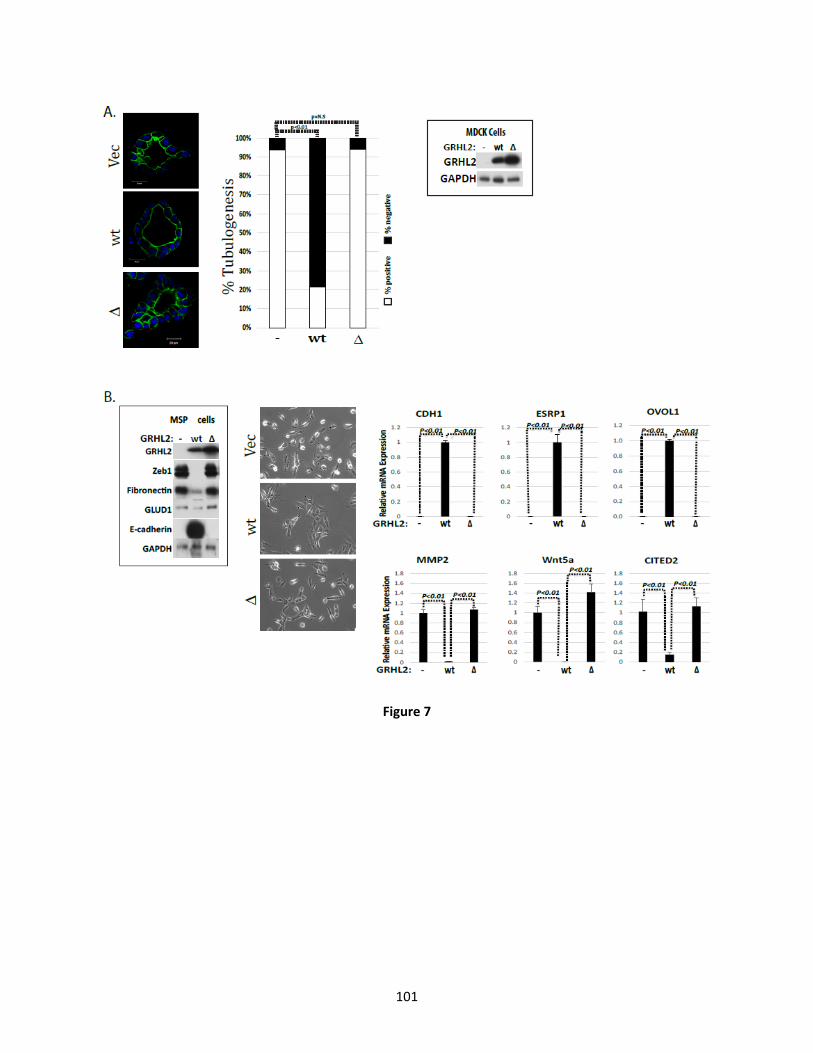
101
Figure 7
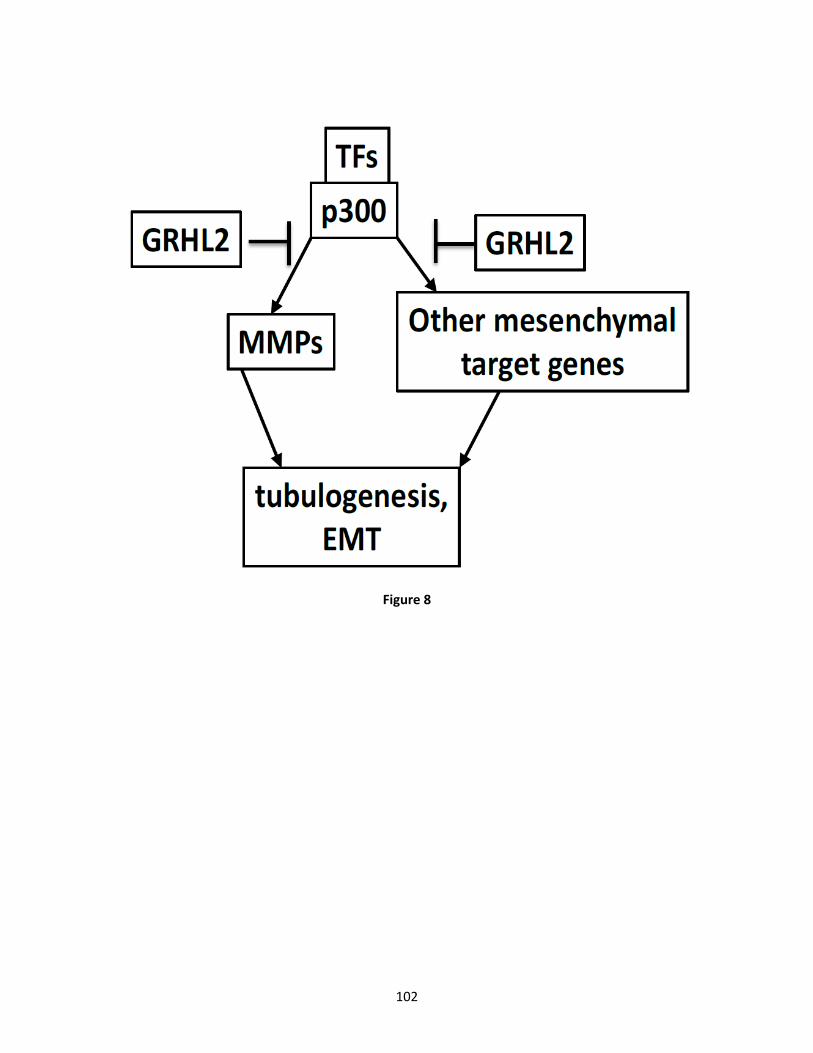
102
Figure 8
103
Supplemental Figure Legends
Figure S1. GRHL2 shRNA accelerates HGF-induced cell scattering (videomicroscopy).
Cell scattering time lapse movies were taken every 15 minutes over a 24 hour period. Time
lapse images were obtained using a Nikon Eclipse TE2000-E with Photometrics CoolSNAP HQ2
Monochrome CCD with Phase 40x/0.75 objective. (left panel): MDCK + vector; (right panel):
MDCK+GRHL2 shRNA
Figure S2. GRHL2 did not affect Erk or Akt signaling downstream of HGF/Met. Lysates
from HGF induction time course using the indicated cell lines was analyzed by western blotting
using the indicated antibodies. Densitometry data represent ratios of phospho-Akt or phospho-
ERK to the corresponding total protein levels.
Figure S3. Effect of GRHL2 on cyst formation. A. Constitutive GRHL2 expression in
mIMCD-3 cells prevents tubulogenesis. B. Knockdown of GRHL2 prevents cyst formation in
MDCK. (left panel) GRHL2 knockdown by western blotting. (middle panel) Quantification of
cysts per well. (right panel) Representative images from MDCK collagen cysts
Figure S4. Knockdown of GRHL2 following cyst formation (inducible shRNA) promotes
tubulogenesis. A. MDCK cells with doxycycline inducible GRHL2 shRNA were induced with
HGF in the presence or absence of doxycycline to induce GRHL2 shRNA. Cyst extensions were
quantified 24 hours after HGF induction. Quantification indicates the number of cysts that did
not have extensions at 24 hours. B. GRHL2 does not alter proliferation in MDCK cells. The
indicated cell lines were plated at equal density and counted in triplicate wells at three days post-
plating.

104
Figure S5. MMPs are important for kidney tubulogenesis. E13.5 ex vivo mouse kidney
cultures were grown for 48 hour with batimastat or solvent control and imaged. Ureteric buds
were counted for quantification.
Figure S6. GRHL2 did not affect FOS or JUN family members. FOS, FOSL1, FOSB, JUN,
and JUNB mRNA expression levels were determined in the indicated cell lines at one or four
hours post-HGF induction via qPCR.
Figure S7. GRHL2 suppresses the p300 pathway. p300 effector and target genes induced by
HGF in MDCK cells with GRHL2 shRNA vs. cells with constitutive GRHL2 determined by IPA
analysis quantitation of the number of unregulated, HGF up-regulated or HGF down-regulated
(red=up-regulated, green=down-regulated, and grey=unregulated)
Figure S8. Validation of p300-dependence of reporter assays using WT vs. p300-non-
binding mutant of E1A. HT1080 cells were cotransfected with the indicated reporters and
expression constructs. Values represent relative luciferase activity normalized to TK-β-
galactosidase control.
Figure S9. Further validation of reporter assays: A. c-Myc did not inhibit GAL4-p300 pG5
assay. B. GRHL2 did not inhibit GAL4-VP16 activation of GAL4- responsive element.
HT1080 cells were transfected with the indicated reporters and expression constructs. Values
represent relative luciferase activity with GRHL2 present compared to empty vector alone
normalized to TK-β-galactosidase control.
105
Figure S10. GRHL1 and GRHL3 inhibit transactivation by p300. HT1080 cells were
cotransfected with the indicated reporters and expression constructs. Values represent relative
luciferase activity normalized to TK-β-galactosidase control.
Figure S11. GRHL2 suppresses activity of the HAT domain (alone) of p300. Recombinant
GRHL2 inhibits recombinant p300 HAT (1283-1673) acetylation of H3K27 in a dose dependent
manner in the H3 acetylation assay. Coomassie stains to assess the quality of recombinant
proteins are shown in figure S19.
Figure S12. GRHL1 and GRHL3 inhibit p300 HAT activity. Recombinant GRHL1 and
GRHL3 inhibit p300’s acetylation of H3K27 in H3 acetylation assay. Coomassie stains to assess
the quality of recombinant proteins are shown in figure S19.
Figure S13. GRHL2 did not cause global changes in heterochromatin condensation like
E1A. (left panel) GRHL2-lacI-mCherry, E1a-lacI-mCherry or lacI-mCherry expression
constructs were transfected into RRE cells and confocal microscopic images of chromatin
condensation were quantitated.
Figure S14. Recombinant GRHL2 and p300 pulldown interaction. Recombinant GRHL2
and p300 were assayed for interaction by p300 IP/GRHL2 western blot.
Figure S15. Mapping of GRHL2 domains involved in inhibiting HAT activity in vitro. A.
Recombinant GST-GRHL2 fragments were generated without the GRHL2 transactivation
domain (136-625), DNA binding domain (∆245-494), or dimerization domain (1-520) and
assayed for inhibition of p300 HAT activity. B. Recombinant GST-GRHL2 fragments were
generated within the GRHL2 transactivation and assayed for inhibition of p300 HAT activity.
Coomassie stains to assess the quality of recombinant proteins are shown in figure S19. C.
106
Synthetic peptide (aa420-442) and scramble peptide were assayed for inhibition of p300 HAT
activity. (right panel) Quantification of H3K27-Ac levels compared to no peptide control.
Figure S16. Mapping of GRHL2 domains involved in inhibiting transactivation by GAL4-
p300 in reporter assays. HT1080 cells were cotransfected with the indicated reporters and
expression constructs. Values represent relative luciferase activity normalized to TK-β-
galactosidase control.
Figure S17. GRHL2 aa 425-437 important for repressing GLUD1 promoter through p300.
HT1080 cells were cotransfected with the indicated reporters and expression constructs. Values
represent relative luciferase activity normalized to TK-β-galactosidase control.
Figure S18. GRHL2 ∆425-437 interacts with p300 in a co-transfection assay. p300 and wt
GRHL2 or GRHL2 ∆425-437 expression vectors were transfected into 293 cells. Lysates were
immunoprecipitated with p300 antibody and probed for GRHL2 interaction.
Figure S19. Confirmation of recombinant proteins (Coomassie blue staining). A.
Prescission cleaved GRHL2 for figure 4A H3 acetylation assay. B. GST-GRHL1 and GST-
GRHL3 for figure S12 H3 acetylation assay. C and D. GST-GRHL2 fragments for figure S15
H3 acetylation assay. E. GST-GRHL2 fragments for figure 6A H3 acetylation assay. F. GST-
GRHL2 fragments for figure 6B H3 acetylation assay.
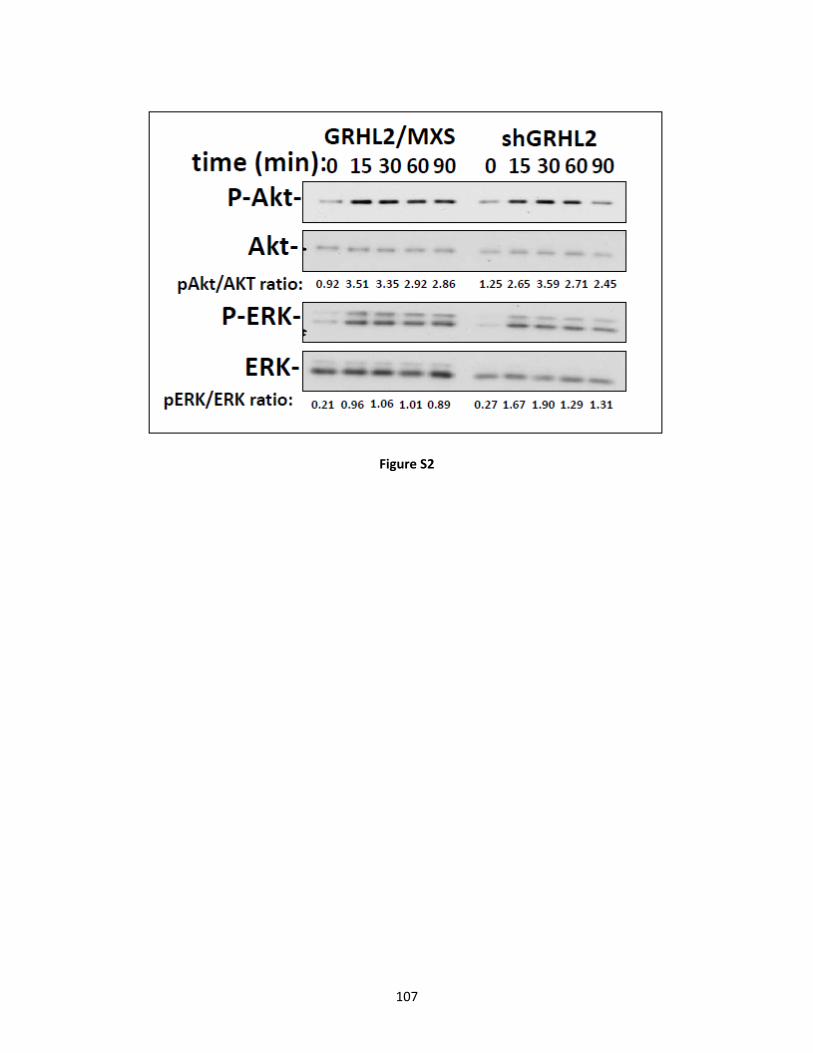
107
Figure S2
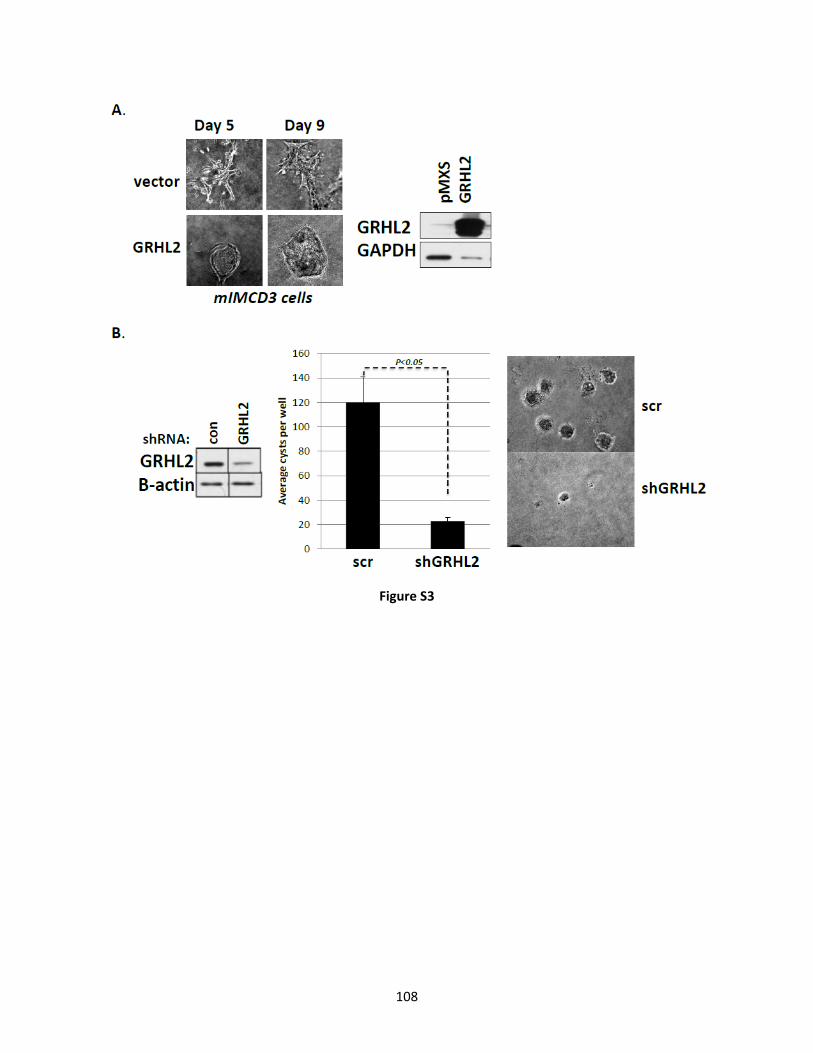
108
Figure S3
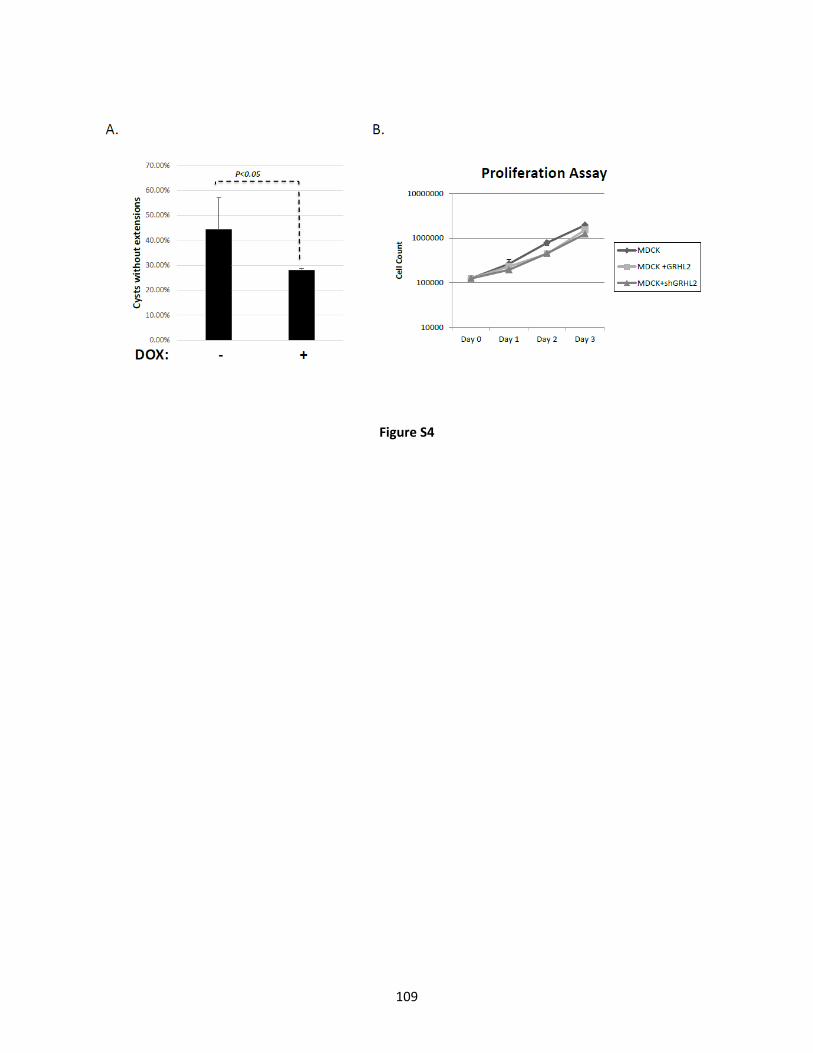
109
Figure S4
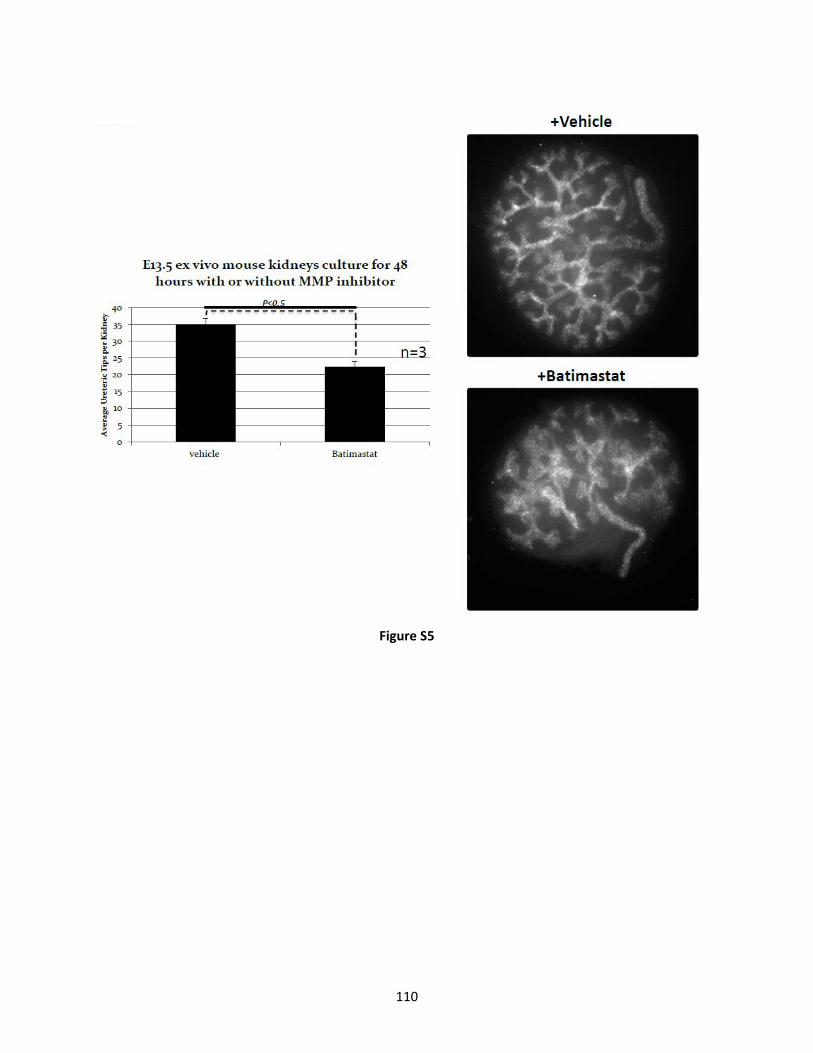
110
Figure S5

111
Figure S6
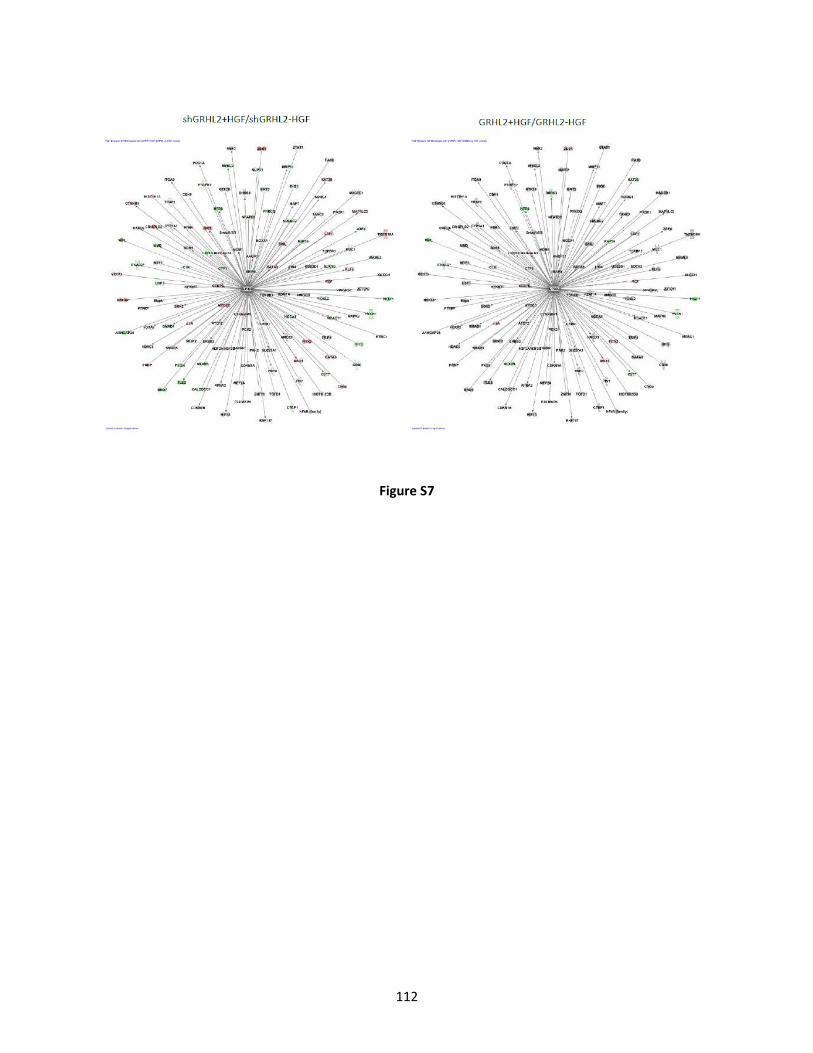
112
Figure S7
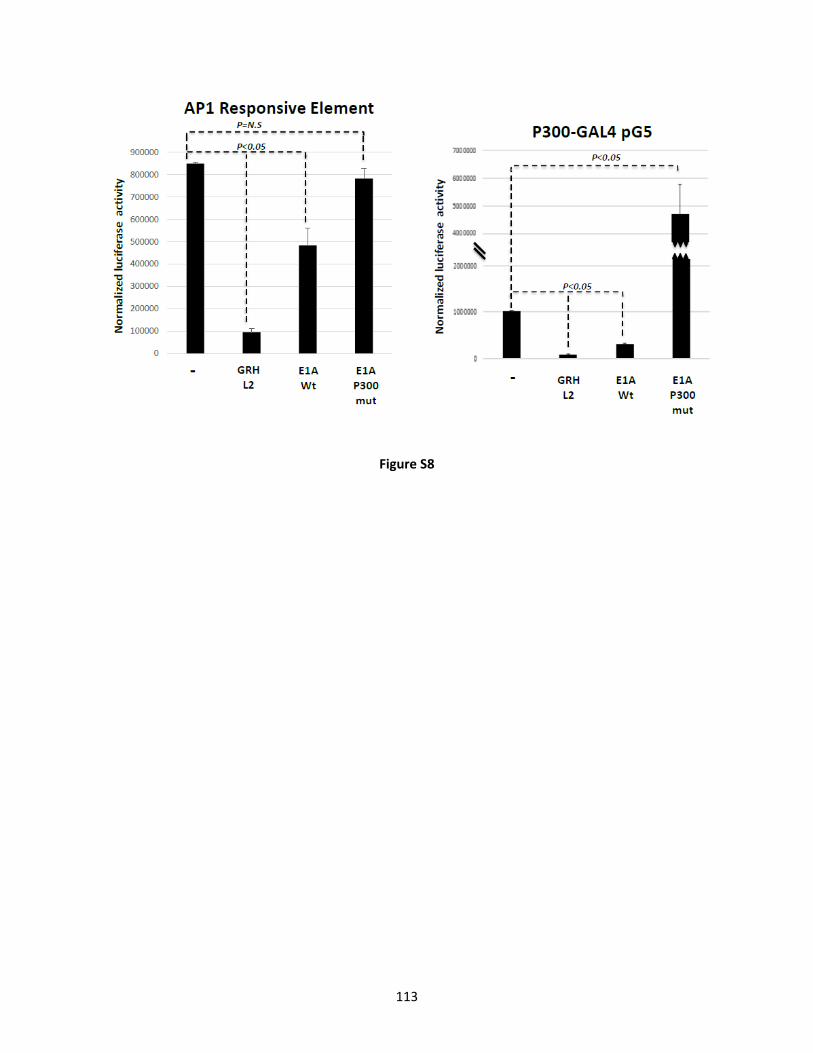
113
Figure S8
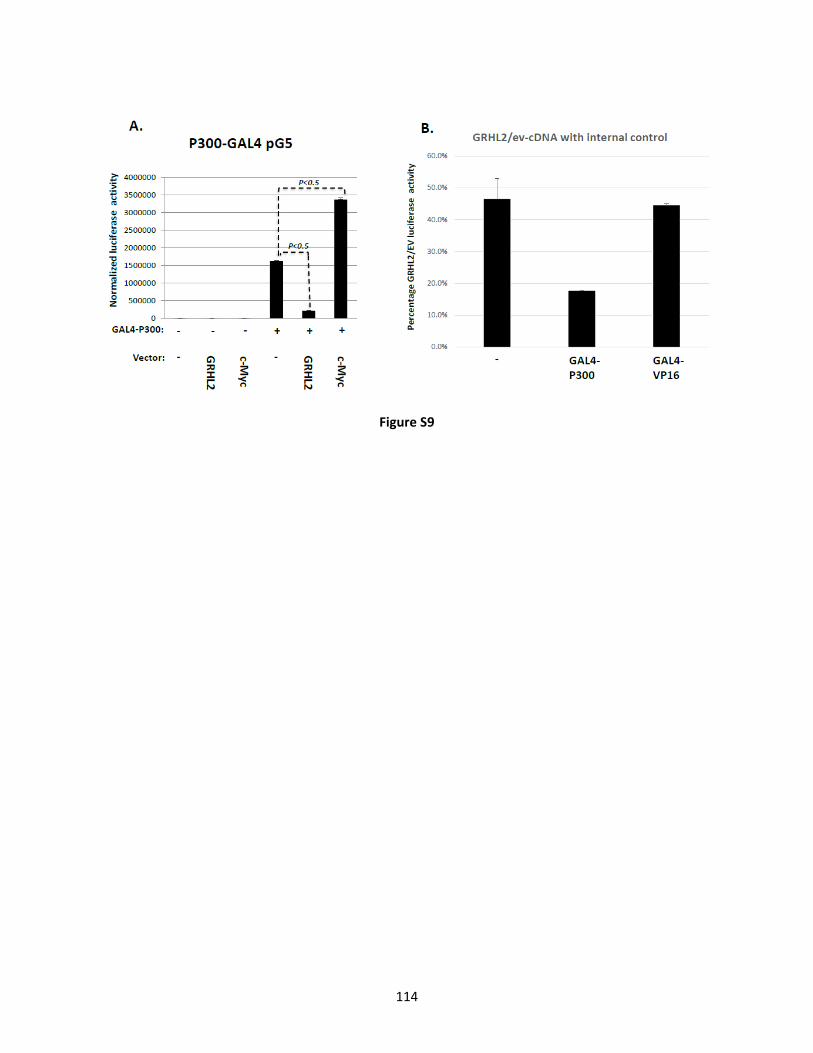
114
Figure S9
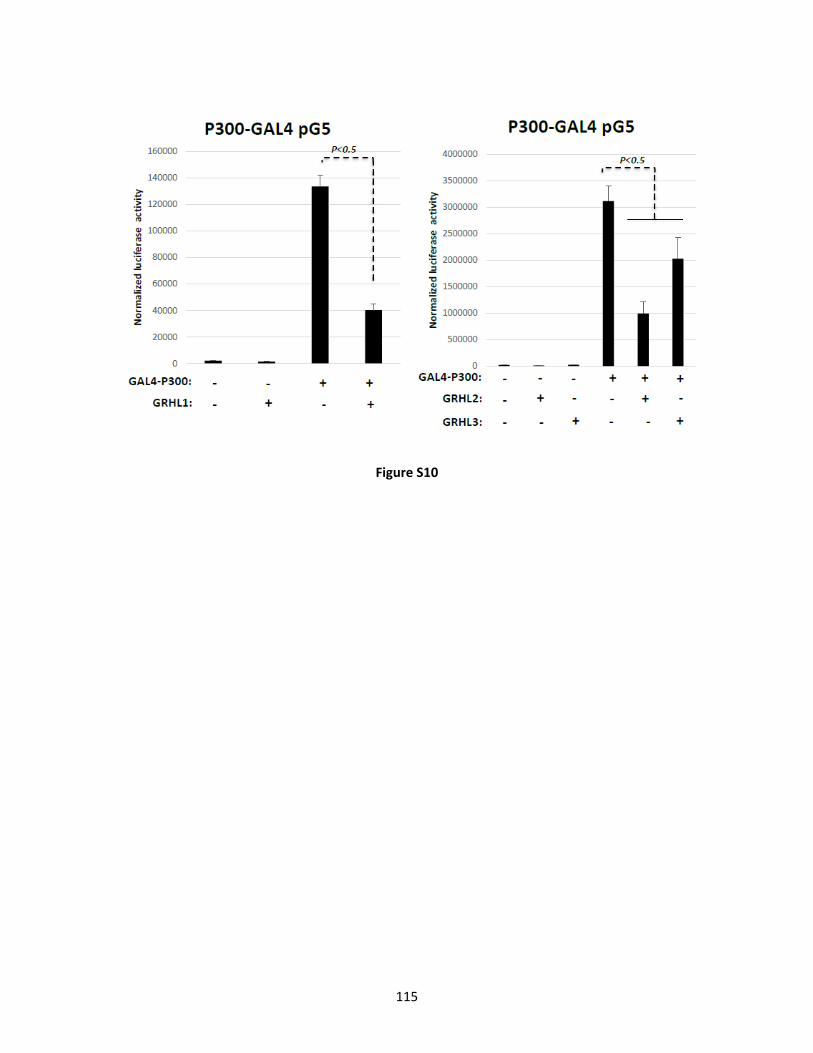
115
Figure S10
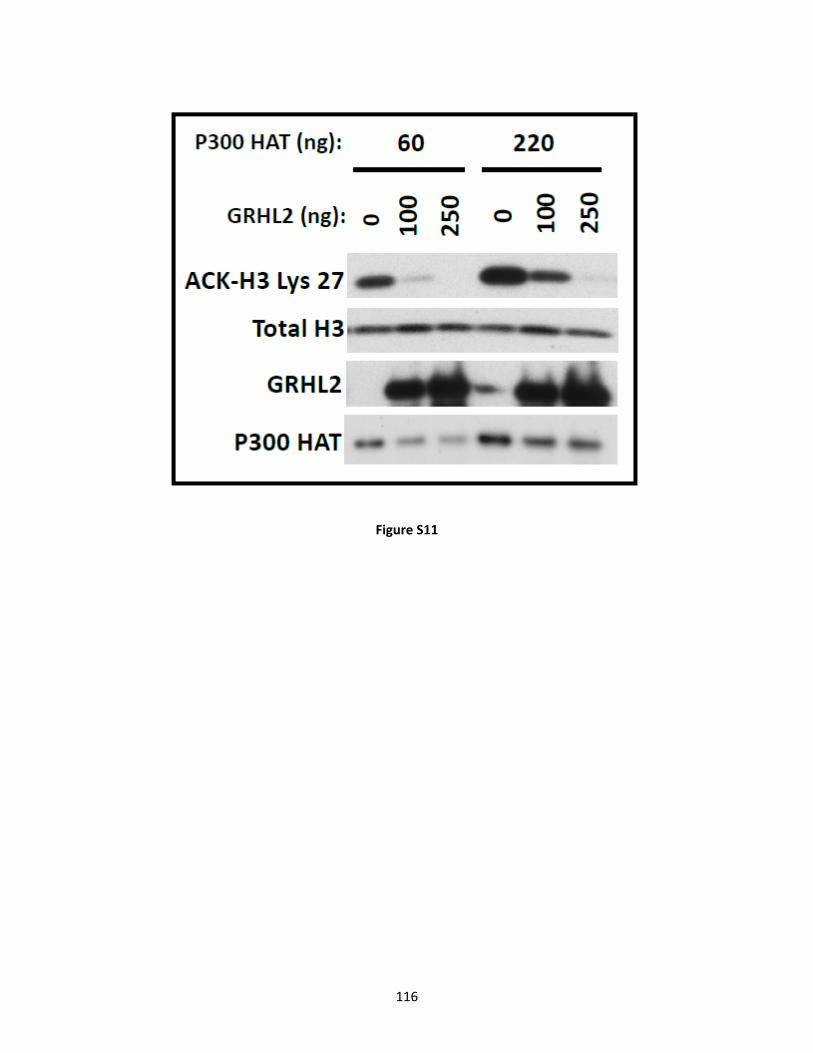
116
Figure S11
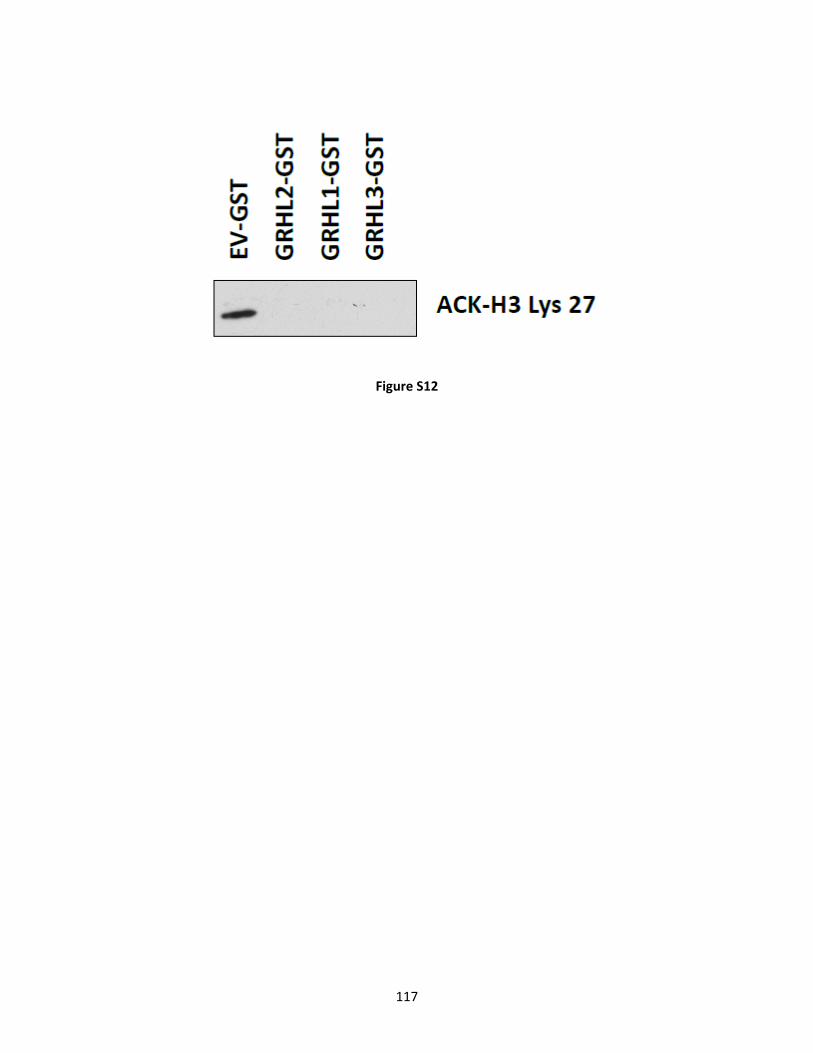
117
Figure S12
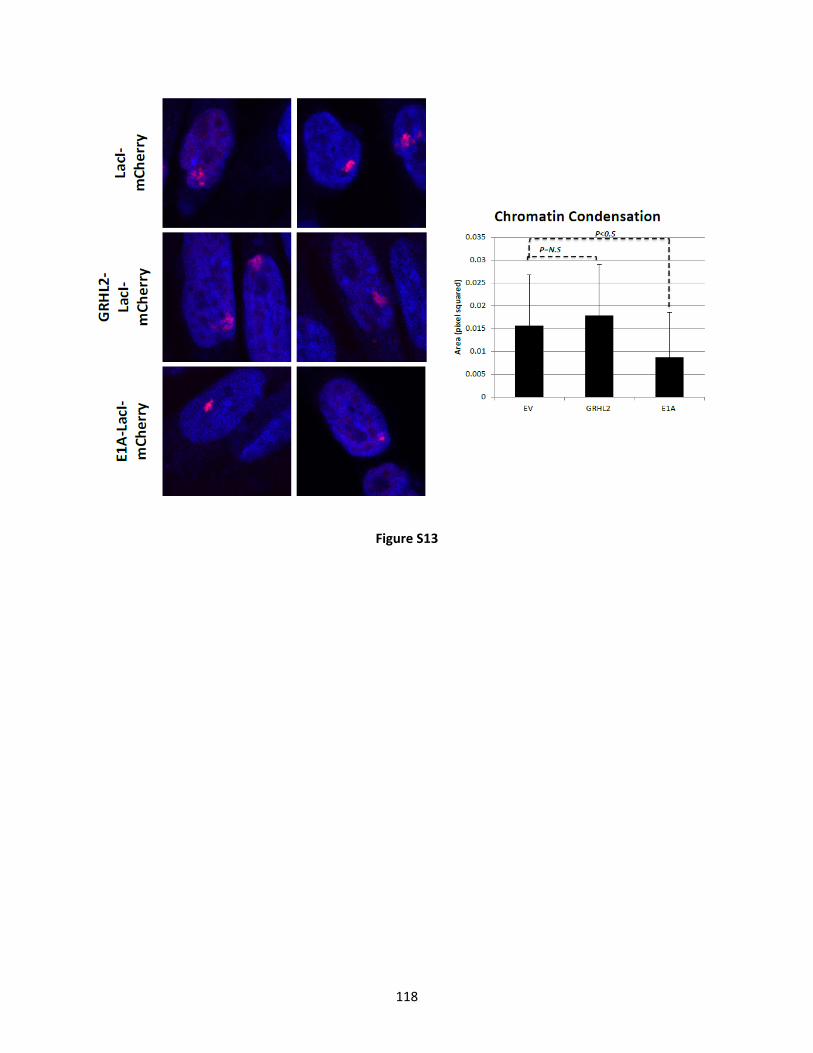
118
Figure S13
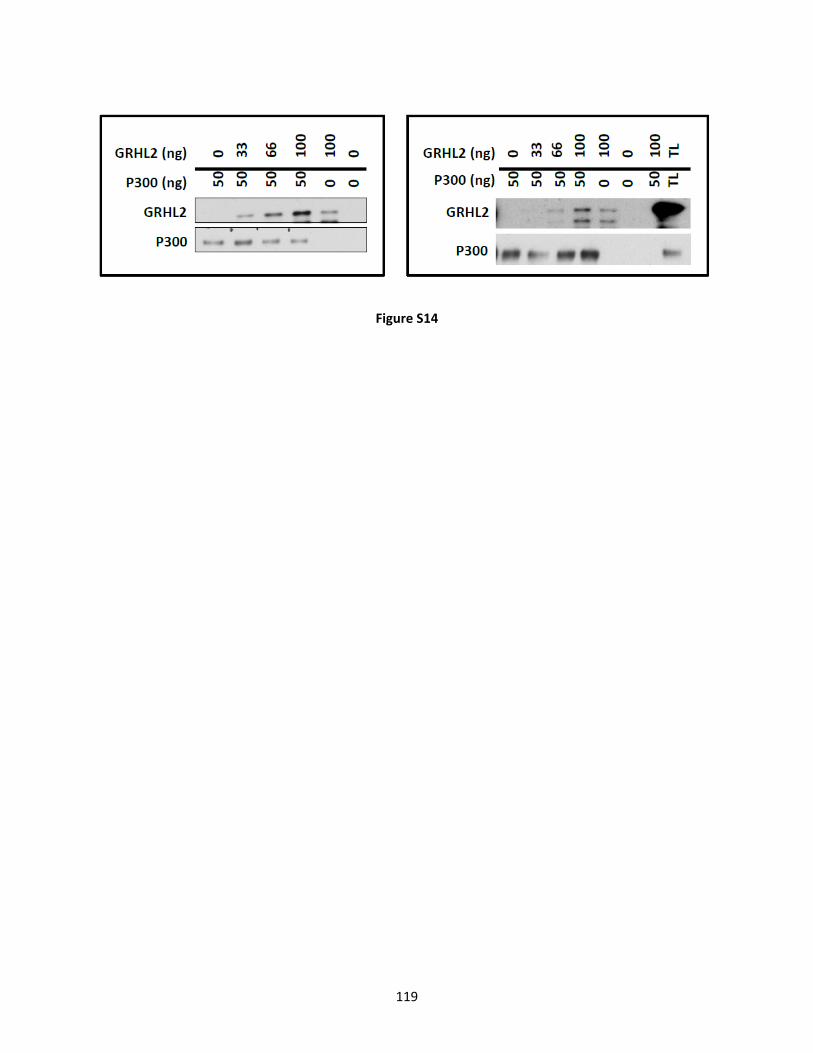
119
Figure S14
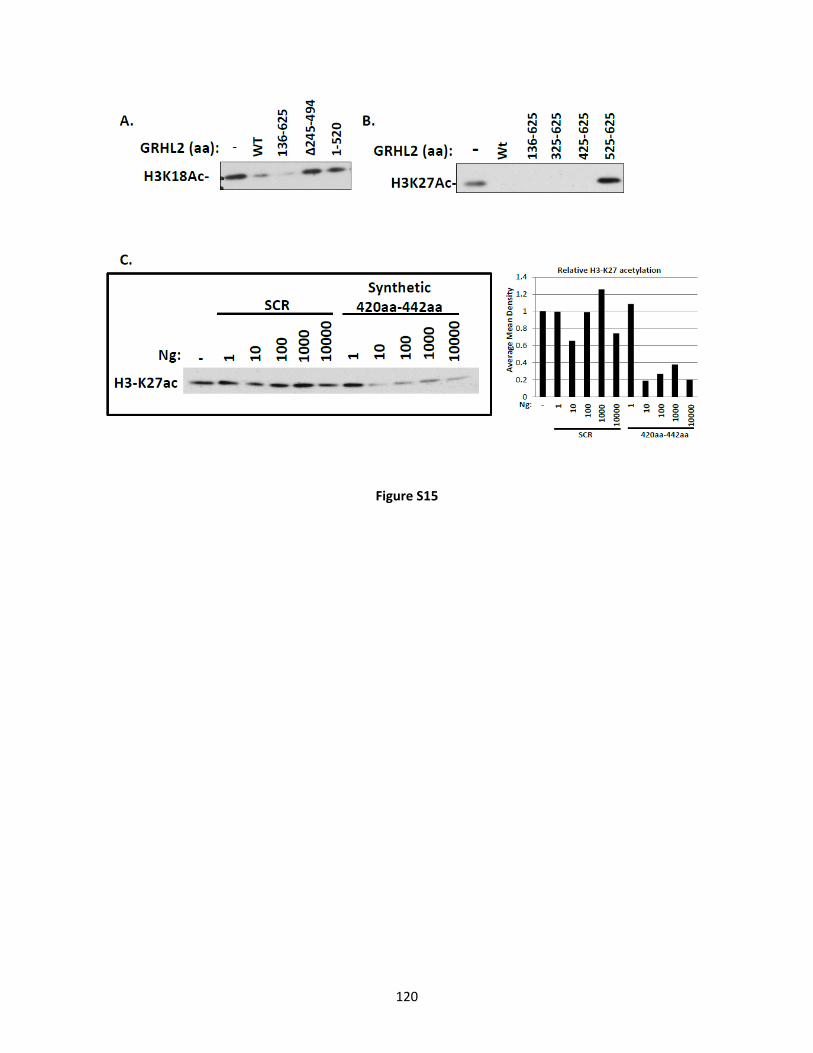
120
Figure S15
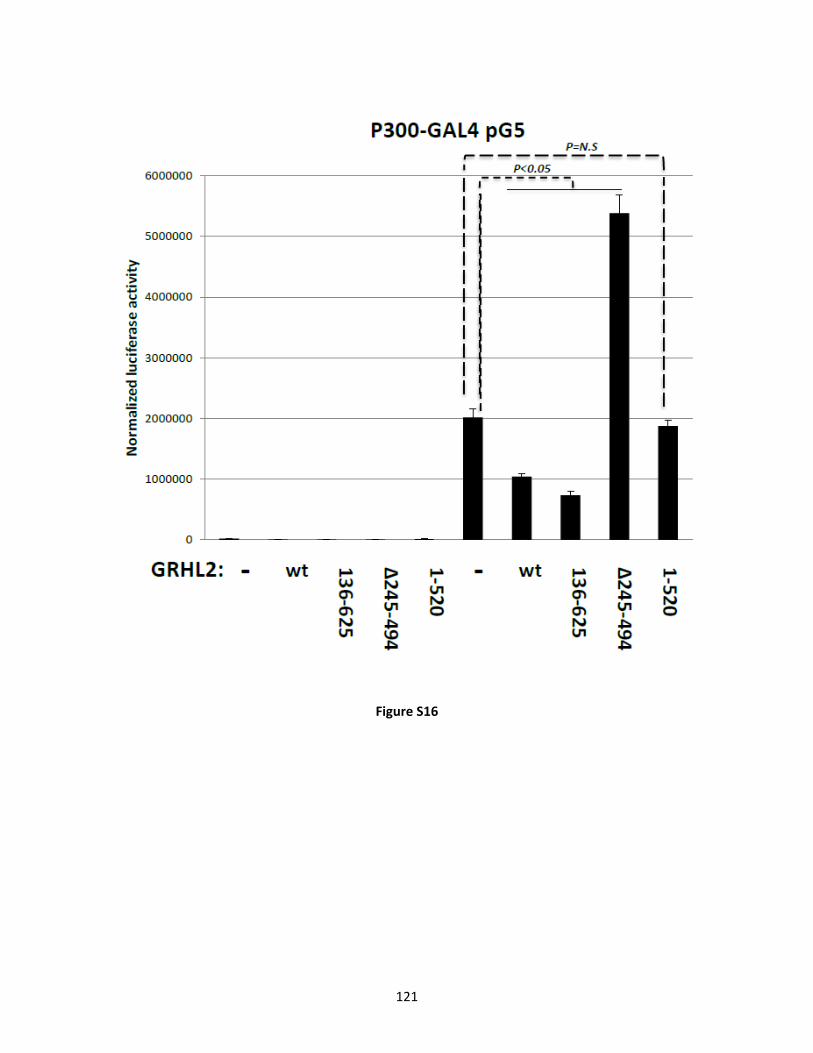
121
Figure S16

122
Figure S17
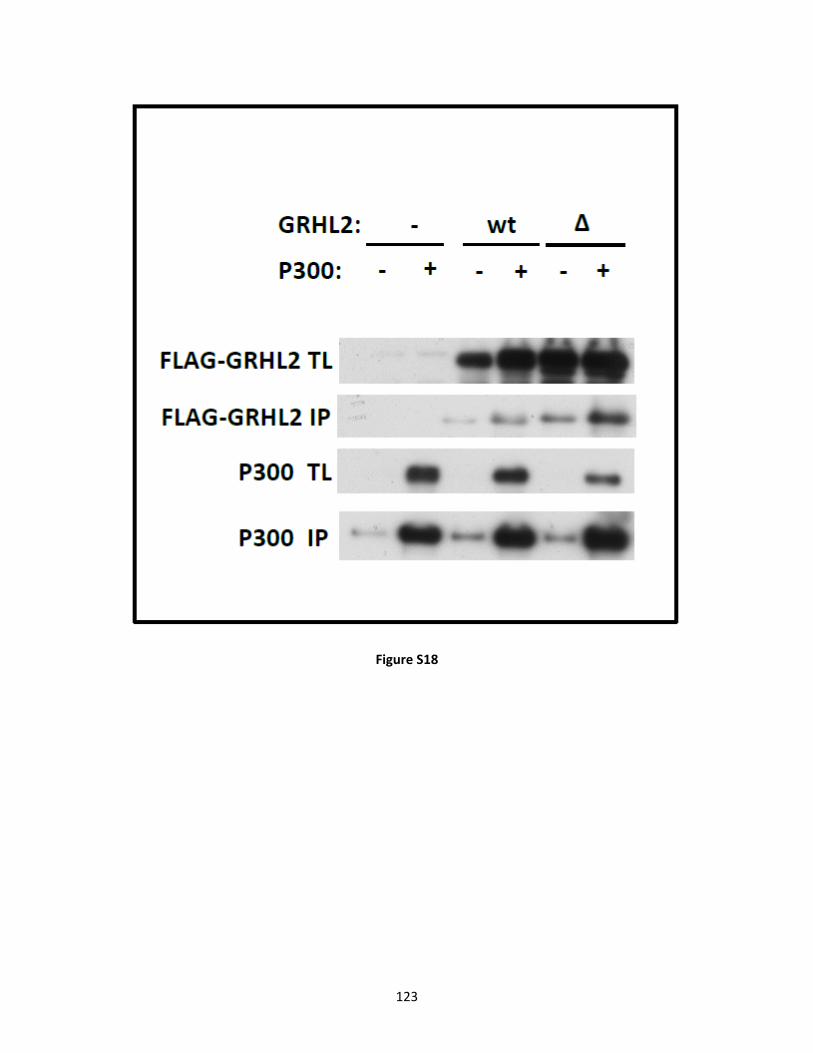
123
Figure S18
124
Figure S19


![[Metabolic myopathies - an overview]](https://img.dokumen.tips/doc/110x75/634624f0596bdb97a909418b/metabolic-myopathies-an-overview.jpg)


