Embed Size (px)
Citation preview
2021 ANNUAL REPORT
AUTOMOTIVE INDUSTRIAL
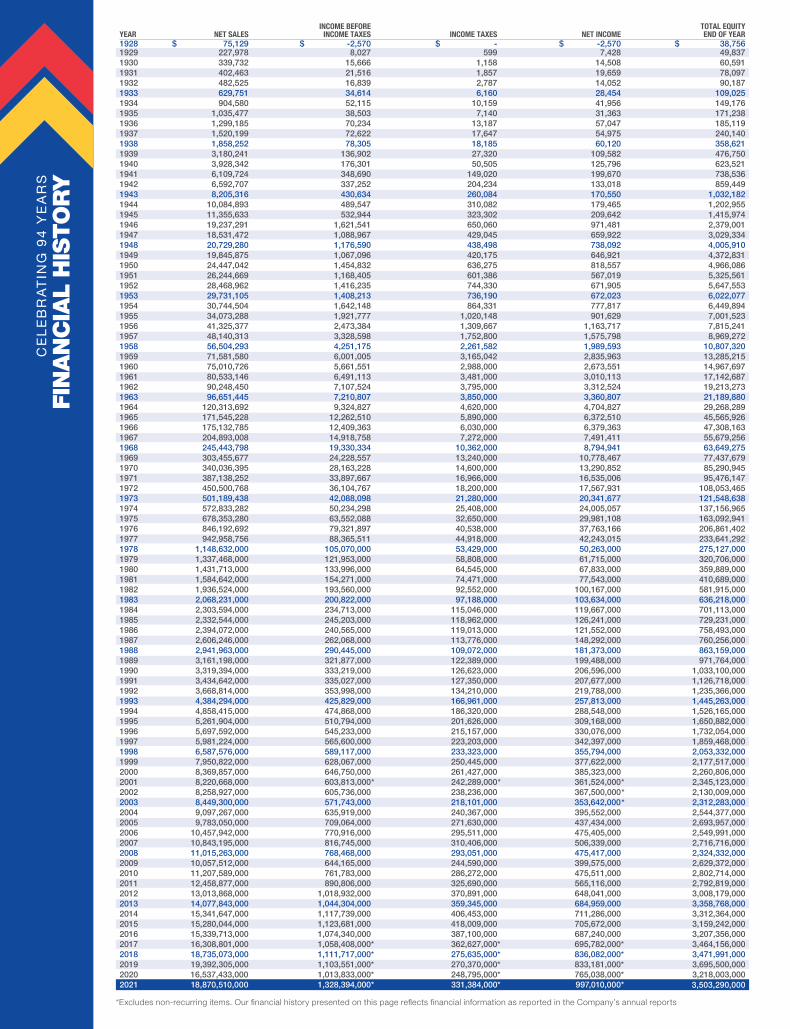
*Excludes non-recurring items. Our financial history presented on this page reflects financial information as reported in the Company’s annual reports
INCOME BEFORE TOTAL EQUITYYEAR NET SALES INCOME TAXES INCOME TAXES NET INCOME END OF YEAR1928 $ 75,129 $ -2,570 $ - $ -2,570 $ 38,7561929 227,978 8,027 599 7,428 49,8371930 339,732 15,666 1,158 14,508 60,5911931 402,463 21,516 1,857 19,659 78,0971932 482,525 16,839 2,787 14,052 90,1871933 629,751 34,614 6,160 28,454 109,0251934 904,580 52,115 10,159 41,956 149,1761935 1,035,477 38,503 7,140 31,363 171,2381936 1,299,185 70,234 13,187 57,047 185,1191937 1,520,199 72,622 17,647 54,975 240,1401938 1,858,252 78,305 18,185 60,120 358,6211939 3,180,241 136,902 27,320 109,582 476,7501940 3,928,342 176,301 50,505 125,796 623,5211941 6,109,724 348,690 149,020 199,670 738,5361942 6,592,707 337,252 204,234 133,018 859,4491943 8,205,316 430,634 260,084 170,550 1,032,1821944 10,084,893 489,547 310,082 179,465 1,202,9551945 11,355,633 532,944 323,302 209,642 1,415,9741946 19,237,291 1,621,541 650,060 971,481 2,379,0011947 18,531,472 1,088,967 429,045 659,922 3,029,3341948 20,729,280 1,176,590 438,498 738,092 4,005,9101949 19,845,875 1,067,096 420,175 646,921 4,372,8311950 24,447,042 1,454,832 636,275 818,557 4,966,0861951 26,244,669 1,168,405 601,386 567,019 5,325,5611952 28,468,962 1,416,235 744,330 671,905 5,647,5531953 29,731,105 1,408,213 736,190 672,023 6,022,0771954 30,744,504 1,642,148 864,331 777,817 6,449,8941955 34,073,288 1,921,777 1,020,148 901,629 7,001,5231956 41,325,377 2,473,384 1,309,667 1,163,717 7,815,2411957 48,140,313 3,328,598 1,752,800 1,575,798 8,969,2721958 56,504,293 4,251,175 2,261,582 1,989,593 10,807,3201959 71,581,580 6,001,005 3,165,042 2,835,963 13,285,2151960 75,010,726 5,661,551 2,988,000 2,673,551 14,967,6971961 80,533,146 6,491,113 3,481,000 3,010,113 17,142,6871962 90,248,450 7,107,524 3,795,000 3,312,524 19,213,2731963 96,651,445 7,210,807 3,850,000 3,360,807 21,189,8801964 120,313,692 9,324,827 4,620,000 4,704,827 29,268,2891965 171,545,228 12,262,510 5,890,000 6,372,510 45,565,9261966 175,132,785 12,409,363 6,030,000 6,379,363 47,308,1631967 204,893,008 14,918,758 7,272,000 7,491,411 55,679,2561968 245,443,798 19,330,334 10,362,000 8,794,941 63,649,2751969 303,455,677 24,228,557 13,240,000 10,778,467 77,437,6791970 340,036,395 28,163,228 14,600,000 13,290,852 85,290,9451971 387,138,252 33,897,667 16,966,000 16,535,006 95,476,1471972 450,500,768 36,104,767 18,200,000 17,567,931 108,053,4651973 501,189,438 42,088,098 21,280,000 20,341,677 121,548,6381974 572,833,282 50,234,298 25,408,000 24,005,057 137,156,9651975 678,353,280 63,552,088 32,650,000 29,981,108 163,092,9411976 846,192,692 79,321,897 40,538,000 37,763,166 206,861,4021977 942,958,756 88,365,511 44,918,000 42,243,015 233,641,2921978 1,148,632,000 105,070,000 53,429,000 50,263,000 275,127,0001979 1,337,468,000 121,953,000 58,808,000 61,715,000 320,706,0001980 1,431,713,000 133,996,000 64,545,000 67,833,000 359,889,0001981 1,584,642,000 154,271,000 74,471,000 77,543,000 410,689,0001982 1,936,524,000 193,560,000 92,552,000 100,167,000 581,915,0001983 2,068,231,000 200,822,000 97,188,000 103,634,000 636,218,0001984 2,303,594,000 234,713,000 115,046,000 119,667,000 701,113,0001985 2,332,544,000 245,203,000 118,962,000 126,241,000 729,231,0001986 2,394,072,000 240,565,000 119,013,000 121,552,000 758,493,0001987 2,606,246,000 262,068,000 113,776,000 148,292,000 760,256,0001988 2,941,963,000 290,445,000 109,072,000 181,373,000 863,159,0001989 3,161,198,000 321,877,000 122,389,000 199,488,000 971,764,0001990 3,319,394,000 333,219,000 126,623,000 206,596,000 1,033,100,0001991 3,434,642,000 335,027,000 127,350,000 207,677,000 1,126,718,0001992 3,668,814,000 353,998,000 134,210,000 219,788,000 1,235,366,0001993 4,384,294,000 425,829,000 166,961,000 257,813,000 1,445,263,0001994 4,858,415,000 474,868,000 186,320,000 288,548,000 1,526,165,0001995 5,261,904,000 510,794,000 201,626,000 309,168,000 1,650,882,0001996 5,697,592,000 545,233,000 215,157,000 330,076,000 1,732,054,0001997 5,981,224,000 565,600,000 223,203,000 342,397,000 1,859,468,0001998 6,587,576,000 589,117,000 233,323,000 355,794,000 2,053,332,0001999 7,950,822,000 628,067,000 250,445,000 377,622,000 2,177,517,0002000 8,369,857,000 646,750,000 261,427,000 385,323,000 2,260,806,0002001 8,220,668,000 603,813,000* 242,289,000* 361,524,000* 2,345,123,0002002 8,258,927,000 605,736,000 238,236,000 367,500,000* 2,130,009,0002003 8,449,300,000 571,743,000 218,101,000 353,642,000* 2,312,283,0002004 9,097,267,000 635,919,000 240,367,000 395,552,000 2,544,377,0002005 9,783,050,000 709,064,000 271,630,000 437,434,000 2,693,957,0002006 10,457,942,000 770,916,000 295,511,000 475,405,000 2,549,991,0002007 10,843,195,000 816,745,000 310,406,000 506,339,000 2,716,716,0002008 11,015,263,000 768,468,000 293,051,000 475,417,000 2,324,332,0002009 10,057,512,000 644,165,000 244,590,000 399,575,000 2,629,372,0002010 11,207,589,000 761,783,000 286,272,000 475,511,000 2,802,714,0002011 12,458,877,000 890,806,000 325,690,000 565,116,000 2,792,819,0002012 13,013,868,000 1,018,932,000 370,891,000 648,041,000 3,008,179,0002013 14,077,843,000 1,044,304,000 359,345,000 684,959,000 3,358,768,0002014 15,341,647,000 1,117,739,000 406,453,000 711,286,000 3,312,364,000 2015 15,280,044,000 1,123,681,000 418,009,000 705,672,000 3,159,242,0002016 15,339,713,000 1,074,340,000 387,100,000 687,240,000 3,207,356,0002017 16,308,801,000 1,058,408,000* 362,627,000* 695,782,000* 3,464,156,0002018 18,735,073,000 1,111,717,000* 275,635,000* 836,082,000* 3,471,991,0002019 19,392,305,000 1,103,551,000* 270,370,000* 833,181,000* 3,695,500,0002020 16,537,433,000 1,013,833,000* 248,795,000* 765,038,000* 3,218,003,000 2021 18,870,510,000 1,328,394,000 * 331,384,000* 997,010,000* 3,503,290,000
CE
LE
BR
AT
ING
94
YE
AR
S
FIN
AN
CIA
L H
ISTO
RY

$1,861
2020
$992
2021
$555
2019
$830
2018
$606
2017
1 A non-GAAP measure. See “Non-GAAP Financial Measures” in this report for more information and a reconciliation to GAAP
2
Founded in 1928, GPC is a global service organization engaged
in the distribution of automotive and industrial replacement
parts. The Company serves hundreds of thousands of
customers from a network of more than 10,000 locations
in 15 countries and has approximately 52,000 employees.
GENUINE PARTS COMPANY
2021 DIVIDEND PER SHARE
$3.26 +3%
2021 TOTAL SHAREHOLDER RETURN
+43%
10-YEAR TOTAL SHAREHOLDER RETURN
+12%
FREE CASH FLOW IN MILLIONS OF DOLLARS2
2021 SALES
$18.9B +14%2021 ADJUSTED DILUTED EPS
$6.91
NEW RECORD
+31%2021 FREE CASH FLOW $1B
SALES HIGHLIGHTS
2021 SALES BY REGION
UNITED STATES: 64%
EUROPE: 15%
CANADA: 9%
AUSTRALASIA: 11%
MEXICO: <1%
$6.91
2021
$5.27
2020
$4.32
2017
$5.26
2018
$5.31
2019
$18.90
2021
$16.54
2020
$14.40
2017
$16.83
2018
$17.52
2019
ADJUSTED DILUTED EARNINGS PER SHARE IN DOLLARS1
SALES IN BILLIONS OF DOLLARS
2021 NET SALES BY SEGMENT
AUTOMOTIVE:66%
INDUSTRIAL: 34%
THE YEAR IN REVIEW
In 2021, total GPC sales were $18.9 billion, a 14.1% increase from 2020. Net earnings were $899 million and diluted earnings per share were $6.23 on a GAAP basis, or $997 million and $6.91 per diluted share on an adjusted basis, representing a 31% increase from adjusted earnings per share in the prior year and a new record.
Our strategy for top-line growth includes a combination of organic and acquisitive initiatives designed to outpace the industry, improve market share and position the Company for long-term profitable growth. For the year, we improved our operating performance and delivered a 60-basis point increase in segment margin by leveraging our strong top-line growth, executing pricing and sourcing actions and further streamlining our cost structure via initiatives to optimize the productivity of our distribution network. These efforts resulted in our sixth consecutive year of improved gross margins and served to offset inflationary cost pressures in areas such as wages and freight.
Our team was also focused on further strengthening our balance sheet and maintaining ample liquidity. Working capital improved to 6% of total sales and we lowered our debt by $268 million, ending the year with a Debt to EBITDA ratio of 1.4x and $2.2 billion in liquidity. Additionally, we generated $1.3 billion in cash from operations and $1.0 billion in free cash flow. We effectively deployed our cash with a balanced approach of investing for enhanced productivity and growth and returning capital to shareholders through dividends and share repurchases.
BUSINESS UPDATE
The Automotive Group generated $12.5 billion in global revenues in 2021, up 15.5% from 2020. The increase in total sales includes 11% organic sales growth driven by the benefits of our strategic initiatives combined with the economic recovery and strong demand throughout the year.
The strength in automotive was led by double-digit organic sales increases in the U.S., Europe and Australasia, with Canada posting mid-single digit sales growth. In the U.S., our focus on key commercial sales programs, B2B and B2C omni-channel investments and pricing strategies drove strong sales with both the Do-it-for-Me (DIFM) and Do-it-Yourself (DIY) customer segments. In addition, the economic recovery provided further tailwinds for DIFM demand, with significant improvement in miles driven, delays of new car production and elevated used car prices driving strong demand. Overall, the favorable sales environment outweighed the supply chain challenges encountered throughout the year.
Our European operations had the strongest sales growth across our geographies, with the U.K. and Benelux outperforming. The growth in Europe reflects our focus on key account development, industry leading inventory availability and the continued roll-out of the NAPA brand. Likewise, in Australasia, the ongoing expansion of our NAPA store strategy and accelerated B2B and B2C digital initiatives drove solid sales again in 2021, with this operation reporting nearly 20% organic growth on a two-year stack.
Automotive sales also benefited from the positive impact of bolt-on acquisitions throughout the year. We expanded our global footprint with the addition of several new store groups, including entry into Ireland, and invested in online automotive companies to enhance our digital capabilities. The combination of organic and inorganic growth initiatives combined with our ongoing cost and productivity measures resulted in a 60-basis point improvement in the automotive segment margin. This represents a 100-basis point increase from 2019.
The Industrial Group generated total global sales of $6.3 billion in 2021, an 11% increase from 2020 and inclusive of 10% organic sales growth. This group posted double-digit organic sales increases in the second, third and fourth quarters, driven by the positive impact of key sales initiatives, the ongoing industrial recovery and broad increase in customer productivity. With these factors in mind, we achieved sales increases across virtually all product categories and industries served.
During the year, we enhanced our digital sales capabilities to accelerate e-commerce growth with existing and new customers, and our strategic pricing initiatives also generated incremental sales. To effectively leverage our top-line growth, the industrial team was also focused on a number of gross margin and operational priorities, and we executed on several measures to advance the productivity of our distribution network. All in, we improved our industrial segment margin by 90-basis points, or 130-basis points from 2019, achieving our fifth consecutive annual increase and highest margin since 2000.
In December, we announced the acquisition of Kaman Distribution Group (“KDG”) which closed January 3, 2022. KDG is a leading power transmission, automation and fluid power industrial distributor and solutions provider with operations across the U.S. and approximately $1.1 billion in annual sales. This highly synergistic acquisition enhances our scale and further strengthens our market-leading position. We look forward to creating significant shareholder value as a premier leader in industrial solutions.
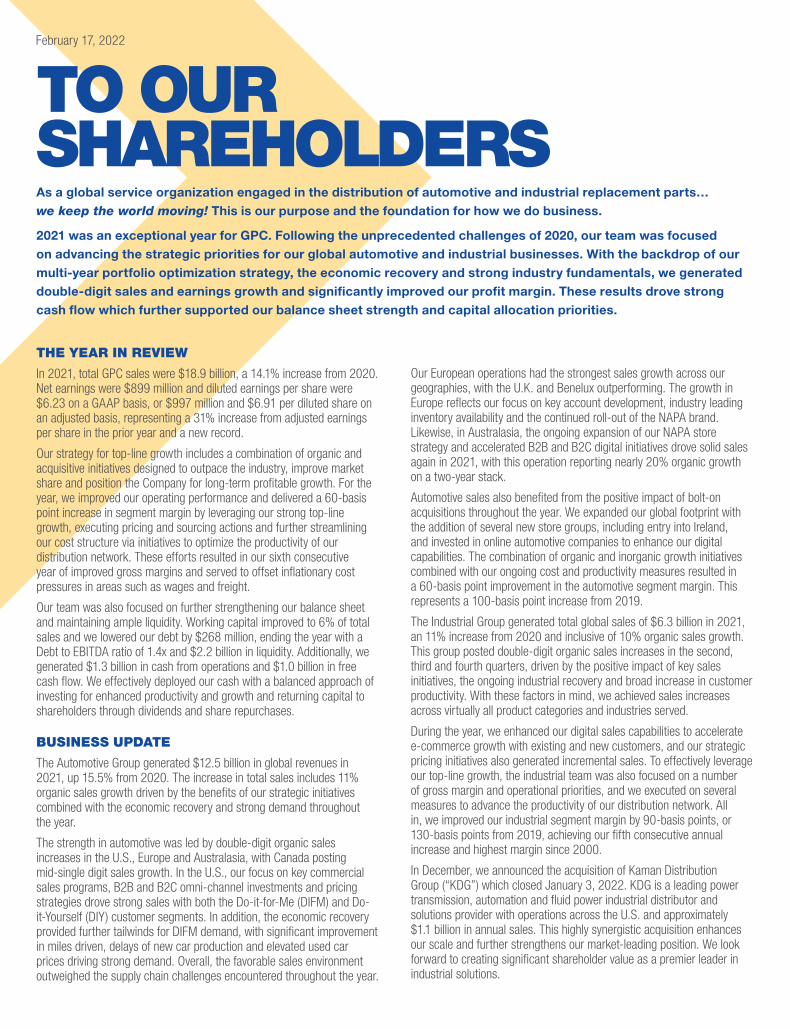
As a global service organization engaged in the distribution of automotive and industrial replacement parts… we keep the world moving! This is our purpose and the foundation for how we do business.
2021 was an exceptional year for GPC. Following the unprecedented challenges of 2020, our team was focused on advancing the strategic priorities for our global automotive and industrial businesses. With the backdrop of our multi-year portfolio optimization strategy, the economic recovery and strong industry fundamentals, we generated double-digit sales and earnings growth and significantly improved our profit margin. These results drove strong cash flow which further supported our balance sheet strength and capital allocation priorities.
TO OUR SHAREHOLDERS
February 17, 2022
KEY MANAGEMENT CHANGES
We want to recognize Carol B. Yancey, our EVP and Chief Financial Officer, who has announced her plan to retire at the end of May. Carol has served in a variety of key financial roles throughout her distinguished 30-year career with the Company, including the last nine years as CFO. We can’t thank her enough for her outstanding leadership and numerous contributions to the success of the Company over this time. Carol will be greatly missed, and we wish her all the best in her retirement.
We are very pleased to welcome Bert Nappier as our next Chief Financial Officer. Bert is a strategic financial executive with broad expertise in key areas such as global finance, operations and business strategy. He joins GPC with a diverse background spanning 25 years, including the last 16 years with FedEx Corporation, and we are confident he will be a valuable addition to our executive management team. We look forward to his contributions to the next phase of growth at GPC.
In June 2021, Naveen Krishna joined the Company as EVP and Chief Information and Digital Officer. Naveen has more than 25 years of technology experience primarily in the omni-channel retail and consumer products industries and has responsibility for leading the strategy and direction for all technology and digital initiatives. We are excited for Naveen’s leadership as we enhance the customer experience and establish technology capabilities that advance our long-term strategy.
ENVIRONMENTAL AND SOCIAL RESPONSIBILITY
In 2021, we further executed our “Roadmap to Sustainability” to meet the needs of our customers, attract and retain talent, benefit the communities in which we work, preserve the environment and serve our shareholders. We prioritize lowering our carbon footprint, giving back to communities and ensuring equality, equity and fair treatment for our teammates, suppliers and customers.
In September, we published our 2021 Sustainability Report Update, highlighting our progress in promoting diversity, equity and inclusion and reducing our greenhouse gas emissions, among other initiatives. We are proud of our teammates for their resilience and contributions to advancing our sustainability goals, yet it’s an ongoing journey. We are currently measuring, assessing and analyzing our global carbon emissions and plan to formalize our carbon emissions reduction plan and targets in 2022. We believe that our sustainability efforts are an important element of creating long-term shareholder value, and we invite you to visit the sustainability page on GPC’s website to learn more about our company-wide commitment to this important initiative.
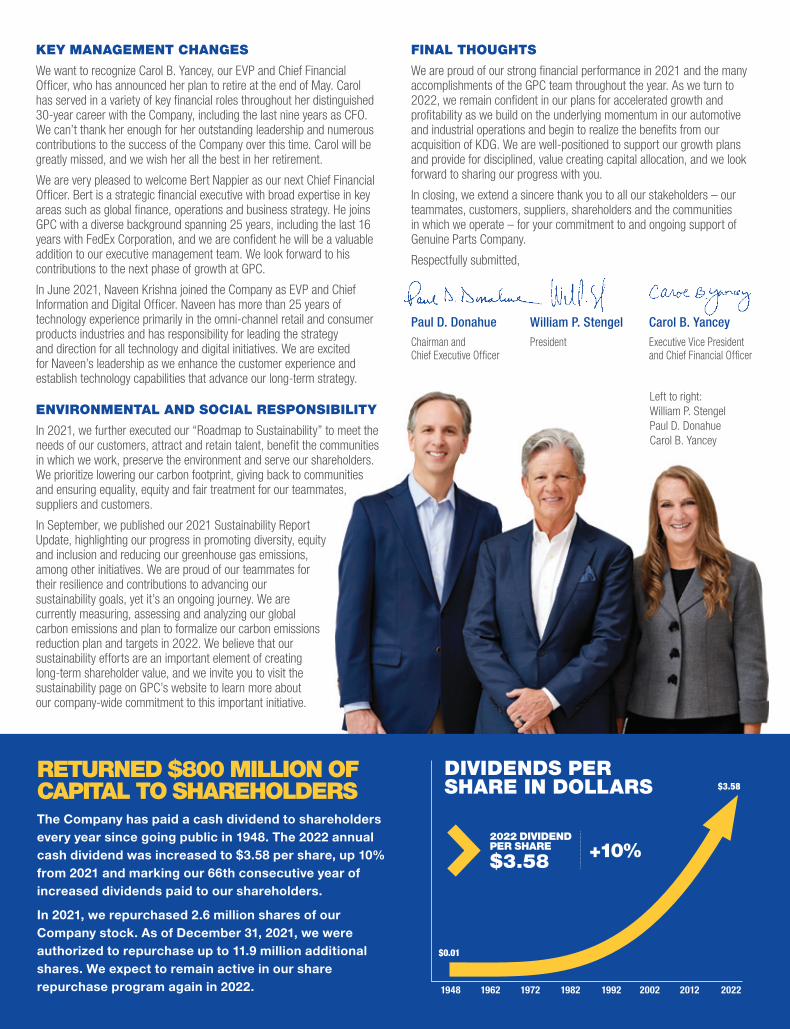
DIVIDENDS PER SHARE IN DOLLARS
1948
$0.01
1962 1972 1982 1992 2002 2012 2022
$3.58RETURNED $800 MILLION OF CAPITAL TO SHAREHOLDERSThe Company has paid a cash dividend to shareholders every year since going public in 1948. The 2022 annual cash dividend was increased to $3.58 per share, up 10% from 2021 and marking our 66th consecutive year of increased dividends paid to our shareholders.
In 2021, we repurchased 2.6 million shares of our Company stock. As of December 31, 2021, we were authorized to repurchase up to 11.9 million additional shares. We expect to remain active in our share repurchase program again in 2022.
FINAL THOUGHTS
We are proud of our strong financial performance in 2021 and the many accomplishments of the GPC team throughout the year. As we turn to 2022, we remain confident in our plans for accelerated growth and profitability as we build on the underlying momentum in our automotive and industrial operations and begin to realize the benefits from our acquisition of KDG. We are well-positioned to support our growth plans and provide for disciplined, value creating capital allocation, and we look forward to sharing our progress with you.
In closing, we extend a sincere thank you to all our stakeholders – our teammates, customers, suppliers, shareholders and the communities in which we operate – for your commitment to and ongoing support of Genuine Parts Company.
Respectfully submitted,
Paul D. DonahueChairman and Chief Executive Officer
William P. StengelPresident
Carol B. YanceyExecutive Vice President and Chief Financial Officer
Left to right:
William P. Stengel
Paul D. Donahue
Carol B. Yancey
2022 DIVIDEND PER SHARE
$3.58 +10%
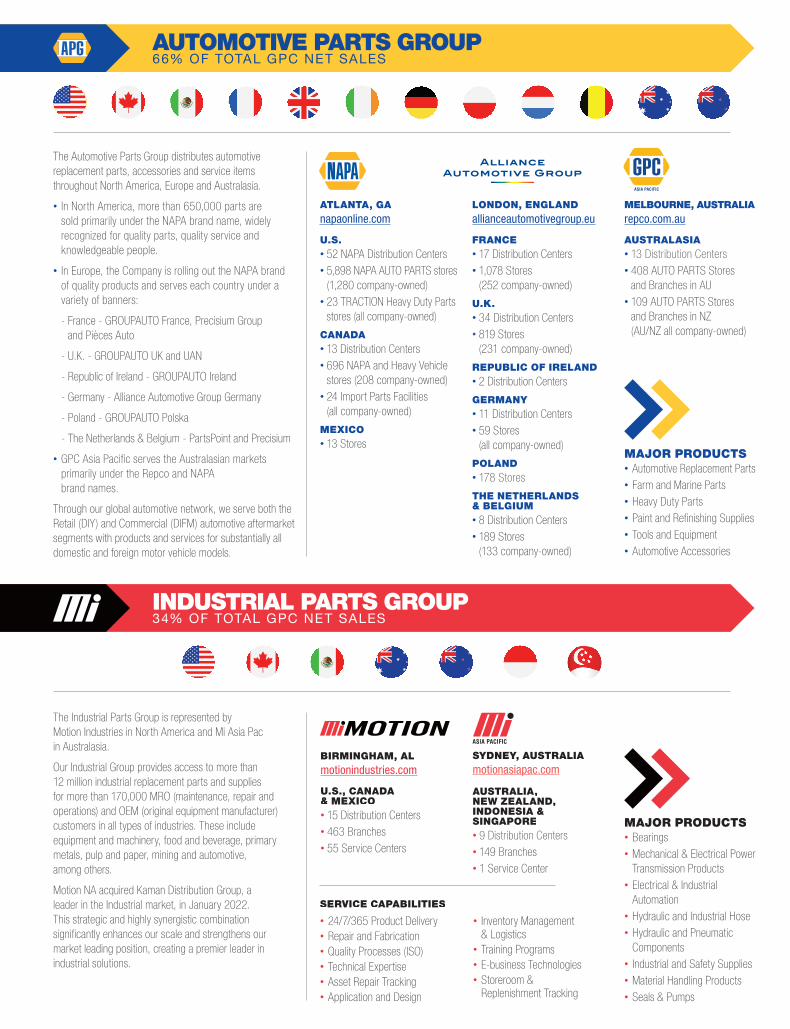
AUTOMOTIVE PARTS GROUP 66% OF TOTAL GPC NET SALES
LONDON, ENGLANDallianceautomotivegroup.eu
FRANCE• 17 Distribution Centers• 1,078 Stores (252 company-owned)
U.K.• 34 Distribution Centers• 819 Stores (231 company-owned)
REPUBLIC OF IRELAND• 2 Distribution Centers
GERMANY• 11 Distribution Centers• 59 Stores
(all company-owned)
POLAND• 178 Stores
THE NETHERLANDS & BELGIUM• 8 Distribution Centers• 189 Stores
(133 company-owned)
ATLANTA, GA napaonline.com
U.S.• 52 NAPA Distribution Centers• 5,898 NAPA AUTO PARTS stores
(1,280 company-owned)• 23 TRACTION Heavy Duty Parts
stores (all company-owned)
CANADA• 13 Distribution Centers• 696 NAPA and Heavy Vehicle
stores (208 company-owned)• 24 Import Parts Facilities
(all company-owned)
MEXICO• 13 Stores
MELBOURNE, AUSTRALIArepco.com.au
AUSTRALASIA• 13 Distribution Centers• 408 AUTO PARTS Stores
and Branches in AU• 109 AUTO PARTS Stores
and Branches in NZ (AU/NZ all company-owned)
The Automotive Parts Group distributes automotive replacement parts, accessories and service items throughout North America, Europe and Australasia.
• In North America, more than 650,000 parts are sold primarily under the NAPA brand name, widely recognized for quality parts, quality service and knowledgeable people.
• In Europe, the Company is rolling out the NAPA brand of quality products and serves each country under a variety of banners:
- France - GROUPAUTO France, Precisium Group and Pièces Auto
- U.K. - GROUPAUTO UK and UAN
- Republic of Ireland - GROUPAUTO Ireland
- Germany - Alliance Automotive Group Germany
- Poland - GROUPAUTO Polska
- The Netherlands & Belgium - PartsPoint and Precisium
• GPC Asia Pacific serves the Australasian markets primarily under the Repco and NAPA brand names.
Through our global automotive network, we serve both the Retail (DIY) and Commercial (DIFM) automotive aftermarket segments with products and services for substantially all domestic and foreign motor vehicle models.
MAJOR PRODUCTS• Automotive Replacement Parts• Farm and Marine Parts• Heavy Duty Parts• Paint and Refinishing Supplies• Tools and Equipment• Automotive Accessories
The Industrial Parts Group is represented by Motion Industries in North America and Mi Asia Pac in Australasia.
Our Industrial Group provides access to more than 12 million industrial replacement parts and supplies for more than 170,000 MRO (maintenance, repair and operations) and OEM (original equipment manufacturer) customers in all types of industries. These include equipment and machinery, food and beverage, primary metals, pulp and paper, mining and automotive, among others.
Motion NA acquired Kaman Distribution Group, a leader in the Industrial market, in January 2022. This strategic and highly synergistic combination significantly enhances our scale and strengthens our market leading position, creating a premier leader in industrial solutions.
BIRMINGHAM, AL motionindustries.com
U.S., CANADA & MEXICO• 15 Distribution Centers• 463 Branches• 55 Service Centers
SYDNEY, AUSTRALIAmotionasiapac.com
AUSTRALIA,NEW ZEALAND, INDONESIA & SINGAPORE• 9 Distribution Centers• 149 Branches• 1 Service Center
MAJOR PRODUCTS• Bearings• Mechanical & Electrical Power
Transmission Products• Electrical & Industrial
Automation• Hydraulic and Industrial Hose• Hydraulic and Pneumatic Components• Industrial and Safety Supplies• Material Handling Products• Seals & Pumps
SERVICE CAPABILITIES
• Inventory Management & Logistics• Training Programs• E-business Technologies• Storeroom & Replenishment Tracking
• 24/7/365 Product Delivery• Repair and Fabrication• Quality Processes (ISO)• Technical Expertise• Asset Repair Tracking • Application and Design
INDUSTRIAL PARTS GROUP 34% OF TOTAL GPC NET SALES
UNITED STATES SECURITIES AND EXCHANGE COMMISSIONWashington, D.C. 20549
Form 10-KÍ ANNUAL REPORT PURSUANT TO SECTION 13 OR 15(d) OF THE
SECURITIES EXCHANGE ACT OF 1934For the fiscal year ended December 31, 2021
Or
‘ TRANSITION REPORT PURSUANT TO SECTION 13 OR 15(d) OFTHE SECURITIES EXCHANGE ACT OF 1934For the transition period from to
Commission file number: 1-5690
GENUINE PARTS COMPANY(Exact name of registrant as specified in its charter)
GA 58-0254510(State or other jurisdiction of
incorporation or organization)(I.R.S. Employer
Identification No.)
2999 WILDWOOD PARKWAY, ATLANTA, GA 30339(Address of principal executive offices) (Zip Code)
678-934-5000(Registrant’s telephone number, including area code)
Securities registered pursuant to Section 12(b) of the Act:Title of each class Trading Symbol(s) Name of each exchange on which registered
Common Stock, $1.00 par value per share GPC New York Stock Exchange
Securities registered pursuant to Section 12(g) of the Act:
NoneIndicate by check mark if the registrant is a well-known seasoned issuer, as defined in Rule 405 of the Securities
Act. Yes È No ‘
Indicate by check mark if the registrant is not required to file reports pursuant to Section 13 or Section 15(d) of theExchange Act. Yes ‘ No È
Indicate by check mark whether the registrant (1) has filed all reports required to be filed by Section 13 or 15(d) ofthe Securities Exchange Act of 1934 during the preceding 12 months (or for such shorter period that the registrant wasrequired to file such reports), and (2) has been subject to such filing requirements for the past90 days. Yes È No ‘
Indicate by check mark whether the registrant has submitted electronically every Interactive Data File required tobe submitted pursuant to Rule 405 of Regulation S-T (§ 232,495 of this chapter) during the preceding 12 months (or forsuch shorter period that the registrant was required to submit such files). Yes È No ‘
Indicate by check mark whether the registrant is a large accelerated filer, an accelerated filer, a non-acceleratedfiler, a smaller reporting company or an emerging growth company. See the definitions of “large accelerated filer,”“accelerated filer,” “smaller reporting company” and “emerging growth company” in Rule 12b-2 of the Exchange Act.
Large accelerated filer È Accelerated filer ‘ Non-accelerated filer ‘ Smaller reporting company ‘
Emerging growth company ‘
If an emerging growth company, indicate by check mark if the registrant has elected not to use the extended tran-sition period for complying with any new or revised financial accounting standards provided pursuant to Section 13(a)of the Exchange Act. ‘
Indicate by check mark whether the Registrant has filed a report on and attestation to its management’s assessmentof the effectiveness of its internal control over financial reporting under Section 404(b) of the Sarbanes-Oxley Act (15U.S.C. 7262(b)) by the registered public accounting firm that prepared or issued its audit report. È
Indicate by check mark whether the registrant is a shell company (as defined in Rule 12b-2 of theAct). Yes ‘ No È
As of June 30, 2021, the aggregate market value of the registrant’s common stock held by non-affiliates of the regis-trant was approximately $17.5 billion based on the closing sale price as reported on the New York Stock Exchange.
There were 141,963,257 shares of the Company’s common stock outstanding as of February 14, 2022.
DOCUMENTS INCORPORATED BY REFERENCE
Specifically identified portions of the Company’s definitive Proxy Statement for the Annual Meeting of Share-holders to be held on April 28, 2022 are incorporated by reference into Part III of this Form 10-K.

[THIS PAGE INTENTIONALLY LEFT BLANK]
Table of Contents
PART I Page
Item 1. Business . . . . . . . . . . . . . . . . . . . . . . . . . . . . . . . . . . . . . . . . . . . . . . . . . . . . . . . . . . . . . . . . . . . . 2Item 1A. Risk Factors . . . . . . . . . . . . . . . . . . . . . . . . . . . . . . . . . . . . . . . . . . . . . . . . . . . . . . . . . . . . . . . . . 8Item 1B. Unresolved Staff Comments . . . . . . . . . . . . . . . . . . . . . . . . . . . . . . . . . . . . . . . . . . . . . . . . . . . . 18Item 2. Properties . . . . . . . . . . . . . . . . . . . . . . . . . . . . . . . . . . . . . . . . . . . . . . . . . . . . . . . . . . . . . . . . . . . 18Item 3. Legal Proceedings . . . . . . . . . . . . . . . . . . . . . . . . . . . . . . . . . . . . . . . . . . . . . . . . . . . . . . . . . . . . 18Item 4. Mine Safety Disclosures . . . . . . . . . . . . . . . . . . . . . . . . . . . . . . . . . . . . . . . . . . . . . . . . . . . . . . . 18
PART II
Item 5. Market for Registrant’s Common Equity, Related Stockholder Matters and Issuer Purchasesof Equity Securities . . . . . . . . . . . . . . . . . . . . . . . . . . . . . . . . . . . . . . . . . . . . . . . . . . . . . . . . . 19
Item 6. Selected Financial Data . . . . . . . . . . . . . . . . . . . . . . . . . . . . . . . . . . . . . . . . . . . . . . . . . . . . . . . . 20Item 7. Management’s Discussion and Analysis of Financial Condition and Results of Operations . . . 21Item 7A. Quantitative and Qualitative Disclosures About Market Risk . . . . . . . . . . . . . . . . . . . . . . . . . . . 34Item 8. Financial Statements and Supplementary Data . . . . . . . . . . . . . . . . . . . . . . . . . . . . . . . . . . . . . . 36Item 9. Changes in and Disagreements With Accountants on Accounting and Financial Disclosure . . . 84Item 9A. Controls and Procedures . . . . . . . . . . . . . . . . . . . . . . . . . . . . . . . . . . . . . . . . . . . . . . . . . . . . . . . 84Item 9B. Other Information . . . . . . . . . . . . . . . . . . . . . . . . . . . . . . . . . . . . . . . . . . . . . . . . . . . . . . . . . . . . . 88Item 9C. Disclosure Regarding Foreign Jurisdictions that Prevent Inspections . . . . . . . . . . . . . . . . . . . . . 88
PART III
Item 10. Directors, Executive Officers and Corporate Governance . . . . . . . . . . . . . . . . . . . . . . . . . . . . . . 89Item 11. Executive Compensation . . . . . . . . . . . . . . . . . . . . . . . . . . . . . . . . . . . . . . . . . . . . . . . . . . . . . . . 90Item 12. Security Ownership of Certain Beneficial Owners and Management and Related Stockholder
Matters . . . . . . . . . . . . . . . . . . . . . . . . . . . . . . . . . . . . . . . . . . . . . . . . . . . . . . . . . . . . . . . . . . . 90Item 13. Certain Relationships and Related Transactions, and Director Independence . . . . . . . . . . . . . . 91Item 14. Principal Accounting Fees and Services . . . . . . . . . . . . . . . . . . . . . . . . . . . . . . . . . . . . . . . . . . . 91
PART IV
Item 15. Exhibits and Financial Statement Schedules . . . . . . . . . . . . . . . . . . . . . . . . . . . . . . . . . . . . . . . . 92Item 16. Form 10-K Summary . . . . . . . . . . . . . . . . . . . . . . . . . . . . . . . . . . . . . . . . . . . . . . . . . . . . . . . . . . 95
Signatures . . . . . . . . . . . . . . . . . . . . . . . . . . . . . . . . . . . . . . . . . . . . . . . . . . . . . . . . . . . . . . . . . . . 96
PART I.
ITEM 1. BUSINESS.
Genuine Parts Company, “GPC”, a Georgia corporation incorporated on May 7, 1928, is a leading serviceorganization engaged in the distribution of automotive and industrial replacement parts, each described in moredetail below. In 2021, business was conducted from more than 10,300 locations throughout North America,Europe, Australia and New Zealand (“Australasia”) through an offering of best in class operating and distributionefficiencies, industry leading coverage of consumable/replacement parts, outstanding just-in-time service andenhanced technology solutions.
As used in this report, the “Company” refers to GPC and its subsidiaries, except as otherwise indicated bythe context; and the terms “automotive parts” and “industrial parts” refer to replacement parts in each respectivecategory.
The Company’s website can be found at www.genpt.com. The Company makes available, free of chargethrough its website, access to the Company’s Annual Reports on Form 10-K, Quarterly Reports on Form 10-Q,Current Reports on Form 8-K, proxy statements, any amendments to these documents, and other reports. Thesedocuments and reports are available under the Investor Relations section of the Company’s website as soon asreasonably practicable after such material is filed with or furnished to the Securities and Exchange Commission(“SEC”). Additionally, our corporate governance guidelines, codes of conduct and ethics, charters of the AuditCommittee and the Compensation, Nominating and Governance Committee of our Board of Directors, andinformation regarding our procedure for shareholders and other interested parties to communicate with our Boardof Directors, are available also on our website.
In Part III of this Form 10-K, we incorporate certain information by reference to our proxy statement for our2022 annual meeting of shareholders. We expect to file the proxy statement with the SEC on or about March 1,2022, and it will be available online at the same time at http://www.proxydocs.com/gpc. Please refer to the proxystatement for the information incorporated by reference into Part III of this Form 10-K when it is available.
OUR PURPOSE & STRATEGY
As a global service organization engaged in the distribution of automotive and industrial replacementparts...we keep the world moving! This is our purpose and foundation for how we do business.
At GPC, our mission is to be a world-class service organization and the employer of choice, supplier ofchoice, valued customer of choice and investment of choice. Additionally, we strive to be a respected businesscommunity member and a good corporate citizen. In order to execute this mission, the Company aligns itsresources with strategic areas of focus for its streamlined operations. Specifically, the Company focuses on itsmarket-leading automotive and industrial businesses in North America, Europe and Australasia to deliver profit-able growth, operational efficiencies and strong cash flow.
We have strategic initiatives designed to build on our current competitive advantages. We believe our pri-mary competitive advantages are our: (1) global presence and brand strength; (2) best-in-class operating and dis-tribution efficiencies; and (3) enhanced technology solutions.
Our strategic financial objectives are intended to complement our mission and drive value for all our stake-holders. These financial objectives include: (1) top line revenue growth in excess of market growth; (2) improvedoperating margin; (3) a strong balance sheet and cash flows; and (4) effective capital allocation.
Our strategy is designed to position the Company for long-term growth and enhance shareholder value.
OUR SEGMENTS
AUTOMOTIVE PARTS GROUP
The Automotive Parts Group is the largest global automotive parts network, distributing automotive parts,accessories and service items in North America, Europe and Australasia. The Automotive Parts Group offers
2
complete inventory, cataloging, marketing, training and other programs to the automotive aftermarket in each ofthese regions which distinguish this business from the competition. To complement its competitiveness in theautomotive aftermarket, the Automotive Parts Group includes investments in select digital/e-commerce busi-nesses across our operations.
In North America, the Automotive Parts Group sells parts primarily under the National Automotive PartsAssociation (“NAPA”) brand name through distribution centers and automotive parts stores (“auto parts stores”or “NAPA AUTO PARTS stores”). In Europe, Alliance Automotive Group (“AAG”), a wholly-owned subsidiaryof the Company, is a leading distributor of vehicle parts, tools and workshop equipment with its primary oper-ations in seven European countries. AAG is rolling out the NAPA brand of products and currently serves itscustomers under a variety of banners, including Groupauto, Precisium Group, Pièces Auto, UAN, AllianceAutomotive Group Germany and PartsPoint. In Australasia, the Automotive Parts Group serves the market pri-marily under the Repco and NAPA brand names.
The Company’s automotive parts network was expanded in 2021 with the acquisitions of various storegroups and automotive operations in North America, Europe and Australasia.
The Company’s global automotive network sells to customers in both commercial do-it-for-me (“DIFM”)and retail do-it-yourself (“DIY”) segments of the market and covers substantially all global motor vehicle mod-els. DIFM customers include local, regional and national repair centers, auto dealers, service stations and bothprivate and public sector accounts. DIY customers are primarily served over-the-counter at our global stores ordigitally. DIFM and DIY customers account for approximately 80% and 20% of the Automotive Parts Group’stotal sales, respectively.
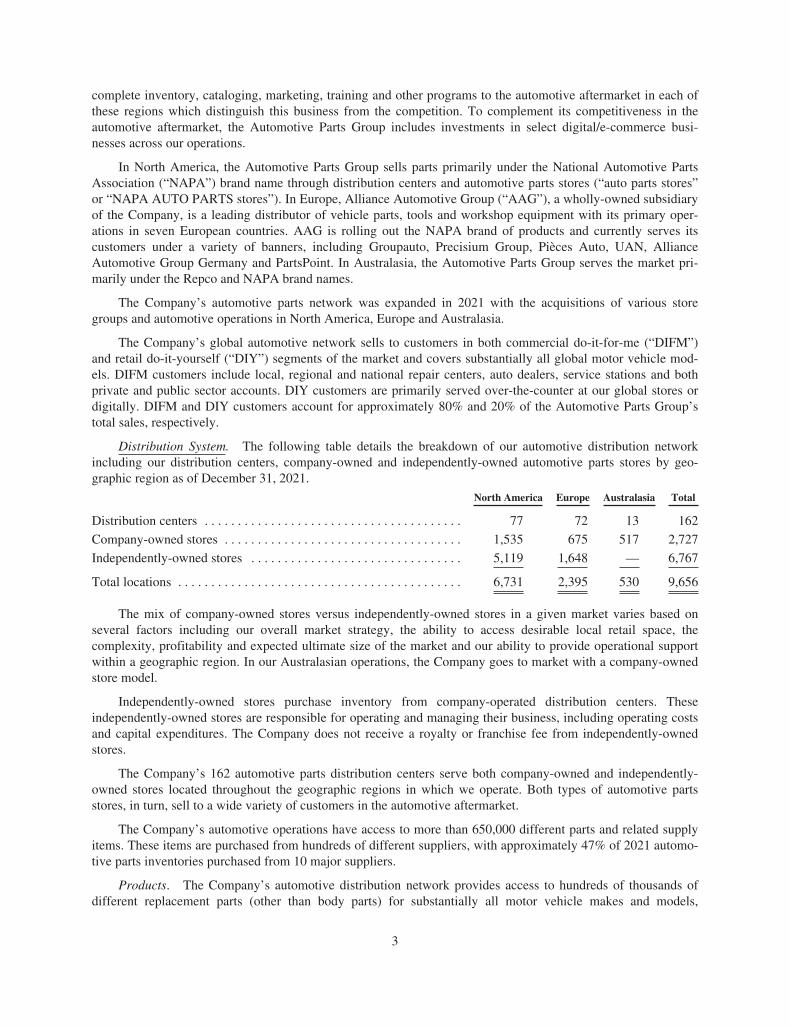
Distribution System. The following table details the breakdown of our automotive distribution networkincluding our distribution centers, company-owned and independently-owned automotive parts stores by geo-graphic region as of December 31, 2021.
North America Europe Australasia Total
Distribution centers . . . . . . . . . . . . . . . . . . . . . . . . . . . . . . . . . . . . . . . 77 72 13 162
Company-owned stores . . . . . . . . . . . . . . . . . . . . . . . . . . . . . . . . . . . . 1,535 675 517 2,727
Independently-owned stores . . . . . . . . . . . . . . . . . . . . . . . . . . . . . . . . 5,119 1,648 — 6,767
Total locations . . . . . . . . . . . . . . . . . . . . . . . . . . . . . . . . . . . . . . . . . . . 6,731 2,395 530 9,656
The mix of company-owned stores versus independently-owned stores in a given market varies based onseveral factors including our overall market strategy, the ability to access desirable local retail space, thecomplexity, profitability and expected ultimate size of the market and our ability to provide operational supportwithin a geographic region. In our Australasian operations, the Company goes to market with a company-ownedstore model.
Independently-owned stores purchase inventory from company-operated distribution centers. Theseindependently-owned stores are responsible for operating and managing their business, including operating costsand capital expenditures. The Company does not receive a royalty or franchise fee from independently-ownedstores.
The Company’s 162 automotive parts distribution centers serve both company-owned and independently-owned stores located throughout the geographic regions in which we operate. Both types of automotive partsstores, in turn, sell to a wide variety of customers in the automotive aftermarket.
The Company’s automotive operations have access to more than 650,000 different parts and related supplyitems. These items are purchased from hundreds of different suppliers, with approximately 47% of 2021 automo-tive parts inventories purchased from 10 major suppliers.
Products. The Company’s automotive distribution network provides access to hundreds of thousands ofdifferent replacement parts (other than body parts) for substantially all motor vehicle makes and models,
3
including hybrid and electric vehicles, trucks, SUVs, buses, motorcycles, recreational vehicles and farm vehicles.Each part is cataloged and numbered for identification and accessibility. Significant inventories are carried toprovide for fast and frequent deliveries to customers whose orders are often filled and shipped the same day theyare received. The Company does not manufacture any of the products it distributes. The majority of productsdistributed in North America are under the NAPA name, a mark licensed to the Company by NAPA, which isimportant to the sales and marketing of these products. In Australasia and Europe, products are distributed underseveral brand names, including many of the national brands, as well as the NAPA name.
In addition, the Company distributes replacement parts for small engines, farm equipment, marine equip-ment and heavy duty equipment. The Company’s inventories also include accessory items for vehicles andequipment, and supply items used by a wide variety of customers in the automotive aftermarket, such as repairshops, service stations, fleet operators, automobile and truck dealers, leasing companies, bus and truck lines,mass merchandisers, farms, and individuals who perform their own maintenance and parts installation.
Traction, the Company’s heavy duty parts business in North America sells products distributed under theHD Plus name, a proprietary line of automotive parts for heavy duty truck market.
Service to NAPA AUTO PARTS Stores. The Company believes that the quality and the range of servicesprovided to its North American automotive parts customers constitute a significant advantage for its automotiveparts distribution system. Such services include fast and frequent delivery, parts cataloging (including the use ofelectronic NAPA AUTO PARTS catalogs) and stock adjustments through a continuing parts classification sys-tem which, as initiated by the Company, allows independently-owned stores to return certain merchandise on ascheduled basis. The Company offers its NAPA AUTO PARTS store customers various management aids, mar-keting aids and service on topics such as inventory control, cost analysis, accounting procedures, group insuranceand retirement benefit plans, as well as marketing conferences and seminars, sales and advertising manuals andtraining programs.
The Company has developed and refined an inventory classification system to determine optimum dis-tribution center and auto parts store inventory levels for automotive parts stocking based on automotive registra-tions, usage rates, production statistics, technological advances, including predictive analytics, and other similarfactors. This system, which undergoes continuous analytical review, is an integral part of the Company’sinventory control procedures and comprises an important feature of the inventory management services that theCompany makes available to its NAPA AUTO PARTS store customers. The Company’s North American oper-ations have return privileges with most of its suppliers, which have protected the Company from inventory obso-lescence. Over the last 25 years, losses to the Company from obsolescence have been insignificant and theCompany attributes this to the successful operation of its classification system, which involves product returnprivileges with most of its suppliers.
NAPA. The Company is the sole member of the National Automotive Parts Association, LLC a voluntaryassociation formed in 1925 to promote the distribution of automotive parts for its members. NAPA, which nei-ther buys nor sells automotive parts, functions as a trade association that develops marketing concepts and pro-grams for its sole member.
Among the automotive products purchased by the Company from various manufacturers for distribution arecertain lines designated, cataloged, advertised and promoted as “NAPA” lines. Generally, the Company is notrequired to purchase any specific quantity of parts so designated and it may purchase competitive lines from thesame as well as other supply sources.
The Company uses the federally registered trademark NAPA® as part of the trade name of its distributioncenters and parts stores. The Company funds NAPA’s national advertising program, which is designed toincrease public recognition of the NAPA name and to promote NAPA product lines.
The Company is a party to, together with the former members of NAPA, a consent decree entered by theFederal District Court in Detroit, Michigan, on May 4, 1954. The consent decree enjoins certain practices underthe federal antitrust laws, including the use of exclusive agreements with manufacturers of automotive parts,allocation or division of territories among the Company and former NAPA members, fixing of prices or terms of
4
sale for such parts among such members, and agreements to adhere to any uniform policy in selecting parts cus-tomers or determining the number and location of, or arrangements with, auto parts customers.
Competition. The automotive parts distribution business is highly competitive. The Company competeswith other large automotive parts retail chains, automobile manufacturers (some of which sell replacement partsfor vehicles built by other manufacturers as well as those that they build themselves), automobile dealers, andwarehouse clubs. In addition, the Company competes with the distributing outlets of parts manufacturers, massmerchandisers (including national retail chains) and other parts distributors and retailers, including onlineretailers. The Automotive Parts Group competes primarily on product offering, service, brand recognition andprice. Further information regarding competition in the industry is set forth in “Item 1A. Risk Factors — We facesubstantial competition in the industries in which we do business.”
INDUSTRIAL PARTS GROUP
The Industrial Parts Group operates in both North America and Australasia. Motion Industries, Inc.(“Motion”), a wholly-owned subsidiary of the Company headquartered in Birmingham, Alabama, operates inNorth America. Motion Asia Pacific, also a wholly-owned subsidiary of the Company headquartered in Sydney,Australia, operates across Australasia.
Motion distributes industrial replacement parts and related supplies such as bearings, mechanical and elec-trical power transmission products, industrial automation and robotics, hose, hydraulic and pneumatic compo-nents, industrial and safety supplies and material handling products to maintenance, repair and operation(“MRO”) and original equipment manufacturer (“OEM”) customers throughout the U.S., Canada and Mexico.
In 2021, Motion served more than 170,000 OEM and MRO customers in all types of industries locatedthroughout North America and Australasia, including equipment and machinery, food and beverage, forest prod-ucts, primary metals, pulp and paper, mining, automotive, oil and gas, petrochemical and pharmaceuticalindustries; as well as strategically targeted specialty industries such as power generation, alternative energy,government, transportation, ports and others. Motion services all manufacturing and processing industries withaccess to a database of over 12 million parts.
The Industrial Parts Group provides customers with supply chain efficiencies achieved through the Compa-ny’s on-site solutions offering. This service provides inventory management, asset repair and tracking, vendormanaged inventory (“VMI”), as well as radio frequency identification (“RFID”) asset management of thecustomer’s inventory. Motion also provides a wide range of services and repairs such as: gearbox and fluidpower assembly and repair, process pump assembly and repair, hydraulic drive shaft repair, electrical panelassembly and repair, hose and gasket manufacture and assembly, and many other value-added services. A highlydeveloped supply chain with vendor partnerships and connectivity are enhanced by Motion’s leading e-businesscapabilities, such as MiSupplierConnect, which provides integration between the Company’s informationtechnology network and suppliers’ systems, creating numerous benefits for both the supplier and customer. Theseservices and supply chain efficiencies assist Motion in providing the cost savings that many of its customersrequire and expect.
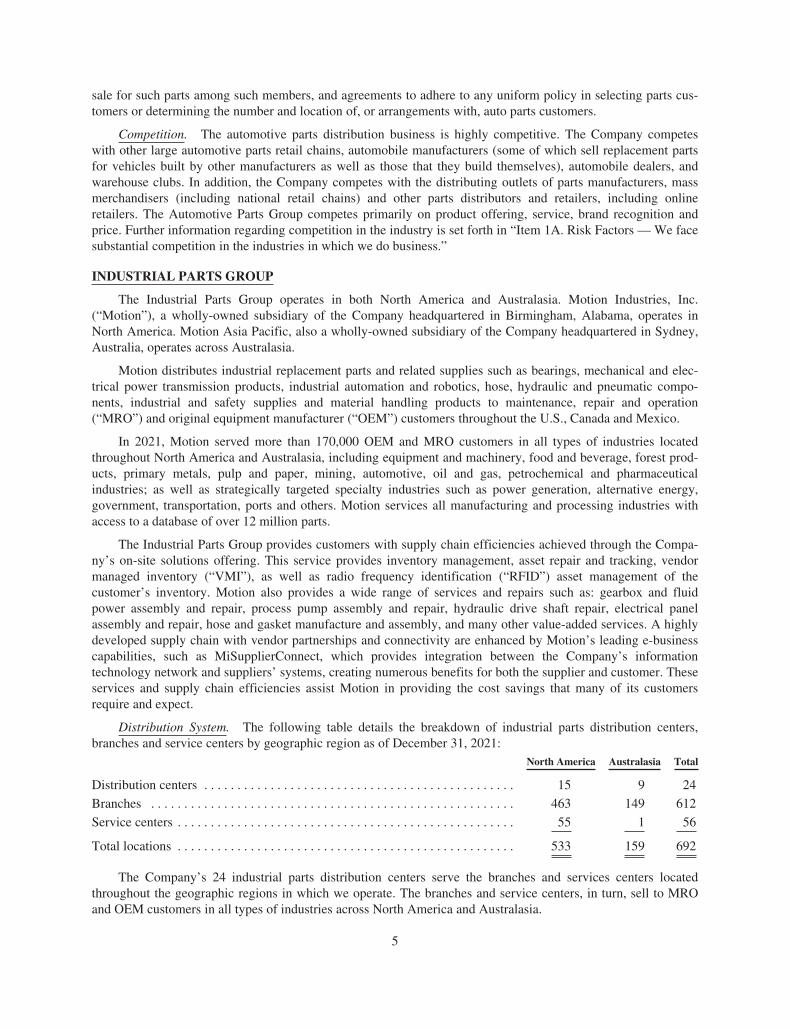
Distribution System. The following table details the breakdown of industrial parts distribution centers,branches and service centers by geographic region as of December 31, 2021:
North America Australasia Total
Distribution centers . . . . . . . . . . . . . . . . . . . . . . . . . . . . . . . . . . . . . . . . . . . . . . . 15 9 24
Branches . . . . . . . . . . . . . . . . . . . . . . . . . . . . . . . . . . . . . . . . . . . . . . . . . . . . . . . 463 149 612
Service centers . . . . . . . . . . . . . . . . . . . . . . . . . . . . . . . . . . . . . . . . . . . . . . . . . . . 55 1 56
Total locations . . . . . . . . . . . . . . . . . . . . . . . . . . . . . . . . . . . . . . . . . . . . . . . . . . . 533 159 692
The Company’s 24 industrial parts distribution centers serve the branches and services centers locatedthroughout the geographic regions in which we operate. The branches and service centers, in turn, sell to MROand OEM customers in all types of industries across North America and Australasia.
5
In North America, the Industrial Parts Group stocks or distributes more than 12 million different itemspurchased from more than 45,000 different suppliers. Its service centers provide hydraulic, hose and mechanicalrepairs for customers. Approximately 50% of total industrial product purchases in 2021 were made from our top50 strategic suppliers. Sales are generated from the Industrial Parts Group’s facilities located in 49 U.S. states,Puerto Rico and nine provinces in Canada and Mexico.
In Australasia, the Industrial Parts Group operated a network of distribution centers and branches acrossAustralia, New Zealand, Indonesia and Singapore as of December 31, 2021.
Additionally, the Company’s industrial parts network was expanded in 2022 with the acquisition of KamanDistribution Group (“KDG”). KDG, which is headquartered in Bloomfield, Connecticut, is a power transmission,automation and fluid power industrial distributor and solutions provider with operations throughout the UnitedStates, providing electro-mechanical products, bearings, power transmission, motion control and electrical andfluid power components to MRO and OEM customers. KDG has approximately 220 locations across the UnitedStates and Puerto Rico.
Most branches have warehouse facilities that stock significant amounts of inventory representative of theproducts used by customers in the respective market areas served.
Products. The Industrial Parts Group distributes a wide variety of parts and products to its customers,which are primarily industrial companies. Products include such items as hoses, belts, bearings, pulleys, pumps,valves, chains, gears, sprockets, speed reducers, electric motors, industrial supplies, assembly tools, test equip-ment, adhesives and chemicals. Motion also offers systems and automation products that support sophisticatedmotion control and process automation for full systems integration of plant equipment. The nature of Motion’sbusiness demands the maintenance of adequate inventories and the ability to promptly meet critical deliveryrequirements. Virtually all of the products distributed are installed by the customer or used in plant and facilitymaintenance activities. Most orders are filled immediately from existing stock and deliveries are normally madewithin 24 hours of order receipt. The majority of all sales are on open account. Motion has ongoing purchaseagreements with many of its national account customers which, collectively, represent approximately 45% of theannual sales volume.
Supply Agreements. Non-exclusive distributor agreements are in effect with most of the Industrial PartsGroup’s suppliers. The terms of these agreements vary; however, it has been the experience of the IndustrialParts Group that the custom of the trade is to treat such agreements as continuing until breached by one party oruntil terminated by mutual consent.
Competition. The industrial parts distribution business is highly competitive and fragmented. TheIndustrial Parts Group competes with other distributors specializing in the distribution of such items, general linedistributors and others who provide similar services. To a lesser extent, the Industrial Parts Group competes withmanufacturers that sell directly to the customer and with various industrial eCommerce sites. The Industrial PartsGroup competes primarily on the breadth of product offerings, service and price. Further information regardingcompetition in the industry is set forth in “Item 1A. Risk Factors — We face substantial competition in theindustries in which we do business.”
ENVIRONMENTAL, SOCIAL AND GOVERNANCE
The Company is committed to the development of sustainable and efficient operations and business practi-ces that enhance and protect our people, our communities and our planet. Our goal is to generate above-marketreturns while aligning our business practices to support the interests of our stakeholders as we strive to be theemployer of choice, the supplier of choice, a valued customer of choice and the investment of choice. Addition-ally, we strive to be a respected business community member and a good corporate citizen.
Our process of defining sustainability priorities focuses on the simultaneous improvement of the environ-mental, social and financial position of the Company, and our strong leadership and governance practices thatstrive to integrate sustainability into the Company’s business strategy and corporate culture. The Compensation,
6
Nominating, and Governance Committee of the Board of Directors oversees our sustainability initiatives whichaims to deliver long-term value for our shareholders and all our stakeholders.
We seek to promote a diverse, equitable and inclusive workplace and to ensure the health, safety and well-being of all employees. In response to the COVID-19 pandemic, we prioritized the health and safety of ouremployees while also contributing to the needs of the community through mask donations and many other ini-tiatives. The Company emphasizes giving back and uplifting the communities in which we operate through part-nerships and volunteer efforts. Refer to the “Human Capital Management” section below for further informationon our human capital management initiatives.
The Company is committed to reducing its environmental footprint and positively impacting the planetthrough the implementation of sustainable initiatives throughout our value chain. We have expanded the use ofLED lighting retrofits and smart HVAC systems in our facilities and have continued to implement and monitorfleet management practices and policies to minimize our energy usage and carbon emissions. Our recyclingefforts divert thousands of tons of waste from landfills annually. The Company is continuously incorporatingenvironmental stewardship in its practices and discovering opportunities to develop more efficient operations.
Additional information regarding our sustainability efforts and future initiatives can be found in our 2021Sustainability Report and the Sustainability section of our website at www.genpt.com.
HUMAN CAPITAL MANAGEMENT
The Company’s key human capital management objectives are to attract, retain and develop the highestquality talent. To support these objectives, our human resources programs are designed to connect prospectiveand current talent to opportunities at the Company, engage current employees through an inclusive and diverseculture, and develop employees to grow for future opportunities within the organization.
Employee Retention and Professional Development
As of December 31, 2021, the Company employed approximately 52,000 people worldwide and operatedwithin 15 countries. We take pride in our employees and are committed to helping them improve their physical,emotional, financial and social well-being. Our well-being programs include an online platform that offers aninteractive way to accomplish personal and financial goals and a rewards platform to reward employees forcompleting Company sponsored competitions and well-being activities.
The Company periodically conducts a global engagement survey as a means of measuring employee engage-ment and satisfaction, as well as a tool for improving our human capital management strategies. Our leadershipteam reviews the survey results and based on the responses, action plans are developed to focus on areas ofopportunity. We are pleased to report that our most recent engagement survey results were favorable overall andhave shown that our employees are proud to work for the Company. The results of the engagement surveys we dohelp us to continuously improve our human capital strategies and find ways to foster engagement and growth forour employees.
In addition, to empower employees to continually enhance their skills and reach their maximum potential,we provide a range of development programs, resources, and opportunities. Many are facilitated locally by eachbusiness with core leadership development at the Corporate level. One of our more significant programs isfocused on high potential employees from all global businesses units. This program is a combination of in-personand virtual coursework and training with the intent that participants become fully immersed in the operations ofour business and develop strategies and improvements cross-functionally. The Company also offers variousinternship and rotational programs that allow employees to see different operations of our business while alsobuilding strong relationships throughout the Company. Other development opportunities include on-demand andlive training courses to help our employees achieve their professional and personal goals. We believe these pro-grams demonstrate the Company’s ongoing commitment of developing our future leaders as well the addition ofresources that specifically focus on the creation and implementation of development programs globally.
7
Diversity, Equity and Inclusion
Our culture is strengthened by our core values, which includes a steadfast commitment to diversity, equityand inclusion. As part of our investment in our people, we make diversity, equity and inclusion a top priority.Our goal is to create an inclusive and welcoming culture where we value, respect, and provide equal oppor-tunities for all employees.
In furtherance of these goals, we created a Diversity, Equity, and Inclusion Council, led by senior leadershipand representatives from each business unit to ensure accountabilities exist to advance new initiatives. Some ini-tiatives include, providing scholarships with an emphasis for students who attend Historically Black Colleges andUniversities (HBCU’s) and collaboration with organizations that support woman such as Women in Technologyand Woman in Auto Care. Our commitment also includes supporting organizations that advance the interests ofdisadvantaged individuals and communities in need. As part of our commitment, we are now a member of theGeorgia Minority Supplier Diversity Council (GMSDC) and the Georgia Hispanic Chamber of Commerce(GHCC). Additionally, we have increased our support for the United Way’s African American Partnership andYoung Professional Leaders programs.
Our efforts are also directed internally where we encourage the exchange of ideas, actively listen toemployee dialogue, provide appropriate training, and ensure that the interests of all our employees are supportedand advanced. Employees will soon be supported through four (4) initial Business Resource Groups (BRG’s)-African American; Asian; Veteran; and Women, which will be established during the first quarter of the year. Forfurther engagement, many of our employees can participate in the McKinsey Connected Leaders Academy. Inaddition, employees at all levels across the organization participated in training to gain a better understanding ofunconscious bias and its impact on the business. Overall, the Company seeks to create an environment wherethere is a sense of belonging and all voices are heard and valued.
Please refer to the Company’s 2021 Sustainability Report and Human Rights Policy, which can be found onthe Company’s investor relations website, for further information on human capital management.
ITEM 1A. RISK FACTORS.
FORWARD-LOOKING STATEMENTS
Some statements in this report, as well as in other materials we file with the SEC or otherwise release to thepublic and in materials that we make available on our website, constitute forward-looking statements that aresubject to the safe harbor provisions of the Private Securities Litigation Reform Act of 1995. Senior officers mayalso make verbal statements to analysts, investors, the media and others that are forward-looking. Forward-looking statements may relate, for example, to future operations, including the anticipated synergies and benefitsof any acquisitions or divestitures, as well as prospects, strategies, including the 2019 Cost Savings Plan, finan-cial condition, economic performance (including growth and earnings), industry conditions and demand for ourproducts and services. The Company cautions that its forward-looking statements involve risks and uncertainties,and while we believe that our expectations for the future are reasonable in view of currently availableinformation, you are cautioned not to place undue reliance on our forward-looking statements. Actual results orevents may differ materially from those indicated in our forward-looking statements as a result of variousimportant factors. Such factors include, but are not limited to, those discussed below.
Forward-looking statements are only as of the date they are made, and the Company undertakes no duty toupdate its forward-looking statements except as required by law. You are advised, however, to review any furtherdisclosures we make on related subjects in our subsequent Forms 10-Q, 8-K and other reports filed with the SEC.
You should carefully consider the risks described below in addition to the other information set forth in thisAnnual Report on Form 10-K. Set forth below are the material risks and uncertainties that, if they were to occur,could materially and adversely affect our business or could cause our actual results to differ materially from theresults contemplated by the forward-looking statements in this report and in the other public statements we make.Please be aware that these risks may change over time and other risks may prove to be important in the future.
8
New risks may emerge at any time, and we cannot predict such risks or estimate the extent to which they mayaffect our business, financial condition, results of operations or the trading price of our securities. The consid-erations and risks that follow are organized within relevant headings but may be relevant to other headings aswell. In addition, the material risks and uncertainties described below does not indicate that the risk has notalready materialized.
STRATEGIC AND OPERATIONAL RISKS
The impact of the COVID-19 pandemic has significantly impacted worldwide economic conditions, and ouroperations and our financial results have been and may in the future be materially impacted, and the dura-tion and extent to which it will impact our business remains uncertain.
The COVID-19 pandemic continues to impact various aspects of our business, and the long-term impact toour business remains unknown. The extent to which the COVID-19 pandemic impacts the Company will dependon numerous factors and future developments that we cannot predict, including the severity of the virus; theoccurrence of additional waves or spikes in infection rates, including due to the emergence and spread of var-iants; the duration of the outbreak; governmental, business or other actions taken in response to the pandemic andthe efficacy of these actions, including partial or complete shut downs, travel restrictions, and stay-at-homeorders among other actions; the timing, distribution, effectiveness and public acceptance of COVID-19 vaccines;and impacts on our supply chain, our ability to keep operating locations open, and on customer demand.
The Company and management continue to focus on mitigating the impact of the COVID-19 pandemic,which has required and will continue to require, a large investment of time and resources. While we have addedsafety measures to protect our employees and customers, continued business disruption caused by COVID-19may require further significant actions to mitigate the impact, including but not limited to, reductions in storehours and store closings as well as ongoing increases in expenses. Conversely, if the unprecedented levels ofcustomer demand we have experienced during the pandemic revert or subside, we may be unable to reduceexpenses or otherwise react quickly and effectively to such changes.
Additional adverse changes and volatility in economic conditions as a result of the pandemic may also leadto increased credit concerns and challenges to recover accounts receivable, reduced liquidity, adverse impacts onour suppliers and customers, including on their abilities to continue to operate as a going concern.
Due to the unprecedented nature of COVID-19 and the myriad of responses thereto, we cannot identify allof the risks we face from the pandemic and its resulting impacts. Even after the pandemic has subsided, we maycontinue to experience adverse impacts to our business as a result of any economic recession that has occurred ormay occur. The pandemic could also amplify other risks and uncertainties described in this 2021 Annual Reporton Form 10-K. The ultimate adverse impacts relating to the potential effect of the COVID-19 pandemic on ourbusiness and the costs that we may incur as a result cannot be reasonably estimated but could be material.
Our business will be adversely affected if demand for our products slows.
Our business depends on customer demand for the products that we distribute. Demand for these productsdepends on many factors.
With respect to our automotive group, the primary factors are:
• the number of miles vehicles are driven annually, as higher vehicle mileage increases the need for main-tenance and repair;
• the number of vehicles in the automotive fleet, a function of new vehicle sales and vehicle scrappagerates, as a steady or growing total vehicle population supports the continued demand for maintenance andrepair;
• the quality of the vehicles manufactured by the original vehicle manufacturers and the length of the war-ranty or maintenance offered on new vehicles;
9
• the number of vehicles in current service that are six years old and older, as these vehicles are typically nolonger under the original vehicle manufacturers’ warranty and will need more maintenance and repairthan newer vehicles;
• the addition of electric vehicles, hybrid vehicles, ride sharing services, alternative transportation meansand autonomously driven vehicles and future legislation related thereto;
• gas prices, as increases in gas prices may deter consumers from using their vehicles;
• changes in travel patterns, which may cause consumers to rely more on other transportation;
• the weather, as milder weather conditions may lower the failure rates of automotive parts, while extendedperiods of rain and winter precipitation may cause our customers to defer maintenance and repair on theirvehicles; extremely hot or cold conditions may enhance demand for our products due to increased failurerates of our customers’ automotive parts, and global warming trends and other significant climate changescan create more variability in the short term or lead to other weather conditions that could impact ourbusiness;
• restrictions on access to diagnostic tools and repair information imposed by the original vehicle manu-facturers or by governmental regulation, as consumers may be forced to have all diagnostic work, repairsand maintenance performed by the vehicle manufacturers’ dealer networks; and
• the economy generally, which in declining conditions may cause consumers to defer vehicle maintenanceand repair and defer discretionary spending.
With respect to our industrial parts group, the primary factors are:
• the level of industrial production and manufacturing capacity utilization, as these indices reflect the needfor industrial replacement parts;
• changes in manufacturing reflected in the level of the Institute for Supply Management’s PurchasingManagers Index, as an index reading of 50 or more implies an expanding manufacturing economy, whilea reading below 50 implies a contracting manufacturing economy;
• the consolidation of certain of our manufacturing customers and the trend of manufacturing operationsbeing moved overseas, which subsequently reduces demand for our products;
• changes in legislation or government regulations or policies which could impact international trade amongour multi-national customer base and cause reduced demand for our products; and
• the economy in general, which in declining conditions may cause reduced demand for industrial output.
We depend on our relationships with our suppliers, and a disruption of these relationships or of our suppli-ers’ operations could harm our business.
As a distributor of automotive and industrial parts, our business depends on developing and maintainingclose and productive relationships with our suppliers. We depend on our suppliers to sell us quality products atfavorable prices. A variety of factors, many outside our control, affect our suppliers’ ability to deliver qualitymerchandise to us at favorable prices and in a timely manner. These include, raw material shortages, inadequatemanufacturing capacity, labor strikes, shortages and disputes anywhere within the supply and distribution chaindelivering products to us, tariff and customs legislation and enforcement, transportation disruptions, tax and otherlegislative uncertainties, pandemics (including the current COVID-19 pandemic) and/or weather conditions.Since the beginning of the COVID-19 pandemic, we have experienced supply chain disruptions, particularly withregard to global labor shortages and inventory sourced from outside the U.S. These disruptions have not had amaterial impact on our business to date, but we cannot provide any assurance that these or new supply chaindisruptions will not materially or adversely impact our business, financial condition and results of operations inthe future
10
Furthermore, financial or operational difficulties at a particular supplier could cause that supplier to increasethe cost, or decrease the quality, of the products we purchase. Supplier consolidation could also limit the numberof suppliers from which we may purchase products and could materially affect the prices we pay for these prod-ucts. In addition, we would suffer an adverse impact if our suppliers limit or cancel the return privileges thatcurrently protect us from inventory obsolescence.
We face substantial competition in the industries in which we do business.
The sale of automotive and industrial parts is highly competitive and impacted by many factors, includingname recognition, product availability, customer service, changing customer preferences, store location, and pric-ing pressures. Because we seek to offer competitive prices, we may be forced to reduce our prices if our com-petitors reduce their prices, which could result in a material decline in our revenues and earnings. Increasedcompetition among distributors of automotive and industrial parts, including increased availability among digitaland e-commerce providers across the markets in which we do business, could cause a material adverse effect onour results of operations. The Company anticipates no decline in competition in any of its business segments inthe foreseeable future.
In particular, the market for replacement automotive parts is highly competitive and subjects us to a widevariety of competitors. We compete primarily with national, international and regional auto parts chains,independently owned regional and local automotive parts and accessories stores, automobile dealers that supplymanufacturer replacement parts and accessories, mass merchandisers, internet providers and wholesale clubs thatsell automotive products, and regional and local full service automotive repair shops, both new and established.
Furthermore, the automotive aftermarket industry continues to experience consolidation. Consolidationamong our competitors could further enhance their financial position, provide them with the ability to offer morecompetitive prices to customers for whom we compete, and allow them to achieve increased efficiencies in theirconsolidated operations that enable them to more effectively compete for customers. If we are unable to continueto develop successful competitive strategies or if our competitors develop more effective strategies, we couldlose customers and our sales and profits may decline.
If we experience a security breach, if our internal information systems fail to function properly or if we areunsuccessful in implementing, integrating or upgrading our information systems, our business operationscould be materially affected.
We depend on information systems to process customer orders, manage inventory and accounts receivablecollections, purchase products, manage accounts payable processes, ship products to customers on a timely basis,maintain cost effective operations, provide superior service to customers and accumulate financial results, amongmany other things.
Despite our implementation of various security measures, our IT systems and operations could be subject todamage or interruption from computer viruses, natural disasters, unauthorized physical or electronic access,power outages, telecommunications failure, computer system or network failures, wire transfer failure, employeeerror/malfeasance, cyber-attacks, security breaches, and other similar disruptions. Additionally, the techniquesand sophistication used to conduct cyber-attacks and breaches of IT systems change frequently and have thepotential to not be recognized until such attacks are launched or have been in place for a period of time.Maintaining, operating, and protecting these systems and related personal information about our employees,customers and suppliers requires continuous investments in physical and technological security measures,employee training, and third-party services which we have made and will continue to make. A cyber-attack orsecurity breach could result in, among other things, sensitive and confidential data being lost, manipulated orexposed to unauthorized persons or to the public or delay our ability to process customer orders and manageinventory. While we also seek to obtain assurances from third parties with whom we interact to protect con-fidential information, there are risks that the confidentiality or accessibility of data held or utilized by such thirdparties may be compromised.
11
To date, we have not experienced a material breach of cyber-security; however, our computer systems havebeen, and will likely continue to be, subjected to unauthorized access or phishing attempts, computer viruses,malware, ransomware or other malicious codes. In particular, in connection with the COVID-19 pandemic, therehas been a spike in cyber-security attacks as shelter in place orders and work from home measures have led busi-nesses to increase reliance on virtual environments and communications systems, which have been subjected toincreasing third-party vulnerabilities and security risks.
A serious prolonged disruption of our information systems for any of the above reasons could materiallyimpair fundamental business processes and increase expenses, decrease sales or otherwise impact earnings andcash flows. Furthermore, such a disruption may harm our reputation and business prospects and subject us tolegal claims if there is loss, disclosure or misappropriation of or access to our customers, employees or suppliers’information. As the regulatory environment related to information security, data collection and use, and privacybecomes increasingly rigorous, compliance with these requirements could also result in significant additionalcosts. As threats related to cybersecurity breaches grow more sophisticated and frequent, it may become moredifficult to timely detect and protect our data and infrastructure.
We may not be able to successfully implement our business initiatives in each of our business segments togrow our sales and earnings, which could adversely affect our business, financial condition, results ofoperations and cash flows.
We have implemented numerous initiatives in each of our business segments to grow sales and earnings,including the introduction of new and expanded product lines, strategic acquisitions such as the recent acquisitionof Kaman Distribution Group, geographic expansion (including through acquisitions), sales to new markets,enhanced customer marketing programs and a variety of gross margin and cost savings initiatives. If we areunable to implement these initiatives efficiently and effectively, or if these initiatives are unsuccessful, our busi-ness, financial condition, results of operations and cash flows could be adversely affected.
Successful implementation of these initiatives also depends on factors specific to the automotive parts andindustrial parts industries and numerous other factors that may be beyond our control. In addition to the other riskfactors contained in this “Item 1A. Risk Factors,” adverse changes in the following factors could undermine ourbusiness initiatives and have a material adverse effect on our business, financial condition, results of operationsand cash flows:
• the competitive environment in our end markets may force us to reduce prices below our desired pricinglevel or to increase promotional spending;
• our ability to anticipate changes in consumer preferences and to meet customers’ needs for our products ina timely manner;
• our ability to successfully enter new markets, including by successfully identifying and acquiring suitableacquisition targets in these new markets;
• our ability to effectively manage our costs;
• our ability to continue to grow through acquisitions and successfully integrate acquired businesses, includ-ing Kaman Distribution Group, in our existing operations, including in particular the challenges asso-ciated with the integration of foreign operations to ensure the adequacy of internal controls;
• our ability to identify and successfully implement appropriate technological, digital and e-commerce sol-utions;
• the rate of adoption of electric vehicles, hybrid vehicles, ride sharing services, alternative transportationmeans and autonomously driven vehicles and future legislation related thereto;
• the economy of each of the nations in which we operate in general, including the monetary policies of theFederal Reserve, which are influenced by various factors, including inflation, unemployment and short-term and long-term changes in the international trade balance and the fiscal policies of the U.S.government;
12
• the occurrence of unusually severe weather events, which can disrupt our operations (forcing temporaryclosure of retail and distribution centers, prohibiting shipment of inventory and products) and negativelyimpact our results in the affected geographies;
• the occurrence of political unrest and strikes, which can disrupt our operations and negatively impact ourresults in the affected geographies;
• volatility in oil prices, which could have a negative impact on the global economy and the economy ofeach of the nations in which we operate, in particular; and
• the adequacy of our disclosure controls and procedures and internal controls over financial reporting.
We recognize the growing demand for business-to-business and business-to-customer e-commerce optionsand solutions, and we could lose business if we fail to provide the e-commerce options and solutions ourcustomers wish to use.
Our retail and business customers increasingly demand convenient, easy-to-use e-commerce tools as anoption to conduct their business with us. The success of our e-commerce platform depends on our ability to accu-rately identify the products to make available through our e-commerce platform, and to provide and maintain anefficient online experience with the highest level of data security for our customers. Operating an e-commerceplatform is a complex undertaking and exposes us to risks and difficulties frequently experienced by internet-based businesses, included risks related to, among other things, our ability to support, expand, and develop ourinternet operations, website, mobile applications and software and related operational systems. Continuing toimprove our e-commerce platform involves substantial investment of capital and resources, increasing supplychain and distribution capabilities, attracting, developing and retaining qualified personnel with relevant subjectmatter expertise and effectively managing and improving the customer experience. If we are unable to success-fully provide the e-commerce solutions our retail and business customers desire, we may lose existing customersand fail to attract new ones. Our business, financial condition, results of operations and cash flows may bematerially and adversely affected as a result.
We are dependent on key personnel and the loss of one or more of those key persons could harm ourbusiness.
Our future success significantly depends on the continued services and performance of our key managementpersonnel. We believe our management team’s depth and breadth of experience in our industry is integral toexecuting our business plan. We also will need to continue to attract, motivate and retain other key personnel.The loss of services of members of our senior management team or other key employees, the inability to attractadditional qualified personnel as needed or failure to plan for the succession of senior management and key per-sonnel could have a material adverse effect on our business.
Our strategic transactions involve risks, which could have an adverse impact on our financial condition andresults of operation, and we may not realize the anticipated benefits of these transactions.
We regularly consider and enter into strategic transactions, including mergers, acquisitions, investments,alliances, and other growth and market expansion strategies, with the expectation that these transactions willresult in increases in sales, cost savings, synergies and various other benefits. Assessing the viability and realiz-ing the benefits of these transactions is subject to significant uncertainty, and we face significant competition inpursuing strategically beneficially transactions. Pursuing strategic transactions is also a time-consuming processthat can involve significant expenses and management attention. For each of our acquisitions, we need tosuccessfully integrate the target company’s products, services, associates and systems into our business oper-ations. Integration can be a complex and time-consuming process, and if the integration is not fully successful oris delayed for a material period of time, we may not achieve the anticipated synergies or benefits of the acquis-ition. Furthermore, even if the target companies are successfully integrated, the acquisitions may fail to furtherour business strategy as anticipated, expose us to increased competition or challenges with respect to our prod-ucts or services, and expose us to additional liabilities. Any impairment of goodwill or other intangible assets
13
acquired in a strategic transaction may reduce our earnings. In addition, any investments we hold in other compa-nies are subject to a risk of partial or total loss of our investment.
Additionally, we consider and enter into divestitures from time to time, with the expectation that these trans-actions will result in increases in cost savings and various other benefits. Strategic divestitures are subject touncertainty and can be a complex and time-consuming process. If the divestiture is not fully successful or isdelayed for a material period of time, or if we are unable to reinvest the proceeds of the divestiture in a mannerconsistent with our strategic objectives, we may not achieve the anticipated benefits of the divestiture.
If we fail to maintain an effective system of internal controls over financial reporting there is a reasonablepossibility that a material misstatement of our annual or interim financial statements will not be preventedor detected on a timely basis, which could result in a loss of investor confidence and negatively impact ourbusiness, results of operations, financial condition and stock price.
Effective internal controls are necessary for us to provide reliable and accurate financial statements and toeffectively prevent fraud. However, a control system, no matter how well conceived and operated, can provideonly reasonable, not absolute, assurance that the objectives of the control system are met. There can be no assur-ance that all control issues or fraud will be detected. As we continue to grow our business, our internal controlscontinue to become more complex and require more resources. Further, many of our employees are workingremotely in response to the impact of the COVID-19 pandemic and may continue to do so for an extendedperiod. An extended period of remote work arrangements could introduce potential vulnerabilities to our finan-cial reporting systems and our internal control environment and the effectiveness of our internal controls overfinancial reporting. Any failure to maintain effective controls could prevent us from timely and reliably reportingfinancial results and may harm our operating results. In addition, if we are unable to conclude that we have effec-tive internal control over financial reporting or, if our independent registered public accounting firm is unable toprovide an unqualified report as to the effectiveness of our internal control over financial reporting, as of eachfiscal year end, we may be exposed to negative publicity, which could cause investors to lose confidence in ourreported financial information. Any failure to maintain effective internal controls and any such resulting negativepublicity may negatively affect our business and stock price.
Additionally, the existence of any material weaknesses or significant deficiencies would require manage-ment to devote significant time and incur significant expense to remediate any such material weaknesses or sig-nificant deficiencies and management may not be able to remediate any such material weaknesses or significantdeficiencies in a timely manner. The existence of any material weakness in our internal control over financialreporting could also result in errors in our financial statements that could require us to restate our financialstatements, cause us to fail to meet our reporting obligations and cause stockholders to lose confidence in ourreported financial information, all of which could materially and adversely affect us and the market price of ourcommon stock.
MACROECONOMIC, INDUSTRY AND FINANCIAL RISKS
Changes in legislation or government regulations or policies, particularly those relating to taxation andinternational trade, could have a significant impact on our results of operations.
Our business is global, so changes to existing international trade agreements, blocking of foreign trade orimposition of tariffs on foreign goods could result in decreased revenues and/or increases in pricing, either ofwhich could have an adverse impact on our business, results of operations, financial condition and cash flows infuture periods. For instance, the United States imposed Section 232 tariffs on many imported products of steeland aluminum in March 2018 and expanded the tariffs to additional derivative products of steel and aluminumeffective February 8, 2020. The United States imposed Section 301 tariffs on most imported products from Chinastarting in July 2018. Although the United States and China reached a Phase One trade deal in January 2020,there was no Phase Two trade deal implemented and most of the tariffs imposed remain in place, whileuncertainty persists in the trade relationship between the two countries that impacts the global trade landscape.
14
In addition, as a global business, we are subject to taxation in each of the jurisdictions in which we operate.Changes in the tax laws of these jurisdictions, or in the interpretation or enforcement of existing tax laws, couldsubject our business to audits, inquiries and legal challenges from taxing authorities and could reduce the benefitof tax structures previously implemented for our operations. As a result, we may incur additional costs, includingtaxes and penalties for historical periods, that may have a material and adverse effect on our business, financialcondition, results of operations and cash flows.
Uncertainty and/or deterioration in general macro-economic conditions domestically and globally, includ-ing inflation or deflation, employment rates and wages, changes in tax policies, changes in energy costs,uncertain credit markets, or other economic conditions, could have a negative impact on our business,financial condition, results of operations and cash flows.
Our business and operating results have been and may in the future be adversely affected by uncertainglobal economic conditions, including inflation or deflation, domestic outputs, political uncertainty and unrest,employment rates and wages, including increases in minimum wage, changes in tax policies, changes in energycosts, instability in credit markets, declining consumer and business confidence, fluctuating commodity prices,interest rates, volatile exchange rates, and other challenges that could affect the global economy. Both ourcommercial and retail customers may experience deterioration of their financial resources, which could result inexisting or potential customers delaying or canceling plans to purchase our products. Our vendors could experi-ence similar negative conditions, which could impact their ability to fulfill their financial obligations to us.Future weakness in the global economy could adversely affect our business, results of operations, financial con-dition and cash flows.
Our debt levels could adversely affect our cash flow and prevent us from fulfilling our obligations.
We have an unsecured revolving credit facility and unsecured senior notes, which could have importantconsequences to our financial health. For example, our level of indebtedness could, among other things:
• make it more difficult to satisfy our financial obligations, including those relating to our unsecured revolv-ing credit facility and our unsecured senior notes;
• increase our vulnerability to adverse economic and industry conditions;
• limit our flexibility in planning for, or reacting to, changes and opportunities in our industry, which mayplace us at a competitive disadvantage;
• require us to dedicate a substantial portion of our cash flows to service the principal and interest on thedebt, reducing the funds available for other business purposes, such as working capital, capitalexpenditures or other cash requirements;
• limit our ability to incur additional debt with acceptable terms; and
• expose us to fluctuations in interest rates.
The terms of our financing obligations include restrictions, such as affirmative, negative and financial cove-nants, conditions on borrowing and subsidiary guarantees. A failure to comply with these restrictions could resultin a default under our financing obligations or could require us to obtain waivers from our lenders for failure tocomply with these restrictions. The occurrence of a default that remains uncured or the inability to secure anecessary consent or waiver could have a material adverse effect on our business, financial condition, results ofoperations and cash flows. We also guarantee the borrowings of certain independently owned automotive partsstores and certain other affiliates in which we have a non-controlling equity ownership interest. To date, we havenot experienced any significant losses in connection with these guarantees. However, if any of the borrowersunder these guarantees experienced a default, we may be required to satisfy their payment obligations in anamount that could be material.
In addition, our indebtedness is rated by credit rating agencies. Our overall credit rating may be negativelyimpacted by deteriorating and uncertain credit markets or other factors that may or may not be within our control.
15
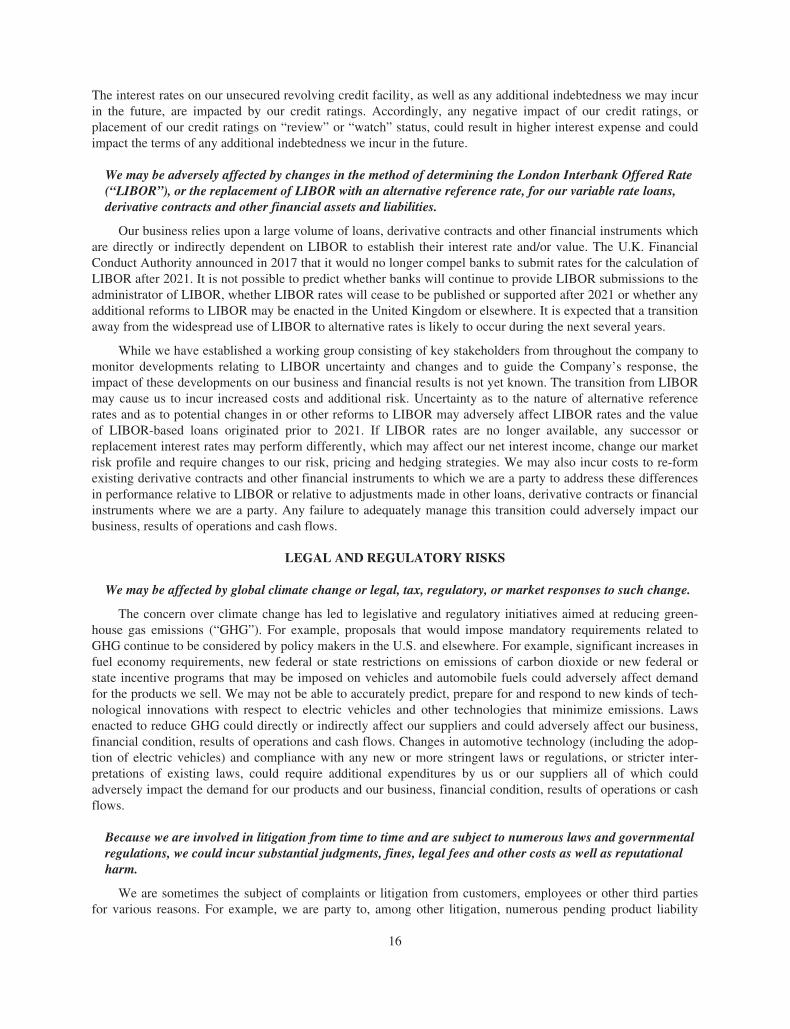
The interest rates on our unsecured revolving credit facility, as well as any additional indebtedness we may incurin the future, are impacted by our credit ratings. Accordingly, any negative impact of our credit ratings, orplacement of our credit ratings on “review” or “watch” status, could result in higher interest expense and couldimpact the terms of any additional indebtedness we incur in the future.
We may be adversely affected by changes in the method of determining the London Interbank Offered Rate(“LIBOR”), or the replacement of LIBOR with an alternative reference rate, for our variable rate loans,derivative contracts and other financial assets and liabilities.
Our business relies upon a large volume of loans, derivative contracts and other financial instruments whichare directly or indirectly dependent on LIBOR to establish their interest rate and/or value. The U.K. FinancialConduct Authority announced in 2017 that it would no longer compel banks to submit rates for the calculation ofLIBOR after 2021. It is not possible to predict whether banks will continue to provide LIBOR submissions to theadministrator of LIBOR, whether LIBOR rates will cease to be published or supported after 2021 or whether anyadditional reforms to LIBOR may be enacted in the United Kingdom or elsewhere. It is expected that a transitionaway from the widespread use of LIBOR to alternative rates is likely to occur during the next several years.
While we have established a working group consisting of key stakeholders from throughout the company tomonitor developments relating to LIBOR uncertainty and changes and to guide the Company’s response, theimpact of these developments on our business and financial results is not yet known. The transition from LIBORmay cause us to incur increased costs and additional risk. Uncertainty as to the nature of alternative referencerates and as to potential changes in or other reforms to LIBOR may adversely affect LIBOR rates and the valueof LIBOR-based loans originated prior to 2021. If LIBOR rates are no longer available, any successor orreplacement interest rates may perform differently, which may affect our net interest income, change our marketrisk profile and require changes to our risk, pricing and hedging strategies. We may also incur costs to re-formexisting derivative contracts and other financial instruments to which we are a party to address these differencesin performance relative to LIBOR or relative to adjustments made in other loans, derivative contracts or financialinstruments where we are a party. Any failure to adequately manage this transition could adversely impact ourbusiness, results of operations and cash flows.
LEGAL AND REGULATORY RISKS
We may be affected by global climate change or legal, tax, regulatory, or market responses to such change.
The concern over climate change has led to legislative and regulatory initiatives aimed at reducing green-house gas emissions (“GHG”). For example, proposals that would impose mandatory requirements related toGHG continue to be considered by policy makers in the U.S. and elsewhere. For example, significant increases infuel economy requirements, new federal or state restrictions on emissions of carbon dioxide or new federal orstate incentive programs that may be imposed on vehicles and automobile fuels could adversely affect demandfor the products we sell. We may not be able to accurately predict, prepare for and respond to new kinds of tech-nological innovations with respect to electric vehicles and other technologies that minimize emissions. Lawsenacted to reduce GHG could directly or indirectly affect our suppliers and could adversely affect our business,financial condition, results of operations and cash flows. Changes in automotive technology (including the adop-tion of electric vehicles) and compliance with any new or more stringent laws or regulations, or stricter inter-pretations of existing laws, could require additional expenditures by us or our suppliers all of which couldadversely impact the demand for our products and our business, financial condition, results of operations or cashflows.
Because we are involved in litigation from time to time and are subject to numerous laws and governmentalregulations, we could incur substantial judgments, fines, legal fees and other costs as well as reputationalharm.
We are sometimes the subject of complaints or litigation from customers, employees or other third partiesfor various reasons. For example, we are party to, among other litigation, numerous pending product liability
16
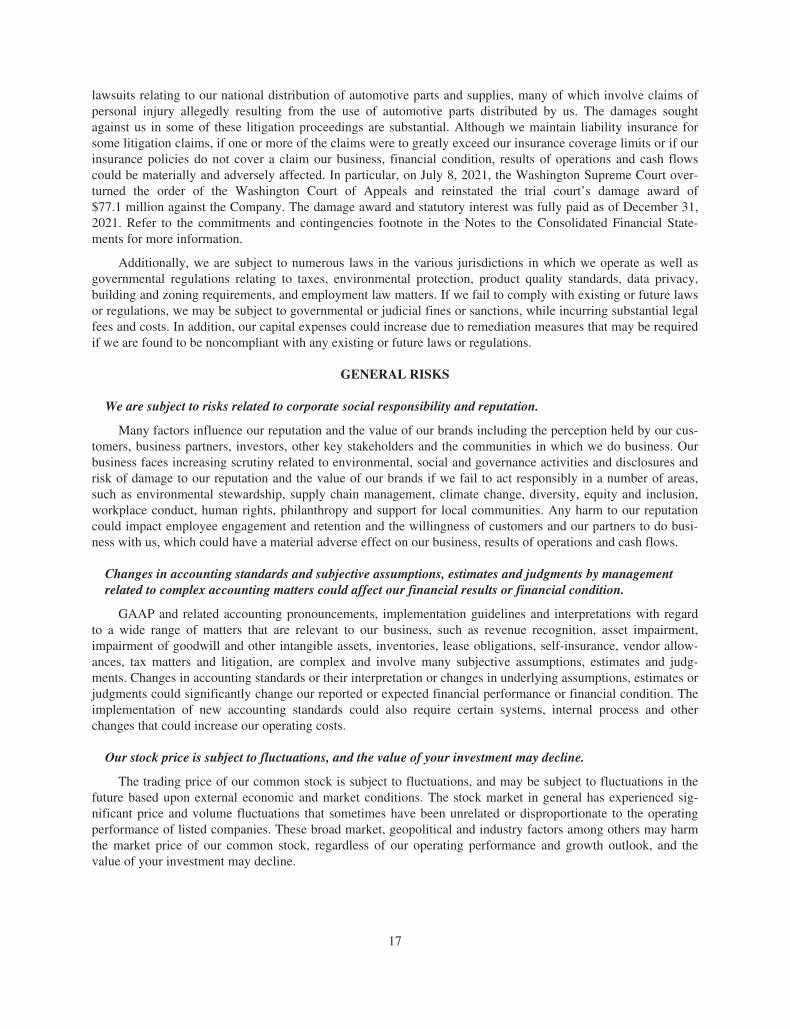
lawsuits relating to our national distribution of automotive parts and supplies, many of which involve claims ofpersonal injury allegedly resulting from the use of automotive parts distributed by us. The damages soughtagainst us in some of these litigation proceedings are substantial. Although we maintain liability insurance forsome litigation claims, if one or more of the claims were to greatly exceed our insurance coverage limits or if ourinsurance policies do not cover a claim our business, financial condition, results of operations and cash flowscould be materially and adversely affected. In particular, on July 8, 2021, the Washington Supreme Court over-turned the order of the Washington Court of Appeals and reinstated the trial court’s damage award of$77.1 million against the Company. The damage award and statutory interest was fully paid as of December 31,2021. Refer to the commitments and contingencies footnote in the Notes to the Consolidated Financial State-ments for more information.
Additionally, we are subject to numerous laws in the various jurisdictions in which we operate as well asgovernmental regulations relating to taxes, environmental protection, product quality standards, data privacy,building and zoning requirements, and employment law matters. If we fail to comply with existing or future lawsor regulations, we may be subject to governmental or judicial fines or sanctions, while incurring substantial legalfees and costs. In addition, our capital expenses could increase due to remediation measures that may be requiredif we are found to be noncompliant with any existing or future laws or regulations.
GENERAL RISKS
We are subject to risks related to corporate social responsibility and reputation.
Many factors influence our reputation and the value of our brands including the perception held by our cus-tomers, business partners, investors, other key stakeholders and the communities in which we do business. Ourbusiness faces increasing scrutiny related to environmental, social and governance activities and disclosures andrisk of damage to our reputation and the value of our brands if we fail to act responsibly in a number of areas,such as environmental stewardship, supply chain management, climate change, diversity, equity and inclusion,workplace conduct, human rights, philanthropy and support for local communities. Any harm to our reputationcould impact employee engagement and retention and the willingness of customers and our partners to do busi-ness with us, which could have a material adverse effect on our business, results of operations and cash flows.
Changes in accounting standards and subjective assumptions, estimates and judgments by managementrelated to complex accounting matters could affect our financial results or financial condition.
GAAP and related accounting pronouncements, implementation guidelines and interpretations with regardto a wide range of matters that are relevant to our business, such as revenue recognition, asset impairment,impairment of goodwill and other intangible assets, inventories, lease obligations, self-insurance, vendor allow-ances, tax matters and litigation, are complex and involve many subjective assumptions, estimates and judg-ments. Changes in accounting standards or their interpretation or changes in underlying assumptions, estimates orjudgments could significantly change our reported or expected financial performance or financial condition. Theimplementation of new accounting standards could also require certain systems, internal process and otherchanges that could increase our operating costs.
Our stock price is subject to fluctuations, and the value of your investment may decline.
The trading price of our common stock is subject to fluctuations, and may be subject to fluctuations in thefuture based upon external economic and market conditions. The stock market in general has experienced sig-nificant price and volume fluctuations that sometimes have been unrelated or disproportionate to the operatingperformance of listed companies. These broad market, geopolitical and industry factors among others may harmthe market price of our common stock, regardless of our operating performance and growth outlook, and thevalue of your investment may decline.
17
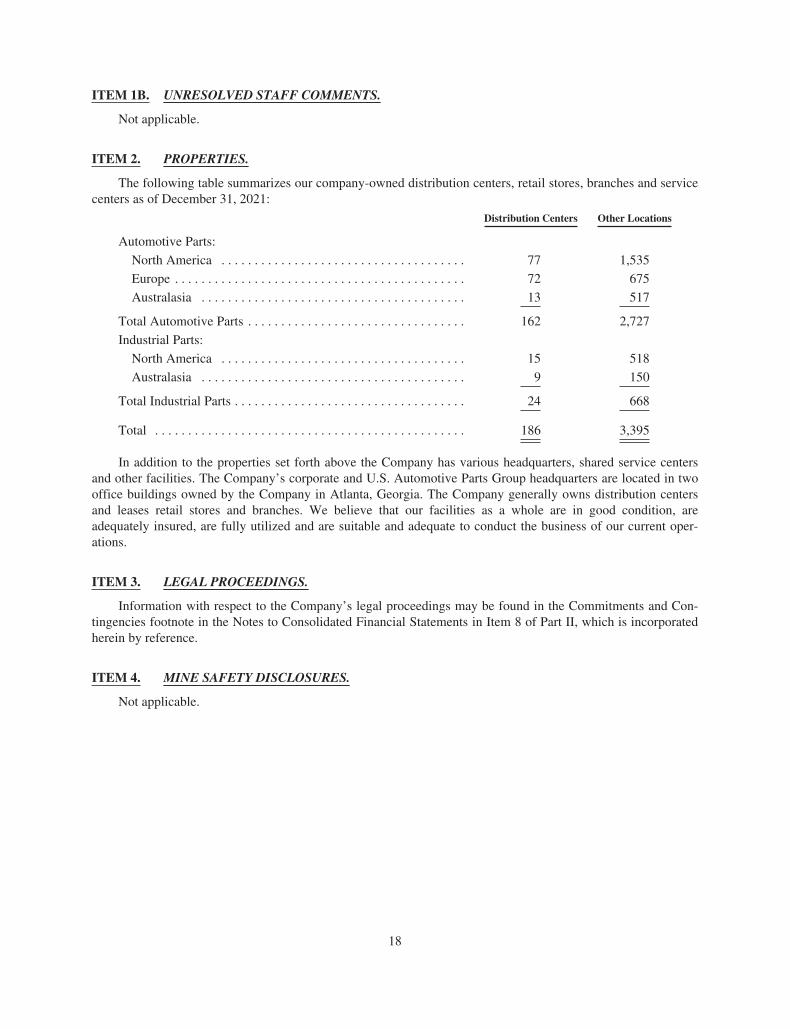
ITEM 1B. UNRESOLVED STAFF COMMENTS.
Not applicable.
ITEM 2. PROPERTIES.
The following table summarizes our company-owned distribution centers, retail stores, branches and servicecenters as of December 31, 2021:
Distribution Centers Other Locations
Automotive Parts:
North America . . . . . . . . . . . . . . . . . . . . . . . . . . . . . . . . . . . . . 77 1,535
Europe . . . . . . . . . . . . . . . . . . . . . . . . . . . . . . . . . . . . . . . . . . . . 72 675
Australasia . . . . . . . . . . . . . . . . . . . . . . . . . . . . . . . . . . . . . . . . 13 517
Total Automotive Parts . . . . . . . . . . . . . . . . . . . . . . . . . . . . . . . . . 162 2,727
Industrial Parts:
North America . . . . . . . . . . . . . . . . . . . . . . . . . . . . . . . . . . . . . 15 518
Australasia . . . . . . . . . . . . . . . . . . . . . . . . . . . . . . . . . . . . . . . . 9 150
Total Industrial Parts . . . . . . . . . . . . . . . . . . . . . . . . . . . . . . . . . . . 24 668
Total . . . . . . . . . . . . . . . . . . . . . . . . . . . . . . . . . . . . . . . . . . . . . . . 186 3,395
In addition to the properties set forth above the Company has various headquarters, shared service centersand other facilities. The Company’s corporate and U.S. Automotive Parts Group headquarters are located in twooffice buildings owned by the Company in Atlanta, Georgia. The Company generally owns distribution centersand leases retail stores and branches. We believe that our facilities as a whole are in good condition, areadequately insured, are fully utilized and are suitable and adequate to conduct the business of our current oper-ations.
ITEM 3. LEGAL PROCEEDINGS.
Information with respect to the Company’s legal proceedings may be found in the Commitments and Con-tingencies footnote in the Notes to Consolidated Financial Statements in Item 8 of Part II, which is incorporatedherein by reference.
ITEM 4. MINE SAFETY DISCLOSURES.
Not applicable.
18
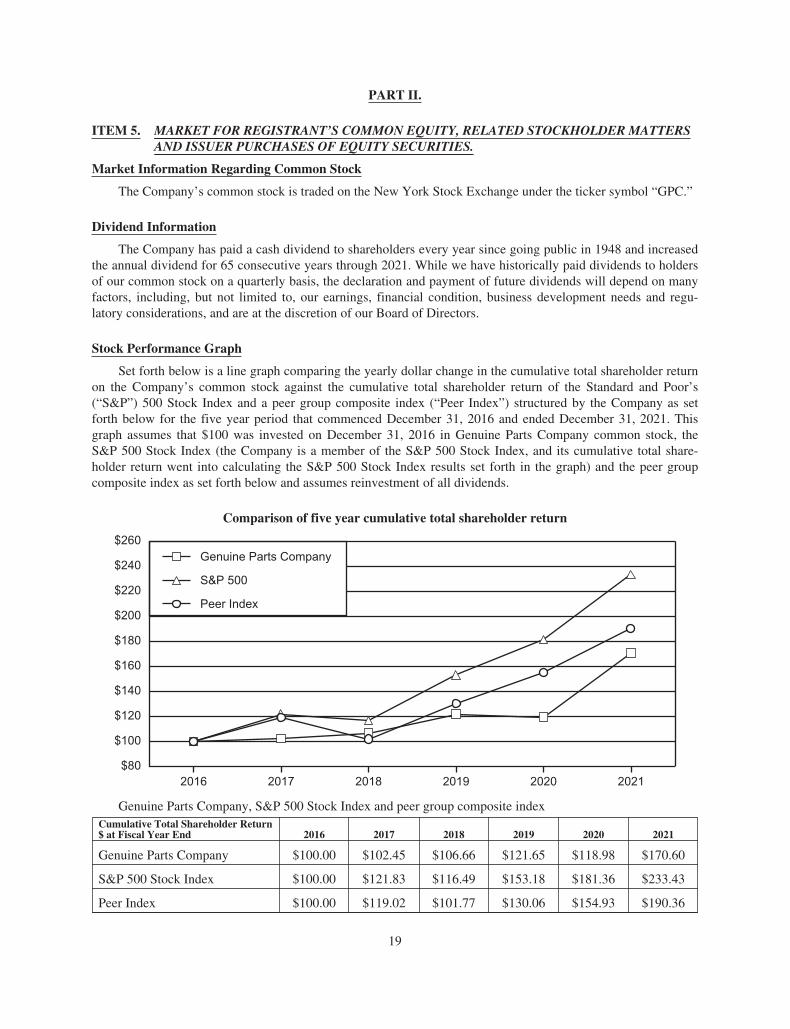
PART II.
ITEM 5. MARKET FOR REGISTRANT’S COMMON EQUITY, RELATED STOCKHOLDER MATTERSAND ISSUER PURCHASES OF EQUITY SECURITIES.
Market Information Regarding Common Stock
The Company’s common stock is traded on the New York Stock Exchange under the ticker symbol “GPC.”
Dividend Information
The Company has paid a cash dividend to shareholders every year since going public in 1948 and increasedthe annual dividend for 65 consecutive years through 2021. While we have historically paid dividends to holdersof our common stock on a quarterly basis, the declaration and payment of future dividends will depend on manyfactors, including, but not limited to, our earnings, financial condition, business development needs and regu-latory considerations, and are at the discretion of our Board of Directors.
Stock Performance Graph
Set forth below is a line graph comparing the yearly dollar change in the cumulative total shareholder returnon the Company’s common stock against the cumulative total shareholder return of the Standard and Poor’s(“S&P”) 500 Stock Index and a peer group composite index (“Peer Index”) structured by the Company as setforth below for the five year period that commenced December 31, 2016 and ended December 31, 2021. Thisgraph assumes that $100 was invested on December 31, 2016 in Genuine Parts Company common stock, theS&P 500 Stock Index (the Company is a member of the S&P 500 Stock Index, and its cumulative total share-holder return went into calculating the S&P 500 Stock Index results set forth in the graph) and the peer groupcomposite index as set forth below and assumes reinvestment of all dividends.
Comparison of five year cumulative total shareholder return
2016 2017 2018 20202019$80
$100
$120
$140
$200
$180
$160
Genuine Parts Company
S&P 500
Peer Index
$260
$240
$220
2021
Genuine Parts Company, S&P 500 Stock Index and peer group composite indexCumulative Total Shareholder Return$ at Fiscal Year End 2016 2017 2018 2019 2020 2021
Genuine Parts Company $100.00 $102.45 $106.66 $121.65 $118.98 $170.60
S&P 500 Stock Index $100.00 $121.83 $116.49 $153.18 $181.36 $233.43
Peer Index $100.00 $119.02 $101.77 $130.06 $154.93 $190.36
19
In constructing the Peer Index for use in the stock performance graph above, the Company used the share-holder returns of various publicly held companies (weighted in accordance with each company’s stock marketcapitalization at December 31, 2016 and including reinvestment of dividends) that compete with the Company inits two industry segments: automotive parts and industrial parts (each group of companies included in the PeerIndex as competing with the Company in a separate industry segment is hereinafter referred to as a “PeerGroup”). Included in the automotive parts Peer Group are those companies making up the Dow Jones U.S. AutoParts Index (the Company is a member of such industry group, and its individual shareholder return was includedwhen calculating the Peer Index results set forth in the performance graph). Included in the industrial parts PeerGroup are Applied Industrial Technologies, Inc., Fastenal Company, and W.W. Grainger, Inc. In determining thePeer Index, each Peer Group was weighted to reflect the Company’s annual net sales in each industry segment.
Holders
As of December 31, 2021, there were 3,953 holders of record of the Company’s common stock. The numberof holders of record does not include beneficial owners of the common stock whose shares are held in the namesof various dealers, clearing agencies, banks, brokers and other fiduciaries.
Issuer Purchases of Equity Securities
The following table provides information about the purchases of shares of the Company’s common stockduring the three month period ended December 31, 2021:
Period
TotalNumber of
SharesPurchased(1)
AveragePrice Paidper Share
Total Number ofShares Purchased as
Part of PubliclyAnnounced Plans or
Programs(2)
Maximum Number ofShares That May Yetbe Purchased Under
the Plans orPrograms
October 1, 2021 through October 31, 2021 . . . 7,799 $133.47 176,237 12,067,038
November 1, 2021 through November 30,2021 . . . . . . . . . . . . . . . . . . . . . . . . . . . . . . . 14,833 $135.25 201,821 11,865,217
December 1, 2021 through December 31,2021 . . . . . . . . . . . . . . . . . . . . . . . . . . . . . . . 21,403 $129.50 — 11,865,217
Total . . . . . . . . . . . . . . . . . . . . . . . . . . . . . . . . . 44,035 $132.14 378,058 11,865,217
(1) Includes shares surrendered by employees to the Company to satisfy tax withholding obligations in con-nection with the vesting of shares of restricted stock, the exercise of share appreciation rights and/or taxwithholding obligations.
(2) On August 21, 2017, the Board of Directors announced that it had authorized the repurchase of 15.0 millionshares. Under this program, shares may be repurchased in privately negotiated and/or open market trans-actions, including under plans complying with Rule 10b5-1 under the Exchange Act. The authorization forthese repurchase plans continues until all such shares have been repurchased or the repurchase program isterminated by action of the Board of Directors. The program may be suspended at any time and does not havean expiration date. Approximately 11.9 million shares authorized remain available to be repurchased by theCompany. There were no other repurchase plans announced as of December 31, 2021.
ITEM 6. SELECTED FINANCIAL DATA.
Not applicable.
20
ITEM 7. MANAGEMENT’S DISCUSSION AND ANALYSIS OF FINANCIAL CONDITION ANDRESULTS OF OPERATIONS.
The following discussion and analysis contains forward-looking statements, including, without limitation,statements relating to our plans, strategies, objectives, expectations, intentions and resources. Such forward-looking statements should be read in conjunction with our disclosures under “Item 1A. Risk Factors” of thisForm 10-K.
This section of this Form 10-K generally discusses 2021 and 2020 results and year-to-year comparisonsbetween 2021 and 2020 results. Discussions of 2019 results and year-to-year comparisons between 2020 and2019 results are not included in this Form 10-K and can be found in “Management’s Discussion and Analysis ofFinancial Condition and Results of Operations” in Part II, Item 7 of our Annual Report on Form 10-K for thefiscal year ended December 31, 2020.
BUSINESS PRODUCTS GROUP
On June 30, 2020, the Company completed the divestiture of its Business Products Group which had pre-viously been reported as a segment. The Business Products Group is reported as discontinued operations in ourconsolidated financial statements for all periods presented. Refer to the acquisitions, divestitures and dis-continued operations footnote in the accompanying consolidated financial statements for more information.
COVID-19 PANDEMIC
The COVID-19 pandemic continues to impact various aspects of our business, and the long-term impact toour business remains unknown. During the year ended December 31, 2021, our business and results of operationscontinued to improve relative to the same period of 2020. In particular, as widespread vaccine distribution con-tinued, we have seen economic recovery in many of the markets where we operate and a significant uptick inconsumer mobility. However, all regions in which we operate continue to experience periodic surges in infectionrates. As a result, our business segments continue to face many uncertainties and our operations remain vulner-able to continuing negative effects caused by the pandemic. However, we are encouraged to see the impact of thepandemic subsiding as evidenced by the improving industrial economy, increase in miles driven and overallconsumer activity.
As of December 31, 2021, all our operations are open for business. Our supply chain partners have beenvery supportive and accommodating, despite strains on the supply chain caused by labor shortages, inventoryshortages, delays in order fulfillment and increased backlogs. This has allowed us to continue to provide qualitycustomer service. We remain in constant communication with our employees regarding changing conditions andprotocol. Based on the length and severity of the pandemic, we may experience continued volatility in customerdemand and supply chain disruption. We will continue to evaluate the nature and extent of these potentialimpacts to our business, consolidated results of operations, segment results, liquidity and capital resources.
KEY BUSINESS METRICS
We consider comparable sales to be a key business metric because management has evaluated its results ofoperations using this metric and we believe that this key indicator provides additional perspective and insightswhen analyzing the operating performance of our business from period to period and trends in its historical oper-ating results. This metric should not be considered superior to, as a substitute for or as an alternative to, andshould be considered in conjunction with, the GAAP financial measures presented in this report.
Comparable Sales
Comparable sales is a key metric that refer to period-over-period comparisons of our net sales excluding theimpact of acquisitions, divestitures, foreign currency and other. We consider this metric useful to investorsbecause it provides greater transparency into management’s view and assessment of our core ongoing operations.This metric is widely used by analysts, investors and competitors in our industry, although our calculation of the
21
metric may not be comparable to similar measures disclosed by other companies, because not all companies andanalysts calculate this metric in the same manner.
OVERVIEW
Genuine Parts Company is a service organization engaged in the global distribution of automotive andindustrial replacement parts. We have a long tradition of growth dating back to 1928, the year we were foundedin Atlanta, Georgia. In 2021, the Company conducted business in North America, Europe and Australasia frommore than 10,300 locations.
The Company’s Automotive Parts Group operated in the U.S., Canada, France, the U.K., Ireland, Germany,Poland, the Netherlands, Belgium, Australia and New Zealand in 2021, and accounted for 66% of total revenuesfor the year. The Industrial Parts Group operated in the U.S., Canada, Mexico, Australia, New Zealand, Indonesiaand Singapore, and accounted for 34% of the Company’s total revenues for the year.
At Genuine Parts Company, our mission is to be a world-class service organization and the employer ofchoice, supplier of choice, valued customer of choice and investment of choice. Additionally, we strive to be arespected business community member and a good corporate citizen. Our strategic financial objectives areintended to align with our mission and drive value for all our stakeholders. Our strategic financial objectivesinclude: (1) top line revenue growth in excess of market growth; (2) improved operating margin; (3) strong bal-ance sheet and cash flows; and (4) effective capital allocation.
Top Line Revenue
The Company’s strategy for top-line revenue growth includes a combination of organic and acquisitive ini-tiatives designed to outpace the industry, improve the market share in each of our business segments and positionthe Company for sustained long-term growth. In 2021, each business segment experienced a year of strongrecovery as pandemic related restrictions eased around the globe and markets reopened. The economic recoveryalong with strong consumer demand and execution of our sales initiatives led to double-digit top-line growth forthe year despite continued uncertainties with COVID-19. Additionally, after limited merger and acquisitionactivity in 2020, we were active in 2021 with strategic bolt-on acquisitions that support the Company’s ongoinggrowth initiatives, including our Industrial segment’s $1.3 billion acquisition of Kaman Distribution Group inearly 2022. While we continue to face uncertainties in the business due to supply chain disruption, cost inflationand labor market constraints, we are encouraged by the current economic outlook and strong consumer demandtrends. We believe these factors and the positive impact of our ongoing strategic initiatives position us for con-tinued sales growth in the upcoming year.
Operating Margins
The Company targets continuous operating margin improvement each year. In 2020, we took certainrestructuring actions across its subsidiaries to simplify our cost structure and distribution networks (the “2019Cost Savings Plan”). We recognized permanent expense reductions of $150 million driven by transformativereductions in payroll and facility costs. Additionally, we had approximately $300 million in temporary savings inresponse to the impact of COVID-19. These actions led to improved segment margins in 2020 and permanentlylowered our cost structure. As business normalized in 2021, the temporary savings ended and we experiencedcost increases in areas such as wages, freight and health insurance. Despite these challenges, we improved seg-ment margins 60 basis points by leveraging strong top-line growth, improving gross margins through pricing andsourcing actions and managing costs through ongoing strategic initiatives. We believe continued execution of ourstrategic priorities in 2022 will further improve our margins.
Balance Sheet and Cash Flow
The Company is focused on maintaining a strong balance sheet and generating strong cash flow to supportour growth initiatives. Our working capital was a source of operating cash flow, and we improved our debt posi-tion and took advantage of favorable financing arrangements throughout the year. In 2021, we generated$1.3 billion in cash from operations.
22
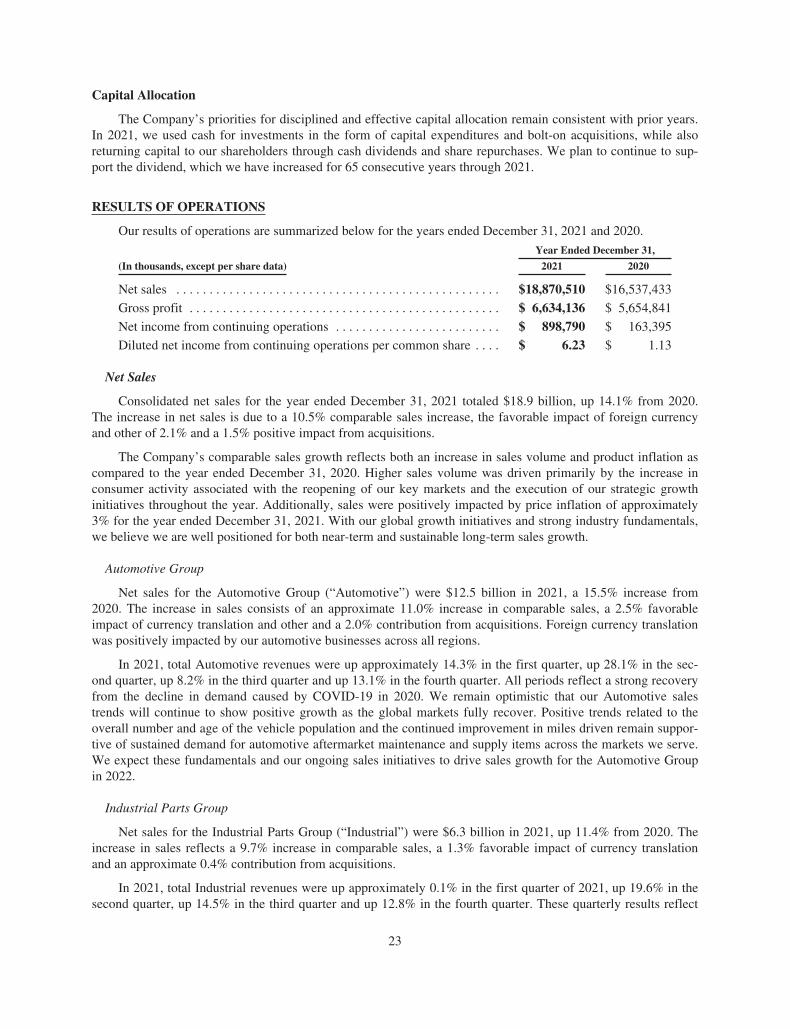
Capital Allocation
The Company’s priorities for disciplined and effective capital allocation remain consistent with prior years.In 2021, we used cash for investments in the form of capital expenditures and bolt-on acquisitions, while alsoreturning capital to our shareholders through cash dividends and share repurchases. We plan to continue to sup-port the dividend, which we have increased for 65 consecutive years through 2021.
RESULTS OF OPERATIONS
Our results of operations are summarized below for the years ended December 31, 2021 and 2020.
Year Ended December 31,
(In thousands, except per share data) 2021 2020
Net sales . . . . . . . . . . . . . . . . . . . . . . . . . . . . . . . . . . . . . . . . . . . . . . . . . $18,870,510 $16,537,433
Gross profit . . . . . . . . . . . . . . . . . . . . . . . . . . . . . . . . . . . . . . . . . . . . . . . $ 6,634,136 $ 5,654,841
Net income from continuing operations . . . . . . . . . . . . . . . . . . . . . . . . . $ 898,790 $ 163,395
Diluted net income from continuing operations per common share . . . . $ 6.23 $ 1.13
Net Sales
Consolidated net sales for the year ended December 31, 2021 totaled $18.9 billion, up 14.1% from 2020.The increase in net sales is due to a 10.5% comparable sales increase, the favorable impact of foreign currencyand other of 2.1% and a 1.5% positive impact from acquisitions.
The Company’s comparable sales growth reflects both an increase in sales volume and product inflation ascompared to the year ended December 31, 2020. Higher sales volume was driven primarily by the increase inconsumer activity associated with the reopening of our key markets and the execution of our strategic growthinitiatives throughout the year. Additionally, sales were positively impacted by price inflation of approximately3% for the year ended December 31, 2021. With our global growth initiatives and strong industry fundamentals,we believe we are well positioned for both near-term and sustainable long-term sales growth.
Automotive Group
Net sales for the Automotive Group (“Automotive”) were $12.5 billion in 2021, a 15.5% increase from2020. The increase in sales consists of an approximate 11.0% increase in comparable sales, a 2.5% favorableimpact of currency translation and other and a 2.0% contribution from acquisitions. Foreign currency translationwas positively impacted by our automotive businesses across all regions.
In 2021, total Automotive revenues were up approximately 14.3% in the first quarter, up 28.1% in the sec-ond quarter, up 8.2% in the third quarter and up 13.1% in the fourth quarter. All periods reflect a strong recoveryfrom the decline in demand caused by COVID-19 in 2020. We remain optimistic that our Automotive salestrends will continue to show positive growth as the global markets fully recover. Positive trends related to theoverall number and age of the vehicle population and the continued improvement in miles driven remain suppor-tive of sustained demand for automotive aftermarket maintenance and supply items across the markets we serve.We expect these fundamentals and our ongoing sales initiatives to drive sales growth for the Automotive Groupin 2022.
Industrial Parts Group
Net sales for the Industrial Parts Group (“Industrial”) were $6.3 billion in 2021, up 11.4% from 2020. Theincrease in sales reflects a 9.7% increase in comparable sales, a 1.3% favorable impact of currency translationand an approximate 0.4% contribution from acquisitions.
In 2021, total Industrial revenues were up approximately 0.1% in the first quarter of 2021, up 19.6% in thesecond quarter, up 14.5% in the third quarter and up 12.8% in the fourth quarter. These quarterly results reflect
23
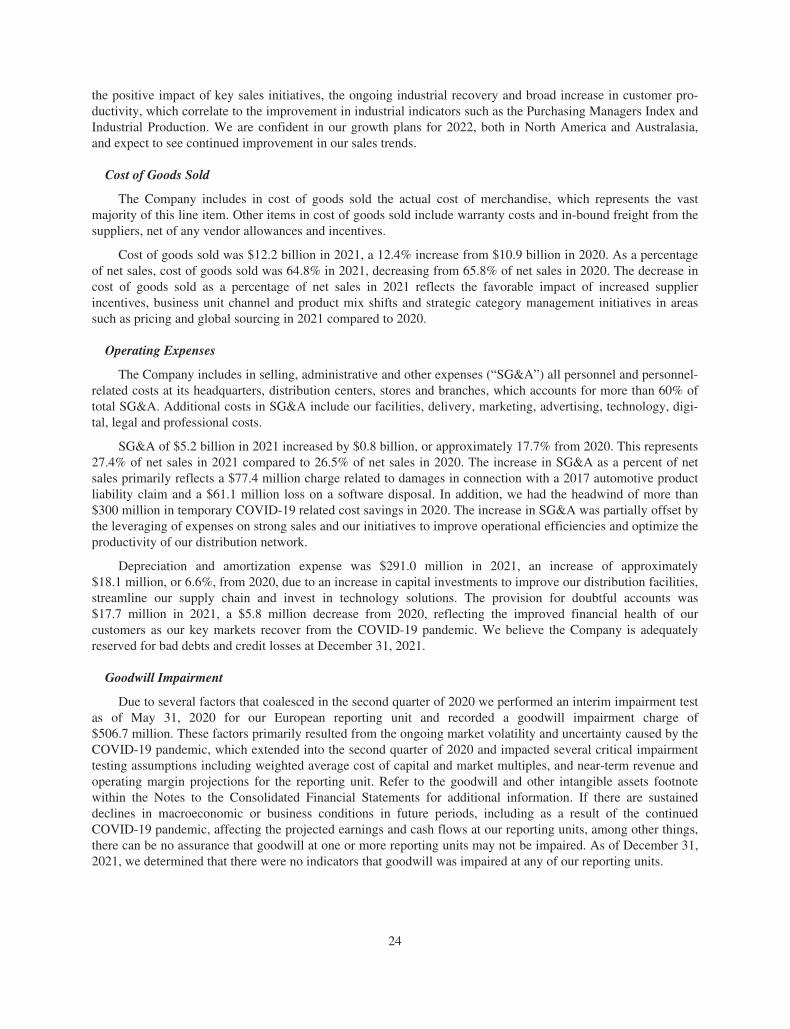
the positive impact of key sales initiatives, the ongoing industrial recovery and broad increase in customer pro-ductivity, which correlate to the improvement in industrial indicators such as the Purchasing Managers Index andIndustrial Production. We are confident in our growth plans for 2022, both in North America and Australasia,and expect to see continued improvement in our sales trends.
Cost of Goods Sold
The Company includes in cost of goods sold the actual cost of merchandise, which represents the vastmajority of this line item. Other items in cost of goods sold include warranty costs and in-bound freight from thesuppliers, net of any vendor allowances and incentives.
Cost of goods sold was $12.2 billion in 2021, a 12.4% increase from $10.9 billion in 2020. As a percentageof net sales, cost of goods sold was 64.8% in 2021, decreasing from 65.8% of net sales in 2020. The decrease incost of goods sold as a percentage of net sales in 2021 reflects the favorable impact of increased supplierincentives, business unit channel and product mix shifts and strategic category management initiatives in areassuch as pricing and global sourcing in 2021 compared to 2020.
Operating Expenses
The Company includes in selling, administrative and other expenses (“SG&A”) all personnel and personnel-related costs at its headquarters, distribution centers, stores and branches, which accounts for more than 60% oftotal SG&A. Additional costs in SG&A include our facilities, delivery, marketing, advertising, technology, digi-tal, legal and professional costs.
SG&A of $5.2 billion in 2021 increased by $0.8 billion, or approximately 17.7% from 2020. This represents27.4% of net sales in 2021 compared to 26.5% of net sales in 2020. The increase in SG&A as a percent of netsales primarily reflects a $77.4 million charge related to damages in connection with a 2017 automotive productliability claim and a $61.1 million loss on a software disposal. In addition, we had the headwind of more than$300 million in temporary COVID-19 related cost savings in 2020. The increase in SG&A was partially offset bythe leveraging of expenses on strong sales and our initiatives to improve operational efficiencies and optimize theproductivity of our distribution network.
Depreciation and amortization expense was $291.0 million in 2021, an increase of approximately$18.1 million, or 6.6%, from 2020, due to an increase in capital investments to improve our distribution facilities,streamline our supply chain and invest in technology solutions. The provision for doubtful accounts was$17.7 million in 2021, a $5.8 million decrease from 2020, reflecting the improved financial health of ourcustomers as our key markets recover from the COVID-19 pandemic. We believe the Company is adequatelyreserved for bad debts and credit losses at December 31, 2021.
Goodwill Impairment
Due to several factors that coalesced in the second quarter of 2020 we performed an interim impairment testas of May 31, 2020 for our European reporting unit and recorded a goodwill impairment charge of$506.7 million. These factors primarily resulted from the ongoing market volatility and uncertainty caused by theCOVID-19 pandemic, which extended into the second quarter of 2020 and impacted several critical impairmenttesting assumptions including weighted average cost of capital and market multiples, and near-term revenue andoperating margin projections for the reporting unit. Refer to the goodwill and other intangible assets footnotewithin the Notes to the Consolidated Financial Statements for additional information. If there are sustaineddeclines in macroeconomic or business conditions in future periods, including as a result of the continuedCOVID-19 pandemic, affecting the projected earnings and cash flows at our reporting units, among other things,there can be no assurance that goodwill at one or more reporting units may not be impaired. As of December 31,2021, we determined that there were no indicators that goodwill was impaired at any of our reporting units.
24
Non-Operating Expenses and Income
Non-operating expenses included net interest expense of $62.2 million in 2021 and $91.0 million in 2020.The decrease in net interest expense of $28.9 million in 2021 primarily reflects the combination of the repaymentof debt and lowered interest rates on our remaining outstanding debt.
“Other” includes equity method investment income, investment dividends, noncontrolling interests andpension income. Other income in 2021 was $99.6 million, an approximate $44.1 million increase from the prioryear due to a variety of factors, including favorable changes in gains on equity investments and retirement planvaluations.
Segment Profit
Segment profit is calculated as net sales less operating expenses excluding general corporate expenses, netinterest expense, equity in income from investees, intangible asset amortization, income attributable to non-controlling interests and other unallocated amounts that are primarily driven by corporate initiatives and adjustedin Non-GAAP Measures (as described further below). Refer to the segment data footnote in the Notes to Con-solidated Financial Statements for additional information.
Automotive Group
Automotive’s segment profit increased 23.7% in 2021 from 2020 and segment profit margin was 8.6% in2021 compared to 8.0% in 2020. The improvement reflects strong operating results across our geographiesresulting from double-digit organic sales growth, gross margin expansion and ongoing cost control actions. Tofurther improve Automotive’s segment margin, this group will continue to execute on its growth plans and costinitiatives going forward.
Industrial Group
Industrial’s segment profit increased 23.5% in 2021 from 2020 and segment profit margin improved to9.4%, an increase from 8.5% in 2020. The improvement primarily reflects the benefits of double-digit organicsales growth and improved gross margin and operational efficiencies. We believe the strength of economicindicators such as Industrial Production and the Purchasing Managers Index combined with effective growth ini-tiatives and cost actions position the Industrial Group for further growth in 2022.
Income Taxes
The Company’s effective income tax rate was 25.1% as of December 31, 2021, compared to 56.9% in 2020.For the year ended December 31, 2021, the rate decrease is primarily due to the non-deductible goodwillimpairment charge that occurred in 2020.
Net Income from Continuing Operations
Net income from continuing operations was $898.8 million in 2021, a significant increase compared to$163.4 million in 2020. On a per share diluted basis, net income from continuing operations was $6.23 in 2021,up 451.3% compared to $1.13 in 2020. Net income from continuing operations was 4.8% of net sales in 2021compared to 1.0% of net sales in 2020. The increase in net income from continuing operations for the year endedDecember 31, 2021 primarily reflects the goodwill impairment charge of $506.7 million that occurred during thesecond quarter of 2020.
Adjusted net income from continuing operations was $997.0 million in 2021, an increase of 30.3% from$765.0 million in 2020. On a per share diluted basis, adjusted net income from continuing operations was $6.91,a 31.1% increase compared to adjusted net income per diluted share from continuing operations of $5.27 in 2020.
Both adjusted net income from continuing operations and adjusted diluted net income from continuing oper-ations per common share are non-GAAP measures (see table below for reconciliations to the most directly com-parable GAAP measures).
25
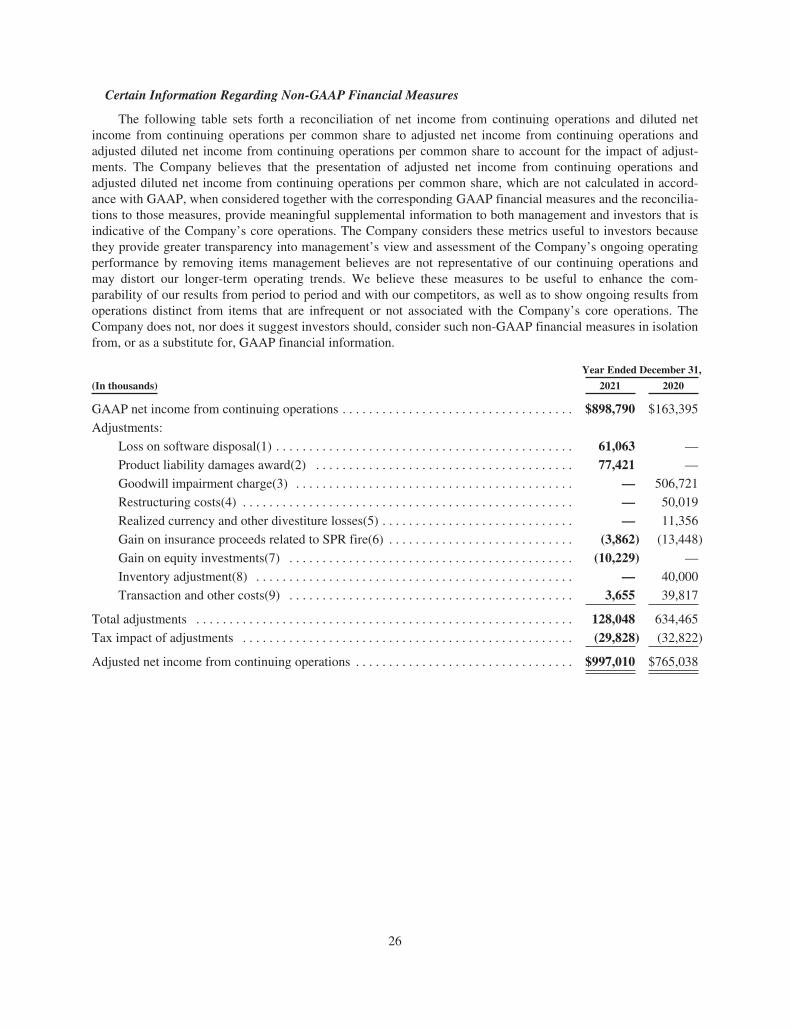
Certain Information Regarding Non-GAAP Financial Measures
The following table sets forth a reconciliation of net income from continuing operations and diluted netincome from continuing operations per common share to adjusted net income from continuing operations andadjusted diluted net income from continuing operations per common share to account for the impact of adjust-ments. The Company believes that the presentation of adjusted net income from continuing operations andadjusted diluted net income from continuing operations per common share, which are not calculated in accord-ance with GAAP, when considered together with the corresponding GAAP financial measures and the reconcilia-tions to those measures, provide meaningful supplemental information to both management and investors that isindicative of the Company’s core operations. The Company considers these metrics useful to investors becausethey provide greater transparency into management’s view and assessment of the Company’s ongoing operatingperformance by removing items management believes are not representative of our continuing operations andmay distort our longer-term operating trends. We believe these measures to be useful to enhance the com-parability of our results from period to period and with our competitors, as well as to show ongoing results fromoperations distinct from items that are infrequent or not associated with the Company’s core operations. TheCompany does not, nor does it suggest investors should, consider such non-GAAP financial measures in isolationfrom, or as a substitute for, GAAP financial information.
Year Ended December 31,
(In thousands) 2021 2020
GAAP net income from continuing operations . . . . . . . . . . . . . . . . . . . . . . . . . . . . . . . . . . . $898,790 $163,395
Adjustments:
Loss on software disposal(1) . . . . . . . . . . . . . . . . . . . . . . . . . . . . . . . . . . . . . . . . . . . . . 61,063 —
Product liability damages award(2) . . . . . . . . . . . . . . . . . . . . . . . . . . . . . . . . . . . . . . . 77,421 —
Goodwill impairment charge(3) . . . . . . . . . . . . . . . . . . . . . . . . . . . . . . . . . . . . . . . . . . — 506,721
Restructuring costs(4) . . . . . . . . . . . . . . . . . . . . . . . . . . . . . . . . . . . . . . . . . . . . . . . . . . — 50,019
Realized currency and other divestiture losses(5) . . . . . . . . . . . . . . . . . . . . . . . . . . . . . — 11,356
Gain on insurance proceeds related to SPR fire(6) . . . . . . . . . . . . . . . . . . . . . . . . . . . . (3,862) (13,448)
Gain on equity investments(7) . . . . . . . . . . . . . . . . . . . . . . . . . . . . . . . . . . . . . . . . . . . (10,229) —
Inventory adjustment(8) . . . . . . . . . . . . . . . . . . . . . . . . . . . . . . . . . . . . . . . . . . . . . . . . — 40,000
Transaction and other costs(9) . . . . . . . . . . . . . . . . . . . . . . . . . . . . . . . . . . . . . . . . . . . 3,655 39,817
Total adjustments . . . . . . . . . . . . . . . . . . . . . . . . . . . . . . . . . . . . . . . . . . . . . . . . . . . . . . . . . 128,048 634,465
Tax impact of adjustments . . . . . . . . . . . . . . . . . . . . . . . . . . . . . . . . . . . . . . . . . . . . . . . . . . (29,828) (32,822)
Adjusted net income from continuing operations . . . . . . . . . . . . . . . . . . . . . . . . . . . . . . . . . $997,010 $765,038
26
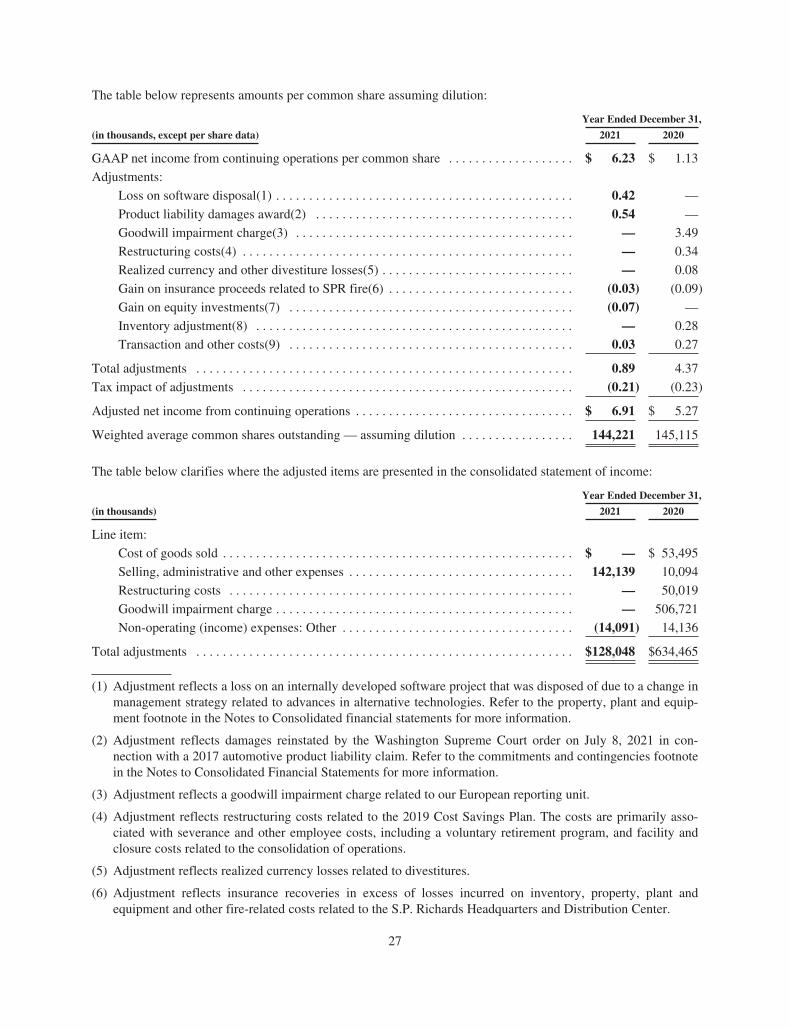
The table below represents amounts per common share assuming dilution:
Year Ended December 31,
(in thousands, except per share data) 2021 2020
GAAP net income from continuing operations per common share . . . . . . . . . . . . . . . . . . . $ 6.23 $ 1.13
Adjustments:
Loss on software disposal(1) . . . . . . . . . . . . . . . . . . . . . . . . . . . . . . . . . . . . . . . . . . . . . 0.42 —
Product liability damages award(2) . . . . . . . . . . . . . . . . . . . . . . . . . . . . . . . . . . . . . . . 0.54 —
Goodwill impairment charge(3) . . . . . . . . . . . . . . . . . . . . . . . . . . . . . . . . . . . . . . . . . . — 3.49
Restructuring costs(4) . . . . . . . . . . . . . . . . . . . . . . . . . . . . . . . . . . . . . . . . . . . . . . . . . . — 0.34
Realized currency and other divestiture losses(5) . . . . . . . . . . . . . . . . . . . . . . . . . . . . . — 0.08
Gain on insurance proceeds related to SPR fire(6) . . . . . . . . . . . . . . . . . . . . . . . . . . . . (0.03) (0.09)
Gain on equity investments(7) . . . . . . . . . . . . . . . . . . . . . . . . . . . . . . . . . . . . . . . . . . . (0.07) —
Inventory adjustment(8) . . . . . . . . . . . . . . . . . . . . . . . . . . . . . . . . . . . . . . . . . . . . . . . . — 0.28
Transaction and other costs(9) . . . . . . . . . . . . . . . . . . . . . . . . . . . . . . . . . . . . . . . . . . . 0.03 0.27
Total adjustments . . . . . . . . . . . . . . . . . . . . . . . . . . . . . . . . . . . . . . . . . . . . . . . . . . . . . . . . . 0.89 4.37
Tax impact of adjustments . . . . . . . . . . . . . . . . . . . . . . . . . . . . . . . . . . . . . . . . . . . . . . . . . . (0.21) (0.23)
Adjusted net income from continuing operations . . . . . . . . . . . . . . . . . . . . . . . . . . . . . . . . . $ 6.91 $ 5.27
Weighted average common shares outstanding — assuming dilution . . . . . . . . . . . . . . . . . 144,221 145,115
The table below clarifies where the adjusted items are presented in the consolidated statement of income:
Year Ended December 31,
(in thousands) 2021 2020
Line item:
Cost of goods sold . . . . . . . . . . . . . . . . . . . . . . . . . . . . . . . . . . . . . . . . . . . . . . . . . . . . . $ — $ 53,495
Selling, administrative and other expenses . . . . . . . . . . . . . . . . . . . . . . . . . . . . . . . . . . 142,139 10,094
Restructuring costs . . . . . . . . . . . . . . . . . . . . . . . . . . . . . . . . . . . . . . . . . . . . . . . . . . . . — 50,019
Goodwill impairment charge . . . . . . . . . . . . . . . . . . . . . . . . . . . . . . . . . . . . . . . . . . . . . — 506,721
Non-operating (income) expenses: Other . . . . . . . . . . . . . . . . . . . . . . . . . . . . . . . . . . . (14,091) 14,136
Total adjustments . . . . . . . . . . . . . . . . . . . . . . . . . . . . . . . . . . . . . . . . . . . . . . . . . . . . . . . . . $128,048 $634,465
(1) Adjustment reflects a loss on an internally developed software project that was disposed of due to a change inmanagement strategy related to advances in alternative technologies. Refer to the property, plant and equip-ment footnote in the Notes to Consolidated financial statements for more information.
(2) Adjustment reflects damages reinstated by the Washington Supreme Court order on July 8, 2021 in con-nection with a 2017 automotive product liability claim. Refer to the commitments and contingencies footnotein the Notes to Consolidated Financial Statements for more information.
(3) Adjustment reflects a goodwill impairment charge related to our European reporting unit.
(4) Adjustment reflects restructuring costs related to the 2019 Cost Savings Plan. The costs are primarily asso-ciated with severance and other employee costs, including a voluntary retirement program, and facility andclosure costs related to the consolidation of operations.
(5) Adjustment reflects realized currency losses related to divestitures.
(6) Adjustment reflects insurance recoveries in excess of losses incurred on inventory, property, plant andequipment and other fire-related costs related to the S.P. Richards Headquarters and Distribution Center.
27
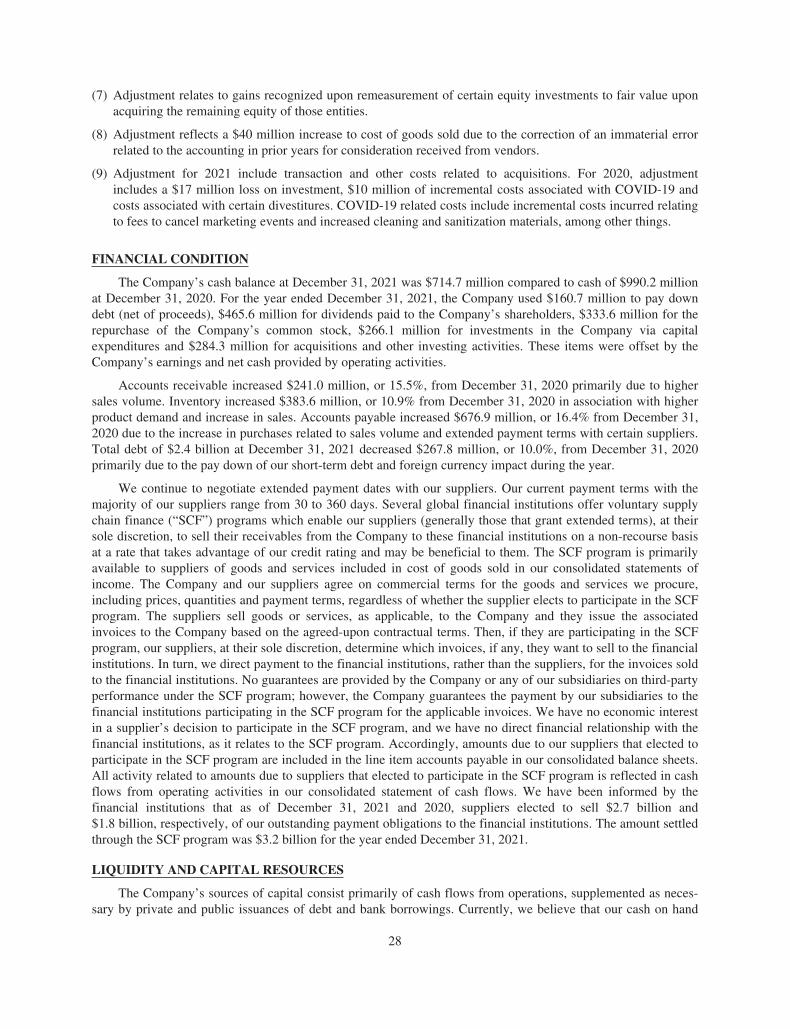
(7) Adjustment relates to gains recognized upon remeasurement of certain equity investments to fair value uponacquiring the remaining equity of those entities.
(8) Adjustment reflects a $40 million increase to cost of goods sold due to the correction of an immaterial errorrelated to the accounting in prior years for consideration received from vendors.
(9) Adjustment for 2021 include transaction and other costs related to acquisitions. For 2020, adjustmentincludes a $17 million loss on investment, $10 million of incremental costs associated with COVID-19 andcosts associated with certain divestitures. COVID-19 related costs include incremental costs incurred relatingto fees to cancel marketing events and increased cleaning and sanitization materials, among other things.
FINANCIAL CONDITION
The Company’s cash balance at December 31, 2021 was $714.7 million compared to cash of $990.2 millionat December 31, 2020. For the year ended December 31, 2021, the Company used $160.7 million to pay downdebt (net of proceeds), $465.6 million for dividends paid to the Company’s shareholders, $333.6 million for therepurchase of the Company’s common stock, $266.1 million for investments in the Company via capitalexpenditures and $284.3 million for acquisitions and other investing activities. These items were offset by theCompany’s earnings and net cash provided by operating activities.
Accounts receivable increased $241.0 million, or 15.5%, from December 31, 2020 primarily due to highersales volume. Inventory increased $383.6 million, or 10.9% from December 31, 2020 in association with higherproduct demand and increase in sales. Accounts payable increased $676.9 million, or 16.4% from December 31,2020 due to the increase in purchases related to sales volume and extended payment terms with certain suppliers.Total debt of $2.4 billion at December 31, 2021 decreased $267.8 million, or 10.0%, from December 31, 2020primarily due to the pay down of our short-term debt and foreign currency impact during the year.
We continue to negotiate extended payment dates with our suppliers. Our current payment terms with themajority of our suppliers range from 30 to 360 days. Several global financial institutions offer voluntary supplychain finance (“SCF”) programs which enable our suppliers (generally those that grant extended terms), at theirsole discretion, to sell their receivables from the Company to these financial institutions on a non-recourse basisat a rate that takes advantage of our credit rating and may be beneficial to them. The SCF program is primarilyavailable to suppliers of goods and services included in cost of goods sold in our consolidated statements ofincome. The Company and our suppliers agree on commercial terms for the goods and services we procure,including prices, quantities and payment terms, regardless of whether the supplier elects to participate in the SCFprogram. The suppliers sell goods or services, as applicable, to the Company and they issue the associatedinvoices to the Company based on the agreed-upon contractual terms. Then, if they are participating in the SCFprogram, our suppliers, at their sole discretion, determine which invoices, if any, they want to sell to the financialinstitutions. In turn, we direct payment to the financial institutions, rather than the suppliers, for the invoices soldto the financial institutions. No guarantees are provided by the Company or any of our subsidiaries on third-partyperformance under the SCF program; however, the Company guarantees the payment by our subsidiaries to thefinancial institutions participating in the SCF program for the applicable invoices. We have no economic interestin a supplier’s decision to participate in the SCF program, and we have no direct financial relationship with thefinancial institutions, as it relates to the SCF program. Accordingly, amounts due to our suppliers that elected toparticipate in the SCF program are included in the line item accounts payable in our consolidated balance sheets.All activity related to amounts due to suppliers that elected to participate in the SCF program is reflected in cashflows from operating activities in our consolidated statement of cash flows. We have been informed by thefinancial institutions that as of December 31, 2021 and 2020, suppliers elected to sell $2.7 billion and$1.8 billion, respectively, of our outstanding payment obligations to the financial institutions. The amount settledthrough the SCF program was $3.2 billion for the year ended December 31, 2021.
LIQUIDITY AND CAPITAL RESOURCES
The Company’s sources of capital consist primarily of cash flows from operations, supplemented as neces-sary by private and public issuances of debt and bank borrowings. Currently, we believe that our cash on hand
28
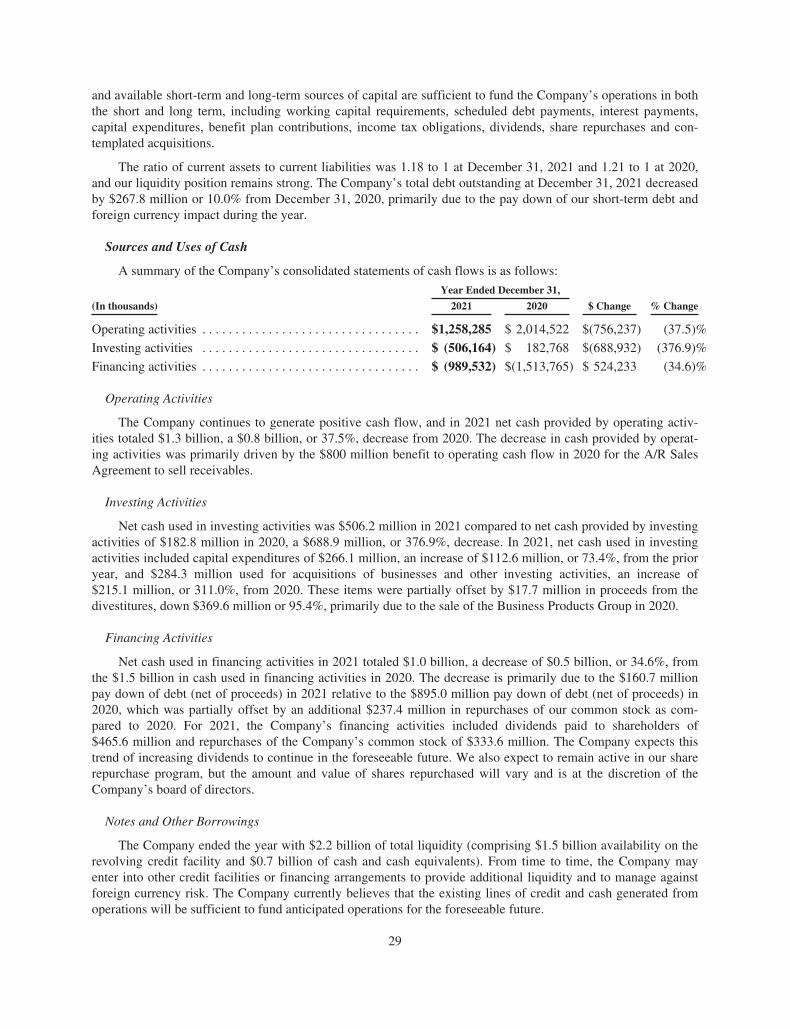
and available short-term and long-term sources of capital are sufficient to fund the Company’s operations in boththe short and long term, including working capital requirements, scheduled debt payments, interest payments,capital expenditures, benefit plan contributions, income tax obligations, dividends, share repurchases and con-templated acquisitions.
The ratio of current assets to current liabilities was 1.18 to 1 at December 31, 2021 and 1.21 to 1 at 2020,and our liquidity position remains strong. The Company’s total debt outstanding at December 31, 2021 decreasedby $267.8 million or 10.0% from December 31, 2020, primarily due to the pay down of our short-term debt andforeign currency impact during the year.
Sources and Uses of Cash
A summary of the Company’s consolidated statements of cash flows is as follows:
Year Ended December 31,
(In thousands) 2021 2020 $ Change % Change
Operating activities . . . . . . . . . . . . . . . . . . . . . . . . . . . . . . . . . $1,258,285 $ 2,014,522 $(756,237) (37.5)%
Investing activities . . . . . . . . . . . . . . . . . . . . . . . . . . . . . . . . . $ (506,164) $ 182,768 $(688,932) (376.9)%
Financing activities . . . . . . . . . . . . . . . . . . . . . . . . . . . . . . . . . $ (989,532) $(1,513,765) $ 524,233 (34.6)%
Operating Activities
The Company continues to generate positive cash flow, and in 2021 net cash provided by operating activ-ities totaled $1.3 billion, a $0.8 billion, or 37.5%, decrease from 2020. The decrease in cash provided by operat-ing activities was primarily driven by the $800 million benefit to operating cash flow in 2020 for the A/R SalesAgreement to sell receivables.
Investing Activities
Net cash used in investing activities was $506.2 million in 2021 compared to net cash provided by investingactivities of $182.8 million in 2020, a $688.9 million, or 376.9%, decrease. In 2021, net cash used in investingactivities included capital expenditures of $266.1 million, an increase of $112.6 million, or 73.4%, from the prioryear, and $284.3 million used for acquisitions of businesses and other investing activities, an increase of$215.1 million, or 311.0%, from 2020. These items were partially offset by $17.7 million in proceeds from thedivestitures, down $369.6 million or 95.4%, primarily due to the sale of the Business Products Group in 2020.
Financing Activities
Net cash used in financing activities in 2021 totaled $1.0 billion, a decrease of $0.5 billion, or 34.6%, fromthe $1.5 billion in cash used in financing activities in 2020. The decrease is primarily due to the $160.7 millionpay down of debt (net of proceeds) in 2021 relative to the $895.0 million pay down of debt (net of proceeds) in2020, which was partially offset by an additional $237.4 million in repurchases of our common stock as com-pared to 2020. For 2021, the Company’s financing activities included dividends paid to shareholders of$465.6 million and repurchases of the Company’s common stock of $333.6 million. The Company expects thistrend of increasing dividends to continue in the foreseeable future. We also expect to remain active in our sharerepurchase program, but the amount and value of shares repurchased will vary and is at the discretion of theCompany’s board of directors.
Notes and Other Borrowings
The Company ended the year with $2.2 billion of total liquidity (comprising $1.5 billion availability on therevolving credit facility and $0.7 billion of cash and cash equivalents). From time to time, the Company mayenter into other credit facilities or financing arrangements to provide additional liquidity and to manage againstforeign currency risk. The Company currently believes that the existing lines of credit and cash generated fromoperations will be sufficient to fund anticipated operations for the foreseeable future.
29
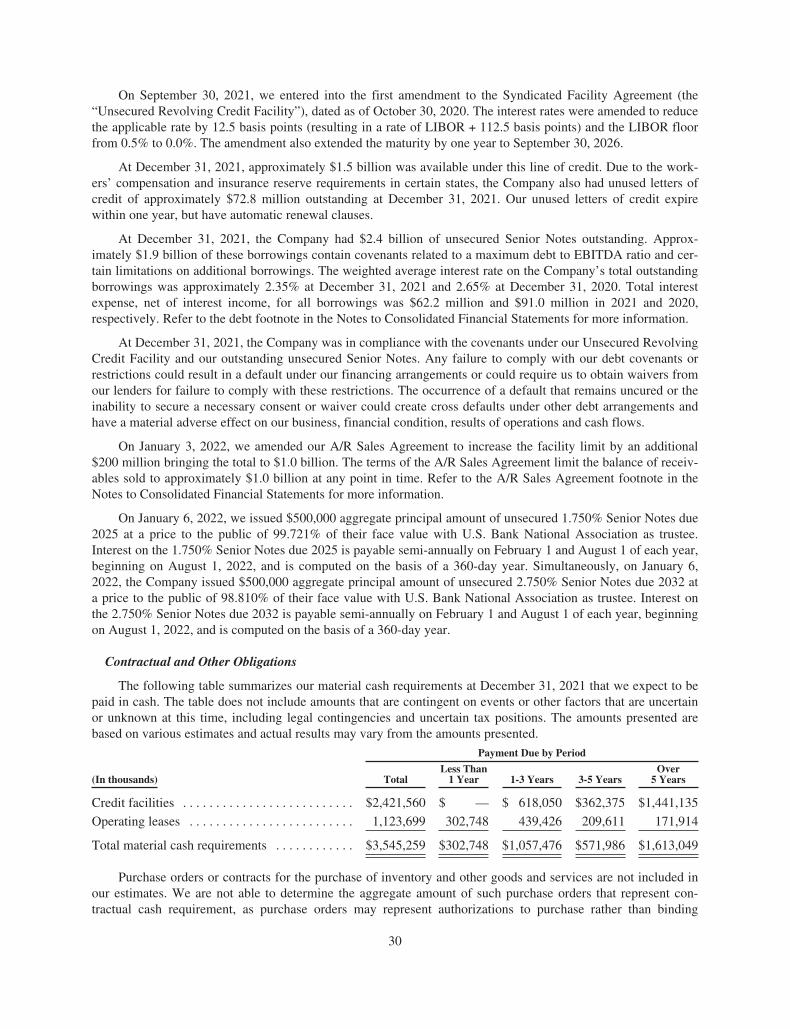
On September 30, 2021, we entered into the first amendment to the Syndicated Facility Agreement (the“Unsecured Revolving Credit Facility”), dated as of October 30, 2020. The interest rates were amended to reducethe applicable rate by 12.5 basis points (resulting in a rate of LIBOR + 112.5 basis points) and the LIBOR floorfrom 0.5% to 0.0%. The amendment also extended the maturity by one year to September 30, 2026.
At December 31, 2021, approximately $1.5 billion was available under this line of credit. Due to the work-ers’ compensation and insurance reserve requirements in certain states, the Company also had unused letters ofcredit of approximately $72.8 million outstanding at December 31, 2021. Our unused letters of credit expirewithin one year, but have automatic renewal clauses.
At December 31, 2021, the Company had $2.4 billion of unsecured Senior Notes outstanding. Approx-imately $1.9 billion of these borrowings contain covenants related to a maximum debt to EBITDA ratio and cer-tain limitations on additional borrowings. The weighted average interest rate on the Company’s total outstandingborrowings was approximately 2.35% at December 31, 2021 and 2.65% at December 31, 2020. Total interestexpense, net of interest income, for all borrowings was $62.2 million and $91.0 million in 2021 and 2020,respectively. Refer to the debt footnote in the Notes to Consolidated Financial Statements for more information.
At December 31, 2021, the Company was in compliance with the covenants under our Unsecured RevolvingCredit Facility and our outstanding unsecured Senior Notes. Any failure to comply with our debt covenants orrestrictions could result in a default under our financing arrangements or could require us to obtain waivers fromour lenders for failure to comply with these restrictions. The occurrence of a default that remains uncured or theinability to secure a necessary consent or waiver could create cross defaults under other debt arrangements andhave a material adverse effect on our business, financial condition, results of operations and cash flows.
On January 3, 2022, we amended our A/R Sales Agreement to increase the facility limit by an additional$200 million bringing the total to $1.0 billion. The terms of the A/R Sales Agreement limit the balance of receiv-ables sold to approximately $1.0 billion at any point in time. Refer to the A/R Sales Agreement footnote in theNotes to Consolidated Financial Statements for more information.
On January 6, 2022, we issued $500,000 aggregate principal amount of unsecured 1.750% Senior Notes due2025 at a price to the public of 99.721% of their face value with U.S. Bank National Association as trustee.Interest on the 1.750% Senior Notes due 2025 is payable semi-annually on February 1 and August 1 of each year,beginning on August 1, 2022, and is computed on the basis of a 360-day year. Simultaneously, on January 6,2022, the Company issued $500,000 aggregate principal amount of unsecured 2.750% Senior Notes due 2032 ata price to the public of 98.810% of their face value with U.S. Bank National Association as trustee. Interest onthe 2.750% Senior Notes due 2032 is payable semi-annually on February 1 and August 1 of each year, beginningon August 1, 2022, and is computed on the basis of a 360-day year.
Contractual and Other Obligations
The following table summarizes our material cash requirements at December 31, 2021 that we expect to bepaid in cash. The table does not include amounts that are contingent on events or other factors that are uncertainor unknown at this time, including legal contingencies and uncertain tax positions. The amounts presented arebased on various estimates and actual results may vary from the amounts presented.
Payment Due by Period
(In thousands) TotalLess Than
1 Year 1-3 Years 3-5 YearsOver
5 Years
Credit facilities . . . . . . . . . . . . . . . . . . . . . . . . . . $2,421,560 $ — $ 618,050 $362,375 $1,441,135
Operating leases . . . . . . . . . . . . . . . . . . . . . . . . . 1,123,699 302,748 439,426 209,611 171,914
Total material cash requirements . . . . . . . . . . . . $3,545,259 $302,748 $1,057,476 $571,986 $1,613,049
Purchase orders or contracts for the purchase of inventory and other goods and services are not included inour estimates. We are not able to determine the aggregate amount of such purchase orders that represent con-tractual cash requirement, as purchase orders may represent authorizations to purchase rather than binding
30
agreements. Our purchase orders are based on our current distribution needs and are fulfilled by our vendorswithin short time horizons. The Company does not have significant agreements for the purchase of inventory orother goods specifying minimum quantities or set prices that exceed our expected requirements.
Additionally, the Company guarantees the borrowings of certain independently owned automotive partsstores (independents) and certain other affiliates in which the Company has a noncontrolling equity ownershipinterest (affiliates). The Company’s maximum exposure to loss as a result of its involvement with theseindependents and affiliates is generally equal to the total borrowings subject to the Company’s guarantee. AtDecember 31, 2021, the total borrowings of the independents and affiliates subject to guarantee by the Companywere approximately $917.5 million. These loans generally mature over periods from one to six years. Ouramount of commitment expiring in 2022 is approximately $304.6 million. To date, the Company has had no sig-nificant losses in connection with guarantees of independents’ and affiliates’ borrowings.
Share Repurchases
In 2021, the Company repurchased approximately 2.6 million shares of its common stock and the Companyhad remaining authority to purchase approximately 11.9 million shares of its common stock at December 31,2021. There were no other repurchase plans announced as of December 31, 2021.
CRITICAL ACCOUNTING POLICIES
Management’s Discussion and Analysis of Financial Condition and Results of Operations is based upon ourconsolidated financial statements, which have been prepared in accordance with U.S. GAAP. The preparation ofour consolidated financial statements requires management to make estimates, assumptions and judgments thataffect the reported amounts of assets, liabilities, net sales and expenses and related disclosure of contingent assetsand liabilities. Management bases its estimates on historical experience and on various other assumptions that arebelieved to be reasonable under the circumstances, the results of which form the basis for making judgmentsabout the carrying values of assets and liabilities that are not readily apparent from other sources. Actual resultsmay differ from these estimates under different assumptions or conditions.
We describe in this section certain critical accounting policies that require us to make significant estimates,assumptions and judgments. An accounting policy is deemed to be critical if it requires an accounting estimate tobe made based on assumptions about matters that are uncertain at the time the estimate is made and if differentestimates that reasonably could have been used, or changes in the accounting estimates that are reasonably likelyto occur periodically, could materially impact the consolidated financial statements. Management believes thefollowing critical accounting policies reflect its most significant estimates and assumptions used in the prepara-tion of the consolidated financial statements. For further information on the critical accounting policies, see thesummary of significant accounting policies footnote in the Notes to Consolidated Financial Statements.
Inventories — Provisions for Slow Moving and Obsolescence
The Company identifies slow moving or obsolete inventories and estimates appropriate provisions relatedthereto. Historically, these losses have not been significant as the vast majority of the Company’s inventories arenot highly susceptible to obsolescence and a majority are eligible for return under various vendor return pro-grams. While the Company has no reason to believe its inventory return privileges will be discontinued in thefuture, its risk of loss associated with obsolete or slow moving inventories would increase if such were to occur.
Allowance for Doubtful Accounts — Methodology
The Company evaluates the collectability of trade accounts receivable based on a combination of factors.The Company estimates an allowance for doubtful accounts as a percentage of net sales based on various factors,including historical experience, current economic conditions and expected future credit losses and collectabilitytrends. The Company periodically adjusts this estimate when the Company becomes aware of a specific custom-er’s inability to meet its financial obligations (e.g., bankruptcy filing) or as a result of changes in the overallaging of accounts receivable. While the Company has a large customer base that is geographically dispersed, a
31
general economic downturn in any of the industry segments in which the Company operates could result inhigher than expected defaults and, therefore, the need to revise estimates for bad debts. For the years endedDecember 31, 2021, 2020 and 2019, the Company recorded provisions for doubtful accounts of approximately$17.7 million, $23.6 million, and $13.9 million, respectively.
Consideration Received from Vendors
The Company may enter into agreements at the beginning of each year with many of its vendors that pro-vide for inventory purchase incentives. Generally, the Company earns inventory purchase incentives uponachieving specified volume purchasing levels or other criteria. The Company accrues for the receipt of theseincentives as part of its inventory cost based on cumulative purchases of inventory to date and projectedinventory purchases through the end of the year. While management believes the Company will continue toreceive consideration from vendors in 2022 and beyond, there can be no assurance that vendors will continue toprovide comparable amounts of incentives in the future or that we will be able to achieve the specified volumesnecessary to take advantage of such incentives.
Impairment of Property, Plant and Equipment and Goodwill and Other Intangible Assets
At least annually, the Company evaluates property, plant and equipment, goodwill and other intangibleassets for potential impairment indicators. The Company’s judgments regarding the existence of impairmentindicators are based on market conditions and operational performance, among other factors. Future events couldcause the Company to conclude that impairment indicators exist and that assets associated with a particular oper-ation are impaired. Evaluating for impairment also requires the Company to estimate future operating results andcash flows which requires judgment by management. Any resulting impairment loss could have a materialadverse impact on the Company’s financial condition and results of operations. Refer to the goodwill and otherintangible assets footnote of the Notes to Consolidated Financial Statements for further information on the resultsof the Company’s annual goodwill impairment testing.
Employee Benefit Plans
The Company’s benefit plan committees in the U.S. and Canada establish investment policies and strategiesand regularly monitor the performance of the Company’s pension plan assets. The plans in Europe are unfundedand therefore there are no plan assets. The pension plan investment strategy implemented by the Company’smanagement is to achieve long-term objectives and invest the pension assets in accordance with the applicablepension legislation in the U.S. and Canada, as well as fiduciary standards. The long-term primary objectives forthe pension plan funds are to provide for a reasonable amount of long-term growth of capital without undueexposure to risk, protect the assets from erosion of purchasing power and provide investment results that meet orexceed the pension plans’ actuarially assumed long-term rates of return. The Company’s investment strategywith respect to pension plan assets is to generate a return in excess of the passive portfolio benchmark (38% U.S.Large-cap stocks, 9% U.S. Mid-cap stocks, 10% International stocks, 3% Emerging Market stocks and 40%Barclays U.S. Gov/Credit Index).
We make several critical assumptions in determining our pension plan assets and liabilities and related pen-sion income. We believe the most critical of these assumptions are the expected rate of return on plan assets andthe discount rate. Other assumptions we make relate to employee demographic factors such as rate of compensa-tion increases, mortality rates, retirement patterns and turnover rates. Refer to the employee benefit plans foot-note of the Notes to Consolidated Financial Statements for more information regarding these assumptions.
Based on the investment policy for the pension plans, as well as an asset study that was performed based onthe Company’s asset allocations and future expectations, the Company’s expected rate of return on plan assets formeasuring 2022 pension income is 6.34% for the plans. The asset study forecasted expected rates of return forthe approximate duration of the Company’s benefit obligations, using capital market data and historicalrelationships.
32
The discount rate is chosen as the rate at which pension obligations could be effectively settled and is basedon capital market conditions as of the measurement date. We have matched the timing and duration of theexpected cash flows of our pension obligations to a yield curve generated from a broad portfolio of high-qualityfixed income debt instruments to select our discount rate. Based upon this cash flow matching analysis, weselected a weighted average discount rate for the plans of 3.04% at December 31, 2021.
Our pension income for 2021 is determined at the December 31, 2020 measurement date. A 25 basis pointincrease in discount rate would result in an approximate $73 million decrease on our projected benefit obligation.A 25 basis point decrease in discount rate would result in approximate $77 million increase on our projectedbenefit obligation. A 25 basis point change in discount rate would have an approximate $1.2 million impact onour pension income. A 25 basis point change in expected return on asset would have an approximate $5.7 millionimpact on our pension income. These sensitivities reflect the effect of changing one assumption at a time andassume no changes to the design of the pension plans.
Effective December 31, 2013, our defined benefit pension plans were amended to freeze benefit planaccruals for participants and provide for immediate vesting of accrued benefits. Net periodic benefit income forour defined benefit pension plans was $19.3 million, $18.0 million, and $16.2 million for the years endedDecember 31, 2021, 2020 and 2019, respectively. The income associated with the pension plans in 2021, 2020and 2019 reflects the impact of the freeze. Refer to the employee benefit plans footnote of the Notes to Con-solidated Financial Statements for more information regarding employee benefit plans.
Business Combinations
When the Company acquires businesses, it applies the acquisition method of accounting and recognizes theidentifiable assets acquired, the liabilities assumed, and any noncontrolling interests in an acquiree at their fairvalues on the acquisition date, which requires significant estimates and assumptions. Goodwill is measured as theexcess of the fair value of the consideration transferred over the net of the acquisition date fair values of the iden-tifiable assets acquired and liabilities assumed. The acquisition method requires the Company to record provi-sional amounts for any items for which the accounting is not complete at the end of a reporting period. TheCompany must complete the accounting during the measurement period, which cannot exceed one year. Adjust-ments made during the measurement period could have a material impact on the Company’s financial conditionand results of operations.
The Company typically measures customer relationship and other intangible assets using an incomeapproach. Significant estimates and assumptions used in this approach include discount rates and certain assump-tions that form the basis of the forecasted cash flows expected to be generated from the asset (e.g., future revenuegrowth rates, operating margins and attrition rates). If the subsequent actual results and updated projections of theunderlying business activity change compared with the assumptions and projections used to develop these values,the Company could record impairment charges. In addition, the Company has estimated the economic lives ofcertain acquired tangible and intangible assets and these lives are used to calculate depreciation and amortizationexpense. If the Company’s estimates of the economic lives change, depreciation or amortization expenses couldbe increased or decreased, or the acquired asset could be impaired.
Legal and Product Liabilities
The Company accrues for potential losses related to legal disputes, litigation, product liabilities, and regu-latory matters when it is probable (the future event or events are likely to occur) that the Company will incur aloss and the amount of the loss can be reasonably estimated.
To calculate product liabilities, the Company estimates potential losses relating to pending claims and alsoestimates the likelihood of additional, similar claims being filed against the Company in the future. To estimatepotential losses on claims that could be filed in the future, the Company considers claims pending against theCompany, claim filing rates, the number of codefendants and the extent to which they share in settlements, andthe amount of loss by claim type. The estimated losses for pending and potential future claims are calculated on adiscounted basis using risk-free interest rates derived from market data about monetary assets with maturities
33
comparable to those of the projected product liabilities. The Company uses an actuarial specialist to assist withmeasuring its product liabilities. Refer to the commitments and contingencies footnote of the Notes to Con-solidated Financial Statements for additional information regarding product liabilities.
Self Insurance
The Company is self-insured for the majority of its group health insurance costs. A reserve for claimsincurred but not reported is developed by analyzing historical claims data provided by the Company’s claimsadministrators. These reserves are included in accrued expenses in the accompanying consolidated balance sheetsas the expenses are expected to be paid within one year.
Long-term insurance liabilities consist primarily of reserves for the Company’s workers’ compensationprogram. In addition, the Company carries various large risk deductible workers’ compensation policies for themajority of workers’ compensation liabilities. The Company records the workers’ compensation reserves basedon an analysis performed by an independent actuary. The analysis calculates development factors, which areapplied to total reserves as provided by the various insurance companies who underwrite the program. While theCompany believes that the assumptions used to calculate these liabilities are appropriate, significant differencesin actual experience or significant changes in these assumptions may materially affect workers’ compensationcosts.
Income Taxes
The Company accounts for income taxes under the asset and liability method. Under this method, deferredtax assets and liabilities are determined based on the differences between the financial statement carrying amountand the tax basis of assets and liabilities using enacted tax rates in effect for the year in which the differences areexpected to reverse. Deferred tax assets and liabilities are recorded net as noncurrent deferred income taxes. Inaddition, valuation allowances are recorded to reduce deferred tax assets to the amount that will more likely thannot be realized. In making this determination, the Company considers all available positive and negative evi-dence including projected future taxable income, future reversals of existing temporary differences, recent finan-cial operations and tax planning strategies.
The Company recognizes a tax benefit from uncertain tax positions when it is more likely than not that theposition will be sustained upon examination, including resolutions of any related appeals or litigation processes,based on the technical merits.
RECENTLY ISSUED ACCOUNTING PRONOUNCEMENTS
Refer to the summary of significant accounting policies footnote in the Notes to Consolidated FinancialStatements for information on recent accounting pronouncements.
ITEM 7A. QUANTITATIVE AND QUALITATIVE DISCLOSURES ABOUT MARKET RISK.
Although the Company does not face material risks related to commodity prices, the Company is exposed tochanges in interest rates and in foreign currency rates with respect to foreign currency denominated operatingrevenues and expenses.
Foreign Currency
The Company incurs translation gains or losses resulting from the translation of an operating unit’s foreignfunctional currency into U.S. dollars for consolidated financial statement purposes. For the periods presented, theCompany’s principal foreign currency exchange exposures are the Euro, the functional currency of our Europeanoperations; the Canadian dollar, the functional currency of our Canadian operations; and the Australian dollar,the functional currency of our Australasian operations. We monitor our foreign currency exposures and fromtime to time, we enter into currency forward contracts to manage our exposure to currency fluctuations. Foreigncurrency exchange exposure, particularly in regard to the Australian and Canadian dollar, and to a lesser extent
34
the Euro, positively impacted our results for the year ended December 31, 2021. Foreign currency exchangeexposure, particularly in regard to the Euro positively impacted our results for the year ended December 31,2020. This positive impact was mostly offset by the negative impact from the Canadian and Australian dollar forthe full year ended December 31, 2020.
During 2021 and 2020, it was estimated that a 10% shift in exchange rates between those foreign functionalcurrencies and the U.S. dollar would have impacted translated net sales by approximately $683 million and$549 million, respectively. A 15% shift in exchange rates between those functional currencies and the U.S. dollarwould have impacted translated net sales by approximately $1.0 billion in 2021 and $824 million in 2020. A 20%shift in exchange rates between those functional currencies and the U.S. dollar would have impacted translatednet sales by approximately $1.4 billion in 2021 and $1.1 billion in 2020.
Interest Rates
The Company is subject to interest rate volatility with regard to existing and future issuances of debt. Wemonitor our mix of fixed-rate and variable-rate debt as well as our mix of short-term debt and long-term debt.From time to time, we enter into interest rate swap agreements to manage our exposure to interest rate fluctua-tions. As of December 31, 2021, we primarily had fixed-rate debt. Based on the Company’s variable-rate debtand derivative instruments outstanding as of December 31, 2021 and 2020, we estimate that a 100 basis pointincrease in interest rates would have an immaterial impact in 2021 and would have increased interest expense by$1.1 million in 2020. However, this increase in interest expense would have been partially offset by the increasesin interest income related to higher interest rates.
35
ITEM 8. FINANCIAL STATEMENTS AND SUPPLEMENTARY DATA.
ANNUAL REPORT ON FORM 10-K
INDEX TO CONSOLIDATED FINANCIAL STATEMENTS
Page
Report of Independent Registered Public Accounting Firm (PCAOB ID: 42) . . . . . . . . . . . . . . . . . . . . . . . . 37
Consolidated Balance Sheets as of December 31, 2021 and 2020 . . . . . . . . . . . . . . . . . . . . . . . . . . . . . . . . . . 40
Consolidated Statements of Income for the Years Ended December 31, 2021, 2020 and 2019 . . . . . . . . . . . 41
Consolidated Statements of Comprehensive Income for the Years Ended December 31, 2021, 2020, and2019 . . . . . . . . . . . . . . . . . . . . . . . . . . . . . . . . . . . . . . . . . . . . . . . . . . . . . . . . . . . . . . . . . . . . . . . . . . . . . . . 42
Consolidated Statements of Equity for the Years Ended December 31, 2021, 2020 and 2019 . . . . . . . . . . . . 43
Consolidated Statements of Cash Flows for the Years Ended December 31, 2021, 2020 and 2019 . . . . . . . . 44
Notes to Consolidated Financial Statements . . . . . . . . . . . . . . . . . . . . . . . . . . . . . . . . . . . . . . . . . . . . . . . . . . 45
36
Report of Independent Registered Public Accounting Firm
To the Shareholders and the Board of Directors of Genuine Parts Company and Subsidiaries
Opinion on the Financial Statements
We have audited the accompanying consolidated balance sheets of Genuine Parts Company and Subsidiaries(the Company) as of December 31, 2021 and 2020, the related consolidated statements of income, compre-hensive income, equity and cash flows for each of the three years in the period ended December 31, 2021, andthe related notes (collectively referred to as the “consolidated financial statements”). In our opinion, the con-solidated financial statements present fairly, in all material respects, the financial position of the Company atDecember 31, 2021 and 2020, and the results of its operations and its cash flows for each of the three years in theperiod ended December 31, 2021, in conformity with U.S. generally accepted accounting principles.
We also have audited, in accordance with the standards of the Public Company Accounting Oversight Board(United States) (PCAOB), the Company’s internal control over financial reporting as of December 31, 2021,based on criteria established in Internal Control-Integrated Framework issued by the Committee of SponsoringOrganizations of the Treadway Commission (2013 framework) and our report dated February 17, 2022 expressedan unqualified opinion thereon.
Basis for Opinion
These financial statements are the responsibility of the Company’s management. Our responsibility is toexpress an opinion on the Company’s financial statements based on our audits. We are a public accounting firmregistered with the PCAOB and are required to be independent with respect to the Company in accordance withthe U.S. federal securities laws and the applicable rules and regulations of the Securities and Exchange Commis-sion and the PCAOB.
We conducted our audits in accordance with the standards of the PCAOB. Those standards require that weplan and perform the audit to obtain reasonable assurance about whether the financial statements are free ofmaterial misstatement, whether due to error or fraud. Our audits included performing procedures to assess therisks of material misstatement of the financial statements, whether due to error or fraud, and performing proce-dures that respond to those risks. Such procedures included examining, on a test basis, evidence regarding theamounts and disclosures in the financial statements. Our audits also included evaluating the accounting principlesused and significant estimates made by management, as well as evaluating the overall presentation of the finan-cial statements. We believe that our audits provide a reasonable basis for our opinion.
Critical Audit Matters
The critical audit matters communicated below are matters arising from the current period audit of the finan-cial statements that were communicated or required to be communicated to the audit committee and that:(1) relate to accounts or disclosures that are material to the financial statements and (2) involved our especiallychallenging, subjective or complex judgments. The communication of critical audit matters does not alter in anyway our opinion on the consolidated financial statements, taken as a whole, and we are not, by communicatingthe critical audit matters below, providing separate opinions on the critical audit matters or on the accounts ordisclosures to which they relate.
37
Valuation of Goodwill
Descriptionof theMatter
As of December 31, 2021, the Company’s goodwill was $1,915,307,000. As disclosed in Note 1 tothe consolidated financial statements, goodwill is tested for impairment at least annually at thereporting unit level. For a reporting unit in which the Company concludes, based on the qualitativeassessment, that it is more likely than not that the fair value of the reporting unit is less than itscarrying amount (or if the Company elects to skip the optional qualitative assessment), the Com-pany is required to perform a quantitative impairment test, which includes measuring the fair valueof the reporting unit and comparing it to the reporting unit’s carrying amount.
Auditing management’s quantitative impairment test for goodwill was complex and judgmental dueto the significant estimation required to determine the fair value of a reporting unit. In particular, thefair value estimate was sensitive to significant assumptions, such as changes in the weighted averagecost of capital and market multiples, and near-term revenue and operating margin projections, whichare affected by expectations about future market or economic conditions.
How WeAddressedthe Matterin OurAudit
We obtained an understanding, evaluated the design and tested the operating effectiveness of con-trols over the Company’s goodwill impairment review process, including controls over manage-ment’s review of the significant assumptions described above.
To test the estimated fair value of a reporting unit where the quantitative impairment test was per-formed, we performed audit procedures that included, among others, assessing methodologies andtesting the significant assumptions discussed above and the underlying data used by the Company inits analysis. For example, we compared the significant assumptions of a reporting unit to currentindustry, market and economic trends, to the Company’s historical results and those of other guide-line companies in the same industry, and to other relevant factors. We involved our valuationspecialists to assist in our evaluation of the Company’s valuation methodology and significantassumptions. In addition, we assessed the historical accuracy of management’s estimates and per-formed sensitivity analyses of significant assumptions to evaluate the changes in the fair value of areporting unit that would result from changes in the assumptions.
Loss Contingencies Related to Product Liabilities
Descriptionof theMatter
As disclosed in Notes 1 and 15 to the consolidated financial statements, the Company is subject topending product liability lawsuits primarily resulting from its national distribution of automotiveparts and supplies. The Company accrues for loss contingencies related to product liabilities if it isprobable that the Company will incur a loss and the loss can be reasonably estimated. The amountaccrued for product liabilities as of December 31, 2021 was $180,746,000.
Auditing the Company’s loss contingencies related to product liabilities was complex due to thesignificant measurement uncertainty associated with the estimate, management’s application of sig-nificant judgment and the use of valuation techniques. In addition, the loss contingencies related toproduct liabilities are sensitive to significant management assumptions, including the number, type,and severity of claims incurred and estimated to be incurred in future periods.
38
How WeAddressedthe Mat-ter in OurAudit
We obtained an understanding, evaluated the design and tested the operating effectiveness of rele-vant controls over the Company’s process for estimating loss contingencies related to productliabilities. For example, we tested controls over management’s review of the significant assump-tions described above and the reconciliation of claims data to that used by the Company’s actuarialspecialist.
To test the estimated loss contingencies related to product liabilities, our audit procedures included,among others, assessing the methodology used, testing the significant assumptions, including testingthe completeness and accuracy of the underlying data, and comparing significant assumptions tohistorical claims as well as external data. We evaluated the legal letters obtained from internal andexternal legal counsel, held discussions with legal counsel, and performed a search for new or con-trary evidence affecting the estimate. We involved our actuarial specialists to assist in our evaluationof the methodology and assumptions used by management and to independently develop a range ofestimated product liabilities using the Company’s historical data as well as other information availablefor similar cases. We compared the Company’s estimated loss contingencies related to productliabilities to the range developed by our actuarial specialists. We also assessed the adequacy of theCompany’s disclosures, included in Notes 1 and 15 to the consolidated financial statements, in rela-tion to these matters.
/s/ Ernst & Young LLP
We have served as the Company’s auditor since 1948.
Atlanta, GeorgiaFebruary 17, 2022
39
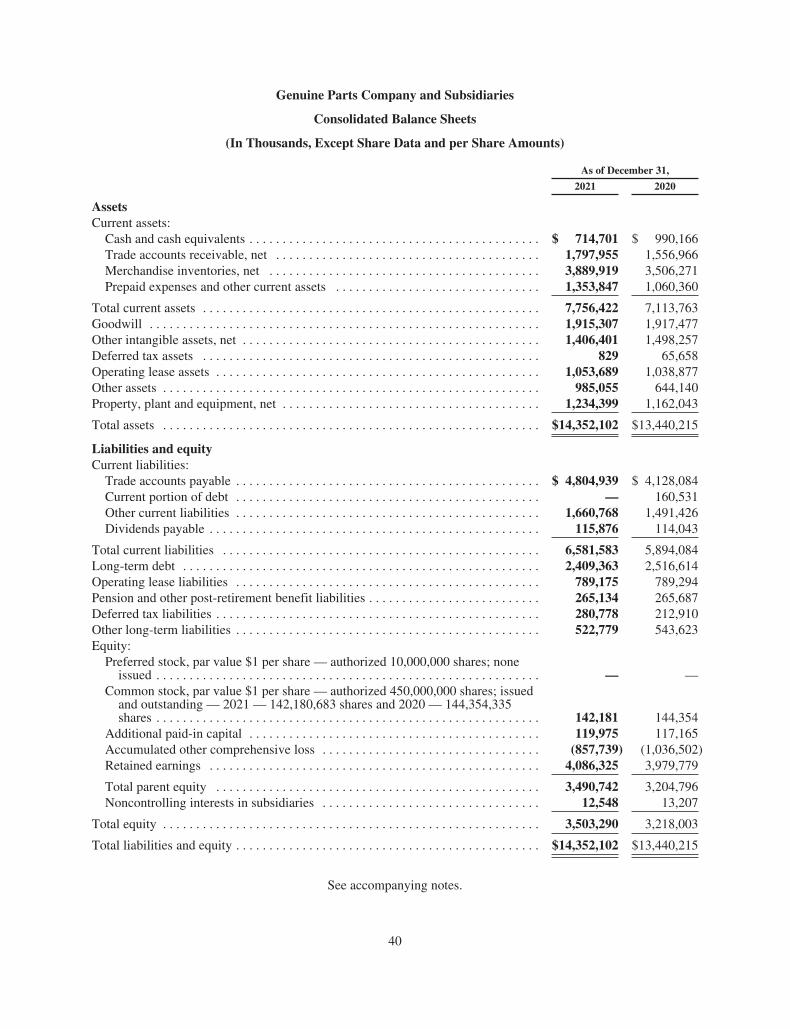
Genuine Parts Company and Subsidiaries
Consolidated Balance Sheets
(In Thousands, Except Share Data and per Share Amounts)
As of December 31,
2021 2020
AssetsCurrent assets:
Cash and cash equivalents . . . . . . . . . . . . . . . . . . . . . . . . . . . . . . . . . . . . . . . . . . . . $ 714,701 $ 990,166Trade accounts receivable, net . . . . . . . . . . . . . . . . . . . . . . . . . . . . . . . . . . . . . . . . 1,797,955 1,556,966Merchandise inventories, net . . . . . . . . . . . . . . . . . . . . . . . . . . . . . . . . . . . . . . . . . 3,889,919 3,506,271Prepaid expenses and other current assets . . . . . . . . . . . . . . . . . . . . . . . . . . . . . . . 1,353,847 1,060,360
Total current assets . . . . . . . . . . . . . . . . . . . . . . . . . . . . . . . . . . . . . . . . . . . . . . . . . . . 7,756,422 7,113,763Goodwill . . . . . . . . . . . . . . . . . . . . . . . . . . . . . . . . . . . . . . . . . . . . . . . . . . . . . . . . . . . 1,915,307 1,917,477Other intangible assets, net . . . . . . . . . . . . . . . . . . . . . . . . . . . . . . . . . . . . . . . . . . . . . 1,406,401 1,498,257Deferred tax assets . . . . . . . . . . . . . . . . . . . . . . . . . . . . . . . . . . . . . . . . . . . . . . . . . . . 829 65,658Operating lease assets . . . . . . . . . . . . . . . . . . . . . . . . . . . . . . . . . . . . . . . . . . . . . . . . . 1,053,689 1,038,877Other assets . . . . . . . . . . . . . . . . . . . . . . . . . . . . . . . . . . . . . . . . . . . . . . . . . . . . . . . . . 985,055 644,140Property, plant and equipment, net . . . . . . . . . . . . . . . . . . . . . . . . . . . . . . . . . . . . . . . 1,234,399 1,162,043
Total assets . . . . . . . . . . . . . . . . . . . . . . . . . . . . . . . . . . . . . . . . . . . . . . . . . . . . . . . . . $14,352,102 $13,440,215
Liabilities and equityCurrent liabilities:
Trade accounts payable . . . . . . . . . . . . . . . . . . . . . . . . . . . . . . . . . . . . . . . . . . . . . . $ 4,804,939 $ 4,128,084Current portion of debt . . . . . . . . . . . . . . . . . . . . . . . . . . . . . . . . . . . . . . . . . . . . . . — 160,531Other current liabilities . . . . . . . . . . . . . . . . . . . . . . . . . . . . . . . . . . . . . . . . . . . . . . 1,660,768 1,491,426Dividends payable . . . . . . . . . . . . . . . . . . . . . . . . . . . . . . . . . . . . . . . . . . . . . . . . . . 115,876 114,043
Total current liabilities . . . . . . . . . . . . . . . . . . . . . . . . . . . . . . . . . . . . . . . . . . . . . . . . 6,581,583 5,894,084Long-term debt . . . . . . . . . . . . . . . . . . . . . . . . . . . . . . . . . . . . . . . . . . . . . . . . . . . . . . 2,409,363 2,516,614Operating lease liabilities . . . . . . . . . . . . . . . . . . . . . . . . . . . . . . . . . . . . . . . . . . . . . . 789,175 789,294Pension and other post-retirement benefit liabilities . . . . . . . . . . . . . . . . . . . . . . . . . . 265,134 265,687Deferred tax liabilities . . . . . . . . . . . . . . . . . . . . . . . . . . . . . . . . . . . . . . . . . . . . . . . . . 280,778 212,910Other long-term liabilities . . . . . . . . . . . . . . . . . . . . . . . . . . . . . . . . . . . . . . . . . . . . . . 522,779 543,623Equity:
Preferred stock, par value $1 per share — authorized 10,000,000 shares; noneissued . . . . . . . . . . . . . . . . . . . . . . . . . . . . . . . . . . . . . . . . . . . . . . . . . . . . . . . . . . — —
Common stock, par value $1 per share — authorized 450,000,000 shares; issuedand outstanding — 2021 — 142,180,683 shares and 2020 — 144,354,335shares . . . . . . . . . . . . . . . . . . . . . . . . . . . . . . . . . . . . . . . . . . . . . . . . . . . . . . . . . . 142,181 144,354
Additional paid-in capital . . . . . . . . . . . . . . . . . . . . . . . . . . . . . . . . . . . . . . . . . . . . 119,975 117,165Accumulated other comprehensive loss . . . . . . . . . . . . . . . . . . . . . . . . . . . . . . . . . (857,739) (1,036,502)Retained earnings . . . . . . . . . . . . . . . . . . . . . . . . . . . . . . . . . . . . . . . . . . . . . . . . . . 4,086,325 3,979,779
Total parent equity . . . . . . . . . . . . . . . . . . . . . . . . . . . . . . . . . . . . . . . . . . . . . . . . . 3,490,742 3,204,796Noncontrolling interests in subsidiaries . . . . . . . . . . . . . . . . . . . . . . . . . . . . . . . . . 12,548 13,207
Total equity . . . . . . . . . . . . . . . . . . . . . . . . . . . . . . . . . . . . . . . . . . . . . . . . . . . . . . . . . 3,503,290 3,218,003
Total liabilities and equity . . . . . . . . . . . . . . . . . . . . . . . . . . . . . . . . . . . . . . . . . . . . . . $14,352,102 $13,440,215
See accompanying notes.
40
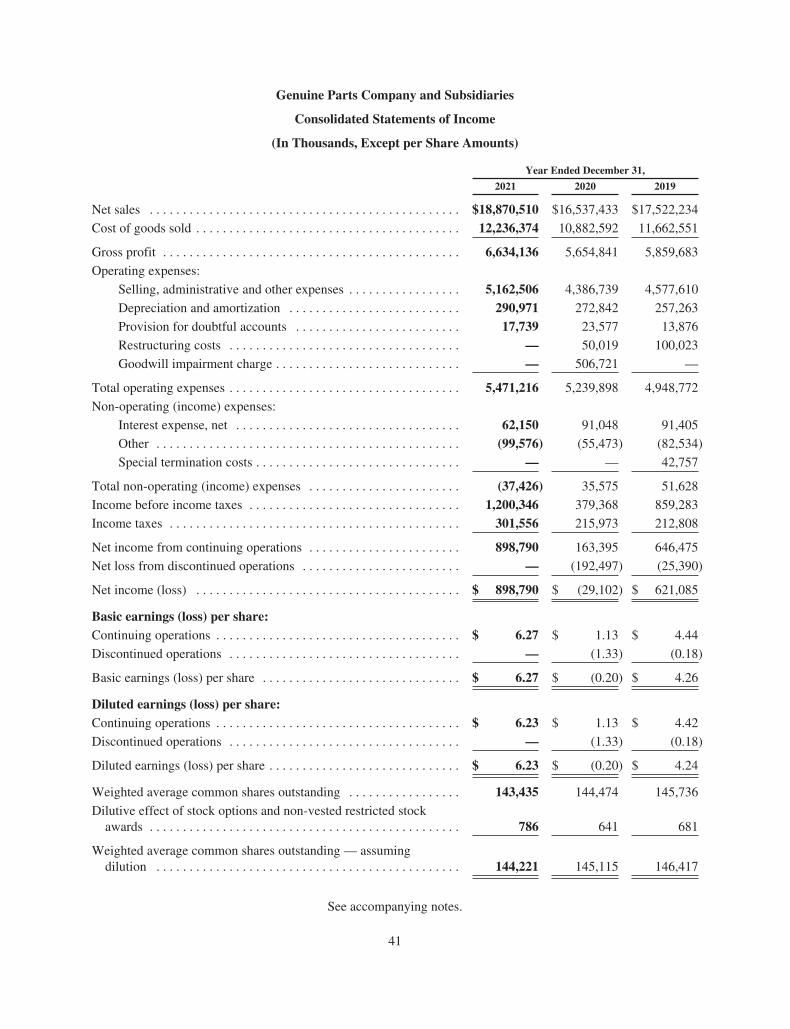
Genuine Parts Company and Subsidiaries
Consolidated Statements of Income
(In Thousands, Except per Share Amounts)
Year Ended December 31,
2021 2020 2019
Net sales . . . . . . . . . . . . . . . . . . . . . . . . . . . . . . . . . . . . . . . . . . . . . . . $18,870,510 $16,537,433 $17,522,234
Cost of goods sold . . . . . . . . . . . . . . . . . . . . . . . . . . . . . . . . . . . . . . . . 12,236,374 10,882,592 11,662,551
Gross profit . . . . . . . . . . . . . . . . . . . . . . . . . . . . . . . . . . . . . . . . . . . . . 6,634,136 5,654,841 5,859,683
Operating expenses:
Selling, administrative and other expenses . . . . . . . . . . . . . . . . . 5,162,506 4,386,739 4,577,610
Depreciation and amortization . . . . . . . . . . . . . . . . . . . . . . . . . . 290,971 272,842 257,263
Provision for doubtful accounts . . . . . . . . . . . . . . . . . . . . . . . . . 17,739 23,577 13,876
Restructuring costs . . . . . . . . . . . . . . . . . . . . . . . . . . . . . . . . . . . — 50,019 100,023
Goodwill impairment charge . . . . . . . . . . . . . . . . . . . . . . . . . . . . — 506,721 —
Total operating expenses . . . . . . . . . . . . . . . . . . . . . . . . . . . . . . . . . . . 5,471,216 5,239,898 4,948,772
Non-operating (income) expenses:
Interest expense, net . . . . . . . . . . . . . . . . . . . . . . . . . . . . . . . . . . 62,150 91,048 91,405
Other . . . . . . . . . . . . . . . . . . . . . . . . . . . . . . . . . . . . . . . . . . . . . . (99,576) (55,473) (82,534)
Special termination costs . . . . . . . . . . . . . . . . . . . . . . . . . . . . . . . — — 42,757
Total non-operating (income) expenses . . . . . . . . . . . . . . . . . . . . . . . (37,426) 35,575 51,628
Income before income taxes . . . . . . . . . . . . . . . . . . . . . . . . . . . . . . . . 1,200,346 379,368 859,283
Income taxes . . . . . . . . . . . . . . . . . . . . . . . . . . . . . . . . . . . . . . . . . . . . 301,556 215,973 212,808
Net income from continuing operations . . . . . . . . . . . . . . . . . . . . . . . 898,790 163,395 646,475
Net loss from discontinued operations . . . . . . . . . . . . . . . . . . . . . . . . — (192,497) (25,390)
Net income (loss) . . . . . . . . . . . . . . . . . . . . . . . . . . . . . . . . . . . . . . . . $ 898,790 $ (29,102) $ 621,085
Basic earnings (loss) per share:Continuing operations . . . . . . . . . . . . . . . . . . . . . . . . . . . . . . . . . . . . . $ 6.27 $ 1.13 $ 4.44
Discontinued operations . . . . . . . . . . . . . . . . . . . . . . . . . . . . . . . . . . . — (1.33) (0.18)
Basic earnings (loss) per share . . . . . . . . . . . . . . . . . . . . . . . . . . . . . . $ 6.27 $ (0.20) $ 4.26
Diluted earnings (loss) per share:Continuing operations . . . . . . . . . . . . . . . . . . . . . . . . . . . . . . . . . . . . . $ 6.23 $ 1.13 $ 4.42
Discontinued operations . . . . . . . . . . . . . . . . . . . . . . . . . . . . . . . . . . . — (1.33) (0.18)
Diluted earnings (loss) per share . . . . . . . . . . . . . . . . . . . . . . . . . . . . . $ 6.23 $ (0.20) $ 4.24
Weighted average common shares outstanding . . . . . . . . . . . . . . . . . 143,435 144,474 145,736
Dilutive effect of stock options and non-vested restricted stockawards . . . . . . . . . . . . . . . . . . . . . . . . . . . . . . . . . . . . . . . . . . . . . . . 786 641 681
Weighted average common shares outstanding — assumingdilution . . . . . . . . . . . . . . . . . . . . . . . . . . . . . . . . . . . . . . . . . . . . . . 144,221 145,115 146,417
See accompanying notes.
41
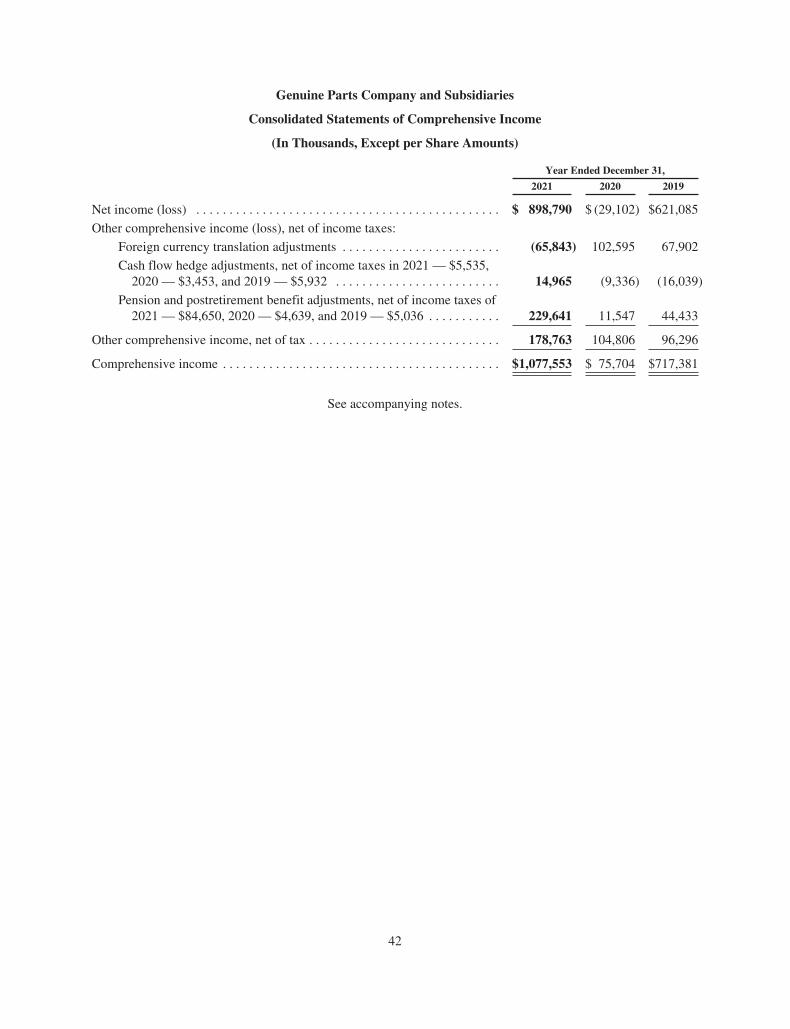
Genuine Parts Company and Subsidiaries
Consolidated Statements of Comprehensive Income
(In Thousands, Except per Share Amounts)
Year Ended December 31,
2021 2020 2019
Net income (loss) . . . . . . . . . . . . . . . . . . . . . . . . . . . . . . . . . . . . . . . . . . . . . . $ 898,790 $ (29,102) $621,085
Other comprehensive income (loss), net of income taxes:
Foreign currency translation adjustments . . . . . . . . . . . . . . . . . . . . . . . . (65,843) 102,595 67,902
Cash flow hedge adjustments, net of income taxes in 2021 — $5,535,2020 — $3,453, and 2019 — $5,932 . . . . . . . . . . . . . . . . . . . . . . . . . 14,965 (9,336) (16,039)
Pension and postretirement benefit adjustments, net of income taxes of2021 — $84,650, 2020 — $4,639, and 2019 — $5,036 . . . . . . . . . . . 229,641 11,547 44,433
Other comprehensive income, net of tax . . . . . . . . . . . . . . . . . . . . . . . . . . . . . 178,763 104,806 96,296
Comprehensive income . . . . . . . . . . . . . . . . . . . . . . . . . . . . . . . . . . . . . . . . . . $1,077,553 $ 75,704 $717,381
See accompanying notes.
42
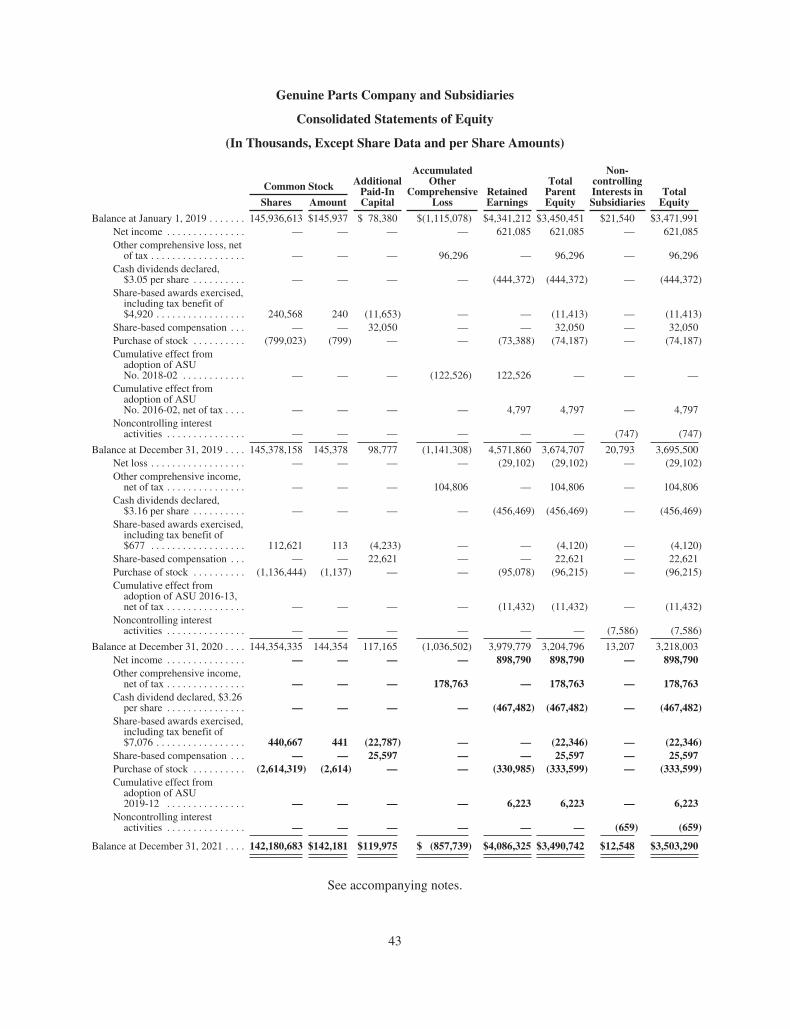
Genuine Parts Company and Subsidiaries
Consolidated Statements of Equity
(In Thousands, Except Share Data and per Share Amounts)
Common Stock AdditionalPaid-InCapital
AccumulatedOther
ComprehensiveLoss
RetainedEarnings
TotalParentEquity
Non-controllingInterests inSubsidiaries
TotalEquityShares Amount
Balance at January 1, 2019 . . . . . . . 145,936,613 $145,937 $ 78,380 $(1,115,078) $4,341,212 $3,450,451 $21,540 $3,471,991Net income . . . . . . . . . . . . . . . — — — — 621,085 621,085 — 621,085Other comprehensive loss, net
of tax . . . . . . . . . . . . . . . . . . — — — 96,296 — 96,296 — 96,296Cash dividends declared,
$3.05 per share . . . . . . . . . . — — — — (444,372) (444,372) — (444,372)Share-based awards exercised,
including tax benefit of$4,920 . . . . . . . . . . . . . . . . . 240,568 240 (11,653) — — (11,413) — (11,413)
Share-based compensation . . . — — 32,050 — — 32,050 — 32,050Purchase of stock . . . . . . . . . . (799,023) (799) — — (73,388) (74,187) — (74,187)Cumulative effect from
adoption of ASUNo. 2018-02 . . . . . . . . . . . . — — — (122,526) 122,526 — — —
Cumulative effect fromadoption of ASUNo. 2016-02, net of tax . . . . — — — — 4,797 4,797 — 4,797
Noncontrolling interestactivities . . . . . . . . . . . . . . . — — — — — — (747) (747)
Balance at December 31, 2019 . . . . 145,378,158 145,378 98,777 (1,141,308) 4,571,860 3,674,707 20,793 3,695,500Net loss . . . . . . . . . . . . . . . . . . — — — — (29,102) (29,102) — (29,102)Other comprehensive income,
net of tax . . . . . . . . . . . . . . . — — — 104,806 — 104,806 — 104,806Cash dividends declared,
$3.16 per share . . . . . . . . . . — — — — (456,469) (456,469) — (456,469)Share-based awards exercised,
including tax benefit of$677 . . . . . . . . . . . . . . . . . . 112,621 113 (4,233) — — (4,120) — (4,120)
Share-based compensation . . . — — 22,621 — — 22,621 — 22,621Purchase of stock . . . . . . . . . . (1,136,444) (1,137) — — (95,078) (96,215) — (96,215)Cumulative effect from
adoption of ASU 2016-13,net of tax . . . . . . . . . . . . . . . — — — — (11,432) (11,432) — (11,432)
Noncontrolling interestactivities . . . . . . . . . . . . . . . — — — — — — (7,586) (7,586)
Balance at December 31, 2020 . . . . 144,354,335 144,354 117,165 (1,036,502) 3,979,779 3,204,796 13,207 3,218,003Net income . . . . . . . . . . . . . . . — — — — 898,790 898,790 — 898,790Other comprehensive income,
net of tax . . . . . . . . . . . . . . . — — — 178,763 — 178,763 — 178,763Cash dividend declared, $3.26
per share . . . . . . . . . . . . . . . — — — — (467,482) (467,482) — (467,482)Share-based awards exercised,
including tax benefit of$7,076 . . . . . . . . . . . . . . . . . 440,667 441 (22,787) — — (22,346) — (22,346)
Share-based compensation . . . — — 25,597 — — 25,597 — 25,597Purchase of stock . . . . . . . . . . (2,614,319) (2,614) — — (330,985) (333,599) — (333,599)Cumulative effect from
adoption of ASU2019-12 . . . . . . . . . . . . . . . — — — — 6,223 6,223 — 6,223
Noncontrolling interestactivities . . . . . . . . . . . . . . . — — — — — — (659) (659)
Balance at December 31, 2021 . . . . 142,180,683 $142,181 $119,975 $ (857,739) $4,086,325 $3,490,742 $12,548 $3,503,290
See accompanying notes.
43
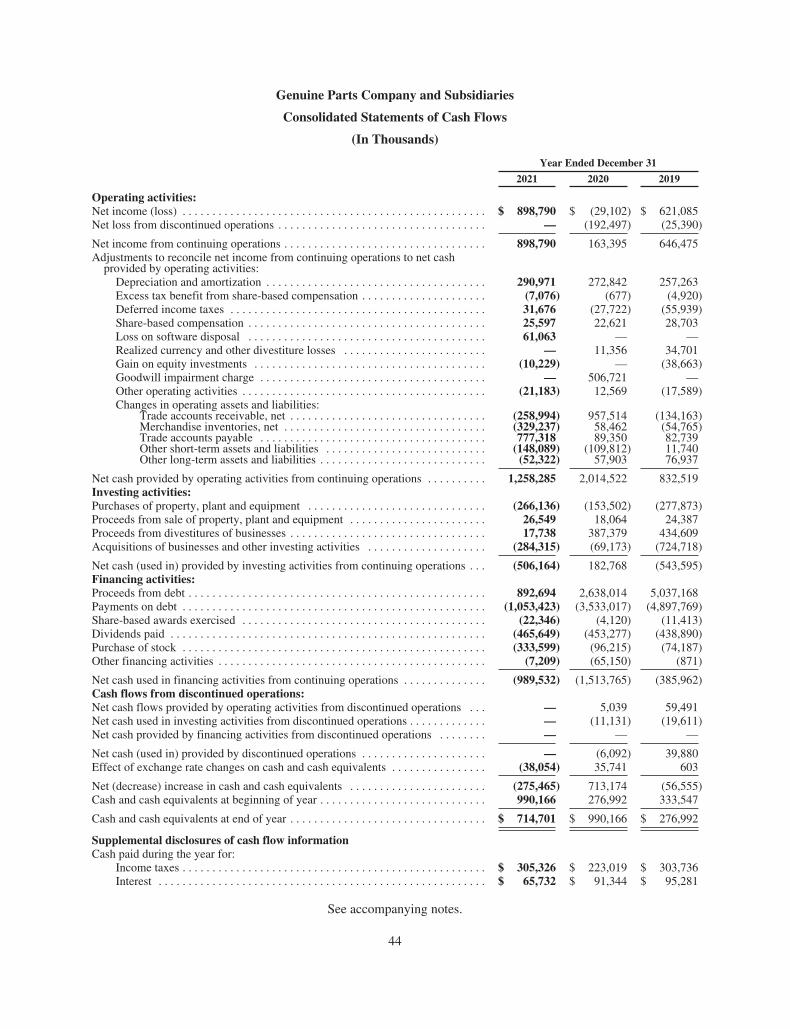
Genuine Parts Company and Subsidiaries
Consolidated Statements of Cash Flows
(In Thousands)
Year Ended December 31
2021 2020 2019
Operating activities:Net income (loss) . . . . . . . . . . . . . . . . . . . . . . . . . . . . . . . . . . . . . . . . . . . . . . . . . . . $ 898,790 $ (29,102) $ 621,085Net loss from discontinued operations . . . . . . . . . . . . . . . . . . . . . . . . . . . . . . . . . . . — (192,497) (25,390)
Net income from continuing operations . . . . . . . . . . . . . . . . . . . . . . . . . . . . . . . . . . 898,790 163,395 646,475Adjustments to reconcile net income from continuing operations to net cash
provided by operating activities:Depreciation and amortization . . . . . . . . . . . . . . . . . . . . . . . . . . . . . . . . . . . . . 290,971 272,842 257,263Excess tax benefit from share-based compensation . . . . . . . . . . . . . . . . . . . . . (7,076) (677) (4,920)Deferred income taxes . . . . . . . . . . . . . . . . . . . . . . . . . . . . . . . . . . . . . . . . . . . 31,676 (27,722) (55,939)Share-based compensation . . . . . . . . . . . . . . . . . . . . . . . . . . . . . . . . . . . . . . . . 25,597 22,621 28,703Loss on software disposal . . . . . . . . . . . . . . . . . . . . . . . . . . . . . . . . . . . . . . . . 61,063 — —Realized currency and other divestiture losses . . . . . . . . . . . . . . . . . . . . . . . . — 11,356 34,701Gain on equity investments . . . . . . . . . . . . . . . . . . . . . . . . . . . . . . . . . . . . . . . (10,229) — (38,663)Goodwill impairment charge . . . . . . . . . . . . . . . . . . . . . . . . . . . . . . . . . . . . . . — 506,721 —Other operating activities . . . . . . . . . . . . . . . . . . . . . . . . . . . . . . . . . . . . . . . . . (21,183) 12,569 (17,589)Changes in operating assets and liabilities:
Trade accounts receivable, net . . . . . . . . . . . . . . . . . . . . . . . . . . . . . . . . . (258,994) 957,514 (134,163)Merchandise inventories, net . . . . . . . . . . . . . . . . . . . . . . . . . . . . . . . . . . (329,237) 58,462 (54,765)Trade accounts payable . . . . . . . . . . . . . . . . . . . . . . . . . . . . . . . . . . . . . . 777,318 89,350 82,739Other short-term assets and liabilities . . . . . . . . . . . . . . . . . . . . . . . . . . . (148,089) (109,812) 11,740Other long-term assets and liabilities . . . . . . . . . . . . . . . . . . . . . . . . . . . . (52,322) 57,903 76,937
Net cash provided by operating activities from continuing operations . . . . . . . . . . 1,258,285 2,014,522 832,519Investing activities:Purchases of property, plant and equipment . . . . . . . . . . . . . . . . . . . . . . . . . . . . . . (266,136) (153,502) (277,873)Proceeds from sale of property, plant and equipment . . . . . . . . . . . . . . . . . . . . . . . 26,549 18,064 24,387Proceeds from divestitures of businesses . . . . . . . . . . . . . . . . . . . . . . . . . . . . . . . . . 17,738 387,379 434,609Acquisitions of businesses and other investing activities . . . . . . . . . . . . . . . . . . . . (284,315) (69,173) (724,718)
Net cash (used in) provided by investing activities from continuing operations . . . (506,164) 182,768 (543,595)Financing activities:Proceeds from debt . . . . . . . . . . . . . . . . . . . . . . . . . . . . . . . . . . . . . . . . . . . . . . . . . . 892,694 2,638,014 5,037,168Payments on debt . . . . . . . . . . . . . . . . . . . . . . . . . . . . . . . . . . . . . . . . . . . . . . . . . . . (1,053,423) (3,533,017) (4,897,769)Share-based awards exercised . . . . . . . . . . . . . . . . . . . . . . . . . . . . . . . . . . . . . . . . . (22,346) (4,120) (11,413)Dividends paid . . . . . . . . . . . . . . . . . . . . . . . . . . . . . . . . . . . . . . . . . . . . . . . . . . . . . (465,649) (453,277) (438,890)Purchase of stock . . . . . . . . . . . . . . . . . . . . . . . . . . . . . . . . . . . . . . . . . . . . . . . . . . . (333,599) (96,215) (74,187)Other financing activities . . . . . . . . . . . . . . . . . . . . . . . . . . . . . . . . . . . . . . . . . . . . . (7,209) (65,150) (871)
Net cash used in financing activities from continuing operations . . . . . . . . . . . . . . (989,532) (1,513,765) (385,962)Cash flows from discontinued operations:Net cash flows provided by operating activities from discontinued operations . . . — 5,039 59,491Net cash used in investing activities from discontinued operations . . . . . . . . . . . . . — (11,131) (19,611)Net cash provided by financing activities from discontinued operations . . . . . . . . — — —
Net cash (used in) provided by discontinued operations . . . . . . . . . . . . . . . . . . . . . — (6,092) 39,880Effect of exchange rate changes on cash and cash equivalents . . . . . . . . . . . . . . . . (38,054) 35,741 603
Net (decrease) increase in cash and cash equivalents . . . . . . . . . . . . . . . . . . . . . . . (275,465) 713,174 (56,555)Cash and cash equivalents at beginning of year . . . . . . . . . . . . . . . . . . . . . . . . . . . . 990,166 276,992 333,547
Cash and cash equivalents at end of year . . . . . . . . . . . . . . . . . . . . . . . . . . . . . . . . . $ 714,701 $ 990,166 $ 276,992
Supplemental disclosures of cash flow informationCash paid during the year for:
Income taxes . . . . . . . . . . . . . . . . . . . . . . . . . . . . . . . . . . . . . . . . . . . . . . . . . . . $ 305,326 $ 223,019 $ 303,736Interest . . . . . . . . . . . . . . . . . . . . . . . . . . . . . . . . . . . . . . . . . . . . . . . . . . . . . . . $ 65,732 $ 91,344 $ 95,281
See accompanying notes.
44
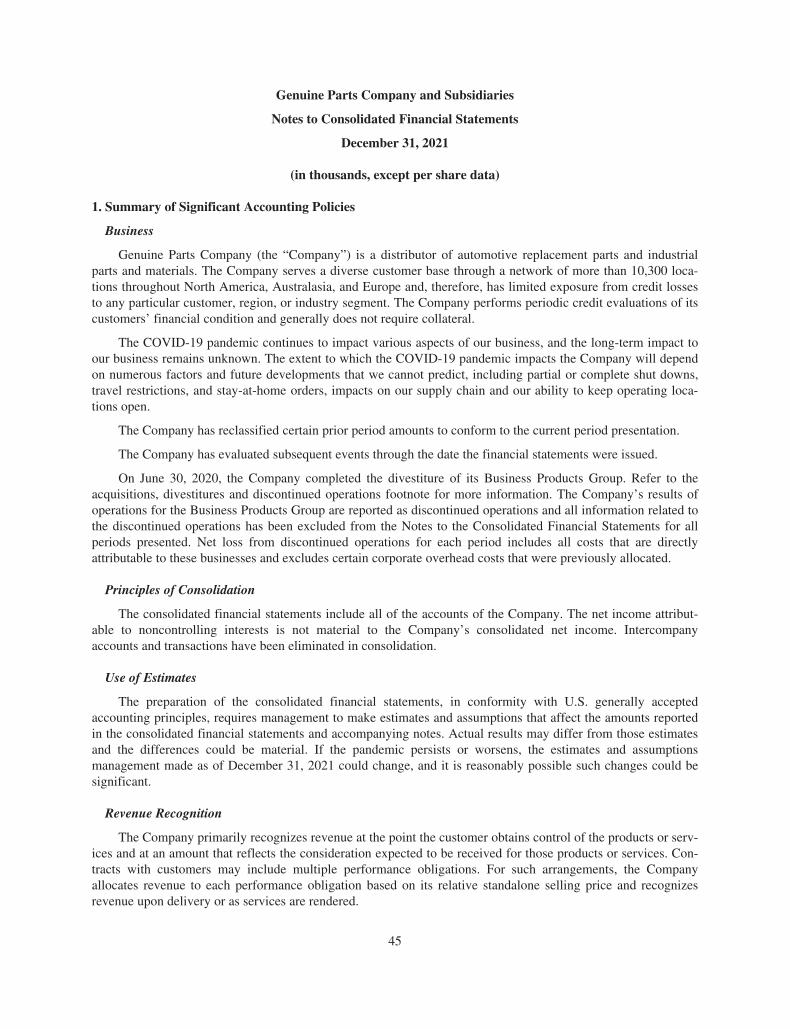
Genuine Parts Company and Subsidiaries
Notes to Consolidated Financial Statements
December 31, 2021
(in thousands, except per share data)
1. Summary of Significant Accounting Policies
Business
Genuine Parts Company (the “Company”) is a distributor of automotive replacement parts and industrialparts and materials. The Company serves a diverse customer base through a network of more than 10,300 loca-tions throughout North America, Australasia, and Europe and, therefore, has limited exposure from credit lossesto any particular customer, region, or industry segment. The Company performs periodic credit evaluations of itscustomers’ financial condition and generally does not require collateral.
The COVID-19 pandemic continues to impact various aspects of our business, and the long-term impact toour business remains unknown. The extent to which the COVID-19 pandemic impacts the Company will dependon numerous factors and future developments that we cannot predict, including partial or complete shut downs,travel restrictions, and stay-at-home orders, impacts on our supply chain and our ability to keep operating loca-tions open.
The Company has reclassified certain prior period amounts to conform to the current period presentation.
The Company has evaluated subsequent events through the date the financial statements were issued.
On June 30, 2020, the Company completed the divestiture of its Business Products Group. Refer to theacquisitions, divestitures and discontinued operations footnote for more information. The Company’s results ofoperations for the Business Products Group are reported as discontinued operations and all information related tothe discontinued operations has been excluded from the Notes to the Consolidated Financial Statements for allperiods presented. Net loss from discontinued operations for each period includes all costs that are directlyattributable to these businesses and excludes certain corporate overhead costs that were previously allocated.
Principles of Consolidation
The consolidated financial statements include all of the accounts of the Company. The net income attribut-able to noncontrolling interests is not material to the Company’s consolidated net income. Intercompanyaccounts and transactions have been eliminated in consolidation.
Use of Estimates
The preparation of the consolidated financial statements, in conformity with U.S. generally acceptedaccounting principles, requires management to make estimates and assumptions that affect the amounts reportedin the consolidated financial statements and accompanying notes. Actual results may differ from those estimatesand the differences could be material. If the pandemic persists or worsens, the estimates and assumptionsmanagement made as of December 31, 2021 could change, and it is reasonably possible such changes could besignificant.
Revenue Recognition
The Company primarily recognizes revenue at the point the customer obtains control of the products or serv-ices and at an amount that reflects the consideration expected to be received for those products or services. Con-tracts with customers may include multiple performance obligations. For such arrangements, the Companyallocates revenue to each performance obligation based on its relative standalone selling price and recognizesrevenue upon delivery or as services are rendered.
45
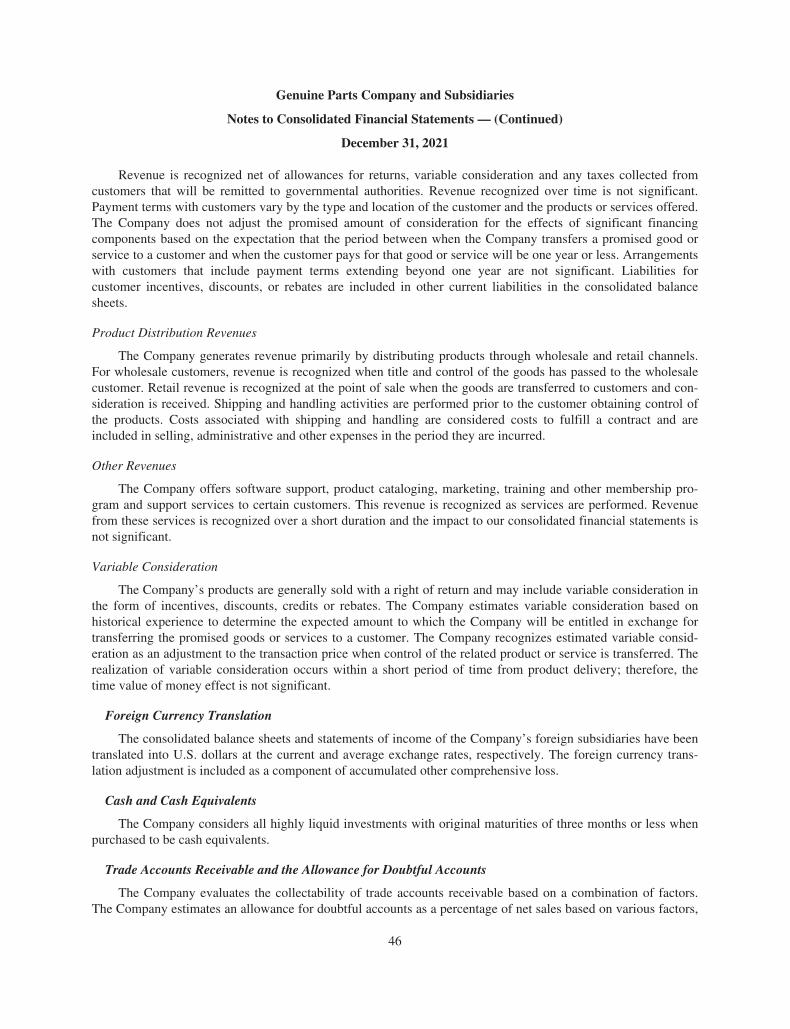
Genuine Parts Company and Subsidiaries
Notes to Consolidated Financial Statements — (Continued)
December 31, 2021
Revenue is recognized net of allowances for returns, variable consideration and any taxes collected fromcustomers that will be remitted to governmental authorities. Revenue recognized over time is not significant.Payment terms with customers vary by the type and location of the customer and the products or services offered.The Company does not adjust the promised amount of consideration for the effects of significant financingcomponents based on the expectation that the period between when the Company transfers a promised good orservice to a customer and when the customer pays for that good or service will be one year or less. Arrangementswith customers that include payment terms extending beyond one year are not significant. Liabilities forcustomer incentives, discounts, or rebates are included in other current liabilities in the consolidated balancesheets.
Product Distribution Revenues
The Company generates revenue primarily by distributing products through wholesale and retail channels.For wholesale customers, revenue is recognized when title and control of the goods has passed to the wholesalecustomer. Retail revenue is recognized at the point of sale when the goods are transferred to customers and con-sideration is received. Shipping and handling activities are performed prior to the customer obtaining control ofthe products. Costs associated with shipping and handling are considered costs to fulfill a contract and areincluded in selling, administrative and other expenses in the period they are incurred.
Other Revenues
The Company offers software support, product cataloging, marketing, training and other membership pro-gram and support services to certain customers. This revenue is recognized as services are performed. Revenuefrom these services is recognized over a short duration and the impact to our consolidated financial statements isnot significant.
Variable Consideration
The Company’s products are generally sold with a right of return and may include variable consideration inthe form of incentives, discounts, credits or rebates. The Company estimates variable consideration based onhistorical experience to determine the expected amount to which the Company will be entitled in exchange fortransferring the promised goods or services to a customer. The Company recognizes estimated variable consid-eration as an adjustment to the transaction price when control of the related product or service is transferred. Therealization of variable consideration occurs within a short period of time from product delivery; therefore, thetime value of money effect is not significant.
Foreign Currency Translation
The consolidated balance sheets and statements of income of the Company’s foreign subsidiaries have beentranslated into U.S. dollars at the current and average exchange rates, respectively. The foreign currency trans-lation adjustment is included as a component of accumulated other comprehensive loss.
Cash and Cash Equivalents
The Company considers all highly liquid investments with original maturities of three months or less whenpurchased to be cash equivalents.
Trade Accounts Receivable and the Allowance for Doubtful Accounts
The Company evaluates the collectability of trade accounts receivable based on a combination of factors.The Company estimates an allowance for doubtful accounts as a percentage of net sales based on various factors,
46
Genuine Parts Company and Subsidiaries
Notes to Consolidated Financial Statements — (Continued)
December 31, 2021
including historical experience, current economic conditions and future expected credit losses and collectabilitytrends. The Company will periodically adjust this estimate when the Company becomes aware of a specific cus-tomer’s inability to meet its financial obligations (e.g., bankruptcy filing) or as a result of changes in the overallaging of accounts receivable. While the Company has a large customer base that is geographically dispersed, ageneral economic downturn in any of the industry segments in which the Company operates could result inhigher than expected defaults and, therefore, the need to revise estimates for bad debts. For the years endedDecember 31, 2021, 2020, and 2019, the Company recorded provisions for doubtful accounts of approximately$17,739, $23,577, and $13,876, respectively. At December 31, 2021 and 2020, the allowance for doubtfulaccounts was approximately $44,425 and $36,622, respectively.
Merchandise Inventories, Including Consideration Received From Vendors
Merchandise inventories are valued at the lower of cost or net realizable value. Cost is determined by thelast-in, first-out (“LIFO”) method for a majority of U.S. automotive and industrial parts, and generally by theweighted average method for non-U.S. and certain other inventories. If the FIFO method had been used in placeof LIFO, cost would have been approximately $628,000 and $524,400 higher than reported at December 31,2021 and 2020, respectively. During 2021 and 2020, reductions in certain industrial parts inventories resulted inliquidations of LIFO inventory layers, which reduced cost of goods sold by approximately $400 and $15,500,respectively.
The Company identifies slow moving or obsolete inventories and estimates appropriate provisions relatedthereto. Historically, these losses have not been significant as the vast majority of the Company’s inventories arenot highly susceptible to obsolescence and are eligible for return under various vendor return programs. Whilethe Company has no reason to believe its inventory return privileges will be discontinued in the future, its risk ofloss associated with obsolete or slow moving inventories would increase if such were to occur.
The Company enters into agreements at the beginning of each year with many of its vendors that provide forinventory purchase incentives. Generally, the Company earns inventory purchase incentives upon achievingspecified volume purchasing levels or other criteria. The Company accrues for the receipt of these incentives aspart of its inventory cost based on cumulative purchases of inventory to date and projected inventory purchasesthrough the end of the year. While management believes the Company will continue to receive considerationfrom vendors in 2022 and beyond, there can be no assurance that vendors will continue to provide comparableamounts of incentives in the future.
Prepaid Expenses and Other Current Assets
Prepaid expenses and other current assets consist primarily of amounts due from vendors, prepaid expenses,and income and other taxes receivable.
Goodwill
The Company reviews its goodwill annually for impairment in the fourth quarter, or sooner if circumstancesindicate that the carrying amount may exceed fair value. The Company tests goodwill for impairment at thereporting unit level, which is an operating segment or a level below an operating segment (a component). Acomponent is a reporting unit if the component constitutes a business for which discrete financial informationand operating results are available and management regularly reviews that information. However, the Companymay aggregate two or more components of an operating segment into a single reporting unit if the componentshave similar economic characteristics.
47
Genuine Parts Company and Subsidiaries
Notes to Consolidated Financial Statements — (Continued)
December 31, 2021
To review goodwill at a reporting unit for impairment, the Company generally elects to first assess qual-itative factors to determine whether it is more likely than not that the fair value of the reporting unit is less thanits carrying amount. Qualitative factors include adverse macroeconomic, industry or market conditions, cost fac-tors, or financial performance. If the Company elects not to perform a qualitative assessment or concludes fromits assessment of qualitative factors that it is more likely than not that the fair value of the reporting unit is lessthan its carrying amount, the Company must perform a quantitative test to evaluate goodwill impairment.
To perform a quantitative test, the Company calculates the fair value of the reporting unit and compares thatamount to the reporting unit’s carrying value. The Company typically calculates the fair value by using a combi-nation of a market approach and an income approach that is based on a discounted cash flow model. The assump-tions used in the market approach generally include benchmark company market multiples and the assumptionsused in the income approach generally include the projected cash flows of the reporting unit, which are based onprojected revenue growth rates and operating margins, and the estimated weighted average cost of capital, work-ing capital and terminal value. The Company uses inputs and assumptions it believes are consistent with those ahypothetical marketplace participant would use. The Company recognizes goodwill impairment (if any) as theexcess of the reporting unit’s carrying value over its fair value, not to exceed the total amount of goodwill allo-cated to the reporting unit.
Refer to the goodwill and other intangible assets footnote for further information on the results of theCompany’s annual goodwill impairment testing.
Long-Lived Assets Other Than Goodwill
The Company assesses its long-lived assets other than goodwill for impairment whenever facts and circum-stances indicate that the carrying amount may not be fully recoverable. To analyze recoverability, the Companyprojects undiscounted net future cash flows over the remaining life of such assets. If these projected cash flowsare less than the carrying amount, an impairment would be recognized, resulting in a write-down of assets with acorresponding charge to earnings. Impairment losses, if any, are measured based upon the difference between thecarrying amount and the fair value of the assets. For the year ended December 31, 2021, the Company recognizeda loss of $61,063 related to the disposal of an internally developed software project (refer to the property, plantand equipment footnote for more information). For the year ended December 31, 2020, the Company recognizedlong-lived asset impairments of $6,243 related to certain assets abandoned in connection with the 2019 CostSavings Plan (refer to the restructuring footnote for more information).
Other Assets
Other assets consist primarily of cash surrender value of life insurance policies, debt securities, equitymethod and other investments, guarantee fees receivable, and deferred compensation benefits.
Property, Plant and Equipment
Property, plant and equipment are stated at cost. Depreciation and amortization are primarily determined ona straight-line basis over the following estimated useful lives of each asset: buildings, 10 to 40 years; machineryand equipment, 5 to 15 years; and the shorter of lease term or useful life for leasehold improvements.
Other Current Liabilities
Other current liabilities consist primarily of current lease obligations, reserves for sales returns expectedwithin the next year, accrued compensation, accrued income and other taxes, and other reserves for expensesincurred.
48
Genuine Parts Company and Subsidiaries
Notes to Consolidated Financial Statements — (Continued)
December 31, 2021
Other Long-term Liabilities
Other long-term liabilities consist primarily of reserves for sales returns expected after the next year, guaran-tee obligations, accrued taxes and other non-current obligations.
Self-Insurance
The Company is self-insured for the majority of its group health insurance costs. A reserve for claimsincurred but not reported is developed by analyzing historical claims data provided by the Company’s claimsadministrators. These reserves are included in accrued expenses in the accompanying consolidated balance sheetsas the expenses are expected to be paid within one year.
Long-term insurance liabilities consist primarily of reserves for the Company’s workers’ compensationprogram. In addition, the Company carries various large risk deductible workers’ compensation policies for themajority of workers’ compensation liabilities. The Company records the workers’ compensation reserves basedon an analysis performed by an independent actuary. The analysis calculates development factors, which areapplied to total reserves as provided by the various insurance companies who underwrite the program. While theCompany believes that the assumptions used to calculate these liabilities are appropriate, significant differencesin actual experience or significant changes in these assumptions may materially affect workers’ compensationcosts.
Business Combinations
When the Company acquires businesses, it applies the acquisition method of accounting and recognizes theidentifiable assets acquired, the liabilities assumed, and any noncontrolling interests in an acquiree at their fairvalues on the acquisition date, which requires significant estimates and assumptions. Goodwill is measured as theexcess of the fair value of the consideration transferred over the net of the acquisition date fair values of the iden-tifiable assets acquired and liabilities assumed. The acquisition method requires the Company to record provi-sional amounts for any items for which the accounting is not complete at the end of a reporting period. TheCompany must complete the accounting during the measurement period, which cannot exceed one year. Adjust-ments made during the measurement period could have a material impact on the Company’s financial conditionand results of operations.
The Company typically measures customer relationship and other intangible assets using an incomeapproach. Significant estimates and assumptions used in this approach include discount rates and certain assump-tions that form the basis of the forecasted cash flows expected to be generated from the asset (e.g., future revenuegrowth rates, operating margins and attrition rates). If the subsequent actual results and updated projections of theunderlying business activity change compared with the assumptions and projections used to develop these values,the Company could record impairment charges. In addition, the Company has estimated the economic lives ofcertain acquired tangible and intangible assets and these lives are used to calculate depreciation and amortizationexpense. If the Company’s estimates of the economic lives change, depreciation or amortization expenses couldbe increased or decreased, or the acquired asset could be impaired.
Legal and Product Liabilities
The Company accrues for potential losses related to legal disputes, litigation, product liabilities, and regu-latory matters when it is probable (the future event or events are likely to occur) that the Company will incur aloss and the amount of the loss can be reasonably estimated.
The amount of the product liability reflects the Company’s reasonable estimate of losses based upon cur-rently known facts. To calculate the liability, the Company estimates potential losses relating to pending claims
49
Genuine Parts Company and Subsidiaries
Notes to Consolidated Financial Statements — (Continued)
December 31, 2021
and also estimates the likelihood of additional, similar claims being filed against the Company in the future. Toestimate potential losses on claims that could be filed in the future, the Company considers claims pendingagainst the Company, claim filing rates, the number of codefendants and the extent to which they share insettlements, and the amount of loss by claim type. The estimated losses for pending and potential future claimsare calculated on a discounted basis using risk-free interest rates derived from market data about monetary assetswith maturities comparable to those of the projected product liabilities. The Company uses an actuarial specialistto assist with measuring its product liabilities.
Fair Value Measurements
Fair value is defined as an exit price, representing the amount that would be received to sell an asset or paidto transfer a liability in an orderly transaction between market participants. Fair value is a market-basedmeasurement that is determined based on assumptions that market participants would use in pricing an asset orliability. Additionally, ASC 820, Fair Value Measurements, defines levels within a hierarchy based uponobservable and non-observable inputs.
• Level 1. Observable inputs such as quoted prices in active markets;
• Level 2. Inputs, other than quoted prices in active markets, that are observable either directly or indirectly;and
• Level 3. Unobservable inputs in which there is little or no market data, which require the reporting entityto develop its own assumptions
At December 31, 2021 and 2020, the fair value of the Company’s senior unsecured notes was approximately$2,457,497 and $2,680,545, respectively, which are designated as Level 2 in the fair value hierarchy. Our valu-ation technique is based primarily on prices and other relevant information generated by observable transactionsinvolving identical or comparable assets or liabilities.
Derivative instruments are recognized in the consolidated balance sheets at fair value and are designated asLevel 2 in the fair value hierarchy. They are valued using inputs other than quoted prices, such as foreignexchange rates and yield curves.
Fair value measurements of non-financial assets and non-financial liabilities are primarily used in theimpairment analyses of goodwill, other intangible assets, and long-lived assets. These involve fair valuemeasurements on a nonrecurring basis using Level 3 inputs as defined in the fair value hierarchy. The carryingamounts reflected in the consolidated balance sheets for cash and cash equivalents, trade accounts receivable,trade accounts payable, and borrowings under the line of credit approximate their respective fair values based onthe short-term nature of these instruments.
Derivatives and Hedging
The Company is exposed to various risks arising from business operations and market conditions, includingfluctuations in interest rates and certain foreign currencies. When deemed appropriate, the Company usesderivative and non-derivative instruments as risk management tools to mitigate the potential impact of interestrate and foreign exchange rate risks. The objective of using these tools is to reduce fluctuations in the Company’searnings, cash flows and net investments in certain foreign subsidiaries associated with changes in these rates.Derivative financial instruments are not used for trading or other speculative purposes. The Company has nothistorically incurred, and does not expect to incur in the future, any losses as a result of counterparty defaultrelated to derivative instruments.
50
Genuine Parts Company and Subsidiaries
Notes to Consolidated Financial Statements — (Continued)
December 31, 2021
The Company formally documents relationships between hedging instruments and hedged items, as well asthe risk management objective and strategy for undertaking various hedge transactions. This process includeslinking cash flow hedges to specific forecasted transactions or variability of cash flow to be paid. The Companyalso formally assesses, both at the hedge’s inception and on an ongoing basis, whether the designated derivativeand non-derivative instruments that are used in hedging transactions are highly effective in offsetting changes inthe cash flows of the hedged items. When a designated instrument is determined not to be highly effective as ahedge or the underlying hedged transaction is no longer probable, hedge accounting is discontinued pro-spectively.
Shipping and Handling Costs
Shipping and handling costs are classified as selling, administrative and other expenses in the accompanyingconsolidated statements of income and totaled approximately $350,369, $301,900, and $303,900, for the yearsended December 31, 2021, 2020, and 2019, respectively.
Advertising Costs
Advertising costs are expensed as incurred and totaled $211,169, $193,900, and $201,600 in the years endedDecember 31, 2021, 2020, and 2019, respectively.
Accounting for Legal Costs
The Company’s legal costs expected to be incurred in connection with loss contingencies are expensed assuch costs are incurred.
Share-Based Compensation
The Company maintains various long-term incentive plans, which provide for the granting of stock options,stock appreciation rights (“SARs”), restricted stock, restricted stock units (“RSUs”), performance awards, divi-dend equivalents and other share-based awards. SARs represent a right to receive upon exercise an amount,payable in shares of common stock, equal to the excess, if any, of the fair market value of the Company’s com-mon stock on the date of exercise over the base value of the grant. The terms of such SARs require net settlementin shares of common stock and do not provide for cash settlement. RSUs represent a contingent right to receiveone share of the Company’s common stock at a future date. The majority of awards previously granted vest on apro-rata basis for periods ranging from one to three years and are expensed accordingly on a straight-line basis.Forfeitures are accounted for as they occur. The Company issues new shares upon exercise or conversion ofawards under these plans.
Income Taxes
The Company accounts for income taxes under the asset and liability method. Under this method, deferredtax assets and liabilities are determined based on the differences between the financial statement carrying amountand the tax basis of assets and liabilities using enacted tax rates in effect for the year in which the differences areexpected to reverse. Deferred tax assets and liabilities are recorded net as noncurrent deferred income taxes. Inaddition, valuation allowances are recorded to reduce deferred tax assets to the amount that will more likely thannot be realized. In making this determination, the Company considers all available positive and negative evi-dence including projected future taxable income, future reversals of existing temporary differences, recent finan-cial operations and tax planning strategies.
51
Genuine Parts Company and Subsidiaries
Notes to Consolidated Financial Statements — (Continued)
December 31, 2021
The Company recognizes a tax benefit from uncertain tax positions when it is more likely than not that theposition will be sustained upon examination, including resolutions of any related appeals or litigation processes,based on the technical merits.
Net Income from Continuing Operations per Common Share
Basic net income from continuing operations per common share is computed by dividing net income fromcontinuing operations by the weighted average number of common shares outstanding during the year. Thecomputation of diluted net income from continuing operations per common share includes the dilutive effect ofstock options, stock appreciation rights and nonvested restricted stock awards options. Options to purchaseapproximately 186, 1,602, and 210 shares of common stock ranging from $72 — $135 per share were out-standing at December 31, 2021, 2020, and 2019, respectively. These options were excluded from the computa-tion of diluted net income from continuing operations per common share because the options’ exercise priceswere greater than the average market prices of common stock in each respective year.
Recent Accounting Pronouncements
Changes to U.S. GAAP are established by the Financial Accounting Standards Board (“FASB”) in the formof Accounting Standard Updates (“ASUs”) to the FASB Accounting Standards Codification (“ASC”). TheCompany considers the applicability and impact of all ASUs and any not listed below were assessed anddetermined to be not applicable or are expected to have a minimal impact on the Company’s consolidated finan-cial statements.
Income Taxes (Topic 740)
In December 2019, the FASB issued ASU 2019-12, Simplifying the Accounting for Income Taxes. Theupdated accounting guidance removes certain exceptions for performing intraperiod tax allocations, recognizingdeferred taxes for investments, and calculating income taxes in interim periods. The guidance also simplifies theaccounting for franchise taxes, transactions that result in a step-up in the tax basis of goodwill, and the effect ofenacted changes in tax laws or rates in interim periods. The Company adopted ASU 2019-12 as of January 1,2021, and recognized a cumulative-effect adjustment to increase opening retained earnings by $6,223.
Credit Losses (Topic 326)
In June 2016, the FASB issued ASU 2016-13, Measurement of Credit Losses on Financial Instruments.Among other things, the ASU and its amendments replace the incurred loss impairment model for receivablesand loan guarantees with a current expected credit loss model. The new model measures impairment based onexpected credit losses over the remaining contractual life of an asset, considering available information about thecollectability of cash flows, past events, current conditions, and reasonable and supportable forecasts. Additionalquantitative and qualitative disclosures are required. The Company adopted ASU 2016-13 and its amendments asof January 1, 2020, which included recognizing a cumulative-effect adjustment to reduce opening retained earn-ings by $11,432, net of taxes.
Compensation — Retirement Benefits (Topic 715)
In August 2018, the FASB issued ASU 2018-14, Changes to the Disclosure Requirements for Defined Bene-fit Plans. The updated accounting guidance modifies the disclosure requirements for employers that sponsordefined benefit pension or other postretirement plans by removing, adding and clarifying certain disclosures. TheCompany adopted this new accounting standard on January 1, 2020 on a retrospective basis. The adoption of thisASU did not have an impact on the Company’s financial position, results of operations, or cash flows.
52
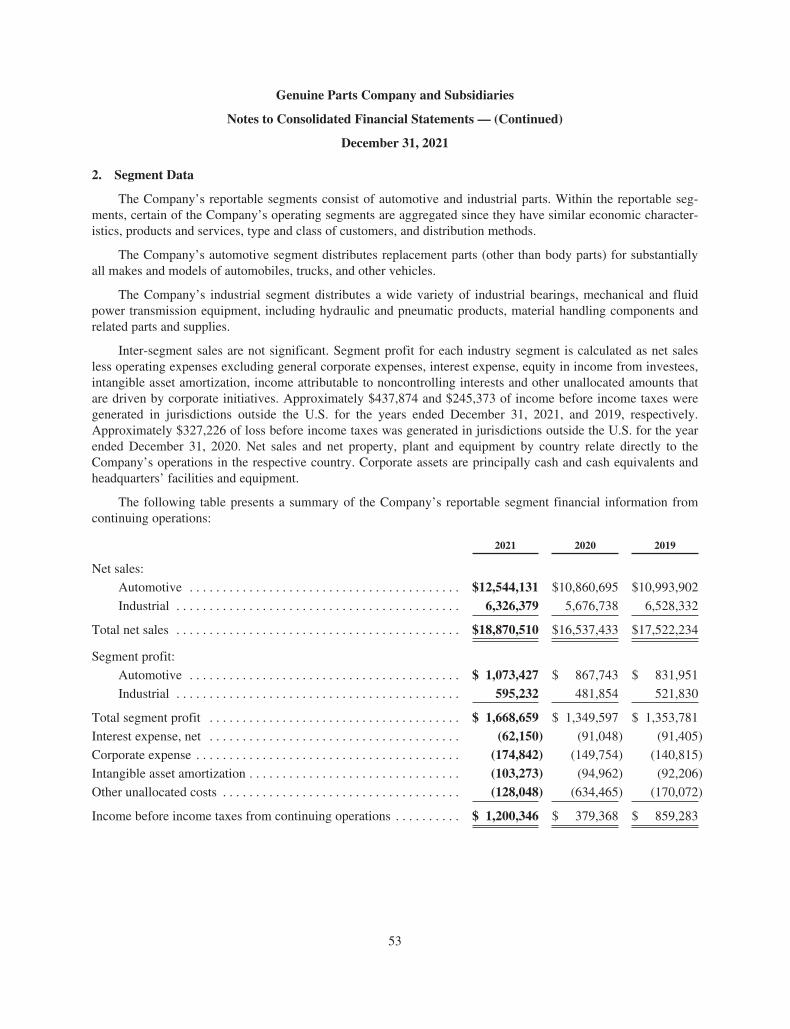
Genuine Parts Company and Subsidiaries
Notes to Consolidated Financial Statements — (Continued)
December 31, 2021
2. Segment Data
The Company’s reportable segments consist of automotive and industrial parts. Within the reportable seg-ments, certain of the Company’s operating segments are aggregated since they have similar economic character-istics, products and services, type and class of customers, and distribution methods.
The Company’s automotive segment distributes replacement parts (other than body parts) for substantiallyall makes and models of automobiles, trucks, and other vehicles.
The Company’s industrial segment distributes a wide variety of industrial bearings, mechanical and fluidpower transmission equipment, including hydraulic and pneumatic products, material handling components andrelated parts and supplies.
Inter-segment sales are not significant. Segment profit for each industry segment is calculated as net salesless operating expenses excluding general corporate expenses, interest expense, equity in income from investees,intangible asset amortization, income attributable to noncontrolling interests and other unallocated amounts thatare driven by corporate initiatives. Approximately $437,874 and $245,373 of income before income taxes weregenerated in jurisdictions outside the U.S. for the years ended December 31, 2021, and 2019, respectively.Approximately $327,226 of loss before income taxes was generated in jurisdictions outside the U.S. for the yearended December 31, 2020. Net sales and net property, plant and equipment by country relate directly to theCompany’s operations in the respective country. Corporate assets are principally cash and cash equivalents andheadquarters’ facilities and equipment.
The following table presents a summary of the Company’s reportable segment financial information fromcontinuing operations:
2021 2020 2019
Net sales:
Automotive . . . . . . . . . . . . . . . . . . . . . . . . . . . . . . . . . . . . . . . . . $12,544,131 $10,860,695 $10,993,902
Industrial . . . . . . . . . . . . . . . . . . . . . . . . . . . . . . . . . . . . . . . . . . . 6,326,379 5,676,738 6,528,332
Total net sales . . . . . . . . . . . . . . . . . . . . . . . . . . . . . . . . . . . . . . . . . . . $18,870,510 $16,537,433 $17,522,234
Segment profit:
Automotive . . . . . . . . . . . . . . . . . . . . . . . . . . . . . . . . . . . . . . . . . $ 1,073,427 $ 867,743 $ 831,951
Industrial . . . . . . . . . . . . . . . . . . . . . . . . . . . . . . . . . . . . . . . . . . . 595,232 481,854 521,830
Total segment profit . . . . . . . . . . . . . . . . . . . . . . . . . . . . . . . . . . . . . . $ 1,668,659 $ 1,349,597 $ 1,353,781
Interest expense, net . . . . . . . . . . . . . . . . . . . . . . . . . . . . . . . . . . . . . . (62,150) (91,048) (91,405)
Corporate expense . . . . . . . . . . . . . . . . . . . . . . . . . . . . . . . . . . . . . . . . (174,842) (149,754) (140,815)
Intangible asset amortization . . . . . . . . . . . . . . . . . . . . . . . . . . . . . . . . (103,273) (94,962) (92,206)
Other unallocated costs . . . . . . . . . . . . . . . . . . . . . . . . . . . . . . . . . . . . (128,048) (634,465) (170,072)
Income before income taxes from continuing operations . . . . . . . . . . $ 1,200,346 $ 379,368 $ 859,283
53
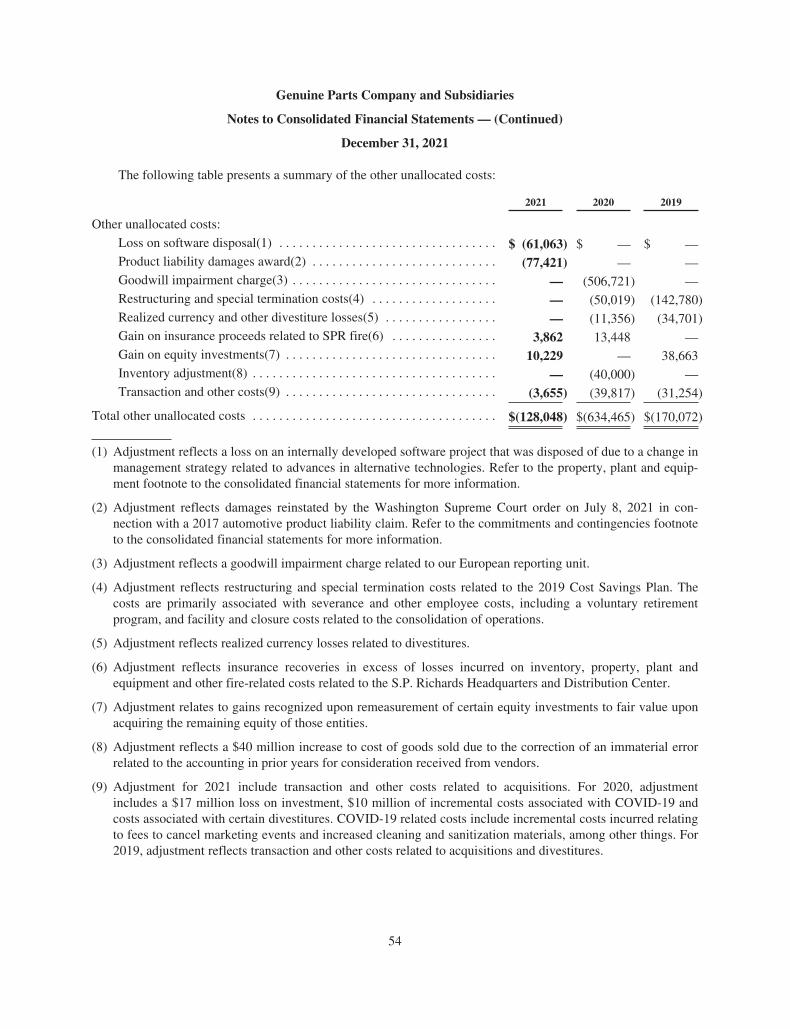
Genuine Parts Company and Subsidiaries
Notes to Consolidated Financial Statements — (Continued)
December 31, 2021
The following table presents a summary of the other unallocated costs:
2021 2020 2019
Other unallocated costs:
Loss on software disposal(1) . . . . . . . . . . . . . . . . . . . . . . . . . . . . . . . . . $ (61,063) $ — $ —Product liability damages award(2) . . . . . . . . . . . . . . . . . . . . . . . . . . . . (77,421) — —Goodwill impairment charge(3) . . . . . . . . . . . . . . . . . . . . . . . . . . . . . . . — (506,721) —Restructuring and special termination costs(4) . . . . . . . . . . . . . . . . . . . — (50,019) (142,780)Realized currency and other divestiture losses(5) . . . . . . . . . . . . . . . . . — (11,356) (34,701)Gain on insurance proceeds related to SPR fire(6) . . . . . . . . . . . . . . . . 3,862 13,448 —Gain on equity investments(7) . . . . . . . . . . . . . . . . . . . . . . . . . . . . . . . . 10,229 — 38,663Inventory adjustment(8) . . . . . . . . . . . . . . . . . . . . . . . . . . . . . . . . . . . . . — (40,000) —Transaction and other costs(9) . . . . . . . . . . . . . . . . . . . . . . . . . . . . . . . . (3,655) (39,817) (31,254)
Total other unallocated costs . . . . . . . . . . . . . . . . . . . . . . . . . . . . . . . . . . . . . $(128,048) $(634,465) $(170,072)
(1) Adjustment reflects a loss on an internally developed software project that was disposed of due to a change inmanagement strategy related to advances in alternative technologies. Refer to the property, plant and equip-ment footnote to the consolidated financial statements for more information.
(2) Adjustment reflects damages reinstated by the Washington Supreme Court order on July 8, 2021 in con-nection with a 2017 automotive product liability claim. Refer to the commitments and contingencies footnoteto the consolidated financial statements for more information.
(3) Adjustment reflects a goodwill impairment charge related to our European reporting unit.
(4) Adjustment reflects restructuring and special termination costs related to the 2019 Cost Savings Plan. Thecosts are primarily associated with severance and other employee costs, including a voluntary retirementprogram, and facility and closure costs related to the consolidation of operations.
(5) Adjustment reflects realized currency losses related to divestitures.
(6) Adjustment reflects insurance recoveries in excess of losses incurred on inventory, property, plant andequipment and other fire-related costs related to the S.P. Richards Headquarters and Distribution Center.
(7) Adjustment relates to gains recognized upon remeasurement of certain equity investments to fair value uponacquiring the remaining equity of those entities.
(8) Adjustment reflects a $40 million increase to cost of goods sold due to the correction of an immaterial errorrelated to the accounting in prior years for consideration received from vendors.
(9) Adjustment for 2021 include transaction and other costs related to acquisitions. For 2020, adjustmentincludes a $17 million loss on investment, $10 million of incremental costs associated with COVID-19 andcosts associated with certain divestitures. COVID-19 related costs include incremental costs incurred relatingto fees to cancel marketing events and increased cleaning and sanitization materials, among other things. For2019, adjustment reflects transaction and other costs related to acquisitions and divestitures.
54
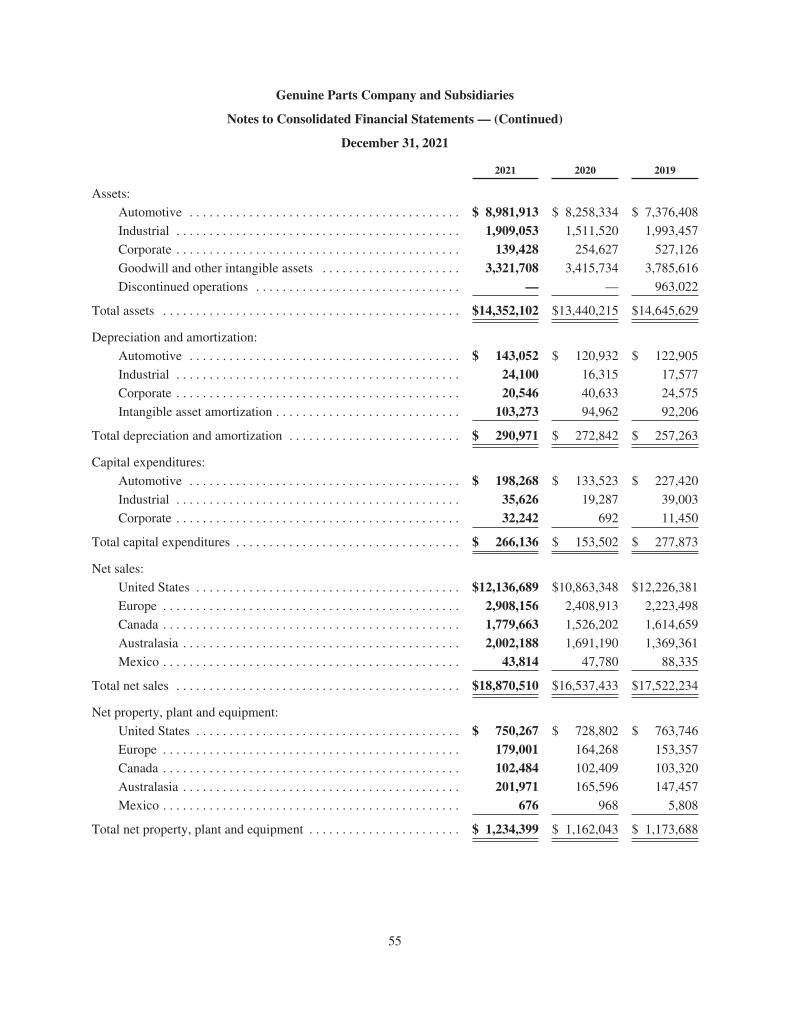
Genuine Parts Company and Subsidiaries
Notes to Consolidated Financial Statements — (Continued)
December 31, 2021
2021 2020 2019
Assets:
Automotive . . . . . . . . . . . . . . . . . . . . . . . . . . . . . . . . . . . . . . . . . $ 8,981,913 $ 8,258,334 $ 7,376,408
Industrial . . . . . . . . . . . . . . . . . . . . . . . . . . . . . . . . . . . . . . . . . . . 1,909,053 1,511,520 1,993,457
Corporate . . . . . . . . . . . . . . . . . . . . . . . . . . . . . . . . . . . . . . . . . . . 139,428 254,627 527,126
Goodwill and other intangible assets . . . . . . . . . . . . . . . . . . . . . 3,321,708 3,415,734 3,785,616
Discontinued operations . . . . . . . . . . . . . . . . . . . . . . . . . . . . . . . — — 963,022
Total assets . . . . . . . . . . . . . . . . . . . . . . . . . . . . . . . . . . . . . . . . . . . . . $14,352,102 $13,440,215 $14,645,629
Depreciation and amortization:
Automotive . . . . . . . . . . . . . . . . . . . . . . . . . . . . . . . . . . . . . . . . . $ 143,052 $ 120,932 $ 122,905
Industrial . . . . . . . . . . . . . . . . . . . . . . . . . . . . . . . . . . . . . . . . . . . 24,100 16,315 17,577
Corporate . . . . . . . . . . . . . . . . . . . . . . . . . . . . . . . . . . . . . . . . . . . 20,546 40,633 24,575
Intangible asset amortization . . . . . . . . . . . . . . . . . . . . . . . . . . . . 103,273 94,962 92,206
Total depreciation and amortization . . . . . . . . . . . . . . . . . . . . . . . . . . $ 290,971 $ 272,842 $ 257,263
Capital expenditures:
Automotive . . . . . . . . . . . . . . . . . . . . . . . . . . . . . . . . . . . . . . . . . $ 198,268 $ 133,523 $ 227,420
Industrial . . . . . . . . . . . . . . . . . . . . . . . . . . . . . . . . . . . . . . . . . . . 35,626 19,287 39,003
Corporate . . . . . . . . . . . . . . . . . . . . . . . . . . . . . . . . . . . . . . . . . . . 32,242 692 11,450
Total capital expenditures . . . . . . . . . . . . . . . . . . . . . . . . . . . . . . . . . . $ 266,136 $ 153,502 $ 277,873
Net sales:
United States . . . . . . . . . . . . . . . . . . . . . . . . . . . . . . . . . . . . . . . . $12,136,689 $10,863,348 $12,226,381
Europe . . . . . . . . . . . . . . . . . . . . . . . . . . . . . . . . . . . . . . . . . . . . . 2,908,156 2,408,913 2,223,498
Canada . . . . . . . . . . . . . . . . . . . . . . . . . . . . . . . . . . . . . . . . . . . . . 1,779,663 1,526,202 1,614,659
Australasia . . . . . . . . . . . . . . . . . . . . . . . . . . . . . . . . . . . . . . . . . . 2,002,188 1,691,190 1,369,361
Mexico . . . . . . . . . . . . . . . . . . . . . . . . . . . . . . . . . . . . . . . . . . . . . 43,814 47,780 88,335
Total net sales . . . . . . . . . . . . . . . . . . . . . . . . . . . . . . . . . . . . . . . . . . . $18,870,510 $16,537,433 $17,522,234
Net property, plant and equipment:
United States . . . . . . . . . . . . . . . . . . . . . . . . . . . . . . . . . . . . . . . . $ 750,267 $ 728,802 $ 763,746
Europe . . . . . . . . . . . . . . . . . . . . . . . . . . . . . . . . . . . . . . . . . . . . . 179,001 164,268 153,357
Canada . . . . . . . . . . . . . . . . . . . . . . . . . . . . . . . . . . . . . . . . . . . . . 102,484 102,409 103,320
Australasia . . . . . . . . . . . . . . . . . . . . . . . . . . . . . . . . . . . . . . . . . . 201,971 165,596 147,457
Mexico . . . . . . . . . . . . . . . . . . . . . . . . . . . . . . . . . . . . . . . . . . . . . 676 968 5,808
Total net property, plant and equipment . . . . . . . . . . . . . . . . . . . . . . . $ 1,234,399 $ 1,162,043 $ 1,173,688
55
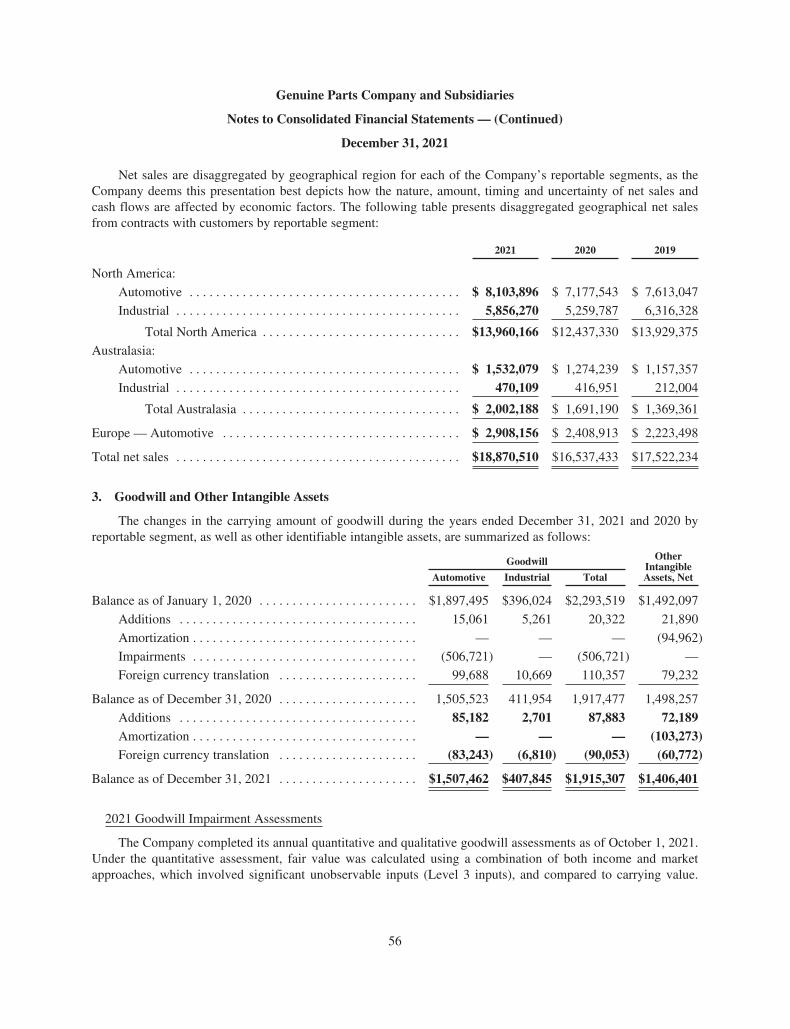
Genuine Parts Company and Subsidiaries
Notes to Consolidated Financial Statements — (Continued)
December 31, 2021
Net sales are disaggregated by geographical region for each of the Company’s reportable segments, as theCompany deems this presentation best depicts how the nature, amount, timing and uncertainty of net sales andcash flows are affected by economic factors. The following table presents disaggregated geographical net salesfrom contracts with customers by reportable segment:
2021 2020 2019
North America:
Automotive . . . . . . . . . . . . . . . . . . . . . . . . . . . . . . . . . . . . . . . . . $ 8,103,896 $ 7,177,543 $ 7,613,047
Industrial . . . . . . . . . . . . . . . . . . . . . . . . . . . . . . . . . . . . . . . . . . . 5,856,270 5,259,787 6,316,328
Total North America . . . . . . . . . . . . . . . . . . . . . . . . . . . . . . $13,960,166 $12,437,330 $13,929,375
Australasia:
Automotive . . . . . . . . . . . . . . . . . . . . . . . . . . . . . . . . . . . . . . . . . $ 1,532,079 $ 1,274,239 $ 1,157,357
Industrial . . . . . . . . . . . . . . . . . . . . . . . . . . . . . . . . . . . . . . . . . . . 470,109 416,951 212,004
Total Australasia . . . . . . . . . . . . . . . . . . . . . . . . . . . . . . . . . $ 2,002,188 $ 1,691,190 $ 1,369,361
Europe — Automotive . . . . . . . . . . . . . . . . . . . . . . . . . . . . . . . . . . . . $ 2,908,156 $ 2,408,913 $ 2,223,498
Total net sales . . . . . . . . . . . . . . . . . . . . . . . . . . . . . . . . . . . . . . . . . . . $18,870,510 $16,537,433 $17,522,234
3. Goodwill and Other Intangible Assets
The changes in the carrying amount of goodwill during the years ended December 31, 2021 and 2020 byreportable segment, as well as other identifiable intangible assets, are summarized as follows:
Goodwill OtherIntangibleAssets, NetAutomotive Industrial Total
Balance as of January 1, 2020 . . . . . . . . . . . . . . . . . . . . . . . . $1,897,495 $396,024 $2,293,519 $1,492,097
Additions . . . . . . . . . . . . . . . . . . . . . . . . . . . . . . . . . . . . 15,061 5,261 20,322 21,890
Amortization . . . . . . . . . . . . . . . . . . . . . . . . . . . . . . . . . . — — — (94,962)
Impairments . . . . . . . . . . . . . . . . . . . . . . . . . . . . . . . . . . (506,721) — (506,721) —
Foreign currency translation . . . . . . . . . . . . . . . . . . . . . 99,688 10,669 110,357 79,232
Balance as of December 31, 2020 . . . . . . . . . . . . . . . . . . . . . 1,505,523 411,954 1,917,477 1,498,257
Additions . . . . . . . . . . . . . . . . . . . . . . . . . . . . . . . . . . . . 85,182 2,701 87,883 72,189Amortization . . . . . . . . . . . . . . . . . . . . . . . . . . . . . . . . . . — — — (103,273)Foreign currency translation . . . . . . . . . . . . . . . . . . . . . (83,243) (6,810) (90,053) (60,772)
Balance as of December 31, 2021 . . . . . . . . . . . . . . . . . . . . . $1,507,462 $407,845 $1,915,307 $1,406,401
2021 Goodwill Impairment Assessments
The Company completed its annual quantitative and qualitative goodwill assessments as of October 1, 2021.Under the quantitative assessment, fair value was calculated using a combination of both income and marketapproaches, which involved significant unobservable inputs (Level 3 inputs), and compared to carrying value.
56
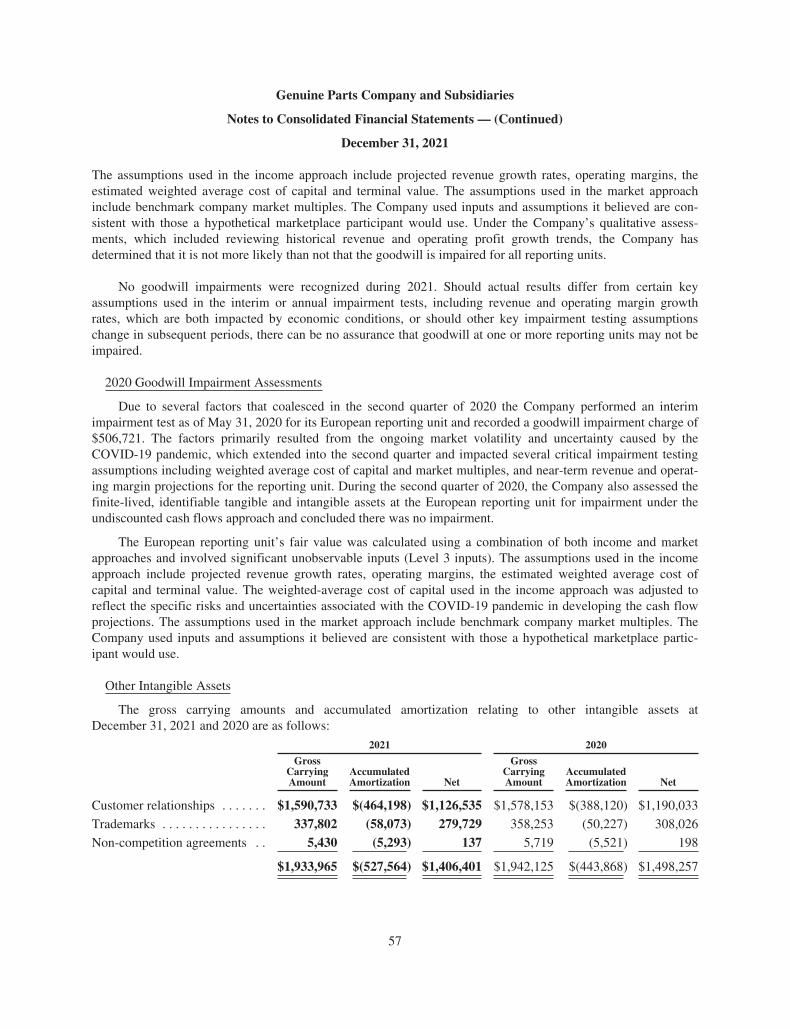
Genuine Parts Company and Subsidiaries
Notes to Consolidated Financial Statements — (Continued)
December 31, 2021
The assumptions used in the income approach include projected revenue growth rates, operating margins, theestimated weighted average cost of capital and terminal value. The assumptions used in the market approachinclude benchmark company market multiples. The Company used inputs and assumptions it believed are con-sistent with those a hypothetical marketplace participant would use. Under the Company’s qualitative assess-ments, which included reviewing historical revenue and operating profit growth trends, the Company hasdetermined that it is not more likely than not that the goodwill is impaired for all reporting units.
No goodwill impairments were recognized during 2021. Should actual results differ from certain keyassumptions used in the interim or annual impairment tests, including revenue and operating margin growthrates, which are both impacted by economic conditions, or should other key impairment testing assumptionschange in subsequent periods, there can be no assurance that goodwill at one or more reporting units may not beimpaired.
2020 Goodwill Impairment Assessments
Due to several factors that coalesced in the second quarter of 2020 the Company performed an interimimpairment test as of May 31, 2020 for its European reporting unit and recorded a goodwill impairment charge of$506,721. The factors primarily resulted from the ongoing market volatility and uncertainty caused by theCOVID-19 pandemic, which extended into the second quarter and impacted several critical impairment testingassumptions including weighted average cost of capital and market multiples, and near-term revenue and operat-ing margin projections for the reporting unit. During the second quarter of 2020, the Company also assessed thefinite-lived, identifiable tangible and intangible assets at the European reporting unit for impairment under theundiscounted cash flows approach and concluded there was no impairment.
The European reporting unit’s fair value was calculated using a combination of both income and marketapproaches and involved significant unobservable inputs (Level 3 inputs). The assumptions used in the incomeapproach include projected revenue growth rates, operating margins, the estimated weighted average cost ofcapital and terminal value. The weighted-average cost of capital used in the income approach was adjusted toreflect the specific risks and uncertainties associated with the COVID-19 pandemic in developing the cash flowprojections. The assumptions used in the market approach include benchmark company market multiples. TheCompany used inputs and assumptions it believed are consistent with those a hypothetical marketplace partic-ipant would use.
Other Intangible Assets
The gross carrying amounts and accumulated amortization relating to other intangible assets atDecember 31, 2021 and 2020 are as follows:
2021 2020
GrossCarryingAmount
AccumulatedAmortization Net
GrossCarryingAmount
AccumulatedAmortization Net
Customer relationships . . . . . . . $1,590,733 $(464,198) $1,126,535 $1,578,153 $(388,120) $1,190,033
Trademarks . . . . . . . . . . . . . . . . 337,802 (58,073) 279,729 358,253 (50,227) 308,026
Non-competition agreements . . 5,430 (5,293) 137 5,719 (5,521) 198
$1,933,965 $(527,564) $1,406,401 $1,942,125 $(443,868) $1,498,257
57
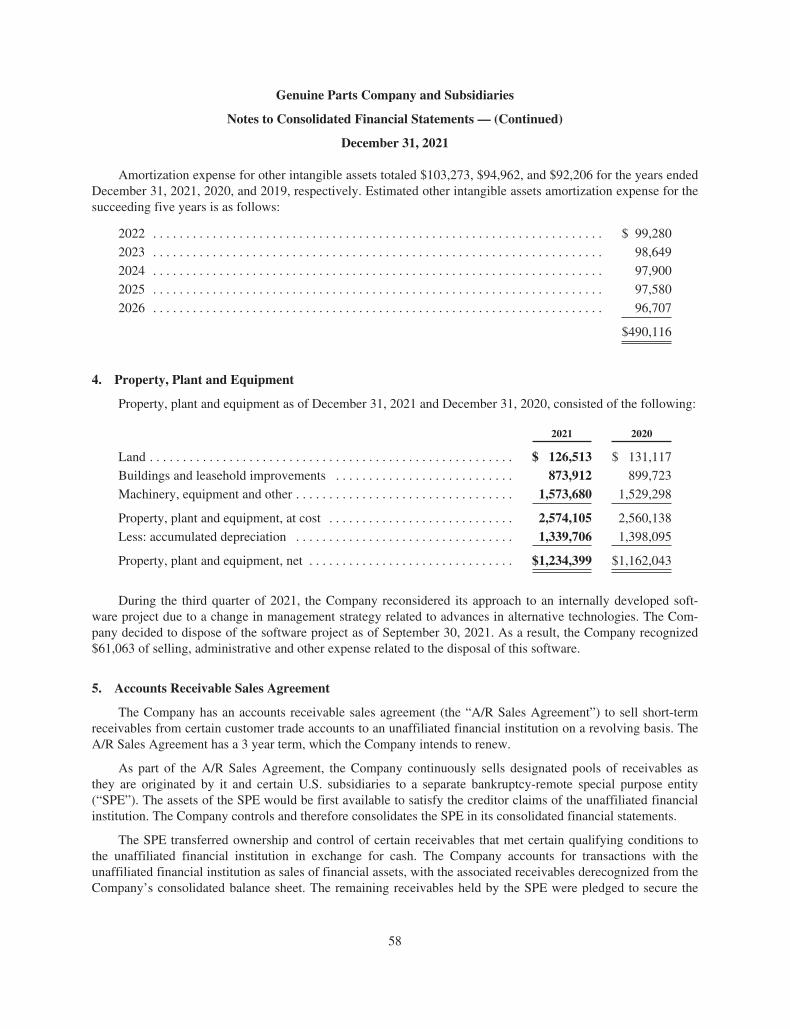
Genuine Parts Company and Subsidiaries
Notes to Consolidated Financial Statements — (Continued)
December 31, 2021
Amortization expense for other intangible assets totaled $103,273, $94,962, and $92,206 for the years endedDecember 31, 2021, 2020, and 2019, respectively. Estimated other intangible assets amortization expense for thesucceeding five years is as follows:
2022 . . . . . . . . . . . . . . . . . . . . . . . . . . . . . . . . . . . . . . . . . . . . . . . . . . . . . . . . . . . . . . . . . . . . $ 99,280
2023 . . . . . . . . . . . . . . . . . . . . . . . . . . . . . . . . . . . . . . . . . . . . . . . . . . . . . . . . . . . . . . . . . . . . 98,649
2024 . . . . . . . . . . . . . . . . . . . . . . . . . . . . . . . . . . . . . . . . . . . . . . . . . . . . . . . . . . . . . . . . . . . . 97,900
2025 . . . . . . . . . . . . . . . . . . . . . . . . . . . . . . . . . . . . . . . . . . . . . . . . . . . . . . . . . . . . . . . . . . . . 97,580
2026 . . . . . . . . . . . . . . . . . . . . . . . . . . . . . . . . . . . . . . . . . . . . . . . . . . . . . . . . . . . . . . . . . . . . 96,707
$490,116
4. Property, Plant and Equipment
Property, plant and equipment as of December 31, 2021 and December 31, 2020, consisted of the following:
2021 2020
Land . . . . . . . . . . . . . . . . . . . . . . . . . . . . . . . . . . . . . . . . . . . . . . . . . . . . . . . $ 126,513 $ 131,117
Buildings and leasehold improvements . . . . . . . . . . . . . . . . . . . . . . . . . . . 873,912 899,723
Machinery, equipment and other . . . . . . . . . . . . . . . . . . . . . . . . . . . . . . . . . 1,573,680 1,529,298
Property, plant and equipment, at cost . . . . . . . . . . . . . . . . . . . . . . . . . . . . 2,574,105 2,560,138
Less: accumulated depreciation . . . . . . . . . . . . . . . . . . . . . . . . . . . . . . . . . 1,339,706 1,398,095
Property, plant and equipment, net . . . . . . . . . . . . . . . . . . . . . . . . . . . . . . . $1,234,399 $1,162,043
During the third quarter of 2021, the Company reconsidered its approach to an internally developed soft-ware project due to a change in management strategy related to advances in alternative technologies. The Com-pany decided to dispose of the software project as of September 30, 2021. As a result, the Company recognized$61,063 of selling, administrative and other expense related to the disposal of this software.
5. Accounts Receivable Sales Agreement
The Company has an accounts receivable sales agreement (the “A/R Sales Agreement”) to sell short-termreceivables from certain customer trade accounts to an unaffiliated financial institution on a revolving basis. TheA/R Sales Agreement has a 3 year term, which the Company intends to renew.
As part of the A/R Sales Agreement, the Company continuously sells designated pools of receivables asthey are originated by it and certain U.S. subsidiaries to a separate bankruptcy-remote special purpose entity(“SPE”). The assets of the SPE would be first available to satisfy the creditor claims of the unaffiliated financialinstitution. The Company controls and therefore consolidates the SPE in its consolidated financial statements.
The SPE transferred ownership and control of certain receivables that met certain qualifying conditions tothe unaffiliated financial institution in exchange for cash. The Company accounts for transactions with theunaffiliated financial institution as sales of financial assets, with the associated receivables derecognized from theCompany’s consolidated balance sheet. The remaining receivables held by the SPE were pledged to secure the
58
Genuine Parts Company and Subsidiaries
Notes to Consolidated Financial Statements — (Continued)
December 31, 2021
collectability of the sold receivables. The amount of receivables pledged as collateral as of December 31, 2021and December 31, 2020 is approximately $973,000 and $771,000, respectively.
The Company continues to be involved with the receivables transferred by the SPE to the unaffiliated finan-cial institution by providing collection services. As cash is collected on sold receivables, the SPE continuouslytransfers ownership and control of new qualifying receivables to the unaffiliated financial institution so that thetotal principal amount outstanding of receivables sold is approximately $800,000 at any point in time (which isthe maximum amount allowed under the agreement). The future amount of receivables outstanding as sold coulddecrease, based on the level of activity and other factors. Total principal amount outstanding of receivables soldis approximately $800,000 as of December 31, 2021 and December 31, 2020, respectively.
The following table summarizes the activity and amounts outstanding under the A/R Sales Agreement as ofperiod end:
December 31,2021
December 31,2020
Receivables sold to the financial institution and derecognized . . . . . . . . . $7,520,474 $3,928,024
Cash collected on sold receivables . . . . . . . . . . . . . . . . . . . . . . . . . . . . . . $7,520,465 $3,128,023
Upon entry into the A/R Sales Agreement, the Company received an initial benefit from cash from oper-ations of approximately $800,000 in the year ended December 31, 2020. Continuous cash activity related to theA/R Sales Agreement is reflected in cash from operating activities in the consolidated statement of cash flows.The SPE incurs fees due to the unaffiliated financial institution related to the accounts receivable sales trans-actions. Those fees, which are immaterial, are recorded within other non-operating expense (income) in the con-solidated statements of income. The SPE has a recourse obligation to repurchase from the unaffiliated financialinstitution any previously sold receivables that are not collected due to the occurrence of certain events, includingcredit quality deterioration and customer sales returns. The reserve recognized for this recourse obligation as ofDecember 31, 2021 and December 31, 2020 is not material. The servicing liability related to the Company’s col-lection services also is not material, given the high quality of the customers underlying the receivables and theanticipated short collection period.
Refer to the subsequent event footnote for information regarding the January 3, 2022 A/R Sales Agreementamendment.
6. Debt
The principal amounts of the Company’s borrowings subject to variable rates (after consideration of hedg-ing arrangements) totaled approximately $840 and $114,002 at December 31, 2021 and 2020, respectively. Theweighted average interest rate on the Company’s outstanding borrowings was approximately 2.35% and 2.65% atDecember 31, 2021 and 2020, respectively.
Certain borrowings require the Company to comply with a financial covenant with respect to a maximumdebt to EBITDA ratio. At December 31, 2021, the Company was in compliance with all such covenants. Due tothe workers’ compensation and insurance reserve requirements in certain states, the Company also had unusedletters of credit of approximately $72,787 and $69,899 outstanding at December 31, 2021 and 2020, respectively.
On September 30, 2021, the Company entered into the first amendment to the Syndicated Facility Agree-ment (the “Unsecured Revolving Credit Facility”), dated as of October 30, 2020. The interest rates were amendedto reduce the applicable rate by 12.5 basis points (resulting in a rate of LIBOR + 112.5 basis points) and theLIBOR floor from 0.5% to 0.0%. The amendment also extended the maturity by one year to September 30, 2026.
59
Genuine Parts Company and Subsidiaries
Notes to Consolidated Financial Statements — (Continued)
December 31, 2021
Refer to the subsequent event footnote for information regarding the January 6, 2022 Senior Note Offering.
Amounts outstanding under the Company’s credit facilities, net of debt issuance costs consist of the following:
December 31,2021
December 31,2020
Unsecured Revolving Credit Facility, $1,500,000, LIBOR plus 1.13%variable, due September 30, 2026 . . . . . . . . . . . . . . . . . . . . . . . . . . . . . $ — $ —
October 27, 2020, Senior Unsecured Notes, $500,000, 1.875% fixed, dueNovember 1, 2030 . . . . . . . . . . . . . . . . . . . . . . . . . . . . . . . . . . . . . . . . . 500,000 500,000
July 29, 2016, Series G Senior Unsecured Notes, $50,000, 2.64% fixed,due July 29, 2021 . . . . . . . . . . . . . . . . . . . . . . . . . . . . . . . . . . . . . . . . . . — 50,000
December 2, 2013, Series F Senior Unsecured Notes, $250,000, 3.24%fixed, due December 2, 2023 . . . . . . . . . . . . . . . . . . . . . . . . . . . . . . . . . 250,000 250,000
June 30, 2019, Series A Senior Unsecured Notes, A$155,000, 3.10%fixed, due June 30, 2024 . . . . . . . . . . . . . . . . . . . . . . . . . . . . . . . . . . . . 112,375 119,133
October 30, 2017, Series J Senior Unsecured Notes, €225,000, 1.40%fixed, due October 30, 2024 . . . . . . . . . . . . . . . . . . . . . . . . . . . . . . . . . . 254,835 276,773
June 30, 2019, Series B Senior Unsecured Notes, A$155,000, 3.43%fixed, due June 30, 2026 . . . . . . . . . . . . . . . . . . . . . . . . . . . . . . . . . . . . 112,375 119,133
November 30, 2016, Series H Senior Unsecured Notes, $250,000, 3.24%fixed, due November 30, 2026 . . . . . . . . . . . . . . . . . . . . . . . . . . . . . . . . 250,000 250,000
October 30, 2017, Series K Senior Unsecured Notes, €250,000, 1.81%fixed, due October 30, 2027 . . . . . . . . . . . . . . . . . . . . . . . . . . . . . . . . . . 283,150 307,525
October 30, 2017, Series I Senior Unsecured Notes, $120,000, 3.70%fixed, due October 30, 2027 . . . . . . . . . . . . . . . . . . . . . . . . . . . . . . . . . . 120,000 120,000
May 31, 2019, Series A Senior Unsecured Notes, €50,000, 1.55% fixed,due May 31, 2029 . . . . . . . . . . . . . . . . . . . . . . . . . . . . . . . . . . . . . . . . . 56,630 61,505
October 30, 2017, Series L Senior Unsecured Notes, €125,000, 2.02%fixed, due October 30, 2029 . . . . . . . . . . . . . . . . . . . . . . . . . . . . . . . . . . 141,575 153,762
May 31, 2019, Series B Senior Unsecured Notes, €100,000, 1.74%fixed, due May 31, 2031 . . . . . . . . . . . . . . . . . . . . . . . . . . . . . . . . . . . . 113,260 123,010
October 30, 2017, Series M Senior Unsecured Notes, €100,000, 2.32%fixed, due October 30, 2032 . . . . . . . . . . . . . . . . . . . . . . . . . . . . . . . . . . 113,260 123,010
May 31, 2019, Series C Senior Unsecured Notes, €100,000, 1.95%fixed, due May 31, 2034 . . . . . . . . . . . . . . . . . . . . . . . . . . . . . . . . . . . . 113,260 123,010
Other unsecured debt . . . . . . . . . . . . . . . . . . . . . . . . . . . . . . . . . . . . . . . . . 840 114,002
Total unsecured debt . . . . . . . . . . . . . . . . . . . . . . . . . . . . . . . . . . . . . . . . . 2,421,560 2,690,863Unamortized debt issuance costs . . . . . . . . . . . . . . . . . . . . . . . . . . . . . . . . (8,041) (9,136)Unamortized discounts . . . . . . . . . . . . . . . . . . . . . . . . . . . . . . . . . . . . . . . . (4,156) (4,582)
Total debt . . . . . . . . . . . . . . . . . . . . . . . . . . . . . . . . . . . . . . . . . . . . . . . . . . 2,409,363 2,677,145Less debt due within one year . . . . . . . . . . . . . . . . . . . . . . . . . . . . . . . . . . — 160,531
Long-term debt, excluding current portion . . . . . . . . . . . . . . . . . . . . . . . . $2,409,363 $2,516,614
60
Genuine Parts Company and Subsidiaries
Notes to Consolidated Financial Statements — (Continued)
December 31, 2021
Approximate maturities under the Company’s credit facilities are as follows:
2022 . . . . . . . . . . . . . . . . . . . . . . . . . . . . . . . . . . . . . . . . . . . . . . . . . . . . . . . . . . . . . . . . . . . $ —
2023 . . . . . . . . . . . . . . . . . . . . . . . . . . . . . . . . . . . . . . . . . . . . . . . . . . . . . . . . . . . . . . . . . . . 250,840
2024 . . . . . . . . . . . . . . . . . . . . . . . . . . . . . . . . . . . . . . . . . . . . . . . . . . . . . . . . . . . . . . . . . . . 367,210
2025 . . . . . . . . . . . . . . . . . . . . . . . . . . . . . . . . . . . . . . . . . . . . . . . . . . . . . . . . . . . . . . . . . . . —
2026 . . . . . . . . . . . . . . . . . . . . . . . . . . . . . . . . . . . . . . . . . . . . . . . . . . . . . . . . . . . . . . . . . . . 362,375
Thereafter . . . . . . . . . . . . . . . . . . . . . . . . . . . . . . . . . . . . . . . . . . . . . . . . . . . . . . . . . . . . . . 1,441,135
$2,421,560
7. Derivatives and Hedging
The Company is exposed to various risks arising from business operations and market conditions, includingfluctuations in interest rates and certain foreign currencies. When deemed appropriate, the Company usesderivative and non-derivative instruments as risk management tools to mitigate the potential impact of interestrate and foreign exchange rate risks. The objective of using these tools is to reduce fluctuations in the Company’searnings and cash flows associated with changes in these rates. Derivative financial instruments are not used fortrading or other speculative purposes. The Company has not historically incurred, and does not expect to incur inthe future, any losses as a result of counterparty default related to derivative instruments.
The Company formally documents relationships between hedging instruments and hedged items, as well asthe risk management objective and strategy for undertaking various hedge transactions. The Company also for-mally assesses, both at the hedge’s inception and on an ongoing basis, whether the designated derivative andnon-derivative instruments that are used in hedging transactions are highly effective in offsetting changes in thecash flows of the hedged items. When a designated instrument is determined not to be highly effective as a hedgeor the underlying hedged transaction is no longer probable, hedge accounting is discontinued prospectively.
Cash Flow Hedges
In 2020, the Company terminated its interest rate swaps and settled the outstanding balances through cashpayments totaling $41,000. The remaining amount in Accumulated Other Comprehensive Loss (“AOCL”) isbeing amortized to interest expense on a straight-line basis over the remaining life of the previously hedgedinstrument.
Net Investment Hedges
The Company has designated certain derivative instruments and a portion of its foreign currency denomi-nated debt, a non-derivative financial instrument, as hedges of the foreign currency exchange rate exposure of theCompany’s Euro-denominated net investment in a European subsidiary. The Company applies the spot method toassess the hedge effectiveness of the derivative instruments and this assessment for each instrument excludes theinitial value related to the difference at contract inception between the foreign exchange spot rate and the forwardrate (i.e., the forward points). The initial value of this excluded component is recognized as a reduction to interestexpense in a systematic and rational manner over the term of the derivative instrument. All other changes invalue for the net investment hedges are included in AOCL within foreign currency translation and would only bereclassified to earnings if the European subsidiary were liquidated, or otherwise disposed.
61
Genuine Parts Company and Subsidiaries
Notes to Consolidated Financial Statements — (Continued)
December 31, 2021
The following table summarizes the location and carrying amounts of the derivative instruments and theforeign currency denominated debt, a non-derivative financial instrument, that are designated and qualify as partof hedging relationships:
December 31, 2021 December 31, 2020
Instrument Balance sheet location Notional Balance Notional Balance
Net investment hedges:
Forward contracts . . . . . . . Prepaid expenses and othercurrent assets $925,810 $ 73,819 $800,000 $ 7,668
Forward contracts . . . . . . . Other current liabilities $235,180 $ (2,935) $360,990 $ 19,442
Foreign currency debt . . . . Long-term debt €700,000 $792,820 €700,000 $861,070
The table below presents pre-tax gains and losses related to cash flow hedges and net investment hedges:
Gain (Loss) Recognized in AOCLBefore Reclassifications
Gain Recognized in InterestExpense For Excluded
Components
2021 2020 2019 2021 2020 2019
Year Ended December 31,
Cash Flow Hedges:
Interest rate contract . . . . . . . . . . . . . . . . $ — $ (29,464) $(21,972) $ — $ — $ —
Net Investment Hedges:
Cross-currency swap . . . . . . . . . . . . . . . . — — 2,936 — — 2,294
Forward contracts . . . . . . . . . . . . . . . . . . 56,362 (85,390) 20,679 26,295 27,146 17,892
Foreign currency debt . . . . . . . . . . . . . . . 68,250 (77,070) 17,010 — — —
Total . . . . . . . . . . . . . . . . . . . . . . . . . . $124,612 $(191,924) $ 18,653 $26,295 $27,146 $20,186
8. Leased Properties
The Company primarily leases real estate for certain retail stores, branches, distribution centers, office spaceand land. The Company also leases equipment (primarily vehicles).
Most real estate leases include one or more options to renew, with renewal terms that generally can extendthe lease term from one to 20 years or more. The exercise of lease renewal options is at the Company’s dis-cretion. The Company evaluates renewal options at lease inception and on an ongoing basis, and includesrenewal options that it is reasonably certain to exercise in its expected lease terms when classifying leases andmeasuring lease liabilities. The Company elected a policy of not recording leases on its consolidated balancesheets when the leases have a term of 12 months or less and the Company is not reasonably certain to elect anoption to purchase the leased asset. Lease agreements generally do not require material variable lease payments,residual value guarantees or restrictive covenants.
62
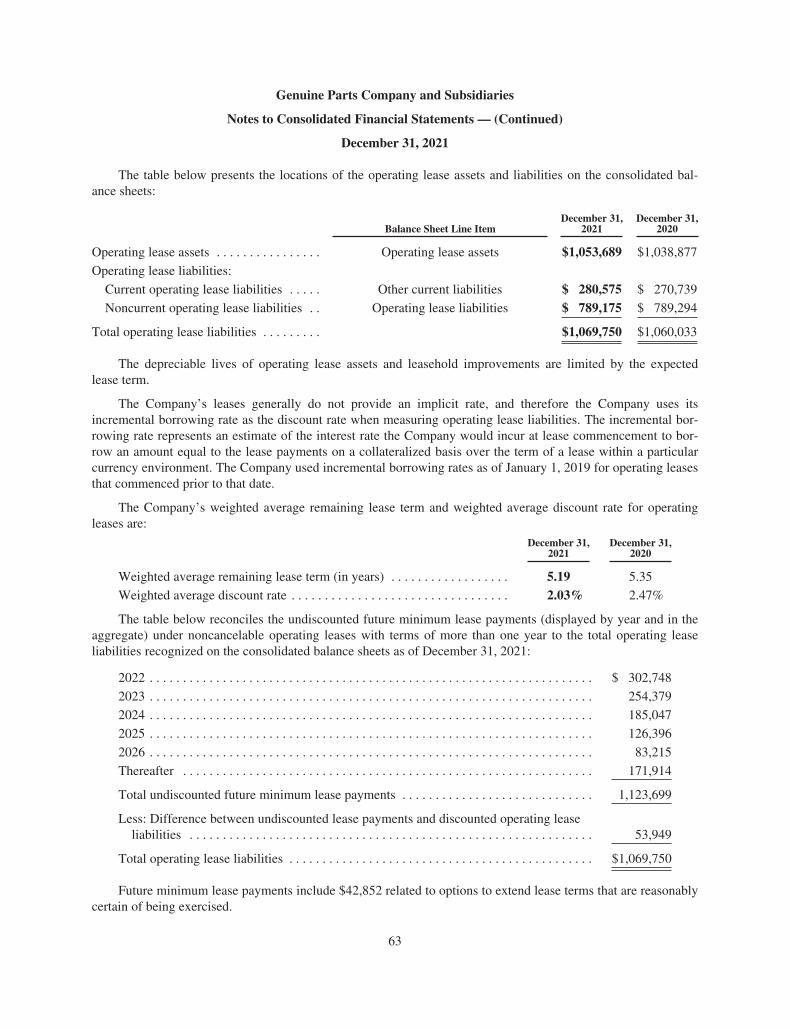
Genuine Parts Company and Subsidiaries
Notes to Consolidated Financial Statements — (Continued)
December 31, 2021
The table below presents the locations of the operating lease assets and liabilities on the consolidated bal-ance sheets:
Balance Sheet Line ItemDecember 31,
2021December 31,
2020
Operating lease assets . . . . . . . . . . . . . . . . Operating lease assets $1,053,689 $1,038,877
Operating lease liabilities:
Current operating lease liabilities . . . . . Other current liabilities $ 280,575 $ 270,739
Noncurrent operating lease liabilities . . Operating lease liabilities $ 789,175 $ 789,294
Total operating lease liabilities . . . . . . . . . $1,069,750 $1,060,033
The depreciable lives of operating lease assets and leasehold improvements are limited by the expectedlease term.
The Company’s leases generally do not provide an implicit rate, and therefore the Company uses itsincremental borrowing rate as the discount rate when measuring operating lease liabilities. The incremental bor-rowing rate represents an estimate of the interest rate the Company would incur at lease commencement to bor-row an amount equal to the lease payments on a collateralized basis over the term of a lease within a particularcurrency environment. The Company used incremental borrowing rates as of January 1, 2019 for operating leasesthat commenced prior to that date.
The Company’s weighted average remaining lease term and weighted average discount rate for operatingleases are:
December 31,2021
December 31,2020
Weighted average remaining lease term (in years) . . . . . . . . . . . . . . . . . . 5.19 5.35
Weighted average discount rate . . . . . . . . . . . . . . . . . . . . . . . . . . . . . . . . . 2.03% 2.47%
The table below reconciles the undiscounted future minimum lease payments (displayed by year and in theaggregate) under noncancelable operating leases with terms of more than one year to the total operating leaseliabilities recognized on the consolidated balance sheets as of December 31, 2021:
2022 . . . . . . . . . . . . . . . . . . . . . . . . . . . . . . . . . . . . . . . . . . . . . . . . . . . . . . . . . . . . . . . . . . . $ 302,748
2023 . . . . . . . . . . . . . . . . . . . . . . . . . . . . . . . . . . . . . . . . . . . . . . . . . . . . . . . . . . . . . . . . . . . 254,379
2024 . . . . . . . . . . . . . . . . . . . . . . . . . . . . . . . . . . . . . . . . . . . . . . . . . . . . . . . . . . . . . . . . . . . 185,047
2025 . . . . . . . . . . . . . . . . . . . . . . . . . . . . . . . . . . . . . . . . . . . . . . . . . . . . . . . . . . . . . . . . . . . 126,396
2026 . . . . . . . . . . . . . . . . . . . . . . . . . . . . . . . . . . . . . . . . . . . . . . . . . . . . . . . . . . . . . . . . . . . 83,215
Thereafter . . . . . . . . . . . . . . . . . . . . . . . . . . . . . . . . . . . . . . . . . . . . . . . . . . . . . . . . . . . . . . 171,914
Total undiscounted future minimum lease payments . . . . . . . . . . . . . . . . . . . . . . . . . . . . . 1,123,699
Less: Difference between undiscounted lease payments and discounted operating leaseliabilities . . . . . . . . . . . . . . . . . . . . . . . . . . . . . . . . . . . . . . . . . . . . . . . . . . . . . . . . . . . . . 53,949
Total operating lease liabilities . . . . . . . . . . . . . . . . . . . . . . . . . . . . . . . . . . . . . . . . . . . . . . $1,069,750
Future minimum lease payments include $42,852 related to options to extend lease terms that are reasonablycertain of being exercised.
63
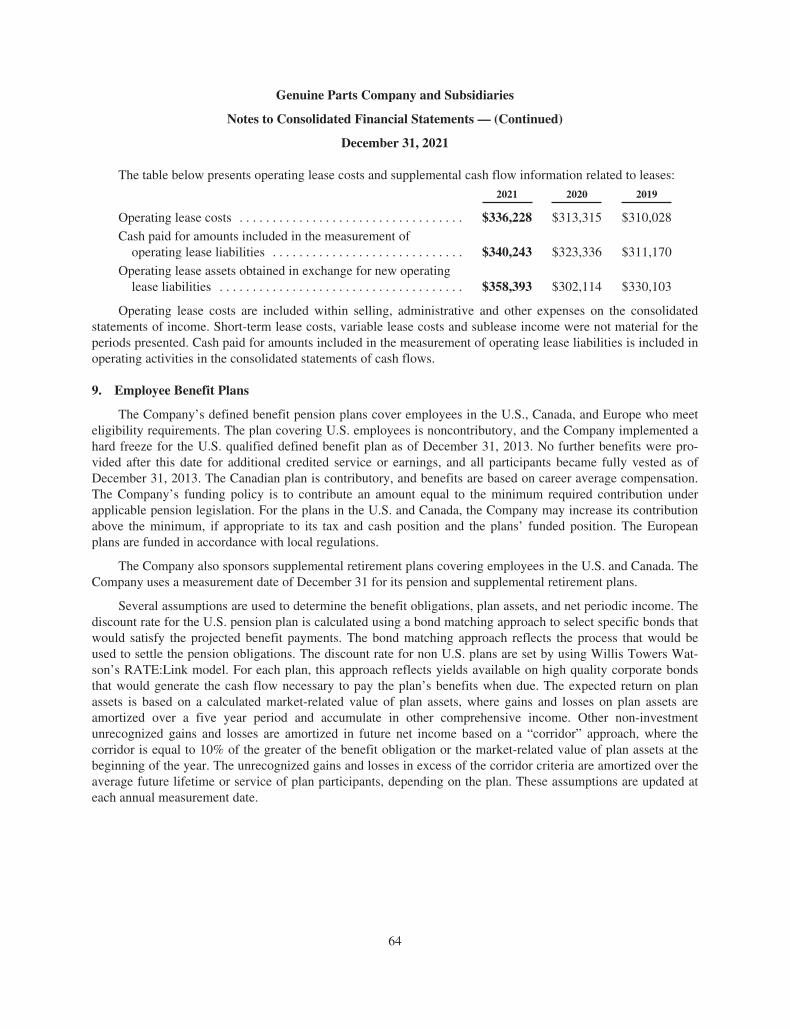
Genuine Parts Company and Subsidiaries
Notes to Consolidated Financial Statements — (Continued)
December 31, 2021
The table below presents operating lease costs and supplemental cash flow information related to leases:
2021 2020 2019
Operating lease costs . . . . . . . . . . . . . . . . . . . . . . . . . . . . . . . . . . $336,228 $313,315 $310,028
Cash paid for amounts included in the measurement ofoperating lease liabilities . . . . . . . . . . . . . . . . . . . . . . . . . . . . . $340,243 $323,336 $311,170
Operating lease assets obtained in exchange for new operatinglease liabilities . . . . . . . . . . . . . . . . . . . . . . . . . . . . . . . . . . . . . $358,393 $302,114 $330,103
Operating lease costs are included within selling, administrative and other expenses on the consolidatedstatements of income. Short-term lease costs, variable lease costs and sublease income were not material for theperiods presented. Cash paid for amounts included in the measurement of operating lease liabilities is included inoperating activities in the consolidated statements of cash flows.
9. Employee Benefit Plans
The Company’s defined benefit pension plans cover employees in the U.S., Canada, and Europe who meeteligibility requirements. The plan covering U.S. employees is noncontributory, and the Company implemented ahard freeze for the U.S. qualified defined benefit plan as of December 31, 2013. No further benefits were pro-vided after this date for additional credited service or earnings, and all participants became fully vested as ofDecember 31, 2013. The Canadian plan is contributory, and benefits are based on career average compensation.The Company’s funding policy is to contribute an amount equal to the minimum required contribution underapplicable pension legislation. For the plans in the U.S. and Canada, the Company may increase its contributionabove the minimum, if appropriate to its tax and cash position and the plans’ funded position. The Europeanplans are funded in accordance with local regulations.
The Company also sponsors supplemental retirement plans covering employees in the U.S. and Canada. TheCompany uses a measurement date of December 31 for its pension and supplemental retirement plans.
Several assumptions are used to determine the benefit obligations, plan assets, and net periodic income. Thediscount rate for the U.S. pension plan is calculated using a bond matching approach to select specific bonds thatwould satisfy the projected benefit payments. The bond matching approach reflects the process that would beused to settle the pension obligations. The discount rate for non U.S. plans are set by using Willis Towers Wat-son’s RATE:Link model. For each plan, this approach reflects yields available on high quality corporate bondsthat would generate the cash flow necessary to pay the plan’s benefits when due. The expected return on planassets is based on a calculated market-related value of plan assets, where gains and losses on plan assets areamortized over a five year period and accumulate in other comprehensive income. Other non-investmentunrecognized gains and losses are amortized in future net income based on a “corridor” approach, where thecorridor is equal to 10% of the greater of the benefit obligation or the market-related value of plan assets at thebeginning of the year. The unrecognized gains and losses in excess of the corridor criteria are amortized over theaverage future lifetime or service of plan participants, depending on the plan. These assumptions are updated ateach annual measurement date.
64
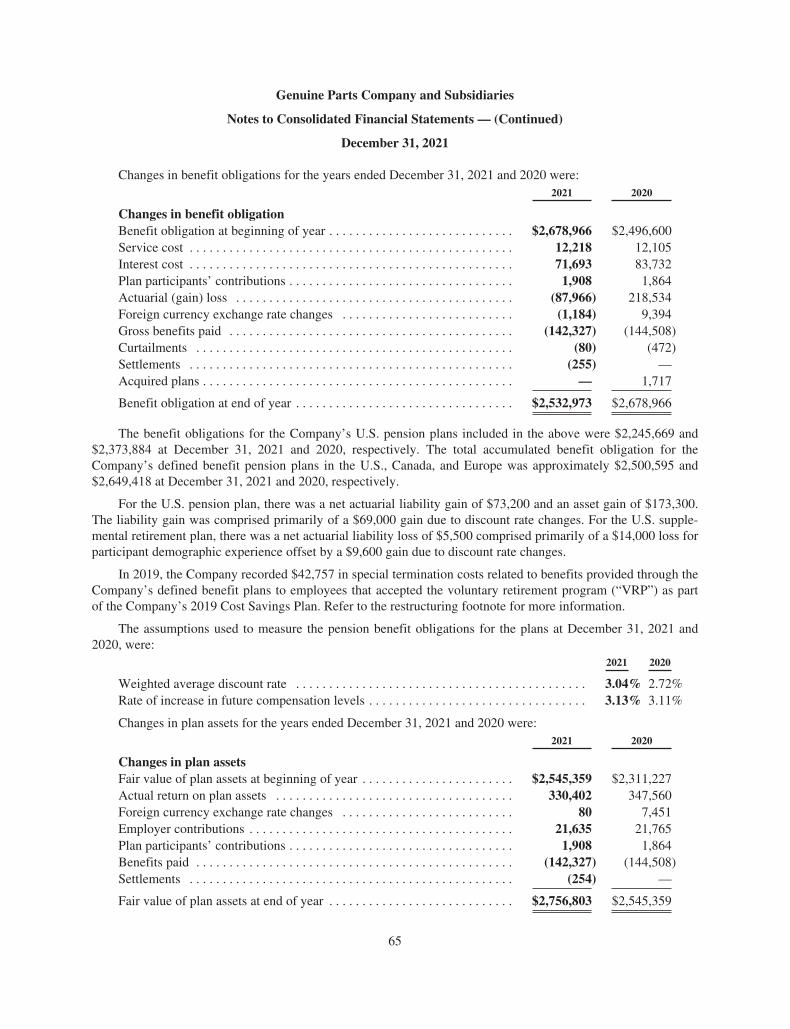
Genuine Parts Company and Subsidiaries
Notes to Consolidated Financial Statements — (Continued)
December 31, 2021
Changes in benefit obligations for the years ended December 31, 2021 and 2020 were:2021 2020
Changes in benefit obligationBenefit obligation at beginning of year . . . . . . . . . . . . . . . . . . . . . . . . . . . . $2,678,966 $2,496,600Service cost . . . . . . . . . . . . . . . . . . . . . . . . . . . . . . . . . . . . . . . . . . . . . . . . . 12,218 12,105Interest cost . . . . . . . . . . . . . . . . . . . . . . . . . . . . . . . . . . . . . . . . . . . . . . . . . 71,693 83,732Plan participants’ contributions . . . . . . . . . . . . . . . . . . . . . . . . . . . . . . . . . . 1,908 1,864Actuarial (gain) loss . . . . . . . . . . . . . . . . . . . . . . . . . . . . . . . . . . . . . . . . . . (87,966) 218,534Foreign currency exchange rate changes . . . . . . . . . . . . . . . . . . . . . . . . . . (1,184) 9,394Gross benefits paid . . . . . . . . . . . . . . . . . . . . . . . . . . . . . . . . . . . . . . . . . . . (142,327) (144,508)Curtailments . . . . . . . . . . . . . . . . . . . . . . . . . . . . . . . . . . . . . . . . . . . . . . . . (80) (472)Settlements . . . . . . . . . . . . . . . . . . . . . . . . . . . . . . . . . . . . . . . . . . . . . . . . . (255) —Acquired plans . . . . . . . . . . . . . . . . . . . . . . . . . . . . . . . . . . . . . . . . . . . . . . . — 1,717
Benefit obligation at end of year . . . . . . . . . . . . . . . . . . . . . . . . . . . . . . . . . $2,532,973 $2,678,966
The benefit obligations for the Company’s U.S. pension plans included in the above were $2,245,669 and$2,373,884 at December 31, 2021 and 2020, respectively. The total accumulated benefit obligation for theCompany’s defined benefit pension plans in the U.S., Canada, and Europe was approximately $2,500,595 and$2,649,418 at December 31, 2021 and 2020, respectively.
For the U.S. pension plan, there was a net actuarial liability gain of $73,200 and an asset gain of $173,300.The liability gain was comprised primarily of a $69,000 gain due to discount rate changes. For the U.S. supple-mental retirement plan, there was a net actuarial liability loss of $5,500 comprised primarily of a $14,000 loss forparticipant demographic experience offset by a $9,600 gain due to discount rate changes.
In 2019, the Company recorded $42,757 in special termination costs related to benefits provided through theCompany’s defined benefit plans to employees that accepted the voluntary retirement program (“VRP”) as partof the Company’s 2019 Cost Savings Plan. Refer to the restructuring footnote for more information.
The assumptions used to measure the pension benefit obligations for the plans at December 31, 2021 and2020, were:
2021 2020
Weighted average discount rate . . . . . . . . . . . . . . . . . . . . . . . . . . . . . . . . . . . . . . . . . . . . 3.04% 2.72%Rate of increase in future compensation levels . . . . . . . . . . . . . . . . . . . . . . . . . . . . . . . . . 3.13% 3.11%
Changes in plan assets for the years ended December 31, 2021 and 2020 were:2021 2020
Changes in plan assetsFair value of plan assets at beginning of year . . . . . . . . . . . . . . . . . . . . . . . $2,545,359 $2,311,227Actual return on plan assets . . . . . . . . . . . . . . . . . . . . . . . . . . . . . . . . . . . . 330,402 347,560Foreign currency exchange rate changes . . . . . . . . . . . . . . . . . . . . . . . . . . 80 7,451Employer contributions . . . . . . . . . . . . . . . . . . . . . . . . . . . . . . . . . . . . . . . . 21,635 21,765Plan participants’ contributions . . . . . . . . . . . . . . . . . . . . . . . . . . . . . . . . . . 1,908 1,864Benefits paid . . . . . . . . . . . . . . . . . . . . . . . . . . . . . . . . . . . . . . . . . . . . . . . . (142,327) (144,508)Settlements . . . . . . . . . . . . . . . . . . . . . . . . . . . . . . . . . . . . . . . . . . . . . . . . . (254) —
Fair value of plan assets at end of year . . . . . . . . . . . . . . . . . . . . . . . . . . . . $2,756,803 $2,545,359
65
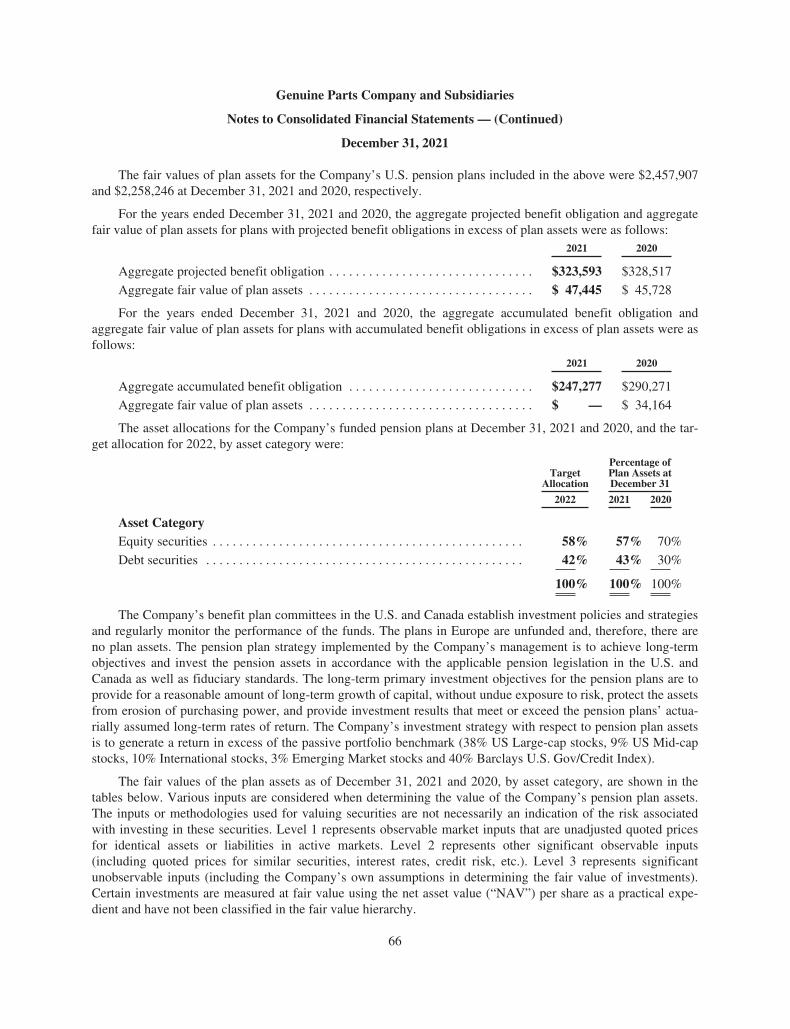
Genuine Parts Company and Subsidiaries
Notes to Consolidated Financial Statements — (Continued)
December 31, 2021
The fair values of plan assets for the Company’s U.S. pension plans included in the above were $2,457,907and $2,258,246 at December 31, 2021 and 2020, respectively.
For the years ended December 31, 2021 and 2020, the aggregate projected benefit obligation and aggregatefair value of plan assets for plans with projected benefit obligations in excess of plan assets were as follows:
2021 2020
Aggregate projected benefit obligation . . . . . . . . . . . . . . . . . . . . . . . . . . . . . . . $323,593 $328,517
Aggregate fair value of plan assets . . . . . . . . . . . . . . . . . . . . . . . . . . . . . . . . . . $ 47,445 $ 45,728
For the years ended December 31, 2021 and 2020, the aggregate accumulated benefit obligation andaggregate fair value of plan assets for plans with accumulated benefit obligations in excess of plan assets were asfollows:
2021 2020
Aggregate accumulated benefit obligation . . . . . . . . . . . . . . . . . . . . . . . . . . . . $247,277 $290,271
Aggregate fair value of plan assets . . . . . . . . . . . . . . . . . . . . . . . . . . . . . . . . . . $ — $ 34,164
The asset allocations for the Company’s funded pension plans at December 31, 2021 and 2020, and the tar-get allocation for 2022, by asset category were:
TargetAllocation
Percentage ofPlan Assets atDecember 31
2022 2021 2020
Asset CategoryEquity securities . . . . . . . . . . . . . . . . . . . . . . . . . . . . . . . . . . . . . . . . . . . . . . . 58% 57% 70%
Debt securities . . . . . . . . . . . . . . . . . . . . . . . . . . . . . . . . . . . . . . . . . . . . . . . . 42% 43% 30%
100% 100% 100%
The Company’s benefit plan committees in the U.S. and Canada establish investment policies and strategiesand regularly monitor the performance of the funds. The plans in Europe are unfunded and, therefore, there areno plan assets. The pension plan strategy implemented by the Company’s management is to achieve long-termobjectives and invest the pension assets in accordance with the applicable pension legislation in the U.S. andCanada as well as fiduciary standards. The long-term primary investment objectives for the pension plans are toprovide for a reasonable amount of long-term growth of capital, without undue exposure to risk, protect the assetsfrom erosion of purchasing power, and provide investment results that meet or exceed the pension plans’ actua-rially assumed long-term rates of return. The Company’s investment strategy with respect to pension plan assetsis to generate a return in excess of the passive portfolio benchmark (38% US Large-cap stocks, 9% US Mid-capstocks, 10% International stocks, 3% Emerging Market stocks and 40% Barclays U.S. Gov/Credit Index).
The fair values of the plan assets as of December 31, 2021 and 2020, by asset category, are shown in thetables below. Various inputs are considered when determining the value of the Company’s pension plan assets.The inputs or methodologies used for valuing securities are not necessarily an indication of the risk associatedwith investing in these securities. Level 1 represents observable market inputs that are unadjusted quoted pricesfor identical assets or liabilities in active markets. Level 2 represents other significant observable inputs(including quoted prices for similar securities, interest rates, credit risk, etc.). Level 3 represents significantunobservable inputs (including the Company’s own assumptions in determining the fair value of investments).Certain investments are measured at fair value using the net asset value (“NAV”) per share as a practical expe-dient and have not been classified in the fair value hierarchy.
66
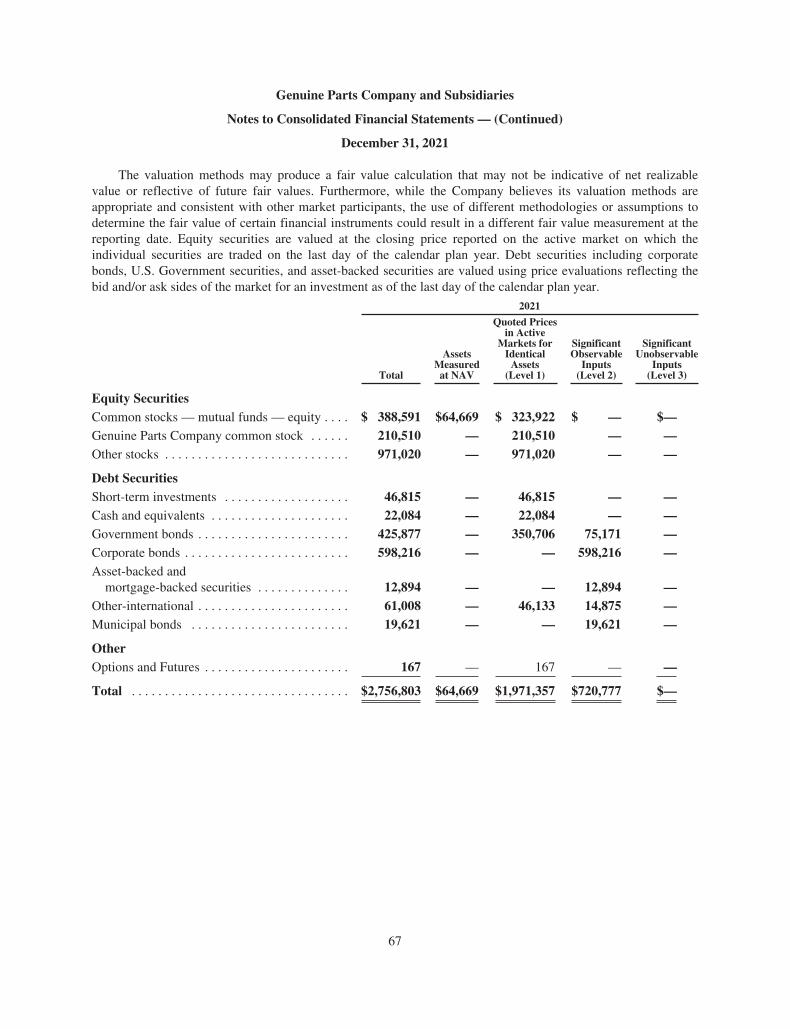
Genuine Parts Company and Subsidiaries
Notes to Consolidated Financial Statements — (Continued)
December 31, 2021
The valuation methods may produce a fair value calculation that may not be indicative of net realizablevalue or reflective of future fair values. Furthermore, while the Company believes its valuation methods areappropriate and consistent with other market participants, the use of different methodologies or assumptions todetermine the fair value of certain financial instruments could result in a different fair value measurement at thereporting date. Equity securities are valued at the closing price reported on the active market on which theindividual securities are traded on the last day of the calendar plan year. Debt securities including corporatebonds, U.S. Government securities, and asset-backed securities are valued using price evaluations reflecting thebid and/or ask sides of the market for an investment as of the last day of the calendar plan year.
2021
Total
AssetsMeasured
at NAV
Quoted Pricesin Active
Markets forIdentical
Assets(Level 1)
SignificantObservable
Inputs(Level 2)
SignificantUnobservable
Inputs(Level 3)
Equity SecuritiesCommon stocks — mutual funds — equity . . . . $ 388,591 $64,669 $ 323,922 $ — $—Genuine Parts Company common stock . . . . . . 210,510 — 210,510 — —Other stocks . . . . . . . . . . . . . . . . . . . . . . . . . . . . 971,020 — 971,020 — —
Debt SecuritiesShort-term investments . . . . . . . . . . . . . . . . . . . 46,815 — 46,815 — —Cash and equivalents . . . . . . . . . . . . . . . . . . . . . 22,084 — 22,084 — —Government bonds . . . . . . . . . . . . . . . . . . . . . . . 425,877 — 350,706 75,171 —Corporate bonds . . . . . . . . . . . . . . . . . . . . . . . . . 598,216 — — 598,216 —Asset-backed and
mortgage-backed securities . . . . . . . . . . . . . . 12,894 — — 12,894 —Other-international . . . . . . . . . . . . . . . . . . . . . . . 61,008 — 46,133 14,875 —Municipal bonds . . . . . . . . . . . . . . . . . . . . . . . . 19,621 — — 19,621 —
OtherOptions and Futures . . . . . . . . . . . . . . . . . . . . . . 167 — 167 — —
Total . . . . . . . . . . . . . . . . . . . . . . . . . . . . . . . . . $2,756,803 $64,669 $1,971,357 $720,777 $—
67
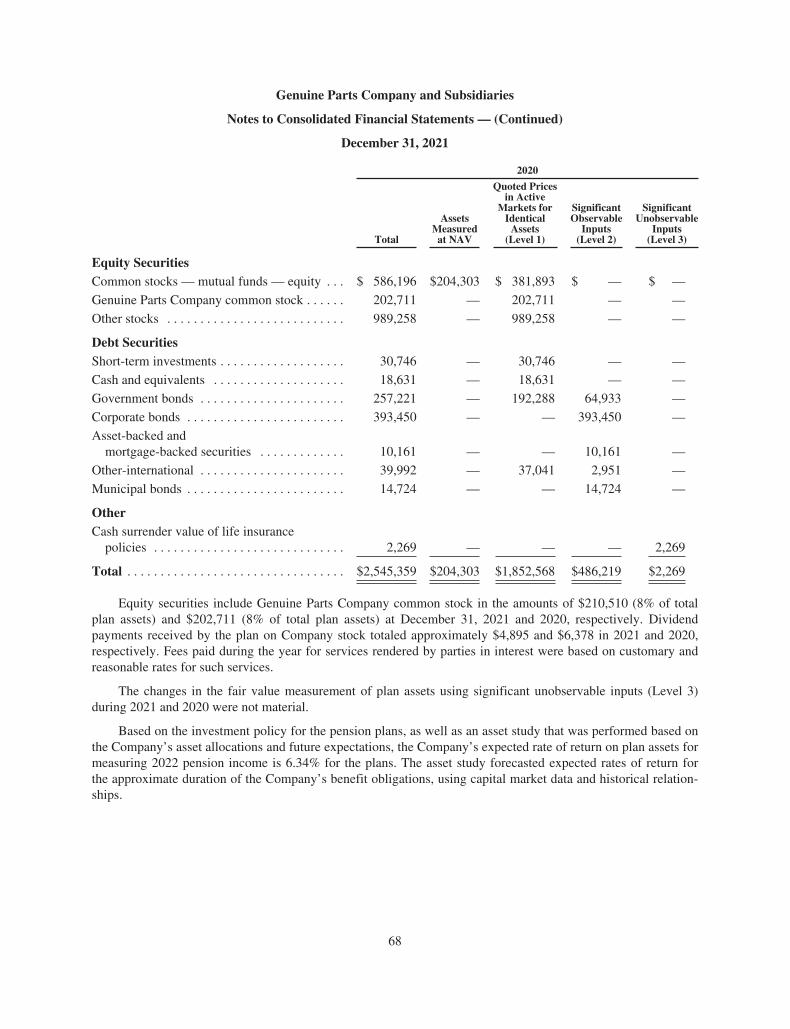
Genuine Parts Company and Subsidiaries
Notes to Consolidated Financial Statements — (Continued)
December 31, 2021
2020
Total
AssetsMeasured
at NAV
Quoted Pricesin Active
Markets forIdentical
Assets(Level 1)
SignificantObservable
Inputs(Level 2)
SignificantUnobservable
Inputs(Level 3)
Equity SecuritiesCommon stocks — mutual funds — equity . . . $ 586,196 $204,303 $ 381,893 $ — $ —
Genuine Parts Company common stock . . . . . . 202,711 — 202,711 — —
Other stocks . . . . . . . . . . . . . . . . . . . . . . . . . . . 989,258 — 989,258 — —
Debt SecuritiesShort-term investments . . . . . . . . . . . . . . . . . . . 30,746 — 30,746 — —
Cash and equivalents . . . . . . . . . . . . . . . . . . . . 18,631 — 18,631 — —
Government bonds . . . . . . . . . . . . . . . . . . . . . . 257,221 — 192,288 64,933 —
Corporate bonds . . . . . . . . . . . . . . . . . . . . . . . . 393,450 — — 393,450 —
Asset-backed andmortgage-backed securities . . . . . . . . . . . . . 10,161 — — 10,161 —
Other-international . . . . . . . . . . . . . . . . . . . . . . 39,992 — 37,041 2,951 —
Municipal bonds . . . . . . . . . . . . . . . . . . . . . . . . 14,724 — — 14,724 —
OtherCash surrender value of life insurance
policies . . . . . . . . . . . . . . . . . . . . . . . . . . . . . 2,269 — — — 2,269
Total . . . . . . . . . . . . . . . . . . . . . . . . . . . . . . . . . $2,545,359 $204,303 $1,852,568 $486,219 $2,269
Equity securities include Genuine Parts Company common stock in the amounts of $210,510 (8% of totalplan assets) and $202,711 (8% of total plan assets) at December 31, 2021 and 2020, respectively. Dividendpayments received by the plan on Company stock totaled approximately $4,895 and $6,378 in 2021 and 2020,respectively. Fees paid during the year for services rendered by parties in interest were based on customary andreasonable rates for such services.
The changes in the fair value measurement of plan assets using significant unobservable inputs (Level 3)during 2021 and 2020 were not material.
Based on the investment policy for the pension plans, as well as an asset study that was performed based onthe Company’s asset allocations and future expectations, the Company’s expected rate of return on plan assets formeasuring 2022 pension income is 6.34% for the plans. The asset study forecasted expected rates of return forthe approximate duration of the Company’s benefit obligations, using capital market data and historical relation-ships.
68
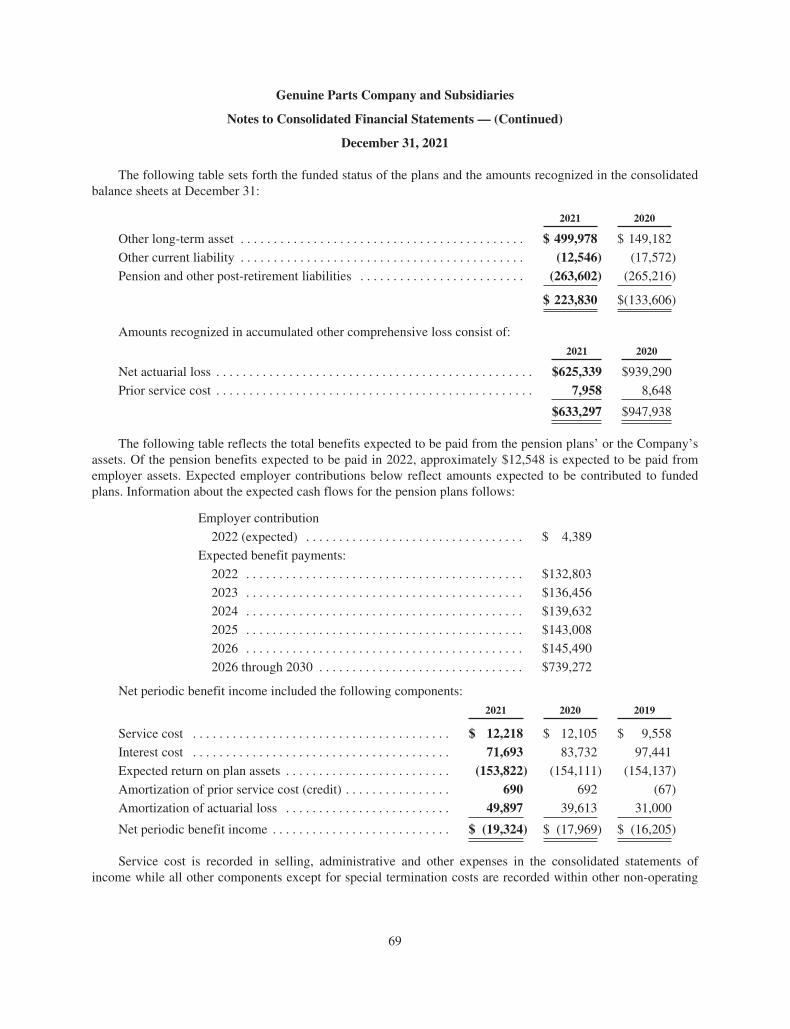
Genuine Parts Company and Subsidiaries
Notes to Consolidated Financial Statements — (Continued)
December 31, 2021
The following table sets forth the funded status of the plans and the amounts recognized in the consolidatedbalance sheets at December 31:
2021 2020
Other long-term asset . . . . . . . . . . . . . . . . . . . . . . . . . . . . . . . . . . . . . . . . . . . $ 499,978 $ 149,182
Other current liability . . . . . . . . . . . . . . . . . . . . . . . . . . . . . . . . . . . . . . . . . . . (12,546) (17,572)
Pension and other post-retirement liabilities . . . . . . . . . . . . . . . . . . . . . . . . . (263,602) (265,216)
$ 223,830 $(133,606)
Amounts recognized in accumulated other comprehensive loss consist of:
2021 2020
Net actuarial loss . . . . . . . . . . . . . . . . . . . . . . . . . . . . . . . . . . . . . . . . . . . . . . . . $625,339 $939,290
Prior service cost . . . . . . . . . . . . . . . . . . . . . . . . . . . . . . . . . . . . . . . . . . . . . . . . 7,958 8,648
$633,297 $947,938
The following table reflects the total benefits expected to be paid from the pension plans’ or the Company’sassets. Of the pension benefits expected to be paid in 2022, approximately $12,548 is expected to be paid fromemployer assets. Expected employer contributions below reflect amounts expected to be contributed to fundedplans. Information about the expected cash flows for the pension plans follows:
Employer contribution
2022 (expected) . . . . . . . . . . . . . . . . . . . . . . . . . . . . . . . . . $ 4,389
Expected benefit payments:
2022 . . . . . . . . . . . . . . . . . . . . . . . . . . . . . . . . . . . . . . . . . . $132,803
2023 . . . . . . . . . . . . . . . . . . . . . . . . . . . . . . . . . . . . . . . . . . $136,456
2024 . . . . . . . . . . . . . . . . . . . . . . . . . . . . . . . . . . . . . . . . . . $139,632
2025 . . . . . . . . . . . . . . . . . . . . . . . . . . . . . . . . . . . . . . . . . . $143,008
2026 . . . . . . . . . . . . . . . . . . . . . . . . . . . . . . . . . . . . . . . . . . $145,490
2026 through 2030 . . . . . . . . . . . . . . . . . . . . . . . . . . . . . . . $739,272
Net periodic benefit income included the following components:
2021 2020 2019
Service cost . . . . . . . . . . . . . . . . . . . . . . . . . . . . . . . . . . . . . . . $ 12,218 $ 12,105 $ 9,558
Interest cost . . . . . . . . . . . . . . . . . . . . . . . . . . . . . . . . . . . . . . . 71,693 83,732 97,441
Expected return on plan assets . . . . . . . . . . . . . . . . . . . . . . . . . (153,822) (154,111) (154,137)
Amortization of prior service cost (credit) . . . . . . . . . . . . . . . . 690 692 (67)
Amortization of actuarial loss . . . . . . . . . . . . . . . . . . . . . . . . . 49,897 39,613 31,000
Net periodic benefit income . . . . . . . . . . . . . . . . . . . . . . . . . . . $ (19,324) $ (17,969) $ (16,205)
Service cost is recorded in selling, administrative and other expenses in the consolidated statements ofincome while all other components except for special termination costs are recorded within other non-operating
69
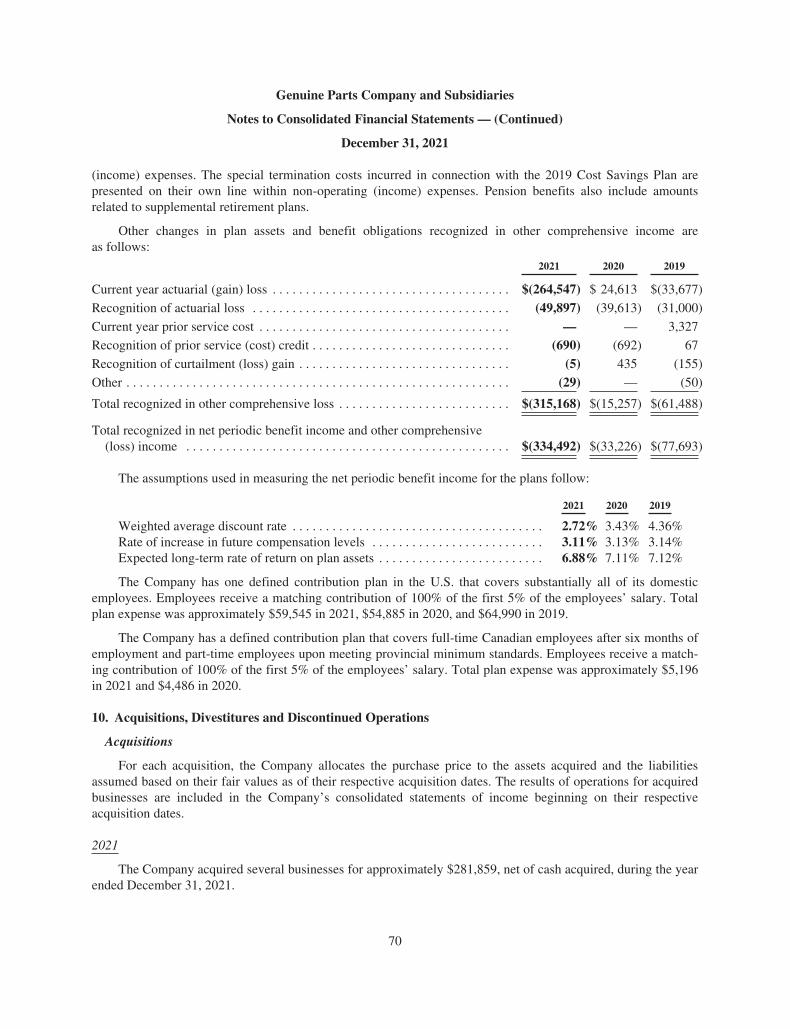
Genuine Parts Company and Subsidiaries
Notes to Consolidated Financial Statements — (Continued)
December 31, 2021
(income) expenses. The special termination costs incurred in connection with the 2019 Cost Savings Plan arepresented on their own line within non-operating (income) expenses. Pension benefits also include amountsrelated to supplemental retirement plans.
Other changes in plan assets and benefit obligations recognized in other comprehensive income areas follows:
2021 2020 2019
Current year actuarial (gain) loss . . . . . . . . . . . . . . . . . . . . . . . . . . . . . . . . . . . . $(264,547) $ 24,613 $(33,677)
Recognition of actuarial loss . . . . . . . . . . . . . . . . . . . . . . . . . . . . . . . . . . . . . . . (49,897) (39,613) (31,000)
Current year prior service cost . . . . . . . . . . . . . . . . . . . . . . . . . . . . . . . . . . . . . . — — 3,327
Recognition of prior service (cost) credit . . . . . . . . . . . . . . . . . . . . . . . . . . . . . . (690) (692) 67
Recognition of curtailment (loss) gain . . . . . . . . . . . . . . . . . . . . . . . . . . . . . . . . (5) 435 (155)
Other . . . . . . . . . . . . . . . . . . . . . . . . . . . . . . . . . . . . . . . . . . . . . . . . . . . . . . . . . . (29) — (50)
Total recognized in other comprehensive loss . . . . . . . . . . . . . . . . . . . . . . . . . . $(315,168) $(15,257) $(61,488)
Total recognized in net periodic benefit income and other comprehensive(loss) income . . . . . . . . . . . . . . . . . . . . . . . . . . . . . . . . . . . . . . . . . . . . . . . . . $(334,492) $(33,226) $(77,693)
The assumptions used in measuring the net periodic benefit income for the plans follow:
2021 2020 2019
Weighted average discount rate . . . . . . . . . . . . . . . . . . . . . . . . . . . . . . . . . . . . . . 2.72% 3.43% 4.36%Rate of increase in future compensation levels . . . . . . . . . . . . . . . . . . . . . . . . . . 3.11% 3.13% 3.14%Expected long-term rate of return on plan assets . . . . . . . . . . . . . . . . . . . . . . . . . 6.88% 7.11% 7.12%
The Company has one defined contribution plan in the U.S. that covers substantially all of its domesticemployees. Employees receive a matching contribution of 100% of the first 5% of the employees’ salary. Totalplan expense was approximately $59,545 in 2021, $54,885 in 2020, and $64,990 in 2019.
The Company has a defined contribution plan that covers full-time Canadian employees after six months ofemployment and part-time employees upon meeting provincial minimum standards. Employees receive a match-ing contribution of 100% of the first 5% of the employees’ salary. Total plan expense was approximately $5,196in 2021 and $4,486 in 2020.
10. Acquisitions, Divestitures and Discontinued Operations
Acquisitions
For each acquisition, the Company allocates the purchase price to the assets acquired and the liabilitiesassumed based on their fair values as of their respective acquisition dates. The results of operations for acquiredbusinesses are included in the Company’s consolidated statements of income beginning on their respectiveacquisition dates.
2021
The Company acquired several businesses for approximately $281,859, net of cash acquired, during the yearended December 31, 2021.
70
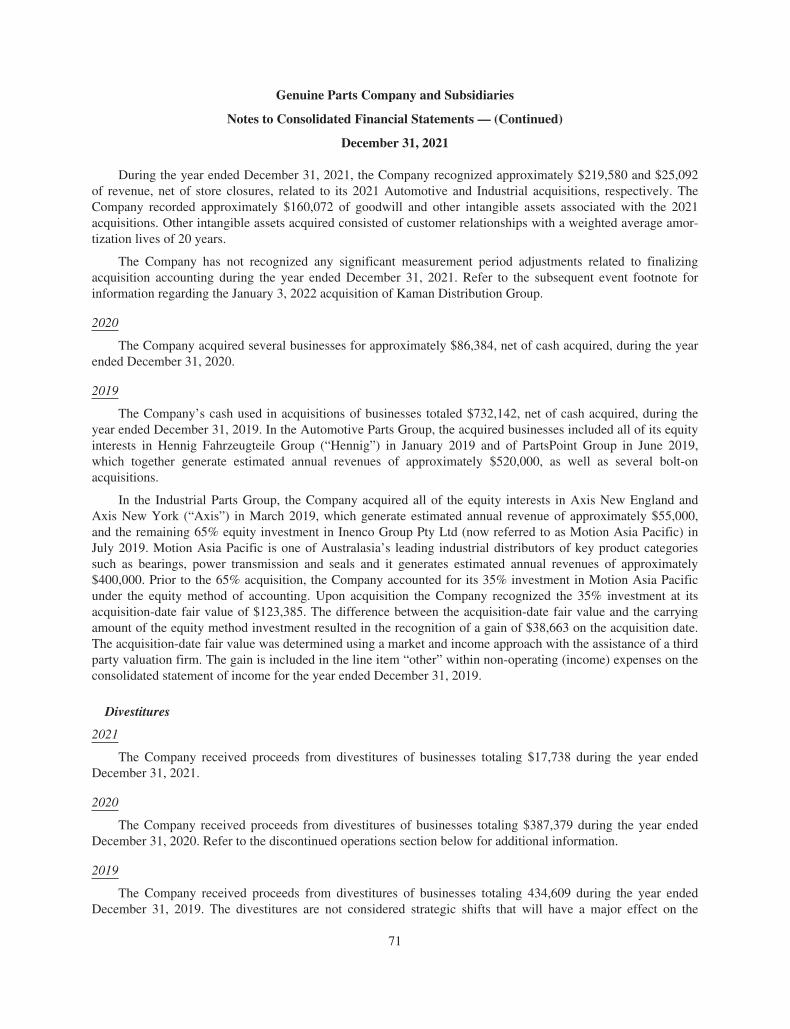
Genuine Parts Company and Subsidiaries
Notes to Consolidated Financial Statements — (Continued)
December 31, 2021
During the year ended December 31, 2021, the Company recognized approximately $219,580 and $25,092of revenue, net of store closures, related to its 2021 Automotive and Industrial acquisitions, respectively. TheCompany recorded approximately $160,072 of goodwill and other intangible assets associated with the 2021acquisitions. Other intangible assets acquired consisted of customer relationships with a weighted average amor-tization lives of 20 years.
The Company has not recognized any significant measurement period adjustments related to finalizingacquisition accounting during the year ended December 31, 2021. Refer to the subsequent event footnote forinformation regarding the January 3, 2022 acquisition of Kaman Distribution Group.
2020
The Company acquired several businesses for approximately $86,384, net of cash acquired, during the yearended December 31, 2020.
2019
The Company’s cash used in acquisitions of businesses totaled $732,142, net of cash acquired, during theyear ended December 31, 2019. In the Automotive Parts Group, the acquired businesses included all of its equityinterests in Hennig Fahrzeugteile Group (“Hennig”) in January 2019 and of PartsPoint Group in June 2019,which together generate estimated annual revenues of approximately $520,000, as well as several bolt-onacquisitions.
In the Industrial Parts Group, the Company acquired all of the equity interests in Axis New England andAxis New York (“Axis”) in March 2019, which generate estimated annual revenue of approximately $55,000,and the remaining 65% equity investment in Inenco Group Pty Ltd (now referred to as Motion Asia Pacific) inJuly 2019. Motion Asia Pacific is one of Australasia’s leading industrial distributors of key product categoriessuch as bearings, power transmission and seals and it generates estimated annual revenues of approximately$400,000. Prior to the 65% acquisition, the Company accounted for its 35% investment in Motion Asia Pacificunder the equity method of accounting. Upon acquisition the Company recognized the 35% investment at itsacquisition-date fair value of $123,385. The difference between the acquisition-date fair value and the carryingamount of the equity method investment resulted in the recognition of a gain of $38,663 on the acquisition date.The acquisition-date fair value was determined using a market and income approach with the assistance of a thirdparty valuation firm. The gain is included in the line item “other” within non-operating (income) expenses on theconsolidated statement of income for the year ended December 31, 2019.
Divestitures
2021
The Company received proceeds from divestitures of businesses totaling $17,738 during the year endedDecember 31, 2021.
2020
The Company received proceeds from divestitures of businesses totaling $387,379 during the year endedDecember 31, 2020. Refer to the discontinued operations section below for additional information.
2019
The Company received proceeds from divestitures of businesses totaling 434,609 during the year endedDecember 31, 2019. The divestitures are not considered strategic shifts that will have a major effect on the
71
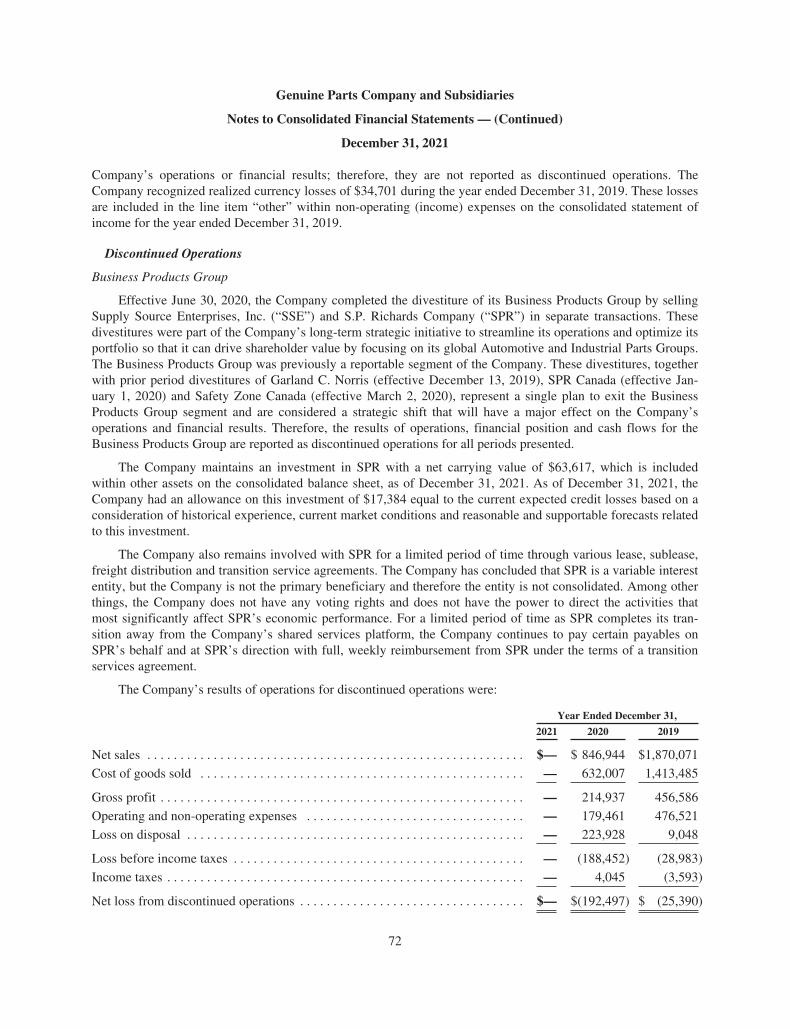
Genuine Parts Company and Subsidiaries
Notes to Consolidated Financial Statements — (Continued)
December 31, 2021
Company’s operations or financial results; therefore, they are not reported as discontinued operations. TheCompany recognized realized currency losses of $34,701 during the year ended December 31, 2019. These lossesare included in the line item “other” within non-operating (income) expenses on the consolidated statement ofincome for the year ended December 31, 2019.
Discontinued Operations
Business Products Group
Effective June 30, 2020, the Company completed the divestiture of its Business Products Group by sellingSupply Source Enterprises, Inc. (“SSE”) and S.P. Richards Company (“SPR”) in separate transactions. Thesedivestitures were part of the Company’s long-term strategic initiative to streamline its operations and optimize itsportfolio so that it can drive shareholder value by focusing on its global Automotive and Industrial Parts Groups.The Business Products Group was previously a reportable segment of the Company. These divestitures, togetherwith prior period divestitures of Garland C. Norris (effective December 13, 2019), SPR Canada (effective Jan-uary 1, 2020) and Safety Zone Canada (effective March 2, 2020), represent a single plan to exit the BusinessProducts Group segment and are considered a strategic shift that will have a major effect on the Company’soperations and financial results. Therefore, the results of operations, financial position and cash flows for theBusiness Products Group are reported as discontinued operations for all periods presented.
The Company maintains an investment in SPR with a net carrying value of $63,617, which is includedwithin other assets on the consolidated balance sheet, as of December 31, 2021. As of December 31, 2021, theCompany had an allowance on this investment of $17,384 equal to the current expected credit losses based on aconsideration of historical experience, current market conditions and reasonable and supportable forecasts relatedto this investment.
The Company also remains involved with SPR for a limited period of time through various lease, sublease,freight distribution and transition service agreements. The Company has concluded that SPR is a variable interestentity, but the Company is not the primary beneficiary and therefore the entity is not consolidated. Among otherthings, the Company does not have any voting rights and does not have the power to direct the activities thatmost significantly affect SPR’s economic performance. For a limited period of time as SPR completes its tran-sition away from the Company’s shared services platform, the Company continues to pay certain payables onSPR’s behalf and at SPR’s direction with full, weekly reimbursement from SPR under the terms of a transitionservices agreement.
The Company’s results of operations for discontinued operations were:
Year Ended December 31,
2021 2020 2019
Net sales . . . . . . . . . . . . . . . . . . . . . . . . . . . . . . . . . . . . . . . . . . . . . . . . . . . . . . . . . $— $ 846,944 $1,870,071
Cost of goods sold . . . . . . . . . . . . . . . . . . . . . . . . . . . . . . . . . . . . . . . . . . . . . . . . . — 632,007 1,413,485
Gross profit . . . . . . . . . . . . . . . . . . . . . . . . . . . . . . . . . . . . . . . . . . . . . . . . . . . . . . . — 214,937 456,586
Operating and non-operating expenses . . . . . . . . . . . . . . . . . . . . . . . . . . . . . . . . . — 179,461 476,521
Loss on disposal . . . . . . . . . . . . . . . . . . . . . . . . . . . . . . . . . . . . . . . . . . . . . . . . . . . — 223,928 9,048
Loss before income taxes . . . . . . . . . . . . . . . . . . . . . . . . . . . . . . . . . . . . . . . . . . . . — (188,452) (28,983)
Income taxes . . . . . . . . . . . . . . . . . . . . . . . . . . . . . . . . . . . . . . . . . . . . . . . . . . . . . . — 4,045 (3,593)
Net loss from discontinued operations . . . . . . . . . . . . . . . . . . . . . . . . . . . . . . . . . . $— $(192,497) $ (25,390)
72
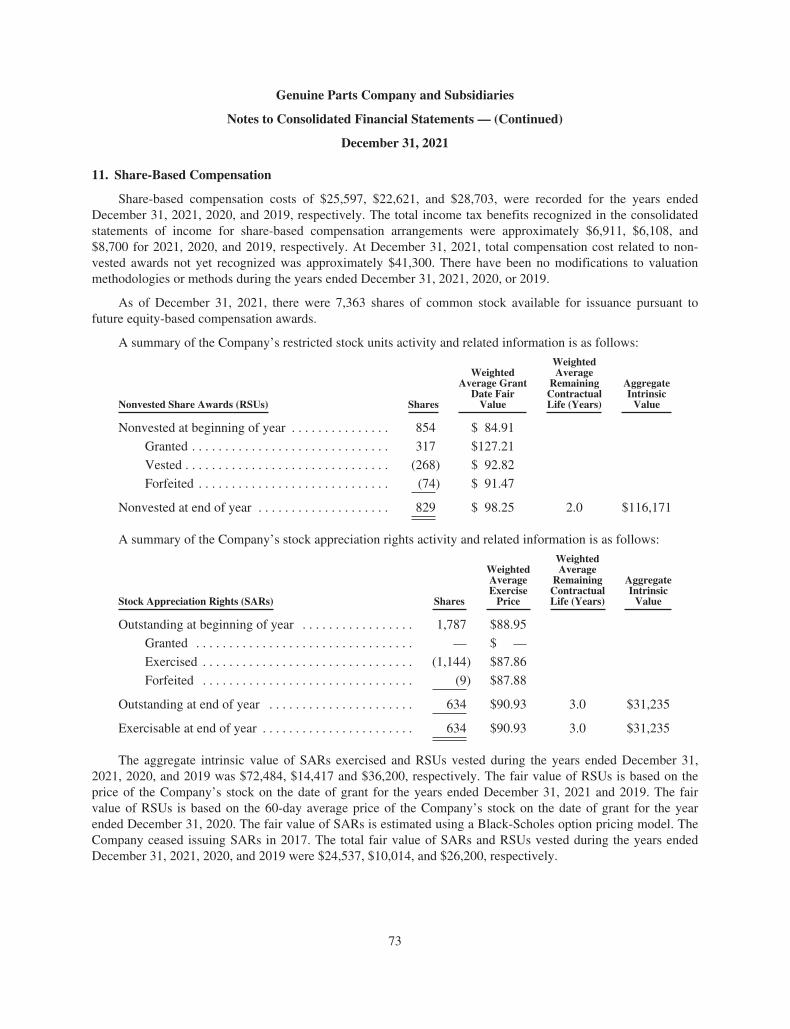
Genuine Parts Company and Subsidiaries
Notes to Consolidated Financial Statements — (Continued)
December 31, 2021
11. Share-Based Compensation
Share-based compensation costs of $25,597, $22,621, and $28,703, were recorded for the years endedDecember 31, 2021, 2020, and 2019, respectively. The total income tax benefits recognized in the consolidatedstatements of income for share-based compensation arrangements were approximately $6,911, $6,108, and$8,700 for 2021, 2020, and 2019, respectively. At December 31, 2021, total compensation cost related to non-vested awards not yet recognized was approximately $41,300. There have been no modifications to valuationmethodologies or methods during the years ended December 31, 2021, 2020, or 2019.
As of December 31, 2021, there were 7,363 shares of common stock available for issuance pursuant tofuture equity-based compensation awards.
A summary of the Company’s restricted stock units activity and related information is as follows:
Nonvested Share Awards (RSUs) Shares
WeightedAverage Grant
Date FairValue
WeightedAverage
RemainingContractualLife (Years)
AggregateIntrinsic
Value
Nonvested at beginning of year . . . . . . . . . . . . . . . 854 $ 84.91
Granted . . . . . . . . . . . . . . . . . . . . . . . . . . . . . . 317 $127.21
Vested . . . . . . . . . . . . . . . . . . . . . . . . . . . . . . . (268) $ 92.82
Forfeited . . . . . . . . . . . . . . . . . . . . . . . . . . . . . (74) $ 91.47
Nonvested at end of year . . . . . . . . . . . . . . . . . . . . 829 $ 98.25 2.0 $116,171
A summary of the Company’s stock appreciation rights activity and related information is as follows:
Stock Appreciation Rights (SARs) Shares
WeightedAverageExercise
Price
WeightedAverage
RemainingContractualLife (Years)
AggregateIntrinsic
Value
Outstanding at beginning of year . . . . . . . . . . . . . . . . . 1,787 $88.95
Granted . . . . . . . . . . . . . . . . . . . . . . . . . . . . . . . . . — $ —
Exercised . . . . . . . . . . . . . . . . . . . . . . . . . . . . . . . . (1,144) $87.86
Forfeited . . . . . . . . . . . . . . . . . . . . . . . . . . . . . . . . (9) $87.88
Outstanding at end of year . . . . . . . . . . . . . . . . . . . . . . 634 $90.93 3.0 $31,235
Exercisable at end of year . . . . . . . . . . . . . . . . . . . . . . . 634 $90.93 3.0 $31,235
The aggregate intrinsic value of SARs exercised and RSUs vested during the years ended December 31,2021, 2020, and 2019 was $72,484, $14,417 and $36,200, respectively. The fair value of RSUs is based on theprice of the Company’s stock on the date of grant for the years ended December 31, 2021 and 2019. The fairvalue of RSUs is based on the 60-day average price of the Company’s stock on the date of grant for the yearended December 31, 2020. The fair value of SARs is estimated using a Black-Scholes option pricing model. TheCompany ceased issuing SARs in 2017. The total fair value of SARs and RSUs vested during the years endedDecember 31, 2021, 2020, and 2019 were $24,537, $10,014, and $26,200, respectively.
73
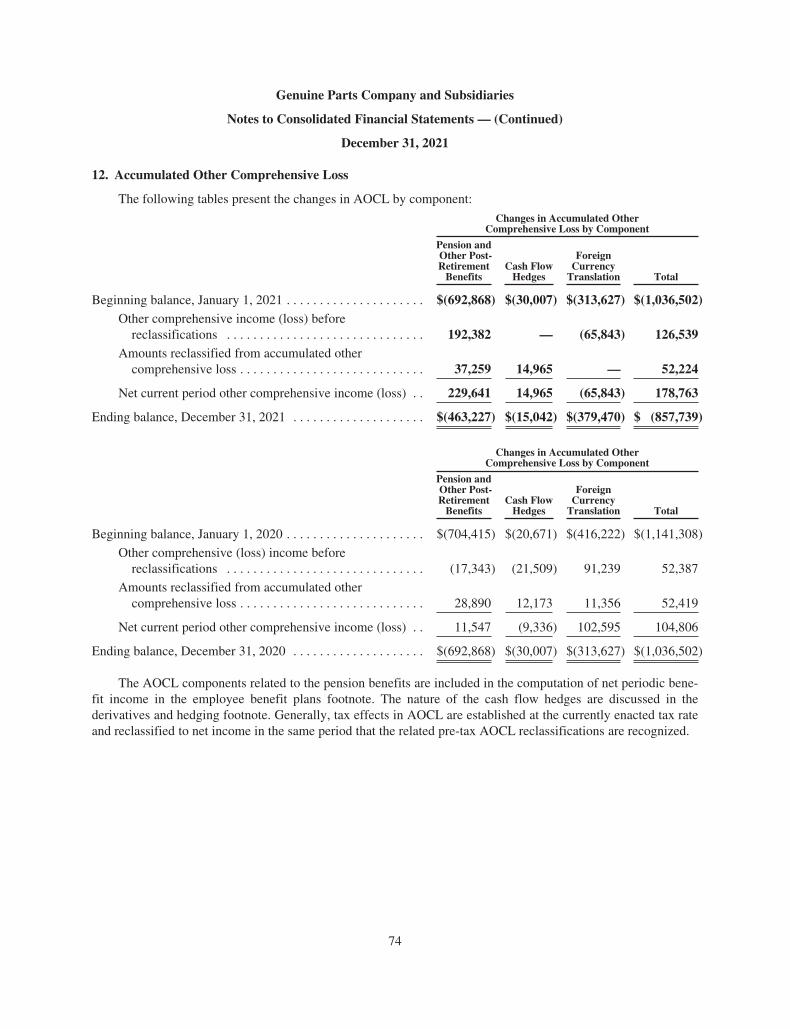
Genuine Parts Company and Subsidiaries
Notes to Consolidated Financial Statements — (Continued)
December 31, 2021
12. Accumulated Other Comprehensive Loss
The following tables present the changes in AOCL by component:
Changes in Accumulated OtherComprehensive Loss by Component
Pension andOther Post-Retirement
BenefitsCash Flow
Hedges
ForeignCurrency
Translation Total
Beginning balance, January 1, 2021 . . . . . . . . . . . . . . . . . . . . . $(692,868) $(30,007) $(313,627) $(1,036,502)Other comprehensive income (loss) before
reclassifications . . . . . . . . . . . . . . . . . . . . . . . . . . . . . . 192,382 — (65,843) 126,539Amounts reclassified from accumulated other
comprehensive loss . . . . . . . . . . . . . . . . . . . . . . . . . . . . 37,259 14,965 — 52,224
Net current period other comprehensive income (loss) . . 229,641 14,965 (65,843) 178,763
Ending balance, December 31, 2021 . . . . . . . . . . . . . . . . . . . . $(463,227) $(15,042) $(379,470) $ (857,739)
Changes in Accumulated OtherComprehensive Loss by Component
Pension andOther Post-Retirement
BenefitsCash Flow
Hedges
ForeignCurrency
Translation Total
Beginning balance, January 1, 2020 . . . . . . . . . . . . . . . . . . . . . $(704,415) $(20,671) $(416,222) $(1,141,308)
Other comprehensive (loss) income beforereclassifications . . . . . . . . . . . . . . . . . . . . . . . . . . . . . . (17,343) (21,509) 91,239 52,387
Amounts reclassified from accumulated othercomprehensive loss . . . . . . . . . . . . . . . . . . . . . . . . . . . . 28,890 12,173 11,356 52,419
Net current period other comprehensive income (loss) . . 11,547 (9,336) 102,595 104,806
Ending balance, December 31, 2020 . . . . . . . . . . . . . . . . . . . . $(692,868) $(30,007) $(313,627) $(1,036,502)
The AOCL components related to the pension benefits are included in the computation of net periodic bene-fit income in the employee benefit plans footnote. The nature of the cash flow hedges are discussed in thederivatives and hedging footnote. Generally, tax effects in AOCL are established at the currently enacted tax rateand reclassified to net income in the same period that the related pre-tax AOCL reclassifications are recognized.
74
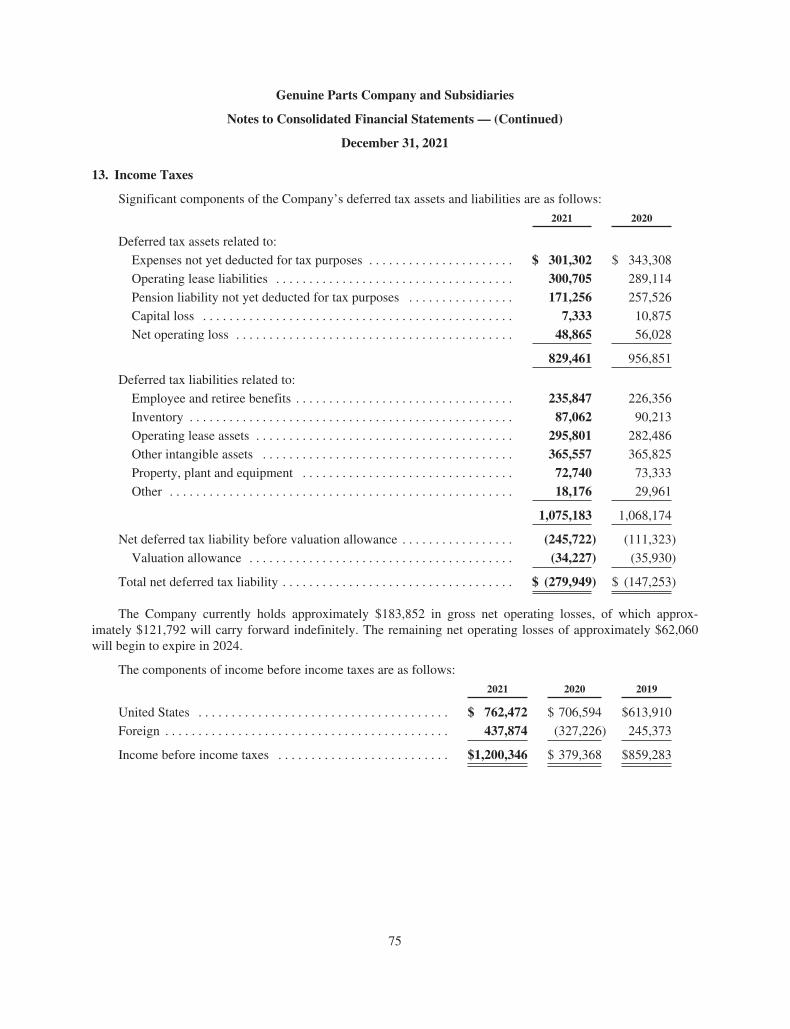
Genuine Parts Company and Subsidiaries
Notes to Consolidated Financial Statements — (Continued)
December 31, 2021
13. Income Taxes
Significant components of the Company’s deferred tax assets and liabilities are as follows:
2021 2020
Deferred tax assets related to:
Expenses not yet deducted for tax purposes . . . . . . . . . . . . . . . . . . . . . . $ 301,302 $ 343,308
Operating lease liabilities . . . . . . . . . . . . . . . . . . . . . . . . . . . . . . . . . . . . 300,705 289,114
Pension liability not yet deducted for tax purposes . . . . . . . . . . . . . . . . 171,256 257,526
Capital loss . . . . . . . . . . . . . . . . . . . . . . . . . . . . . . . . . . . . . . . . . . . . . . . 7,333 10,875
Net operating loss . . . . . . . . . . . . . . . . . . . . . . . . . . . . . . . . . . . . . . . . . . 48,865 56,028
829,461 956,851
Deferred tax liabilities related to:
Employee and retiree benefits . . . . . . . . . . . . . . . . . . . . . . . . . . . . . . . . . 235,847 226,356
Inventory . . . . . . . . . . . . . . . . . . . . . . . . . . . . . . . . . . . . . . . . . . . . . . . . . 87,062 90,213
Operating lease assets . . . . . . . . . . . . . . . . . . . . . . . . . . . . . . . . . . . . . . . 295,801 282,486
Other intangible assets . . . . . . . . . . . . . . . . . . . . . . . . . . . . . . . . . . . . . . 365,557 365,825
Property, plant and equipment . . . . . . . . . . . . . . . . . . . . . . . . . . . . . . . . 72,740 73,333
Other . . . . . . . . . . . . . . . . . . . . . . . . . . . . . . . . . . . . . . . . . . . . . . . . . . . . 18,176 29,961
1,075,183 1,068,174
Net deferred tax liability before valuation allowance . . . . . . . . . . . . . . . . . (245,722) (111,323)
Valuation allowance . . . . . . . . . . . . . . . . . . . . . . . . . . . . . . . . . . . . . . . . (34,227) (35,930)
Total net deferred tax liability . . . . . . . . . . . . . . . . . . . . . . . . . . . . . . . . . . . $ (279,949) $ (147,253)
The Company currently holds approximately $183,852 in gross net operating losses, of which approx-imately $121,792 will carry forward indefinitely. The remaining net operating losses of approximately $62,060will begin to expire in 2024.
The components of income before income taxes are as follows:
2021 2020 2019
United States . . . . . . . . . . . . . . . . . . . . . . . . . . . . . . . . . . . . . . $ 762,472 $ 706,594 $613,910
Foreign . . . . . . . . . . . . . . . . . . . . . . . . . . . . . . . . . . . . . . . . . . . 437,874 (327,226) 245,373
Income before income taxes . . . . . . . . . . . . . . . . . . . . . . . . . . $1,200,346 $ 379,368 $859,283
75
Genuine Parts Company and Subsidiaries
Notes to Consolidated Financial Statements — (Continued)
December 31, 2021
The components of income tax expense are as follows:
2021 2020 2019
Current:Federal . . . . . . . . . . . . . . . . . . . . . . . . . . . . . . . . . . . . . . . . . . . $116,425 $130,680 $162,883State . . . . . . . . . . . . . . . . . . . . . . . . . . . . . . . . . . . . . . . . . . . . . 34,311 35,474 45,488Foreign . . . . . . . . . . . . . . . . . . . . . . . . . . . . . . . . . . . . . . . . . . . 119,144 77,541 60,376
Deferred:Federal . . . . . . . . . . . . . . . . . . . . . . . . . . . . . . . . . . . . . . . . . . . 24,233 2,048 (21,617)State . . . . . . . . . . . . . . . . . . . . . . . . . . . . . . . . . . . . . . . . . . . . . 9,485 801 (11,273)Foreign . . . . . . . . . . . . . . . . . . . . . . . . . . . . . . . . . . . . . . . . . . . (2,042) (30,571) (23,049)
$301,556 $215,973 $212,808
The reasons for the difference between total tax expense and the amount computed by applying the statutoryFederal income tax rate to income before income taxes are as follows:
2021 2020 2019
Statutory rate applied to income(1) . . . . . . . . . . . . . . . . . . . . . . . $252,073 $ 79,667 $180,449Plus state income taxes, net of Federal tax benefit . . . . . . . . . . . 34,599 28,658 27,030Taxation of foreign operations, net(2) . . . . . . . . . . . . . . . . . . . . . 2,299 (9,072) (17,663)U.S. tax reform — transition tax(3) . . . . . . . . . . . . . . . . . . . . . . . — — 4,492Non-deductible goodwill impairment tax effect . . . . . . . . . . . . . — 106,411 —Foreign rate change — deferred tax remeasurement . . . . . . . . . . 17,032 9,045 6,215Valuation allowance . . . . . . . . . . . . . . . . . . . . . . . . . . . . . . . . . . . (2,486) 1,995 4,503Other . . . . . . . . . . . . . . . . . . . . . . . . . . . . . . . . . . . . . . . . . . . . . . . (1,961) (731) 7,782
$301,556 $215,973 $212,808
(1) U.S. statutory rates applied to income are as follows: 2021, 2020 and 2019 at 21%.
(2) The Company’s effective tax rate reflects the impact of having operations outside of the U.S. which are taxedat statutory rates different from the U.S. statutory rate, with some income being fully or partially exemptfrom income taxes due to various operating and financing activities.
(3) Impact of the Tax Cuts and Jobs Act, enacted December 22, 2017.
The Company accounts for Global Intangible Low Taxed income in the year the tax is incurred as a periodcost.
The Company, or one of its subsidiaries, files income tax returns in the U.S., various states, and foreign juris-dictions. With few exceptions, the Company is no longer subject to federal, state and local tax examinations bytax authorities for years before 2018 or subject to non-United States income tax examinations for years endedprior to 2013. The Company is currently under audit in the U.S. and some of its foreign jurisdictions. Someaudits may conclude in the next 12 months and the unrecognized tax benefits recorded in relation to the auditsmay differ from actual settlement amounts. It is not possible to estimate the effect, if any, of the amount of suchchange during the next 12 months to previously recorded uncertain tax positions in connection with the audits;however, the Company does not anticipate that total unrecognized tax benefits will significantly change in thenext 12 months.
76
Genuine Parts Company and Subsidiaries
Notes to Consolidated Financial Statements — (Continued)
December 31, 2021
A reconciliation of the beginning and ending amounts of unrecognized tax benefits is as follows:
2021 2020 2019
Balance at beginning of year . . . . . . . . . . . . . . . . . . . . . . . . . . . . . . . $23,237 $21,461 $18,428Additions based on tax positions related to the current year . . . . . . . 2,196 3,771 3,701Additions for tax positions of prior years . . . . . . . . . . . . . . . . . . . . . 156 3,480 620Reductions for tax positions for prior years . . . . . . . . . . . . . . . . . . . . (733) (1,382) (965)Reduction for lapse in statute of limitations . . . . . . . . . . . . . . . . . . . (2,843) (3,765) —Settlements . . . . . . . . . . . . . . . . . . . . . . . . . . . . . . . . . . . . . . . . . . . . . (2,512) (328) (323)
Balance at end of year . . . . . . . . . . . . . . . . . . . . . . . . . . . . . . . . . . . . $19,501 $23,237 $21,461
The amount of gross unrecognized tax benefits, including interest and penalties, as of December 31, 2021and 2020 was approximately $20,406 and $25,870, respectively, of which approximately $18,595 and $21,426,respectively, if recognized, would affect the effective tax rate.
During the tax years ended December 31, 2021, 2020 and 2019, the Company paid, received refunds, oraccrued insignificant interest and penalties. The Company recognizes potential interest and penalties related tounrecognized tax benefits as a component of income tax expense.
As of December 31, 2021, the Company estimates that it has an outside basis difference in certain foreignsubsidiaries of approximately $731,000, which includes the cumulative undistributed earnings from the Compa-ny’s foreign subsidiaries. The Company continues to be indefinitely reinvested in this outside basis difference.Determining the amount of net unrecognized deferred tax liability related to any additional outside basis differ-ence in these entities is not practicable. This is due to the complexities associated with the calculation todetermine residual taxes on the undistributed earnings, including the availability of foreign tax credits, applic-ability of any additional local withholding tax and other indirect tax consequences that may arise due to the dis-tribution of these earnings.
14. Guarantees
The Company guarantees the borrowings of certain independently controlled automotive parts stores andbusinesses (“independents”) and certain other affiliates in which the Company has a noncontrolling equityownership interest (“affiliates”). Presently, the independents are generally consolidated by unaffiliated enter-prises that have controlling financial interests through ownership of a majority voting interest in theindependents. The Company has no voting interest or equity conversion rights in any of the independents. TheCompany does not control the independents or the affiliates but receives a fee for the guarantees. The Companyhas concluded that the independents are variable interest entities, but that the Company is not the primary benefi-ciary. Specifically, the equity holders of the independents have the power to direct the activities that most sig-nificantly impact the entities’ economic performance including, but not limited to, decisions about hiring andterminating personnel, local marketing and promotional initiatives, pricing and selling activities, credit decisions,monitoring and maintaining appropriate inventories, and store hours. Separately, the Company concluded that theaffiliates are not variable interest entities. The Company’s maximum exposure to loss as a result of its involve-ment with these independents and affiliates is generally equal to the total borrowings subject to the Company’sguarantees. While such borrowings of the independents and affiliates are outstanding, the Company is required tomaintain compliance with certain covenants. At December 31, 2021, the Company was in compliance with allsuch covenants.
77
Genuine Parts Company and Subsidiaries
Notes to Consolidated Financial Statements — (Continued)
December 31, 2021
At December 31, 2021, the total borrowings of the independents and affiliates subject to guarantee by theCompany were approximately $917,461. These loans generally mature over periods from one to six years. TheCompany regularly monitors the performance of these loans and the ongoing operating results, financial con-dition and ratings from credit rating agencies of the independents and affiliates that participate in the guaranteeprograms. In the event that the Company is required to make payments in connection with these guarantees, theCompany would obtain and liquidate certain collateral pledged by the independents or affiliates (e.g., accountsreceivable and inventory) to recover all or a substantial portion of the amounts paid under the guarantees. TheCompany recognizes a liability equal to current expected credit losses over the lives of the loans in the guaran-teed loan portfolio, based on a consideration of historical experience, current conditions, the nature and expectedvalue of any collateral, and reasonable and supportable forecasts. To date, the Company has had no significantlosses in connection with guarantees of independents’ and affiliates’ borrowings and the current expected creditloss reserve is not material. As of December 31, 2021, there are no material guaranteed loans for which the bor-rower is experiencing financial difficulty and recovery is expected to be provided substantially through the oper-ation or sale of the collateral.
The Company has recognized certain assets and liabilities amounting to $81,000 and $81,000 for the guaran-tees related to the independents’ and affiliates’ borrowings at December 31, 2021 and 2020, respectively. Theseassets and liabilities are included in other assets and other long-term liabilities in the consolidated balance sheets.The liabilities relate to the Company’s noncontingent obligation to stand ready to perform under the guaranteeprograms and they are distinct from the Company’s current expected credit loss reserve.
15. Commitments and Contingencies
Legal Matters
The Company is subject to various legal proceedings, many involving routine litigation incidental to thebusinesses, including approximately 2,018 pending product liability lawsuits resulting from its national dis-tribution of automotive parts and supplies. Many of these involve claims of personal injury allegedly resultingfrom the use of automotive parts distributed by the Company. The amount accrued for pending and future claimsas of December 31, 2021 and 2020 was $180,746 and $169,461, respectively. While litigation of any type con-tains an element of uncertainty, the Company believes that its insurance coverage and its defense, and ultimateresolution of pending and reasonably anticipated claims will continue to occur within the ordinary course of theCompany’s business and that resolution of these claims will not have a material effect on the Company’s busi-ness, results of operations or financial condition.
On April 17, 2017, a jury awarded damages against the Company of $81,500 in a litigated automotive prod-uct liability dispute. Through post-trial motions and offsets from previous settlements, the initial verdict wasreduced to $77,100. The Company believed the verdict was not supported by the facts or the law and was con-trary to the Company’s role in the automotive parts industry. The Company challenged the verdict through anappeal to a higher court. On February 19, 2020, the Washington Court of Appeals issued an order entirely revers-ing the jury’s finding on damages and ordering a new trial on damages. The plaintiffs subsequently appealed thisorder to the Washington Supreme Court. On July 7, 2020, the Washington Supreme Court indicated that it wouldconsider a further appeal on this matter, and oral arguments occurred on November 10, 2020. On July 8, 2021,the Washington Supreme Court overturned the order of the Washington Court of Appeals and reinstated the trialcourt’s damage award of $77,100 against the Company. The Company recorded an adjustment to increase sell-ing, general and other expenses by approximately $77,421, inclusive of statutory interest and insurance coverage,in the consolidated statement of income for the year ended December 31, 2021. The damage award and statutoryinterest was fully paid as of December 31, 2021.
78
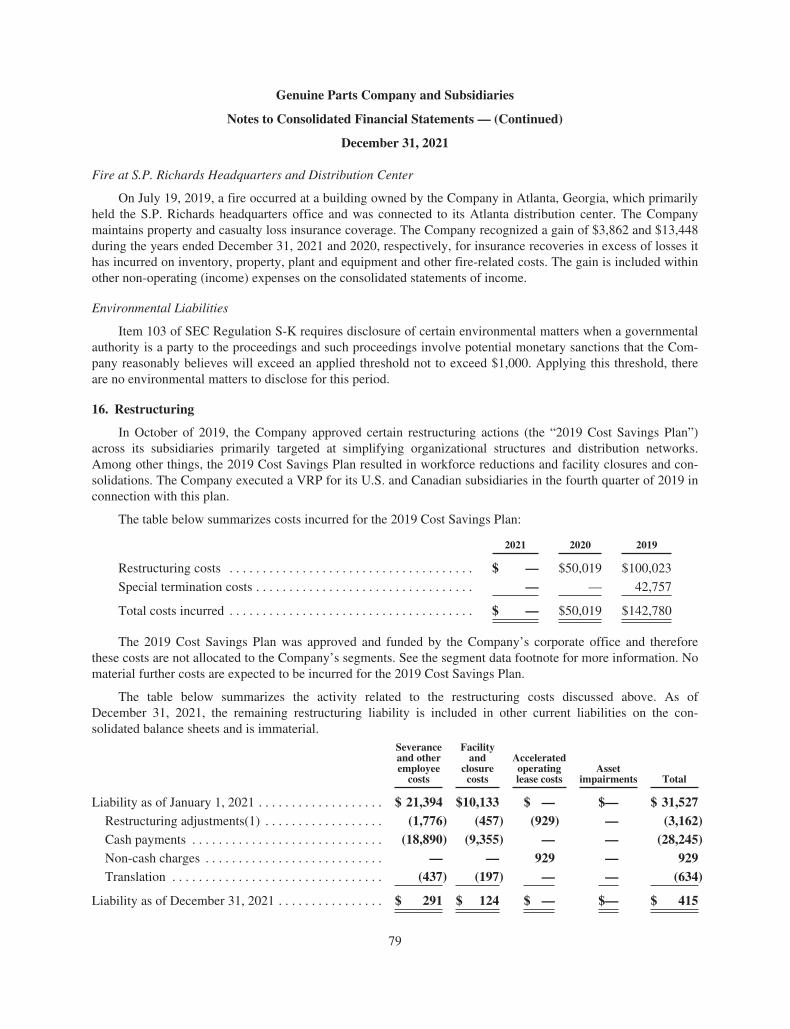
Genuine Parts Company and Subsidiaries
Notes to Consolidated Financial Statements — (Continued)
December 31, 2021
Fire at S.P. Richards Headquarters and Distribution Center
On July 19, 2019, a fire occurred at a building owned by the Company in Atlanta, Georgia, which primarilyheld the S.P. Richards headquarters office and was connected to its Atlanta distribution center. The Companymaintains property and casualty loss insurance coverage. The Company recognized a gain of $3,862 and $13,448during the years ended December 31, 2021 and 2020, respectively, for insurance recoveries in excess of losses ithas incurred on inventory, property, plant and equipment and other fire-related costs. The gain is included withinother non-operating (income) expenses on the consolidated statements of income.
Environmental Liabilities
Item 103 of SEC Regulation S-K requires disclosure of certain environmental matters when a governmentalauthority is a party to the proceedings and such proceedings involve potential monetary sanctions that the Com-pany reasonably believes will exceed an applied threshold not to exceed $1,000. Applying this threshold, thereare no environmental matters to disclose for this period.
16. Restructuring
In October of 2019, the Company approved certain restructuring actions (the “2019 Cost Savings Plan”)across its subsidiaries primarily targeted at simplifying organizational structures and distribution networks.Among other things, the 2019 Cost Savings Plan resulted in workforce reductions and facility closures and con-solidations. The Company executed a VRP for its U.S. and Canadian subsidiaries in the fourth quarter of 2019 inconnection with this plan.
The table below summarizes costs incurred for the 2019 Cost Savings Plan:
2021 2020 2019
Restructuring costs . . . . . . . . . . . . . . . . . . . . . . . . . . . . . . . . . . . . . $ — $50,019 $100,023
Special termination costs . . . . . . . . . . . . . . . . . . . . . . . . . . . . . . . . . — — 42,757
Total costs incurred . . . . . . . . . . . . . . . . . . . . . . . . . . . . . . . . . . . . . $ — $50,019 $142,780
The 2019 Cost Savings Plan was approved and funded by the Company’s corporate office and thereforethese costs are not allocated to the Company’s segments. See the segment data footnote for more information. Nomaterial further costs are expected to be incurred for the 2019 Cost Savings Plan.
The table below summarizes the activity related to the restructuring costs discussed above. As ofDecember 31, 2021, the remaining restructuring liability is included in other current liabilities on the con-solidated balance sheets and is immaterial.
Severanceand otheremployee
costs
Facilityand
closurecosts
Acceleratedoperatinglease costs
Assetimpairments Total
Liability as of January 1, 2021 . . . . . . . . . . . . . . . . . . . $ 21,394 $10,133 $ — $— $ 31,527Restructuring adjustments(1) . . . . . . . . . . . . . . . . . . (1,776) (457) (929) — (3,162)Cash payments . . . . . . . . . . . . . . . . . . . . . . . . . . . . . (18,890) (9,355) — — (28,245)Non-cash charges . . . . . . . . . . . . . . . . . . . . . . . . . . . — — 929 — 929Translation . . . . . . . . . . . . . . . . . . . . . . . . . . . . . . . . (437) (197) — — (634)
Liability as of December 31, 2021 . . . . . . . . . . . . . . . . $ 291 $ 124 $ — $— $ 415
79
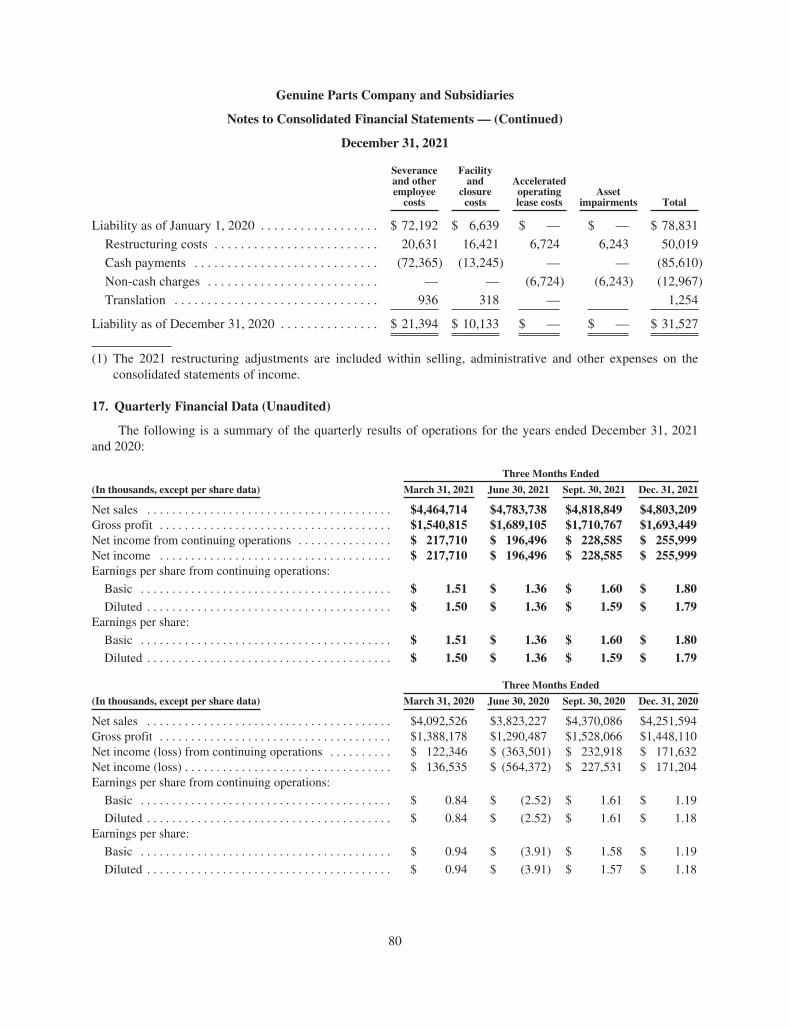
Genuine Parts Company and Subsidiaries
Notes to Consolidated Financial Statements — (Continued)
December 31, 2021
Severanceand otheremployee
costs
Facilityand
closurecosts
Acceleratedoperatinglease costs
Assetimpairments Total
Liability as of January 1, 2020 . . . . . . . . . . . . . . . . . . $ 72,192 $ 6,639 $ — $ — $ 78,831
Restructuring costs . . . . . . . . . . . . . . . . . . . . . . . . . 20,631 16,421 6,724 6,243 50,019
Cash payments . . . . . . . . . . . . . . . . . . . . . . . . . . . . (72,365) (13,245) — — (85,610)
Non-cash charges . . . . . . . . . . . . . . . . . . . . . . . . . . — — (6,724) (6,243) (12,967)
Translation . . . . . . . . . . . . . . . . . . . . . . . . . . . . . . . 936 318 — 1,254
Liability as of December 31, 2020 . . . . . . . . . . . . . . . $ 21,394 $ 10,133 $ — $ — $ 31,527
(1) The 2021 restructuring adjustments are included within selling, administrative and other expenses on theconsolidated statements of income.
17. Quarterly Financial Data (Unaudited)
The following is a summary of the quarterly results of operations for the years ended December 31, 2021and 2020:
Three Months Ended
(In thousands, except per share data) March 31, 2021 June 30, 2021 Sept. 30, 2021 Dec. 31, 2021
Net sales . . . . . . . . . . . . . . . . . . . . . . . . . . . . . . . . . . . . . . . $4,464,714 $4,783,738 $4,818,849 $4,803,209Gross profit . . . . . . . . . . . . . . . . . . . . . . . . . . . . . . . . . . . . . $1,540,815 $1,689,105 $1,710,767 $1,693,449Net income from continuing operations . . . . . . . . . . . . . . . $ 217,710 $ 196,496 $ 228,585 $ 255,999Net income . . . . . . . . . . . . . . . . . . . . . . . . . . . . . . . . . . . . . $ 217,710 $ 196,496 $ 228,585 $ 255,999Earnings per share from continuing operations:
Basic . . . . . . . . . . . . . . . . . . . . . . . . . . . . . . . . . . . . . . . . $ 1.51 $ 1.36 $ 1.60 $ 1.80Diluted . . . . . . . . . . . . . . . . . . . . . . . . . . . . . . . . . . . . . . . $ 1.50 $ 1.36 $ 1.59 $ 1.79
Earnings per share:
Basic . . . . . . . . . . . . . . . . . . . . . . . . . . . . . . . . . . . . . . . . $ 1.51 $ 1.36 $ 1.60 $ 1.80Diluted . . . . . . . . . . . . . . . . . . . . . . . . . . . . . . . . . . . . . . . $ 1.50 $ 1.36 $ 1.59 $ 1.79
Three Months Ended
(In thousands, except per share data) March 31, 2020 June 30, 2020 Sept. 30, 2020 Dec. 31, 2020
Net sales . . . . . . . . . . . . . . . . . . . . . . . . . . . . . . . . . . . . . . . $4,092,526 $3,823,227 $4,370,086 $4,251,594Gross profit . . . . . . . . . . . . . . . . . . . . . . . . . . . . . . . . . . . . . $1,388,178 $1,290,487 $1,528,066 $1,448,110Net income (loss) from continuing operations . . . . . . . . . . $ 122,346 $ (363,501) $ 232,918 $ 171,632Net income (loss) . . . . . . . . . . . . . . . . . . . . . . . . . . . . . . . . . $ 136,535 $ (564,372) $ 227,531 $ 171,204Earnings per share from continuing operations:
Basic . . . . . . . . . . . . . . . . . . . . . . . . . . . . . . . . . . . . . . . . $ 0.84 $ (2.52) $ 1.61 $ 1.19
Diluted . . . . . . . . . . . . . . . . . . . . . . . . . . . . . . . . . . . . . . . $ 0.84 $ (2.52) $ 1.61 $ 1.18Earnings per share:
Basic . . . . . . . . . . . . . . . . . . . . . . . . . . . . . . . . . . . . . . . . $ 0.94 $ (3.91) $ 1.58 $ 1.19
Diluted . . . . . . . . . . . . . . . . . . . . . . . . . . . . . . . . . . . . . . . $ 0.94 $ (3.91) $ 1.57 $ 1.18
80
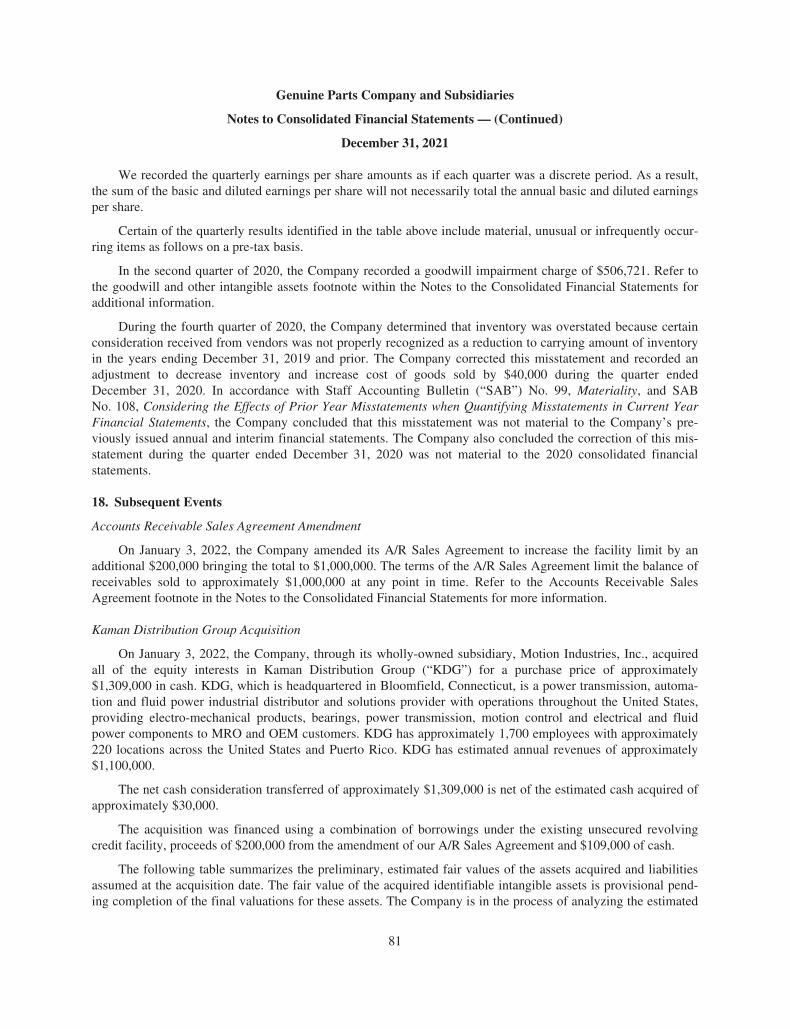
Genuine Parts Company and Subsidiaries
Notes to Consolidated Financial Statements — (Continued)
December 31, 2021
We recorded the quarterly earnings per share amounts as if each quarter was a discrete period. As a result,the sum of the basic and diluted earnings per share will not necessarily total the annual basic and diluted earningsper share.
Certain of the quarterly results identified in the table above include material, unusual or infrequently occur-ring items as follows on a pre-tax basis.
In the second quarter of 2020, the Company recorded a goodwill impairment charge of $506,721. Refer tothe goodwill and other intangible assets footnote within the Notes to the Consolidated Financial Statements foradditional information.
During the fourth quarter of 2020, the Company determined that inventory was overstated because certainconsideration received from vendors was not properly recognized as a reduction to carrying amount of inventoryin the years ending December 31, 2019 and prior. The Company corrected this misstatement and recorded anadjustment to decrease inventory and increase cost of goods sold by $40,000 during the quarter endedDecember 31, 2020. In accordance with Staff Accounting Bulletin (“SAB”) No. 99, Materiality, and SABNo. 108, Considering the Effects of Prior Year Misstatements when Quantifying Misstatements in Current YearFinancial Statements, the Company concluded that this misstatement was not material to the Company’s pre-viously issued annual and interim financial statements. The Company also concluded the correction of this mis-statement during the quarter ended December 31, 2020 was not material to the 2020 consolidated financialstatements.
18. Subsequent Events
Accounts Receivable Sales Agreement Amendment
On January 3, 2022, the Company amended its A/R Sales Agreement to increase the facility limit by anadditional $200,000 bringing the total to $1,000,000. The terms of the A/R Sales Agreement limit the balance ofreceivables sold to approximately $1,000,000 at any point in time. Refer to the Accounts Receivable SalesAgreement footnote in the Notes to the Consolidated Financial Statements for more information.
Kaman Distribution Group Acquisition
On January 3, 2022, the Company, through its wholly-owned subsidiary, Motion Industries, Inc., acquiredall of the equity interests in Kaman Distribution Group (“KDG”) for a purchase price of approximately$1,309,000 in cash. KDG, which is headquartered in Bloomfield, Connecticut, is a power transmission, automa-tion and fluid power industrial distributor and solutions provider with operations throughout the United States,providing electro-mechanical products, bearings, power transmission, motion control and electrical and fluidpower components to MRO and OEM customers. KDG has approximately 1,700 employees with approximately220 locations across the United States and Puerto Rico. KDG has estimated annual revenues of approximately$1,100,000.
The net cash consideration transferred of approximately $1,309,000 is net of the estimated cash acquired ofapproximately $30,000.
The acquisition was financed using a combination of borrowings under the existing unsecured revolvingcredit facility, proceeds of $200,000 from the amendment of our A/R Sales Agreement and $109,000 of cash.
The following table summarizes the preliminary, estimated fair values of the assets acquired and liabilitiesassumed at the acquisition date. The fair value of the acquired identifiable intangible assets is provisional pend-ing completion of the final valuations for these assets. The Company is in the process of analyzing the estimated
81
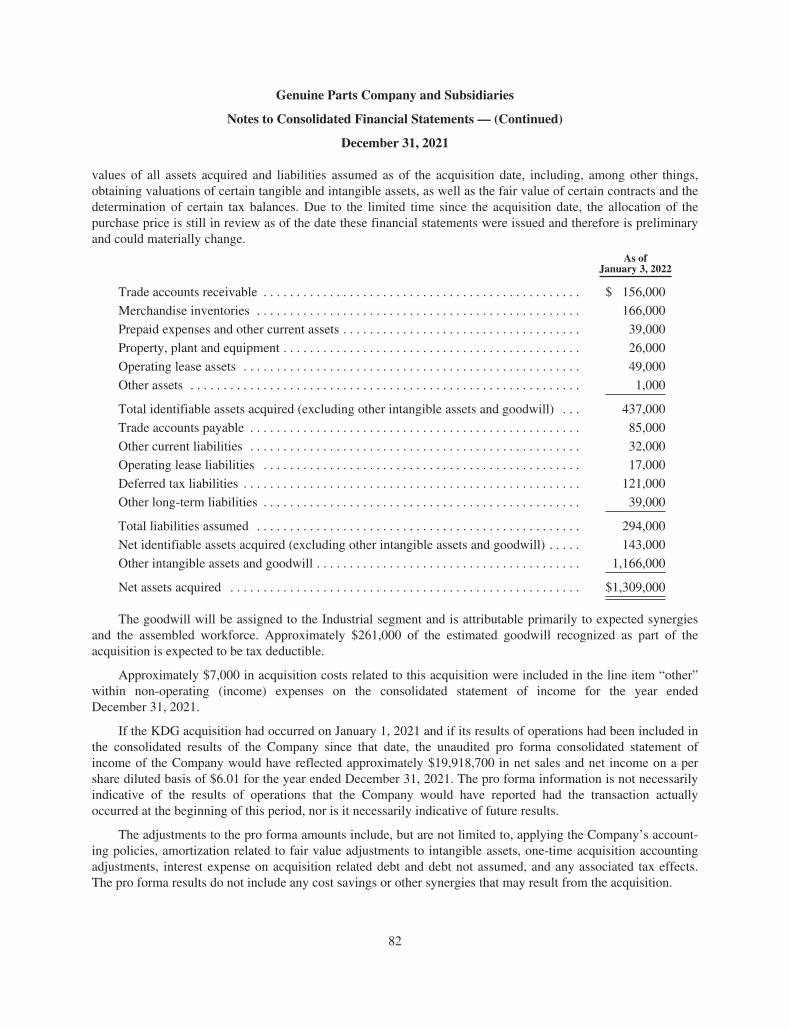
Genuine Parts Company and Subsidiaries
Notes to Consolidated Financial Statements — (Continued)
December 31, 2021
values of all assets acquired and liabilities assumed as of the acquisition date, including, among other things,obtaining valuations of certain tangible and intangible assets, as well as the fair value of certain contracts and thedetermination of certain tax balances. Due to the limited time since the acquisition date, the allocation of thepurchase price is still in review as of the date these financial statements were issued and therefore is preliminaryand could materially change.
As ofJanuary 3, 2022
Trade accounts receivable . . . . . . . . . . . . . . . . . . . . . . . . . . . . . . . . . . . . . . . . . . . . . . . . $ 156,000
Merchandise inventories . . . . . . . . . . . . . . . . . . . . . . . . . . . . . . . . . . . . . . . . . . . . . . . . . 166,000
Prepaid expenses and other current assets . . . . . . . . . . . . . . . . . . . . . . . . . . . . . . . . . . . . 39,000
Property, plant and equipment . . . . . . . . . . . . . . . . . . . . . . . . . . . . . . . . . . . . . . . . . . . . . 26,000
Operating lease assets . . . . . . . . . . . . . . . . . . . . . . . . . . . . . . . . . . . . . . . . . . . . . . . . . . . 49,000
Other assets . . . . . . . . . . . . . . . . . . . . . . . . . . . . . . . . . . . . . . . . . . . . . . . . . . . . . . . . . . . 1,000
Total identifiable assets acquired (excluding other intangible assets and goodwill) . . . 437,000
Trade accounts payable . . . . . . . . . . . . . . . . . . . . . . . . . . . . . . . . . . . . . . . . . . . . . . . . . . 85,000
Other current liabilities . . . . . . . . . . . . . . . . . . . . . . . . . . . . . . . . . . . . . . . . . . . . . . . . . . 32,000
Operating lease liabilities . . . . . . . . . . . . . . . . . . . . . . . . . . . . . . . . . . . . . . . . . . . . . . . . 17,000
Deferred tax liabilities . . . . . . . . . . . . . . . . . . . . . . . . . . . . . . . . . . . . . . . . . . . . . . . . . . . 121,000
Other long-term liabilities . . . . . . . . . . . . . . . . . . . . . . . . . . . . . . . . . . . . . . . . . . . . . . . . 39,000
Total liabilities assumed . . . . . . . . . . . . . . . . . . . . . . . . . . . . . . . . . . . . . . . . . . . . . . . . . 294,000
Net identifiable assets acquired (excluding other intangible assets and goodwill) . . . . . 143,000
Other intangible assets and goodwill . . . . . . . . . . . . . . . . . . . . . . . . . . . . . . . . . . . . . . . . 1,166,000
Net assets acquired . . . . . . . . . . . . . . . . . . . . . . . . . . . . . . . . . . . . . . . . . . . . . . . . . . . . . $1,309,000
The goodwill will be assigned to the Industrial segment and is attributable primarily to expected synergiesand the assembled workforce. Approximately $261,000 of the estimated goodwill recognized as part of theacquisition is expected to be tax deductible.
Approximately $7,000 in acquisition costs related to this acquisition were included in the line item “other”within non-operating (income) expenses on the consolidated statement of income for the year endedDecember 31, 2021.
If the KDG acquisition had occurred on January 1, 2021 and if its results of operations had been included inthe consolidated results of the Company since that date, the unaudited pro forma consolidated statement ofincome of the Company would have reflected approximately $19,918,700 in net sales and net income on a pershare diluted basis of $6.01 for the year ended December 31, 2021. The pro forma information is not necessarilyindicative of the results of operations that the Company would have reported had the transaction actuallyoccurred at the beginning of this period, nor is it necessarily indicative of future results.
The adjustments to the pro forma amounts include, but are not limited to, applying the Company’s account-ing policies, amortization related to fair value adjustments to intangible assets, one-time acquisition accountingadjustments, interest expense on acquisition related debt and debt not assumed, and any associated tax effects.The pro forma results do not include any cost savings or other synergies that may result from the acquisition.
82
Genuine Parts Company and Subsidiaries
Notes to Consolidated Financial Statements — (Continued)
December 31, 2021
1.750% and 2.750% Senior Note Offering
On January 6, 2022, the Company issued $500,000 aggregate principal amount of unsecured 1.750% SeniorNotes due 2025 at a price to the public of 99.721% of their face value with U.S. Bank National Association astrustee. Interest on the 1.750% Senior Notes due 2025 is payable semi-annually on February 1 and August 1 ofeach year, beginning on August 1, 2022, and is computed on the basis of a 360-day year. Simultaneously, onJanuary 6, 2022, the Company issued $500,000 aggregate principal amount of unsecured 2.750% Senior Notesdue 2032 at a price to the public of 98.810% of their face value with U.S. Bank National Association as trustee.Interest on the 2.750% Senior Notes due 2032 is payable semi-annually on February 1 and August 1 of each year,beginning on August 1, 2022, and is computed on the basis of a 360-day year.
The Company utilized the proceeds from this offering to repay a portion of the borrowings under the Revolv-ing Credit Facility incurred to finance a significant portion of the KDG Acquisition.
83
ITEM 9. CHANGES IN AND DISAGREEMENTS WITH ACCOUNTANTS ON ACCOUNTING ANDFINANCIAL DISCLOSURE.
Not applicable.
ITEM 9A. CONTROLS AND PROCEDURES.
Management’s conclusion regarding the effectiveness of disclosure controls and procedures
As of the end of the period covered by this report, an evaluation was performed under the supervision andwith the participation of the Company’s management, including the Chief Executive Officer (“CEO”) and ChiefFinancial Officer (“CFO”), of the effectiveness of the Company’s disclosure controls and procedures, as suchterm is defined in SEC Rule 13a-15(e). Based on that evaluation, the Company’s management, including theCEO and CFO, concluded that the Company’s disclosure controls and procedures were effective, as ofDecember 31, 2021, to ensure that material information was accumulated and communicated to our management,including our Chief Executive Officer and Chief Financial Officer, as appropriate to allow timely decisionsregarding required disclosure.
Management’s report on internal control over financial reporting
The management of Genuine Parts Company and its Subsidiaries (the “Company”) is responsible for estab-lishing and maintaining adequate internal control over financial reporting as defined in Rule 13a-15(f) under theSecurities Exchange Act of 1934.
The Company’s internal control system was designed to provide reasonable assurance to the Company’smanagement and to the board of directors regarding the preparation and fair presentation of the Company’s pub-lished consolidated financial statements. The Company’s internal control over financial reporting includes thosepolicies and procedures that:
i. pertain to the maintenance of records that, in reasonable detail, accurately and fairly reflect the trans-actions and dispositions of the assets of the Company;
ii. provide reasonable assurance that transactions are recorded as necessary to permit preparation of finan-cial statements in accordance with U.S. generally accepted accounting principles, and that receipts andexpenditures of the Company are being made only in accordance with authorizations of management and direc-tors of the Company; and
iii. provide reasonable assurance regarding prevention or timely detection of unauthorized acquisition, useor disposition of the Company’s assets that could have a material effect on the financial statements.
All internal control systems, no matter how well designed, have inherent limitations and may not prevent ordetect misstatements. Therefore, even those systems determined to be effective can provide only reasonableassurance with respect to financial statement preparation and presentation. Also, projections of any evaluation ofeffectiveness to future periods are subject to the risk that controls may become inadequate because of changes inconditions or that the degree of compliance with the policies or procedures may deteriorate.
The Company’s management, including our CEO and CFO, assessed the effectiveness of the Company’sinternal control over financial reporting as of December 31, 2021. In making this assessment, it used the criteriaset forth by the Committee of Sponsoring Organizations of the Treadway Commission (2013 framework)(“COSO”) in “Internal Control-Integrated Framework.” Based on this assessment, management concluded thatthe Company’s internal control over financial reporting was effective as of December 31, 2021.
Changes in internal control over financial reporting
There have been no changes in the Company’s internal control over financial reporting during the Compa-ny’s fourth fiscal quarter ended December 31, 2021 that have materially affected, or are reasonably likely tomaterially affect, the Company’s internal control over financial reporting.
84

The effectiveness of the Company’s internal control over financial reporting as of December 31, 2021 hasbeen audited by Ernst & Young LLP, an independent registered public accounting firm, which also audited ourConsolidated Financial Statements for the year ended December 31, 2021. Ernst & Young LLP’s report on ourinternal control over financial reporting is set forth below.
85
Report of Independent Registered Public Accounting Firm
To the Shareholders and the Board of Directors of Genuine Parts Company and Subsidiaries
Opinion on Internal Control over Financial Reporting
We have audited Genuine Parts Company and Subsidiaries’ internal control over financial reporting as ofDecember 31, 2021, based on criteria established in Internal Control—Integrated Framework issued by theCommittee of Sponsoring Organizations of the Treadway Commission (2013 framework) (the COSO criteria). Inour opinion, Genuine Parts Company and Subsidiaries (the Company) maintained, in all material respects, effec-tive internal control over financial reporting as of December 31, 2021, based on the COSO criteria.
We also have audited, in accordance with the standards of the Public Company Accounting Oversight Board(United States) (PCAOB), the consolidated balance sheets of Genuine Parts Company and Subsidiaries as ofDecember 31, 2021 and 2020, the related consolidated statements of income, comprehensive income, equity andcash flows for each of the three years in the period ended December 31, 2021, and the related notes and ourreport dated February 17, 2022 expressed an unqualified opinion thereon.
Basis of Opinion
The Company’s management is responsible for maintaining effective internal control over financial report-ing and for its assessment of the effectiveness of internal control over financial reporting included in the accom-panying Management’s Report on Internal Control over Financial Reporting. Our responsibility is to express anopinion on the Company’s internal control over financial reporting based on our audit. We are a public account-ing firm registered with the PCAOB and are required to be independent with respect to the Company in accord-ance with the U.S. federal securities laws and the applicable rules and regulations of the Securities and ExchangeCommission and the PCAOB.
We conducted our audit in accordance with the standards of the PCAOB. Those standards require that weplan and perform the audit to obtain reasonable assurance about whether effective internal control over financialreporting was maintained in all material respects.
Our audit included obtaining an understanding of internal control over financial reporting, assessing the riskthat a material weakness exists, testing and evaluating the design and operating effectiveness of internal controlbased on the assessed risk, and performing such other procedures as we considered necessary in the circum-stances. We believe that our audit provides a reasonable basis for our opinion.
Definition and Limitations of Internal Control Over Financial Reporting
A company’s internal control over financial reporting is a process designed to provide reasonable assuranceregarding the reliability of financial reporting and the preparation of financial statements for external purposes inaccordance with generally accepted accounting principles. A company’s internal control over financial reportingincludes those policies and procedures that (1) pertain to the maintenance of records that, in reasonable detail,accurately and fairly reflect the transactions and dispositions of the assets of the company; (2) provide reasonableassurance that transactions are recorded as necessary to permit preparation of financial statements in accordancewith generally accepted accounting principles, and that receipts and expenditures of the company are being madeonly in accordance with authorizations of management and directors of the company; and (3) provide reasonableassurance regarding prevention or timely detection of unauthorized acquisition, use, or disposition of the compa-ny’s assets that could have a material effect on the financial statements.
86

Because of its inherent limitations, internal control over financial reporting may not prevent or detect mis-statements. Also, projections of any evaluation of effectiveness to future periods are subject to the risk that con-trols may become inadequate because of changes in conditions, or that the degree of compliance with the policiesor procedures may deteriorate.
/s/ Ernst & Young LLP
Atlanta, GeorgiaFebruary 17, 2022
87

ITEM 9B. OTHER INFORMATION.
Not applicable.
ITEM 9C. DISCLOSURE REGARDING FOREIGN JURISDICTIONS THAT PREVENT INSPECTIONS
Not applicable.
88
PART III.
ITEM 10. DIRECTORS, EXECUTIVE OFFICERS AND CORPORATE GOVERNANCE.
INFORMATION ABOUT OUR EXECUTIVE OFFICERS.
Executive officers of the Company are appointed by the Board of Directors and each serves at the pleasureof the Board of Directors until his or her successor has been elected and qualified, or until his or her earlier death,resignation, removal, retirement or disqualification. The current executive officers of the Company are:
Paul D. Donahue, age 65, was appointed Chairman of the Board and Chief Executive Officer of theCompany in April of 2019. He served as President and Chief Executive Officer from May 2016 — April2019. Mr. Donahue was President of the Company from January 2012 until April 2019, and he has been aDirector of the Company since April 2012. Previously, Mr. Donahue served as President of the Company’sU.S. Automotive Parts Group from July 2009 to February 1, 2016. Mr. Donahue served as Executive VicePresident of the Company from August 2007 until his appointment as President in 2012. Previously,Mr. Donahue was President and Chief Operating Officer of S.P. Richards Company from 2004 to 2007 andwas Executive Vice President-Sales and Marketing in 2003, the year he joined the Company.
William P. Stengel, age 44, was appointed President of the Company on January 15, 2021. Mr. Stengelpreviously served as Executive Vice President and Chief Transformation Officer of the Company fromNovember 2019. Previously, Mr. Stengel worked for HD Supply, an Atlanta-based industrial distributor,where he served as President and Chief Executive Officer of HD Supply Facilities Maintenance, from Juneof 2017 to October of 2018. Prior to his role as President/CEO, he served as Chief Operating Officer for HDSupply Facilities Maintenance from September of 2016 to May of 2017 and prior to that role, he served asChief Commercial Officer of HD Supply Facilities Maintenance from January of 2016 to September of2016. Mr. Stengel served as Senior Vice President, Strategic Business Development and Investor Relationsof HD Supply from June of 2013 to January of 2016. Prior to HD Supply, Mr. Stengel worked in the Strate-gic Business Development group at the Home Depot as well as at Bank of America and Stonebridge Asso-ciates in various investment banking roles.
Carol B. Yancey, age 58, was appointed Executive Vice President and Chief Financial Officer of theCompany in March 2013, and also held the additional title of Corporate Secretary of the Company up toFebruary 2015. Ms. Yancey was Senior Vice President — Finance and Corporate Secretary from 2005 untilher appointment as Executive Vice President — Finance in November 2012. Previously, Ms. Yancey wasnamed Vice President of the Company in 1999 and Corporate Secretary in 1995. Prior to that, she served asAssistant Corporate Secretary from 1994 to 1995, Director of Shareholder Relations from 1992 to 1994, andDirector of Investor Relations in 1991, when she joined the Company.
James R. Neill, age 60, was appointed Executive Vice President and Chief Human Resource Officer ofthe Company in February of 2020. Prior to that, he served as Senior Vice President of Human Resourcesfrom April 2014 to February of 2020. Mr. Neill was Senior Vice President of Employee Development andHR Services from April 2013 until his appointment as Senior Vice President of Human Resources of theCompany. Previously, Mr. Neill served as the Senior Vice President of Human Resources at MotionIndustries from 2008 to 2013. Mr. Neill joined Motion in 2006 as Vice President of Human Resources andserved in that role from 2006 to 2007.
Randall P. Breaux, age 59, was appointed President of Motion Industries on January 1, 2019.Mr. Breaux was Executive Vice President of Marketing, Distribution, and Strategic Planning at Motion fromJanuary 2018 until his appointment to President. Previously, he served as Senior Vice President of Market-ing, Distribution, and Purchasing from 2015 to 2017. Mr. Breaux joined Motion in 2011 as Senior VicePresident of Marketing, Product Management, and Strategic Planning.
Kevin E. Herron, age 59, was appointed President of the U.S. Automotive Group on January 1, 2019.Mr. Herron previously served as Executive Vice President — U.S. Automotive Parts Group from 2018 to2019, and previous to that role, he was Group Senior Vice President of the U.S. Automotive Parts Group
89
from 2014 to 2018. From 2010 to 2014 he was Division Vice President for the Midwest of the U.S. Automo-tive Parts Group, and prior to that he was Regional Vice President for UAP, the Canadian division of theAutomotive Parts Group. He held that role from 2006 to 2010. Prior to that, Mr. Herron served as RegionalVice President of Corporate Stores from 2004 to 2006, and previously he was District Manager in Mainefrom 1995 to 2003 and held the same title in Vermont during 1994. Prior to those roles, he was AreaManager in Syracuse, New York from 1991 to 1993. Mr. Herron began his career at the Company as amanagement trainee in Syracuse and served in that role from 1989 to 1990.
Further information required by this item is set forth under the heading “Nominees for Director”, under theheading “Corporate Governance — Code of Conduct”, under the heading “Corporate Governance — BoardCommittees — Audit Committee”, and under the heading “Corporate Governance — Director Nominating Proc-ess” of the Proxy Statement and is incorporated herein by reference. We have adopted a Code of Conduct, whichis available on the “Investor Relations” section of our website. Any amendments to, or waivers of, the Code ofConduct will be disclosed on our website promptly following the date of such amendment or waiver.
ITEM 11. EXECUTIVE COMPENSATION.
Information required by this item is set forth under the headings “Executive Compensation”, “AdditionalInformation Regarding Executive Compensation”, “2021 Grants of Plan-Based Awards”, “2021 OutstandingEquity Awards at Fiscal Year-End”, “2021 Option Exercises and Stock Vested”, “2021 Pension Benefits”, “2021Nonqualified Deferred Compensation”, “Post Termination Payments and Benefits”, “Compensation, Nominatingand Governance Committee Report”, “Compensation, Nominating and Governance Committee Interlocks andInsider Participation” and “Compensation of Directors” of the Proxy Statement and is incorporated herein byreference.
ITEM 12. SECURITY OWNERSHIP OF CERTAIN BENEFICIAL OWNERS AND MANAGEMENTAND RELATED STOCKHOLDER MATTERS.
Certain information required by this item is set forth below. Additional information required by this item isset forth under the headings “Security Ownership of Certain Beneficial Owners” and “Security Ownership ofManagement” of the Proxy Statement and is incorporated herein by reference.
Equity Compensation Plan Information
The following table gives information as of December 31, 2021 about the common stock that may be issuedunder all of the Company’s existing equity compensation plans:
Plan Category
(a)Number of Securities tobe Issued upon Exerciseof Outstanding Options,Warrants and Rights(1)
(b)Weighted AverageExercise Price of
Outstanding Options,Warrants and Rights
(c) Number of SecuritiesRemaining Available forFuture Issuance UnderEquity Compensation
Plans (ExcludingSecurities
Reflected in Column (a))
Equity Compensation Plans Approved byShareholders: . . . . . . . . . . . . . . . . . . . . . . . . 282,400(2) $85.12 —
1,316,795(3) $95.60 7,362,781(5)Equity Compensation Plans Not Approved by
Shareholders: . . . . . . . . . . . . . . . . . . . . . . . . 128,027(4) n/a 871,973
Total . . . . . . . . . . . . . . . . . . . . . . . . . . . . . . . . 1,727,222 — 8,234,754
(1) Reflects the maximum number of shares issuable pursuant to the exercise or conversion of stock options,stock appreciation rights, restricted stock units and common stock equivalents. The actual number of sharesissued upon exercise of stock appreciation rights is calculated based on the excess of fair market value of ourcommon stock on date of exercise and the grant price of the stock appreciation rights.
90
(2) Genuine Parts Company 2006 Long-Term Incentive Plan
(3) Genuine Parts Company 2015 Incentive Plan
(4) Genuine Parts Company Directors’ Deferred Compensation Plan, as amended
(5) All of these shares are available for issuance pursuant to grants of full-value stock awards.
ITEM 13. CERTAIN RELATIONSHIPS AND RELATED TRANSACTIONS, AND DIRECTORINDEPENDENCE.
Information required by this item is set forth under the headings “Corporate Governance — IndependentDirectors” and “Transactions with Related Persons” of the Proxy Statement and is incorporated herein by refer-ence.
ITEM 14. PRINCIPAL ACCOUNTANT FEES AND SERVICES.
Information required by this item is set forth under the heading “Proposal 3. Ratification of Selection ofIndependent Auditors” of the Proxy Statement and is incorporated herein by reference.
91
PART IV.
ITEM 15. EXHIBITS AND FINANCIAL STATEMENT SCHEDULES.
(a) Documents filed as part of this report
(1) Financial Statements
The following consolidated financial statements of Genuine Parts Company and Subsidiaries areincorporated in this Item 15 by reference from Part II-Item 8. Financial Statements and Supplemental Dataincluded in this Annual Report on Form 10-K. See Index to Consolidated Financial Statements.
Report of independent registered public accounting firm on the financial statements
Consolidated balance sheets — December 31, 2021 and 2020
Consolidated statements of income — Years ended December 31, 2021, 2020 and 2019
Consolidated statements of comprehensive income — Years ended December 31, 2021, 2020 and 2019
Consolidated statements of equity — Years ended December 31, 2021, 2020 and 2019
Consolidated statements of cash flows — Years ended December 31, 2021, 2020 and 2019
Notes to consolidated financial statements — December 31, 2021
(2) Financial Statement Schedules
Schedules are omitted because the information is not required or because the information required isincluded in the financial statements or notes thereto.
(3) Exhibits
The following exhibits are filed as part of or incorporated by reference in this report. Exhibits that areincorporated by reference to documents filed previously by the Company under the Securities Exchange Act of1934, as amended, are filed with the Securities and Exchange Commission under File No. 1-5690. The Companywill furnish a copy of any exhibit upon request to the Company’s Corporate Secretary.
Instruments with respect to long-term debt where the total amount of securities authorized there under doesnot exceed 10% of the total assets of the Registrant and its subsidiaries on a consolidated basis have not beenfiled. The Registrant agrees to furnish to the Commission a copy of each such instrument upon request.Exhibit Number Description
Exhibit 2.1 Interest Purchase Agreement, by and among Ruby Holdings II, LLC, as the Company, RubyTopco LLC, as the Seller, Motion Industries, Inc., as the Buyer and Genuine Parts Company, asthe Parent, dated as of December 15, 2021
Exhibit 3.1 Amended and Restated Articles of Incorporation of the Company, as amended April 23, 2007.(Incorporated herein by reference from the Company’s Current Report on Form 8-K, datedApril 23, 2007.)
Exhibit 3.2 By-Laws of the Company, as amended and restated November 19, 2018. (Incorporated hereinby reference from the Company’s Current Report on Form 8-K, dated November 19, 2018.)
Exhibit 4.1 Description of Genuine Parts Company Common Stock.Exhibit 4.2 Specimen Common Stock Certificate. (Incorporated herein by reference from the Company’s
Registration Statement on Form S-1, Registration No. 33-63874.)Exhibit 4.3 Indenture, dated October 29, 2020, between the Company and U.S. Bank National Association
(Incorporated herein by reference from the Company’s Current Report on Form 8-K, datedOctober 27, 2020)
Exhibit 4.4 Officer’s Certificate, dated October 29, 2020, pursuant to Sections 3.01 and 3.03 of theIndenture, dated October 29, 2020, setting forth the terms of the 1.875% Senior Notes due 2030(Incorporated herein by reference from the Company’s Current Report on Form 8-K, datedOctober 27, 2020)
92
Exhibit Number Description
Exhibit 4.5 Form of 1.875% Senior Notes due 2030 (included in Exhibit 4.4)Exhibit 10.1* The Genuine Parts Company Tax-Deferred Savings Plan, effective January 1, 1993.
(Incorporated herein by reference from the Company’s Annual Report on Form 10-K, datedMarch 3, 1995.)
Exhibit 10.2* Amendment No. 1 to the Genuine Parts Company Tax-Deferred Savings Plan, dated June 1,1996, effective June 1, 1996. (Incorporated herein by reference from the Company’s AnnualReport on Form 10-K, dated March 7, 2005.)
Exhibit 10.3* Amendment No. 2 to the Genuine Parts Company Tax-Deferred Savings Plan, dated April 19,1999, effective April 19, 1999. (Incorporated herein by reference from the Company’s AnnualReport on Form10-K, dated March 10, 2000.)
Exhibit 10.4* Amendment No. 3 to the Genuine Parts Company Tax-Deferred Savings Plan, datedNovember 28, 2001, effective July 1, 2001. (Incorporated herein by reference from theCompany’s Annual Report on Form 10-K, dated March 7, 2002.)
Exhibit 10.5* Amendment No. 4 to the Genuine Parts Company Tax-Deferred Savings Plan, dated June 5,2003, effective June 5, 2003. (Incorporated herein by reference from the Company’s AnnualReport on Form 10-K, dated March 8, 2004.)
Exhibit 10.6* Amendment No. 5 to the Genuine Parts Company Tax-Deferred Savings Plan, datedDecember 28, 2005, effective January 1, 2006. (Incorporated herein by reference from theCompany’s Annual Report on Form 10-K, dated March 3, 2006.)
Exhibit 10.7* Amendment No. 6 to the Genuine Parts Company Tax-Deferred Savings Plan, datedNovember 28, 2007, effective January 1, 2008. (Incorporated herein by reference from theCompany’s Annual Report on Form 10-K, dated February 29, 2008.)
Exhibit 10.8* Amendment No. 7 to the Genuine Parts Company Tax-Deferred Savings Plan, datedNovember 16, 2010, effective January 1, 2011. (Incorporated herein by reference from theCompany’s Annual Report on Form 10-K, dated February 25, 2011.)
Exhibit 10.9* Amendment No. 8 to the Genuine Parts Company Tax-Deferred Savings Plan, datedDecember 7, 2012, effective December 7, 2012. (Incorporated herein by reference from theCompany’s Annual Report on Form 10-K, dated February 26, 2013.)
Exhibit 10.10* The Genuine Parts Company Original Deferred Compensation Plan, as amended and restatedas of August 19, 1996. (Incorporated herein by reference from the Company’s Annual Reporton Form 10-K, dated March 8, 2004.)
Exhibit 10.11* Amendment to the Genuine Parts Company Original Deferred Compensation Plan, datedApril 19, 1999, effective April 19, 1999. (Incorporated herein by reference from the Compa-ny’s Annual Report on Form 10-K, dated March 10, 2000.)
Exhibit 10.12* Genuine Parts Company Supplemental Retirement Plan, as amended and restated as of Jan-uary 1, 2009. (Incorporated herein by reference from the Company’s Annual Report on Form10-K, dated February 27, 2009.)
Exhibit 10.13* Amendment No. 1 to the Genuine Parts Company Supplemental Retirement Plan, as amendedand restated as of January 1, 2009, dated August 16, 2010, effective August 16, 2010.(Incorporated herein by reference from the Company’s Annual Report on Form 10-K, datedFebruary 25, 2011.)
Exhibit 10.14* Amendment No. 2 to the Genuine Parts Company Supplemental Retirement Plan, as amendedand restated as of January 1, 2009, dated November 16, 2010, effective January 1, 2011.(Incorporated herein by reference from the Company’s Annual Report on Form 10-K, datedFebruary 25, 2011.)
Exhibit 10.15* Amendment No. 3 to the Genuine Parts Company Supplemental Retirement Plan, as amendedand restated as of January 1, 2009, dated December 7, 2012, effective December 31, 2013.(Incorporated herein by reference from the Company’s Annual Report on Form 10-K, datedFebruary 26, 2013.)
Exhibit 10.16* Genuine Parts Company Directors’ Deferred Compensation Plan, as amended and restatedeffective January 1, 2003, and executed November 11, 2003. (Incorporated herein by referencefrom the Company’s Annual Report on Form 10-K, dated March 8, 2004.)
93
Exhibit Number Description
Exhibit 10.17* Amendment No. 1 to the Genuine Parts Company Directors’ Deferred Compensation Plan,dated November 19, 2007, effective January 1, 2008. (Incorporated herein by reference fromthe Company’s Annual Report on Form 10-K, dated February 29, 2008.)
Exhibit 10.18* Amendment No. 2 to the Genuine Parts Company Director’s Deferred Compensation Plan,dated December 7, 2012, effective December 7, 2012. (Incorporated herein by reference fromthe Company’s Annual Report on Form 10-K, dated February 26, 2013.)
Exhibit 10.19* Genuine Parts Company 2006 Long-Term Incentive Plan, effective April 17, 2006.(Incorporated herein by reference from the Company’s Current Report on Form 8-K, datedApril 18, 2006.)
Exhibit 10.20* Amendment to the Genuine Parts Company 2006 Long-Term Incentive Plan, datedNovember 20, 2006, effective November 20, 2006. (Incorporated herein by reference from theCompany’s Annual Report on Form 10-K, dated February 28, 2007.)
Exhibit 10.21* Amendment No. 2 to the Genuine Parts Company 2006 Long-Term Incentive Plan, datedNovember 19, 2007, effective November 19, 2007. (Incorporated herein by reference from theCompany’s Annual Report on Form 10-K, dated February 29, 2008.)
Exhibit 10.22* Genuine Parts Company 2015 Incentive Plan, effective November 17, 2014. (Incorporatedherein by reference from the Company’s Current Report on Form 8-K, dated April 28, 2015.)
Exhibit 10.30* Genuine Parts Company Performance Restricted Stock Unit Award Agreement. (Incorporatedherein by reference from the Company’s Quarterly Report on Form 10-Q, dated May 7, 2014.)
Exhibit 10.24* Genuine Parts Company Stock Appreciation Rights Agreement. (Incorporated herein by refer-ence from the Company’s Annual Report on Form 10-K, dated February 26, 2013.)
Exhibit 10.25* Form of Executive Officer Change in Control Agreement. (Incorporated herein by referencefrom the Company’s Annual Report on Form 10-K, dated February 26, 2015.)
Exhibit 10.26 Genuine Parts Company Note Purchase Agreement dated October 30, 2017 by and amongGenuine Parts Company, J.P. Morgan Securities, LLC and Merill Lynch, Pierce, Fenner &Smith Incorporated, as agents, and the other Lender Parties. (Incorporated herein by referencefrom the Company’s Annual Report on Form 10-K dated February 27, 2018.)
Exhibit 10.27 First Amendment, dated as of May 28, 2019, to Genuine Parts Company Note Purchase Agree-ment dated as of October 30, 2017 by and among Genuine Parts Company and each holder ofOriginal Notes party thereto (Incorporated herein by reference from the Company’s AnnualReport on Form 10-K, dated February 19, 2021).
Exhibit 10.28 Second Amendment, dated as of May 1, 2020, to Genuine Parts Company Note PurchaseAgreement dated as of October 30, 2017 by and among Genuine Parts Company and eachholder of Original Notes party thereto. (Incorporated herein by reference to the Company’sQuarterly Report on Form 10-Q dated July 30, 2020).
Exhibit 10.29* Genuine Parts Company Form of Restricted Stock Unit Award Certificate. (Incorporatedherein by reference from the Company’s Annual Report on Form 10-K, dated February 25,2019.)
Exhibit 10.30* Genuine Parts Company Form of Performance Restricted Stock Unit Award Certificate.(Incorporated herein by reference from the Company’s Annual Report on Form 10-K, datedFebruary 25, 2019.)
Exhibit 10.31* Description of Director Compensation (Incorporated herein by reference from the Company’sQuarterly Report on Form 10-Q, dated July 22, 2021).
Exhibit 10.32 Syndicated Facility Agreement dated October 30, 2020 among Genuine Parts Company, UAP,Inc., and Certain Designated Subsidiaries as Borrowers, JPMorgan Chase Bank, N.A., asAdministrative Agent, Domestic Swing Line Lender and L/C Issuer, JPMorgan Chase Bank,N.A., acting through its Toronto Branch, as Canadian Swing Line Lender and the other Lend-ers and L/C Issuers party thereto. (Incorporated herein by reference from the Company’s Cur-rent Report on Form 8-K dated November 2, 2020.)
94

Exhibit Number Description
Exhibit 10.33 First Amendment, dated as of September 30, 2021, to Genuine Parts Company SyndicatedFacility Agreement dated October 30, 2020 among Genuine Parts Company, UAP, Inc., andCertain Designated Subsidiaries as Borrowers, JPMorgan Chase Bank, N.A., as AdministrativeAgent, Domestic Swing Line Lender and L/C Issuer, JPMorgan Chase Bank, N.A., actingthrough its Toronto Bank, as Canadian Swing Line Lender and the other Lenders and L/CIssuers party thereto. (Incorporated herein by reference from the Company’s Quarterly Reporton Form 10-Q dated October 21, 2021.)
* Indicates management contracts and compensatory plans and arrangements.
Exhibit 21 Subsidiaries of the Company.Exhibit 23 Consent of Independent Registered Public Accounting Firm.Exhibit 31.1 Certification signed by Chief Executive Officer pursuant to SEC Rule 13a-14(a).Exhibit 31.2 Certification signed by Chief Financial Officer pursuant to SEC Rule 13a-14(a).Exhibit 32 Certification Pursuant to 18 U.S.C. Section 1350, as Adopted Pursuant to Section 906 of
the Sarbanes-Oxley Act of 2002, signed by the Chief Executive Officer and Chief Finan-cial Officer (furnished herewith)
Exhibit 101.INS XBRL Instance Document — The instance document does not appear in the interactivedata file because its XBRL tags are embedded within the inline XBRL document.
Exhibit 101.SCH XBRL Taxonomy Extension Schema DocumentExhibit 101.CAL XBRL Taxonomy Extension Calculation Linkbase DocumentExhibit 101.DEF XBRL Taxonomy Extension Definition Linkbase DocumentExhibit 101.LAB XBRL Taxonomy Extension Labels Linkbase DocumentExhibit 101.PRE XBRL Taxonomy Extension Presentation Linkbase DocumentExhibit 104 The cover page from this Annual Report on Form 10-K for the year ended December 31,
2021 formatted in Inline XBRL
ITEM 16. FORM 10-K SUMMARY.
Not applicable.
95
SIGNATURES.
Pursuant to the requirements of Section 13 or 15(d) of the Securities Exchange Act of 1934, the Registranthas duly caused this Report to be signed on its behalf by the undersigned, thereunto duly authorized.
Genuine Parts Company(Registrant)
Date: February 17, 2022 /s/ Paul D. Donahue
Paul D. DonahueChairman and Chief Executive Officer
Date: February 17, 2022 /s/ Carol B. Yancey
Carol B. Yancey
Executive Vice President and Chief Financial Officer(Duly Authorized Officer and Principal FinancialOfficer)
Date: February 17, 2022 /s/ Napoleon B. Rutledge Jr.
Napoleon B. Rutledge Jr.
Senior Vice President and Chief Accounting Officer(Duly Authorized Officer and Principal AccountingOfficer)
96
Pursuant to the requirements of the Securities Exchange Act of 1934, this Report has been signed below bythe following persons on behalf of the Registrant and in the capacities and on the dates indicated.
/s/ Paul D. Donahue 2/14/2022 /s/ Carol B. Yancey 2/14/2022
Paul D. Donahue (Date) Carol B. Yancey (Date)DirectorChairman and Chief Executive Officer(Principal Executive Officer)
Executive Vice President and Chief Finan-cial Officer (Principal Financial Officer)
/s/ Napoleon B. Rutledge Jr. 2/14/2022
Napoleon B. Rutledge Jr. (Date)Senior Vice President and Chief Accounting Officer(Duly Authorized Officer and Principal AccountingOfficer)
/s/ Elizabeth W. Camp 2/14/2022 /s/ Richard Cox, Jr. 2/14/2022
Elizabeth W. Camp (Date) Richard Cox, Jr. (Date)Director Director
/s/ Gary P. Fayard 2/14/2022 /s/ P. Russell Hardin 2/14/2022
Gary P. Fayard (Date) P. Russell Hardin (Date)Director Director
/s/ John R. Holder 2/14/2022 /s/ Donna W. Hyland 2/14/2022
John R. Holder Donna W. Hyland (Date)Director Director
/s/ John D. Johns 2/14/2022 /s/ Jean-Jacques Lafont 2/14/2022
John D. Johns (Date) Jean-Jacques Lafont (Date)Director Director
/s/ Robert C. Loudermilk, Jr. 2/14/2022 /s/ Wendy B. Needham 2/14/2022
Robert C. Loudermilk, Jr. (Date) Wendy B. Needham (Date)Director Director
/s/ Juliette W. Pryor 2/14/2022 /s/ E. Jenner Wood, III 2/14/2022
Juliette W. Pryor (Date) E. Jenner Wood, III (Date)Director Director
97

EXHIBIT 21SUBSIDIARIES OF THE COMPANY
(as of December 31, 2021)
Subsidiary Jurisdiction of Incorporation
NATIONAL AUTOMOTIVE PARTS ASSOCIATION, LLC . . . . . . . . 100.0% GEORGIAMOTION INDUSTRIES, INC. . . . . . . . . . . . . . . . . . . . . . . . . . . . . . . . . . 100.0% DELAWAREUAP INC. . . . . . . . . . . . . . . . . . . . . . . . . . . . . . . . . . . . . . . . . . . . . . . . . . 100.0% QUEBEC, CANADAGPC ASIA PACIFIC HOLDINGS PTY LTD . . . . . . . . . . . . . . . . . . . . . 100.0% VICTORIA, AUSTRALIAGPC EUROPE AUTOMOTIVE GROUP LTD. . . . . . . . . . . . . . . . . . . . . 100.0% LONDON, UNITED KINGDOMMOTION ASIA PACIFIC PTY LTD . . . . . . . . . . . . . . . . . . . . . . . . . . . . 100.0% SOUTH AUSTRALIA, AUSTRALIA
EXHIBIT 23
Consent of Independent Registered Public Accounting Firm
We consent to the incorporation by reference in the following Registration Statements:
(1) Registration Statement (Form S-8 No. 333-21969) pertaining to the Directors’ Deferred CompensationPlan of Genuine Parts Company and Subsidiaries,
(2) Registration Statement (Form S-8 No. 333-133362) pertaining to the 2006 Long-Term Incentive Planof Genuine Parts Company and Subsidiaries,
(3) Registration Statement (Form S-8 No. 333-204390) pertaining to the 2015 Incentive Plan of GenuineParts Company and Subsidiaries, and
(4) Registration Statement (Form S-3 No. 333-249625) of Genuine Parts Company;
of our reports dated February 17, 2022, with respect to the consolidated financial statements of Genuine PartsCompany and Subsidiaries and the effectiveness of internal control over financial reporting of Genuine PartsCompany and Subsidiaries included in this Annual Report (Form 10-K) of Genuine Parts Company for the yearended December 31, 2021.
/s/ Ernst & Young LLP
Atlanta, GeorgiaFebruary 17, 2022
EXHIBIT 31.1
CERTIFICATIONS
I, Paul D. Donahue, certify that:
1. I have reviewed this annual report on Form 10-K of Genuine Parts Company;
2. Based on my knowledge, this report does not contain any untrue statement of a material fact or omitto state a material fact necessary to make the statements made, in light of the circumstances underwhich such statements were made, not misleading with respect to the period covered by this report;
3. Based on my knowledge, the financial statements, and other financial information included in thisreport, fairly present in all material respects the financial condition, results of operations and cashflows of the registrant as of, and for, the periods presented in this report;
4. The registrant’s other certifying officer(s) and I are responsible for establishing and maintainingdisclosure controls and procedures (as defined in Exchange Act Rules 13a-15(e) and 15d-15(e)) andinternal control over financial reporting (as defined in Exchange Act Rules 13a-15(f) and 15d-15(f)) forthe registrant and have:
a) Designed such disclosure controls and procedures, or caused such disclosure controls and proce-dures to be designed under our supervision, to ensure that material information relating to the regis-trant, including its consolidated subsidiaries, is made known to us by others within those entities,particularly during the period in which this report is being prepared;
b) Designed such internal control over financial reporting, or caused such internal control overfinancial reporting to be designed under our supervision, to provide reasonable assurance regarding thereliability of financial reporting and the preparation of financial statements for external purposes inaccordance with generally accepted accounting principles;
c) Evaluated the effectiveness of the registrant’s disclosure controls and procedures and presentedin this report our conclusions about the effectiveness of the disclosure controls and procedures, as ofthe end of the period covered by this report based on such evaluation; and
d) Disclosed in this report any change in the registrant’s internal control over financial reportingthat occurred during the registrant’s most recent fiscal quarter (the registrant’s fourth fiscal quarter inthe case of an annual report) that has materially affected, or is reasonably likely to materially affect, theregistrant’s internal control over financial reporting; and
5. The registrant’s other certifying officer(s) and I have disclosed, based on our most recent evaluationof internal control over financial reporting, to the registrant’s auditors and the audit committee of theregistrant’s board of directors (or persons performing the equivalent functions):
a) All significant deficiencies and material weaknesses in the design or operation of internal con-trol over financial reporting which are reasonably likely to adversely affect the registrant’s ability torecord, process, summarize and report financial information; and
b) Any fraud, whether or not material, that involves management or other employees who have asignificant role in the registrant’s internal control over financial reporting.
/s/ Paul D. Donahue
Paul D. DonahueChairman and Chief Executive Officer
Date: February 17, 2022
EXHIBIT 31.2
CERTIFICATIONS
I, Carol B. Yancey, certify that:
1. I have reviewed this annual report on Form 10-K of Genuine Parts Company;
2. Based on my knowledge, this report does not contain any untrue statement of a material fact or omitto state a material fact necessary to make the statements made, in light of the circumstances underwhich such statements were made, not misleading with respect to the period covered by this report;
3. Based on my knowledge, the financial statements, and other financial information included in thisreport, fairly present in all material respects the financial condition, results of operations and cashflows of the registrant as of, and for, the periods presented in this report;
4. The registrant’s other certifying officer(s) and I are responsible for establishing and maintainingdisclosure controls and procedures (as defined in Exchange Act Rules 13a-15(e) and 15d-15(e)) andinternal control over financial reporting (as defined in Exchange Act Rules 13a-15(f) and 15d-15(f)) forthe registrant and have:
a) Designed such disclosure controls and procedures, or caused such disclosure controls and proce-dures to be designed under our supervision, to ensure that material information relating to the regis-trant, including its consolidated subsidiaries, is made known to us by others within those entities,particularly during the period in which this report is being prepared;
b) Designed such internal control over financial reporting, or caused such internal control overfinancial reporting to be designed under our supervision, to provide reasonable assurance regarding thereliability of financial reporting and the preparation of financial statements for external purposes inaccordance with generally accepted accounting principles;
c) Evaluated the effectiveness of the registrant’s disclosure controls and procedures and presentedin this report our conclusions about the effectiveness of the disclosure controls and procedures, as ofthe end of the period covered by this report based on such evaluation; and
d) Disclosed in this report any change in the registrant’s internal control over financial reportingthat occurred during the registrant’s most recent fiscal quarter (the registrant’s fourth fiscal quarter inthe case of an annual report) that has materially affected, or is reasonably likely to materially affect, theregistrant’s internal control over financial reporting; and
5. The registrant’s other certifying officer(s) and I have disclosed, based on our most recent evaluationof internal control over financial reporting, to the registrant’s auditors and the audit committee of theregistrant’s board of directors (or persons performing the equivalent functions):
a) All significant deficiencies and material weaknesses in the design or operation of internal con-trol over financial reporting which are reasonably likely to adversely affect the registrant’s ability torecord, process, summarize and report financial information; and
b) Any fraud, whether or not material, that involves management or other employees who have asignificant role in the registrant’s internal control over financial reporting.
/s/ Carol B. Yancey
Carol B. YanceyExecutive Vice President and Chief Financial Officer
Date: February 17, 2022
EXHIBIT 32
STATEMENT OF CHIEF EXECUTIVE OFFICER AND CHIEF FINANCIAL OFFICER OFGENUINE PARTS COMPANY
PURSUANT TO 18 U.S.C. SECTION 1350,AS ADOPTED PURSUANT TO
§ 906 OF THE SARBANES-OXLEY ACT OF 2002
In connection with the Annual Report of Genuine Parts Company (the “Company”) on Form 10-K for the yearended December 31, 2021 as filed with the Securities and Exchange Commission on the date hereof (the“Report”), I, Paul D. Donahue, Chairman and Chief Executive Officer of the Company, and, I, Carol B. Yancey,Executive Vice President and Chief Financial Officer of the Company, certify, pursuant to 18 U.S.C. § 1350, asadopted pursuant to § 906 of the Sarbanes-Oxley Act of 2002, that to the best of my knowledge:
1) The Report fully complies with the requirements of Section 13(a) or 15(d) of the SecuritiesExchange Act of 1934; and
2) The information contained in the Report fairly presents, in all material respects, the financial con-dition and results of operations of the Company.
/s/ Paul D. Donahue /s/ Carol B. Yancey
Paul D. DonahueChairman and Chief Executive Officer
Carol B. YanceyExecutive Vice President and Chief Financial Officer
February 17, 2022 February 17, 2022

[THIS PAGE INTENTIONALLY LEFT BLANK]

[THIS PAGE INTENTIONALLY LEFT BLANK]
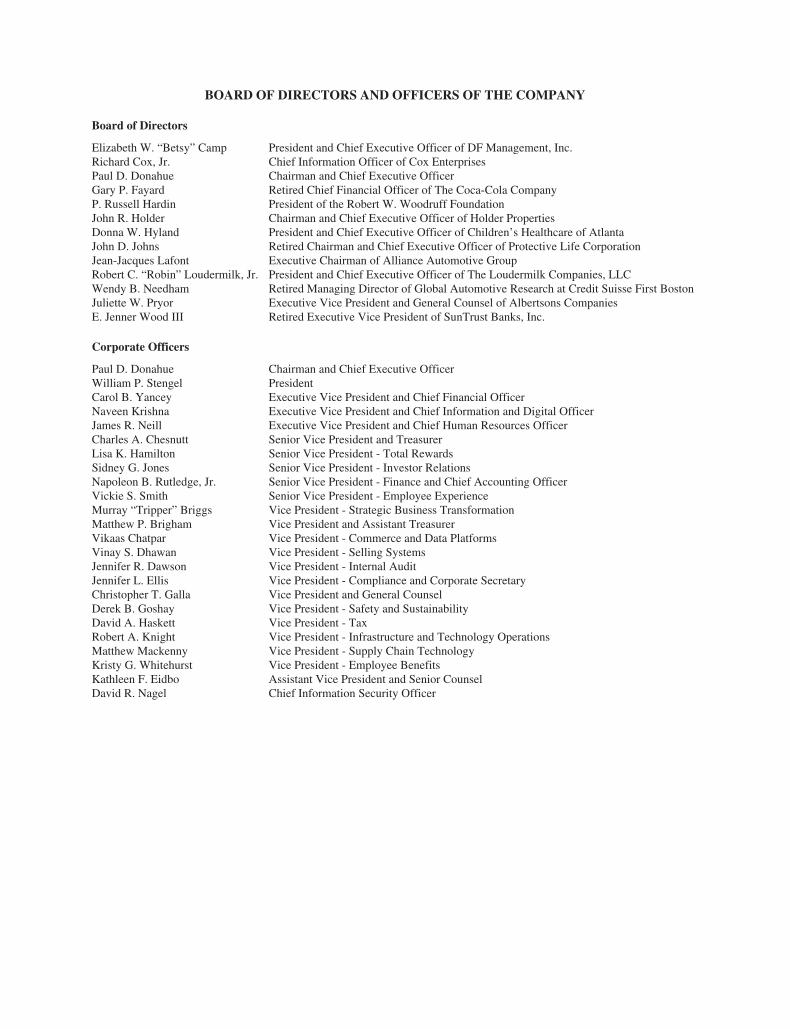
BOARD OF DIRECTORS AND OFFICERS OF THE COMPANY
Board of Directors
Elizabeth W. “Betsy” Camp President and Chief Executive Officer of DF Management, Inc.Richard Cox, Jr. Chief Information Officer of Cox EnterprisesPaul D. Donahue Chairman and Chief Executive OfficerGary P. Fayard Retired Chief Financial Officer of The Coca-Cola CompanyP. Russell Hardin President of the Robert W. Woodruff FoundationJohn R. Holder Chairman and Chief Executive Officer of Holder PropertiesDonna W. Hyland President and Chief Executive Officer of Children’s Healthcare of AtlantaJohn D. Johns Retired Chairman and Chief Executive Officer of Protective Life CorporationJean-Jacques Lafont Executive Chairman of Alliance Automotive GroupRobert C. “Robin” Loudermilk, Jr. President and Chief Executive Officer of The Loudermilk Companies, LLCWendy B. Needham Retired Managing Director of Global Automotive Research at Credit Suisse First BostonJuliette W. Pryor Executive Vice President and General Counsel of Albertsons CompaniesE. Jenner Wood III Retired Executive Vice President of SunTrust Banks, Inc.
Corporate Officers
Paul D. Donahue Chairman and Chief Executive OfficerWilliam P. Stengel PresidentCarol B. Yancey Executive Vice President and Chief Financial OfficerNaveen Krishna Executive Vice President and Chief Information and Digital OfficerJames R. Neill Executive Vice President and Chief Human Resources OfficerCharles A. Chesnutt Senior Vice President and TreasurerLisa K. Hamilton Senior Vice President - Total RewardsSidney G. Jones Senior Vice President - Investor RelationsNapoleon B. Rutledge, Jr. Senior Vice President - Finance and Chief Accounting OfficerVickie S. Smith Senior Vice President - Employee ExperienceMurray “Tripper” Briggs Vice President - Strategic Business TransformationMatthew P. Brigham Vice President and Assistant TreasurerVikaas Chatpar Vice President - Commerce and Data PlatformsVinay S. Dhawan Vice President - Selling SystemsJennifer R. Dawson Vice President - Internal AuditJennifer L. Ellis Vice President - Compliance and Corporate SecretaryChristopher T. Galla Vice President and General CounselDerek B. Goshay Vice President - Safety and SustainabilityDavid A. Haskett Vice President - TaxRobert A. Knight Vice President - Infrastructure and Technology OperationsMatthew Mackenny Vice President - Supply Chain TechnologyKristy G. Whitehurst Vice President - Employee BenefitsKathleen F. Eidbo Assistant Vice President and Senior CounselDavid R. Nagel Chief Information Security Officer

®

BOARD OF DIRECTORS
DIVIDEND REINVESTMENT PLAN AND ENROLLMENT INQUIRIES: www-us.computershare.com/investor/#directstock
SHAREHOLDER WEBSITE: www.computershare.com/investor
SHAREHOLDER ONLINE INQUIRIES: www-us.computershare.com/investor/contact
Left to right: Gary P. Fayard, Jean-Jacques Lafont, Robert C. “Robin” Loudermilk, Jr., John D. Johns, Juliette W. Pryor, Richard Cox, Jr., Elizabeth W. “Betsy” Camp, Wendy B. Needham, Paul D. Donahue, John R. Holder, E. Jenner Wood III, P. Russell Hardin, Donna W. Hyland.
ANNUAL MEETING OF SHAREHOLDERSIn response to continued public health concerns regarding in-person gatherings due to the global pandemic and to support the health and well-being of our teammates, shareholders, and all our stakeholders, the 2022 Annual Meeting will be held virtually at 10:00 a.m. eastern time on April 28, 2022. Detailed directions on how to access the meeting can be found in our 2022 proxy and notice of annual meeting.
SUSTAINABILITYThrough our Corporate Sustainability Update issued in September of 2021, we have provided greater transparency regarding our business and other matters that are of particular interest to our stakeholders, including human capital management disclosure, environmental sustainability programs, including our progress to reduce our carbon emissions, how we give back to the communities in which we operate, and our diversity, equity and inclusion initiatives, among others. The Company's sustainability reports are available at www.genpt.com
STOCK LISTING
Genuine Parts Company's common stock is traded on the New York Stock Exchange under the symbol "GPC".
STOCK TRANSFER AGENT, REGISTRAR OF STOCK, DIVIDEND DISBURSING AGENT AND OTHER SHAREHOLDER SERVICES
Communications concerning share transfer requirements, duplicate mailings, direct deposit of dividends, lost certificates or
dividend checks or change of address should be directed to the Company's transfer agent via mail or the shareholder website provided at the bottom of this page.
BY REGULAR MAIL
ComputersharePO BOX 505000Louisville, KY 40233-5000UNITED STATES
BY OVERNIGHT DELIVERY Computershare462 South 4th StreetSuite 1600Louisville, KY 40202UNITED STATES
DIVIDEND REINVESTMENT PLAN
Shareholders can build their investments in Genuine Parts Company through a low-cost
plan for automatically reinvesting dividends and by making optional cash purchases of the Company's stock. For plan and enrollment information, write to the stock transfer agent or visit the plan website provided on this page.
INVESTOR AND MEDIA RELATIONS
Investor and media inquiries should be directed to the following contacts at 678-934-5000:Investor Contact:Sid Jones, SVP Investor Relations Media Contact:Heather Ross, Sr. Director Strategic Communications
EXECUTIVE OFFICES
Genuine Parts Company 2999 Wildwood Parkway Atlanta, Georgia 30339 678-934-5000
OUR MISSIONEMPLOYER OF CHOICE SUPPLIER OF CHOICE VALUED CUSTOMER GOOD CORPORATE CITIZEN INVESTMENT OF CHOICE

GENUINE PARTS COMPANY2999 WILDWOOD PARKWAY | ATL ANTA, GA 30339 | 678-934-5000 | GENPT.COM


