Embed Size (px)
Citation preview
Global Initiative on Out-of-School Children
ALL CHILDREN IN SCHOOL BY 2015
DemocraticRepublic
of Congo
National Survey on the situation of out-of-school children and adolescents
February 2013
2
This report presents the results of a national survey on the situation of out-of-school children and adolescents in the Democratic Republic of Congo (OOSC-DRC) in 2012 organised by the Ministry of Primary, Secondary and Vocational Education and executed by the Higher Institute for Population Sciences of the University of Ouagadougou (ISSP / UO). OOSC-DRC was conducted with financial support from the UK Department for International Development (DFID) and technical support from the United Nations Children's Fund (UNICEF) and the UNESCO Institute for Statistics.
3
Acronyms and abbreviations ADB: African Development Bank CRC: Convention on the Rights of the Child CSP : CMF :
Vocational Specialisation Cycle Conceptual and Methodological Frameworks
DFID: UK Department For International Development PRGSP: Poverty Reduction and Growth Strategy Paper EFA Education For All EPSP: Primary, Secondary and Professional Education INS: National Institute for Statistics IMF International Monetary Fund IDA ISCED
International Development Association International Standard Classification of Education
MSA Ministry of Social Affairs IOM-DRC International Organisation for Migration in the Democratic Republic of Congo ISSP: Higher Institute for Population Sciences UIS: UNESCO Institute of Statistics MICS: Multiple Indicators Clusters Survey ILO: International Labour Organisation NGO: Non-Governmental Organisation GDP: Gross Domestic Product OOSC: Out-of-school children PIE: Interim Plan for Education PNMLS: National Multi-sector Programme for the Fight against AIDS HIPC: Heavily Indebted Poor Countries PROVED Educational Province SG General Secretariat EU European Union DRC: Democratic Republic of Congo TFP Technical and Financial Partners UCW: Understanding Child Work UNICEF: United Nations Children’s Fund USD WBG
United States Dollar World Bank Group
4
Foreword Education is an essential lever of development, particularly in the context of the Democratic Republic of Congo, where the State embarked several years ago, with support from the development communities and partners, on a process of pacification, economic regeneration and improvement of living conditions. Ensuring all children, adolescents and young people in the DRC a good education is not just about upholding a fundamental human right: it is also about providing opportunities to millions of Congolese people to exit from poverty and thus make a substantial contribution to the nation’s development. This is a priority matter for the Congolese State, as is clear from the Constitution of 18 February 2006 which, in several articles, enshrines compulsory and free primary education in public education establishments, affirms the principle of non-discrimination where education is concerned and sets out the need to eradicate illiteracy. Moreover, the Strategy document for the development of the Sub-sector of Primary, Secondary and Vocational Education 2010/2011-2015/2016 was formally adopted in March 2010. Its overall purpose is to ‘build a high-quality education system’. Also in 2010, His Excellency Joseph KABILA KABANGE, President of the Republic and Head of State, launched the policy of free primary education, initially for the first three years before gradually being extended to the entirety of this level of education. Progress has undoubtedly been made in recent years on education in the DRC. However, it must be admitted that challenges remain in terms of the output of reliable schooling statistics based on scientific evidence to facilitate decision-making. There are further challenges in the development of research methods and the introduction of mechanisms for the collection and processing of reliable data. The study of the situation of ‘Out-of-school children’, which is the subject of this report, addresses this shortcoming. Like other studies of the same kind carried out in 26 countries as part of the global initiative on out-of-school children, this study provides estimates of the scale of the phenomenon, describes the profile of the children concerned, identifies the obstacles and bottlenecks which prevent their schooling, and proposes possible solutions for the integration or reintegration of these children into the education system. It represents a mine of precious information which has become available at the perfect time. We are convinced that all stakeholders in the national education system will draw inspiration from this valuable document in their efforts to improve the equity, effectiveness and efficiency of the system, so that every Congolese child can gain access to high-quality education.
Maker MWANGU FAMBA Minister for Primary, Secondary and Vocational Education
5
Acknowledgements The study of Out-of-School Children in the Democratic Republic of Congo (OOSC-DRC) has been completed with the financial, technical and logistical support of several institutions and the involvement of several people. We therefore wish to extend our sincere thanks to the UK development cooperation body DFID (Felicity Townsend, Janice Dolan, Gabu Kongolo N'singa) for its considerable financial and technical support for the study, and to UNICEF for its monitoring the execution of the study and for its technical input and contribution to organisational matters (Barbara Bentein and Sylvie Fouet for their advocacy, Cecilia Baldeh, Ibrahima Diallo, Pascaline Mupaya, Yumiko Yokozeki, Dina Craissati and Tahina Razafindramary for their technical contributions and their steering of the study). We also wish to express our gratitude to the UNESCO Institute of Statistics (Thierry Lairez, Sheena Bell and Friedrich Huebler) for its technical support, to the Interministerial Technical Committee (Jovin Mukadi, François Kubindikila, Jean Bosco Kelekele, Joseph Kenseka, Jean Baptiste Mbaya Kashala, Henri Bobunda, Botiho Kumi, Marcel Ndiba, Johan Verhaghe, Pierre Gambembo) for technical guidance throughout the conduct of the study and to the Technical Support Unit (CAT) of the Ministry of EPSP (Valère Munsya, Néné Fwamba, Deo Gracias Nendumba and Nicole Fulakio) for technical, administrative and logistical organisation. Thanks are also due to the Higher Institute for Population Sciences (ISSP) of the University of Ouagadougou for coordinating the study via its research team led by Dr Jean-François Kobiané (Research Coordinator) and consisting of MrIdrissa Kaboré (Coordinator’s Permanent Representative in the DRC), Dr Bilampoa Gnoumou/Thiombiano, Dr Bonayi Dabiré, Mr Tinga Sinaré, Mr Simon Makaya, Dr Abdoulaye Ouédraogo, Ms Maria Sombugma, Mr Michel Kaboré, Mr Sié Somé, Prof. Barthélémy Kalambayi, Mr Dramane Boly, Mr Alexis Loyé, Mr Valérien Kafira, Ms Marie-Fidèle Kashimwabi, Mr Adrien Manzanza and the field supervisors and workers and data entry operators for their contribution to the completion of this important research for the DR Congo. We are grateful to Max Gasteen and Mukund Lad, whose comments enriched the final report. Finally, we would like to acknowledge and thank all those involved both at central level (“Partenaires Techniques et Financiers”, national federations, central services of ministries responsible for education, etc.) and at local level (governors’ offices, PROVED and Sub-PROVED, Representatives of the Ministry of Social Affairs, civil society organisations, the media) and the populations in all the selected zones. Without their commitment to the study as a worthwhile venture, the hospitality they extended to numerous survey workers and supervisors in the field and their availability for active participation in the interviews, it would not have been possible to put together the large body of information that made the survey possible.
6
Table of Contents
Acronyms and abbreviations .................................................................................................................................................................................... 3 Foreword ..................................................................................................................................................................................................................... 4 Acknowledgements ................................................................................................................................................................................................... 5 Table of Contents ...................................................................................................................................................................................................... 6 List of Graphs ........................................................................................................................................................................................................... 11 Summary .................................................................................................................................................................................................................. 12 I. Introduction ................................................................................................................................................................................................... 16
1.1 The DRC: context............................................................................................................................................................................. 16 1.1.1 Socio-economic and political situation............................................................................................................................... 16 1.1.2 Demographic context ........................................................................................................................................................... 17 1.1.3 The Congolese education system: educational policy and strategies ........................................................................... 18
1.2 Overall approach to the analysis of out-of-school children: five dimensions of exclusion ...................................................... 19 1.3 Methodology of the national survey on the situation of out-of-school children ........................................................................ 20
1.3.1 Specific characteristics and contributions of the OOSC survey ..................................................................................... 20 1.3.2 Definition of some key concepts ......................................................................................................................................... 21 1.3.3 Points about sampling ......................................................................................................................................................... 22 1.3.4 Methods of data analysis..................................................................................................................................................... 27 1.3.5 Extrapolation of data ............................................................................................................................................................ 28 1.3.6 Evaluation of data quality .................................................................................................................................................... 28
1.4 Overall figures of the surveyed population ................................................................................................................................... 28 1.4.1 Household survey................................................................................................................................................................. 28 1.4.2 Comparison of samples and coverage rates with the EDS (2007) and MICS (2010) surveys .................................. 30 1.4.3 Children and adolescents from broken families ............................................................................................................... 30
1.5 Limitations of the study .................................................................................................................................................................... 33 II. Profile of OOSC ........................................................................................................................................................................................... 35
2.1 School status .................................................................................................................................................................................... 35 2.1.1 Distribution of children and adolescents by school exposure according to age and sex ............................................ 35 2.1.2 Distribution of children and adolescents by school exposure according to area of residence ................................... 37 2.1.3 School exposure of children in childcare facilities and on the streets ........................................................................... 42
2.2 Profile of pre-primary school age OOSC (Dimension 1) ............................................................................................................. 43 2.2.1 Gender and geographical distribution of 3-5 year-old OOSC ......................................................................................... 43 2.2.2 Characteristics of the household head .............................................................................................................................. 44 2.2.3 Household income ............................................................................................................................................................... 45
2.3 Profile of primary and secondary age OOSC (Dimensions 2 and 3) ......................................................................................... 46 2.3.1 Gender and geographical distribution of 6-11 year-old and 12-13 year-old OOSC .................................................... 46 2.3.2 Characteristics of the household head .............................................................................................................................. 47 2.3.3 Household income ............................................................................................................................................................... 47 2.3.4 Typology of out-of-school children ..................................................................................................................................... 48
2.4 Profile of children at risk of dropping out from school (Dimension 4 and 5) ............................................................................. 48 2.4.1 Estimation of dropout risk from rates already observed .................................................................................................. 49 2.4.2 Risk of dropout during the cycle ......................................................................................................................................... 51 2.4.3 Age of school entry .............................................................................................................................................................. 51 2.4.4 Backwardness at school ...................................................................................................................................................... 52 2.4.5 Absenteeism during the 2010-2011 school year .............................................................................................................. 53 2.4.6 Population at risk of dropping out ....................................................................................................................................... 54
III. Obstacles and bottlenecks .................................................................................................................................................................... 60 3.1 Obstacles to schooling .................................................................................................................................................................... 60
3.1.1 Obstacles due to educational provision ............................................................................................................................. 60 3.1.2 Obstacles due to demand ................................................................................................................................................... 60
3.2 Factors in exclusion from school in the DRC ............................................................................................................................... 62 3.2.1 Socio-cultural demand factors and family environment .................................................................................................. 62 3.2.2 Educational capital as a demand factor ............................................................................................................................ 68 3.2.3 Economic factors in demand for schooling ....................................................................................................................... 69 3.2.4 Children out of school and involved in work ..................................................................................................................... 79 3.2.5 Supply side factors and obstacles...................................................................................................................................... 83 3.2.6 Factors relating to policy, governance and funding ......................................................................................................... 92
IV. Policies and strategies .......................................................................................................................................................................... 97 4.1 International standards to meet the five dimensions of exclusion ............................................................................................. 97 4.2 Inclusive education in the policy documents in the DRC ............................................................................................................ 97 4.3 Policies and strategies on the socio-cultural demand side ......................................................................................................... 98 4.4 Policies on economic demand ...................................................................................................................................................... 100 4.5 Policies on the supply side ........................................................................................................................................................... 100 4.6 Policy, management and governance ......................................................................................................................................... 101 4.7 Social protection ............................................................................................................................................................................. 102
V. Conclusion .................................................................................................................................................................................................. 105 Bibliography ............................................................................................................................................................................................................ 108 Appendix 1: Sampling errors ................................................................................................................................................................................ 112 Appendix 2: Formula for calculating the confidence interval of the difference between two proportions .................................................. 118 Appendix 3: Notes on logistic regression and the ranking of the factors of exclusion from school ............................................................ 119 Appendix 4: The tables ......................................................................................................................................................................................... 121 Characteristics ....................................................................................................................................................................................................... 127 School exposure .................................................................................................................................................................................................... 127 Appendix 5: Sampling ........................................................................................................................................................................................... 159
7
List of Tables
Table 1: List of qualitative interviews carried out ...........................................................................................................................................................................................................................27 Table 2: Number of households, number of individual interviews and response rates by area of residence (un-weighted results), DRC 2012 ................................................................29 Table 3: Rates of coverage (in %) of MICS and EDS surveys in various countries...................................................................................................................................................................30 Table 4: Number of households and response rates by area of residence EDS-RDC 2007, MICSRDC-2010 and OOSC-DRC 2012 ...............................................................................30 Table 5: Summary of people included in the survey on the streets and in childcare structures by category ..........................................................................................................................31 Table 6: Distribution (in %) by province of 5-17 year-olds living in care facilities or on the streets ..........................................................................................................................................31 Table 7: Family situation of 5-17 year-old children who are accommodated in childcare facilities and who are on the street, hosted ................................................................................32 Table 8: Distribution of 5-17 year-old children living on the streets by area of residence and place of birth ..........................................................................................................................32 Table 9: Family situation of different categories of children .........................................................................................................................................................................................................33 Table 10: Distribution of the school-age population by age group according to sex and area of residence ...........................................................................................................................35 Table 11: School exposure of 5-17 year-olds by age group and sex ..........................................................................................................................................................................................36 Table 12: School exposure of 5-17 year-old children by age group and area of residence ......................................................................................................................................................38 Table 13: School exposure of 5-17 year-old children accommodated in childcare facilities by age group (in %) ..................................................................................................................42 Table 14: School exposure of 5-17 year-old street children by age group (in %) ......................................................................................................................................................................43 Table 15: Distribution of pre-primary school age OOSC according to school exposure by sex, area of residence and province ........................................................................................44 Table 16: Distribution of pre-school age OOSC according to school exposure by characteristics of the household head .......................................................................................................45 Table 17: Distribution of pre-school age OOSC according to school exposure by monthly household income .....................................................................................................................45 Table 18: Distribution (in %) of OOSC according to school exposure and enrolment age (6-11 years and 12-13 years) by sex, age, area of residence and province .........................46 Table 19: Distribution of OOSC according to school exposure and enrolment age (6-11 years and 12-13 years) by selected characteristics ..................................................................47 Table 20: Distribution of OOSC according to school exposure and school enrolment age (6-11 years and 12-13 years) by monthly household income ................................................48 Table 21: Dropout rate (in %) by grade of primary and lower secondary school children .........................................................................................................................................................50 Table 22: Proportion (in %) of children enrolled in primary school who have fallen behind in the school system by sex and area of residence ...............................................................52 Table 23: Proportion (in %) of children enrolled in lower secondary school who have fallen behind in the school system by sex and area of residence ...................................................53 Table 24: Proportions of absences (per thousand) by province, sex and area, school year 2010-2011 .................................................................................................................................53 Table 25: Proportion of absentees according to level and class .................................................................................................................................................................................................54 Table 26: Average duration of absence in weeks by province according to area of residence ..................................................................................................................................................54 Table 27: Profile of the population at risk of dropping out ............................................................................................................................................................................................................56 Table 28: Overview of the scale of the OOSC phenomenon according to the five dimensions ..................................................................................................................................................58 Table 29: Structure (in %) of households’ education expenditure by expenditure item (in USD) for 2010-2011, by province and area of residence ........................................................75 Table 30: Average household expenditure on education (in USD) for the 2010-2011 school year, by geographical area of residence .............................................................................76 Table 31: Share of households’ estimated expenditure on education in annual income(in USD) for year 2010-2011, by geographical area of residence ..............................................77 Table 32: Proportions of primary and secondary school age OOSC involved in work according to the characteristics of the children and their household ............................................80 Table 33: Proportion (in %) of primary and secondary age children who work according to school exposure, age and sex ................................................................................................81 Table 34: Proportion of primary and secondary age children who work by school exposure according to selected household characteristics .................................................................82 Table 35: Distribution (in %) of pre-primary, primary and secondary schools by province from 2006 to 2011 .......................................................................................................................84 Table 36: Class per school and pupils per class in pre-primary and primary education by province from 2006 to 2011 ......................................................................................................84 Table 37: Distribution (in %) of educators and teachers in primary and secondary school by province from 2006 to 2011 .................................................................................................87 Table 38: Distribution of 6-17 year-old children with a disability by type of disability ................................................................................................................................................................88 Table 39: Distribution of 7-12 year-old primary school children in 2010-2011 according to provision of textbooks by area of residence and sex.............................................................90 Table 40: Distribution (in %) of7-12 year-old children enrolled in primary school in 2010-2011 according to the provision of textbooks by province .......................................................91 Table 41: Relationship between household spending on education and the education budget (amounts in USD) ...............................................................................................................92 Table 42: Key policies to meet the challenges of OOSC ..............................................................................................................................................................................................................97 Table 43: Policies and strategies to address socio-cultural obstacles ........................................................................................................................................................................................99 Table 44: Policies and strategies to address economic obstacles ............................................................................................................................................................................................ 100 Table 45: Policies and strategies to address the obstacles related to supply .......................................................................................................................................................................... 101 Table 46: Policies and strategies to address obstacles related to management and governance......................................................................................................................................... 102 Table 47: Some strategies or actions targeting vulnerable groups ........................................................................................................................................................................................... 103 Table A1: r value and distribution of the OOSC-DRC sample per stratum ............................................................................................................................................................................... 121 Table A2: School exposure of 5-17 year-olds by age (in %) ...................................................................................................................................................................................................... 123 Table A3: School exposure of 5-17 year-olds by age and sex (in %) ........................................................................................................................................................................................ 124 Table A4: School exposure of 5-17 year-olds by age and area of residence (in %) ................................................................................................................................................................ 125 Table A5: School exposure of school-age children by gender and province(in %) .................................................................................................................................................................. 126 Table A6: School exposure of 6-11 year-olds by gender and province (in %) ......................................................................................................................................................................... 127 Table A7: Children in exclusion dimensions 2 and 3 by sex and OOSC classification and by area of residence and OOSC classification (in %) .......................................................... 128 Table A8: School exposure of 5-17 year-olds from broken families by province(in %) ........................................................................................................................................................... 129 Table A9: Distribution of pre-primary age out-of-school children according to school exposure by selected characteristics ............................................................................................. 130 Table A10: Distribution of pre-primary age out-of-school children according to school exposure by selected characteristics ........................................................................................... 131 Table A11: School exposure of 5-17 year-olds by area of residence and monthly household income class (in %)............................................................................................................. 132 Table A12: Distribution (in %) of primary and secondary age OOSC according to monthly household income class by area of residence ..................................................................... 133 Table A13: Distribution (in %) of primary and secondary age OOSC according to orphanhood status by province ............................................................................................................ 134 Table A14: Distribution of primary age OOSC according to school exposure by selected characteristics............................................................................................................................ 135 Table A15: Distribution of primary age OOSC according to school exposure by selected characteristics............................................................................................................................ 136 Table A16: Distribution of secondary age (12-13 years) OOSC according to school exposure by selected characteristics ............................................................................................... 137 Table A17: Distribution of secondary age (12-13 years) OOSC according to school exposure by selected characteristics ............................................................................................... 138 Table A18: Cumulative probabilities (in %) of dropping out by sex and area of residence ..................................................................................................................................................... 139 Table A19: Cumulative probabilities (in %) of dropping out by province ................................................................................................................................................................................... 139 Table A20: Cumulative probabilities (in %) of entering school by sex and area ...................................................................................................................................................................... 140 Table A21: Cumulative probabilities (in %) of entering school according to province ............................................................................................................................................................. 140 Table A22: Distribution (in %) of children enrolled in primary school according to year by relative progress in school system, sex and area of residence ........................................... 141 Table A23: Distribution (in %) of children enrolled in lower secondary school according to year by relative progress in school system, sex and area of residence ............................ 142 Table A24: Distribution (in %) children enrolled in primary education according to relative progress in school system by sex and province ................................................................... 143 Table A25: Distribution (in %) of the 6-11 year-old population according to exclusion status by certain characteristics ..................................................................................................... 144 Table A26: Distribution (in %) of the 12-17 year-old population according to exclusion status by certain characteristics ................................................................................................... 146 Table A27: Urban/rural logistic models (6-11 year-olds and 12-17 year-olds) ......................................................................................................................................................................... 148 Table A28: Logistic models at provincial level (6-11 years) ....................................................................................................................................................................................................... 150 Table A29: Logistic models at provincial level (12-17 years) ..................................................................................................................................................................................................... 151 Table A30: Ranking of variables according to their power to explain the risk for 6-11 year-olds and 12-17 year-olds of being out of school .................................................................. 153 Table A31: Reasons for stopping or dropping out of school (in %) and reasons for not enrolling in school (in %) for 6-11 year-olds and 12-17 year-olds ............................................ 154 Table A32: Distribution (in %) of 6-17 year-olds who have never been to school and who have dropped out according to reasons for not enrolling or for dropping out .................... 156 Table A33: Proportions (in %) of primary- and secondary-age OOSC involved in work according to the characteristics of the child and his/her household......................................... 157 Table A34: Rate of coverage (in %) of OOSC-DRC 2012 by province ..................................................................................................................................................................................... 158
8
List of Graphs Graph 1: Illustration of the five dimensions of exclusion (5DE) ......................................................................................................................... 19 Graph 2: Change in the proportion (in %) of out-of-school children according to age group ........................................................................ 37 Graph 3: Map of proportions and numbers of 5-17 year-old OOSC by province, OOSC-DRC-2012 .......................................................... 39 Graph 4: Map of proportions and numbers of 6-11 year-old OOSC by province, OOSC-DRC .................................................................... 39 Graph 5: Change in the proportion (in %) of 5-17 year-old OOSC by province .............................................................................................. 40 Graph 6: Proportion (in %) of 5-17 year-old OOSC by sex and province ........................................................................................................ 41 Graph 7: School attendance by age and level of education of 5-17 year-olds in 2012 (in %) ...................................................................... 41 Graph 8: Typology of out-of-school children ......................................................................................................................................................... 48 Graph 9: Cumulative probability (in %) of dropout by sex and area of residence ............................................................................................ 51 Graph 10: Cumulative probability (in %) of school entry by sex and area of residence .................................................................................. 52 Graph 11: Schooling profile of children in 2012 according to selected characteristics .................................................................................. 57 Graph 12: Proportion (in %) of OOSC according to orphan category and by age group ............................................................................... 64 Graph 13: Proportion (in %) of OOSC according to the household head’s level of education and children’s age group .......................... 68 Graph 14: Distribution (in %) of income classes by area of residence ............................................................................................................. 70 Graph 15: Distribution of income classes by province ........................................................................................................................................ 71 Graph 16: Proportion (in %) of 5-17 year-old OOSC by monthly household income and by sex ................................................................. 73 Graph 17: Proportion (in %) of 5-17 year-old OOSC by monthly household income and by area of residence ......................................... 73 Graph 18: School profile and involvement in work of 6-13 year-olds, depending on the definition of work ................................................ 79 Graph 19: Change in the proportion (in %) of primary school classrooms in good conditions by province ................................................ 86 Graph 20: Change in the proportion (in %) of secondary school classrooms in good condition by province ............................................. 87 Graph 21: Proportion (in %) of school-age children (5-17 years) out of school depending on the type of disability and sex ................... 90 Graph 22: Proportion (in %) of school-age children (5-17 years) out of school depending on the type of disability and area of residence90 Graph 23: Proportion (in %) of OOSC depending on distance to the nearest school .................................................................................... 92
9
Summary In 2010, UNICEF and the UNESCO Institute for Statistics launched a Global Initiative on Out-of-School Children (OOSC), with a view to improving the system for the provision of statistical information about and analysis of OOSC and examining the factors of exclusion from school. In the DRC, this study of OOSC was conducted in two phases: the first phase involved compiling an inventory, and consisted of a literature review of existing research on education and an analysis of secondary data sources (administrative statistics and household surveys). Drawing lessons from this inventory, the second phase consisted of conducting a national survey on the specific issue of OOSC. The research into OOSC addressed the following questions: “How many OOSC are there?”; “Where are they?”; “Who are they?”; “Why are they out of school?”; “How effective are policies and strategies in the areas of education and social protection, and what is their impact?”; and “What policies and strategies should be adopted to enable all children to attend school?”. How many are there? The proportion of 5-17 year-old OOSC is estimated at 28.9% by OOSC 2012, or in absolute terms 7,375,875 children. Girls account for more than half of these out-of-school children, with a total of 3,892,464 (52.7%). It is also among girls that the OOSC phenomenon is the most extensive: 31.7% for girls against 26.5% for boys. The number of OOSC breaks down as follows by age group: 2,144,195 of the 5 year-old population (78.8%); 3,509,252 of the 6-11 year-old population (26.7%); 513,167 of the 12-13 year-old population (13.1%) and 1,209,262 of the 14-17 year-old population (21.2%). The number of OOSC is therefore greatest in the compulsory schooling age group (6-11 years), which accounts for 47.6% of all OOSC. The change in the proportion of out-of-school children shows that the phenomenon has been in steady decline since 2007, from 38.5% in 2007 (EDS 2007) to 32.5% in 2010 (MICS 2010) and 28.9% in 2012 (OOSC 2012). In five years (2007-2012), the relative decrease in the proportion of OOSC was greatest in the 12-13 years age group (33.5%), followed by 6-11 years (31.5%) and 14-17 years (27.6%). It was lowest for 5 year-old children (14.2%). Where are they? The proportion of OOSC is higher in rural areas (33.4%) than in urban areas (20.0%). In absolute terms, it is also in rural areas that the largest number of OOSC is found: 5,694,525 OOSC in rural areas against 1,681,391 in urban areas. Geographical analysis of the extent of the phenomenon reveals that North Kivu has the highest proportion of OOSC at 43.9%, followed by Katanga (34.8%), Kasai-Occidental (32.4%), Province Orientale (32.2%), South Kivu (30.3%) and Kasai-Oriental (29.3%). In absolute terms, Katanga tops the table with 1,334,876 5-17 year-old children out of school, followed by Province Orientale (1,039,858), North Kivu (994,366) and Equateur (726,194). It is therefore in rural areas and in the provinces with high mining production and those hit by recurrent conflict that the scale of the phenomenon is the greatest. Who are they? Examination of the profiles of OOSC shows that:
Children of pre-primary age who are out of school tend to come from low-income households (56.1%).
OOSC in the 6-11 years age group tend to come from the poorest households (64.3%) and those where the head has no education (65.3%).
OOSC in the 12-13 years age group are more likely to be girls (60.4%), and tend to come from the poorest households (64.9%) and those where the head has no education (46.5%).
OOSC in the 14-17 years age group have a majority of girls (63.8%), and tend to come from the poorest households (60.2%) and those where the head has no education (50.8%).
Moreover, analysis of the combination of inequalities shows that, for girls from the poorest households where the head has no education and living in rural areas, the proportion of OOSC is 45.0% compared with 37.6% for boys in the same situation. This gives an idea of the level of effort that will need to be made to get all children in the DRC into school.
10
Why are they out of school? In terms of the demand for schooling , the determinants of exclusion from school are socio-cultural and economic in nature. Gender inequalities in education were identified. The analyses indicate that although the efforts of the government and its partners in children’s schooling in recent years have significantly reduced inequalities in access to education between boys and girls , gender inequalities still exist at secondary level, especially in rural areas, to the disadvantage of girls. Matrimonial practices and early pregnancies partly explain the higher rate of drop out from school among girls of secondary school age: the results show that the proportion of 12-17 year-old girls who are in school and married is 0.08%, whereas the proportion of 12-17 year-old girls out of school and married at the time of the survey is 9.0%. Although marriage may occur after leaving school and may not necessarily be the reason for drop out, this high proportion of out-of-school girls in this age group who are married suggests that early marriage may be one cause of girls dropping out from school. Moreover, the data on the reasons for dropping out among girls show that marriage was cited in 6.3% of cases and pregnancy in 5.2% of cases. Parents’ survival is another determinant of children’s schooling. Regardless of the area of residence, the death of one or both parents is a factor in exclusion from school. These results recorded in the quantitative analyses are also confirmed in the qualitative interviews, in which certain interviewees stress the low level of schooling among girls as compared with boys at secondary and higher education level, as well as the difficulties of schooling orphans. Child fostering, a common practice in the DRC as in other African countries, is also a determinant of exclusion from school. Foster children (whether related to the household head or not) are at greater risk of ending up out of school than the household head’s biological children. The views given by the interviewees (adults, children and adolescents) on the issue indicate that foster children are often used to perform multiple tasks in the household, which reduces their chances of schooling. Moreover, judging from the interviewees’ comments, the principle of respect for the child's opinion is hardly recognised in Congolese society, as in most African societies, where only adults are allowed to make decisions and participate in the development of their community. This perception of parents regarding children’s rights is undoubtedly a factor that may influence parents’ decisions to invest in the education of their children and hence increase the risk of exclusion from school. The parents’ educational capital is another factor in children's schooling. The results of the quantitative analyses indicate that, regardless of the area of residence, the level of education of the household head is one of the main determinants of exclusion from school. Children living in households where the head is educated to secondary level or higher are less likely to find themselves out of school than those whose household head has no education at all. In economic terms, household income affects children’s school attendance. In both urban and rural areas, low household income is a major obstacle to schooling for children at both primary and secondary level. The proportion of OOSC decreases clearly and steadily as household income rises: at national level, it ranges from 48.9% in households with less than USD 50 per month to 1.9% in households with more than USD 500 per month. According to the estimates made by the OOSC-DRC survey, the average household in the DRC spent more than a tenth (11.2%) of its annual income on its children’s education in 2010-2011. The financial obstacle is the main reason mentioned by households to justify the non-enrolment or dropping out of children, and is also confirmed by the comments of those interviewed in the qualitative interviews. The situation of vulnerable group remains a matter of concern, as the majority of them are out of school: 54.5% of children with a disability; 32.2% of orphans; and 36.6% of children in the poorest households. Although there has been an overall increase of schooling provision in recent years at all levels of education, there are still disparities between provinces and between urban and rural areas in the availability and distribution of school facilities. At pre-primary level, most kindergartens are found in urban areas, mainly in the City-Province of Kinshasa. At primary and secondary level, the number of schools has increased considerably in recent years, but primary and especially secondary schools are still unevenly distributed among the provinces. However, the analyses indicate that distance to school is one of the main factors in exclusion from school in rural areas. In addition and in general terms, with the exception of some provinces there has been a countrywide deterioration in the quality of infrastructure in recent years at both primary and secondary level. Regarding the supply of teaching staff, the distribution of teachers in primary and secondary schools follows the distribution of schools (the most teachers are found in the provinces where there are most schools). However, provision of teachers is inadequate to the needs of specific groups such as children with disabilities. At the political level, the problem lies in particular in the low funding for education by the government, forcing households to devote a significant proportion of their annual income to education expenses (14% in urban areas and
11
7% in rural areas), and in the lack of institutional and human capacity in the education sector. This issue of institutional and human capacity arises at the level of the functioning of school management committees, at the level of human resources management and at the level of coordination and control of the educational system. In overall terms, the stakeholders emphasise the dysfunctional nature of the management committees (poor management capacity, lack of consultation and transparency in the management of funds), and lack of communication between the different stakeholders. For educational policies and strategies to succeed, good coordination of actions and a real dialogue between the various stakeholders of the educational system are required. Regarding human resources management in the education sector, the stakeholders highlighted several difficulties. These include inadequate and irregular payment of teachers’ salaries, the lack of a pension system for teachers, the lack of training for some teachers and the failure to recruit new teaching staff. These difficulties definitely have a negative impact on the quality of education and contribute to children’s exclusion from school.
12
Policies and strategies Based on the problems identified, various targeted policies and strategies have been proposed with a view to removing the obstacles to the schooling of OOSC. At the socio-cultural level, a number of strategies and actions have been proposed to address the problems of social representations which are unfavourable to girls, early marriage and pregnancy, perceptions about the rights and place of children in Congolese society, the sometimes adverse effects of fostering and the perceptions of communities about the economic potential of their living environment. Regarding schooling for girls, particularly at secondary level, it is proposed that awareness-raising campaigns should be intensified, that programmes should be set up for the award of scholarships, and that pilot experiments undertaken elsewhere on the provision of financial incentives for households should be studied. To eliminate the phenomenon of early marriage, it has been suggested that the laws on the legal age for marriage should be enforced, while intensifying sexual and reproductive health education to address the problem of early pregnancy. Regarding the low level of education and literacy among parents and perceptions about children’s rights, it has been suggested that awareness-raising campaigns should target uneducated/illiterate heads of households, that literacy programmes and the socio-economic capacity of young people and adults should be reinforced, and that the stakeholders should be made more aware of child rights and the laws on their protection. Regarding the adverse effects of fostering, there is a proposal to develop programmes in parenting in order to remind parents of their obligations towards their children. Finally, in order to increase communities’ capacities and resources, it has been proposed that multi-sectoral approaches should be introduced to boost the capacity of institutions and communities to become more autonomous in terms of the mobilisation of financial resources to enable vulnerable populations to realise their economic potential in their immediate environment. Regarding economic barriers, the significant role played by poverty as a barrier to the schooling of children underlines the urgency of speeding up and ensuring more effective implementation of the policy on free primary education. Regarding child labour, especially where hazardous work is concerned, there is a need to reinforce the laws protecting children’s rights and to expand parenting programmes. Regarding schooling provision, there is a clear need to substantially expand facilities, to increase the number and quality of teaching staff (and in particular the proportion of women teachers in order to increase the retention of girls at school), to substantially improve teachers’ pay and assure them adequate career management, to introduce specific educational approaches for the various categories of children living with disabilities, and to reinforce initiatives that will make the schooling of street children possible and those that will enable children at gold-panning sites to receive schooling. In terms of policy and governance, it is proposed that there should be a substantial increase in the State resources allocated to education; that a partnership should be developed between the State and the private sector, with annual fora for dialogue organised on preventing the economic exploitation of children and young people; that a ‘community compensation fund’ should be set up in areas with high industrial output, which would not just contribute to the financing of investments in education but would also put money into a fund for social protection; that the possible options should be studied for a steady increase in participation in secondary education for girls and boys; that the management system should be improved (communication between stakeholders at central level but also between the central and local levels); and that mechanisms should be introduced at provincial level to raise awareness and provide information on the provinces’ economic and intellectual potential.
13
I. Introduction Reports on the monitoring of the Millennium Development Goals (MDGs) in recent years reveal that one of the goals on which progress has been observed in developing countries, particularly in Africa, is Goal 2, the achievement of universal primary education. However, despite these advances, many children and adolescents, particularly from the most vulnerable social strata and rural areas, still remain outside the education system. However, as countries move towards the achievement of EFA goals, the effort required to reach those excluded from the education system will become all the more important. The Global Monitoring Report on EFA in 2012 revealed, on the basis of the EFA Development Index (a composite index of progress on EFA), that of the 20 countries that are lagging behind (EDI < 0.80), 12 are located in sub-Saharan Africa (UNESCO, 2012). Beyond this overall situation of the African continent, educational levels reveal differences not only from one country to another, but also within the same country, firstly between geographical areas, and secondly between social groups. Goal 2 of the Dakar Framework highlights the need to take increasing interest in vulnerable or marginalised groups, including "ensuring that by 2015 all children, particularly girls, children in difficult circumstances and those belonging to ethnic minorities, have access to, and complete, free and compulsory primary education of good quality"(UNESCO, 2000, p. 15). In order to meet these challenges and fulfil the right to education for all children, in early 2010 UNICEF and the United Nations Institute for Statistics (UIS), launched a Global Initiative on Out-of-School Children (OOSC), in which 26 countries are involved. The objective of this initiative is to improve the provision of statistical information about and analysis of OOSC and examine the factors behind exclusion from school as well as policies to improve school attendance. In the DRC, the study of OOSC has been conducted under the auspices of the Ministry of Primary, Secondary and Vocational Education (Min-EPSP), with financial support from DFID and UNICEF and technical support from UIS/UNESCO and UNICEF; technical implementation was by the ISSP/University of Ouagadougou. The study was conducted in two phases: the first phase involved compiling an inventory of previous findings (MEPSP-UNICEF-ISSP, 2011), and consisted of a literature review of existing research on the issue and an analysis of secondary data sources (administrative statistics and surveys of households), which led to the production of a report in July 2011. Drawing lessons from this inventory, the second phase consisted of conducting a national survey on the specific issue of OOSC. This final research report on OOSC in the DRC presents the results of this specific national survey of OOSC, while addressing the following research questions: “How many OOSC are there?”; “Where are they?”; “Who are they?”; “Why are they out of school?”; and “How effective are policies and strategies in the areas of education and social protection, and what is their impact?”. Structured around these research questions, the report is divided into five (5) chapters: Chapter 1 (Introduction) successively presents background information about the country, the educational system and the methodological aspects of the study; Chapter 2 (Profile of out-of-school children) recalls some general figures on the population under survey, presents the school profile of OOSC and describes the demographic, social and economic characteristics of OOSC with reference to the five (5) dimensions of exclusion; Chapter 3 (Obstacles and bottlenecks) presents the main factors in terms of both supply and demand which contribute to the exclusion of children from the education system, and the various contributions to the qualitative survey of opinions and perceptions about inequalities in education and the reasons why some children do not attend school; Chapter 4 (Policies and strategies) presents some considerations in terms of political implications for overcoming obstacles to education for all children; Chapter 5 (Conclusion): summarises the main results of the research and its political implications.
14
1.1 The DRC: context
1.1.1 Socio-economic and political situation
Since the late 70s, the economy of the DRC has experienced a multifaceted crisis, which intensified in the early 90s due to the country's political instability. For example, between 1990 and 2000, GDP underwent a cumulative decrease of over 43%. This has resulted in a decrease of nearly 60% in the national average income per capita. Despite the abundant natural resources available in the country, the incidence of poverty (the proportion of people below the poverty threshold) remains huge, as indicated by the analyses carried out in connection with the Poverty Reduction and Growth Strategy Paper (PRGSP) published in 2006 as well as in other works relying in particular on the 1-2-3 survey data of 2004-2005 (World Bank, 2006; Moummi, 2010): the incidence of poverty in 2005 is estimated at 69.2% at the national level, and is higher in rural areas (71.7%) than in urban areas (58.3%) (Moummi, 2010, p. 12). The DRC therefore ranks among the poorest countries in the world, with a GDP per capita of about $120, which is six times less than the average for Africa (DRC, 2009). This situation is exacerbated by the extent of external debt, which, despite the assistance obtained under the HIPC initiative, continues to weigh heavily on the public finances and the balance of payments. For example, in 2007, the outstanding external debt was estimated at more than $10 billion, and the cost of servicing was equivalent to 6.9% of exports and 12.9% of income, at $480 million. During the period 2002-08, growth and inflation increased by 6% and 15.9% per year respectively (DRC, 2010). However, the resumption of cooperation with the support of external partners (the IMF, the World Bank, the EU and the ADB) and the efforts made by the government to establish democracy and peace have led to an economic recovery. Although these positive results should be welcomed, they have to be set against both the enormous challenges that arise and the DRC’s vast potential and national resources. The country’s economic situation clearly has negative effects on the development of the education system in general. In particular it has led to the stagnation and even reduction of the resources allocated to education, which are essential for the implementation of strategic objectives for the development of the education sector in the DRC. However, there are some positive signs with regard to resource mobilisation which should benefit the social sectors, particularly education: recent economic progress (GDP growth of over 7% in 2010 and a fall in the inflation rate to below 10%), and the reaching of the completion point for participation in the Heavily Indebted Poor Countries (HIPC) programme resulted in a reduction of the national debt by $12.3 billion by the Boards of the IMF and the International
Development Association (IDA) of the World Bank in mid-20101.
1.1.2 Demographic context
a) Data sources on the population Conventional data sources on the population consist of general censuses of the population, socio-demographic surveys and the civil registry. The general census is a comprehensive source of information on the population, enabling socio-demographic and economic indicators to be calculated at very fine geographical levels. However, unlike several African countries which have by now performed several general population censuses, the DRC has only performed one, dating from 1984. The projections used in the planning of social needs, including those of the United Nations and the National Institute of Statistics (INS),rely on the data of the 1984 census. Although very useful, they are also questionable insofar as any projection is based on assumptions that should also be reviewed periodically in the light of the results of demographic surveys. The civil registry is not a reliable data source nowadays either, unlike in the colonial period. At that time, the civil registry and population register worked quite well and were updated (Ngondo, 2001; Metela, 2010). As in many African countries, the civil registry is underdeveloped and coverage is limited mainly to urban areas. It is mostly household surveys that regularly provide data on the population. These include the MICS surveys (1995, 2001 and 2010), EDS (2007) and the 1-2-3 survey (2004-2005). However, these sources of information often cannot be used to calculate indicators in small administrative areas, in order to highlight their specific characteristics. Although various highly localised socio-demographic surveys (monographs) are performed, their scope is limited and they cannot be generalised to the whole country.
1Cf. the special report on the DRC in Afrique Magazine of July 2011 (p. 90-91).
15
Finally, the diversity of population data sources explains the multiplicity of and lack of agreement between socio-demographic indicators referring to the same period. b) Characteristics of the Congolese population The lack of recent census data makes it difficult to estimate the Congolese population. The estimated population therefore varies, depending on sources, between 64 and 68 million inhabitants for years 2009 and 2010: 67 million in 2009 according to the National Multi-Sector Programme for the Fight against AIDS in the DRC (PNMLS, 2009); 64,420,000inhabitants in 2010 according to the Ministry of Public Health; and 67,827,000 inhabitants in 2010 according to IOM DRC. The population increased from 13.5 million in 1958 to 30.7 million in 1984. In 2007, the National Institute of Statistics (INS), cited by EDS-RDC 2007, estimated it at 65.8 million, with nearly 8 million in the city of Kinshasa, the capital of the country, alone. The rate of natural increase of the population is estimated at 3.5% for the period between 2005 and 2010 (UNDP, 2009). Based on the average assumption of the United Nations projections, which is one of the most widely used sources, the Congolese population is estimated at 69,781,411 in 2012, with an annual population growth rate of 2.7% between 2009 and 2010. If this strong growth rate remained constant, the Congolese population would double every 26 years.
1.1.3 The Congolese education system: educational policy and strategies
Structuring of the current education system In the DRC, the education system is governed by three ministries: the Ministry of Primary, Secondary and Vocational Education (EPSP), the Ministry of Higher and University Education (ESU) and the Ministry of Social Affairs (MAS). However, other ministries, such as those responsible for scientific research, employment and social welfare, health, youth and sports, are also involved in the education system through certain activities. At the central level, each ministry is managed by a Minister appointed by the President of the Republic and at the provincial level by the Provincial Minister appointed by the Governor. All administrative and pedagogical services are under the direction of a General Secretariat (SG), which implements the Government's policy on education (World Bank, 2005). The EPSP is divided into 30 educational provinces. The ministry is represented in the provinces by provincial divisions (PROVED) and sub-provincial divisions (Sous-PROVED). At the provincial level, the Ministry of EPSP is represented by the Head of Provincial Division who in turn is represented by the sub-divisional heads at the sub-provincial level. EPSP has three levels of education: pre-primary (ISCED 02), primary (ISCED 1) and secondary (ISCED 2 and 3). Pre-primary, organised in a three-year cycle, is optional. It is mostly run by the private sector and takes 3-5 year-old children. The level of primary education lasts six years and takes 6-11 year-old children. The level of secondary education includes four cycles: (i) the long cycle (humanities) for a period of six years, which gives access to higher and university education, is subdivided into two sub-cycles, the first cycle of two years for 12-13 year-old children (ISCED 2) and the second cycle for 14-17 year-old children (ISCED 3), (ii) the for Vocational Specialisation Cycle (CSP), which lasts one or two years, (iii) the Arts and Crafts Cycle lasting one to two years and (iv) the Vocational Cycle lasting four to five years (DRC, 2010). Higher education consists of a first three-year cycle (ISECD 5) and a second of two to three years depending on the courses (ISECD 6). Three types of higher education are provided: academic higher education, pedagogical higher education and technical higher education. The Ministry of Social Affairs (MAS) is responsible for non-formal education, including remedial education, literacy for young people and adults, vocational learning and lifelong education for adults. Other stakeholders, including parents, are also involved in the Congolese education system. Indeed, parents constitute one of the major players in the administration of the Congolese school system. They are represented by parents’ committees in schools and in federations of such committees. These associations have the role of encouraging parents to enrol their children and cooperate in the management of schools. At the organisational level, there are four categories of schools in the DRC: (i) Schools under the direct control of the
2Details on the correspondence between the educational cycles in the DRC and the standard international classification of education may be obtained on the website of the UIS: http://www.uis.unesco.org/Education/ISCEDMappings/Pages/default.aspx?SPSLanguage=EN
16
Government, (ii) Network schools, usually run by churches by agreement with the Government, and known as government-regulated schools; (iii) private schools accredited by the Government, and (iv) private schools not accredited by the Government. The first two types of schools are classified as public schools and the others as private schools (DRC, 2010). b) Current policy A strategy for the development of the sub-sector of primary, secondary and vocational education was adopted by the
Government in March 2010. Pending finalisation of the overall strategy for the education sector3, the Ministry of
EPSP has developed an Interim Plan for Education (PIE) for the period of 2012-2014. This aims at: Improving access and accessibility to primary education; Improving the quality of teaching and learning; Strengthening governance. To achieve these objectives, the PIE is divided into ten (10) programmes: - three (3) programmes aim at increasing and improving supply and demand for education (by facilitating access to preschool, mitigating the financial burden on households through government payment of school fees, and building and renovating schools); - four programmes (4) aim at improving the quality of learning and the relevance of education (among other means by overhauling the initial and continuing education and training of teachers and providing schools with teaching support and materials); - three (3) programmes aim at strengthening the education system’s capacity and stakeholders.
1.2 Overall approach to the analysis of out-of-school children: five dimensions of exclusion
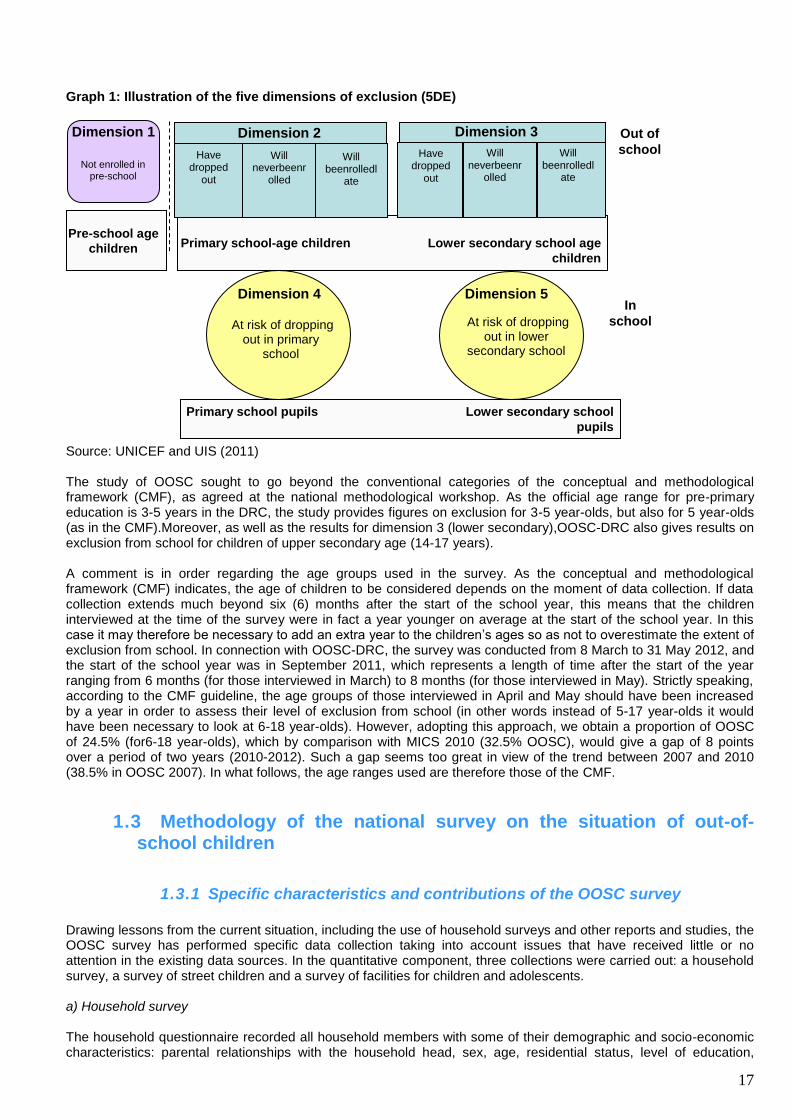
Based on the definition of OOSC (UNICEF and UIS, 2010), the research has been done around the five dimensions of exclusion, and relates to two large groups of children (Graph 1): school-age out-of-school children (dimensions 1, 2 and 3) and children attending school but at high risk of dropping out (dimensions 4 and 5). These various dimensions are defined as follows: Dimension 1: Pre-primary school age children who are not enrolled in pre-primary or primary school; Dimension 2: Primary school age children who are enrolled neither in primary school nor at a higher level; Dimension 3: Secondary school age children who are enrolled neither in secondary school nor at a higher level; Dimension 4: Children enrolled in primary school who are at risk of dropping out; Dimension 5: Children enrolled in lower secondary school who are at risk of dropping out.
3 The two other ministries involved in the education sector, the Ministry of Higher and University Education
(MESU) and the Ministry of Social Affairs (MAS),are in the process of finalising their sub-sector strategies.
17
Graph 1: Illustration of the five dimensions of exclusion (5DE)
Source: UNICEF and UIS (2011)
The study of OOSC sought to go beyond the conventional categories of the conceptual and methodological framework (CMF), as agreed at the national methodological workshop. As the official age range for pre-primary education is 3-5 years in the DRC, the study provides figures on exclusion for 3-5 year-olds, but also for 5 year-olds (as in the CMF).Moreover, as well as the results for dimension 3 (lower secondary),OOSC-DRC also gives results on exclusion from school for children of upper secondary age (14-17 years). A comment is in order regarding the age groups used in the survey. As the conceptual and methodological framework (CMF) indicates, the age of children to be considered depends on the moment of data collection. If data collection extends much beyond six (6) months after the start of the school year, this means that the children interviewed at the time of the survey were in fact a year younger on average at the start of the school year. In this case it may therefore be necessary to add an extra year to the children’s ages so as not to overestimate the extent of exclusion from school. In connection with OOSC-DRC, the survey was conducted from 8 March to 31 May 2012, and the start of the school year was in September 2011, which represents a length of time after the start of the year ranging from 6 months (for those interviewed in March) to 8 months (for those interviewed in May). Strictly speaking, according to the CMF guideline, the age groups of those interviewed in April and May should have been increased by a year in order to assess their level of exclusion from school (in other words instead of 5-17 year-olds it would have been necessary to look at 6-18 year-olds). However, adopting this approach, we obtain a proportion of OOSC of 24.5% (for6-18 year-olds), which by comparison with MICS 2010 (32.5% OOSC), would give a gap of 8 points over a period of two years (2010-2012). Such a gap seems too great in view of the trend between 2007 and 2010 (38.5% in OOSC 2007). In what follows, the age ranges used are therefore those of the CMF.
1.3 Methodology of the national survey on the situation of out-of-school children
1.3.1 Specific characteristics and contributions of the OOSC survey
Drawing lessons from the current situation, including the use of household surveys and other reports and studies, the OOSC survey has performed specific data collection taking into account issues that have received little or no attention in the existing data sources. In the quantitative component, three collections were carried out: a household survey, a survey of street children and a survey of facilities for children and adolescents. a) Household survey The household questionnaire recorded all household members with some of their demographic and socio-economic characteristics: parental relationships with the household head, sex, age, residential status, level of education,
Out of
school
In
school
Primary school-age children Lower secondary school age
children
Dimension 4
At risk of dropping out in primary
school
Dimension 5
At risk of dropping out in lower
secondary school
Dimension 2
Have dropped
out
Will neverbeenr
olled
Will beenrolledl
ate
Dimension 3
Have dropped
out
Will neverbeenr
olled
Will beenrolledl
ate
Dimension 1
Not enrolled in pre-school
Pre-school age
children
Primary school pupils Lower secondary school
pupils
18
economic activity, etc. The primary purpose of the questionnaire was to provide information to determine the reference populations for calculating rates in education (enrolment, school attendance, etc.), and to identify 3-5year-old and 6-17year-old children eligible for individual interviews. The household questionnaire also contained information relating to the household’s living conditions, including housing characteristics, ownership of durables and non-durables, agricultural production, household income, education spending and the situation of household children living elsewhere. The questionnaires on 3-5year-old children and6-17year-old children were used to record information about each category of children. Each of them included the following three sections:
Socio-demographic characteristics of the child;
Education
Child labour. The questionnaire on 3-5 year-old children was addressed to one of the child's parents or a person of reference, while the questionnaire on 6-17year-old children was addressed to the child or adolescent him/herself. b) Survey of children in childcare facilities A “facility datasheet” was developed with a view to surveying childcare institutions, containing information on the identity of the facility, a complete list of people living in the facility with their socio-demographic characteristics (sex, age and place of birth), information on their educational status and survival of parents as well as whether or not they are in contact with their biological parents (if alive) or with other relatives. c) Street children survey For children and adolescents living on the street, a “street child datasheet” was developed. It contains information on the geographical location of the site, the socio-demographic characteristics of children identified on the site (sex, age and place of birth), their educational status, whether their parents survive, whether or not they are in contact with their biological parents (if alive) or with other relatives, and whether they sometimes attend a childcare facility while living on the street.
1.3.2 Definition of some key concepts
a) Child labour The definition of child labour is generally complex. This complexity is due to the reasons for child labour, which are of various kinds: cultural reasons (Erny, 1972; Schlemmer, 1996, Salazar, 1998), as well as economic reasons related to the mode of production (Kamuzora, 1984; Meillassoux, 1992) or related to poverty (Brisset, 2000, UNICEF, 1997). But between socialising work and economic work for children, as also between economic work and the worst forms of child labour, the boundary is not always clear. Two definitions of work will be considered here to highlight how the choice of a particular definition affects the extent of involvement of OOSC in work:
- The first definition is the generally accepted meaning of child labour, in the sense of “economic activity”, i.e. all productive activities undertaken by children, whether commercial or not(Diallo, 2006);
- The second definition is that of UCW (Understanding Children’s Work) used in the methodology of the Global Initiative on OOSC (UIS-UNESCO and UNICEF, 2010),which defines child labour in terms of the number of hours of economic work carried out by the child during the reference period. This definition is a practical version of that adopted at the 18th International Conference of Labour Statisticians in 2008 (ILO, 2009).
b) Household and Head of household
An (ordinary) household is a group of people, related or otherwise, recognising the authority of a ‘head of household’. They usually live under the same roof, in the same courtyard or in the same concession. They usually take their meals together and share the household’s day-to-day expenses. The head of household is the person responsible for the maintenance and running of the household.
19
c) Household children and children living elsewhere
The importance of family solidarity networks in Africa generally relates to the fact that the investment of parents and families in education goes beyond the couple’s own biological children and often extends to other children and adolescents within the kinship group. Confining attention to children residing in the household, be it in terms of education level or in terms of economic investment, can therefore skew the estimation of the extent of households’ contribution to children's education. By household children we mean two categories of children: (i) children living in the household at the time of the survey, including the biological children of the household head and of his (or her) spouse(s) and other children (whether related or not), (ii) the biological children of the household head and of his (or her) spouse(s) living elsewhere. By children living elsewhere, we mean two groups of children: (i) the biological children of the household head and of his (or her) spouse(s) living elsewhere (who are also children belonging to the household) and (ii) children other than the biological children of the household head and of his (or her) spouse(s) living elsewhere, and to the financing of whose schooling the household contributes. d) Poverty Poverty is a “pronounced deprivation in well-being” (World Bank, 2001, p. 15). As deprivation derives from various aspects of human life (income, food, housing, health, education, etc.), poverty is a firmly multidimensional phenomenon, covering either material deprivation or monetary poverty (income poverty) and non-monetary poverty, including unmet basic needs (B.E.N.S approach) and the issue of capabilities introduced by Amartya Sen (1992). Whatever their diversity, all definitions of poverty can be grouped (Hagenaars and De Vos, 1988, p. 212) into three categories: i) absolute poverty (where poverty means possessing below an absolute defined minimum; ii) relative poverty (where poverty means possessing less than others in society), and iii) subjective poverty (where poverty means believing one does not have enough to survive on). The objective of the OOSC research is to examine the effect of income on the risk of exclusion of children and adolescents from the education system. It is thus the effect of monetary poverty that we seek to record. Given the difficulty of collecting information concerning consumer spending in a survey with several other objectives (due to lack of time and resources) or concerning the households’ exact income (due to reluctance to reveal such information),the survey asked households to place themselves in a predefined monthly income category (“less than $50”, “$50-100”, “$101 to 200”, “$201-500”, “$501-1000” and “over $1000”).
1.3.3 Points about sampling
a) Sampling of quantitative data - Survey of children and adolescents living in households: The sampling procedure used in the OOSC-DRC2012 survey is the same as that used in past national surveys, including EDS 2007 and MICS 2010. Sampling plan The following characteristics of the implemented sampling process will be presented: the nature of the survey, the scope of the survey, the levels of stratification, the sampling units, the basis of the sampling, the selection method, and the calculation of the sample size. This sampling plan concerns the sample of children living in households. Nature and scope of the survey The survey is based on stratified and multistage cluster sampling. It covers all 11 provinces of the country. All ordinary households throughout the entire country are concerned, with the exception of collective households and the diplomatic corps. Stratification Each of the 10 provinces is divided into three strata including rural areas, cities and statutory towns. The city-province of Kinshasa is divided into four strata corresponding to the four former districts. This leads to a total of 34 strata. The selection of sampling units was made independently in each stratum.
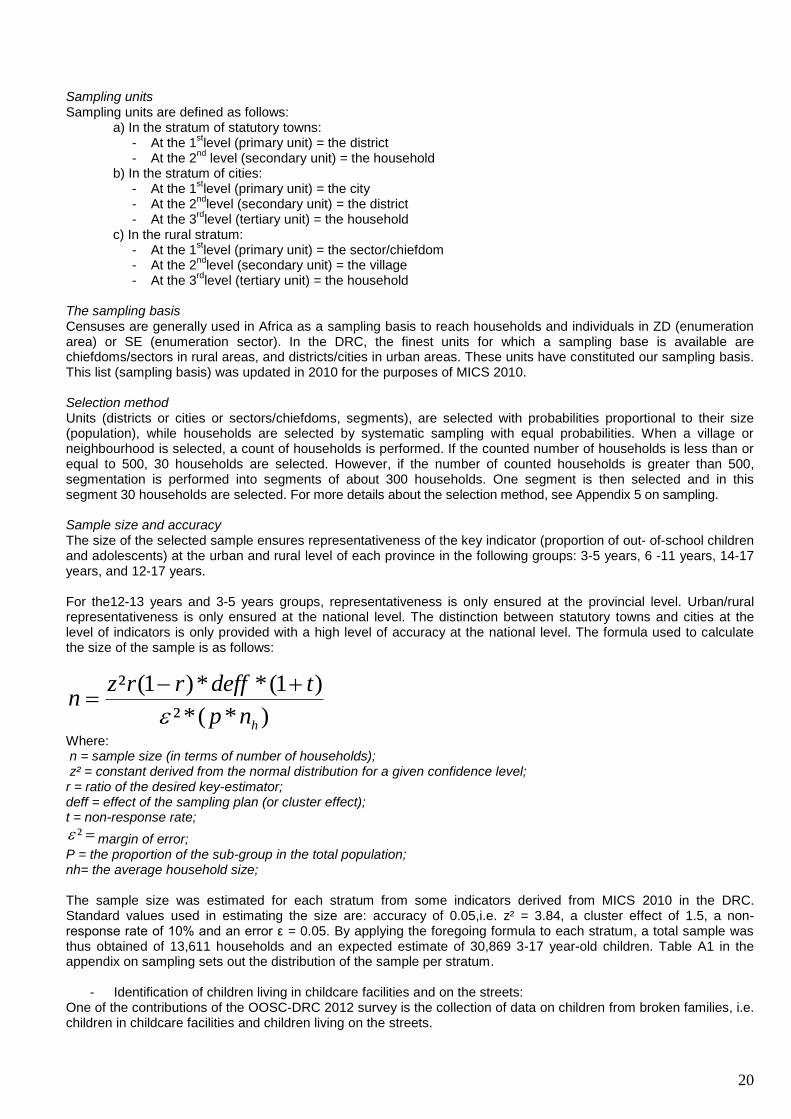
20
Sampling units
Sampling units are defined as follows: a) In the stratum of statutory towns:
- At the 1stlevel (primary unit) = the district
- At the 2nd
level (secondary unit) = the household b) In the stratum of cities:
- At the 1stlevel (primary unit) = the city
- At the 2nd
level (secondary unit) = the district - At the 3
rdlevel (tertiary unit) = the household
c) In the rural stratum: - At the 1
stlevel (primary unit) = the sector/chiefdom
- At the 2nd
level (secondary unit) = the village - At the 3
rdlevel (tertiary unit) = the household
The sampling basis
Censuses are generally used in Africa as a sampling basis to reach households and individuals in ZD (enumeration area) or SE (enumeration sector). In the DRC, the finest units for which a sampling base is available are chiefdoms/sectors in rural areas, and districts/cities in urban areas. These units have constituted our sampling basis. This list (sampling basis) was updated in 2010 for the purposes of MICS 2010. Selection method Units (districts or cities or sectors/chiefdoms, segments), are selected with probabilities proportional to their size (population), while households are selected by systematic sampling with equal probabilities. When a village or neighbourhood is selected, a count of households is performed. If the counted number of households is less than or equal to 500, 30 households are selected. However, if the number of counted households is greater than 500, segmentation is performed into segments of about 300 households. One segment is then selected and in this segment 30 households are selected. For more details about the selection method, see Appendix 5 on sampling. Sample size and accuracy
The size of the selected sample ensures representativeness of the key indicator (proportion of out- of-school children and adolescents) at the urban and rural level of each province in the following groups: 3-5 years, 6 -11 years, 14-17 years, and 12-17 years. For the12-13 years and 3-5 years groups, representativeness is only ensured at the provincial level. Urban/rural representativeness is only ensured at the national level. The distinction between statutory towns and cities at the level of indicators is only provided with a high level of accuracy at the national level. The formula used to calculate the size of the sample is as follows:
)*(*²
)1(**)1(²
hnp
tdeffrrzn
Where: n = sample size (in terms of number of households); z² = constant derived from the normal distribution for a given confidence level; r = ratio of the desired key-estimator; deff = effect of the sampling plan (or cluster effect); t = non-response rate;
² margin of error; P = the proportion of the sub-group in the total population; nh= the average household size;
The sample size was estimated for each stratum from some indicators derived from MICS 2010 in the DRC. Standard values used in estimating the size are: accuracy of 0.05,i.e. z² = 3.84, a cluster effect of 1.5, a non-response rate of 10% and an error ε = 0.05. By applying the foregoing formula to each stratum, a total sample was thus obtained of 13,611 households and an expected estimate of 30,869 3-17 year-old children. Table A1 in the appendix on sampling sets out the distribution of the sample per stratum.
- Identification of children living in childcare facilities and on the streets: One of the contributions of the OOSC-DRC 2012 survey is the collection of data on children from broken families, i.e. children in childcare facilities and children living on the streets.
21
For children in childcare facilities, we initially recovered the list of childcare facilities at the central level from the Ministry of Social Affairs, Humanitarian Action and National Solidarity. These lists were then supplemented on the basis of interviews conducted at the local level in all eleven provinces, with organisations working in the field of childhood. All the facilities were visited with a facility datasheet designed for the purpose. This was used to collect various items of information about the facility and establish an exhaustive list of all persons accommodated there. A total of 232 facilities were identified in the 11 provinces with a total of 13,499 people living in them,including11,301 of whom were 5-17year-old children, or 83.9%.
- Survey of children living on the streets: With regard to children living on the streets, the approach was initially to meet with civil society organisations working in the area in order to gain a basic understanding of the phenomenon and determine the most appropriate process for counting these children. This information collection was performed within all the major cities of the eleven provinces of the country. Information obtained at the central level on the phenomenon and from civil society organisations involved locally with children living on the streets was subsequently updated in the field with local stakeholders. Then, with the help of informants, the places where these children live were identified and a datasheet was used to collect a range of information on the people counted. The identification and count were conducted at night so as to include only those children who sleep on the streets. Children are said to be living on the streets if they actually live and sleep there. This very specific population category lives in small groups and in well-defined areas. During the day, they are scattered across the city in search of means of subsistence in public areas (services, surroundings of shops, banks, markets, street corners, main roads, restaurants, etc.). There, they mingle with another category of people who do not necessarily live on the streets but are forced to also frequent these areas for survival reasons. In order to reach this group of children living on the streets, the following approach was therefore adopted by OOSC-DRC 2012: Directory of living areas and identification of key informants Field workers in urban centres, with the support of the population, administrative, customary, and religious authorities and community leaders identified the areas where each group of children spend the night. Each group has its “protector” who is an adult and to whom the OOSC-DRC researchers turned to be able to approach the group members. Interview times During the day, it was almost impossible to meet the children on the site where they spend the night. It was therefore necessary, with the key informant (the group protector), to make arrangements to interview them at night. Collection duration The OOSC-DRC 2012survey lasted a month and a half in order to allow field workers performing several return visits to find the children and be able to interview them. A total of 212 living areas were identified, involving a total of 5,915 people, of whom 4,365 (73.8%) were 5-17year-old children. Another approach to street children The Network of Street Children’s Educators (REEJER) conducted a survey in 2006 of street children in the City-Province of Kinshasa. This operation, originally scheduled to be carried out at night, was eventually conducted during the day for safety reasons. The operation took place over two days (6 and 7 October 2006
4) and involved 720
survey workers. Comparison of approaches For the City-Province of Kinshasa, OOSC-DRC 2012 counted a total of 2,446 people, including 1,578 0-17 year-olds, actually living on the streets. During its 2006 survey, REEJER counted a total of 18,098 for the City-Province of Kinshasa (14,906 in the open air and 3,192 in enclosed environments). By ‘open air’ (or ‘open site’) is meant “the streets in the broad sense of the term, i.e. including public squares, marketplaces, wastelands, derelict buildings and so on which have become the usual home of the child, who lacks both protection and supervision ". An ‘enclosed environment’ was defined as an "accommodation or transit centre for street children”(REEJER, 2006). The differences observed between the figures of OOSC-DRC 2012 and those from the 2006 REEJER survey are doubtless due to the methodological approaches followed, and probably to positive contextual developments such as the improved stability of institutions, which may have led to greater attention being paid to the situation of children in
4It should be noted, incidentally, that October 2006 saw the second round of the presidential elections in the DRC.
22
difficulty. In addition, the data for the REJEER survey was collected during the day for safety reasons. It is therefore conceivable that children were counted who were spending the day on the streets without necessarily spending the night there too. Some children spend the day in various activities, but return home or to an institution at night. This explains the discrepancy with the figures from the 2006 street children survey conducted by REEJER. b) Sampling of qualitative data The purpose of the qualitative research is to provide information about the profiles of children in situations of exclusion from the school system, examining the reasons for their non-attendance and identifying obstacles and bottlenecks that hinder the implementation of educational policies. Four provinces were selected for the conduct of qualitative interviews with various stakeholders in education. Taking into account the diversity of stakeholders, several interview guides were developed for conducting the interviews. These include:
- Three guides for individual interviews: 1- Interview guide for parents, education system personnel and community leaders; 2- Interview guide for technical and financial partners 3- Interview guide for representatives of institutions and NGOs working in the field of childhood and youth
- Two interview guides for groups 1. Interview guide for groups of children living within households 2. Interview guide for groups of children without family ties
In addition, interview guide templates were developed for the performance of case studies. A total of 156 interviews, 80 group interviews and 13 case studies were conducted on specific topics of interest identified during interviews in the four sampled provinces as well as in Katanga, Bas-Congo and Bandundu. Individual interviews included various stakeholders involved in the education system regardless of sex (Table 1). However, for group interviews in each target group, an equal number of groups of boys and girls were interviewed. In addition to gender, the group discussions also took account of diversity in terms of age (children, adolescents), area of residence (urban/rural), and family structure (household member/without family ties).
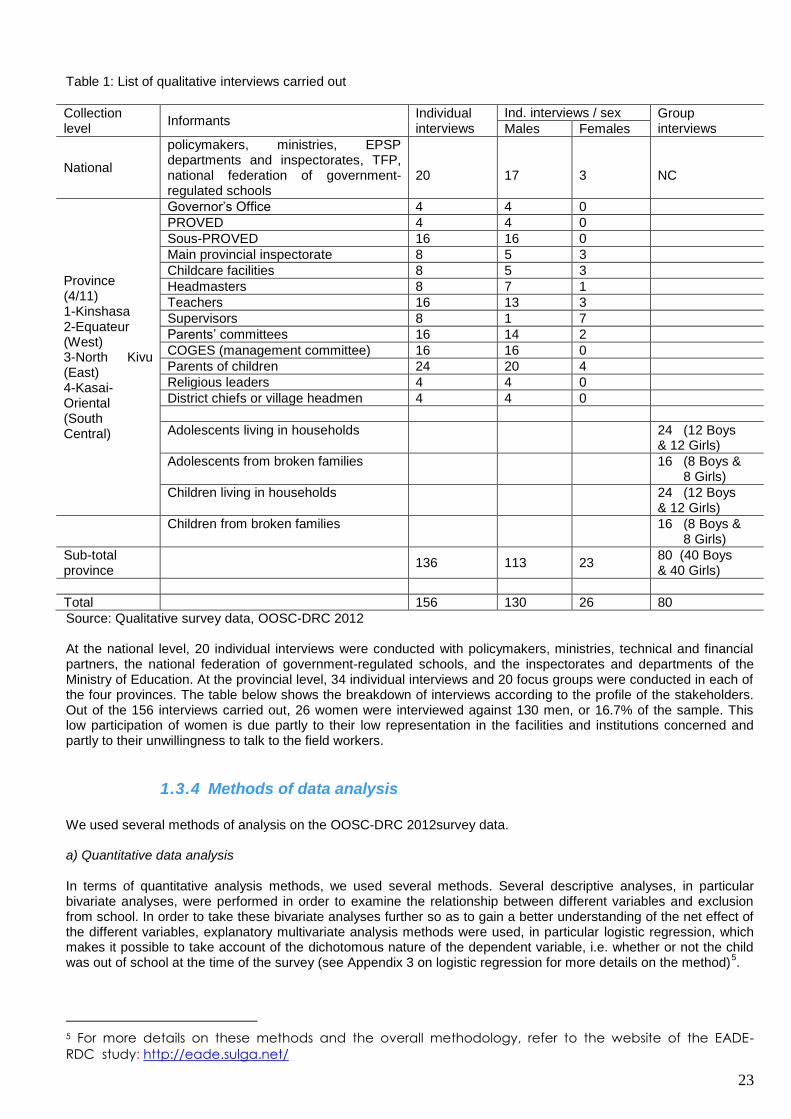
23
Table 1: List of qualitative interviews carried out
Collection level
Informants Individual interviews
Ind. interviews / sex Group interviews Males Females
National
policymakers, ministries, EPSP departments and inspectorates, TFP, national federation of government-regulated schools
20
17
3
NC
Province (4/11) 1-Kinshasa 2-Equateur (West) 3-North Kivu (East) 4-Kasai-Oriental (South Central)
Governor’s Office 4 4 0
PROVED 4 4 0
Sous-PROVED 16 16 0
Main provincial inspectorate 8 5 3
Childcare facilities 8 5 3
Headmasters 8 7 1
Teachers 16 13 3
Supervisors 8 1 7
Parents’ committees 16 14 2
COGES (management committee) 16 16 0
Parents of children 24 20 4
Religious leaders 4 4 0
District chiefs or village headmen 4 4 0
Adolescents living in households
24 (12 Boys & 12 Girls)
Adolescents from broken families
16 (8 Boys & 8 Girls)
Children living in households
24 (12 Boys & 12 Girls)
Children from broken families
16 (8 Boys & 8 Girls)
Sub-total province
136 113 23 80 (40 Boys & 40 Girls)
Total 156 130 26 80
Source: Qualitative survey data, OOSC-DRC 2012 At the national level, 20 individual interviews were conducted with policymakers, ministries, technical and financial partners, the national federation of government-regulated schools, and the inspectorates and departments of the Ministry of Education. At the provincial level, 34 individual interviews and 20 focus groups were conducted in each of the four provinces. The table below shows the breakdown of interviews according to the profile of the stakeholders. Out of the 156 interviews carried out, 26 women were interviewed against 130 men, or 16.7% of the sample. This low participation of women is due partly to their low representation in the facilities and institutions concerned and partly to their unwillingness to talk to the field workers.
1.3.4 Methods of data analysis
We used several methods of analysis on the OOSC-DRC 2012survey data. a) Quantitative data analysis In terms of quantitative analysis methods, we used several methods. Several descriptive analyses, in particular bivariate analyses, were performed in order to examine the relationship between different variables and exclusion from school. In order to take these bivariate analyses further so as to gain a better understanding of the net effect of the different variables, explanatory multivariate analysis methods were used, in particular logistic regression, which makes it possible to take account of the dichotomous nature of the dependent variable, i.e. whether or not the child was out of school at the time of the survey (see Appendix 3 on logistic regression for more details on the method)
5.
5 For more details on these methods and the overall methodology, refer to the website of the EADE-
RDC study: http://eade.sulga.net/
24
b) Qualitative data analysis
Individual and group interviews were recorded, translated for those conducted in local languages, transcribed and entered as text in Microsoft Word by the collection agents. Then, ten or so codification agents codified the data. The texts of qualitative interviews were codified using the Nvivo qualitative data processing software. The data were then analysed using the content analysis method.
1.3.5 Extrapolation of data
A sampling plan was developed for the OOSC DRC survey. This plan is based on an INS sampling base updated for the performance of certain national surveys such as the 1-2-3 Survey. This database provides information about the populations of the various geographical entities (up to the village and sector level) in the DRC. It is this sampling basis that was used to select the sample. From the selection probabilities of the different sampling units (sector or village), the weighting coefficients (the inverse of the selection probabilities) were calculated. The purpose of calculating the weighting coefficients is to extrapolate the results observed at the level of the sample throughout the entire population, and also makes it possible to have estimated absolute figures for the entire DRC. Other parameters were taken into account in the calculation of these weighting coefficients, namely the UN’s projections for the DRC in 2012 (so that the total population figure could be adjusted, for example in the inventory, based on the average assumption of the United Nations projections) and the trends observed in the distribution of the population by province between EDS-RDC 2007 and MICS-RDC 2010.
1.3.6 Evaluation of data quality
The evaluation of the data, and in particular of the age and gender structure of the surveyed population, reveals the same errors in subjects’ statement of their age as are found in household surveys in Africa. In particular, ages tend to be rounded so that they end in a 0 or a 5. Moreover, examination of the age pyramid reveals some peaks at the ages of 18 and 2 years, and hence dips at 17 and 3 years. This is very likely to relate to the tendency of field survey workers to reduce the number of individual questionnaires (3-5 years and 6-17 years), by making 3 year-olds younger and 17 year-olds older. We calculated a correction coefficient which we integrated into the extrapolation coefficients in order to arrive at a school-age population that matched the observed trends. The pyramid for five-year age groups can be used to correct the distortion in respondents’ stated ages. The appearance of the pyramid is similar to that found in countries with a high fertility rate (i.e. it has a wide base and gets narrower further up due to high mortality rates; for more details on this evaluation of the age structure, see the methodological document on the OOSC-DRC survey website: http://OOSC.sulga.net/).
1.4 Overall figures of the surveyed population
1.4.1 Household survey
The 454 clusters selected for the sample of OOSC-DRC 2012were covered. In total, 13,620 households were selected, and of these, 13,614 households were identified in the field at the time of the survey. Of these 13,614 identified households, interviews were successfully conducted at 13,519, representing a response rate of 99.3% (Table 2).With an estimated population of 70,255,072 in 2012 according to United Nations projections, the number of households in the DRC is estimated at around 13,010,199, giving an average household size of 5.4 people. The survey sample covered just over one thousandth of households (1.05‰) and of the population (1.04‰).
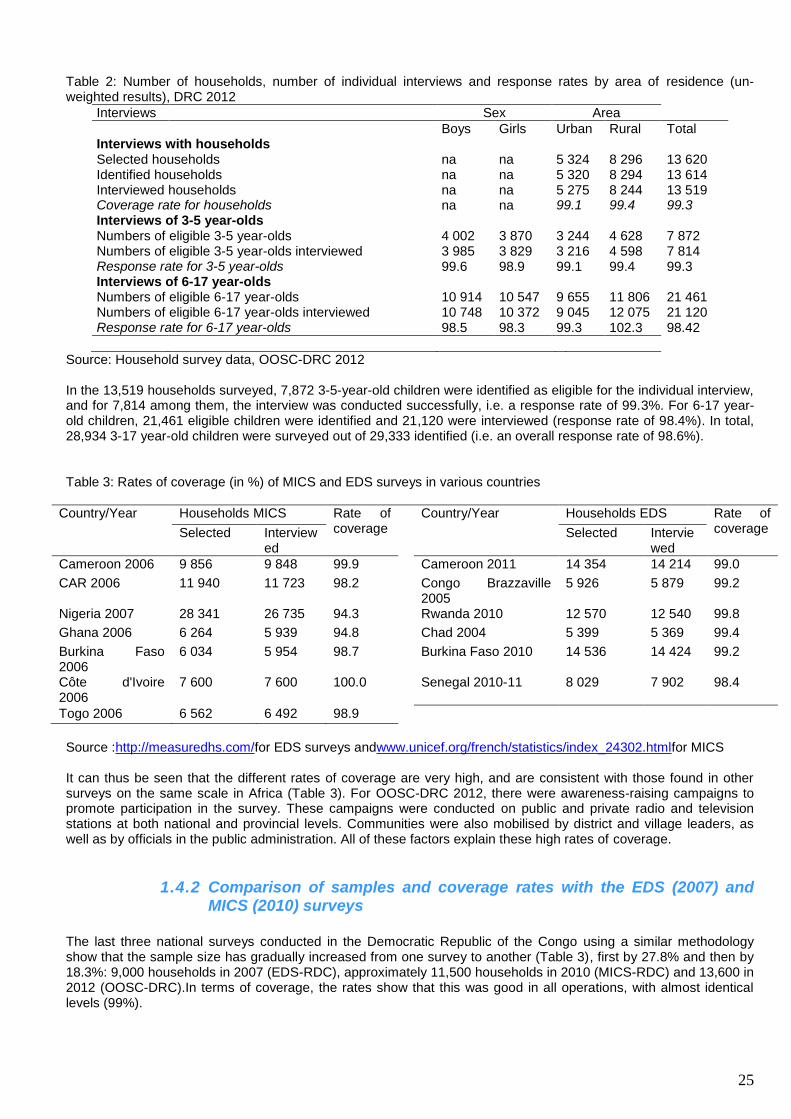
25
Table 2: Number of households, number of individual interviews and response rates by area of residence (un-weighted results), DRC 2012
Interviews Sex Area
Boys Girls Urban Rural Total Interviews with households Selected households na na 5 324 8 296 13 620 Identified households na na 5 320 8 294 13 614 Interviewed households na na 5 275 8 244 13 519 Coverage rate for households na na 99.1 99.4 99.3 Interviews of 3-5 year-olds Numbers of eligible 3-5 year-olds 4 002 3 870 3 244 4 628 7 872 Numbers of eligible 3-5 year-olds interviewed 3 985 3 829 3 216 4 598 7 814 Response rate for 3-5 year-olds 99.6 98.9 99.1 99.4 99.3 Interviews of 6-17 year-olds Numbers of eligible 6-17 year-olds 10 914 10 547 9 655 11 806 21 461 Numbers of eligible 6-17 year-olds interviewed 10 748 10 372 9 045 12 075 21 120 Response rate for 6-17 year-olds 98.5 98.3 99.3 102.3 98.42
Source: Household survey data, OOSC-DRC 2012 In the 13,519 households surveyed, 7,872 3-5-year-old children were identified as eligible for the individual interview, and for 7,814 among them, the interview was conducted successfully, i.e. a response rate of 99.3%. For 6-17 year-old children, 21,461 eligible children were identified and 21,120 were interviewed (response rate of 98.4%). In total, 28,934 3-17 year-old children were surveyed out of 29,333 identified (i.e. an overall response rate of 98.6%). Table 3: Rates of coverage (in %) of MICS and EDS surveys in various countries
Country/Year Households MICS Rate of coverage
Country/Year Households EDS Rate of coverage Selected Interview
ed Selected Intervie
wed
Cameroon 2006 9 856 9 848 99.9 Cameroon 2011 14 354 14 214 99.0
CAR 2006 11 940 11 723 98.2 Congo Brazzaville 2005
5 926 5 879 99.2
Nigeria 2007 28 341 26 735 94.3 Rwanda 2010 12 570 12 540 99.8
Ghana 2006 6 264 5 939 94.8 Chad 2004 5 399 5 369 99.4
Burkina Faso 2006
6 034 5 954 98.7 Burkina Faso 2010 14 536 14 424 99.2
Côte d'Ivoire 2006
7 600 7 600 100.0 Senegal 2010-11 8 029 7 902 98.4
Togo 2006 6 562 6 492 98.9
Source :http://measuredhs.com/for EDS surveys andwww.unicef.org/french/statistics/index_24302.htmlfor MICS It can thus be seen that the different rates of coverage are very high, and are consistent with those found in other surveys on the same scale in Africa (Table 3). For OOSC-DRC 2012, there were awareness-raising campaigns to promote participation in the survey. These campaigns were conducted on public and private radio and television stations at both national and provincial levels. Communities were also mobilised by district and village leaders, as well as by officials in the public administration. All of these factors explain these high rates of coverage.
1.4.2 Comparison of samples and coverage rates with the EDS (2007) and MICS (2010) surveys
The last three national surveys conducted in the Democratic Republic of the Congo using a similar methodology show that the sample size has gradually increased from one survey to another (Table 3), first by 27.8% and then by 18.3%: 9,000 households in 2007 (EDS-RDC), approximately 11,500 households in 2010 (MICS-RDC) and 13,600 in 2012 (OOSC-DRC).In terms of coverage, the rates show that this was good in all operations, with almost identical levels (99%).
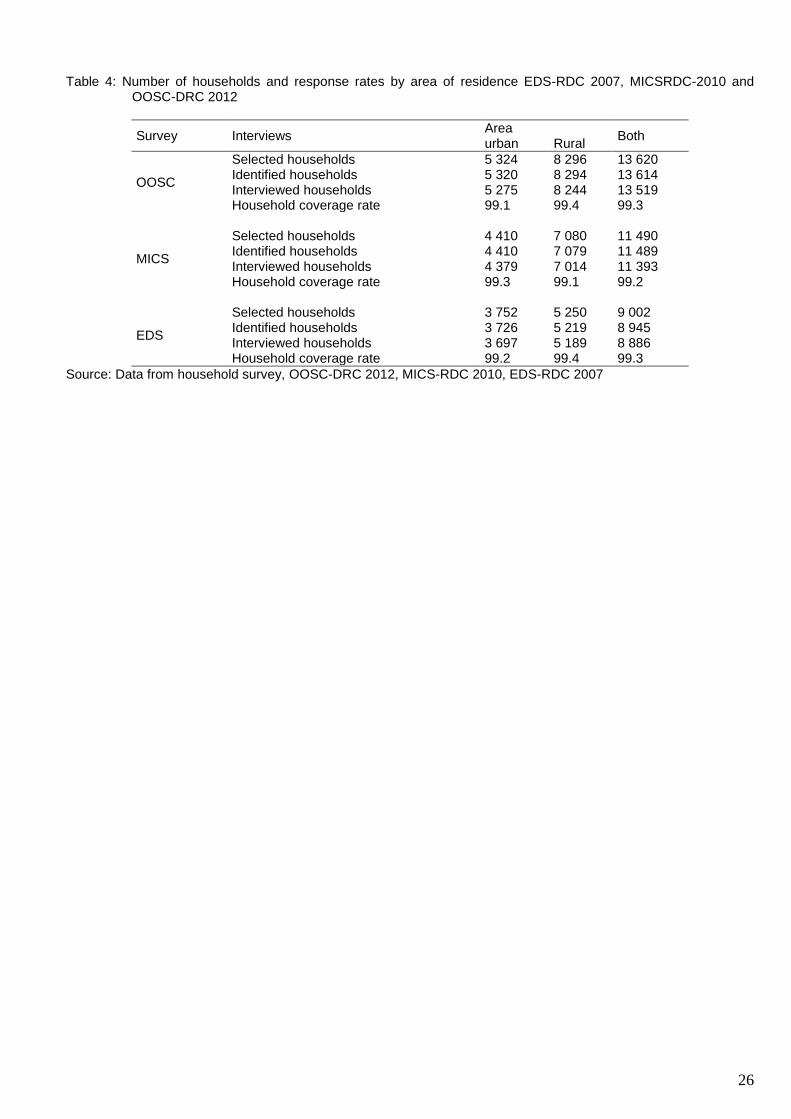
26
Table 4: Number of households and response rates by area of residence EDS-RDC 2007, MICSRDC-2010 and OOSC-DRC 2012
Survey Interviews Area
Both urban Rural
OOSC
Selected households 5 324 8 296 13 620 Identified households 5 320 8 294 13 614 Interviewed households 5 275 8 244 13 519 Household coverage rate 99.1 99.4 99.3
MICS
Selected households 4 410 7 080 11 490 Identified households 4 410 7 079 11 489 Interviewed households 4 379 7 014 11 393 Household coverage rate 99.3 99.1 99.2
EDS
Selected households 3 752 5 250 9 002 Identified households 3 726 5 219 8 945 Interviewed households 3 697 5 189 8 886 Household coverage rate 99.2 99.4 99.3
Source: Data from household survey, OOSC-DRC 2012, MICS-RDC 2010, EDS-RDC 2007
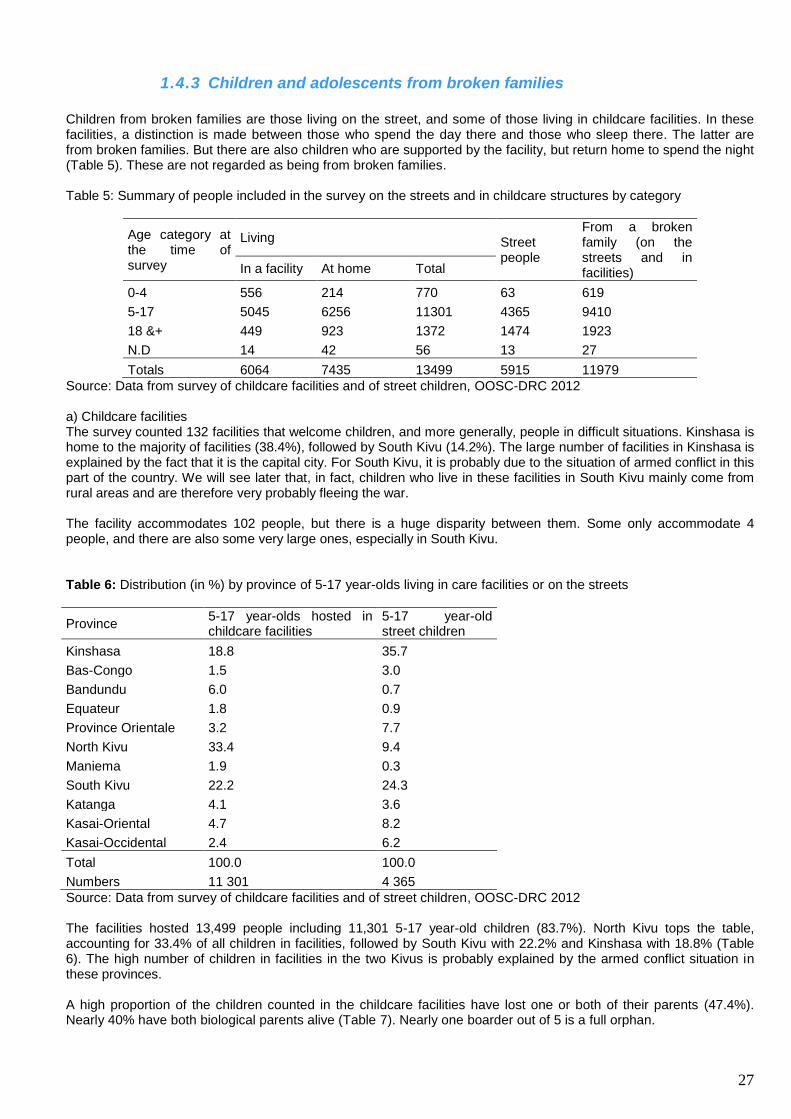
27
1.4.3 Children and adolescents from broken families
Children from broken families are those living on the street, and some of those living in childcare facilities. In these facilities, a distinction is made between those who spend the day there and those who sleep there. The latter are from broken families. But there are also children who are supported by the facility, but return home to spend the night (Table 5). These are not regarded as being from broken families. Table 5: Summary of people included in the survey on the streets and in childcare structures by category
Age category at the time of survey
Living Street people
From a broken family (on the streets and in facilities) In a facility At home Total
0-4 556 214 770 63 619
5-17 5045 6256 11301 4365 9410
18 &+ 449 923 1372 1474 1923
N.D 14 42 56 13 27
Totals 6064 7435 13499 5915 11979
Source: Data from survey of childcare facilities and of street children, OOSC-DRC 2012 a) Childcare facilities The survey counted 132 facilities that welcome children, and more generally, people in difficult situations. Kinshasa is home to the majority of facilities (38.4%), followed by South Kivu (14.2%). The large number of facilities in Kinshasa is explained by the fact that it is the capital city. For South Kivu, it is probably due to the situation of armed conflict in this part of the country. We will see later that, in fact, children who live in these facilities in South Kivu mainly come from rural areas and are therefore very probably fleeing the war. The facility accommodates 102 people, but there is a huge disparity between them. Some only accommodate 4 people, and there are also some very large ones, especially in South Kivu. Table 6: Distribution (in %) by province of 5-17 year-olds living in care facilities or on the streets
Province 5-17 year-olds hosted in childcare facilities
5-17 year-old street children
Kinshasa 18.8 35.7
Bas-Congo 1.5 3.0
Bandundu 6.0 0.7
Equateur 1.8 0.9
Province Orientale 3.2 7.7
North Kivu 33.4 9.4
Maniema 1.9 0.3
South Kivu 22.2 24.3
Katanga 4.1 3.6
Kasai-Oriental 4.7 8.2
Kasai-Occidental 2.4 6.2
Total 100.0 100.0
Numbers 11 301 4 365
Source: Data from survey of childcare facilities and of street children, OOSC-DRC 2012 The facilities hosted 13,499 people including 11,301 5-17 year-old children (83.7%). North Kivu tops the table, accounting for 33.4% of all children in facilities, followed by South Kivu with 22.2% and Kinshasa with 18.8% (Table 6). The high number of children in facilities in the two Kivus is probably explained by the armed conflict situation in these provinces. A high proportion of the children counted in the childcare facilities have lost one or both of their parents (47.4%). Nearly 40% have both biological parents alive (Table 7). Nearly one boarder out of 5 is a full orphan.
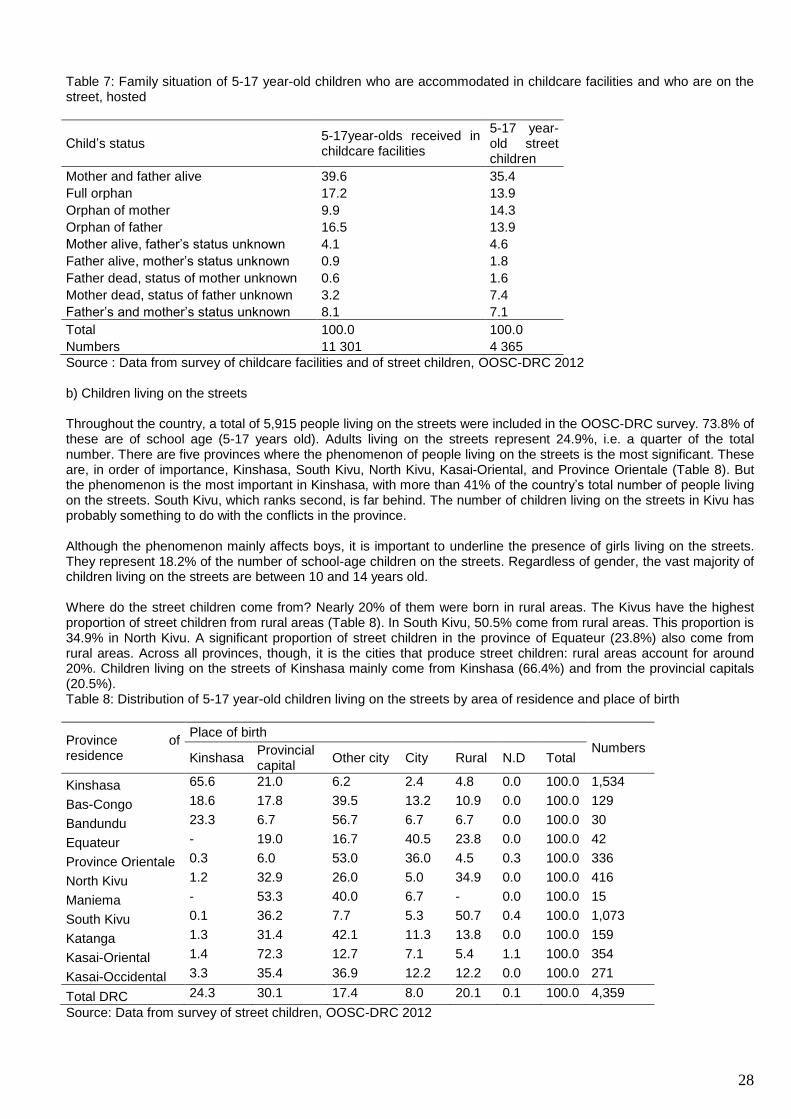
28
Table 7: Family situation of 5-17 year-old children who are accommodated in childcare facilities and who are on the street, hosted
Child’s status 5-17year-olds received in childcare facilities
5-17 year-old street children
Mother and father alive 39.6 35.4
Full orphan 17.2 13.9
Orphan of mother 9.9 14.3
Orphan of father 16.5 13.9
Mother alive, father’s status unknown 4.1 4.6
Father alive, mother’s status unknown 0.9 1.8
Father dead, status of mother unknown 0.6 1.6
Mother dead, status of father unknown 3.2 7.4
Father’s and mother’s status unknown 8.1 7.1
Total 100.0 100.0
Numbers 11 301 4 365
Source : Data from survey of childcare facilities and of street children, OOSC-DRC 2012 b) Children living on the streets Throughout the country, a total of 5,915 people living on the streets were included in the OOSC-DRC survey. 73.8% of these are of school age (5-17 years old). Adults living on the streets represent 24.9%, i.e. a quarter of the total number. There are five provinces where the phenomenon of people living on the streets is the most significant. These are, in order of importance, Kinshasa, South Kivu, North Kivu, Kasai-Oriental, and Province Orientale (Table 8). But the phenomenon is the most important in Kinshasa, with more than 41% of the country’s total number of people living on the streets. South Kivu, which ranks second, is far behind. The number of children living on the streets in Kivu has probably something to do with the conflicts in the province. Although the phenomenon mainly affects boys, it is important to underline the presence of girls living on the streets. They represent 18.2% of the number of school-age children on the streets. Regardless of gender, the vast majority of children living on the streets are between 10 and 14 years old. Where do the street children come from? Nearly 20% of them were born in rural areas. The Kivus have the highest proportion of street children from rural areas (Table 8). In South Kivu, 50.5% come from rural areas. This proportion is 34.9% in North Kivu. A significant proportion of street children in the province of Equateur (23.8%) also come from rural areas. Across all provinces, though, it is the cities that produce street children: rural areas account for around 20%. Children living on the streets of Kinshasa mainly come from Kinshasa (66.4%) and from the provincial capitals (20.5%). Table 8: Distribution of 5-17 year-old children living on the streets by area of residence and place of birth
Province of residence
Place of birth
Numbers Kinshasa
Provincial capital
Other city City Rural N.D Total
Kinshasa 65.6 21.0 6.2 2.4 4.8 0.0 100.0 1,534
Bas-Congo 18.6 17.8 39.5 13.2 10.9 0.0 100.0 129
Bandundu 23.3 6.7 56.7 6.7 6.7 0.0 100.0 30
Equateur - 19.0 16.7 40.5 23.8 0.0 100.0 42
Province Orientale 0.3 6.0 53.0 36.0 4.5 0.3 100.0 336
North Kivu 1.2 32.9 26.0 5.0 34.9 0.0 100.0 416
Maniema - 53.3 40.0 6.7 - 0.0 100.0 15
South Kivu 0.1 36.2 7.7 5.3 50.7 0.4 100.0 1,073
Katanga 1.3 31.4 42.1 11.3 13.8 0.0 100.0 159
Kasai-Oriental 1.4 72.3 12.7 7.1 5.4 1.1 100.0 354
Kasai-Occidental 3.3 35.4 36.9 12.2 12.2 0.0 100.0 271
Total DRC 24.3 30.1 17.4 8.0 20.1 0.1 100.0 4,359
Source: Data from survey of street children, OOSC-DRC 2012
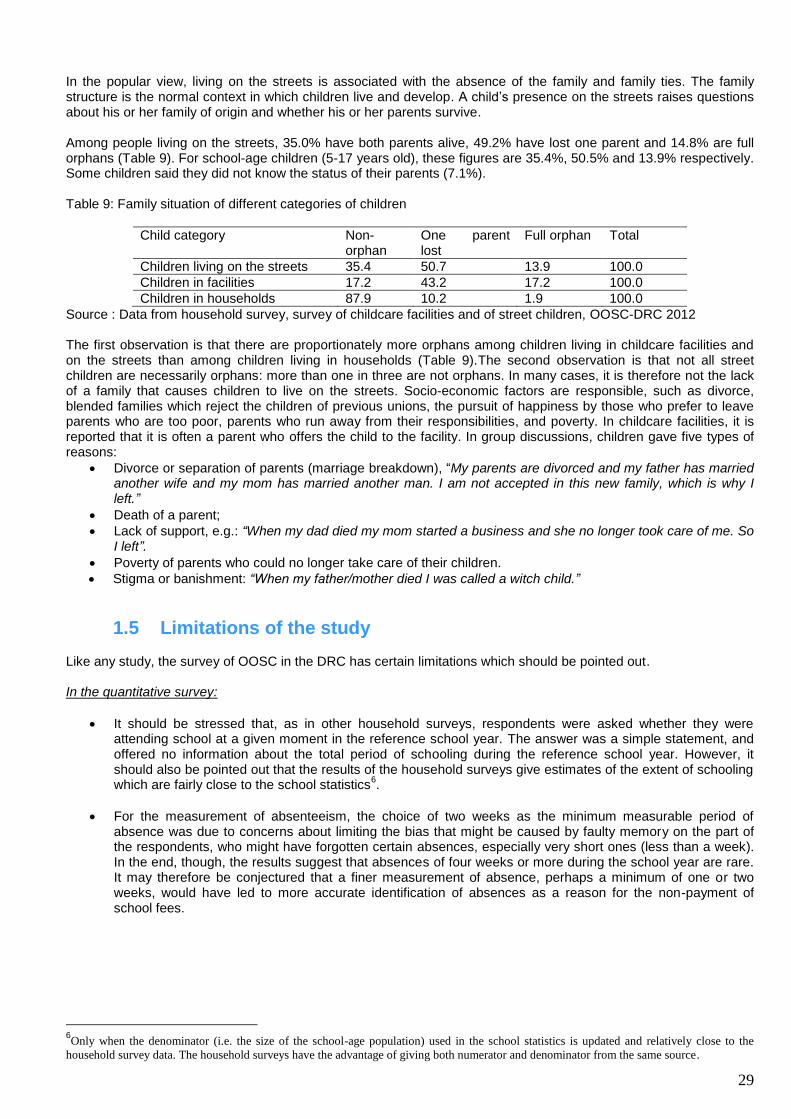
29
In the popular view, living on the streets is associated with the absence of the family and family ties. The family structure is the normal context in which children live and develop. A child’s presence on the streets raises questions about his or her family of origin and whether his or her parents survive. Among people living on the streets, 35.0% have both parents alive, 49.2% have lost one parent and 14.8% are full orphans (Table 9). For school-age children (5-17 years old), these figures are 35.4%, 50.5% and 13.9% respectively. Some children said they did not know the status of their parents (7.1%). Table 9: Family situation of different categories of children
Child category Non- orphan
One parent lost
Full orphan Total
Children living on the streets 35.4 50.7 13.9 100.0
Children in facilities 17.2 43.2 17.2 100.0
Children in households 87.9 10.2 1.9 100.0
Source : Data from household survey, survey of childcare facilities and of street children, OOSC-DRC 2012 The first observation is that there are proportionately more orphans among children living in childcare facilities and on the streets than among children living in households (Table 9).The second observation is that not all street children are necessarily orphans: more than one in three are not orphans. In many cases, it is therefore not the lack of a family that causes children to live on the streets. Socio-economic factors are responsible, such as divorce, blended families which reject the children of previous unions, the pursuit of happiness by those who prefer to leave parents who are too poor, parents who run away from their responsibilities, and poverty. In childcare facilities, it is reported that it is often a parent who offers the child to the facility. In group discussions, children gave five types of reasons:
Divorce or separation of parents (marriage breakdown), “My parents are divorced and my father has married another wife and my mom has married another man. I am not accepted in this new family, which is why I left.”
Death of a parent;
Lack of support, e.g.: “When my dad died my mom started a business and she no longer took care of me. So I left”.
Poverty of parents who could no longer take care of their children.
Stigma or banishment: “When my father/mother died I was called a witch child.”
1.5 Limitations of the study Like any study, the survey of OOSC in the DRC has certain limitations which should be pointed out. In the quantitative survey:
It should be stressed that, as in other household surveys, respondents were asked whether they were attending school at a given moment in the reference school year. The answer was a simple statement, and offered no information about the total period of schooling during the reference school year. However, it should also be pointed out that the results of the household surveys give estimates of the extent of schooling which are fairly close to the school statistics
6.
For the measurement of absenteeism, the choice of two weeks as the minimum measurable period of absence was due to concerns about limiting the bias that might be caused by faulty memory on the part of the respondents, who might have forgotten certain absences, especially very short ones (less than a week). In the end, though, the results suggest that absences of four weeks or more during the school year are rare. It may therefore be conjectured that a finer measurement of absence, perhaps a minimum of one or two weeks, would have led to more accurate identification of absences as a reason for the non-payment of school fees.
6Only when the denominator (i.e. the size of the school-age population) used in the school statistics is updated and relatively close to the
household survey data. The household surveys have the advantage of giving both numerator and denominator from the same source.
30
In the qualitative survey:
The qualitative survey did not relate to all 11 provinces due to limited resources. A decision was therefore made to choose four provinces with diversified socio-economic profiles with regard to the OOSC issue in order to see whether the comments made about the OOSC phenomenon were convergent or divergent. With more resources, it would have been possible to extend the interviews to the other provinces, but the results of the qualitative work do not reveal any differences between the four provinces in terms of what was said.
One of the goals of the qualitative survey was to collect the views of different players in the education system. Regarding the gender structure of teaching staff and managers in the education system, the school statistics reveal that 30% are women and 70% are men. In the procedure used to collect the qualitative data, scrupulous adherence to this gender structure was not a criterion for the selection of education managers. Moreover, the number of female parents interviewed was much lower than that of male parents, due to the social structure which means that the man is almost always the one who is asked about questions relating to the household or the family. In addition, quotas for the proportion of male and female parents to be interviewed were not defined at the outset.
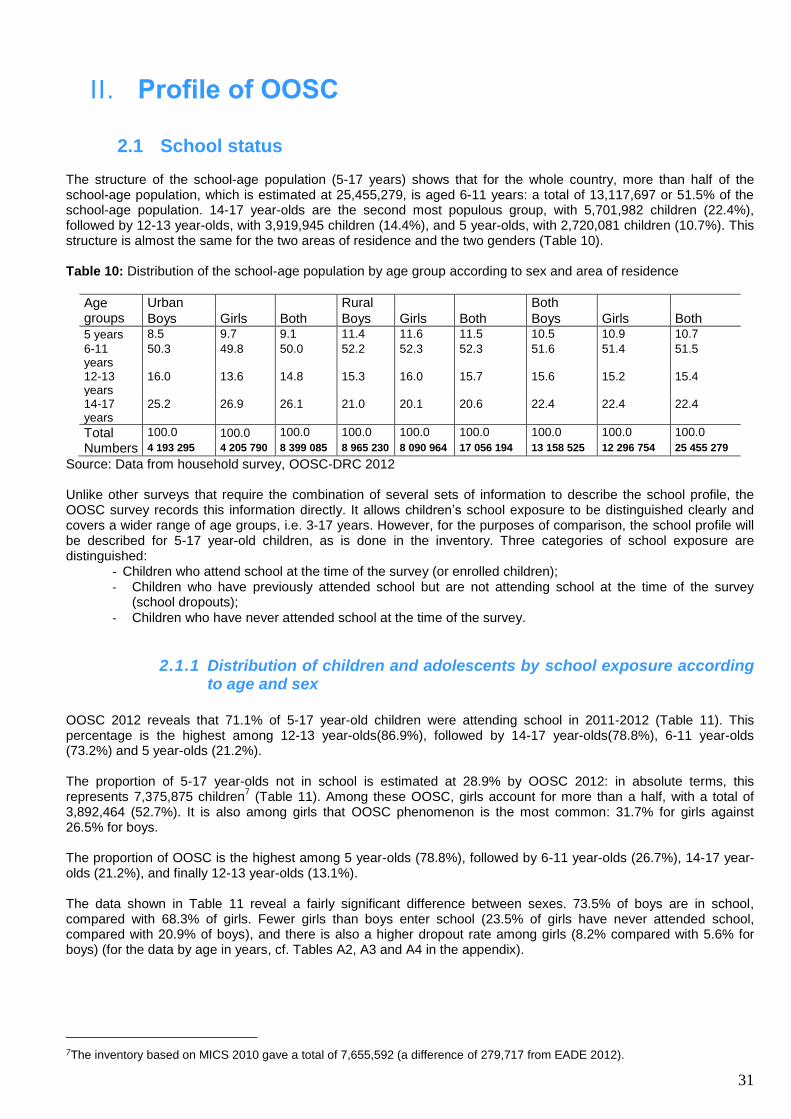
31
II. Profile of OOSC
2.1 School status The structure of the school-age population (5-17 years) shows that for the whole country, more than half of the school-age population, which is estimated at 25,455,279, is aged 6-11 years: a total of 13,117,697 or 51.5% of the school-age population. 14-17 year-olds are the second most populous group, with 5,701,982 children (22.4%), followed by 12-13 year-olds, with 3,919,945 children (14.4%), and 5 year-olds, with 2,720,081 children (10.7%). This structure is almost the same for the two areas of residence and the two genders (Table 10). Table 10: Distribution of the school-age population by age group according to sex and area of residence
Age groups
Urban Rural Both
Boys Girls Both Boys Girls Both Boys Girls Both 5 years 8.5 9.7 9.1 11.4 11.6 11.5 10.5 10.9 10.7
6-11 years
50.3 49.8 50.0 52.2 52.3 52.3 51.6 51.4 51.5
12-13 years
16.0 13.6 14.8 15.3 16.0 15.7 15.6 15.2 15.4
14-17 years
25.2 26.9 26.1 21.0 20.1 20.6 22.4 22.4 22.4
Total 100.0 100.0 100.0 100.0 100.0 100.0 100.0 100.0 100.0
Numbers 4 193 295 4 205 790 8 399 085 8 965 230 8 090 964 17 056 194 13 158 525 12 296 754 25 455 279
Source: Data from household survey, OOSC-DRC 2012 Unlike other surveys that require the combination of several sets of information to describe the school profile, the OOSC survey records this information directly. It allows children’s school exposure to be distinguished clearly and covers a wider range of age groups, i.e. 3-17 years. However, for the purposes of comparison, the school profile will be described for 5-17 year-old children, as is done in the inventory. Three categories of school exposure are distinguished:
- Children who attend school at the time of the survey (or enrolled children); - Children who have previously attended school but are not attending school at the time of the survey
(school dropouts);
- Children who have never attended school at the time of the survey.
2.1.1 Distribution of children and adolescents by school exposure according to age and sex
OOSC 2012 reveals that 71.1% of 5-17 year-old children were attending school in 2011-2012 (Table 11). This percentage is the highest among 12-13 year-olds(86.9%), followed by 14-17 year-olds(78.8%), 6-11 year-olds (73.2%) and 5 year-olds (21.2%). The proportion of 5-17 year-olds not in school is estimated at 28.9% by OOSC 2012: in absolute terms, this represents 7,375,875 children
7 (Table 11). Among these OOSC, girls account for more than a half, with a total of
3,892,464 (52.7%). It is also among girls that OOSC phenomenon is the most common: 31.7% for girls against 26.5% for boys. The proportion of OOSC is the highest among 5 year-olds (78.8%), followed by 6-11 year-olds (26.7%), 14-17 year-olds (21.2%), and finally 12-13 year-olds (13.1%). The data shown in Table 11 reveal a fairly significant difference between sexes. 73.5% of boys are in school, compared with 68.3% of girls. Fewer girls than boys enter school (23.5% of girls have never attended school, compared with 20.9% of boys), and there is also a higher dropout rate among girls (8.2% compared with 5.6% for boys) (for the data by age in years, cf. Tables A2, A3 and A4 in the appendix).
7The inventory based on MICS 2010 gave a total of 7,655,592 (a difference of 279,717 from EADE 2012).
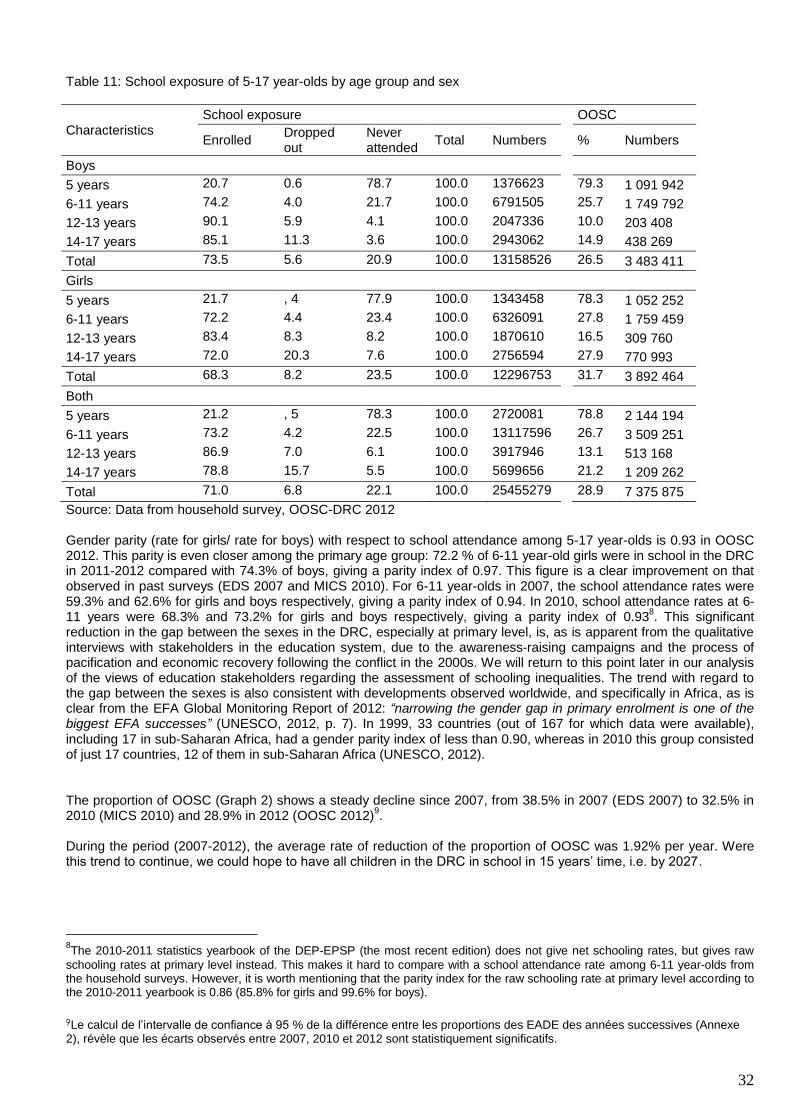
32
Table 11: School exposure of 5-17 year-olds by age group and sex
Characteristics School exposure OOSC
Enrolled Dropped out
Never attended
Total Numbers % Numbers
Boys
5 years 20.7 0.6 78.7 100.0 1376623 79.3 1 091 942
6-11 years 74.2 4.0 21.7 100.0 6791505 25.7 1 749 792
12-13 years 90.1 5.9 4.1 100.0 2047336 10.0 203 408
14-17 years 85.1 11.3 3.6 100.0 2943062 14.9 438 269
Total 73.5 5.6 20.9 100.0 13158526 26.5 3 483 411
Girls
5 years 21.7 , 4 77.9 100.0 1343458 78.3 1 052 252
6-11 years 72.2 4.4 23.4 100.0 6326091 27.8 1 759 459
12-13 years 83.4 8.3 8.2 100.0 1870610 16.5 309 760
14-17 years 72.0 20.3 7.6 100.0 2756594 27.9 770 993
Total 68.3 8.2 23.5 100.0 12296753 31.7 3 892 464
Both
5 years 21.2 , 5 78.3 100.0 2720081 78.8 2 144 194
6-11 years 73.2 4.2 22.5 100.0 13117596 26.7 3 509 251
12-13 years 86.9 7.0 6.1 100.0 3917946 13.1 513 168
14-17 years 78.8 15.7 5.5 100.0 5699656 21.2 1 209 262
Total 71.0 6.8 22.1 100.0 25455279 28.9 7 375 875
Source: Data from household survey, OOSC-DRC 2012 Gender parity (rate for girls/ rate for boys) with respect to school attendance among 5-17 year-olds is 0.93 in OOSC 2012. This parity is even closer among the primary age group: 72.2 % of 6-11 year-old girls were in school in the DRC in 2011-2012 compared with 74.3% of boys, giving a parity index of 0.97. This figure is a clear improvement on that observed in past surveys (EDS 2007 and MICS 2010). For 6-11 year-olds in 2007, the school attendance rates were 59.3% and 62.6% for girls and boys respectively, giving a parity index of 0.94. In 2010, school attendance rates at 6-11 years were 68.3% and 73.2% for girls and boys respectively, giving a parity index of 0.93
8. This significant
reduction in the gap between the sexes in the DRC, especially at primary level, is, as is apparent from the qualitative interviews with stakeholders in the education system, due to the awareness-raising campaigns and the process of pacification and economic recovery following the conflict in the 2000s. We will return to this point later in our analysis of the views of education stakeholders regarding the assessment of schooling inequalities. The trend with regard to the gap between the sexes is also consistent with developments observed worldwide, and specifically in Africa, as is clear from the EFA Global Monitoring Report of 2012: “narrowing the gender gap in primary enrolment is one of the biggest EFA successes” (UNESCO, 2012, p. 7). In 1999, 33 countries (out of 167 for which data were available), including 17 in sub-Saharan Africa, had a gender parity index of less than 0.90, whereas in 2010 this group consisted of just 17 countries, 12 of them in sub-Saharan Africa (UNESCO, 2012). The proportion of OOSC (Graph 2) shows a steady decline since 2007, from 38.5% in 2007 (EDS 2007) to 32.5% in 2010 (MICS 2010) and 28.9% in 2012 (OOSC 2012)
9.
During the period (2007-2012), the average rate of reduction of the proportion of OOSC was 1.92% per year. Were this trend to continue, we could hope to have all children in the DRC in school in 15 years’ time, i.e. by 2027.
8The 2010-2011 statistics yearbook of the DEP-EPSP (the most recent edition) does not give net schooling rates, but gives raw
schooling rates at primary level instead. This makes it hard to compare with a school attendance rate among 6-11 year-olds from the household surveys. However, it is worth mentioning that the parity index for the raw schooling rate at primary level according to the 2010-2011 yearbook is 0.86 (85.8% for girls and 99.6% for boys).
9Le calcul de l’intervalle de confiance à 95 % de la différence entre les proportions des EADE des années successives (Annexe 2), révèle que les écarts observés entre 2007, 2010 et 2012 sont statistiquement significatifs.
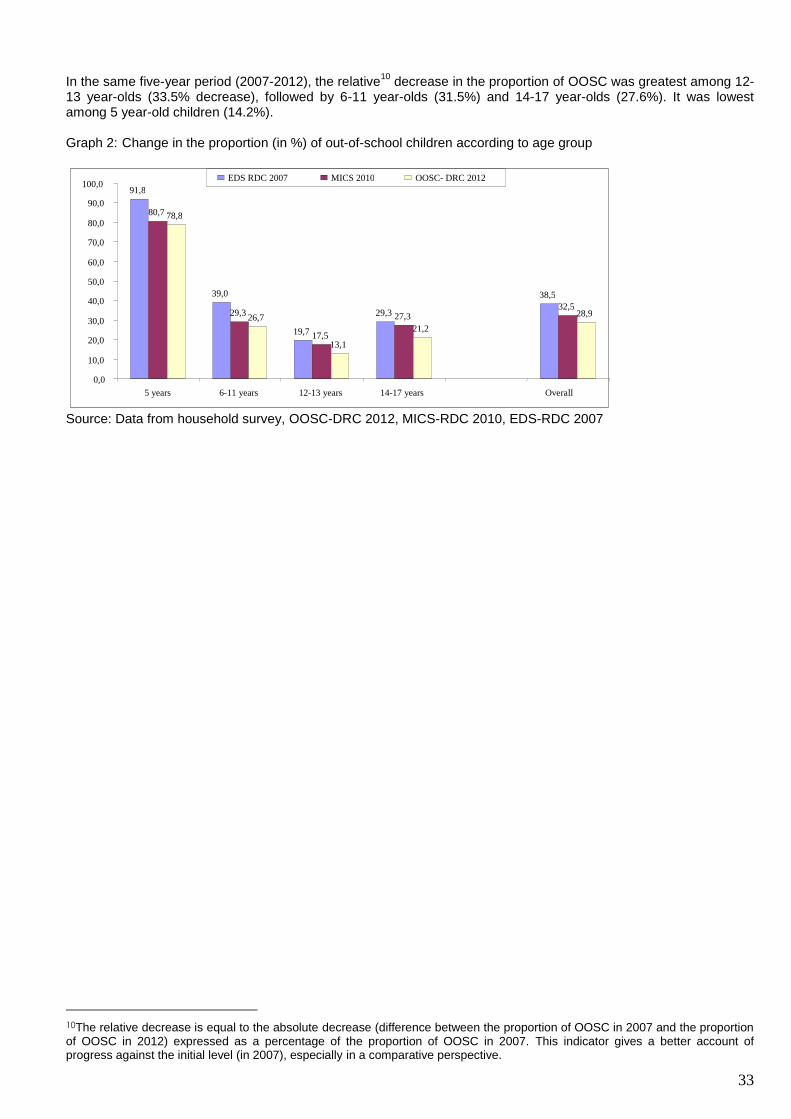
33
In the same five-year period (2007-2012), the relative10
decrease in the proportion of OOSC was greatest among 12-13 year-olds (33.5% decrease), followed by 6-11 year-olds (31.5%) and 14-17 year-olds (27.6%). It was lowest among 5 year-old children (14.2%). Graph 2: Change in the proportion (in %) of out-of-school children according to age group
Source: Data from household survey, OOSC-DRC 2012, MICS-RDC 2010, EDS-RDC 2007
10The relative decrease is equal to the absolute decrease (difference between the proportion of OOSC in 2007 and the proportion of OOSC in 2012) expressed as a percentage of the proportion of OOSC in 2007. This indicator gives a better account of progress against the initial level (in 2007), especially in a comparative perspective.
91,8
39,0
19,7
29,3 38,5
80,7
29,3
17,5
27,3 32,5
78,8
26,7
13,1 21,2
28,9
0,0
10,0
20,0
30,0
40,0
50,0
60,0
70,0
80,0
90,0
100,0
5 years 6-11 years 12-13 years 14-17 years Overall
EDS RDC 2007 MICS 2010 OOSC- DRC 2012
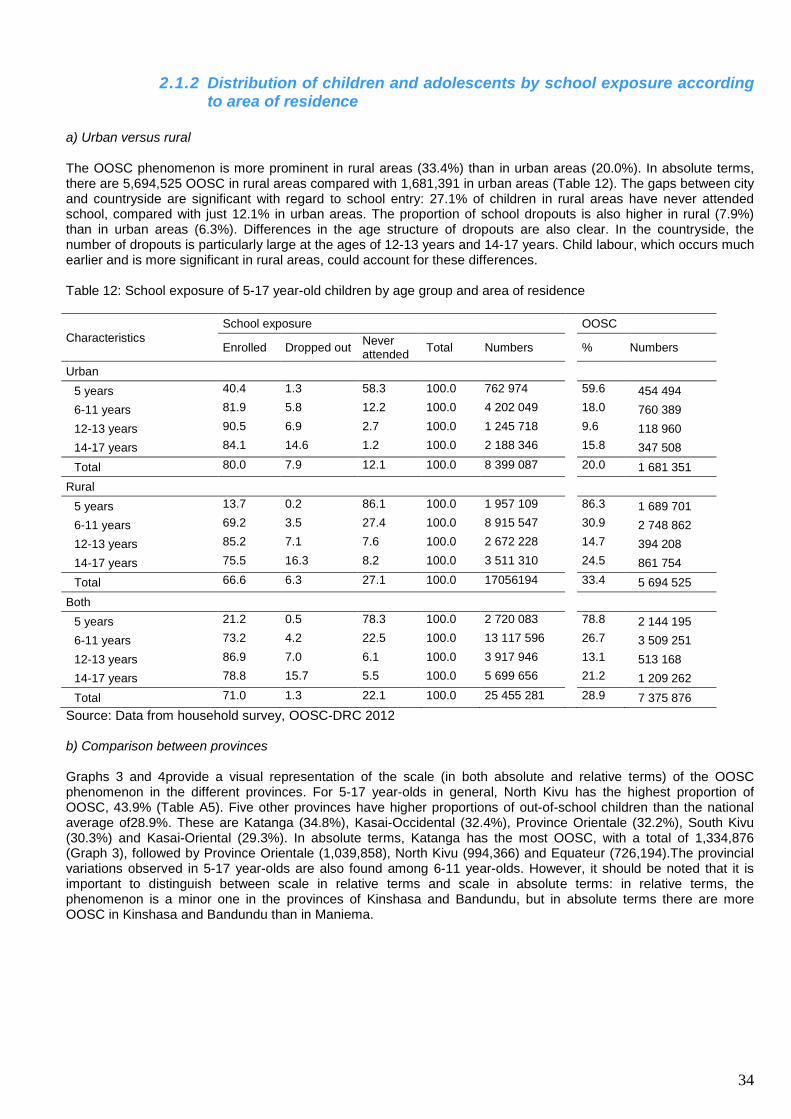
34
2.1.2 Distribution of children and adolescents by school exposure according to area of residence
a) Urban versus rural The OOSC phenomenon is more prominent in rural areas (33.4%) than in urban areas (20.0%). In absolute terms, there are 5,694,525 OOSC in rural areas compared with 1,681,391 in urban areas (Table 12). The gaps between city and countryside are significant with regard to school entry: 27.1% of children in rural areas have never attended school, compared with just 12.1% in urban areas. The proportion of school dropouts is also higher in rural (7.9%) than in urban areas (6.3%). Differences in the age structure of dropouts are also clear. In the countryside, the number of dropouts is particularly large at the ages of 12-13 years and 14-17 years. Child labour, which occurs much earlier and is more significant in rural areas, could account for these differences. Table 12: School exposure of 5-17 year-old children by age group and area of residence
Characteristics
School exposure OOSC
Enrolled Dropped out Never attended
Total Numbers % Numbers
Urban
5 years 40.4 1.3 58.3 100.0 762 974 59.6 454 494
6-11 years 81.9 5.8 12.2 100.0 4 202 049 18.0 760 389
12-13 years 90.5 6.9 2.7 100.0 1 245 718 9.6 118 960
14-17 years 84.1 14.6 1.2 100.0 2 188 346 15.8 347 508
Total 80.0 7.9 12.1 100.0 8 399 087 20.0 1 681 351
Rural
5 years 13.7 0.2 86.1 100.0 1 957 109 86.3 1 689 701
6-11 years 69.2 3.5 27.4 100.0 8 915 547 30.9 2 748 862
12-13 years 85.2 7.1 7.6 100.0 2 672 228 14.7 394 208
14-17 years 75.5 16.3 8.2 100.0 3 511 310 24.5 861 754
Total 66.6 6.3 27.1 100.0 17056194 33.4 5 694 525
Both
5 years 21.2 0.5 78.3 100.0 2 720 083 78.8 2 144 195
6-11 years 73.2 4.2 22.5 100.0 13 117 596 26.7 3 509 251
12-13 years 86.9 7.0 6.1 100.0 3 917 946 13.1 513 168
14-17 years 78.8 15.7 5.5 100.0 5 699 656 21.2 1 209 262
Total 71.0 1.3 22.1 100.0 25 455 281 28.9 7 375 876
Source: Data from household survey, OOSC-DRC 2012 b) Comparison between provinces Graphs 3 and 4provide a visual representation of the scale (in both absolute and relative terms) of the OOSC phenomenon in the different provinces. For 5-17 year-olds in general, North Kivu has the highest proportion of OOSC, 43.9% (Table A5). Five other provinces have higher proportions of out-of-school children than the national average of28.9%. These are Katanga (34.8%), Kasai-Occidental (32.4%), Province Orientale (32.2%), South Kivu (30.3%) and Kasai-Oriental (29.3%). In absolute terms, Katanga has the most OOSC, with a total of 1,334,876 (Graph 3), followed by Province Orientale (1,039,858), North Kivu (994,366) and Equateur (726,194).The provincial variations observed in 5-17 year-olds are also found among 6-11 year-olds. However, it should be noted that it is important to distinguish between scale in relative terms and scale in absolute terms: in relative terms, the phenomenon is a minor one in the provinces of Kinshasa and Bandundu, but in absolute terms there are more OOSC in Kinshasa and Bandundu than in Maniema.
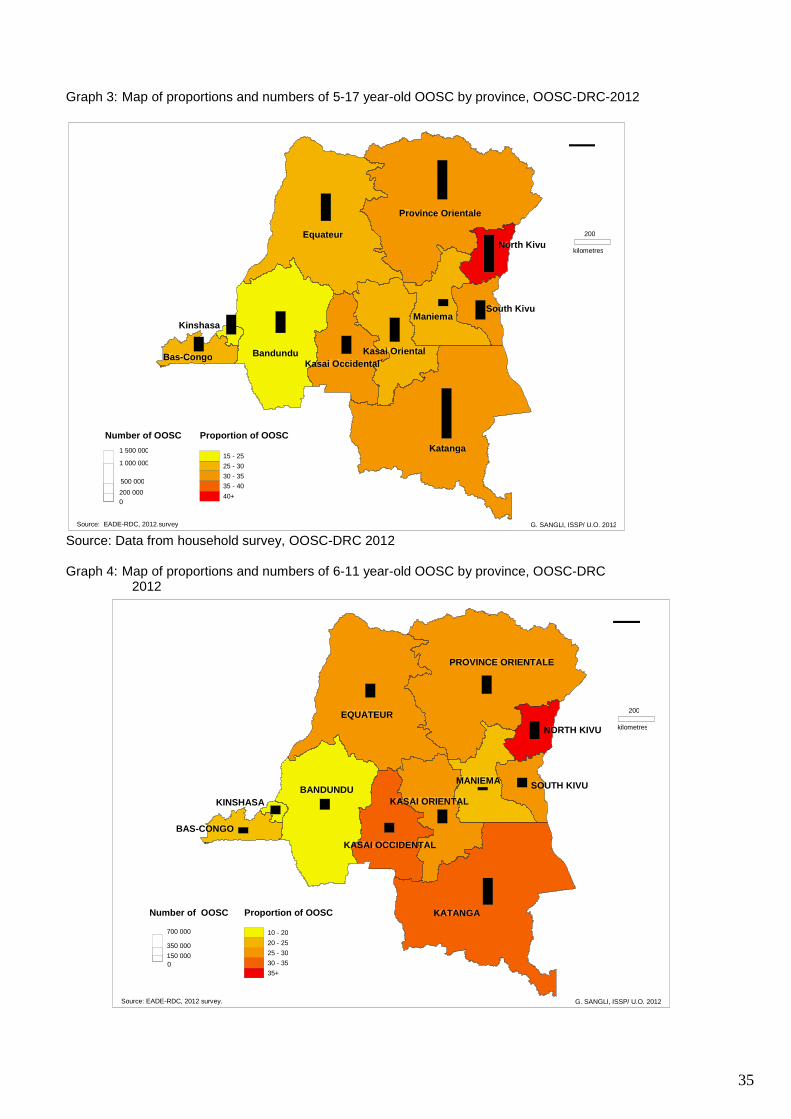
35
Graph 3: Map of proportions and numbers of 5-17 year-old OOSC by province, OOSC-DRC-2012
Source: Data from household survey, OOSC-DRC 2012 Graph 4: Map of proportions and numbers of 6-11 year-old OOSC by province, OOSC-DRC
2012
Katanga
Equateur
Bandundu
Province Orientale
Maniema
Kasai Oriental Kasai Occidental
South Kivu
North Kivu
Bas-Congo
Kinshasa
¯
200 kilometres
Source: EADE-RDC, 2012.survey G. SANGLI, ISSP/ U.O. 2012
Proportion of OOSC
25 - 30 15 - 25
30 - 35 35 - 40 40+
Number of OOSC 1 500 000
200 000 0
1 000 000
500 000
KATANGA
EQUATEUR
BANDUNDU
PROVINCE ORIENTALE
MANIEMA
KASAI ORIENTAL
KASAI OCCIDENTAL
SOUTH KIVU
NORTH KIVU
BAS-CONGO
KINSHASA
¯
200 kilometres
Source: EADE-RDC, 2012 survey. G. SANGLI, ISSP/ U.O. 2012
Number of OOSC Proportion of OOSC
10 - 20
25 - 30 30 - 35 35+
20 - 25 150 000 350 000 700 000
0
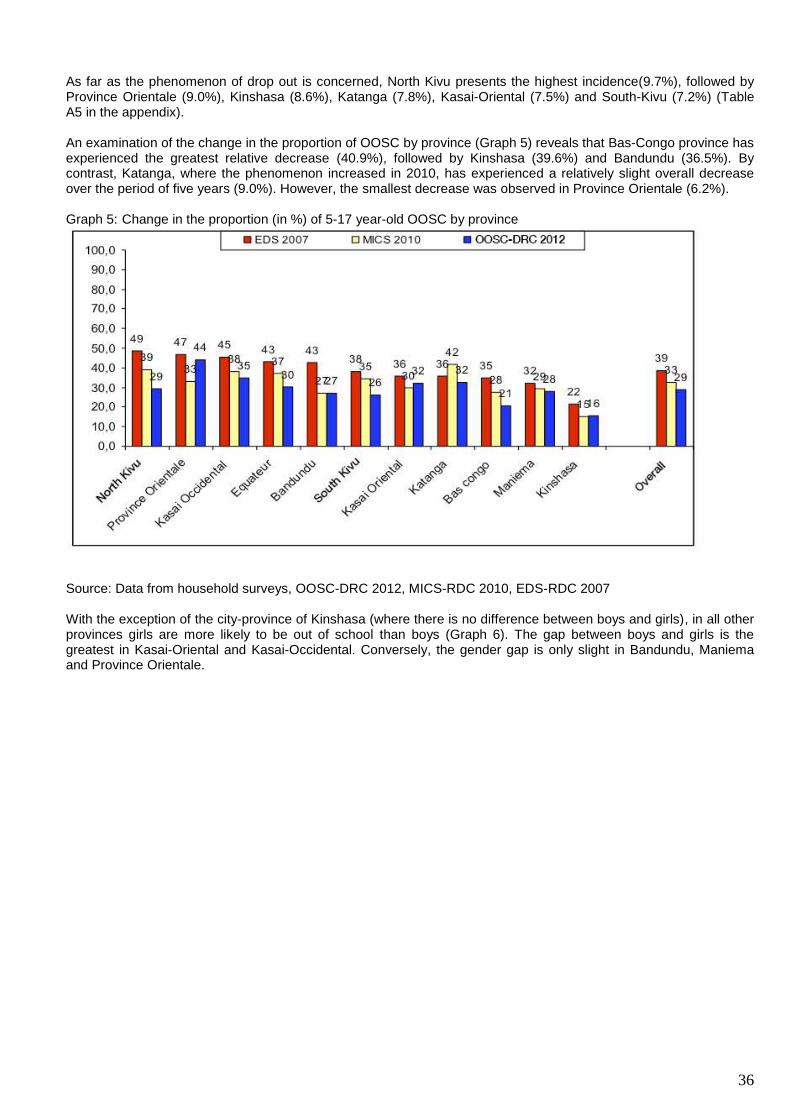
36
As far as the phenomenon of drop out is concerned, North Kivu presents the highest incidence(9.7%), followed by Province Orientale (9.0%), Kinshasa (8.6%), Katanga (7.8%), Kasai-Oriental (7.5%) and South-Kivu (7.2%) (Table A5 in the appendix). An examination of the change in the proportion of OOSC by province (Graph 5) reveals that Bas-Congo province has experienced the greatest relative decrease (40.9%), followed by Kinshasa (39.6%) and Bandundu (36.5%). By contrast, Katanga, where the phenomenon increased in 2010, has experienced a relatively slight overall decrease over the period of five years (9.0%). However, the smallest decrease was observed in Province Orientale (6.2%). Graph 5: Change in the proportion (in %) of 5-17 year-old OOSC by province
Source: Data from household surveys, OOSC-DRC 2012, MICS-RDC 2010, EDS-RDC 2007 With the exception of the city-province of Kinshasa (where there is no difference between boys and girls), in all other provinces girls are more likely to be out of school than boys (Graph 6). The gap between boys and girls is the greatest in Kasai-Oriental and Kasai-Occidental. Conversely, the gender gap is only slight in Bandundu, Maniema and Province Orientale.
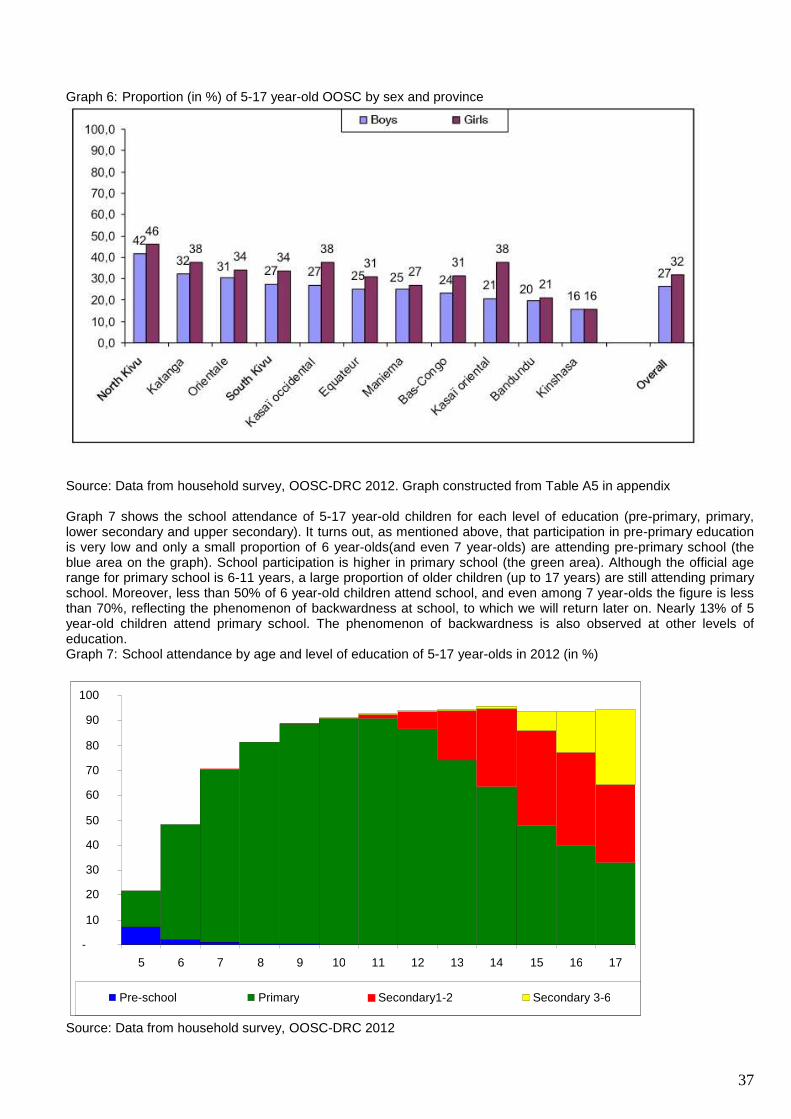
37
Graph 6: Proportion (in %) of 5-17 year-old OOSC by sex and province
Source: Data from household survey, OOSC-DRC 2012. Graph constructed from Table A5 in appendix Graph 7 shows the school attendance of 5-17 year-old children for each level of education (pre-primary, primary, lower secondary and upper secondary). It turns out, as mentioned above, that participation in pre-primary education is very low and only a small proportion of 6 year-olds(and even 7 year-olds) are attending pre-primary school (the blue area on the graph). School participation is higher in primary school (the green area). Although the official age range for primary school is 6-11 years, a large proportion of older children (up to 17 years) are still attending primary school. Moreover, less than 50% of 6 year-old children attend school, and even among 7 year-olds the figure is less than 70%, reflecting the phenomenon of backwardness at school, to which we will return later on. Nearly 13% of 5 year-old children attend primary school. The phenomenon of backwardness is also observed at other levels of education. Graph 7: School attendance by age and level of education of 5-17 year-olds in 2012 (in %)
Source: Data from household survey, OOSC-DRC 2012
-
10
20
30
40
50
60
70
80
90
100
5 6 7 8 9 10 11 12 13 14 15 16 17
Pre-school Primary Secondary1-2 Secondary 3-6
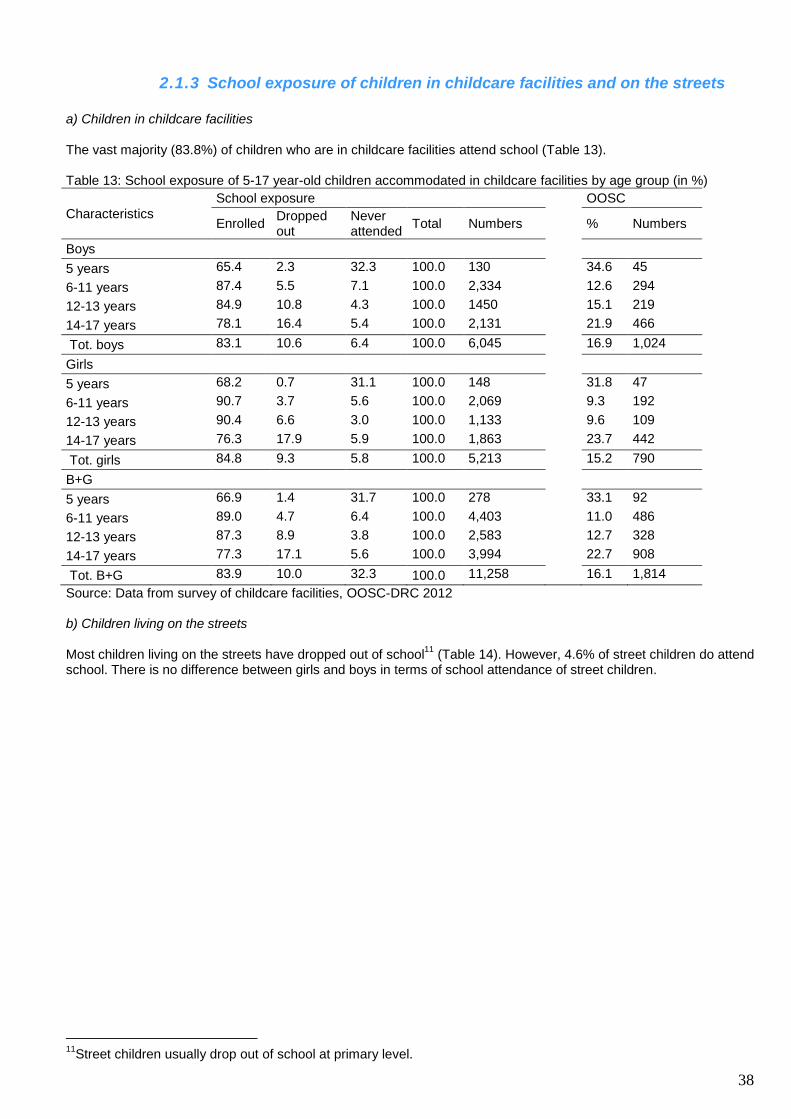
38
2.1.3 School exposure of children in childcare facilities and on the streets
a) Children in childcare facilities The vast majority (83.8%) of children who are in childcare facilities attend school (Table 13). Table 13: School exposure of 5-17 year-old children accommodated in childcare facilities by age group (in %)
Characteristics
School exposure OOSC
Enrolled Dropped out
Never attended
Total Numbers % Numbers
Boys
5 years 65.4 2.3 32.3 100.0 130 34.6 45
6-11 years 87.4 5.5 7.1 100.0 2,334 12.6 294
12-13 years 84.9 10.8 4.3 100.0 1450 15.1 219
14-17 years 78.1 16.4 5.4 100.0 2,131 21.9 466
Tot. boys 83.1 10.6 6.4 100.0 6,045 16.9 1,024
Girls
5 years 68.2 0.7 31.1 100.0 148 31.8 47
6-11 years 90.7 3.7 5.6 100.0 2,069 9.3 192
12-13 years 90.4 6.6 3.0 100.0 1,133 9.6 109
14-17 years 76.3 17.9 5.9 100.0 1,863 23.7 442
Tot. girls 84.8 9.3 5.8 100.0 5,213 15.2 790
B+G
5 years 66.9 1.4 31.7 100.0 278 33.1 92
6-11 years 89.0 4.7 6.4 100.0 4,403 11.0 486
12-13 years 87.3 8.9 3.8 100.0 2,583 12.7 328
14-17 years 77.3 17.1 5.6 100.0 3,994 22.7 908
Tot. B+G 83.9 10.0 32.3 100.0 11,258 16.1 1,814
Source: Data from survey of childcare facilities, OOSC-DRC 2012 b) Children living on the streets Most children living on the streets have dropped out of school
11 (Table 14). However, 4.6% of street children do attend
school. There is no difference between girls and boys in terms of school attendance of street children.
11
Street children usually drop out of school at primary level.
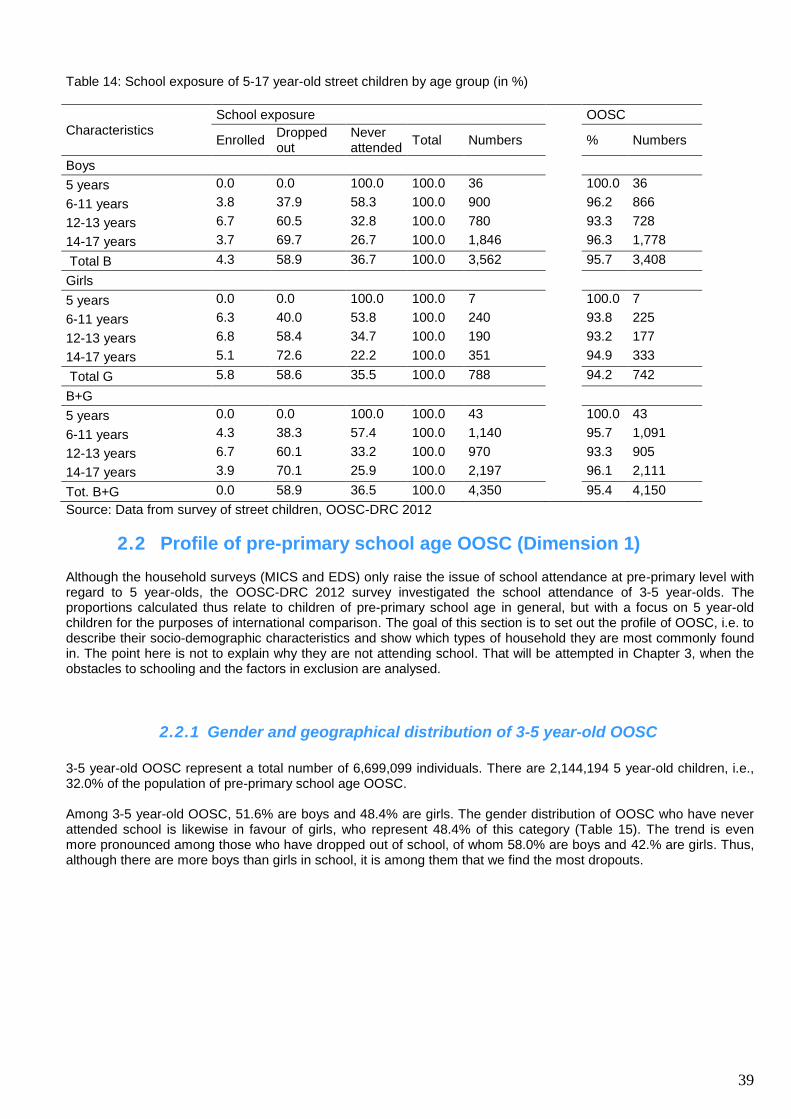
39
Table 14: School exposure of 5-17 year-old street children by age group (in %)
Characteristics School exposure OOSC
Enrolled Dropped out
Never attended
Total Numbers % Numbers
Boys
5 years 0.0 0.0 100.0 100.0 36 100.0 36
6-11 years 3.8 37.9 58.3 100.0 900 96.2 866
12-13 years 6.7 60.5 32.8 100.0 780 93.3 728
14-17 years 3.7 69.7 26.7 100.0 1,846 96.3 1,778
Total B 4.3 58.9 36.7 100.0 3,562 95.7 3,408
Girls
5 years 0.0 0.0 100.0 100.0 7 100.0 7
6-11 years 6.3 40.0 53.8 100.0 240 93.8 225
12-13 years 6.8 58.4 34.7 100.0 190 93.2 177
14-17 years 5.1 72.6 22.2 100.0 351 94.9 333
Total G 5.8 58.6 35.5 100.0 788 94.2 742
B+G
5 years 0.0 0.0 100.0 100.0 43 100.0 43
6-11 years 4.3 38.3 57.4 100.0 1,140 95.7 1,091
12-13 years 6.7 60.1 33.2 100.0 970 93.3 905
14-17 years 3.9 70.1 25.9 100.0 2,197 96.1 2,111
Tot. B+G 0.0 58.9 36.5 100.0 4,350 95.4 4,150
Source: Data from survey of street children, OOSC-DRC 2012
2.2 Profile of pre-primary school age OOSC (Dimension 1) Although the household surveys (MICS and EDS) only raise the issue of school attendance at pre-primary level with regard to 5 year-olds, the OOSC-DRC 2012 survey investigated the school attendance of 3-5 year-olds. The proportions calculated thus relate to children of pre-primary school age in general, but with a focus on 5 year-old children for the purposes of international comparison. The goal of this section is to set out the profile of OOSC, i.e. to describe their socio-demographic characteristics and show which types of household they are most commonly found in. The point here is not to explain why they are not attending school. That will be attempted in Chapter 3, when the obstacles to schooling and the factors in exclusion are analysed.
2.2.1 Gender and geographical distribution of 3-5 year-old OOSC
3-5 year-old OOSC represent a total number of 6,699,099 individuals. There are 2,144,194 5 year-old children, i.e., 32.0% of the population of pre-primary school age OOSC. Among 3-5 year-old OOSC, 51.6% are boys and 48.4% are girls. The gender distribution of OOSC who have never attended school is likewise in favour of girls, who represent 48.4% of this category (Table 15). The trend is even more pronounced among those who have dropped out of school, of whom 58.0% are boys and 42.% are girls. Thus, although there are more boys than girls in school, it is among them that we find the most dropouts.
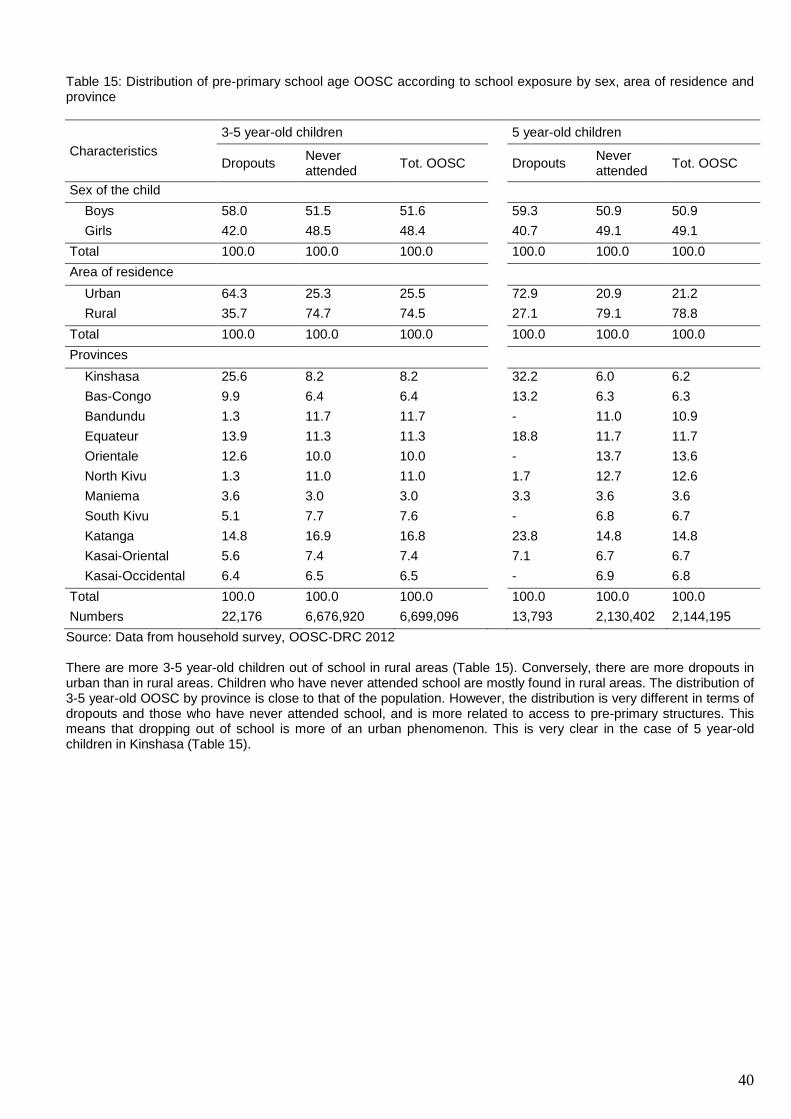
40
Table 15: Distribution of pre-primary school age OOSC according to school exposure by sex, area of residence and province
Characteristics
3-5 year-old children 5 year-old children
Dropouts Never attended
Tot. OOSC Dropouts Never attended
Tot. OOSC
Sex of the child
Boys 58.0 51.5 51.6 59.3 50.9 50.9
Girls 42.0 48.5 48.4 40.7 49.1 49.1
Total 100.0 100.0 100.0 100.0 100.0 100.0
Area of residence
Urban 64.3 25.3 25.5 72.9 20.9 21.2
Rural 35.7 74.7 74.5 27.1 79.1 78.8
Total 100.0 100.0 100.0 100.0 100.0 100.0
Provinces
Kinshasa 25.6 8.2 8.2 32.2 6.0 6.2
Bas-Congo 9.9 6.4 6.4 13.2 6.3 6.3
Bandundu 1.3 11.7 11.7 - 11.0 10.9
Equateur 13.9 11.3 11.3 18.8 11.7 11.7
Orientale 12.6 10.0 10.0 - 13.7 13.6
North Kivu 1.3 11.0 11.0 1.7 12.7 12.6
Maniema 3.6 3.0 3.0 3.3 3.6 3.6
South Kivu 5.1 7.7 7.6 - 6.8 6.7
Katanga 14.8 16.9 16.8 23.8 14.8 14.8
Kasai-Oriental 5.6 7.4 7.4 7.1 6.7 6.7
Kasai-Occidental 6.4 6.5 6.5 - 6.9 6.8
Total 100.0 100.0 100.0 100.0 100.0 100.0
Numbers 22,176 6,676,920 6,699,096 13,793 2,130,402 2,144,195
Source: Data from household survey, OOSC-DRC 2012 There are more 3-5 year-old children out of school in rural areas (Table 15). Conversely, there are more dropouts in urban than in rural areas. Children who have never attended school are mostly found in rural areas. The distribution of 3-5 year-old OOSC by province is close to that of the population. However, the distribution is very different in terms of dropouts and those who have never attended school, and is more related to access to pre-primary structures. This means that dropping out of school is more of an urban phenomenon. This is very clear in the case of 5 year-old children in Kinshasa (Table 15).
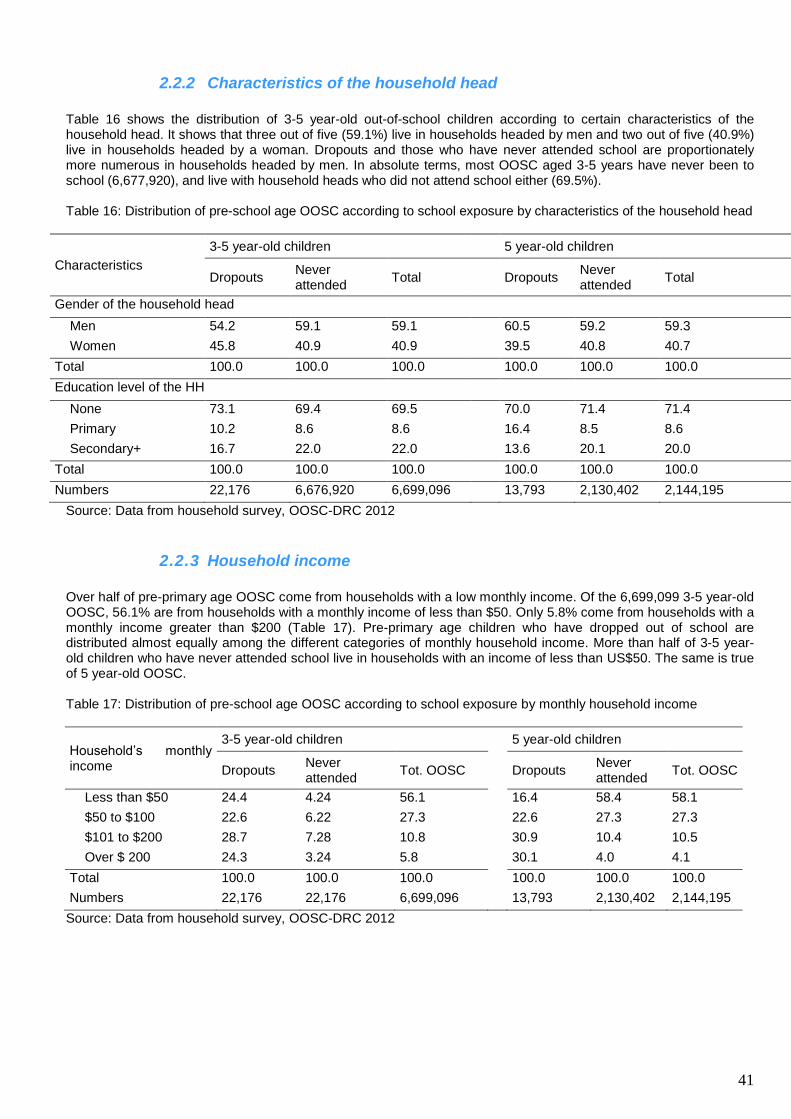
41
2.2.2 Characteristics of the household head
Table 16 shows the distribution of 3-5 year-old out-of-school children according to certain characteristics of the household head. It shows that three out of five (59.1%) live in households headed by men and two out of five (40.9%) live in households headed by a woman. Dropouts and those who have never attended school are proportionately more numerous in households headed by men. In absolute terms, most OOSC aged 3-5 years have never been to school (6,677,920), and live with household heads who did not attend school either (69.5%). Table 16: Distribution of pre-school age OOSC according to school exposure by characteristics of the household head
Characteristics
3-5 year-old children 5 year-old children
Dropouts Never attended
Total Dropouts Never attended
Total
Gender of the household head
Men 54.2 59.1 59.1 60.5 59.2 59.3
Women 45.8 40.9 40.9 39.5 40.8 40.7
Total 100.0 100.0 100.0 100.0 100.0 100.0
Education level of the HH
None 73.1 69.4 69.5 70.0 71.4 71.4
Primary 10.2 8.6 8.6 16.4 8.5 8.6
Secondary+ 16.7 22.0 22.0 13.6 20.1 20.0
Total 100.0 100.0 100.0 100.0 100.0 100.0
Numbers 22,176 6,676,920 6,699,096 13,793 2,130,402 2,144,195
Source: Data from household survey, OOSC-DRC 2012
2.2.3 Household income
Over half of pre-primary age OOSC come from households with a low monthly income. Of the 6,699,099 3-5 year-old OOSC, 56.1% are from households with a monthly income of less than $50. Only 5.8% come from households with a monthly income greater than $200 (Table 17). Pre-primary age children who have dropped out of school are distributed almost equally among the different categories of monthly household income. More than half of 3-5 year-old children who have never attended school live in households with an income of less than US$50. The same is true of 5 year-old OOSC. Table 17: Distribution of pre-school age OOSC according to school exposure by monthly household income
Household’s monthly income
3-5 year-old children 5 year-old children
Dropouts Never attended
Tot. OOSC Dropouts Never attended
Tot. OOSC
Less than $50 24.4 4.24 56.1 16.4 58.4 58.1
$50 to $100 22.6 6.22 27.3 22.6 27.3 27.3
$101 to $200 28.7 7.28 10.8 30.9 10.4 10.5
Over $ 200 24.3 3.24 5.8 30.1 4.0 4.1
Total 100.0 100.0 100.0 100.0 100.0 100.0
Numbers 22,176 22,176 6,699,096 13,793 2,130,402 2,144,195
Source: Data from household survey, OOSC-DRC 2012
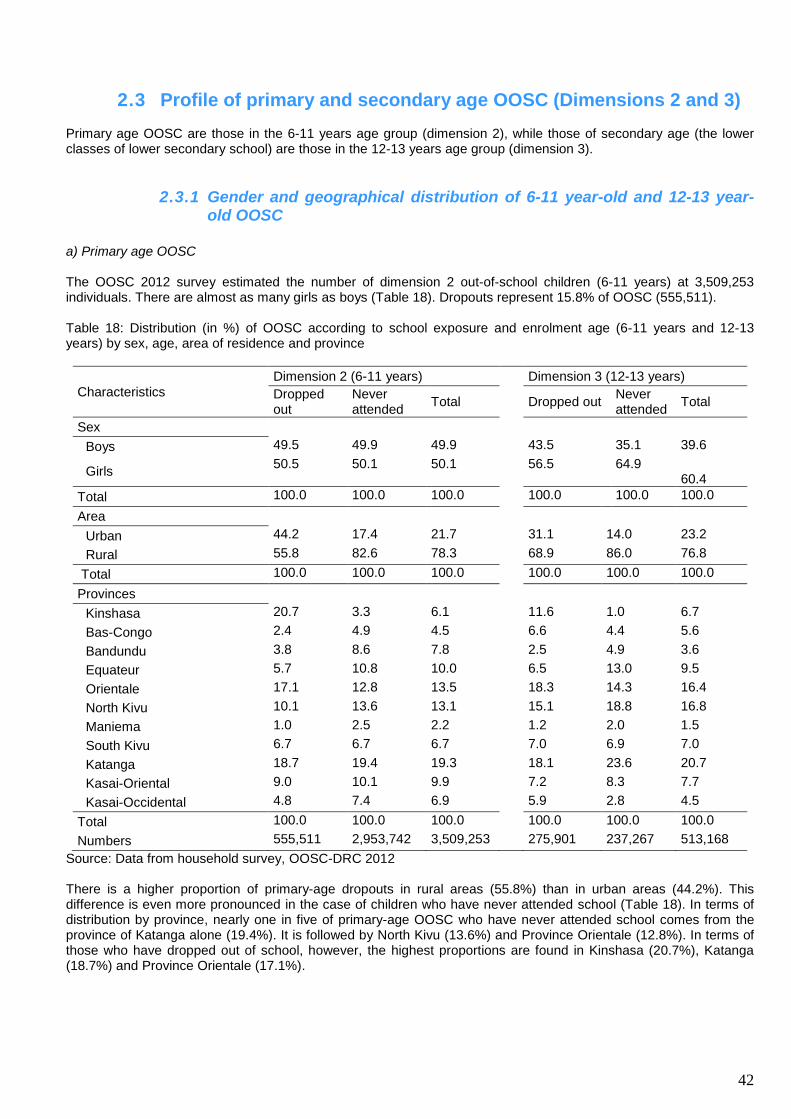
42
2.3 Profile of primary and secondary age OOSC (Dimensions 2 and 3) Primary age OOSC are those in the 6-11 years age group (dimension 2), while those of secondary age (the lower classes of lower secondary school) are those in the 12-13 years age group (dimension 3).
2.3.1 Gender and geographical distribution of 6-11 year-old and 12-13 year-old OOSC
a) Primary age OOSC The OOSC 2012 survey estimated the number of dimension 2 out-of-school children (6-11 years) at 3,509,253 individuals. There are almost as many girls as boys (Table 18). Dropouts represent 15.8% of OOSC (555,511). Table 18: Distribution (in %) of OOSC according to school exposure and enrolment age (6-11 years and 12-13 years) by sex, age, area of residence and province
Characteristics
Dimension 2 (6-11 years) Dimension 3 (12-13 years)
Dropped out
Never attended
Total Dropped out Never attended
Total
Sex
Boys 49.5 49.9 49.9 43.5 35.1 39.6
Girls 50.5 50.1 50.1
56.5 64.9
60.4
Total 100.0 100.0 100.0 100.0 100.0 100.0
Area
Urban 44.2 17.4 21.7 31.1 14.0 23.2
Rural 55.8 82.6 78.3 68.9 86.0 76.8
Total 100.0 100.0 100.0 100.0 100.0 100.0
Provinces
Kinshasa 20.7 3.3 6.1 11.6 1.0 6.7
Bas-Congo 2.4 4.9 4.5 6.6 4.4 5.6
Bandundu 3.8 8.6 7.8 2.5 4.9 3.6
Equateur 5.7 10.8 10.0 6.5 13.0 9.5
Orientale 17.1 12.8 13.5 18.3 14.3 16.4
North Kivu 10.1 13.6 13.1 15.1 18.8 16.8
Maniema 1.0 2.5 2.2 1.2 2.0 1.5
South Kivu 6.7 6.7 6.7 7.0 6.9 7.0
Katanga 18.7 19.4 19.3 18.1 23.6 20.7
Kasai-Oriental 9.0 10.1 9.9 7.2 8.3 7.7
Kasai-Occidental 4.8 7.4 6.9 5.9 2.8 4.5
Total 100.0 100.0 100.0 100.0 100.0 100.0
Numbers 555,511 2,953,742 3,509,253 275,901 237,267 513,168
Source: Data from household survey, OOSC-DRC 2012 There is a higher proportion of primary-age dropouts in rural areas (55.8%) than in urban areas (44.2%). This difference is even more pronounced in the case of children who have never attended school (Table 18). In terms of distribution by province, nearly one in five of primary-age OOSC who have never attended school comes from the province of Katanga alone (19.4%). It is followed by North Kivu (13.6%) and Province Orientale (12.8%). In terms of those who have dropped out of school, however, the highest proportions are found in Kinshasa (20.7%), Katanga (18.7%) and Province Orientale (17.1%).
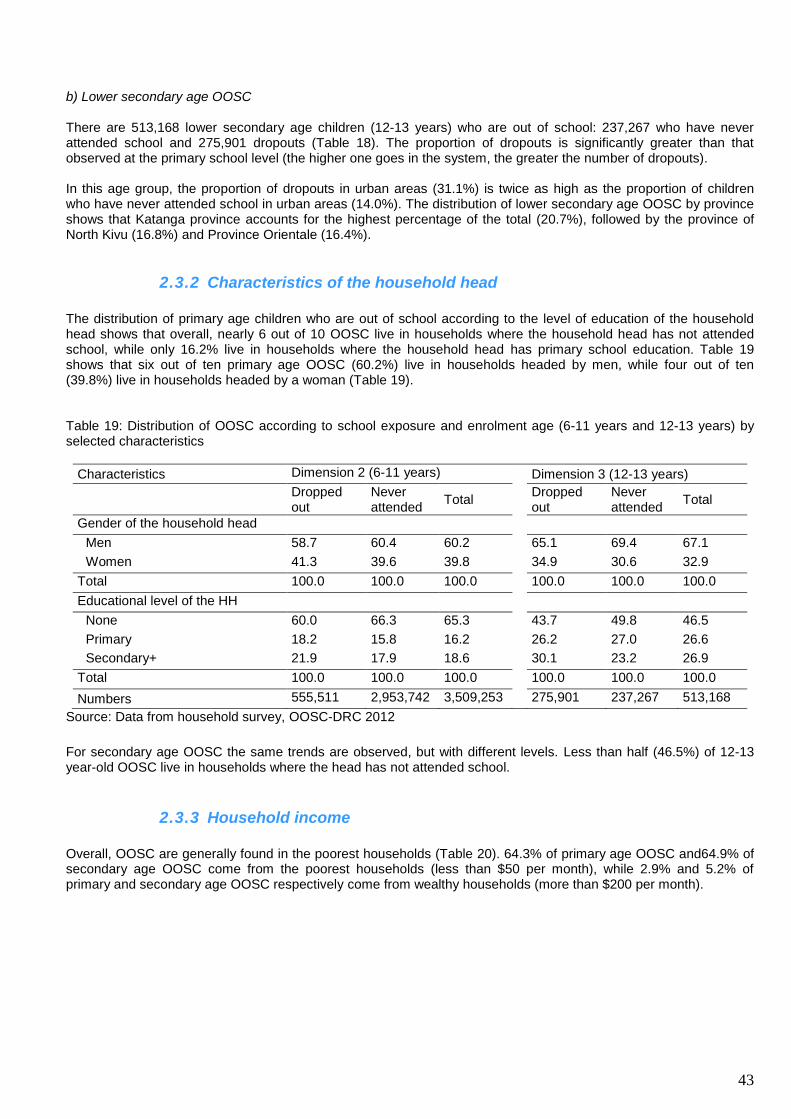
43
b) Lower secondary age OOSC
There are 513,168 lower secondary age children (12-13 years) who are out of school: 237,267 who have never attended school and 275,901 dropouts (Table 18). The proportion of dropouts is significantly greater than that observed at the primary school level (the higher one goes in the system, the greater the number of dropouts). In this age group, the proportion of dropouts in urban areas (31.1%) is twice as high as the proportion of children who have never attended school in urban areas (14.0%). The distribution of lower secondary age OOSC by province shows that Katanga province accounts for the highest percentage of the total (20.7%), followed by the province of North Kivu (16.8%) and Province Orientale (16.4%).
2.3.2 Characteristics of the household head
The distribution of primary age children who are out of school according to the level of education of the household head shows that overall, nearly 6 out of 10 OOSC live in households where the household head has not attended school, while only 16.2% live in households where the household head has primary school education. Table 19 shows that six out of ten primary age OOSC (60.2%) live in households headed by men, while four out of ten (39.8%) live in households headed by a woman (Table 19). Table 19: Distribution of OOSC according to school exposure and enrolment age (6-11 years and 12-13 years) by selected characteristics
Characteristics Dimension 2 (6-11 years) Dimension 3 (12-13 years)
Dropped out
Never attended
Total Dropped out
Never attended
Total
Gender of the household head
Men 58.7 60.4 60.2 65.1 69.4 67.1
Women 41.3 39.6 39.8 34.9 30.6 32.9
Total 100.0 100.0 100.0 100.0 100.0 100.0
Educational level of the HH
None 60.0 66.3 65.3 43.7 49.8 46.5
Primary 18.2 15.8 16.2 26.2 27.0 26.6
Secondary+ 21.9 17.9 18.6 30.1 23.2 26.9
Total 100.0 100.0 100.0 100.0 100.0 100.0
Numbers 555,511 2,953,742 3,509,253 275,901 237,267 513,168
Source: Data from household survey, OOSC-DRC 2012
For secondary age OOSC the same trends are observed, but with different levels. Less than half (46.5%) of 12-13 year-old OOSC live in households where the head has not attended school.
2.3.3 Household income
Overall, OOSC are generally found in the poorest households (Table 20). 64.3% of primary age OOSC and64.9% of secondary age OOSC come from the poorest households (less than $50 per month), while 2.9% and 5.2% of primary and secondary age OOSC respectively come from wealthy households (more than $200 per month).
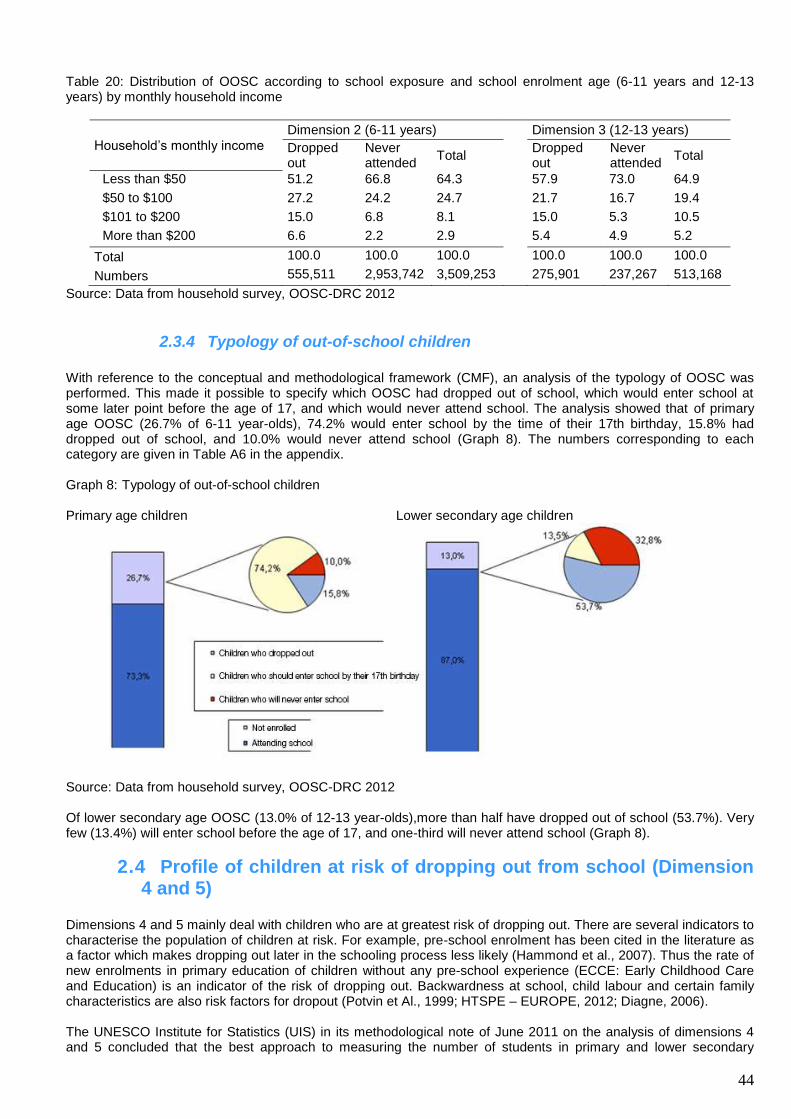
44
Table 20: Distribution of OOSC according to school exposure and school enrolment age (6-11 years and 12-13 years) by monthly household income
Household’s monthly income
Dimension 2 (6-11 years) Dimension 3 (12-13 years)
Dropped out
Never attended
Total Dropped out
Never attended
Total
Less than $50 51.2 66.8 64.3 57.9 73.0 64.9
$50 to $100 27.2 24.2 24.7 21.7 16.7 19.4
$101 to $200 15.0 6.8 8.1 15.0 5.3 10.5
More than $200 6.6 2.2 2.9 5.4 4.9 5.2
Total 100.0 100.0 100.0 100.0 100.0 100.0
Numbers 555,511 2,953,742 3,509,253 275,901 237,267 513,168
Source: Data from household survey, OOSC-DRC 2012
2.3.4 Typology of out-of-school children
With reference to the conceptual and methodological framework (CMF), an analysis of the typology of OOSC was performed. This made it possible to specify which OOSC had dropped out of school, which would enter school at some later point before the age of 17, and which would never attend school. The analysis showed that of primary age OOSC (26.7% of 6-11 year-olds), 74.2% would enter school by the time of their 17th birthday, 15.8% had dropped out of school, and 10.0% would never attend school (Graph 8). The numbers corresponding to each category are given in Table A6 in the appendix. Graph 8: Typology of out-of-school children Primary age children Lower secondary age children
Source: Data from household survey, OOSC-DRC 2012 Of lower secondary age OOSC (13.0% of 12-13 year-olds),more than half have dropped out of school (53.7%). Very few (13.4%) will enter school before the age of 17, and one-third will never attend school (Graph 8).
2.4 Profile of children at risk of dropping out from school (Dimension 4 and 5)
Dimensions 4 and 5 mainly deal with children who are at greatest risk of dropping out. There are several indicators to characterise the population of children at risk. For example, pre-school enrolment has been cited in the literature as a factor which makes dropping out later in the schooling process less likely (Hammond et al., 2007). Thus the rate of new enrolments in primary education of children without any pre-school experience (ECCE: Early Childhood Care and Education) is an indicator of the risk of dropping out. Backwardness at school, child labour and certain family characteristics are also risk factors for dropout (Potvin et Al., 1999; HTSPE – EUROPE, 2012; Diagne, 2006). The UNESCO Institute for Statistics (UIS) in its methodological note of June 2011 on the analysis of dimensions 4 and 5 concluded that the best approach to measuring the number of students in primary and lower secondary
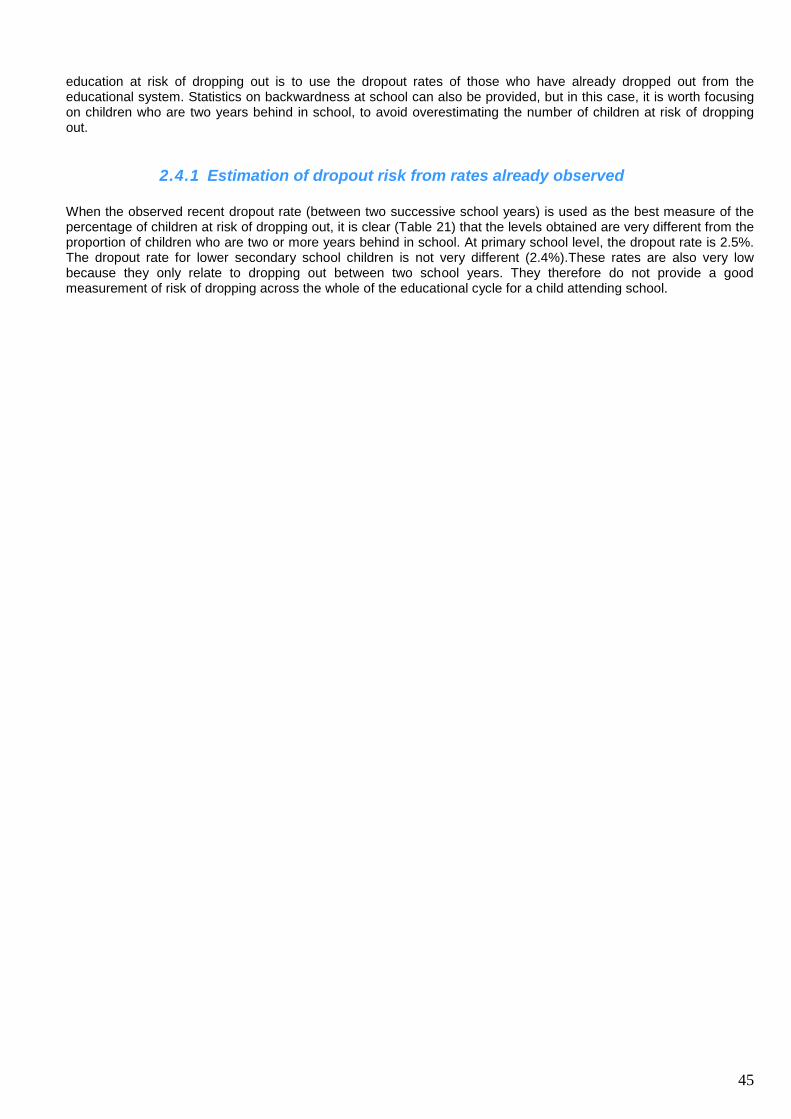
45
education at risk of dropping out is to use the dropout rates of those who have already dropped out from the educational system. Statistics on backwardness at school can also be provided, but in this case, it is worth focusing on children who are two years behind in school, to avoid overestimating the number of children at risk of dropping out.
2.4.1 Estimation of dropout risk from rates already observed
When the observed recent dropout rate (between two successive school years) is used as the best measure of the percentage of children at risk of dropping out, it is clear (Table 21) that the levels obtained are very different from the proportion of children who are two or more years behind in school. At primary school level, the dropout rate is 2.5%. The dropout rate for lower secondary school children is not very different (2.4%).These rates are also very low because they only relate to dropping out between two school years. They therefore do not provide a good measurement of risk of dropping across the whole of the educational cycle for a child attending school.
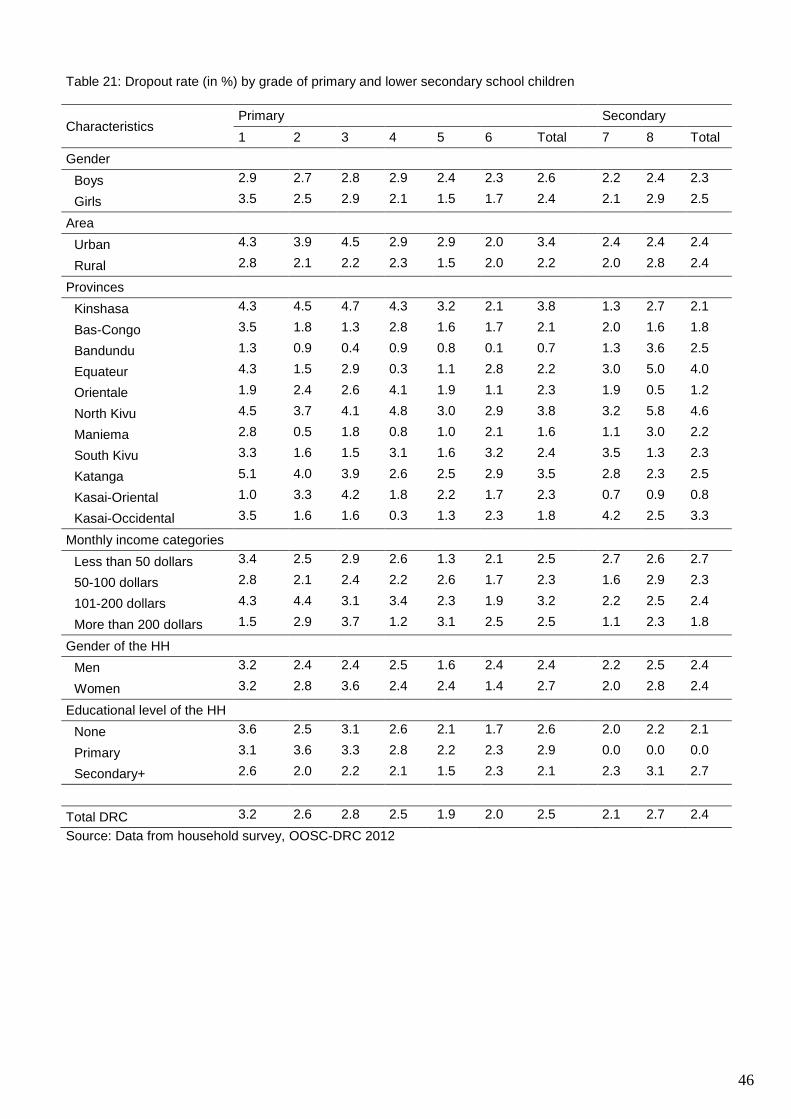
46
Table 21: Dropout rate (in %) by grade of primary and lower secondary school children
Characteristics Primary Secondary
1 2 3 4 5 6 Total 7 8 Total
Gender
Boys 2.9 2.7 2.8 2.9 2.4 2.3 2.6 2.2 2.4 2.3
Girls 3.5 2.5 2.9 2.1 1.5 1.7 2.4 2.1 2.9 2.5
Area
Urban 4.3 3.9 4.5 2.9 2.9 2.0 3.4 2.4 2.4 2.4
Rural 2.8 2.1 2.2 2.3 1.5 2.0 2.2 2.0 2.8 2.4
Provinces
Kinshasa 4.3 4.5 4.7 4.3 3.2 2.1 3.8 1.3 2.7 2.1
Bas-Congo 3.5 1.8 1.3 2.8 1.6 1.7 2.1 2.0 1.6 1.8
Bandundu 1.3 0.9 0.4 0.9 0.8 0.1 0.7 1.3 3.6 2.5
Equateur 4.3 1.5 2.9 0.3 1.1 2.8 2.2 3.0 5.0 4.0
Orientale 1.9 2.4 2.6 4.1 1.9 1.1 2.3 1.9 0.5 1.2
North Kivu 4.5 3.7 4.1 4.8 3.0 2.9 3.8 3.2 5.8 4.6
Maniema 2.8 0.5 1.8 0.8 1.0 2.1 1.6 1.1 3.0 2.2
South Kivu 3.3 1.6 1.5 3.1 1.6 3.2 2.4 3.5 1.3 2.3
Katanga 5.1 4.0 3.9 2.6 2.5 2.9 3.5 2.8 2.3 2.5
Kasai-Oriental 1.0 3.3 4.2 1.8 2.2 1.7 2.3 0.7 0.9 0.8
Kasai-Occidental 3.5 1.6 1.6 0.3 1.3 2.3 1.8 4.2 2.5 3.3
Monthly income categories
Less than 50 dollars 3.4 2.5 2.9 2.6 1.3 2.1 2.5 2.7 2.6 2.7
50-100 dollars 2.8 2.1 2.4 2.2 2.6 1.7 2.3 1.6 2.9 2.3
101-200 dollars 4.3 4.4 3.1 3.4 2.3 1.9 3.2 2.2 2.5 2.4
More than 200 dollars 1.5 2.9 3.7 1.2 3.1 2.5 2.5 1.1 2.3 1.8
Gender of the HH
Men 3.2 2.4 2.4 2.5 1.6 2.4 2.4 2.2 2.5 2.4
Women 3.2 2.8 3.6 2.4 2.4 1.4 2.7 2.0 2.8 2.4
Educational level of the HH
None 3.6 2.5 3.1 2.6 2.1 1.7 2.6 2.0 2.2 2.1
Primary 3.1 3.6 3.3 2.8 2.2 2.3 2.9 0.0 0.0 0.0
Secondary+ 2.6 2.0 2.2 2.1 1.5 2.3 2.1 2.3 3.1 2.7
Total DRC 3.2 2.6 2.8 2.5 1.9 2.0 2.5 2.1 2.7 2.4
Source: Data from household survey, OOSC-DRC 2012
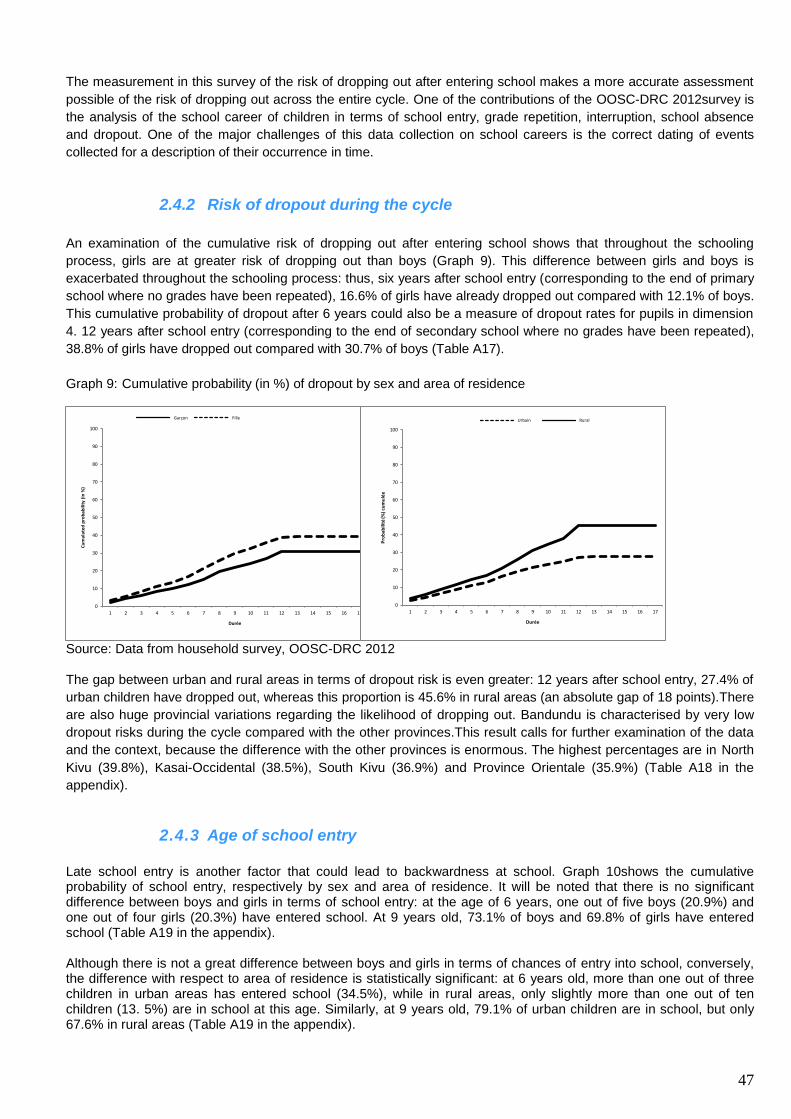
47
The measurement in this survey of the risk of dropping out after entering school makes a more accurate assessment
possible of the risk of dropping out across the entire cycle. One of the contributions of the OOSC-DRC 2012survey is
the analysis of the school career of children in terms of school entry, grade repetition, interruption, school absence
and dropout. One of the major challenges of this data collection on school careers is the correct dating of events
collected for a description of their occurrence in time.
2.4.2 Risk of dropout during the cycle
An examination of the cumulative risk of dropping out after entering school shows that throughout the schooling
process, girls are at greater risk of dropping out than boys (Graph 9). This difference between girls and boys is
exacerbated throughout the schooling process: thus, six years after school entry (corresponding to the end of primary
school where no grades have been repeated), 16.6% of girls have already dropped out compared with 12.1% of boys.
This cumulative probability of dropout after 6 years could also be a measure of dropout rates for pupils in dimension
4. 12 years after school entry (corresponding to the end of secondary school where no grades have been repeated),
38.8% of girls have dropped out compared with 30.7% of boys (Table A17).
Graph 9: Cumulative probability (in %) of dropout by sex and area of residence
Source: Data from household survey, OOSC-DRC 2012 The gap between urban and rural areas in terms of dropout risk is even greater: 12 years after school entry, 27.4% of
urban children have dropped out, whereas this proportion is 45.6% in rural areas (an absolute gap of 18 points).There
are also huge provincial variations regarding the likelihood of dropping out. Bandundu is characterised by very low
dropout risks during the cycle compared with the other provinces.This result calls for further examination of the data
and the context, because the difference with the other provinces is enormous. The highest percentages are in North
Kivu (39.8%), Kasai-Occidental (38.5%), South Kivu (36.9%) and Province Orientale (35.9%) (Table A18 in the
appendix).
2.4.3 Age of school entry
Late school entry is another factor that could lead to backwardness at school. Graph 10shows the cumulative probability of school entry, respectively by sex and area of residence. It will be noted that there is no significant difference between boys and girls in terms of school entry: at the age of 6 years, one out of five boys (20.9%) and one out of four girls (20.3%) have entered school. At 9 years old, 73.1% of boys and 69.8% of girls have entered school (Table A19 in the appendix). Although there is not a great difference between boys and girls in terms of chances of entry into school, conversely, the difference with respect to area of residence is statistically significant: at 6 years old, more than one out of three children in urban areas has entered school (34.5%), while in rural areas, only slightly more than one out of ten children (13. 5%) are in school at this age. Similarly, at 9 years old, 79.1% of urban children are in school, but only 67.6% in rural areas (Table A19 in the appendix).
0
10
20
30
40
50
60
70
80
90
100
1 2 3 4 5 6 7 8 9 10 11 12 13 14 15 16 17
Cu
mu
late
d p
rob
abili
ty (
in %
)
Durée
Garçon Fille
0
10
20
30
40
50
60
70
80
90
100
1 2 3 4 5 6 7 8 9 10 11 12 13 14 15 16 17
Pro
bab
ilité
(%)
cum
ulé
e
Durée
Urbain Rural
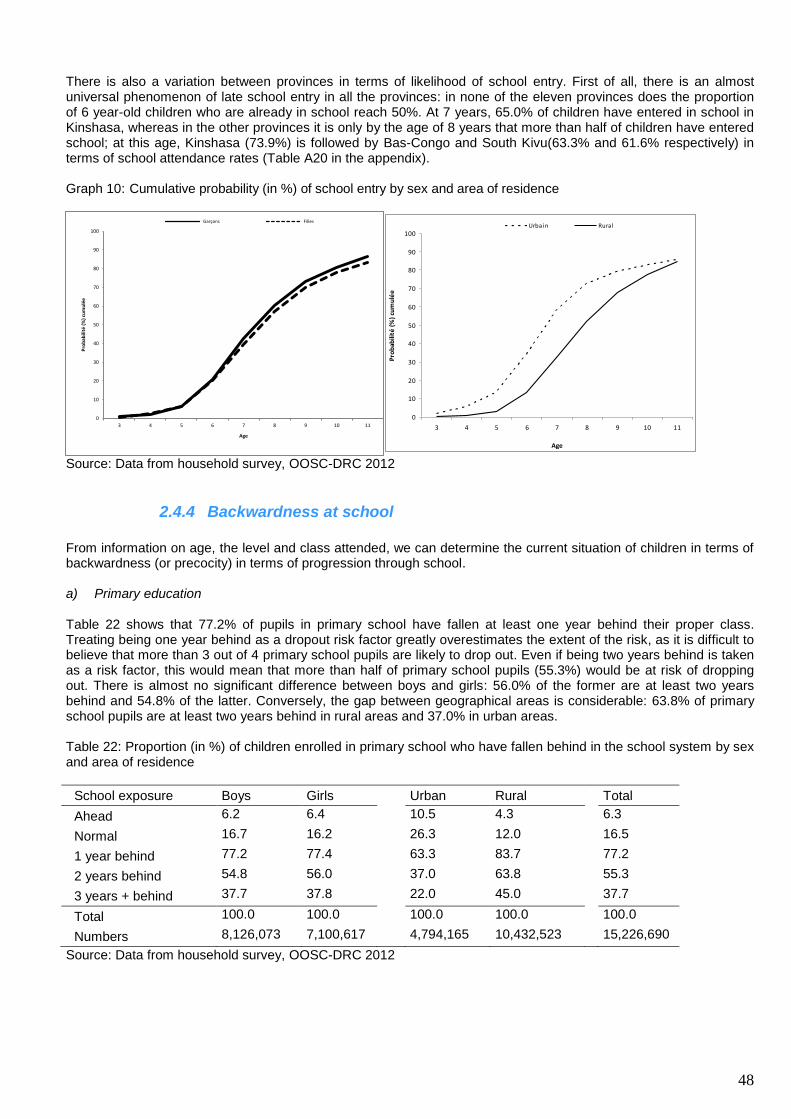
48
There is also a variation between provinces in terms of likelihood of school entry. First of all, there is an almost universal phenomenon of late school entry in all the provinces: in none of the eleven provinces does the proportion of 6 year-old children who are already in school reach 50%. At 7 years, 65.0% of children have entered in school in Kinshasa, whereas in the other provinces it is only by the age of 8 years that more than half of children have entered school; at this age, Kinshasa (73.9%) is followed by Bas-Congo and South Kivu(63.3% and 61.6% respectively) in terms of school attendance rates (Table A20 in the appendix). Graph 10: Cumulative probability (in %) of school entry by sex and area of residence
Source: Data from household survey, OOSC-DRC 2012
2.4.4 Backwardness at school
From information on age, the level and class attended, we can determine the current situation of children in terms of backwardness (or precocity) in terms of progression through school. a) Primary education Table 22 shows that 77.2% of pupils in primary school have fallen at least one year behind their proper class. Treating being one year behind as a dropout risk factor greatly overestimates the extent of the risk, as it is difficult to believe that more than 3 out of 4 primary school pupils are likely to drop out. Even if being two years behind is taken as a risk factor, this would mean that more than half of primary school pupils (55.3%) would be at risk of dropping out. There is almost no significant difference between boys and girls: 56.0% of the former are at least two years behind and 54.8% of the latter. Conversely, the gap between geographical areas is considerable: 63.8% of primary school pupils are at least two years behind in rural areas and 37.0% in urban areas. Table 22: Proportion (in %) of children enrolled in primary school who have fallen behind in the school system by sex and area of residence
School exposure Boys Girls Urban Rural Total
Ahead 6.2 6.4 10.5 4.3 6.3
Normal 16.7 16.2 26.3 12.0 16.5
1 year behind 77.2 77.4 63.3 83.7 77.2
2 years behind 54.8 56.0 37.0 63.8 55.3
3 years + behind 37.7 37.8 22.0 45.0 37.7
Total 100.0 100.0 100.0 100.0 100.0
Numbers 8,126,073 7,100,617 4,794,165 10,432,523 15,226,690
Source: Data from household survey, OOSC-DRC 2012
0
10
20
30
40
50
60
70
80
90
100
3 4 5 6 7 8 9 10 11
Pro
bab
ilité
(%
) cu
mu
lée
Age
Garçons Filles
0
10
20
30
40
50
60
70
80
90
100
3 4 5 6 7 8 9 10 11
Age
Pro
bab
ilité
(%
) cu
mu
lée
Urbain Rural
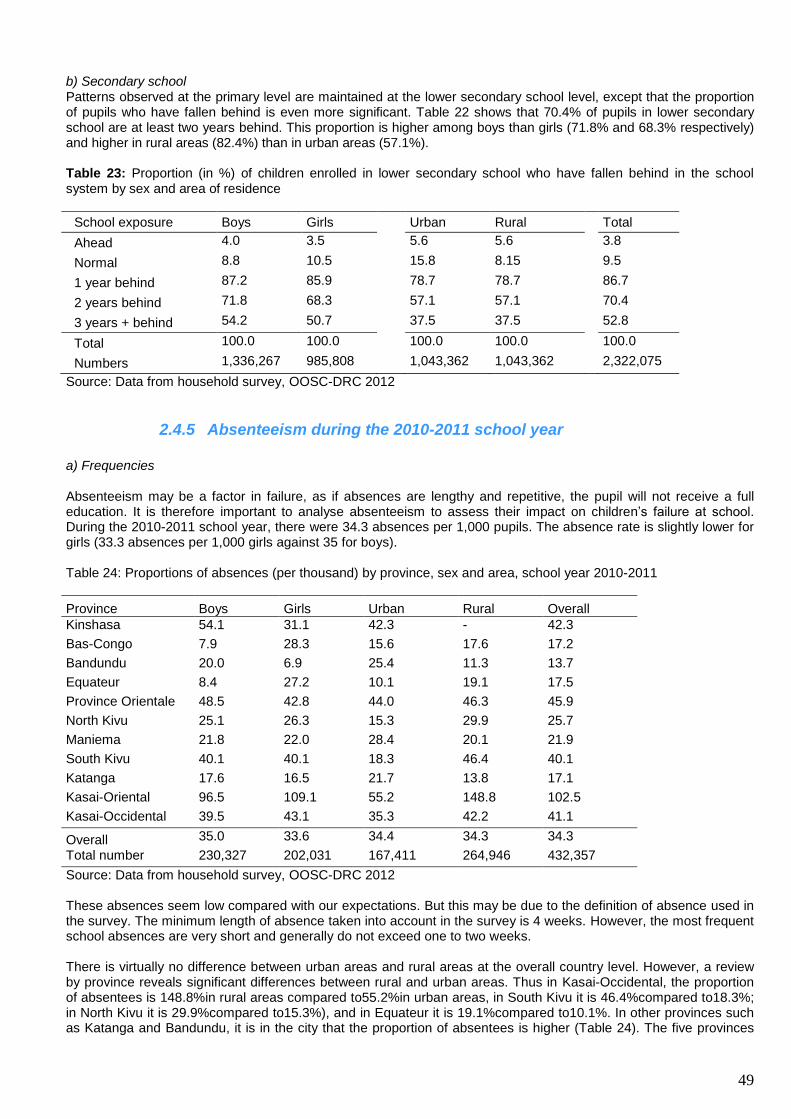
49
b) Secondary school Patterns observed at the primary level are maintained at the lower secondary school level, except that the proportion of pupils who have fallen behind is even more significant. Table 22 shows that 70.4% of pupils in lower secondary school are at least two years behind. This proportion is higher among boys than girls (71.8% and 68.3% respectively) and higher in rural areas (82.4%) than in urban areas (57.1%). Table 23: Proportion (in %) of children enrolled in lower secondary school who have fallen behind in the school system by sex and area of residence
School exposure Boys Girls Urban Rural Total
Ahead 4.0 3.5 5.6 5.6 3.8
Normal 8.8 10.5 15.8 8.15 9.5
1 year behind 87.2 85.9 78.7 78.7 86.7
2 years behind 71.8 68.3 57.1 57.1 70.4
3 years + behind 54.2 50.7 37.5 37.5 52.8
Total 100.0 100.0 100.0 100.0 100.0
Numbers 1,336,267 985,808 1,043,362 1,043,362 2,322,075
Source: Data from household survey, OOSC-DRC 2012
2.4.5 Absenteeism during the 2010-2011 school year
a) Frequencies Absenteeism may be a factor in failure, as if absences are lengthy and repetitive, the pupil will not receive a full education. It is therefore important to analyse absenteeism to assess their impact on children’s failure at school. During the 2010-2011 school year, there were 34.3 absences per 1,000 pupils. The absence rate is slightly lower for girls (33.3 absences per 1,000 girls against 35 for boys). Table 24: Proportions of absences (per thousand) by province, sex and area, school year 2010-2011
Province Boys Girls Urban Rural Overall
Kinshasa 54.1 31.1 42.3 - 42.3
Bas-Congo 7.9 28.3 15.6 17.6 17.2
Bandundu 20.0 6.9 25.4 11.3 13.7
Equateur 8.4 27.2 10.1 19.1 17.5
Province Orientale 48.5 42.8 44.0 46.3 45.9
North Kivu 25.1 26.3 15.3 29.9 25.7
Maniema 21.8 22.0 28.4 20.1 21.9
South Kivu 40.1 40.1 18.3 46.4 40.1
Katanga 17.6 16.5 21.7 13.8 17.1
Kasai-Oriental 96.5 109.1 55.2 148.8 102.5
Kasai-Occidental 39.5 43.1 35.3 42.2 41.1
Overall Total number
35.0 33.6 34.4 34.3 34.3
230,327 202,031 167,411 264,946 432,357
Source: Data from household survey, OOSC-DRC 2012 These absences seem low compared with our expectations. But this may be due to the definition of absence used in the survey. The minimum length of absence taken into account in the survey is 4 weeks. However, the most frequent school absences are very short and generally do not exceed one to two weeks. There is virtually no difference between urban areas and rural areas at the overall country level. However, a review by province reveals significant differences between rural and urban areas. Thus in Kasai-Occidental, the proportion of absentees is 148.8%in rural areas compared to55.2%in urban areas, in South Kivu it is 46.4%compared to18.3%; in North Kivu it is 29.9%compared to15.3%), and in Equateur it is 19.1%compared to10.1%. In other provinces such as Katanga and Bandundu, it is in the city that the proportion of absentees is higher (Table 24). The five provinces
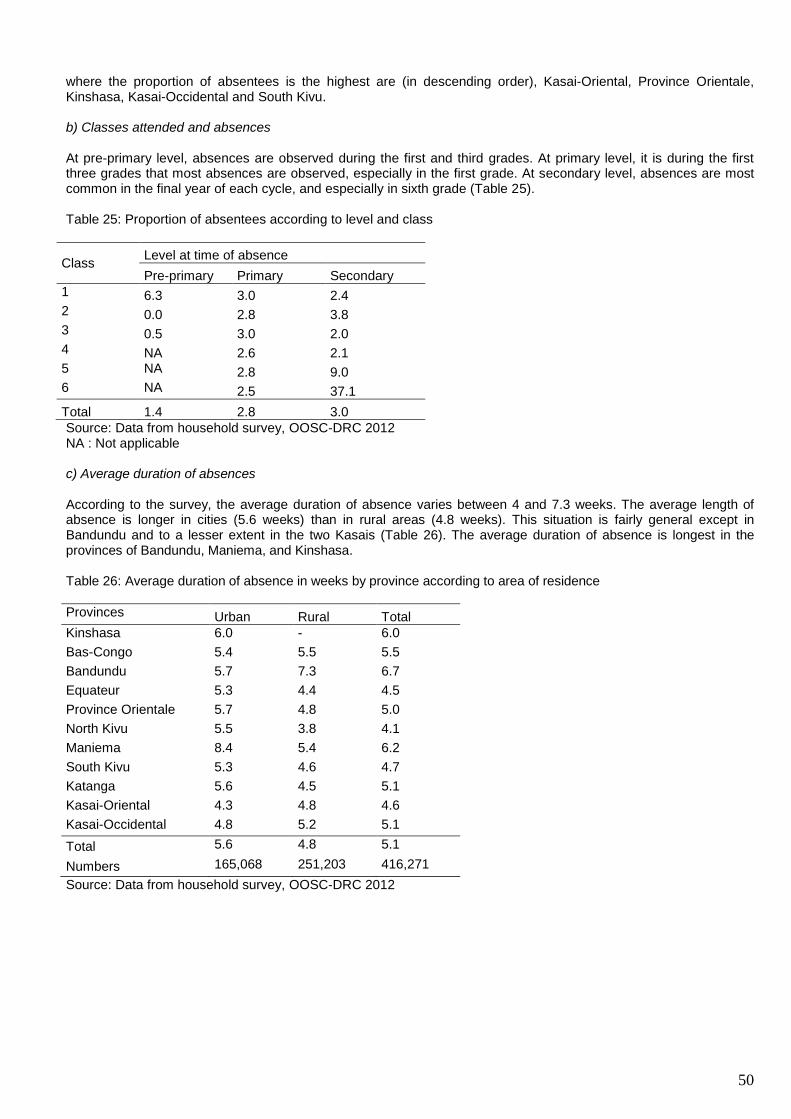
50
where the proportion of absentees is the highest are (in descending order), Kasai-Oriental, Province Orientale, Kinshasa, Kasai-Occidental and South Kivu. b) Classes attended and absences At pre-primary level, absences are observed during the first and third grades. At primary level, it is during the first three grades that most absences are observed, especially in the first grade. At secondary level, absences are most common in the final year of each cycle, and especially in sixth grade (Table 25). Table 25: Proportion of absentees according to level and class
Class Level at time of absence
Pre-primary Primary Secondary
1 6.3 3.0 2.4 2 0.0 2.8 3.8 3 0.5 3.0 2.0 4 NA 2.6 2.1 5 NA 2.8 9.0 6 NA 2.5 37.1
Total 1.4 2.8 3.0
Source: Data from household survey, OOSC-DRC 2012 NA : Not applicable c) Average duration of absences According to the survey, the average duration of absence varies between 4 and 7.3 weeks. The average length of absence is longer in cities (5.6 weeks) than in rural areas (4.8 weeks). This situation is fairly general except in Bandundu and to a lesser extent in the two Kasais (Table 26). The average duration of absence is longest in the provinces of Bandundu, Maniema, and Kinshasa. Table 26: Average duration of absence in weeks by province according to area of residence
Provinces Urban Rural Total
Kinshasa 6.0 - 6.0
Bas-Congo 5.4 5.5 5.5
Bandundu 5.7 7.3 6.7
Equateur 5.3 4.4 4.5
Province Orientale 5.7 4.8 5.0
North Kivu 5.5 3.8 4.1
Maniema 8.4 5.4 6.2
South Kivu 5.3 4.6 4.7
Katanga 5.6 4.5 5.1
Kasai-Oriental 4.3 4.8 4.6
Kasai-Occidental 4.8 5.2 5.1
Total 5.6 4.8 5.1
Numbers 165,068 251,203 416,271
Source: Data from household survey, OOSC-DRC 2012
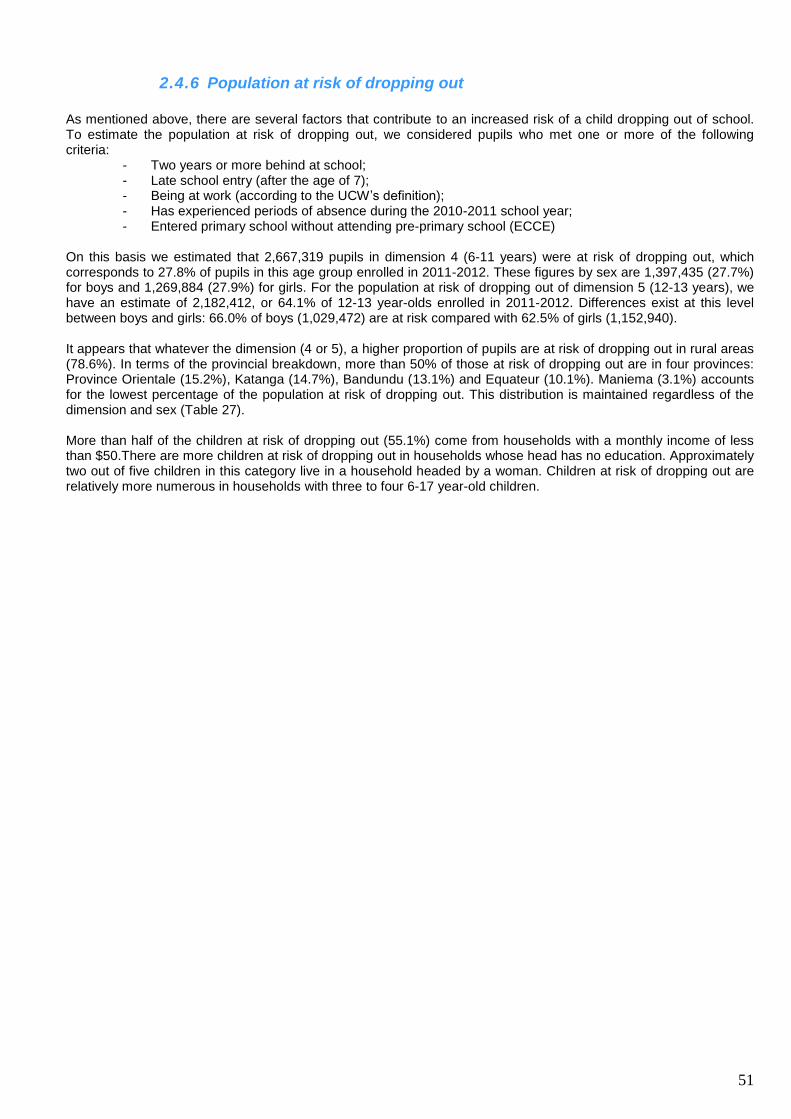
51
2.4.6 Population at risk of dropping out
As mentioned above, there are several factors that contribute to an increased risk of a child dropping out of school. To estimate the population at risk of dropping out, we considered pupils who met one or more of the following criteria:
- Two years or more behind at school; - Late school entry (after the age of 7); - Being at work (according to the UCW’s definition); - Has experienced periods of absence during the 2010-2011 school year; - Entered primary school without attending pre-primary school (ECCE)
On this basis we estimated that 2,667,319 pupils in dimension 4 (6-11 years) were at risk of dropping out, which corresponds to 27.8% of pupils in this age group enrolled in 2011-2012. These figures by sex are 1,397,435 (27.7%) for boys and 1,269,884 (27.9%) for girls. For the population at risk of dropping out of dimension 5 (12-13 years), we have an estimate of 2,182,412, or 64.1% of 12-13 year-olds enrolled in 2011-2012. Differences exist at this level between boys and girls: 66.0% of boys (1,029,472) are at risk compared with 62.5% of girls (1,152,940). It appears that whatever the dimension (4 or 5), a higher proportion of pupils are at risk of dropping out in rural areas (78.6%). In terms of the provincial breakdown, more than 50% of those at risk of dropping out are in four provinces: Province Orientale (15.2%), Katanga (14.7%), Bandundu (13.1%) and Equateur (10.1%). Maniema (3.1%) accounts for the lowest percentage of the population at risk of dropping out. This distribution is maintained regardless of the dimension and sex (Table 27). More than half of the children at risk of dropping out (55.1%) come from households with a monthly income of less than $50.There are more children at risk of dropping out in households whose head has no education. Approximately two out of five children in this category live in a household headed by a woman. Children at risk of dropping out are relatively more numerous in households with three to four 6-17 year-old children.
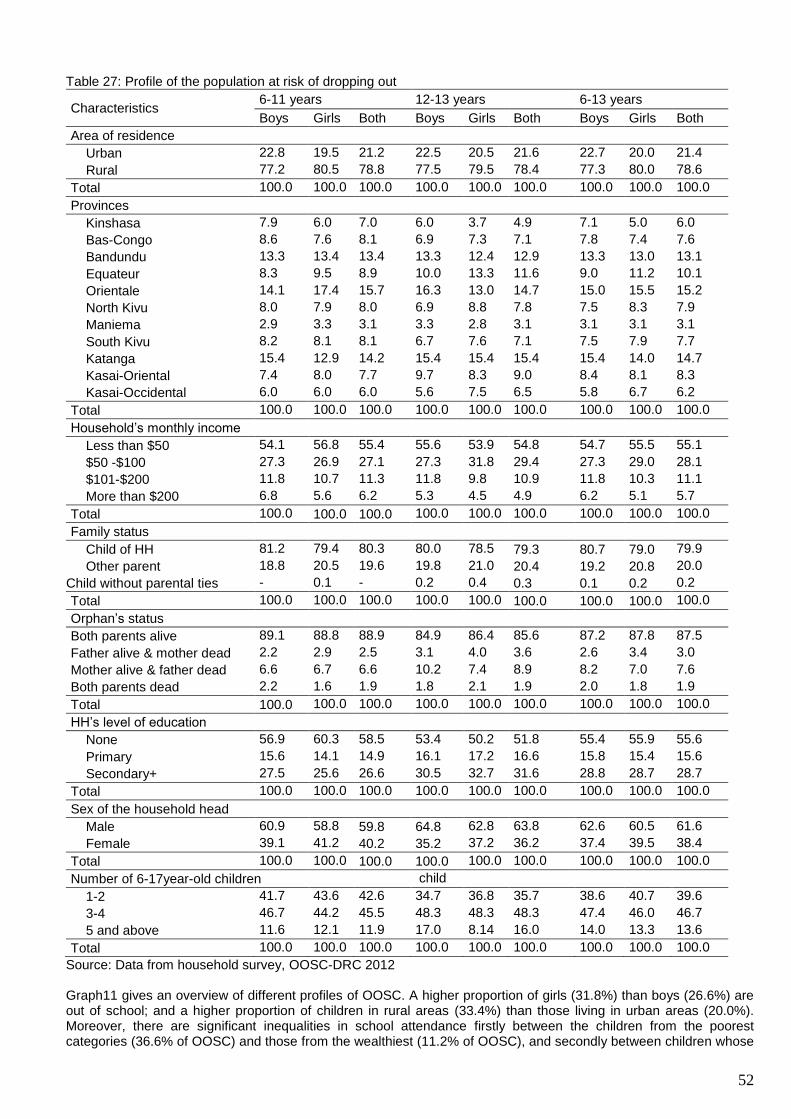
52
Table 27: Profile of the population at risk of dropping out
Characteristics 6-11 years 12-13 years 6-13 years
Boys Girls Both Boys Girls Both Boys Girls Both
Area of residence
Urban 22.8 19.5 21.2 22.5 20.5 21.6 22.7 20.0 21.4
Rural 77.2 80.5 78.8 77.5 79.5 78.4 77.3 80.0 78.6
Total 100.0 100.0 100.0 100.0 100.0 100.0 100.0 100.0 100.0
Provinces
Kinshasa 7.9 6.0 7.0 6.0 3.7 4.9 7.1 5.0 6.0
Bas-Congo 8.6 7.6 8.1 6.9 7.3 7.1 7.8 7.4 7.6
Bandundu 13.3 13.4 13.4 13.3 12.4 12.9 13.3 13.0 13.1
Equateur 8.3 9.5 8.9 10.0 13.3 11.6 9.0 11.2 10.1
Orientale 14.1 17.4 15.7 16.3 13.0 14.7 15.0 15.5 15.2
North Kivu 8.0 7.9 8.0 6.9 8.8 7.8 7.5 8.3 7.9
Maniema 2.9 3.3 3.1 3.3 2.8 3.1 3.1 3.1 3.1
South Kivu 8.2 8.1 8.1 6.7 7.6 7.1 7.5 7.9 7.7
Katanga 15.4 12.9 14.2 15.4 15.4 15.4 15.4 14.0 14.7
Kasai-Oriental 7.4 8.0 7.7 9.7 8.3 9.0 8.4 8.1 8.3
Kasai-Occidental 6.0 6.0 6.0 5.6 7.5 6.5 5.8 6.7 6.2
Total 100.0 100.0 100.0 100.0 100.0 100.0 100.0 100.0 100.0
Household’s monthly income
Less than $50 54.1 56.8 55.4 55.6 53.9 54.8 54.7 55.5 55.1
$50 -$100 27.3 26.9 27.1 27.3 31.8 29.4 27.3 29.0 28.1
$101-$200 11.8 10.7 11.3 11.8 9.8 10.9 11.8 10.3 11.1
More than $200 6.8 5.6 6.2 5.3 4.5 4.9 6.2 5.1 5.7
Total 100.0 100.0 100.0 100.0 100.0 100.0 100.0 100.0 100.0
Family status
Child of HH 81.2 79.4 80.3 80.0 78.5 79.3 80.7 79.0 79.9
Other parent 18.8 20.5 19.6 19.8 21.0 20.4 19.2 20.8 20.0
Child without parental ties - 0.1 - 0.2 0.4 0.3 0.1 0.2 0.2
Total 100.0 100.0 100.0 100.0 100.0 100.0 100.0 100.0 100.0
Orphan’s status
Both parents alive 89.1 88.8 88.9 84.9 86.4 85.6 87.2 87.8 87.5
Father alive & mother dead 2.2 2.9 2.5 3.1 4.0 3.6 2.6 3.4 3.0
Mother alive & father dead 6.6 6.7 6.6 10.2 7.4 8.9 8.2 7.0 7.6
Both parents dead 2.2 1.6 1.9 1.8 2.1 1.9 2.0 1.8 1.9
Total 100.0 100.0 100.0 100.0 100.0 100.0 100.0 100.0 100.0
HH’s level of education
None 56.9 60.3 58.5 53.4 50.2 51.8 55.4 55.9 55.6
Primary 15.6 14.1 14.9 16.1 17.2 16.6 15.8 15.4 15.6
Secondary+ 27.5 25.6 26.6 30.5 32.7 31.6 28.8 28.7 28.7
Total 100.0 100.0 100.0 100.0 100.0 100.0 100.0 100.0 100.0
Sex of the household head
Male 60.9 58.8 59.8 64.8 62.8 63.8 62.6 60.5 61.6
Female 39.1 41.2 40.2 35.2 37.2 36.2 37.4 39.5 38.4
Total 100.0 100.0 100.0 100.0 100.0 100.0 100.0 100.0 100.0
Number of 6-17year-old children child
1-2 41.7 43.6 42.6 34.7 36.8 35.7 38.6 40.7 39.6
3-4 46.7 44.2 45.5 48.3 48.3 48.3 47.4 46.0 46.7
5 and above 11.6 12.1 11.9 17.0 8.14 16.0 14.0 13.3 13.6
Total 100.0 100.0 100.0 100.0 100.0 100.0 100.0 100.0 100.0
Source: Data from household survey, OOSC-DRC 2012 Graph11 gives an overview of different profiles of OOSC. A higher proportion of girls (31.8%) than boys (26.6%) are out of school; and a higher proportion of children in rural areas (33.4%) than those living in urban areas (20.0%). Moreover, there are significant inequalities in school attendance firstly between the children from the poorest categories (36.6% of OOSC) and those from the wealthiest (11.2% of OOSC), and secondly between children whose

53
household head has no education (32.9% of OOSC) and those whose household head has secondary or higher education (18.7% of OOSC). It is important to emphasise that the combination of these inequalities shows what an enormous effort needs to be made: for girls in households with less than $50 per month, where the household head has no level of education and living in rural areas, the proportion of OOSC is 45.0% against 37.6% for boys in the same situation. Graph 11: Schooling profile of children in 2012 according to selected characteristics
Source: Data from household survey, OOSC-DRC 2012
Overall
Boys Girls
Urban Rural
$200 or more Less than $50
HH secondary or higher HH no education
Cumulative inequality – Boys Cumulative inequality – Girls
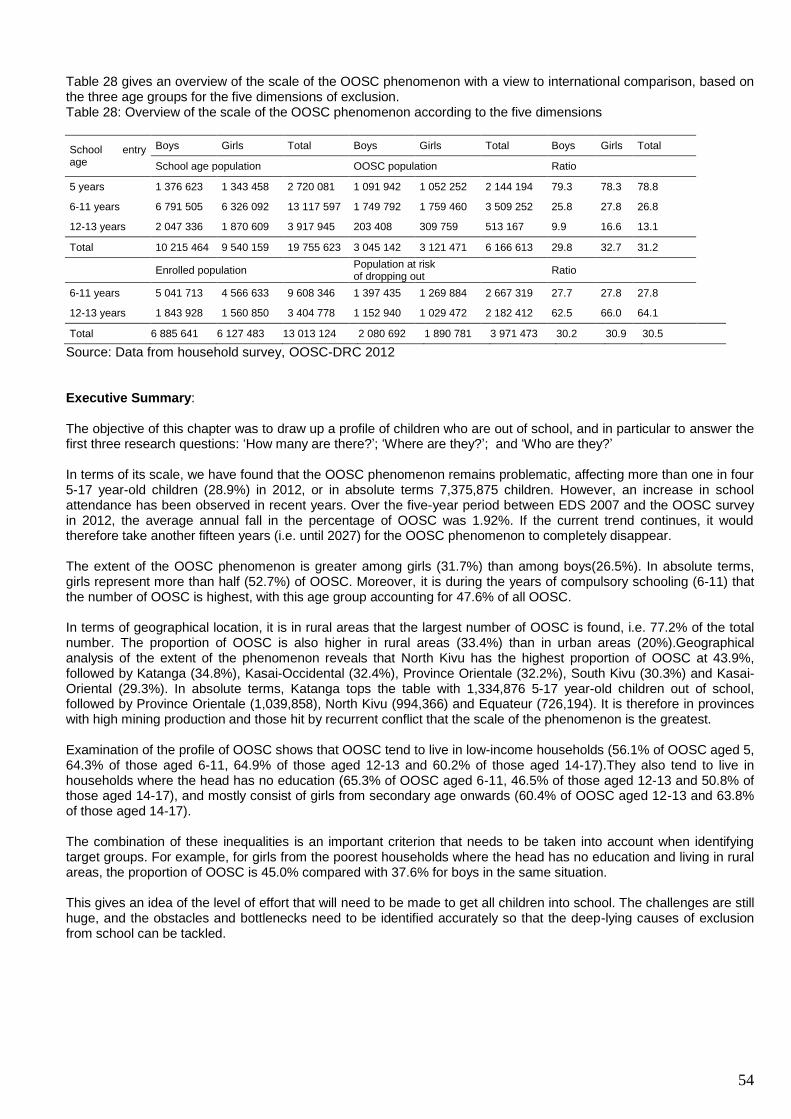
54
Table 28 gives an overview of the scale of the OOSC phenomenon with a view to international comparison, based on the three age groups for the five dimensions of exclusion. Table 28: Overview of the scale of the OOSC phenomenon according to the five dimensions
School entry age
Boys Girls Total Boys Girls Total Boys Girls Total
School age population OOSC population Ratio
5 years 1 376 623 1 343 458 2 720 081 1 091 942 1 052 252 2 144 194 79.3 78.3 78.8
6-11 years 6 791 505 6 326 092 13 117 597 1 749 792 1 759 460 3 509 252 25.8 27.8 26.8
12-13 years 2 047 336 1 870 609 3 917 945 203 408 309 759 513 167 9.9 16.6 13.1
Total 10 215 464 9 540 159 19 755 623 3 045 142 3 121 471 6 166 613 29.8 32.7 31.2
Enrolled population Population at risk of dropping out
Ratio
6-11 years 5 041 713 4 566 633 9 608 346 1 397 435 1 269 884 2 667 319 27.7 27.8 27.8
12-13 years 1 843 928 1 560 850 3 404 778 1 152 940 1 029 472 2 182 412 62.5 66.0 64.1
Total 6 885 641 6 127 483 13 013 124 2 080 692 1 890 781 3 971 473 30.2 30.9 30.5
Source: Data from household survey, OOSC-DRC 2012 Executive Summary: The objective of this chapter was to draw up a profile of children who are out of school, and in particular to answer the first three research questions: ‘How many are there?’; ‘Where are they?’; and ‘Who are they?’ In terms of its scale, we have found that the OOSC phenomenon remains problematic, affecting more than one in four 5-17 year-old children (28.9%) in 2012, or in absolute terms 7,375,875 children. However, an increase in school attendance has been observed in recent years. Over the five-year period between EDS 2007 and the OOSC survey in 2012, the average annual fall in the percentage of OOSC was 1.92%. If the current trend continues, it would therefore take another fifteen years (i.e. until 2027) for the OOSC phenomenon to completely disappear. The extent of the OOSC phenomenon is greater among girls (31.7%) than among boys(26.5%). In absolute terms, girls represent more than half (52.7%) of OOSC. Moreover, it is during the years of compulsory schooling (6-11) that the number of OOSC is highest, with this age group accounting for 47.6% of all OOSC. In terms of geographical location, it is in rural areas that the largest number of OOSC is found, i.e. 77.2% of the total number. The proportion of OOSC is also higher in rural areas (33.4%) than in urban areas (20%).Geographical analysis of the extent of the phenomenon reveals that North Kivu has the highest proportion of OOSC at 43.9%, followed by Katanga (34.8%), Kasai-Occidental (32.4%), Province Orientale (32.2%), South Kivu (30.3%) and Kasai-Oriental (29.3%). In absolute terms, Katanga tops the table with 1,334,876 5-17 year-old children out of school, followed by Province Orientale (1,039,858), North Kivu (994,366) and Equateur (726,194). It is therefore in provinces with high mining production and those hit by recurrent conflict that the scale of the phenomenon is the greatest. Examination of the profile of OOSC shows that OOSC tend to live in low-income households (56.1% of OOSC aged 5, 64.3% of those aged 6-11, 64.9% of those aged 12-13 and 60.2% of those aged 14-17).They also tend to live in households where the head has no education (65.3% of OOSC aged 6-11, 46.5% of those aged 12-13 and 50.8% of those aged 14-17), and mostly consist of girls from secondary age onwards (60.4% of OOSC aged 12-13 and 63.8% of those aged 14-17). The combination of these inequalities is an important criterion that needs to be taken into account when identifying target groups. For example, for girls from the poorest households where the head has no education and living in rural areas, the proportion of OOSC is 45.0% compared with 37.6% for boys in the same situation. This gives an idea of the level of effort that will need to be made to get all children into school. The challenges are still huge, and the obstacles and bottlenecks need to be identified accurately so that the deep-lying causes of exclusion from school can be tackled.
55
III. Obstacles and bottlenecks Analysis of the literature review reveals the existence of many obstacles to schooling on both the supply and demand sides. We shall begin this chapter by listing what these commonly mentioned obstacles are. After this, looking specifically at the DRC and the data collected in the study, we shall present those that appear most critical in the explanation of children’s exclusion from the school system.
3.1 Obstacles to schooling
3.1.1 Obstacles due to educational provision
The availability and proximity of educational facilities, equipment, affordability, qualifications of teachers, teaching content and adaptability, are all factors that emerge from previous studies as influencing the propensity of families or parents to send their children to school or their choice of school. The issue of distance from school is often cited when explaining gender inequalities in access to education. Parents are often reluctant to send girls to schools far from home for fear of exposing them to physical or moral aggression: “In Egypt, Morocco, and Tunisia Parents are reluctant to send their daughters to distant schools because they fear exposing them to moral or physical peril. Even in the relatively more open societies of Malaysia and the Philippines, distance to school is a greater deterrent to girls' enrolment than to boys” (Hill and King, 1993, p. 33). A study in Burkina Faso found that distance from school is the primary factor in children's education in rural areas, and this distance is more significant for girls than for boys (Kobiané, 2006). Alderman et al. (1996) also highlight, in the context of Pakistan’s rural areas, that availability of school infrastructure is one of the factors in girls’ access to and performance at school. Availability of certain facilities at the school is also a factor that can limit the chances of girls: “In Bangladesh parents have withdrawn girls, but not boys, from schools without latrines” (Hill and King, 1993, p. 33). The quality of the school and the costs of schooling also influence the decision of the poorest families to send their children to school or to choose between public and private educational institutions: “...schooling choices of poor households are sensitive to government and private school fees, distance from school, and school quality. In particular, lowering private school fees or distance will increase private school enrolment of poor children” (Alderman et al. (2001, p. 306).
3.1.2 Obstacles due to demand
In addition to the availability and quality of provision, there are many other factors in the family environment that affect the chances of education for children (Chernichovsky 1985; Marcoux, 1994; Pilon, 1995; Lloyd and White, 1996; Buchmann, 2000; Hannum and Buchmann, 2001; Kobiané, 2001 and 2006.). a) Obstacles related to gender relations Several socio-cultural factors are involved in explaining inequalities between boys and girls in educational investment. These include traditional beliefs concerning women’s responsibility for domestic work, early marriage for girls, the girl being considered as “outsider”, etc. (King and Hill, 1993; Lange, 1998; Kobiané, 2007). Forced to leave her family to get married, the girl is usually seen in African societies, where most people live in their father’s home, as a perpetual “outsider” in whom it is not “worth investing”, given that such investment (particularly investment in schooling) will be of more benefit to her future in-laws (Kinda, 1995; Roth, 1996; Zoungrana et al., 1998). b) Orphan status Many studies show that the loss of parents is generally detrimental to the schooling of children (Marcoux et al., 2005; Wakam, 2002; Ainsworth and Filmer, 2002; Case et al., 2004; Kobiané et al., 2005). However, other studies indicate that orphans are not always necessarily less educated than non-orphans and conclude that orphans sometimes reach the same levels of education as non-orphans or even higher (Nyangara, 2004 , Foster et al., 1995; Urassa et al., 1997). This result can be explained, in the African context, by support for orphans within the extended family.
56
c) Fostering
In most African societies, children are fostered for several reasons. Isiugo-Ibanihe (1985) distinguishes five types of fostering: (i) fostering within the extended family (sending children to live with family members to strengthen family bonds), (ii) fostering during a crisis (following the breakdown of the family due to death, divorce or separation), (iii) fostering for alliance or learning purposes (children sent to live with non-relatives with high social status as helpers or apprentices, to strengthen social, political or economic ties), (iv) domestic fostering (sending children to provide help in the home) and (v) school fostering (for schooling). This diversity of motivations for fostering makes the nature of the relationship between the ties with the household head and the chances of schooling ambivalent (Pilon, 2005). The ties can be positive, i.e. fostering may offer children a greater chance of schooling or, on the contrary, by diverting children into other activities, fostering may reduce the chances of schooling. d) Educational level of parents A classic result that emerges from research on the factors in demand for schooling is a positive relationship between the level of parents’ education and schooling for their children. The more educated parents are, the more they value formal education and the more they attach particular importance to the education of their children regardless of sex (Hill and King, 1993). e) Sex of the household head Unlike the results observed in other developing regions, especially Latin America (Barros et al., 1997; Buvinic and Gupta, 1997),studies on sub-Saharan Africa have generally come to the conclusion that female household heads enrol children in schooling more than male household heads (Lloyd and Blanc, 1996; Clévenot and Pilon, 1996; Wakam, 2002 and 2003, Kobiané, 2003 and 2006). The reason most commonly cited in the literature is that women ensure a better allocation of resources within the household (De Vreyer 1993; Clévenot and Pilon, 1996; Lloyd and Blanc, 1996). f) Household income Several studies, both in sub-Saharan Africa and in other developing regions, show that there is a positive relationship between the household’s living standards and the education of children (Marcoux, 1994a; Tambashe and Shapiro, 1996, 1999, 2000; Filmer and Pritchett, 1999). In other words, the better off the household is, the less the children are out of school. This means that poverty is an obstacle to schooling. g) Number of children of school age The negative relationship between the size of the family or household and the education of children has been supported by findings in certain developing regions, particularly in the countries of South-East Asia (Knodel and Wongsith 1991; Sathar and Lloyd , 1993; Degraff et al., 1996; Anh et al., 1998). Studies on sub-Saharan Africa, however, lead to a different result: the relationship between the size of the family or household and the education of children is non-existent or even positive (Gomes, 1984; Chernichovski, 1985; Marcoux, 1994; Lloyd and Blanc 1996, Shapiro 1999). This difference between South-East Asia and sub-Saharan Africa with regard to the nature of the relationship between household size and level of education of children is generally explained by differences in family systems. The existence of family solidarity networks in sub-Saharan Africa, which often allow outsiders to be hosted in the household (children and adults) or some household members to be sent to other residential units, is thought to reduce the pressure from the number of children on the available resources. h) Number of chronically ill people in the household Studies on the effect of adult mortality on the well-being of children, especially in areas of high prevalence of diseases such as HIV/AIDS, show that when there are long-term diseases, this may affect schooling (especially for girls)due to two possible mechanisms: the opportunity cost (or indirect cost) of the education of children, which leads households to withdraw children (especially girls) from school to take care of these patients, or the selective allocation of resources, meaning that more income is allocated to health care, thus compromising the schooling of children
12
(Steinberg et al., 2002; Yamano and Takashi, 2004).. Based on these factors identified in the literature on schooling obstacles and bottlenecks, we can now analyse the situation in the DRC.
12This is why, in the context of the OOSC-DRC study, we have attempted to measure the effect of the number of people with long-term sickness (lasting at least 3 months) during the last 12 months of exclusion from school.
57
3.2 Factors in exclusion from school in the DRC We started by looking at the relationship between each potential obstacle (independent variable) and exclusion from school. In other words, we conducted bivariate analyses. The results of these bivariate analyses together with the associated association measures
13 are presented in Tables A24 and A25 in the appendix.
For a better understanding of the factors in exclusion from school, a multivariate analysis is needed. This has the benefit of allowing the simultaneous consideration of all possible factors and identifying their respective importance in predicting the risk of being out of school. Based on the results of the literature on obstacles to educational demand, the following variables were considered in the multivariate analysis
14:
- Sex of the child; - Orphan status; - Family ties with the household head; - Level of education of the household head; - Sex of the household head; - Household income; - Number of children of school-age (6-17 years old) in the household; - Number of long-term sick in the household for the last 12 months; - Distance from school.
Because the factors in exclusion from school can vary from one age group to another but also from one area of residence to another, logistical regression was carried out at several levels:
- One model for children of primary school age (6-11 years) and another one for children of secondary school age (12-17 years);
- One model for the entire DRC, but also one model for urban areas and another one for rural areas; - One model for each province.
We did not perform any multivariate analysis for the five year-old population given the very low level of participation in school at this age, but also because participation in pre-primary education is largely the prerogative of urban areas and the wealthiest social categories. However, in the synthesis, we shall summarise the obstacles affecting the 5 year-old population. In addition, we have not distinguished 12-13 year-olds from 14-17 year-olds, so as to have sufficient numbers for the multivariate analyses (in particular by province). The coefficients of the logistical regression models and hazard ratios are presented in Tables A20 and A21 in the appendix. In addition to these coefficients, which are used to consider the intervals between different categories of variables, the ranking of variables according to their explanatory power can be used to identify the factors in exclusion from school at the national level and in each area of residence
15. Table A28 gives this ranking of explanatory variables
for the risk of being out of school, both country wide and in the areas of residence (urban/rural and provinces), and for both 6-11 year-old and 12-17 year-old children. The variables are first ranked at the level of the entire country, and their positioning is then examined in the urban and rural areas and in each of the provinces. To facilitate interpretation of the results we have highlighted the first three most important variables in each area (red) and the three least important variables (blue).
3.2.1 Socio-cultural demand factors and family environment
a) Gender inequalities
13
Association measures or coefficients are statistics uses to test the existence of a relationship between two variables, its
intensity and, where relevant (for measurement level variables with an ordinal minimum), the direction of the relationship. Based on the literature and the advantages and limitations of association measures, we have opted for Cramer’s V for nominal measurement level variables and Somers’ D for ordinal measurement level variables. We have treated whether or not a child is out of school (although dichotomous) as an ordinal variable. For more details on measures of association, see especially W. Fox (1999) or A. Gilles (1994). 14The disability variable, though useful, was not taken into account in the multivariate analyses due to the low numbers concerned, raising problems with the calculation of regression coefficients for several categories. 15This ranking of variables (factors) in different models of analysis can be done by calculating the contribution of each variable to explaining the OOSC phenomenon, measured by the Khi-2 statistic of the model (see Appendix 3 of the note on logistical regression and the Khi-2 statistical table).
58
The ranking of variables (Table A29 in appendix) reveals that it is at secondary school age (12-17 years), particularly in rural areas, that gender appears as a determinant of exclusion from school. Gender ranks third as a variable nationally and first in rural areas. It is particularly crucial in Kasai-Occidental (where it ranks first) and Bas-Congo and North Kivu (where it ranks 3
rd). Examination of the hazard ratio (Table A27) shows that a 12-17 year-old girl is 1.49
times more likely to be out of school than a boy in urban areas and 2.28 times more likely in rural areas. Efforts by the government and its partners in the schooling of children in recent years have significantly reduced inequalities in access to school between boys and girls, especially in primary school. Thanks to awareness campaigns throughout the country, many parents have realised the importance of enrolling both boys and girls. “Access for girls and boys? These days girls devote themselves to their studies, even more than boys; you see, in the past, people said they would end up getting married, but now it's the opposite, you see women who are in positions of authority. If I had not gone to school, I would not be working, I would be at home, in my household, but I'm working. This is why you can see a lot of girls devoting themselves to their studies. Like here in our school, there are more girls than boys. You can also see that there are numerous girls’ schools. There are only girls, girls and girls. Many parents have decided to enrol girls rather than boys; this is why girls now devote themselves a great deal to education”(Woman, Parent, Equateur). However, inequality between boys and girls gradually increases the higher one goes in the educational system and thus occurs more in secondary and higher education. "I know that in the past, there was a great disparity between boys’ and girls’ attendance in schools. But in recent years, for about the past five or six years, there has been a campaign, a very big campaign for the schooling of girls. There has been a strong response to this: many girls go to school and the trend has even been reversed ... At the primary school level, a lot of girls are in school and when you count the number of girls in classes, there are more girls than boys. But unfortunately this momentum fades at the end of primary school. At the start of secondary school, we find that the trend begins reversing again: the boys tend to continue in secondary school, and the girls begin dropping out. And when you get to the sixth year of secondary school, boys are more numerous”. (Man, senior educational system official, Kasai-Oriental). The importance of the gender variable at the level of 12-17 year-old children reflects the socio-cultural reality fairly closely, including discriminatory gender relations, which mean that at these ages, matrimonial practices, early pregnancy and generally, the place given to the girl in the family organisation, cause many girls to dropout from school. The proportion of 12-17 year-old girls who are in school and who are married is 0.08%. Conversely, the proportion of 12-17 year-old girls out of school and married at the time of the survey is 9.0%. Even though marriage may occur after leaving school and may not necessarily be the reason for drop out, this high proportion of married girls among girls out of school suggests effects of early marriage as one reason why girls dropout. Table A31 in the appendix (which gives the causes of dropout from school) shows that at the level of the entire country, marriage was mentioned in 3.3% of cases, and this figure reaches 10.2% in Maniema, 8.0% in Kasai-Occidental and 7.6% in Kasai-Oriental. Similarly, pregnancy was mentioned in 3.9% of cases in the entire country, and 11.7% in Bandundu, 11.6% in Maniema and 7.0% in Province Orientale. When these figures are analysed for girls only, they are even more striking: marriage is cited in 6.3% of cases and pregnancy in 5.2% of cases as reasons for girls dropping out of school (Table A32 in the appendix). The following comment from the qualitative interviews illustrates the important role of family imperatives: "There are many parents who say, ... as we say in Lingala, “Aza na ye mwana Mwasi ako finir naye na libala..”. That means: "She is only a girl, she will always end up getting married”. So they prefer to enrol boys so that sooner or later, they will also take care of them[take care of the family]”. (Woman, parent of a child, Kinshasa). b) Parents’ survival The loss of parents is an obstacle to schooling, particularly in urban areas for 12-17 year-olds. Ranking of variables reveals that orphan status is the second factor in exclusion from school in urban areas for 12-17 year-olds (and the sixth factor in rural areas). In Kinshasa, orphan status is the leading factor for 12-17 year-olds and the third factor for 6-11 year-olds. In three other provinces, Bas-Congo, Equateur and Maniema, it is also crucial (second in Bas-Congo and Equateur and third in Maniema). The hazard ratio for 12-17 year-olds (Table A27 in the appendix) indicates that children who have lost their mother are at higher risk of being out of school than non-orphans, regardless of the area of residence, with gaps even greater than those observed for 6-11 year-old children (a hazard ratio of 1.96 in urban areas compared with 1.88 in rural areas). Moreover, a full orphan in rural areas is at greater risk of being out of school than a non-orphan (a hazard ratio of 1.86).
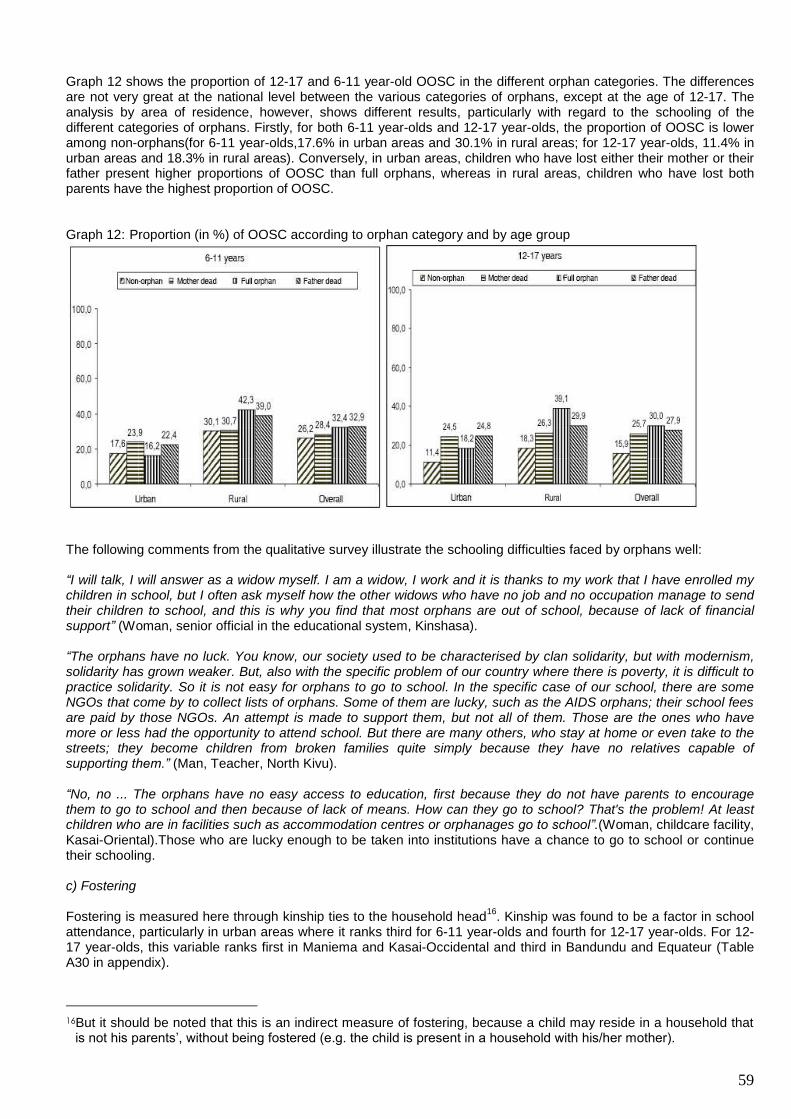
59
Graph 12 shows the proportion of 12-17 and 6-11 year-old OOSC in the different orphan categories. The differences are not very great at the national level between the various categories of orphans, except at the age of 12-17. The analysis by area of residence, however, shows different results, particularly with regard to the schooling of the different categories of orphans. Firstly, for both 6-11 year-olds and 12-17 year-olds, the proportion of OOSC is lower among non-orphans(for 6-11 year-olds,17.6% in urban areas and 30.1% in rural areas; for 12-17 year-olds, 11.4% in urban areas and 18.3% in rural areas). Conversely, in urban areas, children who have lost either their mother or their father present higher proportions of OOSC than full orphans, whereas in rural areas, children who have lost both parents have the highest proportion of OOSC. Graph 12: Proportion (in %) of OOSC according to orphan category and by age group
The following comments from the qualitative survey illustrate the schooling difficulties faced by orphans well: “I will talk, I will answer as a widow myself. I am a widow, I work and it is thanks to my work that I have enrolled my children in school, but I often ask myself how the other widows who have no job and no occupation manage to send their children to school, and this is why you find that most orphans are out of school, because of lack of financial support” (Woman, senior official in the educational system, Kinshasa). “The orphans have no luck. You know, our society used to be characterised by clan solidarity, but with modernism, solidarity has grown weaker. But, also with the specific problem of our country where there is poverty, it is difficult to practice solidarity. So it is not easy for orphans to go to school. In the specific case of our school, there are some NGOs that come by to collect lists of orphans. Some of them are lucky, such as the AIDS orphans; their school fees are paid by those NGOs. An attempt is made to support them, but not all of them. Those are the ones who have more or less had the opportunity to attend school. But there are many others, who stay at home or even take to the streets; they become children from broken families quite simply because they have no relatives capable of supporting them.” (Man, Teacher, North Kivu). “No, no ... The orphans have no easy access to education, first because they do not have parents to encourage them to go to school and then because of lack of means. How can they go to school? That's the problem! At least children who are in facilities such as accommodation centres or orphanages go to school”.(Woman, childcare facility, Kasai-Oriental).Those who are lucky enough to be taken into institutions have a chance to go to school or continue their schooling. c) Fostering Fostering is measured here through kinship ties to the household head
16. Kinship was found to be a factor in school
attendance, particularly in urban areas where it ranks third for 6-11 year-olds and fourth for 12-17 year-olds. For 12-17 year-olds, this variable ranks first in Maniema and Kasai-Occidental and third in Bandundu and Equateur (Table A30 in appendix).
16But it should be noted that this is an indirect measure of fostering, because a child may reside in a household that
is not his parents’, without being fostered (e.g. the child is present in a household with his/her mother).
60
Examination of the hazard ratio (Table A27 in appendix) reveals that the more distant the child is from the household head in terms of kinship, the more he/she runs the risk of being out of school. This result was observed in both rural and urban areas, but is much higher in the latter: a child with parents other than the household head is 1.67 times more likely to be out of school than a biological child of the household head, and this risk is five times higher when a child is not related to the household head. This result regarding the effect of kinship with the household head shows that fostering of children does not necessarily contribute to improving the prospects of schooling. Although schooling is usually mentioned among the reasons for fostering, , in reality, the activity in which the child may end up engaging in his/her host household may be different from schooling. Information collected during the survey on children living away from the household also shows that sending children to other residential units is a relatively important phenomenon. The survey shows that 5-17 year-olds living away from the household of their biological parents accounted for 13.5% of children living with their parents. The reasons why children are sent elsewhere are, in order of decreasing importance, “to attend school” (72.7%), due to “poverty” (16.5%), “to attend school and help with the housework”(7.4%), “for other reasons” (2.1%) and “to help with the housework” (1.3%). The views given in the qualitative survey on the issue of the schooling of fostered children make it clearer why the prospects of school enrolment decrease when children are no longer in the family home: “You know, a child is well educated when he/she lives with his/her parents. What I mean is that these children, even when they can attend school, what are their schooling conditions? Today, the city of Goma is experiencing a shortage of drinking water, there is a water problem. These children have to wake up early in the morning, at four o'clock, to walk many kilometres to fetch water; the child returns very tired and then has to go to school. These are children who, in many households, are treated as servants and you have to imagine that the schooling conditions also become very difficult” (Male, teacher, North Kivu). "For the education of these children [foster children], there is a little problem because some of the children out of school are living out of the household [away] from their parents because of poverty. Some family members neglect the children of their relatives and their extended families in order to support their own children (Woman, national NGO staff). “When a child is fostered by somebody else, and if the person who fosters the child does not have sufficient resources, if he/she has his/her own children at school-age, he/she must, for sure, begin with the schooling of his/her own children. Therefore, foster children are already running the risk of being out of the system, unless they have been fostered by a parent with at least some resources and who is willing to take care of them, alongside his/her own children"(Male, Responsible for planning and monitoring) . During group discussions with children, we also noted several statements showing that fostered children are unlikely to be enrolled at school compared with other children living with their biological parents. The following statements from a discussion with a group of adolescents living in their households in the province of North Kivu (FG 36) reflect the opinion of many children on the schooling prospects of foster children. (i) “He [a foster child] does not have the same chances as the children he will find in this house because the parents of those who belong to the house will help them more than him”. (ii) “For me, they are not equal. The other children will be enrolled, but the foster child will not be enrolled in school”. (iii) “They cannot have the same chances because parents will be willing to enrol their own children in school and will have no desire to enrol the foster child”. (iv)“The foster child will not be treated in the same way as the others because the mum will want the foster child to clean her children’s clothes when they come back home from school. He will be forced to work and he will not have time to go to school”. The following testimony of an adolescent also illustrates the disadvantaged situation of foster children in terms of school achievement. “Because, you see, like some others, I live with my big sister. I was supposed to do my exams, but I have no money for these exams” (Girl, 13 years old, student, Equateur). d) Perceptions and attitudes of parents concerning children’s rights Perceptions of children’s status Cultural perceptions of the society in which children live have an impact on the formulation of their needs and, therefore, of their rights. They are factors in both adult attitudes towards children and their practices concerning children's rights. In the qualitative interviews, adults were therefore asked to state the criteria they use to differentiate children from adults, and their views on the idea that children have rights, equality of girls and boys and the need to consult children on decisions concerning them.
61
The adults identified various criteria for differentiation of the child from the adult. The most commonly used criteria are age, social irresponsibility, dependency, and inability to take and defend their decisions. These criteria are emphasised in the following statements. (i) “... The child is aged from 0 to 18 years. The child differs from the adult because the child does not take care of himself. He has not yet got the resources to take care of himself, he is a developing human being, he is under the authority of someone, he is under the responsibility of someone who protects him ... But the adult takes care of himself, he can take responsible actions (Man, senior educational official, Kinshasa). (ii) “An adult can make decisions by himself and can also balance pros and cons. But the child cannot make a responsible decision. And he may not be able to defend his decision” (Woman, educator, Kinshasa). These comments show that the child is seen, on the one hand, as a developing human being who is essentially dependent because he cannot take care of himself and, on the other hand, as a human being to whom education should be provided. The frequency of these criteria, which are very specific to the child, leads at first sight to the conclusion that Congolese society has a favourable perception of the promotion of children's rights. However, some comments specify that only the very young (under 12 years) are considered as children. 12 to 18 year-olds, who are classified as adolescents, are no longer considered as children by some adults, as expressed in the statements below: “I believe a child is from one year to 10 years old; this is a child ... When talking about the age of puberty which is 15 - 20 years, I think this is the age of an adolescent. I would say that when someone is 12 - 18 years old, he is an adolescent..... This is no longer a child. If it’s a woman, she can get pregnant, whereas a child cannot get pregnant. Below 10 years old, it is not easy, so, that one is a child”.(Male, senior official in the educational system, Equateur). Such a perception of the child presents a danger. Perceiving adolescents as adults and treating them as such can be the source of harmful practices such as early marriages, the worst forms of child labour, child prostitution, sexual violence and economic exploitation of children. It is therefore necessary for information campaigns to dispel any doubt as to the age of children and the need to protect them until adulthood. Adults also identify ignorance as one of the criteria for differentiation between the child and the adult. For them, the child is someone who cannot think properly, who knows nothing. The adult thinks, he knows good and evil, while the child is still ignorant of many things (Male, municipal officer, Kinshasa). However, reference to intelligence to define a child is irrelevant insofar as an adult may be at the same mental level as a child. Moreover, one interviewee said that “the child thinks, it depends on his age, he thinks as far as he is capable” (Male, senior officer in administration, Kasai-Oriental). Anyone who thinks that children are less intelligent than adults will be reluctant to consult them and ask them what they think about issues that concern them. This constitutes a violation of a child’s rights under the Convention on the Rights of the Child (CRC) and the Law on Child Protection. Awareness campaigns should emphasise the specific and relevant criteria for characterising a child and combat prejudices about children’s intelligence. The child is also seen as someone who will take over later on, a form of old-age insurance for parents, as expressed in the following comment: “I believe that the child is my field .... the child is the field ... I have to send him to school ... I pay for his studies. One day, when the child has completed his studies, university ... he will find a good job. When I get older, ....this child will think of me. He calls me ‘dad’, and tells me to have this or that, he buys me pants, he sends a piece of cloth to mom ... he will think of me when I grow old "(Male, Religious Leader, Equateur). Attitude of adults vis-à-vis the principles of the Convention on the Rights of the Child (CRC) The opinions of the people surveyed were collected on two of the four guiding principles of the CRC: the principle of non-discrimination and the principle of child participation. Regarding the equal rights of girls and boys, a high proportion of respondents believe that girls and boys are equal because both are full human beings and none of them asked to be born girl or boy. Therefore, they must have the same protection both in the family and in society and must be treated in the same way without discrimination. However, as pointed out in the comments below, they emphasise that discrimination based on sex is present in Congolese society, especially in family relations. “Girls are disadvantaged compared to boys; they are definitely worse off. Especially in domestic work, domestic work is placed on them. You find that a 14 or 15 year-old girl... has become like a mother and replaces her mother who must spend her days at the market or walk miles and miles to fetch goods. In this respect, the girls are really disadvantaged compared to boys. There are boys that are used in business, but not too much. But the girls are invariably used in domestic work. Of course, there are those who get into immorality, allowing their daughter to practice prostitution in order to get a little money to take care of themselves, that happens too "(Male, teacher, North Kivu) . The principle of child participation or respect for the child's opinion is hardly recognised in Congolese society, as in most African societies, where only adults are allowed to make decisions and participate in the development of their community. The issue of the need to ask the child's opinion on all matters concerning him deeply divided the
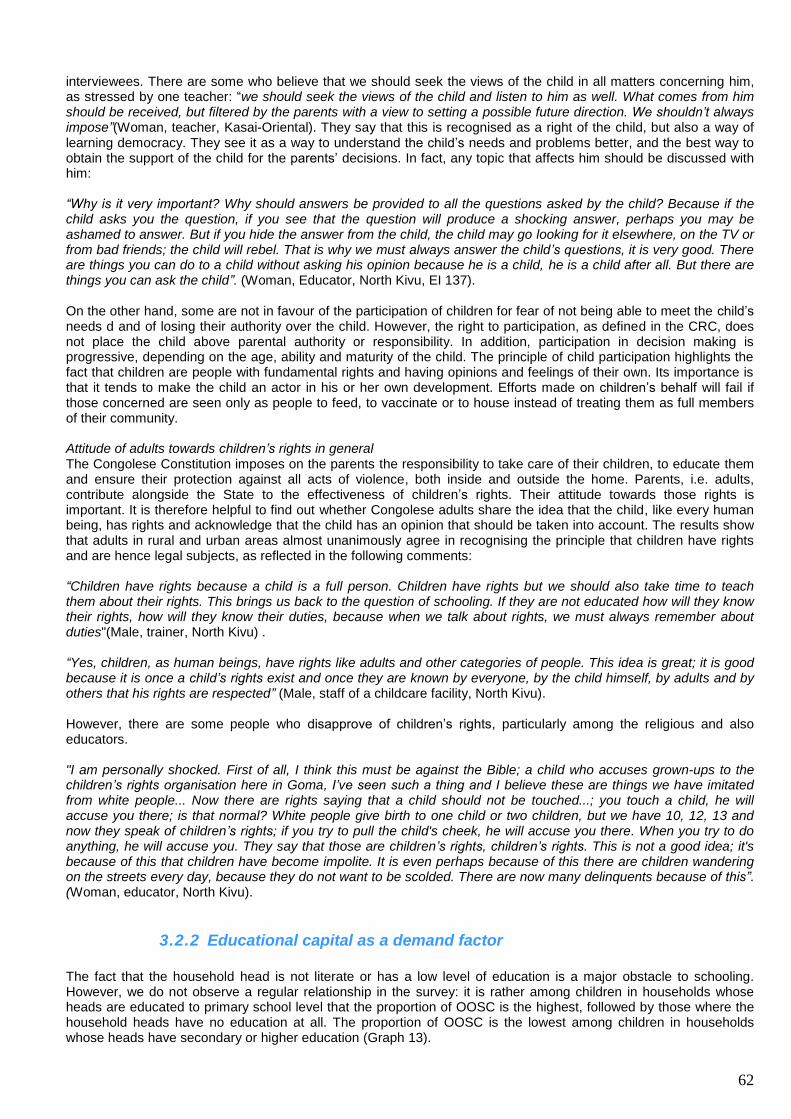
62
interviewees. There are some who believe that we should seek the views of the child in all matters concerning him, as stressed by one teacher: “we should seek the views of the child and listen to him as well. What comes from him should be received, but filtered by the parents with a view to setting a possible future direction. We shouldn’t always impose”(Woman, teacher, Kasai-Oriental). They say that this is recognised as a right of the child, but also a way of learning democracy. They see it as a way to understand the child’s needs and problems better, and the best way to obtain the support of the child for the parents’ decisions. In fact, any topic that affects him should be discussed with him: “Why is it very important? Why should answers be provided to all the questions asked by the child? Because if the child asks you the question, if you see that the question will produce a shocking answer, perhaps you may be ashamed to answer. But if you hide the answer from the child, the child may go looking for it elsewhere, on the TV or from bad friends; the child will rebel. That is why we must always answer the child’s questions, it is very good. There are things you can do to a child without asking his opinion because he is a child, he is a child after all. But there are things you can ask the child”. (Woman, Educator, North Kivu, EI 137). On the other hand, some are not in favour of the participation of children for fear of not being able to meet the child’s needs d and of losing their authority over the child. However, the right to participation, as defined in the CRC, does not place the child above parental authority or responsibility. In addition, participation in decision making is progressive, depending on the age, ability and maturity of the child. The principle of child participation highlights the fact that children are people with fundamental rights and having opinions and feelings of their own. Its importance is that it tends to make the child an actor in his or her own development. Efforts made on children’s behalf will fail if those concerned are seen only as people to feed, to vaccinate or to house instead of treating them as full members of their community. Attitude of adults towards children’s rights in general The Congolese Constitution imposes on the parents the responsibility to take care of their children, to educate them and ensure their protection against all acts of violence, both inside and outside the home. Parents, i.e. adults, contribute alongside the State to the effectiveness of children’s rights. Their attitude towards those rights is important. It is therefore helpful to find out whether Congolese adults share the idea that the child, like every human being, has rights and acknowledge that the child has an opinion that should be taken into account. The results show that adults in rural and urban areas almost unanimously agree in recognising the principle that children have rights and are hence legal subjects, as reflected in the following comments: “Children have rights because a child is a full person. Children have rights but we should also take time to teach them about their rights. This brings us back to the question of schooling. If they are not educated how will they know their rights, how will they know their duties, because when we talk about rights, we must always remember about duties"(Male, trainer, North Kivu) . “Yes, children, as human beings, have rights like adults and other categories of people. This idea is great; it is good because it is once a child’s rights exist and once they are known by everyone, by the child himself, by adults and by others that his rights are respected” (Male, staff of a childcare facility, North Kivu). However, there are some people who disapprove of children’s rights, particularly among the religious and also educators. "I am personally shocked. First of all, I think this must be against the Bible; a child who accuses grown-ups to the children’s rights organisation here in Goma, I’ve seen such a thing and I believe these are things we have imitated from white people... Now there are rights saying that a child should not be touched...; you touch a child, he will accuse you there; is that normal? White people give birth to one child or two children, but we have 10, 12, 13 and now they speak of children’s rights; if you try to pull the child's cheek, he will accuse you there. When you try to do anything, he will accuse you. They say that those are children’s rights, children’s rights. This is not a good idea; it's because of this that children have become impolite. It is even perhaps because of this there are children wandering on the streets every day, because they do not want to be scolded. There are now many delinquents because of this”. (Woman, educator, North Kivu).
3.2.2 Educational capital as a demand factor
The fact that the household head is not literate or has a low level of education is a major obstacle to schooling. However, we do not observe a regular relationship in the survey: it is rather among children in households whose heads are educated to primary school level that the proportion of OOSC is the highest, followed by those where the household heads have no education at all. The proportion of OOSC is the lowest among children in households whose heads have secondary or higher education (Graph 13).
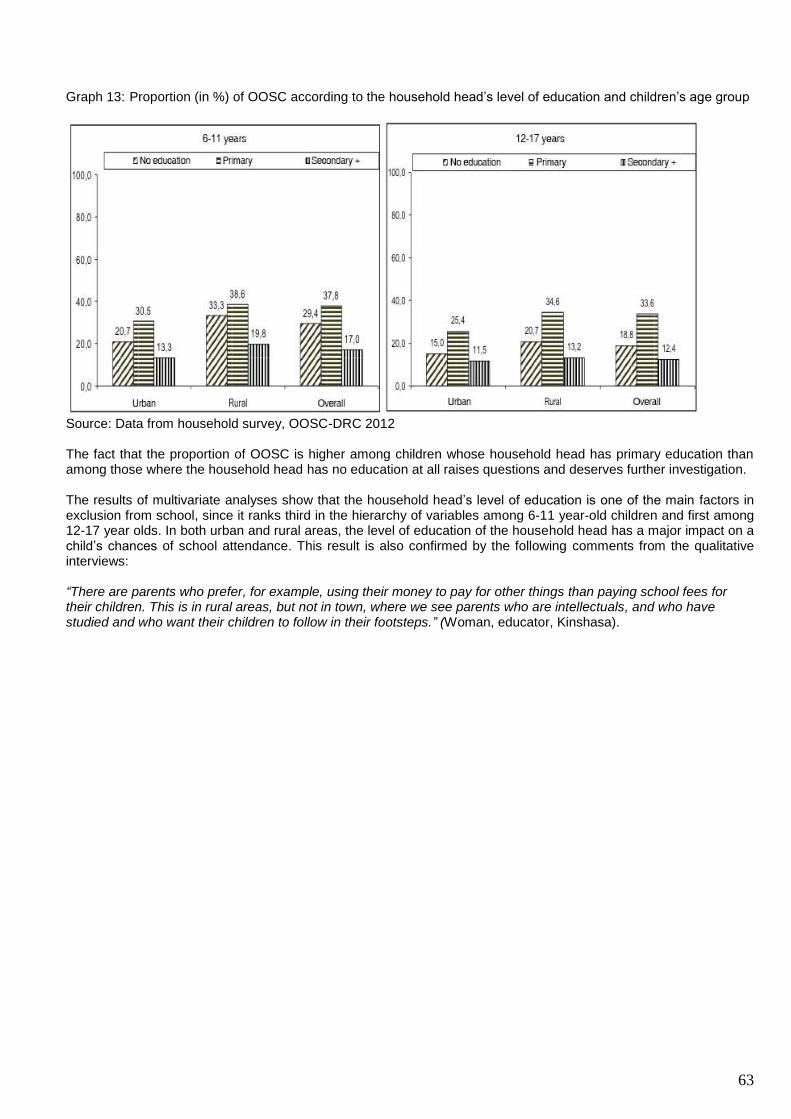
63
Graph 13: Proportion (in %) of OOSC according to the household head’s level of education and children’s age group
Source: Data from household survey, OOSC-DRC 2012 The fact that the proportion of OOSC is higher among children whose household head has primary education than among those where the household head has no education at all raises questions and deserves further investigation. The results of multivariate analyses show that the household head’s level of education is one of the main factors in exclusion from school, since it ranks third in the hierarchy of variables among 6-11 year-old children and first among 12-17 year olds. In both urban and rural areas, the level of education of the household head has a major impact on a child’s chances of school attendance. This result is also confirmed by the following comments from the qualitative interviews: “There are parents who prefer, for example, using their money to pay for other things than paying school fees for their children. This is in rural areas, but not in town, where we see parents who are intellectuals, and who have studied and who want their children to follow in their footsteps.” (Woman, educator, Kinshasa).
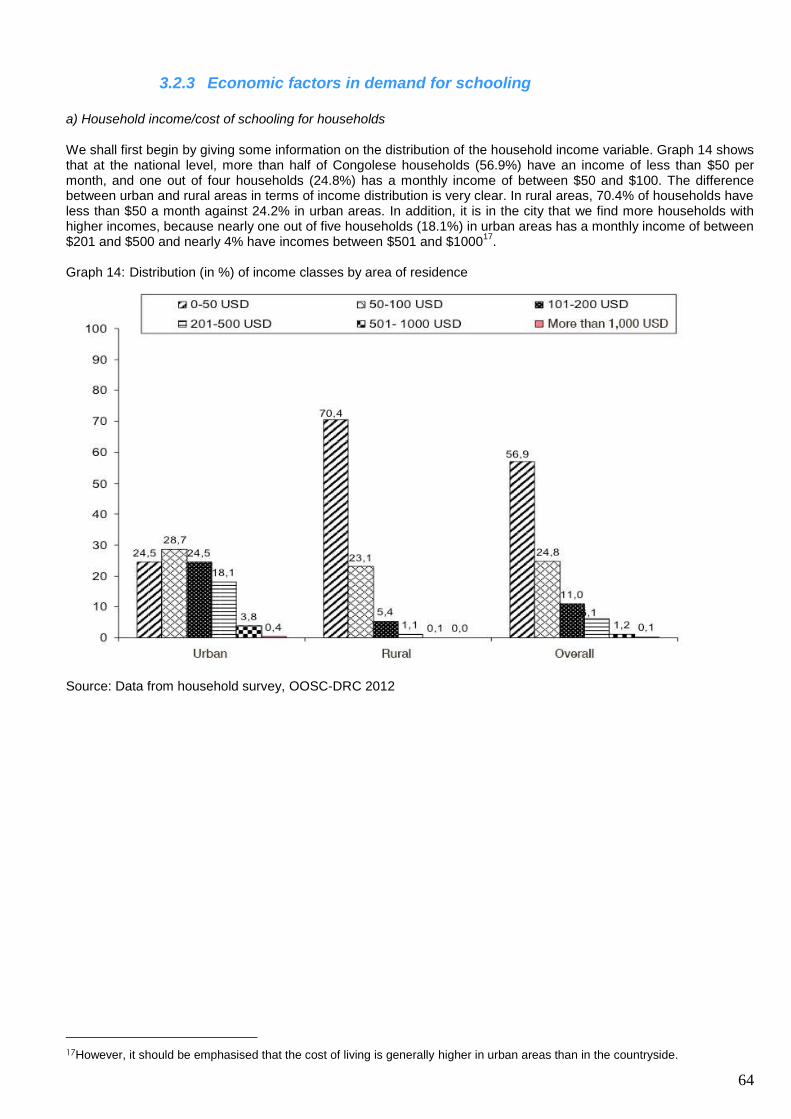
64
3.2.3 Economic factors in demand for schooling
a) Household income/cost of schooling for households We shall first begin by giving some information on the distribution of the household income variable. Graph 14 shows that at the national level, more than half of Congolese households (56.9%) have an income of less than $50 per month, and one out of four households (24.8%) has a monthly income of between $50 and $100. The difference between urban and rural areas in terms of income distribution is very clear. In rural areas, 70.4% of households have less than $50 a month against 24.2% in urban areas. In addition, it is in the city that we find more households with higher incomes, because nearly one out of five households (18.1%) in urban areas has a monthly income of between $201 and $500 and nearly 4% have incomes between $501 and $1000
17.
Graph 14: Distribution (in %) of income classes by area of residence
Source: Data from household survey, OOSC-DRC 2012
17However, it should be emphasised that the cost of living is generally higher in urban areas than in the countryside.
65
A comparison of provinces in terms of income class distribution (Graph15) reveals that in the provinces of Equateur, Maniema and Kasai-Oriental, more than 70% of households have a monthly income below $50 (78.5%, 72.9% and 72.2% respectively). In contrast, Kinshasa (5.2%), Bas-Congo (45.4%) and South Kivu (49.2%) are the provinces where the proportion of households with very low incomes is relatively low (less than 50%). There is consistency between the classification of provinces based on income categories from the OOSC survey and the results of the poverty profile study carried out using the 1-2-3 survey data of 2005 (Moummi, 2010): the latter presented the province of Equateur as the one where the incidence of poverty is highest and Kinshasa as that where it is lowest
18.
Graph 15: Distribution of income classes by province
Source: Data from household survey, OOSC-DRC 2012
18To within two ranks, five (5) provinces out of the eleven (11) have the same ranking on the two variables: poverty profile (Moummi, 2010) and Monthly Income Class (OOSC-DRC 2012).
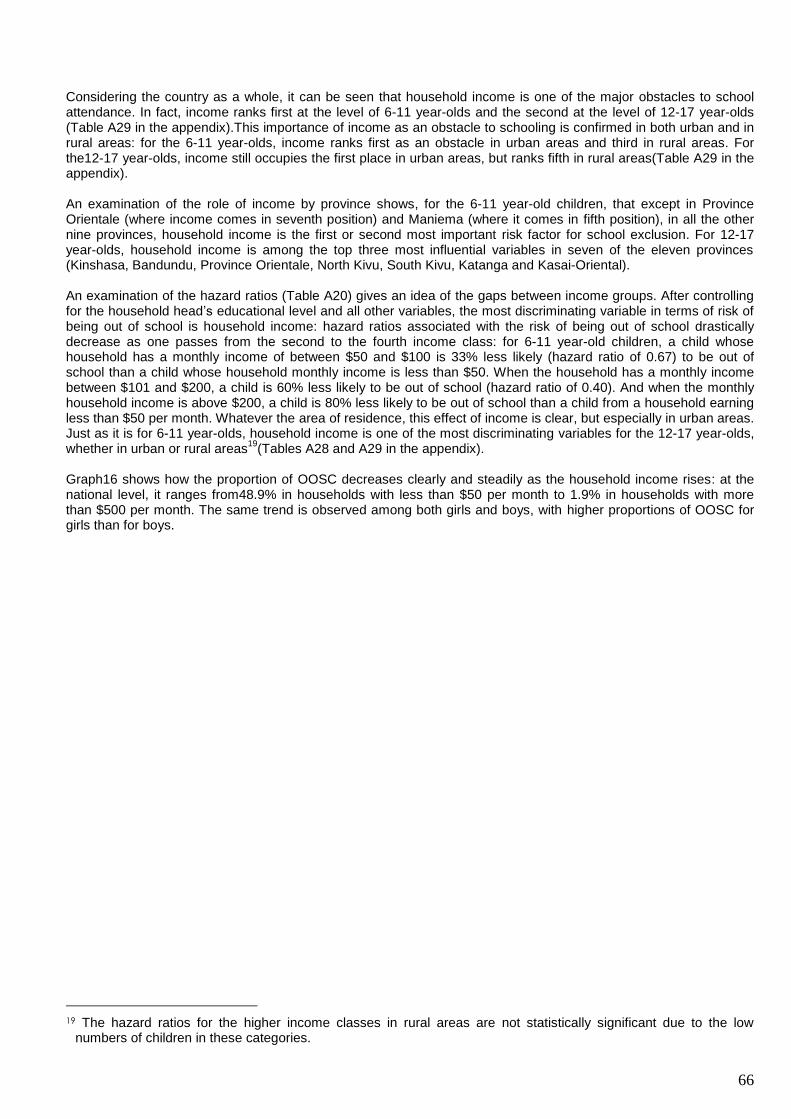
66
Considering the country as a whole, it can be seen that household income is one of the major obstacles to school attendance. In fact, income ranks first at the level of 6-11 year-olds and the second at the level of 12-17 year-olds (Table A29 in the appendix).This importance of income as an obstacle to schooling is confirmed in both urban and in rural areas: for the 6-11 year-olds, income ranks first as an obstacle in urban areas and third in rural areas. For the12-17 year-olds, income still occupies the first place in urban areas, but ranks fifth in rural areas(Table A29 in the appendix). An examination of the role of income by province shows, for the 6-11 year-old children, that except in Province Orientale (where income comes in seventh position) and Maniema (where it comes in fifth position), in all the other nine provinces, household income is the first or second most important risk factor for school exclusion. For 12-17 year-olds, household income is among the top three most influential variables in seven of the eleven provinces (Kinshasa, Bandundu, Province Orientale, North Kivu, South Kivu, Katanga and Kasai-Oriental). An examination of the hazard ratios (Table A20) gives an idea of the gaps between income groups. After controlling for the household head’s educational level and all other variables, the most discriminating variable in terms of risk of being out of school is household income: hazard ratios associated with the risk of being out of school drastically decrease as one passes from the second to the fourth income class: for 6-11 year-old children, a child whose household has a monthly income of between $50 and $100 is 33% less likely (hazard ratio of 0.67) to be out of school than a child whose household monthly income is less than $50. When the household has a monthly income between $101 and $200, a child is 60% less likely to be out of school (hazard ratio of 0.40). And when the monthly household income is above $200, a child is 80% less likely to be out of school than a child from a household earning less than $50 per month. Whatever the area of residence, this effect of income is clear, but especially in urban areas. Just as it is for 6-11 year-olds, household income is one of the most discriminating variables for the 12-17 year-olds, whether in urban or rural areas
19(Tables A28 and A29 in the appendix).
Graph16 shows how the proportion of OOSC decreases clearly and steadily as the household income rises: at the national level, it ranges from48.9% in households with less than $50 per month to 1.9% in households with more than $500 per month. The same trend is observed among both girls and boys, with higher proportions of OOSC for girls than for boys.
19 The hazard ratios for the higher income classes in rural areas are not statistically significant due to the low
numbers of children in these categories.
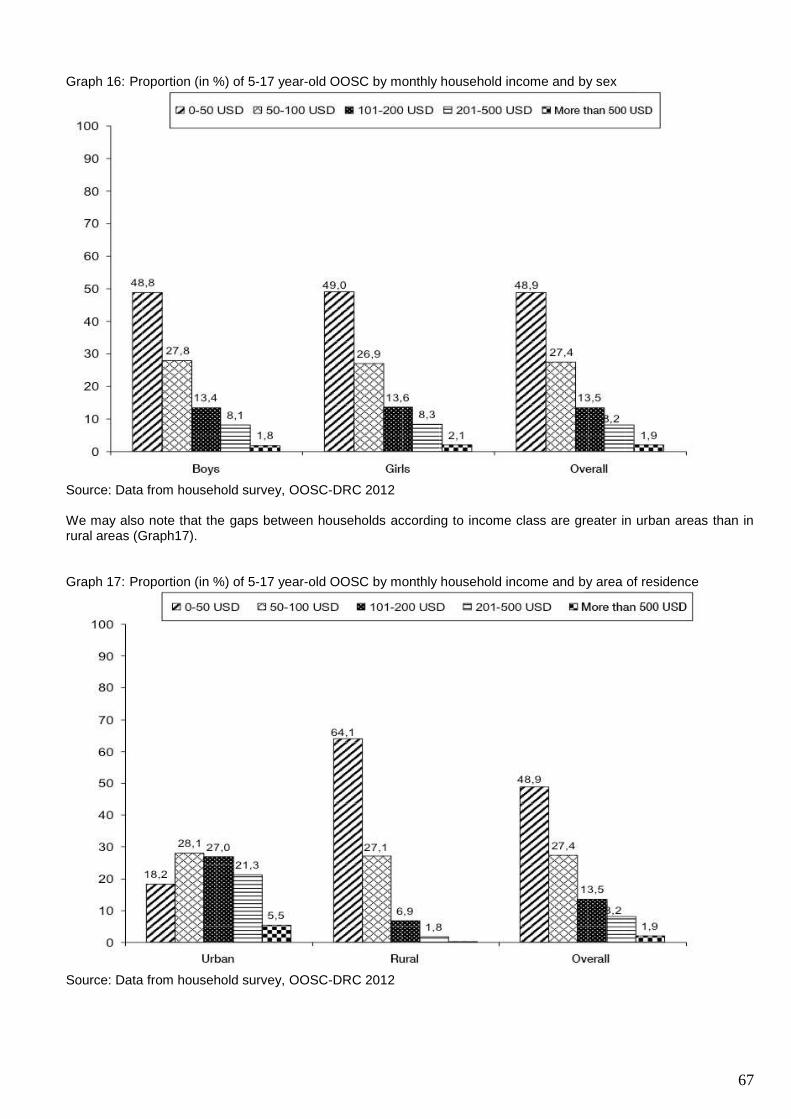
67
Graph 16: Proportion (in %) of 5-17 year-old OOSC by monthly household income and by sex
Source: Data from household survey, OOSC-DRC 2012 We may also note that the gaps between households according to income class are greater in urban areas than in rural areas (Graph17). Graph 17: Proportion (in %) of 5-17 year-old OOSC by monthly household income and by area of residence
Source: Data from household survey, OOSC-DRC 2012
68
The importance of the financial issue as a major obstacle to schooling is confirmed by the reasons given by households to justify non enrolment or dropout. Table A27 shows that regardless of the province, lack of money is the most commonly cited reason: countrywide, it is mentioned as a reason for non-enrolment in 68.7% of cases and as a reason for dropping out in 70.3% of cases. The following comments from the qualitative interviews are consistent with the quantitative results and illustrate the significance of the financial obstacle: “There are several reasons. First, financial reasons: most Congolese parents are poor, even those who work are very poorly paid and the salary comes whenever the employer wants to give it to you. You can’t manage: with this wage you have to pay the rent, the school fees, health, transport, everything. The parent says: I can’t afford this anymore, I’ll choose one or two children and the others will have to wait”(Male, educational senior official). “[Children who have less chance of going to school], these are children who are born in poor families, that's the key word. When you are poor, ultimately you do not know how to manage with the little that you have; children will definitely not have the chance of going to school”(Woman, Educator, North Kivu). “As we have perhaps emphasised in various ways, there is a problem of poverty. There is a lack of money to pay for school fees. Many do not go to school for this reason. Therefore there is this poverty issue”. (Man, teacher, North Kivu). After considering the effect of income on exclusion from school, it is now appropriate to examine the educational spending of Congolese households. The national survey on the situation of out-of-school children has collected information on educational expenditure by households in the school year 2010-2011. Data collection was conducted in 2012; the choice of the previous school year (2010-2011) as the reference year had the benefit of allowing more comprehensive information to be obtained concerning one school year. The children concerned are those aged 3-17 years who were at school in 2010-2011. The data were collected for three distinct groups of children meeting the defined criteria and with the following profiles:
- Resident in the respondent household; - Biological children of the household head or of his or her spouse living elsewhere; - Children not resident in the household, who are not biological children of the household head or of his or her
spouse, but to whose schooling the respondent household contributed in 2010-2011. Studies have been conducted before on the issue of school fees. In this respect, we can mention the study entitled “Politique et pratique des frais scolaires en RDC: frais de fonctionnement ou fonds de famille?” [Policy and practice of school fees in the DRC: operating costs or family fund?](Verhaghe, 2007).However, the OOSC survey is the first major operation to try to estimate households’ spending on education. As underlined in the EPSP development strategy document for2010/2011-2015/2016(RDC/MEPSP, 2010, p. 29), “it is also vital to correctly measure the real impact of parents’ contributions on the functioning of the education system. Any radical change without a sustainable alternative could have negative consequences.” The education expenditure taken into account is categorised into seven headings that were proposed and adopted by the participants at the collection tools validation workshop
20:
- Tuition and fees; - Costs for the purchase of school supplies; - Costs for the purchase of the uniform; - Expenses incurred for the purchase of food (at school); - Pocket money; - One-off costs; - Other expenses.
For the whole country, 39.2% of total expenditure allocated to education relates to tuition and fees (Table 29). The item of expenditure on food for the enrolled child comes second with 14.8%. Supplies, one-off costs and uniforms almost have the same importance in education expenditure (10.9%, 10.9% and 10.8% respectively).
20The collection tools validation workshop that brought together all stakeholders took place from 11 to 12 August
2011. For data collection, in addition to the training of investigators and the presence of a representative of the DEP on school fees, a guidance note was developed for survey personnel to help differentiate between the various expenditure items related to education.
69
Whatever the area of residence, the predominant expenditure item is tuition and contribution fees. It represents 42.0% of education expenditure in urban areas and 31.3% in rural areas. It is worth mentioning that in both urban or rural areas, food expenses (in connection with school) and one-off costs play a significant role in households’ expenditure on education (14.8% and 14.8% for food expenses, and 10.3% and 12.3% for the one-off costs). However, three differences emerge between urban and rural areas in the structure of household expenditure on education: supplies and transport costs represent a larger share of education expenditure in urban areas (15.9% and 6 7%) than in rural areas (9.2% and 0.4%), while fees for uniforms are more significant in education spending in rural areas (19.8%) than in urban areas (7.7%). The analysis according to province indicates that the tuition and fees item is the largest in eight of the eleven provinces (South Kivu, Kinshasa, Maniema, Kasai-Occidental, Bas-Congo, Equateur, Katanga and Province Orientale). In the provinces of North Kivu and Kasai-Oriental, one-off costs are the most important item, with 29.7% and 22.7% respectively of the total education spending. The uniform ranks second in total education expenditure of households in Kasai-Occidental (28.7%), Kasai-Oriental (20.5%) and Bandundu (24.0%). More than a quarter (27.6%) of the total of households’ expenditure on education in 2010-2011 in Province Orientale was devoted to the feeding of the enrolled children.
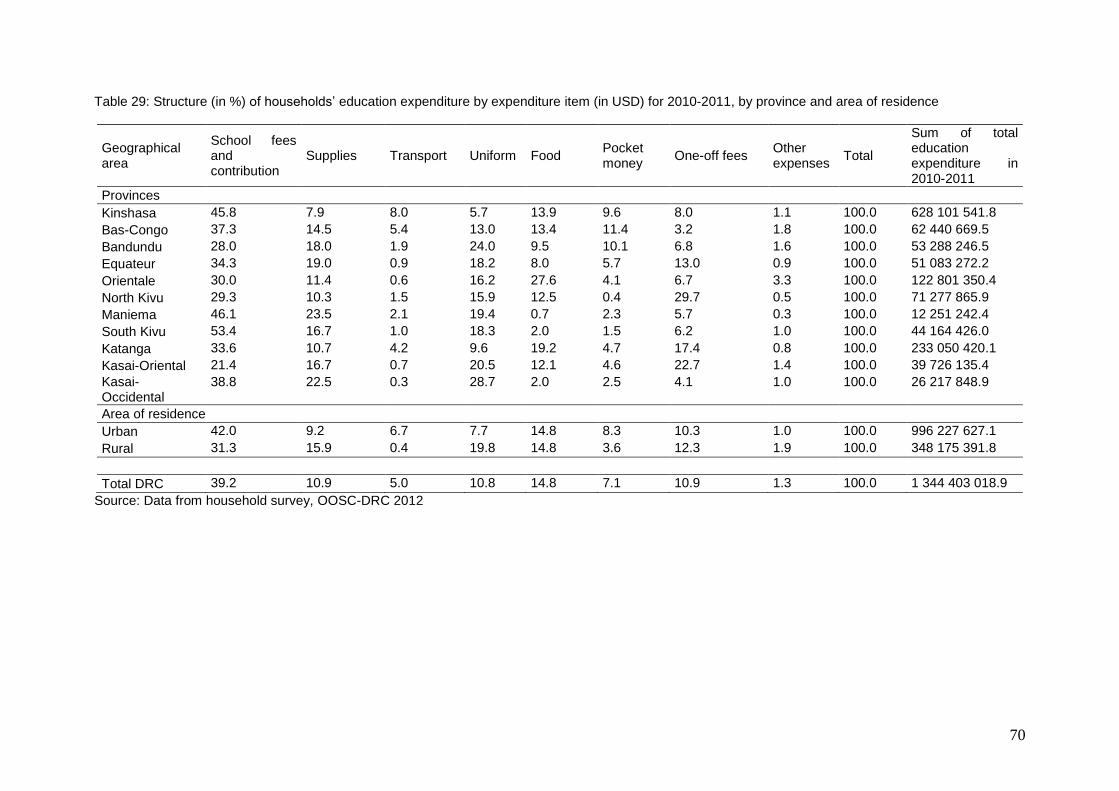
70
Table 29: Structure (in %) of households’ education expenditure by expenditure item (in USD) for 2010-2011, by province and area of residence
Geographical area
School fees and contribution
Supplies Transport Uniform Food Pocket money
One-off fees Other expenses
Total
Sum of total education expenditure in 2010-2011
Provinces
Kinshasa 45.8 7.9 8.0 5.7 13.9 9.6 8.0 1.1 100.0 628 101 541.8
Bas-Congo 37.3 14.5 5.4 13.0 13.4 11.4 3.2 1.8 100.0 62 440 669.5
Bandundu 28.0 18.0 1.9 24.0 9.5 10.1 6.8 1.6 100.0 53 288 246.5
Equateur 34.3 19.0 0.9 18.2 8.0 5.7 13.0 0.9 100.0 51 083 272.2
Orientale 30.0 11.4 0.6 16.2 27.6 4.1 6.7 3.3 100.0 122 801 350.4
North Kivu 29.3 10.3 1.5 15.9 12.5 0.4 29.7 0.5 100.0 71 277 865.9
Maniema 46.1 23.5 2.1 19.4 0.7 2.3 5.7 0.3 100.0 12 251 242.4
South Kivu 53.4 16.7 1.0 18.3 2.0 1.5 6.2 1.0 100.0 44 164 426.0
Katanga 33.6 10.7 4.2 9.6 19.2 4.7 17.4 0.8 100.0 233 050 420.1
Kasai-Oriental 21.4 16.7 0.7 20.5 12.1 4.6 22.7 1.4 100.0 39 726 135.4
Kasai-Occidental
38.8 22.5 0.3 28.7 2.0 2.5 4.1 1.0 100.0 26 217 848.9
Area of residence
Urban 42.0 9.2 6.7 7.7 14.8 8.3 10.3 1.0 100.0 996 227 627.1
Rural 31.3 15.9 0.4 19.8 14.8 3.6 12.3 1.9 100.0 348 175 391.8
Total DRC 39.2 10.9 5.0 10.8 14.8 7.1 10.9 1.3 100.0 1 344 403 018.9
Source: Data from household survey, OOSC-DRC 2012
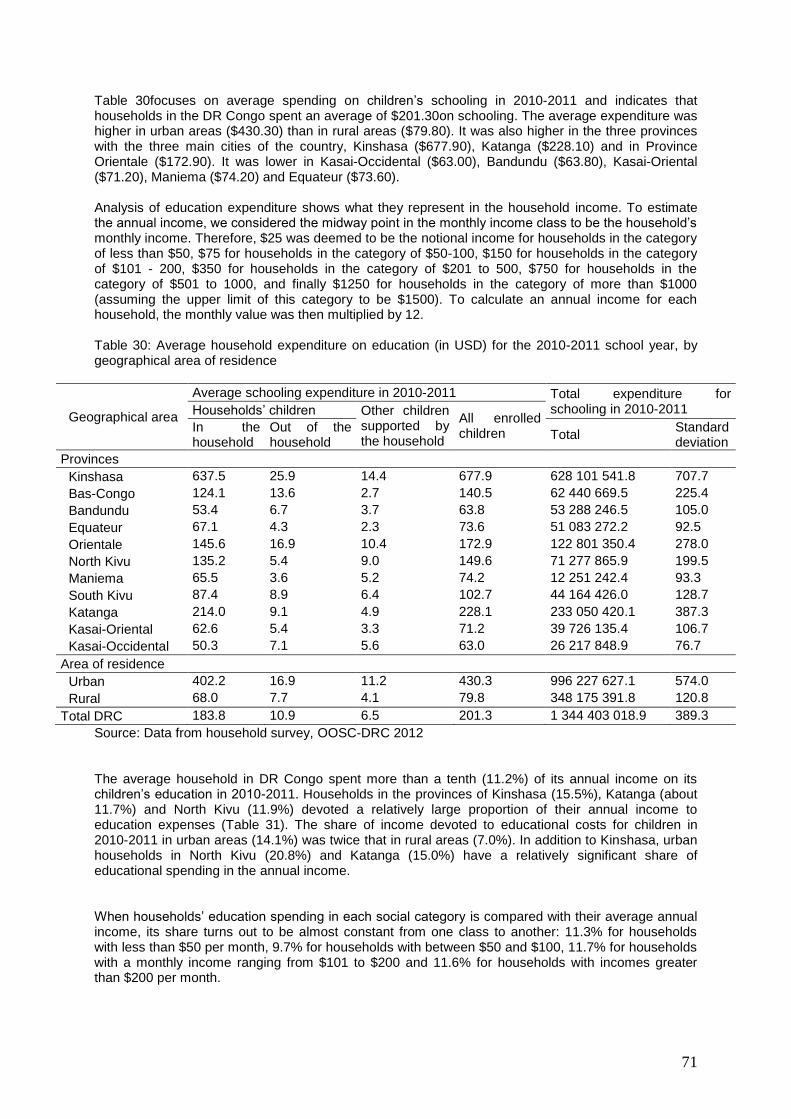
71
Table 30focuses on average spending on children’s schooling in 2010-2011 and indicates that households in the DR Congo spent an average of $201.30on schooling. The average expenditure was higher in urban areas ($430.30) than in rural areas ($79.80). It was also higher in the three provinces with the three main cities of the country, Kinshasa ($677.90), Katanga ($228.10) and in Province Orientale ($172.90). It was lower in Kasai-Occidental ($63.00), Bandundu ($63.80), Kasai-Oriental ($71.20), Maniema ($74.20) and Equateur ($73.60). Analysis of education expenditure shows what they represent in the household income. To estimate the annual income, we considered the midway point in the monthly income class to be the household’s monthly income. Therefore, $25 was deemed to be the notional income for households in the category of less than $50, $75 for households in the category of $50-100, $150 for households in the category of $101 - 200, $350 for households in the category of $201 to 500, $750 for households in the category of $501 to 1000, and finally $1250 for households in the category of more than $1000 (assuming the upper limit of this category to be $1500). To calculate an annual income for each household, the monthly value was then multiplied by 12. Table 30: Average household expenditure on education (in USD) for the 2010-2011 school year, by geographical area of residence
Geographical area
Average schooling expenditure in 2010-2011 Total expenditure for schooling in 2010-2011 Households’ children Other children
supported by the household
All enrolled children
In the household
Out of the household
Total Standard deviation
Provinces
Kinshasa 637.5 25.9 14.4 677.9 628 101 541.8 707.7
Bas-Congo 124.1 13.6 2.7 140.5 62 440 669.5 225.4
Bandundu 53.4 6.7 3.7 63.8 53 288 246.5 105.0
Equateur 67.1 4.3 2.3 73.6 51 083 272.2 92.5
Orientale 145.6 16.9 10.4 172.9 122 801 350.4 278.0
North Kivu 135.2 5.4 9.0 149.6 71 277 865.9 199.5
Maniema 65.5 3.6 5.2 74.2 12 251 242.4 93.3
South Kivu 87.4 8.9 6.4 102.7 44 164 426.0 128.7
Katanga 214.0 9.1 4.9 228.1 233 050 420.1 387.3
Kasai-Oriental 62.6 5.4 3.3 71.2 39 726 135.4 106.7
Kasai-Occidental 50.3 7.1 5.6 63.0 26 217 848.9 76.7
Area of residence
Urban 402.2 16.9 11.2 430.3 996 227 627.1 574.0
Rural 68.0 7.7 4.1 79.8 348 175 391.8 120.8
Total DRC 183.8 10.9 6.5 201.3 1 344 403 018.9 389.3
Source: Data from household survey, OOSC-DRC 2012 The average household in DR Congo spent more than a tenth (11.2%) of its annual income on its children’s education in 2010-2011. Households in the provinces of Kinshasa (15.5%), Katanga (about 11.7%) and North Kivu (11.9%) devoted a relatively large proportion of their annual income to education expenses (Table 31). The share of income devoted to educational costs for children in 2010-2011 in urban areas (14.1%) was twice that in rural areas (7.0%). In addition to Kinshasa, urban households in North Kivu (20.8%) and Katanga (15.0%) have a relatively significant share of educational spending in the annual income. When households’ education spending in each social category is compared with their average annual income, its share turns out to be almost constant from one class to another: 11.3% for households with less than $50 per month, 9.7% for households with between $50 and $100, 11.7% for households with a monthly income ranging from $101 to $200 and 11.6% for households with incomes greater than $200 per month.
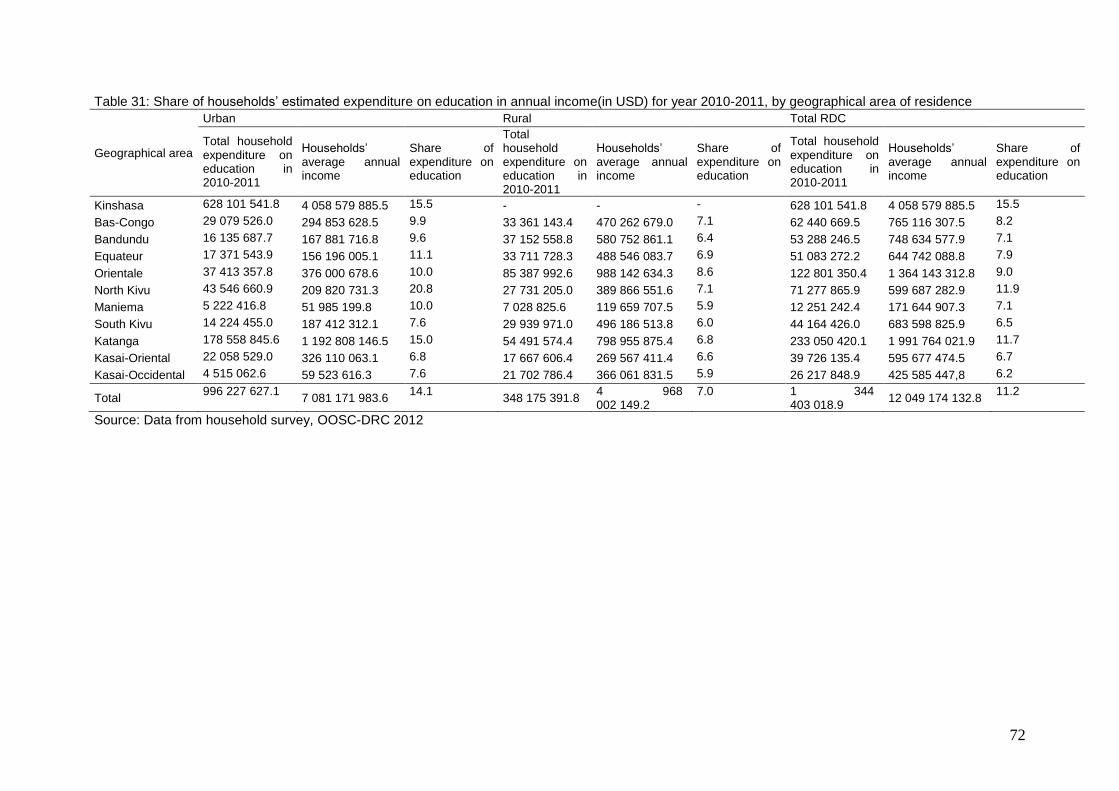
72
Table 31: Share of households’ estimated expenditure on education in annual income(in USD) for year 2010-2011, by geographical area of residence
Geographical area
Urban Rural Total RDC
Total household expenditure on education in 2010-2011
Households’ average annual income
Share of expenditure on education
Total household expenditure on education in 2010-2011
Households’ average annual income
Share of expenditure on education
Total household expenditure on education in 2010-2011
Households’ average annual income
Share of expenditure on education
Kinshasa 628 101 541.8 4 058 579 885.5 15.5 - - - 628 101 541.8 4 058 579 885.5 15.5
Bas-Congo 29 079 526.0 294 853 628.5 9.9 33 361 143.4 470 262 679.0 7.1 62 440 669.5 765 116 307.5 8.2
Bandundu 16 135 687.7 167 881 716.8 9.6 37 152 558.8 580 752 861.1 6.4 53 288 246.5 748 634 577.9 7.1
Equateur 17 371 543.9 156 196 005.1 11.1 33 711 728.3 488 546 083.7 6.9 51 083 272.2 644 742 088.8 7.9
Orientale 37 413 357.8 376 000 678.6 10.0 85 387 992.6 988 142 634.3 8.6 122 801 350.4 1 364 143 312.8 9.0
North Kivu 43 546 660.9 209 820 731.3 20.8 27 731 205.0 389 866 551.6 7.1 71 277 865.9 599 687 282.9 11.9
Maniema 5 222 416.8 51 985 199.8 10.0 7 028 825.6 119 659 707.5 5.9 12 251 242.4 171 644 907.3 7.1
South Kivu 14 224 455.0 187 412 312.1 7.6 29 939 971.0 496 186 513.8 6.0 44 164 426.0 683 598 825.9 6.5
Katanga 178 558 845.6 1 192 808 146.5 15.0 54 491 574.4 798 955 875.4 6.8 233 050 420.1 1 991 764 021.9 11.7
Kasai-Oriental 22 058 529.0 326 110 063.1 6.8 17 667 606.4 269 567 411.4 6.6 39 726 135.4 595 677 474.5 6.7
Kasai-Occidental 4 515 062.6 59 523 616.3 7.6 21 702 786.4 366 061 831.5 5.9 26 217 848.9 425 585 447,8 6.2
Total 996 227 627.1
7 081 171 983.6 14.1
348 175 391.8 4 968 002 149.2
7.0 1 344 403 018.9
12 049 174 132.8 11.2
Source: Data from household survey, OOSC-DRC 2012
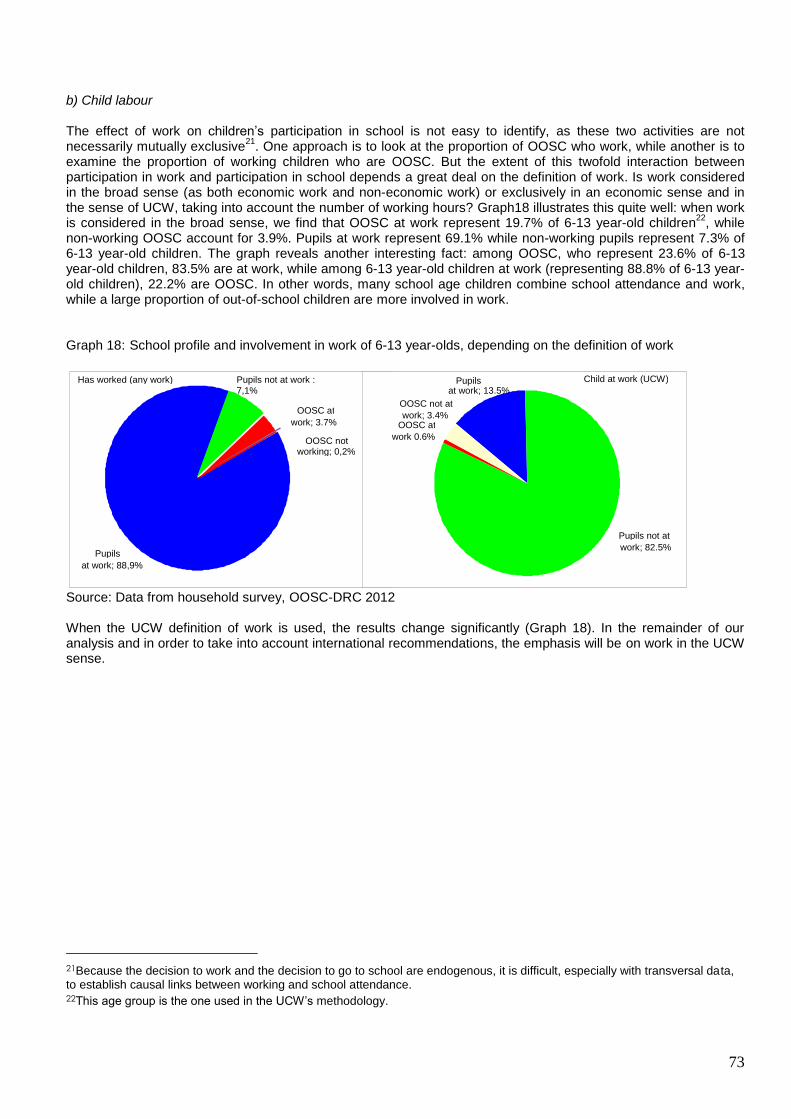
73
b) Child labour
The effect of work on children’s participation in school is not easy to identify, as these two activities are not necessarily mutually exclusive
21. One approach is to look at the proportion of OOSC who work, while another is to
examine the proportion of working children who are OOSC. But the extent of this twofold interaction between participation in work and participation in school depends a great deal on the definition of work. Is work considered in the broad sense (as both economic work and non-economic work) or exclusively in an economic sense and in the sense of UCW, taking into account the number of working hours? Graph18 illustrates this quite well: when work is considered in the broad sense, we find that OOSC at work represent 19.7% of 6-13 year-old children
22, while
non-working OOSC account for 3.9%. Pupils at work represent 69.1% while non-working pupils represent 7.3% of 6-13 year-old children. The graph reveals another interesting fact: among OOSC, who represent 23.6% of 6-13 year-old children, 83.5% are at work, while among 6-13 year-old children at work (representing 88.8% of 6-13 year-old children), 22.2% are OOSC. In other words, many school age children combine school attendance and work, while a large proportion of out-of-school children are more involved in work. Graph 18: School profile and involvement in work of 6-13 year-olds, depending on the definition of work
Source: Data from household survey, OOSC-DRC 2012 When the UCW definition of work is used, the results change significantly (Graph 18). In the remainder of our analysis and in order to take into account international recommendations, the emphasis will be on work in the UCW sense.
21Because the decision to work and the decision to go to school are endogenous, it is difficult, especially with transversal data, to establish causal links between working and school attendance. 22This age group is the one used in the UCW’s methodology.
Has worked (any work)
Pupils at work; 88,9%
OOSC at work; 3.7%
OOSC not working; 0,2%
Pupils not at work : 7,1%
Child at work (UCW) Pupils at work; 13.5%
Pupils not at work; 82.5%
OOSC not at work; 3.4%
OOSC at work 0.6%
74
3.2.4 Children out of school and involved in work
According to the UCW definition of work, for the DRC as a whole 13.5% of 6-13 year-old OOSC were involved in work at the time of the survey in 2012 (Table 32). This involvement of OOSC in work increases rapidly with age. Involvement of out-of-school girls in work is stronger than for boys at certain ages. Involvement of OOSC in work varies considerably according to the environment, with significant differences between out-of-school girls in urban areas (17.7%) and those in rural areas (16.4%). In contrast, girls in rural areas are more involved in work than boys in rural areas (16.4% and 12.5%). Whatever the province, there are OOSC involved in work. The provinces of Bas-Congo, South Kivu and Katanga are characterised by a significantly higher proportion of OOSC in work (close to or more than one in five OOSC).
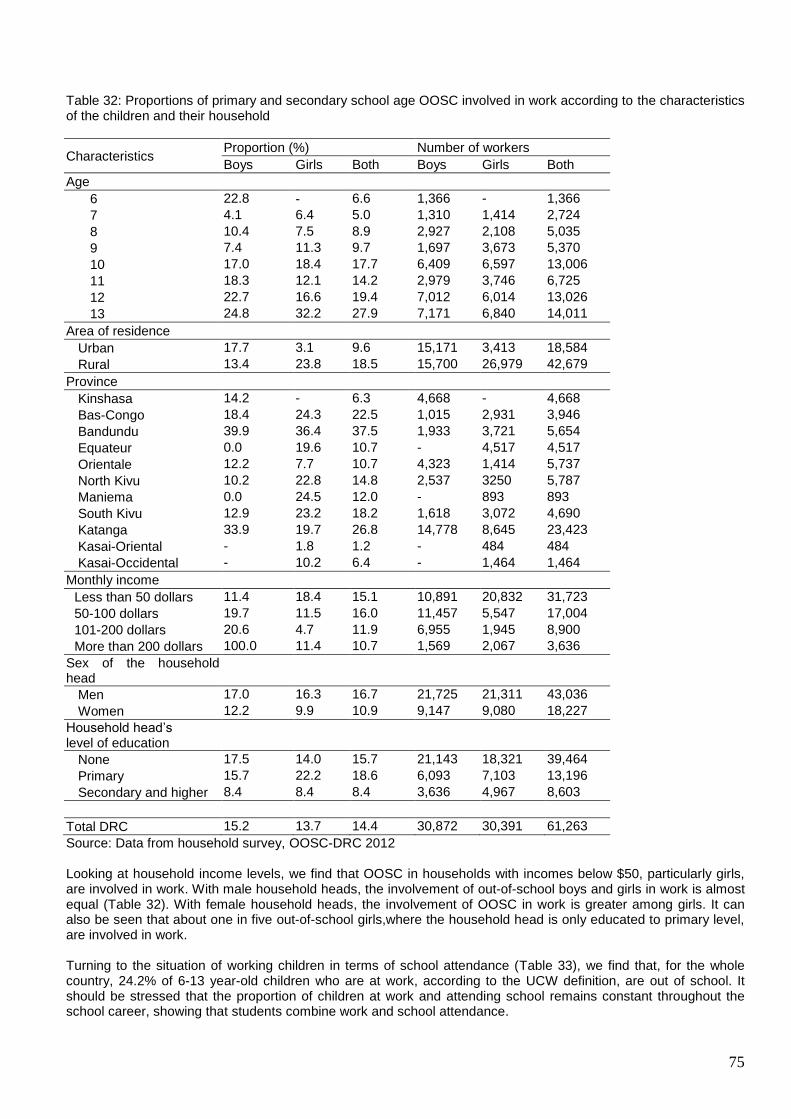
75
Table 32: Proportions of primary and secondary school age OOSC involved in work according to the characteristics of the children and their household
Characteristics Proportion (%) Number of workers
Boys Girls Both Boys Girls Both
Age
6 22.8 - 6.6 1,366 - 1,366
7 4.1 6.4 5.0 1,310 1,414 2,724
8 10.4 7.5 8.9 2,927 2,108 5,035
9 7.4 11.3 9.7 1,697 3,673 5,370
10 17.0 18.4 17.7 6,409 6,597 13,006
11 18.3 12.1 14.2 2,979 3,746 6,725
12 22.7 16.6 19.4 7,012 6,014 13,026
13 24.8 32.2 27.9 7,171 6,840 14,011
Area of residence
Urban 17.7 3.1 9.6 15,171 3,413 18,584
Rural 13.4 23.8 18.5 15,700 26,979 42,679
Province
Kinshasa 14.2 - 6.3 4,668 - 4,668
Bas-Congo 18.4 24.3 22.5 1,015 2,931 3,946
Bandundu 39.9 36.4 37.5 1,933 3,721 5,654
Equateur 0.0 19.6 10.7 - 4,517 4,517
Orientale 12.2 7.7 10.7 4,323 1,414 5,737
North Kivu 10.2 22.8 14.8 2,537 3250 5,787
Maniema 0.0 24.5 12.0 - 893 893
South Kivu 12.9 23.2 18.2 1,618 3,072 4,690
Katanga 33.9 19.7 26.8 14,778 8,645 23,423
Kasai-Oriental - 1.8 1.2 - 484 484
Kasai-Occidental - 10.2 6.4 - 1,464 1,464
Monthly income
Less than 50 dollars 11.4 18.4 15.1 10,891 20,832 31,723
50-100 dollars 19.7 11.5 16.0 11,457 5,547 17,004
101-200 dollars 20.6 4.7 11.9 6,955 1,945 8,900
More than 200 dollars 100.0 11.4 10.7 1,569 2,067 3,636
Sex of the household head
Men 17.0 16.3 16.7 21,725 21,311 43,036
Women 12.2 9.9 10.9 9,147 9,080 18,227
Household head’s level of education
None 17.5 14.0 15.7 21,143 18,321 39,464
Primary 15.7 22.2 18.6 6,093 7,103 13,196
Secondary and higher 8.4 8.4 8.4 3,636 4,967 8,603
Total DRC 15.2 13.7 14.4 30,872 30,391 61,263
Source: Data from household survey, OOSC-DRC 2012 Looking at household income levels, we find that OOSC in households with incomes below $50, particularly girls, are involved in work. With male household heads, the involvement of out-of-school boys and girls in work is almost equal (Table 32). With female household heads, the involvement of OOSC in work is greater among girls. It can also be seen that about one in five out-of-school girls,where the household head is only educated to primary level, are involved in work. Turning to the situation of working children in terms of school attendance (Table 33), we find that, for the whole country, 24.2% of 6-13 year-old children who are at work, according to the UCW definition, are out of school. It should be stressed that the proportion of children at work and attending school remains constant throughout the school career, showing that students combine work and school attendance.
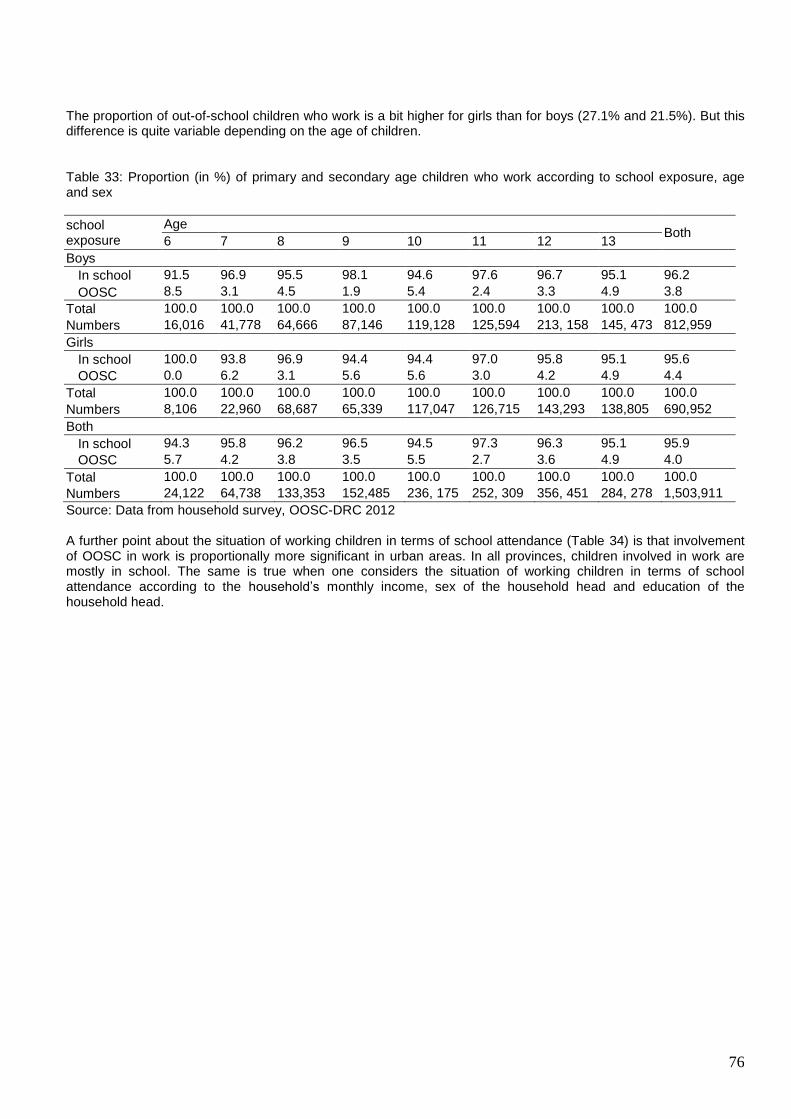
76
The proportion of out-of-school children who work is a bit higher for girls than for boys (27.1% and 21.5%). But this difference is quite variable depending on the age of children. Table 33: Proportion (in %) of primary and secondary age children who work according to school exposure, age and sex
school exposure
Age Both
6 7 8 9 10 11 12 13
Boys
In school 91.5 96.9 95.5 98.1 94.6 97.6 96.7 95.1 96.2
OOSC 8.5 3.1 4.5 1.9 5.4 2.4 3.3 4.9 3.8
Total 100.0 100.0 100.0 100.0 100.0 100.0 100.0 100.0 100.0
Numbers 16,016 41,778 64,666 87,146 119,128 125,594 213, 158 145, 473 812,959
Girls
In school 100.0 93.8 96.9 94.4 94.4 97.0 95.8 95.1 95.6
OOSC 0.0 6.2 3.1 5.6 5.6 3.0 4.2 4.9 4.4
Total 100.0 100.0 100.0 100.0 100.0 100.0 100.0 100.0 100.0
Numbers 8,106 22,960 68,687 65,339 117,047 126,715 143,293 138,805 690,952
Both
In school 94.3 95.8 96.2 96.5 94.5 97.3 96.3 95.1 95.9
OOSC 5.7 4.2 3.8 3.5 5.5 2.7 3.6 4.9 4.0
Total 100.0 100.0 100.0 100.0 100.0 100.0 100.0 100.0 100.0
Numbers 24,122 64,738 133,353 152,485 236, 175 252, 309 356, 451 284, 278 1,503,911
Source: Data from household survey, OOSC-DRC 2012 A further point about the situation of working children in terms of school attendance (Table 34) is that involvement of OOSC in work is proportionally more significant in urban areas. In all provinces, children involved in work are mostly in school. The same is true when one considers the situation of working children in terms of school attendance according to the household’s monthly income, sex of the household head and education of the household head.
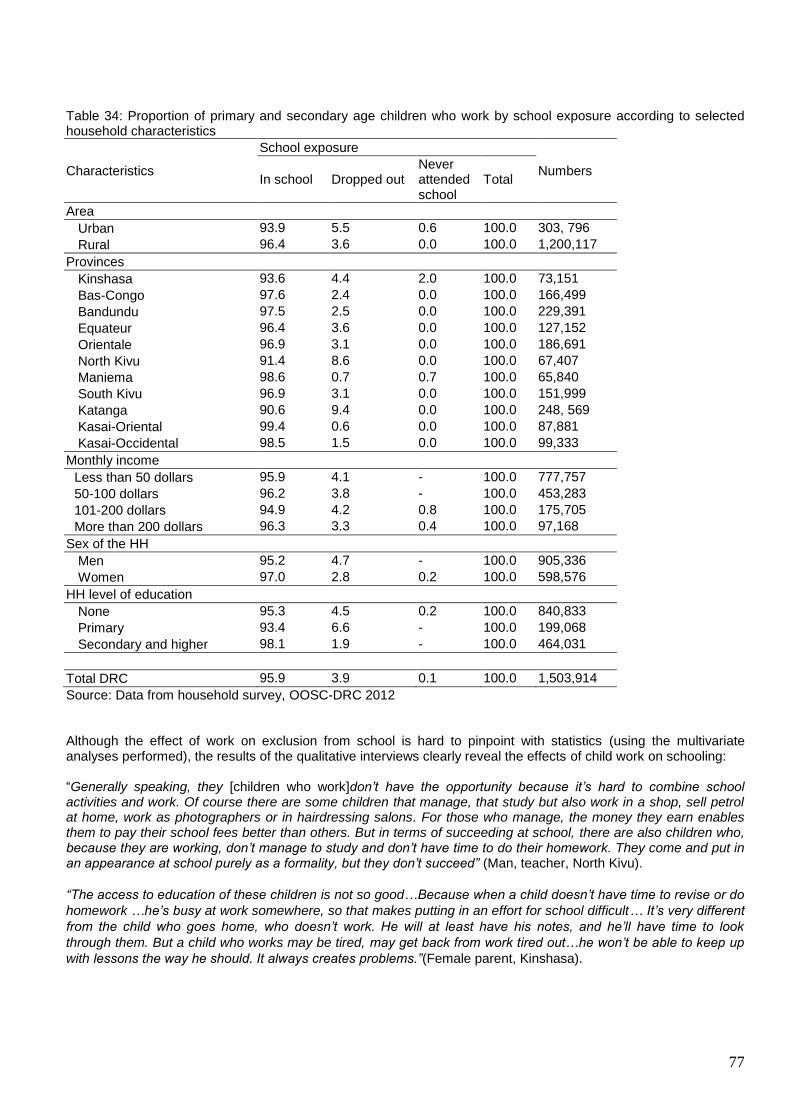
77
Table 34: Proportion of primary and secondary age children who work by school exposure according to selected household characteristics
Characteristics
School exposure
Numbers In school Dropped out
Never attended school
Total
Area
Urban 93.9 5.5 0.6 100.0 303, 796
Rural 96.4 3.6 0.0 100.0 1,200,117
Provinces
Kinshasa 93.6 4.4 2.0 100.0 73,151
Bas-Congo 97.6 2.4 0.0 100.0 166,499
Bandundu 97.5 2.5 0.0 100.0 229,391
Equateur 96.4 3.6 0.0 100.0 127,152
Orientale 96.9 3.1 0.0 100.0 186,691
North Kivu 91.4 8.6 0.0 100.0 67,407
Maniema 98.6 0.7 0.7 100.0 65,840
South Kivu 96.9 3.1 0.0 100.0 151,999
Katanga 90.6 9.4 0.0 100.0 248, 569
Kasai-Oriental 99.4 0.6 0.0 100.0 87,881
Kasai-Occidental 98.5 1.5 0.0 100.0 99,333
Monthly income
Less than 50 dollars 95.9 4.1 - 100.0 777,757
50-100 dollars 96.2 3.8 - 100.0 453,283
101-200 dollars 94.9 4.2 0.8 100.0 175,705
More than 200 dollars 96.3 3.3 0.4 100.0 97,168
Sex of the HH
Men 95.2 4.7 - 100.0 905,336
Women 97.0 2.8 0.2 100.0 598,576
HH level of education
None 95.3 4.5 0.2 100.0 840,833
Primary 93.4 6.6 - 100.0 199,068
Secondary and higher 98.1 1.9 - 100.0 464,031
Total DRC 95.9 3.9 0.1 100.0 1,503,914
Source: Data from household survey, OOSC-DRC 2012 Although the effect of work on exclusion from school is hard to pinpoint with statistics (using the multivariate analyses performed), the results of the qualitative interviews clearly reveal the effects of child work on schooling: “Generally speaking, they [children who work]don’t have the opportunity because it’s hard to combine school activities and work. Of course there are some children that manage, that study but also work in a shop, sell petrol at home, work as photographers or in hairdressing salons. For those who manage, the money they earn enables them to pay their school fees better than others. But in terms of succeeding at school, there are also children who, because they are working, don’t manage to study and don’t have time to do their homework. They come and put in an appearance at school purely as a formality, but they don’t succeed” (Man, teacher, North Kivu).
“The access to education of these children is not so good…Because when a child doesn’t have time to revise or do
homework …he’s busy at work somewhere, so that makes putting in an effort for school difficult… It’s very different
from the child who goes home, who doesn’t work. He will at least have his notes, and he’ll have time to look
through them. But a child who works may be tired, may get back from work tired out…he won’t be able to keep up
with lessons the way he should. It always creates problems.”(Female parent, Kinshasa).
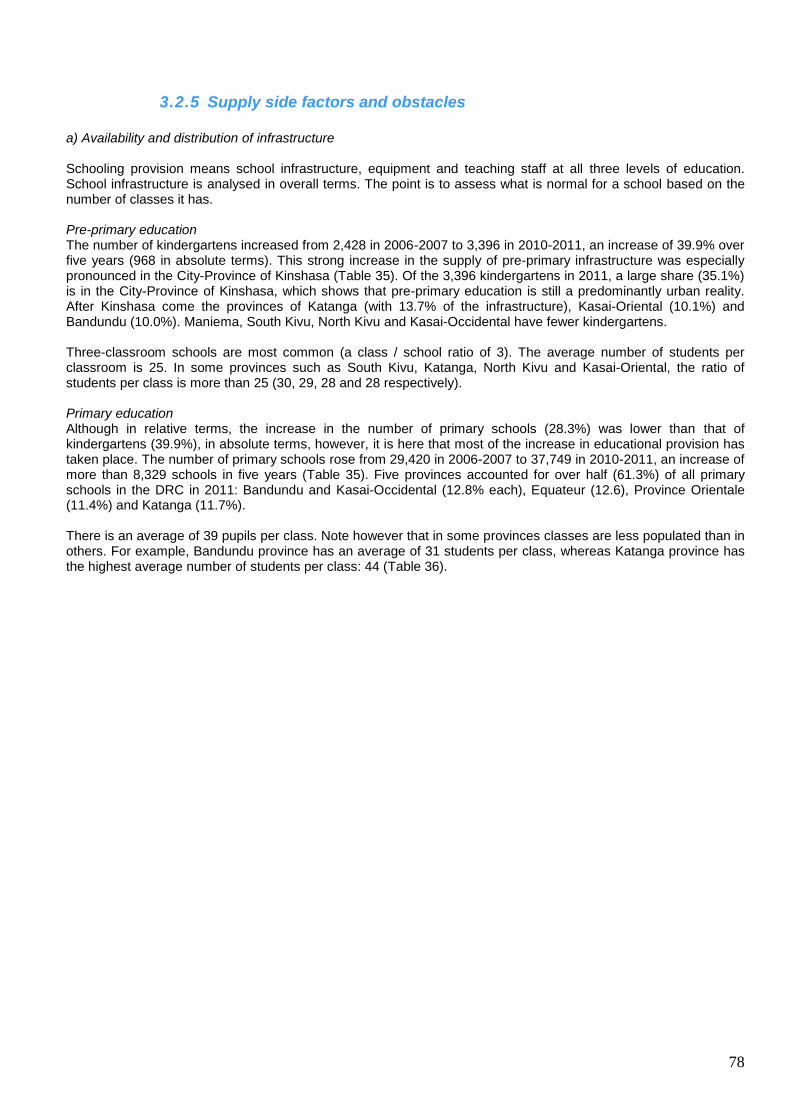
78
3.2.5 Supply side factors and obstacles
a) Availability and distribution of infrastructure Schooling provision means school infrastructure, equipment and teaching staff at all three levels of education. School infrastructure is analysed in overall terms. The point is to assess what is normal for a school based on the number of classes it has. Pre-primary education The number of kindergartens increased from 2,428 in 2006-2007 to 3,396 in 2010-2011, an increase of 39.9% over five years (968 in absolute terms). This strong increase in the supply of pre-primary infrastructure was especially pronounced in the City-Province of Kinshasa (Table 35). Of the 3,396 kindergartens in 2011, a large share (35.1%) is in the City-Province of Kinshasa, which shows that pre-primary education is still a predominantly urban reality. After Kinshasa come the provinces of Katanga (with 13.7% of the infrastructure), Kasai-Oriental (10.1%) and Bandundu (10.0%). Maniema, South Kivu, North Kivu and Kasai-Occidental have fewer kindergartens. Three-classroom schools are most common (a class / school ratio of 3). The average number of students per classroom is 25. In some provinces such as South Kivu, Katanga, North Kivu and Kasai-Oriental, the ratio of students per class is more than 25 (30, 29, 28 and 28 respectively). Primary education Although in relative terms, the increase in the number of primary schools (28.3%) was lower than that of kindergartens (39.9%), in absolute terms, however, it is here that most of the increase in educational provision has taken place. The number of primary schools rose from 29,420 in 2006-2007 to 37,749 in 2010-2011, an increase of more than 8,329 schools in five years (Table 35). Five provinces accounted for over half (61.3%) of all primary schools in the DRC in 2011: Bandundu and Kasai-Occidental (12.8% each), Equateur (12.6), Province Orientale (11.4%) and Katanga (11.7%). There is an average of 39 pupils per class. Note however that in some provinces classes are less populated than in others. For example, Bandundu province has an average of 31 students per class, whereas Katanga province has the highest average number of students per class: 44 (Table 36).
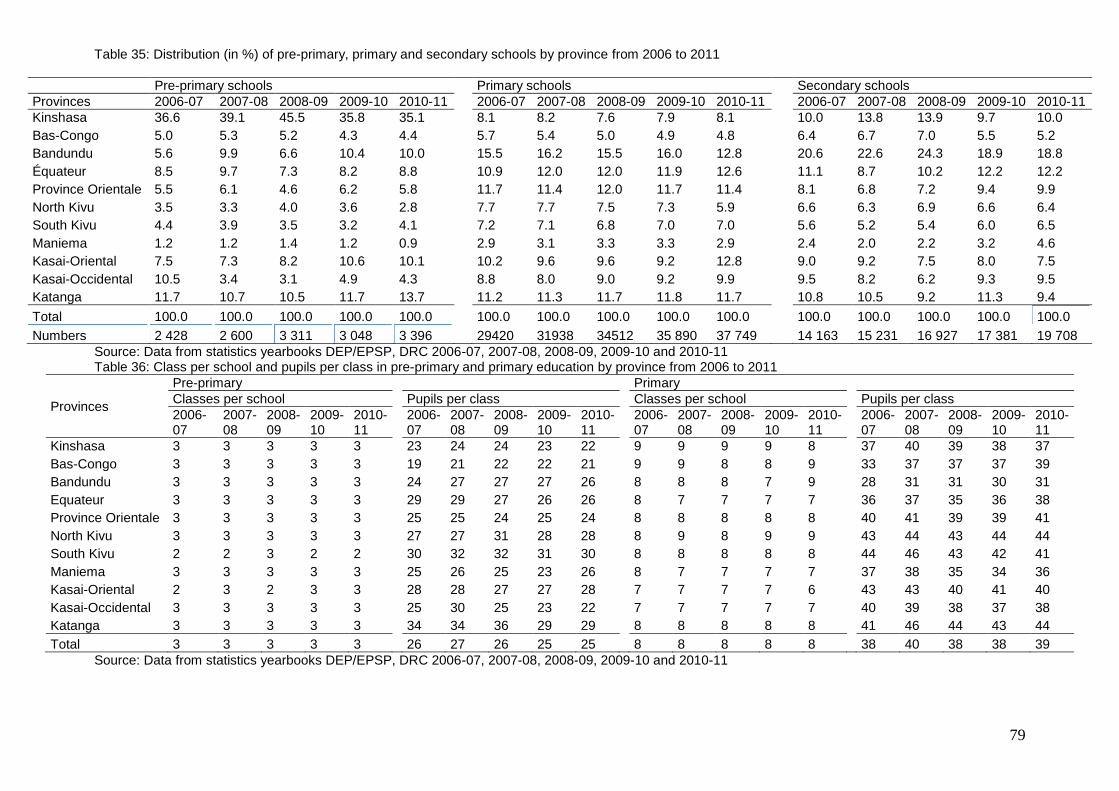
79
Table 35: Distribution (in %) of pre-primary, primary and secondary schools by province from 2006 to 2011
Pre-primary schools Primary schools Secondary schools
Provinces 2006-07 2007-08 2008-09 2009-10 2010-11 2006-07 2007-08 2008-09 2009-10 2010-11 2006-07 2007-08 2008-09 2009-10 2010-11
Kinshasa 36.6 39.1 45.5 35.8 35.1 8.1 8.2 7.6 7.9 8.1 10.0 13.8 13.9 9.7 10.0
Bas-Congo 5.0 5.3 5.2 4.3 4.4 5.7 5.4 5.0 4.9 4.8 6.4 6.7 7.0 5.5 5.2
Bandundu 5.6 9.9 6.6 10.4 10.0 15.5 16.2 15.5 16.0 12.8 20.6 22.6 24.3 18.9 18.8
Équateur 8.5 9.7 7.3 8.2 8.8 10.9 12.0 12.0 11.9 12.6 11.1 8.7 10.2 12.2 12.2
Province Orientale 5.5 6.1 4.6 6.2 5.8 11.7 11.4 12.0 11.7 11.4 8.1 6.8 7.2 9.4 9.9
North Kivu 3.5 3.3 4.0 3.6 2.8 7.7 7.7 7.5 7.3 5.9 6.6 6.3 6.9 6.6 6.4
South Kivu 4.4 3.9 3.5 3.2 4.1 7.2 7.1 6.8 7.0 7.0 5.6 5.2 5.4 6.0 6.5
Maniema 1.2 1.2 1.4 1.2 0.9 2.9 3.1 3.3 3.3 2.9 2.4 2.0 2.2 3.2 4.6
Kasai-Oriental 7.5 7.3 8.2 10.6 10.1 10.2 9.6 9.6 9.2 12.8 9.0 9.2 7.5 8.0 7.5
Kasai-Occidental 10.5 3.4 3.1 4.9 4.3 8.8 8.0 9.0 9.2 9.9 9.5 8.2 6.2 9.3 9.5
Katanga 11.7 10.7 10.5 11.7 13.7 11.2 11.3 11.7 11.8 11.7 10.8 10.5 9.2 11.3 9.4
Total 100.0 100.0 100.0 100.0 100.0 100.0 100.0 100.0 100.0 100.0 100.0 100.0 100.0 100.0 100.0
Numbers 2 428 2 600 3 311 3 048 3 396 29420 31938 34512 35 890 37 749 14 163 15 231 16 927 17 381 19 708
Source: Data from statistics yearbooks DEP/EPSP, DRC 2006-07, 2007-08, 2008-09, 2009-10 and 2010-11 Table 36: Class per school and pupils per class in pre-primary and primary education by province from 2006 to 2011
Provinces
Pre-primary Primary
Classes per school Pupils per class Classes per school Pupils per class
2006-07
2007-08
2008-09
2009-10
2010-11
2006-07
2007-08
2008-09
2009-10
2010-11
2006-07
2007-08
2008-09
2009-10
2010-11
2006-07
2007-08
2008-09
2009-10
2010-11
Kinshasa 3 3 3 3 3 23 24 24 23 22 9 9 9 9 8 37 40 39 38 37
Bas-Congo 3 3 3 3 3 19 21 22 22 21 9 9 8 8 9 33 37 37 37 39
Bandundu 3 3 3 3 3 24 27 27 27 26 8 8 8 7 9 28 31 31 30 31
Equateur 3 3 3 3 3 29 29 27 26 26 8 7 7 7 7 36 37 35 36 38
Province Orientale 3 3 3 3 3 25 25 24 25 24 8 8 8 8 8 40 41 39 39 41
North Kivu 3 3 3 3 3 27 27 31 28 28 8 9 8 9 9 43 44 43 44 44
South Kivu 2 2 3 2 2 30 32 32 31 30 8 8 8 8 8 44 46 43 42 41
Maniema 3 3 3 3 3 25 26 25 23 26 8 7 7 7 7 37 38 35 34 36
Kasai-Oriental 2 3 2 3 3 28 28 27 27 28 7 7 7 7 6 43 43 40 41 40
Kasai-Occidental 3 3 3 3 3 25 30 25 23 22 7 7 7 7 7 40 39 38 37 38
Katanga 3 3 3 3 3 34 34 36 29 29 8 8 8 8 8 41 46 44 43 44
Total 3 3 3 3 3 26 27 26 25 25 8 8 8 8 8 38 40 38 38 39
Source: Data from statistics yearbooks DEP/EPSP, DRC 2006-07, 2007-08, 2008-09, 2009-10 and 2010-11
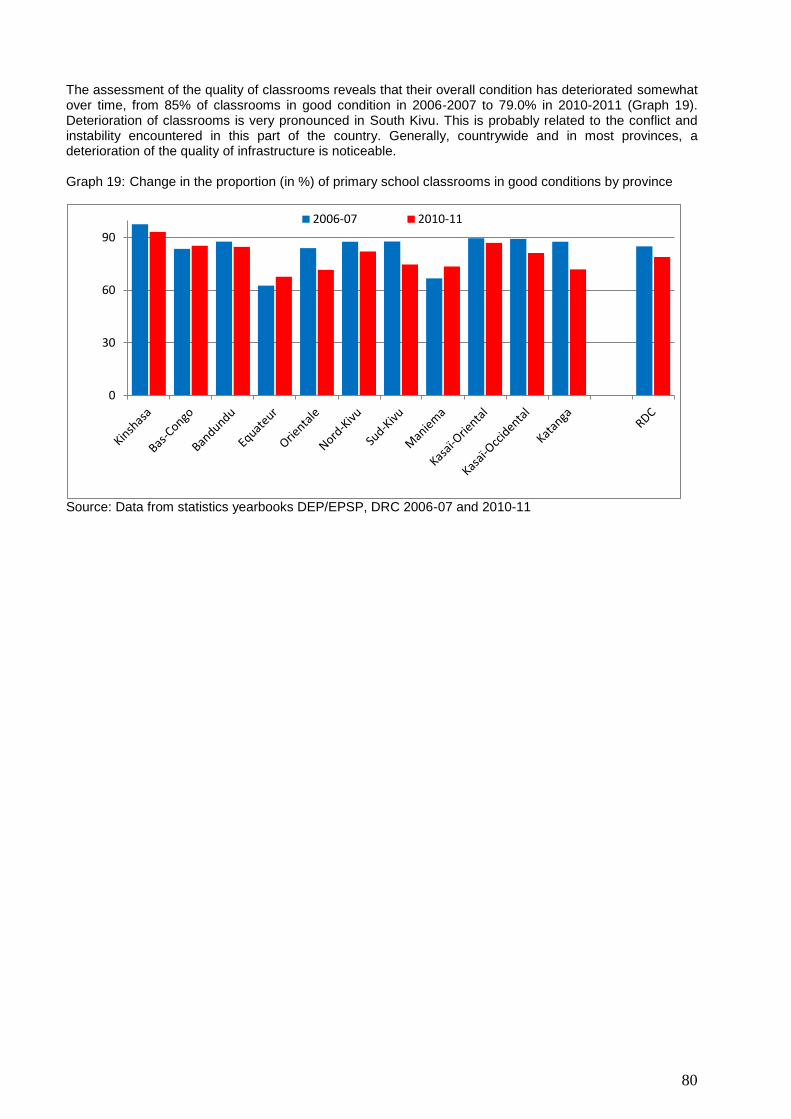
80
The assessment of the quality of classrooms reveals that their overall condition has deteriorated somewhat over time, from 85% of classrooms in good condition in 2006-2007 to 79.0% in 2010-2011 (Graph 19). Deterioration of classrooms is very pronounced in South Kivu. This is probably related to the conflict and instability encountered in this part of the country. Generally, countrywide and in most provinces, a deterioration of the quality of infrastructure is noticeable. Graph 19: Change in the proportion (in %) of primary school classrooms in good conditions by province
Source: Data from statistics yearbooks DEP/EPSP, DRC 2006-07 and 2010-11
0
30
60
90
2006-07 2010-11
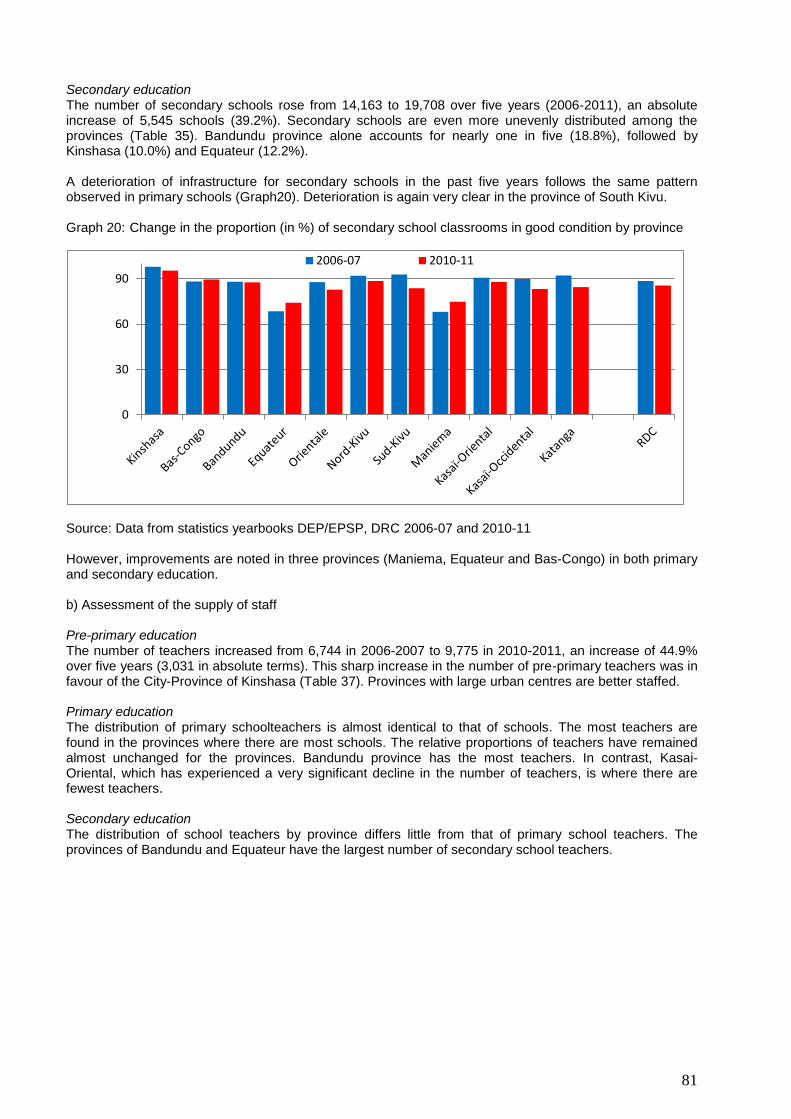
81
Secondary education
The number of secondary schools rose from 14,163 to 19,708 over five years (2006-2011), an absolute increase of 5,545 schools (39.2%). Secondary schools are even more unevenly distributed among the provinces (Table 35). Bandundu province alone accounts for nearly one in five (18.8%), followed by Kinshasa (10.0%) and Equateur (12.2%). A deterioration of infrastructure for secondary schools in the past five years follows the same pattern observed in primary schools (Graph20). Deterioration is again very clear in the province of South Kivu. Graph 20: Change in the proportion (in %) of secondary school classrooms in good condition by province
Source: Data from statistics yearbooks DEP/EPSP, DRC 2006-07 and 2010-11 However, improvements are noted in three provinces (Maniema, Equateur and Bas-Congo) in both primary and secondary education. b) Assessment of the supply of staff Pre-primary education The number of teachers increased from 6,744 in 2006-2007 to 9,775 in 2010-2011, an increase of 44.9% over five years (3,031 in absolute terms). This sharp increase in the number of pre-primary teachers was in favour of the City-Province of Kinshasa (Table 37). Provinces with large urban centres are better staffed. Primary education The distribution of primary schoolteachers is almost identical to that of schools. The most teachers are found in the provinces where there are most schools. The relative proportions of teachers have remained almost unchanged for the provinces. Bandundu province has the most teachers. In contrast, Kasai-Oriental, which has experienced a very significant decline in the number of teachers, is where there are fewest teachers. Secondary education The distribution of school teachers by province differs little from that of primary school teachers. The provinces of Bandundu and Equateur have the largest number of secondary school teachers.
0
30
60
90
2006-07 2010-11
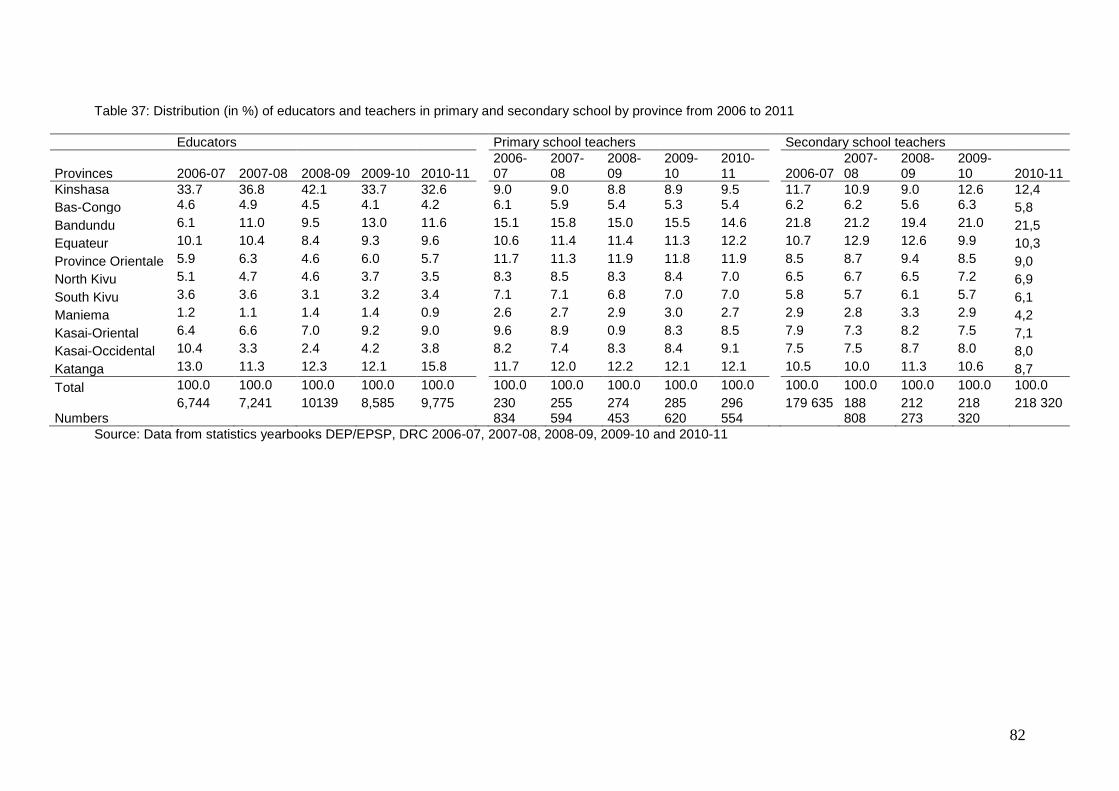
82
Table 37: Distribution (in %) of educators and teachers in primary and secondary school by province from 2006 to 2011
Educators Primary school teachers Secondary school teachers
Provinces 2006-07 2007-08 2008-09 2009-10 2010-11 2006-07
2007-08
2008-09
2009-10
2010-11 2006-07
2007-08
2008-09
2009-10 2010-11
Kinshasa 33.7 36.8 42.1 33.7 32.6 9.0 9.0 8.8 8.9 9.5 11.7 10.9 9.0 12.6 12,4
Bas-Congo 4.6 4.9 4.5 4.1 4.2 6.1 5.9 5.4 5.3 5.4 6.2 6.2 5.6 6.3 5,8
Bandundu 6.1 11.0 9.5 13.0 11.6 15.1 15.8 15.0 15.5 14.6 21.8 21.2 19.4 21.0 21,5
Equateur 10.1 10.4 8.4 9.3 9.6 10.6 11.4 11.4 11.3 12.2 10.7 12.9 12.6 9.9 10,3
Province Orientale 5.9 6.3 4.6 6.0 5.7 11.7 11.3 11.9 11.8 11.9 8.5 8.7 9.4 8.5 9,0
North Kivu 5.1 4.7 4.6 3.7 3.5 8.3 8.5 8.3 8.4 7.0 6.5 6.7 6.5 7.2 6,9
South Kivu 3.6 3.6 3.1 3.2 3.4 7.1 7.1 6.8 7.0 7.0 5.8 5.7 6.1 5.7 6,1
Maniema 1.2 1.1 1.4 1.4 0.9 2.6 2.7 2.9 3.0 2.7 2.9 2.8 3.3 2.9 4,2
Kasai-Oriental 6.4 6.6 7.0 9.2 9.0 9.6 8.9 0.9 8.3 8.5 7.9 7.3 8.2 7.5 7,1
Kasai-Occidental 10.4 3.3 2.4 4.2 3.8 8.2 7.4 8.3 8.4 9.1 7.5 7.5 8.7 8.0 8,0
Katanga 13.0 11.3 12.3 12.1 15.8 11.7 12.0 12.2 12.1 12.1 10.5 10.0 11.3 10.6 8,7
Total 100.0 100.0 100.0 100.0 100.0 100.0 100.0 100.0 100.0 100.0 100.0 100.0 100.0 100.0 100.0
Numbers 6,744 7,241 10139 8,585 9,775
230 834
255 594
274 453
285 620
296 554
179 635 188 808
212 273
218 320
218 320
Source: Data from statistics yearbooks DEP/EPSP, DRC 2006-07, 2007-08, 2008-09, 2009-10 and 2010-11
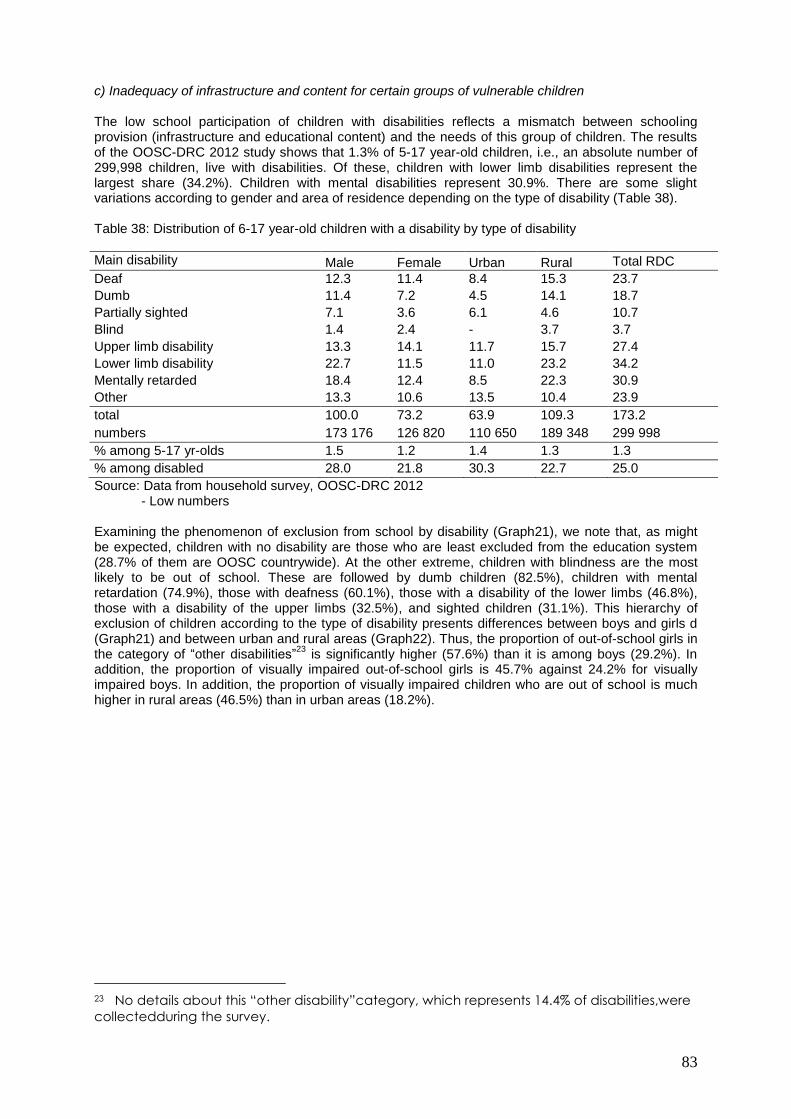
83
c) Inadequacy of infrastructure and content for certain groups of vulnerable children The low school participation of children with disabilities reflects a mismatch between schooling provision (infrastructure and educational content) and the needs of this group of children. The results of the OOSC-DRC 2012 study shows that 1.3% of 5-17 year-old children, i.e., an absolute number of 299,998 children, live with disabilities. Of these, children with lower limb disabilities represent the largest share (34.2%). Children with mental disabilities represent 30.9%. There are some slight variations according to gender and area of residence depending on the type of disability (Table 38). Table 38: Distribution of 6-17 year-old children with a disability by type of disability
Main disability Male Female Urban Rural Total RDC
Deaf 12.3 11.4 8.4 15.3 23.7
Dumb 11.4 7.2 4.5 14.1 18.7
Partially sighted 7.1 3.6 6.1 4.6 10.7
Blind 1.4 2.4 - 3.7 3.7
Upper limb disability 13.3 14.1 11.7 15.7 27.4
Lower limb disability 22.7 11.5 11.0 23.2 34.2
Mentally retarded 18.4 12.4 8.5 22.3 30.9
Other 13.3 10.6 13.5 10.4 23.9
total 100.0 73.2 63.9 109.3 173.2
numbers 173 176 126 820 110 650 189 348 299 998
% among 5-17 yr-olds 1.5 1.2 1.4 1.3 1.3
% among disabled 28.0 21.8 30.3 22.7 25.0
Source: Data from household survey, OOSC-DRC 2012 - Low numbers Examining the phenomenon of exclusion from school by disability (Graph21), we note that, as might be expected, children with no disability are those who are least excluded from the education system (28.7% of them are OOSC countrywide). At the other extreme, children with blindness are the most likely to be out of school. These are followed by dumb children (82.5%), children with mental retardation (74.9%), those with deafness (60.1%), those with a disability of the lower limbs (46.8%), those with a disability of the upper limbs (32.5%), and sighted children (31.1%). This hierarchy of exclusion of children according to the type of disability presents differences between boys and girls d (Graph21) and between urban and rural areas (Graph22). Thus, the proportion of out-of-school girls in the category of “other disabilities”
23 is significantly higher (57.6%) than it is among boys (29.2%). In
addition, the proportion of visually impaired out-of-school girls is 45.7% against 24.2% for visually impaired boys. In addition, the proportion of visually impaired children who are out of school is much higher in rural areas (46.5%) than in urban areas (18.2%).
23 No details about this “other disability”category, which represents 14.4% of disabilities,were
collectedduring the survey.
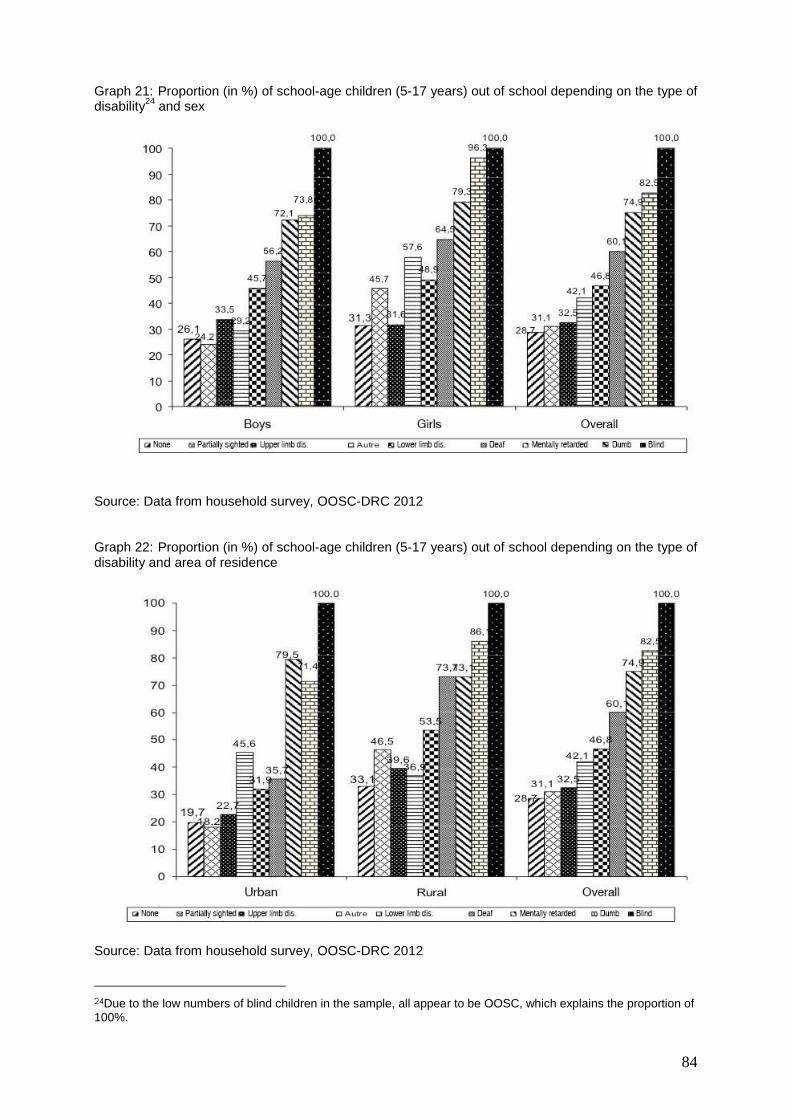
84
Graph 21: Proportion (in %) of school-age children (5-17 years) out of school depending on the type of disability
24 and sex
Source: Data from household survey, OOSC-DRC 2012 Graph 22: Proportion (in %) of school-age children (5-17 years) out of school depending on the type of disability and area of residence
Source: Data from household survey, OOSC-DRC 2012
24Due to the low numbers of blind children in the sample, all appear to be OOSC, which explains the proportion of 100%.
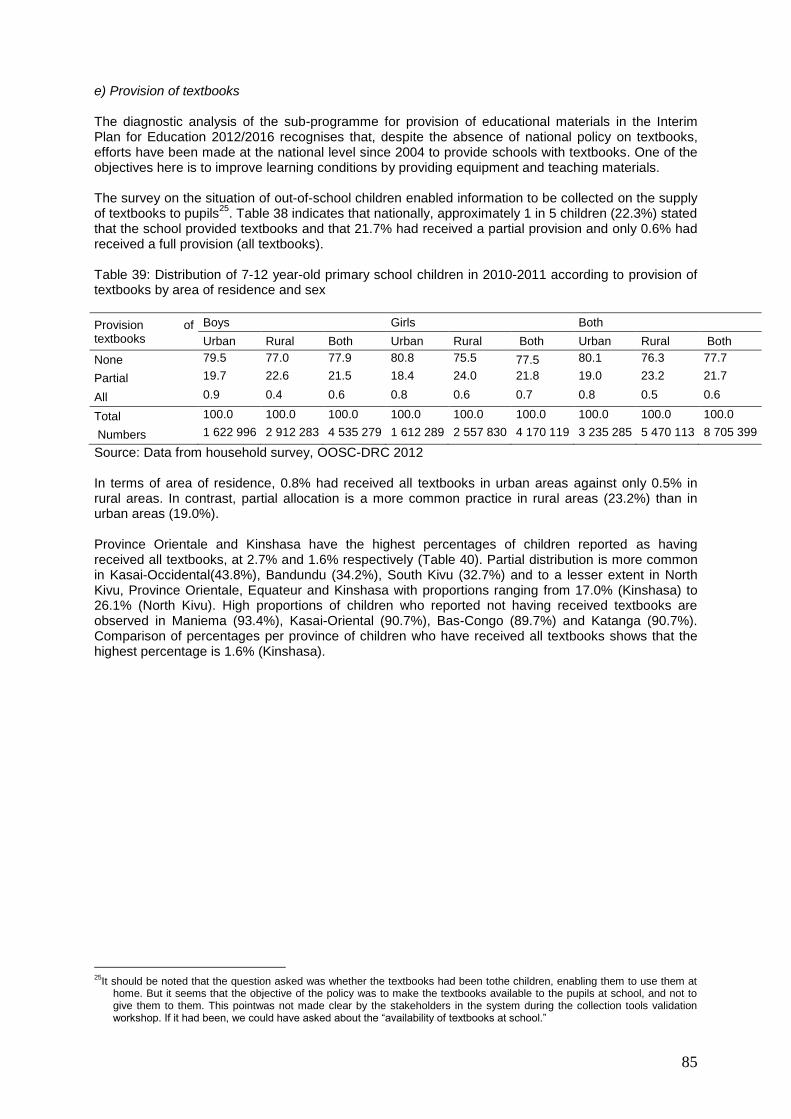
85
e) Provision of textbooks The diagnostic analysis of the sub-programme for provision of educational materials in the Interim Plan for Education 2012/2016 recognises that, despite the absence of national policy on textbooks, efforts have been made at the national level since 2004 to provide schools with textbooks. One of the objectives here is to improve learning conditions by providing equipment and teaching materials. The survey on the situation of out-of-school children enabled information to be collected on the supply of textbooks to pupils
25. Table 38 indicates that nationally, approximately 1 in 5 children (22.3%) stated
that the school provided textbooks and that 21.7% had received a partial provision and only 0.6% had received a full provision (all textbooks). Table 39: Distribution of 7-12 year-old primary school children in 2010-2011 according to provision of textbooks by area of residence and sex
Provision of textbooks
Boys Girls Both
Urban Rural Both Urban Rural Both Urban Rural Both
None 79.5 77.0 77.9 80.8 75.5 77.5 80.1 76.3 77.7
Partial 19.7 22.6 21.5 18.4 24.0 21.8 19.0 23.2 21.7
All 0.9 0.4 0.6 0.8 0.6 0.7 0.8 0.5 0.6
Total 100.0 100.0 100.0 100.0 100.0 100.0 100.0 100.0 100.0
Numbers 1 622 996 2 912 283 4 535 279 1 612 289 2 557 830 4 170 119 3 235 285 5 470 113 8 705 399
Source: Data from household survey, OOSC-DRC 2012 In terms of area of residence, 0.8% had received all textbooks in urban areas against only 0.5% in rural areas. In contrast, partial allocation is a more common practice in rural areas (23.2%) than in urban areas (19.0%). Province Orientale and Kinshasa have the highest percentages of children reported as having received all textbooks, at 2.7% and 1.6% respectively (Table 40). Partial distribution is more common in Kasai-Occidental(43.8%), Bandundu (34.2%), South Kivu (32.7%) and to a lesser extent in North Kivu, Province Orientale, Equateur and Kinshasa with proportions ranging from 17.0% (Kinshasa) to 26.1% (North Kivu). High proportions of children who reported not having received textbooks are observed in Maniema (93.4%), Kasai-Oriental (90.7%), Bas-Congo (89.7%) and Katanga (90.7%). Comparison of percentages per province of children who have received all textbooks shows that the highest percentage is 1.6% (Kinshasa).
25
It should be noted that the question asked was whether the textbooks had been tothe children, enabling them to use them at home. But it seems that the objective of the policy was to make the textbooks available to the pupils at school, and not to give them to them. This pointwas not made clear by the stakeholders in the system during the collection tools validation workshop. If it had been, we could have asked about the “availability of textbooks at school.”
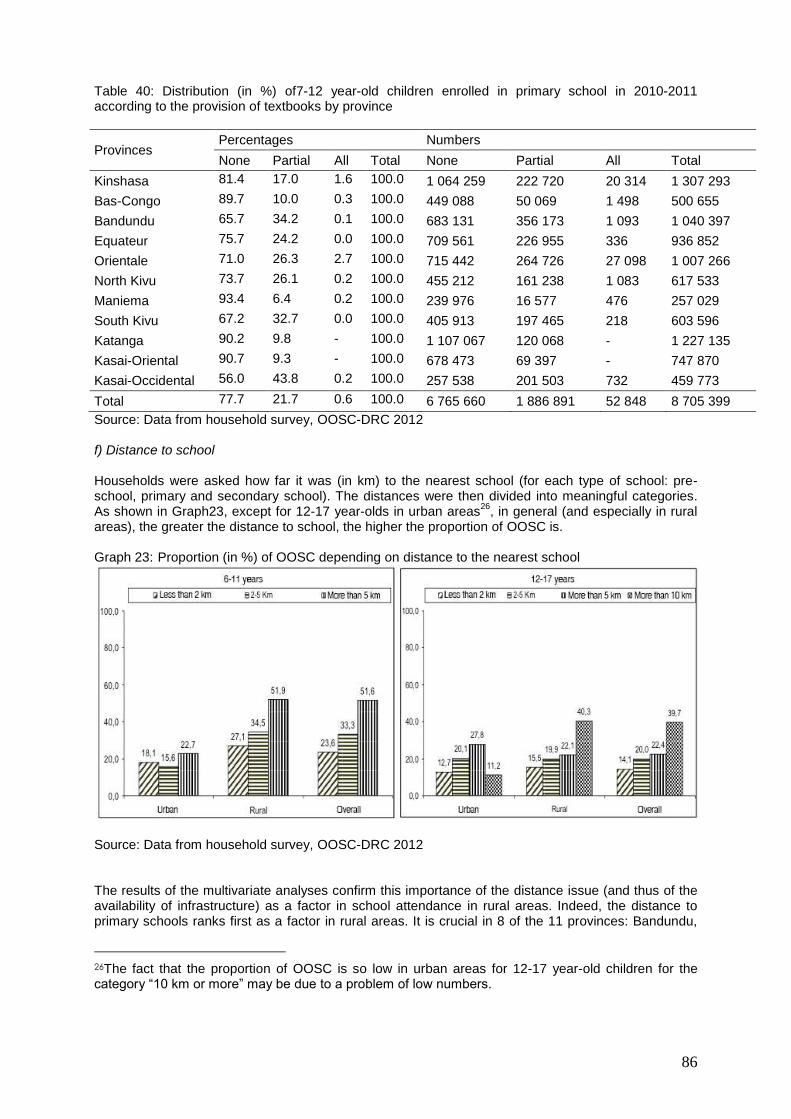
86
Table 40: Distribution (in %) of7-12 year-old children enrolled in primary school in 2010-2011 according to the provision of textbooks by province
Provinces Percentages Numbers
None Partial All Total None Partial All Total
Kinshasa 81.4 17.0 1.6 100.0 1 064 259 222 720 20 314 1 307 293
Bas-Congo 89.7 10.0 0.3 100.0 449 088 50 069 1 498 500 655
Bandundu 65.7 34.2 0.1 100.0 683 131 356 173 1 093 1 040 397
Equateur 75.7 24.2 0.0 100.0 709 561 226 955 336 936 852
Orientale 71.0 26.3 2.7 100.0 715 442 264 726 27 098 1 007 266
North Kivu 73.7 26.1 0.2 100.0 455 212 161 238 1 083 617 533
Maniema 93.4 6.4 0.2 100.0 239 976 16 577 476 257 029
South Kivu 67.2 32.7 0.0 100.0 405 913 197 465 218 603 596
Katanga 90.2 9.8 - 100.0 1 107 067 120 068 - 1 227 135
Kasai-Oriental 90.7 9.3 - 100.0 678 473 69 397 - 747 870
Kasai-Occidental 56.0 43.8 0.2 100.0 257 538 201 503 732 459 773
Total 77.7 21.7 0.6 100.0 6 765 660 1 886 891 52 848 8 705 399
Source: Data from household survey, OOSC-DRC 2012 f) Distance to school Households were asked how far it was (in km) to the nearest school (for each type of school: pre-school, primary and secondary school). The distances were then divided into meaningful categories. As shown in Graph23, except for 12-17 year-olds in urban areas
26, in general (and especially in rural
areas), the greater the distance to school, the higher the proportion of OOSC is. Graph 23: Proportion (in %) of OOSC depending on distance to the nearest school
Source: Data from household survey, OOSC-DRC 2012 The results of the multivariate analyses confirm this importance of the distance issue (and thus of the availability of infrastructure) as a factor in school attendance in rural areas. Indeed, the distance to primary schools ranks first as a factor in rural areas. It is crucial in 8 of the 11 provinces: Bandundu,
26The fact that the proportion of OOSC is so low in urban areas for 12-17 year-old children for the category “10 km or more” may be due to a problem of low numbers.
87
Province Orientale, Maniema and Kasai-Occidental (first), North Kivu and Katanga (second), Equateur and South Kivu (third). For secondary schools, the distance to school ranks third in rural areas. It ranks first in Bandundu, Equateur and Province Orientale and third in Katanga (TablesA28 and A29 in appendix).The example of Equateur is telling: although it is among the provinces with the highest proportion of poor households, it is not income that is the leading factor in school attendance at secondary level, but schooling provision, and in particular distance to school. The most commonly mentioned reason after the financial barrier to justify children’s non-attendance is distance from or absence of school, mentioned in 21.0% of cases (Table A29 in the appendix). The comments collected in the qualitative interviews corroborate this finding: “There are many reasons, there is poverty, and there is unwillingness on the part of some parents. There is also the lack of focus on the part of the children themselves. Sometimes lack of infrastructure is also one of the reasons: you find yourself in a place where there are no schools. For children to get to school, they must travel a distance of 15-20 km. Therefore, 5 or 6 year-old children do not go to school. In order to study, they have to be fostered in the household of a friend or a brother, a household which is in that area. These are the reasons why children cannot go to school” (man, parliamentarian).
3.2.6 Factors relating to policy, governance and funding
a) Lack of funding of the education sector / Ineffectiveness of free education The enormous weight of school-related expenditure for Congolese households is largely due to the low level of public funding in the education sector. A comparison between the total education expenditure of households in 2010-2011 and the EPSP budget (Table 41) shows that households spend nearly three (3) times more than the government on education (a ratio of 2.7 to 1). The share of the 2011 State budget devoted to the EPSP sub-sector remains low at 6.7%; by comparison, households’ financial contribution to the education of 3-17 year-old children represent 17.9% of that budget. Once again these results show how the contribution of Congolese households to children’s education is huge compared with State funding. Table 41: Relationship between household spending on education and the education budget (amounts in USD)
Items Amount
EPSP 2011 budget 504 362 222
National budget for 2011 7 495 555 556
Household spending on education in 2010-2011 (OOSC) 1 344 403 019
Share of EPSP budget in the national budget 6.7%
Household spending on education expressed as a % of the national budget
17.9%
Ratio of household spending on education to EPSP budget 2.7
Source of data on budget: Interim Plan for Education 2012/2014. Conversion of amounts into US dollars by the authors ($1 = 900 Congolese Francs) In addition, free primary education (especially for the first four years of primary school) is far from being fully effective. The stakeholders that we met would like this measure to be extended to all primary schools and the whole of the country. "The policy of free schooling was a good policy because it enables the Millennium Development Goals to be achieved by saying that all children should be in school by 2015. But the implementing measures did not follow. Imagine, when the parents are paying a teacher here in North Kivu can easily earn $150, but on a state salary you are asking the teacher to take a pay cut to $50 ... So people will look for a better salary elsewhere. And children are the ones who will suffer. The State must assume its responsibilities and give an appropriate salary to the teacher and then the objectives will be achieved. Because in the provinces, where parents are poor, if the schools are paid, there is no need for premium from parents, and we will accept all children”.(Male, educational system senior official, North Kivu).
88
b) Lack of human and institutional capacity The issue of institutional and human capacity arises at several levels: at the level of management committees set up in schools, in the management of human resources and at the level of the coordination and control of the educational system. At the level of the management committees In almost all provinces visited, stakeholders stressed the dysfunctional nature of the management of schools’ operating costs. The issues highlighted include the poor management capacity of the school management committees, and the lack of consultation and transparency in the management of funds. “The capacity of school managers needs to be reinforced. Very few schools have this culture of working with the budgetary provision ... You even find the Headmaster preparing the budget himself. He is in charge of both the budget and the expenditure, and that’s unacceptable. The budget should be the visual map of the school; the parent committee must be involved... The headmaster must adhere to the budget; the school is a business that must have accounting, and also monitoring and control "(Male, education senior official). The following comments from one teacher show that not all members of the Management Committee participate in the management of schools as they are supposed to, “As for how the operating costs of schools are organised, speaking as a teacher I see that the headmasters are the ones who manage this. We are mere observers. The headmasters are the ones who manage the money and are inspected and have the detailed information. What do they do with this money? I know that there are some headmasters who manage that money very well; but there are also those who do not manage the money well and think it's their money. It should be used to operate the public institution of the State so that it can move forward. This is a human problem. There are those who manage very well, but they are a minority; the rest seek to take the money for themselves, and treat it as their own money "(Male, teacher, Kinshasa). In terms of human resources management Regarding human resources management in the education sector, in addition to the already mentioned issue of teachers' salaries, several other difficulties are highlighted. These include lack of training for some teachers, the failure to recruit new teaching staff, and the lack of a pension system for teachers, etc. They also include the devaluation of the teaching profession and the lack of motivation of current teachers resulting in frequent absences of teachers from schools and the abandonment of the profession by some teachers. These difficulties, mentioned in the comments below, have a negative impact on the quality of education and school achievement. “Human resources management is an issue, because today we have people who are tired, who are waiting for pensions and then they die six months later and there is nothing - no survivor’s pension. Human resources management is therefore a problem. There are employees who have not been paid for two years; so, what are we going to ask people who come once a week? ... There are those who come from far away to work here, they must pay for transport, and with which salary? So, all this has a negative impact on the performance of employees ... Working conditions need to be improved so that human resources can give the best of themselves; they need to be a little bit well paid, if not very well paid” (man, education senior official, Kinshasa) “In the management of human resources there are failures of course. Regarding recruitment in public schools, I would like to see competitions being organised; that’s what’s supposed to happen when tenured state workers are recruited, so that those who really deserve it are hired. But no competition is organised; this is a weakness, it is really a weakness ... There’s also a human resources management issue in terms of salary too: sometimes teachers are not paid well enough. What the State gives is insufficient. What parents give is sometimes not well distributed, it is not fairly distributed ... When a teacher gets sick he must fend for himself ... There is no social security; there’s no social provision for old age; the teacher is treated as a reject ... Concerning training also, obviously there are SERNAFOR (teacher training service) activities that allow teachers to train themselves. Teachers try to manage with this, but it's a bit outdated, like a formality without any real justification, because there are often no training tools ... It doesn’t really have a very visible impact” (Male, teacher, North Kivu).
89
In terms of the coordination and control of the educational system For educational policies and strategies to succeed, good coordination of actions and a real dialogue between the various stakeholders of the education system are required. However, overall, there is lack of communication between different stakeholders at the central level and those at the provincial level, as indicated by the following comment from a provincial head of education: “Maybe at the national level there is collaboration, but where we are, both at the provincial and local levels, there is no collaboration between these various control systems” (male, educational system, North Kivu). This comment reflects lack of coordination firstly between stakeholders at the central level and those at the decentralised level, and secondly between stakeholders at the provincial level. This explains the lack of commitment on the part of some stakeholders to the implementation of education policies. To remedy this situation and promote the flow of information at all levels, some stakeholders propose the establishment of a communication mechanism at the Ministry of Education with representations at the provincial level. In addition, the education management information system (EMIS) set up in recent years to process and publish school data is an essential means of ensuring that educational statistics are disseminated and taken into account in the education programmes. However, it has been observed that the EMIS is little known even to the major stakeholders in the education system. Besides, the stakeholders point out several weaknesses in the EMIS. Some actors at the central and decentralised levels highlight the poor distribution of statistical annuals. They also highlight the lack of logistical means (computers, means of transport, etc.) to collect information at the provincial level. This probably explains in part the delay in the production of annuals. The following comments illustrate the poor dissemination of annuals. “We are asked to do the statistics, we send them to the division, often one annual for the division, for the educational province, but the document that compiles the information for the entire country is not returned to us; it does not happen. I've never seen it. The annual I have is the annual of the provincial division for the province, but if the educational ministry publishes a document along those lines, I've never seen it” (Male, education senior official, North Kivu). From the perspective of the technical and financial partners (TFPs) interviewed, there is a good consultation system among the TFPs involved in the education sector. “Until proven otherwise the steering is good. Moreover, there are initiatives in order to identify all stakeholders involved in the education sector, so that there is effective coordination of all the partners' interventions in the sector"(Male, TFP staff). However, this system is not well known to other stakeholders, especially at the decentralised level, who believe that TPFs act without consulting them and without real involvement of local stakeholders. “For the steering system, I think there are some things you need to try to supervise. This system must also obey the policy of decentralisation. There is a kind of gap, there are programmes that are designed at the national level, but should also apply at the provincial level. Otherwise there will be a fault line. In Kinshasa, where everything is close, there is no problem, but at the provincial level, we must work with the provincial authorities according to the orientation of the programme”(Male, education senior official). c) Lack of enforcement of laws protecting the rights of children The situation of the DRC’s legislation on children's rights, extensively analysed in the report on the situation in July 2011, can be described as follows: the country has legal instruments at its disposal. Similarly, progress has been made in the implementation of Law 09/001 of 10 January 2009 on the protection of children in the Democratic Republic of Congo. Decree 11/01 of 5 January 2011 sets up ordinary offices and jurisdictions of courts for children. Similarly, Ministerial Orders 002/CAB/MIN/Y&DH/2011 of 5 January 2011 on consolidation of juvenile courts jurisdictions for enforcement of custody, education and reservation and 001/CAB/MIN/Y & DH/2011 of 5 January 2011establishing secondary offices and juvenile courts and defining their jurisdictions have been adopted. Further implementation measures include Inter-Ministerial Decree 490/CAB/MIN Y & DH/2011 and 011/CAB/MIN GEFAG of 25 December2010 on the composition, organisation and functioning of the Mediation Committee for juvenile Justice and Ministerial Decree 0248/GC/CAB MIN / AFF SAHSN/09 of 19 November 2009 regulating the placement of children in difficult conditions. But difficulties arise in the application of laws. As stressed by the Committee on the Rights of the Child, apart from the implementing legislation mentioned above, the enacted laws are not always
90
subject to implementing decrees. Thus, most social protection bodies are not functional and if they are, it is under the influence of an old text not always conducive to effective functioning of the structure. Finally, the activities undertaken to publicise these laws are inadequate. As a result they are little known and are not effectively enforced. d) Uneven distribution of resources / lack of community empowerment One of the Congolese paradoxes mentioned in most recent diagnosis in the field of development and reiterated in the Interim Plan for Education 2012/2014 (MEPSP, 2012) is the fact that the country abounds in huge mineral, forest and agricultural resources, while much of the population lives in poverty. The problems causing this paradox are diverse, but mainly come down to poor and unequal distribution of resources. In addition, communities lack the capacity to perceive and capitalise on all these opportunities that arise in their environment. The different stakeholders in the qualitative survey were correctly asked about the opportunities of their territory in terms of material, financial and institutional resources that could help to meet the challenges in the field of education. In general, it appears from interviews that the interviewees do not perceive the opportunities of their environment. “Our territory has no opportunity to improve our education, because our territory has no companies”.(Male, farmer, Equateur).This comment from a pupil’s parent reflects the views of many stakeholders interviewed. Opportunities are perceived only in terms of contributions of industrial companies. However, some stakeholders highlight some opportunities in their environment. Forest resources, agriculture and livestock farming are mentioned as opportunities in the provinces of North Kivu and Equateur. In North Kivu there are several natural resources such as mining, fishing and tourist sites. In the latter province, peace and road building are mentioned as preconditions for the use of opportunities in the province. "You have spoken of natural resources. You can add financial resources to that; we have our forest which can be exploited…. Natural resources are not lacking. The forest provides us with wood; the forest gives us agricultural products. Since we are an agricultural territory, if we can support parents in this sense with micro-credit through income generating projects by selling their products, they can get money that can help to easily bear the costs of their children's education "(Male, education senior official, Equateur). “The impression I have is that the province of North Kivu is a province that could live well. The big problem we have here is the level of security ... Opportunities exist because there are minerals, there are huge tourism resources. I am always amazed by the sites that I find during the few internal trips I make. There are beautiful places that could attract tourists en masse if there were a minimum level of security and development. There is immense agricultural potential because the ground is fertile here, we are on the equator; there is sun and rain every day throughout the year, so there are fishing opportunities, there are opportunities for cattle breeding; so the opportunities are enormous. Kivu could be a very rich region. If it is not, it is because there has been war in recent years. I also believe that the administration was forced to deal with urgent problems and has forgotten about the rest "(Male, employee of an institution, North Kivu). The comments above show the potential that exists in the provinces that were selected as part of the qualitative study. But all other provinces have their potential too. But people also need to be aware of this potential and exploit it to improve their living conditions and meet the challenges of education. Awareness and support are probably necessary in this regard. e) Lack of social protection system The secondary analysis of the data from the household survey carried out during the inventory shows that the level of social protection for children and their households is very low, and this again reveals the gap between legal texts and frameworks and effective implementation. For example, just one in five children (20.7%) had a birth certificate in 2010. Moreover, it was found that during the twelve months prior to the MICS 2010 survey, the proportion of 0-17 year-olds who had received support was very low: 3.1% had received medical support, 1.0% had received social support, 5.5% had received educational support, 1.8% had received material support and 7.3% had received emotional support. The diagnostic study on “social protection adapted to children’s needs in the DRC” conducted in 2011 by the Overseas Development Institute (ODI), gives a good summary of the situation and the
91
challenges of implementing a system of sound social protection in the DRC (Bailey et al., 2011). The DRC Poverty Reduction Strategy Paper (PRSP) for 2006-2008 highlights the lack of a clear national policy on social protection. It also mentions the fact that there are many interventions from various stakeholders (government, NGOs, grassroots communities, churches), but which are unfortunately not coordinated and are therefore not strategic. Besides, these actions have limited impact since they only involve a limited portion of the population (Bailey et al., 2011). Given this lack of formal state mechanisms of social protection, populations therefore rely on a series of informal networks of social security, which are not always effective.(Bailey,et al., 2011). Executive Summary The objective of this chapter was to identify the obstacles and bottlenecks to education. In other words, it sought to answer the question “Why are children out of school?” Using methods of multivariate statistical analysis for the quantitative data and an analysis of interviewees’ comments for the qualitative data, the study successfully identified the factors in exclusion from school. They relate to schooling demand and provision and education policy. On the demand side, the factors in exclusion from school are socio-cultural and economic. Socio-culturally, gender inequalities remain substantial at secondary level, especially in rural areas. Social representations on the roles and status of the two sexes, and especially marriage practices, often lead families to favour boys when it comes to investment in schooling. The death of parents also considerably increases the risk for children of exclusion from school. Fostering also turned out to be a socio-cultural factor in exclusion from the school, in that foster children are often used to do all kinds of work in their foster home, thus decreasing their chances of receiving schooling. Moreover, the results of the quantitative analyses indicate that, regardless of the area of residence, the level of education of the household head is one of the main factors in exclusion from school. Children living in households where the head has secondary or higher education are less likely to find themselves out of school than those whose household head has no education at all. At the economic level, household income turned out to be a major factor in school attendance, regardless of the area of residence. The financial barrier is the main reason mentioned by households to justify non-enrolment or the dropping out of children, and this is confirmed by the comments made during the qualitative interviews. In terms of schooling provision, the main barrier is the long distances that children have to travel, which thus raises the problem of availability of school infrastructure, equipment and teaching staff. Although there has been an overall increase of school provision in recent years at all levels of education, there are still disparities between provinces and between urban and rural areas, and the problem is particularly acute in rural areas. There are also barriers of a political nature. We have seen that the low funding for education by the government forces households to devote a significant proportion of their annual income to education spending, but also that the human and institutional capacity of the education sector is inadequate. The problem of institutional and human capacity arises in the functioning of the school management committees at the level of management and human resources, at the level of coordination and control of the educational system. Overall, the stakeholders highlight the dysfunctional management committees (lack of management capacity, lack of consultation and transparency in the management of funds), and poor communication between the various stakeholders. To sum up, the obstacles to schooling are huge and varied. On the face of it, it is impossible to assign greater importance to one dimension than to another. To remove these obstacles and bring about a quantitative and qualitative improvement in children’s participation in schooling, a holistic approach in policies and strategies is needed.
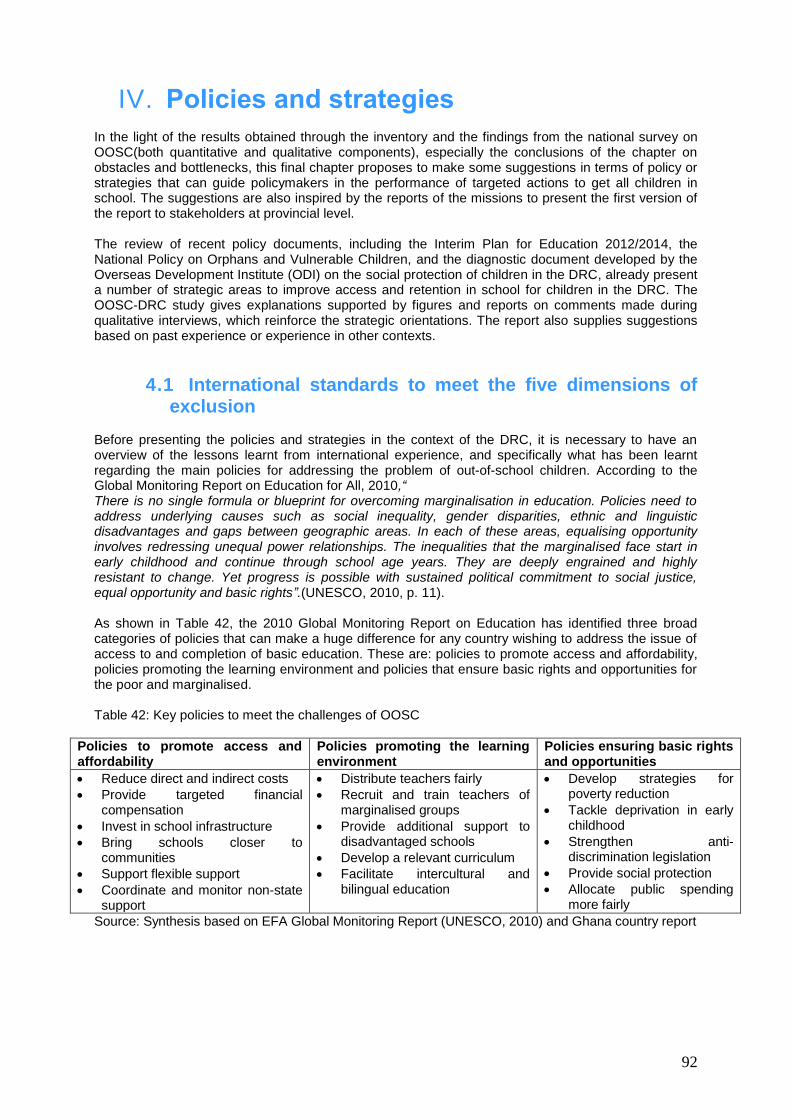
92
IV. Policies and strategies In the light of the results obtained through the inventory and the findings from the national survey on OOSC(both quantitative and qualitative components), especially the conclusions of the chapter on obstacles and bottlenecks, this final chapter proposes to make some suggestions in terms of policy or strategies that can guide policymakers in the performance of targeted actions to get all children in school. The suggestions are also inspired by the reports of the missions to present the first version of the report to stakeholders at provincial level. The review of recent policy documents, including the Interim Plan for Education 2012/2014, the National Policy on Orphans and Vulnerable Children, and the diagnostic document developed by the Overseas Development Institute (ODI) on the social protection of children in the DRC, already present a number of strategic areas to improve access and retention in school for children in the DRC. The OOSC-DRC study gives explanations supported by figures and reports on comments made during qualitative interviews, which reinforce the strategic orientations. The report also supplies suggestions based on past experience or experience in other contexts.
4.1 International standards to meet the five dimensions of exclusion
Before presenting the policies and strategies in the context of the DRC, it is necessary to have an overview of the lessons learnt from international experience, and specifically what has been learnt regarding the main policies for addressing the problem of out-of-school children. According to the Global Monitoring Report on Education for All, 2010,“ There is no single formula or blueprint for overcoming marginalisation in education. Policies need to address underlying causes such as social inequality, gender disparities, ethnic and linguistic disadvantages and gaps between geographic areas. In each of these areas, equalising opportunity involves redressing unequal power relationships. The inequalities that the marginalised face start in early childhood and continue through school age years. They are deeply engrained and highly resistant to change. Yet progress is possible with sustained political commitment to social justice, equal opportunity and basic rights”.(UNESCO, 2010, p. 11). As shown in Table 42, the 2010 Global Monitoring Report on Education has identified three broad categories of policies that can make a huge difference for any country wishing to address the issue of access to and completion of basic education. These are: policies to promote access and affordability, policies promoting the learning environment and policies that ensure basic rights and opportunities for the poor and marginalised. Table 42: Key policies to meet the challenges of OOSC
Policies to promote access and affordability
Policies promoting the learning environment
Policies ensuring basic rights and opportunities
Reduce direct and indirect costs
Provide targeted financial compensation
Invest in school infrastructure
Bring schools closer to communities
Support flexible support
Coordinate and monitor non-state support
Distribute teachers fairly
Recruit and train teachers of marginalised groups
Provide additional support to disadvantaged schools
Develop a relevant curriculum
Facilitate intercultural and bilingual education
Develop strategies for poverty reduction
Tackle deprivation in early childhood
Strengthen anti-discrimination legislation
Provide social protection
Allocate public spending more fairly
Source: Synthesis based on EFA Global Monitoring Report (UNESCO, 2010) and Ghana country report
93
4.2 Inclusive education in the policy documents in the DRC The 2010/2011-2015/2016 Strategy Paper for the development of the sub-sector of primary, secondary and vocational education adopted in March 2010 sets itself the general objective of “building an inclusive and quality education system”. This EPSP development strategy objective is in the spirit of the country’s basic law, the Constitution, which enshrines free and mandatory primary education. This principle will eventually lead to the launch of the policy of free education for the first four years of primary school in 2010. But as clearly indicated in the OOSC-DRC 2012 study, there are many challenges to the effectiveness of the policy of free education, and greater commitment from all stakeholders and mechanisms will certainly be needed to monitor its effectiveness, but also its extension to the entire primary education, as suggested by the interviewees during the survey. The Interim Plan for Education 2012/2014 includes a number of strategic areas or programmes designed to target the issue of OOSC. They include:
- Support to local communities for the development of preschool education: given the importance of early childhood preparation for further schooling, the objective in this sub-programme is to develop, in collaboration with communities, other models of preschool institutions more accessible to a greater number of children;
- In terms of progressive universal primary education, there are plans for the State to pay school fees. The issues of inclusion of out-of-school children and support for girls' education are also important;
- Building the capacities of the education system, among other things by reducing the distance to school, but also by paying special attention to children living with a disability.
4.3 Policies and strategies on the socio-cultural demand side
On the basis of the socio-cultural obstacles identified in Chapter 3, Table 42 provides an overview for each type of obstacle of possible strategies or actions.
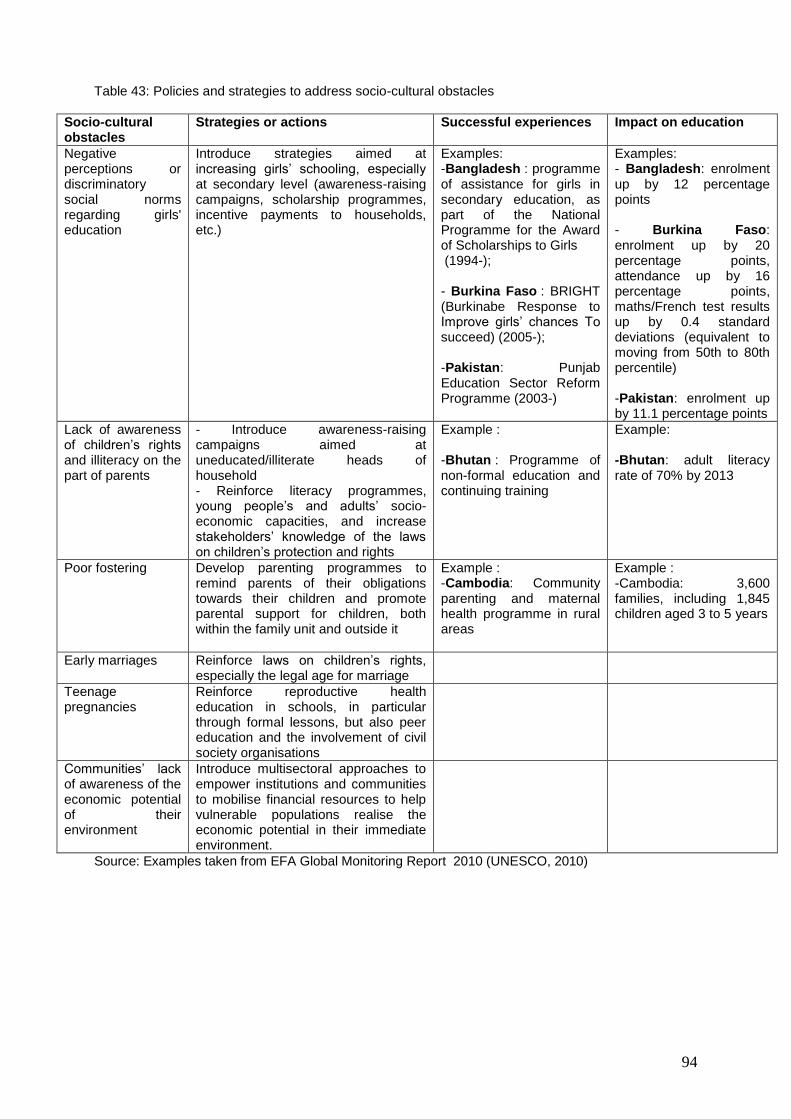
94
Table 43: Policies and strategies to address socio-cultural obstacles
Socio-cultural obstacles
Strategies or actions Successful experiences Impact on education
Negative perceptions or discriminatory social norms regarding girls' education
Introduce strategies aimed at increasing girls’ schooling, especially at secondary level (awareness-raising campaigns, scholarship programmes, incentive payments to households, etc.)
Examples: -Bangladesh : programme of assistance for girls in secondary education, as part of the National Programme for the Award of Scholarships to Girls (1994-); - Burkina Faso : BRIGHT (Burkinabe Response to Improve girls’ chances To succeed) (2005-); -Pakistan: Punjab Education Sector Reform Programme (2003-)
Examples: - Bangladesh: enrolment up by 12 percentage points - Burkina Faso: enrolment up by 20 percentage points, attendance up by 16 percentage points, maths/French test results up by 0.4 standard deviations (equivalent to moving from 50th to 80th percentile) -Pakistan: enrolment up by 11.1 percentage points
Lack of awareness of children’s rights and illiteracy on the part of parents
- Introduce awareness-raising campaigns aimed at uneducated/illiterate heads of household - Reinforce literacy programmes, young people’s and adults’ socio-economic capacities, and increase stakeholders’ knowledge of the laws on children’s protection and rights
Example : -Bhutan : Programme of non-formal education and continuing training
Example: -Bhutan: adult literacy rate of 70% by 2013
Poor fostering
Develop parenting programmes to remind parents of their obligations towards their children and promote parental support for children, both within the family unit and outside it
Example : -Cambodia: Community parenting and maternal health programme in rural areas
Example : -Cambodia: 3,600 families, including 1,845 children aged 3 to 5 years
Early marriages
Reinforce laws on children’s rights, especially the legal age for marriage
Teenage pregnancies
Reinforce reproductive health education in schools, in particular through formal lessons, but also peer education and the involvement of civil society organisations
Communities’ lack of awareness of the economic potential of their environment
Introduce multisectoral approaches to empower institutions and communities to mobilise financial resources to help vulnerable populations realise the economic potential in their immediate environment.
Source: Examples taken from EFA Global Monitoring Report 2010 (UNESCO, 2010)
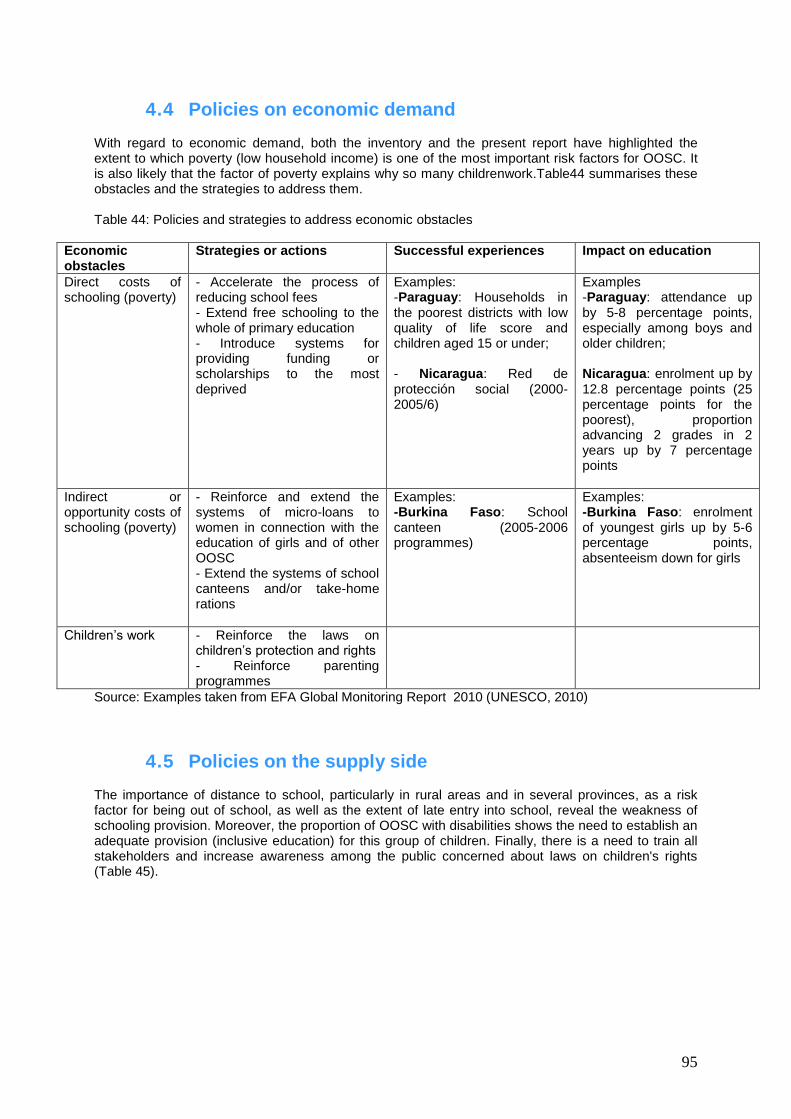
95
4.4 Policies on economic demand With regard to economic demand, both the inventory and the present report have highlighted the extent to which poverty (low household income) is one of the most important risk factors for OOSC. It is also likely that the factor of poverty explains why so many childrenwork.Table44 summarises these obstacles and the strategies to address them. Table 44: Policies and strategies to address economic obstacles
Economic obstacles
Strategies or actions Successful experiences Impact on education
Direct costs of schooling (poverty)
- Accelerate the process of reducing school fees - Extend free schooling to the whole of primary education - Introduce systems for providing funding or scholarships to the most deprived
Examples: -Paraguay: Households in the poorest districts with low quality of life score and children aged 15 or under; - Nicaragua: Red de protección social (2000-2005/6)
Examples -Paraguay: attendance up by 5-8 percentage points, especially among boys and older children; Nicaragua: enrolment up by 12.8 percentage points (25 percentage points for the poorest), proportion advancing 2 grades in 2 years up by 7 percentage points
Indirect or opportunity costs of schooling (poverty)
- Reinforce and extend the systems of micro-loans to women in connection with the education of girls and of other OOSC - Extend the systems of school canteens and/or take-home rations
Examples: -Burkina Faso: School canteen (2005-2006 programmes)
Examples: -Burkina Faso: enrolment of youngest girls up by 5-6 percentage points, absenteeism down for girls
Children’s work
- Reinforce the laws on children’s protection and rights - Reinforce parenting programmes
Source: Examples taken from EFA Global Monitoring Report 2010 (UNESCO, 2010)
4.5 Policies on the supply side The importance of distance to school, particularly in rural areas and in several provinces, as a risk factor for being out of school, as well as the extent of late entry into school, reveal the weakness of schooling provision. Moreover, the proportion of OOSC with disabilities shows the need to establish an adequate provision (inclusive education) for this group of children. Finally, there is a need to train all stakeholders and increase awareness among the public concerned about laws on children's rights (Table 45).
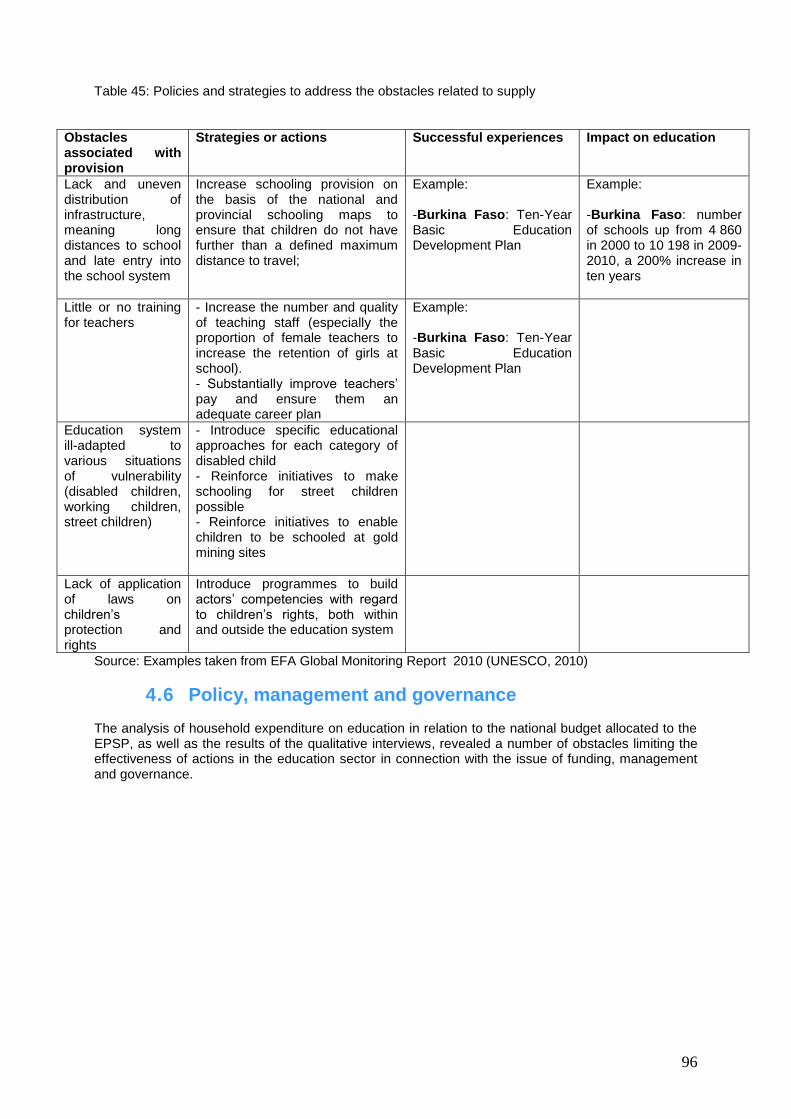
96
Table 45: Policies and strategies to address the obstacles related to supply
Obstacles associated with provision
Strategies or actions Successful experiences Impact on education
Lack and uneven distribution of infrastructure, meaning long distances to school and late entry into the school system
Increase schooling provision on the basis of the national and provincial schooling maps to ensure that children do not have further than a defined maximum distance to travel;
Example: -Burkina Faso: Ten-Year Basic Education Development Plan
Example: -Burkina Faso: number of schools up from 4 860 in 2000 to 10 198 in 2009-2010, a 200% increase in ten years
Little or no training for teachers
- Increase the number and quality of teaching staff (especially the proportion of female teachers to increase the retention of girls at school). - Substantially improve teachers’ pay and ensure them an adequate career plan
Example: -Burkina Faso: Ten-Year Basic Education Development Plan
Education system ill-adapted to various situations of vulnerability (disabled children, working children, street children)
- Introduce specific educational approaches for each category of disabled child - Reinforce initiatives to make schooling for street children possible - Reinforce initiatives to enable children to be schooled at gold mining sites
Lack of application of laws on children’s protection and rights
Introduce programmes to build actors’ competencies with regard to children’s rights, both within and outside the education system
Source: Examples taken from EFA Global Monitoring Report 2010 (UNESCO, 2010)
4.6 Policy, management and governance The analysis of household expenditure on education in relation to the national budget allocated to the EPSP, as well as the results of the qualitative interviews, revealed a number of obstacles limiting the effectiveness of actions in the education sector in connection with the issue of funding, management and governance.
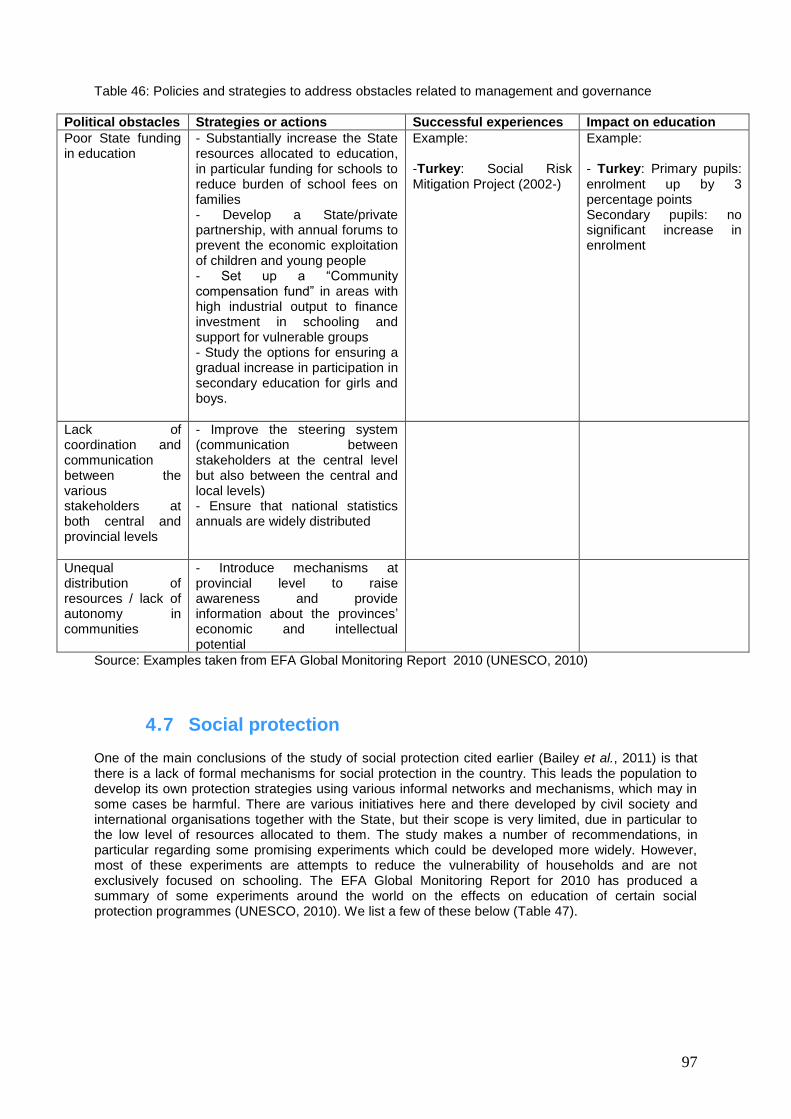
97
Table 46: Policies and strategies to address obstacles related to management and governance
Political obstacles Strategies or actions Successful experiences Impact on education
Poor State funding in education
- Substantially increase the State resources allocated to education, in particular funding for schools to reduce burden of school fees on families - Develop a State/private partnership, with annual forums to prevent the economic exploitation of children and young people - Set up a “Community compensation fund” in areas with high industrial output to finance investment in schooling and support for vulnerable groups - Study the options for ensuring a gradual increase in participation in secondary education for girls and boys.
Example: -Turkey: Social Risk Mitigation Project (2002-)
Example: - Turkey: Primary pupils: enrolment up by 3 percentage points Secondary pupils: no significant increase in enrolment
Lack of coordination and communication between the various stakeholders at both central and provincial levels
- Improve the steering system (communication between stakeholders at the central level but also between the central and local levels) - Ensure that national statistics annuals are widely distributed
Unequal distribution of resources / lack of autonomy in communities
- Introduce mechanisms at provincial level to raise awareness and provide information about the provinces’ economic and intellectual potential
Source: Examples taken from EFA Global Monitoring Report 2010 (UNESCO, 2010)
4.7 Social protection One of the main conclusions of the study of social protection cited earlier (Bailey et al., 2011) is that there is a lack of formal mechanisms for social protection in the country. This leads the population to develop its own protection strategies using various informal networks and mechanisms, which may in some cases be harmful. There are various initiatives here and there developed by civil society and international organisations together with the State, but their scope is very limited, due in particular to the low level of resources allocated to them. The study makes a number of recommendations, in particular regarding some promising experiments which could be developed more widely. However, most of these experiments are attempts to reduce the vulnerability of households and are not exclusively focused on schooling. The EFA Global Monitoring Report for 2010 has produced a summary of some experiments around the world on the effects on education of certain social protection programmes (UNESCO, 2010). We list a few of these below (Table 47).
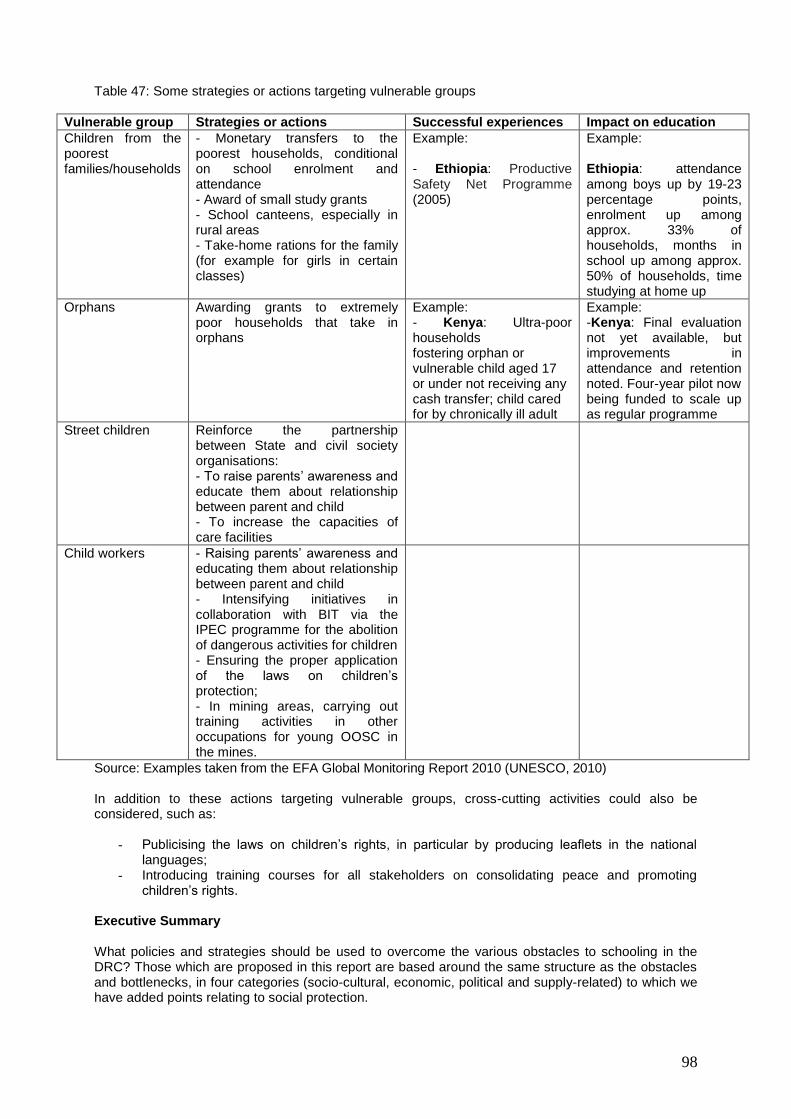
98
Table 47: Some strategies or actions targeting vulnerable groups
Vulnerable group Strategies or actions Successful experiences Impact on education
Children from the poorest families/households
- Monetary transfers to the poorest households, conditional on school enrolment and attendance - Award of small study grants - School canteens, especially in rural areas - Take-home rations for the family (for example for girls in certain classes)
Example: - Ethiopia: Productive Safety Net Programme (2005)
Example: Ethiopia: attendance among boys up by 19-23 percentage points, enrolment up among approx. 33% of households, months in school up among approx. 50% of households, time studying at home up
Orphans Awarding grants to extremely poor households that take in orphans
Example: - Kenya: Ultra-poor households fostering orphan or vulnerable child aged 17 or under not receiving any cash transfer; child cared for by chronically ill adult
Example: -Kenya: Final evaluation not yet available, but improvements in attendance and retention noted. Four-year pilot now being funded to scale up as regular programme
Street children
Reinforce the partnership between State and civil society organisations: - To raise parents’ awareness and educate them about relationship between parent and child - To increase the capacities of care facilities
Child workers - Raising parents’ awareness and educating them about relationship between parent and child - Intensifying initiatives in collaboration with BIT via the IPEC programme for the abolition of dangerous activities for children - Ensuring the proper application of the laws on children’s protection; - In mining areas, carrying out training activities in other occupations for young OOSC in the mines.
Source: Examples taken from the EFA Global Monitoring Report 2010 (UNESCO, 2010) In addition to these actions targeting vulnerable groups, cross-cutting activities could also be considered, such as:
- Publicising the laws on children’s rights, in particular by producing leaflets in the national languages;
- Introducing training courses for all stakeholders on consolidating peace and promoting children’s rights.
Executive Summary What policies and strategies should be used to overcome the various obstacles to schooling in the DRC? Those which are proposed in this report are based around the same structure as the obstacles and bottlenecks, in four categories (socio-cultural, economic, political and supply-related) to which we have added points relating to social protection.
99
In socio-cultural terms, a number of strategies or actions have been proposed to address the problems caused by social representations which are unfavourable to girls, early marriages and pregnancies, perceptions of children’s rights and their place in Congolese society, the sometimes harmful effects of the fostering of children and communities’ perceptions of the economic potential of their local environment. Regarding the schooling of girls, it is proposed that awareness-raising campaigns on schooling for girls should be stepped up, especially at secondary level, that scholarship programmes should be introduced and that consideration should be given to incentivising grants to households, a system which has been tried in other places. To eliminate the problem of early marriages, it is suggested that the laws on the legal age for marriage should be enforced, and to address early pregnancies, that education in sexual and reproductive health should be intensified. Regarding the low level of education and literacy among parents and their perceptions of children’s rights, it is suggested that:
- Awareness-raising campaigns targeting uneducated/illiterate heads of household should be introduced;
- Literacy programmes and the socio-economic capacities of young people and adults should be reinforced, and that stakeholders should be informed about the laws on children’s protection and rights.
Regarding the sometimes negative effects of fostering, there is a need to develop parenting programmes in order to remind parents of their obligations towards their children. Finally, in order to boost communities’ capacities and resources, it is proposed that multi-sectoral approaches should be introduced to empower institutions and communities to mobilise financial resources to help vulnerable populations realise the economic potential in their immediate environment. With regard to economic obstacles, the important role played by poverty as an obstacle to schooling makes it necessary to reaffirm the urgency of accelerating the reduction of school fees and making it effective. With regard to children’s work, especially dangerous work, there is a need to reinforce laws on children’s protection and rights and to reinforce parenting programmes. With regard to schooling provision, there is a need to substantially increase the number of facilities and the number and quality of teaching staff (especially the proportion of female teachers to increase the retention of girls at school). It is also necessary to substantially improve teachers’ pay and ensure them an adequate career plan and to introduce specific educational approaches for each category of disabled child. Finally, initiatives to make schooling possible for street children or children at gold mining sites must be reinforced. In terms of policy and governance, there are proposals to:
- Substantially increase the State resources allocated to education; - Develop a State/private partnership, with annual forums to prevent the economic exploitation
of children and young people; - Set up a “Community compensation fund” in areas with high industrial output to finance
investment in schooling and support for vulnerable groups; - Study the options for ensuring a gradual increase in participation in secondary education for
girls and boys; - Improve the steering system (communication between stakeholders at the central level but
also between the central and local levels); - Introduce mechanisms at provincial level to raise awareness and provide information about
the provinces’ economic and intellectual potential.
100
V. Conclusion Research on out-of-school children and adolescents (OOSC) in the Democratic Republic of Congo (DRC)had the specific goals of measuring the extent of the OOSC phenomenon in the DRC (“How many are there?”), of identifying their geographical location (“Where are they?”), of describing their socio-demographic and economic profile (“Who are they?”), of examining the obstacles and bottlenecks affecting their schooling (“Why are they out of school?”), and of proposing policies to increase their participating in school (“What has been the effectiveness and impact of the policies and strategies in the sectors of education and social protection?”). Magnitude and profile of OOSC in the DRC The results extrapolated from the OOSC-DRC 2012 survey produce an estimated total of 7,375,875 5-17 year-old OOSC in 2012, or in relative terms 28.9% of 5-17 year-olds. The OOSC phenomenon is more extensive among girls (31.7%) than among boys (26.5%). Looking exclusively at the primary school age group, which is the age group during which schooling is compulsory, the number of OOSC among 6-11 year-olds is estimated at 3,509,252, representing 47.6% of all OOSC (26.8% of 6-11 year-olds). The change in the proportion of out-of-school children shows that the phenomenon has been in steady decline since 2007, from 38.5% in 2007 (EDS 2007) to 32.5% in 2010 (MICS 2010) and 28.9% in 2012 (OOSC 2012). In both absolute and relative terms, it is in rural areas that the largest number of OOSC is found: 5, 694,525 OOSC in rural areas against 1,681,391 in urban areas. It is also in rural areas that the scale of the phenomenon is greatest in relative terms: 33.4% in rural areas against 20.0% in urban areas). Geographical analysis of the extent of the phenomenon reveals that it is greatest in provinces with high mining production and those affected by recurrent conflict (North Kivu, Katanga, Kasai-Occidental, Province Orientale, South Kivu, Kasai-Oriental). Moreover, analysis of the profile of OOSC reveals that they tend to come from the poorest households (64.3% of 6-11 year-olds, 60.4% of 12-13 year-olds and 60.2% of 14-17 year-olds), from households where the head has no education (65.3% of 6-11 year-olds, 46.5% of 12-13 year-olds and 50.8% of 14-17 year-olds) and that more of them are girls (50.1% of 6-11 year-olds, 60.4% of 12-13 year-olds and 63.8% of 14-17 year-olds). One of the contributions of the survey has been to identify the scale of the phenomenon of children from broken families (in childcare facilities or on the streets). The study surveyed 19,414 people living on the streets or in facilities, 11,979 of whom came from broken families, and the majority being children of school age (9,410 children aged 5-17 years). Street children are mainly concentrated in Kinshasa, South Kivu, North Kivu, Kasai-Oriental and Province Orientale. In terms of participation in school, most street children have dropped out of school, with most of them having stopped their studies at primary level. Moreover, contrary to what one might think, more than one in three street children are not orphans. In terms of children living in facilities, North Kivu has the highest numbers, followed by South Kivu and Kinshasa. Children in childcare facilities are generally at school. Despite the progress achieved on schooling in the DRC, there is still a good way to go before universal primary education becomes a reality. Those who are excluded from the system are those from the most remote areas, who lack the required financial resources and who are not in family environments that are likely to assure them a good chance of going to school. Obstacles and bottlenecks Analysis of the obstacles shows that the factors reinforcing children’s exclusion from school are multiple and relate to demand for schooling (socio-cultural and economic factors), provision of schooling and policies.
101
In terms of demand for schooling, both the quantitative and the qualitative data reveal the persistence of gender inequalities in education. Although efforts have been made by the State and its partners to improve schooling in recent years, leading to a significant reduction in inequalities in access to education between boys and girls, especially at primary level, gender inequalities (to the disadvantage of girls) still exist at secondary level, especially in rural areas. Moreover, the death of one or both of a child’s parents was seen to be a significant obstacle to schooling for children. Fostering was found to be another factor in exclusion from school, with the analyses showing that foster children, particularly in urban areas, are at greater risk of being out of school than the biological children of the head of household. The parents’ level of education emerged as another factor in exclusion from schooling, regardless of the area of residence: children living in households whose head has no education are more likely to be out of school. This lack of educational capital on the part of the parents would also go some way to explaining parents’ perceptions about children’s rights, which are not always favourable to the promotion of children’s protection and rights. In economic terms, household income affects whether or not children go to school. In both urban and rural areas, low household income is a substantial obstacle to schooling at both primary and secondary level. this obstacle is the main reason cited by households to justify the non-enrolment or dropping out of children; is also confirmed by the comments made during the qualitative interviews. In terms of school provision, it was found that the availability and quality of school infrastructure, facilities and teaching staff at all three levels of education are also factors in whether or not children attend school. Although there has been an overall increase in schooling provision in recent years at all levels, there are disparities between provinces and between urban and rural areas with regard to the availability and distribution of school infrastructure. At pre-primary level, most kindergartens are in urban areas. At primary and secondary levels, the number of schools has increased considerably in recent years, but primary and especially secondary schools are still unevenly distributed between the provinces. At the same time, the analyses show that distance to school is one of the main factors in exclusion from school in rural areas. Moreover, the provision of schooling is ill-adapted to the needs of certain specific groups such as disabled children. Politically, it is clear that the low level of educational funding by the State, which compels households to devote a large proportion of their annual income to spending on education (14% in urban areas and 7% in rural areas), is one of the factors in exclusion from school. The same is true of the lack of institutional and human capacity in the education sector. This problem arises in connection with the functioning of the school management committees, the management of human resources and the coordination and management of the education system. With regard to the management of human resources in the education sector, several difficulties are stressed in the qualitative interviews, including insufficient, irregularly paid teachers’ salaries, the lack of a pension system for teachers, the lack of training for some teachers, and the failure to recruit new teaching staff. Policies and strategies In terms of policies and strategies to remove the obstacles to schooling, the OOSC-DRC study, on the basis of the results of the national survey, especially those in the qualitative section, the contributions of stakeholders in the education system following the presentation of the initial results from the research and experience in other contexts, has identified a number of policies or strategies, based around the identified obstacles and bottlenecks. In socio-cultural terms, to address the problems of social representations which are unfavourable to girls, it is proposed that awareness-raising campaigns regarding girls’ schooling should be intensified, particularly at secondary level, that scholarship programmes should be introduced and that consideration should be given to how this has been tried out elsewhere, and that incentivising grants should be made to households. To deal with the problem of early marriages, it is suggested that the legislation on the legal age for marriage and on early pregnancy should be applied, and that educational courses in sexual and reproductive health should be intensified. To address the low level of education and literacy among parents and their perceptions regarding children’s rights, it is suggested that awareness-raising campaigns should be introduced targeting uneducated/illiterate heads of household, that literacy programmes and young people’s and adults’ socio-economic capacities should be reinforced, and that stakeholders’ knowledge of the laws on children’s protection and rights should be increased. To address the effects of poor fostering, it is proposed that parenting
102
programmes should be developed to remind parents of their obligations towards their children. Finally, to increase communities’ capacities and resources, it is proposed that multi-sectoral approaches should be introduced to empower institutions and communities to mobilise financial resources to help vulnerable populations realise the economic potential in their immediate environment. With regard to economic obstacles, the important role played by poverty as an obstacle to schooling makes it necessary to reaffirm the urgency of accelerating the reduction of school fees and making it effective, as already stipulated in the Strategy document for the development of the Sub-sector of Primary, Secondary and Vocational Education 2010/2011-2015/2016. With regard to children’s work, especially dangerous work, the proposals refer to reinforcing laws on children’s protection and rights and developing or reinforcing parenting programmes. With regard to schooling provision, there is a need to substantially increase the number of facilities and the number and quality of teaching staff (especially the proportion of female teachers to increase the retention of girls at school). It is also necessary to substantially improve teachers’ pay and ensure them an adequate career plan and to introduce specific educational approaches for each category of disabled child. Finally, initiatives to make schooling possible for street children or children at mining sites must be reinforced. In terms of policy and governance, there are proposals to substantially increase the State resources allocated to education, to develop or reinforce the partnership between the State and the private sector, as is done in a number of countries, through annual encounters that make it possible not just to prevent the economic exploitation of children and young people, but to set up and contribute to what might be called a “Community compensation fund” in areas with high industrial output to finance investment in schooling and build up a social protection fund. A proposal has also been made, in view of the persistent gender inequalities in secondary education, to study the options for ensuring a gradual increase in participation in secondary education for girls and boys. Improving the steering system (communication between stakeholders at the central level but also between the central and local levels)emerges as another requirement in order to oversee the various actions undertaken to improve the schooling figures. Finally, in more general terms, there is a definite need for an original and proactive approach in order to break the cycle of poverty and dependency: here, helping communities to perceive the range of economic potential in their local environment (not just mineral resources, but also agricultural resources, fishing resources, tourism and other sources of prosperity) and providing them with the basic requirements (in terms of capabilities and loans) to commercialise them, will ultimately enable households to take more responsibility for their own fortunes and to invest sustainably in the schooling of children.
103
Bibliography AINSWORTH, Martha (1992), Economic Aspects of Child Fostering in Côte d’Ivoire, Living Standards Measurement Study, Working Paper N° 92, World Bank, Washington, 43 p. AINSWORTH, Martha, and Deon FILMER. 2002. Poverty, AIDS, and Children's Schooling. A targeting Dilemma. The World Bank Policy Research Working Paper (2885):41. ANH TRUONG, Si, John KNODEL, David LAM and Jed FRIEDMAN (1998), “Family Size and Children’s Education in Vietnam”, Demography, Vol. 35, N°1, p. 57-70. WORLD BANK (2005), Le renouveau du système éducatif de la République Démocratique du Congo : Priorités et alternatives, Washington, 184 p. BRISSET, C. (2000), “Le travail des enfants”, Problèmes politiques et sociaux, N° 839, Paris, 72 p. BUCHMANN, Claudia, and Emily HANNUM (2001) “Education and stratification in developing countries: A review of theories and research”, Annual Review of Sociology 27, p.77-102. CASE, Anne, Christina PAXON, and Joseph ABLEIDINGER (2004), “Orphans in Africa; Parental death, poverty, and school enrolment”, Demography, 4, n°3, p. 483-508. CHERNICHOVSKY, Dov (1985), “Socioeconomic and Demographic Aspects of School Enrolment and
Attendance in Rural Botswana”, Economic Development and Cultural Change, Vol. 33, N 2, p. 319-332. CRAISSATI, Dina (2011), Conceptual and methodological framework mail 1: profiles, UNICEF, 3 p. DE VREYER, Philippe (1993), “Une analyse économétrique de la demande d’éducation en Côte-d’Ivoire”, Revue d’économie du développement, Vol. 3, p. 51-79. DEGRAFF, Deborah S., Richard E. BILSBORROW and Alejandro N. HERRIN (1996), “Children’s education in the Philippines : Does high fertility matter ?”, Population Research and Policy Review, N° 15, p. 219-247. DIALLO, Y. (2006) Note méthodologique. Du cadre conceptuel aux estimations des formes de travail des enfants : une approche statistique. Version provisoire, 15 p. EADE-RDC (2011), Recherche sur les enfants et adolescents en dehors de l’école en démographique et de santé de la République démographique du Congo, Rapport sur l’état des lieux, UNICEF, Kinshasa, 124 p. EDS-RDC (2007), Enquête démographique et de santé de la République démographique du Congo. FILMER, Deon and Lant H. PRITCHETT (2001), “Estimating Wealth Effects without Expenditure Data-or Tears: an Application to Educational Enrollments in States India”, Demography, Vol. 38, N° 1, p. 115-132. FOSTER G., SHAKESPEARE R., CHINEMANA F., JACKSON H., GREGSON S. MARANGE C., and MASHUMBA S. (1995), “Orphan Prevalence and Extended Family Care in Peri-Urban Community in Zimbabwe”, AIDS Care, 7, n°1 , 3. FOSTER, G., R. SHAKESPEARE, F. CHINEMANA, H. JACKSON, S. GREGSON, C. MARANGE, and S. MASHUMBA. 1995. Orphan Prevalence and Extended Family Care in a Peri-urban Community in Zimbabwe. Aids Care 7 (1):3-17. GERTLER, Paul, David I. LEVINE, and Minnie AMES. 2004. Schooling and Parental Death. The GOMES, Melba (1984), “Family Size and Educational Attainment in Kenya”, Population and
Development Review, Vol. 10, N 4, p. 647-660. HAGENAARS, Aldiand Klaas DE VOS (1988), “The Definition and Measurement of Poverty”, The Journal of Human Resources, Vol. 23, N° 2, p. 211-221.
104
HAMMOND, Cathy, Dan Linton, Jay Smink and Sam Drew (2007), Drop out risk factors and exemplary programs: A technical report. Clemson, SC: National Dropout Prevention Center. HILL, Anne M. and Elizabeth M. KING (1993), “Women’s Education in Developing Countries : An Overview”in : Elizabeth M. KING and M. Anne HILL (edd.), Women’s Education in Developing Countries. Obstacles, Benefits, and Policies, World Bank, The Johns Hopkins University Press, Baltimore, p. 1-50. ISIUGO-ABANIHE Uche C. (1985) “Child fosterage in WestAfrica”, Population and Development Review, vol.11, n°1, p.53-73. KAMUZORA, L. C. (1984), “High Fertility and the Demand for Labor in Peasant Economies : the Case of Bukoba District, Tanzania”, Development and Change, Vol. 15, p. 105-124. KNODEL, John and Malinee WONGSITH (1991), “Family Size and Children’s Education in Thailand : Evidence from a National Sample”, Demography, Vol. 28 N° 1, p. 119-131. KOBIANÉ Jean-François (2001), “Revue générale de la littérature sur la demande d’éducation en Afrique”, in : Marc PILON and Yacouba YARO (éditeurs) La demande d’éducation en Afrique. État des connaissances et perspectives de recherche. Collection Réseaux thématiques de recherche de l’U.E.P.A, N° 1, pp. 19-47. KOBIANÉ Jean-François (2004), “Habitat et bien d'équipement comme indicateurs de niveau de vie des ménages : diversité de méthodologies et implications en matière de politique sociale”, Étude de la Population Africaine, Supplément A au Vol. 19, pp. 265-283. KOBIANÉ Jean-François (2005), “Parental Death and Children’s Schooling in Burkina Faso”, Comparative Education Review, Vol. 49, No 4, pp. 468-489 KOBIANÉ Jean-François (2006), Ménages et scolarisation des enfants au Burkina Faso : à la recherche des déterminants de la demande scolaire, Collection “Monographies de l’Institut de Démographie de l’UCL”, Louvain-la-Neuve, Academia-Bruylant, 306 p. KOBIANÉ Jean-François (2007) “Ethnies, genre et scolarisation au Burkina Faso : du discours anthropologique aux résultats statistiques”, in : Thérèse LOCOH (éd.), Genre et sociétés en Afrique. Implications pour le développement. Collection “Les cahiers de l’INED”, No. 160, pp. 221-241. KOBIANÉ, Jean-François (2003), “Pauvreté, structures familiales et stratégies éducatives à Ouagadougou”, in Éducation, Famille et Dynamiques Démographiques, Cosio M., Marcoux R., Pilon M., et Quesnal A. (dir.), CICRED, Paris, pp.183-217. LANGE, Marie-France (1998), “Introduction”, in : Marie-France LANGE (éd.), L’école et les filles en Afrique. Scolarisation sous conditions, ÉditionsKarthala, Paris, p. 7-26. LLOYD, Cynthia B. and Ann K. BLANC (1996), “Children's Schooling in sub-Saharan Africa: The Role
of Fathers, Mothers, and Others”, Population and development review, Vol. 22, N 2, p. 265-298. MARCOUX, Richard, Amadou NOUMBISSI, andTukufu ZUBERI (2005) “Living arrangements of orphans in sahelian countries” (paper presented at the annual meeting of the population association of America, May 1-3, Minneapolis, 2003). MEILLASSOUX, Claude (1992), Femmes greniers et capitaux, Éditions L’Harmattan, Paris, 251 p. METELA S., (2010), “Physionomie démographique de la République Démocratique du Congo de 1957 à 2007 : évolution et facteurs explicatifs”, Actes du colloque sur les questions de population, développement et pauvreté en RDC, pp. 44-55. (Forthcoming). MICS-RDC (2010), Enquête à indicateurs multiples de la République démographique du Congo, Kinshasa. MOUMMI, Ahmed (2010), “Analyse de la pauvreté en République démocratique du Congo”, African Development Bank Group, Working Paper N° 112, 25 p.
105
NGONDO P. (2001), “Physionomie démographique de la République Démocratique du Congo et de l’Afrique, ”Document Pédagogique n° 2, Université de Kinshasa, Faculté des Sciences Economiques et de Gestion, Département des Sciences de la Population et du Développement, PUK, Kinshasa, 113 p. NYANGARA Florence (2004), Sub-national distribution and situation of orphans : An analysis of the president’s emergency plan for Aids Relief Focus Countries (USAID, Bureau of Africa, Washington, DC, 2004), 33. NYANGARA, Florence. 2004. Sub-National Distribution and Situation of Orphans: An Analysis of the President's Emergency Plan for AIDS Relief Focus Countries: USAID, Bureau of Africa. PILON, Marc (2005), “Confiage et scolarisation en Afrique de l’Ouest : Eclairages à partir des sources de données démographiques”, Communication au Congrès de l’UIESP de Tour, 17 p. PILON, Marc and Denis CLEVENOT (1996), “Femmes et scolarisation des enfants”, Communication au Séminaire international "Femmes et gestion des ressources", IFORD, Yaoundé, 5-7 février 1996, 24 p. Programme National Multisectoriel de Lutte contre le Sida de la RDC, (2009), Plan stratégique national de lutte contre le Sida (2010-2014), 116 p. RDC (2009), “Loi N° 09/001 portant protection de l’enfant du 10 janvier 2009”, Journal Officiel, Numéro spécial, pp 5-6. RDC (2010), The democratic republic of Congo’s country snapshot, Socio-Economic, Macroeconomic Environment and trend in social spending and Characteristics of the social Protection System. Kinshasa, 4 p. RDC/MEPSP (2010), Stratégie pour le développement du sous-secteur de l’EPSP 2010/2011-2015/2016, Kinshasa, 87 p. RDC/MEPSP (2012), Plan intérimaire de l’éducation 2012/2014, Kinshasa, 110 p. ROTH, C. (1996), La séparation des sexes chez les Zara au Burkina Faso, Éditions L’Harmattan, Paris, 254 p. SALAZAR, M. C. (1998), “Child Work and Education in Latin America”, in : M. C. Salazar and W. A. Glasinovich (éd.), Child Work and Education. Five case studies from Latin America, UNICEF, Florence, pp. 1-19. SATHAR, Zeba A. and Cynthia B. LLOYD (1993), “Who Gets Primary Schooling in Pakistan : Inequalities Among and Within Families”, Working Papers N° 52, New York, The Population Council Research Division, 43 p. SCHLEMMER, B. (1996), “Présentation générale”, in : Bernard SCHLEMMER (éd.), L’enfant exploité. Oppression, mise au travail, prolétarisation, Karthala-ORSTOM, Paris, pp. 7-27. SEN, Amartya (1992), Inequality Reexamined, Oxford, Clarendon Press. SHAPIRO, David (1999), “Family Influences on Women’sEducationalAttainment in Kinshasa”, Communication au Séminaire International CICRED “Stratégies éducatives, familles et dynamiques démographiques”, Ouagadougou, Burkina Faso, 15-19 novembre 1999, 20 p. UCW/UNICEF/IOL/WBG (2011), Child labour and out-of-school children: a statistical profile. Italia, Rome, 16 p. UNDP (2009), World population prospects : The 2008 revision. New York: UNDP. UNESCO (2000), Forum mondial sur l’éducation. Cadre d’action de Dakar, Paris, 78 p.
106
UNESCO (2008), Rapport mondial de suivi de l’EPT 2009. Vaincre l’inégalité : l’importance de la gouvernance, Éditions UNESCO, Paris, 490 p. UNESCO (2010), Rapport mondial de suivi de l’EPT 2010. Atteindre les marginalisés, Éditions UNESCO, Paris, 538 p. UNESCO (2012), Rapport mondial de suivi de l’EPT 2012. Jeunes et compétences : l’éducation au travail, Éditions UNESCO, Paris, 524 p. UNICEF (1997), La situation des enfants dans le monde 1997, New York, 116 p. UNICEF and UNESCO-UIS (2011), Global initiative on out-of-school children: Conceptual and methodological framework (CMF). New York and Montreal: UNICEF and UIS, March 16 p. URASHA, Mark, J.Ties BOERMA, Japheth Z.L.NG’WSHERMI, Raphael ISINGO, Dick SCHAPINK, and Yusufu KUMOGOLA (1997), “Orphanhood, child fostering and the Aids Epidemic in Rural Tanzania”, Health Transition Review 7, suppl.2, 141-153. WAKAM, Jean (2002), “La situation des enfants orphelins en matière de scolarisation en Afrique : le cas du Cameroun”, in Jeunesses, vieillesses, démographies et sociétés, Chaire Quetelet 2001/Reseau démographie de l’AUF, ed. Francis Gendreau, Dominique Tabutin, and Maud Poupard (Louvain-la-Neuve : Academia-Bruylant/L’Harmattan, 2002), pp.177-195. WAKAM, Jean (2003), “Structures démographiques des ménages et scolarisation des enfants au Cameroun”, in Éducation, Famille et Dynamiques Démographiques, Cosio M., Marcoux R., Pilon M., and Quesnal A. (dir.), CICRED, Paris, pp.183-217. World Bank (2001), World Development Report 2000/2001. Attacking Poverty, Oxford, Oxford University Press. World Bank (2006), World Development Report 2007.Development and the Next Generation, Washington, 270 p. ZOUNGRANA, Cécile, Joël Marie TOKINDANG, Richard MARCOUX and Mamadou KONATÉ (1998), “La trajectoire scolaire des filles à Bamako. Un parcours semé d’embûches”, in : Marie-France LANGE (éd.), L’école et les filles en Afrique. Scolarisation sous conditions, ÉditionsKarthala, Paris, p. 167-696.
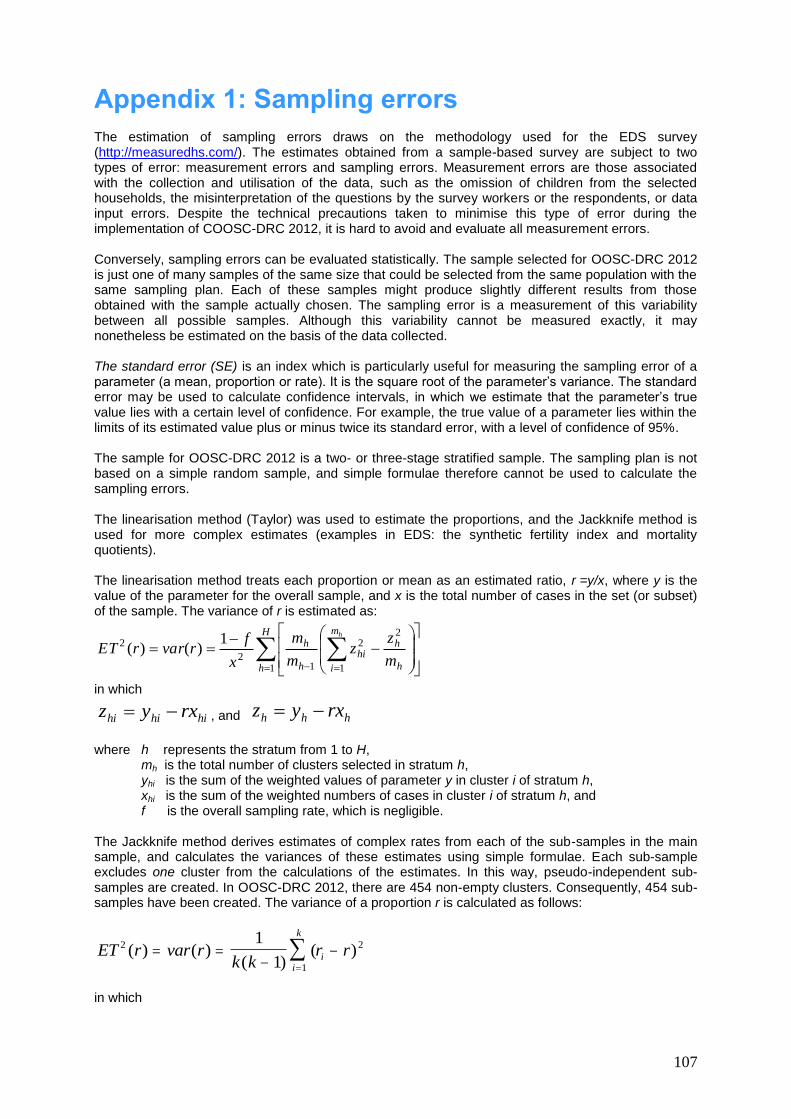
107
Appendix 1: Sampling errors The estimation of sampling errors draws on the methodology used for the EDS survey (http://measuredhs.com/). The estimates obtained from a sample-based survey are subject to two types of error: measurement errors and sampling errors. Measurement errors are those associated with the collection and utilisation of the data, such as the omission of children from the selected households, the misinterpretation of the questions by the survey workers or the respondents, or data input errors. Despite the technical precautions taken to minimise this type of error during the implementation of COOSC-DRC 2012, it is hard to avoid and evaluate all measurement errors. Conversely, sampling errors can be evaluated statistically. The sample selected for OOSC-DRC 2012 is just one of many samples of the same size that could be selected from the same population with the same sampling plan. Each of these samples might produce slightly different results from those obtained with the sample actually chosen. The sampling error is a measurement of this variability between all possible samples. Although this variability cannot be measured exactly, it may nonetheless be estimated on the basis of the data collected. The standard error (SE) is an index which is particularly useful for measuring the sampling error of a parameter (a mean, proportion or rate). It is the square root of the parameter’s variance. The standard error may be used to calculate confidence intervals, in which we estimate that the parameter’s true value lies with a certain level of confidence. For example, the true value of a parameter lies within the limits of its estimated value plus or minus twice its standard error, with a level of confidence of 95%. The sample for OOSC-DRC 2012 is a two- or three-stage stratified sample. The sampling plan is not based on a simple random sample, and simple formulae therefore cannot be used to calculate the sampling errors. The linearisation method (Taylor) was used to estimate the proportions, and the Jackknife method is used for more complex estimates (examples in EDS: the synthetic fertility index and mortality quotients). The linearisation method treats each proportion or mean as an estimated ratio, r =y/x, where y is the value of the parameter for the overall sample, and x is the total number of cases in the set (or subset) of the sample. The variance of r is estimated as:
H
h h
h
m
i
hi
h
h
m
zz
m
m
x
frvarrET
h
1
2
1
2
12
2 1)()(
in which
hihihi rxyz , and hhh rxyz
where h represents the stratum from 1 to H, mh is the total number of clusters selected in stratum h, yhi is the sum of the weighted values of parameter y in cluster i of stratum h, xhi is the sum of the weighted numbers of cases in cluster i of stratum h, and f is the overall sampling rate, which is negligible. The Jackknife method derives estimates of complex rates from each of the sub-samples in the main sample, and calculates the variances of these estimates using simple formulae. Each sub-sample excludes one cluster from the calculations of the estimates. In this way, pseudo-independent sub-samples are created. In OOSC-DRC 2012, there are 454 non-empty clusters. Consequently, 454 sub-samples have been created. The variance of a proportion r is calculated as follows:
ET r var rk k
r ri
k
i
2
1
21
1( ) ( )
( )( )
in which
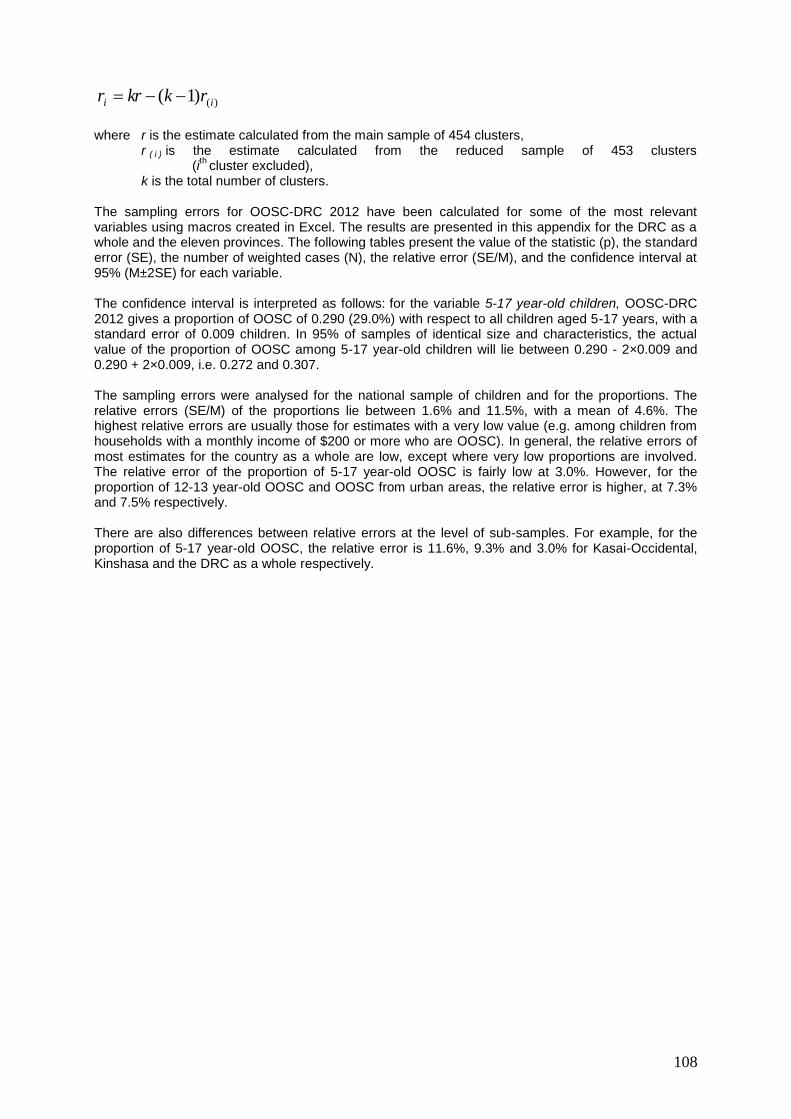
108
)()1( ii rkkrr
where r is the estimate calculated from the main sample of 454 clusters, r ( i ) is the estimate calculated from the reduced sample of 453 clusters (i
th cluster excluded),
k is the total number of clusters. The sampling errors for OOSC-DRC 2012 have been calculated for some of the most relevant variables using macros created in Excel. The results are presented in this appendix for the DRC as a whole and the eleven provinces. The following tables present the value of the statistic (p), the standard error (SE), the number of weighted cases (N), the relative error (SE/M), and the confidence interval at 95% (M±2SE) for each variable. The confidence interval is interpreted as follows: for the variable 5-17 year-old children, OOSC-DRC 2012 gives a proportion of OOSC of 0.290 (29.0%) with respect to all children aged 5-17 years, with a standard error of 0.009 children. In 95% of samples of identical size and characteristics, the actual value of the proportion of OOSC among 5-17 year-old children will lie between 0.290 - 2×0.009 and 0.290 + 2×0.009, i.e. 0.272 and 0.307. The sampling errors were analysed for the national sample of children and for the proportions. The relative errors (SE/M) of the proportions lie between 1.6% and 11.5%, with a mean of 4.6%. The highest relative errors are usually those for estimates with a very low value (e.g. among children from households with a monthly income of $200 or more who are OOSC). In general, the relative errors of most estimates for the country as a whole are low, except where very low proportions are involved. The relative error of the proportion of 5-17 year-old OOSC is fairly low at 3.0%. However, for the proportion of 12-13 year-old OOSC and OOSC from urban areas, the relative error is higher, at 7.3% and 7.5% respectively. There are also differences between relative errors at the level of sub-samples. For example, for the proportion of 5-17 year-old OOSC, the relative error is 11.6%, 9.3% and 3.0% for Kasai-Occidental, Kinshasa and the DRC as a whole respectively.
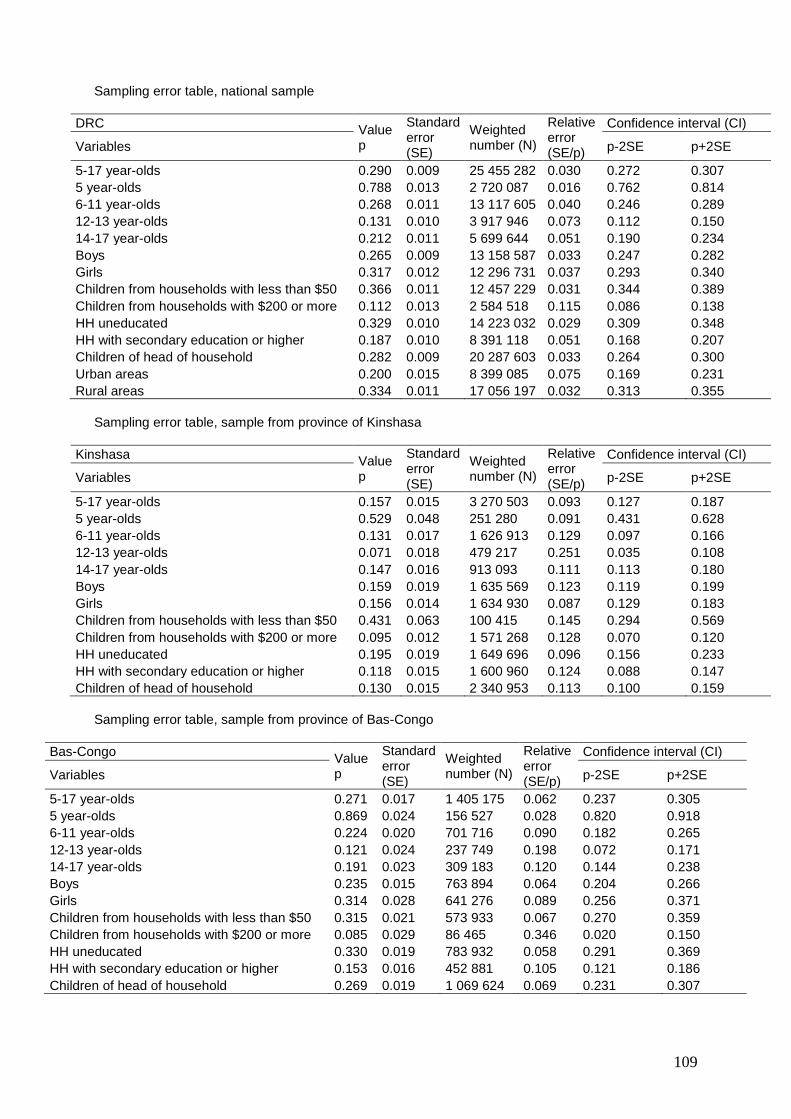
109
Sampling error table, national sample
DRC Value p
Standard error (SE)
Weighted number (N)
Relative error (SE/p)
Confidence interval (CI)
Variables p-2SE p+2SE
5-17 year-olds 0.290 0.009 25 455 282 0.030 0.272 0.307
5 year-olds 0.788 0.013 2 720 087 0.016 0.762 0.814
6-11 year-olds 0.268 0.011 13 117 605 0.040 0.246 0.289
12-13 year-olds 0.131 0.010 3 917 946 0.073 0.112 0.150
14-17 year-olds 0.212 0.011 5 699 644 0.051 0.190 0.234
Boys 0.265 0.009 13 158 587 0.033 0.247 0.282
Girls 0.317 0.012 12 296 731 0.037 0.293 0.340
Children from households with less than $50 0.366 0.011 12 457 229 0.031 0.344 0.389
Children from households with $200 or more 0.112 0.013 2 584 518 0.115 0.086 0.138
HH uneducated 0.329 0.010 14 223 032 0.029 0.309 0.348
HH with secondary education or higher 0.187 0.010 8 391 118 0.051 0.168 0.207
Children of head of household 0.282 0.009 20 287 603 0.033 0.264 0.300
Urban areas 0.200 0.015 8 399 085 0.075 0.169 0.231
Rural areas 0.334 0.011 17 056 197 0.032 0.313 0.355
Sampling error table, sample from province of Kinshasa
Kinshasa Value p
Standard error (SE)
Weighted number (N)
Relative error (SE/p)
Confidence interval (CI)
Variables p-2SE p+2SE
5-17 year-olds 0.157 0.015 3 270 503 0.093 0.127 0.187
5 year-olds 0.529 0.048 251 280 0.091 0.431 0.628
6-11 year-olds 0.131 0.017 1 626 913 0.129 0.097 0.166
12-13 year-olds 0.071 0.018 479 217 0.251 0.035 0.108
14-17 year-olds 0.147 0.016 913 093 0.111 0.113 0.180
Boys 0.159 0.019 1 635 569 0.123 0.119 0.199
Girls 0.156 0.014 1 634 930 0.087 0.129 0.183
Children from households with less than $50 0.431 0.063 100 415 0.145 0.294 0.569
Children from households with $200 or more 0.095 0.012 1 571 268 0.128 0.070 0.120
HH uneducated 0.195 0.019 1 649 696 0.096 0.156 0.233
HH with secondary education or higher 0.118 0.015 1 600 960 0.124 0.088 0.147
Children of head of household 0.130 0.015 2 340 953 0.113 0.100 0.159
Sampling error table, sample from province of Bas-Congo
Bas-Congo Value p
Standard error (SE)
Weighted number (N)
Relative error (SE/p)
Confidence interval (CI)
Variables p-2SE p+2SE
5-17 year-olds 0.271 0.017 1 405 175 0.062 0.237 0.305
5 year-olds 0.869 0.024 156 527 0.028 0.820 0.918
6-11 year-olds 0.224 0.020 701 716 0.090 0.182 0.265
12-13 year-olds 0.121 0.024 237 749 0.198 0.072 0.171
14-17 year-olds 0.191 0.023 309 183 0.120 0.144 0.238
Boys 0.235 0.015 763 894 0.064 0.204 0.266
Girls 0.314 0.028 641 276 0.089 0.256 0.371
Children from households with less than $50 0.315 0.021 573 933 0.067 0.270 0.359
Children from households with $200 or more 0.085 0.029 86 465 0.346 0.020 0.150
HH uneducated 0.330 0.019 783 932 0.058 0.291 0.369
HH with secondary education or higher 0.153 0.016 452 881 0.105 0.121 0.186
Children of head of household 0.269 0.019 1 069 624 0.069 0.231 0.307
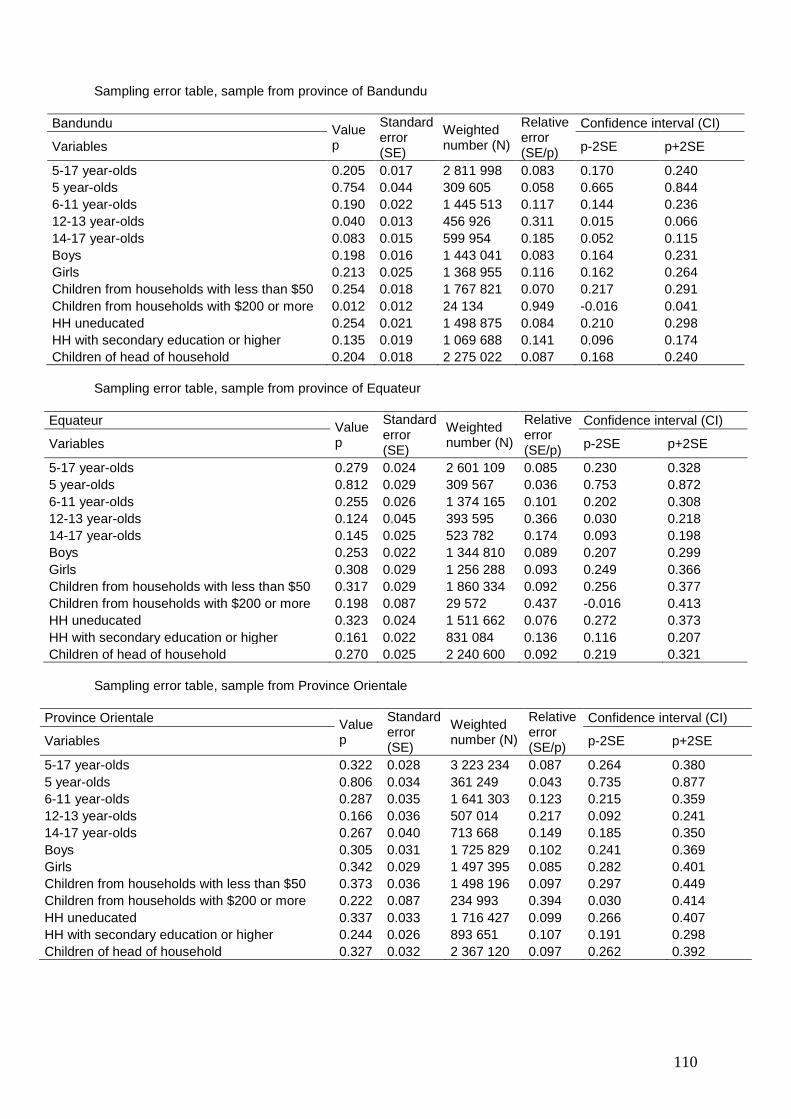
110
Sampling error table, sample from province of Bandundu
Bandundu Value p
Standard error (SE)
Weighted number (N)
Relative error (SE/p)
Confidence interval (CI)
Variables p-2SE p+2SE
5-17 year-olds 0.205 0.017 2 811 998 0.083 0.170 0.240
5 year-olds 0.754 0.044 309 605 0.058 0.665 0.844
6-11 year-olds 0.190 0.022 1 445 513 0.117 0.144 0.236
12-13 year-olds 0.040 0.013 456 926 0.311 0.015 0.066
14-17 year-olds 0.083 0.015 599 954 0.185 0.052 0.115
Boys 0.198 0.016 1 443 041 0.083 0.164 0.231
Girls 0.213 0.025 1 368 955 0.116 0.162 0.264
Children from households with less than $50 0.254 0.018 1 767 821 0.070 0.217 0.291
Children from households with $200 or more 0.012 0.012 24 134 0.949 -0.016 0.041
HH uneducated 0.254 0.021 1 498 875 0.084 0.210 0.298
HH with secondary education or higher 0.135 0.019 1 069 688 0.141 0.096 0.174
Children of head of household 0.204 0.018 2 275 022 0.087 0.168 0.240
Sampling error table, sample from province of Equateur
Equateur Value p
Standard error (SE)
Weighted number (N)
Relative error (SE/p)
Confidence interval (CI)
Variables p-2SE p+2SE
5-17 year-olds 0.279 0.024 2 601 109 0.085 0.230 0.328
5 year-olds 0.812 0.029 309 567 0.036 0.753 0.872
6-11 year-olds 0.255 0.026 1 374 165 0.101 0.202 0.308
12-13 year-olds 0.124 0.045 393 595 0.366 0.030 0.218
14-17 year-olds 0.145 0.025 523 782 0.174 0.093 0.198
Boys 0.253 0.022 1 344 810 0.089 0.207 0.299
Girls 0.308 0.029 1 256 288 0.093 0.249 0.366
Children from households with less than $50 0.317 0.029 1 860 334 0.092 0.256 0.377
Children from households with $200 or more 0.198 0.087 29 572 0.437 -0.016 0.413
HH uneducated 0.323 0.024 1 511 662 0.076 0.272 0.373
HH with secondary education or higher 0.161 0.022 831 084 0.136 0.116 0.207
Children of head of household 0.270 0.025 2 240 600 0.092 0.219 0.321
Sampling error table, sample from Province Orientale
Province Orientale Value p
Standard error (SE)
Weighted number (N)
Relative error (SE/p)
Confidence interval (CI)
Variables p-2SE p+2SE
5-17 year-olds 0.322 0.028 3 223 234 0.087 0.264 0.380
5 year-olds 0.806 0.034 361 249 0.043 0.735 0.877
6-11 year-olds 0.287 0.035 1 641 303 0.123 0.215 0.359
12-13 year-olds 0.166 0.036 507 014 0.217 0.092 0.241
14-17 year-olds 0.267 0.040 713 668 0.149 0.185 0.350
Boys 0.305 0.031 1 725 829 0.102 0.241 0.369
Girls 0.342 0.029 1 497 395 0.085 0.282 0.401
Children from households with less than $50 0.373 0.036 1 498 196 0.097 0.297 0.449
Children from households with $200 or more 0.222 0.087 234 993 0.394 0.030 0.414
HH uneducated 0.337 0.033 1 716 427 0.099 0.266 0.407
HH with secondary education or higher 0.244 0.026 893 651 0.107 0.191 0.298
Children of head of household 0.327 0.032 2 367 120 0.097 0.262 0.392
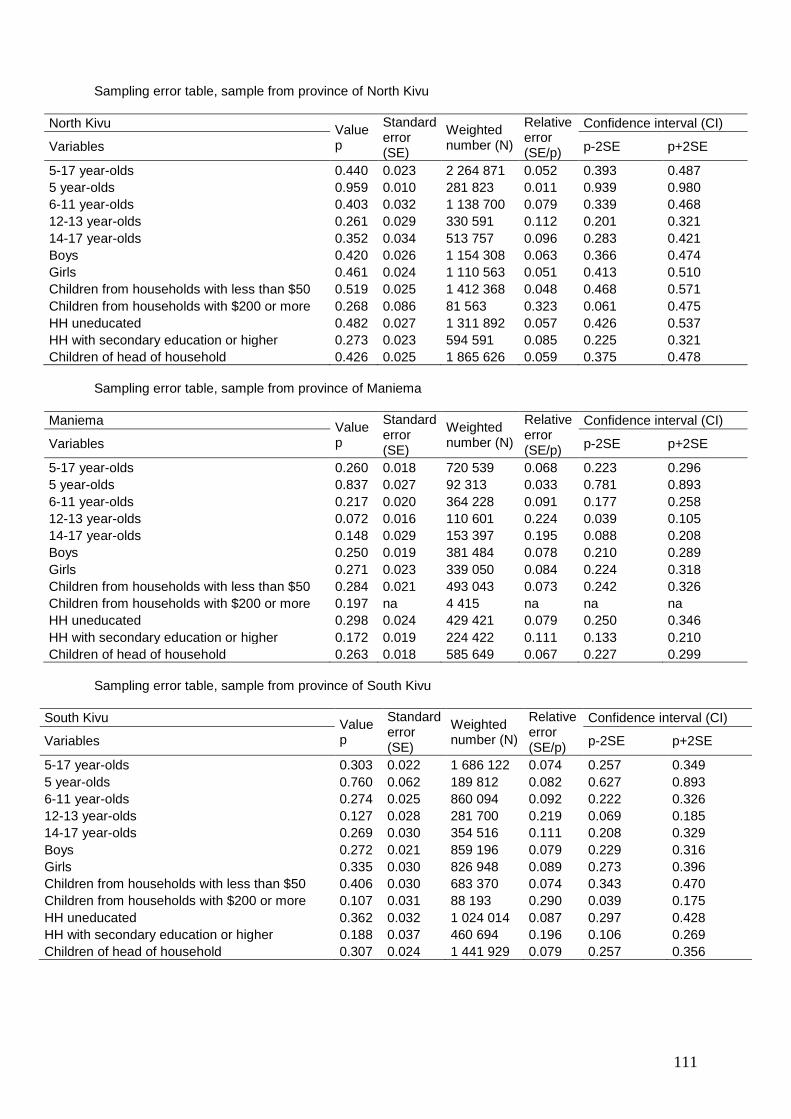
111
Sampling error table, sample from province of North Kivu
North Kivu Value p
Standard error (SE)
Weighted number (N)
Relative error (SE/p)
Confidence interval (CI)
Variables p-2SE p+2SE
5-17 year-olds 0.440 0.023 2 264 871 0.052 0.393 0.487
5 year-olds 0.959 0.010 281 823 0.011 0.939 0.980
6-11 year-olds 0.403 0.032 1 138 700 0.079 0.339 0.468
12-13 year-olds 0.261 0.029 330 591 0.112 0.201 0.321
14-17 year-olds 0.352 0.034 513 757 0.096 0.283 0.421
Boys 0.420 0.026 1 154 308 0.063 0.366 0.474
Girls 0.461 0.024 1 110 563 0.051 0.413 0.510
Children from households with less than $50 0.519 0.025 1 412 368 0.048 0.468 0.571
Children from households with $200 or more 0.268 0.086 81 563 0.323 0.061 0.475
HH uneducated 0.482 0.027 1 311 892 0.057 0.426 0.537
HH with secondary education or higher 0.273 0.023 594 591 0.085 0.225 0.321
Children of head of household 0.426 0.025 1 865 626 0.059 0.375 0.478
Sampling error table, sample from province of Maniema
Maniema Value p
Standard error (SE)
Weighted number (N)
Relative error (SE/p)
Confidence interval (CI)
Variables p-2SE p+2SE
5-17 year-olds 0.260 0.018 720 539 0.068 0.223 0.296
5 year-olds 0.837 0.027 92 313 0.033 0.781 0.893
6-11 year-olds 0.217 0.020 364 228 0.091 0.177 0.258
12-13 year-olds 0.072 0.016 110 601 0.224 0.039 0.105
14-17 year-olds 0.148 0.029 153 397 0.195 0.088 0.208
Boys 0.250 0.019 381 484 0.078 0.210 0.289
Girls 0.271 0.023 339 050 0.084 0.224 0.318
Children from households with less than $50 0.284 0.021 493 043 0.073 0.242 0.326
Children from households with $200 or more 0.197 na 4 415 na na na
HH uneducated 0.298 0.024 429 421 0.079 0.250 0.346
HH with secondary education or higher 0.172 0.019 224 422 0.111 0.133 0.210
Children of head of household 0.263 0.018 585 649 0.067 0.227 0.299
Sampling error table, sample from province of South Kivu
South Kivu Value p
Standard error (SE)
Weighted number (N)
Relative error (SE/p)
Confidence interval (CI)
Variables p-2SE p+2SE
5-17 year-olds 0.303 0.022 1 686 122 0.074 0.257 0.349
5 year-olds 0.760 0.062 189 812 0.082 0.627 0.893
6-11 year-olds 0.274 0.025 860 094 0.092 0.222 0.326
12-13 year-olds 0.127 0.028 281 700 0.219 0.069 0.185
14-17 year-olds 0.269 0.030 354 516 0.111 0.208 0.329
Boys 0.272 0.021 859 196 0.079 0.229 0.316
Girls 0.335 0.030 826 948 0.089 0.273 0.396
Children from households with less than $50 0.406 0.030 683 370 0.074 0.343 0.470
Children from households with $200 or more 0.107 0.031 88 193 0.290 0.039 0.175
HH uneducated 0.362 0.032 1 024 014 0.087 0.297 0.428
HH with secondary education or higher 0.188 0.037 460 694 0.196 0.106 0.269
Children of head of household 0.307 0.024 1 441 929 0.079 0.257 0.356
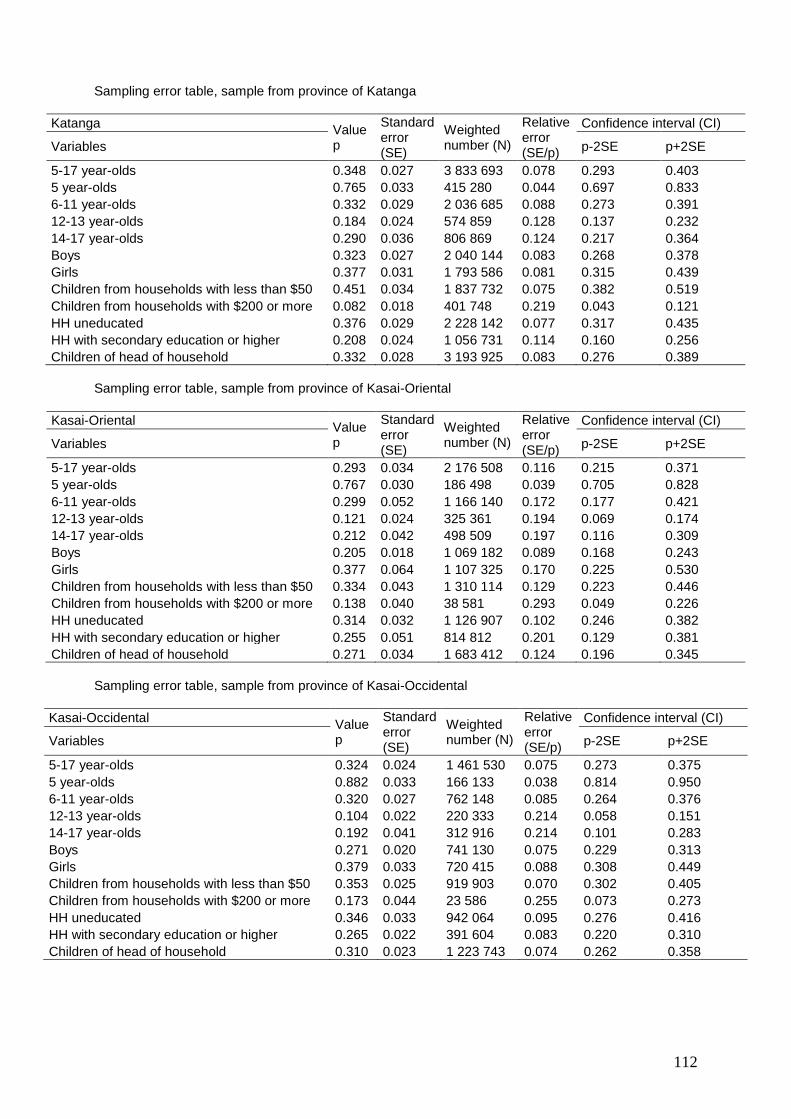
112
Sampling error table, sample from province of Katanga
Katanga Value p
Standard error (SE)
Weighted number (N)
Relative error (SE/p)
Confidence interval (CI)
Variables p-2SE p+2SE
5-17 year-olds 0.348 0.027 3 833 693 0.078 0.293 0.403
5 year-olds 0.765 0.033 415 280 0.044 0.697 0.833
6-11 year-olds 0.332 0.029 2 036 685 0.088 0.273 0.391
12-13 year-olds 0.184 0.024 574 859 0.128 0.137 0.232
14-17 year-olds 0.290 0.036 806 869 0.124 0.217 0.364
Boys 0.323 0.027 2 040 144 0.083 0.268 0.378
Girls 0.377 0.031 1 793 586 0.081 0.315 0.439
Children from households with less than $50 0.451 0.034 1 837 732 0.075 0.382 0.519
Children from households with $200 or more 0.082 0.018 401 748 0.219 0.043 0.121
HH uneducated 0.376 0.029 2 228 142 0.077 0.317 0.435
HH with secondary education or higher 0.208 0.024 1 056 731 0.114 0.160 0.256
Children of head of household 0.332 0.028 3 193 925 0.083 0.276 0.389
Sampling error table, sample from province of Kasai-Oriental
Kasai-Oriental Value p
Standard error (SE)
Weighted number (N)
Relative error (SE/p)
Confidence interval (CI)
Variables p-2SE p+2SE
5-17 year-olds 0.293 0.034 2 176 508 0.116 0.215 0.371
5 year-olds 0.767 0.030 186 498 0.039 0.705 0.828
6-11 year-olds 0.299 0.052 1 166 140 0.172 0.177 0.421
12-13 year-olds 0.121 0.024 325 361 0.194 0.069 0.174
14-17 year-olds 0.212 0.042 498 509 0.197 0.116 0.309
Boys 0.205 0.018 1 069 182 0.089 0.168 0.243
Girls 0.377 0.064 1 107 325 0.170 0.225 0.530
Children from households with less than $50 0.334 0.043 1 310 114 0.129 0.223 0.446
Children from households with $200 or more 0.138 0.040 38 581 0.293 0.049 0.226
HH uneducated 0.314 0.032 1 126 907 0.102 0.246 0.382
HH with secondary education or higher 0.255 0.051 814 812 0.201 0.129 0.381
Children of head of household 0.271 0.034 1 683 412 0.124 0.196 0.345
Sampling error table, sample from province of Kasai-Occidental
Kasai-Occidental Value p
Standard error (SE)
Weighted number (N)
Relative error (SE/p)
Confidence interval (CI)
Variables p-2SE p+2SE
5-17 year-olds 0.324 0.024 1 461 530 0.075 0.273 0.375
5 year-olds 0.882 0.033 166 133 0.038 0.814 0.950
6-11 year-olds 0.320 0.027 762 148 0.085 0.264 0.376
12-13 year-olds 0.104 0.022 220 333 0.214 0.058 0.151
14-17 year-olds 0.192 0.041 312 916 0.214 0.101 0.283
Boys 0.271 0.020 741 130 0.075 0.229 0.313
Girls 0.379 0.033 720 415 0.088 0.308 0.449
Children from households with less than $50 0.353 0.025 919 903 0.070 0.302 0.405
Children from households with $200 or more 0.173 0.044 23 586 0.255 0.073 0.273
HH uneducated 0.346 0.033 942 064 0.095 0.276 0.416
HH with secondary education or higher 0.265 0.022 391 604 0.083 0.220 0.310
Children of head of household 0.310 0.023 1 223 743 0.074 0.262 0.358
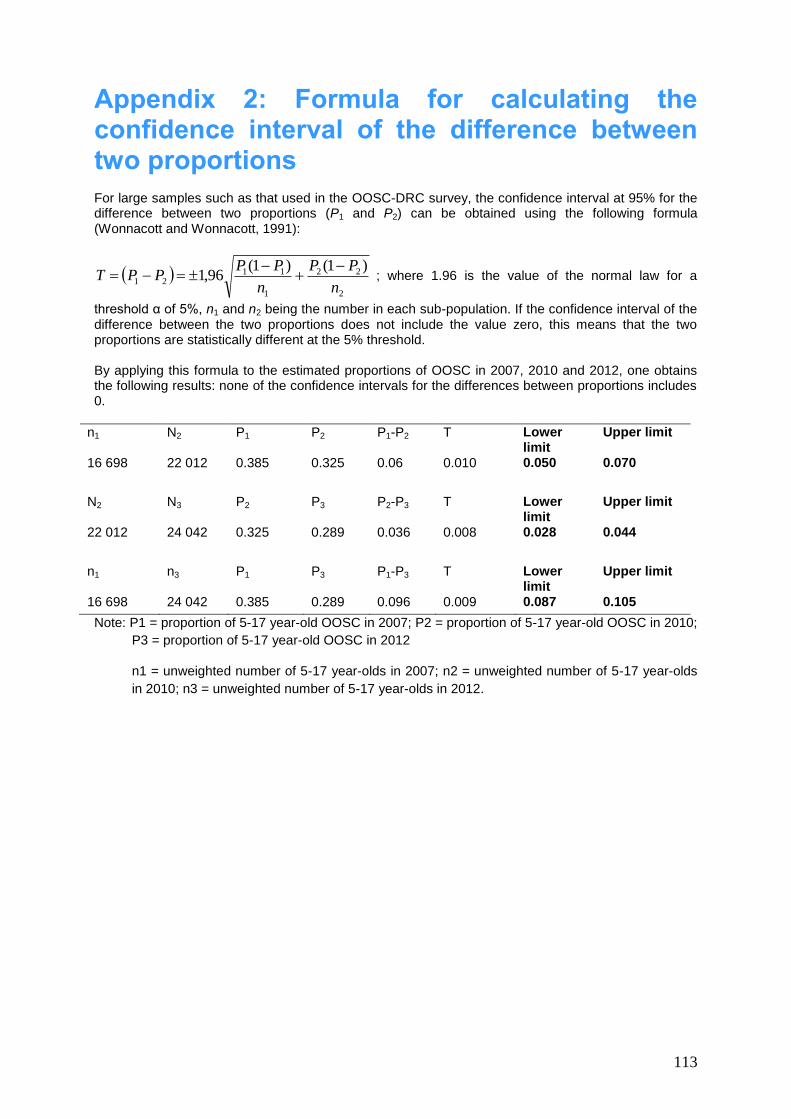
113
Appendix 2: Formula for calculating the confidence interval of the difference between two proportions For large samples such as that used in the OOSC-DRC survey, the confidence interval at 95% for the difference between two proportions (P1 and P2) can be obtained using the following formula (Wonnacott and Wonnacott, 1991):
2
22
1
1121
)1()1(96,1
n
PP
n
PPPPT
; where 1.96 is the value of the normal law for a
threshold α of 5%, n1 and n2 being the number in each sub-population. If the confidence interval of the difference between the two proportions does not include the value zero, this means that the two proportions are statistically different at the 5% threshold. By applying this formula to the estimated proportions of OOSC in 2007, 2010 and 2012, one obtains the following results: none of the confidence intervals for the differences between proportions includes 0.
n1 N2 P1 P2 P1-P2 T Lower limit
Upper limit
16 698 22 012 0.385 0.325 0.06 0.010 0.050 0.070
N2 N3 P2 P3 P2-P3 T Lower limit
Upper limit
22 012 24 042 0.325 0.289 0.036 0.008 0.028 0.044
n1 n3 P1 P3 P1-P3 T Lower limit
Upper limit
16 698 24 042 0.385 0.289 0.096 0.009 0.087 0.105
Note: P1 = proportion of 5-17 year-old OOSC in 2007; P2 = proportion of 5-17 year-old OOSC in 2010;
P3 = proportion of 5-17 year-old OOSC in 2012
n1 = unweighted number of 5-17 year-olds in 2007; n2 = unweighted number of 5-17 year-olds
in 2010; n3 = unweighted number of 5-17 year-olds in 2012.
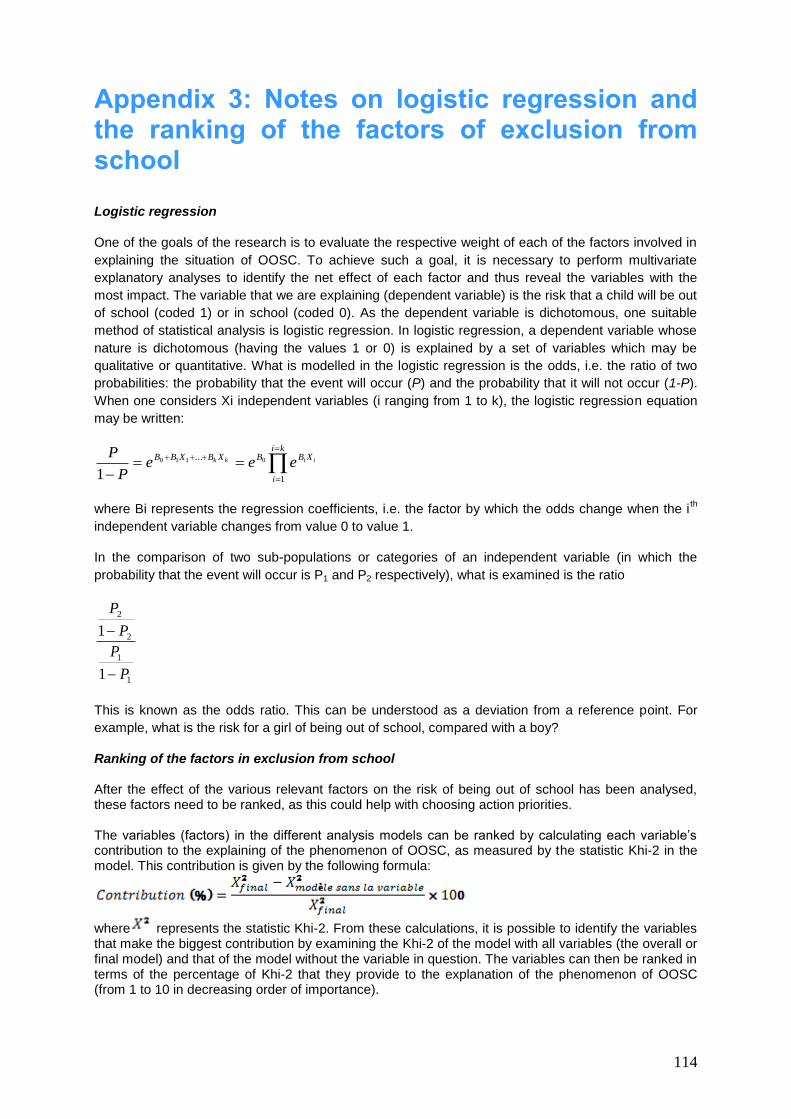
114
Appendix 3: Notes on logistic regression and the ranking of the factors of exclusion from school
Logistic regression
One of the goals of the research is to evaluate the respective weight of each of the factors involved in
explaining the situation of OOSC. To achieve such a goal, it is necessary to perform multivariate
explanatory analyses to identify the net effect of each factor and thus reveal the variables with the
most impact. The variable that we are explaining (dependent variable) is the risk that a child will be out
of school (coded 1) or in school (coded 0). As the dependent variable is dichotomous, one suitable
method of statistical analysis is logistic regression. In logistic regression, a dependent variable whose
nature is dichotomous (having the values 1 or 0) is explained by a set of variables which may be
qualitative or quantitative. What is modelled in the logistic regression is the odds, i.e. the ratio of two
probabilities: the probability that the event will occur (P) and the probability that it will not occur (1-P).
When one considers Xi independent variables (i ranging from 1 to k), the logistic regression equation
may be written:
ki
i
XBBXBXBB iikk eeeP
P
1
... 0110
1
where Bi represents the regression coefficients, i.e. the factor by which the odds change when the ith
independent variable changes from value 0 to value 1.
In the comparison of two sub-populations or categories of an independent variable (in which the
probability that the event will occur is P1 and P2 respectively), what is examined is the ratio
1
1
2
2
1
1
P
P
P
P
This is known as the odds ratio. This can be understood as a deviation from a reference point. For
example, what is the risk for a girl of being out of school, compared with a boy?
Ranking of the factors in exclusion from school
After the effect of the various relevant factors on the risk of being out of school has been analysed, these factors need to be ranked, as this could help with choosing action priorities. The variables (factors) in the different analysis models can be ranked by calculating each variable’s contribution to the explaining of the phenomenon of OOSC, as measured by the statistic Khi-2 in the model. This contribution is given by the following formula:
where represents the statistic Khi-2. From these calculations, it is possible to identify the variables that make the biggest contribution by examining the Khi-2 of the model with all variables (the overall or final model) and that of the model without the variable in question. The variables can then be ranked in terms of the percentage of Khi-2 that they provide to the explanation of the phenomenon of OOSC (from 1 to 10 in decreasing order of importance).
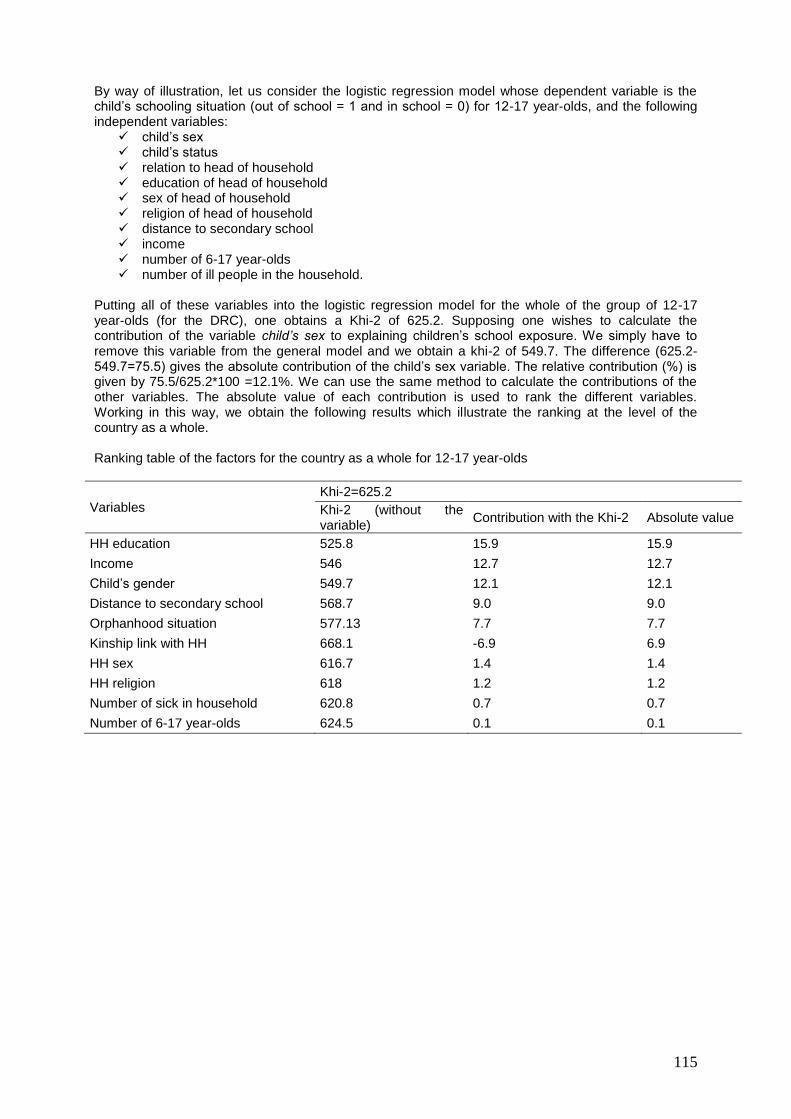
115
By way of illustration, let us consider the logistic regression model whose dependent variable is the child’s schooling situation (out of school = 1 and in school = 0) for 12-17 year-olds, and the following independent variables:
child’s sex child’s status relation to head of household education of head of household sex of head of household religion of head of household distance to secondary school income number of 6-17 year-olds number of ill people in the household.
Putting all of these variables into the logistic regression model for the whole of the group of 12-17 year-olds (for the DRC), one obtains a Khi-2 of 625.2. Supposing one wishes to calculate the contribution of the variable child’s sex to explaining children’s school exposure. We simply have to remove this variable from the general model and we obtain a khi-2 of 549.7. The difference (625.2-549.7=75.5) gives the absolute contribution of the child’s sex variable. The relative contribution (%) is given by 75.5/625.2*100 =12.1%. We can use the same method to calculate the contributions of the other variables. The absolute value of each contribution is used to rank the different variables. Working in this way, we obtain the following results which illustrate the ranking at the level of the country as a whole. Ranking table of the factors for the country as a whole for 12-17 year-olds
Variables
Khi-2=625.2
Khi-2 (without the variable)
Contribution with the Khi-2 Absolute value
HH education 525.8 15.9 15.9
Income 546 12.7 12.7
Child’s gender 549.7 12.1 12.1
Distance to secondary school 568.7 9.0 9.0
Orphanhood situation 577.13 7.7 7.7
Kinship link with HH 668.1 -6.9 6.9
HH sex 616.7 1.4 1.4
HH religion 618 1.2 1.2
Number of sick in household 620.8 0.7 0.7
Number of 6-17 year-olds 624.5 0.1 0.1
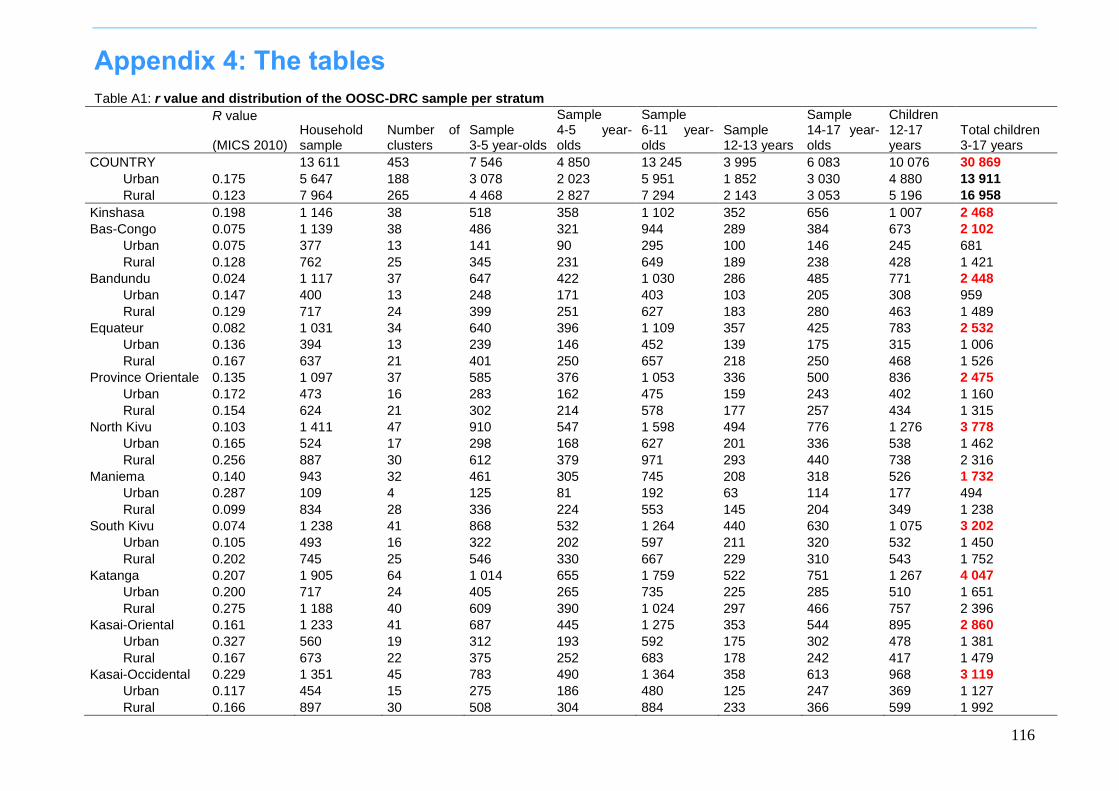
116
Appendix 4: The tables Table A1: r value and distribution of the OOSC-DRC sample per stratum
R value Household sample
Number of clusters
Sample 3-5 year-olds
Sample 4-5 year-olds
Sample 6-11 year-olds
Sample 12-13 years
Sample 14-17 year-olds
Children 12-17 years
Total children 3-17 years (MICS 2010)
COUNTRY 13 611 453 7 546 4 850 13 245 3 995 6 083 10 076 30 869
Urban 0.175 5 647 188 3 078 2 023 5 951 1 852 3 030 4 880 13 911
Rural 0.123 7 964 265 4 468 2 827 7 294 2 143 3 053 5 196 16 958
Kinshasa 0.198 1 146 38 518 358 1 102 352 656 1 007 2 468
Bas-Congo 0.075 1 139 38 486 321 944 289 384 673 2 102
Urban 0.075 377 13 141 90 295 100 146 245 681
Rural 0.128 762 25 345 231 649 189 238 428 1 421
Bandundu 0.024 1 117 37 647 422 1 030 286 485 771 2 448
Urban 0.147 400 13 248 171 403 103 205 308 959
Rural 0.129 717 24 399 251 627 183 280 463 1 489
Equateur 0.082 1 031 34 640 396 1 109 357 425 783 2 532
Urban 0.136 394 13 239 146 452 139 175 315 1 006
Rural 0.167 637 21 401 250 657 218 250 468 1 526
Province Orientale 0.135 1 097 37 585 376 1 053 336 500 836 2 475
Urban 0.172 473 16 283 162 475 159 243 402 1 160
Rural 0.154 624 21 302 214 578 177 257 434 1 315
North Kivu 0.103 1 411 47 910 547 1 598 494 776 1 276 3 778
Urban 0.165 524 17 298 168 627 201 336 538 1 462
Rural 0.256 887 30 612 379 971 293 440 738 2 316
Maniema 0.140 943 32 461 305 745 208 318 526 1 732
Urban 0.287 109 4 125 81 192 63 114 177 494
Rural 0.099 834 28 336 224 553 145 204 349 1 238
South Kivu 0.074 1 238 41 868 532 1 264 440 630 1 075 3 202
Urban 0.105 493 16 322 202 597 211 320 532 1 450
Rural 0.202 745 25 546 330 667 229 310 543 1 752
Katanga 0.207 1 905 64 1 014 655 1 759 522 751 1 267 4 047
Urban 0.200 717 24 405 265 735 225 285 510 1 651
Rural 0.275 1 188 40 609 390 1 024 297 466 757 2 396
Kasai-Oriental 0.161 1 233 41 687 445 1 275 353 544 895 2 860
Urban 0.327 560 19 312 193 592 175 302 478 1 381
Rural 0.167 673 22 375 252 683 178 242 417 1 479
Kasai-Occidental 0.229 1 351 45 783 490 1 364 358 613 968 3 119
Urban 0.117 454 15 275 186 480 125 247 369 1 127
Rural 0.166 897 30 508 304 884 233 366 599 1 992
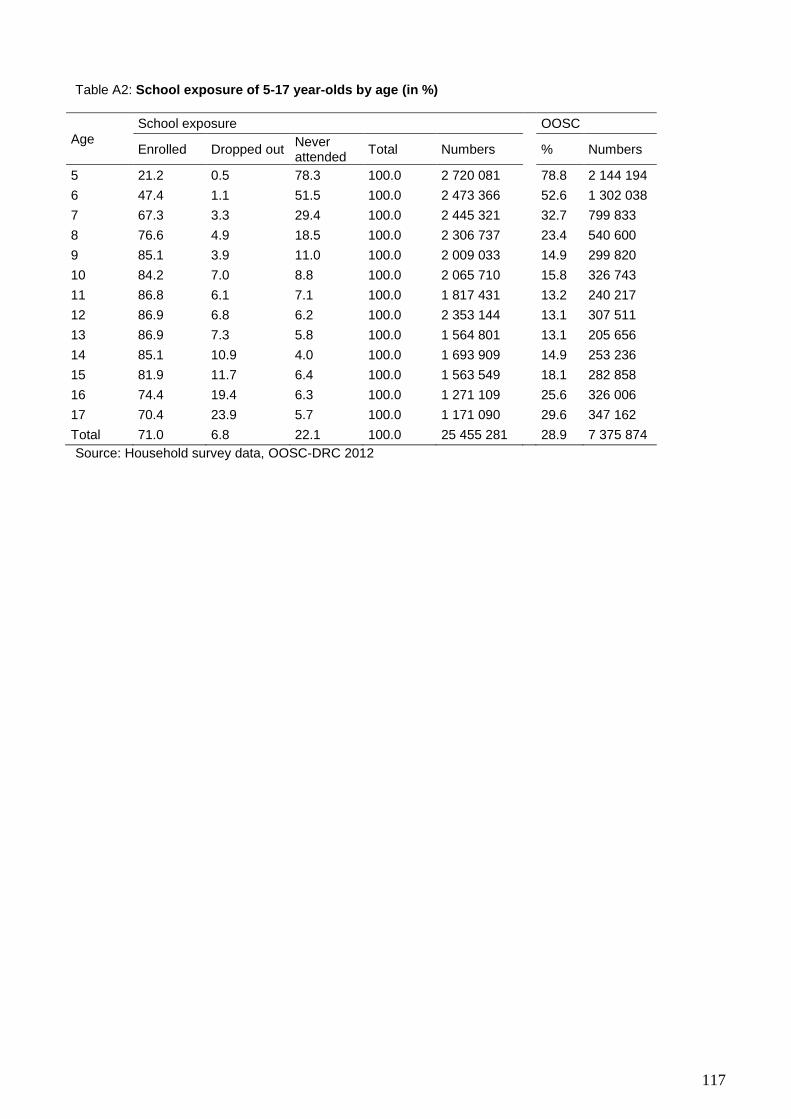
117
Table A2: School exposure of 5-17 year-olds by age (in %)
Age
School exposure OOSC
Enrolled Dropped out Never attended
Total Numbers % Numbers
5 21.2 0.5 78.3 100.0 2 720 081 78.8 2 144 194
6 47.4 1.1 51.5 100.0 2 473 366 52.6 1 302 038
7 67.3 3.3 29.4 100.0 2 445 321 32.7 799 833
8 76.6 4.9 18.5 100.0 2 306 737 23.4 540 600
9 85.1 3.9 11.0 100.0 2 009 033 14.9 299 820
10 84.2 7.0 8.8 100.0 2 065 710 15.8 326 743
11 86.8 6.1 7.1 100.0 1 817 431 13.2 240 217
12 86.9 6.8 6.2 100.0 2 353 144 13.1 307 511
13 86.9 7.3 5.8 100.0 1 564 801 13.1 205 656
14 85.1 10.9 4.0 100.0 1 693 909 14.9 253 236
15 81.9 11.7 6.4 100.0 1 563 549 18.1 282 858
16 74.4 19.4 6.3 100.0 1 271 109 25.6 326 006
17 70.4 23.9 5.7 100.0 1 171 090 29.6 347 162
Total 71.0 6.8 22.1 100.0 25 455 281 28.9 7 375 874
Source: Household survey data, OOSC-DRC 2012
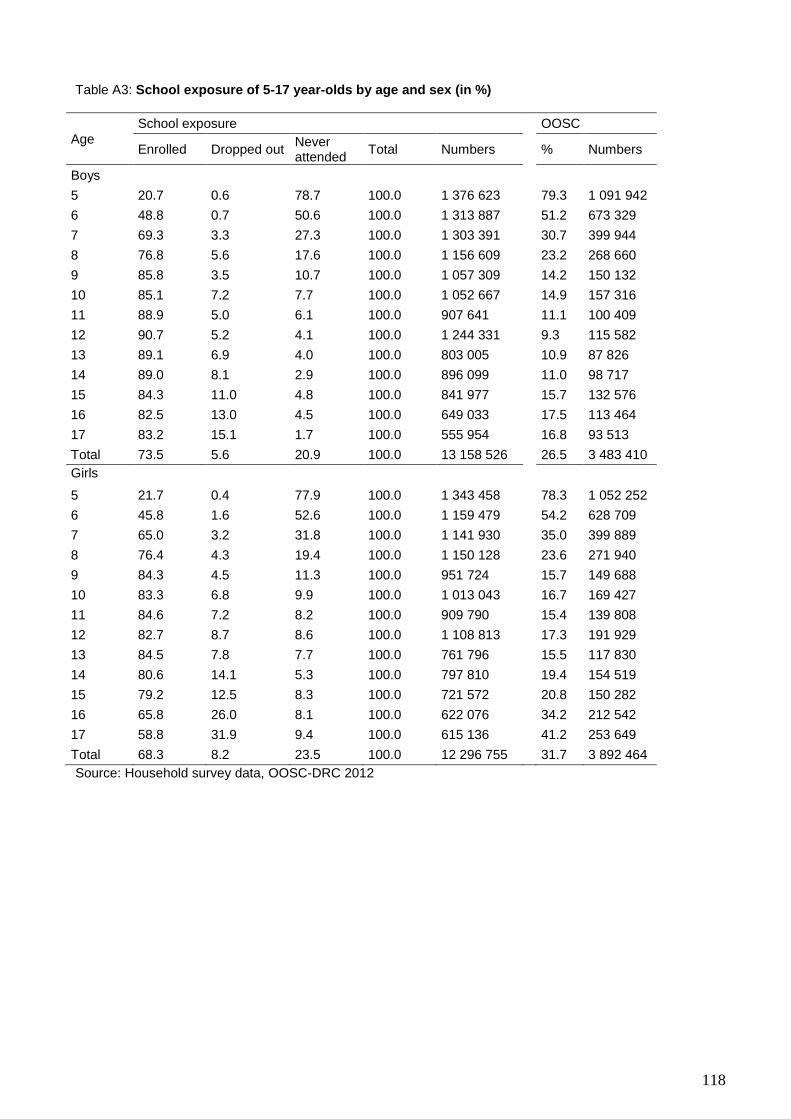
118
Table A3: School exposure of 5-17 year-olds by age and sex (in %)
Age
School exposure OOSC
Enrolled Dropped out Never attended
Total Numbers % Numbers
Boys
5 20.7 0.6 78.7 100.0 1 376 623 79.3 1 091 942
6 48.8 0.7 50.6 100.0 1 313 887 51.2 673 329
7 69.3 3.3 27.3 100.0 1 303 391 30.7 399 944
8 76.8 5.6 17.6 100.0 1 156 609 23.2 268 660
9 85.8 3.5 10.7 100.0 1 057 309 14.2 150 132
10 85.1 7.2 7.7 100.0 1 052 667 14.9 157 316
11 88.9 5.0 6.1 100.0 907 641 11.1 100 409
12 90.7 5.2 4.1 100.0 1 244 331 9.3 115 582
13 89.1 6.9 4.0 100.0 803 005 10.9 87 826
14 89.0 8.1 2.9 100.0 896 099 11.0 98 717
15 84.3 11.0 4.8 100.0 841 977 15.7 132 576
16 82.5 13.0 4.5 100.0 649 033 17.5 113 464
17 83.2 15.1 1.7 100.0 555 954 16.8 93 513
Total 73.5 5.6 20.9 100.0 13 158 526 26.5 3 483 410
Girls
5 21.7 0.4 77.9 100.0 1 343 458 78.3 1 052 252
6 45.8 1.6 52.6 100.0 1 159 479 54.2 628 709
7 65.0 3.2 31.8 100.0 1 141 930 35.0 399 889
8 76.4 4.3 19.4 100.0 1 150 128 23.6 271 940
9 84.3 4.5 11.3 100.0 951 724 15.7 149 688
10 83.3 6.8 9.9 100.0 1 013 043 16.7 169 427
11 84.6 7.2 8.2 100.0 909 790 15.4 139 808
12 82.7 8.7 8.6 100.0 1 108 813 17.3 191 929
13 84.5 7.8 7.7 100.0 761 796 15.5 117 830
14 80.6 14.1 5.3 100.0 797 810 19.4 154 519
15 79.2 12.5 8.3 100.0 721 572 20.8 150 282
16 65.8 26.0 8.1 100.0 622 076 34.2 212 542
17 58.8 31.9 9.4 100.0 615 136 41.2 253 649
Total 68.3 8.2 23.5 100.0 12 296 755 31.7 3 892 464
Source: Household survey data, OOSC-DRC 2012
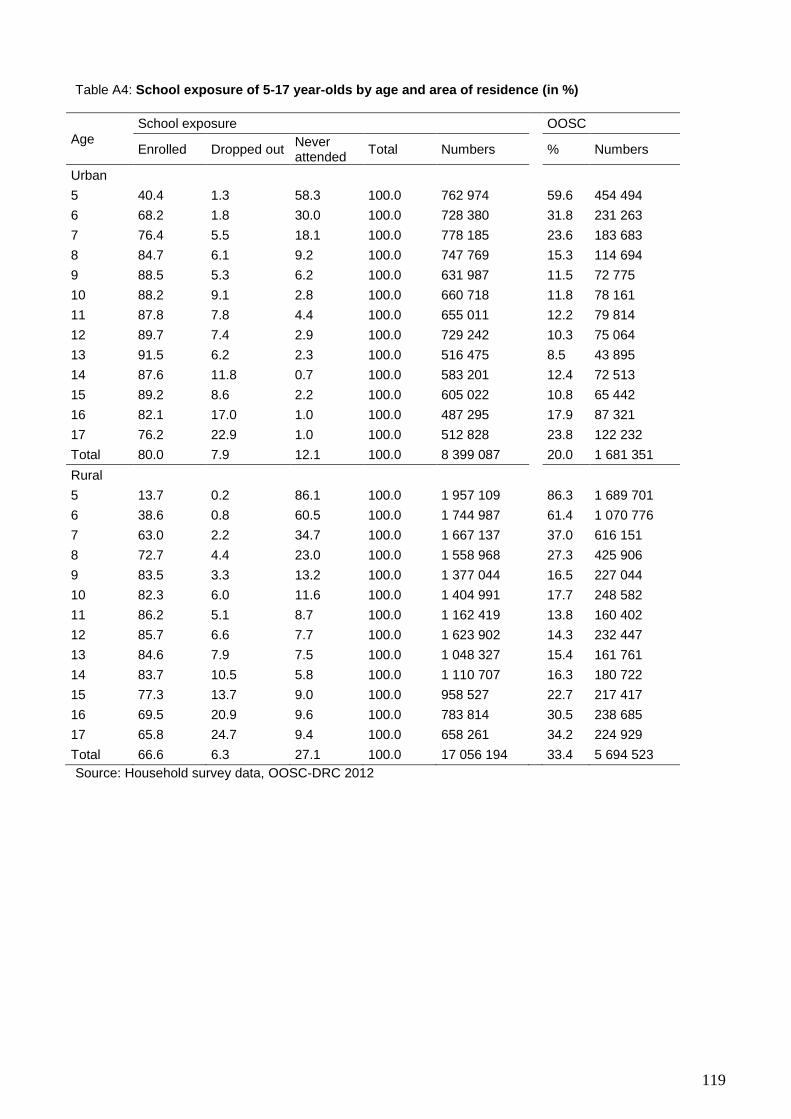
119
Table A4: School exposure of 5-17 year-olds by age and area of residence (in %)
Age
School exposure OOSC
Enrolled Dropped out Never attended
Total Numbers % Numbers
Urban
5 40.4 1.3 58.3 100.0 762 974 59.6 454 494
6 68.2 1.8 30.0 100.0 728 380 31.8 231 263
7 76.4 5.5 18.1 100.0 778 185 23.6 183 683
8 84.7 6.1 9.2 100.0 747 769 15.3 114 694
9 88.5 5.3 6.2 100.0 631 987 11.5 72 775
10 88.2 9.1 2.8 100.0 660 718 11.8 78 161
11 87.8 7.8 4.4 100.0 655 011 12.2 79 814
12 89.7 7.4 2.9 100.0 729 242 10.3 75 064
13 91.5 6.2 2.3 100.0 516 475 8.5 43 895
14 87.6 11.8 0.7 100.0 583 201 12.4 72 513
15 89.2 8.6 2.2 100.0 605 022 10.8 65 442
16 82.1 17.0 1.0 100.0 487 295 17.9 87 321
17 76.2 22.9 1.0 100.0 512 828 23.8 122 232
Total 80.0 7.9 12.1 100.0 8 399 087 20.0 1 681 351
Rural
5 13.7 0.2 86.1 100.0 1 957 109 86.3 1 689 701
6 38.6 0.8 60.5 100.0 1 744 987 61.4 1 070 776
7 63.0 2.2 34.7 100.0 1 667 137 37.0 616 151
8 72.7 4.4 23.0 100.0 1 558 968 27.3 425 906
9 83.5 3.3 13.2 100.0 1 377 044 16.5 227 044
10 82.3 6.0 11.6 100.0 1 404 991 17.7 248 582
11 86.2 5.1 8.7 100.0 1 162 419 13.8 160 402
12 85.7 6.6 7.7 100.0 1 623 902 14.3 232 447
13 84.6 7.9 7.5 100.0 1 048 327 15.4 161 761
14 83.7 10.5 5.8 100.0 1 110 707 16.3 180 722
15 77.3 13.7 9.0 100.0 958 527 22.7 217 417
16 69.5 20.9 9.6 100.0 783 814 30.5 238 685
17 65.8 24.7 9.4 100.0 658 261 34.2 224 929
Total 66.6 6.3 27.1 100.0 17 056 194 33.4 5 694 523
Source: Household survey data, OOSC-DRC 2012
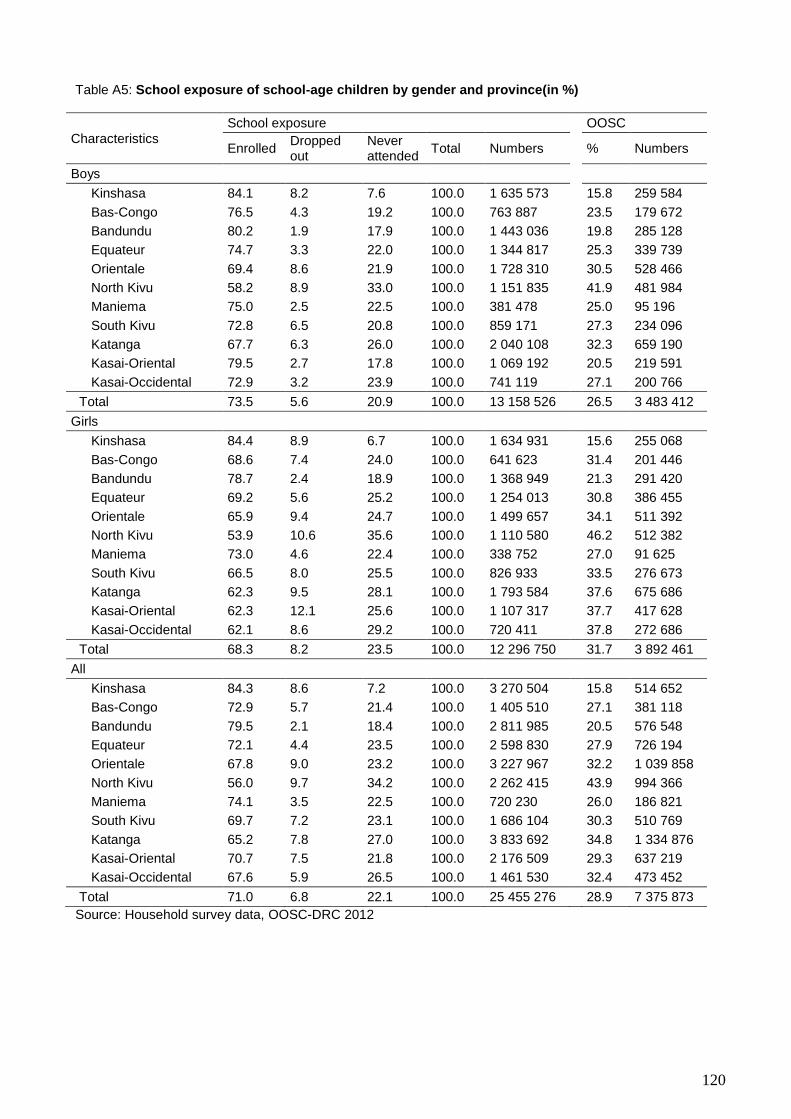
120
Table A5: School exposure of school-age children by gender and province(in %)
Characteristics
School exposure OOSC
Enrolled Dropped out
Never attended
Total Numbers % Numbers
Boys
Kinshasa 84.1 8.2 7.6 100.0 1 635 573 15.8 259 584
Bas-Congo 76.5 4.3 19.2 100.0 763 887 23.5 179 672
Bandundu 80.2 1.9 17.9 100.0 1 443 036 19.8 285 128
Equateur 74.7 3.3 22.0 100.0 1 344 817 25.3 339 739
Orientale 69.4 8.6 21.9 100.0 1 728 310 30.5 528 466
North Kivu 58.2 8.9 33.0 100.0 1 151 835 41.9 481 984
Maniema 75.0 2.5 22.5 100.0 381 478 25.0 95 196
South Kivu 72.8 6.5 20.8 100.0 859 171 27.3 234 096
Katanga 67.7 6.3 26.0 100.0 2 040 108 32.3 659 190
Kasai-Oriental 79.5 2.7 17.8 100.0 1 069 192 20.5 219 591
Kasai-Occidental 72.9 3.2 23.9 100.0 741 119 27.1 200 766
Total 73.5 5.6 20.9 100.0 13 158 526 26.5 3 483 412
Girls
Kinshasa 84.4 8.9 6.7 100.0 1 634 931 15.6 255 068
Bas-Congo 68.6 7.4 24.0 100.0 641 623 31.4 201 446
Bandundu 78.7 2.4 18.9 100.0 1 368 949 21.3 291 420
Equateur 69.2 5.6 25.2 100.0 1 254 013 30.8 386 455
Orientale 65.9 9.4 24.7 100.0 1 499 657 34.1 511 392
North Kivu 53.9 10.6 35.6 100.0 1 110 580 46.2 512 382
Maniema 73.0 4.6 22.4 100.0 338 752 27.0 91 625
South Kivu 66.5 8.0 25.5 100.0 826 933 33.5 276 673
Katanga 62.3 9.5 28.1 100.0 1 793 584 37.6 675 686
Kasai-Oriental 62.3 12.1 25.6 100.0 1 107 317 37.7 417 628
Kasai-Occidental 62.1 8.6 29.2 100.0 720 411 37.8 272 686
Total 68.3 8.2 23.5 100.0 12 296 750 31.7 3 892 461
All
Kinshasa 84.3 8.6 7.2 100.0 3 270 504 15.8 514 652
Bas-Congo 72.9 5.7 21.4 100.0 1 405 510 27.1 381 118
Bandundu 79.5 2.1 18.4 100.0 2 811 985 20.5 576 548
Equateur 72.1 4.4 23.5 100.0 2 598 830 27.9 726 194
Orientale 67.8 9.0 23.2 100.0 3 227 967 32.2 1 039 858
North Kivu 56.0 9.7 34.2 100.0 2 262 415 43.9 994 366
Maniema 74.1 3.5 22.5 100.0 720 230 26.0 186 821
South Kivu 69.7 7.2 23.1 100.0 1 686 104 30.3 510 769
Katanga 65.2 7.8 27.0 100.0 3 833 692 34.8 1 334 876
Kasai-Oriental 70.7 7.5 21.8 100.0 2 176 509 29.3 637 219
Kasai-Occidental 67.6 5.9 26.5 100.0 1 461 530 32.4 473 452
Total 71.0 6.8 22.1 100.0 25 455 276 28.9 7 375 873
Source: Household survey data, OOSC-DRC 2012
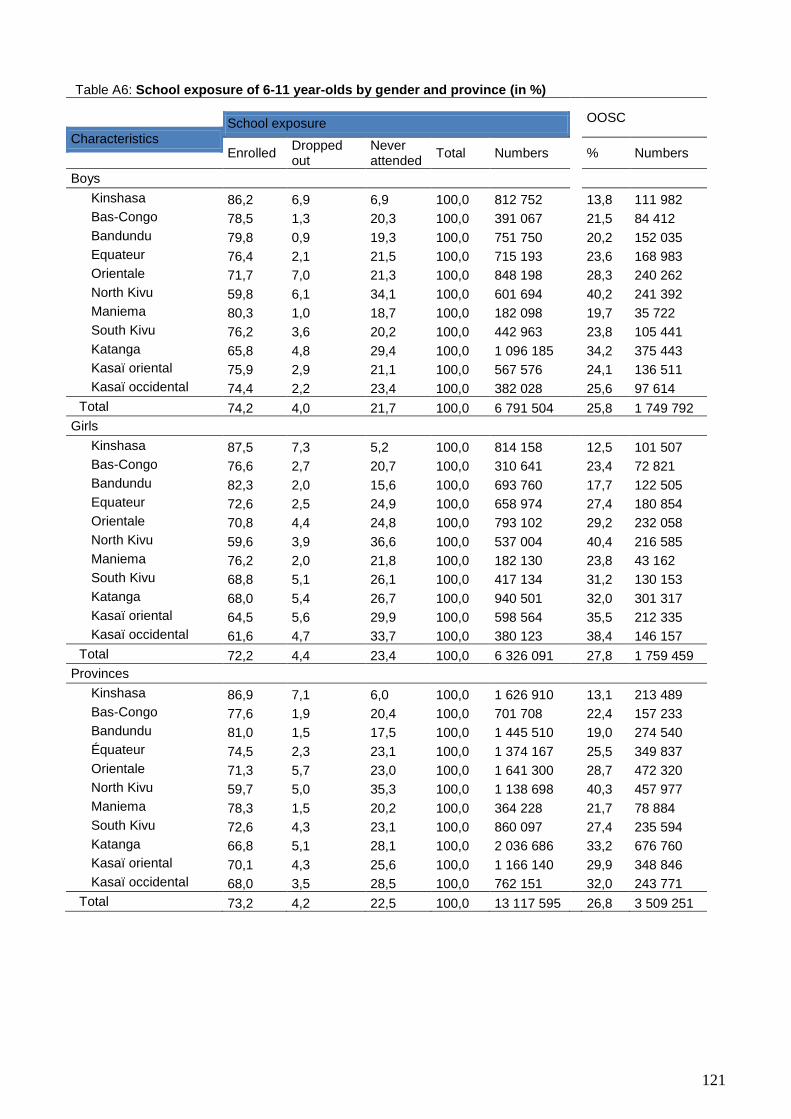
121
Table A6: School exposure of 6-11 year-olds by gender and province (in %)
Characteristics School exposure OOSC
Enrolled Dropped out
Never attended
Total Numbers % Numbers
Boys
Kinshasa 86,2 6,9 6,9 100,0 812 752 13,8 111 982
Bas-Congo 78,5 1,3 20,3 100,0 391 067 21,5 84 412
Bandundu 79,8 0,9 19,3 100,0 751 750 20,2 152 035
Equateur 76,4 2,1 21,5 100,0 715 193 23,6 168 983
Orientale 71,7 7,0 21,3 100,0 848 198 28,3 240 262
North Kivu 59,8 6,1 34,1 100,0 601 694 40,2 241 392
Maniema 80,3 1,0 18,7 100,0 182 098 19,7 35 722
South Kivu 76,2 3,6 20,2 100,0 442 963 23,8 105 441
Katanga 65,8 4,8 29,4 100,0 1 096 185 34,2 375 443
Kasaï oriental 75,9 2,9 21,1 100,0 567 576 24,1 136 511
Kasaï occidental 74,4 2,2 23,4 100,0 382 028 25,6 97 614
Total 74,2 4,0 21,7 100,0 6 791 504 25,8 1 749 792
Girls
Kinshasa 87,5 7,3 5,2 100,0 814 158 12,5 101 507
Bas-Congo 76,6 2,7 20,7 100,0 310 641 23,4 72 821
Bandundu 82,3 2,0 15,6 100,0 693 760 17,7 122 505
Equateur 72,6 2,5 24,9 100,0 658 974 27,4 180 854
Orientale 70,8 4,4 24,8 100,0 793 102 29,2 232 058
North Kivu 59,6 3,9 36,6 100,0 537 004 40,4 216 585
Maniema 76,2 2,0 21,8 100,0 182 130 23,8 43 162
South Kivu 68,8 5,1 26,1 100,0 417 134 31,2 130 153
Katanga 68,0 5,4 26,7 100,0 940 501 32,0 301 317
Kasaï oriental 64,5 5,6 29,9 100,0 598 564 35,5 212 335
Kasaï occidental 61,6 4,7 33,7 100,0 380 123 38,4 146 157
Total 72,2 4,4 23,4 100,0 6 326 091 27,8 1 759 459
Provinces
Kinshasa 86,9 7,1 6,0 100,0 1 626 910 13,1 213 489
Bas-Congo 77,6 1,9 20,4 100,0 701 708 22,4 157 233
Bandundu 81,0 1,5 17,5 100,0 1 445 510 19,0 274 540
Équateur 74,5 2,3 23,1 100,0 1 374 167 25,5 349 837
Orientale 71,3 5,7 23,0 100,0 1 641 300 28,7 472 320
North Kivu 59,7 5,0 35,3 100,0 1 138 698 40,3 457 977
Maniema 78,3 1,5 20,2 100,0 364 228 21,7 78 884
South Kivu 72,6 4,3 23,1 100,0 860 097 27,4 235 594
Katanga 66,8 5,1 28,1 100,0 2 036 686 33,2 676 760
Kasaï oriental 70,1 4,3 25,6 100,0 1 166 140 29,9 348 846
Kasaï occidental 68,0 3,5 28,5 100,0 762 151 32,0 243 771
Total 73,2 4,2 22,5 100,0 13 117 595 26,8 3 509 251
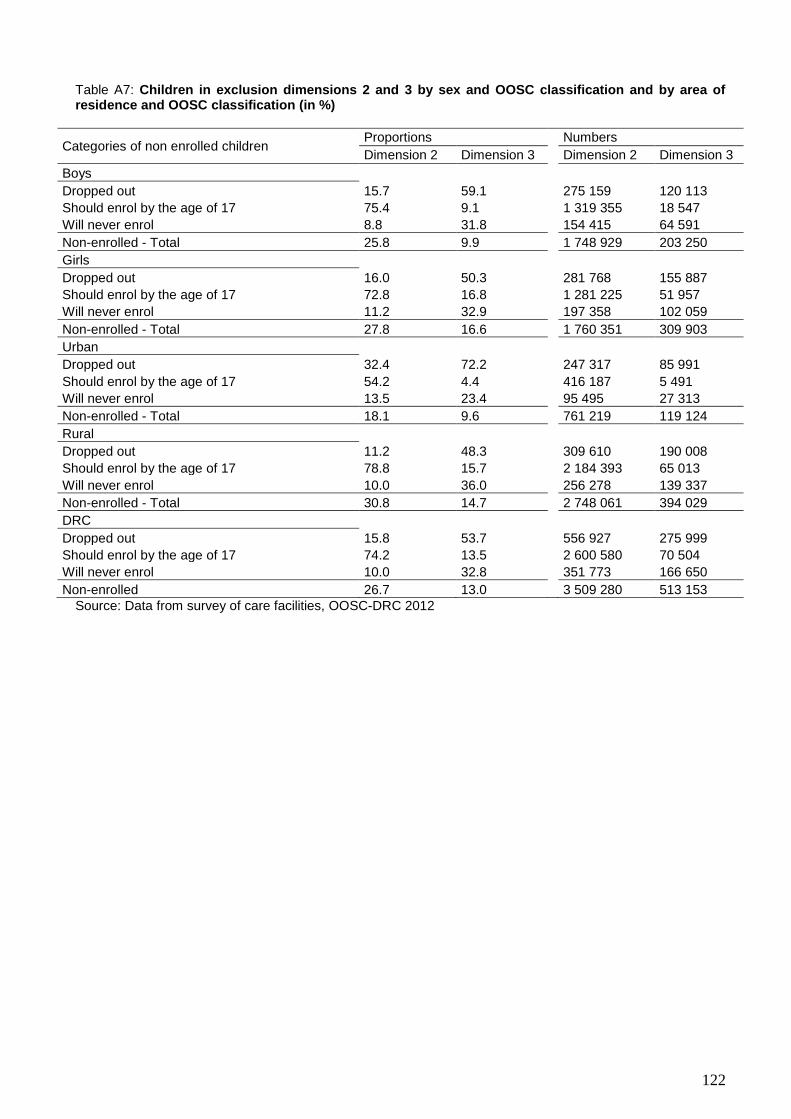
122
Table A7: Children in exclusion dimensions 2 and 3 by sex and OOSC classification and by area of residence and OOSC classification (in %)
Categories of non enrolled children Proportions Numbers
Dimension 2 Dimension 3 Dimension 2 Dimension 3
Boys
Dropped out 15.7 59.1 275 159 120 113
Should enrol by the age of 17 75.4 9.1 1 319 355 18 547
Will never enrol 8.8 31.8 154 415 64 591
Non-enrolled - Total 25.8 9.9 1 748 929 203 250
Girls
Dropped out 16.0 50.3 281 768 155 887
Should enrol by the age of 17 72.8 16.8 1 281 225 51 957
Will never enrol 11.2 32.9 197 358 102 059
Non-enrolled - Total 27.8 16.6 1 760 351 309 903
Urban
Dropped out 32.4 72.2 247 317 85 991
Should enrol by the age of 17 54.2 4.4 416 187 5 491
Will never enrol 13.5 23.4 95 495 27 313
Non-enrolled - Total 18.1 9.6 761 219 119 124
Rural
Dropped out 11.2 48.3 309 610 190 008
Should enrol by the age of 17 78.8 15.7 2 184 393 65 013
Will never enrol 10.0 36.0 256 278 139 337
Non-enrolled - Total 30.8 14.7 2 748 061 394 029
DRC
Dropped out 15.8 53.7 556 927 275 999
Should enrol by the age of 17 74.2 13.5 2 600 580 70 504
Will never enrol 10.0 32.8 351 773 166 650
Non-enrolled 26.7 13.0 3 509 280 513 153
Source: Data from survey of care facilities, OOSC-DRC 2012
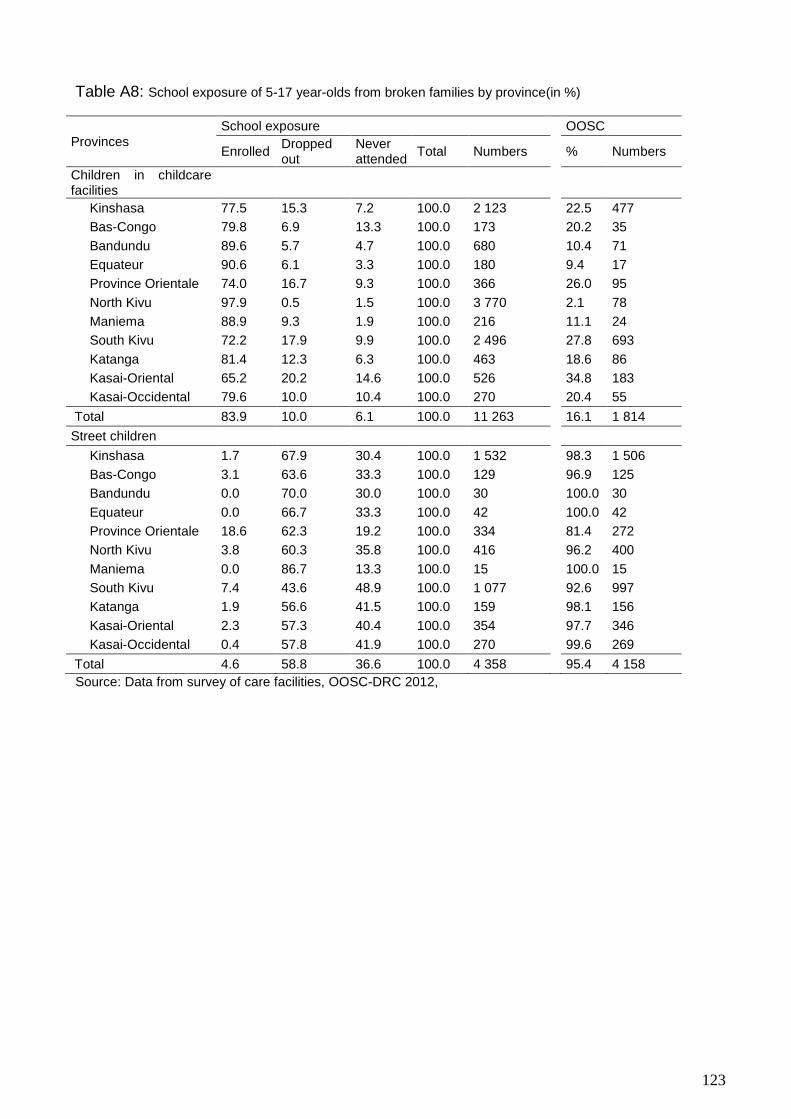
123
Table A8: School exposure of 5-17 year-olds from broken families by province(in %)
Provinces
School exposure OOSC
Enrolled Dropped out
Never attended
Total Numbers % Numbers
Children in childcare facilities
Kinshasa 77.5 15.3 7.2 100.0 2 123 22.5 477
Bas-Congo 79.8 6.9 13.3 100.0 173 20.2 35
Bandundu 89.6 5.7 4.7 100.0 680 10.4 71
Equateur 90.6 6.1 3.3 100.0 180 9.4 17
Province Orientale 74.0 16.7 9.3 100.0 366 26.0 95
North Kivu 97.9 0.5 1.5 100.0 3 770 2.1 78
Maniema 88.9 9.3 1.9 100.0 216 11.1 24
South Kivu 72.2 17.9 9.9 100.0 2 496 27.8 693
Katanga 81.4 12.3 6.3 100.0 463 18.6 86
Kasai-Oriental 65.2 20.2 14.6 100.0 526 34.8 183
Kasai-Occidental 79.6 10.0 10.4 100.0 270 20.4 55
Total 83.9 10.0 6.1 100.0 11 263 16.1 1 814
Street children
Kinshasa 1.7 67.9 30.4 100.0 1 532 98.3 1 506
Bas-Congo 3.1 63.6 33.3 100.0 129 96.9 125
Bandundu 0.0 70.0 30.0 100.0 30 100.0 30
Equateur 0.0 66.7 33.3 100.0 42 100.0 42
Province Orientale 18.6 62.3 19.2 100.0 334 81.4 272
North Kivu 3.8 60.3 35.8 100.0 416 96.2 400
Maniema 0.0 86.7 13.3 100.0 15 100.0 15
South Kivu 7.4 43.6 48.9 100.0 1 077 92.6 997
Katanga 1.9 56.6 41.5 100.0 159 98.1 156
Kasai-Oriental 2.3 57.3 40.4 100.0 354 97.7 346
Kasai-Occidental 0.4 57.8 41.9 100.0 270 99.6 269
Total 4.6 58.8 36.6 100.0 4 358 95.4 4 158
Source: Data from survey of care facilities, OOSC-DRC 2012,
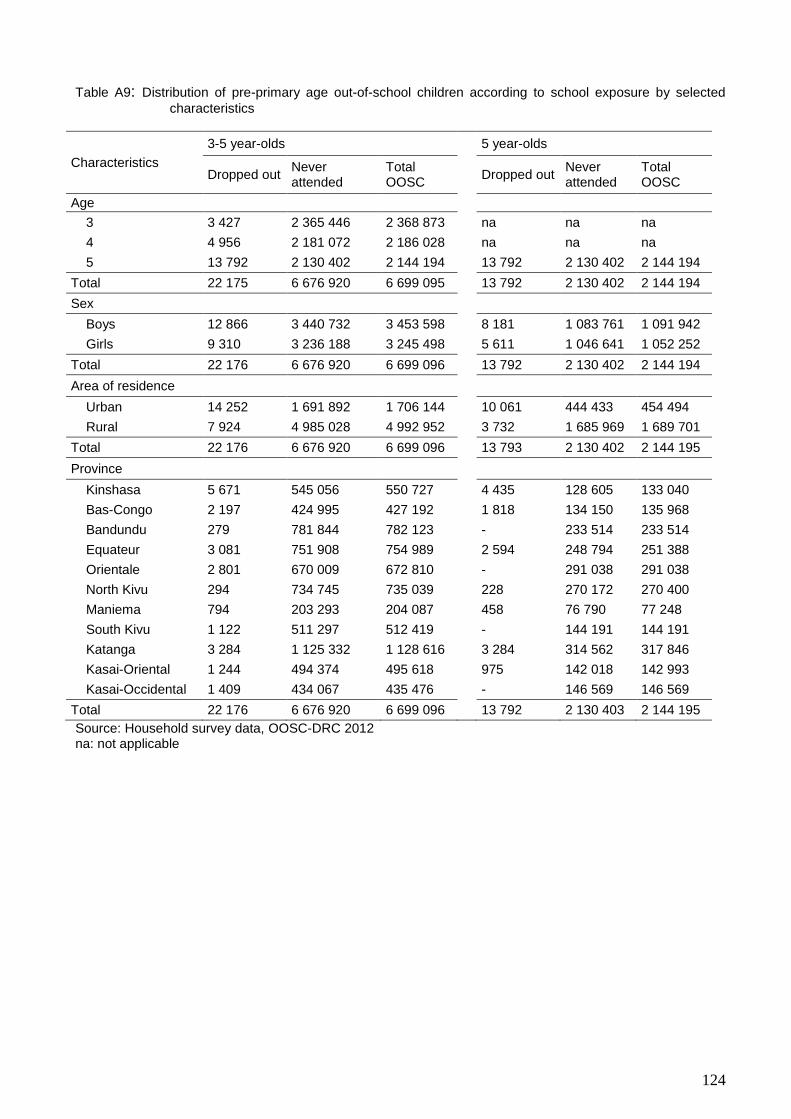
124
Table A9: Distribution of pre-primary age out-of-school children according to school exposure by selected
characteristics
Characteristics
3-5 year-olds 5 year-olds
Dropped out Never attended
Total OOSC
Dropped out Never attended
Total OOSC
Age
3 3 427 2 365 446 2 368 873 na na na
4 4 956 2 181 072 2 186 028 na na na
5 13 792 2 130 402 2 144 194 13 792 2 130 402 2 144 194
Total 22 175 6 676 920 6 699 095 13 792 2 130 402 2 144 194
Sex
Boys 12 866 3 440 732 3 453 598 8 181 1 083 761 1 091 942
Girls 9 310 3 236 188 3 245 498 5 611 1 046 641 1 052 252
Total 22 176 6 676 920 6 699 096 13 792 2 130 402 2 144 194
Area of residence
Urban 14 252 1 691 892 1 706 144 10 061 444 433 454 494
Rural 7 924 4 985 028 4 992 952 3 732 1 685 969 1 689 701
Total 22 176 6 676 920 6 699 096 13 793 2 130 402 2 144 195
Province
Kinshasa 5 671 545 056 550 727 4 435 128 605 133 040
Bas-Congo 2 197 424 995 427 192 1 818 134 150 135 968
Bandundu 279 781 844 782 123 - 233 514 233 514
Equateur 3 081 751 908 754 989 2 594 248 794 251 388
Orientale 2 801 670 009 672 810 - 291 038 291 038
North Kivu 294 734 745 735 039 228 270 172 270 400
Maniema 794 203 293 204 087 458 76 790 77 248
South Kivu 1 122 511 297 512 419 - 144 191 144 191
Katanga 3 284 1 125 332 1 128 616 3 284 314 562 317 846
Kasai-Oriental 1 244 494 374 495 618 975 142 018 142 993
Kasai-Occidental 1 409 434 067 435 476 - 146 569 146 569
Total 22 176 6 676 920 6 699 096 13 792 2 130 403 2 144 195
Source: Household survey data, OOSC-DRC 2012 na: not applicable
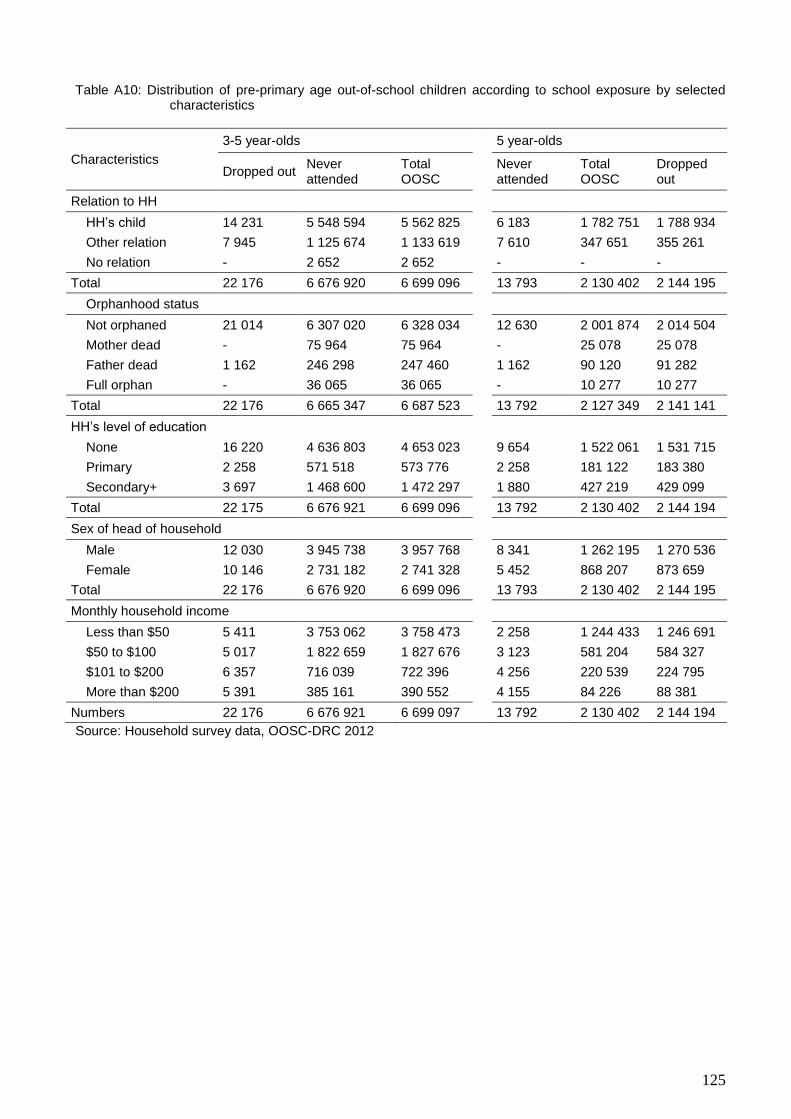
125
Table A10: Distribution of pre-primary age out-of-school children according to school exposure by selected characteristics
Characteristics
3-5 year-olds 5 year-olds
Dropped out Never attended
Total OOSC
Never attended
Total OOSC
Dropped out
Relation to HH
HH’s child 14 231 5 548 594 5 562 825 6 183 1 782 751 1 788 934
Other relation 7 945 1 125 674 1 133 619 7 610 347 651 355 261
No relation - 2 652 2 652 - - -
Total 22 176 6 676 920 6 699 096 13 793 2 130 402 2 144 195
Orphanhood status
Not orphaned 21 014 6 307 020 6 328 034 12 630 2 001 874 2 014 504
Mother dead - 75 964 75 964 - 25 078 25 078
Father dead 1 162 246 298 247 460 1 162 90 120 91 282
Full orphan - 36 065 36 065 - 10 277 10 277
Total 22 176 6 665 347 6 687 523 13 792 2 127 349 2 141 141
HH’s level of education
None 16 220 4 636 803 4 653 023 9 654 1 522 061 1 531 715
Primary 2 258 571 518 573 776 2 258 181 122 183 380
Secondary+ 3 697 1 468 600 1 472 297 1 880 427 219 429 099
Total 22 175 6 676 921 6 699 096 13 792 2 130 402 2 144 194
Sex of head of household
Male 12 030 3 945 738 3 957 768 8 341 1 262 195 1 270 536
Female 10 146 2 731 182 2 741 328 5 452 868 207 873 659
Total 22 176 6 676 920 6 699 096 13 793 2 130 402 2 144 195
Monthly household income
Less than $50 5 411 3 753 062 3 758 473 2 258 1 244 433 1 246 691
$50 to $100 5 017 1 822 659 1 827 676 3 123 581 204 584 327
$101 to $200 6 357 716 039 722 396 4 256 220 539 224 795
More than $200 5 391 385 161 390 552 4 155 84 226 88 381
Numbers 22 176 6 676 921 6 699 097 13 792 2 130 402 2 144 194
Source: Household survey data, OOSC-DRC 2012
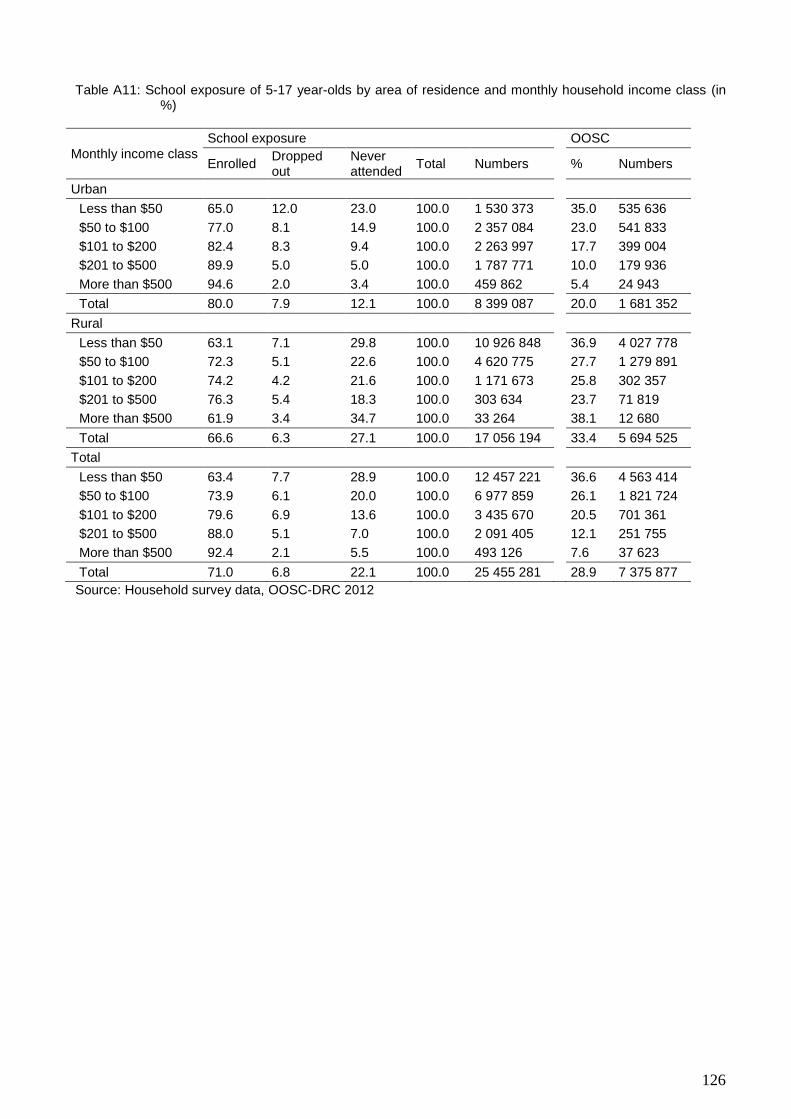
126
Table A11: School exposure of 5-17 year-olds by area of residence and monthly household income class (in %)
Monthly income class
School exposure OOSC
Enrolled Dropped out
Never attended
Total Numbers % Numbers
Urban
Less than $50 65.0 12.0 23.0 100.0 1 530 373 35.0 535 636
$50 to $100 77.0 8.1 14.9 100.0 2 357 084 23.0 541 833
$101 to $200 82.4 8.3 9.4 100.0 2 263 997 17.7 399 004
$201 to $500 89.9 5.0 5.0 100.0 1 787 771 10.0 179 936
More than $500 94.6 2.0 3.4 100.0 459 862 5.4 24 943
Total 80.0 7.9 12.1 100.0 8 399 087 20.0 1 681 352
Rural
Less than $50 63.1 7.1 29.8 100.0 10 926 848 36.9 4 027 778
$50 to $100 72.3 5.1 22.6 100.0 4 620 775 27.7 1 279 891
$101 to $200 74.2 4.2 21.6 100.0 1 171 673 25.8 302 357
$201 to $500 76.3 5.4 18.3 100.0 303 634 23.7 71 819
More than $500 61.9 3.4 34.7 100.0 33 264 38.1 12 680
Total 66.6 6.3 27.1 100.0 17 056 194 33.4 5 694 525
Total
Less than $50 63.4 7.7 28.9 100.0 12 457 221 36.6 4 563 414
$50 to $100 73.9 6.1 20.0 100.0 6 977 859 26.1 1 821 724
$101 to $200 79.6 6.9 13.6 100.0 3 435 670 20.5 701 361
$201 to $500 88.0 5.1 7.0 100.0 2 091 405 12.1 251 755
More than $500 92.4 2.1 5.5 100.0 493 126 7.6 37 623
Total 71.0 6.8 22.1 100.0 25 455 281 28.9 7 375 877
Source: Household survey data, OOSC-DRC 2012
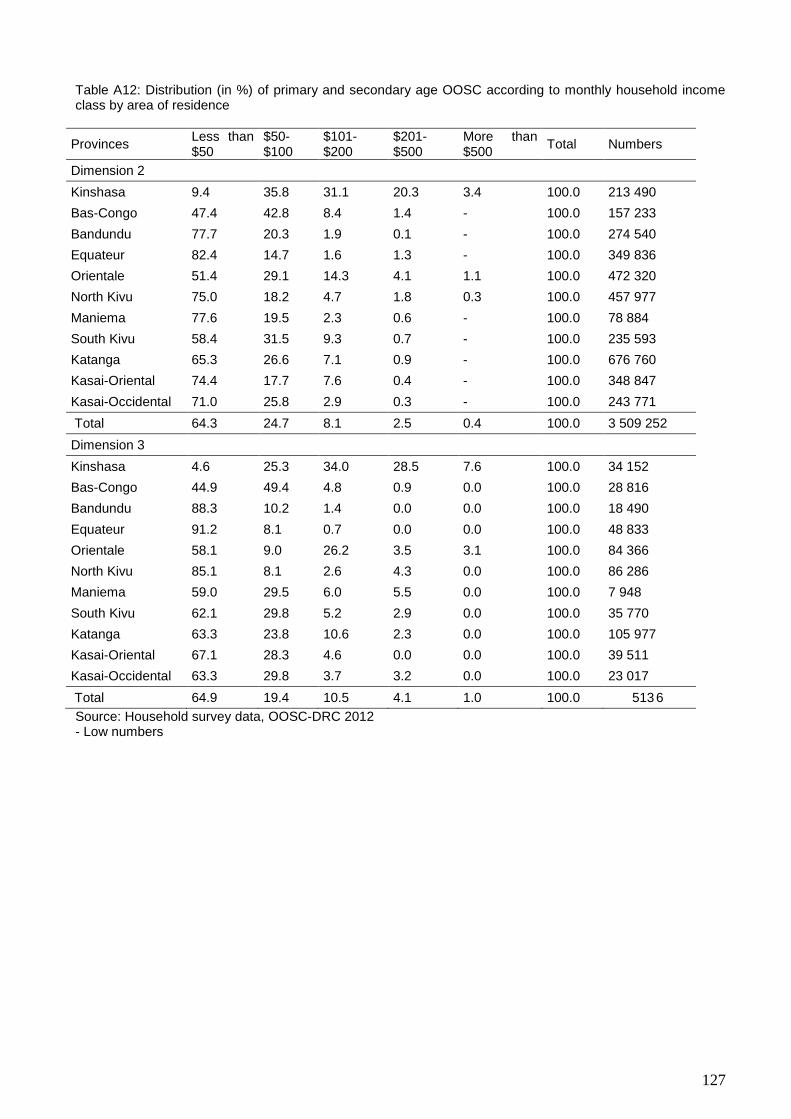
127
Table A12: Distribution (in %) of primary and secondary age OOSC according to monthly household income class by area of residence
Provinces Less than $50
$50-$100
$101-$200
$201-$500
More than $500
Total Numbers
Dimension 2
Kinshasa 9.4 35.8 31.1 20.3 3.4 100.0 213 490
Bas-Congo 47.4 42.8 8.4 1.4 - 100.0 157 233
Bandundu 77.7 20.3 1.9 0.1 - 100.0 274 540
Equateur 82.4 14.7 1.6 1.3 - 100.0 349 836
Orientale 51.4 29.1 14.3 4.1 1.1 100.0 472 320
North Kivu 75.0 18.2 4.7 1.8 0.3 100.0 457 977
Maniema 77.6 19.5 2.3 0.6 - 100.0 78 884
South Kivu 58.4 31.5 9.3 0.7 - 100.0 235 593
Katanga 65.3 26.6 7.1 0.9 - 100.0 676 760
Kasai-Oriental 74.4 17.7 7.6 0.4 - 100.0 348 847
Kasai-Occidental 71.0 25.8 2.9 0.3 - 100.0 243 771
Total 64.3 24.7 8.1 2.5 0.4 100.0 3 509 252
Dimension 3
Kinshasa 4.6 25.3 34.0 28.5 7.6 100.0 34 152
Bas-Congo 44.9 49.4 4.8 0.9 0.0 100.0 28 816
Bandundu 88.3 10.2 1.4 0.0 0.0 100.0 18 490
Equateur 91.2 8.1 0.7 0.0 0.0 100.0 48 833
Orientale 58.1 9.0 26.2 3.5 3.1 100.0 84 366
North Kivu 85.1 8.1 2.6 4.3 0.0 100.0 86 286
Maniema 59.0 29.5 6.0 5.5 0.0 100.0 7 948
South Kivu 62.1 29.8 5.2 2.9 0.0 100.0 35 770
Katanga 63.3 23.8 10.6 2.3 0.0 100.0 105 977
Kasai-Oriental 67.1 28.3 4.6 0.0 0.0 100.0 39 511
Kasai-Occidental 63.3 29.8 3.7 3.2 0.0 100.0 23 017
Total 64.9 19.4 10.5 4.1 1.0 100.0 513 6
Source: Household survey data, OOSC-DRC 2012 - Low numbers
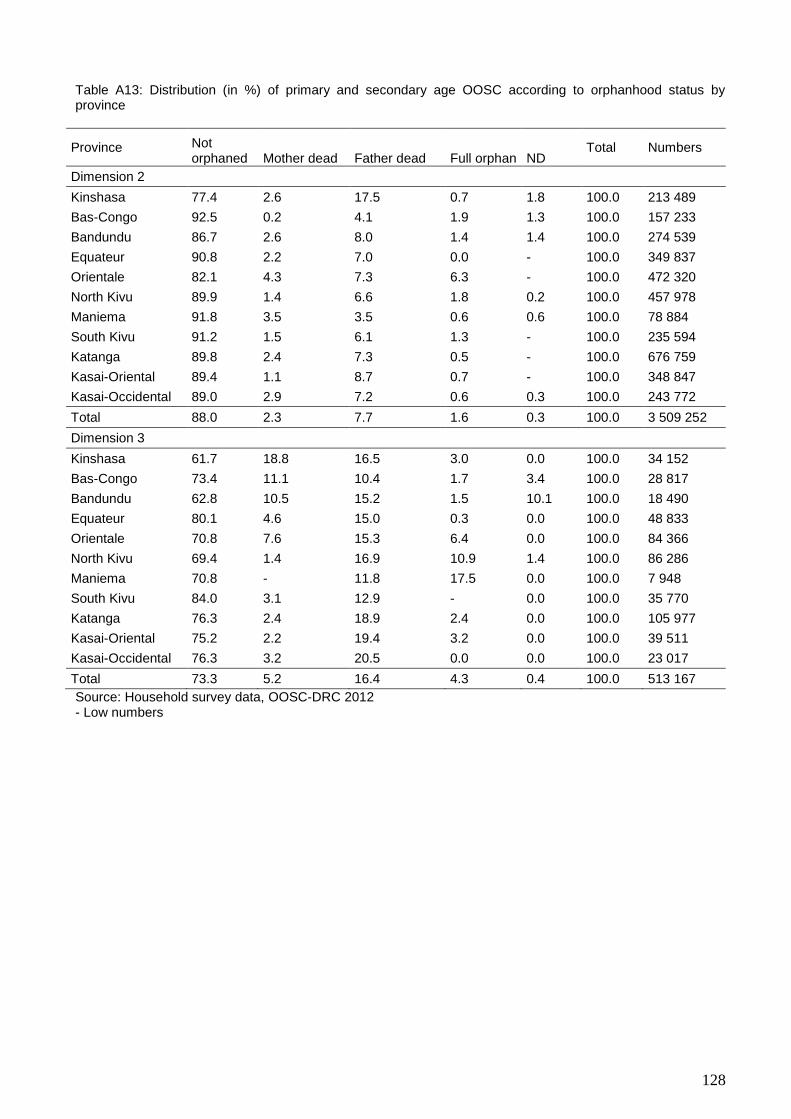
128
Table A13: Distribution (in %) of primary and secondary age OOSC according to orphanhood status by province
Province Not orphaned Mother dead Father dead Full orphan ND
Total Numbers
Dimension 2
Kinshasa 77.4 2.6 17.5 0.7 1.8 100.0 213 489
Bas-Congo 92.5 0.2 4.1 1.9 1.3 100.0 157 233
Bandundu 86.7 2.6 8.0 1.4 1.4 100.0 274 539
Equateur 90.8 2.2 7.0 0.0 - 100.0 349 837
Orientale 82.1 4.3 7.3 6.3 - 100.0 472 320
North Kivu 89.9 1.4 6.6 1.8 0.2 100.0 457 978
Maniema 91.8 3.5 3.5 0.6 0.6 100.0 78 884
South Kivu 91.2 1.5 6.1 1.3 - 100.0 235 594
Katanga 89.8 2.4 7.3 0.5 - 100.0 676 759
Kasai-Oriental 89.4 1.1 8.7 0.7 - 100.0 348 847
Kasai-Occidental 89.0 2.9 7.2 0.6 0.3 100.0 243 772
Total 88.0 2.3 7.7 1.6 0.3 100.0 3 509 252
Dimension 3
Kinshasa 61.7 18.8 16.5 3.0 0.0 100.0 34 152
Bas-Congo 73.4 11.1 10.4 1.7 3.4 100.0 28 817
Bandundu 62.8 10.5 15.2 1.5 10.1 100.0 18 490
Equateur 80.1 4.6 15.0 0.3 0.0 100.0 48 833
Orientale 70.8 7.6 15.3 6.4 0.0 100.0 84 366
North Kivu 69.4 1.4 16.9 10.9 1.4 100.0 86 286
Maniema 70.8 - 11.8 17.5 0.0 100.0 7 948
South Kivu 84.0 3.1 12.9 - 0.0 100.0 35 770
Katanga 76.3 2.4 18.9 2.4 0.0 100.0 105 977
Kasai-Oriental 75.2 2.2 19.4 3.2 0.0 100.0 39 511
Kasai-Occidental 76.3 3.2 20.5 0.0 0.0 100.0 23 017
Total 73.3 5.2 16.4 4.3 0.4 100.0 513 167
Source: Household survey data, OOSC-DRC 2012 - Low numbers
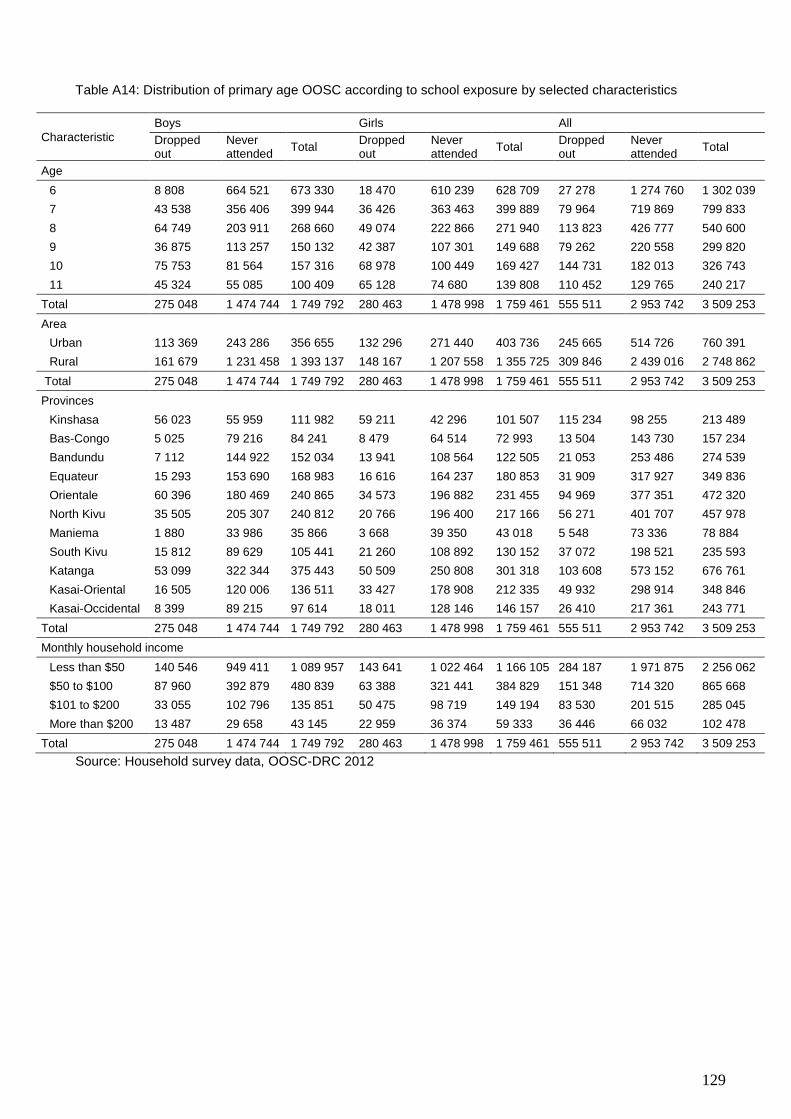
129
Table A14: Distribution of primary age OOSC according to school exposure by selected characteristics
Characteristic
Boys Girls All
Dropped out
Never attended
Total Dropped out
Never attended
Total Dropped out
Never attended
Total
Age
6 8 808 664 521 673 330 18 470 610 239 628 709 27 278 1 274 760 1 302 039
7 43 538 356 406 399 944 36 426 363 463 399 889 79 964 719 869 799 833
8 64 749 203 911 268 660 49 074 222 866 271 940 113 823 426 777 540 600
9 36 875 113 257 150 132 42 387 107 301 149 688 79 262 220 558 299 820
10 75 753 81 564 157 316 68 978 100 449 169 427 144 731 182 013 326 743
11 45 324 55 085 100 409 65 128 74 680 139 808 110 452 129 765 240 217
Total 275 048 1 474 744 1 749 792 280 463 1 478 998 1 759 461 555 511 2 953 742 3 509 253
Area
Urban 113 369 243 286 356 655 132 296 271 440 403 736 245 665 514 726 760 391
Rural 161 679 1 231 458 1 393 137 148 167 1 207 558 1 355 725 309 846 2 439 016 2 748 862
Total 275 048 1 474 744 1 749 792 280 463 1 478 998 1 759 461 555 511 2 953 742 3 509 253
Provinces
Kinshasa 56 023 55 959 111 982 59 211 42 296 101 507 115 234 98 255 213 489
Bas-Congo 5 025 79 216 84 241 8 479 64 514 72 993 13 504 143 730 157 234
Bandundu 7 112 144 922 152 034 13 941 108 564 122 505 21 053 253 486 274 539
Equateur 15 293 153 690 168 983 16 616 164 237 180 853 31 909 317 927 349 836
Orientale 60 396 180 469 240 865 34 573 196 882 231 455 94 969 377 351 472 320
North Kivu 35 505 205 307 240 812 20 766 196 400 217 166 56 271 401 707 457 978
Maniema 1 880 33 986 35 866 3 668 39 350 43 018 5 548 73 336 78 884
South Kivu 15 812 89 629 105 441 21 260 108 892 130 152 37 072 198 521 235 593
Katanga 53 099 322 344 375 443 50 509 250 808 301 318 103 608 573 152 676 761
Kasai-Oriental 16 505 120 006 136 511 33 427 178 908 212 335 49 932 298 914 348 846
Kasai-Occidental 8 399 89 215 97 614 18 011 128 146 146 157 26 410 217 361 243 771
Total 275 048 1 474 744 1 749 792 280 463 1 478 998 1 759 461 555 511 2 953 742 3 509 253
Monthly household income
Less than $50 140 546 949 411 1 089 957 143 641 1 022 464 1 166 105 284 187 1 971 875 2 256 062
$50 to $100 87 960 392 879 480 839 63 388 321 441 384 829 151 348 714 320 865 668
$101 to $200 33 055 102 796 135 851 50 475 98 719 149 194 83 530 201 515 285 045
More than $200 13 487 29 658 43 145 22 959 36 374 59 333 36 446 66 032 102 478
Total 275 048 1 474 744 1 749 792 280 463 1 478 998 1 759 461 555 511 2 953 742 3 509 253
Source: Household survey data, OOSC-DRC 2012
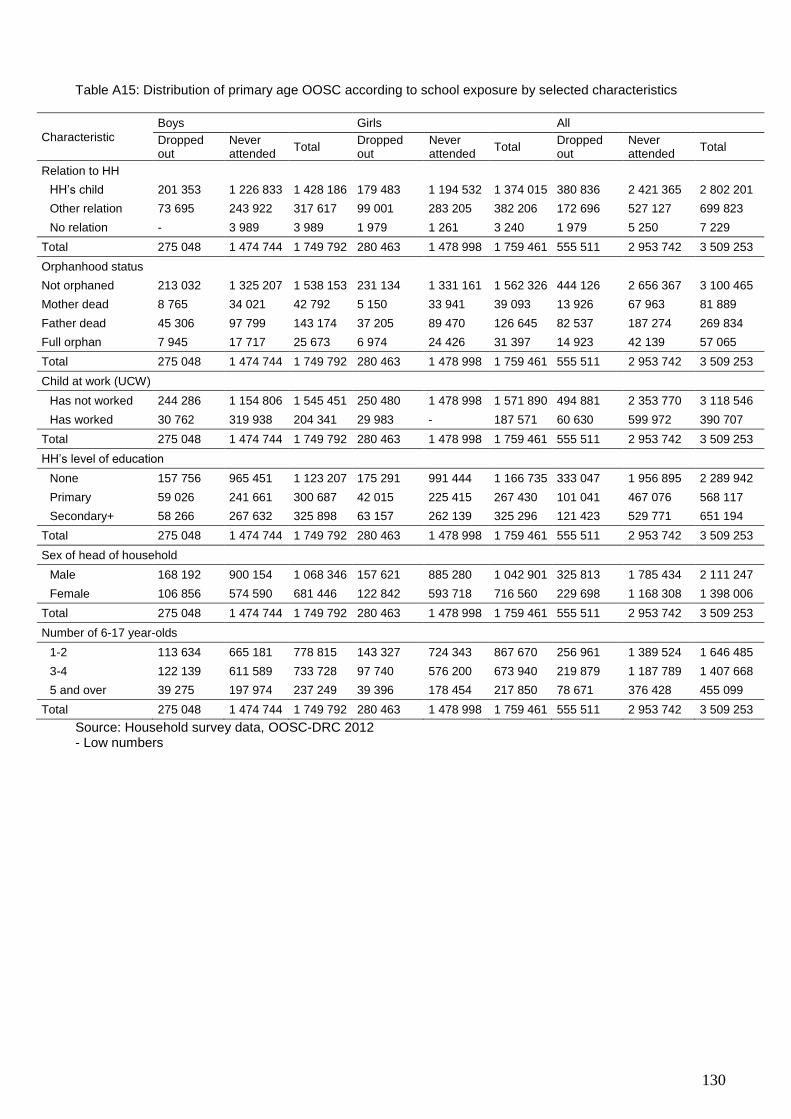
130
Table A15: Distribution of primary age OOSC according to school exposure by selected characteristics
Characteristic
Boys Girls All
Dropped out
Never attended
Total Dropped out
Never attended
Total Dropped out
Never attended
Total
Relation to HH
HH’s child 201 353 1 226 833 1 428 186 179 483 1 194 532 1 374 015 380 836 2 421 365 2 802 201
Other relation 73 695 243 922 317 617 99 001 283 205 382 206 172 696 527 127 699 823
No relation - 3 989 3 989 1 979 1 261 3 240 1 979 5 250 7 229
Total 275 048 1 474 744 1 749 792 280 463 1 478 998 1 759 461 555 511 2 953 742 3 509 253
Orphanhood status
Not orphaned 213 032 1 325 207 1 538 153 231 134 1 331 161 1 562 326 444 126 2 656 367 3 100 465
Mother dead 8 765 34 021 42 792 5 150 33 941 39 093 13 926 67 963 81 889
Father dead 45 306 97 799 143 174 37 205 89 470 126 645 82 537 187 274 269 834
Full orphan 7 945 17 717 25 673 6 974 24 426 31 397 14 923 42 139 57 065
Total 275 048 1 474 744 1 749 792 280 463 1 478 998 1 759 461 555 511 2 953 742 3 509 253
Child at work (UCW)
Has not worked 244 286 1 154 806 1 545 451 250 480 1 478 998 1 571 890 494 881 2 353 770 3 118 546
Has worked 30 762 319 938 204 341 29 983 - 187 571 60 630 599 972 390 707
Total 275 048 1 474 744 1 749 792 280 463 1 478 998 1 759 461 555 511 2 953 742 3 509 253
HH’s level of education
None 157 756 965 451 1 123 207 175 291 991 444 1 166 735 333 047 1 956 895 2 289 942
Primary 59 026 241 661 300 687 42 015 225 415 267 430 101 041 467 076 568 117
Secondary+ 58 266 267 632 325 898 63 157 262 139 325 296 121 423 529 771 651 194
Total 275 048 1 474 744 1 749 792 280 463 1 478 998 1 759 461 555 511 2 953 742 3 509 253
Sex of head of household
Male 168 192 900 154 1 068 346 157 621 885 280 1 042 901 325 813 1 785 434 2 111 247
Female 106 856 574 590 681 446 122 842 593 718 716 560 229 698 1 168 308 1 398 006
Total 275 048 1 474 744 1 749 792 280 463 1 478 998 1 759 461 555 511 2 953 742 3 509 253
Number of 6-17 year-olds
1-2 113 634 665 181 778 815 143 327 724 343 867 670 256 961 1 389 524 1 646 485
3-4 122 139 611 589 733 728 97 740 576 200 673 940 219 879 1 187 789 1 407 668
5 and over 39 275 197 974 237 249 39 396 178 454 217 850 78 671 376 428 455 099
Total 275 048 1 474 744 1 749 792 280 463 1 478 998 1 759 461 555 511 2 953 742 3 509 253
Source: Household survey data, OOSC-DRC 2012 - Low numbers
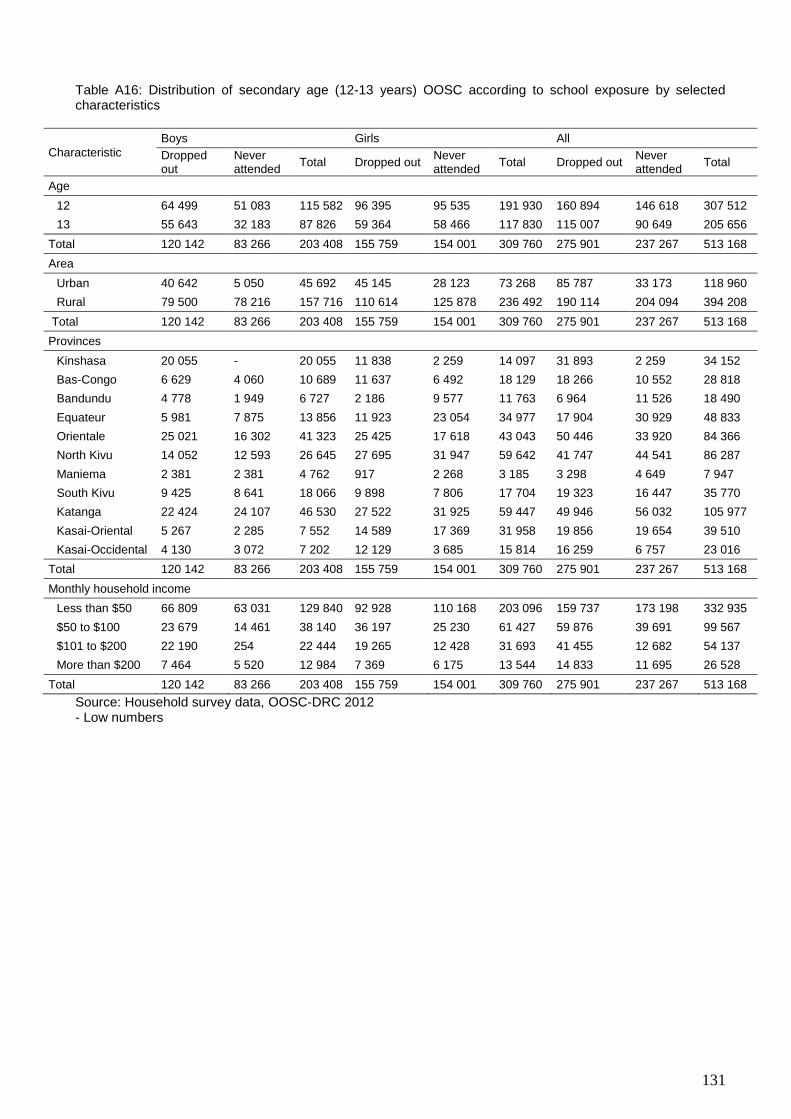
131
Table A16: Distribution of secondary age (12-13 years) OOSC according to school exposure by selected characteristics
Characteristic
Boys Girls All
Dropped out
Never attended
Total Dropped out Never attended
Total Dropped out Never attended
Total
Age
12 64 499 51 083 115 582 96 395 95 535 191 930 160 894 146 618 307 512
13 55 643 32 183 87 826 59 364 58 466 117 830 115 007 90 649 205 656
Total 120 142 83 266 203 408 155 759 154 001 309 760 275 901 237 267 513 168
Area
Urban 40 642 5 050 45 692 45 145 28 123 73 268 85 787 33 173 118 960
Rural 79 500 78 216 157 716 110 614 125 878 236 492 190 114 204 094 394 208
Total 120 142 83 266 203 408 155 759 154 001 309 760 275 901 237 267 513 168
Provinces
Kinshasa 20 055 - 20 055 11 838 2 259 14 097 31 893 2 259 34 152
Bas-Congo 6 629 4 060 10 689 11 637 6 492 18 129 18 266 10 552 28 818
Bandundu 4 778 1 949 6 727 2 186 9 577 11 763 6 964 11 526 18 490
Equateur 5 981 7 875 13 856 11 923 23 054 34 977 17 904 30 929 48 833
Orientale 25 021 16 302 41 323 25 425 17 618 43 043 50 446 33 920 84 366
North Kivu 14 052 12 593 26 645 27 695 31 947 59 642 41 747 44 541 86 287
Maniema 2 381 2 381 4 762 917 2 268 3 185 3 298 4 649 7 947
South Kivu 9 425 8 641 18 066 9 898 7 806 17 704 19 323 16 447 35 770
Katanga 22 424 24 107 46 530 27 522 31 925 59 447 49 946 56 032 105 977
Kasai-Oriental 5 267 2 285 7 552 14 589 17 369 31 958 19 856 19 654 39 510
Kasai-Occidental 4 130 3 072 7 202 12 129 3 685 15 814 16 259 6 757 23 016
Total 120 142 83 266 203 408 155 759 154 001 309 760 275 901 237 267 513 168
Monthly household income
Less than $50 66 809 63 031 129 840 92 928 110 168 203 096 159 737 173 198 332 935
$50 to $100 23 679 14 461 38 140 36 197 25 230 61 427 59 876 39 691 99 567
$101 to $200 22 190 254 22 444 19 265 12 428 31 693 41 455 12 682 54 137
More than $200 7 464 5 520 12 984 7 369 6 175 13 544 14 833 11 695 26 528
Total 120 142 83 266 203 408 155 759 154 001 309 760 275 901 237 267 513 168
Source: Household survey data, OOSC-DRC 2012 - Low numbers
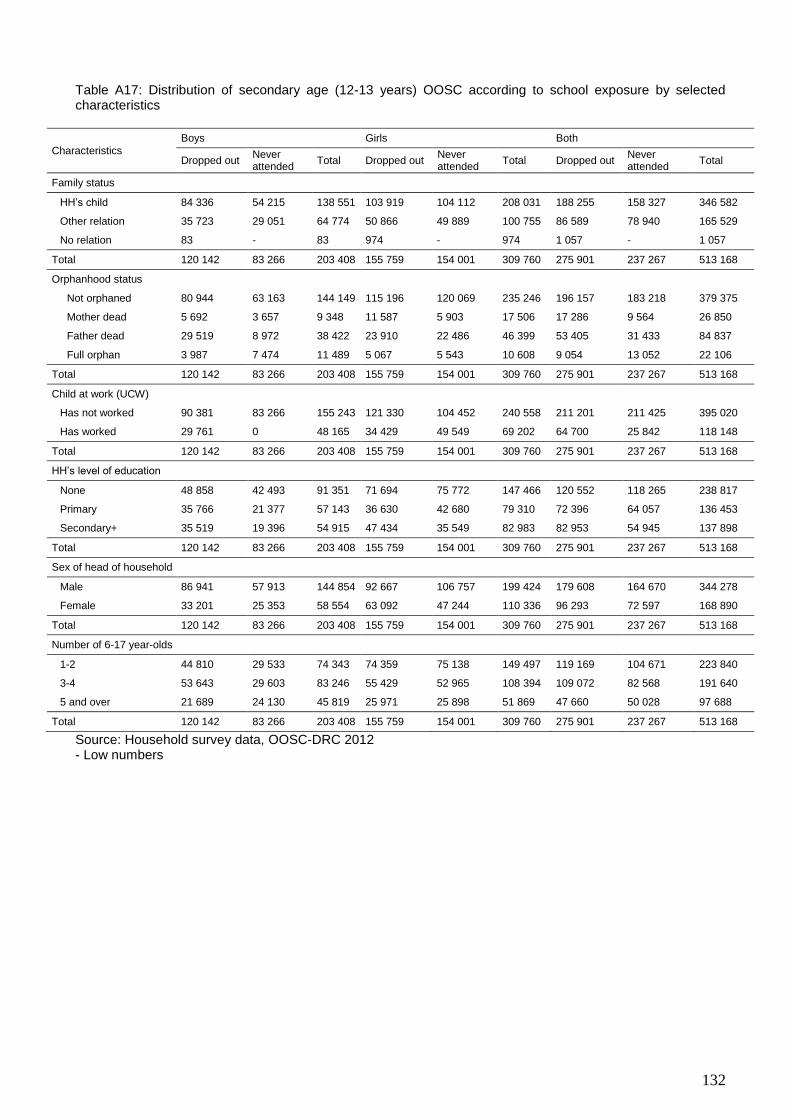
132
Table A17: Distribution of secondary age (12-13 years) OOSC according to school exposure by selected characteristics
Characteristics
Boys Girls Both
Dropped out Never attended
Total Dropped out Never attended
Total Dropped out Never attended
Total
Family status
HH’s child 84 336 54 215 138 551 103 919 104 112 208 031 188 255 158 327 346 582
Other relation 35 723 29 051 64 774 50 866 49 889 100 755 86 589 78 940 165 529
No relation 83 - 83 974 - 974 1 057 - 1 057
Total 120 142 83 266 203 408 155 759 154 001 309 760 275 901 237 267 513 168
Orphanhood status
Not orphaned 80 944 63 163 144 149 115 196 120 069 235 246 196 157 183 218 379 375
Mother dead 5 692 3 657 9 348 11 587 5 903 17 506 17 286 9 564 26 850
Father dead 29 519 8 972 38 422 23 910 22 486 46 399 53 405 31 433 84 837
Full orphan 3 987 7 474 11 489 5 067 5 543 10 608 9 054 13 052 22 106
Total 120 142 83 266 203 408 155 759 154 001 309 760 275 901 237 267 513 168
Child at work (UCW)
Has not worked 90 381 83 266 155 243 121 330 104 452 240 558 211 201 211 425 395 020
Has worked 29 761 0 48 165 34 429 49 549 69 202 64 700 25 842 118 148
Total 120 142 83 266 203 408 155 759 154 001 309 760 275 901 237 267 513 168
HH’s level of education
None 48 858 42 493 91 351 71 694 75 772 147 466 120 552 118 265 238 817
Primary 35 766 21 377 57 143 36 630 42 680 79 310 72 396 64 057 136 453
Secondary+ 35 519 19 396 54 915 47 434 35 549 82 983 82 953 54 945 137 898
Total 120 142 83 266 203 408 155 759 154 001 309 760 275 901 237 267 513 168
Sex of head of household
Male 86 941 57 913 144 854 92 667 106 757 199 424 179 608 164 670 344 278
Female 33 201 25 353 58 554 63 092 47 244 110 336 96 293 72 597 168 890
Total 120 142 83 266 203 408 155 759 154 001 309 760 275 901 237 267 513 168
Number of 6-17 year-olds
1-2 44 810 29 533 74 343 74 359 75 138 149 497 119 169 104 671 223 840
3-4 53 643 29 603 83 246 55 429 52 965 108 394 109 072 82 568 191 640
5 and over 21 689 24 130 45 819 25 971 25 898 51 869 47 660 50 028 97 688
Total 120 142 83 266 203 408 155 759 154 001 309 760 275 901 237 267 513 168
Source: Household survey data, OOSC-DRC 2012 - Low numbers
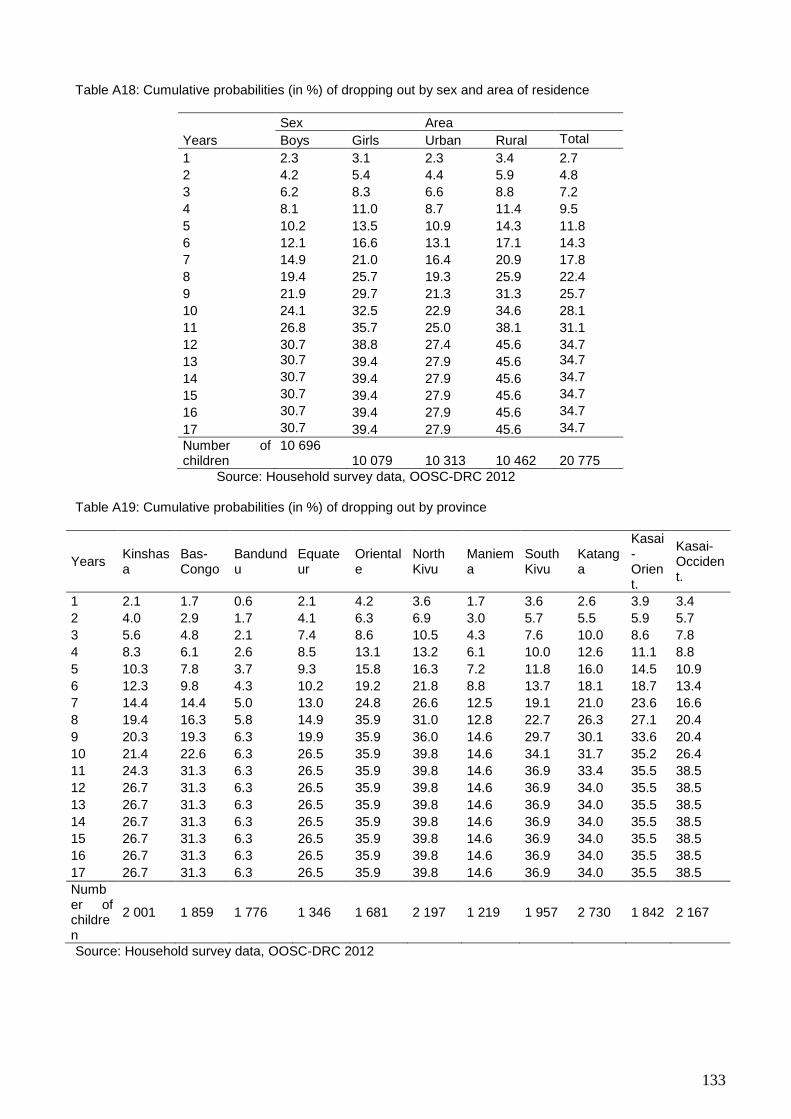
133
Table A18: Cumulative probabilities (in %) of dropping out by sex and area of residence
Sex Area
Years Boys Girls Urban Rural Total
1 2.3 3.1 2.3 3.4 2.7
2 4.2 5.4 4.4 5.9 4.8
3 6.2 8.3 6.6 8.8 7.2
4 8.1 11.0 8.7 11.4 9.5
5 10.2 13.5 10.9 14.3 11.8
6 12.1 16.6 13.1 17.1 14.3
7 14.9 21.0 16.4 20.9 17.8
8 19.4 25.7 19.3 25.9 22.4
9 21.9 29.7 21.3 31.3 25.7
10 24.1 32.5 22.9 34.6 28.1
11 26.8 35.7 25.0 38.1 31.1
12 30.7 38.8 27.4 45.6 34.7
13 30.7 39.4 27.9 45.6 34.7
14 30.7 39.4 27.9 45.6 34.7
15 30.7 39.4 27.9 45.6 34.7
16 30.7 39.4 27.9 45.6 34.7
17 30.7 39.4 27.9 45.6 34.7
Number of children
10 696 10 079 10 313 10 462 20 775
Source: Household survey data, OOSC-DRC 2012 Table A19: Cumulative probabilities (in %) of dropping out by province
Years Kinshasa
Bas-Congo
Bandundu
Equateur
Orientale
North Kivu
Maniema
South Kivu
Katanga
Kasai-Orient.
Kasai-Occident.
1 2.1 1.7 0.6 2.1 4.2 3.6 1.7 3.6 2.6 3.9 3.4
2 4.0 2.9 1.7 4.1 6.3 6.9 3.0 5.7 5.5 5.9 5.7
3 5.6 4.8 2.1 7.4 8.6 10.5 4.3 7.6 10.0 8.6 7.8
4 8.3 6.1 2.6 8.5 13.1 13.2 6.1 10.0 12.6 11.1 8.8
5 10.3 7.8 3.7 9.3 15.8 16.3 7.2 11.8 16.0 14.5 10.9
6 12.3 9.8 4.3 10.2 19.2 21.8 8.8 13.7 18.1 18.7 13.4
7 14.4 14.4 5.0 13.0 24.8 26.6 12.5 19.1 21.0 23.6 16.6
8 19.4 16.3 5.8 14.9 35.9 31.0 12.8 22.7 26.3 27.1 20.4
9 20.3 19.3 6.3 19.9 35.9 36.0 14.6 29.7 30.1 33.6 20.4
10 21.4 22.6 6.3 26.5 35.9 39.8 14.6 34.1 31.7 35.2 26.4
11 24.3 31.3 6.3 26.5 35.9 39.8 14.6 36.9 33.4 35.5 38.5
12 26.7 31.3 6.3 26.5 35.9 39.8 14.6 36.9 34.0 35.5 38.5
13 26.7 31.3 6.3 26.5 35.9 39.8 14.6 36.9 34.0 35.5 38.5
14 26.7 31.3 6.3 26.5 35.9 39.8 14.6 36.9 34.0 35.5 38.5
15 26.7 31.3 6.3 26.5 35.9 39.8 14.6 36.9 34.0 35.5 38.5
16 26.7 31.3 6.3 26.5 35.9 39.8 14.6 36.9 34.0 35.5 38.5
17 26.7 31.3 6.3 26.5 35.9 39.8 14.6 36.9 34.0 35.5 38.5
Number of children
2 001 1 859 1 776 1 346 1 681 2 197 1 219 1 957 2 730 1 842 2 167
Source: Household survey data, OOSC-DRC 2012
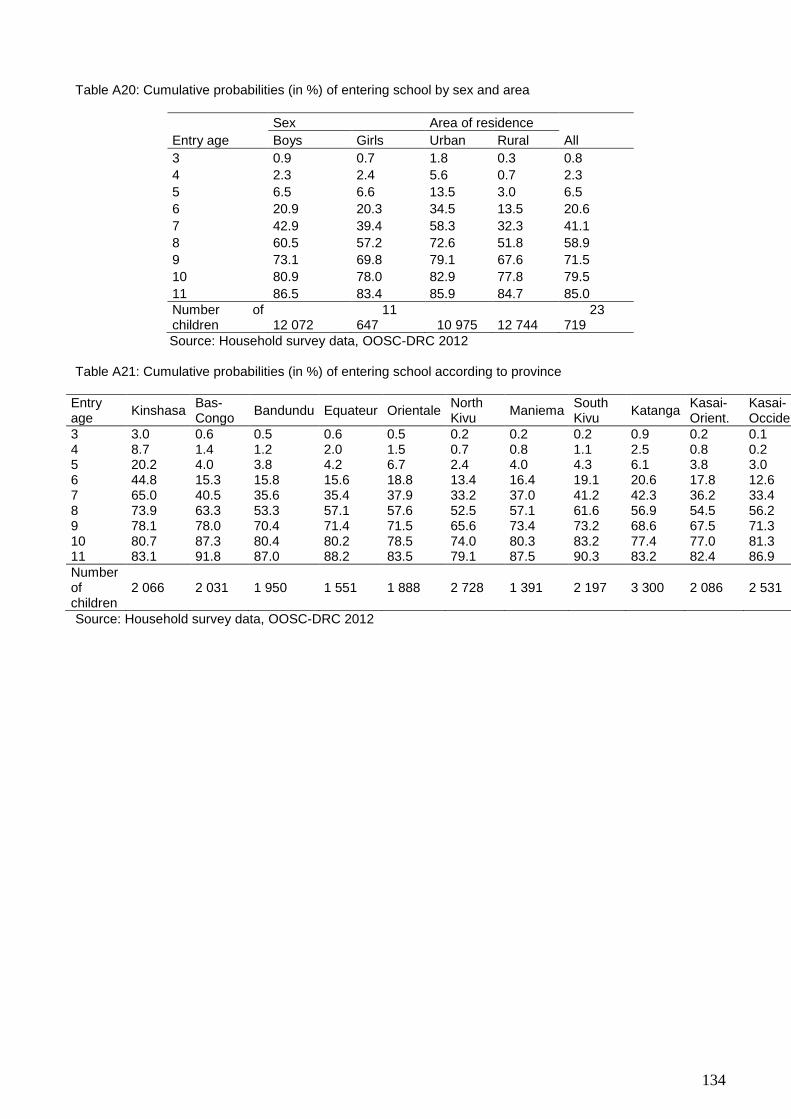
134
Table A20: Cumulative probabilities (in %) of entering school by sex and area
Sex Area of residence
Entry age Boys Girls Urban Rural All
3 0.9 0.7 1.8 0.3 0.8
4 2.3 2.4 5.6 0.7 2.3
5 6.5 6.6 13.5 3.0 6.5
6 20.9 20.3 34.5 13.5 20.6
7 42.9 39.4 58.3 32.3 41.1
8 60.5 57.2 72.6 51.8 58.9
9 73.1 69.8 79.1 67.6 71.5
10 80.9 78.0 82.9 77.8 79.5
11 86.5 83.4 85.9 84.7 85.0
Number of children 12 072
11 647 10 975 12 744
23 719
Source: Household survey data, OOSC-DRC 2012 Table A21: Cumulative probabilities (in %) of entering school according to province
Entry age
Kinshasa Bas-Congo
Bandundu Equateur Orientale North Kivu
Maniema South Kivu
Katanga Kasai-Orient.
Kasai-Occident.
3 3.0 0.6 0.5 0.6 0.5 0.2 0.2 0.2 0.9 0.2 0.1 4 8.7 1.4 1.2 2.0 1.5 0.7 0.8 1.1 2.5 0.8 0.2 5 20.2 4.0 3.8 4.2 6.7 2.4 4.0 4.3 6.1 3.8 3.0 6 44.8 15.3 15.8 15.6 18.8 13.4 16.4 19.1 20.6 17.8 12.6 7 65.0 40.5 35.6 35.4 37.9 33.2 37.0 41.2 42.3 36.2 33.4 8 73.9 63.3 53.3 57.1 57.6 52.5 57.1 61.6 56.9 54.5 56.2 9 78.1 78.0 70.4 71.4 71.5 65.6 73.4 73.2 68.6 67.5 71.3 10 80.7 87.3 80.4 80.2 78.5 74.0 80.3 83.2 77.4 77.0 81.3 11 83.1 91.8 87.0 88.2 83.5 79.1 87.5 90.3 83.2 82.4 86.9
Number of children
2 066 2 031 1 950 1 551 1 888 2 728 1 391 2 197 3 300 2 086 2 531
Source: Household survey data, OOSC-DRC 2012
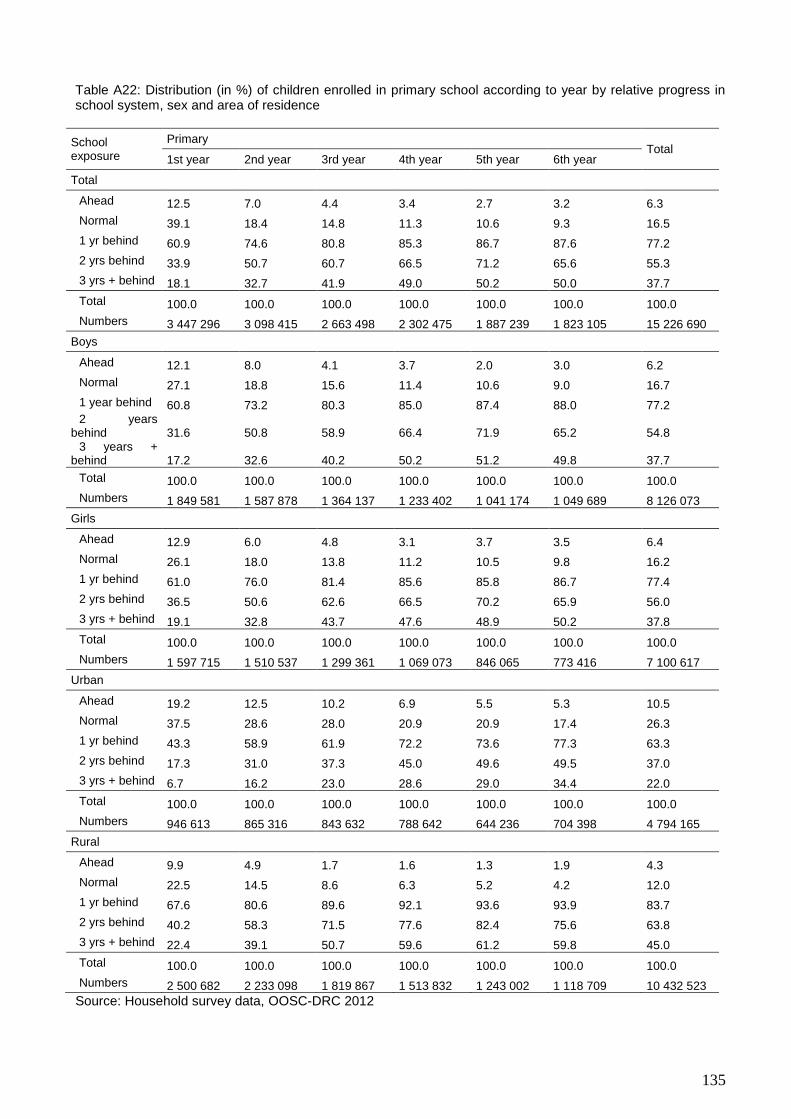
135
Table A22: Distribution (in %) of children enrolled in primary school according to year by relative progress in school system, sex and area of residence
School exposure
Primary Total
1st year 2nd year 3rd year 4th year 5th year 6th year
Total
Ahead 12.5 7.0 4.4 3.4 2.7 3.2 6.3
Normal 39.1 18.4 14.8 11.3 10.6 9.3 16.5
1 yr behind 60.9 74.6 80.8 85.3 86.7 87.6 77.2
2 yrs behind 33.9 50.7 60.7 66.5 71.2 65.6 55.3
3 yrs + behind 18.1 32.7 41.9 49.0 50.2 50.0 37.7
Total 100.0 100.0 100.0 100.0 100.0 100.0 100.0
Numbers 3 447 296 3 098 415 2 663 498 2 302 475 1 887 239 1 823 105 15 226 690
Boys
Ahead 12.1 8.0 4.1 3.7 2.0 3.0 6.2
Normal 27.1 18.8 15.6 11.4 10.6 9.0 16.7
1 year behind 60.8 73.2 80.3 85.0 87.4 88.0 77.2 2 years
behind 31.6 50.8 58.9 66.4 71.9 65.2 54.8 3 years +
behind 17.2 32.6 40.2 50.2 51.2 49.8 37.7
Total 100.0 100.0 100.0 100.0 100.0 100.0 100.0
Numbers 1 849 581 1 587 878 1 364 137 1 233 402 1 041 174 1 049 689 8 126 073
Girls
Ahead 12.9 6.0 4.8 3.1 3.7 3.5 6.4
Normal 26.1 18.0 13.8 11.2 10.5 9.8 16.2
1 yr behind 61.0 76.0 81.4 85.6 85.8 86.7 77.4
2 yrs behind 36.5 50.6 62.6 66.5 70.2 65.9 56.0
3 yrs + behind 19.1 32.8 43.7 47.6 48.9 50.2 37.8
Total 100.0 100.0 100.0 100.0 100.0 100.0 100.0
Numbers 1 597 715 1 510 537 1 299 361 1 069 073 846 065 773 416 7 100 617
Urban
Ahead 19.2 12.5 10.2 6.9 5.5 5.3 10.5
Normal 37.5 28.6 28.0 20.9 20.9 17.4 26.3
1 yr behind 43.3 58.9 61.9 72.2 73.6 77.3 63.3
2 yrs behind 17.3 31.0 37.3 45.0 49.6 49.5 37.0
3 yrs + behind 6.7 16.2 23.0 28.6 29.0 34.4 22.0
Total 100.0 100.0 100.0 100.0 100.0 100.0 100.0
Numbers 946 613 865 316 843 632 788 642 644 236 704 398 4 794 165
Rural
Ahead 9.9 4.9 1.7 1.6 1.3 1.9 4.3
Normal 22.5 14.5 8.6 6.3 5.2 4.2 12.0
1 yr behind 67.6 80.6 89.6 92.1 93.6 93.9 83.7
2 yrs behind 40.2 58.3 71.5 77.6 82.4 75.6 63.8
3 yrs + behind 22.4 39.1 50.7 59.6 61.2 59.8 45.0
Total 100.0 100.0 100.0 100.0 100.0 100.0 100.0
Numbers 2 500 682 2 233 098 1 819 867 1 513 832 1 243 002 1 118 709 10 432 523
Source: Household survey data, OOSC-DRC 2012
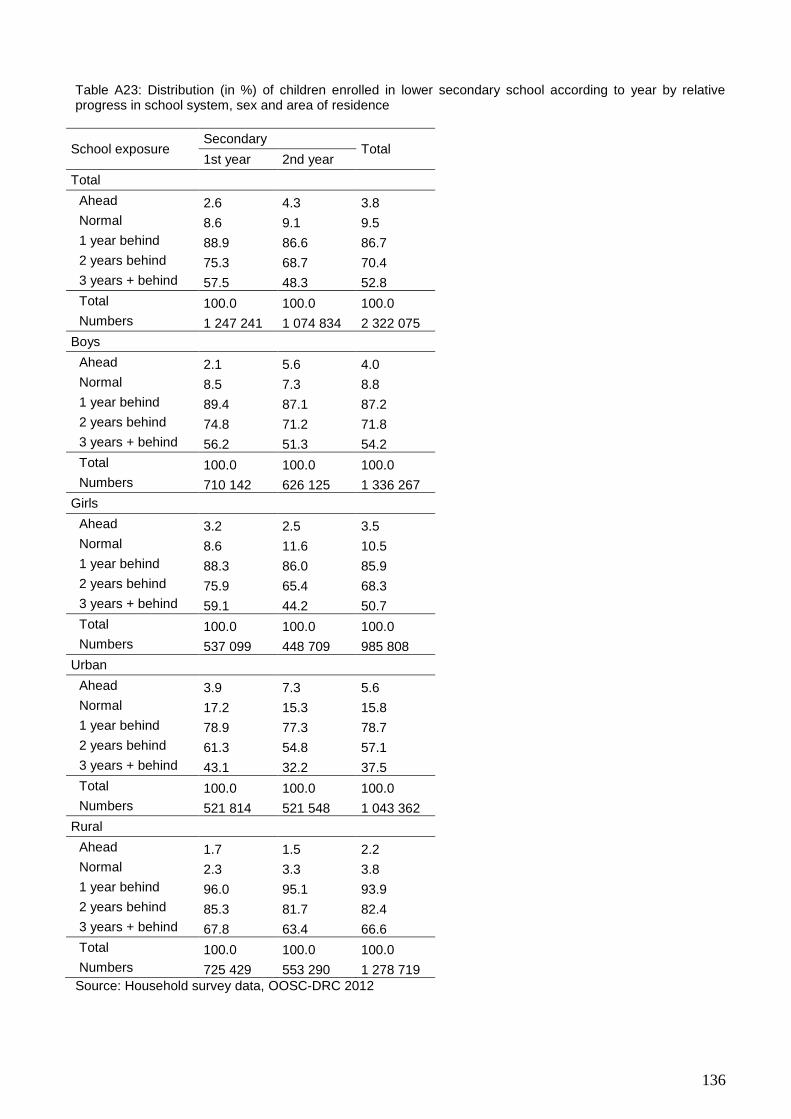
136
Table A23: Distribution (in %) of children enrolled in lower secondary school according to year by relative progress in school system, sex and area of residence
School exposure Secondary
Total 1st year 2nd year
Total
Ahead 2.6 4.3 3.8
Normal 8.6 9.1 9.5
1 year behind 88.9 86.6 86.7
2 years behind 75.3 68.7 70.4
3 years + behind 57.5 48.3 52.8
Total 100.0 100.0 100.0
Numbers 1 247 241 1 074 834 2 322 075
Boys
Ahead 2.1 5.6 4.0
Normal 8.5 7.3 8.8
1 year behind 89.4 87.1 87.2
2 years behind 74.8 71.2 71.8
3 years + behind 56.2 51.3 54.2
Total 100.0 100.0 100.0
Numbers 710 142 626 125 1 336 267
Girls
Ahead 3.2 2.5 3.5
Normal 8.6 11.6 10.5
1 year behind 88.3 86.0 85.9
2 years behind 75.9 65.4 68.3
3 years + behind 59.1 44.2 50.7
Total 100.0 100.0 100.0
Numbers 537 099 448 709 985 808
Urban
Ahead 3.9 7.3 5.6
Normal 17.2 15.3 15.8
1 year behind 78.9 77.3 78.7
2 years behind 61.3 54.8 57.1
3 years + behind 43.1 32.2 37.5
Total 100.0 100.0 100.0
Numbers 521 814 521 548 1 043 362
Rural
Ahead 1.7 1.5 2.2
Normal 2.3 3.3 3.8
1 year behind 96.0 95.1 93.9
2 years behind 85.3 81.7 82.4
3 years + behind 67.8 63.4 66.6
Total 100.0 100.0 100.0
Numbers 725 429 553 290 1 278 719
Source: Household survey data, OOSC-DRC 2012
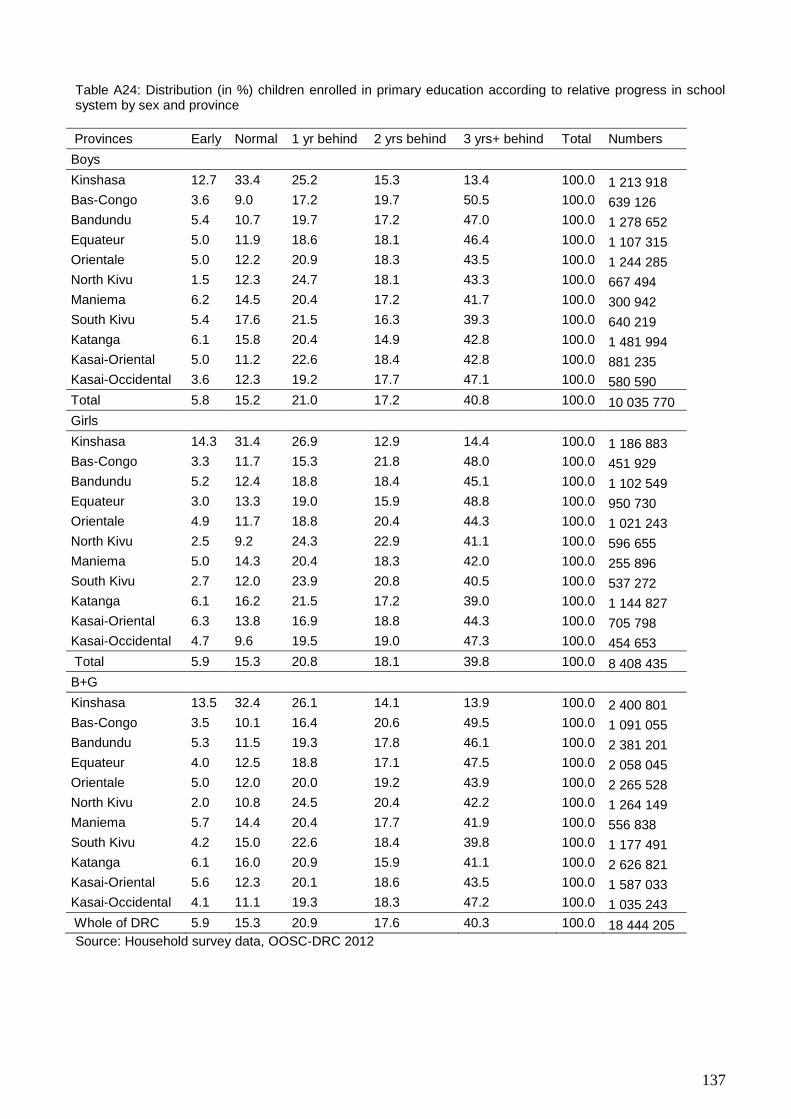
137
Table A24: Distribution (in %) children enrolled in primary education according to relative progress in school system by sex and province
Provinces Early Normal 1 yr behind 2 yrs behind 3 yrs+ behind Total Numbers
Boys
Kinshasa 12.7 33.4 25.2 15.3 13.4 100.0 1 213 918
Bas-Congo 3.6 9.0 17.2 19.7 50.5 100.0 639 126
Bandundu 5.4 10.7 19.7 17.2 47.0 100.0 1 278 652
Equateur 5.0 11.9 18.6 18.1 46.4 100.0 1 107 315
Orientale 5.0 12.2 20.9 18.3 43.5 100.0 1 244 285
North Kivu 1.5 12.3 24.7 18.1 43.3 100.0 667 494
Maniema 6.2 14.5 20.4 17.2 41.7 100.0 300 942
South Kivu 5.4 17.6 21.5 16.3 39.3 100.0 640 219
Katanga 6.1 15.8 20.4 14.9 42.8 100.0 1 481 994
Kasai-Oriental 5.0 11.2 22.6 18.4 42.8 100.0 881 235
Kasai-Occidental 3.6 12.3 19.2 17.7 47.1 100.0 580 590
Total 5.8 15.2 21.0 17.2 40.8 100.0 10 035 770
Girls
Kinshasa 14.3 31.4 26.9 12.9 14.4 100.0 1 186 883
Bas-Congo 3.3 11.7 15.3 21.8 48.0 100.0 451 929
Bandundu 5.2 12.4 18.8 18.4 45.1 100.0 1 102 549
Equateur 3.0 13.3 19.0 15.9 48.8 100.0 950 730
Orientale 4.9 11.7 18.8 20.4 44.3 100.0 1 021 243
North Kivu 2.5 9.2 24.3 22.9 41.1 100.0 596 655
Maniema 5.0 14.3 20.4 18.3 42.0 100.0 255 896
South Kivu 2.7 12.0 23.9 20.8 40.5 100.0 537 272
Katanga 6.1 16.2 21.5 17.2 39.0 100.0 1 144 827
Kasai-Oriental 6.3 13.8 16.9 18.8 44.3 100.0 705 798
Kasai-Occidental 4.7 9.6 19.5 19.0 47.3 100.0 454 653
Total 5.9 15.3 20.8 18.1 39.8 100.0 8 408 435
B+G
Kinshasa 13.5 32.4 26.1 14.1 13.9 100.0 2 400 801
Bas-Congo 3.5 10.1 16.4 20.6 49.5 100.0 1 091 055
Bandundu 5.3 11.5 19.3 17.8 46.1 100.0 2 381 201
Equateur 4.0 12.5 18.8 17.1 47.5 100.0 2 058 045
Orientale 5.0 12.0 20.0 19.2 43.9 100.0 2 265 528
North Kivu 2.0 10.8 24.5 20.4 42.2 100.0 1 264 149
Maniema 5.7 14.4 20.4 17.7 41.9 100.0 556 838
South Kivu 4.2 15.0 22.6 18.4 39.8 100.0 1 177 491
Katanga 6.1 16.0 20.9 15.9 41.1 100.0 2 626 821
Kasai-Oriental 5.6 12.3 20.1 18.6 43.5 100.0 1 587 033
Kasai-Occidental 4.1 11.1 19.3 18.3 47.2 100.0 1 035 243
Whole of DRC 5.9 15.3 20.9 17.6 40.3 100.0 18 444 205
Source: Household survey data, OOSC-DRC 2012
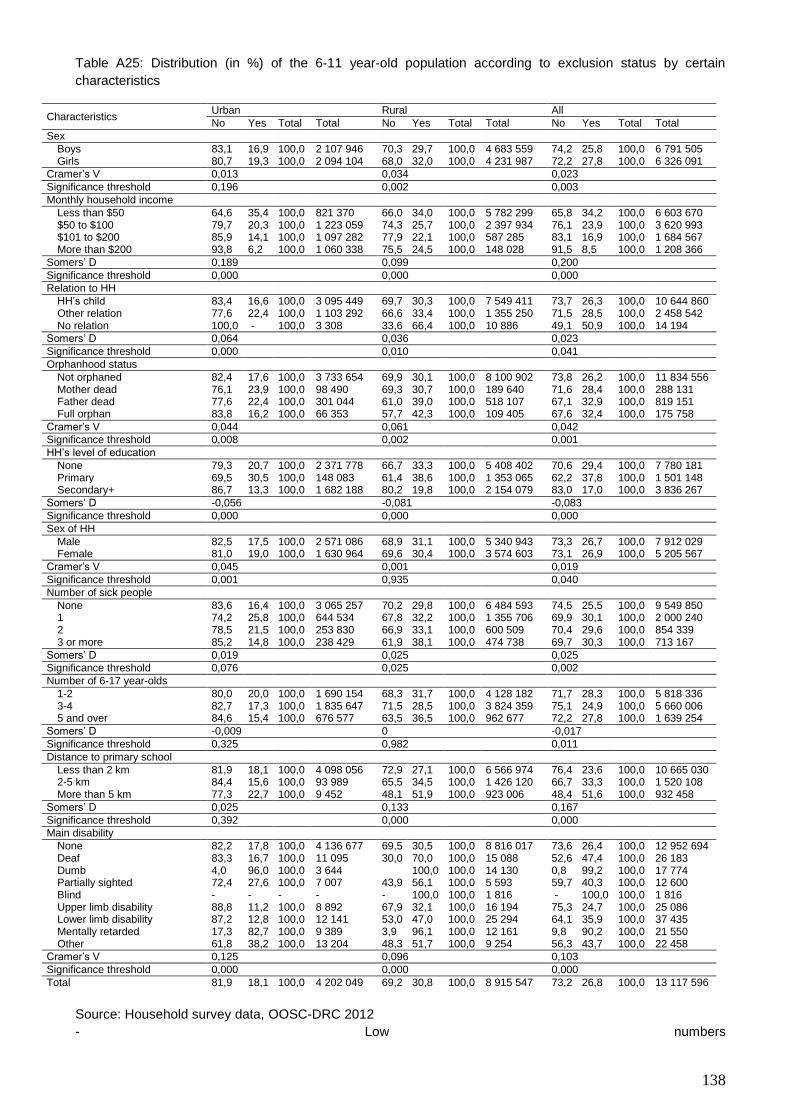
138
Table A25: Distribution (in %) of the 6-11 year-old population according to exclusion status by certain
characteristics
Characteristics Urban Rural All
No Yes Total Total No Yes Total Total No Yes Total Total
Sex Boys 83,1 16,9 100,0 2 107 946 70,3 29,7 100,0 4 683 559 74,2 25,8 100,0 6 791 505
Girls 80,7 19,3 100,0 2 094 104 68,0 32,0 100,0 4 231 987 72,2 27,8 100,0 6 326 091
Cramer’s V 0,013 0,034 0,023
Significance threshold 0,196 0,002 0,003
Monthly household income Less than $50 64,6 35,4 100,0 821 370 66,0 34,0 100,0 5 782 299 65,8 34,2 100,0 6 603 670
$50 to $100 79,7 20,3 100,0 1 223 059 74,3 25,7 100,0 2 397 934 76,1 23,9 100,0 3 620 993 $101 to $200 85,9 14,1 100,0 1 097 282 77,9 22,1 100,0 587 285 83,1 16,9 100,0 1 684 567 More than $200 93,8 6,2 100,0 1 060 338 75,5 24,5 100,0 148 028 91,5 8,5 100,0 1 208 366
Somers’ D 0,189 0,099 0,200
Significance threshold 0,000 0,000 0,000
Relation to HH HH’s child 83,4 16,6 100,0 3 095 449 69,7 30,3 100,0 7 549 411 73,7 26,3 100,0 10 644 860
Other relation 77,6 22,4 100,0 1 103 292 66,6 33,4 100,0 1 355 250 71,5 28,5 100,0 2 458 542 No relation 100,0 - 100,0 3 308 33,6 66,4 100,0 10 886 49,1 50,9 100,0 14 194
Somers’ D 0,064 0,036 0,023
Significance threshold 0,000 0,010 0,041
Orphanhood status Not orphaned 82,4 17,6 100,0 3 733 654 69,9 30,1 100,0 8 100 902 73,8 26,2 100,0 11 834 556
Mother dead 76,1 23,9 100,0 98 490 69,3 30,7 100,0 189 640 71,6 28,4 100,0 288 131 Father dead 77,6 22,4 100,0 301 044 61,0 39,0 100,0 518 107 67,1 32,9 100,0 819 151 Full orphan 83,8 16,2 100,0 66 353 57,7 42,3 100,0 109 405 67,6 32,4 100,0 175 758
Cramer’s V 0,044 0,061 0,042
Significance threshold 0,008 0,002 0,001
HH’s level of education None 79,3 20,7 100,0 2 371 778 66,7 33,3 100,0 5 408 402 70,6 29,4 100,0 7 780 181
Primary 69,5 30,5 100,0 148 083 61,4 38,6 100,0 1 353 065 62,2 37,8 100,0 1 501 148 Secondary+ 86,7 13,3 100,0 1 682 188 80,2 19,8 100,0 2 154 079 83,0 17,0 100,0 3 836 267
Somers’ D -0,056 -0,081 -0,083
Significance threshold 0,000 0,000 0,000
Sex of HH Male 82,5 17,5 100,0 2 571 086 68,9 31,1 100,0 5 340 943 73,3 26,7 100,0 7 912 029
Female 81,0 19,0 100,0 1 630 964 69,6 30,4 100,0 3 574 603 73,1 26,9 100,0 5 205 567
Cramer’s V 0,045 0,001 0,019
Significance threshold 0,001 0,935 0,040
Number of sick people None 83,6 16,4 100,0 3 065 257 70,2 29,8 100,0 6 484 593 74,5 25,5 100,0 9 549 850
1 74,2 25,8 100,0 644 534 67,8 32,2 100,0 1 355 706 69,9 30,1 100,0 2 000 240 2 78,5 21,5 100,0 253 830 66,9 33,1 100,0 600 509 70,4 29,6 100,0 854 339 3 or more 85,2 14,8 100,0 238 429 61,9 38,1 100,0 474 738 69,7 30,3 100,0 713 167
Somers’ D 0,019 0,025 0,025
Significance threshold 0,076 0,025 0,002
Number of 6-17 year-olds 1-2 80,0 20,0 100,0 1 690 154 68,3 31,7 100,0 4 128 182 71,7 28,3 100,0 5 818 336
3-4 82,7 17,3 100,0 1 835 647 71,5 28,5 100,0 3 824 359 75,1 24,9 100,0 5 660 006 5 and over 84,6 15,4 100,0 676 577 63,5 36,5 100,0 962 677 72,2 27,8 100,0 1 639 254
Somers’ D -0,009 0 -0,017
Significance threshold 0,325 0,982 0,011
Distance to primary school Less than 2 km 81,9 18,1 100,0 4 098 056 72,9 27,1 100,0 6 566 974 76,4 23,6 100,0 10 665 030
2-5 km 84,4 15,6 100,0 93 989 65,5 34,5 100,0 1 426 120 66,7 33,3 100,0 1 520 108 More than 5 km 77,3 22,7 100,0 9 452 48,1 51,9 100,0 923 006 48,4 51,6 100,0 932 458
Somers’ D 0,025 0,133 0,167
Significance threshold 0,392 0,000 0,000
Main disability None 82,2 17,8 100,0 4 136 677 69,5 30,5 100,0 8 816 017 73,6 26,4 100,0 12 952 694
Deaf 83,3 16,7 100,0 11 095 30,0 70,0 100,0 15 088 52,6 47,4 100,0 26 183 Dumb 4,0 96,0 100,0 3 644
100,0 100,0 14 130 0,8 99,2 100,0 17 774
Partially sighted 72,4 27,6 100,0 7 007 43,9 56,1 100,0 5 593 59,7 40,3 100,0 12 600 Blind - - - - - 100,0 100,0 1 816 - 100,0 100,0 1 816 Upper limb disability 88,8 11,2 100,0 8 892 67,9 32,1 100,0 16 194 75,3 24,7 100,0 25 086 Lower limb disability 87,2 12,8 100,0 12 141 53,0 47,0 100,0 25 294 64,1 35,9 100,0 37 435 Mentally retarded 17,3 82,7 100,0 9 389 3,9 96,1 100,0 12 161 9,8 90,2 100,0 21 550 Other 61,8 38,2 100,0 13 204 48,3 51,7 100,0 9 254 56,3 43,7 100,0 22 458
Cramer’s V 0,125 0,096 0,103
Significance threshold 0,000 0,000 0,000
Total 81,9 18,1 100,0 4 202 049 69,2 30,8 100,0 8 915 547 73,2 26,8 100,0 13 117 596
Source: Household survey data, OOSC-DRC 2012
- Low numbers
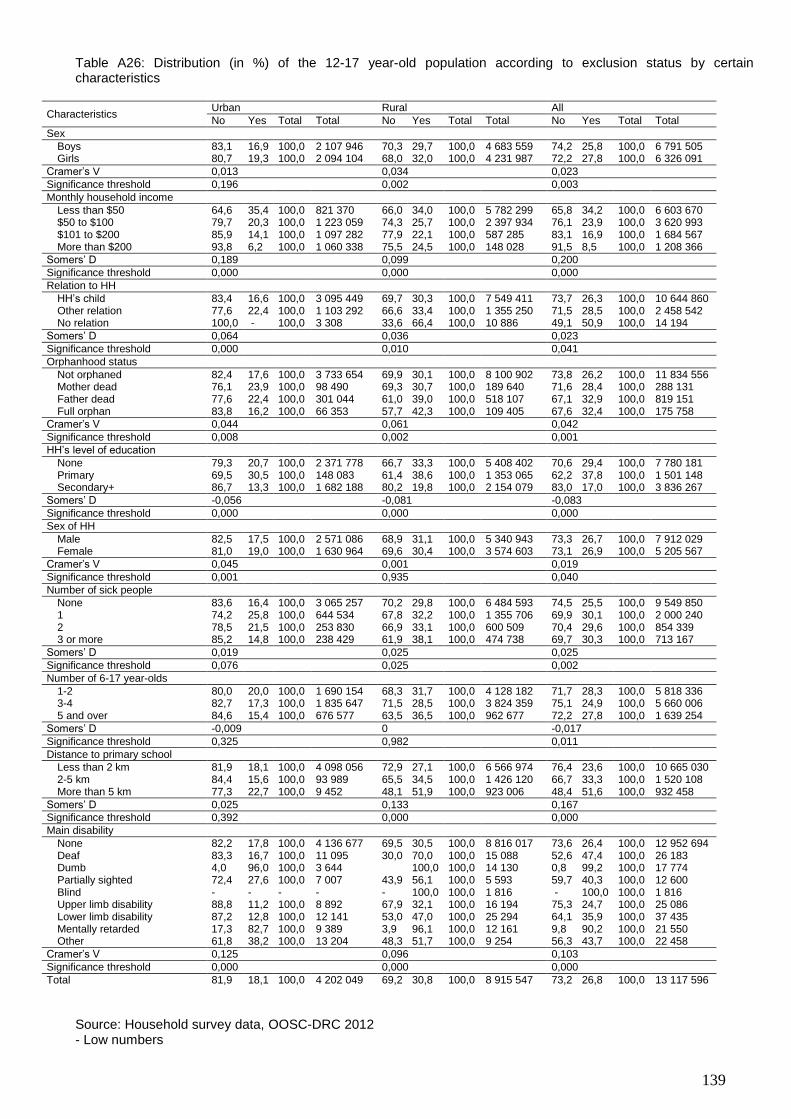
139
Table A26: Distribution (in %) of the 12-17 year-old population according to exclusion status by certain characteristics
Characteristics Urban Rural All
No Yes Total Total No Yes Total Total No Yes Total Total
Sex Boys 83,1 16,9 100,0 2 107 946 70,3 29,7 100,0 4 683 559 74,2 25,8 100,0 6 791 505
Girls 80,7 19,3 100,0 2 094 104 68,0 32,0 100,0 4 231 987 72,2 27,8 100,0 6 326 091
Cramer’s V 0,013 0,034 0,023
Significance threshold 0,196 0,002 0,003
Monthly household income Less than $50 64,6 35,4 100,0 821 370 66,0 34,0 100,0 5 782 299 65,8 34,2 100,0 6 603 670
$50 to $100 79,7 20,3 100,0 1 223 059 74,3 25,7 100,0 2 397 934 76,1 23,9 100,0 3 620 993 $101 to $200 85,9 14,1 100,0 1 097 282 77,9 22,1 100,0 587 285 83,1 16,9 100,0 1 684 567 More than $200 93,8 6,2 100,0 1 060 338 75,5 24,5 100,0 148 028 91,5 8,5 100,0 1 208 366
Somers’ D 0,189 0,099 0,200
Significance threshold 0,000 0,000 0,000
Relation to HH HH’s child 83,4 16,6 100,0 3 095 449 69,7 30,3 100,0 7 549 411 73,7 26,3 100,0 10 644 860
Other relation 77,6 22,4 100,0 1 103 292 66,6 33,4 100,0 1 355 250 71,5 28,5 100,0 2 458 542 No relation 100,0 - 100,0 3 308 33,6 66,4 100,0 10 886 49,1 50,9 100,0 14 194
Somers’ D 0,064 0,036 0,023
Significance threshold 0,000 0,010 0,041
Orphanhood status Not orphaned 82,4 17,6 100,0 3 733 654 69,9 30,1 100,0 8 100 902 73,8 26,2 100,0 11 834 556
Mother dead 76,1 23,9 100,0 98 490 69,3 30,7 100,0 189 640 71,6 28,4 100,0 288 131 Father dead 77,6 22,4 100,0 301 044 61,0 39,0 100,0 518 107 67,1 32,9 100,0 819 151 Full orphan 83,8 16,2 100,0 66 353 57,7 42,3 100,0 109 405 67,6 32,4 100,0 175 758
Cramer’s V 0,044 0,061 0,042
Significance threshold 0,008 0,002 0,001
HH’s level of education None 79,3 20,7 100,0 2 371 778 66,7 33,3 100,0 5 408 402 70,6 29,4 100,0 7 780 181
Primary 69,5 30,5 100,0 148 083 61,4 38,6 100,0 1 353 065 62,2 37,8 100,0 1 501 148 Secondary+ 86,7 13,3 100,0 1 682 188 80,2 19,8 100,0 2 154 079 83,0 17,0 100,0 3 836 267
Somers’ D -0,056 -0,081 -0,083
Significance threshold 0,000 0,000 0,000
Sex of HH Male 82,5 17,5 100,0 2 571 086 68,9 31,1 100,0 5 340 943 73,3 26,7 100,0 7 912 029
Female 81,0 19,0 100,0 1 630 964 69,6 30,4 100,0 3 574 603 73,1 26,9 100,0 5 205 567
Cramer’s V 0,045 0,001 0,019
Significance threshold 0,001 0,935 0,040
Number of sick people None 83,6 16,4 100,0 3 065 257 70,2 29,8 100,0 6 484 593 74,5 25,5 100,0 9 549 850
1 74,2 25,8 100,0 644 534 67,8 32,2 100,0 1 355 706 69,9 30,1 100,0 2 000 240 2 78,5 21,5 100,0 253 830 66,9 33,1 100,0 600 509 70,4 29,6 100,0 854 339 3 or more 85,2 14,8 100,0 238 429 61,9 38,1 100,0 474 738 69,7 30,3 100,0 713 167
Somers’ D 0,019 0,025 0,025
Significance threshold 0,076 0,025 0,002
Number of 6-17 year-olds 1-2 80,0 20,0 100,0 1 690 154 68,3 31,7 100,0 4 128 182 71,7 28,3 100,0 5 818 336
3-4 82,7 17,3 100,0 1 835 647 71,5 28,5 100,0 3 824 359 75,1 24,9 100,0 5 660 006 5 and over 84,6 15,4 100,0 676 577 63,5 36,5 100,0 962 677 72,2 27,8 100,0 1 639 254
Somers’ D -0,009 0 -0,017
Significance threshold 0,325 0,982 0,011
Distance to primary school Less than 2 km 81,9 18,1 100,0 4 098 056 72,9 27,1 100,0 6 566 974 76,4 23,6 100,0 10 665 030
2-5 km 84,4 15,6 100,0 93 989 65,5 34,5 100,0 1 426 120 66,7 33,3 100,0 1 520 108 More than 5 km 77,3 22,7 100,0 9 452 48,1 51,9 100,0 923 006 48,4 51,6 100,0 932 458
Somers’ D 0,025 0,133 0,167
Significance threshold 0,392 0,000 0,000
Main disability None 82,2 17,8 100,0 4 136 677 69,5 30,5 100,0 8 816 017 73,6 26,4 100,0 12 952 694
Deaf 83,3 16,7 100,0 11 095 30,0 70,0 100,0 15 088 52,6 47,4 100,0 26 183 Dumb 4,0 96,0 100,0 3 644
100,0 100,0 14 130 0,8 99,2 100,0 17 774
Partially sighted 72,4 27,6 100,0 7 007 43,9 56,1 100,0 5 593 59,7 40,3 100,0 12 600 Blind - - - - - 100,0 100,0 1 816 - 100,0 100,0 1 816 Upper limb disability 88,8 11,2 100,0 8 892 67,9 32,1 100,0 16 194 75,3 24,7 100,0 25 086 Lower limb disability 87,2 12,8 100,0 12 141 53,0 47,0 100,0 25 294 64,1 35,9 100,0 37 435 Mentally retarded 17,3 82,7 100,0 9 389 3,9 96,1 100,0 12 161 9,8 90,2 100,0 21 550 Other 61,8 38,2 100,0 13 204 48,3 51,7 100,0 9 254 56,3 43,7 100,0 22 458
Cramer’s V 0,125 0,096 0,103
Significance threshold 0,000 0,000 0,000
Total 81,9 18,1 100,0 4 202 049 69,2 30,8 100,0 8 915 547 73,2 26,8 100,0 13 117 596
Source: Household survey data, OOSC-DRC 2012 - Low numbers
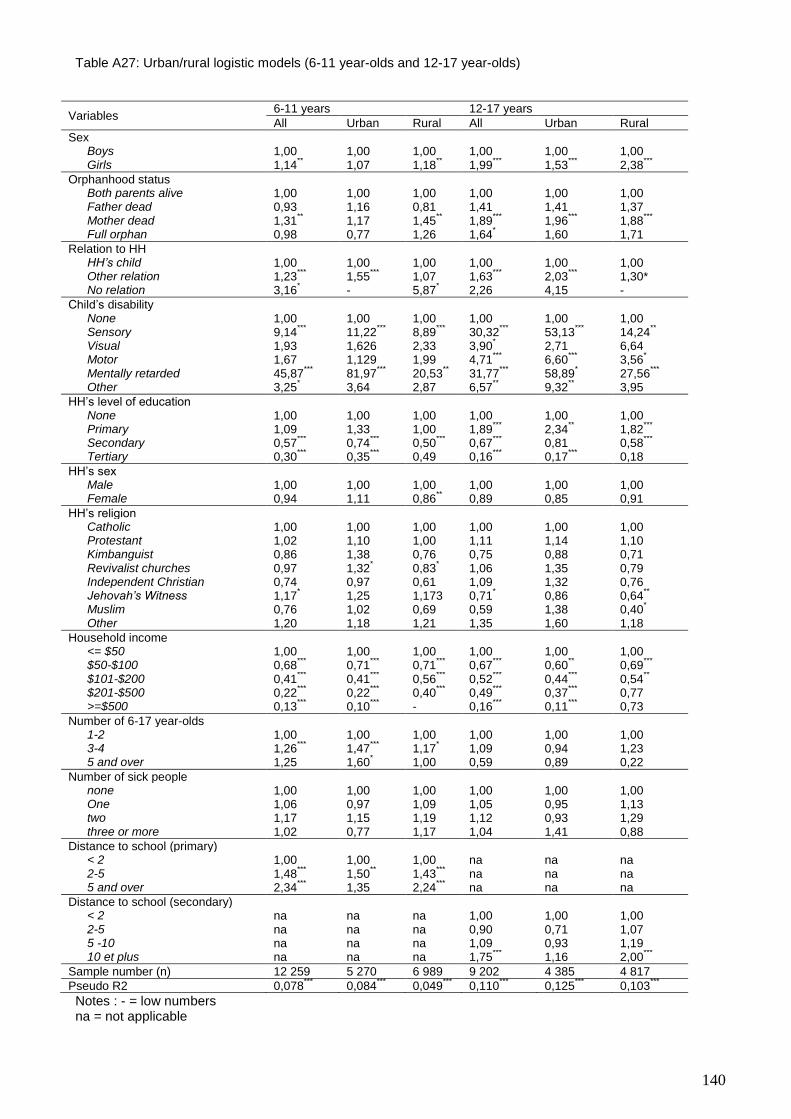
140
Table A27: Urban/rural logistic models (6-11 year-olds and 12-17 year-olds)
Variables 6-11 years 12-17 years
All Urban Rural All Urban Rural
Sex Boys 1,00 1,00 1,00 1,00 1,00 1,00 Girls 1,14
** 1,07 1,18
** 1,99
*** 1,53
*** 2,38
***
Orphanhood status Both parents alive 1,00 1,00 1,00 1,00 1,00 1,00 Father dead 0,93 1,16 0,81 1,41 1,41 1,37 Mother dead 1,31
** 1,17 1,45
** 1,89
*** 1,96
*** 1,88
***
Full orphan 0,98 0,77 1,26 1,64* 1,60 1,71
Relation to HH HH’s child 1,00 1,00 1,00 1,00 1,00 1,00 Other relation 1,23
*** 1,55
*** 1,07 1,63
*** 2,03
*** 1,30*
No relation 3,16* - 5,87
* 2,26 4,15 -
Child’s disability None 1,00 1,00 1,00 1,00 1,00 1,00 Sensory 9,14
*** 11,22
*** 8,89
*** 30,32
*** 53,13
*** 14,24
**
Visual 1,93 1,626 2,33 3,90* 2,71 6,64
Motor 1,67 1,129 1,99 4,71***
6,60***
3,56*
Mentally retarded 45,87***
81,97***
20,53** 31,77
*** 58,89
* 27,56
***
Other 3,25* 3,64 2,87 6,57
** 9,32
** 3,95
HH’s level of education None 1,00 1,00 1,00 1,00 1,00 1,00 Primary 1,09 1,33 1,00 1,89
*** 2,34
** 1,82
***
Secondary 0,57***
0,74***
0,50***
0,67***
0,81 0,58***
Tertiary 0,30
*** 0,35
*** 0,49 0,16
*** 0,17
*** 0,18
HH’s sex Male 1,00 1,00 1,00 1,00 1,00 1,00 Female 0,94 1,11 0,86
** 0,89 0,85 0,91
HH’s religion Catholic 1,00 1,00 1,00 1,00 1,00 1,00 Protestant 1,02 1,10 1,00 1,11 1,14 1,10 Kimbanguist 0,86 1,38 0,76 0,75 0,88 0,71 Revivalist churches 0,97 1,32
* 0,83
* 1,06 1,35 0,79
Independent Christian 0,74 0,97 0,61 1,09 1,32 0,76 Jehovah’s Witness 1,17
* 1,25 1,173 0,71
* 0,86 0,64
**
Muslim 0,76 1,02 0,69 0,59 1,38 0,40*
Other 1,20 1,18 1,21 1,35 1,60 1,18
Household income <= $50 1,00 1,00 1,00 1,00 1,00 1,00 $50-$100 0,68
*** 0,71
*** 0,71
*** 0,67
*** 0,60
** 0,69
***
$101-$200 0,41***
0,41***
0,56***
0,52***
0,44***
0,54**
$201-$500 0,22***
0,22***
0,40***
0,49***
0,37***
0,77 >=$500 0,13
*** 0,10
*** - 0,16
*** 0,11
*** 0,73
Number of 6-17 year-olds 1-2 1,00 1,00 1,00 1,00 1,00 1,00 3-4 1,26
*** 1,47
*** 1,17
* 1,09 0,94 1,23
5 and over 1,25 1,60* 1,00 0,59 0,89 0,22
Number of sick people none 1,00 1,00 1,00 1,00 1,00 1,00 One 1,06 0,97 1,09 1,05 0,95 1,13 two 1,17 1,15 1,19 1,12 0,93 1,29 three or more 1,02 0,77 1,17 1,04 1,41 0,88
Distance to school (primary) < 2 1,00 1,00 1,00 na na na 2-5 1,48
*** 1,50
** 1,43
*** na na na
5 and over 2,34***
1,35 2,24***
na na na
Distance to school (secondary) < 2 na na na 1,00 1,00 1,00 2-5 na na na 0,90 0,71 1,07 5 -10 na na na 1,09 0,93 1,19 10 et plus na na na 1,75
*** 1,16 2,00
***
Sample number (n) 12 259 5 270 6 989 9 202 4 385 4 817
Pseudo R2 0,078***
0,084***
0,049***
0,110***
0,125***
0,103***
Notes : - = low numbers na = not applicable
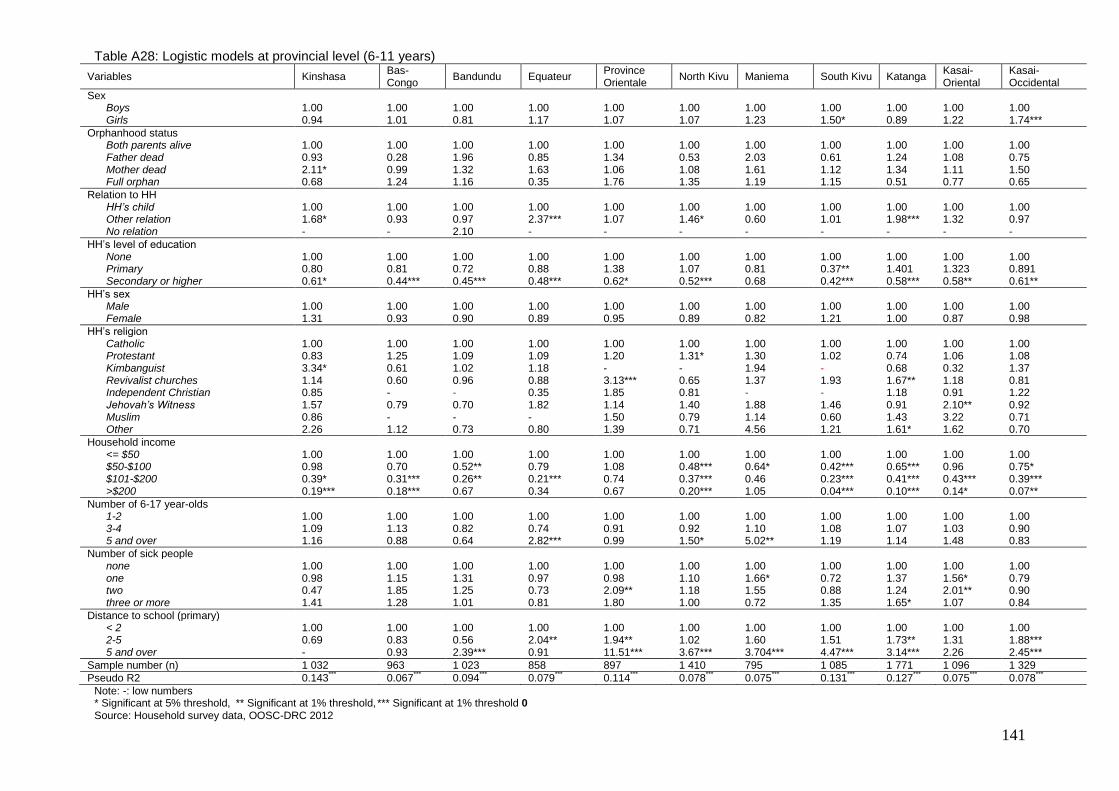
141
Table A28: Logistic models at provincial level (6-11 years)
Variables Kinshasa Bas-Congo
Bandundu Equateur Province Orientale
North Kivu Maniema South Kivu Katanga Kasai-Oriental
Kasai-Occidental
Sex Boys 1.00 1.00 1.00 1.00 1.00 1.00 1.00 1.00 1.00 1.00 1.00 Girls 0.94 1.01 0.81 1.17 1.07 1.07 1.23 1.50* 0.89 1.22 1.74***
Orphanhood status Both parents alive 1.00 1.00 1.00 1.00 1.00 1.00 1.00 1.00 1.00 1.00 1.00 Father dead 0.93 0.28 1.96 0.85 1.34 0.53 2.03 0.61 1.24 1.08 0.75 Mother dead 2.11* 0.99 1.32 1.63 1.06 1.08 1.61 1.12 1.34 1.11 1.50 Full orphan 0.68 1.24 1.16 0.35 1.76 1.35 1.19 1.15 0.51 0.77 0.65
Relation to HH HH’s child 1.00 1.00 1.00 1.00 1.00 1.00 1.00 1.00 1.00 1.00 1.00 Other relation 1.68* 0.93 0.97 2.37*** 1.07 1.46* 0.60 1.01 1.98*** 1.32 0.97 No relation - - 2.10 - - - - - - - -
HH’s level of education None 1.00 1.00 1.00 1.00 1.00 1.00 1.00 1.00 1.00 1.00 1.00 Primary 0.80 0.81 0.72 0.88 1.38 1.07 0.81 0.37** 1.401 1.323 0.891 Secondary or higher 0.61* 0.44*** 0.45*** 0.48*** 0.62* 0.52*** 0.68 0.42*** 0.58*** 0.58** 0.61**
HH’s sex Male 1.00 1.00 1.00 1.00 1.00 1.00 1.00 1.00 1.00 1.00 1.00 Female 1.31 0.93 0.90 0.89 0.95 0.89 0.82 1.21 1.00 0.87 0.98
HH’s religion Catholic 1.00 1.00 1.00 1.00 1.00 1.00 1.00 1.00 1.00 1.00 1.00 Protestant 0.83 1.25 1.09 1.09 1.20 1.31* 1.30 1.02 0.74 1.06 1.08 Kimbanguist 3.34* 0.61 1.02 1.18 - - 1.94 - 0.68 0.32 1.37 Revivalist churches 1.14 0.60 0.96 0.88 3.13*** 0.65 1.37 1.93 1.67** 1.18 0.81 Independent Christian 0.85 - - 0.35 1.85 0.81 - - 1.18 0.91 1.22 Jehovah’s Witness 1.57 0.79 0.70 1.82 1.14 1.40 1.88 1.46 0.91 2.10** 0.92 Muslim 0.86 - - - 1.50 0.79 1.14 0.60 1.43 3.22 0.71 Other 2.26 1.12 0.73 0.80 1.39 0.71 4.56 1.21 1.61* 1.62 0.70
Household income <= $50 1.00 1.00 1.00 1.00 1.00 1.00 1.00 1.00 1.00 1.00 1.00 $50-$100 0.98 0.70 0.52** 0.79 1.08 0.48*** 0.64* 0.42*** 0.65*** 0.96 0.75* $101-$200 0.39* 0.31*** 0.26** 0.21*** 0.74 0.37*** 0.46 0.23*** 0.41*** 0.43*** 0.39*** >$200 0.19*** 0.18*** 0.67 0.34 0.67 0.20*** 1.05 0.04*** 0.10*** 0.14* 0.07**
Number of 6-17 year-olds 1-2 1.00 1.00 1.00 1.00 1.00 1.00 1.00 1.00 1.00 1.00 1.00 3-4 1.09 1.13 0.82 0.74 0.91 0.92 1.10 1.08 1.07 1.03 0.90 5 and over 1.16 0.88 0.64 2.82*** 0.99 1.50* 5.02** 1.19 1.14 1.48 0.83
Number of sick people none 1.00 1.00 1.00 1.00 1.00 1.00 1.00 1.00 1.00 1.00 1.00 one 0.98 1.15 1.31 0.97 0.98 1.10 1.66* 0.72 1.37 1.56* 0.79 two 0.47 1.85 1.25 0.73 2.09** 1.18 1.55 0.88 1.24 2.01** 0.90 three or more 1.41 1.28 1.01 0.81 1.80 1.00 0.72 1.35 1.65* 1.07 0.84
Distance to school (primary) < 2 1.00 1.00 1.00 1.00 1.00 1.00 1.00 1.00 1.00 1.00 1.00 2-5 0.69 0.83 0.56 2.04** 1.94** 1.02 1.60 1.51 1.73** 1.31 1.88*** 5 and over - 0.93 2.39*** 0.91 11.51*** 3.67*** 3.704*** 4.47*** 3.14*** 2.26 2.45***
Sample number (n) 1 032 963 1 023 858 897 1 410 795 1 085 1 771 1 096 1 329
Pseudo R2 0.143***
0.067***
0.094***
0.079***
0.114***
0.078***
0.075***
0.131***
0.127***
0.075***
0.078***
Note: -: low numbers * Significant at 5% threshold, ** Significant at 1% threshold, *** Significant at 1% threshold 0 Source: Household survey data, OOSC-DRC 2012
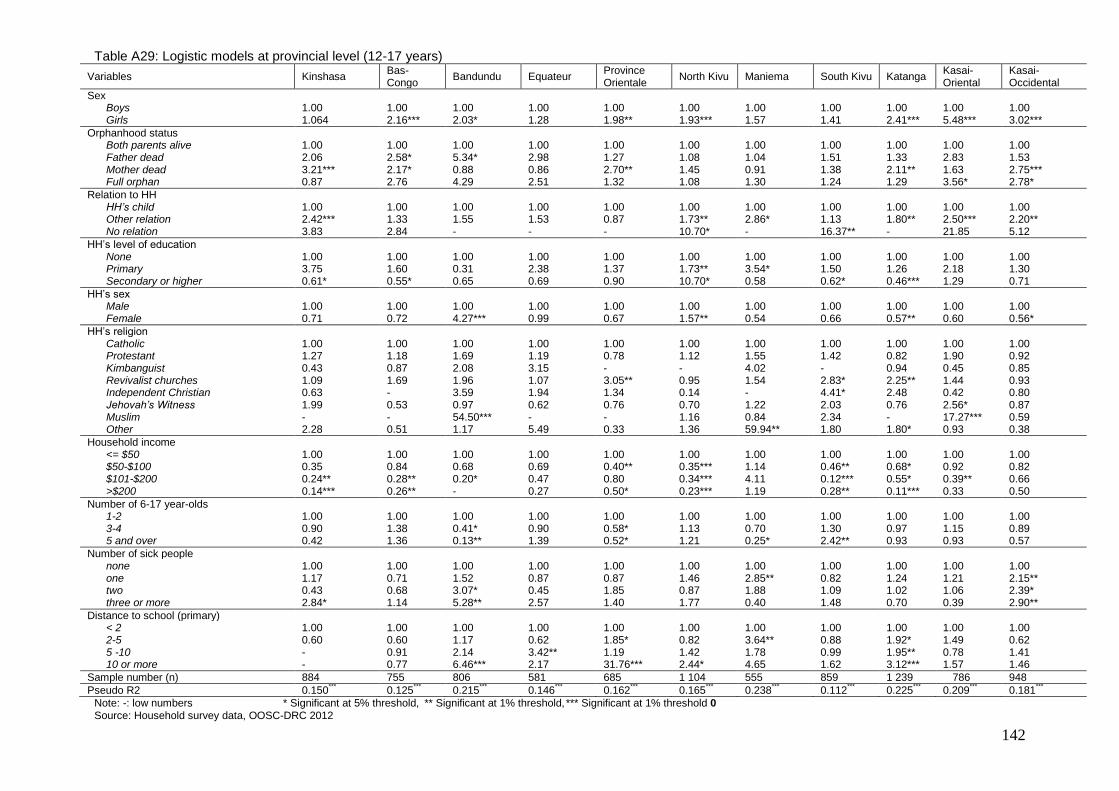
142
Table A29: Logistic models at provincial level (12-17 years)
Variables Kinshasa Bas-Congo
Bandundu Equateur Province Orientale
North Kivu Maniema South Kivu Katanga Kasai-Oriental
Kasai-Occidental
Sex Boys 1.00 1.00 1.00 1.00 1.00 1.00 1.00 1.00 1.00 1.00 1.00 Girls 1.064 2.16*** 2.03* 1.28 1.98** 1.93*** 1.57 1.41 2.41*** 5.48*** 3.02***
Orphanhood status Both parents alive 1.00 1.00 1.00 1.00 1.00 1.00 1.00 1.00 1.00 1.00 1.00 Father dead 2.06 2.58* 5.34* 2.98 1.27 1.08 1.04 1.51 1.33 2.83 1.53 Mother dead 3.21*** 2.17* 0.88 0.86 2.70** 1.45 0.91 1.38 2.11** 1.63 2.75*** Full orphan 0.87 2.76 4.29 2.51 1.32 1.08 1.30 1.24 1.29 3.56* 2.78*
Relation to HH HH’s child 1.00 1.00 1.00 1.00 1.00 1.00 1.00 1.00 1.00 1.00 1.00 Other relation 2.42*** 1.33 1.55 1.53 0.87 1.73** 2.86* 1.13 1.80** 2.50*** 2.20** No relation 3.83 2.84 - - - 10.70* - 16.37** - 21.85 5.12
HH’s level of education None 1.00 1.00 1.00 1.00 1.00 1.00 1.00 1.00 1.00 1.00 1.00 Primary 3.75 1.60 0.31 2.38 1.37 1.73** 3.54* 1.50 1.26 2.18 1.30 Secondary or higher 0.61* 0.55* 0.65 0.69 0.90 10.70* 0.58 0.62* 0.46*** 1.29 0.71
HH’s sex Male 1.00 1.00 1.00 1.00 1.00 1.00 1.00 1.00 1.00 1.00 1.00 Female 0.71 0.72 4.27*** 0.99 0.67 1.57** 0.54 0.66 0.57** 0.60 0.56*
HH’s religion Catholic 1.00 1.00 1.00 1.00 1.00 1.00 1.00 1.00 1.00 1.00 1.00 Protestant 1.27 1.18 1.69 1.19 0.78 1.12 1.55 1.42 0.82 1.90 0.92 Kimbanguist 0.43 0.87 2.08 3.15 - - 4.02 - 0.94 0.45 0.85 Revivalist churches 1.09 1.69 1.96 1.07 3.05** 0.95 1.54 2.83* 2.25** 1.44 0.93 Independent Christian 0.63 - 3.59 1.94 1.34 0.14 - 4.41* 2.48 0.42 0.80 Jehovah’s Witness 1.99 0.53 0.97 0.62 0.76 0.70 1.22 2.03 0.76 2.56* 0.87 Muslim - - 54.50*** - - 1.16 0.84 2.34 - 17.27*** 0.59 Other 2.28 0.51 1.17 5.49 0.33 1.36 59.94** 1.80 1.80* 0.93 0.38
Household income <= $50 1.00 1.00 1.00 1.00 1.00 1.00 1.00 1.00 1.00 1.00 1.00 $50-$100 0.35 0.84 0.68 0.69 0.40** 0.35*** 1.14 0.46** 0.68* 0.92 0.82 $101-$200 0.24** 0.28** 0.20* 0.47 0.80 0.34*** 4.11 0.12*** 0.55* 0.39** 0.66 >$200 0.14*** 0.26** - 0.27 0.50* 0.23*** 1.19 0.28** 0.11*** 0.33 0.50
Number of 6-17 year-olds 1-2 1.00 1.00 1.00 1.00 1.00 1.00 1.00 1.00 1.00 1.00 1.00 3-4 0.90 1.38 0.41* 0.90 0.58* 1.13 0.70 1.30 0.97 1.15 0.89 5 and over 0.42 1.36 0.13** 1.39 0.52* 1.21 0.25* 2.42** 0.93 0.93 0.57
Number of sick people none 1.00 1.00 1.00 1.00 1.00 1.00 1.00 1.00 1.00 1.00 1.00 one 1.17 0.71 1.52 0.87 0.87 1.46 2.85** 0.82 1.24 1.21 2.15** two 0.43 0.68 3.07* 0.45 1.85 0.87 1.88 1.09 1.02 1.06 2.39* three or more 2.84* 1.14 5.28** 2.57 1.40 1.77 0.40 1.48 0.70 0.39 2.90**
Distance to school (primary) < 2 1.00 1.00 1.00 1.00 1.00 1.00 1.00 1.00 1.00 1.00 1.00 2-5 0.60 0.60 1.17 0.62 1.85* 0.82 3.64** 0.88 1.92* 1.49 0.62 5 -10 - 0.91 2.14 3.42** 1.19 1.42 1.78 0.99 1.95** 0.78 1.41 10 or more - 0.77 6.46*** 2.17 31.76*** 2.44* 4.65 1.62 3.12*** 1.57 1.46
Sample number (n) 884 755 806 581 685 1 104 555 859 1 239 786 948
Pseudo R2 0.150***
0.125***
0.215***
0.146***
0.162***
0.165***
0.238***
0.112***
0.225***
0.209***
0.181***
Note: -: low numbers * Significant at 5% threshold, ** Significant at 1% threshold, *** Significant at 1% threshold 0 Source: Household survey data, OOSC-DRC 2012
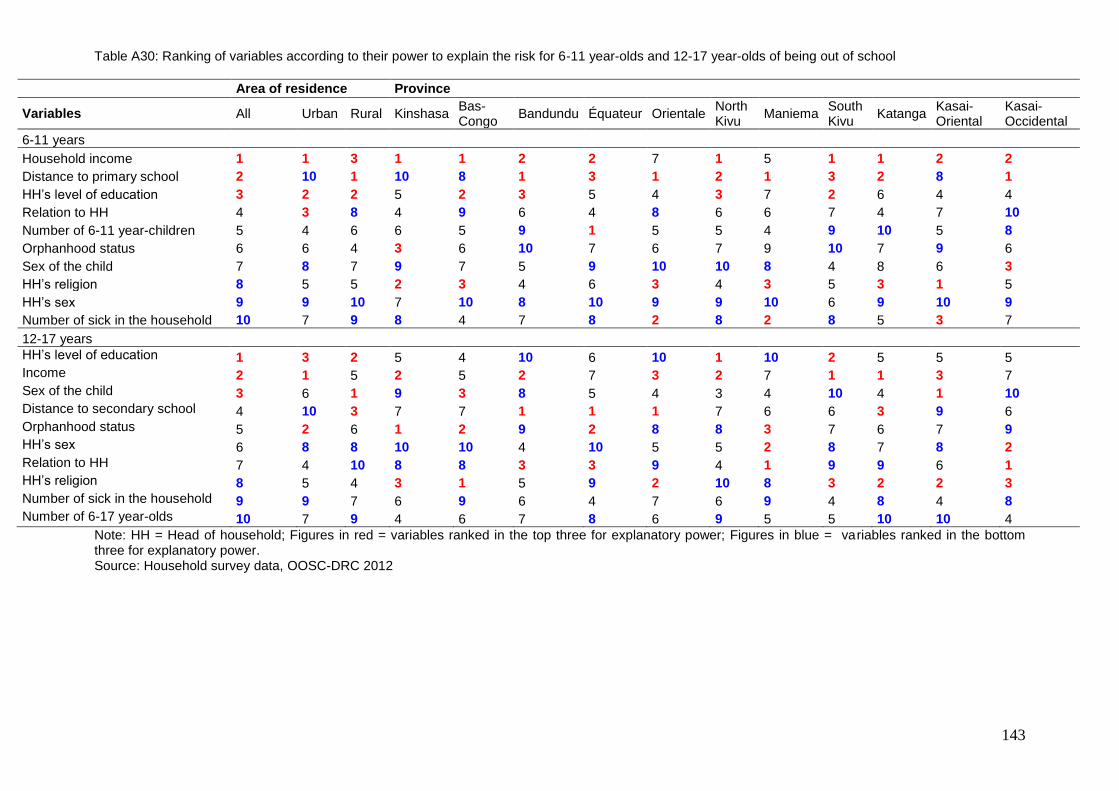
143
Table A30: Ranking of variables according to their power to explain the risk for 6-11 year-olds and 12-17 year-olds of being out of school
Area of residence Province
Variables All Urban Rural Kinshasa Bas-Congo
Bandundu Équateur Orientale North Kivu
Maniema South Kivu
Katanga Kasai-Oriental
Kasai-Occidental
6-11 years
Household income 1 1 3 1 1 2 2 7 1 5 1 1 2 2
Distance to primary school 2 10 1 10 8 1 3 1 2 1 3 2 8 1
HH’s level of education 3 2 2 5 2 3 5 4 3 7 2 6 4 4
Relation to HH 4 3 8 4 9 6 4 8 6 6 7 4 7 10
Number of 6-11 year-children 5 4 6 6 5 9 1 5 5 4 9 10 5 8
Orphanhood status 6 6 4 3 6 10 7 6 7 9 10 7 9 6
Sex of the child 7 8 7 9 7 5 9 10 10 8 4 8 6 3
HH’s religion 8 5 5 2 3 4 6 3 4 3 5 3 1 5
HH’s sex 9 9 10 7 10 8 10 9 9 10 6 9 10 9
Number of sick in the household 10 7 9 8 4 7 8 2 8 2 8 5 3 7
12-17 years
HH’s level of education 1 3 2 5 4 10 6 10 1 10 2 5 5 5 Income 2 1 5 2 5 2 7 3 2 7 1 1 3 7 Sex of the child 3 6 1 9 3 8 5 4 3 4 10 4 1 10 Distance to secondary school 4 10 3 7 7 1 1 1 7 6 6 3 9 6 Orphanhood status 5 2 6 1 2 9 2 8 8 3 7 6 7 9 HH’s sex 6 8 8 10 10 4 10 5 5 2 8 7 8 2 Relation to HH 7 4 10 8 8 3 3 9 4 1 9 9 6 1 HH’s religion 8 5 4 3 1 5 9 2 10 8 3 2 2 3 Number of sick in the household 9 9 7 6 9 6 4 7 6 9 4 8 4 8 Number of 6-17 year-olds 10 7 9 4 6 7 8 6 9 5 5 10 10 4
Note: HH = Head of household; Figures in red = variables ranked in the top three for explanatory power; Figures in blue = variables ranked in the bottom three for explanatory power. Source: Household survey data, OOSC-DRC 2012
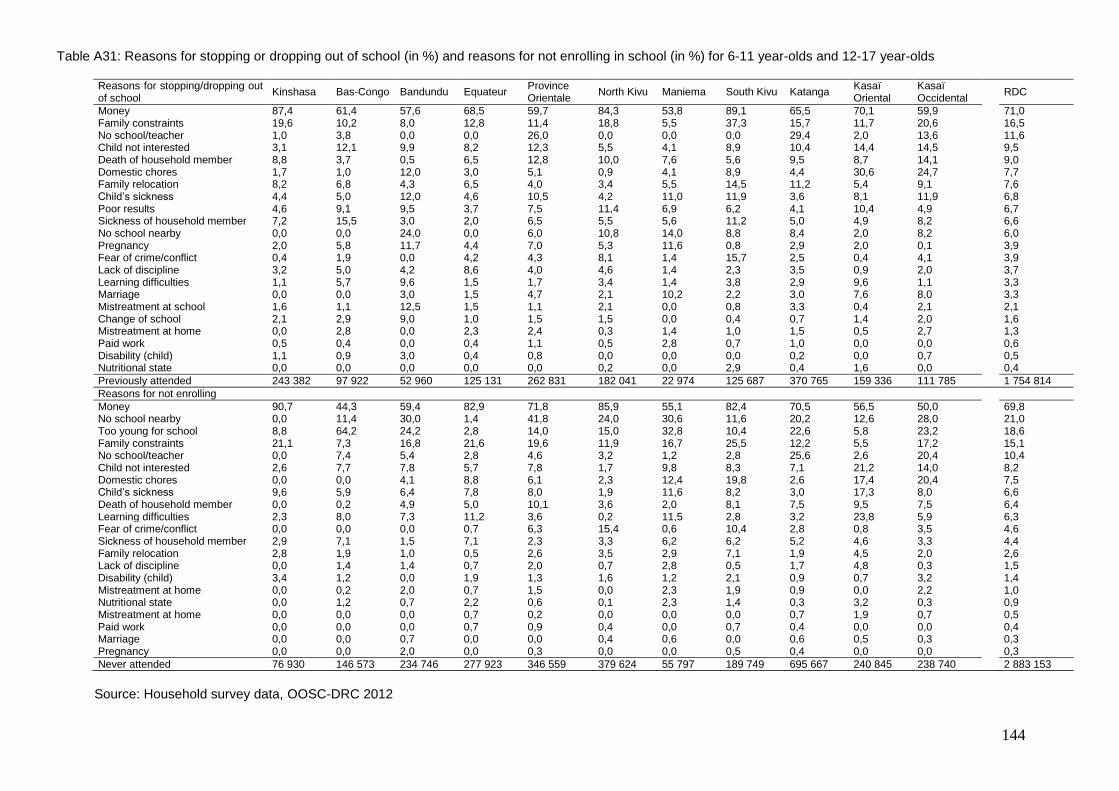
144
Table A31: Reasons for stopping or dropping out of school (in %) and reasons for not enrolling in school (in %) for 6-11 year-olds and 12-17 year-olds Reasons for stopping/dropping out of school
Kinshasa Bas-Congo Bandundu Equateur Province Orientale
North Kivu Maniema South Kivu Katanga Kasaï Oriental
Kasaï Occidental
RDC
Money 87,4 61,4 57,6 68,5 59,7 84,3 53,8 89,1 65,5 70,1 59,9
71,0 Family constraints 19,6 10,2 8,0 12,8 11,4 18,8 5,5 37,3 15,7 11,7 20,6
16,5
No school/teacher 1,0 3,8 0,0 0,0 26,0 0,0 0,0 0,0 29,4 2,0 13,6
11,6 Child not interested 3,1 12,1 9,9 8,2 12,3 5,5 4,1 8,9 10,4 14,4 14,5
9,5
Death of household member 8,8 3,7 0,5 6,5 12,8 10,0 7,6 5,6 9,5 8,7 14,1
9,0 Domestic chores 1,7 1,0 12,0 3,0 5,1 0,9 4,1 8,9 4,4 30,6 24,7
7,7
Family relocation 8,2 6,8 4,3 6,5 4,0 3,4 5,5 14,5 11,2 5,4 9,1
7,6 Child’s sickness 4,4 5,0 12,0 4,6 10,5 4,2 11,0 11,9 3,6 8,1 11,9
6,8
Poor results 4,6 9,1 9,5 3,7 7,5 11,4 6,9 6,2 4,1 10,4 4,9
6,7 Sickness of household member 7,2 15,5 3,0 2,0 6,5 5,5 5,6 11,2 5,0 4,9 8,2
6,6
No school nearby 0,0 0,0 24,0 0,0 6,0 10,8 14,0 8,8 8,4 2,0 8,2
6,0 Pregnancy 2,0 5,8 11,7 4,4 7,0 5,3 11,6 0,8 2,9 2,0 0,1
3,9
Fear of crime/conflict 0,4 1,9 0,0 4,2 4,3 8,1 1,4 15,7 2,5 0,4 4,1
3,9 Lack of discipline 3,2 5,0 4,2 8,6 4,0 4,6 1,4 2,3 3,5 0,9 2,0
3,7
Learning difficulties 1,1 5,7 9,6 1,5 1,7 3,4 1,4 3,8 2,9 9,6 1,1
3,3 Marriage 0,0 0,0 3,0 1,5 4,7 2,1 10,2 2,2 3,0 7,6 8,0
3,3
Mistreatment at school 1,6 1,1 12,5 1,5 1,1 2,1 0,0 0,8 3,3 0,4 2,1
2,1 Change of school 2,1 2,9 9,0 1,0 1,5 1,5 0,0 0,4 0,7 1,4 2,0
1,6
Mistreatment at home 0,0 2,8 0,0 2,3 2,4 0,3 1,4 1,0 1,5 0,5 2,7
1,3 Paid work 0,5 0,4 0,0 0,4 1,1 0,5 2,8 0,7 1,0 0,0 0,0
0,6
Disability (child) 1,1 0,9 3,0 0,4 0,8 0,0 0,0 0,0 0,2 0,0 0,7
0,5 Nutritional state 0,0 0,0 0,0 0,0 0,0 0,2 0,0 2,9 0,4 1,6 0,0
0,4
Previously attended 243 382 97 922 52 960 125 131 262 831 182 041 22 974 125 687 370 765 159 336 111 785 1 754 814
Reasons for not enrolling
Money 90,7 44,3 59,4 82,9 71,8 85,9 55,1 82,4 70,5 56,5 50,0
69,8 No school nearby 0,0 11,4 30,0 1,4 41,8 24,0 30,6 11,6 20,2 12,6 28,0
21,0
Too young for school 8,8 64,2 24,2 2,8 14,0 15,0 32,8 10,4 22,6 5,8 23,2
18,6 Family constraints 21,1 7,3 16,8 21,6 19,6 11,9 16,7 25,5 12,2 5,5 17,2
15,1
No school/teacher 0,0 7,4 5,4 2,8 4,6 3,2 1,2 2,8 25,6 2,6 20,4
10,4 Child not interested 2,6 7,7 7,8 5,7 7,8 1,7 9,8 8,3 7,1 21,2 14,0
8,2
Domestic chores 0,0 0,0 4,1 8,8 6,1 2,3 12,4 19,8 2,6 17,4 20,4
7,5 Child’s sickness 9,6 5,9 6,4 7,8 8,0 1,9 11,6 8,2 3,0 17,3 8,0
6,6
Death of household member 0,0 0,2 4,9 5,0 10,1 3,6 2,0 8,1 7,5 9,5 7,5
6,4 Learning difficulties 2,3 8,0 7,3 11,2 3,6 0,2 11,5 2,8 3,2 23,8 5,9
6,3
Fear of crime/conflict 0,0 0,0 0,0 0,7 6,3 15,4 0,6 10,4 2,8 0,8 3,5
4,6 Sickness of household member 2,9 7,1 1,5 7,1 2,3 3,3 6,2 6,2 5,2 4,6 3,3
4,4
Family relocation 2,8 1,9 1,0 0,5 2,6 3,5 2,9 7,1 1,9 4,5 2,0
2,6 Lack of discipline 0,0 1,4 1,4 0,7 2,0 0,7 2,8 0,5 1,7 4,8 0,3
1,5
Disability (child) 3,4 1,2 0,0 1,9 1,3 1,6 1,2 2,1 0,9 0,7 3,2
1,4 Mistreatment at home 0,0 0,2 2,0 0,7 1,5 0,0 2,3 1,9 0,9 0,0 2,2
1,0
Nutritional state 0,0 1,2 0,7 2,2 0,6 0,1 2,3 1,4 0,3 3,2 0,3
0,9 Mistreatment at home 0,0 0,0 0,0 0,7 0,2 0,0 0,0 0,0 0,7 1,9 0,7
0,5
Paid work 0,0 0,0 0,0 0,7 0,9 0,4 0,0 0,7 0,4 0,0 0,0
0,4 Marriage 0,0 0,0 0,7 0,0 0,0 0,4 0,6 0,0 0,6 0,5 0,3
0,3
Pregnancy 0,0 0,0 2,0 0,0 0,3 0,0 0,0 0,5 0,4 0,0 0,0
0,3
Never attended 76 930 146 573 234 746 277 923 346 559 379 624 55 797 189 749 695 667 240 845 238 740 2 883 153
Source: Household survey data, OOSC-DRC 2012
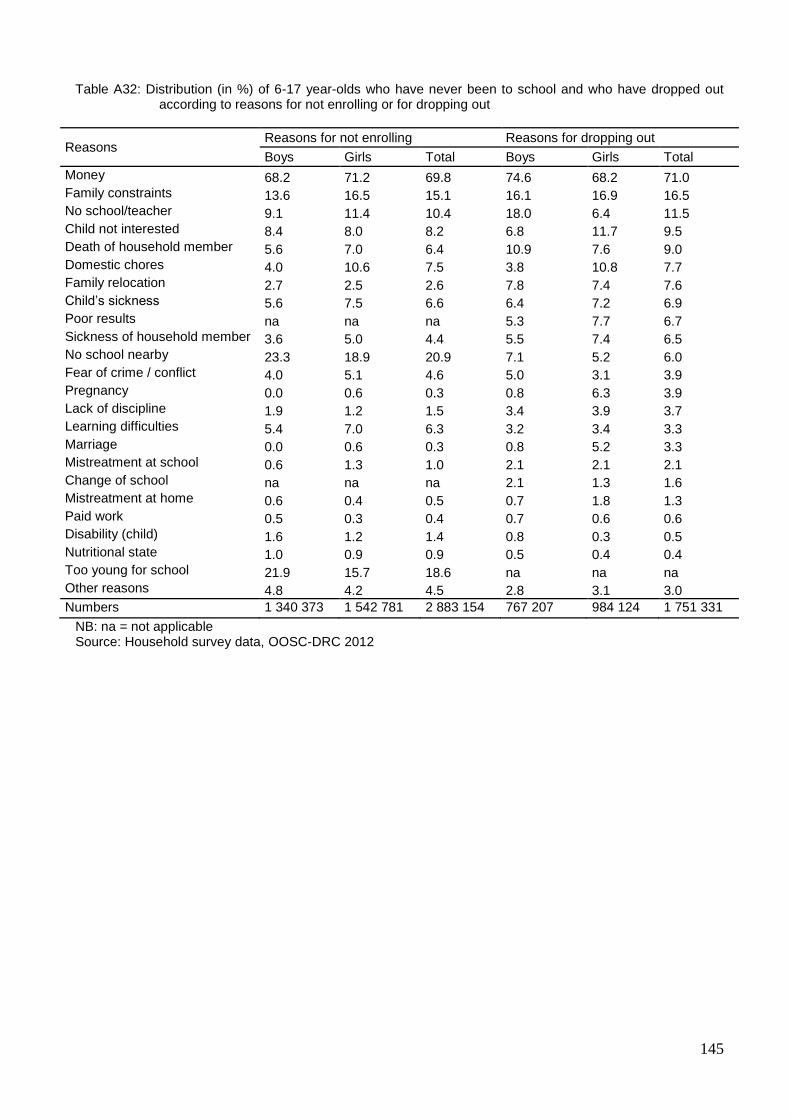
145
Table A32: Distribution (in %) of 6-17 year-olds who have never been to school and who have dropped out according to reasons for not enrolling or for dropping out
Reasons Reasons for not enrolling Reasons for dropping out
Boys Girls Total Boys Girls Total
Money 68.2 71.2 69.8 74.6 68.2 71.0 Family constraints 13.6 16.5 15.1 16.1 16.9 16.5 No school/teacher 9.1 11.4 10.4 18.0 6.4 11.5 Child not interested 8.4 8.0 8.2 6.8 11.7 9.5 Death of household member 5.6 7.0 6.4 10.9 7.6 9.0 Domestic chores 4.0 10.6 7.5 3.8 10.8 7.7 Family relocation 2.7 2.5 2.6 7.8 7.4 7.6 Child’s sickness 5.6 7.5 6.6 6.4 7.2 6.9 Poor results na na na 5.3 7.7 6.7 Sickness of household member 3.6 5.0 4.4 5.5 7.4 6.5 No school nearby 23.3 18.9 20.9 7.1 5.2 6.0 Fear of crime / conflict 4.0 5.1 4.6 5.0 3.1 3.9 Pregnancy 0.0 0.6 0.3 0.8 6.3 3.9 Lack of discipline 1.9 1.2 1.5 3.4 3.9 3.7 Learning difficulties 5.4 7.0 6.3 3.2 3.4 3.3 Marriage 0.0 0.6 0.3 0.8 5.2 3.3 Mistreatment at school 0.6 1.3 1.0 2.1 2.1 2.1 Change of school na na na 2.1 1.3 1.6 Mistreatment at home 0.6 0.4 0.5 0.7 1.8 1.3 Paid work 0.5 0.3 0.4 0.7 0.6 0.6 Disability (child) 1.6 1.2 1.4 0.8 0.3 0.5 Nutritional state 1.0 0.9 0.9 0.5 0.4 0.4 Too young for school 21.9 15.7 18.6 na na na Other reasons 4.8 4.2 4.5 2.8 3.1 3.0
Numbers 1 340 373 1 542 781 2 883 154 767 207 984 124 1 751 331
NB: na = not applicable Source: Household survey data, OOSC-DRC 2012
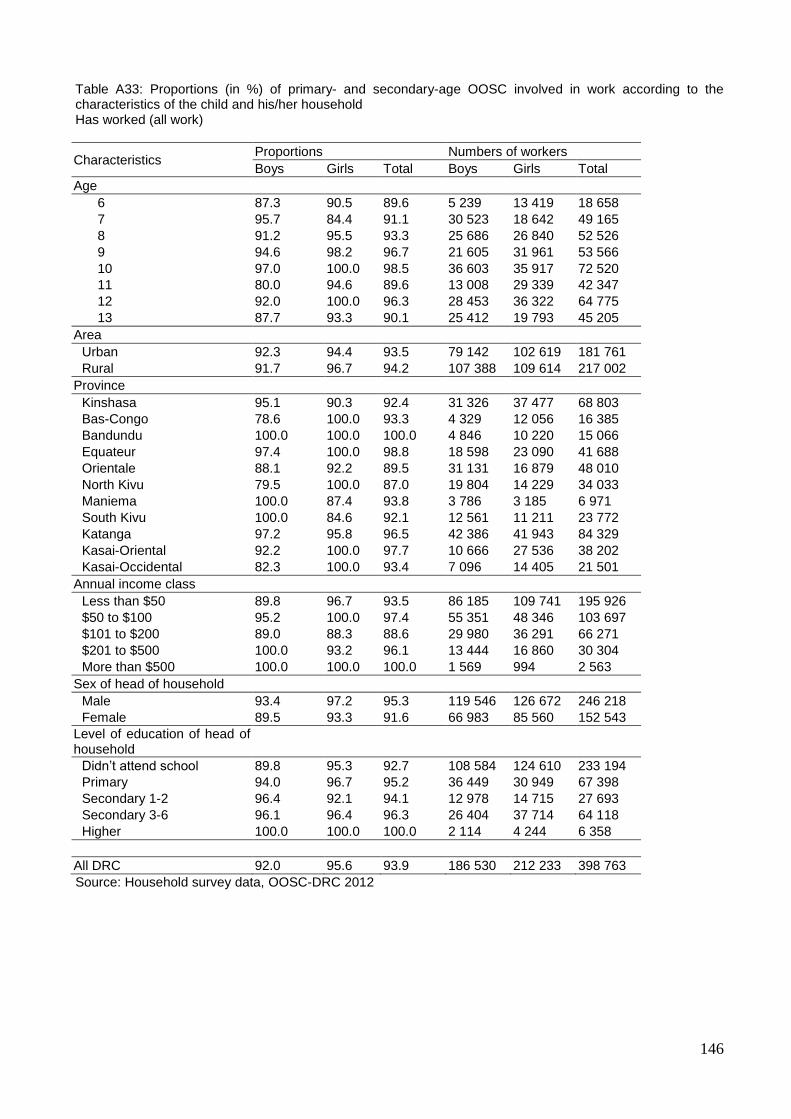
146
Table A33: Proportions (in %) of primary- and secondary-age OOSC involved in work according to the characteristics of the child and his/her household Has worked (all work)
Characteristics Proportions Numbers of workers
Boys Girls Total Boys Girls Total
Age
6 87.3 90.5 89.6 5 239 13 419 18 658
7 95.7 84.4 91.1 30 523 18 642 49 165
8 91.2 95.5 93.3 25 686 26 840 52 526
9 94.6 98.2 96.7 21 605 31 961 53 566
10 97.0 100.0 98.5 36 603 35 917 72 520
11 80.0 94.6 89.6 13 008 29 339 42 347
12 92.0 100.0 96.3 28 453 36 322 64 775
13 87.7 93.3 90.1 25 412 19 793 45 205
Area
Urban 92.3 94.4 93.5 79 142 102 619 181 761
Rural 91.7 96.7 94.2 107 388 109 614 217 002
Province
Kinshasa 95.1 90.3 92.4 31 326 37 477 68 803
Bas-Congo 78.6 100.0 93.3 4 329 12 056 16 385
Bandundu 100.0 100.0 100.0 4 846 10 220 15 066
Equateur 97.4 100.0 98.8 18 598 23 090 41 688
Orientale 88.1 92.2 89.5 31 131 16 879 48 010
North Kivu 79.5 100.0 87.0 19 804 14 229 34 033
Maniema 100.0 87.4 93.8 3 786 3 185 6 971
South Kivu 100.0 84.6 92.1 12 561 11 211 23 772
Katanga 97.2 95.8 96.5 42 386 41 943 84 329
Kasai-Oriental 92.2 100.0 97.7 10 666 27 536 38 202
Kasai-Occidental 82.3 100.0 93.4 7 096 14 405 21 501
Annual income class
Less than $50 89.8 96.7 93.5 86 185 109 741 195 926
$50 to $100 95.2 100.0 97.4 55 351 48 346 103 697
$101 to $200 89.0 88.3 88.6 29 980 36 291 66 271
$201 to $500 100.0 93.2 96.1 13 444 16 860 30 304
More than $500 100.0 100.0 100.0 1 569 994 2 563
Sex of head of household
Male 93.4 97.2 95.3 119 546 126 672 246 218
Female 89.5 93.3 91.6 66 983 85 560 152 543
Level of education of head of household
Didn’t attend school 89.8 95.3 92.7 108 584 124 610 233 194
Primary 94.0 96.7 95.2 36 449 30 949 67 398
Secondary 1-2 96.4 92.1 94.1 12 978 14 715 27 693
Secondary 3-6 96.1 96.4 96.3 26 404 37 714 64 118
Higher 100.0 100.0 100.0 2 114 4 244 6 358
All DRC 92.0 95.6 93.9 186 530 212 233 398 763
Source: Household survey data, OOSC-DRC 2012
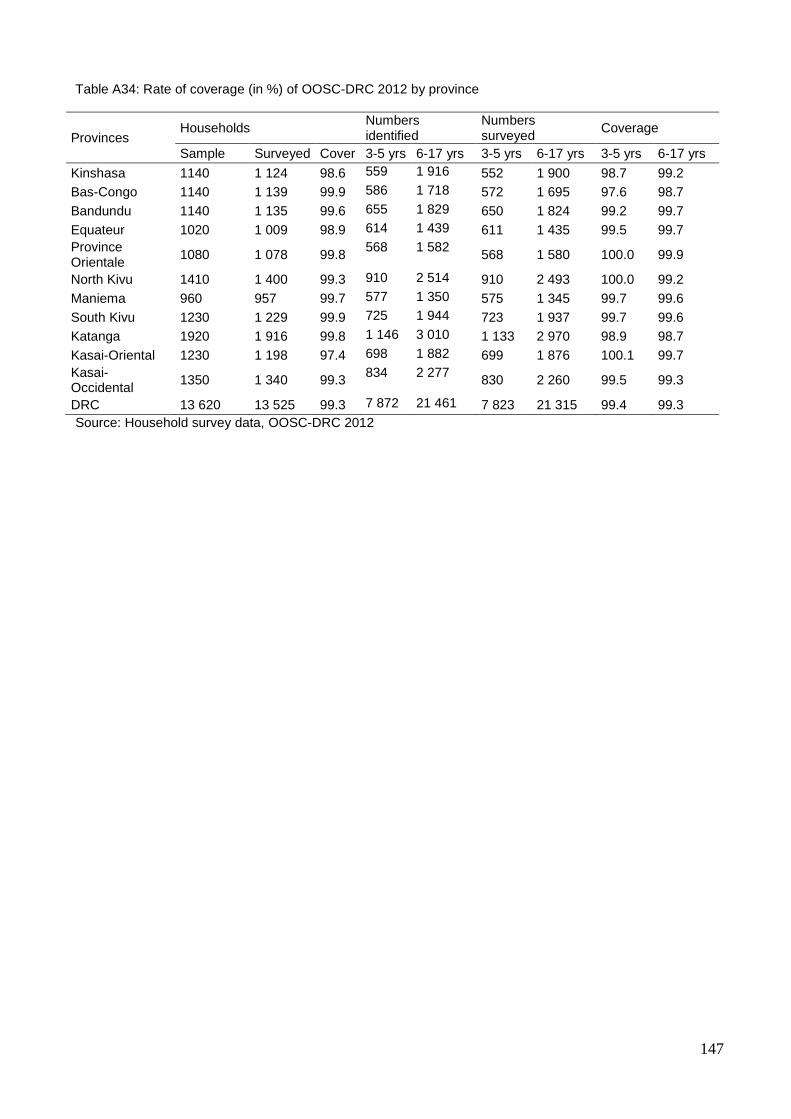
147
Table A34: Rate of coverage (in %) of OOSC-DRC 2012 by province
Provinces Households
Numbers identified
Numbers surveyed
Coverage
Sample Surveyed Cover 3-5 yrs 6-17 yrs 3-5 yrs 6-17 yrs 3-5 yrs 6-17 yrs
Kinshasa 1140 1 124 98.6 559 1 916 552 1 900 98.7 99.2
Bas-Congo 1140 1 139 99.9 586 1 718 572 1 695 97.6 98.7
Bandundu 1140 1 135 99.6 655 1 829 650 1 824 99.2 99.7
Equateur 1020 1 009 98.9 614 1 439 611 1 435 99.5 99.7
Province Orientale
1080 1 078 99.8 568 1 582
568 1 580 100.0 99.9
North Kivu 1410 1 400 99.3 910 2 514 910 2 493 100.0 99.2
Maniema 960 957 99.7 577 1 350 575 1 345 99.7 99.6
South Kivu 1230 1 229 99.9 725 1 944 723 1 937 99.7 99.6
Katanga 1920 1 916 99.8 1 146 3 010 1 133 2 970 98.9 98.7
Kasai-Oriental 1230 1 198 97.4 698 1 882 699 1 876 100.1 99.7
Kasai-Occidental
1350 1 340 99.3 834 2 277
830 2 260 99.5 99.3
DRC 13 620 13 525 99.3 7 872 21 461 7 823 21 315 99.4 99.3
Source: Household survey data, OOSC-DRC 2012
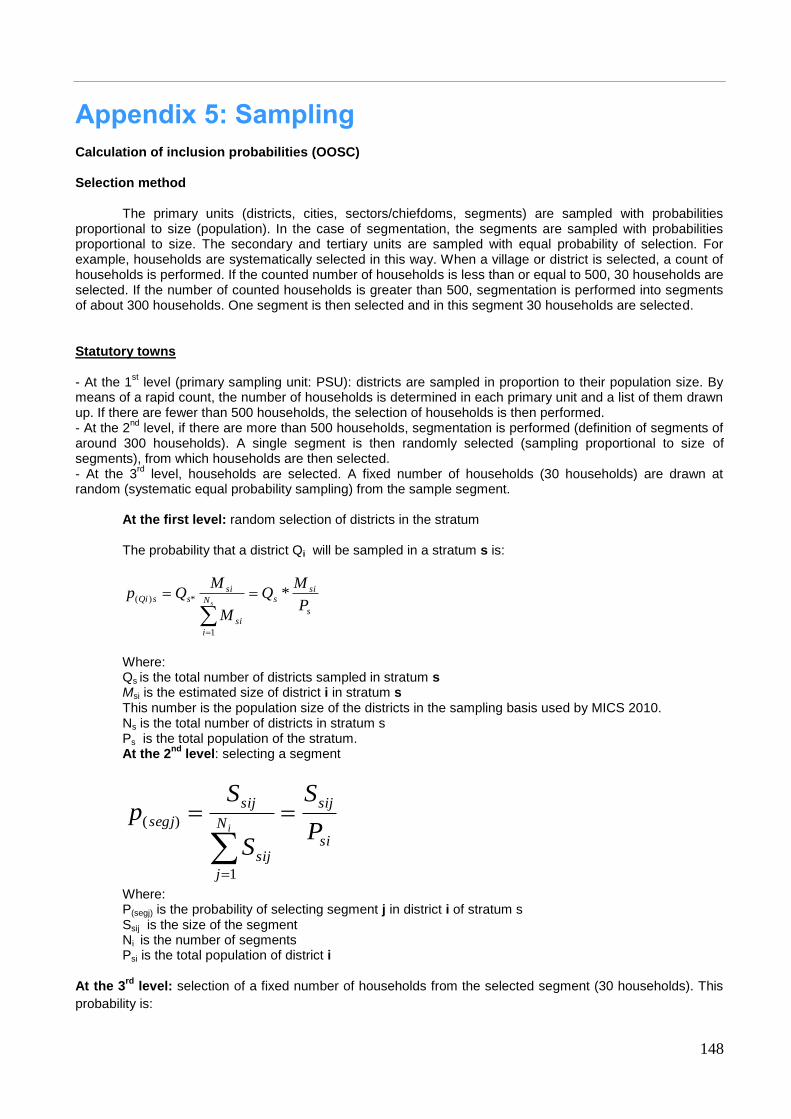
148
Appendix 5: Sampling Calculation of inclusion probabilities (OOSC) Selection method
The primary units (districts, cities, sectors/chiefdoms, segments) are sampled with probabilities proportional to size (population). In the case of segmentation, the segments are sampled with probabilities proportional to size. The secondary and tertiary units are sampled with equal probability of selection. For example, households are systematically selected in this way. When a village or district is selected, a count of households is performed. If the counted number of households is less than or equal to 500, 30 households are selected. If the number of counted households is greater than 500, segmentation is performed into segments of about 300 households. One segment is then selected and in this segment 30 households are selected.
Statutory towns - At the 1
st level (primary sampling unit: PSU): districts are sampled in proportion to their population size. By
means of a rapid count, the number of households is determined in each primary unit and a list of them drawn up. If there are fewer than 500 households, the selection of households is then performed. - At the 2
nd level, if there are more than 500 households, segmentation is performed (definition of segments of
around 300 households). A single segment is then randomly selected (sampling proportional to size of segments), from which households are then selected. - At the 3
rd level, households are selected. A fixed number of households (30 households) are drawn at
random (systematic equal probability sampling) from the sample segment.
At the first level: random selection of districts in the stratum The probability that a district Qi will be sampled in a stratum s is:
s
sisN
i
si
sissQi
P
MQ
M
MQp
s*
1
*)(
Where: Qs is the total number of districts sampled in stratum s Msi is the estimated size of district i in stratum s This number is the population size of the districts in the sampling basis used by MICS 2010. Ns is the total number of districts in stratum s Ps is the total population of the stratum. At the 2
nd level: selecting a segment
si
sij
N
j
sij
sij
segjP
S
S
Sp
i
1
)(
Where: P(segj) is the probability of selecting segment j in district i of stratum s Ssij is the size of the segment Ni is the number of segments Psi is the total population of district i
At the 3rd
level: selection of a fixed number of households from the selected segment (30 households). This
probability is:
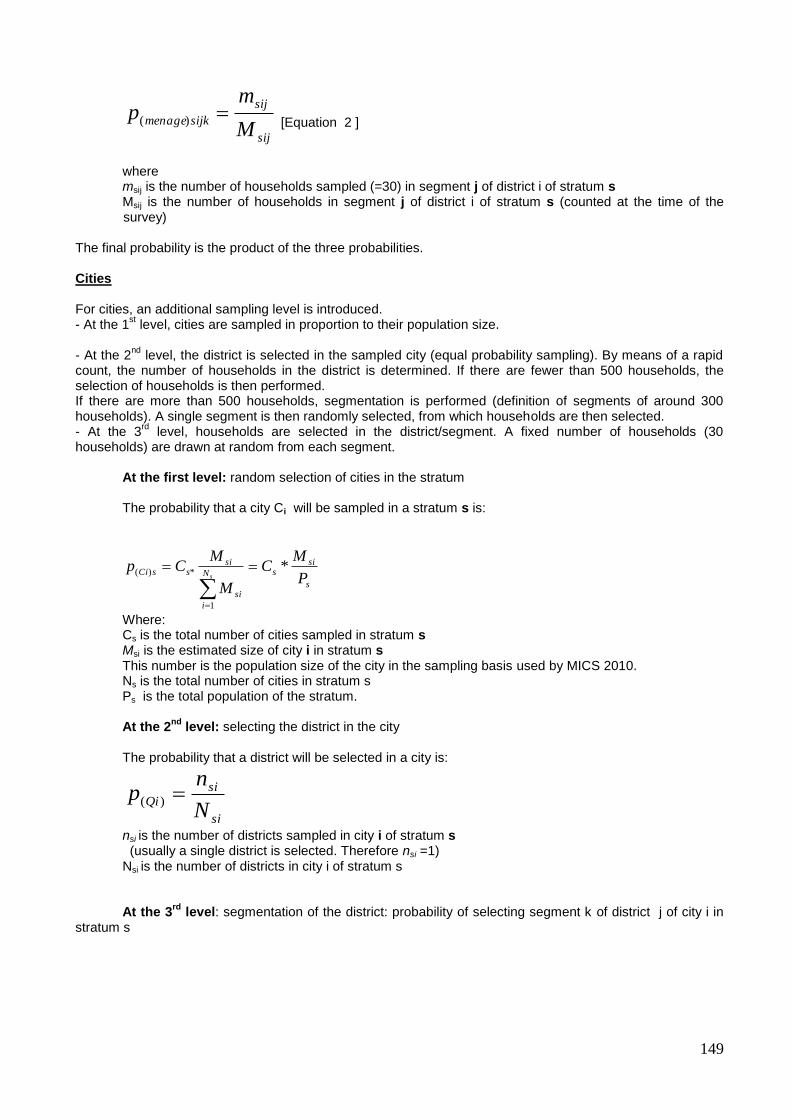
149
sij
sij
sijkmenageM
mp )( [Equation 2 ]
where msij is the number of households sampled (=30) in segment j of district i of stratum s Msij is the number of households in segment j of district i of stratum s (counted at the time of the survey)
The final probability is the product of the three probabilities.
Cities For cities, an additional sampling level is introduced. - At the 1
st level, cities are sampled in proportion to their population size.
- At the 2
nd level, the district is selected in the sampled city (equal probability sampling). By means of a rapid
count, the number of households in the district is determined. If there are fewer than 500 households, the selection of households is then performed. If there are more than 500 households, segmentation is performed (definition of segments of around 300 households). A single segment is then randomly selected, from which households are then selected. - At the 3
rd level, households are selected in the district/segment. A fixed number of households (30
households) are drawn at random from each segment.
At the first level: random selection of cities in the stratum The probability that a city Ci will be sampled in a stratum s is:
s
sisN
i
si
sissCi
P
MC
M
MCp
s*
1
*)(
Where: Cs is the total number of cities sampled in stratum s Msi is the estimated size of city i in stratum s This number is the population size of the city in the sampling basis used by MICS 2010. Ns is the total number of cities in stratum s Ps is the total population of the stratum.
At the 2
nd level: selecting the district in the city
The probability that a district will be selected in a city is:
si
siQi
N
np )(
nsi is the number of districts sampled in city i of stratum s (usually a single district is selected. Therefore nsi =1) Nsi is the number of districts in city i of stratum s
At the 3rd
level: segmentation of the district: probability of selecting segment k of district j of city i in stratum s
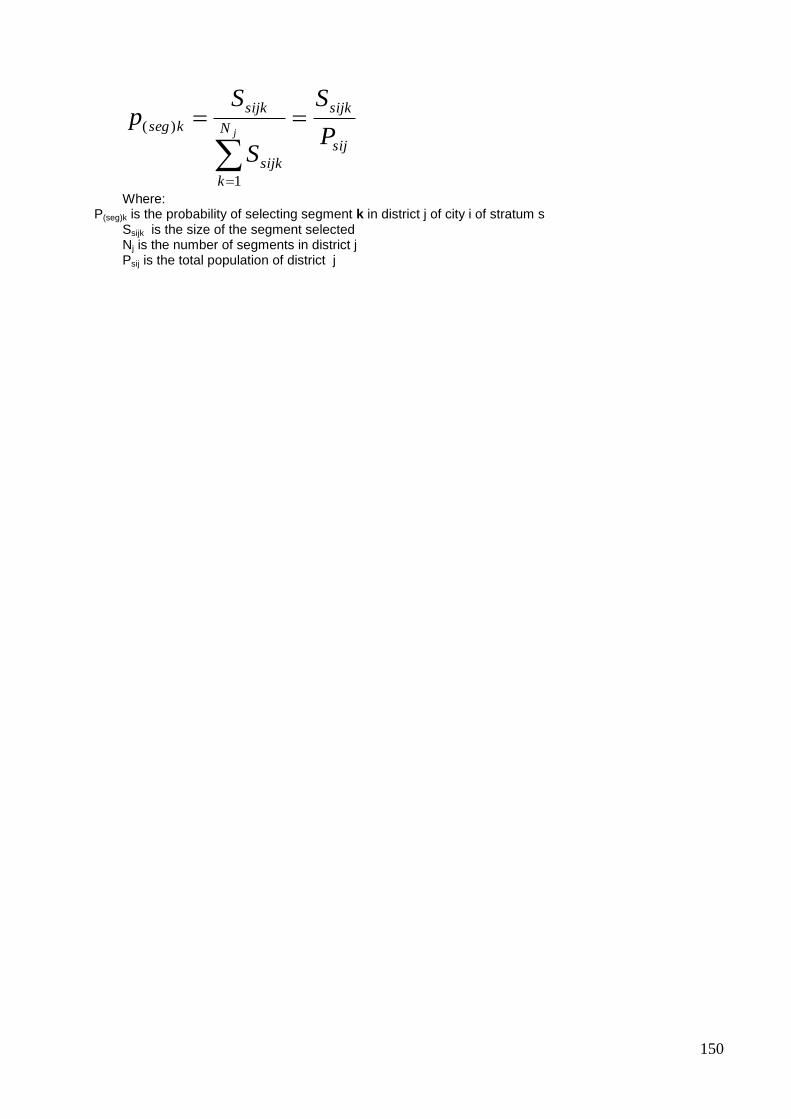
150
sij
sijk
N
k
sijk
sijk
ksegP
S
S
Sp
j
1
)(
Where: P(seg)k is the probability of selecting segment k in district j of city i of stratum s
Ssijk is the size of the segment selected Nj is the number of segments in district j Psij is the total population of district j
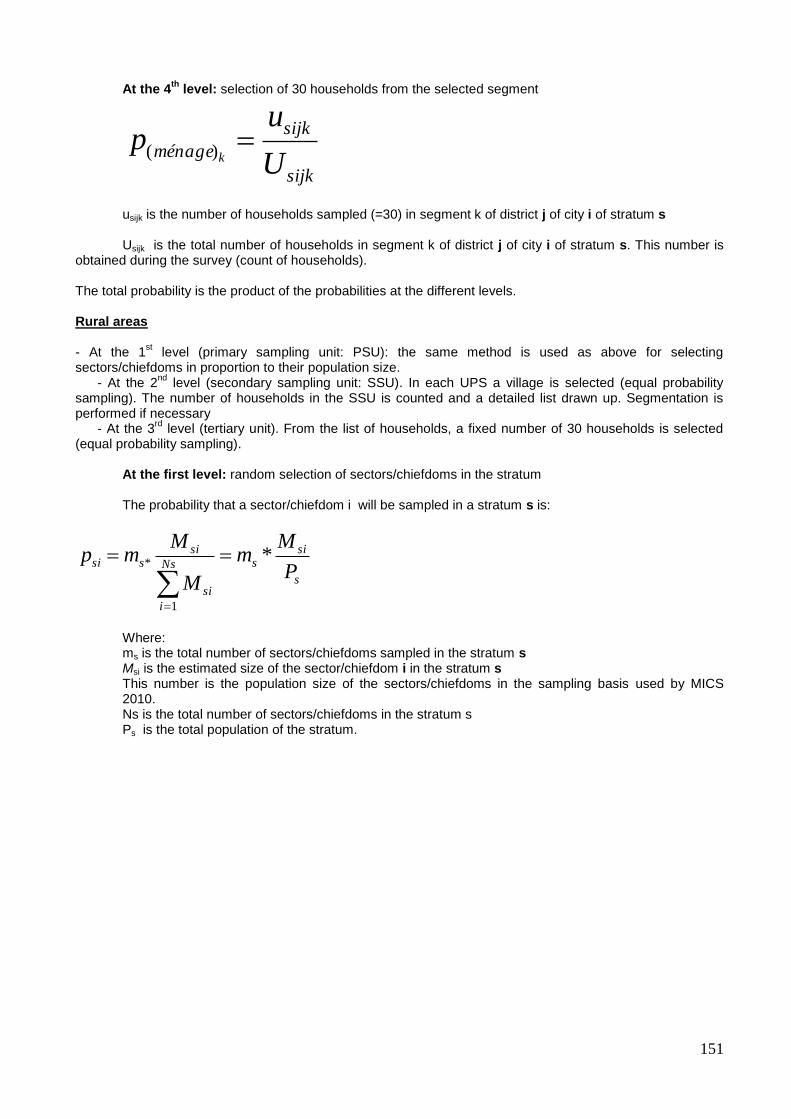
151
At the 4th
level: selection of 30 households from the selected segment
sijk
sijk
ménageU
up
k)(
usijk is the number of households sampled (=30) in segment k of district j of city i of stratum s Usijk is the total number of households in segment k of district j of city i of stratum s. This number is
obtained during the survey (count of households).
The total probability is the product of the probabilities at the different levels. Rural areas - At the 1
st level (primary sampling unit: PSU): the same method is used as above for selecting
sectors/chiefdoms in proportion to their population size. - At the 2
nd level (secondary sampling unit: SSU). In each UPS a village is selected (equal probability
sampling). The number of households in the SSU is counted and a detailed list drawn up. Segmentation is performed if necessary - At the 3
rd level (tertiary unit). From the list of households, a fixed number of 30 households is selected
(equal probability sampling).
At the first level: random selection of sectors/chiefdoms in the stratum The probability that a sector/chiefdom i will be sampled in a stratum s is:
s
sisNs
i
si
sissi
P
Mm
M
Mmp *
1
*
Where: ms is the total number of sectors/chiefdoms sampled in the stratum s Msi is the estimated size of the sector/chiefdom i in the stratum s This number is the population size of the sectors/chiefdoms in the sampling basis used by MICS 2010. Ns is the total number of sectors/chiefdoms in the stratum s Ps is the total population of the stratum.
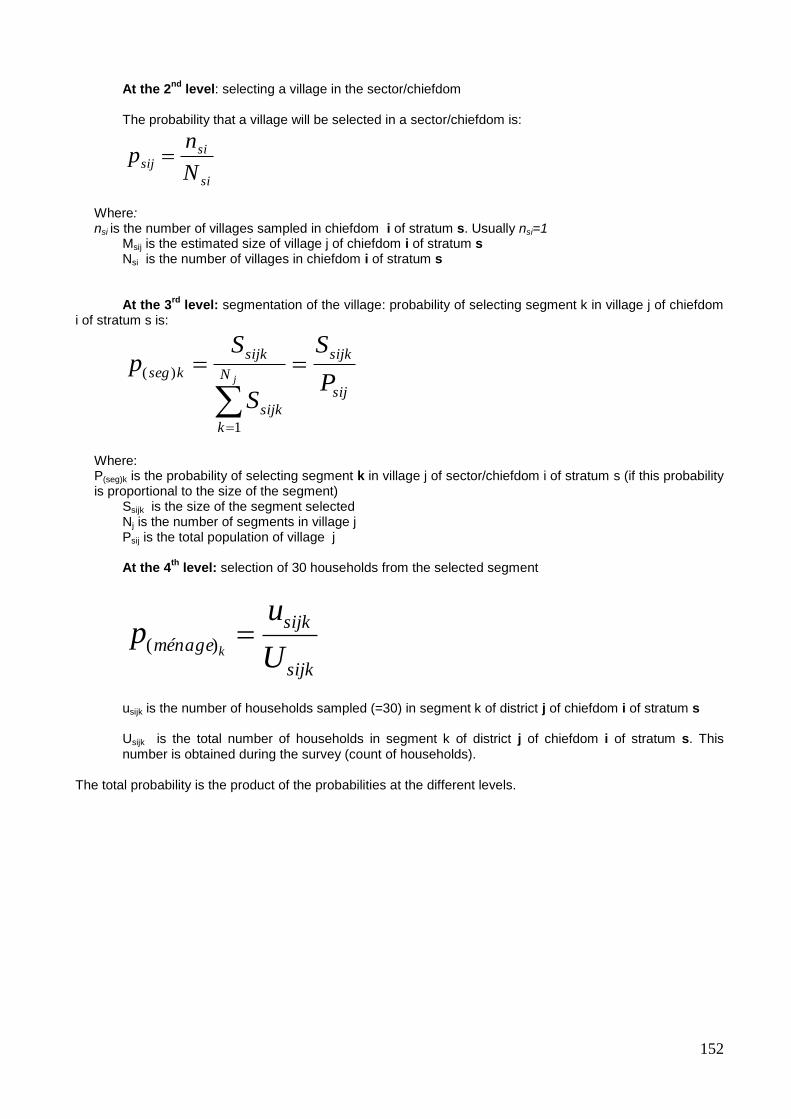
152
At the 2nd
level: selecting a village in the sector/chiefdom The probability that a village will be selected in a sector/chiefdom is:
si
sisij
N
np
Where: nsi is the number of villages sampled in chiefdom i of stratum s. Usually nsi=1
Msij is the estimated size of village j of chiefdom i of stratum s Nsi is the number of villages in chiefdom i of stratum s At the 3
rd level: segmentation of the village: probability of selecting segment k in village j of chiefdom
i of stratum s is:
sij
sijk
N
k
sijk
sijk
ksegP
S
S
Sp
j
1
)(
Where: P(seg)k is the probability of selecting segment k in village j of sector/chiefdom i of stratum s (if this probability is proportional to the size of the segment)
Ssijk is the size of the segment selected Nj is the number of segments in village j Psij is the total population of village j At the 4
th level: selection of 30 households from the selected segment
sijk
sijk
ménageU
up
k)(
usijk is the number of households sampled (=30) in segment k of district j of chiefdom i of stratum s Usijk is the total number of households in segment k of district j of chiefdom i of stratum s. This number is obtained during the survey (count of households).
The total probability is the product of the probabilities at the different levels.
153
For more information:
Visit our Website: www.unicef.org
Or contact:
Ministère de l’Enseignement Primaire, Secondaire et Professionnel, Croisement des Avenues Batetela et des Cliniques Commune de la Gombe, Kinshasa, République Démocratique du Congo. Tél : (243) 998 33 6049 / (243) 998 47 2671 E-mail : [email protected] / [email protected] Internet : http://www.eduquepsp.cd or l’UNICEF/RDC Concession IMMOTEX, 372 Ave. Col Mondjiba, Kintambo, Kinshasa, République Démocratique du Congo. Tél : (243) 99 605 0346 E-mail : [email protected] ISSP 03 BP 7118 Ouagadougou 03 Tél. : (226) 50 30 25 58/59 Fax : (226) 50 30 25 60 E-mail : [email protected] Internet :http://www.issp.bf


