Embed Size (px)
Citation preview
1
Global distribution of convection penetrating the tropical tropopause
Chuntao Liu and Edward J. Zipser
Dept. of Meteorology, University of Utah
Date: April 2005
Key words: deep convection, tropical tropopause, overshoot, precipitation feature,
TRMM
Corresponding author address: Dr. Chuntao Liu, Department of Meteorology, University
of Utah, 135S 1460E WBB Rm. 819 Salt Lake City, UT, 84112-0110, Email:
2
Abstract
Tropical deep convection with overshooting tops is identified by defining five
different reference heights using a 5-year TRMM database. The common properties of
these extreme convective systems are examined from a global perspective. It is found that
1.3% of tropical convection systems reach 14 km and 0.1% of them may even penetrate
the 380K potential temperature level. Overshooting convection is more frequent over
land than over water, especially over central Africa, Indonesia, and South America. The
seasonal, diurnal and geo-distribution patterns of overshooting deep convection show
very little sensitivity to the definition of the reference level. The global distribution of
overshooting area, volume and precipitating ice mass shows that central Africa makes a
disproportionately large contribution to overshooting convection. A semi annual cycle of
total overshooting area, volume and precipitating ice mass is found.
3
1. Introduction
Tropical cumulonimbus clouds have long been recognized not only to be essential to the
global energy balance by transporting moist static energy to upper troposphere [Riehl and
Malkus, 1958], but also by playing important role on global circulation and mass
exchange between troposphere and stratosphere [Yulaeva et al., 1994, Rosenlof, 1995].
Some recent theoretical studies [Sherwood and Dessler, 2000, Dessler, 2002, Salby et al.,
2003] and a modeling study [Jensen and Pfister, 2004] suggest that these clouds may
have a major impact on the Tropical Tropopause Layer (TTL) water vapor budget.
It is now well-known that statistically, tropical cumulonimbus over oceans are
generally weak, if strength is equated with vertical velocity (LeMone and Zipser 1980,
Jorgensen et al. 1985, Jorgensen and LeMone 1989, Lucas et al. 1994, Wei et al. 1998).
It is precisely because these storms are weak, and therefore generally safe to penetrate
with research aircraft, that direct measurements are abundant in tropical oceanic cloud
systems. It is widely accepted that their continental counterparts are stronger, but most
direct comparisons are statistical, and are based upon indirect inferences. The global
databases with longest period of record are from satellites, and those most commonly
used are outgoing visible and long wave radiation (OLR). Examples are numerous, e.g.
Mapes and Houze [1993], Liu et al. [1995], Hall and Vonder Haar [1999], Roca and
Ramanathan,[2000], Massie et al. [2002], and Gettelman et al. [2002]. However,
information on cloud top temperatures, without corresponding knowledge of the vertical
structure of deep convection, leaves many questions unanswered. For example, infrared
satellite data show that deep convection is more frequent over the western Tropical
Pacific than over continents, but not whether these presumably weaker convective clouds
have a larger impact on the tropical tropopause layer than the less frequent but more
4
intense convection over tropical continents. That is the main question addressed by this
study.
The goals of the Tropical Rainfall Measuring Mission (TRMM) program were
outlined by Simpson et. al. [1988] and remain largely valid today. The TRMM satellite
measurements began in December 1997 and continue as of this writing. The instrument
suite is described in Kummerow and Barnes, [1998]. These measurements are not only
invaluable for global precipitation estimates [Adler, 2000], but also have provided a
unique opportunity to study the properties of the precipitating cloud systems [Nesbitt et.
al. 2000; Toracinta et al., 2002; Cecil et al., 2002, 2005; Nesbitt and Zipser, 2003].
Furthermore, the high vertical resolution of the TRMM Precipitation Radar (PR) permits
quantification of the heights reached by deep convection in the tropics. Alcala and
Dessler [2002] described the distribution of deep convection with radar tops above 14
km over the entire tropics using 4 months of TRMM data. Their study analyzed the
overshooting (radar echo above the reference height, i.e. 14 km) properties based on the
TRMM PR pixel level measurements.
The motivation of this study is to use a larger database than has been applied to these
issues before to quantify the properties of convective systems that contain overshooting
tops. In this study, we address the following questions including:
1) Is overshooting most common over the ocean, especially over the West Pacific?
2) What are the patterns of diurnal and seasonal variation of the overshooting area,
volume and ice mass?
3) What are the sizes and the convective intensities of the convection with
overshooting tops? How does their intensity compare over land and over ocean?
4) What are the differences between the conclusions of overshooting studies using
5
visible and infrared radiance, and those using PR measurements of radar
reflectivity profiles?
In the following sections, the size, overshooting area, volume and ice mass, geo-
distribution, diurnal and seasonal variations of convection with overshooting tops are
quantitatively investigated with 5 years of TRMM data using the Utah TRMM
precipitation feature database. The convective intensity proxies of overshooting
convection are defined, and compared with existing convective system definitions by
Nesbitt et al. [2000]. Then, the results from this study and the results using overshooting
as defined with visible and infrared radiance are specifically compared.
2. Data and Methodology
Since the TRMM satellite was launched in Dec 1997, more than 7 years of
observations have been obtained. However, during 2001, the satellite altitude was
increased to lengthen the mission. During the orbit boost, the quality of radar data is
questionable. So in this study, we use the data from Jan 1998 to Nov 2000 and from Dec
2001 to Dec2003. 5 years of TRMM precipitation radar (PR) measured reflectivity are
grouped into precipitation features (PFs) with adjacent pixels using the method described
by Nesbitt et al [2000]. To minimize noise, the minimum near surface 4 adjacent pixels
greater than 20 dBZ (about 80 km2) were required for every PF. As the result, more than
5 million PFs were found in 20oN-20oS tropical region. Then the environment sounding
for each one of these PFs are obtained by interpolation from 2.5o × 2.5o, 6 hour interval
NCEP reanalysis data described by Kistler et al [2001]. After recording the general
information of PF size (total pixel numbers), mean rain rate, convective rain contribution
6
etc., the convective intensity proxies for each PF, such as minimum 85 GHz Polarization
Corrected Temperature (PCT) [Spencer et al., 1989] estimated from TRMM Microwave
Imager observed radiance, the maximum heights of PR 20 and 40 dBZ, maximum PR
reflectivity at 6 and 9 km and flash counts observed by TRMM Lightning Imaging Sensor
(LIS) for each PF are analyzed. Additional information on the Utah PF database and its
uses can be found in Nesbitt et al.[2000], Toracinta et al.[2002], Cecil et al.[2002, 2005],
and Nesbitt and Zipser [2003].
To find the PFs with overshooting tops, a definition of reference height is required. In
addition to the 14 km used by Alcala and Dessler [2002], four different reference heights
are defined and used here: level of NCEP reanalysis tropopause (hereinafter referred to as
Ztrop), level of potential temperature θ equal to 380 K (hereinafter referred to as Z380K)
calculated from NCEP sounding, Level of Neutral Buoyancy (LNB) calculated using
NCEP sounding and surface equivalent potential temperature θe (hereinafter referred to as
LNBsfc) and Level of Neutral Buoyancy calculated using θe at 925 and 1000 mb,
whichever is greater (hereinafter referred to as LNB925&1000). After the reference heights
are calculated from NCEP soundings for each PFs, the Overshooting PFs (OPFs) are
found from 5 million PFs when maximum height of PR 20 dBZ above 14 km and greater
than the reference heights respectively.
The overshooting area of each OPF is calculated by multiplying the number of
overshooting pixels with more than 20 dBZ at the reference height with the pixel size
(~17.92 km2 before the satellite orbit change and ~20.35 km2 after the orbit boost. Here
the pixel size is the effective pixel size. After the satellite orbit boost, the TRMM PR scan
swath width increase about 15%, but scanning rate did not change. Therefore, actual
pixels overlap with each other mainly in orbit direction and the effective pixel size only
7
increase ~14%.). In addition to overshooting area, the overshooting volume and
precipitating ice mass for each OPF are calculated as well. The overshooting volume of
each OPF is calculated by summing all pixels above the reference heights with
reflectivity > 20 dBZ and multiplying the unit volume of each pixel (~4.48 km3 before
the satellite orbit change and ~5.09 km3 after the orbit boost). The overshooting mass is
calculated by integrating the precipitating ice mass of pixels above the reference level.
The precipitating ice mass of each pixel is estimated using the Z-Mice relation described
by Carey and Rutledge [2000] in equation (1).
Mice= 1000π(ρice)N03/7
(5.28×10⁻¹⁸/720 Zice )
4/7 ×UnitVolume (1)
where N0 = 4×10⁶ m-4, ρice=917kgm
-3, Zice is the PR reflectivity and ice mass Mice is in
unit (g).
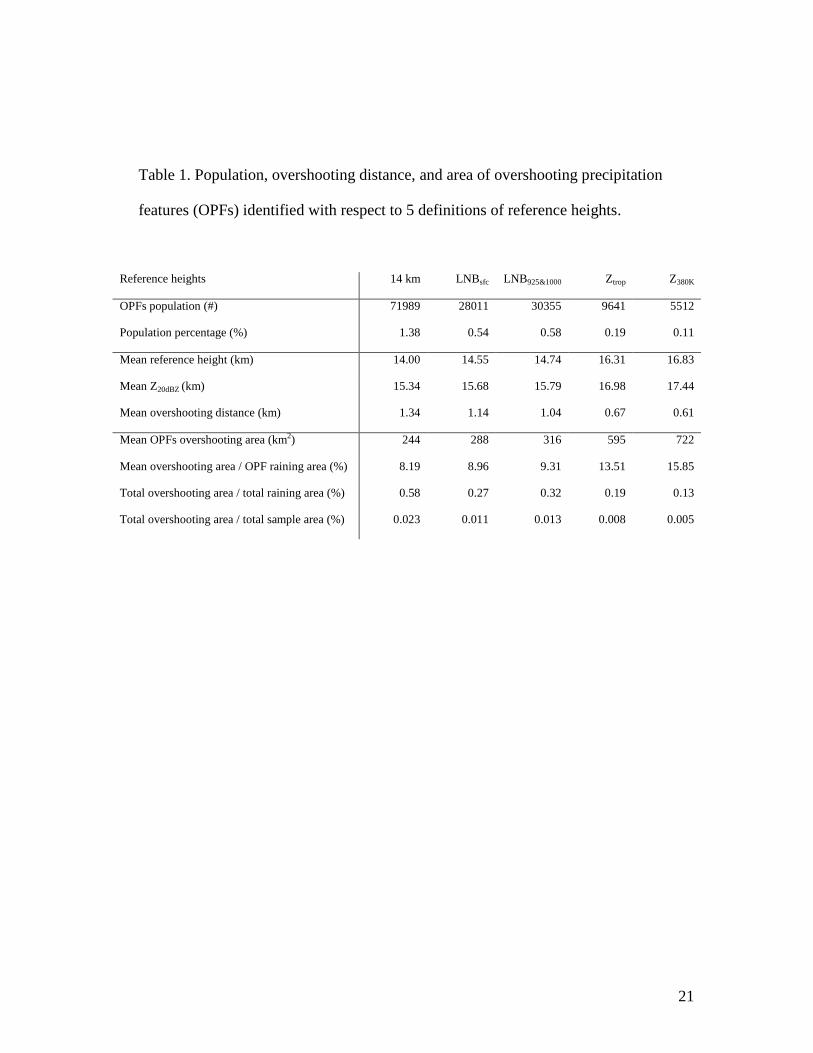
Population, mean overshooting distance, and overshooting area of the identified OPFs
are listed in Table 1. It is not surprising that mean Z380K for identified OPF is the highest
at 16.8km. When 1.38% of PFs have 20 dBZ signal at 14 km, only 0.1% of PFs were
found reaching level of 380 K. On average, ~8% of OPF raining area detected by the PR
has overshooting above 14 km from these OPFs, which is only 0.023% of total PR
sample area. When higher reference heights are used, the PFs tend to have larger
overshooting area and smaller raining area – indicating that as definition becomes
restricted to the very tallest strongest storms, they may be at a very early stage of their
life cycle , or isolated severe convective storms that may not ever evolve into mesoscale
convective systems (MCSs). Comparing with ~0.5% overshooting area in the tropics
reported by Gettelman et al. [2002], only 0.008% of the total sample area has 20 dBZ
echo above the NCEP tropopause. The difference can be attributed to the difference
between the height of the 20dBZ surface and the height of the infrared radiometric top of
8
the convective clouds, or the large cloud area of anvils, and will be discussed further in
section 3.7.
3. Results and discussion
With 5 reference heights, 5 year TRMM observed OPFs were identified in 5 groups.
In this section, the global distribution, seasonal, diurnal variation and the properties of
these OPFs will be discussed.
3.1 Global distribution of population of OPFs
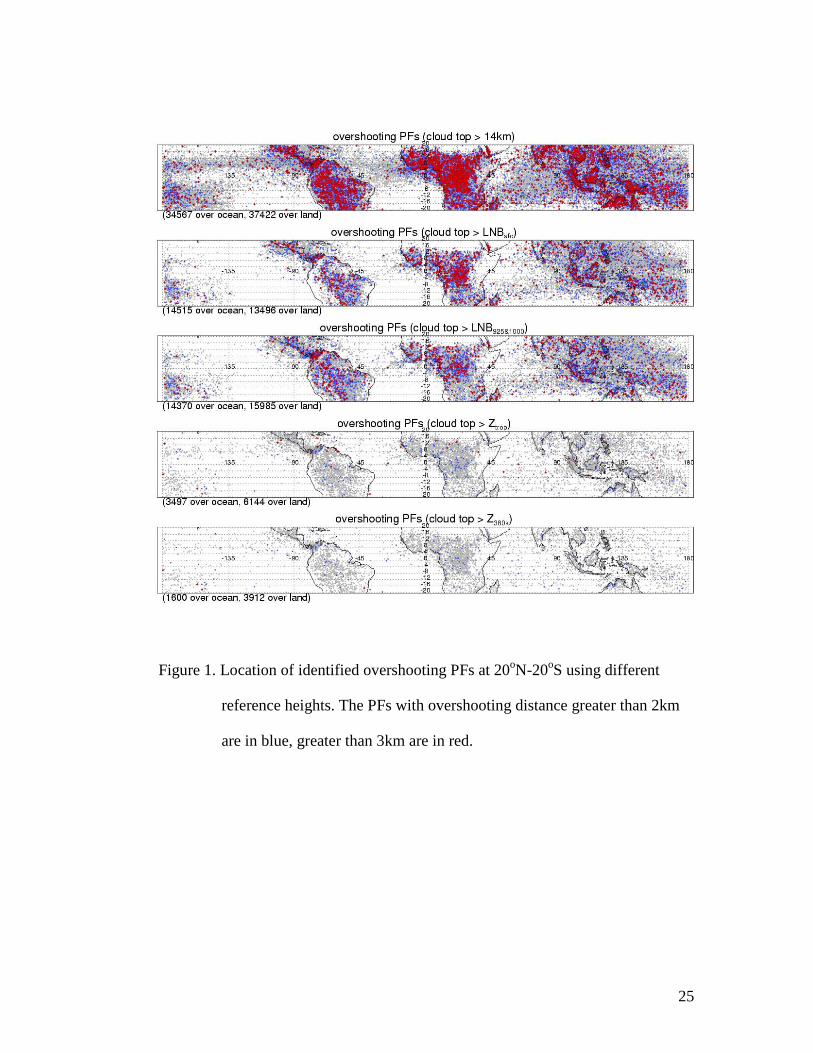
Figure 1 demonstrates the locations of PFs penetrating different reference heights. The
similar geo location distribution pattern exists in all 5 groups: OPFs were found mainly
over west Pacific, Central Africa, South America, ITCZ and SPCZ; The overshooting
tops above 17 km (red dots in the top panel of Figure 1) happened mainly over land.
About same number of PFs above 14 km cloud top were found over land and ocean. But
more land PFs were capable of penetrating the higher reference heights (Z380K and
Ztropopause). There is less strong overshoot activity at ITCZ over east Pacific and Atlantic.
Two regions were found with frequent strong overshoot activities: Congo basin and
Panama. Over west Pacific, strong overshoot happened mostly over land.
3.2 seasonal and diurnal variation of population of OPFs
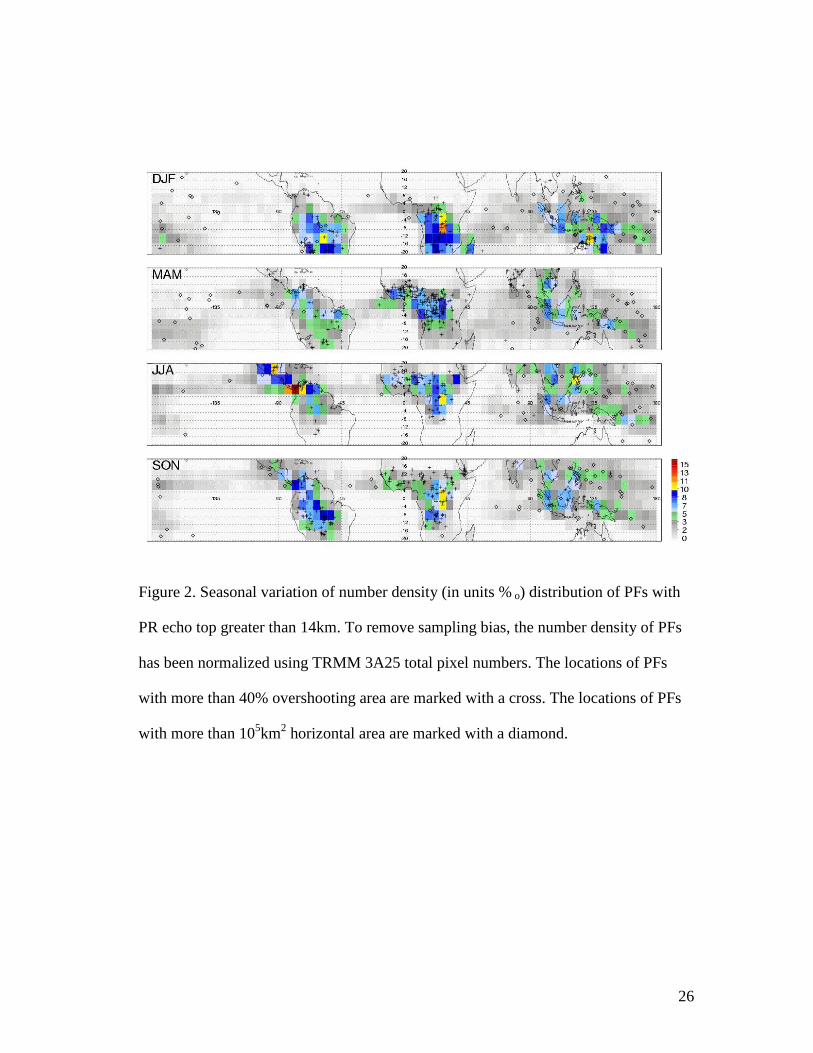
In order to show the seasonal variation of penetrative convection, population of
9
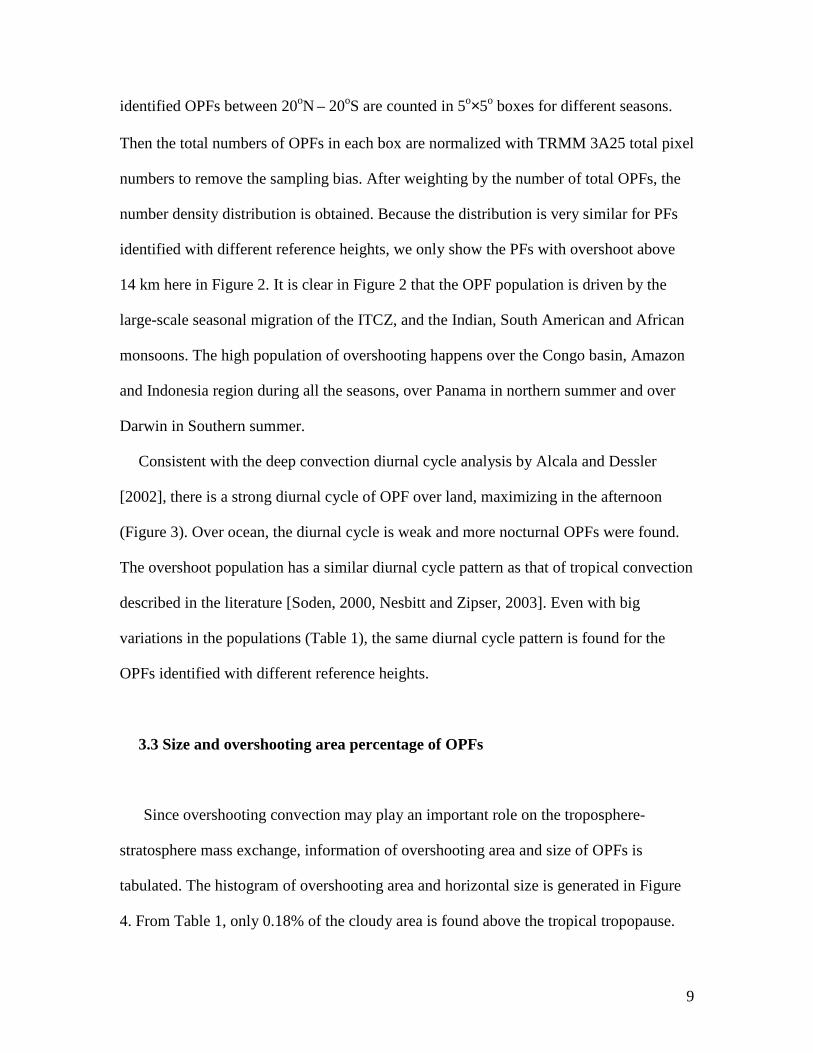
identified OPFs between 20oN – 20oS are counted in 5o×5o boxes for different seasons.
Then the total numbers of OPFs in each box are normalized with TRMM 3A25 total pixel
numbers to remove the sampling bias. After weighting by the number of total OPFs, the
number density distribution is obtained. Because the distribution is very similar for PFs
identified with different reference heights, we only show the PFs with overshoot above
14 km here in Figure 2. It is clear in Figure 2 that the OPF population is driven by the
large-scale seasonal migration of the ITCZ, and the Indian, South American and African
monsoons. The high population of overshooting happens over the Congo basin, Amazon
and Indonesia region during all the seasons, over Panama in northern summer and over
Darwin in Southern summer.
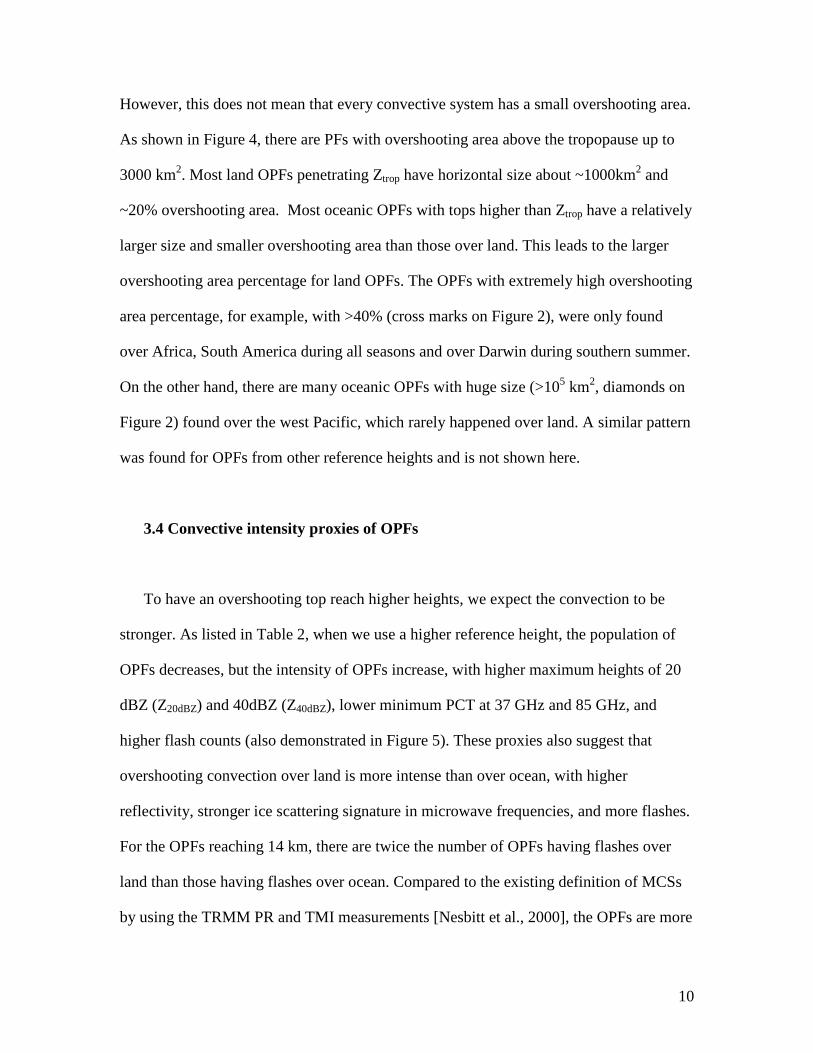
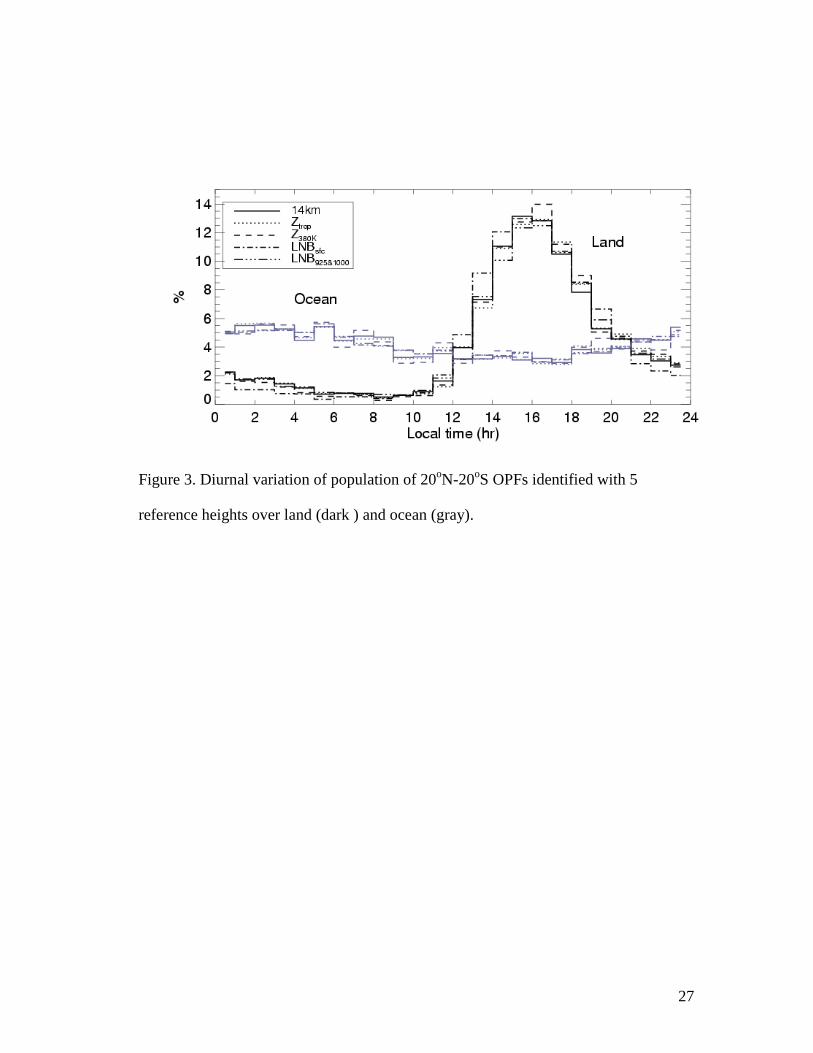
Consistent with the deep convection diurnal cycle analysis by Alcala and Dessler
[2002], there is a strong diurnal cycle of OPF over land, maximizing in the afternoon
(Figure 3). Over ocean, the diurnal cycle is weak and more nocturnal OPFs were found.
The overshoot population has a similar diurnal cycle pattern as that of tropical convection
described in the literature [Soden, 2000, Nesbitt and Zipser, 2003]. Even with big
variations in the populations (Table 1), the same diurnal cycle pattern is found for the
OPFs identified with different reference heights.
3.3 Size and overshooting area percentage of OPFs
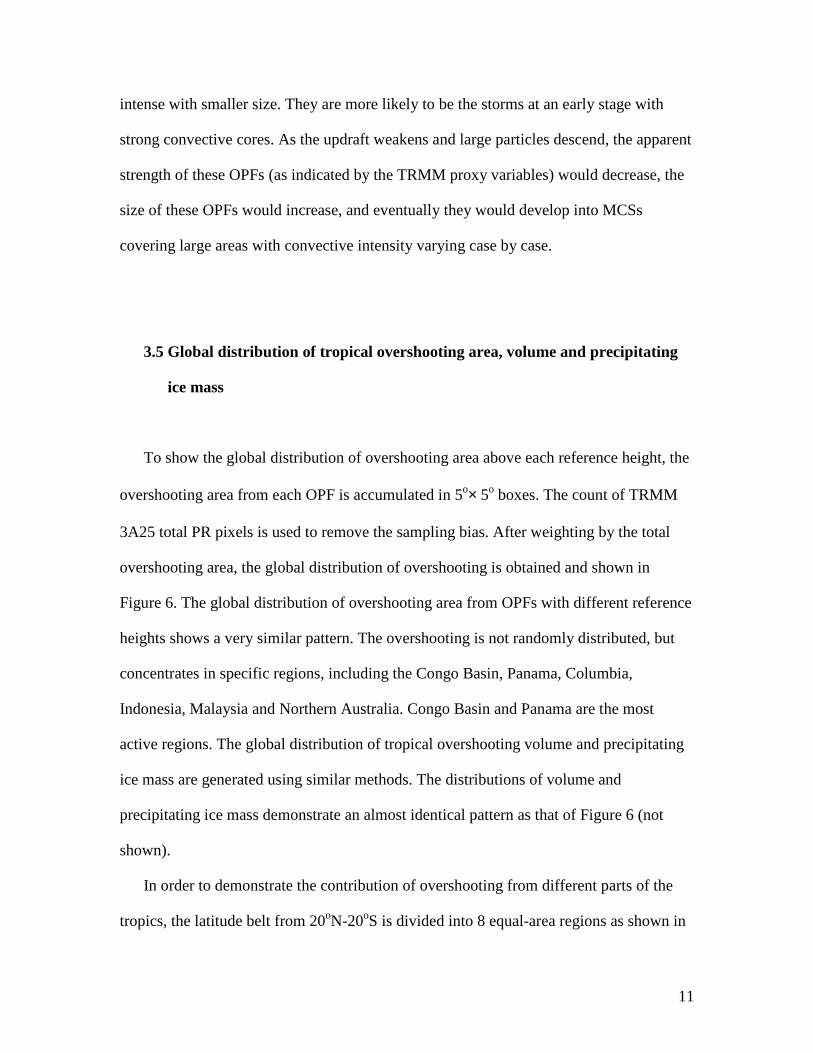
Since overshooting convection may play an important role on the troposphere-
stratosphere mass exchange, information of overshooting area and size of OPFs is
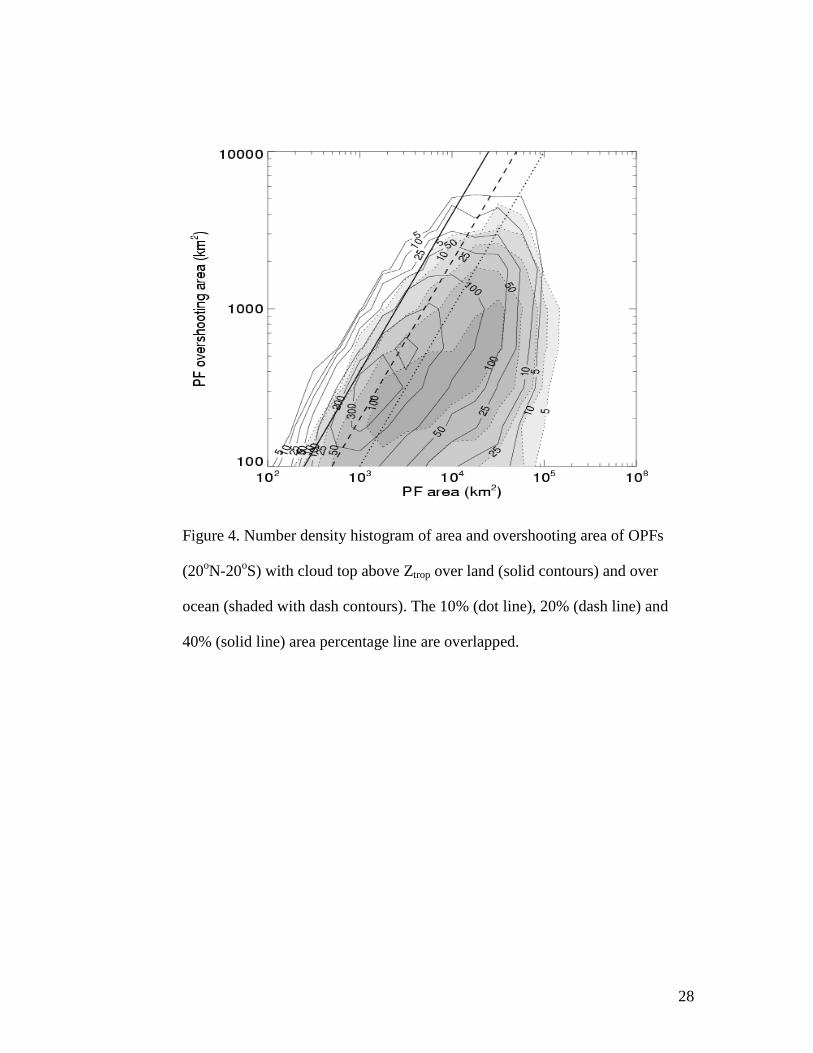
tabulated. The histogram of overshooting area and horizontal size is generated in Figure
4. From Table 1, only 0.18% of the cloudy area is found above the tropical tropopause.
10
However, this does not mean that every convective system has a small overshooting area.
As shown in Figure 4, there are PFs with overshooting area above the tropopause up to
3000 km2. Most land OPFs penetrating Ztrop have horizontal size about ~1000km2 and
~20% overshooting area. Most oceanic OPFs with tops higher than Ztrop have a relatively
larger size and smaller overshooting area than those over land. This leads to the larger
overshooting area percentage for land OPFs. The OPFs with extremely high overshooting
area percentage, for example, with >40% (cross marks on Figure 2), were only found
over Africa, South America during all seasons and over Darwin during southern summer.
On the other hand, there are many oceanic OPFs with huge size (>105 km2, diamonds on
Figure 2) found over the west Pacific, which rarely happened over land. A similar pattern
was found for OPFs from other reference heights and is not shown here.
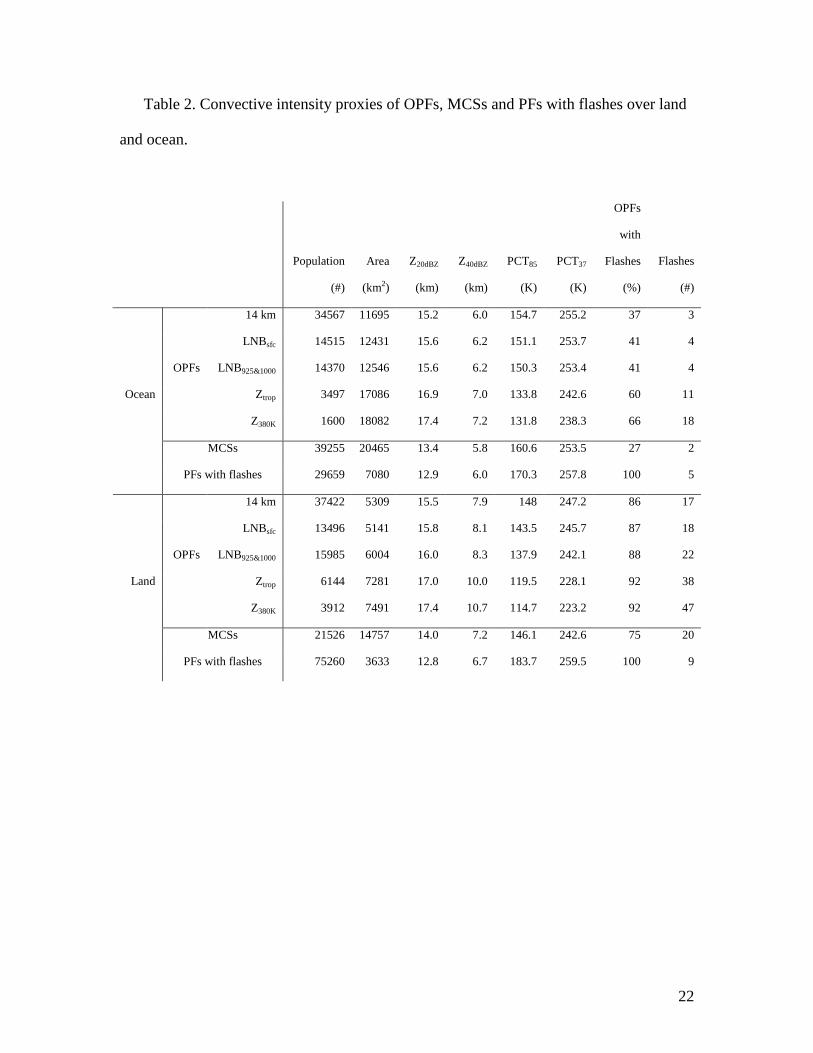
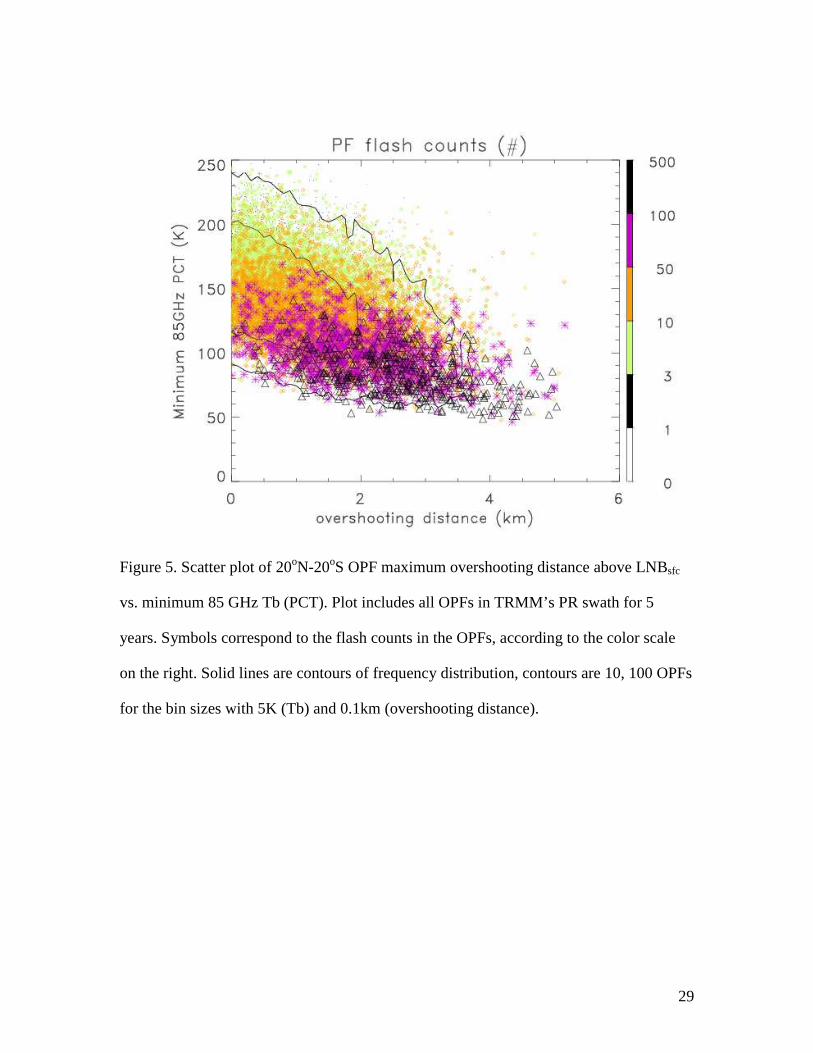
3.4 Convective intensity proxies of OPFs
To have an overshooting top reach higher heights, we expect the convection to be
stronger. As listed in Table 2, when we use a higher reference height, the population of
OPFs decreases, but the intensity of OPFs increase, with higher maximum heights of 20
dBZ (Z20dBZ) and 40dBZ (Z40dBZ), lower minimum PCT at 37 GHz and 85 GHz, and
higher flash counts (also demonstrated in Figure 5). These proxies also suggest that
overshooting convection over land is more intense than over ocean, with higher
reflectivity, stronger ice scattering signature in microwave frequencies, and more flashes.
For the OPFs reaching 14 km, there are twice the number of OPFs having flashes over
land than those having flashes over ocean. Compared to the existing definition of MCSs
by using the TRMM PR and TMI measurements [Nesbitt et al., 2000], the OPFs are more
11
intense with smaller size. They are more likely to be the storms at an early stage with
strong convective cores. As the updraft weakens and large particles descend, the apparent
strength of these OPFs (as indicated by the TRMM proxy variables) would decrease, the
size of these OPFs would increase, and eventually they would develop into MCSs
covering large areas with convective intensity varying case by case.
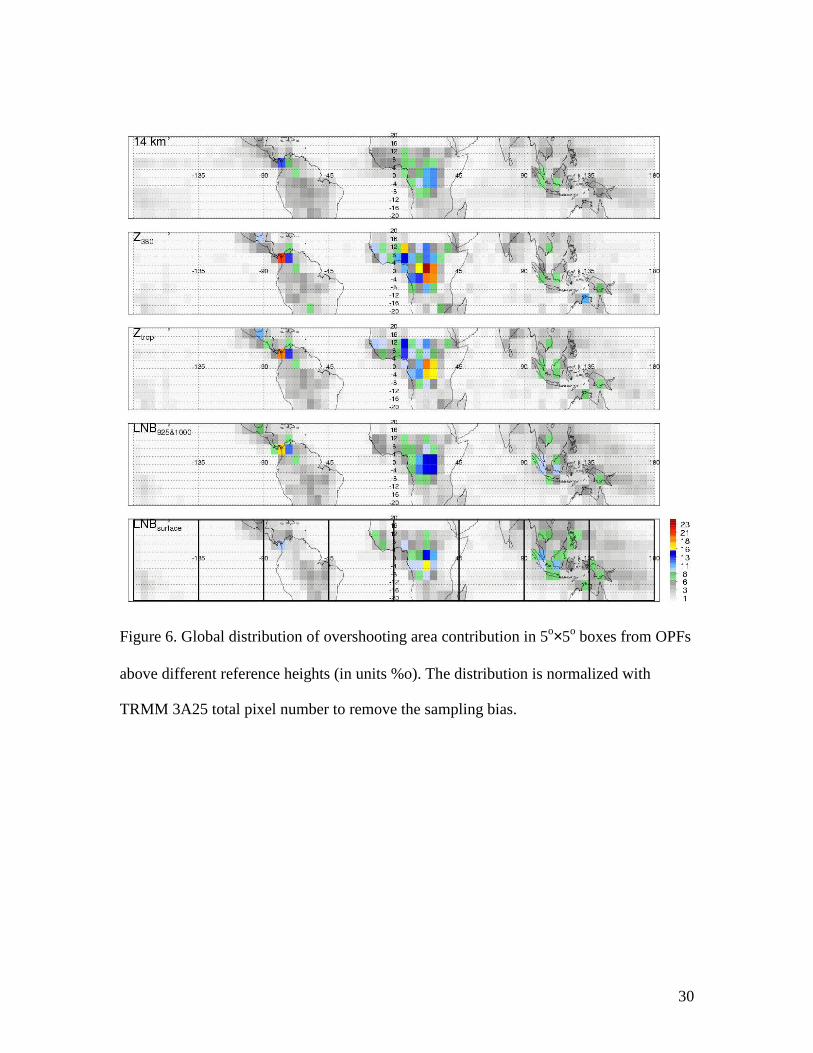
3.5 Global distribution of tropical overshooting area, volume and precipitating
ice mass
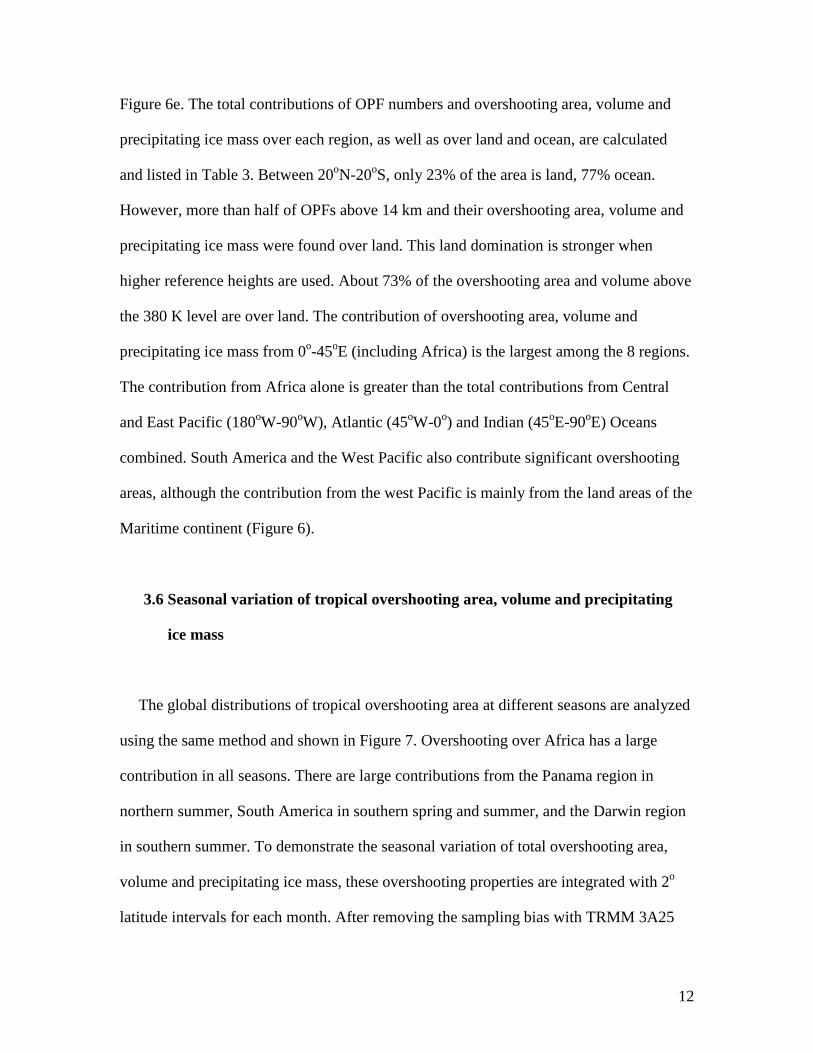
To show the global distribution of overshooting area above each reference height, the
overshooting area from each OPF is accumulated in 5o× 5o boxes. The count of TRMM
3A25 total PR pixels is used to remove the sampling bias. After weighting by the total
overshooting area, the global distribution of overshooting is obtained and shown in
Figure 6. The global distribution of overshooting area from OPFs with different reference
heights shows a very similar pattern. The overshooting is not randomly distributed, but
concentrates in specific regions, including the Congo Basin, Panama, Columbia,
Indonesia, Malaysia and Northern Australia. Congo Basin and Panama are the most
active regions. The global distribution of tropical overshooting volume and precipitating
ice mass are generated using similar methods. The distributions of volume and
precipitating ice mass demonstrate an almost identical pattern as that of Figure 6 (not
shown).
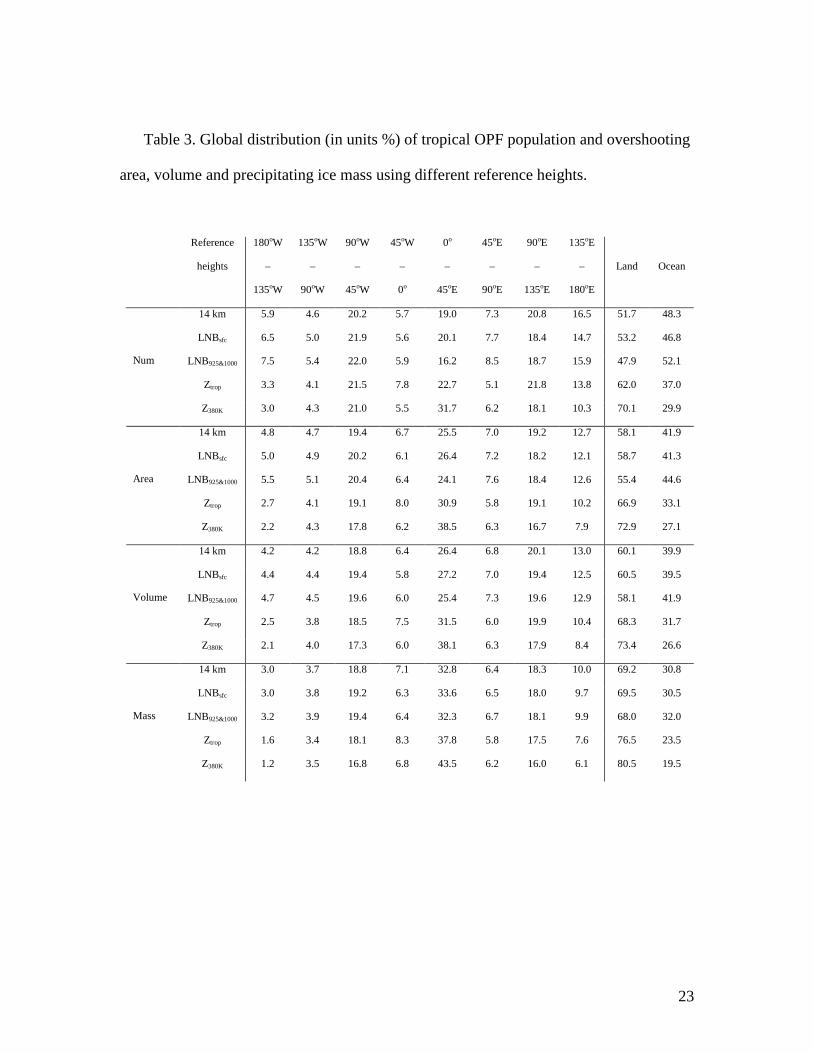
In order to demonstrate the contribution of overshooting from different parts of the
tropics, the latitude belt from 20oN-20oS is divided into 8 equal-area regions as shown in
12
Figure 6e. The total contributions of OPF numbers and overshooting area, volume and
precipitating ice mass over each region, as well as over land and ocean, are calculated
and listed in Table 3. Between 20oN-20oS, only 23% of the area is land, 77% ocean.
However, more than half of OPFs above 14 km and their overshooting area, volume and
precipitating ice mass were found over land. This land domination is stronger when
higher reference heights are used. About 73% of the overshooting area and volume above
the 380 K level are over land. The contribution of overshooting area, volume and
precipitating ice mass from 0o-45oE (including Africa) is the largest among the 8 regions.
The contribution from Africa alone is greater than the total contributions from Central
and East Pacific (180oW-90oW), Atlantic (45oW-0o) and Indian (45oE-90oE) Oceans
combined. South America and the West Pacific also contribute significant overshooting
areas, although the contribution from the west Pacific is mainly from the land areas of the
Maritime continent (Figure 6).
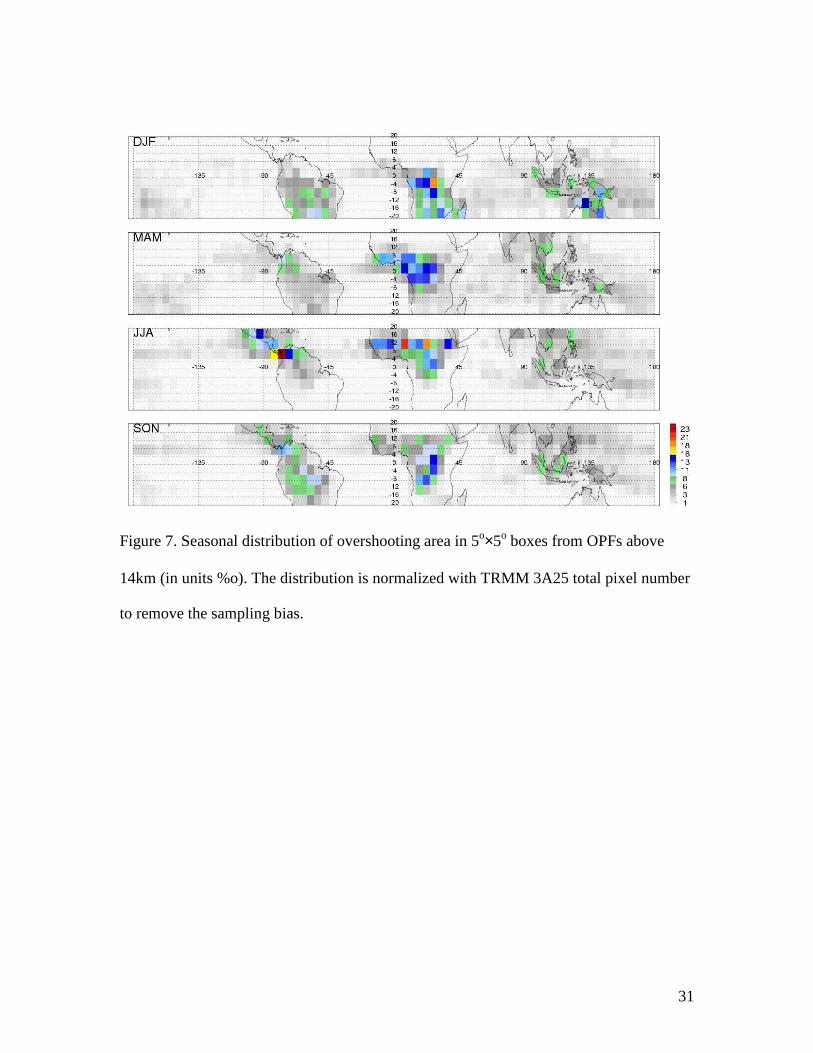
3.6 Seasonal variation of tropical overshooting area, volume and precipitating
ice mass
The global distributions of tropical overshooting area at different seasons are analyzed
using the same method and shown in Figure 7. Overshooting over Africa has a large
contribution in all seasons. There are large contributions from the Panama region in
northern summer, South America in southern spring and summer, and the Darwin region
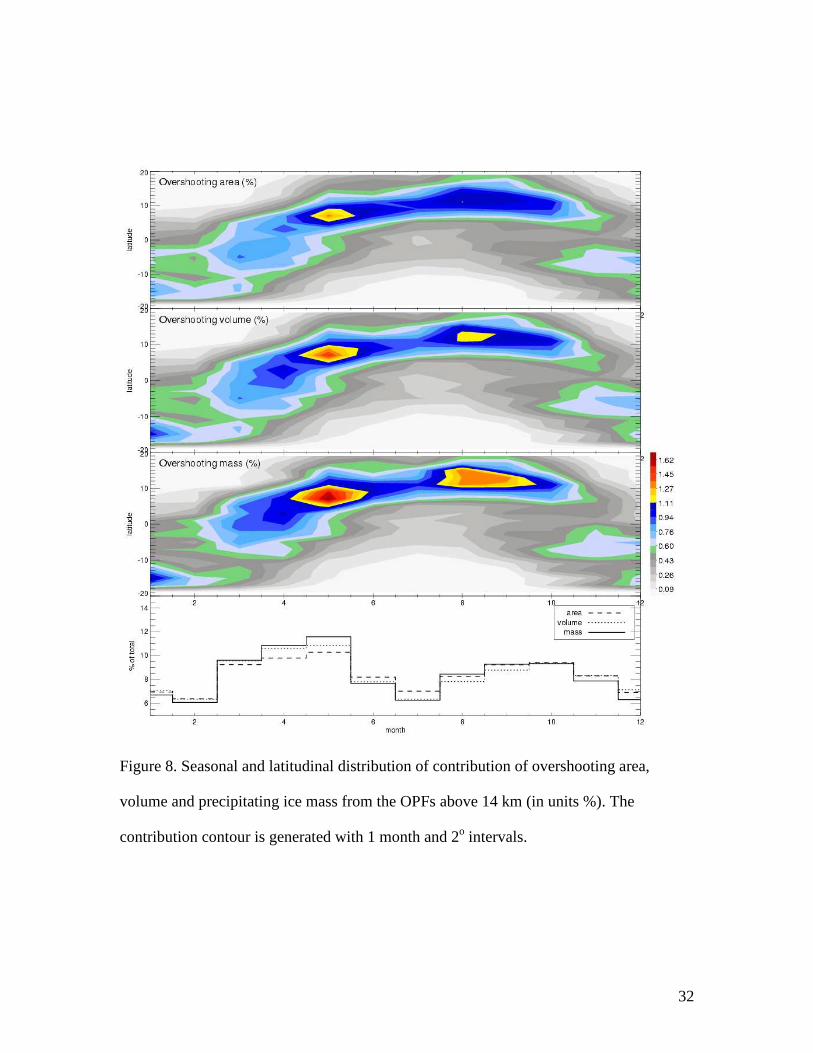
in southern summer. To demonstrate the seasonal variation of total overshooting area,
volume and precipitating ice mass, these overshooting properties are integrated with 2o
latitude intervals for each month. After removing the sampling bias with TRMM 3A25
13
total pixels, the percentage of overshooting contribution at each 2o latitude region in each
month is calculated by weighting the total amount of overshooting area, volume and
precipitating ice mass respectively. As shown in Figure 8, there are two main
overshooting seasons in Northern tropics, May, and September-October. These two
overshooting seasons are mainly driven by Africa (Figure 7). Note that there is a semi
annual cycle of overshooting area, volume and precipitating ice mass (Figure 8). A
similar pattern is found for OPFs defined with other reference heights (not shown).
3.7 Comparison to overshooting defined by IR temperature
As shown in section 2, the overshooting area from OPFs defined with the PR
reflectivity is much smaller than the overshooting area defined with the IR temperature
colder than tropopause reported by Gettelman et al., [2000]. They found a large area of
cloud top temperature colder than the tropopause over the West Pacific Ocean. However,
large OPFs overshooting area was found over land in this study. The difference may
come from two aspects. First, because PR detected reliable value is 20 dBZ, the 20dBZ
top is typically lower than the IR detected cloud top. Therefore, some overshooting
events detected by cold IR temperature are missed by the OPF definitions. Second, large
areas of anvil clouds no longer including any active convection with low IR temperature
could have lower reflectivity and may not be included in the OPFs in this study.
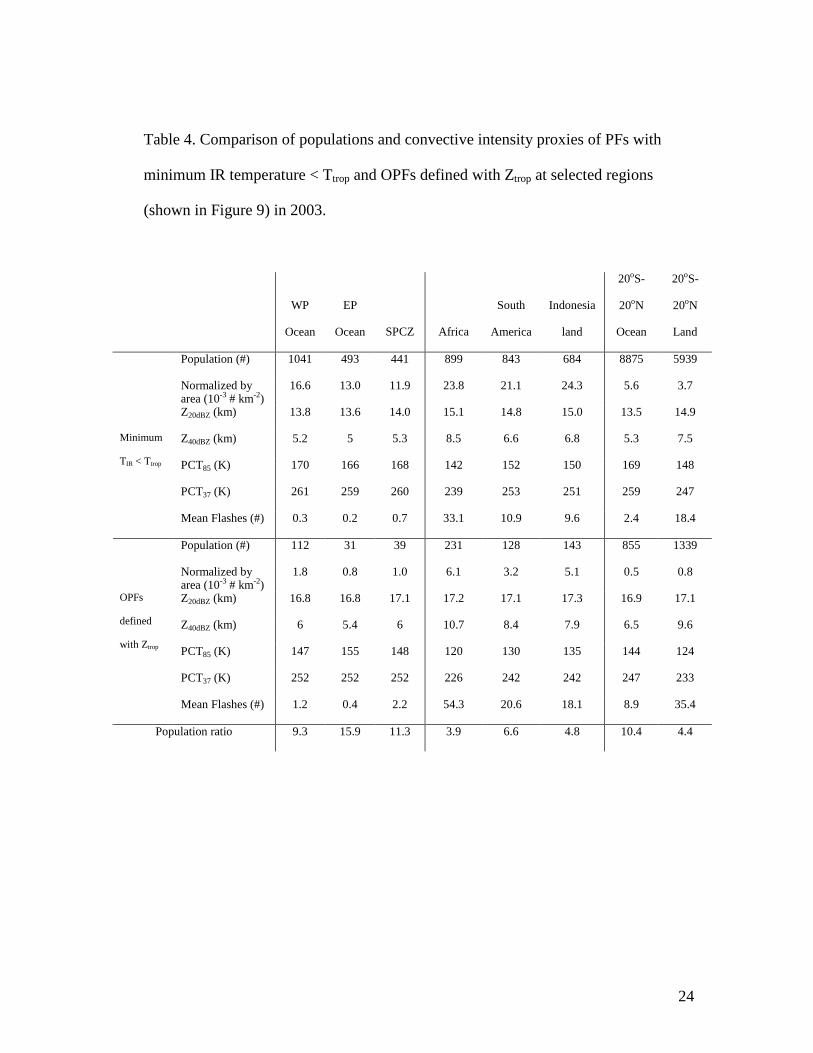
To investigate how many events might be missed by the OPF definition, the
minimum IR temperature (calculated from TRMM VIRS measured radiance at 10.8 µm
channel) for each PF in 2003 is compared with the NCEP reanalysis tropopause
temperature Ttrop. 1.4% of PFs are found with minimum IR temperature < Ttrop. Their
14
locations are shown in Figure 9. In contrast with the land domination of OPFs shown in
Figure 1, large number of PFs with cold IR tops is found over the ocean. To demonstrate
the global number density of these PFs, the populations of these PFs as well as the OPFs
defined with Ztrop in selected regions (Figure 9) are listed in Table 4. The population of
cold IR top PFs over ocean is greater than that over land. However, normalizing
populations by area suggests that those cold IR top PFs over Africa, South America and
Indonesia happen more frequently than those over the West Pacific Ocean, East Pacific
Ocean and South Pacific convergence Zone (SPCZ). The total number of PFs with 20
dBZ reaching 14 km was found to be ~ 7 times less than the number of PFs with IR
temperature < Ttrop. However, they are ~10 time less frequent over ocean but only ~4
times less frequent over land. But they are more convectively intense than the PFs with
cold IR top. Over land, convection is stronger, so larger ice particles are transported to
higher altitudes and cause the higher reflectivity and lower PCTs. As a result, the infrared
tops are closer to the 20 dBZ tops over land. Over ocean, the convection is weaker than
over land, only small particles are able to be transported to high altitudes. Thus even
though the infrared tops may be very cold, the 20 dBZ top could be at a much lower
level.
3.8 Implications of observed overshooting properties
The overshooting area, volume and mass shown in this study only apply directly to
precipitating ice particles with 20 dBZ echoes above the reference heights in convection.
Most likely these particles would fall out of the TTL in a short time [Alcala and Dessler,
2002]. A major question that we cannot answer at this time is the relationship between
15
what we can measure with the TRMM PR, and what we cannot measure. What is the
relationship between the precipitating ice mass, and the mass of small ice particles which
accompany the larger particles in intense convective overshooting towers? These small
ice particles fall slowly and may remain aloft for a long time, and may evaporate at
unknown altitudes within the TTL. To relate the overshooting air and ice mass to the
troposphere and stratosphere mass exchange, it is necessary to know how much air and
ice mass would remain in the TTL. However, the mixing and detrainment of air and ice
mass from the overshooting cloud tops to the environment in the TTL is a complicated
process and still under investigation [Sherwood and Dessler, 2003]. This limits our ability
to relate our results to the troposphere-stratosphere transport problem.
However, it may be reasonable to speculate that there is a positive relationship
between the TRMM-detected overshooting area and the amount of air and mass of small
ice particles injected into TTL by intense convection. If so, the global distribution of
overshooting area found in this study may represent the distribution of air colder and
dryer than the environment TTL. In that case, the results in this study may lead to a
contradiction. Some studies suggest that the deep convection has an important impact on
the water vapor budget [Dessler, 2002, Sherwood and Dessler, 2000]. From this study, it
is hard to use the semi annual cycle of the deep convection overshooting area to explain
the well known annual cycle of water vapor in the low stratosphere [McCormick et al.,
1993]. Thus, the clarification of the relationship between the mass of large ice particles
and the mass of small ice particles in the overshooting tops, and the rate of mixing and
detraining of air and ice mass from overshooting tops to the TTL environment demands
further study.
16
4. Summary
Five groups of tropical deep convection with overshooting tops are identified with
five different reference heights using 5-year TRMM data. The common properties of
these extreme convective systems are examined from a global perspective. It is found that
1% of deep convection systems reach 14 km and 0.1% of them may even penetrate the
380K potential temperature level. Convection with large overshooting distance tends to
have more flashes and strong ice scattering signature in the85 GHz channel. A high
population of overshooting deep convection over Africa is found during all the seasons.
Stronger overshooting convection is found over land, especially central Africa, South
America and the large islands of the Indonesian region. Overshooting area and the
relative percentage for convective systems over land tend to be larger than that over
ocean. There is a large seasonal variation of overshooting over South America. The
largest contribution of overshooting area, volume and precipitating ice mass is found
from convection over central Africa. There is a semi annual cycle in the total
overshooting area, volume and precipitating ice mass over the tropics as a whole. The
seasonal, diurnal and geo-distribution patterns show a good consistency among the 5
groups of overshooting deep convection, differently defined. There are more PFs with IR
temperature colder than the tropopause than those above the tropopause height from the
TRMM radar, the difference being greater over ocean than over land.
Acknowledgments. This work was supported by the NASA TRMM office under grant
NAG5-10682. The data were processed by the TRMM Science Data and Information
System (TSDIS).
17
References
Adler, R. F., G. J. Huffman, D. T. Bolvin, S. Curtis, and E. J. Nelkin, Tropical rainfall
distributions determined using TRMM combined with other satellite and rain gauge
information, J. Appl. Meteorol., 39, 2007-2023, 2000.
Alcala, C. M. and A. E. Dessler, Observations of deep convection in the tropics using the
tropical rainfall measuring (TRMM) precipitation radar, J. Geophys. Res., 107,
doi:10.1029/2002JD002457, 2002.
Carey, L. D., and S. A. Rutledge, The relationship between precipitation and lightning in
tropical island convection: a c-band polarimetric radar study, Mon. Weather Rev.,
128, 2687-2710, 2000.
Cecil, D. J., E. J. Zipser, and S. W. Nesbitt, Reflectivity, ice scattering and lightning
characteristics of hurricane eyewalls and ranbands. PartI: quantitative description,
Mon. Weather Rev., 130, 769-784, 2002.
Cecil, D. J., S. J. Goodman, D. J. Boccippio, E. J. Zipser, and S. W. Nesbitt, Three years
of TRMM precipitation features. Part I: radar, radiometric and lightning
characteristics, Mon. Weather Rev., 133, 543-566, 2005.
Dessler, A. E., The effect of deep, tropical convection on the tropical tropopause layer, J.
Geophys. Res., 107, doi:10.1029/2001JD000511, 2002.
Gettelman, A., M. L. Salby, and F. Sassi, Distribution and influence of convection in the
tropical tropopause region, J. Geophys. Res., 107, doi:10.1029/2001JD001048, 2002.
Hall, T. J., and T. H. Vonder Haar, The diurnal cycle of west Pacific deep convection and
its relation to the special and temporal variations of tropical MCSs, J. Atmos. Sci.,
18
56, 3401-3415, 1999.
Jensen, E. J., and L. Pfister, Transport and freeze-drying in the tropical tropopause layer,
J. Geophys. Res, 109, doi: 10.1029/2003JD004022, 2004.
Jorgenson, D. P., E. J. Zipser, and M. A. LeMone, Vertical motion in intense hurricanes,
J. Atmos. Sci., 42, 839-856, 1985.
Jorgenson, D. P., and M. A. LeMone, Vertical velocity characteristics of oceanic
convection, J. Atmos. Sci., 46, 621-640, 1989.
Kistler, R., E. Kalnay, W. Collins, S. Saha, G. White, J. Woollen, M. Chelliah,
W. Ebisuzaki, M. Kanamitsu, V. Kousky, H. Dool, R. Jenne, and M. Fiorino, The
NCEP-NCAR 50-year reanalysis: monthly means CD–ROM and documentation,
Bull. Am. Meteorol. Soc., 82, 247-267, 2001.
Kummerow, C., and W. Barnes, The tropical rainfall measuring mission (TRMM) sensor
package, J. Atmos. Oceanic Technol., 15, 809-817, 1998.
LeMone, M. A., and E. J. Zipser, Cumulonimbus vertical velocity events in GATE. Part
I: Diameter, intensity, and mass flux, J. Atmos. Sci., 37, 2444-2457, 1980.
Liu, G., J. A. Curry, and R.-S. Sheu, Classification of clouds over the western equatorial
Pacific Ocean using combined infrared and microwave satellite data, J. Geophys.
Res., 100, 13,811-13,826, 1995.
Lucas, C., M. A. LeMone, and E. J. Zipser, Vertical velocity in oceanic convection off
tropical Australia, J. Atmos. Sci., 51, 3183-3193, 1994.
Mapes, B., and R. Houze, Cloud clusters and super clusters over the oceanic warm pool,
Mon. Weather Rev., 121, 1398-1415, 1993.
Massie, S., A. Gettelman, W. Randel, and D. Baumgardner, Distribution of tropical cirus
in relation to convection, J. Geophys. Res., 107, doi:10.1029/2001JD001293, 2002.
19
McCormick, M. P., E. W. Chiou, L. R. McMaster, W. P. Chu, J. C. Larsen, D. Rind, and
S. Oltmans, Annual variation of water vapor in the stratosphere and upper
troposphere observed by the Stratospheric Aerosol and Gas Experiment II, J.
Geophys. Res., 98, 4867-4874, 1993.
Nesbitt, S. W., E. J. Zipser, and D. J. Cecil, A census of precipitation features in the
tropics using TRMM: radar, ice scattering, and lightning observations, J. Clim., 13,
4087-4106, 2000.
Nesbitt, S. W., and E. J. Zipser, The diurnal cycle of rainfall and convective intensity
according to three years of TRMM measurements, J. Clim., 16, 1456-1475, 2003.
Riehl, H., and J. S. Malkus, On the heat balance in the equatorial trough zone,
Geophysica, 6, 503-538, 1958.
Roca, R., and V. Ramanathan, Scale dependence of monsooonal convective systems over
the Indian Ocean, J. Clim., 13,1286-1298, 2000.
Rosenlof, K. H., The seasonal cycle of the residual mean meridional circulation in the
stratosphere, J. Geophys, Res., 100, 5173-5191, 1995.
Salby, M., F. Sassi, P. Callaghan, W. Read, and H. Pumphrey, Fluctuations of cloud,
humidity, and thermal structure near the tropical tropopause, J. Clim., 16, 3428-3446,
2003.
Sherwood, S. C., and A. E. Dessler, On the control of stratospheric humidity, Geophys.
Res. Lett., 27, 2513-2516, 2000.
Sherwood, S. C., and A. E. Dessler, Convective mixing near the tropical tropopause:
insights from seasonal variations, J. Atmos. Sci., 60, 2674-2685, 2003.
Simpson, J., R. F. Adler, and G. R. North, A proposed tropical rainfall measuring mission
(TRMM) satellite, Bull. Am. Meteorol. Soc., 69, 278-295, 1988.
20
Soden, B. J., The diurnal cycle of convection, clouds, and water vapor in the tropical
upper troposphere, Geophys. Res. Lett., 27, 2173-2176, 2000.
Spencer, R. W., H. G. Goodman, and R. E. Hood, Precipitation retrieval over land and
ocean with the SSM/I: identification and characteristics of the scattering signal, J.
Atmos. Oceanic Technol., 6, 254-273, 1989.
Toracinta, E. R., D. J. Cecil, E. J. Zipser, and S. W. Nesbitt, Radar, passive, microwave,
and lightning characteristics of precipitation systems in the tropics, Mon. Weather
Rev., 130, 802-824, 2002.
Wei, D., A. M. Blyth, and D. J. Raymond, Buoyancy of convective clouds in TOGA
COARE, J. Atmos. Sci., 55, 3381-3391, 1998.
Yulaeva, E., J. R. Holton, and J. M. Wallace, On the cause of the annual cycle in the
tropical lower stratospheric temperature, J. Atmos. Sci., 51, 169-174, 1994.
21
Table 1. Population, overshooting distance, and area of overshooting precipitation
features (OPFs) identified with respect to 5 definitions of reference heights.
Reference heights 14 km LNBsfc LNB925&1000 Ztrop Z380K
OPFs population (#) 71989 28011 30355 9641 5512
Population percentage (%) 1.38 0.54 0.58 0.19 0.11
Mean reference height (km) 14.00 14.55 14.74 16.31 16.83
Mean Z20dBZ (km) 15.34 15.68 15.79 16.98 17.44
Mean overshooting distance (km) 1.34 1.14 1.04 0.67 0.61
Mean OPFs overshooting area (km2) 244 288 316 595 722
Mean overshooting area / OPF raining area (%) 8.19 8.96 9.31 13.51 15.85
Total overshooting area / total raining area (%) 0.58 0.27 0.32 0.19 0.13
Total overshooting area / total sample area (%) 0.023 0.011 0.013 0.008 0.005
22
Table 2. Convective intensity proxies of OPFs, MCSs and PFs with flashes over land
and ocean.
Population
(#)
Area
(km2)
Z20dBZ
(km)
Z40dBZ
(km)
PCT85
(K)
PCT37
(K)
OPFs
with
Flashes
(%)
Flashes
(#)
14 km 34567 11695 15.2 6.0 154.7 255.2 37 3
LNBsfc 14515 12431 15.6 6.2 151.1 253.7 41 4
LNB925&1000 14370 12546 15.6 6.2 150.3 253.4 41 4
Ztrop 3497 17086 16.9 7.0 133.8 242.6 60 11
OPFs
Z380K 1600 18082 17.4 7.2 131.8 238.3 66 18
MCSs 39255 20465 13.4 5.8 160.6 253.5 27 2
Ocean
PFs with flashes 29659 7080 12.9 6.0 170.3 257.8 100 5
14 km 37422 5309 15.5 7.9 148 247.2 86 17
LNBsfc 13496 5141 15.8 8.1 143.5 245.7 87 18
LNB925&1000 15985 6004 16.0 8.3 137.9 242.1 88 22
Ztrop 6144 7281 17.0 10.0 119.5 228.1 92 38
OPFs
Z380K 3912 7491 17.4 10.7 114.7 223.2 92 47
MCSs 21526 14757 14.0 7.2 146.1 242.6 75 20
Land
PFs with flashes 75260 3633 12.8 6.7 183.7 259.5 100 9
23
Table 3. Global distribution (in units %) of tropical OPF population and overshooting
area, volume and precipitating ice mass using different reference heights.
Reference
heights
180oW
–
135oW
135oW
–
90oW
90oW
–
45oW
45oW
–
0o
0o
–
45oE
45oE
–
90oE
90oE
–
135oE
135oE
–
180oE
Land
Ocean
14 km 5.9 4.6 20.2 5.7 19.0 7.3 20.8 16.5 51.7 48.3
LNBsfc 6.5 5.0 21.9 5.6 20.1 7.7 18.4 14.7 53.2 46.8
LNB925&1000 7.5 5.4 22.0 5.9 16.2 8.5 18.7 15.9 47.9 52.1
Ztrop 3.3 4.1 21.5 7.8 22.7 5.1 21.8 13.8 62.0 37.0
Num
Z380K 3.0 4.3 21.0 5.5 31.7 6.2 18.1 10.3 70.1 29.9
14 km 4.8 4.7 19.4 6.7 25.5 7.0 19.2 12.7 58.1 41.9
LNBsfc 5.0 4.9 20.2 6.1 26.4 7.2 18.2 12.1 58.7 41.3
LNB925&1000 5.5 5.1 20.4 6.4 24.1 7.6 18.4 12.6 55.4 44.6
Ztrop 2.7 4.1 19.1 8.0 30.9 5.8 19.1 10.2 66.9 33.1
Area
Z380K 2.2 4.3 17.8 6.2 38.5 6.3 16.7 7.9 72.9 27.1
14 km 4.2 4.2 18.8 6.4 26.4 6.8 20.1 13.0 60.1 39.9
LNBsfc 4.4 4.4 19.4 5.8 27.2 7.0 19.4 12.5 60.5 39.5
LNB925&1000 4.7 4.5 19.6 6.0 25.4 7.3 19.6 12.9 58.1 41.9
Ztrop 2.5 3.8 18.5 7.5 31.5 6.0 19.9 10.4 68.3 31.7
Volume
Z380K 2.1 4.0 17.3 6.0 38.1 6.3 17.9 8.4 73.4 26.6
14 km 3.0 3.7 18.8 7.1 32.8 6.4 18.3 10.0 69.2 30.8
LNBsfc 3.0 3.8 19.2 6.3 33.6 6.5 18.0 9.7 69.5 30.5
LNB925&1000 3.2 3.9 19.4 6.4 32.3 6.7 18.1 9.9 68.0 32.0
Ztrop 1.6 3.4 18.1 8.3 37.8 5.8 17.5 7.6 76.5 23.5
Mass
Z380K 1.2 3.5 16.8 6.8 43.5 6.2 16.0 6.1 80.5 19.5
24
Table 4. Comparison of populations and convective intensity proxies of PFs with
minimum IR temperature < Ttrop and OPFs defined with Ztrop at selected regions
(shown in Figure 9) in 2003.
WP
Ocean
EP
Ocean SPCZ Africa
South
America
Indonesia
land
20oS-
20oN
Ocean
20oS-
20oN
Land
Population (#) 1041 493 441 899 843 684 8875 5939
Normalized by area (10-3 # km-2)
16.6 13.0 11.9 23.8 21.1 24.3 5.6 3.7
Z20dBZ (km) 13.8 13.6 14.0 15.1 14.8 15.0 13.5 14.9
Z40dBZ (km) 5.2 5 5.3 8.5 6.6 6.8 5.3 7.5
PCT85 (K) 170 166 168 142 152 150 169 148
PCT37 (K) 261 259 260 239 253 251 259 247
Minimum
TIR < Ttrop
Mean Flashes (#) 0.3 0.2 0.7 33.1 10.9 9.6 2.4 18.4
Population (#) 112 31 39 231 128 143 855 1339
Normalized by area (10-3 # km-2)
1.8 0.8 1.0 6.1 3.2 5.1 0.5 0.8
Z20dBZ (km) 16.8 16.8 17.1 17.2 17.1 17.3 16.9 17.1
Z40dBZ (km) 6 5.4 6 10.7 8.4 7.9 6.5 9.6
PCT85 (K) 147 155 148 120 130 135 144 124
PCT37 (K) 252 252 252 226 242 242 247 233
OPFs
defined
with Ztrop
Mean Flashes (#) 1.2 0.4 2.2 54.3 20.6 18.1 8.9 35.4
Population ratio 9.3 15.9 11.3 3.9 6.6 4.8 10.4 4.4
25
Figure 1. Location of identified overshooting PFs at 20oN-20oS using different
reference heights. The PFs with overshooting distance greater than 2km
are in blue, greater than 3km are in red.
26
Figure 2. Seasonal variation of number density (in units % o) distribution of PFs with
PR echo top greater than 14km. To remove sampling bias, the number density of PFs
has been normalized using TRMM 3A25 total pixel numbers. The locations of PFs
with more than 40% overshooting area are marked with a cross. The locations of PFs
with more than 105km2 horizontal area are marked with a diamond.
27
Figure 3. Diurnal variation of population of 20oN-20oS OPFs identified with 5
reference heights over land (dark ) and ocean (gray).
28
Figure 4. Number density histogram of area and overshooting area of OPFs
(20oN-20oS) with cloud top above Ztrop over land (solid contours) and over
ocean (shaded with dash contours). The 10% (dot line), 20% (dash line) and
40% (solid line) area percentage line are overlapped.
29
Figure 5. Scatter plot of 20oN-20oS OPF maximum overshooting distance above LNBsfc
vs. minimum 85 GHz Tb (PCT). Plot includes all OPFs in TRMM’s PR swath for 5
years. Symbols correspond to the flash counts in the OPFs, according to the color scale
on the right. Solid lines are contours of frequency distribution, contours are 10, 100 OPFs
for the bin sizes with 5K (Tb) and 0.1km (overshooting distance).
30
Figure 6. Global distribution of overshooting area contribution in 5o×5o boxes from OPFs
above different reference heights (in units %o). The distribution is normalized with
TRMM 3A25 total pixel number to remove the sampling bias.
31
Figure 7. Seasonal distribution of overshooting area in 5o×5o boxes from OPFs above
14km (in units %o). The distribution is normalized with TRMM 3A25 total pixel number
to remove the sampling bias.
32
Figure 8. Seasonal and latitudinal distribution of contribution of overshooting area,
volume and precipitating ice mass from the OPFs above 14 km (in units %). The
contribution contour is generated with 1 month and 2o intervals.
33
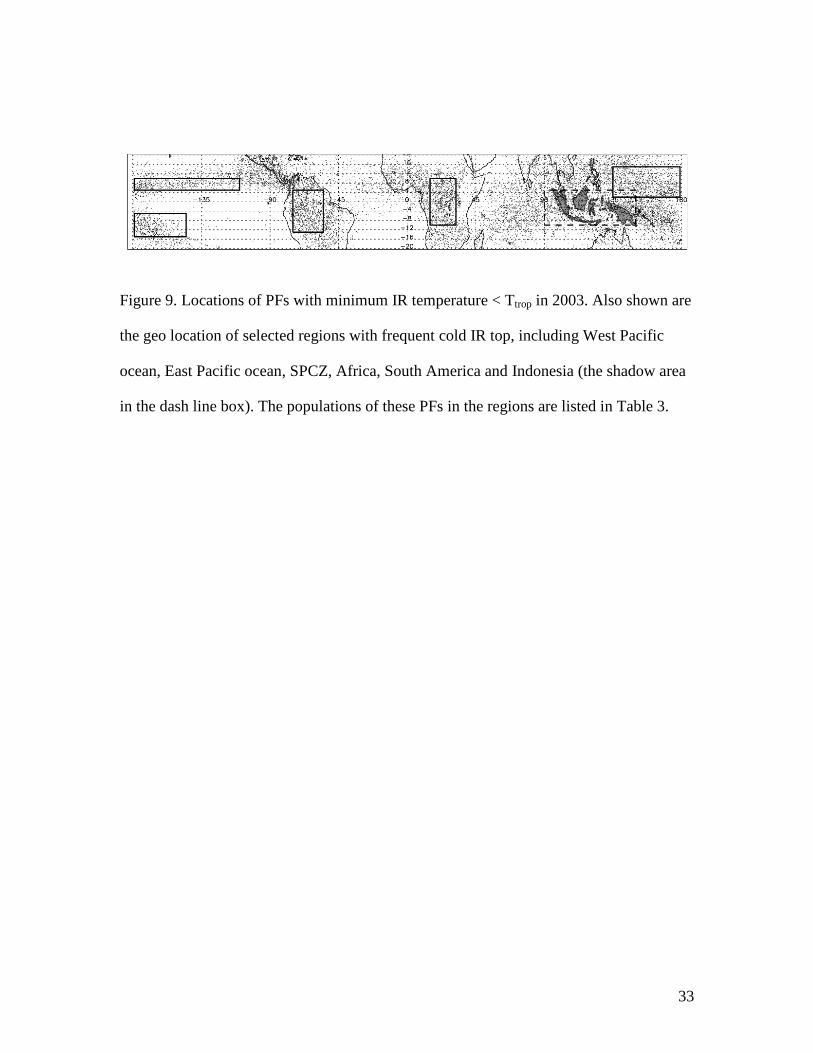
Figure 9. Locations of PFs with minimum IR temperature < Ttrop in 2003. Also shown are
the geo location of selected regions with frequent cold IR top, including West Pacific
ocean, East Pacific ocean, SPCZ, Africa, South America and Indonesia (the shadow area
in the dash line box). The populations of these PFs in the regions are listed in Table 3.


