Embed Size (px)
Citation preview
Utah State University Utah State University
DigitalCommons@USU DigitalCommons@USU
All Graduate Theses and Dissertations Graduate Studies
5-2022
Global Change Effects on Carbon Cycling in Terrestrial Global Change Effects on Carbon Cycling in Terrestrial
Ecosystems Ecosystems
Guopeng Liang Utah State University
Follow this and additional works at: https://digitalcommons.usu.edu/etd
Part of the Biology Commons, and the Ecology and Evolutionary Biology Commons
Recommended Citation Recommended Citation Liang, Guopeng, "Global Change Effects on Carbon Cycling in Terrestrial Ecosystems" (2022). All Graduate Theses and Dissertations. 8426. https://digitalcommons.usu.edu/etd/8426
This Dissertation is brought to you for free and open access by the Graduate Studies at DigitalCommons@USU. It has been accepted for inclusion in All Graduate Theses and Dissertations by an authorized administrator of DigitalCommons@USU. For more information, please contact [email protected].
GLOBAL CHANGE EFFECTS ON CARBON CYCLING IN TERRESTRIAL
ECOSYSTEMS
by
Guopeng Liang
A dissertation submitted in partial fulfillment
of the requirements for the degree
of
DOCTOR OF PHILOSOPHY
in
Ecology
Approved:
___________________________ ___________________________
John M. Stark, Ph.D. Bonnie G. Waring, Ph.D.
Major Professor Committee Member
___________________________ ___________________________
Jeanette M. Norton, Ph.D. Andrew Kulmatiski, Ph.D.
Committee Member Committee Member
___________________________ ___________________________
William D. Pearse, Ph.D. D. Richard Cutler, Ph.D.
Committee Member Interim Vice Provost
of Graduate Studies
UTAH STATE UNIVERSITY
Logan, Utah
2022

ii
Copyright © Guopeng Liang 2022
All Rights Reserved
iii
ABSTRACT
Global Change Effects on Carbon Cycling in Terrestrial Ecosystems
by
Guopeng Liang, Doctor of Philosophy in Biology
Utah State University, 2022
Major Professor: Dr. John M. Stark
Department: Biology
Terrestrial ecosystems play a significant role in global warming by releasing or
absorbing CO2. Given that terrestrial ecosystems store approximately 3 times more
carbon than the atmosphere, small decreases in terrestrial carbon caused by climate
change can significantly increase CO2 concentration in the atmosphere, which in turn
exacerbates global warming. However, unknowns still remain regarding the underlying
mechanisms of global change effects on terrestrial C cycling.
In chapter 2, a meta-analysis study was conducted to determine whether nitrogen
deposition effects on plant productivity in terrestrial ecosystems change over time. 44%
of studies showed evidence of a consistent directional change in the strength of the
impacts of nitrogen additions over time. The direction of this change varied with biome
type (forests, decrease; grasslands and shrublands, increase). The results indicate that
temporally dynamic impacts of long-term nitrogen addition on plant productivity are
generally observed in terrestrial ecosystems.
iv
In chapter 3, the effects of multiple global change factors on soil respiration in
dryland soils were examined in an incubation experiment. The experiment included four
factors: previous warming, carbon availability, soil moisture content, and soil moisture
variability. The individual effect of each of the four global change factors on soil
respiration was significant, although carbon availability caused the most increase in soil
respiration. Soil respiration under variable soil moisture was lower than that under stable
soil moisture. This study suggests that the effect of one global change factor on soil
carbon cycling in dryland soils is affected by other factors.
In chapter 4, synthetic root/soil systems were used to quantify the effects of
carbon input quality, root exudates, soil clay activity, and soil microbial community on
soil organic carbon cycling. Greater positive effects of root exudates on soil respiration
were found in low than high activity clays. Root exudates decreased mineral-associated
organic carbon when clay activity was low and medium but increased it in soils with high
clay activity. These suggest that root exudates and soil minerology interactions play a
significant role in soil carbon dynamics, which should be studied more in the future.
(213 pages)
v
PUBLIC ABSTRACT
Global Change Effects on Carbon Cycling in Terrestrial Ecosystems
by
Guopeng Liang
Since terrestrial ecosystems store approximately 3 times more carbon (C) than the
atmosphere, they have a significant effect on the atmospheric CO2 concentration.
Although many studies have been conducted to determine global change effects on C
cycling in terrestrial ecosystems, the underlying mechanisms remain uncertain. To
address this knowledge gap, I utilized meta-analysis, laboratory experiments, and soil
microbial community analysis.
In chapter 2, I conducted a meta-analysis to examine whether effects of long-term
N addition on plant productivity can shift over time. I found that 44% of studies showed a
marked trend (increase or decrease) in the strength of N impacts over time. The temporal
trend of N impacts on plant productivity was mainly explained by climate variables (e.g.
mean annual temperature and precipitation). This chapter suggests that, to estimate N
impacts on terrestrial ecosystem more accurately, not only the magnitude of N impacts on
plant productivity, but also their temporal pattern should be considered in future studies.
In chapter 3, I determined the responses of dryland soil C cycling to multiple
global change factors (e.g. previous warming, C availability, soil moisture content, and
soil moisture variability) by conducting a laboratory incubation experiment. I found that
interactive effects of multiple global change factors were ubiquitous in drylands. For
example, effects of soil moisture and previous warming on soil respiration were
vi
insignificant without C addition. However, higher soil respiration was found under high
soil moisture and prior warming in soils with C additions. This chapter indicates that
future experiments should include multiple global change factors to assess their
interactive effects on soil C cycling and to unravel underlying mechanisms.
In chapter 4, I quantified roles of plant-microbe-soil interactions in soil C cycling
by utilizing synthetic root/soil systems. The treatments consisted of C input quality, root
exudates, soil minerology, and soil microbial community composition. I found that the
root exudates-soil minerology interaction was dominant in regulating soil C cycling.
More specifically, the positive effect of root exudates on soil respiration decreased with
increasing soil clay activity. This chapter suggests that plant-soil interactions play a great
role in soil C formation and loss.

vii
ACKNOWLEDGMENTS
I would like to thank my PhD supervisors, Dr. Bonnie Waring and Dr. John Stark,
for their years of guidance and support. This dissertation would not have been possible
without their help. I would also like to thank my committee members, Dr.
Jeanette Norton, Dr. Andrew Kulmatiski, and Dr. Will Pearse, for their help and service.
I thank the help from my colleagues during my PhD program: Jessica Murray,
Karen Foley, Kirsten Butcher, and Savannah Adkins. Thanks to the undergraduate
technicians of Waring lab: Preston Christensen, Camilla Moses, and Jalynn Jones for
their help. In addition, I acknowledge the scholarships and grants from The Department
of Biology at Utah State University and Department of Energy of the US.
Thanks to my parents, who are always there for me. Most importantly, I would
like to thank my wife, Pengyan Sun, for all her support, encouragement, and patience and
especially for bringing up our daughter Sophie Liang.
Guopeng Liang
viii
CONTENTS
Page
ABSTRACT ....................................................................................................................... iii
PUBLIC ABSTRACT .........................................................................................................v
ACKNOWLEDGMENTS ................................................................................................ vii
LIST OF TABLES ...............................................................................................................x
LIST OF FIGURES .......................................................................................................... xii
CHAPTER
1. INTRODUCTION ..............................................................................................1
Introduction ..........................................................................................................1
Impacts of N deposition on plant productivity .....................................................2
Effects of multiple global change factors on soil respiration in drylands ............4
Roles of plant-microbe-soil interactions in soil organic C formation and loss ....6
Dissertation Outline ..............................................................................................9
Reference ............................................................................................................10
2. NITROGEN EFFECTS ON PLANT PRODUCTIVITY CHANGE AT
DECADAL TIMESCALES ..............................................................................22
Abstract ..............................................................................................................22
Introduction ........................................................................................................23
Methods ..............................................................................................................26
Results ................................................................................................................32
Discussion ..........................................................................................................35
References ..........................................................................................................40
Figures ................................................................................................................50
3. EFFECTS OF MULTIPLE GLOBAL CHANGE FACTORS ON SOIL
RESPIRATION IN A DRYLAND ECOSYSTEM ..........................................54
Abstract ..............................................................................................................54
Introduction ........................................................................................................55
Methods ..............................................................................................................59
Results ................................................................................................................67
Discussion ..........................................................................................................69
Conclusion ..........................................................................................................77
References ..........................................................................................................78
Tables .................................................................................................................87
Figures ................................................................................................................89
ix
4. ROLES OF PLANT-MICROBE-SOIL INTERACTIONS IN SOIL
CARBON CYCLING .......................................................................................95
Abstract ..............................................................................................................95
Introduction ........................................................................................................96
Methods ............................................................................................................101
Results ..............................................................................................................111
Discussion ........................................................................................................116
Conclusion ........................................................................................................122
References ........................................................................................................123
Tables ...............................................................................................................133
Figures ..............................................................................................................135
5. CONCLUSIONS.............................................................................................143
APPENDICES .................................................................................................................146
Appendix A – Supplementary Information for Chapter 2 ................................147
Appendix B – Supplementary Information for Chapter 3 ................................154
Appendix C – Supplementary Information for Chapter 4 ................................164
CURRICULUM VITAE ..................................................................................................193
x
LIST OF TABLES
Table Page
3.1 Change (%) in soil respiration due to effects of the five treatment factors.......87
4.1 Effects of all treatments on soil respiration in synthetic soil system during
Phase 2 ............................................................................................................133
4.2 Effects of all treatments on soil variables in synthetic soil system during
Phase 2 ............................................................................................................134
B1 Change (%) in mean weighted diameter due to the effects of the five
treatment factors ..............................................................................................154
B2 Change (%) in mean soil enzyme activity due to the effects of five
treatment factors ..............................................................................................156
B3 Change (%) in soil total carbon concentration due to the effects of five
treatment factors ..............................................................................................157
B4 Change (%) in soil total nitrogen concentration due to the effects of five
treatment factors ..............................................................................................158
B5 Change (%) in soil microbial biomass carbon due to the effects of five
treatment factors ..............................................................................................159
B6 Change (%) in soil priming effect due to the effects of three treatment
factors ..............................................................................................................160
C1 Nutrient content of the Master Blend fertilizer ...............................................164
C2 Effects of all treatments on soil respiration in synthetic soil system during
Phase 1 ............................................................................................................165
C3 Effects of all treatments on soil variables in synthetic soil system during
Phase 1 ............................................................................................................166
C4 Change (%) in soil respiration due to the effects of the treatment factors
during Phase 2 .................................................................................................167
C5 Change (%) in soil microbial biomass carbon due to the effects of the
treatment factors during Phase 2 .....................................................................169
C6 Change (%) in mean soil enzyme activity due to the effects of the treatment
factors during Phase 2 .....................................................................................170

xi
C7 Change (%) in heavy fraction carbon content due to the effects of the
treatment factors during Phase 2 .....................................................................171
C8 Change (%) in net change in soil carbon due to the effects of the treatment
factors during Phase 2 .....................................................................................172
xii
LIST OF FIGURES
Figure Page
2.1 Weighted response ratios of plant productivity (WRR) under N addition in
studies grouped by biome, climate condition, N fertilization rate, initial soil
pH, N fertilizer type, and forest age ..................................................................50
2.2 Relative influence of predictor variables on (a) 𝑅𝑅𝑓𝑖𝑟𝑠𝑡, 𝑅𝑅𝑚𝑒𝑎𝑛, and 𝑅𝑅𝑙𝑎𝑠𝑡
or (b) the coefficient of variation (CV) of the response ratio of the effect of
N addition on plant productivity (RR) and the slope of the linear regression
between RR and time ........................................................................................51
2.3 The slope of the linear regression between response ratio (RR) and time (a)
and the coefficient of variation (CV) of RR with time (b) in studies grouped
by biome, climate condition, N fertilization rate, initial soil pH, N fertilizer
type, and forest age ...........................................................................................52
2.4 Long-term N addition impacts on plant productivity and their temporal
trends over time .................................................................................................53
3.1 A diagram representing the experimental setup including the treatments and
sampling timelines ............................................................................................89
3.2 Interactive effects of global change factors on mean soil respiration rates
during both rewetting and recovery periods......................................................90
3.3 Interactive effects of global change factors on mean weighted diameter
(MWD, an index of aggregate stability) during both rewetting and recovery
periods ...............................................................................................................91
3.4 Interactive effects of global change factors on the soil priming effect during
both rewetting and recovery periods .................................................................92
3.5 NMDS of soil fungal communities (a) and the relative abundance of fungal
phyla (b) under carbon input treatment .............................................................93
3.6 Correlations among mean soil respiration rates (CO2), mean weighted
diameter (MWD), mean enzyme activity (Enzyme), soil microbial biomass
carbon (MBC), soil total carbon concentration (TC), and mean priming
effect (PE) .........................................................................................................94
4.1 Soil variables in both synthetic and real soil systems by the end of Phase 1 ..135
4.2 Effects of carbon input quality on soil variables in synthetic soil system
during Phase 2 .................................................................................................136
4.3 Net change in carbon under all treatments in synthetic soil system during
xiii
the course of experiment .................................................................................137
4.4 Effects of root exudates on soil variables in synthetic soil system during
Phase 2 ............................................................................................................138
4.5 Effects of soil microbial community composition on soil variables in
synthetic soil system during Phase 2 ...............................................................139
4.6 Effects of soil clay activity on soil variables in synthetic soil system during
Phase 2 ............................................................................................................140
4.7 Effects of root exudates-soil clay activity interactions on soil variables in
synthetic soil system during Phase 2 ...............................................................141
4.8 Effects of root exudates-soil microbial community composition-soil clay
activity interactions on heavy fraction carbon content, net change in carbon,
and mean enzyme activity in synthetic soil system during Phase 2 ................142
A1 Soil variables in both synthetic and real soil systems by the end of Phase 1 ..147
A2 Effects of carbon input quality on soil variables in synthetic soil system
during Phase 2 .................................................................................................148
A3 Net change in carbon under all treatments in synthetic soil system during
the course of experiment .................................................................................149
A4 Effects of root exudates on soil variables in synthetic soil system during
Phase 2 ............................................................................................................150
A5 Effects of soil microbial community composition on soil variables in
synthetic soil system during Phase 2 ...............................................................151
A6 Effects of soil clay activity on soil variables in synthetic soil system during
Phase 2 ............................................................................................................152
A7 Effects of root exudates-soil clay activity interactions on soil variables in
synthetic soil system during Phase 2 ...............................................................153
B1 Correlations among soil enzyme activities .....................................................161
B2 Soil respiration rates under control (a) and carbon input treatments (b) over
the course of the incubation experiment .........................................................162
B3 NMDS of soil fungal communities (a-d) and the relative abundance of
fungal phyla (e-h) under different treatments .................................................163
C1 The pictures of artificial soil (a) and root system (b) ......................................173
C2 Effects of root exudates on soil variables in synthetic soil system during
xiv
Phase 1 ............................................................................................................174
C3 Effects of soil microbial community composition on soil variables in
synthetic soil system during Phase 1 ...............................................................175
C4 Effects of soil clay activity on soil variables in synthetic soil system during
Phase 1 ............................................................................................................176
C5 The temporal pattern of soil respiration under all treatments in synthetic
soil system during Phase 1 ..............................................................................177
C6 The interactive effects of root exudates and soil mineralogy on soil
microbial biomass carbon in synthetic soil system during Phase 1 ................178
C7 The interactive effects of root exudates and soil microbial community
composition on soil microbial carbon use efficiency in synthetic soil system
during Phase 1 .................................................................................................179
C8 The interactive effects of root exudates and soil clay activity on mean
enzyme activity in synthetic soil system during Phase 1 ................................180
C9 The interactive effects of C input quality, soil microbial community
composition, and soil clay activity on soil respiration in synthetic soil
system during Phase 2 .....................................................................................181
C10 The interactive effects of C input quality, root exudates, and soil clay
activity on soil microbial biomass carbon in synthetic soil system during
Phase 2 ............................................................................................................182
C11 The interactive effects of C input quality, root exudates, and soil microbial
community composition on soil microbial biomass carbon in synthetic soil
system during Phase 2 .....................................................................................183
C12 The interactive effects of C input quality and soil clay activity on mean
enzyme activity in synthetic soil system during Phase 2 ................................184
C13 The interactive effects of C input quality, root exudates, and soil microbial
community composition on mean enzyme activity in synthetic soil system
during Phase 2 .................................................................................................185
C14 The interactive effects of root exudates, soil microbial community
composition, and soil clay activity on mean enzyme activity in synthetic
soil system during Phase 2 ..............................................................................186
C15 The interactive effects of root exudates, soil microbial community
composition, and soil clay activity on heavy fraction carbon content in
synthetic soil system during Phase 2 ...............................................................187
xv
C16 The interactive effects of carbon input quality, root exudates, and soil clay
activity on heavy fraction carbon content in synthetic soil system during
Phase 2 ............................................................................................................188
C17 The interactive effects of root exudates, soil clay activity, and harvest on
heavy fraction carbon content in synthetic soil system during Phase 2 ..........189
C18 The interactive effects of carbon input quality, root exudates, soil microbial
community composition, and harvest on heavy fraction carbon content in
synthetic soil system during Phase 2 ...............................................................190
C19 The interactive effects of C input quality, soil microbial community
composition, soil clay activity, and harvest on heavy fraction carbon
content in synthetic soil system during Phase 2 ..............................................191
C20 The interactive effects of treatments on net change in carbon in synthetic
soil system during Phase 2 ..............................................................................192
CHAPTER 1
INTRODUCTION
Introduction
Terrestrial ecosystems are critical to the global carbon (C) cycle. The atmosphere
currently contains about 750 GtC (1 GtC = 1012 kg C), and terrestrial ecosystems contain
about 2190 GtC, of which about 610 GtC is living vegetation and about 1580 GtC is in
the top 1 m of soil (Schimel, 1995). By definition, the C balance of terrestrial ecosystems
at any point in time is the difference between its C gains and losses. Terrestrial
ecosystems gain C through photosynthesis and lose it primarily as CO2 through plant
(autotrophic) respiration and soil (heterotrophic) respiration (Cao & Woodward, 1998).
Given that terrestrial ecosystems store approximately 3 times more C than the
atmosphere, small changes in terrestrial C caused by climate change may have a serious
impact on CO2 concentration in the atmosphere, which in turn exacerbates climate
change. Terrestrial ecosystems may switch from C sinks to C source under future climate
change (Heimann & Reichstein, 2008). Although many studies have been done to
determine the response of terrestrial ecosystems to global climate changes, unknowns
remain regarding the underlying mechanisms. Due to the lack of this information, there
are large uncertainties in the predictions of future climate change effects on terrestrial C
dynamics (Ahlström et al., 2012; Huntzinger et al., 2017). To improve our understanding
and the accuracy of earth system models (ESMs), more studies are needed to unravel the
mechanisms of terrestrial ecosystems responses to climate change.
In this chapter, I do literature review on “Impacts of nitrogen (N) deposition on
plant productivity”, “effects of multiple global change factors on soil respiration in
2
drylands”, and “roles of plant-microbe-soil interactions in soil organic C formation and
loss” first. I then outline the studies that I have conducted to address relevant knowledge
gaps in C cycling in terrestrial ecosystems.
Impacts of N deposition on plant productivity
N deposition is one of the most important global change factors affecting
terrestrial ecosystem (Janssens & Luyssaert, 2009; Reay et al., 2008). Due to the great
role of N deposition in terrestrial ecosystems, many experiments have been conducted to
study effects of N deposition on plant productivity in the past decades. For example,
(Reich et al., 2020) conducted a long-term N deposition experiment in a grassland, and
found that N deposition increased net primary productivity (NPP) by 16.2%. The similar
result was also found by another 10-year N addition field study in grassland ecosystems
(Ren et al., 2017). They found that N deposition could significantly increase NPP in the
long term. The large amount of N addition studies at the local scale provides an
opportunity to summarize the general pattern of N impacts on plant productivity.
Therefore, some meta-analysis studies have been conducted, and they found that N
deposition usually stimulates plant productivity in terrestrial ecosystems (Du et al.,
2020a; Lebauer & Treseder, 2008; Song et al., 2019). Overall, although insignificant N
impacts on plant productivity have been observed in some studies (Lu et al., 2018),
nitrogen limitation of plant productivity in terrestrial ecosystems is globally distributed.
Since long-term experiments require enormous resource investment, the results of
positive N impacts on plant productivity are mainly from short-term studies. This may
lead to inaccurate estimation of N effects on terrestrial because there may be a temporal
trend of long-term N impacts on plant productivity over time (Leuzinger et al., 2011).
3
There are some potential reasons leading to the temporal change in long-term N impacts.
On one hand, short term N addition can stimulate plant growth by increasing soil N
availability (Ren et al., 2017). On the other hand, terrestrial ecosystems maybe N-
saturated after long-term N addition (Tian et al., 2016). In addition, N addition can cause
soil acidification (Falkengren-Grerup & Tyler, 1993; Tian & Niu, 2015); increase N
immobilization (Zheng et al., 2017); and lead to N losses due to leaching and
denitrification (Lu et al., 2011). All these can weaken positive effects of N on plant
productivity, and these negative impacts on plant productivity may strengthen or weaken
over time, depending on the resistance and adaptation capacities of ecosystems.
The predictive abilities of earth system models have been significantly improved
by incorporating C-N interactions (Tang & Riley, 2018; Thomas et al., 2015; Wieder,
Cleveland, Lawrence, et al., 2015). However, the potentially temporal trends in N
impacts on terrestrial ecosystems are not considered in most models. To further advance
model development, we must determine whether long-term N impacts on plant
productivity change over time and what controls the temporal trend. Although the value
of long‐term studies for advancing knowledge of global change effects on ecosystems
and C cycling is widely recognized among ecologists (Kuebbing et al., 2018), no study
has been done to summarize results of temporal trend in plant productivity responses to N
addition based on the long-term experiments. Addressing this knowledge gap will
improve our understanding of N impacts on terrestrial and also improve models’
predictive abilities.
4
Effects of multiple global change factors on soil respiration in drylands
Drylands cover approximately 45% of the planet’s surface and store
approximately 32% of soil organic C (SOC) in terrestrial ecosystems (Plaza et al., 2018;
Prăvălie, 2016). However, drylands are considered as one of the most sensitive areas to
climate change (Huang et al., 2016), which can usually switch between C sinks and
sources (Biederman et al., 2017). Due to the large amount of soil C in drylands, they have
a large potential for C sequestration and climate change mitigation (Lal, 2004).
Therefore, it is essential to study effects of multiple global change factors on soil
respiration in drylands, which can provide more useful information for future climate
change mitigation.
Relatively low and highly variable precipitation in drylands lead to the scarcity of
water (Plaza et al., 2018). Drought is projected to be more severe globally (Dai, 2011),
and drylands may expand to cover 56% of the world’s land area by the end of this
century (Huang et al., 2016). Because of this, thousands of studies have been conducted
in drylands to determine the responses of soil respiration to drought. For example,
Escolar et al. (2015) conducted a rainfall exclusion experiment in a semi-arid grassland,
and found that drought significantly decreased soil respiration. In addition, Talmon et al.
(2011) determined precipitation effects on soil respiration in a desert ecosystem. This
experiment consisted of three treatments: wet (30% increase in precipitation amount),
control (natural precipitation amount), and drought (30% decrease in precipitation
amount). They found that annual rate of soil respiration were 564 g C m-2 yr-1, 472 g C m-
2 yr-1, and 177 g C m-2 yr-1 under wet, control, and drought treatments, respectively. In
addition to change in precipitation amount, variable precipitation (e.g. drying-rewetting)
5
is very common in drylands (Plaza et al., 2018). However, the effects of rewetting on soil
respiration were less studied when compared to effects of precipitation amount. (Li et al.,
2018a) collected soil samples from a semiarid ecosystem with different plantations (e.g.
polar and Mongolian pine) to conduct an incubation experiment to examine rewetting
effects on soil respiration. They found that drying-rewetting cycles increased the respired
CO2 by 68 g C m−2 in the poplar soils and 19 g C m−2 in the Mongolian pine soils, when
compared to constant moisture treatment. Overall, drying-rewetting cycles usually
stimulate soil respiration by disrupting soil aggregates and releasing osmolytes from the
microbial biomass and/or cell lysis (Hu et al., 2018; Lado-Monserrat et al., 2014;
Schimel, 2018).
Warming is happening at the global scale and will be more serious in the future. It
is considered as another important factor that can significantly affect soil respiration in
drylands. (Dacal et al., 2020) assessed short- (0-2 years) and long-term (8-10 years)
warming effects on soil respiration in a biocrust-dominated dryland ecosystem. They
found that warming could stimulate soil respiration in the short term by increasing soil
temperature. Insignificant difference in soil respiration was found between warming and
control in the long-term, which could be explained by thermal acclimation and warming-
induced reductions in biocrust cover. However, opposite results were found in other
studies (e.g. Guan et al., 2019). They simulated warming (+ 1.5 °C) in the Tengger
Desert, northern China, and found that warming decreased soil respiration because of the
reduction in soil moisture caused by warming. The inconsistent results about warming
effects on soil respiration in drylands which were reported by different studies require
more future studies to be done to unravel the underlying mechanisms of how warming
6
affects dryland soil respiration. Comparing to precipitation and warming, the effects of
substrate availability (e.g. C input) on soil respiration have been less studied although soil
microbes in drylands are thought to be C starved (Schimel, 2018). The limited
information inhibits our understanding of soil C cycling in drylands; therefore, it is
essential to investigate how dryland soil respiration responds to C input.
The individual effects of the global change factors on soil respiration in drylands
are well known. However, little is known about how they interactively affect dryland soil
C cycling because few relevant studies have been conducted. For example, Escolar et al.
(2015) found a significant interactive effects of warming and drought in a semiarid
grassland from central Spain during a dry year (mean annual precipitation: 214 mm). This
study indicates that interactions between global change factors are common in drylands.
Nonetheless, nearly no studies have been conducted to assess how soil respiration
responds to more than two global change factors in drylands, although they happen
simultaneously in the real world. The unknowns regarding whether multiple global
change factors can interactively affect soil respiration may inhibit our prediction about
dryland soil C cycling in the future.
Roles of plant-microbe-soil interactions in soil organic C formation and loss
Soils store at least two times more C than the atmosphere (Batjes, 1996;
Scharlemann et al., 2014). Therefore, small changes in soil C pool can result in large
variations in the atmospheric CO2 concentration, which in turn aggravate or slow global
warming (Minasny et al., 2017; Smith et al., 2020). Although many relevant studies have
been conducted, our mechanistic understanding of SOC formation and loss is still limited
(Cotrufo et al., 2013; Lehmann et al., 2020; Sokol et al., 2018). Partly due to this, models
7
exhibit large divergences and great uncertainty among predictions of changes in soil C
pool (Shi et al., 2018). Therefore, it is urgent to examine the relative importance of each
of the controls on SOC dynamics, and to unravel the mechanisms by which they affect
the formation and loss of SOC.
There are four major controls (e.g. C input quality, root exudates, soil microbial
community traits, and soil minerology) over soil C cycling along the plant-microbe-soil
continuum (Merino et al., 2015; Sokol et al., 2019; Sokol & Bradford, 2019).
Traditionally, recalcitrant C input was thought to be the dominant mechanism of SOC
formation because it is inherently resistant to microbial decay (Melillo et al., 2008).
However, a suite of emerging paradigms hold that labile C input may constitute an
important pathway of SOC formation (Cotrufo et al., 2013, 2015; Sokol et al., 2018). Soil
microbial C use efficiency (CUE), the fraction of substrate that is assimilated into
microbial biomass vs. respired (Sinsabaugh et al., 2013), has been used to elucidate the
mechanisms of effects of C input quality on soil C cycling. For example, the
decomposition of labile C requires less activation energy (Manzoni et al., 2012), CUE
should be higher under labile than recalcitrant C input (Frey et al., 2013a; Qiao et al.,
2019). Given that soil microbial biomass significantly contributes to persistent SOC
formation (Liang et al., 2017), labile C input can lead to much more persistent SOC
accumulation than recalcitrant C input (Cotrufo et al., 2013). However, after continuous
labile C input, copiotrophic can be the dominated soil microorganism, which has an
inherently lower CUE (Geyer et al., 2016; Roller & Schmidt, 2015). Therefore, the
effects of C input quality on SOC formation are likely to hinge upon plant-microbe
interactions which develop over time.
8
There is growing recognition that root exudates have a significant impact on SOC
formation and loss (Sokol et al., 2018, 2019). Briefly speaking, on one hand, root
exudates mainly provide labile C which has higher CUE, which in turn contribute to SOC
accumulation (Sokol et al., 2019; Sokol & Bradford, 2019). On the other hand, root
exudates can result in large SOC loss thorough positive rhizosphere priming effect
(Cheng et al., 2014; Kuzyakov et al., 2000). Dijkstra et al. (2021) hold that the net effect
of root exudates on SOC stabilization is dependent on soil minerology. For example, root
exudates may increase persistent SOC accumulation in clayey soils which provide a large
potential to stabilize SOC into mineral-associated organic C (MAOC). However, root
exudates may result in SOC loss in sandy soils which do not have enough minerals to
bond with SOC to form MAOC. Although this conceptual framework seems reasonable,
no relevant studies have been done to test it.
Although consensus is emerging that microbial residues greatly contribute to SOC
stabilization, no direct evidence has been provided by experimental studies. Therefore,
Kallenbach et al. (2016) utilized synthetic soil systems to determine the roles of soil
microbial traits in SOC formation and loss. They found greatest microbial-derived SOC
accumulation in soils with higher fungal abundances, which indicated that soil microbial
community was the most important factor affecting SOC stabilization. Given that soil
minerology (e.g. clay content and activity) mainly controls the formation of MAOC, it
should significantly affect SOC cycling. However, some recent experimental studies did
not find significant effects of soil minerology on SOC formation (Kallenbach et al., 2016;
Rasmussen et al., 2018). These surprising results could emerge from the interactions
between soil minerology and plant inputs and/or soil microbes that we mentioned above.
9
Soil C cycling models have been developed for decades, but they adopt different
model structures and/or mechanisms partly because of the limited information of roles of
plant-soil-microbe interactions in SOC dynamics that experimental studies can provide
(Shi et al., 2018). Therefore, it is essential to reconcile contradictory findings about
effects of C input quality, root exudates, soil microbial communities, and soil minerology
on SOC formation. The opposite results which were reported by previous studies are
partly because most of them have considered some, but not all, of these four critical
drivers, which also strongly co-vary in real soils. Therefore, conducting a study including
all potential factors affecting SOC formation and loss independently can help us unravel
their interactions and isolate direction of causality.
Dissertation Outline
Chapter 2 - Nitrogen effects on plant productivity change at decadal timescales
Many experimental and meta-analysis studies have found N limitation of plant
productivity in terrestrial ecosystems (Du et al., 2020a; Lebauer & Treseder, 2008; Reich
et al., 2020; Song et al., 2019). However, unknown remains regarding whether the
positive effect of N deposition on plant productivity can change over time in the long
term. By overlooking the potentially temporal trend of N impacts, we may under- or
overestimate N effects on terrestrial ecosystems. To address this knowledge gap, I
conducted a meta-analysis study to collect data from 63 long-term N addition studies
across the world.
Chapter 3 - Effects of multiple global change factors on soil respiration in drylands
Due to the significant role of drylands in climate mitigation (Lal, 2004; Plaza et
al., 2018), thousands of studies have been conducted to examine climate change effects
10
on dryland soil respiration (Dacal et al., 2020; Escolar et al., 2015; Guan et al., 2019,
2021; Li et al., 2018a). Most studies only focus on the individual effects of global change
factors on soil C cycling although the interactive effects have been found (Escolar et al.,
2015). I conducted an incubation experiment to assess how multiple global change
factors (e.g. warming, drought, drying-rewetting cycles, and C input) interactively affect
soil respiration in drylands.
Chapter 4 - Roles of plant-microbe-soil interactions in soil organic C formation and loss
There is growing recognition that plant-microbe-soil interactions significantly
affect SOC formation and loss (Cotrufo et al., 2013; Lehmann et al., 2020; Sokol et al.,
2018). However, opposite results regarding effects of plant input, soil microbial traits, or
soil minerology on SOC stabilization (Cotrufo et al., 2013; Dijkstra et al., 2021;
Kallenbach et al., 2016; Lavallee et al., 2020; Pierson et al., 2021; Rasmussen et al.,
2018; Schnecker et al., 2019). These surprising results could emerge from the interactions
among plant input, soil microbes, and soil minerology. I utilized synthetic root/soil
systems to disentangle the pathways by which plants, microbes, and soils interactively
affect SOC cycling and assess the relative importance of each driver.
Chapter 5 - Conclusions
I summarize the major results from each chapter and point out some suggests for
future studies.
Reference
Ahlström, A., Schurgers, G., Arneth, A., & Smith, B. (2012). Robustness and uncertainty
in terrestrial ecosystem carbon response to CMIP5 climate change projections.
11
Environmental Research Letters, 7(4). https://doi.org/10.1088/1748-
9326/7/4/044008
Batjes, N. H. (1996). Total carbon and nitrogen in the soils of the world. European
Journal of Soil Science, 47, 151–163.
Biederman, J. A., Scott, R. L., Bell, T. W., Bowling, D. R., Dore, S., Garatuza-Payan, J.,
Kolb, T. E., Krishnan, P., Krofcheck, D. J., Litvak, M. E., Maurer, G. E., Meyers, T.
P., Oechel, W. C., Papuga, S. A., Ponce-Campos, G. E., Rodriguez, J. C., Smith, W.
K., Vargas, R., Watts, C. J., … Goulden, M. L. (2017). CO2 exchange and
evapotranspiration across dryland ecosystems of southwestern North America.
Global Change Biology, 23(10), 4204–4221. https://doi.org/10.1111/gcb.13686
Cao, M., & Woodward, F. I. (1998). Dynamic responses of terrestrial ecosystem carbon
cycling to global climate change. Nature, 393, 249–252.
https://doi.org/10.1038/246170a0
Cheng, W., Parton, W. J., Gonzalez-Meler, M. A., Phillips, R., Asao, S., Mcnickle, G. G.,
Brzostek, E., & Jastrow, J. D. (2014). Synthesis and modeling perspectives of
rhizosphere priming. New Phytologist, 201(1), 31–44.
https://doi.org/10.1111/nph.12440
Cotrufo, M. F., Soong, J. L., Horton, A. J., Campbell, E. E., Haddix, M. L., Wall, D. H.,
& Parton, W. J. (2015). Formation of soil organic matter via biochemical and
physical pathways of litter mass loss. Nature Geoscience, 8(10), 776–779.
https://doi.org/10.1038/ngeo2520
Cotrufo, M. F., Wallenstein, M. D., Boot, C. M., Denef, K., & Paul, E. (2013). The
Microbial Efficiency-Matrix Stabilization (MEMS) framework integrates plant litter
12
decomposition with soil organic matter stabilization: Do labile plant inputs form
stable soil organic matter? Global Change Biology, 19(4), 988–995.
https://doi.org/10.1111/gcb.12113
Dacal, M., García-Palacios, P., Asensio, S., Cano-Díaz, C., Gozalo, B., Ochoa, V., &
Maestre, F. T. (2020). Contrasting mechanisms underlie short- and longer-term soil
respiration responses to experimental warming in a dryland ecosystem. Global
Change Biology, 26(9), 5254–5266. https://doi.org/10.1111/gcb.15209
Dai, A. (2011). Drought under global warming: A review. Climate Change, 2(1), 45–65.
https://doi.org/10.1002/wcc.81
Dijkstra, F. A., Zhu, B., & Cheng, W. (2021). Root effects on soil organic carbon: a
double-edged sword. New Phytologist, 230(1), 60–65.
https://doi.org/10.1111/nph.17082
Du, E., Terrer, C., Pellegrini, A. F. A., Ahlström, A., van Lissa, C. J., Zhao, X., Xia, N.,
Wu, X., & Jackson, R. B. (2020). Global patterns of terrestrial nitrogen and
phosphorus limitation. Nature Geoscience. https://doi.org/10.1038/s41561-019-
0530-4
Escolar, C., Maestre, F. T., & Rey, A. (2015). Biocrusts modulate warming and rainfall
exclusion effects on soil respiration in a semi-arid grassland. Soil Biology and
Biochemistry, 80, 9–17. https://doi.org/10.1016/j.soilbio.2014.09.019
Falkengren-Grerup, U., & Tyler, G. (1993). Experimental evidence for the relative
sensitivity of deciduous forest plants to high soil acidity. Forest Ecology and
Management, 60(3–4), 311–326. https://doi.org/10.1016/0378-1127(93)90086-3
13
Frey, S. D., Lee, J., Melillo, J. M., & Six, J. (2013). The temperature response of soil
microbial efficiency and its feedback to climate. Nature Climate Change, 3(4), 395–
398. https://doi.org/10.1038/nclimate1796
Geyer, K., Kyker-snowman, E., Grandy, S., & Frey, S. D. (2016). Microbial carbon use
efficiency: accounting for population , community , and ecosystem-scale controls
over the fate of metabolized organic matter. Biogeochemistry, 127(2), 173–188.
https://doi.org/10.1007/s10533-016-0191-y
Guan, C., Li, X., Chen, N., Zhang, P., & Zhao, C. (2019). Warming effects on soil
respiration in moss-dominated crusts in the Tengger Desert, northern China. Plant
and Soil, 443(1–2), 591–603. https://doi.org/10.1007/s11104-019-04255-y
Guan, C., Zhang, P., Zhao, C., & Li, X. (2021). Effects of warming and rainfall pulses on
soil respiration in a biological soil crust-dominated desert ecosystem. Geoderma,
381(August 2020), 114683. https://doi.org/10.1016/j.geoderma.2020.114683
Heimann, M., & Reichstein, M. (2008). Terrestrial ecosystem carbon dynamics and
climate feedbacks. Nature, 451(7176), 289–292. https://doi.org/10.1038/nature06591
Hu, B., Wang, Y., Wang, B., Wang, Y., Liu, C., & Wang, C. (2018). Impact of drying-
wetting cycles on the soil aggregate stability of Alfisols in southwestern China.
Journal of Soil and Water Conservation, 73(4), 469–478.
https://doi.org/10.2489/jswc.73.4.469
Huang, J., Yu, H., Guan, X., Wang, G., & Guo, R. (2016). Accelerated dryland expansion
under climate change. Nature Climate Change, 6(2), 166–171.
https://doi.org/10.1038/nclimate2837
14
Huntzinger, D. N., Michalak, A. M., Schwalm, C., Ciais, P., King, A. W., Fang, Y.,
Schaefer, K., Wei, Y., Cook, R. B., Fisher, J. B., Hayes, D., Huang, M., Ito, A., Jain,
A. K., Lei, H., Lu, C., Maignan, F., Mao, J., Parazoo, N., … Zhao, F. (2017).
Uncertainty in the response of terrestrial carbon sink to environmental drivers
undermines carbon-climate feedback predictions. Scientific Reports, 7(1), 1–8.
https://doi.org/10.1038/s41598-017-03818-2
Janssens, I. A., & Luyssaert, S. (2009). Carbon cycle: Nitrogen’s carbon bonus. Nature
Geoscience, 2(5), 318–319. https://doi.org/10.1038/ngeo505
Kallenbach, C. M., Frey, S. D., & Grandy, A. S. (2016). Direct evidence for microbial-
derived soil organic matter formation and its ecophysiological controls. Nature
Communications, 7. https://doi.org/10.1038/ncomms13630
Kuebbing, S. E., Reimer, A. P., Rosenthal, S. A., Feinberg, G., Leiserowitz, A., Lau, J.
A., & Bradford, M. A. (2018). Long-term research in ecology and evolution: a
survey of challenges and opportunities. Ecological Monographs, 88(2), 245–258.
https://doi.org/10.1002/ecm.1289
Kuzyakov, Y., Friedel, J. ., & Stahr, K. (2000). Review of mechanisms and quantification
of priming effects. Soil Biology and Biochemistry, 32(11–12), 1485–1498.
https://doi.org/10.1016/S0038-0717(00)00084-5
Lado-Monserrat, L., Lull, C., Bautista, I., Lidón, A., & Herrera, R. (2014). Soil moisture
increment as a controlling variable of the “Birch effect”. Interactions with the pre-
wetting soil moisture and litter addition. Plant and Soil, 379(1–2), 21–34.
https://doi.org/10.1007/s11104-014-2037-5
15
Lal, R. (2004). Carbon sequestration in dryland ecosystems. Environmental Management,
33(4), 528–544. https://doi.org/10.1007/s00267-003-9110-9
Lavallee, J. M., Soong, J. L., & Cotrufo, M. F. (2020). Conceptualizing soil organic
matter into particulate and mineral-associated forms to address global change in the
21st century. Global Change Biology, 26(1), 261–273.
https://doi.org/10.1111/gcb.14859
Lebauer, D., & Treseder, K. K. (2008). Nitrogen limitation of net primary productivity in
terrestrial ecosystems is globally distributed. Ecology, 89(2), 371–379.
https://doi.org/10.1007/BF00153104
Lehmann, J., Hansel, C. M., Kaiser, C., Kleber, M., Maher, K., Manzoni, S., Nunan, N.,
Reichstein, M., Schimel, J. P., Torn, M. S., Wieder, W. R., & Kögel-Knabner, I.
(2020). Persistence of soil organic carbon caused by functional complexity. Nature
Geoscience, 13(8), 529–534. https://doi.org/10.1038/s41561-020-0612-3
Leuzinger, S., Luo, Y., Beier, C., Dieleman, W., Vicca, S., & Körner, C. (2011). Do
global change experiments overestimate impacts on terrestrial ecosystems? Trends
in Ecology and Evolution, 26(5), 236–241.
https://doi.org/10.1016/j.tree.2011.02.011
Li, J. T., Wang, J. J., Zeng, D. H., Zhao, S. Y., Huang, W. L., Sun, X. K., & Hu, Y. L.
(2018). The influence of drought intensity on soil respiration during and after
multiple drying-rewetting cycles. Soil Biology and Biochemistry, 127(September),
82–89. https://doi.org/10.1016/j.soilbio.2018.09.018
16
Liang, C., Schimel, J. P., & Jastrow, J. D. (2017). The importance of anabolism in
microbial control over soil carbon storage. Nature Microbiology, 2(8), 1–6.
https://doi.org/10.1038/nmicrobiol.2017.105
Lu, M., Yang, Y., Luo, Y., Fang, C., Zhou, X., Chen, J., Yang, X., & Li, B. (2011).
Responses of ecosystem nitrogen cycle to nitrogen addition: A meta-analysis. New
Phytologist, 189(4), 1040–1050. https://doi.org/10.1111/j.1469-8137.2010.03563.x
Lu, X., Vitousek, P. M., Mao, Q., Gilliam, F. S., Luo, Y., Zhou, G., Zou, X., Bai, E.,
Scanlon, T. M., Hou, E., & Mo, J. (2018). Plant acclimation to long-term high
nitrogen deposition in an N-rich tropical forest. Proceedings of the National
Academy of Sciences, 115(20), 5187–5192.
https://doi.org/10.1073/pnas.1720777115
Manzoni, S., Taylor, P., Richter, A., Porporato, A., & Ågren, G. I. (2012). Environmental
and stoichiometric controls on microbial carbon-use efficiency in soils. New
Phytologist, 196(1), 79–91. https://doi.org/10.1111/j.1469-8137.2012.04225.x
Melillo, J. M., Aber, J. D., Muratore, J. F., & Jun, N. (2008). Nitrogen and Lignin
Control of Hardwood Leaf Litter Decomposition Dynamics NITROGEN AND
LIGNIN CONTROL O F HARDWOOD L E A F LITTER DECOMPOSITION
DYNAMICS1. Ecology, 63(3), 621–626.
Merino, C., Nannipieri, P., & Matus, F. (2015). Soil carbon controlled by plant,
microorganism and mineralogy interactions. Journal of Soil Science and Plant
Nutrition, 15(2), 321–332. https://doi.org/10.4067/s0718-95162015005000030
Minasny, B., Malone, B. P., McBratney, A. B., Angers, D. A., Arrouays, D., Chambers,
A., Chaplot, V., Chen, Z. S., Cheng, K., Das, B. S., Field, D. J., Gimona, A., Hedley,
17
C. B., Hong, S. Y., Mandal, B., Marchant, B. P., Martin, M., McConkey, B. G.,
Mulder, V. L., … Winowiecki, L. (2017). Soil carbon 4 per mille. Geoderma, 292,
59–86. https://doi.org/10.1016/j.geoderma.2017.01.002
Pierson, D., Evans, L., Kayhani, K., Bowden, R. D., Nadelhoffer, K., Simpson, M., &
Lajtha, K. (2021). Mineral stabilization of soil carbon is suppressed by live roots,
outweighing influences from litter quality or quantity. Biogeochemistry, 154(3),
433–449. https://doi.org/10.1007/s10533-021-00804-9
Plaza, C., Zaccone, C., Sawicka, K., Méndez, A. M., Tarquis, A., Gascó, G., Heuvelink,
G. B. M., Schuur, E. A. G., & Maestre, F. T. (2018). Soil resources and element
stocks in drylands to face global issues. Scientific Reports, 8(1), 1–8.
https://doi.org/10.1038/s41598-018-32229-0
Prăvălie, R. (2016). Drylands extent and environmental issues. A global approach. Earth-
Science Reviews, 161, 259–278. https://doi.org/10.1016/j.earscirev.2016.08.003
Qiao, Y., Wang, J., Liang, G., Du, Z., Zhou, J., & Zhu, C. (2019). Global variation of soil
microbial carbon-use efficiency in relation to growth temperature and substrate
supply. Scientific Reports, March, 1–8. https://doi.org/10.1038/s41598-019-42145-6
Rasmussen, C., Heckman, K., Wieder, W. R., Keiluweit, M., Lawrence, C. R., Berhe, A.
A., Blankinship, J. C., Crow, S. E., Druhan, J. L., Hicks Pries, C. E., Marin-Spiotta,
E., Plante, A. F., Schädel, C., Schimel, J. P., Sierra, C. A., Thompson, A., & Wagai,
R. (2018). Beyond clay: towards an improved set of variables for predicting soil
organic matter content. Biogeochemistry, 137(3), 297–306.
https://doi.org/10.1007/s10533-018-0424-3

18
Reay, D. S., Dentener, F. J., Smith, P., Grace, J., & Feely, R. A. (2008). Global nitrogen
deposition and carbon sinks. Nature Geoscience, 1, 430–437.
https://doi.org/10.1038/ngeo230
Reich, P. B., Hobbie, S. E., Lee, T. D., Rich, R., Pastore, M. A., & Worm, K. (2020).
Synergistic effects of four climate change drivers on terrestrial carbon cycling.
Nature Geoscience, 13(12), 787–793. https://doi.org/10.1038/s41561-020-00657-1
Ren, H., Xu, Z., Isbell, F., Huang, J., Han, X., Wan, S., Chen, S., Wang, R., Zeng, D. H.,
Jiang, Y., & Fang, Y. (2017). Exacerbated nitrogen limitation ends transient
stimulation of grassland productivity by increased precipitation. Ecological
Monographs, 87(3), 457–469. https://doi.org/10.1002/ecm.1262
Roller, B. R. K., & Schmidt, T. M. (2015). The physiology and ecological implications of
efficient growth. ISME Journal, 9(7), 1481–1487.
https://doi.org/10.1038/ismej.2014.235
Scharlemann, J. P. W., Tanner, E. V. J., Hiederer, R., & Kapos, V. (2014). Global soil
carbon: Understanding and managing the largest terrestrial carbon pool. Carbon
Management, 5(1), 81–91. https://doi.org/10.4155/cmt.13.77
Schimel, D. S. (1995). Terrestrial ecosystems and the carbon cycle. Global Change
Biology, 1(1), 77–91. https://doi.org/10.1111/j.1365-2486.1995.tb00008.x
Schimel, J. P. (2018). Life in dry soils: Effects of drought on soil microbial communities
and processes. Annual Review of Ecology, Evolution, and Systematics, 49, 409–
432. https://doi.org/10.1146/annurev-ecolsys-110617-062614
Schnecker, J., Bowles, T., Hobbie, E. A., Smith, R. G., & Grandy, A. S. (2019). Substrate
quality and concentration control decomposition and microbial strategies in a model
19
soil system. Biogeochemistry, 8, 47–59. https://doi.org/10.1007/s10533-019-00571-
8
Shi, Z., Crowell, S., Luo, Y., & Moore, B. (2018). Model structures amplify uncertainty
in predicted soil carbon responses to climate change. Nature Communications, 9(1),
1–11. https://doi.org/10.1038/s41467-018-04526-9
Sinsabaugh, R. L., Manzoni, S., Moorhead, D. L., & Richter, A. (2013). Carbon use
efficiency of microbial communities: Stoichiometry, methodology and modelling.
Ecology Letters, 16(7), 930–939. https://doi.org/10.1111/ele.12113
Smith, P., Soussana, J. F., Angers, D., Schipper, L., Chenu, C., Rasse, D. P., Batjes, N.
H., van Egmond, F., McNeill, S., Kuhnert, M., Arias-Navarro, C., Olesen, J. E.,
Chirinda, N., Fornara, D., Wollenberg, E., Álvaro-Fuentes, J., Sanz-Cobena, A., &
Klumpp, K. (2020). How to measure, report and verify soil carbon change to realize
the potential of soil carbon sequestration for atmospheric greenhouse gas removal.
Global Change Biology, 26(1), 219–241. https://doi.org/10.1111/gcb.14815
Sokol, N. W., & Bradford, M. A. (2019). Microbial formation of stable soil carbon is
more efficient from belowground than aboveground input. Nature Geoscience,
12(1), 46–53. https://doi.org/10.1038/s41561-018-0258-6
Sokol, N. W., Kuebbing, S. E., Karlsen-Ayala, E., & Bradford, M. A. (2019). Evidence
for the primacy of living root inputs, not root or shoot litter, in forming soil organic
carbon. New Phytologist, 221(1), 233–246. https://doi.org/10.1111/nph.15361
Sokol, N. W., Sanderman, J., & Bradford, M. A. (2018). Pathways of mineral-associated
soil organic matter formation: Integrating the role of plant carbon source, chemistry,
20
and point of entry. Global Change Biology, 25(1), 12–24.
https://doi.org/10.1111/gcb.14482
Song, J., Wan, S., Piao, S., Knapp, A. K., Classen, A. T., Vicca, S., Ciais, P., Hovenden,
M. J., Leuzinger, S., Beier, C., Kardol, P., Xia, J., Liu, Q., Ru, J., Zhou, Z., Luo, Y.,
Guo, D., Adam Langley, J., Zscheischler, J., … Zheng, M. (2019). A meta-analysis
of 1,119 manipulative experiments on terrestrial carbon-cycling responses to global
change. Nature Ecology and Evolution, 3(9), 1309–1320.
https://doi.org/10.1038/s41559-019-0958-3
Talmon, Y., Sternberg, M., & Grünzweig, J. M. (2011). Impact of rainfall manipulations
and biotic controls on soil respiration in Mediterranean and desert ecosystems along
an aridity gradient. Global Change Biology, 17(2), 1108–1118.
https://doi.org/10.1111/j.1365-2486.2010.02285.x
Tang, J., & Riley, W. J. (2018). Predicted Land Carbon Dynamics Are Strongly
Dependent on the Numerical Coupling of Nitrogen Mobilizing and Immobilizing
Processes: A Demonstration with the E3SM Land Model. Earth Interactions, 22(11),
1–18. https://doi.org/10.1175/EI-D-17-0023.1
Thomas, Q., Brookshire, J., & Gerber, S. (2015). Nitrogen limitation on land: how can it
occur in Earth system models? Global Change Biology, 21, 1777–1793.
https://doi.org/10.1111/gcb.12813
Tian, D., & Niu, S. (2015). A global analysis of soil acidification caused by nitrogen
addition. Environmental Research Letters, 10, 024019. https://doi.org/10.1088/1748-
9326/10/2/024019
21
Tian, D., Wang, H., Sun, J., & Niu, S. (2016). Global evidence on nitrogen saturation of
terrestrial ecosystem net primary productivity. Environmental Research Letters, 11,
024012. http://stacks.iop.org/1748-9326/11/i=2/a=024012
Wieder, W. R., Cleveland, C. C., Lawrence, D. M., & Bonan, G. B. (2015). Effects of
model structural uncertainty on carbon cycle projections: biological nitrogen fixation
as a case study. Environmental Research Letters, 10, 044016.
https://doi.org/10.1088/1748-9326/10/4/044016
Zheng, J., Guo, R., Li, D., Zhang, J., & Han, S. (2017). Nitrogen addition, drought and
mixture effects on litter decomposition and nitrogen immobilization in a temperate
forest. Plant and Soil, 416(1–2), 165–179. https://doi.org/10.1007/s11104-017-3202-
4
22
CHAPTER 2
NITROGEN EFFECTS ON PLANT PRODUCTIVITY CHANGE AT DECADAL
TIMESCALES1
Abstract
Although some long-term studies have been conducted to quantify nitrogen (N)
impacts on plant productivity, uncertainties remain regarding whether these impacts
change over time and the underlying mechanisms. By overlooking this, we may over- or
under-estimate N impacts on terrestrial ecosystems. Our goal was to determine whether N
impacts on plant productivity increase, decrease, or do not change over time in the long
term, and what controls these dynamics. We synthesized 63 N addition studies with
duration 8 years in natural terrestrial ecosystems. Our results showed temporally
dynamic N impacts on plant productivity in terrestrial ecosystems: the interannual
coefficient of variation (CV) of N impacts ranged from 19% to 768% across 63 studies,
with higher variability in acidic soils. Moreover, a substantial proportion (44%) of studies
showed evidence of a consistent directional change in the strength of N effects over time.
The direction of change varied with biome type (forests: decrease; grasslands and
shrublands: increase). The temporal trend of N impacts was mostly responsive to mean
annual precipitation (MAP), mean annual temperature (MAT), and initial soil pH, which
accounted for 24%, 19%, and 19% of the variation, respectively. Our findings indicate
that effects of long-term N addition on plant productivity tend to shift (e.g. increase or
decrease), and N impacts have large fluctuations between years in terrestrial ecosystems.
1 Co-authors: Yiqi Luo, Zhenghu Zhou, Bonnie G. Waring
23
Therefore, not only the magnitude of N impacts on plant productivity, but also their
temporal trend and variability, should be considered in future experimental and model
research.
Introduction
Nitrogen (N) addition can enhance the plant uptake of atmospheric carbon dioxide
by increasing plant productivity in terrestrial ecosystems (Janssens & Luyssaert, 2009;
Reay et al., 2008). While N is considered as a significant factor affecting plant
productivity in terrestrial ecosystems (Du et al., 2020a; Dukes et al., 2005; Lebauer &
Treseder, 2008; Lu et al., 2018; Vitousek & Howarth, 1991), most Earth System
Models implement C-N interactions inconsistently because the underlying mechanisms of
linking terrestrial C and N cycling remain far from clear (Thomas et al., 2015). This leads
to large uncertainties in predicting climate change feedbacks in terrestrial ecosystems
(Ciais et al., 2019; Green et al., 2019; Wieder et al., 2015). Therefore, in order to provide
valuable information for future climate change mitigation and food security policies, a
deep understanding of plant productivity responses to N addition is essential.
Given the large impact of N availability on terrestrial ecosystems, many N
fertilization experiments have been conducted in the past decades (Kunzová & Hejcman,
2010; Oishi et al., 2014; Reich & Hobbie, 2013). However, most of them focus on short-
term N effects because long-term experiments require enormous resource investment.
Moreover, very few meta-analysis studies have been done to collect measurements from
long-term N addition experiments. Suding et al. (2005) conducted a meta-analysis study
and found that N addition led to declines in plant diversity over time, but studies of this
type are rare. As a result, there is much less information regarding long-term N addition
24
effects on plant productivity when compared to its short-term impacts. Meta-analyses of
shorter-term responses have revealed that N impacts on plant productivity vary across
ecosystem types, and in relation to mean annual temperature (MAT), precipitation
(MAP), and N fertilizer type and application rate (Chen et al., 2015; Lebauer & Treseder,
2008; Yan et al., 2019; Yue et al., 2016). Yet few of them quantified how soil properties
(e.g. soil texture, nutrient availability, and pH) mediate N impacts on plant productivity
(Fay et al., 2015).
Due to the limited information data synthesis can provide, few earth system
models include the roles of soil properties in regulating N impacts on terrestrial
ecosystems, which may reduce their predictive ability. These models exhibit large
divergences among predictions of terrestrial C sink pattern at decadal and centennial
timescales. This may occur, in part, because the relative contributions of factors affecting
N impacts on plant productivity change over longer timescales. Therefore, it is urgent to
assess the factors controlling N effects on terrestrial ecosystems in the both short- and
long-term.
Although temporal trend in N effects on plant productivity have been reported by
some individual studies (Brooks & Coulombe, 2009), the underlying mechanisms remain
poorly explored. First, long-term N addition can stimulate plant productivity by relieving
nitrogen limitation. However, the magnitude of this stimulation can change over time,
due to the degree of co-limitation by other resources (e.g. phosphorus (P), potassium (K),
microelements, light, and water) (Du et al., 2020b; Fay et al., 2015). Second, N addition
can result in soil acidification (Falkengren-Grerup & Tyler, 1993; Tian & Niu, 2015);
increase N immobilization and sequestration into organic pools (Zheng et al., 2017); lead
25
to N losses due to leaching and denitrification (Lu et al., 2011); decrease plant
biodiversity (which is positively related to plant productivity) (Chalcraft et al., 2008;
Chen et al., 2018; Liang et al., 2015; Midolo et al., 2019; Suding et al., 2005); and reduce
relative abundances of mycorrhizal fungi and oligotrophic bacteria, which are crucial for
nutrient cycling in N limited ecosystems (Collins et al., 2008; Leff et al., 2015). These
negative impacts on plant productivity may strengthen or weaken over time, depending
on the resistance and adaptation capacities of ecosystems. Thus, the sign and temporal
trend of plant responses to N addition will therefore depend both on the absolute
magnitude of positive vs. negative effects, and the relative rates at which these effects
change over time.
Temporal trends in plant responses to fertilization can be mediated by a variety of
site-specific factors, e.g. initial soil pH, C:N, P availability, MAT, and MAP. For
example, in extremely N limited (high soil C:N) sites, plant productivity may increase
over time as added N accumulates in the ecosystem. Consequently, positive N impacts on
plant productivity may predominate and strengthen through time. Conversely, in sites
where the soil is extremely acidic, plant productivity responses may diminish over time
as soil acidification progresses. Climatic variables such as MAT and MAP indirectly
affect these patterns through their influences on soil pH, soil nutrient availability, soil
microbial community structure, and plant diversity (Crowther et al., 2019; Hou et al.,
2018; Jing et al., 2015). Interannual variability in these climatic drivers might also lead to
temporal fluctuations in plant community responses to added N: for example, N
fertilization may not stimulate plant growth in a drought year, when water becomes
limiting. Moreover, N use efficiency and uptake rate vary across N fertilizer types
26
(Abbasi et al., 2013; Kaštovská & Šantrůčková, 2011), the magnitude of the decrease in
soil pH, and the time needed for ecosystems to approach N saturation are dependent on N
application rate (Tian et al., 2016; Tian & Niu, 2015). Consequently, fertilizer type and
application rate may also play a critical role in regulating temporal trend of N effects on
plant productivity.
The performance of earth system models has been improved by incorporating C-
N interactions (Tang & Riley, 2018; Thomas et al., 2015; Wieder et al., 2015), however,
most models do not consider the temporal trends in N impacts. To advance model
development, we must determine when and where N impacts on plant productivity vary
through time. Although the value of long‐term studies for advancing knowledge of global
change effects on ecosystems and C cycling is widely recognized among ecologists
(Kuebbing et al., 2018), no study has been done to summarize results of temporal trend
and/or interannual variability in plant productivity responses to N addition based on the
long-term experiments. Here, we synthesized 63 long-term ( 8 years) N addition studies
from around the world to address three research objectives: 1) to determine the short- and
long- term and overall effects of N addition on plant productivity in terrestrial
ecosystems; 2) to quantify temporal trend and variability in these plant responses; and 3)
to identify underlying controls on the magnitude, temporal trend and variability of plant
responses to N.
Methods
Data sources
Publications reporting the response of plant productivity to experimental N addition in
terrestrial ecosystems were collected by searching Web of Science. The keywords used
27
for the literature search consisted of “long-term nitrogen addition” OR “long-term
nitrogen fertilizer” OR “long-term nitrogen deposition” AND “biomass” OR
“productivity” OR “tree growth". The dataset provided by a recent meta-analysis about
the effect of N addition on forest carbon (Schulte-Uebbing & de Vries, 2018) was also
used in the present study. We screened all resulting publications using the following
criteria: 1) The studies were conducted at a field site for greater than or equal to 8 years.
The distribution of experimental duration of 63 case studies selected in this study can be
found from Fig. A1 in the appendices. 2) Plant productivity under both control (0 N kg
ha-1 yr-1) and N addition treatment (no other nutrients were added) was continuously
measured every year from the beginning of the experiment. 3) Since aboveground and
belowground plant productivity may show divergent responses to N addition (Chen et al.,
2018; Cusack et al., 2011; Li et al., 2011), we only collected data from the studies that
reported aboveground (56 out of 63 studies) or whole plant productivity (7 out of 63
studies) if aboveground plant productivity was not provided. 4) The data from different
plant productivity types or N application rate in the same study were regarded as
independent observations. 5) Plant productivity was assessed either by measuring basal
area increment (for forests), biomass (for grasslands), or canopy height (for shrublands).
Note that for some experiments, plant productivity was not measured every year;
however, if the number of measurements was equal to or greater than five, and the
frequency of measurements could capture both short- (e.g. < 3 years), medium-, and
long-term (e.g. > 8 years) trends well, they were also included in our study. It also should
be noted that, in 16 out of 63 studies, N was only applied at the beginning of the
experiment; however, N was applied continuously each year in the remaining 47 studies.
28
The geographical locations (latitude and longitude), climate factors (MAT and MAP),
initial soil variables (organic C, total N and P, extractable N, P, and K, pH, clay content,
bulk density), N fertilizer variables (N type and application rate), and ecosystem related
variables (ecosystem type and forest age) were also obtained from the papers. If papers
did not include MAT and MAP, we extracted them from the database at
http://www.worldclim.org/ using latitude and longitude with “raster” package (Hijmans
& van Etten, 2012). In the event that soil pH, bulk density, and clay content were not
provided in the papers, they were extracted from the database at https://www.isric.org/
using “GSIF” package with the help of the latitude and longitude (Hengl, 2020). The data
presented in figure form were extracted by using Engauge Digitizer software (Free
Software Foundation, Inc., Boston, MA, USA). All data were grouped by biome, climate
condition, N fertilization rate, initial soil pH, N fertilizer type, and forest age. Median
values (6.3 °C, 875 mm, 50 kg N hr-1 yr-1, and 30 years) were used to separate MAT,
MAP, N fertilization rate, and forest age into “high” and “low” categories, respectively.
Following this preliminary screening, our meta-analysis included 20 publications
providing 63 N fertilizer case studies (44 for forests, 25 for grasslands, and 4 for
shrublands) from 20 field sites (Fig. A2 in the appendices).
Data analysis
Determining N impacts on plant productivity
The means of plant productivity under control (Xc) and N addition treatment (Xt) in every
year in each case study were used to compute a response ratio (RR) as follows:
RR = ln (Xt/Xc) = ln (Xt) – ln (Xc) (1)
29
Next, we generated three summary response ratios (RR) for each study: 1)
RRfirst: RR in the first year for each study; 2) RRmean: average RR across all years for
each study; and 3) RRlast: RR in the last year for each study. Most studies did not provide
standard deviation of plant productivity (60 out of 63 studies). Therefore, RRmean and
RRlast were weighted by sample size and experimental duration by following (Terrer et
al., 2016):
W = (nc × nt)/( nc + nt) + (yr × yr)/(yr + yr) (2)
RRfirst was weighted by sample size:
Wfirst = (nc × nt)/( nc + nt) (3)
where W is the weighting factor; nc and nt is sample size under control and N addition
treatment, respectively; and yr is the length of the study in years. If sample sizes were not
provided (3 out of 63 studies), they were assigned as the median of sample sizes of other
60 studies. For WRRfirst, WRRmean, and WRRlast, the 95% confidence interval (95% CI)
was calculated, and N effects on plant productivity were considered significant if the 95%
CI did not overlap with zero. Since some field sites included multiple case studies, we
calculated the average of RRmean (RRaverage) for each field site if appropriate.
The quality check of this meta-analysis and statistical choices were done
following previous papers (Gurevitch & Hedges, 1999; Hedges et al., 1999; Viechtbauer,
2010). The meta-analyses were performed using “metafor” package in the R studio
Version v.1.2.5033 program (Viechtbauer, 2010). We created funnel plots to detect
publication bias using the “funnel” function, and no significant publication bias was

30
found. The “leave1out” function was used to perform sensitivity test, we found that
excluding any one of the studies did not affect the overall results.
Quantifying temporal trend and variability in long-term N impacts on plant productivity
We used simple linear regression to determine the relationship between
experimental duration (year) and RR for each study (Fig. A3 in the appendices). The
slope of this linear regression for each study and the corresponding standard error were
recorded. To permit comparison across studies, the weighted mean of slopes (S) was
calculated as follows (Kim, 2011):
S = ∑Si vi⁄
∑1 vi⁄ (4)
where Si is the slope for each study; and vi is the squared standard error for each study.
The corresponding standard error of the weighted mean (SE) was given by:
SE = √1
∑ 1vi
(5)
We recognize that a simple linear relationship might not be the best-fit model to
describe the temporal dynamics of N impacts in each study; it would be theoretically
possible to observe exponential relationships, saturating relationships, or the absence of a
relationship between RR and time. In the context of a meta-analysis, however, we had to
derive a summary statistic that could be directly compared across studies, so we
parsimoniously selected a linear model to minimize the number of parameters estimated.
However, we also evaluated the suitability of these linear models by performing
Spearman Rank-Order Correlation tests. 35 out of 63 studies had an absolute value of the
Spearman correlation coefficient ≥ 0.40, above which value we considered the monotonic
relationship to be moderately strong (Fig. A4 in the appendices). Since some field sites
31
included multiple case studies, we described the directionality of temporal trend of N
impacts on plant productivity at one field site as “increased” if the slopes of the linear
regression between RR and time were higher than zero in all case studies; as “decreased”
if the slopes of the linear regression between RR and time were lower than zero in all
case studies; and as “mixed” if the field site included case studies showing both
“increased” and “decreased” trends of N impacts on plant productivity.
Given that there was weak evidence of directional relationships between RR and
time in about half of studies examined, we also determined the temporal variability of
long-term N impacts on plant productivity. The coefficient of variation (CV) for each
study was calculated as follows:
CV = σ
μ (6)
where σ is the standard deviation of RR for each study; and μ is the absolute value of
mean RR for each study.
Predictors of N impacts on plant productivity, and the temporal trend and variability of
these impacts
The relative influences of predictor variables were quantified by using boosted
regression tree (BRT) analysis, including predictor variables that were reported in more
than 50% of studies. Multicollinearity was tested to eliminate the variables that were
redundant before running the BRT analysis. We included MAT, MAP, N application rate,
RRfirst, initial soil pH, initial soil clay content, and initial soil bulk density as predictor
variables (except when the response variable was RRfirst; in this case it was obviously
not included as a predictor). The reason why we included RRfirst as a predictor variable
32
was to determine whether the overall or long-term response of plant productivity to N
addition is predictable based on the short-term response. The BRT analysis was run in R
with “gbm” package (Greenwell, 2019) using the appropriate weighting factor. The three
main parameters needing optimization in the BRT analysis were the learning rate
(shrinkage), the depth of each regression tree (interaction.depth), and the number of
iteration (ntree). In the present study, the three optimized parameters for shrinkage,
interaction.depth, and ntree were 0.01, 2, and 12000, respectively. Overall, the BRT
analysis explained 97% of the variation in RRfirst, 97% in RRmean, 96% in RRlast, 89%
in S, and 87% in CV. All statistical analyses and graphs were performed using the R
studio Version v.1.2.5033 program.
Results
Plant productivity responses to N addition
Short-term (WRRfirst) effects of N addition on plant productivity in terrestrial
ecosystems were insignificant, with detectable effects only under conditions of high (> 7)
initial soil pH. By contrast, most long-term (WRRlast) and overall (WRRmean) N impacts
were significantly positive (Fig. 2.1). Positive overall N impacts on plant productivity
were found at most field sites (19 out of 20), and they were distributed evenly at the
global scale without showing a strong latitudinal pattern (Fig. A5 in the appendices). By
contrast, negative effects of N addition on plant productivity were found in 6 out of 63
studies (data not shown). Overall and long-term N impacts showed the same trends
regarding their significance and magnitude (Fig. 2.1). N impacts on overall productivity
were positive in forests and grasslands, but non-significant in shrublands. N also boosted
productivity under conditions of low MAT (< 6.3 °C) and low MAP (< 875 mm),
33
whereas fertilization did not impact productivity under warmer and wetter conditions.
Effects were also more positive for younger forests (< 30 years at the start of the
experiment) rather than older stands. Generally speaking, N impacts on plant productivity
were non-significant in the short term but became significant and positive in the long
term under most situations.
MAP was the most influential factor determining the magnitude of overall
(RRmean) plant productivity responses (Fig. 2.2a). By contrast, the influence of N
application rate on plant productivity responses to N addition was relatively small, and its
influence did not change when measured in the first year, last year, or as the mean
response across all years. Additionally, except for initial soil pH, the overall contribution
of soil properties (e.g. initial soil clay content and bulk density) to N impacts on plant
productivity was also relatively minor. The most influential factor determining the
magnitude of plant productivity responses varied according to when the productivity
response was measured (short-term: initial soil pH, long-term: MAP).
Temporal variability and trend of long-term N impacts
Impacts of N on plant productivity varied greatly from year to year. The CV of
RR ranged from 19% to 768% across studies, and the mean value was 109% ± 148%
(Fig. 2.3b and Fig. A6 in the appendices). CV of RR in alkaline soils (24%) was much
lower than that in acidic soils (121%), but there were no other consistent differences in
CV across experimental groups. According to BRT analysis, soil variables (53%) mostly
explained cross-study patterns in CV, followed by fertilizer variables (18%), RRfirst
(17%), and climate variables (12%).
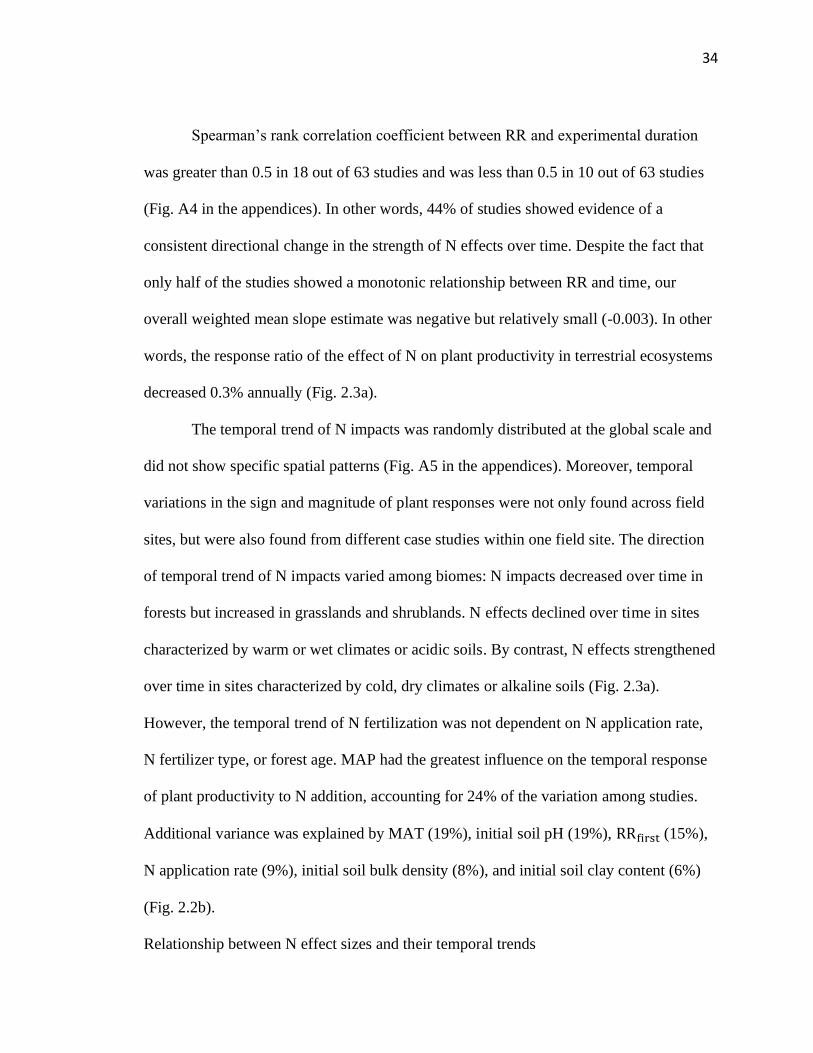
34
Spearman’s rank correlation coefficient between RR and experimental duration
was greater than 0.5 in 18 out of 63 studies and was less than 0.5 in 10 out of 63 studies
(Fig. A4 in the appendices). In other words, 44% of studies showed evidence of a
consistent directional change in the strength of N effects over time. Despite the fact that
only half of the studies showed a monotonic relationship between RR and time, our
overall weighted mean slope estimate was negative but relatively small (-0.003). In other
words, the response ratio of the effect of N on plant productivity in terrestrial ecosystems
decreased 0.3% annually (Fig. 2.3a).
The temporal trend of N impacts was randomly distributed at the global scale and
did not show specific spatial patterns (Fig. A5 in the appendices). Moreover, temporal
variations in the sign and magnitude of plant responses were not only found across field
sites, but were also found from different case studies within one field site. The direction
of temporal trend of N impacts varied among biomes: N impacts decreased over time in
forests but increased in grasslands and shrublands. N effects declined over time in sites
characterized by warm or wet climates or acidic soils. By contrast, N effects strengthened
over time in sites characterized by cold, dry climates or alkaline soils (Fig. 2.3a).
However, the temporal trend of N fertilization was not dependent on N application rate,
N fertilizer type, or forest age. MAP had the greatest influence on the temporal response
of plant productivity to N addition, accounting for 24% of the variation among studies.
Additional variance was explained by MAT (19%), initial soil pH (19%), RRfirst (15%),
N application rate (9%), initial soil bulk density (8%), and initial soil clay content (6%)
(Fig. 2.2b).
Relationship between N effect sizes and their temporal trends
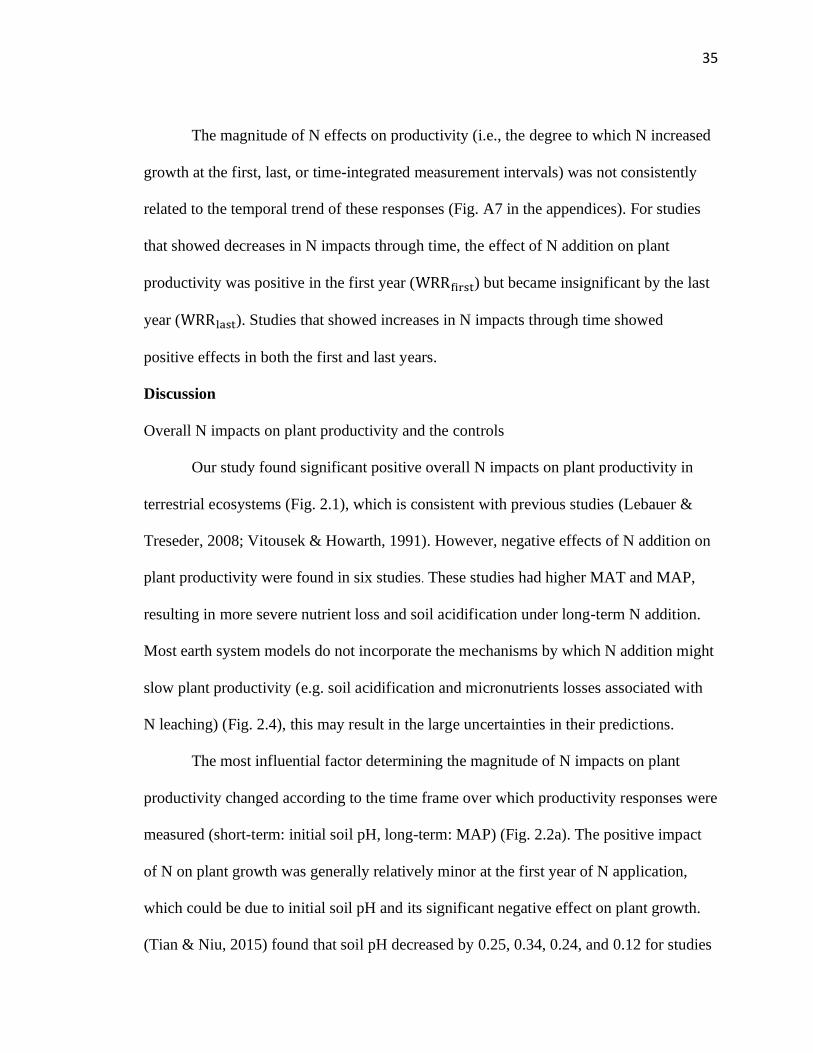
35
The magnitude of N effects on productivity (i.e., the degree to which N increased
growth at the first, last, or time-integrated measurement intervals) was not consistently
related to the temporal trend of these responses (Fig. A7 in the appendices). For studies
that showed decreases in N impacts through time, the effect of N addition on plant
productivity was positive in the first year (WRRfirst) but became insignificant by the last
year (WRRlast). Studies that showed increases in N impacts through time showed
positive effects in both the first and last years.
Discussion
Overall N impacts on plant productivity and the controls
Our study found significant positive overall N impacts on plant productivity in
terrestrial ecosystems (Fig. 2.1), which is consistent with previous studies (Lebauer &
Treseder, 2008; Vitousek & Howarth, 1991). However, negative effects of N addition on
plant productivity were found in six studies. These studies had higher MAT and MAP,
resulting in more severe nutrient loss and soil acidification under long-term N addition.
Most earth system models do not incorporate the mechanisms by which N addition might
slow plant productivity (e.g. soil acidification and micronutrients losses associated with
N leaching) (Fig. 2.4), this may result in the large uncertainties in their predictions.
The most influential factor determining the magnitude of N impacts on plant
productivity changed according to the time frame over which productivity responses were
measured (short-term: initial soil pH, long-term: MAP) (Fig. 2.2a). The positive impact
of N on plant growth was generally relatively minor at the first year of N application,
which could be due to initial soil pH and its significant negative effect on plant growth.
(Tian & Niu, 2015) found that soil pH decreased by 0.25, 0.34, 0.24, and 0.12 for studies
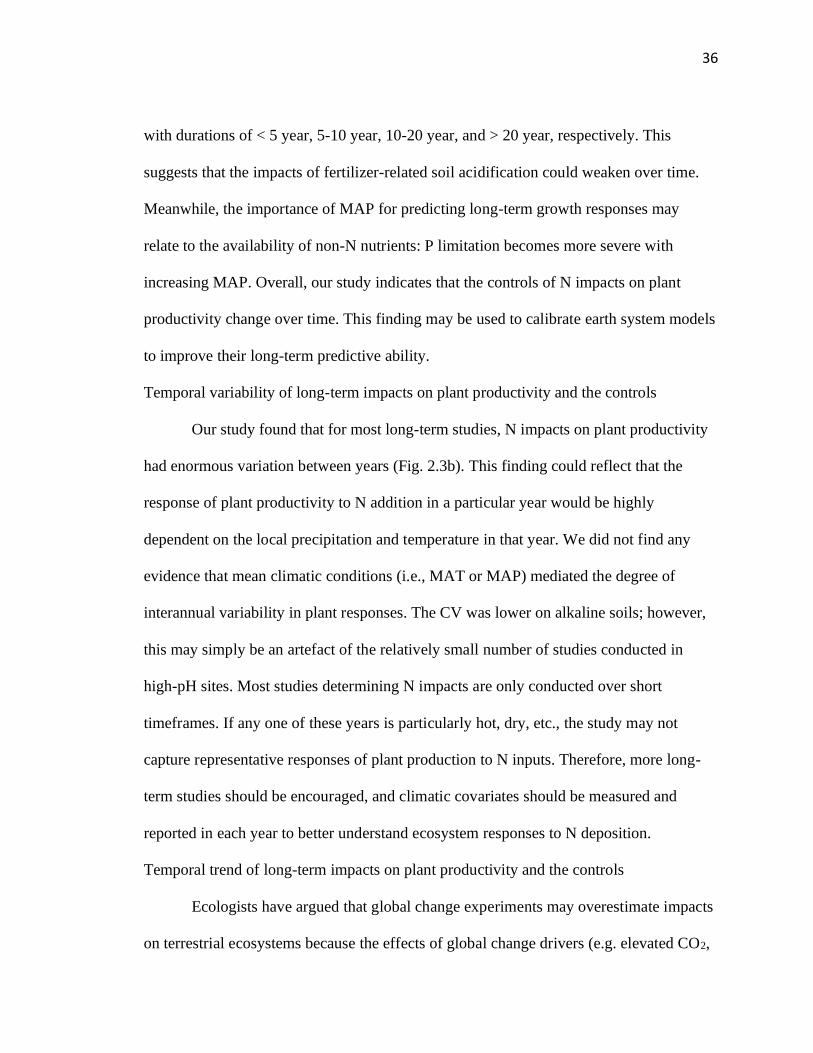
36
with durations of < 5 year, 5-10 year, 10-20 year, and > 20 year, respectively. This
suggests that the impacts of fertilizer-related soil acidification could weaken over time.
Meanwhile, the importance of MAP for predicting long-term growth responses may
relate to the availability of non-N nutrients: P limitation becomes more severe with
increasing MAP. Overall, our study indicates that the controls of N impacts on plant
productivity change over time. This finding may be used to calibrate earth system models
to improve their long-term predictive ability.
Temporal variability of long-term impacts on plant productivity and the controls
Our study found that for most long-term studies, N impacts on plant productivity
had enormous variation between years (Fig. 2.3b). This finding could reflect that the
response of plant productivity to N addition in a particular year would be highly
dependent on the local precipitation and temperature in that year. We did not find any
evidence that mean climatic conditions (i.e., MAT or MAP) mediated the degree of
interannual variability in plant responses. The CV was lower on alkaline soils; however,
this may simply be an artefact of the relatively small number of studies conducted in
high-pH sites. Most studies determining N impacts are only conducted over short
timeframes. If any one of these years is particularly hot, dry, etc., the study may not
capture representative responses of plant production to N inputs. Therefore, more long-
term studies should be encouraged, and climatic covariates should be measured and
reported in each year to better understand ecosystem responses to N deposition.
Temporal trend of long-term impacts on plant productivity and the controls
Ecologists have argued that global change experiments may overestimate impacts
on terrestrial ecosystems because the effects of global change drivers (e.g. elevated CO2,
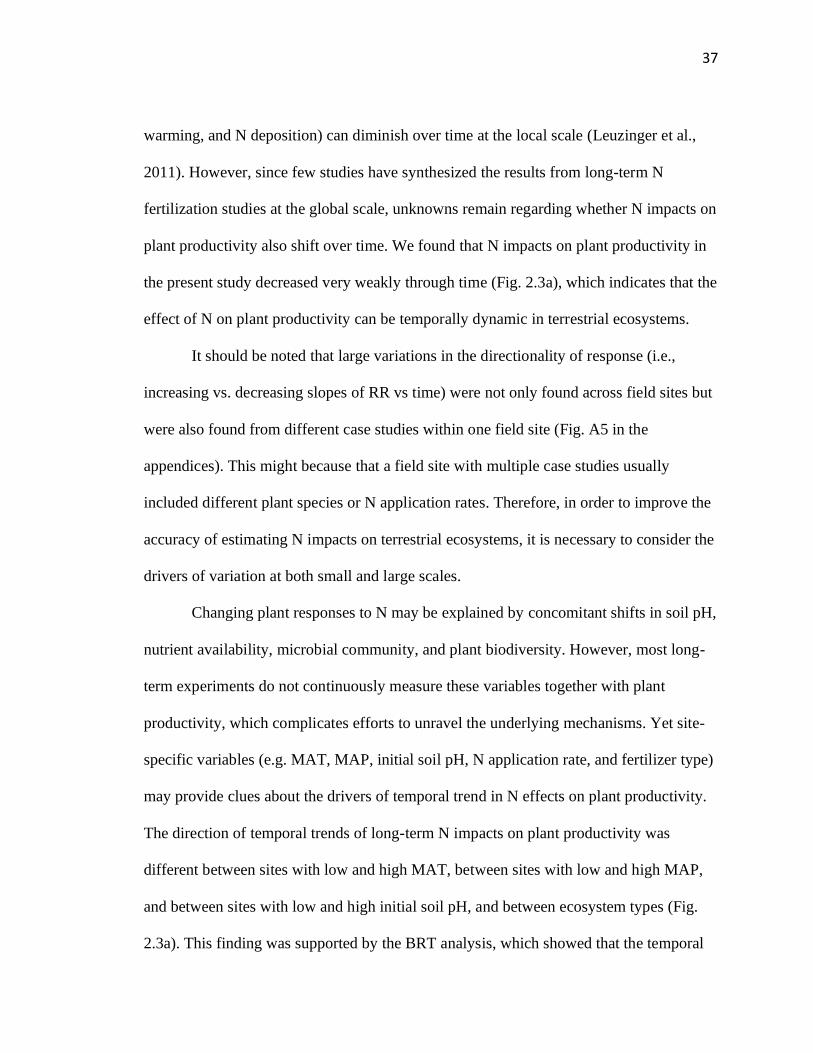
37
warming, and N deposition) can diminish over time at the local scale (Leuzinger et al.,
2011). However, since few studies have synthesized the results from long-term N
fertilization studies at the global scale, unknowns remain regarding whether N impacts on
plant productivity also shift over time. We found that N impacts on plant productivity in
the present study decreased very weakly through time (Fig. 2.3a), which indicates that the
effect of N on plant productivity can be temporally dynamic in terrestrial ecosystems.
It should be noted that large variations in the directionality of response (i.e.,
increasing vs. decreasing slopes of RR vs time) were not only found across field sites but
were also found from different case studies within one field site (Fig. A5 in the
appendices). This might because that a field site with multiple case studies usually
included different plant species or N application rates. Therefore, in order to improve the
accuracy of estimating N impacts on terrestrial ecosystems, it is necessary to consider the
drivers of variation at both small and large scales.
Changing plant responses to N may be explained by concomitant shifts in soil pH,
nutrient availability, microbial community, and plant biodiversity. However, most long-
term experiments do not continuously measure these variables together with plant
productivity, which complicates efforts to unravel the underlying mechanisms. Yet site-
specific variables (e.g. MAT, MAP, initial soil pH, N application rate, and fertilizer type)
may provide clues about the drivers of temporal trend in N effects on plant productivity.
The direction of temporal trends of long-term N impacts on plant productivity was
different between sites with low and high MAT, between sites with low and high MAP,
and between sites with low and high initial soil pH, and between ecosystem types (Fig.
2.3a). This finding was supported by the BRT analysis, which showed that the temporal
38
trend of N impacts was mostly regulated by MAP, MAT, and initial soil pH (Fig. 2.2b).
N effects tended to decrease in sites characterized by warm and wet climates; or acidic
soils but tended to increase in sites characterized by cold and dry climates, or alkaline
soils (Fig. 2.3a). These patterns likely reflect non-target effects of N on soil properties. N
leaching rate is higher under high MAP and MAT, and it becomes more severe with
continuous N application. Soil acidification, base cations (Ca2+, K+, Mg2+, and Na+)
losses, and soil erosion may occur with N leaching and become more serious over time.
Additionally, soil acidification caused by N addition and Al3+ accumulation associated
with soil acidification tend to be more severe in acidic soils (Tian & Niu, 2015).
Increases in the magnitude of these negative impacts may explain why the benefits of N
addition declined with time at high MAP and low pH sites, but continued to increase with
time at low MAP and high pH sites.
Limitations of the study
First, the goal of this study was to determine whether N impacts on plant
productivity change over time; we used the slope of the relationship between RR and
time to assess this. This simple linear model might not be the best-fit model for any
particular study, especially in the case of a non-monotonic relationship (e.g., a hump-
shaped relationship between RR and time). When inspecting the raw data, we saw that
most studies displayed: 1) a monotonic relationship between RR and time, which could
be well-described by a linear model, or 2) no relationship, in which case the slope
estimate was close to zero, and the SE was large. Our meta-analysis calculations
accurately captured both of these scenarios, as they incorporated slope estimates and their
associated standard errors. It should be noted that the linear slopes for RR vs time ranged
39
from -0.03 to 0.02 y-1 (i.e. the magnitude of plant responses to N declined up to 3%
annually or increased up to 2% annually). In other words, directional changes in plant
responses to N, when present, are relatively mild. Second, we were not able to assess
with certainty the mechanisms that drove temporal trend of ecosystem N response. This
mainly reflects a lack of time-series data related to changes in soil pH, nutrient
availability, microbial communities, and plant biodiversity. More replicated manipulative
studies should be conducted in the future to measure these variables together with plant
productivity continuously. Third, we used the data in the first year and in the last year to
represent short-term and long-term responses, respectively. It should be noted that the
response of plant productivity to N addition in a particular year would be highly
dependent on the local climatic conditions in that year – a conclusion which is
highlighted by the extremely high interannual variability in N responses observed within
and among studies. Last, most long-term N studies were conducted in the temperate and
continental regions, which means that our study cannot shed light on long-term N trend in
tropical zones. More studies in tropical ecosystems should be done in the future because
of their great role in climate change mitigation (Bonan, 2008).
Implications
Our study found that long-term N impacts on plant productivity in terrestrial
ecosystems are positive – higher N availability generally stimulates plant growth.
However, the degree of stimulation shows large temporal variability from year to year,
with a substantial number of ecosystems displaying consistent increases or declines in the
magnitude of response (Fig. 2.1, 2.3, and 2.4). This finding indicates that we may over-
or underestimate N effects on terrestrial ecosystems at a specific field site by making
40
inferences based on short-term measurements. Unfortunately, the magnitude of N impacts
in the short term (RRfirst) was not a very strong predictor of the magnitude of long-term
N impacts, their temporal trend, or their temporal variability (Fig. 2.2). This result
demonstrates the value of long‐term experiments which can be used to explore the
mechanisms that drive decadal responses to N addition. Most field experiments last less
than 3 years, which means that patterns extrapolated from short-term measurements may
not reflect long-term ecosystem dynamics. Our study highlights the necessity of long-
term experiments: it is essential for funding agencies to invest more in experiments at
multi-decadal timescales.
Terrestrial ecosystems play a great role in mitigating climate warming by
absorbing atmospheric carbon dioxide. For Earth System Models that include C-N
interactions, most consider the positive effect of N on plant growth rate, which has been
widely observed from many experimental studies. However, they do not incorporate the
mechanisms of potentially decreased N impacts on plant productivity over time via soil
acidification, N saturation, and so on. As a result, Earth System Models may overestimate
terrestrial ecosystems’ future climate mitigation potential. In order to predict C cycling in
terrestrial ecosystems under future climate change, it is urgent to pay more attention to
the underlying mechanisms that drive temporal trend of plant responses to N. Moreover,
when quantifying N impacts on terrestrial ecosystems in the long term, future meta-
analysis studies should generate time-integrated response metrics to avoid inaccurate
estimation.
Reference
41
Abbasi, M. K., Tahir, M. M., & Rahim, N. (2013). Effect of N fertilizer source and
timing on yield and N use efficiency of rainfed maize (Zea mays L.) in Kashmir-
Pakistan. Geoderma, 195–196, 87–93.
https://doi.org/10.1016/j.geoderma.2012.11.013
Bonan, G. B. (2008). Forests and climate change: Forcings, feedbacks, and the climate
benefits of forests. Science, 320(5882), 1444–1449.
https://doi.org/10.1126/science.1155121
Brooks, J. R., & Coulombe, R. (2009). Physiological responses to fertilization recorded
in tree rings: isotopic lessons from a long-term fertilization trial. Ecological
Applications, 19(4), 1044–1060.
Chalcraft, D. R., Cox, S. B., Clark, C., Cleland, E. E., Suding, K. N., Weiher, E., &
Pennington, D. (2008). Scale-dependent responses of plant biodiversity to nitrogen
enrichment. Ecology, 89(8), 2165–2171. https://doi.org/10.1890/07-0971.1
Chen, H., Li, D., Gurmesa, G. A., Yu, G., Li, L., Zhang, W., Fang, H., & Mo, J. (2015).
Effects of nitrogen deposition on carbon cycle in terrestrial ecosystems of China: A
meta-analysis. Environmental Pollution, 206, 352–360.
https://doi.org/10.1016/j.envpol.2015.07.033
Chen, J.-B., Dong, C.-C., Yao, X.-D., & Wang, W. (2018). Effects of nitrogen addition
on plant biomass and tissue elemental content in different degradation stages of
temperate steppe in northern China. Journal of Plant Ecology, 11(5), 730–739.
https://doi.org/10.1093/jpe/rtx035
Chen, S., Wang, W., Xu, W., Wang, Y., Wan, H., Chen, D., Tang, Z., Tang, X., Zhou, G.,
Xie, Z., Zhou, D., Shangguan, Z., Huang, J., He, J. S., Wang, Y., Sheng, J., Tang,
42
L., Li, X., Dong, M., … Bai, Y. (2018). Plant diversity enhances productivity and
soil carbon storage. Proceedings of the National Academy of Sciences of the United
States of America, 115(16), 4027–4032. https://doi.org/10.1073/pnas.1700298114
Ciais, P., Tan, J., Wang, X., Roedenbeck, C., Chevallier, F., Piao, S.-L., Moriarty, R.,
Broquet, G., Le Quéré, C., Canadell, J. G., Peng, S., Poulter, B., Liu, Z., & Tans, P.
(2019). Five decades of northern land carbon uptake revealed by the
interhemispheric CO2 gradient. Nature, 568, 221–225.
https://doi.org/10.1038/s41586-019-1078-6
Collins, S. L., Sinsabaugh, R. L., Crenshaw, C., Green, L., Porras-alfaro, A., Stursova,
M., & Zeglin, L. H. (2008). Pulse dynamics and microbial processes in aridland
ecosystems. Journal of Ecology, 96, 413–420. https://doi.org/10.1111/j.1365-
2745.2008.01362.x
Crowther, T. W., Hoogen, J., Wan, J., Mayes, M. A., Keiser, A. D., Mo, L., Averill, C.,
& Maynard, D. S. (2019). The global soil community and its influence on
biogeochemistry. Science, 772(6455), eaav0550.
https://doi.org/10.1126/science.aav0550
Cusack, D. F., Silver, W. L., Torn, M. S., & McDowell, W. H. (2011). Effects of nitrogen
additions on above- and belowground carbon dynamics in two tropical forests.
Biogeochemistry, 104(1–3), 203–225. https://doi.org/10.1007/s10533-010-9496-4
Du, E., Terrer, C., Pellegrini, A. F. A., Ahlström, A., van Lissa, C. J., Zhao, X., Xia, N.,
Wu, X., & Jackson, R. B. (2020a). Global patterns of terrestrial nitrogen and
phosphorus limitation. Nature Geoscience. https://doi.org/10.1038/s41561-019-
0530-4
43
Du, E., Terrer, C., Pellegrini, A. F. A., Ahlström, A., van Lissa, C. J., Zhao, X., Xia, N.,
Wu, X., & Jackson, R. B. (2020b). Global patterns of terrestrial nitrogen and
phosphorus limitation. Nature Geoscience, 13(3), 221–226.
https://doi.org/10.1038/s41561-019-0530-4
Dukes, J. S., Chiariello, N. R., Cleland, E. E., Moore, L. A., Rebecca Shaw, M., Thayer,
S., Tobeck, T., Mooney, H. A., & Field, C. B. (2005). Responses of grassland
production to single and multiple global environmental changes. PLoS Biology,
3(10), e319. https://doi.org/10.1371/journal.pbio.0030319
Falkengren-Grerup, U., & Tyler, G. (1993). Experimental evidence for the relative
sensitivity of deciduous forest plants to high soil acidity. Forest Ecology and
Management, 60(3–4), 311–326. https://doi.org/10.1016/0378-1127(93)90086-3
Fay, P. A., Prober, S. M., Harpole, W. S., Knops, J. M. H., Bakker, J. D., Borer, E. T.,
Lind, E. M., MacDougall, A. S., Seabloom, E. W., Wragg, P. D., Adler, P. B.,
Blumenthal, D. M., Buckley, Y. M., Chu, C., Cleland, E. E., Collins, S. L., Davies,
K. F., Du, G., Feng, X., … Yang, L. H. (2015). Grassland productivity limited by
multiple nutrients. Nature Plants, 1(July), 1–5.
https://doi.org/10.1038/nplants.2015.80
Green, J. K., Seneviratne, S. I., Berg, A. M., Findell, K. L., Lawrence, D. M., & Gentine,
P. (2019). Large influence of soil moisture variability on long-term terrestrial carbon
uptake. Nature, 565, 476–479. https://doi.org/10.1038/s41586-018-0848-x
Greenwell, B. (2019). gbm: Generalized Boosted Regression Models.
44
Gurevitch, J., & Hedges, L. V. (1999). Statistical issues in ecological meta-analyses.
Ecology, 80(4), 1142–1149. https://doi.org/10.1890/0012-
9658(1999)080[1142:SIIEMA]2.0.CO;2
Hedges, L. V., Gurevitch, J., & Curtis, P. S. (1999). The meta-analysis of response ratios
in experimental ecology. Ecology, 80(4), 1150–1156. https://doi.org/10.1890/0012-
9658(1999)080[1150:TMAORR]2.0.CO;2
Hou, E., Chen, C., Luo, Y., Zhou, G., Kuang, Y., Zhang, Y., Heenan, M., Lu, X., & Wen,
D. (2018). Effects of climate on soil phosphorus cycle and availability in natural
terrestrial ecosystems. Global Change Biology, 24(8), 3344–3356.
https://doi.org/10.1111/gcb.14093
Janssens, I. A., & Luyssaert, S. (2009). Carbon cycle: Nitrogen’s carbon bonus. Nature
Geoscience, 2(5), 318–319. https://doi.org/10.1038/ngeo505
Jing, X., Sanders, N. J., Shi, Y., Chu, H., Classen, A. T., Zhao, K., Chen, L., Shi, Y.,
Jiang, Y., & He, J. S. (2015). The links between ecosystem multifunctionality and
above-and belowground biodiversity are mediated by climate. Nature
Communications, 6, 8159. https://doi.org/10.1038/ncomms9159
Kaštovská, E., & Šantrůčková, H. (2011). Comparison of uptake of different N forms by
soil microorganisms and two wet-grassland plants: A pot study. Soil Biology and
Biochemistry, 43(6), 1285–1291. https://doi.org/10.1016/j.soilbio.2011.02.021
Kim, R. S. (2011). Standardized regression coefficients as indices of effect sizes in meta-
analysis. Dissertation Abstracts International Section A: Humanities and Social
Sciences.
45
https://login.ezproxy.net.ucf.edu/login?auth=shibb&url=http://search.ebscohost.com
/login.aspx?direct=true&db=psyh&AN=2012-99150-049&site=eds-live&scope=site
Kuebbing, S. E., Reimer, A. P., Rosenthal, S. A., Feinberg, G., Leiserowitz, A., Lau, J.
A., & Bradford, M. A. (2018). Long-term research in ecology and evolution: a
survey of challenges and opportunities. Ecological Monographs, 88(2), 245–258.
https://doi.org/10.1002/ecm.1289
Kunzová, E., & Hejcman, M. (2010). Yield development of winter wheat over 50 years
of nitrogen, phosphorus and potassium application on greyic Phaeozem in the Czech
Republic. European Journal of Agronomy, 33(3), 166–174.
https://doi.org/10.1016/j.eja.2010.05.002
Lebauer, D., & Treseder, K. K. (2008). Nitrogen limitation of net primary productivity in
terrestrial ecosystems is globally distributed. Ecology, 89(2), 371–379.
https://doi.org/10.1007/BF00153104
Leff, J. W., Jones, S. E., Prober, S. M., Barberán, A., Borer, E. T., Firn, J. L., Harpole,
W. S., Hobbie, S. E., Hofmockel, K. S., Knops, J. M. H., McCulley, R. L., La Pierre,
K., Risch, A. C., Seabloom, E. W., Schütz, M., Steenbock, C., Stevens, C. J., &
Fierer, N. (2015). Consistent responses of soil microbial communities to elevated
nutrient inputs in grasslands across the globe. Proceedings of the National Academy
of Sciences, 112(35), 10967–10972. https://doi.org/10.1073/pnas.1508382112
Leuzinger, S., Luo, Y., Beier, C., Dieleman, W., Vicca, S., & Körner, C. (2011). Do
global change experiments overestimate impacts on terrestrial ecosystems? Trends
in Ecology and Evolution, 26(5), 236–241.
https://doi.org/10.1016/j.tree.2011.02.011
46
Li, J., Lin, S., Taube, F., Pan, Q., & Dittert, K. (2011). Above and belowground net
primary productivity of grassland influenced by supplemental water and nitrogen in
Inner Mongolia. Plant and Soil, 340(1), 253–264. https://doi.org/10.1007/s11104-
010-0612-y
Liang, J., Zhou, M., Tobin, P. C., McGuire, A. D., & Reich, P. B. (2015). Biodiversity
influences plant productivity through niche-efficiency. Proceedings of the National
Academy of Sciences of the United States of America, 112(18), 5738–5743.
https://doi.org/10.1073/pnas.1409853112
Lu, M., Yang, Y., Luo, Y., Fang, C., Zhou, X., Chen, J., Yang, X., & Li, B. (2011).
Responses of ecosystem nitrogen cycle to nitrogen addition: A meta-analysis. New
Phytologist, 189(4), 1040–1050. https://doi.org/10.1111/j.1469-8137.2010.03563.x
Lu, X., Vitousek, P. M., Mao, Q., Gilliam, F. S., Luo, Y., Zhou, G., Zou, X., Bai, E.,
Scanlon, T. M., Hou, E., & Mo, J. (2018). Plant acclimation to long-term high
nitrogen deposition in an N-rich tropical forest. Proceedings of the National
Academy of Sciences, 115(20), 5187–5192.
https://doi.org/10.1073/pnas.1720777115
Midolo, G., Alkemade, R., Schipper, A. M., Benítez-López, A., Perring, M. P., & De
Vries, W. (2019). Impacts of nitrogen addition on plant species richness and
abundance: A global meta-analysis. Global Ecology and Biogeography, 28(3), 398–
413. https://doi.org/10.1111/geb.12856
Oishi, A. C., Palmroth, S., Johnsen, K. H., Mccarthy, H. R., & Oren, R. (2014). Sustained
effects of atmospheric [CO2] and nitrogen availability on forest soil CO2 efflux.
Global Change Biology, 20(4), 1146–1160. https://doi.org/10.1111/gcb.12414
47
Reay, D. S., Dentener, F. J., Smith, P., Grace, J., & Feely, R. A. (2008). Global nitrogen
deposition and carbon sinks. Nature Geoscience, 1, 430–437.
https://doi.org/10.1038/ngeo230
Reich, P. B., & Hobbie, S. E. (2013). Decade-long soil nitrogen constraint on the CO2
fertilization of plant biomass. Nature Climate Change, 3(3), 278–282.
https://doi.org/10.1038/nclimate1694
Robert J. Hijmans, & Jacob van Etten. (2012). raster: Geographic analysis and modeling
with raster data.
Schulte-Uebbing, L., & de Vries, W. (2018). Global-scale impacts of nitrogen deposition
on tree carbon sequestration in tropical, temperate, and boreal forests: A meta-
analysis. Global Change Biology, 24(2), e416–e431.
https://doi.org/10.1111/gcb.13862
Suding, K. N., Collins, S. L., Gough, L., Clark, C., Cleland, E. E., Gross, K. L.,
Milchunas, D. G., & Pennings, S. (2005). Functional- and abundance-based
mechanisms explain diversity loss due to N fertilization. Proceedings of the National
Academy of Sciences of the United States of America, 102(12), 4387–4392.
https://doi.org/10.1073/pnas.0408648102
Tang, J., & Riley, W. J. (2018). Predicted Land Carbon Dynamics Are Strongly
Dependent on the Numerical Coupling of Nitrogen Mobilizing and Immobilizing
Processes: A Demonstration with the E3SM Land Model. Earth Interactions, 22(11),
1–18. https://doi.org/10.1175/EI-D-17-0023.1
48
Terrer, C., Vicca, S., Hungate, B. A., Phillips, R. P., & Prentice, I. C. (2016).
Mycorrhizal association as a primary control of the CO₂ fertilization effect. Science,
353(6294), 72–74. https://doi.org/10.1126/science.aaf4610
Thomas, Q., Brookshire, J., & Gerber, S. (2015). Nitrogen limitation on land: how can it
occur in Earth system models? Global Change Biology, 21, 1777–1793.
https://doi.org/10.1111/gcb.12813
Tian, D., & Niu, S. (2015). A global analysis of soil acidification caused by nitrogen
addition. Environmental Research Letters, 10, 024019. https://doi.org/10.1088/1748-
9326/10/2/024019
Tian, D., Wang, H., Sun, J., & Niu, S. (2016). Global evidence on nitrogen saturation of
terrestrial ecosystem net primary productivity. Environmental Research Letters, 11,
024012. http://stacks.iop.org/1748-9326/11/i=2/a=024012
Tomislav Hengl. (2020). GSIF: Global Soil Information Facilities.
Viechtbauer, W. (2010). Conducting Meta-Analyses in R with the metafor Package.
Journal of Statistical Software, 36(3), 1–48.
https://doi.org/10.1103/PhysRevB.91.121108
Vitousek, P. M., & Howarth, R. W. (1991). Nitrogen limitation on land and in the sea:
How can it occur? Biogeochemistry, 13, 87–115.
https://doi.org/10.1007/BF00002772
Wieder, W. R., Cleveland, C. C., Lawrence, D. M., & Bonan, G. B. (2015). Effects of
model structural uncertainty on carbon cycle projections: biological nitrogen fixation
as a case study. Environmental Research Letters, 10, 044016.
https://doi.org/10.1088/1748-9326/10/4/044016
49
Wieder, W. R., Cleveland, C. C., Smith, W. K., & Todd-Brown, K. (2015). Future
productivity and carbon storage limited by terrestrial nutrient availability. Nature
Geoscience, 8(6), 441–444. https://doi.org/10.1038/NGEO2413
Yan, L., Xu, X., & Xia, J. (2019). Different impacts of external ammonium and nitrate
addition on plant growth in terrestrial ecosystems: A meta-analysis. Science of the
Total Environment, 686, 1010–1018. https://doi.org/10.1016/j.scitotenv.2019.05.448
Yue, K., Peng, Y., Peng, C., Yang, W., Peng, X., & Wu, F. (2016). Stimulation of
terrestrial ecosystem carbon storage by nitrogen addition: A meta-analysis.
Scientific Reports, 19895. https://doi.org/10.1038/srep19895
Zheng, J., Guo, R., Li, D., Zhang, J., & Han, S. (2017). Nitrogen addition, drought and
mixture effects on litter decomposition and nitrogen immobilization in a temperate
forest. Plant and Soil, 416(1–2), 165–179. https://doi.org/10.1007/s11104-017-3202-
4
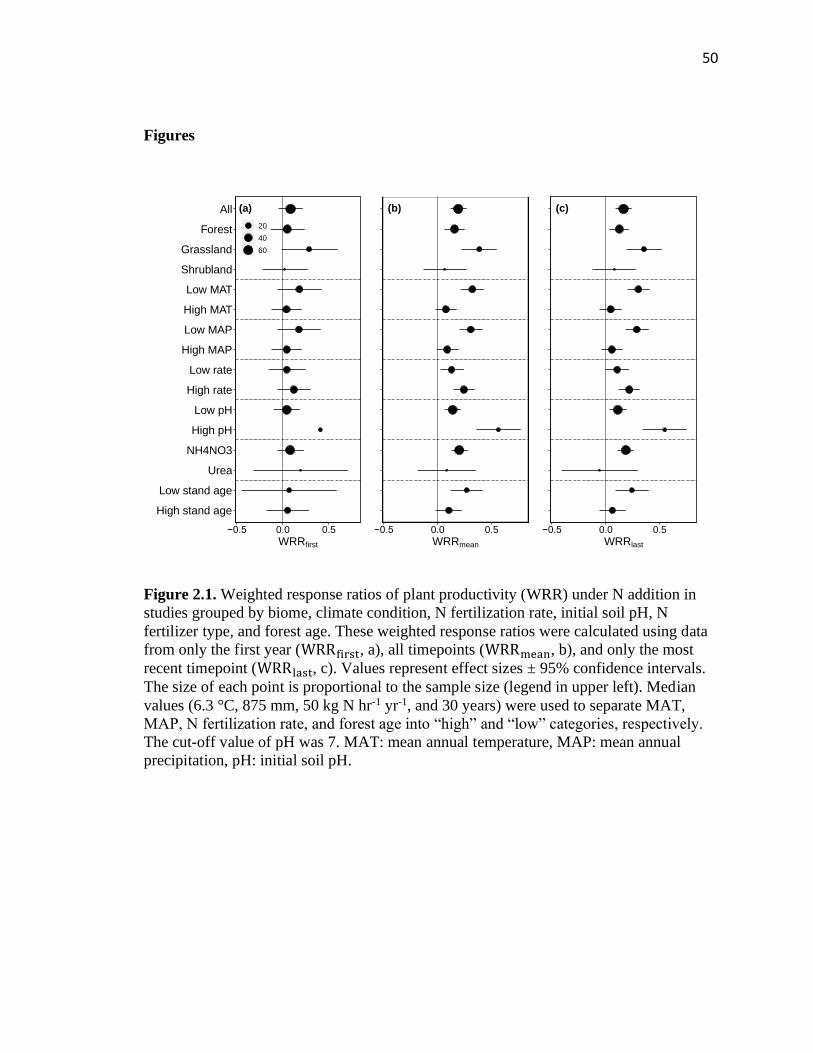
50
Figures
Figure 2.1. Weighted response ratios of plant productivity (WRR) under N addition in
studies grouped by biome, climate condition, N fertilization rate, initial soil pH, N
fertilizer type, and forest age. These weighted response ratios were calculated using data
from only the first year (WRRfirst, a), all timepoints (WRRmean, b), and only the most
recent timepoint (WRRlast, c). Values represent effect sizes ± 95% confidence intervals.
The size of each point is proportional to the sample size (legend in upper left). Median
values (6.3 °C, 875 mm, 50 kg N hr-1 yr-1, and 30 years) were used to separate MAT,
MAP, N fertilization rate, and forest age into “high” and “low” categories, respectively.
The cut-off value of pH was 7. MAT: mean annual temperature, MAP: mean annual
precipitation, pH: initial soil pH.
High stand age
Low stand age
Urea
NH4NO3
High pH
Low pH
High rate
Low rate
High MAP
Low MAP
High MAT
Low MAT
Shrubland
Grassland
Forest
All
−0.5 0.0 0.5
WRRfirst
20
40
60
−0.5 0.0 0.5
WRRmean
−0.5 0.0 0.5
WRRlast
(a) (b) (c)
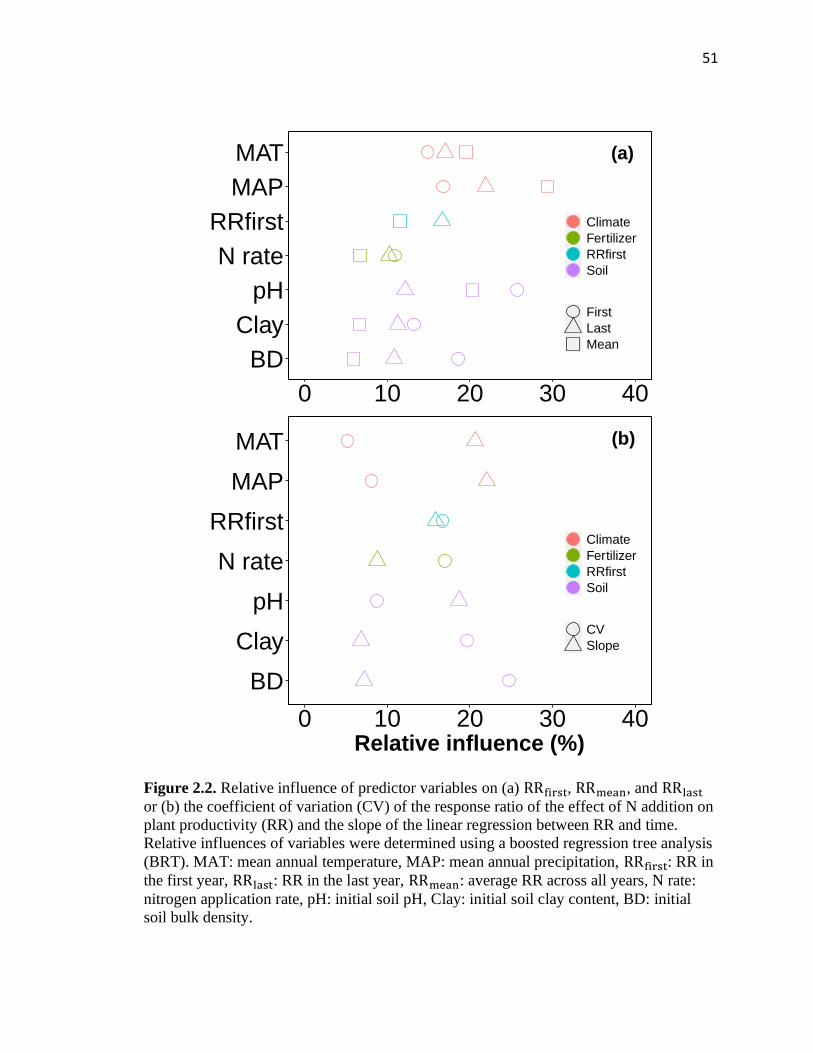
51
Figure 2.2. Relative influence of predictor variables on (a) RRfirst, RRmean, and RRlast
or (b) the coefficient of variation (CV) of the response ratio of the effect of N addition on
plant productivity (RR) and the slope of the linear regression between RR and time.
Relative influences of variables were determined using a boosted regression tree analysis
(BRT). MAT: mean annual temperature, MAP: mean annual precipitation, RRfirst: RR in
the first year, RRlast: RR in the last year, RRmean: average RR across all years, N rate:
nitrogen application rate, pH: initial soil pH, Clay: initial soil clay content, BD: initial
soil bulk density.
BD
Clay
pH
N rate
RRfirst
MAP
MAT
0 10 20 30 40
Climate
Fertilizer
RRfirst
Soil
First
Last
Mean
BD
Clay
pH
N rate
RRfirst
MAP
MAT
0 10 20 30 40Relative influence (%)
Climate
Fertilizer
RRfirst
Soil
CV
Slope
(a)
(b)
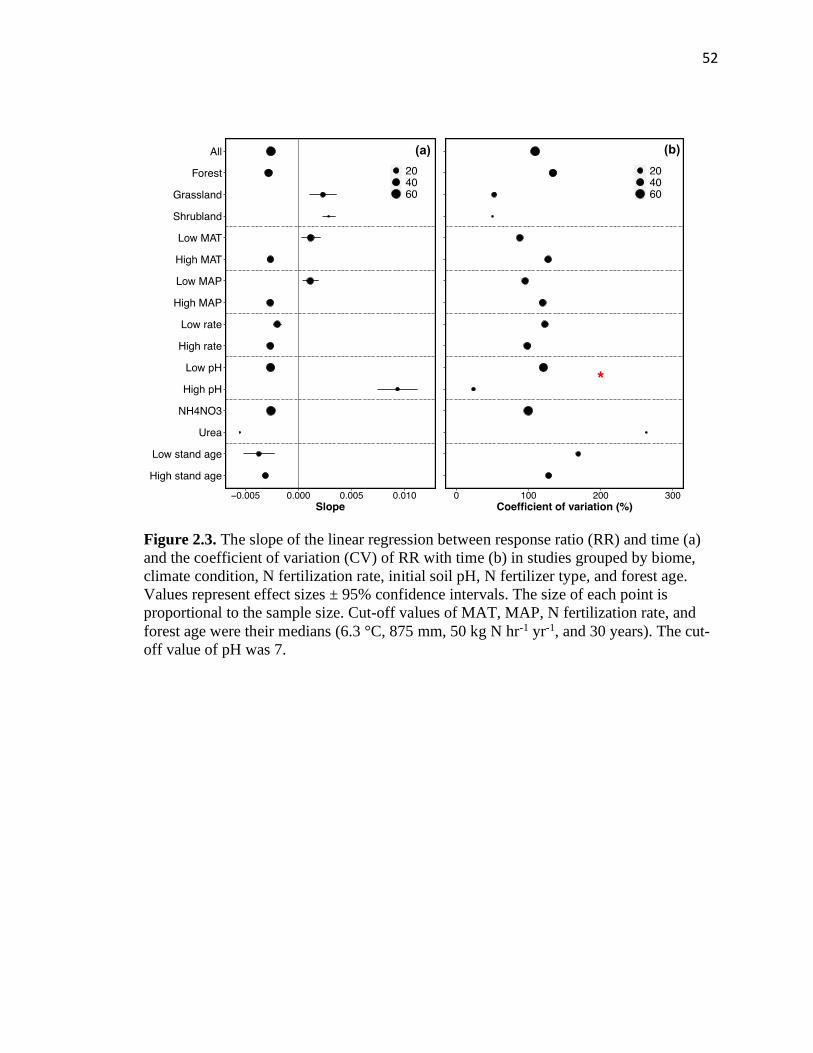
52
Figure 2.3. The slope of the linear regression between response ratio (RR) and time (a)
and the coefficient of variation (CV) of RR with time (b) in studies grouped by biome,
climate condition, N fertilization rate, initial soil pH, N fertilizer type, and forest age.
Values represent effect sizes ± 95% confidence intervals. The size of each point is
proportional to the sample size. Cut-off values of MAT, MAP, N fertilization rate, and
forest age were their medians (6.3 °C, 875 mm, 50 kg N hr-1 yr-1, and 30 years). The cut-
off value of pH was 7.

53
Figure 2.4. Long-term N addition impacts on plant productivity and their temporal trends
over time. Red arrows represent negative N impacts/decreasing plant productivity
responses, whereas green arrows represent positive N impacts/increasing plant
productivity responses. The purple bowties represent the factors influencing overall N
impacts or its temporal trend, the relative contribution is shown next to the corresponding
factor.
-
+
N additionClimate: 49%Soil: 32%
RRfirst: 12%Fertilizer: 7%
↑ Soil acidification;↓ Fungi/Bacteria;
↓ Plant biodiversity;↑ Al3+ accumulation;
etc.
↓ Soil C/N;↑ Soil enzyme activity;
etc.
Climate: 43%Soil: 33%
RRfirst: 15%Fertilizer: 9%
Magnitude
Temporal pattern
Un
ders
tan
din
g
Eff
ort
Time
Neff
ects
Eff
ort
Grasslands ShrublandsForests
54
CHAPTER 3
EFFECTS OF MULTIPLE GLOBAL CHANGE FACTORS ON SOIL RESPIRATION
IN A DRYLAND ECOSYSTEM
Abstract
Due to their large stocks of carbon (C) and strong sensitivity to climate, drylands have a
large potential for C sequestration and climate change mitigation. However, uncertainties
remain regarding how multiple global change factors affect soil C cycling in drylands
individually and interactively. To address this knowledge gap, we conducted a dryland
soil incubation experiment including four global change factors (prior warming, C
availability, soil moisture content, and soil moisture variability [rewetting]) combined in
a factorial design. The experiment was divided into two periods: 1) a rewetting period
consisting of six 14-d drying-rewetting cycles; and 2) a recovery period lasting 28 days.
The individual effects of all four global change factors on soil respiration were
significant. In contrast to many in situ studies, rates of respiration under variable soil
moisture (drying-rewetting cycles) were lower than stable soil moisture regimes. In many
cases, past treatments (e.g. prior warming and drying-rewetting cycles) continued to
influence soil biogeochemical patterns. Importantly, interactive effects of global change
drivers on soil C cycling were found. For example, effects of soil moisture and prior
warming on soil respiration were insignificant in soils without C input; however, higher
soil respiration was found under high soil moisture and prior warming in soils with C
input. Our study strongly suggests not only the individual factor but also the interactive
effects of multiple global change factors are critical for improving our understanding and
forecasting of soil C cycling in drylands.
55
Introduction
Drylands, which cover ~45% of the world’s land area and store 32% of all
terrestrial soil organic carbon (SOC) (Plaza et al., 2018; Prăvălie, 2016), have a
significant effect on global carbon (C) cycling. Drylands store a significant amount of C
and are highly sensitive to climate change (Huang et al., 2016). For example, drylands
often switch between functioning as C sinks and sources, which mainly depend on
precipitation (Biederman et al., 2017). Therefore, they are considered to have a large
potential for C sequestration and climate change mitigation (Lal, 2004). To better
understand how soil C cycling will change under future climate change, it is essential to
determine the individual and interactive effects of multiple global change factors on
dryland C cycling.
Water is thought to be the most important factor regulating soil biogeochemical
processes in drylands, and the magnitude and timing of precipitation events have strong
impacts on both above- and belowground processes (Cable et al., 2008; Sala et al., 2012).
In addition to natural seasonal variation in precipitation, drought events are common in
drylands (Schimel, 2018), and are likely to become more severe in the future. Drought
includes two types: 1) the amount of precipitation is constantly low for a long time, and
precipitation events are relatively evenly distributed; and 2) infrequent large precipitation
events are followed by a long period without any precipitation (Seneviratne et al., 2012).
It is important to determine how these two types of droughts affect soil respiration
because they can impact soil C cycling differently. Water affects microbial dynamics in
three fundamental ways: as resource, as solvent, and as transport medium (Schimel,
2018). Low soil moisture negatively impacts all three of these functions, decreasing
56
microbial activity and soil respiration. Drying-rewetting cycles can further affect soil
respiration by disrupting soil aggregates and releasing osmolytes from the microbial
biomass and/or cell lysis (Hu et al., 2018; Lado-Monserrat et al., 2014; Schimel, 2018).
This is hypothesized to be the mechanism underlying the pulse of CO2 emitted from dry
soils upon re-wetting, the so-called ‘Birch effect.’ It is possible for the temporal
distribution of precipitation to change without a change in the total amount of water
inputs during a specific period. However, few studies have disentangled the effects of
mean soil moisture content from its variability (Fierer & Schimel, 2002). Conducting
related studies to answer this question is crucial for better understanding of soil
respiration responses to drought in drylands.
Although precipitation is often thought to be the dominant control on soil C
cycling in arid environments, there is strong evidence that C limitation also plays an
important role (Austin, 2011). Due to the scarcity of water and nutrients, litterfall inputs
and root exudates (the main C source for soil microbes) are relatively low in drylands
(Berhongaray et al., 2019; Cui et al., 2019; Dijkstra et al., 2021). As a result, soil
microbes in drylands are thought to be C starved (Schimel, 2018). Therefore, C addition
can stimulate soil microbial activity and soil respiration. However, the vegetation in
drylands usually forms a mosaic structure in which plant and litterfall patches are
separated by areas of exposed soil (Meloni et al., 2017). Once precipitation happens, a
large amount of soluble organic matter from litter can be released into soils (Austin,
2011). Therefore, it is essential to study the response of soil respiration to high substrate
availability and the underlying mechanisms.

57
Although variation in soil abiotic conditions (temperature, water, and substrate
availability) may occur simultaneously, most studies only determine the effect of one
global change factor on soil functions (Rillig et al., 2019). Some of these studies provide
the clues to infer the interactive effects of two global change factors on soil C cycling.
For example, substrate availability and soil moisture should interactively affect soil
respiration: C addition may not have significant effects on soil respiration when soil
moisture is extremely low because water is too limited to dissolve, diffuse, and transport
substrate. When soil moisture increases, however, C may be rapidly metabolized by the
microbial biomass and a significant stimulation of soil respiration is observed (Schimel,
2018). In addition, warming can both increase metabolic rates (Davidson & Janssens,
2006) but also decrease soil moisture (Luo et al., 2010); therefore, there should be an
interactive effect of warming and soil moisture on soil respiration. Once the number of
global change factors is greater than two, it can be hard to infer the interactive effects
because the underlying processes can be complex. Global climate events, even if not
extreme in a statistical sense, can still lead to extreme impacts on ecosystem function,
either by crossing a critical threshold in a social, ecological, or physical system, or by
occurring simultaneously with other events (Seneviratne et al., 2012). Few studies have
been conducted to assess how soil responds to more than two environmental factors at a
time, although this has been called for (Rillig et al., 2019). The unknowns regarding
whether multiple global change factors can interactively affect soil respiration may
inhibit our prediction about soil C cycling in the future.
Finally, another major uncertainty concerns the temporal dimension of soil
responses to global change drivers. The so-called ‘legacy effects’ of drying-rewetting
58
cycles on soil respiration have been relatively well recognized (Li et al., 2018b). For
example, Fierer and Schimel (2002) found that the effect of drying-rewetting cycles on
soil respiration lasted for more than a month once drying-rewetting cycles stopped.
Drylands are exquisitely sensitive to perturbations and are generally slow to recover post
disturbance because of their limited resource availability (Poulter et al., 2014; Steven et
al., 2021). However, few studies have directly assessed patterns in soil biogeochemistry
following the cessation of climatic perturbations, like warming or drying-rewetting
cycles. Therefore, it is necessary to determine the potential legacy impacts of drying-
rewetting cycles in drylands. Otherwise, we may over- or underestimate climate effects
on soil respiration.
Our objective was to determine the individual and interactive effects of four
global change factors (prior warming, soil moisture content, soil moisture variability
[drying-rewetting cycles], and substrate availability) on soil respiration in drylands, and
to identify the underlying mechanisms. We hypothesized that 1) because these dryland
soils are extremely C-poor, C availability is the most influential global change driver that
affects soil respiration in drylands. 2) After controlling for differences in mean soil
moisture, variable soil moisture regimes (e.g., drying-rewetting cycles) produce greater
cumulative soil respiration than stable soil moisture regimes, due to the “Birch effect”. 3)
Since drylands are highly sensitive to climate change, the effect of past climate
manipulations (e.g., warming and drying-rewetting cycles) on soil biogeochemistry can
last for a relatively long time once they stop. 4) Interactive effects of global change
factors on soil respiration are common in drylands. In the present study, we conducted an
incubation experiment of 16 weeks combining six 2-week drying-rewetting cycles and 4
59
weeks of post-wetting recovery during which dryland soils were maintained at a stable
moisture content. To help us interpret patterns in the respiration data, we also quantified
the size of the microbial biomass, the activity of extracellular enzymes involved in
organic matter decay, and the protection of organic matter in different aggregate size
classes. Finally, given that fungi plays a critical role in dryland C cycling under climate
change (Collins et al., 2008), we assessed the composition of the soil fungal community
via ITS sequencing to determine if changes in fungal community structure could explain
treatment effects.
Methods
Site description
We sampled soils from a study site located in a semiarid ecosystem on the
Colorado Plateau near Castle Valley, Utah, USA (38◦ 38’ 4’’ N, 109◦ 24’ 38’’ W; 1310 m
above sea level). Mean annual temperature and precipitation are 13 °C and 269 mm,
respectively. The soils are classified as Rizno fine sandy loam (Loamy, mixed,
superactive, calcareous, mesic Lithic Ustic Torriorthents), which are shallow, well
drained soils formed in residuum, colluvium, and eolian material derived from sandstone,
siltstone and limestone. The vegetation is a mix of grasses (Achnatherum hymenoides)
and shrubs (e.g. Atriplex confertifolia and Gutierrezia sarothrae). A field experiment was
conducted at this site starting in August 2017, and it included a fully factorial
combination of two treatments: 1) warming (4°C above ambient conditions vs. control);
and 2) C input (Atriplex confertifolia leaf litter vs. biocrust). At the beginning of the
experiment, approximately 400 g Atriplex confertifolia leaf litter was applied to 3 cm soil
depth in the appropriate chamber. Sections of live biocrust from adjacent soils were
60
transferred to the appropriate chamber until covering 0.11 m2 soil surface area. There
were 20 plots in total, and each plot contained an automated measurement chamber (38
cm diameter) in which CO2 fluxes were measured hourly. At the start of this experiment,
soils (0.040 ± 0.013 g organic C kg-1 soil) from all 20 autochambers were excavated,
pooled together, and sieved, then were washed with concentrated sodium hypochlorite
solution to remove soil organic matter by using methods modified from (Mikutta et al.,
2005). Treated soils had a remaining organic C concentration of 0.029 ± 0.001 g organic
C kg-1 soil, representing a 28% decrease from initial values. This aimed to keep initial
SOC at low and comparable levels for both C input treatments. The autochambers were
then back-filled with treated soils to a consistent depth and allowed to incubate in situ for
15 months. Because no vascular plants grew within the chambers, the only organic C
input to the soils during this period was from the Atriplex litter layer or biocrusts. We
collected soils from all 20 autochambers in November 2018; however, for this study, we
only used soils collected from the 10 plots treated with Atriplex litter. We composited
soil samples from the five chambers under control climate and composited the samples
from the five warming chambers. The former and latter composite soil samples were used
to represent control and prior warming treatments in this incubation experiment,
respectively. The goal was to examine the initial and legacy effects of the field warming
treatment on soil physico-chemical and biological parameters.
Experimental design
Laboratory treatments were applied to 50 g of air-dried soils incubated at room
temperature in 250 mL Mason jars. The experiment was a fully factorial combination of
the following treatments: 1) prior warming: prior warmed soils versus unwarmed soils; 2)
61
soil moisture: 0.04 g H2O g-1 dry soil (20% water-holding capacity) versus 0.08 g g-1
(40% water-holding capacity); 3) soil moisture variability: stable versus variable (see
below); and 4) C addition: control versus C addition (2.0 mg glucose-C g−1 dry soil for
each drying-rewetting cycle). Prior to the start of the experiment, soils were sieved to 4
mm, homogenized, and conditioned for one week at the appropriate soil water content
(0.04 g g-1 or 0.08 g g-1). For the ‘variable’ soil moisture treatment, soils were subject to
two-week drying/rewetting cycles. During each cycle, soils in the ‘variable’ treatment
were rewetted to 0.16 g g-1 (80% water-holding capacity) gravimetric soil moisture, then
allowed to dry sufficiently to achieve a time-weighted mean moisture equal to one of the
mean soil moistures described in 2). With 16 unique treatment combinations and 5
replicates per treatment, there were 80 microcosms in total.
This experiment had two periods: 1) a rewetting period including six two-week
drying-rewetting cycles; and 2) a recovery period that lasted four weeks (Fig. 1). To
maintain both stable and variable soil moisture treatments at the same average water
content (0.04 g g-1 or 0.08 g g-1) during the rewetting period, preliminary studies were
conducted to determine soil drying curves during the ‘drying period’. For example, for
variable soil moisture treatment with 0.04 g g-1 average soil moisture, soils were rewetted
to 0.16 g g-1 soil moisture at the beginning of each drying-rewetting cycle using sterile
deionized water. The soils were allowed to dry to 0.003 g g-1 soil moisture, which we
accomplished by removing the jar lid for 168 hours. Then the jar lid was closed loosely
until next drying-rewetting cycle (Fig. 3.1a). This protocol ensured that mean soil
moisture over the course of the drying-rewetting cycle was equivalent to 0.04 g g-1.
Similarly, for the variable soil moisture treatment with 0.08 g g-1 average soil moisture,
62
soils were rewetted to 0.16 g g-1 soil moisture at the beginning of each drying-rewetting
cycle. The soils were dried to 0.062 g g-1 soil moisture by removing the jar lid for 92.9
hours, and the jar lid was closed loosely until next drying-rewetting cycle (Fig. 3.1b). For
stable soil moisture treatments, jar lid was kept closed loosely to avoid soil evaporation
during rewetting period. Appropriate, small amounts of sterile deionized water was added
to soils to keep soil moisture at 0.04 g g-1 or 0.08 g g-1 at the same time when we rewetted
soils for variable soil moisture treatments. During the rewetting period, 0.625 ml glucose
solution (which is equal to 2.0 mg glucose-C g−1 dry soil) was added into soils under the
C input treatment; this volume was accounted for in our calculations of soil moisture so
that we did not over-wet the soils when adding glucose. We did not add glucose solution
to C input treatment during recovery period.
At the beginning of the last drying-rewetting cycle, a 13C glucose solution (2.0 mg
glucose-C g−1 dry soil at 5 atom % 13C) was added instead of the 12C glucose solution to
the C input treatment to quantify priming effects. After six two-week drying-rewetting
cycles, variable soil moisture treatments were adjusted to the corresponding stable soil
moisture treatments for the four-week recovery period.
Measurements of soil respiration and soil parameters
During the course of the incubation experiment, headspace samples (10 ml) were
collected by using syringe once a week after sealing jars tightly for 24 hours (Fig. 3.1).
Headspace CO2 concentration was analyzed using gas chromatography (GC-2016
Greenhouse Gas Analyzer, Shimadzu, Kyoto, Japan). Headspace 13CO2 concentration and
isotopic abundance was measured during the last drying-rewetting cycle of rewetting
63
period using a G2131-i Isotope and Gas Concentration Analyzer (Picarro Inc., Santa
Clara, CA, USA).
We destructively harvested subsets of the microcosms in each treatment at the end
of rewetting and recovery periods, respectively (Fig. 3.1). Soils from 3 of the 5 replicate
jars under each treatment were collected during the first harvest, at the end of the
rewetting period, and soils from the remaining 2 jars were collected during the second
harvest, at the end of the recovery period. Soil samples collected during harvests were
immediately used to measure soil microbial biomass C. Soil subsamples were also air-
dried at room temperature for measuring soil total organic C and nitrogen (N)
concentrations. Additional subsamples were stored at either 4 °C for measuring soil
aggregate stability or at -80 °C for measuring soil enzyme activities and soil fungal
community composition.
Soil microbial biomass C was determined via a modified fumigation-extraction
technique (Brookes et al., 1985). Briefly, two aliquots of fresh soil samples
(approximately 5.0 g each aliquot) were collected. One aliquot was fumigated by adding
2 ml of ethanol-free chloroform to the soil sample and incubating for 24 hours, and the
other aliquot was kept untreated as control. The fumigated and unfumigated soil samples
were then extracted with 25 ml of 0.5 M K2SO4. After shaking one hour, soil solutions
were filtered through Whatman filters, and the filtrates were stored at -20 °C. The
extracts from unfumigated and fumigated soils were analyzed for dissolved organic C
concentration (TOC-L, Shimadzu, Kyoto, Japan). 0.45 was used as the conversion factor
to calculate soil microbial biomass C. If organic C content for the fumigated samples was
64
lower than that under the corresponding unfumigated samples, we set soil microbial
biomass C as zero.
Before measuring soil total organic C and N via an elemental analyzer (ECS 4010
Elemental Analyzer, Costech Analytical Technologies, Valencia, CA, USA), inorganic C
was first removed from the soil using 5 mL of 6% sulfurous acid (H2SO3) at 80 °C for 24
h. For soil samples from the first harvest, atom % 13C of the soil organic C was
determined when measuring soil total organic C and total N through the elemental
analyzer. Soil aggregates were fractionated into four different size classes (>2, 2-0.25,
0.25-0.053, and <0.053 mm) via wet sieving following (Denef & Six, 2005), and the
mass of soil in each size class was quantified.
Activities of the extracellular enzymes acid phosphatase, β-glucosidase,
cellobiohydrolase, leucine aminopeptidase, and β-N-acetylglucosaminidase were assayed
for each of subsamples using p-nitrophenol conjugated substrates following (German et
al., 2011). Approximately 1.0 g soil sample was homogenized by using 30 ml of sodium
acetate trihydrate buffer. 40 µL of soil slurry was transferred to 96-well microplate, and
180 µL of sodium acetate trihydrate buffer and 20 L of appropriate substrate solution
were added to each well. The microplate was incubated at room temperature for one hour.
90 L of supernatant from each well was transferred to a fresh microplate, and then 10
L of 1M NaOH was added to each well. Absorbance of each microplate was read at 410
nm on a microplate spectrophotometer (Spectramax M2 microplate spectrophotometer,
Molecular Devices, San Jose, CA, USA). The enzyme activities were expressed in units
of nmol h−1 g−1. Since significant and positive correlations were found among the
65
activities of all five soil enzymes (Fig. B1 in the appendices), we reported the mean
activity of all enzymes combined.
A DNeasy PowerSoil Kit (Qiagen, Hilden, Germany) was used to extract DNA
for all soil subsamples from both first and second harvests. Since the concentration of
DNA extract from each soil sample was low, we combined all DNA extracts within a
treatment and a harvest, respectively. As a result, we had a total of 32 samples (16
samples each for the first and second harvests). We concentrated the DNA extracts using
a kit (ReliaPrep™ DNA Clean-Up and Concentration System). DNA extracts were then
pooled in equimolar concentrations and sequenced on the Illumina MiSeq platform.
Primers ITS1f-ITS2 were used to amplify fungal marker genes following Earth
Microbiome Project protocols, and we used the QIIME 2 (version 2020.11.0) to analyze
the sequencing data (Bolyen et al., 2019). The DADA2 algorithm was used to denoise
sequences and to produce putatively error-free amplicon sequence variants (ASVs) that
lacked chimeras. A Naïve Bayesian classifier was trained on the UNITE (version 8.2)
training dataset to assign fungal taxonomy (Abarenkov et al., 2020). In order to remove
non-fungal ASVs from the dataset, a taxonomy-based filtering procedure was applied.
Before determining α-diversity for each treatment by using package “vegan” in R, fungal
sequences were rarified to 12,000.
Data calculation and statistical analyses
The aggregate mean weighted diameter (MWD, mm) which is an index of
aggregate stability was calculated as follows:
MWD = ∑ Xi Wi 4i=1 (1)
66
Where Xi is the mean diameter of the ith size fraction (mm), and Wi is the proportion of
the ith size fraction in the whole soil (%).
The priming effect (μg CO2-C g-1 soil) was determined following Eq. (2) (Chen et
al., 2019):
Priming effect = Ctreat × (1 – (at%treat − at%control) / (at%glucose − at%SOM)) –
Ccontrol (2)
where Ctreat and Ccontrol are the total CO2-C (μg CO2-C g−1 soil) from the C input and
non-C input treatments, respectively. at%treat and at%control are the 13C isotope
abundances (in atom% 13C) of CO2 from the C input soil and non-C input soil,
respectively. at%glucose and at%SOM are the 13C isotope abundances of added glucose
and soil organic matter, respectively. It should be noted that at%control and at%SOM had
the same value, which was equal to the 13C isotope abundances (in atom% 13C) of CO2
from the non-C input soil. Ctreat and Ccontrol were measured 1 and 13 days after adding
13C-glucose. at%treat, at%control, and at%SOM were measured 13 days after adding 13C-
glucose. Therefore, priming effect was measured two times during the last drying-
rewetting cycle. Since the priming effect did not change significantly between two times
that we measured it, we reported the mean priming effect for these two times.
Soil fungal community data were visualized with non-metric multidimensional
scaling (NMDS) plots. Repeated-measures five-way ANOVA analysis was conducted to
quantify the individual and interactive effects of the four global change factors and two
incubation periods on soil respiration, and five-way ANOVA analysis was conducted for
MWD, soil enzyme activity, soil microbial biomass C, priming effect, and soil total C
67
and N concentrations. For ANOVA analysis, the random effect was microcosm, and R
package “lmertest” was used to estimate P values in mixed effects models. Pearson’s
correlations were used to determine relationships among measured soil variables. All
statistical analyses were conducted in R.
Results
Soil respiration
The four experimental treatments (prior warming, C addition, soil moisture
content, soil moisture variation) had strong individual and interactive effects on soil
respiration (Table 3.1). C input enhanced soil respiration responses to soil moisture -
higher soil moisture increased soil respiration by 1.0% in soils without C input versus
79.4% in soils with C input (Fig. 3.2a). C input also increased respiration responses to
prior warming, and prior warmed soils had 14.4% higher respiration in soils without C
input, but 35.3% in soils with C input (Fig. 3.2b). Moreover, higher soil moisture
increased soil respiration by 38.3% in prior unwarmed soils versus 66.0% in prior
warmed soils (Fig. 3.2c). We did not find significant differences in soil respiration rates
between the rewetting and recovery periods (Table 3.1 and Fig. B2 in the appendices).
Soil physiochemical and biological properties
Soil aggregate mean weighted diameter responded to a three-way interaction
among C input, soil moisture content, and prior warming (Fig. 3.3a and b and Table B1 in
the appendices) and the interaction among C input, soil moisture content, and soil
moisture variability (Fig. 3.3c and d). In general, MWD was greatest in soils with high
soil moisture, added C input, and a stable, non-fluctuating soil moisture regime (Fig.
3.3d).
68
Only soil moisture and prior warming showed significant individual effects on
soil enzyme activity (Table B2 in the appendices), increasing soil enzyme activity by
22.6% and 12.8%, respectively. Soil enzyme activity was significantly higher during the
recovery than the rewetting period. We also found higher soil total C concentration under
C input, rewetting, and high soil moisture (Table B3 in the appendices). Total C
concentration responded to the four-way interaction among C input, soil moisture
content, soil moisture variability, and prior warming, with a similar pattern for total N,
although C input had by far the largest absolute effect. By contrast, only C input showed
significant and positive individual effect on soil microbial biomass C (Table B5 in the
appendices).
Soil moisture content and prior warming significantly and individually affected
the soil priming effect (Table B6 in the appendices). More specifically, high soil moisture
and prior warming significantly increased the soil priming effect (the enhanced
degradation of SOC due to addition of exogenous C) by 128.9% and 66.8%, respectively.
Soil moisture content significantly mediated the effects of prior warming or drying-
rewetting cycles on the soil priming effect. More specifically, when compared to stable
soil moisture treatment, soil priming effect under drying-rewetting cycles was lower
under low soil moisture content, but became higher under high soil moisture content (Fig.
3.4). In addition, the difference in soil priming effect between control and prior warming
was minor under low soil moisture content; however, higher soil priming effect was
found under prior warming when soil moisture content was high.
Significant interactions of experiment period (rewetting vs. recovery) with C
input, prior warming, and soil moisture content treatments were found; however, the
69
interactive effects of soil moisture variability and period on soil respiration and
physiochemical properties were not significant (Table 3.1 and Table B1-B5 in the
appendices). In other words, once rewetting stopped, its effect on soil functions persisted.
Soil fungal community
According to the results of the NMDS analysis, soil fungal communities were
significantly affected by C input and prior warming (Fig. 3.5a and Fig. B3a in the
appendices). In particular, the percentage of Ascomycota was increased by C input but
was decreased by prior warming (Fig. 3.5b and Fig. B3e in the appendices). The relative
abundance of fungal phyla was not significantly affected by soil moisture content, soil
moisture variability, or experimental period (Fig. B3 in the appendices).
Correlations between soil respiration and soil parameters
According to Pearson’s correlation analysis, mean soil respiration was positively
correlated with soil total C concentration (p < 0.001), soil priming effect (p < 0.01), soil
microbial biomass C (p < 0.001), and MWD (p < 0.01) (Fig. 3.6). No significant
relationship between mean soil respiration and mean enzyme activity was found.
Discussion
Our dryland soil incubation experiment provided mixed support for our four
hypotheses. First, among all four global factors (prior warming, sugar addition, soil
moisture content, and soil moisture variability), sugar addition was the most influential
factor affecting soil respiration in drylands, which is consistent with our hypothesis.
Second, after controlling for differences in mean soil moisture, variable soil moisture
regimes produced lower cumulative soil respiration than stable soil moisture regimes,
which is inconsistent with our expectation. Third, as we expected, legacy effects of
70
warming and drying-rewetting cycles on soil biogeochemistry were observed. Last, many
global change drivers showed interactive effects on soil C cycling, which is consistent
with our initial prediction. Below, we discuss the biogeochemical mechanisms underlying
these patterns.
Individual effects of global change factors on soil C dynamics
The magnitude of C input effects on soil respiration was much greater when
compared to soil moisture content, rewetting, and prior warming, which is consistent with
our first hypothesis: substrate availability is the most influential global change factor that
affects soil respiration in these severely C-depleted soils, which are typical of many
drylands (Schimel, 2018). We note that soil moisture was present in all treatments and
that the effects of C input would be unlikely to be observed in dry soils, but for the
conditions of this experiment, C input had the largest effect. In particular, substrate
availability contributed to soil C cycling by affecting processes that lead to C loss and
accumulation. On one hand, C input stimulated soil C loss by enhancing total respiration,
including increased mineralization of both added C and native soil organic matter (i.e., a
positive priming effect) (Kuzyakov, 2010). On the other hand, these same C input had a
positive influence on the size of soil aggregates and the soil microbial biomass, both of
which are associated with the formation of stable and mineral-protected soil C (Cotrufo et
al., 2013; C. Liang et al., 2017). We also found that C input increased the relative
abundance of Ascomycota. This is because Ascomycota has higher capacity to
decompose labile C (e.g. glucose that we added as C input in the present study) (Treseder
& Lennon, 2015). Overall, in our study, soils gained more C from fresh inputs than they
lost via respiration; therefore, higher soil C concentration was found under the C input
71
treatment relative to the control. However, in this experimental context, net accumulation
of C may reflect N limitation of soil microorganisms, as we added glucose only and N
limitation could develop over time. Nonetheless, our results emphasize that relieving
microbes from C limitation can simultaneously enhance the soil C losses as well as the
potential stabilization of fresh C input.
We expected soil respiration rates would increase with soil moisture content and
soil moisture variability. Previous studies have found that drying-rewetting cycles are
associated with pulses of soil respiration, presumably driven by enhanced microbial
consumption of osmolytes or organic matter released from disrupted aggregates (Barnard
et al., 2020; Fierer & Schimel, 2002; Schimel, 2018). Consistent with this expectation,
we found that repeated rewetting cycles were associated with slower rates of aggregate
formation on average, as the physical disruption associated with rewetting can prevent
aggregate formation (Denef et al., 2001). We would expect that a decrease in the physical
protection of organic matter would increase soil respiration. However, we found that the
moisture variability treatment decreased soil respiration when compared to the stable soil
moisture treatment, which is contrary to our second hypothesis. This might reflect sharp
transitions in soil moisture status over the course of the drying rewetting cycle.
Immediately following rewetting, soil moisture was extremely high (80% WHC),
potentially reducing oxygen for soil microbes. To maintain the same mean moisture
content as observed in the ‘stable’ moisture treatment, the soils were then dried to below
the target gravimetric soil moisture (0.04 g g-1 or 0.08 g g-1, respectively) at the end of the
rewetting cycle, presumably inducing moisture limitation. The relatively brief window of
time during which moisture conditions were optimal could have contributed to the slow
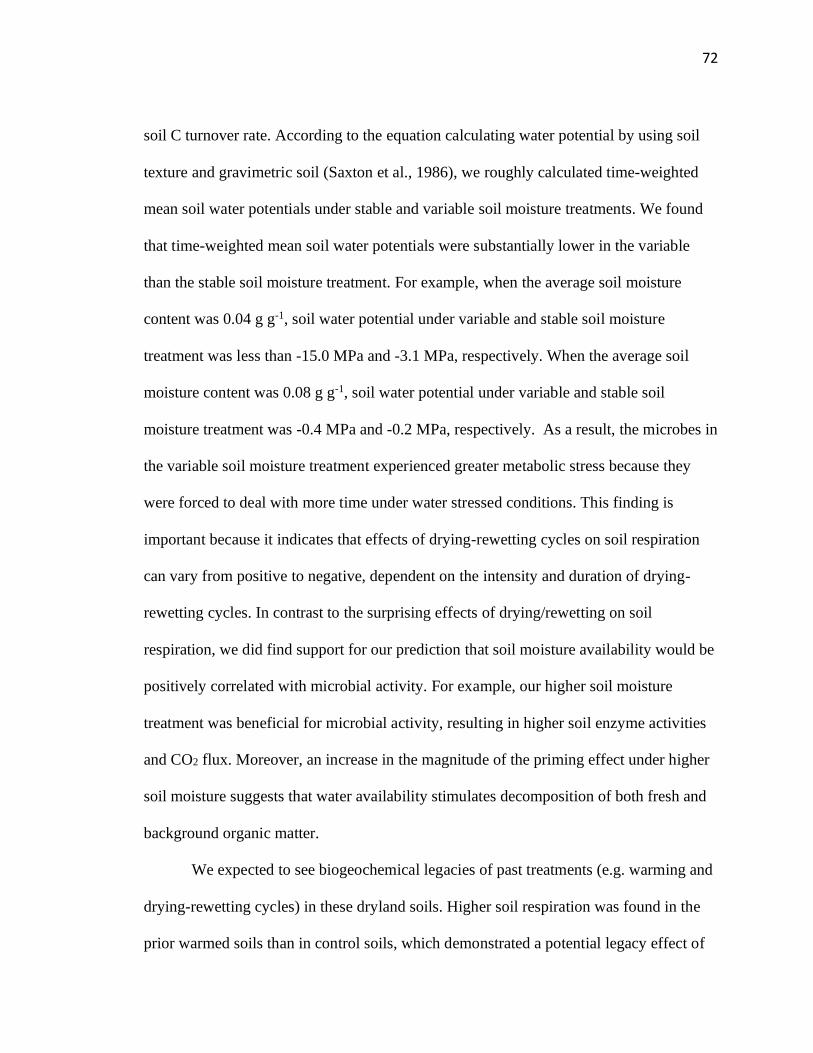
72
soil C turnover rate. According to the equation calculating water potential by using soil
texture and gravimetric soil (Saxton et al., 1986), we roughly calculated time-weighted
mean soil water potentials under stable and variable soil moisture treatments. We found
that time-weighted mean soil water potentials were substantially lower in the variable
than the stable soil moisture treatment. For example, when the average soil moisture
content was 0.04 g g-1, soil water potential under variable and stable soil moisture
treatment was less than -15.0 MPa and -3.1 MPa, respectively. When the average soil
moisture content was 0.08 g g-1, soil water potential under variable and stable soil
moisture treatment was -0.4 MPa and -0.2 MPa, respectively. As a result, the microbes in
the variable soil moisture treatment experienced greater metabolic stress because they
were forced to deal with more time under water stressed conditions. This finding is
important because it indicates that effects of drying-rewetting cycles on soil respiration
can vary from positive to negative, dependent on the intensity and duration of drying-
rewetting cycles. In contrast to the surprising effects of drying/rewetting on soil
respiration, we did find support for our prediction that soil moisture availability would be
positively correlated with microbial activity. For example, our higher soil moisture
treatment was beneficial for microbial activity, resulting in higher soil enzyme activities
and CO2 flux. Moreover, an increase in the magnitude of the priming effect under higher
soil moisture suggests that water availability stimulates decomposition of both fresh and
background organic matter.
We expected to see biogeochemical legacies of past treatments (e.g. warming and
drying-rewetting cycles) in these dryland soils. Higher soil respiration was found in the
prior warmed soils than in control soils, which demonstrated a potential legacy effect of
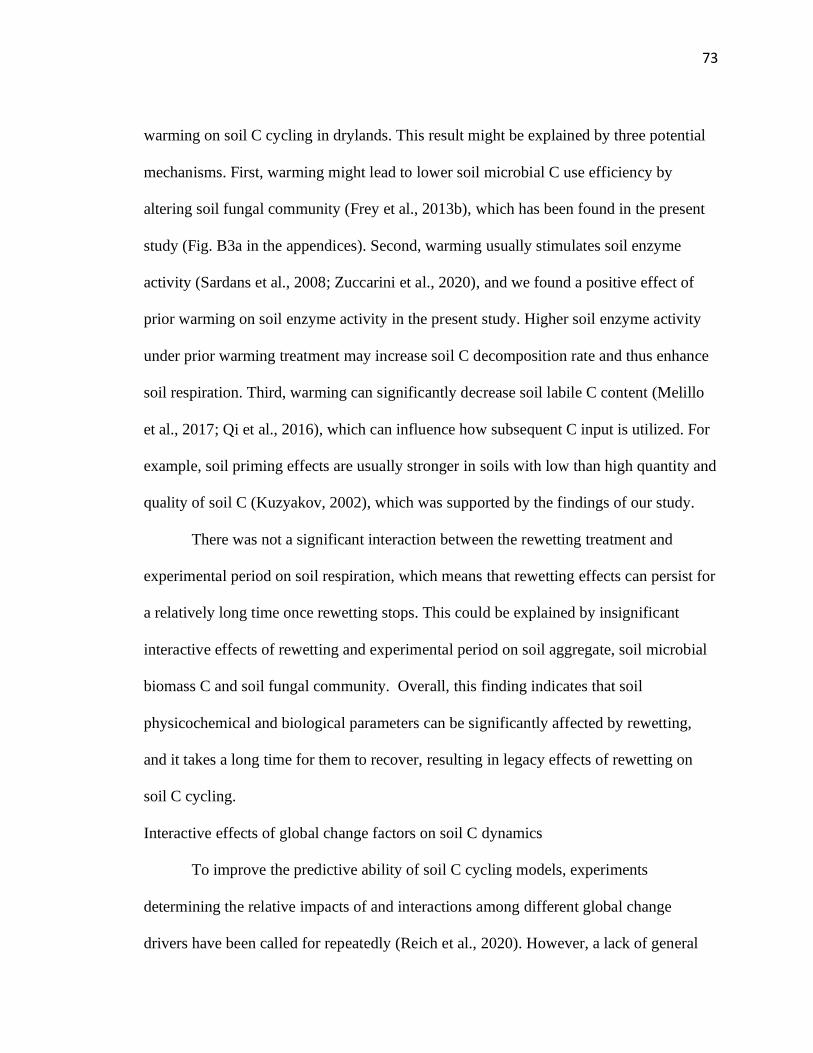
73
warming on soil C cycling in drylands. This result might be explained by three potential
mechanisms. First, warming might lead to lower soil microbial C use efficiency by
altering soil fungal community (Frey et al., 2013b), which has been found in the present
study (Fig. B3a in the appendices). Second, warming usually stimulates soil enzyme
activity (Sardans et al., 2008; Zuccarini et al., 2020), and we found a positive effect of
prior warming on soil enzyme activity in the present study. Higher soil enzyme activity
under prior warming treatment may increase soil C decomposition rate and thus enhance
soil respiration. Third, warming can significantly decrease soil labile C content (Melillo
et al., 2017; Qi et al., 2016), which can influence how subsequent C input is utilized. For
example, soil priming effects are usually stronger in soils with low than high quantity and
quality of soil C (Kuzyakov, 2002), which was supported by the findings of our study.
There was not a significant interaction between the rewetting treatment and
experimental period on soil respiration, which means that rewetting effects can persist for
a relatively long time once rewetting stops. This could be explained by insignificant
interactive effects of rewetting and experimental period on soil aggregate, soil microbial
biomass C and soil fungal community. Overall, this finding indicates that soil
physicochemical and biological parameters can be significantly affected by rewetting,
and it takes a long time for them to recover, resulting in legacy effects of rewetting on
soil C cycling.
Interactive effects of global change factors on soil C dynamics
To improve the predictive ability of soil C cycling models, experiments
determining the relative impacts of and interactions among different global change
drivers have been called for repeatedly (Reich et al., 2020). However, a lack of general
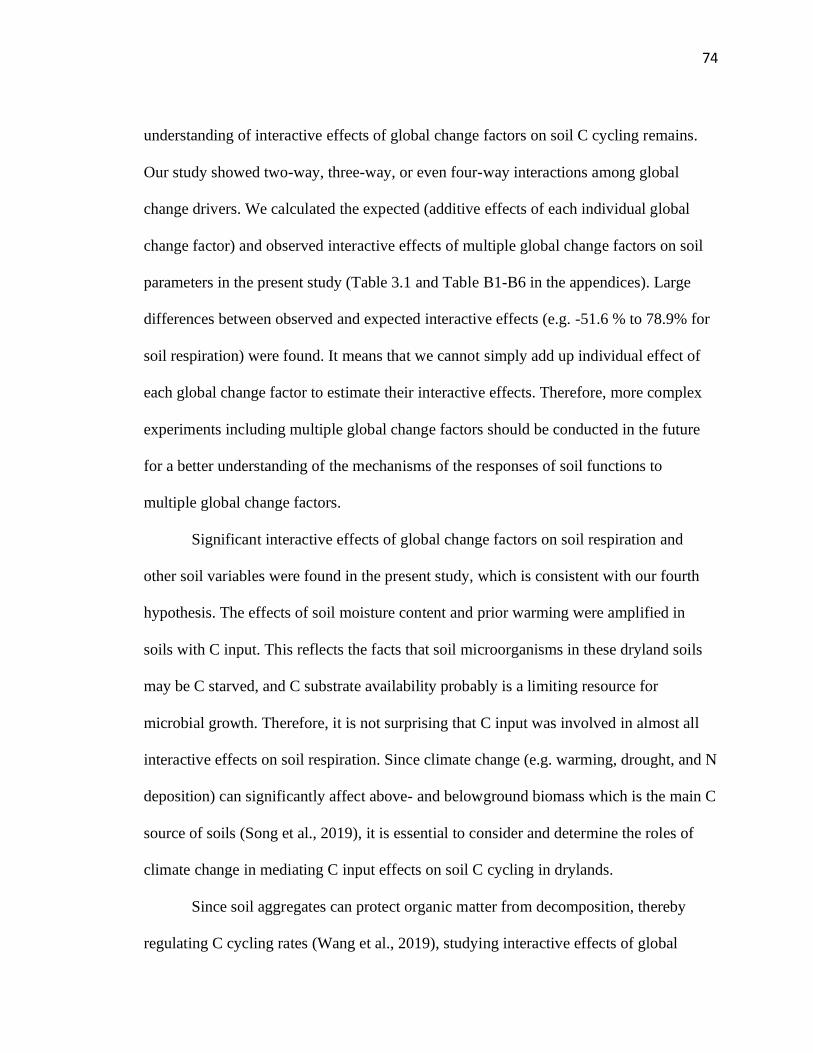
74
understanding of interactive effects of global change factors on soil C cycling remains.
Our study showed two-way, three-way, or even four-way interactions among global
change drivers. We calculated the expected (additive effects of each individual global
change factor) and observed interactive effects of multiple global change factors on soil
parameters in the present study (Table 3.1 and Table B1-B6 in the appendices). Large
differences between observed and expected interactive effects (e.g. -51.6 % to 78.9% for
soil respiration) were found. It means that we cannot simply add up individual effect of
each global change factor to estimate their interactive effects. Therefore, more complex
experiments including multiple global change factors should be conducted in the future
for a better understanding of the mechanisms of the responses of soil functions to
multiple global change factors.
Significant interactive effects of global change factors on soil respiration and
other soil variables were found in the present study, which is consistent with our fourth
hypothesis. The effects of soil moisture content and prior warming were amplified in
soils with C input. This reflects the facts that soil microorganisms in these dryland soils
may be C starved, and C substrate availability probably is a limiting resource for
microbial growth. Therefore, it is not surprising that C input was involved in almost all
interactive effects on soil respiration. Since climate change (e.g. warming, drought, and N
deposition) can significantly affect above- and belowground biomass which is the main C
source of soils (Song et al., 2019), it is essential to consider and determine the roles of
climate change in mediating C input effects on soil C cycling in drylands.
Since soil aggregates can protect organic matter from decomposition, thereby
regulating C cycling rates (Wang et al., 2019), studying interactive effects of global
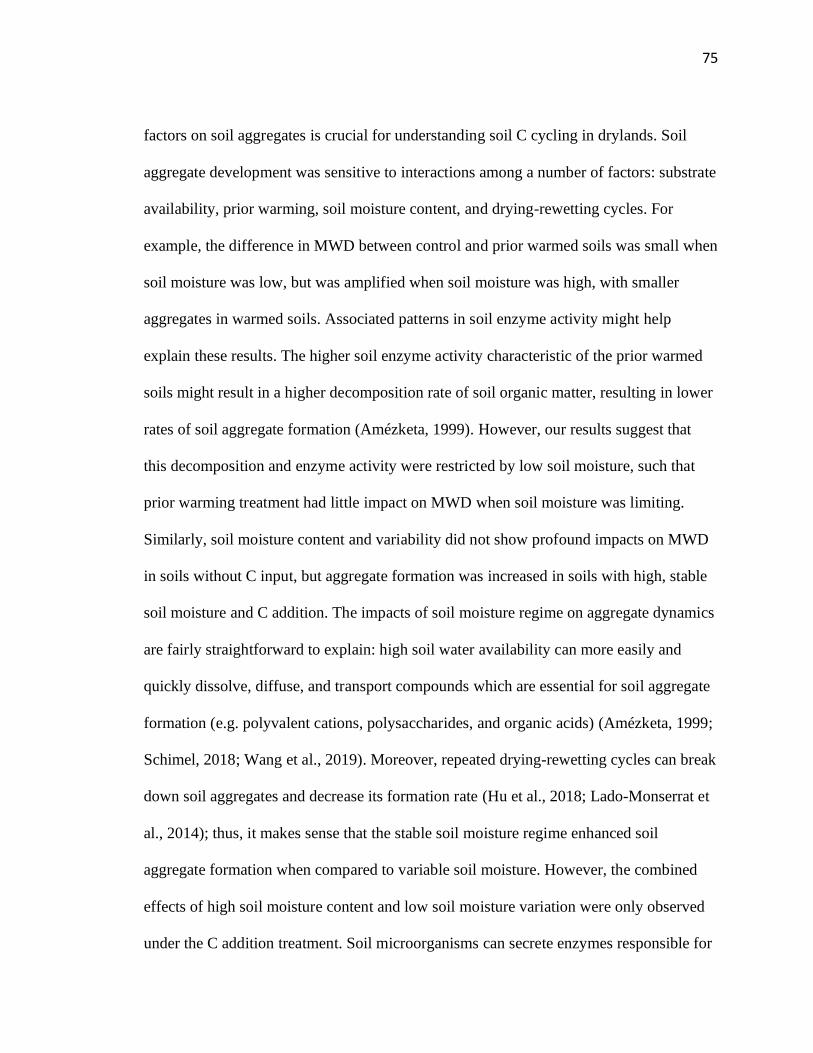
75
factors on soil aggregates is crucial for understanding soil C cycling in drylands. Soil
aggregate development was sensitive to interactions among a number of factors: substrate
availability, prior warming, soil moisture content, and drying-rewetting cycles. For
example, the difference in MWD between control and prior warmed soils was small when
soil moisture was low, but was amplified when soil moisture was high, with smaller
aggregates in warmed soils. Associated patterns in soil enzyme activity might help
explain these results. The higher soil enzyme activity characteristic of the prior warmed
soils might result in a higher decomposition rate of soil organic matter, resulting in lower
rates of soil aggregate formation (Amézketa, 1999). However, our results suggest that
this decomposition and enzyme activity were restricted by low soil moisture, such that
prior warming treatment had little impact on MWD when soil moisture was limiting.
Similarly, soil moisture content and variability did not show profound impacts on MWD
in soils without C input, but aggregate formation was increased in soils with high, stable
soil moisture and C addition. The impacts of soil moisture regime on aggregate dynamics
are fairly straightforward to explain: high soil water availability can more easily and
quickly dissolve, diffuse, and transport compounds which are essential for soil aggregate
formation (e.g. polyvalent cations, polysaccharides, and organic acids) (Amézketa, 1999;
Schimel, 2018; Wang et al., 2019). Moreover, repeated drying-rewetting cycles can break
down soil aggregates and decrease its formation rate (Hu et al., 2018; Lado-Monserrat et
al., 2014); thus, it makes sense that the stable soil moisture regime enhanced soil
aggregate formation when compared to variable soil moisture. However, the combined
effects of high soil moisture content and low soil moisture variation were only observed
under the C addition treatment. Soil microorganisms can secrete enzymes responsible for
76
mineralizing high molecular weight compounds, and also release extracellular
polysaccharides which bind soil particles, stabilizing soil aggregates (Amézketa, 1999). C
input may have contributed to soil aggregate formation by stimulating soil microbial
growth. Overall, these results suggest that the processes controlling the physical
protection of soil organic matter are complex and regulated both by climate and C input.
Priming of old or ‘background’ soil organic matter by fresh C input can
significantly influence the magnitude of C losses from soil (Kuzyakov, 2002), which is
supported by our results. We found a significant and positive correlation between the soil
priming effect and soil respiration rates, confirming that added glucose stimulated release
of C (0.009 µg CO2-C g-1 soil in the present study) from background soil organic matter,
which was approximately 0.6% of soil respiration under non-C input treatment (0.062 µg
CO2-C g-1 soil). Therefore, in order to deeply understand soil respiration in drylands, it is
essential to disentangle the mechanisms of interactive effects of multiple global factors
on any soil priming effects. In the present study, we found that prior warming and soil
moisture content interactively affected the magnitude of the soil priming effect. This
pattern may be partially explained by observed patterns of soil enzyme activities, which
play a large role in priming, since the decomposition of old SOC is enzymatically
catalyzed (Kuzyakov, 2010; Kuzyakov et al., 2000). Therefore, higher soil enzyme
activities are often associated with higher soil priming effects (R. Chen et al., 2014). In
our study, we found soil enzyme activities were higher overall under prior warmed soils
versus control soils, potentially reflecting greater capacity for enzyme stimulation by
added C. In addition, Sardans & Peñuelas (2005) found that low soil moisture
significantly inhibited soil enzyme activity, which is also supported by our results. Soil
77
water limitation constrained the soil priming effect across all treatments, likely reflecting
constrains on microbial activity. We also found that rewetting treatment decreased the
soil priming effect when soil moisture was low but increased priming when soil moisture
was high. Our study did not provide enough evidence to explain this result, although it is
consistent with patterns in aggregate formation, which suggest soil organic matter was
less protected from decomposition in soils with high and variable soil moisture content.
Conclusion
There is uncertainty about how multiple global change factors interactively affect soil C
cycling in drylands, as well as the underlying mechanisms that drive these interactions.
Our incomplete understanding of dryland C cycling controls and responses to change lead
to inaccurate estimation and prediction of the potential of drylands for C sequestration
and mitigate climate change. Here we showed that multiple global change factors
individually and strongly interactively affected soil respiration and a host of associated
soil variables. Among four global change factors that were included in the present
experiment (prior warming, substrate availability, soil moisture content, and soil moisture
variability), substrate availability was the most influential factor affecting soil C cycling,
and it was involved in almost all interactive effects. In addition, legacy effects of prior
warming and drying-rewetting cycles on soil biogeochemistry were found. Taken
together, these data point to the need for future studies to include multiple global change
factors to determine how they individually and interactively affect soil C cycling in
drylands. Only in this way can we better estimate and predict how global drylands will
respond to the climate changes they face in the future.
References
78
Amézketa, E., 1999. Soil aggregate stability: A review. Journal of Sustainable
Agriculture 14, 83–151. doi:10.1300/J064v14n02_08
Austin, A.T., 2011. Has water limited our imagination for aridland biogeochemistry.
Trends in Ecology and Evolution 26, 229–235. doi:10.1016/j.tree.2011.02.003
Barnard, R.L., Blazewicz, S.J., Firestone, M.K., 2020. Rewetting of soil: Revisiting the
origin of soil CO2 emissions. Soil Biology and Biochemistry.
doi:10.1016/j.soilbio.2020.107819
Berhongaray, G., Cotrufo, F.M., Janssens, I.A., Ceulemans, R., 2019. Below-ground
carbon inputs contribute more than above-ground inputs to soil carbon accrual in a
bioenergy poplar plantation. Plant and Soil 434, 363–378. doi:10.1007/s11104-018-
3850-z
Biederman, J.A., Scott, R.L., Bell, T.W., Bowling, D.R., Dore, S., Garatuza-Payan, J.,
Kolb, T.E., Krishnan, P., Krofcheck, D.J., Litvak, M.E., Maurer, G.E., Meyers, T.P.,
Oechel, W.C., Papuga, S.A., Ponce-Campos, G.E., Rodriguez, J.C., Smith, W.K.,
Vargas, R., Watts, C.J., Yepez, E.A., Goulden, M.L., 2017. CO2 exchange and
evapotranspiration across dryland ecosystems of southwestern North America.
Global Change Biology 23, 4204–4221. doi:10.1111/gcb.13686
Bolyen, E., Rideout, J.R., Dillon, M.R., Bokulich, N.A., Abnet, C.C., Al-Ghalith, G.A.,
Alexander, H., Alm, E.J., Arumugam, M., Asnicar, F., Bai, Y., Bisanz, J.E.,
Bittinger, K., Brejnrod, A., Brislawn, C.J., Brown, C.T., Callahan, B.J., Caraballo-
Rodríguez, A.M., Chase, J., Cope, E.K., Da Silva, R., Diener, C., Dorrestein, P.C.,
Douglas, G.M., Durall, D.M., Duvallet, C., Edwardson, C.F., Ernst, M., Estaki, M.,
Fouquier, J., Gauglitz, J.M., Gibbons, S.M., Gibson, D.L., Gonzalez, A., Gorlick,
79
K., Guo, J., Hillmann, B., Holmes, S., Holste, H., Huttenhower, C., Huttley, G.A.,
Janssen, S., Jarmusch, A.K., Jiang, L., Kaehler, B.D., Kang, K. Bin, Keefe, C.R.,
Keim, P., Kelley, S.T., Knights, D., Koester, I., Kosciolek, T., Kreps, J., Langille,
M.G.I., Lee, J., Ley, R., Liu, Y.X., Loftfield, E., Lozupone, C., Maher, M., Marotz,
C., Martin, B.D., McDonald, D., McIver, L.J., Melnik, A. V., Metcalf, J.L., Morgan,
S.C., Morton, J.T., Naimey, A.T., Navas-Molina, J.A., Nothias, L.F., Orchanian,
S.B., Pearson, T., Peoples, S.L., Petras, D., Preuss, M.L., Pruesse, E., Rasmussen,
L.B., Rivers, A., Robeson, M.S., Rosenthal, P., Segata, N., Shaffer, M., Shiffer, A.,
Sinha, R., Song, S.J., Spear, J.R., Swafford, A.D., Thompson, L.R., Torres, P.J.,
Trinh, P., Tripathi, A., Turnbaugh, P.J., Ul-Hasan, S., van der Hooft, J.J.J., Vargas,
F., Vázquez-Baeza, Y., Vogtmann, E., von Hippel, M., Walters, W., Wan, Y.,
Wang, M., Warren, J., Weber, K.C., Williamson, C.H.D., Willis, A.D., Xu, Z.Z.,
Zaneveld, J.R., Zhang, Y., Zhu, Q., Knight, R., Caporaso, J.G., 2019. Reproducible,
interactive, scalable and extensible microbiome data science using QIIME 2. Nature
Biotechnology 37, 852–857. doi:10.1038/s41587-019-0209-9
Brookes, P.C., Landman, A., Pruden, G., Jenkinson, D.S., 1985. Chloroform fumigation
and the release of soil nitrogen: A rapid direct extraction method to measure
microbial biomass nitrogen in soil. Soil Biology and Biochemistry 17, 837–842.
doi:10.1016/0038-0717(85)90144-0
Cable, J.M., Ogle, K., Williams, D.G., Weltzin, J.F., Huxman, T.E., 2008. Soil texture
drives responses of soil respiration to precipitation pulses in the sonoran desert:
Implications for climate change. Ecosystems 11, 961–979. doi:10.1007/s10021-008-
9172-x
80
Chen, L., Liu, L., Qin, S., Yang, G., Fang, K., Zhu, B., Kuzyakov, Y., Chen, P., Xu, Y.,
Yang, Y., 2019. Regulation of priming effect by soil organic matter stability over a
broad geographic scale. Nature Communications 10, 1–10. doi:10.1038/s41467-019-
13119-z
Chen, R., Senbayram, M., Blagodatsky, S., Myachina, O., Dittert, K., Lin, X.,
Blagodatskaya, E., Kuzyakov, Y., 2014. Soil C and N availability determine the
priming effect: Microbial N mining and stoichiometric decomposition theories.
Global Change Biology 20, 2356–2367. doi:10.1111/gcb.12475
Collins, S.L., Sinsabaugh, R.L., Crenshaw, C., Green, L., Porras-alfaro, A., Stursova, M.,
Zeglin, L.H., 2008. Pulse dynamics and microbial processes in aridland ecosystems.
Journal of Ecology 96, 413–420. doi:10.1111/j.1365-2745.2008.01362.x
Cotrufo, M.F., Wallenstein, M.D., Boot, C.M., Denef, K., Paul, E., 2013. The Microbial
Efficiency-Matrix Stabilization (MEMS) framework integrates plant litter
decomposition with soil organic matter stabilization: Do labile plant inputs form
stable soil organic matter? Global Change Biology 19, 988–995.
doi:10.1111/gcb.12113
Cui, Y., Fang, L., Deng, L., Guo, X., Han, F., Ju, W., Wang, X., Chen, H., Tan, W.,
Zhang, X., 2019. Patterns of soil microbial nutrient limitations and their roles in the
variation of soil organic carbon across a precipitation gradient in an arid and semi-
arid region. Science of the Total Environment 658, 1440–1451.
doi:10.1016/j.scitotenv.2018.12.289
81
Davidson, E.A., Janssens, I.A., 2006. Temperature sensitivity of soil carbon
decomposition and feedbacks to climate change. Nature 440, 165–173.
doi:10.1038/nature04514
Denef, K., Six, J., 2005. Clay mineralogy determines the importance of biological versus
abiotic processes for macroaggregate formation and stabilization. European Journal
of Soil Science 56, 469–479. doi:10.1111/j.1365-2389.2004.00682.x
Denef, K., Six, J., Bossuyt, H., Frey, S.D., Elliott, E.T., Merckx, R., Paustian, K., 2001.
Influence of dry–wet cycles on the interrelationship between aggregate, particulate
organic matter, and microbial community dynamics. Soil Biology and Biochemistry
33, 1599–1611.
Dijkstra, F.A., Zhu, B., Cheng, W., 2021. Root effects on soil organic carbon: a double-
edged sword. New Phytologist 230, 60–65. doi:10.1111/nph.17082
Fierer, N., Schimel, J.P., 2002. Effects of drying - rewetting frequency on soil carbon and
nitrogen transformations. Soil Biology & Biochemistry 34, 777–787.
Frey, S.D., Lee, J., Melillo, J.M., Six, J., 2013. The temperature response of soil
microbial efficiency and its feedback to climate. Nature Climate Change 3, 395–398.
doi:10.1038/nclimate1796
German, D.P., Weintraub, M.N., Grandy, A.S., Lauber, C.L., Rinkes, Z.L., Allison, S.D.,
2011. Optimization of hydrolytic and oxidative enzyme methods for ecosystem
studies. Soil Biology and Biochemistry 43, 1387–1397.
doi:10.1016/j.soilbio.2011.03.017
82
Hu, B., Wang, Y., Wang, B., Wang, Y., Liu, C., Wang, C., 2018. Impact of drying-
wetting cycles on the soil aggregate stability of Alfisols in southwestern China.
Journal of Soil and Water Conservation 73, 469–478. doi:10.2489/jswc.73.4.469
Huang, J., Yu, H., Guan, X., Wang, G., Guo, R., 2016. Accelerated dryland expansion
under climate change. Nature Climate Change 6, 166–171.
doi:10.1038/nclimate2837
Kuzyakov, Y., 2010. Priming effects: Interactions between living and dead organic
matter. Soil Biology and Biochemistry 42, 1363–1371.
doi:10.1016/j.soilbio.2010.04.003
Kuzyakov, Y., 2002. Review: Factors affecting rhizosphere priming effects. Journal of
Plant Nutrition and Soil Science 165, 382–396. doi:10.1002/1522-
2624(200208)165:4<382::AID-JPLN382>3.0.CO;2-#
Kuzyakov, Y., Friedel, J.., Stahr, K., 2000. Review of mechanisms and quantification of
priming effects. Soil Biology and Biochemistry 32, 1485–1498. doi:10.1016/S0038-
0717(00)00084-5
Lado-Monserrat, L., Lull, C., Bautista, I., Lidón, A., Herrera, R., 2014. Soil moisture
increment as a controlling variable of the “Birch effect”. Interactions with the pre-
wetting soil moisture and litter addition. Plant and Soil 379, 21–34.
doi:10.1007/s11104-014-2037-5
Lal, R., 2004. Carbon sequestration in dryland ecosystems. Environmental Management
33, 528–544. doi:10.1007/s00267-003-9110-9
Li, J.T., Wang, J.J., Zeng, D.H., Zhao, S.Y., Huang, W.L., Sun, X.K., Hu, Y.L., 2018.
The influence of drought intensity on soil respiration during and after multiple
83
drying-rewetting cycles. Soil Biology and Biochemistry 127, 82–89.
doi:10.1016/j.soilbio.2018.09.018
Liang, C., Schimel, J.P., Jastrow, J.D., 2017. The importance of anabolism in microbial
control over soil carbon storage. Nature Microbiology 2, 1–6.
doi:10.1038/nmicrobiol.2017.105
Luo, C., Xu, G., Chao, Z., Wang, S., Lin, X., Hu, Y., Zhang, Z., Duan, J., Chang, X., Su,
A., Li, Y., Zhao, X., Du, M., Tang, Y., Kimball, B., 2010. Effect of warming and
grazing on litter mass loss and temperature sensitivity of litter and dung mass loss on
the Tibetan plateau. Global Change Biology 16, 1606–1617. doi:10.1111/j.1365-
2486.2009.02026.x
Melillo, J.M., Frey, S.D., DeAngelis, K.M., Werner, W.J., Bernard, M.J., Bowles, F.P.,
Pold, G., Knorr, M.A., Grandy, A.S., 2017. Long-term pattern and magnitude of soil
carbon feedback to the climate system in a warming world. Science 358, 101–105.
doi:10.1126/science.aan2874
Meloni, F., Granzotti, C.R.F., Bautista, S., Martinez, A.S., 2017. Scale dependence and
patch size distribution: Clarifying patch patterns in Mediterranean drylands.
Ecosphere 8. doi:10.1002/ecs2.1690
Mikutta, R., Kleber, M., Kaiser, K., Jahn, R., 2005. Review: Organic matter removal
from soils using hydrogen peroxide, sodium hypochlorite, and disodium
peroxodisulfate. Soil Science Society of America Journal 69, 120–135.
doi:10.2136/sssaj2005.0120
Plaza, C., Zaccone, C., Sawicka, K., Méndez, A.M., Tarquis, A., Gascó, G., Heuvelink,
G.B.M., Schuur, E.A.G., Maestre, F.T., 2018. Soil resources and element stocks in
84
drylands to face global issues. Scientific Reports 8, 1–8. doi:10.1038/s41598-018-
32229-0
Poulter, B., Frank, D., Ciais, P., Myneni, R.B., Andela, N., Bi, J., Broquet, G., Canadell,
J.G., Chevallier, F., Liu, Y.Y., Running, S.W., Sitch, S., Van Der Werf, G.R., 2014.
Contribution of semi-arid ecosystems to interannual variability of the global carbon
cycle. Nature 509, 600–603. doi:10.1038/nature13376
Prăvălie, R., 2016. Drylands extent and environmental issues. A global approach. Earth-
Science Reviews 161, 259–278. doi:10.1016/j.earscirev.2016.08.003
Qi, R., Li, J., Lin, Z., Li, Z., Li, Y., Yang, X., Zhang, J., Zhao, B., 2016. Temperature
effects on soil organic carbon, soil labile organic carbon fractions, and soil enzyme
activities under long-term fertilization regimes. Applied Soil Ecology 102, 36–45.
doi:10.1016/j.apsoil.2016.02.004
Reich, P.B., Hobbie, S.E., Lee, T.D., Rich, R., Pastore, M.A., Worm, K., 2020.
Synergistic effects of four climate change drivers on terrestrial carbon cycling.
Nature Geoscience 13, 787–793. doi:10.1038/s41561-020-00657-1
Rillig, M.C., Ryo, M., Lehmann, A., Aguilar-Trigueros, C.A., Buchert, S., Wulf, A.,
Iwasaki, A., Roy, J., Yang, G., 2019. The role of multiple global change factors in
driving soil functions and microbial biodiversity. Science 366, 886–890.
doi:10.1126/science.aay2832
Sala, O.E., Gherardi, L.A., Reichmann, L., Jobbágy, E., Peters, D., 2012. Legacies of
precipitation fluctuations on primary production: Theory and data synthesis.
Philosophical Transactions of the Royal Society B: Biological Sciences 367, 3135–
3144. doi:10.1098/rstb.2011.0347
85
Sardans, J., Peñuelas, J., 2005. Drought decreases soil enzyme activity in a
Mediterranean Quercus ilex L. forest. Soil Biology and Biochemistry 37, 455–461.
doi:10.1016/j.soilbio.2004.08.004
Sardans, J., Peñuelas, J., Estiarte, M., 2008. Changes in soil enzymes related to C and N
cycle and in soil C and N content under prolonged warming and drought in a
Mediterranean shrubland. Applied Soil Ecology 39, 223–235.
doi:10.1016/j.apsoil.2007.12.011
Saxton, K.E., Rawls, W.J., Romberger, J.S., Papendick, R.I., 1986. Estimating
Generalized Soil-water Characteristics from Texture. Soil Science Society of
America Journal 50, 1031–1036.
Schimel, J.P., 2018. Life in dry soils: Effects of drought on soil microbial communities
and processes. Annual Review of Ecology, Evolution, and Systematics 49, 409–432.
doi:10.1146/annurev-ecolsys-110617-062614
Seneviratne, S.I., Nicholls, N., Easterling, D., Goodess, C.M., Kanae, S., Kossin, J., Luo,
Y., Marengo, J., McInnes, K., Rahimi, M., Reichstein, M., Sorteberg, A., Vera, C.,
Zhang, X., 2012. Changes in Climate Extremes and their Impacts on the Natural
Physical Environment, in: IPCC. Cambridge University Press, Cambridge, UK and
New York, NY, USA, pp. 109–230. doi:10.1017/CBO9781139177245.006
Song, J., Wan, S., Piao, S., Knapp, A.K., Classen, A.T., Vicca, S., Ciais, P., Hovenden,
M.J., Leuzinger, S., Beier, C., Kardol, P., Xia, J., Liu, Q., Ru, J., Zhou, Z., Luo, Y.,
Guo, D., Adam Langley, J., Zscheischler, J., Dukes, J.S., Tang, J., Chen, J.,
Hofmockel, K.S., Kueppers, L.M., Rustad, L., Liu, L., Smith, M.D., Templer, P.H.,
Quinn Thomas, R., Norby, R.J., Phillips, R.P., Niu, S., Fatichi, S., Wang, Y., Shao,

86
P., Han, H., Wang, D., Lei, L., Wang, J., Li, Xiaona, Zhang, Q., Li, Xiaoming, Su,
F., Liu, B., Yang, F., Ma, G., Li, G., Liu, Yanchun, Liu, Yinzhan, Yang, Z., Zhang,
K., Miao, Y., Hu, M., Yan, C., Zhang, A., Zhong, M., Hui, Y., Li, Y., Zheng, M.,
2019. A meta-analysis of 1,119 manipulative experiments on terrestrial carbon-
cycling responses to global change. Nature Ecology and Evolution 3, 1309–1320.
doi:10.1038/s41559-019-0958-3
Steven, B., Phillips, M.L., Belnap, J., Gallegos-Graves, L.V., Kuske, C.R., Reed, S.C.,
2021. Resistance, Resilience, and Recovery of Dryland Soil Bacterial Communities
Across Multiple Disturbances. Frontiers in Microbiology 12, 1–12.
doi:10.3389/fmicb.2021.648455
Treseder, K.K., Lennon, J.T., 2015. Fungal Traits That Drive Ecosystem Dynamics on
Land. Microbiology and Molecular Biology Reviews 79, 243–262.
doi:10.1128/mmbr.00001-15
Wang, B., Brewer, P.E., Shugart, H.H., Lerdau, M.T., Allison, S.D., 2019. Soil
aggregates as biogeochemical reactors and implications for soil–atmosphere
exchange of greenhouse gases—A concept. Global Change Biology 25, 373–385.
doi:10.1111/gcb.14515
Zuccarini, P., Asensio, D., Ogaya, R., Sardans, J., Peñuelas, J., 2020. Effects of seasonal
and decadal warming on soil enzymatic activity in a P-deficient Mediterranean
shrubland. Global Change Biology 26, 3698–3714. doi:10.1111/gcb.15077
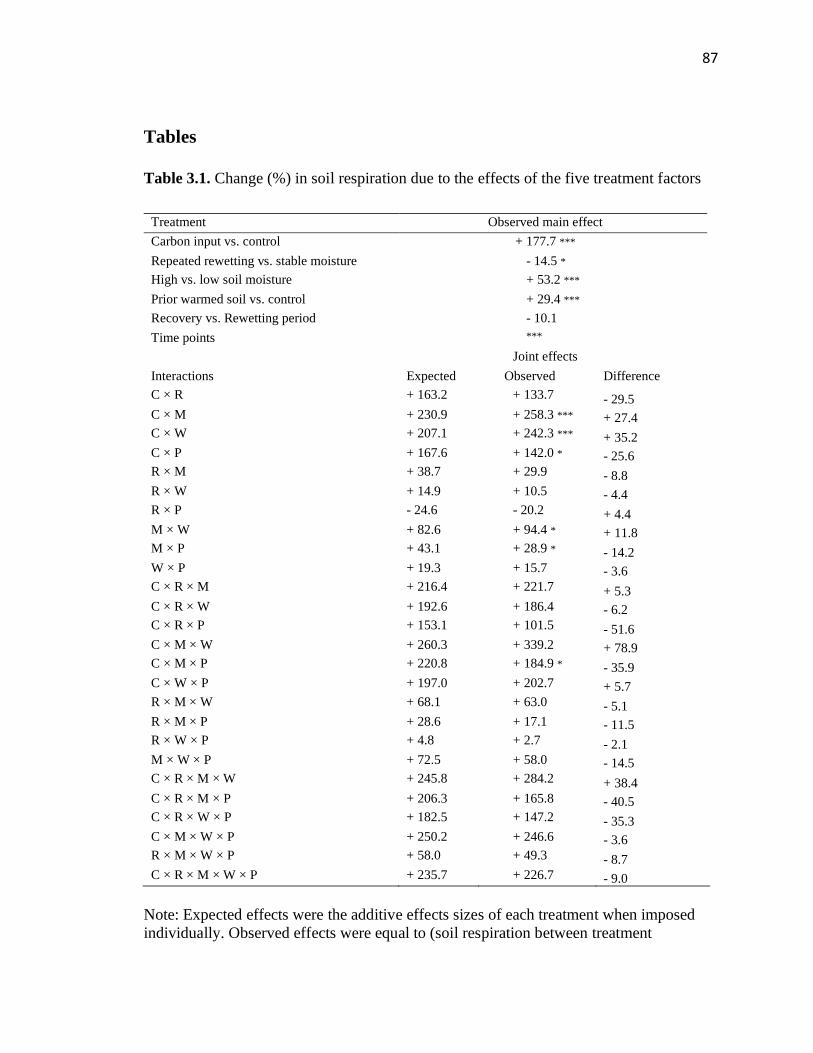
87
Tables
Table 3.1. Change (%) in soil respiration due to the effects of the five treatment factors
Treatment Observed main effect
Carbon input vs. control + 177.7 ***
Repeated rewetting vs. stable moisture - 14.5 *
High vs. low soil moisture + 53.2 ***
Prior warmed soil vs. control + 29.4 ***
Recovery vs. Rewetting period - 10.1
Time points ***
Joint effects
Interactions Expected Observed Difference
C × R + 163.2 + 133.7 - 29.5
C × M + 230.9 + 258.3 *** + 27.4
C × W + 207.1 + 242.3 *** + 35.2
C × P + 167.6 + 142.0 * - 25.6
R × M + 38.7 + 29.9 - 8.8
R × W + 14.9 + 10.5 - 4.4
R × P - 24.6 - 20.2 + 4.4
M × W + 82.6 + 94.4 * + 11.8
M × P + 43.1 + 28.9 * - 14.2
W × P + 19.3 + 15.7 - 3.6
C × R × M + 216.4 + 221.7 + 5.3
C × R × W + 192.6 + 186.4 - 6.2
C × R × P + 153.1 + 101.5 - 51.6
C × M × W + 260.3 + 339.2 + 78.9
C × M × P + 220.8 + 184.9 * - 35.9
C × W × P + 197.0 + 202.7 + 5.7
R × M × W + 68.1 + 63.0 - 5.1
R × M × P + 28.6 + 17.1 - 11.5
R × W × P + 4.8 + 2.7 - 2.1
M × W × P + 72.5 + 58.0 - 14.5
C × R × M × W + 245.8 + 284.2 + 38.4
C × R × M × P + 206.3 + 165.8 - 40.5
C × R × W × P + 182.5 + 147.2 - 35.3
C × M × W × P + 250.2 + 246.6 - 3.6
R × M × W × P + 58.0 + 49.3 - 8.7
C × R × M × W × P + 235.7 + 226.7 - 9.0
Note: Expected effects were the additive effects sizes of each treatment when imposed
individually. Observed effects were equal to (soil respiration between treatment
88
combination – soil respiration under the corresponding control) / soil respiration under
the corresponding control. Difference was equal to observed effect – expected effect. For
Carbon × Rewetting × Moisture × Warming × Period, the expected effect was equal to
177.7 + (-14.5) + 53.2 + 29.4 + (-10.1); the observed effect was equal to (mean soil
respiration under carbon input, repeated rewetting cycles, high soil moisture, prior
warming during recovery period - mean soil respiration under no carbon input, stable soil
moisture, low soil moisture, no prior warming during rewetting period) / mean soil
respiration under no carbon input, stable soil moisture, low soil moisture, no prior
warming during rewetting period. Time points: different time points that we measured
soil respiration. C: carbon input; R: rewetting; M: soil moisture; W: prior warming; P:
period. * P<0.05; ** P<0.01; *** P<0.001.
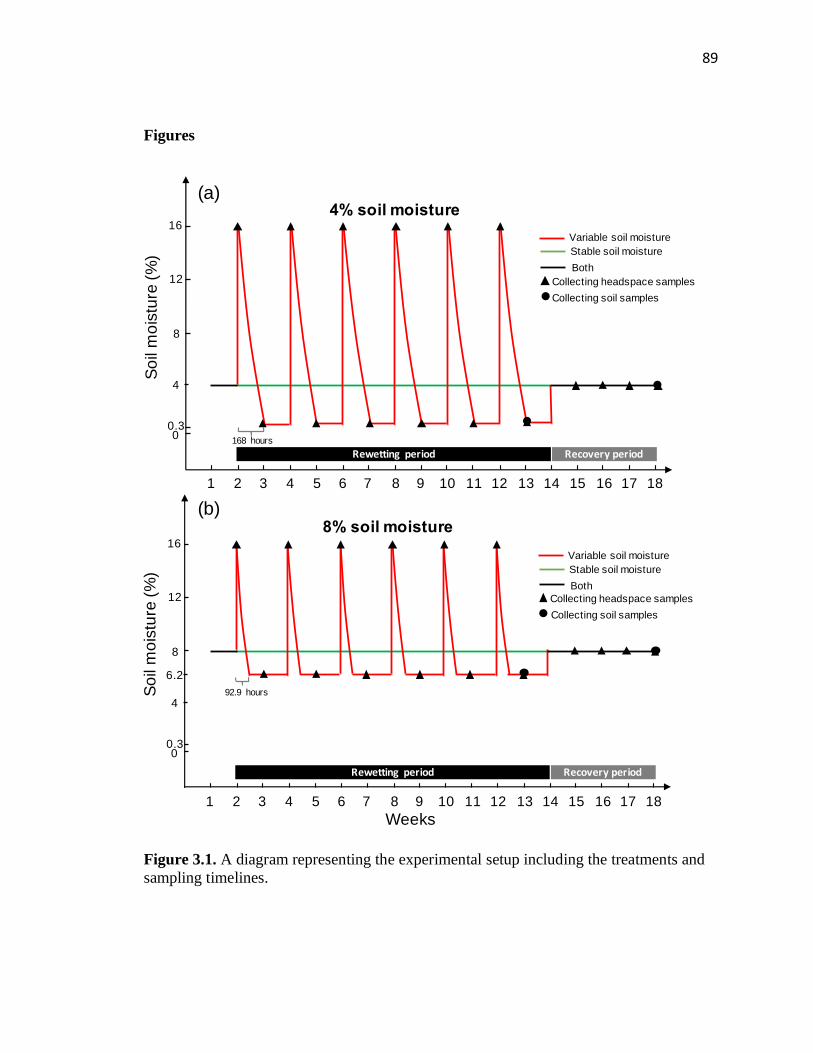
89
Figures
Figure 3.1. A diagram representing the experimental setup including the treatments and
sampling timelines.
So
il m
ois
ture
(%
)
0
4
8
12
16
1 2 3 4 5 6 10 11 12 13 147 8 9 15 16 17
0.3
18
168 hours
Rewetting period Recovery period
Variable soil moisture
Stable soil moisture
Both
4% soil moisture
So
il m
ois
ture
(%
)
Weeks
0
4
8
12
16
1 2 3 4 5 6 10 11 12 13 147 8 9 15 16 17
0.3
18
92.9 hours
Rewetting period Recovery period
Variable soil moisture
Stable soil moisture
Both
8% soil moisture
6.2
Collecting headspace samples
Collecting soil samples
Collecting headspace samples
Collecting soil samples
(a)
(b)
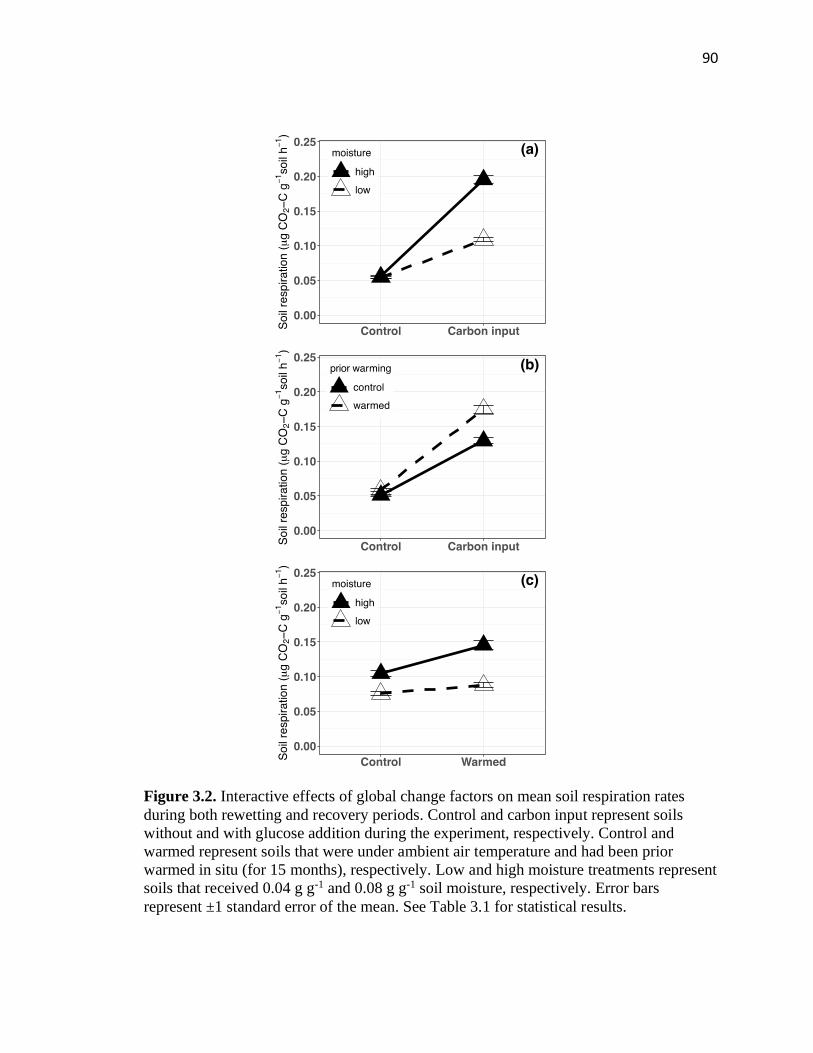
90
Figure 3.2. Interactive effects of global change factors on mean soil respiration rates
during both rewetting and recovery periods. Control and carbon input represent soils
without and with glucose addition during the experiment, respectively. Control and
warmed represent soils that were under ambient air temperature and had been prior
warmed in situ (for 15 months), respectively. Low and high moisture treatments represent
soils that received 0.04 g g-1 and 0.08 g g-1 soil moisture, respectively. Error bars
represent ±1 standard error of the mean. See Table 3.1 for statistical results.
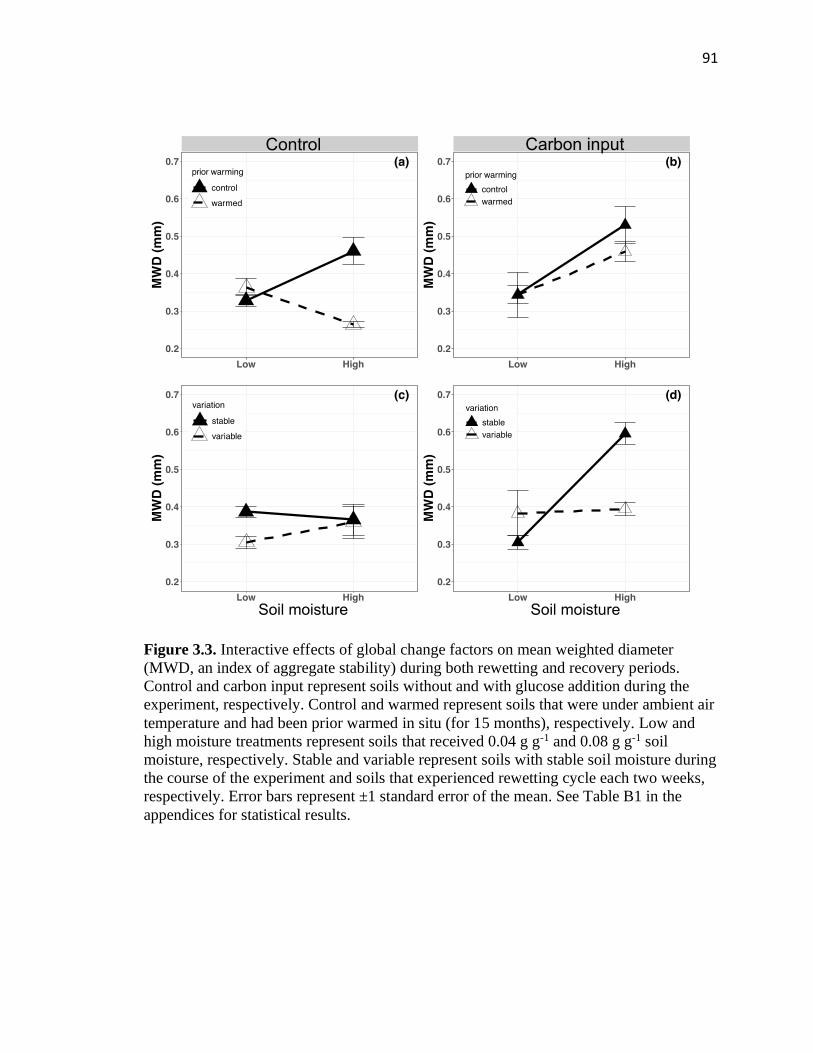
91
Figure 3.3. Interactive effects of global change factors on mean weighted diameter
(MWD, an index of aggregate stability) during both rewetting and recovery periods.
Control and carbon input represent soils without and with glucose addition during the
experiment, respectively. Control and warmed represent soils that were under ambient air
temperature and had been prior warmed in situ (for 15 months), respectively. Low and
high moisture treatments represent soils that received 0.04 g g-1 and 0.08 g g-1 soil
moisture, respectively. Stable and variable represent soils with stable soil moisture during
the course of the experiment and soils that experienced rewetting cycle each two weeks,
respectively. Error bars represent ±1 standard error of the mean. See Table B1 in the
appendices for statistical results.
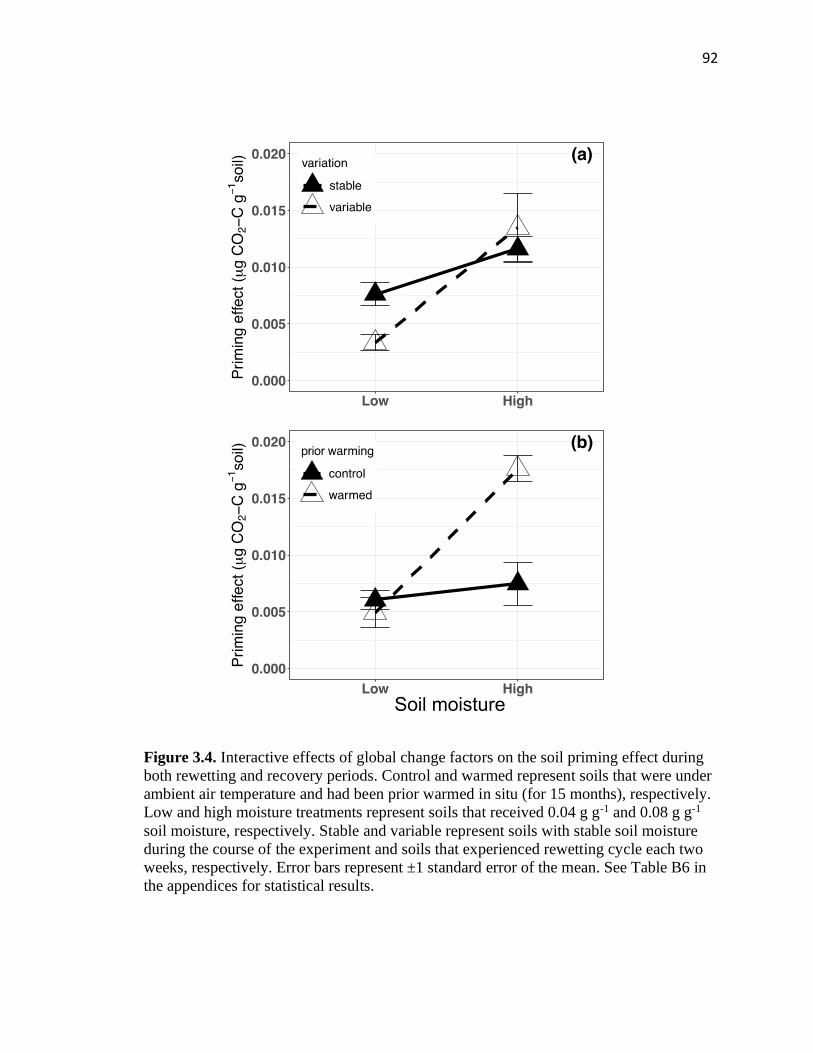
92
Figure 3.4. Interactive effects of global change factors on the soil priming effect during
both rewetting and recovery periods. Control and warmed represent soils that were under
ambient air temperature and had been prior warmed in situ (for 15 months), respectively.
Low and high moisture treatments represent soils that received 0.04 g g-1 and 0.08 g g-1
soil moisture, respectively. Stable and variable represent soils with stable soil moisture
during the course of the experiment and soils that experienced rewetting cycle each two
weeks, respectively. Error bars represent ±1 standard error of the mean. See Table B6 in
the appendices for statistical results.
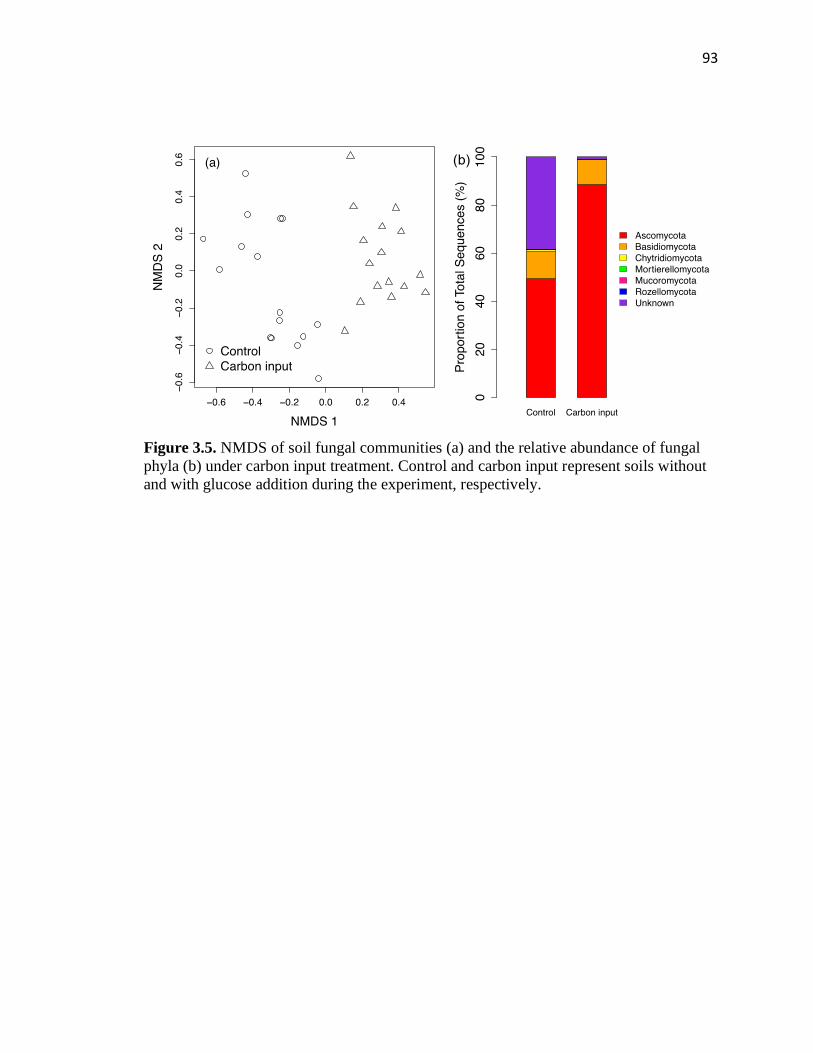
93
Figure 3.5. NMDS of soil fungal communities (a) and the relative abundance of fungal
phyla (b) under carbon input treatment. Control and carbon input represent soils without
and with glucose addition during the experiment, respectively.
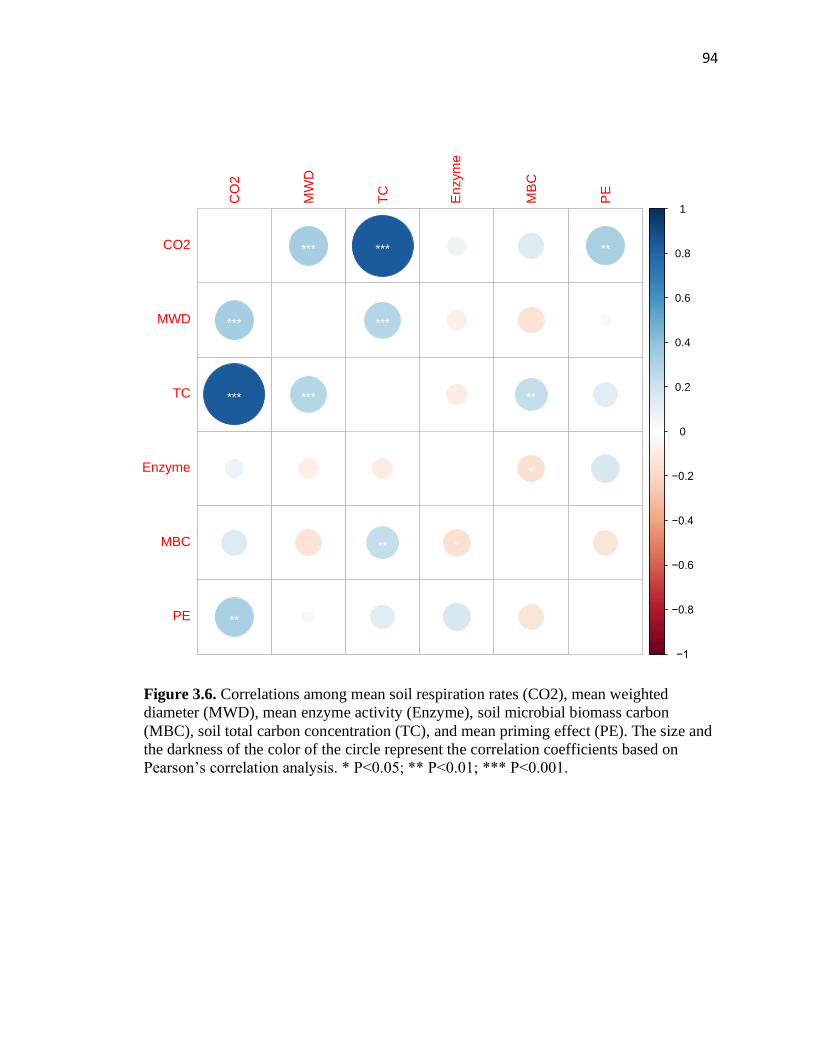
94
Figure 3.6. Correlations among mean soil respiration rates (CO2), mean weighted
diameter (MWD), mean enzyme activity (Enzyme), soil microbial biomass carbon
(MBC), soil total carbon concentration (TC), and mean priming effect (PE). The size and
the darkness of the color of the circle represent the correlation coefficients based on
Pearson’s correlation analysis. * P<0.05; ** P<0.01; *** P<0.001.
*
*
**
**
**
**
***
***
***
***
***
***
−1
−0.8
−0.6
−0.4
−0.2
0
0.2
0.4
0.6
0.8
1
CO
2
MW
D
TC
Enzym
e
MB
C
PE
CO2
MWD
TC
Enzyme
MBC
PE
95
CHAPTER 4
ROLES OF PLANT-MICROBE-SOIL INTERACTIONS IN SOIL CARBON
CYCLING
Abstract
It has been accepted that soil organic carbon (SOC) is strongly regulated by at least four
factors along the plant-microbe-soil continuum: C input quality, root exudates, soil
microbial community structure, and soil mineralogy. However, conflicting effects on
SOC cycling have been reported. This is partly because most previous studies only
examined a subset of these drivers, and the results may have been influenced by variation
the factors that were not considered. To disentangle the pathways by which these four
factors interactively influence SOC cycling, we conducted a fully factorial manipulation
using a synthetic root and soil system. We found that all four factors markedly affected
SOC cycling: 1) soil respiration increased with increasing C input quality, and
interactions were found between C input quality, soil microbial community structure, and
soil mineralogy; 2) root exudates generally stimulated soil respiration and decreased
mineral-associated organic C (MAOC), and their effect was mediated by the other three
drivers; 3) the bacteria + fungi treatment generally had higher MAOC than the bacteria-
only treatment, and this result was also modified by the other three drivers; and 4) higher
soil respiration and MAOC was found in high-activity clay, which had higher surface
area, charge density, and cation + anion exchange capacity, than in low- and medium-
activity clay. Interactions between soil clay activity and other drivers were also common,
especially a strong and consistent interaction between root exudates and soil clay activity.
Specifically, root exudates stimulated soil respiration in all soil clay activities, but the
96
magnitude of the positive effect tended to decrease with increasing soil clay activity.
Furthermore, MAOC was decreased by root exudates under low and medium clay
activity; however, root exudates resulted in higher MAOC under high clay activity.
Finally, the interactions between these drivers varied with time. Our study provides
evidence for the critical role of root exudates-soil mineralogy interaction in SOC cycling,
which should be studied more in the future.
Introduction
Soils store at least twice as much carbon (C) as is in the atmosphere (Batjes, 1996;
Scharlemann et al., 2014), such that modest changes in soil C cycling can significantly
impact atmospheric CO2 concentration (Minasny et al., 2017; Smith et al., 2020). Yet our
mechanistic understanding of soil organic C (SOC) formation and loss is still limited
(Cotrufo et al., 2013; Lehmann et al., 2020; Sokol et al., 2018), and soil feedbacks on
climate change represent one of the largest sources of uncertainty in Earth system models
(Luo et al., 2016; Shi et al., 2018). Four fundamental factors shape soil C cycling along
the plant-microbe-soil continuum: the quantity and chemical composition of plant inputs,
their point of entry (above- vs. belowground), the functional capacity of the soil
microbial community, and soil mineralogy (Merino et al., 2015; Schnecker et al., 2019;
Sokol et al., 2019; Sokol & Bradford, 2019). Yet the relative importance of each of these
controls, and the mechanisms by which they impact the formation and loss of SOC, are
all topics of debate.
For decades, one of the guiding paradigms of soil biogeochemistry was the idea of
selective preservation of recalcitrant (i.e. chemically complex) plant inputs, which were
thought to resist microbial decomposition and therefore contribute to the formation of
97
‘persistent’ SOC (Melillo et al., 2008). However, this hypothesis has been largely
rejected by newer hypotheses which hold that microbial access to organic matter, rather
than its chemical composition, controls the fate of soil C inputs. Studies have consistently
shown that soil microbial biomass residues are themselves the primary constituent of
mineral-associated organic C (MAOC), which is thought to be the most persistent form of
SOC (Cotrufo et al., 2013; Lavallee et al., 2020; C. Liang et al., 2017). This new
understanding has upended long-held theories about the relationship between plant tissue
chemistry and soil biogeochemistry; in fact, it is labile C inputs which are now thought to
contribute more to SOC stabilization (Cotrufo et al., 2013, 2015; Sokol et al., 2018).
Because C use efficiency (CUE), the fraction of substrate that is assimilated into
microbial biomass vs. respired (Sinsabaugh et al., 2013), is higher when microbes are
consuming labile substrates (Frey et al., 2013a; Qiao et al., 2019), these inputs should
favor retention of plant-derived C belowground. Since this new framework was proposed
(Cotrufo et al., 2013), some studies have confirmed the importance of microbial-mineral
interactions for SOC cycling (Frey et al., 2016; Neurath et al., 2021), but significant gaps
in our understanding remain.
The new paradigm holds that labile litterfall inputs lead to more persistent SOC
stabilization, relative to recalcitrant litterfall inputs, because they are utilized more
efficiently by microbes. Although this hypothesis has been increasingly accepted,
conflicting results have been reported by some studies. Results from a 20-year field
manipulation, for example, showed that labile litterfall input (e.g. needle and leaf litter)
did not significantly increase MAOC when compared to recalcitrant litterfall input
(e.g. wood debris) (Pierson et al., 2021). By contrast, particulate organic matter (POM)
98
was significantly higher under labile than recalcitrant litterfall input. This may be because
the effect of C input chemistry on SOC stabilization is markedly mediated by soil
microbial community composition. For instance, labile C input typically results in higher
CUE but may also shift soil microbial community to a copiotrophic-dominated one over
time, which has an inherently lower CUE (Geyer et al., 2016; Roller & Schmidt, 2015).
Therefore, the role of C input chemistry in SOC stabilization is likely to hinge upon
plant-microbe interactions which develop through time. In the real world, new C inputs
are constantly arriving, so the mixture of labile/recalcitrant C is constantly changing. To
isolate these community shifts, it is essential to conduct controlled experiments.
In addition to the chemical composition of plant inputs, it is increasingly
acknowledged that the ‘point of entry’ (above- vs. belowground) also plays a significant
role in SOC cycling (Sokol et al., 2018). Rhizosphere processes significantly regulate
SOC stabilization and loss (Finzi et al., 2015); therefore, a growing body of studies have
been done to determine the effects of root exudates on SOC cycling, but opposite results
have been reported. On one hand, some studies suggest that root exudates can stimulate
SOC stabilization and reduce SOC loss because root exudates mainly consist of labile C,
which have higher CUE, thereby promoting MAOC formation (Sokol et al., 2019; Sokol
& Bradford, 2019). On the other hand, other studies find that root exudates accelerate
SOC decomposition and destabilize SOC thorough the rhizosphere priming effect (Cheng
et al., 2014; Kuzyakov et al., 2000). A framework named “Rhizo-Engine” was recently
proposed, which acknowledges that the effect of root exudates on SOC cycling is a
‘double-edged sword’, and the net effect of exudates on the SOC stock will be mediated
by other factors (e.g. soil mineralogy and nutrient status) (Dijkstra et al., 2021). For
99
example, root exudates can lead to SOC accumulation if there is a large potential to
stabilize SOC into MAOC, such as in clayey soils. On the other hand, root exudates can
lead to SOC loss if there is little potential to stabilize SOC into MOAM, such as in sandy
soils or when soils are already saturated with MAOC. Although these hypotheses seem
plausible, they have not been tested explicitly (Pierson et al., 2021).
Finally, variation in microbial community structure may be important in driving
SOC cycling, such that soil C losses and gains depend not only on climate, soil
mineralogy, and plant litter inputs, but also community composition (Glassman et al.,
2018). For example, the “home-field advantage” phenomenon describes a scenario where
soil microbial communities adapted to recalcitrant C input may degrade and assimilate
recalcitrant C more easily and efficiently than labile C (Keiser et al., 2014). Although
such variation in the catabolic potential of the soil microbial community has long been
acknowledged as a major control on SOC cycling, newer frameworks emphasize not only
the role of catabolism but also microbial anabolism, as 50-80% of persistent SOC is
microbially derived (Liang & Balser, 2011; Simpson et al., 2008). Just as not all soil
microbial communities perceive litter ‘recalcitrance’ the same way, different microbial
communities might convert identical plant biomolecules into a different suite of
compounds, which are stabilized to different degrees (Grandy et al., 2009). Nonetheless,
the role of soil microbial community composition in SOC stabilization has not been
systematically evaluated along gradients of plant input chemistry and soil mineralogy.
A primary tenet of our modern understanding of SOC stabilization is the
importance of soil mineralogy: clay minerals are what generate chemical bonds with
organic C to form MAOC (Cotrufo et al., 2019; Kaiser et al., 2016; Kleber et al., 2007;
100
Kleber, 2010; Kleber et al., 2015; Lavallee et al., 2020). High clay content and/or high
clay activity can fundamentally stimulate SOC stabilization because of their high surface
area, charge density, and cation + anion exchange capacity (Cotrufo et al., 2013; Lavallee
et al., 2020). However, some recent experimental studies showed that SOC stabilization
does not significantly respond to soil mineralogy (either clay content (Rasmussen et al.,
2018) or clay activity (Kallenbach et al., 2016)). These surprising results could emerge
from the interactions between soil mineralogy and plant inputs and/or soil microbes. For
instance, recalcitrant plant inputs or soil microbial communities with low CUE cannot
result in much persistent SOC accumulation regardless of soil mineralogy (Kallenbach et
al., 2016). However, few studies have been conducted to test this hypothesis, and this
inhibits our understanding of how SOC cycling responds to interactions between clay
mineralogy and plants or microbes.
As our understanding of SOC dynamics rapidly evolves, there is a need to
reconcile contradictory findings about effects of substrate quality and point-of-entry,
microbial communities, and organo-mineral interactions on SOC stabilization. Some of
these uncertainties may arise because previous studies have considered some, but not all,
of these four critical drivers, which also strongly co-vary in real soils. Manipulating all
potential factors affecting SOC cycling independently can help us unravel their
interactions and isolate direction of causality. Therefore, in the present study, we used
synthetic root/soil systems to quantify effects of litter input quality, root exudates, soil
microbial community composition, and soil clay mineralogy on SOC stabilization and
loss. In addition, real soils were used to determine the efficacy of our synthetic soil
system. Our overall goal was to disentangle the pathways by which plants, microbes, and
101
soils interactively affect SOC cycling and assess the relative importance of each driver.
We hypothesized that: 1) compared with recalcitrant C input, labile C inputs will elevate
microbial CUE, leading to more MAOC stabilization and less soil respiration losses; 2)
root exudates will lead to more soil respiration but less MAOC via priming effects; 3)
due to the greater CUE and slower turnover rates of fungi, communities consisting of
both bacteria and fungi will result in less soil respiration and more MAOC, when
compared to communities of only bacteria; and 4) soils with higher clay activity will
stimulate more C stabilization via organo-mineral bonds.
Methods
Experimental design
We developed synthetic root/soil systems to conduct a 13-month incubation
experiment including a fully factorial manipulation of C input quality, root exudation
quantity, soil microbial community composition (only bacteria vs. both bacteria and
fungi), and soil clay mineralogy (clay content was the same among three clay activities,
but the surface area, charge density, and cation + anion exchange capacity increased with
increasing clay activity). The experiment consisted of two phases, which lasted 3 and 10
months, respectively, with CO2 fluxes being measured at two-week intervals throughout.
Prior to the beginning of Phase 1, we constructed synthetic root/soil systems (see below).
Treatments applied to these systems included root exudates, soil microbial community
composition, and soil clay mineralogy, and each treatment combination had 24 replicates
(N = 288 in total). In order to test the efficacy of synthetic soil system, real soils were
also incubated under the same treatments with the synthetic soil system (N = 108 in
total). At the end of Phase 1, six replicates of each treatment combination were harvested
102
to assess treatment effects on CUE, soil enzyme activity, and soil microbial biomass C
(MBC). Next, at the beginning of Phase 2, within each root x microbe x mineralogy
treatment combination, six microcosms were randomly assigned to each C input quality
treatment (glucose, cellobiose, and xylan). A subset of these microcosms (three replicates
for each harvest in the synthetic soil system and two replicates for each harvest in the real
soil system) was destructively harvested at 4 and 10 months into Phase 2 to quantify soil
enzyme activity, MBC, and heavy fraction C content.
Creating synthetic soils
We used organic-matter-free sand, pure minerals (kaolinite, montmorillonite, and
goethite), and ground corn leaves (sterilized via autoclaving) to construct sterile artificial
soils with equivalent clay contents (0.1 kg clay kg-1 soil) and carbon concentrations
(0.017 kg C kg-1 soil), but different levels of clay activity. All soils contained 0.86 kg
quartz Granusil sand kg-1 soil and 0.04 kg leaves kg-1 soil, ground to pass through a 1 mm
mesh (Fig. C1a in the appendices). Soils in the ‘low’ clay activity treatment contained 0.1
kg kaolinite kg-1 soil (surface area of kaolinite: 17.5 m2 g-1, cation exchange capacity of
kaolinite: 9 meq/100g); soils in the ‘medium’ clay activity treatment included 0.1 kg
montmorillonite kg-1 soil (surface area of montmorillonite: 60 m2 g-1, cation exchange
capacity of montmorillonite: 100 meq/100g); and those in the ‘high’ clay activity
treatment contained 0.09 kg montmorillonite kg-1 soil and 0.01 kg goethite kg-1 soil
(surface area of goethite: 200 m2 g-1, cation exchange capacity of goethite: 52 meq/100g)
(Macht et al., 2011). All three clays were bought from Fisher Scientific International, Inc.
Synthetic soils in each of the three mineralogy treatments were mixed well in sterilized
bins, and then 20.0 g of synthetic soils were added to 60-mL borosilicate glass
103
microcosms before the incubation experiment. Finally, we made a nutrient solution by
blending NH4Cl and fertilizer (MasterBlend 4-18-38, Masterblend International, Inc.)
with sterile DI water. More information about the fertilizer is described in Table C1 in the
appendices. An appropriate amount of this solution was added to each microcosm to
bring initial soil C/nitrogen (N) and C/phosphorus to their global averages of (25:1) and
(195:1), respectively (Cleveland & Liptzin, 2007), after accounting for nutrient content
of the ground corn tissues. To evaluate the capacity of synthetic soils to capture
biogeochemical dynamics of real soils, we constructed 108 microcosms, each with 20 g
soil collected from a sagebush shrubland in Rich County, UT, USA. This was a coarse-
silty Xeric Haplocalcid with a soil C concentration of 17.3 g kg-1 soil and clay content of
0.121 kg kg-1 soil. The soil was sterilized via double-autoclaving prior to microcosm
construction. These microcosms were also subject to a fully factorial manipulation of root
exudates and soil microbial community composition in Phase 1. Each treatment
combination had 18 replicates.
Creating artificial roots
In order to realistically mimic root exudation, we modified the methods described
by (Van Bruggen et al., 2000) to create a gravity-fed artificial root system. Specifically,
each artificial root system consisted of one 5-mL syringe (with the plunger removed) and
ten, 10-cm long polysulfone hollow fiber dialysis membranes (HFMs) (Fresenius
Medical Care North America, Ogden, UT). These HFMs were characterized by a lumen
diameter of <200 m and wall thickness of <50 m, allowing the exchange of
biomolecules <60 kDa across either side of the membrane, and are therefore ideal for the
construction of ‘root mimetics’ (Bonebrake et al., 2018). To create artificial roots, we
104
used parafilm to tightly wrap one end of the 10-HFM bundle to the end of a metal wire,
and then guided the HFM bundle through the hole at the bottom of the syringe (Fig. C1b
in the appendices). Approximately 2 cm of HFM was left inside the syringe, and then
UV-cured Dymax glue (Dymax, Torrington, CT) was added to the inside of the syringe
opening so that liquid could only exit the syringe tip by moving through the HFMs. At
the beginning of the experiment, we installed one artificial root system, consisting of the
syringe and its ten HFMs, in each microcosm. The artificial root was positioned such that
the tip of the syringe, from which the HFMs emerged, was flush with the soil surface.
Each root system received 5 mL of either root exudate solution (see below) or sterile
water (depending upon treatment) every two weeks. For the real-soil microcosms, 72
microcosms received artificial root systems, and the remaining 36 were planted with five
sterile Lolium perenne seedlings. This helped us evaluate whether real and simulated root
exudations affect soils in similar ways.
Soil microbial community composition treatment
To create the inoculum (both fungi and bacteria vs. only bacteria), 5 g of compost
(EcoScraps, Marysville, OH) was blended in 1 L sterile water. Half of the blend was set
aside as inoculum for the ‘fungi + bacteria’ treatment. To create bacterial inoculum, the
antifungal captan was added to the remaining inoculum (0.05 mg mL-1), and then the
mixture was filtered through a 2 m filter, using a fresh filter for every 5 mL of fluid.
Appropriate amounts of these two inoculums were filtered through a 0.45 m
nitrocellulose filter, stained with acid fuchsin, and mounted on a microscope slide to
verify the presence or absence of fungi. A 0.6 ml aliquot of the inoculum was added to
105
the appropriate microcosms (both synthetic and ‘real’ soils) before the incubation
experiment.
Phase 1
During Phase 1, we quantified changes in soil C cycling as microbial
communities became established. During this phase of the experiment, microcosms in the
‘artificial root’ treatment received a low level of exudate C input. We used glucose,
fructose, sucrose, and tryptic soy broth to create root exudates at a concentration of 200
mg C L-1 by following the recipe from van Bruggen et al. (2000). At the beginning of
two-week ‘cycles’, the syringes in each microcosm under the artificial soil treatment
were loaded with 5 mL of either sterile water or the root exudate solution, which
provided 0.025 mg C g-1 soil per week. This quantity of C is similar to root exudation
rates measured in a variety of ecosystems (Finzi et al., 2015; Phillips et al., 2011; Yin et
al., 2014). During Phase 1, soil respiration was measured at the beginning of the two-
week ‘cycles’ which began when artificial root systems were reloaded with either exudate
solution or sterile water. One day before the beginning of each cycle, an appropriate
amount of DI water was added to each microcosm to adjust soil moisture to 45% water
holding capacity (WHC), following which microcosms were sealed tightly. After 24
hours, headspace samples (10 ml) were collected using a gastight syringe. At the end of
Phase 1, six microcosms per treatment combination for synthetic soils and two for real
soils were used to measure CUE. A syringe was used to inject 0.5 mL of a solution to add
0.116 mg glucose-C g-1 soil with an enrichment of 26 atom % 13C to ~1 cm depth of the
soil evenly around the artificial roots 3 times. The lids of microcosms were closed for 24
hours, and then headspace samples were collected to measure 12C and 13C-CO2
106
concentrations (see below). After collecting headspace samples, subsamples of the soil
were immediately extracted with 0.5 M K2SO4 for MBC measurement (Brookes et al.,
1985). The remaining soil samples were stored at -80 °C for determining soil enzyme
activity.
Phase 2
During Phase 2, in addition to continuing the three treatments in Phase 1, we
implemented an aboveground C input treatment. Within each root x microbe x
mineralogy treatment combination, six microcosms were randomly assigned to a C input
treatment representing a gradient of chemical complexity: glucose (monosaccharide),
cellobiose (disaccharide), and xylan (polysaccharide). Overall, each microcosm under C
input treatment received a solution supplying 0.385 mg C g-1 soil every two weeks. In
addition, an appropriate amount of NH4Cl was also added along with the C to keep C/N
of the solution as 25:1. The solutions containing the appropriate C-compound were added
to each microcosm by dripping them onto the soil surface as evenly as possible. The same
C-input treatments were also applied to the real-soil microcosms. We also increased the
concentration of the root exudation solution to increase the supply rate from 0.05 mg C g-
1 soil during Phase 1 to 0.5 mg C g-1 soil each two-week cycle during Phase 2. Soil
respiration was determined every two weeks at the beginning of each two-week cycle
described for Phase 1. Destructive harvests (N = 3 per unique treatment combination for
synthetic soils, and N = 2 for real soils) were conducted at 4 and 10 months into Phase 2.
In addition to soil variables that we measured during Phase 1 (except CUE, which was
not quantified), light and heavy fractions of SOC were obtained using density
fractionation (see below).
107
Measurements of soil variables
Soil respiration
CO2 concentration of headspace samples that we collected every two weeks was
determined by gas chromatography using a flame ionization detector and hydrogen as the
carrier gas (GC-2016 Greenhouse Gas Analyzer, Shimadzu, Kyoto, Japan). We analyzed
headspace 12C- and 13C-CO2 concentrations during the last cycle of Phase 1 using a
G2131-i Isotope and Gas Concentration Analyzer (Picaro Inc., Santa Clara, CA, USA).
Net change in soil C
We calculated the net change in soil C as Cinput - Coutput, where Cinput is the amount
of C input through substrate addition and/or root exudates, and Coutput is the amount of C
released during soil respiration.
MBC
A modified fumigation-extraction technique was used to measure MBC (Brookes
et al., 1985), where MBC = (the difference in extractable soil C between chloroform
fumigated and nonfumigated samples)/Kec. Briefly, for nonfumigated samples,
approximately 5.0 g of fresh soil sample from each microcosm was weighed and added
into a 50-mL Falcon tube with 25 ml of 0.5 M K2SO4. After shaking one hour, soil
solutions were filtered through Whatman filters, and the filtrates were stored in
scintillation vials before analyzing filtrates for DOC. In addition, the residual
unfumigated soil samples (soil remaining following extraction) were oven dried, and the
δ13C and C concentration were measured via an elemental analyzer (ECS 4010 Elemental
Analyzer, Costech Analytical Technologies, Valencia, CA, USA). The 13C retained in
these residual soil samples (mg 13C excess kg-1 soil) was used to estimate glucose-C
108
assimilation by microbes during calculation of microbial C-use efficiency (CUE) (see
below). For fumigated samples, we weighed approximately 5.0 g of fresh soil sample
from each microcosm into a Falcon tube with 2 ml of ethanol-free chloroform. All tubes
were capped and stored in the dark for 24 hours, and then we uncapped all tubes and
allowed them to vent in a fume hood. After approximately 6 hours, 25 ml of 0.5 M K2SO4
was added into each tube to extract the soil as described for unfumigated samples. All
extracts were stored at -20 C before measuring C and N concentrations using a TOC-L
(Shimadzu, Kyoto, Japan). By using isotope data from both fumigated and unfumigated
soil residues at the end of Phase 1, we calculated Kec as (the amount of 13C from
unfumigated soil residue - the amount of 13C from fumigated soil residue) / the amount of
13C from unfumigated soil residue. Briefly, Kec only significantly varied with clay
activity (e.g. high: 0.82; medium: 0.72; low: 0.61). Therefore, MBC was calculated using
different values of Kec for samples with the three different clay activities.
Soil enzyme activities
Following the method of (German et al., 2011), we measured activities of the
extracellular enzymes including β-xylosidase, acid phosphatase, β-glucosidase,
cellobiohydrolase, leucine aminopeptidase, and β-N-acetylglucosaminidase. p-
nitrophenol conjugated substrates were used to assay all these six enzymes. Briefly, we
used 30 ml of sodium acetate trihydrate buffer to homogenize approximately 1.0 g soil
sample. After transferring 40 µL of soil slurry to each well in a 96-well microplate, we
added 180 µL of sodium acetate trihydrate buffer and 20 L of the appropriate substrate
solution to each well. After one hour of incubation at room temperature, we transferred
109
90 L of supernatant from each well to a fresh microplate. Finally, 10 L of 1M NaOH
was added to each well. Absorbance was read at 410 nm on a microplate
spectrophotometer (Spectramax M2 microplate spectrophotometer, Molecular Devices,
San Jose, CA, USA). The enzyme activities were expressed in units of nmol g−1 soil h−1.
Since the activities of all enzymes were significantly related to each other, we only report
the mean activity of all enzymes.
Soil microbial C use efficiency
We calculated soil microbial C use efficiency as dBC / (dBC + ∑ CO2 − C), where
dBC is the amount of glucose-C incorporated into microbial biomass (determined from
the 13C content of unfumigated soil residues), and ∑ CO2 − C is the cumulative
respiration of glucose C (based on 13CO2 measurements) over 24-h. Following the
methods of Herron et al. (2009) and Butcher et al. (2020), we estimated dBC by extracting
and then oven-drying (24 h at 65 °C) unfumigated soil residues following incubation with
13C-glucose, and then measuring the mass of 13C in excess of natural abundance that was
remaining in the sample. This method assumes that there is no abiotic sorption of glucose
and that all of the non-extractable 13C resulted from microbial assimilation (Herron et al.
2009; Butcher et al. 2020).
Light and heavy fractions of SOC
The method described by (Six et al., 1998) was modified to separate light and
heavy SOC fractions. Approximately 2 g of air-dried soil was placed into a 50 mL vial
with 10 mL sodium polytungstate (SPT, 1.6 g/cm3). The vial was shaken for 1h at 160
rpm to mix the sample with SPT well. After shaking, SPT was used to rinse residual soil
and debris adhering to the vial’s cap and sides. The vial was then centrifuged at 4000 rpm
110
for 30 minutes. The supernatant containing the floating light fraction was filtered through
a pre-combusted quartz filter placed onto a Nalgene vacuum filter holder. SPT solution
was pulled through with a vacuum pump. The aforementioned steps were repeated twice
more. After that, 25 mL of DI water was added to the vial with the heavy fraction pellet.
The vial was shaken by hand to fully resuspend the pellet and then was centrifuged at
4000 rpm for 15 minutes. The supernatant was vacuumed through the same filters that we
used before. These steps were repeated two more times. The pellet remaining in the vial
at this point was considered to be heavy SOC fraction. The light SOC fraction material on
the filter was rinsed with a total 175 mL of DI water. Both light and heavy SOC fractions
were dried in the oven at 65°C for 48 h and then weighed. In addition, the dried heavy
SOC fraction was ground to a fine powder to measure C and N concentration with an
elemental analyzer (ECS 4010 Elemental Analyzer, Costech Analytical Technologies,
Valencia, CA, USA). Light and heavy SOC fractions represented particulate (POC) and
mineral associated organic C (MAOC), respectively.
Statistical analyses
Phase 1 and 2 of the experiment were analyzed separately, as distinct
experimental manipulations were performed in each. Three-way ANOVAs were
performed to determine effects of synthetic root exudates, soil microbial community
composition, and soil mineralogy on soil variables (e.g. CUE, soil enzyme activity, MBC,
and net change in C) during Phase 1. Repeated-measures four-way ANOVAs were
conducted to quantify effects of aboveground C input type, root exudates, soil microbial
community composition, and clay mineralogy on soil variables measured during Phase 2.
Repeated-measures three-way ANOVAs and mixed models (using R package lme4; fixed
111
effects included four treatments and the two-week cycle, and random effect was
microcosm) were conducted to quantify effects of treatments on soil respiration during
both Phase 1 and 2, respectively. R package “lmertest” was used to estimate P values in
mixed effects models. All analyses were conducted in R.
Results
The efficacy of synthetic soil system and treatments during Phase 1
By the end of Phase 1, mean enzyme activities in synthetic and real soils were
comparable (synthetic soil: 2.79 ± 0.22 [SE] µmol g-1 soil h-1; real soil: 4.15 ± 0.15 µmol
g-1 soil h-1). However, soil respiration (synthetic soil: 1.90 ± 0.05 µg CO2-C g-1 soil h-1;
real soil: 0.12 ± 0.00 µg CO2-C g-1 soil h-1), CUE (synthetic soil: 0.71 ± 0.01; real soil:
0.50 ± 0.01), and MBC (synthetic soil: 1822 ± 110 µg g-1 soil; real soil: 868 ± 50 µg g-1
soil) were lower in real soils (Fig. 4.1).
The presence of root exudates, soil microbial community composition, and soil
mineralogy all created some differences in ‘baseline’ functions across soils at the end of
Phase 1 (Fig. C2-C5 and Table C2 and C3 in the appendices). Soil respiration was
affected by the four-way interaction between root exudates, inoculum type, soil
mineralogy, and time (Table C2 in the appendices). More specifically, soil respiration
was initially highest under bacteria-only treatment in soils with medium and high clay
activities when root exudates were not present (Fig. C5 in the appendices). By contrast,
when root exudates were present, higher soil respiration was found under bacteria-only
treatment in soils with low clay activity, at least early on during Phase 1. By the end of
Phase 1, however, there were no appreciable differences among treatments.

112
The microbial biomass C pool responded to the interaction between root exudates
and soil mineralogy (Table C3 in the appendices). Root exudates did not markedly affect
biomass C under medium and high clay activities, but decreased MBC under low clay
activity (Fig. C6 in the appendices). Soil mineralogy also significantly affected CUE
(Table C3 in the appendices), with lower CUE under low clay activity (Fig. C4 in the
appendices). In addition, we found interactive effects of root exudates and soil microbial
community composition on CUE (Table C3 in the appendices). Specifically, soil
microbial community composition did not markedly affect CUE under root exudates, but
higher CUE was found under bacteria only (0.75 ± 0.01) than the bacteria + fungi
treatment (0.68 ± 0.02) when root exudates were not present (Fig. C7 in the appendices).
Soil mineralogy showed a strong effect on mean enzyme activity (Table C3 and
Fig. C4 in the appendices). Mean enzyme activity was greatest in high-activity clays but
lowest in medium-activity clays. As was true for the microbial biomass C, mean enzyme
activity responded to the interaction between root exudates and soil mineralogy, with the
presence of root exudates reducing enzyme activity only under high clay activity (Table
C3 and Fig. C8 in the appendices).
By the end of Phase 1, SOC remaining in each microcosm (i.e., calculated net
change in SOC) varied in response to soil microbial community composition and root
exudates (Table C3 in the appendices). More SOC was lost under bacteria only (-2.58 ±
0.12 mg g-1 soil) than the bacteria + fungi treatment (-1.97 ± 0.08 mg g-1 soil). Moreover,
root exudates stimulated less SOC loss (-2.12 ± 0.10 mg g-1 soil) than the control (-2.43 ±
0.12 mg g-1 soil). It should be noted that real soil experiment was mainly conducted to
113
test the efficacy of synthetic soil system, and it did not include clay activity treatment.
Therefore, we only described results from the artificial soil system during Phase 2 below.
Roles of plant-microbe-soil interactions in soil carbon cycling during Phase 2
In the second phase of the experiment, all four treatments generally had strong
impacts on the soil variables we measured, both alone and through two-, three-, and even
four-way interactions. However, the strongest and most consistent interaction was
between root exudates and soil mineralogy (Table 4.1 and 4.2).
Soil respiration was significantly affected by root exudates (Table 4.1), with soils
from root exudates respiring approximately 34% more on average than those from the
control (Fig. 4.4 and Table C4 in the appendices). Respiration also increased with clay
activity, with CO2 fluxes 22% higher, on average, in high- vs. low-activity clays (Fig. 4.6
and Table C4 in the appendices). In addition, soil respiration also responded to a much
smaller extent on the four-way interaction of soil mineralogy, inoculum type, C input
quality, and time (Table 4.1). Overall, the highest rates of soil respiration were found
under high-activity clays with addition of glucose or cellobiose. The lowest soil
respiration was found under low-activity clays with xylan as the C input (Fig. C9 in the
appendices). C input patterns in the medium-activity clays were more dependent upon
inoculum type. It should be noted that the interaction of soil mineralogy, inoculum type,
and C input quality varied between the times that we measured soil respiration.
Root exudates tended to enhance the size of the biomass, but this was dependent
upon clay type, external C input, and microbial inoculum (Fig. 4.4, Table 4.2, and Table
C5 in the appendices). In low- and medium-activity clays, effects of root exudates on the
biomass were dependent upon whether glucose, cellobiose, or xylan was added. In high
114
activity clays, root exudates always increased the biomass, regardless of C input quality
(Fig. C10 in the appendices). Moreover, the positive effect of root exudates on soil
microbial biomass C increased with C input quality under the bacteria only treatment, but
the opposite trend was observed in the bacteria + fungi treatment (Fig. C11 in the
appendices). We also found that the interactive effects of root exudates and inoculum and
the interactive effects of soil mineralogy and C input quality varied between harvests
(Table 4.2).
Harvest and soil mineralogy or inoculum interactively affected mean enzyme
activity (Table 4.2 and Table C6 in the appendices). In addition, mean enzyme activity
depended on the two-way interactions of soil mineralogy and C input quality, the three-
way interactions of root exudates, soil microbial community composition, and C input
quality, and the four-way interactions of root exudates, soil mineralogy, soil microbial
community composition, and harvest. Specifically, mean enzyme activity declined with
increasing C input quality in high activity clay but did not markedly respond to C input
quality in soils with low and medium clay activities (Fig. C12 in the appendices). Mean
enzyme activity in the presence of fungi was lower than in the bacteria-only treatment
regardless of C input quality, except in the root exudate treatment when the ‘background’
C input was xylan (Fig. C13 in the appendices). Root exudates slightly increased mean
enzyme activity when C input quality was glucose, regardless of inoculum type.
However, when the non-root C input was cellobiose or xylan, root exudates slightly
decreased mean enzyme activity under bacteria only treatment but increased it under the
bacteria + fungi treatment. Finally, within the bacteria-only treatment, mean enzyme
activity did not markedly respond to root exudates in soils with low clay activity, but was
115
increased and decreased by root exudates in soils with medium and high clay activity,
respectively (Fig. C14 in the appendices). For the bacteria + fungi treatment, there was no
large difference in mean enzyme activity between root exudates and control in medium
and high activity clay; however, higher mean enzyme activity was found under root
exudates in low activity clay.
MAOC was strongly influenced by the interaction between soil mineralogy and
root exudates (Table 4.2 and Table C7 in the appendices). However, these effects were
modified to some extent by non-root carbon inputs, the composition of the microbial
community, and harvest. For example, root exudates increased MAOC in high-activity
clay in the presence of bacteria but not fungi (Fig. C15 in the appendices), and when C
was added as cellobiose or xylan but not glucose (Fig. C16 in the appendices). By
contrast, root exudates decreased MAOC in low-activity clay, regardless of inoculum or
non-root C input, with intermediate and more complex patterns in medium-activity clays.
To a lesser extent we also observed three-way interactions among root exudates, soil
mineralogy, and harvest (Fig. C17 in the appendices), four-way interactions among C
input quality, root exudates, soil microbial community composition, and harvest (Fig.
C18 in the appendices), and four-way interactions among C input quality, soil microbial
community composition, soil mineralogy, and harvest (Fig. C19 in the appendices).
Overall, net change in SOC was always negative, which means that microcosms
always lost C during the course of the experiment. The effects of all four treatments on
net change in SOC varied with harvest (Table 4.2 and Table C8 in the appendices). For
example, more SOC was lost with increasing C input quality and soil clay activity during
both second and third harvests, but larger differences among C inputs and soil clay
116
activities were found during third harvest. In addition, the bacteria-only treatment had
less SOC loss than the bacteria + fungi treatment during second harvest, but the opposite
result was found during third harvest. Root exudates led to less SOC loss than control
during both harvests; however, larger difference was found during third harvest. Mineral
type had a strong effect on SOC change that was modified by root exudates, inoculum
type, and C input quality (Fig. C20 in the appendices). In general, net carbon loss
increased with clay activity (Fig. 4.3). Root exudates had positive effect of on net change
in SOC (i.e., root exudates tended to counteract SOC loss), and this effect also increased
with soil clay activity. Moreover, while less SOC was lost under xylan addition vs.
glucose and cellobiose, the difference between C inputs was more pronounced under
high-activity clay.
Discussion
We utilized synthetic root and soil systems to determine roles of plant-microbe-
soil interactions (C input quality, root exudates, soil microbial community, and soil
mineralogy) in SOC cycling. Before the experiment, we hypothesized that: 1) with
increasing C input quality, CUE increases, soil respiration decreases, and MAOC
increases; 2) root exudates stimulate soil respiration through rhizosphere priming effect;
3) the bacteria + fungi treatment would have less soil respiration and more MAOC than
the bacteria only treatment because fungi are believed to have greater CUE and slower
turnover rates; and 4) SOC stabilization would increase with increasing soil clay activity.
We found that only some of our hypotheses were supported by the findings of this study.
We discuss the overall effects of four drivers on SOC cycling and the common
interactions between root exudates and soil mineralogy below.
117
Effects of C input quality on SOC cycling
Overall, we found that among the four drivers, C input quality had the strongest
effects on soil respiration. Soil respiration was significantly lower when C input was
xylan than glucose or cellobiose. However, MAOC did not significantly respond to C
input quality. These findings were inconsistent with our hypotheses and prevalent
conceptual framework (Cotrufo et al., 2013), but were consistent with the results from a
recent long-term field study (Pierson et al., 2021) which found insignificant effects of C
input quality on MAOC. According to the MEMS framework, labile C has higher CUE
than recalcitrant C, resulting in more microbial-derived C, which in turn stimilates SOC
accumulation (Cotrufo et al., 2013; C. Liang et al., 2017). However, our results did not
fully surpport this idea. For example, slightly higher soil microbial biomass C was found
under cellobiose than glucose and xylan (Table 4.2 and Fig. 4.2). This finding was
consistent with a previous study which reported that, when compared to cellobiose, xylan
produced greater bacterial and fungal PLFA and ergosterol content, which are good
indicators for soil microbial biomass (Ali et al., 2018). In addition, on one hand, different
substrates might trigger shifts in microbial community composition, such that xylan could
lead to a more growth-efficient community (Kallenbach et al., 2016). On the other hand,
labile C input (e.g. glucose) can result in higher priming effect (Kuzyakov, 2010;
Kuzyakov et al., 2000), thus stimulating soil respiration. Finally, since xylan mainly
consisted of recalcitrant C, some of the xylan was still laying around unmetabolized,
whereas most of the glucose and cellobiose was consumed by soil microbes. Because of
potential higher priming effect and decomposition rate but slightly lower soil microbial
biomass C, we found higher soil respiration when C input was glucose.
118
Effects of root exudates on SOC cycling
We found that root exudates strongly influenced soil respiration and were the
most important factor affecting MAOC (Table 4.1 and 4.2), which was consistent with
our hypothesis. According to some previous studies, root exudates can promote SOC
accumulation because they mainly consist of labile C which has a higher CUE (Schmidt
et al., 2011; Slessarev et al., 2020; Sokol et al., 2019; Sokol & Bradford, 2019). This
opinion was partly supported by our results. For example, we found that root exudates
tended to increase soil microbial biomass C (Fig. 4.4). By contrast, other studies found
that root exudates could result in rhizosphere priming effect, thus destabilizing SOC
(Cheng et al., 2014). Since the decomposition of persistent SOC is enzymatically
catalyzed (Kuzyakov, 2010; Kuzyakov et al., 2000), higher soil enzyme activities usually
represent higher soil priming effect (Chen et al., 2014). Despite the four-way interactions
of root exudates, soil mineralogy, soil microbial community composition, and harvest, we
found that root exudates generally tended to slightly increase mean enzyme activity,
which also suggests that root exudates may have led to a positive rhizosphere priming
effect. Overall, dual effects of root exudates on SOC cycling were found in the present
study. Root exudates contributed to SOC loss via rhizosphere priming effects, but also
promoted SOC accumulation by increasing soil microbial biomass C. Overall, the dual
effects of root exudates on SOC cycling were mediated by other factors like soil
mineralogy, which we will discuss more below.
Effects of soil microbial community composition on SOC cycling
We hypothesized that more SOC will be lost when soil microbial community
composition is bacteria only rather than bacteria + fungi. This hypothesis was supported
119
by our findings, which showed higher MAOC under the bacteria + fungi treatment (Table
4.2 and Fig. 4.5), although this effect also depended upon the other three drivers, and
harvest. Many previous studies have found that fungi are better for SOC stabilization than
bacteria because fungi have longer turnover time (Ali et al., 2020). In addition,
significantly higher enzyme activities under bacteria only treatment were found in our
study. This may reflect that more enzymes were involved in destabilizing persistent SOC
under bacteria only treatment.
Effects of soil mineralogy on SOC cycling
It has been widely accepted that high clay activity and/or content can stimulate
persistent SOC accumulation because these clays have high surface area and/or great
affinity to chemically bond with organic C to form MAOC (Cotrufo et al., 2013; Lavallee
et al., 2020). Consistent with this, we also found the highest value of MAOC in high-
activity clay (Fig. 4.6). However, our results showed that soil respiration increased with
the increasing clay activity (Fig. 4.6), which is opposite to what we expected. Similarly,
higher enzyme activity was also found in soils with high clay activity (Fig. 4.6). This
finding suggests that high-activity clay also can stabilize more enzymes, thus increasing
the decomposition rate of SOC and soil respiration. Compared to MAOC, soil respiration
responded to clay activity more greatly (Table 4.1 and 4.2). As a result, more SOC loss
was found in soils with high clay activity (Fig. 4.3). Overall, our results indicate that the
effect of soil clay activity on SOC cycling is a ‘double-edged sword’.
Responses of soil C cycling to plant-microbe-soil interactions
Although most variables responded to complex treatment interactions, the root
exudates x mineral interaction was usually the biggest in the present study. For example,
120
soil respiration ranged from 2.24 g CO2-C g-1 soil h-1 under low clay activity in soils
without root exudates to 3.78 g CO2-C g-1 soil h-1 under high clay activity in soils with
root exudates (Fig. 4.7). In addition, MAOC ranged from 4.37 g kg-1 under low clay
activity in soils with root exudates to 6.30 g kg-1 under low clay activity in soils without
root exudates. There has been a greater recognition that root exudates play a great role in
SOC stabilization and loss (Sokol et al., 2019; Sokol & Bradford, 2019). However, either
positive or negative effects of root exudates on SOC stabilization have been found by
previous studies (Cheng et al., 2014; Slessarev et al., 2020). Dijkstra et al. (2021) raised a
framework named “Rhizo-Engine”, which held that whether root exudates lead to more
SOC stabilization or loss depends on other factors such as soil mineralogy and nutrient
condition. In other words, the opposite results that were reported before might be because
the experiments studying root effects on SOC were conducted in different soil conditions
(e.g. different soil microbial community composition and clay activities). Nonetheless, no
study has been done to test this hypothesis. Our study provides the first direct evidence
that root effects on SOC cycling are significantly mediated by soil mineralogy (e.g. the
strongest and most consistent interaction between root exudates and soil clay activity)
(Fig. 4.7). For example, root exudates decreased MAOC in soils with low and medium
clay activities but increased MAOC in soils with high clay activity. This might be
because of relatively low potential of low- and medium-activity clay to generate chemical
bonds with C from root exudates to form MAOC. However, relatively high area surface
and affinity of high-activity clay can absorb more organic C, resulting in MAOC
accumulation. Although high clay activity could reduce respiration caused by root
exudates, C still tended to release from soils regardless of clay activity (Fig. 4.7). This
121
indicates that SOC loss caused by root exudates via rhizosphere priming effect was
greater than SOC stabilization via MAOC accumulation. However, unknowns remain
whether the results can vary with the amount of root exudates, which should be further
studied in the future.
In addition to the interactions between root exudates and soil mineralogy, we also
found some interesting interactions between root exudates and soil microbial community
composition and between soil microbial community composition and soil mineralogy
(Fig. 4.8). Without root exudates, higher MAOC was found under bacteria + fungi than
under the bacteria only treatment. In the presence of root exudates, however, no marked
difference in MAOC was found between two soil microbial community compositions.
Fungi usually have longer turn-over time than bacteria (Ali et al., 2020). In addition, soil
enzyme activity was low under bacteria + fungi relative to bacteria only (Fig. 4.8). As a
result, higher MAOC was found under the bacteria + fungi treatment when root exudates
were not present. Once root exudates were loaded, however, soil enzyme activity
increased significantly under the bacteria + fungi treatment (Fig. 4.8). This increase in
enzymatic activity may have resulted in a greater rhizosphere priming effect under the
bacteria + fungi treatment. Overall, our study indicates that the effects of root exudates on
SOC cycling were not only mediated by soil mineralogy but also soil microbial
community composition. In addition, the net change in SOC responded to the interactions
of soil microbial community composition and soil mineralogy (Fig. 4.8). It is interesting
that when compared to bacteria only, SOC loss was slightly lower under the bacteria +
fungi in low-and high-activity clay but became higher in soils with medium clay activity.
However, our measurements did not provide enough hints to explain this, and thus, more
122
studies will be required to disentangle the underlying mechanisms. Finally, it should be
noted that the individual effects of four drivers and their interactions varied over time
(Table 4.1 and 4.2). However, most laboratory studies are conducted in very short time
(e.g. < 3 months), and variables related to SOC cycling are only measured one time
(Schnecker et al., 2019; Sokol & Bradford, 2019). In order to unravel the mechanisms of
SOC cycling more accurately, our results strongly suggest that long-term experiment
should be conducted in the future and that relevant variables should be measured at
multiple times.
Conclusion
Soil C cycling plays a great role in global climate mitigation. However, unknowns
still remain regarding how SOC cycling responds to plant-microbe-soil interactions. A
synthetic root and soil system was utilized to assess how C input quality, root exudates,
soil microbial community, and soil mineralogy interactively affect SOC stabilization and
loss, and to quantify the relative importance of each of these controls. C input quality was
the most important factor affecting soil respiration, and soil respiration was significantly
lower under xylan than glucose or cellobiose. In addition, the variation of MAOC was
most explained by root exudates and soil microbial community composition. Specifically,
root exudates decreased MAOC, and higher MAOC was found under the fungi + bacteria
than bacteria only treatment. Along the plant-microbe-soil continuum, the strongest and
most consistent interactive effects on SOC cycling was found between root exudates and
soil mineralogy. The increase in soil respiration stimulated by root exudates tended to
decrease with the increasing of soil clay activity, and root exudates decreased MAOC
under low and medium clay activities but increased MAOC under high soil clay activity.
123
We strongly suggest more studies should be conducted to disentangle the mechanisms of
how root-soil interactions affect SOC cycling.
References
Ali, R. S., Poll, C., & Kandeler, E. (2018). Dynamics of soil respiration and microbial
communities: Interactive controls of temperature and substrate quality. Soil Biology
and Biochemistry, 127(August), 60–70.
https://doi.org/10.1016/j.soilbio.2018.09.010
Ali, R. S., Poll, C., & Kandeler, E. (2020). Soil Properties Control Microbial Carbon
Assimilation and Its Mean Residence Time. Frontiers in Environmental Science,
8(March), 1–9. https://doi.org/10.3389/fenvs.2020.00033
Batjes, N. H. (1996). Total carbon and nitrogen in the soils of the world. European
Journal of Soil Science, 47, 151–163.
Bonebrake, M., Anderson, K., Valiente, J., Jacobson, A., McLean, J. E., Anderson, A., &
Britt, D. W. (2018). Biofilms Benefiting Plants Exposed to ZnO and CuO
Nanoparticles Studied with a Root-Mimetic Hollow Fiber Membrane. Journal of
Agricultural and Food Chemistry, 66(26), 6619–6627.
https://doi.org/10.1021/acs.jafc.7b02524
Brookes, P. C., Landman, A., Pruden, G., & Jenkinson, D. S. (1985). Chloroform
fumigation and the release of soil nitrogen: A rapid direct extraction method to
measure microbial biomass nitrogen in soil. Soil Biology and Biochemistry, 17(6),
837–842. https://doi.org/10.1016/0038-0717(85)90144-0
Butcher, K. R., Nasto, M. K., Norton, J. M., & Stark, J. M. (2020). Physical mechanisms
for soil moisture effects on microbial carbon-use efficiency in a sandy loam soil in
124
the western United States. Soil Biology and Biochemistry, 150(August), 107969.
https://doi.org/10.1016/j.soilbio.2020.107969
Chen, R., Senbayram, M., Blagodatsky, S., Myachina, O., Dittert, K., Lin, X.,
Blagodatskaya, E., & Kuzyakov, Y. (2014). Soil C and N availability determine the
priming effect: Microbial N mining and stoichiometric decomposition theories.
Global Change Biology, 20(7), 2356–2367. https://doi.org/10.1111/gcb.12475
Cheng, W., Parton, W. J., Gonzalez-Meler, M. A., Phillips, R., Asao, S., Mcnickle, G. G.,
Brzostek, E., & Jastrow, J. D. (2014). Synthesis and modeling perspectives of
rhizosphere priming. New Phytologist, 201(1), 31–44.
https://doi.org/10.1111/nph.12440
Cleveland, C. C., & Liptzin, D. (2007). C:N:P stoichiometry in soil: Is there a “Redfield
ratio” for the microbial biomass? Biogeochemistry, 85(3), 235–252.
https://doi.org/10.1007/s10533-007-9132-0
Cotrufo, M. F., Ranalli, M. G., Haddix, M. L., Six, J., & Lugato, E. (2019). Soil carbon
storage informed by particulate and mineral-associated organic matter. Nature
Geoscience, 12(12), 989–994. https://doi.org/10.1038/s41561-019-0484-6
Cotrufo, M. F., Soong, J. L., Horton, A. J., Campbell, E. E., Haddix, M. L., Wall, D. H.,
& Parton, W. J. (2015). Formation of soil organic matter via biochemical and
physical pathways of litter mass loss. Nature Geoscience, 8(10), 776–779.
https://doi.org/10.1038/ngeo2520
Cotrufo, M. F., Wallenstein, M. D., Boot, C. M., Denef, K., & Paul, E. (2013). The
Microbial Efficiency-Matrix Stabilization (MEMS) framework integrates plant litter
decomposition with soil organic matter stabilization: Do labile plant inputs form
125
stable soil organic matter? Global Change Biology, 19(4), 988–995.
https://doi.org/10.1111/gcb.12113
Dijkstra, F. A., Zhu, B., & Cheng, W. (2021). Root effects on soil organic carbon: a
double-edged sword. New Phytologist, 230(1), 60–65.
https://doi.org/10.1111/nph.17082
Finzi, A. C., Abramoff, R. Z., Spiller, K. S., Brzostek, E. R., Darby, B. A., Kramer, M.
A., & Phillips, R. P. (2015). Rhizosphere processes are quantitatively important
components of terrestrial carbon and nutrient cycles. Global Change Biology, 21(5),
2082–2094. https://doi.org/10.1111/gcb.12816
Frey, S. D., Grandy, A. S., & Kallenbach, C. M. (2016). Direct evidence for microbial-
derived soil organic matter formation and its ecophysiological controls. Nature
Communications, 7, 1–10. https://doi.org/10.1038/ncomms13630
Frey, S. D., Lee, J., Melillo, J. M., & Six, J. (2013). The temperature response of soil
microbial efficiency and its feedback to climate. Nature Climate Change, 3(4), 395–
398. https://doi.org/10.1038/nclimate1796
German, D. P., Weintraub, M. N., Grandy, A. S., Lauber, C. L., Rinkes, Z. L., & Allison,
S. D. (2011). Optimization of hydrolytic and oxidative enzyme methods for
ecosystem studies. Soil Biology and Biochemistry, 43(7), 1387–1397.
https://doi.org/10.1016/j.soilbio.2011.03.017
Geyer, K., Kyker-snowman, E., Grandy, S., & Frey, S. D. (2016). Microbial carbon use
efficiency: accounting for population , community , and ecosystem-scale controls
over the fate of metabolized organic matter. Biogeochemistry, 127(2), 173–188.
https://doi.org/10.1007/s10533-016-0191-y
126
Glassman, S. I., Weihe, C., Li, J., Albright, M. B. N., Looby, C. I., Martiny, A. C.,
Treseder, K. K., Allison, S. D., & Martiny, J. B. H. (2018). Decomposition
responses to climate depend on microbial community composition. Proceedings of
the National Academy of Sciences of the United States of America, 115(47), 11994–
11999. https://doi.org/10.1073/pnas.1811269115
Grandy, A. S., Strickland, M. S., Lauber, C. L., Bradford, M. A., & Fierer, N. (2009).
The influence of microbial communities, management, and soil texture on soil
organic matter chemistry. Geoderma, 150(3–4), 278–286.
https://doi.org/10.1016/j.geoderma.2009.02.007
Kaiser, M., Zederer, D. P., Ellerbrock, R. H., Sommer, M., & Ludwig, B. (2016). Effects
of mineral characteristics on content, composition, and stability of organic matter
fractions separated from seven forest topsoils of different pedogenesis. Geoderma,
263, 1–7. https://doi.org/10.1016/j.geoderma.2015.08.029
Kallenbach, C. M., Frey, S. D., & Grandy, A. S. (2016). Direct evidence for microbial-
derived soil organic matter formation and its ecophysiological controls. Nature
Communications, 7. https://doi.org/10.1038/ncomms13630
Keiser, A. D., Keiser, D. A., Strickland, M. S., & Bradford, M. A. (2014). Disentangling
the mechanisms underlying functional differences among decomposer communities.
Journal of Ecology, 102(3), 603–609. https://doi.org/10.1111/1365-2745.12220
Kleber, M. (2010). What is recalcitrant soil organic matter? Environmental Chemistry,
7(4), 320–332. https://doi.org/10.1071/EN10006
Kleber, M., Eusterhues, K., Keiluweit, M., Mikutta, C., Mikutta, R., & Nico, P. S. (2015).
Mineral-Organic Associations: Formation, Properties, and Relevance in Soil
127
Environments. In Advances in Agronomy (Vol. 130). Elsevier Ltd.
https://doi.org/10.1016/bs.agron.2014.10.005
Kleber, M., Sollins, P., & Sutton, R. (2007). A conceptual model of organo-mineral
interactions in soils: Self-assembly of organic molecular fragments into zonal
structures on mineral surfaces. Biogeochemistry, 85(1), 9–24.
https://doi.org/10.1007/s10533-007-9103-5
Kuzyakov, Y. (2010). Priming effects: Interactions between living and dead organic
matter. Soil Biology and Biochemistry, 42(9), 1363–1371.
https://doi.org/10.1016/j.soilbio.2010.04.003
Kuzyakov, Y., Friedel, J. K., & Stahr, K. (2000). Review of mechanisms and
quantification of priming effects. Soil Biology and Biochemistry, 32(11–12), 1485–
1498. https://doi.org/10.1016/S0038-0717(00)00084-5
Lavallee, J. M., Soong, J. L., & Cotrufo, M. F. (2020). Conceptualizing soil organic
matter into particulate and mineral-associated forms to address global change in the
21st century. Global Change Biology, 26(1), 261–273.
https://doi.org/10.1111/gcb.14859
Lehmann, J., Hansel, C. M., Kaiser, C., Kleber, M., Maher, K., Manzoni, S., Nunan, N.,
Reichstein, M., Schimel, J. P., Torn, M. S., Wieder, W. R., & Kögel-Knabner, I.
(2020). Persistence of soil organic carbon caused by functional complexity. Nature
Geoscience, 13(8), 529–534. https://doi.org/10.1038/s41561-020-0612-3
Liang, C., & Balser, T. C. (2011). Microbial production of recalcitrant organic matter in
global soils: Implications for productivity and climate policy. Nature Reviews
Microbiology, 9(1), 75. https://doi.org/10.1038/nrmicro2386-c1
128
Liang, C., Schimel, J. P., & Jastrow, J. D. (2017). The importance of anabolism in
microbial control over soil carbon storage. Nature Microbiology, 2(8), 1–6.
https://doi.org/10.1038/nmicrobiol.2017.105
Luo, Y., Ahlström, A., Allison, S. D., Batjes, N. H., Brovkin, V., Carvalhais, N.,
Chappell, A., Ciais, P., Davidson, E. A., Finzi, A., Georgiou, K., Guenet, B.,
Hararuk, O., Harden, J. W., He, Y., Hopkins, F., Jiang, L., Koven, C., Jackson, R.
B., … Zhou, T. (2016). Toward more realistic projections of soil carbon dynamics
by Earth system models. Global Biogeochemical Cycles, 30, 40–56.
https://doi.org/10.1002/2015GB005239.
Macht, F., Eusterhues, K., Pronk, G. J., & Totsche, K. U. (2011). Specific surface area of
clay minerals: Comparison between atomic force microscopy measurements and
bulk-gas (N2) and -liquid (EGME) adsorption methods. Applied Clay Science,
53(1), 20–26. https://doi.org/10.1016/j.clay.2011.04.006
Melillo, J. M., Aber, J. D., Muratore, J. F., & Jun, N. (2008). Nitrogen and Lignin
Control of Hardwood Leaf Litter Decomposition Dynamics. Ecology, 63(3), 621–
626.
Merino, C., Nannipieri, P., & Matus, F. (2015). Soil carbon controlled by plant,
microorganism and mineralogy interactions. Journal of Soil Science and Plant
Nutrition, 15(2), 321–332. https://doi.org/10.4067/s0718-95162015005000030
Minasny, B., Malone, B. P., McBratney, A. B., Angers, D. A., Arrouays, D., Chambers,
A., Chaplot, V., Chen, Z. S., Cheng, K., Das, B. S., Field, D. J., Gimona, A., Hedley,
C. B., Hong, S. Y., Mandal, B., Marchant, B. P., Martin, M., McConkey, B. G.,
129
Mulder, V. L., … Winowiecki, L. (2017). Soil carbon 4 per mille. Geoderma, 292,
59–86. https://doi.org/10.1016/j.geoderma.2017.01.002
Neurath, R. A., Pett-Ridge, J., Chu-Jacoby, I., Herman, D., Whitman, T., Nico, P. S.,
Lipton, A. S., Kyle, J., Tfaily, M. M., Thompson, A., & Firestone, M. K. (2021).
Root Carbon Interaction with Soil Minerals Is Dynamic, Leaving a Legacy of
Microbially Derived Residues. Environmental Science & Technology.
https://doi.org/10.1021/acs.est.1c00300
Phillips, R. P., Finzi, A. C., & Bernhardt, E. S. (2011). Enhanced root exudation induces
microbial feedbacks to N cycling in a pine forest under long-term CO2 fumigation.
Ecology Letters, 14(2), 187–194. https://doi.org/10.1111/j.1461-0248.2010.01570.x
Pierson, D., Evans, L., Kayhani, K., Bowden, R. D., Nadelhoffer, K., Simpson, M., &
Lajtha, K. (2021). Mineral stabilization of soil carbon is suppressed by live roots,
outweighing influences from litter quality or quantity. Biogeochemistry, 154(3),
433–449. https://doi.org/10.1007/s10533-021-00804-9
Qiao, Y., Wang, J., Liang, G., Du, Z., Zhou, J., & Zhu, C. (2019). Global variation of soil
microbial carbon-use efficiency in relation to growth temperature and substrate
supply. Scientific Reports, March, 1–8. https://doi.org/10.1038/s41598-019-42145-6
Rasmussen, C., Heckman, K., Wieder, W. R., Keiluweit, M., Lawrence, C. R., Berhe, A.
A., Blankinship, J. C., Crow, S. E., Druhan, J. L., Hicks Pries, C. E., Marin-Spiotta,
E., Plante, A. F., Schädel, C., Schimel, J. P., Sierra, C. A., Thompson, A., & Wagai,
R. (2018). Beyond clay: towards an improved set of variables for predicting soil
organic matter content. Biogeochemistry, 137(3), 297–306.
https://doi.org/10.1007/s10533-018-0424-3
130
Roller, B. R. K., & Schmidt, T. M. (2015). The physiology and ecological implications of
efficient growth. ISME Journal, 9(7), 1481–1487.
https://doi.org/10.1038/ismej.2014.235
Scharlemann, J. P. W., Tanner, E. V. J., Hiederer, R., & Kapos, V. (2014). Global soil
carbon: Understanding and managing the largest terrestrial carbon pool. Carbon
Management, 5(1), 81–91. https://doi.org/10.4155/cmt.13.77
Schmidt, M. W. I., Torn, M. S., Abiven, S., Dittmar, T., Guggenberger, G., Janssens, I.
A., Kleber, M., Kögel-Knabner, I., Lehmann, J., Manning, D. A. C., Nannipieri, P.,
Rasse, D. P., Weiner, S., & Trumbore, S. E. (2011). Persistence of soil organic
matter as an ecosystem property. Nature, 478(7367), 49–56.
https://doi.org/10.1038/nature10386
Schnecker, J., Bowles, T., Hobbie, E. A., Smith, R. G., & Grandy, A. S. (2019). Substrate
quality and concentration control decomposition and microbial strategies in a model
soil system. Biogeochemistry, 8, 47–59. https://doi.org/10.1007/s10533-019-00571-
8
Shi, Z., Crowell, S., Luo, Y., & Moore, B. (2018). Model structures amplify uncertainty
in predicted soil carbon responses to climate change. Nature Communications, 9(1),
1–11. https://doi.org/10.1038/s41467-018-04526-9
Simpson, A., Simpson, M., Smith, E., & Kelleher, B. (2008). Microbially derived inputs
to soil organic matter: Are current estimates too low? Environmental Science and
Technology, 41, 8070–8076. https://doi.org/10.1021/es8000932
131
Sinsabaugh, R. L., Manzoni, S., Moorhead, D. L., & Richter, A. (2013). Carbon use
efficiency of microbial communities: Stoichiometry, methodology and modelling.
Ecology Letters, 16(7), 930–939. https://doi.org/10.1111/ele.12113
Six, J., Elliott, E. T., Paustian, K., & Doran, J. W. (1998). Aggregation and Soil Organic
Matter Accumulation in Cultivated and Native Grassland Soils. Soil Science Society
of America Journal, 62(5), 1367–1377.
https://doi.org/10.2136/sssaj1998.03615995006200050032x
Slessarev, E. W., Nuccio, E. E., McFarlane, K. J., Ramon, C. E., Saha, M., Firestone, M.
K., & Pett-Ridge, J. (2020). Quantifying the effects of switchgrass (Panicum
virgatum) on deep organic C stocks using natural abundance 14C in three marginal
soils. GCB Bioenergy, 12(10), 834–847. https://doi.org/10.1111/gcbb.12729
Smith, P., Soussana, J. F., Angers, D., Schipper, L., Chenu, C., Rasse, D. P., Batjes, N.
H., van Egmond, F., McNeill, S., Kuhnert, M., Arias-Navarro, C., Olesen, J. E.,
Chirinda, N., Fornara, D., Wollenberg, E., Álvaro-Fuentes, J., Sanz-Cobena, A., &
Klumpp, K. (2020). How to measure, report and verify soil carbon change to realize
the potential of soil carbon sequestration for atmospheric greenhouse gas removal.
Global Change Biology, 26(1), 219–241. https://doi.org/10.1111/gcb.14815
Sokol, N. W., & Bradford, M. A. (2019). Microbial formation of stable soil carbon is
more efficient from belowground than aboveground input. Nature Geoscience,
12(1), 46–53. https://doi.org/10.1038/s41561-018-0258-6
Sokol, N. W., Kuebbing, S. E., Karlsen-Ayala, E., & Bradford, M. A. (2019). Evidence
for the primacy of living root inputs, not root or shoot litter, in forming soil organic
carbon. New Phytologist, 221(1), 233–246. https://doi.org/10.1111/nph.15361
132
Sokol, N. W., Sanderman, J., & Bradford, M. A. (2018). Pathways of mineral-associated
soil organic matter formation: Integrating the role of plant carbon source, chemistry,
and point of entry. Global Change Biology, 25(1), 12–24.
https://doi.org/10.1111/gcb.14482
Van Bruggen, A. H. C., Semenov, A. M., & Zelenev, V. V. (2000). Wavelike
distributions of microbial populations along an artificial root moving through soil.
Microbial Ecology, 40(3), 250–259. https://doi.org/10.1007/s002480000030
van Bruggen, A. H. C., Semenov, A. M., & Zelenev, V. v. (2000). Wavelike distributions
of microbial populations along an artificial root moving through soil. Microbial
Ecology, 40(3), 250–259. https://doi.org/10.1007/s002480000030
Wu, J., Joergensen, R. G., Pommeren, G., & Brook, P. C. (1990). Measurement of soil
microbial biomass by fumigation-extraction-an automated procedure (Vol. 22, Issue
8).
Yin, H., Wheeler, E., & Phillips, R. P. (2014). Root-induced changes in nutrient cycling
in forests depend on exudation rates. Soil Biology and Biochemistry, 78, 213–221.
https://doi.org/10.1016/j.soilbio.2014.07.022
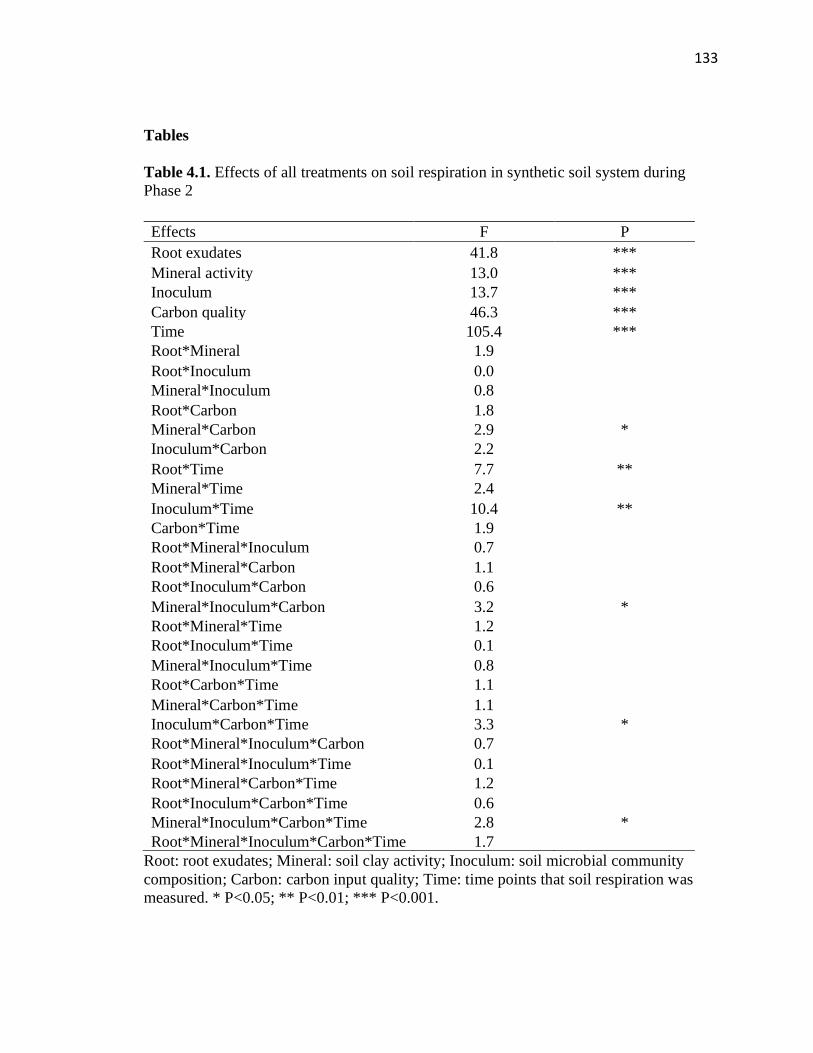
133
Tables
Table 4.1. Effects of all treatments on soil respiration in synthetic soil system during
Phase 2
Root: root exudates; Mineral: soil clay activity; Inoculum: soil microbial community
composition; Carbon: carbon input quality; Time: time points that soil respiration was
measured. * P<0.05; ** P<0.01; *** P<0.001.
Effects F P
Root exudates 41.8 ***
Mineral activity 13.0 ***
Inoculum 13.7 ***
Carbon quality 46.3 ***
Time 105.4 ***
Root*Mineral 1.9
Root*Inoculum 0.0
Mineral*Inoculum 0.8
Root*Carbon 1.8
Mineral*Carbon 2.9 *
Inoculum*Carbon 2.2
Root*Time 7.7 **
Mineral*Time 2.4
Inoculum*Time 10.4 **
Carbon*Time 1.9
Root*Mineral*Inoculum 0.7
Root*Mineral*Carbon 1.1
Root*Inoculum*Carbon 0.6
Mineral*Inoculum*Carbon 3.2 *
Root*Mineral*Time 1.2
Root*Inoculum*Time 0.1
Mineral*Inoculum*Time 0.8
Root*Carbon*Time 1.1
Mineral*Carbon*Time 1.1
Inoculum*Carbon*Time 3.3 *
Root*Mineral*Inoculum*Carbon 0.7
Root*Mineral*Inoculum*Time 0.1
Root*Mineral*Carbon*Time 1.2
Root*Inoculum*Carbon*Time 0.6
Mineral*Inoculum*Carbon*Time 2.8 *
Root*Mineral*Inoculum*Carbon*Time 1.7
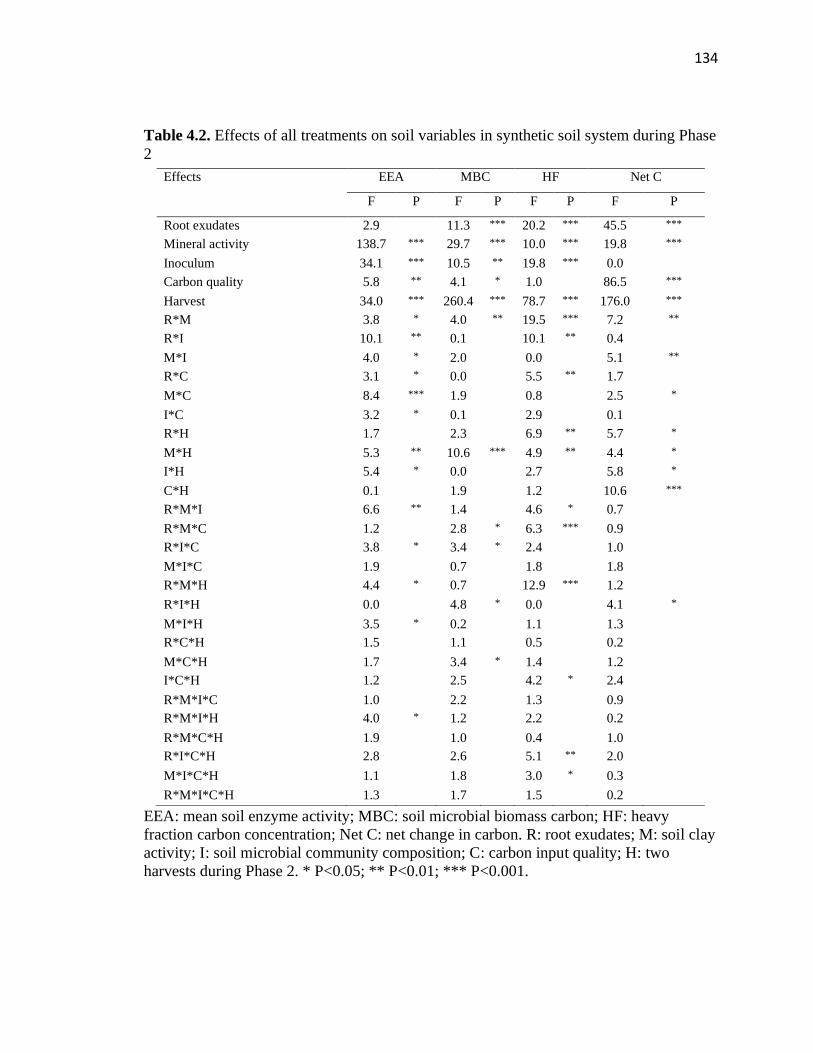
134
Table 4.2. Effects of all treatments on soil variables in synthetic soil system during Phase
2
EEA: mean soil enzyme activity; MBC: soil microbial biomass carbon; HF: heavy
fraction carbon concentration; Net C: net change in carbon. R: root exudates; M: soil clay
activity; I: soil microbial community composition; C: carbon input quality; H: two
harvests during Phase 2. * P<0.05; ** P<0.01; *** P<0.001.
Effects EEA MBC HF Net C
F P F P F P F P
Root exudates 2.9 11.3 *** 20.2 *** 45.5 ***
Mineral activity 138.7 *** 29.7 *** 10.0 *** 19.8 ***
Inoculum 34.1 *** 10.5 ** 19.8 *** 0.0
Carbon quality 5.8 ** 4.1 * 1.0 86.5 ***
Harvest 34.0 *** 260.4 *** 78.7 *** 176.0 ***
R*M 3.8 * 4.0 ** 19.5 *** 7.2 **
R*I 10.1 ** 0.1 10.1 ** 0.4
M*I 4.0 * 2.0 0.0 5.1 **
R*C 3.1 * 0.0 5.5 ** 1.7
M*C 8.4 *** 1.9 0.8 2.5 *
I*C 3.2 * 0.1 2.9 0.1
R*H 1.7 2.3 6.9 ** 5.7 *
M*H 5.3 ** 10.6 *** 4.9 ** 4.4 *
I*H 5.4 * 0.0 2.7 5.8 *
C*H 0.1 1.9 1.2 10.6 ***
R*M*I 6.6 ** 1.4 4.6 * 0.7
R*M*C 1.2 2.8 * 6.3 *** 0.9
R*I*C 3.8 * 3.4 * 2.4 1.0
M*I*C 1.9 0.7 1.8 1.8
R*M*H 4.4 * 0.7 12.9 *** 1.2
R*I*H 0.0 4.8 * 0.0 4.1 *
M*I*H 3.5 * 0.2 1.1 1.3
R*C*H 1.5 1.1 0.5 0.2
M*C*H 1.7 3.4 * 1.4 1.2
I*C*H 1.2 2.5 4.2 * 2.4
R*M*I*C 1.0 2.2 1.3 0.9
R*M*I*H 4.0 * 1.2 2.2 0.2
R*M*C*H 1.9 1.0 0.4 1.0
R*I*C*H 2.8 2.6 5.1 ** 2.0
M*I*C*H 1.1 1.8 3.0 * 0.3
R*M*I*C*H 1.3 1.7 1.5 0.2
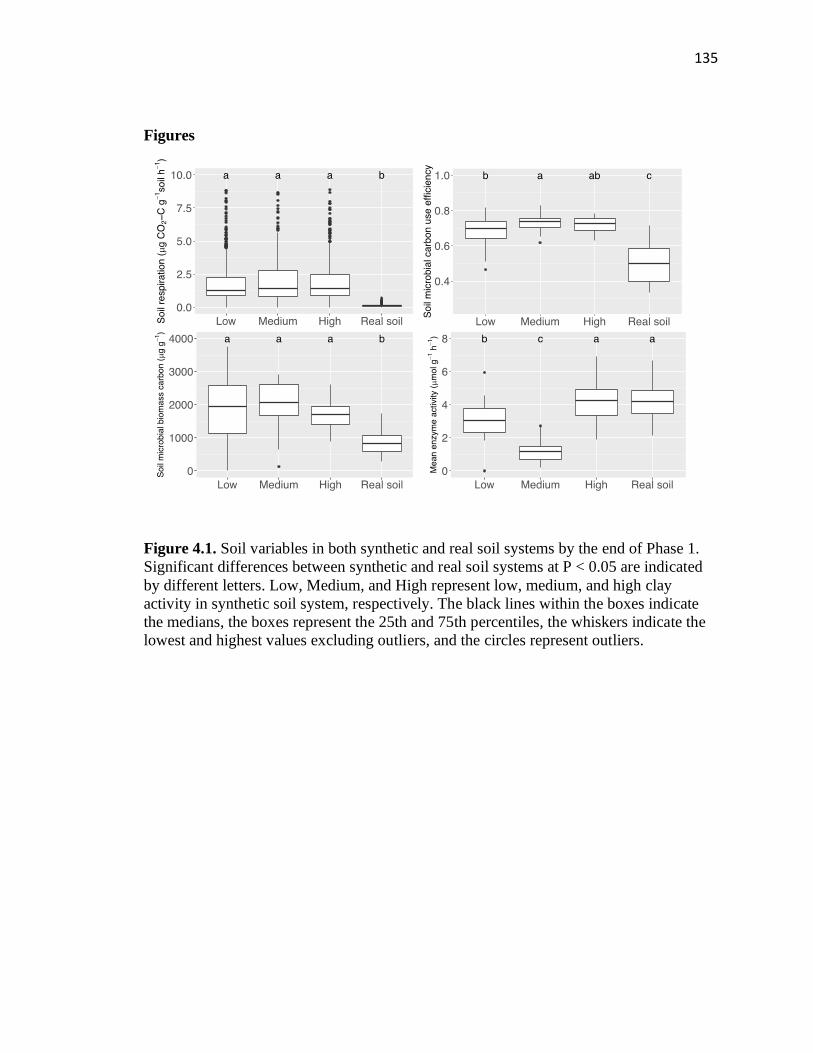
135
Figures
Figure 4.1. Soil variables in both synthetic and real soil systems by the end of Phase 1.
Significant differences between synthetic and real soil systems at P < 0.05 are indicated
by different letters. Low, Medium, and High represent low, medium, and high clay
activity in synthetic soil system, respectively. The black lines within the boxes indicate
the medians, the boxes represent the 25th and 75th percentiles, the whiskers indicate the
lowest and highest values excluding outliers, and the circles represent outliers.
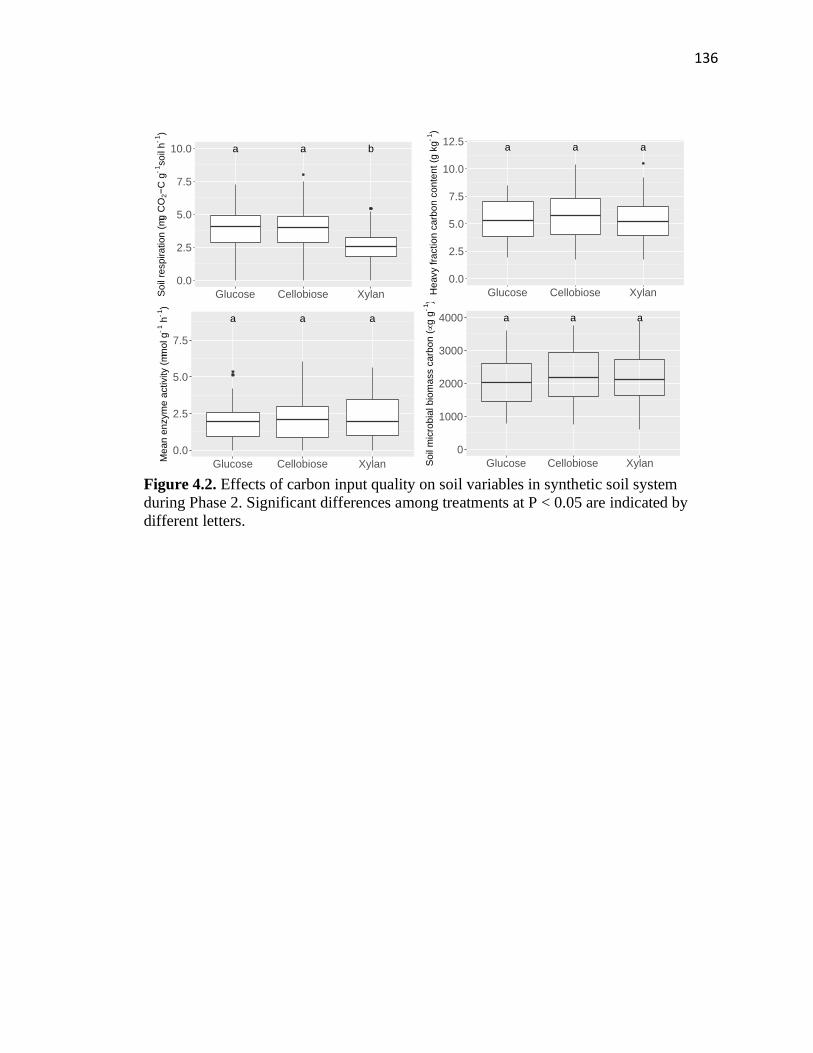
136
Figure 4.2. Effects of carbon input quality on soil variables in synthetic soil system
during Phase 2. Significant differences among treatments at P < 0.05 are indicated by
different letters.
a a a
0
1000
2000
3000
4000
Glucose Cellobiose XylanSo
il m
icro
bia
l b
iom
ass c
arb
on
(µ
g g
-1)
a a a
0.0
2.5
5.0
7.5
Glucose Cellobiose Xylan
Me
an
en
zym
e a
ctivity (
mm
ol g
-1 h
-1)
a a a
0.0
2.5
5.0
7.5
10.0
12.5
Glucose Cellobiose XylanHe
avy f
ractio
n c
arb
on
co
nte
nt
(g k
g-
1)
a a b
0.0
2.5
5.0
7.5
10.0
Glucose Cellobiose XylanSo
il re
sp
ira
tio
n (
mg
CO
2−
C g
-1so
il h
-1)
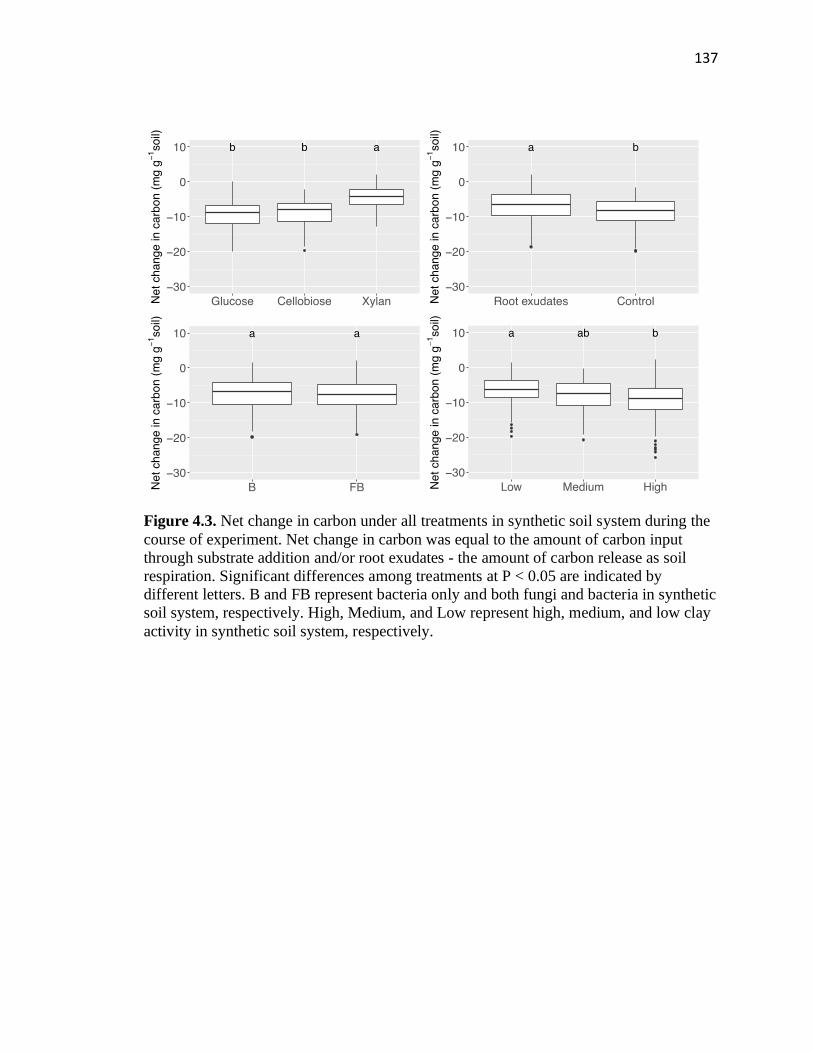
137
Figure 4.3. Net change in carbon under all treatments in synthetic soil system during the
course of experiment. Net change in carbon was equal to the amount of carbon input
through substrate addition and/or root exudates - the amount of carbon release as soil
respiration. Significant differences among treatments at P < 0.05 are indicated by
different letters. B and FB represent bacteria only and both fungi and bacteria in synthetic
soil system, respectively. High, Medium, and Low represent high, medium, and low clay
activity in synthetic soil system, respectively.
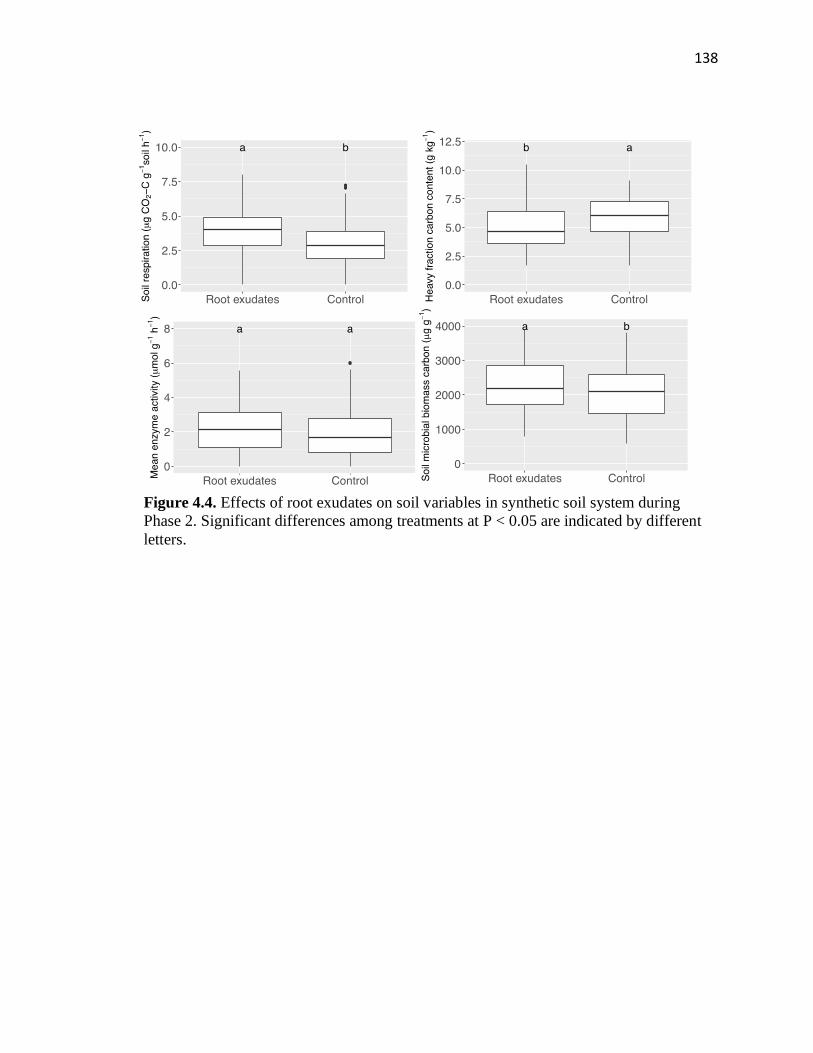
138
Figure 4.4. Effects of root exudates on soil variables in synthetic soil system during
Phase 2. Significant differences among treatments at P < 0.05 are indicated by different
letters.
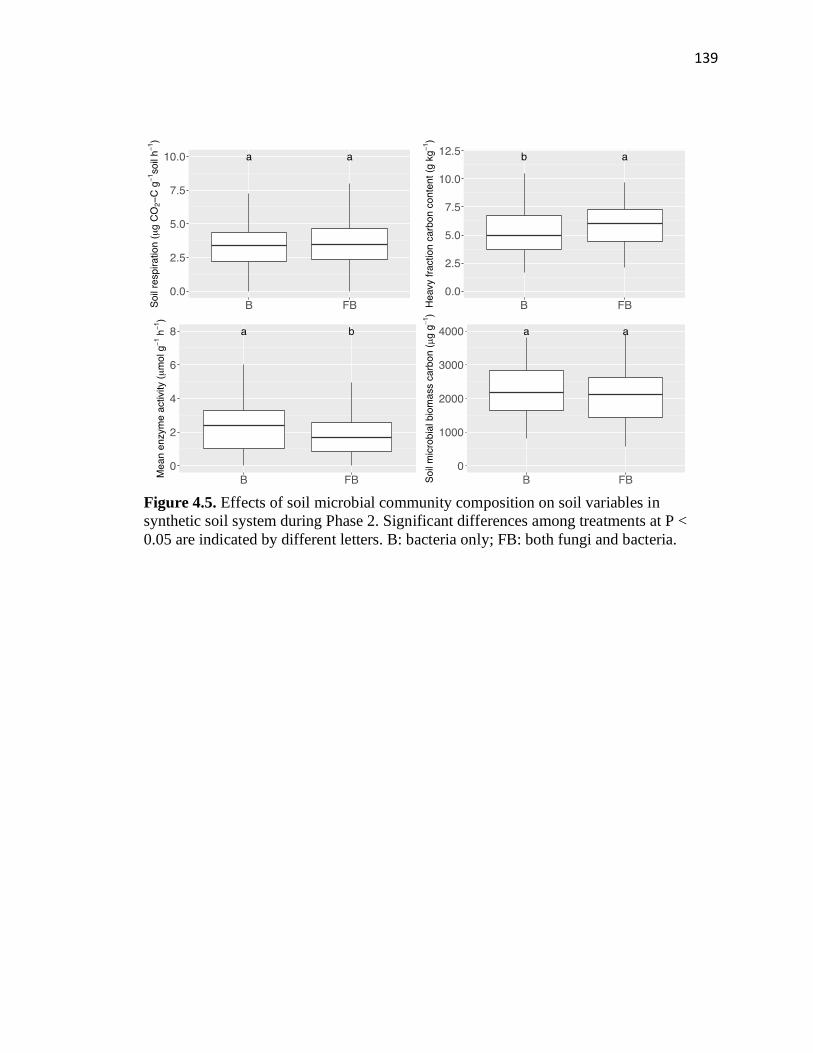
139
Figure 4.5. Effects of soil microbial community composition on soil variables in
synthetic soil system during Phase 2. Significant differences among treatments at P <
0.05 are indicated by different letters. B: bacteria only; FB: both fungi and bacteria.
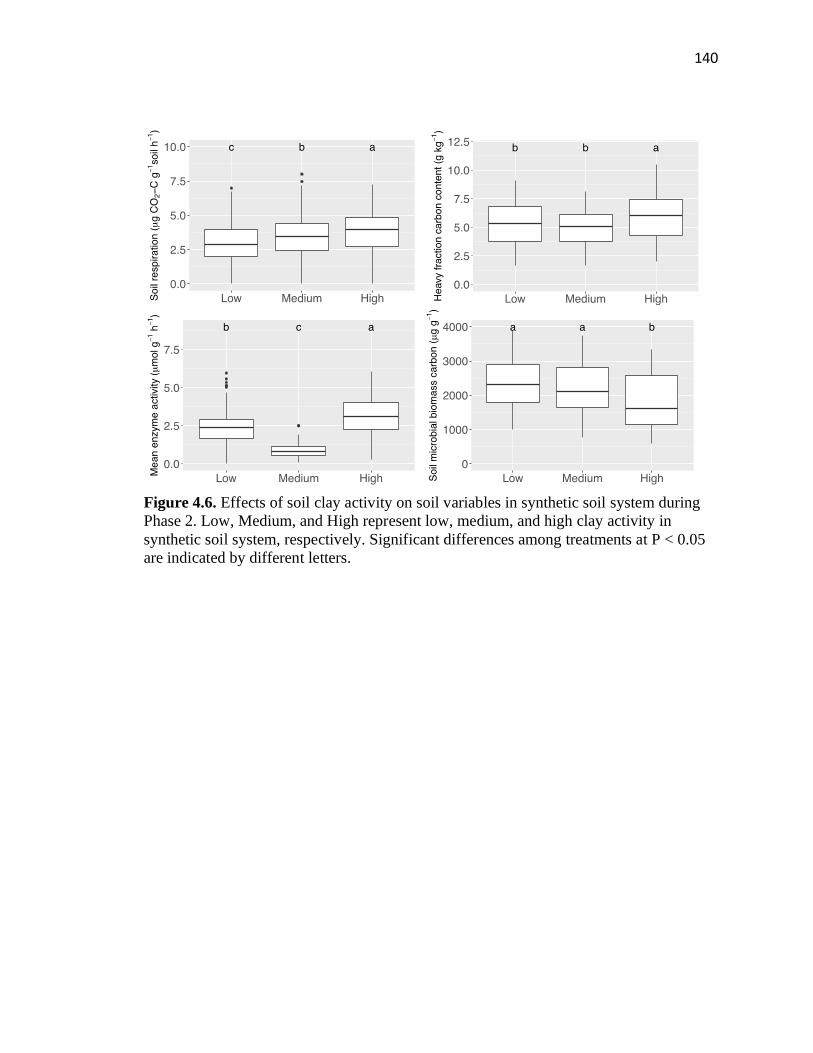
140
Figure 4.6. Effects of soil clay activity on soil variables in synthetic soil system during
Phase 2. Low, Medium, and High represent low, medium, and high clay activity in
synthetic soil system, respectively. Significant differences among treatments at P < 0.05
are indicated by different letters.
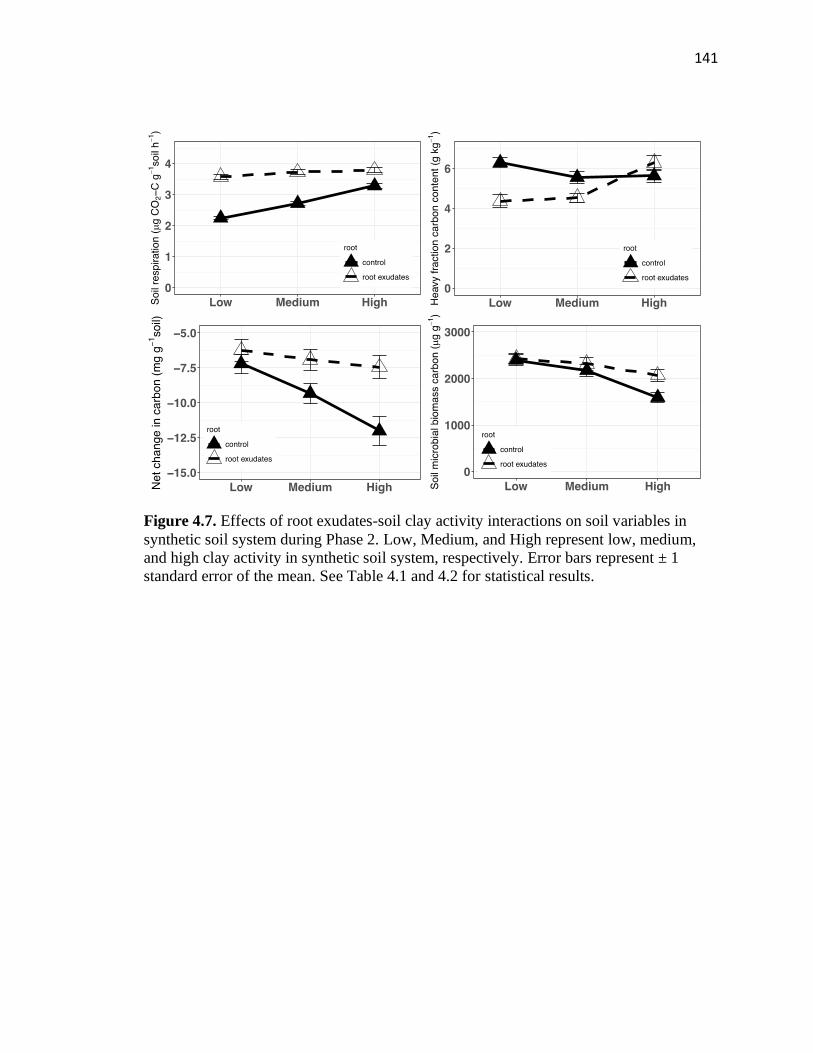
141
Figure 4.7. Effects of root exudates-soil clay activity interactions on soil variables in
synthetic soil system during Phase 2. Low, Medium, and High represent low, medium,
and high clay activity in synthetic soil system, respectively. Error bars represent ± 1
standard error of the mean. See Table 4.1 and 4.2 for statistical results.
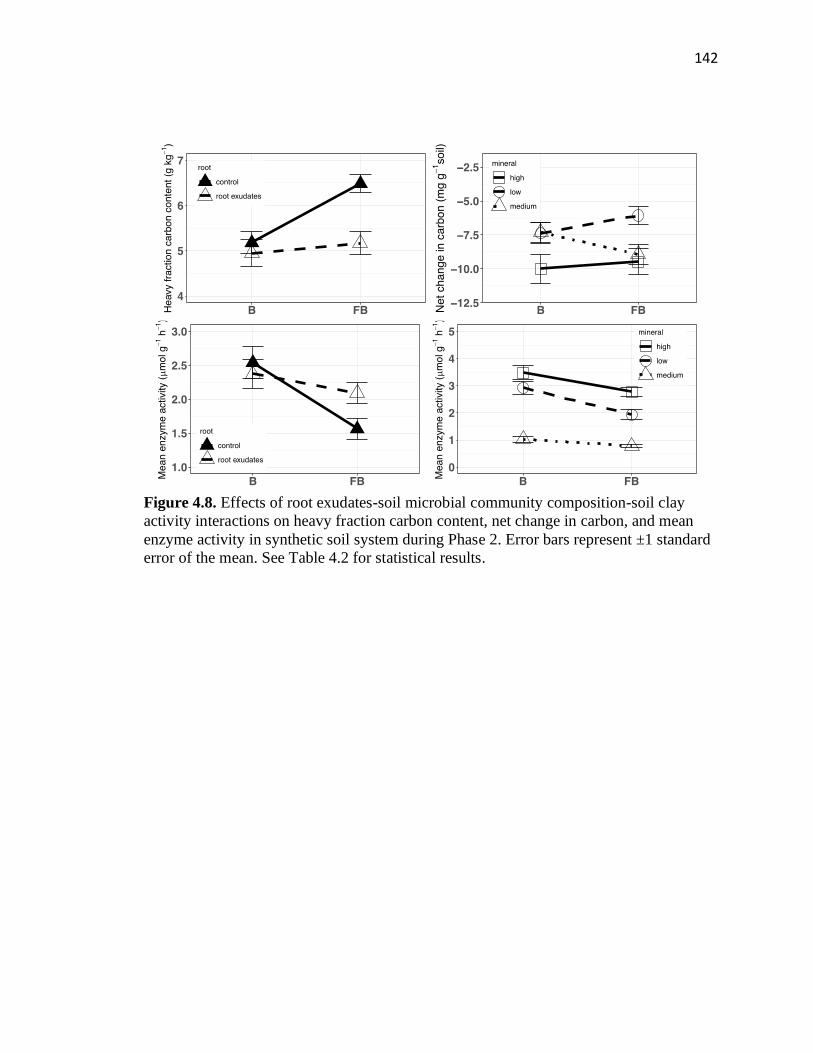
142
Figure 4.8. Effects of root exudates-soil microbial community composition-soil clay
activity interactions on heavy fraction carbon content, net change in carbon, and mean
enzyme activity in synthetic soil system during Phase 2. Error bars represent ±1 standard
error of the mean. See Table 4.2 for statistical results.
143
CHAPTER 5
CONCLUSIONS
Due to the great role of terrestrial ecosystems in climate mitigation, it is essential
to study climate change effects on C cycling in terrestrial ecosystem. In my PhD
dissertation, I utilized several approaches (e.g. meta-analysis, experiments, and soil
microbial community analysis) to address some knowledge gaps in the responses of
terrestrial C cycling to global change factors.
In chapter 2, I conducted a meta-analysis to determine whether long-term N
impacts on plant productivity change over time. I found that 44% of long-term N addition
studies showed significant temporal trend of N effects on plant productivity in terrestrial
ecosystem. The direction of change varied with biome type (forests: decrease; grasslands
and shrublands: increase). The temporal trend of N impacts was mostly explained by
mean annual precipitation, mean annual temperature, and initial soil pH, which accounted
for 24%, 19%, and 19% of the variation, respectively.
In chapter 3, I investigated how multiple global change factors (e.g. prior
warming, C input, soil water content, and soil moisture variability [rewetting])
individually and interactively affect soil respiration in drylands. I found that prior
warming, high soil water content, and C input stimulated soil respiration; however,
multiple rewetting cycles decreased soil respiration when compared to stable soil
moisture. Importantly, substantial interactive effects on soil respiration were found
among global change drivers. For example, effects of soil water content and prior
warming on soil respiration were not significant when C was not added. However, high
soil water content and prior warming stimulated soil respiration when C was added.
144
In chapter 4, I utilized synthetic root/soil systems to disentangle the pathways by
which plants, microbes, and soils interactively affect SOC cycling and assess the relative
importance of each driver. I found that high C input quality, high soil clay activity, and
root exudates stimulated soil respiration. Root exudates-soil minerology interactions
played a great role in SOC formation and loss. Specifically, the positive effect of root
exudates on soil respiration decreased with the increasing of soil clay activity. In
addition, root exudates decreased MAOC content in soils with low and medium clay
activity; however, the opposite result was found when soil clay activity was high.
Overall, my PhD dissertation advanced our understanding of global change
effects on above- and belowground C cycling in terrestrial ecosystems by addressing
three knowledge gaps. More specifically, first, chapter 1 found that long term N impacts
on aboveground activity in terrestrial ecosystems decreased over time. Second, chapter 2
showed that interactive effects of global change drivers on soil respiration in drylands
were ubiquitous. Third, chapter 3 indicated that root exudates-soil minerology interaction
played a critical role in SOC stabilization. In order to determine climate change effects on
terrestrial C cycling more accurately, three chapters in my PhD dissertation have three
suggestions for future research: 1) not only the magnitude of N impacts on plant
productivity, but also their temporal trend, should be considered in future experimental
and model research. Otherwise, we may under- or overestimate N impacts on terrestrial
ecosystem. 2) in order to estimate and predict soil C cycling in drylands more accurately,
future studies should not only determine the individual factor but also examine the
interactive effects of multiple global change factors. 3) due to the great role of
interactions between root exudates and soil minerology in SOC cycling, more research on

145
studying this interaction should be done in the future to improve our understanding of
mechanisms of how plant-microbe-soil interactions affect SOC dynamics.

146
APPENDICES
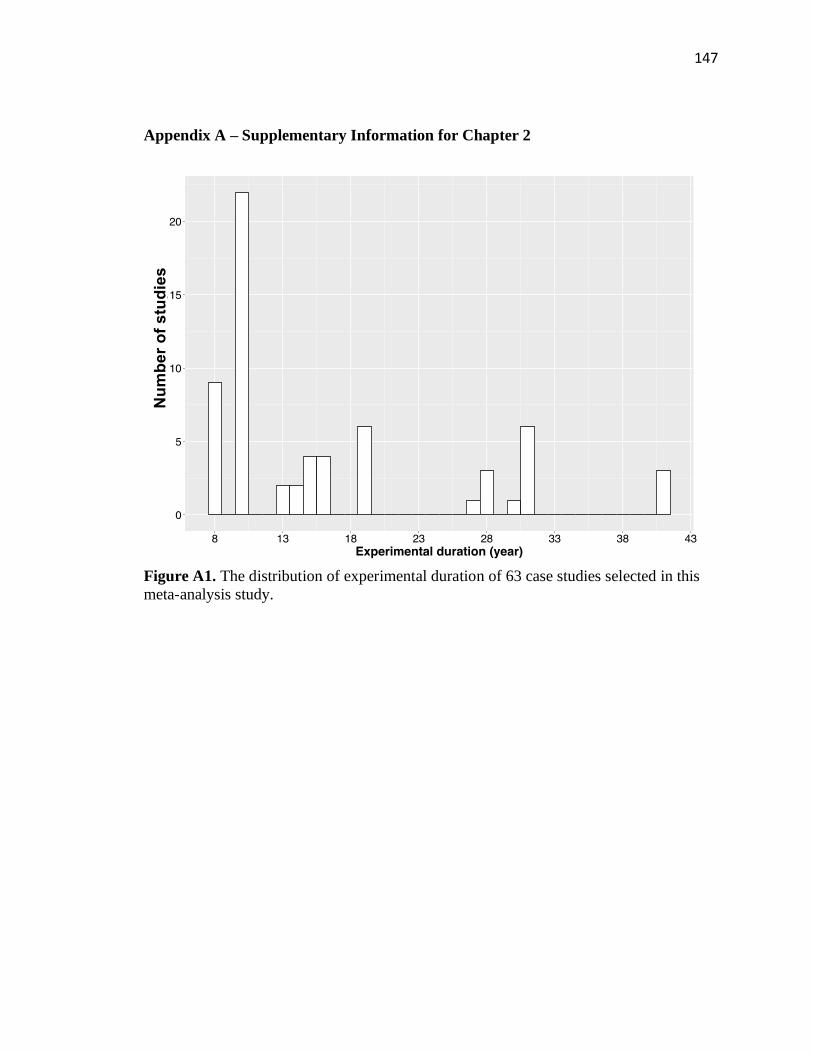
147
Appendix A – Supplementary Information for Chapter 2
Figure A1. The distribution of experimental duration of 63 case studies selected in this
meta-analysis study.
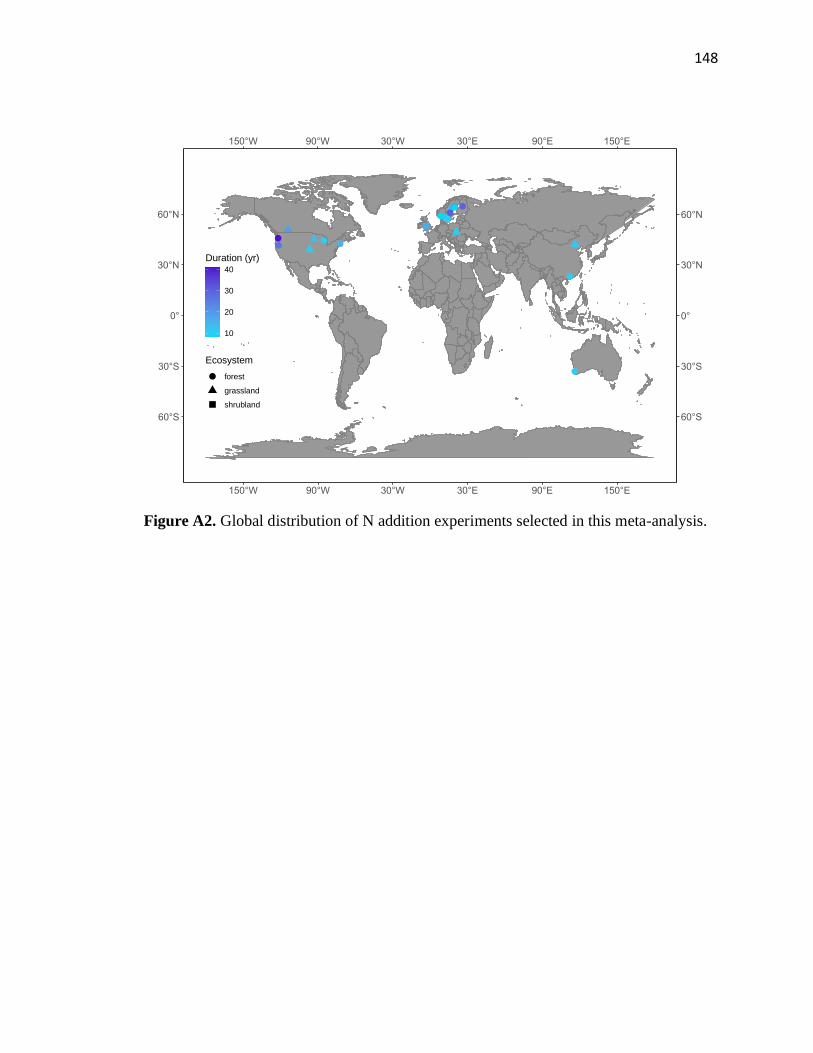
148
Figure A2. Global distribution of N addition experiments selected in this meta-analysis.
150°W 90°W 30°W 30°E 90°E 150°E
60°S
30°S
0°
30°N
60°N
60°S
30°S
0°
30°N
60°N
150°W 90°W 30°W 30°E 90°E 150°E
10
20
30
40
Duration (yr)
Ecosystem
forest
grassland
shrubland
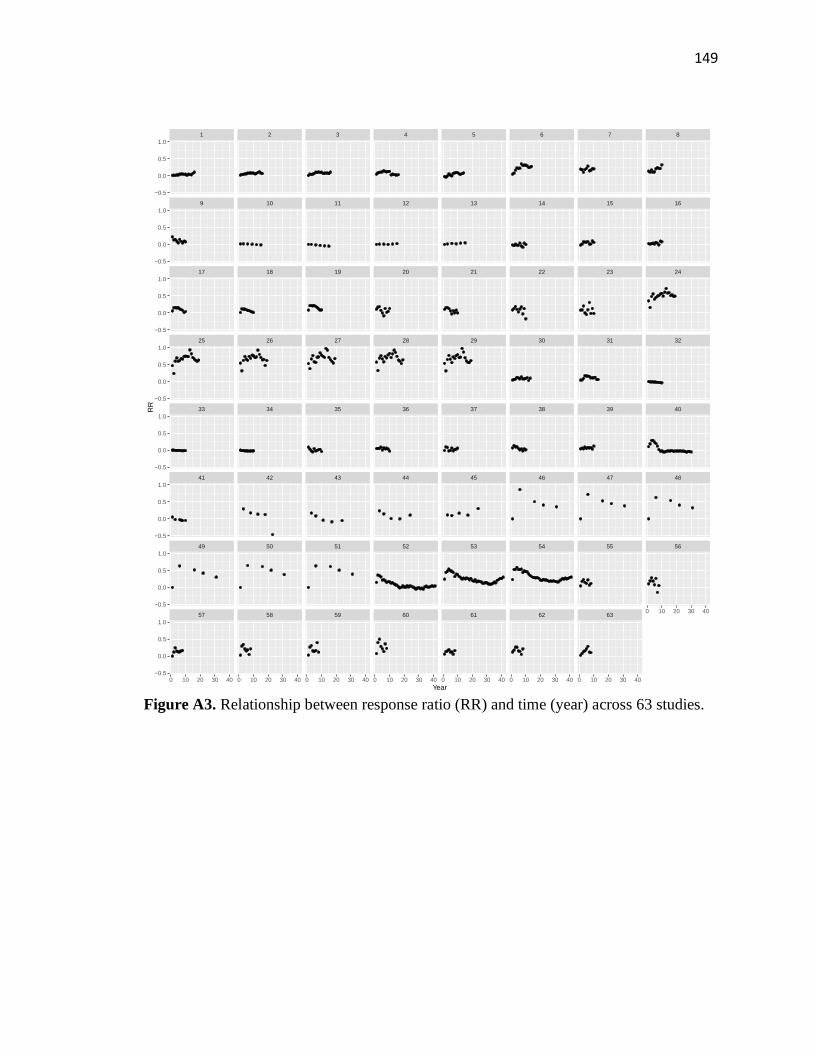
149
Figure A3. Relationship between response ratio (RR) and time (year) across 63 studies.
57 58 59 60 61 62 63
49 50 51 52 53 54 55 56
41 42 43 44 45 46 47 48
33 34 35 36 37 38 39 40
25 26 27 28 29 30 31 32
17 18 19 20 21 22 23 24
9 10 11 12 13 14 15 16
1 2 3 4 5 6 7 8
0 10 20 30 40 0 10 20 30 40 0 10 20 30 40 0 10 20 30 40 0 10 20 30 40 0 10 20 30 40 0 10 20 30 40
0 10 20 30 40
−0.5
0.0
0.5
1.0
−0.5
0.0
0.5
1.0
−0.5
0.0
0.5
1.0
−0.5
0.0
0.5
1.0
−0.5
0.0
0.5
1.0
−0.5
0.0
0.5
1.0
−0.5
0.0
0.5
1.0
−0.5
0.0
0.5
1.0
Year
RR
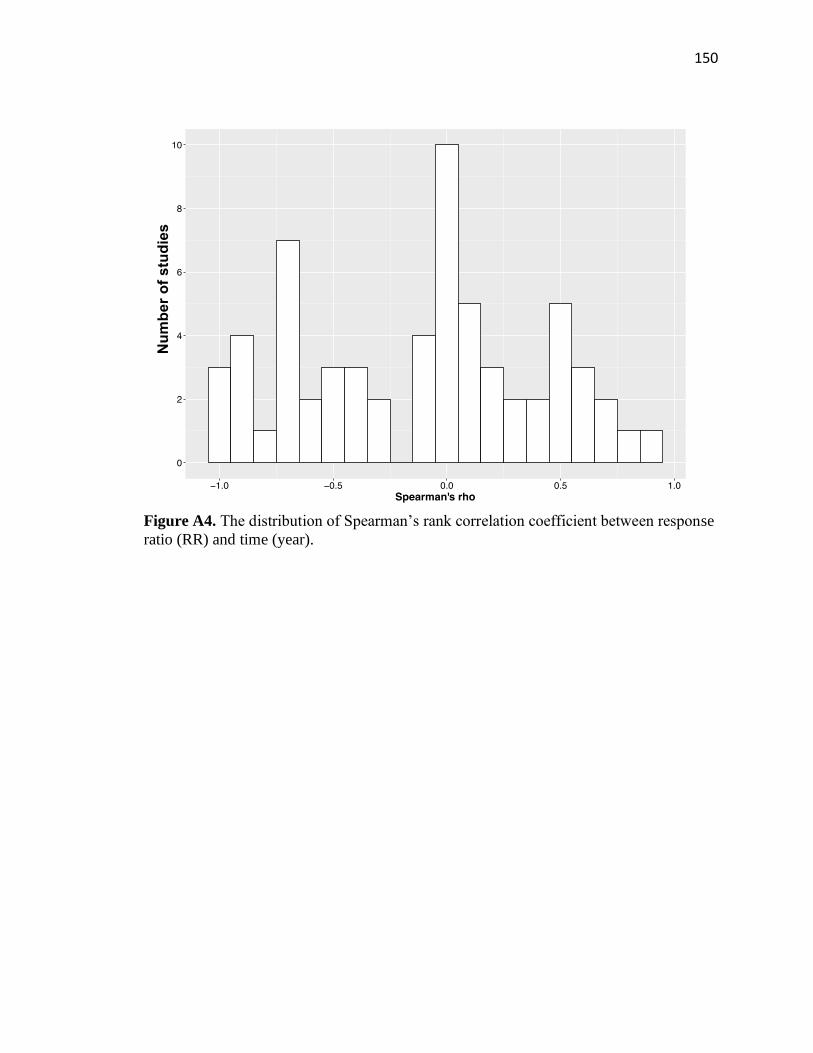
150
Figure A4. The distribution of Spearman’s rank correlation coefficient between response
ratio (RR) and time (year).
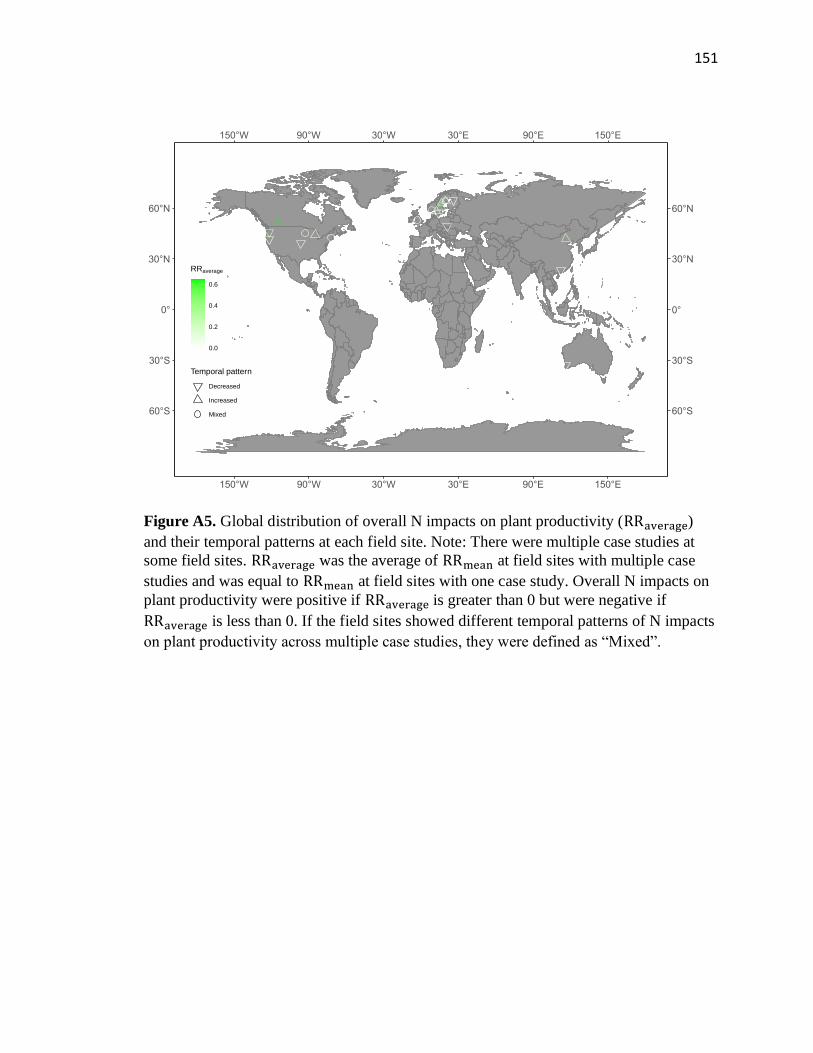
151
Figure A5. Global distribution of overall N impacts on plant productivity (RRaverage)
and their temporal patterns at each field site. Note: There were multiple case studies at
some field sites. RRaverage was the average of RRmean at field sites with multiple case
studies and was equal to RRmean at field sites with one case study. Overall N impacts on
plant productivity were positive if RRaverage is greater than 0 but were negative if
RRaverage is less than 0. If the field sites showed different temporal patterns of N impacts
on plant productivity across multiple case studies, they were defined as “Mixed”.
150°W 90°W 30°W 30°E 90°E 150°E
60°S
30°S
0°
30°N
60°N
60°S
30°S
0°
30°N
60°N
150°W 90°W 30°W 30°E 90°E 150°E
0.0
0.2
0.4
0.6
RRaverage
Temporal pattern
Decreased
Increased
Mixed
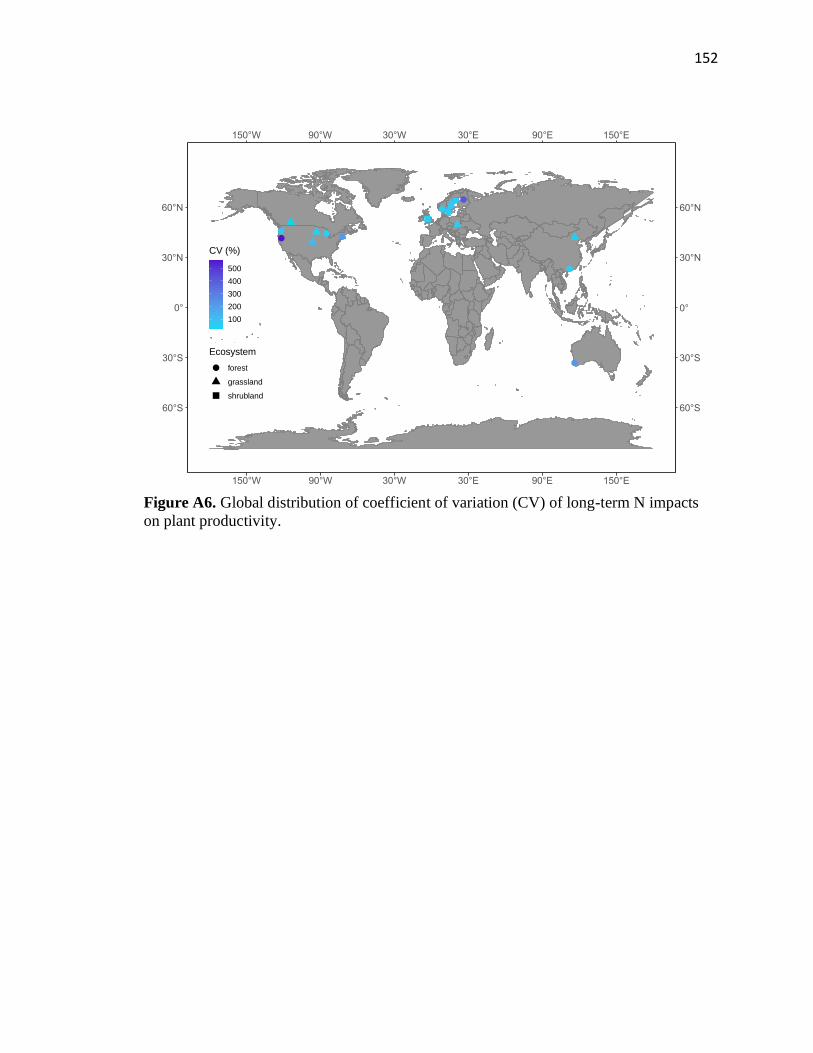
152
Figure A6. Global distribution of coefficient of variation (CV) of long-term N impacts
on plant productivity.
150°W 90°W 30°W 30°E 90°E 150°E
60°S
30°S
0°
30°N
60°N
60°S
30°S
0°
30°N
60°N
150°W 90°W 30°W 30°E 90°E 150°E
100
200
300
400
500
CV (%)
Ecosystem
forest
grassland
shrubland
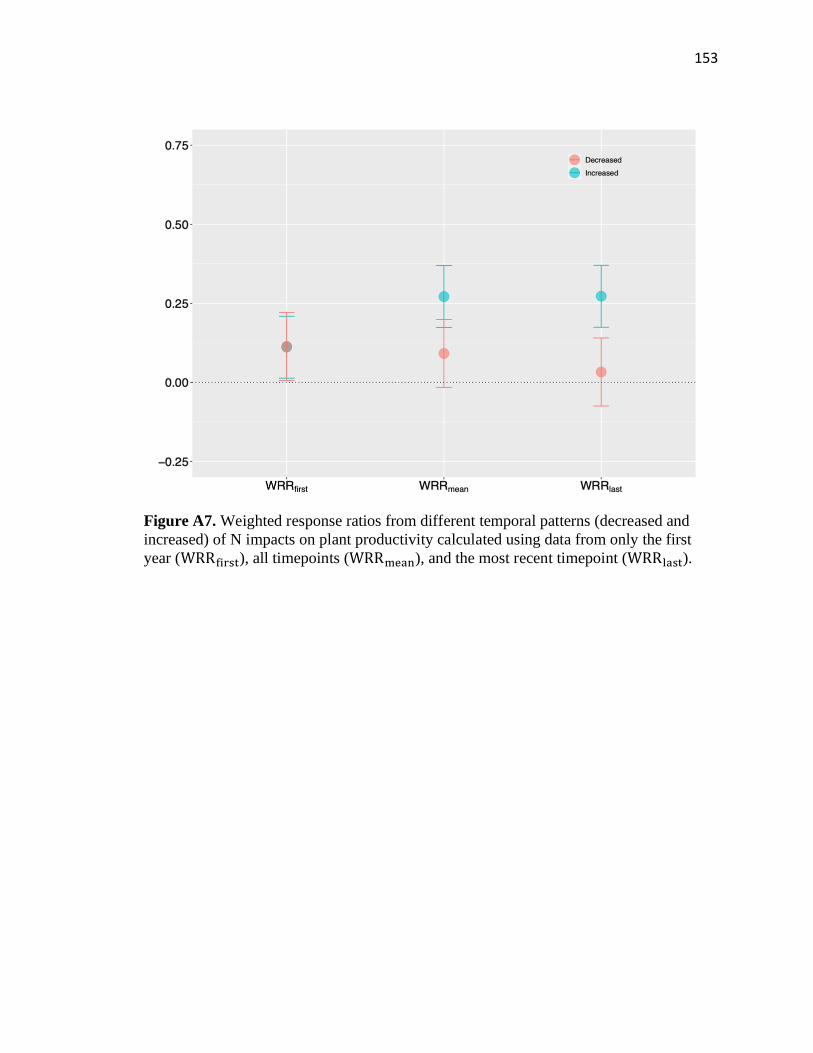
153
Figure A7. Weighted response ratios from different temporal patterns (decreased and
increased) of N impacts on plant productivity calculated using data from only the first
year (WRRfirst), all timepoints (WRRmean), and the most recent timepoint (WRRlast).
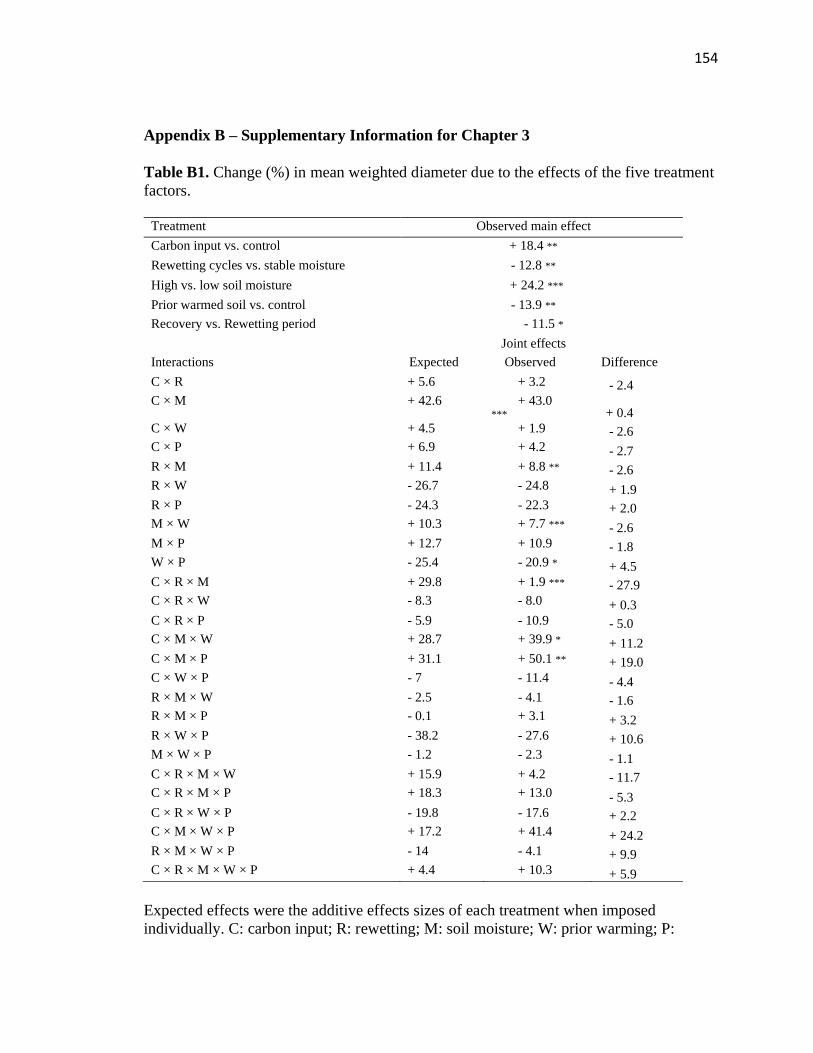
154
Appendix B – Supplementary Information for Chapter 3
Table B1. Change (%) in mean weighted diameter due to the effects of the five treatment
factors.
Treatment Observed main effect
Carbon input vs. control + 18.4 **
Rewetting cycles vs. stable moisture - 12.8 **
High vs. low soil moisture + 24.2 ***
Prior warmed soil vs. control - 13.9 **
Recovery vs. Rewetting period - 11.5 *
Joint effects
Interactions Expected Observed Difference
C × R + 5.6 + 3.2 - 2.4
C × M + 42.6 + 43.0 *** + 0.4
C × W + 4.5 + 1.9 - 2.6
C × P + 6.9 + 4.2 - 2.7
R × M + 11.4 + 8.8 ** - 2.6
R × W - 26.7 - 24.8 + 1.9
R × P - 24.3 - 22.3 + 2.0
M × W + 10.3 + 7.7 *** - 2.6
M × P + 12.7 + 10.9 - 1.8
W × P - 25.4 - 20.9 * + 4.5
C × R × M + 29.8 + 1.9 *** - 27.9
C × R × W - 8.3 - 8.0 + 0.3
C × R × P - 5.9 - 10.9 - 5.0
C × M × W + 28.7 + 39.9 * + 11.2
C × M × P + 31.1 + 50.1 ** + 19.0
C × W × P - 7 - 11.4 - 4.4
R × M × W - 2.5 - 4.1 - 1.6
R × M × P - 0.1 + 3.1 + 3.2
R × W × P - 38.2 - 27.6 + 10.6
M × W × P - 1.2 - 2.3 - 1.1
C × R × M × W + 15.9 + 4.2 - 11.7
C × R × M × P + 18.3 + 13.0 - 5.3
C × R × W × P - 19.8 - 17.6 + 2.2
C × M × W × P + 17.2 + 41.4 + 24.2
R × M × W × P - 14 - 4.1 + 9.9
C × R × M × W × P + 4.4 + 10.3 + 5.9
Expected effects were the additive effects sizes of each treatment when imposed
individually. C: carbon input; R: rewetting; M: soil moisture; W: prior warming; P:

155
period. * P<0.05; ** P<0.01; *** P<0.001. See Table 3.1 for more details about
calculating expected and observed effects and the difference between them.

156
Table B2. Change (%) in mean soil enzyme activity due to the effects of five treatment
factors
Treatment Observed main effect
Carbon input vs. control - 5.4
Rewetting cycles vs. stable moisture - 5.0
High vs. low soil moisture + 22.6 ***
Prior warmed soil vs. control + 12.8 **
Recovery vs. Rewetting period + 23.7 ***
Joint effects
Interactions Expected Observed Difference
C × R - 10.2 - 10.4 - 0.2
C × M + 16.5 + 17.2 + 0.7
C × W + 6.6 + 7.4 + 0.8
C × P + 16.8 + 18.3 + 1.5
R × M + 16.0 + 17.6 + 1.6
R × W + 7.3 + 7.8 + 0.5
R × P + 17.1 + 18.7 + 1.6
M × W + 37.3 + 35.4 - 1.9
M × P + 51.7 + 46.3 - 5.4
W × P + 39.9 + 36.5 - 3.4
C × R × M + 15.0 + 12.2 - 2.8
C × R × W + 8.4 + 2.4 - 6.0
C × R × P + 7.9 + 13.3 + 5.4
C × M × W + 33.1 + 30.0 - 3.1
C × M × P + 33.6 + 40.9 * + 7.3
C × W × P + 19.0 + 31.1 ** + 12.1
R × M × W + 22.5 + 30.4 + 7.9
R × M × P + 26.8 + 41.3 ** + 14.5
R × W × P + 44.7 + 31.5 * - 13.2
M × W × P + 48.5 + 59.1 ** + 10.6
C × R × M × W + 33.1 + 25.0 - 8.1
C × R × M × P + 11.9 + 35.9 + 24.0
C × R × W × P + 27.6 + 26.1 - 1.5
C × M × W × P + 19.5 + 53.7 + 34.2
R × M × W × P + 28.1 + 54.1 + 26.0
C × R × M × W × P + 10.3 + 48.7 + 38.4
Expected effects were the additive effects sizes of each treatment when imposed
individually. C: carbon input; R: rewetting; M: soil moisture; W: prior warming; P:
period. * P<0.05; ** P<0.01; *** P<0.001. See Table 3.1 for more details about
calculating expected and observed effects and the difference between them.
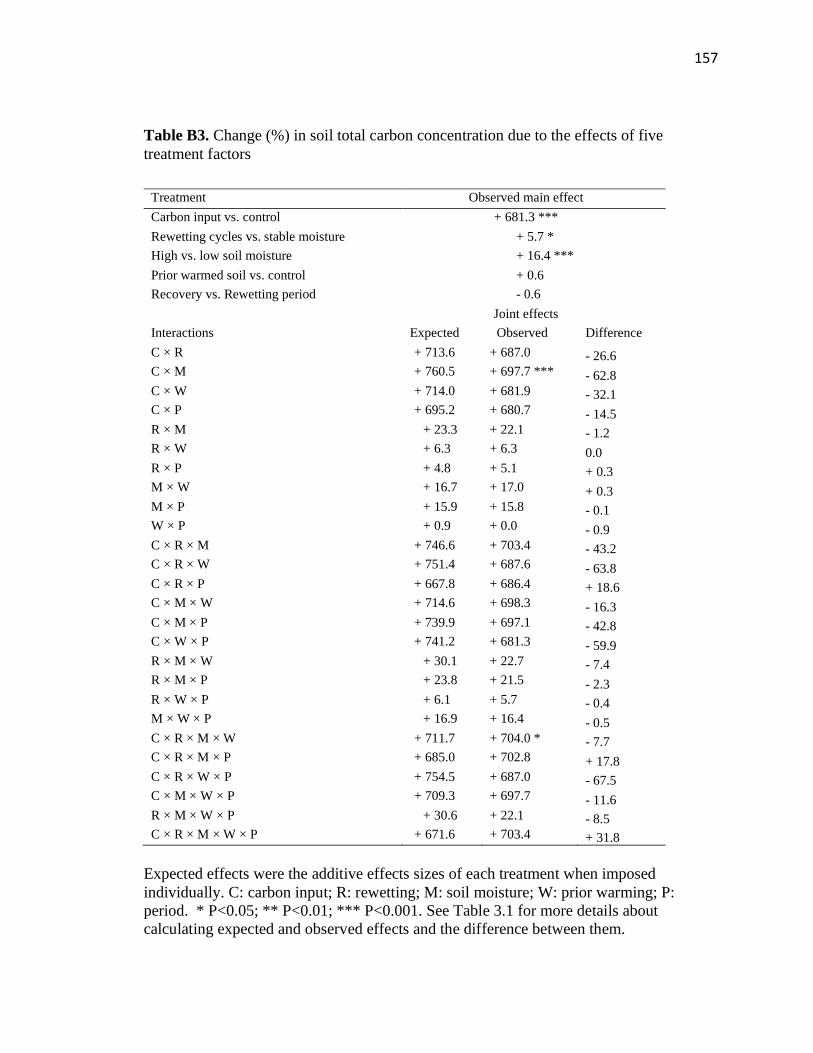
157
Table B3. Change (%) in soil total carbon concentration due to the effects of five
treatment factors
Treatment Observed main effect
Carbon input vs. control + 681.3 ***
Rewetting cycles vs. stable moisture + 5.7 *
High vs. low soil moisture + 16.4 ***
Prior warmed soil vs. control + 0.6
Recovery vs. Rewetting period - 0.6
Joint effects
Interactions Expected Observed Difference
C × R + 713.6 + 687.0 - 26.6
C × M + 760.5 + 697.7 *** - 62.8
C × W + 714.0 + 681.9 - 32.1
C × P + 695.2 + 680.7 - 14.5
R × M + 23.3 + 22.1 - 1.2
R × W + 6.3 + 6.3 0.0
R × P + 4.8 + 5.1 + 0.3
M × W + 16.7 + 17.0 + 0.3
M × P + 15.9 + 15.8 - 0.1
W × P + 0.9 + 0.0 - 0.9
C × R × M + 746.6 + 703.4 - 43.2
C × R × W + 751.4 + 687.6 - 63.8
C × R × P + 667.8 + 686.4 + 18.6
C × M × W + 714.6 + 698.3 - 16.3
C × M × P + 739.9 + 697.1 - 42.8
C × W × P + 741.2 + 681.3 - 59.9
R × M × W + 30.1 + 22.7 - 7.4
R × M × P + 23.8 + 21.5 - 2.3
R × W × P + 6.1 + 5.7 - 0.4
M × W × P + 16.9 + 16.4 - 0.5
C × R × M × W + 711.7 + 704.0 * - 7.7
C × R × M × P + 685.0 + 702.8 + 17.8
C × R × W × P + 754.5 + 687.0 - 67.5
C × M × W × P + 709.3 + 697.7 - 11.6
R × M × W × P + 30.6 + 22.1 - 8.5
C × R × M × W × P + 671.6 + 703.4 + 31.8
Expected effects were the additive effects sizes of each treatment when imposed
individually. C: carbon input; R: rewetting; M: soil moisture; W: prior warming; P:
period. * P<0.05; ** P<0.01; *** P<0.001. See Table 3.1 for more details about
calculating expected and observed effects and the difference between them.
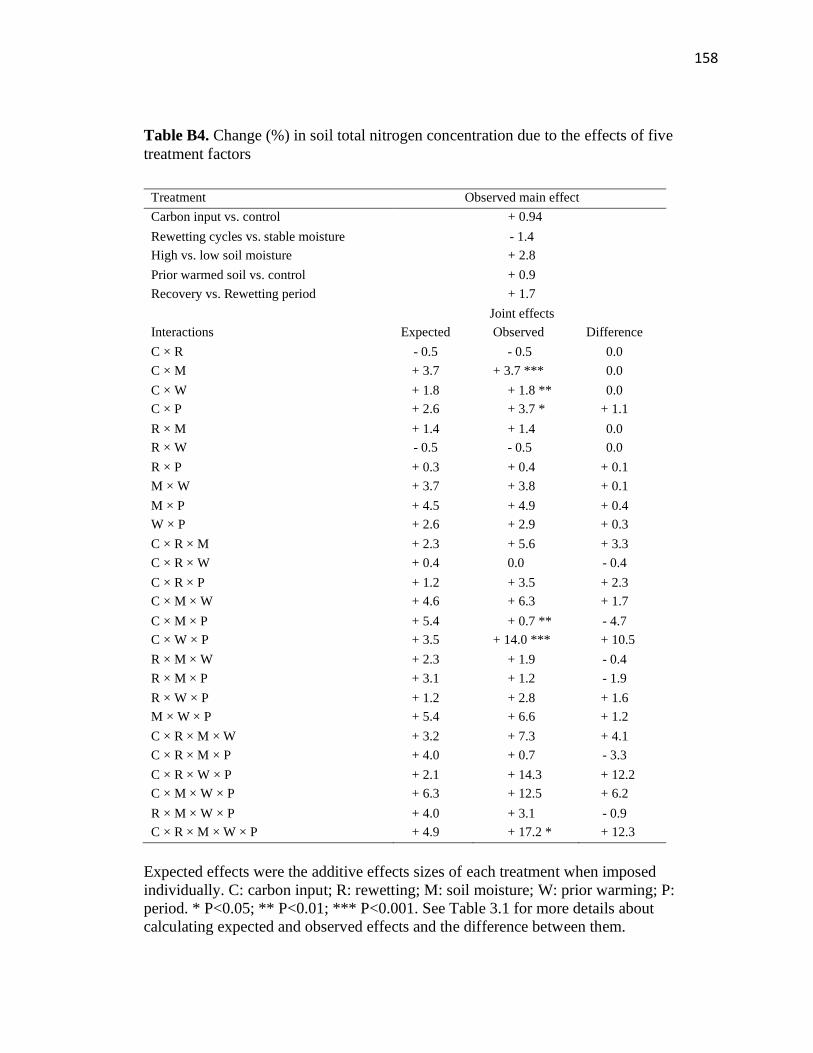
158
Table B4. Change (%) in soil total nitrogen concentration due to the effects of five
treatment factors
Treatment Observed main effect
Carbon input vs. control + 0.94
Rewetting cycles vs. stable moisture - 1.4
High vs. low soil moisture + 2.8
Prior warmed soil vs. control + 0.9
Recovery vs. Rewetting period + 1.7
Joint effects
Interactions Expected Observed Difference
C × R - 0.5 - 0.5 0.0
C × M + 3.7 + 3.7 *** 0.0
C × W + 1.8 + 1.8 ** 0.0
C × P + 2.6 + 3.7 * + 1.1
R × M + 1.4 + 1.4 0.0
R × W - 0.5 - 0.5 0.0
R × P + 0.3 + 0.4 + 0.1
M × W + 3.7 + 3.8 + 0.1
M × P + 4.5 + 4.9 + 0.4
W × P + 2.6 + 2.9 + 0.3
C × R × M + 2.3 + 5.6 + 3.3
C × R × W + 0.4 0.0 - 0.4
C × R × P + 1.2 + 3.5 + 2.3
C × M × W + 4.6 + 6.3 + 1.7
C × M × P + 5.4 + 0.7 ** - 4.7
C × W × P + 3.5 + 14.0 *** + 10.5
R × M × W + 2.3 + 1.9 - 0.4
R × M × P + 3.1 + 1.2 - 1.9
R × W × P + 1.2 + 2.8 + 1.6
M × W × P + 5.4 + 6.6 + 1.2
C × R × M × W + 3.2 + 7.3 + 4.1
C × R × M × P + 4.0 + 0.7 - 3.3
C × R × W × P + 2.1 + 14.3 + 12.2
C × M × W × P + 6.3 + 12.5 + 6.2
R × M × W × P + 4.0 + 3.1 - 0.9
C × R × M × W × P + 4.9 + 17.2 * + 12.3
Expected effects were the additive effects sizes of each treatment when imposed
individually. C: carbon input; R: rewetting; M: soil moisture; W: prior warming; P:
period. * P<0.05; ** P<0.01; *** P<0.001. See Table 3.1 for more details about
calculating expected and observed effects and the difference between them.
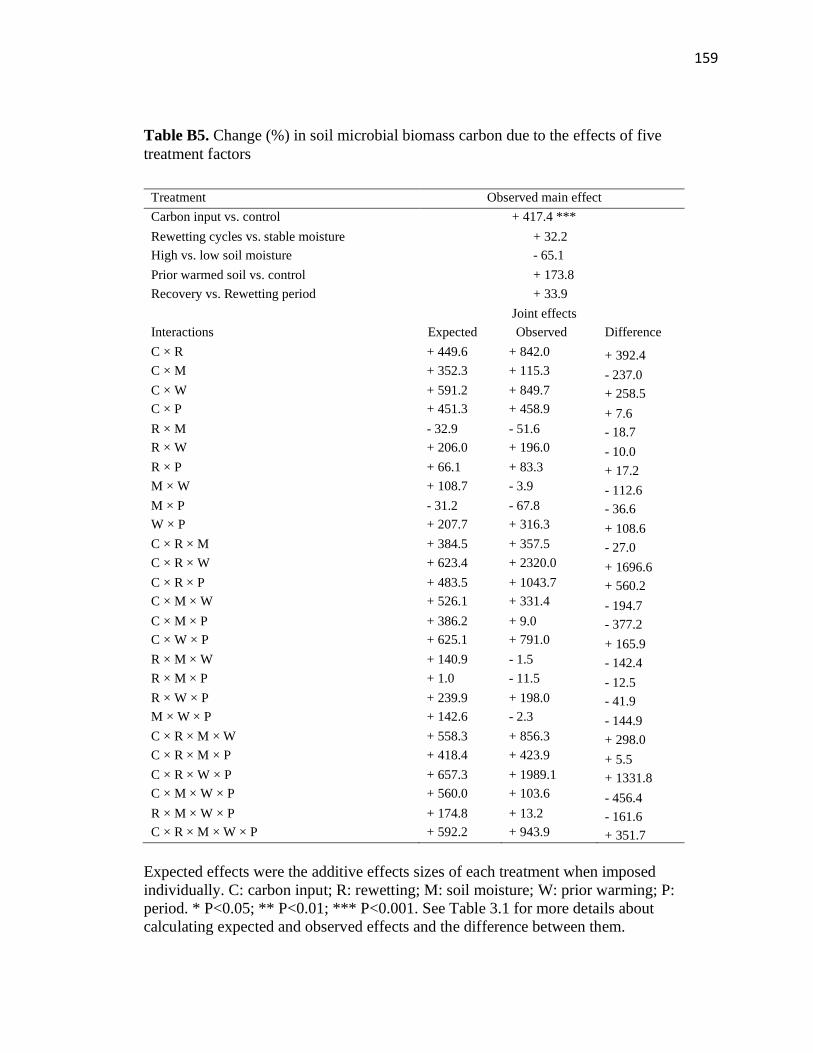
159
Table B5. Change (%) in soil microbial biomass carbon due to the effects of five
treatment factors
Treatment Observed main effect
Carbon input vs. control + 417.4 ***
Rewetting cycles vs. stable moisture + 32.2
High vs. low soil moisture - 65.1
Prior warmed soil vs. control + 173.8
Recovery vs. Rewetting period + 33.9
Joint effects
Interactions Expected Observed Difference
C × R + 449.6 + 842.0 + 392.4
C × M + 352.3 + 115.3 - 237.0
C × W + 591.2 + 849.7 + 258.5
C × P + 451.3 + 458.9 + 7.6
R × M - 32.9 - 51.6 - 18.7
R × W + 206.0 + 196.0 - 10.0
R × P + 66.1 + 83.3 + 17.2
M × W + 108.7 - 3.9 - 112.6
M × P - 31.2 - 67.8 - 36.6
W × P + 207.7 + 316.3 + 108.6
C × R × M + 384.5 + 357.5 - 27.0
C × R × W + 623.4 + 2320.0 + 1696.6
C × R × P + 483.5 + 1043.7 + 560.2
C × M × W + 526.1 + 331.4 - 194.7
C × M × P + 386.2 + 9.0 - 377.2
C × W × P + 625.1 + 791.0 + 165.9
R × M × W + 140.9 - 1.5 - 142.4
R × M × P + 1.0 - 11.5 - 12.5
R × W × P + 239.9 + 198.0 - 41.9
M × W × P + 142.6 - 2.3 - 144.9
C × R × M × W + 558.3 + 856.3 + 298.0
C × R × M × P + 418.4 + 423.9 + 5.5
C × R × W × P + 657.3 + 1989.1 + 1331.8
C × M × W × P + 560.0 + 103.6 - 456.4
R × M × W × P + 174.8 + 13.2 - 161.6
C × R × M × W × P + 592.2 + 943.9 + 351.7
Expected effects were the additive effects sizes of each treatment when imposed
individually. C: carbon input; R: rewetting; M: soil moisture; W: prior warming; P:
period. * P<0.05; ** P<0.01; *** P<0.001. See Table 3.1 for more details about
calculating expected and observed effects and the difference between them.
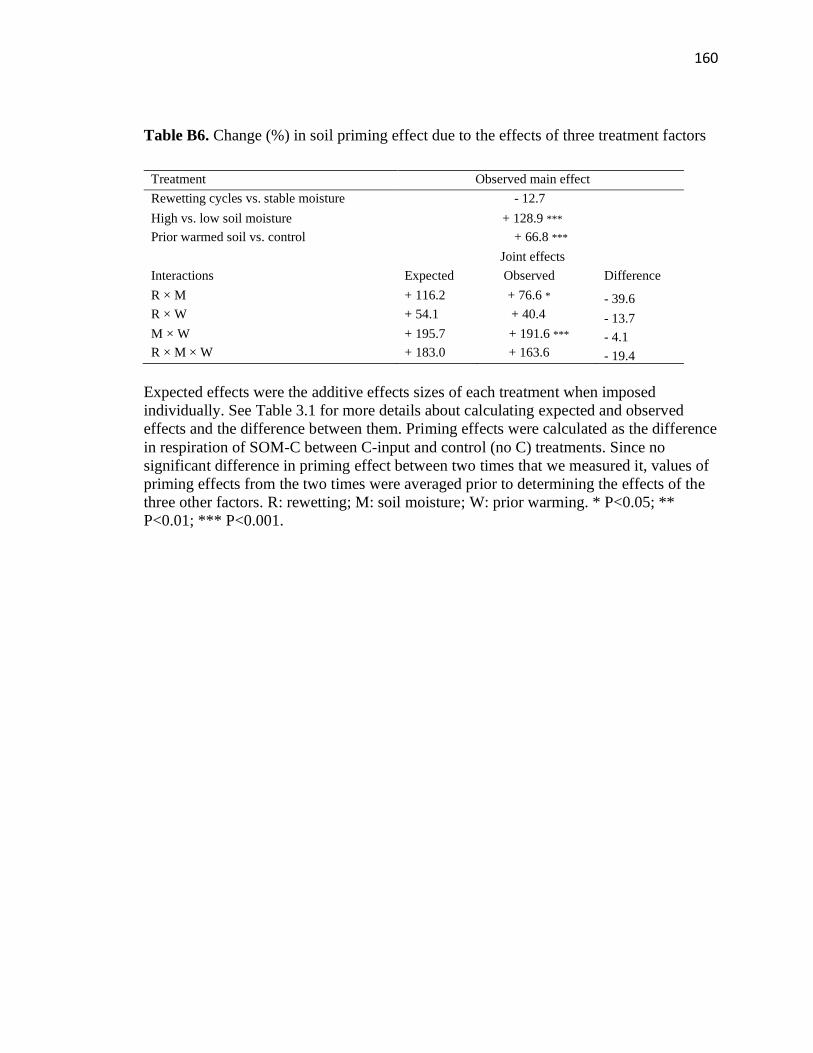
160
Table B6. Change (%) in soil priming effect due to the effects of three treatment factors
Treatment Observed main effect
Rewetting cycles vs. stable moisture - 12.7
High vs. low soil moisture + 128.9 ***
Prior warmed soil vs. control + 66.8 ***
Joint effects
Interactions Expected Observed Difference
R × M + 116.2 + 76.6 * - 39.6
R × W + 54.1 + 40.4 - 13.7
M × W + 195.7 + 191.6 *** - 4.1
R × M × W + 183.0 + 163.6 - 19.4
Expected effects were the additive effects sizes of each treatment when imposed
individually. See Table 3.1 for more details about calculating expected and observed
effects and the difference between them. Priming effects were calculated as the difference
in respiration of SOM-C between C-input and control (no C) treatments. Since no
significant difference in priming effect between two times that we measured it, values of
priming effects from the two times were averaged prior to determining the effects of the
three other factors. R: rewetting; M: soil moisture; W: prior warming. * P<0.05; **
P<0.01; *** P<0.001.
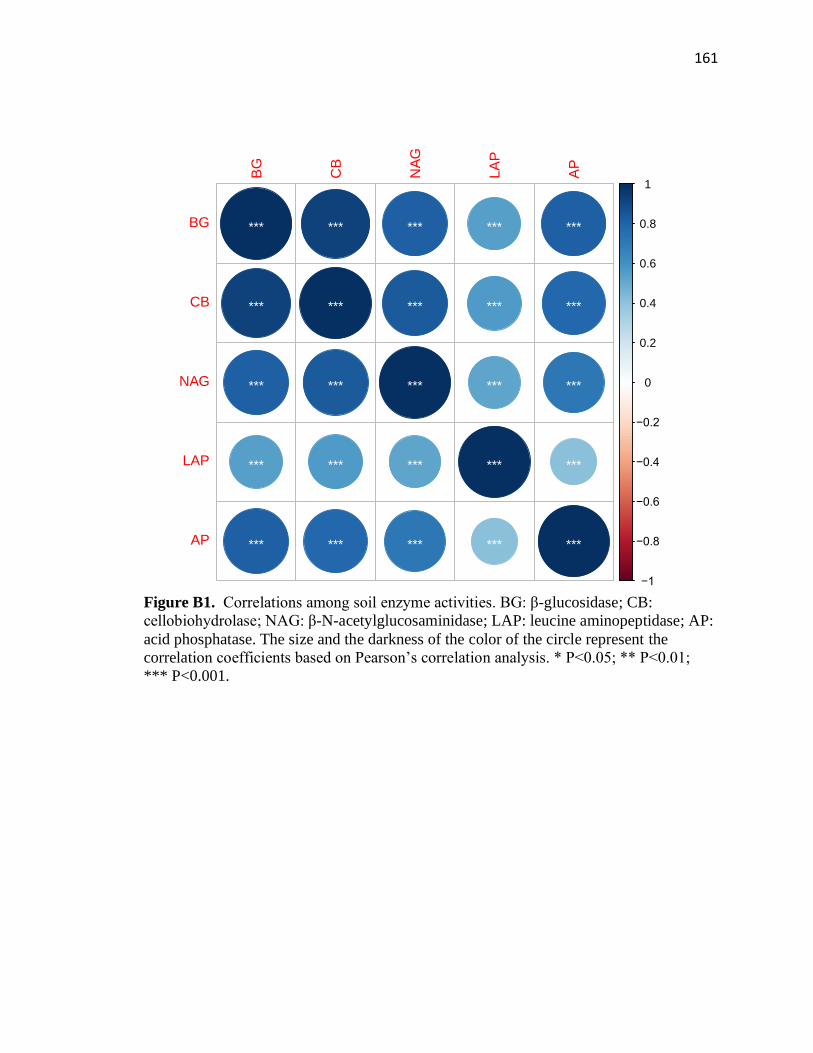
161
Figure B1. Correlations among soil enzyme activities. BG: β-glucosidase; CB:
cellobiohydrolase; NAG: β-N-acetylglucosaminidase; LAP: leucine aminopeptidase; AP:
acid phosphatase. The size and the darkness of the color of the circle represent the
correlation coefficients based on Pearson’s correlation analysis. * P<0.05; ** P<0.01;
*** P<0.001.
***
***
***
***
***
***
***
***
***
***
***
***
***
***
***
***
***
***
***
***
***
***
***
***
***
−1
−0.8
−0.6
−0.4
−0.2
0
0.2
0.4
0.6
0.8
1
BG
CB
NA
G
LA
P
AP
BG
CB
NAG
LAP
AP

162
Figure B2. Soil respiration rates under control (a) and carbon input treatments (b) over
the course of the incubation experiment. Note the difference in y-axis scale between
panels (a) and (b). The grey area represents the weeks when rewetting treatment were
conducted. The grey solid vertical lines between weeks 12 and 13 represents the start of
recovery period.
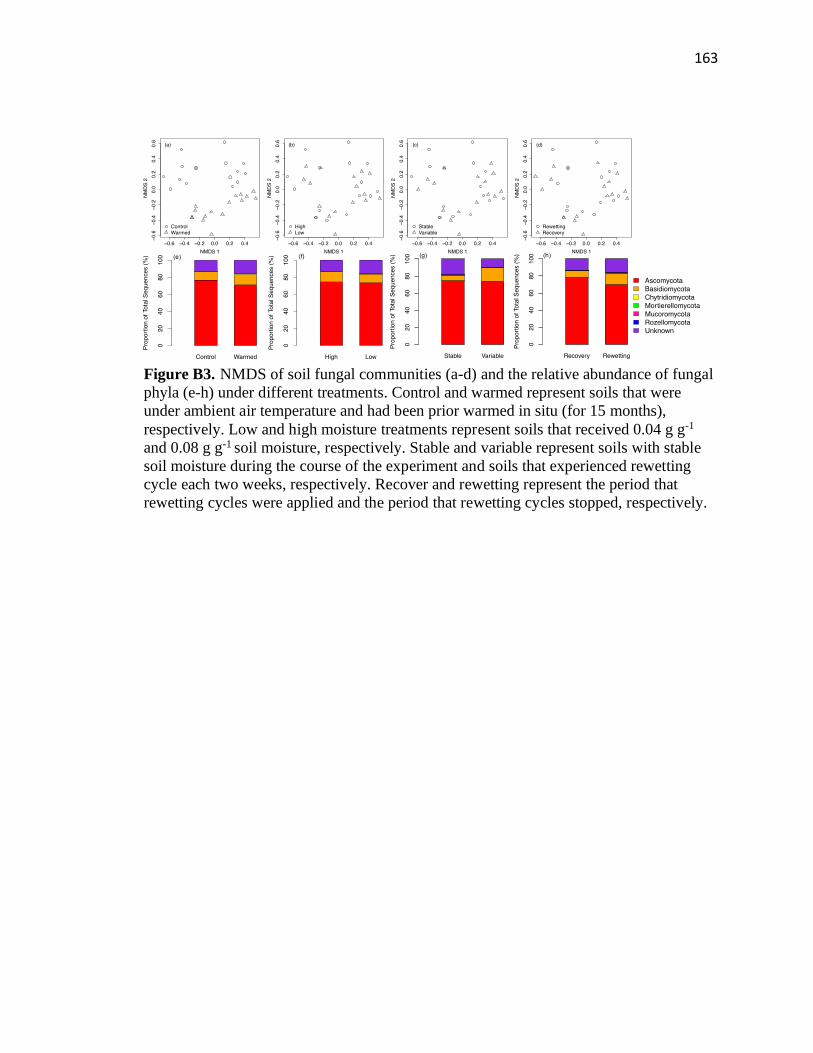
163
Figure B3. NMDS of soil fungal communities (a-d) and the relative abundance of fungal
phyla (e-h) under different treatments. Control and warmed represent soils that were
under ambient air temperature and had been prior warmed in situ (for 15 months),
respectively. Low and high moisture treatments represent soils that received 0.04 g g-1
and 0.08 g g-1 soil moisture, respectively. Stable and variable represent soils with stable
soil moisture during the course of the experiment and soils that experienced rewetting
cycle each two weeks, respectively. Recover and rewetting represent the period that
rewetting cycles were applied and the period that rewetting cycles stopped, respectively.

164
Appendix C – Supplementary Information for Chapter 4
Table C1. Nutrient content of the Master Blend fertilizer
Nutrients Content (%)
Total Nitrogen 4
Available Phosphate 18
Soluble Potash 38
Total Magnesium 0.5
Boron 0.2
Copper 0.05
Iron 0.4
Manganese 0.2
Molybdenum 0.01
Zinc 0.05
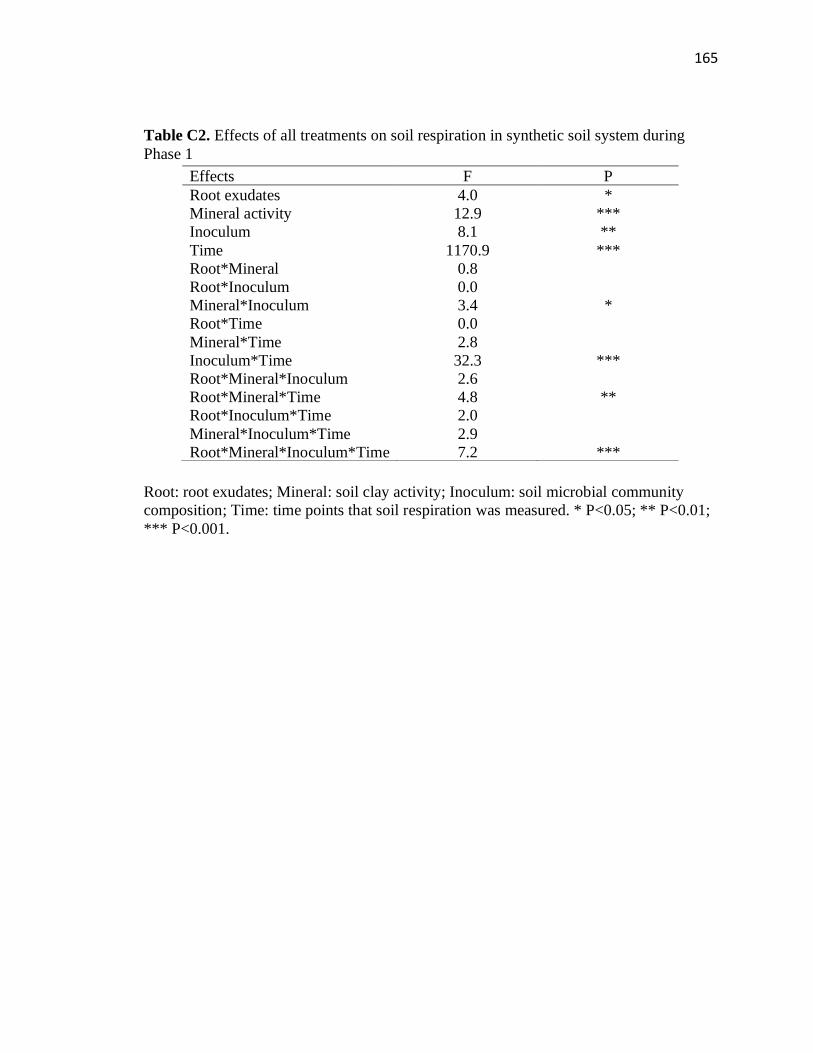
165
Table C2. Effects of all treatments on soil respiration in synthetic soil system during
Phase 1
Root: root exudates; Mineral: soil clay activity; Inoculum: soil microbial community
composition; Time: time points that soil respiration was measured. * P<0.05; ** P<0.01;
*** P<0.001.
Effects F P
Root exudates 4.0 *
Mineral activity 12.9 ***
Inoculum 8.1 **
Time 1170.9 ***
Root*Mineral 0.8
Root*Inoculum 0.0
Mineral*Inoculum 3.4 *
Root*Time 0.0
Mineral*Time 2.8
Inoculum*Time 32.3 ***
Root*Mineral*Inoculum 2.6
Root*Mineral*Time 4.8 **
Root*Inoculum*Time 2.0
Mineral*Inoculum*Time 2.9
Root*Mineral*Inoculum*Time 7.2 ***
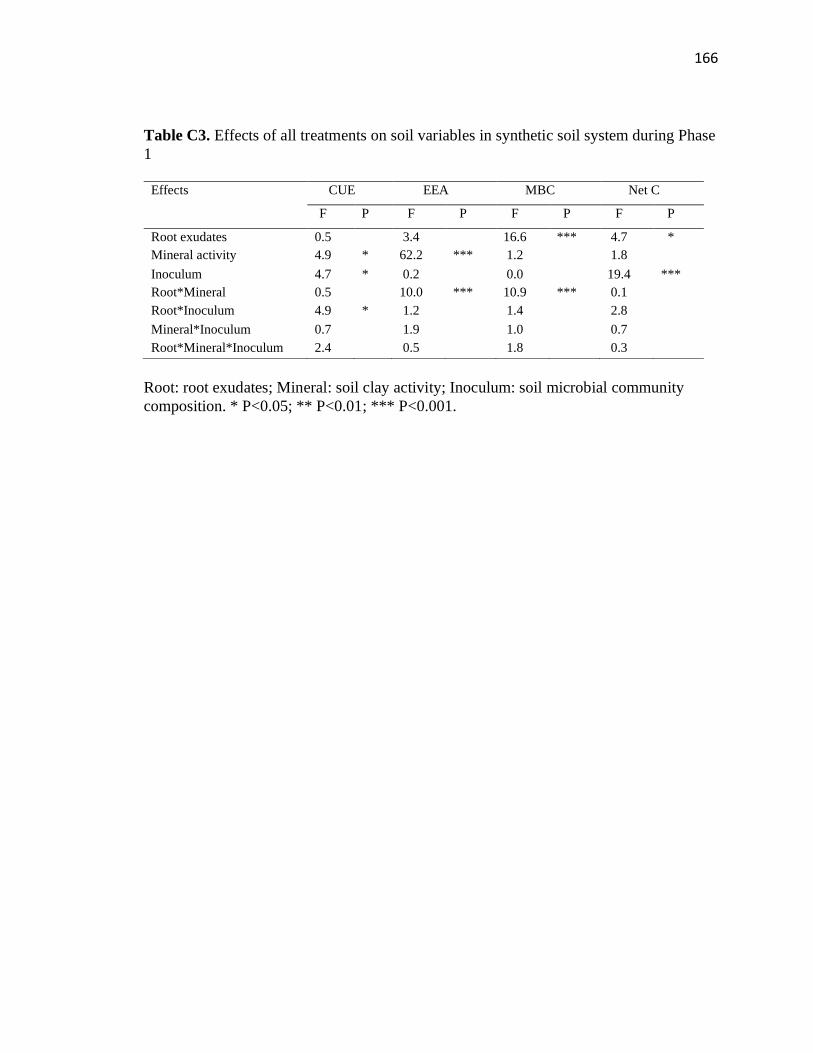
166
Table C3. Effects of all treatments on soil variables in synthetic soil system during Phase
1
Root: root exudates; Mineral: soil clay activity; Inoculum: soil microbial community
composition. * P<0.05; ** P<0.01; *** P<0.001.
Effects CUE EEA MBC Net C
F P F P F P F P
Root exudates 0.5 3.4 16.6 *** 4.7 *
Mineral activity 4.9 * 62.2 *** 1.2 1.8
Inoculum 4.7 * 0.2 0.0 19.4 ***
Root*Mineral 0.5 10.0 *** 10.9 *** 0.1
Root*Inoculum 4.9 * 1.2 1.4 2.8
Mineral*Inoculum 0.7 1.9 1.0 0.7
Root*Mineral*Inoculum 2.4 0.5 1.8 0.3
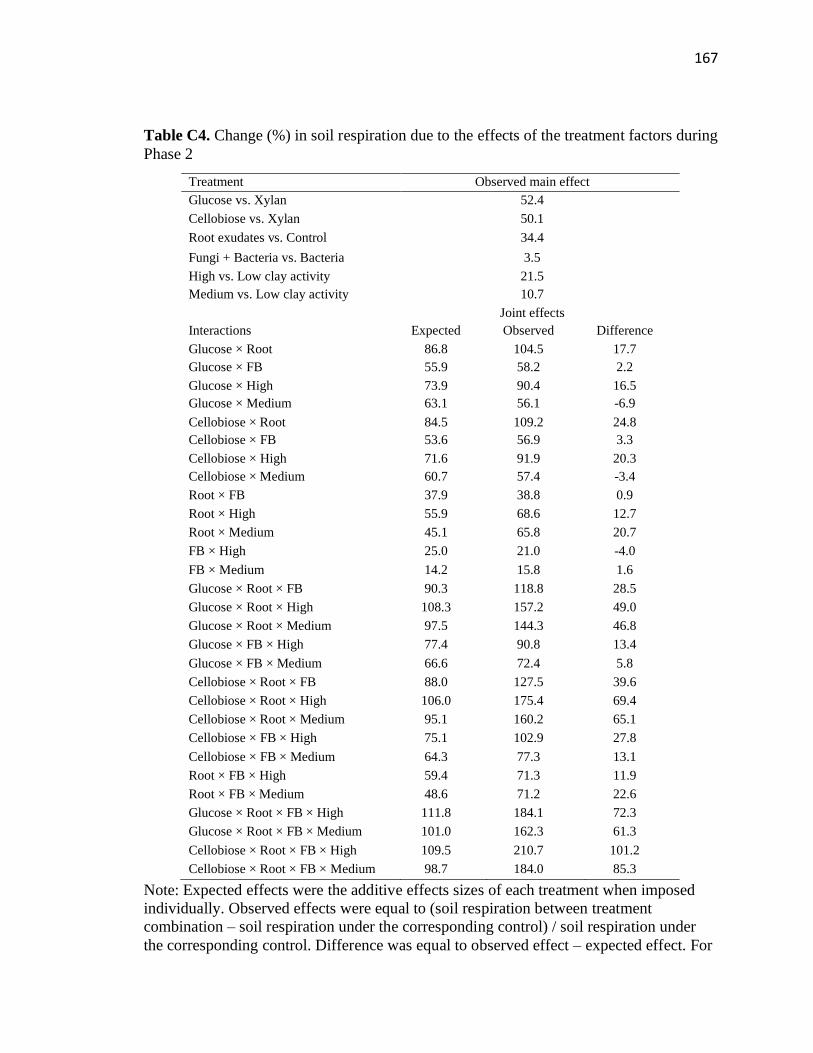
167
Table C4. Change (%) in soil respiration due to the effects of the treatment factors during
Phase 2
Note: Expected effects were the additive effects sizes of each treatment when imposed
individually. Observed effects were equal to (soil respiration between treatment
combination – soil respiration under the corresponding control) / soil respiration under
the corresponding control. Difference was equal to observed effect – expected effect. For
Treatment Observed main effect
Glucose vs. Xylan 52.4
Cellobiose vs. Xylan 50.1
Root exudates vs. Control 34.4
Fungi + Bacteria vs. Bacteria 3.5
High vs. Low clay activity 21.5
Medium vs. Low clay activity 10.7
Joint effects
Interactions Expected Observed Difference
Glucose × Root 86.8 104.5 17.7
Glucose × FB 55.9 58.2 2.2
Glucose × High 73.9 90.4 16.5
Glucose × Medium 63.1 56.1 -6.9
Cellobiose × Root 84.5 109.2 24.8
Cellobiose × FB 53.6 56.9 3.3
Cellobiose × High 71.6 91.9 20.3
Cellobiose × Medium 60.7 57.4 -3.4
Root × FB 37.9 38.8 0.9
Root × High 55.9 68.6 12.7
Root × Medium 45.1 65.8 20.7
FB × High 25.0 21.0 -4.0
FB × Medium 14.2 15.8 1.6
Glucose × Root × FB 90.3 118.8 28.5
Glucose × Root × High 108.3 157.2 49.0
Glucose × Root × Medium 97.5 144.3 46.8
Glucose × FB × High 77.4 90.8 13.4
Glucose × FB × Medium 66.6 72.4 5.8
Cellobiose × Root × FB 88.0 127.5 39.6
Cellobiose × Root × High 106.0 175.4 69.4
Cellobiose × Root × Medium 95.1 160.2 65.1
Cellobiose × FB × High 75.1 102.9 27.8
Cellobiose × FB × Medium 64.3 77.3 13.1
Root × FB × High 59.4 71.3 11.9
Root × FB × Medium 48.6 71.2 22.6
Glucose × Root × FB × High 111.8 184.1 72.3
Glucose × Root × FB × Medium 101.0 162.3 61.3
Cellobiose × Root × FB × High 109.5 210.7 101.2
Cellobiose × Root × FB × Medium 98.7 184.0 85.3

168
Glucose × Root × FB × High, the expected effect was equal to 52.2 + 34.4 + 3.5 + 21.5;
the observed effect was equal to (mean soil respiration under glucose, root exudates,
fungi + bacteria, and high clay activity - mean soil respiration under xylan, no root
exudates, bacteria only, and low clay activity) / mean soil respiration under xylan, no root
exudates, bacteria only, and low clay activity.
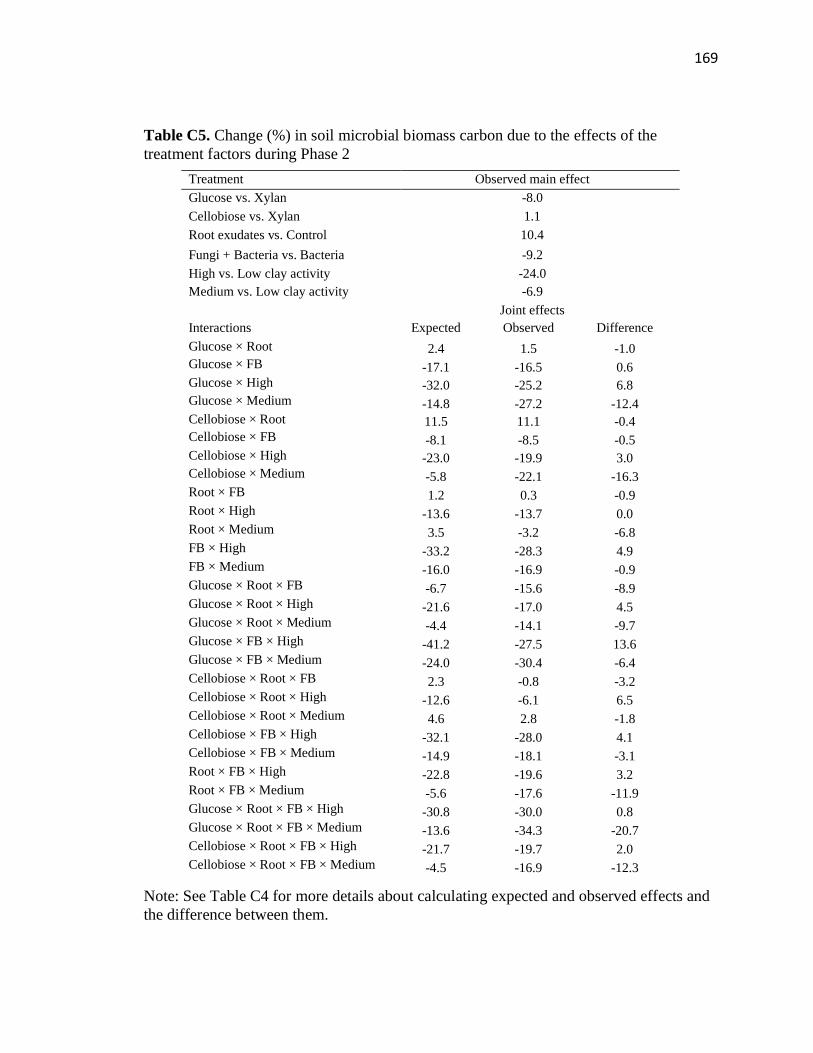
169
Table C5. Change (%) in soil microbial biomass carbon due to the effects of the
treatment factors during Phase 2
Note: See Table C4 for more details about calculating expected and observed effects and
the difference between them.
Treatment Observed main effect
Glucose vs. Xylan -8.0
Cellobiose vs. Xylan 1.1
Root exudates vs. Control 10.4
Fungi + Bacteria vs. Bacteria -9.2
High vs. Low clay activity -24.0
Medium vs. Low clay activity -6.9
Joint effects
Interactions Expected Observed Difference
Glucose × Root 2.4 1.5 -1.0
Glucose × FB -17.1 -16.5 0.6
Glucose × High -32.0 -25.2 6.8
Glucose × Medium -14.8 -27.2 -12.4
Cellobiose × Root 11.5 11.1 -0.4
Cellobiose × FB -8.1 -8.5 -0.5
Cellobiose × High -23.0 -19.9 3.0
Cellobiose × Medium -5.8 -22.1 -16.3
Root × FB 1.2 0.3 -0.9
Root × High -13.6 -13.7 0.0
Root × Medium 3.5 -3.2 -6.8
FB × High -33.2 -28.3 4.9
FB × Medium -16.0 -16.9 -0.9
Glucose × Root × FB -6.7 -15.6 -8.9
Glucose × Root × High -21.6 -17.0 4.5
Glucose × Root × Medium -4.4 -14.1 -9.7
Glucose × FB × High -41.2 -27.5 13.6
Glucose × FB × Medium -24.0 -30.4 -6.4
Cellobiose × Root × FB 2.3 -0.8 -3.2
Cellobiose × Root × High -12.6 -6.1 6.5
Cellobiose × Root × Medium 4.6 2.8 -1.8
Cellobiose × FB × High -32.1 -28.0 4.1
Cellobiose × FB × Medium -14.9 -18.1 -3.1
Root × FB × High -22.8 -19.6 3.2
Root × FB × Medium -5.6 -17.6 -11.9
Glucose × Root × FB × High -30.8 -30.0 0.8
Glucose × Root × FB × Medium -13.6 -34.3 -20.7
Cellobiose × Root × FB × High -21.7 -19.7 2.0
Cellobiose × Root × FB × Medium -4.5 -16.9 -12.3
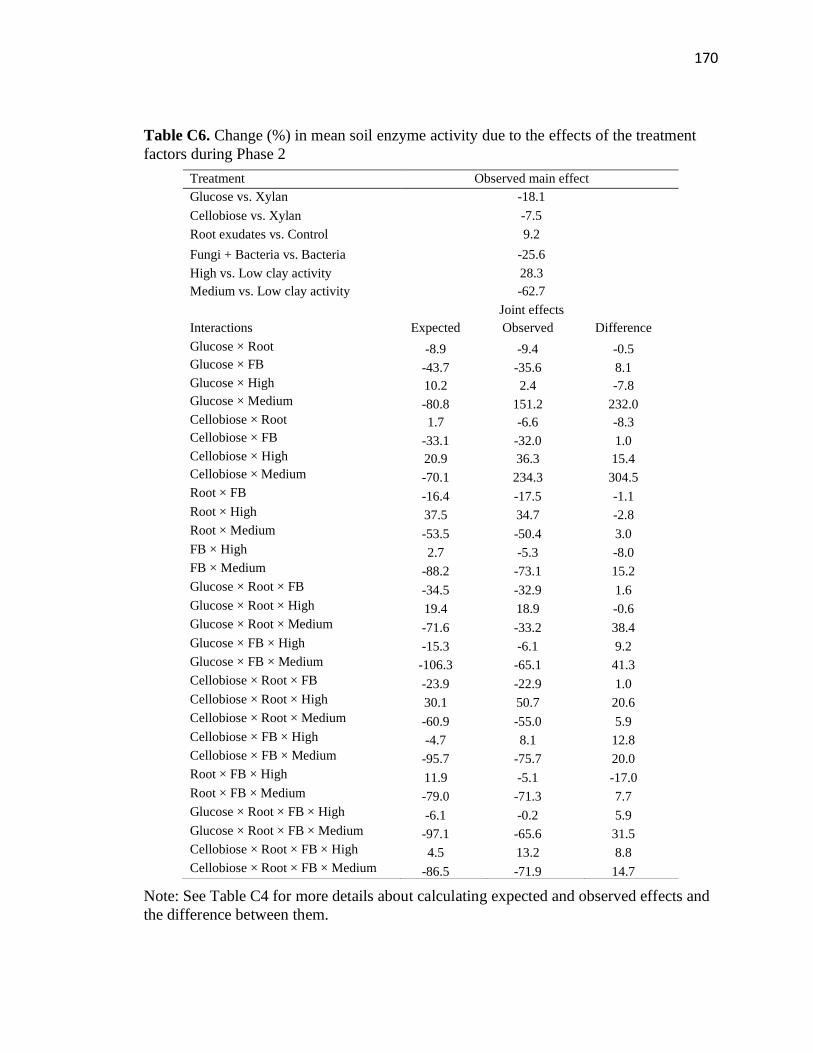
170
Table C6. Change (%) in mean soil enzyme activity due to the effects of the treatment
factors during Phase 2
Note: See Table C4 for more details about calculating expected and observed effects and
the difference between them.
Treatment Observed main effect
Glucose vs. Xylan -18.1
Cellobiose vs. Xylan -7.5
Root exudates vs. Control 9.2
Fungi + Bacteria vs. Bacteria -25.6
High vs. Low clay activity 28.3
Medium vs. Low clay activity -62.7
Joint effects
Interactions Expected Observed Difference
Glucose × Root -8.9 -9.4 -0.5
Glucose × FB -43.7 -35.6 8.1
Glucose × High 10.2 2.4 -7.8
Glucose × Medium -80.8 151.2 232.0
Cellobiose × Root 1.7 -6.6 -8.3
Cellobiose × FB -33.1 -32.0 1.0
Cellobiose × High 20.9 36.3 15.4
Cellobiose × Medium -70.1 234.3 304.5
Root × FB -16.4 -17.5 -1.1
Root × High 37.5 34.7 -2.8
Root × Medium -53.5 -50.4 3.0
FB × High 2.7 -5.3 -8.0
FB × Medium -88.2 -73.1 15.2
Glucose × Root × FB -34.5 -32.9 1.6
Glucose × Root × High 19.4 18.9 -0.6
Glucose × Root × Medium -71.6 -33.2 38.4
Glucose × FB × High -15.3 -6.1 9.2
Glucose × FB × Medium -106.3 -65.1 41.3
Cellobiose × Root × FB -23.9 -22.9 1.0
Cellobiose × Root × High 30.1 50.7 20.6
Cellobiose × Root × Medium -60.9 -55.0 5.9
Cellobiose × FB × High -4.7 8.1 12.8
Cellobiose × FB × Medium -95.7 -75.7 20.0
Root × FB × High 11.9 -5.1 -17.0
Root × FB × Medium -79.0 -71.3 7.7
Glucose × Root × FB × High -6.1 -0.2 5.9
Glucose × Root × FB × Medium -97.1 -65.6 31.5
Cellobiose × Root × FB × High 4.5 13.2 8.8
Cellobiose × Root × FB × Medium -86.5 -71.9 14.7
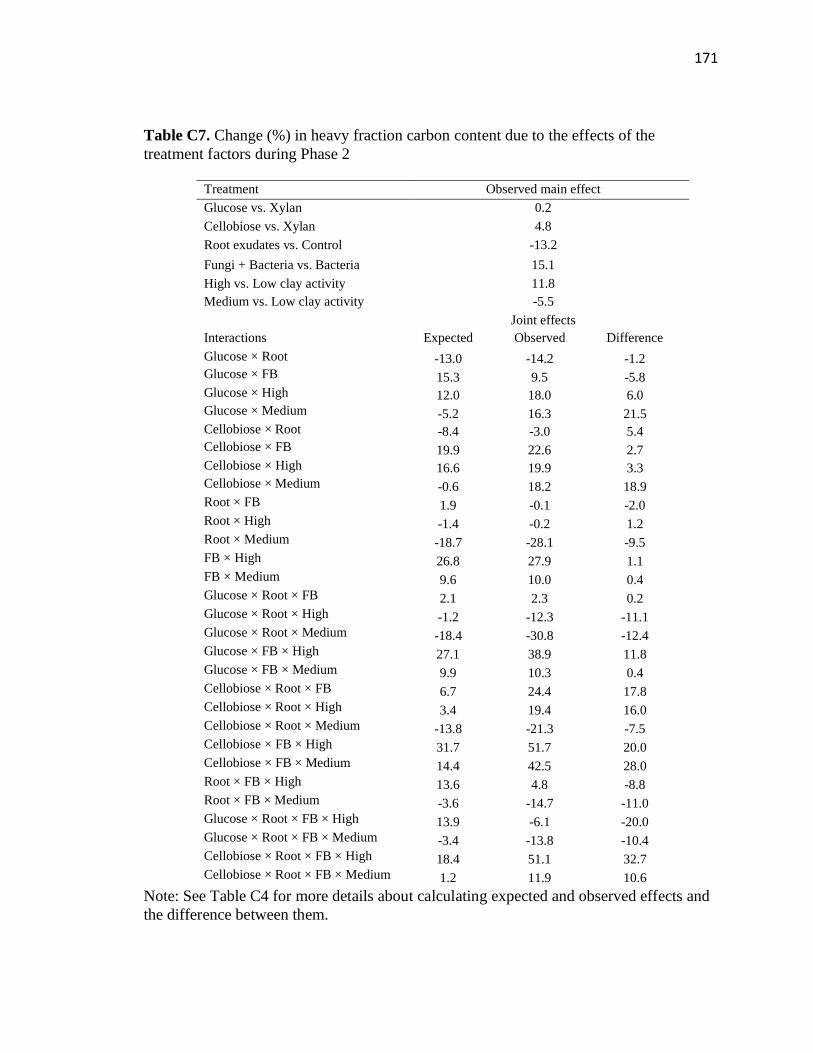
171
Table C7. Change (%) in heavy fraction carbon content due to the effects of the
treatment factors during Phase 2
Note: See Table C4 for more details about calculating expected and observed effects and
the difference between them.
Treatment Observed main effect
Glucose vs. Xylan 0.2
Cellobiose vs. Xylan 4.8
Root exudates vs. Control -13.2
Fungi + Bacteria vs. Bacteria 15.1
High vs. Low clay activity 11.8
Medium vs. Low clay activity -5.5
Joint effects
Interactions Expected Observed Difference
Glucose × Root -13.0 -14.2 -1.2
Glucose × FB 15.3 9.5 -5.8
Glucose × High 12.0 18.0 6.0
Glucose × Medium -5.2 16.3 21.5
Cellobiose × Root -8.4 -3.0 5.4
Cellobiose × FB 19.9 22.6 2.7
Cellobiose × High 16.6 19.9 3.3
Cellobiose × Medium -0.6 18.2 18.9
Root × FB 1.9 -0.1 -2.0
Root × High -1.4 -0.2 1.2
Root × Medium -18.7 -28.1 -9.5
FB × High 26.8 27.9 1.1
FB × Medium 9.6 10.0 0.4
Glucose × Root × FB 2.1 2.3 0.2
Glucose × Root × High -1.2 -12.3 -11.1
Glucose × Root × Medium -18.4 -30.8 -12.4
Glucose × FB × High 27.1 38.9 11.8
Glucose × FB × Medium 9.9 10.3 0.4
Cellobiose × Root × FB 6.7 24.4 17.8
Cellobiose × Root × High 3.4 19.4 16.0
Cellobiose × Root × Medium -13.8 -21.3 -7.5
Cellobiose × FB × High 31.7 51.7 20.0
Cellobiose × FB × Medium 14.4 42.5 28.0
Root × FB × High 13.6 4.8 -8.8
Root × FB × Medium -3.6 -14.7 -11.0
Glucose × Root × FB × High 13.9 -6.1 -20.0
Glucose × Root × FB × Medium -3.4 -13.8 -10.4
Cellobiose × Root × FB × High 18.4 51.1 32.7
Cellobiose × Root × FB × Medium 1.2 11.9 10.6
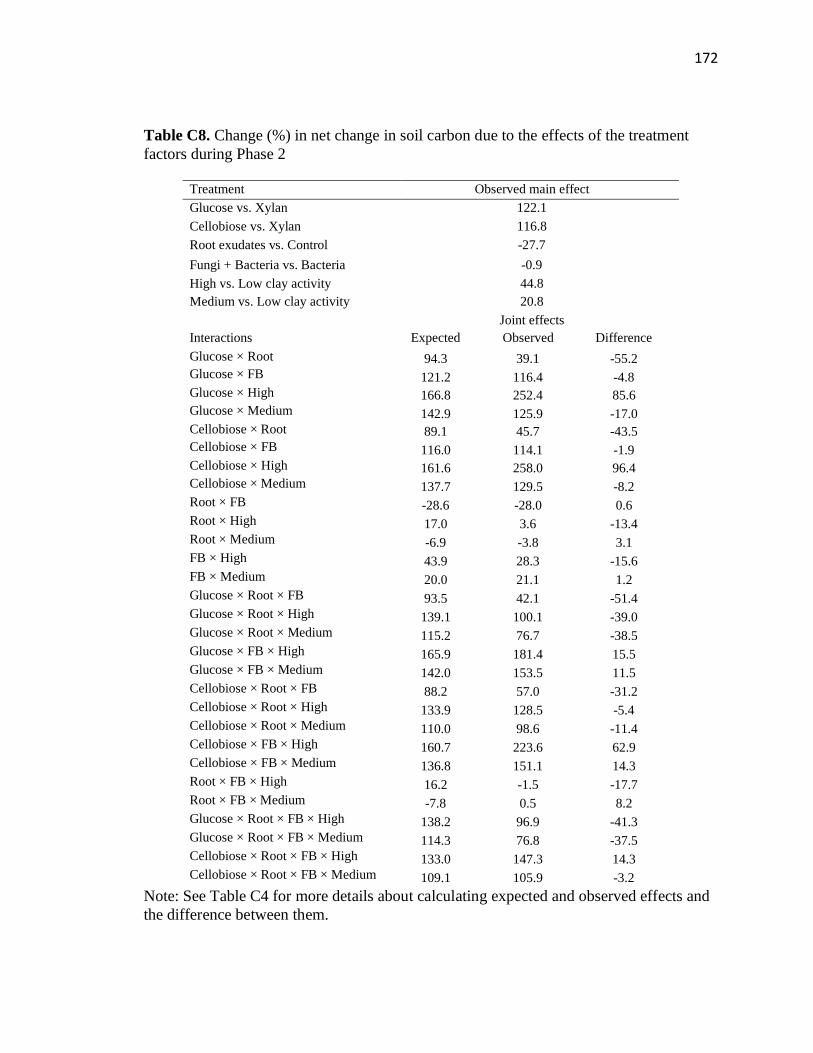
172
Table C8. Change (%) in net change in soil carbon due to the effects of the treatment
factors during Phase 2
Note: See Table C4 for more details about calculating expected and observed effects and
the difference between them.
Treatment Observed main effect
Glucose vs. Xylan 122.1
Cellobiose vs. Xylan 116.8
Root exudates vs. Control -27.7
Fungi + Bacteria vs. Bacteria -0.9
High vs. Low clay activity 44.8
Medium vs. Low clay activity 20.8
Joint effects
Interactions Expected Observed Difference
Glucose × Root 94.3 39.1 -55.2
Glucose × FB 121.2 116.4 -4.8
Glucose × High 166.8 252.4 85.6
Glucose × Medium 142.9 125.9 -17.0
Cellobiose × Root 89.1 45.7 -43.5
Cellobiose × FB 116.0 114.1 -1.9
Cellobiose × High 161.6 258.0 96.4
Cellobiose × Medium 137.7 129.5 -8.2
Root × FB -28.6 -28.0 0.6
Root × High 17.0 3.6 -13.4
Root × Medium -6.9 -3.8 3.1
FB × High 43.9 28.3 -15.6
FB × Medium 20.0 21.1 1.2
Glucose × Root × FB 93.5 42.1 -51.4
Glucose × Root × High 139.1 100.1 -39.0
Glucose × Root × Medium 115.2 76.7 -38.5
Glucose × FB × High 165.9 181.4 15.5
Glucose × FB × Medium 142.0 153.5 11.5
Cellobiose × Root × FB 88.2 57.0 -31.2
Cellobiose × Root × High 133.9 128.5 -5.4
Cellobiose × Root × Medium 110.0 98.6 -11.4
Cellobiose × FB × High 160.7 223.6 62.9
Cellobiose × FB × Medium 136.8 151.1 14.3
Root × FB × High 16.2 -1.5 -17.7
Root × FB × Medium -7.8 0.5 8.2
Glucose × Root × FB × High 138.2 96.9 -41.3
Glucose × Root × FB × Medium 114.3 76.8 -37.5
Cellobiose × Root × FB × High 133.0 147.3 14.3
Cellobiose × Root × FB × Medium 109.1 105.9 -3.2
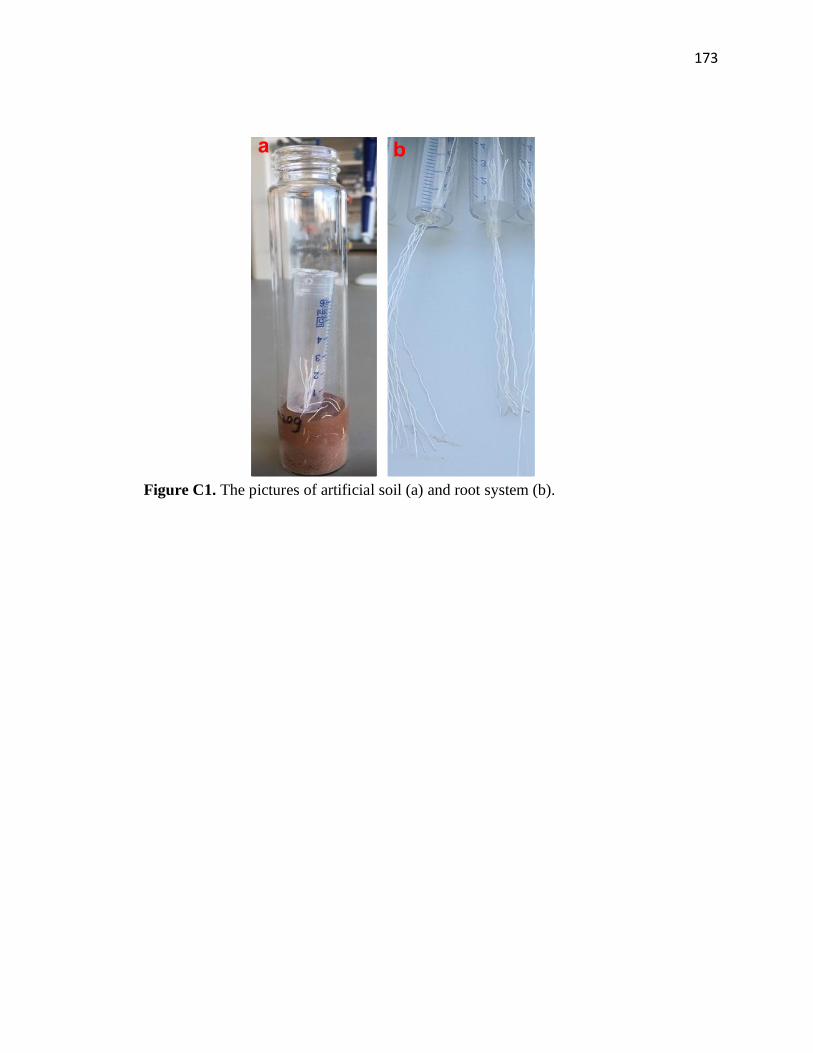
173
Figure C1. The pictures of artificial soil (a) and root system (b).
a b
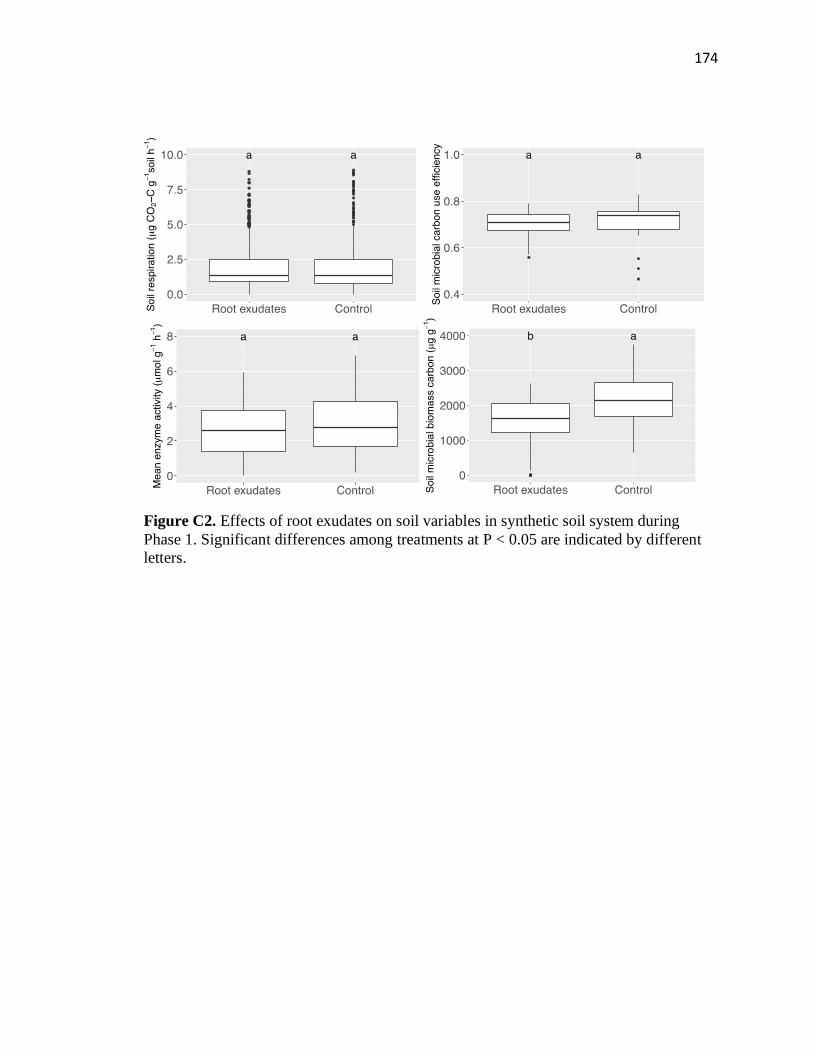
174
Figure C2. Effects of root exudates on soil variables in synthetic soil system during
Phase 1. Significant differences among treatments at P < 0.05 are indicated by different
letters.
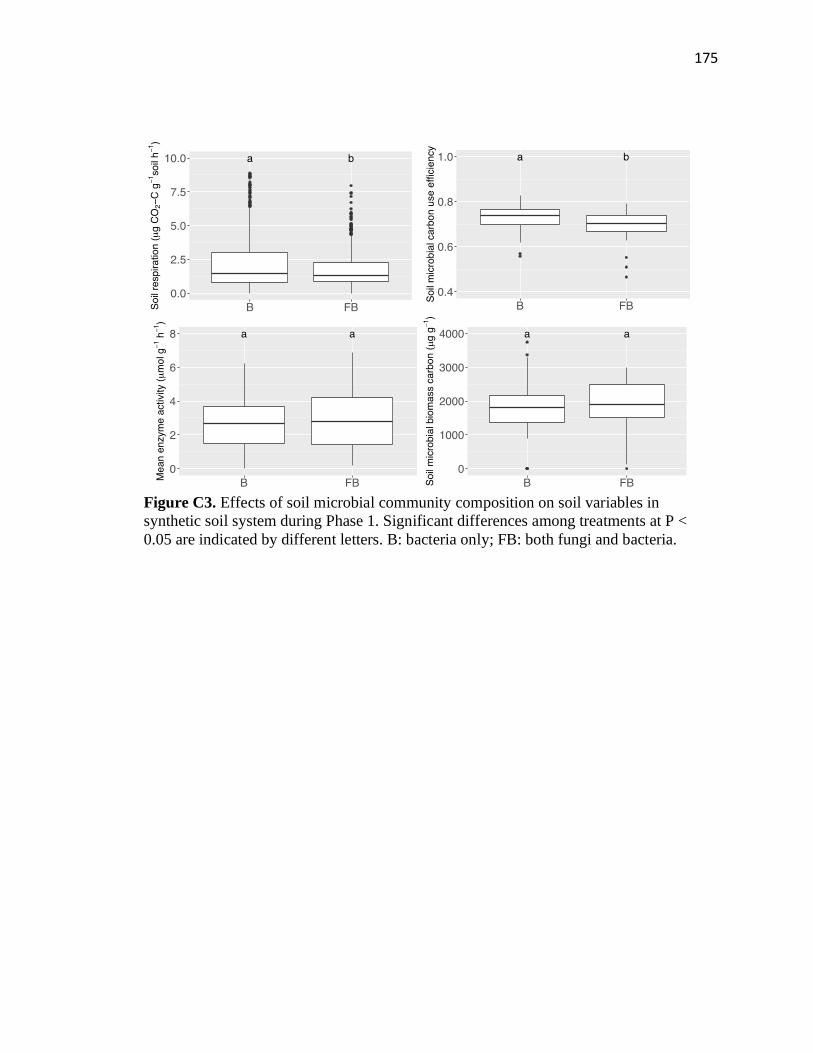
175
Figure C3. Effects of soil microbial community composition on soil variables in
synthetic soil system during Phase 1. Significant differences among treatments at P <
0.05 are indicated by different letters. B: bacteria only; FB: both fungi and bacteria.
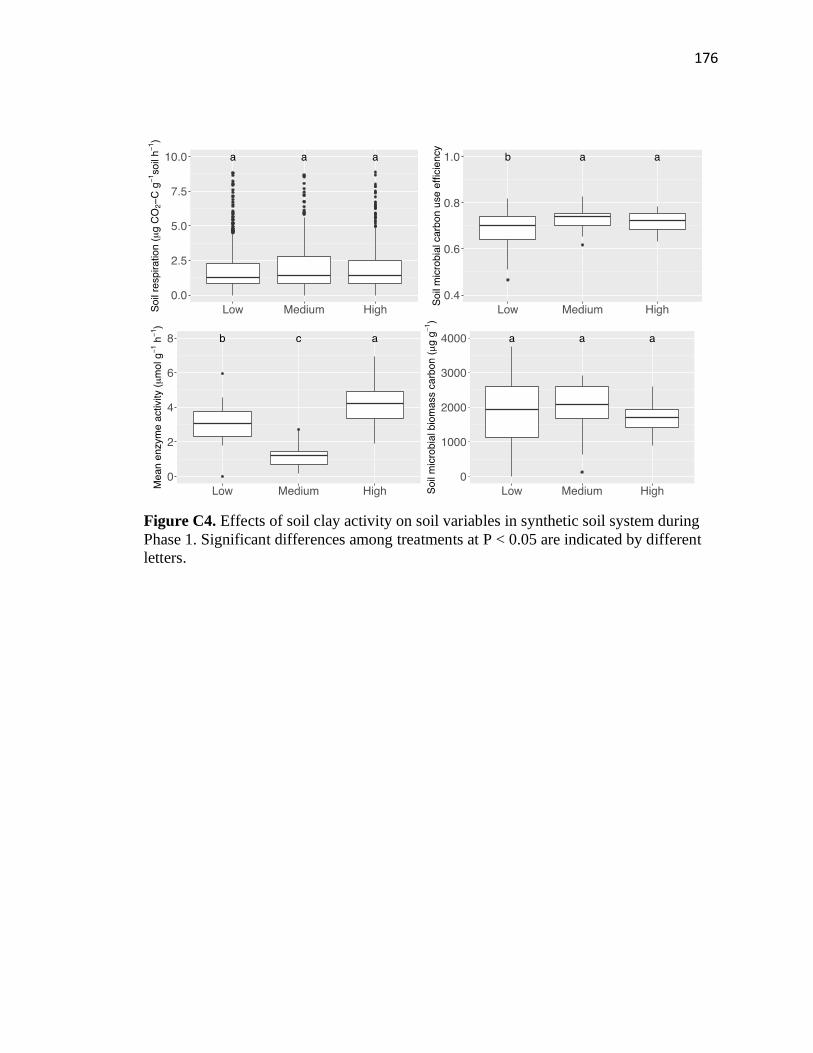
176
Figure C4. Effects of soil clay activity on soil variables in synthetic soil system during
Phase 1. Significant differences among treatments at P < 0.05 are indicated by different
letters.

177
Figure C5. The temporal pattern of soil respiration under all treatments in synthetic soil
system during Phase 1.
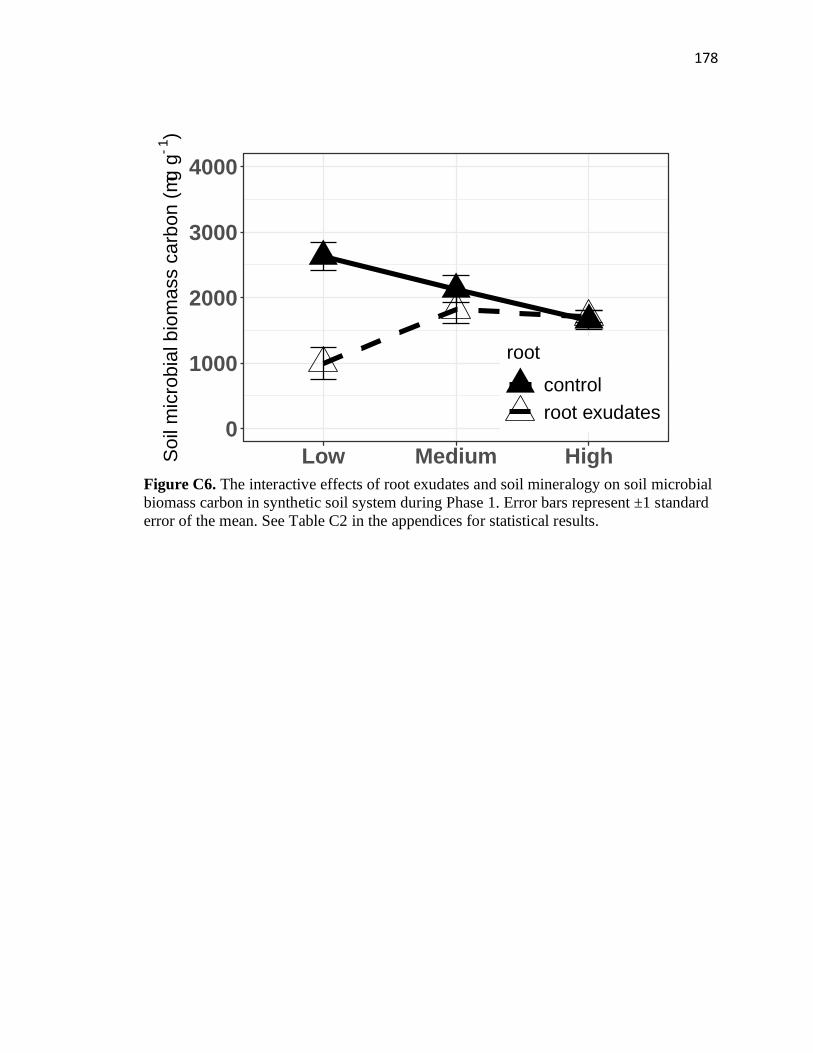
178
Figure C6. The interactive effects of root exudates and soil mineralogy on soil microbial
biomass carbon in synthetic soil system during Phase 1. Error bars represent ±1 standard
error of the mean. See Table C2 in the appendices for statistical results.
0
1000
2000
3000
4000
Low Medium HighSo
il m
icro
bia
l b
iom
ass c
arb
on
(m
g g
-1)
root
control
root exudates
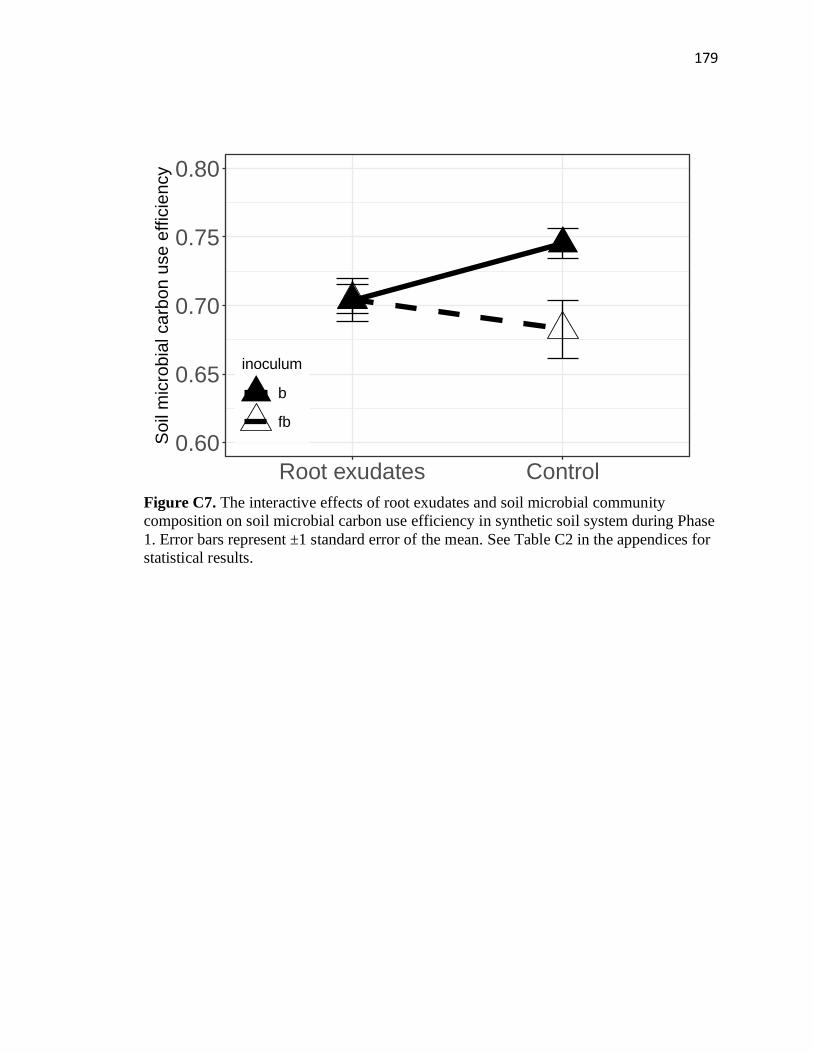
179
Figure C7. The interactive effects of root exudates and soil microbial community
composition on soil microbial carbon use efficiency in synthetic soil system during Phase
1. Error bars represent ±1 standard error of the mean. See Table C2 in the appendices for
statistical results.
0.60
0.65
0.70
0.75
0.80
Root exudates Control
Soil
mic
rob
ial ca
rbo
n u
se
eff
icie
ncy
inoculum
b
fb
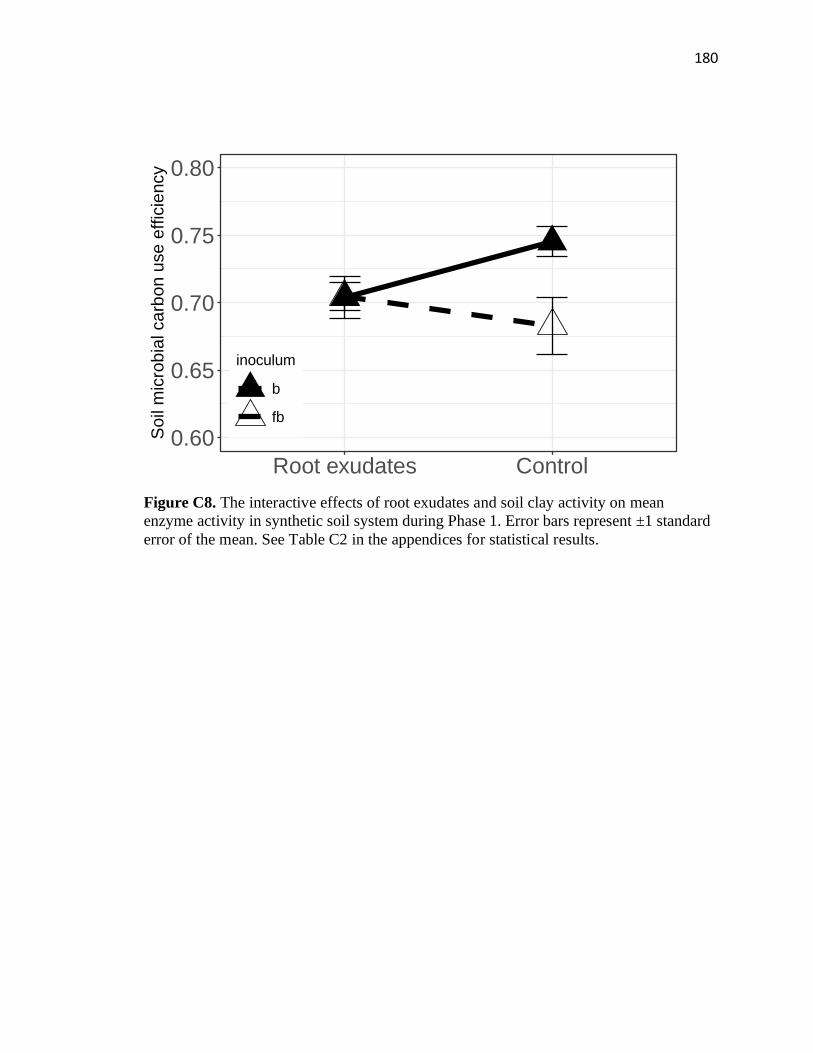
180
Figure C8. The interactive effects of root exudates and soil clay activity on mean
enzyme activity in synthetic soil system during Phase 1. Error bars represent ±1 standard
error of the mean. See Table C2 in the appendices for statistical results.
0.60
0.65
0.70
0.75
0.80
Root exudates Control
Soil
mic
rob
ial ca
rbo
n u
se
eff
icie
ncy
inoculum
b
fb
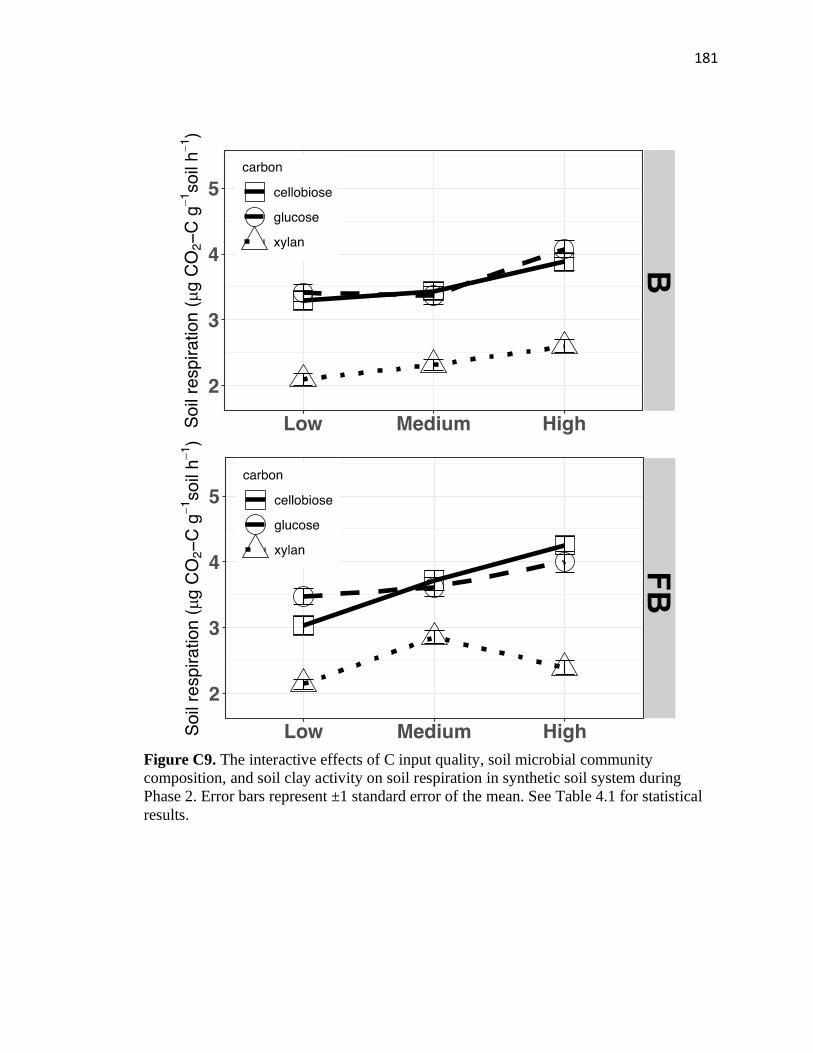
181
Figure C9. The interactive effects of C input quality, soil microbial community
composition, and soil clay activity on soil respiration in synthetic soil system during
Phase 2. Error bars represent ±1 standard error of the mean. See Table 4.1 for statistical
results.
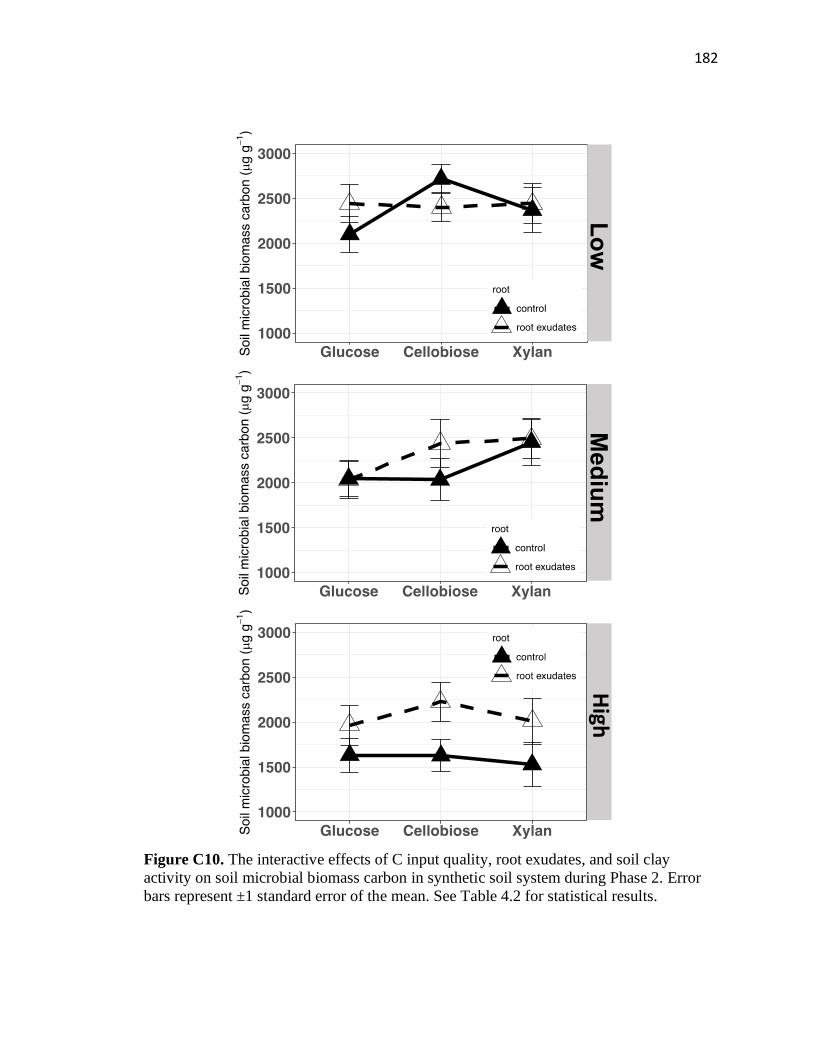
182
Figure C10. The interactive effects of C input quality, root exudates, and soil clay
activity on soil microbial biomass carbon in synthetic soil system during Phase 2. Error
bars represent ±1 standard error of the mean. See Table 4.2 for statistical results.
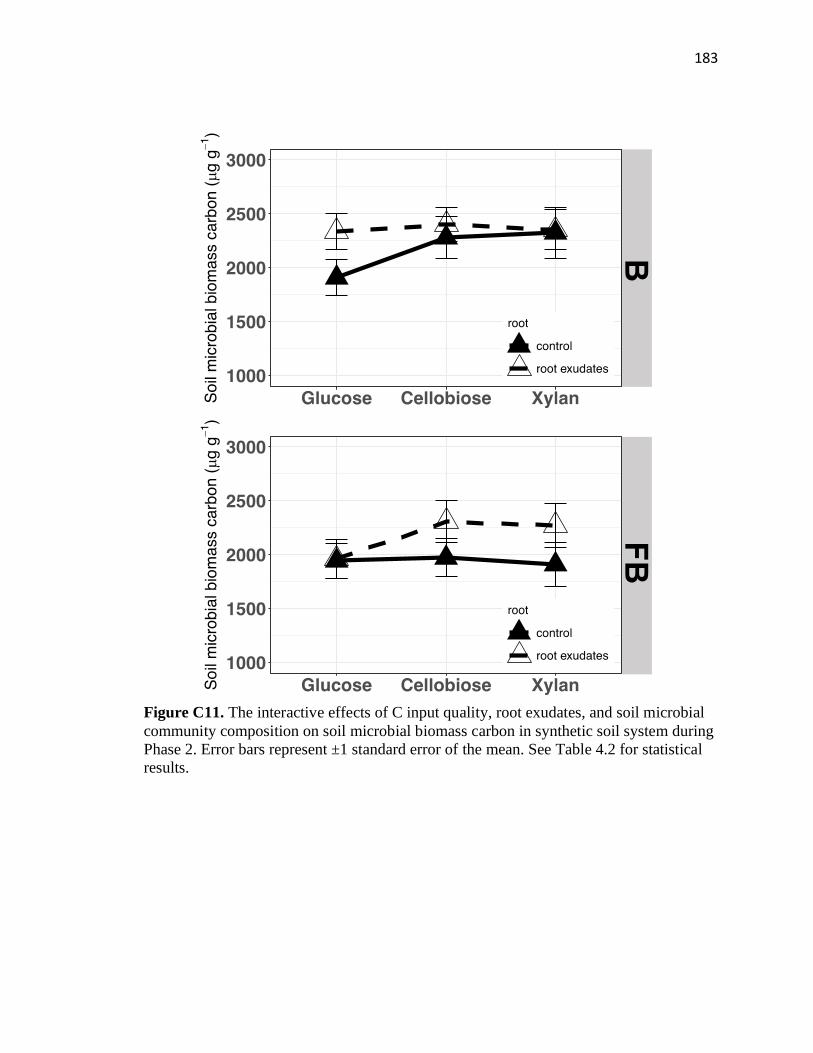
183
Figure C11. The interactive effects of C input quality, root exudates, and soil microbial
community composition on soil microbial biomass carbon in synthetic soil system during
Phase 2. Error bars represent ±1 standard error of the mean. See Table 4.2 for statistical
results.
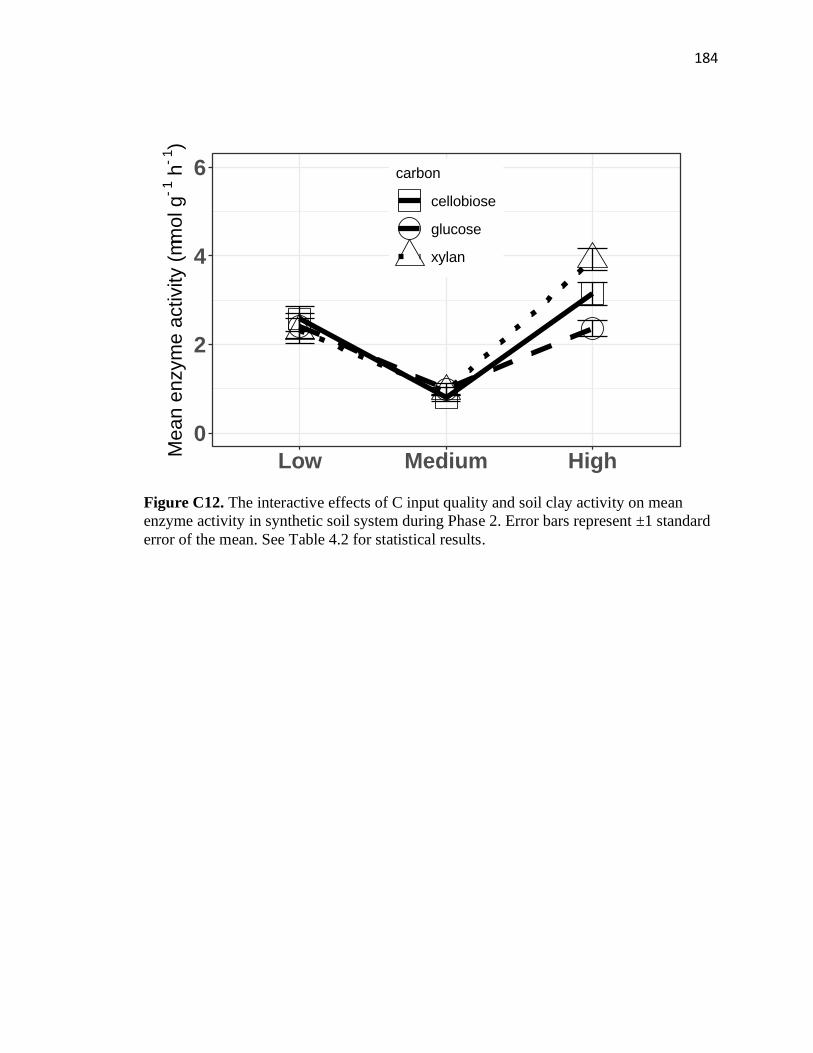
184
Figure C12. The interactive effects of C input quality and soil clay activity on mean
enzyme activity in synthetic soil system during Phase 2. Error bars represent ±1 standard
error of the mean. See Table 4.2 for statistical results.
0
2
4
6
Low Medium High
Mea
n e
nzym
e a
ctivity (
mm
ol g
-1 h
-1)
carbon
cellobiose
glucose
xylan
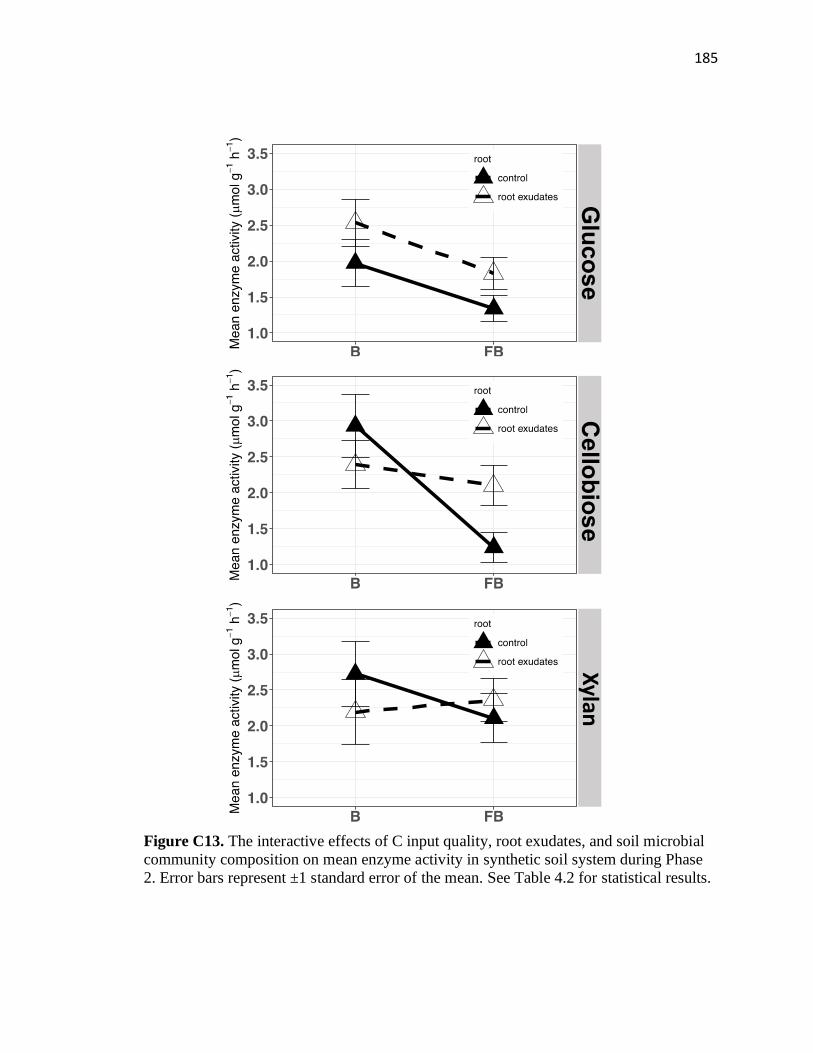
185
Figure C13. The interactive effects of C input quality, root exudates, and soil microbial
community composition on mean enzyme activity in synthetic soil system during Phase
2. Error bars represent ±1 standard error of the mean. See Table 4.2 for statistical results.
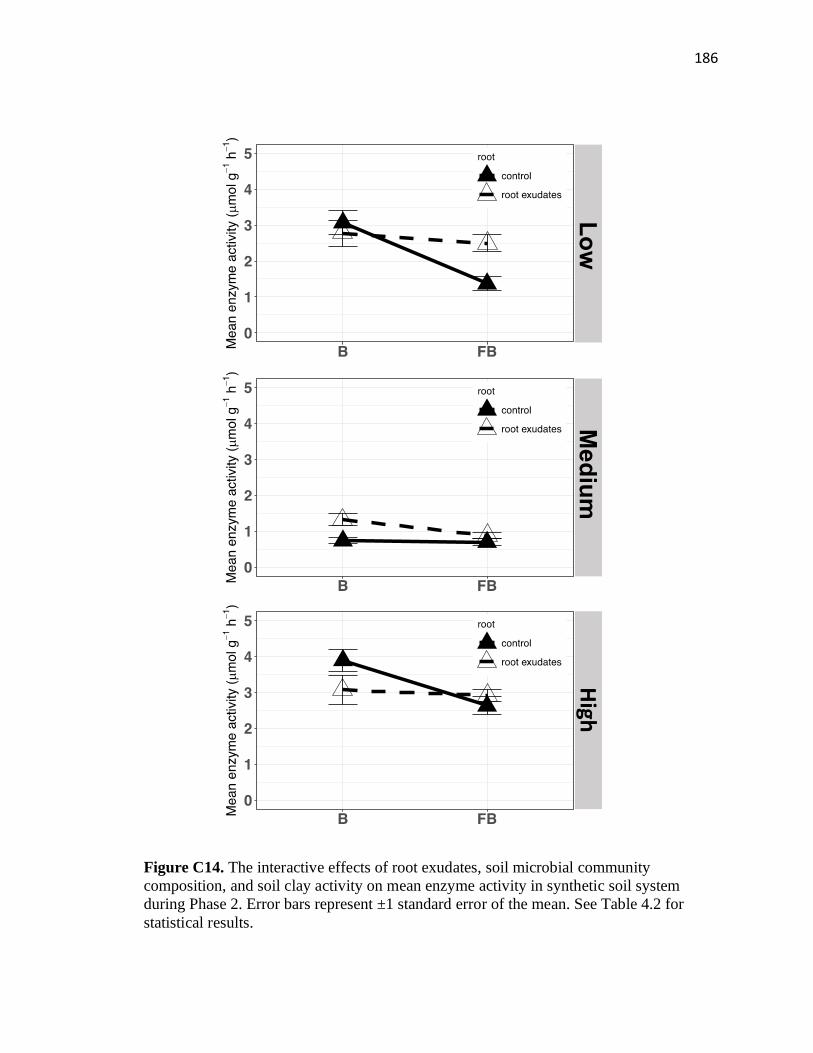
186
Figure C14. The interactive effects of root exudates, soil microbial community
composition, and soil clay activity on mean enzyme activity in synthetic soil system
during Phase 2. Error bars represent ±1 standard error of the mean. See Table 4.2 for
statistical results.
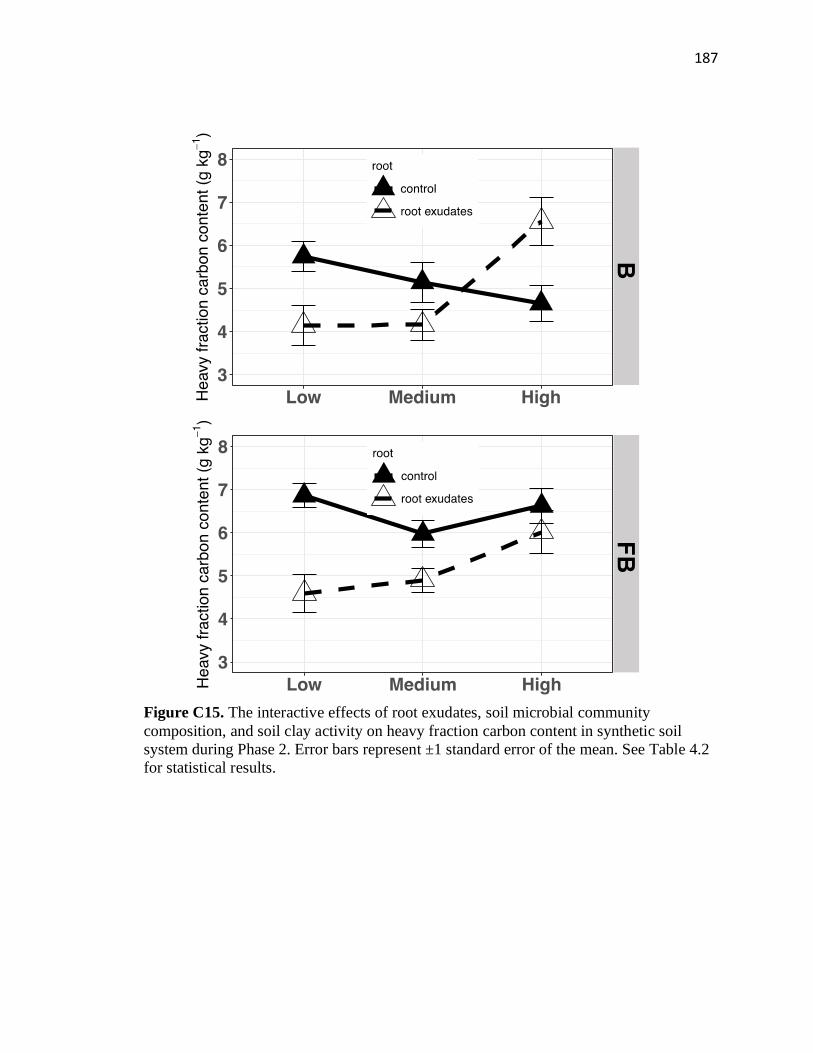
187
Figure C15. The interactive effects of root exudates, soil microbial community
composition, and soil clay activity on heavy fraction carbon content in synthetic soil
system during Phase 2. Error bars represent ±1 standard error of the mean. See Table 4.2
for statistical results.
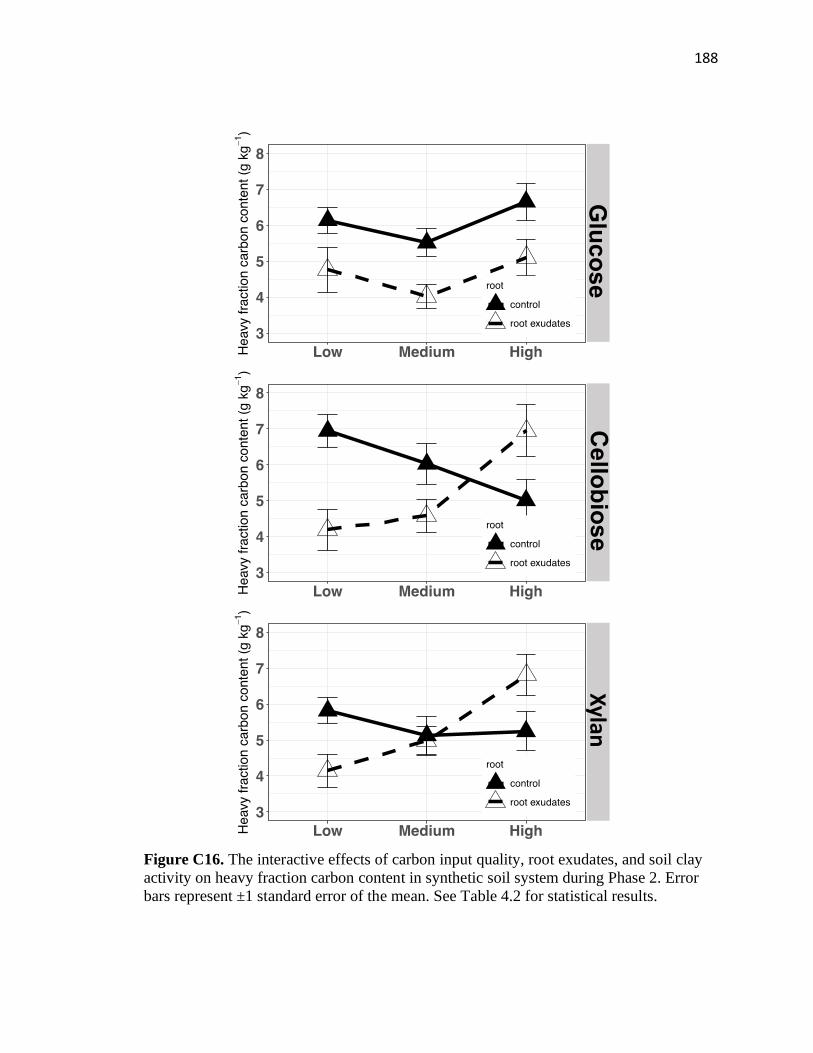
188
Figure C16. The interactive effects of carbon input quality, root exudates, and soil clay
activity on heavy fraction carbon content in synthetic soil system during Phase 2. Error
bars represent ±1 standard error of the mean. See Table 4.2 for statistical results.
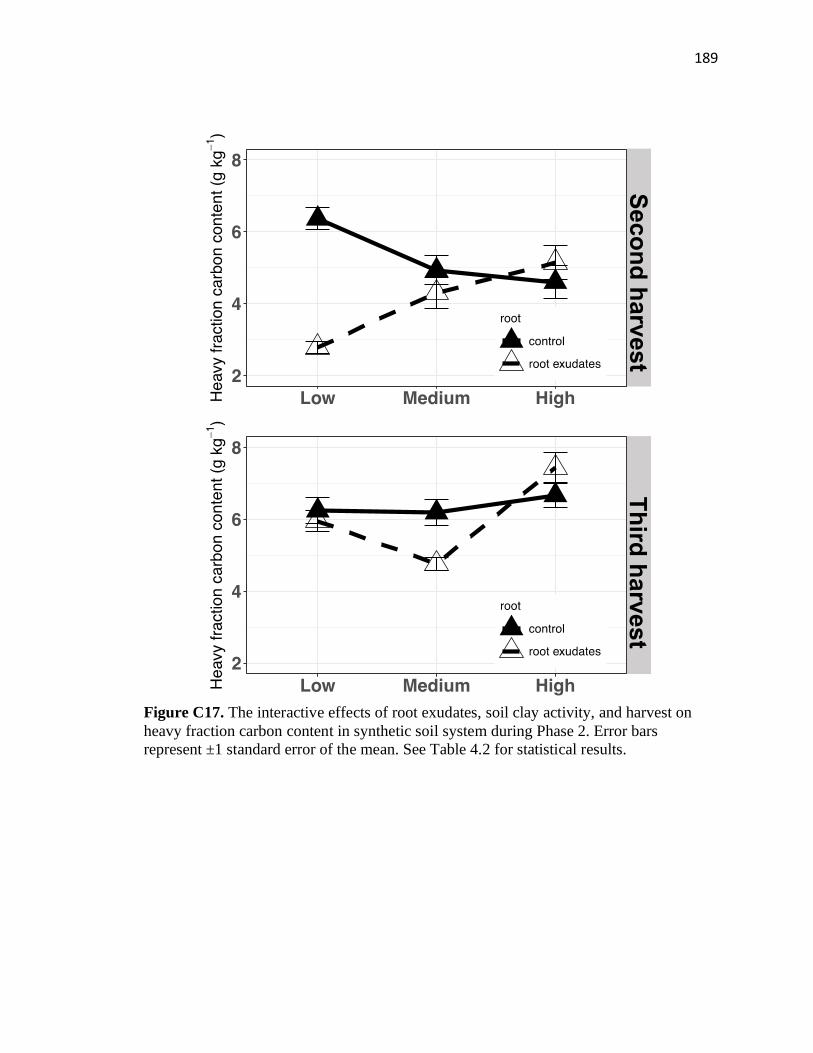
189
Figure C17. The interactive effects of root exudates, soil clay activity, and harvest on
heavy fraction carbon content in synthetic soil system during Phase 2. Error bars
represent ±1 standard error of the mean. See Table 4.2 for statistical results.
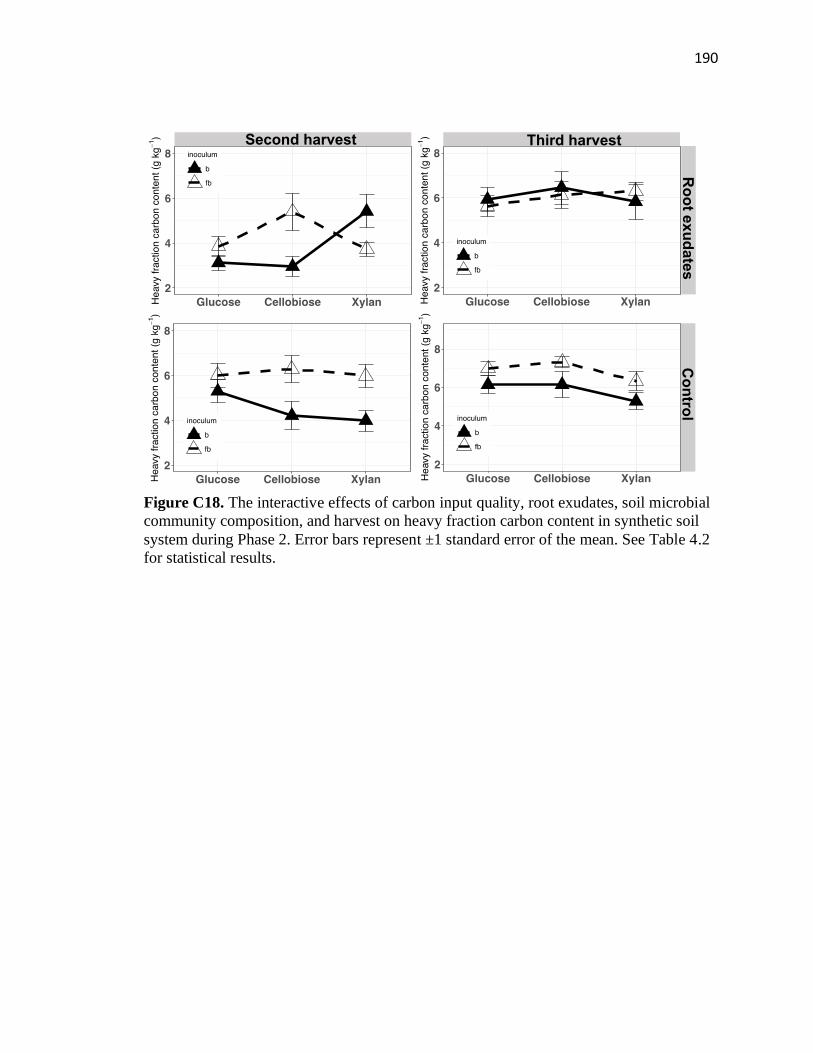
190
Figure C18. The interactive effects of carbon input quality, root exudates, soil microbial
community composition, and harvest on heavy fraction carbon content in synthetic soil
system during Phase 2. Error bars represent ±1 standard error of the mean. See Table 4.2
for statistical results.
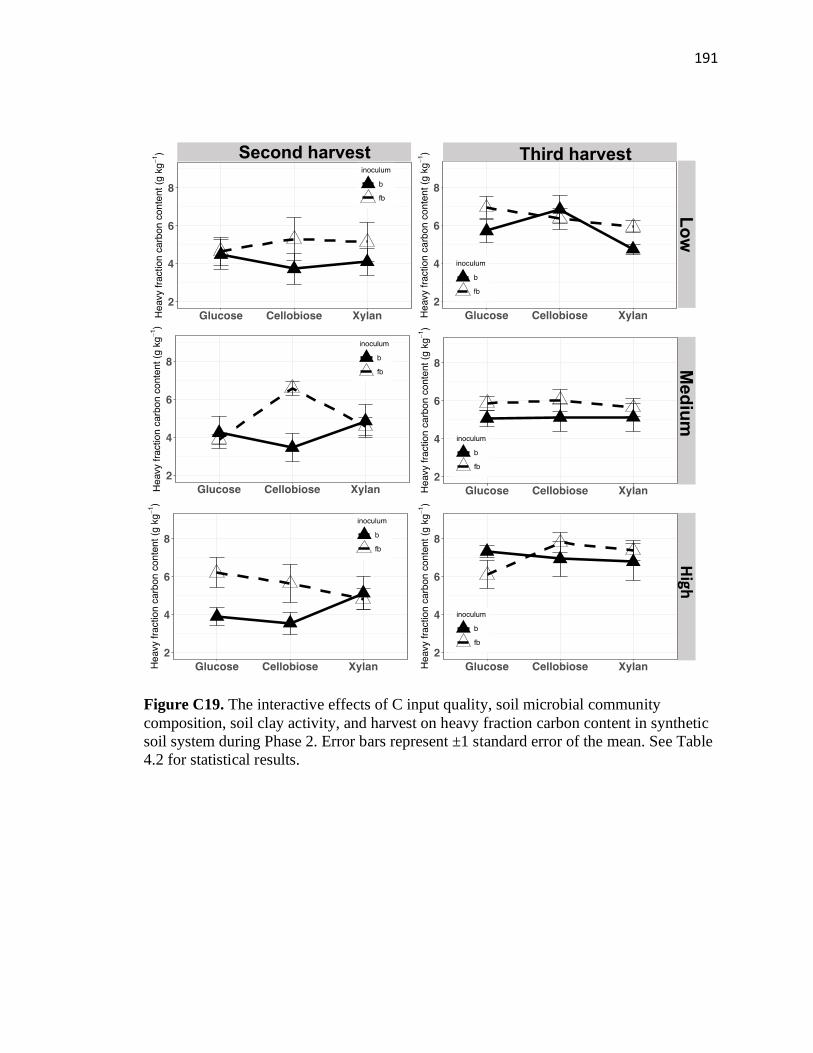
191
Figure C19. The interactive effects of C input quality, soil microbial community
composition, soil clay activity, and harvest on heavy fraction carbon content in synthetic
soil system during Phase 2. Error bars represent ±1 standard error of the mean. See Table
4.2 for statistical results.
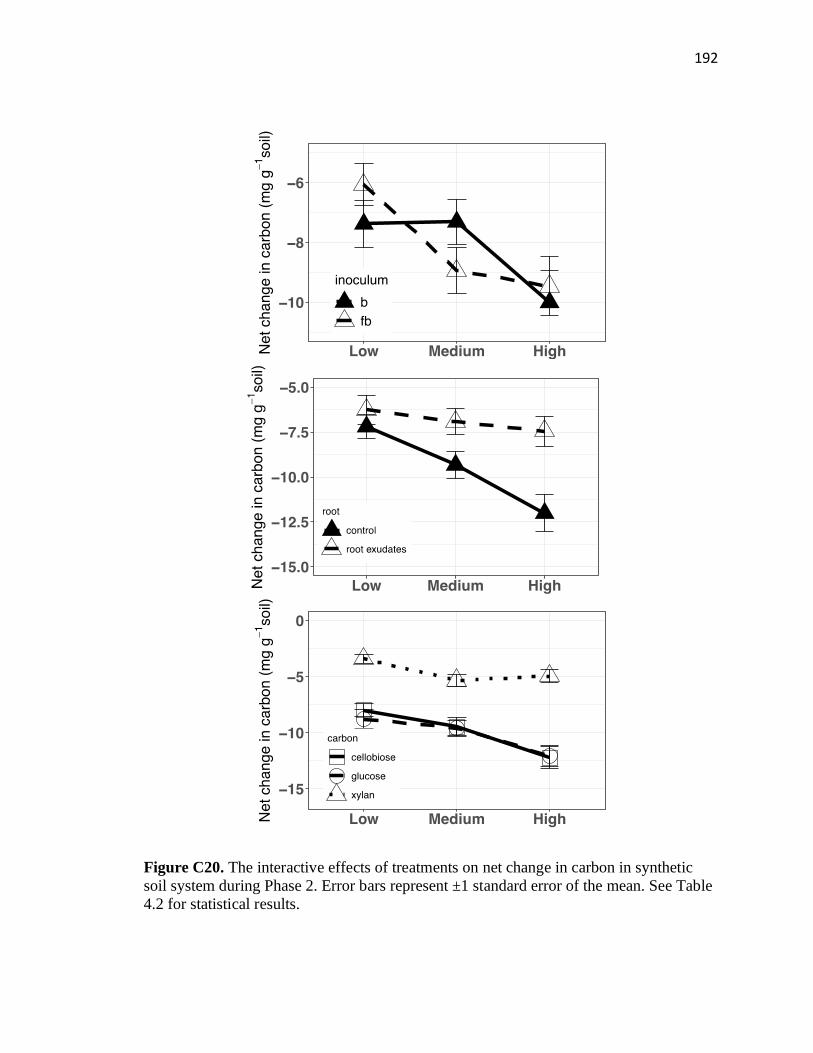
192
Figure C20. The interactive effects of treatments on net change in carbon in synthetic
soil system during Phase 2. Error bars represent ±1 standard error of the mean. See Table
4.2 for statistical results.
193
CURRICULUM VITAE
Guopeng Liang, Ph.D.
Department of Forest Resources, University of Minnesota, Saint Paul, MN 55108
[email protected] | https://guopengliang.wixsite.com/ecosystem-ecology
EDUCATION
Ph.D. in Ecology 2016 - 2021
Utah State University, Logan, UT.
M.S. in Soil Science 2013 - 2016
Chinese Academy of Agricultural Sciences, Beijing, China.
B.S. in Agricultural Resources and Environment/Laws 2009 - 2013
Shandong Agricultural University, Tai’an, China
PROFESSIONAL EXPERIENCE
Postdoctoral associate, University of Minnesota 2022 -
RESEARCH INTERESTS
Global Change Ecology, Ecosystem Carbon Cycling, Plant Ecology, Soil
Biogeochemistry, Plant-Soil-Microbe Interactions
PEER-REVIEWED PUBLICATIONS (Google Scholar: H index = 12, 560+ citations)
In review, revision, or preparation:
1. Liang, G., Sasha, R., Stark, J., Waring, B (2022) Effects of multiple global change
factors on soil respiration in a dryland ecosystem. Submitted to Soil Biology and
Biochemistry.
2. Liang, G., Waring, B (2022) Nitrogen agronomic efficiency decreases at decadal
timescales: evidence from 164 global long-term nitrogen application studies. Submitted
to PNAS.
3. Liang, G (2022) Long-term nitrogen fertilization not only increases crop yield but also
promotes its stability and sustainability: a global synthesis. Field Crops Research. In
review.
4. Li, S., Lu, J., Liang, G., Wu, X., Zhang, M., Plougonven, E., Wang, Y., Gao, L.,
Abdelrhman, A., Song, X., Liu, X., Degré, A (2022) Does soil water repellency reduce
corn yield by changing soil water availability under long-term tillage management?
SOIL. In revision.
5. Wen, J., Brahney, J., Sun, N., Zheng, J., Ji, H., Kang, H., Du, B., Liang, G., Umair, M.,
Lin, Y., Ma, Z., Liu, C (2022) Plant functional type is the primary driver of allometric
scaling relationships between leaf nitrogen and phosphorus across a gradient in P
availability in a subtropical forest ecosystem. Forestry Research. In review.
6. Song, X., Li, J., Liu, X., Liang, G., Li, S., Zhang, M., Zheng, F., Wang, B., Wu, X.,
Wu, H (2022) Altered microbial resource limitation regulates soil organic carbon
sequestration based on ecoenzyme stoichiometry under long-term tillage systems.
Geoderma. In review.
194
7. Yin, S., Liang, G., Wang, C., Zhou, Z (2022) Temporal niche differentiation between
plants and soil microorganisms is common in nature. Submitted to Ecology.
8. Liu, X., Li, Q., Tan, S., Wu, X., Song, X., Gao, H., Han, Z., Jia, A., Liang, G., Li, S
(2022) Lower carbon mineralization but higher temperature sensitivity is linked with soil
macro-aggregates at various soil moistures in 21-year conservation tillage systems.
Submitted to Soil and Tillage Research.
9. Waring, B., Gee, A., Liang, G., Adkins, S (2022) How much do the microbes matter?
A quantitative analysis of microbial community structure-function relationships in litter
decay. Submitted to iScience.
Published:
1. Liang, G., Luo, Y., Zhou, Z., Waring, B (2021) Nitrogen effects on plant productivity
change at decadal timescales. Global Ecology and Biogeography.
2. Lu, J., Li, S., Liang, G., Wu, X., Zhang, Q., Gao, C., Li, J., Jin, D., Zheng, F., Zhang,
M., Abdelrhman, A., Degré, A (2021) The contribution of microorganisms to soil organic
carbon stock under fertilization varies among aggregate size classes. Agronomy.
3. Liu, X., Wu, X., Liang, G., Zheng, F., Li, S (2021) A global meta-analysis of the
impacts of no-tillage on soil aggregation and aggregate-associated organic carbon. Land
Degradation and Development.
4. Lu, J., Li, S., Wu, X., Liang, G., Gao, C., Li, J., Jin, D., Wang, B., Zhang, M., Zheng,
F., Degré, A (2021) The dominant microorganisms vary with aggregates sizes in
promoting soil C accumulation under straw application. Archives of Agronomy and Soil
Science.
5. Xu, H., Cai, A., Wu, D., Liang, G., Xiao, J., Gao, Q., Li, Y., Zhang, W., Xu, M (2021)
Effects of biochar application on crop productivity, soil carbon sequestration, and global
warming potential controlled by biochar C:N and soil pH: a global meta-analysis. Soil
and Tillage Research. 213: 105125
6. Liang, G., Wu, X., Cai, A., Dai, H., Zhou, L., Cai, D., Houssou, A.A., Gao, L., Wang,
B., Li, S., Song, X., Wu, H (2021) Correlations among soil biochemical parameters, crop
yield, and soil respiration vary with growth stage and soil depth under fertilization.
Agronomy Journal. 113: 2450–2462
7. Li, S., Tan, D., Wu, X., Degré, A., Long, H., Zhang, S., Lu, J., Gao, L., Zheng, F., Liu,
X., Liang, G (2021) Negative pressure irrigation increases vegetable water productivity
and nitrogen use efficiency by improving soil water and NO3-N distributions.
Agricultural Water Management 251: 106853
8. Li, S., Lu, J., Liang, G., Wu, X., Zhang, M., Plougonven, E., Wang, Y., Gao, L.,
Abdelrhman, A., Song, X., Liu, X., Degré, A (2021) Factors governing soil water
repellency under tillage management: the role of pore structure and hydrophobic
substances. Land Degradation and Development 32: 1046–1059
9. Wilcox, K., Komatsu, K., Avolio, M., C2E consortium (2020) Improving
collaborations between empiricists and modelers to advance grassland community
dynamics in ecosystem models. New Phytologist 228: 1467–1471
10. Cai, A., Liang, G., Yang, W., Zhu, J., Han, T., Zhang, W., Xu, M (2020) Patterns and
driving factors of litter decomposition across Chinese terrestrial ecosystems. Journal of
Cleaner Production 278: 23964.
195
11. Li, Y., Li, Z., Cui S., Liang, G., Zhang, Q (2020) Microbial-derived carbon
components are critical for enhancing soil organic carbon in no-tillage croplands: A
global perspective. Soil and Tillage Research 105: 104758
12. Li, S., Wu, X., Liang, G., Gao, L., Wang, B., Lu, J., Abdelrhman, A., Song, X.,
Zhang, M., Zheng, F., Degré, A (2020) Is least limiting water range a useful indicator of
the impact of tillage management on maize yield? Soil and Tillage Research 199:
104602.
13. Cai, A., Chang, N., Zhang, W., Liang, G., Zhang, X., Hou, E., Jiang, L., Chen, X.,
Xu, M., Luo, Y (2020) The spatial patterns of litter turnover time in Chinese terrestrial
ecosystems. European Journal of Soil Science 71: 856-867.
14. Gao, L., Wang, B., Li, S., Han, Y., Zhang, X., Gong, D., Ma, M., Liang, G., Wu, H.,
Wu, X., Cai, D., Degré, A (2019) Effects of different long-term tillage systems on the
composition of organic matter by 13C CP/TOSS NMR in physical fractions in the Loess
Plateau of China. Soil and Tillage Research 194: 104321.
15. Wang, B., Yu, W., Wu, X., Gao, L., Li, J., Li, S., Liu, C., Li, Q., Liang, G., Cai, D.,
Zhang, J (2019) Effect of straw addition on the formation of aggregates and accumulation
of organic carbon in dryland soil. Scientia Agricultura Sinica 9: 1553-1563. (in Chinese
with English abstract)
16. Wang, B., Gao, L., Yu, W., Wei, X., Li, S., Li, J., Liang, G., Song, X., Cai, D., Wu, X
(2019) Soil aggregates and organic carbon distribution in deep soil under dryland long-
term tillage and residue retention. Journal of Arid Land 11: 241-254.
17. Wang, J., Yang, Q., Zhai, D., Jiang, L., Liang, G., Qiao, Y., Sun, X., Wei, N., Wang,
X., Xia, J (2019) Relative contributions of biotic and abiotic factors to the spatial
variation of litter stock in an old-growth subtropical forest. Journal of Plant Ecology 12:
769–780
18. Qiao, Y., Wang, J., Liang, G., Du, Z., Zhou, J., Zhu, C., Huang, K., Zhou, X., Luo,
Y., Yan, L., Xia, J (2019) Global variation of soil microbial carbon-use efficiency in
relation to growth temperature and substrate supply. Scientific Reports 9: 5621.
19. Cai, A., Xu, M., Wang, B., Zhang, W., Liang, G., Hou, E., Luo, Y (2019) Manure
acts as a better fertilizer for increasing crop yields than synthetic fertilizer does by
improving soil fertility. Soil and Tillage Research 189: 168-175.
20. Liang, G., Cai, A., Wu, H., Wu, X., Houssou, A.A., Ren, C., Wang, Z., Gao, L.,
Wang, B., Li, S., Song, X., Cai, D (2019) Soil biochemical parameters in the rhizosphere
contribute more to changes in soil respiration and its components than those in the bulk
soil under nitrogen application in croplands. Plant and soil 435: 111-125.
21. Gao, L., Wang, B., Li, S., Wu, H., Wu, X., Liang, G., Gong, D., Zhang, X., Cai, D.,
Degré, A (2019) Soil wet aggregate distribution and pore size distribution under different
tillage systems after 16 years in the Loess Plateau of China. Catena 173: 38-47.
22. Song, X., Wu, H., Wu, X., Li, Q., Wang, B., Li, S., Liang, G., Li, J., Liu, C., Zhang,
M (2018) Long-term conservation tillage improves surface soil carbon and nitrogen
content and rhizosphere soil enzyme activities. Journal of Plant Nutrition and Fertilizer
24: 1588-1597. (in Chinese with English abstract)
23. Cai, A., Liang, G., Zhang, X., Zhang, W., Li, L., Rui, Y., Xu, M., Luo, Y (2018)
Long-term straw decomposition in agro-ecosystems described by a unified three-
196
exponentiation equation with thermal time. Science of the Total Environment 636: 699-
708.
24. Liang, G., Wu, H., Houssou, A.A., Cai, D., Wu, X., Gao, L., Wang, B., Li, S (2018)
Soil respiration, glomalin content, and enzymatic activity response to straw application in
a wheat-maize rotation system. Journal of Soils and Sediments 18: 697-707.
25. Gao, L., Becker, E., Liang, G., Houssou, A.A., Wu, H., Wu, X., Cai, D., Degré, A
(2017) Effect of different tillage systems on aggregate structure and inner distribution of
organic carbon. Geoderma 288: 97-104.
26. Li, S., Wu, X., Dang J., Pei, X., Gao, L., Li, J., Wang, B., Liang, G., Long, H (2017)
Effects of negative pressure irrigation on yield, quality and water and nitrogen use
efficiency of cucumber. Soil and Fertilizer Sciences in China 2: 55-62. (in Chinese with
English abstract)
27. Li, S., Wu, X., Long, H., Zhang, S., Wang, X., Liang, G., Gao, L., Li, J., Wang, B.,
Hao, X., Li, J., Zhang, S (2017) Water and nitrogen use efficiencies of cucumber under
negatively pressurized fertigation. Journal of Plant Nutrition and Fertilizer 23: 416-426.
(in Chinese with English abstract)
28. Houssou, A.A., Liang, G., Gao, L., Li, J., Wu, X., Wu, H., Wang, X., Cai, D (2016)
Effect of conservation tillage on soil respiration rate and water content under
wheat/maize system in North China Plain. Journal of Soil Science and Environmental
Management 7: 10-22.
29. Liang, G., Houssou, A.A., Wu, H., Wu, X., Cai, D., Gao, L., Li, J., Wang, B., Li, S
(2016) Soil nitrogen content and enzyme activities in the rhizosphere and non-
rhizosphere of summer maize under different application rates. Chinese Journal of
Applied Ecology 27: 1917-1924. (in Chinese with English abstract)
30. Liang, G., Houssou, A.A., Wu, H., Cai, D., Wu, X., Gao, L., Li, J., Wang, B., Li, S
(2015) Seasonal patterns of soil respiration and related soil biochemical properties under
nitrogen addition in winter wheat field. PLoS ONE 10(12): e0144115.
31. Houssou, A.A., Liang, G., Gao, L., Wu, X., Wu, H., Wang, X., Cai, D (2015) Effect
of conservation tillage on soil respiration, organic carbon, moisture and yield of wheat
/maize system on North China Plain. International Journal of Science and Research 4:
2460-2467.
32. Wang, B., Wu, X., Yu, W., Yang, Y., Wang, X., Li, J., Liang, G., Cai, D (2015)
Different carbon and nitrogen managements on soil respiration of spring maize farmland.
Soil and Fertilizer Sciences in China 4: 1-7. (in Chinese with English abstract)
33. Wang, B., Cai, D., Li, J., Liang, G., Yu, W., Wang, X., Yang, Y., Wang, X (2015)
Effects of long-term conservation tillage on soil organic carbon, corn yield and water
utilization. Journal of Plant Nutrition and Fertilizer 21: 1455-1464. (in Chinese with
English abstract)
34. Li, J., Wu, H., Wu, X., Cai, D., Wang, B., Liang, G., Yao, Y., Lv, J (2015) Effects of
15-year conservation tillage on soil and aggregate organic carbon sequestration in the
Loess Hilly Region of China. Scientia Agricultura Sinica 48: 4690-4697. (in Chinese
with English abstract)
35. Dou, Q., Wang, J., Yin, B., Liang, G., Cui, X (2015) Alleviating effects of exogenous
EBR on tomato seedlings during copper stress. Plant Physiology Journal 3: 287-294. (in
Chinese with English abstract)
197
36. Yin, B., Liang, G., Jia, W., Cui, X (2014) Exogenous EBR mediated the plant growth
and absorption and accumulation of Cu, Fe and Zn in tomato seedlings under Cu stress.
Chinese Journal of Eco-Agriculture 22: 578-584. (in Chinese with English abstract)
37. Zhang, M., Liang, G., Jiang, C., Cui, X (2014) Exogenous nitric oxide involved in the
accumulation and subcellular distribution of Fe, Zn and Mn in tomato seedlings under
copper stress. Journal of Plant Nutrition and Fertilizer 3: 670-680. (in Chinese with
English abstract)
TEACHING EXPERIENCE
• Teaching Assistant, Biology lab. Utah State University, Fall 2019.
• Teaching Assistant, Microbiology lab. Utah State University, Spring 2019.
• Teaching Assistant, Agricultural Water Resources and Utilization, Chinese Academy of
Agricultural Sciences, Spring 2014.
• Teaching Assistant, Modern Soil Tillage, Chinese Academy of Agricultural Sciences,
Fall 2013.
MENTORING EXPERIENCE
• Yundi Bai (2020 - 2021), master student at Imperial College London.
• Camilla Moses (2020 - 2021), undergraduate technician at Utah State University.
• Jalynn Jones (2019 - 2021), undergraduate technician at Utah State University.
• Preston Christensen (2018 - 2019), undergraduate technician at Utah State University.
ACADEMIC SERVICE
• Guest editor for Agronomy
• Journal peer review (> 100 reviews, verified by Publons): Agricultural Water
Management, Agricultural and Forest Meteorology, Agronomy, Applied Soil Ecology,
Archives of Agronomy and Soil Science, CATENA, Environmental Microbiology,
Environmental Research, Field Crops Research, Geoderma, Global Change Biology,
Global Ecology and Biogeography, Heliyon, Journal of Agronomy and Crop Science,
Journal of Environmental Management, Journal of Cleaner Production, Land Degradation
& Development, Plant & Soil, PLOS ONE, Soil & Tillage Research
GRANTS
• Guopeng Liang. Modeled carbon cycle responses to altered precipitation and
interannual variation in desert grasslands. Sevilleta LTER Graduate Fellowship funded
by Sevilleta LTER. 2018. $4,000.
• Guopeng Liang. The impacts of manure on vegetable growth. Undergraduate
Fellowship funded by Tai'an Environmental Protection Agency, China. 2011. $1,000.
AWARDS
• Joseph E. Greaves Endowed Scholarship ($3,000), 2021
Sponsored by Utah State University
• Travel Award for attending SSSA meeting ($500), 2020
Sponsored by Utah State University
• IPNI Scholarship ($2,000), 2016
Sponsored by International Plant Nutrition Institute (IPNI)
• Monsanto Scholarship ($1,000), 2016

198
Sponsored by Monsanto Company
• Best Oral Presentation, 2016
Sponsored by Symposium for Chinese Young Soil Scientists
• Academic Scholarship, 2013-2014
Sponsored by Chinese Academy of Agricultural Sciences
• Outstanding Student in Social Work, 2011-2012
Sponsored by Shandong Agricultural University
• Academic Scholarship, 2011-2012
Sponsored by Shandong Agricultural University
• Second prize of Environmental design contest, 2011
Sponsored by Shandong Society of Environmental Sciences
OUTREACH ACTIVITIES
• Proposal reviewer for 2019 Biology Graduate Student Association (BGSA) award
sponsored by Department of Biology at Utah State University.
• Member of both the Ecology Center Seminar Committee in 2019 and the Biology
Department Seminar Committee in 2021 at Utah State University to invite and host
seminar speakers.
METHODS EXPERTISE
Design, installation, and maintenance of manipulative experiments in the field
(treatments included: different nitrogen application levels, straw, inorganic and organic
fertilizer application, warming and altered precipitation amount).
Design and maintenance of incubation experiments in the laboratory (treatments
included: rewetting cycles and artificial root-soil systems [e.g. different inoculums,
different substrate types, and different soil clay contents]).
Soil respiration: Li-COR 8100 soil CO2 flux chamber in the field; gas chromatography
and PICARRO in the lab.
Leaf photosynthesis: Li-COR 6400.
Biological soil analyses: microbial biomass (using chloroform fumigation extraction);
enzyme activities (using fluorimetric assays); glomalin content (using Bradford method);
soil DNA extraction (using DNA extraction kit); PCR.
Physical and chemical soil analyses: pH (using probe in laboratory); soil bulk density;
total carbon and nitrogen (Elementar Analysen-systeme GmbH); available nitrogen
(using a flow injection autoanalyzer); aggregate size distribution (wet sieving); density-
based fractionation of soil organic carbon (using SPT).
Isotope technique: using 13C-glucose to measure soil microbial carbon use efficiency.
Statistical analysis: QIIME; using R to run ANOVA and regression, structural equation
modeling, PCA and RDA analysis, and boosted regression trees.
Scientific graphing software: R; Sigmaplot; Origin.
Synthesis of ecological data using meta-analysis: using engauge digitizer and package
“metafor” in R.
Earth system models: Terrestrial ECOsystem (TECO) model (using Fortran).


