Embed Size (px)
Citation preview
The Cryosphere, 14, 309–330, 2020https://doi.org/10.5194/tc-14-309-2020© Author(s) 2020. This work is distributed underthe Creative Commons Attribution 4.0 License.
Glacier algae accelerate melt rates on the south-westernGreenland Ice SheetJoseph M. Cook1,2, Andrew J. Tedstone3, Christopher Williamson4, Jenine McCutcheon5, Andrew J. Hodson6,7,Archana Dayal1,6, McKenzie Skiles8, Stefan Hofer3, Robert Bryant1, Owen McAree9, Andrew McGonigle1,10,Jonathan Ryan12, Alexandre M. Anesio13, Tristram D. L. Irvine-Fynn11, Alun Hubbard14, Edward Hanna15,Mark Flanner16, Sathish Mayanna17, Liane G. Benning5,17,18, Dirk van As19, Marian Yallop4, James B. McQuaid5,Thomas Gribbin3, and Martyn Tranter3
1Department of Geography, University of Sheffield, Winter Street, Sheffield, South Yorkshire, S10 2TN, UK2Institute of Biological, Environmental and Rural Sciences, Aberystwyth University, Aberystwyth, SY23 3DA, UK3Bristol Glaciology Centre, School of Geographical Sciences, University of Bristol, Berkely Square, Bristol, BS8 1RL, UK4School of Biological Sciences, University of Bristol, Tyndall Ave, Bristol, BS8 1TQ, UK5School of Earth and Environment, University of Leeds, Leeds, LS2 9JT, UK6Department of Geology, University Centre in Svalbard, Longyearbyen, 9171, Norway7Department of Environmental Sciences, Western Norway University of Applied Sciences, 6856 Sogndal, Norway8Department of Geography, University of Utah, Central Campus Dr, Salt Lake City, Utah, USA9Faculty of Science, Liverpool John Moores University, James Parsons Building, Byrom Street, Liverpool, L3 3AF, UK10School of Geosciences, University of Sydney, Sydney, NSW 2006, Australia11Department of Geography and Earth Science, Aberystwyth University, Wales, SY23 3DB, UK12Institute at Brown for Environment and Society, Brown University, Providence, Rhode Island, USA13Department of Environmental Science, Aarhus University, 4000 Roskilde, Denmark14Centre for Gas Hydrate, Environment and Climate, University of Tromsø, 9010 Tromsø, Norway15School of Geography and Lincoln Centre for Water and Planetary Health, University of Lincoln, Think Tank, Ruston Way,Lincoln, LN6 7DW, UK16Climate and Space Sciences and Engineering, University of Michigan, 2455 Hayward St. Ann Arbor, Michigan, USA17German Research Centre for Geosciences, GFZ, Potsdam, Germany18Department of Earth Sciences, University of Berlin, Berlin, Germany19Geological Survey of Denmark and Greenland, Copenhagen, Denmark
Correspondence: Joseph M. Cook ([email protected])
Received: 18 March 2019 – Discussion started: 3 April 2019Revised: 16 December 2019 – Accepted: 18 December 2019 – Published: 29 January 2020
Abstract. Melting of the Greenland Ice Sheet (GrIS) is thelargest single contributor to eustatic sea level and is ampli-fied by the growth of pigmented algae on the ice surface,which increases solar radiation absorption. This biologicalalbedo-reducing effect and its impact upon sea level rise hasnot previously been quantified. Here, we combine field spec-troscopy with a radiative-transfer model, supervised clas-sification of unmanned aerial vehicle (UAV) and satelliteremote-sensing data, and runoff modelling to calculate bio-logically driven ice surface ablation. We demonstrate that al-
gal growth led to an additional 4.4–6.0 Gt of runoff from bareice in the south-western sector of the GrIS in summer 2017,representing 10 %–13 % of the total. In localized patcheswith high biomass accumulation, algae accelerated meltingby up to 26.15± 3.77 % (standard error, SE). The year 2017was a high-albedo year, so we also extended our analysisto the particularly low-albedo 2016 melt season. The runofffrom the south-western bare-ice zone attributed to algae wasmuch higher in 2016 at 8.8–12.2 Gt, although the propor-tion of the total runoff contributed by algae was similar at
Published by Copernicus Publications on behalf of the European Geosciences Union.
310 J. M. Cook et al.: Glacier algae accelerate melt rates
9 %–13 %. Across a 10 000 km2 area around our field site, al-gae covered similar proportions of the exposed bare ice zonein both years (57.99 % in 2016 and 58.89 % in 2017), butmore of the algal ice was classed as “high biomass” in 2016(8.35 %) than 2017 (2.54 %). This interannual comparisondemonstrates a positive feedback where more widespread,higher-biomass algal blooms are expected to form in high-melt years where the winter snowpack retreats further andearlier, providing a larger area for bloom development andalso enhancing the provision of nutrients and liquid waterliberated from melting ice. Our analysis confirms the impor-tance of this biological albedo feedback and that its omissionfrom predictive models leads to the systematic underestima-tion of Greenland’s future sea level contribution, especiallybecause both the bare-ice zones available for algal coloniza-tion and the length of the biological growth season are set toexpand in the future.
1 Introduction
Mass loss from the Greenland Ice Sheet (GrIS) has increasedover the past 2 decades (Shepherd et al., 2012; Hanna et al.,2013) and is the largest single contributor to cryospheric sealevel rise, adding 37 % or 0.69 mm yr−1 between 2012 and2016 (Bamber et al., 2018). This is due to enhanced surfacemelting (Ngheim et al., 2012) that exceeds calving losses atthe ice sheet’s marine-terminating margins (Enderlin et al.,2014; van den Broeke et al., 2016). Surface melting is con-trolled by net solar radiation, which in turn depends upon thealbedo of the ice surface, making albedo a critical factor formodulating ice sheet mass loss (Box et al., 2012; Ryan etal., 2018a). The largest shift in albedo occurs when the win-ter snow retreats to expose bare glacier ice. However, thereare several linked mechanisms that then change the albedo ofthe exposed ice and determine its rate of melting, includingmeltwater accumulation, ice surface weathering and the ac-cumulation of light-absorbing particles (LAPs), such as soot(Flanner et al., 2007) and mineral dust (Skiles et al., 2017).Photosynthetic algae also reduce the albedo of the GrIS (Ue-take et al., 2010; Yallop et al., 2012; Stibal et al., 2017; Ryanet al., 2017, 2018b). Despite being identified in the late 1800s(Nordenskiöld, 1875), their effects have not yet been quanti-fied, mapped or incorporated into any predictive surface massbalance models (Langen et al., 2017; Noël et al., 2016; Fet-tweis et al., 2017). Hence, biological growth may play an im-portant yet underappreciated role in the melting of the Green-land Ice Sheet and its contributions to sea level rise (Benninget al., 2014).
The snow-free surface of the GrIS has a conspicuous darkstripe along its western margin that expands and contractsseasonally, covering 4 %–10 % of the ablating bare-ice area(Shimada et al., 2016). The extent and darkness of this “darkzone” may be biologically and/or geologically controlled
(Wientjes et al., 2011, 2016; Tedstone et al., 2017; Stibal etal., 2017). There is a growing literature demonstrating thealbedo-reducing role played by a community of algae thatgrow on glacier ice on the eastern (Lutz et al., 2014) andwestern (Uetake et al., 2010; Yallop et al., 2012; Stibal et al.,2017; Tedstone et al., 2017; Williamson et al., 2018) GrIS.The algal community on the GrIS is dominated by Mesotae-nium berggrenii and Ancylonema nordenskioldii (Yallop etal., 2012; Stibal et al., 2017; Williamson et al., 2018, 2019;Lutz et al., 2018), which are collectively known as “glacieralgae” to distinguish them from snow algae and sea ice al-gae. The presence of these glacier algae reduces the albedoof the ice surface, mostly due to a purple purpurogallin-likepigment (Williamson et al., 2018; Stibal et al., 2017; Remiaset al., 2012).
An equivalent albedo reduction due to algae has alsobeen studied on snow. Worldwide, snow algal communitiesare dominated by unicellular Chlamydomonaceae, the mostabundant of which belong to the collective taxon Chlamy-domonas nivalis (Leya et al., 2004). These algae have beenshown to be associated with low-albedo snow in easternGreenland (Lutz et al., 2014) and to be responsible for 17 %of snowmelt in Alaska (Ganey et al., 2017). However, forglacier algae, quantification of the biological albedo reduc-tion, radiative forcing and melt acceleration has remainedelusive due to the difficulty of separating biological fromnon-biological albedo-reducing processes and a lack of di-agnostic biosignatures for remote sensing. For snow, remotedetection has been achieved by measuring the “uniquely bio-logical” chlorophyll absorption feature at 680 nm (Painter etal., 2001), a broader carotenoid absorption feature (Takeuchiet al., 2006), a normalized difference spectral index (Ganeyet al., 2017) and a spectral unmixing model (Huovinen etal., 2018). However, these signature spectra can be ambigu-ous for glacier algae due to the presence of the phenolic pig-ment with a broad range of absorption across the UV and VISwavelengths that obscures features associated with other pig-ments in raw reflectance spectra and is further complicatedby the highly variable optics of the underlying ice and mix-ing of algae with other impurities.
The dark zone is of the order 105 km2 in extent and is un-dergoing long-term expansion (Shimada et al., 2016; Ted-stone et al., 2017). Quantifying the impact of algal coloniza-tion on the dark zone is therefore paramount. Upscaling ofunmanned aerial vehicle (UAV) observations made in a smallsector of the dark zone to satellite data has demonstrated that“distributed impurities” including algae exert a primary con-trol on the surface albedo, but isolating the biological effectand upscaling to the regional scale has been prevented bya lack of spectral resolution and ground validation (Ryan etal., 2018a). Recently, Wang et al. (2018) applied the vege-tation red edge (difference in reflectance between 673 and709 nm) to map glacier algae over the south-western GrISusing Sentinel-3 OLCI data at 300 m ground resolution. Nei-
The Cryosphere, 14, 309–330, 2020 www.the-cryosphere.net/14/309/2020/
J. M. Cook et al.: Glacier algae accelerate melt rates 311
ther of these previous studies quantified the effect of glacieralgae effect on albedo or melt at the regional scale.
Here, we directly address these issues, resolving a majorknowledge gap limiting our ability to forecast ice sheet meltrates into the future. First, we use spectroscopy to quantifythe effect of glacier algae on albedo and radiative forcing inice. We then use a new radiative-transfer model to isolatethe effects of individual light-absorbing particles on the icesurface for the first time, enabling a comparison between lo-cal mineral dust and algae and providing the first candidatealbedo parameterization that could enable glacier algae to beincorporated into mass balance models. To determine spa-tial coverage, we apply a supervised classification algorithm(random forest) to map glacier algae in multispectral UAVand satellite data. Runoff modelling informed by our empir-ical measurements and remote-sensing observations enablesus to estimate the biological contribution to GrIS runoff forthe first time.
2 Field sites and methods
2.1 Overview
In this study we present a suite of empirical, theoretical andremote-sensing data to quantify and map algal contributionsto melting on the south-western GrIS. At our field site wepaired spectral reflectance and albedo measurements with re-moval of surface ice samples for biological and mineralogi-cal analyses in order to quantify the relationship between cellabundance and broadband and spectral albedo. The imagi-nary part of the refractive index of the local mineral dustsand the purpurogallin-type phenolic compound that domi-nates absorption in the local glacier algae were measured inthe laboratory and incorporated into a new radiative-transfermodel. The albedo effects of each impurity were thus ex-amined in isolation and compared. At the same time, wealso undertook a sensitivity study with other bulk dust op-tical properties from previous literature to further test thepotential role of mineral dusts in darkening the ice surface.Furthermore, by combining albedo measurements with in-coming irradiance spectra and measurements of local meltrates, we estimated the radiative forcing and the proportionof melting that could be attributed to algae in areas of highand low algal biomass (Hbio and Lbio). At our field site wemade UAV flights with a multispectral camera in order tomap algal coverage at high spatial resolution. We achievedthis by training a random-forest (RF) algorithm on our fieldspectroscopy data to classify the ice surface into discrete cat-egories including Hbio and Lbio. This enabled estimates ofalgal coverage in a 200× 200 m area at our field site. Wethen retrained our classifier for Sentinel-2 satellite imageryand used this to upscale further within the south-western re-gion of the GrIS (to a 100× 100 km Sentinel-2 tile coveringour field site and UAV image area). With these estimates of
algal coverage from our remote-sensing imagery and calcu-lations of the proportion of melting attributed to algae fromour field data, we were able to estimate runoff attributed toalgae using the runoff model by van As et al. (2017). Thedetails of each stage of our methodology are provided in thefollowing Sect. 2.2–2.10.
2.2 Field site
Experiments were carried out at the Black and Bloom Projectfield site (67.04◦ N, 49.07◦W; Fig. 1), near the Institute forMarine and Atmospheric research Utrecht (IMAU) Auto-matic Weather Station “S6” on the south-western Green-land Ice Sheet between 10 and 22 July 2017. We estab-lished a 200× 200 m area for UAV mapping (centred on67.07789444◦ N, 49.350000◦W) where only essential ac-cess was allowed (e.g. for placing ground control points,GCPs, for geo-rectifying our UAV images) and sample re-moval was prohibited. We also delineated an additional ad-jacent 20× 200 m area that we referred to as the “samplingstrip” in which we made spectral reflectance and albedo mea-surements paired with removal of samples for biological andmineralogical analyses, as detailed in the following sections.The sampling strip was subdivided into smaller subregionsthat were then systematically visited each day of our fieldseason. This was necessary because ice surface samples weredestructively removed for analysis and this method ensuredthat each area visited had not been disturbed by our pres-ence on previous days. Some ancillary directional reflectancemeasurements were also made at the same field site between15 and 25 July 2016 and appended to our training dataset forsupervised classification (Sect. 2.8).
2.3 Field spectroscopy
At each site in our sampling strip, albedo was measured us-ing an ASD (Analytical Spectral Devices, Colorado) Field-Spec Pro 3 spectroradiometer with an ASD cosine collector.The cosine collector was mounted horizontally on a 1.5 mcrossbar levelled on a tripod with a height between 30 and50 cm above the ice surface. The cosine collector was po-sitioned over a sample surface, connected to the spectrora-diometer using an ASD fibre optic. Following this, the spec-troradiometer was controlled remotely from a laptop, mean-ing the operators could move away from the instrument toavoid shading it. Two upwards- and two downwards-lookingmeasurements were made in close succession (∼ 2 min) toaccount for any change in atmospheric conditions, althoughthe measurements presented were all made during constantconditions of clear skies at solar noon ±2 h. Each retrievalwas the average of > 20 replicates.
Immediately after making the albedo measurements, thecosine collector was replaced with a 10◦ collimating lens,enabling a nadir view hemispheric conical reflectance fac-tor (HCRF) measurement to be obtained. For HCRF mea-
www.the-cryosphere.net/14/309/2020/ The Cryosphere, 14, 309–330, 2020
312 J. M. Cook et al.: Glacier algae accelerate melt rates
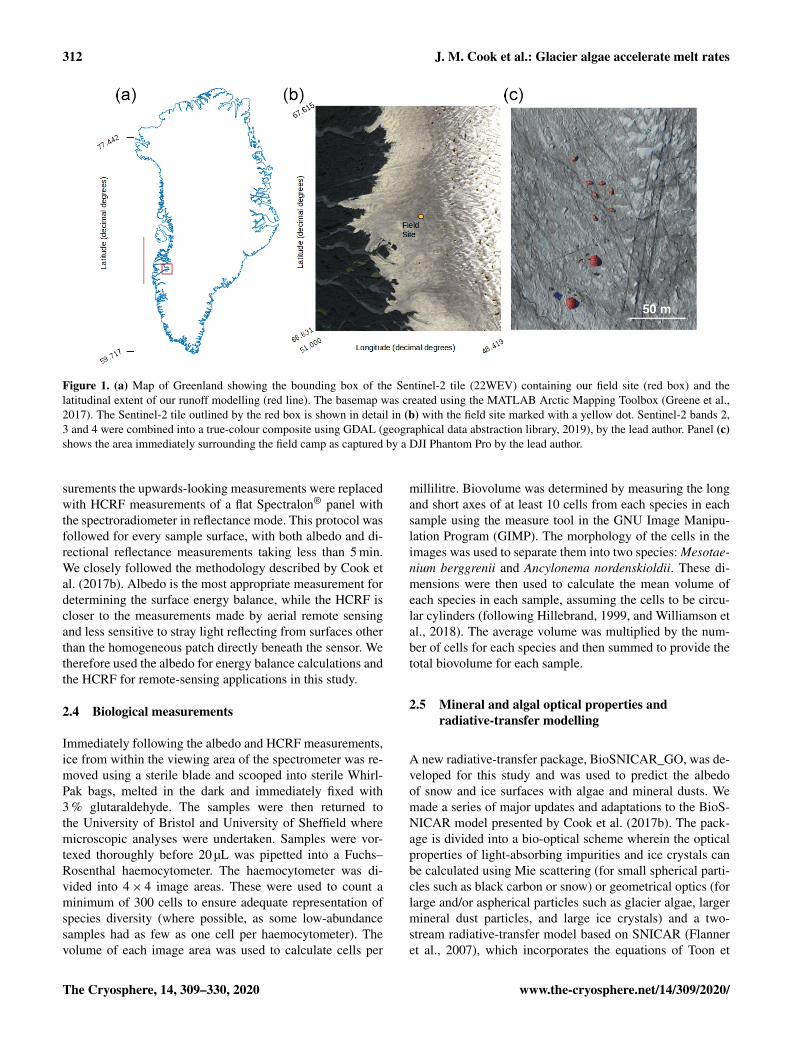
Figure 1. (a) Map of Greenland showing the bounding box of the Sentinel-2 tile (22WEV) containing our field site (red box) and thelatitudinal extent of our runoff modelling (red line). The basemap was created using the MATLAB Arctic Mapping Toolbox (Greene et al.,2017). The Sentinel-2 tile outlined by the red box is shown in detail in (b) with the field site marked with a yellow dot. Sentinel-2 bands 2,3 and 4 were combined into a true-colour composite using GDAL (geographical data abstraction library, 2019), by the lead author. Panel (c)shows the area immediately surrounding the field camp as captured by a DJI Phantom Pro by the lead author.
surements the upwards-looking measurements were replacedwith HCRF measurements of a flat Spectralon® panel withthe spectroradiometer in reflectance mode. This protocol wasfollowed for every sample surface, with both albedo and di-rectional reflectance measurements taking less than 5 min.We closely followed the methodology described by Cook etal. (2017b). Albedo is the most appropriate measurement fordetermining the surface energy balance, while the HCRF iscloser to the measurements made by aerial remote sensingand less sensitive to stray light reflecting from surfaces otherthan the homogeneous patch directly beneath the sensor. Wetherefore used the albedo for energy balance calculations andthe HCRF for remote-sensing applications in this study.
2.4 Biological measurements
Immediately following the albedo and HCRF measurements,ice from within the viewing area of the spectrometer was re-moved using a sterile blade and scooped into sterile Whirl-Pak bags, melted in the dark and immediately fixed with3 % glutaraldehyde. The samples were then returned tothe University of Bristol and University of Sheffield wheremicroscopic analyses were undertaken. Samples were vor-texed thoroughly before 20 µL was pipetted into a Fuchs–Rosenthal haemocytometer. The haemocytometer was di-vided into 4× 4 image areas. These were used to count aminimum of 300 cells to ensure adequate representation ofspecies diversity (where possible, as some low-abundancesamples had as few as one cell per haemocytometer). Thevolume of each image area was used to calculate cells per
millilitre. Biovolume was determined by measuring the longand short axes of at least 10 cells from each species in eachsample using the measure tool in the GNU Image Manipu-lation Program (GIMP). The morphology of the cells in theimages was used to separate them into two species: Mesotae-nium berggrenii and Ancylonema nordenskioldii. These di-mensions were then used to calculate the mean volume ofeach species in each sample, assuming the cells to be circu-lar cylinders (following Hillebrand, 1999, and Williamson etal., 2018). The average volume was multiplied by the num-ber of cells for each species and then summed to provide thetotal biovolume for each sample.
2.5 Mineral and algal optical properties andradiative-transfer modelling
A new radiative-transfer package, BioSNICAR_GO, was de-veloped for this study and was used to predict the albedoof snow and ice surfaces with algae and mineral dusts. Wemade a series of major updates and adaptations to the BioS-NICAR model presented by Cook et al. (2017b). The pack-age is divided into a bio-optical scheme wherein the opticalproperties of light-absorbing impurities and ice crystals canbe calculated using Mie scattering (for small spherical parti-cles such as black carbon or snow) or geometrical optics (forlarge and/or aspherical particles such as glacier algae, largermineral dust particles, and large ice crystals) and a two-stream radiative-transfer model based on SNICAR (Flanneret al., 2007), which incorporates the equations of Toon et
The Cryosphere, 14, 309–330, 2020 www.the-cryosphere.net/14/309/2020/
J. M. Cook et al.: Glacier algae accelerate melt rates 313
al. (1989). A schematic of the model structure is providedin the Supplement (Sect. S1).
To incorporate glacier algae into BioSNICAR_GO, ge-ometrical optics were employed to determine the single-scattering optical properties of the glacier algae, since theyare large (∼ 103 µm3, making Mie calculations impracticallycomputationally expensive) and best approximated as circu-lar cylinders (Hillebrand, 1999; Lee and Pilon, 2003). Ourapproach is adapted from the geometric optics parameteriza-tion of van Diedenhoven (2014). The inputs to the geomet-ric optics calculations are the cell dimensions and the com-plex refractive index. The imaginary part of the refractive in-dex was calculated using a mixing model based upon Cooket al. (2017b), where the absolute mass of each pigment inthe algal cells was measured in field samples. The absorp-tion spectra for the algal pigments is provided in Fig. 2a.We updated the mixing model by Cook et al. (2017b) to ap-ply a volume-weighted average of the imaginary part of therefractive index of water and the algal pigments so that thesimulated cell looks like water at wavelengths where pig-ments are non-absorbing. We consider this to be more phys-ically realistic than having cells that are completely non-absorbing at wavelengths > 0.75 µm, especially since a wa-ter fraction (Xw) is used in the calculations to represent thenon-pigmented cellular components of the total cell volume.This approach also prevents the refractive index from be-coming infinite when the water fraction is zero, removingthe constraint 0<Xw < 1 from the bio-optical scheme inthe original BioSNICAR model. Based upon experimentalevidence in Dauchet et al. (2015) for the model species C.reinhardii, the real part of the refractive index has been up-dated from 1.5 (in Cook et al., 2017b) to 1.4. The absorp-tion coefficients from which the imaginary refractive indexis calculated are from Dauchet et al. (2015), apart from thepurpurogallin-type phenol, whose optical properties were de-termined empirically (Fig. 2a). The calculated optical prop-erties were added to the lookup library for BioSNICAR-GOfor a range of cell dimensions. For the simulations presentedin this study, we included two classes of glacier algae rep-resenting Mesotaenium berggrenii and Ancylonema norden-skioldii with length and diameter and also the relative abun-dance of each species matching the means measured in ourmicroscopy described in Sect. 2.4. In simulations (Sect. S2)we found that ice albedo was relatively insensitive to the di-mensions of the cells within a realistic range of lengths anddiameters. This low sensitivity to cell length and diameter islikely because all of the cells considered here are large froma radiative-transfer perspective.
For mineral dusts, we took measured values for surfacedust composition and particle size distribution (PSD) ob-tained at our field site from McCutcheon et al. (2020; here-after, referred to as McC). We then used complex refrac-tive indices for the appropriate minerals obtained from theexisting literature, mixed them using the Maxwell Garnettdielectric mixing approximation according to the measured
mass fractions (after converting to volumetric fractions us-ing the mineral densities), generated the single-scatteringoptical properties using a Mie scattering code and applieda weighted average using the PSD to obtain the bulk opti-cal properties for the dust. Since the mineralogy of the dustvaried between sites we generated three dust “scenarios”.In the low-absorption scenario (LO-DUST) all the mineralswere set to the minimum volume-fraction measured acrossall of McC’s samples except for quartz, which comprised theremainder. In the high-absorption scenario (HI-DUST) allthe minerals were set to their maximum measured volume-fraction, apart from quartz, which comprised the remainder.Finally, in the mean scenario (MN-DUST) all the mineralswere present with their volume fractions equal to the meanacross all of the field samples. The mineralogy of each ofthese scenarios is described in Table 1. Refractive indiceswere not available for all of the individual minerals presentin McC’s analysis, so we represented the feldspar mineralsusing the refractive index for andesite (Pollack et al., 1973)and all pyroxenes with the refractive index for enstatite (Jägeret al., 2003), and, in the absence of a refractive index foramphibole phases, we used the refractive index for the simi-larly green mineral olivine (OCDB, 2002). Refractive indicesfor all other minerals were available (Rothman et al., 1998;Roush et al., 1991; Pollack et al., 1973; Egan and Hilgeman,1983; Nitsche and Fritz, 2004).
The ice optical properties in BioSNICAR-GO were alsocalculated using a parameterization of geometric opticsadapted from van Diedenhoven et al. (2014). A geometri-cal optics approach to generating ice optical properties waschosen because it enables arbitrarily large ice grains witha hexagonal columnar shape to be simulated, in order tobetter estimate the albedo of glacier ice where grains arelarge and aspherical. While the real ice surface is composedof irregularly shaped and sized grains, this approach en-abled us to simulate our field spectra much more accuratelyand circumvented the requirements that individual grains besmall and spherical in the case of the Lorenz–Mie approach.The optical properties of the ice grains were modelled us-ing refractive indices from Warren and Brandt (2008). Theradiative-transfer model is a two-stream model described infull in Cook et al. (2017b) and Flanner et al. (2007). For theradiative-transfer modelling presented in this study, the fol-lowing model parameters were used: diffuse illumination; icecrystal side-length and diameter per vertical layer = 3, 4, 5,8, and 10 mm; layer thicknesses = 0.1, 1, 1, 1 and 1 cm; un-derlying surface albedo = 0.15; and layer densities = 500,500, 600, 600 and 600 kg m−3. These ice physical propertieswere chosen to reduce the absolute error between the simu-lated albedo for ice without any impurities (“clean ice”) andour mean field-measured clean-ice spectrum.
To realistically simulate measured dust and algal massloadings on the ice surface, we took measured values forHbio field samples. For mineral dusts we took the mean andmaximum mineral mass mixing ratios from McC. They mea-
www.the-cryosphere.net/14/309/2020/ The Cryosphere, 14, 309–330, 2020
314 J. M. Cook et al.: Glacier algae accelerate melt rates
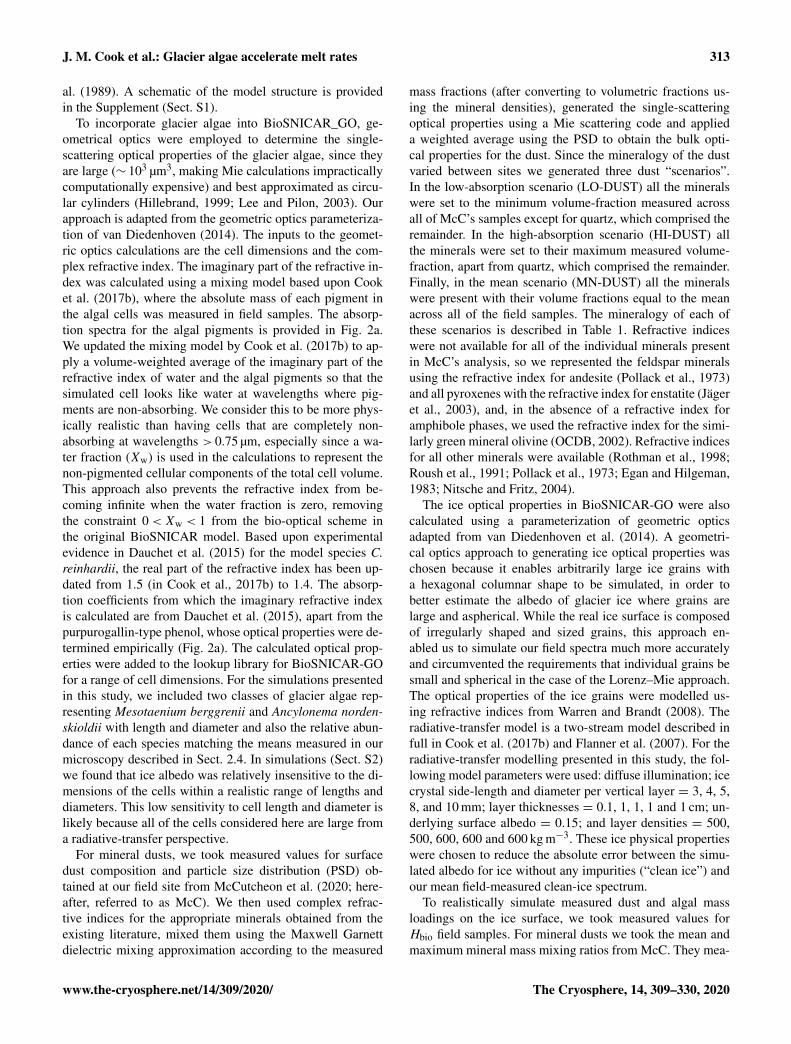
Figure 2. (a) Mass absorption coefficients of the major algal pigments including the purpurogallin-type phenol. (b) Measured spectral albedosfor each surface type (Hbio is heavy biomass loading, Lbio is light biomass loading, CI is clean ice and SN is snow). (c) Plot showing thenatural logarithm of cell abundance against broadband albedo. (d) Microscope image showing examples of both algal species and mineralfragments from a melted Hbio sample.
Table 1. Composition of each mineral dust “scenario” in percent of total by volume.
Fraction of total (% by volume)
Scenario Quartz Andesite Olivine Enstatite Kaolinite Illite Muscovite
HI-DUST 3.42 67.12 10.53 8.42 3.36 1.70 5.46LO-DUST 45.39 50.67 3.31 0.64 0 0 0MN-DUST 24.19 61.03 6.95 3.90 1.37 0.19 2.37
sured 394± 194 µgLAP mLice−1, of which ∼ 95 % was inor-
ganic, giving mean and maximum mineral dust loadings of373 and 567 µgLAP mLice
−1. Assuming 1 mL of ice to weigh0.917 g, this gives mean and maximum mass mixing ratiosof 342 and 519 µgdust gice
−1. For glacier algae we calculatedmass mixing ratios by taking the mean cell volume across allcells in our microscope images, converting to per-cell mass
using a constant cell density (0.87 g cm−3; Hu, 2014) andmultiplying by our mean and maximumHbio cell abundance.This gave mean and maximum mass mixing ratios of 349and 646 µgalgae gice
−1. We also varied the mass mixing ratiosover a range of hypothetical values to study the sensitivityof ice surface albedo to dust and glacier algae. Glacier algaeand each of the mineral dusts (LO-DUST, HI-DUST, MN-
The Cryosphere, 14, 309–330, 2020 www.the-cryosphere.net/14/309/2020/
J. M. Cook et al.: Glacier algae accelerate melt rates 315
DUST) were added individually to the upper 0.1 cm layer inmixing ratios of 10, 100, 500 and 1000 µgLAP gice
−1, plus themean and maximum measured mass mixing ratios for dustand algae, to quantify their effects on the surface albedo. Wealso ran a sensitivity study where we repeated the simulationswith two other dust types, sourced from previous literature,with contrasting mineralogies to our field site.
2.6 Empirical measurement of mineral dust reflectance
For two samples of local mineral dusts obtained from Hbiosites, we chemically removed the organic matter and mea-sured the PSD using scanning electron microscopy (full de-tails in Sect. S3). The chemical cleaning method avoided theartificial “reddening” of the mineral dust sample associatedwith removing organic matter by ignition. We then arrangedthe mineral dust samples into an optically thick layer on amicroscope slide and pressed them tightly against the openaperture of a Thorlabs IS200-4 integrating sphere to mea-sure their reflectance. The other apertures were covered withSM05CP2C caps and the sample reflectance was measuredusing the same ASD Field Spec Pro 3 as was used for fieldmeasurements.
2.7 Radiative forcing and biological melt acceleration
The biological radiative forcing was calculated by first differ-encing the albedo for algal surfaces and the albedo for cleanice surfaces measured at our field site. This gives the differ-ence in albedo between the clean and algal ice surfaces, αdiff.The product of each αdiff and the incoming irradiance, I ∗,provided the instantaneous power density (PDalg) absorbedby the algae. We assume that photosynthetic processes uti-lize 5 % of this absorbed energy – at the upper end of a re-alistic range for photosynthetic microalgae (Blankenship etal., 2011; Masojídek et al., 2013). The remainder of PDalgis conducted into the surrounding ice, giving the instanta-neous radiative forcing due to algae (IRFalg). Since thesecells are coloured by the purple purpurogallin pigment, weassume the reflective radiative forcing to be negligible, asdemonstrated by Dial et al. (2018). IRFalg was calculatedat hourly intervals using incoming irradiance simulated forour field site using the PVSystems solar irradiance program(https://pvlighthouse.com.au, last access: July 2019) at 1 nmspectral resolution, following Dial et al. (2018). The radiativeforcing was assumed to be constant between each 1 h timestep, meaning the radiative forcing over 1 h (HRFalg) couldbe calculated by multiplying IRFalg by 3600 s h−1, assumingthat instantaneous radiative forcing is equal to radiative forc-ing per second. Daily radiative forcing due to algae (RFalg)was then calculated as the sum of HRFalg between 00:00 and23:00 UTC.
To calculate the algal contribution to melting (Malg),IRFalg was multiplied by 104 to convert the radiative forcingfrom units of W m−2 to W cm−2 and then divided by the la-
tent heat of fusion for melting ice (334 J g−1) and integratedover the entire day as described above. This provided a valuefor the amount of melting caused by the presence of algaeper day assuming the cold content of the ice to be depleted.We calculated uncertainty by running these calculations forevery possible combination of our measured algal and cleanice spectra and calculating the mean, standard error, and stan-dard deviation of the pooled results.
We corroborated these estimates using a point surface en-ergy balance model (Brock and Arnold, 2000; Tedstone,2019). This model predicts melting in millimetres of wa-ter equivalent given local meteorological data and informa-tion about the ice surface albedo and roughness. We ran thismodel with the albedo set equal to the broadband albedo foreach clean ice (CI), heavy biomass (Hbio) and light biomass(Lbio) spectrum in our field measurements. The hourly mete-orological data for 21 July 2017 used to force the model werefrom a Delta-T GP1 automatic weather station positioned atour field site. The difference in predicted melt between thealgal surfaces and the clean ice surfaces provided the meltattributed to the presence of algae. As for the radiative forc-ing calculations, the uncertainty was calculated by runningthe energy balance model for every possible combination ofalgal and clean ice spectra and calculating the mean, standarderror, and standard deviation of the pooled results.
2.8 UAV and Sentinel-2 remote sensing
Having quantified algal melt acceleration in localizedpatches using the methods described in Sect. 2.2–2.6, wethen used a multispectral camera mounted to a UAV to quan-tify algal coverage across a 200× 200 m area at our field site.This sample area was kept pristine throughout the study pe-riod to minimize artefacts of our presence appearing in theUAV imagery. Inside the sampling area we placed fifteen10× 10 cm ground control points (GCPs), whose precise lo-cation was measured using a Trimble differential GPS. Atthese markers we also made ground spectral measurementsusing an ASD-Field Spec Pro 3 immediately after each flight.The UAV itself was a Steadidrone Mavrik-M quadcopter,onto which we integrated a MicaSense Red-Edge multispec-tral camera. The camera is sensitive in five discrete bands,with centre wavelengths of 475, 560, 668, 717, and 840 nmand bandwidths of 20, 20, 10, 10, and 40 nm, respectively.The horizontal field of view was 47.2◦ and the focal length5.4 mm. The camera was remotely triggered through the au-topilot, which was programmed along with the flight coordi-nates in the open-source software Mission Planner (Osborne,2019). Images were acquired at approximately 2 cm groundresolution with 60 % overlap and 40 % sidelap. The flightswere less than 20 min long and at an altitude of 30 m abovethe ice surface.
We applied radiometric calibration and geometric dis-tortion correction procedures to acquired imagery follow-ing MicaSense procedures (Micasense, 2019). We then con-
www.the-cryosphere.net/14/309/2020/ The Cryosphere, 14, 309–330, 2020
316 J. M. Cook et al.: Glacier algae accelerate melt rates
verted from radiance to reflectance using time-dependent re-gression between images of the MicaSense Calibrated Re-flectance Panel acquired before and after each flight (i.e.a regression line was computed between the reflectance ofthe white reference panel at the start and end of the flightand used to quantify the change in irradiance during theflight). Finally, the individual reflectance-corrected imageswere mosaicked using AgiSoft PhotoScan following pro-cedures developed by the United States Geological Survey(USGS, 2017), yielding a multi-spectral ortho-mosaic with5 cm ground resolution, georectified to our GCPs. There wasgenerally close agreement between the ground, UAV andsatellite-derived albedo, although there are some differencesthat we believe to be the result of different radiometric cal-ibration techniques for satellite, UAV and ground measure-ments, and the differing degrees of spatial integration havebeen examined in detail in Tedstone et al. (2019).
To upscale further, we used multispectral data fromthe Copernicus Sentinel-2 satellite. We selected the100× 100 km tile covering our field site (T22WEV) on theclosest cloud-free day to our UAV flight on 21 July. TheL1C product was downloaded from SentinelHub (Sinergise,Slovenia). The L1C product was processed to L2A using theEuropean Space Agency (ESA) Sen2Cor processor, includ-ing atmospheric correction and reprojection to 20 m resolu-tion.
2.9 Supervised classification algorithms and albedomapping
To map and quantify spatial coverage of algae over theice sheet surface we employed a supervised classificationscheme. A random forest (RF) classifier was trained on thefield spectra collected on the ice surface (see Sect. 2.3) andthen applied to multispectral images gathered by the UAVand Sentinel-2. We also included spectra obtained at the samefield site in July 2016 to our training set, giving a total of 231labelled spectra. A schematic of the classification workflowis provided in Sect. S4. Our HCRF measurements were firstreduced to reflectance values at five key wavelengths coinci-dent with the centre wavelengths measured by the MicaSenseRed-Edge camera mounted to the UAV (blue: 0.475; green:0.560; red: 0.668; red edge: 0.717; NIR: 0.840 µm), yield-ing reflectance at each wavelength as a feature vector forthe classifier (in this case the spectral response function ofthe camera was not accounted for). The classification labelswere the surface type as determined by visual inspection: SN(snow), CI (clean ice), CC (cryoconite), WAT (water), Lbio(low-biomass algae) and Hbio (high-biomass algae). For thealgal surface classes our visual assessment was corroboratedby microscopy, as described in Sect. 2.2. This dataset wasthen shuffled and split into a training set (80 %) and a testset (20 %). The training set was used to train three individualsupervised classification algorithms: Naive Bayes, k-nearestneighbours (KNN) and support vector machine (SVM). For
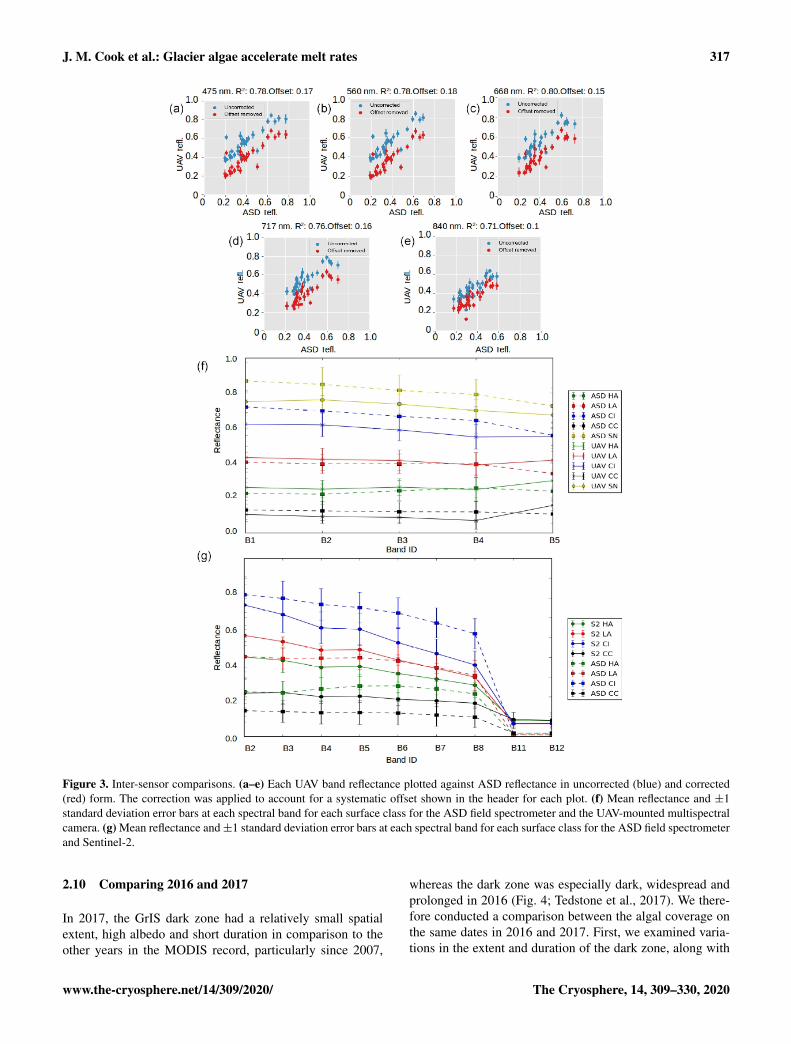
the SVM, the parameters C and gamma were tuned usinggrid search cross validation. Two ensemble classifiers werealso trained: a voting classifier that combined the predictionsof each of the three individual classifiers and a RF algorithm.The performance of each classifier was measured using pre-cision, accuracy, recall, and F1 score and also by plotting theconfusion matrix and normalized confusion matrix for eachclassifier. In all cases the RF outperformed the other classi-fiers according to all available metrics (Sect. S5). The perfor-mance of the RF classifier was finally measured on the testset, demonstrating the algorithm’s ability to generalize to un-seen data outside of the training set. Overfitting is not usuallyassociated with the RF classifier, and the strong performanceon both our training and test sets confirms that the model gen-eralizes well. For these reasons, we used the RF algorithm toclassify our multispectral UAV and Sentinel-2 images. Train-ing the classifier using data from field spectroscopy ensuresthe quality of each labelled data point in the training set, sinceour sampling areas were homogeneous and surface sampleswere analysed in the laboratory, circumventing issues of spa-tial heterogeneity and uncertainty in labelling that could leadto ambiguity for direct labelling of aerial images. Compar-isons between the directional reflectance spectra gathered us-ing the ASD field spectrometer and those measured using theUAV and Sentinel-2 are provided in Fig. 3. Simultaneouslywith the surface classification, we calculated the albedo ineach UAV pixel using the narrowband to broadband conver-sion of Knap et al. (1999) applied to the reflectance at eachof the five bands.
This protocol was repeated for Sentinel-2 imagery. Addi-tional bands are available for use as feature vectors in thecase of Sentinel-2. Directional reflectance data gathered us-ing the ASD field spectrometer were reduced to only thosenine wavelengths coincident with the centre wavelengthsmeasured by Sentinel-2 at 20 m ground resolution (0.480,0.560, 0.665, 0.705, 0.740, 0.788, 0.865, 1.610, 2.190 µm).Training on reduced hyperspectral data has several advan-tages over training directly on aerial multispectral data. First,the method is sensor agnostic because the classifier can beretrained with a different selection of wavelengths for otherupscaling platforms, enhancing the reusability of the fieldmeasurements. Second, we have confidence in our labels be-cause each sample has been analysed in a laboratory to con-firm its composition, reducing label ambiguity. Finally, thelimited field of view of the field spectrometer reduces errorsarising from mixing of spectra from heterogeneous ice sur-faces. Sentinel-2 imagery was masked using the MeASUREsGreenland Ice Mapping Project ice mask (Howat, 2017) toeliminate non-ice areas. Pixels with more than 30 % prob-ability of being obscured by cloud were masked using theSentinel-2 L2A cloud product generated by the Sen2Cor pro-cessor. For the calculation of albedo in each pixel, the addi-tional bands available in the Sentinel-2 images enabled theapplication of Liang et al.’s (2001) narrowband to broadbandconversion.
The Cryosphere, 14, 309–330, 2020 www.the-cryosphere.net/14/309/2020/
J. M. Cook et al.: Glacier algae accelerate melt rates 317
Figure 3. Inter-sensor comparisons. (a–e) Each UAV band reflectance plotted against ASD reflectance in uncorrected (blue) and corrected(red) form. The correction was applied to account for a systematic offset shown in the header for each plot. (f) Mean reflectance and ±1standard deviation error bars at each spectral band for each surface class for the ASD field spectrometer and the UAV-mounted multispectralcamera. (g) Mean reflectance and±1 standard deviation error bars at each spectral band for each surface class for the ASD field spectrometerand Sentinel-2.
2.10 Comparing 2016 and 2017
In 2017, the GrIS dark zone had a relatively small spatialextent, high albedo and short duration in comparison to theother years in the MODIS record, particularly since 2007,
whereas the dark zone was especially dark, widespread andprolonged in 2016 (Fig. 4; Tedstone et al., 2017). We there-fore conducted a comparison between the algal coverage onthe same dates in 2016 and 2017. First, we examined varia-tions in the extent and duration of the dark zone, along with
www.the-cryosphere.net/14/309/2020/ The Cryosphere, 14, 309–330, 2020
318 J. M. Cook et al.: Glacier algae accelerate melt rates
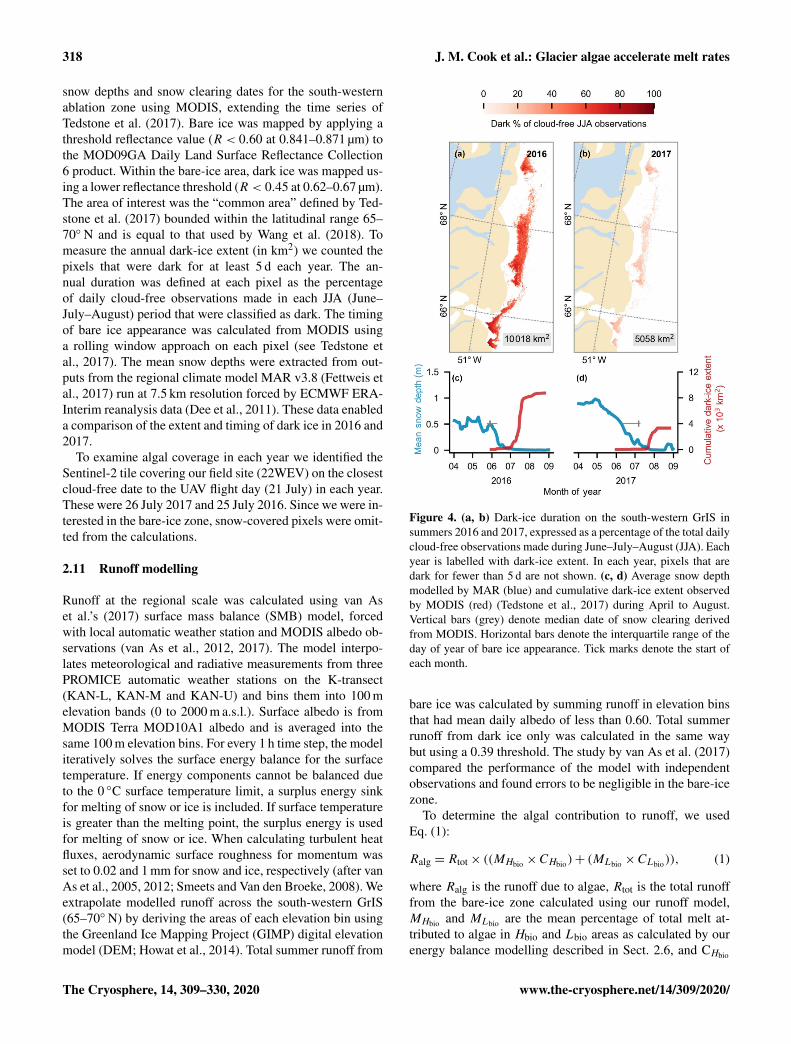
snow depths and snow clearing dates for the south-westernablation zone using MODIS, extending the time series ofTedstone et al. (2017). Bare ice was mapped by applying athreshold reflectance value (R < 0.60 at 0.841–0.871 µm) tothe MOD09GA Daily Land Surface Reflectance Collection6 product. Within the bare-ice area, dark ice was mapped us-ing a lower reflectance threshold (R < 0.45 at 0.62–0.67 µm).The area of interest was the “common area” defined by Ted-stone et al. (2017) bounded within the latitudinal range 65–70◦ N and is equal to that used by Wang et al. (2018). Tomeasure the annual dark-ice extent (in km2) we counted thepixels that were dark for at least 5 d each year. The an-nual duration was defined at each pixel as the percentageof daily cloud-free observations made in each JJA (June–July–August) period that were classified as dark. The timingof bare ice appearance was calculated from MODIS usinga rolling window approach on each pixel (see Tedstone etal., 2017). The mean snow depths were extracted from out-puts from the regional climate model MAR v3.8 (Fettweis etal., 2017) run at 7.5 km resolution forced by ECMWF ERA-Interim reanalysis data (Dee et al., 2011). These data enableda comparison of the extent and timing of dark ice in 2016 and2017.
To examine algal coverage in each year we identified theSentinel-2 tile covering our field site (22WEV) on the closestcloud-free date to the UAV flight day (21 July) in each year.These were 26 July 2017 and 25 July 2016. Since we were in-terested in the bare-ice zone, snow-covered pixels were omit-ted from the calculations.
2.11 Runoff modelling
Runoff at the regional scale was calculated using van Aset al.’s (2017) surface mass balance (SMB) model, forcedwith local automatic weather station and MODIS albedo ob-servations (van As et al., 2012, 2017). The model interpo-lates meteorological and radiative measurements from threePROMICE automatic weather stations on the K-transect(KAN-L, KAN-M and KAN-U) and bins them into 100 melevation bands (0 to 2000 m a.s.l.). Surface albedo is fromMODIS Terra MOD10A1 albedo and is averaged into thesame 100 m elevation bins. For every 1 h time step, the modeliteratively solves the surface energy balance for the surfacetemperature. If energy components cannot be balanced dueto the 0 ◦C surface temperature limit, a surplus energy sinkfor melting of snow or ice is included. If surface temperatureis greater than the melting point, the surplus energy is usedfor melting of snow or ice. When calculating turbulent heatfluxes, aerodynamic surface roughness for momentum wasset to 0.02 and 1 mm for snow and ice, respectively (after vanAs et al., 2005, 2012; Smeets and Van den Broeke, 2008). Weextrapolate modelled runoff across the south-western GrIS(65–70◦ N) by deriving the areas of each elevation bin usingthe Greenland Ice Mapping Project (GIMP) digital elevationmodel (DEM; Howat et al., 2014). Total summer runoff from
Figure 4. (a, b) Dark-ice duration on the south-western GrIS insummers 2016 and 2017, expressed as a percentage of the total dailycloud-free observations made during June–July–August (JJA). Eachyear is labelled with dark-ice extent. In each year, pixels that aredark for fewer than 5 d are not shown. (c, d) Average snow depthmodelled by MAR (blue) and cumulative dark-ice extent observedby MODIS (red) (Tedstone et al., 2017) during April to August.Vertical bars (grey) denote median date of snow clearing derivedfrom MODIS. Horizontal bars denote the interquartile range of theday of year of bare ice appearance. Tick marks denote the start ofeach month.
bare ice was calculated by summing runoff in elevation binsthat had mean daily albedo of less than 0.60. Total summerrunoff from dark ice only was calculated in the same waybut using a 0.39 threshold. The study by van As et al. (2017)compared the performance of the model with independentobservations and found errors to be negligible in the bare-icezone.
To determine the algal contribution to runoff, we usedEq. (1):
Ralg = Rtot× ((MHbio ×CHbio)+ (MLbio ×CLbio)), (1)
where Ralg is the runoff due to algae, Rtot is the total runofffrom the bare-ice zone calculated using our runoff model,MHbio and MLbio are the mean percentage of total melt at-tributed to algae in Hbio and Lbio areas as calculated by ourenergy balance modelling described in Sect. 2.6, and CHbio
The Cryosphere, 14, 309–330, 2020 www.the-cryosphere.net/14/309/2020/
J. M. Cook et al.: Glacier algae accelerate melt rates 319
and CLbio are the proportion of Ctot comprised of Hbio andLbio areas in our UAV or Sentinel-2 images. As discussedlater, the Sentinel-2 algal coverage estimate is conservativebecause it often fails to resolve Hbio surfaces and thereforeprovides a lower bound on the runoff attributed to algae.An upper bound was therefore also calculated by assumingthe spatial coverage derived from our UAV remote sensing– which can accurately distinguish Lbio and Hbio – surfacesis representative of the south-western dark zone. We werethereby able to estimate upper and lower limits for the runoffattributed to algal growth on the south-western ablation zone.
3 Results and discussion
3.1 Algae reduce ice albedo
The ice surfaces we studied were divided into four classes de-pending upon the algal abundance measured in the melted icesamples: high algal abundance (Hbio), low algal abundance(Lbio), clean ice (CI) and snow (SN). The algal abundance(cells mL−1) in each class was as follows:Hbio = 2.9×10⁴
±
2.01×10⁴; Lbio = 4.73×10³±2.57×10³; CI= 625±381;
and SN= 0± 0 (1 SD). These cell abundances were signifi-cantly different between the classes (one-way ANOVA: F =10.21; p = 3×10⁻⁵), which Bonferroni-corrected t tests in-dicated to be due to variance between all four groups. Thedominant species of algae were Mesotaenium berggreniiand Ancylonema nordenskioldii (Fig. 2d), confirming ob-servations made by Stibal et al. (2017) and Williamson etal. (2018) in the same region. Their long, thin and approxi-mately cylindrical morphology has been shown to be near-optimal for light absorption (Kirk, 1976). The albedo ofthe ice surface also varied significantly between the sur-face classes (one-way ANOVA for broadband albedo: F =7.9; p = 2.8×10⁻⁴), again with Bonferroni-corrected t testsshowing variance between all four groups (Sect. S6a, b).Greater algal abundance was associated with lower albedo,with the albedo reduction concentrated in the visible wave-lengths (Fig. 2b) where both solar energy receipt and al-gal absorption peak (Cook et al., 2017b; Williamson etal., 2018), diminishing towards longer near infra-red (NIR:> 0.70 µm) wavelengths where ice absorption, representedby the effective grain size, is most likely to cause albedo dif-ferences (Warren, 1982). A strong inverse correlation (Pear-son’s R = 0.75, p = 2.74×10⁻⁹) was observed between thenatural logarithm of algal cell abundance (cells mL−1) in thesurface ice samples and broadband albedo (Fig. 2c). Thelinear regression coefficient of determination between thealbedo and the natural logarithm of cell abundance was 0.57.It is unsurprising that the cell abundance does not account forall variation in albedo because there are also albedo-reducingeffects related to the physical structure of the ice and pres-ence of melt water (as demonstrated for snow by, for ex-ample, Warren, 1982). An inverse relationship was also ob-
served between broadband albedo and biovolume (calculatedas the sum of the products of the mean measured cell volumesand the cell counts for each algal species), but the coefficientof determination was lower (r2
= 0.42). This may well be theresult of larger cells having a smaller effect on albedo thanmore numerous, smaller cells for a given total volume. Therelationship between absorption and scattering coefficientsand cell size may also not be straightforward for algal cellsdue to an increasingly important contribution to the cell op-tical properties from internal heterogeneity, organelles, cellwalls and the pigment packaging effect in larger cells (Moreland Bricaud, 1981; Haardt and Maske, 1987).
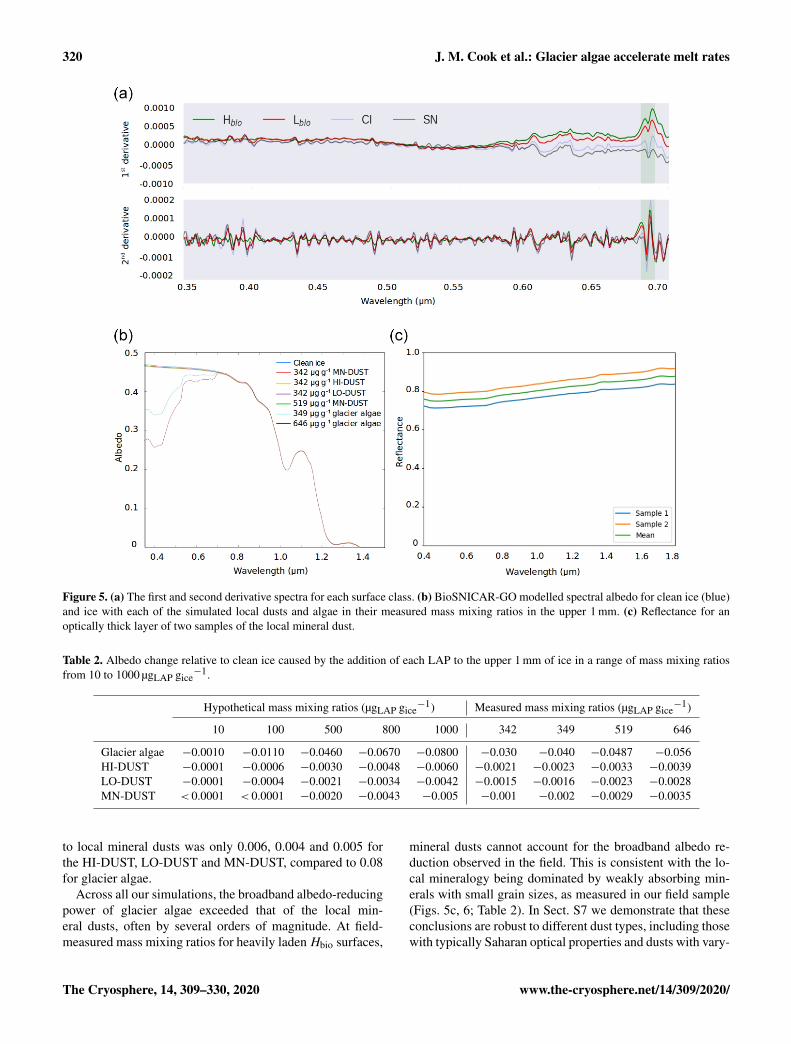
The albedo of Hbio and Lbio surfaces is depressed in thevisible wavelengths (0.40–0.70 µm, Fig. 2b), creating a red-edge spectrum commonly used in other environments as amarker for photosynthetic pigments (Seager et al., 2005) andfor mapping algae over the GrIS by Wang et al. (2018).Chlorophyll a has a specific absorption feature at 0.68 µmwhich is hard to discern in the raw spectra but clear in thederivative spectra (Fig. 5a) for Hbio and Lbio but not CI andSN. This feature has previously been described as “uniquelybiological” (Painter et al., 2001) and supports the hypoth-esis that the albedo reduction observed in these samples isprimarily due to algae. Our measurements therefore stronglyindicate a biological role in reducing the albedo of the GrISsurface; however, to test that the lower broadband and spec-tral albedo observed on algal surfaces is primarily due to thepresence of algal cells, it was also necessary to compare thealbedo-reducing effects of the algae to that of local mineraldust.
3.2 Algae have greater impact on albedo than mineraldust
Radiative-transfer simulations demonstrated that at measuredmass mixing ratios mineral dusts only have a very small(< 0.003) albedo-reducing effect at our field site on thesouth-western GrIS, whereas glacier algae reduce the icealbedo by up to 0.06, not accounting for indirect albedo-reducing feedbacks. The effect of adding the mean measuredmass mixing ratio of MN-DUST to the clean ice was a verysmall albedo reduction of 0.002 (Table 2; Fig. 5b). In con-trast, adding the mean measured mass mixing ratio of glacieralgae reduced the albedo by 0.03, preferentially in the shortvisible wavelengths in a similar way to our field-measuredreflectance spectra (Table 2; Fig. 5b). This effect was greaterwhen the mass mixing ratio was increased to the maximummeasured values (646 µgalgae gice
−1 and 519 µgdust gice−1)
which caused an albedo reduction of 0.06 for glacier algaeand 0.003 for MN-DUST. Changing the proportions of theminerals in our simulated local dusts had a very small effecton the albedo reduction. At the mean measured mass mix-ing ratio, HI-DUST reduced the albedo by just 0.0023, whileLO-DUST reduced the albedo by 0.0016. Even with a massmixing ratio of 1000 µgdust gice
−1, the albedo reduction due
www.the-cryosphere.net/14/309/2020/ The Cryosphere, 14, 309–330, 2020
320 J. M. Cook et al.: Glacier algae accelerate melt rates
Figure 5. (a) The first and second derivative spectra for each surface class. (b) BioSNICAR-GO modelled spectral albedo for clean ice (blue)and ice with each of the simulated local dusts and algae in their measured mass mixing ratios in the upper 1 mm. (c) Reflectance for anoptically thick layer of two samples of the local mineral dust.
Table 2. Albedo change relative to clean ice caused by the addition of each LAP to the upper 1 mm of ice in a range of mass mixing ratiosfrom 10 to 1000 µgLAP gice
−1.
Hypothetical mass mixing ratios (µgLAP gice−1) Measured mass mixing ratios (µgLAP gice
−1)
10 100 500 800 1000 342 349 519 646
Glacier algae −0.0010 −0.0110 −0.0460 −0.0670 −0.0800 −0.030 −0.040 −0.0487 −0.056HI-DUST −0.0001 −0.0006 −0.0030 −0.0048 −0.0060 −0.0021 −0.0023 −0.0033 −0.0039LO-DUST −0.0001 −0.0004 −0.0021 −0.0034 −0.0042 −0.0015 −0.0016 −0.0023 −0.0028MN-DUST < 0.0001 < 0.0001 −0.0020 −0.0043 −0.005 −0.001 −0.002 −0.0029 −0.0035
to local mineral dusts was only 0.006, 0.004 and 0.005 forthe HI-DUST, LO-DUST and MN-DUST, compared to 0.08for glacier algae.
Across all our simulations, the broadband albedo-reducingpower of glacier algae exceeded that of the local min-eral dusts, often by several orders of magnitude. At field-measured mass mixing ratios for heavily ladenHbio surfaces,
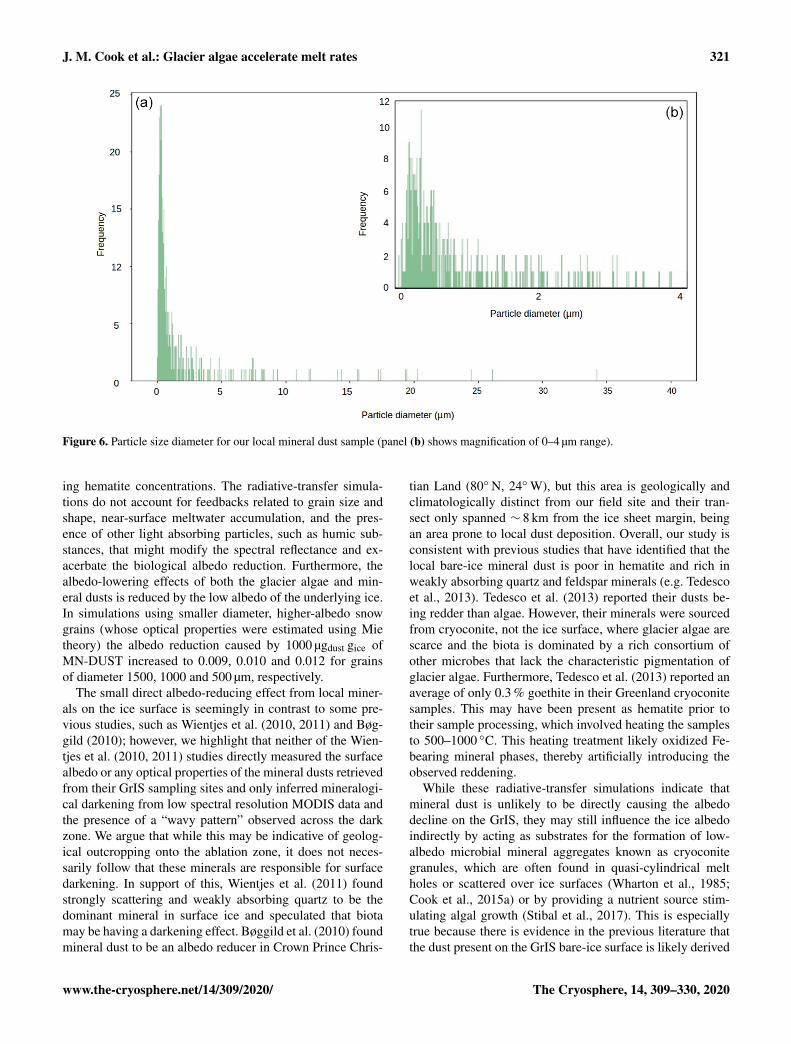
mineral dusts cannot account for the broadband albedo re-duction observed in the field. This is consistent with the lo-cal mineralogy being dominated by weakly absorbing min-erals with small grain sizes, as measured in our field sample(Figs. 5c, 6; Table 2). In Sect. S7 we demonstrate that theseconclusions are robust to different dust types, including thosewith typically Saharan optical properties and dusts with vary-
The Cryosphere, 14, 309–330, 2020 www.the-cryosphere.net/14/309/2020/
J. M. Cook et al.: Glacier algae accelerate melt rates 321
Figure 6. Particle size diameter for our local mineral dust sample (panel (b) shows magnification of 0–4 µm range).
ing hematite concentrations. The radiative-transfer simula-tions do not account for feedbacks related to grain size andshape, near-surface meltwater accumulation, and the pres-ence of other light absorbing particles, such as humic sub-stances, that might modify the spectral reflectance and ex-acerbate the biological albedo reduction. Furthermore, thealbedo-lowering effects of both the glacier algae and min-eral dusts is reduced by the low albedo of the underlying ice.In simulations using smaller diameter, higher-albedo snowgrains (whose optical properties were estimated using Mietheory) the albedo reduction caused by 1000 µgdust gice ofMN-DUST increased to 0.009, 0.010 and 0.012 for grainsof diameter 1500, 1000 and 500 µm, respectively.
The small direct albedo-reducing effect from local miner-als on the ice surface is seemingly in contrast to some pre-vious studies, such as Wientjes et al. (2010, 2011) and Bøg-gild (2010); however, we highlight that neither of the Wien-tjes et al. (2010, 2011) studies directly measured the surfacealbedo or any optical properties of the mineral dusts retrievedfrom their GrIS sampling sites and only inferred mineralogi-cal darkening from low spectral resolution MODIS data andthe presence of a “wavy pattern” observed across the darkzone. We argue that while this may be indicative of geolog-ical outcropping onto the ablation zone, it does not neces-sarily follow that these minerals are responsible for surfacedarkening. In support of this, Wientjes et al. (2011) foundstrongly scattering and weakly absorbing quartz to be thedominant mineral in surface ice and speculated that biotamay be having a darkening effect. Bøggild et al. (2010) foundmineral dust to be an albedo reducer in Crown Prince Chris-
tian Land (80◦ N, 24◦W), but this area is geologically andclimatologically distinct from our field site and their tran-sect only spanned ∼ 8 km from the ice sheet margin, beingan area prone to local dust deposition. Overall, our study isconsistent with previous studies that have identified that thelocal bare-ice mineral dust is poor in hematite and rich inweakly absorbing quartz and feldspar minerals (e.g. Tedescoet al., 2013). Tedesco et al. (2013) reported their dusts be-ing redder than algae. However, their minerals were sourcedfrom cryoconite, not the ice surface, where glacier algae arescarce and the biota is dominated by a rich consortium ofother microbes that lack the characteristic pigmentation ofglacier algae. Furthermore, Tedesco et al. (2013) reported anaverage of only 0.3 % goethite in their Greenland cryoconitesamples. This may have been present as hematite prior totheir sample processing, which involved heating the samplesto 500–1000 ◦C. This heating treatment likely oxidized Fe-bearing mineral phases, thereby artificially introducing theobserved reddening.
While these radiative-transfer simulations indicate thatmineral dust is unlikely to be directly causing the albedodecline on the GrIS, they may still influence the ice albedoindirectly by acting as substrates for the formation of low-albedo microbial mineral aggregates known as cryoconitegranules, which are often found in quasi-cylindrical meltholes or scattered over ice surfaces (Wharton et al., 1985;Cook et al., 2015a) or by providing a nutrient source stim-ulating algal growth (Stibal et al., 2017). This is especiallytrue because there is evidence in the previous literature thatthe dust present on the GrIS bare-ice surface is likely derived
www.the-cryosphere.net/14/309/2020/ The Cryosphere, 14, 309–330, 2020
322 J. M. Cook et al.: Glacier algae accelerate melt rates
from a local source with no contribution from Asian dustsor volcanic ash (Wientjes et al., 2011) and that red miner-als such as hematite, goethite and ilmenite are present onlyin very low concentrations (Wientjes et al., 2011; Tedesco etal., 2013; Sanna and Romeo, 2018) that would have a negli-gible effect on the ice albedo.
Therefore, we have demonstrated using empirical mea-surements and radiative-transfer modelling that glacier algaeare potent albedo reducers on the south-western GreenlandIce Sheet and mineral dusts are not. These findings are con-sistent with several previous studies (Stibal et al., 2017; Yal-lop et al., 2012) that found mineral dust to be insignificantfor explaining albedo variations in the same region.
3.3 Indirect effects of algae
Algae predominantly reduce the ice albedo in the visiblewavelengths (0.40–0.70 µm), whereas variations in the NIRresult mainly from changes to ice grain radii and the pres-ence of liquid water (Warren, 1982; Green et al., 2002). Vari-ations in the NIR albedo between the surface classes there-fore suggest that the lower albedo of algal surfaces is not ex-plained entirely by enhanced absorption due to algae but alsoby the smoother, wetter ice surface with fewer opportuni-ties for high-angle scattering of photons (Jonsell et al., 2003)compared to the well-drained and porous CI surfaces. Thespatial and temporal development of the weathering crustis therefore an important control on ice albedo (Muller andKeeler, 1969; Jonsell et al., 2003). Algal growth is stimu-lated by melt, which can be enhanced by algal growth (Yal-lop et al., 2012; Ganey et al., 2017; Stibal et al., 2017; Cooket al., 2017a, b; Dial et al., 2018) – an example of a bio-cryomorphic process where biota alter the physical, chemicaland hydrological conditions of the ice surface with beneficialconsequences to the biota (Cook et al., 2015b).
3.4 Algae enhance radiative forcing and melt
Having determined that glacier algae reduce the ice surfacealbedo, we took an empirical approach to quantifying theirimpact upon energy balance following Ganey et al. (2017),which includes both direct albedo effects (enhanced absorp-tion of shortwave solar radiation by the algal cells) and theindirect effects explained above. Integrated over the entireday, this indicated a daily mean biological radiative forcingof 116 and 65 W m−2 for Hbio and Lbio surfaces, respec-tively, similar to RFs for Alaskan snow algae calculated byGaney et al. (2017). We used the biological radiative forc-ing integrated over the entire day and the latent heat of fu-sion for ice (334 J cm−3) to estimate 1.35± 0.01 (standarderror, SE) cm w.e. of melting due to algae in Hbio areas on21 July. For Lbio sites, biological melting on 21 July 2017was 1.01± 0.01 (SE) cm w.e.
We corroborated this estimate using a point surface energybalance model (Brock and Arnold et al., 2000). The melt at-
tributed to the presence of algae predicted by the energy bal-ance modelling method was similar to that predicted usingthe radiative forcing method, with 1.37± 0.48 (SE) cm w.e.attributed to Hbio and 0.95± 0.41 (SE) cm w.e. attributed toLbio. Expressing the melt attributed to algae as a proportionof the total melting in the algal sites gives 26.15± 3.77 %(SE) of the local melting attributed to algae in the Hbio sur-faces and 21.62± 5.07 % (SE) for Lbio surfaces.
3.5 Algae are widespread across the south-westernablation zone
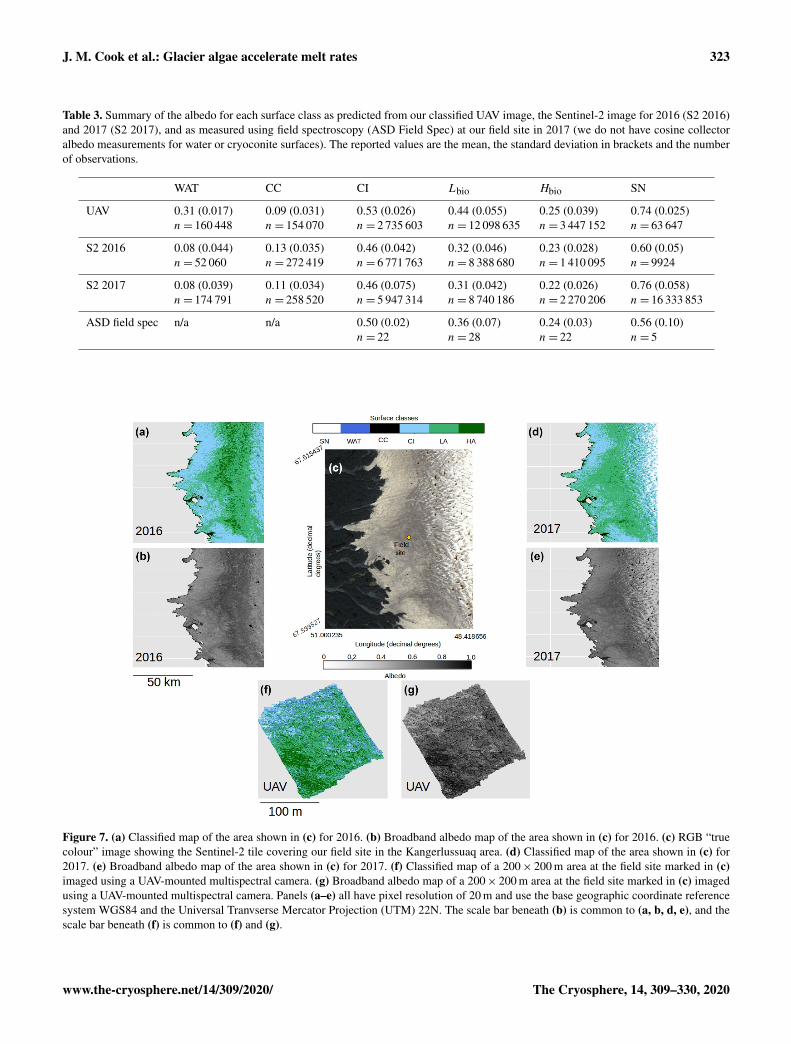
Our analyses demonstrate that algae have a dramatic dark-ening effect on the ice surface, leading to increased melt-ing. However, the importance of this effect depends upon thespatial extent of the algal blooms over thousands of kilome-tres. To determine spatial coverage at our field site we clas-sified multispectral images acquired from a UAV flown overa 200× 200 m area. The classified UAV image indicated that78.5 % of the area was covered by algal blooms, of which61.1 % was Lbio and 17.4 % was Hbio (Table 3; Fig. 7). Thehigh ground resolution of the imagery enabled a qualitativeassessment of the algorithm performance by visual compar-ison between the classifier and the raw imagery (followingRyan et al., 2018a). The algorithm produced qualitatively re-alistic bloom shapes, correctly placed water in channels andindividual cryoconite holes in their correct positions. Theconfusion matrix indicates that occasional misclassificationsare generally between water and cryoconite (Sect. S8). Thisis unsurprising since both cryoconite and water have rela-tively flat spectral shapes with few spectral features and cry-oconite is often found beneath pools of surface water. Wealso point out that our cryoconite spectral reflectance mea-surements were made with cryoconite filling the entire fieldof view of the spectrometer and thus best represent largecryoconite holes or dispersed cryoconite rather than surfacespeppered with many small holes. There was also some am-biguity between thin, wet snow and bare glacier ice, as thesesurfaces are spectrally similar. Nevertheless, these misclassi-fications affect a small area of the pixel and do not affect ourestimate of algal bloom coverage.
We also classified Sentinel-2 satellite data (Fig. 7). Theconfusion matrices (Sect. S8) indicate similar misclassifi-cation types and frequencies to the UAV model. The pre-dicted algal coverage was 58.87 %. Hbio surfaces were muchless common than Lbio (Hbio = 2.53 %; Lbio = 56.54 %; Ta-ble 3). The spatial coverage by algae was different in the Sen-tinel and UAV datasets especially for Hbio, likely because(a) the Sentinel-2 imagery includes ice that is outside of thedark zone, raising the overall reflectivity, and (b) even in theUAV image, which was retrieved from within the dark zone,Hbio surfaces comprise just 17 % of the ice surface and have apatchy distribution. The lowest-albedo surfaces – cryoconiteand water – cover a small fraction (< 3 %) of the total areain both UAV and Sentinel-2 images (Table 4), although we
The Cryosphere, 14, 309–330, 2020 www.the-cryosphere.net/14/309/2020/
J. M. Cook et al.: Glacier algae accelerate melt rates 323
Table 3. Summary of the albedo for each surface class as predicted from our classified UAV image, the Sentinel-2 image for 2016 (S2 2016)and 2017 (S2 2017), and as measured using field spectroscopy (ASD Field Spec) at our field site in 2017 (we do not have cosine collectoralbedo measurements for water or cryoconite surfaces). The reported values are the mean, the standard deviation in brackets and the numberof observations.
WAT CC CI Lbio Hbio SN
UAV 0.31 (0.017)n= 160 448
0.09 (0.031)n= 154 070
0.53 (0.026)n= 2 735 603
0.44 (0.055)n= 12 098 635
0.25 (0.039)n= 3 447 152
0.74 (0.025)n= 63 647
S2 2016 0.08 (0.044)n= 52 060
0.13 (0.035)n= 272 419
0.46 (0.042)n= 6 771 763
0.32 (0.046)n= 8 388 680
0.23 (0.028)n= 1 410 095
0.60 (0.05)n= 9924
S2 2017 0.08 (0.039)n= 174 791
0.11 (0.034)n= 258 520
0.46 (0.075)n= 5 947 314
0.31 (0.042)n= 8 740 186
0.22 (0.026)n= 2 270 206
0.76 (0.058)n= 16 333 853
ASD field spec n/a n/a 0.50 (0.02)n= 22
0.36 (0.07)n= 28
0.24 (0.03)n= 22
0.56 (0.10)n= 5
Figure 7. (a) Classified map of the area shown in (c) for 2016. (b) Broadband albedo map of the area shown in (c) for 2016. (c) RGB “truecolour” image showing the Sentinel-2 tile covering our field site in the Kangerlussuaq area. (d) Classified map of the area shown in (c) for2017. (e) Broadband albedo map of the area shown in (c) for 2017. (f) Classified map of a 200× 200 m area at the field site marked in (c)imaged using a UAV-mounted multispectral camera. (g) Broadband albedo map of a 200× 200 m area at the field site marked in (c) imagedusing a UAV-mounted multispectral camera. Panels (a–e) all have pixel resolution of 20 m and use the base geographic coordinate referencesystem WGS84 and the Universal Tranvserse Mercator Projection (UTM) 22N. The scale bar beneath (b) is common to (a, b, d, e), and thescale bar beneath (f) is common to (f) and (g).
www.the-cryosphere.net/14/309/2020/ The Cryosphere, 14, 309–330, 2020
324 J. M. Cook et al.: Glacier algae accelerate melt rates
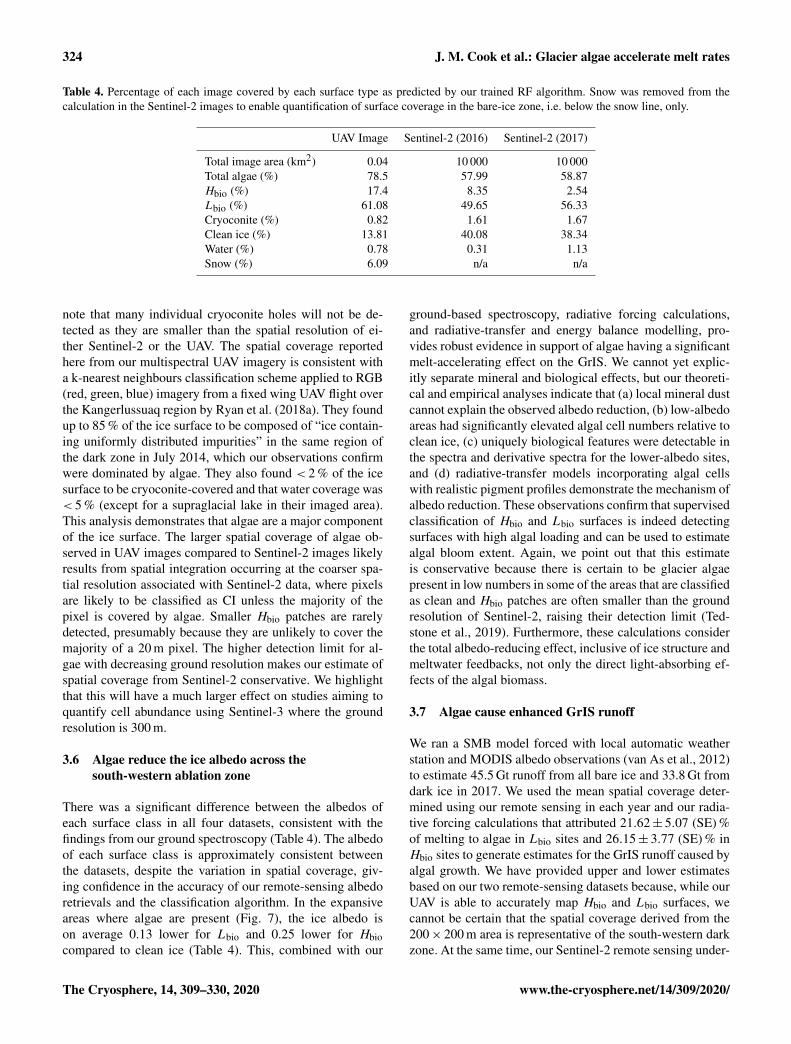
Table 4. Percentage of each image covered by each surface type as predicted by our trained RF algorithm. Snow was removed from thecalculation in the Sentinel-2 images to enable quantification of surface coverage in the bare-ice zone, i.e. below the snow line, only.
UAV Image Sentinel-2 (2016) Sentinel-2 (2017)
Total image area (km2) 0.04 10 000 10 000Total algae (%) 78.5 57.99 58.87Hbio (%) 17.4 8.35 2.54Lbio (%) 61.08 49.65 56.33Cryoconite (%) 0.82 1.61 1.67Clean ice (%) 13.81 40.08 38.34Water (%) 0.78 0.31 1.13Snow (%) 6.09 n/a n/a
note that many individual cryoconite holes will not be de-tected as they are smaller than the spatial resolution of ei-ther Sentinel-2 or the UAV. The spatial coverage reportedhere from our multispectral UAV imagery is consistent witha k-nearest neighbours classification scheme applied to RGB(red, green, blue) imagery from a fixed wing UAV flight overthe Kangerlussuaq region by Ryan et al. (2018a). They foundup to 85 % of the ice surface to be composed of “ice contain-ing uniformly distributed impurities” in the same region ofthe dark zone in July 2014, which our observations confirmwere dominated by algae. They also found < 2 % of the icesurface to be cryoconite-covered and that water coverage was< 5 % (except for a supraglacial lake in their imaged area).This analysis demonstrates that algae are a major componentof the ice surface. The larger spatial coverage of algae ob-served in UAV images compared to Sentinel-2 images likelyresults from spatial integration occurring at the coarser spa-tial resolution associated with Sentinel-2 data, where pixelsare likely to be classified as CI unless the majority of thepixel is covered by algae. Smaller Hbio patches are rarelydetected, presumably because they are unlikely to cover themajority of a 20 m pixel. The higher detection limit for al-gae with decreasing ground resolution makes our estimate ofspatial coverage from Sentinel-2 conservative. We highlightthat this will have a much larger effect on studies aiming toquantify cell abundance using Sentinel-3 where the groundresolution is 300 m.
3.6 Algae reduce the ice albedo across thesouth-western ablation zone
There was a significant difference between the albedos ofeach surface class in all four datasets, consistent with thefindings from our ground spectroscopy (Table 4). The albedoof each surface class is approximately consistent betweenthe datasets, despite the variation in spatial coverage, giv-ing confidence in the accuracy of our remote-sensing albedoretrievals and the classification algorithm. In the expansiveareas where algae are present (Fig. 7), the ice albedo ison average 0.13 lower for Lbio and 0.25 lower for Hbiocompared to clean ice (Table 4). This, combined with our
ground-based spectroscopy, radiative forcing calculations,and radiative-transfer and energy balance modelling, pro-vides robust evidence in support of algae having a significantmelt-accelerating effect on the GrIS. We cannot yet explic-itly separate mineral and biological effects, but our theoreti-cal and empirical analyses indicate that (a) local mineral dustcannot explain the observed albedo reduction, (b) low-albedoareas had significantly elevated algal cell numbers relative toclean ice, (c) uniquely biological features were detectable inthe spectra and derivative spectra for the lower-albedo sites,and (d) radiative-transfer models incorporating algal cellswith realistic pigment profiles demonstrate the mechanism ofalbedo reduction. These observations confirm that supervisedclassification of Hbio and Lbio surfaces is indeed detectingsurfaces with high algal loading and can be used to estimatealgal bloom extent. Again, we point out that this estimateis conservative because there is certain to be glacier algaepresent in low numbers in some of the areas that are classifiedas clean and Hbio patches are often smaller than the groundresolution of Sentinel-2, raising their detection limit (Ted-stone et al., 2019). Furthermore, these calculations considerthe total albedo-reducing effect, inclusive of ice structure andmeltwater feedbacks, not only the direct light-absorbing ef-fects of the algal biomass.
3.7 Algae cause enhanced GrIS runoff
We ran a SMB model forced with local automatic weatherstation and MODIS albedo observations (van As et al., 2012)to estimate 45.5 Gt runoff from all bare ice and 33.8 Gt fromdark ice in 2017. We used the mean spatial coverage deter-mined using our remote sensing in each year and our radia-tive forcing calculations that attributed 21.62± 5.07 (SE) %of melting to algae in Lbio sites and 26.15± 3.77 (SE) % inHbio sites to generate estimates for the GrIS runoff caused byalgal growth. We have provided upper and lower estimatesbased on our two remote-sensing datasets because, while ourUAV is able to accurately map Hbio and Lbio surfaces, wecannot be certain that the spatial coverage derived from the200× 200 m area is representative of the south-western darkzone. At the same time, our Sentinel-2 remote sensing under-
The Cryosphere, 14, 309–330, 2020 www.the-cryosphere.net/14/309/2020/
J. M. Cook et al.: Glacier algae accelerate melt rates 325
estimates algal coverage because it includes ice outside of thedark zone andHbio patches are often too small to be resolvedat 20 m pixel resolution (Tedstone et al., 2019). Therefore,we used the spatial coverage determined by our Sentinel-2classification as a lower bound and spatial coverage deter-mined by our UAV classification as an upper bound on ourestimate of total runoff attributed to the presence of algae.
We found that in 2017 between 4.4 and 6.0 Gt of ice losscould be attributed to the growth of algae, representing 10 %–13 % of the total runoff from the south-western GrIS, with thelower estimate generated using algal coverage from Sentinel-2 and the upper estimate generated using spatial coverage atour field site from our UAV. When the calculations were re-stricted to the dark zone only (i.e. excluding areas in the ab-lation zone not classified as “dark”), algal contributions tototal runoff were up to 18 %. These calculations confirm thatalgal growth is an important factor in the contribution of theGrIS to global sea level rise. This contribution will increaseif biologically darkened areas expand or a greater proportionof the ice is covered by high-biomass blooms under warmerclimates. These observations therefore indicate that the omis-sion of biological growth is leading current models to under-estimate future GrIS contributions to sea level rise.
3.8 Interannual variability and potential positivefeedback
MODIS data (Fig. 4) indicate that 2017 was a particularlyhigh-albedo year when the dark zone was especially smalland bright, whereas 2016 was a particularly low-albedo yearwhere the dark zone was wider and darker than most years(Fig. 4a and b and Tedstone et al., 2017). Previous field ev-idence (Williamson et al., 2018) demonstrates that the icewas darkened by high concentrations of algae in 2016. Inour Sentinel-2 remote-sensing tile (22WEV) the bare-icezone was wider in 2016 (6758 km2) than in 2017 (6205 km2)and a larger area was covered with algae (on 25 July 2016,3919 km2 was covered by algae compared to 3653 km2 on28 July 2017). While the proportional total algal cover-age was similar between the 2 years (57.99 % in 2016 and58.87 % in 2017), the proportion of the algal ice that wasclassified Hbio was much higher in 2016 (8.35 %) comparedto 2017 (2.54 %). The mean albedos and their standard de-viations were very similar for each ice surface class in bothyears (Table 4). The runoff from the south-western GrIS bareice (albedo< 0.6) was 94.1 Gt in 2016, of which 67.6 wasfrom dark ice (albedo< 0.39). We estimate that 8.8–12.2 Gtof this runoff was attributable to the growth of algae, repre-senting 9 %–13 % of the total runoff from bare-ice sectors.The absolute values for runoff are therefore much higher butthe proportion of the bare-ice total attributed to algae wasapproximately the same between the 2 years.
The snow line retreated further and earlier in 2016 com-pared to 2017, creating a wider bare-ice zone that existed forlonger and was not transiently covered by summer snowfall
events, whereas in 2017 a smaller bare-ice area was exposedlater and was covered by 5–10 cm of snow several times dur-ing the summer (Fig. 4c, d). The more prolonged exposureof a larger bare-ice zone in 2016 enabled Lbio surfaces toextend to higher elevations and biomass to accumulate togreater mass concentrations at lower elevations in summer2016, explaining the greater Hbio coverage. This indicatesthat the intensity of the algal bloom is a function of exposuretime, as postulated by Tedstone et al. (2017) and Williamsonet al. (2018). More prolonged exposure of larger ablation ar-eas under a warming climate (Stroeve et al., 2013; Shimadaet al., 2016; Tedesco et al., 2016; Tedstone et al., 2017) arelikely to be prone to more spatially expansive, darker algalblooms that enhance melt rates, leading to a potential pos-itive feedback that is not currently accounted for in surfacemass balance models, whereby earlier exposure of bare iceleads to enhanced algal coverage, which will be able to ac-cumulate higher biomass and accelerate melting. Melting inturn stimulates algal growth by liberating nutrients and liquidwater.
4 Conclusions
Our measurements and modelling demonstrate that thegrowth of algae on the GrIS accelerates the rate of melt-ing and increases the GrIS contribution to global sea levelrise. Field spectra show a dramatic depression of the sur-face albedo in the visible wavelengths for surfaces contami-nated by algae. Derivative analysis of the same spectra showuniquely biological absorption features and an inverse rela-tionship was observed between biomass and surface albedo.We employ a novel radiative-transfer model to show thatthis albedo decline cannot be attributed to local mineraldusts. Radiative forcing calculations and an energy balancemodel predict that melting of glacier ice can be acceleratedby 21.62± 5.07 (SE) % for Lbio surfaces and 26.15± 3.77(SE) % for Hbio surfaces. We demonstrate that the growthof algae occurs over a large proportion of the ablating areaof the south-western GrIS by identifying algal blooms inremote-sensing data from a UAV and Sentinel-2, finding78.5 % of the surface within a 200× 200 m sample area atour field site to be covered by algae. Using Sentinel-2 we de-tected algae covering 57.99 % of the Kangerlussuaq region in2017 and 58.87 % of the same region in 2016. The spatial res-olution of the sensor makes these conservative estimates, es-pecially forHbio surfaces. Runoff modelling informed by ourfield measurements and remote-sensing estimate between 4.4and 6.0 Gt of runoff from the south-western ablation zonecould be attributed to the growth of algae in summer 2017,representing 10 %–13 % of the total. Because 2017 was a par-ticularly high-albedo year for the south-western GrIS, wealso ran our analysis for the particularly low-albedo 2016melt season. In 2016 a wider bare-ice zone was exposed forlonger, and there was a concomitant increase in the extent
www.the-cryosphere.net/14/309/2020/ The Cryosphere, 14, 309–330, 2020
326 J. M. Cook et al.: Glacier algae accelerate melt rates
of the algal bloom, more of which was classified as Hbio(high biomass). The percentage algal contribution to south-western GrIS runoff was approximately the same as in 2017(9 %–13 %), but the absolute volume was much higher (8.8–12.2 Gt). This interannual comparison indicates the existenceof a feedback because in years where snow retreats furtherand earlier, there is a larger and more prolonged area foralgal bloom development where melting is enhanced, stim-ulating further algal growth. This study therefore demon-strates that algae are important albedo reducers and cause amelt-enhancing feedback across the south-western GrIS. Theomission of these critical biological albedo feedbacks frompredictive models of GrIS runoff is leading to underestima-tion of future ice mass loss and contribution to global sealevel rise. This is particularly significant because larger abla-tion zones and longer growth seasons are expected in a futurewarmer climate.
Code and data availability. Codes and datasets used in this studyare available at the following DOIs.
– BioSNICAR-GO code and data:https://doi.org/10.5281/zenodo.3564517 (Cook et al., 2020a).
– Ice surface classification codes:https://doi.org/10.5281/zenodo.3564529 (Cook et al., 2020b).
– Spectra processing codes:https://doi.org/10.5281/zenodo.2598219 (Cook, 2020).
– Field and associated data:https://doi.org/10.5281/zenodo.3564501 (Cook et al., 2020c).
Supplement. The supplement related to this article is available on-line at: https://doi.org/10.5194/tc-14-309-2020-supplement.
Author contributions. JMC developed the measurement protocol,gathered field measurements, analysed the data, wrote the maincode, curated the data repository, produced the figures and wrotethe manuscript. OMcA was instrumental in building and testing theUAV. AJT, CW, JM and SH gathered field data. CW provided adviceregarding microscopy and biological sampling protocols, helpedwith experimental design, and led the empirical measurements ofglacier algae pigmentation and absorption coefficients. AJT wrotethe code for radiometric calibration of multispectral imagery fromthe UAV and post-processed the UAV images, derived 2016 and2017 dark-ice extent from MODIS imagery, analysed MAR snowdepth outputs, produced Fig. 4, translated the energy balance modelinto Python, and made significant contributions to the manuscriptwriting and experimental design. JM and SM provided cleaned min-eral dust and PSD data to feed into the radiative-transfer model,and JM provided useful discussions regarding experimental design.MS provided DISORT modelling and estimates of mineral dust re-fractive indices. MF helped develop the bio-optical model. RB pro-vided advice regarding field spectroscopy and helped measure min-eral dust refractive indices in the laboratory. AJH helped developthe experimental design. AJH, JR and AM all provided advice on
UAV remote sensing. JR, DvA and AJH modelled runoff from theGrIS dark zone. AD provided microscopy images from field sam-ples. Other authors contributed to field work and/or sample prepa-ration and commented on the style and content of the final paper.
Competing interests. The authors declare that they have no conflictof interest.
Acknowledgements. Joseph M. Cook, Andrew J. Tedstone, An-drew J. Hodson, Christopher Williamson, Archana Dayal, StefanHofer, Andrew McGonigle, Alexandre M. Anesio, Tristram D. L.Irvine-Fynn, Edward Hanna, Marian Yallop and Martyn Tranteracknowledge funding from UK National Environmental ResearchCouncil large grant “Black and Bloom”. Joseph M. Cook grate-fully acknowledges the Rolex Awards for Enterprise, National Ge-ographic and Microsoft (“AI for Earth”) and NERC Standard Grant“MicroMelt” . Liane G. Benning, Jenine McCutcheon and JamesB. McQuaid acknowledge funding from the UK National Envi-ronmental Research Council large grant “Black and Bloom”, andLiane G. Benning and Sathish Mayanna acknowledge funding fromthe German Helmholtz Recruiting Initiative. Thomas Gribbin ac-knowledges the Gino Watkins Memorial Fund and Nottingham Ed-ucation Trust. Greenland Analogue Project (GAP) weather stationdata are made available through the Programme for Monitoring ofthe Greenland Ice Sheet (http://www.promice.dk/home.html, lastaccess: January 2020). MAR v3.8.1 regional climate model out-puts used to estimate mean snow depth were provided by XavierFettweis. We thank Stephen Warren his for helpful comments thatimproved the manuscript.
Financial support. This research has been supported by theUK National Environmental Research Council (grant no.NE/M021025/1), the UK National Environmental Research Coun-cil (grant nos. NE/M020770/1, NE/S001034/1), and the GermanHelmholtz Recruiting Initiative (grant no. I-044-16-01).
Review statement. This paper was edited by Marco Tedesco and re-viewed by Stephen Warren and one anonymous referee.
References
Bamber, J., Westaway, R. M., Marzeion, B., and Wouters, B.:The land ice contribution to sea level during the satellite era,Environ. Res. Lett., 13 063008, https://doi.org/10.1088/1748-9326/aac2f0, 2018.
Benning, L. G., Anesio, A. M., Lutz, S., and Tranter, M.: Bi-ological impact on Greenland’s albedo, Nat. Geosci., 7, 691,https://doi.org/10.1038/ngeo2260, 2014.
Blankenship, R. E., Tiede, D. M., Barber, J., Brudvig, G. W., Flem-ing, G., Ghirardi, M., Gunner, M. R., Junge, W., Kramer, D. M.,Melis, A., Moore, T. A., Moser, C. C., Nocera, D. G., Nozik, A.J., Ort, D. R., Parson, W. W., Prince, R. C., and Sayre, R. T.:Comparing photosynthetic and photovoltaic efficiencies and rec-
The Cryosphere, 14, 309–330, 2020 www.the-cryosphere.net/14/309/2020/
J. M. Cook et al.: Glacier algae accelerate melt rates 327
ognizing the potential for improvement, Science, 332, 805–809,2011.
Bøggild, C. E., Brandt, R. E., Brown, K. J., and Warren, S. G.: Theablation zone in northeast Greenland: ice types, albedos and im-purities, J. Glaciol., 56, 101–113, 2010.
Box, J. E., Fettweis, X., Stroeve, J. C., Tedesco, M., Hall, D. K.,and Steffen, K.: Greenland ice sheet albedo feedback: thermo-dynamics and atmospheric drivers, The Cryosphere, 6, 821–839,https://doi.org/10.5194/tc-6-821-2012, 2012.
Brock, B. W. and Arnold, N. S.: A spreadsheet-based (Mi-crosoft Excel) point surface energy balance model for glacierand snow melt studies, Earth Surf. Proc. Land., 25, 649–658. https://doi.org/10.1002/1096-9837(200006)25:6<649::aid-esp97>3.0.co;2-u, 2000.
Cook, J. M., Edwards, A., Irvine-Fynn, T. D. I., and Takeuchi, N.:Cryoconite: Dark biological secret of the cryosphere, Prog. Phys.Geog., 40, 66–111, https://doi.org/10.1177/0309133315616574,2015a.
Cook, J. M., Edwards, A., and Hubbard, A.: Biocryomorphol-ogy: Integrating Microbial Processes with Ice Surface Hydrol-ogy, Topography, and Roughness, Front. Earth Sci., 3, 78,https://doi.org/10.3389/feart.2015.00078, 2015b.
Cook, J. M., Hodson, A. J., Taggart, A. J., Mernild, S.H., and Tranter, M.: A predictive model for the spectral“bioalbedo” of snow, J. Geophys. Res.-Earth Surf., 122, 434–454, https://doi.org/10.1002/2016JF003932, 2017a.
Cook, J. M., Hodson, A. J., Gardner, A. S., Flanner, M., Tedstone,A. J., Williamson, C., Irvine-Fynn, T. D. L., Nilsson, J., Bryant,R., and Tranter, M.: Quantifying bioalbedo: a new physicallybased model and discussion of empirical methods for characteris-ing biological influence on ice and snow albedo, The Cryosphere,11, 2611–2632, https://doi.org/10.5194/tc-11-2611-2017, 2017b.
Cook, J. M.: Spectra Processing Codes, Zenodo,https://doi.org/10.5281/zenodo.2598219, last access: January2020.
Cook, J. M., Williamson, C., Tedstone, A. J., Mc-Cutcheon, J., and Flanner, M.: BioSNICAR-GO, Zenodo,https://doi.org/10.5281/zenodo.3564517, last access: January2020a.
Cook, J. M., Tedstone, A. J., Williamson, A. J., andMcCutcheon, J.: Ice surface classifiers, Zenodo,https://doi.org/10.5281/zenodo.3564529, last access: January2020b.
Cook, J. M., Tedstone, A. J., Williamson, C., and Mc-Cutcheon, J.: Field and associated data, Zenodo,https://doi.org/10.5281/zenodo.3564501, last access: January2020c.
Dauchet, J., Blanco, S., Cornet, J.-F., and Fournier, R.: Calculationof radiative properties of photnthetic microorganisms, J. Quant.Spectrosc. Ra., 161, 60–84, 2015.
Dee, D. P., Uppala, S. M., Simmons, A. J., Berrisford, P., Poli,P., Kobayashi, S., Andrae, U., Balmaseda, M. A., Balsamo, G.,Bauer, P., Bechtold, P., Beljaars, A. C. M., van de Berg, I., Biblot,J., Bormann, N., Delsol, C., Dragani, R., Fuentes, M., Greer, A.J., Haimberger, L., Healy, S. B., Hersbach, H., Holm, E. V., Isak-sen, L., Kallberg, P., Kohler, M., Matricardi, M., McNally, A. P.,Mong-Sanz, B. M., Morcette, J.-J., Park, B.-K., Peubey, C., deRosnay, P., Tavolato, C., Thepaut, J. N., and Vitart, F.: The ERA-Interim reanalysis: Configuration and performance of the data
assimilation system, Q. J. Roy. Meteorol. Soc., 137, 553–597,https://doi.org/10.1002/qj.828, 2011.
Dial, R., Ganey, G., and Skiles, S. M.: What colour shouldglacier algae be? An ecological role for red carbon inthe cryosphere, FEMS Microbiol. Ecol., 94, fiy2007,https://doi.org/10.1093/femsec/fiy007, 2018.
Egan, W. G. and Hilgeman, T. W.: Optical properties of inho-mogenous materials: applications to geology, astronomy, chem-istry and engineering, Academic Press, San Diego, USA, ISBN:0122326504, 1979.
Enderlin, E. M., Howat, I. M., Jeong, S., Noh, M.-J., van Angelen,J. H., and van den Broeke, M. R.: An improved mass budgetfor the Greenland ice sheet, Geophys. Res. Lett., 41, 866–872,https://doi.org/10.1002/2013GL059010, 2014.
Fettweis, X., Box, J. E., Agosta, C., Amory, C., Kittel, C., Lang, C.,van As, D., Machguth, H., and Gallée, H.: Reconstructions of the1900–2015 Greenland ice sheet surface mass balance using theregional climate MAR model, The Cryosphere, 11, 1015–1033,https://doi.org/10.5194/tc-11-1015-2017, 2017.
Flanner, M. G., Zender, C. S., Randerson, J. T., and Rasch,P. J.: Present-day climate forcing and response fromblack carbon in snow, J. Geophys. Res., 112, D11202,https://doi.org/10.1029/2006JD008003, 2007.
Ganey, G. Q., Loso, M. G., Burgess, A. B., and Dial, R.J.: The role of microbes in snowmelt and radiative forc-ing on an Alaskan icefield, Nat. Geosci., 10, 754–759,https://doi.org/10.1038/ngeo3027, 2017.
GDAL/OGR contributors: GDAL/OGR Geospatial Data Abstrac-tion software Library, Open Source Geospatial Foundation, avail-able at: https://gdal.org/ (last access: January 2020), 2019.
Green, R. O., Dozier, J., Roberts, D., and Painter, T. H.: Spectralsnow-reflectance models for grain size and liquid water fractionin melting snow for the solar reflected spectrum, Ann. Glaciol.,34, 71–73, 2002.
Greene, C. A., Gwyther, D. E., and Blankenship, D. D.: Antarc-tic Mapping Tools for Matlab, Comput. Geosci., 104, 151–157,https://doi.org/10.1016/j.cageo.2016.08.003. 2017.
Haardt, H. and Maske, H.: Specific in vivo absorption coefficient ofchlorophyll a at 675 nm, Limnol. Oceanogr., 32, 608–619, 1987.
Hanna, E., Navarro, F. J., Pattyn, F., Domingues, C. M., Fet-tweiss, X., Ivins, E. R., Nicholls, R. J., Ritz, C., Smith,B., Tulaczyk, S., Whitehouse, P., and Zwally, J.: Ice sheetmass balance and climate change. Nature, 498, 51–59,https://doi.org/10.1038/nature12238, 2013.
Hillebrand, H., Dürselen, C.-D., Kirschtel, D., Pollingher, U., andZohary, T.: Biovolume calculation for pelagic and benthic mi-croalgae, J. Phycol., 35, 403–24, 1999.
Howat, I.: MEaSUREs Greenland Ice Mapping Project(GIMP) Land Ice and Ocean Classification Mask, Ver-sion 1., NASA National Snow and Ice Data Center Dis-tributed Active Archive Center, Boulder, Colorado USA,https://doi.org/10.5067/B8X58MQBFUPA (last access: August2018), 2017.
Howat, I. M., Negrete, A., and Smith, B. E.: The Green-land Ice Mapping Project (GIMP) land classification andsurface elevation data sets, The Cryosphere, 8, 1509–1518,https://doi.org/10.5194/tc-8-1509-2014, 2014.
Hu, W.: Dry weight and cell density of individual algaland cyanobacterial cells for algae research and develop-
www.the-cryosphere.net/14/309/2020/ The Cryosphere, 14, 309–330, 2020
328 J. M. Cook et al.: Glacier algae accelerate melt rates
ment, PhD thesis, University of Missouri-Columbia, avail-able at: https://mospace.umsystem.edu/xmlui/bitstream/handle/10355/46477/research.pdf (last access: September 2019), 2014.
Huovinen, P., Ramirez, J., and Gomez, I.: Remote sensing ofalbedo-reducing snow algae and impurities in the MaritimeAntarctic, ISPRS J. Photogramm., 146, 507–517, 2018.
Jäger, C., Fabian, D., Schrempel, F., Dorschner, J., Hen-ning, T., and Wesch, W.: Structural processing of en-statite by ion bombardement, Astron. Astrophys. 401, 57–65,https://doi.org/10.1051/0004-6361:20030002, 2003.
Jonsell, U., Hock, R., and Holmgren, B.: Spatial and temporal vari-ations in albedo on Storglaciären, Sweden, J. Glaciol., 49, 59–68,https://doi.org/10.3189/172756503781830980, 2003.
Kirk, J. T. O.: A theoretical analysis of the contribution of algal cellsto the attenuation of light within natural waters III. Cylindricaland spheroidal cells, New Phytol., 77, 341–358, 1976.
Knap, W. H., Brock, B. W., Oerlemans, J., and Willis, I. C.: Compar-ison of Landsat TM- derived and ground-based albedos of HautGlacier d’Arolla, Switzerland, Int. J. Remote Sens., 20, 3293–3310, 1999.
Langen, P. L., Fauso, R. S., Vendecrux, B., Mottram, R. H., andBox, J. E.: Liquid water flow and retention on the Green-land Ice Sheet in the regional climate model HIRHAM5:local and large scale impacts, Front. Earth Sci., 4, 110,https://doi.org/10.3389/feart.2016.00110, 2017.
Lee, E. and Pilon, L.: Absorption and scattering by long and ran-domly oriented linear chains of spheres, J. Opt. Soc. Am., 30,1892–1900, 2013.
Leya, T.: Fedlstudien und genetische Untersuchungen zur Ky-rophilie der Schneealgen Nordwestspitzbergens, Shaker Verlag,Aachen, 2014.
Liang, S.: Narrowband to broadband conversions of landsurface albedo I. Remote Sens. Environ., 76, 213–238,https://doi.org/10.1016/S0034-4257(00)00205-4, 2001.
Lutz, S., Anesio, A. M., Jorge Villar, S. E., Benning, L.G.: Variations of algal communities cause darkening of aGreenland glacier, FEMS Microbiol. Ecol., 89, 402–414,https://doi.org/10.1111/1574-6941.12351, 2014.
Lutz, S., McCutcheon, J., McQuaid, J. B., and Benning, L.G.: The diversity of ice algal communities on the GreenlandIce Sheet revealed by oligotyping, Microb. Genom., 4, 1–10,https://doi.org/10.1099/mgen.0.000159, 2018.
Masojídek, J., Torzillo, G., and Koblížek, M.: Photosynthesisin Microalgae, in: Handbook of Microalgal Culture, editedby: Richmond, A. and Hu, Q., John Wiley and Sons, Ltd.,https://doi.org/10.1002/9781118567166.ch2, 2013.
McCutcheon, J., Lutz, S., Williamson, C., Cook, J. M., Tedstone, A.J., Vanderstraeten, A., Wilson, S. A., Stockdale, A., Bonneville,S., McQuaid, J. B., Tranter, M., and Benning, L. G.: Mineralphosphorous drives glacier algal blooms on the Greenland IceSheet, in preparation, 2020.
Micasense: Red-Edge camera radiometric calibration model,available at: https://support.micasense.com/hc/en-us/articles/115000351194-RedEdge-Camera-Radiometric-Calibration-Model(last access: November 2018), 2019.
Morel, A. and Bricaud, A.: Theoretical results concerning light ab-sorption in a discrete medium, and application to specific absorp-tion of phytoplankton, Deep-Sea Res., 28, 1375–1393, 1981.
Muller, F. and Keeler, C. M.: Errors in short term ablation measure-ments on melting ice surfaces, J. Glaciol., 8, 91–105, 1969.
Ngheim, S. V., Hall, D. K., Mote, T. L., Tedesco, M. Al-bert, M. R., Keegan, K., Shuman, C. A., DiGirolamo, N.E., and Neumann, G.: The extreme melt across the Green-land Ice Sheet in 2012, Geophys. Res. Lett., 39, L20502,https://doi.org/10.1029/2012GL053611, 2012.
Nitsche, R. and Fritz, T.: Precise determination of the com-plex optical constant of mica, Appl. Opt., 43, 3263,https://doi.org/10.1364/ao.43.003263, 2004.
Noël, B., van de Berg, W. J., Machguth, H., Lhermitte, S., Howat,I., Fettweis, X., and van den Broeke, M. R.: A daily, 1 kmresolution data set of downscaled Greenland ice sheet surfacemass balance (1958–2015), The Cryosphere, 10, 2361–2377,https://doi.org/10.5194/tc-10-2361-2016, 2016.
Nordenskiöld, A. E.: Cryoconite found 1870, 19–25 July, on thein-land ice, east of Auleitsivik Fjord, Disco Bay, Greenland, Geol.Mag., 2, 157–162, 1875.
OCDB: Optical Constants Database, Laboratory AstrophysicsGroup of the AIU Jena, Stubachtal Olivine dataset, avail-able at: https://www.astro.uni-jena.de/Laboratory/OCDB/data/silicate/crystalline/oliv_vis.txt (last access: November 2019),2002.
Osborne, M.: Ardupilot Mission Planner (v1.3.48), available at:https://ardupilot.org/ardupilot/index.html, 2017.
Painter, T. H., Duval, B., and Thomas, W. H.: Detectionand quantification of snow algae with an airborne imag-ing spectrometer, Appl. Environ. Microbiol., 67, 5267–5272,https://doi.org/10.1128/AEM.67.11.5267-5272.2001, 2001.
Pollack, J. B., Toon, O. B., and Khare, B. K.: Optical properties ofsome terrestrial rocks and glasses, Icarus, 19, 372–389, 1973.
Remias, D., Schwaiger, S., Aigner, S., Leya, T., Stuppner,H., and Lutz, C.: Characterization of an UV- and VIS-absorbing, purpurogallin-derived secondary pigment newto algae and highly abundant in Mesotaenium berggrenii(Zygnematophyceae, Chlorophyta), an extremophyte liv-ing on glaciers, FEMS Microbiol. Ecol., 79, 638–648,https://doi.org/10.1111/j.1574-6941.2011.01245.x, 2012.
Rothman, L. S., Rinsland, C. P., Goldman, A., Massie, S. T., Ed-wards, D. P., Flaud, J.-M., Perrin, A., Camy-Peyrey, C., Dana,V., Mandin, J.-Y., Schroeder, J., McCann, A., Gamache, R. R.,Wattson, R. B., Yohino, K., Chance, K. V., Jucks, K. W., Brown,L. R., Nemtchinov, V., and Varanasi, P.: The HITRAN molecu-lar spectroscopic database and HAWKS (HITRAN atmosphericworkstation): 1996 edition, J. Quant. Spectrosc. Ra., 60, 665–710, https://doi.org/10.1016/S0022-4073(98)00078-8, 1998.
Roush, T., Pollack, J., and Orenberg, J.: Derivation of midinfrared(5-25 µm) optical constants of some silicates and palagonite,Icarus, 94, 191–208, 1991.
Ryan, J., Hubbard, A., Irvine-Fynn, T. D., Doyle, S. ., Cook, J. M.,Stibal, M., and Box, J. E.: How robust are in situ observationsfor validating satellite-derived albedo over the dark zone of theGreenland Ice Sheet?, Geophys. Res. Lett., 44, 6218–6225, 2017.
Ryan, J., Hubbard, A., Irvine-Fynn, Cook, J. T., Smith, L. C.,Cameron, K., and Box, J. E.: Dark zone of the GreenlandIce Sheet controlled by distributed biologically-active impuri-ties, Nat. Commun., 9, 1065, https://doi.org/10.1038/s41467-018-03353-2, 2018a.
The Cryosphere, 14, 309–330, 2020 www.the-cryosphere.net/14/309/2020/
J. M. Cook et al.: Glacier algae accelerate melt rates 329
Ryan, J., van As, D., Cooley, S. W., Cooper, M. G., Pitcher, L.H., and Hubbard, A.: Greenland Ice Sheet surface melt ampli-fied by snow line migration and bare ice exposure, Sci. Adv., 5,eeav3738, https://doi.org/10.1126/sciadv.aav3738, 2018b.
Sanna, L. and Romeo, A.: Mineralogy and geochemistry of cry-oconite sediments in Eqip Sermia glacier (central-west Green-land), J. Mediterr. Earth Sci., 10, 159–166, 2018.
Seager, S., Turner, E. L., Schafer, J., and Ford, E. B.: Vegetation’sred edge: a possible spectroscopic biosignature of extraterrestrialplants, Astrobiology, 5, 372–390, 2005.
Shepherd, A., Ivins, E. R., Barletta, V. R., Bentley, M. J., Bettad-pur, S., Briggs, K. H., Bromwich, D. H., Forsberg, R., Galin, N.,Horwath, M., Jacobs, S., Joughin, I., King, M. A., Lenaerts, J.T. M., Li, J., Ligtenberg, S. R. M., Luckman, A., Luthcke, S.B., McMillan, M., Meister, R., Milne, G., Mouginot, J., Muir,A., Nicolas, J. P., Paden, J., Payne, A. J., Pritchard, H., Rig-not, E., Rott, H., Sohn, H.G. Rensen, L. S., Scambos, T. A.,Scheuchl, B., Schrama, E. J. O., Smith, B., Sundal, A. V., vanAngelen, J. H., van de Berg, W. J., van den Broeke, M. R.,Vaughan, D. G., Velicogna, I., Wahr, J., Whitehouse, P. L., Wing-ham, D. J., Yi, D., Young, D., and Zwally, H. J.: A ReconciledEstimate of Ice-Sheet Mass Balance, Science, 338, 1183–1189,https://doi.org/10.1126/science.1228102, 2012.
Shimada, R., Takeuchi, N., and Aoki, T.: Inter-annual and geograph-ical variations in the extent of bare ice and dark ice on the Green-land ice sheet derived from MODIS satellite images, Front. EarthSci., 4, 43, https://doi.org/10.3389/feart.2016.00043, 2016.
Skiles, S. M., Painter, T. H., and Okin, G. S.: A method to retrievethe spectral complex refractive index and single scattering opticalproperties of dust deposited in mountain snow, J. Glaciol., 63,133–147, https://doi.org/10.1017/jog.2016.126, 2017.
Smeets, C. J. P. P. and Van den Broeke, M. R.: Temporal and spa-tial variations of the aerodynamic roughness length in the abla-tion zone of the Greenland ice sheet, Bound.-Lay. Meteorol., 128,315–338, https://doi.org/10.1007/s10546-008-9291-0, 2008.
Stibal, M., Box, J. E., Cameron, K. A., Langen, P. L., Yallop, M.,Mottram, R. H., Khan, A. L., Molotch, N. P., Chrismas, N. A. M.,Quaglia, F. C., Remias, D., Smeets, C. J. P., van den Broecke,M. R., Ryan, J. C., Hubbard, A., Tranter, M., van As, D., andAhlstrøm, A. P.: Algae drive enhanced darkening of bare ice onthe Greenland Ice Sheet, Geophys. Res. Lett., 44, 11463–11471,2017.
Stroeve, J., Box, J. E., Wang, Z., Schaaf, C., and Barett,A.: Re-evaluation of MODIS MCD43 Greenland albedo ac-curacy and trends, Remote Sens. Environ., 138, 99–214.https://doi.org/10.1016/j.rse.2013.07.023, 2013.
Takeuchi, N., Dial, R., Kohshima, S., Segawa, T., andUetake, J.: Spatial distribution and abundance of redsnow algae on the Harding Icefield, Alaska derivedfrom a satellite image, Geophys. Res. Lett., 33, L21502,https://doi.org/10.1029/2006GL027819, 2006.
Tedesco, M., Foreman, C., Anton, J., Steiner, N., and Schwartzman,T.: Comparative analysis of morphological, mineralogical andspectral properties of cryoconite in Jakobshavn Isbræ, Green-land, and Canada Glacier, Antarctica, Ann. Glaciol., 54, 147–157, https://doi.org/10.3189/2013AoG63A417, 2013.
Tedesco, M., Doherty, S., Fettweis, X., Alexander, P., Jeyaratnam,J., and Stroeve, J.: The darkening of the Greenland ice sheet:
trends, drivers, and projections (1981–2100), The Cryosphere,10, 477–496, https://doi.org/10.5194/tc-10-477-2016, 2016.
Tedstone, A. J.: Python implementation of point surface energy bal-ance model, Zenodo, https://doi.org/10.5281/zenodo.3228331,2019.
Tedstone, A. J., Bamber, J. L., Cook, J. M., Williamson, C. J., Fet-tweis, X., Hodson, A. J., and Tranter, M.: Dark ice dynamics ofthe south-west Greenland Ice Sheet, The Cryosphere, 11, 2491–2506, https://doi.org/10.5194/tc-11-2491-2017, 2017.
Tedstone, A. J., Cook, J. M., Williamson, C. J., Hofer, S., Mc-Cutcheon, J., Irvine-Fynn, T., Gribbin, T., and Tranter, M.:Algal growth and weathering crust structure drive variabilityin Greenland Ice Sheet ice albedo, The Cryosphere Discuss.,https://doi.org/10.5194/tc-2019-131, in review, 2019.
Toon, O. B., McKay, C. P., Ackerman, T. P., and San-thanam, K.: Rapid calculation of radiative heating ratesand photodissociation rates in inhomogeneous multiple scat-tering atmospheres, J. Geophys. Res., 94, 16287–16301,https://doi.org/10.1029/JD094iD13p16287, 1989.
Uetake, J., Naganuma, T., Hebsgaard, M. B., Kanda, H.,and Kohshima, S.: Communities of algae and cyanobacte-ria on glaciers in west Greenland, Polar Sci., 4, 71–80,https://doi.org/10.1016/j.polar.2010.03.002, 2010.
United States Geological Survey (USGS): Unmanned Air-craft Systems data post-processing: Structure from mo-tion photogrammetry, available at: https://uas.usgs.gov/nupo/pdf/PhotoScanProcessingMicaSenseMar2017.pdf (last access:May 2018), 2017.
van As, D., Van den Broeke, M. R., Reijmer, C. H., and VandeWal, R. S. W.: The summer surface energy balance of thehigh Antarctic Plateau, Bound.-Lay. Meteorol., 115, 289–317,https://doi.org/10.1007/s10546-004-4631-1, 2005.
van As, D., Hubbard, A. L., Hasholt, B., Mikkelsen, A. B., vanden Broeke, M. R., and Fausto, R. S.: Large surface meltwa-ter discharge from the Kangerlussuaq sector of the Greenlandice sheet during the record-warm year 2010 explained by de-tailed energy balance observations, The Cryosphere, 6, 199–209,https://doi.org/10.5194/tc-6-199-2012, 2012.
van As, D., Bech Mikkelsen, A., Holtegaard Nielsen, M., Box, J. E.,Claesson Liljedahl, L., Lindbäck, K., Pitcher, L., and Hasholt, B.:Hypsometric amplification and routing moderation of Greenlandice sheet meltwater release, The Cryosphere, 11, 1371–1386,https://doi.org/10.5194/tc-11-1371-2017, 2017.
van den Broeke, M. R., Enderlin, E. M., Howat, I. M., KuipersMunneke, P., Noël, B. P. Y., van de Berg, W. J., van Meijgaard,E., and Wouters, B.: On the recent contribution of the Greenlandice sheet to sea level change, The Cryosphere, 10, 1933–1946,https://doi.org/10.5194/tc-10-1933-2016, 2016.
van Diedenhoven, B., Ackerman, A. S., Cairns, B., and Fridlind,A. M.: A flexible paramaterization for shortwave opticalproperties of ice crystals, J. Atmos. Sci., 71, 1763–1782,https://doi.org/10.1175/JAS-D-13-0205.1, 2014.
Wang, S., Tedesco, M., Xu, M., and Alexander, P. M.: Mapping icealgal blooms in southwest Greenland from space, Geophys. Res.Lett., 45, 11779–11788, https://doi.org/10.1029/2018GL080455,2018.
Warren, S. G.: Optical properties of snow, Rev. Geophys., 20, 67–89, https://doi.org/10.1029/RG020i001p00067, 1982.
www.the-cryosphere.net/14/309/2020/ The Cryosphere, 14, 309–330, 2020
330 J. M. Cook et al.: Glacier algae accelerate melt rates
Warren, S. G. and Brandt, R. E.: Optical constantsof ice from the ultraviolet to the microwave: A re-vised compilation, J. Geophys. Res., 113, D14220,https://doi.org/10.1029/2007JD009744,2008, 2008.
Wharton, R. A., McKay, C. P., Simmons, G. M., and Parker, B. C.:Cryoconite holes on glaciers, BioScience, 35, 499–503, 1985.
Wientjes, I. G. M. and Oerlemans, J.: An explanation for the darkregion in the western melt zone of the Greenland ice sheet, TheCryosphere, 4, 261–268, https://doi.org/10.5194/tc-4-261-2010,2010.
Wientjes, I. G. M., Van de Wal, R. S. W., Reichart, G. J., Sluijs,A., and Oerlemans, J.: Dust from the dark region in the west-ern ablation zone of the Greenland ice sheet, The Cryosphere, 5,589–601, https://doi.org/10.5194/tc-5-589-2011, 2011.
Williamson, C. J., Anesio, A. M., Cook, J., Tedstone, A.,Poniecka, E., Holland, A., Fagan, D., Tranter, M., and Yal-lop, M. L.: Ice algal bloom development on the surface ofthe Greenland Ice Sheet, FEMS Microbiology Ecology, fiy025,https://doi.org/10.1093/femsec/fiy02, 2018.
Williamson, C. J., Cameron, K. A., Cook, J. M., Zarsky,J. D., Stibal, M., and Edwards, A.: Glacier Algae: ADark Past and a Darker Future, Front. Microbiol., 10, 524,https://doi.org/10.3389/fmicb.2019.00524, 2019.
Yallop, M. L., Anesio, A. J., Perkins, R. G., Cook, J., Telling, J., Fa-gan, D., MacFarlane, J., Stibal, M., Barker, G., Bellas, C., Hod-son, A., Tranter, M., Wadham, J., and Roberts, N. W.: Photophys-iology and albedo-changing potential of the ice-algal communityon the surface of the Greenland ice sheet, ISME J., 6, 2302–2313,2012.
The Cryosphere, 14, 309–330, 2020 www.the-cryosphere.net/14/309/2020/