Embed Size (px)
Citation preview
Journal of Volcanology and Geothermal Research 191 (2010) 117–128
Contents lists available at ScienceDirect
Journal of Volcanology and Geothermal Research
j ourna l homepage: www.e lsev ie r.com/ locate / jvo lgeores
Geostatistics and multivariate analysis as a tool to characterize volcaniclasticdeposits: Application to Nevado de Toluca volcano, Mexico
F. Bellotti a,⁎, L. Capra b, D. Sarocchi c, M. D'Antonio b
a Dipartimento di Scienze della Terra—A. Desio, Università degli Studi di Milano, via Mangiagalli 34, 20133 Milano, Italyb Centro de Geociencias, UNAM, Campus Juriquilla, 76230 Queretaro, Mexicoc Inst. de Geología / Fac. de Ingeniería Universidad Autónoma de San Luis Potosí, av. Dr. Manuel Nava N.5 Zona Universitaria, C.P. 78240 San Luis Potosí, Mexico
⁎ Corresponding author. Dipartimento di Scienze deldegli Studi di Milano, via Mangiagalli 34, 20133 Milano
E-mail address: [email protected] (F. Bellot
0377-0273/$ – see front matter © 2010 Elsevier B.V. Aldoi:10.1016/j.jvolgeores.2010.01.005
a b s t r a c t
a r t i c l e i n f oArticle history:Received 31 March 2009Accepted 8 January 2010Available online 25 January 2010
Keywords:Nevado de Tolucagrain size analysesgeostatisticsmultivariate analysisvolcaniclastic flow characterizationGIS applications
Grain size analysis of volcaniclastic deposits is mainly used to study flow transport and depositionalprocesses, in most cases by comparing some statistical parameters and how they change with distance fromthe source.In this work the geospatial and multivariate analyses are presented as a strong adaptable geostatistical toolapplied to volcaniclastic deposits in order to provide an effective and relatively simplemethodology for texturedescription, deposit discrimination and interpretation of depositional processes.We choose the case of Nevado de Toluca volcano (Mexico) due to existing knowledge of its geologicalevolution, stratigraphic succession and spatial distribution of volcaniclastic units. Grain size analyses andfrequency distribution curves have been carried out to characterize and compare the 28-ka block-and-ash flowdeposit associated to a dome destruction episode, and the El Morral debris avalanche deposit originated fromthe collapse of the south-eastern sector of the volcano. The geostatistical interpolation of sedimentological dataallows to realize bidimensional maps draped over the volcano topography, showing the granulometricdistribution, sorting and fine material concentration into the whole deposit with respect to topographicchanges. In this way, it is possible to analyze a continuous surface of the grain size distribution of volcaniclasticdeposits and better understand flow transport processes.The application ofmultivariate statistic analysis (discriminant function) indicates that this methodology couldbe useful in discriminating deposits with different origin or different depositional lithofacies within the samedeposit.The proposedmethodology could be an interesting approach to sustainmore classical analysis of volcaniclasticdeposits, especially where a clear field classification appears problematic because of a homogeneous texture ofthe deposits or their scarce and discontinuous outcrops. Our study is an example of the strong versatility ofgeospatial analysis to provide an effective and relatively clear methodology for the characterization ofvolcaniclastic deposits.
la Terra, “A. Desio”, Università, Italy.ti).
l rights reserved.
© 2010 Elsevier B.V. All rights reserved.
1. Introduction
Particle size analysis is widely used in sedimentology to determinethe characteristics of different depositional environments and to inferflow transport anddepositional processes. Spatial variations ingrain sizeparameters result from different processes, such as abrasion, selectivetransport and mixing with sediments of other sources (McLaren andBowles, 1985; Gao and Collins, 1991, 1992; Poizot et al., 2006).
However, in the case of volcaniclastic deposits, particle sizeanalysis has been applied mainly for a descriptive purpose of down-flow variation of statistical parameters to interpret sedimentation andtransport mechanism of pyroclastic density current (i.e. Myabuchi,
1999; Schwarzkopf et al., 2005; Sulpizio and Dellino, 2008) or debrisflow (Scott, 1988), or in case of fallout, for eruption modelling (i.e.Koyaguchi and Ohno, 2001;Mastin et al., 2009). Classification diagramsbased on granulometric statistical parameters have been proposed todistinguish among pyroclastic deposit (i.e. Walker, 1971) or epiclasticdeposits (i.e. Carreras-Soriano and Capra, 2008) and they represent atool to better constrain field observations in determining the origin of adeposit. But the generic approach consists on identifying cluster of datarepresenting samples of deposits with same origin. Transport anddepositional processes of gravity driven flows are mostly affected bytopographic changes and irregularities (i.e. slope variation, obstacle, andnarrow ravines), promoting textural and granulometric variations. Inthis sense, classic xy diagrams (i.e. mean or sorting vs. distance from thesource) cannot reproduce spatial variations.
The aim of this work is to improve the classical grain size analyseswith a newapproach based on discriminant analyses and geostatistical
118 F. Bellotti et al. / Journal of Volcanology and Geothermal Research 191 (2010) 117–128
119F. Bellotti et al. / Journal of Volcanology and Geothermal Research 191 (2010) 117–128
spatial interpolation. The discriminant analyses will be used here toshow its potential in differentiating deposits and their lithofacies, suchas block-and-ash flow and debris avalanche, based on their grain sizestatistical parameters. The geostatistical spatial interpolation will bepresented here as an alternative tool to better represent grain sizevariations of a block-and-ash flow deposit in relation with distancefrom its source and its interaction with the topography. For thispurpose we selected two deposits which originated from the Nevadode Toluca volcano, such as the 28 ka block-and-ash flowdeposit whichoriginated from a dome collapse event (Macías et al., 1997; D'Antonioet al., 2008) and the El Morral debris avalanche deposit whichoriginated from the collapse of the SW sector (Galgano, 2006). Thesedeposits have a great exposition alongmain ravines on the eastern andsouthern sectors of the volcano respectively, which assures arepresentative sampling. The geostatistical spatial interpolation willallow to obtain the continuous spatial distribution of some descriptivestatistical parameters for the block-and-ash flow deposit by means ofstrict geostatistical criteria. The advantage of this analysis consists inthe possibility to superimpose thematic maps on the volcanotopography, showing their relation with the spatial variation ingranulometric characteristics of the deposit and relate them withdepositional processes. In addition, the discriminant function will bealso used to distinguish sample from the same deposit that belongs todifferent depositional areas, supporting textural field observations. Itis worth to stress here that the methodology here proposed does notrepresent a tool to have a more effective granulometric distribution incase of lack of samples, but to better understand spatial variation. Avalidation test will be presented to better illustrate this aspect.
2. Previous knowledge about Nevado de Toluca volcano
TheNevado de Toluca volcano (NdT) is situated 80 kmSWofMexicoCity and 20 km S of Toluca town, at the boundary between the centraland eastern sectors of TransMexicanVolcanic Belt (TMVB) (Fig. 1a). TheTMVB is an E–Wactive continental volcanic arc, extending for 1200 kmbetween the Gulf of Mexico and the Pacific Ocean. The TMVB volcanismis generated by the Rivera–Cocos plate subduction beneath the NorthAmericanplate at theMiddleAmerican Trench (Ponceet al., 1992; Pardoand Suárez, 1993; Pérez-Campos et al., 2008).
The activity at NdT started 2.6 Ma ago and was dominated by theextrusion of mainly andesitic lava flows and domes (García-Palomoet al., 2002; Bellotti et al., 2003, 2006) and ended approximately1.2 Ma ago. After a long period of inactivity, controlled by erosiveprocesses and sector collapse, the magmatic activity renewed at 42 kaBP (Macías et al., 1997). The Pleistocene–Holocene period wascharacterized by different eruptive phases, including five domecollapses dated at 37, 32, 28, 26.5 and 13 ka (Macías et al., 1997;García-Palomo et al., 2002) and four plinian eruptions at 36 ka (OchrePumice), 21.7 ka (Lower Toluca Pumice, LTP) (Bloomfield et al., 1977;Capra et al., 2006), 12.1 ka (Middle Toluca Pumice, MDP) (Arce et al.,2005), and 10.5 ka (Upper Toluca Pumice, UTP) (Macías et al., 1997;Arce et al., 2003). The eruptive sequence is topped by a surge depositdated at ∼3.3 ka B.P. (Macías et al., 1997). This period was alsocharacterized by flank collapses that emplaced debris avalanchedeposits (Macías et al., 1997; Bellotti et al., 2006; Caballero, 2007).
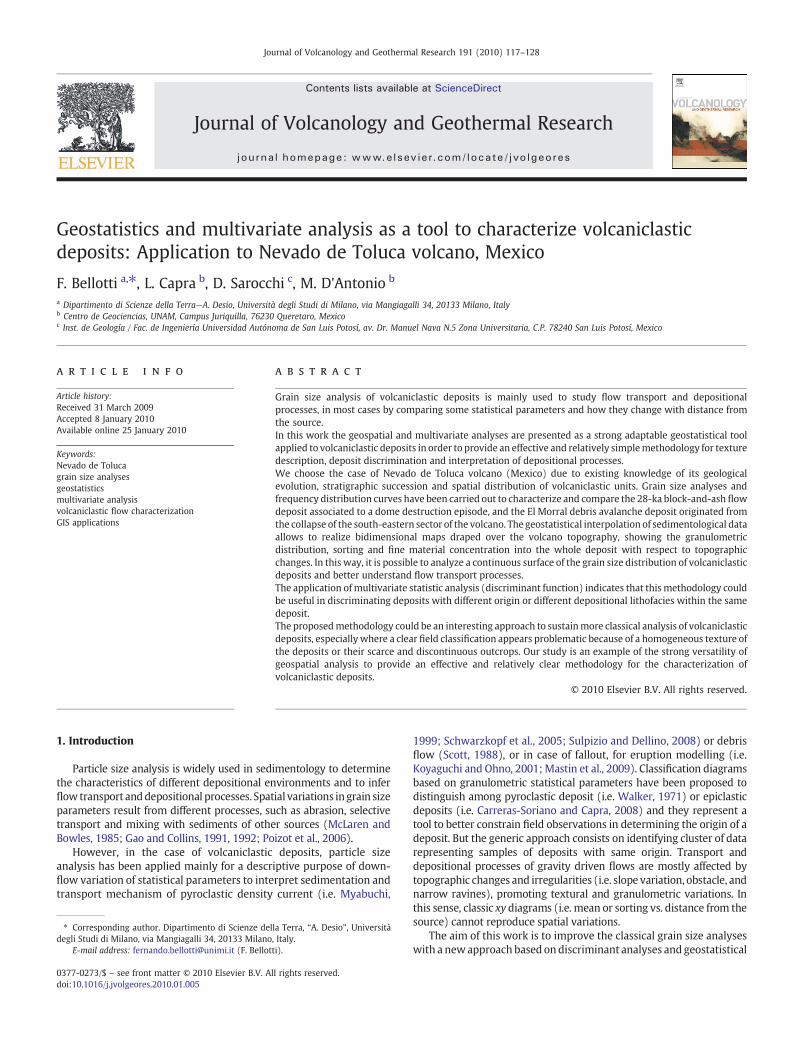
In this study two deposits are analyzed: 1) The 28 ka BP block-and-ashflow(Macías et al., 1997;D'Antonio et al., 2008) (wewill refer to it as28 ka-BAF), constituted by a series of flow units that crop out all aroundthe volcano. Samples were collected in the NE sector (Fig. 1b and c),where it is possible to observe the best deposit exposures. 2) The ElMorral debris avalanche deposit (El Morral-DAD), of unknown age, but
Fig. 1. a) Trans Mexican Volcanic Belt (TMVB) arrangement and major volcanoes in centraToluca, Jo: Jocotitlan, Iz: Iztlaccihuatl, Po: Popocatepetl, PdO: Pico de Orizaba, MAT: Middle AChain, MX: México City. (b) Nevado de Toluca hillshade showing: the localization of 28-BAFand location for the 28 ka-BAF.
probably between 42 ka and 19 ka BP (Galgano, 2006), that crops out ontheSE sector (Fig. 1b), close to theElMorral locality. Thesedepositswereselected due to the knowledge about their distribution and stratigraphicposition obtained in previousworks (Macías et al., 1997; García-Palomoet al., 2000; Bellotti et al., 2004, 2006; D'Antonio et al., 2008).
3. Methodology
3.1. Grain size analysis
In order to obtain a representative analysis of the whole grain sizedistribution of the studied deposits, the entire granulometricspectrum was obtained by joining photo-sieving, dry sieving andphoto-sedimentographic methodologies.
The photo-sieving measures the percentage of particle size classescoarser than −3ϕ (8 mm), using point-counting method (i.e. Capraand Macías, 2000, 2002) using a regular net (∼1×1 m) with 100nodes on scaled photographs, and assumes these as representative ofweight percentage (Kellerhals and Bray, 1971). In this paper we usedthis technique to measure clasts size comprised between −8ϕ(256 mm) and −4ϕ (16 mm). From the same outcrop a ∼1.5 kg ofbulk sample finer than −4ϕ has been collected in order to realize drygrain size analyses of clasts comprised between −3ϕ (8 mm) and 4ϕ(0.064 mm). Block-and-ash flow deposits here studied generally formvertical walls of very friable material, and it results impossible to takesamples at different altitudes. This is not a limitation since, asdescribed in the next paragraph, the deposits here studied are mostlymassive without lens or clasts layer accumulation.
Fractions finer than 4ϕwere analyzed by means of photo-sedimento-graphic analyses (Kaye, 1999), inwhich volumepercentage of particles ismeasured using transmittance, calculated by Lambert–Beer Law (Stein,1985; Kaye, 1999). The calculated dimensionally homogeneous (Keller-hals and Bray, 1971) percentages from each methodology werecombined to obtain the complete granolumetric spectrum.
3.2. Statistics
The statistical parameters were calculated from frequency distribu-tion curves:mean grain size (Mz); standard deviation (σI), the extent ofclasts sorting; skewness (SkI), which describes the presence ofasymmetry in grain size distribution and the nature of its tails; kurtosis(k), the extent of grain size distribution flattening (Inmann, 1952; Folkand Ward, 1957). Parameters were calculated using the DECOLOG 2.0freeware program (www.decolog.org, Sarocchi, 2006; Capra et al.,2010). This program decodes samples with polymodal distributions,using as paradigm the 3-parameter log-normal distribution andsearching an optimal mixture of these distributions. Besides providingstatistical parameters of each log-normal component, the DECOLOGsoftware provides Folk and Ward equivalent parameters optimized bymeans of a Monte Carlo interpolation (Sarocchi, 2006). In the presentwork the program has been mainly used to obtain the statisticalparameters based on the modified Folk–Ward interpolation method.This method, compared to other techniques, provides more represen-tative values especially for strongly asymmetric curves (Folk, 1980).Finally, to describe grain size classes we are using the terminologyproposed by White and Houghton (2006).
3.3. Geostatistic
Geostatistic assumes that spatial neighbouring features arespatially correlated to each other (Goovaerts, 1997; Houlding, 2000).
l Mexico. CVC: Colima Volcanic Complex, Ce: Ceboruco, Pa: Patamban, NT: Nevado demerican Trench, CHVC: Chiapanecan Volcanic Chain, CAVC: Central American Volcanicand El Morral-DAD. (c) Detailed DEM of the North-eastern area showing sample name

Fig. 2. a) Distribution of the 28 ka-BAF on the eastern sector of the volcano showing the variation in its thickness. b) Topographic section along the main flow axis, showing mainsbreak in slope and location of topographic profiles transversal to the flow direction. c) Stratigraphic sections at first outcrops where the deposit shows the mMsf (d) and mCs(e) lithofacies. f) Stratigraphic sections at the front of the middle zone, where the deposit thickness, showing the mCs lithofacies along the main flow line (g) and the mMsf on lateralravines (h). (i) Sections on the distal zone where the deposit on lateral ravinemaintain the mMsf lithofacies (l andm), while alongmain flow direction the deposit shows an increasein matrix component (n) (mMs).
120 F. Bellotti et al. / Journal of Volcanology and Geothermal Research 191 (2010) 117–128
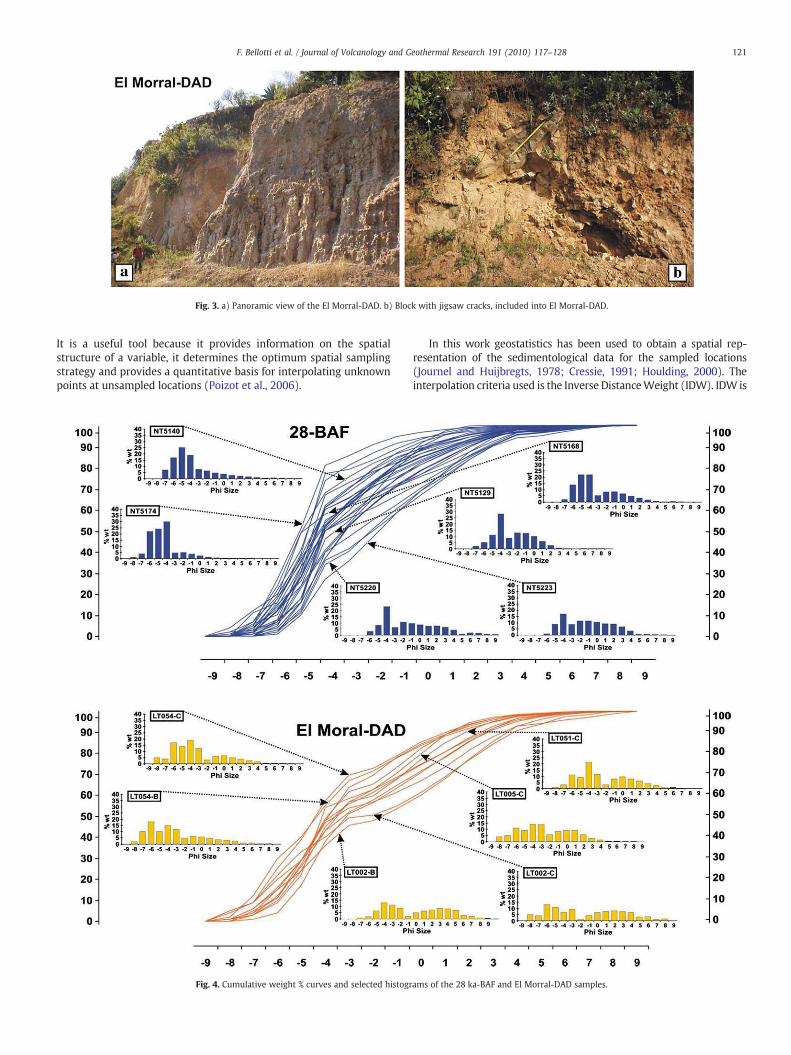
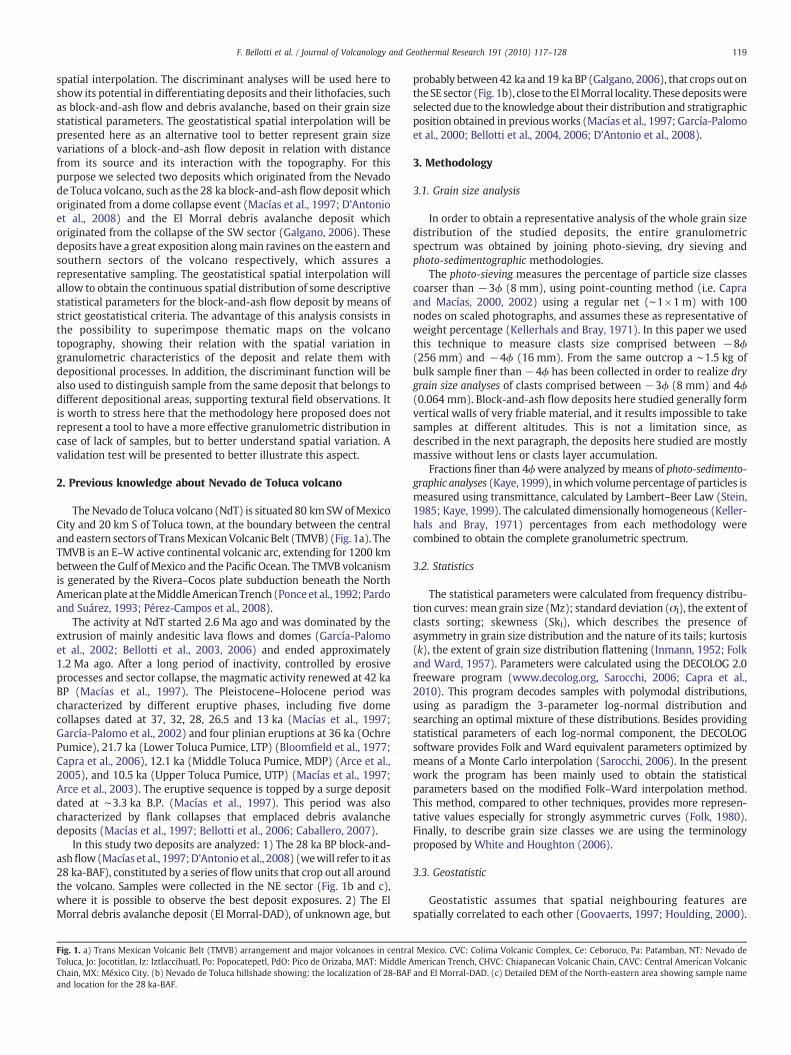
Fig. 3. a) Panoramic view of the El Morral-DAD. b) Block with jigsaw cracks, included into El Morral-DAD.
121F. Bellotti et al. / Journal of Volcanology and Geothermal Research 191 (2010) 117–128
It is a useful tool because it provides information on the spatialstructure of a variable, it determines the optimum spatial samplingstrategy and provides a quantitative basis for interpolating unknownpoints at unsampled locations (Poizot et al., 2006).
Fig. 4. Cumulative weight % curves and selected histogr
In this work geostatistics has been used to obtain a spatial rep-resentation of the sedimentological data for the sampled locations(Journel and Huijbregts, 1978; Cressie, 1991; Houlding, 2000). Theinterpolation criteria used is the Inverse DistanceWeight (IDW). IDW is
ams of the 28 ka-BAF and El Morral-DAD samples.
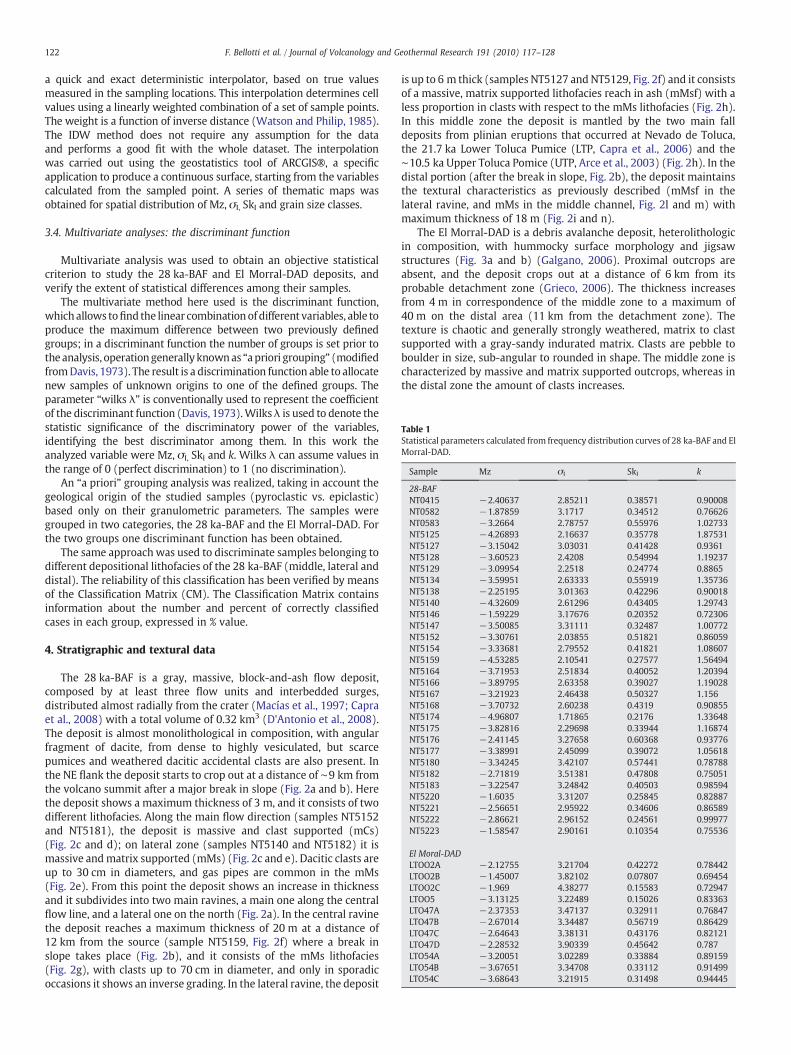
Table 1Statistical parameters calculated from frequency distribution curves of 28 ka-BAF and ElMorral-DAD.
Sample Mz σI SkI k
28-BAFNT0415 −2.40637 2.85211 0.38571 0.90008NT0582 −1.87859 3.1717 0.34512 0.76626NT0583 −3.2664 2.78757 0.55976 1.02733NT5125 −4.26893 2.16637 0.35778 1.87531NT5127 −3.15042 3.03031 0.41428 0.9361NT5128 −3.60523 2.4208 0.54994 1.19237NT5129 −3.09954 2.2518 0.24774 0.8865NT5134 −3.59951 2.63333 0.55919 1.35736NT5138 −2.25195 3.01363 0.42296 0.90018NT5140 −4.32609 2.61296 0.43405 1.29743NT5146 −1.59229 3.17676 0.20352 0.72306NT5147 −3.50085 3.31111 0.32487 1.00772NT5152 −3.30761 2.03855 0.51821 0.86059NT5154 −3.33681 2.79552 0.41821 1.08607NT5159 −4.53285 2.10541 0.27577 1.56494NT5164 −3.71953 2.51834 0.40052 1.20394NT5166 −3.89795 2.63358 0.39027 1.19028NT5167 −3.21923 2.46438 0.50327 1.156NT5168 −3.70732 2.60238 0.4319 0.90855NT5174 −4.96807 1.71865 0.2176 1.33648NT5175 −3.82816 2.29698 0.33944 1.16874NT5176 −2.41145 3.27658 0.60368 0.93776NT5177 −3.38991 2.45099 0.39072 1.05618NT5180 −3.34245 3.42107 0.57441 0.78788NT5182 −2.71819 3.51381 0.47808 0.75051NT5183 −3.22547 3.24842 0.40503 0.98594NT5220 −1.6035 3.31207 0.25845 0.82887NT5221 −2.56651 2.95922 0.34606 0.86589NT5222 −2.86621 2.96152 0.24561 0.99977NT5223 −1.58547 2.90161 0.10354 0.75536
El Moral-DADLTOO2A −2.12755 3.21704 0.42272 0.78442LTOO2B −1.45007 3.82102 0.07807 0.69454LTOO2C −1.969 4.38277 0.15583 0.72947LTOO5 −3.13125 3.22489 0.15026 0.83363LTO47A −2.37353 3.47137 0.32911 0.76847LTO47B −2.67014 3.34487 0.56719 0.86429LTO47C −2.64643 3.38131 0.43176 0.82121LTO47D −2.28532 3.90339 0.45642 0.787LTO54A −3.20051 3.02289 0.33884 0.89159LTO54B −3.67651 3.34708 0.33112 0.91499LTO54C −3.68643 3.21915 0.31498 0.94445
122 F. Bellotti et al. / Journal of Volcanology and Geothermal Research 191 (2010) 117–128
a quick and exact deterministic interpolator, based on true valuesmeasured in the sampling locations. This interpolation determines cellvalues using a linearly weighted combination of a set of sample points.The weight is a function of inverse distance (Watson and Philip, 1985).The IDW method does not require any assumption for the dataand performs a good fit with the whole dataset. The interpolationwas carried out using the geostatistics tool of ARCGIS®, a specificapplication to produce a continuous surface, starting from the variablescalculated from the sampled point. A series of thematic maps wasobtained for spatial distribution of Mz, σI, SkI and grain size classes.
3.4. Multivariate analyses: the discriminant function
Multivariate analysis was used to obtain an objective statisticalcriterion to study the 28 ka-BAF and El Morral-DAD deposits, andverify the extent of statistical differences among their samples.
The multivariate method here used is the discriminant function,whichallows tofind the linear combinationofdifferent variables, able toproduce the maximum difference between two previously definedgroups; in a discriminant function the number of groups is set prior tothe analysis, operationgenerally knownas “apriori grouping” (modifiedfromDavis, 1973). The result is a discrimination function able to allocatenew samples of unknown origins to one of the defined groups. Theparameter “wilks λ” is conventionally used to represent the coefficientof the discriminant function (Davis, 1973).Wilksλ is used to denote thestatistic significance of the discriminatory power of the variables,identifying the best discriminator among them. In this work theanalyzed variable were Mz, σI, SkI and k. Wilks λ can assume values inthe range of 0 (perfect discrimination) to 1 (no discrimination).
An “a priori” grouping analysis was realized, taking in account thegeological origin of the studied samples (pyroclastic vs. epiclastic)based only on their granulometric parameters. The samples weregrouped in two categories, the 28 ka-BAF and the El Morral-DAD. Forthe two groups one discriminant function has been obtained.
The same approach was used to discriminate samples belonging todifferent depositional lithofacies of the 28 ka-BAF (middle, lateral anddistal). The reliability of this classification has been verified by meansof the Classification Matrix (CM). The Classification Matrix containsinformation about the number and percent of correctly classifiedcases in each group, expressed in % value.
4. Stratigraphic and textural data
The 28 ka-BAF is a gray, massive, block-and-ash flow deposit,composed by at least three flow units and interbedded surges,distributed almost radially from the crater (Macías et al., 1997; Capraet al., 2008) with a total volume of 0.32 km3 (D'Antonio et al., 2008).The deposit is almost monolithological in composition, with angularfragment of dacite, from dense to highly vesiculated, but scarcepumices and weathered dacitic accidental clasts are also present. Inthe NE flank the deposit starts to crop out at a distance of ∼9 km fromthe volcano summit after a major break in slope (Fig. 2a and b). Herethe deposit shows a maximum thickness of 3 m, and it consists of twodifferent lithofacies. Along the main flow direction (samples NT5152and NT5181), the deposit is massive and clast supported (mCs)(Fig. 2c and d); on lateral zone (samples NT5140 and NT5182) it ismassive andmatrix supported (mMs) (Fig. 2c and e). Dacitic clasts areup to 30 cm in diameters, and gas pipes are common in the mMs(Fig. 2e). From this point the deposit shows an increase in thicknessand it subdivides into two main ravines, a main one along the centralflow line, and a lateral one on the north (Fig. 2a). In the central ravinethe deposit reaches a maximum thickness of 20 m at a distance of12 km from the source (sample NT5159, Fig. 2f) where a break inslope takes place (Fig. 2b), and it consists of the mMs lithofacies(Fig. 2g), with clasts up to 70 cm in diameter, and only in sporadicoccasions it shows an inverse grading. In the lateral ravine, the deposit
is up to 6 m thick (samples NT5127 and NT5129, Fig. 2f) and it consistsof a massive, matrix supported lithofacies reach in ash (mMsf) with aless proportion in clasts with respect to the mMs lithofacies (Fig. 2h).In this middle zone the deposit is mantled by the two main falldeposits from plinian eruptions that occurred at Nevado de Toluca,the 21.7 ka Lower Toluca Pumice (LTP, Capra et al., 2006) and the∼10.5 ka Upper Toluca Pomice (UTP, Arce et al., 2003) (Fig. 2h). In thedistal portion (after the break in slope, Fig. 2b), the deposit maintainsthe textural characteristics as previously described (mMsf in thelateral ravine, and mMs in the middle channel, Fig. 2l and m) withmaximum thickness of 18 m (Fig. 2i and n).
The El Morral-DAD is a debris avalanche deposit, heterolithologicin composition, with hummocky surface morphology and jigsawstructures (Fig. 3a and b) (Galgano, 2006). Proximal outcrops areabsent, and the deposit crops out at a distance of 6 km from itsprobable detachment zone (Grieco, 2006). The thickness increasesfrom 4 m in correspondence of the middle zone to a maximum of40 m on the distal area (11 km from the detachment zone). Thetexture is chaotic and generally strongly weathered, matrix to clastsupported with a gray-sandy indurated matrix. Clasts are pebble toboulder in size, sub-angular to rounded in shape. The middle zone ischaracterized by massive and matrix supported outcrops, whereas inthe distal zone the amount of clasts increases.
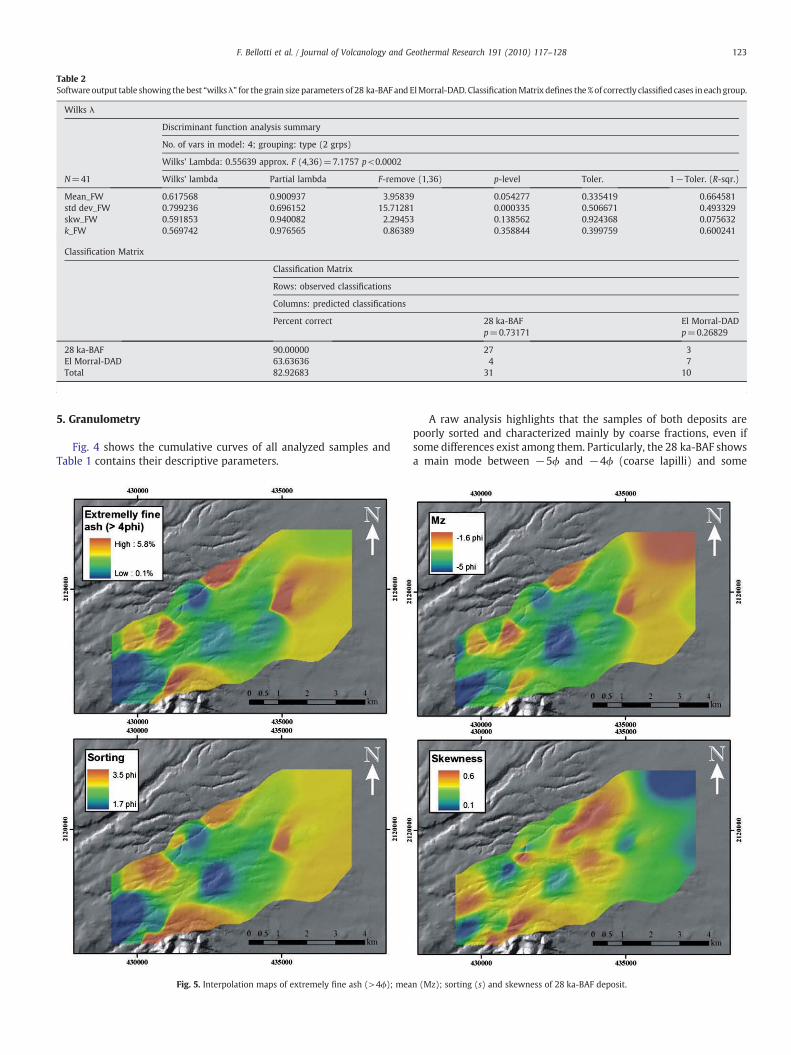
Table 2Software output table showing the best “wilksλ” for the grain size parameters of 28 ka-BAF and ElMorral-DAD. ClassificationMatrix defines the%of correctly classifiedcases in eachgroup.
Wilks λ
Discriminant function analysis summary
No. of vars in model: 4; grouping: type (2 grps)
Wilks' Lambda: 0.55639 approx. F (4,36)=7.1757 p<0.0002
N=41 Wilks' lambda Partial lambda F-remove (1,36) p-level Toler. 1−Toler. (R-sqr.)
Mean_FW 0.617568 0.900937 3.95839 0.054277 0.335419 0.664581std dev_FW 0.799236 0.696152 15.71281 0.000335 0.506671 0.493329skw_FW 0.591853 0.940082 2.29453 0.138562 0.924368 0.075632k_FW 0.569742 0.976565 0.86389 0.358844 0.399759 0.600241
Classification Matrix
Classification Matrix
Rows: observed classifications
Columns: predicted classifications
Percent correct 28 ka-BAFp=0.73171
El Morral-DADp=0.26829
28 ka-BAF 90.00000 27 3El Morral-DAD 63.63636 4 7Total 82.92683 31 10
123F. Bellotti et al. / Journal of Volcanology and Geothermal Research 191 (2010) 117–128
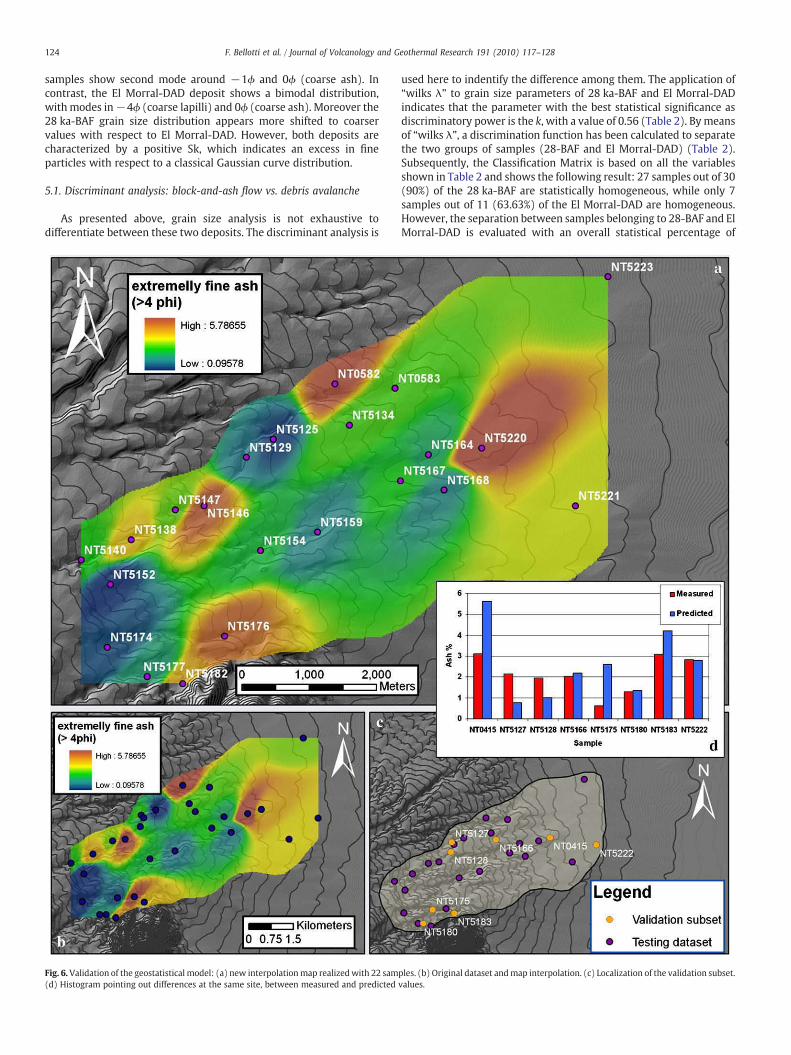
5. Granulometry
Fig. 4 shows the cumulative curves of all analyzed samples andTable 1 contains their descriptive parameters.
Fig. 5. Interpolation maps of extremely fine ash (>4ϕ); mea
A raw analysis highlights that the samples of both deposits arepoorly sorted and characterized mainly by coarse fractions, even ifsome differences exist among them. Particularly, the 28 ka-BAF showsa main mode between −5ϕ and −4ϕ (coarse lapilli) and some
n (Mz); sorting (s) and skewness of 28 ka-BAF deposit.
124 F. Bellotti et al. / Journal of Volcanology and Geothermal Research 191 (2010) 117–128
samples show second mode around −1ϕ and 0ϕ (coarse ash). Incontrast, the El Morral-DAD deposit shows a bimodal distribution,withmodes in−4ϕ (coarse lapilli) and 0ϕ (coarse ash). Moreover the28 ka-BAF grain size distribution appears more shifted to coarservalues with respect to El Morral-DAD. However, both deposits arecharacterized by a positive Sk, which indicates an excess in fineparticles with respect to a classical Gaussian curve distribution.
5.1. Discriminant analysis: block-and-ash flow vs. debris avalanche
As presented above, grain size analysis is not exhaustive todifferentiate between these two deposits. The discriminant analysis is
Fig. 6. Validation of the geostatistical model: (a) new interpolationmap realizedwith 22 sam(d) Histogram pointing out differences at the same site, between measured and predicted
used here to indentify the difference among them. The application of“wilks λ” to grain size parameters of 28 ka-BAF and El Morral-DADindicates that the parameter with the best statistical significance asdiscriminatory power is the k, with a value of 0.56 (Table 2). By meansof “wilks λ”, a discrimination function has been calculated to separatethe two groups of samples (28-BAF and El Morral-DAD) (Table 2).Subsequently, the Classification Matrix is based on all the variablesshown in Table 2 and shows the following result: 27 samples out of 30(90%) of the 28 ka-BAF are statistically homogeneous, while only 7samples out of 11 (63.63%) of the El Morral-DAD are homogeneous.However, the separation between samples belonging to 28-BAF and ElMorral-DAD is evaluated with an overall statistical percentage of
ples. (b) Original dataset andmap interpolation. (c) Localization of the validation subset.values.
125F. Bellotti et al. / Journal of Volcanology and Geothermal Research 191 (2010) 117–128
82.92%. This high percentage represents a good result and confirmsthe validity of this approach to better distinguish among volcaniclasticdeposits.
6. Geostatistical analysis
Using geostatistics and considering spatial map distributions ofdescriptive statistical parameters,more informationabout sedimentationand depositional processes can be obtained for pyroclastic densitycurrent such as block-and-ash flow (BAF). In fact, the spatialinterpolation of these values better describes and displays theirvariations in thewhole deposit area not onlywith respectwith distancefrom the source but also in relation to the morphology of the area. Themaps realized for 28 ka-BAF are described below.
The extremely fine ash (>4ϕ, and here referred as fines) and theMz maps (Fig. 5a and b) were realized to show the granulometricspatial distribution of the 28 ka-BAF deposit. These maps show thatthe deposit along the main flow direction is fine depleted with respectto the deposit on lateral and distal zones. In particular, as alreadydescribed, proximal outcrops show the lower fine content (mCslithofacies), while in lateral andmore elevated ravines the deposit hasthe higher values (mMsf lithofacies).
The map of σI distribution (Fig. 5c) highlights a heterogeneousspatial behaviour of this variable. Particularly, in the middle zone thedeposit is well sorted (with σI values range between ϕ 1.71 and ϕ 2.20;Table 1). The σI value increases in lateral and distal zones, reaching arange of ϕ 2.85 up to ϕ 3.80, where it is indicating a poor sorting(Table 1).
The spatial distribution map of Sk (Fig. 5d) provides similarinformation about the 28 ka-BAF grain size, showing the spatialvariation of the fine tail of the studied deposit. The Sk map displaysvalues comprised between 0.46 and 0.60 along lateral sides (fine tail)(Table 1) but with values close to 0 in themiddle zone (Gaussian curve)(Fig. 1c).
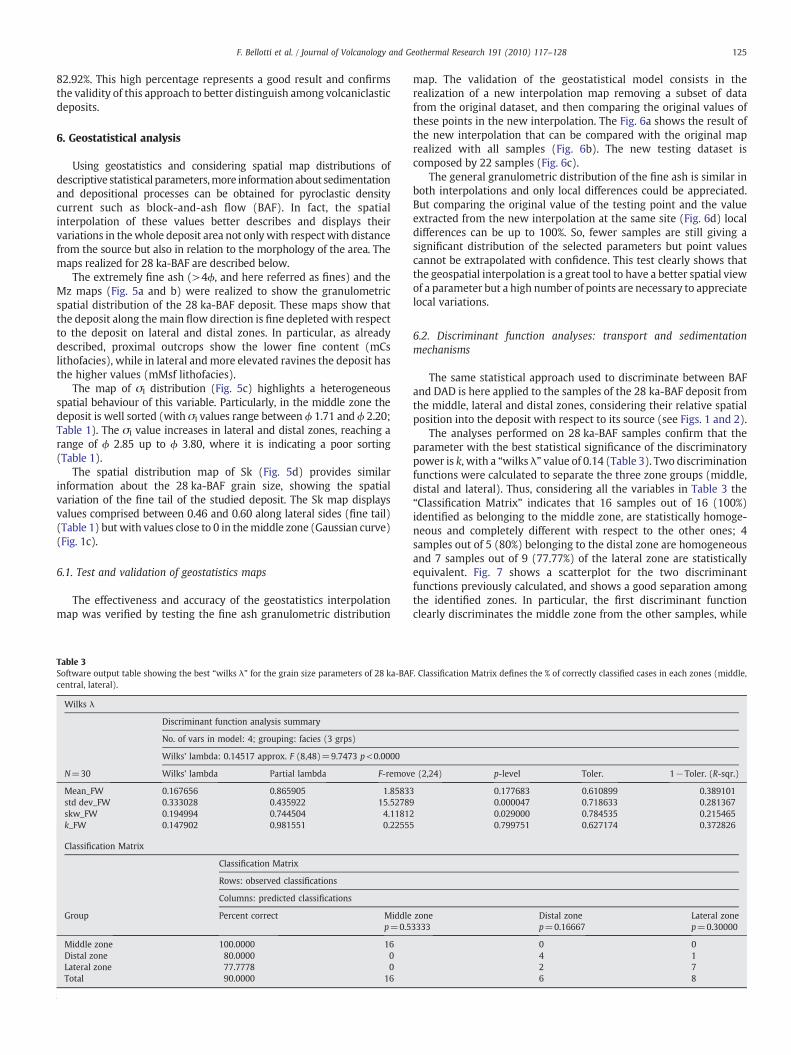
6.1. Test and validation of geostatistics maps
The effectiveness and accuracy of the geostatistics interpolationmap was verified by testing the fine ash granulometric distribution
Table 3Software output table showing the best “wilks λ” for the grain size parameters of 28 ka-BAFcentral, lateral).
Wilks λ
Discriminant function analysis summary
No. of vars in model: 4; grouping: facies (3 grps)
Wilks' lambda: 0.14517 approx. F (8,48)=9.7473 p<0.0000
N=30 Wilks' lambda Partial lambda F-remov
Mean_FW 0.167656 0.865905 1.85833std dev_FW 0.333028 0.435922 15.52789skw_FW 0.194994 0.744504 4.11812k_FW 0.147902 0.981551 0.22555
Classification Matrix
Classification Matrix
Rows: observed classifications
Columns: predicted classifications
Group Percent correct Middlep=0.5
Middle zone 100.0000 16Distal zone 80.0000 0Lateral zone 77.7778 0Total 90.0000 16
map. The validation of the geostatistical model consists in therealization of a new interpolation map removing a subset of datafrom the original dataset, and then comparing the original values ofthese points in the new interpolation. The Fig. 6a shows the result ofthe new interpolation that can be compared with the original maprealized with all samples (Fig. 6b). The new testing dataset iscomposed by 22 samples (Fig. 6c).
The general granulometric distribution of the fine ash is similar inboth interpolations and only local differences could be appreciated.But comparing the original value of the testing point and the valueextracted from the new interpolation at the same site (Fig. 6d) localdifferences can be up to 100%. So, fewer samples are still giving asignificant distribution of the selected parameters but point valuescannot be extrapolated with confidence. This test clearly shows thatthe geospatial interpolation is a great tool to have a better spatial viewof a parameter but a high number of points are necessary to appreciatelocal variations.
6.2. Discriminant function analyses: transport and sedimentationmechanisms
The same statistical approach used to discriminate between BAFand DAD is here applied to the samples of the 28 ka-BAF deposit fromthe middle, lateral and distal zones, considering their relative spatialposition into the deposit with respect to its source (see Figs. 1 and 2).
The analyses performed on 28 ka-BAF samples confirm that theparameter with the best statistical significance of the discriminatorypower is k, with a “wilks λ” value of 0.14 (Table 3). Two discriminationfunctions were calculated to separate the three zone groups (middle,distal and lateral). Thus, considering all the variables in Table 3 the“Classification Matrix” indicates that 16 samples out of 16 (100%)identified as belonging to the middle zone, are statistically homoge-neous and completely different with respect to the other ones; 4samples out of 5 (80%) belonging to the distal zone are homogeneousand 7 samples out of 9 (77.77%) of the lateral zone are statisticallyequivalent. Fig. 7 shows a scatterplot for the two discriminantfunctions previously calculated, and shows a good separation amongthe identified zones. In particular, the first discriminant functionclearly discriminates the middle zone from the other samples, while
. Classification Matrix defines the % of correctly classified cases in each zones (middle,
e (2,24) p-level Toler. 1−Toler. (R-sqr.)
0.177683 0.610899 0.3891010.000047 0.718633 0.2813670.029000 0.784535 0.2154650.799751 0.627174 0.372826
zone3333
Distal zonep=0.16667
Lateral zonep=0.30000
0 04 12 76 8
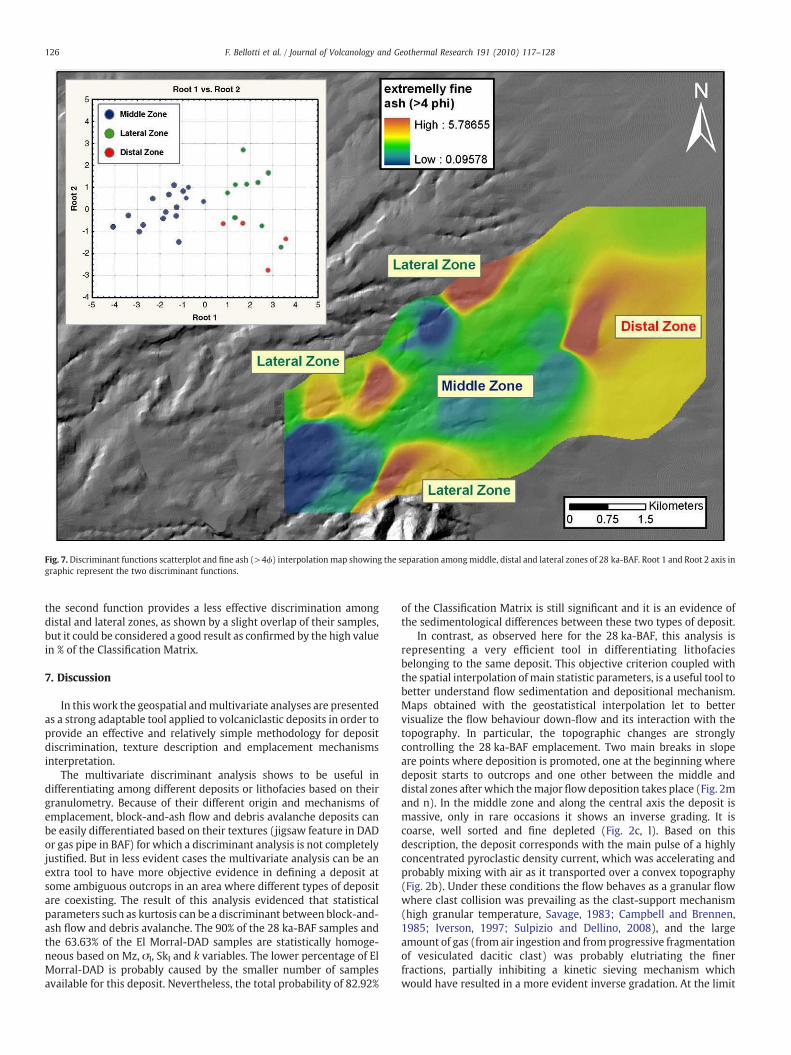
Fig. 7. Discriminant functions scatterplot and fine ash (>4ϕ) interpolationmap showing the separation amongmiddle, distal and lateral zones of 28 ka-BAF. Root 1 and Root 2 axis ingraphic represent the two discriminant functions.
126 F. Bellotti et al. / Journal of Volcanology and Geothermal Research 191 (2010) 117–128
the second function provides a less effective discrimination amongdistal and lateral zones, as shown by a slight overlap of their samples,but it could be considered a good result as confirmed by the high valuein % of the Classification Matrix.
7. Discussion
In this work the geospatial andmultivariate analyses are presentedas a strong adaptable tool applied to volcaniclastic deposits in order toprovide an effective and relatively simple methodology for depositdiscrimination, texture description and emplacement mechanismsinterpretation.
The multivariate discriminant analysis shows to be useful indifferentiating among different deposits or lithofacies based on theirgranulometry. Because of their different origin and mechanisms ofemplacement, block-and-ash flow and debris avalanche deposits canbe easily differentiated based on their textures (jigsaw feature in DADor gas pipe in BAF) for which a discriminant analysis is not completelyjustified. But in less evident cases the multivariate analysis can be anextra tool to have more objective evidence in defining a deposit atsome ambiguous outcrops in an area where different types of depositare coexisting. The result of this analysis evidenced that statisticalparameters such as kurtosis can be a discriminant between block-and-ash flow and debris avalanche. The 90% of the 28 ka-BAF samples andthe 63.63% of the El Morral-DAD samples are statistically homoge-neous based on Mz, σI, SkI and k variables. The lower percentage of ElMorral-DAD is probably caused by the smaller number of samplesavailable for this deposit. Nevertheless, the total probability of 82.92%
of the Classification Matrix is still significant and it is an evidence ofthe sedimentological differences between these two types of deposit.
In contrast, as observed here for the 28 ka-BAF, this analysis isrepresenting a very efficient tool in differentiating lithofaciesbelonging to the same deposit. This objective criterion coupled withthe spatial interpolation of main statistic parameters, is a useful tool tobetter understand flow sedimentation and depositional mechanism.Maps obtained with the geostatistical interpolation let to bettervisualize the flow behaviour down-flow and its interaction with thetopography. In particular, the topographic changes are stronglycontrolling the 28 ka-BAF emplacement. Two main breaks in slopeare points where deposition is promoted, one at the beginning wheredeposit starts to outcrops and one other between the middle anddistal zones after which themajor flow deposition takes place (Fig. 2mand n). In the middle zone and along the central axis the deposit ismassive, only in rare occasions it shows an inverse grading. It iscoarse, well sorted and fine depleted (Fig. 2c, l). Based on thisdescription, the deposit corresponds with the main pulse of a highlyconcentrated pyroclastic density current, which was accelerating andprobably mixing with air as it transported over a convex topography(Fig. 2b). Under these conditions the flow behaves as a granular flowwhere clast collision was prevailing as the clast-support mechanism(high granular temperature, Savage, 1983; Campbell and Brennen,1985; Iverson, 1997; Sulpizio and Dellino, 2008), and the largeamount of gas (from air ingestion and from progressive fragmentationof vesiculated dacitic clast) was probably elutriating the finerfractions, partially inhibiting a kinetic sieving mechanism whichwould have resulted in a more evident inverse gradation. At the limit
127F. Bellotti et al. / Journal of Volcanology and Geothermal Research 191 (2010) 117–128
with the distal zone where a break in slope takes place (resulting in aconcave topographic profile), the flow rapidly decelerates inducing amassive depositional process. In contrast, in the lateral zone thatcorresponds with secondary ravines, which are shallower and athigher altitude (Fig. 2), the deposit is still massive, poorly sorted, andenriched in extremely fine ash fraction (mMsf lithofacies) and gaspipe is also common. Its massive texture and the presence of gas pipeagainst the absence of more than one depositional unit or an inversegradation point to a partially fluidized, matrix supported mechanismof transport (i.e. Branney and Kokelaar, 2002; Sulpizio and Dellino,2008), where sedimentation of particles induce fluid expulsion whichdelays settling. At the same time part of the fluid remains entrapped inthe flow favouring clast supporting. The interpretation here presentedwould benefit of a more detailed sedimentological study such asvertical granulometric and componentry profiles but, as previouslypointed out, it is quite impossible and dangerous to perform a verticalsampling.
Geospatial interpolation of data and their superimposition overthe topography are here giving an immediate visualization of the flowbehaviour during emplacement, facilitating data interpretation. But itis worth mentioning that the methodology here proposed is not a toolto have a better distribution in case of lack of samples. The inter-polation is not used here to supply the absence of outcrops sincepyroclastic density current are not uniform flows and they are highlysensible to topographic changes. Nevertheless in a general view, thevalidation test demonstrated that a good samples allocation into astudied deposit could satisfactorily approximate its granulometricdistribution, providing a general and descriptive tendency ofbidimensional textural characteristics of the deposit.
8. Concluding remarks
The spatial interpolation obtained with geostatistical criteria hasbeen used in this work to enhance sedimentological data description,starting from classical grain size analysis.
The aim of this approach is to provide a continuous spatialcharacterization of clast size, sorting and matrix distribution into avolcaniclastic deposit, in substitution of classic xy diagrams wherestatistical parameters are plotted against down-flow distance.
Once the maps of the grain size parameters are realized, it isimmediately possible to compare their distributions and highlight thedifferences in depositional processes also with respect to topographicchanges.
The discriminant function could be a useful tool to compare vol-caniclastic deposit with different origin, like BAF and DAD. Particularly,in this paper we observed that the 28 ka-BAF and El Morral-DADdeposits have different texture and clast distribution, which led to anobjective discrimination.
The geostatistical approach and spatial representation of texturalfeature of a deposit represents a powerful tool and plays an importantrole to visualize the texture of volcaniclastic deposits, providingfurther information to explain their sedimentation and depositionalmechanism as showed here for the 28 ka-BAF.
This methodology could be an interesting approach to improvemore classical analyses of volcaniclastic deposits, especially where aclear field classification appears problematic. Our study is an exampleof the strong versatility of geospatial analysis that can be applied as adifferent approach to furnish an effective and relatively simple meth-odology for the description of texture and emplacementmechanismofvolcaniclastic deposits.
Acknowledgments
This work was supported by the CONACYT 46340 grant to LuciaCapra. We would like to thank L. Borselli for the Decolog 2.0 setup andhelpful suggestions that significantly improve this work. Thanks to L.
Carreras for the constructive discussions during the different stages ofthe work and for supporting us during the fieldwork sampling. The ElMorral-DAD mapping, sampling and grain size analysis wereproduced by the authors with contributions of F. Galgano and G.Groppelli. Comments of Volentik and an anonymous reviewer greatlyimproved the manuscript.
References
Arce, J.L., Macías, J.L., Vázquez-Selem, L., 2003. The 10.5 ka Plinian eruption of nevado deToluca volcano, Mexico: stratigraphy and hazard implications. Geological Society ofAmerica Bulletin 115 (2), 230–248.
Arce, J.L., Cervantes, K.E., Macías, J.L., Mora, J.C., 2005. The 12.1 ka Middle TolucaPumice: a dacitic Plinian–subplinian eruption of Nevado de Toluca in CentralMexico. Journal of Volcanology and Geothermal Research 147 (1–2), 125–143.
Bellotti, F., Capra, L., Casartelli, M., D'Antonio, M., De Beni, E., Gigliuto, A., Groppelli, G.,Lunghi, R., Macías, J.L., Merlini, A., Norini, G., Pasquarè, G., Sarocchi, D., 2003.Preliminary geological and structural data about Nevado de Toluca Volcano (Mexico).Volcanic evolution of a complex stratovolcano and information for hazard evaluation.Regional Geomorphology Conference, Geomorphic Hazards: Towards the Preventionof Disasters, Mexico City, October 27th–November 2nd, 2003.
Bellotti, F., Capra, L., Casartelli, M., D'Antonio, M., De Beni, E., Gigliuto, A., Lunghi, R.,Merlini, A., Norini, G., Sarocchi, D., 2004. Geology of Nevado de Toluca Volcano(Mexico). 32nd International Geological Congress, Florence, 22–28 Agosto 2004.
Bellotti, F., Capra, L., Groppelli, G., Norini, G., 2006. Tectonic evolution of the central-eastern sector of Trans Mexican volcanic belt and its influence on the eruptivehistory of the Nevado de Toluca Volcano (Mexico). Journal of Volcanology andGeothermal Research 158, 21–36 Special Issue.
Bloomfield, K., Sánchez Rubio, G., Wilson, L., 1977. Plinian eruptions of Nevado deToluca. Volcanology Geological Rundschau 66 (1), 120–146.
Branney, M.J., Kokelaar, P., 2002. Pyroclastic Density Currents and Sedimentation ofIgnimbrites: Geological Society, London Memoirs, vol. 27. 143 pp.
Caballero, A. M. L., 2007. Análisis textural del depósito de avalancha de escombros “Elzaguán”, volcan Nevado de Toluca: dinámica de transporte y mecanismos deemplazamiento. Posgrado en Ciencias de la Tierra, Instituto de geofísica, UNAM 16de febrero del 2007.
Campbell, C.S., Brennen, C.E., 1985. Computer simulation of granular shear flows.Journal of Fluid Mechanics 151, 167–188.
Capra, L., Borselli, L., Varley, N., Norini, G., Gavilanes, J.C., Sarocchi, D., Caballero, L., 2010.Rainfall-triggered lahars at Volcán de Colima, Mexico: surface hydro-repellency asinitiation process. Journal of Volcanology and Geothermal Research 189 (1–2),105–117.
Capra, L.,Macías, J.L., 2000. Pleistocene cohesive debrisflows atNevadode Toluca Volcano,central Mexico. Journal of Volcanology and Geothermal Research 102 (1/2), 149–167.
Capra, L., Macías, J.L., 2002. The cohesive Naranjo debris flow deposit (10 km3): a dambreakout flow derived from the pleistocene debris-avalanche deposit of Nevado deColima volcano (México). Journal of Volcanology and Geothermal Research 117,213–235.
Capra, L., Carreras, L., Arce, J.L., Macías, J.L., 2006. The lower Toluca pumice: a 21,700 yrB.P. plinian eruption of the Nevado de Toluca volcano, Mexico. GSA Special Volume“Neogene–Quaternary Continental Margin Volcanism: A Perspective fromMexico”,vol. 402, pp. 155–174.
Capra, L., Norini, G., Groppelli, G., Macías, J.L., Arce, J.L., 2008. Volcanic hazard zonation ofNevado de Toluca Volcano. Journal of Volcanology and Geothermal Research 176,469–484.
Carreras-Soriano, L., Capra, L., 2008. Estudio granulométrico comparativo de losdepósitos epiclásticos en ambientes volcánicos. Revista Mexicana de CienciasGeológicas 25 (1), 97–114.
Cressie, N., 1991. Statistics for Spatial Data. Wiley and Sons, Inc, NY, p. 900.D'Antonio, M., Capra, L., Sarocchi, D., Bellotti, F., 2008. Reconstrucción del evento eruptivo
asociado al emplazamiento del flujo piroclástico El Refugio hace 13 ka, volcán Nevadode Toluca (México). Revista mexicana de Ciencias Geologicas 25, 115–134.
Davis, J.C., 1973. Statistics and Data Analysis in Geology. John Wiley & Sons, Inc., NY.Folk, R.L., 1980. Petrology of Sedimentary Rocks. Hemphill, Austin, TX. 182 pp.Folk, R.L., Ward, W.C., 1957. Brazos river bar: a study in the significance of grain size
parameters. Journal of Sedimentary Petrology 27 (1), 3–26.Galgano, F., 2006. Studio stratigrafico e caratterizzazione sedimentologica del versante
sud- orientale del vulcano Nevado de Toluca (Messico). Università degli Studi diMilano. Degree Thesis.
Gao, S., Collins, M., 1991. A critique of the McLaren Method for defining sedimenttransport paths: discussion. Journal of Sedimentary Petrology 61 (1), 143–146.
Gao, S., Collins, M., 1992. Sand sediment tranport patterns inferred from grain-size trendsbased upon definition of “transport vectors”. Sedimentary Geology 80, 47–60.
Garcia-Palomo, A., Macías, J.L., Arce, J.L., Capra, L., Espíndola, J.M., Garduno, V.H., 2002.Geology of Nevado de Toluca Volcano and surrounding areas, central Mexico.Geological Society of America Map and Chart Series, MCH089.
García-Palomo, A.,Macías, J.L., Garduno, V.H., 2000.Miocene to Recent structural evolutionof theNevadodeToluca volcano region, CentralMexico. Tectonophysics 318, 281–302.
Goovaerts, P., 1997. Geostatistics for Natural Hazard Evaluation. Oxford UniversityPress, London.
Grieco, F., 2006. Evoluzione geologica del versante sud-orientale del Nevado de Toluca(Messico) e implicazioni per la valutazione della pericolosità vulcanica. Universitàdegli Studi di Milano, Degree Thesis.

128 F. Bellotti et al. / Journal of Volcanology and Geothermal Research 191 (2010) 117–128
Houlding, S.W., 2000. Practical geostatistics. Modelling and Spatial Analysis. Springler-Verlag, Berlin.
Inmann, D.L., 1952. Measures for describing the size distribution of sediments. Journalof Sedimentary Petrology 22 (3), 125–145.
Iverson, R.M., 1997. The physics of debris flows. Reviews of Geophysics 35, 254–296.Journel, A.G., Huijbregts, Ch.J., 1978. Mining Geostatistics. Academic Press, London.Kaye, B.H., 1999. Characterization of Powder and Aerosols, 1. Wiley-VCH, New York.
312 pp.Kellerhals, R., Bray, D.I., 1971. Sampling procedures for coarse fluvial sediments. Journal
of Hydraulics Division 97 (HY8), 1165–1180.Koyaguchi, T., Ohno, M., 2001. Reconstruction of Eruption Column Dynamics on the
Basis of Grain Size of Tephra Fall Deposits, 2, Application to the Pinatubo 1991Eruption, p. 6513.
Macías, J.L., García-Palomo, A., Arce, J.L., Siebe, C., Espindola, J.M., Komorowski, J.C.,Scott, K.M., 1997. Late Pleistocene–Holocene cataclysmic eruptions at Nevado deToluca and Jocotitlán Volcanoes, Central Mexico. In: Kowallis, B.J. (Ed.), Proterozoicto Recent Stratigraphy, Tectonics, and Volcanology, Utah, Nevada, Southern Idahoand Central Mexico: BYU Geology Studies, pp. 493–528.
Mastin, L.G., Guffanti, M., Servranckx, R.,Webley, P., Barsotti, S., Dean, K., Durant, A., Ewert,J.W., Neri, A., Rose, W.I., Schneider, D., Siebert, L., Stunder, B., Swanson, G., Tupper, A.,Volentik, A.,Waythomas, C.F., 2009. Amultidisciplinary effort to assign realistic sourceparameters to models of volcanic ash-cloud transport and dispersion duringeruptions. Journal of Volcanology and Geothermal Research 186 (1–2), 10–21.
McLaren, P., Bowles, D., 1985. The effects of sediment transport on grain sizedistributions. Journal of Sedimentary Petrology 55 (4), 457–470.
Myabuchi, Y., 1999. Deposits associated with the 1990–1995 eruption of Unzenvolcano, Japan. Journal of Volcanology and Geothermal Research 89, 139–158.
Pardo, M., Suárez, G., 1993. Steep subduction geometry of the Rivera Plate beneath theJalisco block in Western Mexico. Geophysical Research Letters 20 (21), 2391–2396.
Pérez-Campos, X., Kim, Y., Husker, A., Davis, P.M., Clayton, R.W., Iglesias, A., Pacheco, J.F.,Singh, S.K., Manea, V.C., Gurnis, M., 2008. Horizontal subduction and truncation of the
Cocos Plate beneath central Mexico. Geophysical Research Letters 35, L18303.doi:10.1029/2008GL035127.
Poizot, A., Mear, Y., Thomas, M., Garnaud, S., 2006. The application of geostatistics indefining the characteristic distance for grain size trend analysis. Computers &Geosciences 32, 360–370.
Ponce, L., Gaulon, R., Suárez, G., Lomas, E., 1992. Geometry and state of stress of thedowngoing Cocos Plate in the Isthmus of Tehuantepic, Mexico. GeophysicalResearch Letters 19 (8), 773–776.
Sarocchi, D., 2006. Análisis textural del depósito de flujos de bloques y ceniza del 17 dejulio de 1999 en el volcán de Colima: Universidad Nacional Autónoma de México,Instituto de Geofísica. PhD dissertation, 222 pp.
Savage, S.B., 1983. Granular flows down rough inclines — review and extension. In:Jenkins, J.T., Satake, M. (Eds.), Mechanics of Granular Materials: New Models andConstitutive Relations. Elsevier, Amsterdam, pp. 261–281.
Schwarzkopf, L.M., Schmincke, H.U., Cronin, S.J., 2005. A conceptual model for block-and-ash flow basal avalanche and deposition, based on deposit architecture of 1998 and1994 Merapi flows. Journal of Volcanology and Geothermal Research 139, 117–134.
Scott, K.M., 1988. Origin, behavior, and sedimentology of lahars and lahar-runout flows intheToutle-CowlitzRiverSystem.U.S.Geological SurveyProfessional Paper1447-A(74).
Stein, R., 1985. Rapid grain-size analysis of clay and silt fraction by Sedigraph 5000D:comparision with Coulter Counter and Atterberg methods. Journal of Sedimentarypetrology 55 (4), 590–615.
Sulpizio, R., Dellino, P., 2008. Sedimentology, depositional mechanisms and pulsatingbehaviour of pyroclastic density currents. In: Gottsman, J., Marti, J. (Eds.), CalderaVolcanism: Analysis, Modelling and Response. : Developments in Volcanology, vol.10. Elsevier, Amsterdam, pp. 57–96. doi:10.1016/S1871-644X(07)00002-2.
Walker, G.P.L., 1971. Grainsize characteristics of pyroclastic deposits. Journal of Geology79, 696–714.
Watson, D.F., Philip, G.M., 1985. A refinement of inverse distance weightedinterpolation. Geoprocessing 2, 315–327.
White, J.D.L., Houghton, B.F., 2006. Primary volcaniclastic rocks. Geology 34 (8), 677–680.


