Embed Size (px)
Citation preview

&)YR5 - 2 6 4'
POLICY RESEARCH WORKING PAPER 2256
Geographical Disadvantage What effect does distancehave on costs for economies
at different locations? Exports
A Heckscher-Ohlin-von Thunen and imports of final and
Model of International Specialization intermediate goods beartransport costs that increase
with distance Production andAnthony J. Venables
trade depend on factorNuno Limdo
endowments and factor
intensities as well as on
distance and the transport
intensities of different goods.
The World Bank
Development Research Group
Trade UDecember 1999
Pub
lic D
iscl
osur
e A
utho
rized
Pub
lic D
iscl
osur
e A
utho
rized
Pub
lic D
iscl
osur
e A
utho
rized
Pub
lic D
iscl
osur
e A
utho
rized

POLICY RESEARCH WORKING PAPER 2256
Summary findings
The combination of distance, poor infrastructure, and Countries close to the economic center may specializebeing landlocked by neighbors with poor infrastructure in transport-intensive activities; countries further outcan make transport costs many times higher for some become diversified, producing and sometimes tradingdeveloping countries than for most others. more goods; countries still further out may become
Drawing on two traditions of economic modeling - import-substituting (replacing some of their importsHeckscher-Ohlin trade theory and von Thunen's work from the center with local production); in the extreme,on the "isolated state" - Venables and Limao analyze regions become autarkic. More remote locations havethe trade and production patterns of countries located at lower real incomes.varying distances from an economic center. Globalization changes the terms of trade, improving
Predicting a country's production and trade pattern the welfare of regions further out from economicrequires knowledge of the country's location, its factor centers, though reducing the welfare of closer regions.endowment, and the factor intensities and transport Where will a new activity, such as assembly of a newintensities of goods. product, locate? Remote locations are disadvantaged if
Venables and Limao define transport intensity and the product has high transport intensity (perhaps becauseshow how location and transport intensity should be of heavy requirements for intermediate inputs). But thecombined with factor abundance and factor intensity in costs of remoteness are already incorporated into thedetermining trade flows. A theory based on only one set factor prices of those regions, which makes them moreof those variables, such as factor abundance, will attractive. Which location is chosen depends, therefore,systematically make incorrect predictions. on how existing activities compare with the new activity
They report that geography and endowments interact in transport intensity and factor intensity.in such a way that the world divides up into economiczones with different trade patterns.
This paper - a product of Trade, Development Research Group - is part of a larger effort in the group to study the locationof economic activity. Copies of the paper are available free from the World Bank, 1818 H Street, NW, Washington, DC20433. Please contact Lili Tabada, room MC3-333, telephone 202-473-6896, fax 202-522-1159, email [email protected]. Policy Research Working Papers are also posted on the Web at wvwv.worldbank.org/research/workingpapers. The authors may be contacted at [email protected] or ngl4eacolumbia.edu. December 1999. (29pages)
The Policy Research Working Paper Series disseminates the findings of work in progress to encourage the exchange of ideas about
development issues. An objective of the series is to get the findings out quickly, even if the presentations are less than fully polished. Thepapers carry the names of the authors and should be cited accordingly. The findings, interpretations, and conclusions expressed in this
paper are entirely those of the authors. They do ,not necessarily represent the view of the World Bank, its Executive Directors, or thecountries they represent.
Produced by the Policy Research Dissemination Center

Geographical disadvantage:a Heckscher-Ohlin-von Thunen model of international specialisation.
Anthony J. Venables*World Bank and London School of Economics.
Nuno LimaoColumbia University
* Thanks to participants in seminars at the World Bank, the University of Colorado, Boulder, andUniversity of California, Santa Cruz.
JEL number: F10Keywords: trade, specialisation, transport costs.
Author's address:A.J. VenablesWorld Bank1818 H Street NWWashington DC 20433
email: [email protected]

"I

Non-technical summary:'Geographical disadvantage: a Heckscher-Ohlin-von Thunen model of international specialization' A.J.Venables and N. Limao
Distance is a powerful explanatory variable in determining trade flows, as is demonstrated by countlessapplications of the gravity model, yet trade theory has remarkably little to say about its implications.How do distance and the associated transport costs determine not just the volume of trade, but also thepatterns of trade, industrial structure, factor prices and income across countries? This question isparticularly important for developing countries, some of which, even after trade liberalization, findparticipation in world trade impeded by transport costs and other real barriers to trade. Thecombination of distance, poor infrastructure, and perhaps also being landlocked by neighbours withpoor infrastructure, can make transport costs many times higher for some developing countries than formost developed countries. For example, the costs of shipping a standard container from Baltimore tovarious West African destinations varies from $3,000 (Cote D'Ivoire), through $7,000 (Benin, BurkinaFaso) to $13,000 (Central African Republic). These costs have dramatic effects in choking off tradevolumes -- estimates suggest that doubling transport costs can reduce trade flows by around 80%.Landlocked countries typically have average transport costs around 50% higher than otherwise similarcoastal economies, giving trade volumes two-thirds lower (see Limao and Venables 1999).
The analysis of this paper is intended to be suggestive of the effects of these costs of distanceon economies at different locations. Our approach is to take as given the existence of a centre ofeconomic activity and show how the structure and income of countries varies as we move fromlocations close to this centre to locations which are more remote. The analysis is based on acombination of two traditions of economic modelling. One is the spatial economic analysis developedoriginally in von Thunen's celebrated work on the 'isolated state' (von Thunen (1826), Samuelson(1983)). Following this approach we assume the existence of a central location and a set of moreremote locations. Locations at greater distance receive lower prices for their exports to the centre, andpay higher prices for any goods they import from the centre. The other tradition is the factor abundanceapproach of Heckscher-Ohlin trade theory, based on locations having fixed endowments of severaltypes of factors of production and goods having different factor intensities. Thus, whereas vonThunen' s regional analysis assumed that workers could move costlessly between locations, we interpretlocations as countries and assume that workers (and other factors of production) are geographicallyimmobile.
Our main results are, first, that the interaction of geography and endowments will generallycause the world to divide up into economic zones. Countries close to the centre may specialise intransport intensive activities. Moving further out, locations become diversified producing more goodsand possibly (although not necessarily) trading more of them. Still further out, regions may becomeimport substituting (replacing some of their imports from the centre with local production), and in theextreme, regions become autarkic. More remote locations have lower real incomes, although theincomes of particular factors of production may rise or fall, depending on the factor intensities of theproducts being produced and the factor endowments of the countries.
Second, predicting the production and trade pattern of a country requires that we know both itsfactor endowment and the factor intensities of goods, and its location and the transport intensities ofgoods; the analysis offers a precise definition of transport intensity and shows how location/ transportintensity should be combined with factor abundance/ factor intensity in determining trade flows. Atheory based on just one of these sets of variables - eg factor abundance - will give systematically

incorrect predictions.Third, we turn to a simple analysis of globalization, taken to be a reduction in transport costs
on all activities. This is similar to moving all locations closer to the centre and tends to raise incomes.However, it also typically turns the terms of trade against non-central locations. On balance we findregions close to the centre experiencing welfare loss, and those further out gaining.
Finally, we address the question of where a new activity - such as assembly of a new product- might locate. Remote locations are disadvantaged if the product has high transport intensity (dueperhaps to high imported intermediate input requirements). However, the costs of remoteness arealready incorporated in the factor prices of these regions, increasing their attractiveness. The chosenlocation therefore depends on comparison of the transport intensity and factor intensity of the newactivity with the intensities of existing activities.

1: Introduction:
Distance is a powerful explanatory variable in determining trade flows, as is demonstrated by
countless applications of the gravity model, yet trade theory has remarkably little to say about its
implications. How do distance and the associated transport costs determine not just the volume of
trade, but also the patterns of trade, industrial structure, factor prices and income across countries?
This question is particularly important for developing countries, some of which, even after trade
liberalization, find participation in world trade impeded by transport costs and other real barriers to
trade. The combination of distance, poor infrastructure, and perhaps also being landlocked by
neighbours with poor infrastructure, can make transport costs many times higher for some
developing countries than for most developed countries.' These costs have dramatic effects in
choking off trade volumes -- estimates suggest that doubling transport costs can reduce trade flows
by around 80%. Landlocked countries typically have average transport costs around 50% higher
than otherwise similar coastal economies, giving trade volumes two-thirds lower (see Limao and
Venables 1999).
The analysis of this paper is intended to be suggestive of the effects of these costs of distance
on economies at different locations. Our approach is to take as given the existence of a centre of
economic activity and show how the structure and income of countries varies as we move from
locations close to this centre to locations which are more remote. We see that the world divides up
into zones with different production activities, factor prices, and real incomes. Some of these zones
are export oriented, others import substituting, and some, in the extreme, may be autarkic.
The analysis is based on a combination of two traditions of economic modelling. One is the
spatial economic analysis developed originally in von Thunen's celebrated work on the 'isolated
1

state' (von Thunen (1826), Samuelson (1983)). Following this approach we assume the existence of
a central location and a set of more remote locations. Locations at greater distance receive lower
prices for their exports to the centre, and pay higher prices for any goods they import from the
centre. The other tradition is the factor abundance approach of Heckscher-Ohlin trade theory, based
on locations having fixed endowments of several types of factors of production and goods having
different factor intensities. Thus, whereas von Thunen' s regional analysis assumed that workers
could move costlessly between locations, we interpret locations as countries and assume that
workers (and other factors of production) are geographically immobile. We also work with a more
general production structure than is usual in these models, allowing commodities produced in the
centre to be produced elsewhere, and adding intermediate goods in order to study the location of
final assembly activities, important in many countries' development.
Combining these traditions gives outcomes determined by the interaction of two types of
country characteristics with two types of commodity characteristics. The country characteristics are
location and endowment of primary factors, and the commodity characteristics are transport intensity
and factor intensity. We show how the interaction of these elements determines the pattern of trade
and production. Thus, it is possible that all locations have the same production structures - but only
if their endowments vary in a particular way, to cancel out changing locational effects. More
generally, the world divides into economic zones, with both inter- and intra- zone differences in
economic structures depending on location and endowments. Our results show a theory based on
just one of these sets of interactions - for example, just factor abundance and factor intensity - will
give systematically incorrect predictions.
We regard the model developed in the paper as a 'benchmark' model, showing how to
2

combine traditional comparative advantage and spatial economics, but ignoring many important
considerations. In particular, the model is based entirely on constant returns to scale, perfect
competition, and absence of market imperfections. We therefore abstract from the 'linkages' and
cumulative causation processes studied in much of the new economic geography.2
The paper is organised as follows. In the following section we outline the model. Section 3
characterizes the equilibrium, first by looking at an illustrative example, and then by fuller analysis
of the various zones of specialisation that form. Section 4 discusses comparative statics, both for
their intrinsic interest, and to get a sense of the generality of the results of section 3. Section 5 looks
at real income across space and illustrates how globalization -- taken to be a uniform reduction in all
transport costs -- may benefit some locations and harm others. Section 6 looks at the attractiveness
of different locations for production of a newly tradeable activity, and section 7 concludes.
2. The model
Our model will, in the tradition of von Thunen, take as given a central location in which
there is a concentration of certain economic activities. The central location has the defining
properties that (a) there is one good (or composite of goods) that is exported by the central location,
(b) the central location imports all other tradeable goods,3 and (c) all other locations can be arranged
on a line going through the centre. Assumptions (a) and (b) are restrictive, but not out of line with
the context of this paper. For example, we can think of the central location as the established
manufacturing regions, and take these to be exporters of a range of high technology manufactures (or
services). We allow these goods to be used in other locations both for final consumption and as
intermediates in production. We do not model the reason for the centre's trade pattern although this
3

could easily be done, by giving the centre the appropriate factor endowment, or some Ricardian
advantage, or by modelling agglomeration forces binding production of certain goods to the centre.
Assumption (c) restricts the geography of the world to be one dimensional. We doubt that the
generalisation to two dimensions would change qualitative results.
Locations away from the centre are endowed with two immobile factors of production, and
we have to determnine the mix of goods that each produces and trades. All goods are subject to trade
costs which depend on the distance shipped, so arbitrage generates price functions over the space;
these price functions have to be lined up with production costs in locations where a good is
produced. We shall see that this determines factor prices in all locations and gives rise to zones in
which different mixes of goods are produced.
Turning to a more formal model description, let us assume that there are three tradable
goods, which will be subscripted 0, 1 and 2. The geographical space is the real line, points on which
are labelled z so, for example, pi(z) and xi(z) denote the price and production of good i at location z.
We take point 0 as the central location, and look only at points to the right of 0 ( z > 0), since the
concentration of activities at 0 means that there is no interaction between economies on either side
of this point.
Goods are subject to iceberg trade costs, so to deliver one unit of good i from location r to
location z, ti(r, z) 2 1 units have to be shipped. We assume that these costs are exponential, so Ti(r,
z) = exp[tilr - zl]. We are able often to focus on transport costs between the centre and location z,
and write ti(z) =- i(O, z) = exp[t, z].
The central location has a predetermined pattern of trade, exporting good 0 and importing
goods I and 2. The price of xo at location 0 is unity, so the border price at location z is simply ro(z).
4

Income at the central location we assume to be fixed in terms of the good 0 (an assumption that can
easily be given micro-foundations). The centre's imports of the other two goods, denoted c,(O), are.
given by import demand functions,
Cl(O) = c1(P1(O),p2 (0)), c2(0) = C2((0)P 2 (O)), (1)
which we assume to be strictly positive.
Other locations, z > 0, are endowed with quantities of two factors, labour and capital; we
denote these L(z), K(z), and assume that they are zero beyond some value of z which defines the
edge of the economy.4 Factor prices are w(z) and r(z), creating income levels
y(z) - w(z)L(z) + r(z)K(z). (2)
Consumers at each location consume all three goods. Their utility is u(z) and their preferences are
described by a homothetic expenditure function, so the equality of income to expenditure is
y(z) = ep 0(Z),P1(Z)'P2 (Z))u(z)- (3)
Each of these locations can produce the goods x0, xi and x2, using primary factors and possibly also
good x0 as an intermediate; unit costs are expressed as bi (w(z), r(z), po(z)), i = 0, 1, 2. In any
location where good i is produced price equals unit cost, so
pi(z) < bi(w(z), r(z),po(z)), xi(z) Ž 0, complementary slack, i = 0, 1, 2. (4)
Factor market clearing at each location is given by
5

Z3bo(w, r,po) abl(w, r,p0 ) ab 2 (W, r,p0 )
aw aw aw(5)
Kbo(w, rip) x b1(W,r,p0 ) + b2(W( rP0 )(5K(z) x0() 0ar a~ 1 z r a 2 Z r
It remains to determine the price functions, pi(z), and these are illustrated on figure 1. First
consider p0 (z). Since this is numeraire, po(O) = 1, and as we move away from z = 0 the price function
increases exponentially, deterring imports of the good. We define ZO as the first location across
which there is no outwards flow of good 0. (Or equivalently, there is no net import demand for good
0 coming from the right of ZO; such a point may or may not exist). To the left of Z4 the price is set
by imports from the centre, so p0(z) = r0(z). Locations beyond z0 are 'disconnected' from the
centre, and have p0(z) < To(z) (if this inequality were reversed, it would be profitable to supply them
from the centre). We assume that all such locations are self-sufficient in good 0, so have price
poj(z) implicitly defined by the equality of local supply and demand (coming from consumption and
from intermediate demand),
poa(z) = bo (w(z), r(z), poa(Z)), with
ae p0 (z),P1(Z),p2(z)) Lb (6)x0(Z) = u(z) + i. .x(z)
This is illustrated by the wiggly line poa(z). What underlying assumption supports self sufficiency
of these regions? A sufficient condition is that To(r, r + s)pO'(r) > po'(r + s) for all r, r + s > ZO .
This says that if locations r and r + s are self sufficient, it is not worthwhile shipping between them.
It will be satisfied providing p a(z) does not vary too much between locations, which is in turn
6

ensured if relative endowments do not vary too much.5 We make this assumption from now on.
Summarizing, we have price function po(z) given by:
For z < z, P0(z) = to(Z)
For z = z0*, P0(z) = To(Z) = pj (Z). (7)
For z > z, P(z) = p j(Z) •'To(Z)
Notice that it may not be the case that all locations in (0, zo*) import good 0 from the centre. For
example, some locations in (0, z) m could export good 0, but providing there is still an outwards
flow of the good through these locations, they will have price given by po(z) = lo(Z)-
The determination of the price functions for the other two goods, pI(z) and p2(z), has two
components -- the level of the functions, as determined by central prices p,(O) and P2(0), and their
shapes away from the centre. The shapes depend on transport costs, in a manner analogous to po(z),
although since these products are shipped to the centre, the function has negative gradient, as
illustrated on figure 1. We define zj* and Z2 as the furthest locations across which there is no flow
of good 1 (respectively 2) to the centre. To the left of these points prices are set by central prices net
of transport costs, and to the right we assume that locations are self-sufficient. We therefore have,
fori= 1,2:
For z < zi , Pj(Z) = Pi(°)/Ti(Z).
For z = zi , Pi(Z) = Pi (0)Iri(Z) = Pia(Z) (8)
For z > zi*' pi(z) Pi(Z) ' Pi(Ž)/Tg(Z).
Finally, we must find the level of the price functions by finding pj(0) and P2(O). This is determined
7

by overall supply and demand for each good, which takes the form,
Joi(z)dz = c(O) + Ae (z)dp1(z),P2(z)) u(z)dz + T.
T _f o f(z) _ae(p 0 (z),p1 (z)'p2(z)) u(z) (Ti(z) - 1)dz
where demand consists of consumption demand at the centre, at all other points, and also quantities
of the good used up in shipping, Ti, as given in the second equation.
3. Zones of specialisation
We are now in a position to investigate characteristics of the equilibrium, and we start by looking at
the pattern of specialisation across countries. This is most easily done if we first illustrate the
equilibrium, and then investigate its properties analytically.
3.1: Illustration: We start by illustrating an example constructed with good 1 having a higher
transport intensity than good 2 -- we offer a precise definition of transport intensity later. In the
example endowments are assumed to be the same in all locations (further details of the example are
given in the appendix). Figure 2 gives the gross output of industries across locations (measured on
the horizontal axis), figure 3 gives the exports and imports of each location, and figure 4 the
cumulated trade flows from outlying regions to the centre. Figure 5 gives the real income and factor
8

prices at each location. The figures show how the world economy divides up into zones, and we
discuss each of those zones in turn. Fuller description and analysis follows in the next sub-section.
At low values of z, i.e. locations close to the centre, there is a region which we label zone I.
Locations in this zone specialise in good 1, the relatively transport intensive good, exporting this
good and importing goods 0 and 2.
Adjacent is zone II, defined as the set of locations producing goods 1 and 2 and exporting
good 1. As we move outwards across zone II production of 1 falls and production of 2 increases,
with locations beyond some point becoming exporters of good 2 (see figure 3). The shift from good
1 to good 2 production occurs because of the lower transport intensity of good 2. The fact that there
is more than one immobile factor means that - unlike in von Thunen - there is not complete
specialisation of regions, but instead this area of overlap within which both activities are active. The
two goods have different factor intensities -- we label factors such that good 2 is capital intensive --
and this gives the diverging factor prices illustrated in figure 5.
Moving further out again, we enter zone mI, in which it is not profitable to export good 1.
This occurs as we pass point z,*, so that locations become self sufficient in good 1, while continuing
to export good 2.
Zone IV is one of import substitution - good 0 has become so expensive that it is profitable
to produce it locally. Within this zone each location imports good 0 and exports good 2, but in
smaller quantities as we move further out. In our example good 0 is relatively labour intensive, and
this brings the change in direction in relative factor prices (figure 5). Eventually, in zone V, there is
autarky. The dividing line between zones IV and V is location zJ = Z; the two points must
coincide, because of payments balance.
9

While figure 3 gives the trade flows of each location, it is also instructive to look at the flow
of goods across locations, and this is given in figure 4, in which the curves for goods 1 and 2 are
cumulative exports from outer locations towards the centre, and for good 0, cumulative imports of
outer locations from the centre. We see that zi* is the first point at which there is no flow of good 1
to the centre; since all locations to the left of this point are net exporters of good 1, the flow
increases steadily as we approach the centre. For goods 0 and 2, flows go to zero on the boundary
between zones IV and V. Notice that for good 2 the cumulative flow curve increases steadily until
some point in zone II at which production of good 2 drops below consumption. The curve then
declines, until its intercept with the vertical axis gives the quantity of good 2 delivered to the centre.
3.2: Analysis: The example raises a number of issues which we now address analytically, zone by
zone.
Zone I: Let us initially take as given the existence of a zone of specialisation close to the centre,
labelling goods such that good 1 is produced in the zone. Production is characterised by
p, (0) = r(z)b1 (w(z), r(z), To(Z)), (z) p2(O) - t (z)b2 (w(z), r(z), ToZ)) < 0 (10)
where the first equation says that good I's marginal cost of supply (inclusive of transport costs)
equals the price in the centre, and the second defines (p(z) as the amount by which the central price
of good 2 exceeds or falls short of industry 2 cost (including the cost of shipping) at location z; since
it is not profitable to produce this good in zone I, we have p(z) < 0. Factor market clearing at each
location in zone I implies
10

ab1lew L(z)
db/lar K(z)
What happens as we move outwards from the centre, while staying within zone I? We find the
answer by totally differentiating (10) and (11). As we do this (and subsequent exercises) we denote
proportionate changes in variables with respect to a change in z by A, and the shares of labor, capital,
and intermediates in production in industry i by aj, Pi, y respectively (a, + P1i + y1 = 1). The
derivative of (11) is, from the definition of the elasticity of substitution6, a1, (L - K) = ( -
Using this in the total derivative of industry l's break even condition (equation (10)) gives the
following expressions for the changes in factor prices:
(K -L) 3 1/a, - (t1 +y1to)
1 _-)
(12)(L - K)al /la - (ti +'yito )
r =-I - Y1
These say that changes in factor prices are driven by two components. One is transport costs on
good 1 and on the intermediate good 0, causing both factor prices to fall equi-proportionately. The
other is changing relative factor endowments, as measured by L - K. In figure 5 we assumed that
L K, so w and r both decline at the same rate. If, however, L - K 0 0, then one of the factor
prices may increase if its endowment becomes sufficiently scarce at more distant locations.
Movements in factor prices hold industry 1 at break-even, and also change the potential
profitability of industry 2, p(z). The movement of p(z) within zone I is
11

tl 1 tO t 2 +72 to + A0 2 (13)~2= _~~0 1 2 + (K-L) ~ (1_ 2 2 ( (13)
l Y2 1 - 71 1 - Y2 (1-72)02 (1 7 )Y1,
(derived by totally differentiating the expression in (10) and using (12)). Industry 2 is moving
towards profitability if v > 0. Suppose first that relative endowments are uniform across space, so
K - L = 0. Good 2 is then moving towards profitability if the first term is positive, and we shall
say that good 2 is relatively transport unintensive (good 1 is relatively transport intensive) if this
holds, i.e.
good 1 transport intensive: I10 +1_ t .2 (14)I -]' 1 -72
These expressions give the proportionate change in transport costs -- on sales and on imported
inputs -- from an increase in distance, per unit value added (since 1 -yj is the share of primary
factors in costs). We see immediately that good 1 is more transport intensive the larger is t, and the
larger is the share of imported inputs in its costs, y,.
Two comments are in order. First, the condition tells us that it is not transport costs per unit
value output that matter in determining location. Instead it is transport costs per unit value added,
since this is the criterion which minimises resource cost per unit sales, as we know from the
literature on effective protection. Second, since transport costs are exponential in distance the terms
t; are constants, and if technologies are Cobb-Douglas, so too are the yp. More generally however,
we cannot rule out 'transport intensity reversals'.
We can see from equation (13) that if relative endowments are uniform, then the good
12

produced in zone I must be that which is more transport intensive. If not, equation (13) would be
negative, (p(z) would be decreasing, and good 2 would never produced, which cannot be an
equilibrium. What we have shown then is that the intuition that transport intensive goods are
produced close to the centre is formalised in the first term of equation (13) and the definition of
transport intensity.
What if K - L • 0? The profitability of good 2 in different locations then depends both on
its relative transport intensity and on the changing relative factor abundance of these locations. This
is most readily interpreted if the elasticities of substitution in the two industries are the same, in
which case the second term in (13) is proportionate to (K - L)(a1f32 - axf3). If regions become
more capital abundant and good 2 is capital intensive (so 1i32 - %PI > 0) then this is positive,
promoting the profitability of industry 2. More generally, equation (13) tells us how to combine the
relative transport intensities of industries with their comparative advantage due to factor intensity
differences. Transport costs are more important relative to factor endowments the greater is the
difference in factor intensities between the two products, and the higher are the elasticities of
substitution between primary factors.
Zone HI: In zone II both goods 1 and 2 are produced, and the production mix changes as we move to
more distant locations. Zero profit conditions for the two industries are,
p1(O) = T(z)b,(w(z), r(z), zO(z)),(15)
P2 (0) = T2(z)b2(w(z), r(z), to(Z)),
and totally differentiating these equations we derive the following expression for the change in
13

relative factor prices,
(1- )(2 +YTA) O (1 'Y2)(tI M lO)w -r =ap i (16)
cc11½ a201
The denominator of expression (16) gives the relative capital-labour ratios of the two industries, and
is positive if industry 1 is labour intensive. The numerator gives the correct way of measuring the
effects of changing location as transmitted through transport costs, and is the expression for relative
transport intensity that we saw in equation (13). If good 1 is transport intensive this is negative and
w/r (the relative price of the factor intensive in good 1) decreases at more distant locations. This
causes both industries to become more labour intensive, so full employment of factors requires that
industry 1 - the labour intensive sector - shrinks and industry 2 expands, giving the changing
industry production levels that we see in zone U of figure 2.
It is worth noting that each location in zone II has the characteristics of a Heckscher-Ohlin
economy. Equation (16) says that factor prices change only because of transport costs, and are
independent of factor endowments and preferences (termed 'factor price insensitivity' by Leamer
and Levinsohn 1995). The reason is of course that the number of goods which are both produced
and traded (two) is the same as the number of factors. As a corollary, we know how any variations
in endowments affects production -just through Rybczynski effects.
The factor price changes as we move across zone I are of interest in their own right.
Expressing each separately we have,
14

W=1 (t2 +1y2t0) - 02 (tl + Ylt0 )
a1f 2 - a21 1
(17)a2(t, +Y1 t,) - a](t2 +'72t0 )
a12 - afi3
Intuition on these comes from Stolper-Samuelson, although the expressions are complicated by the
fact that both output prices and the intermediate input price are changing. If only good 1 is subject
to transport costs, we have the usual Stolper-Samuelson effects; as we move away from the centre r
increases and w falls, and this fall is larger than the price fall (since P2 > (aA1 2 - %Pa)). More
generally, it is possible that both factor prices fall, although not that both rise. These are nominal
changes; the real changes (deflated by the unit expenditure function) are shown in figure 5, and we
see Stolper-Samuelson effects in operation.
Zone III: Locations in zone Im export good 2, are self sufficient in good 1, and import all their good
0. The price - cost equations are
P2(0) = T2 (z) b2(w(z), r(z), x0 (z)),
'r0(z) < bO(w(z), r(z), T0 (z)).
The first equation says that, for good 2, price is set by sales to the centre; the second says that
exports of good 1 to the centre are not profitable, so the price is the self-sufficiency price; the third
says that it is cheaper to import good 0 than to produce it domestically. Notice that economies in
zone Im are not 'Heckscher-Ohlin like': only one good (good 2) is both produced and traded, and as
15

a consequence factor prices depend on local endowments and local preferences (since these enter the
self-sufficiency price, P,a(Z))
Although the inequality in the second equation (18) implies that it is not worth any zone III
location selling good 1 to the centre, we must ensure that it is not profitable to export to some other
location -- eg a neighbouring point in zone HI. Location z cannot profitably export to location s + z
if cost differences between the locations are less than transport costs on the product, i.e, if p,(z) <
t1(s)p1(s+z). As discussed earlier, this condition will be satisfied providing differences in factor
endowments between the locations are not too large.
Zone IV: lmport substitution commences in this region, with locations producing all three goods.
Since both good 0 and good 2 are traded with the centre, prices satisfy,
p(z) = lo(z) = bo(w(z), r(z), Tr(z)),(19)
p 2 (0) = T2 (Z)b 2 (W(Z), r(z), T(Z)).
Good 1 is produced just for local sale, as in (18). Equations (19) determine factor prices, and totally
differentiating them we derive
2(l- yo)tO + OP(t2 + M2tO)
aOp2 - a2PiO
r= 2(l 7o)to + a(t 2 +7 2to)] (20)
aOP2 - a2%0
(1 - YO)O + t2 )
162 - a20
16

Like zone II, these economies have factor prices independent of endowments and preferences. The
technical coefficients and transport intensities that determine these prices are now those of industries
2 and 0, and the equations are different in form from those that apply in zone II (equations 18)
because good 0 is an input to production. We see that w and r must move in opposite directions,
with w increasing if good 0 is labour intensive compared to good 2.
Zone V: In autarky prices are all set by local supply and demand, with prices of goods 1 and 2
exceeding the border prices (pi(z) = pia(Z) > pi(O)/r1i(z) for i = 1,2) and the price of good 0 less
than the border price (p0(z) = p0(z) <
4. Comparative statics
Figures 2 - 5 do not illustrate the only possible configuration of regions. Obviously, it is
possible to select the factor endowment of a particular point in a way such that the point produces,
say, just good 1. In general, how does the structure of these zones depend on parameters of the
model?
4.1: Demand: The sizes of the zones depend on overall supply and demand for the goods. For
example, consider the effects of reducing the centre's demand for good 1. This will shrink zone I
and, if demand is small enough, cause it to disappear, so zone II then runs up to the centre. Even so,
the general point remains that transport intensive industries will produce close to the centre, unless
transport intensity effects are overturned by variations in endowments.
17

4.2: Transport costs: In section 5 we investigate the effects of reductions in transport costs that
affect all sectors. What about differences in transport costs between industries? The relative
transport intensities of industries 1 and 2 determine where each is located, as previously discussed.
The more similar are the transport intensities of industries 1 and 2, then the wider will be the zones
in which both are produced. What about good O? If transport costs on this good are very low then
import substitution zones (IV and V) will not occur, while if they are sufficiently high zone HI will
not exist (domestic production of good 0 will start in the region where both goods 1 and 2 are
exported).
4.3: Factor intensities: How do our results depend on the factor intensities of the different
industries? The relative intensities of goods 1 and 2 is simply a matter of labelling (we have made 1
the more labor intensive). The more similar the factor intensities of the two goods, the sharper are
the changes in production patterns across space (recall that if there is a single factor then there are no
areas of overlap) and the smaller the changes in relative factor prices. Good 0 is, in the example
illustrated in the figures, made labour intensive relative to both goods. Changing this would not
change the zones of specialisation, but would alter the factor price story illustrated on figure 5; if
good 0 were the most capital intensive good then, instead of converging, relative factor prices would
diverge further as we move out to zones IV and V.
4.4: Factor endowments: We saw in section 3.2 that the production mix within zones depends on
factor endowments, and so too can the overall arrangement of the zones. Evidently, patterns of
endowment can be constructed to give different patterns of specialisation. A few intuitive points
18

can be made. For example, suppose that more remote locations are more abundant in labour, the
factor used intensively in the transport intensive sector; then this will tend to shift the zone W1/III
boundary further to the right, since the more labour intensive good (good 1) will continue to be
produced at the more labour intensive locations. Alternatively, we could ask, what pattern of factor
endowments holds the relative exports of goods 1 and 2 the same for all locations? If both goods 1
and 2 are traded, then the configuration is as described in zone II. If the transport intensive sector is
labour intensive, then the wlr ratio falls at further locations, (as in figure 5), making production in
both sectors more labour intensive. To hold relative trade levels constant, further locations must
therefore have more labour intensive endowments.7 The main point to note is that in this case,
although factor endowments vary across space, the pattern of trade does not - the differential
transport intensities overturn Heckscher-Ohlin predictions about the pattern of trade.
5. Transport costs and real incomes
Figure 5 illustrates that real income falls steadily the further are locations away from the centre, up
to the point at which they are autarkic. For given endowments, the change in real income is - to a
first order approximation obtained by differentiating (3) - simply the change in transport costs
times the value of trade,
- tozm0 z p1 zI 1 z ( $z2 2 z( y(z) y(z) y(z) ) (21)
Ž 0 <0 ?
where m,(z) is net imports of good i at location z, so the bracketed terms are import and export
19
shares in income. Imports are non-negative for good 0, non-positive for good 1 (exported or self-
sufficient at all locations), and for good 2, switch from being positive to negative in zone II. The
main point to note from this is that the real income loss arises on all elements of the gross trade
flows - on imports and exports, and on intermediates as well as final goods; these might be large
relative to value added, y(z), the denominators in this expression.
What happens if transport costs in all sectors increase or decrease? The simplest experiment
is to change all transport costs equi-proportionately while holding central prices, pi(O), constant. An
increase in transport costs is then just a stretching of the horizontal axis of figures 2 - 5, and a
decrease a compression (zones all move further from the centre), meaning that the zones further out
might cease to exist. This says simply that if transport costs are low enough then even the furthest
zones will trade (zone V does not exist), may not be import substituting (zone IV does not exist),
and may perhaps continue to export good 1 (zone m1 does not exist). Holding prices constant, all
locations away from the centre experience a real income increase as a consequence of the lower
transport costs.
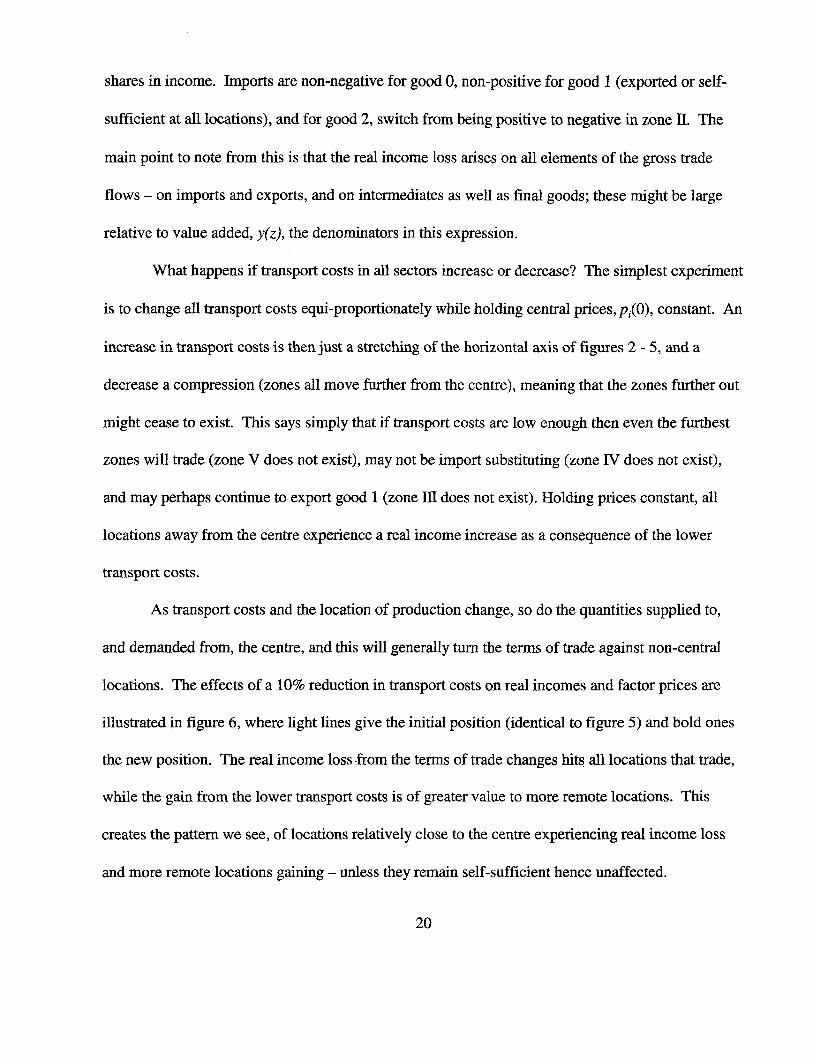
As transport costs and the location of production change, so do the quantities supplied to,
and demanded from, the centre, and this will generally turn the terms of trade against non-central
locations. The effects of a 10% reduction in transport costs on real incomes and factor prices are
illustrated in figure 6, where light lines give the initial position (identical to figure 5) and bold ones
the new position. The real income loss from the terms of trade changes hits all locations that trade,
while the gain from the lower transport costs is of greater value to more remote locations. This
creates the pattern we see, of locations relatively close to the centre experiencing real income loss
and more remote locations gaining - unless they remain self-sufficient hence unaffected.
20

6. Where are new activities located?
It is sometimes suggested that regions with high transport costs are disadvantaged as
locations for assembly production, or for other sorts of activity that can now be moved from their
traditional locations. Clearly, there is some truth in this, in so far as such activities may be transport
intensive, requiring both high volumes of imported inputs and the export of a high proportion of
their output. However, simple statements of the argument ignore the fact that distant locations
already bear a transport cost disadvantage on their exports, and that this is already incorporated in
their factor prices. To find the location where some new activity will become established, we must
therefore compare both its transport intensity and its factor intensity with those of existing activities.
To analyse this, let us take the equilibrium described so far, and suppose that a new good
(good 3) can now be produced at any location, and that at least part of its output will be shipped to
the centre. It will be produced in the location that offers the lowest unit cost, including transport,
i.e. the z that minimizes T3 (z) b3 (w(z), r(z), To(Z)). Using our previous example, we can find, for
different values of good 3's transport intensity and factor intensity, the location where this is
minimised.8
Results are plotted on figure 7. The horizontal axis is the labour-capital ratio for good 3, and
the two points marked are the labour-capital ratios for goods 1 and 2. The vertical axis is the
transport intensity of good 3, (t3 + 7 3 t0 ) /(1 - 7 3 ), and the points marked are the transport intensities
of goods 1 and 2. Regions of the figure are labelled according to the zone in which production of
good 3 is cheapest.
The figure is quite complex, but we see that the location of good 3 depends on transport
21

costs and factor intensities in intuitive ways. It will locate closer to the centre, the higher its
transport intensity, (t3 + 7 3tO)1(l - W3) When it is more transport intensive than goods 1 and 2 it
will locate in zone I, adjacent to the centre (0/I), unless it is also more labour intensive than both of
them - in which case it may go to the location at the far edge of zone 1I (the zone II/III boundary),
where the wage is lowest relative to the capital rental rate (see figure 5). Conversely, if good 3 is
less transport intensive than goods I and 2 then it will it locate in (or on the edge of) of the import
substituting or autarky regions, unless it is very much less labour intensive, in which case it may be
drawn to the far edge of zone I (zone YIl boundary), where r/w is low. In the intermediate range of
transport intensity we see that the cost minimising location could be in zones L II or Im, and is
further out the more labour intensive is good 3; once again, this follows from the relative values of
wir in figure 5.
The general point is then that location of new investment depends on both its transport
intensity and its factor intensity, each relative to those of existing activities. However, since the
pattern of location of existing activities is itself endogenous and varying across space, the details are
inevitably complex.
7. Concluding comments
Transport costs vary widely across goods and across locations, typically reaching peaks for
landlocked developing countries (see Limao and Venables (1999)). A theory of trade that ignores
these costs will yield systematically incorrect predictions about trade patterns, industrial structure,
and factor incomes. This paper shows how to combine transport costs with a standard factor
abundance trade model. There are several main findings.
22

First, although the model has an essentially Heckscher-Ohlin structure (each location has
primary factors that can be used in any of the constant returns industries), factor endowments and
factor intensities are not sufficient to predict the structure of production or pattern of trade. This
also depends on the location of the country - in particular its remoteness from the economic centre -
and on the transport intensity of goods. A precise definition of transport intensity is given,
depending on the costs of shipping both final output and the intermediates used in production.
Second, remoteness reduces real income, other things being equal. Its effects on the prices
of different factors is more complex, depending on the interactions between transport intensity and
factor intensity; it is possible that the return to particular factors may peak at locations away from
the centre. Transport costs are the reason for the real income penalty suffered by remote regions, but
reducing transport costs will not necessarily benefit all regions. Induced supply responses will cause
terms of trade changes, so typically a reduction in transport costs will increase real income in
relatively remote regions, but may reduce it in less distant regions.
Finally, we consider the location of a newly tradable activity. Remote regions need not be a
poor location for the activity, since their remoteness is already reflected in their factor prices.
Choice of location depends on both the factor intensity and the transport intensity of the new
activity, compared to these intensities in existing activities.
23

Appendix:
Figures 1 - 4 are constructed with Cobb-Douglas preferences with expenditures equally divided
between the three goods. Technologies are Cobb-Douglas with input share coefficients:
Labour Capital Good 0
Good 0 0.62 0.38 0
Good 1 0.435 0.315 0.25
Good 2 0.336 0.464 0.2
Good 3 0.33 0.42 0.25
Functions ti (z) are exponential, ti (z) = exp (tiz), with to = 0.25, t, = 0.3, t2 = 0.2, t3 = 0.2. This gives
transport intensities,
±I '-Y1 to ________t t3 Y3 t0= 0.483, + - 0.312, 0.35. (22)
171Y 1 -72 1 -73 =03.(2
The economy is one unit distance from centre to edge, so to deliver one unit of good 0 from centre
to edge requires that 1.284 (=exp(0.25) units be shipped; for goods 1 and 2 the corresponding
numbers are 1.35 and 1.22.
In section 5 transport costs are reduced to 90% of the levels given above. Terms of trade change
calculations are abased on the centre having import demand functions with elasticity of 2.
Endnotes:
1. The costs of shipping a standard container from Baltimore to various West African destinationsvaries from $3,000 (Cote D'Ivoire), through $7,000 (Benin, Burkina Faso) to $13,000 (CentralAfrican Republic). Estimates of transport costs and of the elasticity of trade with respect to transportcosts come from Limao and Venables (1999).
24

2. See Fujita, Krugman and Venables (1999) for development of these alternative models.
3. All goods can be produced at all locations, so these assumptions refer to trades not production
4. Of course, the factors capital and labour are just conventional labels. They can equally well bethought of as two types of labour or labour and land.
5. This statement can be made precise by mapping out how prices change with endowments. It iscomplex, and no particular insight is gained from so doing.
6. Assuming capital and labour are separable from the intermediate input.
7. This case corresponds to all locations that trade being in zone II. Factor prices then moveaccording to equation (16), from which it is straightforward to calculate endowments that holdrelative exports of goods 1 and 2 constant.
8. Our experiment is to ask where a 'small' amount of good 3 production will locate, given theinitial equilibrium prices. We do not allow production of good 3 to change factor prices.
References:
Fujita, M., P. Krugman and A.J. Venables, (1999) 'The spatial economy; cities, regions and
international trade', MIT Press, Cambridge.
Leamer, E. and J. Levinsohn, (1995), 'International trade theory; the evidence' in G. Grossman and
K. Rogoff (ed) Handbook of International Economics, vol mII, Elsevier, Amsterdam.
Limao, N. and A.J. Venables, (1999), 'Infrastructure, geographical disadvantage and transport costs',
processed, World Bank.
Samuelson, P.A. (1983), 'Thunen at Two Hundred', Journal of Economic Literature, XXI, 1468-88.
Von Thunen, J.H. (1826), 'Der Isolierte Staaat in Beziehung aufLandtschaft undNationalokonomie,
Hamburg. (English translation by C.M. Wartenburg von Thunen's Isolated State, Oxford,
Pergamon Press.
25

Price Pe(z) = exp[toz],"
Pi(O) iv A Z)
po(O) o() I
Pi((O) ' pi
pl(O)/to(z) = pl(O)exp[-t,z]
. , , --. , I . 1, . .o zj* zO* Locations, z.
Figure 1: Transport costs and prices
OutputOutput \Pl
X "\~~~~~~~~~~~~~~~px
Zone
I 'i v v0 z 1 * ZO*= Z2*
Locations, z.
Figure 2: Zones of specialization

Good I" Good 2
Exports
O . ... .. .. ... .. ... . . . . .. . .
Imports
I l II g III IV V
0Locations, z.
Figure 3: Trade flows
flow to Cumulative flow ofcentre "good 1 to centre
~~~~~~ Cumul~~~~ative flow of0~ ~~~~~~~~~~~~go 2 to entre
flowfrom Cumulative flow ofcentre good 0 from centre
I HIII 11 IV 1 V
0 z1* zO* Z2* Locations, z.
Figure 4: Trade flows to/ from the centre

Realincomes
Realr --- -
0
0~
l- \
0_ Rea w \0
o
0
Locations, z.
Figure 5: Factor prices and incomes
In
O
0
U,
10
o I
°o Locations, z.
Figure 6: Lower transport costs and real income:initial (light) and fimal (bold) levels.

Transportintensitygood 3. @
00
t1 - Yi to
t 2 + Y2 to 0lY2 0
N ~~~V III/IV
'(L/K) 2 1 (L/K)I
0.4 0.8 1.2 1.6 Labour/capital
ratio, (L/K)3
Figure 7: Location of a new activity


Policy Research Working Paper Series
ContactTitle Author Date for paper
WPS2240 The Effects of Land Registration on Frank F. K. Byamugisha November 1999 E. GelosFinancial Development and Economic 37846Growth: A Theoretical and ConceptualFramework
WPS2241 How Land Registration Affects Frank F. K. Byamugisha November 1999 E. GelosFinancial Development and Economic 37846Growth in Thailand
WPS2242 Confronting Competition: Investment Ritva Reinikka November 1999 H. SladovichResponse and Constraints in Uganda Jakob Svensson 37698
WPS2243 Designing Pro-Poor Water and Kristin Komives November 1999 M. SalehiSewer Concessions: Early Lessons 37157from Bolivia
WPS2244 True World Income Distribution, 1988 Branko Milanovic November 1999 P. Saderand 1993: First Calculations, Based 33902on Household Surveys Alone
WPS2245 Opportunities for Improving Susmita Dasgupta November 1999 Y. D'SouzaEnvironmental Compliance in Mexico 31449
WPS2246 Infrastructure's Contribution to David Canning November 1999 H. SladovichAggregate Output 37698
WPS2247 Does Deposit Insurance Increase Ashl Demirguc-Kunt November 1999 K. LabrieBanking System Stability? Enrica Detragiache 31001An Empirical Investigation
WPS2248 Privatization and Regulation of Antonio Estache November 1999 G. Chenet-SmithTransport Infrastructure in the 363701990s: Successes ... and Bugs toFix for the Next Millennium
WPS2249 Argentina's Transport Privatization Antonio Estache November 1999 G. Chenet-Smithand Re-Regulation: Ups and Downs Jose C. Carbajo 36370of a Daring Decade-Long Experience Gines de Rus
WPS2250 Universal Service Obligations in Omar Chisari November 1999 G. Chenet-SmithUtility Concession Contracts and Antonio Estache 36370the Needs of the Poor in Argentina'sPrivatizations
WPS2251 Will the Euro Create a Bonanza Daniel Cohen November 1999 H. VargasFor Africa? Nicolai Kristensen 37871
Dorte Verner

Policy Research Working Paper Series
ContactTitle Author Date for paper
WPS2252 Productivity Growth, Capital Ejaz Ghani December 1999 N. MensahAccumulation, and the Banking Vivek Suri 80546Sector: Some Lessons from Malaysia
WPS2253 Revenue Recycling and the Welfare Ian W. H. Parry December 1999 R. YazigiEffects of Road Pricing Antonio Miguel R. Bento 37176
WPS2254 Does "Grease Money" Speed Up Daniel Kaufmann December 1999 H. Sladovichthe Wheels of Commerce? Shang-Jin Wei 37698
WPS2255 Risk and Efficiency in East Asian Luc Laeven December 1999 R. VoBanks 33722


