Embed Size (px)
Citation preview

www.elsevier.com/locate/jconhyd
Journal of Contaminant Hydrology 69 (2004) 45–71
Geochemical characterization of acid mine drainage
from a waste rock pile, Mine Doyon,
Quebec, Canada
O. Sraceka,1, M. Choquettea, P. Gelinasa,R. Lefebvreb,*, R.V. Nicholsonc
aDepartment of Geology, Laval University, Quebec City, Quebec, Canada G1K 7P4b INRS-Eau, Terre et Environnement, Institut National de la Recherche Scientifique, 880 Chemin Sainte-Foy,
Bureau 840, C.P. 7500 Sainte-Foy, Quebec, Canada G1V 4C7cDepartment of Earth Sciences, University of Waterloo, Waterloo, Ontario, Canada N2L 4GI
Received 22 October 2002; accepted 2 July 2003
Abstract
Water quality in the unsaturated and saturated zones of a waste rock pile containing sulphides was
investigated. The main objectives of the project were (1) the evaluation of geochemical trends
including the acid mine drainage (AMD)-buffering mechanism and the role of secondary minerals,
and (2) the investigation of the use of stable isotopes for the interpretation of physical and
geochemical processes in waste rock. Pore water in unsaturated zone was sampled from suction
lysimeters and with piezometers in underlying saturated rocks. The investigation revealed strong
temporal (dry period vs. recharge period), and spatial (slope vs. central region of pile) variability in
the formation of acid mine drainage. The main secondary minerals observed were gypsum and
jarosite. There was a higher concentration of gypsum in solid phase at Site TBT than at Site 6,
suggesting that part of the gypsum formed at Site 6 in the early stage of AMD has been already
dissolved. Formation of secondary minerals contributed to the formation of AMD by opening of
foliation planes in waste rock, thus increasing the access of oxidants like O2 and Fe3 + to previously
encapsulated pyrite. The behavior of several dissolved species such as Mg, Al, and Fe2 + can be
considered as conservative in the leachate. Stable isotopes, deuterium and 18O, indicated internal
0169-7722/$ - see front matter D 2003 Elsevier B.V. All rights reserved.
doi:10.1016/S0169-7722(03)00150-5
* Corresponding author. Tel.: +1-418-654-2651; fax: +1-418-654-2615.
E-mail addresses: [email protected] (O. Sracek), [email protected] (R. Lefebvre).1 Present address: Institute of Geological Sciences, Faculty of Science, Masaryk University, Kotlarska 2, 611
37 Brno, Czech Republic.

O. Sracek et al. / Journal of Contaminant Hydrology 69 (2004) 45–7146
evaporation within the pile, and were used to trace recharge pulses from snowmelt. Isotope trends for34S and 18O(SO4) indicated a lack of sulfate reduction and zones of active oxidation of pyrite,
respectively. Results of numerical modeling of pyrite oxidation and gas and water transport were
consistent with geochemical and isotopic trends and confirmed zones of high evaporation rate within
the rock pile close to the slope. The results indicate that physical and chemical processes within the
pile are strongly coupled and cannot be considered separately when oxidation rates are high and
influence gas transport as a result of heat generation.
D 2003 Elsevier B.V. All rights reserved.
Keywords: Acid mine drainage; Waste rock pile; Geochemistry; Stable isotopes; Internal evaporation; Transport
modeling
1. Introduction
Acid mine drainage (AMD) represents significant environmental and financial
liability for the mining industry. It is caused by the oxidation of sulfides in mine
waste with resulting acidic conditions and mobilization of metals. There are two types
of mine waste. Mine tailings are the final product of ore treatment or processing and
are composed of sand and silt size particles. Waste rock is the non-economic material
removed from a mine to access the ore body. Particle size is generally large,
depending on the mechanical properties of the rock, and on the type of blasting
operation.
The AMD production in mine tailings has been studied extensively, for example by
Dubrovsky et al. (1985), Morin et al. (1988), and Blowes et al. (1991). In contrast,
much less is known about AMD generation from waste rock. Several waste rock
studies have evaluated temperature and gas concentration profiles (Harries and Ritchie,
1985; Lefebvre et al., 1993, 2001; Kuo and Ritchie, 1999). These studies revealed a
significant role of air convection in the unsaturated zone of very reactive waste rock
piles. However, the geochemical environment within waste rock piles is less well
known. Until recently, the focus on waste rock geochemical studies has been on the
quality of drainage water flowing out of the waste rock base (Morin et al., 1994). This
type of monitoring represents an integral over space and time of the acid drainage
produced in various parts of the dump. However, this information does not provide a
clear picture of geochemical processes within the pile (Ritchie, 1994). There have
been attempts to obtain data on water chemistry within the unsaturated zone of waste
rock piles (Shafer et al., 1994), but they were not very successful because of low
water content and correspondingly high suction values characteristic of semiarid
climate conditions in the Northwest USA. The acquisition of geochemical data from
the unsaturated zone of a waste rock pile remains a topic of on-going research (for
example, Smith et al., 1995; Stockwell et al., 2001). Our approach to the assessment
of water quality within waste rock deposits was based on sampling of leachate from
both unsaturated and saturated zones within the pile, combined with transport and
geochemical modeling, and solid phase analysis.

O. Sracek et al. / Journal of Contaminant Hydrology 69 (2004) 45–71 47
2. Site description
The study site is located between Rouyn-Noranda and Val d’Or in Abitibi, Quebec,
Canada (Fig. 1). The Mine Doyon is a gold mine that has been operating since 1978.
Initially, open pit mining was conducted with two pits excavated along the strike of the ore
body. Mining operations have been underground since 1989. Most of the excavated waste
rock exists in the South Dump covering an area of more than 50 ha and a volume of about
11.5 million m3 (Gelinas et al., 1994). More than half of this volume consists of sericite
schist, which is the host rock of the ore body. The height of local relief of the pile is 30–35
m between the highest points and the level of drainage ditches (Fig. 2). The AMD
production in the South Dump became apparent 2 years after the construction of the pile
and since 1988 the acid production appears to have attained steady state.
The sericite schist is the main contributor to acid generation. This rock type contains
more than 7% pyrite, generally distributed along schistosity planes. This rock occurs at
Site 6 and Site 7 in the southern part of the pile (Fig. 2). The northwest and central zones
of the pile contain low-grade ore associated with diorite at the top of the pile (a 5-m-thick
layer) at Site TBT (Fig. 2).
Acid drainage from the pile is discharged at the toe because the permeability of the
underlying rocks is very low. The effluent is pumped to a water treatment plant, where the
acidity is neutralized and heavy metals are precipitated. High-density sludge is stored in
special basins and the effluent is released to the Bousquet river in the proximity of the pile.
The south pile was studied by researchers from Laval University from 1990 to 1996
(Gelinas et al., 1992). There was drilling and instrumentation of seven boreholes through
Fig. 1. Site location.

Fig. 2. Site map.
O. Sracek et al. / Journal of Contaminant Hydrology 69 (2004) 45–7148
the entire thickness of the pile and in the upper part of the underlying rocks. The boreholes
were instrumented for multilevel sampling of gas and measurement of temperature in the
unsaturated zone, and for sampling of water in the saturated zone. Gravity drainage
lysimeters were also installed in the unsaturated zone, allowing sampling down to a depth
of about 4.0 m. Periodic sampling of water in ditches around the pile was also conducted.
Maximum temperatures in the profiles within the pile ranged from 45 to 70 jC.Lefebvre et al. (1993), used temperature data to derive thermal properties of waste rock
and to determine the pyrite oxidation rate (POR) using 1-D analytical models. That

O. Sracek et al. / Journal of Contaminant Hydrology 69 (2004) 45–71 49
investigation revealed an important role for air convection within the pile. There is a high
convection zone with upward air flow component adjacent to the slope and in the upper
part of the pile and low convection or diffusion zones at the lower elevations within and far
from the edges of the pile. Lefebvre (1994) modeled the AMD generation in the pile using
the non-isothermal multiphase flow model TOUGH AMD expanded from the code
TOUGH2 (Pruess, 1991).
This study focused on geochemical aspects of the AMD behavior with the following
main objectives: (1) characterization of pore water chemistry in the unsaturated zone
including determination of the main geochemical processes, and identification of the
AMD-buffering mechanisms, mineralogical transformations, and role of secondary min-
erals, and (2) assessment of the potential of stable isotopes for the investigation of AMD.
3. Methods and materials
3.1. Sampling devices
Sampling of water in the saturated zone and gas in the unsaturated zone, respectively,
was conducted using piezometers and gas sampling ports installed during previous
investigations (Gelinas et al., 1994). All new boreholes were drilled by reverse-circulation
air-drilling with an eccentric bit. Each borehole contained several sampling devices,
including two ground water piezometers. A shallow piezometer was completed with 19-
mm PVC pipe in the saturated waste rock at the base of the pile (depth of about 32.0 m)
and a deeper one with 38-mm PVC pipe was completed in the underlying bedrock (depth
of about 39.0 m). Polyethylene gas sampling tubes were strapped to the shallower
piezometer with openings at different depths. The gas sampling tubes were located in a
sand pack in the annular space between the wall of boreholes and the piezometer pipes.
Thermistors were also installed in all boreholes to measure temperature with depth.
Water sampling of the unsaturated zone represented a challenge because of the coarse
grain composition of waste rock material. Nests of suction lysimeters (1920L24, Soil
Moisture, Santa Barbara, CA) were installed at three sites: Site 6, Site TBT, and Site 7
(Fig. 2). Suction lysimeters with a 5.0-cm diameter porous cup and with an air-entry
pressure of 1.9 bar were installed in boreholes of 0.15-m diameter. Silica flour with a grain
size of about 200 mesh was deposited at the base of each hole. The thickness of the silica
flour layer was about 0.5 m. A bentonite seal, 1.0 m thick, was placed above the silica
flour and the boreholes were filled with medium sand to the surface of the pile.
3.2. Solids analysis
All boreholes drilled for suction lysimeters were sampled at approximately 1.5-m
intervals. Samples of waste rock cuttings from rotary air-drilling were collected at the pile
surface. Mineralogical composition of the samples was investigated by X-ray diffraction
using a Siemens D-5000 diffractometer. Drilling cutting samples were split and sieved to
less than 2-mm fraction. Characteristic peaks of X-ray diffraction were used for semi-
quantitative determination of selected minerals.

O. Sracek et al. / Journal of Contaminant Hydrology 69 (2004) 45–7150
Selected samples were observed under Scanning Electron Microscopy (SEM), with
emphasis placed on detection of secondary minerals. Drill cuttings were observed in
secondary electron mode (SE), using a JEOL 840-A microscope with EDX attachment
capable of light elements analysis. The carbonate content of samples was determined using
the Chittick device described by Dreimanis (1962). Total sulfur in drill samples was
determined using a LECO SC432 furnace based on release of SO2 during combustion of
samples. Total sulfate was extracted with 10% Na2CO3. Sulfate was split into a gypsum
fraction, determined by leaching of 50 g of drilling powder in 200 ml of distilled water,
and a jarosite fraction, determined as weight difference after conversion of jarosite to
goethite by the application of NaOH (Choquette in Gelinas et al., 1994).
3.3. Water analysis
Piezometers were sampled with a WATERRA (foot valve) pump. Suction lysimeters
were sampled by the combination of pressure and suction pumping. Parameters such as
pH, temperature, and Eh were measured immediately after recovery of samples in the
field. The pH electrode (Orion Ross combination pH electrode, model 815600) was
calibrated with standard buffers, and the Eh electrode (Orion platinum redox electrode,
model 96-7800) was checked with a ZoBelle’s solution. Samples were then filtered
through a 0.45-Am membrane and split into two subsamples. One, designated for cation
analysis, was acidified with HNO3 to a pH of about 1.0. The second, designated for anion
analysis, was unacidified. All samples were analyzed for selected index parameters (Ca,
Mg, K, Fe2 +, Fetotal and SO4). Samples from Spring 1996 were also analyzed for Na, Cu,
Zn, Pb and some samples were also analyzed for Cl and PO4. The majority of the analyses
were conducted by atomic adsorption spectrometry (AAS). Sulfate, chloride and phos-
phate were determined by ion chromatography and Fe2 + by the potassium dichromate
method. Concentrations of Fe3 + were determined from the difference between Fetotaland Fe2 +.
3.4. Isotopic analysis
Samples for D and 18O analysis were collected during both dry and wet periods. Several
samples had such high TDS content that they had to be diluted by toluene distillation prior
to the analysis. Results from the mass spectrometer were expressed as d18O and d D per
mil with respect to the Standard Mean Ocean Water (SMOW) standard, with analytical
precision F 0.15xand F 1x, respectively.
For 13C analysis, dissolved carbonate was precipitated as BaCO3 by the addition of
NaOH and BaCl2. Analysis of13C was then conducted on CO2 evolved via reaction with
H3PO4 and results were reported in d13C per mil notation with respect to the PDB standard
with a precision of F 0.5x.
Dissolved sulfate was co-precipitated with BaCO3 as BaSO4. Then BaCO3 was
removed by acidification with 10% HCl. The oxygen in the sulfate samples was converted
to CO2 for18O(SO4) analysis with the graphite reduction method. Analyses were reported
as d18O per mil with respect to the SMOW with a precision F 0.5x. Concentration of34S in the sulfate was analyzed using the SO2 gas produced by thermal decomposition of

O. Sracek et al. / Journal of Contaminant Hydrology 69 (2004) 45–71 51
BaSO4. Values were reported as 34S per mil with respect to the Canyon Diablo Troilite
(CDT) standard with a precision of F 0.3x.
3.5. Other measurements and modeling
Temperature and oxygen concentrations were also measured during dry and wet
periods. Concentrations of oxygen were determined with a temperature compensated
electrode of 0.1% resolution.
The water content in the unsaturated waste rock was determined by neutron activation
in boreholes about 12.0 m deep with PVC casings. The neutron probe was calibrated in a
barrel filled by waste rock and results were reported in g/cm3, corresponding to water
contents on a mass basis.
Flow and gas transport in the unsaturated zone were modeled using the code TOUGH
AMD adapted from the code TOUGH2 (Pruess, 1991), and described by Lefebvre (1994)
and Lefebvre et al. (2001). Hydrogeochemical modeling was performed using the code
SIMUL (Reardon, 1992). The code is based on Pitzer’s equations and can handle
extremely high ionic strength (at Mine Doyon in some cases >10 mol/l). The Pitzer’s
equation parameters were available for only 25 jC. Saturation indices were expressed in
logarithmic form (SI = log (IAP/Ksp)), e.g., values higher than zero indicate supersatura-
tion, and values lower than zero indicate undersaturation with respect to a given mineral.
4. Physical properties of waste rock and oxygen and heat transport
4.1. Physical properties
Physical properties of the waste rock were determined on samples from shallow
trenches. Selected parameters are presented in Table 1. Fragments larger than 70 mm
represented between 17% and 60% of waste rock material. The sericite schist from Site 6
was more brittle and produced a greater amount of fines than diorite in the upper zone of
the pile at Site TBT. Inter-block porosity was determined as 0.33 by gravimetric
measurements. Intra-block porosity determined for fresh samples was about 0.05, but
much greater values were evident for weathered material. The average volumetric water
Table 1
Selected physical parameters (after Gelinas et al., 1994)
Parameter Value/units
Bulk density 1836 kg/m3
Inter-block porosity/intra-block porositya 0.33/0.05
Grain size d10 0.5–1.0 mm
Grain size d60 15–100 mm
Van Genuchten’s a/n 0.23/0.504 Pa� 1
Saturated hydraulic conductivity 10� 3 m s� 1
Hydraulic conductivity at 0.40 saturation 10� 8 m s� 1
a Fresh material.

O. Sracek et al. / Journal of Contaminant Hydrology 69 (2004) 45–7152
content at shallow depths was 0.078 for sericite schist and 0.038 for diorite during the dry
period. These values correspond to saturation values of 0.42 and 0.21, respectively.
Significant differences between the dry (August 1995) and wet period (March 1996)
existed only at shallow depth (less than 2.0 m) (Sracek, 1997).
4.2. Temperature and oxygen profiles
A temperature profile for Site 6 is shown in Fig. 3a. There was an increase in
temperature down to a depth of 6.0 m. At that depth, the temperature was as high as 60 jCand increased slightly with depth. However, data between 5 and 15 m depth were not
available because those thermistors were damaged. Measurement of the phase and
amplitude of temperature variations were used in analytical solutions by Lefebvre et al.
(1993) to determine the thermal properties of waste rock. The temperature profile at Site
TBT (Fig. 3b) indicated a much lower maximum temperature of about 35 jC at 12-m
depth. This observation is consistent with less reactive diorite material at the top of that
Fig. 3. Temperature and oxygen profiles: (a) Site 6, (b) Site TBT, (c) Site 7.

O. Sracek et al. / Journal of Contaminant Hydrology 69 (2004) 45–71 53
site. The temperature profile at Site 7 (Fig. 3c) indicated an increase of temperature down
to about 32.0 m.
The oxygen concentration profile at Site 6 is shown in Fig. 3a. The concentration of
oxygen was high down to a depth of 10.0 m (about 15 vol.%) and then decreased to 2–3
vol.%. This behavior was interpreted to result from lateral convective transport of oxygen
from the slope of the pile at intermediate depths and diffusive transport at depth. The
decrease of oxygen concentration at Site TBT started deeper, at about 15.0 m (Fig. 3b) and
dropped to 2–3% at a depth of 25.0 m. High concentrations of oxygen at the top of the
profile appeared to be related to the less reactive diorite layer at the top. The profile at Site
7 (Fig. 3c) showed almost exponential decrease with depth, indicating a diffusive supply
of oxygen in the central zone of the pile as expected (Lefebvre et al., 1993; Ritchie, 1994).
Thus, both convective and diffusive regimes of the oxygen supply appear to be present
within the Mine Doyon pile. The presence of convective cells close to the slope and in the
upper zone of the pile was also revealed by the airborne survey using an infrared
thermographic camera (Gelinas et al., 1994). High-temperature anomalies were typical
especially for the upper zone close to the edges of the pile indicating that hot air was
leaving the pile. The horizontal distance separating temperature maxima and minima in the
central zone of pile varied from 10 to 15 m.
5. Solid phase composition
The composition of fresh samples of waste rock was determined by Savoie et al.
(1991). The average concentrations of pyrite in the sericite schist and in the diorite were
7.0 and 5.5 wt.%, respectively. The calcite concentration was almost identical in both
types of fresh rock, 2.25 and 2.3 wt.% in the sericite schist and diorite, respectively. The
ratio Al/Mg was 4.26 in the sericite schist and 5.07 in the diorite. The main silicates
consisted of plagioclase feldspar, muscovite and chlorite. The representative formulas
were (Mg3.90Fe0.71Al1.39)(Al1.21Si2.79)O10(OH)8 for chlorite, and (Na0.20K0.80)Al2(Al0.90Si3.10)O10(OH)2 for muscovite The Al/Mg ratio in chlorite is about 0.75, and the observed
bulk Al/Mg ratio that was much larger than 1.0 resulted from the relatively high quantities
of muscovite and plagioclase present in waste rock.
The results of X-ray diffraction analysis (Sracek, 1997) revealed the presence of
gypsum and jarosite throughout the complete thickness of the pile. There were no
pronounced trends of secondary mineral formation with depth. Muscovite, plagioclases,
and chlorite were present in all samples. Pyrite was found in all samples and calcite was
absent in all samples, except for the sample at 2.0 m depth at Site TBT with diorite at the
surface. This is consistent with extremely acid conditions in the pile.
The scanning electron microscopy (SEM) analyses indicated a variable degree of pyrite
alteration, in some cases independent of depth in the pile. There was a high degree of
alteration of chlorite, which was preferentially depleted in Mg, especially at the margin of
the crystallographic plates. The alteration of muscovite during the smectization phase was
also observed. This was accompanied by a loss of K, Al, and by a gain in Mg. This
suggests that the behavior of Mg in water may not be conservative in some cases,
especially during the early stages of smectization at immature profiles. K-jarosite was

Fig. 4. Reduced and oxidized S profiles: (a) Site 6, (b) Site TBT, (c) Site 7.
O. Sracek et al. / Journal of Contaminant Hydrology 69 (2004) 45–7154
observed in almost all samples. This mineral tends to crystallize close to the source of
potassium, epitaxially on muscovite (Sracek, 1997). Aggregates and clusters of gypsum
were observed on planes parallel to the schistosity of the sericite schist. The formation of
gypsum and jarosite observed under SEM seems to accelerate the oxidation of pyrite by
physically breaking-up the rock and thus increasing the accessibility of oxidants to fresh,
unoxidized pyrite grains within the waste rock fragments (Sracek, 1997).
Analysis of reduced sulfur concentrations in the solid phase, corresponding to the pyrite
content, showed an S-shaped curve close to the slope of the pile at Site 6 (Fig. 4a). The
deeper concentration minimum likely corresponded to the entry of oxygen supplied by
convection from the slope with a significant upward flow component. Trends at Site TBT
were less evident (Fig. 4b), but there was an initial increase of reduced sulfur concentration
followed by decrease with depth. A maximum of oxidized sulfur concentration was at a
depth of about 12.0 m (Sracek, 1997). The deeper oxidized sulfur maximum compared to
Site 6 was related to the less reactive diorite cover with lower concentrations of pyrite at
the top of the profile. Finally, there was an increase down to 5 m and then a gradual
decrease of reduced sulfur concentration at Site 7 (Fig. 4c). However, there was a decrease
of concentration below the depth at 15 m, which was interpreted as to be the result of a
paleo-surface (break of waste rock deposition) with high degree of pyrite oxidation at
shallow depths prior to ongoing deposition. The oxidized sulfur profile exhibited a
maximum at shallow depths (about 5.0 m) and then there was a general trend of decreasing
Table 2
Remaining pyrite and sulfate within the pile (1995)
Site Pyrite
(kg)
Pyrite
(kg/tonne)
Sulfate
(kg)
Sulfate
(kg/tonne)
Pyrite/sulfate
(kg/kg)
Site 6 3433 65.61 1124 21.48 3.054
Site TBT 3326 63.56 1519 29.03 2.190
Site 7 4059 84.38 560 11.64 7.248

Table 3
Average gypsum and jarosite sulfate concentrations in the solid phase (1995)
Site Gyp. SO4
(wt.%)
Gypsum
(wt.%)
Jar. SO4
(wt.%)
Jarosite
(wt.%)
Total SO4
(wt.%)
Calcite
(wt.%)
Site 6 0.63 1.13 2.20 5.70 2.84 0.59
Site TBT 2.29 4.10 2.35 6.03 4.64 1.04
O. Sracek et al. / Journal of Contaminant Hydrology 69 (2004) 45–71 55
concentrations with depth down to 15 m, followed by increasing concentrations and
second maximum at about 21 m depth.
Concentrations of both forms of sulfur at all sites were numerically integrated with
depth and results are presented in Table 2. The difference in remaining pyrite between Site
6 and Site TBT was relatively small. In contrast, there was a higher sulfate content and
thus, lower pyrite/sulfate ratio in the solids at Site TBT. This is related to higher
concentration of gypsum at Site TBT (see below). Site 7 at the central zone of the pile
had a higher pyrite content, and a lower sulfate content than other sites. This is consistent
with diffusive supply of oxygen and resulting lower pyrite oxidation rates at greater
distances from the edge of the pile.
Total sulfate in the solid phase at Site 6 and Site TBT was split into water-soluble
(gypsum) and water-insoluble (jarosite) contents. There were some discrepancies between
total oxidized sulfur and the sum of gypsum and jarosite sulfate, but we believe that
concentration trends are correct. Average gypsum and jarosite sulfate contents together
with remaining calcite contents are presented in Table 3. The total content of sulfate was
higher at Site TBT than at Site 6. The total sulfate content was highest (5.10 wt.%) at
depths of 7.3 m at Site 6 and 16.5 m (5.19 wt.%) at Site TBT (Sracek, 1997). However, the
main difference in sulfate content between Site 6 and Site TBT was related to the
difference in gypsum content. This was also consistent with a higher average remaining
calcite content at Site TBT (1.04 wt.%) than at Site 6 (0.59 wt.%). The initial calcite
content at both sites was almost identical (about 2.3 wt.%), suggesting that Site 6 may
represent an environment with higher rates of acid generation and consumption of calcite,
which was depleted earlier than at Site TBT. At Site 6, most of calcite in solid phase was
probably depleted earlier than at Site TBT and a part of gypsum formed during early stage
of AMD generation has already been dissolved.
6. Hydrogeochemical behavior
This section presents the results of sampling of suction lysimeters in the unsaturated
zone and piezometers in the saturated zone. Temporal and spatial trends of index
parameters (Ca, Mg, K, Fe3 +, Fetotal and SO4) with saturation indices for secondary
minerals are presented and discussed.
6.1. Temporal and spatial trends
There were two distinct periods of temporal trends based on the infiltration pattern: a
recharge period (late March–early June) and a dry period (mid-June–February). The

O. Sracek et al. / Journal of Contaminant Hydrology 69 (2004) 45–7156
profiles of pH, Eh, Ca, Mg, Al, Fe3 +, Fetotal, and SO4 at Site 6 during both periods
(October 1995 and April 1996) are presented in Fig. 5a.
At Site 6, there was a slight increase of pH from values of about 2.0 at shallow depths
to values of about 3.0 in deeper zones in both periods. The concentrations of Mg and Al
reached their maximum values at a depth of 10.0 m in October 1995. The concentration of
Al was about 33,500 mg/l during the dry period, which appears to be the highest
concentration of Al reported for AMD. Concentration of Mg was also high, with a
maximum value of 24,000 mg/l during the dry period. The maximum concentrations
observed were much lower during the recharge period. There were only moderate
increases of concentrations with depth and maximum values were less than 10,000 mg/
l for both dissolved species discussed above.
The behavior of Fetotal was more complex. There was a minimum at shallow depths
(7.3 m), a local maximum at a depth of 10.0 m, and a steady increase from 22.0 m down
to water table. The peak disappeared during the recharge period, but the relative
minimum at 7.3 m was similar for both sampling periods. The behavior of sulfate was
similar, with a maximum value of 230,000 mg/l at 10.0 m depth during the dry period
and lower values (less than 100,000 mg/l) during the recharge period. Behavior of other
species is discussed later.
Concentrations for the same species at Site TBT are presented in Fig. 5b. Concen-
trations generally increased downward in both periods and reached maximum values at a
depth about 22.0 m. During the recharge period, concentrations were generally lower, but
the decreases were not as large as at Site 6. The profiles at Site 7 are not presented here
because only data from August 1995 were available. However, concentration maximums
at intermediate depths, followed by gradual decreases downward were observed at this site
(Sracek, 1997).
6.2. The Eh values and iron speciation
The Eh values probably reflect the variations in the dominant Fe2 +/Fe3 + redox couple
because concentrations of iron were generally higher than 20 g/l. Nordstrom et al. (1979)
have shown that Eh values are likely to be meaningful in high iron and low pH waters. The
values of Eh and Fe3 + concentrations at Site 6 are shown in Fig. 5a. Both parameters
decreased with some fluctuations below 10 m depth.
The principal reactions responsible for generation of dissolved iron are (Stumm and
Morgan, 1981):
FeS2ðsÞ þ 7=2O2 þ H2O ! Fe2þ þ 2SO2�4 þ 2Hþ ð1Þ
Fe2þ þ 1=4O2 þ Hþ ! Fe3þ þ 1=2H2O ð2Þ
FeS2ðsÞ þ 14Fe3þ þ 8H2O ! 15Fe2þ þ 2SO2�4 þ 16Hþ ð3Þ
Reaction (1) represents the oxidation of pyrite by atmospheric oxygen. Reaction (2)
represents the oxidation of Fe2 + to Fe3 + by oxygen and is considered to be the rate-

Fig. 5. Pore water concentrations: (a) Site 6, (b) Site TBT.
O. Sracek et al. / Journal of Contaminant Hydrology 69 (2004) 45–71 57

O. Sracek et al. / Journal of Contaminant Hydrology 69 (2004) 45–7158
limiting step for the oxidation of pyrite (Singer and Stumm, 1970). Finally, reaction (3)
represents the oxidation of pyrite by ferric iron. The last reaction is dependent on reaction
(2) because it can take place only if the Fe2 + generated by the oxidation of pyrite is
recycled back to Fe3 +. Thus, when the concentration of O2 decreases significantly below
atmospheric values at depth greater than 10.0 m (Fig. 3), the Fe2 + is no longer oxidized
and remains in solution. This situation results in decreasing Eh values with depth.
Melanterite (FeSO4�7H2O) represents a potential solubility control on Fe2 +, but there
was undersaturation with respect to this phase for water samples below 10.0 m depth
(Sracek, 1997). Thus, ferrous iron likely behaved conservatively in the zones of the pile
with low oxygen concentrations.
The chemical behavior of iron is somewhat complicated by precipitation of Fe3 +minerals
including K-jarosite (KFe3(SO4)2(OH)6). Precipitation of K-jarosite is expressed as
Kþ þ 3Fe3þ þ 2SO2�4 þ 6H2O ¼ KFe3ðSO4Þ2ðOHÞ6ðsÞ þ 6Hþ ð4Þ
and this reaction requires a source of K+. Concentrations of K+ in pore water were
generally less than 1 mg/l. The K+ is probably consumed by the precipitation of K-jarosite
in micro-layers on the surface of muscovite, and the concentrations of K+ in bulk solution
may not be representative of what is available for K-jarosite formation in the muscovite
interlayer spaces. Saturation indices for K-jarosite at Site 6 from April 1996 are shown in
Fig. 6a. There are no results available for 1995 because potassium was not included in
earlier analyses. The samples at a depth of 4.0 m and at 10.0 m were supersaturated with
respect to K-jarosite. Calculations are based on data from the recharge period, with lower
dissolved Fe3 + concentrations. It can be assumed that more samples were supersaturated
with respect to K-jarosite in the dry period. The maximum accumulation of jarosite based
on solid phase analyses was at a depth of 7.3 m, corresponding to a sharp decline of
Fetotal concentrations. Precipitation of other Fe3 + mineral phases such as Fe(OH)3 was
prevented by low pH conditions in most samples.
Fig. 6. (a) SI values for K-jarosite (April 1996), (b) dissolved Si (October 1995).

6.3. Behavior of magnesium and aluminum
Concentrations of aluminum and magnesium were very high, especially at Site 6 (Fig.
5a). This was a consequence of an advanced stage of neutralization by silicate minerals.
The likely source of magnesium is the dissolution of chlorite that can be represented by the
reaction:
ðAl;Mg4; FeÞðSi3AlÞO10ðOHÞ8ðsÞ þ 16Hþ
¼ 2Al3þ þ Fe2þ þ 4Mg2þ þ 3H4SiO4 þ 6H2O ð5Þ
In this reaction, 16 mol of H+ is consumed by the dissolution of 1 mol of chlorite.
However, dissolution of silicates is constrained kinetically (Appelo and Postma, 1993). A
possible sink for magnesium is precipitation of epsomite (MgSO4�7H2O), but all samples
were undersaturated with respect to that mineral (Sracek, 1997). Temporary implementa-
tion of magnesium into clays during smectization was found under SEM in several
samples. Transformation of micas follows the sequence muscovite!vermiculite! smec-
smectite! amorphous silica (Gelinas et al., 1994). Thus, when smectite is later converted
to amorphous silica, magnesium is released back to pore water. This means that the
behavior of magnesium can be relatively conservative in the long term.
The amount of Mg stored in pore water between the pile surface and a depth of 16.5 m
was estimated through the waste rock for a column with a 1 m2 base (Sracek, 1997).
There was a decrease from 27 kg in August 1995 to 12 kg in April 1996. The quantity of
Mg decreased to 44.5% during the recharge period, suggesting a mass loss by a factor
of 2.25.
The behavior of Al was similar to the behavior of Mg, but concentrations were
generally higher for Al (Fig. 5a). The Al/Mg ratio in chlorite is 0.75. This means that in
water samples with Al/Mg ratios greater than 0.75, the additional Al may originate from
muscovite (KAl3(AlSi3O10)(OH)2), which has no Mg. The Al/Mg ratios were generally
>1.0, and in some cases as high as 1.65. This supports the conclusion that there is a
significant contribution from muscovite dissolution to AMD neutralization. The majority
of samples were undersaturated with respect to gibbsite, Al(OH)3, due to low pH values.
According to Nordstrom (1982) and Nordstrom and Ball (1986), the gibbsite solubility
controls dissolved Al starting at a pH of about 4.2. Some samples were supersaturated with
respect to alunite (KAl3(SO4)2(OH)6), but that mineral phase does not appear to control Al
concentrations in this system. Precipitation of alunite may be prevented kinetically, and
also by preferential incorporation of potassium into K-jarosite. Thus, it is possible to
conclude that both Mg and Al behave in a relatively conservative fashion under low pH
conditions, which correspond to most samples.
6.4. Behavior of sulfate
Sulfate was practically the only anion present in water samples at the Mine Doyon
site. Its principal source is the oxidation of pyrite. Regardless of the mechanism of
reaction (Eq. (1) or Eq. (3)), 1 mol of pyrite produces 2 mol of sulfate. Reduction of
O. Sracek et al. / Journal of Contaminant Hydrology 69 (2004) 45–71 59

O. Sracek et al. / Journal of Contaminant Hydrology 69 (2004) 45–7160
sulfate and precipitation of secondary sulfides was not expected because there is no
significant reductant available and 34S(SO4) values (Table 5) were almost constant.
Thus, the potential sinks for sulfate include the precipitation of K-jarosite in the shallow
zone of the pile with ferric iron and precipitation of gypsum as shown in the following
equation:
Ca2þ þ SO2�4 þ 2H2O ¼ CaSO4 � 2H2OðsÞ ð6Þ
The precipitation of K-jarosite requires Fe3 + and, thus, maximum concentrations of K-
jarosite in the solid phase were found at relatively shallow depths (7.3 m at Site 6) where
Fe3 + is produced in the presence of oxygen. However, measurable quantities of K-jarosite
were also found at depth because of the extremely high sulfate concentrations that counter-
balanced the decreasing concentrations of ferric iron.
The precipitation of gypsum is not directly dependent on redox or pH conditions, but
requires the input of Ca2 +. Thus, more gypsum was found at Site TBT that contained
higher residual calcite concentrations than at Site 6. All samples from the Site TBTwere at
equilibrium with respect to gypsum. Samples from Site 6 were at equilibrium during the
dry period, but several samples were undersaturated with respect to gypsum during the
recharge period (Sracek, 1997). At Site 6, part of the gypsum formed in the earlier stage of
AMD generation has probably been dissolved as a consequence of low calcium
concentration in pore water and sulfate was flushed out of the pile.
6.5. Other dissolved species
The behavior of calcium was controlled by calcite dissolution and by equilibrium with
gypsum (Eq. (6)). Samples with extremely high sulfate concentrations in the summer of
1995 generally had lower concentrations of calcium (Fig. 5a) because extremely high
dissolved sulfate concentrations force Eq. (6) to the right.
The behavior of dissolved silica was strongly influenced by the ionic strength. There
was an inverse relation between these parameters in which maximum values of ionic
strength corresponded to the minimum concentrations of dissolved silica and vice versa
(Sracek, 1997). The concentration of Si vs. depth at Site 6 in October 1995 is shown in
Fig. 6b. Dissolved silica at the observed pH range is present as the uncharged species
H4SiO40 (Drever, 1997), and the activity coefficient for H4SiO4
0 increases with increasing
ionic strength. In this case, the reaction
SiO2ðamÞðsÞ þ 2H2O ¼ H4SiO04 ð7Þ
is pushed to the left and amorphous silica precipitates as the ionic strength increases.
There was also a correlation observed between the concentration of Fe3 + and that of
several dissolved species including Na, Cu, Zn, and Pb (Sracek, 1997). No other saturation
values for minerals containing these species were observed. This suggests that co-
precipitation of these metals with K- and Na-jarosite may have occurred. However, data
were limited (only from April 1996) and this remains a matter of conjecture.

O. Sracek et al. / Journal of Contaminant Hydrology 69 (2004) 45–71 61
7. Isotopic results
Results of stable isotope analyses presented in this section are discussed with the
purpose of relating it to the internal evaporation process within the pile, to elucidate the
behavior of sulfate, and to verify the possibility of neutralization of AMD by carbonates
present in the solid phase.
7.1. Deuterium and oxygen-18
The local meteoric water line (LMWL) was determined for the Mine Doyon region on
the basis of sampling of local precipitation. This equation of LMWL is
dD ¼ 7:02d18Oþ 7:67 ð8Þ
The principal characteristic of precipitation at the Mine Doyon site was the large
difference between winter snow precipitation, (dD less than � 120x, d18O less than
� 16x) and summer rain precipitation (dD greater than � 90x, d18O greater than
� 13x). The difference was used to trace recharge pulses from the melting of snow.
The interpretation of processes within the pile is based on the departure from the
LMWL. When evaporation from a free water surface takes place, there is an enrichment in
heavier isotopes with a shift of values from the LMWL and the expected slope of the
resulting evaporation line is about 5.0 (Clark and Fritz, 1997). When evaporation takes
place within a porous media, the slope of the evaporation line changes (Allison, 1982;
Allison et al., 1983). The slope decreases to about 2.0–3.0 due to more resistance for
diffusion of water vapor in partially saturated porous media. This behavior was described
in arid regions by Dincer et al. (1974). Internal evaporation was observed at the Mine
Doyon site during the drilling operation in June 1994, when a borehole 22.0 m deep at Site
6 acted as a chimney for upward vapor transport, and the temperature of the vapor was 54
jC. The isotopic data for the summer 1995 samples are presented in Fig. 7a. There was
clear deviation from the LMWL, which can be expressed as
dD ¼ 2:4d18O� 66:0 ð9Þ
The slope of 2.4 is consistent with findings of Allison (1982), and suggests internal
evaporation is occurring within the waste rock pile. The internal evaporation line intersects
the LMWL at a point with coordinates dD=� 96x, d18O =� 13.6x. This is mid-point
between typical composition of snow and early spring precipitation (May), suggesting an
almost equal contribution of melted snow and spring precipitation to the recharge in the
pile. There is a potential isotopic exchange with 18O in silicates, which would result in a
similar deviation from the LMWL. However, isotopic exchange of water with silicates is
generally limited at temperatures below 150 jC (Truesdell and Hulston, 1980; Clark and
Fritz, 1997).
The data from the recharge period (April 1996) are presented in Fig. 7b. There was
a shift towards snow isotopic values, indicating a significant recharge from melted
snow. At Site 6, only shallow samples (above 13.2 m depth) were influenced. On the

Fig. 7. Stable isotopes data: (a) Summer 1995, (b) Spring 1996.
O. Sracek et al. / Journal of Contaminant Hydrology 69 (2004) 45–7162
other hand, a portion of snow recharge penetrated to the saturated zone at Site TBT
(Sracek, 1997). The contribution of snow recharge for different samples is shown in
Table 4. The mixing equation was applied, with an initial isotopic composition based
on the summer 1995 data and resulting isotopic compositions based on the early spring
1996 data.
The depth of snow recharge penetration seems to be dependent on the location in the
pile and on the type of rock, which also determines the oxidation rate, temperature, and,
thus, internal evaporation in the pile.
Table 4
Penetration of snow recharge based on stable isotope data (spring 1996)
Site Depth (m) Snow recharge (%) Comment
Site 6 4.0 51.1 unsaturated zone
Site 6 7.3 31.9 unsaturated zone
Site 6 13.2 10.5 unsaturated zone
Site 6 32.0 none saturated zone
Site TBT 7.3 50.5 unsaturated zone
Site TBT 16.5 16.6 unsaturated zone
Site TBT 32.0 16.2 saturated zone
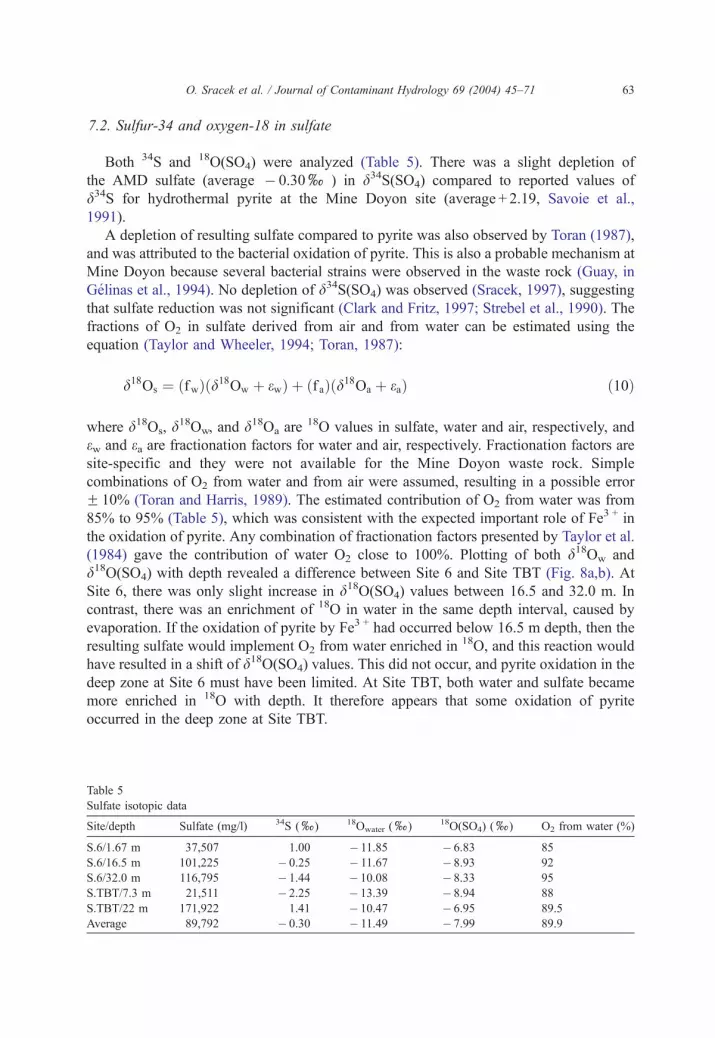
7.2. Sulfur-34 and oxygen-18 in sulfate
Both 34S and 18O(SO4) were analyzed (Table 5). There was a slight depletion of
the AMD sulfate (average � 0.30x) in d34S(SO4) compared to reported values of
d34S for hydrothermal pyrite at the Mine Doyon site (average + 2.19, Savoie et al.,
1991).
A depletion of resulting sulfate compared to pyrite was also observed by Toran (1987),
and was attributed to the bacterial oxidation of pyrite. This is also a probable mechanism at
Mine Doyon because several bacterial strains were observed in the waste rock (Guay, in
Gelinas et al., 1994). No depletion of d34S(SO4) was observed (Sracek, 1997), suggesting
that sulfate reduction was not significant (Clark and Fritz, 1997; Strebel et al., 1990). The
fractions of O2 in sulfate derived from air and from water can be estimated using the
equation (Taylor and Wheeler, 1994; Toran, 1987):
d18Os ¼ ðfwÞðd18Ow þ ewÞ þ ðf aÞðd18Oa þ eaÞ ð10Þ
where d18Os, d18Ow, and d18Oa are18O values in sulfate, water and air, respectively, and
ew and ea are fractionation factors for water and air, respectively. Fractionation factors are
site-specific and they were not available for the Mine Doyon waste rock. Simple
combinations of O2 from water and from air were assumed, resulting in a possible error
F 10% (Toran and Harris, 1989). The estimated contribution of O2 from water was from
85% to 95% (Table 5), which was consistent with the expected important role of Fe3 + in
the oxidation of pyrite. Any combination of fractionation factors presented by Taylor et al.
(1984) gave the contribution of water O2 close to 100%. Plotting of both d18Ow and
d18O(SO4) with depth revealed a difference between Site 6 and Site TBT (Fig. 8a,b). At
Site 6, there was only slight increase in d18O(SO4) values between 16.5 and 32.0 m. In
contrast, there was an enrichment of 18O in water in the same depth interval, caused by
evaporation. If the oxidation of pyrite by Fe3 + had occurred below 16.5 m depth, then the
resulting sulfate would implement O2 from water enriched in 18O, and this reaction would
have resulted in a shift of d18O(SO4) values. This did not occur, and pyrite oxidation in the
deep zone at Site 6 must have been limited. At Site TBT, both water and sulfate became
more enriched in 18O with depth. It therefore appears that some oxidation of pyrite
occurred in the deep zone at Site TBT.
O. Sracek et al. / Journal of Contaminant Hydrology 69 (2004) 45–71 63
Table 5
Sulfate isotopic data
Site/depth Sulfate (mg/l) 34S (x) 18Owater (x) 18O(SO4) (x) O2 from water (%)
S.6/1.67 m 37,507 1.00 � 11.85 � 6.83 85
S.6/16.5 m 101,225 � 0.25 � 11.67 � 8.93 92
S.6/32.0 m 116,795 � 1.44 � 10.08 � 8.33 95
S.TBT/7.3 m 21,511 � 2.25 � 13.39 � 8.94 88
S.TBT/22 m 171,922 1.41 � 10.47 � 6.95 89.5
Average 89,792 � 0.30 � 11.49 � 7.99 89.9

Fig. 8. d18O water and sulfate data: (a) Site 6, (b) Site TBT.
O. Sracek et al. / Journal of Contaminant Hydrology 69 (2004) 45–7164
7.3. Carbon-13
The average d13C value of calcite in waste rock was � 2.63x(Savoie et al., 1991).
Carbon generated by decomposition of organic matter has d13C values about � 25x, and
the fractionation factor for dissolution of CO2 in water is almost negligible at pH less than
4.5 (Clark and Fritz, 1997), that was observed in the pile. Thus, the d13C(DIC)approximates the carbon isotopic composition of a carbon source. The average d13C(DIC)C(DIC) values in the saturated zone water were � 21.42xand � 8.12xat Site 6 and
Site TBT, respectively. These values correspond to 16.0% and 75% contributions of
carbon from calcite at Site 6, and Site TBT, respectively. These results are consistent with
the low content of residual calcite at Site 6 and with organic matter (wood and grass)
observed in the saturated zone at that site. At Site TBT, a significant input of carbon from
calcite dissolution masked the fingerprint of carbon from decomposition of organic matter.
No data on d13C were available for water from the unsaturated zone because CO2 was
expelled from water by combined effects of extreme ionic strength and temperature, and
also by suction applied in the suction lysimeters.
8. Recharge and role of internal evaporation
Two main approaches can be used for the estimation of recharge into a waste rock pile:
recharge can be considered as the water entering the unsaturated zone on the top of the pile
or recharge can be considered as the water entering the saturated zone at the base of the
pile. Both terms can be different for calculation on an annual basis because a part of the
water can be retained in the unsaturated zone of the pile by: (1) retention of water by
capillary forces in fine grained material, (2) retention of water in hydrated minerals like
gypsum, and (3) evaporation and partial re-condensation of water in the pile.

O. Sracek et al. / Journal of Contaminant Hydrology 69 (2004) 45–71 65
The quantity of water entering and discharging from the saturated zone was estimated
by base flow hydrograph separation for the trench surrounding the pile (Bourque, 1994).
The average recharge value for the pile based on hydrograph analyses was determined to
be 205 mm/year, which comprises about 24% of the average precipitation. The mass
balance based on simulation of saturated flow at the base of pile (Sracek, 1997) indicated
that less than 1.0% of water in the saturated zone infiltrates into bedrock underlying the
pile. Thus, discharge into the collection trench approximates well the recharge into the
saturated zone of the pile.
The quantity of water retained in fine grained material does not seem to change
significantly during the year except for depths shallower than 2.0 m (Sracek, 1997). The
retention of water within the pile was important only at the initial stage of the pile
construction, when fresh and relatively dry waste rock was deposited and infiltration was
initiated. Some time is required to ‘‘wet up’’ the pile to ‘‘field capacity’’ before water in the
unsaturated zone migrates to the saturated zone.
Retention of water in gypsum was determined by data on the composition of solids. The
average gypsum content in the waste rock was 1.13 wt.% at Site 6 and 4.10 wt.% at Site
TBT (Table 3). Water retained in gypsum was calculated using the bulk density of waste
rock (1836 kg/m3), and the thickness of the unsaturated zone (32.0 m). Assuming that
infiltration occurred over 13.5 years at an average rate of 205 mm/year, the estimated
quantity of water retained in gypsum is about 5.0% at Site 6, and 18.2% at Site TBT. This
means that a non-negligible quantity of water remains in the unsaturated zone locked in
secondary gypsum.
Internal evaporation has been confirmed by visual observation (vapor leaving boreholes
during drilling) and by isotopic data presented above. The AMD water was also sampled
for chloride, assuming that the only factor contributing to the increase of chloride
concentration was evaporation (Table 6). The concentration factors were expressed with
respect to the shallowest samples because the chloride input from precipitation was not
known. The concentration factors approached values from 6 to 7 in the deep unsaturated
zone, which indicates that up to 83–86% of deeper water was evaporated compared to the
shallowest suction lysimeter at a depth of 4.0 m. The evaporated water was convected
towards the upper zone of the pile. Comparison of data at a depth of 16.5 m indicated that
evaporation was two times larger at Site 6 than at Site TBT.
At the Mine Doyon site, the internal source of heat results in evaporation within the
porous media. It is assumed that there is a threshold value of infiltration necessary for
penetration of recharge to the water table. The water balance is complicated by re-
Table 6
Dissolved chloride data (April 1996)
Sample Cl (mg/l) Concentration factor
Site 6: 4.0 m 3 1.0
Site 6: 10.0 m 8 2.7
Site 6: 16.5 m 21 7.0
Site TBT: 7.3 m 6 1.0
Site TBT: 16.5 m 20 3.3
Site TBT: 22.0 m 38 6.3

O. Sracek et al. / Journal of Contaminant Hydrology 69 (2004) 45–7166
condensation of evaporated water close to the surface of the pile and by the existence of
preferential flow zones in large openings between blocks.
Hypotheses for the roles of infiltration, evaporation and re-condensation were tested
using the numerical multiphase flow code TOUGH AMD. The TOUGH AMD model was
adapted for acid mine drainage modeling and comprises the oxidation of pyrite, convective
and diffusive fluxes of oxygen, transport of heat, and advective transport of sulfate
(Lefebvre et al., 2001). However, geochemical reactions are not considered. Simulations
were run for a period of 13.5 year, corresponding to the lifetime of the pile in 1995. The
domain was wedge-shaped with the unsaturated zone 30 m thick and a base length of 85
m. The boundary conditions were: temperature 5 jC, water saturation 0.42, infiltration 350mm/year and atmospheric oxygen fraction 0.2315. The water retention curve used for
modeling was derived by Lefebvre (1994) based on the grain size distribution of the
material from the pile. The right boundary corresponds to a symmetry line at the center of
the pile.
The calculated distribution of temperature is presented in Fig. 9a. The calculated
temperature maximum was more than 65 jC at 15 m from the upper left margin of the pile.
This is a consequence of the oxygen supply in the region. The region corresponds to the
zone of maximum evaporation and is represented by Site 6. The calculated temperature
was much lower at the right boundary of the modeling domain, corresponding to the
central zone of the pile (less than 25 jC). These results are consistent with simulations by
Pantelis and Ritchie (1993), Lefebvre (1994), and Lefebvre et al. (2001). Vapor flux (Fig.
9a) was high at distance of about 15 m from the slope and was directed upward. The vapor
Fig. 9. Numerical modeling: (a) Temperature and water vapor flux, (b) water saturation and water flux.

O. Sracek et al. / Journal of Contaminant Hydrology 69 (2004) 45–71 67
flux was limited in the central zone of the pile. The presence of an eddy in the central zone
was not confirmed in the field and remains questionable. In contrast, water flux (Fig. 9b)
was always downward and the maximum recharge of re-condensated water was estimated
to occur closer to the central zone of the pile, where convective vapor transport occurred to
the pile surface. This has a direct impact on the hydrogeochemical behavior because water
evaporated close to the slope does not return to its original location, but contributes to the
recharge closer to the central zone of the pile. The zones close to the slope also had lower
water contents (Fig. 9b). Thus, evaporation contributes to extremely high concentrations in
pore water observed at Site 6 near the edge of the pile. Concentrations of dissolved species
are lower at the much colder Site TBT that is closer to the central zone of the pile. This
suggests that both physical and geochemical processes in the pile are interconnected and
contribute to water quality within the pile.
9. Character of transport in waste rock
The data originally presented an apparent paradox that involved significant concentra-
tion changes for conservative species like Mg and Al, accompanied by almost insignificant
changes of water content below a depth of 2.0 m. The water content in the deeper zone
varied between 0.20 and 0.25 (water saturation 0.60–0.75) (Sracek, 1997). At the
beginning of the recharge period at Site 6, the quantity of Mg stored between the surface
and a depth of 16.5 m decreased to 45% of the quantity in the dry period and the extreme
concentrations at a depth of 10 m completely disappeared. There was also a significant
decrease of other species concentrations. A similar trend was observed at Site TBT.
At Site 6, recharge effects were apparent at a depth of 13.2 m, but the recharge pulse did
not seem to penetrate deeper. In contrast, the recharge pulse penetrated to a depth of at
least 22.0 m at Site TBT (Sracek, 1997).
The apparent paradox can be explained when it is understood that the waste rock at
Mine Doyon can be considered as an example of double or even multiple porosity media
with an important role of matrix diffusion. This topic has been studied, for example, by
McKay et al. (1993), Parker et al. (1994) and others. Relatively small changes in water
content can cause significant changes in concentrations of dissolved species, when reverse
diffusion occurs from decomposed waste rock blocks into relatively fresh water migrating
in preferential flow zones. During recharge periods, mobile water in preferential flow
zones becomes gradually more concentrated with depth as a consequence of diffusion
from lower permeability zones and partially decomposed blocs containing very high
concentrations. It was impossible to precisely estimate the time of recharge available for
reverse diffusion. However, the maximum time limit is less than 6 months because the last
sampling before the recharge period sampling was in October 1995. The distance
influenced by 1-D transient diffusion was calculated (Sracek, 1997), and reduction of
concentration at a distance of 1 cm from the preferential flow zone was about 0.12 times
the initial concentration (C0) in the blocks. For similar conditions, a reduction factor of
0.55 was calculated for a travel distance in the block of 5 cm. Thus, diffusion may
equilibrate concentrations in the mobile water phase within the waste rock even during
relatively limited time periods.

O. Sracek et al. / Journal of Contaminant Hydrology 69 (2004) 45–7168
10. Summary and conclusions
This hydrogeochemical and isotopic investigation of acid mine drainage at Mine Doyon
in the unsaturated zone of waste rock contributed to a better understanding of the processes
within a sulphide-bearing waste rock pile. There were strong spatial (slope vs. core) and
temporal (dry period vs. recharge period) variations in geochemical and physical behavior.
Site 6 represented an environment close to the slope of the pile containing friable sericite
schist material, with high temperatures and a convective supply of oxygen. Site TBT
represented a central zone of the pile containing diorite material and affected by the
proximity of a deep depression, with low temperature and a mixture of convective and
diffusive oxygen supply. Site 7, with limited data, represented the central zone of the pile
dominated by diffusive oxygen transport.
The main secondary minerals found during mineralogical investigations were K-
jarosite, and gypsum. Concentrations of gypsum in solid phase were higher at Site TBT
than at Site 6, suggesting that a part of gypsum formed at early stage of AMD at Site 6 has
already been dissolved. Crystallization of secondary minerals along foliation planes of
sericite schist contributed to the splitting of exfoliation in waste rock followed by
penetration of oxidants to previously unoxidized pyrite within the blocks of waste rock.
Thus, pyrite oxidation rates were higher in sericite schist than in diorite due to different
textures in each rock type.
Concentrations of several dissolved species in the unsaturated zone of the pile exhibited
extreme values, especially close to the slope of pile. A concentration maximum was
observed at a depth of 10.0 m at Site 6 during the dry period. Concentrations of iron in
pore water at shallow depths were controlled by the precipitation of K-jarosite and by the
oxidation of pyrite by dissolved ferric iron. Concentrations of ferrous iron were not
controlled by precipitation of a mineral phase. Concentrations of Al and Mg exhibited
maximum values of 33 and 24 g/l, respectively, at Site 6 during the dry period, and both
species seemed to behave conservatively in most of the samples. There was a decrease of
concentrations during the recharge period even though water content remained constant
and the concentration peak at 10 m depth completely disappeared. Concentrations at Site
TBT were lower than at Site 6, but there was also a relative decrease in observed pore
water concentrations during the recharge period.
Isotopic data based on dD and d18O revealed an important role of internal evaporation
within the pile. There was a shift from the internal evaporation line with a slope of 2.4
towards the dD and d18O values typical for snow during the recharge period. The colder
Site TBT exhibited a greater influence from snow recharge than warmer Site 6. The
d34S(SO4) values indicated bacterial oxidation of pyrite and an absence of sulfate
reduction within the pile. The d18O(SO4) suggested that 85–95% of oxygen was derived
from water and a comparison with d18O in water suggested that pyrite oxidation occurred
at depth at Site TBT, but not at Site 6.
Internal evaporation was also confirmed from increasing chloride concentrations with
depth. A significant portion of recharged water was retained in gypsum within the pile.
Numerical modeling of pyrite oxidation with the TOUGH AMD code coupled with heat
transport and multiphase flow gave results consistent with geochemical and isotopic data,
supported the observed high temperatures and upward air convection close to the slope of

O. Sracek et al. / Journal of Contaminant Hydrology 69 (2004) 45–71 69
the pile, and zones of lower temperature and diffusion-limited oxygen transport in the
central zone of the pile. Evaporated water does not return to the zone of evaporation close
to slope, but re-condensates and infiltrates closer to the central zone of the pile and,
therefore, contributes to the extreme concentrations of dissolved species observed in the
pore water in the unsaturated zone close to the slope during period without recharge.
These results indicate that both physical and geochemical processes within a waste rock
pile are interconnected for highly reactive sulphide waste rock, and they cannot be
considered separately. Furthermore, there is an important role of rock texture and strength
in the generation of acid mine drainage, where AMD generation rates are much faster in
more friable material even when the pyrite content of rocks is similar.
Acknowledgements
The authors acknowledge the assistance of Pierre Therrien from the Universite Laval
with application of the code TOUGH AMD. Thanks also go to Eric Reardon from the
University of Waterloo, who provided us with his code SIMUL, to Michel Giguere from
the Universite Laval, who performed the chemical analysis, and to Robert Drimmie and
his staff from the Isotope Laboratory of the University of Waterloo, who performed the
isotopic analysis. Assistance of Dominique Marceau during field sampling is appreciated.
Fieldwork was financed by the Mine Doyon, which belonged to the Barrick/Cambior
group during the project period. The first author gratefully appreciates financial support
awarded by NSERC Canada and FCAR Quebec. We also thank Uli Mayer from the
University of British Columbia in Vancouver and John Molson and Michel Aubertin from
Ecole Polytechnique in Montreal for their review of the paper, which helped to improve
this manuscript.
References
Allison, G.B., 1982. The relationship between 18O and deuterium in water in sand columns undergoing evapo-
ration. J. Hydrol. 55, 163–169.
Allison, G.B., Barnes, C.J., Hughes, M.W., 1983. The distribution of deuterium and 18O in dry soils: 2. Ex-
perimental. J. Hydrol. 64, 377–397.
Appelo, C.A.J., Postma, D., 1993. Geochemistry, Groundwater and Pollution. A.A. Balkema, Rotterdam. 536 pp.
Blowes, D.W., Reardon, J.E., Jambor, J.L., Cherry, J.A., 1991. The formation and potential importance of
cemented layers in inactive sulfide mine tailings. Geochim. Cosmochim. Acta 55, 965–978.
Bourque, E., 1994. Hydrologie d’une halde de steriles miniers affectee par la drainage minier acide (In French:
Hydrology of a waste rock pile influenced by acid mine drainage), MSc thesis, Universite Laval.
Clark, I., Fritz, P., 1997. Environmental Isotopes in Hydrogeology. Lewis Publishers, Boca Raton. 328 pp.
Dincer, T., Al-Mugrin, A., Zimmermann, U., 1974. Study of the infiltration and recharge through the sand dunes
in arid zones with special reference to the stable isotopes and thermonuclear tritium. J. Hydrol. 23, 79–100.
Dreimanis, A., 1962. Quantitative gazometric determination of calcite and dolomite by using Chittick apparatus.
J. Sediment. Petrol. 32, 520–529.
Drever, J.I., 1997. The Geochemistry of Natural Waters: Surface and Groundwater Environments, 3rd ed.
Prentice-Hall, New Jersey. 436 pp.
Dubrovsky, J.M., Cherry, J.A., Reardon, J.E., Vivyurka, A.J., 1985. Geochemical evolution of inactive pyritic
tailings in the Eliot Lake uranium district: 1. The Groundwater zone. Can. Geotech. J. 22, 110–128.
O. Sracek et al. / Journal of Contaminant Hydrology 69 (2004) 45–7170
Gelinas, P., Lefebvre, R., Choquette, M., 1992. Characterization of acid mine drainage production from a waste
rock dump at La Mine Doyon, Quebec. 2nd Int. Conf. on Env. Issues and Manag. of Waste in Energy and
Mineral Production, Calgary, Alberta, Canada, 1–4 Sept. A.A. Balkema, Rotterdam, pp. 747–756.
Gelinas, P., Lefebvre, R., Choquette, M., Isabel, D., Locat, J., Guay, R., 1994. Monitoring and modeling of acid
mine drainage from waste rock dumps: Mine Doyon case study, Report GREGI 1994-12, Final report
presented to MEND Prediction committee, DSS contract 23440-3-9231/01-SQ.
Harries, J.R., Ritchie, A.I.M., 1985. Pore gas composition in waste rock dump undergoing pyritic oxidation. Soil
Sci. 140, 143–152.
Kuo, E.Y., Ritchie A.I.M., 1999. The impact of convection on the overall oxidation rates in sulfidic waste rock
dumps. Proceedings of Conference: Sudbury ’99-Mining and the Environment. Paper AD2, vol. 1, pp. 9–18.
Lefebvre, R., 1994. Characterization and numerical modeling of acid mine drainage in waste rock dump, PhD
thesis, Universite Laval. 375 pp.
Lefebvre, R., Gelinas, P., Isabel, D., 1993. Heat transfer during acid mine drainage production in a waste rock
dump, La Mine Doyon, Quebec, Report GREGI 93-03 submitted to CANMET. 46 pp.
Lefebvre, R., Hockley, D., Smolensky, J., Lamontagne, A., 2001. Multiphase transfer processes in a waste
rock piles producing acid mine drainage: 2. Applications of numerical simulation. J. Contam. Hydrol. 52,
165–186.
McKay, L.D., Gillham, R.W., Cherry, J.A., 1993. Field experiments in a fractured clay till: 2. Solute and colloid
transport. Water Resour. Res. 29, 3879–3890.
Morin, K.A., Cherry, J.A., Dave, N.K., Lim, T.P., Vivyurka, A.J., 1988. Migration of acidic groundwater seepage
from uranium-tailings impoundments: 1. Field study and conceptual hydrogeochemical model. J. Contam.
Hydrol. 2, 271–303.
Morin, K.A., Home, I.A., Riehm, D., 1994. High frequency geochemical monitoring of the seepage from mine-
rock dumps, BHP mineral’s copper mine, British Columbia. Proceedings of Pittsburg Conference, U.S.
Bureau Mines Special Publications SP 06A-94, pp. 355–364.
Nordstrom, D.K., 1982. The effect of sulfate in aluminium concentrations in natural waters: some stability
relations in the system Al2O3–SO3–H2O at 298 jK. Geochim. Cosmochim. Acta 46, 681–692.
Nordstrom, D.K., Ball, J.W., 1986. The geochemical behavior of aluminium in acidified surface streams. Science
232, 54–56.
Nordstrom, D.K., Plummer, L.N., Wigley, T.M.L., Wolery, T.J., Ball, J.W., 1979. A comparison of compu-
terized chemical models for equilibrium calculations in aqueous systems. In: Jenne, E.A. (Ed.), Chemical
Modeling in Aqueous Systems. Am. Chem. Soc. Symp. Ser., vol. 93. Am. Chem. Soc., Washington, DC,
pp. 857–892.
Pantelis, G., Ritchie, A.I.M., 1993. Optimizing oxidation rates in heaps of pyritic material. In: Tomm, A.B., Apel,
M.I., Brierley, C.L. (Eds.), Biohydrometallurgical Technologies. Minerals Metals & Materials Society, War-
rendale, PA, USA, pp. 731–738.
Parker, B.L., Gillham, R.W., Cherry, J.A., 1994. Diffusive disappearance of dense, immiscible phase organic
liquids in fractured geologic media. Groundwater 32, 805–820.
Pruess, K., 1991. TOUGH2—A General-Purpose Numerical Simulator for Multiphase Fluid and Heat Transfer.
Lawrence Berkeley Laboratory LBL-29400, Berkeley, CA, USA. 102 pp.
Reardon, E., 1992. SIMUL—Geochemical Code Based on Pitzer’s Equations. Internal Report. University of
Waterloo, Waterloo, Canada.
Ritchie, A.I.M., 1994. The waste-rock environment. In: Jambor, J.L., Blowes, D.W. (Eds.), Short Course Hand-
book on Environmental Geochemistry of Sulfide Mine-Wastes. Mineralogical Association of Canada, Ottawa,
Canada, pp. 133–161.
Savoie, A., Trudel, P., Sauve, P., Hoy, L., Kheang, L., 1991. Geologie de la Mine Doyon (region Cadillac)
(Geology of Mine Doyon in Cadillac region), in French Rapport ET 90-05. Ministere de l’Energie et des
Ressources du Quebec, Quebec City, Canada. 80 pp.
Shafer, W.M., Smith, S., Luckay, C., Smith, T., 1994. Monitoring gaseous and liquid flux in sulfide waste rock.
Proceedings of Pittsburg Conference. U.S. Bureau Mines Special Publications, SP 06A-94, pp. 410–418.
Singer, P.C., Stumm, W., 1970. Acid mine drainage: the rate limiting step. Science 167, 1121–1123.
Smith, L., Lopez, D.L., Beckie, R., Morin, K., Dawson, R., Price, W., 1995. Hydrogeology of waste rock dumps,
Report for Dep. of Natural Resources Canada, Ontario, Canada.

O. Sracek et al. / Journal of Contaminant Hydrology 69 (2004) 45–71 71
Sracek, O., 1997. Hydrogeochemical and isotopic investigation of acid drainage from waste rock at Mine Doyon,
Quebec, Canada, PhD thesis. Universite Laval, Quebec, Canada.
Stockwell, J., Beckie, R., Smith, L., 2001. Hydrogeology of an unsaturated waste rock pile, Key Lake,
Saskatchewan. Proc. IAH Conf., Calgary, 1582–1587.
Strebel, O., Bottcher, J., Fritz, P., 1990. Use of isotope fractionation of sulfate– sulfur and sulfate–oxygen to
assess bacterial desulfurication in a sandy aquifer. J. Hydrol. 121, 155–172.
Stumm, W., Morgan, J.J., 1981. Aquatic Chemistry, 2nd ed. Wiley, New York. 780 pp.
Taylor, B.E., Wheeler, M.C., 1994. Sulfur- and oxygen-isotope geochemistry of acid mine drainage in the
Western United States, field and experimental studies revisited. In: Alpers, C.N., Blowes, D.W. (Eds.),
Environmental Geochemistry of Sulfide Oxidation. Am. Chem. Soc. Symp. Series, vol. 550, pp. 481–514.
Taylor, B.E., Wheeler, M.C., Nordstrom, D.K., 1984. Stable isotope geochemistry of acid mine drainage:
experimental oxidation of pyrite. Geochim. Cosmochim. Acta 48, 2669–2678.
Toran, L., 1987. Sulphate contamination in groundwater from a carbonate-hosted mine. J. Contam. Hydrol. 2,
239–253.
Toran, L., Harris, R.F., 1989. Interpretation of sulfur and oxygen isotopes in biological and abiological sulfide
oxidation. Geochim. Cosmochim. Acta 53, 2342–2348.
Truesdell, A.H., Hulston, J.R., 1980. Isotopic evidence on environments of geothermal systems. In: Fritz, P.,
Fontes, J.C. (Eds.), Handbook of Environmental Isotope Geochemistry, A: Vol. 1. The Terrestrial Environ-
ment. Elsevier, Amsterdam, The Netherlands, pp. 179–219.


