Embed Size (px)
Citation preview
Journal of Plant Breeding and Crop Science Vol. 4(3), pp. 39-48, 23 February, 2012 Available online at http://www.academicjournals.org/JPBCS DOI: 10.5897/JPBCS11.078 ISSN 2006-9758 © 2012 Academic Journals
Full Length Research Paper
Genetic variability of Ethiopian fenugreek (Trigonella foenum-graecum L.) landraces
Million Fikreselassie1*, Habtamu Zeleke1 and Nigussie Alemayehu2
1School of Plant Sciences, Haramaya University, P. O. Box 138, Dire Dawa, Ethiopia.
2Agriculture and Rural Development Consultant, FAO-Ethiopia, Addis Ababa, Ethiopia.
Accepted 20 February, 2012
Keeping in view the lack of information on genetic diversity in Ethiopian, 144 random samples of fenugreek accessions with standard check were used to determine the extent and pattern of genetic diversity and associations with their geographic origins. The field experiment was conducted at Adadi and Ambo during 2006 and 2007 cropping seasons. Treatments were arranged in a 12 ×12 simple lattice design and data were subjected to the ANOVA performed by the SAS software. The mean squares of the accessions were highly significant for most of the characters, implying that a wide range of variability has been obtained for the traits studied. The GCV ranged from 1.65 to 68.95%, while the PCV from 3.30 to 158.06%. The estimated broad sense heritability ranged from 2.92 to 82.02%. The first four PC accounted for more than 88% of the total variation. The 144 germplasm materials were grouped into six clusters based on Mahalanobis’ D
2 statistic. It was asserted that geographic diversity should not
necessarily be used as an index of genetic diversity and parental selection but should be based on systematic study of genetic diversity in a specific population. Key words: Genetic variability, Fenugreek, Trigonella foenum-graecum L., Landraces.
INTRODUCTION The genus Trigonella is one of the largest genera of the tribe Trifoliate in the family Fabaceae and sub-family Papilionaceae (Balodi and Rao, 1991). Among Trigonella species, Trigonella foenum-graecum (commonly known as fenugreek) is an annual species, with autogamous flowers occasionally visited by insects. It is indigenous to countries on the Eastern shores of the Mediterranean, but widely cultivated in India, Egypt, Ethiopia, Morocco and occasionally in England (Polhil and Raven, 1981; Davoud et al., 2010). The principal use of fenugreek in Ethiopia includes: 1) as a rotation crop, it improves both the soil structure and fertility; 2) it also fetches high revenue for farmers and producers; 3) its flour is used as a flavoring of the traditional bread (loaf) and maintains soft texture of “tef-injera” in relatively cooler zones of the country where the latter is a staple food (Jemal, 1998). The flour of fenugreek is used in various spice makings. In a *Corresponding author. E-mail: [email protected]. Tel: +251-911-560697. Fax: +251-255-530325.
typical case of such a use, the powder is soaked over-night and the water poured off the next morning while the remnant is mixed with honey which becomes a delicious beverage. In the absence of milk, fenugreek is a substitute of infant feed.
The production distribution of fenugreek in Ethiopia is nearly similar to those of other cool season food legumes such as fababean, field pea, lentils, chickpea, and grass pea, etc. Its cultivation and economic importance in the Ethiopian agriculture date back to a long period of history. Although, the present production scale makes it rank 6
th
among the highland pulses. Fenugreek stands as number one in generating cash. Thus, improving this crop means opening a new vista of market opportunity in the face of the ever expanding world trade for the country in general and for the resource-poor farmer in particular. One additional advantage of fenugreek is the wide variety of its uses at different crop stages such as green manuring, leaf vegetable and seed production for the international market of condiments or feed (Beyene, 1965).
Knowledge of the extent and pattern of variability particularly of genetic variability present in a population of
40 J. Plant Breed. Crop Sci. a given crop is indisputably essential for further improvement. As is true for a long list of plant species, Ethiopia is endowed with a bounty of genetic resources also for fenugreek which, nevertheless, is still being cultivated using age-old methods of farming without any significant coverage of better cultivars developed through intentional and systematic selection other than the one made by nature.
Further neglect and under-use of this locally important crop will inadvertently entail the risk of loosing some important germplasm material that has been developed over thousands of years of cultivation. One important factor, however, restricting its large-scale production and development of better varieties is that very little infor-mation is available about its genetic diversity. Therefore, in order to best exploit the available genetic wealth, unraveling the information on the extent and nature of genetic diversity of the population and the inter-relationships among characters that would help in formulating efficient scheme of selection based on multiples of traits is of utmost importance. However, only little of such vital information on fenugreek landraces is present under Ethiopian conditions. In view of filling up such a technical gap, this piece of research work was conceived to address the major objectives subsequently given. To determine the extent and pattern of genetic diversity for morpho-physiological traits and associations between the geographic origins of the germplasm and genetic diversity and to establish such fundamental genetic facts as heritabilities and covariances of traits is of interest for further improvement of the crop.
MATERIALS AND METHODS
The field experiment was conducted at two locations in Ambo and Adadi during 2006 and 2007 main cropping seasons. Ambo has an altitude of 2300 m.a.s.l. and average annual rainfall of 1000 mm, while Adadi has an altitude of 2050 m.a.s.l. and average annual rainfall of 900 mm. The soil at Ambo is characterized as a vertisol with a pH of 6.1 while that of Adadi is light vertisol with a pH of 7.5.
One hundred and forty-three random samples of fenugreek accessions along with one commercial variety (Challa) were considered in this study. The accessions were collected by the Institute of Biodiversity Conservation (IBC) from the most important production complexes of Ethiopia representing different agro-ecologies of varying altitude, rainfall, temperature and soil type.
Treatments were arranged in a 12 × 12 simple lattice design. Seeding was done in a plot of four rows with 2 m length and regular spacing of 10 cm between plants and 25 cm between rows. The layout and randomization were as per the standard procedure set by Cochran and Cox (1957). Two seeds per hole were placed carefully to ensure the first germination. Thinning was made at the true leaf stage. Weeding and other cultural practices were done as per the recommendations adopted for the respective sites.
The following data were collected in both 2006 and 2007 either from the whole plot or from ten plants sampled randomly from each plot with respect to days prior to flowering, plot uniformity, thousand seed weight, number of pods per plant, plant height, number of
seeds per plant, number of seeds per pod, seed colour, seed shape, seed yield/plant, biomass yield per plot and per plant, harvest index. Before proceeding with the analysis of variance for
each variable, tests were made for homogeneity of variances using the Fmax test. The data were subjected to the analyses of variance (ANOVA) and combined analysis of variance over environment for simple lattice design was performed using the SAS program software (SAS, 1996). The total variability for the traits was quantified using pooled analyses of variance over two years and locations using the following model:
Pijmkt = + ym + lt+ ri(m)(t) + bj(i)(t)(m) + gk + (gy)km + (yl)mt +(gl)kt + (ylg)mtk + eijmkt where Pijmkt = phenotypic value of k
th genotype under i
th replication
during mth year at t
th location and j
th incomplete block with
replication i, location t and year m; ym= mth
year; lt= tth
location; ri(m)(t) = the effect of replication i with in year m and location t; b j(i)(t)(m) = the effect of incomplete block j with in replication i, location t and year
m; gk = the effect of kth accession; = grand mean and (gy)km, (yl)mt,
(gl)kt and (ylg)kmt = the interaction effects and eijmkt = random error. Partitioning of the total variation into components due to genotype
(g2), environment (e
2) and genotype by environment interaction
(ge2) deviations was performed from the analyses of variance by
calculating the expected mean squares and similarly, the components from pooled analysis of variance over years and locations were calculated. The coefficients of variations at phenotypic and genotypic levels were estimated using the formula adopted by Johnson et al. (1955) as:
PCV= [σp/
x
x ] x 100
GCV= [σg/
x
x ] x 100 Where σp = phenotypic standard deviation (σg + σe), σg= genotypic standard deviation, σe= environmental standard deviation
and
x
x = grand mean for the character x; PCV and GCV = phenotypic and genotypic coefficients of variation, respectively. Estimate of heritability
Broad-sense heritability (h
2) for traits was estimated for pooled
analyses over two years and locations using the formula adopted by Allard (1960) as:
h2 = [
r/lyr gyl/ylgy/y gl/l g
g 22222
2
] × 100
Where 2g = genotypic variance,
2gl= genotype by location variance,
2gy = genotypic by year variance,
2gyl = genotypic by year and
location variance, 2r = replication variance, y= number of year, l=
number of locations and r= number of replications. Genetic advance in absolute unit (GA) and percent of the mean
(GAM), assuming selection of the superior 5% of the genotypes, was estimated in accordance with the methods illustrated by
Johnson et al. (1955) as:
GA = kph2
GAM = (GA/
x
x ) x 100 Where k = the standardized selection differential at 5% selection intensity (k = 2.063), σp = phenotypic standard deviation, h
2 =
heritability and
x
x = Grand mean. Genetic diversity between clusters based on correlation matrix
was calculated using the SAS software package (SAS Institute, 1996).
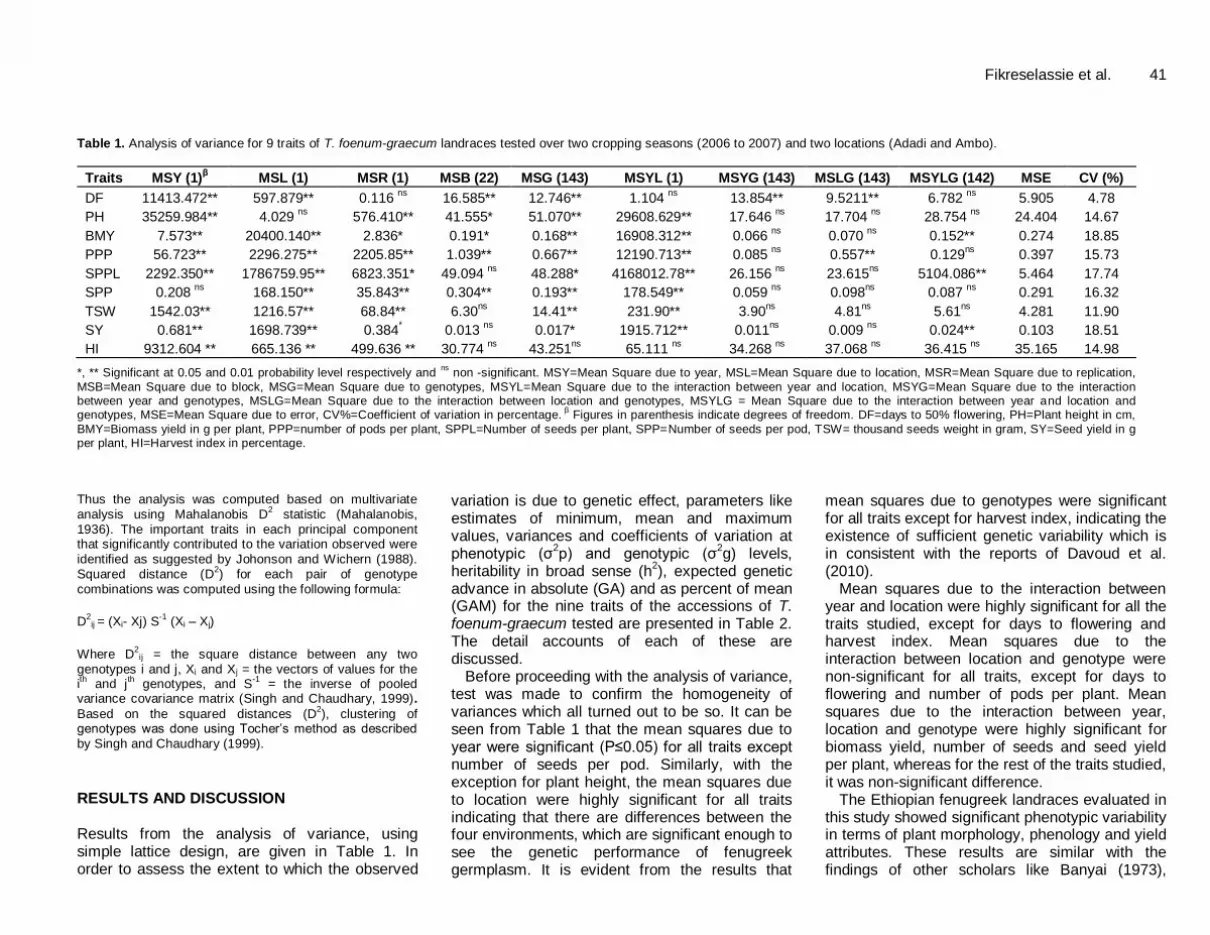
Fikreselassie et al. 41 Table 1. Analysis of variance for 9 traits of T. foenum-graecum landraces tested over two cropping seasons (2006 to 2007) and two locations (Adadi and Ambo).
Traits MSY (1)β MSL (1) MSR (1) MSB (22) MSG (143) MSYL (1) MSYG (143) MSLG (143) MSYLG (142) MSE CV (%)
DF 11413.472** 597.879** 0.116 ns
16.585** 12.746** 1.104 ns
13.854** 9.5211** 6.782 ns
5.905 4.78
PH 35259.984** 4.029 ns
576.410** 41.555* 51.070** 29608.629** 17.646 ns
17.704 ns
28.754 ns
24.404 14.67
BMY 7.573** 20400.140** 2.836* 0.191* 0.168** 16908.312** 0.066 ns
0.070 ns
0.152** 0.274 18.85
PPP 56.723** 2296.275** 2205.85** 1.039** 0.667** 12190.713** 0.085 ns
0.557** 0.129ns
0.397 15.73
SPPL 2292.350** 1786759.95** 6823.351* 49.094 ns
48.288* 4168012.78** 26.156 ns
23.615ns
5104.086** 5.464 17.74
SPP 0.208 ns
168.150** 35.843** 0.304** 0.193** 178.549** 0.059 ns
0.098ns
0.087 ns
0.291 16.32
TSW 1542.03** 1216.57** 68.84** 6.30ns
14.41** 231.90** 3.90ns
4.81ns
5.61ns
4.281 11.90
SY 0.681** 1698.739** 0.384* 0.013
ns 0.017* 1915.712** 0.011
ns 0.009
ns 0.024** 0.103 18.51
HI 9312.604 ** 665.136 ** 499.636 ** 30.774 ns
43.251ns
65.111 ns
34.268 ns
37.068 ns
36.415 ns
35.165 14.98
*, ** Significant at 0.05 and 0.01 probability level respectively and ns
non -significant. MSY=Mean Square due to year, MSL=Mean Square due to location, MSR=Mean Square due to replication,
MSB=Mean Square due to block, MSG=Mean Square due to genotypes, MSYL=Mean Square due to the interaction between year and location, MSYG=Mean Square due to the interaction between year and genotypes, MSLG=Mean Square due to the interaction between location and genotypes, MSYLG = Mean Square due to the interaction between year and location and genotypes, MSE=Mean Square due to error, CV%=Coefficient of variation in percentage.
β Figures in parenthesis indicate degrees of freedom. DF=days to 50% flowering, PH=Plant height in cm,
BMY=Biomass yield in g per plant, PPP=number of pods per plant, SPPL=Number of seeds per plant, SPP=Number of seeds per pod, TSW= thousand seeds weight in gram, SY=Seed yield in g per plant, HI=Harvest index in percentage.
Thus the analysis was computed based on multivariate analysis using Mahalanobis D
2 statistic (Mahalanobis,
1936). The important traits in each principal component that significantly contributed to the variation observed were identified as suggested by Johonson and Wichern (1988). Squared distance (D
2) for each pair of genotype
combinations was computed using the following formula:
D
2ij = (Xi- Xj) S
-1 (Xi – Xj)
Where D
2ij = the square distance between any two
genotypes i and j, Xi and Xj = the vectors of values for the ith and j
th genotypes, and S
-1 = the inverse of pooled
variance covariance matrix (Singh and Chaudhary, 1999).
Based on the squared distances (D2), clustering of
genotypes was done using Tocher’s method as described
by Singh and Chaudhary (1999).
RESULTS AND DISCUSSION Results from the analysis of variance, using simple lattice design, are given in Table 1. In order to assess the extent to which the observed
variation is due to genetic effect, parameters like estimates of minimum, mean and maximum values, variances and coefficients of variation at phenotypic (σ
2p) and genotypic (σ
2g) levels,
heritability in broad sense (h2), expected genetic
advance in absolute (GA) and as percent of mean (GAM) for the nine traits of the accessions of T. foenum-graecum tested are presented in Table 2. The detail accounts of each of these are discussed.
Before proceeding with the analysis of variance, test was made to confirm the homogeneity of variances which all turned out to be so. It can be seen from Table 1 that the mean squares due to year were significant (P≤0.05) for all traits except number of seeds per pod. Similarly, with the exception for plant height, the mean squares due to location were highly significant for all traits indicating that there are differences between the four environments, which are significant enough to see the genetic performance of fenugreek germplasm. It is evident from the results that
mean squares due to genotypes were significant for all traits except for harvest index, indicating the existence of sufficient genetic variability which is in consistent with the reports of Davoud et al. (2010).
Mean squares due to the interaction between year and location were highly significant for all the traits studied, except for days to flowering and harvest index. Mean squares due to the interaction between location and genotype were non-significant for all traits, except for days to flowering and number of pods per plant. Mean squares due to the interaction between year, location and genotype were highly significant for biomass yield, number of seeds and seed yield per plant, whereas for the rest of the traits studied, it was non-significant difference.
The Ethiopian fenugreek landraces evaluated in this study showed significant phenotypic variability in terms of plant morphology, phenology and yield attributes. These results are similar with the findings of other scholars like Banyai (1973),
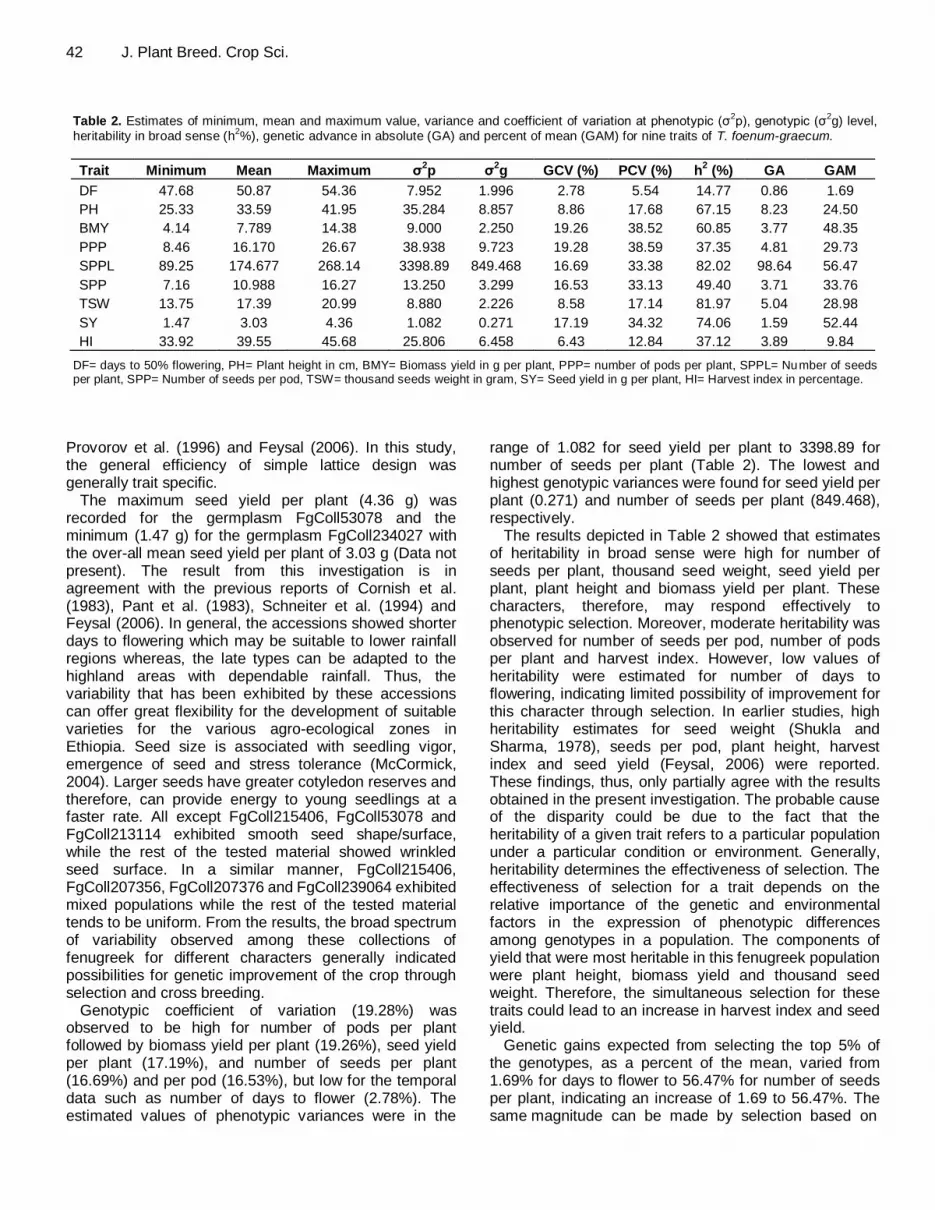
42 J. Plant Breed. Crop Sci. Table 2. Estimates of minimum, mean and maximum value, variance and coefficient of variation at phenotypic (σ
2p), genotypic (σ
2g) level,
heritability in broad sense (h2%), genetic advance in absolute (GA) and percent of mean (GAM) for nine traits of T. foenum-graecum.
Trait Minimum Mean Maximum σ2p σ
2g GCV (%) PCV (%) h
2 (%) GA GAM
DF 47.68 50.87 54.36 7.952 1.996 2.78 5.54 14.77 0.86 1.69
PH 25.33 33.59 41.95 35.284 8.857 8.86 17.68 67.15 8.23 24.50
BMY 4.14 7.789 14.38 9.000 2.250 19.26 38.52 60.85 3.77 48.35
PPP 8.46 16.170 26.67 38.938 9.723 19.28 38.59 37.35 4.81 29.73
SPPL 89.25 174.677 268.14 3398.89 849.468 16.69 33.38 82.02 98.64 56.47
SPP 7.16 10.988 16.27 13.250 3.299 16.53 33.13 49.40 3.71 33.76
TSW 13.75 17.39 20.99 8.880 2.226 8.58 17.14 81.97 5.04 28.98
SY 1.47 3.03 4.36 1.082 0.271 17.19 34.32 74.06 1.59 52.44
HI 33.92 39.55 45.68 25.806 6.458 6.43 12.84 37.12 3.89 9.84
DF= days to 50% flowering, PH= Plant height in cm, BMY= Biomass yield in g per plant, PPP= number of pods per plant, SPPL= Number of seeds per plant, SPP= Number of seeds per pod, TSW= thousand seeds weight in gram, SY= Seed yield in g per plant, HI= Harvest index in percentage.
Provorov et al. (1996) and Feysal (2006). In this study, the general efficiency of simple lattice design was generally trait specific.
The maximum seed yield per plant (4.36 g) was recorded for the germplasm FgColl53078 and the minimum (1.47 g) for the germplasm FgColl234027 with the over-all mean seed yield per plant of 3.03 g (Data not present). The result from this investigation is in agreement with the previous reports of Cornish et al. (1983), Pant et al. (1983), Schneiter et al. (1994) and Feysal (2006). In general, the accessions showed shorter days to flowering which may be suitable to lower rainfall regions whereas, the late types can be adapted to the highland areas with dependable rainfall. Thus, the variability that has been exhibited by these accessions can offer great flexibility for the development of suitable varieties for the various agro-ecological zones in Ethiopia. Seed size is associated with seedling vigor, emergence of seed and stress tolerance (McCormick, 2004). Larger seeds have greater cotyledon reserves and therefore, can provide energy to young seedlings at a faster rate. All except FgColl215406, FgColl53078 and FgColl213114 exhibited smooth seed shape/surface, while the rest of the tested material showed wrinkled seed surface. In a similar manner, FgColl215406, FgColl207356, FgColl207376 and FgColl239064 exhibited mixed populations while the rest of the tested material tends to be uniform. From the results, the broad spectrum of variability observed among these collections of fenugreek for different characters generally indicated possibilities for genetic improvement of the crop through selection and cross breeding.
Genotypic coefficient of variation (19.28%) was observed to be high for number of pods per plant followed by biomass yield per plant (19.26%), seed yield per plant (17.19%), and number of seeds per plant (16.69%) and per pod (16.53%), but low for the temporal data such as number of days to flower (2.78%). The estimated values of phenotypic variances were in the
range of 1.082 for seed yield per plant to 3398.89 for number of seeds per plant (Table 2). The lowest and highest genotypic variances were found for seed yield per plant (0.271) and number of seeds per plant (849.468), respectively.
The results depicted in Table 2 showed that estimates of heritability in broad sense were high for number of seeds per plant, thousand seed weight, seed yield per plant, plant height and biomass yield per plant. These characters, therefore, may respond effectively to phenotypic selection. Moreover, moderate heritability was observed for number of seeds per pod, number of pods per plant and harvest index. However, low values of heritability were estimated for number of days to flowering, indicating limited possibility of improvement for this character through selection. In earlier studies, high heritability estimates for seed weight (Shukla and Sharma, 1978), seeds per pod, plant height, harvest index and seed yield (Feysal, 2006) were reported. These findings, thus, only partially agree with the results obtained in the present investigation. The probable cause of the disparity could be due to the fact that the heritability of a given trait refers to a particular population under a particular condition or environment. Generally, heritability determines the effectiveness of selection. The effectiveness of selection for a trait depends on the relative importance of the genetic and environmental factors in the expression of phenotypic differences among genotypes in a population. The components of yield that were most heritable in this fenugreek population were plant height, biomass yield and thousand seed weight. Therefore, the simultaneous selection for these traits could lead to an increase in harvest index and seed yield.
Genetic gains expected from selecting the top 5% of the genotypes, as a percent of the mean, varied from 1.69% for days to flower to 56.47% for number of seeds per plant, indicating an increase of 1.69 to 56.47%. The same magnitude can be made by selection based on
Fikreselassie et al. 43
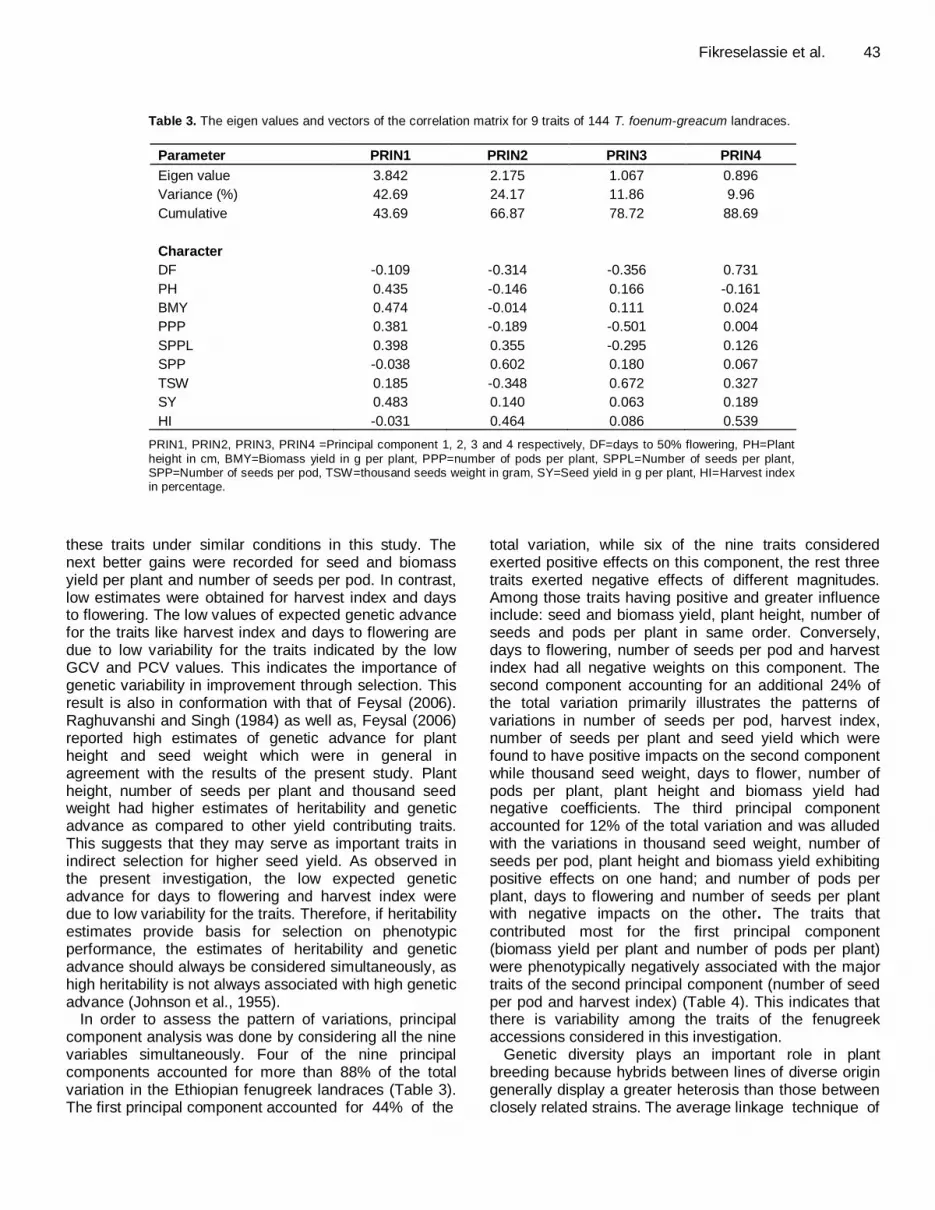
Table 3. The eigen values and vectors of the correlation matrix for 9 traits of 144 T. foenum-greacum landraces.
Parameter PRIN1 PRIN2 PRIN3 PRIN4
Eigen value 3.842 2.175 1.067 0.896
Variance (%) 42.69 24.17 11.86 9.96
Cumulative 43.69 66.87 78.72 88.69
Character
DF -0.109 -0.314 -0.356 0.731
PH 0.435 -0.146 0.166 -0.161
BMY 0.474 -0.014 0.111 0.024
PPP 0.381 -0.189 -0.501 0.004
SPPL 0.398 0.355 -0.295 0.126
SPP -0.038 0.602 0.180 0.067
TSW 0.185 -0.348 0.672 0.327
SY 0.483 0.140 0.063 0.189
HI -0.031 0.464 0.086 0.539
PRIN1, PRIN2, PRIN3, PRIN4 =Principal component 1, 2, 3 and 4 respectively, DF=days to 50% flowering, PH=Plant
height in cm, BMY=Biomass yield in g per plant, PPP=number of pods per plant, SPPL=Number of seeds per plant, SPP=Number of seeds per pod, TSW=thousand seeds weight in gram, SY=Seed yield in g per plant, HI=Harvest index in percentage.
these traits under similar conditions in this study. The next better gains were recorded for seed and biomass yield per plant and number of seeds per pod. In contrast, low estimates were obtained for harvest index and days to flowering. The low values of expected genetic advance for the traits like harvest index and days to flowering are due to low variability for the traits indicated by the low GCV and PCV values. This indicates the importance of genetic variability in improvement through selection. This result is also in conformation with that of Feysal (2006). Raghuvanshi and Singh (1984) as well as, Feysal (2006) reported high estimates of genetic advance for plant height and seed weight which were in general in agreement with the results of the present study. Plant height, number of seeds per plant and thousand seed weight had higher estimates of heritability and genetic advance as compared to other yield contributing traits. This suggests that they may serve as important traits in indirect selection for higher seed yield. As observed in the present investigation, the low expected genetic advance for days to flowering and harvest index were due to low variability for the traits. Therefore, if heritability estimates provide basis for selection on phenotypic performance, the estimates of heritability and genetic advance should always be considered simultaneously, as high heritability is not always associated with high genetic advance (Johnson et al., 1955).
In order to assess the pattern of variations, principal component analysis was done by considering all the nine variables simultaneously. Four of the nine principal components accounted for more than 88% of the total variation in the Ethiopian fenugreek landraces (Table 3). The first principal component accounted for 44% of the
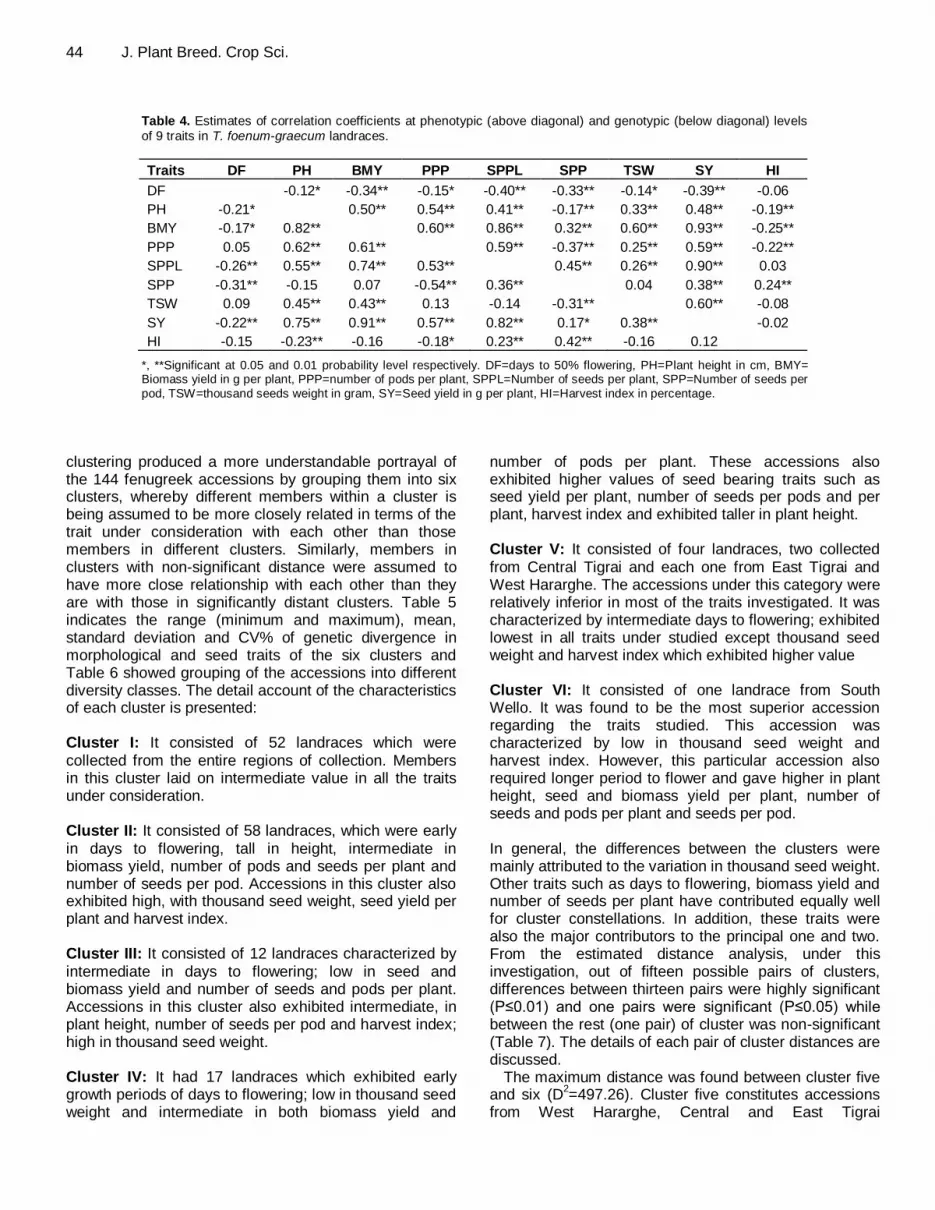
total variation, while six of the nine traits considered exerted positive effects on this component, the rest three traits exerted negative effects of different magnitudes. Among those traits having positive and greater influence include: seed and biomass yield, plant height, number of seeds and pods per plant in same order. Conversely, days to flowering, number of seeds per pod and harvest index had all negative weights on this component. The second component accounting for an additional 24% of the total variation primarily illustrates the patterns of variations in number of seeds per pod, harvest index, number of seeds per plant and seed yield which were found to have positive impacts on the second component while thousand seed weight, days to flower, number of pods per plant, plant height and biomass yield had negative coefficients. The third principal component accounted for 12% of the total variation and was alluded with the variations in thousand seed weight, number of seeds per pod, plant height and biomass yield exhibiting positive effects on one hand; and number of pods per plant, days to flowering and number of seeds per plant with negative impacts on the other. The traits that contributed most for the first principal component (biomass yield per plant and number of pods per plant) were phenotypically negatively associated with the major traits of the second principal component (number of seed per pod and harvest index) (Table 4). This indicates that there is variability among the traits of the fenugreek accessions considered in this investigation.
Genetic diversity plays an important role in plant breeding because hybrids between lines of diverse origin generally display a greater heterosis than those between closely related strains. The average linkage technique of
44 J. Plant Breed. Crop Sci.
Table 4. Estimates of correlation coefficients at phenotypic (above diagonal) and genotypic (below diagonal) levels of 9 traits in T. foenum-graecum landraces.
Traits DF PH BMY PPP SPPL SPP TSW SY HI
DF -0.12* -0.34** -0.15* -0.40** -0.33** -0.14* -0.39** -0.06
PH -0.21* 0.50** 0.54** 0.41** -0.17** 0.33** 0.48** -0.19**
BMY -0.17* 0.82** 0.60** 0.86** 0.32** 0.60** 0.93** -0.25**
PPP 0.05 0.62** 0.61** 0.59** -0.37** 0.25** 0.59** -0.22**
SPPL -0.26** 0.55** 0.74** 0.53** 0.45** 0.26** 0.90** 0.03
SPP -0.31** -0.15 0.07 -0.54** 0.36** 0.04 0.38** 0.24**
TSW 0.09 0.45** 0.43** 0.13 -0.14 -0.31** 0.60** -0.08
SY -0.22** 0.75** 0.91** 0.57** 0.82** 0.17* 0.38** -0.02
HI -0.15 -0.23** -0.16 -0.18* 0.23** 0.42** -0.16 0.12
*, **Significant at 0.05 and 0.01 probability level respectively. DF=days to 50% flowering, PH=Plant height in cm, BMY= Biomass yield in g per plant, PPP=number of pods per plant, SPPL=Number of seeds per plant, SPP=Number of seeds per
pod, TSW=thousand seeds weight in gram, SY=Seed yield in g per plant, HI=Harvest index in percentage.
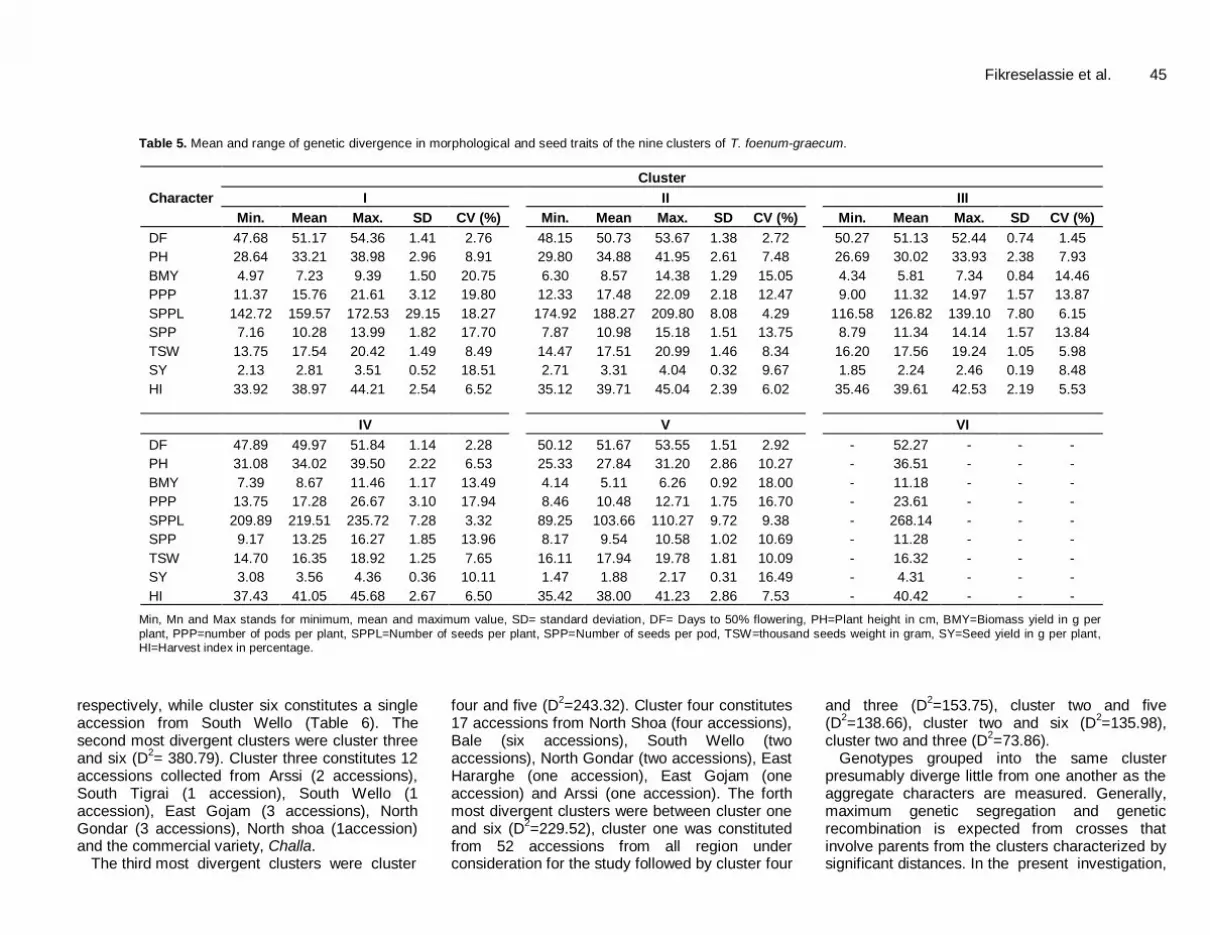
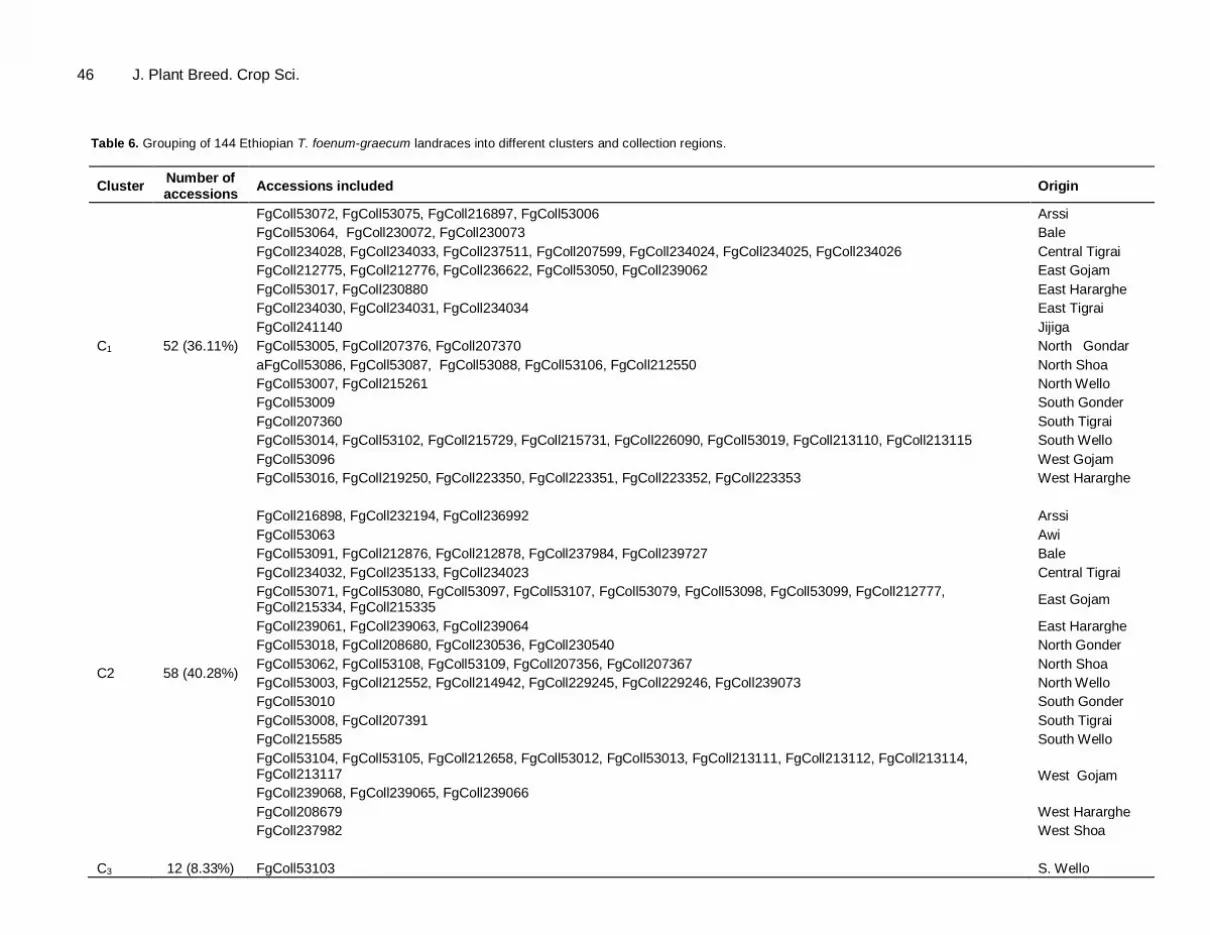
clustering produced a more understandable portrayal of the 144 fenugreek accessions by grouping them into six clusters, whereby different members within a cluster is being assumed to be more closely related in terms of the trait under consideration with each other than those members in different clusters. Similarly, members in clusters with non-significant distance were assumed to have more close relationship with each other than they are with those in significantly distant clusters. Table 5 indicates the range (minimum and maximum), mean, standard deviation and CV% of genetic divergence in morphological and seed traits of the six clusters and Table 6 showed grouping of the accessions into different diversity classes. The detail account of the characteristics of each cluster is presented:
Cluster I: It consisted of 52 landraces which were collected from the entire regions of collection. Members in this cluster laid on intermediate value in all the traits under consideration.
Cluster II: It consisted of 58 landraces, which were early in days to flowering, tall in height, intermediate in biomass yield, number of pods and seeds per plant and number of seeds per pod. Accessions in this cluster also exhibited high, with thousand seed weight, seed yield per plant and harvest index.
Cluster III: It consisted of 12 landraces characterized by intermediate in days to flowering; low in seed and biomass yield and number of seeds and pods per plant. Accessions in this cluster also exhibited intermediate, in plant height, number of seeds per pod and harvest index; high in thousand seed weight.
Cluster IV: It had 17 landraces which exhibited early growth periods of days to flowering; low in thousand seed weight and intermediate in both biomass yield and
number of pods per plant. These accessions also exhibited higher values of seed bearing traits such as seed yield per plant, number of seeds per pods and per plant, harvest index and exhibited taller in plant height.
Cluster V: It consisted of four landraces, two collected from Central Tigrai and each one from East Tigrai and West Hararghe. The accessions under this category were relatively inferior in most of the traits investigated. It was characterized by intermediate days to flowering; exhibited lowest in all traits under studied except thousand seed weight and harvest index which exhibited higher value
Cluster VI: It consisted of one landrace from South Wello. It was found to be the most superior accession regarding the traits studied. This accession was characterized by low in thousand seed weight and harvest index. However, this particular accession also required longer period to flower and gave higher in plant height, seed and biomass yield per plant, number of seeds and pods per plant and seeds per pod.
In general, the differences between the clusters were mainly attributed to the variation in thousand seed weight. Other traits such as days to flowering, biomass yield and number of seeds per plant have contributed equally well for cluster constellations. In addition, these traits were also the major contributors to the principal one and two. From the estimated distance analysis, under this investigation, out of fifteen possible pairs of clusters, differences between thirteen pairs were highly significant (P≤0.01) and one pairs were significant (P≤0.05) while between the rest (one pair) of cluster was non-significant (Table 7). The details of each pair of cluster distances are discussed.
The maximum distance was found between cluster five and six (D
2=497.26). Cluster five constitutes accessions
from West Hararghe, Central and East Tigrai
Fikreselassie et al. 45
Table 5. Mean and range of genetic divergence in morphological and seed traits of the nine clusters of T. foenum-graecum.
Character
Cluster
I
II
III
Min. Mean Max. SD CV (%) Min. Mean Max. SD CV (%) Min. Mean Max. SD CV (%)
DF 47.68 51.17 54.36 1.41 2.76 48.15 50.73 53.67 1.38 2.72 50.27 51.13 52.44 0.74 1.45
PH 28.64 33.21 38.98 2.96 8.91 29.80 34.88 41.95 2.61 7.48 26.69 30.02 33.93 2.38 7.93
BMY 4.97 7.23 9.39 1.50 20.75 6.30 8.57 14.38 1.29 15.05 4.34 5.81 7.34 0.84 14.46
PPP 11.37 15.76 21.61 3.12 19.80 12.33 17.48 22.09 2.18 12.47 9.00 11.32 14.97 1.57 13.87
SPPL 142.72 159.57 172.53 29.15 18.27 174.92 188.27 209.80 8.08 4.29 116.58 126.82 139.10 7.80 6.15
SPP 7.16 10.28 13.99 1.82 17.70 7.87 10.98 15.18 1.51 13.75 8.79 11.34 14.14 1.57 13.84
TSW 13.75 17.54 20.42 1.49 8.49 14.47 17.51 20.99 1.46 8.34 16.20 17.56 19.24 1.05 5.98
SY 2.13 2.81 3.51 0.52 18.51 2.71 3.31 4.04 0.32 9.67 1.85 2.24 2.46 0.19 8.48
HI 33.92 38.97 44.21 2.54 6.52 35.12 39.71 45.04 2.39 6.02 35.46 39.61 42.53 2.19 5.53
IV V VI
DF 47.89 49.97 51.84 1.14 2.28 50.12 51.67 53.55 1.51 2.92 - 52.27 - - -
PH 31.08 34.02 39.50 2.22 6.53 25.33 27.84 31.20 2.86 10.27 - 36.51 - - -
BMY 7.39 8.67 11.46 1.17 13.49 4.14 5.11 6.26 0.92 18.00 - 11.18 - - -
PPP 13.75 17.28 26.67 3.10 17.94 8.46 10.48 12.71 1.75 16.70 - 23.61 - - -
SPPL 209.89 219.51 235.72 7.28 3.32 89.25 103.66 110.27 9.72 9.38 - 268.14 - - -
SPP 9.17 13.25 16.27 1.85 13.96 8.17 9.54 10.58 1.02 10.69 - 11.28 - - -
TSW 14.70 16.35 18.92 1.25 7.65 16.11 17.94 19.78 1.81 10.09 - 16.32 - - -
SY 3.08 3.56 4.36 0.36 10.11 1.47 1.88 2.17 0.31 16.49 - 4.31 - - -
HI 37.43 41.05 45.68 2.67 6.50 35.42 38.00 41.23 2.86 7.53 - 40.42 - - -
Min, Mn and Max stands for minimum, mean and maximum value, SD= standard deviation, DF= Days to 50% flowering, PH=Plant height in cm, BMY=Biomass yield in g per
plant, PPP=number of pods per plant, SPPL=Number of seeds per plant, SPP=Number of seeds per pod, TSW=thousand seeds weight in gram, SY=Seed yield in g per plant, HI=Harvest index in percentage.
respectively, while cluster six constitutes a single accession from South Wello (Table 6). The second most divergent clusters were cluster three and six (D
2= 380.79). Cluster three constitutes 12
accessions collected from Arssi (2 accessions), South Tigrai (1 accession), South Wello (1 accession), East Gojam (3 accessions), North Gondar (3 accessions), North shoa (1accession) and the commercial variety, Challa.
The third most divergent clusters were cluster
four and five (D2=243.32). Cluster four constitutes
17 accessions from North Shoa (four accessions), Bale (six accessions), South Wello (two accessions), North Gondar (two accessions), East Hararghe (one accession), East Gojam (one accession) and Arssi (one accession). The forth most divergent clusters were between cluster one and six (D
2=229.52), cluster one was constituted
from 52 accessions from all region under consideration for the study followed by cluster four
and three (D2=153.75), cluster two and five
(D2=138.66), cluster two and six (D
2=135.98),
cluster two and three (D2=73.86).
Genotypes grouped into the same cluster presumably diverge little from one another as the aggregate characters are measured. Generally, maximum genetic segregation and genetic recombination is expected from crosses that involve parents from the clusters characterized by significant distances. In the present investigation,
46 J. Plant Breed. Crop Sci.
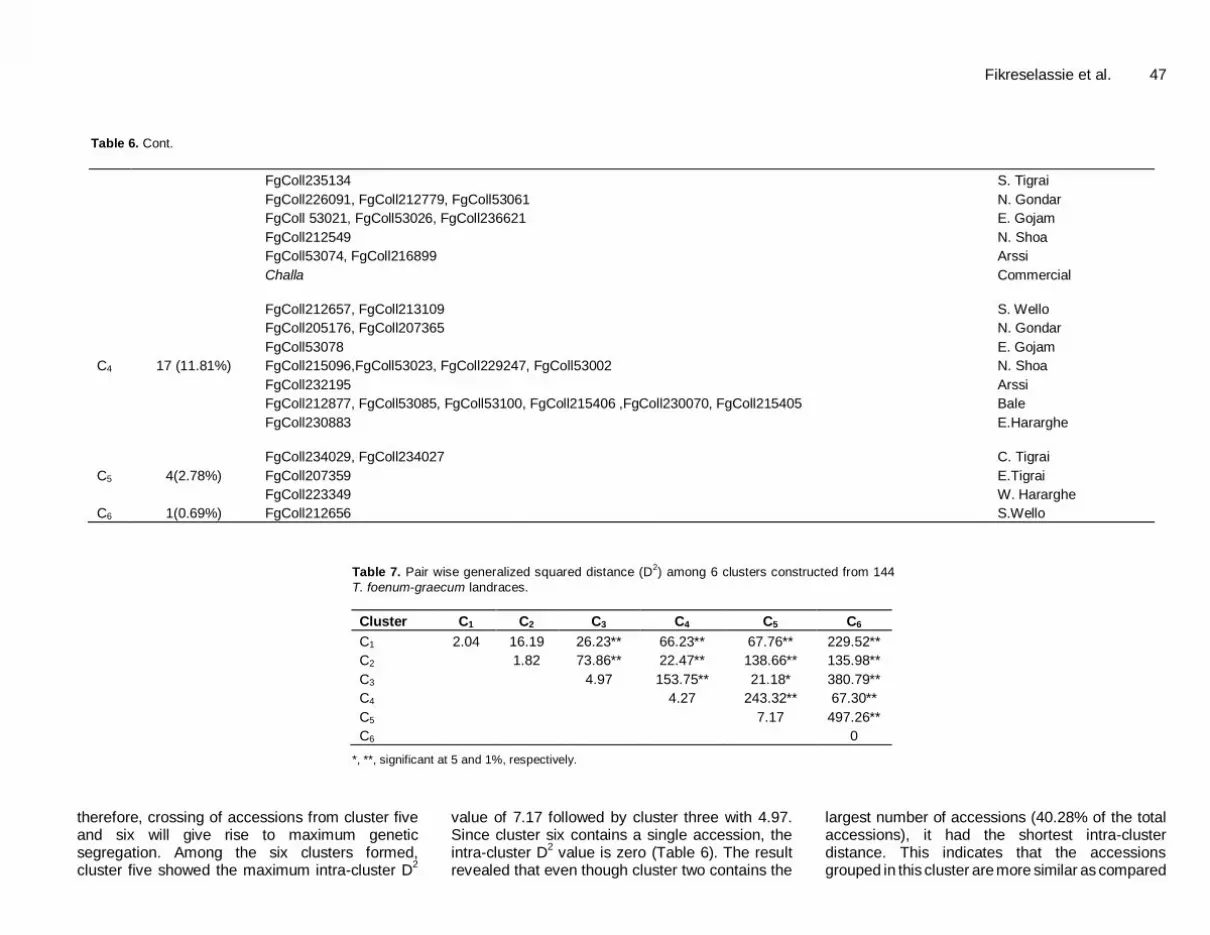
Table 6. Grouping of 144 Ethiopian T. foenum-graecum landraces into different clusters and collection regions.
Cluster Number of accessions
Accessions included Origin
C1 52 (36.11%)
FgColl53072, FgColl53075, FgColl216897, FgColl53006 Arssi
FgColl53064, FgColl230072, FgColl230073 Bale
FgColl234028, FgColl234033, FgColl237511, FgColl207599, FgColl234024, FgColl234025, FgColl234026 Central Tigrai
FgColl212775, FgColl212776, FgColl236622, FgColl53050, FgColl239062 East Gojam
FgColl53017, FgColl230880 East Hararghe
FgColl234030, FgColl234031, FgColl234034 East Tigrai
FgColl241140 Jijiga
FgColl53005, FgColl207376, FgColl207370 North Gondar
aFgColl53086, FgColl53087, FgColl53088, FgColl53106, FgColl212550 North Shoa
FgColl53007, FgColl215261 North Wello
FgColl53009 South Gonder
FgColl207360 South Tigrai
FgColl53014, FgColl53102, FgColl215729, FgColl215731, FgColl226090, FgColl53019, FgColl213110, FgColl213115 South Wello
FgColl53096 West Gojam
FgColl53016, FgColl219250, FgColl223350, FgColl223351, FgColl223352, FgColl223353 West Hararghe
C2 58 (40.28%)
FgColl216898, FgColl232194, FgColl236992 Arssi
FgColl53063 Awi
FgColl53091, FgColl212876, FgColl212878, FgColl237984, FgColl239727 Bale
FgColl234032, FgColl235133, FgColl234023 Central Tigrai
FgColl53071, FgColl53080, FgColl53097, FgColl53107, FgColl53079, FgColl53098, FgColl53099, FgColl212777, FgColl215334, FgColl215335
East Gojam
FgColl239061, FgColl239063, FgColl239064 East Hararghe
FgColl53018, FgColl208680, FgColl230536, FgColl230540 North Gonder
FgColl53062, FgColl53108, FgColl53109, FgColl207356, FgColl207367 North Shoa
FgColl53003, FgColl212552, FgColl214942, FgColl229245, FgColl229246, FgColl239073 North Wello
FgColl53010 South Gonder
FgColl53008, FgColl207391 South Tigrai
FgColl215585 South Wello
FgColl53104, FgColl53105, FgColl212658, FgColl53012, FgColl53013, FgColl213111, FgColl213112, FgColl213114, FgColl213117 West Gojam
FgColl239068, FgColl239065, FgColl239066
FgColl208679 West Hararghe
FgColl237982 West Shoa
C3 12 (8.33%) FgColl53103 S. Wello
Fikreselassie et al. 47
Table 6. Cont.
FgColl235134 S. Tigrai
FgColl226091, FgColl212779, FgColl53061 N. Gondar
FgColl 53021, FgColl53026, FgColl236621 E. Gojam
FgColl212549 N. Shoa
FgColl53074, FgColl216899 Arssi
Challa Commercial
C4 17 (11.81%)
FgColl212657, FgColl213109 S. Wello
FgColl205176, FgColl207365 N. Gondar
FgColl53078 E. Gojam
FgColl215096,FgColl53023, FgColl229247, FgColl53002 N. Shoa
FgColl232195 Arssi
FgColl212877, FgColl53085, FgColl53100, FgColl215406 ,FgColl230070, FgColl215405 Bale
FgColl230883 E.Hararghe
C5 4(2.78%)
FgColl234029, FgColl234027 C. Tigrai
FgColl207359 E.Tigrai
FgColl223349 W. Hararghe
C6 1(0.69%) FgColl212656 S.Wello
Table 7. Pair wise generalized squared distance (D
2) among 6 clusters constructed from 144
T. foenum-graecum landraces.
Cluster C1 C2 C3 C4 C5 C6
C1 2.04 16.19 26.23** 66.23** 67.76** 229.52**
C2 1.82 73.86** 22.47** 138.66** 135.98**
C3 4.97 153.75** 21.18* 380.79**
C4 4.27 243.32** 67.30**
C5 7.17 497.26**
C6 0
*, **, significant at 5 and 1%, respectively.
therefore, crossing of accessions from cluster five and six will give rise to maximum genetic segregation. Among the six clusters formed, cluster five showed the maximum intra-cluster D
2
value of 7.17 followed by cluster three with 4.97. Since cluster six contains a single accession, the intra-cluster D
2 value is zero (Table 6). The result
revealed that even though cluster two contains the
largest number of accessions (40.28% of the total accessions), it had the shortest intra-cluster distance. This indicates that the accessions grouped in this cluster are more similar as compared
48 J. Plant Breed. Crop Sci. with the rest of the accessions in the rest of the clusters. In a similar fashion, there were only four accessions for cluster five, but it was more divergent as compared with the accessions present in the rest of the clusters (Table 6).
Conclusion A collection of 144 fenugreek accessions representing about 38% of the country’s fenugreek germplasm collection was evaluated. From this investigation, the fenugreek accessions were highly variable for several traits, including phenology and yield components indicating the possibilities for genetic improvement of the crop through selection and cross breeding. The varying characters of the superior accessions have implications for further work. Thus, the variation for the different characters found in fenugreek accessions included in this study could be exploited and used in fenugreek breeding programs. The results obtained in this study indicated that single plant or pure line selection for the number of seeds per plant and thousand seed weight may be effective for improvement of seed yield in fenugreek. As a breeding strategy, recurrent or family selection will be employed for the improvement of the traits that had low heritability and genetic advance.
There are implications from the variations among high performing accessions in this study that will provide a basis for a genetically diverse breeding program and provide diversity. Crossing these accessions in a breeding program should result in segregating populations. Therefore, there is a high chance of genetic improvement and of increasing the level of desirable traits in new accessions. Although, such strong relationship of diversity and geographical origin may be possible and was observed in the present investigation, more emphasis has to be put at population level than at geographical level as a source of diversity.
ACKNOWLEDEGMENTS This report is part of M.Sc. research thesis work of the first author. The financial assistance from Canadian Education and Training Awards for Africa (CETAA), International Center for Agricultural Research in the Dry Areas (ICARDA) and Holetta Agricultural Research Center (HARC) for the research work is highly acknowledged. The authors also wish to thank all the staff of the Highland Pulse Research Program at Holetta Research Center who managed the trial.
REFERENCES Allard RW (1960). Principles of Plant Breeding. John Willey and sons,
Inc. New York. Balodi B, Rao RR (1991). The genus Trigonella L. (Fabaceae) in the
Northwest Himalaya. J. Econ. Taxon., 5: 11–16.
Banyai L (1973). Botanical and qualitative studies on ecotypes of fenugreek (Trigonella foenum-graecum). Agrobotanika, 15: 175-186.
Beyene C (1965). Studies on Biological Evaluation of the protein quality of teff (Eragrostis abyssinica) and abish (Trigonella foenum-graecum L) and the supplementary value of abish when added to teff. An MSc
Thesis Presented to the Faculty of the Graduate School of Cornell
University, New York. Cochran WG, Cox M (1957). Experimental Designs. John Wiley and
Sons Inc. New York.
Cornish MA, Hardman R, Sadler RM (1983). Hybridization for genetic improvement in the yield of diosgenin from fenugreek seed. Planta Med., 48: 149-152.
Davoud SA, Hassandokht MR, Kashi AK, Amri A, Alizadeh KH (2010). Genetic Variability of Some Agronomic Traits in the Iranian Fenugreek Landraces under Drought Stress and non-stress
conditions. Afr. J. Plant Sci., 4(2): 012-020. Feysal B (2006). Genetic Divergence and Association among seed
yield, yield related traits and protein content of some fenugreek (Trigonella foenum-graecum L.) landraces in Ethiopia. An MSc thesis
presented to the School of Graduate Studies of Alemaya University, Ethiopia.
Jemal A (1998). Determination of Spacing of fenugreek (Trigonella foenum-graecum L.) and Effect of Intercropping Fenugreek with Sorghum (Sorghum bicolor L., Moench) on yield and Soil Nitrogen.
An MSc Thesis presented to the School of Graduate Studies Alemaya University, Ethiopia.
Johnson HW, Robinson HF, Comstock RE (1955). Estimates of Genetic
and Environmental Variability in Soya beans. Agro. J., 47: 314-318. Johonson RA, Wichern DW (1988). Applied Multivariate Statistical
Analysis. Prentice Hall, Englewood Cliffs, NJ.
Mahalanobis PC (1936). On generalized distance in statistics. Proc. Natl. Inst. Sci. India, 2:49-55.
McCormick KM (2004). Fenugreek (Trigonella foenum-graecum) for
south-eastern Australian farming systems. Ph.D. thesis, School of Agriculture and Food Systems, the University of Melbourne, Victoria, Australia.
Pant KC, Chandel KPS, Singh BM, Saha SN (1983). Diversity in the genetic material of Trigonella foenum-graecum and T. corniculata.
Indian J. Agric. Sci., 53: 537-543.
Polhil RM, Raven PH (1981). Advances in legume systematic. Royal Botanical Gardens, Kew, England.
Provorov NA, Soskov YD, Lutova LA, Sokolova OA, Bairamov SS (1996). Investigation of the fenugreek (Trigonella foenum-graecum
L.) genotypes for fresh weight, seed productivity, symbiotic activity, callus formation and accumulation of steroids. Euphytica, 88: 129-138.
Raghuvanshi SS, Singh RR (1984). Genetics of yield and component characters in fenugreek. SABRAO J., 16: 1-7.
SAS (Statistical Analysisi Software) (1996). SAS/STAT guide for
personal computers, version 6.12 edition. Cary, NC: SAS Institute Inc.
Schneiter A, Johnson BL, Hanson B (1994). New Crop evaluation,
North Dakota State University, Fargo, USA. Shukla GP, Sharma RK (1978). Genetic variability, correlation and path
analysis in fenugreek. Indian J. Agric. Sci., 48: 518-21.
Singh RK, Chaudhary BD (1999). Biometrical Methods in Quantitative Genetics Analysis, Kalyani publishers, New Delhi.318p.


