Embed Size (px)
Citation preview
Genetic instability and clonal expansion
Martin A. Nowak1,*, Franziska Michor1,2, and Yoh Iwasa3
1Program for Evolutionary Dynamics, Department of Organismic and Evolutionary Biology,Department of Mathematics, Harvard University, Cambridge MA 02138, USA2Harvard Society of Fellows, 78 Mt. Auburn Street, Cambridge, MA 02138, USA3Department of Biology, Faculty of Sciences, Kyushu University, Fukuoka 812-8581, Japan
AbstractInactivation of tumor suppressor genes can lead to clonal expansion. We study the evolutionarydynamics of this process and calculate the probability that inactivation of a tumor suppressor geneis preceded by mutations in genes that confer genetic instability. Unstable cells might have aslower rate of clonal expansion than stable cells because of an increased probability of generatinglethal mutations or inducing apoptosis. We show that the different growth rates of geneticallystable and unstable cells during clonal expansion represent, in general, only a small disadvantagefor genetic instability. The intuitive reason for this conclusion is that robust clonal expansion,where cellular birth rates are significantly greater than death rates, occurs on a much faster timescale than waiting for those mutations that allow clonal expansion. Moreover, in special caseswhere clonal expansion is very slow, genetically unstable cells have a higher probability toaccumulate additional mutations during clonal expansion that confer a selective advantage. Clonalexpansion represents a major disadvantage for genetic instability only when inactivation of thetumor suppressor gene leads to a very small increase of the cellular reproductive rate that iscancelled by the increased mortality of unstable cells.
1. IntroductionCancer progression is an evolutionary process. Cells of somatic tissues receive mutationsthat can alter their phenotype leading to increased reproductive rates and increased mutationrates. Mutations in oncogenes and tumor suppressor genes enhance the net reproductiverates of a cell, while mutations in genetic instability genes increase the rate of mutationalprocesses such as point mutations, insertions, deletions, gene amplification, chromosomerearrangements and gain or loss of whole chromosomes (Vogelstein & Kinzler 1998). Thereis much discussion at present whether genetic instability is an early event and therefore adriving force of cancer progression or a late stage consequence of the somatic evolution thatleads to cancer (Rajagopalan et al 2003, Sieber et al 2003).
The idea that cancer progression is accelerated by an enhanced mutation rate (a so-called‘mutator phenotype’) was first introduced by Loeb (1971). So far, two main types of geneticinstability have been observed in human cancers. Mutations in mismatch repair genes lead tomicrosatellite instability (MIN) while mutations in genes that maintain the integrity of thechromosomes during cell division can lead to chromosomal instability (CIN) (Lengauer et al1997, 1998, Cahill et al 1998, Loeb 2001, Duval & Hamelin 2002, Rajagopalan et al 2004,Rajagopalan & Lengauer 2004). Whereas MIN is rarely found in cancers other than colon
*Author for correspondence. martin [email protected].
NIH Public AccessAuthor ManuscriptJ Theor Biol. Author manuscript; available in PMC 2012 February 24.
Published in final edited form as:J Theor Biol. 2006 July 7; 241(1): 26–32. doi:10.1016/j.jtbi.2005.11.012.
NIH
-PA Author Manuscript
NIH
-PA Author Manuscript
NIH
-PA Author Manuscript
cancer, CIN appears to be a common genetic instability which is widespread among solidtumors (Vogelstein & Kinzler 1998).
Genetic instability can increase the mutation rate of pre-cancer cells, but it will also causemany deleterious mutations that might slow down the growth rate of a population of cells.This is called the ‘cost’ of genetic instability. The main question is: Under whichcircumstances will the benefits of an increased mutation rate outpace the cost of geneticinstability? In previous papers, we have investigated whether tumorigenesis could beinitiated by mutations in genes that confer CIN or MIN (Nowak et al 2002, Komarova et al2002). We have concluded that it is very likely that CIN mutations induce the firstphenotypic change in cancer pathways where inactivation of a tumor suppressor generepresents the first step towards cancer. In particular, we have calculated the probability thatinactivation of the APC tumor suppressor gene in colon cancer is preceeded by mutations inCIN genes (Michor et al 2004a 2005).
In this paper, we analyze the following question. Suppose genetically unstable cells have areduced rate of successful cell division and/or an increased rate of cell death. This cost ofgenetic instability could lead to a slower clonal expansion of pre-cancer cells. What is theeffect of this slower clonal expansion on the overall probability that cancers are initiated bymutations that confer genetic instability?
This paper is part of the rapidly growing effort to understand the evolutionary dynamics ofcancer progression with the help of mathematical models (Moolgavkar & Knudson 1981,Sheratt & Nowak 1992, Wodarz & Krakauer 2001, Luebeck & Moolgavkar 2002, Gatenby& Maini 2003, Gatenby & Vincent 2003, Little & Wright 2003, Iwasa et al 2004, Michor etal 2004a,b, 2005a,b, Nowak et al 2004, Frank 2005, Breivik 2005, Wodarz & Komarova2005).
2. Cancer initiation by tumor suppressor gene inactivationLet us design the simplest possible model that allows us to study the effect of clonalexpansion on chromosomal instability (CIN). Consider a somatic tissue that is subdividedinto compartments. Each compartment is fed by a small number of stem cells. Forsimplicity, let us assume that there is only one stem cell per compartment. Suppose theinactivation of a tumor suppressor gene, A, in a stem cell leads to clonal expansion. A wildtype stem cell has two unmutated alleles of A, A+/+. A mutation in one allele leads to a cellwith genotype A+/−. A mutation in the second allele or loss of heterozygosity (LOH) canlead to a cell with genotype A−/−. Let us denote these three cell types by X0, X1 and X2. Inaddition, there can be mutations in CIN genes which lead to the three cell types A+/+CIN,A+/−CIN, and A−/−CIN. These three cell types are, respectively, denoted by Y0, Y1 and Y2.
The mutational diagram is shown in Figure 1. The first allele of the tumor suppressor gene(TSG) is inactivated by a point mutation or a small genetic modification such as an insertionor a deletion; this mutation rate is not affected by chromosomal instability. Therefore, therate for inactivating the first allele of the TSG is the same in CIN and non-CIN cells and isgiven by u1. The rate for inactivating the second allele of the TSG (including LOH events) isgiven by u2 for non-CIN cells and by u3 for CIN cells. The rate of acquiring CIN mutationsis given by uc. All mutation rates are given as probabilities per cell division. Time is alsomeasured in units of cell divisions. For example, if the stem cell divides once a week, thenthe unit of time is one week.
The probability that a compartment has generated a stem cell of type X2 by time t is given by
Nowak et al. Page 2
J Theor Biol. Author manuscript; available in PMC 2012 February 24.
NIH
-PA Author Manuscript
NIH
-PA Author Manuscript
NIH
-PA Author Manuscript

(1)
The mutation from cell type X0 to X1 occurs at rate u1. The mutation from cell type X1 to X2occurs at rate u2. The probability that the stem cell has mutated to type X2 by time t is given
by the convolution . For u1u2t2 ≪ 1 this expression leads toeq (1). Similarly, the probability that a compartment has generated a stem cell of type Y2 bytime t is given by
(2)
These equations hold for u3 ≫ 1/t ≫ u1, u2, uc which is certainly the case for reasonablevalues of the mutation rates and the time scale of human life. The probability to inactivateone allele of a TSG with a point mutation is estimated to be about 10−7 per cell division.Therefore, u1 ≈ 2 × 10⁻⁷ because there are two alleles that represent targets for the first hit.The second allele of a TSG can be inactivated by another point mutation or by LOH. Therate of LOH in normal cells is not well known, but estimates range from 10−7 to 10−6. InCIN cells the rate of LOH was determined to be 10−2 (Lengauer et al 1997). The rate ofacquiring CIN depends on the number and type of CIN genes (Michor et al 2004b); areasonable range is uc = 10−7 to 10−5. If the relevant cells divide once per day then t =30000 cell generations occur in about 82 years. For detailed derivations of equations (1) and(2) including more general cases see Nowak et al (2002), Komarova et al (2003) and Iwasaet al (2004).
If Py(t) > Px(t), then the majority of cancer lesions will start from cells where theinactivation of the second allele of the TSG was preceeded by a CIN mutation. Thisinequality leads to
(3)
If the mutation rate that leads to CIN is greater than half of the mutation rate for the secondhit in stable cells, then the majority of cancers will start with CIN. The factor 1/2 comesfrom the fact that the CIN mutation could occur before or after the inactivation of the firstTSG allele; in Figure 1, there are two evolutionary pathways from X0 to Y1. If, for somereason, the CIN mutation could only occur after inactivating the first allele, then the relevantcondition is uc > u2. In general, if the mutation rate conferring CIN is of the same order ofmagnitude as the inactivation rate of the second allele, then a significant fraction of cancerswill start with CIN.
The mutation rate conferring CIN depends on the number of CIN genes in the humangenome. In yeast, more than hundred genes have been identified, each of which is sufficientto trigger CIN when genetically altered (Shonn et al 2000, Kolodner et al 2002, Nasmyth2002). By analogy, we expect hundreds of human CIN genes, but only few have beenidentified so far (see Michor et al 2004b). Therefore, the mutation rate triggering CIN couldbe hundred times larger than the mutation rate inactivating the first TSG allele, and CIN willalmost certainly arise very early in tumorigenesis.
3. Clonal expansionLet us now add clonal expansion. Suppose clonal expansion starts once both alleles of theTSG have been inactivated. This means clonal expansion is initiated by cells of type X2 orY2. We model clonal expansion as a probabilistic branching process describing the birth and
Nowak et al. Page 3
J Theor Biol. Author manuscript; available in PMC 2012 February 24.
NIH
-PA Author Manuscript
NIH
-PA Author Manuscript
NIH
-PA Author Manuscript
death of cells. In a branching process, there are two possibilities: either the cell populationbecomes extinct after some time or continues to grow. We interpret extinction as follows:the mutated stem cell initiates a clonal expansion, but the stochastic fluctuations in cell birthand death lead to the extinction of this clone. In this case, we assume that also the mutatedstem cell that has initiated the wave of clonal expansion has died. This assumption describesa scenario where the mutated stem cell is just one of the cells of the clonally expandingpopulation. If this population dies out, then naturally the mutated stem cell has alsodisappeared. Another plausible scenario is that the mutated stem cell sits in a protectedniche, will not disappear and might generate several waves of clonal expansions. We do notinvestigate this case in the present paper, but note that both the analysis and the conclusionsare very similar.
For X2 cells, the rate of cell division is given by a and the rate of cell death by b. For Y2cells, the rate of cell division is given by c and the rate of cell death by d. The probabilitythat clonal expansion starting from a single X2 cell results in extinction is given by b/a. Theprobability that such clonal expansion leads to a lesion is given by 1 − b/a. Similarly, theprobability that clonal expansion starting from a single Y2 cell results in extinction is givenby d/c. The probability that such clonal expansion leads to a lesion is given by 1 − d/c.
In the Appendix, we derive the following results. The probability that a compartment hasgiven rise to a lesion of size M without CIN by time t is approximately given by
(4)
The probability that a compartment has given rise to a lesion of size M with CIN by time t isapproximately given by
(5)
Here Tx and Ty indicate the time scale of clonal expansion for stable and unstable lesions.We have
(6)
and
(7)
Figures 2 and 3 show the excellent agreement between these equations and exact numericalsimulations.
If Qy(t) > Qx(t), then the majority of cancer lesions (by time t) have been initiated with aCIN mutation. In the reasonable parameter regime where the time scale for inactivating thetumor suppressor gene is much larger than the time scale for the clonal expansion, t ≫ Txand t ≫ Ty, the inequality Qy(t) > Qx(t) leads to
(8)
Nowak et al. Page 4
J Theor Biol. Author manuscript; available in PMC 2012 February 24.
NIH
-PA Author Manuscript
NIH
-PA Author Manuscript
NIH
-PA Author Manuscript
Let us define robust clonal expansion as the birth rate of cells being much larger than theircorresponding death rate. For stable cells, this means a ≫ b, and for unstable cells, c ≫ d.Either by inspecting the simple inequality (8) or by comparing the more accurate eqs (4) and(5) we conclude that robust clonal expansion has only a very small effect on the relativeimportance of genetic instability for initiating tumor progression. For example, if a = 4b andc = 2d, then the non-CIN clone has an exponential growth rate which is twice as fast as theCIN clone. This corresponds to a 50% fitness disadvantage of CIN. In this case inequality(8) leads to uc > (3/4)u2. This has to be compared with inequality (3), uc > (1/2)u2, whichneglects the effect of clonal expansion. Therefore, robust clonal expansion has almost noconsequence for evaluating the contribution of early genetic instability.
4. DiscussionIn this paper, we have analyzed the effect of clonal expansion on genetic instability. Robustclonal expansion is defined by the property that cell division is significantly faster than celldeath. In this case, clonal expansion has little effect for evaluating the probability thatchromosomal instability (CIN) precedes inactivation of the first tumor suppressor gene(TSG) on the way to cancer. Our conclusions differ from those reached by Komarova &Wodarz (2004) who argue that CIN is always slower when clonal expansion is taken intoaccount. Their conclusion is based on the time at which the average number of clonallyexpanding cells reaches a certain size. In their approach, however, the average number ofcells includes evolutionary trajectories where early mutations have given rise to a clonalexpansion that leads to unreasonably large population sizes (more than the total number ofall cells in the body, for example). Such trajectories could never occur and therefore must beexcluded from the calculation. This effect is stronger for faster clonal expansion, andtherefore, Komarova & Wodarz (2004) have concluded that the faster growing non-CINcells always outperform the slower growing CIN cells.
The problem with using the average number of cells can be illustrated by studying thenumerical example of Figure 2. Using the calculation of Komarova and Wodarz (seeAppendix B), the average number of X2 cells reaches M at time t̄x = 47.72 while the averagenumber of Y2 cells reaches M at time t̄y = 101.88. From these results it would be wrong toconclude that non-CIN outperforms CIN, because CIN lesions (of size M) are always moreabundant than non-CIN lesions - as shown in Figure 2. Therefore, in this example, theprobability that a cancer is initiated with an early CIN mutation is higher than the probabilitythat a cancer is initiated without a CIN mutation.
If clonal expansion is not robust, then obviously the situation can turn against CIN. Supposethat inactivation of the TSG leads to a weak clonal expansion where the birth rate a is onlymarginally larger than the death rate b in the stable cell type. The cost of CIN could thenimply that the birth rate c is smaller than the death rate d in the unstable cell type. In thisspecial case, CIN lesions cannot form.
Whenever the possible relevance of early genetic instability is evaluated, there is theconcern that the increased mutation rate may not compensate for the reduced fitness ofunstable cells. But it is important to keep in mind that genetic instability could also beassociated with an increased rate of cell division, if for example certain cell cyclecheckpoints are ignored. Thus, in some cases, unstable cells could have a fitness advantage(Nowak et al 2002). It has also been proposed that certain carcinogens could select forgenetic instability (Bardelli et al 2001, Breivik et al 2001, Blagosklonny 2001). Moreover, ifthere are factors that select for genetic instability before clonal expansion, they could also doso during clonal expansion.
Nowak et al. Page 5
J Theor Biol. Author manuscript; available in PMC 2012 February 24.
NIH
-PA Author Manuscript
NIH
-PA Author Manuscript
NIH
-PA Author Manuscript

For most cancers, inactivation of the first TSG may not lead immediately to an enormousclonal expansion, but instead the first wave of clonal expansion comes to a halt when acertain size is reached. At this point, additional mutations in TSGs or oncogenes may benecessary for further clonal expansion. In pathways of tumorigenesis where two or moreTSGs must be inactivated in rate limiting situations (when the number of replicating cancercells is not too large), CIN will almost certainly occur before the inactivation of the firstTSG (Michor et al 2005).
In summary, we conclude that robust clonal expansion even to very large cell numbers hasonly a small effect when evaluating the probability that tumorigenesis is initiated via geneticinstability. The intuitive reason is that the time scale for clonal expansion is much shorterthan the time scale of waiting for those mutations that cause clonal expansion.
Appendix AEquation (1) gives the probability that a compartment has generated a stem cell of type 2before time t. The clonal expansion of type 2 cells can either reach size M or die out againwhich results in the elimination of the whole compartment. We are interested in theprobability that the clone reaches size M before time t. We consider the extinctionprobability and the time delay required for the cell population to increase from 1 to M. Let sdenote the time delay required for the clonal expansion. Consider a continuous-timebranching process starting from a single individual, N(0)=1, that reaches population size Mafter time s. We have N(s)= M . Note that the population grows exponentially with rate a-bwhen it is sufficiently large. For a very large population size, the stochasticity caused bydemographic process becomes less important, and the population can be approximated bydeterministic exponential growth. Trajectories of different simulation runs differ in s and thetiming of reaching M due to the stochasticity while the population size is small. Hence wehave
(A.1)
According to the branching process calculation, the arithmetic average of the population sizeis E [N(t)] = exp [(a − b)t]. This average is calculated by considering both trajectories ofclonal expansion and of extinction. In contrast, the amount of delay for the clonal expansionshould be averaged over only those runs that show exponential growth. Let ⟨•⟩ denote theaverage with respect to the trajectories that do not go extinct. Using this average, we haveE[N(t)] = (1 − b/a)⟨N(t)⟩ + (b/a)·0, leading to ⟨N(t)⟩ = exp[(a − b)t]/(1 − b/a). If ⟨N(t)⟩ isequivalent to N(t) in equation (A.1), the time required for clonal expansion is given by
(A.2)
In the following, we estimate the mean time delay more carefully by considering thevariance of trajectories.
Mean and variance of the cell population sizeLet g(ξ,t) be the generating function of the cell number, defined as g(ξ,t) = E[ξN(t)∣N(0)=1],where ξ is a positive parameter (0 < ξ ≤ 1). Within a short time interval of length Δt, a celldies with probability bΔt, divides (becomes two cells) with probability aΔt, and remainsunchanged otherwise. We obtain
Nowak et al. Page 6
J Theor Biol. Author manuscript; available in PMC 2012 February 24.
NIH
-PA Author Manuscript
NIH
-PA Author Manuscript
NIH
-PA Author Manuscript
Here we have used E[ξN(t)∣N(0)= 2] = E[ξN(t)∣N(0)=1]2 = g(ξ, t)2, because two lineagesstarting from different cells at a given time behave independently. In the limit ofinfinitesimal Δt, we obtain ∂g/∂t = (ag − b)(g − 1) (see Iwasa et al., 2004). With the initialcondition g(ξ,0) = ξ we have
(A.3)
When ξ → 0, we have the extinction probability, which becomes g(0,∞)= b/a when t → ∞.By taking the derivative of equation (A.3) and letting ξ → 1, we have
This is the unconditional mean number of cells, where the average is calculated includingpaths that go extinct. Also, by the second derivative of equation (A.1) and by letting ξ →1,we have
Note that ∂2g/∂ξ2 (1, t) = E[N(N − 1)]. This too is the unconditional mean. Let us nowcalculate the conditional mean and conditional variance, i.e. the mean and variancecalculated only for the paths that grow exponentially. These are given by
(A.4a)
(A.4b)
Here we pick up the leading order terms only. We have Var(N)/⟨N⟩2 ≈ 1. Now consider theTaylor expansion of lnN around ⟨N⟩,
Hence we have(A.5)
Here only leading order terms are shown. They are accurate if M is sufficiently large.
Delay caused by clonal expansionDue to the stochasticity when the cell number is small, a different realization of the cellpopulation growth has a different time at which the population reaches size M. This time,denoted by s, differs between simulation runs (i.e. different clones). Let ⟨•⟩ be the average
Nowak et al. Page 7
J Theor Biol. Author manuscript; available in PMC 2012 February 24.
NIH
-PA Author Manuscript
NIH
-PA Author Manuscript
NIH
-PA Author Manuscript

with respect to the different runs that end up with exponential growth. Then we have fromequation (A.1)
(A.6)
Hence, from equations (A.6), (A.4a), and (A.5), we have
(A.7)
which is denoted by Tx and is given by equation (6) in the text. Using this estimate of themean delay, we can obtain equation (4) by multiplying the probability of non-extinction, (1− b/a), and by replacing t by t − Tx.
Similarly, the time delay for the clonal expansion of type 2 cells with CIN is given byequation (7), which is equation (A.7) where a and b are replaced by c and d, respectively.
Appendix B
The time until the average cell number reaches M is much shorter than theaverage time until the cell number reaches M
To explain the reason why Komarova and Wodarz (2004) reach a different conclusion thanwe do, consider the average number of type X2 cells. When the first X2 cell arises at time t’,the number of type X2 cells increases exponentially following e(a−b)(t−t’). The rate at whichnew type X2 cells arise is given by dPx/dt = u1u2t. The probability that the clone does not goextinct is 1 − b/a. Hence the mean number of type X2 cells averaged over different patientsis given by
(B.1)
In a similar way, the mean number of Y2 cells averaged over different patients is given by
(B.2)
By integration by part, we have . Here we neglect small terms. Nowconsider the time at the mean number of X2 cells reaches size M, and denote it by t̄x. FromZx(t̄x) = M we have
Similarly, we calculate the time at which the mean number of Y2 cells reaches M as Zy(t̄y)=M. This leads to
Nowak et al. Page 8
J Theor Biol. Author manuscript; available in PMC 2012 February 24.
NIH
-PA Author Manuscript
NIH
-PA Author Manuscript
NIH
-PA Author Manuscript
With the parameter values used in Fig. 2, we have t̄x = 47.72 and t̄y = 101.88. Hence, usingthis criterion, the mean number of type X2 cells reaches size M earlier than the mean numberof type Y2 cells. This might suggests that tumorigenesis without CIN is more important thantumorigenesis with CIN, if clonal expansion is taken into account. This conclusion,however, is opposite to the conclusion that is reached by considering the mean time until theclone becomes size M (Fig. 2).
Note that the estimates of t̄x= 47.72 and t̄y= 101.88 are much shorter than the mean waitingtimes shown in Fig. 2. There is a large variation between patients concerning the timing atwhich the first X2 cell (or Y2 cell) arises. In rare cases, in which the first mutant cell arisesmuch earlier than in most cases, the cells quickly increase exponentially to unrealisticallyhigh numbers. When calculating the average cell number over different patients, those rarecases cause a large contribution to the average number and decreases the time at which themean cell number reaches M. Since this tendency is stronger when the exponential growthrate is faster, X2 cells (with exponential growth rate a-b) show an apparently earlier increasethan Y2 cells (with exponential growth rate c-d<a-b). Komarova and Wodarz (2004) carriedout essentially the same calculation as above, although they used a convolution integral oftwo exponential functions rather than a linear function for the rate of producing mutants.
AcknowledgmentsThis work was done during Yoh Iwasa’s visits at Harvard University in 2004 and 2005. The Program forEvolutionary Dynamics at Harvard University is sponsored by Jeffrey Epstein.
ReferencesBardelli A, Cahill DP, Lederer G, Speicher MR, Kinzler KW, Vogelstein B, Lengauer C. Carcinogen-
specific induction of genetic instability. P Natl Acad Sci USA. 2001; 98:5770–5775.Blagosklonny MV. How carcinogens (or telomere dysfunction) induce genetic instability: associated-
selection model. FEBS Lett. 2001; 506:169–172. [PubMed: 11602239]Breivik J. Don’t stop for repairs in a war zone: Darwinian evolution unites genes and environment in
cancer development. Proc Natl Acad Sci U S A. 2001; 98:5379–5381. [PubMed: 11344279]Breivik J. The evolutionary origin of genetic instability in cancer development. Semin Cancer Biol.
2005; 15:51–60. [PubMed: 15613288]Cahill DP, Lengauer C, Yu J, Riggins GJ, Willson JKV, Markowitz SD, Kinzler KW, Vogelstein B.
Mutations of mitotic checkpoint genes in human cancers. Nature. 1998; 392:300–303. [PubMed:9521327]
Duval A, Hamelin R. Genetic instability in human mismatch repair deficient cancers. Ann Genet.45:71–75. [PubMed: 12119215]
Gatenby RA, Maini PK. Mathematical oncology: Cancer summed up. Nature. 2003; 421:321–321.[PubMed: 12540881]
Gatenby RA, Vincent TL. An evolutionary model of carcinogenesis. Cancer Res. 2003; 63:6212–6220.[PubMed: 14559806]
Frank SA. Age-specific incidence of inherited versus sporadic cancers: A test of the multistage theoryof carcinogenesis. P Natl Acad Sci USA. 2005; 102:1071–1075.
Iwasa Y, Michor F, Nowak MA. Stochastic tunnels in evolutionary dynamics. Genetics. 2004a;166:1571–1579. [PubMed: 15082570]
Iwasa Y, Michor F, Nowak MA. Evolutionary dynamics of invasion and escape. J theor Biol. 2004b;226:205–214. [PubMed: 14643190]
Iwasa Y, Michor F, Komarova NL, Nowak MA. Population genetics of tumor suppressor genes. Jtheor Biol. 2005; 233:15–23. [PubMed: 15615616]
Kolodner RD, Putnam CD, Myung K. Maintenance of genome stability in Saccharomyces cerevisiae.Science. 2002; 297:552–557. [PubMed: 12142524]
Nowak et al. Page 9
J Theor Biol. Author manuscript; available in PMC 2012 February 24.
NIH
-PA Author Manuscript
NIH
-PA Author Manuscript
NIH
-PA Author Manuscript

Komarova NL, Lengauer C, Vogelstein B, Nowak MA. Dynamics of genetic instability in sporadicand familial colorectal cancer. Cancer Biotherapy. 2002; 1:685–692.
Komarova NL, Sengupta A, Nowak MA. Mutation-selection networks of cancer initiation: Tumorsuppressor genes and chromosomal instability. J theor Biol. 2003; 223:433–450. [PubMed:12875822]
Komarova NL, Wodarz D. The optimal rate of chromosome loss for the inactivation of tumorsuppressor genes in cancer. Proc Natl Acad Sci U S A. 2004; 101:7017–7021. [PubMed:15105448]
Lengauer C, Kinzler KW, Vogelstein B. Genetic instability in colorectal cancers. Nature. 1997;386:623–627. [PubMed: 9121588]
Lengauer C, Kinzler KW, Vogelstein B. Genetic instabilities in human cancers. Nature. 1998;396:623–649. [PubMed: 9872305]
Little MP, Wright EG. A stochastic carcinogenesis model incorporating genomic instability fitted tocolon cancer data. Math Biosci. 2003; 183:111–134. [PubMed: 12711407]
Loeb LA. A mutator phenotype in cancer. Cancer Res. 2001; 61:3230–3239. [PubMed: 11309271]Luebeck EG, Moolgavkar SH. Multistage carcinogenesis and the incidence of colorectal cancer. P Natl
Acad Sci USA. 2002; 99:15095–15100.Michor F, Iwasa Y, Rajagopalan H, Lengauer C, Nowak MA. Linear model of colon cancer initiation.
Cell Cycle. 2004a; 3:358–362. [PubMed: 14726709]Michor F, Iwasa Y, Nowak MA. Dynamics of cancer progression. Nat Rev Cancer. 2004b; 4:197–205.
[PubMed: 14993901]Michor F, Iwasa Y, Vogelstein B, Lengauer C, Nowak MA. Can chromosomal instability initiate
tumorigenesis? Semin Cancer Biol. 2005a; 15:43–49. [PubMed: 15613287]Michor F, Hughes T, Iwasa Y, Branford S, Shah N, Sawyers C, Nowak MA. Dynamics of chronic
myeloid leukaemia. Nature. 2005b; 435:1267–1270. [PubMed: 15988530]Moolgavkar SH, Knudson AG. Mutation and cancer: A model for human carcinogenesis. J Natl
Cancer I. 1981; 66:1037–1052.Nasmyth K. Segregating sister genomes: the molecular biology of chromosome separation. Science.
2002; 297:559–565. [PubMed: 12142526]Nowak MA, Michor F, Komarova NL, Iwasa Y. Evolutionary dynamics of tumor suppressor gene
inactivation. P Natl Acad Sci USA. 2004; 101:10635–10638.Nowak MA, Komarova NL, Sengupta A, Jallepalli PV, Shih I-M, Vogelstein B, Lengauer C. The role
of chromosomal instability in tumor initiation. P Natl Acad Sci USA. 2002; 99:16226–16231.Rajagopalan H, Nowak MA, Vogelstein B, Lengauer C. The significance of unstable chromosomes in
colorectal cancer. Nat Rev Cancer. 2003; 3:695–701. [PubMed: 12951588]Rajagopalan H, Jallepalli PV, Rago C, Velculescu VE, Kinzler KW, Vogelstein B, Lengauer C.
Inactivation of hCDC4 can cause chromosomal instability. Nature. 2004; 428:77–81. [PubMed:14999283]
Rajagopalan H, Lengauer C. hCDC4 and genetic instability in cancer. Cell Cycle. 2004; 3:693–694.[PubMed: 15118416]
Sheratt JA, Nowak MA. Oncogenes, anti-oncogenes and the immune response to cancer: amathematical model. Proc R Soc Lond B. 1992; 248:261–271.
Shonn MA, McCarroll R, Murray AW. Requirement of the spindle checkpoint for proper chromosomesegregation in budding yeast mitosis. Science. 2000; 289:300–303. [PubMed: 10894778]
Sieber OM, Heinimann K. Tomlison I P M Genomic instability - the engine of tumorigenesis? Nat RevCancer. 3:701. [PubMed: 12951589]
Vogelstein, B.; Kinzler, KW., editors. The genetic basis of human cancer. Toronto, Ontario: McGraw-Hill; 1998.
Wodarz, D.; Komarova, N. Computational Biology of Cancer. World Scientific; 2005.Wodarz D, Krakauer DC. Genetic instability and the evolution of angiogenic tumor cell lines. Oncol
Rep. 2001; 8:1195–1201. [PubMed: 11605033]
Nowak et al. Page 10
J Theor Biol. Author manuscript; available in PMC 2012 February 24.
NIH
-PA Author Manuscript
NIH
-PA Author Manuscript
NIH
-PA Author Manuscript

Figure 1.The mechanism of cancer initiation that is analyzed in this paper assumes that inactivationof a tumor suppressor gene, A, leads to clonal expansion. The mutation rates for inactivatingthe first and second alleles are given by u1 and u2, respectively. There can also occurmutations, at rate uc, which lead to chromosomal instability (CIN). CIN causes very fastinactivation of the second allele of the tumor suppressor gene (TSG) by loss ofheterozygosity (LOH); this step occurs on a much faster time scale than in stable cells and isusually not rate limiting. Thus, it requires two rate limiting hits to inactivate a TSG with orwithout CIN (eqs 1 and 2). We assume that the subsequent clonal expansion occurs at afaster rate in stable cells than in CIN cells, because the latter might suffer from a reducedrate of successful cell division and/or an increased death rate. We calculate the probabilitythat a lesion consisting of M cells with or without CIN has arisen by a certain time (see eqs 4and 5).
Nowak et al. Page 11
J Theor Biol. Author manuscript; available in PMC 2012 February 24.
NIH
-PA Author Manuscript
NIH
-PA Author Manuscript
NIH
-PA Author Manuscript

Figure 2.Perfect agreement between the analytical approximations given by eqs 4 and 5 (lines) andexact numerical simulation (points). We perform a stochastic simulation for the cancerinitiation process described in the main text and illustrated in Figure 1. In each time step, arandom event is chosen proportionally to its rate. Before clonal expansion, there is only one(stem) cell. Initially, this cell is of type X0. Mutation to X1 or Y1 occurs with probabilities u1and uc, respectively. A Y0 cell can mutate to a Y1 cell with probability u1. An X1 cell canmutate to an X2 cell with probability u2 or to a Y1 cell with probability uc. A Y1 cell canmutate to a Y2 cell with probability u3. An X2 cell initiates clonal expansion; cells dividewith rate a and die with rate b. Similarly, a Y2 cell initiates clonal expansion; cells dividewith rate c and die with rate d. The simulation is stopped if the clone has died out or hasreached M cells. The figure shows the probability that a single (stem) cell has given rise to astable lesion or a CIN lesion. Parameter values are u1 = 2 × 10⁻⁷, u2 = 10−6, u3 = 10−2, uc =5u1, a = 1, b = 0.1, c = 0.5, d = 0.1, and M = 106. The probability is evaluated over 107 runs.
Nowak et al. Page 12
J Theor Biol. Author manuscript; available in PMC 2012 February 24.
NIH
-PA Author Manuscript
NIH
-PA Author Manuscript
NIH
-PA Author Manuscript
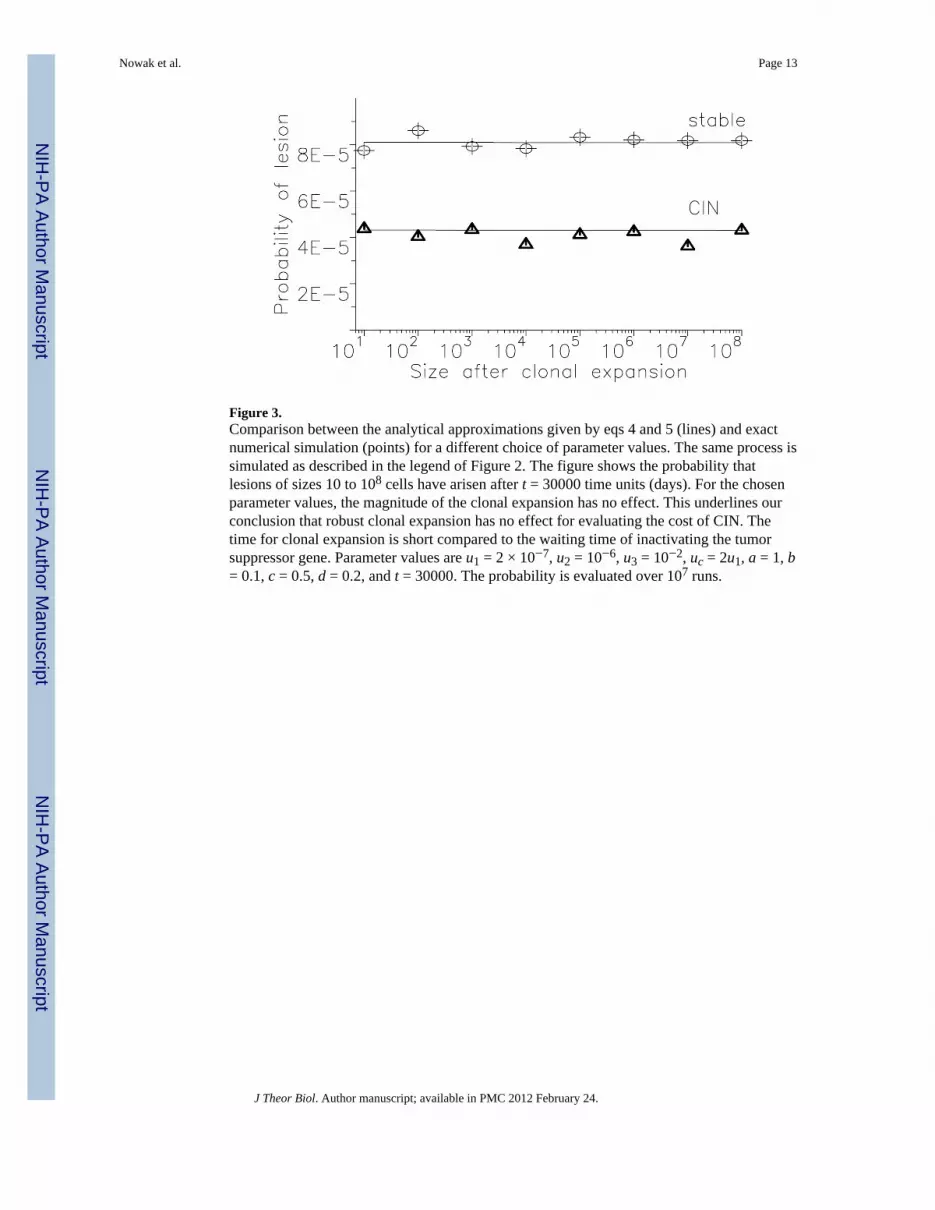
Figure 3.Comparison between the analytical approximations given by eqs 4 and 5 (lines) and exactnumerical simulation (points) for a different choice of parameter values. The same process issimulated as described in the legend of Figure 2. The figure shows the probability thatlesions of sizes 10 to 108 cells have arisen after t = 30000 time units (days). For the chosenparameter values, the magnitude of the clonal expansion has no effect. This underlines ourconclusion that robust clonal expansion has no effect for evaluating the cost of CIN. Thetime for clonal expansion is short compared to the waiting time of inactivating the tumorsuppressor gene. Parameter values are u1 = 2 × 10⁻⁷, u2 = 10−6, u3 = 10−2, uc = 2u1, a = 1, b= 0.1, c = 0.5, d = 0.2, and t = 30000. The probability is evaluated over 107 runs.
Nowak et al. Page 13
J Theor Biol. Author manuscript; available in PMC 2012 February 24.
NIH
-PA Author Manuscript
NIH
-PA Author Manuscript
NIH
-PA Author Manuscript


