Embed Size (px)
Citation preview
Washington University in St. Louis Washington University in St. Louis
Washington University Open Scholarship Washington University Open Scholarship
All Theses and Dissertations (ETDs)
January 2010
Genetic Influences on Preterm Birth Genetic Influences on Preterm Birth
Jevon Plunkett Washington University in St. Louis
Follow this and additional works at: https://openscholarship.wustl.edu/etd
Recommended Citation Recommended Citation Plunkett, Jevon, "Genetic Influences on Preterm Birth" (2010). All Theses and Dissertations (ETDs). 277. https://openscholarship.wustl.edu/etd/277
This Dissertation is brought to you for free and open access by Washington University Open Scholarship. It has been accepted for inclusion in All Theses and Dissertations (ETDs) by an authorized administrator of Washington University Open Scholarship. For more information, please contact [email protected].
Washington University
Division of Biology and Biomedical Sciences
Human and Statistical Genetics
Dissertation Examination Committee Louis Muglia (chairperson)
Alison Goate (co-chairperson) Ingrid Borecki
James Cheverud Justin Fay John Rice
Nancy Saccone
GENETIC INFLUENCES ON PRETERM BIRTH
by Jevon Anastasia Plunkett
A dissertation presented to the Graduate School of Arts and Sciences
of Washington University in partial fulfillment of the
requirements for the degree of Doctor of Philosophy
August 2010
Saint Louis, Missouri
ii
ABSTRACT OF THE DISSERTATION
Genetic Influences on Preterm Birth
by
Jevon Anastasia Plunkett
Doctor of Philosophy in Biology and Biomedical Sciences (Human and Statistical
Genetics)
Washington University in St. Louis, 2010
Professor Louis Muglia, Chairperson
Professor Alison Goate, Co-chairperson
Preterm birth (PTB) is a leading cause of mortality and disease burden globally;
however, determinants of human parturition remain largely uncharacterized, making
prediction and prevention of difficult. Genetic studies are one way in which we can
attempt to better understand this disorder.
We first sought to develop a model for the genetic influences on PTB to facilitate
gene discovery. Study of standard measures of familial aggregation, the sibling risk ratio
and the sibling-sibling odds ratio, and segregation analyses of gestational age, a
iii
quantitative proxy for preterm birth, lend support to a genetic component contributing to
birth timing, since preterm deliveries cluster in families and models in which
environmental factors alone contribute to gestational age are strongly rejected. Analyses
of gestational age attributed to the infant support a model in which mother’s genome
and/or maternally-inherited genes acting in the fetus are largely responsible for birth
timing.
We also aimed to discover specific genes associated with PTB by screening genes
selected based on an evolutionary-motivated filter, rather than known parturition
physiology. Because humans are born developmentally less mature than other mammals,
birth timing mechanisms may differ between humans and model organisms that have
been typically studied; as a result, we screened 150 genes, selected because of their rapid
evolution along the human lineage. A screen of over 8000 SNPs in 165 Finnish preterm
and 163 control mothers identified an enrichment of variants in FSHR associated with
PTB and prompted further study of the gene. Additionally, PLA2G4C, identified as the
gene with the most statistically significant evidence for rapid evolution that was also
included in a list of preterm birth candidate genes, was examined further. Three SNPs in
PLA2G4C and one SNP in FSHR were statistically significant across populations after
multiple testing corrections. Additional work to identify variants in these genes with
functional effects was also initiated, including comparisons of prostaglandin metabolite
levels among genotype classes for significantly associated SNPs in PLA2G4C and
sequencing of FSHR to identify functional coding variants. Together, these experiments
better characterize the nature of genetic influences on PTB and support the role of
PLA2G4C and FSHR in PTB.

iv
Acknowledgements
This work was supported in part by grants from the Children’s Discovery Institute
at Washington University School of Medicine and St. Louis Children’s Hospital and from
the March of Dimes awarded to Dr. Lou Muglia. This research was also supported by
T32 GM081739 from the National Institute of General Medical Science and the Mr. and
Mrs. Spencer T. Olin Fellowship for Women in Graduate Study at Washington
University in St. Louis awarded to Jevon Plunkett.
This work would not have been possible without the generous participation of
families and study recruitment by various clinicians and support staff in both the United
States and Finland, with particular gratitude to Drs. Bimal Chaudhari, Emily DeFranco,
Zach Kistka, and Tammy Shen at Washington University; Kari Teramo and colleagues at
University of Helsinki; and Mikko Hallman and colleagues at University of Oulu. I
would like to thank our collaborators at the following institutions for their willingness to
share resources: Drs. Ram Menon and colleagues at Emory University; Jeff Murray and
colleagues at University of Iowa, and Errol Norwitz and colleagues at Yale University. I
would also like to express gratitude to Microarray Core Facility at Washington University
and Cara Sutcliffe and Rachel Wiseman of the DNA Resources Core at Vanderbilt
University for assistance with genotyping. I also thank Dr. Mary Feitosa for her
assistance with the segregation analysis and Drs. Olivier Boutaud and John Oates for
their collaboration on the prostaglandin metabolite analysis.
I would like to express my gratitude to the following individuals for their
mentorship: Dr. Lou Muglia for acting as my thesis mentor; Dr. Ingrid Borecki for acting
my thesis co-mentor; and Drs. James Cheverud, Justin Fay, Alison Goate, John Rice and

v
Nancy Saccone for serving on my thesis advisory committee. I would also like to
acknowledge the informal mentorship of Drs. Tom Morgan, Tracy McGregor and David
Stamillo. Each of these professors contributed important insights to this work and
facilitated my development as a scientist and academic.
I also am thankful for interactions with my colleagues at Washington University
and Vanderbilt University. I thank the present and former members of the Muglia lab and
Morgan lab for their friendship and collaboration, with particular gratitude to Sherri
Vogt, Donte Smith and Drs. Beth Kozel and Guilherme Orabona, for their assistance with
experiments related to this work. I would also like to acknowledge the members of the
Washington University Human and Statistical Genetics (HSG) program, with particular
gratitude to directors Drs. Anne Bowcock and D. C. Rao for their vision for the program;
Dr. Mike Lovett for his dedication to recruitment and to educating first year students;
coordinators Dana Sterbenz and Kristina Hedtkamp for facilitating practical aspects of
the program and their genuine care for HSG students; and my HSG classmates. I am
grateful for interactions with members of the Center for Human Genetics Research at
Vanderbilt University, with particular gratitude to Scott Williams and the students of the
Vanderbilt University Human Genetics graduate program.

vi
Dedication
To my sister, Jamie Plunkett, my first, and very best, friend.
vii
Table of Contents
Abstract ii
Acknowledgements ix
Dedication x
Table of Contents xi
List of Tables xiv
List of Figures xv
Chapter 1: Introduction 1
Clinical aspects of preterm birth (PTB) 1
Motivation for studying genetics 2
Evidence for genetic influences on birth timing 3
Complexity of genetic effects on birth timing 7
Identifying specific genes associated with PTB 8
Objectives of dissertation 9
Chapter 2: Increased risk to siblings of preterm infants suggests genetic factors may
influence PTB 18
Abstract 18
Introduction 19
Results 22
Discussion 25
Material and Methods 30
Chapter 3: Patterns of inheritance in familial PTB suggest PTB is complex genetic
disorder 37
viii
Abstract 37
Introduction 38
Results 39
Modeling of gestational age attributed to the infant 39
Modeling of gestational age attributed to the mother 40
Heterogeneity between Blacks and Whites 40
Discussion 42
Material and Methods 47
Chapter 4: Considering genes rapidly evolving along the human lineage facilitates
discovery of novel gene for PTB: follicle-stimulating hormone, FSHR 60
Abstract 60
Introduction 60
Results and Discussion 62
Life history traits 62
Signature of rapid evolution 63
Association analysis of rapidly evolving genes 65
Materials and Methods 69
Chapter 5: Association of cystolic phospholipase A2 gamma, PLA2G4C,
with PTB risk 107
Abstract 107
Introduction 108
Results 109
Discussion 112

ix
Materials and Methods 115
Chapter 6: Conclusions and Future Directions 133
References 139
Curriculum Vitae 150

x
List of Tables
Table 1.1 12
Table 2.1 33
Table 2.2 34
Table 2.3 35
Table 2.4 36
Table 3.1 55
Table 3.2 56
Table 3.3 57
Table 3.4 58
Table 3.5 59
Table 4.1 88
Table 4.2 89
Table 4.3 93
Table 4.4 100
Table 4.5 101
Table 5.1 126
Table 5.2 127
Table 5.3 128
Table 5.4 129

xi
List of Figures
Figure 1.1 11
Figure 3.1 53
Figure 4.1 79
Figure 4.2 80
Figure 4.3 82
Figure 4.4 83
Figure 4.5 84
Figure 4.6 85
Figure 4.7 86
Figure 4.8 87
Figure 5.1 119
Figure 5.2 121
Figure 5.3 122
Figure 5.4 123
Figure 5.5 126
Figure 5.6 127
Figure 5.7 128
Chapter 1: Introduction*
Clinical aspects of preterm birth (PTB)
Human parturition typically occurs between 37-42 weeks of gestation, with 40
weeks being the most common time of delivery (Figure 1.1). Deliveries before 37 weeks
are designated as “preterm” births by the World Health Organization [1] and represent an
important public health concern. Approximately one-third of infant deaths are attributable
to prematurity [2]. Preterm infants also have an increased risk of serious health problems,
such as respiratory illness, blindness and cerebral palsy [3]. Moreover, the severity and
incidence of these problems worsen with decreasing gestational age [4].
A variety of subtypes of PTB can be described. For example, preterm births may
be spontaneous or medically indicated. For 20-30% preterm births, women are delivered
early to minimize complications from maternal conditions, like preeclampsia, or fetal
distress [4]. However, most preterm births result from spontaneous preterm labor or
preterm premature rupture of membranes (PPROM) [4]. Preterm labor or PPROM may
arise in response to various stimuli, such as damage to the placental unit, intrauterine
infection or changes in cervical length, but the mechanisms by which these processes are
initiated are unknown. Additionally, early births of multiple gestations, which are
generally delivered earlier than singletons, may occur by different mechanisms than
singleton PTB. Hence, considerable heterogeneity in etiology may exist among various
subgroups of PTB and warrants careful consideration of phenotype in studies of PTB.
PTB is common, with rates consistently rising in recent decades. In 2006, 12.8%
of births in the United States occurred before 37 weeks, a 21% increase since 1990 [5].
* This chapter is adapted from: Plunkett J & Muglia LJ. (2008) Genetic Contributions to PTB:
Implications from Epidemiological and Genetic Association Studies. Ann Med., 40(3):167-95.
1
While the recent rise in multiple births, which are generally delivered earlier than
singletons, contributes to this increase, the rate among singleton gestations has risen 13%
since 1990 and is now 11.1%. Among singleton PTB, late-preterm births (34-36 weeks)
account for all of the increase, with essentially no change in the rate of births <34 weeks
during this period. Importantly, cesarean-delivery rates have also increased since 1990,
such that medically-indicated PTB may represent a greater portion of the increase in
overall PTB rate. Consequently, distinguishing spontaneous from medically-indicated
PTB may be important in identifying risk factors for this condition.
Of note, rates differ among racial groups. Blacks experience approximately twice
the rate of PTB than that of Whites. The highest PTB rates are observed when both
parents are Black and remain higher when one parent is Black, whether that parent is the
mother or father [6; 7]. According to a study by Goldenberg and colleagues [8], these
racial disparities are not explained entirely by measured medical and environmental risk
factors, such as smoking, hypertension, education level or socioeconomic status,
suggesting that other differences among races, such as genetic ancestry, contribute to the
disorder. As a result, careful consideration of important differences in social, cultural and
biological factors among races also are important in studies of PTB risk.
Motivation for studying genetics
While a number of risk factors have been identified, accurate prediction and
prevention of PTB are difficult [4]. For example, biomarkers, such as serum protein
concentrations of IL-6, IL-8, TNF or relaxin, while strong predictors of PTB, may not
be useful in large low-risk populations [9]. One problem may be that such markers vary
2
over time or among individuals, making it difficult to determine levels at which risk for
PTB is increased.
In contrast, genetic factors are stable over time and therefore may be better
predictors of risk. As a result, genetic studies may identify markers which more
accurately predict PTB than currently known risk factors. Genetic studies may also
identify novel proteins and/or pathways involved in the disorder. This new information
will augment our general understanding of parturition and provide new targets for drug
therapies, potentially improving both prevention and treatment of PTB.
Evidence for genetic influences on birth timing
Birth timing across pregnancies in the same woman
A wealth of evidence suggests that genetics are important in birth timing. For
example, both preterm and postterm births tend to recur in mothers [10-15]. Moreover,
the most likely age for a recurrent PTB is same week as the first PTB [12; 16; 17],
suggesting that factors that are stable over time, such as genetics, affect birth timing.
Birth timing trends among family members
Familial trends for birth timing also suggest that genetics influence this trait.
Women who are born preterm are more likely to have a preterm delivery themselves [18],
indicating that mothers and their daughters share risk. Sisters of women who have had a
preterm delivery also have an increased risk for preterm delivery [15]. Due to the nature
of family studies, environmental factors shared between mothers and daughters or
between sisters cannot be untangled from genetic influences. As a result, it is difficult to
3
determine the relative importance of genetic versus environmental factors from these
studies alone.
Partitioning variance in birth timing into genetic versus environmental components
In contrast to family studies, twin studies measure the relative importance of
genes in overall trait variance within a population. By comparing concordance rates
between monozygotic and dizygotic twins, which share 100% and approximately 50% of
their genes, respectively, one can model the genetic and environmental factors that
influence a trait. Such studies indicate that genes account for about 30% of variation in
preterm delivery [19; 20] and child’s gestational age as continuous trait [19; 21], when
the mother is considered the proband of a delivery.
A similar method was used to estimate the influence of maternal and fetal genetic
factors by Lunde and colleagues [22]. Comparing concordance rates among full and half
siblings for gestation age, the authors estimated that 11% of variation for this trait is due
to fetal genetic factors and 14% of variation is due to maternal genetic factors [22]. Such
comparisons use the degree of genetic relatedness (on average 50% for full siblings and
25% for half siblings) and trait concordance to estimate the relative importance of genetic
versus environmental factors. Because siblings that are not monozygotic twins display
some variability in their percent genetic identity and may differ in important dominance
or interactive genetic effects, these estimates are more difficult to make using non-twin
siblings. Despite the limitations in estimating the heritability, each study suggests that
genetics play an important role in PTB.
Another approach to separating genetic and environmental factors is the
coefficient of kinship. This measure depicts the degree of genetic relatedness within a
4
population. Ward and colleagues [23] used this measure to examine genetic influences on
PTB in a Utah population. The Utah population from which the families were drawn was
established by 10,000 people who moved to the state to establish the Mormon religion
[23]. Because Mormons are discouraged from using alcohol or tobacco and have low
rates of substance abuse and sexually-transmitted diseases, this population may represent
individuals with relatively few environmental risk factors for PTB [23]. As a result,
detecting genetic effects may be easier in this cohort of Utah preterm families. In this
study, Ward and colleagues found that families with preterm deliveries had a
significantly lower coefficient of kinship than controls [23], indicating that these families
are more closely genetically-related than control families. This evidence suggests that the
increased rate of PTB in these families can be explained by genetic factors. It is important
to note that the authors of this study did not report the relative abundance of any
environmental risk factors for PTB in the two populations. It is possible that one or more
important environmental risk factors differ between these groups, in addition to genetic
relatedness. Hence, the results of Ward et al. [23] support the significance of genetics in
PTB, but do not address their relative importance compared to known environmental risk
factors.
Mendelian disorders
Certain Mendelian disorders are associated with PTB, further supporting genetic
effects on birth timing. Ehlers-Danlos Syndrome (EDS) represents a diverse group of
Mendelian disorders affecting connective tissue, primarily inherited in an autosomal
dominant manner [24]. Women with vascular EDS have an increased risk of delivering
preterm, primarily due to PPROM [24]. Since this disorder is inherited in an autosomal
5
dominant pattern, there is a 50% chance the fetus has inherited the disorder, making it
less clear whether the mother’s or infant’s genome contributes to the increase in PPROM
risk.
Possible role of fetal genome in birth timing
Several lines of evidence further suggest that fetal genetic effects may influence
birth timing. First, fetal genes that are paternally imprinted mainly control placental and
fetal membrane growth [25]. Because the placenta and fetal membranes likely play a role
in PTB, fetal genes controlling these tissues may also contribute. Additionally, several
studies suggest that paternity affects risk for the disorder. For example, several studies
indicate that partner changes between pregnancies reduced risk of PTB [26; 27];
however, changes in paternity may reflect association with long interpregnancy intervals
rather than paternity effects per se. Paternal race also has been associated with PTB risk
[6; 7], suggesting that fetal race may influence birth timing. However, father’s family
history of PTB has been shown to have only a weak association with risk. While an early
study of a Norwegian birth registry demonstrated a correlation between fathers’ and
children’s gestational ages [28], a more recent and extensive study of this registry
suggested fathers contributed little to no risk to preterm delivery risk [29]. Similarly,
recent studies [21; 30] suggested that paternal genetics contributed little to gestational
age, but could not refute the possible role of maternally-inherited genes expressed in the
fetus. Hence, while paternally-inherited genes may contribute little to PTB or other
disorders, maternally-inherited genes expressed in the fetus may still be important.
Together, these data suggests that the fetal genome may contribute to birth timing,
motivating further study defining the infant as the proband.
6
Complexity of genetic effects on birth timing
There is increasing evidence that PTB can be conceptualized as a common,
complex disorder. In contrast to Mendelian disorders in which alterations of a single gene
can lead to disease, complex diseases are influenced by a variety of factors, none
necessary and sufficient to cause the disorder itself. As a result, there is not a direct
relationship between genotypes and phenotypes [31]. These disorders likely depend on a
number of interacting factors, including genetic, epigenetic and environmental risk
factors[31]. Modeling procedures used by twin studies suggest that additive genetic
factors and environmental risk factors that are not shared among siblings both influence
PTB [19; 20; 32]. Additionally, interactions between genes [33; 34] have been associated
with PTB risk. Several studies suggest that gene-environment interactions, such as
interactions between inflammatory gene risk alleles and bacterial infections [35-37], also
influence the disorder. Together, these studies imply that the etiology of PTB likely
involves genetic as well as environmental factors in complex interactions.
In addition to the complexity of genetic effects described above, several issues
complicate how investigators think about the disorder. As mentioned above, it is not clear
whether the mother or infant from a preterm delivery should be considered the proband.
As a result, it is not clear which individual’s DNA should be interrogated. Additionally,
preterm delivery as a trait can be thought of in two ways. First, PTB can be thought of as
discrete, resulting from genetic factors that lead to either term or early delivery.
Alternatively, gestational age can be thought of as a quantitative trait, with preterm ages
as extremely low values; hence, genetic effects may be quantitative trait loci (QTLs) that
7
influence the value of gestational age in both term and preterm deliveries. As disease
models shape how one approaches identifying genes, it is important to consider the
uncertainty about how to conceptualize PTB when evaluating various approaches taken
to study this trait.
Identifying specific genes associated with PTB
Functional candidate gene studies have identified few genes consistently associated
with PTB
Candidate genes in a variety of pathways believed to be important in parturition
have been tested with mixed results (summary in Table 1.1). Few positive association
findings for PTB have been consistent. To illustrate, for TNF, the most extensively
studied gene, 11 studies report major effects of the gene[34; 36; 38-46]; yet, 13 others
report no major effects of the gene [35; 47-56], including a meta-analysis of 7 studies
[51]. Similarly, IL1RN was associated in 4 studies [57-60], but not in another 6 [39; 46;
53; 56; 61]. One possible explanation may be that some polymorphisms are significant
only in the context of a particular environmental factor, such as infection. For example,
IL6 has been associated in 2 studies without considering environmental influences [62;
63], associated in another 2 studies only in the context of infection [35; 37], associated in
another study only in interaction with other genes [41], and not associated in an
additional 10 studies [34; 39; 42; 46; 53; 54; 56; 64; 65].
A number of problems in previous studies’ design may limit their ability to detect
true genetic effects. Most of these studies have been underpowered, because of small
sample sizes and/or incomplete sampling of genetic variation in a gene of interest.
8
Phenotypic heterogeneity also may confound many studies’ results, as most consist of
mothers and/or children collected using a variety of phenotype definitions that may have
different etiologies. In addition, genetic etiologies may differ across ethnic groups, since
pregnancies in which either the mother or father is Black are at increased risk for preterm
delivery, regardless of which parent is Black; however, few studies have included
analyses separately by race or attempted to correct for possible population substructure,
further questioning the validity of many genes associated to date. Moreover, no genetic
model has been identified for PTB to suggest what nature of genetic effects is expected,
limiting investigators’ ability to appropriately design such studies. This proposal
considers such issues to better identify PTB genes.
Alternative approaches
A variety of alternative genetic approaches may be undertaken to identify specific
genes involved in PTB. For example, unbiased genome-wide screens, such as the screen
conducted on a Danish cohort as part of the National Institutes of Health Gene
Environment Association Studies (GENEVA) program, may identify novel genes and
pathways. Additionally, non-additive genetic effects, such as copy number or structural
variation, may be important avenues for future research. Such approaches may enable
investigators to identify novel genes and pathways involved in birth timing with
important clinical applications.
Objectives of dissertation
The etiology of PTB is complex and likely involves both genetic and
environmental risk factors. A variety of evidence supports genetic influences on PTB, yet
9
few specific genes have been associated with PTB. Developing a model for the genetic
influences on PTB may facilitate gene discovery. As little work had been done to
systematically identify a genetic model for PTB, we used sibling risk estimates and
segregation analyses to identify one. Another method to facilitate discovery of specific
genes associated with PTB is using a priori methods. Using information from
comparative genomic studies, we conducted a screen of genes minimally biased by our
current understanding of parturition to identify novel PTB genes. In order to validate our
findings, we replicated genes identified in this screen in additional populations. Of note,
genes encoding the follicle-stimulating hormone receptor, FSHR, and a phospholipase,
PLA2G4C, showed evidence of association across populations and was investigated
further. Together, these experiments better characterize the nature of genetic influences
on PTB and provide evidence for novel genes involved in this disorder.
10

Fig
ure
1.1
: B
irth
tim
ing i
n M
isso
uri
(1978
-1997).
H
um
an p
artu
riti
on t
ypic
ally
occ
urs
bet
wee
n 3
7-4
2 w
eeks
of
ges
tati
on, w
ith 4
0 w
eeks
bei
ng t
he
most
com
mon t
ime
of
del
iver
y.
11
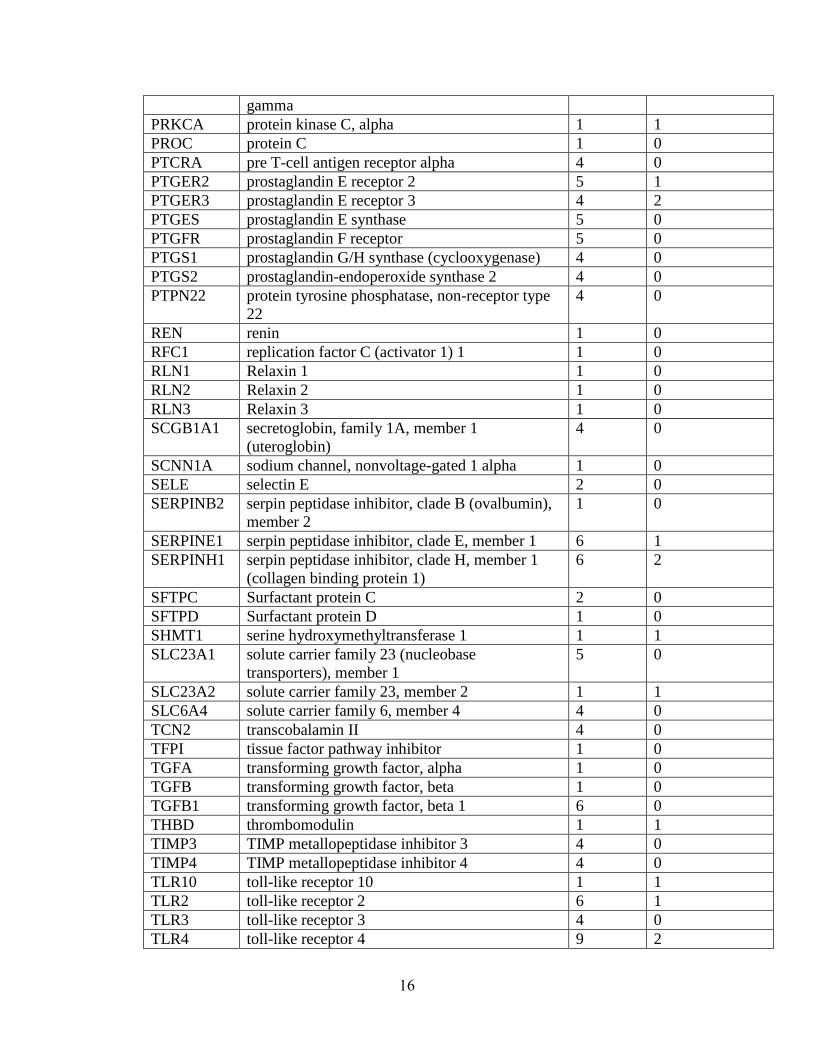
Table 1.1: Summary of candidate gene association studies’ findings as of May 2010.
Gene
Symbol
Gene Name Number
of
Studies
Studies reporting
positive findings
ABCA1 ATP-binding cassette, sub-family A, member 1 1 0
ACE angiotensin I converting enzyme 1 7 1
ADD1 adducin 1 (alpha) 2 0
ADH1B alcohol dehydrogenase 1B 4 0
ADH1C alcohol dehydrogenase 1c 5 0
ADRB2 adrenergic, beta-2, receptor, surface 8 3
AGT angiotensinogen 3 2
AGTR1 angiotensin II receptor, type 1 2 0
ALOX5AP arachidonate 5-lipoxygenase-activating protein 1 0
ANXA5 annexin A5 1 0
APOA1 apolipoprotein A-I 1 0
APOA4 apolipoprotein A-4 1 0
APOA5 apolipoprotein A-5 1 0
APOB apolipoprotein B 1 0
APOC2 apolipoprotein C2 1 0
APOC3 apolipoprotein C3 1 0
APOE apolipoprotein E 1 0
BHMT betaine-homocysteine methyltransferase 1 0
CBS cystathionine-beta-synthase 5 1
CCL2 chemokine (C-C motif) ligand 2 4 0
CCL3 chemokine (C-C motif) ligand 3 4 0
CCL8 chemokine (C-C motif) ligand 8 4 0
CD14 monocyte differentiation antigen CD14 5 1
CETP cholesteryl ester transfer protein, plasma 1 0
COL1A1 collagen, type I, alpha 1 3 0
COL1A2 collagen, type I, alpha 2 3 0
COL3A1 collagen, type 3, alpha 1 3 0
COL5A1 collagen, type 5, alpha 1 4 0
COL5A2 collagen, type 5, alpha 2 4 0
CRH corticotropin releasing hormone 4 0
CRHBP corticotropin releasing hormone binding protein 5 1
CRHR1 corticotropin releasing hormone receptor 1 4 0
CRHR2 corticotropin releasing hormone receptor 2 4 0
CRP C-reactive protein, pentraxin-related 4 0
CSF3 colony stimulating factor 3 1 0
CTGF connective tissue growth factor 1 0
CTLA4 cytotoxic T-lymphocyte-associated protein 4 4 1
CYP19A1 cytochrome P450, family 19, subfamily A,
polypeptide 1
4 0
CYP1A1 cytochrome P450, family 1, subfamily A, 7 2
12
polypeptide 1
CYP2C19 cytochrome P450, family 2, subfamily C,
polypeptide 19
1 0
CYP2D6 cytochrome P450, family 2, subfamily D,
polypeptide 6
4 0
CYP2E1 cytochrome P450, family 2, subfamily E,
polypeptide 1
2 0
CYP3A4 cytochrome P450, family 3, subfamily A,
polypeptide 4
1 0
DHCR24 24-dehydrocholesterol reductase 1 0
DHCR7 7-dehydrocholesterol reductase 1 0
DHFR dihydrofolate reductase 4 0
DRD2 dopamine receptor D2 1 0
EDN2 endothelin 2 4 0
PROCR protein C receptor, endothelial (EPCR) 1 0
EPHX1 epoxide hydrolase 1, microsomal (xenobiotic) 5 0
EPHX2 epoxide hydrolase 2, microsomal (xenobiotic) 4 0
F13A1 coagulation factor XIII, A1 polypeptide 1 0
F2 coagulation factor II (thrombin) 9 0
F5 coagulation factor V 12 4
F7 coagulation factor VII 7 1
FAS Fas 4 0
FASLG Fas ligand 4 0
FGB fibrinogen beta chain 2 0
FLT1 fms-related tyrosine kinase 1 1 0
GNB3 guanine nucleotide binding protein, beta
polypeptide 3
1 0
GSTM1 glutathione S-transferase mu 1 4 2
GSTP1 glutathione S-transferase pi 1 5 0
GSTT1 glutathione S-transferase theta 1 5 2
GSTT2 glutathione S-transferase theta 2 4 0
HMGCR 3-hydroxy-3-methylglutaryl-Coenzyme A
reductase
1 1
HSD11B1 hydroxysteroid (11-beta) dehydrogenase 1 4 0
HSD17B7 hydroxysteroid (17-beta) dehydrogenase 7 4 0
HSPA14 heat shock 70kDa protein 14 4 0
HSPA1A heat shock 70kDa protein 1A 4 0
HSPA1B heat shock 70kDa protein 1B 4 0
HSPA1L heat shock 70kDa protein 1-like 4 1
HSPA4 heat shock 70kDa protein 4 4 0
HSPA6 heat shock 70kDa protein 6 4 0
ICAM1 intercellular adhesion molecule 1 2 1
ICAM3 intercellular adhesion molecule 3 1 0
IFNG interferon, gamma 6 2
IFNGR1 interferon, gamma receptor 1 1 0
13
IGF1 insulin-like growth factor 1 4 0
IGFBP3 insulin-like growth factor binding protein 3 4 0
IL10 interleukin 10 9 2
IL10RA interleukin 10 receptor, alpha 5 1
IL10RB interleukin 10 receptor, beta 4 0
IL11 interleukin 11 1 0
IL12A interleukin 12A 1 0
IL13 interleukin 13 5 1
IL15 interleukin 15 4 1
IL18 interleukin 18 5 0
IL1A interleukin 1, alpha 8 1
IL1B interleukin 1, beta 9 1
IL1R1 interleukin 1 receptor, type I 5 0
IL1R2 interleukin 1 receptor, type 2 5 1
IL1RAP interleukin 1 receptor accessory protein 4 0
IL1RN interleukin 1 receptor antagonist 10 4
IL2 interleukin 2 6 1
IL2RA interleukin 2 receptor, alpha 4 1
IL2RB interleukin 2 receptor, beta 4 1
IL4 interleukin 4 8 3
IL4R interleukin 4 receptor 4 0
IL5 interleukin 5 4 1
IL6 interleukin 6 15 5
IL6R interleukin 6 receptor 7 3
IL8 interleukin 8 7 0
IL8RA interleukin 8 receptor alpha 4 0
ITGA2 integrin, alpha 2 1 0
ITGB3 integrin, beta 3 1 0
KL Klotho 4 1
LCAT lecithin-cholesterol acyltransferase 1 0
LDLR LDL receptor 1 0
LIPC lipase, hepatic 1 0
LNPEP leucyl/cystinyl aminopeptidase 1 0
LOXL1 lysyl oxidase-like 1 1 0
LPL lipoprotein lipase 1 0
LST1 leukocyte specific transcript 1 4 0
LTA lymphotoxin alpha 5 1
MASP2 mannan-binding lectin serine peptidase 2 1 0
MBL2 mannose-binding lectin 2, soluble 10 6
MMP1 matrix metallopeptidase 1 5 1
MMP2 matrix metallopeptidase 2 4 1
MMP3 matrix metallopeptidase 3 5 0
MMP8 matrix metallopeptidase 8 4 0
MMP9 matrix metallopeptidase 9 5 2
MTHFD1 methylenetetrahydrofolate dehydrogenase 4 0
14
MTHFR 5,10-methylenetetrahydrofolate reductase 11 0
MTR 5-methyltetrahydrofolate-homocysteine
methyltransferase
1 0
MTRR 5-methyltetrahydrofolate-homocysteine
methyltransferase reductase
2 1
NAT1 N-acetyltransferase 1 5 0
NAT2 N-acetyltransferase 2 6 0
NFKB1 nuclear factor of kappa light polypeptide gene
enhancer in B-cells 1
4 0
NFKB2 nuclear factor of kappa light polypeptide gene
enhancer in B-cells 2
4 0
NFKBIA nuclear factor of kappa light polypeptide gene
enhancer in B-cells inhibitor, alpha
4 0
NFKBIB nuclear factor of kappa light polypeptide gene
enhancer in B-cells inhibitor, beta
4 0
NFKBIE nuclear factor of kappa light polypeptide gene
enhancer in B-cells inhibitor, epsilon
4 0
NOD2 nucleotide-binding oligomerization domain
containing 2
2 1
NOD2/CAR
D15
nucleotide-binding oligomerization domain
containing 2
4 0
NOS2A nitric oxide synthase 2, inducible 2 2
NOS3 nucleotide-binding oligomerization domain
containing 3
7 1
NPPA natriuretic peptide precursor A 1 0
NQO1 NAD(P)H dehydrogenase, quinone 1 1 0
NR3C1 glucocorticoid receptor 4 0
OPRM1 opioid receptor, mu 1 1 1
OXT oxytocin 1 0
OXTR oxytocin receptor 1 1
PAFAH1B1 platelet-activating factor acetylhydrolase,
isoform Ib, subunit 1
4 0
PAFAH1B2 platelet-activating factor acetylhydrolase,
isoform Ib, subunit 2
4 0
PDE4D phosphodiesterase 4D, cAMP-specific 1 0
PGEA1 chibby homolog 1 4 0
PGR progesterone receptor 9 1
PGRMC1 progesterone receptor membrane component 1 4 0
PGRMC2 progesterone receptor membrane component 2 4 0
PLA2G4A phospholipase A2, group IVA 4 0
PLAT plasminogen activator, tissue 6 2
POMC proopiomelanocortin 4 0
PON1 paraoxonase 1 7 3
PON2 paraoxonase 2 6 2
PPARG peroxisome proliferator-activated receptor 1 1
15
gamma
PRKCA protein kinase C, alpha 1 1
PROC protein C 1 0
PTCRA pre T-cell antigen receptor alpha 4 0
PTGER2 prostaglandin E receptor 2 5 1
PTGER3 prostaglandin E receptor 3 4 2
PTGES prostaglandin E synthase 5 0
PTGFR prostaglandin F receptor 5 0
PTGS1 prostaglandin G/H synthase (cyclooxygenase) 4 0
PTGS2 prostaglandin-endoperoxide synthase 2 4 0
PTPN22 protein tyrosine phosphatase, non-receptor type
22
4 0
REN renin 1 0
RFC1 replication factor C (activator 1) 1 1 0
RLN1 Relaxin 1 1 0
RLN2 Relaxin 2 1 0
RLN3 Relaxin 3 1 0
SCGB1A1 secretoglobin, family 1A, member 1
(uteroglobin)
4 0
SCNN1A sodium channel, nonvoltage-gated 1 alpha 1 0
SELE selectin E 2 0
SERPINB2 serpin peptidase inhibitor, clade B (ovalbumin),
member 2
1 0
SERPINE1 serpin peptidase inhibitor, clade E, member 1 6 1
SERPINH1 serpin peptidase inhibitor, clade H, member 1
(collagen binding protein 1)
6 2
SFTPC Surfactant protein C 2 0
SFTPD Surfactant protein D 1 0
SHMT1 serine hydroxymethyltransferase 1 1 1
SLC23A1 solute carrier family 23 (nucleobase
transporters), member 1
5 0
SLC23A2 solute carrier family 23, member 2 1 1
SLC6A4 solute carrier family 6, member 4 4 0
TCN2 transcobalamin II 4 0
TFPI tissue factor pathway inhibitor 1 0
TGFA transforming growth factor, alpha 1 0
TGFB transforming growth factor, beta 1 0
TGFB1 transforming growth factor, beta 1 6 0
THBD thrombomodulin 1 1
TIMP3 TIMP metallopeptidase inhibitor 3 4 0
TIMP4 TIMP metallopeptidase inhibitor 4 4 0
TLR10 toll-like receptor 10 1 1
TLR2 toll-like receptor 2 6 1
TLR3 toll-like receptor 3 4 0
TLR4 toll-like receptor 4 9 2
16
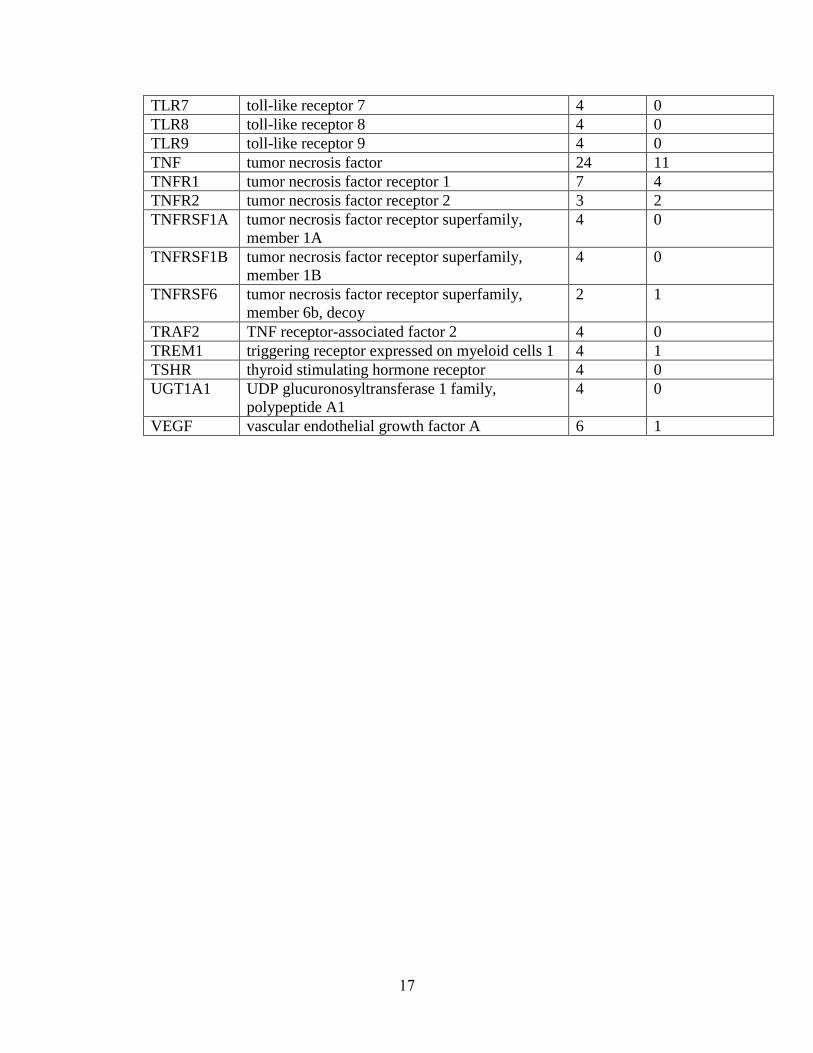
TLR7 toll-like receptor 7 4 0
TLR8 toll-like receptor 8 4 0
TLR9 toll-like receptor 9 4 0
TNF tumor necrosis factor 24 11
TNFR1 tumor necrosis factor receptor 1 7 4
TNFR2 tumor necrosis factor receptor 2 3 2
TNFRSF1A tumor necrosis factor receptor superfamily,
member 1A
4 0
TNFRSF1B tumor necrosis factor receptor superfamily,
member 1B
4 0
TNFRSF6 tumor necrosis factor receptor superfamily,
member 6b, decoy
2 1
TRAF2 TNF receptor-associated factor 2 4 0
TREM1 triggering receptor expressed on myeloid cells 1 4 1
TSHR thyroid stimulating hormone receptor 4 0
UGT1A1 UDP glucuronosyltransferase 1 family,
polypeptide A1
4 0
VEGF vascular endothelial growth factor A 6 1
17
Chapter 2: Increased risk to siblings of preterm infants suggests genetic factors may
influence PTB†
Abstract
Adverse pregnancy outcomes, such as PTB, PPROM, placental abruption, and
preeclampsia, are common and contribute to spontaneous and medically-indicated
preterm deliveries, with acute and long-term complications for both the mother and
infant. Etiologies underlying such adverse outcomes are not well understood. As maternal
and fetal genetic factors may influence these outcomes, we estimated the magnitude of
familial aggregation as one index of possible heritable contributions. Using the Missouri
Department of Health’s maternally-linked birth certificate database, we performed a
retrospective population-based cohort study of births (1989-1997), designating an
individual born from an affected pregnancy as the proband for each outcome studied. We
estimated the increased risk to siblings compared to the population risk, using the sibling
risk ratio, s, and sibling-sibling odds ratio (sib-sib OR), for the adverse pregnancy
outcomes of PTB, PPROM, placental abruption, and preeclampsia. Risk to siblings of an
affected individual was elevated above the population prevalence of a given disorder, as
indicated by S ( S (95% CI): 4.3 (4.0-4.6), 8.2 (6.5-9.9), 4.0 (2.6-5.3), and 4.5 (4.4-4.8),
for PTB, PPROM, placental abruption, and preeclampsia, respectively). Risk to siblings
of an affected individual was similarly elevated above that of siblings of unaffected
individuals, as indicated by the sib-sib OR (sib-sib OR adjusted for known risk factors
† This chapter is adapted from: Plunkett J, et al. (2008) Population-based estimate of sibling risk
for adverse pregnancy outcomes. BMC Genetics, 9:44.
18
(95% CI): 4.2 (3.9-4.5), 9.6 (7.6-12.2), 3.8 (2.6-5.5), 8.1 (7.5-8.8) for PTB, PPROM,
placental abruption, and preeclampsia, respectively). These results suggest that the
adverse pregnancy outcomes of PTB, PPROM, placental abruption, and preeclampsia
aggregate in families, which may be explained in part by genetics.
Introduction
In the United States, 12.7% of births occur preterm (<37 weeks) [66],
approximately one-fourth of which occur due to PPROM [67]. Preeclampsia, high blood
pressure and fluid retention in pregnancy, and placental abruption, early detachment of
the placenta from the uterus, affect approximately 7% [68] and 1% [69] of all
pregnancies, respectively. While many pregnancies share more than one of these
complications, together they affect a significant portion of pregnancies and represent the
most common reasons for early delivery. Moreover, adverse pregnancy outcomes are
important causes of perinatal morbidity and mortality. For example, placental abruption,
while uncommon, accounts for 12% of all perinatal deaths [25]. The incidence of PTB
[66] and placental abruption [25] have increased over recent decades, further motivating
additional study to understand susceptibility factors which contribute to these outcomes.
Prediction and prevention of these adverse outcomes is difficult. Etiologies
underlying PTB, PPROM, placental abruption and preeclampsia are not well understood.
Genetic studies are one way in which we can attempt to better understand these disorders.
Such studies may identify genetic markers that can predict one’s risk for a particular
pregnancy outcome. Genetic studies may also identify novel proteins and/or pathways
involved in the disorder.
19
Both maternal and fetal genetic factors may influence adverse pregnancy
outcomes. Evidence suggests that maternal genetic factors contribute to PTB [70; 71],
PPROM [71-73], placental abruption [74; 75] and preeclampsia [76-79]. In contrast, fetal
effects on these outcomes have not been well studied. Several lines of evidence suggest
that fetal genetic effects may influence adverse pregnancy outcomes. First, fetal genes
that are paternally imprinted mainly control placental and fetal membrane growth [25].
Because the placenta and fetal membranes likely play a role in adverse pregnancy
outcomes, fetal genes controlling these tissues may also contribute. Additionally,
heritability studies, which estimate the relative portion of population variation in a trait
due to genetics, suggest that PTB [22] and preeclampsia [80] are influenced in part by
fetal genetic factors. Lastly, several studies suggest that paternity affects risk for PTB and
preeclampsia. For example, several studies indicate that partner changes between
pregnancies reduce risk of PTB [26; 27] and preeclampsia [80-83]. Changes in paternity
may reflect association with long interpregnancy intervals rather than paternity effects
per se; however, for preeclampsia [78; 84], fathers’ family history affects risk for the
disorder in their partners’ pregnancies. For PTB, father’s family history has been shown
to have only a weak association with risk. While an early study of a Norway birth registry
demonstrated a correlation between father and children’s gestational ages [28], a more
recent and extensive study of this registry suggested fathers contributed little to no risk to
preterm delivery risk [29]. Also, paternal race has been associated with PTB risk [6; 7].
Together, this data suggests that paternal genes expressed in the fetus may contribute to
these disorders, motivating study of maternal-fetal influences, assessed by defining the
infant as the proband, in addition to influences that are maternal-specific.
20
While multiple lines of evidence suggest the importance of genetic contributors in
adverse pregnancy outcomes, observing clustering of such outcomes in families is
necessary to assert genetic influences on a disorder. A disorder that does not aggregate in
families is unlikely to be influenced by inherited factors. Hence, detecting an increased
risk for a disorder among siblings or other family members of an individual born from a
pregnancy affected by the same adverse outcome would further support genetic
influences on these conditions. However, familial aggregation is not sufficient to claim
genetic influences on a disorder. Since family members share both genes and
environment, any similarities seen in families may be explained by genetic or shared
environmental factors (such as in utero environment) or by their interaction.
Two standard measures of familial aggregation are increase in risk to siblings of
affected individuals, compared to the population risk for the disorder, the sibling risk
ratio, s [85], and compared to siblings of unaffected individuals, the sibling-sibling odds
ratio (sib-sib OR) [86]. These measures have been estimated for a variety of disorders,
ranging from single locus Mendelian disorders, such as cystic fibrosis [87], to complex
disorders, including hypertension [88], type 2 diabetes [89], and myopia [90; 91]. These
familial aggregation measures have been incompletely documented in pregnancy
outcomes. When considering mother as the affected individual, investigators have
reported increased risk among first-degree relatives of women affected with PTB [15;
18], placental abruption [75] and preeclampsia [78; 92]; however, few of these studies
have scaled the increase in risk among relatives by the population prevalence for a given
pregnancy outcome (placental abruption [75] , preeclampsia [92] ), as done to calculate
s. Maternal recurrence risk, similar in calculation to the sib-sib OR, has previously been
21
reported for these disorders [73; 93-98]. Yet, only one study of PTB and PPROM [73]
scaled maternal recurrence relative to population prevalence of the disorder and did not
consider this measure as an indication of familial aggregation. s and sib-sib OR,
defining the infant of an affected pregnancy as proband, have not been reported for these
disorders. Estimating s, in which the increased risk for a disorder is scaled by population
prevalence, is particularly important, as population prevalence can vary by race. While
there may be a significant increase in risk among siblings or a significant maternal
recurrence risk, such a risk may reflect high population prevalence, rather than familial
effects, per se. As a result, calculating s may lead to different conclusions that those
made by previous reports of maternal recurrence risk. Since individual demographic
factors, such as socioeconomic status or body mass index, may also contribute to risk, we
calculate sib-sib OR adjusted for important medical and environmental risk factors to
assess to what extent genetic effects may account for familial aggregation.
In order to test whether genetic effects may influence these outcomes, our
analyses define the infant of an affected pregnancy as the proband. We estimate s and
sib-sib OR to determine whether each outcome clusters in families.
Results
Preterm birth. The population risks for PTB at <35 gestational weeks were
estimated as 3.6%, 2.8%, and 7.8%, in all races, Whites and Blacks, respectively. Among
second-born siblings in the sibling subcohort whose older sibling was affected, rates of
PTB for all races, Whites and Blacks, respectively, were used to estimate the sibling risk
(see Table 2.1). S and its 95% CI were 4.3 (4.0-4.6), 4.4 (4.0-4.7), and 2.8 (2.6-3.1) for
22
all races, Whites, and Blacks, respectively, indicating a significant increase in risk to
siblings of PTB patients compared to the population.
Individuals whose older sibling was affected by PTB were also at significantly
higher risk compared to individuals whose older sibling was unaffected (see Table 2.1).
This increase in risk persisted after adjusting for known risk factors. Adjusted OR with
95% CI were 4.2 (3.9-4.5), 5.1 (4.6-5.7), and 3.3 (2.9-3.7) for all races, Whites and
Blacks, respectively.
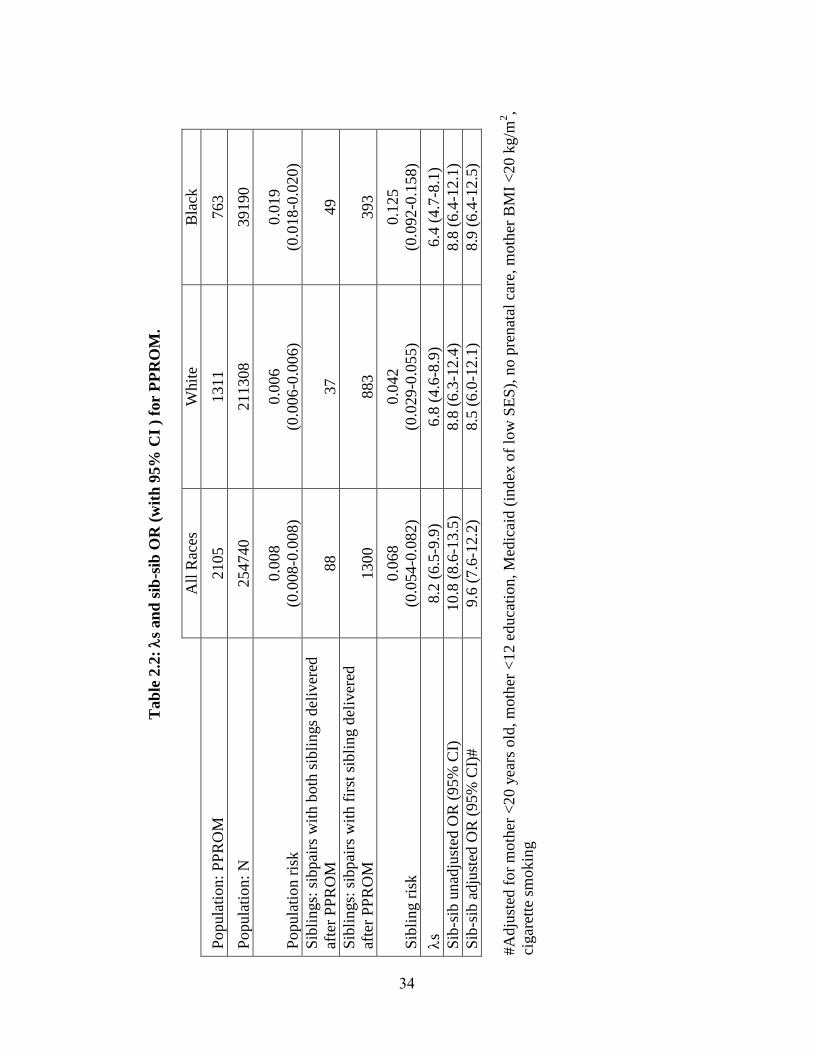
PPROM. The population risks for PPROM were estimated as 0.8%, 0.6% and
1.9%, in all races, Whites and Blacks, respectively. Among second siblings in the
matched sibling sub-cohort whose older sibling was affected, rates of PPROM were used
to estimate sibling risk (see Table 2.2). S and its 95% confidence interval were 8.19
(6.50-9.88), 6.75 (4.59-8.91), and 6.40 (4.66-8.14) for all races, Whites, and Blacks,
respectively, indicating a significant increase in risk to siblings of PPROM patients
compared to the population.
Individuals whose older sibling was affected by PPROM were also at
significantly higher risk compared to individuals whose older sibling was unaffected (see
Table 2.2). This increase in risk persisted after adjusting for known risk factors. Adjusted
OR with 95% CI were 9.6 (7.6-12.2), 8.5 (6.0-12.1), and 8.9 (6.4-12.5) for all races,
Whites and Blacks, respectively.
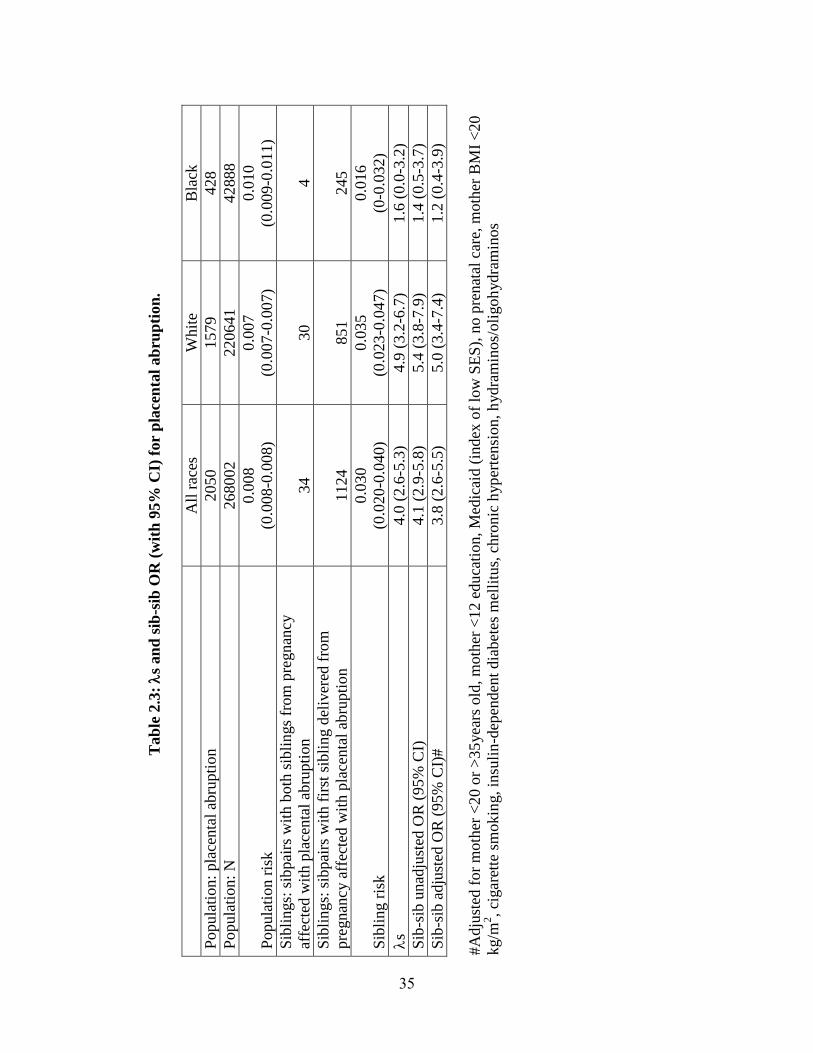
Placental Abruption. Population rates of placental abruption were estimated as
0.8%, 0.7%, 1.0%, in all races, Whites and Blacks respectively. Among second siblings
in the matched sibling sub-cohort whose older sibling was affected, rates of placental
abruption were used to estimate risk to siblings (see Table 2.3). S and its 95%
23
confidence interval were 3.95 (2.63-5.27) and 4.93 (3.18-6.68), for all races and Whites,
respectively, indicating a significant increase in risk to siblings of placental abruption
patients compared to the population.
We found that individuals whose older sibling was affected by placental abruption
were also at significantly higher risk compared to individuals whose older sibling was
unaffected (see Table 2.3). This increase in risk persisted after adjusting for known risk
factors. Adjusted OR with 95% CI: 3.8 (2.6-5.5) and 5.0 (3.4-7.4) for all races and
Whites, respectively.
Blacks did not show a significant increase in risk to siblings of placental
abruption births either compared to the population ( S= 1.64 (0.04-3.24)) or compared to
siblings of births unaffected by this disorder (unadjusted OR: 1.4 (0.5-3.7), adjusted OR:
1.2 (0.4-3.9)).
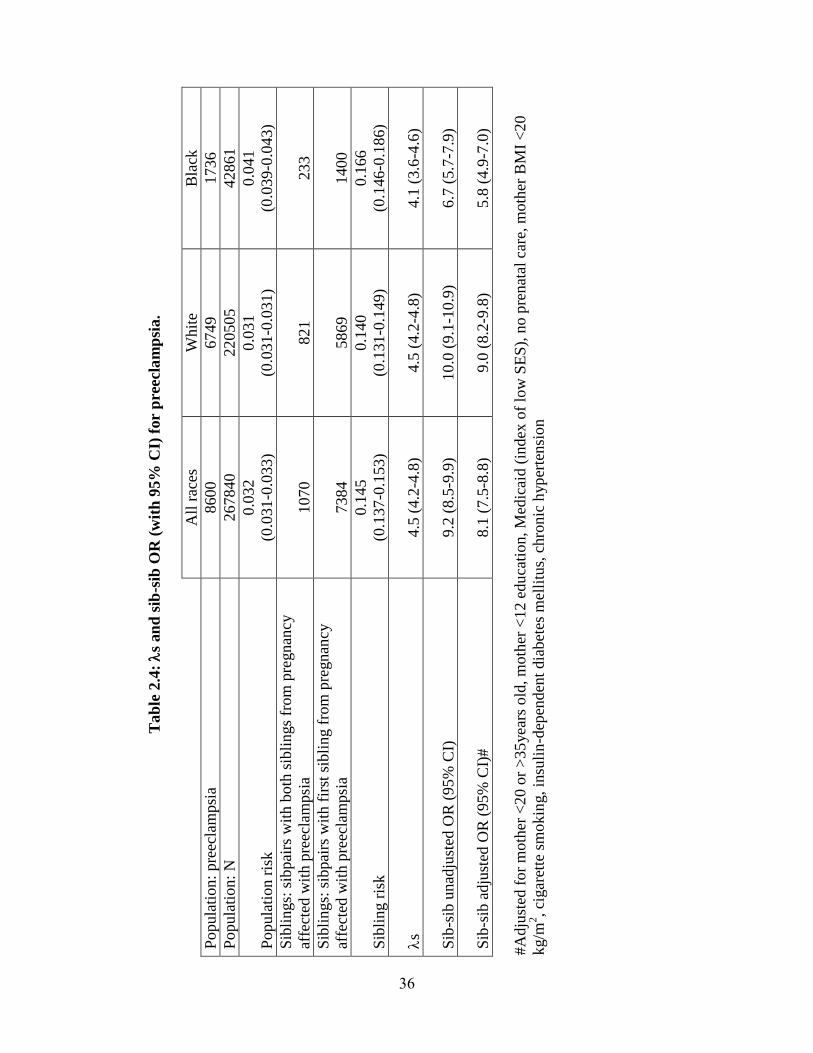
Preeclampsia. Population rates of preeclampsia were estimated as 3.2%, 3.1%,
and 4.1%, in all races, Whites and Blacks, respectively. Among second siblings in the
matched sibling sub-cohort whose older sibling was affected, rates of preeclampsia were
used to calculate sibling risk (see Table 2.4). S and its 95% confidence interval were
4.51 (4.24-4.78), 4.52 (4.21-4.83), and 4.11 (3.59-4.63) for all races, Whites, and Blacks,
respectively.
We found that individuals whose older sibling was affected by preeclampsia were
also at significantly higher risk compared to individuals whose older sibling was
unaffected (see Table 2.4). This increase in risk persisted after adjusting for known risk
factors. Adjusted OR with 95% CI were 8.1 (7.5-8.8), 9.0 (8.2-9.8), and 5.8 (4.9-7.0) for
all races, Whites and Blacks, respectively.
24
Discussion
We hypothesized that siblings of individuals who were products of pregnancies
affected by one of several adverse outcomes, PTB, PPROM, placental abruption and pre-
eclampsia, would be at increased risk for the same outcome. s and sib-sib OR values
significantly greater than one indicate that risk to siblings of adverse pregnancy outcome
births is elevated compared to the population rate and to the rate in siblings of unaffected
individuals, respectively. None of the 95% CI for s or sib-sib OR values overlap with
one, with the exception of placental abruption in Blacks. The lack of evidence for familial
aggregation of placental abruption in Blacks may be explained by the rarity of the event
and the relatively small racial subgroup (see Table 2.3). These data suggest that genetic
and/or environmental risk factors shared among siblings affect these disorders.
Estimates of sib-sib OR are consistent with previous studies of maternal
recurrence risk in the Missouri birth certificate database [93; 94], and of maternal
recurrence risk scaled to the population prevalence for PTB [73]. Our estimate of s is
noticeably smaller than the maternal recurrence risk, scaled by population prevalence of
PPROM estimated in [73] (OR (95% CI): 20.6 (4.7, 90.2)). This difference likely reflects
the larger and population-based cohort used in our study, in contrast to [73] in which
relatively small groups of PPROM (n=114) and normal term (n=208) deliveries were
selected from a hospital population.
The utility of these measures lies primarily in establishing familial aggregation of
a disorder, a prerequisite to claiming genetic influences on any trait. Yet, s values may
also be used to make tentative assessments of future genetic studies. The magnitude of s
values may reflect the mode of genetic etiology, influencing future studies’ design. For
25
example, for complex disorders, to which multiple genetic and environmental factors
likely contribute, reported s values range from 1.3-75, with peaks at 3-4 and 10-15 [88];
in contrast, monogenic Mendelian disorders show s values an order of magnitude higher
or more (e.g. cystic fibrosis s ~500 [87]). Thus, moderate values for s, such as those
reported for the adverse pregnancy outcomes studied (see Tables 2.1-2.4), are consistent
with complex genetic and environmental etiologies. Among complex disorders, s has
been used to estimate the ability of a study to detect specific genes [99]. However, large
values of s do not necessarily predict linkage [88; 100] or association [101] studies’
success. Additionally, measures that reflect the strength of a genetic effect detected either
by linkage, s calculated with respect to a specific locus, or by association, genotype
relative risk, γ, which measures the ratio of disease risks between individuals with and
those without the susceptibility genotypes, have only an indirect correlation with s
[101]. Moderate s values may correspond with high γ values (e.g. rheumatoid arthritis
[101]) and vice versa. While limitations in interpreting s values exist, disorders with
similar s values to the adverse pregnancy outcomes reported here have had specific
genes mapped (e.g. hypertension, obesity [88]), suggesting that identification of specific
genes influencing these conditions may be possible.
While the increased risk to siblings may be explained in part by shared genetics,
some evidence suggests that multiple interacting environment factors can account for
familial clustering [102]. Hence, the clustering of multiple non-genetic risk factors in
families may account for these results. In order to distinguish genetic from other familial
risk factors, we calculated sib-sib OR unadjusted and adjusted for important known
environmental risk factors. Overall, the elevated risk to siblings persists after adjustment
26
for such factors. While there may be important non-genetic factors affecting each
outcome for which we have not accounted, we believe these results suggest that genetic
influences may contribute to each of the adverse pregnancy outcomes studied.
Interestingly, s and sib-sib OR estimates in Blacks are generally smaller than
those for Whites. For PROM and preeclampsia, the 95% CI for s and sib-sib OR
estimates for the two racial groups overlap; however, these CI do not overlap for PTB or
placental abruption. Hence, it is difficult to determine to what extent family clustering of
these outcomes may differ among races. Differences in the magnitude of s and sib-sib
OR estimates between Blacks and Whites may be explained in part by the higher
population prevalence for Blacks compared to Whites for each outcome studied (non-
overlapping 95% CI, see Tables 2.1-2.4), which may reflect higher overall rates of
genetic and/or environmental risk factors in this population.
The Missouri database provides many of this study’s strengths. The large number
of first recorded siblings in the population cohort (n=267,472) and matched sibpairs in
the sibling cohort (n=163,826) provides a large sample size from which to estimate s
and sib-sib OR. Additionally, because this database represents a population cohort of
births, rather than births selected based on any particular pregnancy outcome, biases due
to ascertainment and overreporting, which can inflate s values [103], should be minimal.
However, using a birth certificate database like this one also presents several
limitations. First, complications of labor and delivery and maternal and infant medical
conditions recorded in such databases may be underreported [104]; as a result, population
and/or sibling risk for a particular disorder may be underestimated, potentially biasing
our results. For example, the relative rarity of placental abruption in the population makes
27
concordant sibships, particularly in Blacks, rare, thereby reducing sample sizes for risk
estimates for this disorder. Additionally, gestational age estimates contained in birth
certificate databases are based primarily on the date of the last menstrual period, which
may be recalled inaccurately or misclassified due to postconceptional bleeding [104],
potentially influencing estimates of PTB and PPROM prevalence in this dataset. We also
acknowledge that each of the categories of PTB that we analyzed may in themselves be
rather heterogeneous. For example, initiation of spontaneous labor may result in PTB in
each of the categories, though for some etiologies, particularly preeclampsia, iatrogenic
delivery could contribute significantly. Our utilization of a more rigorous definition of
PTB at less than 35 weeks should minimize the contribution of iatrogenic delivery. A
final important limitation to this database is the limited amount of information on race.
Maternal race is self-reported and possibly subject to population stratification and/or
admixture. Additionally, information on paternal race is incomplete, further affecting the
accuracy of infants’ reported race.
The Missouri database also does not document relationships between mothers; as
a result, similar calculations cannot be made to estimate familial clustering when the
mother of an affected pregnancy is considered the proband. Moreover, the database
contains little information on fathers, making it impossible to distinguish full from half
siblings in most sibships. Because we cannot distinguish siblings that share both maternal
and paternal factors from those that share maternal factors only, we cannot assess to what
extent the increased risk can be attributed to factors unique to the fetus, rather than those
shared with its mother. Due to these limitations, we cannot examine the relative
importance of maternal versus fetal genetic effects, studied by Wilcox et al. [29] and
28
Cnattingius et al. [80], for PTB and preeclampsia, respectively. Cnattingius et al. [80]
reports 20% of variation in preeclampsia risk is due to fetal genetic effects and the
combined effect of fetal genetic factors and couple effects are as important as maternal
genetic effects. In contrast, Wilcox and colleagues [29] report only a weak association
between father’s family history and risk for PTB (RR (95% CI): 1.12 (1.01-1.25)), which
became nonsignificant at earlier gestational ages (RR (95% CI): 1.06 (0.77-1.44). From
this trend, the authors conclude that fetal genes may contribute to normal labor, but, not
preterm delivery [29]; however, Wilcox and colleagues [29] have relatively few early
preterm offspring of early preterm mothers (n=91) and fathers (n=39) from which risk
was estimated, and do not stratify based upon race/ethnicity. Similarly, a recent study
[21] suggested that paternal genetics contributed little to gestational age, but could not
refute the possible role of maternally-inherited genes expressed in the fetus. Hence, while
paternally-inherited genes may contribute little to PTB or other disorders, maternally-
inherited genes expressed in the fetus may still be important. Because of our study’s
limitations, we may be detecting effects due to shared uterine environment, shaped in part
by maternal genes, rather than maternally-inherited genes in siblings. Hence, fetal genetic
effects may make contributions of lesser magnitude than maternal genetic factors, with
fetal genetic factors having a more prominent role in certain etiologies of PTB.
We have observed familial aggregation of PTB, PPROM, placental abruption and
preeclampsia. Overall, siblings are at increased risk for each outcome, even after
adjusting for important known environmental risk factors. While the influence of shared
unmeasured environmental risk factors on sibling risk cannot, and should not, be
discounted, we hypothesize that maternal and/or fetal genetic influences account for some
29

of the increased risk to siblings observed. Moreover, though it is difficult to determine to
what extent fetal and maternal effects overlap in these analyses, we postulate that fetal
genetic factors may contribute to these disorders and suggest that they are studied further.
Methods
Study design. A protocol was approved by the Missouri Department of Health
and Senior Services and by Washington University School of Medicine to analyze the
state’s maternally linked birth-death certificate database. We analyzed this database to
assess the recurrence risk for a discrete group of adverse pregnancy outcomes, including
PTB, PPROM, placental abruption, and pre-eclampsia, in maternally-linked siblings.
Births to the same mother were linked by a unique identifier called a sibship number,
described elsewhere [105]. Full siblings and half-siblings resulting from pregnancies in
the same mother were not distinguished. All protected health information with personal
identifiers was removed before distributing the data for analysis.
This analysis was restricted to births that occurred between 1989 and 1997, since
births that occurred before 1989 lacked complete medical and social histories. Fetal
deaths occurring at <20 weeks gestation, multiple gestation pregnancies and individuals
with no maternally-linked siblings recorded in the database were excluded from this
analysis. After excluding such cases, the remaining cohort consisted of 473,881 births, of
which 383,812 (81.2%) were White and 81,889 (17.3%) were Black. 267,472 births
(220,728 (82.5%) White and 42,899 (16.0%) Black) were the first maternally-linked
sibling in the database and used to estimate the population prevalence for each outcome.
A second cohort of matched siblings was constructed from this dataset to analyze
sibling risk for each outcome. The two oldest siblings born to the same mother during the
30
study period were included. The dataset was not restricted to parity 0 and parity 1
women, in order to be as unbiased as possible in estimating risk for siblings and
providing the best index of population prevalence. Additional siblings born to the same
mother were excluded to simplify the statistical model. This cohort comprised of 327,652
matched siblings, of which 265,947 (81.2%) were White and 55,555 (17.0%) were Black.
Second-born siblings whose older sibling was affected by a particular outcome were used
to estimate sibling risk for s and sib-sib OR.
Definitions. PTB is defined by the World Health Organization as delivery <37
weeks [1]. To avoid inclusion of borderline gestational ages which may introduce
misclassification bias, we defined PTB as delivery <35 weeks in this study. Information
from the last menstrual period and clinical data were used to calculate the best estimate of
gestational age. PPROM was defined as births delivered <35 weeks complicated by
premature rupture of membranes. For PPROM, births complicated by pre-eclampsia,
insulin-dependent and other diabetes, or eclampsia were excluded from analysis due to
the potential for these births being delivered for medical reasons. First-born sibling and
second-born sibling refer to the two oldest siblings recorded in database.
Statistical analysis
prevalence Population
sibling) affected|P(affecteds
S was calculated as the frequency of an outcome in the individuals whose older
sibling was affected with the disorder in the sibling cohort divided by the frequency of
the outcome in first siblings in the larger cohort. 95% confidence intervals (CI) for
sibling risk, population risk and sibling risk ratio were calculated by standard procedures
for a binomial variable.
31
sibling) unaffected|P(affected
sibling) affected|P(affectedOR sibSib
Sib-sib OR was calculated as the odds of a child being affected with a particular
adverse outcome, given that their older sibling was affected, divided by the odds of a
child being affected with a particular adverse outcome, given that their older sibling was
unaffected. Sib-sib OR were adjusted for known medical and environmental risk factors
for the outcome to most conservatively estimate residual familial effects on risk. For
preterm-birth and PPROM, OR were adjusted for: mother’s age <20 years old, mother
<12 years of education, recipient of state-funded assistance (an index of low
socioeconomic status), no prenatal care, mother’s body mass index (BMI) <20 kg/m2, and
cigarette smoking during pregnancy. In addition to these risk factors, preeclampsia ORs
were corrected for: mother’s age >35years old, insulin-dependent diabetes mellitus,
chronic hypertension. ORs for placental abruption were corrected for
hydraminos/oligohydraminos in addition to the risk factors listed above.
Frequencies for S and logistic regression analyses for the sib-sib OR were
performed using Stata 9 [106]. Each calculation was made for PTB, PPROM, placental
abruption, and preeclampsia in all races (including individuals whose race was neither
Black nor White), as well as stratified by Black or White race. S and sib-sib ORs
calculated by race compare siblings of affected individuals designated as Black or White
to the siblings of unaffected individuals of the same race or the population prevalence for
that race.
32

Tab
le 2
.1:
Est
imate
d s
ibli
ng r
isk
rati
o (
s) a
nd
sib
lin
g-s
ibli
ng o
dd
s ra
tio (
sib
-sib
OR
) fo
r P
TB
<35 w
eek
s.
A
ll R
aces
W
hit
e B
lack
Popula
tion:
Pre
term
bir
ths
9759
6232
3354
Popula
tion:
Tota
l bir
ths
268103
220728
42899
Popula
tion R
isk
0.0
36
(0.0
35
-0.0
37)
0.0
28
(0.0
27-0
.029)
0.0
78
(0.0
75-0
.081)
Sib
lings:
sib
pai
rs w
ith
both
sib
lings
del
iver
ed p
rete
rm
1020
514
489
Sib
lings:
sib
pai
rs w
ith
fir
st s
ibli
ng d
eliv
ered
pre
term
6522
4181
2210
Sib
ling R
isk
0.1
56
(0.1
47
-0.1
65)
0.1
23
(0.1
13-0
.133)
0.2
21
(0.2
04-0
.238)
s
(95%
CI)
4.3
(4.0
-4.6
) 4.4
(4.0
-4.7
) 2.8
(2.6
-3.1
)
Sib
-sib
un
adju
sted
OR
(95%
CI)
5.6
(5.2
-6.0
) 5.7
(5.2
-6.3
) 3.6
(3.2
-4.0
)
Sib
-sib
adju
sted
OR
(95%
CI)
#
4.2
(3.9
-4.5
) 5.1
(4.6
-5.7
) 3.3
(2.9
-3.7
)
#A
dju
sted
for
moth
er <
20 y
ears
old
, m
oth
er <
12 e
duca
tion, M
edic
aid (
ind
ex o
f lo
w S
ES
), n
o p
renat
al c
are,
moth
er B
MI
<20 k
g/m
2,
cigar
ette
sm
ok
ing
33
Tab
le 2
.2:
s an
d s
ib-s
ib O
R (
wit
h 9
5%
CI
) fo
r P
PR
OM
.
A
ll R
aces
W
hit
e B
lack
Popula
tion:
PP
RO
M
2105
1311
763
Popula
tion:
N
254740
211308
39190
Popula
tion r
isk
0.0
08
(0.0
08-0
.008)
0.0
06
(0.0
06-0
.006)
0.0
19
(0.0
18
-0.0
20)
Sib
lings:
sib
pai
rs w
ith
both
sib
lings
del
iver
ed
afte
r P
PR
OM
88
37
49
Sib
lings:
sib
pai
rs w
ith
fir
st s
ibli
ng d
eliv
ered
afte
r P
PR
OM
1300
883
393
Sib
ling r
isk
0.0
68
(0.0
54-0
.082)
0.0
42
(0.0
29-0
.055)
0.1
25
(0.0
92
-0.1
58)
s
8.2
(6.5
-9.9
) 6.8
(4.6
-8.9
) 6.4
(4.7
-8.1
)
Sib
-sib
unad
just
ed O
R (
95%
CI)
10.8
(8.6
-13.5
) 8.8
(6.3
-12.4
) 8.8
(6.4
-12.1
)
Sib
-sib
adju
sted
OR
(95%
CI)
#
9.6
(7.6
-12.2
) 8.5
(6.0
-12.1
) 8.9
(6.4
-12.5
)
#A
dju
sted
for
moth
er <
20 y
ears
old
, m
oth
er <
12 e
duca
tion, M
edic
aid (
ind
ex o
f lo
w S
ES
), n
o p
renat
al c
are,
moth
er B
MI
<20 k
g/m
2,
cigar
ette
sm
ok
ing
34
Tab
le 2
.3:
s an
d s
ib-s
ib O
R (
wit
h 9
5%
CI)
for
pla
cen
tal
ab
rup
tion
.
A
ll r
aces
W
hit
e B
lack
Popula
tion:
pla
centa
l ab
rupti
on
2050
1579
428
Popula
tion:
N
268002
220641
42888
Popula
tion r
isk
0.0
08
(0.0
08
-0.0
08)
0.0
07
(0.0
07-0
.007)
0.0
10
(0.0
09
-0.0
11)
Sib
lings:
sib
pai
rs w
ith
both
sib
lings
from
pre
gnan
cy
affe
cted
wit
h p
lace
nta
l ab
rupti
on
34
30
4
Sib
lings:
sib
pai
rs w
ith
fir
st s
ibli
ng d
eliv
ered
fro
m
pre
gnan
cy a
ffec
ted w
ith p
lace
nta
l ab
rupti
on
1124
851
245
Sib
ling r
isk
0.0
30
(0.0
20
-0.0
40)
0.0
35
(0.0
23-0
.047)
0.0
16
(0-0
.032)
s
4.0
(2.6
-5.3
) 4.9
(3.2
-6.7
) 1.6
(0.0
-3.2
)
Sib
-sib
un
adju
sted
OR
(95%
CI)
4.1
(2.9
-5.8
) 5.4
(3.8
-7.9
) 1.4
(0.5
-3.7
)
Sib
-sib
adju
sted
OR
(95%
CI)
#
3.8
(2.6
-5.5
) 5.0
(3.4
-7.4
) 1.2
(0.4
-3.9
)
#A
dju
sted
for
moth
er <
20 o
r >
35
yea
rs o
ld, m
oth
er <
12 e
du
cati
on, M
edic
aid (
index
of
low
SE
S),
no p
renat
al c
are,
moth
er B
MI
<20
kg/m
2, ci
gar
ette
sm
ok
ing, in
suli
n-d
epen
den
t dia
bet
es m
elli
tus,
chro
nic
hyp
erte
nsi
on
, h
ydra
min
os/
oli
goh
ydra
min
os
35
Tab
le 2
.4:
s an
d s
ib-s
ib O
R (
wit
h 9
5%
CI)
for
pre
ecl
am
psi
a.
A
ll r
aces
W
hit
e B
lack
Popula
tion:
pre
ecla
mpsi
a 8600
6749
1736
Popula
tion:
N
267840
220505
42861
Popula
tion r
isk
0.0
32
(0.0
31
-0.0
33)
0.0
31
(0.0
31-0
.031)
0.0
41
(0.0
39
-0.0
43)
Sib
lings:
sib
pai
rs w
ith b
oth
sib
lings
from
pre
gnan
cy
affe
cted
wit
h p
reec
lam
psi
a 1070
821
233
Sib
lings:
sib
pai
rs w
ith
fir
st s
ibli
ng f
rom
pre
gnan
cy
affe
cted
wit
h p
reec
lam
psi
a 7384
5869
1400
Sib
ling r
isk
0.1
45
(0.1
37
-0.1
53)
0.1
40
(0.1
31-0
.149)
0.1
66
(0.1
46
-0.1
86)
s
4.5
(4.2
-4.8
) 4.5
(4.2
-4.8
) 4.1
(3.6
-4.6
)
Sib
-sib
un
adju
sted
OR
(95%
CI)
9.2
(8.5
-9.9
) 10.0
(9.1
-10.9
) 6.7
(5.7
-7.9
)
Sib
-sib
adju
sted
OR
(95%
CI)
#
8.1
(7.5
-8.8
) 9.0
(8.2
-9.8
) 5.8
(4.9
-7.0
)
#A
dju
sted
for
moth
er <
20 o
r >
35
yea
rs o
ld, m
oth
er <
12 e
du
cati
on, M
edic
aid (
index
of
low
SE
S),
no p
renat
al c
are,
moth
er B
MI
<20
kg/m
2, ci
gar
ette
sm
ok
ing, in
suli
n-d
epen
den
t dia
bet
es m
elli
tus,
chro
nic
hyp
erte
nsi
on
36
Chapter 3: Patterns of inheritance suggest familial PTB is complex genetic disorder‡
Abstract
While multiple lines of evidence suggest the importance of genetic contributors to
risk of PTB, the nature of the genetic component has not been identified. We perform
segregation analyses to identify the best fitting genetic model for gestational age, a
quantitative proxy for PTB. Because either mother or infant can be considered the
proband from a preterm delivery and there is evidence to suggest that genetic factors in
either one or both may influence the trait, we performed segregation analysis for
gestational age either attributed to the infant (infant’s gestational age), or the mother (by
averaging the gestational ages at which her children were delivered), using 96 multiplex
preterm families.
These data lend further support to a genetic component contributing to birth
timing since sporadic (i.e. no familial resemblance) and nontransmission (i.e.
environmental factors alone contribute to gestational age) models are strongly rejected.
Analyses of gestational age attributed to the infant support a model in which mother’s
genome and/or maternally-inherited genes acting in the fetus are largely responsible for
birth timing, with a smaller contribution from the paternally-inherited alleles in the fetal
genome. Our findings suggest that genetic influences on birth timing are important and
likely complex.
‡ This chapter is adapted from: Plunkett J, et al. (2009) Mother’s genome or maternally-inherited
genes acting in the fetus influence gestational age in familial PTB. Hum Hered 68:209-219.
37
Introduction
While multiple lines of evidence suggest genetic contributors are important in
PTB, a specific mode of inheritance has not been identified. No prominent simple
Mendelian pattern of inheritance has been observed in multiplex pedigrees identified to
date. Modeling procedures used by twin studies suggest that additive genetic factors and
environmental risk factors that are not shared among siblings both influence PTB [19-
21]. Moderate values of sibling risk ratio ( S), a measure of risk to siblings of affected
individuals compared to the population risk for a disorder, estimated for PTB ( S (95%
CI): 4.3 (4.0-4.6)) [107] are also consistent with complex genetic and environmental
etiologies [88]. Moreover, association studies have reported gene-gene [33; 34] and gene-
environment [35; 108; 109] interactions with PTB. Together, these studies imply that the
etiology of PTB likely involves genetic as well as environmental factors in complex
interactions. However, there has not been a systematic study of possible genetic models
for PTB to date.
In this study, we performed segregation analyses to identify the best fitting
genetic model for gestational age, a quantitative proxy for PTB. Because either mother or
infant can be considered the proband from a preterm delivery, and there is evidence to
suggest that genetic factors in either one or both may influence the trait, we performed
segregation analysis for gestational age as a quantitative trait either attributed to the
infant, infant’s gestational age, or to the mother, by averaging the gestational ages at
which her children were delivered, using 96 multiplex preterm families. We also tested
parent of origin models for infant’s gestational age to examine whether mother’s
genotype is the sole determinant of variation in this trait. Additionally, as pregnancies in
38
which either the mother [10; 13] or father [6; 7] is Black are at increased risk for preterm
delivery, we performed segregation analysis for each phenotype in the total sample, as
well as stratified by Black and White race, to test for heterogeneity between these two
groups.
Results
Modeling of gestational age attributed to the infant. We first analyzed
gestational age of the infant. The number of subjects and descriptive statistics for this
phenotype are shown in Table 3.1. Table 3.2 presents the likelihood ratio tests (LRTs)
and Akaike’s Information Criterion (AIC) values for segregation analysis of infant’s
gestational age for 17 models of inheritance. The parameter estimates for segregation
analysis of infant’s gestational age are listed in Table 3.1. The hypotheses of no familial
resemblance (model 2), no major gene effect (model 3), and no multifactorial effect
(model 4) are rejected, suggesting the presence of both a major gene and a multifactorial
effect. Additionally, the equal τ's hypotheses (models 10, 12 and 14) are rejected for the
mixed, recessive mixed and dominant mixed models, respectively. In the free τ's models,
the estimated τAa differed from 0.5, expected under the Mendelian model, and fit the data
better than their respective general models (models 1, 7 and 8) for all groups. Together,
this evidence supports a genetic component for PTB transmitted from parents to offspring
and suggests that the transmitted effect is complex. Similar models were tested for
general parent of origin effects, as well as maternal-specific and paternal-specific effects
under Mendelian transmission (models 15-17). The parent of origin model (model 15)
best fit the data as judged by AIC values and was chosen as the most parsimonious model
(Table 3.3). This model suggests that, when attributing gestational age to the infant of a
39
delivery, genetic factors influence this trait and the parent from whom such factors are
inherited influences the overall trait value.
Modeling of gestational age attributed to the mother. We also analyzed
gestational age attributed to the mother, by averaging the gestational ages at which her
children were delivered (see Table 3.1). Table 3.2 presents the likelihood ratio tests and
AIC values for segregation analysis on mother’s average gestational age of children for
14 models of inheritance. The parameter estimates for the combined dataset are listed in
Table 3.4. The hypotheses of no familial resemblance (model 2), no major gene effect
(model 3), and no multifactorial effect (model 4) are rejected, suggesting the presence of
both a major gene and a multifactorial effect. The equal τ's (models 10, 12 and 14) are
rejected. None of the free τ's models (models 9, 11 and 13) converged initially. In order to
estimate these models, τAA and τaa were fixed to 1 and 0, respectively. Only τAa was
estimated and, in each case, differed from 0.5, expected under the Mendelian model.
Additionally, the free τ's models fit the data better than their respective general models
(models 1, 7 and 8), perhaps suggesting that the major effect observed is more complex
than the single biallelic locus modeled here. Together, this evidence supports a genetic
component for PTB transmitted from parents to offspring and suggests that the
transmitted effect is complex. The mixed free ’s model (model 9) best fit the data as
judged by the AIC values and was chosen as the most parsimonious model (Table 3.5).
This model suggests that a multifactorial genetic model most likely best accounts for
variation in gestational age, when the trait is attributed to the mother of a delivery.
Heterogeneity between Blacks and Whites. Since pregnancies in which either
the mother [10; 13] or father [6; 7] is Black are at increased risk for preterm delivery, we
40
tested for evidence of genetic heterogeneity between these two groups. Segregation
analyses of infant’s gestational age and mother’s average gestational age over all her
children also were performed in Black and White subgroups. Table 3.1 documents the
number of subjects and descriptive statistics for both phenotypes by race. The segregation
analyses of infant’s gestational age supported similar conclusions in the combined sample
and Black and White subgroups. However, several results differed in the segregation
analysis of mother’s average gestational age of children when the sample was stratified
by Black and White race, compared to the combined sample. In the race-stratified
samples, final estimates of the free τ's models had higher -2ln likelihoods than did similar
models with fewer parameters, indicating that the maximum likelihood was not reached.
As a result, the equal τ's hypotheses (models 10, 12 and 14) and the free τ's hypotheses
(models 9, 11 and 13) were not rejected for the mixed, recessive mixed and dominant
mixed models, respectively, in Black and White subgroup analysis. The best fitting
model according to AIC values was the mixed equal τ's model and was selected as the
most parsimonious model in both race subgroups (data not shown).
To test formally for heterogeneity between Blacks and Whites, we used the
heterogeneity 2 test [110; 111] in which the -2lnL value under a given model for the
combined data is subtracted from the summed -2lnL values from stratified analyses. For
infant’s gestational age, evidence for genetic heterogeneity among races was observed
when comparing values under the multifactorial model (2
= 698.07 Black + 2010.02
White) -2690.72 combined =17.37, 3 df, p=0.0006). Of note, parameter estimates for
Blacks and Whites differed, particularly estimates of p, H and AA which were generally
higher in Blacks than Whites. For the multifactorial model, H was estimated as 0.46
41
(95% CI: 0.27, 0.65) for Blacks and 0.23 (95% CI: 0.13, 0.33) for Whites. While these
point estimates are quite different, the 95% CI overlap, indicating that this difference may
not be statistically significant. For mother’s average gestational age of children, evidence
for genetic heterogeneity among races was observed when comparing values under the
multifactorial model (2 = (54.92 Black +213.58 White)-216.37 combined =52.13, 3 df,
p=2.81x10⁻¹¹
). Of note, parameter estimates for Blacks and Whites differed, particularly
estimates of H, which are generally higher in Blacks than Whites. For the mixed free τ's
model, H was estimated as 0.70 (95% CI: 0-1) for Blacks and 0.23 (95% CI: 0-0.57) for
Whites. As the 95% confidence intervals overlap, this difference is not significant in the
sample size analyzed here.
Discussion
PTB likely has a complex etiology involving both genetic and environmental risk
factors, based on evidence from previous studies. This study is the first to explicitly test
different modes of inheritance for birth timing, by assessing gestational age as a
phenotype of either mother or infant. These data lend further support to a genetic
component contributing to birth timing since sporadic (i.e. no familial resemblance) and
nontransmission models, in which gestational age is attributed to environmental factors
alone, are strongly rejected (Tables 3.2 and 3.4). Our findings suggest that genetic
influences on birth timing are important and likely complex.
For infant’s gestational age, the parent of origin model (model 15) best fit the data
according to the AIC values and was chosen as the most parsimonious model (Table 3.2).
Based on the mean estimates for AA, Aa, aA and aa under this model (Table 3.3), it
appears that this parent of origin effect is largely maternal. Heterozygotes who inherit the
42
A allele from their mother (Aa) have a mean closer to, but not equal to, AA. Under a
strict maternal model, AA and Aa would be equivalent, since mother’s A allele would be
expected to be the sole determinant of phenotype. In contrast, heterozygotes who
inherited the A allele from their father (aA) have a mean that is approximately equivalent
to that of aa, suggesting that father’s A allele has little effect on phenotype. A model in
which the maternally-inherited allele was the sole determinant of the phenotype (model
16) did not fit the data better than the parent of origin model in which the entire genotype
was considered. Importantly, father’s genes also affect phenotype in this model, aligning
with previous work showing paternity [26; 27] as well as paternal race [6; 7] influence
PTB risk. Hence, both maternal and paternal alleles seem to contribute to infant’s
gestational age, with maternally-inherited alleles having a stronger effect on phenotype
than those inherited from the father. This finding may support previous studies that have
observed stronger effects of mother’s race [6; 7] and family history on risk for PTB [29]
than those of the father.
These data suggest that maternally-inherited genes acting in the fetus and/or
maternal genes acting in the mother are largely responsible for birth timing; however,
these two possibilities are not easily distinguished. Maternal genetic effects can create the
same pattern of phenotypic variation as genomic imprinting [112]. These two classes of
effects can be distinguished by comparing the offspring of heterozygous mothers [112];
however, such comparisons are not possible in our dataset in which individuals were
assigned probabilities for each possible genotypic state, rather than having known
genotypes measured empirically. Previous studies in cattle [113; 114] have observed
maternal genetic effects on gestational age, but did not consider parent of origin effects.
43
Consequently, further study is needed to determine whether maternal effects or
imprinting account for our observations. In either case, considering the mother of a
preterm delivery as proband may be most useful in identifying genetic contributions to
PTB.
Segregation analysis of mother’s average gestational age of children also
supported a complex genetic model. The mixed free τ's model (model 9) best fit the data
according to the AIC values and was chosen as the most parsimonious model (Table 3.4).
This model, in combination with results from LRTs, suggests that genetic influences on
birth timing are important and likely complex. Importantly, fewer individuals are
informative when mother is considered the proband in a preterm delivery (Figure 3.1),
and the smaller sample size affects the power of the analysis. As a result, the parameter
and likelihood estimates made when considering mother as proband are more affected by
sampling variance; however, conclusions made by comparing across models should be
less affected by sample size.
Overall, mother-based and infant-based analyses both support the importance of
genetic factors, perhaps primarily acting in the mother or maternally-inherited alleles
acting in the fetus, in birth timing. The genetic component influencing PTB likely
involves many genes in interaction with environmental and other genetic factors. These
results are consistent with previous studies suggesting that genes and environments [19-
21], as well as gene-gene [33; 34] and gene-environment [35; 108; 109] interactions
influence PTB. Estimates from the multifactorial model (model 3, Tables 3.3 and 3.5)
indicate 30-40% of variation in gestational age, attributed to either mother or infant, can
be explained by genetics, consistent with estimates from previous twin studies [19; 21].
44
As twins may not be representative of the population as a whole, our heritability
estimates corroborate the general importance of genetics in birth timing. Heritability
estimates were generally higher in mother-based analyses (0.44 (95% CI: 0.11, 0.77))
than in infant-based analysis (0.33 (95% CI: 0.24, 0.42)), but not significantly different
(Tables 3.3, 3.5). While many genes may be contributing to the observed genetic
influence on birth timing, the moderate heritability observed suggests that the cumulative
effect of these genes accounts for an important amount of variation in gestational age.
Although alternative methods for segregation analysis exist, we considered the
Pedigree Analysis Package (PAP) to be the best method for our primary goal of
identifying the best-fitting genetic model for birth timing. Using PAP, we were able
compare models directly and identify the most parsimonious model. In contrast, Markov
Chain Monte Carlo (MCMC) methods, such as those used by the Loki [115] and Morgan
[116] packages, generate a series of posterior probabilities for various models, but no one
model is identified as superior. Moreover, MCMC methods model several Mendelian loci
simultaneously but do not include a polygenic component, which we wanted to include in
the models we examined. Furthermore, one cannot correct for ascertainment within
MCMC analysis, in contrast to PAP. One of the disadvantages of using PAP exclusively
was that we were not able to estimate the approximate number of loci contributing to
birth timing, as could be done with MCMC methods. Additionally, MCMC methods may
be better at handling large, complex pedigrees than PAP [117]; however, since our
families were relatively small and simple (e.g. containing no inbreeding), we did not
consider this a limitation.
45
We have likely enriched for genetic and/or common environmental effects by
using 96 multiplex families, all of whom were recruited based on having two or more
first degree relatives delivered preterm. These multiplex families provided a large sample
size from which genetic effects could be examined. However, the ascertainment scheme
also introduces bias, as the families were not collected randomly and may overestimate
the importance of certain genetic models. To minimize errors due to such bias, all
analyses were corrected for ascertainment by conditioning on the initial proband, either
the mother or the offspring depending which phenotype was considered, that led to the
ascertainment of the family, assuming single ascertainment. However, if our assumption
of single ascertainment is incorrect, conditioning on probands in this manner may create
bias in estimating model parameters [118], leading to inaccurate conclusions about the
best-fitting model for familial PTB. Because we believe our ascertainment scheme is
consistent with single ascertainment, these results appear to be most appropriate for
modeling genetic effects in familial PTB. Yet, it is possible that our conclusions drawn
from familial cases of PTB may not generalize to all instances of this disorder. Familial
cases of PTB may have a different genetic contribution than isolated cases, perhaps
having different etiologies than isolated cases.
This study is also limited by the phenotypes studied. Information on gestational
age was collected by self-report data from questionnaires for many individuals used in
this analysis. While it was possible to verify gestational ages from medical records in
some cases, including all births delivered at the participating institutions, many
gestational ages could not be verified and may be subject to reporting errors.
Additionally, many individuals for whom we could not verify precise gestational ages
46
were reported as “full term” and assigned gestational age of 40 weeks. While this is the
most likely gestational age for infants to be born [12], we may lose some variability in
the overall distribution of gestational age by doing so. As modeling of trait variance is
essential to segregation analysis, this approach also may have affected our results.
Our findings suggest that genetic influences on birth timing are important.
Modeling for both mother and infant phenotypes indicate that a genetic component
influences gestational age and is complex in nature. In analyses using either mother or
infant as proband, monogenic Mendelian models were strongly rejected, suggesting that a
single gene model cannot fully explain birth timing in these families. A number of genes
probably contribute to the genetic influence on birth timing and PTB described. Analyses
of gestational age attributed to the infant support a model in which mother’s genome
and/or maternally-inherited genes acting in the fetus are largely responsible for birth
timing, with a smaller contribution from the paternally-inherited alleles in the fetal
genome. Hence, considering the mother of a preterm delivery as proband may be more
useful in identifying specific genetic contributions to PTB. Interestingly, results from the
heterogeneity 2 test comparing race-stratified analyses suggest that genetic influences on
birth timing may differ between Blacks and Whites. Hence, in future association studies,
race-stratified analyses or population stratification corrections may improve our ability to
identify specific genes associated with PTB. Overall, as multiple genes in the mother’s
genome may explain the bulk of genetic influences on birth timing, future studies to
identify specific genes influencing PTB perhaps will be most fruitful by using large scale
studies of mothers’ genomes.
Material and Methods
47
Proband mother-infant pair was initially identified through premature birth of a
live singleton fetus before 37 weeks of gestation [1] by review of delivery logs at
university medical center hospitals at Washington University and University of Helsinki
or by self-identification through the study’s website from 2003 to October 2007. To avoid
misclassification bias at borderline gestational ages, we defined PTB as <35 weeks in the
US cohort and <36 weeks in the Finland cohort. Our gestational age criteria was less
stringent in the Finland cohort due to the high number of early ultrasounds performed,
leading to more accurate gestational ages in this cohort. To include only families with
spontaneous onset of preterm singleton birth, the following mother-infant pairs were
further excluded: elective deliveries without spontaneous onset of labor and deliveries in
which either maternal (e.g. systemic infection) or fetal (e.g. malformation) disease with
known predisposition to premature birth was indicated. Families were extended through
affected individuals on both maternal and paternal sides until no additional first degree
relatives were identified as either mother of infant of a preterm delivery. Families were
recruited into the study only if two or more members were mothers and/or infants of
preterm deliveries. 55 families were recruited from the US, of which 31 were Black and
24 were White. 41 White families were recruited from Finland. In the US cohort, families
ranged from 9 to 36 individuals with phenotypic information with a median family size of
18 individuals. In the Finland cohort, families ranged from 8 to 73 individuals with
phenotypic information with a median family size of 16 individuals. Informed consent
was obtained from participants and the study was approved by the institutional review
board of Washington University School of Medicine and the ethics committee of Helsinki
University Central Hospital.
48
From the US cohort, an individual’s gestational age was calculated based on his
or her mother’s self report of expected due dates and actual delivery dates for a
pregnancy or of how many weeks early that family member was born. For all individuals
born at the Washington University School of Medicine, gestational ages were verified
from medical records. From the Finland cohort, an individual’s gestational age was
obtained from medical records. Individuals for whom pedigree information indicated that
they were born <35 or <36 weeks without a specific gestational age designated were
assigned a gestational age of 34 or 35 weeks, respectively. Similarly, those individuals
indicated as “term” were designated 40 weeks. Infant’s gestational age was treated as a
quantitative trait, which was standardized to a normal distribution ( =0, =1) prior to any
analysis. A total of 1378 individuals had non-missing phenotypes, with a median of 13
individuals per family (range 3-80). The number of sibpairs with phenotypic information
for this phenotype was 309, with a median of 3 sibpairs per family (range 1-7). The
median number of generations with phenotypic information was 3 (range 1-5).
For both cohorts, a variable representing the average gestational age of all
children born to a given mother was constructed. For mothers who had one or more
children born before 37 weeks, this variable was calculated as the mean of the gestational
ages for all children born to that woman. Mothers who gave birth to all of their children
at term (>37 weeks) were assigned a value of 40 weeks. Mothers for whom one or more
children had missing gestational ages were coded as missing. Additionally, all males and
females who had not yet given birth were coded as missing. This phenotype was treated
as a quantitative trait, which was standardized to a normal distribution ( =0, =1) prior
to any analysis. Univariate statistics and standardizations for each phenotype were
49
performed with SAS language v. 9.1.3 for Linux OS (SAS Institute, Cary, NC). A total of
404 individuals had non-missing phenotypes, with a median of 4 individuals per family
(range 1-17). The number of sibpairs with phenotypic information for this phenotype was
309, with a median of 0 sibpairs per family (range 0-5). The median number of
generations with phenotypic information was 2 (range 1-4).
We used the Pedigree Analysis Package (PAP), Version 5.0 [119] to perform
segregation analysis. Under the mixed Mendelian model (model 1), the phenotype is
influenced by a major gene, polygenic background and an untransmitted environmental
component. The major gene is biallelic (A, a), with allele A, occurring at frequency p,
associated with lower trait values. Mean values for the three genotypes (μAA, μAa, μaa,
where the order of the means is constrained to be μAA ≤ μAa ≤ μaa) and a common
standard deviation for all genotypes are estimated. Parent-to-offspring transmission
probabilities for the three genotypes (τAA, τAa, and τaa) also are included in the model. τAA,
τAa, and τaa designate the probability of transmitting allele A for the genotypes AA, Aa,
and aa, with Mendelian expectations of 1, 0.5, 0, respectively. When the τ’s are set equal
to p, there is no transmission of the major effect. Polygenic heritability (H) after
accounting for the putative major gene effect was also estimated. For parent of origin
models, heterozygotes who inherited A from their mother (Aa) and heterozygotes who
inherited A from their father (aA) are distinguished from one another and allowed to have
different means. Many of the free τ's models did not converge initially. In order to
estimate these models, τAA and τaa were fixed to 1 and 0, respectively, and likelihoods
calculated under these additional assumptions were used for the analysis.
50
All parameters were estimated using a maximum likelihood method. Nested
models representing null hypotheses were tested against a more general model using a
LRT, in which the difference between negative twice the log-likelihood (-2 ln L) values
for two models approximates a chi-square distribution with degrees of freedom equal to
the number of independent parameter restrictions. The most parsimonious model of those
not rejected by likelihood ratio test (p>0.01) was determined using AIC [120], which is
computed as -2 ln L of the model plus twice the number of parameters estimated. The
model with the lowest AIC indicates the most parsimonious fit to the observed data.
To account for the ascertainment of the families, the likelihood of each model was
conditioned on the likelihood of the proband’s phenotype under the model, an appropriate
correction for the manner in which these families were extended [121]. While our
criterion required 2 or more preterm first degree relatives for a family to be enrolled in
the study, the ascertainment scheme is approximately equivalent to single ascertainment
[122]. Because not all preterm deliveries in the metropolitan St. Louis or Finnish health
care systems occurring during the study period were captured under our ascertainment
scheme, the probability that a family was identified through multiple probands is small
and should be proportional to the number of affected deliveries in a family, as expected
under single ascertainment[123]. Under single ascertainment, conditioning on the
proband’s phenotype is sufficient to adjust for the ascertainment of families [123]. Hence,
analyses for infant’s gestational age were corrected for the proband infant’s gestational
age jointly with PTB (<37 weeks) affection status. Similarly, analyses attributing
gestational age to the mother were corrected for the proband mother’s average gestational
age of children jointly with her PTB (<37 weeks) affection status.
51

To test genetic heterogeneity among races, we used the heterogeneity 2 test [110;
111] in which the -2lnL value under the best fitting model for the combined data is
subtracted from the summation of -2lnL values for stratified analyses to obtain the test
statistic. This test statistic approximates a 2 distribution with df equal to K*J-K where J
is the number of subgroups and K is the number of parameters in the model.
52
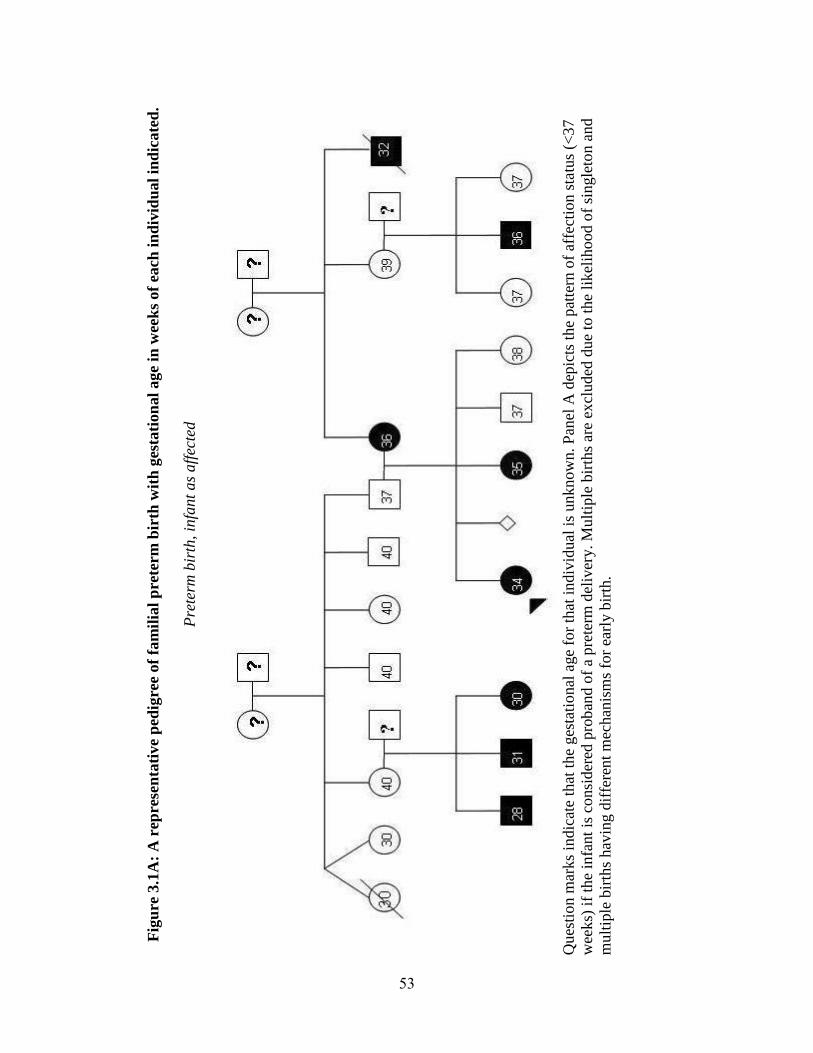
Fig
ure
3.1
A:
A r
epre
sen
tati
ve
ped
igre
e of
fam
ilia
l p
rete
rm
bir
th w
ith
ges
tati
on
al
age
in w
eek
s of
each
in
div
idu
al
ind
icate
d.
Pre
term
bir
th, in
fant
as
aff
ecte
d
Q
ues
tion m
arks
indic
ate
that
the
ges
tati
onal
age
for
that
indiv
idual
is
unknow
n. P
anel
A d
epic
ts t
he
pat
tern
of
affe
ctio
n s
tatu
s (<
37
wee
ks)
if
the
infa
nt
is c
onsi
der
ed p
rob
and o
f a
pre
term
del
iver
y. M
ult
iple
bir
ths
are
excl
uded
due
to t
he
likel
ihood o
f si
ngle
ton a
nd
mult
iple
bir
ths
hav
ing d
iffe
rent
mec
han
ism
s fo
r ea
rly b
irth
.
53
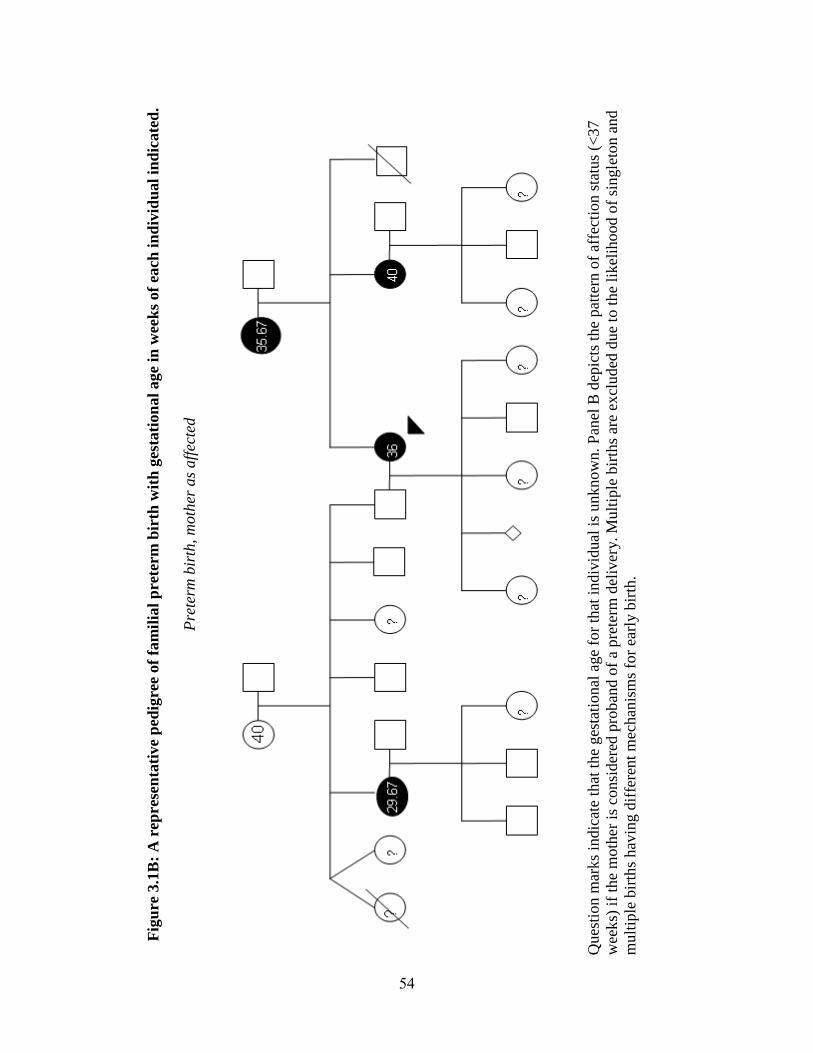
Fig
ure
3.1
B:
A r
epres
en
tati
ve
ped
igre
e of
fam
ilia
l p
rete
rm
bir
th w
ith
ges
tati
on
al
age
in w
eek
s of
each
in
div
idu
al
ind
icate
d.
Pre
term
bir
th,
moth
er a
s aff
ecte
d
Ques
tion m
arks
indic
ate
that
the
ges
tati
onal
age
for
that
indiv
idual
is
unknow
n.
Pan
el B
dep
icts
the
pat
tern
of
affe
ctio
n s
tatu
s (<
37
wee
ks)
if
the
moth
er i
s co
nsi
der
ed p
rob
and o
f a
pre
term
del
iver
y. M
ult
iple
bir
ths
are
excl
ud
ed d
ue
to t
he
likel
ihood o
f si
ngle
ton a
nd
mult
iple
bir
ths
hav
ing d
iffe
rent
mec
han
ism
s fo
r ea
rly b
irth
.
54
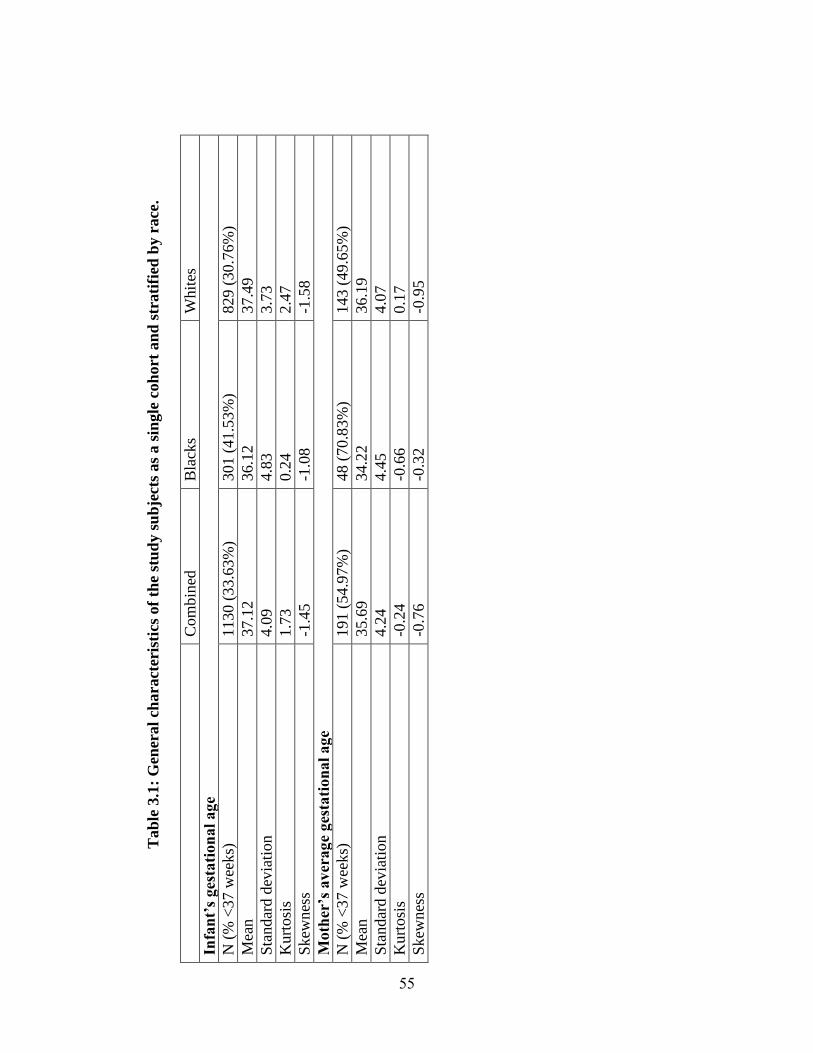
Tab
le 3
.1:
Gen
eral
charact
eris
tics
of
the
stu
dy s
ub
ject
s as
a s
ingle
coh
ort
an
d s
trati
fied
by r
ace
.
C
om
bin
ed
Bla
cks
Whit
es
Infa
nt’
s ges
tati
on
al
age
N (
% <
37 w
eeks)
1130 (
33.6
3%
) 301 (
41.5
3%
) 829 (
30.7
6%
)
Mea
n
37.1
2
36.1
2
37.4
9
Sta
ndar
d d
evia
tion
4.0
9
4.8
3
3.7
3
Kurt
osi
s
1.7
3
0.2
4
2.4
7
Skew
nes
s -1
.45
-1.0
8
-1.5
8
Moth
er’s
av
erag
e ges
tati
on
al
age
N (
% <
37 w
eeks)
191 (
54.9
7%
) 48 (
70.8
3%
) 143 (
49.6
5%
)
Mea
n
35.6
9
34.2
2
36.1
9
Sta
ndar
d d
evia
tion
4.2
4
4.4
5
4.0
7
Kurt
osi
s
-0.2
4
-0.6
6
0.1
7
Skew
nes
s -0
.76
-0.3
2
-0.9
5
55
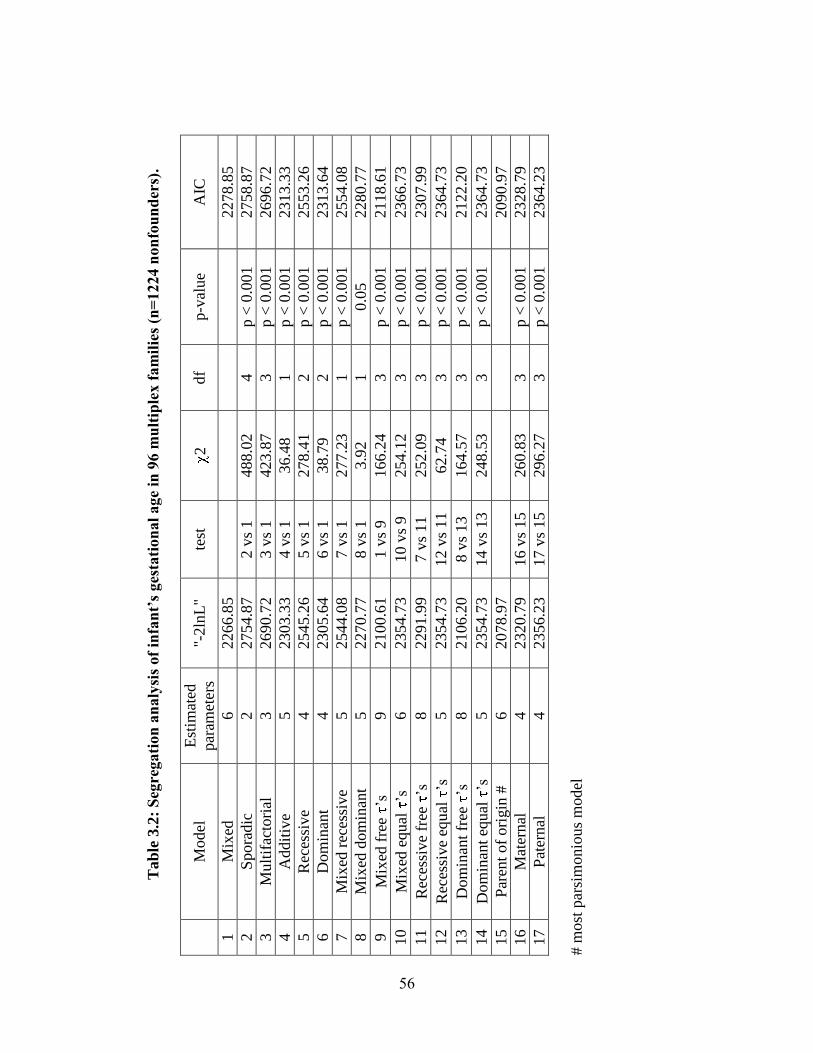
Tab
le 3
.2:
Seg
regati
on
an
aly
sis
of
infa
nt’
s ges
tati
on
al
age
in 9
6 m
ult
iple
x f
am
ilie
s (n
=1224 n
on
fou
nd
ers)
.
M
odel
E
stim
ated
par
amet
ers
"-2ln
L"
test
2
df
p-v
alue
AIC
1
Mix
ed
6
2266.8
5
2278.8
5
2
Spora
dic
2
2754.8
7
2 v
s 1
488.0
2
4
p <
0.0
01
2758.8
7
3
Mult
ifac
tori
al
3
2690.7
2
3 v
s 1
423.8
7
3
p <
0.0
01
2696.7
2
4
Addit
ive
5
2303.3
3
4 v
s 1
36.4
8
1
p <
0.0
01
2313.3
3
5
Rec
essi
ve
4
2545.2
6
5 v
s 1
278.4
1
2
p <
0.0
01
2553.2
6
6
Dom
inan
t 4
2305.6
4
6 v
s 1
38.7
9
2
p <
0.0
01
2313.6
4
7
Mix
ed r
eces
sive
5
2544.0
8
7 v
s 1
277.2
3
1
p <
0.0
01
2554.0
8
8
Mix
ed d
om
inan
t 5
2270.7
7
8 v
s 1
3.9
2
1
0.0
5
2280.7
7
9
Mix
ed f
ree
’s
9
2100.6
1
1 v
s 9
166.2
4
3
p <
0.0
01
2118.6
1
10
M
ixed
equal
’s
6
2354.7
3
10 v
s 9
254.1
2
3
p <
0.0
01
2366.7
3
11
R
eces
sive
free
’s
8
2291.9
9
7 v
s 11
252.0
9
3
p <
0.0
01
2307.9
9
12
R
eces
sive
equ
al ’s
5
2354.7
3
12 v
s 11
62.7
4
3
p <
0.0
01
2364.7
3
13
D
om
inan
t fr
ee ’s
8
2106.2
0
8 v
s 13
164.5
7
3
p <
0.0
01
2122.2
0
14
D
om
inan
t eq
ual
’s
5
2354.7
3
14 v
s 13
248.5
3
3
p <
0.0
01
2364.7
3
15
P
aren
t of
ori
gin
#
6
2078.9
7
2090.9
7
16
M
ater
nal
4
2320.7
9
16 v
s 15
260.8
3
3
p <
0.0
01
2328.7
9
17
P
ater
nal
4
2356.2
3
17 v
s 15
296.2
7
3
p <
0.0
01
2364.2
3
# m
ost
par
sim
onio
us
model
56
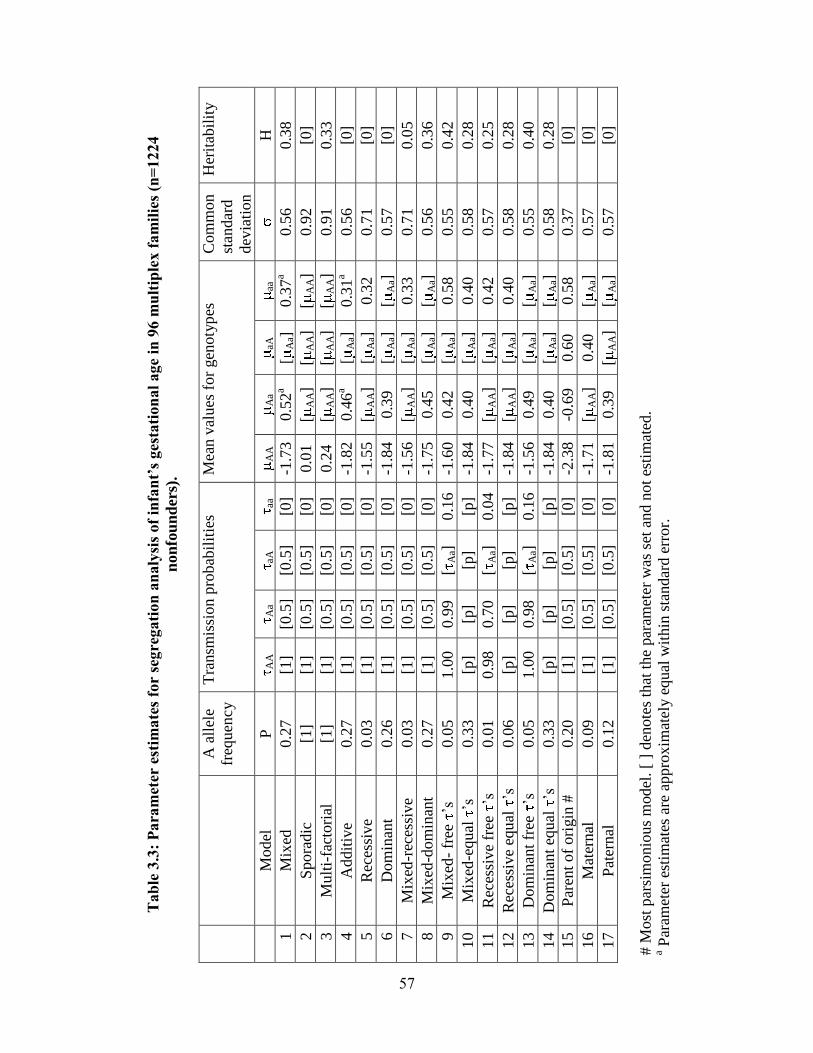
Tab
le 3
.3:
Para
met
er e
stim
ate
s fo
r se
gre
gati
on
an
aly
sis
of
infa
nt’
s ges
tati
on
al
age
in 9
6 m
ult
iple
x f
am
ilie
s (n
=1224
non
fou
nd
ers)
.
A a
llel
e
freq
uen
cy
Tra
nsm
issi
on p
robab
ilit
ies
Mea
n v
alues
for
gen
oty
pes
C
om
mon
stan
dar
d
dev
iati
on
Her
itab
ilit
y
M
odel
P
A
A
Aa
aA
aa
AA
Aa
aA
aa
H
1
Mix
ed
0.2
7
[1]
[0.5
] [0
.5]
[0]
-1.7
3
0.5
2a
[A
a]
0.3
7a
0.5
6
0.3
8
2
Spora
dic
[1
] [1
] [0
.5]
[0.5
] [0
] 0.0
1
[A
A]
[A
A]
[A
A]
0.9
2
[0]
3
Mult
i-fa
ctori
al
[1]
[1]
[0.5
] [0
.5]
[0]
0.2
4
[A
A]
[A
A]
[A
A]
0.9
1
0.3
3
4
Addit
ive
0.2
7
[1]
[0.5
] [0
.5]
[0]
-1.8
2
0.4
6a
[A
a]
0.3
1a
0.5
6
[0]
5
Rec
essi
ve
0.0
3
[1]
[0.5
] [0
.5]
[0]
-1.5
5
[A
A]
[A
a]
0.3
2
0.7
1
[0]
6
Dom
inan
t 0.2
6
[1]
[0.5
] [0
.5]
[0]
-1.8
4
0.3
9
[A
a]
[A
a]
0.5
7
[0]
7
Mix
ed-r
eces
sive
0.0
3
[1]
[0.5
] [0
.5]
[0]
-1.5
6
[A
A]
[A
a]
0.3
3
0.7
1
0.0
5
8
Mix
ed-d
om
inan
t 0.2
7
[1]
[0.5
] [0
.5]
[0]
-1.7
5
0.4
5
[A
a]
[A
a]
0.5
6
0.3
6
9
Mix
ed-
free
’s
0.0
5
1.0
0
0.9
9
[A
a]
0.1
6
-1.6
0
0.4
2
[A
a]
0.5
8
0.5
5
0.4
2
10
M
ixed
-equal
’s
0.3
3
[p]
[p]
[p]
[p]
-1.8
4
0.4
0
[A
a]
0.4
0
0.5
8
0.2
8
11
R
eces
sive
free
’s
0.0
1
0.9
8
0.7
0
[A
a]
0.0
4
-1.7
7
[A
A]
[A
a]
0.4
2
0.5
7
0.2
5
12
R
eces
sive
equ
al ’s
0.0
6
[p]
[p]
[p]
[p]
-1.8
4
[A
A]
[A
a]
0.4
0
0.5
8
0.2
8
13
D
om
inan
t fr
ee ’s
0.0
5
1.0
0
0.9
8
[A
a]
0.1
6
-1.5
6
0.4
9
[A
a]
[A
a]
0.5
5
0.4
0
14
D
om
inan
t eq
ual
’s
0.3
3
[p]
[p]
[p]
[p]
-1.8
4
0.4
0
[A
a]
[A
a]
0.5
8
0.2
8
15
P
aren
t of
ori
gin
#
0.2
0
[1]
[0.5
] [0
.5]
[0]
-2.3
8
-0.6
9
0.6
0
0.5
8
0.3
7
[0]
16
M
ater
nal
0.0
9
[1]
[0.5
] [0
.5]
[0]
-1.7
1
[A
A]
0.4
0
[A
a]
0.5
7
[0]
17
P
ater
nal
0.1
2
[1]
[0.5
] [0
.5]
[0]
-1.8
1
0.3
9
[A
A]
[A
a]
0.5
7
[0]
# M
ost
par
sim
onio
us
model
. [
] den
ote
s th
at t
he
par
amet
er w
as s
et a
nd n
ot
esti
mat
ed.
a Par
amet
er e
stim
ates
are
appro
xim
atel
y e
qual
wit
hin
sta
ndar
d e
rror.
57
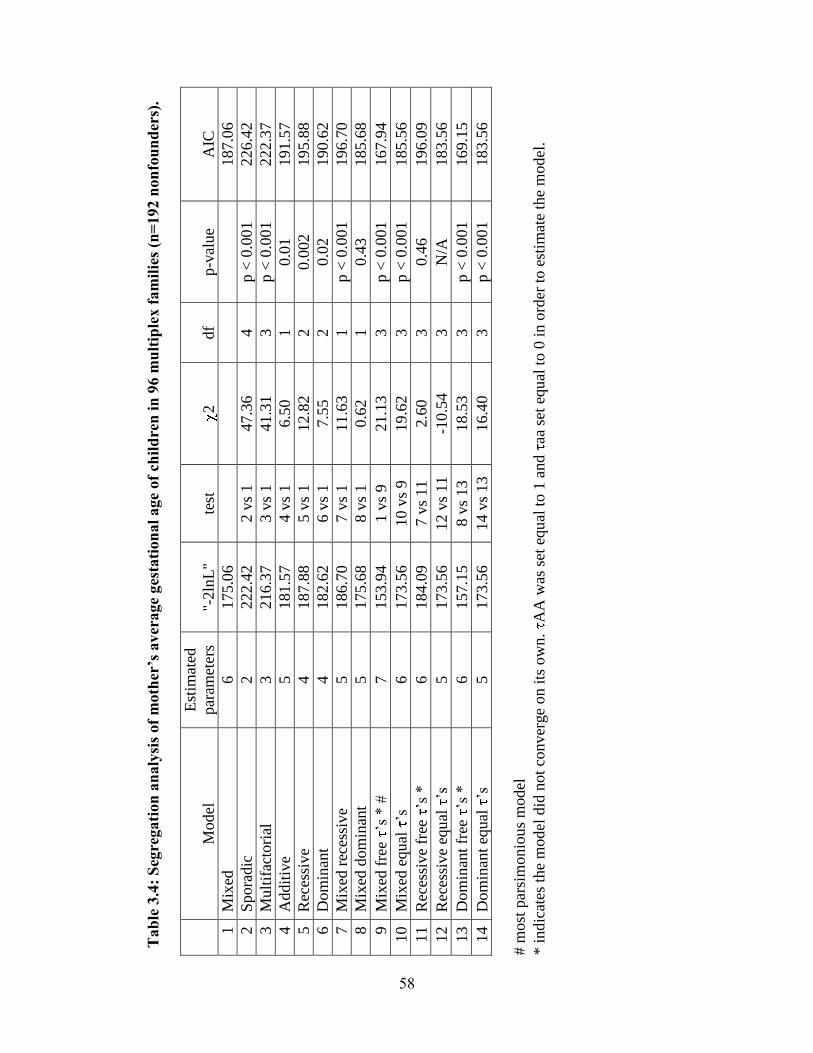
Tab
le 3
.4:
Seg
regati
on
an
aly
sis
of
moth
er’s
av
erage
ges
tati
on
al
age
of
chil
dre
n i
n 9
6 m
ult
iple
x f
am
ilie
s (n
=192 n
on
fou
nd
ers)
.
Model
Est
imat
ed
par
amet
ers
"-2ln
L"
test
2
df
p-v
alue
AIC
1
Mix
ed
6
175.0
6
187.0
6
2
Spora
dic
2
222.4
2
2 v
s 1
47.3
6
4
p <
0.0
01
226.4
2
3
Mult
ifac
tori
al
3
216.3
7
3 v
s 1
41.3
1
3
p <
0.0
01
222.3
7
4
Addit
ive
5
181.5
7
4 v
s 1
6.5
0
1
0.0
1
191.5
7
5
Rec
essi
ve
4
187.8
8
5 v
s 1
12.8
2
2
0.0
02
195.8
8
6
Dom
inan
t 4
182.6
2
6 v
s 1
7.5
5
2
0.0
2
190.6
2
7
Mix
ed r
eces
sive
5
186.7
0
7 v
s 1
11.6
3
1
p <
0.0
01
196.7
0
8
Mix
ed d
om
inan
t 5
175.6
8
8 v
s 1
0.6
2
1
0.4
3
185.6
8
9
Mix
ed f
ree
’s *
#
7
153.9
4
1 v
s 9
21.1
3
3
p <
0.0
01
167.9
4
10
M
ixed
equal
’s
6
173.5
6
10 v
s 9
19.6
2
3
p <
0.0
01
185.5
6
11
R
eces
sive
free
’s
*
6
184.0
9
7 v
s 11
2.6
0
3
0.4
6
196.0
9
12
R
eces
sive
equ
al
’s
5
173.5
6
12 v
s 11
-1
0.5
4
3
N/A
183.5
6
13
D
om
inan
t fr
ee
’s *
6
157.1
5
8 v
s 13
18.5
3
3
p <
0.0
01
169.1
5
14
D
om
inan
t eq
ual
’s
5
173.5
6
14 v
s 13
16.4
0
3
p <
0.0
01
183.5
6
# m
ost
par
sim
onio
us
model
* i
ndic
ates
the
model
did
not
conver
ge
on i
ts o
wn.
AA
was
set
equ
al t
o 1
and
aa s
et e
qu
al t
o 0
in o
rder
to e
stim
ate
the
model
.
58
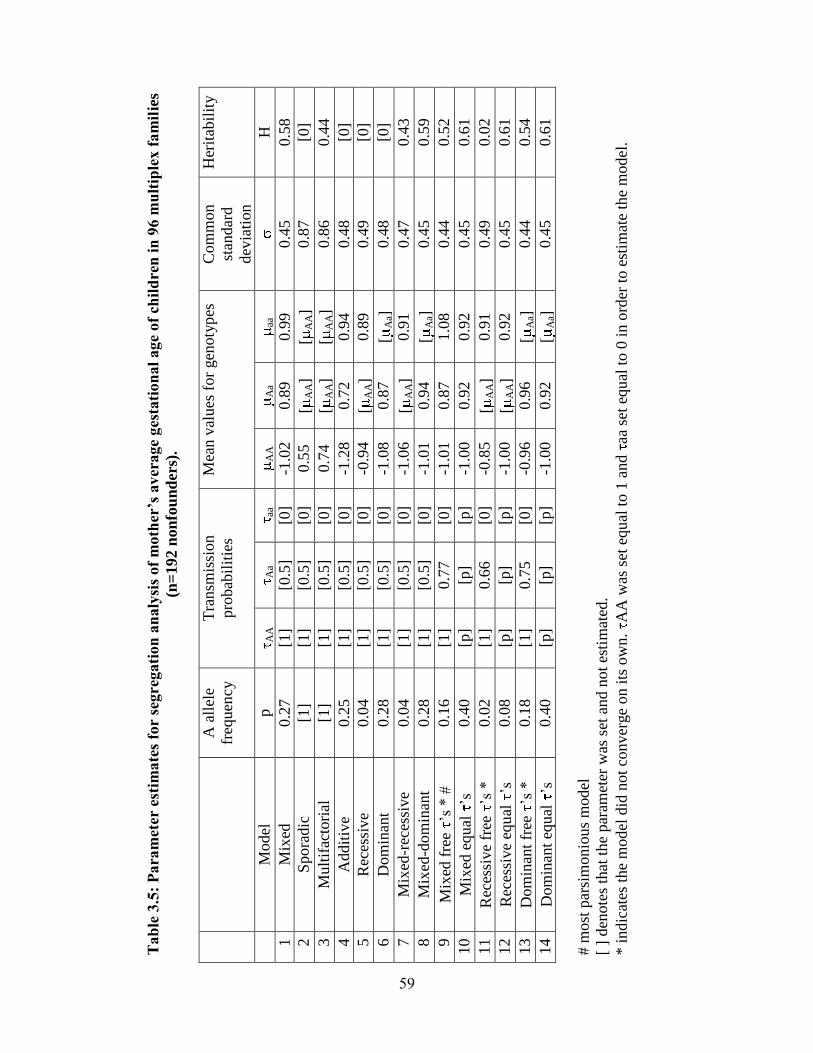
Tab
le 3
.5:
Para
met
er e
stim
ate
s fo
r se
gre
gati
on
an
aly
sis
of
moth
er’s
av
erage
ges
tati
on
al
age
of
chil
dre
n i
n 9
6 m
ult
iple
x f
am
ilie
s
(n=
192 n
on
fou
nd
ers)
.
A a
llel
e
freq
uen
cy
Tra
nsm
issi
on
pro
bab
ilit
ies
Mea
n v
alues
for
gen
oty
pes
C
om
mon
stan
dar
d
dev
iati
on
Her
itab
ilit
y
M
odel
p
AA
Aa
aa
AA
Aa
aa
H
1
Mix
ed
0.2
7
[1]
[0.5
] [0
] -1
.02
0.8
9
0.9
9
0.4
5
0.5
8
2
Spora
dic
[1
] [1
] [0
.5]
[0]
0.5
5
[A
A]
[A
A]
0.8
7
[0]
3
Mult
ifac
tori
al
[1]
[1]
[0.5
] [0
] 0.7
4
[A
A]
[A
A]
0.8
6
0.4
4
4
Addit
ive
0.2
5
[1]
[0.5
] [0
] -1
.28
0.7
2
0.9
4
0.4
8
[0]
5
Rec
essi
ve
0.0
4
[1]
[0.5
] [0
] -0
.94
[A
A]
0.8
9
0.4
9
[0]
6
Dom
inan
t 0.2
8
[1]
[0.5
] [0
] -1
.08
0.8
7
[A
a]
0.4
8
[0]
7
Mix
ed-r
eces
sive
0.0
4
[1]
[0.5
] [0
] -1
.06
[A
A]
0.9
1
0.4
7
0.4
3
8
Mix
ed-d
om
inan
t 0.2
8
[1]
[0.5
] [0
] -1
.01
0.9
4
[A
a]
0.4
5
0.5
9
9
Mix
ed f
ree
’s *
#
0.1
6
[1]
0.7
7
[0]
-1.0
1
0.8
7
1.0
8
0.4
4
0.5
2
10
M
ixed
equal
’s
0.4
0
[p]
[p]
[p]
-1.0
0
0.9
2
0.9
2
0.4
5
0.6
1
11
R
eces
sive
free
’s
*
0.0
2
[1]
0.6
6
[0]
-0.8
5
[A
A]
0.9
1
0.4
9
0.0
2
12
R
eces
sive
equ
al
’s
0.0
8
[p]
[p]
[p]
-1.0
0
[A
A]
0.9
2
0.4
5
0.6
1
13
D
om
inan
t fr
ee
’s *
0.1
8
[1]
0.7
5
[0]
-0.9
6
0.9
6
[A
a]
0.4
4
0.5
4
14
D
om
inan
t eq
ual
’s
0.4
0
[p]
[p]
[p]
-1.0
0
0.9
2
[A
a]
0.4
5
0.6
1
# m
ost
par
sim
onio
us
model
[ ]
den
ote
s th
at t
he
par
amet
er w
as s
et a
nd n
ot
esti
mat
ed.
* i
ndic
ates
the
model
did
not
conver
ge
on i
ts o
wn.
AA
was
set
equ
al t
o 1
and
aa s
et e
qu
al t
o 0
in o
rder
to e
stim
ate
the
model
.
59
Chapter 4: Considering rapidly evolving genes facilitates discovery of novel gene for
PTB: follicle-stuimulating hormone receptor, FSHR §
Abstract
The signals initiating parturition in humans have remained elusive, due to
divergence in physiological mechanisms between humans and model organisms typically
studied. Because of relatively large human head size and narrow birth canal cross-
sectional area compared to other primates, we hypothesized that genes involved in
parturition have evolved rapidly along the human and/or higher primate phylogenetic
lineages to decrease the length of gestation and alleviate complications arising from these
constraints. Consistent with our hypothesis, many genes involved in reproduction show
rapid evolution in their coding or adjacent noncoding regions. We screened >8,000 SNPs
in 150 rapidly evolving genes in 165 Finnish preterm and 163 control mothers for
association with PTB. A linkage disequilibrium block of SNPs in FSHR, rs11686474,
rs11680730 and rs12473870, showed significant association across ethnically diverse
populations. By considering rapid evolution, we identified a novel gene associated with
PTB, FSHR. We anticipate other rapidly evolving genes will similarly be associated with
PTB risk and elucidate essential pathways for human parturition.
Introduction
Because humans are born developmentally less mature than other mammals [124;
125], birth timing mechanisms may differ between humans and model organisms that
have been typically studied [126]. Evidence suggests that parturition has changed along
the human lineage in response to other uniquely human adaptations. The dramatic
§ This chapter is adapted from: Plunkett J, et al. Evolution History of FSHR in Humans
Predicts Role in Birth Timing. Submitted.
60
increase in brain size, along with the human pelvis becoming narrower to facilitate
bipedalism, places unique constraints on birth in humans compared even with
evolutionarily close relatives such as Neanderthals and chimpanzees [127; 128]. Given
the historically high mortality rate associated with pregnancy, these human adaptations
are likely to have generated a strong selective pressure to initiate parturition at a
relatively earlier time in gestation compared to non-human primates to avoid
cephalopelvic disproportion and arrested labor. High rates of human versus non-human
primate divergence in human pregnancy-related genes, such as genes in the reproduction
Gene Ontology (GO) category [129; 130] as well as GO categories related to fetal
development, including transcription factors [131], nuclear hormone receptors [131],
transcriptional regulation [132] and development [130], support the notion that human
gestation length has been shortened to accommodate features unique to human
pregnancy. As a result, the set of genes rapidly evolving on the human lineage likely
includes genes that play important roles in regulating parturition and potentially influence
PTB risk.
Genetic influences on birth timing in humans appear to be substantial; however,
association studies using candidates selected from suspected pathways have not detected
robust susceptibility variants for PTB. Genome-wide association studies (GWAS) are
promising but will require large numbers of well-characterized subjects in order to
overcome the challenge of multiple statistical comparisons. To address these limitations,
we applied an evolutionarily-motivated filter to examine genes showing marked
divergence between humans and other mammals, defined by relative nucleotide
substitution rates in coding and highly conserved noncoding regions, for association with
61
PTB. Here we show that genes with the signature of rapid evolution in humans provide
an informative group of candidates, and demonstrate as proof of concept that one rapidly
evolving gene, follicle-stimulating hormone receptor (FSHR), has significant association
with PTB.
Results and Discussion
Life history traits. Because of large human head size and narrow birth canal
cross-section compared to other primates [127], we hypothesized that genes involved in
parturition have evolved rapidly along the human phylogenetic lineage to decrease the
length of gestation and alleviate the complications arising from these constraints. We
performed a comparative analysis of life history traits in mammals to further evaluate
whether the relative gestational period in humans has decreased compared to other
primates and mammals. Data acquired by Sacher and Staffeldt [133] and reanalyzed by
us show that both adult and neonatal primates have higher brain to body weight ratios
compared to other mammals (Figure 4.1A, B). The decoupling of brain/body size ratios
in primates makes it possible to ask whether gestation in primates is linked to brain size
or body size. Primates and other mammals have equivalent gestational periods with
respect to brain weight (Figure 4.1C). In contrast, the gestational period in primates is
longer relative to the length of gestation in mammals with equivalent neonatal body
weights (Figure 4.1D). This suggests that the length of gestation is expected to change
with brain size but not body size.
Humans have evolved the highest adult brain to body weight ratio of any mammal
[29]. In contrast to the evolution of brain/body ratios along the lineage leading to
primates, the increase in the brain/body ratio along the lineage leading to humans is
62
present in adults but not neonates (Figure 4.1B). The simplest explanation is that adult
brain/body ratios have changed independently of neonatal ratios. However, the ratio of
brain/body weight is highest at birth and declines until adulthood. Thus, an alternative
explanation is that both adult and neonatal brain/body ratios have increased in humans, as
in primates, but that a concurrent decrease in the length of gestation lowered the neonatal
brain/body ratio. This second possibility is supported by the relative immaturity of human
neonates compared to other primates [124; 125] and that the length of human gestation,
relative to either neonatal brain or body weight, is shorter than most other primates
(Figure 4.1C,D).
To examine the evolution of gestation length relative to neonatal brain and body
weight in primates, we inferred the evolution of these characters across a phylogenetic
tree. For both gestation-neonatal body ratio (Figure 4.2A) and gestation-neonatal brain
ratio (Figure 4.2B) there is a consistent trend of a relatively shorter length of gestation on
branches leading to humans. Of note, human has the lowest gestation-neonatal body ratio
(Figure 4.2A) or gestation-neonatal brain ratio (Figure 4.2B) of all the 20 primates. The
gestation-neonatal brain ratio for humans is 69% that of gorilla and 45% that of
chimpanzee. The gestation-neonatal body ratio of human is 49% that of gorilla and 50%
that of chimpanzee.
Signature of rapid evolution. In light of this evidence for human adaptation for
birth timing, we examined whether genes involved in parturition would display a
signature of positive selection, an increased rate of amino acid altering to synonymous
nucleotide substitutions (dN/dS; Figure 4.3). We found that, of 120 suggested candidate
genes for PTB [134] that were included in ENSEMBL database, 7 showed statistically
63
significant increased rate acceleration (i.e. increased dN/dS; p<0.05) along the human
lineage in comparison to the other lineages. Table 4.1 shows these 7 genes plus 2
accelerated human genes significantly rapidly evolving along the human-chimpanzee
ancestor lineage (complete analysis of dN/dS reported in [135; 136]). Of these, common
variants of PGR [137] and MMP8 [138] have previously been found to contribute to PTB
risk. Of note, this candidate gene list derived from the Institute of Medicine report on
PTB [134], and information from the Gene Cards and Online Mendelian Inheritance in
Man databases was relatively enriched for genes rapidly evolving along the human
lineage compared to a normal distribution (3/120 expected; p=0.02) and exhibited a
similar trend for enrichment in comparison to other human genes in the ENSEMBL
database (408/10,440 observed with p<0.05; p=0.14 vs. suggested PTB candidates).
Using criterion agnostic to possible involvement with PTB, and measuring genome-wide
changes, we identified 175 genes either rapidly evolving along the human (40 genes) or
on the human and human-chimpanzee ancestor lineages combined (135 genes) at a 5%
false discovery rate (FDR) [139] from this analysis of protein-coding sequences.
Motivated by this evidence of protein coding region evolution for genes involved
in parturition and that positive selection has also been found to act on noncoding regions,
we developed a method to identify rapidly evolving noncoding sequences [132; 140]. We
identified a total of 401 elements significant along the human lineage and 2103 elements
significant along the human and human-chimpanzee ancestor lineages at a 5% FDR. To
choose candidate genes, we calculated gene-wise p-values for each gene locus by
assigning each conserved element to its nearest RefSeq gene [141] and a Fisher’s
combined p-value across the locus. This resulted in identification of a total of 279
64
candidate genes (complete analysis of rapidly evolving non-coding regions reported in
[135; 136]). 150 of the genes identified as rapidly evolving in the protein-coding
sequence and highly conserved noncoding elements screens, selected based on expression
and functional information suggesting potential roles in parturition, were analyzed for
association with PTB (Table 4.2).
Association analysis of rapidly evolving genes. Because recent data suggests
that heritability of risk of PTB acts largely or exclusively through the maternal genome
[29; 30; 32] and the Finnish have low environmental risk and high genetic homogeneity
compared to other populations, we genotyped Finnish (165 preterm, 163 control) mothers
for 8,490 SNPs in the gene regions of our prioritized list of 150 rapidly evolving genes
(Figure 4.4). The most significant finding was rs6741370 (p=9.28 x 10⁻⁵
) in the follicle-
stimulating hormone (FSH) receptor gene (FSHR). 91 SNPs were significant at the
p<0.01 level by allelic tests (Table 4.3). However, no SNPs were significant after
correcting for 6,042 independent tests, considering relationships among markers, by the
Bonferroni method (p<8.27 x 10⁻⁶
). Of note, 8 of the 10 most statistically significant
SNPs were located in FSHR. We identified FSHR as rapidly evolving in the noncoding
analysis, with 40 changes in 4,218 bp of 17 conserved elements (human lineage p = 5.4 X
10-5
). Moreover, FSHR was revealed as rapidly evolving in a study of noncoding
conserved elements by Prabhakar and colleagues [140], which otherwise had limited
overlap with our gene list (see Methods). FSHR also harbors SNPs with extreme iHS
values in the Yoruban population, reflecting extended haplotype homozygosity and
suggesting a recent selective sweep [142]. Bird and colleagues [143] identified a region
less than 1 megabase downstream of the FSHR gene boundaries as rapidly evolving in
65
their study, further supporting rapid evolution of the locus. This information, together
with the known importance of variation in human FSHR in subfertility [144; 145], a risk
factor for preterm delivery independent of the use of assisted reproductive technologies
[146; 147], and evidence suggesting its expression in uterus and cervix [148-150],
motivated its specific study.
16 SNPs in FSHR showing potential association in the screening analysis (p<0.1)
were genotyped in US White (147 preterm, 157 control), US Black (79 preterm, 164
controls) and US Hispanic (73 preterm, 292 control) mothers (Figure 4.5; Table 4.4).
Several SNPs exhibited suggestive association (p<0.01) with PTB risk. One SNP in the
US Blacks, rs12473815, was significant after correcting multiple testing (13 independent
tests; p<0.004). The SNP rs12473815 is in high linkage disequilibrium (LD) with three
nearby SNPs, rs11686474, rs11680730 and rs12473870 (Figure 4.5), all of which showed
evidence of association across populations. Meta-analysis of these SNPs resulted in odds
ratios ranging from 1.37 to 1.41 with a common 95% confidence interval of 1.26-1.50. Of
note, when combining data from all populations tested by meta-analysis, p-values for
rs11686474 (p=0.0006) and rs11680730 (p=0.002) are significant after a Bonferroni
correction (p<0.003).
In FSHR, 4 SNPs in high LD show evidence of association with PTB across the
populations studied. These SNPs lie within intron 2 of FSHR (Figure 4.5) and show little
LD with variants outside of this intron, based on available information from the
International HapMap Project database [151]. Variants in this intron may tag yet
uncharacterized variants in coding regions or nearby regulatory sequences. Alternatively,
an intronic variant in FSHR may affect risk directly by altering functional sequences
66
contained within the intron, such as microRNA binding sites, splice regulatory sites or
transcription regulation sites. For instance, a variant in a splice enhancer site may change
splicing patterns in favor of transcripts that promote PTB risk, as several alternatively
spliced FSHR isoforms have been observed with altered function [152]. Risk-promoting
variation in this gene likely contributes to birth timing, rather than size at birth, based on
additional tests examining gestational age or birth-weight Z-score as a quantitative trait,
rather than PTB affection status (Table 4.5). Hence, FSHR may represent a novel gene
involved in birth timing and PTB risk.
FSHR encodes the follicle-stimulating hormone (FSH) receptor. FSH is secreted
from the pituitary and, in females, acts primarily on receptors in the ovaries to stimulate
follicle development and synthesis of estrogens. Investigators also have observed FSHR
protein and mRNA expression in nongonadal tissues, including uterus and cervix [148-
150]. In these tissues, FSHR may mediate uterine relaxation, as suggested by FSH’s
ability to modify electrical signaling in the myometrium, independent of estrogen and
progesterone [148]. Padmanabhan and colleagues [153] noted a progressive rise in
bioactive serum FSH levels during pregnancy. Because high levels of FSH are known to
downregulate FSHR expression [154], increasing levels of FSH may lead to gradual
desensitization to the hormone and resultant increase in contractility as term approaches.
Additionally, evidence from the FSHR haploinsufficient mouse [155] suggests that FSHR
levels affect the relative abundance of progesterone receptor isoforms A (PR-A) and B
(PR-B). Increased PR-A: PR-B ratios, occurring in human pregnancy normally near term
and observed in FSHR haploinsufficient mice in non-pregnant states, are correlated with
67
increased myometrium contractility. Hence, dysregulation of FSHR may contribute to
early uterine contractility and promote PTB.
Aspects of our approach pose limitations on interpretation of this work. First, we
assigned conserved elements to the nearest RefSeq gene to calculate gene-wise p-values;
however, conserved elements may not be associated with the nearest gene per se,
potentially affecting the accuracy of the estimated gene-wise p-values. Additionally,
because we use adjacent genes to estimate expected synonymous and nonsynonymous
rates for a given locus, rapidly evolving genes that are located physically nearby other
genes undergoing rapid evolution, such as gene families with multiple members in the
same region, may miss detection. The variability in number of probes represented on the
Affymetrix Genome-Wide Human SNP Array 6.0 within the gene regions of the 150
rapidly evolving genes tested poses another limitation. Although the coverage is adequate
for most rapidly evolving genes, there are some genes with too few probes tested to
support or refute their potential association with PTB; as a result, this study may have
failed to detect association between PTB and rapidly evolving genes underrepresented on
this genotyping array. Lastly, while precedence exists for intronic variants affecting
protein structure and function [156; 157], additional study is needed to determine whether
any of the SNPs associated with PTB in this work has a functional effect.
Overall, FSHR represents a likely candidate for involvement in PTB. Even though
FSHR has a plausible role in parturition physiology, it has not been considered in
previous association studies or appeared on candidate gene lists like that in the Institute
of Medicine report on PTB [134]. Thus, by considering rapid evolution, we identified a
gene associated with PTB that otherwise would not have been revealed by current models
68
of parturition physiology. Moreover, our approach exploits an evolutionarily-motivated
filter to more efficiently utilize currently available datasets for PTB, which are probably
underpowered to detect variants of effect sizes reported in GWAS of other complex traits.
Our approach represents an alternative method for a priori gene discovery in which fewer
comparisons are made than in GWAS, thus potentially retaining more power to detect
effect sizes typical for common variants. We anticipate that other rapidly evolving genes
will similarly be associated with PTB risk and elucidate the essential pathways for human
parturition.
Materials and Methods
Allometric Analysis. Data acquired by Sacher and Staffeldt [133] was used to
examine the relationships among brain size, body size and gestation length among
mammalian species. Specifically, we compared logarithm-transformed values for these
traits between human, primate and non-primate mammals, using linear regression
implemented in R [158]. Additionally, we used allometric data from this paper and the
primate phylogeny delineated by Purvis [159] to trace the evolution of gestation-neonatal
body size ratio, and gestation-neonatal brain size ratio, using Mesquite [160]. Given a
phylogenic tree, the Mesquite method uses parsimony to reconstruct the ancestral states
by assuming a squared change for a continuous character from state x to state y is (x-y)2.
Coding sequence multiple sequence alignments. We obtained a set of 10,639
human gene predictions from the ENSEMBL database with one-to-one orthologs in the
chimpanzee, macaque, mouse, rat, dog, and cow genomes (Release 46) [161]. We limited
our analysis to only those proteins where the human, chimpanzee, macaque, and at least
75% of the mammalian genomes were present. To prevent spurious results arising from
69
comparing different isoforms from different species, we compared all of the human gene
models against all of the chimpanzee gene models by BLAST searches, keeping the pair
with the highest percent identity (and longest gene model in case of tie). We then
compared this human gene model against all of the models from the other species,
finding the best match among the gene models in the other species. We generated a
multiple sequence alignment using the MUSCLE algorithm [162] and reverse translated
these alignments to generate nucleotide alignments. We limited our analysis to only those
proteins where the human, chimpanzee, macaque, and at least 75% of the mammalian
genomes were present. Chi-squared analysis was used to determine the statistical
significance of observed and expected genes with p<0.05 in suggested PTB candidate and
overall human gene lists.
Noncoding sequence multiple sequence alignments. We obtained a set of
highly conserved elements from UCSC Genome Browser [163]. In total, 443,061
noncoding sequences with a conservation score >=400 were tested. Of these elements,
34% overlapped coding sequence by at least one nucleotide and were excluded from the
analysis. The remaining noncoding elements span 47 MB (approximately 1.5% of the
genome). Therefore, these sequences represent only the most highly conserved noncoding
sequences and not the entire 6% of the noncoding genome that is functionally constrained
[164]. The median total branch length for these elements was 0.235, which is 1/4 the
synonymous rate. Therefore, these are not perfectly conserved sequences, but they are
evolving substantially slower than the neutral expectation. From the 17-way MultiZ
alignments that are publicly available (downloaded March 2007) [165], we extracted the
human, chimpanzee, macaque, mouse, rat, dog and cow sequences. We filtered this
70
alignment set using two criteria. First, any alignment that contained 2 or more human
homoplasies (the human nucleotide was equal to a conserved nucleotide in the
mammalian outgroups, but different from the nucleotide shared between macaque and
chimpanzee) were removed. Second, if the human sequence had a paralog with a percent
difference less than twice the percent difference of the human-chimpanzee orthologs,
then that sequence was excluded (e.g. if the human-chimpanzee sequences were 98%
identical, the human paralog had to be less than 96% identical). This filter reduced the
chance that a rapidly evolving human sequence was actually a misaligned paralog.
Likelihood ratio tests. We used the phylogeny ( (Human, Chimpanzee),
Macaque), ( (Mouse, Rat), (Dog, Cow))). The evolutionary models were implemented in
the HYPHY package [166] and we used the Q-value software [139] to establish
statistical thresholds to achieve 5% false discovery rates (p-value distributions and pi_0
values in Figure 4.6). HYPHY creates a molecular evolution programming language,
enabling comparison of multiple evolutionary models and phylogenies. The source code
and documentation of the HYPHY tests is available from the Fay Laboratory.
For both tests, the alternative model has one additional degree of freedom and the
significance of the change in likelihood was determined using 2
statistics. Both models
use adjacent coding or conserved noncoding sequences to estimate the expectation for a
given sequence that accounts for variable mutation rates across the genome as well as
lineage-specific differences in effective population size by allowing for branch-specific
differences in selective constraint. For the coding sequence, we used 20 adjacent genes,
ten upstream and downstream when possible, to estimate the expected synonymous rate
and average constraints on each lineage. Twenty genes were used because the
71
synonymous rate does vary across the genome in windows of approximately 10 MB
[167]. For noncoding sequences, we concatenated blocks of 25 kb of conserved
noncoding sequence. These blocks typically spanned about 1 MB of the genome. Each
element in the middle 50% of the window was tested against the expectation for that
window to limit edge effect. The window was then advanced to the element at the 50%
percentile of the window.
Previous studies of both coding [9, 46] and noncoding [11, 21] sequences identify
regions evolving under positive selection by a rate of evolution faster than a neutral rate.
However, we felt that this criterion is too restrictive since some genes may have an
increased rate of evolution along the human lineage relative to other mammals, but not
increased above the neutral rate. To include genes with a significantly increased rate in
humans compared to other mammals for testing in a population association study, we
identify genes as rapidly evolving by testing whether omega along the human (or
human+human-chimpanzee ancestor) lineage is significantly higher than omega along the
non-human lineages (or non-human+non-human-chimpanzee ancestor). Here, omega is
dN/dS-adj or dNC/dNC-adj, where dNC is the noncoding rate and dS-adj and dNC-adj
are the adjacent synonymous rates from the 10 upstream and 10 downstream genes and
the adjacent noncoding rates from 25 kb of conserved noncoding sequences, respectively.
Thus, we test whether the data is more likely under a model with 1 omega value or 2
omega values (Figure 4.3). The coding sequence model used the MG94xHKY85 [168]
model of codon evolution. The noncoding sequences model used an HKY85 model. We
calculated gene-wise p-values for each gene locus by assigning each conserved element
to its nearest RefSeq gene [141] and a Fisher’s combined p-value across the locus. Chi-
72
squared analysis was used to determine the statistical significance of observed and
expected genes with p<0.05 in suggested PTB candidate and overall human gene lists.
Comparisons with published studies of rapid evolution. The following data
was extracted from published studies for comparison with results from our coding
analysis: genes with p<0.01 for test of dN/dS>1 from Nielson et al. [46]; genes with
p<0.01 for test of dN>dS on human lineage Clark et al. [9]; genes with adjusted p<0.05
for test of 1 omega versus 2 omegas (i.e. 1 on human lineage, 1 for other species) Arbiza
et al [48]. For comparison with results from our noncoding analysis, we compared closest
genes to human accelerated regions listed in Table S7 of Pollard et al. [11] and closest
genes to regions in listed in Table S1 of Prabhakar et al [21]. Ensembl gene identification
numbers and/or HUGO Gene Nomenclature Committee (HGNC) gene symbols, as
available, were compared among studies to determine the degree of overlap. The Venny
[169] online tool was used to visually represent the degree of overlap among studies as
Venn diagrams (Figures 4.7 and 4.8).
Our list of rapidly evolving coding region gene list showed low overlap with
previous studies that required for dN/dS > 1 in their analyses (6% with Clark et al. [130],
0% Nielson et al. [170]) and more overlap with Arbiza et al. [171] (26%), which
considered rate acceleration on the human lineage by methods more similar to ours than
those used by [130; 170] (Figure 4.7). For rapidly evolving conserved noncoding
elements in humans, 22% of the elements we identified were in common with Prabhakar
et al. [140]. Considering unique genes associated with rapidly evolving conserved
noncoding elements in humans, 11% of our genes also were identified by Prabhakar et al.
73
[140], and 4% identified by Pollard et al. [132]. Similar to our study, 4% of unique genes
in the Prabhakar study overlapped with those identified by Pollard et al. (Figure 4.8).
Candidate rapidly evolving gene list. To minimize the number of tests we
would perform and thereby retain more power to detect small effects, we selected a
subset of genes likely to be involved in parturition, based on expression and functional
information, to use as candidate genes. A candidate gene list was developed using genes
identified as rapidly evolving from following categories: 10% FDR human lineage from
coding screen, 10% FDR human lineage from noncoding screen and 5% FDR human-
chimpanzee lineage from coding screen. A total of 742 genes are included in this
comprehensive list of rapidly evolving genes. To minimize the number of tests we would
perform and thereby retain more power to detect small effects, we selected a subset of
genes likely to be involved in parturition, based on expression and functional
information, to use as candidate genes. Genes were included as candidates if at least 2 of
3 conditions met: had a GO term suggesting possible biological role in parturition (e.g.
extracellular matrix, calcium ion, DNA-binding/transcription, intracellular signaling, cell
fate/apoptosis, cell growth); were previously identified as candidate gene; had expression
included relevant tissues (e.g. uterus, placenta, brain) documented in Unigene [172].
Duplicated genes from a list developed by Bailey and colleagues [173] that were
identified as pregnancy, fetal, placental or hormone-related genes were also included as
candidates. A total of 150 of genes were used as candidate genes in subsequent analysis
(Table 4.2).
Human Subjects. Mothers of preterm or term infants were enrolled for genetic
analysis by methods approved by Institutional Review Boards/Ethics Committees at each
74
participating institution. Informed consent was obtained for all participants. Mothers with
PTB were included if the birth was spontaneous (non-iatrogenic), singleton, had no
obvious precipitating stimulus (trauma, infection, drug use), and was less the 37 weeks
(Yale University; New York University) or 36 weeks (University of Helsinki; University
of Oulu; Centennial Hospital, Nashville, TN) of completed gestation. DNA from blood or
saliva was prepared by standard methods. Race/ethnicity was assigned by self-report. For
the US Black cohort, no differences in were found in the distribution of 24 ancestry
informative markers selected across the genome comparing cases and controls (data not
shown). All specimens were linked with demographic and medical data abstracted from
maternal/neonatal records.
Genotyping. Initial genotyping of the Finnish cohort was performed using the
Affymetrix® Genome-Wide Human SNP Array 6.0. Genotypes were called from cell
intensity data by the birdseed v2 algorithm, implemented in Affymetrix® Genotyping
Console 3.0. Of 428 SNP 6.0 arrays available for analysis, only 392 samples had their
raw intensity data converted to genotype calls using the birdseed v2 algorithm in
Affymetrix Genotype Console 3.0, after poor quality chips (i.e. “out of bounds”
designation or XY gender call by Genotyping Console) were excluded. We selected
SNPs within the gene regions, defined as 5 kilobases (kb) upstream to 5 kb downstream
of the most inclusive gene boundaries between those listed for the longest transcript
documented in the Ensembl database and those defined in our comparative genomic
analysis, of our 171 rapidly evolving candidate genes for analysis. A total of 12,444
SNPs were located within our rapidly evolving genes. The gene coverage ranged from 0-
900 SNPs/gene region, with a median of 13 SNPs/gene region. 11 genes had no SNPs in
75
the gene region represented on the SNP 6.0 array. Genotyping for additional analysis of
the Finnish cohort and replication analysis was performed using the Sequenom iPLEX
massARRAY technology (Sequenom, San Diego, CA).
Finnish cohort analysis. Data cleaning was performed with the Whole-genome
Association Study Pipeline (WASP) software package [174] and PLINK [175]. An
additional 6 individuals were excluded because of possible cryptic relatedness, as
suggested by their presence in IBS distance-defined clusters far from the rest of the
genotyped subjects. 58 individuals were removed due to a high genotype missing rate for
the SNPs of interest (i.e. <95% call rate), leaving a total of 165 preterm and 163 control
mothers in the final analysis. Of 12,444 SNPs selected, 9,610 SNPs were used in the final
analysis after removing SNPs not in Hardy-Weinberg Equilibrium in controls (p<0.001),
<95% genotype call rate, with minor allele frequency<0.05 or were duplicate probes.
Allelic (2, df 1) and genotypic (
2, df 2) tests for association, LD measures and odds
ratios were estimated for each cohort using WASP and/or PLINK. Our primary analysis
considered PTB affection status (i.e. delivery <36 weeks) as a binary trait, comparing
allele and genotype frequencies between case and control groups by 2
test. We also
examined gestational age and birth-weight Z-score as quantitative traits, standardized to
normal distributions ( =0, =1) using a Wald test to compare the mean phenotype
between different allele or genotype classes.
A variety of measures were taken to ensure that results from these test were
explained by true associations. First, genomic control measures of population
substructure ( =1.07) indicated little inflation of statistics due to substructure. Correction
for IBS clustering to bring to 1 resulted in the same SNPs being found as most
76
significantly associated, suggesting that whatever minor population substructure may
exist does not explain the association findings. Confounding of the results due to
genotyping batch or location effects was not observed. Furthermore, minor allele
frequencies observed in controls were generally consistent with HapMap estimates for
Caucasians. As some SNPs are expected to show significant association with PTB by
chance due to the large number of tests we are performing, we corrected for multiple
testing using the simpleM method [176], which estimates the number of independent
tests, given the LD relationships among SNPs, used to adjust the significance level.
Extension of genotyping in Finnish cohort. Because FSHR showed evidence of
enrichment of significant p-values as well as representing a plausible agent in parturition,
we chose to examine the genes in greater depth. Of the 149 SNPs tested in FSHR in the
Affymetrix analysis, 22 showed evidence of association (p<0.01) in the SNP 6.0 analysis
and 9 were genotyped with the Sequenom technology for cross-platform validation. SNP
genotypes showed high degree of concordance across platforms (~98%) and association
results were consistent.
To increase coverage, we genotyped an additional 42 SNPs spanning the FSHR
gene region in a subset of the Finnish cohort (n= 105 preterm, 95 control mothers) based
on DNA availability and quality. For SNP selection, data from the HapMap CEU
population was examined in the Haploview program [177], using tagger and haplotype
block functions, to identify regions of high LD. We selected 1 SNP per haplotype block,
defined using the D’ confidence interval method [178], having the highest minor allele
frequency (MAF) in the CEU population for genotyping. We also included coding SNPs
and SNPs to improve coverage of conserved elements contributing to the gene’s
77
designation as “rapidly evolving.” This selection scheme resulted in approximately 20-
30% coverage of the gene region at r2≥0.8. Data cleaning and analysis was conducted as
described above. In total, 40 SNPs met quality control standards (Hardy-Weinberg
Equilibrium in controls p>0.001, >95% call rate, MAF>0.01) and were analyzed. Of the
SNPs genotyped to increase coverage, those that showed suggestive association (p<0.1;
n=16) were examined further.
Replication Analysis. 16 SNPs in FSHR showing potential association in the
screening analysis (p<0.1) were genotyped in US White (147 preterm, 157 control), US
Black (79 preterm, 164 controls) and US Hispanic (73 preterm, 292 control) mothers
(Figure 4.4; Table 4.4). Data cleaning and analysis was performed as described above.
Meta-analysis of data for significant SNPs was done using the Mantel-Haenszel method,
after successfully passing the test of homogeneity.
78
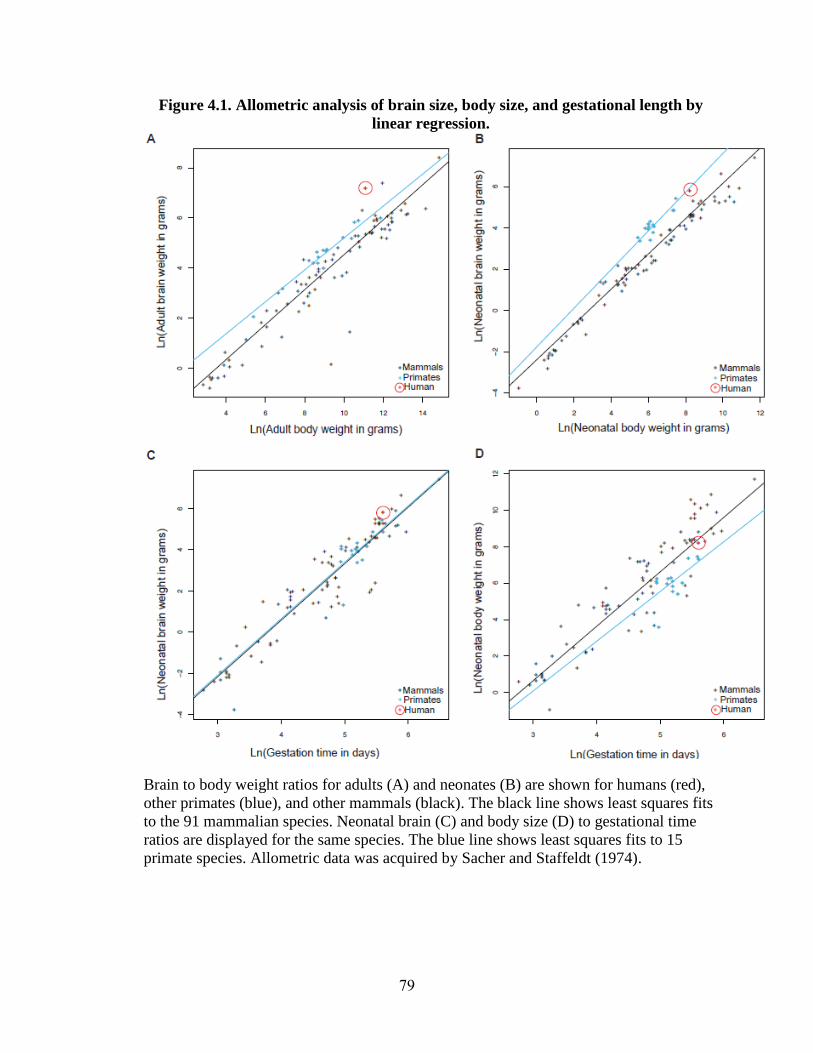
Figure 4.1. Allometric analysis of brain size, body size, and gestational length by
linear regression.
Brain to body weight ratios for adults (A) and neonates (B) are shown for humans (red),
other primates (blue), and other mammals (black). The black line shows least squares fits
to the 91 mammalian species. Neonatal brain (C) and body size (D) to gestational time
ratios are displayed for the same species. The blue line shows least squares fits to 15
primate species. Allometric data was acquired by Sacher and Staffeldt (1974).
79
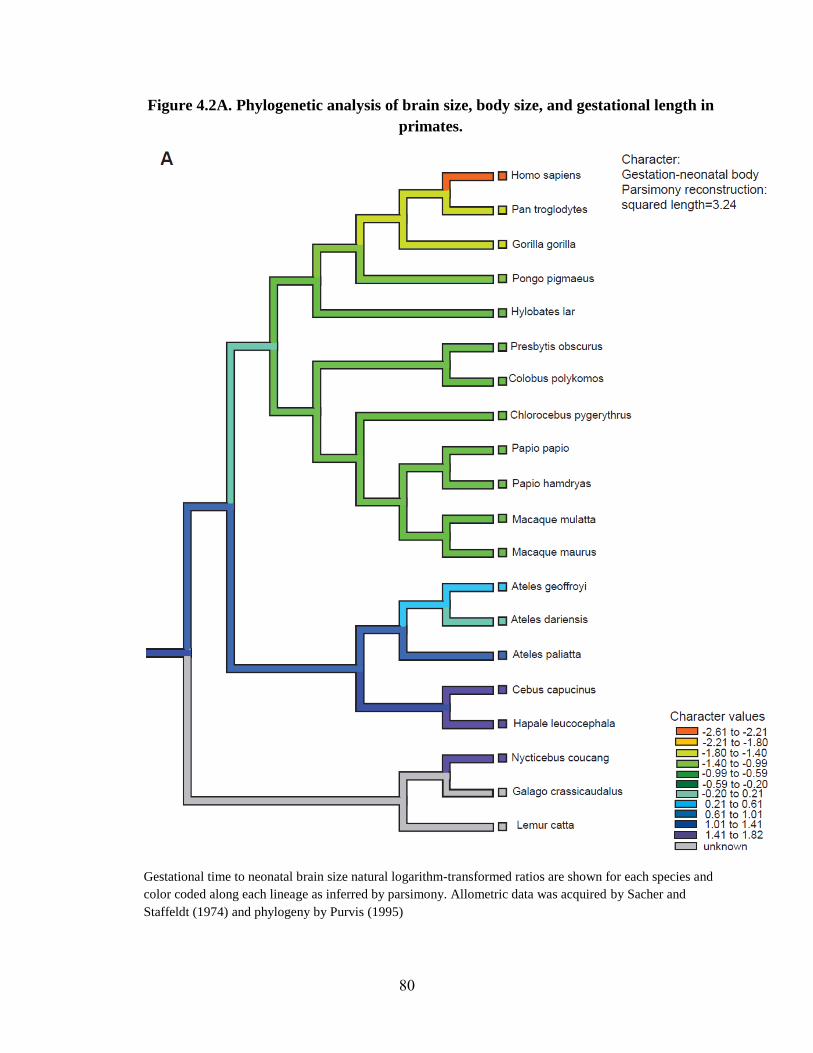
Figure 4.2A. Phylogenetic analysis of brain size, body size, and gestational length in
primates.
Gestational time to neonatal brain size natural logarithm-transformed ratios are shown for each species and
color coded along each lineage as inferred by parsimony. Allometric data was acquired by Sacher and
Staffeldt (1974) and phylogeny by Purvis (1995)
80
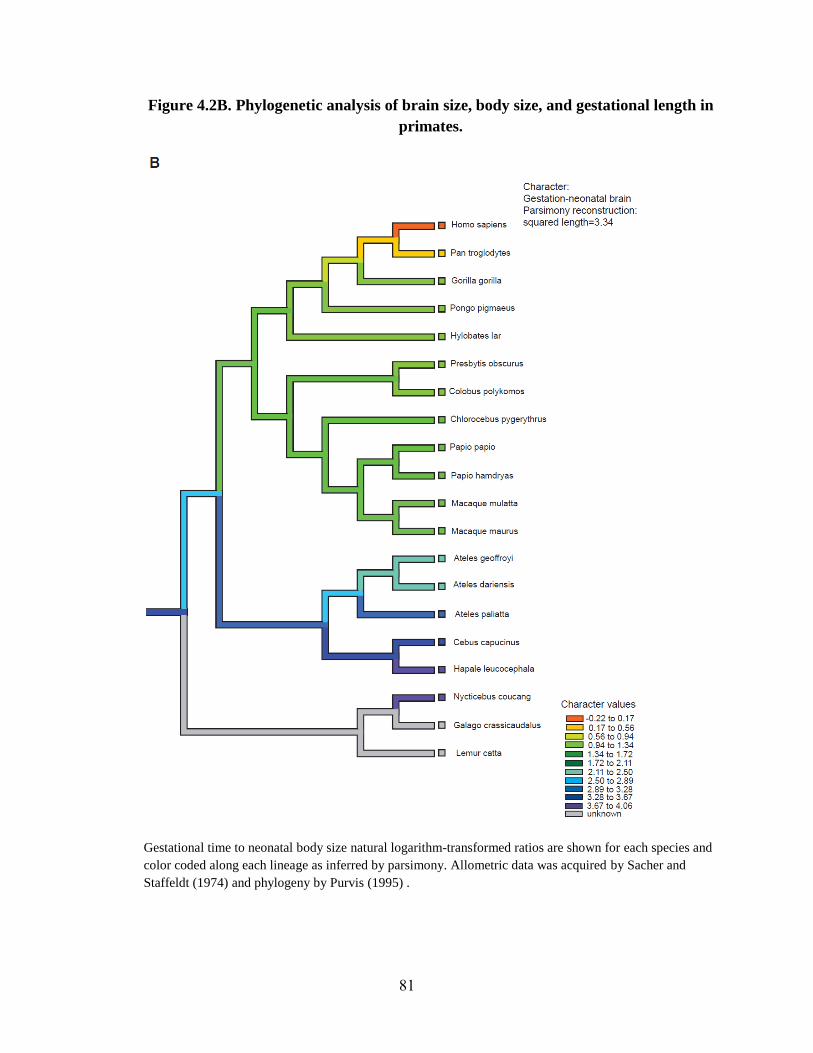
Figure 4.2B. Phylogenetic analysis of brain size, body size, and gestational length in
primates.
Gestational time to neonatal body size natural logarithm-transformed ratios are shown for each species and
color coded along each lineage as inferred by parsimony. Allometric data was acquired by Sacher and
Staffeldt (1974) and phylogeny by Purvis (1995) .
81
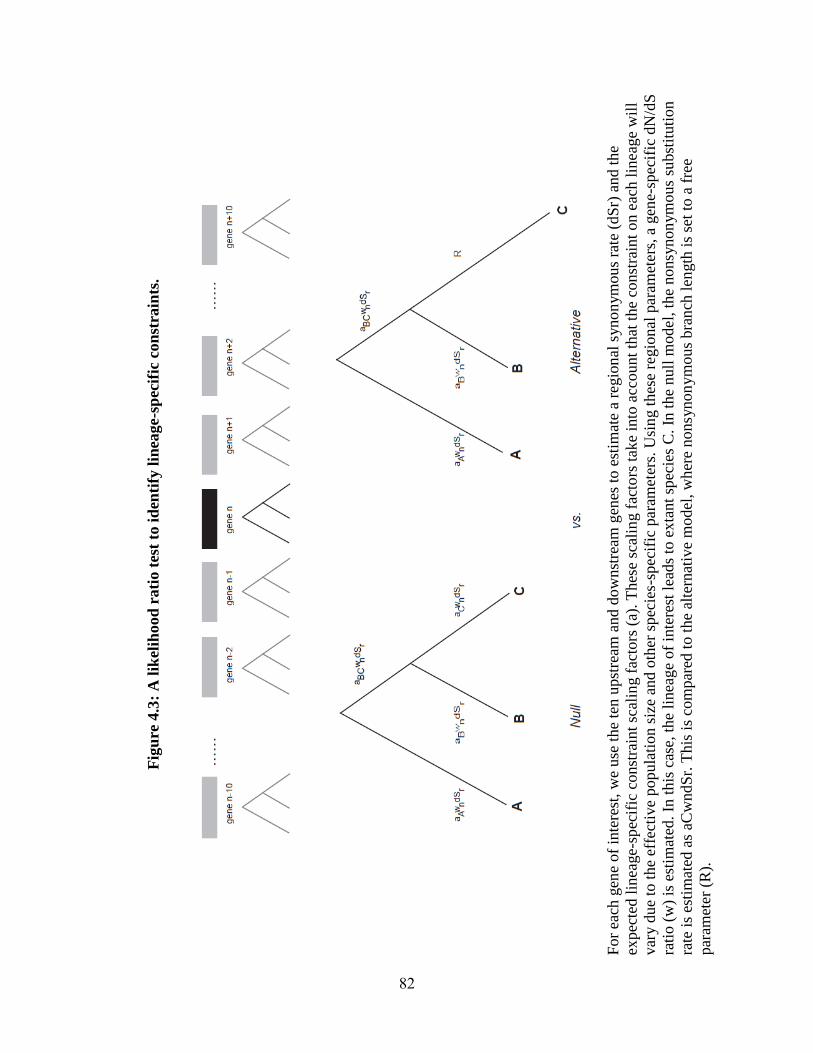
Fig
ure
4.3
: A
lik
elih
ood
rati
o t
est
to i
den
tify
lin
eage-s
pec
ific
con
stra
ints
.
For
each
gen
e of
inte
rest
, w
e use
the
ten u
pst
ream
and d
ow
nst
ream
gen
es t
o e
stim
ate
a re
gio
nal
syno
nym
ous
rate
(dS
r) a
nd t
he
expec
ted l
inea
ge-
spec
ific
const
rain
t sc
alin
g f
acto
rs (
a). T
hes
e sc
alin
g f
acto
rs t
ake
into
acc
ou
nt
that
the
const
rain
t on e
ach l
inea
ge
wil
l
var
y d
ue
to t
he
effe
ctiv
e popula
tion s
ize
and o
ther
spec
ies-
spec
ific
par
amet
ers.
Usi
ng t
hes
e re
gio
nal
par
amet
ers,
a g
ene-
spec
ific
dN
/dS
rati
o (
w)
is e
stim
ated
. In
this
cas
e, t
he
linea
ge
of
inte
rest
lea
ds
to e
xta
nt
spec
ies
C.
In t
he
nu
ll m
odel
, th
e nonsy
non
ym
ous
subst
ituti
on
rate
is
esti
mat
ed a
s aC
wndS
r. T
his
is
com
par
ed t
o t
he
alte
rnat
ive
model
, w
her
e nonsy
non
ym
ous
bra
nch
len
gth
is
set
to a
fre
e
par
amet
er (
R).
82
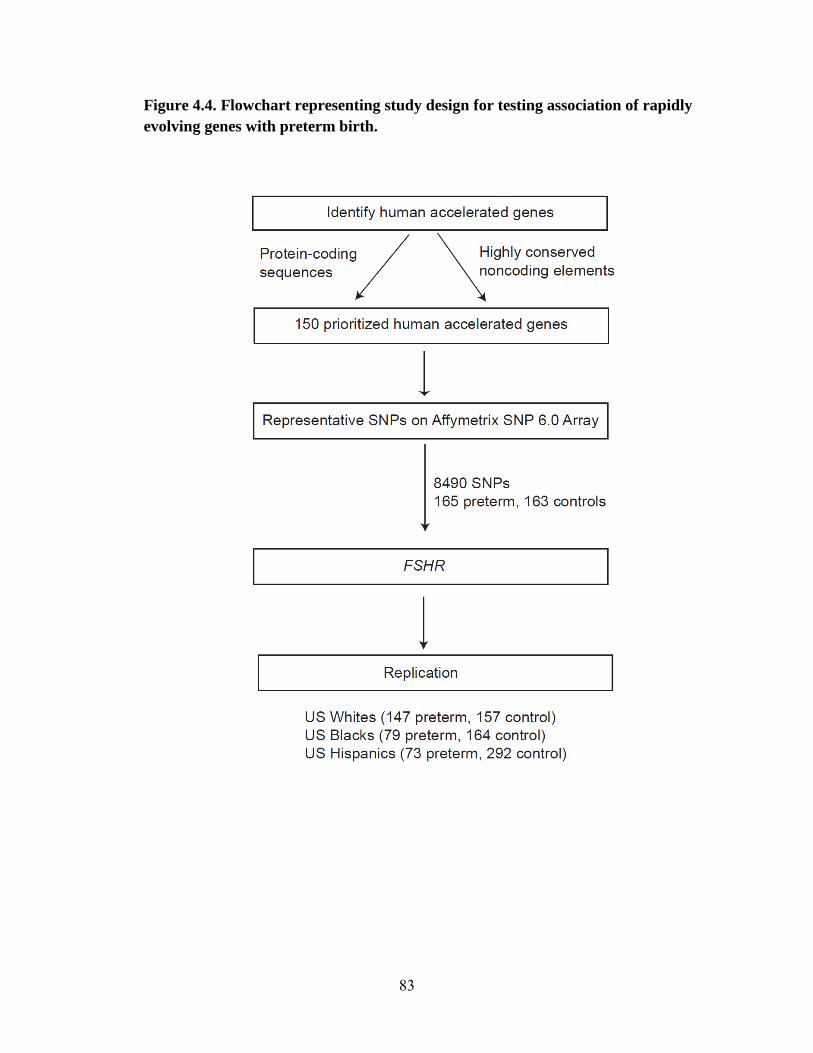
Figure 4.4. Flowchart representing study design for testing association of rapidly
evolving genes with preterm birth.
83
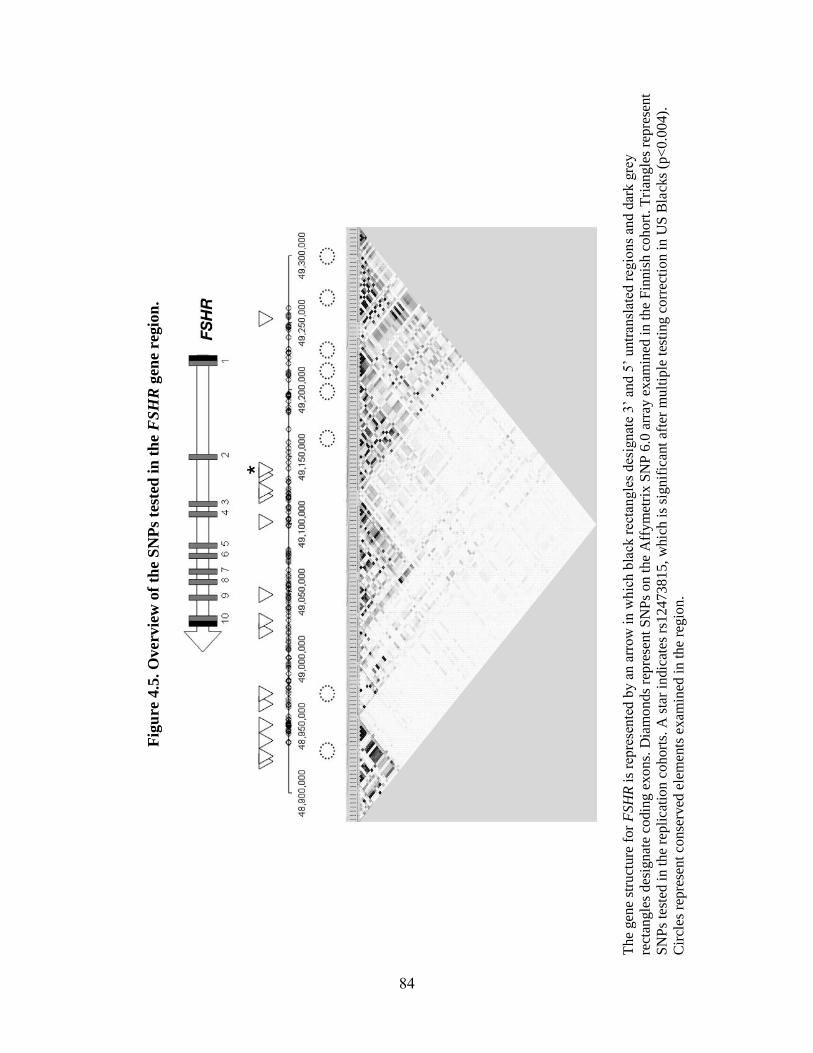
Fig
ure
4.5
. O
verv
iew
of
the
SN
Ps
test
ed i
n t
he
FS
HR
gen
e re
gio
n.
The
gen
e st
ruct
ure
fo
r F
SH
R i
s re
pre
sen
ted b
y a
n a
rrow
in w
hic
h b
lack
rec
tangle
s des
ignat
e 3’
and 5
’ u
ntr
ansl
ated
reg
ion
s an
d d
ark g
rey
rect
angle
s des
ign
ate
codin
g e
xo
ns.
Dia
mo
nds
repre
sent
SN
Ps
on t
he
Aff
ym
etri
x S
NP
6.0
arr
ay e
xam
ined
in
th
e F
innis
h c
oh
ort
. T
rian
gle
s re
pre
sen
t
SN
Ps
test
ed i
n t
he
repli
cati
on
co
hort
s. A
sta
r in
dic
ates
rs1
2473815,
whic
h i
s si
gnif
ican
t af
ter
mult
iple
tes
tin
g c
orr
ecti
on i
n U
S B
lack
s (p
<0
.00
4).
Cir
cles
rep
rese
nt
conse
rved
ele
men
ts e
xam
ined
in t
he
regio
n.
84
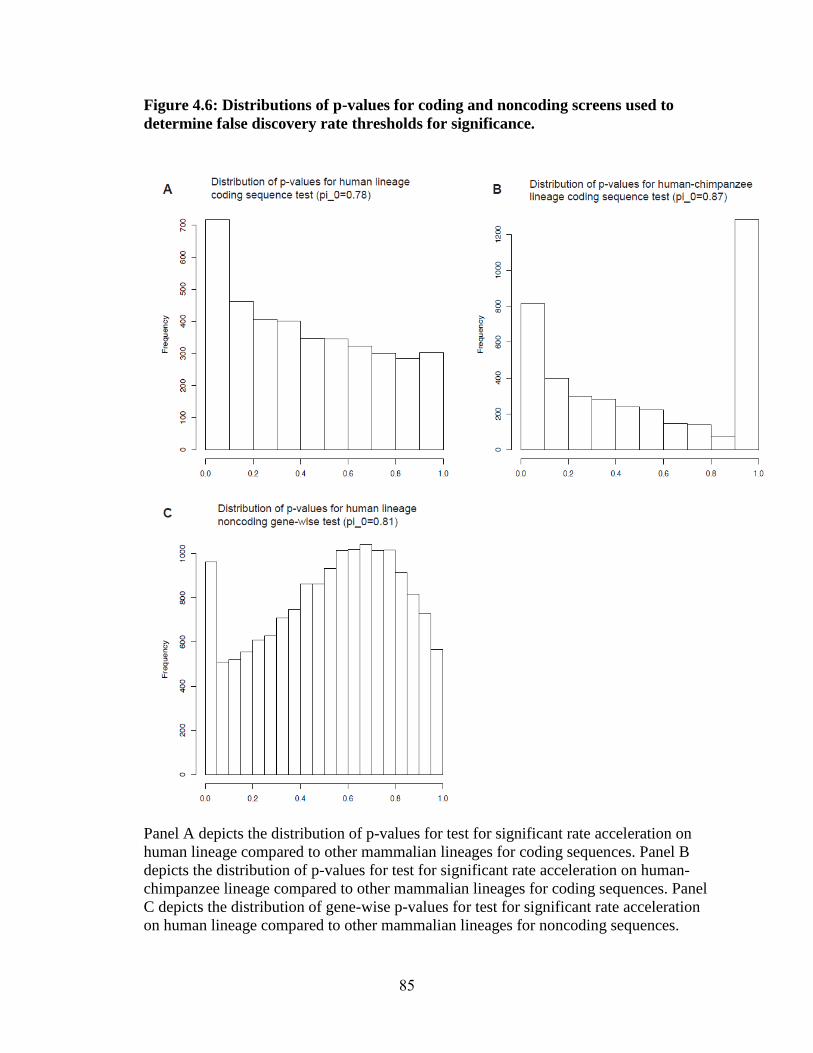
Figure 4.6: Distributions of p-values for coding and noncoding screens used to
determine false discovery rate thresholds for significance.
Panel A depicts the distribution of p-values for test for significant rate acceleration on
human lineage compared to other mammalian lineages for coding sequences. Panel B
depicts the distribution of p-values for test for significant rate acceleration on human-
chimpanzee lineage compared to other mammalian lineages for coding sequences. Panel
C depicts the distribution of gene-wise p-values for test for significant rate acceleration
on human lineage compared to other mammalian lineages for noncoding sequences.
85
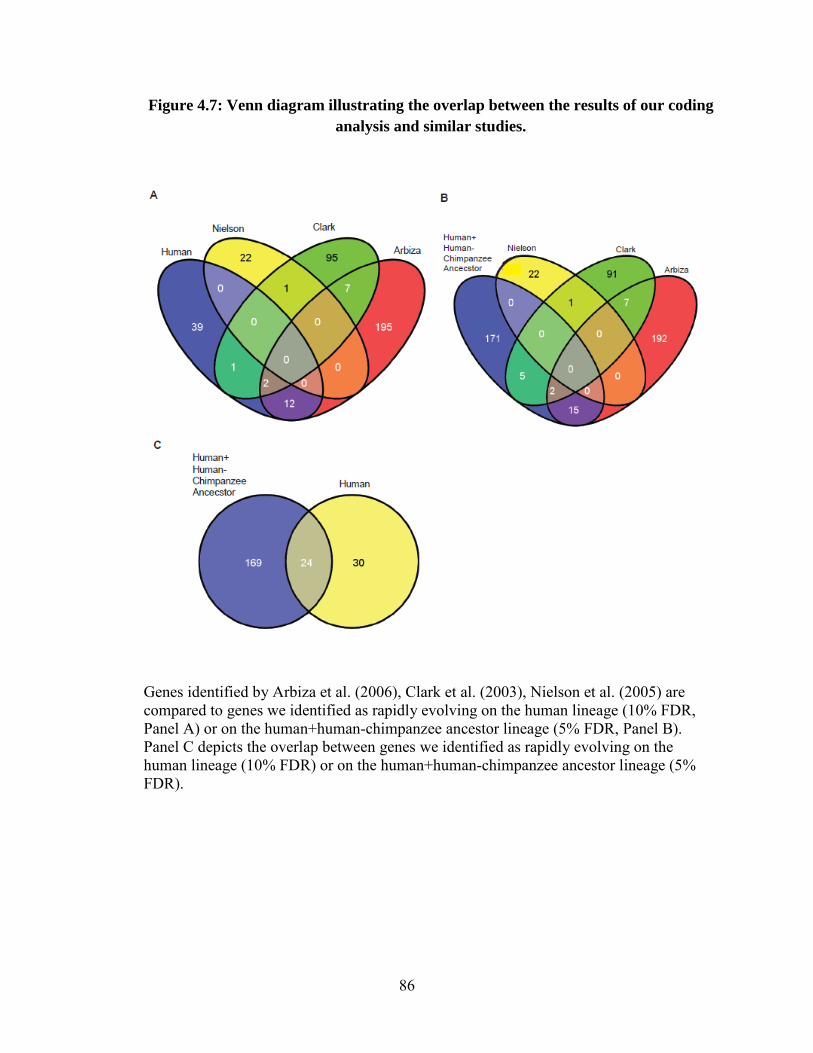
Figure 4.7: Venn diagram illustrating the overlap between the results of our coding analysis and similar studies.
Genes identified by Arbiza et al. (2006), Clark et al. (2003), Nielson et al. (2005) are compared to genes we identified as rapidly evolving on the human lineage (10% FDR, Panel A) or on the human+human-chimpanzee ancestor lineage (5% FDR, Panel B). Panel C depicts the overlap between genes we identified as rapidly evolving on the human lineage (10% FDR) or on the human+human-chimpanzee ancestor lineage (5% FDR).
86
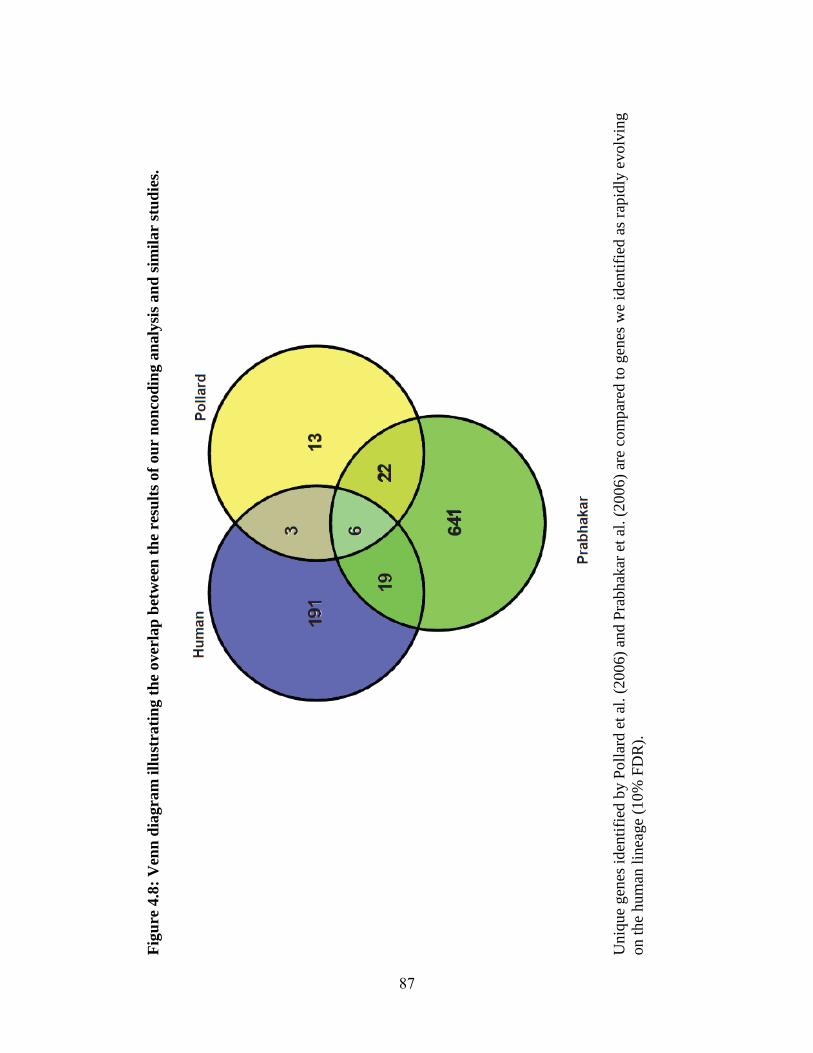
Fig
ure
4.8
: V
enn
dia
gra
m i
llu
stra
tin
g t
he
overl
ap
bet
wee
n t
he
resu
lts
of
ou
r n
on
cod
ing a
naly
sis
an
d s
imil
ar
stu
die
s.
U
niq
ue
gen
es i
den
tifi
ed b
y P
oll
ard e
t al
. (2
006)
and P
rabhak
ar e
t al
. (2
006
) ar
e co
mpar
ed t
o g
enes
we
iden
tifi
ed a
s ra
pid
ly e
volv
ing
on t
he
hum
an l
i nea
ge
(10
% F
DR
).
87
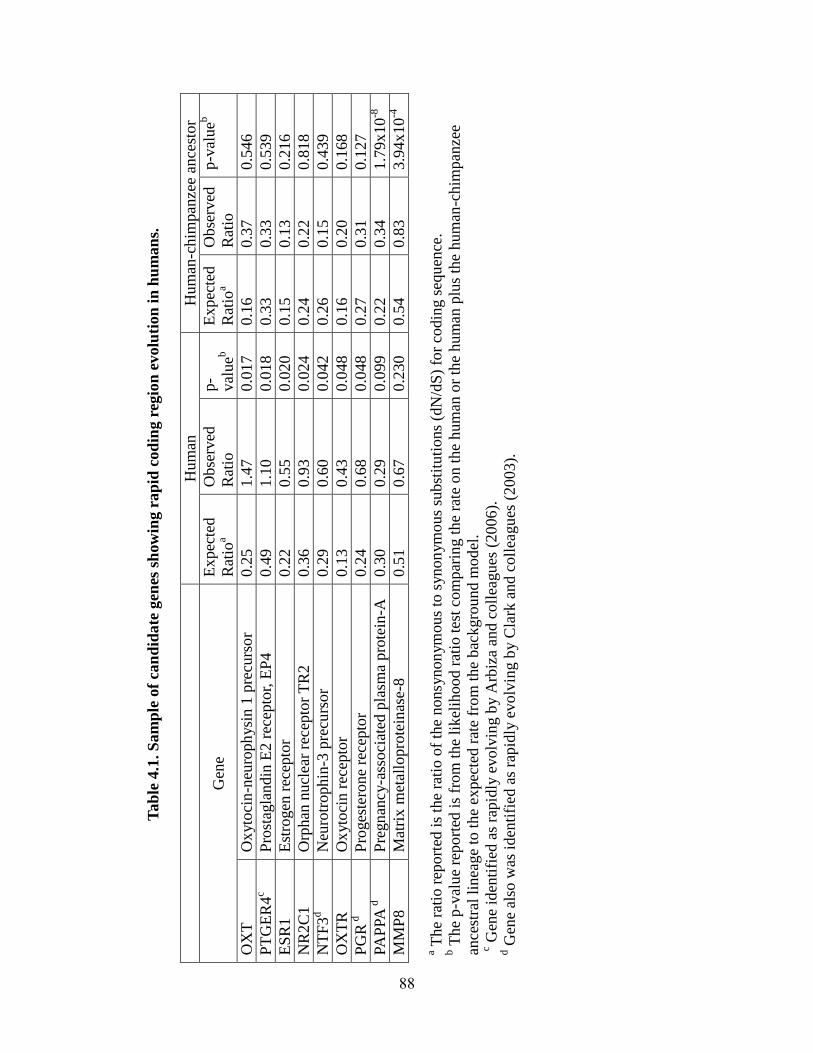
Tab
le 4
.1. S
am
ple
of
can
did
ate
gen
es s
how
ing r
ap
id c
od
ing r
egio
n e
volu
tion
in
hu
man
s.
H
um
an
Hum
an-c
him
pan
zee
ance
stor
Gen
e E
xpec
ted
Rat
ioa
Obse
rved
Rat
io
p-
val
ueb
Ex
pec
ted
Rat
ioa
Obse
rved
Rat
io
p-v
alueb
OX
T
Ox
yto
cin
-neu
roph
ysi
n 1
pre
curs
or
0.2
5
1.4
7
0.0
17
0.1
6
0.3
7
0.5
46
PT
GE
R4
c P
rost
agla
ndin
E2 r
ecep
tor,
EP
4
0.4
9
1.1
0
0.0
18
0.3
3
0.3
3
0.5
39
ES
R1
Est
rogen
rec
epto
r 0.2
2
0.5
5
0.0
20
0.1
5
0.1
3
0.2
16
NR
2C
1
Orp
han
nucl
ear
rece
pto
r T
R2
0.3
6
0.9
3
0.0
24
0.2
4
0.2
2
0.8
18
NT
F3
d
Neu
rotr
ophin
-3 p
recu
rsor
0.2
9
0.6
0
0.0
42
0.2
6
0.1
5
0.4
39
OX
TR
O
xyto
cin r
ecep
tor
0.1
3
0.4
3
0.0
48
0.1
6
0.2
0
0.1
68
PG
R d
Pro
ges
tero
ne
rece
pto
r 0.2
4
0.6
8
0.0
48
0.2
7
0.3
1
0.1
27
PA
PPA
d
Pre
gn
ancy-a
ssoci
ated
pla
sma
pro
tein
-A
0.3
0
0.2
9
0.0
99
0.2
2
0.3
4
1.7
9x
10
-8
MM
P8
Mat
rix
met
allo
pro
tein
ase-
8
0.5
1
0.6
7
0.2
30
0.5
4
0.8
3
3.9
4x
10
-4
a The
rati
o r
eport
ed i
s th
e ra
tio o
f th
e nonsy
non
ym
ous
to s
ynon
ym
ous
subst
ituti
ons
(dN
/dS
) fo
r co
din
g s
equ
ence
. b T
he
p-v
alue
repo
rted
is
from
the
likel
ihood r
atio
tes
t co
mpar
ing t
he
rate
on t
he
hum
an o
r th
e hum
an p
lus
the
hum
an-c
him
pan
zee
ance
stra
l li
nea
ge
to t
he
expec
ted r
ate
from
the
bac
kgro
und m
od
el.
c Gen
e id
enti
fied
as
rapid
ly e
volv
ing b
y A
rbiz
a an
d c
oll
eagues
(2006
).
d G
ene
also
was
iden
tifi
ed a
s ra
pid
ly e
volv
ing b
y C
lark
and c
oll
eagu
es (
20
03).
88
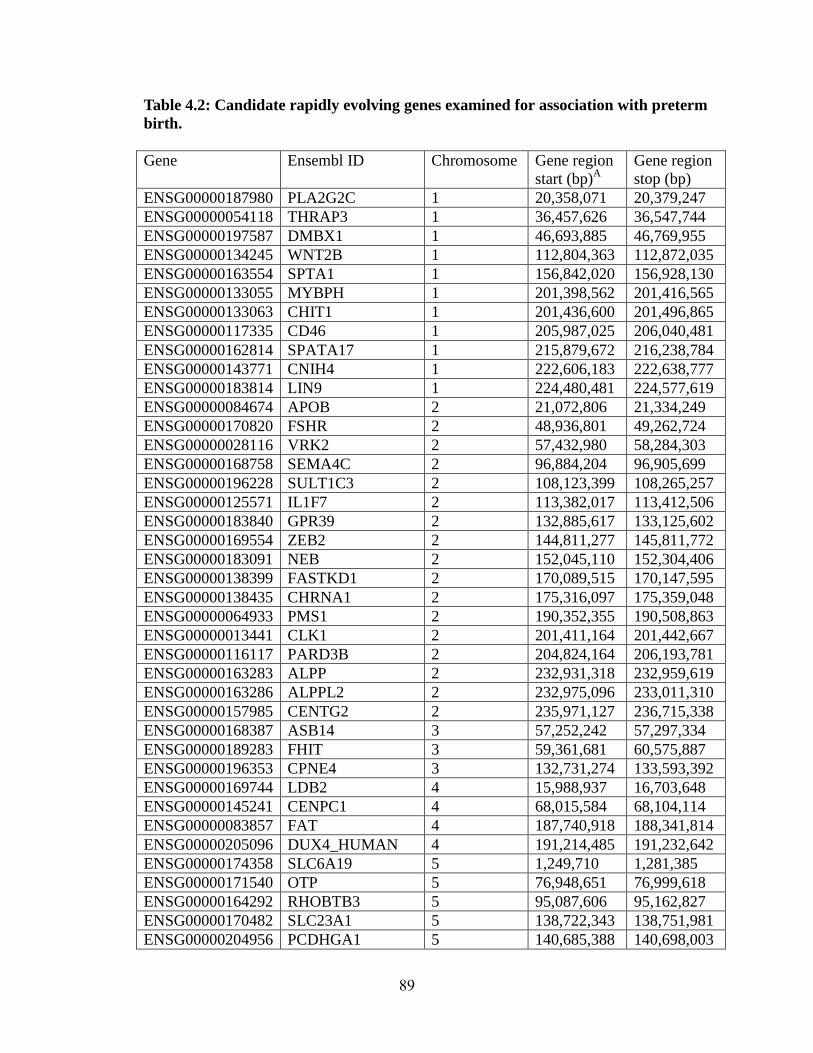
Table 4.2: Candidate rapidly evolving genes examined for association with preterm
birth.
Gene Ensembl ID Chromosome Gene region
start (bp)A
Gene region
stop (bp)
ENSG00000187980 PLA2G2C 1 20,358,071 20,379,247
ENSG00000054118 THRAP3 1 36,457,626 36,547,744
ENSG00000197587 DMBX1 1 46,693,885 46,769,955
ENSG00000134245 WNT2B 1 112,804,363 112,872,035
ENSG00000163554 SPTA1 1 156,842,020 156,928,130
ENSG00000133055 MYBPH 1 201,398,562 201,416,565
ENSG00000133063 CHIT1 1 201,436,600 201,496,865
ENSG00000117335 CD46 1 205,987,025 206,040,481
ENSG00000162814 SPATA17 1 215,879,672 216,238,784
ENSG00000143771 CNIH4 1 222,606,183 222,638,777
ENSG00000183814 LIN9 1 224,480,481 224,577,619
ENSG00000084674 APOB 2 21,072,806 21,334,249
ENSG00000170820 FSHR 2 48,936,801 49,262,724
ENSG00000028116 VRK2 2 57,432,980 58,284,303
ENSG00000168758 SEMA4C 2 96,884,204 96,905,699
ENSG00000196228 SULT1C3 2 108,123,399 108,265,257
ENSG00000125571 IL1F7 2 113,382,017 113,412,506
ENSG00000183840 GPR39 2 132,885,617 133,125,602
ENSG00000169554 ZEB2 2 144,811,277 145,811,772
ENSG00000183091 NEB 2 152,045,110 152,304,406
ENSG00000138399 FASTKD1 2 170,089,515 170,147,595
ENSG00000138435 CHRNA1 2 175,316,097 175,359,048
ENSG00000064933 PMS1 2 190,352,355 190,508,863
ENSG00000013441 CLK1 2 201,411,164 201,442,667
ENSG00000116117 PARD3B 2 204,824,164 206,193,781
ENSG00000163283 ALPP 2 232,931,318 232,959,619
ENSG00000163286 ALPPL2 2 232,975,096 233,011,310
ENSG00000157985 CENTG2 2 235,971,127 236,715,338
ENSG00000168387 ASB14 3 57,252,242 57,297,334
ENSG00000189283 FHIT 3 59,361,681 60,575,887
ENSG00000196353 CPNE4 3 132,731,274 133,593,392
ENSG00000169744 LDB2 4 15,988,937 16,703,648
ENSG00000145241 CENPC1 4 68,015,584 68,104,114
ENSG00000083857 FAT 4 187,740,918 188,341,814
ENSG00000205096 DUX4_HUMAN 4 191,214,485 191,232,642
ENSG00000174358 SLC6A19 5 1,249,710 1,281,385
ENSG00000171540 OTP 5 76,948,651 76,999,618
ENSG00000164292 RHOBTB3 5 95,087,606 95,162,827
ENSG00000170482 SLC23A1 5 138,722,343 138,751,981
ENSG00000204956 PCDHGA1 5 140,685,388 140,698,003
89
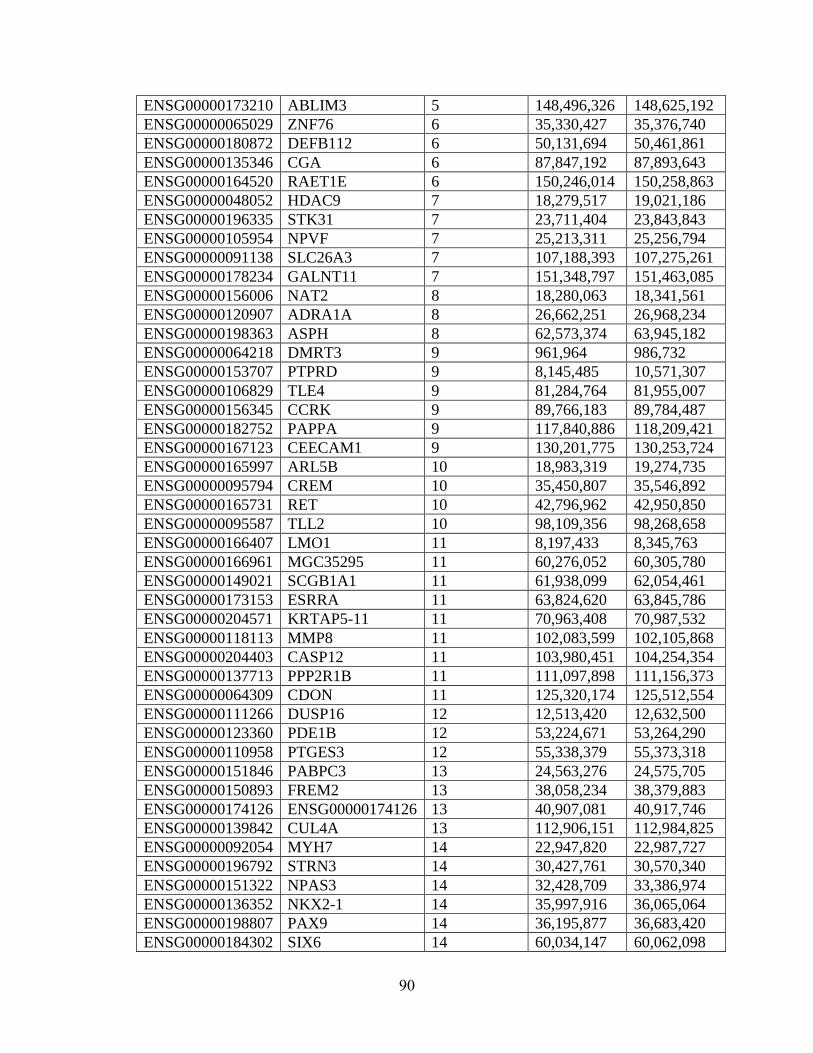
ENSG00000173210 ABLIM3 5 148,496,326 148,625,192
ENSG00000065029 ZNF76 6 35,330,427 35,376,740
ENSG00000180872 DEFB112 6 50,131,694 50,461,861
ENSG00000135346 CGA 6 87,847,192 87,893,643
ENSG00000164520 RAET1E 6 150,246,014 150,258,863
ENSG00000048052 HDAC9 7 18,279,517 19,021,186
ENSG00000196335 STK31 7 23,711,404 23,843,843
ENSG00000105954 NPVF 7 25,213,311 25,256,794
ENSG00000091138 SLC26A3 7 107,188,393 107,275,261
ENSG00000178234 GALNT11 7 151,348,797 151,463,085
ENSG00000156006 NAT2 8 18,280,063 18,341,561
ENSG00000120907 ADRA1A 8 26,662,251 26,968,234
ENSG00000198363 ASPH 8 62,573,374 63,945,182
ENSG00000064218 DMRT3 9 961,964 986,732
ENSG00000153707 PTPRD 9 8,145,485 10,571,307
ENSG00000106829 TLE4 9 81,284,764 81,955,007
ENSG00000156345 CCRK 9 89,766,183 89,784,487
ENSG00000182752 PAPPA 9 117,840,886 118,209,421
ENSG00000167123 CEECAM1 9 130,201,775 130,253,724
ENSG00000165997 ARL5B 10 18,983,319 19,274,735
ENSG00000095794 CREM 10 35,450,807 35,546,892
ENSG00000165731 RET 10 42,796,962 42,950,850
ENSG00000095587 TLL2 10 98,109,356 98,268,658
ENSG00000166407 LMO1 11 8,197,433 8,345,763
ENSG00000166961 MGC35295 11 60,276,052 60,305,780
ENSG00000149021 SCGB1A1 11 61,938,099 62,054,461
ENSG00000173153 ESRRA 11 63,824,620 63,845,786
ENSG00000204571 KRTAP5-11 11 70,963,408 70,987,532
ENSG00000118113 MMP8 11 102,083,599 102,105,868
ENSG00000204403 CASP12 11 103,980,451 104,254,354
ENSG00000137713 PPP2R1B 11 111,097,898 111,156,373
ENSG00000064309 CDON 11 125,320,174 125,512,554
ENSG00000111266 DUSP16 12 12,513,420 12,632,500
ENSG00000123360 PDE1B 12 53,224,671 53,264,290
ENSG00000110958 PTGES3 12 55,338,379 55,373,318
ENSG00000151846 PABPC3 13 24,563,276 24,575,705
ENSG00000150893 FREM2 13 38,058,234 38,379,883
ENSG00000174126 ENSG00000174126 13 40,907,081 40,917,746
ENSG00000139842 CUL4A 13 112,906,151 112,984,825
ENSG00000092054 MYH7 14 22,947,820 22,987,727
ENSG00000196792 STRN3 14 30,427,761 30,570,340
ENSG00000151322 NPAS3 14 32,428,709 33,386,974
ENSG00000136352 NKX2-1 14 35,997,916 36,065,064
ENSG00000198807 PAX9 14 36,195,877 36,683,420
ENSG00000184302 SIX6 14 60,034,147 60,062,098
90
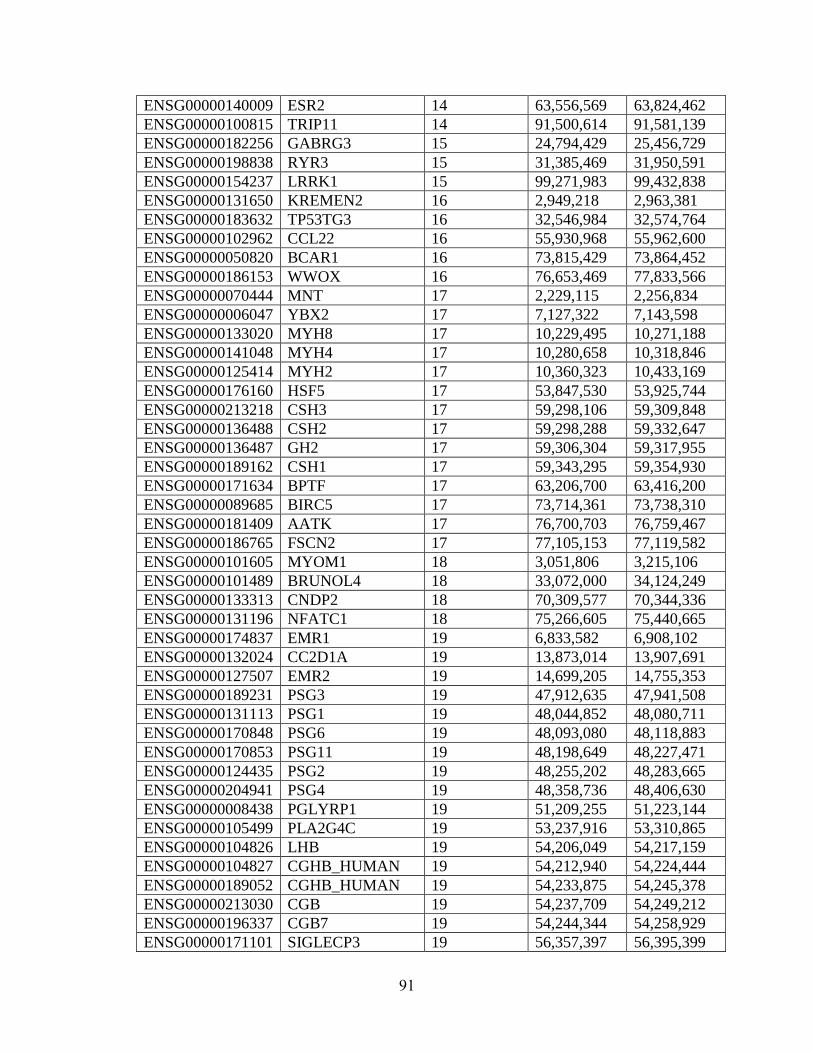
ENSG00000140009 ESR2 14 63,556,569 63,824,462
ENSG00000100815 TRIP11 14 91,500,614 91,581,139
ENSG00000182256 GABRG3 15 24,794,429 25,456,729
ENSG00000198838 RYR3 15 31,385,469 31,950,591
ENSG00000154237 LRRK1 15 99,271,983 99,432,838
ENSG00000131650 KREMEN2 16 2,949,218 2,963,381
ENSG00000183632 TP53TG3 16 32,546,984 32,574,764
ENSG00000102962 CCL22 16 55,930,968 55,962,600
ENSG00000050820 BCAR1 16 73,815,429 73,864,452
ENSG00000186153 WWOX 16 76,653,469 77,833,566
ENSG00000070444 MNT 17 2,229,115 2,256,834
ENSG00000006047 YBX2 17 7,127,322 7,143,598
ENSG00000133020 MYH8 17 10,229,495 10,271,188
ENSG00000141048 MYH4 17 10,280,658 10,318,846
ENSG00000125414 MYH2 17 10,360,323 10,433,169
ENSG00000176160 HSF5 17 53,847,530 53,925,744
ENSG00000213218 CSH3 17 59,298,106 59,309,848
ENSG00000136488 CSH2 17 59,298,288 59,332,647
ENSG00000136487 GH2 17 59,306,304 59,317,955
ENSG00000189162 CSH1 17 59,343,295 59,354,930
ENSG00000171634 BPTF 17 63,206,700 63,416,200
ENSG00000089685 BIRC5 17 73,714,361 73,738,310
ENSG00000181409 AATK 17 76,700,703 76,759,467
ENSG00000186765 FSCN2 17 77,105,153 77,119,582
ENSG00000101605 MYOM1 18 3,051,806 3,215,106
ENSG00000101489 BRUNOL4 18 33,072,000 34,124,249
ENSG00000133313 CNDP2 18 70,309,577 70,344,336
ENSG00000131196 NFATC1 18 75,266,605 75,440,665
ENSG00000174837 EMR1 19 6,833,582 6,908,102
ENSG00000132024 CC2D1A 19 13,873,014 13,907,691
ENSG00000127507 EMR2 19 14,699,205 14,755,353
ENSG00000189231 PSG3 19 47,912,635 47,941,508
ENSG00000131113 PSG1 19 48,044,852 48,080,711
ENSG00000170848 PSG6 19 48,093,080 48,118,883
ENSG00000170853 PSG11 19 48,198,649 48,227,471
ENSG00000124435 PSG2 19 48,255,202 48,283,665
ENSG00000204941 PSG4 19 48,358,736 48,406,630
ENSG00000008438 PGLYRP1 19 51,209,255 51,223,144
ENSG00000105499 PLA2G4C 19 53,237,916 53,310,865
ENSG00000104826 LHB 19 54,206,049 54,217,159
ENSG00000104827 CGHB_HUMAN 19 54,212,940 54,224,444
ENSG00000189052 CGHB_HUMAN 19 54,233,875 54,245,378
ENSG00000213030 CGB 19 54,237,709 54,249,212
ENSG00000196337 CGB7 19 54,244,344 54,258,929
ENSG00000171101 SIGLECP3 19 56,357,397 56,395,399
91
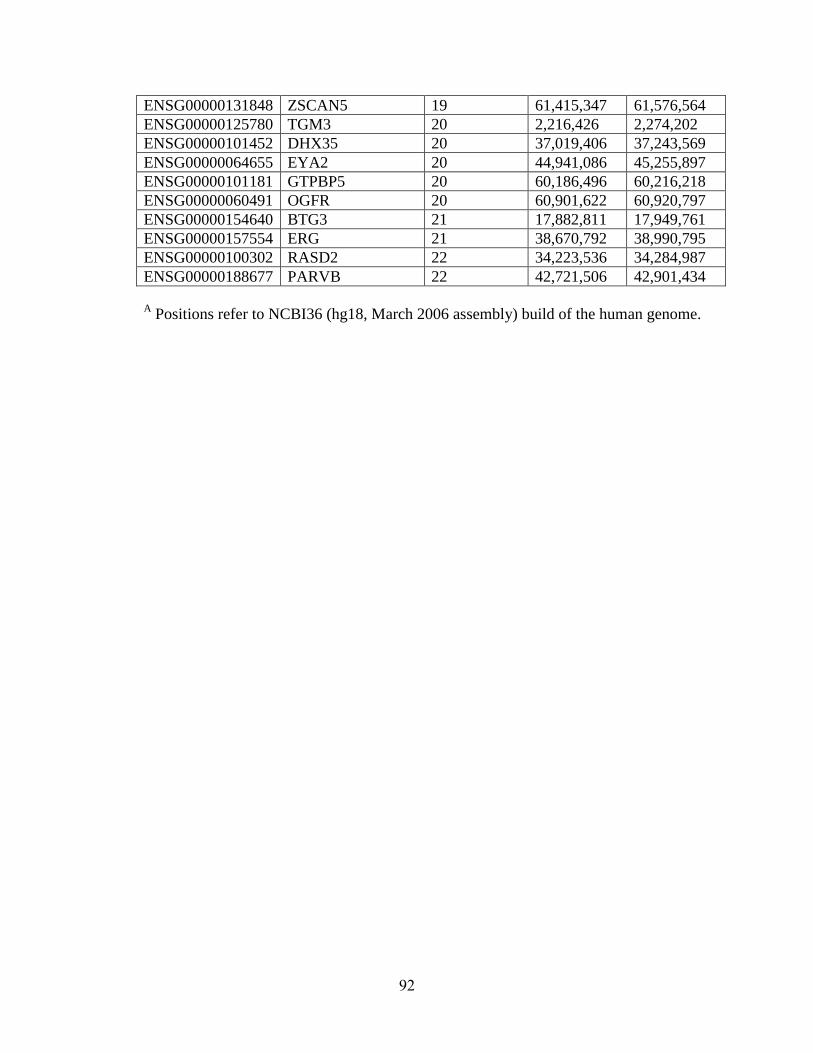
ENSG00000131848 ZSCAN5 19 61,415,347 61,576,564
ENSG00000125780 TGM3 20 2,216,426 2,274,202
ENSG00000101452 DHX35 20 37,019,406 37,243,569
ENSG00000064655 EYA2 20 44,941,086 45,255,897
ENSG00000101181 GTPBP5 20 60,186,496 60,216,218
ENSG00000060491 OGFR 20 60,901,622 60,920,797
ENSG00000154640 BTG3 21 17,882,811 17,949,761
ENSG00000157554 ERG 21 38,670,792 38,990,795
ENSG00000100302 RASD2 22 34,223,536 34,284,987
ENSG00000188677 PARVB 22 42,721,506 42,901,434
A Positions refer to NCBI36 (hg18, March 2006 assembly) build of the human genome.
92
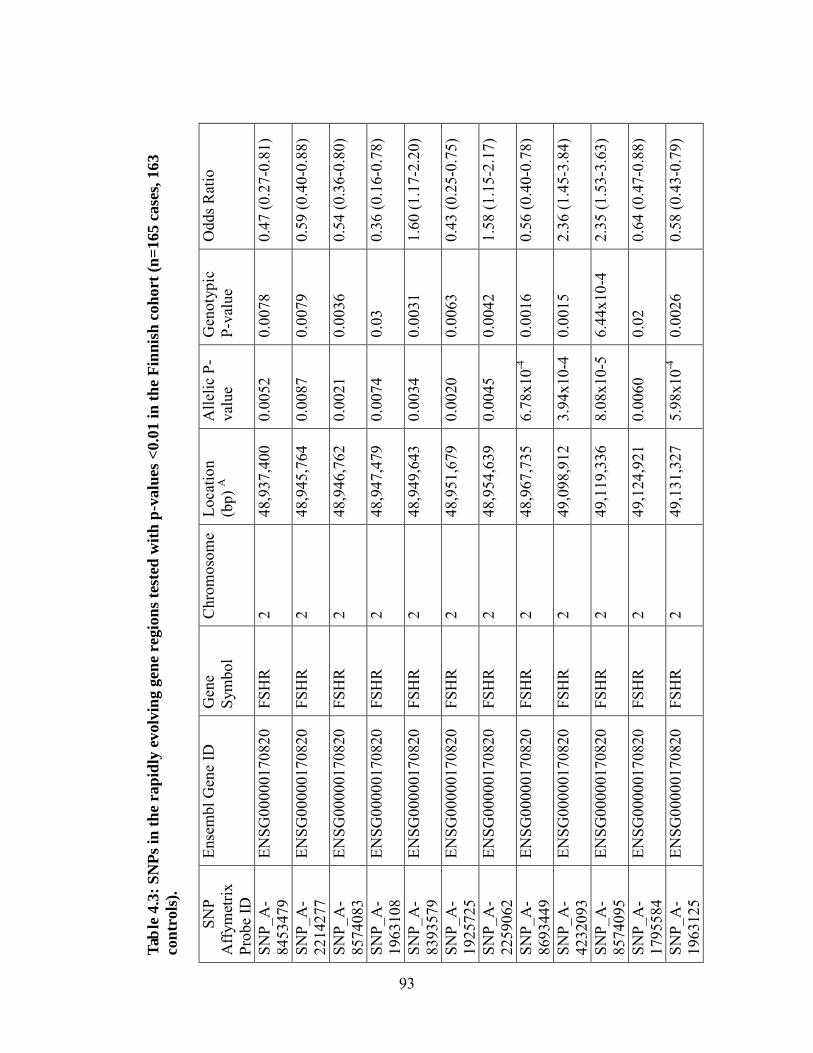
Tabl
e 4.
3: S
NPs
in th
e ra
pidl
y ev
olvi
ng g
ene
regi
ons t
este
d w
ith p
-val
ues <
0.01
in th
e Fi
nnis
h co
hort
(n=1
65 c
ases
, 163
co
ntro
ls).
SN
P A
ffym
etrix
Pr
obe
ID
Ense
mbl
Gen
e ID
G
ene
Sym
bol
Chr
omos
ome
Loca
tion
(bp)
A
Alle
lic P
-va
lue
Gen
otyp
ic
P-va
lue
Odd
s Rat
io
SNP_
A-
8453
479
ENSG
0000
0170
820
FSH
R
2 48
,937
,400
0.
0052
0.
0078
0.
47 (0
.27-
0.81
)
SNP_
A-
2214
277
ENSG
0000
0170
820
FSH
R
2 48
,945
,764
0.
0087
0.
0079
0.
59 (0
.40-
0.88
)
SNP_
A-
8574
083
ENSG
0000
0170
820
FSH
R
2 48
,946
,762
0.
0021
0.
0036
0.
54 (0
.36-
0.80
)
SNP_
A-
1963
108
ENSG
0000
0170
820
FSH
R
2 48
,947
,479
0.
0074
0.
03
0.36
(0.1
6-0.
78)
SNP_
A-
8393
579
ENSG
0000
0170
820
FSH
R
2 48
,949
,643
0.
0034
0.
0031
1.
60 (1
.17-
2.20
)
SNP_
A-
1925
725
ENSG
0000
0170
820
FSH
R
2 48
,951
,679
0.
0020
0.
0063
0.
43 (0
.25-
0.75
)
SNP_
A-
2259
062
ENSG
0000
0170
820
FSH
R
2 48
,954
,639
0.
0045
0.
0042
1.
58 (1
.15-
2.17
)
SNP_
A-
8693
449
ENSG
0000
0170
820
FSH
R
2 48
,967
,735
6.
78x1
0-4
0.00
16
0.56
(0.4
0-0.
78)
SNP_
A-
4232
093
ENSG
0000
0170
820
FSH
R
2 49
,098
,912
3.
94x1
0-4
0.00
15
2.36
(1.4
5-3.
84)
SNP_
A-
8574
095
ENSG
0000
0170
820
FSH
R
2 49
,119
,336
8.
08x1
0-5
6.44
x10-
4 2.
35 (1
.53-
3.63
)
SNP_
A-
1795
584
ENSG
0000
0170
820
FSH
R
2 49
,124
,921
0.
0060
0.
02
0.64
(0.4
7-0.
88)
SNP_
A-
1963
125
ENSG
0000
0170
820
FSH
R
2 49
,131
,327
5.
98x1
0-4
0.00
26
0.58
(0.4
3-0.
79)
93
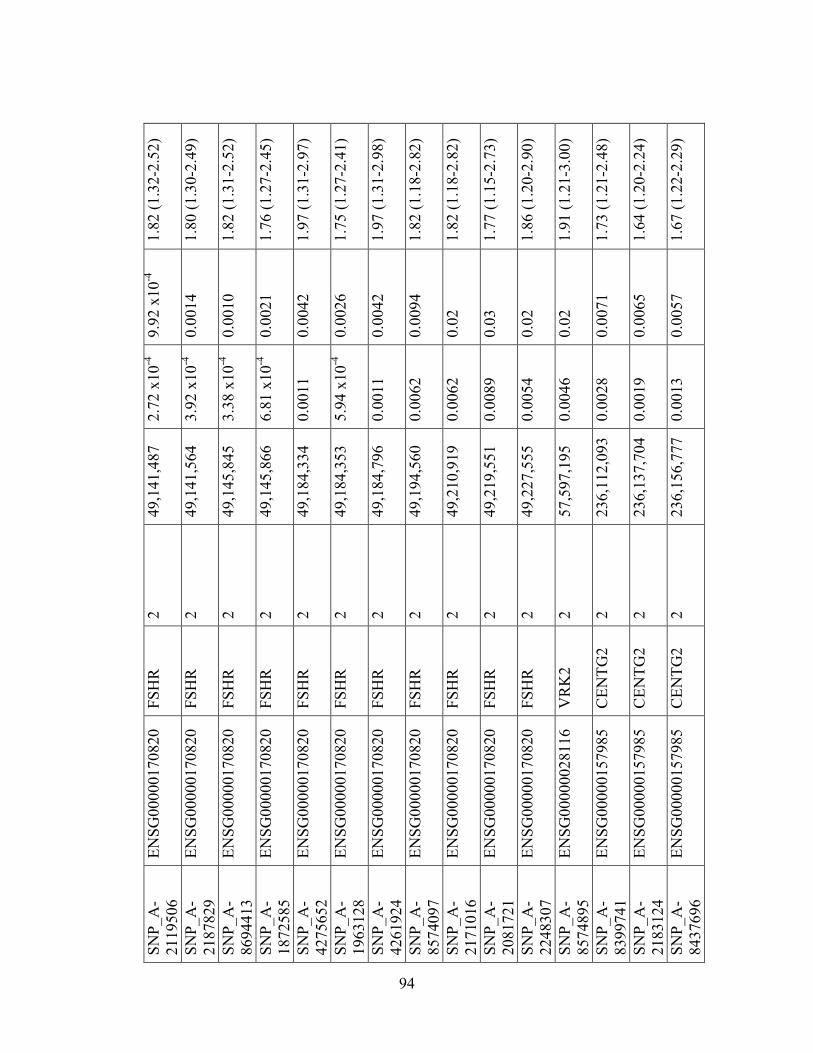
SNP_
A-
2119
506
ENSG
0000
0170
820
FSH
R
2 49
,141
,487
2.
72 x
10-4
9.
92 x
10-4
1.
82 (1
.32-
2.52
)
SNP_
A-
2187
829
ENSG
0000
0170
820
FSH
R
2 49
,141
,564
3.
92 x
10-4
0.
0014
1.
80 (1
.30-
2.49
)
SNP_
A-
8694
413
ENSG
0000
0170
820
FSH
R
2 49
,145
,845
3.
38 x
10-4
0.
0010
1.
82 (1
.31-
2.52
)
SNP_
A-
1872
585
ENSG
0000
0170
820
FSH
R
2 49
,145
,866
6.
81 x
10-4
0.
0021
1.
76 (1
.27-
2.45
)
SNP_
A-
4275
652
ENSG
0000
0170
820
FSH
R
2 49
,184
,334
0.
0011
0.
0042
1.
97 (1
.31-
2.97
)
SNP_
A-
1963
128
ENSG
0000
0170
820
FSH
R
2 49
,184
,353
5.
94 x
10-4
0.
0026
1.
75 (1
.27-
2.41
)
SNP_
A-
4261
924
ENSG
0000
0170
820
FSH
R
2 49
,184
,796
0.
0011
0.
0042
1.
97 (1
.31-
2.98
)
SNP_
A-
8574
097
ENSG
0000
0170
820
FSH
R
2 49
,194
,560
0.
0062
0.
0094
1.
82 (1
.18-
2.82
)
SNP_
A-
2171
016
ENSG
0000
0170
820
FSH
R
2 49
,210
,919
0.
0062
0.
02
1.82
(1.1
8-2.
82)
SNP_
A-
2081
721
ENSG
0000
0170
820
FSH
R
2 49
,219
,551
0.
0089
0.
03
1.77
(1.1
5-2.
73)
SNP_
A-
2248
307
ENSG
0000
0170
820
FSH
R
2 49
,227
,555
0.
0054
0.
02
1.86
(1.2
0-2.
90)
SNP_
A-
8574
895
ENSG
0000
0028
116
VR
K2
2 57
,597
,195
0.
0046
0.
02
1.91
(1.2
1-3.
00)
SNP_
A-
8399
741
ENSG
0000
0157
985
CEN
TG2
2 23
6,11
2,09
3 0.
0028
0.
0071
1.
73 (1
.21-
2.48
)
SNP_
A-
2183
124
ENSG
0000
0157
985
CEN
TG2
2 23
6,13
7,70
4 0.
0019
0.
0065
1.
64 (1
.20-
2.24
)
SNP_
A-
8437
696
ENSG
0000
0157
985
CEN
TG2
2 23
6,15
6,77
7 0.
0013
0.
0057
1.
67 (1
.22-
2.29
)
94
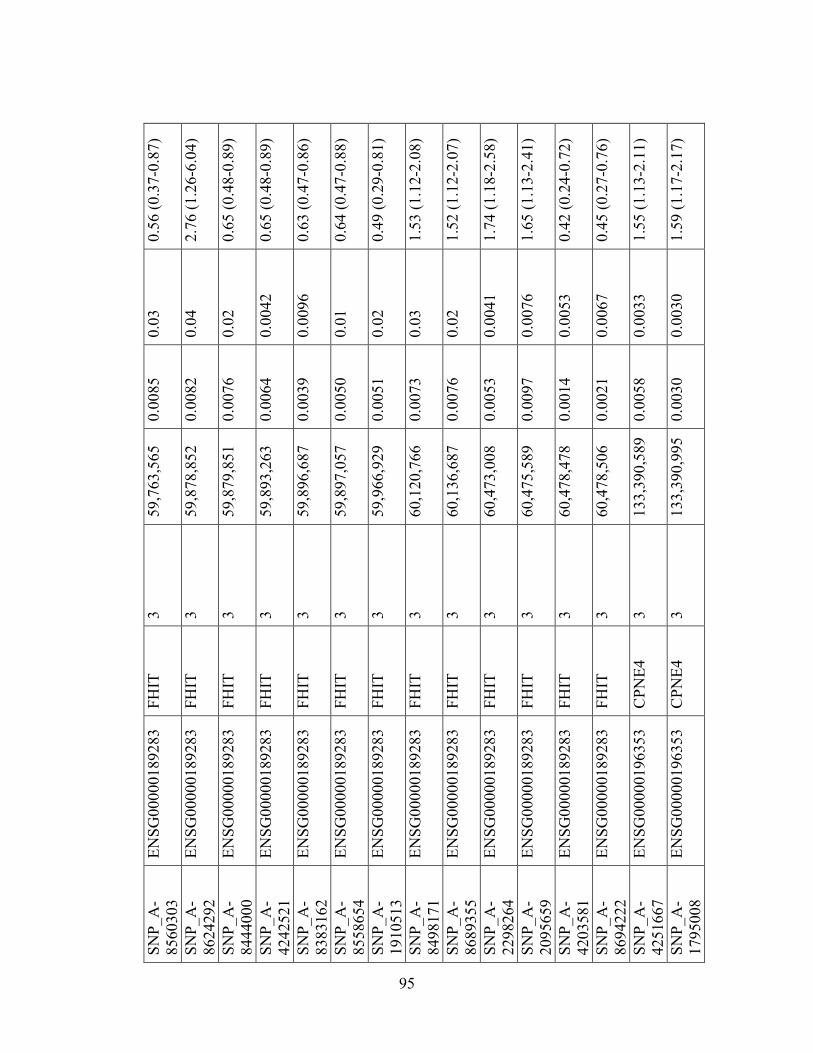
SNP_
A-
8560
303
ENSG
0000
0189
283
FHIT
3
59,7
63,5
65
0.00
85
0.03
0.
56 (0
.37-
0.87
)
SNP_
A-
8624
292
ENSG
0000
0189
283
FHIT
3
59,8
78,8
52
0.00
82
0.04
2.
76 (1
.26-
6.04
)
SNP_
A-
8444
000
ENSG
0000
0189
283
FHIT
3
59,8
79,8
51
0.00
76
0.02
0.
65 (0
.48-
0.89
)
SNP_
A-
4242
521
ENSG
0000
0189
283
FHIT
3
59,8
93,2
63
0.00
64
0.00
42
0.65
(0.4
8-0.
89)
SNP_
A-
8383
162
ENSG
0000
0189
283
FHIT
3
59,8
96,6
87
0.00
39
0.00
96
0.63
(0.4
7-0.
86)
SNP_
A-
8558
654
ENSG
0000
0189
283
FHIT
3
59,8
97,0
57
0.00
50
0.01
0.
64 (0
.47-
0.88
)
SNP_
A-
1910
513
ENSG
0000
0189
283
FHIT
3
59,9
66,9
29
0.00
51
0.02
0.
49 (0
.29-
0.81
)
SNP_
A-
8498
171
ENSG
0000
0189
283
FHIT
3
60,1
20,7
66
0.00
73
0.03
1.
53 (1
.12-
2.08
)
SNP_
A-
8689
355
ENSG
0000
0189
283
FHIT
3
60,1
36,6
87
0.00
76
0.02
1.
52 (1
.12-
2.07
)
SNP_
A-
2298
264
ENSG
0000
0189
283
FHIT
3
60,4
73,0
08
0.00
53
0.00
41
1.74
(1.1
8-2.
58)
SNP_
A-
2095
659
ENSG
0000
0189
283
FHIT
3
60,4
75,5
89
0.00
97
0.00
76
1.65
(1.1
3-2.
41)
SNP_
A-
4203
581
ENSG
0000
0189
283
FHIT
3
60,4
78,4
78
0.00
14
0.00
53
0.42
(0.2
4-0.
72)
SNP_
A-
8694
222
ENSG
0000
0189
283
FHIT
3
60,4
78,5
06
0.00
21
0.00
67
0.45
(0.2
7-0.
76)
SNP_
A-
4251
667
ENSG
0000
0196
353
CPN
E4
3 13
3,39
0,58
9 0.
0058
0.
0033
1.
55 (1
.13-
2.11
)
SNP_
A-
1795
008
ENSG
0000
0196
353
CPN
E4
3 13
3,39
0,99
5 0.
0030
0.
0030
1.
59 (1
.17-
2.17
)
95
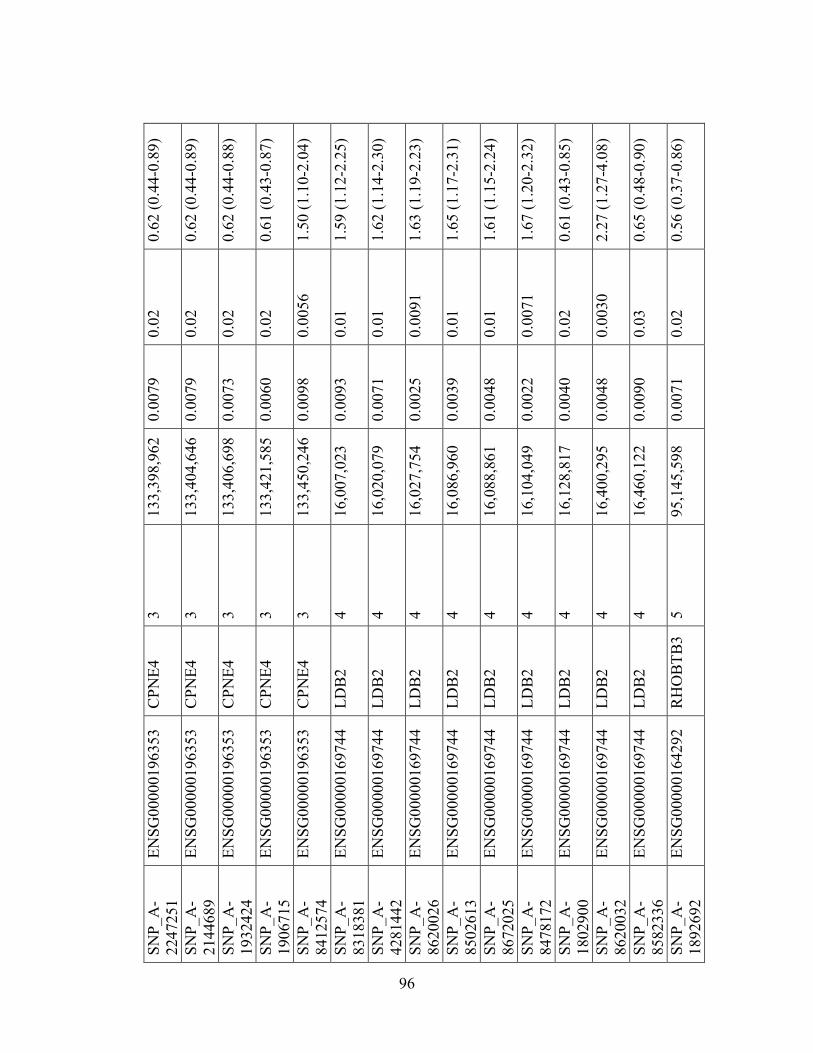
SNP_
A-
2247
251
ENSG
0000
0196
353
CPN
E4
3 13
3,39
8,96
2 0.
0079
0.
02
0.62
(0.4
4-0.
89)
SNP_
A-
2144
689
ENSG
0000
0196
353
CPN
E4
3 13
3,40
4,64
6 0.
0079
0.
02
0.62
(0.4
4-0.
89)
SNP_
A-
1932
424
ENSG
0000
0196
353
CPN
E4
3 13
3,40
6,69
8 0.
0073
0.
02
0.62
(0.4
4-0.
88)
SNP_
A-
1906
715
ENSG
0000
0196
353
CPN
E4
3 13
3,42
1,58
5 0.
0060
0.
02
0.61
(0.4
3-0.
87)
SNP_
A-
8412
574
ENSG
0000
0196
353
CPN
E4
3 13
3,45
0,24
6 0.
0098
0.
0056
1.
50 (1
.10-
2.04
)
SNP_
A-
8318
381
ENSG
0000
0169
744
LDB
2 4
16,0
07,0
23
0.00
93
0.01
1.
59 (1
.12-
2.25
)
SNP_
A-
4281
442
ENSG
0000
0169
744
LDB
2 4
16,0
20,0
79
0.00
71
0.01
1.
62 (1
.14-
2.30
)
SNP_
A-
8620
026
ENSG
0000
0169
744
LDB
2 4
16,0
27,7
54
0.00
25
0.00
91
1.63
(1.1
9-2.
23)
SNP_
A-
8502
613
ENSG
0000
0169
744
LDB
2 4
16,0
86,9
60
0.00
39
0.01
1.
65 (1
.17-
2.31
)
SNP_
A-
8672
025
ENSG
0000
0169
744
LDB
2 4
16,0
88,8
61
0.00
48
0.01
1.
61 (1
.15-
2.24
)
SNP_
A-
8478
172
ENSG
0000
0169
744
LDB
2 4
16,1
04,0
49
0.00
22
0.00
71
1.67
(1.2
0-2.
32)
SNP_
A-
1802
900
ENSG
0000
0169
744
LDB
2 4
16,1
28,8
17
0.00
40
0.02
0.
61 (0
.43-
0.85
)
SNP_
A-
8620
032
ENSG
0000
0169
744
LDB
2 4
16,4
00,2
95
0.00
48
0.00
30
2.27
(1.2
7-4.
08)
SNP_
A-
8582
336
ENSG
0000
0169
744
LDB
2 4
16,4
60,1
22
0.00
90
0.03
0.
65 (0
.48-
0.90
)
SNP_
A-
1892
692
ENSG
0000
0164
292
RH
OB
TB3
5 95
,145
,598
0.
0071
0.
02
0.56
(0.3
7-0.
86)
96
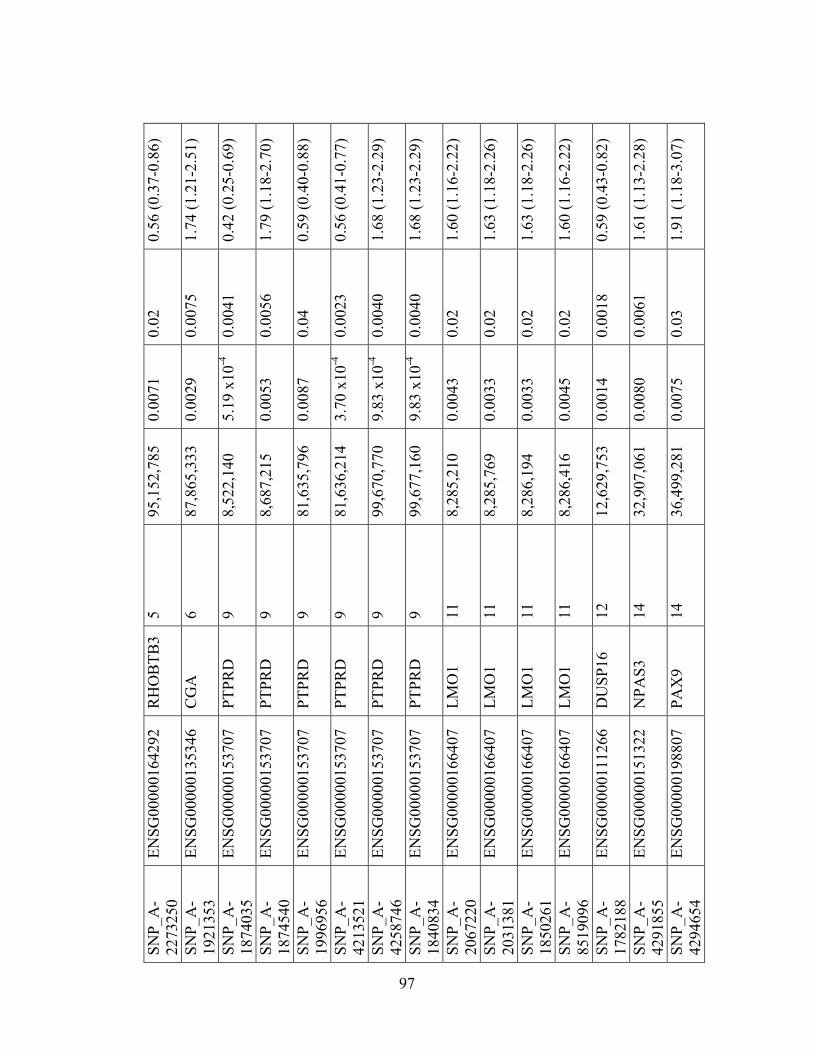
SNP_
A-
2273
250
ENSG
0000
0164
292
RH
OB
TB3
5 95
,152
,785
0.
0071
0.
02
0.56
(0.3
7-0.
86)
SNP_
A-
1921
353
ENSG
0000
0135
346
CG
A
6 87
,865
,333
0.
0029
0.
0075
1.
74 (1
.21-
2.51
)
SNP_
A-
1874
035
ENSG
0000
0153
707
PTPR
D
9 8,
522,
140
5.19
x10
-4
0.00
41
0.42
(0.2
5-0.
69)
SNP_
A-
1874
540
ENSG
0000
0153
707
PTPR
D
9 8,
687,
215
0.00
53
0.00
56
1.79
(1.1
8-2.
70)
SNP_
A-
1996
956
ENSG
0000
0153
707
PTPR
D
9 81
,635
,796
0.
0087
0.
04
0.59
(0.4
0-0.
88)
SNP_
A-
4213
521
ENSG
0000
0153
707
PTPR
D
9 81
,636
,214
3.
70 x
10-4
0.
0023
0.
56 (0
.41-
0.77
)
SNP_
A-
4258
746
ENSG
0000
0153
707
PTPR
D
9 99
,670
,770
9.
83 x
10-4
0.
0040
1.
68 (1
.23-
2.29
)
SNP_
A-
1840
834
ENSG
0000
0153
707
PTPR
D
9 99
,677
,160
9.
83 x
10-4
0.
0040
1.
68 (1
.23-
2.29
)
SNP_
A-
2067
220
ENSG
0000
0166
407
LMO
1 11
8,
285,
210
0.00
43
0.02
1.
60 (1
.16-
2.22
)
SNP_
A-
2031
381
ENSG
0000
0166
407
LMO
1 11
8,
285,
769
0.00
33
0.02
1.
63 (1
.18-
2.26
)
SNP_
A-
1850
261
ENSG
0000
0166
407
LMO
1 11
8,
286,
194
0.00
33
0.02
1.
63 (1
.18-
2.26
)
SNP_
A-
8519
096
ENSG
0000
0166
407
LMO
1 11
8,
286,
416
0.00
45
0.02
1.
60 (1
.16-
2.22
)
SNP_
A-
1782
188
ENSG
0000
0111
266
DU
SP16
12
12
,629
,753
0.
0014
0.
0018
0.
59 (0
.43-
0.82
)
SNP_
A-
4291
855
ENSG
0000
0151
322
NPA
S3
14
32,9
07,0
61
0.00
80
0.00
61
1.61
(1.1
3-2.
28)
SNP_
A-
4294
654
ENSG
0000
0198
807
PAX
9 14
36
,499
,281
0.
0075
0.
03
1.91
(1.1
8-3.
07)
97
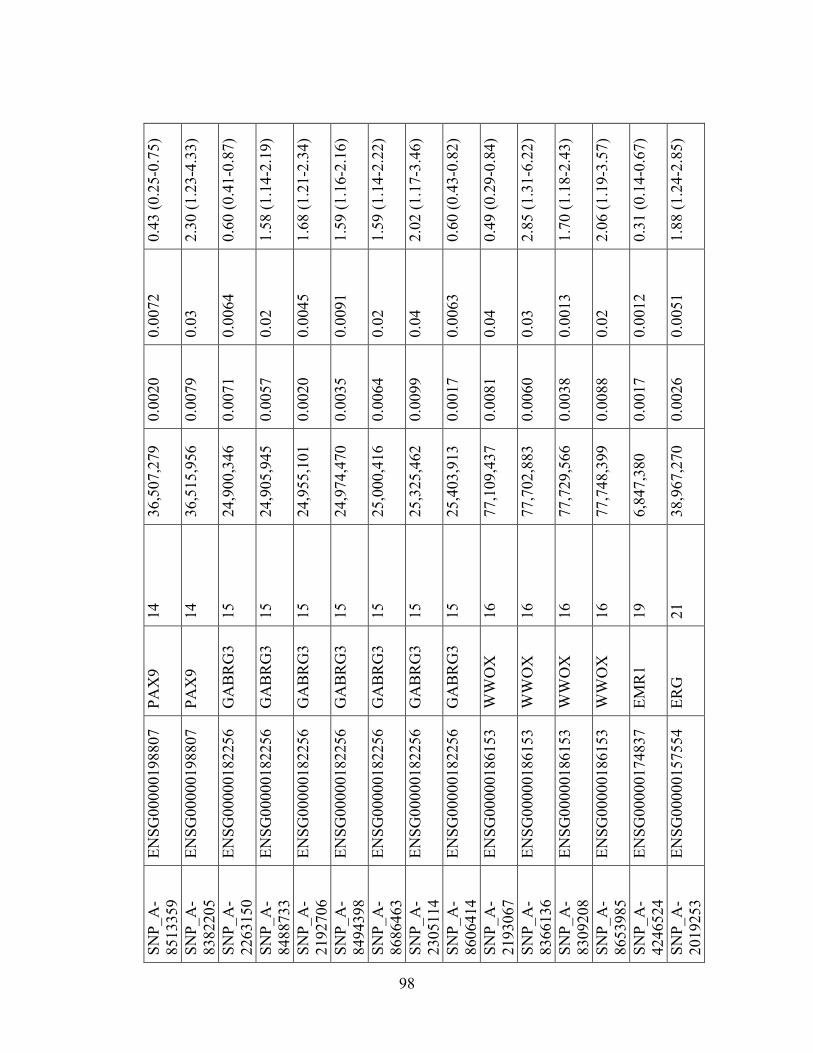
SNP_
A-
8513
359
ENSG
0000
0198
807
PAX
9 14
36
,507
,279
0.
0020
0.
0072
0.
43 (0
.25-
0.75
)
SNP_
A-
8382
205
ENSG
0000
0198
807
PAX
9 14
36
,515
,956
0.
0079
0.
03
2.30
(1.2
3-4.
33)
SNP_
A-
2263
150
ENSG
0000
0182
256
GA
BR
G3
15
24,9
00,3
46
0.00
71
0.00
64
0.60
(0.4
1-0.
87)
SNP_
A-
8488
733
ENSG
0000
0182
256
GA
BR
G3
15
24,9
05,9
45
0.00
57
0.02
1.
58 (1
.14-
2.19
)
SNP_
A-
2192
706
ENSG
0000
0182
256
GA
BR
G3
15
24,9
55,1
01
0.00
20
0.00
45
1.68
(1.2
1-2.
34)
SNP_
A-
8494
398
ENSG
0000
0182
256
GA
BR
G3
15
24,9
74,4
70
0.00
35
0.00
91
1.59
(1.1
6-2.
16)
SNP_
A-
8686
463
ENSG
0000
0182
256
GA
BR
G3
15
25,0
00,4
16
0.00
64
0.02
1.
59 (1
.14-
2.22
)
SNP_
A-
2305
114
ENSG
0000
0182
256
GA
BR
G3
15
25,3
25,4
62
0.00
99
0.04
2.
02 (1
.17-
3.46
)
SNP_
A-
8606
414
ENSG
0000
0182
256
GA
BR
G3
15
25,4
03,9
13
0.00
17
0.00
63
0.60
(0.4
3-0.
82)
SNP_
A-
2193
067
ENSG
0000
0186
153
WW
OX
16
77
,109
,437
0.
0081
0.
04
0.49
(0.2
9-0.
84)
SNP_
A-
8366
136
ENSG
0000
0186
153
WW
OX
16
77
,702
,883
0.
0060
0.
03
2.85
(1.3
1-6.
22)
SNP_
A-
8309
208
ENSG
0000
0186
153
WW
OX
16
77
,729
,566
0.
0038
0.
0013
1.
70 (1
.18-
2.43
)
SNP_
A-
8653
985
ENSG
0000
0186
153
WW
OX
16
77
,748
,399
0.
0088
0.
02
2.06
(1.1
9-3.
57)
SNP_
A-
4246
524
ENSG
0000
0174
837
EMR
1 19
6,
847,
380
0.00
17
0.00
12
0.31
(0.1
4-0.
67)
SNP_
A-
2019
253
ENSG
0000
0157
554
ERG
21
38
,967
,270
0.
0026
0.
0051
1.
88 (1
.24-
2.85
)
98
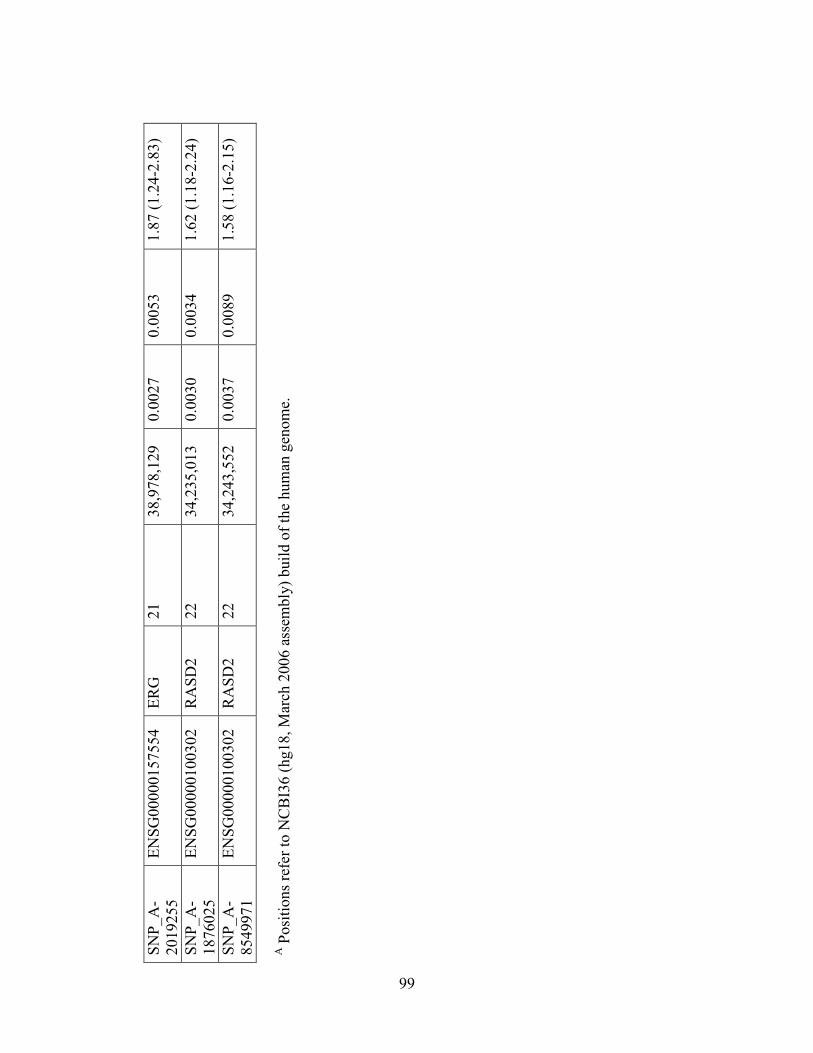
SNP_
A-
2019
255
ENSG
0000
0157
554
ERG
21
38
,978
,129
0.
0027
0.
0053
1.
87 (1
.24-
2.83
)
SNP_
A-
1876
025
ENSG
0000
0100
302
RA
SD2
22
34,2
35,0
13
0.00
30
0.00
34
1.62
(1.1
8-2.
24)
SNP_
A-
8549
971
ENSG
0000
0100
302
RA
SD2
22
34,2
43,5
52
0.00
37
0.00
89
1.58
(1.1
6-2.
15)
A P
ositi
ons r
efer
to N
CB
I36
(hg1
8, M
arch
200
6 as
sem
bly)
bui
ld o
f the
hum
an g
enom
e.
99
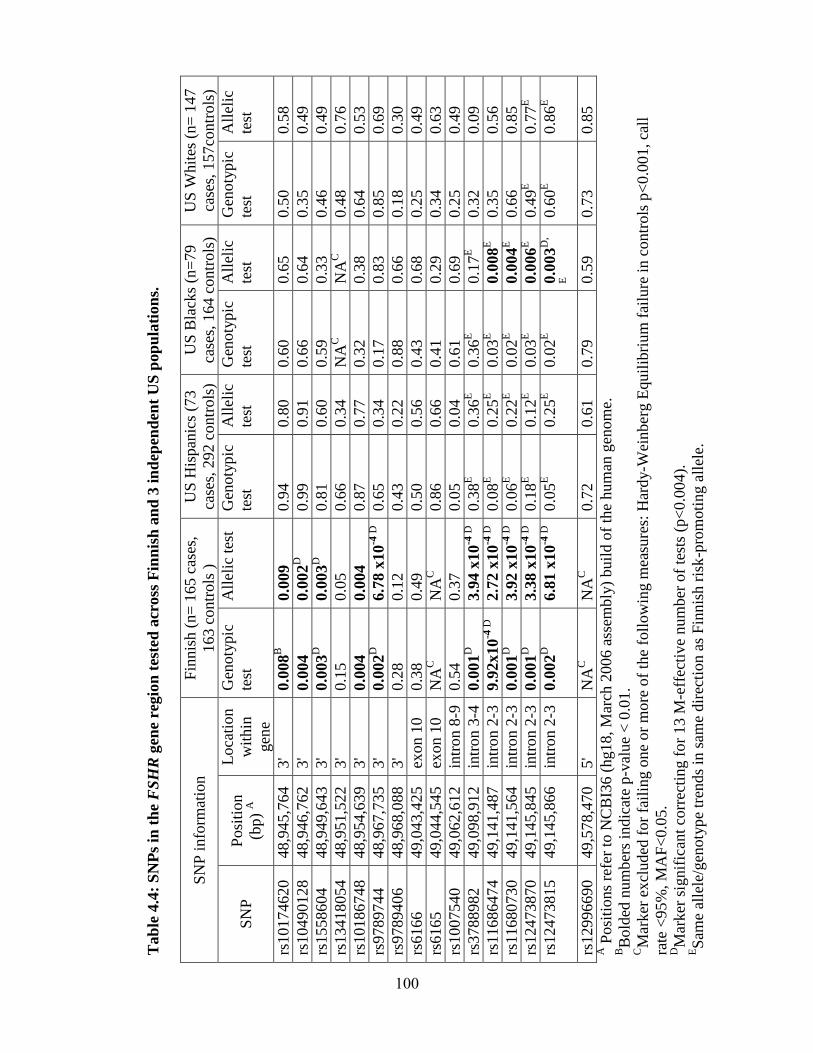
Tab
le 4
.4:
SN
Ps
in t
he
FS
HR
gen
e re
gio
n t
este
d a
cross
Fin
nis
h a
nd
3 i
nd
epen
den
t U
S p
op
ula
tion
s.
SN
P i
nfo
rmat
ion
F
innis
h (
n=
165 c
ases
,
163 c
ontr
ols
)
US
His
pan
ics
(73
case
s, 2
92 c
ontr
ols
)
US
Bla
cks
(n=
79
case
s, 1
64 c
ontr
ols
)
US
Whit
es (
n=
147
case
s, 1
57co
ntr
ols
)
SN
P
Posi
tion
(bp)
A
Loca
tion
wit
hin
gen
e
Gen
oty
pic
test
All
elic
tes
t G
enoty
pic
test
All
elic
test
Gen
oty
pic
test
All
elic
test
Gen
oty
pic
test
All
elic
test
rs10174620
48,9
45,7
64
3'
0.0
08
B
0.0
09
0.9
4
0.8
0
0.6
0
0.6
5
0.5
0
0.5
8
rs10490128
48,9
46,7
62
3'
0.0
04
0.0
02
D
0.9
9
0.9
1
0.6
6
0.6
4
0.3
5
0.4
9
rs1558604
48,9
49,6
43
3'
0.0
03
D
0.0
03
D
0.8
1
0.6
0
0.5
9
0.3
3
0.4
6
0.4
9
rs13418054
48,9
51,5
22
3'
0.1
5
0.0
5
0.6
6
0.3
4
NA
C
NA
C
0.4
8
0.7
6
rs10186748
48,9
54,6
39
3'
0.0
04
0.0
04
0.8
7
0.7
7
0.3
2
0.3
8
0.6
4
0.5
3
rs9789744
48,9
67,7
35
3'
0.0
02
D
6.7
8 x
10
-4 D
0.6
5
0.3
4
0.1
7
0.8
3
0.8
5
0.6
9
rs9789406
48,9
68,0
88
3'
0.2
8
0.1
2
0.4
3
0.2
2
0.8
8
0.6
6
0.1
8
0.3
0
rs6166
49,0
43,4
25
exon 1
0
0.3
8
0.4
9
0.5
0
0.5
6
0.4
3
0.6
8
0.2
5
0.4
9
rs6165
49,0
44,5
45
exon 1
0
NA
C
NA
C
0.8
6
0.6
6
0.4
1
0.2
9
0.3
4
0.6
3
rs1007540
49,0
62,6
12
intr
on 8
-9
0.5
4
0.3
7
0.0
5
0.0
4
0.6
1
0.6
9
0.2
5
0.4
9
rs3788982
49,0
98,9
12
intr
on 3
-4
0.0
01
D
3.9
4 x
10
-4 D
0.3
8E
0.3
6E
0.3
6E
0.1
7E
0.3
2
0.0
9
rs11686474
49,1
41,4
87
intr
on 2
-3
9.9
2x10
-4 D
2.7
2 x
10
-4 D
0.0
8E
0.2
5E
0.0
3E
0.0
08
E
0.3
5
0.5
6
rs11680730
49,1
41,5
64
intr
on 2
-3
0.0
01
D
3.9
2 x
10
-4 D
0.0
6E
0.2
2E
0.0
2E
0.0
04
E
0.6
6
0.8
5
rs12473870
49,1
45,8
45
intr
on 2
-3
0.0
01
D
3.3
8 x
10
-4 D
0.1
8E
0.1
2E
0.0
3E
0.0
06
E
0.4
9E
0.7
7E
rs12473815
49,1
45,8
66
intr
on 2
-3
0.0
02
D
6.8
1 x
10
-4 D
0.0
5E
0.2
5E
0.0
2E
0.0
03
D,
E
0.6
0E
0.8
6E
rs12996690
49,5
78,4
70
5'
NA
C
NA
C
0.7
2
0.6
1
0.7
9
0.5
9
0.7
3
0.8
5
A P
osi
tions
refe
r to
NC
BI3
6 (
hg18, M
arch
2006 a
ssem
bly
) buil
d o
f th
e hum
an g
enom
e.
BB
old
ed n
um
ber
s in
dic
ate
p-v
alue
< 0
.01.
CM
arker
ex
cluded
for
fail
ing o
ne
or
mo
re o
f th
e fo
llow
ing m
easu
res:
Har
dy-W
einber
g E
quil
ibri
um
fai
lure
in c
ontr
ols
p<
0.0
01, ca
ll
rate
<95
%, M
AF
<0.0
5.
DM
arker
sig
nif
ican
t co
rrec
ting f
or
13 M
-eff
ecti
ve
num
ber
of
test
s (p
<0.0
04
).
ES
ame
alle
le/g
enoty
pe
tren
ds
in s
ame
dir
ecti
on a
s F
innis
h r
isk
-pro
moti
ng a
llel
e.
100
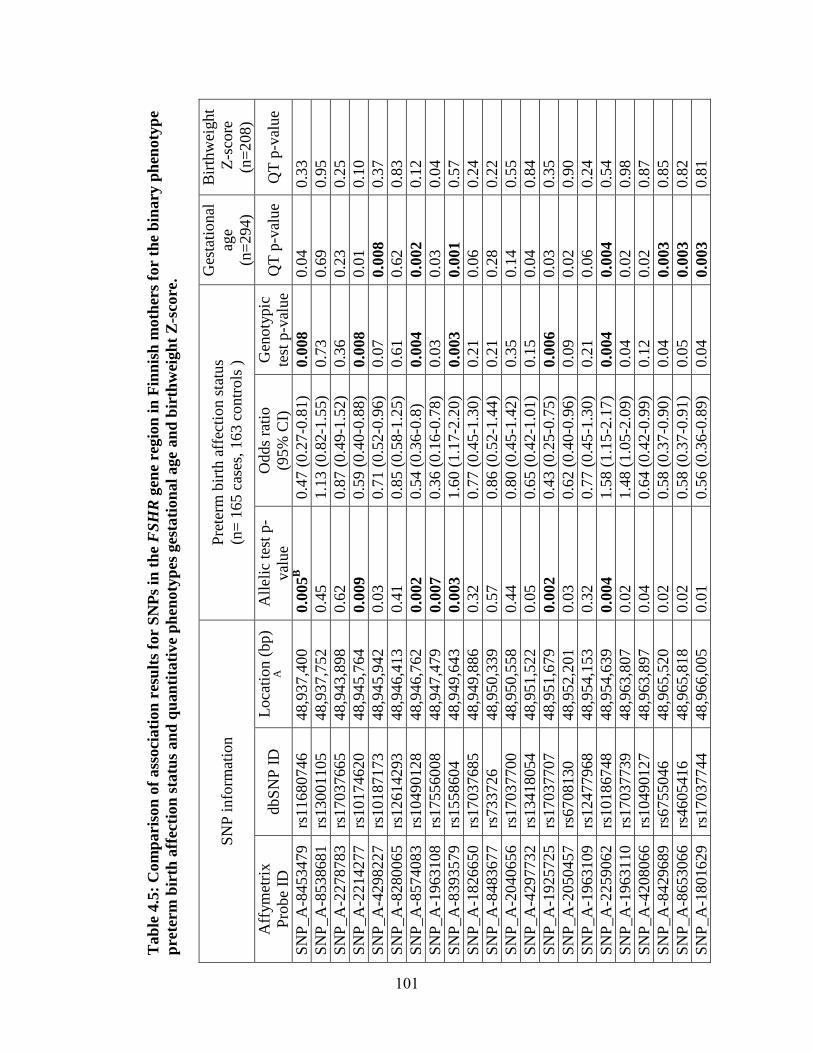
Tab
le 4
.5:
Com
pari
son
of
ass
oci
ati
on
res
ult
s fo
r S
NP
s in
th
e F
SH
R g
ene
regio
n i
n F
inn
ish
moth
ers
for
the
bin
ary
ph
enoty
pe
pre
term
bir
th a
ffec
tion
sta
tus
an
d q
uan
tita
tive
ph
enoty
pes
ges
tati
on
al
age a
nd
bir
thw
eigh
t Z
-sco
re.
SN
P i
nfo
rmat
ion
P
rete
rm b
irth
aff
ecti
on s
tatu
s
(n=
16
5 c
ases
, 16
3 c
ontr
ols
)
Ges
tati
onal
age
(n=
294)
Bir
thw
eight
Z-s
core
(n=
208)
Aff
ym
etri
x
Pro
be
ID
dbS
NP
ID
L
oca
tion (
bp)
A
All
elic
tes
t p
-
val
ue
Odds
rati
o
(95%
CI)
Gen
oty
pic
test
p-v
alue
QT
p-v
alue
QT
p-v
alue
SN
P_A
-8453479
rs11680746
48
,937,4
00
0.0
05
B
0.4
7 (
0.2
7-0
.81)
0.0
08
0.0
4
0.3
3
SN
P_A
-8538681
rs13001105
48
,937,7
52
0.4
5
1.1
3 (
0.8
2-1
.55)
0.7
3
0.6
9
0.9
5
SN
P_A
-2278783
rs17037665
48
,943,8
98
0.6
2
0.8
7 (
0.4
9-1
.52)
0.3
6
0.2
3
0.2
5
SN
P_A
-2214277
rs10174620
48
,945,7
64
0.0
09
0.5
9 (
0.4
0-0
.88)
0.0
08
0.0
1
0.1
0
SN
P_A
-4298227
rs10187173
48
,945,9
42
0.0
3
0.7
1 (
0.5
2-0
.96)
0.0
7
0.0
08
0.3
7
SN
P_A
-8280065
rs12614293
48
,946,4
13
0.4
1
0.8
5 (
0.5
8-1
.25)
0.6
1
0.6
2
0.8
3
SN
P_A
-8574083
rs10490128
48
,946,7
62
0.0
02
0.5
4 (
0.3
6-0
.8)
0.0
04
0.0
02
0.1
2
SN
P_A
-1963108
rs17556008
48
,947,4
79
0.0
07
0.3
6 (
0.1
6-0
.78)
0.0
3
0.0
3
0.0
4
SN
P_A
-8393579
rs1558604
48
,949,6
43
0.0
03
1.6
0 (
1.1
7-2
.20)
0.0
03
0.0
01
0.5
7
SN
P_A
-1826650
rs17037685
48
,949,8
86
0.3
2
0.7
7 (
0.4
5-1
.30)
0.2
1
0.0
6
0.2
4
SN
P_A
-8483677
rs733726
48
,950,3
39
0.5
7
0.8
6 (
0.5
2-1
.44)
0.2
1
0.2
8
0.2
2
SN
P_A
-2040656
rs17037700
48
,950,5
58
0.4
4
0.8
0 (
0.4
5-1
.42)
0.3
5
0.1
4
0.5
5
SN
P_A
-4297732
rs13418054
48
,951,5
22
0.0
5
0.6
5 (
0.4
2-1
.01)
0.1
5
0.0
4
0.8
4
SN
P_A
-1925725
rs17037707
48
,951,6
79
0.0
02
0.4
3 (
0.2
5-0
.75)
0.0
06
0.0
3
0.3
5
SN
P_A
-2050457
rs6708130
48
,952,2
01
0.0
3
0.6
2 (
0.4
0-0
.96)
0.0
9
0.0
2
0.9
0
SN
P_A
-1963109
rs12477968
48
,954,1
53
0.3
2
0.7
7 (
0.4
5-1
.30)
0.2
1
0.0
6
0.2
4
SN
P_A
-2259062
rs10186748
48
,954,6
39
0.0
04
1.5
8 (
1.1
5-2
.17)
0.0
04
0.0
04
0.5
4
SN
P_A
-1963110
rs17037739
48
,963,8
07
0.0
2
1.4
8 (
1.0
5-2
.09)
0.0
4
0.0
2
0.9
8
SN
P_A
-4208066
rs10490127
48
,963,8
97
0.0
4
0.6
4 (
0.4
2-0
.99)
0.1
2
0.0
2
0.8
7
SN
P_A
-8429689
rs6755046
48
,965,5
20
0.0
2
0.5
8 (
0.3
7-0
.90)
0.0
4
0.0
03
0.8
5
SN
P_A
-8653066
rs4605416
48
,965,8
18
0.0
2
0.5
8 (
0.3
7-0
.91)
0.0
5
0.0
03
0.8
2
SN
P_A
-1801629
rs17037744
48
,966,0
05
0.0
1
0.5
6 (
0.3
6-0
.89)
0.0
4
0.0
03
0.8
1
101
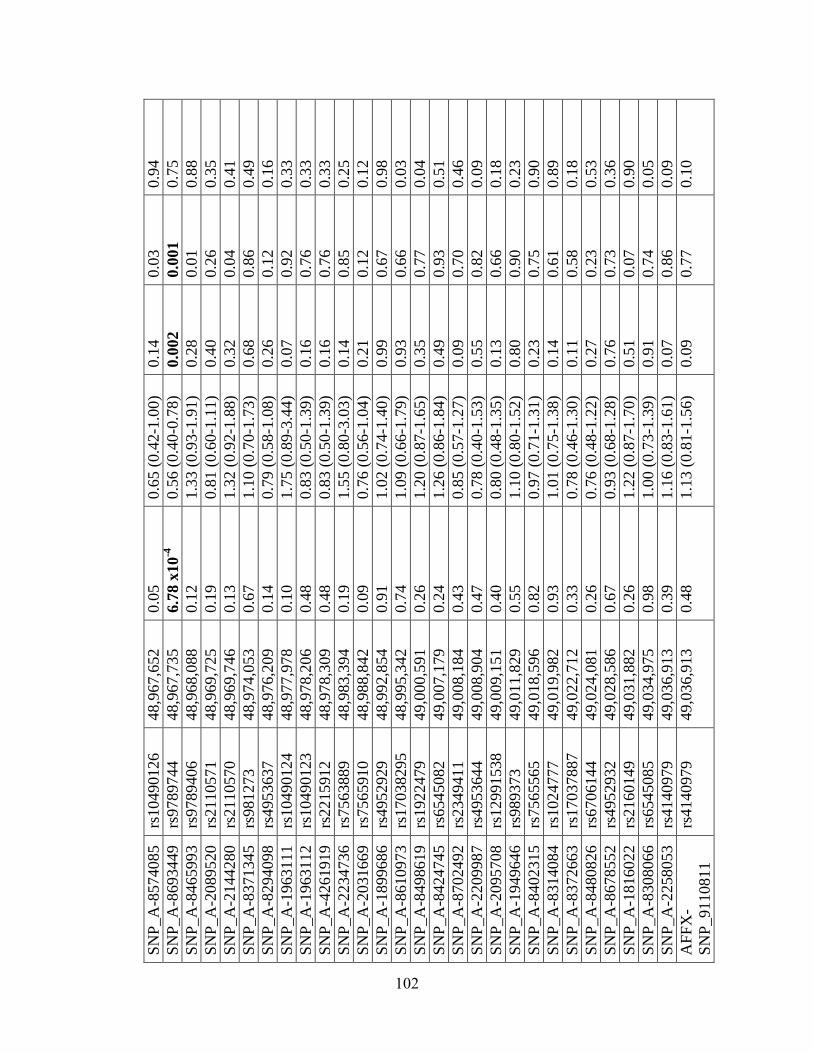
SN
P_A
-8574085
rs10490126
48
,967,6
52
0.0
5
0.6
5 (
0.4
2-1
.00)
0.1
4
0.0
3
0.9
4
SN
P_A
-8693449
rs9789744
48
,967,7
35
6.7
8 x
10
-4
0.5
6 (
0.4
0-0
.78)
0.0
02
0.0
01
0.7
5
SN
P_A
-8465993
rs9789406
48
,968,0
88
0.1
2
1.3
3 (
0.9
3-1
.91)
0.2
8
0.0
1
0.8
8
SN
P_A
-2089520
rs2110571
48
,969,7
25
0.1
9
0.8
1 (
0.6
0-1
.11)
0.4
0
0.2
6
0.3
5
SN
P_A
-2144280
rs2110570
48
,969,7
46
0.1
3
1.3
2 (
0.9
2-1
.88)
0.3
2
0.0
4
0.4
1
SN
P_A
-8371345
rs981273
48
,974,0
53
0.6
7
1.1
0 (
0.7
0-1
.73)
0.6
8
0.8
6
0.4
9
SN
P_A
-8294098
rs4953637
48
,976,2
09
0.1
4
0.7
9 (
0.5
8-1
.08)
0.2
6
0.1
2
0.1
6
SN
P_A
-1963111
rs10490124
48
,977,9
78
0.1
0
1.7
5 (
0.8
9-3
.44)
0.0
7
0.9
2
0.3
3
SN
P_A
-1963112
rs10490123
48
,978,2
06
0.4
8
0.8
3 (
0.5
0-1
.39)
0.1
6
0.7
6
0.3
3
SN
P_A
-4261919
rs2215912
48
,978,3
09
0.4
8
0.8
3 (
0.5
0-1
.39)
0.1
6
0.7
6
0.3
3
SN
P_A
-2234736
rs7563889
48
,983,3
94
0.1
9
1.5
5 (
0.8
0-3
.03)
0.1
4
0.8
5
0.2
5
SN
P_A
-2031669
rs7565910
48
,988,8
42
0.0
9
0.7
6 (
0.5
6-1
.04)
0.2
1
0.1
2
0.1
2
SN
P_A
-1899686
rs4952929
48
,992,8
54
0.9
1
1.0
2 (
0.7
4-1
.40)
0.9
9
0.6
7
0.9
8
SN
P_A
-8610973
rs17038295
48
,995,3
42
0.7
4
1.0
9 (
0.6
6-1
.79)
0.9
3
0.6
6
0.0
3
SN
P_A
-8498619
rs1922479
49
,000,5
91
0.2
6
1.2
0 (
0.8
7-1
.65)
0.3
5
0.7
7
0.0
4
SN
P_A
-8424745
rs6545082
49
,007,1
79
0.2
4
1.2
6 (
0.8
6-1
.84)
0.4
9
0.9
3
0.5
1
SN
P_A
-8702492
rs2349411
49
,008,1
84
0.4
3
0.8
5 (
0.5
7-1
.27)
0.0
9
0.7
0
0.4
6
SN
P_A
-2209987
rs4953644
49
,008,9
04
0.4
7
0.7
8 (
0.4
0-1
.53)
0.5
5
0.8
2
0.0
9
SN
P_A
-2095708
rs12991538
49
,009,1
51
0.4
0
0.8
0 (
0.4
8-1
.35)
0.1
3
0.6
6
0.1
8
SN
P_A
-1949646
rs989373
49
,011,8
29
0.5
5
1.1
0 (
0.8
0-1
.52)
0.8
0
0.9
0
0.2
3
SN
P_A
-8402315
rs7565565
49
,018,5
96
0.8
2
0.9
7 (
0.7
1-1
.31)
0.2
3
0.7
5
0.9
0
SN
P_A
-8314084
rs1024777
49
,019,9
82
0.9
3
1.0
1 (
0.7
5-1
.38)
0.1
4
0.6
1
0.8
9
SN
P_A
-8372663
rs17037887
49
,022,7
12
0.3
3
0.7
8 (
0.4
6-1
.30)
0.1
1
0.5
8
0.1
8
SN
P_A
-8480826
rs6706144
49
,024,0
81
0.2
6
0.7
6 (
0.4
8-1
.22)
0.2
7
0.2
3
0.5
3
SN
P_A
-8678552
rs4952932
49
,028,5
86
0.6
7
0.9
3 (
0.6
8-1
.28)
0.7
6
0.7
3
0.3
6
SN
P_A
-1816022
rs2160149
49
,031,8
82
0.2
6
1.2
2 (
0.8
7-1
.70)
0.5
1
0.0
7
0.9
0
SN
P_A
-8308066
rs6545085
49
,034,9
75
0.9
8
1.0
0 (
0.7
3-1
.39)
0.9
1
0.7
4
0.0
5
SN
P_A
-2258053
rs4140979
49
,036,9
13
0.3
9
1.1
6 (
0.8
3-1
.61)
0.0
7
0.8
6
0.0
9
AF
FX
-
SN
P_91108
11
rs4140979
49
,036,9
13
0.4
8
1.1
3 (
0.8
1-1
.56)
0.0
9
0.7
7
0.1
0
102
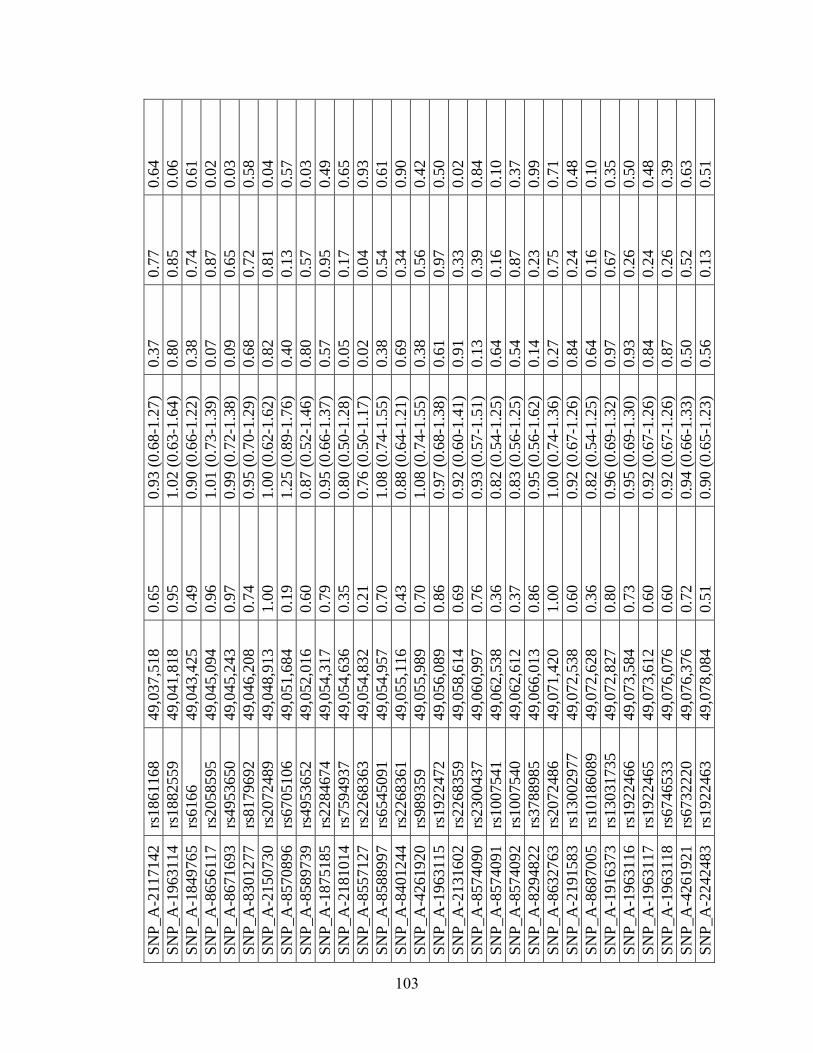
SN
P_A
-2117142
rs1861168
49
,037,5
18
0.6
5
0.9
3 (
0.6
8-1
.27)
0.3
7
0.7
7
0.6
4
SN
P_A
-1963114
rs1882559
49
,041,8
18
0.9
5
1.0
2 (
0.6
3-1
.64)
0.8
0
0.8
5
0.0
6
SN
P_A
-1849765
rs6166
49
,043,4
25
0.4
9
0.9
0 (
0.6
6-1
.22)
0.3
8
0.7
4
0.6
1
SN
P_A
-8656117
rs2058595
49
,045,0
94
0.9
6
1.0
1 (
0.7
3-1
.39)
0.0
7
0.8
7
0.0
2
SN
P_A
-8671693
rs4953650
49
,045,2
43
0.9
7
0.9
9 (
0.7
2-1
.38)
0.0
9
0.6
5
0.0
3
SN
P_A
-8301277
rs8179692
49
,046,2
08
0.7
4
0.9
5 (
0.7
0-1
.29)
0.6
8
0.7
2
0.5
8
SN
P_A
-2150730
rs2072489
49
,048,9
13
1.0
0
1.0
0 (
0.6
2-1
.62)
0.8
2
0.8
1
0.0
4
SN
P_A
-8570896
rs6705106
49
,051,6
84
0.1
9
1.2
5 (
0.8
9-1
.76)
0.4
0
0.1
3
0.5
7
SN
P_A
-8589739
rs4953652
49
,052,0
16
0.6
0
0.8
7 (
0.5
2-1
.46)
0.8
0
0.5
7
0.0
3
SN
P_A
-1875185
rs2284674
49
,054,3
17
0.7
9
0.9
5 (
0.6
6-1
.37)
0.5
7
0.9
5
0.4
9
SN
P_A
-2181014
rs7594937
49
,054,6
36
0.3
5
0.8
0 (
0.5
0-1
.28)
0.0
5
0.1
7
0.6
5
SN
P_A
-8557127
rs2268363
49
,054,8
32
0.2
1
0.7
6 (
0.5
0-1
.17)
0.0
2
0.0
4
0.9
3
SN
P_A
-8588997
rs6545091
49
,054,9
57
0.7
0
1.0
8 (
0.7
4-1
.55)
0.3
8
0.5
4
0.6
1
SN
P_A
-8401244
rs2268361
49
,055,1
16
0.4
3
0.8
8 (
0.6
4-1
.21)
0.6
9
0.3
4
0.9
0
SN
P_A
-4261920
rs989359
49
,055,9
89
0.7
0
1.0
8 (
0.7
4-1
.55)
0.3
8
0.5
6
0.4
2
SN
P_A
-1963115
rs1922472
49
,056,0
89
0.8
6
0.9
7 (
0.6
8-1
.38)
0.6
1
0.9
7
0.5
0
SN
P_A
-2131602
rs2268359
49
,058,6
14
0.6
9
0.9
2 (
0.6
0-1
.41)
0.9
1
0.3
3
0.0
2
SN
P_A
-8574090
rs2300437
49
,060,9
97
0.7
6
0.9
3 (
0.5
7-1
.51)
0.1
3
0.3
9
0.8
4
SN
P_A
-8574091
rs1007541
49
,062,5
38
0.3
6
0.8
2 (
0.5
4-1
.25)
0.6
4
0.1
6
0.1
0
SN
P_A
-8574092
rs1007540
49
,062,6
12
0.3
7
0.8
3 (
0.5
6-1
.25)
0.5
4
0.8
7
0.3
7
SN
P_A
-8294822
rs3788985
49
,066,0
13
0.8
6
0.9
5 (
0.5
6-1
.62)
0.1
4
0.2
3
0.9
9
SN
P_A
-8632763
rs2072486
49
,071,4
20
1.0
0
1.0
0 (
0.7
4-1
.36)
0.2
7
0.7
5
0.7
1
SN
P_A
-2191583
rs13002977
49
,072,5
38
0.6
0
0.9
2 (
0.6
7-1
.26)
0.8
4
0.2
4
0.4
8
SN
P_A
-8687005
rs10186089
49
,072,6
28
0.3
6
0.8
2 (
0.5
4-1
.25)
0.6
4
0.1
6
0.1
0
SN
P_A
-1916373
rs13031735
49
,072,8
27
0.8
0
0.9
6 (
0.6
9-1
.32)
0.9
7
0.6
7
0.3
5
SN
P_A
-1963116
rs1922466
49
,073,5
84
0.7
3
0.9
5 (
0.6
9-1
.30)
0.9
3
0.2
6
0.5
0
SN
P_A
-1963117
rs1922465
49
,073,6
12
0.6
0
0.9
2 (
0.6
7-1
.26)
0.8
4
0.2
4
0.4
8
SN
P_A
-1963118
rs6746533
49
,076,0
76
0.6
0
0.9
2 (
0.6
7-1
.26)
0.8
7
0.2
6
0.3
9
SN
P_A
-4261921
rs6732220
49
,076,3
76
0.7
2
0.9
4 (
0.6
6-1
.33)
0.5
0
0.5
2
0.6
3
SN
P_A
-2242483
rs1922463
49
,078,0
84
0.5
1
0.9
0 (
0.6
5-1
.23)
0.5
6
0.1
3
0.5
1
103
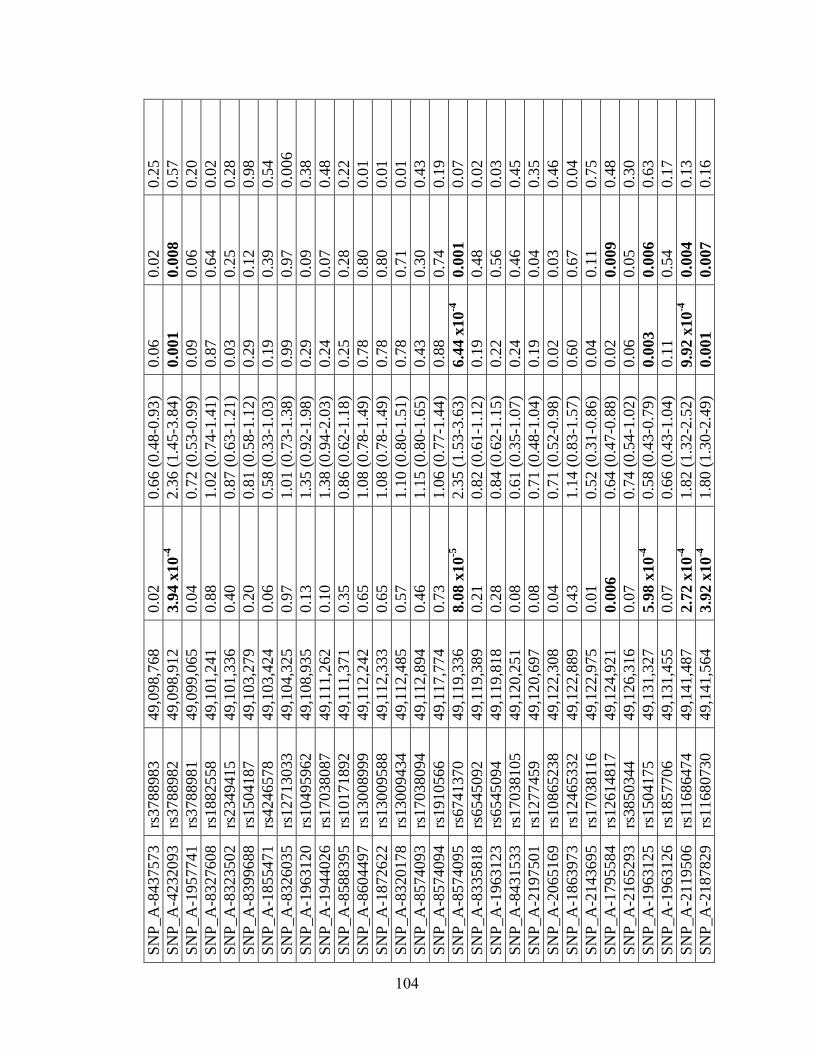
SN
P_A
-8437573
rs3788983
49
,098,7
68
0.0
2
0.6
6 (
0.4
8-0
.93)
0.0
6
0.0
2
0.2
5
SN
P_A
-4232093
rs3788982
49
,098,9
12
3.9
4 x
10
-4
2.3
6 (
1.4
5-3
.84)
0.0
01
0.0
08
0.5
7
SN
P_A
-1957741
rs3788981
49
,099,0
65
0.0
4
0.7
2 (
0.5
3-0
.99)
0.0
9
0.0
6
0.2
0
SN
P_A
-8327608
rs1882558
49
,101,2
41
0.8
8
1.0
2 (
0.7
4-1
.41)
0.8
7
0.6
4
0.0
2
SN
P_A
-8323502
rs2349415
49
,101,3
36
0.4
0
0.8
7 (
0.6
3-1
.21)
0.0
3
0.2
5
0.2
8
SN
P_A
-8399688
rs1504187
49
,103,2
79
0.2
0
0.8
1 (
0.5
8-1
.12)
0.2
9
0.1
2
0.9
8
SN
P_A
-1855471
rs4246578
49
,103,4
24
0.0
6
0.5
8 (
0.3
3-1
.03)
0.1
9
0.3
9
0.5
4
SN
P_A
-8326035
rs12713033
49
,104,3
25
0.9
7
1.0
1 (
0.7
3-1
.38)
0.9
9
0.9
7
0.0
06
SN
P_A
-1963120
rs10495962
49
,108,9
35
0.1
3
1.3
5 (
0.9
2-1
.98)
0.2
9
0.0
9
0.3
8
SN
P_A
-1944026
rs17038087
49
,111,2
62
0.1
0
1.3
8 (
0.9
4-2
.03)
0.2
4
0.0
7
0.4
8
SN
P_A
-8588395
rs10171892
49
,111,3
71
0.3
5
0.8
6 (
0.6
2-1
.18)
0.2
5
0.2
8
0.2
2
SN
P_A
-8604497
rs13008999
49
,112,2
42
0.6
5
1.0
8 (
0.7
8-1
.49)
0.7
8
0.8
0
0.0
1
SN
P_A
-1872622
rs13009588
49
,112,3
33
0.6
5
1.0
8 (
0.7
8-1
.49)
0.7
8
0.8
0
0.0
1
SN
P_A
-8320178
rs13009434
49
,112,4
85
0.5
7
1.1
0 (
0.8
0-1
.51)
0.7
8
0.7
1
0.0
1
SN
P_A
-8574093
rs17038094
49
,112,8
94
0.4
6
1.1
5 (
0.8
0-1
.65)
0.4
3
0.3
0
0.4
3
SN
P_A
-8574094
rs1910566
49
,117,7
74
0.7
3
1.0
6 (
0.7
7-1
.44)
0.8
8
0.7
4
0.1
9
SN
P_A
-8574095
rs6741370
49
,119,3
36
8.0
8 x
10
-5
2.3
5 (
1.5
3-3
.63)
6.4
4 x
10
-4
0.0
01
0.0
7
SN
P_A
-8335818
rs6545092
49
,119,3
89
0.2
1
0.8
2 (
0.6
1-1
.12)
0.1
9
0.4
8
0.0
2
SN
P_A
-1963123
rs6545094
49
,119,8
18
0.2
8
0.8
4 (
0.6
2-1
.15)
0.2
2
0.5
6
0.0
3
SN
P_A
-8431533
rs17038105
49
,120,2
51
0.0
8
0.6
1 (
0.3
5-1
.07)
0.2
4
0.4
6
0.4
5
SN
P_A
-2197501
rs1277459
49
,120,6
97
0.0
8
0.7
1 (
0.4
8-1
.04)
0.1
9
0.0
4
0.3
5
SN
P_A
-2065169
rs10865238
49
,122,3
08
0.0
4
0.7
1 (
0.5
2-0
.98)
0.0
2
0.0
3
0.4
6
SN
P_A
-1863973
rs12465332
49
,122,8
89
0.4
3
1.1
4 (
0.8
3-1
.57)
0.6
0
0.6
7
0.0
4
SN
P_A
-2143695
rs17038116
49
,122,9
75
0.0
1
0.5
2 (
0.3
1-0
.86)
0.0
4
0.1
1
0.7
5
SN
P_A
-1795584
rs12614817
49
,124,9
21
0.0
06
0.6
4 (
0.4
7-0
.88)
0.0
2
0.0
09
0.4
8
SN
P_A
-2165293
rs3850344
49
,126,3
16
0.0
7
0.7
4 (
0.5
4-1
.02)
0.0
6
0.0
5
0.3
0
SN
P_A
-1963125
rs1504175
49
,131,3
27
5.9
8 x
10
-4
0.5
8 (
0.4
3-0
.79)
0.0
03
0.0
06
0.6
3
SN
P_A
-1963126
rs1857706
49
,131,4
55
0.0
7
0.6
6 (
0.4
3-1
.04)
0.1
1
0.5
4
0.1
7
SN
P_A
-2119506
rs11686474
49
,141,4
87
2.7
2 x
10
-4
1.8
2 (
1.3
2-2
.52)
9.9
2 x
10
-4
0.0
04
0.1
3
SN
P_A
-2187829
rs11680730
49
,141,5
64
3.9
2 x
10
-4
1.8
0 (
1.3
0-2
.49)
0.0
01
0.0
07
0.1
6
104
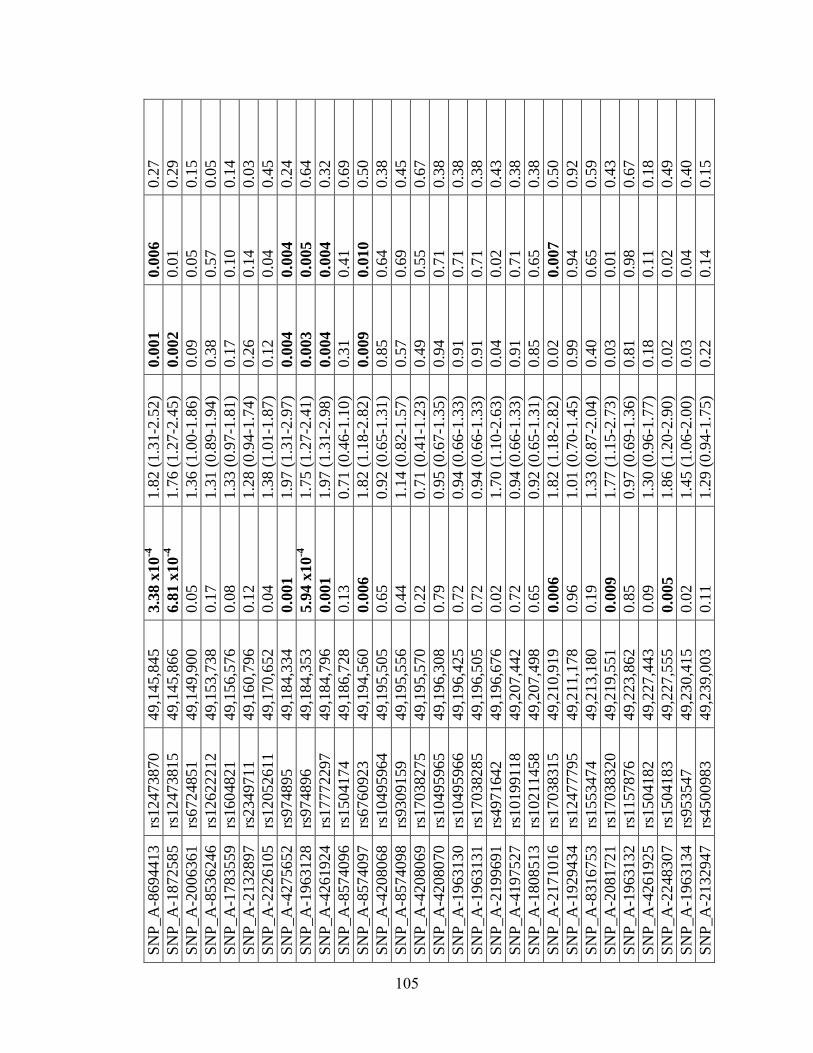
SN
P_A
-8694413
rs12473870
49
,145,8
45
3.3
8 x
10
-4
1.8
2 (
1.3
1-2
.52)
0.0
01
0.0
06
0.2
7
SN
P_A
-1872585
rs12473815
49
,145,8
66
6.8
1 x
10
-4
1.7
6 (
1.2
7-2
.45)
0.0
02
0.0
1
0.2
9
SN
P_A
-2006361
rs6724851
49
,149,9
00
0.0
5
1.3
6 (
1.0
0-1
.86)
0.0
9
0.0
5
0.1
5
SN
P_A
-8536246
rs12622212
49
,153,7
38
0.1
7
1.3
1 (
0.8
9-1
.94)
0.3
8
0.5
7
0.0
5
SN
P_A
-1783559
rs1604821
49
,156,5
76
0.0
8
1.3
3 (
0.9
7-1
.81)
0.1
7
0.1
0
0.1
4
SN
P_A
-2132897
rs2349711
49
,160,7
96
0.1
2
1.2
8 (
0.9
4-1
.74)
0.2
6
0.1
4
0.0
3
SN
P_A
-2226105
rs12052611
49
,170,6
52
0.0
4
1.3
8 (
1.0
1-1
.87)
0.1
2
0.0
4
0.4
5
SN
P_A
-4275652
rs974895
49
,184,3
34
0.0
01
1.9
7 (
1.3
1-2
.97)
0.0
04
0.0
04
0.2
4
SN
P_A
-1963128
rs974896
49
,184,3
53
5.9
4 x
10
-4
1.7
5 (
1.2
7-2
.41)
0.0
03
0.0
05
0.6
4
SN
P_A
-4261924
rs17772297
49
,184,7
96
0.0
01
1.9
7 (
1.3
1-2
.98)
0.0
04
0.0
04
0.3
2
SN
P_A
-8574096
rs1504174
49
,186,7
28
0.1
3
0.7
1 (
0.4
6-1
.10)
0.3
1
0.4
1
0.6
9
SN
P_A
-8574097
rs6760923
49
,194,5
60
0.0
06
1.8
2 (
1.1
8-2
.82)
0.0
09
0.0
10
0.5
0
SN
P_A
-4208068
rs10495964
49
,195,5
05
0.6
5
0.9
2 (
0.6
5-1
.31)
0.8
5
0.6
4
0.3
8
SN
P_A
-8574098
rs9309159
49
,195,5
56
0.4
4
1.1
4 (
0.8
2-1
.57)
0.5
7
0.6
9
0.4
5
SN
P_A
-4208069
rs17038275
49
,195,5
70
0.2
2
0.7
1 (
0.4
1-1
.23)
0.4
9
0.5
5
0.6
7
SN
P_A
-4208070
rs10495965
49
,196,3
08
0.7
9
0.9
5 (
0.6
7-1
.35)
0.9
4
0.7
1
0.3
8
SN
P_A
-1963130
rs10495966
49
,196,4
25
0.7
2
0.9
4 (
0.6
6-1
.33)
0.9
1
0.7
1
0.3
8
SN
P_A
-1963131
rs17038285
49
,196,5
05
0.7
2
0.9
4 (
0.6
6-1
.33)
0.9
1
0.7
1
0.3
8
SN
P_A
-2199691
rs4971642
49
,196,6
76
0.0
2
1.7
0 (
1.1
0-2
.63)
0.0
4
0.0
2
0.4
3
SN
P_A
-4197527
rs10199118
49
,207,4
42
0.7
2
0.9
4 (
0.6
6-1
.33)
0.9
1
0.7
1
0.3
8
SN
P_A
-1808513
rs10211458
49
,207,4
98
0.6
5
0.9
2 (
0.6
5-1
.31)
0.8
5
0.6
5
0.3
8
SN
P_A
-2171016
rs17038315
49
,210,9
19
0.0
06
1.8
2 (
1.1
8-2
.82)
0.0
2
0.0
07
0.5
0
SN
P_A
-1929434
rs12477795
49
,211,1
78
0.9
6
1.0
1 (
0.7
0-1
.45)
0.9
9
0.9
4
0.9
2
SN
P_A
-8316753
rs1553474
49
,213,1
80
0.1
9
1.3
3 (
0.8
7-2
.04)
0.4
0
0.6
5
0.5
9
SN
P_A
-2081721
rs17038320
49
,219,5
51
0.0
09
1.7
7 (
1.1
5-2
.73)
0.0
3
0.0
1
0.4
3
SN
P_A
-1963132
rs1157876
49
,223,8
62
0.8
5
0.9
7 (
0.6
9-1
.36)
0.8
1
0.9
8
0.6
7
SN
P_A
-4261925
rs1504182
49
,227,4
43
0.0
9
1.3
0 (
0.9
6-1
.77)
0.1
8
0.1
1
0.1
8
SN
P_A
-2248307
rs1504183
49
,227,5
55
0.0
05
1.8
6 (
1.2
0-2
.90)
0.0
2
0.0
2
0.4
9
SN
P_A
-1963134
rs953547
49
,230,4
15
0.0
2
1.4
5 (
1.0
6-2
.00)
0.0
3
0.0
4
0.4
0
SN
P_A
-2132947
rs4500983
49
,239,0
03
0.1
1
1.2
9 (
0.9
4-1
.75)
0.2
2
0.1
4
0.1
5
105
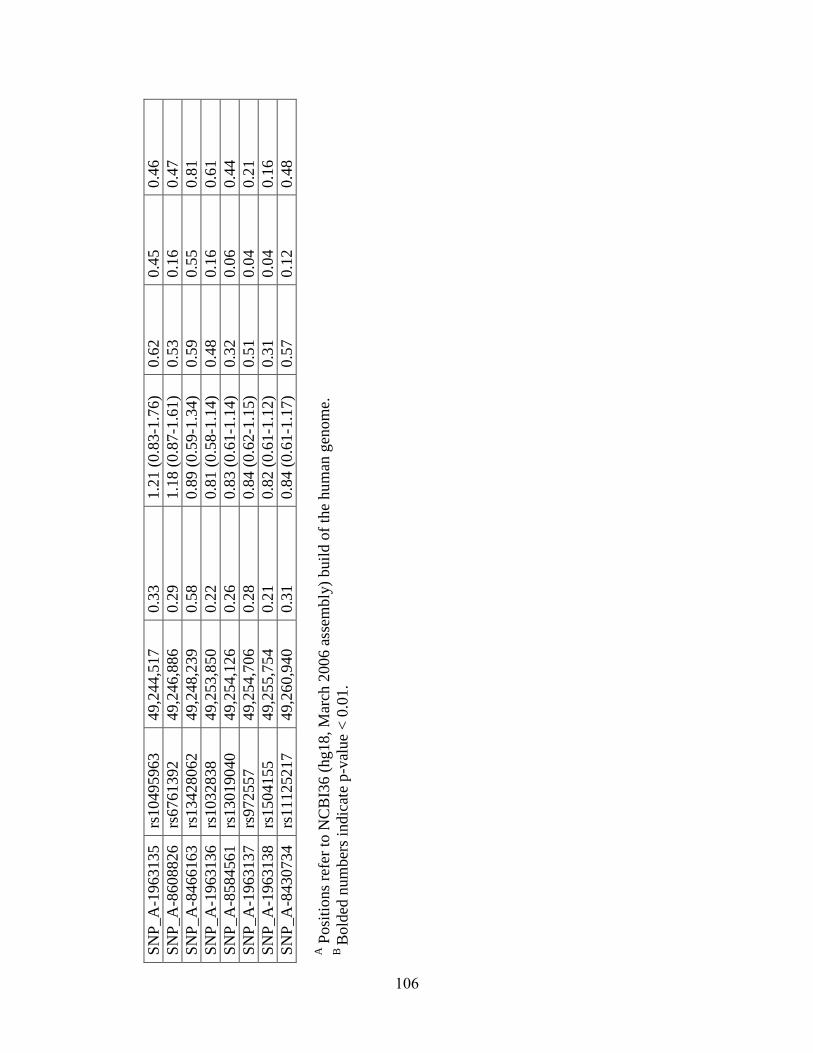
SN
P_A
-1963135
rs10495963
49
,244,5
17
0.3
3
1.2
1 (
0.8
3-1
.76)
0.6
2
0.4
5
0.4
6
SN
P_A
-8608826
rs6761392
49
,246,8
86
0.2
9
1.1
8 (
0.8
7-1
.61)
0.5
3
0.1
6
0.4
7
SN
P_A
-8466163
rs13428062
49
,248,2
39
0.5
8
0.8
9 (
0.5
9-1
.34)
0.5
9
0.5
5
0.8
1
SN
P_A
-1963136
rs1032838
49
,253,8
50
0.2
2
0.8
1 (
0.5
8-1
.14)
0.4
8
0.1
6
0.6
1
SN
P_A
-8584561
rs13019040
49
,254,1
26
0.2
6
0.8
3 (
0.6
1-1
.14)
0.3
2
0.0
6
0.4
4
SN
P_A
-1963137
rs972557
49
,254,7
06
0.2
8
0.8
4 (
0.6
2-1
.15)
0.5
1
0.0
4
0.2
1
SN
P_A
-1963138
rs1504155
49
,255,7
54
0.2
1
0.8
2 (
0.6
1-1
.12)
0.3
1
0.0
4
0.1
6
SN
P_A
-8430734
rs11125217
49
,260,9
40
0.3
1
0.8
4 (
0.6
1-1
.17)
0.5
7
0.1
2
0.4
8
A P
osi
tions
refe
r to
NC
BI3
6 (
hg18, M
arch
2006 a
ssem
bly
) buil
d o
f th
e hum
an g
enom
e.
B B
old
ed n
um
ber
s in
dic
ate
p-v
alue
< 0
.01.
106
Chapter 5: Association of cystolic phospholipase A2 gamma, PLA2G4C, with PTB risk**
Abstract
Correlating differences in genomic sequences with differences in reproductive
physiology across species may led to new insights into mechanisms underlying birth
timing. PLA2G4C, a phospholipase A isoform involved in prostaglandin synthesis,
emerged from a comparative genomics screen of highly conserved noncoding elements as
rapidly evolving in humans. Detailed structural and phylogenic analysis of PLA2G4C
suggested a short genomic element within the gene duplicated from a paralogous highly
conserved element on chromosome 1 specifically in primates. To examine whether this
gene demonstrating primate-specific evolution was associated with birth timing, we
genotyped common variation in PLA2G4C in US Hispanic (n= 73 preterm, 292 control),
US White (n= 147 preterm, 157 control) and US Black (n= 79 preterm, 166 control)
mothers. SNPs rs8110925 and rs2307276 in US Hispanics and rs11564620 in US Whites
were significant after correcting for multiple tests (p<0.004). Additionally, rs11564620
(Thr360Pro) was associated with increased metabolite levels of the prostaglandin
thromboxane in healthy individuals (p=0.02), suggesting this variant may affect
PLA2G4C activity. Association findings suggest variation in PLA2G4C gene may
influence PTB risk by increasing levels of prostaglandins, which are known to regulate
labor.
**
This chapter is adapted from: Plunkett J, et al. Primate-specific evolution of noncoding
element insertion into PLA2G4C and human preterm birth. In preparation.
107
Introduction
A growing body of evidence supports genetic influences on PTB risk; however,
few genes have been consistently associated with the disorder [179; 180]. Investigators
have typically focused on candidate genes selected based on predicted parturition
physiology; however, this approach may be limited by the divergence in physiological
mechanisms between humans and model organisms that have been typically studied. For
example, while a rapid decline in progesterone plays a prominent role in initiating
parturition in rodents and sheep, this signal does not seem to precede human labor [181].
Other parturition-related traits, such as placental morphology and source of progesterone,
also differ importantly in humans compared to model organisms typically studied and
may limit what generalizations can be made [181].
Differences in parturition physiology between apes, including humans, and other
mammals may have developed in response to uniquely human adaptations including
relatively large human head size and narrow birth canal cross-sectional area [127]. Genes
involved in parturition likely have evolved differentially along the human and/or higher
primate phylogenetic lineages to decrease the length of gestation and alleviate the
complications arising from these constraints. As a result, the set of genes rapidly evolving
on the human and/or higher primate lineage likely includes genes that play important
roles in regulating parturition and potentially influence PTB risk. Consistent with our
hypothesis, we identified FSHR as rapidly evolving by nucleotide substitution and as
associated with PTB risk across independent populations [136].
In addition to nucleotide substitution, genomic rearrangements account for an
important portion of genomic divergence among species. For example, Frazer et al. [182]
108
and Wetterbom et al. [183] observed insertions and deletions frequently when comparing
genome sequences among humans, chimpanzees and other primate species. Moreover,
these rearrangements may account for a larger fraction of genomic divergence than
nucleotide substitutions [183]. Rearrangements can lead to loss or acquisition of exons,
splice sites and promoters, facilitating differences in expression patterns, such as those
observed for transcript variants of CHRM3 and SFTPB with differing transposable
element insertion events [184; 185]. Hence, genomic rearrangement may contribute to
rapid evolution along the human and/or higher primate lineages in response to unique
physiological constraints.
We hypothesize that genes with genomic rearrangements from the ancestral state
occurring on the human and/or higher primate lineages may play important roles in birth
timing and preterm delivery. Here, we examine common variants in a gene, PLA2G4C, in
which we have identified a primate-specific insertion event and whose expression in the
uterus [186] and role in prostaglandin synthesis suggest a potential role in parturition, for
association with PTB.
Results
Evolutionary history of a primate-specific PLA2G4C noncoding element. We
identified genes showing evidence of rapid evolution along the human lineage, based on
evidence from a comparative genomic screen of highly conserved noncoding elements as
described in [136]. Among the rapidly evolving genes emerging from our noncoding
screen, PLA2G4C was identified as the most statistically significant gene (human lineage
p=2.2x10⁻⁷
, significant at 10% False Discovery Rate threshold) that was also included in
109
a list of PTB candidate genes [134]. Because the reported deletion of PLA2G4C in cattle
[187] contrasted with its presence in the 17-way MultiZ alignments [165] we used to
identify the gene as rapidly evolving (Figure 5.1A), we examined the history of this
region in greater depth. We compared sequence surrounding the 130 basepair (bp) highly
conserved noncoding element in intron 14 of PLA2G4C on chromosome 19q13.3, which
strongly motivated the gene’s designation as rapidly evolving along the human lineage, to
other mammalian and primate genomes. From such comparisons, we determined that this
130 bp element on human chromosome 19 was highly similar to a highly conserved
noncoding element on human chromosome 1 (BLASTN 114/130 bp identical (87%),
BLAST expect value= 5x10-38
; Figure 5.1B). Subsequent analysis showed the MultiZ
alignments we used in our comparative genomics screen had misaligned the human
chromosome 19 element with sequences in other mammals which were orthologous to
human chromosome 1. When appropriate alignments were examined, we observed that
the human chromosome 19 element was nearly identical in higher primate species
(chimpanzee, gorilla, orangutan, macaque) examined, but, absent in syntenic sequences
in lower primates (lemur, bushbaby, tarsier) and other mammalian species. Chromosome
1 elements from higher primates are more similar to lower primates and other
mammalian species than chromosome 19 elements (Figure 5.2). The chromosome 1
element occurs in the 5’ untranslated region of RNF11, a gene involved in inflammatory
signaling, as it does in mouse. Thus, a duplication of chromosome 1 noncoding element
to chromosome 19 likely occurred before the last common ancestor between apes and
macaque. A phylogenetic tree of coding sequences for PLA2G4C follows the expected
mammalian phylogeny (Figure 5.3), suggesting that the duplication did not include
110
coding sequences. Together these results suggest that neither element would qualify as
rapidly evolving along the human lineage due to nucleotide substitution, but, the
chromosome 19 element may represent a primate-specific change meriting further study.
Association with preterm birth. Because of recent data that suggests heritability
of risk of PTB acts largely or exclusively through the maternal genome [29; 30; 32], we
genotyped US Hispanic (73 preterm, 292 control), US Whites (n= 147 preterm, 157
control) and US Blacks (n= 79 preterm, 166 control) mothers for 14 SNPs in the
PLA2G4C gene region (Table 5.1). The results from these analyses, reported in Table 5.2,
include two SNPs, rs8110925 and rs2307276, in the US Hispanics and one in the US
Whites, rs11564620, that were significant after correcting for 14 tests (p<0.004). The
direction of effect was generally consistent across populations for these SNPs, as noted in
Table 5.2. Meta-analysis p-values for SNPs rs8110925, rs2307276, and rs11564620 were
also statistically significant after correcting for 14 tests (p<0.004; Figure 5.4).
Additionally, 2, 3 and 4 SNP haplotypes containing SNPs rs8110925 and
rs2307276 were significant in the US Hispanics after correcting for 18 haplotype
comparisons (p<0.003), although not more significant than single SNP association
findings (Table 5.3). 2 SNP haplotypes containing rs11564620 were moderately
significant (p<0.05) in US Whites (Table 5.3). Linkage disequilibrium (LD) among SNPs
rs8110925, rs2307276, and rs11564620 was very low (r2<0.1) in the three populations
studied (Figure 5.5), suggesting multiple independent associations were observed.
Association with prostaglandin concentrations. To test the potential functional
effect of associated PLA2G4C variants on prostaglandin metabolism, we compared levels
of metabolites of prostaglandin E2 (PGE), prostaglandin I2 (PGI) and thromboxane (11-
111
DTXB2) among genotype classes for associated SNPs rs8110925, rs2307276, and
rs11564620 in healthy individuals using a two-sided Wald test (Table 5.4). Of note,
rs11564620, a nonsynonymous coding polymorphism, is associated with 11-DTXB2
levels (p=0.04) despite the limited sample size available. The minor allele of rs11564620,
present at approximately 10% frequency in US Whites, is associated with both risk for
PTB and higher 11-DTXB2 levels (Wilcoxon one-sided p=0.02; Figure 5.6).
Discussion
Genomic analysis of PLA2G4C indicated that the conserved element which
brought the gene to our attention was highly similar to a conserved element on human
chromosome 1. Further study suggested that the conserved element on chromosome 1
was duplicated to chromosome 19 along the primate lineage. As a result, human
chromosome 19 noncoding element in intron 14 of PLA2G4C seems to represent a
primate-specific change involving amplification and subsequent divergence rather than a
region of increased nucleotide substitution, per se. We propose this duplicated element
insertion represents a primate-specific change with a potential regulatory role in human
parturition.
Single SNP and haplotype association results implicate the role of SNPs
rs8110925, rs2307276, and rs11564620 in conferring PTB risk (Tables 5.2 and 5.3). The
associated SNPs are located in an 8 kilobase (kb) region of the 3’ end of PLA2G4C, near
the genomic element of interest (Figure 5.7), but show little LD with each other (Figure
5.5) or other SNPs in PLA2G4C documented in the International HapMap Project
database [151]. Of note, Polyphen [188] and SIFT [189] programs predict rs11564620, a
112
nonsynonymous polymorphism in exon 13 resulting in a change in amino acid 360 from
threonine to proline, to be possibly damaging to the protein structure. This 8 kb region
also includes coding sequence for aspartic acid 385, one of the three amino acids that
make up the putative active site of the enzyme [190], such that the proline substitution
may alter the active site’s physical conformation. Supporting the potential functional
effect of rs11564620, this polymorphism is associated with 11-DTXB2 levels in healthy
individuals (p=0.02; Figure 5.6), with proline allele carriers having elevated thromboxane
metabolite levels, compared to threonine homozygotes.
PLA2G4C encodes cytosolic phospholipase A2 gamma, which hydrolizes
phospholipids from the cellular membrane to free arachidonic acid, from which
prostaglandins, including prostaglandins D, E, F, I2 (also known as prostacyclin), and
thromboxane A2 are generated. Prostaglandins likely play an important role in
parturition. Pharmacologically, prostaglandins are used to induce abortion, for cervical
ripening and labor induction, and drugs inhibiting prostaglandin synthesis are successful
in preventing preterm labor [191]. Levels of prostaglandins, including thromboxane A2,
are elevated in pregnant compared to non-pregnant women, and in later (36 weeks)
compared to earlier (20, 30 weeks) gestation [192], suggesting a link between
prostaglandin abundance and parturition timing. Prostaglandins may facilitate labor by
several mechanisms. These hormones are known uterotonic agents and also promote
luteolysis and the onset of labor in species that exhibit progesterone withdrawal prior to
birth [193]. Prostaglandins may also facilitate delivery by affecting placenta function,
since thromboxane A2 induces platelet aggregation and acts as a vasoconstrictor [192].
113

Hence, higher prostaglandin levels than expected may initiate parturition prematurely and
lead to preterm delivery.
The PLA2G4C enzyme is the only cytosolic phospholipase A2 family member
that is constitutively associated with the cellular membrane, the site of prostaglandin
synthesis, rather than translocating to the membrane in response to calcium signaling
[186]. Hence, dysregulation of PLA2G4C may alter prostaglandins levels independent of
other parturition signals, such as oxytocin [194], that act via intracellular calcium
signaling. For example, rs11564620 may contribute to a conformational change in the
enzyme’s active site, rendering it more active than usual and leading to increased
synthesis of prostaglandins, as demonstrated by our observation of higher levels of
thromboxane A2 in minor allele carriers for this polymorphism. Moreover, multiple
splice isoforms of PLA2G4C exist, differing in transcript length, presence of certain
exons and overlapping exons with different boundaries (AceView, NCBI,
http://www.ncbi.nlm.nih.gov/IEB/Research/Acembly/). As a result, variation in
PLA2G4C may contribute to differences in tissue-specific expression or relative
abundance of various PLA2G4C isoforms, potentially altering function. Further study of
the region encompassing these SNPs, including the genomic element of interest, is
needed to examine the mechanism by which variation in PLA2G4C influences birth
timing.
Specialization within multi-gene families, like the large phospholipase A2 gene
family, can create individualized functions among paralogous genes. For example,
PLA2G4C has a continuous association with the cellular membrane, unlike other
phospholipase A2 genes, potentially differentiating its role in prostaglandin synthesis
114
from those of other family members. Genomic variation, such as the element insertion
observed in PLA2G4C, may contribute to gene specialization, as demonstrated by
divergence in PLA2G4C expression patterns in humans versus mice, who lack the
element insertion and express PLA2G4C only in ovary and oocytes [195]. Specialized
genes are potentially better therapeutic targets than gene products with multiple roles
within cell, since pharmaceutically targeting such genes may lead to fewer side effects.
As a result, PLA2G4C may be a useful target for designing novel therapies to prolong
pregnancy and reduce the incidence of PTB.
Material and Methods
Genomic alignments to investigate evolutionary history of PLA2G4C. Noting
the deletion of PLA2G4C reported in the Taurine Cattle genome [187] contrasted with its
presence in the 17-way MultiZ alignments [165] we used to identify the gene as rapidly
evolving (analysis conducted Spring 2007 and presented in [136]), we examined the
history of this region in greater depth. We extracted sequence surrounding the 130 bp
highly conserved noncoding element (human chromosome 19: 48,560,500 -48,560,630;
hg19 genome build) which largely contributed to our designation of PLA2G4C as rapid
evolving along the human lineage. A BLASTN search of the element revealed highly
identical conserved noncoding elements on human chromosomes 1 (87% identity) and 2
(85% identity) (Figure 5.1B). We compared the human chromosome 19 and chromosome
1 sequences to 31 eutherian mammalian genomes using Ensembl Genomic alignments
(accessed September 2009), and ClustalW alignment, and to specific primate genomes
using BLASTN searches of human, chimpanzee, gorilla, orangutan, macaque, and
115
bushbaby genomes (accessed September 2009). We then reconstructed history of the
element by creating phylogenies using the neighbor joining with Kimura distances and
maximum likelihood methods with sequences homologous to the human chromosome 19
element (Figures 5.2) and coding sequences homologous to human PLA2G4C (Figure
5.3).
Human subjects. Study subjects were enrolled for genetic analysis by methods
approved by Institutional Review Boards/Ethics Committees at each participating
institution. Informed consent was obtained for all participants. Mothers with PTB were
included if the birth was spontaneous (non-iatrogenic), singleton, had no obvious
precipitating stimulus (trauma, infection, drug use), and was less than 37 weeks (Yale
University; New York University) or 36 weeks (University of Helsinki; University of
Oulu; Centennial Hospital, Nashville, TN) of completed gestation. Control mothers were
included if they delivered two or more children at 37 weeks or later spontaneously.
Healthy volunteers were recruited at Vanderbilt University for studies of prostaglandin
metabolism. DNA from blood or saliva was prepared by standard methods.
Race/ethnicity was assigned by self-report. All specimens were linked with demographic
and medical data abstracted from maternal/neonatal records. DNA from blood or saliva
was prepared by standard methods.
Prostaglandin metabolite levels. For individuals enrolled in the prostaglandin
study, urine was collected by standard methods. Levels of the urinary metabolites of
prostaglandin E (PGE), prostaglandin I (PGI) and thromboxane (11-DTXB2) were
quantified by mass spectrometry and normalized to creatinine levels, an indicator of renal
function, in 44 healthy control individuals of Black, Hispanic or White race (median age
116
29, 60% male, 77% White).
Genotyping. We genotyped 14 SNPs spanning the PLA2G4C gene region (Table
5.1) on human chromosome 19 in cohorts of US Hispanics (n= 73 preterm, 292 control
mothers), US Whites (n= 147 preterm, 157 control mothers) and US Blacks (n= 79
preterm, 166 control mothers). For SNP selection, data from the HapMap CEU
population was examined in the Haploview program [177], using tagger and haplotype
block functions, to identify regions of high LD. We selected 1 SNP per haplotype block,
defined using the D’ confidence interval method [178], having the highest minor allele
frequency (MAF) in the CEU population for genotyping. We also included coding SNPs
and SNPs to improve coverage of conserved elements contributing to the gene’s
designation as “rapidly evolving.” This selection scheme resulted in approximately 35%
coverage of the gene region at r2≥0.8. SNPs showing evidence of association in one or
more cohort (p<0.01; n=4) were then genotyped in healthy individuals on whom data on
their concentrations of several prostaglandin metabolites was available to examine
potential functional effects of the variants. All SNPs were genotyped using the Sequenom
iPLEX massARRAY technology (Sequenom, San Diego, CA).
Data Analysis. Data cleaning and analysis was performed with Whole-genome
Association Study Pipeline (WASP) [174] and PLINK [175]. We excluded individuals
based on genotyping quality (<90% call rate) and possible cryptic relatedness and SNPs
based on the following criteria: not in Hardy-Weinberg Equilibrium in controls (p<0.001
2 test), <90% genotype call rate, MAF<0.01). Linkage disequilibrium among SNPs
tested was determined using the Haploview program [177].
117
Our analysis considered PTB affection status (i.e. delivery <37 weeks) as a binary
trait, comparing frequencies between case and control groups of alleles and genotypes by
2 test. Sliding windows of 2,3 and 4 SNP haplotypes also were compared between cases
and controls [175]. Meta-analysis of data for significant SNPs was done using the
Mantel-Haenszel method. We corrected for multiple testing using the simpleM method
[176], which estimates the number of independent tests, given the LD relationships
among SNPs, used to obtain a Bonferroni-corrected critical value.
To test the potential functional effect of associated PLA2G4C variants on
prostaglandin metabolism, we examined the levels of PGE, PGI, and 11-DTXB2,
standardized to normal distributions ( =0, =1), as quantitative traits. A Wald test was
performed to compare the mean phenotype between different allele or genotype classes
for associated SNPs. We also tested whether rs11564620 risk-allele carriers had higher
prostaglandin levels than noncarriers, by comparing the 11-DTXB2 value distribution
among genotype classes with box plots and one-sided Wilcoxon nonparametric test
performed in R [158].
118
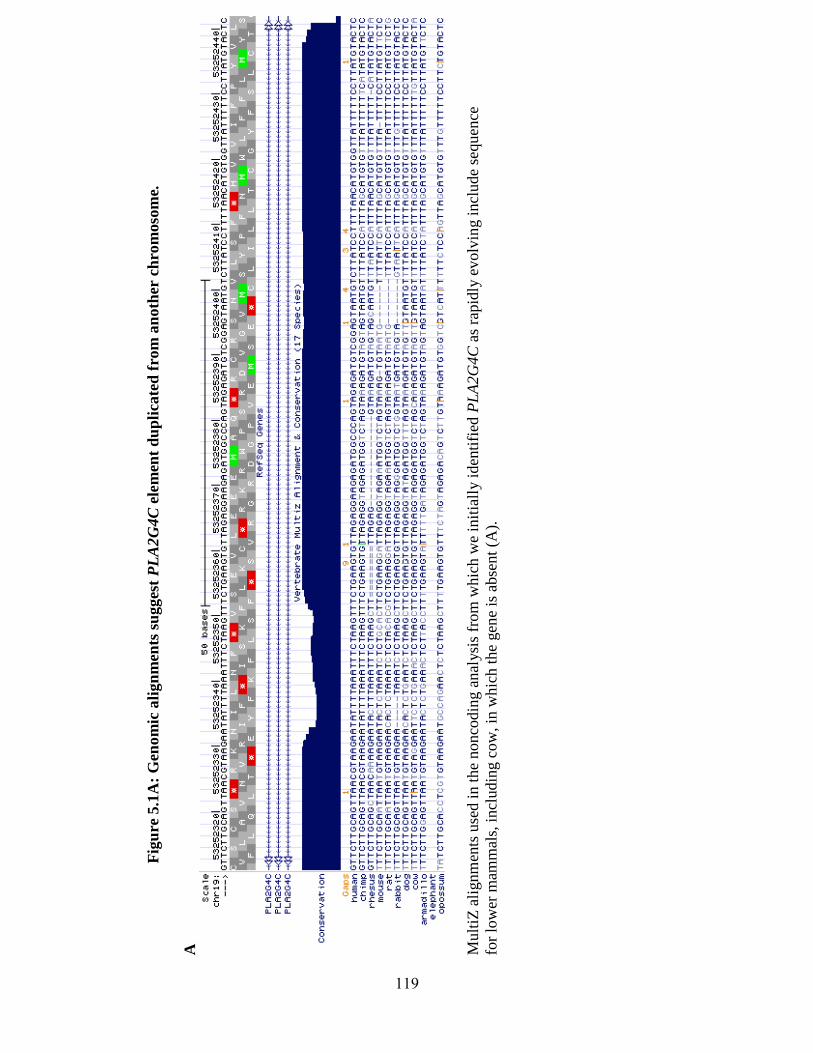
Fig
ure
5.1
A:
Gen
om
ic a
lign
men
ts s
ug
ges
t P
LA
2G
4C
ele
men
t d
up
lica
ted
fro
m a
noth
er c
hro
moso
me.
A
M
ult
iZ a
lignm
ents
use
d i
n t
he
nonco
din
g a
nal
ysi
s fr
om
whic
h w
e in
itia
lly i
den
tifi
ed P
LA
2G
4C
as
rapid
ly e
volv
ing i
ncl
ude
sequen
ce
for
low
er m
amm
als,
incl
udin
g c
ow
, in
whic
h t
he
gen
e is
abse
nt
(A).
119
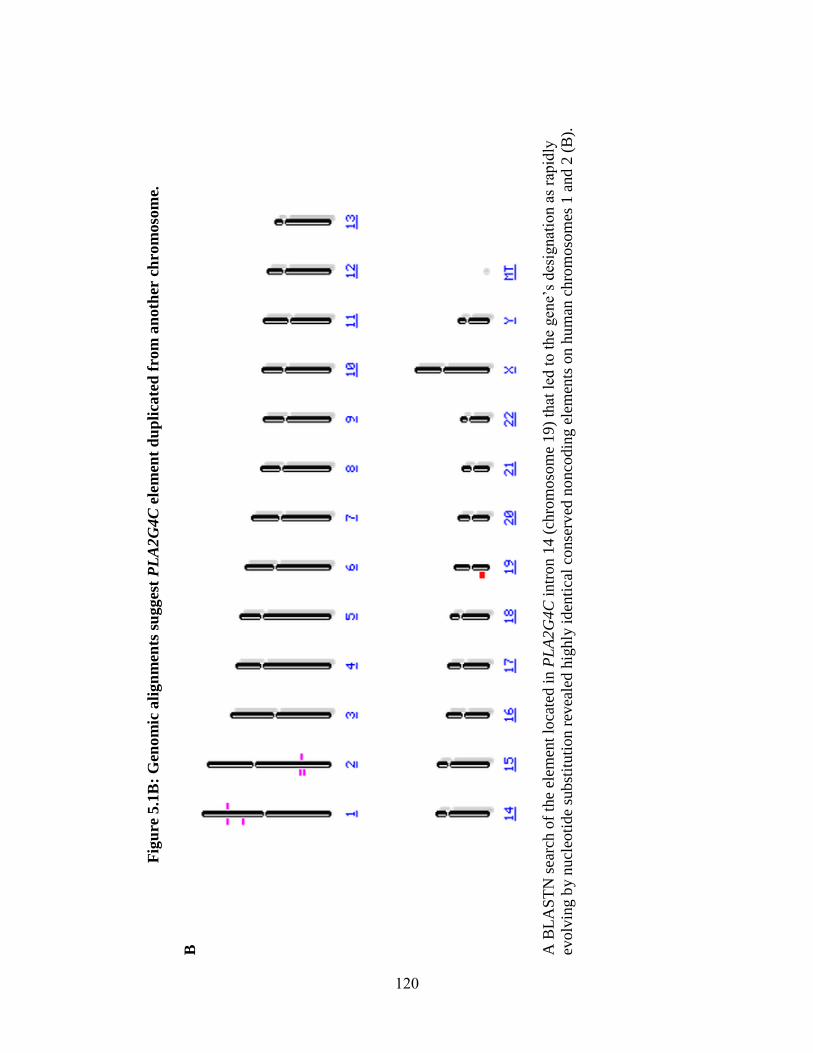
Fig
ure
5.1
B:
Gen
om
ic a
lign
men
ts s
ug
ges
t P
LA
2G
4C
ele
men
t d
up
lica
ted
fro
m a
noth
er c
hro
moso
me.
B
A
BL
AS
TN
sea
rch o
f th
e el
emen
t lo
cate
d i
n P
LA
2G
4C
intr
on 1
4 (
chro
moso
me
19)
that
led
to t
he
gen
e’s
des
ignat
ion a
s ra
pid
ly
evolv
ing b
y n
ucl
eoti
de
subst
ituti
on r
evea
led h
ighly
iden
tica
l co
nse
rved
no
nco
din
g e
lem
ents
on h
um
an c
hro
moso
mes
1 a
nd 2
(B
).
120
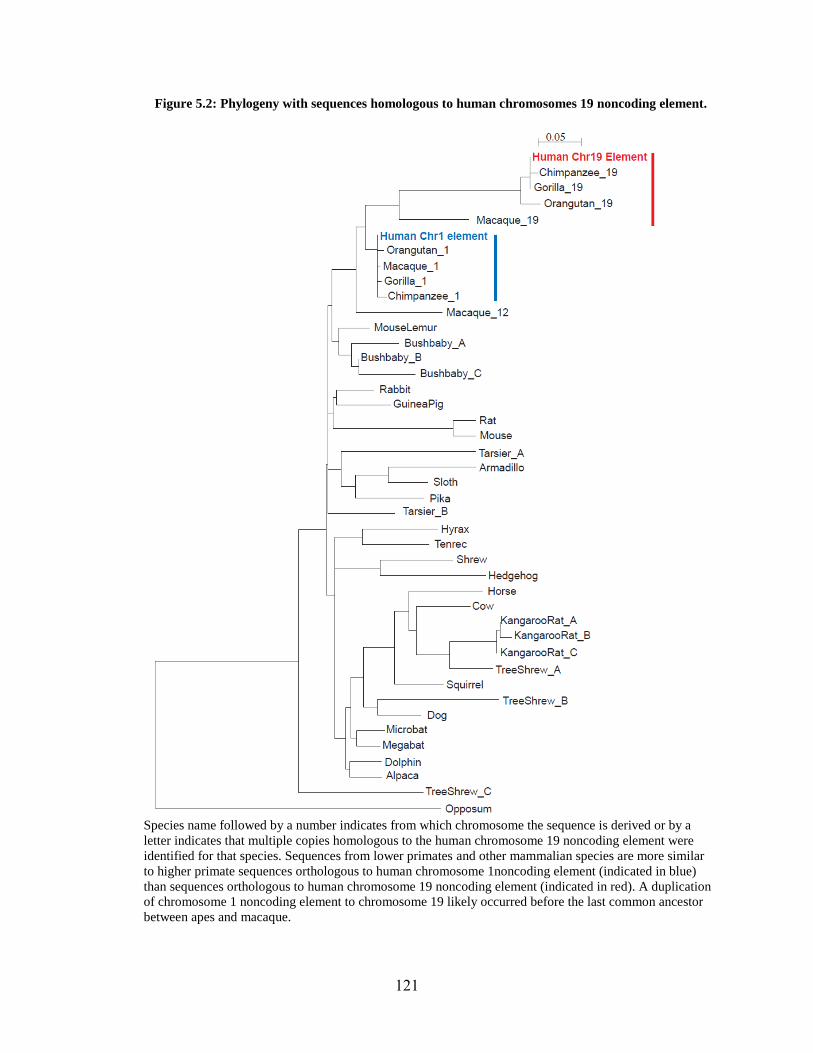
Figure 5.2: Phylogeny with sequences homologous to human chromosomes 19 noncoding element.
Species name followed by a number indicates from which chromosome the sequence is derived or by a
letter indicates that multiple copies homologous to the human chromosome 19 noncoding element were
identified for that species. Sequences from lower primates and other mammalian species are more similar
to higher primate sequences orthologous to human chromosome 1noncoding element (indicated in blue)
than sequences orthologous to human chromosome 19 noncoding element (indicated in red). A duplication
of chromosome 1 noncoding element to chromosome 19 likely occurred before the last common ancestor
between apes and macaque.
121
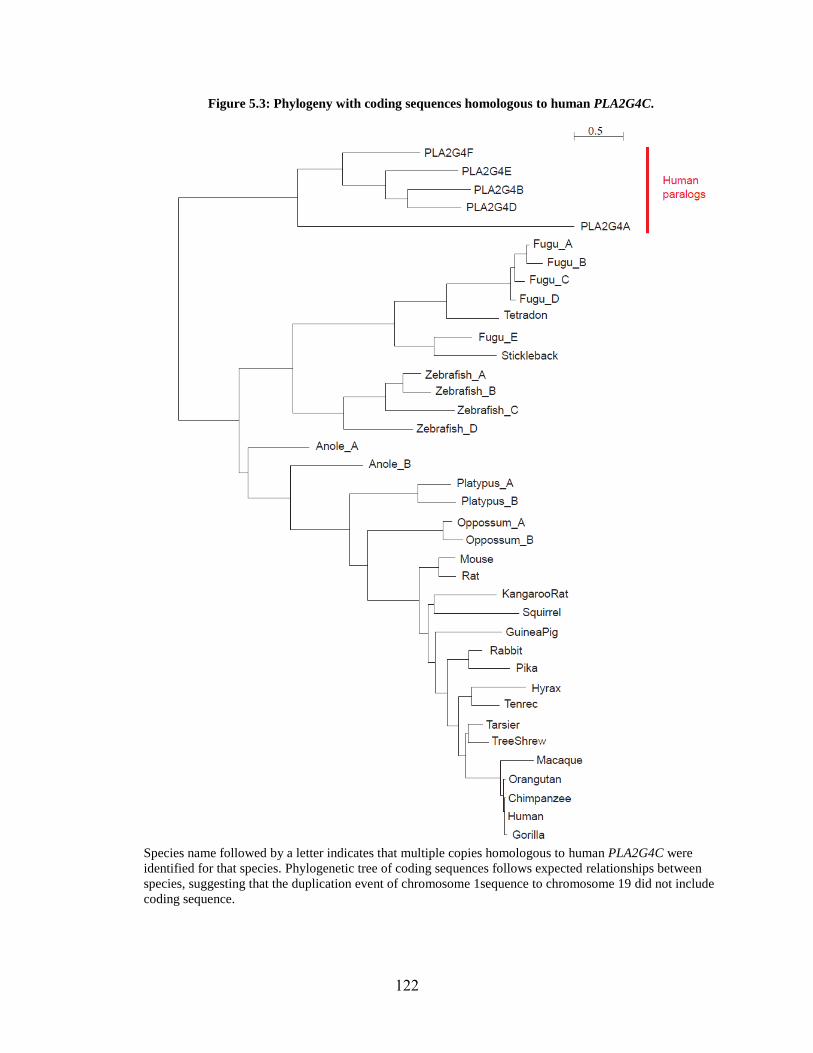
Figure 5.3: Phylogeny with coding sequences homologous to human PLA2G4C.
Species name followed by a letter indicates that multiple copies homologous to human PLA2G4C were
identified for that species. Phylogenetic tree of coding sequences follows expected relationships between
species, suggesting that the duplication event of chromosome 1sequence to chromosome 19 did not include
coding sequence.
122
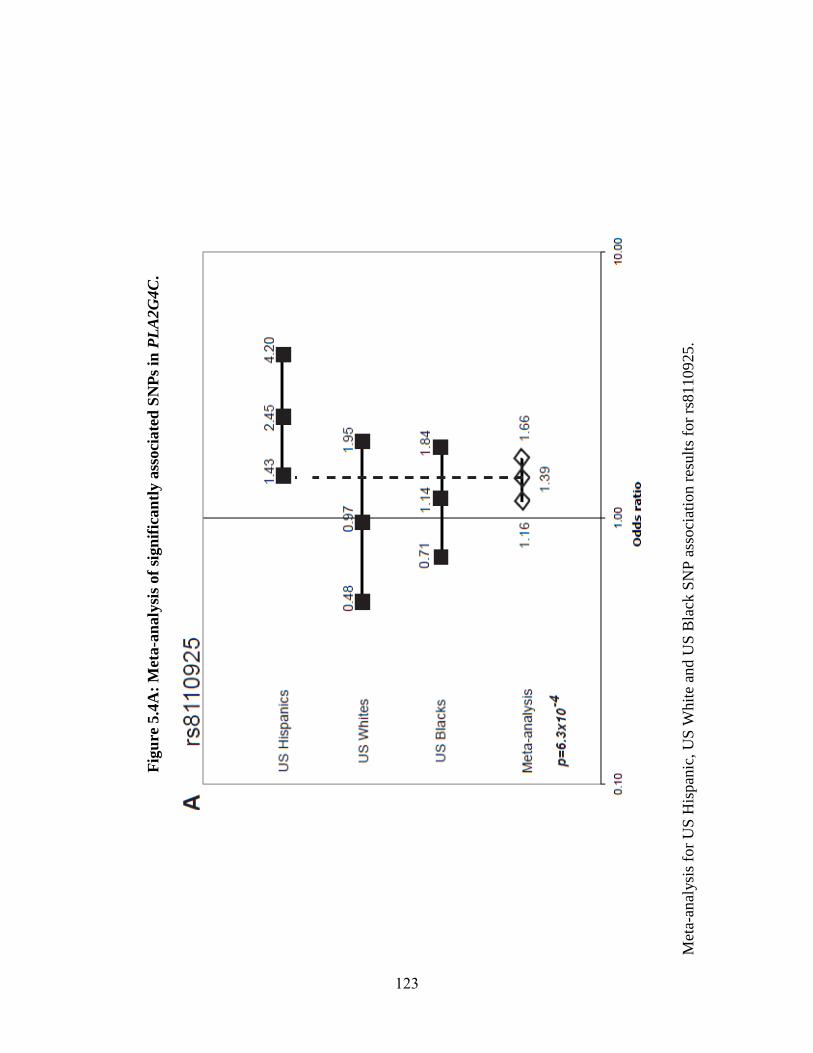
Fig
ure
5.4
A:
Met
a-a
naly
sis
of
sign
ific
an
tly a
ssoci
ate
d S
NP
s in
PL
A2G
4C
.
Met
a-an
alysi
s fo
r U
S H
ispan
ic, U
S W
hit
e an
d U
S B
lack
SN
P a
ssoci
atio
n r
esult
s fo
r rs
8110925.
123
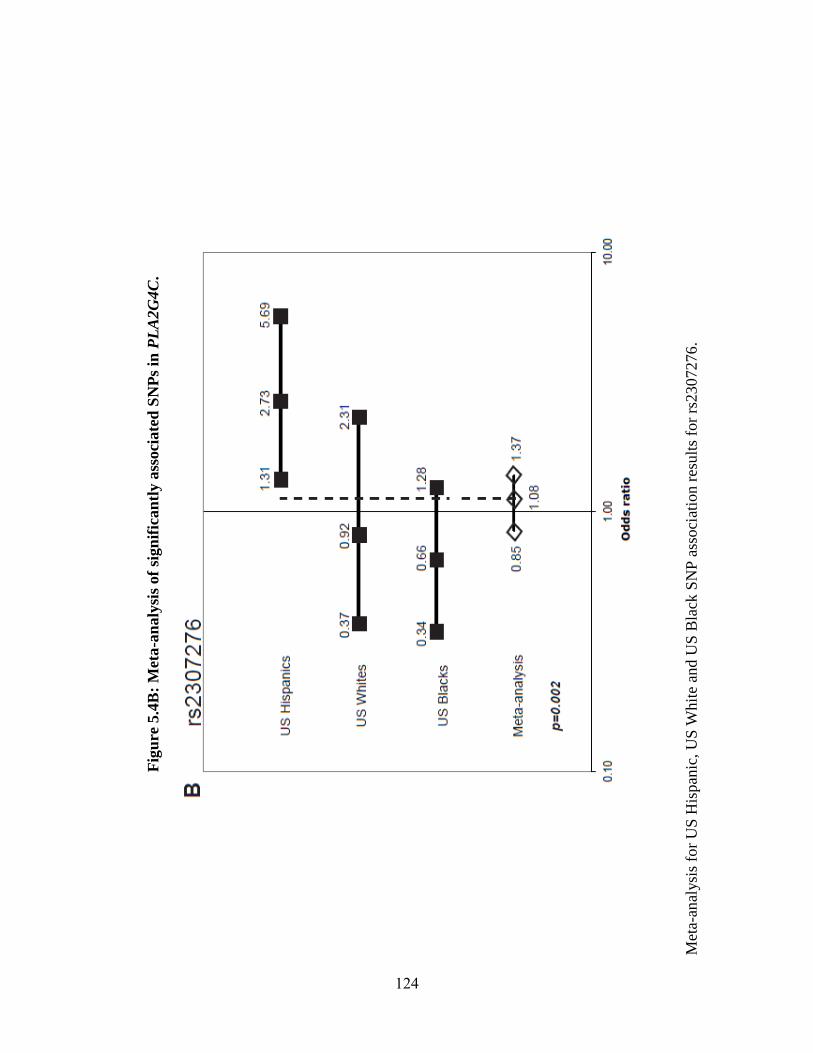
Fig
ure
5.4
B:
Met
a-a
naly
sis
of
sign
ific
an
tly a
ssoci
ate
d S
NP
s in
PL
A2G
4C
.
Met
a-an
alysi
s fo
r U
S H
ispan
ic, U
S W
hit
e an
d U
S B
lack
SN
P a
ssoci
atio
n r
esult
s fo
r rs
2307276
.
124
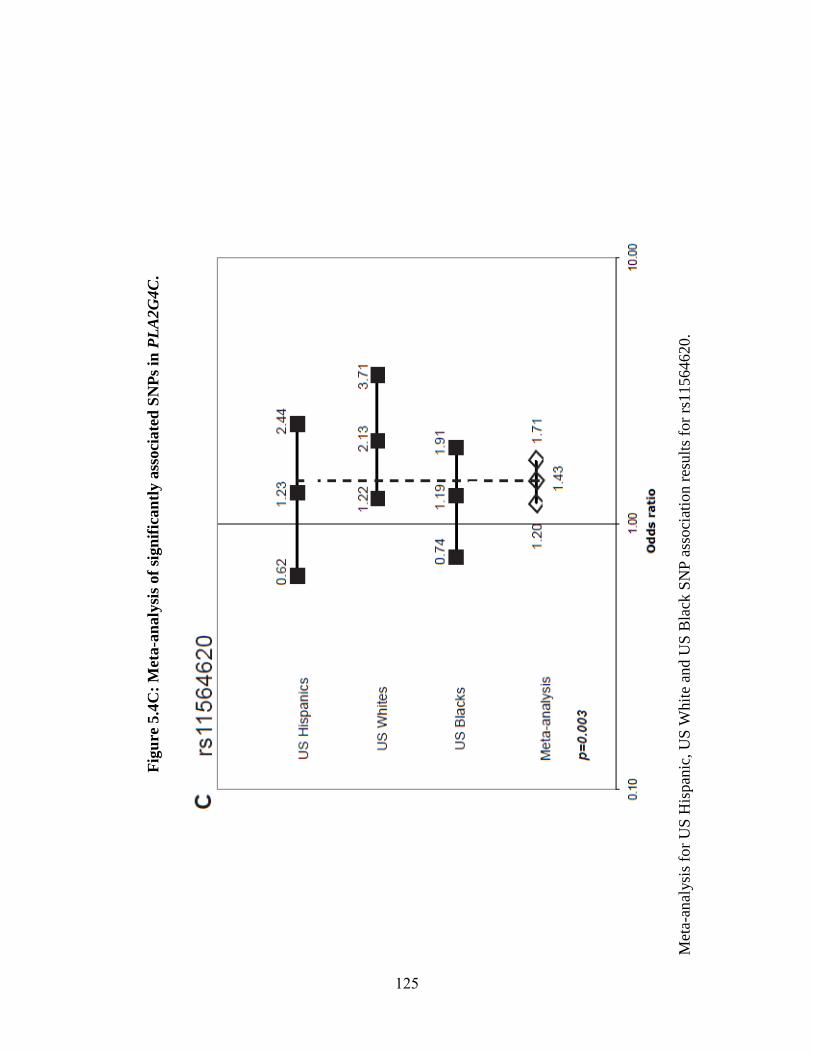
Fig
ure
5.4
C:
Met
a-a
naly
sis
of
sign
ific
an
tly a
ssoci
ate
d S
NP
s in
PL
A2G
4C
.
Met
a-an
alysi
s fo
r U
S H
ispan
ic, U
S W
hit
e an
d U
S B
lack
SN
P a
ssoci
atio
n r
esult
s fo
r rs
11564620.
125
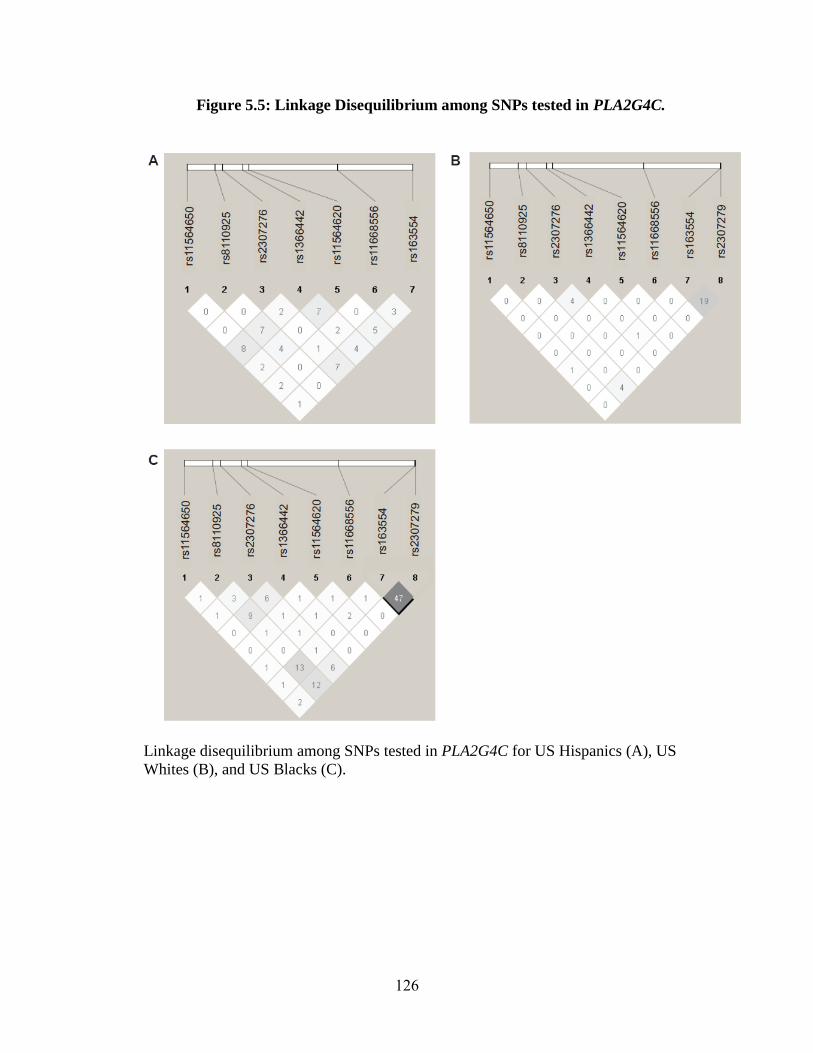
Figure 5.5: Linkage Disequilibrium among SNPs tested in PLA2G4C.
Linkage disequilibrium among SNPs tested in PLA2G4C for US Hispanics (A), US
Whites (B), and US Blacks (C).
126
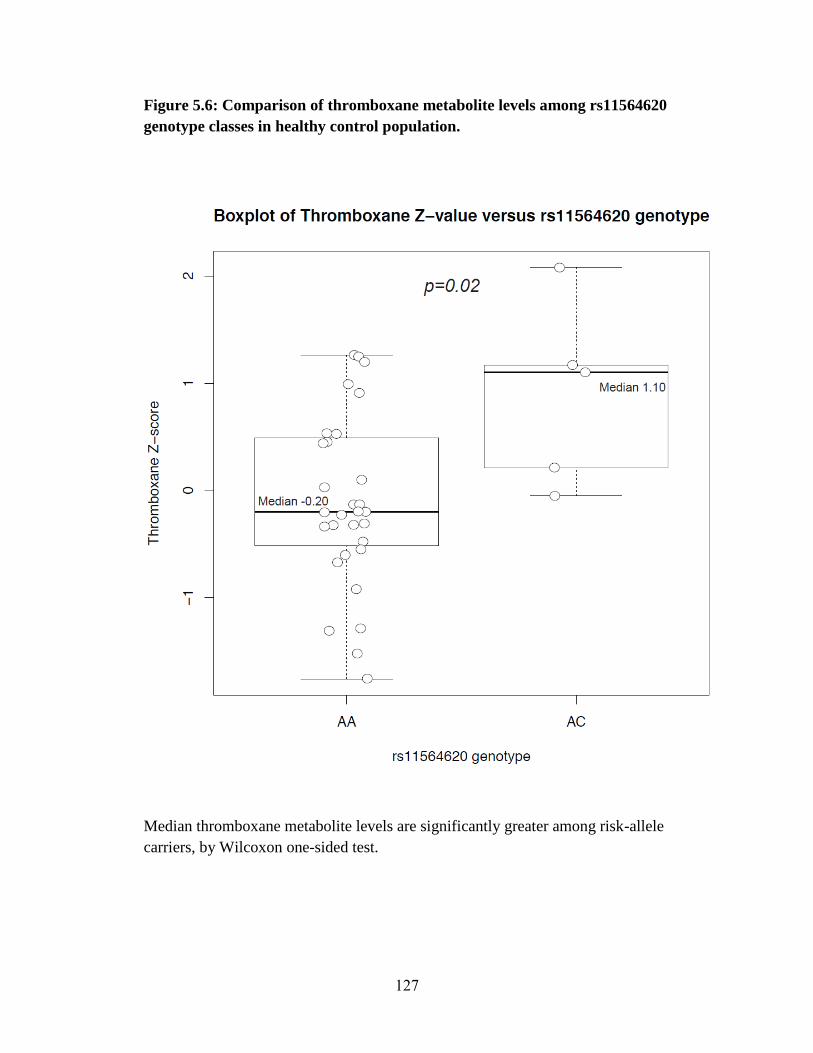
Figure 5.6: Comparison of thromboxane metabolite levels among rs11564620
genotype classes in healthy control population.
Median thromboxane metabolite levels are significantly greater among risk-allele
carriers, by Wilcoxon one-sided test.
127
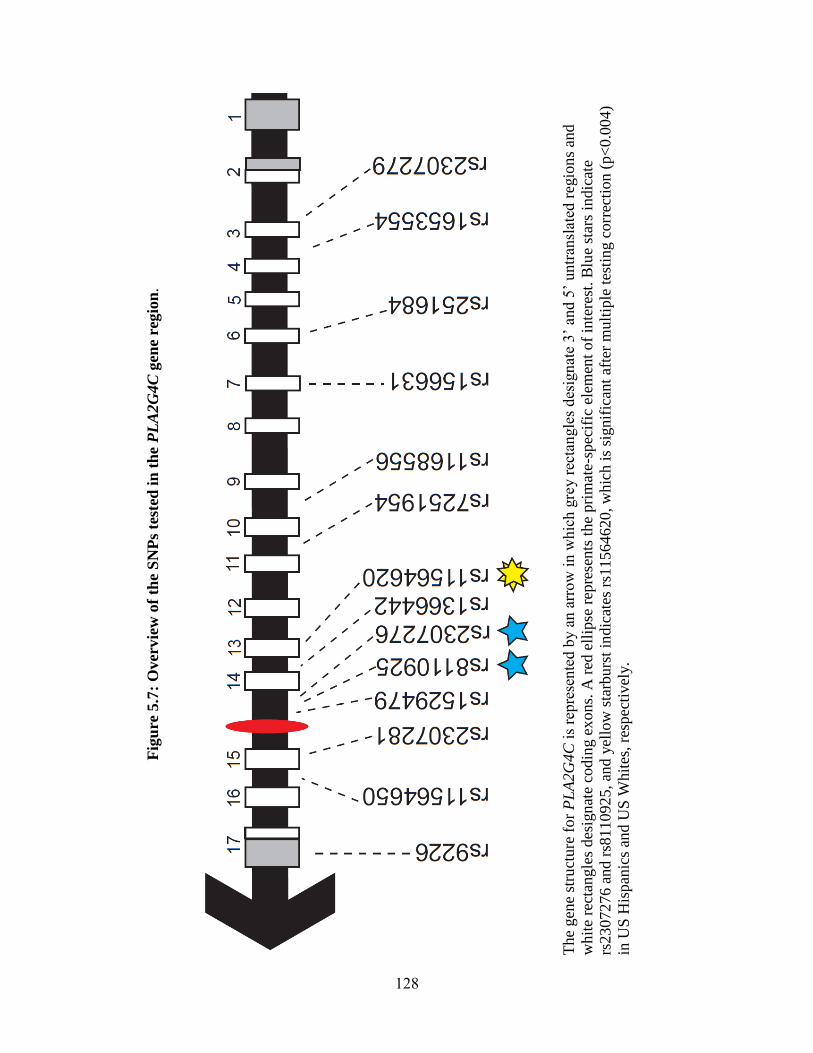
Fig
ure
5.7
: O
ver
vie
w o
f th
e S
NP
s te
sted
in
th
e P
LA
2G
4C
gen
e re
gio
n.
T
he
gen
e st
ruct
ure
fo
r P
LA
2G
4C
is
repre
sente
d b
y a
n a
rro
w i
n w
hic
h g
rey r
ecta
ngle
s d
esig
nat
e 3’
and 5
’ untr
ansl
ated
reg
ion
s an
d
whit
e re
ctan
gle
s des
ignat
e co
din
g e
xon
s. A
red
ell
ipse
rep
rese
nts
the
pri
mat
e-s
pec
ific
ele
men
t of
inte
rest
. B
lue
star
s in
dic
ate
rs2307276 a
nd r
s811092
5, an
d y
ello
w s
tarb
urs
t in
dic
ates
rs1
1564620, w
hic
h i
s si
gnif
ican
t af
ter
mult
iple
tes
ting c
orr
ecti
on (
p<
0.0
04)
in U
S H
ispan
ics
and U
S W
hit
es, re
spec
tivel
y.
128
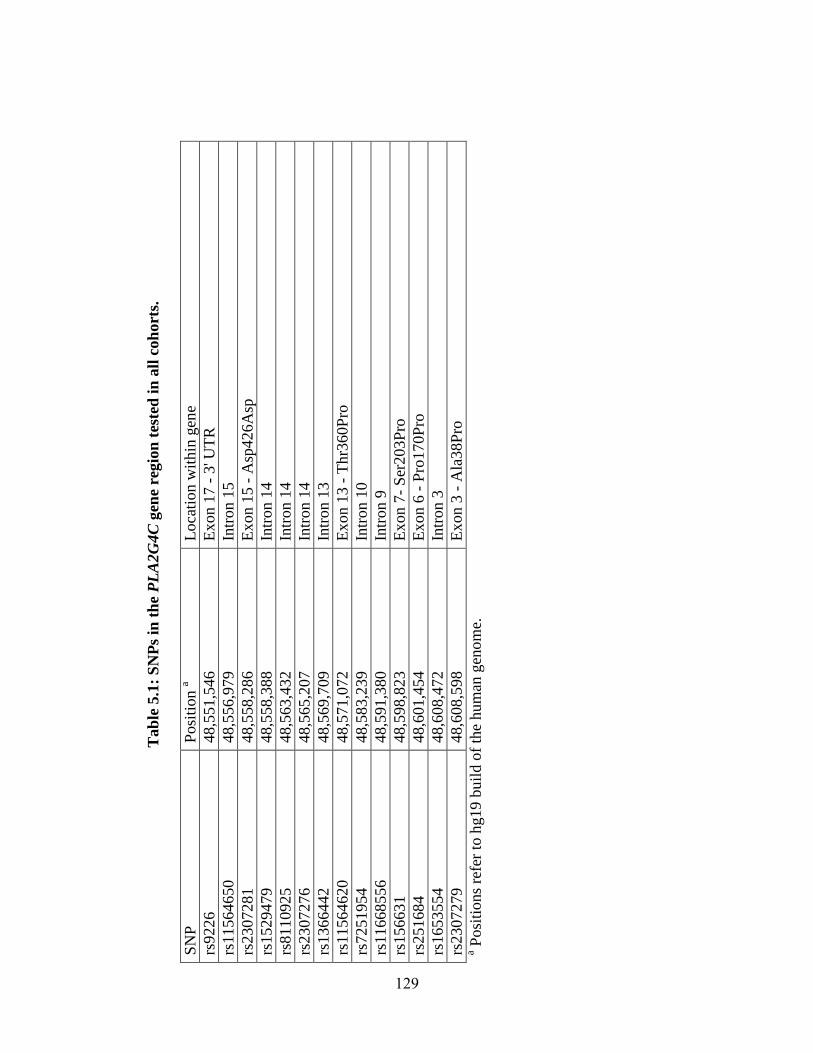
Tab
le 5
.1:
SN
Ps
in t
he
PL
A2G
4C
gen
e re
gio
n t
este
d i
n a
ll c
oh
ort
s.
SN
P
Posi
tion a
Loca
tion w
ithin
gen
e
rs9226
48,5
51,5
46
E
xon 1
7 -
3' U
TR
rs11564650
48,5
56,9
79
In
tron 1
5
rs2307281
48,5
58,2
86
E
xon 1
5 -
Asp
426A
sp
rs1529479
48,5
58,3
88
In
tron 1
4
rs8110925
48,5
63,4
32
In
tron 1
4
rs2307276
48,5
65,2
07
In
tron 1
4
rs1366442
48,5
69,7
09
In
tron 1
3
rs11564620
48,5
71,0
72
E
xon 1
3 -
Thr3
60P
ro
rs7251954
48,5
83,2
39
In
tron 1
0
rs11668556
48,5
91,3
80
In
tron 9
rs156631
48,5
98,8
23
E
xon 7
- S
er203P
ro
rs251684
48,6
01,4
54
E
xon 6
- P
ro170P
ro
rs1653554
48,6
08,4
72
In
tron 3
rs2307279
48,6
08,5
98
E
xon 3
- A
la38P
ro
a Posi
tions
refe
r to
hg19 b
uil
d o
f th
e hum
an g
eno
me.
129
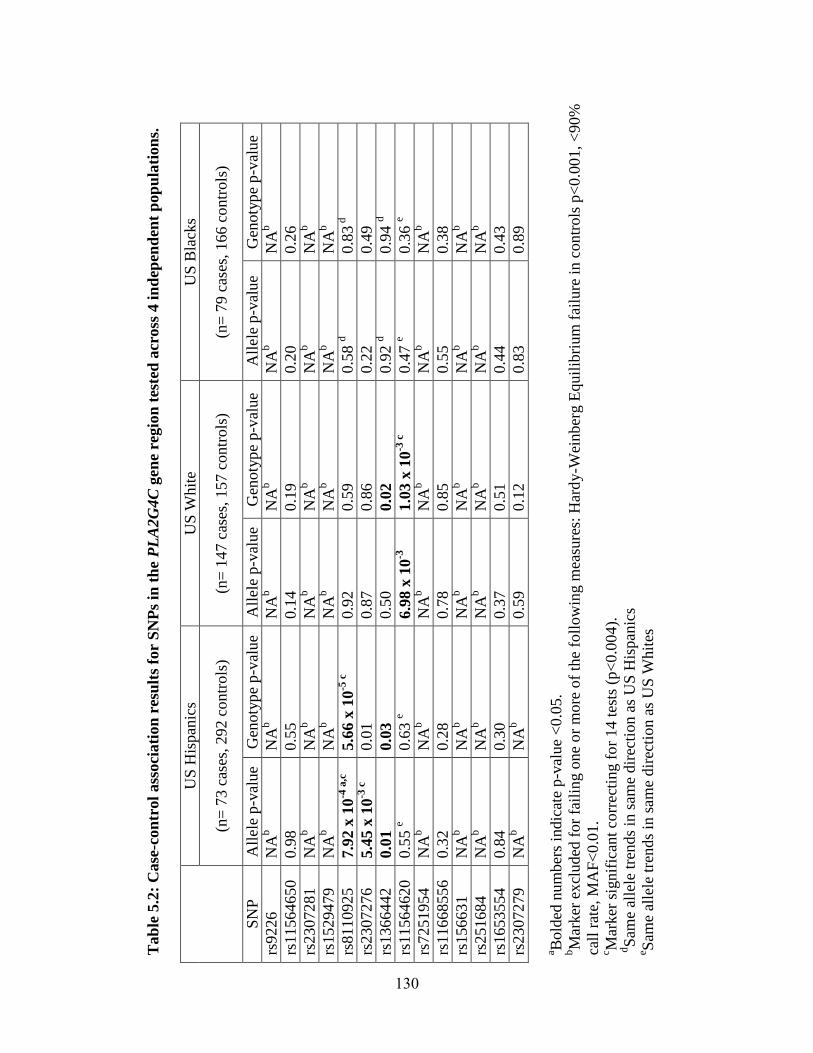
Tab
le 5
.2:
Case
-con
trol
ass
oci
ati
on
res
ult
s fo
r S
NP
s in
th
e P
LA
2G
4C
gen
e re
gio
n t
este
d a
cross
4 i
nd
epen
den
t p
op
ula
tion
s.
US
His
pan
ics
US
Whit
e U
S B
lack
s
(n=
73 c
ases
, 292 c
ontr
ols
) (n
= 1
47 c
ases
, 157 c
ontr
ols
) (n
= 7
9 c
ases
, 166 c
ontr
ols
)
SN
P
All
ele
p-v
alue
Gen
oty
pe
p-v
alue
All
ele
p-v
alue
Gen
oty
pe
p-v
alue
All
ele
p-v
alue
Gen
oty
pe
p-v
alue
rs9226
NA
b
NA
b
NA
b
NA
b
NA
b
NA
b
rs11564650
0.9
8
0.5
5
0.1
4
0.1
9
0.2
0
0.2
6
rs2307281
NA
b
NA
b
NA
b
NA
b
NA
b
NA
b
rs1529479
NA
b
NA
b
NA
b
NA
b
NA
b
NA
b
rs8110925
7.9
2 x
10
-4 a
,c
5.6
6 x
10
-5 c
0.9
2
0.5
9
0.5
8 d
0.8
3 d
rs2307276
5.4
5 x
10
-3 c
0.0
1
0.8
7
0.8
6
0.2
2
0.4
9
rs1366442
0.0
1
0.0
3
0.5
0
0.0
2
0.9
2 d
0.9
4 d
rs11564620
0.5
5 e
0.6
3 e
6.9
8 x
10
-3
1.0
3 x
10
-3 c
0.4
7 e
0.3
6 e
rs7251954
NA
b
NA
b
NA
b
NA
b
NA
b
NA
b
rs11668556
0.3
2
0.2
8
0.7
8
0.8
5
0.5
5
0.3
8
rs156631
NA
b
NA
b
NA
b
NA
b
NA
b
NA
b
rs251684
NA
b
NA
b
NA
b
NA
b
NA
b
NA
b
rs1653554
0.8
4
0.3
0
0.3
7
0.5
1
0.4
4
0.4
3
rs2307279
NA
b
NA
b
0.5
9
0.1
2
0.8
3
0.8
9
a Bold
ed n
um
ber
s in
dic
ate
p-v
alue
<0.0
5.
bM
arker
ex
cluded
for
fail
ing o
ne
or
mo
re o
f th
e fo
llow
ing m
easu
res:
Har
dy
-Wei
nber
g E
quil
ibri
um
fai
lure
in c
ontr
ols
p<
0.0
01, <
90%
call
rat
e, M
AF
<0.0
1.
c Mar
ker
sig
nif
ican
t co
rrec
ting f
or
14 t
ests
(p<
0.0
04).
d
Sam
e al
lele
tre
nds
in s
ame
dir
ecti
on a
s U
S H
ispan
ics
e Sam
e al
lele
tre
nds
in s
ame
dir
ecti
on a
s U
S W
hit
es
130
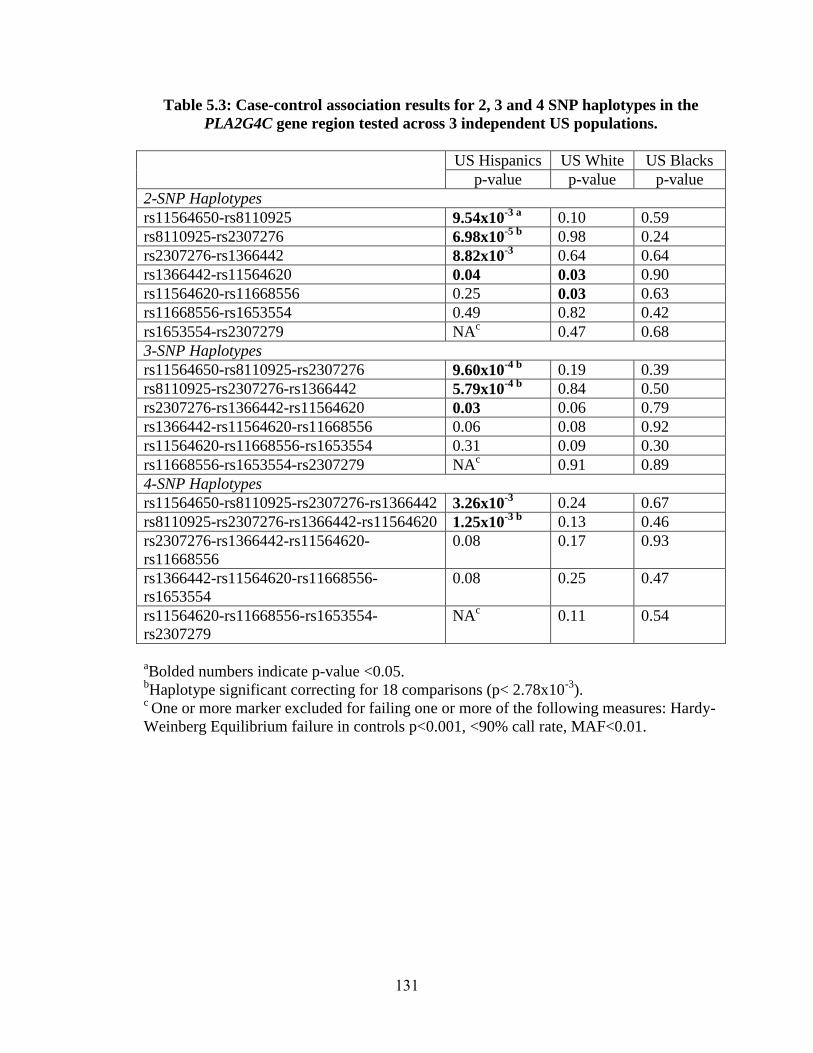
Table 5.3: Case-control association results for 2, 3 and 4 SNP haplotypes in the
PLA2G4C gene region tested across 3 independent US populations.
US Hispanics US White US Blacks
p-value p-value p-value
2-SNP Haplotypes
rs11564650-rs8110925 9.54x10⁻³ a 0.10 0.59
rs8110925-rs2307276 6.98x10⁻⁵ b 0.98 0.24
rs2307276-rs1366442 8.82x10⁻³ 0.64 0.64
rs1366442-rs11564620 0.04 0.03 0.90
rs11564620-rs11668556 0.25 0.03 0.63
rs11668556-rs1653554 0.49 0.82 0.42
rs1653554-rs2307279 NAc 0.47 0.68
3-SNP Haplotypes
rs11564650-rs8110925-rs2307276 9.60x10⁻⁴ b 0.19 0.39
rs8110925-rs2307276-rs1366442 5.79x10⁻⁴ b
0.84 0.50
rs2307276-rs1366442-rs11564620 0.03 0.06 0.79
rs1366442-rs11564620-rs11668556 0.06 0.08 0.92
rs11564620-rs11668556-rs1653554 0.31 0.09 0.30
rs11668556-rs1653554-rs2307279 NAc 0.91 0.89
4-SNP Haplotypes
rs11564650-rs8110925-rs2307276-rs1366442 3.26x10⁻³
0.24 0.67
rs8110925-rs2307276-rs1366442-rs11564620 1.25x10⁻³ b 0.13 0.46
rs2307276-rs1366442-rs11564620-
rs11668556
0.08 0.17 0.93
rs1366442-rs11564620-rs11668556-
rs1653554
0.08 0.25 0.47
rs11564620-rs11668556-rs1653554-
rs2307279
NAc 0.11 0.54
aBolded numbers indicate p-value <0.05.
bHaplotype significant correcting for 18 comparisons (p< 2.78x10
-3).
c One or more marker excluded for failing one or more of the following measures: Hardy-
Weinberg Equilibrium failure in controls p<0.001, <90% call rate, MAF<0.01.
131
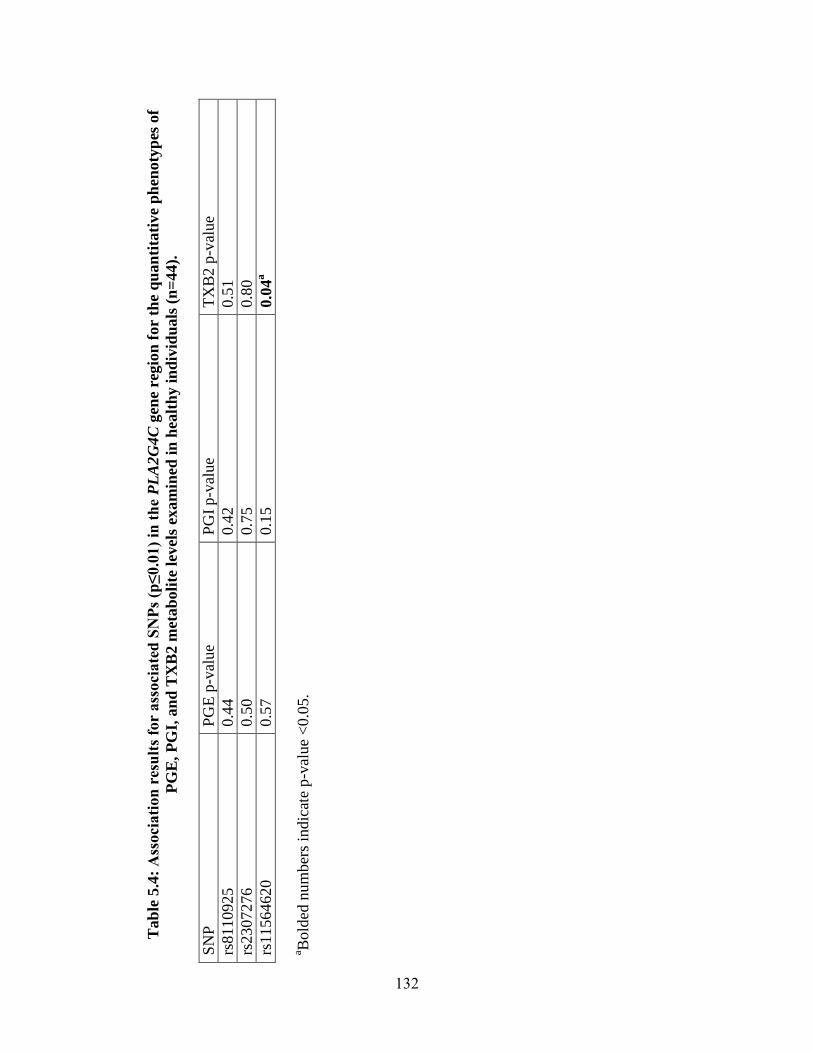
Tab
le 5
.4:
Ass
oci
ati
on
res
ult
s fo
r ass
oci
ate
d S
NP
s (p
≤0.0
1)
in t
he
PL
A2
G4C
gen
e re
gio
n f
or
the q
uan
tita
tive
ph
enoty
pes
of
PG
E,
PG
I, a
nd
TX
B2 m
etab
oli
te l
evel
s ex
am
ined
in
hea
lth
y i
nd
ivid
uals
(n
=44).
SN
P
PG
E p
-val
ue
PG
I p
-val
ue
TX
B2 p
-val
ue
rs8110925
0.4
4
0.4
2
0.5
1
rs2307276
0.5
0
0.7
5
0.8
0
rs11564620
0.5
7
0.1
5
0.0
4a
a Bold
ed n
um
ber
s in
dic
ate
p-v
alue
<0.0
5.
132
Chapter 6: Conclusions and future directions
State of preterm birth genetics prior to this work
Despite the important public health consequences of PTB [3; 4], determinants of
human parturition remain largely uncharacterized, making prediction and prevention of
PTB difficult. Genetic studies are one way in which we can attempt to better understand
this disorder. Prior to this work, little work had been done to characterize genetic
influences on PTB comprehensively. For example, while a variety of evidence suggested
that PTB was influenced by complex genetic and environmental factors, no study had
tested genetic and non-genetic models to support this notion explicitly. Additionally, few
specific genes were associated with PTB at the initiation of this work. Importantly, few
studies examined genes outside of the inflammation and infection pathways, limiting the
potential of genetic studies to identify new biology. As a result, we began this work to
describe genetic influences on PTB in greater depth and identify novel genes associated
with this disorder.
Dissertation specific aims
Because the etiology of PTB is complex and likely involves both genetic and
environmental risk factors, developing a model for the genetic influences on PTB may
facilitate gene discovery. As little work had been done to systematically identify a genetic
model for PTB,we used sibling risk estimates and segregation analyses to identify one.
We examined two standard measures of familial aggregation, the sibling risk
ratio, s, and the sibling-sibling odds ratio (sib-sib OR) to test whether siblings of
preterm infants were at higher risk for preterm delivery themselves. Risk to siblings of an
affected individual was elevated above the population prevalence of a given disorder, as
133
indicated by S ( S (95% CI): 4.3 (4.0-4.6)), and above that of siblings of unaffected
individuals, as indicated by the sib-sib OR (sib-sib OR adjusted for known risk factors
(95% CI): 4.2 (3.9-4.5)). These results suggest that the PTB aggregates in families, which
may be explained in part by genetics.
Additionally, we performed segregation analyses to identify the best fitting
genetic model for gestational age, a quantitative proxy for PTB. We performed
segregation analysis for gestational age as a quantitative trait either attributed to the
infant, infant’s gestational age, or to the mother, by averaging the gestational ages at
which her children were delivered, using 96 multiplex preterm families. Additionally, as
pregnancies in which either the mother [10; 13] or father [6; 7] is Black are at increased
risk for preterm delivery, we performed segregation analysis for each phenotype in the
total sample, as well as stratified by Black and White race, to test for heterogeneity
between these two groups. Results from our segregation analyses lend further support to a
genetic component contributing to birth timing since sporadic (i.e. no familial
resemblance) and nontransmission (i.e. environmental factors alone contribute to
gestational age) models are strongly rejected. Moreover, these results corroborate the
conceptualization of PTB as a complex diseases are influenced by a variety of factors,
none necessary and sufficient to cause the disorder itself, in contrast to Mendelian
disorders in which alterations of a single gene can lead to disease. Analyses of gestational
age attributed to the infant support a model in which mother’s genome and/or maternally-
inherited genes acting in the fetus are largely responsible for birth timing, with a smaller
contribution from the paternally-inherited alleles in the fetal genome. Additionally,
results from a heterogeneity 2 test comparing race-stratified analyses suggest that
134
genetic influences on birth timing may differ between Blacks and Whites. Overall, as
multiple genes in the mother’s genome may explain the bulk of genetic influences on
birth timing and heterogeneity exists among racial groups, future studies to identify
specific genes influencing PTB perhaps will be most fruitful by using large scale studies
of mothers’ genomes and by considering racial composition of the study samples
carefully in their statistical analysis.
We also aimed to discover specific genes associated with PTB using an a priori
method, a screen of genes selected based on an evolutionary-motivated filter, rather than
predicted parturition physiology. Because humans are born developmentally less mature
than other mammals [124; 125], birth timing mechanisms may differ between humans
and model organisms that have been typically studied [126]; as a result,we screened 150
genes, selected because of their rapid evolution along the human lineage, compared to
other mammalian species, rather than our current understanding of parturition. An initial
screen of over 8000 SNPs in 165 preterm and 163 Finnish mothers identified an
enrichment of variants in FSHR associated with PTB and prompted further study of the
gene. Additionally, the phospholipase gene, PLA2G4C, was examined in greater depth, as
it was identified as the gene with the most statistically significant evidence for rapid
evolution that was also included in a list of PTB candidate genes [134]. Several variants
in PLA2G4C showed potential association and were considered for follow-up analysis.
To validate our initial findings,we examined 74 variants showing moderate levels
of association in Finnish mothers in three additional US populations. Three SNPs in
PLA2G4C and one SNP in FSHR were statistically significant after correcting for the
number of independent tests performed for each gene. Meta-analysis p-values for these
135
variants were also significant correcting for multiple comparisons, supporting the role of
PLA2G4C and FSHR in PTB.
Additional work to identify variants in these genes with functional effects was
also initiated. First, we compared metabolite levels of three important downstream targets
of PLA2G4C among genotype classes for significantly associated SNPs in healthy
controls. The nonsynonymous SNP rs11564620 (Thr360Pro) was associated with levels
of the prostaglandin thromboxane, suggesting this variant may affect PLA2G4C activity.
Secondly, because the robustly associated SNP in FSHR was intronic and unlikely to
have a direct effect on function, we initiated sequencing of coding and highly conserved
non-coding regions in the gene in Finnish preterm and control mothers to identify
additional variants, which may have functional effects.
Together, these experiments better characterize the nature of genetic influences on
PTB and provide evidence for novel genes involved in this disorder.
Future directions
While two novel genes have been associated with PTB as the result of this
dissertation project, additional work will be needed to dissect the genetic underpinnings
of PTB robustly and apply this new knowledge towards improved patient care. Such
work may include identifying additional variants in FSHR and PLA2G4C and
determining the ability of highly associated SNPs to predict PTB. Because this work has
examined only common variants, investigating rare variants may be particularly
enlightening. Rare variants tend to have stronger effects on phenotype and may underlie
associations attributed to common variants [196]. A single rare variant or a combination
of multiple rare variants in FSHR, PLA2G4C or other genes may contribute to PTB risk,
as has been shown for other common diseases, like type 1 diabetes and obesity [197];
136
thus, whole exome or targeted sequencing may identify risk-promoting variants in FSHR
and PLA2G4C, and additional genes involved in PTB. For genetic variants of interest,
gravid women may be followed prospectively to compare the pregnancy histories
between women with high risk and low risk genotypes. Further study of the proteins
encoded by FSHR and PLA2G4C will also be important to understand the biological
mechanism by which these genes influence PTB risk. In addition to extensions of our
work on PTB, the evolutionarily-motivated approach we used to identify FSHR and
PLA2G4C also may be applied to other traits that differ between humans and other
mammalian species, such as neurological and language-related traits, to assist gene
discovery.
Alternative approaches may also be used to identify additional genes associated
with PTB. Unbiased genome-wide screens, such as the case-control screen conducted on
a Danish cohort as part of the National Institutes of Health Gene Environment
Association Studies (GENEVA) program, may identify novel genes and pathways for
birth timing, as for other complex disorders like type 2 diabetes [198]. Additionally, non-
additive genetic effects, such as copy number or structural variation, may be important
avenues for future research. Moreover, because complex disorders likely depend on a
number of interacting factors, including genetic, epigenetic and environmental risk
factors [31], some polymorphisms may only increase risk in the context of other genetic
polymorphisms or certain environmental factors; as a result, considering polymorphisms
in multiple genes or gene-environment interactions may increase our power to detect
genetic effects. Investigators have applied this approach in candidate gene studies of
PTB, including two studies of IL6 found association with the gene and disorder only in
137
the presence of bacterial vaginosis [35] or microbial invasion of intra-amniotic cavity
[37]. Similarly, a study found interactive effects for TNF x IL6 x IL6R, but no main
effects for any of the genes [34]. As a result, testing for gene-gene and gene-environment
interactions globally may improve our ability to discover novel PTB genes. Such
approaches may enable investigators to identify novel genes and pathways involved in
birth timing with important clinical applications.
Overall, future studies to understand genetic influences on PTB likely will include
identifying additional genes and specific variants associated with risk and followed with
work to examine biological mechanisms for their involvement in birth timing. In the
same way that the study of other complex disorders has affected the field of PTB
genetics, the evolutionarily-motivated approach for prioritizing genes for inclusion in
association studies we used to identify FSHR and PLA2G4C may be extended to other
complex traits.
138
REFERENCES
1. World Health Organization (1992) International statistical classification of
diseases and related health problems. World Health Organization, Geneva,
Switzerland.
2. Mathews TJ, MacDorman MF (2008) Infant mortality statistics from the 2005
period linked birth/infant death data set. Natl Vital Stat Rep 57:1-32.
3. Esplin MS (2006) Preterm birth: a review of genetic factors and future directions
for genetic study. Obstet Gynecol Surv 61:800-806.
4. Green NS, et al. (2005) Research agenda for preterm birth: recommendations
from the March of Dimes. Am J Obstet Gynecol 193:626-635.
5. Martin JA, et al. (2008) Annual summary of vital statistics: 2006. Pediatrics
121:788-801.
6. Palomar L, et al. (2007) Paternal race is a risk factor for preterm birth. Am J
Obstet Gynecol 197:152 e151-157.
7. Tan H, et al. (2004) Parental race, birth weight, gestational age, and fetal growth
among twin infants in the United States. Early Hum Dev 80:153-160.
8. Goldenberg RL, et al. (1996) Medical, psychosocial, and behavioral risk factors
do not explain the increased risk for low birth weight among black women. Am J
Obstet Gynecol 175:1317-1324.
9. Goldenberg RL, Goepfert AR, Ramsey PS (2005) Biochemical markers for the
prediction of preterm birth. Am J Obstet Gynecol 192:S36-46.
10. Adams MM, et al. (2000) Rates of and factors associated with recurrence of
preterm delivery. J A M A 283:1591-1596.
11. Basso O, Olsen J, Christensen K (1999) Study of environmental, social, and
paternal factors in preterm delivery using sibs and half sibs. A population-based
study in Denmark. J Epidemiol Community Health 53:20-23.
12. Kistka ZA, et al. (2007) Risk for postterm delivery after previous postterm
delivery. Am J Obstet Gynecol 196:241 e241-246.
13. Kistka ZA, et al. (2007) Racial disparity in the frequency of recurrence of preterm
birth. Am J Obstet Gynecol 196:131 e131-136.
14. Mercer BM, et al. (1999) The preterm prediction study: effect of gestational age
and cause of preterm birth on subsequent obstetric outcome. National Institute of
Child Health and Human Development Maternal-Fetal Medicine Units Network.
Am J Obstet Gynecol 181:1216-1221.
15. Winkvist A, Mogren I, Hogberg U (1998) Familial patterns in birth
characteristics: impact on individual and population risks. Int J Epidemiol 27:248-
254.
16. Bloom SL, et al. (2001) Recurrence of preterm birth in singleton and twin
pregnancies. Obstet Gynecol 98:379-385.
17. Melve KK, et al. (1999) Recurrence of gestational age in sibships: implications
for perinatal mortality. Am J Epidemiol 150:756-762.
18. Porter TF, et al. (1997) The risk of preterm birth across generations. Obstet
Gynecol 90:63-67.
139
19. Clausson B, Lichtenstein P, Cnattingius S (2000) Genetic influence on
birthweight and gestational length determined by studies in offspring of twins.
BJOG 107:375-381.
20. Treloar SA, et al. (2000) Genetic influences on premature parturition in an
Australian twin sample. Twin Res 3:80-82.
21. Kistka ZA, et al. (2008) Heritability of parturition timing: an extended twin
design analysis. Am J Obstet Gynecol.
22. Lunde A, et al. (2007) Genetic and environmental influences on birth weight,
birth length, head circumference, and gestational age by use of population-based
parent-offspring data. Am J Epidemiol 165:734-741.
23. Ward K, et al. (2005) The heritability of preterm delivery. Obstet Gynecol
106:1235-1239.
24. Volkov N, et al. (2007) Ehlers-Danlos syndrome: insights on obstetric aspects.
Obstet Gynecol Surv 62:51-57.
25. Ananth CV, Wilcox AJ (2001) Placental abruption and perinatal mortality in the
United States. Am J Epidemiol 153:332-337.
26. Li DK (1999) Changing paternity and the risk of preterm delivery in the
subsequent pregnancy. Epidemiology 10:148-152.
27. Vatten LJ, Skjaerven R (2003) Effects on pregnancy outcome of changing partner
between first two births: prospective population study. Bmj 327:1138.
28. Lie RT, Wilcox AJ, Skjaerven R (2006) Maternal and paternal influences on
length of pregnancy. Obstet Gynecol 107:880-885.
29. Wilcox AJ, Skaerven R, Lie RT (2008) Familial patterns of preterm delivery:
maternal and fetal contributions. Am J Epidemiol 167:474-479.
30. Plunkett J, et al. (2009) Mother's genome or maternally-inherited genes acting in
the fetus influence gestational age in familial preterm birth. Hum Hered 68:209-
219.
31. Joober R, Sengupta S, Boksa P (2005) Genetics of developmental psychiatric
disorders: pathways to discovery. J Psychiatry Neurosci 30:349-354.
32. Kistka ZA, et al. (2008) Heritability of parturition timing: an extended twin
design analysis. Am J Obstet Gynecol 199:43 e41-45.
33. Kalish RB, et al. (2006) Association of a maternal CD14 -159 gene polymorphism
with preterm premature rupture of membranes and spontaneous preterm birth in
multi-fetal pregnancies. J Reprod Immunol 70:109-117.
34. Menon R, et al. (2006) Multilocus interactions at maternal tumor necrosis factor-
alpha, tumor necrosis factor receptors, interleukin-6 and interleukin-6 receptor
genes predict spontaneous preterm labor in European-American women. Am J
Obstet Gynecol 194:1616-1624.
35. Engel SA, et al. (2005) Risk of spontaneous preterm birth is associated with
common proinflammatory cytokine polymorphisms. Epidemiology 16:469-477.
36. Macones GA, et al. (2004) A polymorphism in the promoter region of TNF and
bacterial vaginosis: preliminary evidence of gene-environment interaction in the
etiology of spontaneous preterm birth. Am J Obstet Gynecol 190:1504-1508;
discussion 1503A.
140
37. Velez DR, et al. (2007) Ethnic differences in interleukin 6 (IL-6) and IL6 receptor
genes in spontaneous preterm birth and effects on amniotic fluid protein levels.
Ann Hum Genet 71:586-600.
38. Amory JH, et al. (2004) Adverse outcomes after preterm labor are associated with
tumor necrosis factor-alpha polymorphism -863, but not -308, in mother-infant
pairs. Am J Obstet Gynecol 191:1362-1367.
39. Annells MF, et al. (2004) Interleukins-1, -4, -6, -10, tumor necrosis factor,
transforming growth factor-beta, FAS, and mannose-binding protein C gene
polymorphisms in Australian women: Risk of preterm birth. Am J Obstet Gynecol
191:2056-2067.
40. Chen D, et al. (2003) Tumor necrosis factor-alpha gene G308A polymorphism is
associated with the risk of preterm delivery. Beijing Da Xue Xue Bao 35:377-381.
41. Fortunato SJ, et al. (2008) Racial disparity in maternal-fetal genetic epistasis in
spontaneous preterm birth. Am J Obstet Gynecol 198:666 e661-669; discussion
666 e669-610.
42. Hollegaard MV, et al. (2008) Polymorphisms in the tumor necrosis factor alpha
and interleukin 1-beta promoters with possible gene regulatory functions increase
the risk of preterm birth. Acta Obstet Gynecol Scand 87:1285-1290.
43. Menon R, et al. (2008) Genetic regulation of amniotic fluid TNF-alpha and
soluble TNF receptor concentrations affected by race and preterm birth. Hum
Genet 124:243-253.
44. Moore S, et al. (2004) An investigation into the association among preterm birth,
cytokine gene polymorphisms and periodontal disease. BJOG 111:125-132.
45. Roberts AK, et al. (1999) Association of polymorphism within the promoter of
the tumor necrosis factor alpha gene with increased risk of preterm premature
rupture of the fetal membranes. Am J Obstet Gynecol 180:1297-1302.
46. Velez DR, et al. (2009) Spontaneous preterm birth in African Americans is
associated with infection and inflammatory response gene variants. Am J Obstet
Gynecol 200:209 e201-227.
47. Chen BH, et al. (2007) Association between 49 infant gene polymorphisms and
preterm delivery. Am J Med Genet A 143:1990-1996.
48. Dizon-Townson DS, et al. (1997) A promoter mutation that increases
transcription of the tumor necrosis factor-alpha gene is not associated with
preterm delivery. Am J Obstet Gynecol 177:810-813.
49. Dolan SM, et al. (2007) Systematic review and meta-analyses of preterm birth
genetic association studies. . American Society of Human Genetics, San Diego,
CA.
50. Heinzmann A, et al. (2009) Association of Interleukin-13/-4 and Toll-Like
Receptor 10 with Preterm Births. Neonatology 96:175-181.
51. Menon R, et al. (2006) Analysis of association between maternal tumor necrosis
factor-alpha promoter polymorphism (-308), tumor necrosis factor concentration,
and preterm birth. Am J Obstet Gynecol 195:1240-1248.
52. Menon R, et al. (2006) Ethnic differences in key candidate genes for spontaneous
preterm birth: TNF-alpha and its receptors. Hum Hered 62:107-118.
53. Ryckman KK, et al. Maternal and fetal genetic associations of PTGER3 and
PON1 with preterm birth. PLoS One 5:e9040.
141
54. Speer EM, et al. (2006) Role of single nucleotide polymorphisms of cytokine
genes in spontaneous preterm delivery. Hum Immunol 67:915-923.
55. Stonek F, et al. (2007) A tumor necrosis factor-alpha promoter polymorphism and
pregnancy complications: results of a prospective cohort study in 1652 pregnant
women. Reprod Sci 14:425-429.
56. Velez DR, et al. (2008) Preterm birth in Caucasians is associated with coagulation
and inflammation pathway gene variants. PLoS ONE 3:e3283.
57. Chaves JH, et al. (2008) Maternal and neonatal interleukin-1 receptor antagonist
genotype and pregnancy outcome in a population with a high rate of pre-term
birth. Am J Reprod Immunol 60:312-317.
58. Genc MR, et al. (2004) Polymorphism in intron 2 of the interleukin-1 receptor
antagonist gene, local midtrimester cytokine response to vaginal flora, and
subsequent preterm birth. Am J Obstet Gynecol 191:1324-1330.
59. Murtha AP, et al. (2006) Association of maternal IL-1 receptor antagonist intron 2
gene polymorphism and preterm birth. Am J Obstet Gynecol 195:1249-1253.
60. Witkin SS, et al. (2003) Polymorphism in intron 2 of the fetal interleukin-1
receptor antagonist genotype influences midtrimester amniotic fluid
concentrations of interleukin-1beta and interleukin-1 receptor antagonist and
pregnancy outcome. Am J Obstet Gynecol 189:1413-1417.
61. Hao K, et al. (2004) A candidate gene association study on preterm delivery:
application of high-throughput genotyping technology and advanced statistical
methods. Hum Mol Genet 13:683-691.
62. Hartel C, et al. (2004) Polymorphisms of genes involved in innate immunity:
association with preterm delivery. Mol Hum Reprod 10:911-915.
63. Simhan HN, et al. (2003) Interleukin-6 promoter -174 polymorphism and
spontaneous preterm birth. Am J Obstet Gynecol 189:915-918.
64. Gomez LM, et al. (2010) Evidence of a gene-environment interaction that
predisposes to spontaneous preterm birth: a role for asymptomatic bacterial
vaginosis and DNA variants in genes that control the inflammatory response. Am
J Obstet Gynecol 202:386 e381-386.
65. Sata F, et al. (2009) Proinflammatory cytokine polymorphisms and the risk of
preterm birth and low birthweight in a Japanese population. Mol Hum Reprod
15:121-130.
66. Hamilton BE, et al. (2007) Annual summary of vital statistics: 2005. Pediatrics
119:345-360.
67. Tucker JM, et al. (1991) Etiologies of preterm birth in an indigent population: is
prevention a logical expectation? Obstet Gynecol 77:343-347.
68. Carr DB, et al. (2005) A sister's risk: family history as a predictor of
preeclampsia. Am J Obstet Gynecol 193:965-972.
69. Hladky K, Yankowitz J, Hansen WF (2002) Placental abruption. Obstet Gynecol
Surv 57:299-305.
70. Crider KS, Whitehead N, Buus RM (2005) Genetic variation associated with
preterm birth: a HuGE review. Genet Med 7:593-604.
71. DeFranco E, Teramo K, Muglia L (2007) Genetic influences on preterm birth.
Semin Reprod Med 25:40-51.
142
72. Doody DR, et al. (1997) Risk factors for the recurrence of premature rupture of
the membranes. Paediatr Perinat Epidemiol 11 Suppl 1:96-106.
73. Lee T, et al. (2003) Preterm premature rupture of membranes: risks of recurrent
complications in the next pregnancy among a population-based sample of gravid
women. Am J Obstet Gynecol 188:209-213.
74. Ananth CV, Savitz DA, Williams MA (1996) Placental abruption and its
association with hypertension and prolonged rupture of membranes: a
methodologic review and meta-analysis. Obstet Gynecol 88:309-318.
75. Toivonen S, et al. (2004) Risk of placental abruption in first-degree relatives of
index patients. Clin Genet 66:244-246.
76. Nilsson E, et al. (2004) The importance of genetic and environmental effects for
pre-eclampsia and gestational hypertension: a family study. BJOG 111:200-206.
77. Salonen Ros H, et al. (2000) Genetic effects on the liability of developing pre-
eclampsia and gestational hypertension. Am J Med Genet 91:256-260.
78. Skjaerven R, et al. (2005) Recurrence of pre-eclampsia across generations:
exploring fetal and maternal genetic components in a population based cohort.
BMJ 331:877.
79. Thornton JG, Macdonald AM (1999) Twin mothers, pregnancy hypertension and
pre-eclampsia. Br J Obstet Gynaecol 106:570-575.
80. Cnattingius S, et al. (2004) Maternal and fetal genetic factors account for most of
familial aggregation of preeclampsia: a population-based Swedish cohort study.
Am J Med Genet A 130:365-371.
81. Mostello D, et al. (2008) Recurrence of preeclampsia: effects of gestational age at
delivery of the first pregnancy, body mass index, paternity, and interval between
births. Am J Obstet Gynecol.
82. Trogstad LI, et al. (2001) Changing paternity and time since last pregnancy; the
impact on pre-eclampsia risk. A study of 547 238 women with and without
previous pre-eclampsia. Int J Epidemiol 30:1317-1322.
83. Zhang J, Patel G (2007) Partner change and perinatal outcomes: a systematic
review. Paediatr Perinat Epidemiol 21 Suppl 1:46-57.
84. Esplin MS, et al. (2001) Paternal and maternal components of the predisposition
to preeclampsia. N Engl J Med 344:867-872.
85. Risch N (1990) Linkage strategies for genetically complex traits. I. Multilocus
models. Am J Hum Genet 46:222-228.
86. La Batide-Alanore A, et al. (2002) Familial aggregation of fetal growth restriction
in a French cohort of 7,822 term births between 1971 and 1985. Am J Epidemiol
156:180-187.
87. Lander ES, Schork NJ (1994) Genetic dissection of complex traits. Science
265:2037-2048.
88. Altmuller J, et al. (2001) Genomewide scans of complex human diseases: true
linkage is hard to find. Am J Hum Genet 69:936-950.
89. Weijnen CF, et al. (2002) Risk of diabetes in siblings of index cases with Type 2
diabetes: implications for genetic studies. Diabet Med 19:41-50.
90. Farbrother JE, et al. (2004) Family aggregation of high myopia: estimation of the
sibling recurrence risk ratio. Invest Ophthalmol Vis Sci 45:2873-2878.
143
91. Fotouhi A, et al. (2007) Familial aggregation of myopia in the Tehran eye study:
estimation of the sibling and parent offspring recurrence risk ratios. Br J
Ophthalmol 91:1440-1444.
92. Dawson LM, et al. (2002) Familial risk of preeclampsia in Newfoundland: a
population-based study. J Am Soc Nephrol 13:1901-1906.
93. Ananth CV, et al. (2006) Recurrence of spontaneous versus medically indicated
preterm birth. Am J Obstet Gynecol 195:643-650.
94. Ananth CV, et al. (2007) Recurrence of ischemic placental disease. Obstet
Gynecol 110:128-133.
95. Kilpatrick SJ, et al. (2006) Risk factors for previable premature rupture of
membranes or advanced cervical dilation: a case control study. Am J Obstet
Gynecol 194:1168-1174; discussion 1174-1165.
96. Ladfors L, et al. (2000) Prevalence and risk factors for prelabor rupture of the
membranes (PROM) at or near-term in an urban Swedish population. J Perinat
Med 28:491-496.
97. Lindqvist PG, Happach C (2006) Risk and risk estimation of placental abruption.
Eur J Obstet Gynecol Reprod Biol 126:160-164.
98. Rasmussen S, Irgens LM, Dalaker K (1997) The effect on the likelihood of
further pregnancy of placental abruption and the rate of its recurrence. Br J Obstet
Gynaecol 104:1292-1295.
99. Risch N (1990) Linkage strategies for genetically complex traits. II. The power of
affected relative pairs. Am J Hum Genet 46:229-241.
100. Guo SW (2002) Sibling recurrence risk ratio as a measure of genetic effect:
caveat emptor! Am J Hum Genet 70:818-819.
101. Rybicki BA, Elston RC (2000) The relationship between the sibling recurrence-
risk ratio and genotype relative risk. Am J Hum Genet 66:593-604.
102. Guo SW (2000) Familial aggregation of environmental risk factors and familial
aggregation of disease. Am J Epidemiol 151:1121-1131.
103. Guo SW (1998) Inflation of sibling recurrence-risk ratio, due to ascertainment
bias and/or overreporting. Am J Hum Genet 63:252-258.
104. Schoendorf KC, Branum AM (2006) The use of United States vital statistics in
perinatal and obstetric research. Am J Obstet Gynecol 194:911-915.
105. Herman AA, et al. (1997) Data linkage methods used in maternally-linked birth
and infant death surveillance data sets from the United States (Georgia, Missouri,
Utah and Washington State), Israel, Norway, Scotland and Western Australia.
Paediatr Perinat Epidemiol 11 Suppl 1:5-22.
106. StataCorp (2005) Stata Statistical Software: Release 9. StataCorp LP, College
Station, TX.
107. Plunkett J, et al. (2008) Population-based estimate of sibling risk for preterm
birth, preterm premature rupture of membranes, placental abruption and pre-
eclampsia. BMC Genet 9:44.
108. Macones GA, et al. (2004) A polymorphism in the promoter region of TNF and
bacterial vaginosis: preliminary evidence of gene-environment interaction in the
etiology of spontaneous preterm birth. Am J Obstet Gynecol 190:1504-1508.
144
109. Velez DR, et al. (2007) Ethnic differences in interleukin 6 (IL-6) and IL6 receptor
genes in spontaneous preterm birth and effects on amniotic fluid protein levels.
Ann Hum Genet.
110. Khoury MJ, James LM (1993) Population and familial relative risks of disease
associated with environmental factors in the presence of gene-environment
interaction. Am J Epidemiol 137:1241-1250.
111. Williams WR, Anderson DE (1984) Genetic epidemiology of breast cancer:
segregation analysis of 200 Danish pedigrees. Genet Epidemiol 1:7-20.
112. Hager R, Cheverud JM, Wolf JB (2008) Maternal effects as the cause of parent-
of-origin effects that mimic genomic imprinting. Genetics 178:1755-1762.
113. Crews DH, Jr. (2006) Age of dam and sex of calf adjustments and genetic
parameters for gestation length in Charolais cattle. J Anim Sci 84:25-31.
114. Jamrozik J, et al. (2005) Estimates of genetic parameters for Canadian Holstein
female reproduction traits. J Dairy Sci 88:2199-2208.
115. Heath SC (1997) Markov chain Monte Carlo segregation and linkage analysis for
oligogenic models. Am J Hum Genet 61:748-760.
116. Thompson (1995) Monte Carlo in Genetic Analysis. Technical report No 294.
Department of Statistics, University of Washington, Seattle.
117. Snow GL, Wijsman EM (1998) Pedigree analysis package (PAP) vs. MORGAN:
model selection and hypothesis testing on a large pedigree. Genet Epidemiol
15:355-369.
118. Boehnke M, Greenberg DA (1984) The effects of conditioning on probands to
correct for multiple ascertainment. Am J Hum Genet 36:1298-1308.
119. Hasstedt S (2002) Pedigree Analysis Package. Department of Human Genetics,
University of Utah, Salt Lake City.
120. Akaike H (1974) A new look at the statistical model identification. IEEE Trans
Automat Control 19:716-723.
121. Cannings C, Thompson EA (1977) Ascertainment in the sequential sampling of
pedigrees. Clin Genet 12:208-212.
122. Comuzzie AG, Williams JT (1999) Correcting for ascertainment bias in the
COGA data set. Genet Epidemiol 17 Suppl 1:S109-114.
123. Elston R, Olson J, Palmer L (2002) Ascertainment. Biostatistical Genetics and
Genetic Epidemiology. John Wiley and Sons, Chichester.
124. Boothe RG, Dobson V, Teller DY (1985) Postnatal development of vision in
human and nonhuman primates. Annu Rev Neurosci 8:495-545.
125. Smith BH (1989) Dental Development as a Measure of Life-History in Primates.
Evolution 43:683-688.
126. Smith R (2007) Parturition. N Engl J Med 356:271-283.
127. Rosenberg K, Trevathan W (2002) Birth, obstetrics and human evolution. BJOG
109:1199-1206.
128. Weaver TD, Hublin JJ (2009) Neandertal birth canal shape and the evolution of
human childbirth. Proc Natl Acad Sci U S A 106:8151-8156.
129. Chimpanzee Sequencing and Analysis Consortium (2005) Initial sequence of the
chimpanzee genome and comparison with the human genome. Nature 437:69-87.
130. Clark AG, et al. (2003) Inferring nonneutral evolution from human-chimp-mouse
orthologous gene trios. Science 302:1960-1963.
145
131. Bustamante CD, et al. (2005) Natural selection on protein-coding genes in the
human genome. Nature 437:1153-1157.
132. Pollard KS, et al. (2006) An RNA gene expressed during cortical development
evolved rapidly in humans. Nature 443:167-172.
133. Sacher GA, Staffeldt EF (1974) Relation of gestation time to brain weight for
placental mammals: implications for the theory of vertebrate growth. The
American Naturalist 108:593-615.
134. Committee on Understanding Premature Birth and Assuring Healthy Outcomes
(2006) Preterm Birth: Causes, Consequences, and Prevention. The National
Academies Press, Washington, D.C..
135. Doniger S (2008) Comparing and Contrasting Cis-regulatory Sequences to
Identify Functional Noncoding Sequence Variation. Division of Biology and
Biomedical Sciences. Washington University, Saint Louis, Missouri.
136. Plunkett J, et al. Rapid Evolution of FSHR in Humans Predicts Role in Birth
Timing. In preparation.
137. Ehn NL, et al. (2007) Evaluation of fetal and maternal genetic variation in the
progesterone receptor gene for contributions to preterm birth. Pediatr Res 62:630-
635.
138. Wang H, et al. (2004) Functionally significant SNP MMP8 promoter haplotypes
and preterm premature rupture of membranes (PPROM). Hum Mol Genet
13:2659-2669.
139. Storey JD, Tibshirani R (2003) Statistical significance for genomewide studies.
Proc Natl Acad Sci U S A 100:9440-9445.
140. Prabhakar S, et al. (2006) Accelerated evolution of conserved noncoding
sequences in humans. Science 314:786.
141. Wheeler DL, et al. (2007) Database resources of the National Center for
Biotechnology Information. Nucleic Acids Res 35:D5-12.
142. Voight BF, et al. (2006) A Map of Recent Positive Selection in the Human
Genome. PLoS Biol 4:e72.
143. Bird C, et al. (2007) Fast-evolving noncoding sequences in the human genome.
Genome Biol 8:R118.
144. Lussiana C, et al. (2008) Mutations and polymorphisms of the FSH receptor
(FSHR) gene: clinical implications in female fecundity and molecular biology of
FSHR protein and gene. Obstet Gynecol Surv 63:785-795.
145. Meduri G, et al. (2008) Molecular pathology of the FSH receptor: new insights
into FSH physiology. Mol Cell Endocrinol 282:130-142.
146. Ludwig M (2009) Are adverse outcomes associated with assisted reproduction
related to the technology or couples' subfertility? Nat Clin Pract Urol 6:8-9.
147. Romundstad LB, et al. (2008) Effects of technology or maternal factors on
perinatal outcome after assisted fertilisation: a population-based cohort study.
Lancet 372:737-743.
148. Hascalik S, et al. (2009) Effects of highly purified urinary FSH and human
menopausal FSH on Uterine Myoelectrical Dynamics. Mol Hum Reprod.
149. Mizrachi D, Shemesh M (1999) Follicle-stimulating hormone receptor and its
messenger ribonucleic acid are present in the bovine cervix and can regulate
cervical prostanoid synthesis. Biol Reprod 61:776-784.
146
150. Shemesh M, et al. (2001) Functional importance of bovine myometrial and
vascular LH receptors and cervical FSH receptors. Semin Reprod Med 19:87-96.
151. The International HapMap Consortium (2007) A second generation human
haplotype map of over 3.1 million SNPs. Nature 449:851-861.
152. Li Y, et al. (2007) FSH stimulates ovarian cancer cell growth by action on growth
factor variant receptor. Mol Cell Endocrinol 267:26-37.
153. Padmanabhan V, et al. (1989) Serum bioactive follicle-stimulating hormone-like
activity increases during pregnancy. J Clin Endocrinol Metab 69:968-977.
154. Simoni M, Gromoll J, Nieschlag E (1997) The follicle-stimulating hormone
receptor: biochemistry, molecular biology, physiology, and pathophysiology.
Endocr Rev 18:739-773.
155. Danilovich N, Roy I, Sairam MR (2002) Emergence of uterine pathology during
accelerated biological aging in FSH receptor-haploinsufficient mice.
Endocrinology 143:3618-3627.
156. Faustino NA, Cooper TA (2003) Pre-mRNA splicing and human disease. Genes
Dev 17:419-437.
157. Pagani F, et al. (2003) New type of disease causing mutations: the example of the
composite exonic regulatory elements of splicing in CFTR exon 12. Hum Mol
Genet 12:1111-1120.
158. R Development Core Team (2009) R: A language and environment for statistical
computing. R Foundation for Statistical Computing.
159. Purvis A (1995) A Composite Estimate of Primate Phylogeny. Philosophical
Transactions: Biological Sciences 348:405-421.
160. Maddison W, Maddison D (2009) Mesquite: a modular system for evolutionary
analysis. http://mesquiteproject.org.
161. Hubbard TJ, et al. (2007) Ensembl 2007. Nucleic Acids Res 35:D610-617.
162. Edgar RC (2004) MUSCLE: a multiple sequence alignment method with reduced
time and space complexity. BMC Bioinformatics 5:113.
163. Kuhn RM, et al. (2007) The UCSC genome browser database: update 2007.
Nucleic Acids Res 35:D668-673.
164. Siepel A, et al. (2005) Evolutionarily conserved elements in vertebrate, insect,
worm, and yeast genomes. Genome Res 15:1034-1050.
165. Blanchette M, et al. (2004) Aligning multiple genomic sequences with the
threaded blockset aligner. Genome Res 14:708-715.
166. Pond SL, Frost SD, Muse SV (2005) HyPhy: hypothesis testing using
phylogenies. Bioinformatics 21:676-679.
167. Chuang JH, Li H (2004) Functional bias and spatial organization of genes in
mutational hot and cold regions in the human genome. PLoS Biol 2:E29.
168. Muse SV, Gaut BS (1994) A likelihood approach for comparing synonymous and
nonsynonymous nucleotide substitution rates, with application to the chloroplast
genome. Mol Biol Evol 11:715-724.
169. Oliveros JC (2007) VENNY. An interactive tool for comparing lists with Venn
Diagrams. http://bioinfogp.cnb.csic.es/tools/venny/index.html.
170. Nielsen R, et al. (2005) A Scan for Positively Selected Genes in the Genomes of
Humans and Chimpanzees. PLoS Biol 3:e170.
147
171. Arbiza L, Dopazo J, Dopazo Hn (2006) Positive Selection, Relaxation, and
Acceleration in the Evolution of the Human and Chimp Genome. PLoS Comput
Biol 2:e38.
172. Pontius JU, Wagner L, Schuler GD (2003) UniGene: a unified view of the
transcriptome. The NCBI Handbook National Center for Biotechnology
Information, Bethesda, MD.
173. Bailey JA, et al. (2002) Recent segmental duplications in the human genome.
Science 297:1003-1007.
174. Hafler DA, et al. (2007) Risk alleles for multiple sclerosis identified by a
genomewide study. N Engl J Med 357:851-862.
175. Purcell S, et al. (2007) PLINK: a tool set for whole-genome association and
population-based linkage analyses. Am J Hum Genet 81:559-575.
176. Gao X, et al. (2009) Avoiding the high Bonferroni penalty in genome-wide
association studies. Genet Epidemiol.
177. Barrett JC, et al. (2005) Haploview: analysis and visualization of LD and
haplotype maps. Bioinformatics 21:263-265.
178. Gabriel SB, et al. (2002) The structure of haplotype blocks in the human genome.
Science 296:2225-2229.
179. Chaudhari BP, et al. (2008) The genetics of birth timing: insights into a
fundamental component of human development. Clin Genet 74:493-501.
180. Plunkett J, Muglia LJ (2008) Genetic contributions to preterm birth: Implications
from epidemiological and genetic association studies. Ann Med 40:167-179.
181. Mitchell BF, Taggart MJ (2009) Are animal models relevant to key aspects of
human parturition? Am J Physiol Regul Integr Comp Physiol 297:R525-545.
182. Frazer KA, et al. (2003) Genomic DNA insertions and deletions occur frequently
between humans and nonhuman primates. Genome Res 13:341-346.
183. Wetterbom A, et al. (2006) Comparative genomic analysis of human and
chimpanzee indicates a key role for indels in primate evolution. J Mol Evol
63:682-690.
184. Huh JW, et al. (2009) Gain of new exons and promoters by lineage-specific
transposable elements-integration and conservation event on CHRM3 gene. Mol
Cells 28:111-117.
185. Lee JR, et al. (2009) Lineage specific evolutionary events on SFTPB gene: Alu
recombination-mediated deletion (ARMD), exonization, and alternative splicing
events. Gene 435:29-35.
186. Tithof PK, et al. (2007) Distinct phospholipase A2 enzymes regulate
prostaglandin E2 and F2alpha production by bovine endometrial epithelial cells.
Reprod Biol Endocrinol 5:16.
187. Elsik CG, et al. (2009) The genome sequence of taurine cattle: a window to
ruminant biology and evolution. Science 324:522-528.
188. Ramensky V, Bork P, Sunyaev S (2002) Human non-synonymous SNPs: server
and survey. Nucleic Acids Research 30:3894-3900.
189. Ng PC, Henikoff S (2003) SIFT: predicting amino acid changes that affect protein
function. Nucleic Acids Research 31:3812-3814.
148
190. Underwood KW, et al. (1998) A novel calcium-independent phospholipase A2,
cPLA2-gamma, that is prenylated and contains homology to cPLA2. J Biol Chem
273:21926-21932.
191. Khan AH, Carson RJ, Nelson SM (2008) Prostaglandins in labor--a translational
approach. Front Biosci 13:5794-5809.
192. Hayashi M, et al. (2002) The levels of five markers of hemostasis and endothelial
status at different stages of normotensive pregnancy. Acta Obstet Gynecol Scand
81:208-213.
193. Gross G, et al. (2000) Inhibition of cyclooxygenase-2 prevents inflammation-
mediated preterm labor in the mouse. Am J Physiol Regul Integr Comp Physiol
278:R1415-1423.
194. Burns PD, et al. (2001) Cellular mechanisms by which oxytocin mediates ovine
endometrial prostaglandin F2alpha synthesis: role of G(i) proteins and mitogen-
activated protein kinases. Biol Reprod 65:1150-1155.
195. Vitale A, et al. (2005) Mouse cPLA2[gamma], a novel oocyte and early embryo-
abundant phospholipase A2 gamma-like protein, is targeted to the nuclear
envelope during germinal vesicle breakdown. Developmental Biology 282:374-
384.
196. Dickson SP, et al. Rare Variants Create Synthetic Genome-Wide Associations.
PLoS Biol 8:e1000294.
197. Schork NJ, et al. (2009) Common vs. rare allele hypotheses for complex diseases.
Current Opinion in Genetics & Development 19:212-219.
198. Grant SF, et al. (2006) Variant of transcription factor 7-like 2 (TCF7L2) gene
confers risk of type 2 diabetes. Nat Genet 38:320-323.
149

Curriculum Vitae
Jevon Plunkett
Email: [email protected]; [email protected] Current Address: Permanent Address: 3612 Wilbur Place, Nashville, Tennessee 37204 1343 Melia Street, Camarillo, California 93010 (314) 452-3568 (805) 987-4743 RESEARCH INTERESTS My main research interest is the genetic etiology of adverse pregnancy outcomes. I am particularly interested in exploring the complexity of pathways to disease, incorporating genetic information with physiological and environmental data to create a holistic view of disease. I am also interested in using genetic information in pharmacogenetic studies and public health screenings related to obstetrics. EDUCATION
• Doctor of Philosophy in Human and Statistical Genetics, August 2010 Washington University, Saint Louis, Missouri
Dissertation: Genetics Influences on Preterm Birth Mentors: Louis Muglia, M.D., Ph.D. and Ingrid Borecki, Ph.D.
• Bachelor of Arts summa cum laude in biology, with minor in psychology, May 2006 Honors thesis: Complexities in the Genetics of Alcohol Dependence: The Chromosome 5 GABA-A Receptor Gene Cluster and Alcohol-Related Behaviors in the Collaborative Study on the Genetics of Alcoholism Mentor: Danielle Dick, Ph.D. RESEARCH EXPERIENCE • Doctoral student, 2006-2010 Washington University (2006-2008), Vanderbilt University (2009-2010) Mentor: Louis Muglia, M.D., Ph.D. Sibling risk estimates, segregation analysis, and case-control association tests to detect genetic effects in preterm birth. **Fellowship support from: Mr. and Mrs. Spencer T. Olin Fellowship for Women in Graduate Study at Washington University in St. Louis, 2006-2010; National Institute of General Medical Science training grant (T32 GM081739) for interdisciplinary training of graduate students in psychology, neuroscience and genetics at Washington University, 2007-2009 • Undergraduate honors student, 2005-2006 Washington University Mentor: Danielle Dick, Ph.D. Family-based SNP and haplotype association tests, genotype-environment interaction tests in Collaborative Study on Genetics of Alcoholism (COGA) sample. **Summer funding from: Washington University Hoopes Undergraduate Research Award, 2005; Washington University/Howard Hughes Medical Institute (HHMI) Summer Undergraduate Research Fellowship, 2005 **Travel Award: Hoopes Undergraduate Research Travel Award, Washington University, 2006; Washington University/HHMI Undergraduate Research Travel Award, 2006 • Undergraduate researcher, 2002-2004
150

Washington University Mentor: Alan Shiels, Ph.D. Parametric linkage analysis reactions and direct sequencing for family studies of hereditary eye disorders **Summer funding from Washington University/HHMI Summer Undergraduate Research Fellowship, 2004; Washington University/HHMI Summer Scholars Program in Biology and Biomedical Research Award, 2002 TEACHING EXPERIENCE
• Mentored graduate student’s rotation project, 2010 Vanderbilt University, Nashville, Tennessee
• Mentored high school student’s summer project, 2009, 2010 • Guest lecturer, Research Internship Program, 2009
• Course Instructor, Problem-based Learning (lower division undergraduate), Fall 2008 Washington University, Saint Louis, Missouri
• Course Instructor, Summer Focus program Writing Course (rising high school seniors in summer research program), Summer 2008
• Teaching Assistant, Human Genetics (upper division undergraduate), Spring 2008 • Teaching Assistant, Fundamentals of Mammalian Genetics (graduate), Fall 2007 • Teaching Assistant, Principles of Biology II: Genetics (lower division undergraduate), Fall 2004 • Tutor, Principles of Biology courses, 2005-2006 OTHER PROFESSIONAL EXPERIENCE • Ad hoc reviewer, Journal of Women’s Health 2009, American Journal of Epidemiology 2008 • Professional Affiliations with: American Society for Human Genetics (ASHG) 2007-present;
International Genetic Epidemiology Society 2009; American Medical Writers Association 2009; Association for Women in Science, 2006; Behavior Genetics Association, 2006
• Shadowed Maternal-Fetal Medicine specialist, Lavinda Carpenter, M.D., Vanderbilt University, Nashville, Tennessee, 2010
• Clinic observer and volunteer at the student-run Shade Tree Family Clinic, Vanderbilt University, Nashville, Tennessee, 2010
• Participation in teaching development workshops hosted by: American Society of Microbiology Conference on Undergraduate Education, Beverly, Massachusetts, 2008; Vanderbilt University Center for Teaching, Nashville, Tennessee, 2009-2010; Washington University Teaching Center, Saint Louis, Missouri, 2007-2008
UNIVERSITY SERVICE Vanderbilt University, Nashville, Tennessee • Human Genetics Student Association member, 2009-2010 • Editor’s Club member, 2009-2010 • Annals of Biomedical Student/Trainee Research and Current Trends (A.B.S.T.R.A.C.T.) publication
contributor, 2009 Washington University, Saint Louis, Missouri • Washington University Future Educators member and group facilitator, 2006-2008 • Human and Statistical Genetics program website development committee, 2008 • Graduate School of Arts and Sciences Peer Mentor, 2007-2008 • Human and Statistical Genetics program recruitment, 2007-2008 • Olin Fellowship Conference planning committee, 2006-2008
151
PUBLICATIONS
1. Plunkett J, Doniger S, Orabona G, Morgan T, Haatajae R, Hallmane M, Puttonenf H, Menon R, Kuczynskii E, Norwitzi E, Snegovskikhi V, Palotie A, Peltonen L, Fellman V, DeFranco EA, Chaudhari BP, Teramo K, Borecki I, Fay J, Muglia L. Rapid evolution of FSHR in humans predicts role in birth timing. Submitted.
Submitted / in preparation
2. Haataja R, Karjalainen MK, Luukkonen A, Teramo K, Puttonen H, Ojaniemi M, Varilo T, Chaudhari BP, Plunkett J, Murray JC, McCarroll SA, Peltonen L, Muglia LJ, Palotie A, Hallman M. Mapping a new spontaneous preterm birth susceptibility gene IGF1R using linkage, haplotype sharing and association analysis. Submitted.
3. Plunkett J, Doniger S, Orabona G, Morgan T, Haatajae R, Hallmane M, Puttonenf H, Menon R, Kuczynskii E, Norwitzi E, Snegovskikhi V, Palotie A, Peltonen L, Fellman V, DeFranco EA, Chaudhari BP, Teramo K, Borecki I, Fay J, Muglia L. Primate-specific evolution of conserved noncoding element insertion into PLA2G4C and human preterm birth. In preparation.
1. Daw EW, Plunkett J, Feitosa M, Gao X, Van Brunt A, Ma D, Czajkowski J, Province MA, Borecki I. (2009) A framework for analyzing both linkage and association: an analysis of Genetic Analysis Workshop 16 simulated data. BMC Proc. 3 Suppl 7:S98.
Original research
2. Plunkett J, Feitosa MF, Trusgnich M, Wangler M, Palomar L, Kistka ZAF, DeFranco EA, Shen T, Stormo A, Puttonen H, Hallman M, Haataja R, Fellman V, Peltonen L, Palotie A, Daw EW , An P, Teramo K, Borecki I, Muglia LJ. (2009) Mother’s genome or maternally-inherited genes acting in the fetus influence gestational age in familial preterm birth. Hum Hered 68:209-219.
3. Plunkett J, Borecki I, Morgan T, Stamilio D, Muglia LJ. (2008) Population-based estimate of sibling risk for adverse pregnancy outcomes. BMC Genetics, 9:44.
4. Kistka ZA, DeFranco EA, Ligthart L, Willemsen G, Plunkett J, Muglia LJ, Boomsma DI. Heritability of parturition timing: an extended twin design analysis. (2008) Am J Obstet Gynecol., 199 (1): 43 e1-5.
5. Dick DM, Wang JC, Plunkett J, Aliev F, Hinrichs A, Bertelsen S, Budde JP, Goldstein EL, Kaplan D, Edenberg HJ, Nurnberger J, Hesselbrock V, Schuckit M, Kuperman S, Tischfield J, Porjesz B, Begleiter H, Bierut LJ, & Goate A. (2007) Family-based association analyses of alcohol dependence phenotypes across DRD2 and neighboring gene ANKK1. Alcohol Clin Exp Res., 31(10): 1645-53.
6. Dick DM, Plunkett J, Hamlin D, Nurnberger J, Kuperman S, Schuckit M, Hesselbrock V, Edenberg H, Bierut L. (2007) Association analyses of the serotonin transporter gene with lifetime depression and alcohol dependence in the Collaborative Study on the Genetics of Alcoholism (COGA) sample. Psychiatric Genet., 17(1): 35-8.
7. Dick DM, Plunkett J, Wetherill LF, Xuei X, Goate A, Hesselbrock V, Schuckit M, Crowe R, Edenberg HJ, Foroud T. (2006) Association between GABRA1 and drinking behaviors in the collaborative study on the genetics of alcoholism sample. Alcohol Clin Exp Res., 30(7): 1101-10.
1. Plunkett J & Muglia LJ. (2008) Genetic Contributions to Preterm Birth: Implications from Epidemiological and Genetic Association Studies. Ann Med., 40(3):167-95.
Invited Review
2. Chaudhari BP, Plunkett J, Ratajczak CK, Shen TT, DeFranco EA, Muglia LJ. (2008) The genetics of birth timing: insights into a fundamental component of human development. Clin Genet., 74(6):493-501.
ABSTRACTS AND PRESENTATIONS
152

• Plunkett J, Muglia L. (2007) Sibling risk for adverse pregnancy outcomes. Am J Obstet Gynecol., 197 (6): S186.
Abstracts
• Defranco E, Kistka Z, Ligthart L, Willemsen G, Plunkett J, Muglia L, Boomsma DI. (2007) Heritability of parturition timing: An extended twin design analysis. Am J Obstet Gynecol., 197 (6): S199.
• Rapidly evolving genes as candidate genes for preterm birth (2009) Platform presentation at American Society for Human Genetics Annual Meeting, Honolulu, Hawaii.
Presentations
• Mother’s genome or maternally-inherited genes acting in the fetus influence gestational age in familial preterm birth (2008) Platform presentation at American Society for Human Genetics Annual Meeting. Philadelphia, Pennsylvania.
• Sibling Risk for Adverse Pregnancy Outcomes (2008) Poster presentation at Society for Maternal-Fetal Medicine Annual Meeting, Dallas, Texas.
• Association between GABRA1 and Drinking Behaviors in the Collaborative Study on the Genetics of Alcoholism Sample (2006) Poster presentation at Behavior Genetics Association Annual Meeting, Storrs, Connecticut
.
HONORS AND AWARDS • Semifinalist, American Society of Human Genetics (ASHG) Trainee Award, Predoctoral Clinical
category, 2009 • Finalist, ASHG Trainee Award, Predoctoral Clinical category, 2008 • ASHG travel award to attend American Society of Microbiology Conference on Undergraduate
Education, 2008 • Teaching citation, Washington University, 2008 • Phi Beta Kappa Honor Society, 2006 • Sigma Xi, the Scientific Research Society, 2006 • Washington University College of Arts and Sciences Dean’s List, 2002-2006 COMMUNITY INVOLVEMENT
• Scientist on Site program participant, Adventure Science Center, Nashville, Tennessee, 2009-2010 Science outreach
• Graduate student mentor for Research Internship Program, Vanderbilt University Center for Science Outreach, Nashville, Tennessee, 2009
• Young Scientist Program, Saint Louis Missouri, 2006-2008 o Summer Focus program tutor, 2007, 2008 o Teacher-Researcher Partnership member, 2008 o Steering Committee member, 2006-2008 o Forensics Teaching Team Member, 2006-2008
• Science Fair Judge, 2008-2009 o Head Magnet Middle School, Nashville, Tennessee o Jackson Park Elementary School, University City, Missouri
• Washington University Science Outreach, Saint Louis Missouri, 2003-2006 o Science Club for Webster Middle School, 2005-2006 o Genetics Teaching Team Member 2003-2005
Service
153
• Mentor for MentorNet e-mentoring program, 2006-2010 • First Church Unity, Nashville, Tennessee, 2009-2010
o Co-organizer, Creating Connections social networking group o Leader for teen programming
• Breast Health Educator for Siloam Family Health Center, Nashville, Tennessee, 2009 • Girls on the Run International, Nashville, Tennessee, 2009-2010
o Coach and running buddy o Fundraising through SoleMates program
• Team in Training, The Leukemia & Lymphoma Society (LLS), Nashville, Tennessee, 2009 o Team member- raised $1835 while training for the 2009 Country Music Half Marathon o Team captain - fundraising and training support for new team members
• Restore St. Louis, Saint Louis, Missouri, 2007-2008 o Tutor, Firm Foundations Tutoring Program o Volunteer and crew leader, Work Day ministry
• Endurance running Hobbies and personal interests
o completed 2 half marathons to date, training for full marathon in 2010 • Ballroom dancing
o Bronze level dancer • Member of Toastmasters International, 2007-2008
154


